Recensioni per il Intel Core i5-11300H processore
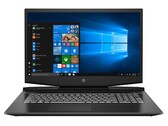
Recensione del portatile HP Pavilion Gaming 17: Un buon display a un prezzo economico
Mentre la maggior parte dei portatili da gioco con prezzo inferiore a 1.000 euro (~$1.002) mostra significative debolezze nella qualità dell'immagine (parola chiave: spazio colore), HP dichiara che il Pavilion Gaming 17-cd2146ng offre una copertura sRGB del 100%. Abbiamo messo alla prova il 17 pollici.
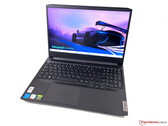
Intel Core i5-11300H, NVIDIA GeForce RTX 3050 Ti Laptop GPU, 17.3", 2.8 kgRecensione del laptop Lenovo IdeaPad Gaming 3i 15 G6: Laptop gaming economico con display scadente
L'IdeaPad Gaming 3i 15 di Lenovo è un notebook da gioco economico di sesta generazione. La nostra unità di recensione, al prezzo di circa 900 dollari, accoppia un processore Intel Tiger Lake H35 con una RTX 3050 Ti da 90 W GeForce - una combinazione ideale per il gioco FHD.
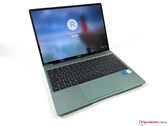
Intel Core i5-11300H, NVIDIA GeForce RTX 3050 Ti Laptop GPU, 15.6", 2 kgRecensione Huawei MateBook 13s: Ottimo subnotebook con display a 90 Hz
Il MateBook 13s di Huawei è un subnotebook molto compatto con uno schermo da 13 pollici ad alta risoluzione e un moderno processore Tiger Lake-H35 di Intel. Combinato con dispositivi di input decenti e buoni altoparlanti, il MateBook 13s risulta essere un pacchetto molto interessante.
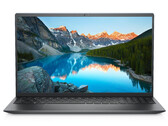
Intel Core i5-11300H, Iris Xe G7 80EUs, 13.4", 1.3 kgRecensione del Dell Inspiron 15 5518: La CPU è rallentata
L'Inspiron 15 5518 offre un processore Core i5-11300H, una GPU GeForce-MX450 e 8 GB di memoria di lavoro. Quest'ultima funziona in modalità single-channel. Positivo: Il notebook offre un'ottima autonomia della batteria ed offre spazio per due SSD NVMe.
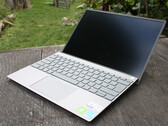
Intel Core i5-11300H, NVIDIA GeForce MX450, 15.6", 1.8 kgRecensione del Dell Inspiron 13 5310: Più grafica, maggiore autonomia
L'Inspiron 13 5310 da 13 pollici di Dell combina tutto ciò che il tuo cuore desidera: Un potente processore Intel-H con 35 watt, una scheda grafica dedicata, un display sRGB opaco con risoluzione Full HD e due porte Thunderbolt 4, oltre a una grande batteria da 56 Wh. Cosa potrebbe mai andare storto?
Intel Core i5-11300H, NVIDIA GeForce MX450, 13.3", 1.3 kgLenovo IdeaPad 5 Pro 16IHU6: NVIDIA GeForce MX450, 16.00", 1.9 kg
recensione » Recensione del Lenovo IdeaPad 5 Pro 16IHU6: un 16 pollici tuttofare con una buona durata della batteria
Acer Nitro 5 AN517-53-54DQ: NVIDIA GeForce RTX 3050 4GB Laptop GPU, 17.30", 2.6 kg
recensione » Recensione dell'Acer Nitro 5 AN517-53: un LaptopGaming economico con RTX 3050
Dell Inspiron 14 5410, i5-11300H: Intel Iris Xe Graphics G7 80EUs, 14.00", 1.4 kg
Recensioni esterne » Dell Inspiron 14 5410, i5-11300H
Asus Vivobook 15 F1605PA: Intel Iris Xe Graphics G7 80EUs, 16.00", 1.9 kg
Recensioni esterne » Asus Vivobook 15 F1605PA
Asus Vivobook Pro 15 K3500PC-L1293: NVIDIA GeForce RTX 3050 4GB Laptop GPU, 15.60", 1.7 kg
Recensioni esterne » Asus Vivobook Pro 15 K3500PC-L1293
Lenovo Yoga Slim 7 Pro 14IHU5-82NH0048GE: Intel Iris Xe Graphics G7 80EUs, 14.00", 1.4 kg
Recensioni esterne » Lenovo Yoga Slim 7 Pro 14IHU5-82NH0048GE
Acer Swift 3 SF316-51-57D7: Intel Iris Xe Graphics G7 80EUs, 16.10", 1.8 kg
Recensioni esterne » Acer Swift 3 SF316-51-57D7
Microsoft Surface Laptop Studio i5-11300H: Intel Iris Xe Graphics G7 80EUs, 14.40", 1.7 kg
Recensioni esterne » Microsoft Surface Laptop Studio i5-11300H
Xiaomi Mi Notebook Ultra 2021 i5: Intel Iris Xe Graphics G7 80EUs, 15.60", 1.7 kg
Recensioni esterne » Xiaomi Mi Notebook Ultra 2021 i5
Acer Nitro 5 AN515-56-54DF: NVIDIA GeForce GTX 1650 Mobile, 15.60", 2.3 kg
Recensioni esterne » Acer Nitro 5 AN515-56-54DF
Acer Nitro 5 AN515-56-51V8: NVIDIA GeForce GTX 1650 Mobile, 15.60", 2.3 kg
Recensioni esterne » Acer Nitro 5 AN515-56-51V8
Lenovo IdeaPad Gaming 3 15IHU6-82K100QHGE: NVIDIA GeForce RTX 3050 4GB Laptop GPU, 15.60", 2.3 kg
Recensioni esterne » Lenovo IdeaPad Gaming 3 15IHU6-82K100QHGE
Asus Vivobook Pro 14 K3400PA-WH51: Intel Iris Xe Graphics G7 80EUs, 14.00", 1.4 kg
Recensioni esterne » Asus Vivobook Pro 14 K3400PA-WH51
Asus Vivobook Pro 16X N7600PC-L2012R: NVIDIA GeForce RTX 3050 4GB Laptop GPU, 16.10", 2 kg
Recensioni esterne » Asus Vivobook Pro 16X N7600PC-L2012R
Asus Vivobook Pro 14 K3400, i5-11300H GTX 1650: NVIDIA GeForce GTX 1650 Mobile, 14.00", 1.4 kg
Recensioni esterne » Asus Vivobook Pro 14 K3400, i5-11300H GTX 1650
HP Pavilion Gaming 15-dk2002TX: NVIDIA GeForce RTX 3050 4GB Laptop GPU, 15.60", 2.2 kg
Recensioni esterne » HP Pavilion Gaming 15-dk2002TX
Asus VivoBook Pro 14X N7400, i5-11300H RTX 3050: NVIDIA GeForce RTX 3050 4GB Laptop GPU, 14.00", 1.5 kg
Recensioni esterne » Asus VivoBook Pro 14X N7400, i5-11300H RTX 3050
Asus VivoBook Pro 15 K3500PC-L1009T: NVIDIA GeForce RTX 3050 4GB Laptop GPU, 15.60", 1.7 kg
Recensioni esterne » Asus VivoBook Pro 15 K3500PC-L1009T
Lenovo IdeaPad Gaming 3 15IHU6-82K1002QGE: NVIDIA GeForce RTX 3050 4GB Laptop GPU, 15.60", 2.3 kg
Recensioni esterne » Lenovo IdeaPad Gaming 3 15IHU6-82K1002QGE
Huawei MateBook 14s i5: Intel Iris Xe Graphics G7 80EUs, 14.20", 1.4 kg
Recensioni esterne » Huawei MateBook 14s i5
Xiaomi RedmiBook Pro 15, i5-11300H iGPU: Intel Iris Xe Graphics G7 80EUs, 15.60", 1.7 kg
Recensioni esterne » Xiaomi RedmiBook Pro 15, i5-11300H iGPU
Acer Swift 3 SF316-51-51BS: Intel Iris Xe Graphics G7 80EUs, 16.10", 1.8 kg
Recensioni esterne » Acer Swift 3 SF316-51-51BS
Acer Nitro 5 AN515-56-58CQ: NVIDIA GeForce GTX 1650 Mobile, 15.60", 2.3 kg
Recensioni esterne » Acer Nitro 5 AN515-56-58CQ
Xiaomi Mi Notebook Pro 15, i5-11300H MX450: NVIDIA GeForce MX450, 15.60", 1.8 kg
Recensioni esterne » Xiaomi Mi Notebook Pro 15, i5-11300H MX450
Xiaomi RedmiBook Pro 15, i5-11300H MX450: NVIDIA GeForce MX450, 15.60", 1.7 kg
Recensioni esterne » Xiaomi RedmiBook Pro 15, i5-11300H MX450
Acer Aspire Nitro 5 AN517-53-51FQ: NVIDIA GeForce GTX 1650 Mobile, 17.30", 2.7 kg
Recensioni esterne » Acer Aspire Nitro 5 AN517-53-51FQ
Acer Predator Triton 300SE PT314-51s-57YJ: NVIDIA GeForce RTX 3060 Laptop GPU, 14.00", 1.7 kg
Recensioni esterne » Acer Predator Triton 300SE PT314-51s-57YJ