Recensioni Notebook con NVIDIA GeForce MX450 la scheda grafica
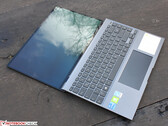
Recensione del convertibile Asus ZenBook Flip 15 Q508U: la GeForce MX450 rimane indietro
Un ultrabook AMD Zen + Nvidia MX sembrava interessante qualche anno fa, ma è troppo poco e troppo tardi ora che le CPU Zen 3+ sono disponibili con la Radeon 680M integrata, più veloce, più piccola e più efficiente. L'MX450 di GeForce non è comunque male se non vi dispiace il peso e lo spessore aggiuntivi.
AMD Ryzen 7 5700U, NVIDIA GeForce MX450, 15.6", 1.9 kgRecensione dell'Asus ZenBook 14X OLED: Giochi ed intensi colori 3K
Asus ha fatto il passo più lungo della gamba: Il 14 pollici combina le prestazioni grafiche facilmente regolabili di un MX450 con un Core i7 scalabile Tiger Lake. Oltre a questo, ha un colorato schermo OLED widescreen 3K. Questo lascia qualcosa a desiderare?
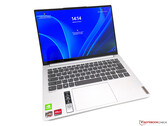
Intel Core i7-1165G7, NVIDIA GeForce MX450, 14", 1.4 kgRecensione del Lenovo Yoga Slim 7 Pro 14 OLED: Un subnotebook con CPU potente
Opzionalmente, Lenovo offre anche il suo subnotebook compatto da 14 pollici Yoga Slim 7 Pro con un display OLED e GeForce MX450 dedicato. Allo stesso tempo, non dovrete fare a meno di un processore AMD Ryzen 9 molto potente in questa configurazione.
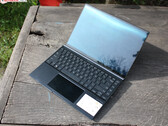
AMD Ryzen 9 5900HS, NVIDIA GeForce MX450, 14", 1.4 kgRecensione del prototipo Asus Zenbook 14X OLED: Che bei colori intensi!
Il portatile da 14 pollici di Asus combina uno splendido display OLED con un case di prima classe, robusto e di alta qualità. Anche le prestazioni dovrebbero essere ottime grazie all'MX450 e ad un SoC Tiger Lake di Intel. Continuate a leggere per scoprire cosa ci è piaciuto e non ci è piaciuto del modello di pre-produzione.
Intel Core i7-1165G7, NVIDIA GeForce MX450, 14", 1.4 kgRecensione del Dell Inspiron 15 5518: La CPU è rallentata
L'Inspiron 15 5518 offre un processore Core i5-11300H, una GPU GeForce-MX450 e 8 GB di memoria di lavoro. Quest'ultima funziona in modalità single-channel. Positivo: Il notebook offre un'ottima autonomia della batteria ed offre spazio per due SSD NVMe.
Intel Core i5-11300H, NVIDIA GeForce MX450, 15.6", 1.8 kgDell Inspiron 13 5310-NJ24J: Intel Core i5-11300H, 13.30", 1.3 kg
recensione » Recensione del Dell Inspiron 13 5310: Più grafica, maggiore autonomia
Lenovo IdeaPad 5 Pro 16IHU6: Intel Core i5-11300H, 16.00", 1.9 kg
recensione » Recensione del Lenovo IdeaPad 5 Pro 16IHU6: un 16 pollici tuttofare con una buona durata della batteria
HP Envy 17-cg: Intel Core i5-1135G7, 17.30", 2.7 kg
recensione » Recensione del computer portatile HP Envy 17 cg1356ng: Un ottimo portatile multimediale
MSI Modern 14 B11SB-085: Intel Core i7-1165G7, 14.00", 1.3 kg
recensione » Recensione dell'MSI Modern 14 B11SB: un 14 pollici tuttofare che soffre con le temperature elevate
Xiaomi RedmiBook Pro 15: Intel Core i7-11370H, 15.60", 1.7 kg
recensione » Recensione dello Xiaomi RedmiBook Pro 15 (2021): un computer portatile economico con caratteristiche notevoli
HP Pavilion 15-eg: Intel Core i7-1165G7, 15.60", 1.7 kg
recensione » Recensione del computer portatile HP Pavilion 15 (2021): Intel di 11a generazione e GeForce MX450 Combo
HP Envy 13-ba1475ng: Intel Core i7-1165G7, 13.30", 1.3 kg
recensione » Recensione del computer portatile HP Envy 13 con Intel Tiger Lake e GeForce MX450
Lenovo ThinkPad T14 Gen2-20W1S00000: Intel Core i7-1165G7, 14.00", 1.5 kg
recensione » Recensione del portatile Lenovo ThinkPad T14 Gen 2: Beneficia dell'Intel Tiger Lake
Lenovo ThinkPad T15 Gen2-20W5S00100: Intel Core i7-1165G7, 15.60", 1.9 kg
recensione » Recensione del Computer portatile Lenovo ThinkPad T15 Gen2: dispositivo Business con GPU media e Tiger Lake
Lenovo ThinkPad E15 Gen2-20TD002MGE: Intel Core i7-1165G7, 15.60", 1.8 kg
recensione » Recensione del Laptop Lenovo ThinkPad E15 Gen 2: Computer portatile Tiger-Lake con una Nvidia GeForce MX450
Asus Zenbook 14 UX435EG: Intel Core i7-1165G7, 14.00", 1.3 kg
recensione » Recensione del Laptop Asus ZenBook 14 UX435EG: Un tuttofare multimediale compatto e mobile con un inutile touchscreen
Asus Zenbook Flip 15 UM562UG-AC018WS: AMD Ryzen 7 5700U, 15.60", 1.9 kg
Recensioni esterne » Asus Zenbook Flip 15 UM562UG-AC018WS
HP Envy 17-ch1056nf: Intel Core i7-1195G7, 17.30", 2.5 kg
Recensioni esterne » HP Envy 17-ch1056nf
Dell Inspiron 15 5510, i7-11390H MX450: Intel Core i7-11390H, 15.60", 1.6 kg
Recensioni esterne » Dell Inspiron 15 5510, i7-11390H MX450
Dell Inspiron 15 5518-NP37P: Intel Core i5-11320H, 15.60", 1.8 kg
Recensioni esterne » Dell Inspiron 15 5518-NP37P
Lenovo Yoga Slim 7 Pro 14IHU5-82NH002QGE: Intel Core i7-11370H, 14.00", 1.4 kg
Recensioni esterne » Lenovo Yoga Slim 7 Pro 14IHU5-82NH002QGE
Acer Aspire 5 A517-52G-59GP: Intel Core i5-1135G7, 17.30", 2.6 kg
Recensioni esterne » Acer Aspire 5 A517-52G-59GP
Lenovo Yoga Slim 7 Pro 14 OLED Ryzen 9: AMD Ryzen 9 5900HS, 14.00", 1.4 kg
Recensioni esterne » Lenovo Yoga Slim 7 Pro 14 OLED Ryzen 9
Dell Latitude 15 5521, i5-11500H MX450: Intel Core i5-11500H, 15.60", 1.8 kg
Recensioni esterne » Dell Latitude 15 5521, i5-11500H MX450
MSI Modern 14 B11SB, i5-1135G7 MX450: Intel Core i5-1135G7, 14.00", 1.3 kg
Recensioni esterne » MSI Modern 14 B11SB, i5-1135G7 MX450
Asus Zenbook 14X UX5400EG, i5-1135G7: Intel Core i5-1135G7, 14.00", 1.4 kg
Recensioni esterne » Asus Zenbook 14X UX5400EG, i5-1135G7
HP Envy 13-ba1002ns: Intel Core i7-1165G7, 13.30", 1.3 kg
Recensioni esterne » HP Envy 13-ba1002ns
Lenovo Yoga Slim 7 Carbon 14ACN6, 5800U: AMD Ryzen 7 5800U, 14.00", 1.1 kg
Recensioni esterne » Lenovo Yoga Slim 7 Carbon 14ACN-6, 5800U
Lenovo Yoga Slim 7 Pro 14ARH5-82NK001PSB: AMD Ryzen 9 5900HS, 14.00", 1.3 kg
Recensioni esterne » Lenovo Yoga Slim 7 Pro 14ARH5-82NK001PSB
Asus Zenbook 14X UX5400E: Intel Core i7-1165G7, 14.00", 1.4 kg
Recensioni esterne » Asus Zenbook 14X UX5400E
HP Envy 13-ba1012ns: Intel Core i7-1165G7, 13.30", 1.3 kg
Recensioni esterne » HP Envy 13-ba1012ns
HP Pavilion 15-eg0006ns: Intel Core i7-1165G7, 15.60", 1.8 kg
Recensioni esterne » HP Pavilion 15-eg0006ns
HP Pavilion 15-eg0007ns: Intel Core i7-1165G7, 15.60", 1.8 kg
Recensioni esterne » HP Pavilion 15-eg0007ns
HP Envy 17-ch0000ns: Intel Core i7-1165G7, 17.30", 2.5 kg
Recensioni esterne » HP Envy 17-ch0000ns
MSI Prestige 15 A11SB-449: Intel Core i5-1135G7, 15.60", 1.7 kg
Recensioni esterne » MSI Prestige 15 A11SB-449
HP Pavilion 15-eg: Intel Core i7-1165G7, 15.60", 1.7 kg
Recensioni esterne » HP Pavilion 15-eg0025cl
MSI Modern 14 B11SB-008ES: Intel Core i7-1165G7, 14.00", 1.3 kg
Recensioni esterne » MSI Modern 14 B11SB-008ES
MSI Modern 15 A11SB-011ES: Intel Core i7-1165G7, 15.60", 1.6 kg
Recensioni esterne » MSI Modern 15 A11SB-011ES
Xiaomi Mi Notebook Pro 15, i5-11300H MX450: Intel Core i5-11300H, 15.60", 1.8 kg
Recensioni esterne » Xiaomi Mi Notebook Pro 15, i5-11300H MX450
HP Envy 17-cg1000ns: Intel Core i7-1165G7, 17.30", 2.7 kg
Recensioni esterne » HP Envy 17-cg1000ns
Xiaomi RedmiBook Pro 14 2021, i7-1165G7 MX450: Intel Core i7-1165G7, 14.00", 1.5 kg
Recensioni esterne » Xiaomi RedmiBook Pro 14 2021, i7-1165G7 MX450
Xiaomi RedmiBook Pro 15, i5-11300H MX450: Intel Core i5-11300H, 15.60", 1.7 kg
Recensioni esterne » Xiaomi RedmiBook Pro 15, i5-11300H MX450
HP Pavilion 14-dv0005ns: Intel Core i7-1165G7, 14.00", 1.4 kg
Recensioni esterne » HP Pavilion 14-dv0005ns
Lenovo IdeaPad 5 14ITL05-82FE005QGE: Intel Core i7-1165G7, 14.00"
Recensioni esterne » Lenovo IdeaPad 5 14ITL05-82FE005QGE
MSI Modern 14 B11SB-009XES: Intel Core i7-1165G7, 14.00", 1.3 kg
Recensioni esterne » MSI Modern 14 B11SB-009XES
HP Envy 13-ba1033tx: Intel Core i7-1165G7, 13.30", 1.3 kg
Recensioni esterne » HP Envy 13-ba1033tx
HP Pavilion 14-dv0065tx: Intel Core i5-1135G7, 14.00", 1.4 kg
Recensioni esterne » HP Pavilion 14-dv0065tx
HP Pavilion 14-dv0067tx: Intel Core i7-1165G7, 14.00", 1.5 kg
Recensioni esterne » HP Pavilion 14-dv0067tx
Lenovo Yoga Slim 7i Pro: Intel Core i7-1165G7, 14.00", 1.5 kg
Recensioni esterne » Lenovo Yoga Slim 7i Pro
HP Envy 17-cg1490nd : Intel Core i7-1165G7, 17.30", 2.8 kg
Recensioni esterne » HP Envy 17-cg1490nd
Asus Zenbook 14 UX435EG: Intel Core i7-1165G7, 14.00", 1.3 kg
Recensioni esterne » Asus Zenbook 14 UX435EG
MSI Modern 15 A11SB-039RU: Intel Core i7-1165G7, 15.60", 1.6 kg
Recensioni esterne » MSI Modern 15 A11SB-039RU
HP Envy 17-cg1279ng: Intel Core i7-1165G7, 17.30", 2.7 kg
Recensioni esterne » HP Envy 17-cg1279ng
Asus ZenBook Flip 15 Q508U: AMD Ryzen 7 5700U, 15.60", 1.9 kg
» La serie Nvidia GeForce MX fatica contro la AMD Radeon 680M
Lenovo Yoga Slim 7 Pro 14 OLED Ryzen 9: AMD Ryzen 9 5900HS, 14.00", 1.4 kg
» Alder Lake di Intel è più lento di Cezanne Zen 3 di AMD a 45W TDP
HP Pavilion 15-eg: Intel Core i7-1165G7, 15.60", 1.7 kg
» Nvidia ha dato ai produttori di laptop un inutile punteggio esagerato GeForce MX450 3DMark che si è dimostrato impossibile da raggiungere