Notebookcheck Logo

Intel UHD Graphics 630

Intel UHD Graphics 630

La Intel UHD Graphics 630 (GT2) è una scheda grafica integrata, che può essere trovata in vari processori desktop e notebook della generazione Coffee-Lake. La versione "GT2" della GPU offre 24 Execution Units (EUs) e i clock dipendono dal modello di CPU. A causa della sua mancanza di memoria grafica dedicata o cache eDRAM, l'UHD 630 deve accedere alla memoria principale (2x 64-bit DDR3L-1600 / DDR4-2133). Rispetto alla vecchia HD Graphics 630 (Kaby-Lake), la nuova GPU UHD è identica ma può essere clockata leggermente più in alto.

Prestazioni

Le prestazioni esatte della UHD Graphics 630 dipendono da vari fattori come TDP, L3 Cache, memoria (DDR3/DDR4) e frequenza di clock massima del modello specifico. Tuttavia, dovrebbe essere abbastanza simile alla HD Graphics 530 e HD Graphics 630 e quindi adatta solo a giochi poco esigenti come Overwatch o Farming Simulator 2017 (dettagli bassi).

Caratteristiche

Le caratteristiche della UHD 630 sono le stesse della HD 630 e quindi il profilo H.265/HEVC Main10 a 10-bit di profondità di colore sono supportati in hardware. Inoltre, l'HDCP 2.2 è supportato in tutti i chip, il che permette ad esempio i video 4K di Netflix. HDMI 2.0 però è ancora supportato solo con un chip convertitore esterno (LSPCon).

Consumo energetico

La UHD Graphics 630 può essere trovata in diversi processori per notebook e desktop di diverse classi di TDP (35 - 91 W).

Gen. 9.5 Serie

Iris Plus Graphics 655 48 @ 0.3 - 1.2 GHz
Iris Plus Graphics 650 48 @ 0.3 - 1.1 GHz64/128 Bit
Iris Plus Graphics 645 48 @ 0.3 - 1.15 GHz
Iris Plus Graphics 640 48 @ 0.3 - 1.05 GHz64/128 Bit
UHD Graphics 630 24 @ 0.3 - 1.15 GHz64/128 Bit
UHD Graphics P630 24 @ 0.3 - 1.2 GHz64/128 Bit
HD Graphics 630 24 @ 0.3 - 1.15 GHz64/128 Bit
HD Graphics P630 24 64/128 Bit
UHD Graphics 620 24 @ 0.3 - 1.15 GHz
HD Graphics 620 24 @ 0.3 - 1.05 GHz64/128 Bit
UHD Graphics 617 24 @ 0.3 - 1.15 GHz64/128 Bit
UHD Graphics 615 24 @ 0.3 - 1 GHz64/128 Bit
HD Graphics 615 24 @ 0.3 - 1.05 GHz64/128 Bit
Nome in codiceKaby-Lake-H-GT2
ArchitetturaGen. 9.5
Pipelines24 - unified
Velocità del core300 - 1150 (Boost) MHz
Larghezza del bus di memoria64/128 Bit
Memoria condivisasi
APIDirectX 12_1, OpenGL 4.4
tecnologia14 nm
CaratteristicheQuickSync
Data dell'annuncio01.10.2017
CPU in UHD Graphics 630GPU Base SpeedGPU Boost / Turbo
Intel Core i9-10900K10 x 3700 MHz, 125 W350 MHz1200 MHz
Intel Core i9-10850K10 x 3600 MHz, 125 W? MHz? MHz
Intel Core i9-1091010 x 3600 MHz, 125 W? MHz? MHz
min. - max.350 MHz1000 - 1250 MHz

Benchmark

Performance Rating - 3DMark 11 + Fire Strike + Time Spy
0.6 pt (2%)
AMD Radeon HD 8180
0.06605 -88%
...
0.529 -4%
0.532 -4%
0.534 -3%
0.536 -3%
Intel UHD Graphics 24EUs (Alder Lake-N)
0.539 -2%
0.546 -1%
Intel UHD Graphics Xe 16EUs (Tiger Lake-H)
0.548 -1%
AMD Radeon R7 M340
0.551 0%
0.551 0%
Intel UHD Graphics 630
0.552
0.558 1%
0.573 4%
0.581 5%
AMD Radeon R5 (Bristol Ridge)
0.585 6%
0.59 7%
0.594 8%
0.601 9%
0.609 10%
0.611 11%
...
21.1 3722%
max:
33.3 5933%
0%
100%
3DMark - 3DMark Time Spy Score
min: 425     media: 474.5     media: 479.5 (1%)     massimo: 534 Points
3DMark - 3DMark Time Spy Graphics
min: 367     media: 409.5     media: 414.5 (1%)     massimo: 459 Points
113 -72%
...
343.7 -16%
Intel UHD Graphics Xe 16EUs (Tiger Lake-H)
344.7 -16%
349 -15%
Intel HD Graphics 630
368 -10%
371.8 -9%
377 -8%
381 -7%
389.1 -5%
397 -3%
Intel UHD Graphics 630
409.5
410 0%
417 2%
Intel UHD Graphics G1 (Ice Lake 32 EU)
419.6 2%
442.5 8%
450.5 10%
452.3 10%
AMD Radeon 610M
458.3 12%
AMD Radeon R7 M445
471 15%
493 20%
...
19434 4646%
max:
36485 8810%
0%
100%
3DMark - 3DMark Ice Storm Unlimited Graphics
min: 37815     media: 97120     media: 106362 (12%)     massimo: 122355 Points
3DMark - 3DMark Ice Storm Extreme Graphics
min: 19075     media: 40640     media: 45176 (6%)     massimo: 48377 Points
3DMark - 3DMark Cloud Gate Score
min: 3712     media: 9196     media: 9545 (10%)     massimo: 11286 Points
3DMark - 3DMark Cloud Gate Graphics
min: 3863     media: 9333     media: 9798 (3%)     massimo: 11199 Points
3DMark - 3DMark Fire Strike Standard Score
min: 779     media: 1143     media: 1115 (2%)     massimo: 1355 Points
3DMark - 3DMark Fire Strike Standard Graphics
min: 722     media: 1228     media: 1211 (1%)     massimo: 1472 Points
3DMark - 3DMark Wild Life Unlimited
3195 Points (2%)
3DMark - 3DMark Wild Life Extreme Unlimited
882 Points (1%)
3DMark - 3DMark Night Raid
6929 Points (7%)
3DMark - 3DMark Night Raid Graphics Score
6446 Points (2%)
3DMark 11 - 3DM11 Performance Score
min: 790     media: 1990     media: 2030 (3%)     massimo: 2326 Points
3DMark 11 - 3DM11 Performance GPU
min: 642     media: 1742     media: 1789.5 (2%)     massimo: 2025 Points
171.8 -90%
...
Intel HD Graphics 630
1696 -3%
1703 -2%
AMD Radeon R5 (Bristol Ridge)
1708 -2%
1708 -2%
AMD Radeon R5 (Carrizo)
1711 -2%
1711 -2%
1728 -1%
1734 0%
1741 0%
Intel UHD Graphics 630
1742
1749 0%
1749 0%
1757 1%
1784 2%
1792 3%
1793 3%
1807 4%
1819 4%
1823 5%
...
59943 3341%
max:
106023 5986%
0%
100%
3DMark Vantage
3DM Vant. Perf. total +
3DM Vant. Perf. GPU no PhysX +
3DMark 06 3DMark 06 - Standard 1280x1024 +
3DMark 06
min: 11920     media: 13425     media: 13216.5 (17%)     massimo: 15020 Points
Unigine Valley 1.0 - Unigine Valley 1.0 DX
min: 5.7     media: 6.1     media: 6.1 (2%)     massimo: 6.4 fps
Unigine Heaven 3.0 - Unigine Heaven 3.0 DX 11
18.9 fps (6%)
SPECviewperf 12
specvp12 sw-03 +
SPECviewperf 12 - specvp12 sw-03
min: 28.56     media: 28.8     media: 28.8 (7%)     massimo: 29.03 fps
specvp12 snx-02 +
SPECviewperf 12 - specvp12 snx-02
min: 3.14     media: 3.3     media: 3.3 (0%)     massimo: 3.37 fps
specvp12 showcase-01 +
SPECviewperf 12 - specvp12 showcase-01
min: 7.98     media: 8.2     media: 8.2 (2%)     massimo: 8.38 fps
specvp12 mediacal-01 +
SPECviewperf 12 - specvp12 mediacal-01
min: 2.96     media: 3.1     media: 3.1 (1%)     massimo: 3.32 fps
specvp12 maya-04 +
SPECviewperf 12 - specvp12 maya-04
min: 14.66     media: 15.2     media: 15.2 (4%)     massimo: 15.67 fps
specvp12 energy-01 +
SPECviewperf 12 - specvp12 energy-01
min: 0.29     media: 0.3     media: 0.3 (0%)     massimo: 0.32 fps
specvp12 creo-01 +
SPECviewperf 12 - specvp12 creo-01
min: 13.57     media: 14     media: 14 (6%)     massimo: 14.51 fps
specvp12 catia-04 +
SPECviewperf 12 - specvp12 catia-04
min: 15.36     media: 16     media: 16 (3%)     massimo: 16.61 fps
specvp12 3dsmax-05 +
SPECviewperf 12 - specvp12 3dsmax-05
min: 11.27     media: 12.6     media: 12.6 (2%)     massimo: 14 fps
SPECviewperf 13 specvp13 sw-04 +
SPECviewperf 13 - specvp13 sw-04
min: 35.74     media: 36.9     media: 36.9 (10%)     massimo: 37.96 fps
specvp13 snx-03 +
SPECviewperf 13 - specvp13 snx-03
min: 5.64     media: 5.9     media: 5.9 (1%)     massimo: 6.07 fps
specvp13 showcase-02 +
SPECviewperf 13 - specvp13 showcase-02
min: 7.91     media: 8.1     media: 8.1 (2%)     massimo: 8.34 fps
specvp13 medical-02 +
SPECviewperf 13 - specvp13 medical-02
min: 2.13     media: 2.2     media: 2.2 (0%)     massimo: 2.28 fps
specvp13 maya-05 +
SPECviewperf 13 - specvp13 maya-05
min: 21.35     media: 22.2     media: 22.2 (3%)     massimo: 23.03 fps
specvp13 energy-02 +
SPECviewperf 13 - specvp13 energy-02
0.8 fps (0%)
specvp13 creo-02 +
SPECviewperf 13 - specvp13 creo-02
min: 17.54     media: 18.2     media: 18.2 (3%)     massimo: 18.83 fps
specvp13 catia-05 +
SPECviewperf 13 - specvp13 catia-05
min: 21.7     media: 22.5     media: 22.5 (3%)     massimo: 23.36 fps
specvp13 3dsmax-06 +
SPECviewperf 13 - specvp13 3dsmax-06
min: 14     media: 14.5     media: 14.5 (3%)     massimo: 14.98 fps
Cinebench R10 Cinebench R10 Shading (32bit) +
Cinebench R10 - Cinebench R10 Shading (32bit)
min: 6430     media: 8573     media: 8578 (6%)     massimo: 10435 punti
Cinebench R11.5 Cinebench R11.5 OpenGL 64 Bit +
Cinebench R15
Cinebench R15 OpenGL 64 Bit +
Cinebench R15 - Cinebench R15 OpenGL 64 Bit
min: 17     media: 52.2     media: 54.5 (3%)     massimo: 63.1 fps
Cinebench R15 OpenGL Ref. Match 64 Bit +
Cinebench R15 - Cinebench R15 OpenGL Ref. Match 64 Bit
min: 97.8     media: 97.8     media: 97.8 (98%)     massimo: 98 %
Basemark GPU 1.2 - Basemark GPU 1.2 Vulkan Official Medium Offscreen 1080
105 fps (1%)
Geekbench 6.2 - Geekbench 6.2 GPU OpenCL
5449 punti (2%)
Geekbench 6.2 - Geekbench 6.2 GPU Vulkan
5749 punti (2%)
LuxMark v2.0 64Bit - LuxMark v2.0 Room GPU
363 Samples/s (2%)
LuxMark v2.0 64Bit - LuxMark v2.0 Sala GPU
696 Samples/s (1%)
ComputeMark v2.1 - ComputeMark v2.1 Result
894 punti (1%)
Power Consumption - Furmark Stress Test Power Consumption - external Monitor *
min: 35.2     media: 50.7     media: 54.9 (8%)     massimo: 61.9 Watt
0102030405060708090100110Tooltip
- Valori di benchmark per questa scheda grafica
- Valori medi di benchmark per questa scheda grafica
* Numeri più piccoli rappresentano prestazioni supeiori

Benchmarks per i giochi

I seguenti benchmarks deirivano dai benchmarks dei portatili recensiti. Le prestazioni dipendono dalla scheda grafica utilizzata, dal clock rate, dal processore, dai settaggi di sistema, dai drivers, e dai sistemi operativi. Quindi i risultati non sono rappresentativi per i portatili con questa GPU. Per informazioni dettagliate sui risultati del benchmark, cliccate sul numero di fps.

Palworld

Palworld

2024
basso 1920x1080
6  fps    + Confronta + 📈 Graph
» Il Benchmark indica che il gioco non è utilizzabile con i settaggi testati.
Additional Benchmarks
Very Low Preset 1280x720
12.3
Prince of Persia The Lost Crown

Prince of Persia The Lost Crown

2024
medio 1920x1080
42.7  fps    + Confronta + 📈 Graph
alto 1920x1080
22.4  fps    + Confronta + 📈 Graph
ultra 1920x1080
22.1  fps    + Confronta + 📈 Graph
» Giocabile con tutti i portatili testati con dettagli medio.
Ready or Not

Ready or Not

2023
basso 1920x1080
11.7  fps    + Confronta + 📈 Graph
» Il Benchmark indica che il gioco non è utilizzabile con i settaggi testati.
Total War Pharaoh

Total War Pharaoh

2023
basso 1920x1080
16.4  fps    + Confronta
» Il Benchmark indica che il gioco non è utilizzabile con i settaggi testati.
Additional Benchmarks
Low Preset 1280x720
29.8
EA Sports FC 24

EA Sports FC 24

2023
basso 1920x1080
13.1  fps    + Confronta + 📈 Graph
» Il Benchmark indica che il gioco non è utilizzabile con i settaggi testati.
Additional Benchmarks
Low Preset 1280x720
24
Counter-Strike 2

Counter-Strike 2

2023
basso 1920x1080
27.3  fps    + Confronta + 📈 Graph
medio 1920x1080
19.3  fps    + Confronta + 📈 Graph
alto 1920x1080
8.6  fps    + Confronta + 📈 Graph
» Il Benchmark indica che il gioco non è utilizzabile con i settaggi testati.
Additional Benchmarks
Low Preset 1280x720
43.1
Cyberpunk 2077 2.0 Phantom Liberty

Cyberpunk 2077 2.0 Phantom Liberty

2023
basso 1920x1080
4.9  fps    + Confronta
» Il Benchmark indica che il gioco non è utilizzabile con i settaggi testati.
Additional Benchmarks
Low Preset (FSR off) 1280x720
8.6
Steam Deck 1280x720
10.1
basso 1920x1080
9.8  fps    + Confronta + 📈 Graph
» Il Benchmark indica che il gioco non è utilizzabile con i settaggi testati.
Additional Benchmarks
Low Preset 1280x720
16.5
basso 1920x1080
4.9  fps    + Confronta + 📈 Graph
» Il Benchmark indica che il gioco non è utilizzabile con i settaggi testati.
Additional Benchmarks
Low Preset 1280x720
9.4
basso 1920x1080
3.8  fps    + Confronta + 📈 Graph
» Il Benchmark indica che il gioco non è utilizzabile con i settaggi testati.
Additional Benchmarks
Very Low Preset 1280x720
5.3
5.7
Diablo 4

Diablo 4

2023
basso 1920x1080
9.8  fps    + Confronta + 📈 Graph
» Il Benchmark indica che il gioco non è utilizzabile con i settaggi testati.
Additional Benchmarks
Low Preset 1280x720
17.4
Dead Island 2

Dead Island 2

2023
basso 1920x1080
8.8  fps    + Confronta + 📈 Graph
» Il Benchmark indica che il gioco non è utilizzabile con i settaggi testati.
Additional Benchmarks
Low Preset Low TAA 1280x720
18.9
basso 1920x1080
2.6  fps    + Confronta + 📈 Graph
» Il Benchmark indica che il gioco non è utilizzabile con i settaggi testati.
Additional Benchmarks
Prioritize Performance Preset 1280x720
4.5
basso 1920x1080
8  fps    + Confronta + 📈 Graph
» Il Benchmark indica che il gioco non è utilizzabile con i settaggi testati.
Additional Benchmarks
Low Preset 1280x720
13
basso 1920x1080
5.3  fps    + Confronta + 📈 Graph
» Il Benchmark indica che il gioco non è utilizzabile con i settaggi testati.
Additional Benchmarks
Low Preset Low TAA 1280x720
8.7
basso 1920x1080
10.8  fps    + Confronta + 📈 Graph
» Il Benchmark indica che il gioco non è utilizzabile con i settaggi testati.
Additional Benchmarks
Low Preset 1280x720
17
basso 1920x1080
6.9  fps    + Confronta
» Il Benchmark indica che il gioco non è utilizzabile con i settaggi testati.
Additional Benchmarks
Low Preset (without FSR Upscaling) 1280x720
11.9
basso 1920x1080
6.7 (!)  fps    + Confronta + 📈 Graph
» Il Benchmark indica che il gioco non è utilizzabile con i settaggi testati.
Additional Benchmarks
Low Preset 1280x720
9.7
10.9 (!)
basso 1920x1080
4.6  fps    + Confronta + 📈 Graph
» Il Benchmark indica che il gioco non è utilizzabile con i settaggi testati.
Additional Benchmarks
Low Preset 1280x720
5.9
FIFA 23

FIFA 23

2022
basso 1920x1080
14.3  fps    + Confronta + 📈 Graph
» Il Benchmark indica che il gioco non è utilizzabile con i settaggi testati.
Additional Benchmarks
Low Rendering Quality 1280x720
25.8
11.1
basso 1920x1080
16.6  fps    + Confronta + 📈 Graph
medio 1920x1080
10.7  fps    + Confronta + 📈 Graph
alto 1920x1080
8.4  fps    + Confronta + 📈 Graph
» Il Benchmark indica che il gioco non è utilizzabile con i settaggi testati.
Additional Benchmarks
Low Preset 1280x720
28.8
basso 1920x1080
8  fps    + Confronta
» Il Benchmark indica che il gioco non è utilizzabile con i settaggi testati.
Additional Benchmarks
Lowest Preset (DX12) 1280x720
16
basso 1920x1080
4.9  fps    + Confronta
» Il Benchmark indica che il gioco non è utilizzabile con i settaggi testati.
Additional Benchmarks
Low Preset 1280x720
8.5
basso 1920x1080
22  fps    + Confronta
medio 1920x1080
16.2  fps    + Confronta
alto 1920x1080
12.8  fps    + Confronta
» Il Benchmark indica che il gioco non è utilizzabile con i settaggi testati.
Additional Benchmarks
Low Preset 1280x720
31.1
basso 1920x1080
10  fps    + Confronta
» Il Benchmark indica che il gioco non è utilizzabile con i settaggi testati.
Additional Benchmarks
Ultra Low Preset (with Fixed Resolution Quality) 1280x720
17
basso 1280x720
40.5  fps    + Confronta + 📈 Graph
» Giocabile con tutti i portatili testati con dettagli basso.
basso 1280x720
18  fps    + Confronta
» Il Benchmark indica che il gioco non è utilizzabile con i settaggi testati.
Additional Benchmarks
Low Preset 1920x1080
10
basso 1280x720
10  fps    + Confronta
» Il Benchmark indica che il gioco non è utilizzabile con i settaggi testati.
Additional Benchmarks
Low Preset 1920x1080
7
basso 1280x720
21.3  fps    + Confronta + 📈 Graph
medio 1920x1080
8.7  fps    + Confronta + 📈 Graph
» Il Benchmark indica che il gioco non è utilizzabile con i settaggi testati.
Additional Benchmarks
Low Preset (DX12) 1920x1080
12.7
basso 1280x720
21.6  fps    + Confronta + 📈 Graph
» Il Benchmark indica che il gioco non è utilizzabile con i settaggi testati.
Additional Benchmarks
Low Preset 1920x1080
11.5
Days Gone

Days Gone

2021
basso 1280x720
11.8  fps    + Confronta + 📈 Graph
» Il Benchmark indica che il gioco non è utilizzabile con i settaggi testati.
Additional Benchmarks
Low Preset 1920x1080
7.9
basso 1280x720
38.5  fps    + Confronta + 📈 Graph
ultra 1920x1080
16.1  fps    + Confronta + 📈 Graph
QHD 2560x1440
9.6  fps    + Confronta + 📈 Graph
» Giocabile con tutti i portatili testati con dettagli basso.
Outriders

Outriders

2021
basso 1280x720
20.7  fps    + Confronta + 📈 Graph
medio 1920x1080
13.2  fps    + Confronta + 📈 Graph
» Il Benchmark indica che il gioco non è utilizzabile con i settaggi testati.
Additional Benchmarks
Low Preset 1920x1080
14.5
Hitman 3

Hitman 3

2021
basso 1280x720
21.8  fps    + Confronta
medio 1920x1080
8  fps    + Confronta
» Il Benchmark indica che il gioco non è utilizzabile con i settaggi testati.
Additional Benchmarks
Minimum Settings 1920x1080
11.8
basso 1280x720
16  fps    + Confronta + 📈 Graph
medio 1920x1080
5.7  fps    + Confronta + 📈 Graph
» Il Benchmark indica che il gioco non è utilizzabile con i settaggi testati.
FIFA 21

FIFA 21

2020
basso 1280x720
59.1  fps    + Confronta + 📈 Graph
medio 1920x1080
29.8  fps    + Confronta + 📈 Graph
alto 1920x1080
27.5  fps    + Confronta + 📈 Graph
» Giocabile con tutti i portatili testati con dettagli basso.
basso 1280x720
11.9  fps    + Confronta + 📈 Graph
» Il Benchmark indica che il gioco non è utilizzabile con i settaggi testati.
basso 1280x720
31.9  fps    + Confronta + 📈 Graph
medio 1920x1080
7  fps    + Confronta + 📈 Graph
» Il Benchmark indica che il gioco non è utilizzabile con i settaggi testati.
basso 1280x720
21.6  fps    + Confronta + 📈 Graph
medio 1920x1080
4.9  fps    + Confronta + 📈 Graph
» Il Benchmark indica che il gioco non è utilizzabile con i settaggi testati.
basso 1280x720
11.7  fps    + Confronta + 📈 Graph
» Il Benchmark indica che il gioco non è utilizzabile con i settaggi testati.
basso 1280x720
13.7  fps    + Confronta + 📈 Graph
medio 1920x1080
7.8  fps    + Confronta + 📈 Graph
» Il Benchmark indica che il gioco non è utilizzabile con i settaggi testati.
F1 2020

F1 2020

2020
basso 1280x720
23  fps    + Confronta
medio 1920x1080
12  fps    + Confronta
» Il Benchmark indica che il gioco non è utilizzabile con i settaggi testati.
basso 1280x720
38.1   fps    + Confronta
medio 1920x1080
13.2  fps    + Confronta
alto 1920x1080
7.5  fps    + Confronta
ultra 1920x1080
5.4  fps    + Confronta
» Giocabile con tutti i portatili testati con dettagli basso.
basso 1280x720
16.8  fps    + Confronta + 📈 Graph
medio 1920x1080
8.4  fps    + Confronta + 📈 Graph
» Il Benchmark indica che il gioco non è utilizzabile con i settaggi testati.
basso 1280x720
17.3  fps    + Confronta
» Il Benchmark indica che il gioco non è utilizzabile con i settaggi testati.
basso 1280x720
13.4  fps    + Confronta
medio 1920x1080
7.4  fps    + Confronta
» Il Benchmark indica che il gioco non è utilizzabile con i settaggi testati.
medio 1920x1080
9  fps    + Confronta + 📈 Graph
alto 1920x1080
7.5  fps    + Confronta + 📈 Graph
» Il Benchmark indica che il gioco non è utilizzabile con i settaggi testati.
FIFA 20

FIFA 20

2019
basso 1280x720
73.7  fps    + Confronta
medio 1920x1080
37.4  fps    + Confronta
alto 1920x1080
34.4  fps    + Confronta
ultra 1920x1080
27  fps    + Confronta
» Giocabile con tutti i portatili testati con dettagli medio.
basso 1280x720
17.8  fps    + Confronta
medio 1920x1080
6.8  fps    + Confronta
» Il Benchmark indica che il gioco non è utilizzabile con i settaggi testati.
Control

Control

2019
basso 1280x720
16.2  fps    + Confronta
» Il Benchmark indica che il gioco non è utilizzabile con i settaggi testati.
F1 2019

F1 2019

2019
basso 1280x720
35  fps    + Confronta
medio 1920x1080
13  fps    + Confronta
» Il Benchmark indica che il gioco non è utilizzabile con i settaggi testati.
basso 1280x720
177.9  fps    + Confronta
medio 1920x1080
149.2  fps    + Confronta
alto 1920x1080
111.4  fps    + Confronta
ultra 1920x1080
103.7  fps    + Confronta
» Giocabile con tutti i portatili testati con dettagli ultra.
basso 1280x720
43.2  fps    + Confronta
medio 1920x1080
12.4  fps    + Confronta
» Giocabile con tutti i portatili testati con dettagli basso.
Rage 2

Rage 2

2019
basso 1280x720
16.6  fps    + Confronta
» Il Benchmark indica che il gioco non è utilizzabile con i settaggi testati.
basso 1280x720
23  fps    + Confronta
medio 1920x1080
9  fps    + Confronta
» Il Benchmark indica che il gioco non è utilizzabile con i settaggi testati.
basso 1280x720
52.1  fps    + Confronta
medio 1920x1080
16  fps    + Confronta
» Giocabile con tutti i portatili testati con dettagli basso.
Anthem

Anthem

2019
basso 1280x720
12.9  fps    + Confronta
» Il Benchmark indica che il gioco non è utilizzabile con i settaggi testati.
basso 1280x720
17  fps    + Confronta
medio 1920x1080
8  fps    + Confronta
» Il Benchmark indica che il gioco non è utilizzabile con i settaggi testati.
basso 1280x720
15.4  fps    + Confronta
medio 1920x1080
7.6  fps    + Confronta
» Il Benchmark indica che il gioco non è utilizzabile con i settaggi testati.
basso 1280x720
35.1  fps    + Confronta
medio 1920x1080
13.1  fps    + Confronta
» Giocabile con tutti i portatili testati con dettagli basso.
basso 1280x720
15.5  fps    + Confronta
medio 1920x1080
8.9  fps    + Confronta
» Il Benchmark indica che il gioco non è utilizzabile con i settaggi testati.
basso 1280x720
22.6  fps    + Confronta
» Il Benchmark indica che il gioco non è utilizzabile con i settaggi testati.
basso 1280x720
71.1  fps    + Confronta
medio 1920x1080
23.9  fps    + Confronta
alto 1920x1080
11.3  fps    + Confronta
» Giocabile con tutti i portatili testati con dettagli basso.
basso 1280x720
16.7  fps    + Confronta
medio 1920x1080
8.1  fps    + Confronta
» Il Benchmark indica che il gioco non è utilizzabile con i settaggi testati.
Hitman 2

Hitman 2

2018
basso 1280x720
12.8  fps    + Confronta
medio 1920x1080
7.5  fps    + Confronta
» Il Benchmark indica che il gioco non è utilizzabile con i settaggi testati.
basso 1280x720
25.9  fps    + Confronta
medio 1920x1080
9.7  fps    + Confronta
» Il Benchmark indica che il gioco non è utilizzabile con i settaggi testati.
basso 1280x720
11  fps    + Confronta
medio 1920x1080
7  fps    + Confronta
» Il Benchmark indica che il gioco non è utilizzabile con i settaggi testati.
FIFA 19

FIFA 19

2018
basso 1280x720
57.1  fps    + Confronta
medio 1920x1080
29.9  fps    + Confronta
alto 1920x1080
27.2  fps    + Confronta
» Giocabile con tutti i portatili testati con dettagli basso.
basso 1280x720
17  fps    + Confronta
medio 1920x1080
6  fps    + Confronta
» Il Benchmark indica che il gioco non è utilizzabile con i settaggi testati.
Strange Brigade

Strange Brigade

2018
basso 1280x720
31.1 31.3 ~ 31 fps    + Confronta
medio 1920x1080
12.6 14.1 ~ 13 fps    + Confronta
alto 1920x1080
12.3  fps    + Confronta
ultra 1920x1080
10.9  fps    + Confronta
» Il Benchmark indica che il gioco non è utilizzabile con i settaggi testati.
F1 2018

F1 2018

2018
basso 1280x720
35  fps    + Confronta
medio 1920x1080
16  fps    + Confronta
» Il Benchmark indica che il gioco non è utilizzabile con i settaggi testati.
basso 1280x720
20.3  fps    + Confronta
medio 1920x1080
7.7  fps    + Confronta
» Il Benchmark indica che il gioco non è utilizzabile con i settaggi testati.
basso 1280x720
16.6  fps    + Confronta
medio 1920x1080
6.8  fps    + Confronta
» Il Benchmark indica che il gioco non è utilizzabile con i settaggi testati.
Far Cry 5

Far Cry 5

2018
basso 1280x720
13 14 15 ~ 14 fps    + Confronta
medio 1920x1080
6  fps    + Confronta
» Il Benchmark indica che il gioco non è utilizzabile con i settaggi testati.
World of Tanks enCore

World of Tanks enCore

2018
basso 1366x768
207.9  fps    + Confronta
medio 1920x1080
25.2  fps    + Confronta
ultra 1920x1080
9.6  fps    + Confronta
» Giocabile con tutti i portatili testati con dettagli basso.
basso 1280x720
11.6 12.7 14.3 14.8 17.6 22.4 24.5 29.7 31.3 31.3 ~ 21 fps    + Confronta
medio 1920x1080
10.7 11 11.2 12.2 14.3 14.9 15.1 18.9 20.1 20.1 ~ 15 fps    + Confronta
alto 1920x1080
10.3 11 11 12.1 12.8 13.3 13.3 17.2 18.3 18.3 ~ 14 fps    + Confronta
4K 3840x2160
7  fps    + Confronta
» Il Benchmark indica che il gioco non è utilizzabile con i settaggi testati.
basso 1280x720
16.9  fps    + Confronta
medio 1920x1080
6.9  fps    + Confronta
» Il Benchmark indica che il gioco non è utilizzabile con i settaggi testati.
basso 1280x720
9.5 11.3 14 ~ 12 fps    + Confronta
medio 1920x1080
4.8  fps    + Confronta
» Il Benchmark indica che il gioco non è utilizzabile con i settaggi testati.
basso 1280x720
19.9  fps    + Confronta
medio 1920x1080
6.5  fps    + Confronta
» Il Benchmark indica che il gioco non è utilizzabile con i settaggi testati.
basso 1280x720
19.3  fps    + Confronta
medio 1920x1080
8.9  fps    + Confronta
» Il Benchmark indica che il gioco non è utilizzabile con i settaggi testati.
basso 1280x720
29.8  fps    + Confronta
medio 1920x1080
17.4  fps    + Confronta
» Il Benchmark indica che il gioco non è utilizzabile con i settaggi testati.
basso 1280x720
17.7  fps    + Confronta
medio 1920x1080
9.1  fps    + Confronta
» Il Benchmark indica che il gioco non è utilizzabile con i settaggi testati.
basso 1280x720
10  fps    + Confronta
medio 1920x1080
7  fps    + Confronta
» Il Benchmark indica che il gioco non è utilizzabile con i settaggi testati.
Destiny 2

Destiny 2

2017
basso 1280x720
17  fps    + Confronta
medio 1920x1080
9.2  fps    + Confronta
» Il Benchmark indica che il gioco non è utilizzabile con i settaggi testati.
ELEX

ELEX

2017
basso 1280x720
14.5  fps    + Confronta
medio 1920x1080
6.8  fps    + Confronta
» Il Benchmark indica che il gioco non è utilizzabile con i settaggi testati.
basso 1280x720
11.4  fps    + Confronta
medio 1920x1080
6.1  fps    + Confronta
» Il Benchmark indica che il gioco non è utilizzabile con i settaggi testati.
basso 1280x720
20  fps    + Confronta
medio 1920x1080
12  fps    + Confronta
» Il Benchmark indica che il gioco non è utilizzabile con i settaggi testati.
FIFA 18

FIFA 18

2017
basso 1280x720
67.3 82 ~ 75 fps    + Confronta
medio 1920x1080
39.4 44 ~ 42 fps    + Confronta
alto 1920x1080
30.9 33.7 ~ 32 fps    + Confronta
ultra 1920x1080
25.1 28.8 ~ 27 fps    + Confronta
» Giocabile con tutti i portatili testati con dettagli medio.
F1 2017

F1 2017

2017
basso 1280x720
36 41 ~ 39 fps    + Confronta
» Giocabile con tutti i portatili testati con dettagli basso.
basso 1280x720
24.9  fps    + Confronta
» Il Benchmark indica che il gioco non è utilizzabile con i settaggi testati.
basso 1280x720
113  fps    + Confronta
medio 1366x768
88 97 ~ 93 fps    + Confronta
alto 1920x1080
51.6 (!)  fps    + Confronta
ultra 1920x1080
26 (!)  fps    + Confronta
» Giocabile con tutti i portatili testati con dettagli alto.
Dirt 4

Dirt 4

2017
basso 1280x720
52  fps    + Confronta
medio 1920x1080
13.8  fps    + Confronta
» Giocabile con tutti i portatili testati con dettagli basso.
basso 1280x720
67.8  fps    + Confronta
medio 1920x1080
38.6  fps    + Confronta
alto 1920x1080
24.9 27.9 ~ 26 fps    + Confronta
» Giocabile con tutti i portatili testati con dettagli medio.
Prey

Prey

2017
basso 1280x720
28.9  fps    + Confronta
medio 1920x1080
11.3  fps    + Confronta
» Il Benchmark indica che il gioco non è utilizzabile con i settaggi testati.
basso 1280x720
43.7  fps    + Confronta
» Giocabile con tutti i portatili testati con dettagli basso.
basso 1280x720
18.3  fps    + Confronta
» Il Benchmark indica che il gioco non è utilizzabile con i settaggi testati.
basso 1280x720
19.1  fps    + Confronta
» Il Benchmark indica che il gioco non è utilizzabile con i settaggi testati.
For Honor

For Honor

2017
basso 1280x720
30.7  fps    + Confronta
medio 1920x1080
11.6  fps    + Confronta
» Il Benchmark indica che il gioco non è utilizzabile con i settaggi testati.
basso 1280x720
29.5  fps    + Confronta
medio 1920x1080
12.6  fps    + Confronta
» Il Benchmark indica che il gioco non è utilizzabile con i settaggi testati.
basso 1280x720
93  fps    + Confronta
medio 1366x768
66  fps    + Confronta
alto 1920x1080
24.6 28.4 ~ 27 fps    + Confronta
ultra 1920x1080
12.4 14.9 ~ 14 fps    + Confronta
» Giocabile con tutti i portatili testati con dettagli medio.
basso 1280x720
39.3  fps    + Confronta
medio 1366x768
23.5  fps    + Confronta
» Giocabile con tutti i portatili testati con dettagli basso.
basso 1024x768
0 (!) 39.6 ~ 20 fps    + Confronta
medio 1366x768
14.4  fps    + Confronta
» Giocabile con tutti i portatili testati con dettagli basso.
basso 1280x720
18.8 21.7 ~ 20 fps    + Confronta
» Il Benchmark indica che il gioco non è utilizzabile con i settaggi testati.
basso 1280x720
19.8  fps    + Confronta
medio 1366x768
13.7  fps    + Confronta
» Il Benchmark indica che il gioco non è utilizzabile con i settaggi testati.
Overwatch

Overwatch

2016
basso 1280x720
62  fps    + Confronta
medio 1366x768
41.5  fps    + Confronta
alto 1920x1080
19.5  fps    + Confronta
» Giocabile con tutti i portatili testati con dettagli medio.
Doom

Doom

2016
basso 1280x720
23.3  fps    + Confronta
medio 1366x768
18.1  fps    + Confronta
» Il Benchmark indica che il gioco non è utilizzabile con i settaggi testati.
basso 1280x720
27.1  fps    + Confronta
» Il Benchmark indica che il gioco non è utilizzabile con i settaggi testati.
basso 1280x720
23 26 ~ 25 fps    + Confronta
» Il Benchmark indica che il gioco non è utilizzabile con i settaggi testati.
basso 1024x768
21.9 27.4 ~ 25 fps    + Confronta
» Il Benchmark indica che il gioco non è utilizzabile con i settaggi testati.
basso 1024x768
51.7  fps    + Confronta
medio 1366x768
32.5  fps    + Confronta
» Giocabile con tutti i portatili testati con dettagli basso.
Anno 2205

Anno 2205

2015
basso 1024x768
32.4  fps    + Confronta
medio 1366x768
16.9  fps    + Confronta
» Il Benchmark indica che il gioco non è utilizzabile con i settaggi testati.
basso 1366x768
83.7  fps    + Confronta
medio 1366x768
51.4  fps    + Confronta
alto 1920x1080
23.2  fps    + Confronta
» Giocabile con tutti i portatili testati con dettagli medio.
basso 1024x768
60  fps    + Confronta
medio 1366x768
40.7  fps    + Confronta
alto 1920x1080
13.4  fps    + Confronta
» Giocabile con tutti i portatili testati con dettagli medio.
basso 1280x720
70.4 70.7 76.7 77 78 79 81.1 83 83.1 89 99.1 ~ 81 fps    + Confronta
medio 1366x768
44.8 45.8 48 48 49.5 49.7 50 50.1 52.1 55.8 60.3 ~ 50 fps    + Confronta
alto 1920x1080
7.8 19.7 20 20 20.2 21 21 21.3 22.9 23.7 23.8 ~ 20 fps    + Confronta
ultra 1920x1080
6.8 17.4 17.5 17.6 17.9 18.8 19.1 19.1 20.1 20.9 21 ~ 18 fps    + Confronta
4K 3840x2160
6.5 7.5 ~ 7 fps    + Confronta
» Giocabile con tutti i portatili testati con dettagli medio.
basso 1024x768
15.2 16 17.3 ~ 16 fps    + Confronta
medio 1366x768
9.9 10.8 ~ 10 fps    + Confronta
» Il Benchmark indica che il gioco non è utilizzabile con i settaggi testati.
basso 1024x768
153.6  fps    + Confronta
medio 1366x768
35.6  fps    + Confronta
alto 1920x1080
15.2  fps    + Confronta
» Giocabile con tutti i portatili testati con dettagli medio.
GTA V

GTA V

2015
basso 1024x768
44.9 57.7 ~ 51 fps    + Confronta
medio 1366x768
34.6 45.9 ~ 40 fps    + Confronta
alto 1920x1080
7.9 10.2 ~ 9 fps    + Confronta
ultra 1920x1080
4.2  fps    + Confronta
» Giocabile con la maggior parte dei portatili testati con dettagli medio.
Additional Benchmarks
Normal/Off 4xAF 1920x1080
29.3
Lowest Settings possible 1920x1080
30.8
basso 1024x768
41.8  fps    + Confronta
medio 1366x768
28.7  fps    + Confronta
alto 1920x1080
9.8  fps    + Confronta
» Giocabile con tutti i portatili testati con dettagli basso.
basso 1280x720
39.6  fps    + Confronta
medio 1344x756
23.7  fps    + Confronta
» Giocabile con tutti i portatili testati con dettagli basso.
Sims 4

Sims 4

2014
basso 1024x768
171  fps    + Confronta
medio 1366x768
65  fps    + Confronta
alto 1920x1080
29.1  fps    + Confronta
» Giocabile con tutti i portatili testati con dettagli medio.
basso 1280x720
58.7 64.6 69.8 82.4 ~ 69 fps    + Confronta
medio 1366x768
34.4 34.7 40.1 41.8 41.8 ~ 39 fps    + Confronta
alto 1366x768
27.3 29.9 33.9 37.1 ~ 32 fps    + Confronta
ultra 1920x1080
8.1 9.8 10.8 15 ~ 11 fps    + Confronta
» Giocabile con la maggior parte dei portatili testati con dettagli medio.
basso 1024x768
100.1  fps    + Confronta
medio 1366x768
49.1  fps    + Confronta
alto 1366x768
28.7  fps    + Confronta
» Giocabile con tutti i portatili testati con dettagli medio.
basso 1024x768
146.8  fps    + Confronta
medio 1366x768
102.4  fps    + Confronta
alto 1366x768
54.1  fps    + Confronta
ultra 1920x1080
28.6  fps    + Confronta
» Giocabile con tutti i portatili testati con dettagli alto.
basso 1024x768
93.3  fps    + Confronta
medio 1366x768
59.9  fps    + Confronta
alto 1366x768
56.6  fps    + Confronta
ultra 1920x1080
31.5  fps    + Confronta
» Giocabile con tutti i portatili testati con dettagli alto.
basso 1280x720
63.3  fps    + Confronta
medio 1366x768
31.9  fps    + Confronta
alto 1366x768
18.5  fps    + Confronta
ultra 1920x1080
9.7  fps    + Confronta
» Giocabile con tutti i portatili testati con dettagli basso.
basso 1024x768
241.5  fps    + Confronta
medio 1360x768
59.5  fps    + Confronta
alto 1360x768
34.9  fps    + Confronta
» Giocabile con tutti i portatili testati con dettagli medio.
bassomedioaltoultraQHD4K
Palworld5.96
Prince of Persia The Lost Crown42.722.422.1
Ready or Not11.7
Total War Pharaoh16.4
EA Sports FC 2413.1
Counter-Strike 227.319.38.56
Cyberpunk 2077 2.0 Phantom Liberty4.88
Armored Core 69.76
Atlas Fallen4.94
Ratchet & Clank Rift Apart3.81
Diablo 49.77
Dead Island 28.81
Resident Evil 4 Remake2.56
Atomic Heart7.98
Hogwarts Legacy5.33
High On Life10.8
The Callisto Protocol6.9
Need for Speed Unbound6.65
Uncharted Legacy of Thieves Collection4.58
FIFA 2314.3
Vampire Bloodhunt16.610.78.43
Tiny Tina's Wonderlands8
Cyberpunk 2077 1.64.9
GRID Legends2216.212.8
Rainbow Six Extraction10
Farming Simulator 2240.5
Forza Horizon 518
Riders Republic10
Back 4 Blood21.38.71
Alan Wake Remastered21.6
Days Gone11.8
Mass Effect Legendary Edition38.516.19.59
Outriders20.713.2
Hitman 321.88
Yakuza Like a Dragon165.7
FIFA 2159.129.827.5
Mafia Definitive Edition11.9
Serious Sam 431.96.96
Crysis Remastered21.64.93
Flight Simulator 202011.7
Death Stranding13.77.78
F1 20202312
Gears Tactics38.113.27.55.4
Doom Eternal16.88.39
Escape from Tarkov17.3
Red Dead Redemption 213.47.4
Star Wars Jedi Fallen Order97.48
FIFA 2073.737.434.427
Borderlands 317.86.8
Control16.2
F1 20193513
League of Legends177.9149.2111.4103.7
Total War: Three Kingdoms43.212.4
Rage 216.6
The Division 2239
Dirt Rally 2.052.116
Anthem12.9
Far Cry New Dawn178
Metro Exodus15.47.6
Apex Legends35.113.1
Just Cause 415.58.9
Battlefield V22.6
Farming Simulator 1971.123.911.3
Fallout 7616.78.1
Hitman 212.87.5
Call of Duty Black Ops 425.99.7
Assassin´s Creed Odyssey117
FIFA 1957.129.927.2
Shadow of the Tomb Raider176
Strange Brigade311312.310.9
F1 20183516
Monster Hunter World20.37.7
The Crew 216.66.8
Far Cry 5146
World of Tanks enCore207.925.29.6
X-Plane 11.112115146.96
Kingdom Come: Deliverance16.96.9
Final Fantasy XV Benchmark124.8
Star Wars Battlefront 219.96.5
Need for Speed Payback19.38.9
Call of Duty WWII29.817.4
Wolfenstein II: The New Colossus17.79.1
Assassin´s Creed Origins107
Destiny 2179.2
ELEX14.56.8
The Evil Within 211.46.1
Middle-earth: Shadow of War2012
FIFA 1875423227
F1 201739
Playerunknown's Battlegrounds (PUBG)24.9
Team Fortress 21139351.626
Dirt 45213.8
Rocket League67.838.626
Prey28.911.3
Warhammer 40.000: Dawn of War III43.7
Mass Effect Andromeda18.3
Ghost Recon Wildlands19.1
For Honor30.711.6
Resident Evil 729.512.6
Farming Simulator 1793662714
Battlefield 139.323.5
Civilization VI2014.4
Deus Ex Mankind Divided20
Mirror's Edge Catalyst19.813.7
Overwatch6241.519.5
Doom23.318.1
The Division27.1
Far Cry Primal25
Rise of the Tomb Raider25
Rainbow Six Siege51.732.5
Anno 220532.416.9
World of Warships83.751.423.2
Metal Gear Solid V6040.713.4
Dota 2 Reborn815020187
The Witcher 31610
Dirt Rally153.635.615.2
GTA V514094.18
Dragon Age: Inquisition41.828.79.8
Middle-earth: Shadow of Mordor39.623.7
Sims 41716529.1
BioShock Infinite69393211
Tomb Raider100.149.128.7
Counter-Strike: GO146.8102.454.128.6
Diablo III93.359.956.631.5
The Elder Scrolls V: Skyrim63.331.918.59.7
StarCraft 2241.559.534.9
< 30 fps
< 60 fps
< 120 fps
≥ 120 fps
82
22
14
6
62
16
4
1
23
7
1
14
1
1
1


2


Per conoscere altri giochi che potrebbero essere utilizzabili e per una lista completa di tutti i giochi e delle schede grafiche visitate la nostra Gaming List

v1.26
log 24. 19:53:16

#0 no ids found in url (should be separated by "_") +0s ... 0s

#1 not redirecting to Ajax server +0s ... 0s

#2 did not recreate cache, as it is less than 5 days old! Created at Mon, 22 Apr 2024 05:40:21 +0200 +0.001s ... 0.001s

#3 no comparison url found in template nbc.compare_page_1 needed +0.04s ... 0.041s

#4 no comparison url found in template nbc.compare_page_1 needed +0s ... 0.041s

#5 no comparison url found in template nbc.compare_page_1 needed +0s ... 0.041s

#6 no comparison url found in template nbc.compare_page_1 needed +0s ... 0.041s

#7 no comparison url found in template nbc.compare_page_1 needed +0s ... 0.041s

#8 no comparison url found in template nbc.compare_page_1 needed +0s ... 0.041s

#9 no comparison url found in template nbc.compare_page_1 needed +0s ... 0.042s

#10 no comparison url found in template nbc.compare_page_1 needed +0s ... 0.042s

#11 no comparison url found in template nbc.compare_page_1 needed +0s ... 0.042s

#12 no comparison url found in template nbc.compare_page_1 needed +0s ... 0.042s

#13 no comparison url found in template nbc.compare_page_1 needed +0s ... 0.042s

#14 no comparison url found in template nbc.compare_page_1 needed +0s ... 0.042s

#15 composed specs +0s ... 0.042s

#16 did output specs +0s ... 0.042s

#17 start showIntegratedCPUs +0s ... 0.042s

#18 getting avg benchmarks for device 8126 +0.039s ... 0.081s

#19 got single benchmarks 8126 +0.039s ... 0.121s

#20 got avg benchmarks for devices +0s ... 0.121s

#21 min, max, avg, median took s +0.817s ... 0.938s

#22 before gaming benchmark output +0s ... 0.938s

#23 Got 363 rows for game benchmarks. +0.02s ... 0.958s

#24 composed SQL query for gamebenchmarks +0s ... 0.958s

#25 got data and put it in $dataArray +0.074s ... 1.032s

#26 benchmarks composed for output. +2.165s ... 3.197s

#27 no comparison url found in template nbc.compare_page_1 needed +0.006s ... 3.203s

#28 return log +0s ... 3.203s

Recensioni Notebook con Intel UHD Graphics 630 la scheda grafica

Dell Latitude 15 5511-VNJNW

Recensione del Laptop Dell Latitude 15 5511: Computer portatile aziendale per un lavoro produttivo

Il Dell Latitude 15 5511 non è esattamente quello che definireste un piccolo portatile. Tuttavia, non solo c'è spazio per molte porte grazie al case ampio, ma c...
Intel Core i5-10400H | Intel UHD Graphics 630 | 15.60" | 1.9 kg
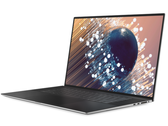
Recensione del Laptop Dell XPS 17 9700 - Computer portatile multimediale con pannello FHD opaco e batteria a lunga durata

Recensione del Laptop Dell XPS 17 9700 - Computer portatile multimediale con pannello FHD opaco e batteria a lunga durata

Dell è uno dei pochi produttori che offrono grandi portatili multimediali senza schede grafiche dedicate. Se non siete interessati al gaming, potete comunque ot...
Intel Core i5-10300H | Intel UHD Graphics 630 | 17.30" | 2.3 kg
Recensione dell'Intel NUC 9 Extreme con Core i9 ed RTX 2070

Recensione dell'Intel NUC 9 Extreme con Core i9 ed RTX 2070

I sistemi NUC di Intel sono in circolazione da molti anni e sono noti per la loro struttura compatta. Il nuovo Intel NUC 9 Extreme offre persino spazio sufficie...
Intel Core i9-9980HK | Intel UHD Graphics 630 | 0.00"
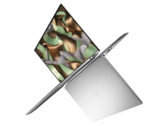
Recensione del Laptop Dell XPS 15 9500 Core i5: Ora ancora più simile a un MacBook Pro

Recensione del Laptop Dell XPS 15 9500 Core i5: Ora ancora più simile a un MacBook Pro

Questo è il più grande aggiornamento dell'XPS 15 dal 2016, ma è tutto quello che i fans di XPS desideravano? Certo che no - i fans irriducibili troveranno sempr...
Intel Core i5-10300H | Intel UHD Graphics 630 | 15.60" | 1.8 kg
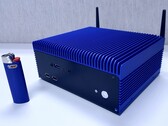
Recensione del MIni PC Impact Display Solutions IMP-3654-B1-R: Core i9 con raffreddamento passivo

Recensione del MIni PC Impact Display Solutions IMP-3654-B1-R: Core i9 con raffreddamento passivo

È possibile gestire un processore Core i9 8-cores16 threads con nient'altro che un enorme dissipatore di calore? Sottoponiamo a stress test il mini PC Impact Di...
Intel Core i9-9900T | Intel UHD Graphics 630 | | 2 kg

Dell XPS 15 7590 i5 iGPU FHD: Intel Core i5-9300H, 15.60", 1.9 kg
  recensione » Recensione del Laptop Dell XPS 15 7590: è sufficiente il modello base con Core i5 e pannello FHD?

SCHENKER Work 15: Intel Core i7-8750H, 15.60", 2.2 kg
  recensione » Recensione del Computer Portatile Schenker Work 15 (Core i7-8750H, 16 GB RAM, FHD)

Lenovo ThinkCentre M920z: Intel Core i5-8500, 23.50", 6.1 kg
  recensione » Recensione dell'All-in-One Desktop Lenovo ThinkCentre M920z

Dell Latitude 14 5411, i5-10400H: Intel Core i5-10400H, 14.00", 1.5 kg
  Recensioni esterne » Dell Latitude 14 5411, i5-10400H

Dell Latitude 15 5511, i5-10400H: Intel Core i5-10400H, 15.60", 1.9 kg
  Recensioni esterne » Dell Latitude 15 5511, i5-10400H

Dell XPS 17 9700 i5-10300H: Intel Core i5-10300H, 17.30", 2.3 kg
  Recensioni esterne » Dell XPS 17 9700 i5-10300H

Dell XPS 15 9500 Core i5: Intel Core i5-10300H, 15.60", 1.8 kg
  Recensioni esterne » Dell XPS 15 9500 Core i5

Dell Latitude 14 5401-P8TG4: Intel Core i7-9850H, 14.00", 1.5 kg
  Recensioni esterne » Dell Latitude 5401-P8TG4

HP Pavilion 15-dk0010ns: Intel Core i5-9300H, 15.60", 2.3 kg
  Recensioni esterne » HP Pavilion 15-dk0010ns

Lenovo IdeaPad 530S-14IKB-81EU00SXMH: Intel Core i5-8250U, 14.00", 1.6 kg
  Recensioni esterne » Lenovo IdeaPad 530S-14IKB-81EU00SXMH

HP EliteBook 1050 G1-3ZH19EA: Intel Core i5-8300H, 15.60", 2.1 kg
  Recensioni esterne » HP EliteBook 1050 G1-3ZH19EA

Dell Latitude 5491 (8850H, UHD 630): Intel Core i7-8850H, 14.00", 1.8 kg
  Recensioni esterne » Dell Latitude 5491 (8850H, UHD 630)

Dell Latitude 15 5511-VNJNW: Intel Core i5-10400H, 15.60", 1.9 kg
   » Dell Latitude 15 5511: Grande laptop da 15" per utenti business

Please share our article, every link counts!

Classe 1

NVIDIA RTX A6000 Desktop
Radeon Pro W6800 Desktop
Radeon RX 6800 Desktop
NVIDIA Titan RTX Desktop
Radeon RX 6750 XT Desktop
Radeon RX 6700 XT Desktop
Radeon RX 6650 XT Desktop
GeForce RTX 2080 Super Mobile

Classe 2

NVIDIA GeForce RTX 3060 Desktop
Titan X Pascal Desktop
Radeon VII Desktop
Radeon RX 5700 XT (Desktop) Desktop
M1 Max 32-Core GPU *
GeForce RTX 2070 Super Mobile
M1 Max 24-Core GPU *
Radeon RX 5700 (Desktop) Desktop
Radeon RX 5700M *
M1 Pro 16-Core GPU *
Radeon PRO W6600M *
GeForce RTX 2070 Super Max-Q
M1 Pro 14-Core GPU *
RX Vega 56 Desktop
Radeon RX 5600 XT (Desktop) Desktop
Pro Vega 56 Desktop
Quadro P4200
GeForce GTX 1650 Super (Desktop) Desktop
Quadro P5000 Max-Q *
GeForce RTX 3050 4GB Laptop GPU
Radeon RX 580 Desktop
GeForce GTX 1060 (Desktop) Desktop
Radeon RX 570 Desktop
Radeon RX 480 Desktop
Quadro P4000 Max-Q
Radeon RX 580X (Laptop) *
Radeon RX 580 (Laptop)
Arc A380 Desktop
Radeon Pro 5300M
Radeon RX 5300M
Quadro P3000 Max-Q *
Radeon Pro WX 7100 *
Radeon RX 570X (Laptop) *
Radeon RX 570 (Laptop) *
Radeon RX 470 (Laptop) *

Classe 3

GeForce GTX 1050 Ti Mobile
Radeon 680M
Quadro P2000 Max-Q
Radeon R9 M395X
GeForce GTX 1050 Ti Max-Q *
WX Vega M GL
Radeon R9 M485X
GeForce GTX 1050 Max-Q *
Radeon 660M
Radeon RX 560X (Laptop)
Radeon RX 560 (Laptop)
Radeon Pro 560X
Radeon Pro 560
Radeon Pro 460
Radeon Pro WX 4130 *
Quadro P620 *
Radeon RX 550X (Laptop)
Radeon Pro 555X
Radeon Pro 555
Radeon Pro 455
Quadro P600
Radeon RX 540X *
Radeon Pro WX 2100 *
Radeon Pro WX 3100 *
Radeon Pro 450
Radeon 630
Radeon 540X *
Quadro P520
Quadro P500 *
Iris Plus Graphics G7 (Ice Lake 64 EU) *
Vega 10 *
Iris Pro Graphics 580
Vega 9
FirePro W5130M
UHD Graphics Xe G4 48EUs *
UHD Graphics 32EUs
UHD Graphics Xe 32EUs (Tiger Lake-H) *
UHD Graphics 750
UHD Graphics Xe 750 32EUs * Desktop
Vega 7
Radeon R7 M465
FirePro W4100 Desktop
Vega 8
Iris Plus Graphics G4 (Ice Lake 48 EU)
Quadro M600M
FirePro W4190M
Radeon R7 M445
UHD Graphics 24EUs (Alder Lake-N) *
Radeon R7 M340
Radeon 610M *
UHD Graphics G1 (Ice Lake 32 EU)
UHD Graphics P630 Desktop
UHD Graphics Xe 16EUs (Tiger Lake-H) *
HD Graphics 630 Desktop
Radeon R5 (Bristol Ridge)
Adreno 690 *
Adreno 685 *
Adreno 680 *
FirePro W2100 Desktop

Classe 4

UHD Graphics 730
Radeon R5 M315 *
Radeon R5 M420 *
UHD Graphics 617
UHD Graphics 615
Radeon R4 (Stoney Ridge)
Radeon R2 (Stoney Ridge)
HD Graphics (Broadwell)

Classe 5

Posizione approssimativa dell'adattatore grafico

> Recensioni e prove di notebook, tablets e smartphones > Info Techniche / Tips > Confronto delle schede video > Intel > Intel UHD Graphics 630
Klaus Hinum, 2021-10-30 (Update: 2021-10-30)