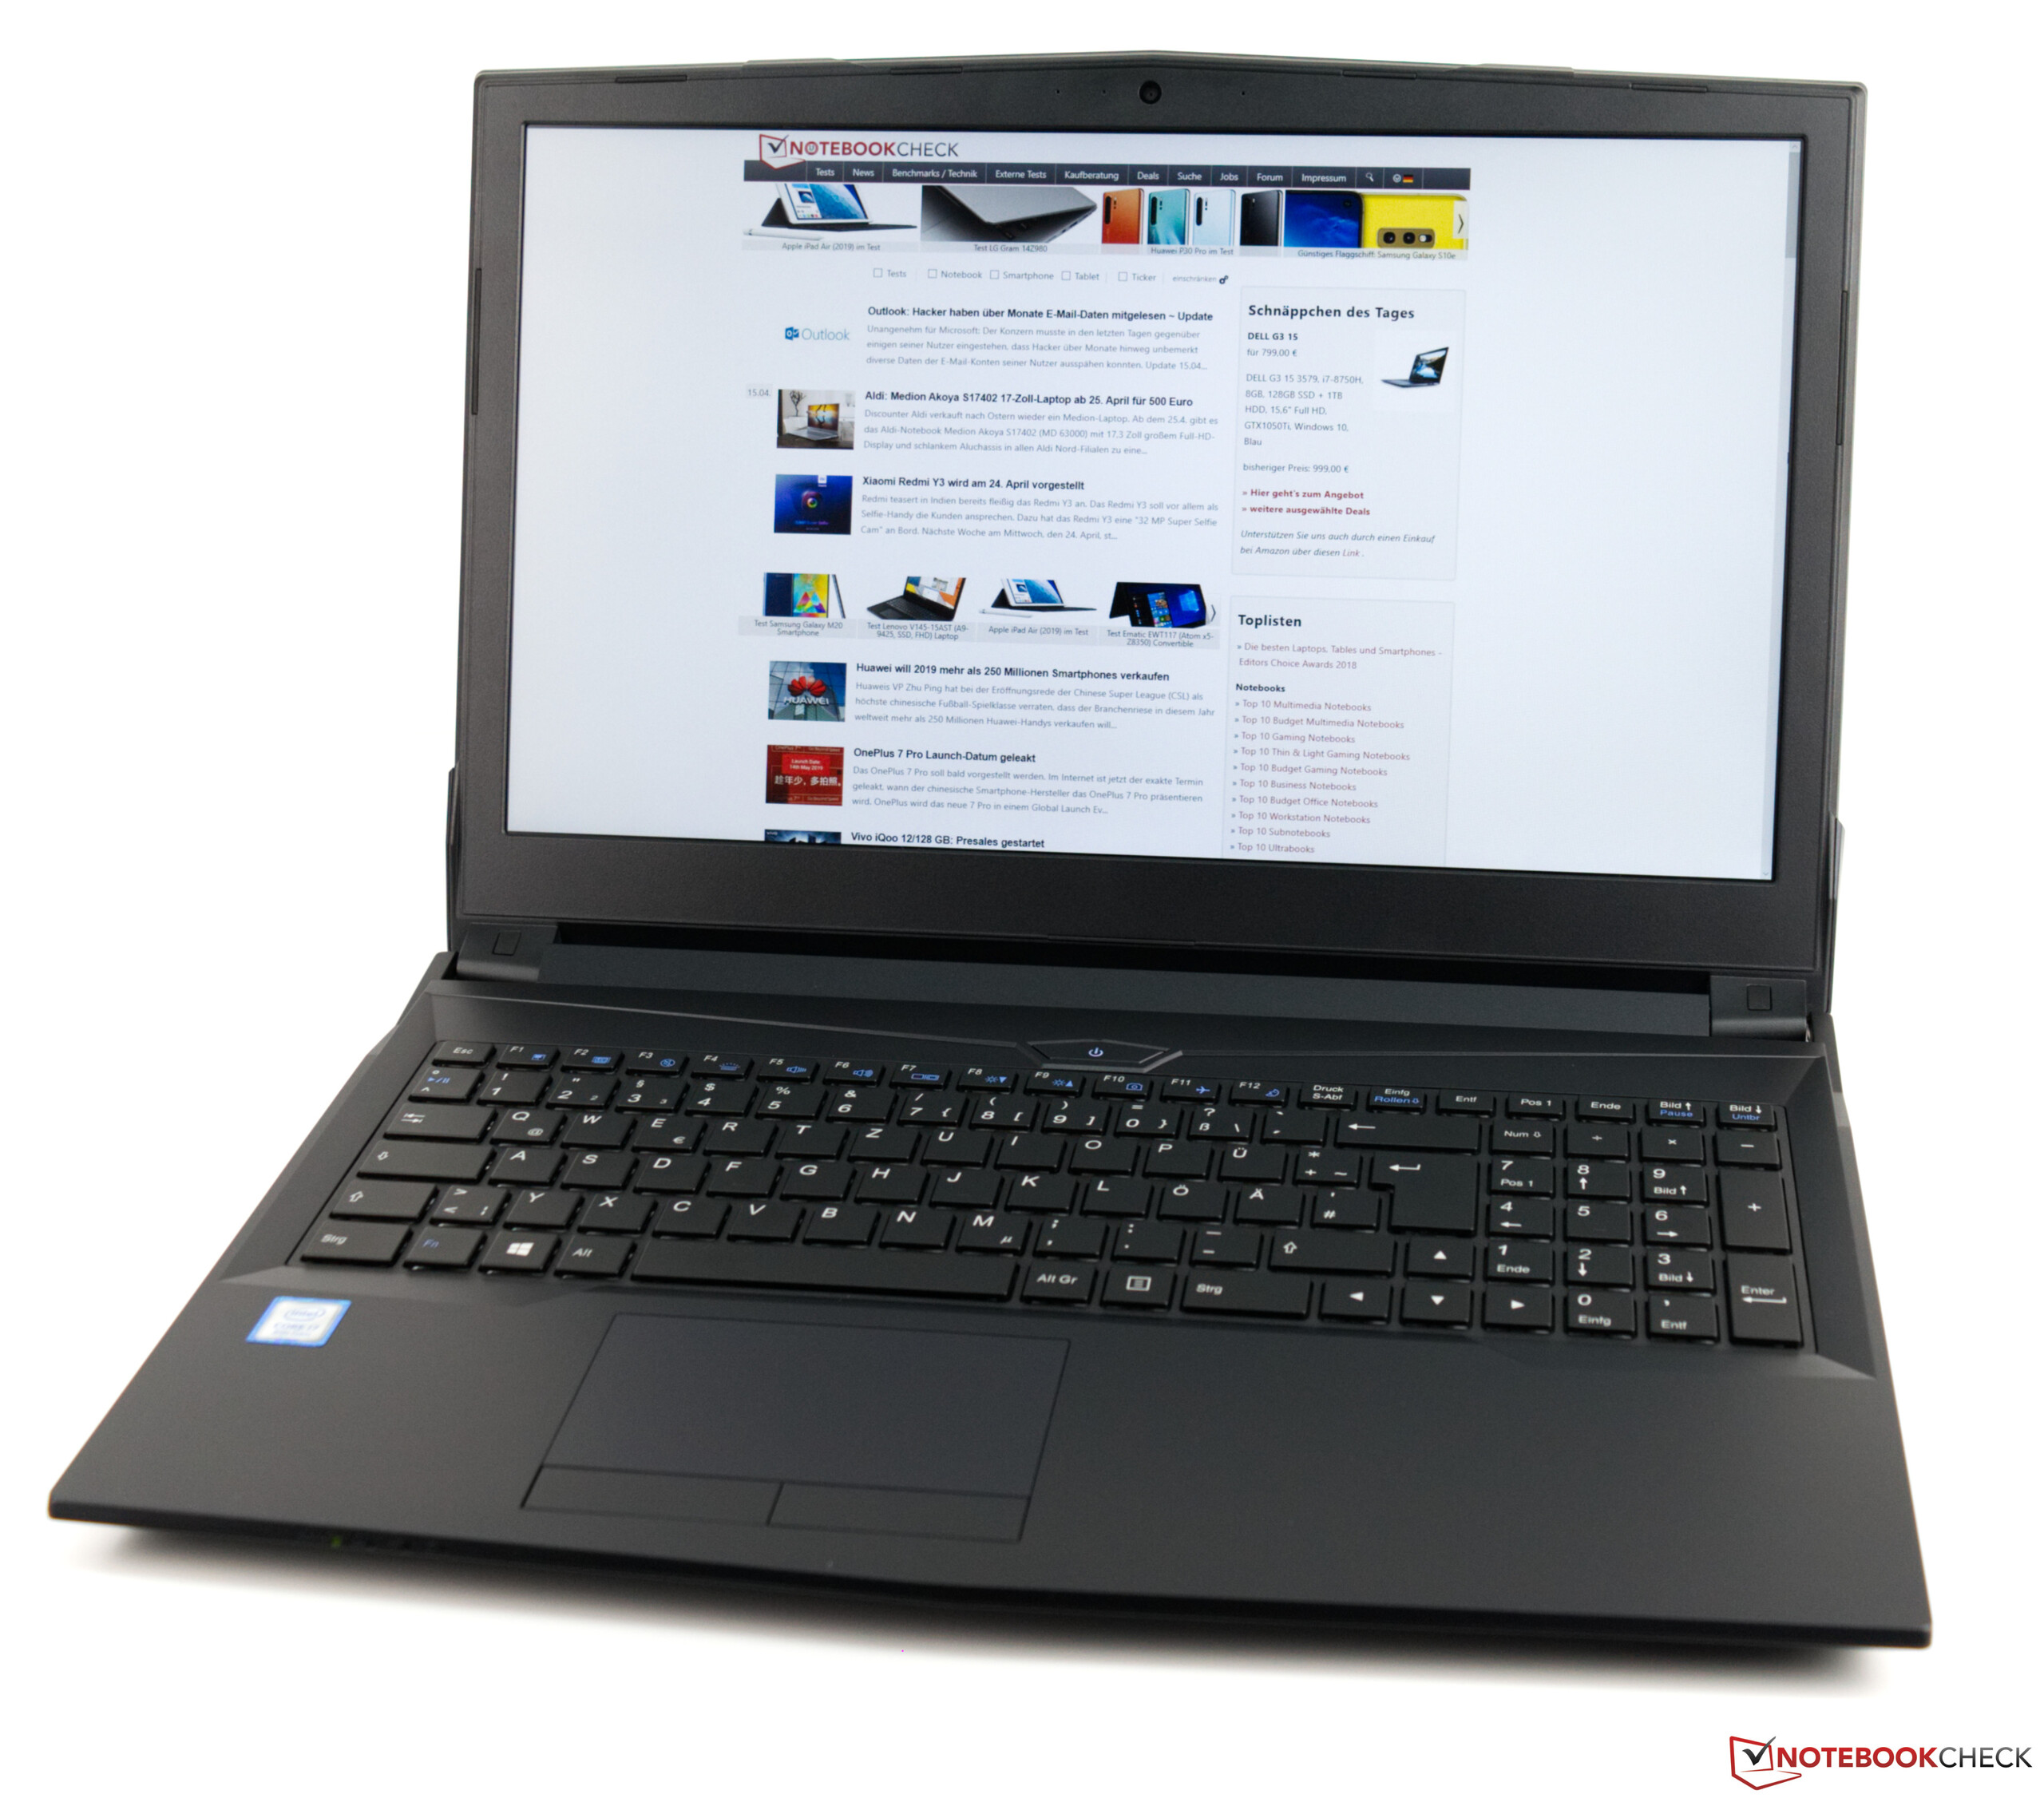
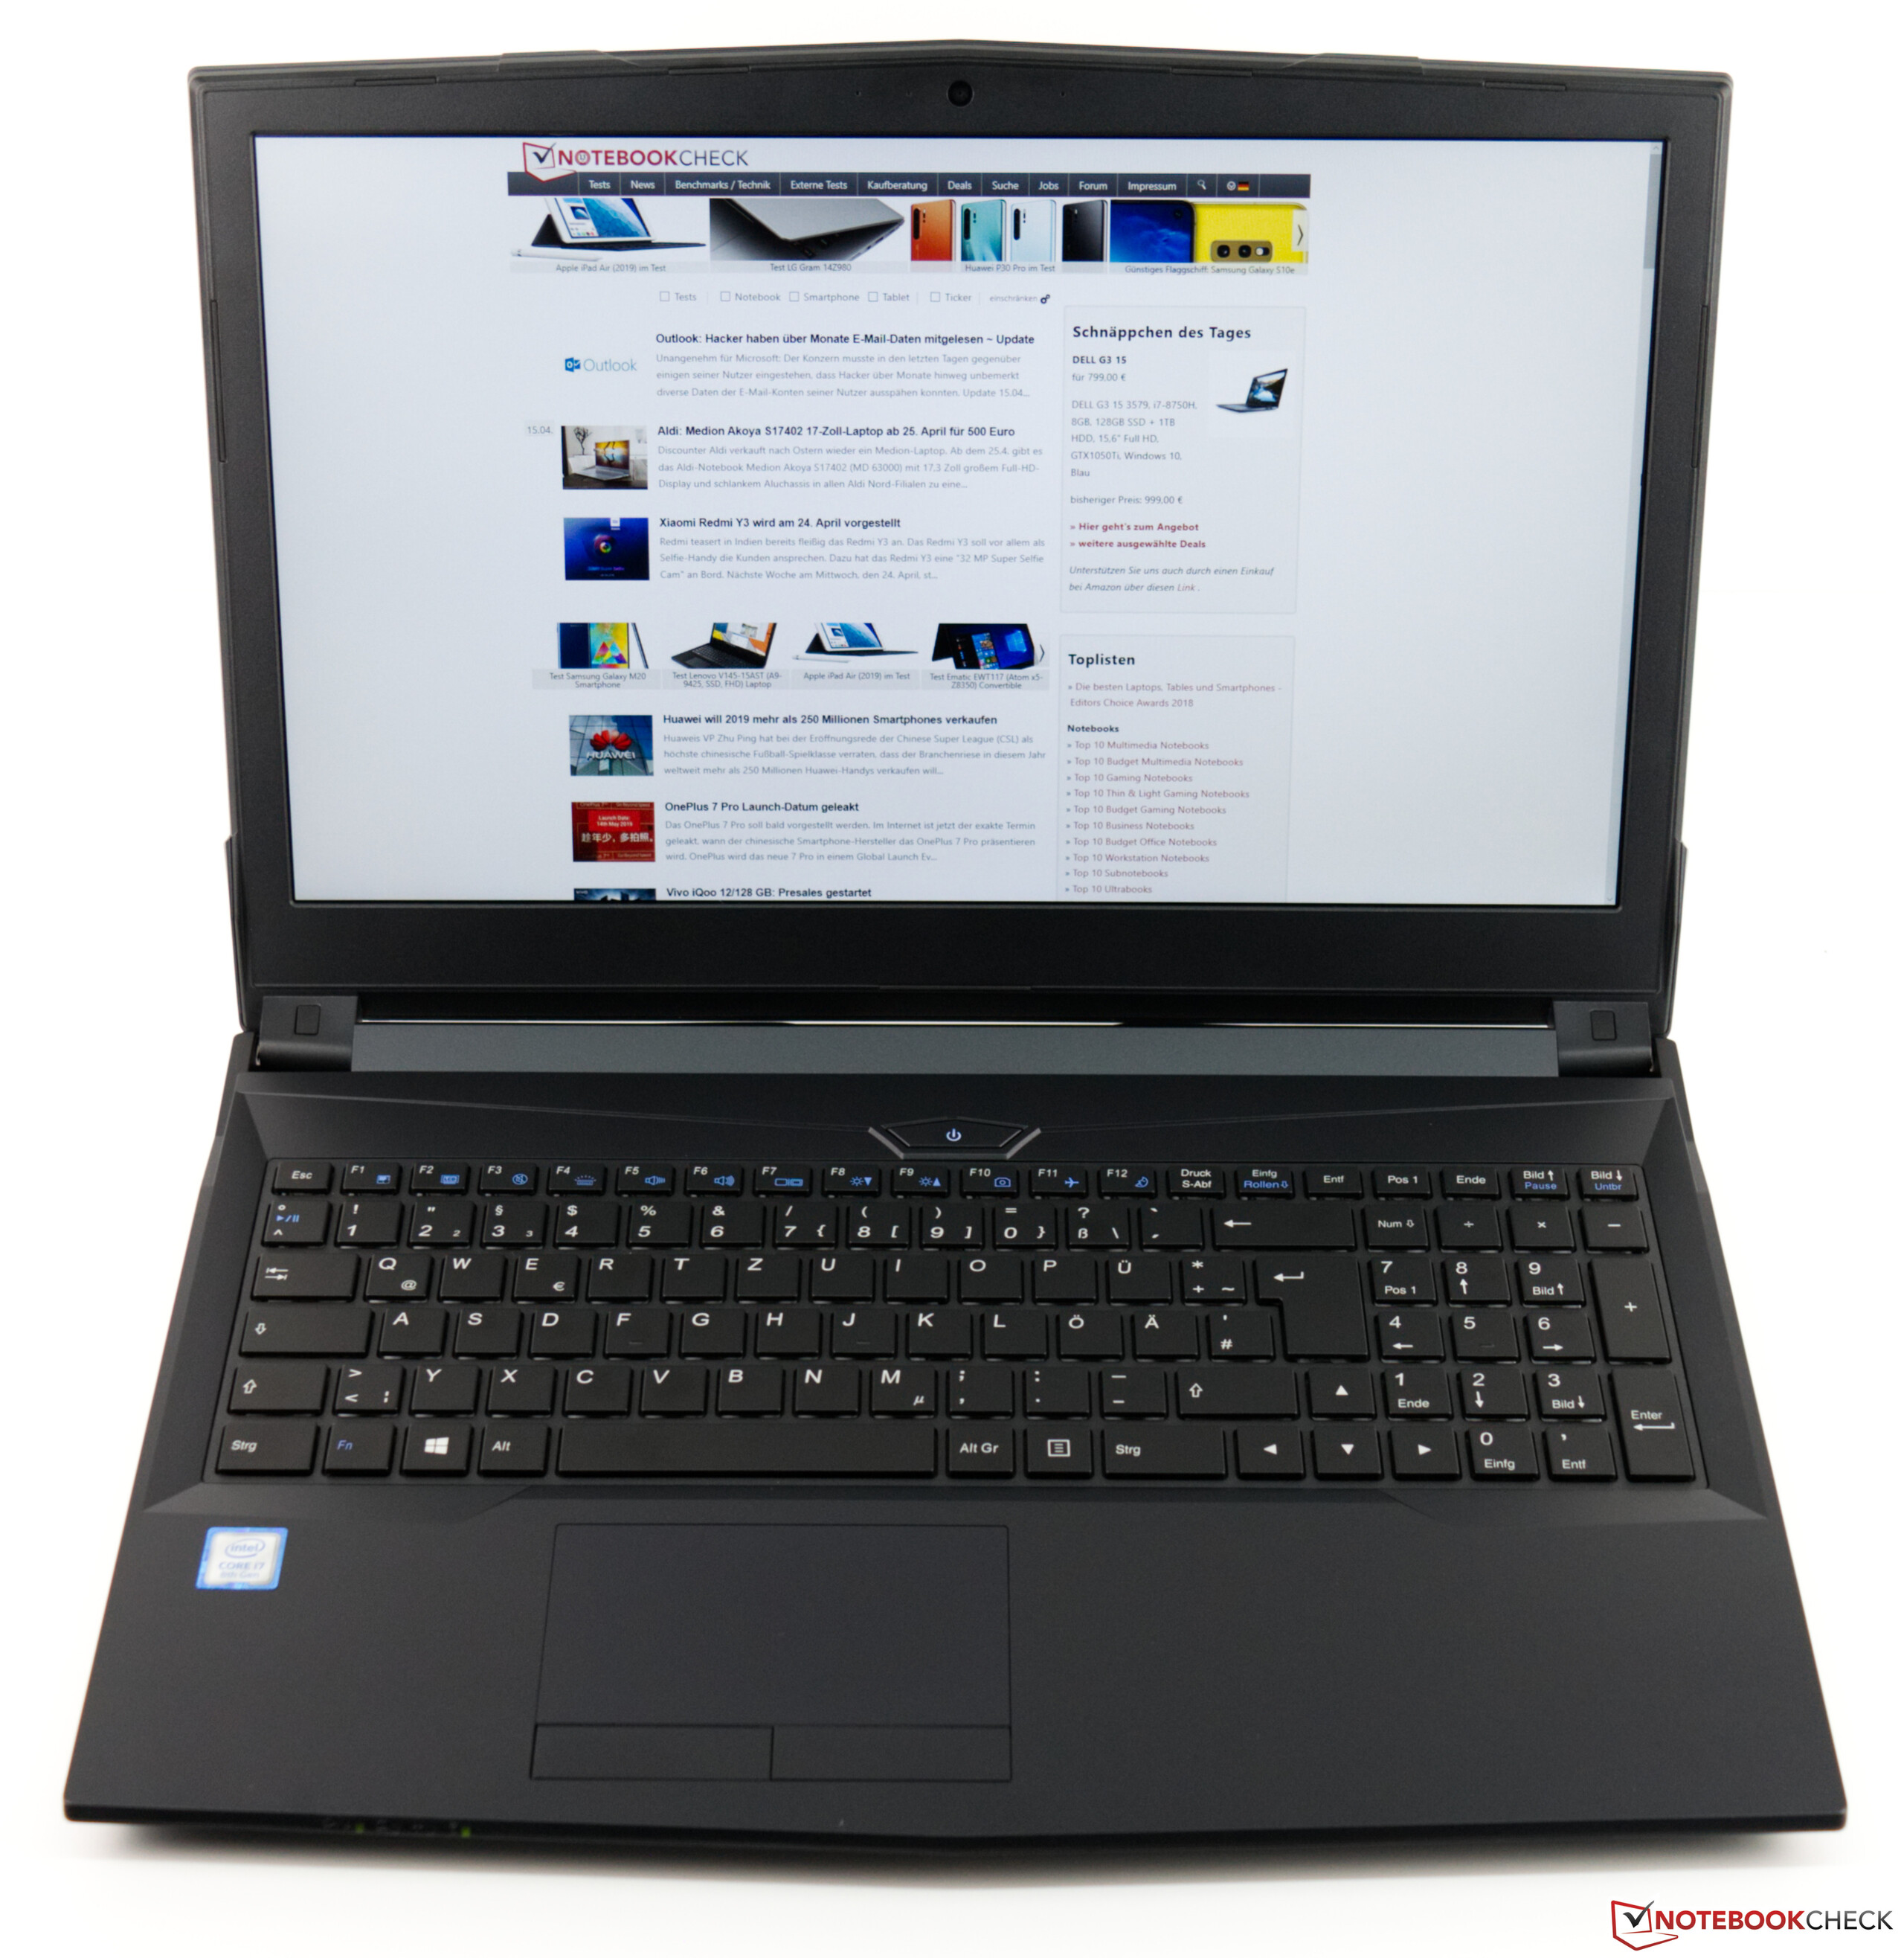
Recensione del Computer Portatile Schenker Work 15 (Core i7-8750H, 16 GB RAM, FHD)
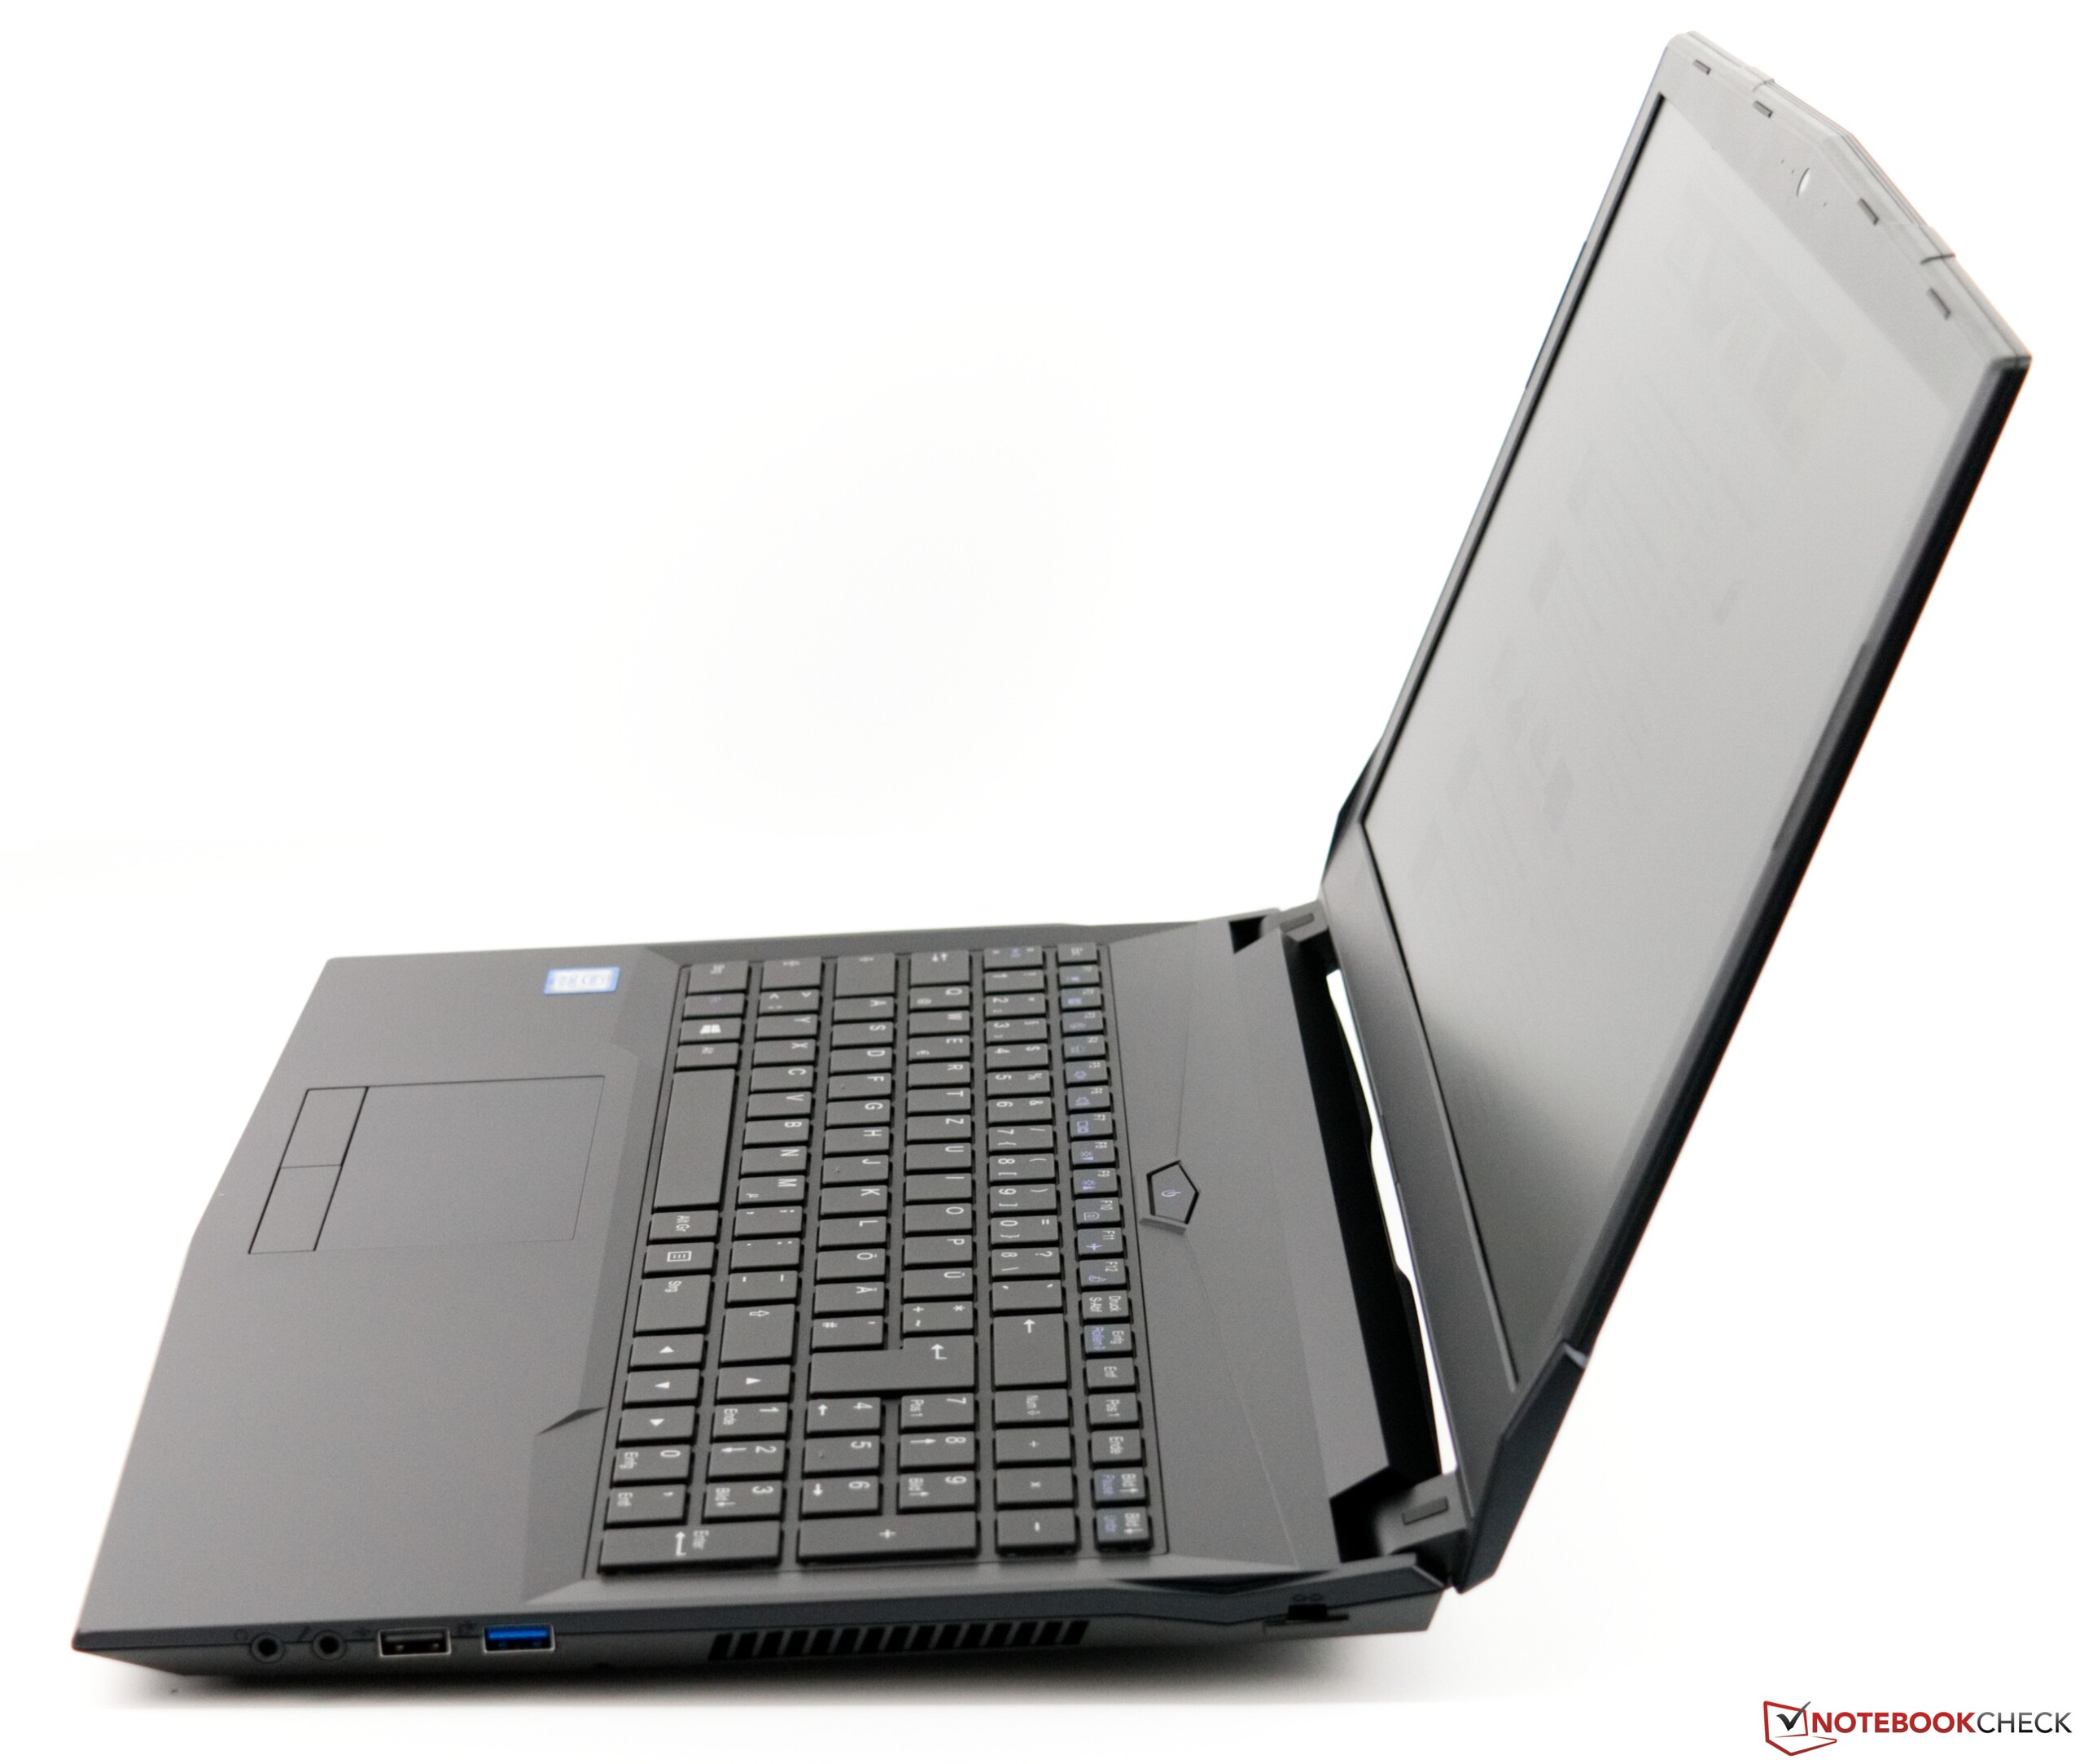
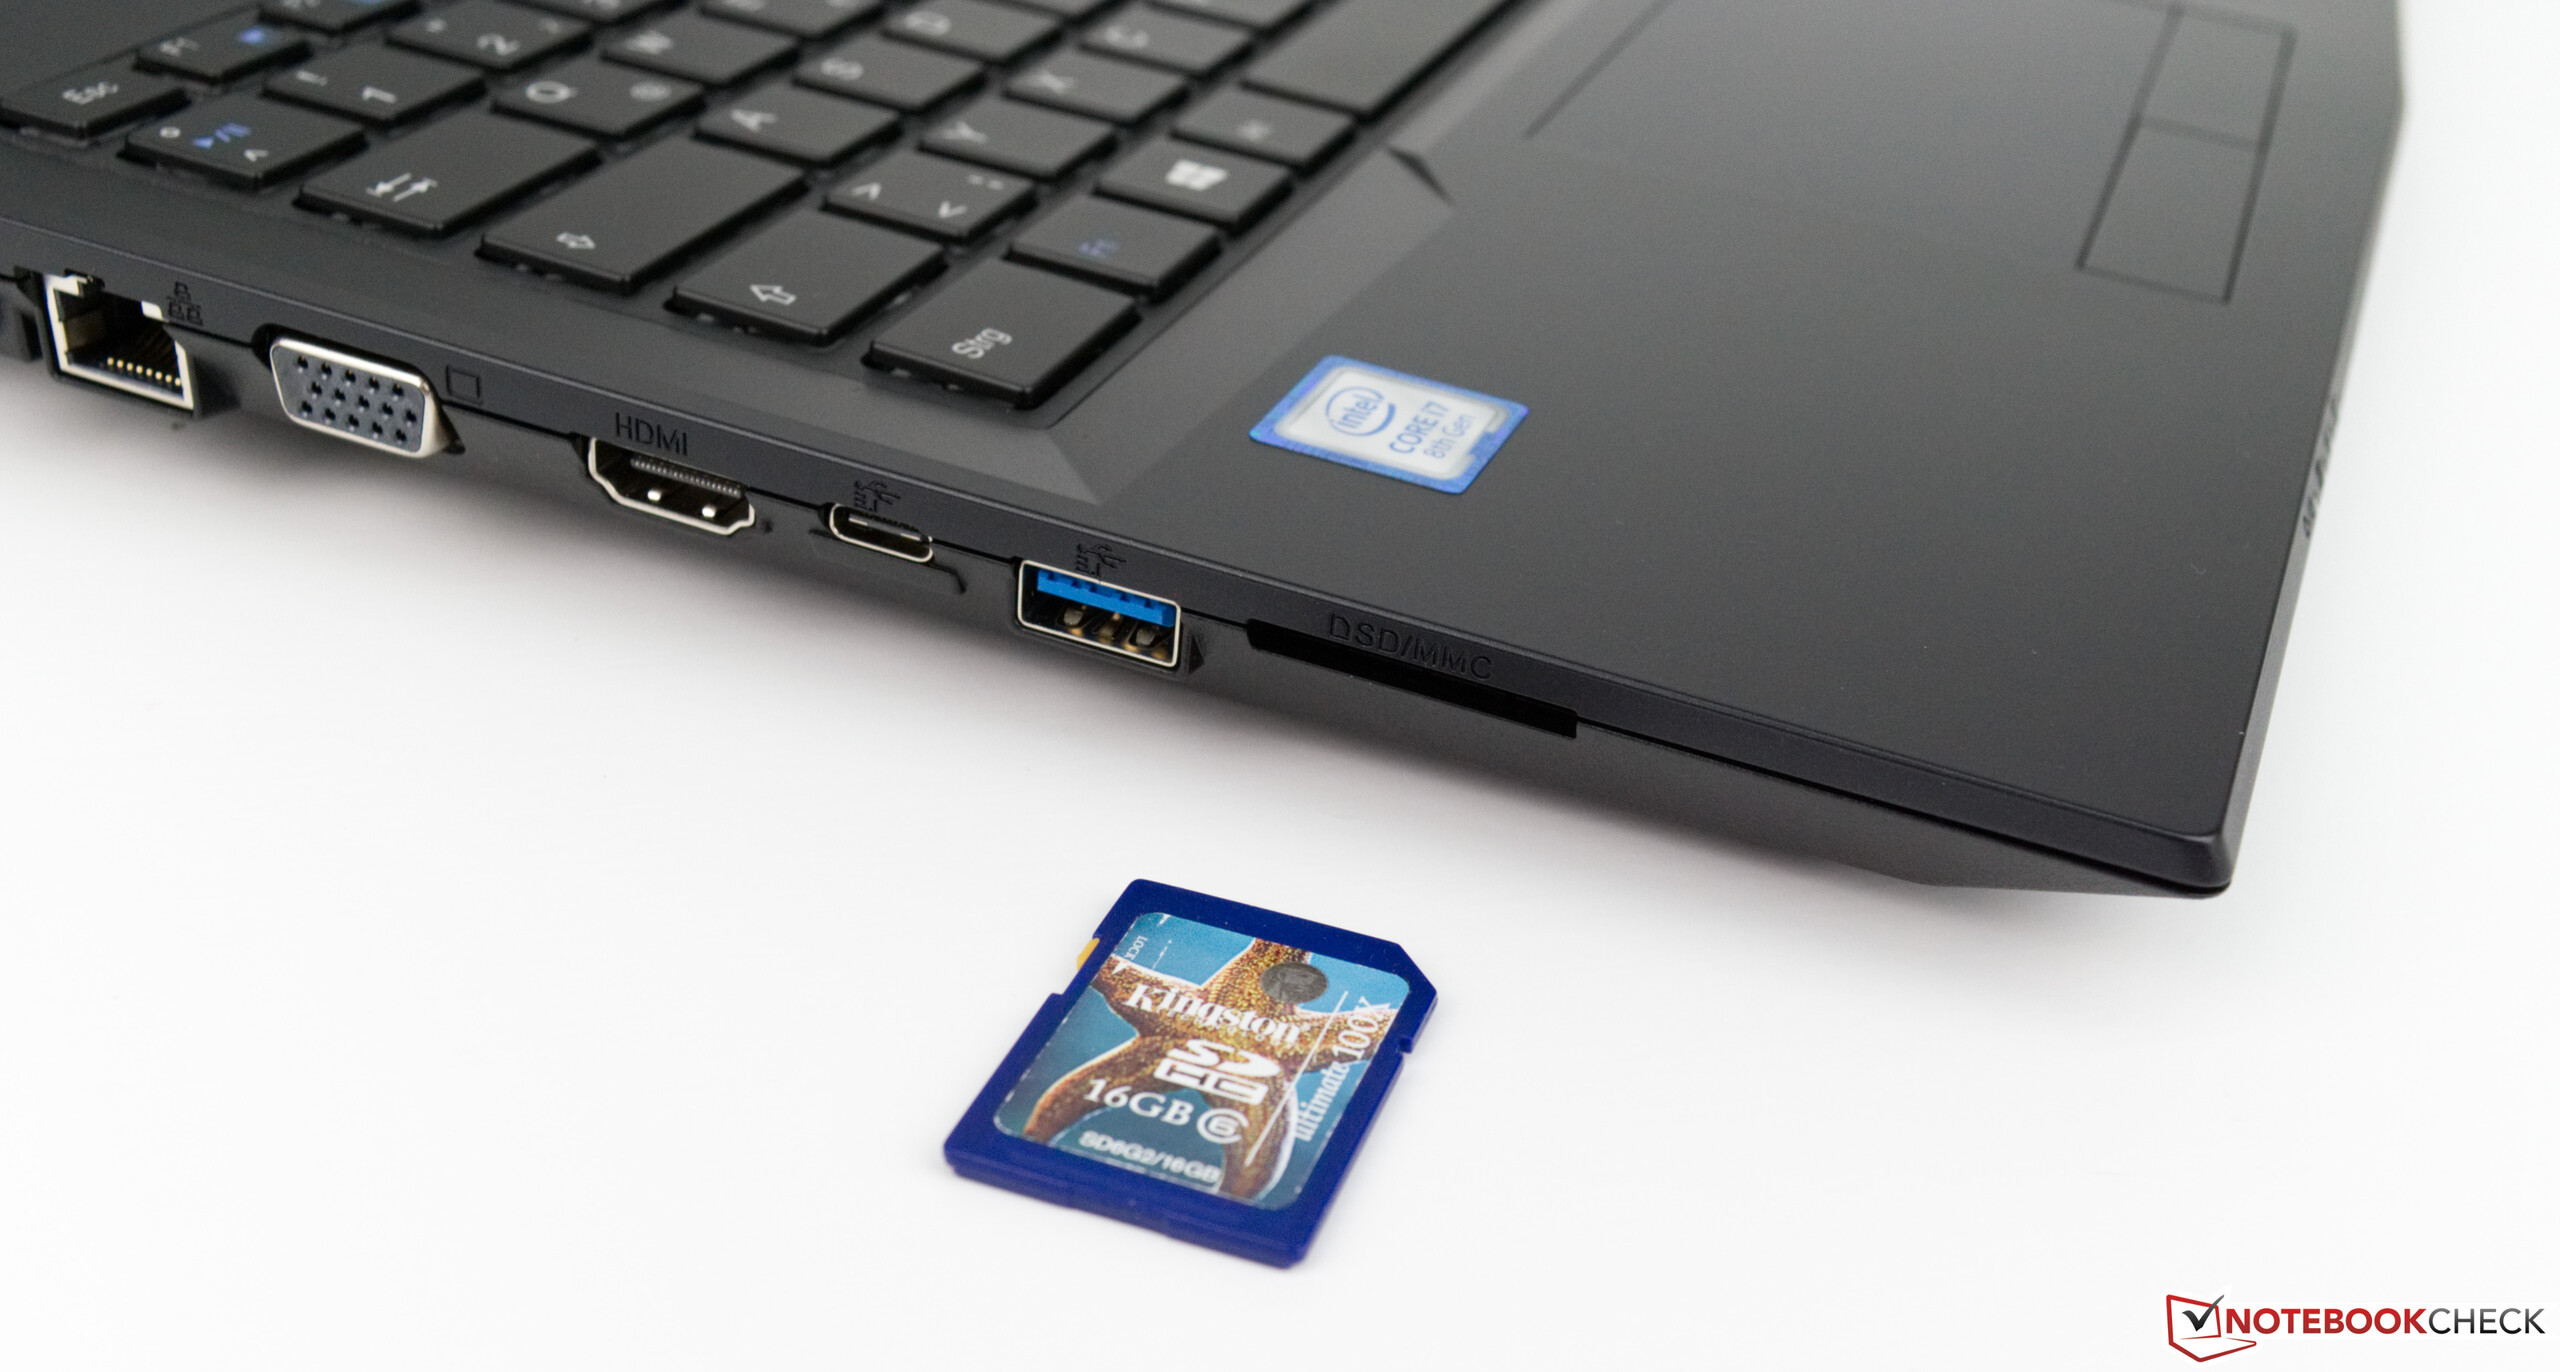
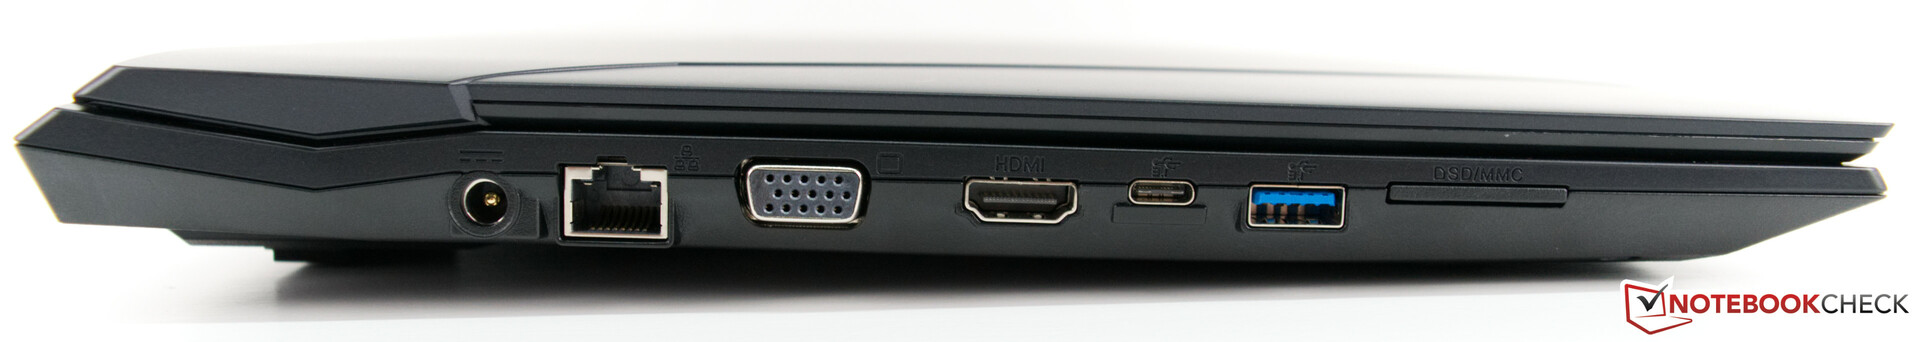
Connettività

| SD Card Reader | |
| average JPG Copy Test (av. of 3 runs) | |
| Dell Latitude 5590 (Toshiba Exceria Pro SDXC 64 GB UHS-II) | |
| Schenker Work 15 (Toshiba Exceria Pro SDXC 64 GB UHS-II) | |
| HP ProBook 450 G6-5TJ93EA (Toshiba Exceria Pro SDXC 64 GB UHS-II) | |
| Lenovo ThinkPad T580-20L9001AUS (Toshiba Exceria Pro SDXC 64 GB UHS-II) | |
| Fujitsu Lifebook E558 E5580MP581DE (Toshiba Exceria Pro SDXC 64 GB UHS-II) | |
| Media della classe Office (22.4 - 198.5, n=22, ultimi 2 anni) | |
| maximum AS SSD Seq Read Test (1GB) | |
| Dell Latitude 5590 (Toshiba Exceria Pro SDXC 64 GB UHS-II) | |
| Lenovo ThinkPad T580-20L9001AUS (Toshiba Exceria Pro SDXC 64 GB UHS-II) | |
| Schenker Work 15 (Toshiba Exceria Pro SDXC 64 GB UHS-II) | |
| HP ProBook 450 G6-5TJ93EA (Toshiba Exceria Pro SDXC 64 GB UHS-II) | |
| Media della classe Office (27.4 - 249, n=20, ultimi 2 anni) | |
| Fujitsu Lifebook E558 E5580MP581DE (Toshiba Exceria Pro SDXC 64 GB UHS-II) | |
| Networking | |
| iperf3 transmit AX12 | |
| HP ProBook 450 G6-5TJ93EA | |
| Schenker Work 15 | |
| Fujitsu Lifebook E558 E5580MP581DE | |
| Dell Latitude 5590 | |
| Lenovo ThinkPad T580-20L9001AUS | |
| iperf3 receive AX12 | |
| Lenovo ThinkPad T580-20L9001AUS | |
| Schenker Work 15 | |
| HP ProBook 450 G6-5TJ93EA | |
| Fujitsu Lifebook E558 E5580MP581DE | |
| Dell Latitude 5590 | |
| |||||||||||||||||||||||||
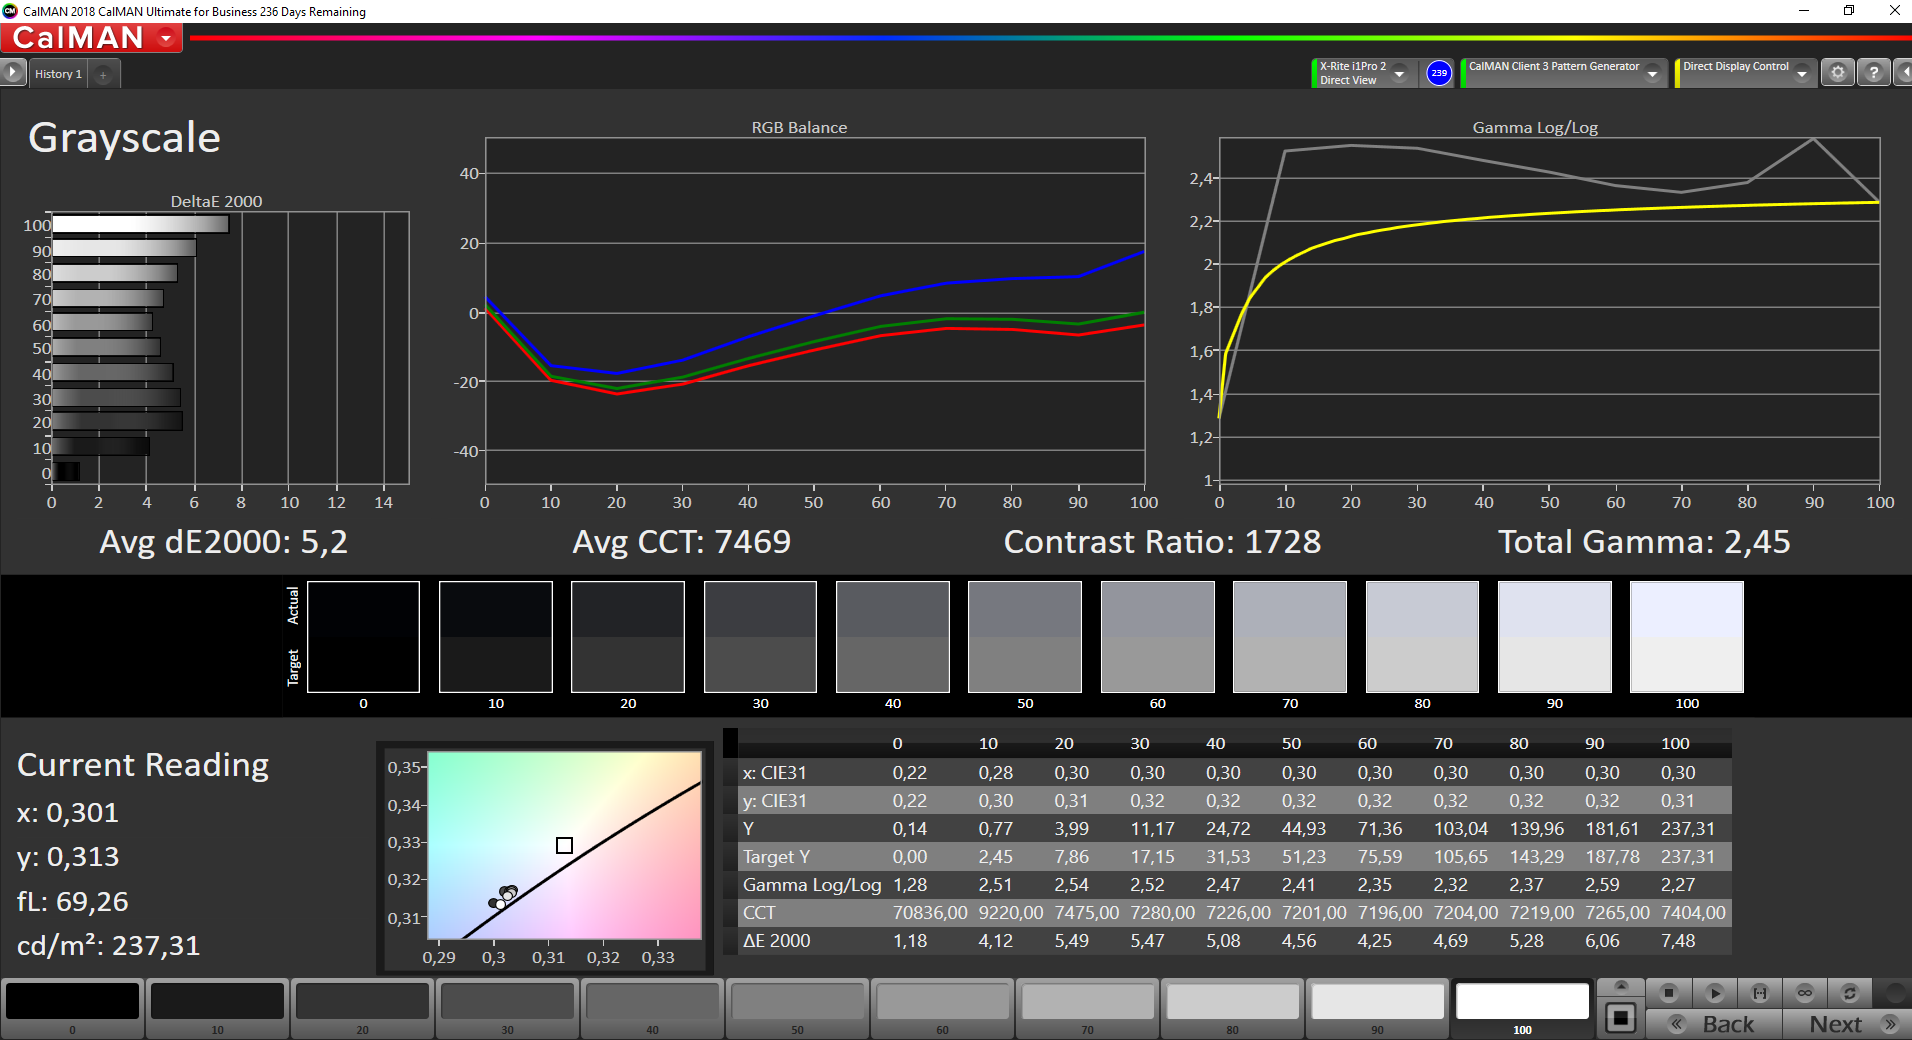
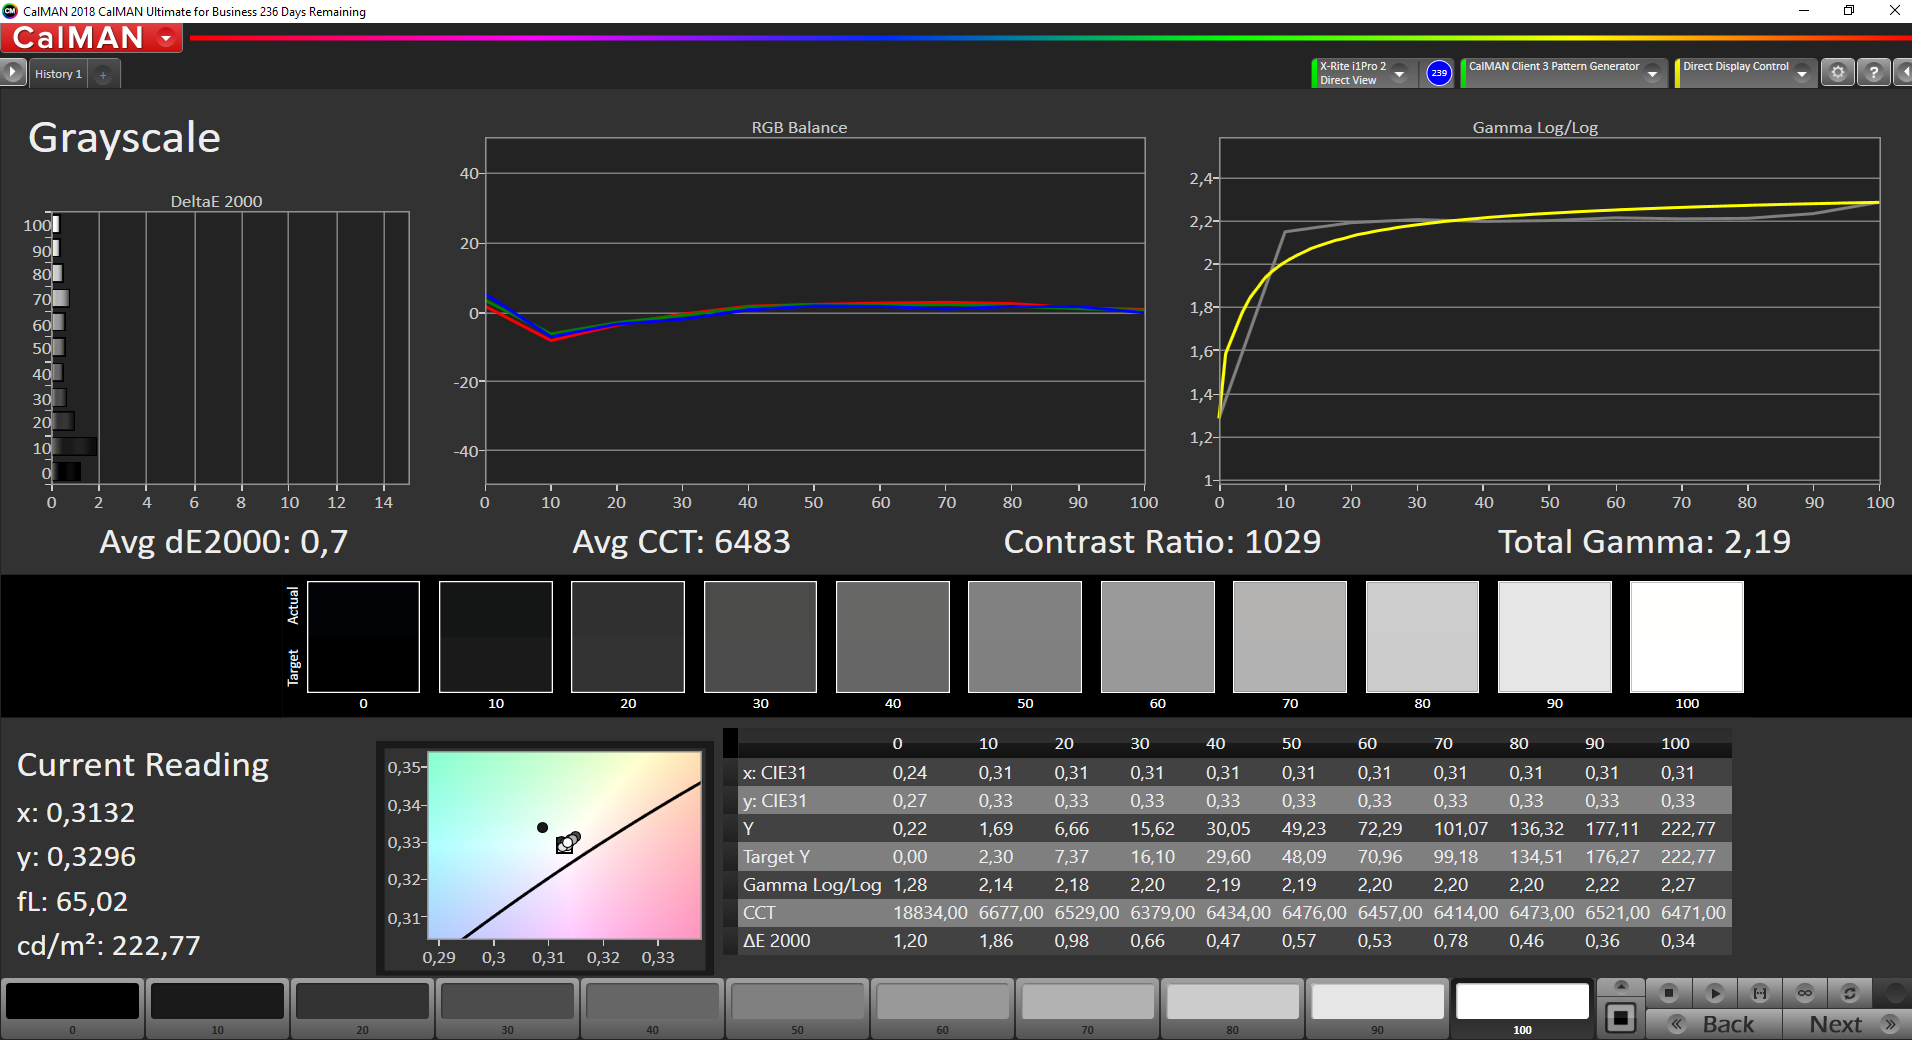
Distribuzione della luminosità: 87 %
Al centro con la batteria: 241 cd/m²
Contrasto: 1700:1 (Nero: 0.14 cd/m²)
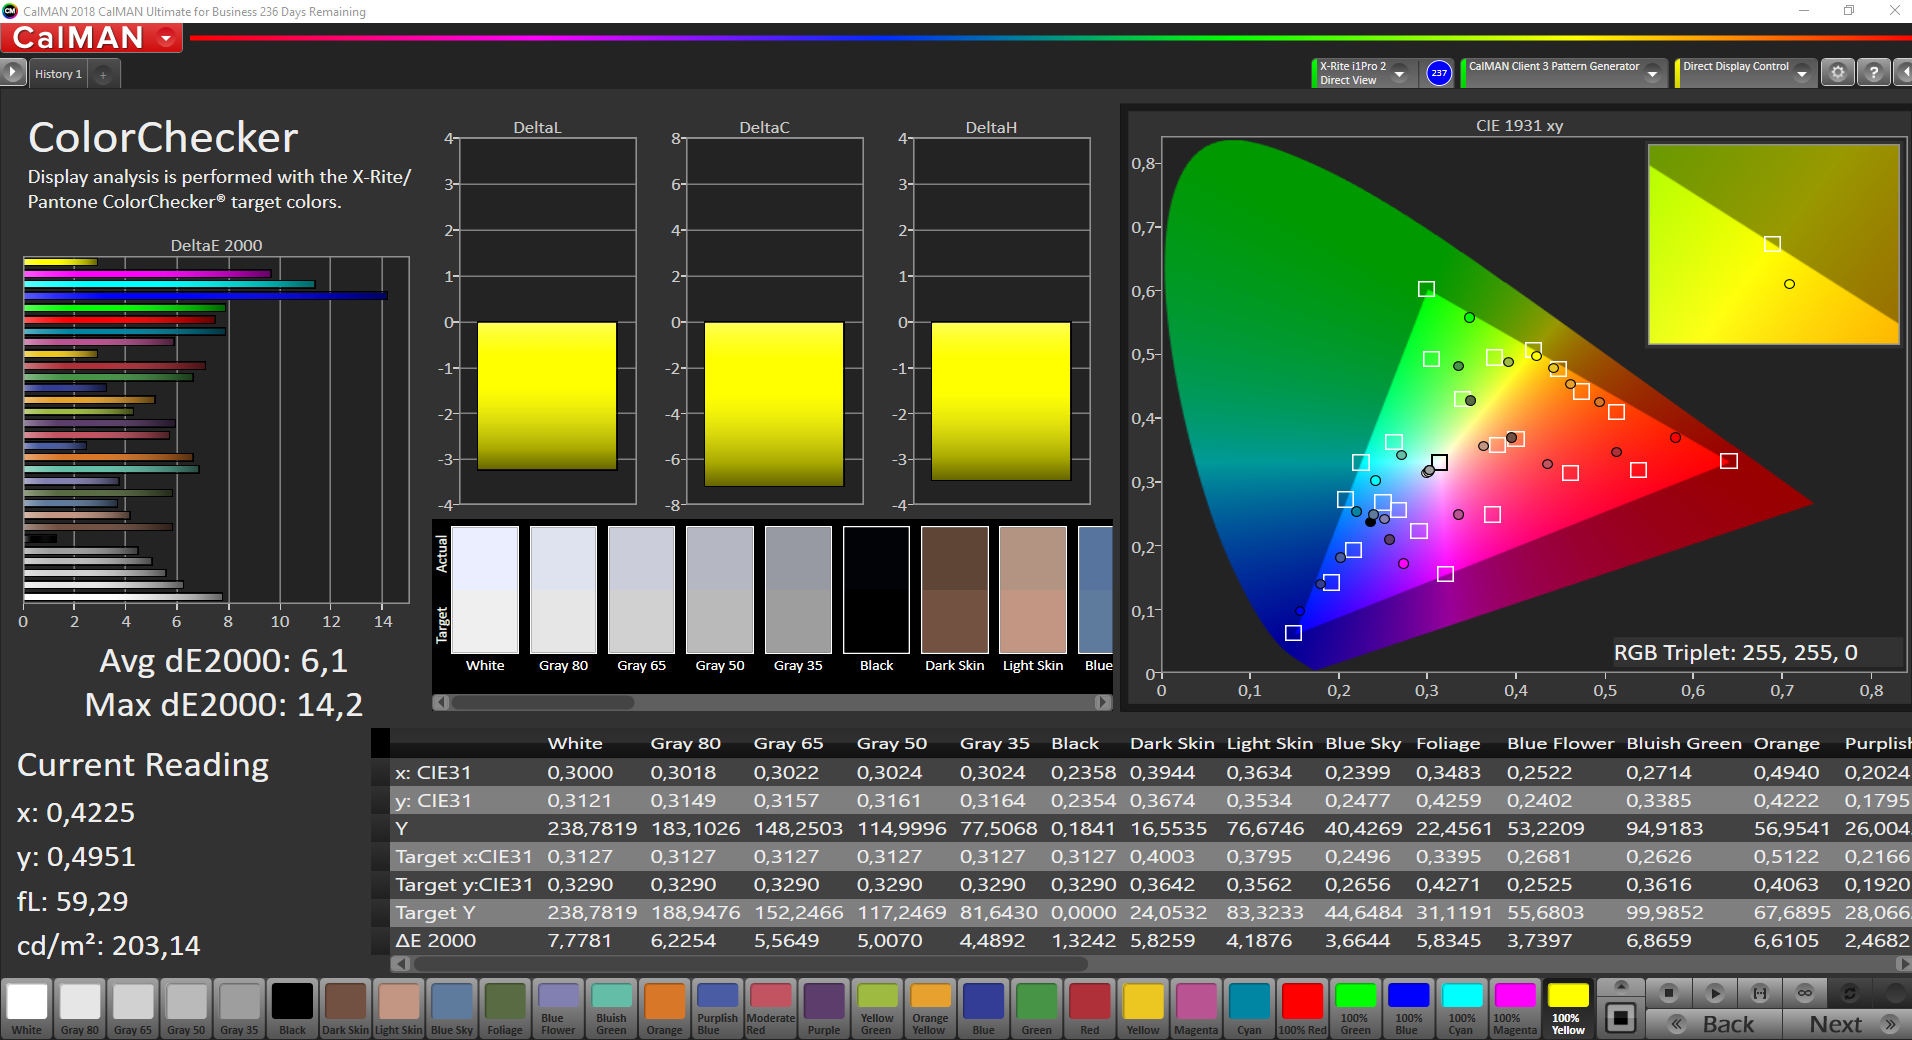
ΔE ColorChecker Calman: 6.1 | ∀{0.5-29.43 Ø4.73}
calibrated: 4.4
ΔE Greyscale Calman: 5.2 | ∀{0.09-98 Ø4.97}
57.2% sRGB (Argyll 1.6.3 3D)
36.3% AdobeRGB 1998 (Argyll 1.6.3 3D)
39.39% AdobeRGB 1998 (Argyll 3D)
57.4% sRGB (Argyll 3D)
38.12% Display P3 (Argyll 3D)
Gamma: 2.45
CCT: 7469 K
| Schenker Work 15 LP156WFC-SPP1, IPS, 1920x1080, 15.6" | HP ProBook 450 G6-5TJ93EA Chi Mei CMN15FE, IPS, 1920x1080, 15.6" | Lenovo ThinkPad T580-20L9001AUS B156HAK02.0, IPS, 1920x1080, 15.6" | Fujitsu Lifebook E558 E5580MP581DE LG Philips LP156WFB-SPB1, IPS, 1920x1080, 15.6" | Dell Latitude 5590 NV15N42, IPS, 1920x1080, 15.6" | |
|---|---|---|---|---|---|
| Display | 12% | -3% | -8% | 8% | |
| Display P3 Coverage (%) | 38.12 | 42.83 12% | 36.94 -3% | 35.25 -8% | 41.56 9% |
| sRGB Coverage (%) | 57.4 | 64.2 12% | 55.3 -4% | 53 -8% | 61.3 7% |
| AdobeRGB 1998 Coverage (%) | 39.39 | 44.29 12% | 38.16 -3% | 36.43 -8% | 42.93 9% |
| Response Times | 9% | 5% | 6% | -45% | |
| Response Time Grey 50% / Grey 80% * (ms) | 37.2 ? | 34.4 ? 8% | 33.2 ? 11% | 36 ? 3% | 53.2 ? -43% |
| Response Time Black / White * (ms) | 27.2 ? | 24.4 ? 10% | 27.6 ? -1% | 25 ? 8% | 39.6 ? -46% |
| PWM Frequency (Hz) | 26040 ? | 1000 ? | |||
| Screen | -1% | -9% | 5% | -12% | |
| Brightness middle (cd/m²) | 238 | 242 2% | 254.5 7% | 231 -3% | 243 2% |
| Brightness (cd/m²) | 235 | 226 -4% | 238 1% | 227 -3% | 234 0% |
| Brightness Distribution (%) | 87 | 88 1% | 87 0% | 88 1% | 83 -5% |
| Black Level * (cd/m²) | 0.14 | 0.21 -50% | 0.27 -93% | 0.16 -14% | 0.19 -36% |
| Contrast (:1) | 1700 | 1152 -32% | 943 -45% | 1444 -15% | 1279 -25% |
| Colorchecker dE 2000 * | 6.1 | 4.7 23% | 4.58 25% | 4.83 21% | 6.6 -8% |
| Colorchecker dE 2000 max. * | 14.2 | 18.5 -30% | 17.99 -27% | 8.42 41% | 22.3 -57% |
| Colorchecker dE 2000 calibrated * | 4.4 | 4 9% | 4.34 1% | 5 -14% | |
| Greyscale dE 2000 * | 5.2 | 2.7 48% | 3.3 37% | 3.49 33% | 5.2 -0% |
| Gamma | 2.45 90% | 2.26 97% | 2.403 92% | 2.54 87% | 2.24 98% |
| CCT | 7469 87% | 6442 101% | 6355 102% | 6233 104% | 6990 93% |
| Color Space (Percent of AdobeRGB 1998) (%) | 36.3 | 40.8 12% | 35 -4% | 34 -6% | 39.2 8% |
| Color Space (Percent of sRGB) (%) | 57.2 | 64 12% | 55 -4% | 53 -7% | 60.8 6% |
| Media totale (Programma / Settaggio) | 7% /
3% | -2% /
-6% | 1% /
2% | -16% /
-12% |
* ... Meglio usare valori piccoli
Tempi di risposta del Display
| ↔ Tempi di risposta dal Nero al Bianco | ||
|---|---|---|
| 27.2 ms ... aumenta ↗ e diminuisce ↘ combinato | ↗ 17.2 ms Incremento | 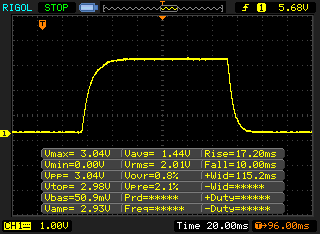 |
| ↘ 10 ms Calo | ||
| Lo schermo mostra tempi di risposta relativamente lenti nei nostri tests e potrebbe essere troppo lento per i gamers. In confronto, tutti i dispositivi di test variano da 0.1 (minimo) a 240 (massimo) ms. » 69 % di tutti i dispositivi è migliore. Questo significa che i tempi di risposta rilevati sono peggiori rispetto alla media di tutti i dispositivi testati (19.9 ms). | ||
| ↔ Tempo di risposta dal 50% Grigio all'80% Grigio | ||
| 37.2 ms ... aumenta ↗ e diminuisce ↘ combinato | ↗ 19.2 ms Incremento | 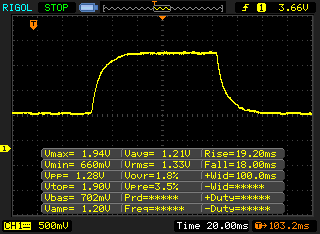 |
| ↘ 18 ms Calo | ||
| Lo schermo mostra tempi di risposta lenti nei nostri tests e sarà insoddisfacente per i gamers. In confronto, tutti i dispositivi di test variano da 0.165 (minimo) a 636 (massimo) ms. » 54 % di tutti i dispositivi è migliore. Questo significa che i tempi di risposta rilevati sono peggiori rispetto alla media di tutti i dispositivi testati (31.1 ms). | ||
Sfarfallio dello schermo / PWM (Pulse-Width Modulation)
| flickering dello schermo / PWM non rilevato | 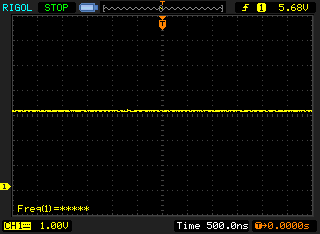 | ||
In confronto: 52 % di tutti i dispositivi testati non utilizza PWM per ridurre la luminosita' del display. Se è rilevato PWM, una media di 7798 (minimo: 5 - massimo: 343500) Hz è stata rilevata. | |||
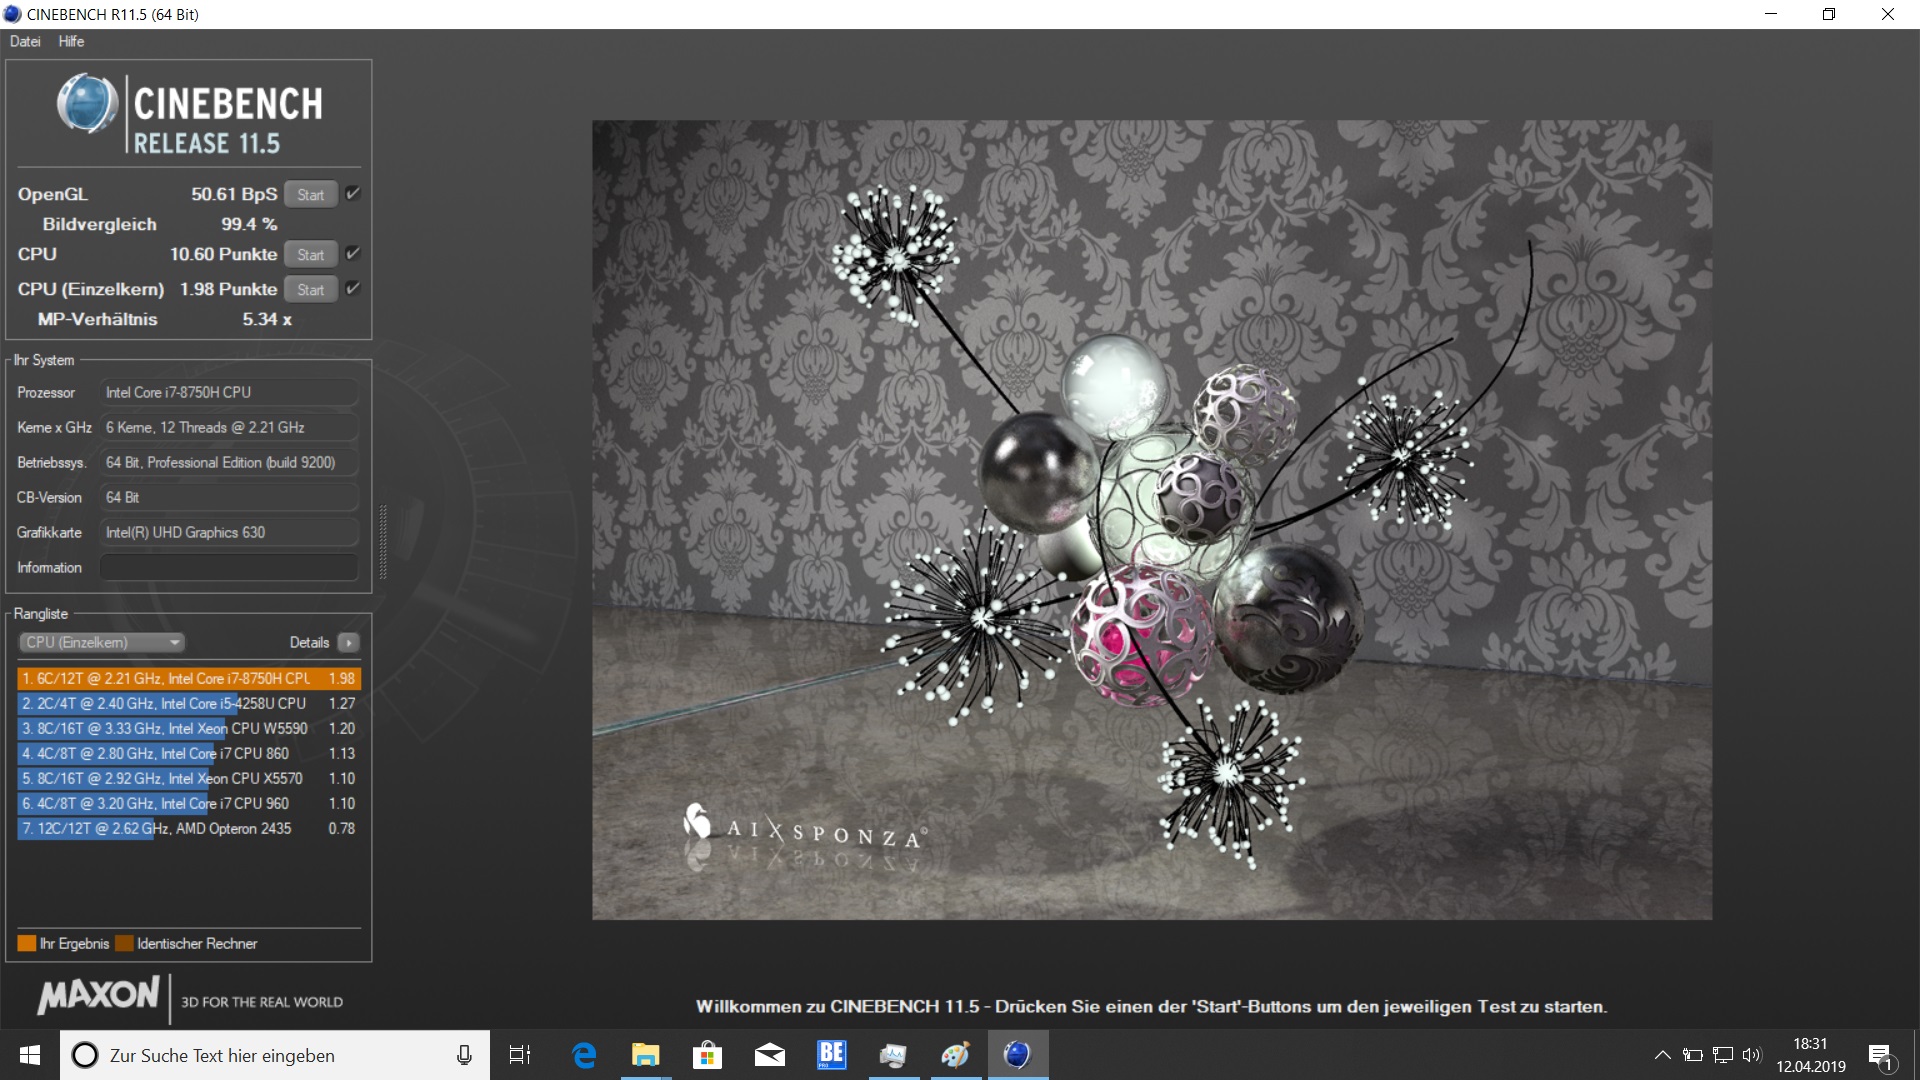
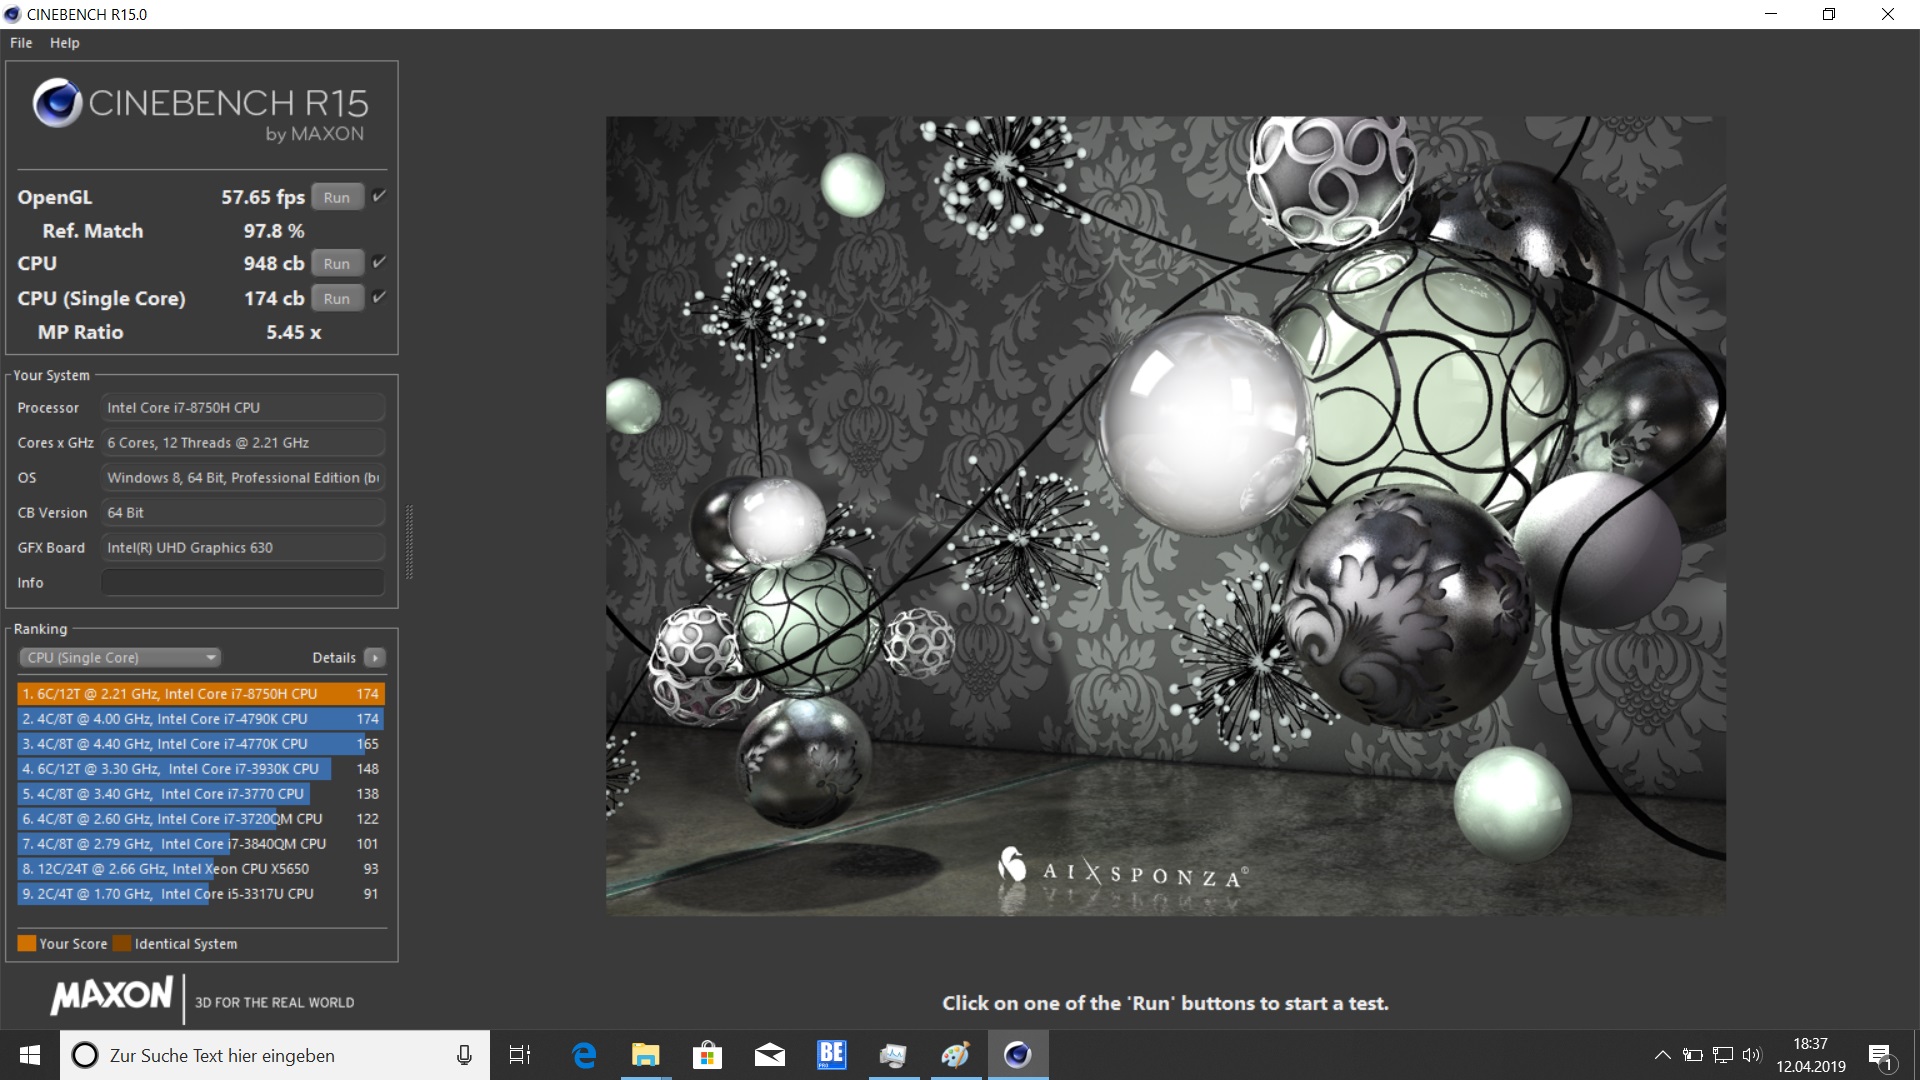
| Cinebench R11.5 | |
| CPU Single 64Bit | |
| Media della classe Office (2 - 3.6, n=13, ultimi 2 anni) | |
| Schenker Work 15 | |
| Media Intel Core i7-8750H (1.89 - 2, n=40) | |
| HP ProBook 450 G6-5TJ93EA | |
| Dell Latitude 5590 | |
| CPU Multi 64Bit | |
| Media della classe Office (9.76 - 31.5, n=13, ultimi 2 anni) | |
| Media Intel Core i7-8750H (9.54 - 13.5, n=41) | |
| Schenker Work 15 | |
| Dell Latitude 5590 | |
| HP ProBook 450 G6-5TJ93EA | |
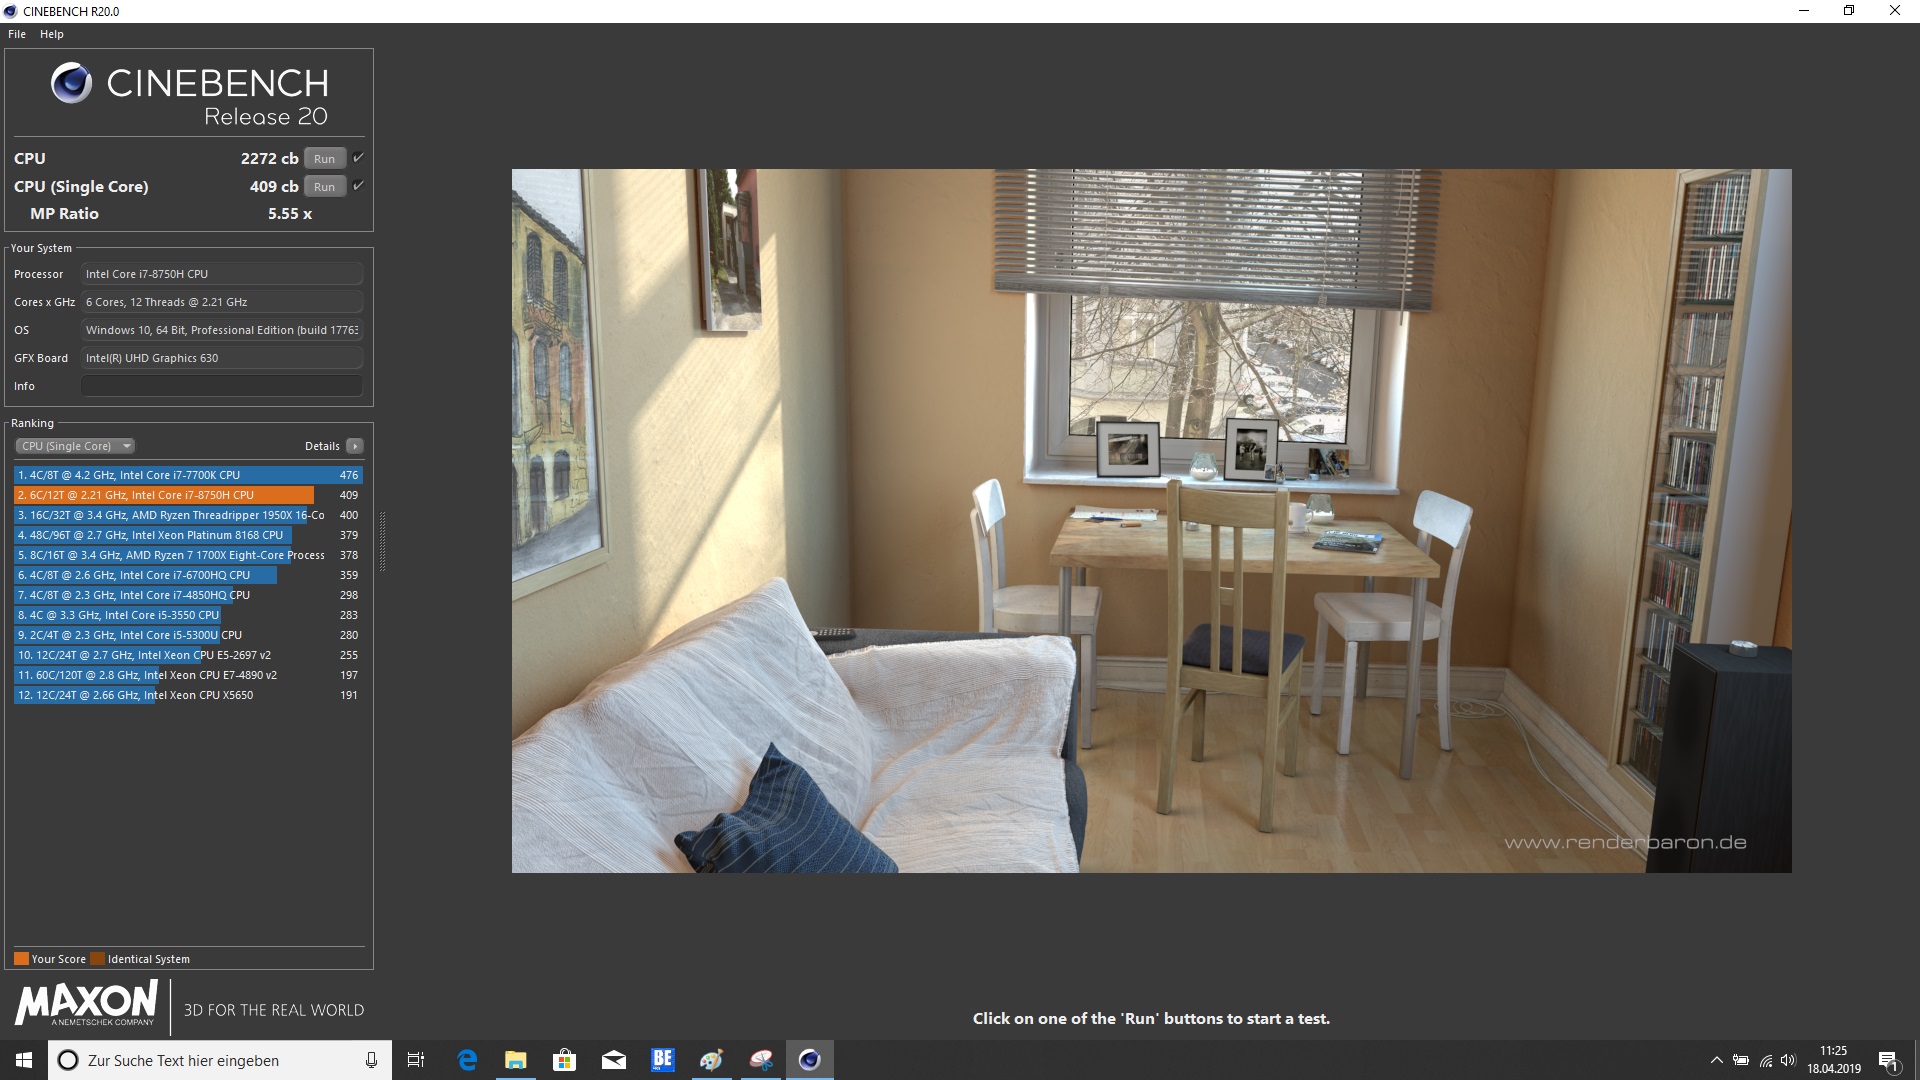
| Cinebench R20 | |
| CPU (Single Core) | |
| Media della classe Office (345 - 816, n=72, ultimi 2 anni) | |
| Media Intel Core i7-8750H (403 - 418, n=6) | |
| Schenker Work 15 | |
| CPU (Multi Core) | |
| Media della classe Office (648 - 8840, n=72, ultimi 2 anni) | |
| Media Intel Core i7-8750H (2142 - 2707, n=6) | |
| Schenker Work 15 | |
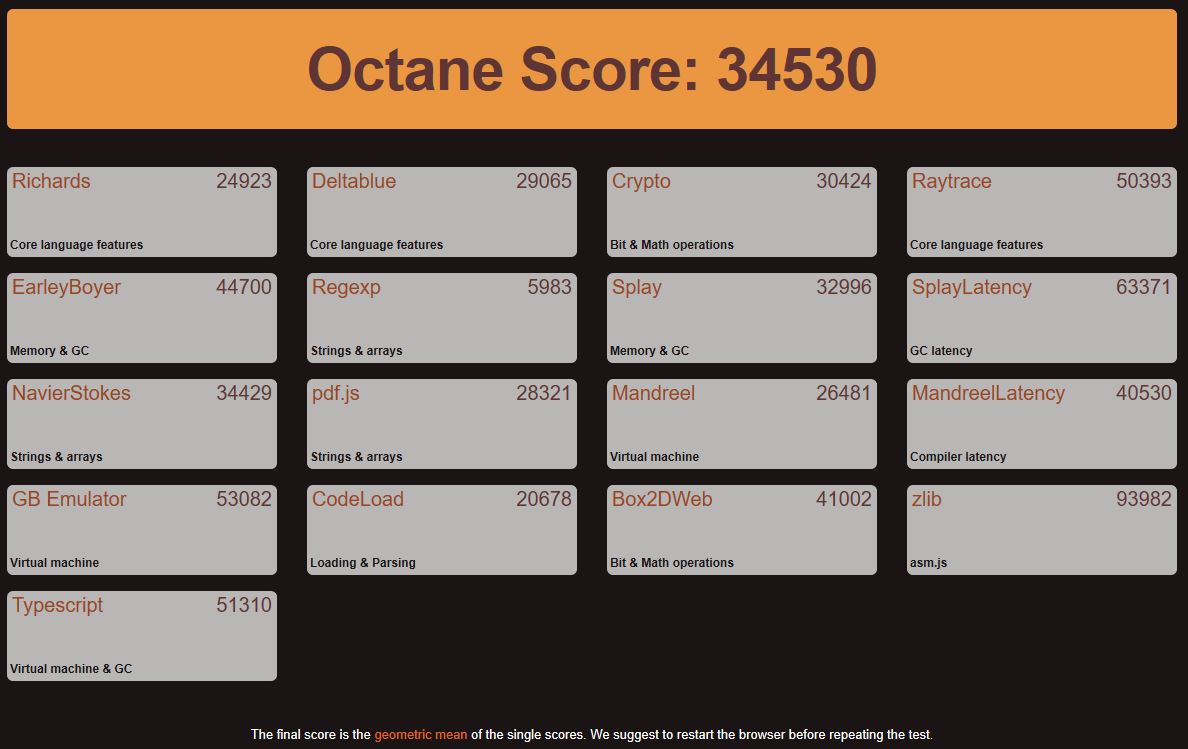
| Octane V2 - Total Score | |
| Media della classe Office (49011 - 122119, n=19, ultimi 2 anni) | |
| Lenovo ThinkPad T580-20L9001AUS | |
| Schenker Work 15 | |
| Media Intel Core i7-8750H (27460 - 44549, n=47) | |
| Dell Latitude 5590 | |
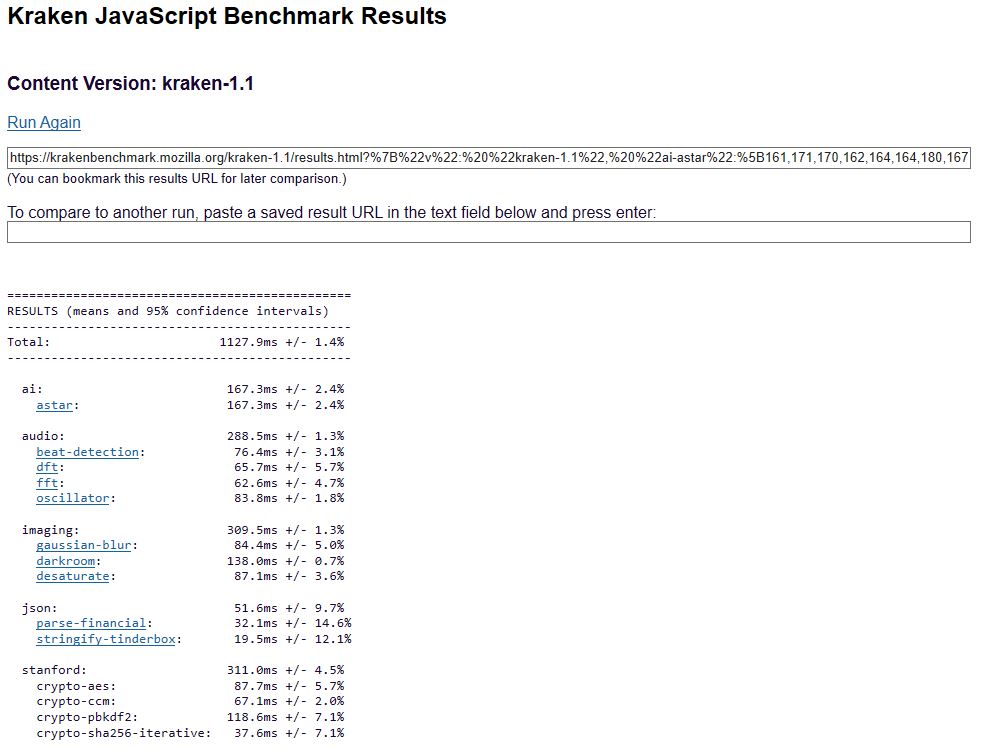
| Mozilla Kraken 1.1 - Total | |
| Dell Latitude 5590 | |
| Schenker Work 15 | |
| Media Intel Core i7-8750H (695 - 1272, n=50) | |
| Lenovo ThinkPad T580-20L9001AUS | |
| Media della classe Office (391 - 1297, n=76, ultimi 2 anni) | |
| HWBOT x265 Benchmark v2.2 - 4k Preset | |
| Media della classe Office (2.21 - 26, n=73, ultimi 2 anni) | |
| Media Intel Core i7-8750H (7.56 - 9.55, n=5) | |
| Schenker Work 15 | |
| Schenker Work 15 | |
| HP ProBook 450 G6-5TJ93EA | |
| Blender - v2.79 BMW27 CPU | |
| HP ProBook 450 G6-5TJ93EA | |
| Schenker Work 15 | |
| Schenker Work 15 | |
| Media Intel Core i7-8750H (396 - 486, n=6) | |
| Media della classe Office (158 - 1940, n=73, ultimi 2 anni) | |
* ... Meglio usare valori piccoli
| PCMark 8 - Home Score Accelerated v2 | |
| Media della classe Office (n=1ultimi 2 anni) | |
| Schenker Work 15 | |
| Media Intel Core i7-8750H, Intel UHD Graphics 630 (n=1) | |
| Dell Latitude 5590 | |
| Lenovo ThinkPad T580-20L9001AUS | |
| Fujitsu Lifebook E558 E5580MP581DE | |
| HP ProBook 450 G6-5TJ93EA | |
| PCMark 8 Home Score Accelerated v2 | 4326 punti | |
| PCMark 8 Creative Score Accelerated v2 | 5102 punti | |
| PCMark 8 Work Score Accelerated v2 | 5164 punti | |
| PCMark 10 Score | 4154 punti | |
Aiuto | ||
| Schenker Work 15 Samsung SSD 970 EVO Plus 500GB | HP ProBook 450 G6-5TJ93EA Samsung SSD PM981 MZVLB512HAJQ | Lenovo ThinkPad T580-20L9001AUS Samsung SSD PM981 MZVLB512HAJQ | Fujitsu Lifebook E558 E5580MP581DE Micron 1100 MTFDDAV256TBN | Dell Latitude 5590 SK hynix SC311 M.2 | Media Samsung SSD 970 EVO Plus 500GB | Media della classe Office | |
|---|---|---|---|---|---|---|---|
| CrystalDiskMark 5.2 / 6 | -9% | -37% | -64% | -62% | 5% | 26% | |
| Write 4K (MB/s) | 149.6 | 126.1 -16% | 122.1 -18% | 80.5 -46% | 76.7 -49% | 159.2 ? 6% | 151.4 ? 1% |
| Read 4K (MB/s) | 49.29 | 43.92 -11% | 44.61 -9% | 26.14 -47% | 28.41 -42% | 48.5 ? -2% | 72.8 ? 48% |
| Write Seq (MB/s) | 1653 | 1669 1% | 826 -50% | 356.6 -78% | 436.7 -74% | 2114 ? 28% | 2558 ? 55% |
| Read Seq (MB/s) | 1468 | 2224 51% | 811 -45% | 467.1 -68% | 508 -65% | 2044 ? 39% | 3237 ? 121% |
| Write 4K Q32T1 (MB/s) | 478.2 | 410.4 -14% | 293.9 -39% | 257.2 -46% | 288.1 -40% | 435 ? -9% | 424 ? -11% |
| Read 4K Q32T1 (MB/s) | 561 | 338.1 -40% | 374.8 -33% | 243.3 -57% | 271.9 -52% | 508 ? -9% | 509 ? -9% |
| Write Seq Q32T1 (MB/s) | 3272 | 1979 -40% | 1714 -48% | 437.4 -87% | 503 -85% | 3238 ? -1% | 3999 ? 22% |
| Read Seq Q32T1 (MB/s) | 3550 | 3368 -5% | 1772 -50% | 526 -85% | 549 -85% | 3499 ? -1% | 5962 ? 68% |
| Write 4K Q8T8 (MB/s) | 2067 | 2067 ? 0% | 901 ? -56% | ||||
| Read 4K Q8T8 (MB/s) | 1064 | 1064 ? 0% | 1317 ? 24% | ||||
| AS SSD | -61% | -29% | -86% | -84% | -1% | -6% | |
| Seq Read (MB/s) | 2716 | 2063 -24% | 1454 -46% | 445 -84% | 503 -81% | 2640 ? -3% | 4258 ? 57% |
| Seq Write (MB/s) | 2531 | 1163 -54% | 1324 -48% | 333.8 -87% | 393 -84% | 2500 ? -1% | 2707 ? 7% |
| 4K Read (MB/s) | 55.9 | 50.6 -9% | 50.8 -9% | 24.6 -56% | 29.03 -48% | 54.8 ? -2% | 57.3 ? 3% |
| 4K Write (MB/s) | 134.7 | 125.4 -7% | 106.2 -21% | 71.8 -47% | 73.5 -45% | 141.2 ? 5% | 163 ? 21% |
| 4K-64 Read (MB/s) | 1183 | 1352 14% | 1140 -4% | 236 -80% | 306 -74% | 1345 ? 14% | 924 ? -22% |
| 4K-64 Write (MB/s) | 2280 | 1023 -55% | 1325 -42% | 270.9 -88% | 212.7 -91% | 2116 ? -7% | 1631 ? -28% |
| Access Time Read * (ms) | 0.034 | 0.044 -29% | 0.047 -38% | 0.093 -174% | 0.111 -226% | 0.0475 ? -40% | 0.08483 ? -150% |
| Access Time Write * (ms) | 0.028 | 0.182 -550% | 0.035 -25% | 0.059 -111% | 0.047 -68% | 0.02775 ? 1% | 0.05741 ? -105% |
| Score Read (Points) | 1510 | 1608 6% | 1336 -12% | 305 -80% | 385 -75% | 1664 ? 10% | 1407 ? -7% |
| Score Write (Points) | 2668 | 1265 -53% | 1564 -41% | 376 -86% | 326 -88% | 2507 ? -6% | 2065 ? -23% |
| Score Total (Points) | 4952 | 3658 -26% | 3587 -28% | 841 -83% | 912 -82% | 5023 ? 1% | 4127 ? -17% |
| Copy ISO MB/s (MB/s) | 2041 | 1382 -32% | 302.2 -85% | 311.5 -85% | 1989 ? -3% | 2527 ? 24% | |
| Copy Program MB/s (MB/s) | 405.7 | 414.3 2% | 154.6 -62% | 208.6 -49% | 442 ? 9% | 793 ? 95% | |
| Copy Game MB/s (MB/s) | 1000 | 660 -34% | 234.8 -77% | 210 -79% | 1121 ? 12% | 1607 ? 61% | |
| Media totale (Programma / Settaggio) | -35% /
-42% | -33% /
-32% | -75% /
-78% | -73% /
-76% | 2% /
2% | 10% /
7% |
* ... Meglio usare valori piccoli

| 3DMark 11 - 1280x720 Performance GPU | |
| Media della classe Office (2551 - 18313, n=68, ultimi 2 anni) | |
| HP ProBook 450 G6-5TJ93EA | |
| Schenker Work 15 | |
| Lenovo ThinkPad T580-20L9001AUS | |
| Media Intel UHD Graphics 630 (642 - 2025, n=12) | |
| Dell Latitude 5590 | |
| Fujitsu Lifebook E558 E5580MP581DE | |
| 3DMark | |
| 1920x1080 Fire Strike Graphics | |
| Media della classe Office (736 - 21871, n=72, ultimi 2 anni) | |
| HP ProBook 450 G6-5TJ93EA | |
| Schenker Work 15 | |
| Media Intel UHD Graphics 630 (722 - 1472, n=11) | |
| Lenovo ThinkPad T580-20L9001AUS | |
| Dell Latitude 5590 | |
| Fujitsu Lifebook E558 E5580MP581DE | |
| 1280x720 Cloud Gate Standard Graphics | |
| Media della classe Office (11640 - 118515, n=37, ultimi 2 anni) | |
| HP ProBook 450 G6-5TJ93EA | |
| Schenker Work 15 | |
| Media Intel UHD Graphics 630 (3863 - 11199, n=9) | |
| Lenovo ThinkPad T580-20L9001AUS | |
| Dell Latitude 5590 | |
| Fujitsu Lifebook E558 E5580MP581DE | |
| 2560x1440 Time Spy Graphics | |
| Media della classe Office (493 - 6679, n=67, ultimi 2 anni) | |
| Media Intel UHD Graphics 630 (367 - 459, n=10) | |
| Schenker Work 15 | |
| Dell Latitude 5590 | |
| 3DMark 11 Performance | 2070 punti | |
| 3DMark Ice Storm Standard Score | 69790 punti | |
| 3DMark Cloud Gate Standard Score | 10919 punti | |
| 3DMark Fire Strike Score | 1215 punti | |
| 3DMark Fire Strike Extreme Score | 580 punti | |
| 3DMark Time Spy Score | 470 punti | |
Aiuto | ||
| basso | medio | alto | ultra | |
|---|---|---|---|---|
| BioShock Infinite (2013) | 82.4 | 40.1 | 33.9 | 10.8 |
| Dota 2 Reborn (2015) | 76.7 | 48 | 21 | 19.1 |
| X-Plane 11.11 (2018) | 31.3 | 20.1 | 18.3 |
Rumorosità
| Idle |
| 29.2 / 29.2 / 29.7 dB(A) |
| Sotto carico |
| 35.4 / 47.4 dB(A) |
 | ||
30 dB silenzioso 40 dB(A) udibile 50 dB(A) rumoroso |
||
min: | ||
| Schenker Work 15 UHD Graphics 630, i7-8750H, Samsung SSD 970 EVO Plus 500GB | HP ProBook 450 G6-5TJ93EA GeForce MX130, i7-8565U, Samsung SSD PM981 MZVLB512HAJQ | Lenovo ThinkPad T580-20L9001AUS UHD Graphics 620, i7-8650U, Samsung SSD PM981 MZVLB512HAJQ | Fujitsu Lifebook E558 E5580MP581DE UHD Graphics 620, i5-8250U, Micron 1100 MTFDDAV256TBN | Dell Latitude 5590 UHD Graphics 620, i5-8250U, SK hynix SC311 M.2 | |
|---|---|---|---|---|---|
| Noise | 5% | 3% | 4% | 2% | |
| off /ambiente * (dB) | 29.2 | 29 1% | 28.6 2% | 30 -3% | 29 1% |
| Idle Minimum * (dB) | 29.2 | 29 1% | 28.6 2% | 30 -3% | 29 1% |
| Idle Average * (dB) | 29.2 | 29 1% | 28.6 2% | 30 -3% | 29 1% |
| Idle Maximum * (dB) | 29.7 | 29 2% | 28.6 4% | 30 -1% | 31.3 -5% |
| Load Average * (dB) | 35.4 | 34.2 3% | 37.4 -6% | 34.8 2% | 36.6 -3% |
| Load Maximum * (dB) | 47.4 | 38.4 19% | 40 16% | 33.5 29% | 40.9 14% |
| Witcher 3 ultra * (dB) | 34.2 |
* ... Meglio usare valori piccoli
(±) La temperatura massima sul lato superiore è di 40.2 °C / 104 F, rispetto alla media di 34.3 °C / 94 F, che varia da 21.2 a 62.5 °C per questa classe Office.
(±) Il lato inferiore si riscalda fino ad un massimo di 43 °C / 109 F, rispetto alla media di 36.8 °C / 98 F
(+) In idle, la temperatura media del lato superiore è di 23.9 °C / 75 F, rispetto alla media deld ispositivo di 29.5 °C / 85 F.
(+) I poggiapolsi e il touchpad sono piu' freddi della temperatura della pelle con un massimo di 28.9 °C / 84 F e sono quindi freddi al tatto.
(±) La temperatura media della zona del palmo della mano di dispositivi simili e'stata di 27.5 °C / 81.5 F (-1.4 °C / -2.5 F).
| Schenker Work 15 UHD Graphics 630, i7-8750H, Samsung SSD 970 EVO Plus 500GB | HP ProBook 450 G6-5TJ93EA GeForce MX130, i7-8565U, Samsung SSD PM981 MZVLB512HAJQ | Lenovo ThinkPad T580-20L9001AUS UHD Graphics 620, i7-8650U, Samsung SSD PM981 MZVLB512HAJQ | Fujitsu Lifebook E558 E5580MP581DE UHD Graphics 620, i5-8250U, Micron 1100 MTFDDAV256TBN | Dell Latitude 5590 UHD Graphics 620, i5-8250U, SK hynix SC311 M.2 | |
|---|---|---|---|---|---|
| Heat | -2% | -20% | -5% | 2% | |
| Maximum Upper Side * (°C) | 40.2 | 39.4 2% | 39 3% | 42 -4% | 36.6 9% |
| Maximum Bottom * (°C) | 43 | 50.2 -17% | 56 -30% | 41 5% | 47.5 -10% |
| Idle Upper Side * (°C) | 24.7 | 22.9 7% | 28.2 -14% | 26.8 -9% | 23.2 6% |
| Idle Bottom * (°C) | 24.4 | 24.1 1% | 34.2 -40% | 27.2 -11% | 24.2 1% |
* ... Meglio usare valori piccoli
Schenker Work 15 analisi audio
(±) | potenza degli altiparlanti media ma buona (75.7 dB)
Bassi 100 - 315 Hz
(-) | quasi nessun basso - in media 25.3% inferiori alla media
(±) | la linearità dei bassi è media (10.2% delta rispetto alla precedente frequenza)
Medi 400 - 2000 Hz
(±) | medi elevati - circa 8.6% superiore alla media
(±) | linearità dei medi adeguata (11.1% delta rispetto alla precedente frequenza)
Alti 2 - 16 kHz
(±) | alti elevati - circa 6% superiori alla media
(±) | la linearità degli alti è media (10.3% delta rispetto alla precedente frequenza)
Nel complesso 100 - 16.000 Hz
(-) | suono nel complesso non lineare (34.2% di differenza rispetto alla media
Rispetto alla stessa classe
» 96% di tutti i dispositivi testati in questa classe è stato migliore, 2% simile, 2% peggiore
» Il migliore ha avuto un delta di 7%, medio di 21%, peggiore di 53%
Rispetto a tutti i dispositivi testati
» 93% di tutti i dispositivi testati in questa classe è stato migliore, 1% similare, 6% peggiore
» Il migliore ha avuto un delta di 4%, medio di 24%, peggiore di 134%
Lenovo ThinkPad T580-20L9001AUS analisi audio
(±) | potenza degli altiparlanti media ma buona (80.4 dB)
Bassi 100 - 315 Hz
(±) | bassi ridotti - in media 7.5% inferiori alla media
(±) | la linearità dei bassi è media (7.8% delta rispetto alla precedente frequenza)
Medi 400 - 2000 Hz
(+) | medi bilanciati - solo only 3.6% rispetto alla media
(±) | linearità dei medi adeguata (7% delta rispetto alla precedente frequenza)
Alti 2 - 16 kHz
(+) | Alti bilanciati - appena 2.3% dalla media
(±) | la linearità degli alti è media (8.3% delta rispetto alla precedente frequenza)
Nel complesso 100 - 16.000 Hz
(+) | suono nel complesso lineare (12.7% differenza dalla media)
Rispetto alla stessa classe
» 6% di tutti i dispositivi testati in questa classe è stato migliore, 2% simile, 93% peggiore
» Il migliore ha avuto un delta di 7%, medio di 21%, peggiore di 53%
Rispetto a tutti i dispositivi testati
» 12% di tutti i dispositivi testati in questa classe è stato migliore, 3% similare, 86% peggiore
» Il migliore ha avuto un delta di 4%, medio di 24%, peggiore di 134%
| Off / Standby | |
| Idle | |
| Sotto carico |
|
Leggenda:
min: | |
| Schenker Work 15 i7-8750H, UHD Graphics 630, Samsung SSD 970 EVO Plus 500GB, IPS, 1920x1080, 15.6" | HP ProBook 450 G6-5TJ93EA i7-8565U, GeForce MX130, Samsung SSD PM981 MZVLB512HAJQ, IPS, 1920x1080, 15.6" | Lenovo ThinkPad T580-20L9001AUS i7-8650U, UHD Graphics 620, Samsung SSD PM981 MZVLB512HAJQ, IPS, 1920x1080, 15.6" | Fujitsu Lifebook E558 E5580MP581DE i5-8250U, UHD Graphics 620, Micron 1100 MTFDDAV256TBN, IPS, 1920x1080, 15.6" | Dell Latitude 5590 i5-8250U, UHD Graphics 620, SK hynix SC311 M.2, IPS, 1920x1080, 15.6" | Media Intel UHD Graphics 630 | Media della classe Office | |
|---|---|---|---|---|---|---|---|
| Power Consumption | -7% | -16% | 13% | 2% | -12% | -6% | |
| Idle Minimum * (Watt) | 3.7 | 3.12 16% | 4.7 -27% | 3.8 -3% | 3.6 3% | 3.95 ? -7% | 4.4 ? -19% |
| Idle Average * (Watt) | 6.4 | 6.3 2% | 7.9 -23% | 6.7 -5% | 6.5 -2% | 7.23 ? -13% | 7.32 ? -14% |
| Idle Maximum * (Watt) | 7.1 | 9.78 -38% | 11.4 -61% | 8.3 -17% | 7.2 -1% | 8.87 ? -25% | 8.56 ? -21% |
| Load Average * (Watt) | 42.5 | 57.6 -36% | 47.2 -11% | 29 32% | 46.2 -9% | 45.9 ? -8% | 42.5 ? -0% |
| Load Maximum * (Watt) | 86 | 67.3 22% | 48.1 44% | 36.7 57% | 68.8 20% | 93.8 ? -9% | 64.1 ? 25% |
| Witcher 3 ultra * (Watt) | 42 |
* ... Meglio usare valori piccoli
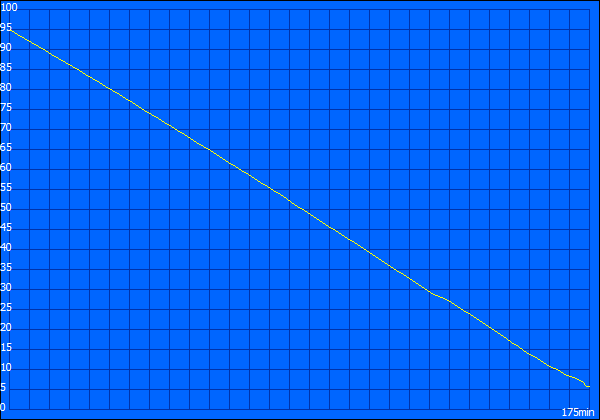
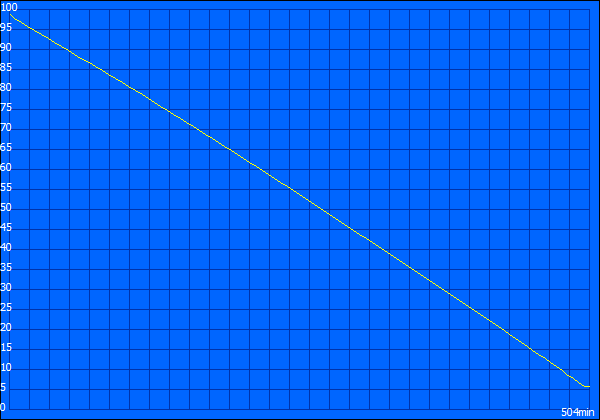
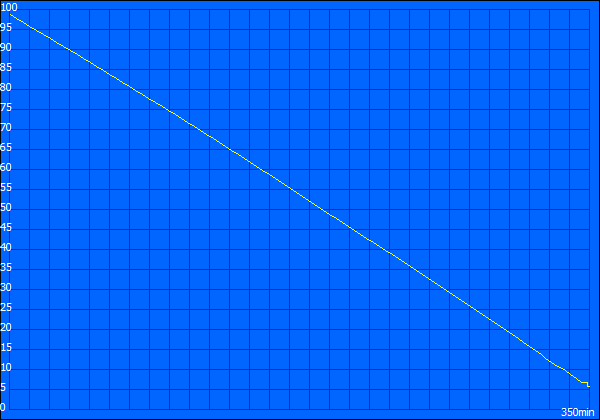
| Battery Runtime - WiFi Websurfing | |
| Media della classe Office (3.83 - 31.5, n=75, ultimi 2 anni) | |
| HP ProBook 450 G6-5TJ93EA | |
| Schenker Work 15 | |
| Dell Latitude 5590 | |
| Fujitsu Lifebook E558 E5580MP581DE | |
| Lenovo ThinkPad T580-20L9001AUS | |

Pro
Contro
Lo Schenker Work 15 è senza dubbio un potente computer portatile da 15 pollici. Per 1.200 euro (~$1.345) vi offre un computer portatile con processore Hexacore, 16 GB di RAM e un SSD veloce. Inoltre, il suo display è un piacere da usare, anche se avremmo voluto che fosse più preciso nei colori. Nel complesso, il Work 15 ha spesso superato i nostri dispositivi di confronto grazie al suo potente processore Core i7-8750H, anche se non soddisfa le aspettative di ciò che la CPU dovrebbe raggiungere.
Il sistema di raffreddamento è però sottoalimentato, il che ostacola le prestazioni della CPU. La nostra unità di prova può comunque mantiene il clock di base della CPU quando spinto ai suoi limiti, ma il sistema di raffreddamento non può impedire al chip di surriscaldarsi, così invece di raffreddarsi si verifica throttling termico.
In breve, l'Work 15 è un dispositivo di lavoro solido, ma non ha gli ultimi ritocchi della concorrenza. Non ha un lettore di smart card, uno scanner di impronte digitali o una fotocamera a infrarossi, che gli OEM di solito adornano i loro dispositivi aziendali. L'unica consolazione qui è il modulo opzionale LTE, ma questo non compensa la mancanza di caratteristiche di sicurezza a nostro avviso.
Lo Schenker Work 15 è un cavallo da lavoro veloce con una potente CPU da cui, purtroppo, non può trarre il massimo vantaggio.
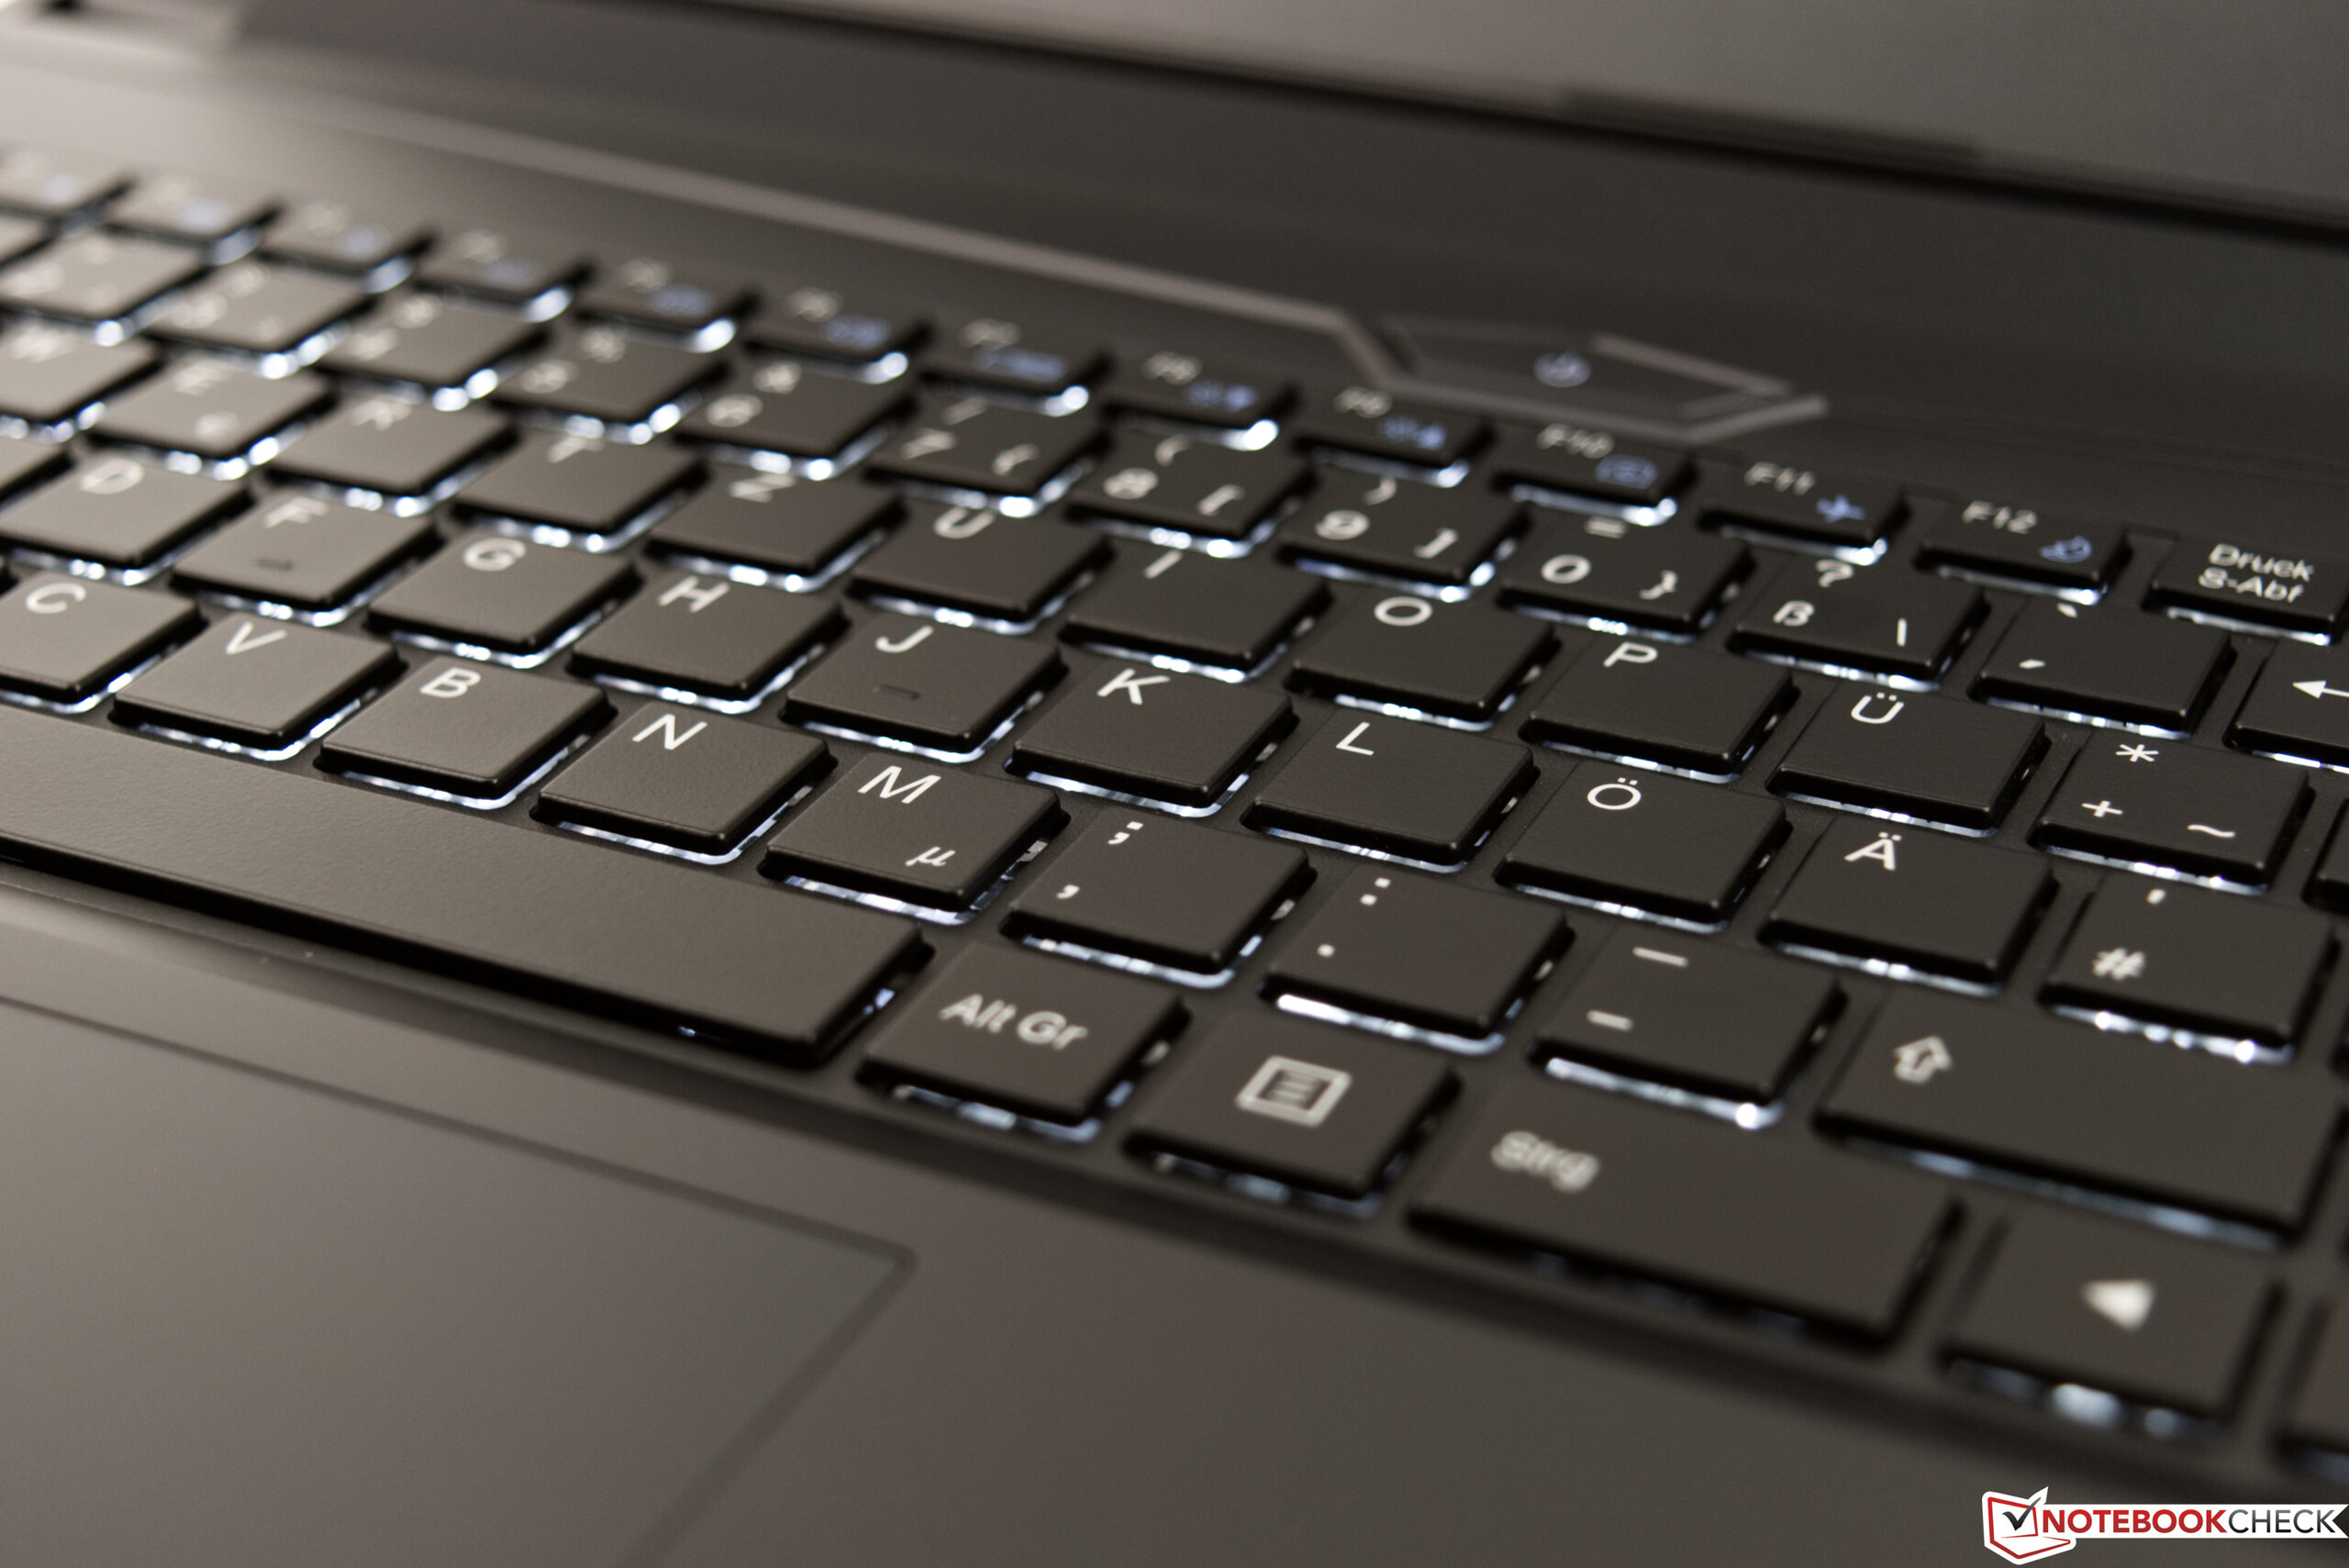
Inoltre il Work 15 ha una tastiera decente, ma non è allo stesso livello del ThinkPad T580. Anche il trackpad e i pulsanti dedicati del mouse hanno funzionato bene, ma avremmo preferito un trackpad più grande. Allo stesso modo, una porta Type-C che supporta DisplayPort sarebbe stata la benvenuta. Nel complesso, il Work 15 è un portatile da ufficio decente, ma ha alcuni compromessi.
Schenker Work 15
- 04/18/2019 v6 (old)
Sebastian Bade
Price comparison
