Recensione del Laptop Schenker Work 15 Tiger Lake-H: Illuminazione RGB in ufficio
I portatili da lavoro di Schenker combinano un hardware robusto con molte opzioni di configurazione. Così, i notebook da ufficio dell'azienda possono essere adattati bene allo scopo richiesto. Intel Core i5 e i7 della serie H sono disponibili come processori accompagnati da un massimo di 64 GB di memoria di lavoro. Un case robusto, principalmente in alluminio, completa il quadro generale.
Il nostro dispositivo di test con 32 GB di memoria di lavoro, Intel Core i7-11370He 1 TB NVMe SSD costa 1440 euro senza una licenza Windows. La configurazione più economica tramite il sito web del produttore costa circa 1000 euro.
Diversi dispositivi da ufficio da 15 pollici sono disponibili come concorrenti del Work 15. Similmente configurabili sono, per esempio, ilLenovo ThinkPad E15e ilDell Inspiron 15 3501. Tuttavia, nessun altro portatile da ufficio vanta una tastiera con illuminazione RGB.
Potenziali concorrenti a confronto
Punteggio | Data | Modello | Peso | Altezza | Dimensione | Risoluzione | Prezzo |
|---|---|---|---|---|---|---|---|
| 84.3 % v7 (old) | 02/2022 | Schenker Work 15 Tiger Lake-H i7-11370H, Iris Xe G7 96EUs | 1.7 kg | 19.9 mm | 15.60" | 1920x1080 | |
| 84.9 % v7 (old) | 01/2022 | LG Gram 15Z90P-G.AA89G i7-1165G7, Iris Xe G7 96EUs | 1.1 kg | 17.4 mm | 15.60" | 1920x1080 | |
| 80.5 % v7 (old) | 10/2021 | Dell Inspiron 15 3501 i7-1165G7, Iris Xe G7 96EUs | 2 kg | 19.9 mm | 15.60" | 1920x1080 | |
| 85.5 % v7 (old) | 08/2021 | Lenovo ThinkPad E15 G3-20YG003UGE R7 5700U, Vega 8 | 1.8 kg | 18.9 mm | 15.60" | 1920x1080 | |
| 82.1 % v7 (old) | 07/2021 | Asus VivoBook S15 D533UA R7 5700U, Vega 8 | 1.8 kg | 16.1 mm | 15.60" | 1920x1080 | |
| 80.8 % v7 (old) | 07/2021 | HP Pavilion x360 15-er0155ng i5-1135G7, Iris Xe G7 80EUs | 1.8 kg | 19.9 mm | 15.60" | 1920x1080 |
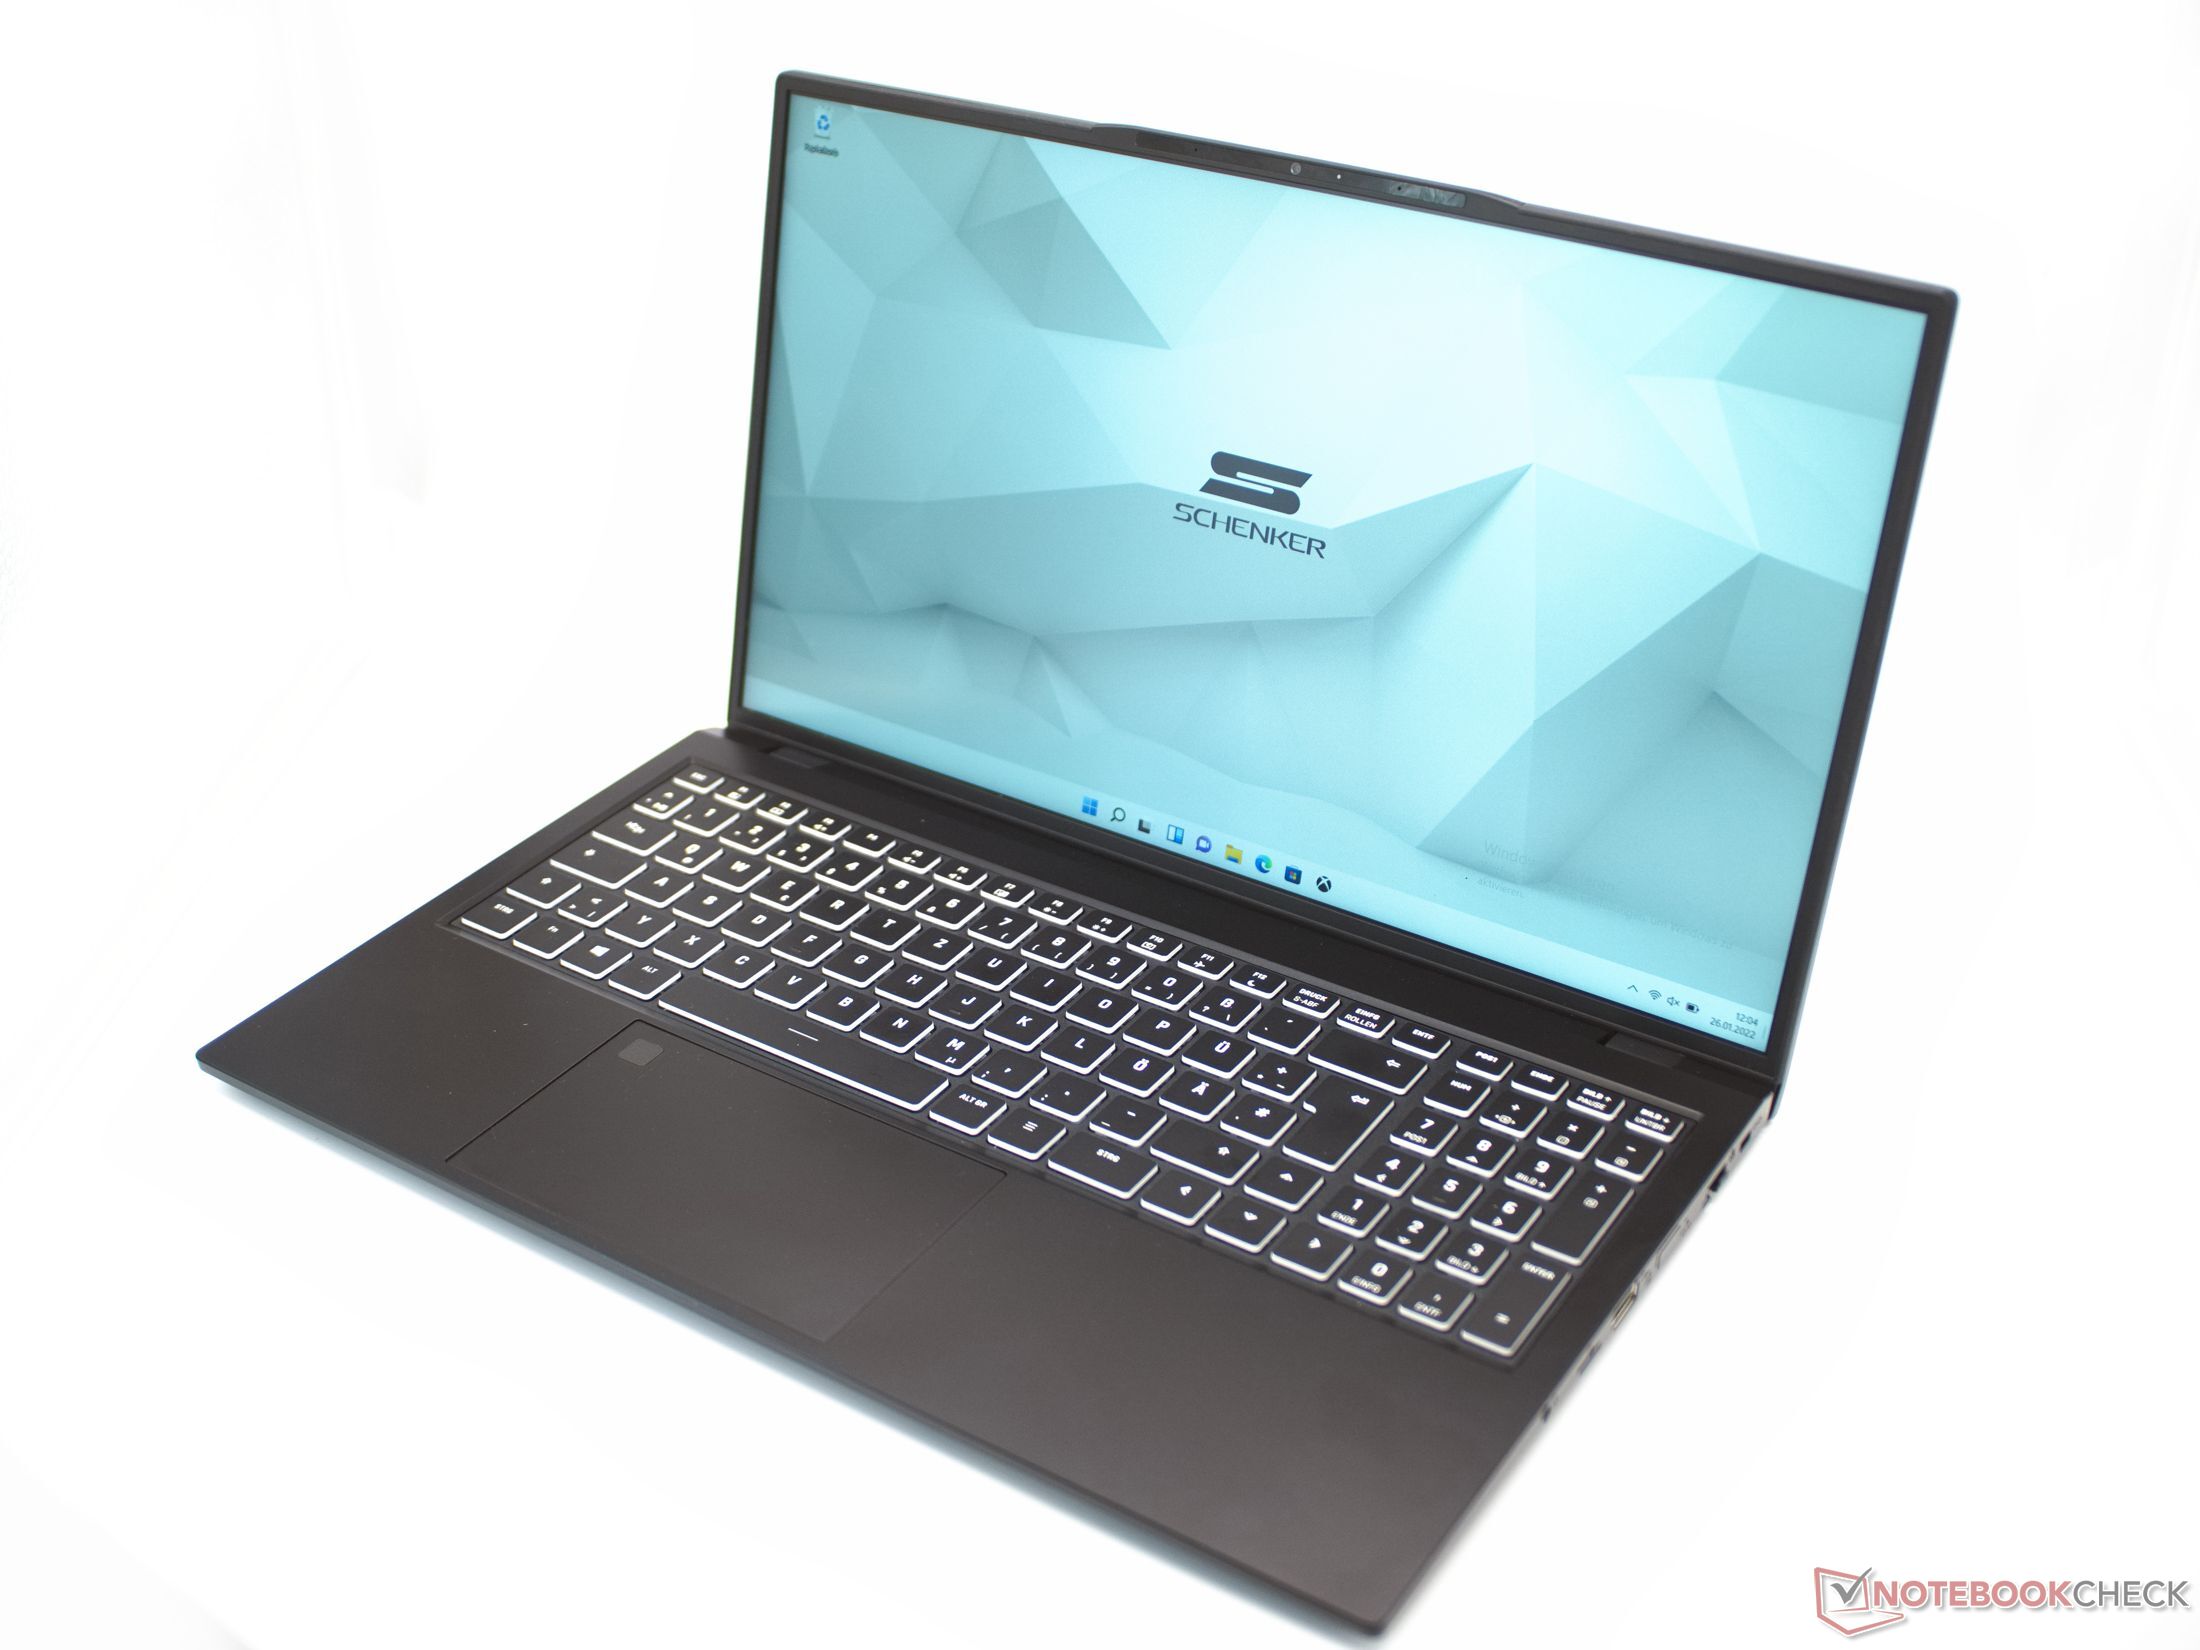
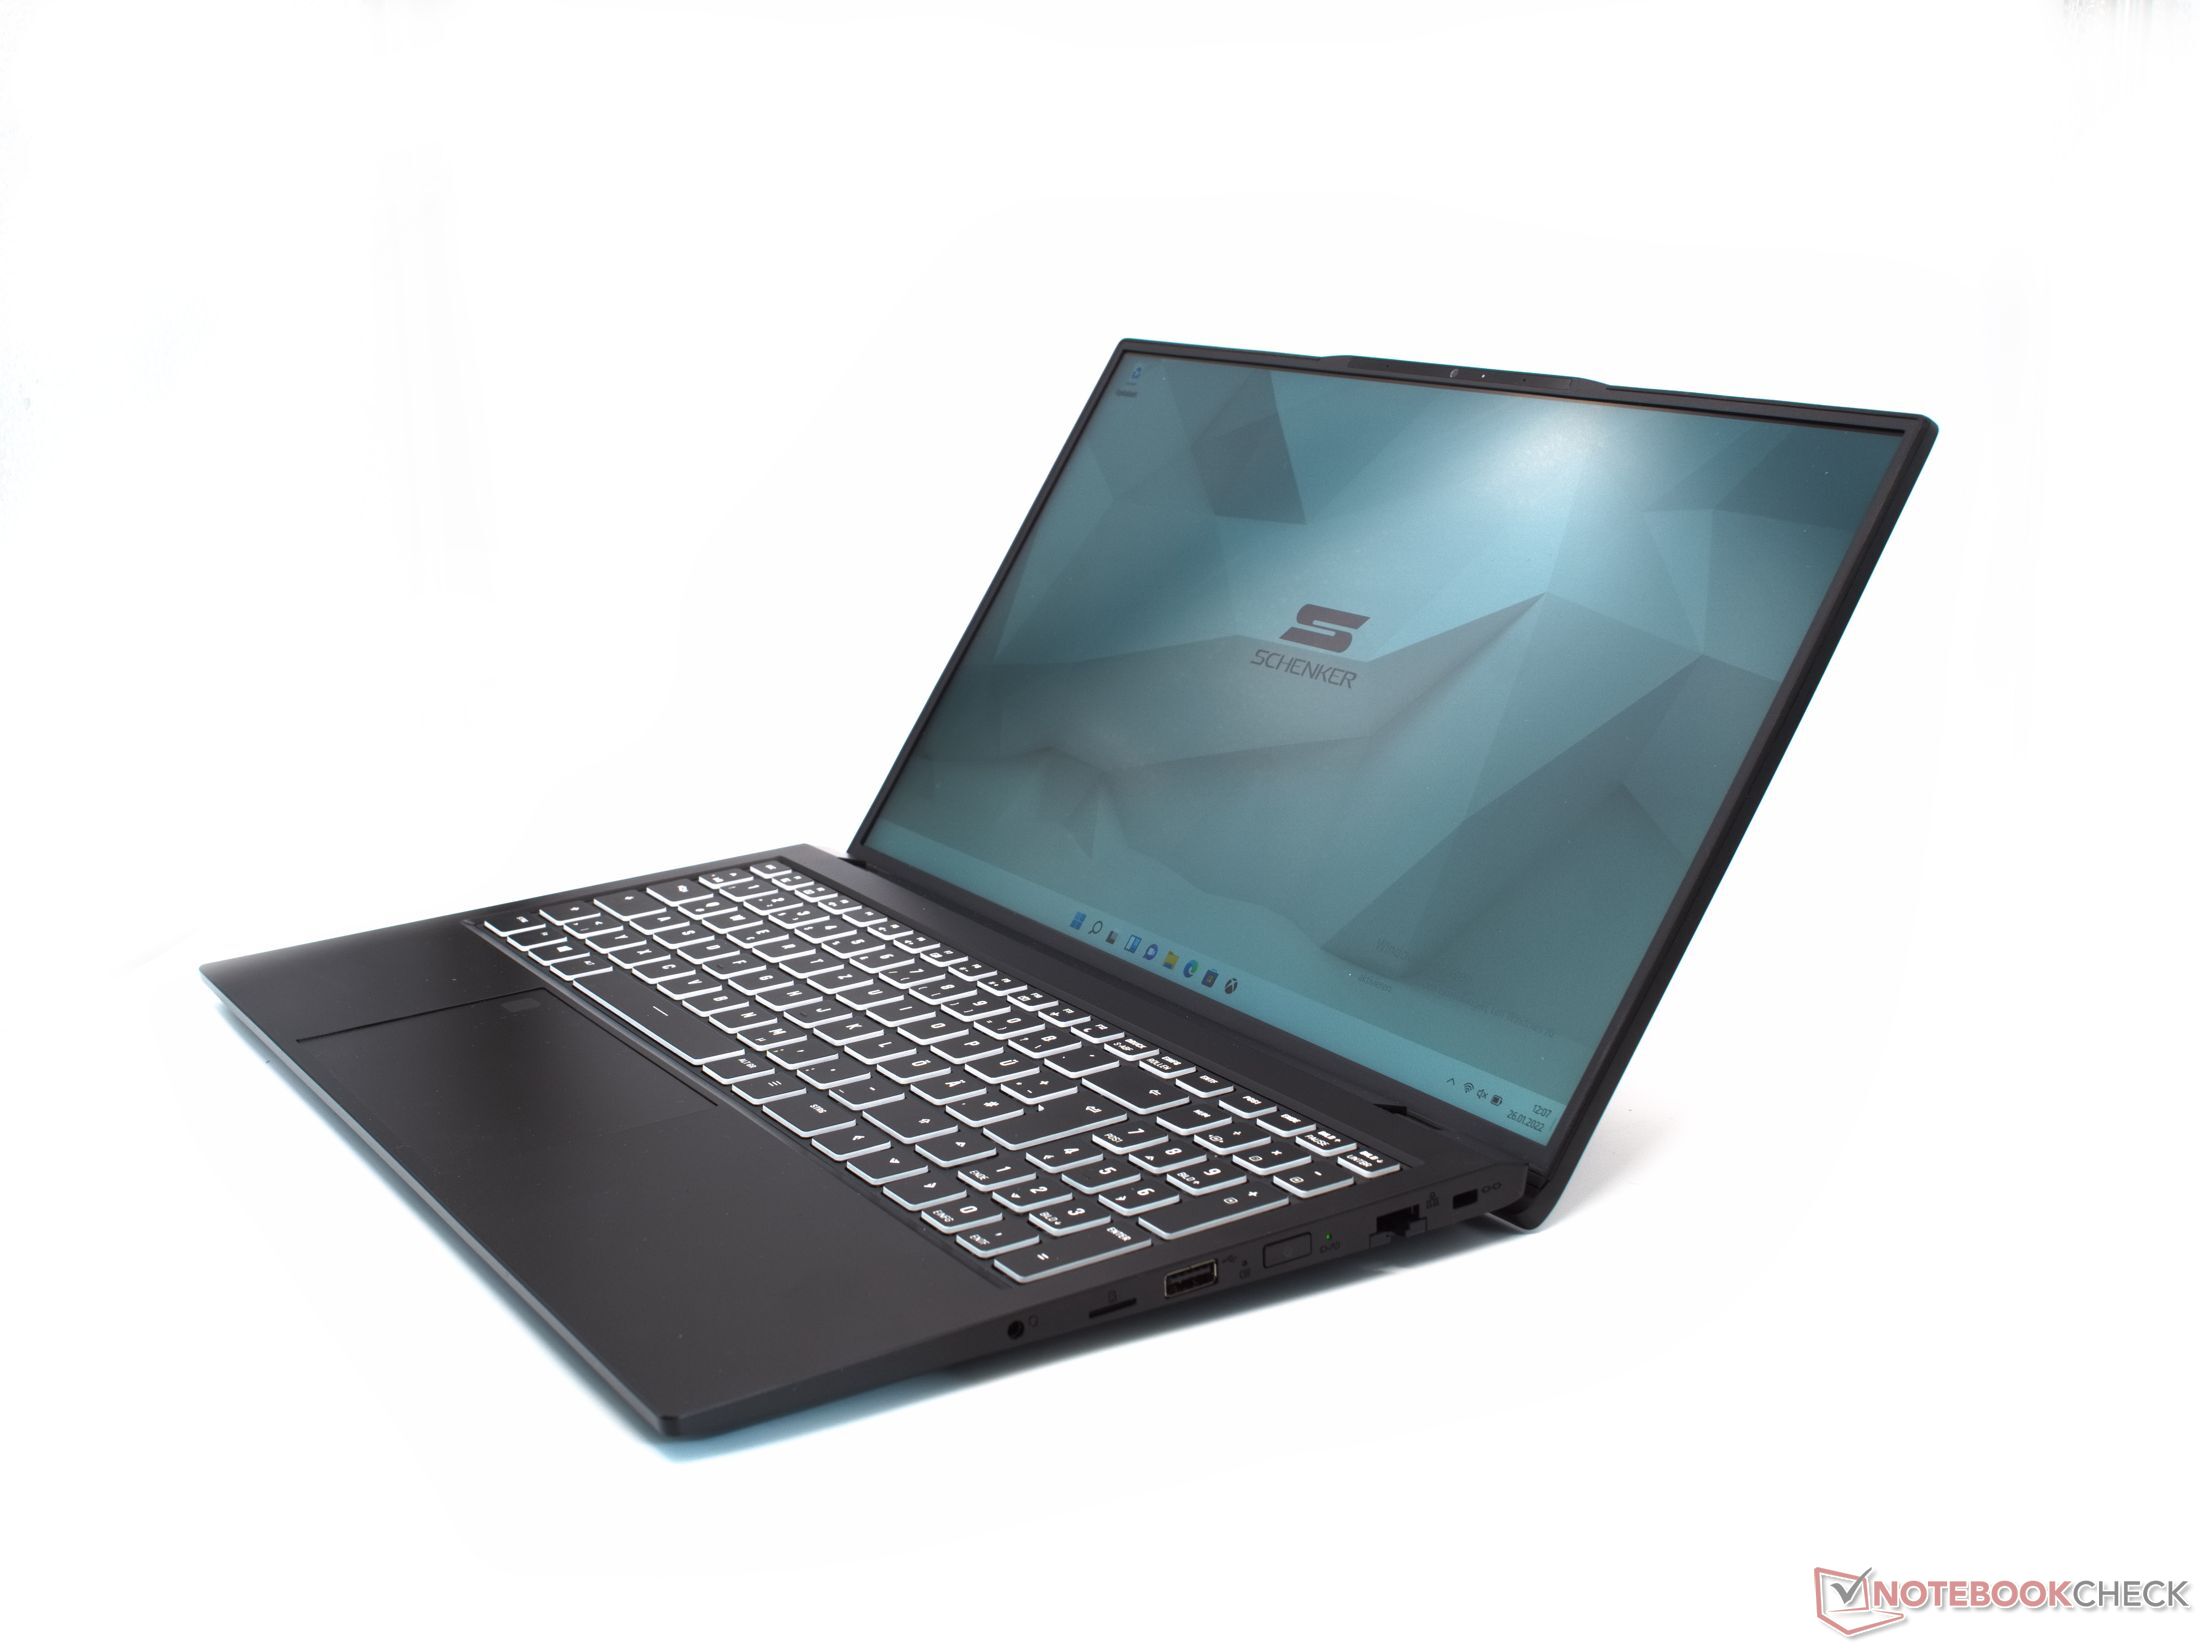
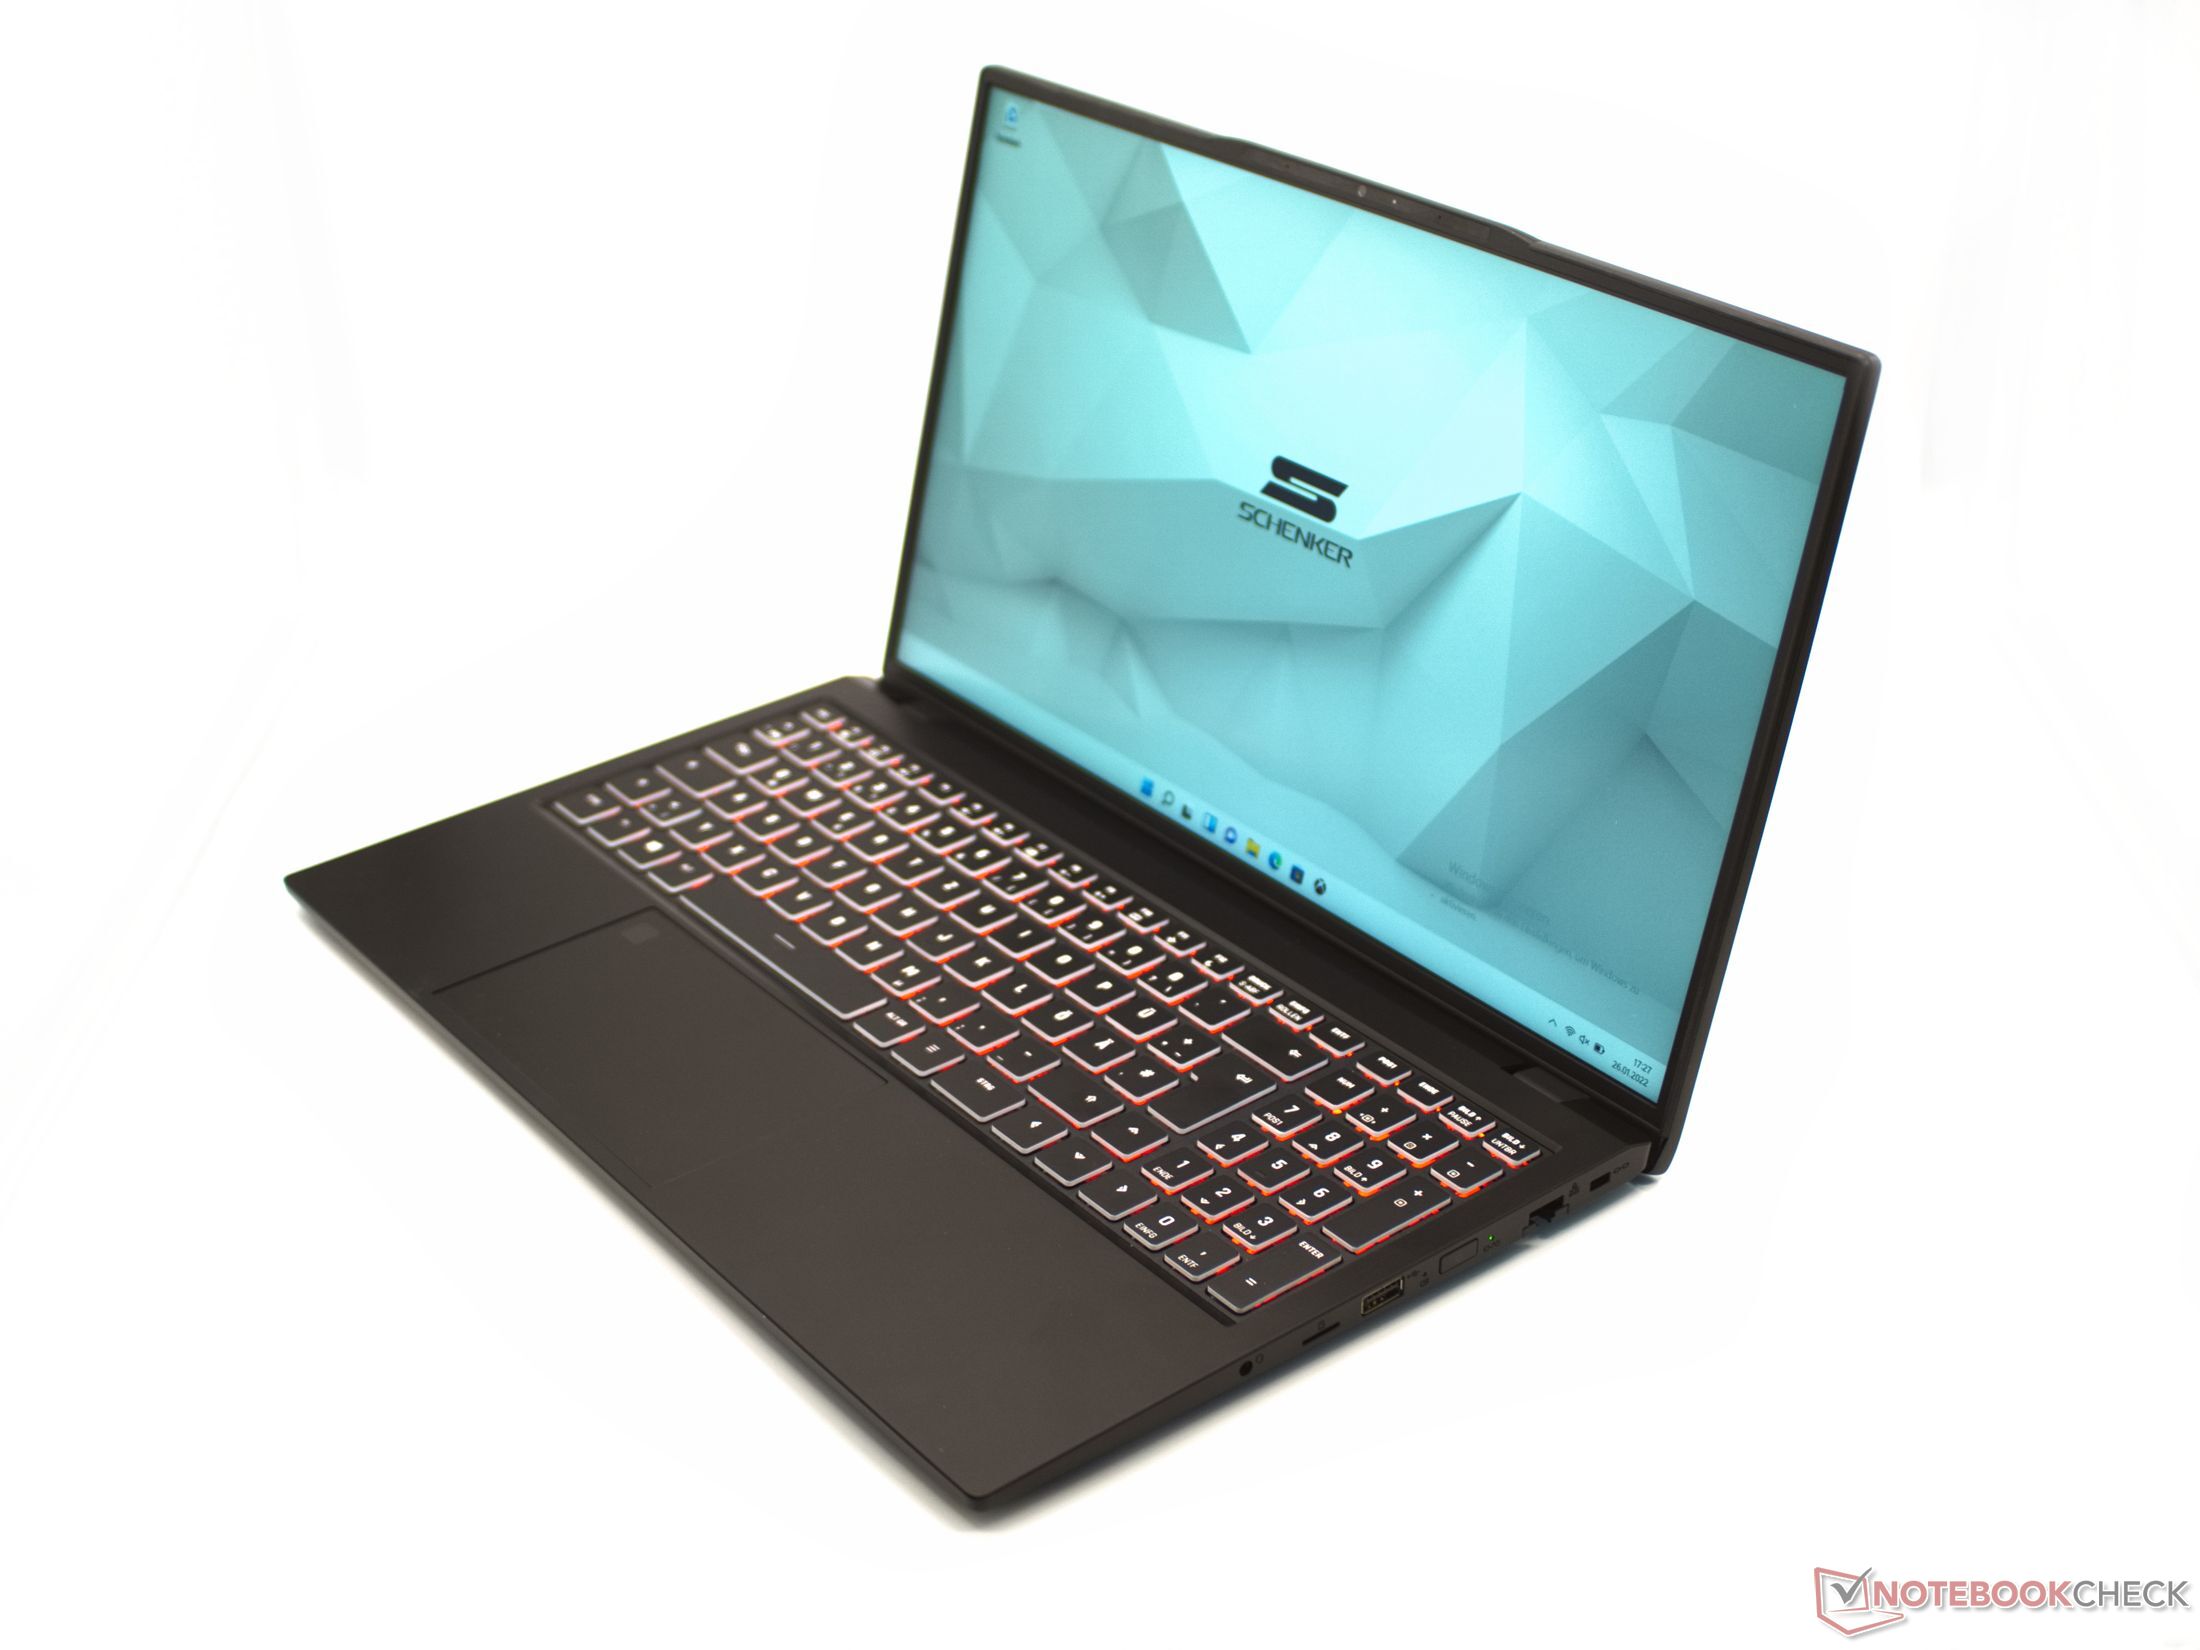
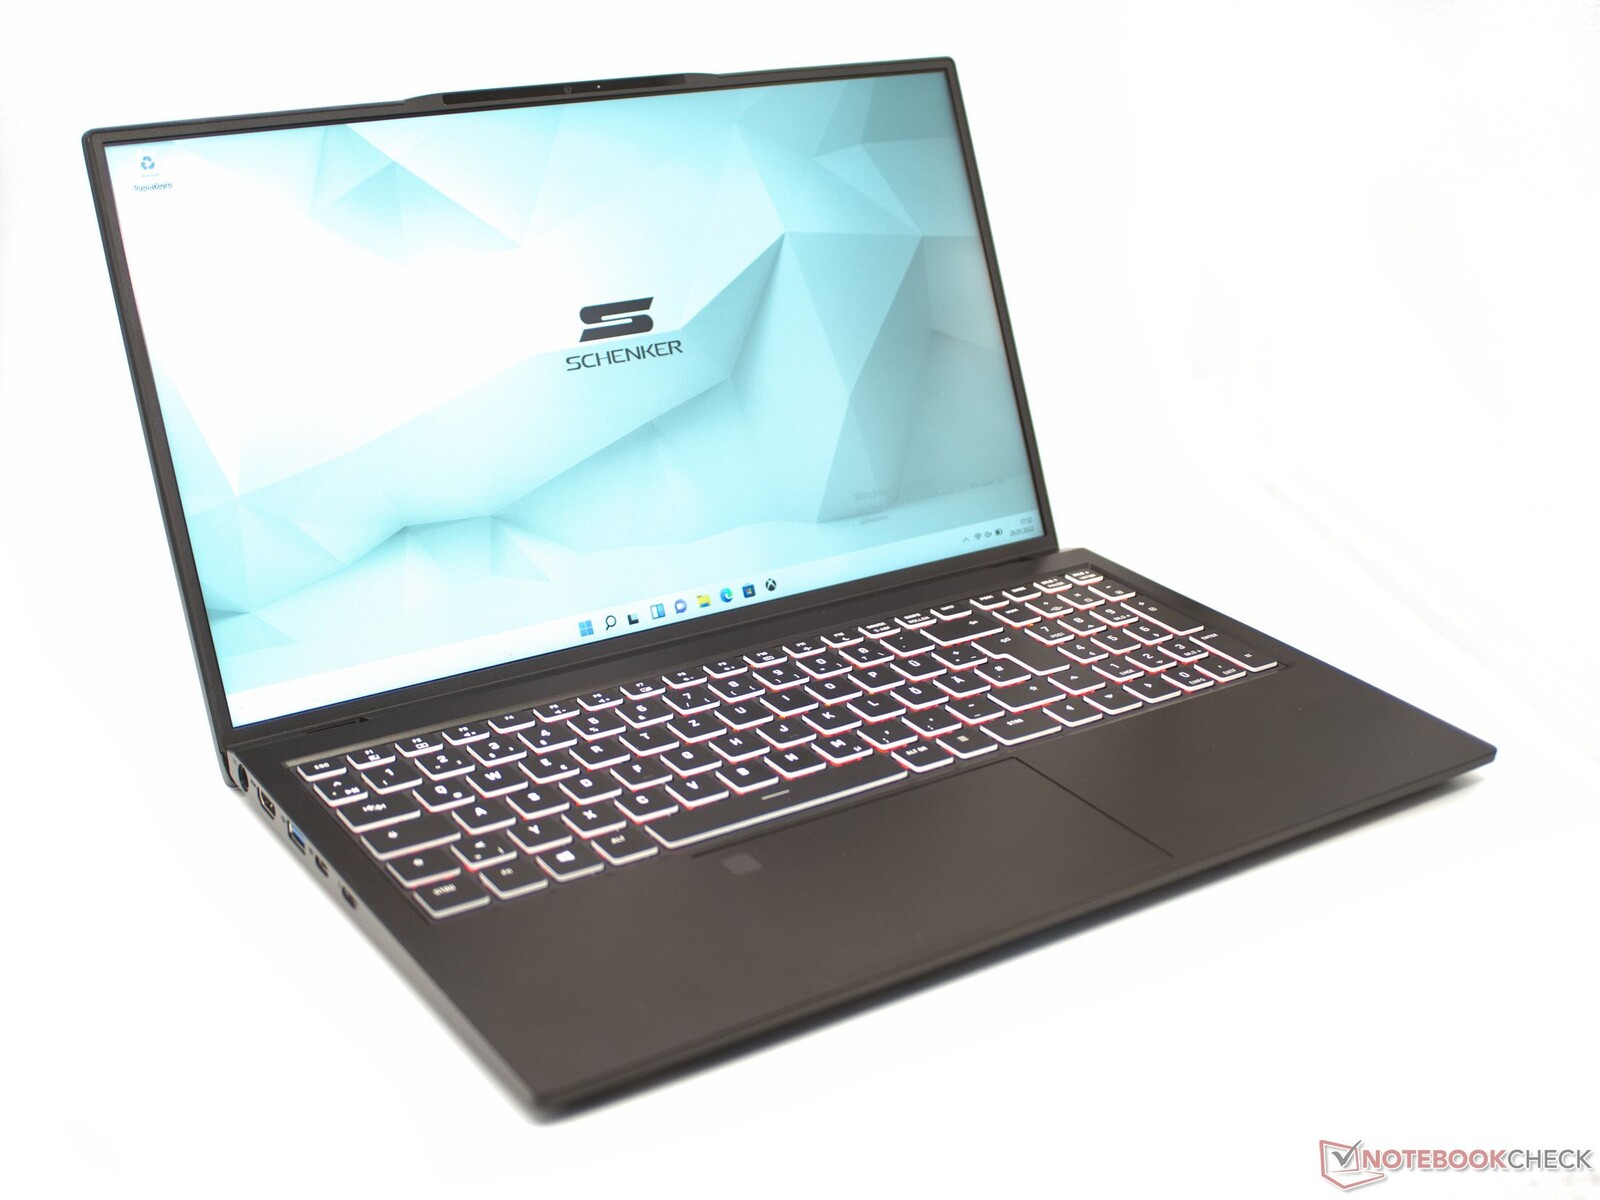
Caso e attrezzatura: Case in alluminio e Thunderbolt 4
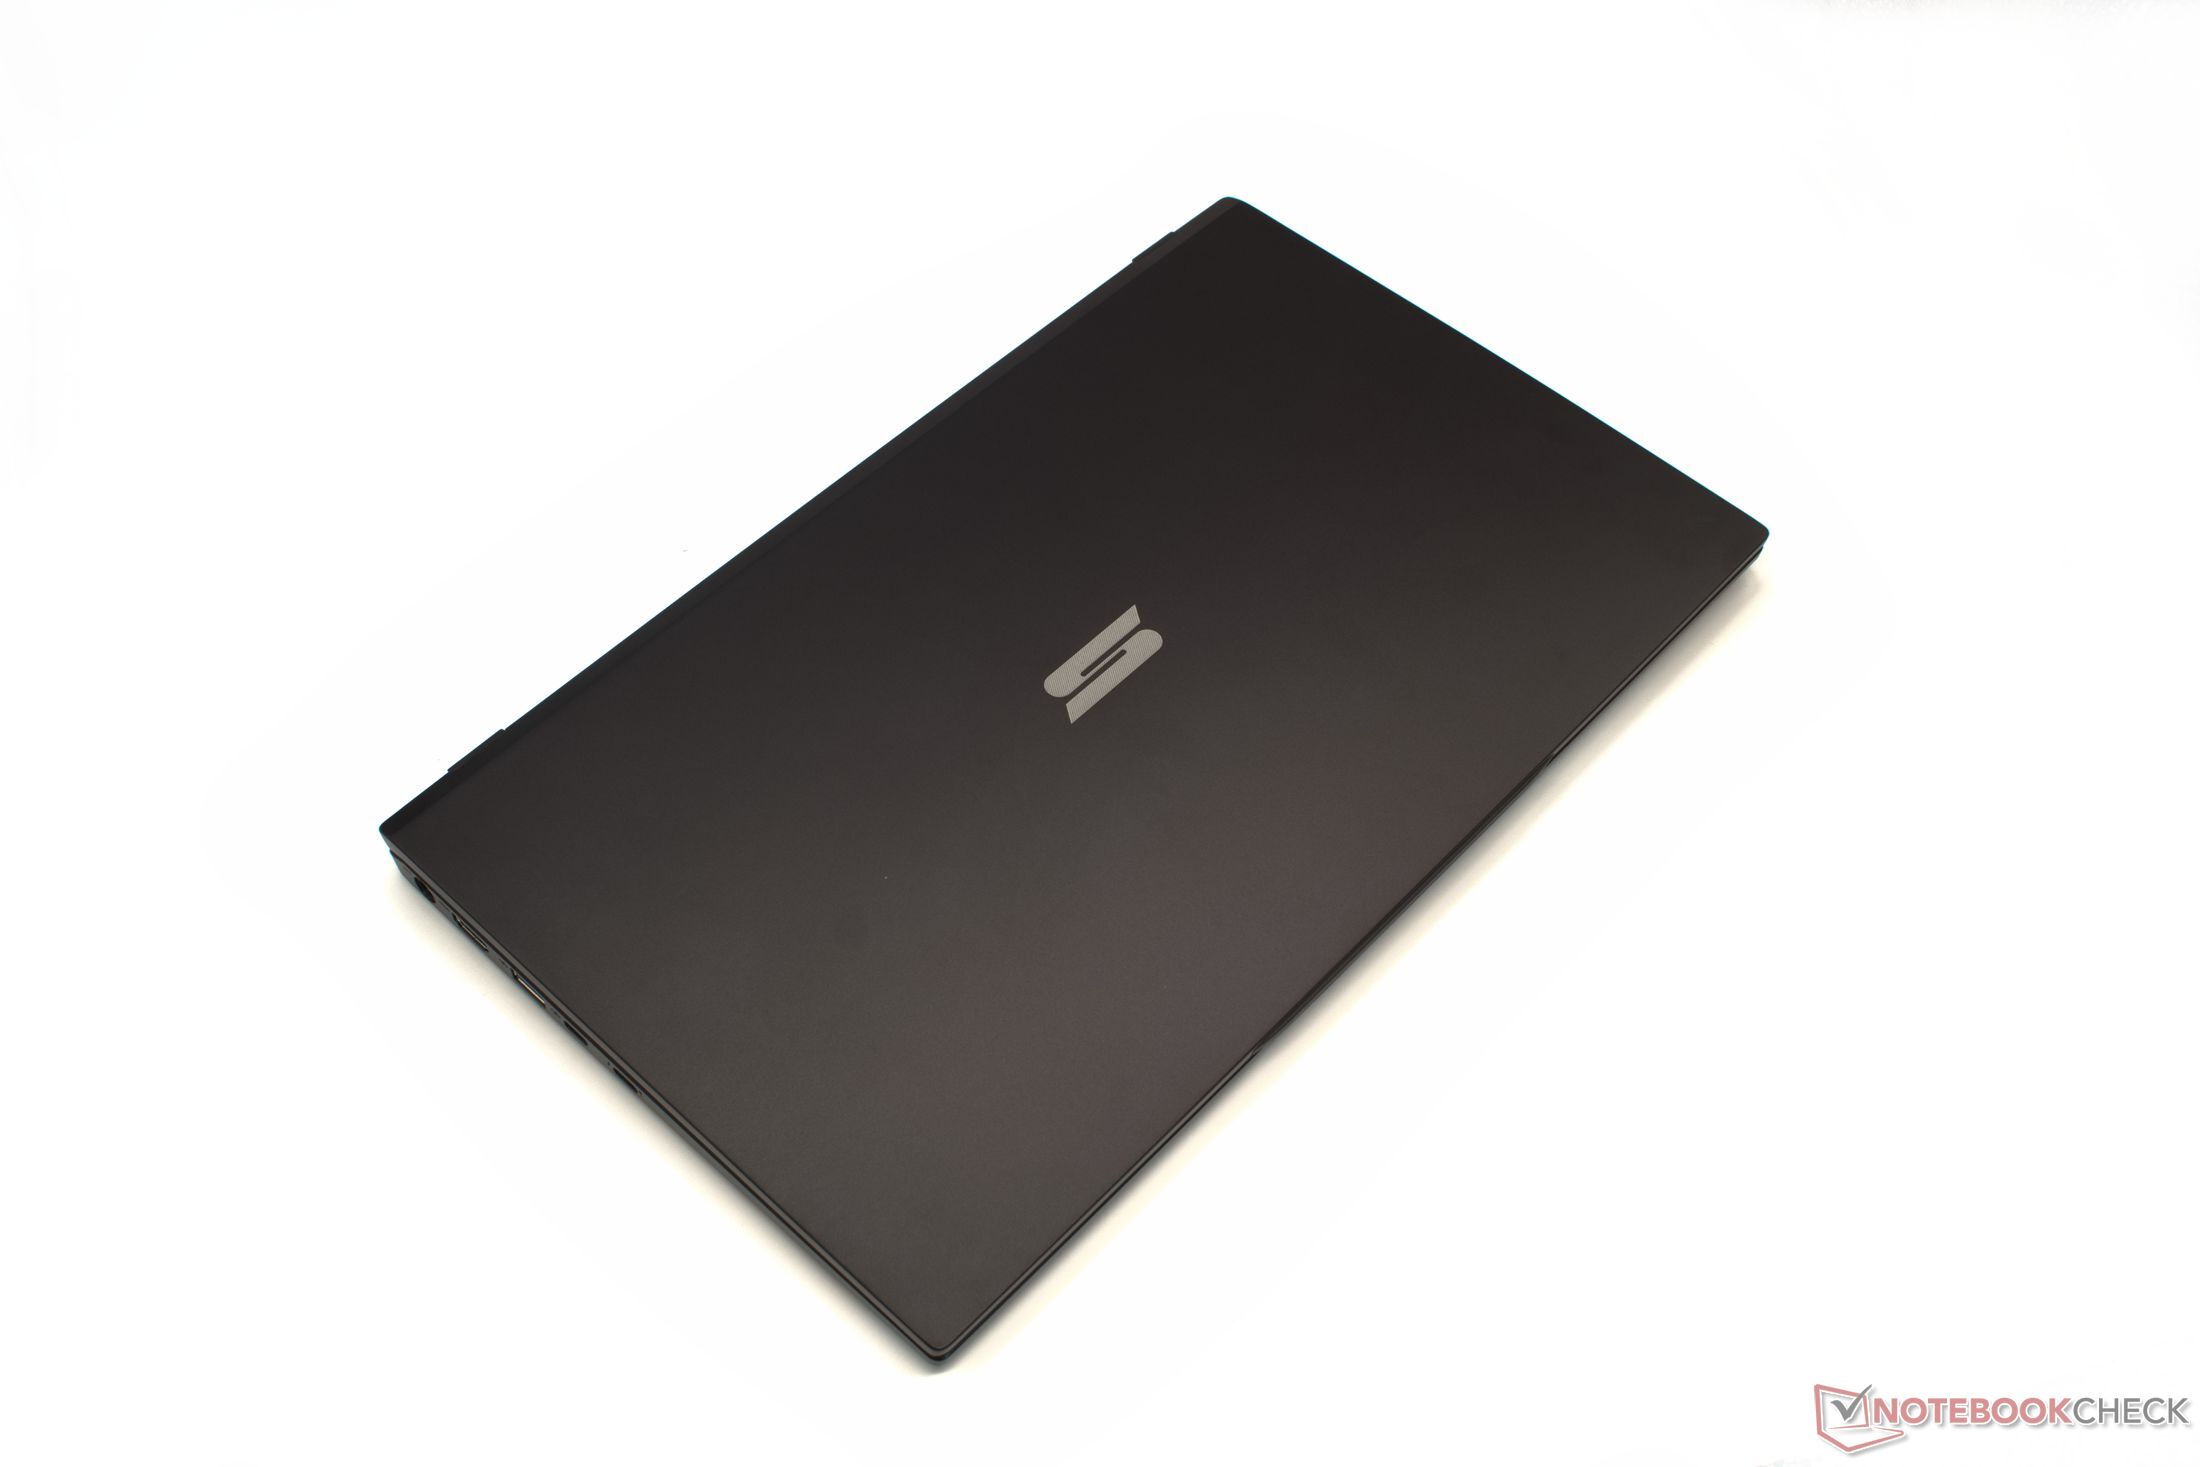
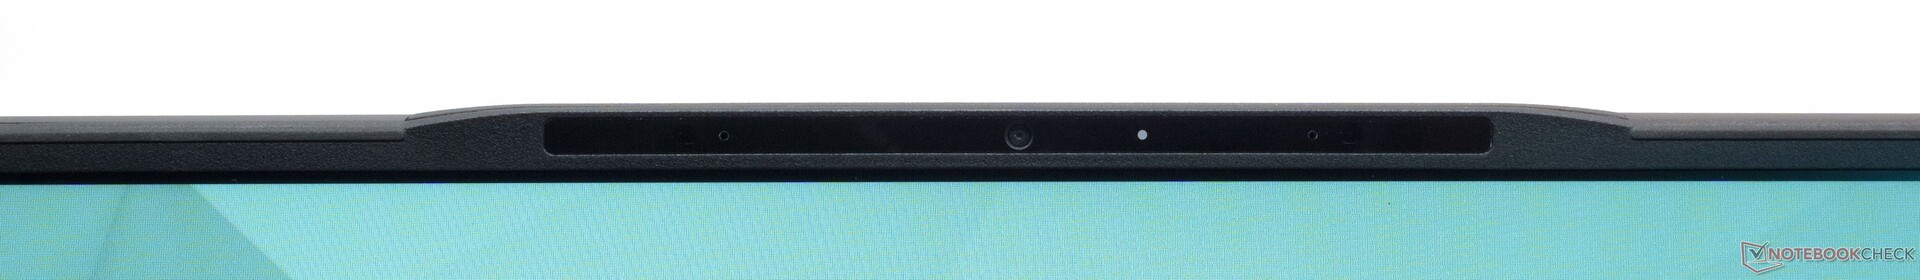
La cassa nera in metallo e plastica è molto sottile e offre ancora un'alta connettività. Il display è circondato da una cornice larga 6 mm. La cornice è allargata un po' solo per la webcam e i microfoni. La superficie opaca non è suscettibile allo sporco e offre una sensazione piacevole. Bordi chiari e piccoli raggi determinano l'esterno del portatile. Il design di Schenker è molto semplice e sembra di alta qualità allo stesso tempo. La parte inferiore della base e il coperchio del display sono fatti di metallo, mentre la parte superiore della base è fatta di plastica.
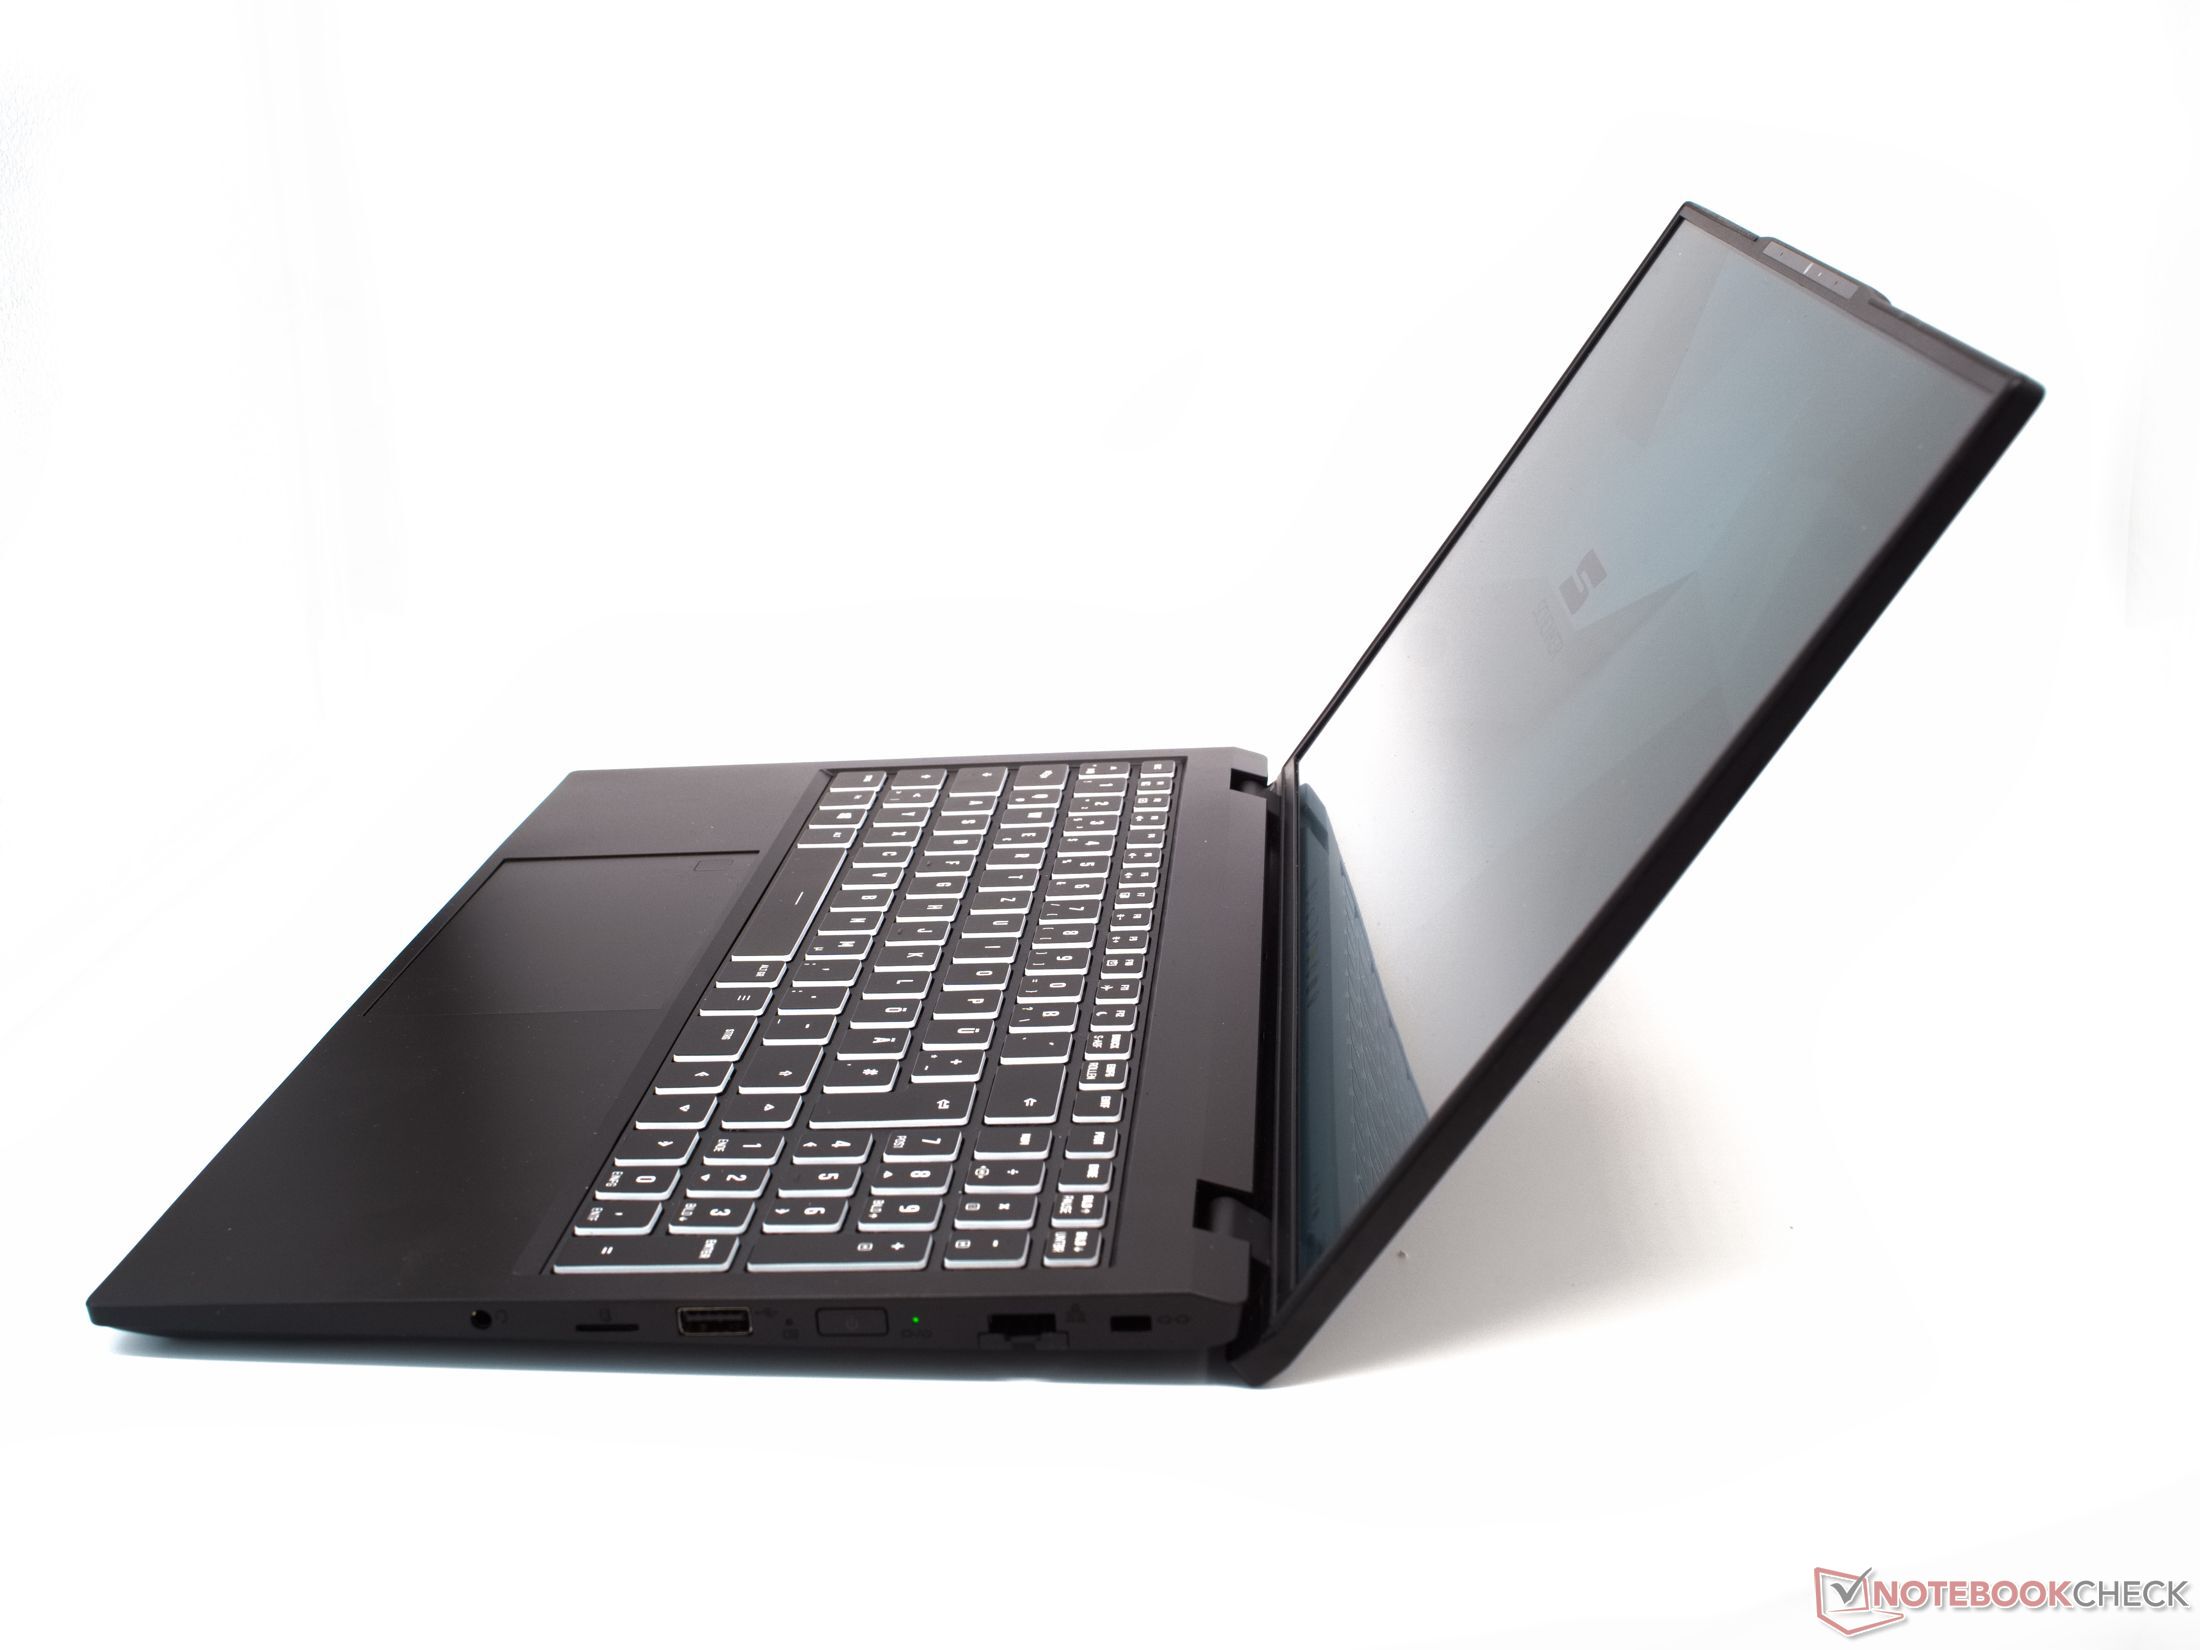
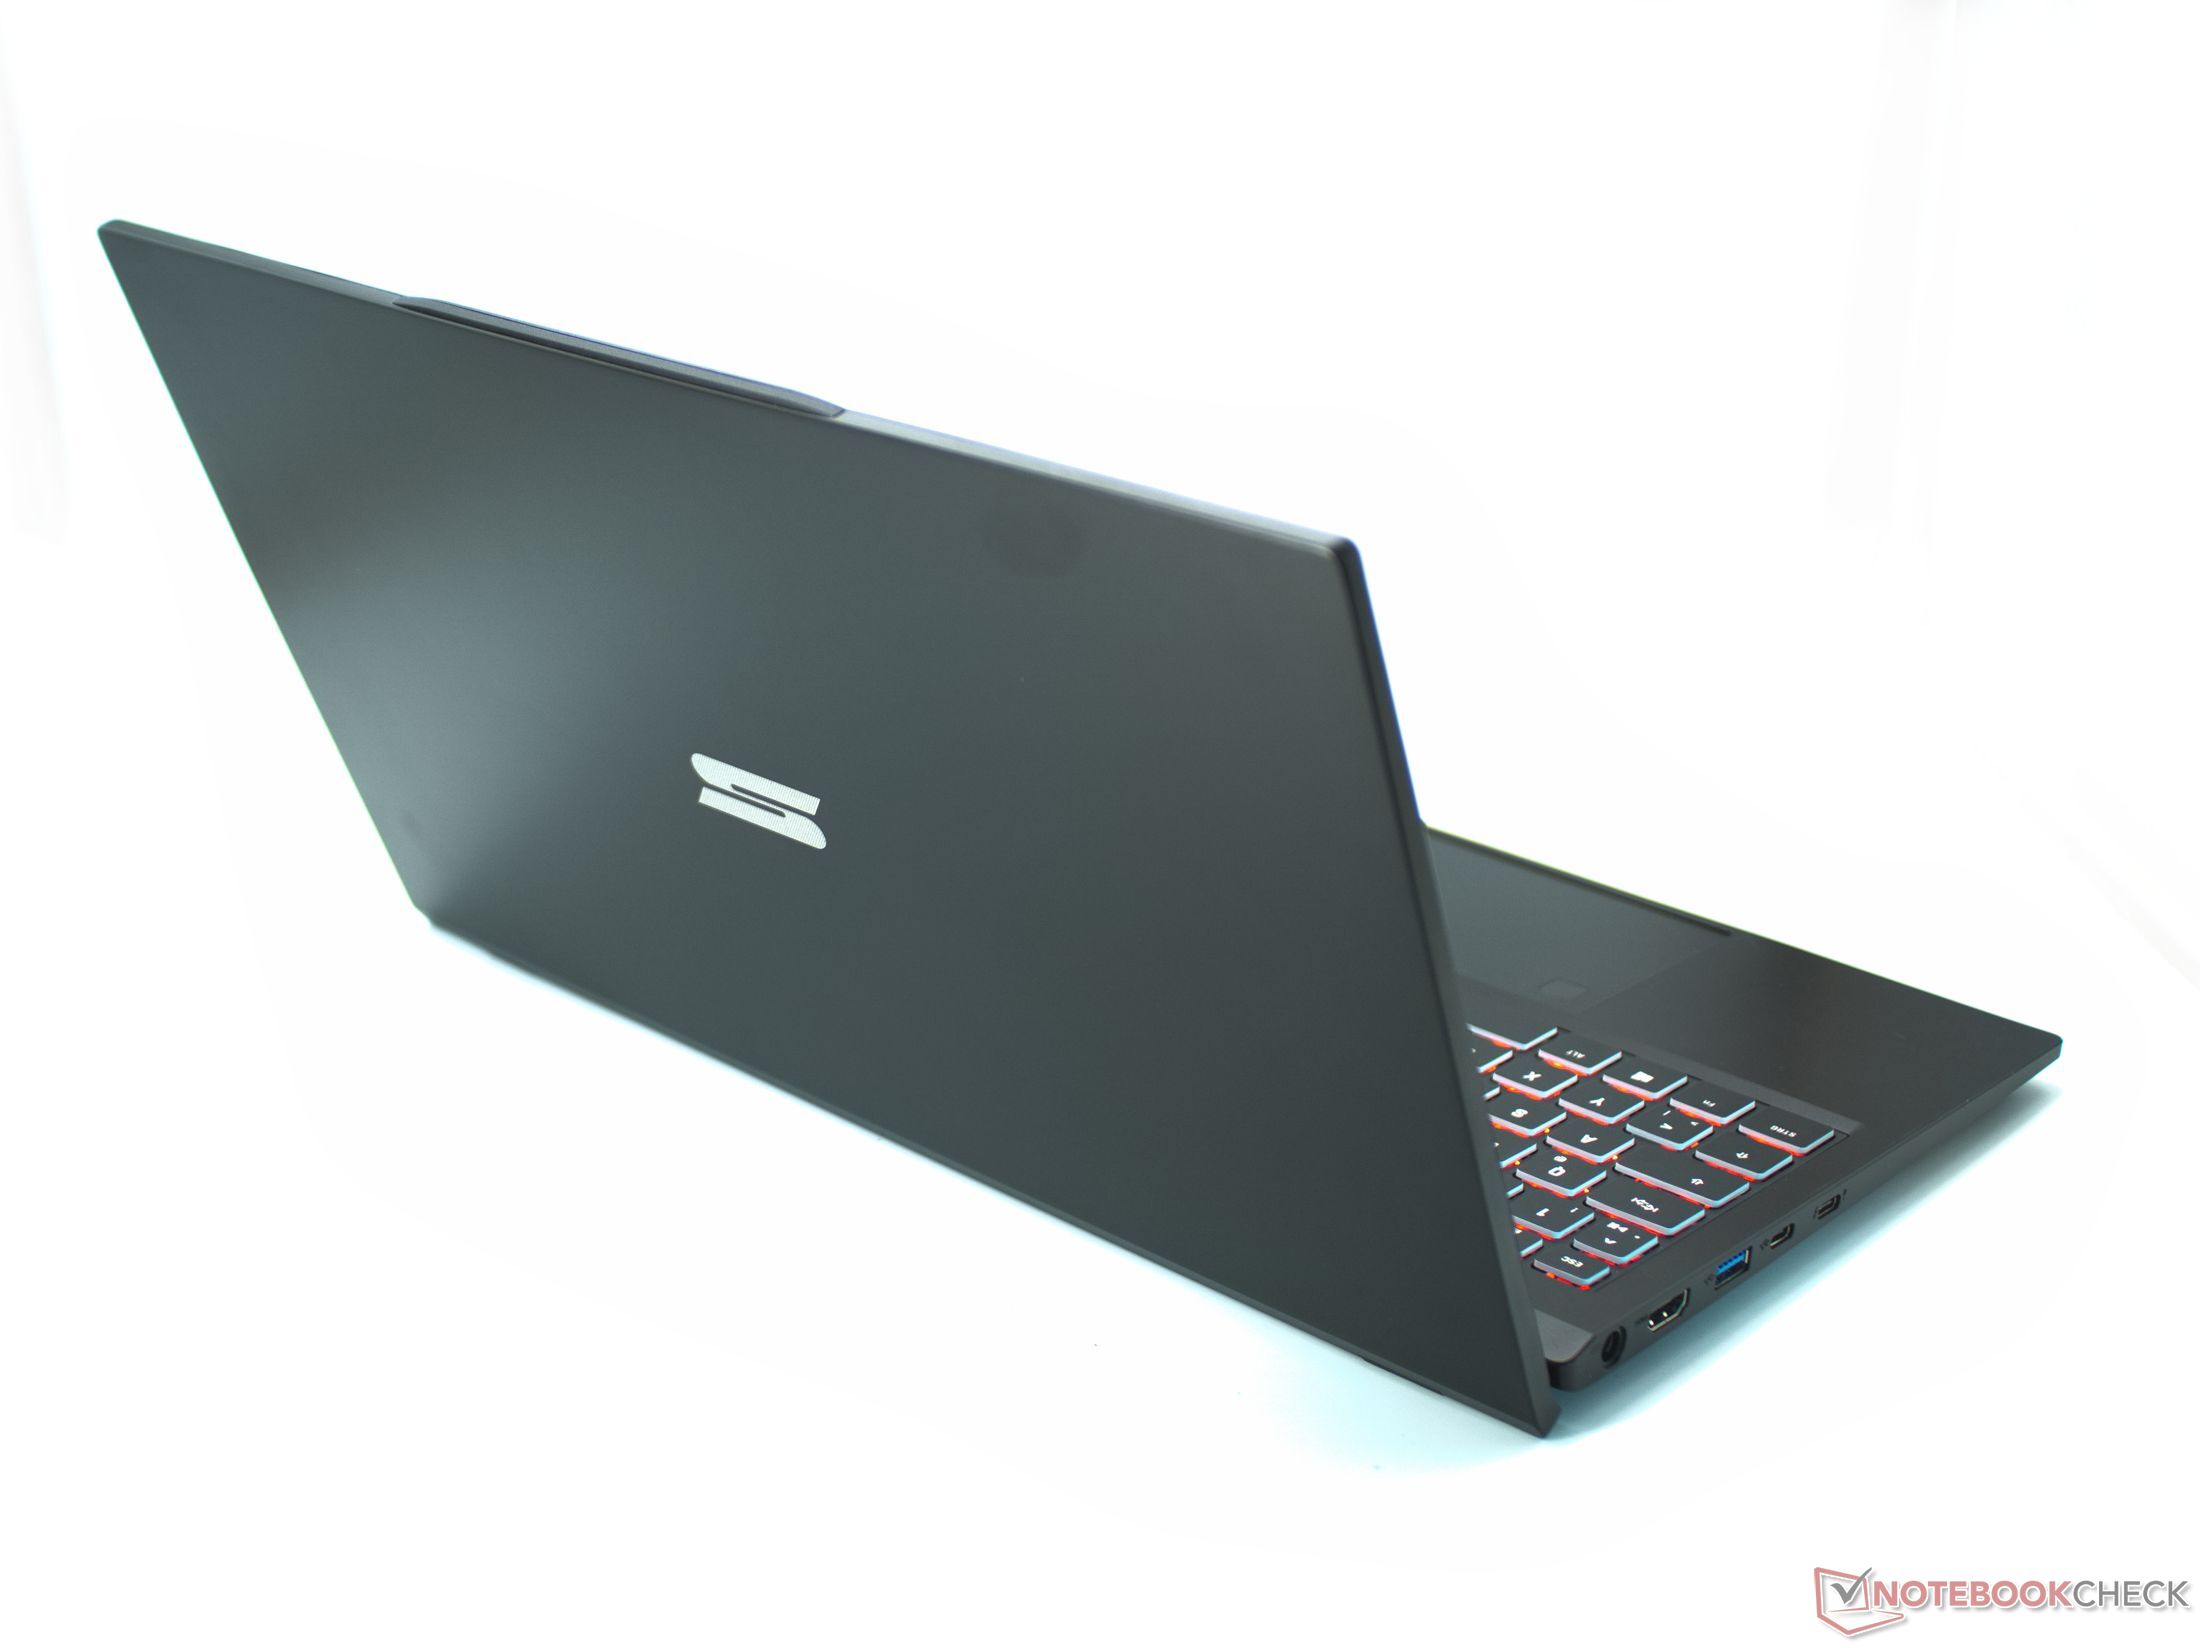

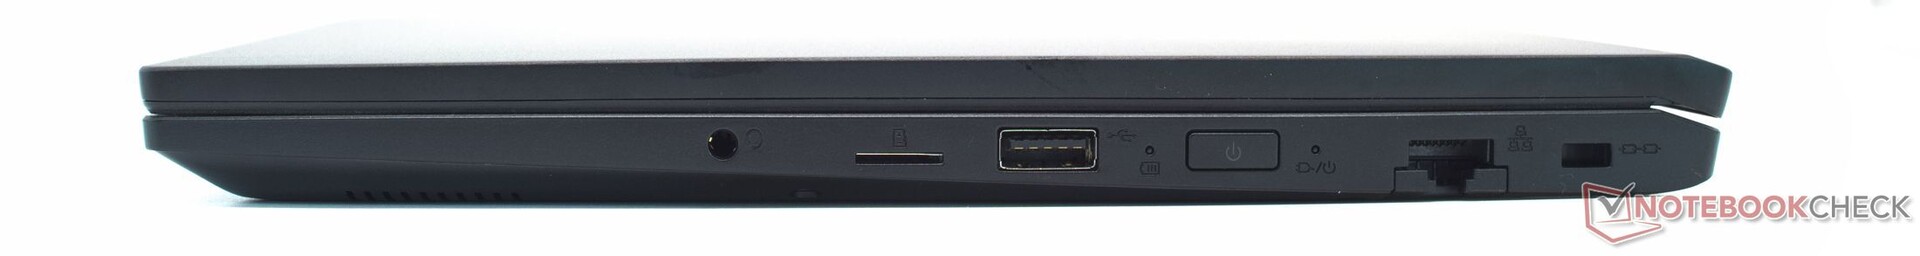
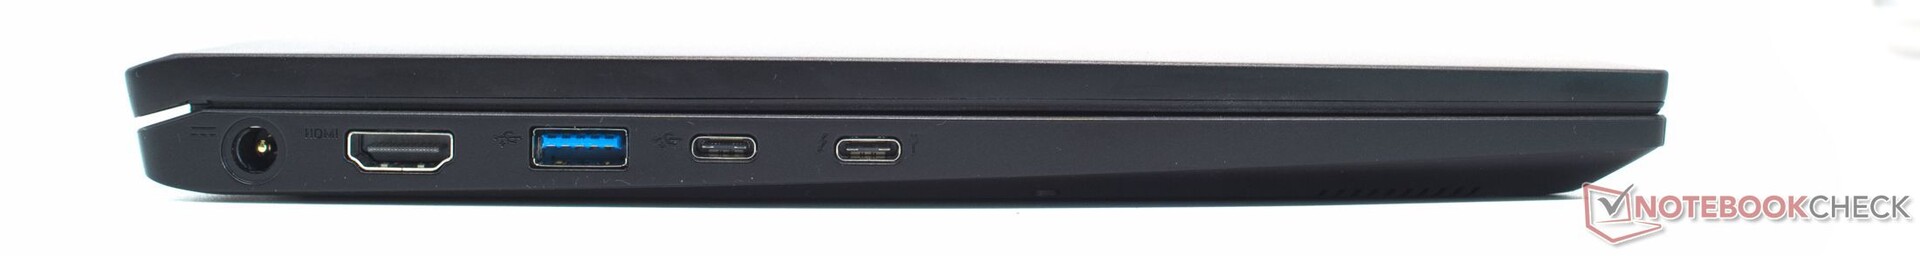
Lo Schenker Work 15 offre una vasta gamma di opzioni di connettività. Il lettore di schede microSD e il Wi-Fi 6 funzionano con la velocità prevista. Grazie a Thunderbolt 4 e PowerDelivery, entrambe le porte USB-C forniscono la gamma completa di funzioni. Sono disponibili anche HDMI e Gigabit LAN. Per la sicurezza, le funzioni di sicurezza dell'Intel Core i7-11370H sono disponibili insieme al sensore di impronte digitali e allo slot di blocco Kensington. La webcam mostra la tipica bassa qualità delle webcam dei laptop.
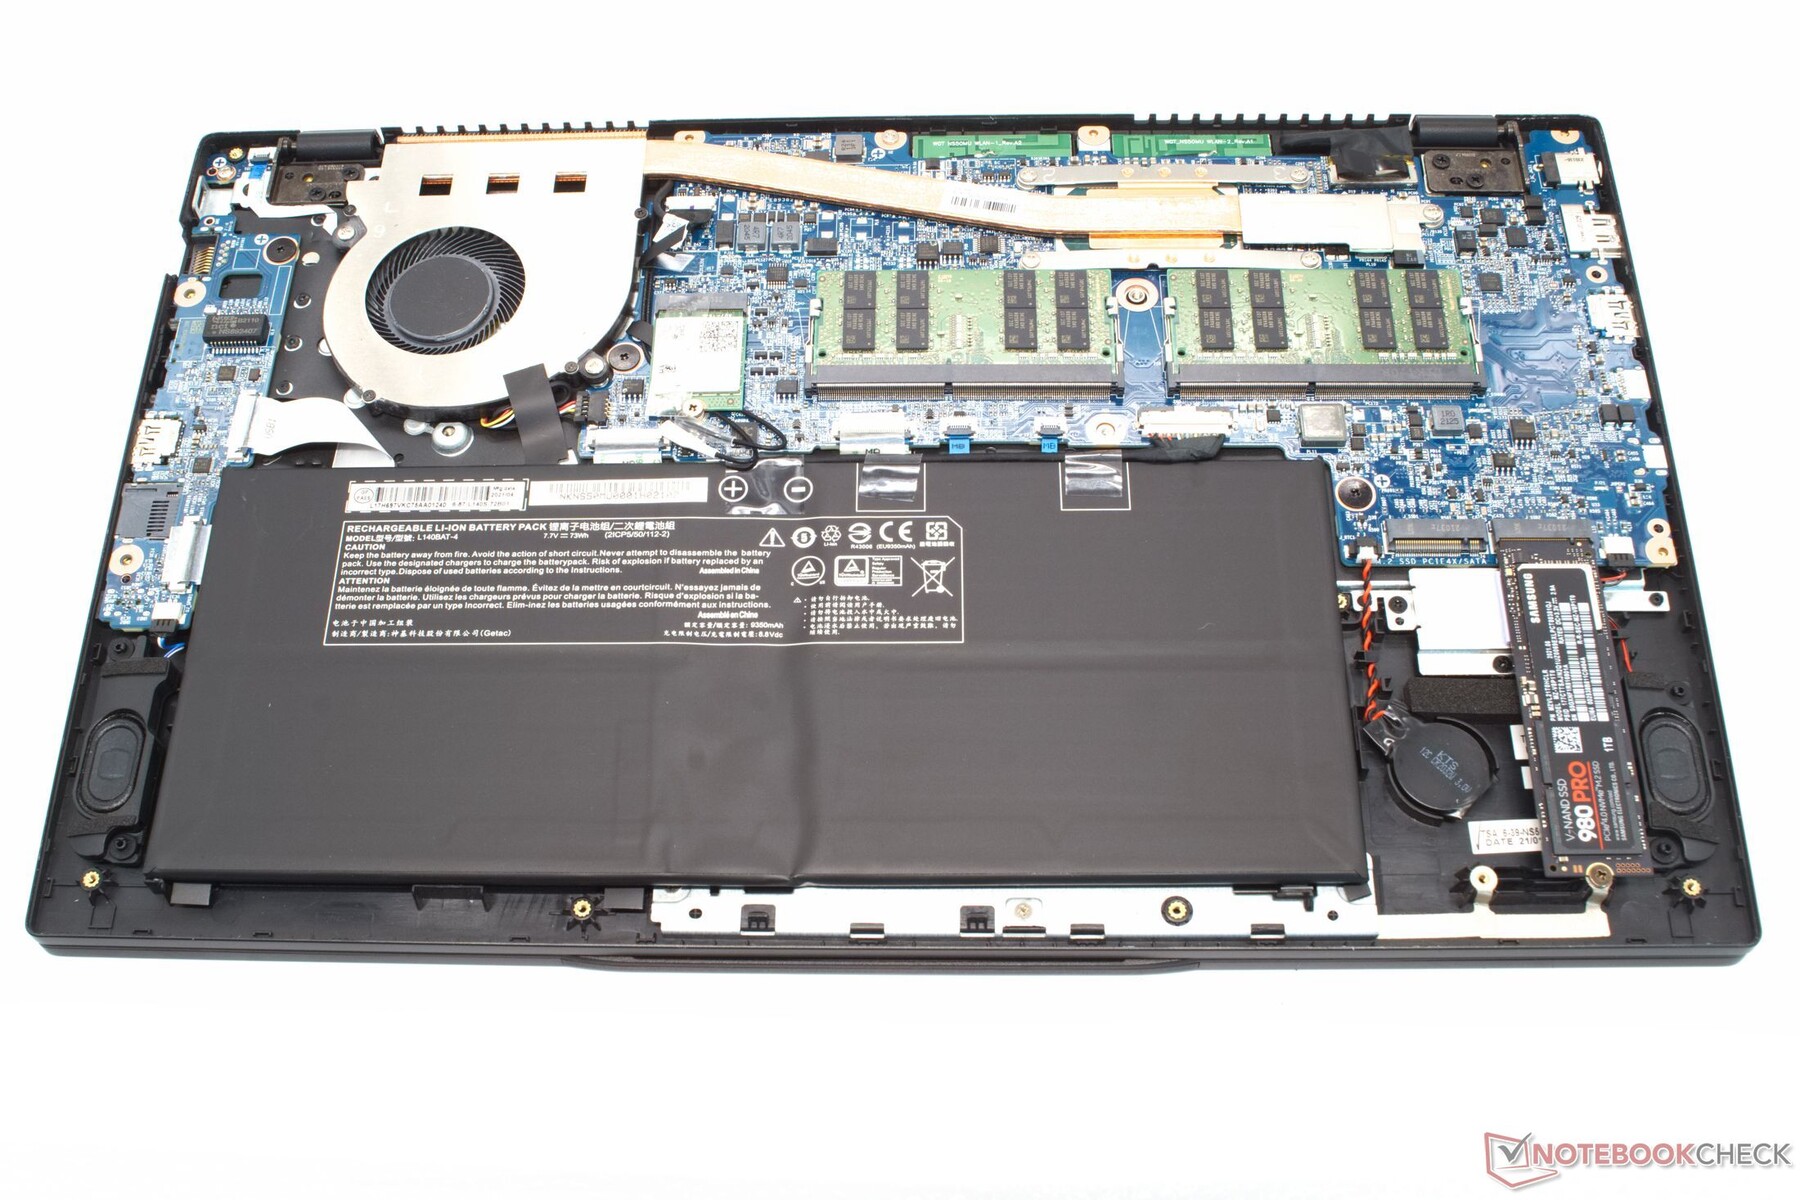
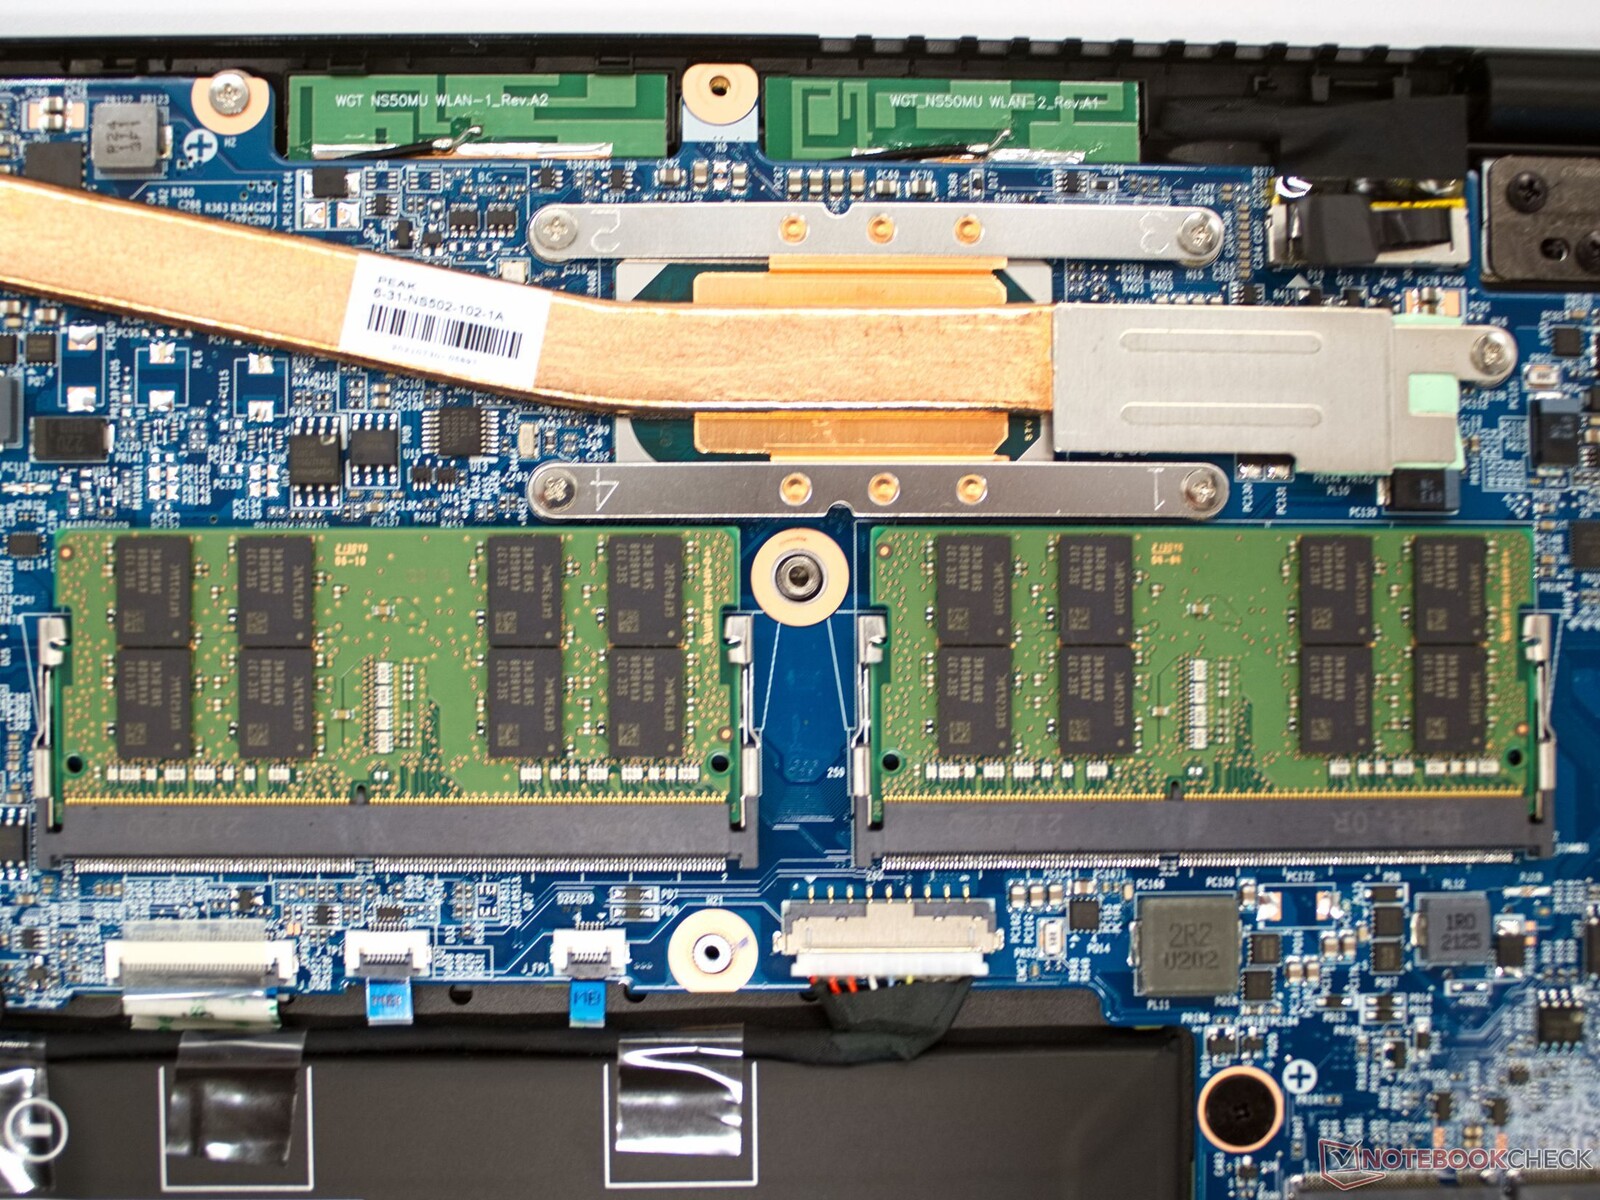
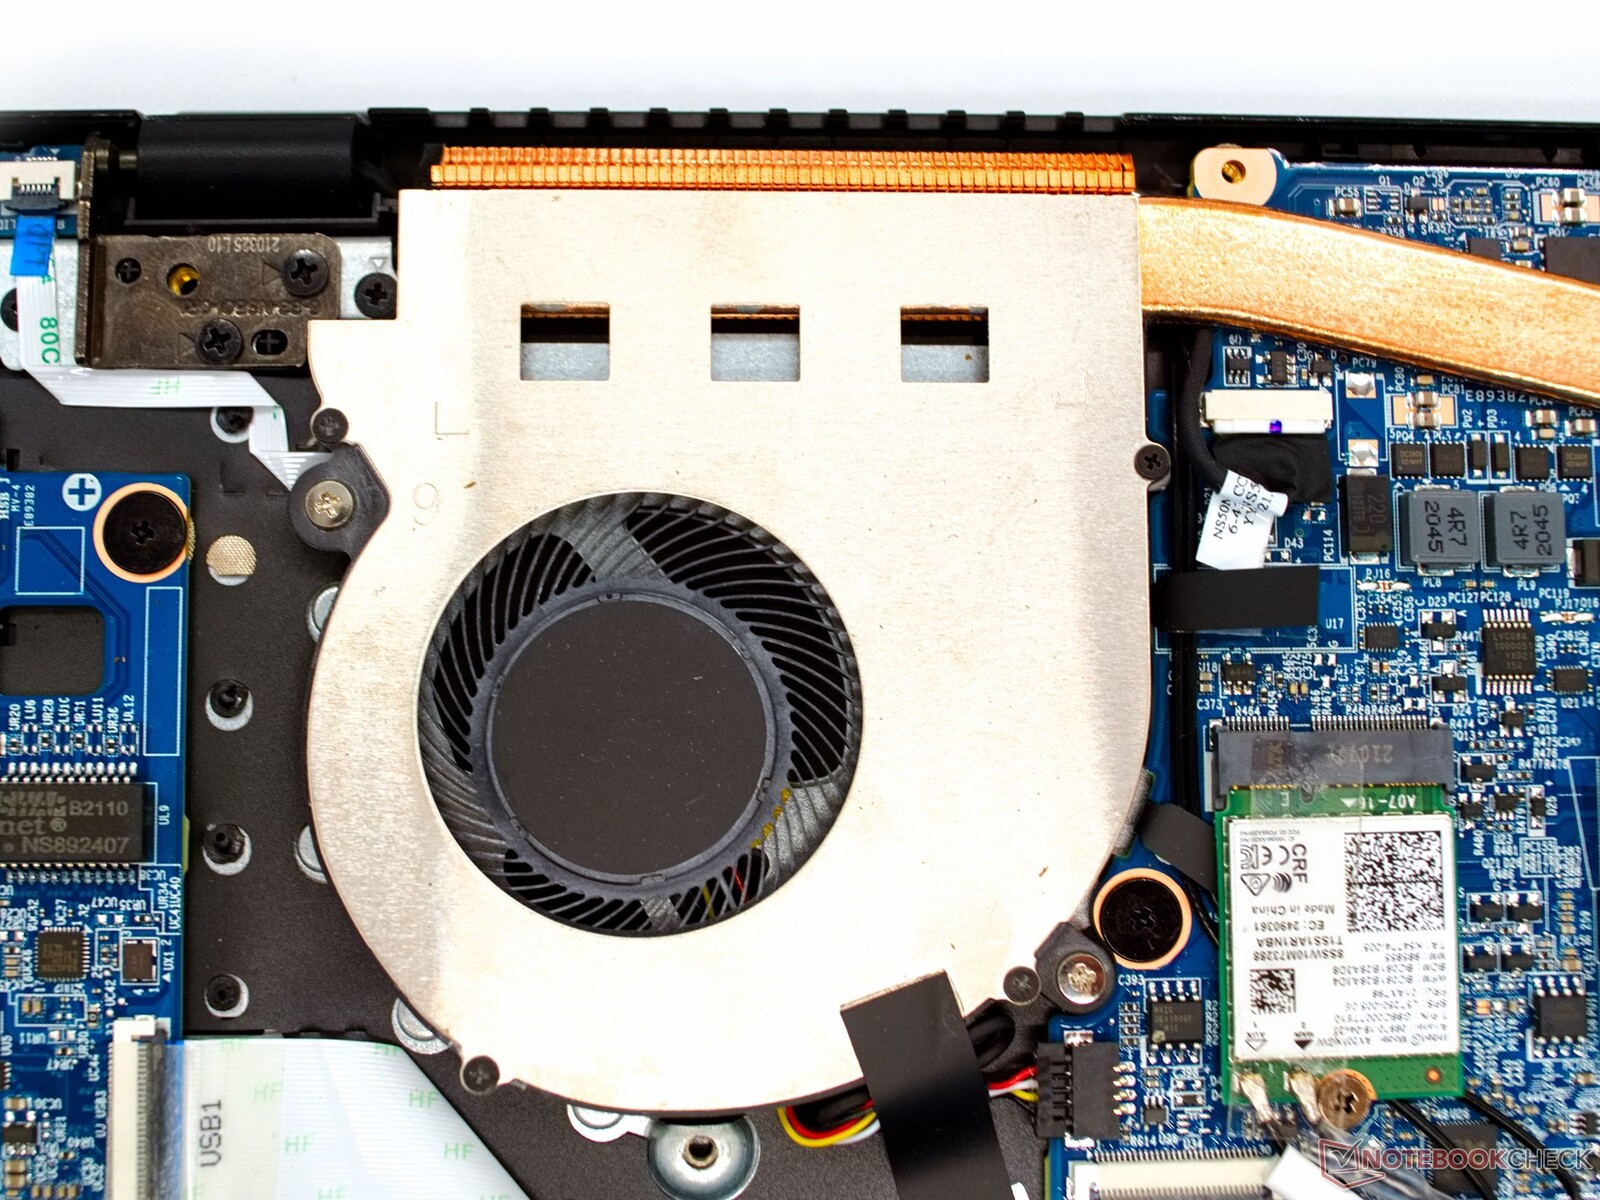
Il coperchio del case sul fondo è tenuto in posizione da molte viti, ma una volta rimosso, l'esemplare in esame è facile da aprire. Sotto ci sono la memoria di lavoro aggiornabile e uno slot M.2 libero per un altro SSD
| SD Card Reader | |
| average JPG Copy Test (av. of 3 runs) | |
| LG Gram 15Z90P-G.AA89G (AV Pro SD microSD 128 GB V60) | |
| HP Pavilion x360 15-er0155ng (AV PRO microSD 128 GB V60) | |
| Schenker Work 15 Tiger Lake-H (Angelbird AV Pro V60) | |
| Media della classe Office (19.8 - 198.5, n=22, ultimi 2 anni) | |
| Asus VivoBook S15 D533UA (AV PRO microSD 128 GB V60) | |
| Dell Inspiron 15 3501 (AV Pro SD 128 GB V60) | |
| maximum AS SSD Seq Read Test (1GB) | |
| LG Gram 15Z90P-G.AA89G (AV Pro SD microSD 128 GB V60) | |
| HP Pavilion x360 15-er0155ng (AV PRO microSD 128 GB V60) | |
| Media della classe Office (27.4 - 249, n=21, ultimi 2 anni) | |
| Schenker Work 15 Tiger Lake-H (Angelbird AV Pro V60) | |
| Asus VivoBook S15 D533UA (AV PRO microSD 128 GB V60) | |
| Dell Inspiron 15 3501 (AV Pro SD microSD 128 GB V60) | |


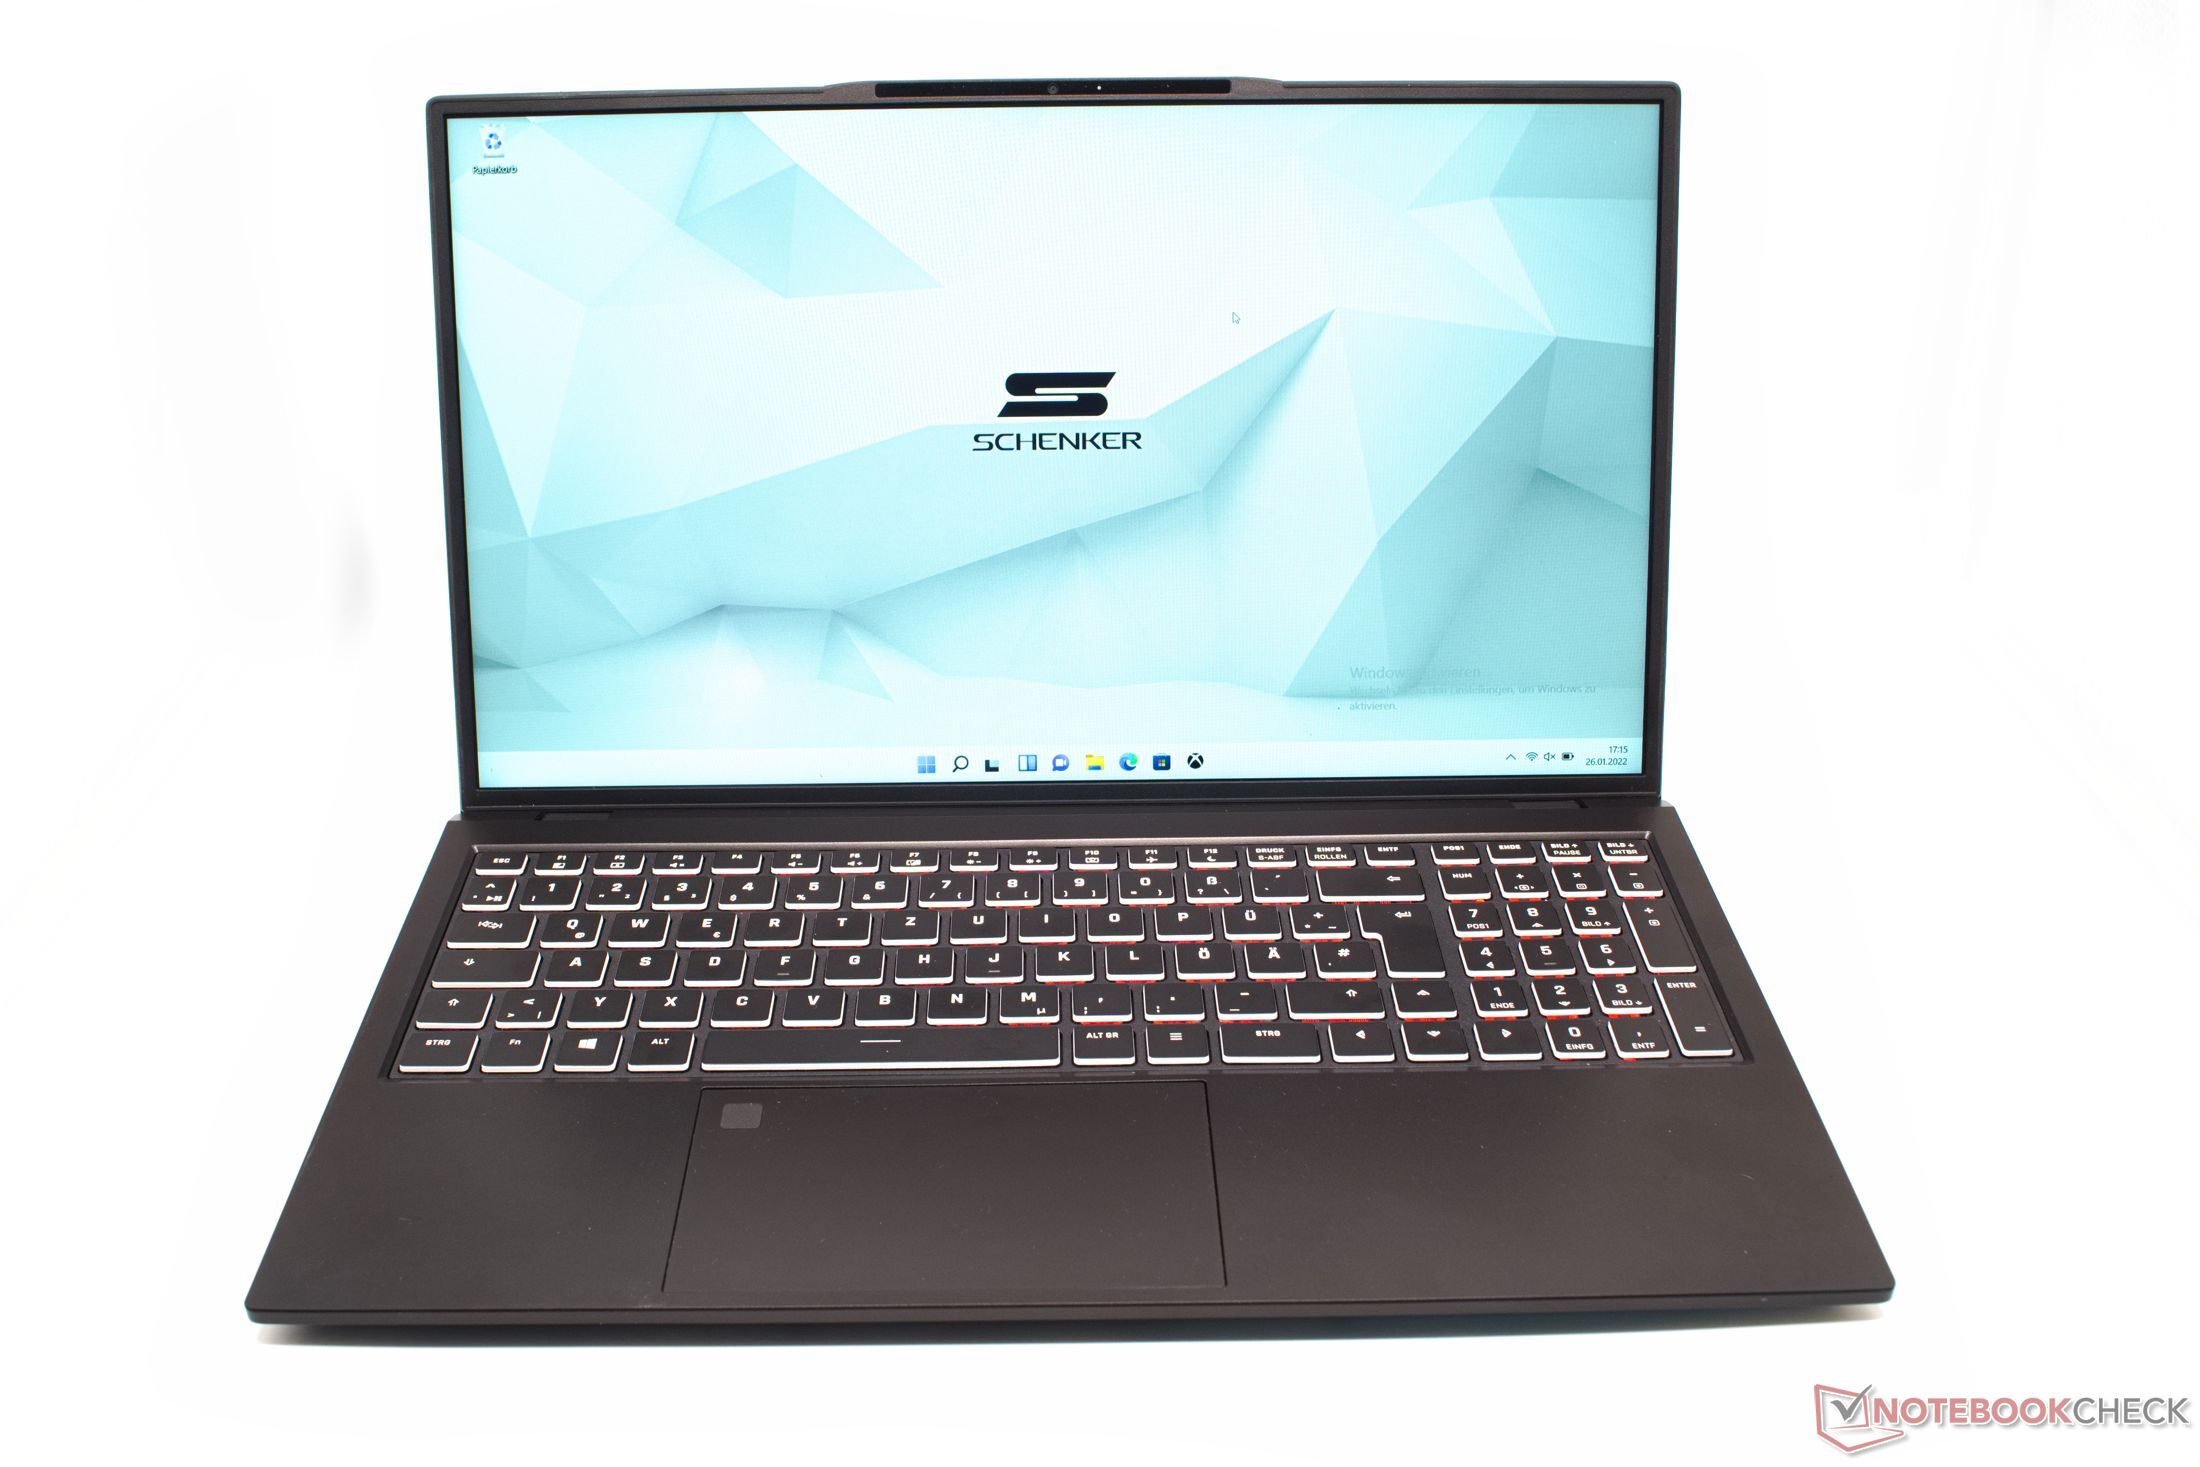
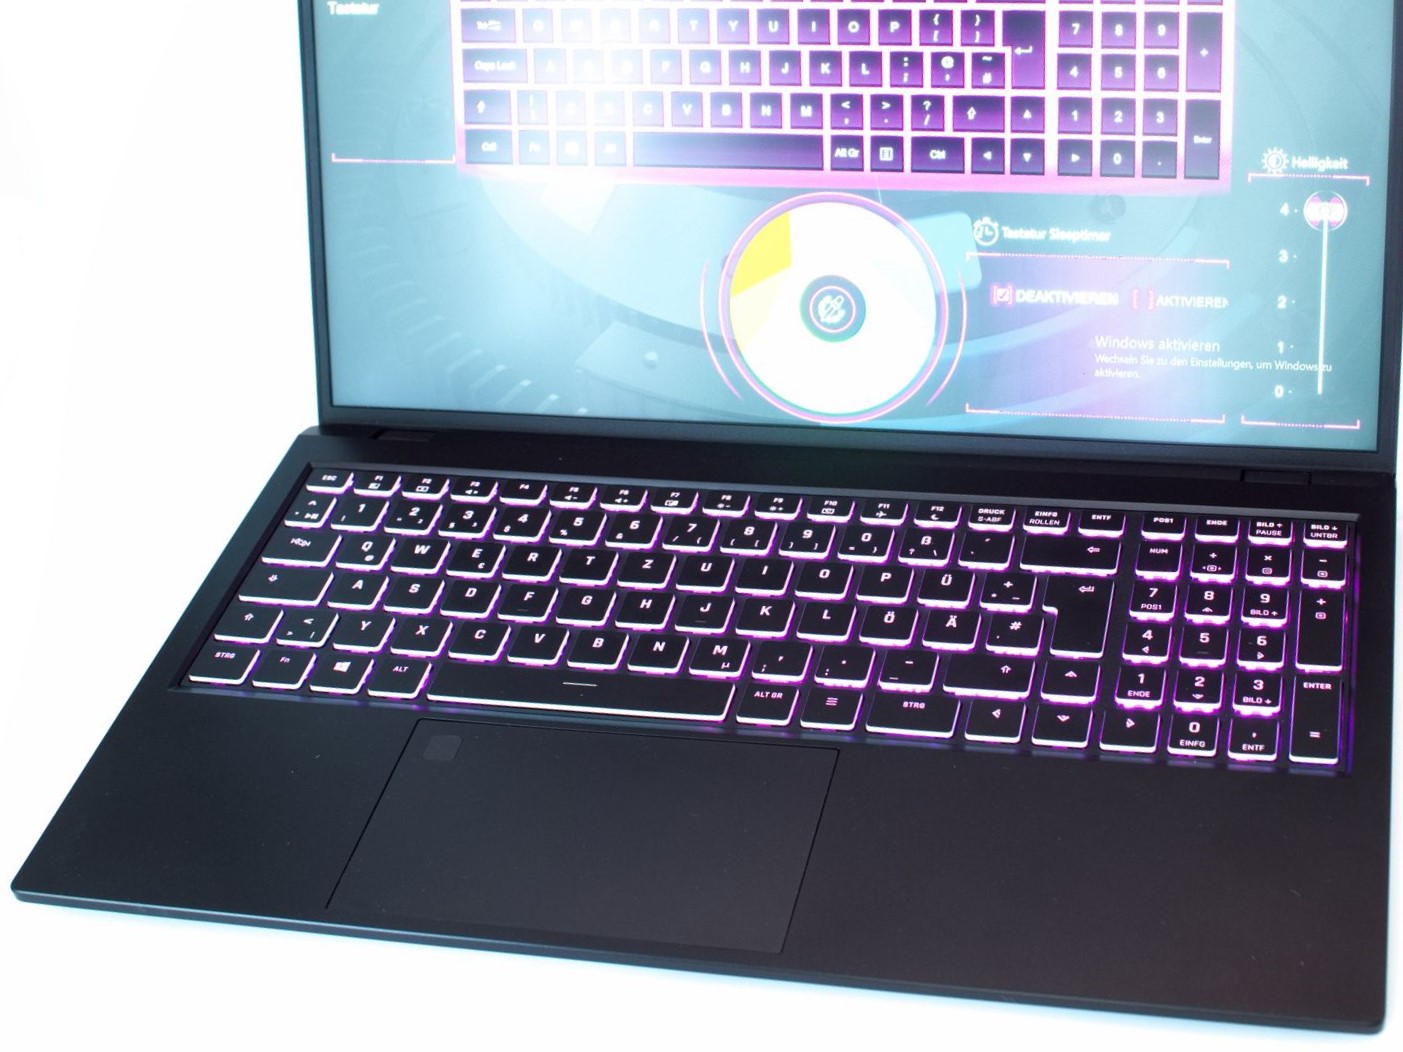
Dispositivi di input: Con luce RGB
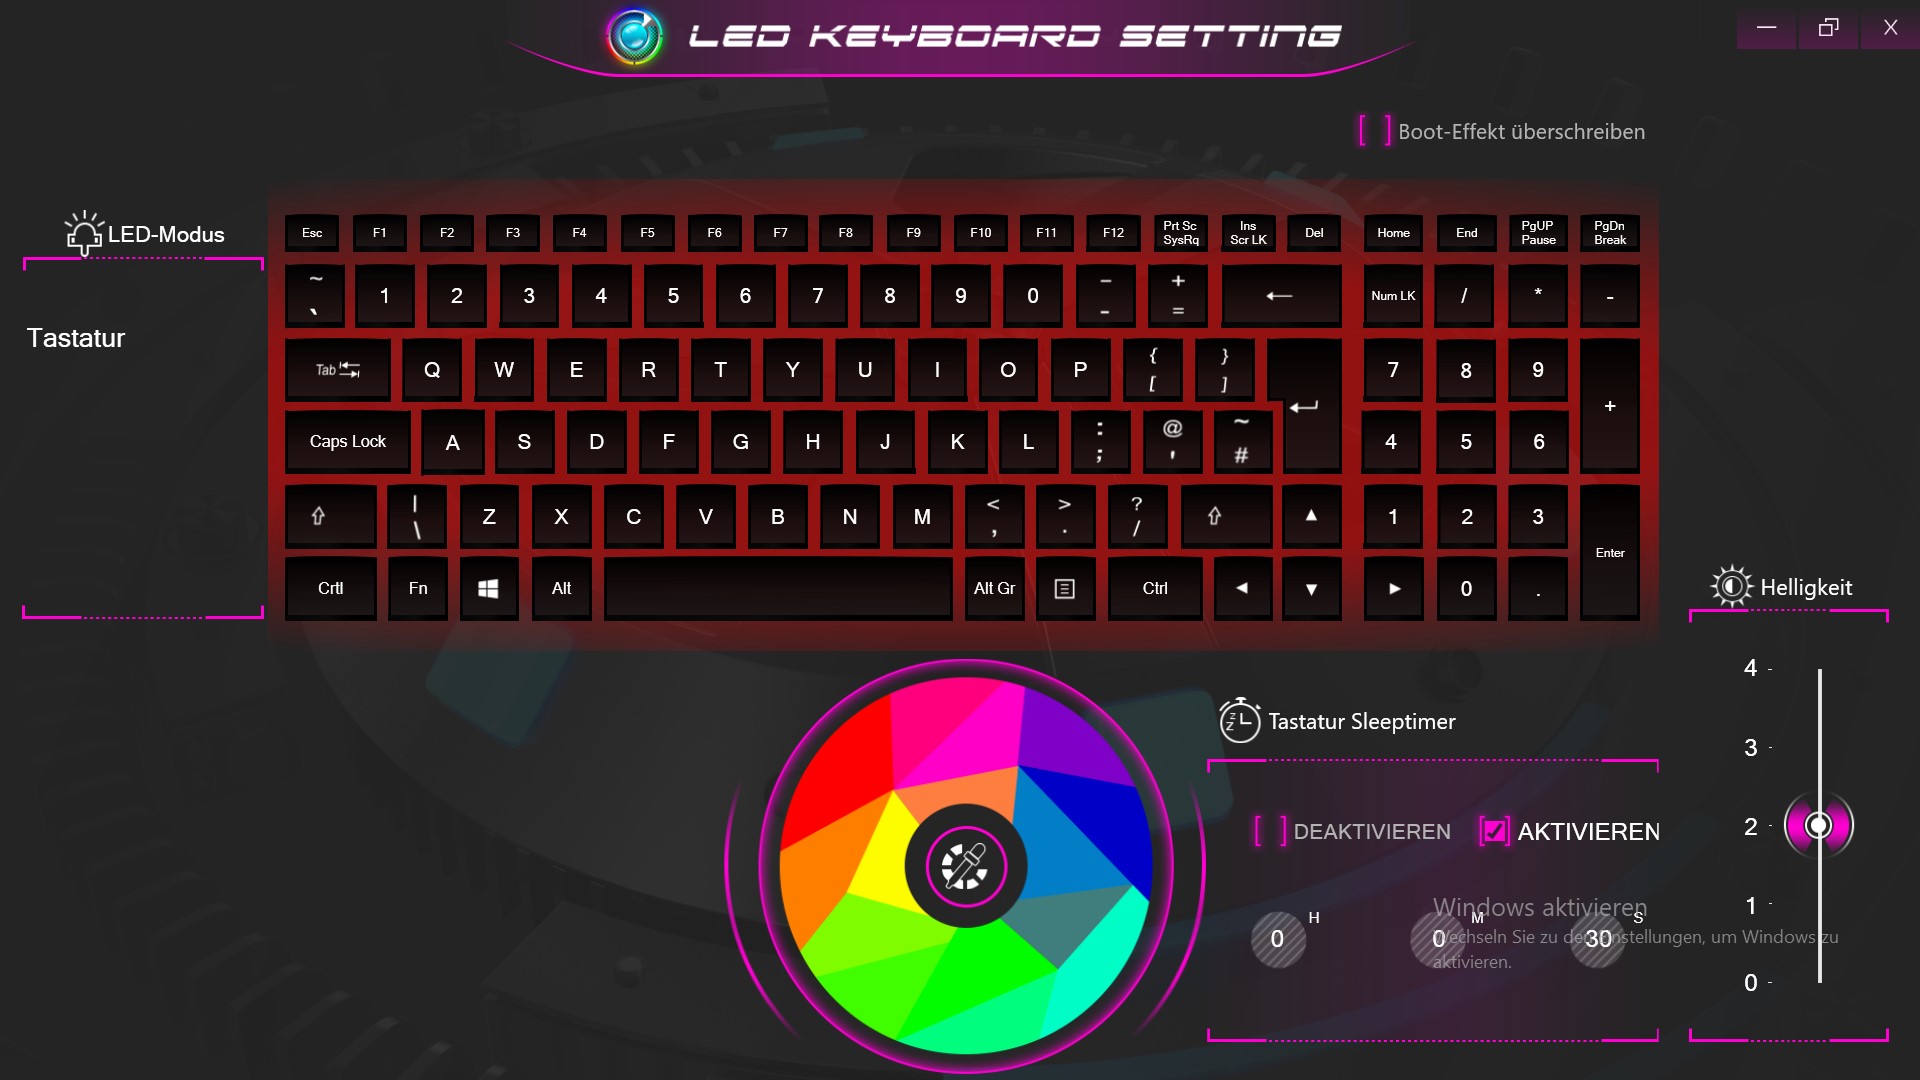
I tasti grandi con un'adeguata corsa dei tasti e un buon feedback aptico danno alla tastiera dello Schenker Work 15 una sensazione piacevole durante la digitazione. La retroilluminazione RGB sembra un po' insolita all'inizio, ma almeno si può regolare l'illuminazione secondo le necessità.
Il touchpad di 12 cm × 7 cm ha una superficie liscia e scorrevole e fornisce input precisi. Un sensore di impronte digitali è integrato nell'angolo superiore sinistro del clickpad.
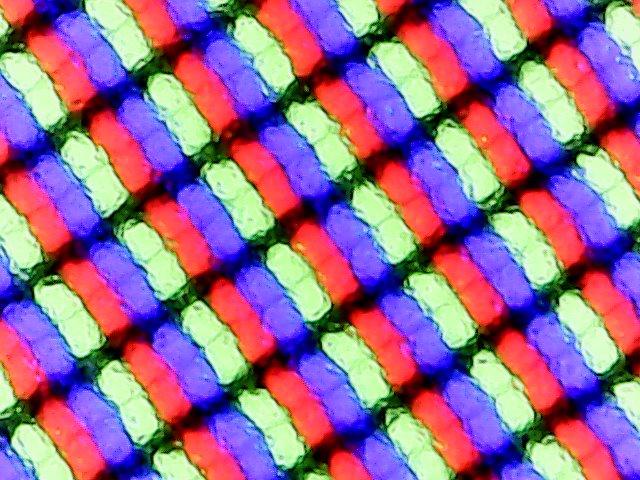
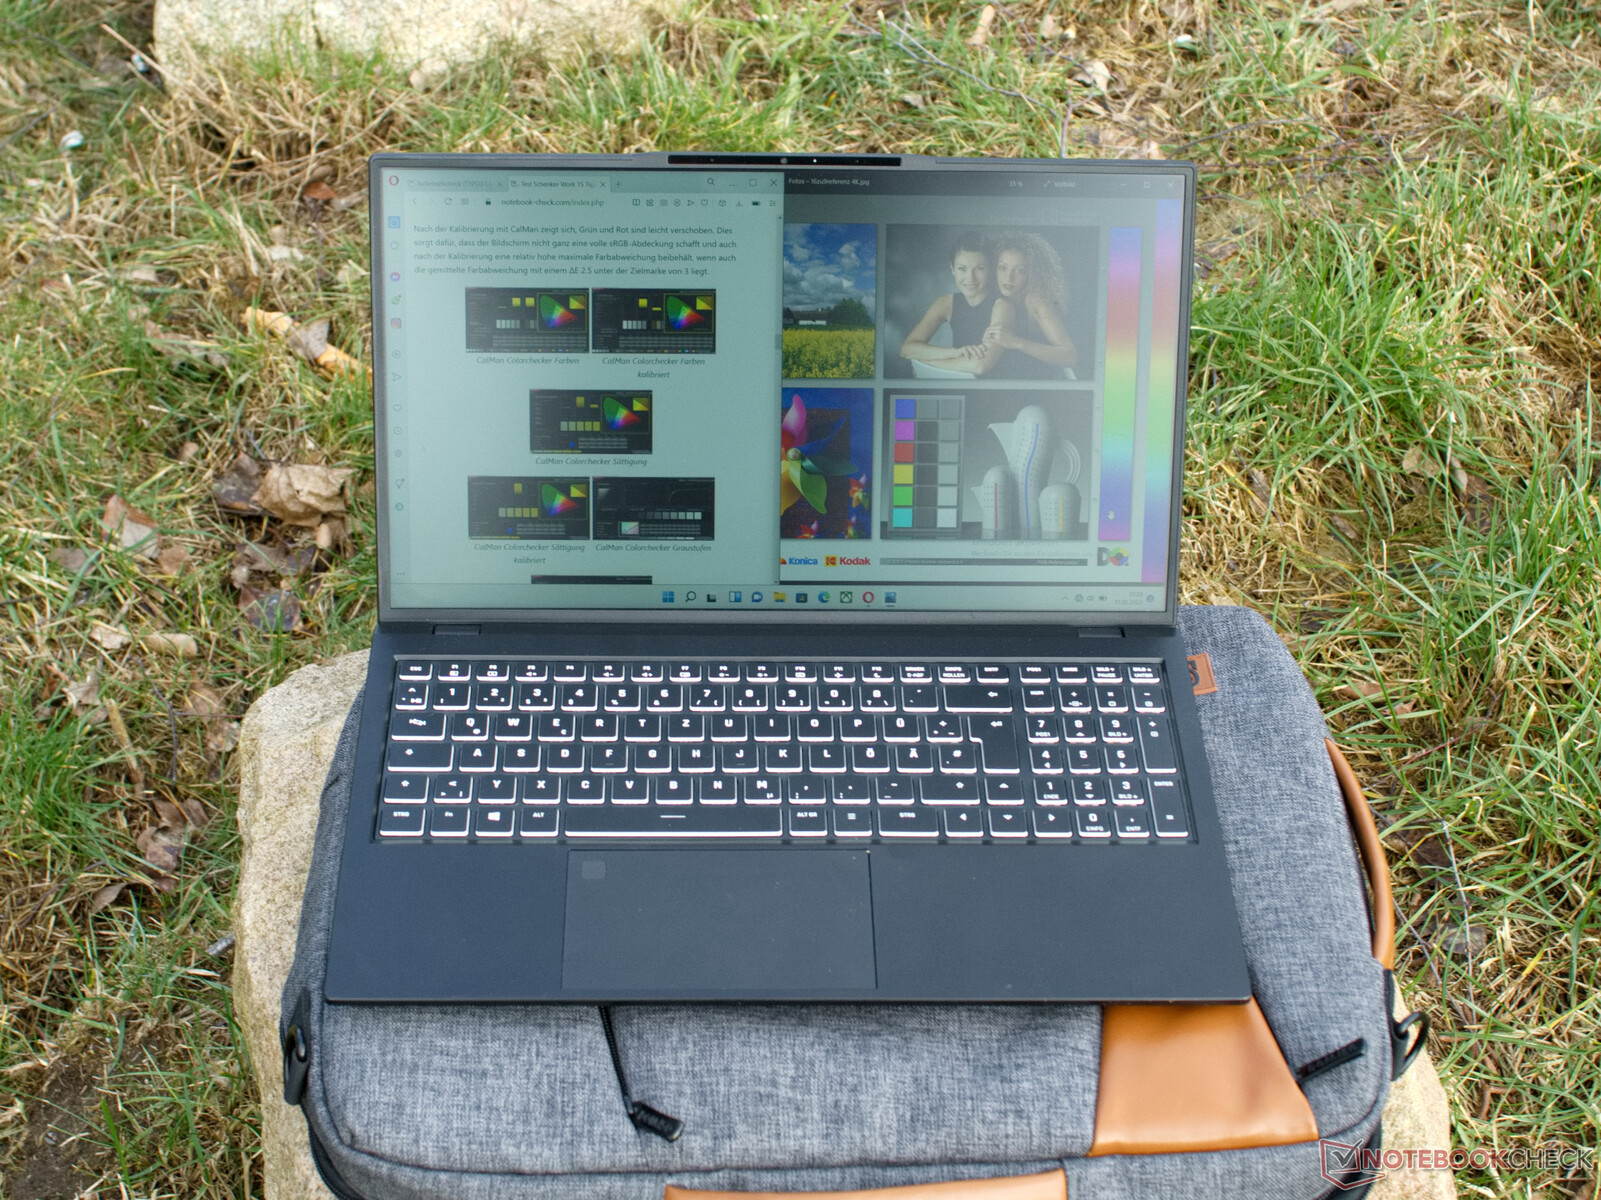
Display: Lavoro 15 con pannello IPS opaco
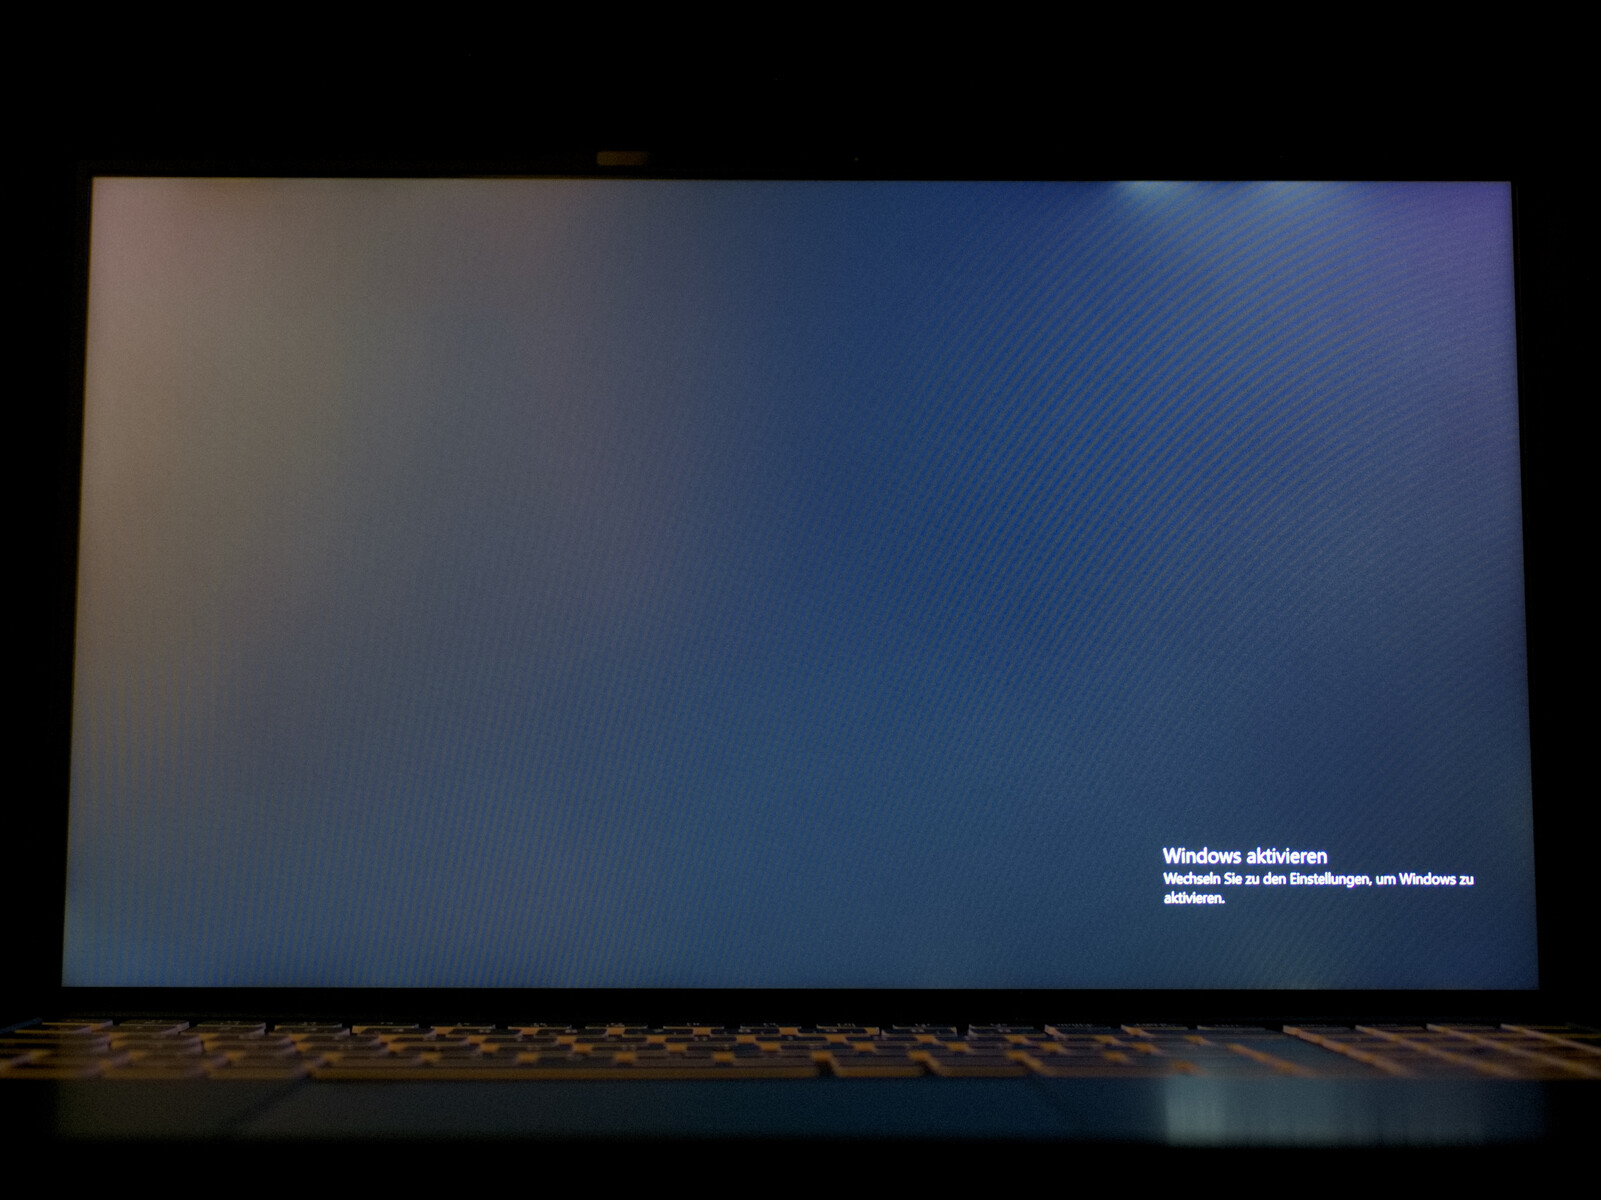
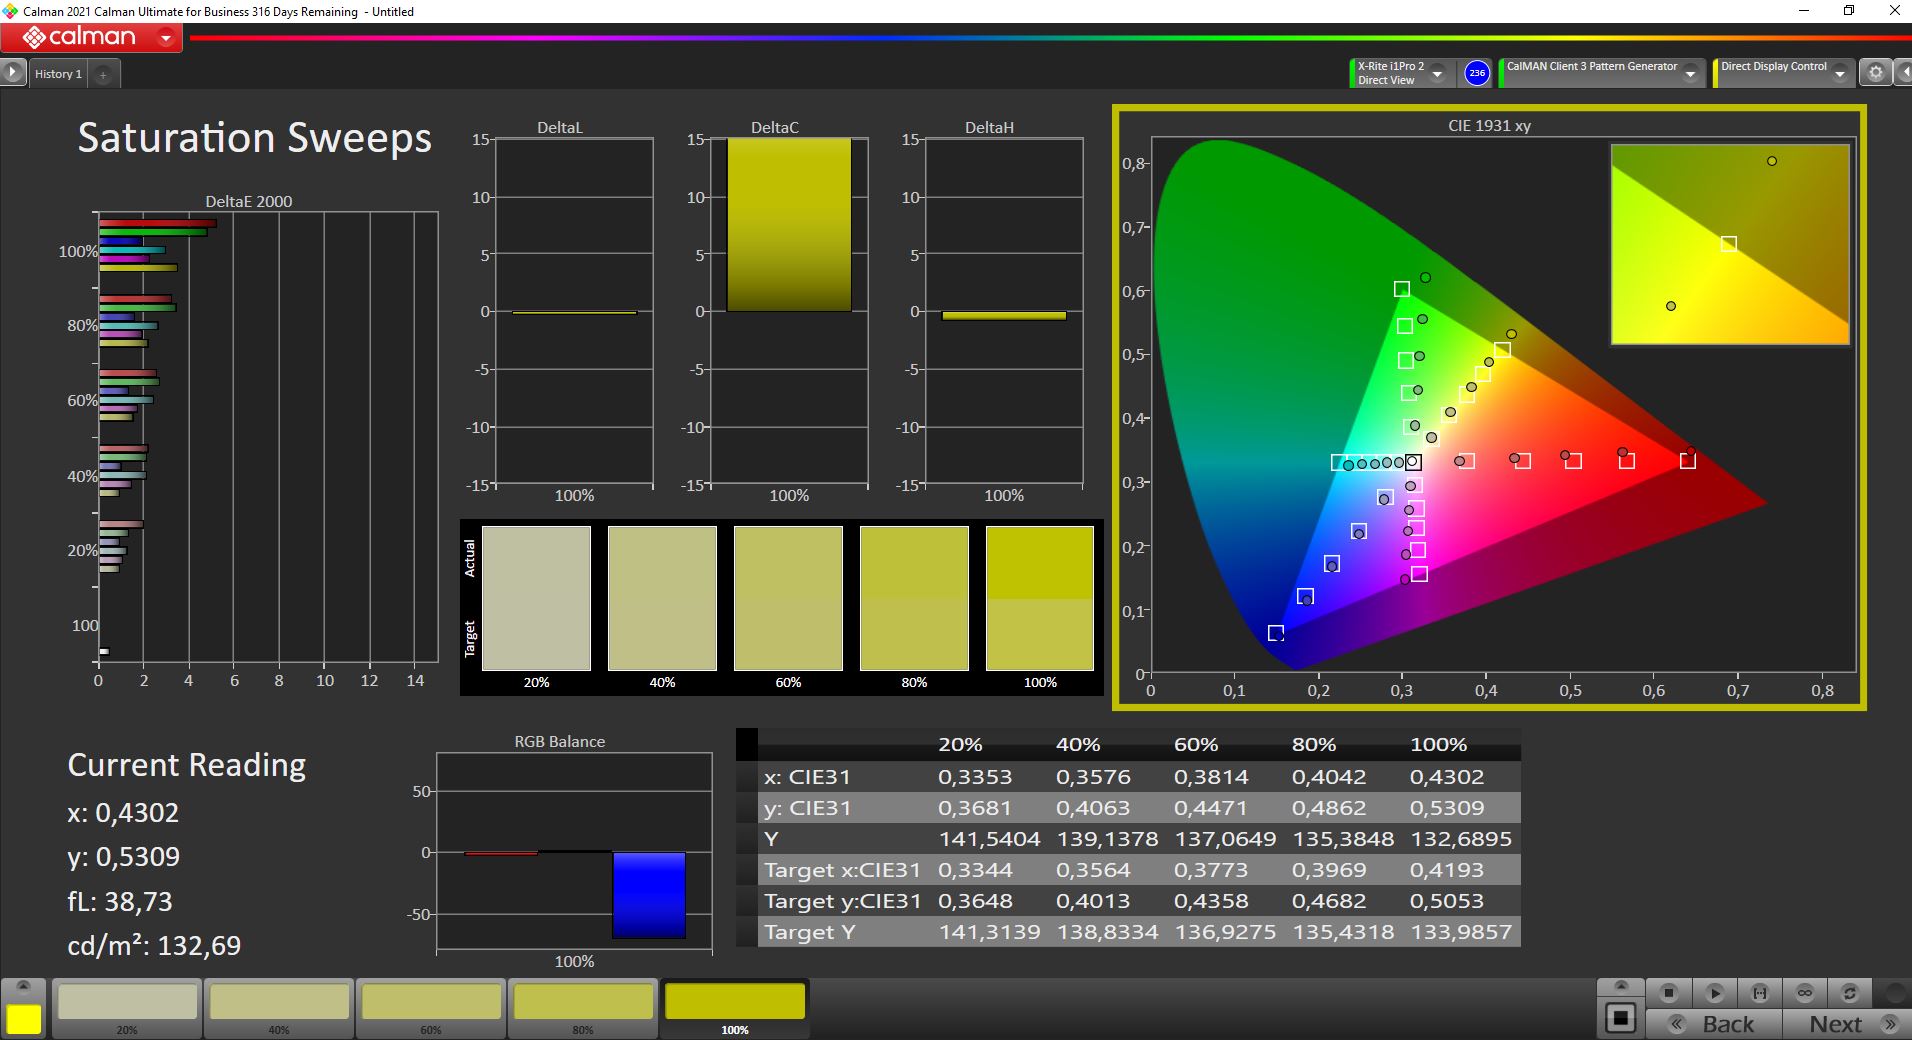
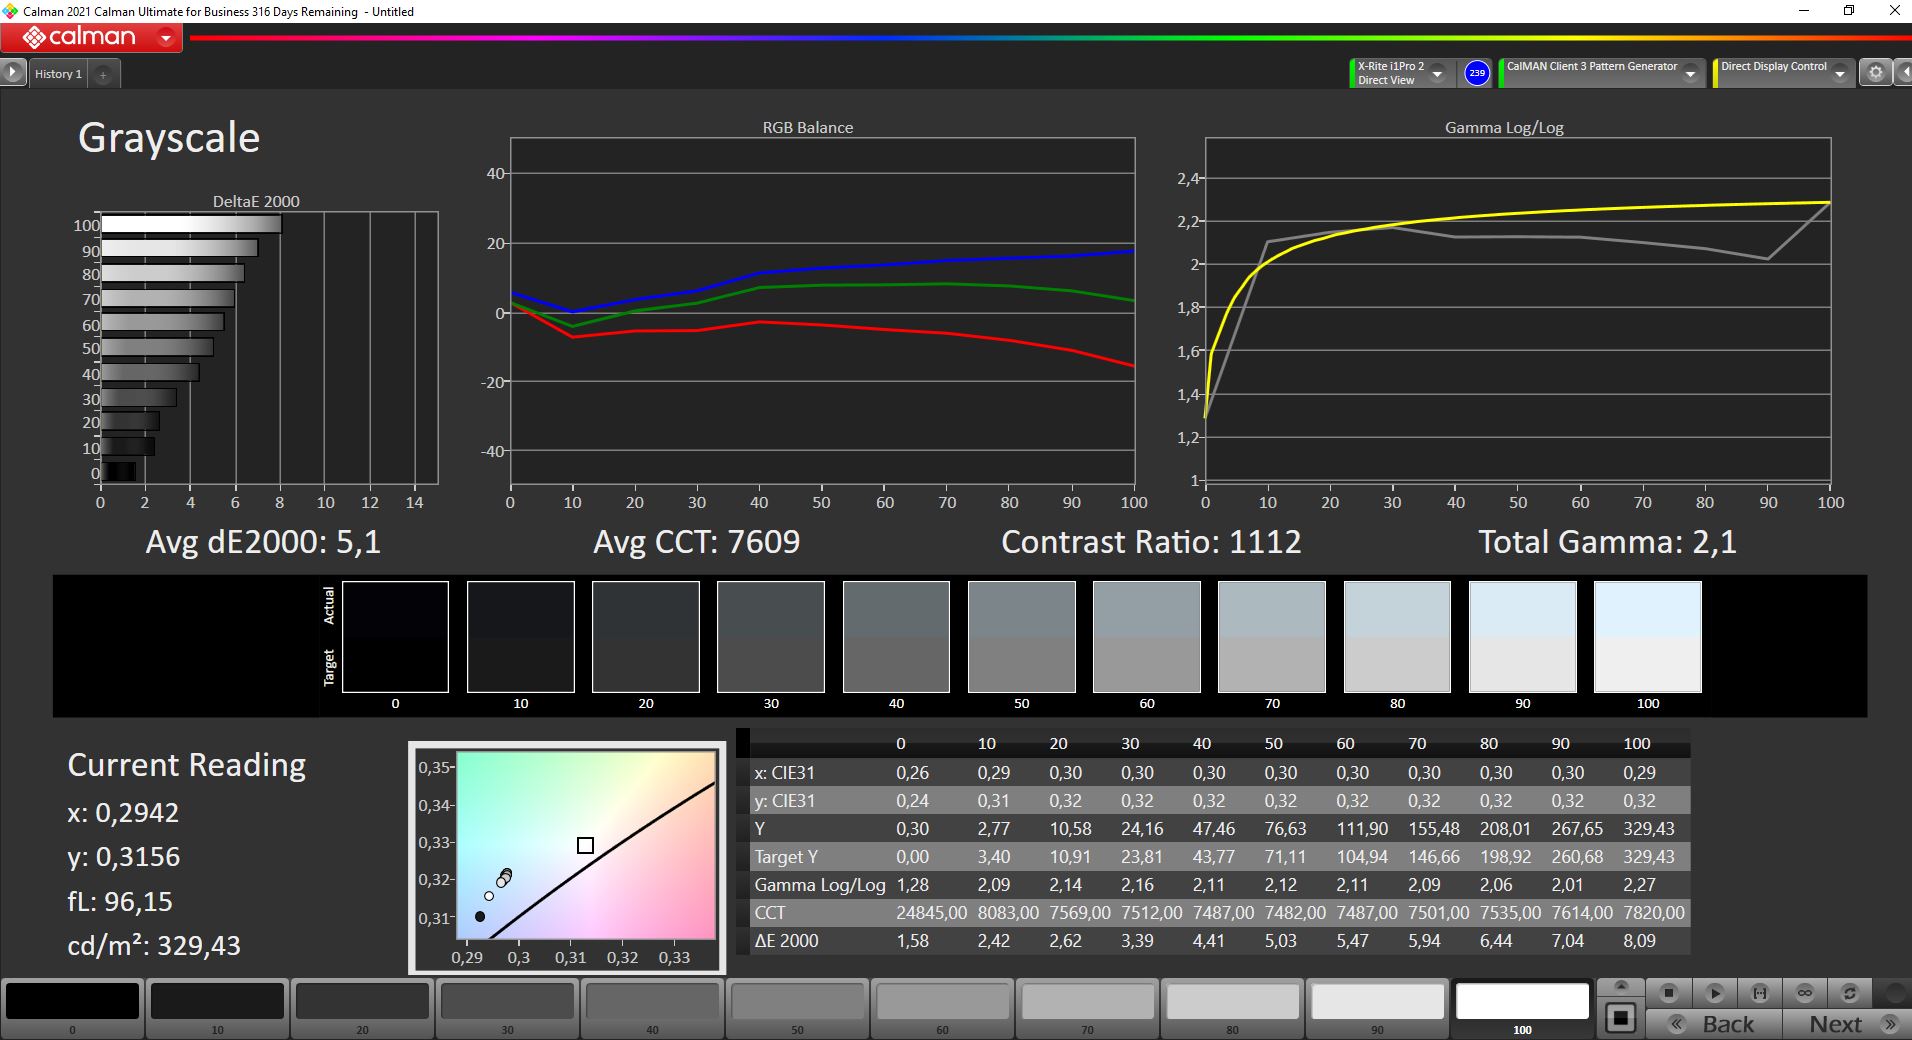
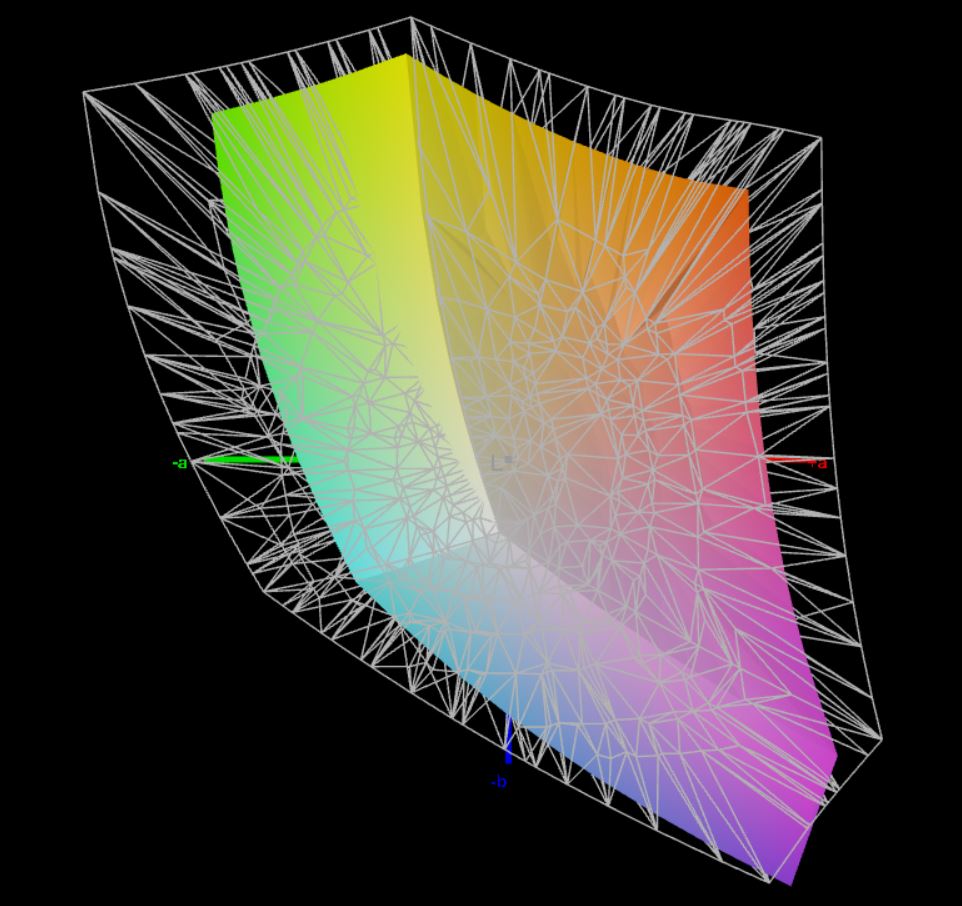
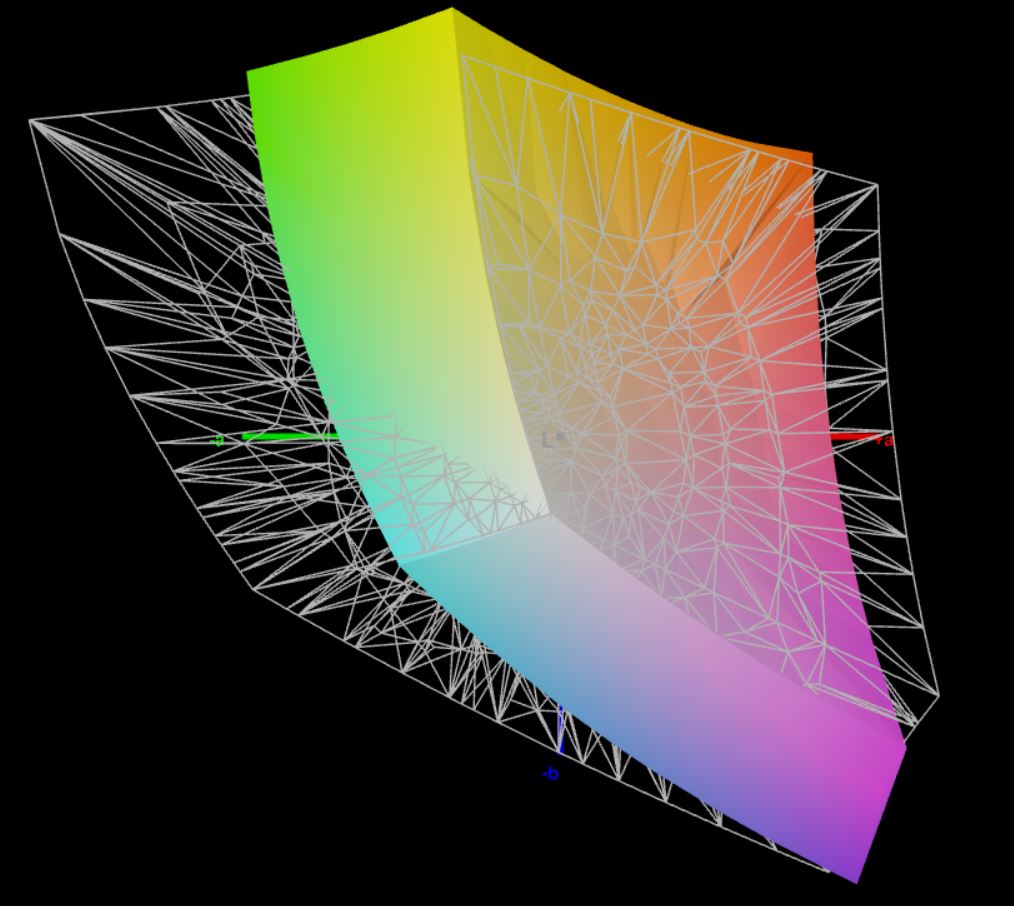
Il display opaco dello Schenker Work 15 fornisce una buona immagine complessiva con risoluzione Full HD. La luminosità di oltre 300 cd/m² assicura una buona leggibilità, anche all'aperto. L'illuminazione è così uniforme che lo screen bleeding non si nota, a meno che non sia osservato con una fotocamera con lunghi tempi di esposizione. La copertura dello spazio colore dell'86,2% sRGB e le deviazioni di colore sono sufficienti per il lavoro d'ufficio ma non sono adatte all'editing delle immagini. Lo sfarfallio non può essere rilevato sullo schermo e il rapporto di contrasto di 1097:1 è anche decente.
| |||||||||||||||||||||||||
Distribuzione della luminosità: 92 %
Al centro con la batteria: 329 cd/m²
Contrasto: 1097:1 (Nero: 0.3 cd/m²)
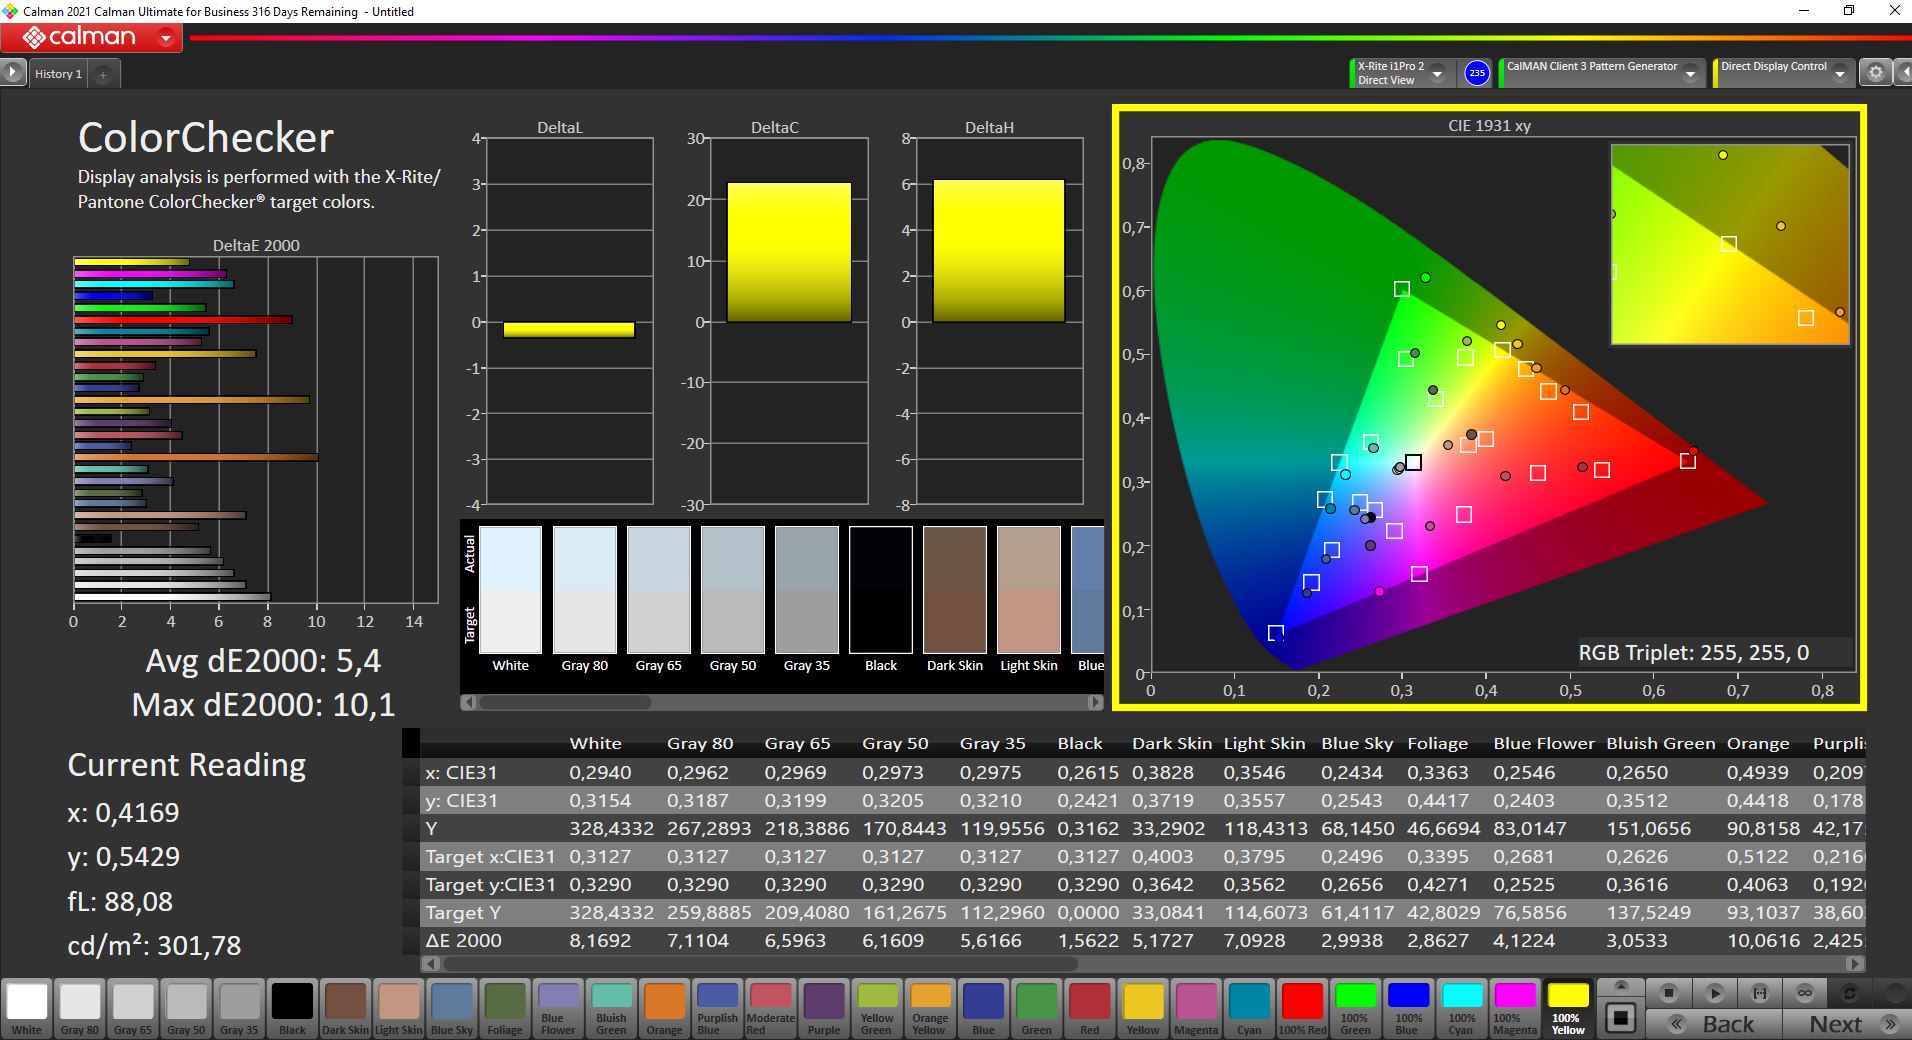
ΔE ColorChecker Calman: 5.4 | ∀{0.5-29.43 Ø4.71}
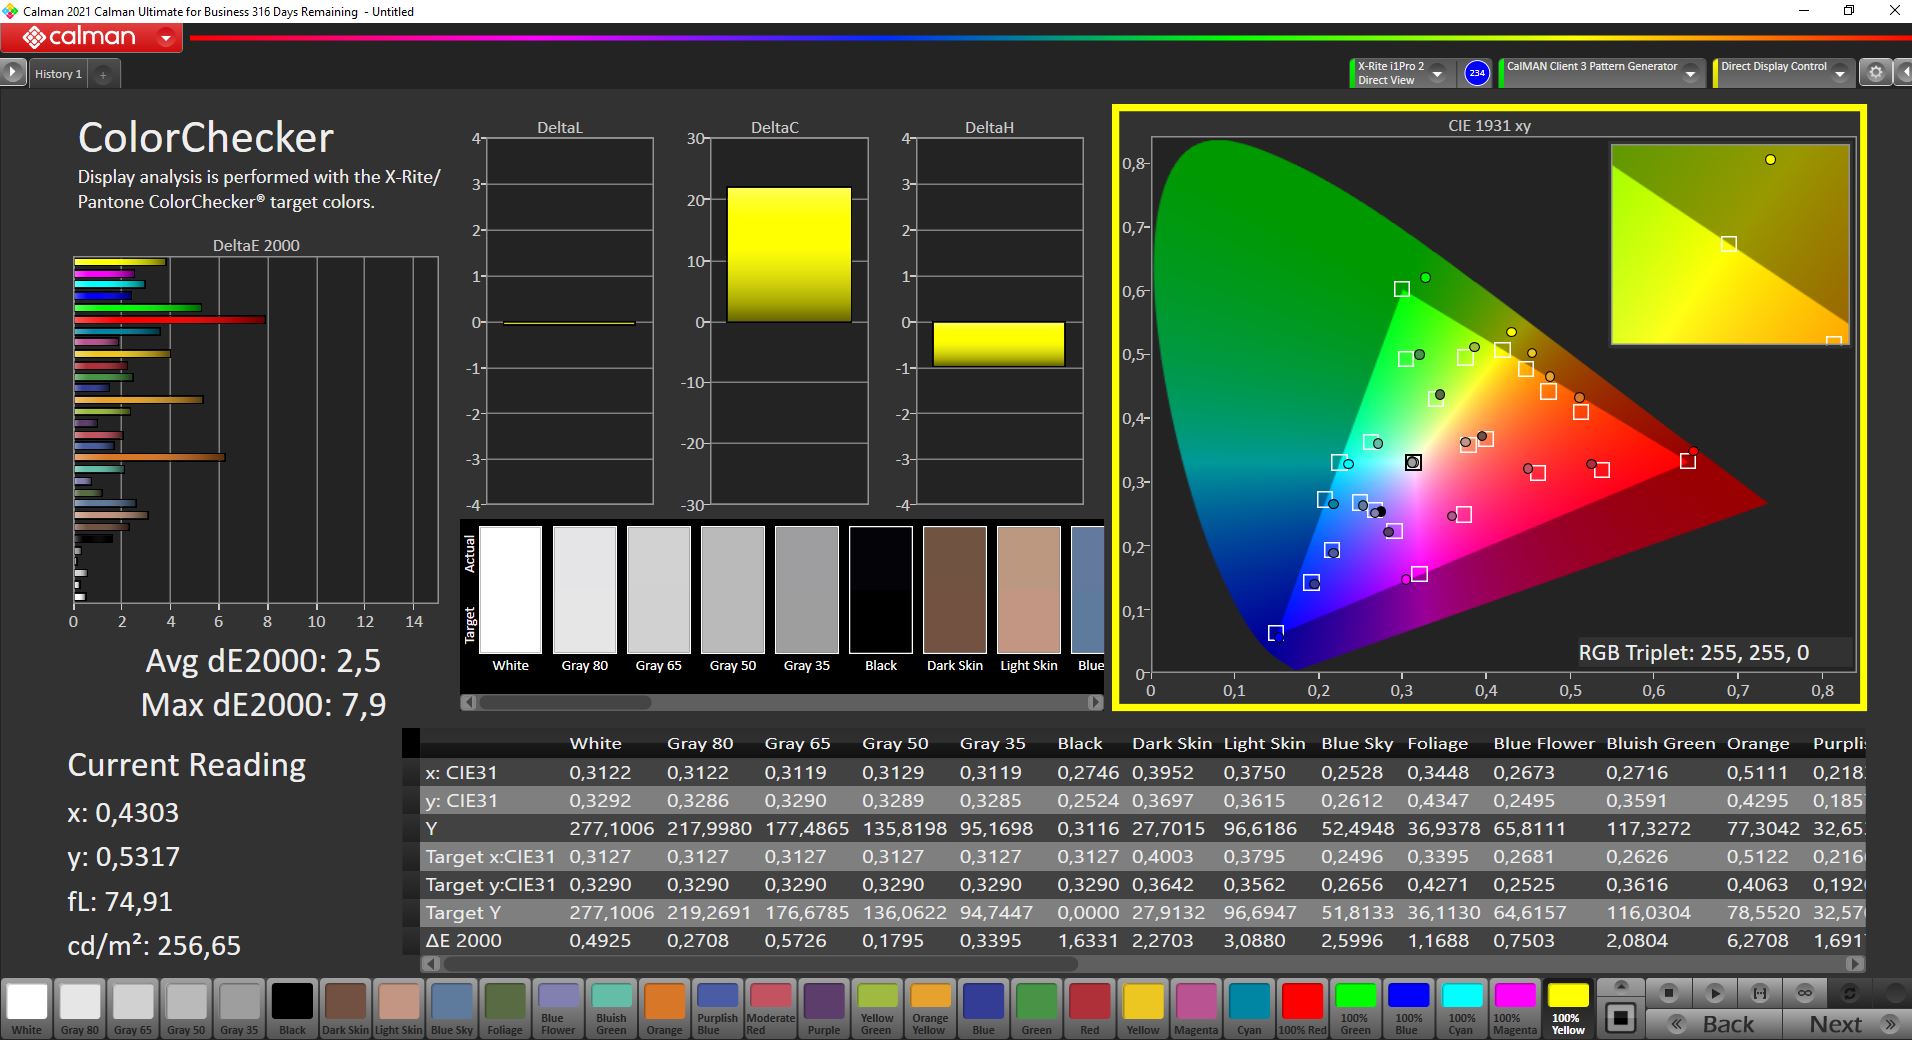
calibrated: 2.5
ΔE Greyscale Calman: 5.1 | ∀{0.09-98 Ø4.96}
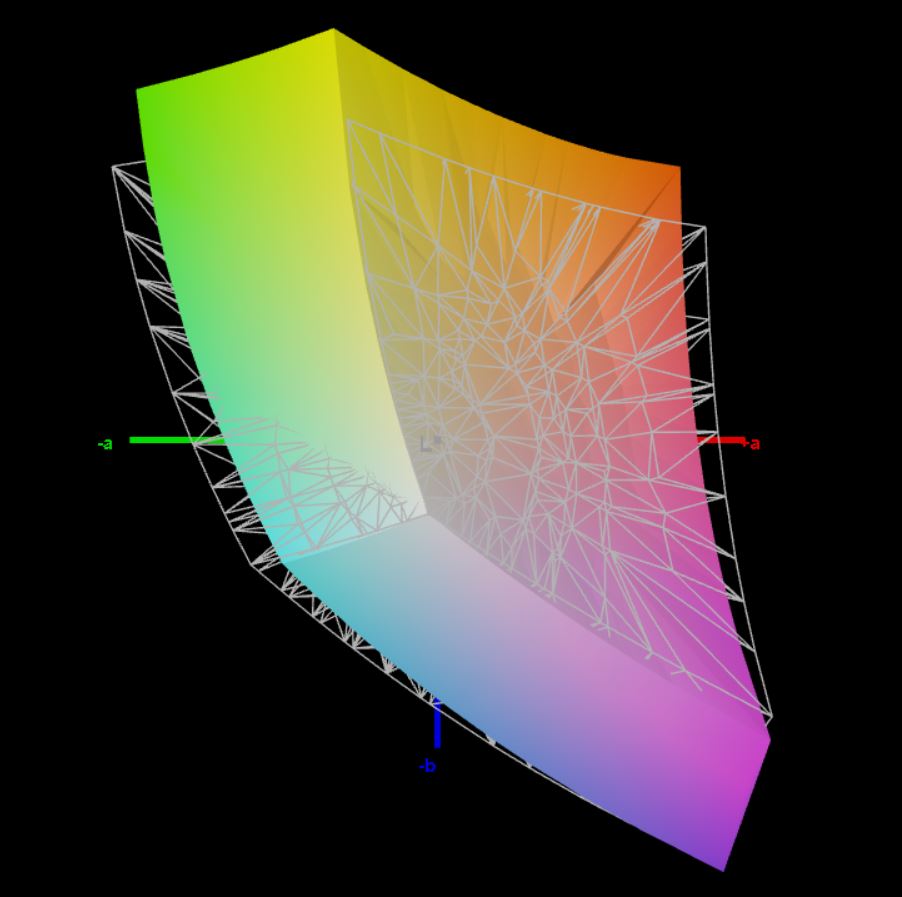
62.9% AdobeRGB 1998 (Argyll 3D)
86.2% sRGB (Argyll 3D)
64.5% Display P3 (Argyll 3D)
Gamma: 2.1
CCT: 7609 K
| Schenker Work 15 Tiger Lake-H BOE07D8, IPS, 1920x1080, 15.6" | LG Gram 15Z90P-G.AA89G LG Display LP156WFC-SPY1, IPS 99% sRGB, 1920x1080, 15.6" | Dell Inspiron 15 3501 BOE NV15N3D (Dell P/N: N39X1), IPS, 1920x1080, 15.6" | Lenovo ThinkPad E15 G3-20YG003UGE B156HAN02.1, IPS, 1920x1080, 15.6" | Asus VivoBook S15 D533UA Chi Mei N156HCA-EAB, IPS, 1920x1080, 15.6" | HP Pavilion x360 15-er0155ng AU Optronics AUOC48A, IPS, 1920x1080, 15.6" | |
|---|---|---|---|---|---|---|
| Display | 2% | -35% | -34% | -28% | -35% | |
| Display P3 Coverage (%) | 64.5 | 62 -4% | 39.4 -39% | 40.3 -38% | 43.6 -32% | 39.8 -38% |
| sRGB Coverage (%) | 86.2 | 92 7% | 58.7 -32% | 60.2 -30% | 65.2 -24% | 59.7 -31% |
| AdobeRGB 1998 Coverage (%) | 62.9 | 64 2% | 40.7 -35% | 41.6 -34% | 45 -28% | 41.1 -35% |
| Response Times | 44% | 18% | 20% | 58% | 24% | |
| Response Time Grey 50% / Grey 80% * (ms) | 58.4 ? | 36 ? 38% | 43 ? 26% | 44 ? 25% | 18 ? 69% | 42 ? 28% |
| Response Time Black / White * (ms) | 35.2 ? | 18 ? 49% | 32 ? 9% | 30.4 ? 14% | 19 ? 46% | 28 ? 20% |
| PWM Frequency (Hz) | 1000 ? | |||||
| Screen | 6% | 20% | -4% | -10% | -10% | |
| Brightness middle (cd/m²) | 329 | 343 4% | 271 -18% | 347 5% | 289 -12% | 249 -24% |
| Brightness (cd/m²) | 316 | 311 -2% | 263 -17% | 329 4% | 267 -16% | 246 -22% |
| Brightness Distribution (%) | 92 | 86 -7% | 92 0% | 93 1% | 85 -8% | 93 1% |
| Black Level * (cd/m²) | 0.3 | 0.46 -53% | 0.15 50% | 0.25 17% | 0.56 -87% | 0.29 3% |
| Contrast (:1) | 1097 | 746 -32% | 1807 65% | 1388 27% | 516 -53% | 859 -22% |
| Colorchecker dE 2000 * | 5.4 | 3.5 35% | 4.83 11% | 4.7 13% | 3.96 27% | 6.01 -11% |
| Colorchecker dE 2000 max. * | 10.1 | 6.25 38% | 7 31% | 19.4 -92% | 6.76 33% | 11.01 -9% |
| Colorchecker dE 2000 calibrated * | 2.5 | 1.17 53% | 4.4 -76% | |||
| Greyscale dE 2000 * | 5.1 | 4.35 15% | 3.36 34% | 1.7 67% | 3.43 33% | 4.67 8% |
| Gamma | 2.1 105% | 2.55 86% | 2.56 86% | 2.2 100% | 2.28 96% | 2.79 79% |
| CCT | 7609 85% | 6016 108% | 6764 96% | 6475 100% | 7191 90% | 6390 102% |
| Color Space (Percent of AdobeRGB 1998) (%) | 42 | 38 | ||||
| Color Space (Percent of sRGB) (%) | 65 | 59 | ||||
| Media totale (Programma / Settaggio) | 17% /
10% | 1% /
7% | -6% /
-7% | 7% /
-4% | -7% /
-10% |
* ... Meglio usare valori piccoli
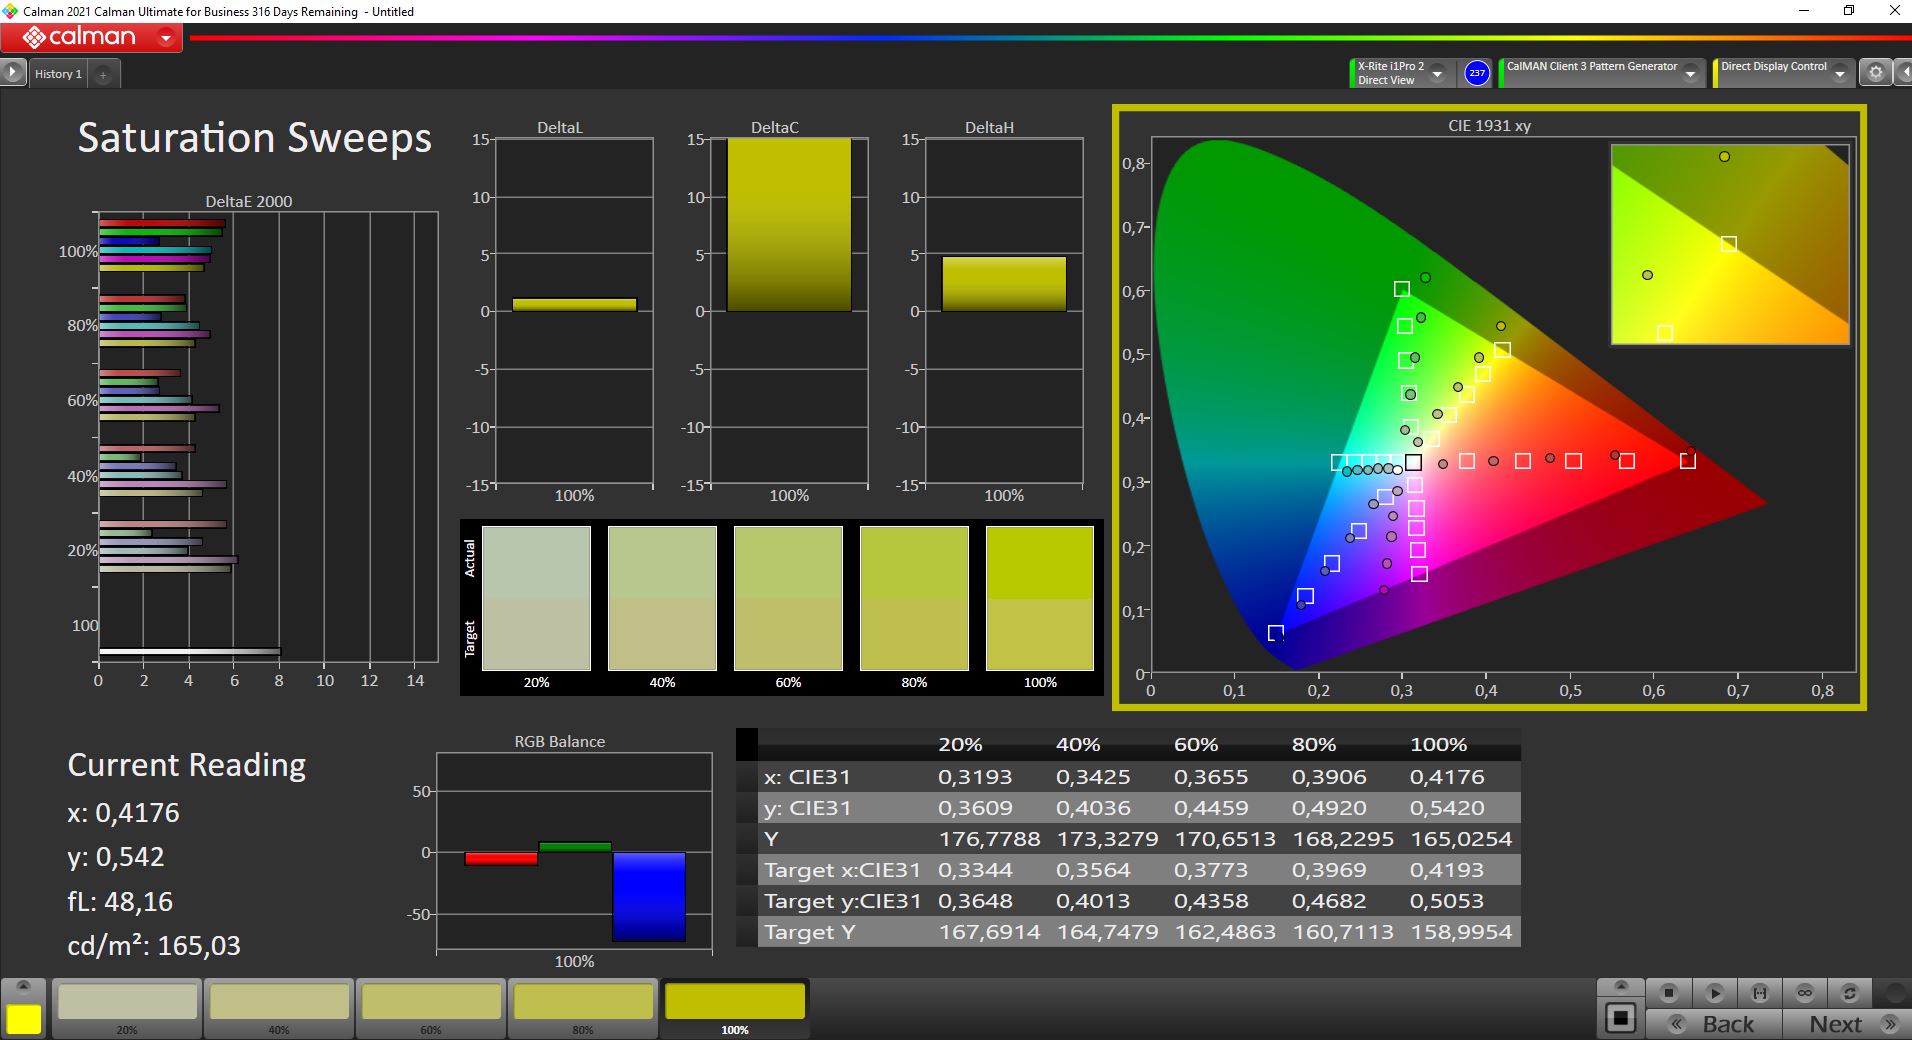
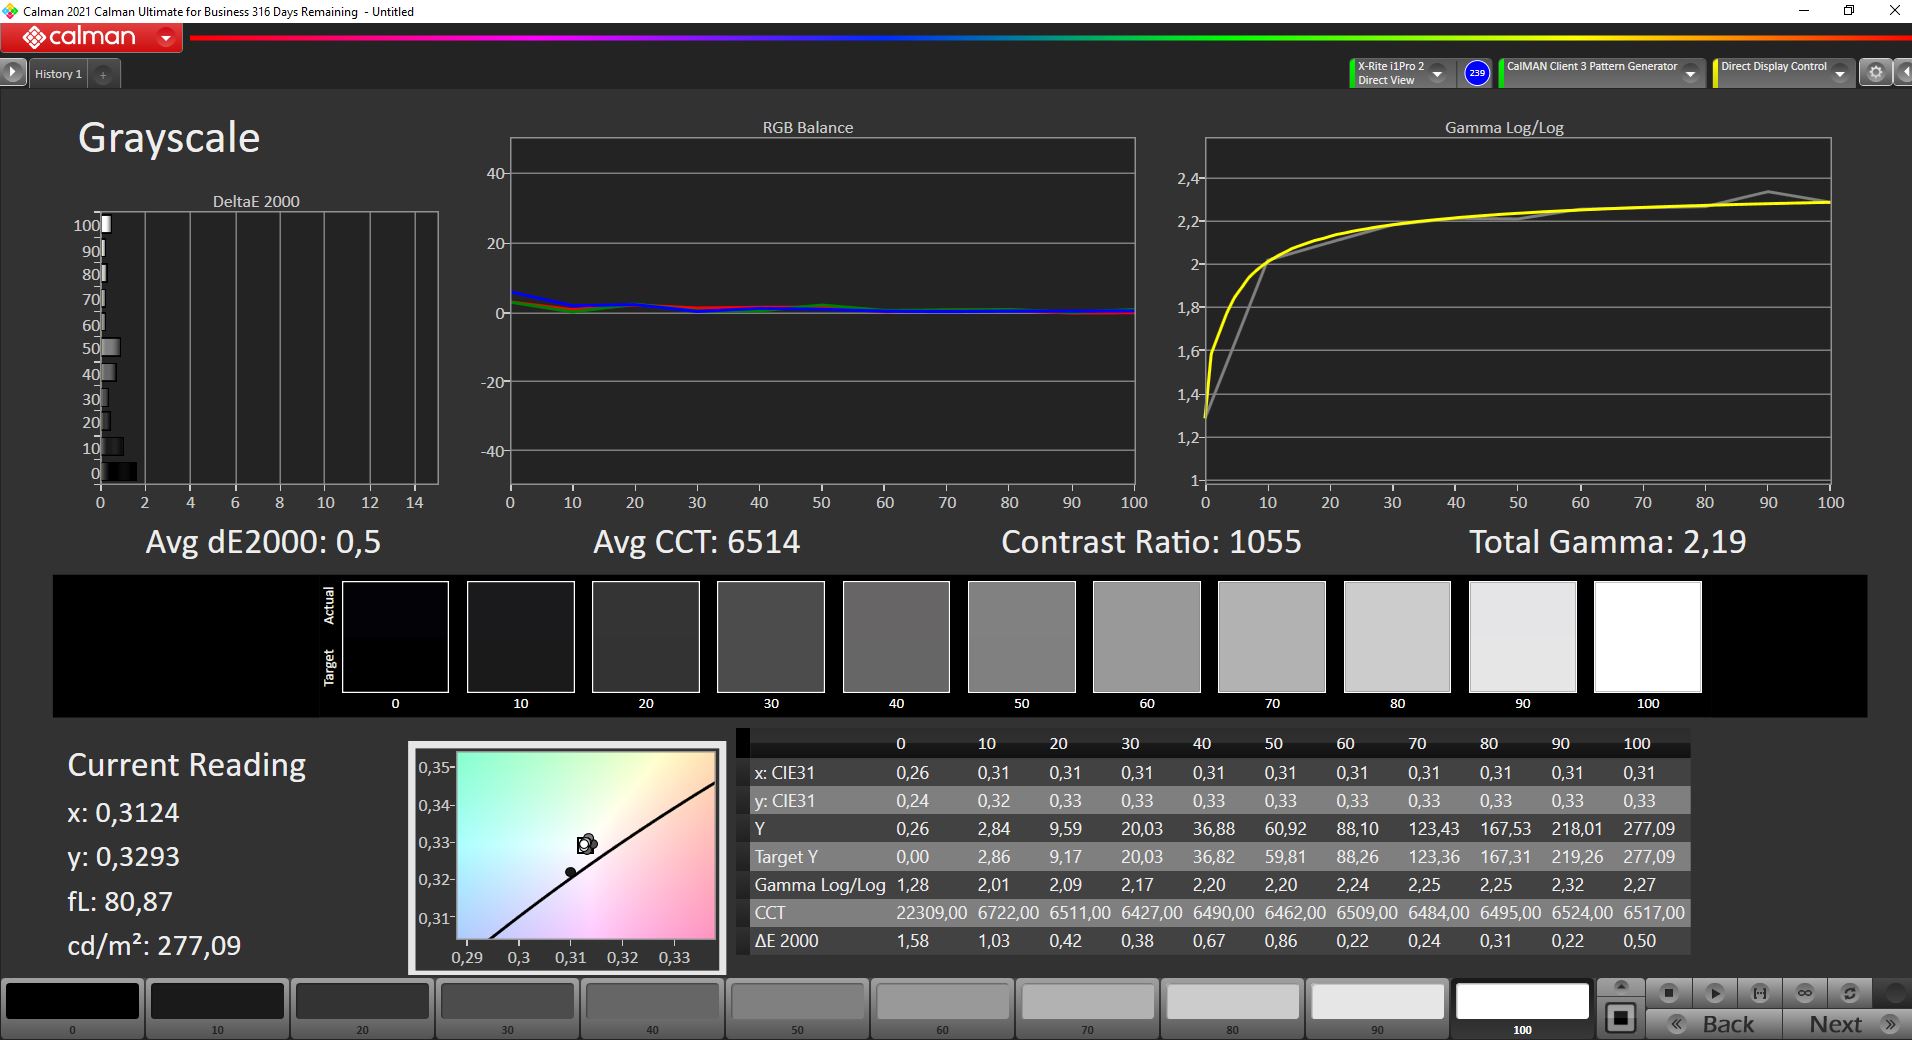
I controlli dei colori con CalMan mostrano che il verde e il rosso sono leggermente spostati. Questo dimostra che lo schermo non raggiunge la piena copertura sRGB, e mantiene una deviazione massima dei colori relativamente alta anche dopo la calibrazione. Tuttavia, la deviazione media del colore con un ΔΕ 2.5 è ancora al di sotto del target di 3
Tempi di risposta del Display
| ↔ Tempi di risposta dal Nero al Bianco | ||
|---|---|---|
| 35.2 ms ... aumenta ↗ e diminuisce ↘ combinato | ↗ 18 ms Incremento | 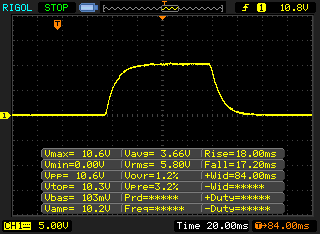 |
| ↘ 17.2 ms Calo | ||
| Lo schermo mostra tempi di risposta lenti nei nostri tests e sarà insoddisfacente per i gamers. In confronto, tutti i dispositivi di test variano da 0.1 (minimo) a 240 (massimo) ms. » 93 % di tutti i dispositivi è migliore. Questo significa che i tempi di risposta rilevati sono peggiori rispetto alla media di tutti i dispositivi testati (19.8 ms). | ||
| ↔ Tempo di risposta dal 50% Grigio all'80% Grigio | ||
| 58.4 ms ... aumenta ↗ e diminuisce ↘ combinato | ↗ 26.8 ms Incremento | 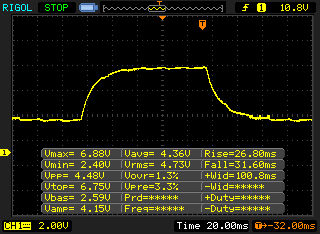 |
| ↘ 31.6 ms Calo | ||
| Lo schermo mostra tempi di risposta lenti nei nostri tests e sarà insoddisfacente per i gamers. In confronto, tutti i dispositivi di test variano da 0.165 (minimo) a 636 (massimo) ms. » 95 % di tutti i dispositivi è migliore. Questo significa che i tempi di risposta rilevati sono peggiori rispetto alla media di tutti i dispositivi testati (31 ms). | ||
Sfarfallio dello schermo / PWM (Pulse-Width Modulation)
| flickering dello schermo / PWM non rilevato | 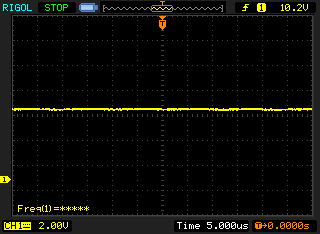 | ||
In confronto: 52 % di tutti i dispositivi testati non utilizza PWM per ridurre la luminosita' del display. Se è rilevato PWM, una media di 7757 (minimo: 5 - massimo: 343500) Hz è stata rilevata. | |||
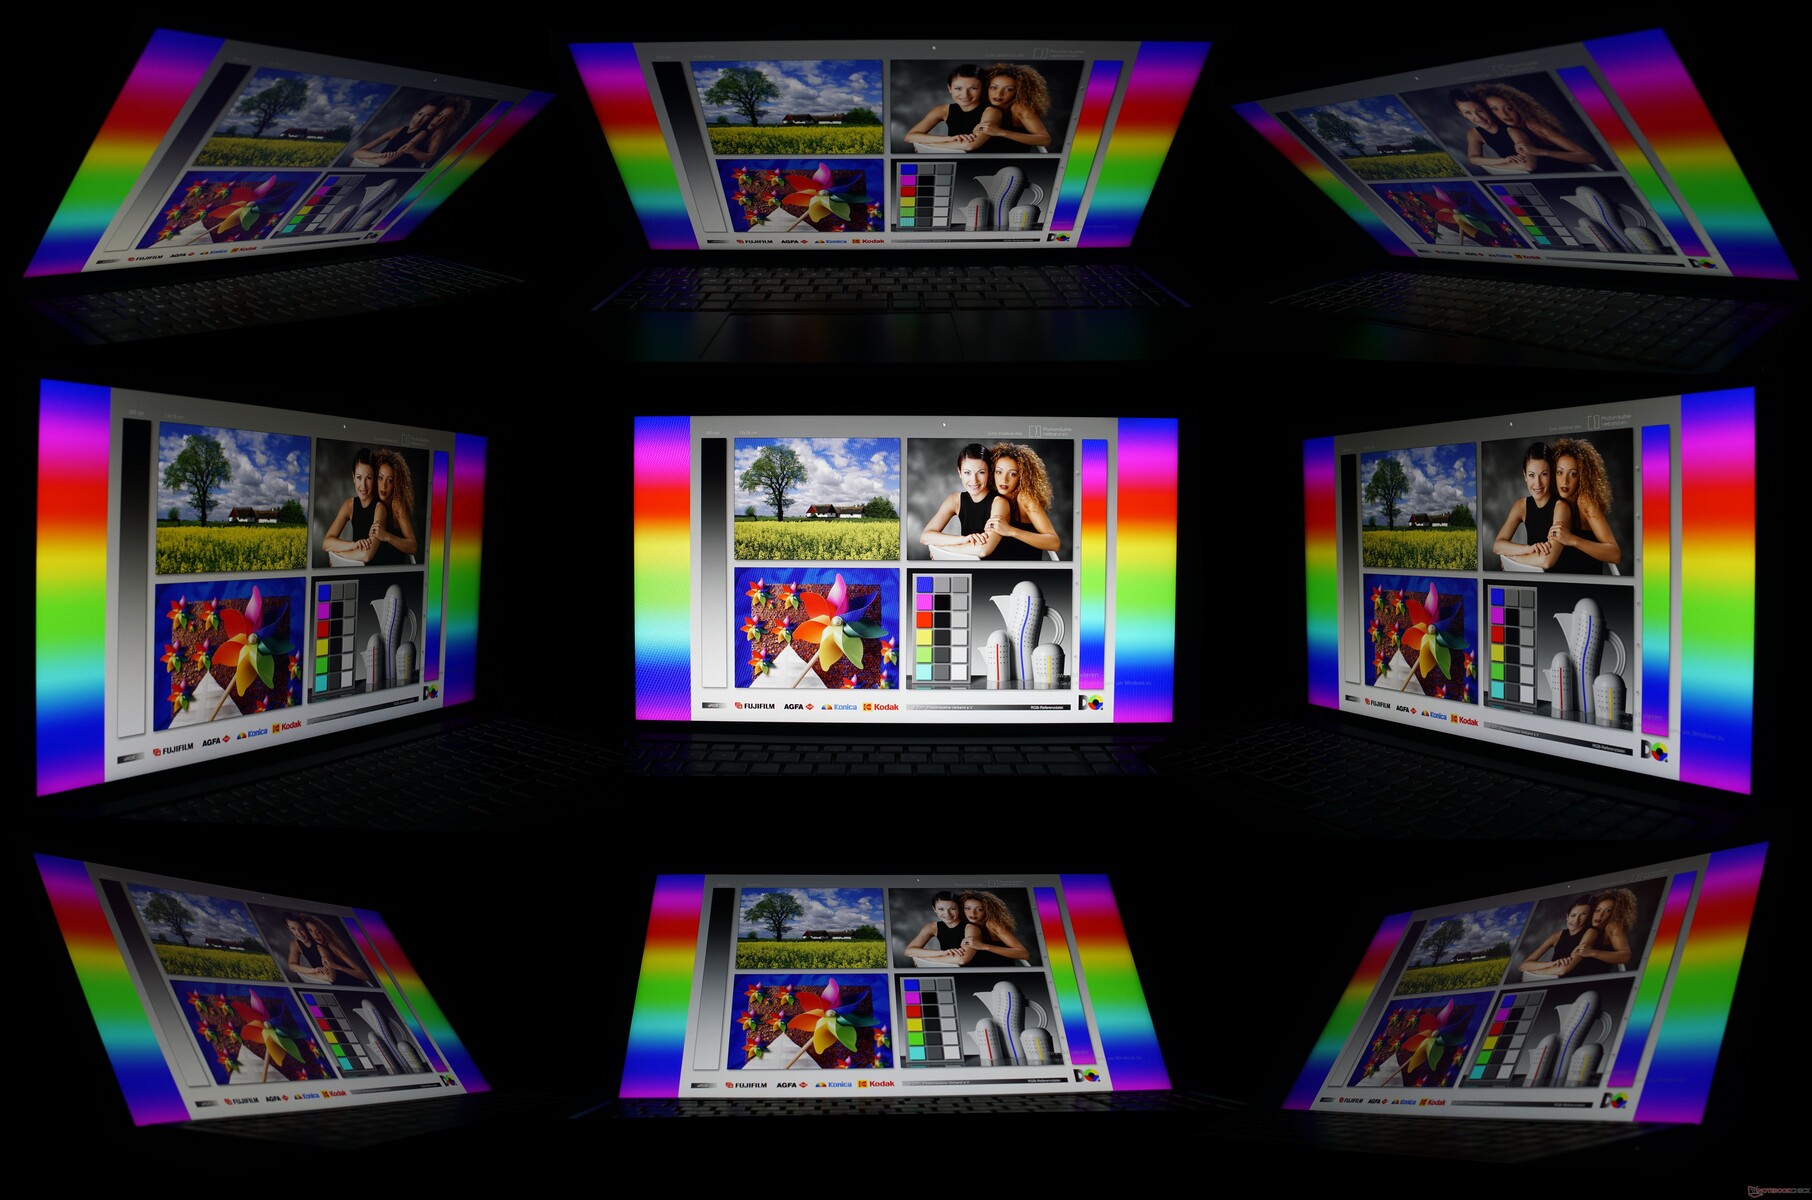
Leggere all'aperto diventa difficile solo quando il sole si riflette direttamente sulla superficie opaca del display. Il portatile da ufficio mostra una buona immagine sia all'aperto che da varie angolazioni.
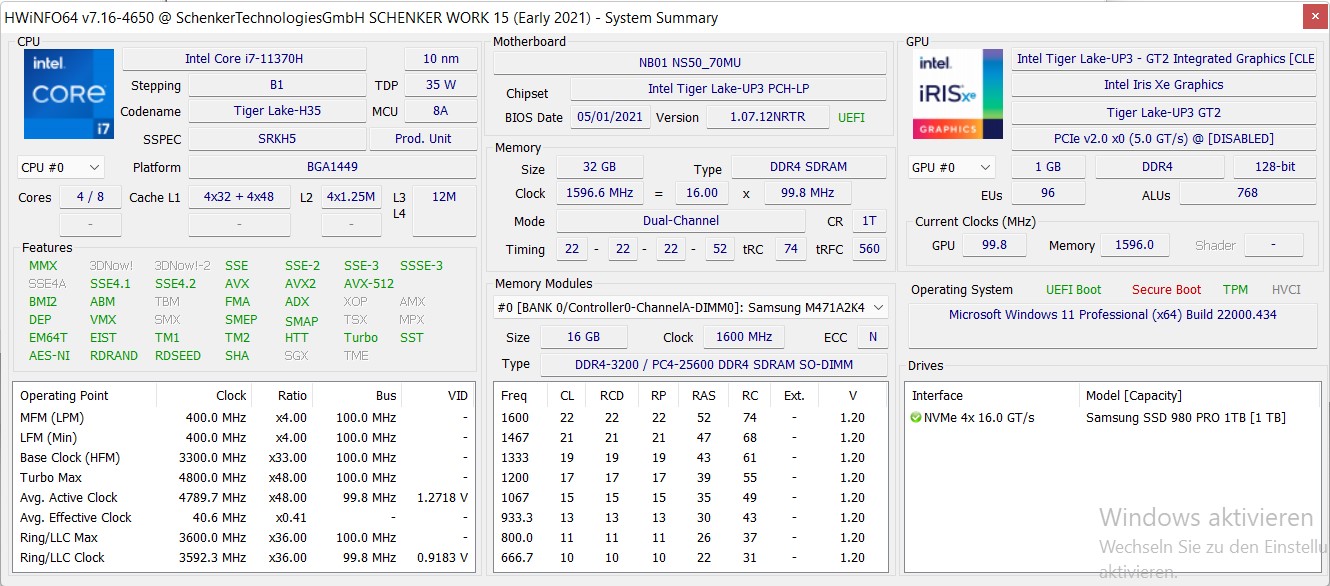
Performance: Una questione di atteggiamento
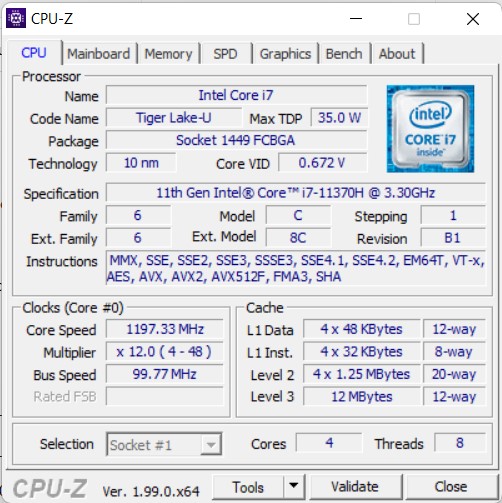
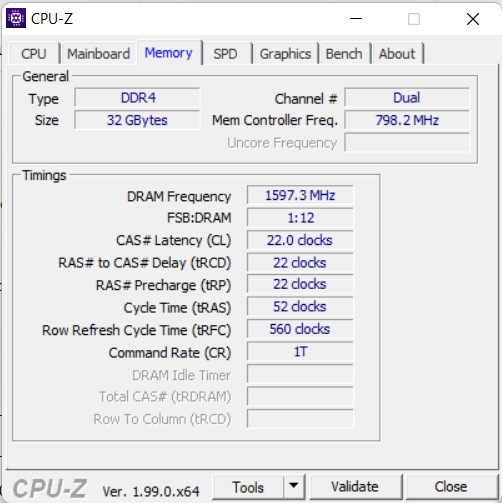
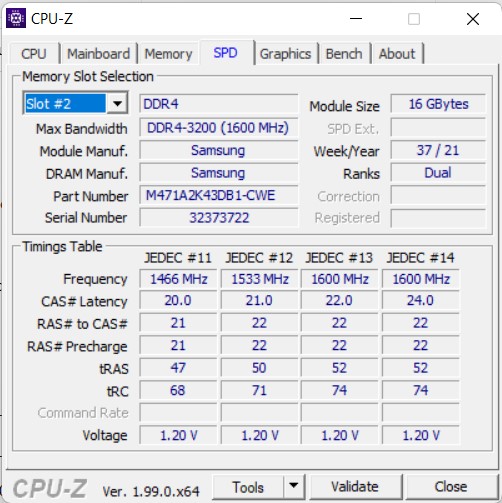
Grazie a molte configurazioni liberamente selezionabili, lo Schenker Work 15 può essere adattato a molti campi di utilizzo. Il nostro dispositivo di prova è equipaggiato con ilIntel Core i7-11370H, 32 GB di memoria di lavoro e 1 TB di SSD NVMe veloce. Ulteriori opzioni di configurazione sono disponibili con l Intel Core i5-11300H, da 8 a 32 GB di memoria di lavoro, diversi storage SSD fino a 8 TB, e molte altre opzioni per la garanzia, WLAN, tastiera e sistema operativo
Condizioni di prova
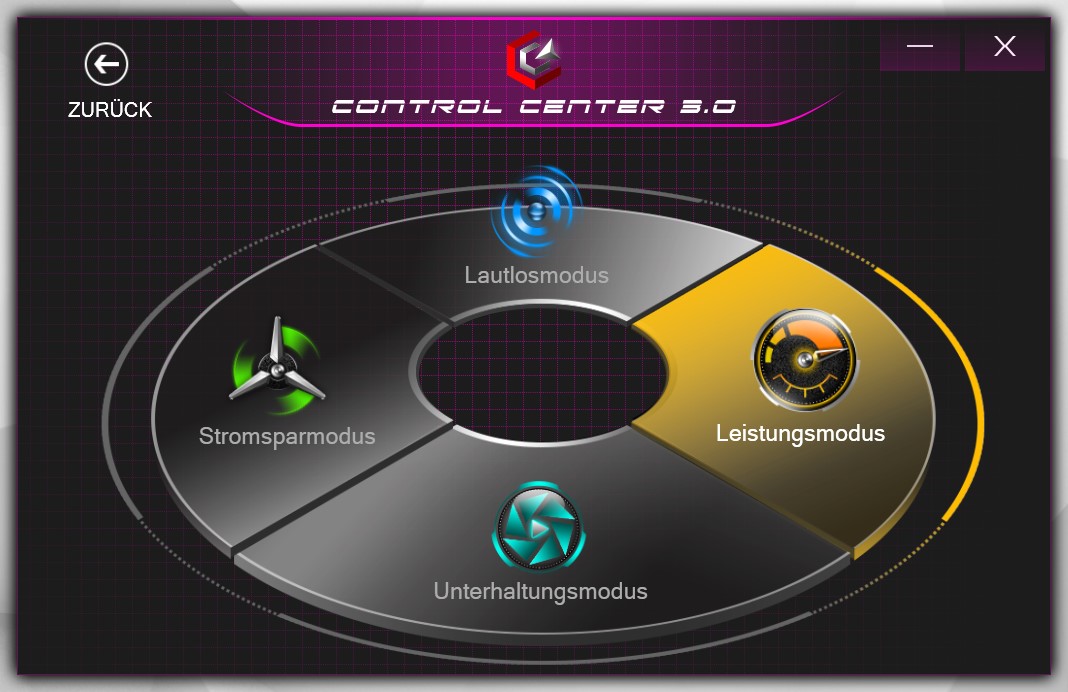
Tutti i benchmark sono stati eseguiti nel piano d'azione di Windows "Best Performance". Il preset "Entertainment mode" è stato selezionato nel Control Center di Schenker. Questo risulta in un PL2 di 42 W e un PL1 di circa 22 W per l'Intel Core i7.
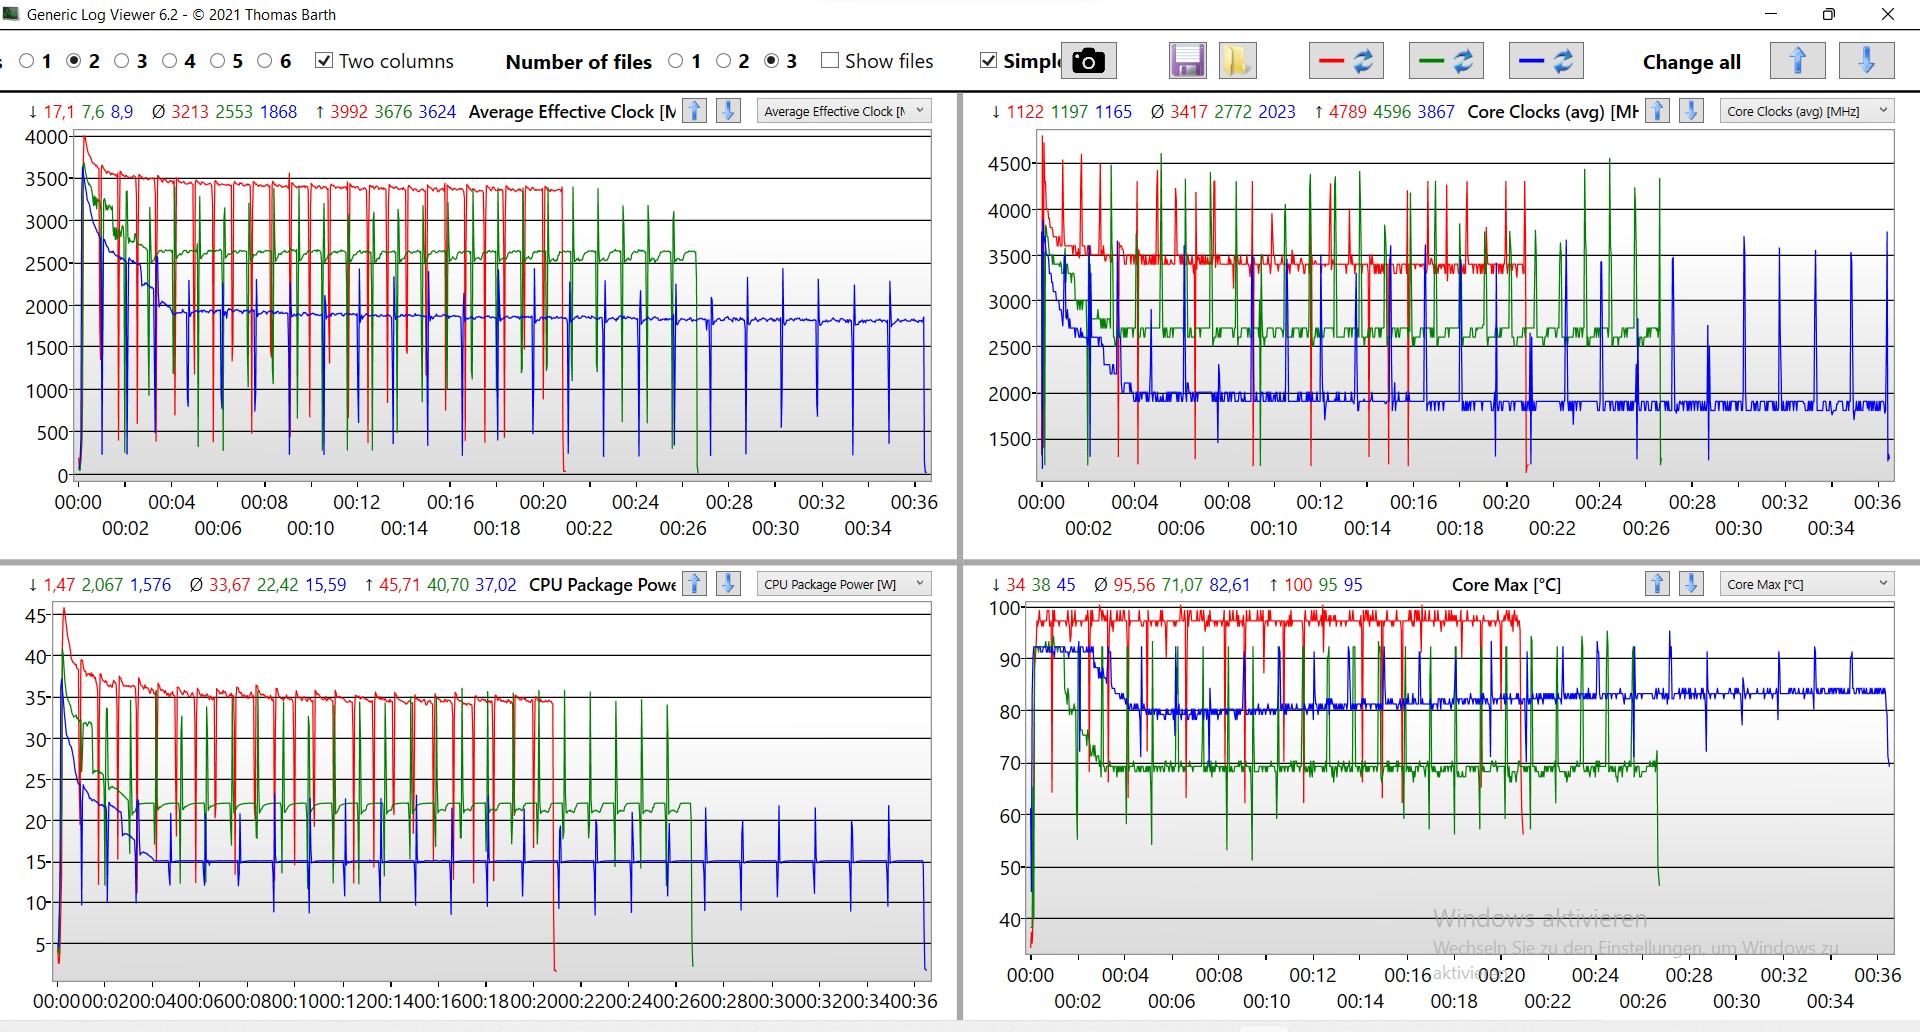
Il Control Center offre anche altre modalità di performance. Così, un PL1 considerevolmente più alto di 35 W può essere raggiunto nella modalità performance. Tuttavia, la temperatura del core aumenta anche qui fino a 100 °C. A parte alcuni benchmark generici per processori, come Cinebench, non si vede un chiaro guadagno di prestazioni con questa modalità.
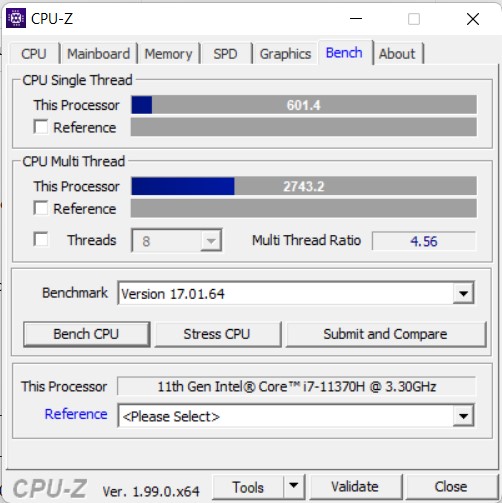
Processore
Il Intel Core i7-11370H è particolarmente comune nelle workstation sottili e nei notebook da gioco. A seconda della modalità di prestazione impostata, il processore mostra prestazioni leggermente inferiori alla media nei benchmark con carico a lungo termine. Il processore può convincere pienamente solo in modalità performance. Tuttavia, grazie alle prestazioni Boost relativamente elevate e alle prestazioni single-core tipicamente forti, lo Schenker Work 15 fornisce sempre buoni punteggi nei test, a parte Cinebench.
In modalità batteria, il processore può lavorare con circa 16 W. Rispetto alla modalità performance, poco più della metà della potenza di calcolo è disponibile nel benchmark Cinebench R15.
Cinebench R15 Multi Dauertest
Cinebench R23: Multi Core | Single Core
Cinebench R20: CPU (Multi Core) | CPU (Single Core)
Cinebench R15: CPU Multi 64Bit | CPU Single 64Bit
Blender: v2.79 BMW27 CPU
7-Zip 18.03: 7z b 4 | 7z b 4 -mmt1
Geekbench 5.5: Multi-Core | Single-Core
HWBOT x265 Benchmark v2.2: 4k Preset
LibreOffice : 20 Documents To PDF
R Benchmark 2.5: Overall mean
| CPU Performance rating | |
| Media della classe Office | |
| Asus VivoBook S15 D533UA | |
| Lenovo ThinkPad E15 G3-20YG003UGE | |
| Media Intel Core i7-11370H | |
| Schenker Work 15 Tiger Lake-H | |
| Dell Inspiron 15 3501 | |
| HP Pavilion x360 15-er0155ng | |
| LG Gram 15Z90P-G.AA89G | |
| Cinebench R23 / Multi Core | |
| Media della classe Office (1673 - 22808, n=75, ultimi 2 anni) | |
| Asus VivoBook S15 D533UA | |
| Lenovo ThinkPad E15 G3-20YG003UGE | |
| Media Intel Core i7-11370H (3696 - 6646, n=12) | |
| Dell Inspiron 15 3501 | |
| Schenker Work 15 Tiger Lake-H | |
| HP Pavilion x360 15-er0155ng | |
| LG Gram 15Z90P-G.AA89G | |
| Cinebench R23 / Single Core | |
| Media della classe Office (708 - 2130, n=75, ultimi 2 anni) | |
| Media Intel Core i7-11370H (1081 - 1556, n=11) | |
| Schenker Work 15 Tiger Lake-H | |
| Dell Inspiron 15 3501 | |
| HP Pavilion x360 15-er0155ng | |
| Asus VivoBook S15 D533UA | |
| Lenovo ThinkPad E15 G3-20YG003UGE | |
| LG Gram 15Z90P-G.AA89G | |
| Cinebench R20 / CPU (Multi Core) | |
| Media della classe Office (648 - 8840, n=74, ultimi 2 anni) | |
| Asus VivoBook S15 D533UA | |
| Lenovo ThinkPad E15 G3-20YG003UGE | |
| Media Intel Core i7-11370H (1438 - 2578, n=11) | |
| Dell Inspiron 15 3501 | |
| HP Pavilion x360 15-er0155ng | |
| Schenker Work 15 Tiger Lake-H | |
| LG Gram 15Z90P-G.AA89G | |
| Cinebench R20 / CPU (Single Core) | |
| Media della classe Office (345 - 816, n=74, ultimi 2 anni) | |
| Media Intel Core i7-11370H (475 - 601, n=11) | |
| Dell Inspiron 15 3501 | |
| Schenker Work 15 Tiger Lake-H | |
| HP Pavilion x360 15-er0155ng | |
| Asus VivoBook S15 D533UA | |
| Lenovo ThinkPad E15 G3-20YG003UGE | |
| LG Gram 15Z90P-G.AA89G | |
| Cinebench R15 / CPU Multi 64Bit | |
| Media della classe Office (250 - 3380, n=76, ultimi 2 anni) | |
| Asus VivoBook S15 D533UA | |
| Lenovo ThinkPad E15 G3-20YG003UGE | |
| Media Intel Core i7-11370H (606 - 1086, n=17) | |
| Schenker Work 15 Tiger Lake-H | |
| Schenker Work 15 Tiger Lake-H | |
| Schenker Work 15 Tiger Lake-H | |
| Dell Inspiron 15 3501 | |
| LG Gram 15Z90P-G.AA89G | |
| HP Pavilion x360 15-er0155ng | |
| Cinebench R15 / CPU Single 64Bit | |
| Media della classe Office (99.5 - 316, n=76, ultimi 2 anni) | |
| Media Intel Core i7-11370H (162.9 - 233, n=15) | |
| Schenker Work 15 Tiger Lake-H | |
| Schenker Work 15 Tiger Lake-H | |
| HP Pavilion x360 15-er0155ng | |
| Asus VivoBook S15 D533UA | |
| Lenovo ThinkPad E15 G3-20YG003UGE | |
| LG Gram 15Z90P-G.AA89G | |
| Dell Inspiron 15 3501 | |
| Blender / v2.79 BMW27 CPU | |
| LG Gram 15Z90P-G.AA89G | |
| Schenker Work 15 Tiger Lake-H | |
| HP Pavilion x360 15-er0155ng | |
| Dell Inspiron 15 3501 | |
| Media Intel Core i7-11370H (432 - 762, n=11) | |
| Media della classe Office (158 - 1940, n=75, ultimi 2 anni) | |
| Asus VivoBook S15 D533UA | |
| Lenovo ThinkPad E15 G3-20YG003UGE | |
| 7-Zip 18.03 / 7z b 4 | |
| Media della classe Office (7098 - 76886, n=76, ultimi 2 anni) | |
| Asus VivoBook S15 D533UA | |
| Lenovo ThinkPad E15 G3-20YG003UGE | |
| Media Intel Core i7-11370H (18961 - 28520, n=11) | |
| Dell Inspiron 15 3501 | |
| HP Pavilion x360 15-er0155ng | |
| Schenker Work 15 Tiger Lake-H | |
| LG Gram 15Z90P-G.AA89G | |
| 7-Zip 18.03 / 7z b 4 -mmt1 | |
| Media della classe Office (3387 - 6469, n=76, ultimi 2 anni) | |
| Media Intel Core i7-11370H (5074 - 5550, n=11) | |
| Schenker Work 15 Tiger Lake-H | |
| Dell Inspiron 15 3501 | |
| HP Pavilion x360 15-er0155ng | |
| LG Gram 15Z90P-G.AA89G | |
| Asus VivoBook S15 D533UA | |
| Lenovo ThinkPad E15 G3-20YG003UGE | |
| Geekbench 5.5 / Multi-Core | |
| Media della classe Office (1483 - 16999, n=72, ultimi 2 anni) | |
| Asus VivoBook S15 D533UA | |
| Lenovo ThinkPad E15 G3-20YG003UGE | |
| Schenker Work 15 Tiger Lake-H | |
| Media Intel Core i7-11370H (3828 - 6115, n=10) | |
| HP Pavilion x360 15-er0155ng | |
| LG Gram 15Z90P-G.AA89G | |
| Dell Inspiron 15 3501 | |
| Geekbench 5.5 / Single-Core | |
| Media della classe Office (811 - 2175, n=72, ultimi 2 anni) | |
| Schenker Work 15 Tiger Lake-H | |
| Media Intel Core i7-11370H (1376 - 1607, n=10) | |
| LG Gram 15Z90P-G.AA89G | |
| Dell Inspiron 15 3501 | |
| HP Pavilion x360 15-er0155ng | |
| Asus VivoBook S15 D533UA | |
| Lenovo ThinkPad E15 G3-20YG003UGE | |
| HWBOT x265 Benchmark v2.2 / 4k Preset | |
| Media della classe Office (2.21 - 26, n=75, ultimi 2 anni) | |
| Asus VivoBook S15 D533UA | |
| Lenovo ThinkPad E15 G3-20YG003UGE | |
| Media Intel Core i7-11370H (4.98 - 8.82, n=11) | |
| Dell Inspiron 15 3501 | |
| HP Pavilion x360 15-er0155ng | |
| Schenker Work 15 Tiger Lake-H | |
| LG Gram 15Z90P-G.AA89G | |
| LibreOffice / 20 Documents To PDF | |
| Lenovo ThinkPad E15 G3-20YG003UGE | |
| Asus VivoBook S15 D533UA | |
| Media della classe Office (39.9 - 102.3, n=75, ultimi 2 anni) | |
| LG Gram 15Z90P-G.AA89G | |
| Dell Inspiron 15 3501 | |
| HP Pavilion x360 15-er0155ng | |
| Media Intel Core i7-11370H (23.6 - 56.5, n=11) | |
| Schenker Work 15 Tiger Lake-H | |
| R Benchmark 2.5 / Overall mean | |
| LG Gram 15Z90P-G.AA89G | |
| HP Pavilion x360 15-er0155ng | |
| Dell Inspiron 15 3501 | |
| Lenovo ThinkPad E15 G3-20YG003UGE | |
| Asus VivoBook S15 D533UA | |
| Schenker Work 15 Tiger Lake-H | |
| Media Intel Core i7-11370H (0.544 - 0.596, n=11) | |
| Media della classe Office (0.393 - 0.888, n=75, ultimi 2 anni) | |
* ... Meglio usare valori piccoli
AIDA64: FP32 Ray-Trace | FPU Julia | CPU SHA3 | CPU Queen | FPU SinJulia | FPU Mandel | CPU AES | CPU ZLib | FP64 Ray-Trace | CPU PhotoWorxx
| Performance rating | |
| Media della classe Office | |
| Asus VivoBook S15 D533UA | |
| Lenovo ThinkPad E15 G3-20YG003UGE | |
| Schenker Work 15 Tiger Lake-H | |
| Media Intel Core i7-11370H | |
| Dell Inspiron 15 3501 | |
| HP Pavilion x360 15-er0155ng | |
| LG Gram 15Z90P-G.AA89G | |
| AIDA64 / FP32 Ray-Trace | |
| Media della classe Office (2083 - 31245, n=82, ultimi 2 anni) | |
| Asus VivoBook S15 D533UA | |
| Lenovo ThinkPad E15 G3-20YG003UGE | |
| Media Intel Core i7-11370H (5204 - 8413, n=10) | |
| Schenker Work 15 Tiger Lake-H | |
| Dell Inspiron 15 3501 | |
| HP Pavilion x360 15-er0155ng | |
| LG Gram 15Z90P-G.AA89G | |
| AIDA64 / FPU Julia | |
| Media della classe Office (8191 - 125394, n=82, ultimi 2 anni) | |
| Asus VivoBook S15 D533UA | |
| Lenovo ThinkPad E15 G3-20YG003UGE | |
| Media Intel Core i7-11370H (23958 - 34020, n=10) | |
| Schenker Work 15 Tiger Lake-H | |
| Dell Inspiron 15 3501 | |
| HP Pavilion x360 15-er0155ng | |
| LG Gram 15Z90P-G.AA89G | |
| AIDA64 / CPU SHA3 | |
| Media della classe Office (433 - 5755, n=82, ultimi 2 anni) | |
| Media Intel Core i7-11370H (1656 - 2297, n=10) | |
| Schenker Work 15 Tiger Lake-H | |
| Asus VivoBook S15 D533UA | |
| Lenovo ThinkPad E15 G3-20YG003UGE | |
| Dell Inspiron 15 3501 | |
| HP Pavilion x360 15-er0155ng | |
| LG Gram 15Z90P-G.AA89G | |
| AIDA64 / CPU Queen | |
| Asus VivoBook S15 D533UA | |
| Lenovo ThinkPad E15 G3-20YG003UGE | |
| Media della classe Office (22784 - 115197, n=67, ultimi 2 anni) | |
| Schenker Work 15 Tiger Lake-H | |
| Media Intel Core i7-11370H (42086 - 52930, n=10) | |
| Dell Inspiron 15 3501 | |
| HP Pavilion x360 15-er0155ng | |
| LG Gram 15Z90P-G.AA89G | |
| AIDA64 / FPU SinJulia | |
| Asus VivoBook S15 D533UA | |
| Lenovo ThinkPad E15 G3-20YG003UGE | |
| Media della classe Office (1378 - 18321, n=82, ultimi 2 anni) | |
| Schenker Work 15 Tiger Lake-H | |
| Media Intel Core i7-11370H (3755 - 5027, n=10) | |
| Dell Inspiron 15 3501 | |
| HP Pavilion x360 15-er0155ng | |
| LG Gram 15Z90P-G.AA89G | |
| AIDA64 / FPU Mandel | |
| Media della classe Office (4601 - 66922, n=82, ultimi 2 anni) | |
| Asus VivoBook S15 D533UA | |
| Lenovo ThinkPad E15 G3-20YG003UGE | |
| Media Intel Core i7-11370H (14433 - 20417, n=10) | |
| Schenker Work 15 Tiger Lake-H | |
| Dell Inspiron 15 3501 | |
| HP Pavilion x360 15-er0155ng | |
| LG Gram 15Z90P-G.AA89G | |
| AIDA64 / CPU AES | |
| Schenker Work 15 Tiger Lake-H | |
| Media Intel Core i7-11370H (44267 - 76866, n=10) | |
| Dell Inspiron 15 3501 | |
| Asus VivoBook S15 D533UA | |
| Lenovo ThinkPad E15 G3-20YG003UGE | |
| HP Pavilion x360 15-er0155ng | |
| Media della classe Office (4854 - 155900, n=82, ultimi 2 anni) | |
| LG Gram 15Z90P-G.AA89G | |
| AIDA64 / CPU ZLib | |
| Media della classe Office (114.6 - 1366, n=82, ultimi 2 anni) | |
| Asus VivoBook S15 D533UA | |
| Lenovo ThinkPad E15 G3-20YG003UGE | |
| Schenker Work 15 Tiger Lake-H | |
| Media Intel Core i7-11370H (289 - 422, n=10) | |
| Dell Inspiron 15 3501 | |
| HP Pavilion x360 15-er0155ng | |
| LG Gram 15Z90P-G.AA89G | |
| AIDA64 / FP64 Ray-Trace | |
| Media della classe Office (1109 - 17834, n=82, ultimi 2 anni) | |
| Asus VivoBook S15 D533UA | |
| Lenovo ThinkPad E15 G3-20YG003UGE | |
| Media Intel Core i7-11370H (2756 - 4551, n=10) | |
| Schenker Work 15 Tiger Lake-H | |
| Dell Inspiron 15 3501 | |
| HP Pavilion x360 15-er0155ng | |
| LG Gram 15Z90P-G.AA89G | |
| AIDA64 / CPU PhotoWorxx | |
| Media della classe Office (11090 - 65229, n=82, ultimi 2 anni) | |
| LG Gram 15Z90P-G.AA89G | |
| Schenker Work 15 Tiger Lake-H | |
| Media Intel Core i7-11370H (15892 - 40069, n=10) | |
| HP Pavilion x360 15-er0155ng | |
| Dell Inspiron 15 3501 | |
| Asus VivoBook S15 D533UA | |
| Lenovo ThinkPad E15 G3-20YG003UGE | |
Prestazioni del sistema
Lo Schenker Work 15 non scende a compromessi in termini di prestazioni di sistema. Un Boost elevato e la generosa memoria di lavoro di 32 GB permettono al dispositivo di test di raggiungere un risultato leggermente superiore alla media nel benchmark PCMark10. Così, si ottiene un dispositivo reattivo e potente per un uso normale
| PCMark 10 / Score | |
| Media della classe Office (2601 - 9298, n=67, ultimi 2 anni) | |
| Schenker Work 15 Tiger Lake-H | |
| Lenovo ThinkPad E15 G3-20YG003UGE | |
| Asus VivoBook S15 D533UA | |
| Media Intel Core i7-11370H, Intel Iris Xe Graphics G7 96EUs (5199 - 5459, n=6) | |
| Dell Inspiron 15 3501 | |
| LG Gram 15Z90P-G.AA89G | |
| HP Pavilion x360 15-er0155ng | |
| PCMark 10 / Essentials | |
| Schenker Work 15 Tiger Lake-H | |
| Media Intel Core i7-11370H, Intel Iris Xe Graphics G7 96EUs (9996 - 10650, n=6) | |
| Media della classe Office (3245 - 11594, n=67, ultimi 2 anni) | |
| LG Gram 15Z90P-G.AA89G | |
| Dell Inspiron 15 3501 | |
| HP Pavilion x360 15-er0155ng | |
| Lenovo ThinkPad E15 G3-20YG003UGE | |
| Asus VivoBook S15 D533UA | |
| PCMark 10 / Productivity | |
| Media della classe Office (5336 - 17243, n=67, ultimi 2 anni) | |
| Lenovo ThinkPad E15 G3-20YG003UGE | |
| Asus VivoBook S15 D533UA | |
| Media Intel Core i7-11370H, Intel Iris Xe Graphics G7 96EUs (6911 - 7388, n=6) | |
| Schenker Work 15 Tiger Lake-H | |
| Dell Inspiron 15 3501 | |
| LG Gram 15Z90P-G.AA89G | |
| HP Pavilion x360 15-er0155ng | |
| PCMark 10 / Digital Content Creation | |
| Media della classe Office (2049 - 13541, n=67, ultimi 2 anni) | |
| Schenker Work 15 Tiger Lake-H | |
| Media Intel Core i7-11370H, Intel Iris Xe Graphics G7 96EUs (5483 - 5838, n=6) | |
| Asus VivoBook S15 D533UA | |
| Lenovo ThinkPad E15 G3-20YG003UGE | |
| Dell Inspiron 15 3501 | |
| LG Gram 15Z90P-G.AA89G | |
| HP Pavilion x360 15-er0155ng | |
| PCMark 10 Score | 5415 punti | |
Aiuto | ||
| AIDA64 / Memory Copy | |
| Media della classe Office (20075 - 110930, n=79, ultimi 2 anni) | |
| LG Gram 15Z90P-G.AA89G | |
| Schenker Work 15 Tiger Lake-H | |
| Media Intel Core i7-11370H (32035 - 64524, n=10) | |
| HP Pavilion x360 15-er0155ng | |
| Asus VivoBook S15 D533UA | |
| Lenovo ThinkPad E15 G3-20YG003UGE | |
| Dell Inspiron 15 3501 | |
| AIDA64 / Memory Read | |
| Media della classe Office (10084 - 128030, n=80, ultimi 2 anni) | |
| LG Gram 15Z90P-G.AA89G | |
| Schenker Work 15 Tiger Lake-H | |
| Media Intel Core i7-11370H (37216 - 62417, n=10) | |
| HP Pavilion x360 15-er0155ng | |
| Asus VivoBook S15 D533UA | |
| Lenovo ThinkPad E15 G3-20YG003UGE | |
| Dell Inspiron 15 3501 | |
| AIDA64 / Memory Write | |
| Media della classe Office (20073 - 119858, n=80, ultimi 2 anni) | |
| LG Gram 15Z90P-G.AA89G | |
| Media Intel Core i7-11370H (36920 - 65610, n=10) | |
| Schenker Work 15 Tiger Lake-H | |
| HP Pavilion x360 15-er0155ng | |
| Asus VivoBook S15 D533UA | |
| Lenovo ThinkPad E15 G3-20YG003UGE | |
| Dell Inspiron 15 3501 | |
| AIDA64 / Memory Latency | |
| LG Gram 15Z90P-G.AA89G | |
| Media della classe Office (7.6 - 162.9, n=75, ultimi 2 anni) | |
| Lenovo ThinkPad E15 G3-20YG003UGE | |
| Asus VivoBook S15 D533UA | |
| Dell Inspiron 15 3501 | |
| Media Intel Core i7-11370H (73.4 - 103, n=10) | |
| Schenker Work 15 Tiger Lake-H | |
| HP Pavilion x360 15-er0155ng | |
* ... Meglio usare valori piccoli
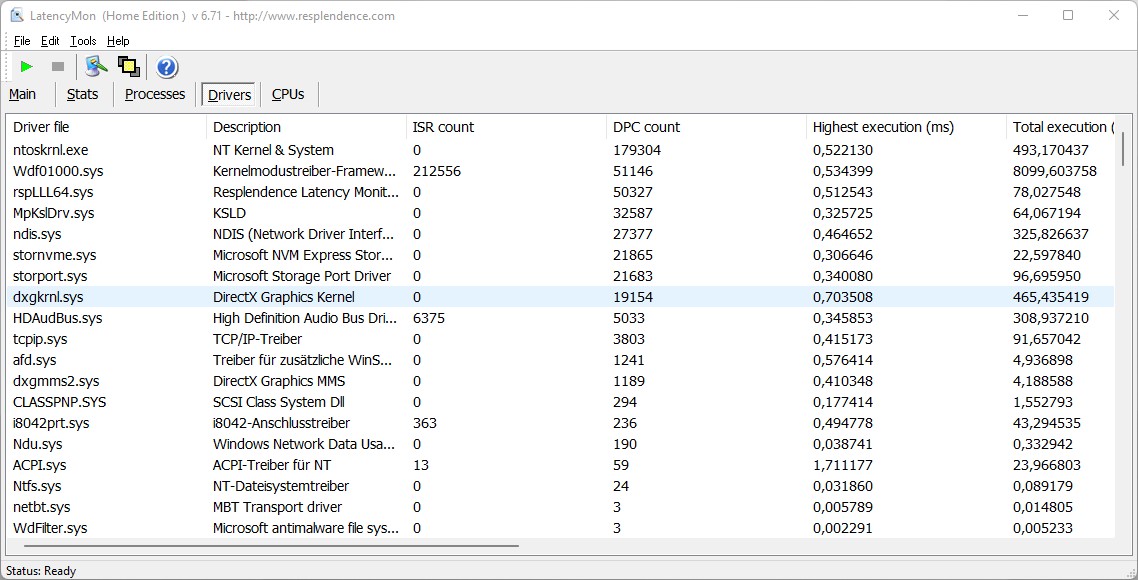
Latenza DPC
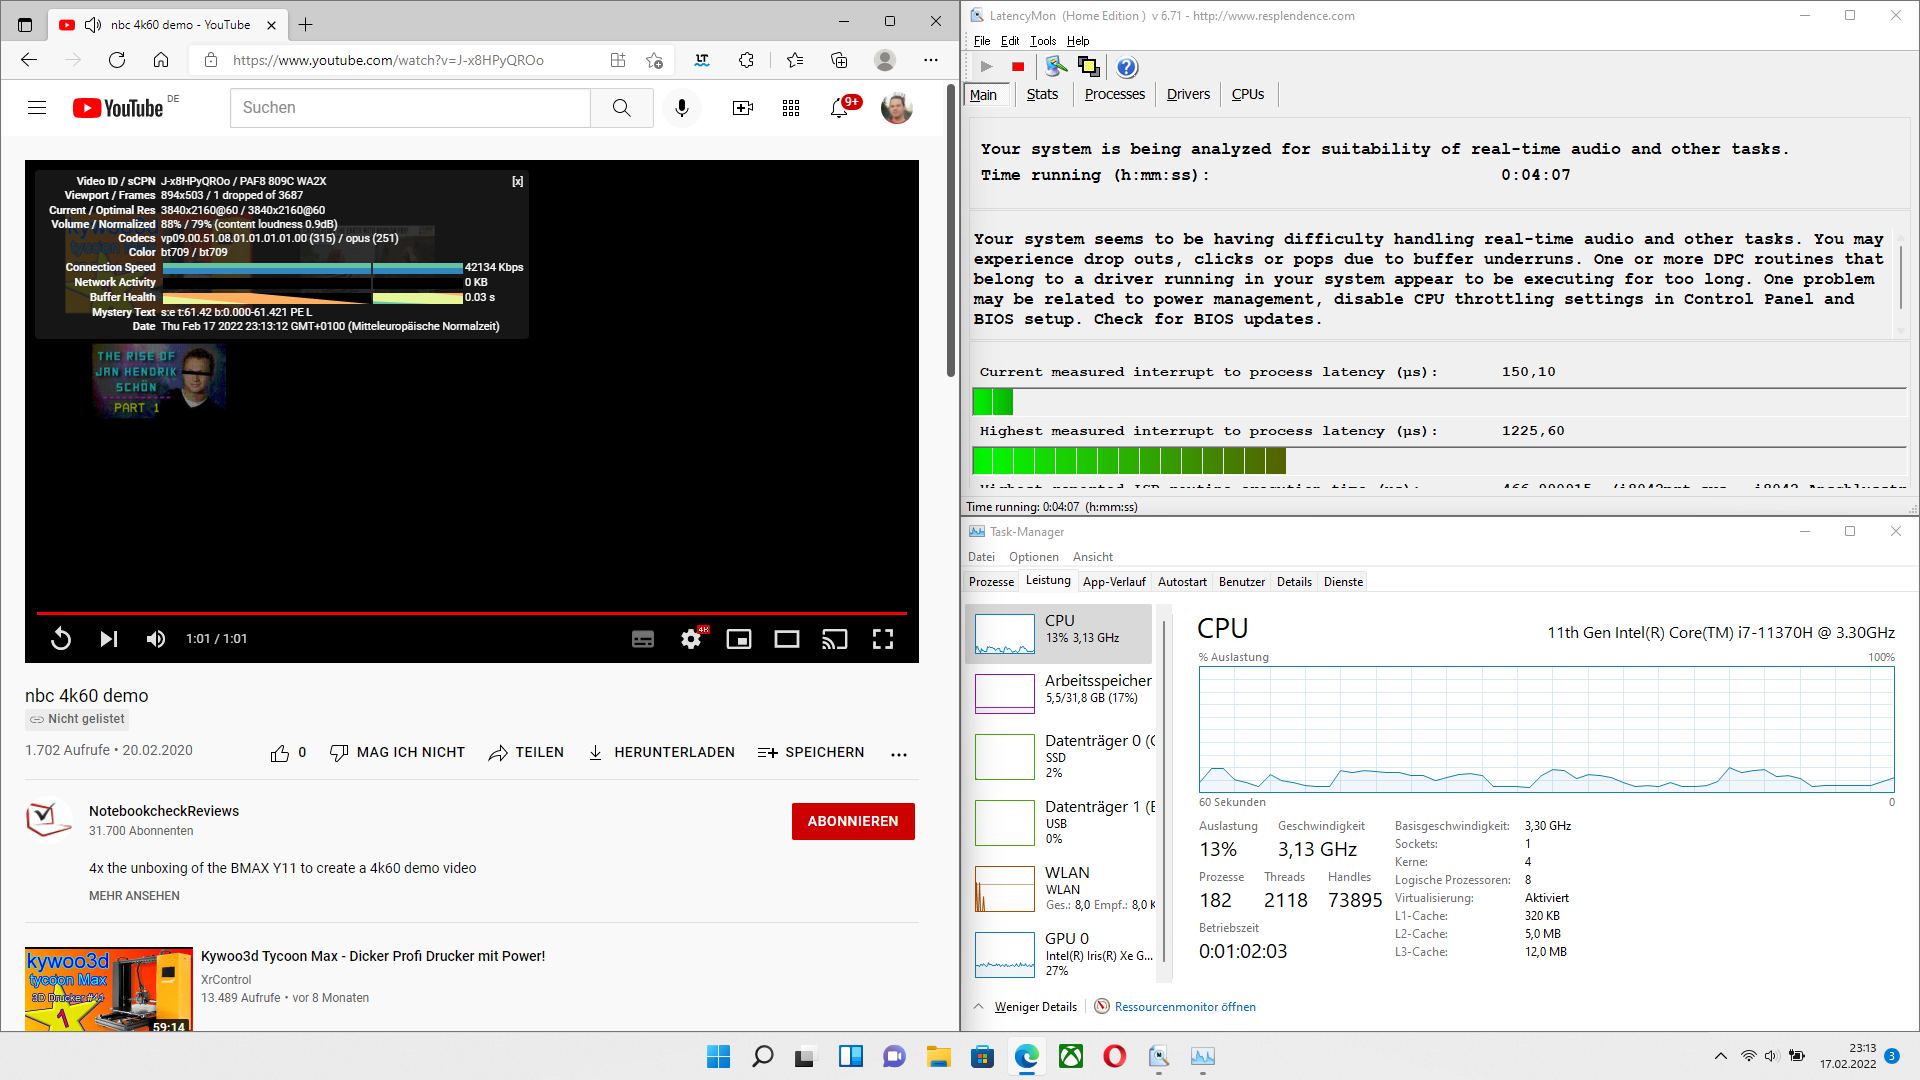
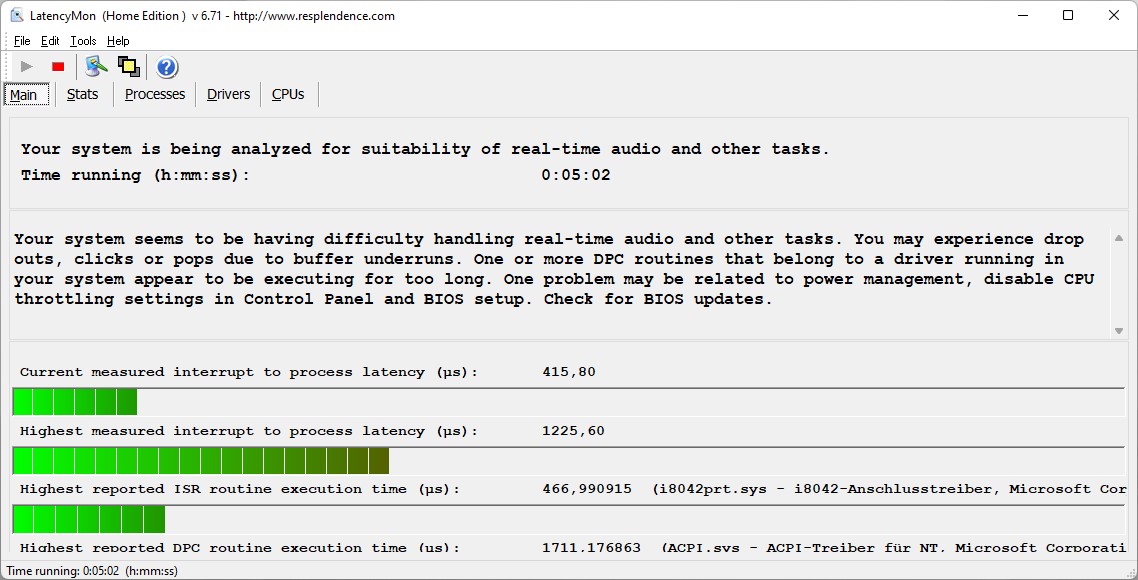
Con unaLatenza DPC di oltre un millisecondo, lo Schenker Work 15 non è solo nel campo del confronto. Questo valore tutt'altro che buono riflette i problemi di molti portatili attuali, ma questo può oscillare notevolmente con gli aggiornamenti dei driver.
| DPC Latencies / LatencyMon - interrupt to process latency (max), Web, Youtube, Prime95 | |
| LG Gram 15Z90P-G.AA89G | |
| Schenker Work 15 Tiger Lake-H | |
| Dell Inspiron 15 3501 | |
| Lenovo ThinkPad E15 G3-20YG003UGE | |
| Asus VivoBook S15 D533UA | |
* ... Meglio usare valori piccoli
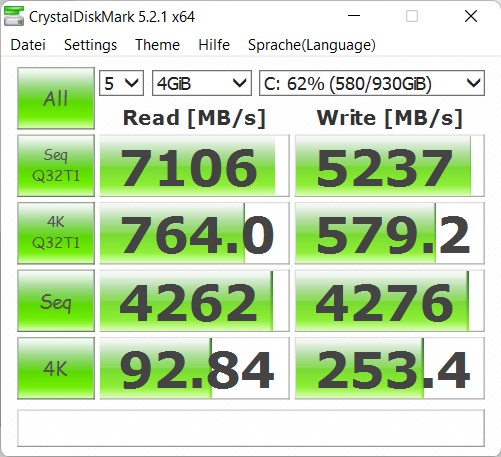
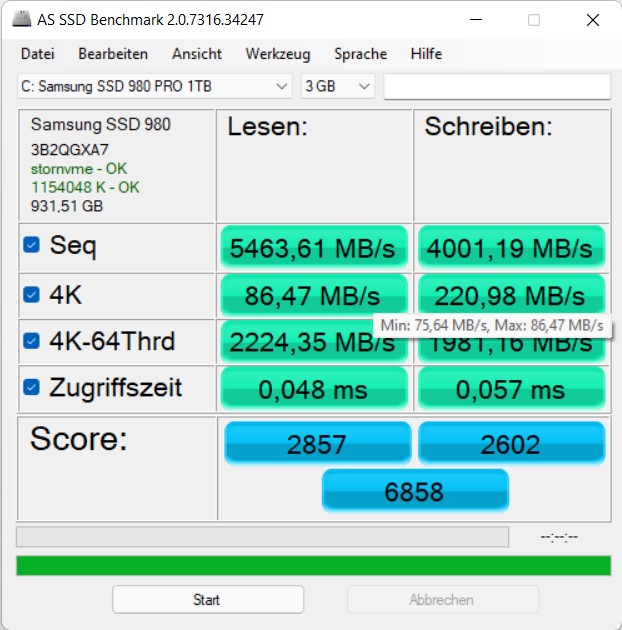
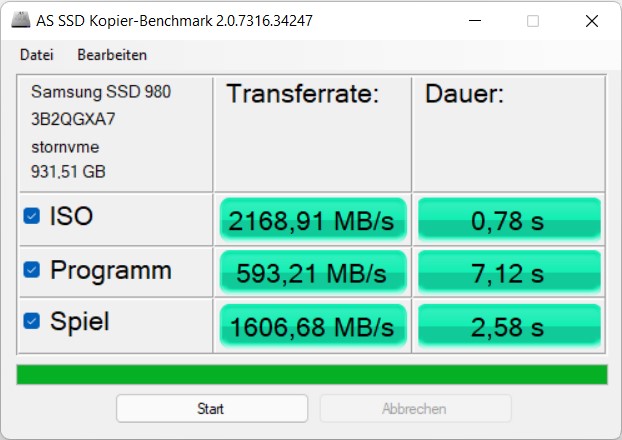
Archiviazione di massa
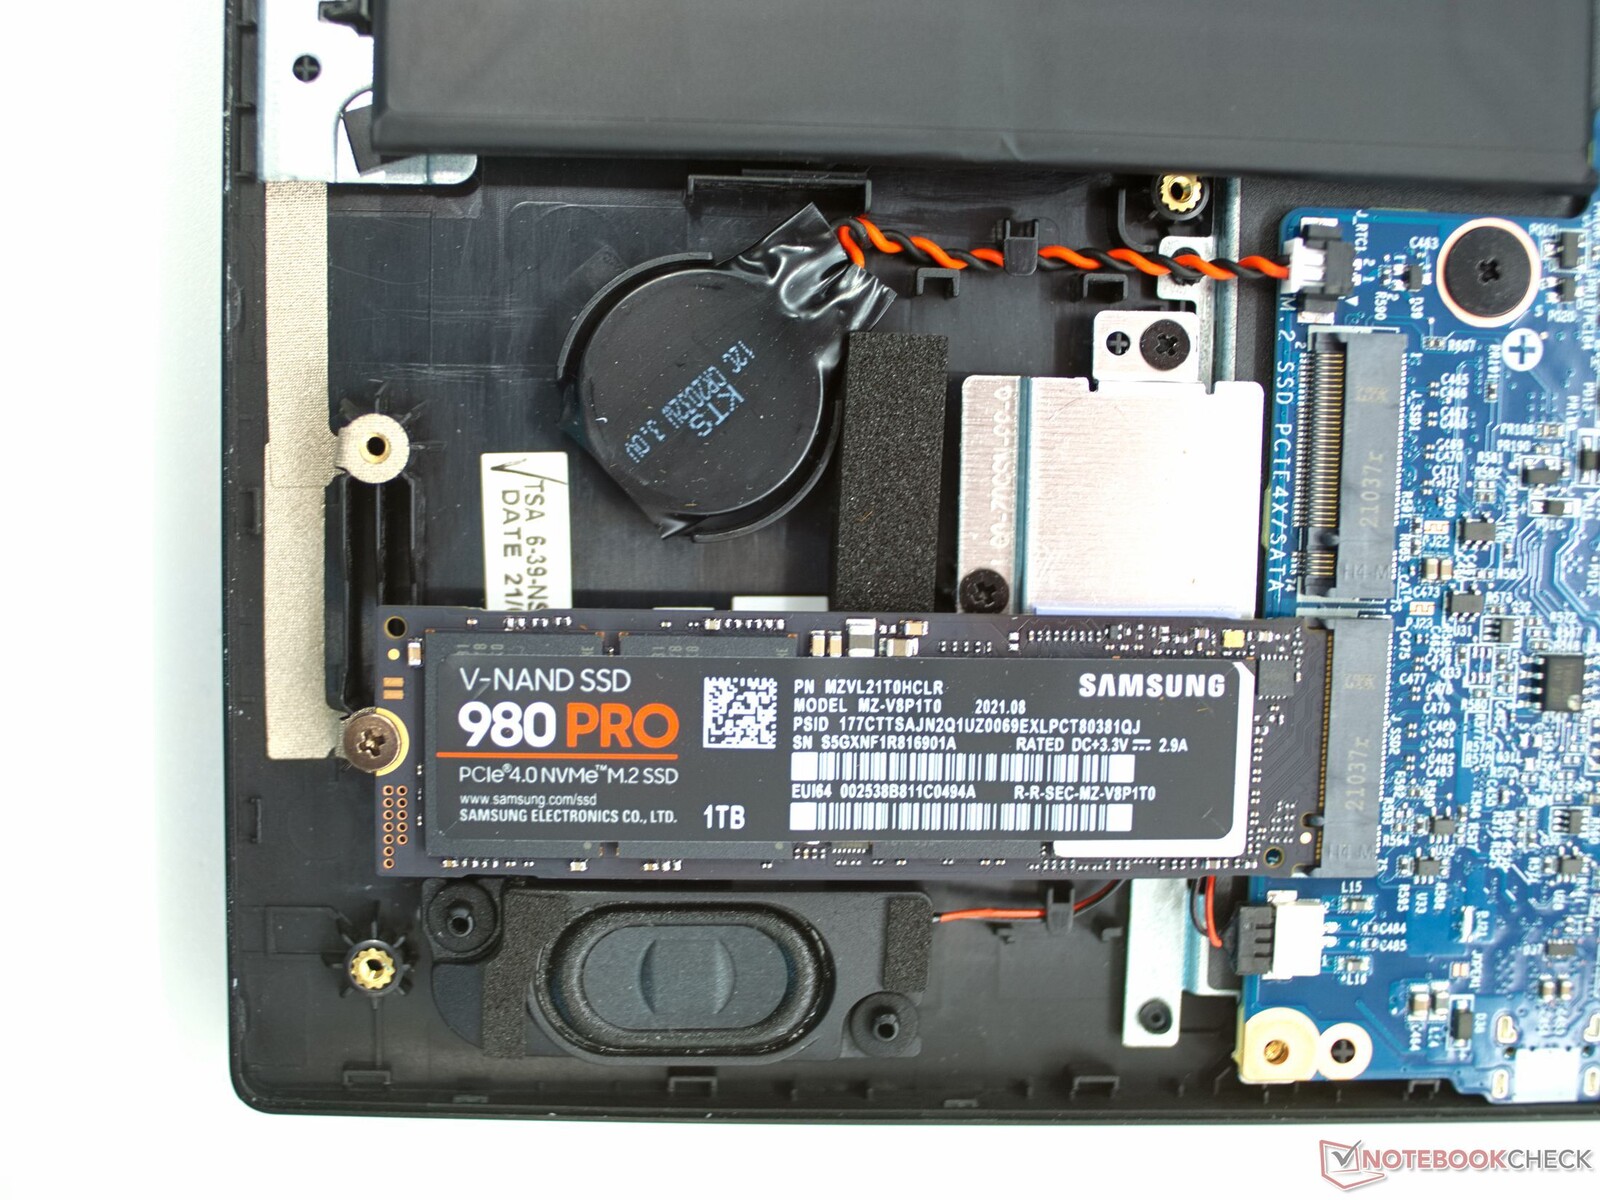
Il Samsung 980 Pro con 1 TB di spazio di archiviazione è una delle opzioni di archiviazione più veloci, secondo la nostra tabella di benchmark di SSD e HDD. L'SSD funziona alle alte velocità previste nel portatile Schenker grazie al PCIe 4.0 (il secondo slot M.2 utilizza un'interfaccia PCIe 3.0 x4).

* ... Meglio usare valori piccoli
Dauerleistung Lesen: DiskSpd Read Loop, Queue Depth 8
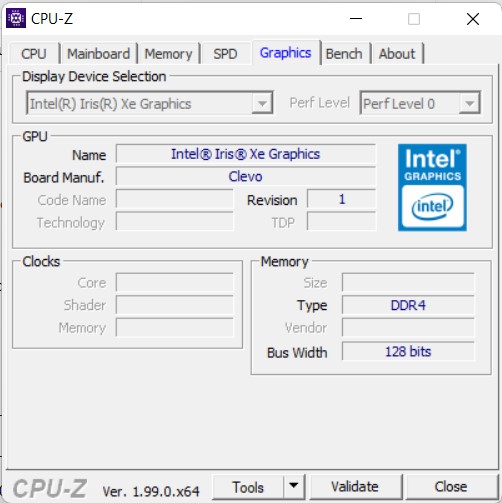
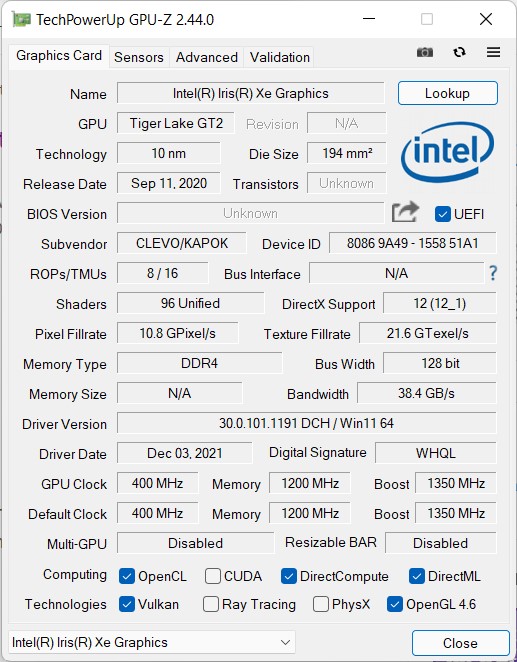
Scheda grafica
Con la Intel Iris Xe Graphics G7 con 96EUs lo Schenker Work 15 non diventa un portatile da gioco, ma il notebook da ufficio può ancora rendere molti giochi senza problemi. Il portatile fornisce anche punteggi abbastanza buoni nei benchmark 3DMark, soprattutto perché l'iGPU ha un sacco di memoria di lavoro a sua disposizione. Se avete bisogno di più potenza grafica, è possibile collegare una scheda grafica esterna tramite la porta Thunderbolt 4.
| 3DMark 06 Standard Score | 27110 punti | |
| 3DMark Ice Storm Standard Score | 72531 punti | |
| 3DMark Fire Strike Score | 4450 punti | |
| 3DMark Time Spy Score | 1774 punti | |
Aiuto | ||
| The Witcher 3 | |
| 1366x768 Medium Graphics & Postprocessing | |
| Media della classe Office (44.7 - 90.4, n=3, ultimi 2 anni) | |
| Schenker Work 15 Tiger Lake-H | |
| Media Intel Iris Xe Graphics G7 96EUs (21.4 - 77.8, n=185) | |
| Dell Inspiron 15 3501 | |
| Asus VivoBook S15 D533UA | |
| LG Gram 15Z90P-G.AA89G | |
| 1920x1080 High Graphics & Postprocessing (Nvidia HairWorks Off) | |
| Media della classe Office (23.7 - 53.4, n=3, ultimi 2 anni) | |
| Media Intel Iris Xe Graphics G7 96EUs (10.6 - 45.9, n=191) | |
| Schenker Work 15 Tiger Lake-H | |
| Lenovo ThinkPad E15 G3-20YG003UGE | |
| Asus VivoBook S15 D533UA | |
| LG Gram 15Z90P-G.AA89G | |
| Dell Inspiron 15 3501 | |
| F1 2021 | |
| 1920x1080 Medium Preset AA:T AF:16x | |
| Schenker Work 15 Tiger Lake-H | |
| Media Intel Iris Xe Graphics G7 96EUs (29.4 - 64.9, n=45) | |
| Lenovo ThinkPad E15 G3-20YG003UGE | |
| 1920x1080 High Preset AA:T AF:16x | |
| Schenker Work 15 Tiger Lake-H | |
| Media Intel Iris Xe Graphics G7 96EUs (24 - 50.8, n=45) | |
| Lenovo ThinkPad E15 G3-20YG003UGE | |
Witcher 3 FPS-Diagramm
| basso | medio | alto | ultra | |
|---|---|---|---|---|
| GTA V (2015) | 92 | 73.2 | 24.7 | 10.1 |
| The Witcher 3 (2015) | 91.2 | 59.2 | 22 | 12.6 |
| Dota 2 Reborn (2015) | 120 | 70 | 47 | 47.2 |
| X-Plane 11.11 (2018) | 40 | 34 | 30.4 | |
| Far Cry 5 (2018) | 47 | 25 | 22 | |
| Strange Brigade (2018) | 87 | 36.9 | 29.9 | 24.4 |
| F1 2021 (2021) | 99.1 | 48.2 | 38.1 | 26.9 |
Emissioni ed energia: Forte ma fresco
Emissioni di rumore
Con emissioni di rumore intorno ai 45 dB(A), lo Schenker Work 15 non è proprio silenzioso sotto carico ed è quasi fastidiosamente rumoroso. Tuttavia, la ventola rimane sotto la soglia di percezione o può spegnersi completamente a seconda della modalità di alimentazione impostata. Le ventole non producono in ogni caso frequenze sgradevolmente alte.
Rumorosità
| Idle |
| 24.4 / 24.4 / 26.7 dB(A) |
| Sotto carico |
| 43.8 / 44.8 dB(A) |
 | ||
30 dB silenzioso 40 dB(A) udibile 50 dB(A) rumoroso |
||
min: | ||
| Schenker Work 15 Tiger Lake-H Iris Xe G7 96EUs, i7-11370H, Samsung SSD 980 Pro 1TB MZ-V8P1T0BW | LG Gram 15Z90P-G.AA89G Iris Xe G7 96EUs, i7-1165G7, SK Hynix HFM001TD3JX013N | Dell Inspiron 15 3501 Iris Xe G7 96EUs, i7-1165G7, Samsung PM991a MZ9LQ512HBLU-00BD1 | Lenovo ThinkPad E15 G3-20YG003UGE Vega 8, R7 5700U, SK Hynix PC711 1TB HFS001TDE9X084N | Asus VivoBook S15 D533UA Vega 8, R7 5700U, WDC PC SN530 SDBPNPZ-1T00 | HP Pavilion x360 15-er0155ng Iris Xe G7 80EUs, i5-1135G7, WDC PC SN530 SDBPNPZ-512G | |
|---|---|---|---|---|---|---|
| Noise | 8% | 3% | 8% | -5% | 2% | |
| off /ambiente * (dB) | 24.4 | 25 -2% | 26 -7% | 23.8 2% | 26 -7% | 26 -7% |
| Idle Minimum * (dB) | 24.4 | 25 -2% | 26 -7% | 23.8 2% | 26 -7% | 26 -7% |
| Idle Average * (dB) | 24.4 | 25 -2% | 26 -7% | 23.8 2% | 26 -7% | 26 -7% |
| Idle Maximum * (dB) | 26.7 | 26.7 -0% | 26 3% | 28 -5% | 28.8 -8% | 26 3% |
| Load Average * (dB) | 43.8 | 32.2 26% | 35.9 18% | 32.9 25% | 45 -3% | 35.1 20% |
| Witcher 3 ultra * (dB) | 43.8 | |||||
| Load Maximum * (dB) | 44.8 | 32.4 28% | 35.8 20% | 35 22% | 45 -0% | 39.6 12% |
* ... Meglio usare valori piccoli
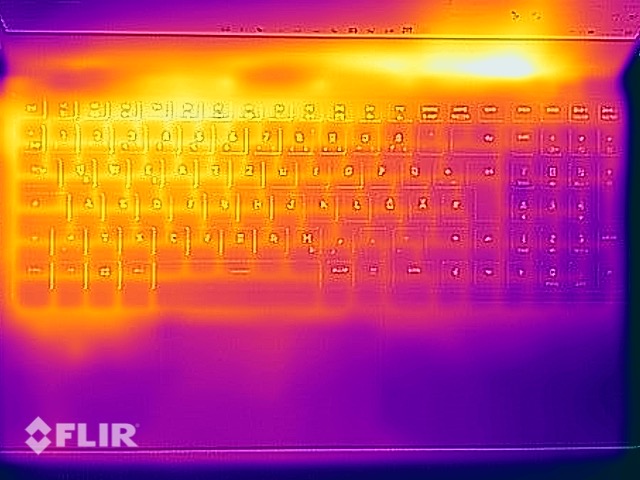
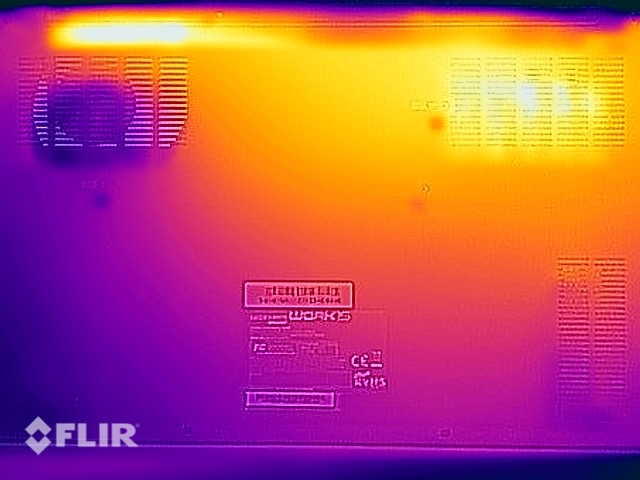
Temperatura
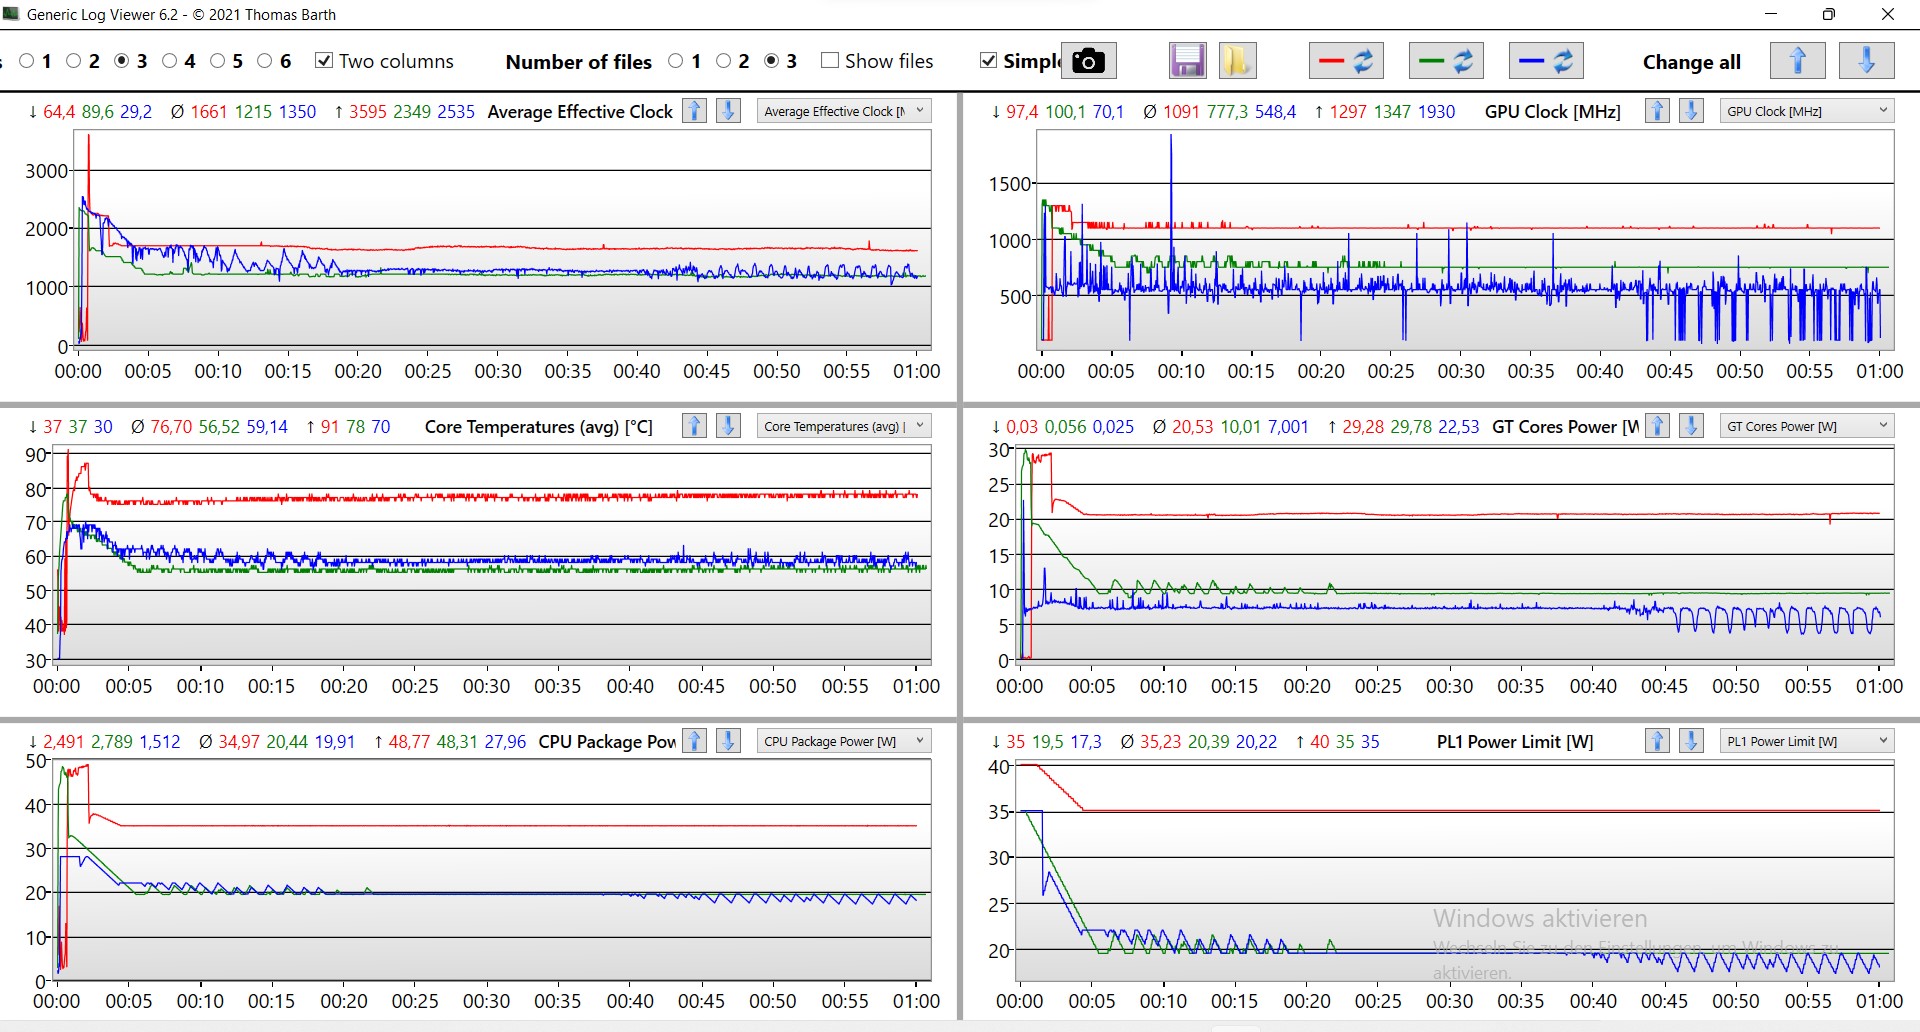
Le temperature della superficie del portatile sono appena al di sopra della temperatura del corpo umano nello stress test. La parte inferiore diventa notevolmente più calda della parte superiore, ma i palmari rimangono sempre relativamente freschi
Nello stress test, il portatile può mantenere le prestazioni impostate tramite il Control Center per un lungo periodo. Così, il portatile da ufficio mostra una grande resistenza. Tuttavia, si nota che si verificano leggere fluttuazioni del PL1 in modalità Entertainment.
(+) La temperatura massima sul lato superiore è di 39.1 °C / 102 F, rispetto alla media di 34.3 °C / 94 F, che varia da 21.2 a 62.5 °C per questa classe Office.
(±) Il lato inferiore si riscalda fino ad un massimo di 43.4 °C / 110 F, rispetto alla media di 36.8 °C / 98 F
(+) In idle, la temperatura media del lato superiore è di 23.6 °C / 74 F, rispetto alla media deld ispositivo di 29.5 °C / 85 F.
(+) Riproducendo The Witcher 3, la temperatura media per il lato superiore e' di 31.6 °C / 89 F, rispetto alla media del dispositivo di 29.5 °C / 85 F.
(+) I poggiapolsi e il touchpad sono piu' freddi della temperatura della pelle con un massimo di 29 °C / 84.2 F e sono quindi freddi al tatto.
(±) La temperatura media della zona del palmo della mano di dispositivi simili e'stata di 27.5 °C / 81.5 F (-1.5 °C / -2.7 F).
| Schenker Work 15 Tiger Lake-H Intel Core i7-11370H, Intel Iris Xe Graphics G7 96EUs | LG Gram 15Z90P-G.AA89G Intel Core i7-1165G7, Intel Iris Xe Graphics G7 96EUs | Dell Inspiron 15 3501 Intel Core i7-1165G7, Intel Iris Xe Graphics G7 96EUs | Lenovo ThinkPad E15 G3-20YG003UGE AMD Ryzen 7 5700U, AMD Radeon RX Vega 8 (Ryzen 4000/5000) | Asus VivoBook S15 D533UA AMD Ryzen 7 5700U, AMD Radeon RX Vega 8 (Ryzen 4000/5000) | HP Pavilion x360 15-er0155ng Intel Core i5-1135G7, Intel Iris Xe Graphics G7 80EUs | |
|---|---|---|---|---|---|---|
| Heat | -1% | -11% | -20% | -13% | -5% | |
| Maximum Upper Side * (°C) | 39.1 | 42.9 -10% | 45.6 -17% | 46.4 -19% | 46.1 -18% | 39.9 -2% |
| Maximum Bottom * (°C) | 43.4 | 39.4 9% | 41 6% | 60.9 -40% | 46.6 -7% | 43.1 1% |
| Idle Upper Side * (°C) | 24.3 | 25.4 -5% | 28.2 -16% | 26.5 -9% | 27.4 -13% | 26.3 -8% |
| Idle Bottom * (°C) | 25.1 | 24.9 1% | 29.1 -16% | 27.5 -10% | 28.2 -12% | 27.4 -9% |
* ... Meglio usare valori piccoli
Altoparlante
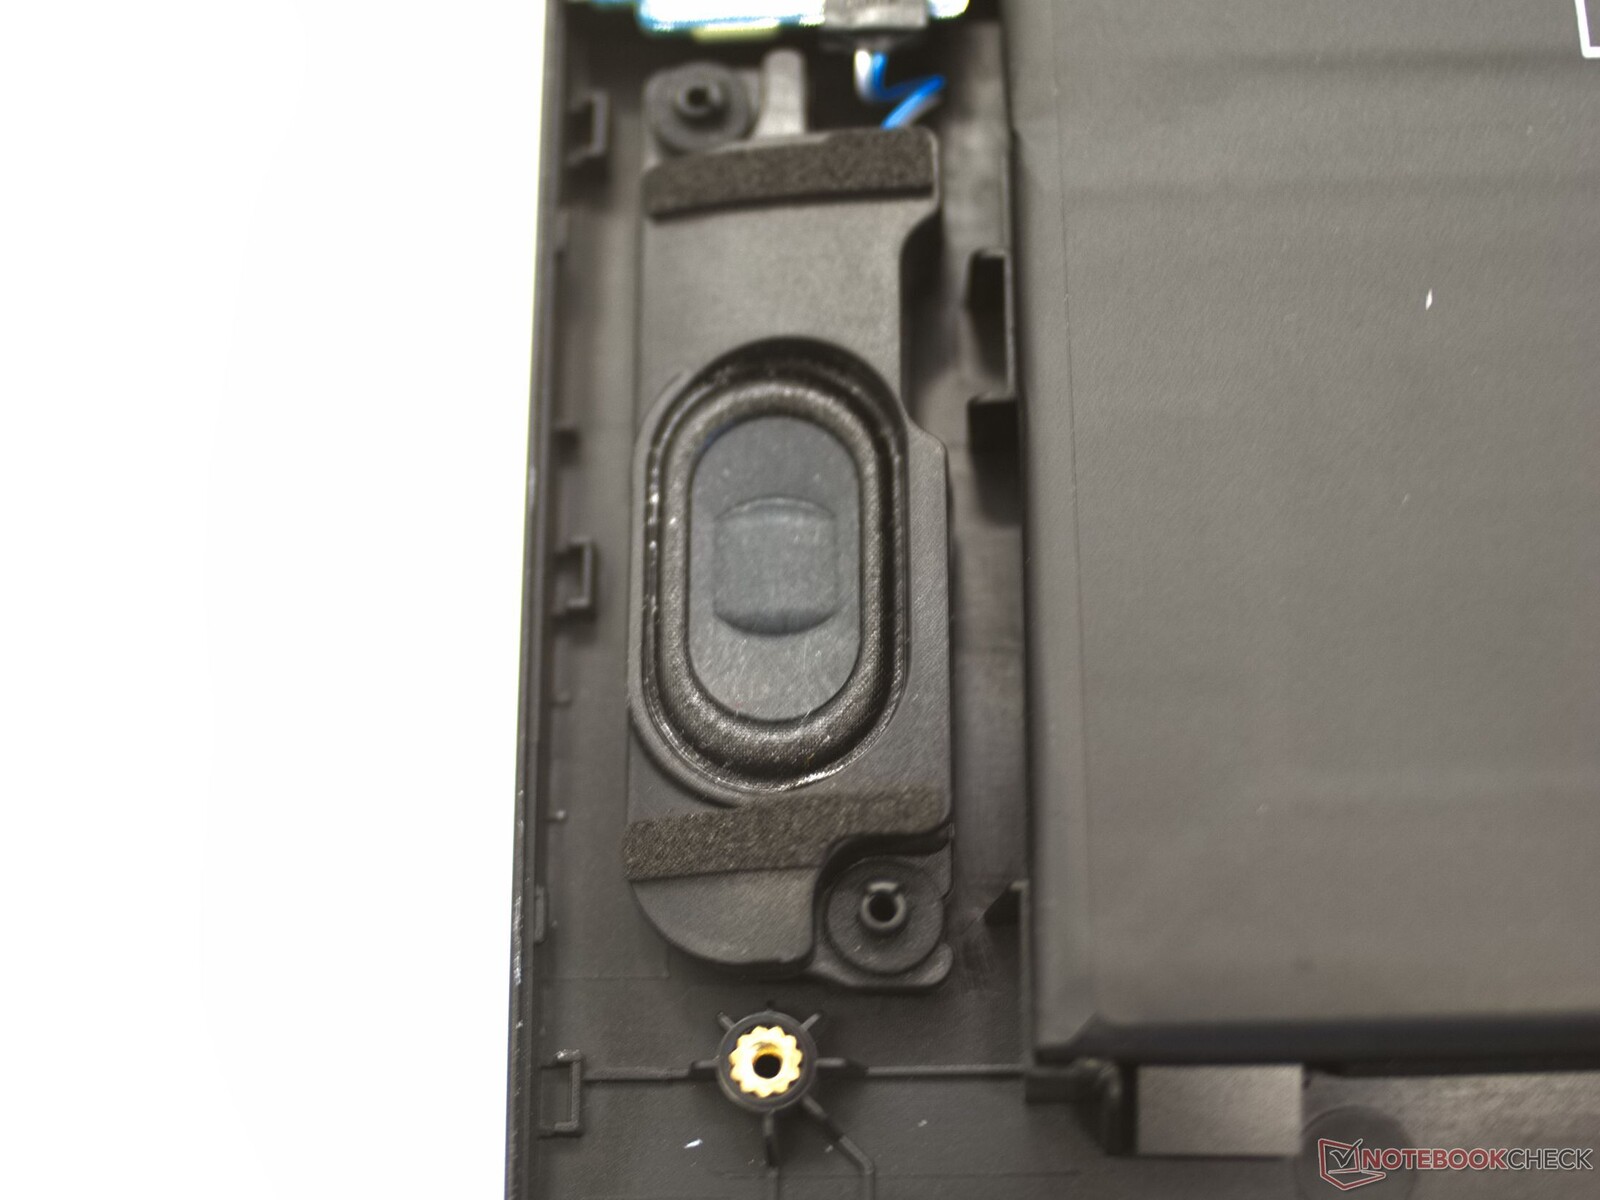
I piccoli altoparlanti dello Schenker Work 15 sono sufficienti per un portatile da ufficio. Tuttavia, a causa di una riproduzione meno lineare delle diverse frequenze e della mancanza di bassi e sub-bassi, il suono risulta molto metallico.
Schenker Work 15 Tiger Lake-H analisi audio
(+) | gli altoparlanti sono relativamente potenti (82.3 dB)
Bassi 100 - 315 Hz
(-) | quasi nessun basso - in media 27.2% inferiori alla media
(+) | bassi in lineaa (6.5% delta rispetto alla precedente frequenza)
Medi 400 - 2000 Hz
(±) | medi elevati - circa 10.1% superiore alla media
(-) | medi non in linea (15.1% delta rispetto alla precedente frequenza)
Alti 2 - 16 kHz
(+) | Alti bilanciati - appena 4.1% dalla media
(+) | alti lineari (6.9% delta rispetto alla precedente frequenza)
Nel complesso 100 - 16.000 Hz
(±) | la linearità complessiva del suono è media (28.8% di differenza rispetto alla media
Rispetto alla stessa classe
» 89% di tutti i dispositivi testati in questa classe è stato migliore, 2% simile, 8% peggiore
» Il migliore ha avuto un delta di 7%, medio di 21%, peggiore di 53%
Rispetto a tutti i dispositivi testati
» 86% di tutti i dispositivi testati in questa classe è stato migliore, 3% similare, 11% peggiore
» Il migliore ha avuto un delta di 4%, medio di 23%, peggiore di 134%
LG Gram 15Z90P-G.AA89G analisi audio
(+) | gli altoparlanti sono relativamente potenti (85.3 dB)
Bassi 100 - 315 Hz
(-) | quasi nessun basso - in media 19.7% inferiori alla media
(±) | la linearità dei bassi è media (13.4% delta rispetto alla precedente frequenza)
Medi 400 - 2000 Hz
(+) | medi bilanciati - solo only 2.1% rispetto alla media
(+) | medi lineari (3.7% delta rispetto alla precedente frequenza)
Alti 2 - 16 kHz
(±) | alti elevati - circa 7.4% superiori alla media
(±) | la linearità degli alti è media (7.7% delta rispetto alla precedente frequenza)
Nel complesso 100 - 16.000 Hz
(±) | la linearità complessiva del suono è media (16.6% di differenza rispetto alla media
Rispetto alla stessa classe
» 43% di tutti i dispositivi testati in questa classe è stato migliore, 6% simile, 51% peggiore
» Il migliore ha avuto un delta di 5%, medio di 18%, peggiore di 53%
Rispetto a tutti i dispositivi testati
» 29% di tutti i dispositivi testati in questa classe è stato migliore, 6% similare, 65% peggiore
» Il migliore ha avuto un delta di 4%, medio di 23%, peggiore di 134%
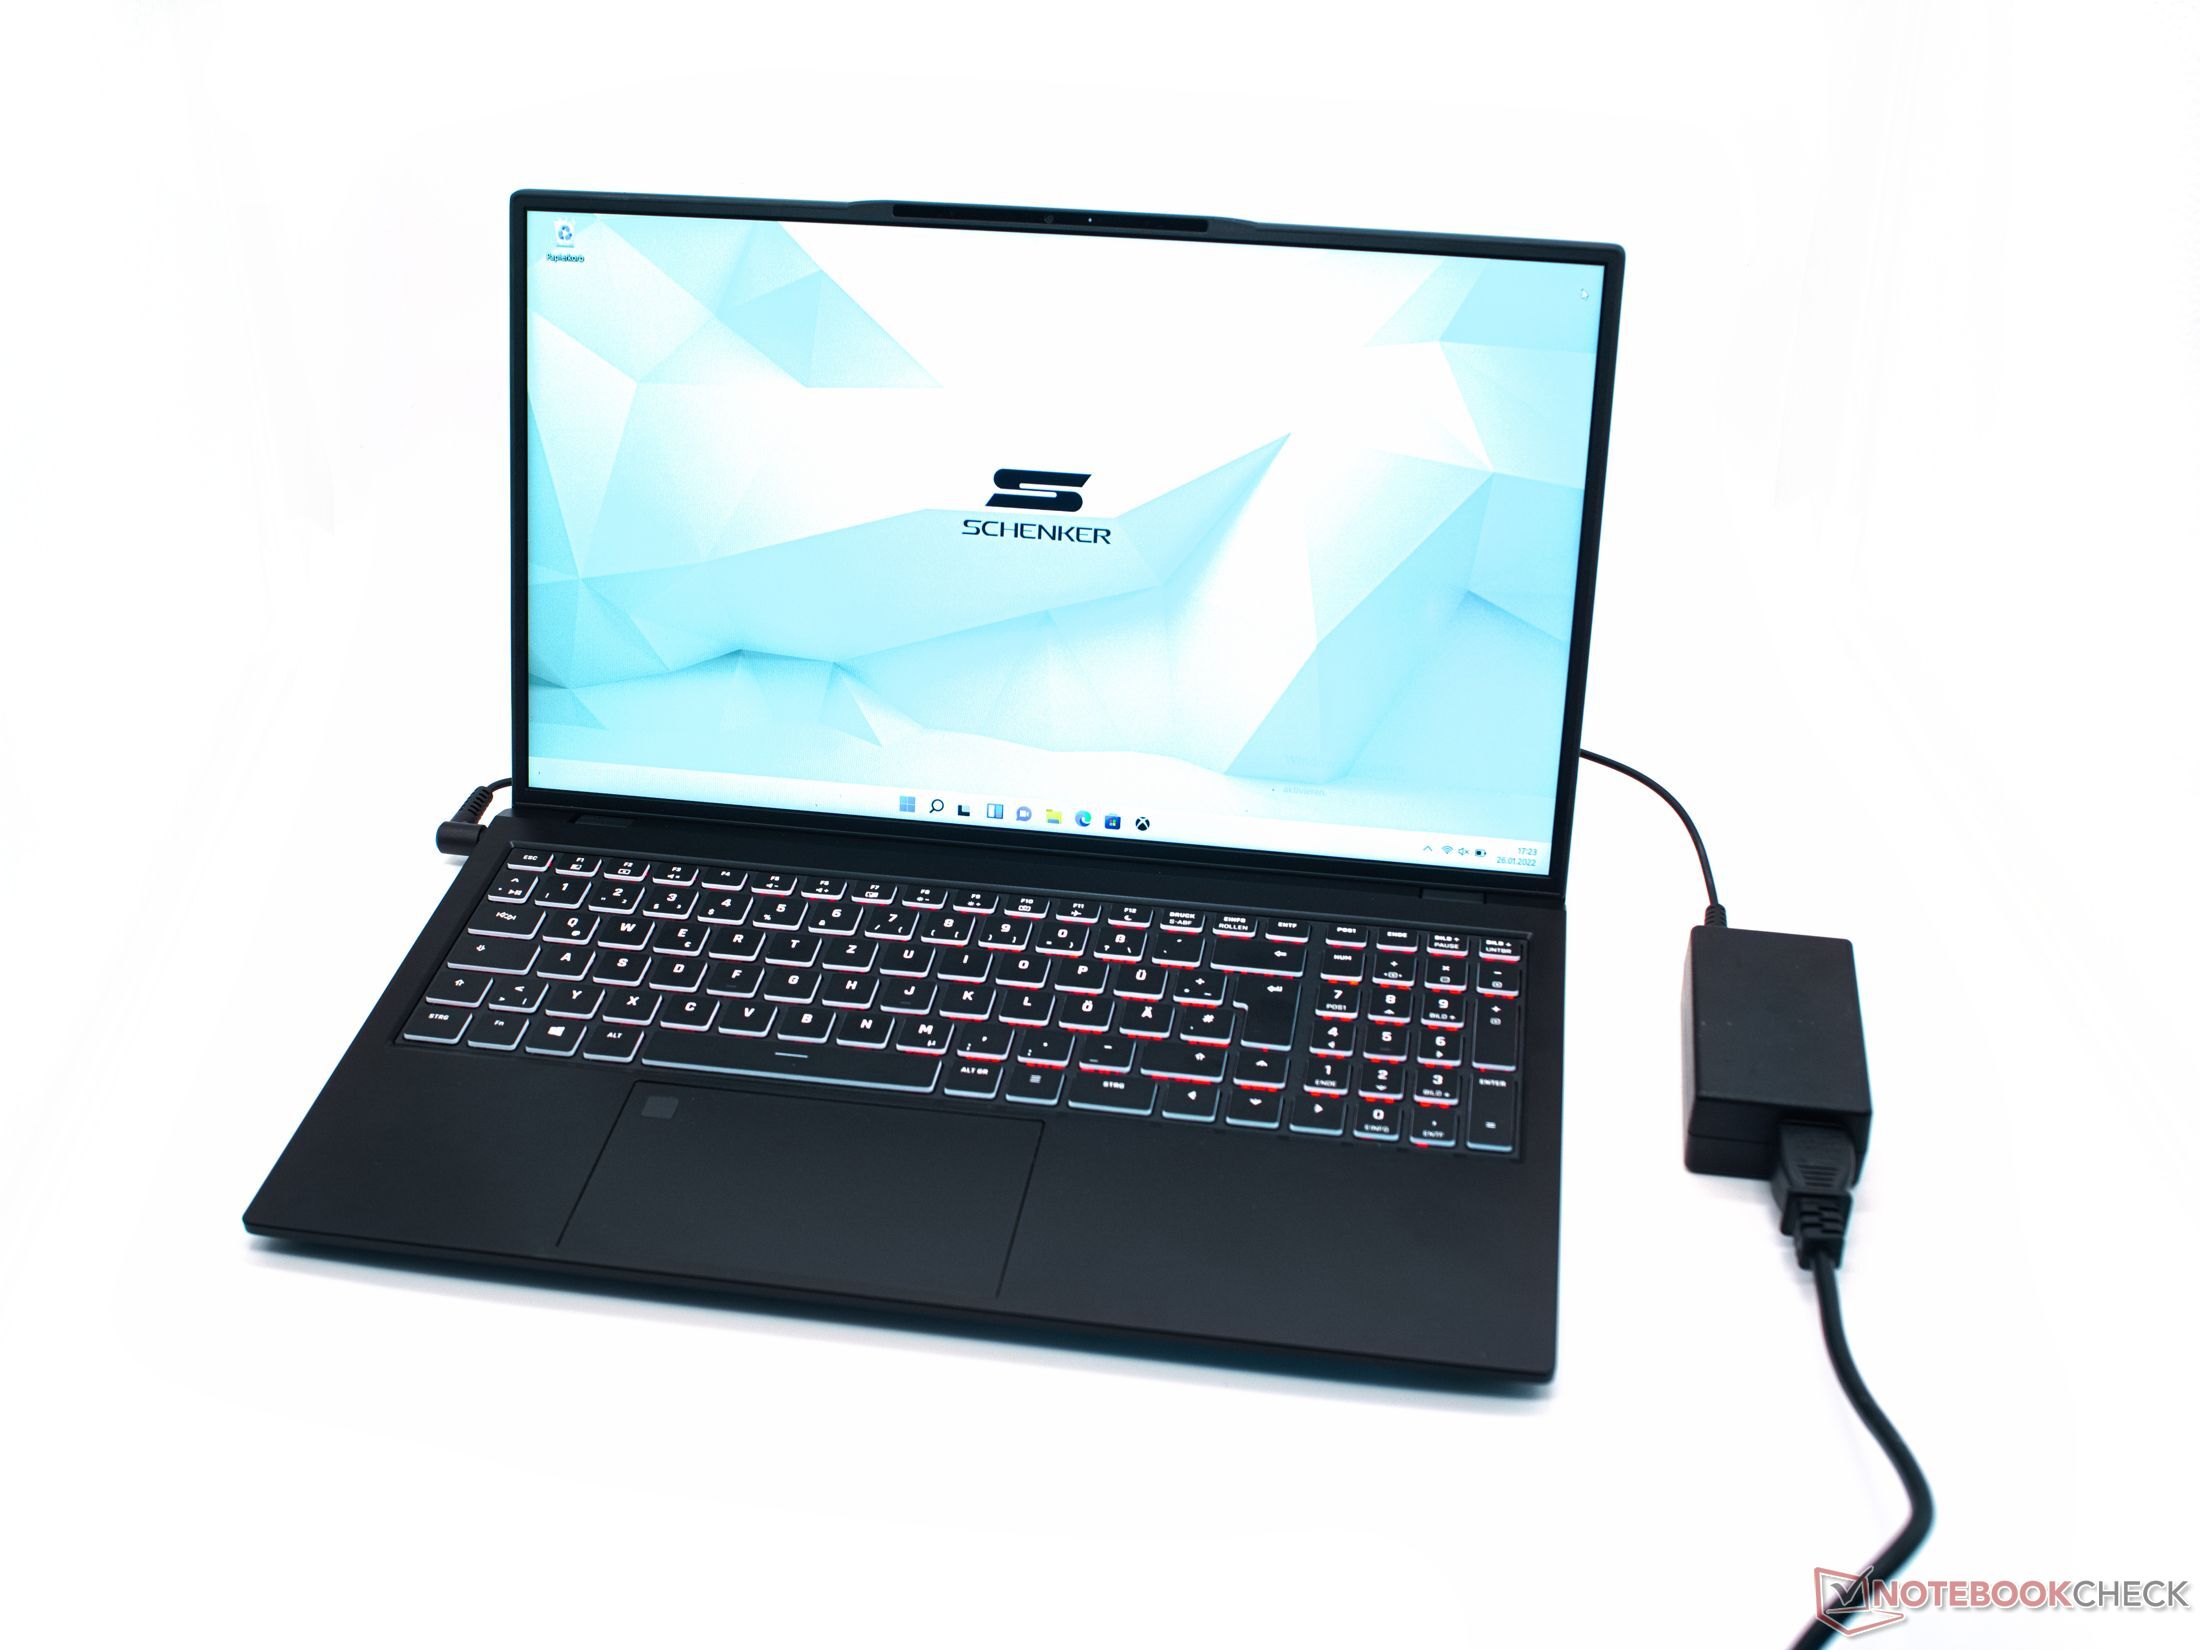
Gestione dell'energia: Lunga durata della batteria
Assorbimento di energia
Con una media di 8 W di consumo di energia inattivo, il portatile di Schenker è abbastanza efficiente dal punto di vista energetico. Sotto carico, tuttavia, può anche utilizzare pienamente il limite di potenza di 65 W dell'alimentatore incluso per diversi minuti. Con un consumo massimo misurato di 69,4 W, l'alimentatore è appena sufficiente.
| Off / Standby | |
| Idle | |
| Sotto carico |
|
Leggenda:
min: | |
Energieaufnahme Witcher 3 / Stresstest
Power consumption with external monitor
Durata della batteria
La batteria agli ioni di litio a due celle da 74 Whr consente un'autonomia relativamente lunga per lo Schenker Work 15. Da 8 a 10 ore nel nostro test pratico di navigazione web Wi-Fi dovrebbero risultare in tempi di lavoro reali altrettanto lunghi. Anche sotto carico, i tempi di funzionamento sono relativamente lunghi, ma con la restrizione che la potenza di calcolo disponibile è significativamente inferiore rispetto al funzionamento a rete.
| Schenker Work 15 Tiger Lake-H i7-11370H, Iris Xe G7 96EUs, 73 Wh | LG Gram 15Z90P-G.AA89G i7-1165G7, Iris Xe G7 96EUs, 80 Wh | Dell Inspiron 15 3501 i7-1165G7, Iris Xe G7 96EUs, 42 Wh | Lenovo ThinkPad E15 G3-20YG003UGE R7 5700U, Vega 8, 57 Wh | Asus VivoBook S15 D533UA R7 5700U, Vega 8, 50 Wh | Media della classe Office | |
|---|---|---|---|---|---|---|
| Autonomia della batteria | 41% | -33% | -2% | -12% | 18% | |
| Reader / Idle (h) | 24.5 | 26 6% | 24.5 ? 0% | |||
| H.264 (h) | 9.6 | 15.5 ? 61% | ||||
| WiFi v1.3 (h) | 10.2 | 13.7 34% | 6.8 -33% | 10 -2% | 9 -12% | 13 ? 27% |
| Load (h) | 2.2 | 4 82% | 1.808 ? -18% |
Pro
Contro
Verdetto: opzioni di configurazione eccitanti con potenziale di risparmio
Un'eccellente tastiera, una lunga durata della batteria e molte porte rendono lo Schenker Work 15 un eccellente portatile da ufficio. Tuttavia, le buone prestazioni dell'Intel Core i7-11370H sono accompagnate da un livello di rumore relativamente alto. Molte opzioni di configurazione nel software e nell'hardware permettono agli acquirenti di adattare il notebook alle proprie esigenze
Le applicazioni internet e office così come molti giochi non rappresentano una grande sfida per l'APU. Il portatile non mostra nessuna debolezza importante. Solo lo schermo potrebbe essere un po' migliore, ma è adeguato per un dispositivo da ufficio
Lo Schenker Work 15 è un insolito portatile da ufficio con molte opzioni di configurazione
Gli utenti che non vogliono pagare l'alto prezzo di acquisto possono risparmiare un sacco di soldi nel configuratore con un i5 e meno memoria di lavoro. Presumibilmente, il Core i5-11300H leggermente più debole non dovrebbe avere un impatto significativamente negativo sulle prestazioni di calcolo. Tuttavia, il prezzo di acquisto può anche essere ridotto di un bel po' di euro scegliendo un periodo di garanzia più breve o un SSD diverso.
Prezzo e disponibilità
Lo Schenker Work 15 è disponibile dal produttore in varie configurazioni a partire da 927 euro.
Schenker Work 15 Tiger Lake-H
- 02/18/2022 v7 (old)
Marc Herter
Price comparison
