Recensioni per il Intel Core i7-8750H processore
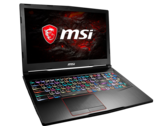
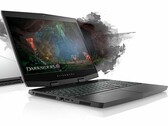
Recensione del Laptop MSI GE63 Raider 8SG: GeForce RTX 2080 a prezzo basso
Può non avere le sexy cornici strette degli ultimi computer portatili, ma il GE63 è ancora dotato di una delle più veloci GPU Nvidia disponibili e di un display ultra-smooth a 144 Hz con quasi nessun ghosting.
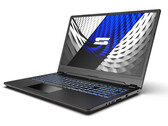
Intel Core i7-8750H, NVIDIA GeForce RTX 2080 Mobile, 15.6", 2.6 kgRecensione del Computer portatile Schenker Key 16 (Clevo P960EN-K): un notebook sottile con elevata potenza di calcolo
Il potente hardware dello Schenker Key 16 è in grado di gestire tutti gli attuali giochi per computer senza problemi sullo schermo opaco da 16,1 pollici (FHD, IPS, 144 Hz). Schenker offre opzioni di configurazione individuali, come ad esempio fino a tre unità di memorizzazione (2x M.2-2280, 1x 2.5-in) e fino a 64 GB di memoria di lavoro. Inoltre, il BIOS consente di ridurre il voltaggio di CPU e iGPU.
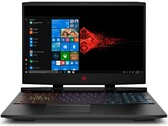
Intel Core i7-8750H, NVIDIA GeForce RTX 2080 Max-Q, 16.1", 2.2 kgRecensione del Computer Portatile HP Omen 15 Laptop: GeForce RTX 2070 Max-Q e 144 Hz gaming
L'Omen 15 può somigliare al suo predecessore, ma HP ha rivisto i componenti interni. Una CPU hexa-core e una GPU all'avanguardia dovrebbero fare un uso migliore del pannello a 144 Hz rispetto all'hardware dell'ultimo Omen 15 che abbiamo recensito, anche se la RAM single-channel può ostacolare leggermente le prestazioni. Continuate a leggere per scoprire cosa offrono il Core i7-8750H e la RTX 2070 Max-Q.
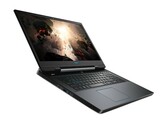
Intel Core i7-8750H, NVIDIA GeForce RTX 2070 Max-Q, 15.6", 2.4 kgRecensione del Computer Portatile Dell G7 17 7790 (i7-8750H, RTX 2070 Max-Q)
L'ultimo portatile da gioco di fascia media di Dell incorpora caratteristiche sia della serie G3 entry-level che della serie Alienware di fascia alta. Ciononostante, il sistema è relativamente pesante e persino più pesante del 17,3 pollici Alienware m17 di diverse centinaia di grammi.
Intel Core i7-8750H, NVIDIA GeForce RTX 2070 Max-Q, 17.3", 3.2 kgRecensione del Computer Portatile Alienware m15 P79F (i7-8750H, RTX 2070 Max-Q, OLED)
L'OLED è incredibile, ma non è il sacro graal delle tecnologie dei display. Alcuni svantaggi chiave al di fuori del prezzo più caro fanno ritenere che ci siano ancora buone ragioni per scegliere l'IPS a seconda dello scenario di utilizzo.
Intel Core i7-8750H, NVIDIA GeForce RTX 2070 Max-Q, 15.6", 2.2 kgDell G5 15 5590: NVIDIA GeForce RTX 2060 Mobile, 15.60", 2.7 kg
recensione » Recensione del Computer Portatile Dell G5 15 5590 (i7-8750H, RTX 2060, SSD, FHD)
MSI GF75 8RD-001: NVIDIA GeForce GTX 1050 Ti Max-Q, 17.30", 2.2 kg
recensione » Recensione del Computer Portatile MSI GF75 Thin 3RD (i7-8750H, GTX 1050Ti Max-Q)
Aorus 15 W9: NVIDIA GeForce RTX 2060 Mobile, 15.60", 2.2 kg
recensione » Recensione del Computer Portatile Aorus 15-W9 (i7-8750H, RTX 2060)
Schenker Work 15: Intel UHD Graphics 630, 15.60", 2.2 kg
recensione » Recensione del Computer Portatile Schenker Work 15 (Core i7-8750H, 16 GB RAM, FHD)
Asus Zephyrus S GX531GX: NVIDIA GeForce RTX 2080 Max-Q, 15.60", 2.1 kg
recensione » Recensione del Computer Portatile Asus Zephyrus S GX531GX (i7-8750H, RTX 2080 Max-Q)
MSI GS75 8SG Stealth: NVIDIA GeForce RTX 2080 Max-Q, 17.30", 2.3 kg
recensione » Recensione del Computer Portatile MSI GS75 8SG Stealth (i7-8750H, RTX 2080 Max-Q)
Schenker XMG Neo 15 Turing: NVIDIA GeForce RTX 2070 Max-Q, 15.60", 2 kg
recensione » Recensione del Computer Portatile Schenker XMG Neo 15 (i7-8750H, RTX 2070 Max-Q) Tongfang GK5CQ7Z
MSI GE75 8SG Raider: NVIDIA GeForce RTX 2080 Mobile, 17.30", 2.6 kg
recensione » Recensione del Computer Portatile MSI GE75 8SG Raider (i7-8750H, RTX 2080)
Aorus 15 X9: NVIDIA GeForce RTX 2070 Mobile, 15.60", 2.4 kg
recensione » Recensione del Computer Portatile Aorus 15 (i7-8750H, RTX 2070)
Schenker XMG Neo 17: NVIDIA GeForce RTX 2070 Mobile, 17.30", 2.5 kg
recensione » Recensione del Computer Portatile Schenker XMG Neo 17 (Core i7-8750H, GeForce RTX 2070) Tongfang GK7CP7S
HP Spectre x360 15-df0126ng: NVIDIA GeForce GTX 1050 Ti Max-Q, 15.60", 2.2 kg
recensione » Recensione del Convertibile HP Spectre x360 15 (Core i7-8750H, GTX 1050 Ti Max-Q, 2 TB SSD, 4K)
Lenovo Legion Y740-15ICHg: NVIDIA GeForce RTX 2070 Max-Q, 15.60", 2.3 kg
recensione » Recensione del Computer Portatile Lenovo Legion Y740-15ICH (i7-8750H, RTX 2070 Max-Q)
MSI GE75 8SF: NVIDIA GeForce RTX 2070 Mobile, 17.30", 2.6 kg
recensione » Recensione del Portatile MSI GE75 Raider 8SF (i7-8750H, RTX 2070)
Lenovo Legion Y740-17ICH: NVIDIA GeForce RTX 2080 Max-Q, 17.30", 2.8 kg
recensione » Recensione del Portatile Lenovo Legion Y740-17ICH (i7-8750H, RTX 2080 Max-Q)
Asus Zephyrus S GX701GX: NVIDIA GeForce RTX 2080 Max-Q, 17.30", 2.6 kg
recensione » Recensione del Portatile Asus ROG Zephyrus S GX701GX (i7-8750H, RTX 2080 Max-Q)
Gigabyte Aero 15-X9: NVIDIA GeForce RTX 2070 Max-Q, 15.60", 2.1 kg
recensione » Recensione del Portatile Gigabyte Aero 15-X9 (Core i7-8750H, RTX 2070 Max-Q)
MSI GL73 8SE-010US: NVIDIA GeForce RTX 2060 Mobile, 17.30", 2.7 kg
recensione » Recensione del Portatile MSI GL73 8SE (i7-8750H, RTX 2060)
Asus ROG G703GX: NVIDIA GeForce RTX 2080 Mobile, 17.30", 4.7 kg
recensione » Recensione del Portatile Asus ROG G703GX (i7-8750H, RTX 2080)
Acer Predator Triton 500: NVIDIA GeForce RTX 2080 Max-Q, 15.60", 2.1 kg
recensione » Recensione del Portatile Acer Predator Triton 500 (i7-8750H, RTX 2080 Max-Q)
Fujitsu Celsius H980: NVIDIA Quadro P3200, 17.30", 3.5 kg
recensione » Recensione della Workstation Fujitsu Celsius H980 (Core i7-8750H, NVIDIA Quadro P3200)
Asus ROG Strix Scar II GL704GW: NVIDIA GeForce RTX 2070 Mobile, 17.30", 2.9 kg
recensione » Recensione del Portatile ASUS ROG Strix Scar II GL704GW (Core i7-8750H, RTX 2070)
Asus TUF FX705GE-EW096T: NVIDIA GeForce GTX 1050 Ti Mobile, 17.30", 2.6 kg
recensione » Recensione del Portatile Asus TUF Gaming FX705GE (i7-8750H, GTX 1050 Ti, SSD, FHD)
Razer Blade 15 RTX 2070 Max-Q: NVIDIA GeForce RTX 2070 Max-Q, 15.60", 2.1 kg
recensione » Recensione del Portatile Razer Blade 15 Advanced Model (RTX 2070 Max-Q, FHD)
Acer Aspire 7 A715-72G-704Q: NVIDIA GeForce GTX 1050 Ti Mobile, 15.60", 2.4 kg
recensione » Recensione del Portatile Acer Aspire 7 A715-72G (i7-8750H, GTX 1050 Ti, SSD, FHD)
Alienware m15 GTX 1070 Max-Q: NVIDIA GeForce GTX 1070 Max-Q, 15.60", 2.2 kg
recensione » Recensione del Portatile Alienware m15 (i7-8750H, GTX 1070 Max-Q)
Asus Zephyrus S GX531GM: NVIDIA GeForce GTX 1060 Mobile, 15.60", 2.1 kg
recensione » Recensione del Portatile Asus RoG Zephyrus S GX531GM (i7-8750H, GTX 1060, SSD, FHD)
MSI P65 8RF-451 - Creator: NVIDIA GeForce GTX 1070 Max-Q, 15.60", 1.9 kg
recensione » Recensione del Portatile MSI P65 Creator 8RF (i7-8750H, GTX 1070 Max-Q, 512 GB SSD, 144 Hz)
Lenovo Legion Y530-15ICH: NVIDIA GeForce GTX 1060 Mobile, 15.60", 2.3 kg
recensione » Recensione del Portatile Lenovo Legion Y530 (i7-8750H, GTX1060)
HP Pavilion Gaming 15-cx0003ng: NVIDIA GeForce GTX 1050 Ti Mobile, 15.60", 2.4 kg
recensione » Recensione del Portatile HP Pavilion Gaming 15 (i7-8750H, GTX 1050 Ti, Optane Memory, FHD)
HP Omen 15-dc0015ng: NVIDIA GeForce GTX 1070 Max-Q, 15.60", 2.5 kg
recensione » Recensione del Portatile HP Omen 15 (i7-8750H, GTX 1070 Max-Q, SSD, FHD)
HP ZBook Studio x360 G5-4QH13EA: NVIDIA Quadro P1000, 15.60", 2.4 kg
recensione » Recensione della Workstation HP ZBook Studio x360 G5 (i7, P1000, FHD)
Lenovo Legion Y7000P-1060: NVIDIA GeForce GTX 1060 Mobile, 15.60", 2.4 kg
recensione » Recensione del Portatile Lenovo Legion Y7000 (i7-8750H, GTX 1060)
Gigabyte Sabre 17-W8: NVIDIA GeForce GTX 1060 Mobile, 17.30", 2.9 kg
recensione » Recensione portatile Gigabyte Sabre 17 (i7-8750H, GTX 1060)
HP ZBook Studio G5-4QH10EA: NVIDIA Quadro P1000, 15.60", 2.1 kg
recensione » Recensione della Workstation HP ZBook Studio G5 (i7, P1000, 4K)
Asus Zephyrus S GX531GS: NVIDIA GeForce GTX 1070 Max-Q, 15.60", 2.1 kg
recensione » Recensione del Portatile Asus ROG Zephyrus S GX531GS (i7-8750H, GTX 1070 Max-Q, FHD)
Asus GL704GM-DH74: NVIDIA GeForce GTX 1060 Mobile, 17.30", 2.9 kg
recensione » Recensione del Portatile Asus ROG Strix Scar II GL704GM (i7-8750H, GTX 1060)
Razer Blade 15 Base Model: NVIDIA GeForce GTX 1060 Max-Q, 15.60", 2 kg
recensione » Recensione del Portatile Razer Blade 15 Base Model (i7-8750H, GTX 1060 Max-Q)
Lenovo Legion Y730-17ICH, i7-8750H: NVIDIA GeForce GTX 1050 Ti Mobile, 17.30", 2.9 kg
recensione » Recensione del Portatile Lenovo Legion Y730-17ICH (i7-8750H, GTX 1050 Ti)
Asus TUF FX705GM: NVIDIA GeForce GTX 1060 Mobile, 17.30", 2.8 kg
recensione » Recensione del Portatile Asus TUF FX705GM (i7-8750H, GTX 1060, FHD)
Lenovo ThinkPad X1 Extreme-20MF000XGE: NVIDIA GeForce GTX 1050 Ti Max-Q, 15.60", 1.8 kg
recensione » Recensione del Portatile Lenovo ThinkPad X1 Extreme (i7, 4K-HDR, GTX 1050 Ti Max-Q)
HP EliteBook 1050 G1-4QY20EA: NVIDIA GeForce GTX 1050 Max-Q, 15.60", 2.1 kg
recensione » Recensione del portatile HP EliteBook 1050 G1 (i7-8750H, 4K, GTX 1050 Max-Q)
Dell XPS 15 9570 i7 UHD: NVIDIA GeForce GTX 1050 Ti Max-Q, 15.60", 2 kg
recensione » Recensione del Portatile Dell XPS 15 9570 (i7, UHD, GTX 1050 Ti Max-Q)
MSI GS65 Stealth Thin 8RE-051US: NVIDIA GeForce GTX 1060 Mobile, 15.60", 1.8 kg
recensione » Recensione del Portatile MSI GS65 Stealth Thin 9RE-051US (GTX 1060)
Alienware 17 R5: NVIDIA GeForce GTX 1070 Mobile, 17.30", 4.4 kg
recensione » Recensione del Portatile Alienware 17 R5 (i7-8750H, GTX 1070, QHD)
Monster Tulpar T5 V18.1.1: NVIDIA GeForce GTX 1060 Mobile, 15.60", 2.1 kg
recensione » Recensione del Portatile Monster Tulpar T5 (Tongfang GK5CN6Z, i7-8750H, GTX 1060, FHD)
Asus Strix GL504GM: NVIDIA GeForce GTX 1060 Mobile, 15.60", 2.5 kg
recensione » Recensione del Laptop Asus ROG Strix GL504GM Hero II (i7-8750H, GTX 1060, FHD)
HP Omen 17t-3AW55AV_1: NVIDIA GeForce GTX 1070 Mobile, 17.30", 3.7 kg
recensione » Recensione del Laptop HP Omen 17t (i7-8750H, GTX 1070)
MSI GS73 Stealth 8RF-011: NVIDIA GeForce GTX 1070 Max-Q, 17.30", 2.4 kg
recensione » Recensione del Portatile MSI GS73 8RF Stealth (i7-8750H, GTX 1070 Max-Q, FHD)
MSI GE63 Raider RGB 8RF-008: NVIDIA GeForce GTX 1070 Mobile, 15.60", 2.5 kg
recensione » Recensione del Portatile MSI GE63 Raider RGB 8RF (i7-8750H, GTX 1070, FHD)
Asus GL504GS: NVIDIA GeForce GTX 1070 Mobile, 15.60", 2.5 kg
recensione » Recensione di Asus ROG Strix GL504 Scar II (i7-8750H, GTX 1070, FHD)
Lenovo ThinkPad P52 20MAS03N00: NVIDIA Quadro P1000, 15.60", 2.6 kg
recensione » Recensione della Workstation Lenovo ThinkPad P52 (i7, P1000, FHD)
Acer Nitro 5 AN515-52-74DR: NVIDIA GeForce GTX 1050 Ti Mobile, 15.60", 2.3 kg
recensione » Recensione del Portatile Acer Nitro 5 (i7-8750H, GTX 1050 Ti, FHD)
Dell G7 15-7588: NVIDIA GeForce GTX 1060 Max-Q, 15.60", 2.6 kg
recensione » Recensione del Portatile Dell G7 15 (i7-8750H, GTX 1060 Max-Q)
Schenker XMG Neo 15: NVIDIA GeForce GTX 1060 Mobile, 15.60", 2 kg
recensione » Recensione del Portatile Schenker XMG Neo 15 (i7-8750H, GTX 1060, Full HD)
Razer Blade 15 GTX 1060: NVIDIA GeForce GTX 1060 Max-Q, 15.60", 2.1 kg
recensione » Recensione del Portatile Razer Blade 15 (i7-8750H, GTX 1060 Max-Q, FHD)
MSI GT63 Titan 8RG-046: NVIDIA GeForce GTX 1080 Mobile, 15.60", 2.9 kg
recensione » Recensione del Portatile MSI GT63 Titan 8RG-046 (i7-8750H, GTX 1080, FHD)
Asus Strix GL703GM-DS74: NVIDIA GeForce GTX 1060 Mobile, 17.30", 2.9 kg
recensione » Recensione del Portatile Asus ROG Strix GL703GM Scar Edition (8750H, GTX 1060, FHD 120 Hz)
Schenker XMG A707 Coffee Lake: NVIDIA GeForce GTX 1050 Ti Mobile, 17.30", 2.9 kg
recensione » Recensione del Portatile Schenker XMG A707 (Clevo N871EK1)
MSI GP63 Leopard 8RE-013US: NVIDIA GeForce GTX 1060 Mobile, 15.60", 2.3 kg
recensione » Recensione del Portatile MSI GP63 Leopard 8RE (i7-8750H, GTX 1060, FHD) Xotic PC Edition
Schenker XMG A517 Coffee Lake: NVIDIA GeForce GTX 1060 Mobile, 15.60", 2.3 kg
recensione » Recensione del Portatile Schenker XMG A517 (Clevo N850EP6)
MSI GE73 8RF-008 Raider RGB: NVIDIA GeForce GTX 1070 Mobile, 17.30", 2.9 kg
recensione » Recensione del Portatile MSI GE73 8RF Raider RGB (i7-8750H, GTX 1070, Full-HD)
Asus ROG GU501GM-BI7N8: NVIDIA GeForce GTX 1060 Mobile, 15.60", 2.5 kg
recensione » Recensione del Portatile Asus ROG GU501GM (i7-8750H, GTX 1060)
Acer Predator Helios 500 PH517-51-79BY: NVIDIA GeForce GTX 1070 Mobile, 17.30", 3.8 kg
recensione » Recensione del Portatile Acer Predator Helios 500 (GTX 1070, i7-8750H)
Eurocom Q6: NVIDIA GeForce GTX 1070 Max-Q, 15.60", 2.2 kg
recensione » Recensione del Portatile Eurocom Q6 (i7-8750H, GTX 1070 Max-Q, FHD)
Razer Blade 15 2018: NVIDIA GeForce GTX 1070 Max-Q, 15.60", 2.1 kg
recensione » Recensione del Portatile Razer Blade 15 (2018)
Asus GL703GE-ES73: NVIDIA GeForce GTX 1050 Ti Mobile, 17.30", 2.7 kg
recensione » Recensione del Portatile Asus GL703GE (Core i7-8750H, GTX 1050 Ti)
MSI GS65 8RF-019DE Stealth Thin: NVIDIA GeForce GTX 1070 Max-Q, 15.60", 1.8 kg
recensione » Recensione del Portatile MSI GS65 8RF Stealth Thin (i7-8750H, GTX 1070 Max-Q, Full HD)
Gigabyte Aero 14-K8: NVIDIA GeForce GTX 1050 Ti Mobile, 14.00", 1.9 kg
recensione » Recensione del Poratile Gigabyte Aero 14 v8 (i7-8750H, GTX 1050 Ti, QHD)
Gigabyte Aero 15X v8: NVIDIA GeForce GTX 1070 Max-Q, 15.60", 2.1 kg
recensione » Recensione del Portatile Gigabyte Aero 15X v8 (i7-8750H, GTX 1070 Max-Q, Full-HD)
Asus Zephyrus M GM501: NVIDIA GeForce GTX 1070 Mobile, 15.60", 2.5 kg
recensione » Recensione del Portatile Asus ROG Zephyrus M GM501 (i7-8750H, GTX 1070, Full-HD)
HP Omen 15-dc1016no: NVIDIA GeForce RTX 2070 Mobile, 15.60", 2.4 kg
Recensioni esterne » HP Omen 15-dc1016no
Asus TUF FX505GD-BQ137T: NVIDIA GeForce GTX 1050 Mobile, 15.60", 2.2 kg
Recensioni esterne » Asus TUF FX505GD-BQ137T
MSI GE63 Raider RGB 8SF-031XES: NVIDIA GeForce RTX 2070 Mobile, 15.60", 2.4 kg
Recensioni esterne » MSI GE63 Raider RGB 8SF-031XES
MSI GF63 8RD-028ES: NVIDIA GeForce GTX 1050 Ti Mobile, 15.60", 1.9 kg
Recensioni esterne » MSI GF63 8RD-028ES
HP Pavilion 17-ab455nd: NVIDIA GeForce GTX 1050 Ti Mobile, 17.30", 3.1 kg
Recensioni esterne » HP Pavilion 17-ab455nd
Acer Predator Helios 300 PH315-52-73ZX: NVIDIA GeForce RTX 2060 Mobile, 15.60", 2.5 kg
Recensioni esterne » Acer Predator Helios 300 PH315-52-73ZX
Acer Aspire Nitro 7 AN715-51-76XG: NVIDIA GeForce GTX 1650 Mobile, 15.60", 2.5 kg
Recensioni esterne » Acer Aspire Nitro 7 AN715-51-76XG
HP Omen 15-dc1041nl: NVIDIA GeForce RTX 2060 Mobile, 15.60", 2.4 kg
Recensioni esterne » HP Omen 15-dc1041nl
Asus TUF FX504GM-EN479: NVIDIA GeForce GTX 1060 Mobile, 15.60", 2.2 kg
Recensioni esterne » Asus TUF FX504GM-EN479
Acer Predator Helios 500 PH517-51-79T5: NVIDIA GeForce GTX 1070 Mobile, 17.30", 4 kg
Recensioni esterne » Acer Predator Helios 500 PH517-51-79T5
Lenovo Ideapad 330-15ICH-81FK00EHSP: NVIDIA GeForce GTX 1050 Mobile, 15.60", 2.2 kg
Recensioni esterne » Lenovo Ideapad 330-15ICH-81FK00EHSP
MSI GL63 8SD-269ES: NVIDIA GeForce GTX 1660 Ti Mobile, 15.60", 2.2 kg
Recensioni esterne » MSI GL63 8SD-269ES
HP Omen 15-DC0046NS: NVIDIA GeForce GTX 1050 Ti Mobile, 15.60", 2.4 kg
Recensioni esterne » HP Omen 15-DC0046NS
HP Omen 15-DC0014NS: NVIDIA GeForce GTX 1050 Mobile, 15.60", 2.4 kg
Recensioni esterne » HP Omen 15-DC0014NS
MSI GP63 Leopard 8RD-694XES: NVIDIA GeForce GTX 1050 Ti Mobile, 15.60", 2.2 kg
Recensioni esterne » MSI GP63 Leopard 8RD-694XES
HP Pavilion 15-BC410NS: NVIDIA GeForce GTX 1050 Ti Mobile, 15.60", 2.2 kg
Recensioni esterne » HP Pavilion 15-BC410NS
MSI GE75 Raider 8SF-032ES: NVIDIA GeForce RTX 2070 Mobile, 17.30", 2.7 kg
Recensioni esterne » MSI GE75 Raider 8SF-032ES
HP Omen 15-dc0015NS: NVIDIA GeForce GTX 1050 Ti Mobile, 15.60", 2.4 kg
Recensioni esterne » HP Omen 15-DC0015NS
HP Omen 15-dc1002ns: NVIDIA GeForce RTX 2060 Mobile, 15.60", 2.5 kg
Recensioni esterne » HP Omen 15-dc1002ns
Asus ROG Strix HERO II GL504GM-ES237T: NVIDIA GeForce GTX 1060 Mobile, 15.60", 2.4 kg
Recensioni esterne » Asus ROG Strix HERO II GL504GM-ES237T
Asus TUF FX504GD-EN1354: NVIDIA GeForce GTX 1050 Mobile, 15.60", 2.3 kg
Recensioni esterne » Asus TUF FX504GD-EN1354
MSI WE63 8SI-240XES: NVIDIA Quadro P1000, 15.60", 2.3 kg
Recensioni esterne » MSI WE63 8SI-240XES
Asus TUF FX504GD-EN421: NVIDIA GeForce GTX 1050 Mobile, 15.60", 2.3 kg
Recensioni esterne » Asus TUF FX504GD-EN421
HP Pavilion Gaming 15-cx0004ns : NVIDIA GeForce GTX 1050 Mobile, 15.60", 2.2 kg
Recensioni esterne » HP Pavilion Gaming 15-cx0004ns
Asus TUF FX505GD-BQ142: NVIDIA GeForce GTX 1050 Mobile, 15.60", 2.2 kg
Recensioni esterne » Asus TUF FX505GD-BQ142
HP Omen 17-an102nd: NVIDIA GeForce GTX 1060 Mobile, 15.60", 3.8 kg
Recensioni esterne » HP Omen 17-an102nd
HP Omen 15-dc1303ng: NVIDIA GeForce RTX 2070 Max-Q, 15.60", 2.4 kg
Recensioni esterne » HP Omen 15-dc1303ng
Asus ROG Zephyrus S GX701-EV020T: NVIDIA GeForce RTX 2080 Max-Q, 17.30", 2.7 kg
Recensioni esterne » Asus ROG Zephyrus S GX701-EV020T
MSI GS63 Stealth 8RE-063XES: NVIDIA GeForce GTX 1060 Mobile, 15.60", 1.8 kg
Recensioni esterne » MSI GS63 Stealth 8RE-063XES
Asus TUF FX504GD-EN561: NVIDIA GeForce GTX 1050 Mobile, 15.60", 2.3 kg
Recensioni esterne » Asus TUF FX504GD-EN561
MSI GL63 8SD-270XES: NVIDIA GeForce GTX 1660 Ti Mobile, 15.60", 2.3 kg
Recensioni esterne » MSI GL63 8SD-270XES
HP Spectre x360 15-df0500nd: NVIDIA GeForce GTX 1050 Ti Mobile, 15.60", 2.2 kg
Recensioni esterne » HP Spectre x360 15-df0500nd
Asus TUF FX505GM-BQ189T: NVIDIA GeForce GTX 1060 Mobile, 15.60", 2.2 kg
Recensioni esterne » Asus TUF FX505GM-BQ189T
Acer Predator Triton 500 PT515-51-74JA: NVIDIA GeForce RTX 2080 Max-Q, 15.60", 2 kg
Recensioni esterne » Acer Predator Triton 500 PT515-51-74JA
Asus Zephyrus S GX701GW-EV047R: NVIDIA GeForce RTX 2070 Mobile, 17.30", 2.7 kg
Recensioni esterne » Asus Zephyrus S GX701GW-EV047R
Razer Blade 15 RTX 2080 Max-Q, Core i7-8750H: NVIDIA GeForce RTX 2080 Max-Q, 15.60", 2.1 kg
Recensioni esterne » Razer Blade 15 RTX 2080 Max-Q, Core i7-8750H
Acer Predator Triton 500 PT515-51-73G6: NVIDIA GeForce RTX 2060 Mobile, 15.60", 2.1 kg
Recensioni esterne » Acer Predator Triton 500 PT515-51-73G6
Asus ROG Strix Hero II GL504GM-ES157T: NVIDIA GeForce GTX 1060 Mobile, 15.60", 2.4 kg
Recensioni esterne » Asus ROG Strix Hero II GL504GM-ES157T
Asus Zenbook Pro 15 UX580GE-BO024: NVIDIA GeForce GTX 1050 Ti Mobile, 15.60", 1.4 kg
Recensioni esterne » Asus Zenbook Pro 15 UX580GE-BO024
HP Omen 15-dc1001ns: NVIDIA GeForce RTX 2070 Mobile, 15.60", 2.5 kg
Recensioni esterne » HP OMEN 15-dc1001ns
Asus TUF FX705GM-EV020: NVIDIA GeForce GTX 1060 Mobile, 17.30", 2.6 kg
Recensioni esterne » Asus TUF FX705GM-EV020
Asus TUF FX505GD-BQ326T: NVIDIA GeForce GTX 1050 Mobile, 15.60", 2.2 kg
Recensioni esterne » Asus TUF FX505GD-BQ326T
HP OMEN 15-dc0012ns: NVIDIA GeForce GTX 1060 Mobile, 15.60", 2.5 kg
Recensioni esterne » HP OMEN 15-dc0012ns
Lenovo Legion Y530-81FV00QARU: NVIDIA GeForce GTX 1050 Mobile, 15.60", 2.3 kg
Recensioni esterne » Lenovo Legion Y530-81FV00QARU
HP Omen 17-an105ns: NVIDIA GeForce GTX 1070 Mobile, 17.30", 3.8 kg
Recensioni esterne » HP OMEN 17-an105ns
MSI GE63 Raider RGB-053: NVIDIA GeForce RTX 2060 Mobile, 15.60", 2.6 kg
Recensioni esterne » MSI GE63 Raider RGB-053
MSI GE75 Raider 049-HID4-US: NVIDIA GeForce RTX 2070 Mobile, 17.30", 2.6 kg
Recensioni esterne » MSI GE75 Raider 049-HID4-US
Asus Zephyrus S GX701GVR-EV003R: NVIDIA GeForce RTX 2060 Mobile, 17.30", 2.7 kg
Recensioni esterne » Asus Zephyrus S GX701GVR-EV003R
Alienware m17 9JX63: NVIDIA GeForce RTX 2060 Mobile, 17.30", 2.6 kg
Recensioni esterne » Alienware m17 9JX63
MSI GF62 8RE-041NL: NVIDIA GeForce GTX 1060 Mobile, 15.60", 2.2 kg
Recensioni esterne » MSI GF62 8RE-041NL
MSI GS65 Stealth 8SE-037ES: NVIDIA GeForce RTX 2060 Mobile, 15.60", 1.9 kg
Recensioni esterne » MSI GS65 Stealth 8SE-037ES
Asus Zephyrus S GX701GWR-EV021R: NVIDIA GeForce RTX 2070 Mobile, 17.30", 2.7 kg
Recensioni esterne » Asus Zephyrus S GX701GWR-EV021R
Lenovo Legion Y740-15ICHg: NVIDIA GeForce RTX 2070 Max-Q, 15.60", 2.3 kg
Recensioni esterne » Lenovo Legion Y740-15ICHg
HP ZBook Studio G5-4QH10EA: NVIDIA Quadro P1000, 15.60", 2.1 kg
Recensioni esterne » HP ZBook Studio G5-4QH10EA
MSI GS65 8SF-057: NVIDIA GeForce RTX 2070 Max-Q, 15.60", 1.9 kg
Recensioni esterne » MSI GS65 8SF-057
MSI GE65 Raider-9SF, i7-8750H: NVIDIA GeForce RTX 2070 Mobile, 15.60", 2.3 kg
Recensioni esterne » MSI GE65 Raider-9SF, i7-8750H
Asus TUF FX705GD-EW086: NVIDIA GeForce GTX 1050 Mobile, 17.30", 2.7 kg
Recensioni esterne » Asus TUF FX705GD-EW086
MSI P65 Creator 8RD-095XES: NVIDIA GeForce GTX 1050 Ti Mobile, 15.60", 1.9 kg
Recensioni esterne » MSI P65 Creator 8RD-095XES
MSI GF63 8RC-069ES: NVIDIA GeForce GTX 1050 Mobile, 15.60", 1.9 kg
Recensioni esterne » MSI GF63 8RC-069ES
MSI P65 Creator 8RE-028NL: NVIDIA GeForce GTX 1060 Max-Q, 15.60", 1.8 kg
Recensioni esterne » MSI P65 Creator 8RE-028NL
MSI GL73 8SD-044ES: NVIDIA GeForce GTX 1660 Ti Mobile, 17.30", 2.9 kg
Recensioni esterne » MSI GL73 8SD-044ES
Asus ROG Strix SCAR II GL504GV-ES020: NVIDIA GeForce RTX 2060 Mobile, 15.60", 2.4 kg
Recensioni esterne » Asus ROG Strix SCAR II GL504GV-ES020
Dell G5 15 5590: NVIDIA GeForce RTX 2060 Mobile, 15.60", 2.7 kg
Recensioni esterne » Dell G5 15 5590
Dell G7 17 7790: NVIDIA GeForce RTX 2070 Max-Q, 17.30", 3.2 kg
Recensioni esterne » Dell G7 17 7790
MSI GS65 8SE-060: NVIDIA GeForce RTX 2060 Mobile, 15.60", 1.9 kg
Recensioni esterne » MSI GS65 8SE-060
Dell G7 15-7590 (i7-8750H, RTX 2060): NVIDIA GeForce RTX 2060 Mobile, 15.60", 2.5 kg
Recensioni esterne » Dell G7 15-7590 (i7-8750H, RTX 2060)
MSI GL73 8SE-010US: NVIDIA GeForce RTX 2060 Mobile, 17.30", 2.7 kg
Recensioni esterne » MSI GL73 8SE-010US
Schenker XMG Neo 15 Turing: NVIDIA GeForce RTX 2070 Max-Q, 15.60", 2 kg
Recensioni esterne » Schenker XMG Neo 15 Turing
HP Omen 15-dc0006ur: NVIDIA GeForce GTX 1070 Mobile, 15.60", 2.5 kg
Recensioni esterne » HP Omen 15-dc0006ur
Lenovo Ideapad 330-15ICH-81FK00EJSP: NVIDIA GeForce GTX 1050 Mobile, 15.60", 2.2 kg
Recensioni esterne » Lenovo Ideapad 330-15ICH-81FK00EJSP
Asus TUF FX504GM-EN480: NVIDIA GeForce GTX 1060 Mobile, 15.60", 2.3 kg
Recensioni esterne » Asus TUF FX504GM-EN480
Lenovo Legion Y530-15ICH-81LB007CSP: NVIDIA GeForce GTX 1060 Mobile, 15.60", 2.3 kg
Recensioni esterne » Lenovo Legion Y530-15ICH-81LB007CSP
MSI GL63 8RD-643XES: NVIDIA GeForce GTX 1050 Ti Mobile, 15.60", 2.2 kg
Recensioni esterne » MSI GL63 8RD-643XES
Asus TUF FX504GD-DM883: NVIDIA GeForce GTX 1050 Mobile, 15.60", 2.3 kg
Recensioni esterne » Asus TUF FX504GD-DM883
MSI GL63 8RD-675ES: NVIDIA GeForce GTX 1050 Ti Mobile, 15.60", 2.2 kg
Recensioni esterne » MSI GL63 8RD-675ES
MSI GE75 Raider 8SE-035XES: NVIDIA GeForce RTX 2060 Mobile, 17.30", 2.7 kg
Recensioni esterne » MSI GE75 Raider 8SE-035XES
MSI GS75 Stealth 8SF-099FR: NVIDIA GeForce RTX 2070 Mobile, 17.30", 2.3 kg
Recensioni esterne » MSI GS75 Stealth 8SF-099FR
Lenovo ThinkPad X1 Extreme-20MF000TRT: NVIDIA GeForce GTX 1050 Ti Max-Q, 15.60", 1.8 kg
Recensioni esterne » Lenovo ThinkPad X1 Extreme-20MF000TRT
BTO Notebooks X-Book 17X882: NVIDIA GeForce RTX 2070 Mobile, 17.30", 2.6 kg
Recensioni esterne » BTO Notebooks X-Book 17X882
Asus ROG Strix Scar II GL504GW-ES043: NVIDIA GeForce RTX 2070 Mobile, 15.60", 2.4 kg
Recensioni esterne » Asus ROG Strix Scar II GL504GW-ES043
MSI GL63 8SD-437ID: NVIDIA GeForce GTX 1660 Ti Mobile, 15.60", 2.2 kg
Recensioni esterne » MSI GL63 8SD-437ID
MSI GS75 Stealth 8SF-099EN: NVIDIA GeForce RTX 2070 Mobile, 17.30", 2.3 kg
Recensioni esterne » MSI GS75 Stealth 8SF-099EN
MSI GL73 8RD-099XES: NVIDIA GeForce GTX 1050 Ti Mobile, 17.30", 2.7 kg
Recensioni esterne » MSI GL73 8RD-099XES
Asus ROG Strix SCAR II GL504GM-ES363T: NVIDIA GeForce GTX 1060 Mobile, 15.60", 2.4 kg
Recensioni esterne » Asus ROG Strix SCAR II GL504GM-ES363T
Alienware m15 P79F: NVIDIA GeForce RTX 2070 Max-Q, 15.60", 2.2 kg
Recensioni esterne » Alienware m15 P79F
Lenovo Legion Y740-15CHg-81HE0041GE: NVIDIA GeForce RTX 2070 Max-Q, 15.60", 2.2 kg
Recensioni esterne » Lenovo Legion Y740-15CHg-81HE0041GE
Origin PC EVO16-S (i7-8750H, RTX 2080 Max-Q): NVIDIA GeForce RTX 2080 Max-Q, 16.10", 2.1 kg
Recensioni esterne » Origin PC EVO16-S (i7-8750H, RTX 2080 Max-Q)
Aorus 15 X9: NVIDIA GeForce RTX 2070 Mobile, 15.60", 2.4 kg
Recensioni esterne » Aorus 15 X9
Medion Erazer X15805: NVIDIA GeForce RTX 2070 Max-Q, 15.60", 2.2 kg
Recensioni esterne » Medion Erazer X15805
Lenovo Legion Y740-15ICHg-81HE0044GE: NVIDIA GeForce RTX 2070 Max-Q, 15.60", 2.2 kg
Recensioni esterne » Lenovo Legion Y740-15ICHg-81HE0044GE
Lenovo Legion Y740-15ICHg-81HE0004US: NVIDIA GeForce RTX 2070 Max-Q, 15.60", 2.2 kg
Recensioni esterne » Lenovo Legion Y740-15ICHg-81HE0004US
HP Pavilion 17-ab402ng: NVIDIA GeForce GTX 1050 Mobile, 17.30", 3.1 kg
Recensioni esterne » HP Pavilion 17-ab402ng
Asus Zephyrus S GX701GX-EV021R: NVIDIA GeForce RTX 2080 Max-Q, 17.30", 2.7 kg
Recensioni esterne » Asus Zephyrus S GX701GX-EV021R
MSI GS75 Stealth 8SE-066ES: NVIDIA GeForce RTX 2060 Mobile, 17.30", 2.3 kg
Recensioni esterne » MSI GS75 Stealth 8SE-066ES
Lenovo Ideapad 330-17ICH-81FL008VGE: NVIDIA GeForce GTX 1050 Mobile, 17.30", 2.8 kg
Recensioni esterne » Lenovo Ideapad 330-17ICH-81FL008VGE
Medion Erazer P6705-MD61347: NVIDIA GeForce GTX 1050 Ti Mobile, 15.60", 2.5 kg
Recensioni esterne » Medion Erazer P6705-MD61347
Medion Erazer P6705-MD61343: NVIDIA GeForce GTX 1050 Ti Mobile, 15.60", 2.7 kg
Recensioni esterne » Medion Erazer P6705-MD61343
Asus TUF FX565GM-ES277T: NVIDIA GeForce GTX 1060 Mobile, 15.60", 2.3 kg
Recensioni esterne » Asus TUF FX565GM-ES277T
BTO Notebooks X-Book 16X885: NVIDIA GeForce RTX 2060 Mobile, 16.10", 2.1 kg
Recensioni esterne » BTO Notebooks X-Book 16X885
Acer Aspire Nitro 7 AN715-51: NVIDIA GeForce GTX 1650 Mobile, 15.60", 2.2 kg
Recensioni esterne » Acer Aspire Nitro 7 AN715-51
MSI GS65 8SG-005: NVIDIA GeForce RTX 2080 Max-Q, 15.60", 1.9 kg
Recensioni esterne » MSI GS65 8SG-005
Dell G5 15 5590-650GJ: NVIDIA GeForce RTX 2060 Mobile, 15.60", 2.8 kg
Recensioni esterne » Dell G5 15 5590-650GJ
Acer Predator Triton 500 PT515-51-73G6: NVIDIA GeForce RTX 2060 Mobile, 15.60", 2.1 kg
Recensioni esterne » Acer Predator Triton 500 PT515-51-73G6
HP Gaming Pavilion 15-cx0205ng: NVIDIA GeForce GTX 1050 Ti Mobile, 15.60", 2.3 kg
Recensioni esterne » HP Gaming Pavilion 15-cx0205ng
Asus ROG Strix Hero II G515GV-ES048T: NVIDIA GeForce RTX 2060 Mobile, 15.60", 2.4 kg
Recensioni esterne » Asus ROG Strix Hero II G515GV-ES048T
MSI GS75 8SF-071: NVIDIA GeForce RTX 2070 Max-Q, 17.30", 2.3 kg
Recensioni esterne » MSI GS75 8SF-071
Lenovo Legion Y740-17ICHg-81HH001NGE: NVIDIA GeForce RTX 2080 Max-Q, 17.30", 2.9 kg
Recensioni esterne » Lenovo Legion Y740-17ICHg-81HH001NGE
Alienware m15-KV74W: NVIDIA GeForce RTX 2070 Max-Q, 15.60", 2.2 kg
Recensioni esterne » Alienware m15-KV74W
Dell G7 17-7790-WMGG1: NVIDIA GeForce RTX 2060 Mobile, 17.30", 3.3 kg
Recensioni esterne » Dell G7 17-7790-WMGG1
MSI GS75 8SF-005NL: NVIDIA GeForce RTX 2070 Max-Q, 17.30", 2.3 kg
Recensioni esterne » MSI GS75 8SF-005NL
Asus TUF FX505GE-BQ166: NVIDIA GeForce GTX 1050 Ti Mobile, 15.60", 2.2 kg
Recensioni esterne » Asus TUF FX505GE-BQ166
Asus Zephyrus S GX531GX: NVIDIA GeForce RTX 2080 Max-Q, 15.60", 2.1 kg
Recensioni esterne » Asus Zephyrus S GX531GX
Asus Zephyrus S GX701GX-EV064T: NVIDIA GeForce RTX 2080 Max-Q, 17.30", 2.6 kg
Recensioni esterne » Asus Zephyrus S GX701GX-EV064T
Razer Blade 15 RTX 2060: NVIDIA GeForce RTX 2060 Mobile, 15.60", 2.1 kg
Recensioni esterne » Razer Blade 15 RTX 2060
Lenovo Legion Y740-15ICHg-81HE0000US: NVIDIA GeForce RTX 2060 Mobile, 15.60", 2.2 kg
Recensioni esterne » Lenovo Legion Y740-15ICHg-81HE0000US
Origin PC NT-15 Quadro: NVIDIA Quadro P4200, 15.60", 2 kg
Recensioni esterne » Origin PC NT-15 Quadro
Lenovo Legion Y540-15ICH: NVIDIA GeForce RTX 2060 Mobile, 15.60", 2.4 kg
Recensioni esterne » Lenovo Legion Y540-15ICH
Asus Zephyrus S GX531GW-ES035R: NVIDIA GeForce RTX 2070 Max-Q, 15.60", 2.1 kg
Recensioni esterne » Asus Zephyrus S GX531GW-ES035R
MSI GE75 8SE-047: NVIDIA GeForce RTX 2060 Mobile, 17.30", 2.6 kg
Recensioni esterne » MSI GE75 8SE-047
Asus ROG Strix Scar II GL704GV-EV024T: NVIDIA GeForce RTX 2060 Mobile, 17.30", 2.9 kg
Recensioni esterne » Asus ROG Strix Scar II GL704GV-EV024T
MSI GS75 Stealth 8SG-054NE: NVIDIA GeForce RTX 2080 Mobile, 17.30", 2.3 kg
Recensioni esterne » MSI GS75 Stealth 8SG-054NE
Acer Predator Triton 500 PT515-51-73UX: NVIDIA GeForce RTX 2080 Mobile, 15.60", 2 kg
Recensioni esterne » Acer Predator Triton 500 PT515-51-73UX
Aorus 15 W9: NVIDIA GeForce RTX 2060 Mobile, 15.60", 2.2 kg
Recensioni esterne » Aorus 15 W9
Dell G5 15 5590-931WJ: NVIDIA GeForce RTX 2060 Mobile, 15.60", 2.8 kg
Recensioni esterne » Dell G5 15 5590-931WJ
Asus ROG Strix Scar II GL704GW: NVIDIA GeForce RTX 2070 Mobile, 17.30", 2.9 kg
Recensioni esterne » Asus ROG Strix Scar II GL704GW
Lenovo Legion Y740-17ICHG-81HH0012GE: NVIDIA GeForce RTX 2070 Max-Q, 17.30", 2.9 kg
Recensioni esterne » Lenovo Legion Y740-17ICHG-81HH0012GE
MSI GE75 8SG-042 Raider: NVIDIA GeForce RTX 2080 Mobile, 17.30", 2.7 kg
Recensioni esterne » MSI GE75 8SG-042 Raider
MSI GE75 8SF: NVIDIA GeForce RTX 2070 Mobile, 17.30", 2.6 kg
Recensioni esterne » MSI GE75 8SF
Asus ROG Strix Scar II GL704GW-EV042T: NVIDIA GeForce RTX 2070 Mobile, 17.00", 2.9 kg
Recensioni esterne » Asus ROG Strix Scar II GL704GW-EV042T
MSI GE75 Raider 8SF-033XES: NVIDIA GeForce RTX 2070 Mobile, 17.30", 2.7 kg
Recensioni esterne » MSI GE75 Raider 8SF-033XES
MSI GE63 Raider 8RF-040ES: NVIDIA GeForce GTX 1070 Mobile, 15.60", 2.4 kg
Recensioni esterne » MSI GE63 Raider 8RF-040ES
MSI GL63 8RC-679XES: NVIDIA GeForce GTX 1050 Mobile, 15.60", 2.2 kg
Recensioni esterne » MSI GL63 8RC-679XES
MSI GL73 8SE-008XES: NVIDIA GeForce RTX 2060 Mobile, 17.30", 2.9 kg
Recensioni esterne » MSI GL73 8SE-008XES
MSI GP73 Leopard 8RE-658XES: NVIDIA GeForce GTX 1060 Mobile, 17.30", 2.7 kg
Recensioni esterne » MSI GP73 Leopard 8RE-658XES
Asus TUF FX505GD-BQ137: NVIDIA GeForce GTX 1050 Mobile, 15.60", 2.3 kg
Recensioni esterne » Asus TUF FX505GD-BQ137
BTO Notebooks X-Book 17CL875: NVIDIA GeForce GTX 1060 Mobile, 17.30", 3 kg
Recensioni esterne » BTO Notebooks X-Book 17CL875
Asus Zephyrus S GX735GW-EV005T: NVIDIA GeForce RTX 2070 Mobile, 17.30", 2.7 kg
Recensioni esterne » Asus Zephyrus S GX735GW-EV005T
Medion Erazer P6605-MD61232: NVIDIA GeForce GTX 1050 Mobile, 15.60", 2.7 kg
Recensioni esterne » Medion Erazer P6605-MD61232
Medion Erazer X7861: NVIDIA GeForce GTX 1070 Mobile, 17.30", 3.4 kg
Recensioni esterne » Medion Erazer X7861
MSI GS65 Stealth 8SF-051FR: NVIDIA GeForce RTX 2070 Max-Q, 15.60", 1.9 kg
Recensioni esterne » MSI GS65 Stealth 8SF-051FR
MSI GS75 8SG-064ES: NVIDIA GeForce RTX 2080 Mobile, 17.30", 2.3 kg
Recensioni esterne » MSI GS75 8SG-064ES
MSI GL63 8SE-026XES: NVIDIA GeForce RTX 2060 Mobile, 15.60", 2.3 kg
Recensioni esterne » MSI GL63 8SE-026XES
MSI GV62 8RD-011XES: NVIDIA GeForce GTX 1050 Ti Mobile, 15.60", 2.2 kg
Recensioni esterne » MSI GV62 8RD-011XES
MSI GL63 8RC-644XES: NVIDIA GeForce GTX 1050 Mobile, 15.60", 2.2 kg
Recensioni esterne » MSI GL63 8RC-644XES
BTO Notebooks X-Book 17X872: NVIDIA GeForce GTX 1050 Ti Mobile, 17.20", 2.5 kg
Recensioni esterne » BTO Notebooks X-Book 17X872
Asus ROG Strix Scar II GL504GW-ES012T: NVIDIA GeForce RTX 2070 Mobile, 15.60", 2.4 kg
Recensioni esterne » Asus ROG Strix Scar II GL504GW-ES012T
HP ZBook Studio x360 G5-4QH13EA: NVIDIA Quadro P1000, 15.60", 2.4 kg
Recensioni esterne » HP ZBook Studio x360 G5-4QH13EA
HP Pavilion 15-cx0510nd: NVIDIA GeForce GTX 1060 Mobile, 15.60", 2.4 kg
Recensioni esterne » HP Pavilion 15-cx0510nd
Lenovo Legion Y740-15CHg-81HE000RCK: NVIDIA GeForce RTX 2070 Max-Q, 15.60", 2.2 kg
Recensioni esterne » Lenovo Legion Y740-15CHg-81HE000RCK
Asus Strix Scar II GL504GV-ES087T : NVIDIA GeForce RTX 2060 Mobile, 15.60", 2.4 kg
Recensioni esterne » Asus Strix Scar II GL504GV-ES087T
Asus ROG Strix Scar II GL504GM-ES040T: NVIDIA GeForce GTX 1060 Mobile, 15.60", 2.4 kg
Recensioni esterne » Asus ROG Strix Scar II GL504GM-ES040T
Asus Strix GL504GW-DS74: NVIDIA GeForce RTX 2070 Mobile, 15.60", 2.5 kg
Recensioni esterne » Asus Strix GL504GW-DS74
Alienware m17-XW6MJ: NVIDIA GeForce RTX 2070 Max-Q, 17.30", 2.6 kg
Recensioni esterne » Alienware m17-XW6MJ
Asus Strix Scar II GL704GV-EV052T: NVIDIA GeForce RTX 2060 Mobile, 17.30", 2.9 kg
Recensioni esterne » Asus Strix Scar II GL704GV-EV052T
MSI P65 Creator 8RF-442: NVIDIA GeForce GTX 1070 Mobile, 15.60", 1.9 kg
Recensioni esterne » MSI P65 Creator 8RF-442
Asus Zephyrus S GX531GX-ES036R: NVIDIA GeForce RTX 2080 Max-Q, 15.60", 2.1 kg
Recensioni esterne » Asus Zephyrus S GX531GX-ES036R
HP Omen 15-dc0010ng: NVIDIA GeForce GTX 1070 Max-Q, 15.60", 2.5 kg
Recensioni esterne » HP Omen 15-dc0010ng
HP Spectre x360 15 (OLED 2019): NVIDIA GeForce MX150, 15.60", 2.2 kg
Recensioni esterne » HP Spectre x360 15 (OLED 2019)
Asus TUF FX705GE-EW096T: NVIDIA GeForce GTX 1050 Ti Mobile, 17.30", 2.6 kg
Recensioni esterne » Asus TUF FX705GE-EW096T
Lenovo ThinkPad X1 Extreme-20MF000XUK: NVIDIA GeForce GTX 1050 Ti Mobile, 15.60", 1.7 kg
Recensioni esterne » Lenovo ThinkPad X1 Extreme-20MF000XUK
Asus TUF FX504GE-E4183T: NVIDIA GeForce GTX 1050 Ti Mobile, 15.60", 2.3 kg
Recensioni esterne » Asus TUF FX504GE-E4183T
Asus ROG G703GX: NVIDIA GeForce RTX 2080 Mobile, 17.30", 4.7 kg
Recensioni esterne » Asus ROG G703GX
Asus TUF FX705GM-BI7N5: NVIDIA GeForce GTX 1060 Mobile, 17.30", 2.8 kg
Recensioni esterne » Asus TUF FX705GM-BI7N5
Lenovo Legion Y7000P-1060: NVIDIA GeForce GTX 1060 Mobile, 15.60", 2.4 kg
Recensioni esterne » Lenovo Legion Y7000P-1060
MSI GL63 8SE-071: NVIDIA GeForce RTX 2060 Mobile, 15.60", 2.3 kg
Recensioni esterne » MSI GL63 8SE-071
Acer Predator Triton 500: NVIDIA GeForce RTX 2080 Max-Q, 15.60", 2.1 kg
Recensioni esterne » Acer Predator Triton 500
Lenovo Legion Y740-17ICH: NVIDIA GeForce RTX 2080 Max-Q, 17.30", 2.8 kg
Recensioni esterne » Lenovo Legion Y740-17ICH
Asus TUF FX505GM-ES011T: NVIDIA GeForce GTX 1060 Mobile, 15.60", 2.3 kg
Recensioni esterne » Asus TUF FX505GM-ES011T
Asus Zephyrus M GM501GM-EI005T: NVIDIA GeForce GTX 1060 Max-Q, 15.60", 2.5 kg
Recensioni esterne » Asus Zephyrus M GM501GM-EI005T
MSI GS75 8SE-073: NVIDIA GeForce RTX 2060 Mobile, 17.30", 2.3 kg
Recensioni esterne » MSI GS75 8SE-073
MSI Creator P65 8RF-453NE: NVIDIA GeForce GTX 1070 Max-Q, 15.60", 1.9 kg
Recensioni esterne » MSI Creator P65 8RF-453NE
HP Omen 15-dc0805no: NVIDIA GeForce GTX 1070 Mobile, 15.60", 2.5 kg
Recensioni esterne » HP Omen 15-dc0805no
Lenovo ThinkPad X1 Extreme-20MF000TMD: NVIDIA GeForce GTX 1050 Ti Mobile, 15.60", 1.8 kg
Recensioni esterne » Lenovo ThinkPad X1 Extreme-20MF000TMD
Acer Predator Helios 500 517-51-59BH: NVIDIA GeForce GTX 1070 Mobile, 17.30", 4 kg
Recensioni esterne » Acer Predator Helios 500 517-51-59BH
Asus Zephyrus S GX701GX: NVIDIA GeForce RTX 2080 Max-Q, 17.30", 2.6 kg
Recensioni esterne » Asus Zephyrus S GX701GX
Gigabyte Sabre 15-K v8: NVIDIA GeForce GTX 1060 Mobile, 15.60", 2.5 kg
Recensioni esterne » Gigabyte Sabre 15-K v8
Gigabyte Aero 15-X9: NVIDIA GeForce RTX 2070 Max-Q, 15.60", 2.1 kg
Recensioni esterne » Gigabyte Aero 15-X9
MSI GS65 8SG-055: NVIDIA GeForce RTX 2080 Max-Q, 15.60", 1.9 kg
Recensioni esterne » MSI GS65 8SG-055
MSI GF72 8RD-081XES: NVIDIA GeForce GTX 1050 Ti Mobile, 17.30", 2.7 kg
Recensioni esterne » MSI GF72 8RD-081XES
MSI GE73 Raider 8RF-029ES: NVIDIA GeForce GTX 1070 Mobile, 17.30", 2.8 kg
Recensioni esterne » MSI GE73 Raider 8RF-029ES
Dell G3 15 3579-CN35713: NVIDIA GeForce GTX 1060 Max-Q, 15.60", 2.5 kg
Recensioni esterne » Dell G3 15 3579-CN35713
Asus TUF FX504GD-DM030T : NVIDIA GeForce GTX 1050 Mobile, 15.60", 2.3 kg
Recensioni esterne » Asus TUF FX504GD-DM030T
Asus ZenBook Pro 15 UX550GD-BN026T: NVIDIA GeForce GTX 1050 Mobile, 15.60", 1.9 kg
Recensioni esterne » Asus ZenBook Pro 15 UX550GD-BN026T
Lenovo Ideapad 330-15ICH-81FK006YSP: NVIDIA GeForce GTX 1050 Mobile, 15.60", 2.2 kg
Recensioni esterne » Lenovo Ideapad 330-15ICH-81FK006YSP
Asus ROG Strix Scar II GL704GW-EV005T: NVIDIA GeForce RTX 2070 Mobile, 17.30", 2.9 kg
Recensioni esterne » Asus ROG Strix Scar II GL704GW-EV005T
Razer Blade 15 RTX 2070 Max-Q: NVIDIA GeForce RTX 2070 Max-Q, 15.60", 2.1 kg
Recensioni esterne » Razer Blade 15 RTX 2070 Max-Q
MSI GS75 8SG Stealth: NVIDIA GeForce RTX 2080 Max-Q, 17.30", 2.3 kg
Recensioni esterne » MSI GS75 8SG Stealth
HP Spectre x360 15-df0004: NVIDIA GeForce GTX 1050 Ti Mobile, 15.60", 2.2 kg
Recensioni esterne » HP Spectre x360 15-df0004
MSI GE75 Raider 8RF-012XES: NVIDIA GeForce GTX 1070 Mobile, 17.30", 2.6 kg
Recensioni esterne » MSI GE75 Raider 8RF-012XES
Lenovo Legion Y530-15ICH-81FV001MTX: NVIDIA GeForce GTX 1050 Ti Mobile, 15.60", 2.3 kg
Recensioni esterne » Lenovo Legion Y530-15ICH-81FV001MTX
Alienware M15, GTX 1070: NVIDIA GeForce GTX 1070 Mobile, 15.60", 2.2 kg
Recensioni esterne » Alienware M15, GTX 1070
Asus TUF FX504GE-DM286: NVIDIA GeForce GTX 1050 Ti Mobile, 15.60", 2.3 kg
Recensioni esterne » Asus TUF FX504GE-DM286
Asus ROG Strix GL504GM-ES158T: NVIDIA GeForce GTX 1060 Mobile, 15.60", 2.4 kg
Recensioni esterne » Asus ROG Strix GL504GM-ES158T
Asus G703GI-E5013T: NVIDIA GeForce GTX 1080 Mobile, 17.30", 4.7 kg
Recensioni esterne » Asus G703GI-E5013T
Asus Strix GL504GM-ES157T: NVIDIA GeForce GTX 1060 Mobile, 15.60", 2.4 kg
Recensioni esterne » Asus Strix GL504GM-ES157T
Asus Zephyrus S GX531GM-ES037T: NVIDIA GeForce GTX 1060 Mobile, 15.60", 2.1 kg
Recensioni esterne » Asus Zephyrus S GX531GM-ES037T
Lenovo Legion Y730-15ICH-81HD001LSP: NVIDIA GeForce GTX 1050 Ti Mobile, 15.60", 2.2 kg
Recensioni esterne » Lenovo Legion Y730-15ICH-81HD001LSP
Lenovo Legion Y530-15ICH-81FV00E2SP: NVIDIA GeForce GTX 1050 Mobile, 15.60", 2.3 kg
Recensioni esterne » Lenovo Legion Y530-15ICH-81FV00E2SP
Medion Erazer P6705-MD61204: NVIDIA GeForce GTX 1050 Ti Mobile, 15.60", 2.5 kg
Recensioni esterne » Medion Erazer P6705-MD61204
Lenovo Ideapad 330-15ICH-81FK00ADGE: NVIDIA GeForce GTX 1050 Mobile, 15.60", 2.2 kg
Recensioni esterne » Lenovo Ideapad 330-15ICH-81FK00ADGE
Medion Erazer X6807-i7-512F16: NVIDIA GeForce GTX 1060 Mobile, 15.60", 2 kg
Recensioni esterne » Medion Erazer X6807-i7-512F16
Alienware m15 GTX 1070 Max-Q: NVIDIA GeForce GTX 1070 Max-Q, 15.60", 2.2 kg
Recensioni esterne » Alienware m15 GTX 1070 Max-Q
MSI P65 8RF-451 - Creator: NVIDIA GeForce GTX 1070 Max-Q, 15.60", 1.9 kg
Recensioni esterne » MSI P65 8RF-451 - Creator
MSI GS65 8RF-233NL: NVIDIA GeForce GTX 1070 Max-Q, 15.60", 1.9 kg
Recensioni esterne » MSI GS65 8RF-233NL
MSI GE63 8RE-021XES: NVIDIA GeForce GTX 1060 Mobile, 15.60", 2.4 kg
Recensioni esterne » MSI GE63 8RE-021XES
HP Omen 15-dc0024nl: NVIDIA GeForce GTX 1060 Mobile, 15.60", 2.5 kg
Recensioni esterne » HP Omen 15-dc0024nl
HP Pavilion Gaming 15-cx0000ns : NVIDIA GeForce GTX 1050 Ti Mobile, 15.60", 2.3 kg
Recensioni esterne » HP Pavilion Gaming 15-cx0000ns
Xiaomi Mi Gaming Laptop 8750H 1060: NVIDIA GeForce GTX 1060 Mobile, 15.60", 2.7 kg
Recensioni esterne » Xiaomi Mi Gaming Laptop 8750H 1060
MSI GF72 8RE-062XES: NVIDIA GeForce GTX 1060 Mobile, 17.30", 2.8 kg
Recensioni esterne » MSI GF72 8RE-062XES
Asus TUF FX705GM: NVIDIA GeForce GTX 1060 Mobile, 17.30", 2.8 kg
Recensioni esterne » Asus TUF FX705GM
Asus TUF FX765GM-EV191T: NVIDIA GeForce GTX 1060 Mobile, 17.30", 2.7 kg
Recensioni esterne » Asus TUF FX765GM-EV191T
MSI P65 8RE-042CZ: NVIDIA GeForce GTX 1060 Max-Q, 15.60", 1.8 kg
Recensioni esterne » MSI P65 8RE-042CZ
Lenovo ThinkPad P72-20MB0005GE: NVIDIA Quadro P2000, 17.30", 3.4 kg
Recensioni esterne » Lenovo ThinkPad P72-20MB0005GE
Lenovo Legion Y530-15ICH: NVIDIA GeForce GTX 1060 Mobile, 15.60", 2.3 kg
Recensioni esterne » Lenovo Legion Y530-15ICH
MSI GF63 8RD-254UK: NVIDIA GeForce GTX 1050 Ti Mobile, 15.60", 1.9 kg
Recensioni esterne » MSI GF63 8RD-254UK
Razer Blade 15 Base Model: NVIDIA GeForce GTX 1060 Max-Q, 15.60", 2 kg
Recensioni esterne » Razer Blade 15 Base Model
Lenovo Legion Y530-15ICH-81LB0033GE: NVIDIA GeForce GTX 1060 Mobile, 15.60", 2.3 kg
Recensioni esterne » Lenovo Legion Y530-15ICH-81LB0033GE
Asus ROG Strix Scar II GL704GM-EV027T: NVIDIA GeForce GTX 1060 Mobile, 17.30", 2.9 kg
Recensioni esterne » Asus ROG Strix Scar II GL704GM-EV027T
MSI P65 8RE-005ES: NVIDIA GeForce GTX 1060 Mobile, 15.60", 1.9 kg
Recensioni esterne » MSI P65 8RE-005ES
MSI P65 8RE-006ES: NVIDIA GeForce GTX 1060 Mobile, 15.60", 1.9 kg
Recensioni esterne » MSI P65 8RE-006ES
Lenovo Thinkpad P52-20M9001FSP: NVIDIA Quadro P1000, 15.60", 2.5 kg
Recensioni esterne » Lenovo Thinkpad P52-20M9001FSP
Medion Erazer P6705-MD61203: NVIDIA GeForce GTX 1050 Ti Mobile, 15.60", 2.7 kg
Recensioni esterne » Medion Erazer P6705-MD61203
MSI GF63 8RC-457XES: NVIDIA GeForce GTX 1050 Mobile, 15.60", 1.9 kg
Recensioni esterne » MSI GF63 8RC-457XES
MSI GS73 Stealth 8RD-006XES: NVIDIA GeForce GTX 1050 Ti Mobile, 17.30", 2.4 kg
Recensioni esterne » MSI GS73 Stealth 8RD-006XES
Acer Predator Helios 300 PH315-51-762W: NVIDIA GeForce GTX 1060 Mobile, 15.60", 2.7 kg
Recensioni esterne » Acer Predator Helios 300 PH315-51-762W
Asus FX504GD-DM473: NVIDIA GeForce GTX 1050 Mobile, 15.60", 2.3 kg
Recensioni esterne » Asus FX504GD-DM473
Lenovo Ideapad 330-15ICH-81FK0072SP: NVIDIA GeForce GTX 1050 Mobile, 15.60", 2.2 kg
Recensioni esterne » Lenovo Ideapad 330-15ICH-81FK0072SP
Asus ROG Strix GL504GM-ES070T: NVIDIA GeForce GTX 1060 Mobile, 15.60", 2.4 kg
Recensioni esterne » Asus ROG Strix GL504GM-ES070T
Asus Strix Scar II GL504GS-ES082T: NVIDIA GeForce GTX 1070 Mobile, 15.60", 2.5 kg
Recensioni esterne » Asus Strix Scar II GL504GS-ES082T
MSI GF63 8RC-230CH: NVIDIA GeForce GTX 1050 Mobile, 15.60", 1.9 kg
Recensioni esterne » MSI GF63 8RC-230CH
Dell XPS 15 9575-Y4H2V: NVIDIA GeForce GTX 1050 Mobile, 15.60", 2 kg
Recensioni esterne » Dell XPS 15 9575-Y4H2V
MSI GF63 8RD-291XES: NVIDIA GeForce GTX 1050 Ti Max-Q, 15.60", 1.9 kg
Recensioni esterne » MSI GF63 8RD-291XES
Asus ZenBook Pro 15 UX550GD-BN015T: NVIDIA GeForce GTX 1050 Mobile, 15.60", 1.9 kg
Recensioni esterne » Asus ZenBook Pro 15 UX550GD-BN015T
Asus TUF FX705GE-EW103: NVIDIA GeForce GTX 1050 Ti Mobile, 17.30", 2.7 kg
Recensioni esterne » Asus TUF FX705GE-EW103
MSI GF63 8RD-010ES: NVIDIA GeForce GTX 1050 Ti Max-Q, 15.60", 1.9 kg
Recensioni esterne » MSI GF63 8RD-010ES
Asus TUF FX505GE-BQ159T: NVIDIA GeForce GTX 1050 Ti Mobile, 15.60", 2.2 kg
Recensioni esterne » Asus TUF FX505GE-BQ159T
Asus TUF FX505GM-ES088T: NVIDIA GeForce GTX 1060 Mobile, 15.60", 2.3 kg
Recensioni esterne » Asus TUF FX505GM-ES088T
Lenovo ThinkPad X1 Extreme-20MF000TGE: NVIDIA GeForce GTX 1050 Ti Mobile, 15.60", 1.8 kg
Recensioni esterne » Lenovo ThinkPad X1 Extreme-20MF000TGE
Lenovo Legion Y530-15ICH-81FV00L5TX: NVIDIA GeForce GTX 1050 Ti Mobile, 15.60", 2.8 kg
Recensioni esterne » Lenovo Legion Y530-15ICH-81FV00L5TX
MSI P65 Creator 8RF-456NL: NVIDIA GeForce GTX 1070 Max-Q, 15.60", 1.9 kg
Recensioni esterne » MSI P65 Creator 8RF-456NL
HP 15-dc0036TX: NVIDIA GeForce GTX 1050 Ti Mobile, 15.60", 2.3 kg
Recensioni esterne » HP 15-dc0036TX
Lenovo Legion Y530-81FV00JQPB: NVIDIA GeForce GTX 1050 Ti Mobile, 15.60", 2.2 kg
Recensioni esterne » Lenovo Legion Y530-81FV00JQPB
Acer Predator Helios 300 Special Edition PH315-51-78UA: NVIDIA GeForce GTX 1060 Mobile, 15.60", 2.7 kg
Recensioni esterne » Acer Predator Helios 300 Special Edition PH315-51-78UA
Acer Predator Helios 300 PH315-51-78NP: NVIDIA GeForce GTX 1060 Mobile, 15.60", 2.7 kg
Recensioni esterne » Acer Predator Helios 300 PH315-51-78NP
Acer Predator Helios 300 PH315-51-757A: NVIDIA GeForce GTX 1060 Mobile, 15.60", 2.7 kg
Recensioni esterne » Acer Predator Helios 300 PH315-51-757A
Asus GL704GM-DH74: NVIDIA GeForce GTX 1060 Mobile, 17.30", 2.9 kg
Recensioni esterne » Asus GL704GM-DH74
HP Omen 15-dc0029na: NVIDIA GeForce GTX 1060 Mobile, 15.60", 2.5 kg
Recensioni esterne » HP Omen 15-dc0029na
HP Pavilion 15-cx0004ng: NVIDIA GeForce GTX 1050 Ti Mobile, 15.60", 2.3 kg
Recensioni esterne » HP Pavilion 15-cx0004ng
Acer Predator Helios 300 PH315-51-76VB: NVIDIA GeForce GTX 1060 Mobile, 15.60", 2.7 kg
Recensioni esterne » Acer Predator Helios 300 PH315-51-76VB
Acer Predator Helios 300 PH315-51-7581: NVIDIA GeForce GTX 1060 Mobile, 15.60", 2.7 kg
Recensioni esterne » Acer Predator Helios 300 PH315-51-7581
MSI GF63 8RD-010XES: NVIDIA GeForce GTX 1050 Ti Max-Q, 15.60", 1.9 kg
Recensioni esterne » MSI GF63 8RD-010XES
MSI P65 Creator 8RF-445ES: NVIDIA GeForce GTX 1070 Max-Q, 15.60", 1.9 kg
Recensioni esterne » MSI P65 Creator 8RF-445ES
MSI GE73 Raider 8RE-023XES: NVIDIA GeForce GTX 1060 Mobile, 17.30", 2.8 kg
Recensioni esterne » MSI GE73 Raider 8RE-023XES
Asus Strix Scar II GL704GM-DH74: NVIDIA GeForce GTX 1060 Mobile, 17.30", 3 kg
Recensioni esterne » Asus Strix Scar II GL704GM-DH74
HP Omen 15-dc0096nd: NVIDIA GeForce GTX 1060 Mobile, 15.60", 2.5 kg
Recensioni esterne » HP Omen 15-dc0096nd
MSI GE63 8RE-045NL: NVIDIA GeForce GTX 1060 Mobile, 15.60", 2.5 kg
Recensioni esterne » MSI GE63 8RE-045NL
MSI GF63 8RD-050NL: NVIDIA GeForce GTX 1050 Ti Mobile, 15.60", 1.9 kg
Recensioni esterne » MSI GF63 8RD-050NL
MSI GS65 Stealth Thin 8RE-051US: NVIDIA GeForce GTX 1060 Mobile, 15.60", 1.8 kg
Recensioni esterne » MSI GS65 Stealth Thin 8RE-051US
Acer Nitro 5 AN515-52-73Y8: NVIDIA GeForce GTX 1060 Mobile, 15.60", 2.7 kg
Recensioni esterne » Acer Nitro 5 AN515-52-73Y8
Alienware m15, GTX 1070 Max-Q: NVIDIA GeForce GTX 1070 Max-Q, 15.60", 2.2 kg
Recensioni esterne » Alienware m15, GTX 1070 Max-Q
Asus TUF FX504GM-E4326T: NVIDIA GeForce GTX 1060 Mobile, 15.60", 2.3 kg
Recensioni esterne » Asus TUF FX504GM-E4326T
Alienware 17 R5: NVIDIA GeForce GTX 1070 Mobile, 17.30", 4.4 kg
Recensioni esterne » Alienware 17 R5
Asus Strix Scar II GL504GM-ES155T: NVIDIA GeForce GTX 1060 Mobile, 15.60", 2.4 kg
Recensioni esterne » Asus Strix Scar II GL504GM-ES155T
Asus ROG Strix Scar II GL504GS-ES056T: NVIDIA GeForce GTX 1070 Mobile, 15.60", 2.4 kg
Recensioni esterne » Asus ROG Strix Scar II GL504GS-ES056T
Asus FX504GE-E4063: NVIDIA GeForce GTX 1050 Ti Mobile, 15.60", 2.3 kg
Recensioni esterne » Asus FX504GE-E4063
Asus Zephyrus GX501GI: NVIDIA GeForce GTX 1080 Max-Q, 15.60", 2.3 kg
Recensioni esterne » Asus Zephyrus GX501GI
MSI WS63 8SJ-047ES: NVIDIA Quadro P2000, 15.60", 1.9 kg
Recensioni esterne » MSI WS63 8SJ-047ES
MSI GF62 8RD-010XES: NVIDIA GeForce GTX 1050 Ti Mobile, 15.60", 2.2 kg
Recensioni esterne » MSI GF62 8RD-010XES
MSI GV62 8RC-012XES: NVIDIA GeForce GTX 1050 Mobile, 15.60", 2.2 kg
Recensioni esterne » MSI GV62 8RC-012XES
Dell G3 15 3579-CN35712: NVIDIA GeForce GTX 1050 Ti Mobile, 15.60", 2.5 kg
Recensioni esterne » Dell G3 15 3579-CN35712
Asus STRIX GL503GE-RS71 SCAR Edition: NVIDIA GeForce GTX 1050 Ti Mobile, 15.60", 2.6 kg
Recensioni esterne » Asus STRIX GL503GE-RS71 SCAR Edition
Asus Vivobook Pro N580GD-E4189T: NVIDIA GeForce GTX 1050 Mobile, 15.60", 2 kg
Recensioni esterne » Asus Vivobook Pro N580GD-E4189T
Asus Vivobook R570ZD-DM107: NVIDIA GeForce GTX 1050 Mobile, 15.60", 2 kg
Recensioni esterne » Asus Vivobook R570ZD-DM107
HP EliteBook 1050 G1-4QY21EA: NVIDIA GeForce GTX 1050 Mobile, 15.60", 2.1 kg
Recensioni esterne » HP EliteBook 1050 G1-4QY21EA
HP Gaming Pavilion 15-cx0144tx: NVIDIA GeForce GTX 1050 Ti Mobile, 15.60", 2.2 kg
Recensioni esterne » HP Gaming Pavilion 15-cx0144tx
Asus ZenBook Pro 15 UX550GD: NVIDIA GeForce GTX 1050 Mobile, 15.60", 1.9 kg
Recensioni esterne » Asus ZenBook Pro 15 UX550GD
Asus TUF FX705GM-EW019T: NVIDIA GeForce GTX 1060 Mobile, 17.30", 2.8 kg
Recensioni esterne » Asus TUF FX705GM-EW019T
MSI GT63 Titan 8RG-048: NVIDIA GeForce GTX 1080 Mobile, 15.60", 2.9 kg
Recensioni esterne » MSI GT63 Titan 8RG-048
MSI GP63 8RD-409MY Leopard: NVIDIA GeForce GTX 1050 Ti Mobile, 15.60", 2.3 kg
Recensioni esterne » MSI GP63 8RD-409MY Leopard
Dell XPS 15 9570 i7 FHD, GTX 1050 Ti Max-Q: NVIDIA GeForce GTX 1050 Ti Max-Q, 15.60", 2 kg
Recensioni esterne » Dell XPS 15 9570 i7 FHD, GTX 1050 Ti Max-Q
Lenovo Legion Y530-15ICH-81FV008SGE: NVIDIA GeForce GTX 1050 Ti Mobile, 15.60", 2.3 kg
Recensioni esterne » Lenovo Legion Y530-15ICH-81FV008SGE
Asus TUF FX505GE-BQ153T: NVIDIA GeForce GTX 1050 Ti Mobile, 15.60", 2.2 kg
Recensioni esterne » Asus TUF FX505GE-BQ153T
MSI GF63 8RD-251: NVIDIA GeForce GTX 1050 Ti Max-Q, 15.60", 1.9 kg
Recensioni esterne » MSI GF63 8RD-251
HP EliteBook 1050 G1-4QY20EA: NVIDIA GeForce GTX 1050 Max-Q, 15.60", 2.1 kg
Recensioni esterne » HP EliteBook 1050 G1-4QY20EA
Asus TUF FX504GD-EN579T: NVIDIA GeForce GTX 1050 Mobile, 15.60", 2.3 kg
Recensioni esterne » Asus TUF FX504GD-EN579T
Medion Erazer X6805-MD61085: NVIDIA GeForce GTX 1060 Mobile, 15.60", 2.5 kg
Recensioni esterne » Medion Erazer X6805-MD61085
MSI GS65 Stealth Thin 8RF-086TR: NVIDIA GeForce GTX 1070 Mobile, 15.60", 1.9 kg
Recensioni esterne » MSI GS65 Stealth Thin 8RF-086TR
Lenovo Legion Y530-15ICH-81FV00GFMH: NVIDIA GeForce GTX 1050 Mobile, 15.60", 2.3 kg
Recensioni esterne » Lenovo Legion Y530-15ICH-81FV00GFMH
HP Pavilion 15-cx0815no: NVIDIA GeForce GTX 1060 Mobile, 15.60", 2.4 kg
Recensioni esterne » HP Pavilion 15-cx0815no
Lenovo ThinkPad X1 Extreme-20MF000XGE: NVIDIA GeForce GTX 1050 Ti Max-Q, 15.60", 1.8 kg
Recensioni esterne » Lenovo ThinkPad X1 Extreme-20MF000XGE
HP Omen 17-an113NS: NVIDIA GeForce GTX 1070 Mobile, 17.30", 3.8 kg
Recensioni esterne » HP Omen 17-AN113NS
MSI GE63 Raider 8RE-020ES: NVIDIA GeForce GTX 1060 Mobile, 15.60", 2.3 kg
Recensioni esterne » MSI GE63 Raider 8RE-020ES
Acer Aspire 7 A715-72G-75AN: NVIDIA GeForce GTX 1050 Mobile, 15.60", 2.4 kg
Recensioni esterne » Acer Aspire 7 A715-72G-75AN
Acer Predator Helios 300 PH317-52-78X3: NVIDIA GeForce GTX 1050 Ti Mobile, 17.30", 3 kg
Recensioni esterne » Acer Predator Helios 300 PH317-52-78X3
Apple MacBook Pro 15 2018 (2.2 GHz, 555X): AMD Radeon Pro 555X, 15.60", 1.8 kg
Recensioni esterne » Apple MacBook Pro 15 2018 (2.2 GHz, 555X)
Asus Strix GL504GM: NVIDIA GeForce GTX 1060 Mobile, 15.60", 2.5 kg
Recensioni esterne » Asus Strix GL504GM
MSI GS65 Stealth Thin 8RF-038NL: NVIDIA GeForce GTX 1070 Max-Q, 15.60", 1.9 kg
Recensioni esterne » MSI GS65 Stealth Thin 8RF-038NL
HP Pavilion 15-cx0670nd: NVIDIA GeForce GTX 1050 Ti Mobile, 15.60", 2.4 kg
Recensioni esterne » HP Pavilion 15-cx0670nd
HP Omen 15-dc0850nd: NVIDIA GeForce GTX 1050 Ti Mobile, 15.60", 2.4 kg
Recensioni esterne » HP Omen 15-dc0850nd
HP Omen 17-an104nd: NVIDIA GeForce GTX 1070 Mobile, 17.30", 3.8 kg
Recensioni esterne » HP Omen 17-an104nd
HP Omen 15-dc0982nd: NVIDIA GeForce GTX 1070 Mobile, 15.60", 2.4 kg
Recensioni esterne » HP Omen 15-dc0982nd
Dell XPS 15 9570 CNX97009: NVIDIA GeForce GTX 1050 Ti Mobile, 15.60", 1.8 kg
Recensioni esterne » Dell XPS 15 9570 CNX97009
Asus Zenbook Pro 15 UX580GD-E2006T: NVIDIA GeForce GTX 1050 Mobile, 15.60", 1.9 kg
Recensioni esterne » Asus Zenbook Pro 15 UX580GD-E2006T
Dell XPS 15 9570-CPC1J: NVIDIA GeForce GTX 1050 Ti Mobile, 15.60", 1.9 kg
Recensioni esterne » Dell XPS 15 9570-CPC1J
Acer Predator Helios 500 PH517-51-72NU: NVIDIA GeForce GTX 1070 Mobile, 17.30", 3.8 kg
Recensioni esterne » Acer Predator Helios 500 PH517-51-72NU
Xiaomi Mi Notebook Pro GTX-G58725D6D/CN: NVIDIA GeForce GTX 1060 Mobile, 15.60", 2.7 kg
Recensioni esterne » Xiaomi Mi Notebook Pro GTX-G58725D6D/CN
HP Pavilion 15-bc451ns: NVIDIA GeForce GTX 1050 Mobile, 15.60", 2.2 kg
Recensioni esterne » HP Pavilion 15-bc451ns
Acer Aspire Nitro 5 AN515-52-76N6: NVIDIA GeForce GTX 1050 Mobile, 15.60", 2.7 kg
Recensioni esterne » Acer Aspire Nitro 5 AN515-52-76N6
Acer Aspire 7 A717-72G-7600: NVIDIA GeForce GTX 1050 Mobile, 17.30", 3 kg
Recensioni esterne » Acer Aspire 7 A717-72G-7600
Asus Zephyrus M GM501GS-EI004T: NVIDIA GeForce GTX 1070 Mobile, 15.60", 2.5 kg
Recensioni esterne » Asus Zephyrus M GM501GS-EI004T
HP Pavilion 15-cx001nl: NVIDIA GeForce GTX 1050 Mobile, 15.60", 2.6 kg
Recensioni esterne » HP Pavilion 15-cx001nl
MSI GL73 8RD-019XES: NVIDIA GeForce GTX 1050 Ti Mobile, 17.30", 2.7 kg
Recensioni esterne » MSI GL73 8RD-019XES
MSI GS63 Stealth 8RE-012XES: NVIDIA GeForce GTX 1060 Mobile, 15.60", 1.8 kg
Recensioni esterne » MSI GS63 Stealth 8RE-012XES
HP ZBook Studio G5-2ZC50EA: NVIDIA Quadro P1000, 15.60", 2 kg
Recensioni esterne » HP ZBook Studio G5-2ZC50EA
HP Omen 15-dc0980nd: NVIDIA GeForce GTX 1060 Mobile, 15.60", 2.5 kg
Recensioni esterne » HP Omen 15-dc0980nd
MSI GP63 8RD-008BE: NVIDIA GeForce GTX 1050 Ti Mobile, 15.60", 2.2 kg
Recensioni esterne » MSI GP63 8RD-008BE
BTO Notebooks X-Book 15CL875: NVIDIA GeForce GTX 1060 Mobile, 15.60", 2 kg
Recensioni esterne » BTO Notebooks X-Book 15CL875
Asus ROG Strix G703GI-E5026R: NVIDIA GeForce GTX 1080 Mobile, 17.30", 4.7 kg
Recensioni esterne » Asus ROG Strix G703GI-E5026R
Asus ROG Strix GL504GM Scar II Edition: NVIDIA GeForce GTX 1070 Mobile, 15.60", 2.4 kg
Recensioni esterne » Asus ROG Strix GL504GM Scar II Edition
HP Gaming Pavilion 15-cx0005ng: NVIDIA GeForce GTX 1060 Max-Q, 15.60", 2.3 kg
Recensioni esterne » HP Gaming Pavilion 15-cx0005ng
HP Omen 15-dc0015ng: NVIDIA GeForce GTX 1070 Mobile, 15.60", 2.5 kg
Recensioni esterne » HP Omen 15-dc0015ng
Dell XPS 15 9570-CTXKW: NVIDIA GeForce GTX 1050 Ti Mobile, 15.60", 1.8 kg
Recensioni esterne » Dell XPS 15 9570-CTXKW
Dell G3 15 3579-7972BLK: NVIDIA GeForce GTX 1050 Ti Mobile, 15.60", 2.5 kg
Recensioni esterne » Dell G3 15 3579-7972BLK
Acer Predator Helios 300 PH315-51-73C5: NVIDIA GeForce GTX 1060 Mobile, 15.60", 2.7 kg
Recensioni esterne » Acer Predator Helios 300 PH315-51-73C5
HP EliteBook 1050 G1-4NC55UT: NVIDIA GeForce GTX 1050 Mobile, 15.60", 2.1 kg
Recensioni esterne » HP EliteBook 1050 G1-4NC55UT
Asus Zephyrus M GM501GS-90NR0031-M00420: NVIDIA GeForce GTX 1070 Mobile, 15.60", 2.5 kg
Recensioni esterne » Asus Zephyrus M GM501GS-90NR0031-M00420
Asus Zephyrus S GX531GS: NVIDIA GeForce GTX 1070 Max-Q, 15.60", 2.1 kg
Recensioni esterne » Asus GX531GS (Zephyrus S)
Asus Zephyrus S GX531GM: NVIDIA GeForce GTX 1060 Mobile, 15.60", 2.1 kg
Recensioni esterne » Asus GX531GM (Zephyrus S)
MSI GE63 Raider RGB-010: NVIDIA GeForce GTX 1070 Mobile, 15.60", 2.5 kg
Recensioni esterne » MSI GE63 Raider RGB-010
Lenovo Legion Y730-17ICH, i7-8750H: NVIDIA GeForce GTX 1050 Ti Mobile, 17.30", 2.9 kg
Recensioni esterne » Lenovo Legion Y730-17ICH, i7-8750H
Lenovo Legion Y730-15ICH, i7-8750H: NVIDIA GeForce GTX 1050 Ti Mobile, 15.60", 2.2 kg
Recensioni esterne » Lenovo Legion Y730-15ICH, i7-8750H
Dell XPS 15 9570 i7 UHD: NVIDIA GeForce GTX 1050 Ti Max-Q, 15.60", 2 kg
Recensioni esterne » Dell XPS 15 9570 i7 UHD
Dell G7 15-7588: NVIDIA GeForce GTX 1060 Max-Q, 15.60", 2.6 kg
Recensioni esterne » Dell G7 15-7588
Gigabyte Sabre 17-W8: NVIDIA GeForce GTX 1060 Mobile, 17.30", 2.8 kg
Recensioni esterne » Gigabyte Sabre 17-W8
Dell G5 15 5587-M36TX: NVIDIA GeForce GTX 1060 Max-Q, 15.60", 2.9 kg
Recensioni esterne » Dell G5 15 5587-M36TX
Alienware 15 R4-9PTN3: NVIDIA GeForce GTX 1070 Mobile, 15.60", 3.5 kg
Recensioni esterne » Alienware 15 R4-9PTN3
Asus GL504GM-DS74 Strix Hero II: NVIDIA GeForce GTX 1060 Mobile, 15.60", 2.4 kg
Recensioni esterne » Asus GL504GM-DS74 Strix Hero II
Origin PC EVO15-S 2018, 8750H: NVIDIA GeForce GTX 1070 Max-Q, 15.60", 2 kg
Recensioni esterne » Origin PC EVO15-S 2018, 8750H
Lenovo Legion Y530-15ICH-81FV008RGE: NVIDIA GeForce GTX 1050 Ti Mobile, 15.60", 2.3 kg
Recensioni esterne » Lenovo Legion Y530-15ICH-81FV008RGE
Acer Predator Helios 300 PH317-52-75L8: NVIDIA GeForce GTX 1060 Mobile, 17.30", 2.9 kg
Recensioni esterne » Acer Predator Helios 300 PH317-52-75L8
Acer Nitro 5 AN515-52-74DR: NVIDIA GeForce GTX 1050 Ti Mobile, 15.60", 2.3 kg
Recensioni esterne » Acer Nitro 5 AN515-52-74DR
Asus GL504GS: NVIDIA GeForce GTX 1070 Mobile, 15.60", 2.5 kg
Recensioni esterne » Asus GL504
Lenovo ThinkPad P52 20MAS03N00: NVIDIA Quadro P1000, 15.60", 2.6 kg
Recensioni esterne » Lenovo ThinkPad P52 20MAS03N00
HP Pavilion Gaming 15-cx0003ng: NVIDIA GeForce GTX 1050 Ti Mobile, 15.60", 2.3 kg
Recensioni esterne » HP Pavilion Gaming 15-cx0003ng
Schenker XMG Neo 15: NVIDIA GeForce GTX 1060 Mobile, 15.60", 2 kg
Recensioni esterne » Schenker XMG Neo 15
MSI GP73 Leopard 8RE-039XES: NVIDIA GeForce GTX 1060 Mobile, 17.30", 2.7 kg
Recensioni esterne » MSI GP73 Leopard 8RE-039XES
HP Omen 15-dc0005NS: NVIDIA GeForce GTX 1050 Mobile, 15.60", 2.4 kg
Recensioni esterne » HP Omen 15-DC0005NS
MSI GT63 Titan 8RG-060XES: NVIDIA GeForce GTX 1080 Mobile, 15.60", 3 kg
Recensioni esterne » MSI GT63 Titan 8RG-060XES
MSI GP73 Leopard 8RF-415XES: NVIDIA GeForce GTX 1070 Mobile, 17.30", 2.2 kg
Recensioni esterne » MSI GP73 Leopard 8RF-415XES
HP Pavilion 15-cx0675nd: NVIDIA GeForce GTX 1060 Mobile, 15.60", 2.4 kg
Recensioni esterne » HP Pavilion 15-cx0675nd
Asus Zenbook Pro 15 UX580GE-E2005T: NVIDIA GeForce GTX 1050 Ti Mobile, 15.60", 1.9 kg
Recensioni esterne » Asus Zenbook Pro 15 UX580GE-E2005T
Gigabyte Aero 14-K8: NVIDIA GeForce GTX 1050 Ti Mobile, 14.00", 1.9 kg
Recensioni esterne » Gigabyte Aero 14-K8
Dell G5 15 5587 CN55815: NVIDIA GeForce GTX 1050 Ti Mobile, 15.60", 2.7 kg
Recensioni esterne » Dell G5 15 5587 CN55815
Hyperbook Pulsar Z15: NVIDIA GeForce GTX 1060 Mobile, 15.60", 2 kg
Recensioni esterne » Hyperbook Pulsar Z15
Asus TUF FX504GD-E4075: NVIDIA GeForce GTX 1050 Mobile, 15.60", 2.3 kg
Recensioni esterne » Asus TUF FX504GD-E4075
MSI GS65 Stealth Thin 8RE-016NE: NVIDIA GeForce GTX 1070 Mobile, 15.60", 1.8 kg
Recensioni esterne » MSI GS65 Stealth Thin 8RE-016NE
Asus Strix GL703GM-DS74: NVIDIA GeForce GTX 1060 Mobile, 17.30", 2.9 kg
Recensioni esterne » Asus Strix GL703GM-DS74
Hyperbook SL950VR2: NVIDIA GeForce GTX 1070 Max-Q, 15.60", 1.9 kg
Recensioni esterne » Hyperbook SL950VR2
MSI GT63 Titan 8RG-046: NVIDIA GeForce GTX 1080 Mobile, 15.60", 2.9 kg
Recensioni esterne » MSI GT63 Titan 8RG-046
MSI GT75 Titan 8RG, i7-8750H: NVIDIA GeForce GTX 1080 Mobile, 17.30", 4.6 kg
Recensioni esterne » MSI GT75 Titan 8RG, i7-8750H
Cyberpower Tracer III, i7-8750H, GTX 1060: NVIDIA GeForce GTX 1060 Mobile, 15.60"
Recensioni esterne » Cyberpower Tracer III, i7-8750H, GTX 1060
Asus GL703GS Strix Scar Edition 90NR00E1-M00160: NVIDIA GeForce GTX 1070 Mobile, 17.30", 2.9 kg
Recensioni esterne » Asus GL703GS Strix Scar Edition 90NR00E1-M00160
HP Pavilion 17-ab404ng: NVIDIA GeForce GTX 1050 Ti Mobile, 17.30", 3.1 kg
Recensioni esterne » HP Pavilion 17-ab404ng
MSI GL63 8RD-407XES: NVIDIA GeForce GTX 1050 Ti Mobile, 15.60", 2.2 kg
Recensioni esterne » MSI GL63 8RD-407XES
Asus Rog Strix Scar Edition GL703GM-E5016: NVIDIA GeForce GTX 1060 Mobile, 17.30", 3 kg
Recensioni esterne » Asus Rog Strix Scar Edition GL703GM-E5016
MSI GE63 Raider RGB 8RF-039XES: NVIDIA GeForce GTX 1070 Mobile, 15.60", 2.5 kg
Recensioni esterne » MSI GE63 Raider RGB 8RF-039XES
Asus FX504GE-DM198T: NVIDIA GeForce GTX 1050 Ti Mobile, 15.60", 2.3 kg
Recensioni esterne » Asus FX504GE-DM198T
MSI GL63 8RC-015XES: NVIDIA GeForce GTX 1050 Mobile, 15.60", 2.2 kg
Recensioni esterne » MSI GL63 8RC-015XES
MSI GP63 8RE-041XES: NVIDIA GeForce GTX 1060 Mobile, 15.60", 2.2 kg
Recensioni esterne » MSI GP63 8RE-041XES
Asus TUF FX504GE-EN088T: NVIDIA GeForce GTX 1050 Ti Mobile, 15.60", 2.3 kg
Recensioni esterne » Asus TUF FX504GE-EN088T
MSI GS65 8RF-040NL: NVIDIA GeForce GTX 1070 Mobile, 15.60", 1.9 kg
Recensioni esterne » MSI GS65 8RF-040NL
MSI GP63 Leopard 8RE-013US: NVIDIA GeForce GTX 1060 Mobile, 15.60", 2.3 kg
Recensioni esterne » MSI GP63 Leopard 8RE-013US
Asus Zephyrus GM501G: NVIDIA GeForce GTX 1070 Mobile, 15.60", 2.5 kg
Recensioni esterne » Asus Zephyrus GM501G
Asus ROG GU501GM-BI7N8: NVIDIA GeForce GTX 1060 Mobile, 15.60", 2.5 kg
Recensioni esterne » Asus ROG GU501GM-BI7N8
Acer Aspire 7 A717-72G-71PM: NVIDIA GeForce GTX 1050 Mobile, 17.30", 3 kg
Recensioni esterne » Acer Aspire 7 A717-72G-71PM
Asus Zenbook Pro 15 UX550GE-BN026R: NVIDIA GeForce GTX 1050 Ti Mobile, 15.60", 2 kg
Recensioni esterne » Asus Zenbook Pro 15 UX550GE-BN026R
Razer Blade 15 2018: NVIDIA GeForce GTX 1070 Max-Q, 15.60", 2.1 kg
Recensioni esterne » Razer Blade 15 2018
MSI GE73 8RF-211DE - Raider RGB: NVIDIA GeForce GTX 1070 Mobile, 17.30", 2.9 kg
Recensioni esterne » MSI GE73 8RF-211DE - Raider RGB
MSI GE63 8RE-222DE: NVIDIA GeForce GTX 1060 Mobile, 15.60", 2.5 kg
Recensioni esterne » MSI GE63 8RE-222DE
Acer Predator Helios 500 PH517-51-79BY: NVIDIA GeForce GTX 1070 Mobile, 17.30", 3.8 kg
Recensioni esterne » Acer Predator Helios 500 PH517-51-79BY
MSI GE73 8RF-008 Raider RGB: NVIDIA GeForce GTX 1070 Mobile, 17.30", 2.9 kg
Recensioni esterne » MSI GE73 8RF-008 Raider RGB
MSI GS65 8RF-019DE Stealth Thin: NVIDIA GeForce GTX 1070 Max-Q, 15.60", 1.8 kg
Recensioni esterne » MSI GS65 8RF-019DE Stealth Thin
Acer Predator Helios 300 PH315-51-78TP: NVIDIA GeForce GTX 1060 Mobile, 15.60", 2.7 kg
Recensioni esterne » Acer Predator Helios 300 PH315-51-78TP
Gigabyte Aero 14 v8: NVIDIA GeForce GTX 1050 Ti Mobile, 14.00", 1.9 kg
Recensioni esterne » Gigabyte Aero 14 v8
MSI GE73-008 8RF Raider RGB: NVIDIA GeForce GTX 1070 Mobile, 17.30", 2.9 kg
Recensioni esterne » MSI GE73-008 8RF Raider RGB
Gigabyte Aero 15W v8-DE025PB: NVIDIA GeForce GTX 1060 Mobile, 15.60", 2 kg
Recensioni esterne » Gigabyte Aero 15W v8-DE025PB
MSI GL63 8RD-014XES: NVIDIA GeForce GTX 1050 Ti Mobile, 15.60", 2.2 kg
Recensioni esterne » MSI GL63 8RD-014XES
MSI GE63 Raider RGB 8RF-008: NVIDIA GeForce GTX 1070 Mobile, 15.60", 2.5 kg
Recensioni esterne » MSI GE63 Raider 8RF-008
MSI GT63 8RG-018-Titan 4K: NVIDIA GeForce GTX 1080 Mobile, 15.60", 2.9 kg
Recensioni esterne » MSI GT63 8RG-018-Titan 4K
Asus Zephyrus M GM501: NVIDIA GeForce GTX 1070 Mobile, 15.60", 2.5 kg
Recensioni esterne » Asus Zephyrus M GM501
MSI GS65 8RF-078 Stealth Thin: NVIDIA GeForce GTX 1070 Max-Q, 15.60", 1.8 kg
Recensioni esterne » MSI GS65 8RF-078 Stealth Thin
MSI GS65 8RE-079 Stealth Thin: NVIDIA GeForce GTX 1060 Mobile, 15.60", 1.8 kg
Recensioni esterne » MSI GS65 8RE-079 Stealth Thin
Gigabyte Aero 15X v8: NVIDIA GeForce GTX 1070 Max-Q, 15.60", 2.1 kg
Recensioni esterne » Gigabyte Aero 15X v8