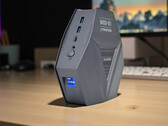
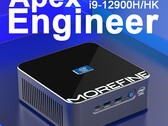
Recensione del mini PC ispirato ad Alienware: Alliwava GH9 con Intel Core i9 e Thunderbolt 4 a confronto con Geekom, Minisforum & Co.
Intel Core i9-12900HK | Intel Iris Xe Graphics G7 96EUs | 402 gr
L'Intel Core i9-12900HK è un processore per computer portatili di fascia alta basato sull'architettura Alder Lake. È stato annunciato all'inizio del 2022 e offre 6 core per le prestazioni (core P, architettura Golden Cove) e 8 core per l'efficienza (core E, architettura Gracemont). I P-cores supportano l'Hyper-Threading, che aumenta il numero di thread supportati a 20 se combinati con gli E-cores. La frequenza di clock varia da 2,5 a 5 GHz sul cluster di prestazioni e da 1,8 a 3,8 GHz sul cluster di efficienza. Le prestazioni degli E-cores dovrebbero essere simili a quelle dei vecchi core Skylake (si confronti il Core i7-6920HQ). Tutti i core possono utilizzare fino a 24 MB di cache L3. Come variante K, il processore offre un moltiplicatore aperto e quindi la possibilità di overcloccare i core del processore. Rispetto all'analogo i9-12900H, il 12900HK offre solo le funzioni "Essentials" di vPro.
Prestazioni
L'i9-12900HK è una delle CPU mobili più veloci nei nostri test ed è superata solo dai modelli HX con TDP più elevato. Le prestazioni dipendono dalle impostazioni di raffreddamento e TDP, ma in media possono battere un AMD Ryzen 9 6900HX dell'11% (al momento della stesura di questo articolo, vedere il confronto ora). L'influenza del raffreddamento del portatile è visibile nel nostro database, in quanto un Core i9-12900H teoricamente più lento è attualmente più veloce in media. Nonostante questo, il processore è molto adatto a tutti i casi d'uso più impegnativi, come i giochi, la creazione di contenuti e i calcoli scientifici.
Caratteristiche
Il controller di memoria integrato supporta diversi tipi di memoria fino a DDR5-4800, DDR4-3200, LPDDR5-5200 e LPDDR4x-4267. Il Thread Director (in hardware) può aiutare il sistema operativo a decidere quale thread utilizzare sui core efficienti o ad alte prestazioni per ottenere le migliori prestazioni. Per le attività di intelligenza artificiale, il processore dispone anche di GNA 3.0 e DL Boost (tramite AVX2). La versione 8 di Quick Sync è la stessa delle CPU Rocket Lake e supporta la decodifica MPEG-2, AVC, VC-1, JPEG, VP8, VP9, HEVC e AV1 in hardware. La CPU supporta solo PCIe 4.0 (x8 per la GPU e due x4 per le unità SSD).
La scheda grafica integrata è basata sull'architettura Xe e offre 96 UE (unità di esecuzione) che funzionano fino a 1,45 GHz.
La CPU ha una potenza di base di 45 W (115 W PL2), ma la maggior parte dei computer portatili utilizza un PL1 di circa 60 Watt. Il SoC è prodotto con un processo a 10 nm presso Intel, noto come Intel 7.
| Nome in codice | Alder Lake-H | ||||||||||||||||||||||||||||
| Serie | Intel Alder Lake-P | ||||||||||||||||||||||||||||
Serie: Alder Lake-P Alder Lake-H
| |||||||||||||||||||||||||||||
| Clock Rate | 1800 - 5000 MHz | ||||||||||||||||||||||||||||
| Level 1 Cache | 1.2 MB | ||||||||||||||||||||||||||||
| Level 2 Cache | 11.5 MB | ||||||||||||||||||||||||||||
| Level 3 Cache | 24 MB | ||||||||||||||||||||||||||||
| Numero di Cores / Threads | 14 / 20 | ||||||||||||||||||||||||||||
| Consumo energetico (TDP = Thermal Design Power) | 45 Watt | ||||||||||||||||||||||||||||
| Tecnologia del produttore | 10 nm | ||||||||||||||||||||||||||||
| Temperatura massima | 100 °C | ||||||||||||||||||||||||||||
| Socket | BGA1744 | ||||||||||||||||||||||||||||
| Features | DDR4-3200/LPDDR4x-4266/DDR5-4800/LPDDR5-5200 RAM, PCIe 4, Thr. Director, DL Boost, GNA, vPro Ess., MMX, SSE, SSE2, SSE3, SSSE3, SSE4.1, SSE4.2, AES, AVX, AVX2, FMA3, SHA | ||||||||||||||||||||||||||||
| GPU | Intel Iris Xe Graphics G7 96EUs ( - 1450 MHz) | ||||||||||||||||||||||||||||
| 64 Bit | Supporto 64 Bit | ||||||||||||||||||||||||||||
| Architecture | x86 | ||||||||||||||||||||||||||||
| Data di annuncio | 01/04/2022 | ||||||||||||||||||||||||||||
| Collegamento Prodotto (esterno) | ark.intel.com | ||||||||||||||||||||||||||||

Alienware x17 R2 P48E: NVIDIA GeForce RTX 3080 Ti Laptop GPU, 17.30", 3.1 kg
recensione » Recensione del portatile Alienware x17 R2: Prestazioni di picco 175 W GeForce RTX 3080 Ti
Medion Erazer Beast X30: NVIDIA GeForce RTX 3080 Ti Laptop GPU, 17.30", 2.2 kg
recensione » Recensione del Medion Erazer Beast X30: gaming Notebook QHD sottile e potente
Gigabyte Aero 16 YE5: NVIDIA GeForce RTX 3080 Ti Laptop GPU, 16.00", 2.3 kg
recensione » Recensione del Gigabyte Aero 16 YE5: Notebook multimediale compatto 4K
MSI GE76 Raider: NVIDIA GeForce RTX 3080 Ti Laptop GPU, 17.30", 3 kg
recensione » Recensione del portatile MSI GE76 Raider: Con Alder Lake e RTX 3080 Ti nel paradiso del gaming
MSI Raider GE66 12UHS: NVIDIA GeForce RTX 3080 Ti Laptop GPU, 15.60", 2.4 kg
Recensioni esterne » MSI Raider GE66 12UHS
MSI Vector GP76 12UGS-618: NVIDIA GeForce RTX 3070 Ti Laptop GPU, 17.30", 2.8 kg
Recensioni esterne » MSI Vector GP76 12UGS-618
Medion Erazer Beast X30: NVIDIA GeForce RTX 3080 Ti Laptop GPU, 17.30", 2.2 kg
Recensioni esterne » Medion Erazer Beast X30
Alienware x14 i9 RTX 3060: NVIDIA GeForce RTX 3060 Laptop GPU, 14.00", 1.8 kg
Recensioni esterne » Alienware x14 i9 RTX 3060
Alienware x17 R2 P48E: NVIDIA GeForce RTX 3080 Ti Laptop GPU, 17.30", 3.1 kg
Recensioni esterne » Alienware x17 R2 P48E
Razer Blade 15 Advanced RZ09-0421PGF3-R3G1: NVIDIA GeForce RTX 3080 Ti Laptop GPU, 15.60", 2 kg
Recensioni esterne » Razer Blade 15 Advanced RZ09-0421PGF3-R3G1
Gigabyte Aero 16 YE5: NVIDIA GeForce RTX 3080 Ti Laptop GPU, 16.00", 2.3 kg
Recensioni esterne » Gigabyte Aero 16 YE5
MSI Raider GE76 12UHS-214: NVIDIA GeForce RTX 3080 Ti Laptop GPU, 17.30", 2.9 kg
Recensioni esterne » MSI Raider GE76 12UHS-214
Pre-Sample: Intel Arc A770M, 0.00"
» Le prestazioni dell'Intel ARC A770 sono notevolmente migliorate grazie ai driver aggiornati che offrono il 9% in più di fps medi nei giochi DirectX 11/12
» Confronto CPU Mobile
Confronto di tutte le serie di CPU mobile
» Processori Mobile - Elenco Benchmark
Elenco Benchmark di tutte le CPUs conosciute, usate nei portatili (CPUs desktop e portatili)
I nostri Top 10
» Top 10 Portatili Multimedia
» Top 10 Portatili Gaming
» Top 10 Portatili Gaming Leggeri
» Top 10 Portatili da Ufficio e Business economici
» Top 10 Portatili Premium da Ufficio/Business
» Top 10 Portatili sotto i 300 Euro
» Top 10 Portatili sotto i 500 Euro
» Top 10 dei Portatili Workstation
» Top 10 Subnotebooks
» Top 10 Ultrabooks
» Top 10 Convertibili
» Top 10 Tablets
» Top 10 Tablets Windows
» Top 10 Smartphones