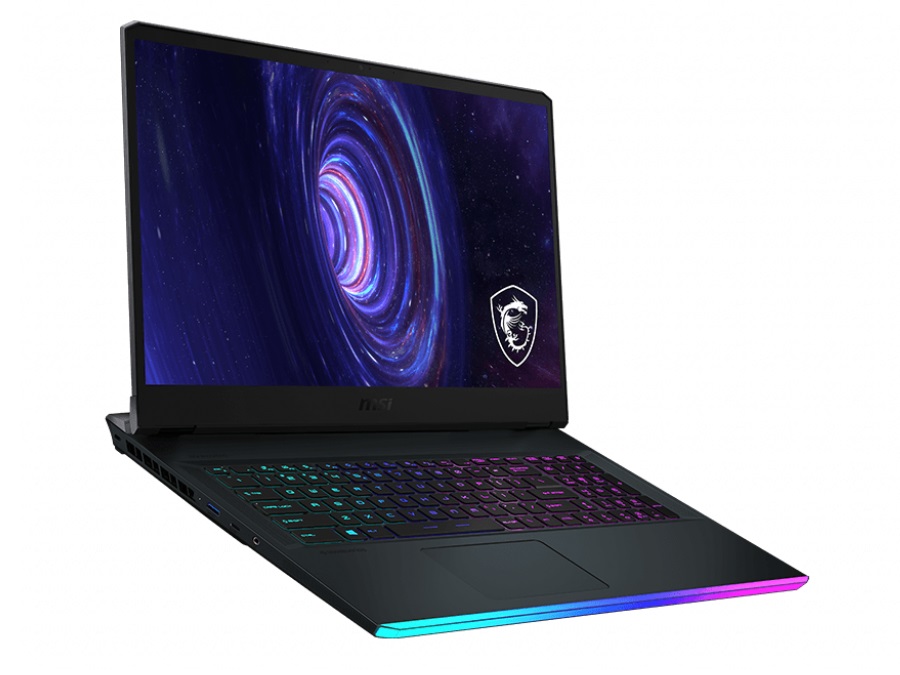
Recensione del portatile MSI GE76 Raider: Con Alder Lake e RTX 3080 Ti nel paradiso del gaming

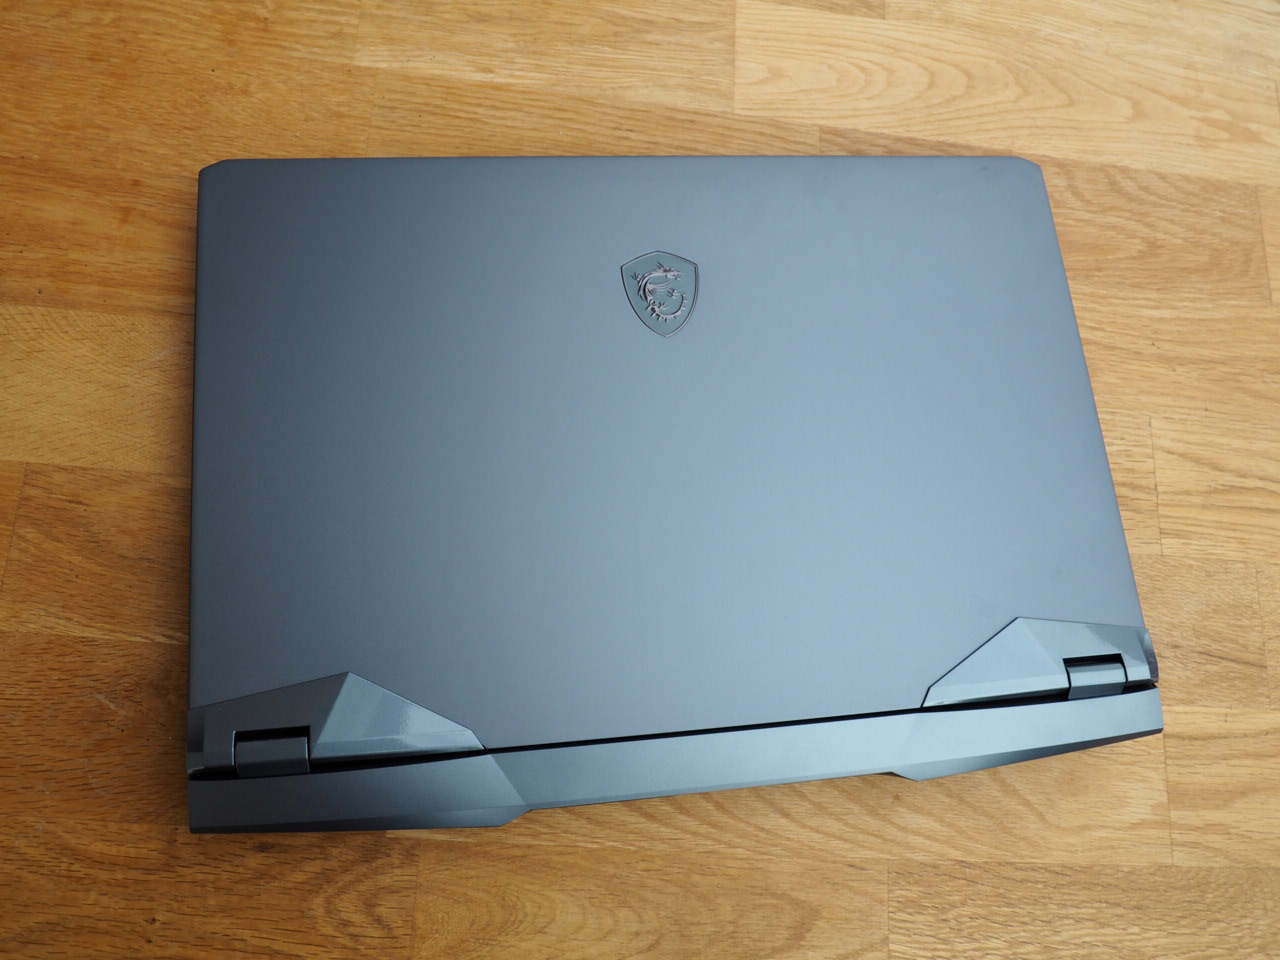
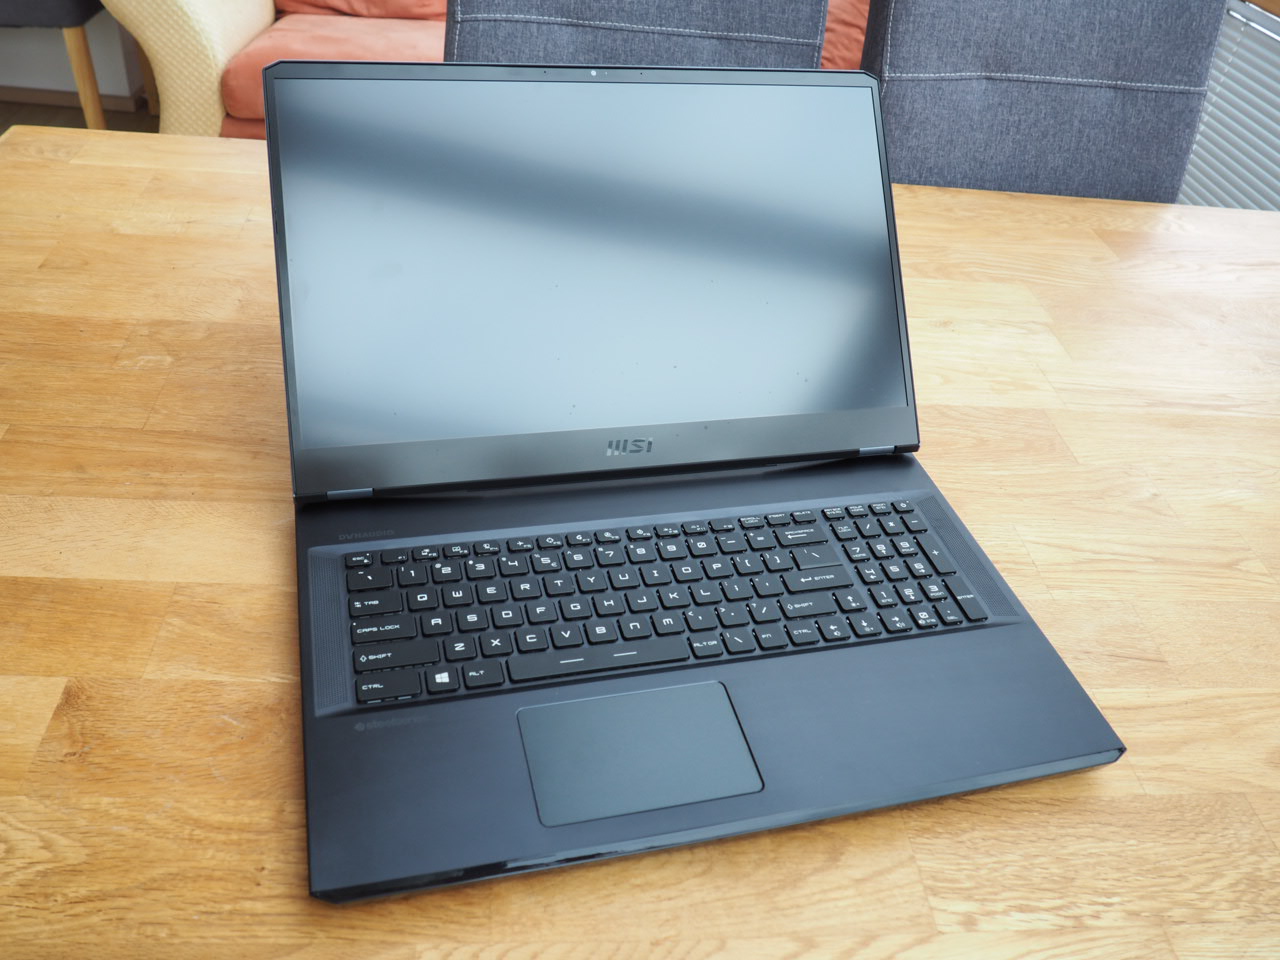
Con un peso di 3 kg e un'altezza di 2,6 cm (piedini sul fondo non inclusi), il GE76 Raider non è né un ingombrante mostro da gioco, né un sottile e leggero, ma una buona miscela di entrambe le categorie
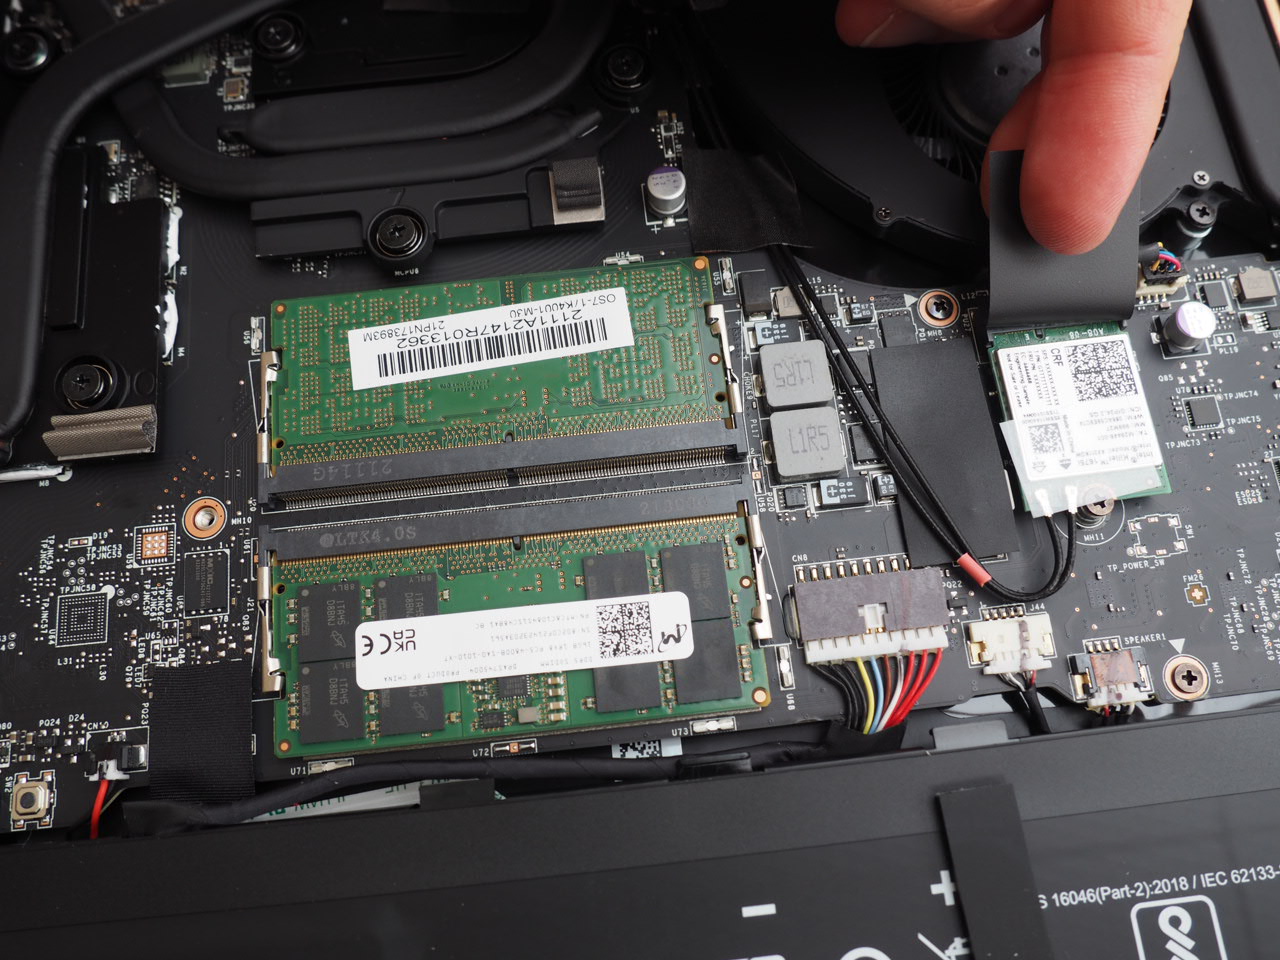
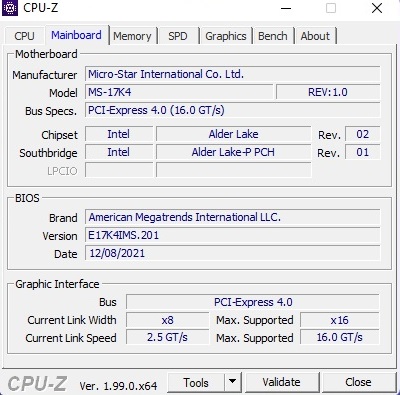
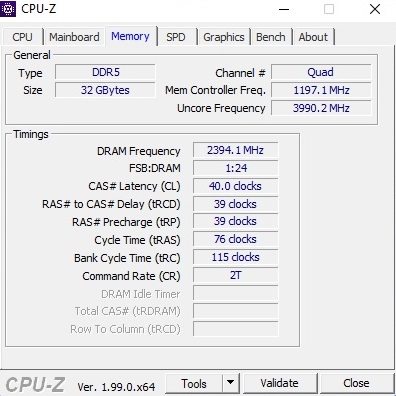
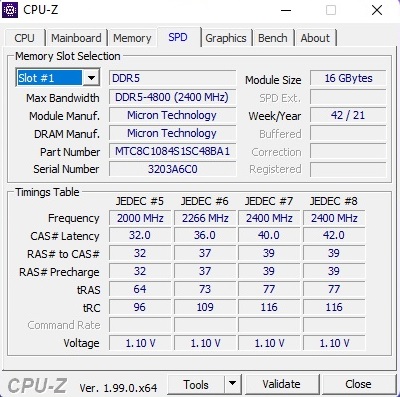
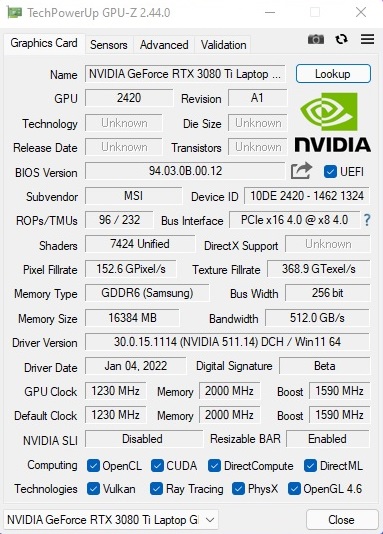
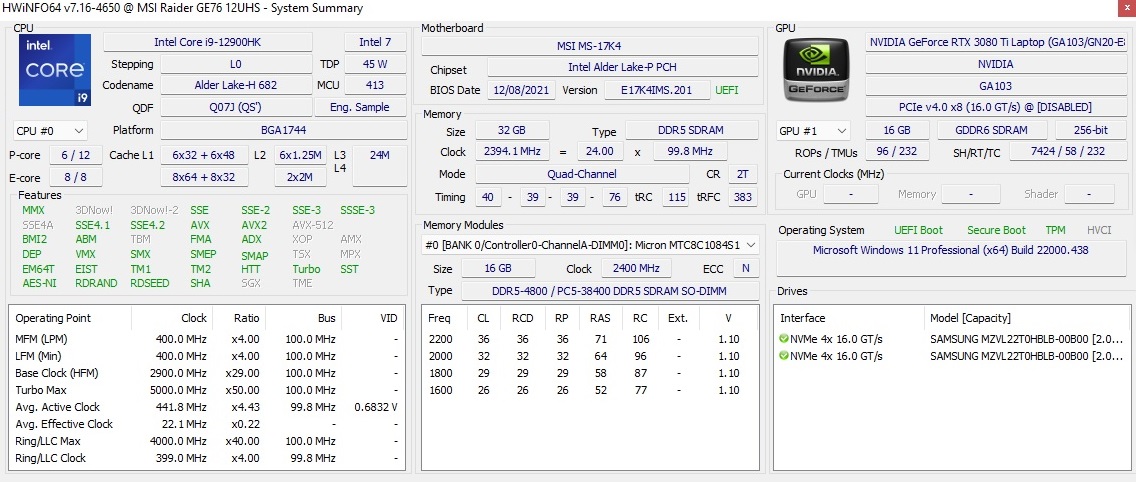
Nonostante il profilo un po' sottile, il portatile da 17 pollici è ancora dotato di componenti potenti. MSI utilizza l'ultimaGeForce RTX 3080 TigPU mobile di punta, che vuole attirare i clienti con 16 GB di GDDR6 VRAM. Poi c'è il nuovo, velocissimo Intel Alder LakeCore i9-12900HKun chip con quattordici core, che può eseguire fino a 20 thread contemporaneamente. Il nostro campione, che è un'unità di pre-produzione (pre-campione), sfoggia anche 32 GB di RAM DDR5-4800 (2x 16 GB dual-channel) così come due SSD NVMe da 2 TB. La risoluzione del display è limitata a 1080p, ma è un pannello molto veloce con una frequenza di aggiornamento di 360 Hz
Non c'era un prezzo ufficiale da MSI al momento della recensione, ma ci aspettiamo almeno 3000 euro (più verso i 4000 euro in realtà).
I concorrenti sono principalmente sistemi di gioco da 17 pollici con laGeForce RTX 3080e impostazioni TGP massime. Questi includono ilSchenker XMG Neo 17, ilAlienware x17, ilAsus ROG Zephyrus S17e loSchenker XMG Ultra 17.
Potential Competitors in Comparison
Punteggio | Data | Modello | Peso | Altezza | Dimensione | Risoluzione | Prezzo |
|---|---|---|---|---|---|---|---|
| 87.5 % v7 (old) | 01/2022 | MSI GE76 Raider i9-12900HK, GeForce RTX 3080 Ti Laptop GPU | 3 kg | 26 mm | 17.30" | 1920x1080 | |
| 87.4 % v7 (old) | 09/2021 | Schenker XMG NEO 17 GM7TG8S i7-11800H, GeForce RTX 3080 Laptop GPU | 2.6 kg | 27.45 mm | 17.30" | 2560x1440 | |
| 89 % v7 (old) | 09/2021 | Alienware x17 RTX 3080 P48E i7-11800H, GeForce RTX 3080 Laptop GPU | 3.2 kg | 21.4 mm | 17.30" | 3840x2160 | |
| 90.1 % v7 (old) | 07/2021 | Asus ROG Zephyrus S17 GX703HSD i9-11900H, GeForce RTX 3080 Laptop GPU | 2.8 kg | 19.9 mm | 17.30" | 2560x1440 | |
| 84.9 % v7 (old) | 04/2021 | Schenker XMG Ultra 17 Rocket Lake i9-11900K, GeForce RTX 3080 Laptop GPU | 4.7 kg | 43.5 mm | 17.30" | 1920x1080 |
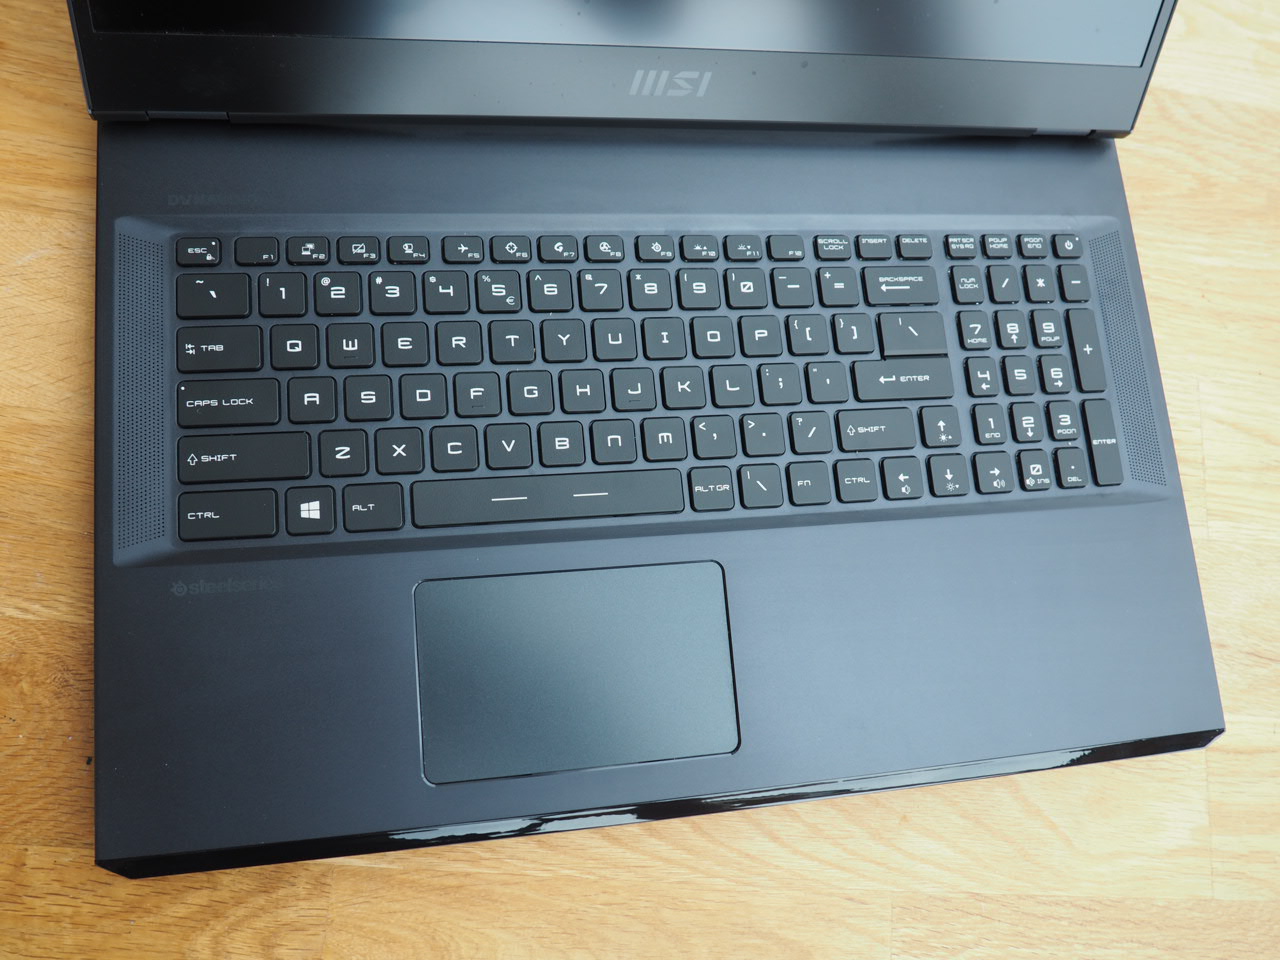
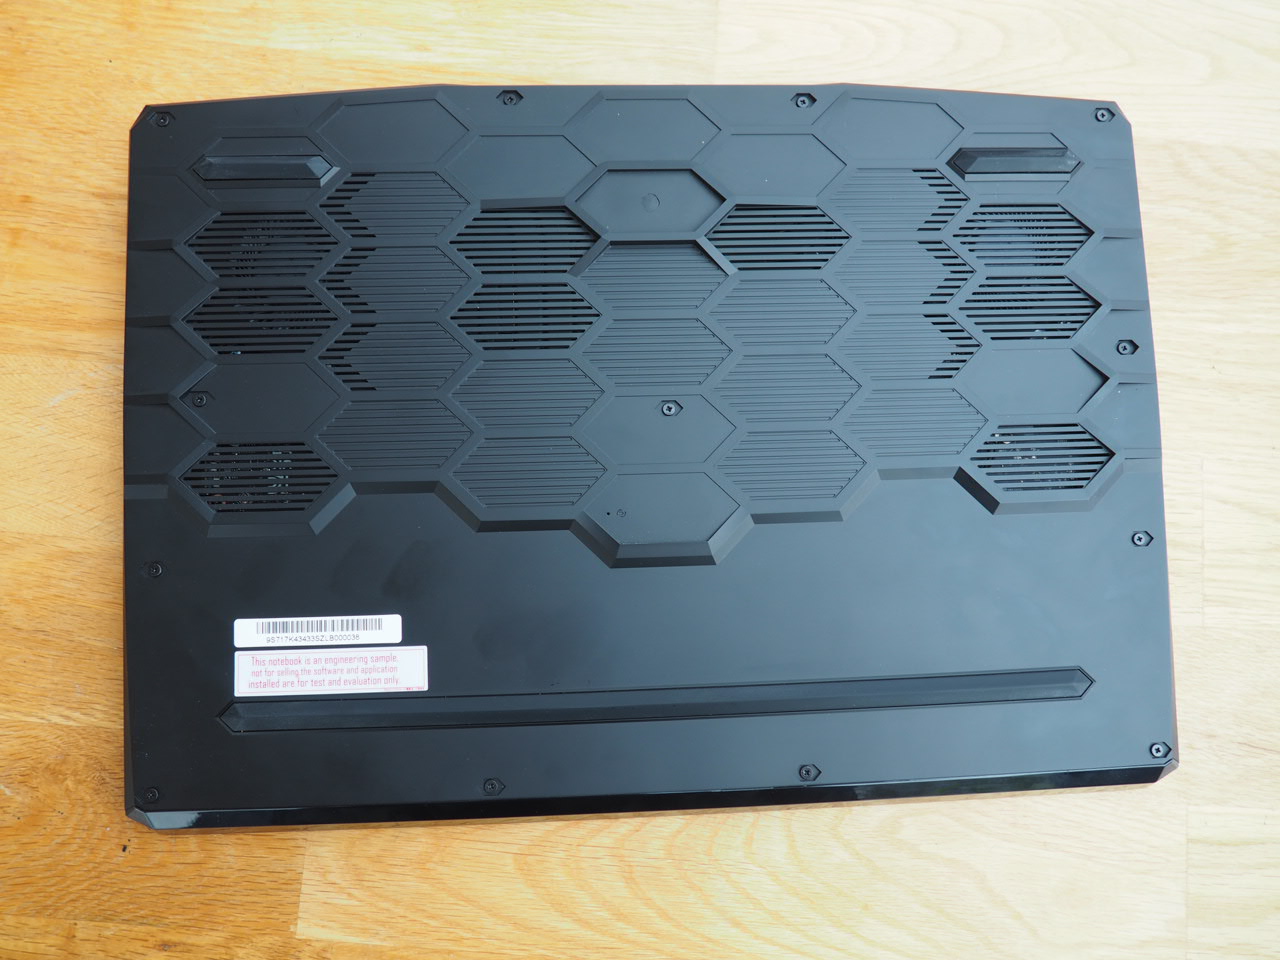
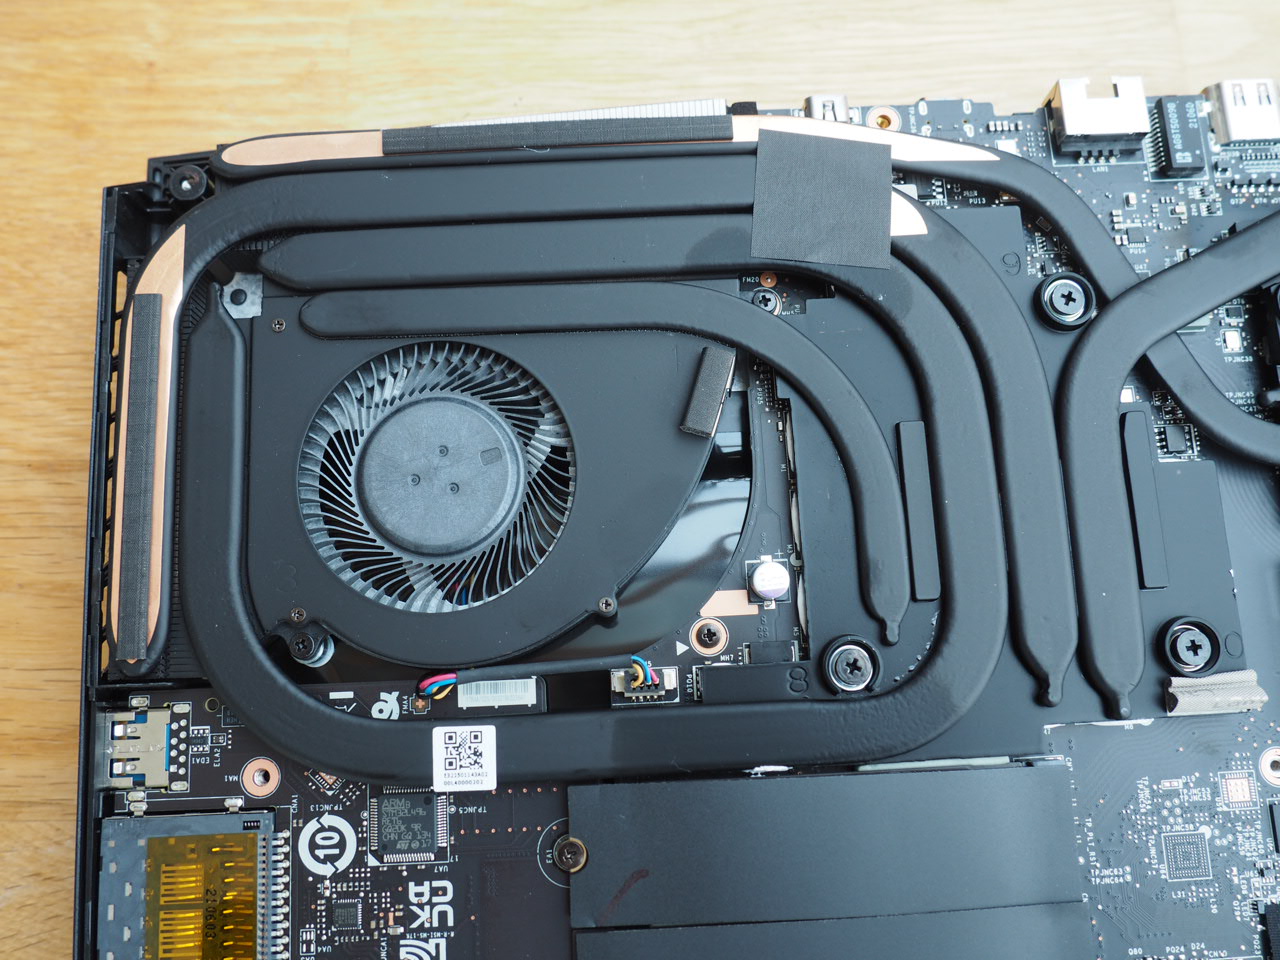
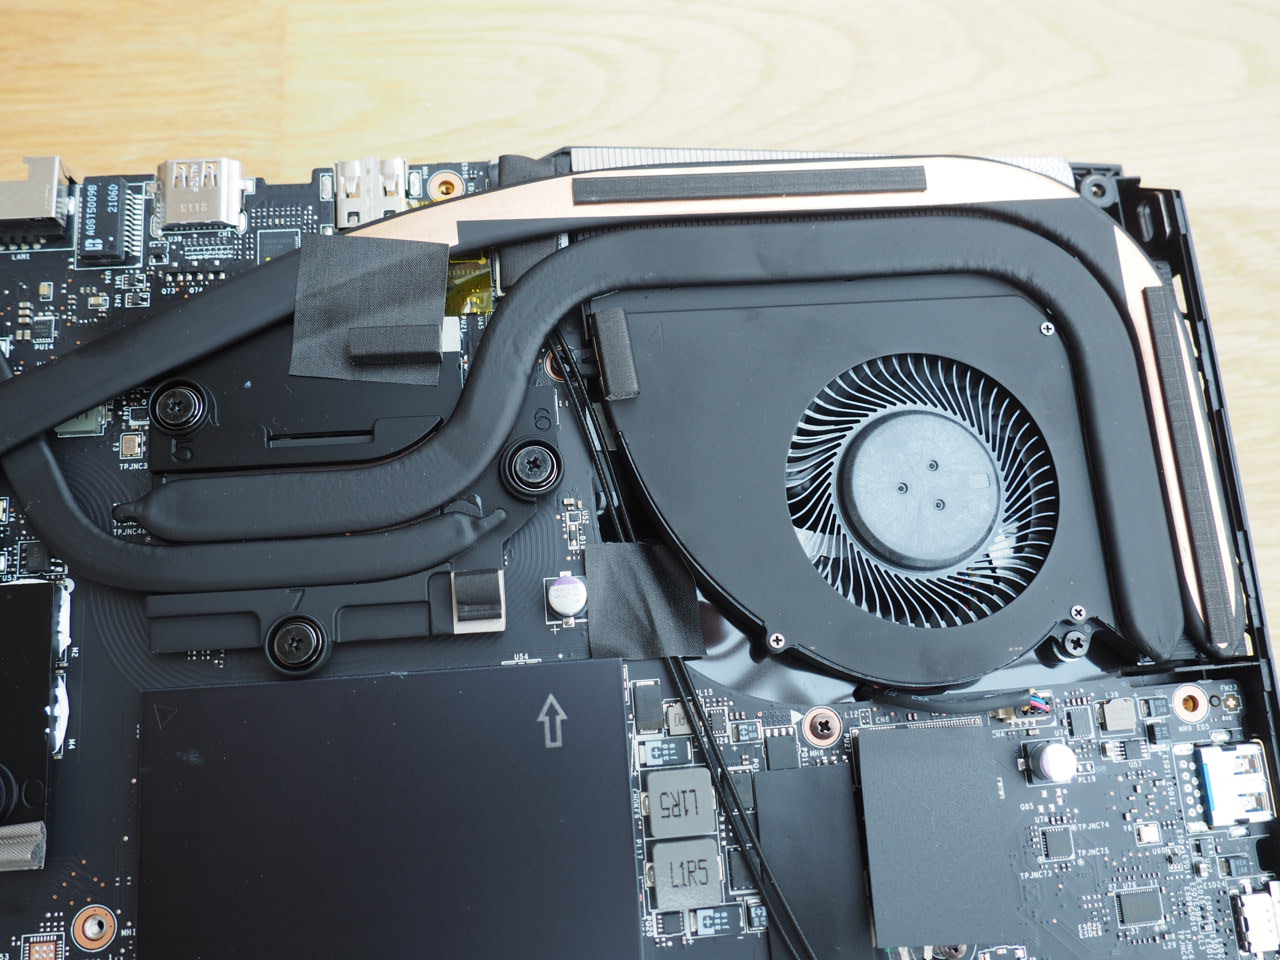
Lo chassis è identico al (pre)predecessore, quindi non copriremo il case, la connettività e i dispositivi di input come parte di questa recensione. Si prega di vedere ilGE76 Raider 10UHper tutte le informazioni corrispondenti.
Lettore di schede SD
| SD Card Reader - average JPG Copy Test (av. of 3 runs) | |
| Schenker XMG Ultra 17 Rocket Lake | |
| Asus ROG Zephyrus S17 GX703HSD | |
| Alienware x17 RTX 3080 P48E (AV Pro V60) | |
| Media della classe Gaming (20.9 - 210, n=54, ultimi 2 anni) | |
| MSI GE76 Raider (AV PRO microSD 128 GB V60) | |
| Schenker XMG NEO 17 GM7TG8S | |
Comunicazione
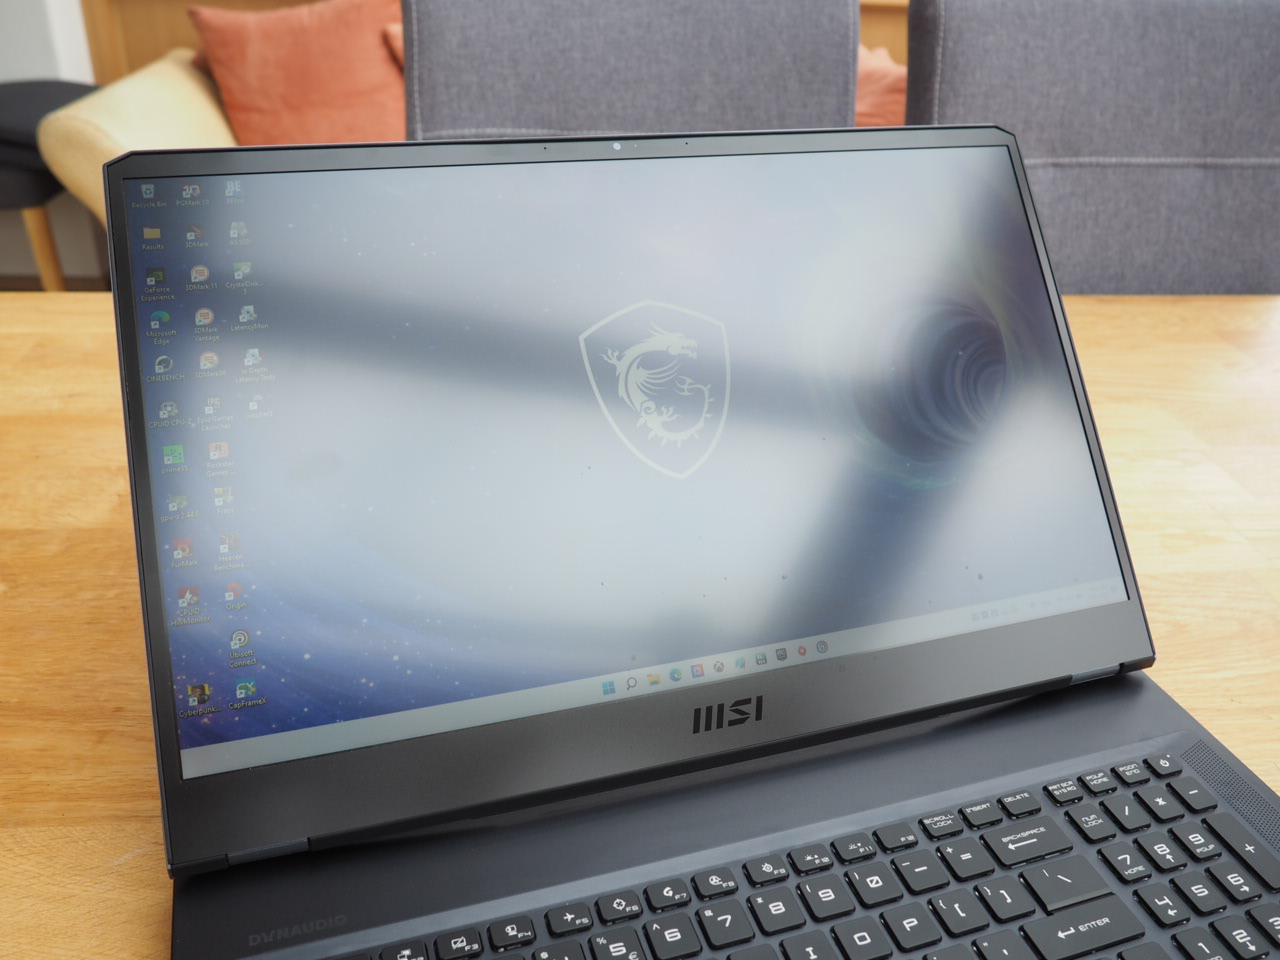
Webcam


Visualizza
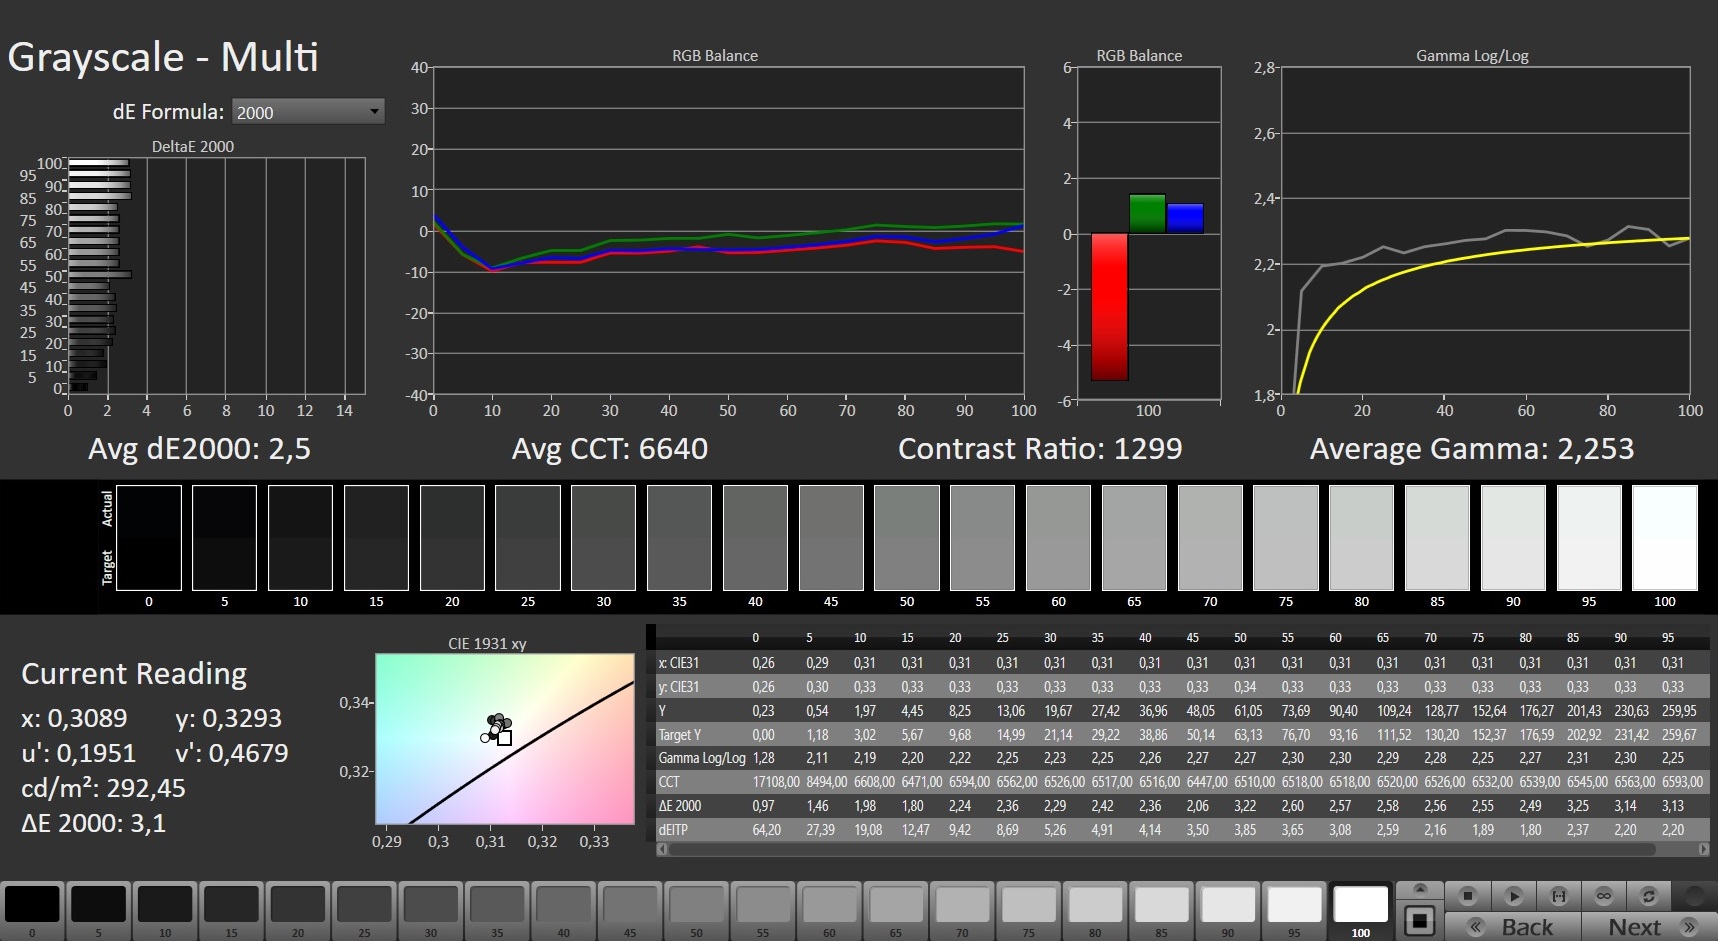
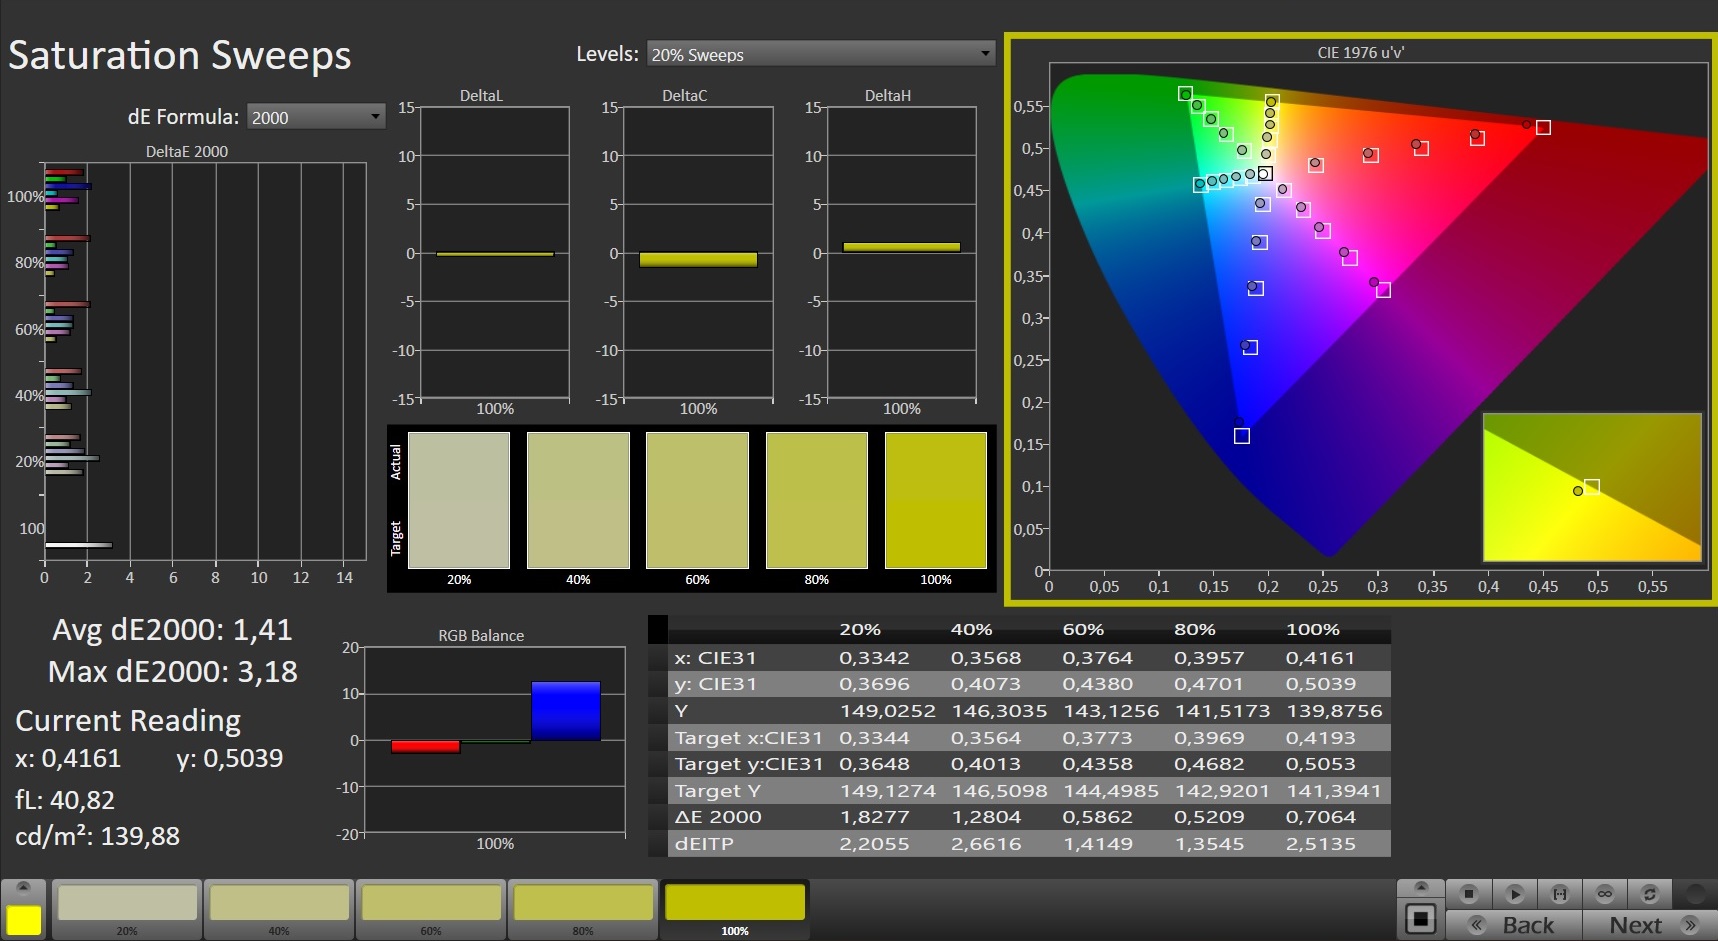
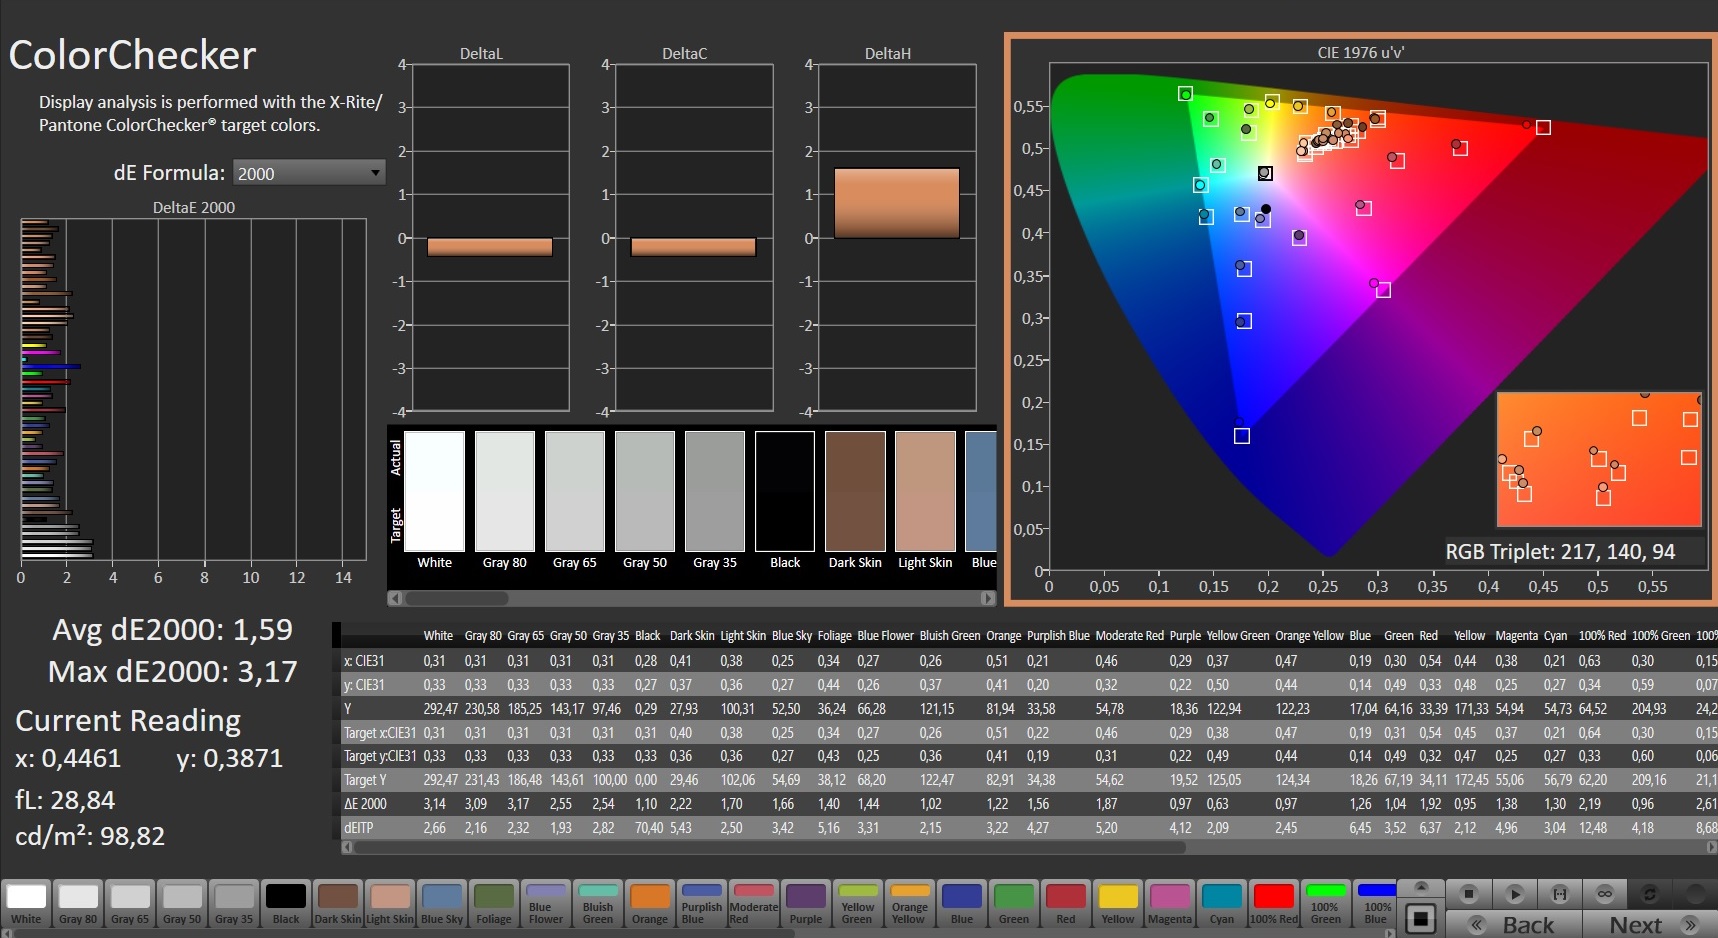
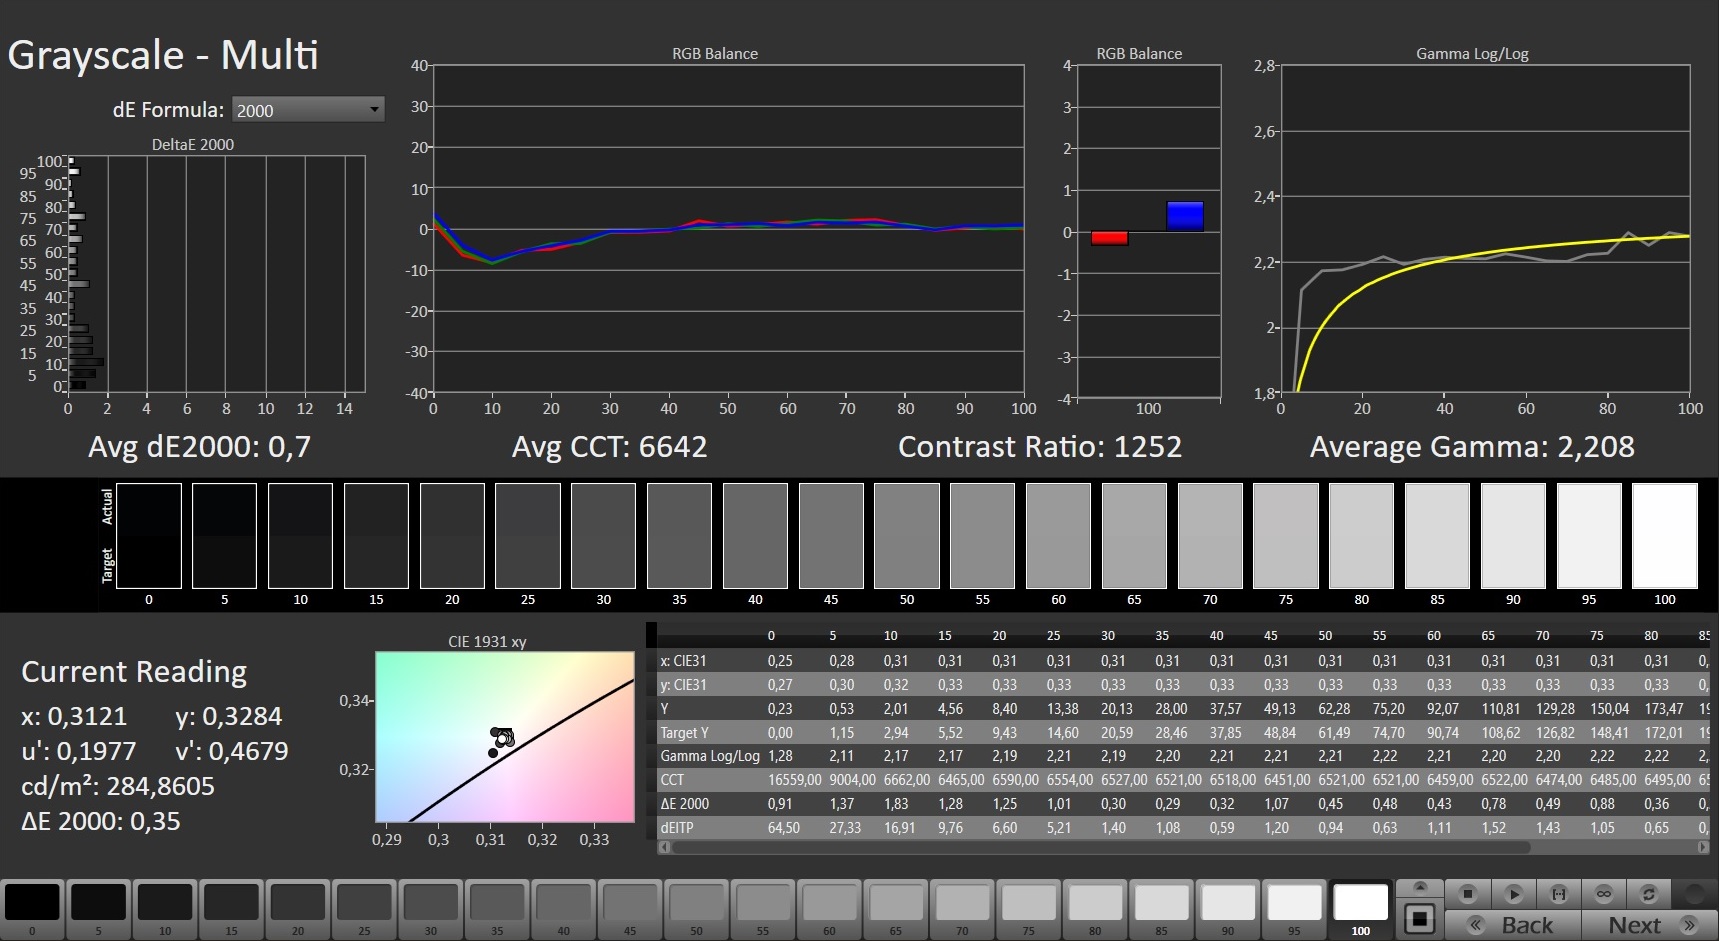
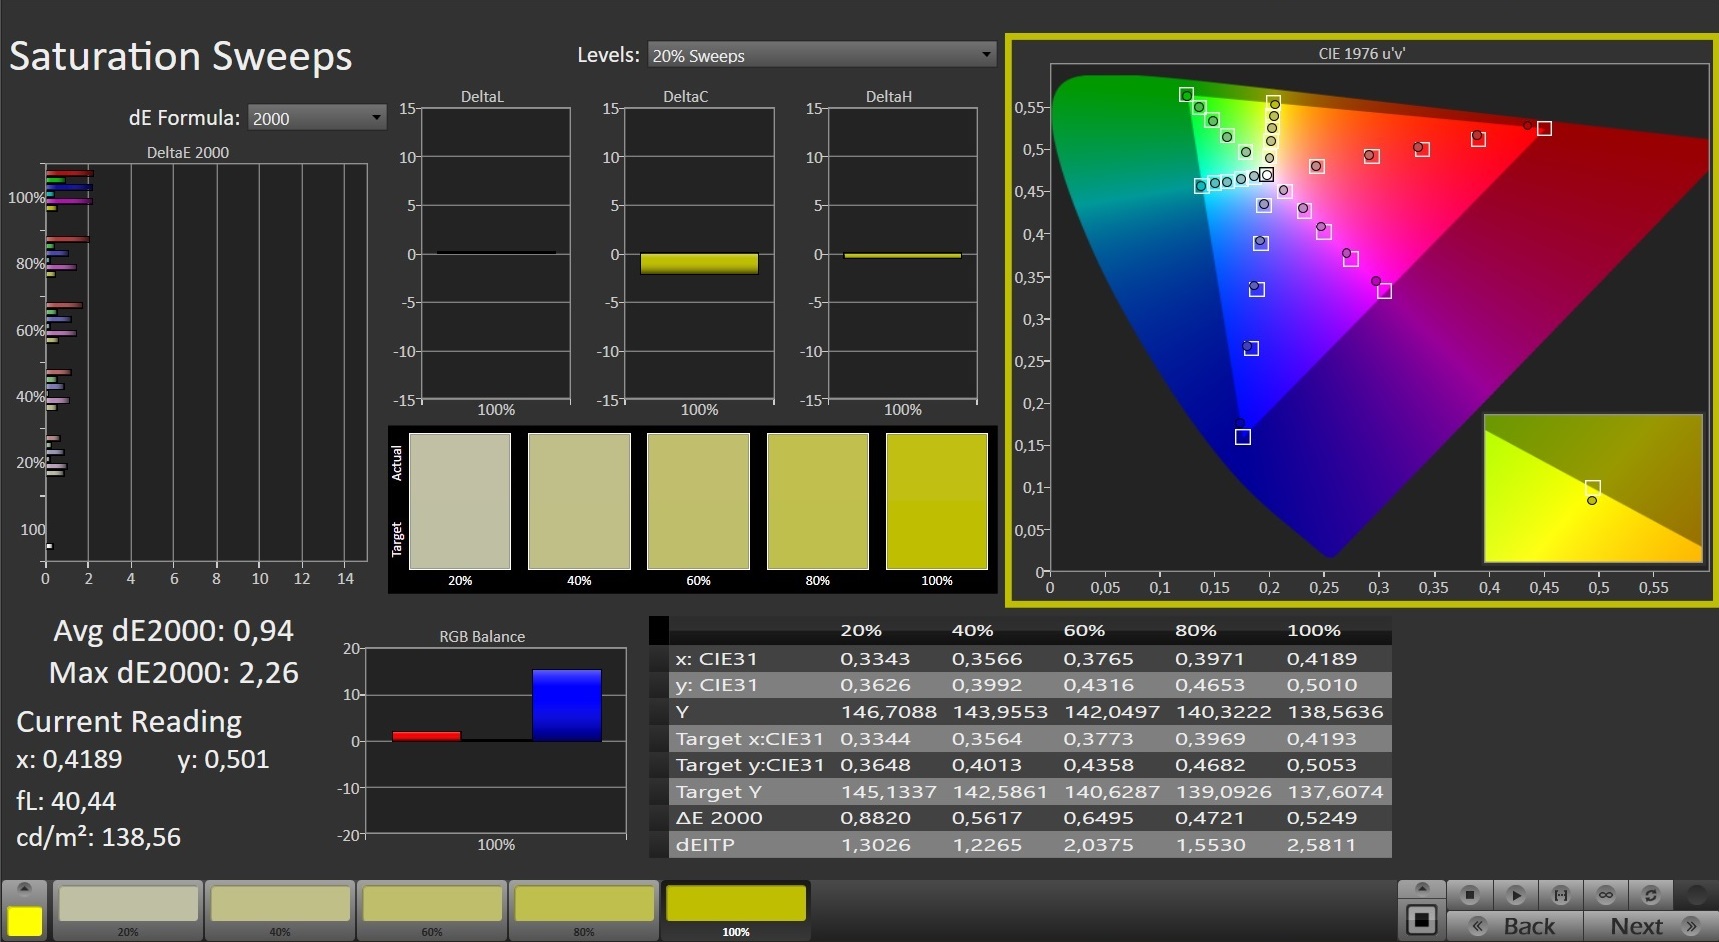
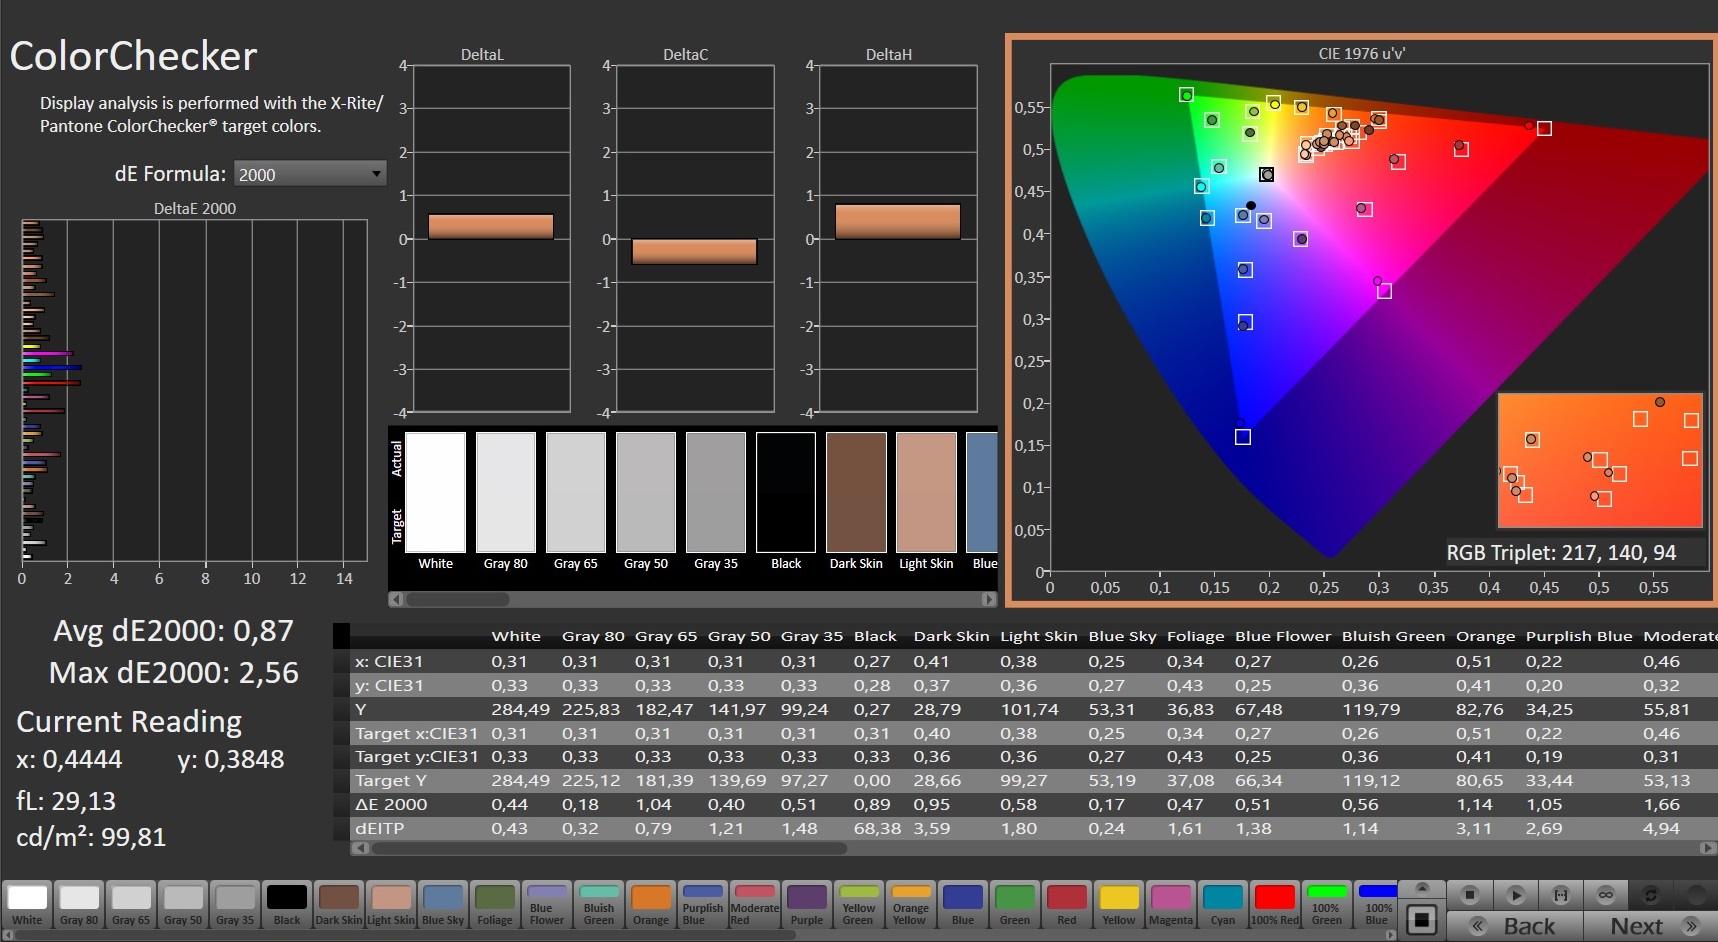
MSI fa uso apparentemente dello stesso pannello AUOE295 che abbiamo visto nel GE76 Raider 11UH ma con miglioramenti su più fronti. Oltre alla gamma di colori più ampia (94 vs 74% sRGB), anche la precisione del colore è migliore. Sia la scala di grigi che le deviazioni del color checker sono già molto buone (DeltaE inferiore a 3) nelle nostre misurazioni CalMAN senza calibrazione.
Tutte le altre misurazioni sono comparabili. Un valore del nero di 0,23 cd/m² è altrettanto rispettabile quanto un rapporto di contrasto di 1261:1. Il produttore dovrebbe però migliorare la luminosità. Una luminanza media di 290 nits potrebbe essere sufficiente per la maggior parte degli scenari interni, ma il GE76 non è grande all'esterno. I tempi di risposta d'altra parte sono ottimi (<10 ms), quindi anche i veloci sparatutto in prima persona possono essere giocati senza limitazioni.
| |||||||||||||||||||||||||
Distribuzione della luminosità: 96 %
Al centro con la batteria: 290 cd/m²
Contrasto: 1261:1 (Nero: 0.23 cd/m²)
ΔE ColorChecker Calman: 1.59 | ∀{0.5-29.43 Ø4.72}
calibrated: 0.87
ΔE Greyscale Calman: 2.5 | ∀{0.09-98 Ø4.97}
65.2% AdobeRGB 1998 (Argyll 3D)
94% sRGB (Argyll 3D)
63.1% Display P3 (Argyll 3D)
Gamma: 2.253
CCT: 6640 K
| MSI GE76 Raider AU Optronics B173HAN05.4 (AUOE295), IPS-Level, 1920x1080, 17.3" | Schenker XMG NEO 17 GM7TG8S BOE0977 (NE173QHM-NY2), IPS, 2560x1440, 17.3" | Alienware x17 RTX 3080 P48E AU Optronics B173ZAN, IPS, 3840x2160, 17.3" | Asus ROG Zephyrus S17 GX703HSD BOE099D (BOE CQ NE173QHM-NY3), IPS, 2560x1440, 17.3" | Schenker XMG Ultra 17 Rocket Lake AU Optronics B173HAN05.1, IPS, 1920x1080, 17.3" | |
|---|---|---|---|---|---|
| Display | 4% | 33% | 28% | 8% | |
| Display P3 Coverage (%) | 63.1 | 67.1 6% | 88.3 40% | 94.2 49% | 69.8 11% |
| sRGB Coverage (%) | 94 | 96.3 2% | 100 6% | 98.7 5% | 97.2 3% |
| AdobeRGB 1998 Coverage (%) | 65.2 | 68.6 5% | 100 53% | 84.4 29% | 72 10% |
| Response Times | -82% | -83% | 16% | 2% | |
| Response Time Grey 50% / Grey 80% * (ms) | 5.6 ? | 15.2 -171% | 14.4 ? -157% | 4.8 14% | 5.6 ? -0% |
| Response Time Black / White * (ms) | 9.6 ? | 8.8 8% | 10.4 ? -8% | 8 17% | 9.2 ? 4% |
| PWM Frequency (Hz) | |||||
| Screen | -7% | -36% | -40% | -10% | |
| Brightness middle (cd/m²) | 290 | 396 37% | 438.7 51% | 322 11% | 306 6% |
| Brightness (cd/m²) | 290 | 366 26% | 435 50% | 288 -1% | 299 3% |
| Brightness Distribution (%) | 96 | 82 -15% | 91 -5% | 72 -25% | 93 -3% |
| Black Level * (cd/m²) | 0.23 | 0.45 -96% | 0.48 -109% | 0.3 -30% | 0.22 4% |
| Contrast (:1) | 1261 | 880 -30% | 914 -28% | 1073 -15% | 1391 10% |
| Colorchecker dE 2000 * | 1.59 | 1.43 10% | 4.34 -173% | 3.05 -92% | 1.92 -21% |
| Colorchecker dE 2000 max. * | 3.17 | 2.2 31% | 7.3 -130% | 5.23 -65% | 4.78 -51% |
| Colorchecker dE 2000 calibrated * | 0.87 | 1.34 -54% | 0.72 17% | 1.92 -121% | 1.34 -54% |
| Greyscale dE 2000 * | 2.5 | 1.8 28% | 2.4 4% | 3.11 -24% | 2 20% |
| Gamma | 2.253 98% | 2.4 92% | 2.09 105% | 2.13 103% | 2.153 102% |
| CCT | 6640 98% | 6489 100% | 6413 101% | 6553 99% | 6738 96% |
| Color Space (Percent of AdobeRGB 1998) (%) | 84 | 72 | |||
| Color Space (Percent of sRGB) (%) | 99 | 93 | |||
| Media totale (Programma / Settaggio) | -28% /
-15% | -29% /
-28% | 1% /
-18% | 0% /
-4% |
* ... Meglio usare valori piccoli
Tempi di risposta del Display
| ↔ Tempi di risposta dal Nero al Bianco | ||
|---|---|---|
| 9.6 ms ... aumenta ↗ e diminuisce ↘ combinato | ↗ 5.2 ms Incremento | 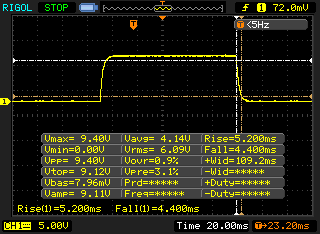 |
| ↘ 4.4 ms Calo | ||
| Lo schermo mostra veloci tempi di risposta durante i nostri tests e dovrebbe esere adatto al gaming In confronto, tutti i dispositivi di test variano da 0.1 (minimo) a 240 (massimo) ms. » 26 % di tutti i dispositivi è migliore. Questo significa che i tempi di risposta rilevati sono migliori rispettto alla media di tutti i dispositivi testati (19.8 ms). | ||
| ↔ Tempo di risposta dal 50% Grigio all'80% Grigio | ||
| 5.6 ms ... aumenta ↗ e diminuisce ↘ combinato | ↗ 2 ms Incremento | 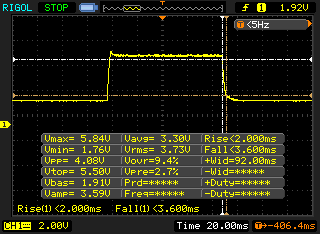 |
| ↘ 3.6 ms Calo | ||
| Lo schermo ha mostrato valori di risposta molto veloci nei nostri tests ed è molto adatto per i gaming veloce. In confronto, tutti i dispositivi di test variano da 0.165 (minimo) a 636 (massimo) ms. » 18 % di tutti i dispositivi è migliore. Questo significa che i tempi di risposta rilevati sono migliori rispettto alla media di tutti i dispositivi testati (31 ms). | ||
Sfarfallio dello schermo / PWM (Pulse-Width Modulation)
| flickering dello schermo / PWM non rilevato | 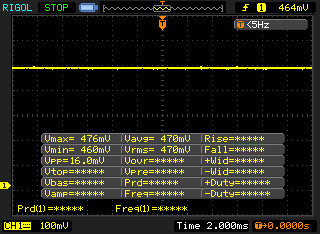 | ||
In confronto: 52 % di tutti i dispositivi testati non utilizza PWM per ridurre la luminosita' del display. Se è rilevato PWM, una media di 7778 (minimo: 5 - massimo: 343500) Hz è stata rilevata. | |||
Performance
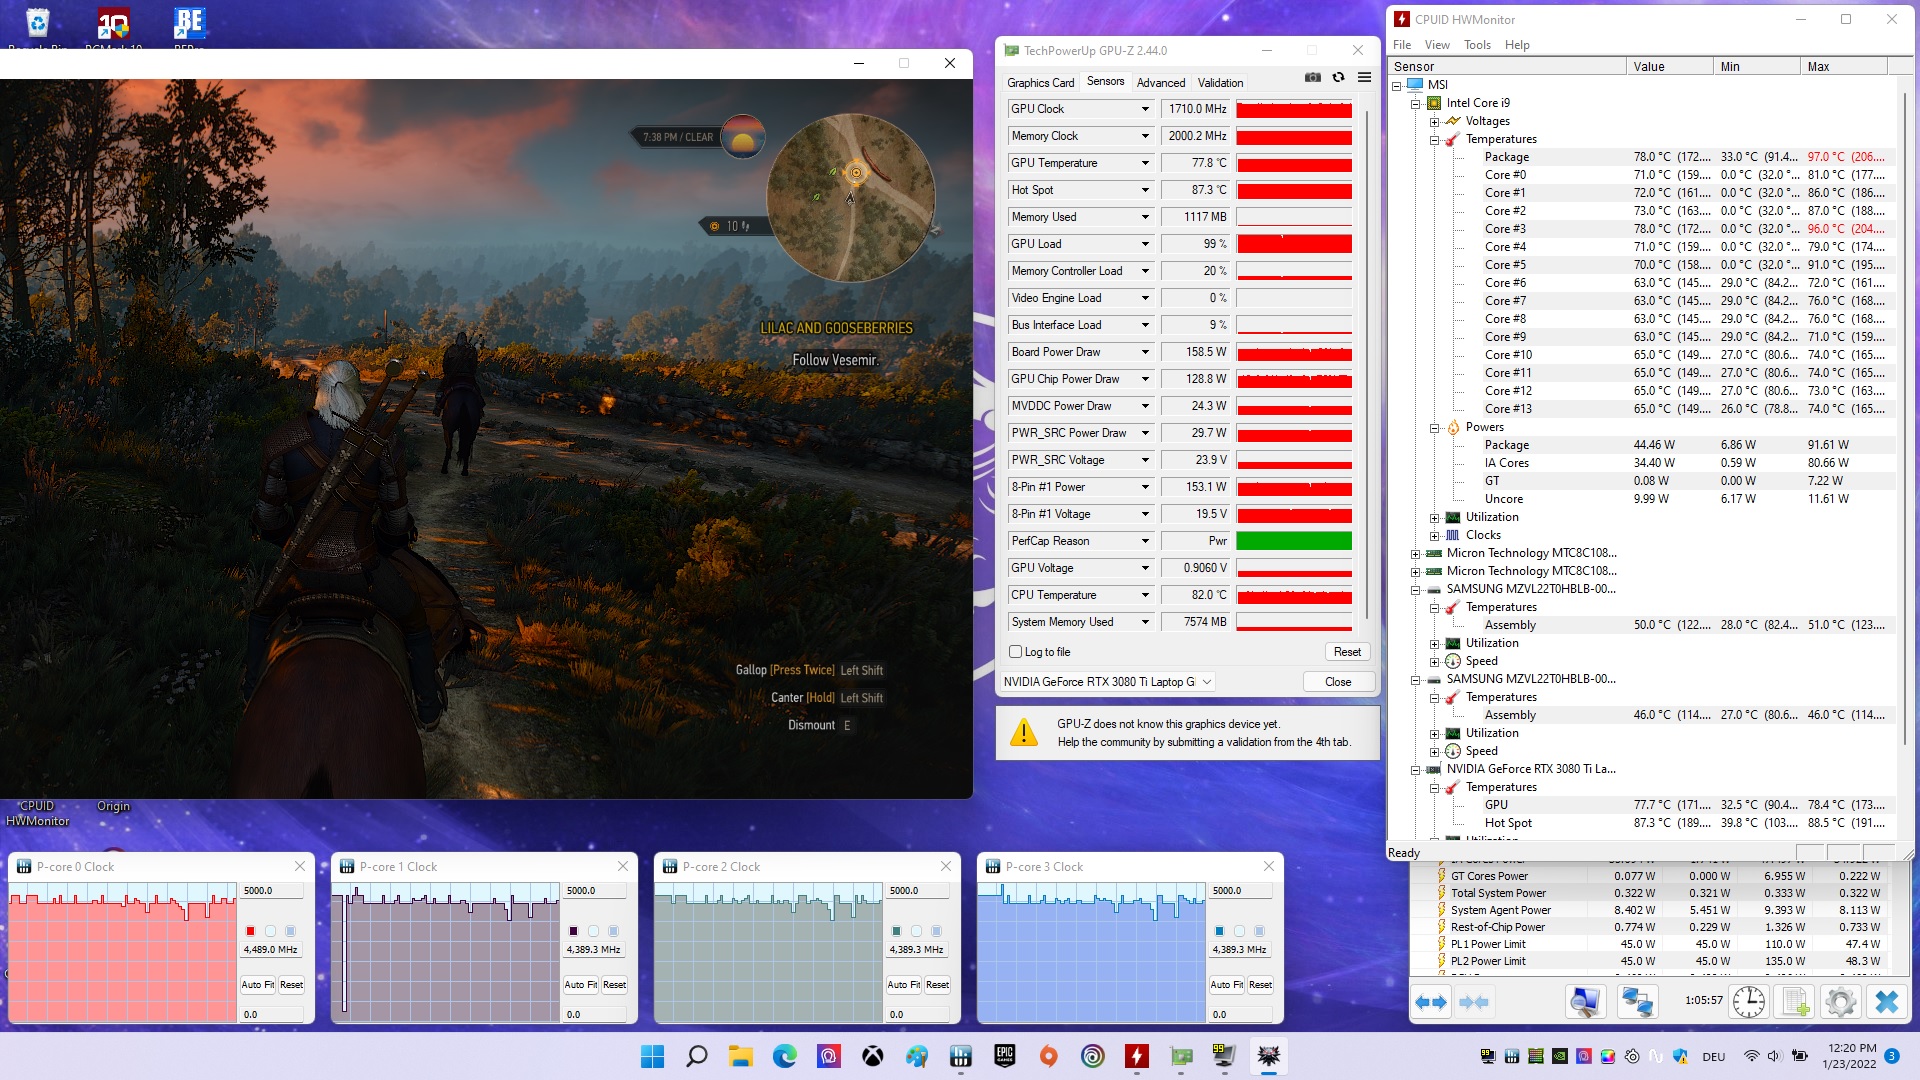
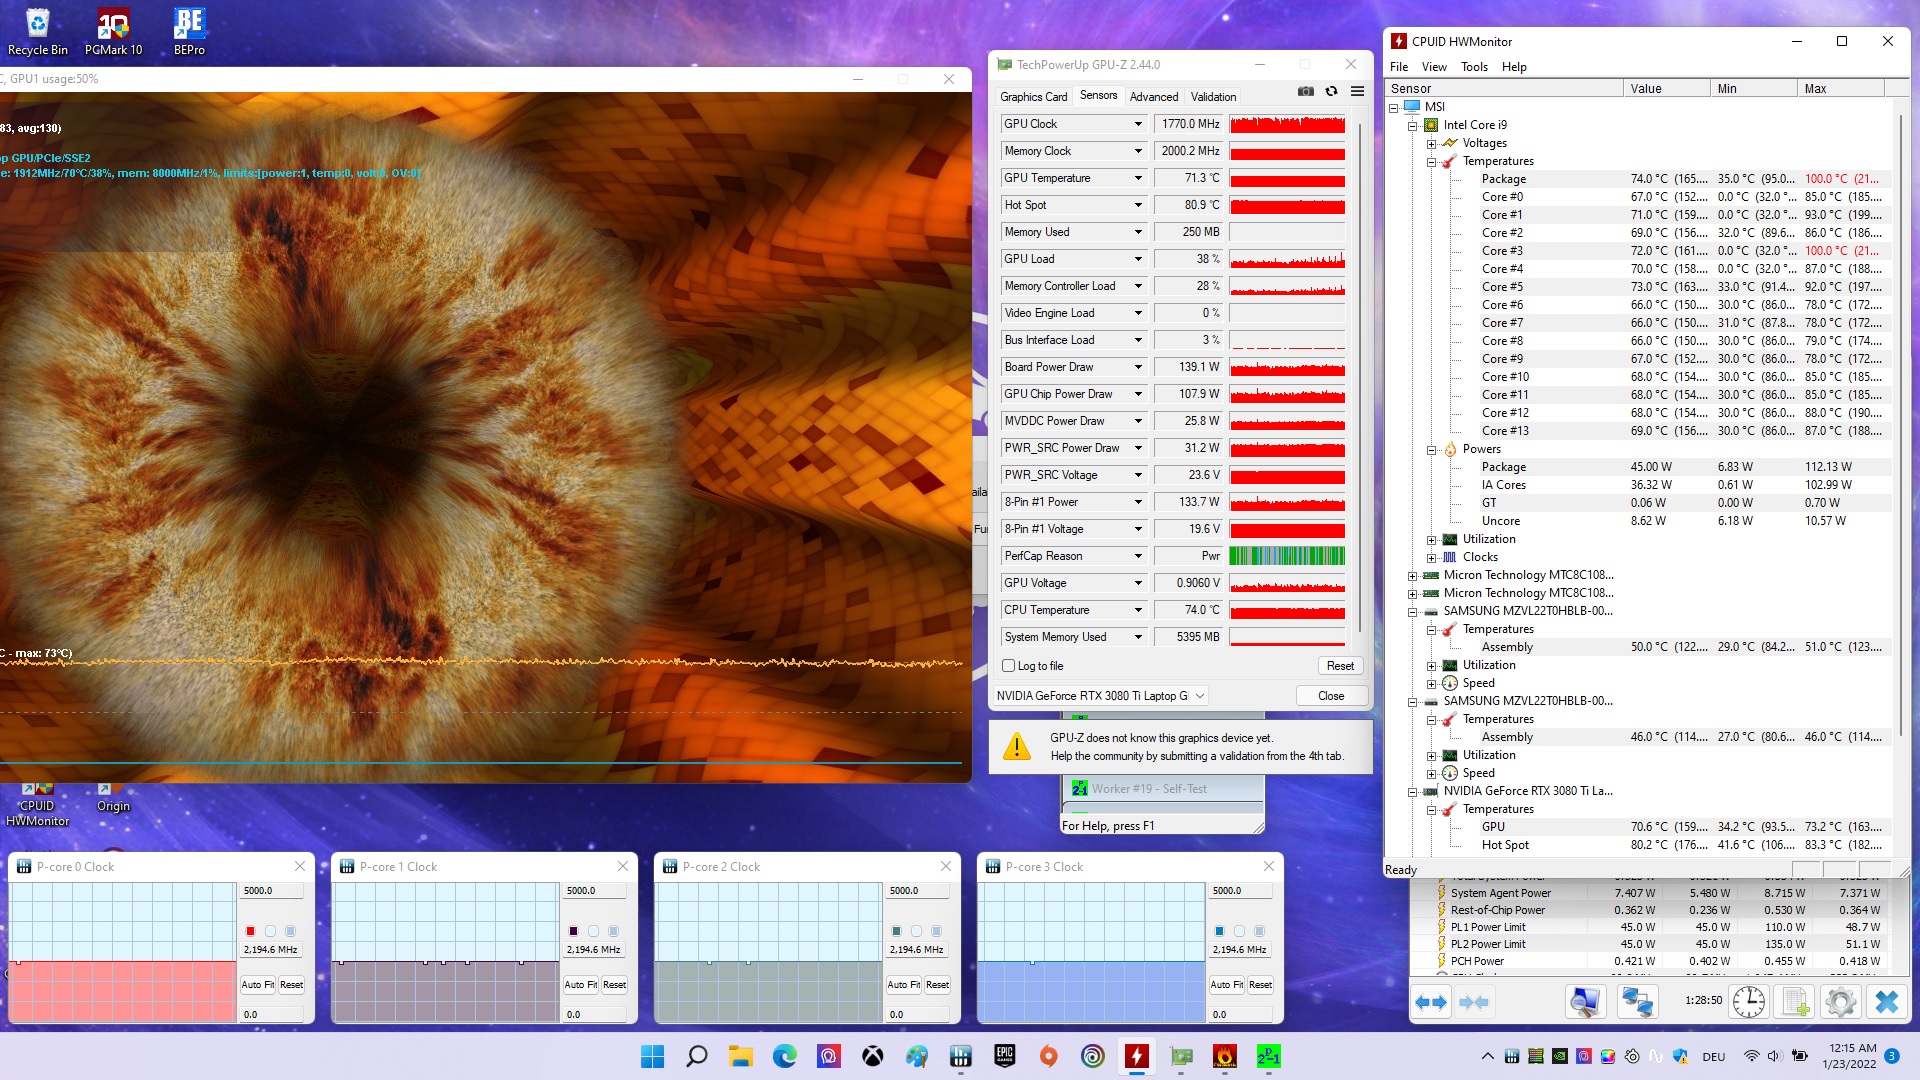
Grazie alla nuova CPU di fascia alta e alla GPU di punta, il GE76 Raider è ovviamente uno dei notebook da gioco più veloci che si possano avere in questo momento. 32 GB di RAM e un totale di 4 TB di archiviazione SSD sono anche una base eccellente per molti anni di gioco felice.
Condizioni di prova
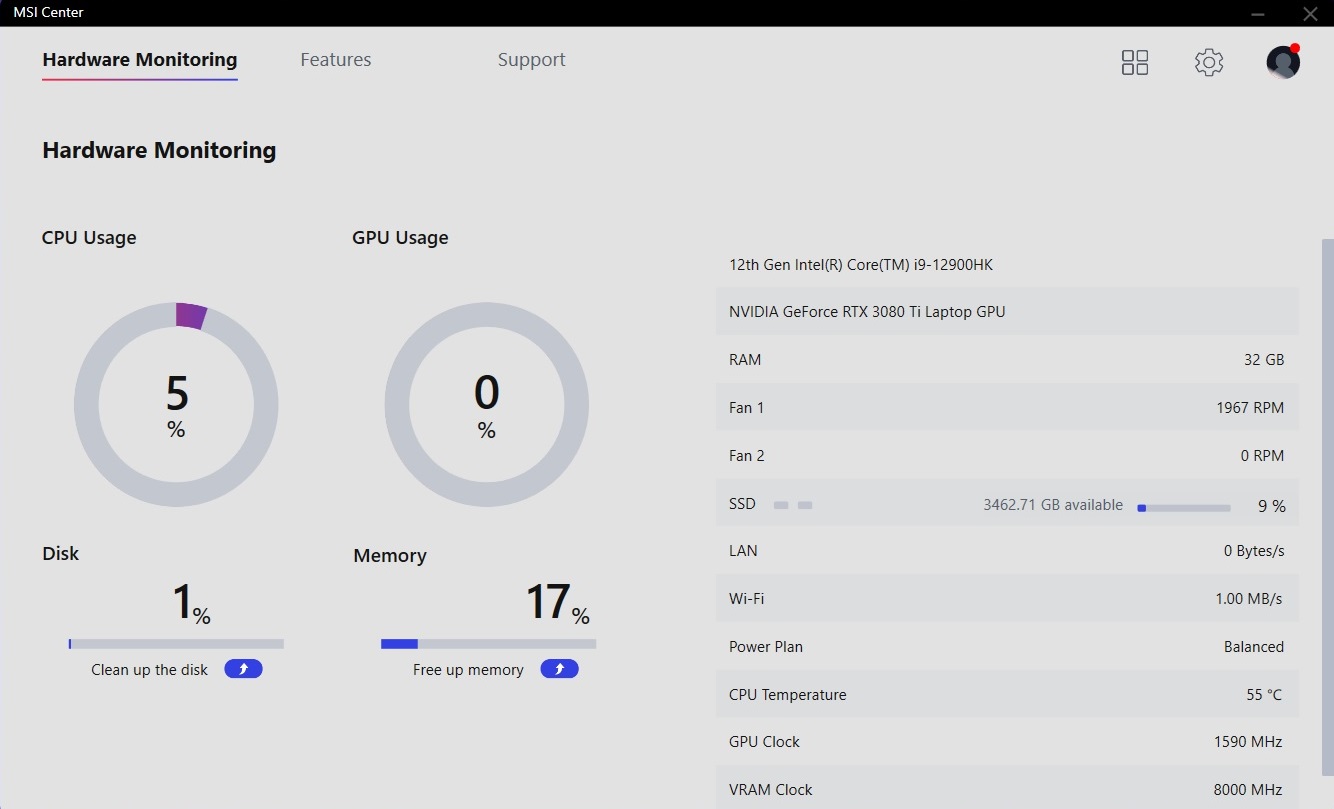
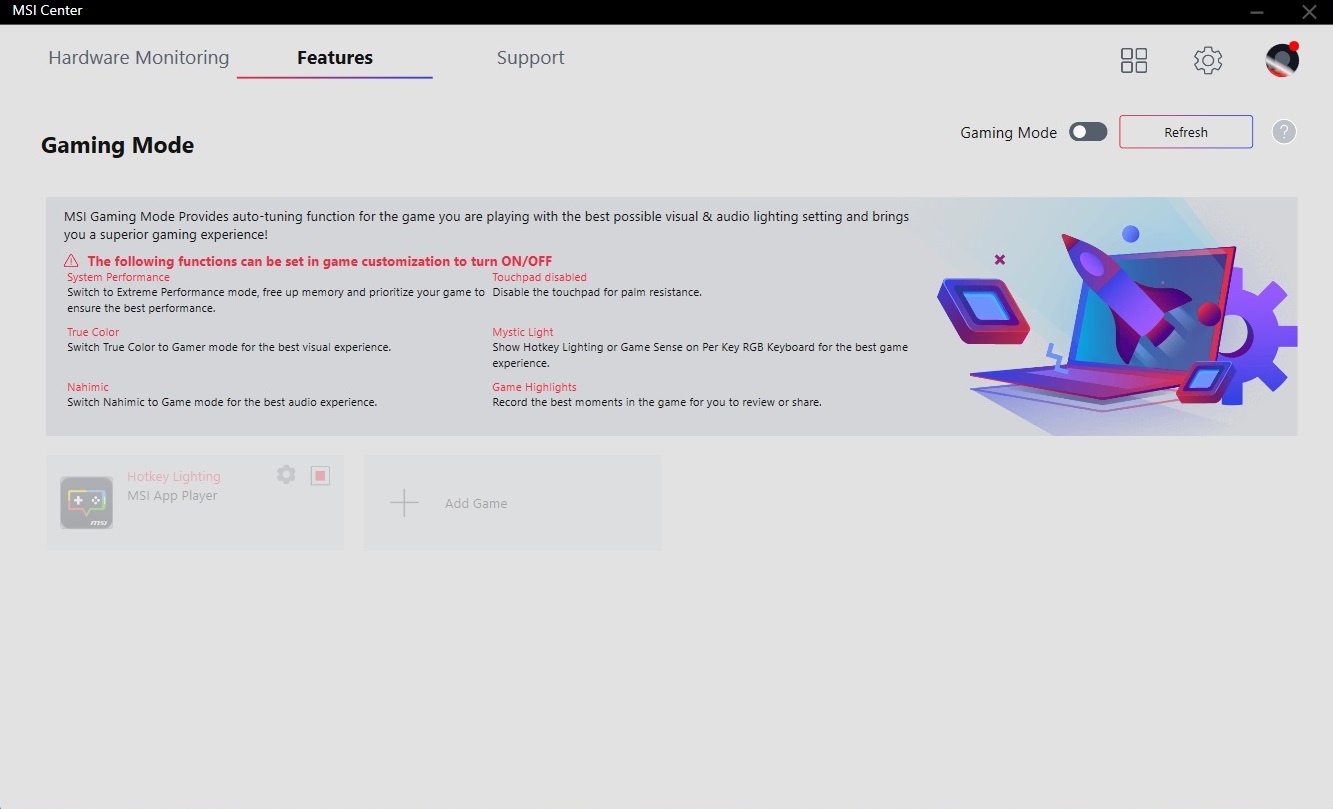
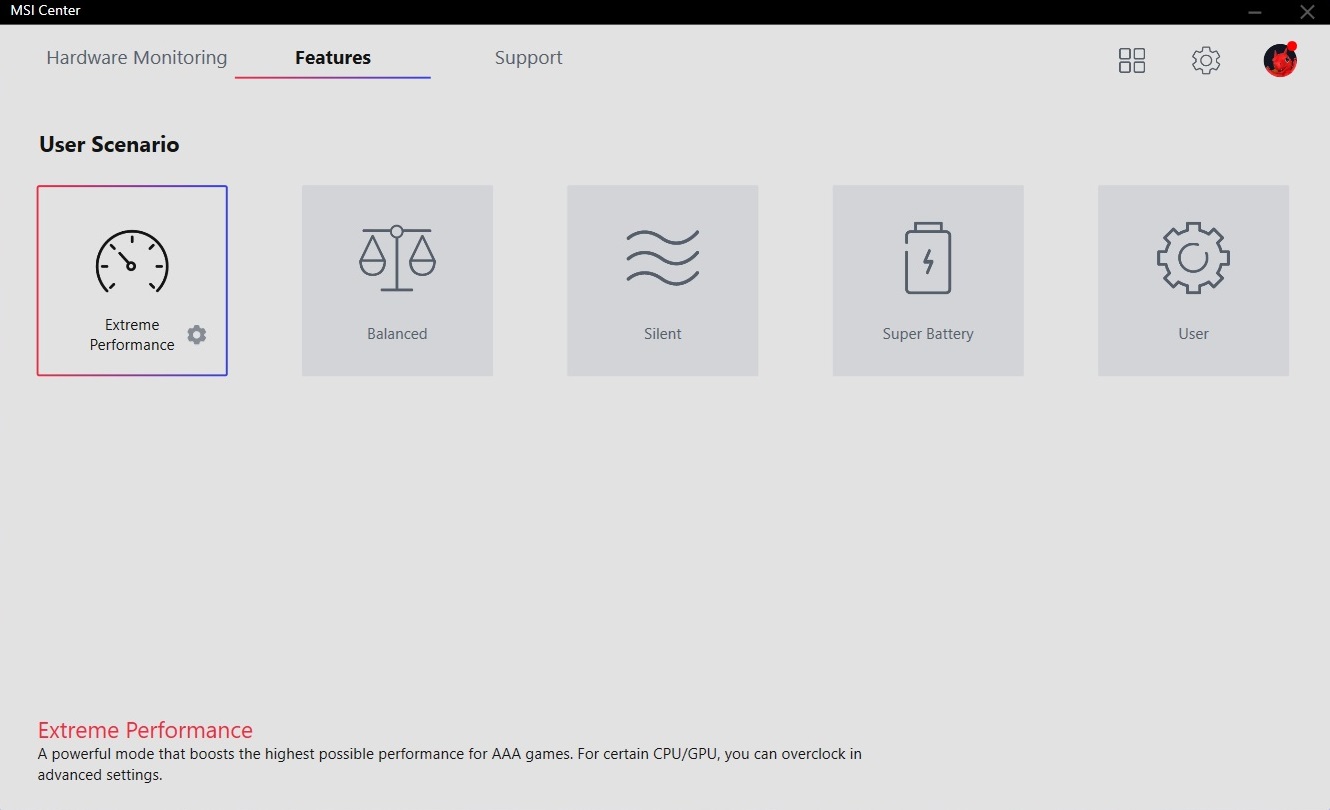
Il notebook viene fornito con un potente software di fine-tuning che è esattamente quello che ci aspettiamo. L'MSI Center precaricato permette di monitorare l'hardware (carico, clock, temperature) e si possono selezionare diverse modalità di alimentazione.
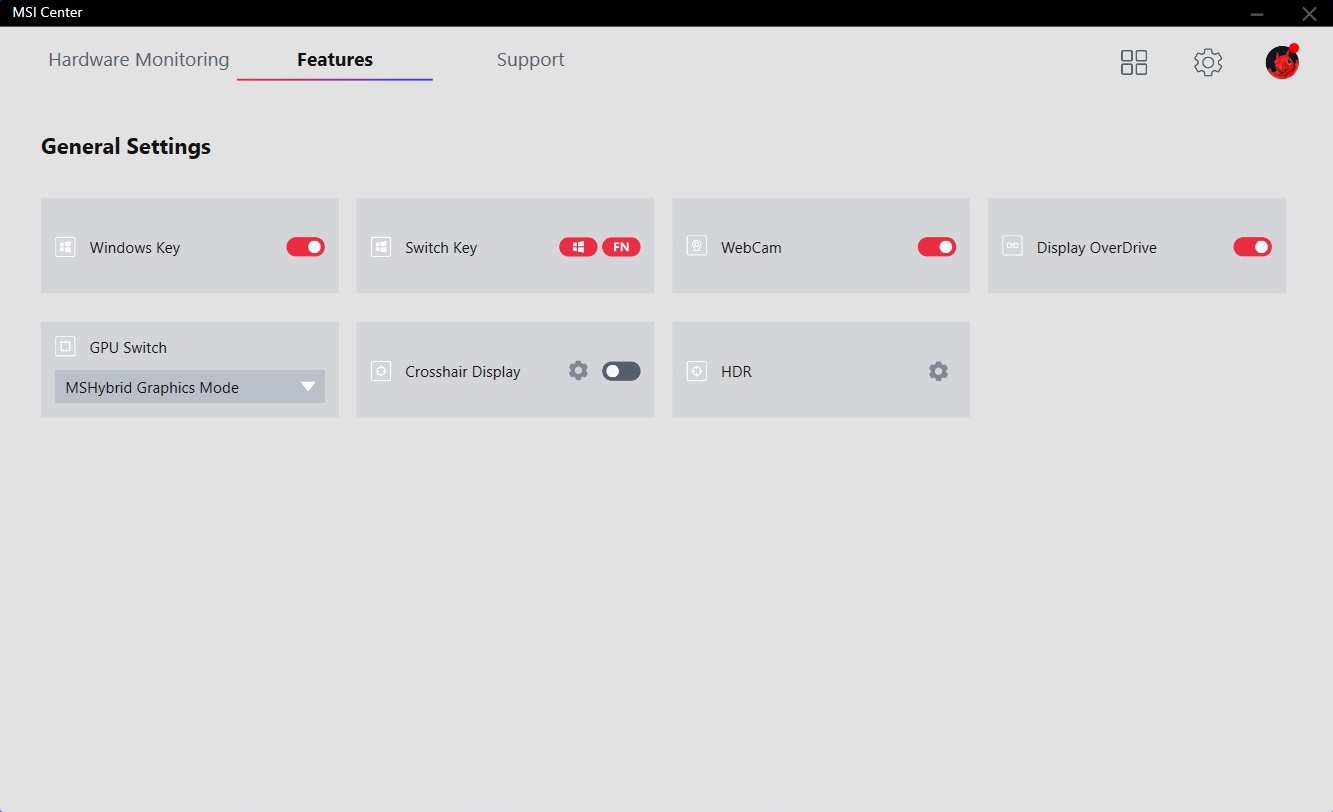
Abbiamo deciso di utilizzare il profilo Extreme Performance in modo da ottenere le migliori prestazioni possibili dai componenti. Il Cooler Boost opzionale non era attivo a causa di quanto fosse insopportabilmente rumoroso. I benchmark 3D e di gioco qui sotto sono stati eseguiti con lo switching grafico disattivato, ma abbiamo abilitato la tecnologia Optimus quando abbiamo fatto i test per altre sezioni della recensione (abbiamo impostato lo Switch GPU su MSI Hybrid Graphics Mode in MSI Center per ottenere ciò). Le modalità di performance disponibili e l'effetto che hanno su GPU/CPU sono elencati nella tabella qui sotto.
| MSI Center profile | Extreme Performance | Balanced | Silent | Super Battery |
|---|---|---|---|---|
| CPU PL1 (HWiNFO) | 110 Watts | 110 Watts | 30 Watts | 15 Watts |
| CPU PL2 (HWiNFO) | 135 Watts | 135 Watts | 30 Watts | 15 Watts |
| Assorbimento della scheda GPU (GPU-Z) Witcher 3 | ~160 Watt | ~145 Watt | ~145 Watt | ~135 Watt |
| Rumore della ventola, Witcher 3 | 53 dB(A) | 46 dB(A) | 37 dB(A) | 36 dB(A) |
Processore
Come detto prima, il Core i9-12900HK è attualmente la CPU per notebook più veloce. Il modello 10-nm della generazione Alder Lake è dotato di 6 core di prestazioni con supporto per l'iperfiltraggio e di 8 core di efficienza senza iperfiltraggio. Il 12900HK offre anche 24 MB di cache L3; la K nella denominazione del modello indica il moltiplicatore libero
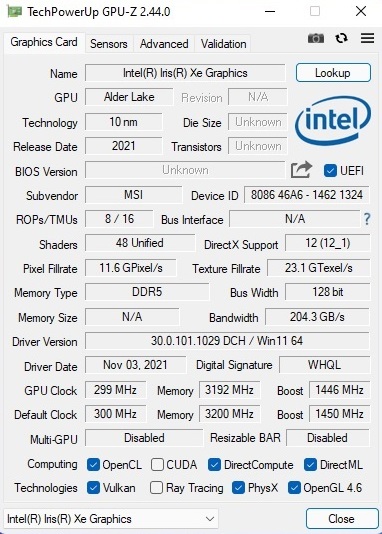
La grafica integrata Iris Xe G7 è un'altra nuova caratteristica dei modelli H45. L'iGPU gestirà tutti i carichi di lavoro leggeri come l'ufficio, la riproduzione video e la navigazione web, il che migliora il consumo di energia e la durata della batteria, rispettivamente
Le prestazioni sono molto impressionanti rispetto alla vecchia generazione Tiger Lake. Secondo la nostra valutazione delle prestazioni, il GE76 è circa il 30-50% più veloce dei portatili con ilCore i9-11900HeCore i7-11800H, rispettivamente. Anche il modello desktopCore i9-11900Knon ha alcuna possibilità nei benchmark multi-core. I risultati calano leggermente durante il ciclo Cinebench, ma il deficit di prestazioni non è così grande.
Cinebench R15 Multi Loop
| CPU Performance rating - Percent | |
| Media della classe Gaming | |
| MSI GE76 Raider | |
| Schenker XMG Ultra 17 Rocket Lake | |
| Asus ROG Zephyrus S17 GX703HSD | |
| Alienware x17 RTX 3080 P48E -2! | |
| Schenker XMG NEO 17 GM7TG8S | |
* ... Meglio usare valori piccoli
AIDA64: FP32 Ray-Trace | FPU Julia | CPU SHA3 | CPU Queen | FPU SinJulia | FPU Mandel | CPU AES | CPU ZLib | FP64 Ray-Trace | CPU PhotoWorxx
| Performance rating | |
| Media della classe Gaming | |
| Schenker XMG Ultra 17 Rocket Lake | |
| MSI GE76 Raider | |
| Schenker XMG NEO 17 GM7TG8S -9! | |
| Alienware x17 RTX 3080 P48E -9! | |
| Asus ROG Zephyrus S17 GX703HSD -9! | |
| AIDA64 / FP32 Ray-Trace | |
| Media della classe Gaming (10227 - 85542, n=109, ultimi 2 anni) | |
| Schenker XMG Ultra 17 Rocket Lake | |
| MSI GE76 Raider | |
| AIDA64 / FPU Julia | |
| Media della classe Gaming (51376 - 238426, n=109, ultimi 2 anni) | |
| Schenker XMG Ultra 17 Rocket Lake | |
| MSI GE76 Raider | |
| AIDA64 / CPU SHA3 | |
| Media della classe Gaming (2180 - 9817, n=109, ultimi 2 anni) | |
| Schenker XMG Ultra 17 Rocket Lake | |
| MSI GE76 Raider | |
| AIDA64 / CPU Queen | |
| Media della classe Gaming (49785 - 173351, n=98, ultimi 2 anni) | |
| MSI GE76 Raider | |
| Schenker XMG Ultra 17 Rocket Lake | |
| AIDA64 / FPU SinJulia | |
| Media della classe Gaming (4424 - 33636, n=109, ultimi 2 anni) | |
| Schenker XMG Ultra 17 Rocket Lake | |
| MSI GE76 Raider | |
| AIDA64 / FPU Mandel | |
| Media della classe Gaming (25115 - 128721, n=109, ultimi 2 anni) | |
| Schenker XMG Ultra 17 Rocket Lake | |
| MSI GE76 Raider | |
| AIDA64 / CPU AES | |
| Schenker XMG Ultra 17 Rocket Lake | |
| Media della classe Gaming (39258 - 247074, n=109, ultimi 2 anni) | |
| MSI GE76 Raider | |
| AIDA64 / CPU ZLib | |
| Media della classe Gaming (574 - 2531, n=109, ultimi 2 anni) | |
| MSI GE76 Raider | |
| Schenker XMG Ultra 17 Rocket Lake | |
| Asus ROG Zephyrus S17 GX703HSD | |
| Schenker XMG NEO 17 GM7TG8S | |
| Alienware x17 RTX 3080 P48E | |
| AIDA64 / FP64 Ray-Trace | |
| Media della classe Gaming (5509 - 45446, n=109, ultimi 2 anni) | |
| Schenker XMG Ultra 17 Rocket Lake | |
| MSI GE76 Raider | |
| AIDA64 / CPU PhotoWorxx | |
| Media della classe Gaming (12271 - 89891, n=109, ultimi 2 anni) | |
| MSI GE76 Raider | |
| Schenker XMG Ultra 17 Rocket Lake | |
Prestazioni del sistema
L'MSI GE76 è anche in cima al confronto in termini di prestazioni di sistema con 8000 punti in PCMark 10, che di solito era riservato ad alcuni sistemi desktop. Questo non è solo il risultato della costosa combinazione CPU/GPU, ma anche delle veloci unità a stato solido.
| PCMark 10 / Score | |
| Media della classe Gaming (5828 - 11574, n=96, ultimi 2 anni) | |
| MSI GE76 Raider | |
| Schenker XMG Ultra 17 Rocket Lake | |
| Alienware x17 RTX 3080 P48E | |
| Asus ROG Zephyrus S17 GX703HSD | |
| Schenker XMG NEO 17 GM7TG8S | |
| PCMark 10 / Essentials | |
| Schenker XMG Ultra 17 Rocket Lake | |
| MSI GE76 Raider | |
| Media della classe Gaming (8810 - 12600, n=100, ultimi 2 anni) | |
| Asus ROG Zephyrus S17 GX703HSD | |
| Schenker XMG NEO 17 GM7TG8S | |
| Alienware x17 RTX 3080 P48E | |
| PCMark 10 / Productivity | |
| Media della classe Gaming (6845 - 21327, n=98, ultimi 2 anni) | |
| MSI GE76 Raider | |
| Schenker XMG Ultra 17 Rocket Lake | |
| Alienware x17 RTX 3080 P48E | |
| Schenker XMG NEO 17 GM7TG8S | |
| Asus ROG Zephyrus S17 GX703HSD | |
| PCMark 10 / Digital Content Creation | |
| Media della classe Gaming (7602 - 19657, n=98, ultimi 2 anni) | |
| MSI GE76 Raider | |
| Schenker XMG Ultra 17 Rocket Lake | |
| Alienware x17 RTX 3080 P48E | |
| Asus ROG Zephyrus S17 GX703HSD | |
| Schenker XMG NEO 17 GM7TG8S | |
| PCMark 10 Score | 8007 punti | |
Aiuto | ||
| AIDA64 / Memory Copy | |
| Media della classe Gaming (21750 - 129946, n=109, ultimi 2 anni) | |
| MSI GE76 Raider | |
| Media Intel Core i9-12900HK (42967 - 62959, n=15) | |
| Schenker XMG Ultra 17 Rocket Lake | |
| AIDA64 / Memory Read | |
| Media della classe Gaming (22956 - 118858, n=109, ultimi 2 anni) | |
| MSI GE76 Raider | |
| Media Intel Core i9-12900HK (44419 - 66989, n=15) | |
| Schenker XMG Ultra 17 Rocket Lake | |
| AIDA64 / Memory Write | |
| Media della classe Gaming (22297 - 135096, n=109, ultimi 2 anni) | |
| MSI GE76 Raider | |
| Media Intel Core i9-12900HK (42144 - 65268, n=15) | |
| Schenker XMG Ultra 17 Rocket Lake | |
| AIDA64 / Memory Latency | |
| Media della classe Gaming (75.3 - 259, n=109, ultimi 2 anni) | |
| MSI GE76 Raider | |
| Media Intel Core i9-12900HK (79.9 - 109, n=15) | |
| Schenker XMG Ultra 17 Rocket Lake | |
| Asus ROG Zephyrus S17 GX703HSD | |
| Schenker XMG NEO 17 GM7TG8S | |
| Alienware x17 RTX 3080 P48E | |
* ... Meglio usare valori piccoli
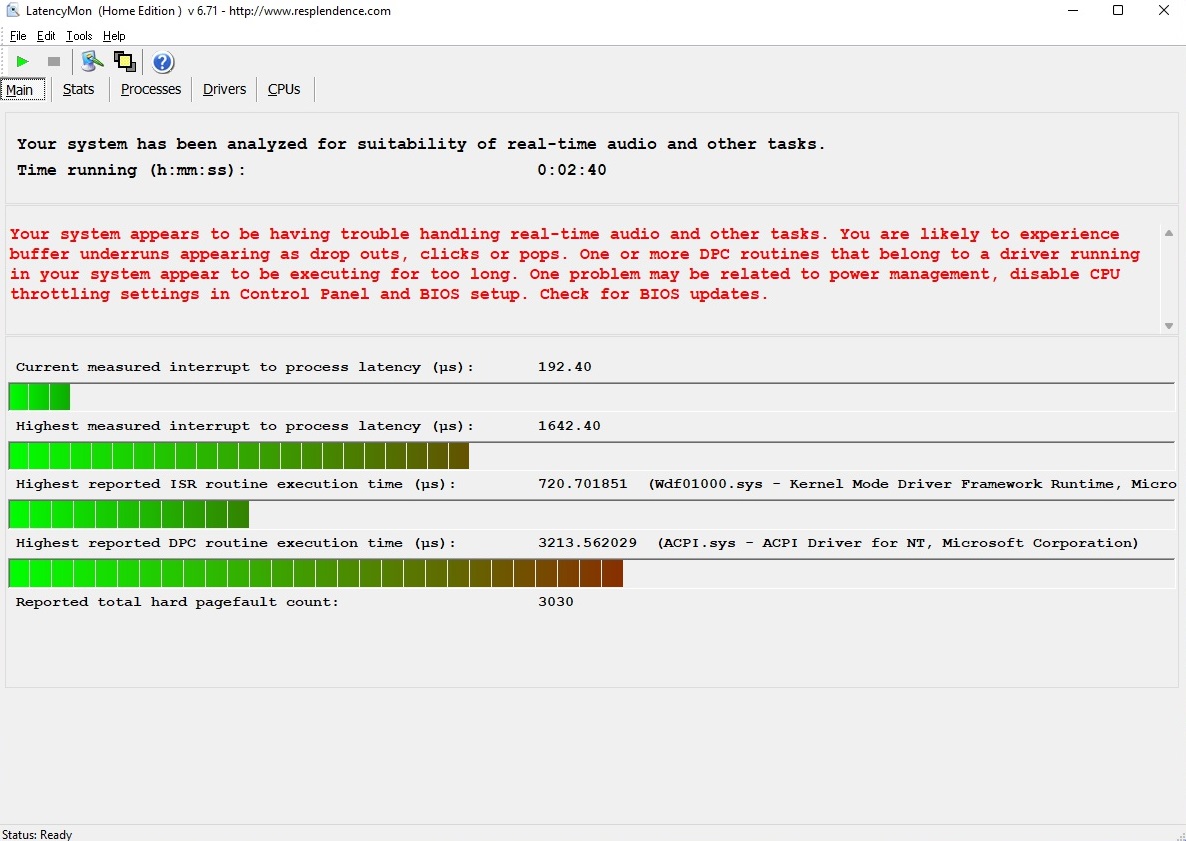
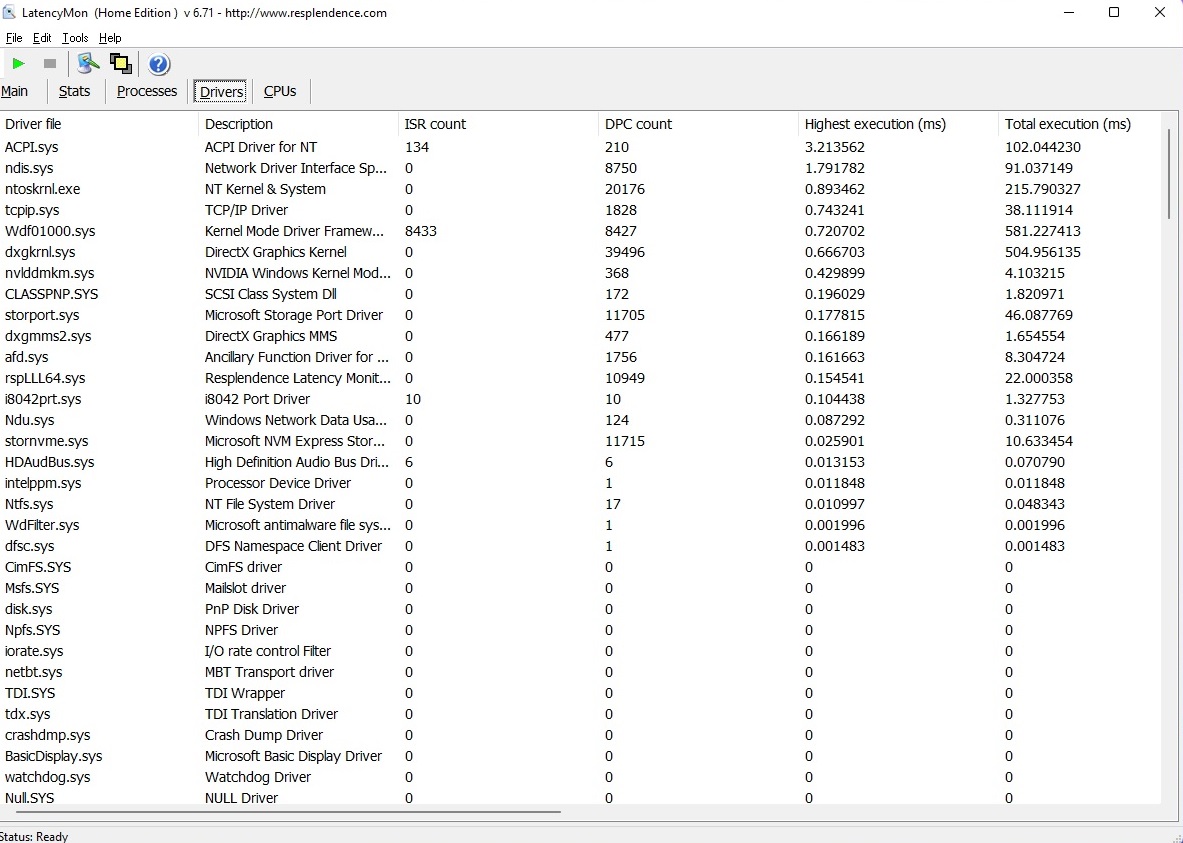
Latenze DPC
Vediamo alcuni margini di miglioramento nel test di latenza. Lo strumento LatencyMon indica alcuni problemi quando si modificano file video o audio in tempo reale, ma questo problema riguarda molti portatili e di solito può essere risolto dall'utente con alcune modifiche.
| DPC Latencies / LatencyMon - interrupt to process latency (max), Web, Youtube, Prime95 | |
| Schenker XMG NEO 17 GM7TG8S | |
| Alienware x17 RTX 3080 P48E | |
| MSI GE76 Raider | |
| Asus ROG Zephyrus S17 GX703HSD | |
| Schenker XMG Ultra 17 Rocket Lake | |
* ... Meglio usare valori piccoli
Stoccaggio
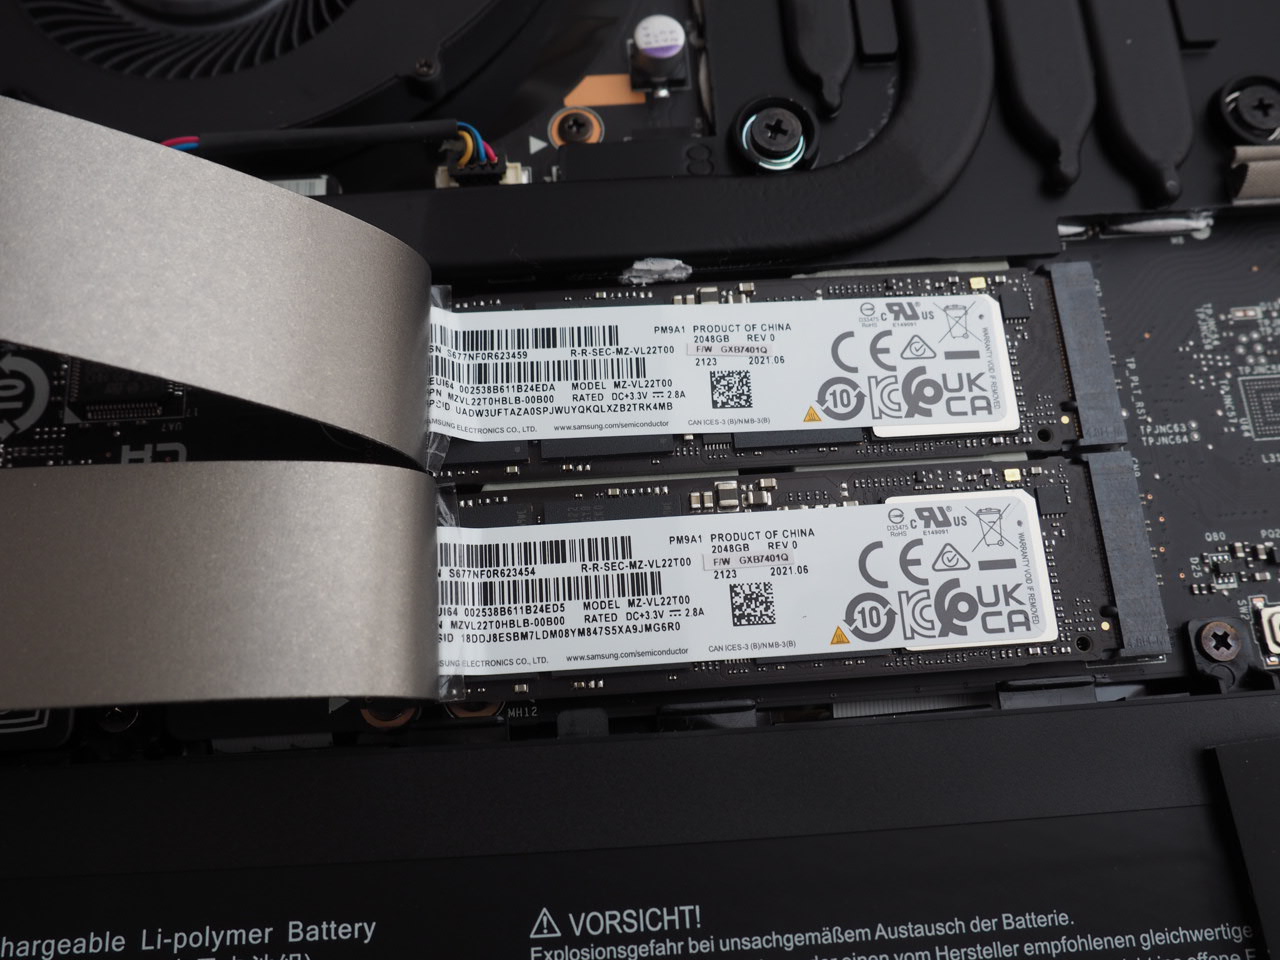
La soluzione di archiviazione è molto impressionante: MSI ha equipaggiato i due slot M.2 con la versione da 2 TB del Samsung PM9A1, che gestisce grandi velocità di trasferimento grazie all'interfaccia PCIe-x4. Velocità di trasferimento in lettura e scrittura sequenziale di oltre 5000 MB/s e 3000 MB/s (AS SSD Benchmark), rispettivamente, sarebbero state impensabili un paio di anni fa.

| Drive Performance rating - Percent | |
| Asus ROG Zephyrus S17 GX703HSD | |
| MSI GE76 Raider | |
| Schenker XMG NEO 17 GM7TG8S | |
| Schenker XMG Ultra 17 Rocket Lake | |
| Media della classe Gaming | |
| Alienware x17 RTX 3080 P48E | |
* ... Meglio usare valori piccoli
Disk Throttling: DiskSpd Read Loop, Queue Depth 8
Prestazioni della GPU
Il grande punto forte del GE76 Raider sarà la scheda grafica per molti utenti. La nuova GeForce RTX 3080 Ti di Nvidia è un vero mostro di prestazioni, che - come noto dalle altre GPU Ampere - può avere prestazioni molto diverse a seconda delle impostazioni TGP.
MSI non fa compromessi e usa il massimo TGP di 175 Watt (incluso il Dynamic Boost) per la RTX 3080 Ti. Questo significa che il GE76 batte tutti i portatili precedenti nei nostri benchmark, ma il vantaggio sulla RTX 3080 con impostazioni TGP elevate non è enorme nei test 3DMark. Non dovreste aspettarvi un vantaggio di più del 10-20% (la differenza è spesso molto più grande nei test di gioco 4K). Tutti i modelli della RTX 3080 Ti sono dotati di 16 GB di GDDR6-VRAM, mentre alcune versioni della RTX 3080 erano dotate di soli 8 GB. Si prega di vedere la nostrasezione tecnicae la nostraAnalisi delle prestazioniper maggiori dettagli tecnici.
| 3DMark Performance rating - Percent | |
| Media della classe Gaming | |
| MSI GE76 Raider | |
| Schenker XMG Ultra 17 Rocket Lake | |
| Schenker XMG NEO 17 GM7TG8S -1! | |
| Alienware x17 RTX 3080 P48E | |
| Asus ROG Zephyrus S17 GX703HSD -1! | |
| 3DMark 06 Standard Score | 56967 punti | |
| 3DMark Vantage P Result | 94760 punti | |
| 3DMark 11 Performance | 36650 punti | |
| 3DMark Cloud Gate Standard Score | 66067 punti | |
| 3DMark Fire Strike Score | 27992 punti | |
| 3DMark Time Spy Score | 13413 punti | |
Aiuto | ||
Prestazioni di gioco
Il GE76 è il primo dispositivo con la RTX 3080 Ti, quindi abbiamo testato più di 30 giochi con diverse impostazioni e risoluzioni - partendo da 1080p/Medium fino a 4K/Ultra (vedi tabella).
Risultato: La nuova ammiraglia di Nvidia non è intimidita da titoli esigenti. La maggior parte dei giochi girerà a più di 60 fps anche con 3840 x 2160 pixel e le impostazioni massime. Ci sono solo una manciata di eccezioni (comeCyberpunk 2077&Crysis Remastered) in cui è necessario ridurre le impostazioni e/o la risoluzione, ma questo è più probabilmente causato dalla codifica che dalle prestazioni della GPU. La RTX 3080 Ti è anche adatta al Ray Tracing.
| Performance rating - Percent | |
| MSI GE76 Raider -167! | |
| Schenker XMG Ultra 17 Rocket Lake -289! | |
| XMG Neo 15 @165 W TGP -160! | |
| Schenker XMG NEO 17 GM7TG8S -308! | |
| XMG Neo 17 @140 W TGP -155! | |
| Alienware x17 RTX 3080 P48E -300! | |
| Asus ROG Zephyrus S17 GX703HSD -307! | |
| The Witcher 3 v4 | |
| 1920x1080 RT Ultra Preset / On AA:FX | |
| XMG Neo 15 @165 W TGP | |
| XMG Neo 17 @140 W TGP | |
| 2560x1440 Ultra Preset / On AA:FX | |
| XMG Neo 15 @165 W TGP | |
| XMG Neo 17 @140 W TGP | |
| 1920x1080 Ultra Preset / On AA:FX | |
| XMG Neo 15 @165 W TGP | |
| XMG Neo 17 @140 W TGP | |
| 1920x1080 High Preset / On AA:FX | |
| XMG Neo 15 @165 W TGP | |
| XMG Neo 17 @140 W TGP | |
| 1920x1080 Medium Preset / On AA:FX | |
| XMG Neo 15 @165 W TGP | |
| XMG Neo 17 @140 W TGP | |
| 1920x1080 Low Preset / Off | |
| XMG Neo 15 @165 W TGP | |
| XMG Neo 17 @140 W TGP | |
| Need for Speed Unbound | |
| 2560x1440 Ultra Preset | |
| XMG Neo 15 @165 W TGP | |
| XMG Neo 17 @140 W TGP | |
| 1920x1080 Ultra Preset | |
| XMG Neo 15 @165 W TGP | |
| XMG Neo 17 @140 W TGP | |
| 1920x1080 High Preset | |
| XMG Neo 15 @165 W TGP | |
| XMG Neo 17 @140 W TGP | |
| 1920x1080 Medium Preset | |
| XMG Neo 15 @165 W TGP | |
| XMG Neo 17 @140 W TGP | |
| 1920x1080 Low Preset | |
| XMG Neo 15 @165 W TGP | |
| XMG Neo 17 @140 W TGP | |
| The Callisto Protocol | |
| 1920x1080 Ultra Preset (without FSR Upscaling) + Full Ray-Tracing | |
| XMG Neo 15 @165 W TGP | |
| XMG Neo 17 @140 W TGP | |
| 3840x2160 Ultra Preset (without FSR Upscaling) | |
| XMG Neo 15 @165 W TGP | |
| XMG Neo 17 @140 W TGP | |
| 2560x1440 Ultra Preset (without FSR Upscaling) | |
| XMG Neo 15 @165 W TGP | |
| XMG Neo 17 @140 W TGP | |
| 1920x1080 Ultra Preset (without FSR Upscaling) | |
| XMG Neo 15 @165 W TGP | |
| XMG Neo 17 @140 W TGP | |
| 1920x1080 High Preset (without FSR Upscaling) | |
| XMG Neo 15 @165 W TGP | |
| XMG Neo 17 @140 W TGP | |
| 1920x1080 Medium Preset (without FSR Upscaling) | |
| XMG Neo 15 @165 W TGP | |
| XMG Neo 17 @140 W TGP | |
| Spider-Man Miles Morales | |
| 1920x0180 Very High Preset + Ray-Tracing AA:T | |
| XMG Neo 15 @165 W TGP | |
| XMG Neo 17 @140 W TGP | |
| 3840x2160 Very High Preset AA:T | |
| XMG Neo 15 @165 W TGP | |
| XMG Neo 17 @140 W TGP | |
| 2560x1440 Very High Preset AA:T | |
| XMG Neo 15 @165 W TGP | |
| XMG Neo 17 @140 W TGP | |
| 1920x1080 Very High Preset AA:T | |
| XMG Neo 15 @165 W TGP | |
| XMG Neo 17 @140 W TGP | |
| 1920x1080 High Preset AA:T | |
| XMG Neo 15 @165 W TGP | |
| XMG Neo 17 @140 W TGP | |
| 1920x1080 Medium Preset AA:SM | |
| XMG Neo 15 @165 W TGP | |
| XMG Neo 17 @140 W TGP | |
| Uncharted Legacy of Thieves Collection | |
| 3840x2160 Ultra Preset | |
| XMG Neo 15 @165 W TGP | |
| XMG Neo 17 @140 W TGP | |
| 2560x1440 Ultra Preset | |
| XMG Neo 15 @165 W TGP | |
| XMG Neo 17 @140 W TGP | |
| 1920x1080 Ultra Preset | |
| XMG Neo 15 @165 W TGP | |
| XMG Neo 17 @140 W TGP | |
| 1920x1080 High Preset | |
| XMG Neo 15 @165 W TGP | |
| XMG Neo 17 @140 W TGP | |
| 1920x1080 Medium Preset | |
| XMG Neo 15 @165 W TGP | |
| XMG Neo 17 @140 W TGP | |
| A Plague Tale Requiem | |
| 3840x2160 Ultra Preset | |
| XMG Neo 15 @165 W TGP | |
| XMG Neo 17 @140 W TGP | |
| 2560x1440 Ultra Preset | |
| XMG Neo 15 @165 W TGP | |
| XMG Neo 17 @140 W TGP | |
| 1920x1080 Ultra Preset | |
| XMG Neo 15 @165 W TGP | |
| XMG Neo 17 @140 W TGP | |
| 1920x1080 High Preset | |
| XMG Neo 15 @165 W TGP | |
| XMG Neo 17 @140 W TGP | |
| 1920x1080 Medium Preset | |
| XMG Neo 15 @165 W TGP | |
| XMG Neo 17 @140 W TGP | |
| Call of Duty Modern Warfare 2 2022 | |
| 3840x2160 Extreme Quality Preset AA:T2X Filmic SM | |
| XMG Neo 15 @165 W TGP | |
| XMG Neo 17 @140 W TGP | |
| 2560x1440 Extreme Quality Preset AA:T2X Filmic SM | |
| XMG Neo 15 @165 W TGP | |
| XMG Neo 17 @140 W TGP | |
| 1920x1080 Extreme Quality Preset AA:T2X Filmic SM | |
| XMG Neo 15 @165 W TGP | |
| XMG Neo 17 @140 W TGP | |
| 1920x1080 Ultra Quality Preset AA:T2X Filmic SM | |
| XMG Neo 15 @165 W TGP | |
| XMG Neo 17 @140 W TGP | |
| 1920x1080 Balanced Quality Preset AA:T2X SM | |
| XMG Neo 15 @165 W TGP | |
| XMG Neo 17 @140 W TGP | |
| FIFA 23 | |
| 3840x2160 Ultra Rendering Quality | |
| XMG Neo 15 @165 W TGP | |
| XMG Neo 17 @140 W TGP | |
| 2560x1440 Ultra Rendering Quality | |
| XMG Neo 15 @165 W TGP | |
| XMG Neo 17 @140 W TGP | |
| 1920x1080 Ultra Rendering Quality | |
| XMG Neo 15 @165 W TGP | |
| XMG Neo 17 @140 W TGP | |
| 1920x1080 High Rendering Quality | |
| XMG Neo 15 @165 W TGP | |
| XMG Neo 17 @140 W TGP | |
| 1920x1080 Medium Rendering Quality | |
| XMG Neo 15 @165 W TGP | |
| XMG Neo 17 @140 W TGP | |
| F1 22 | |
| 3840x2160 Ultra High Preset AA:T AF:16x | |
| XMG Neo 15 @165 W TGP | |
| XMG Neo 17 @140 W TGP | |
| 2560x1440 Ultra High Preset AA:T AF:16x | |
| XMG Neo 15 @165 W TGP | |
| XMG Neo 17 @140 W TGP | |
| 1920x1080 Ultra High Preset AA:T AF:16x | |
| XMG Neo 15 @165 W TGP | |
| XMG Neo 17 @140 W TGP | |
| 1920x1080 High Preset AA:T AF:16x | |
| XMG Neo 15 @165 W TGP | |
| XMG Neo 17 @140 W TGP | |
| 1920x1080 Medium Preset AA:T AF:16x | |
| XMG Neo 15 @165 W TGP | |
| XMG Neo 17 @140 W TGP | |
| The Quarry | |
| 3840x2160 Ultra Preset | |
| XMG Neo 15 @165 W TGP | |
| XMG Neo 17 @140 W TGP | |
| 2560x1440 Ultra Preset | |
| XMG Neo 15 @165 W TGP | |
| XMG Neo 17 @140 W TGP | |
| 1920x1080 Ultra Preset | |
| XMG Neo 15 @165 W TGP | |
| XMG Neo 17 @140 W TGP | |
| 1920x1080 High Preset | |
| XMG Neo 15 @165 W TGP | |
| XMG Neo 17 @140 W TGP | |
| 1920x1080 Medium Preset | |
| XMG Neo 15 @165 W TGP | |
| XMG Neo 17 @140 W TGP | |
| Vampire Bloodhunt | |
| 3840x2160 Ultra Preset | |
| XMG Neo 15 @165 W TGP | |
| XMG Neo 17 @140 W TGP | |
| 2560x1440 Ultra Preset | |
| XMG Neo 15 @165 W TGP | |
| XMG Neo 17 @140 W TGP | |
| 1920x1080 Ultra Preset | |
| XMG Neo 15 @165 W TGP | |
| XMG Neo 17 @140 W TGP | |
| 1920x1080 High Preset | |
| XMG Neo 15 @165 W TGP | |
| XMG Neo 17 @140 W TGP | |
| 1920x1080 Medium Preset | |
| XMG Neo 15 @165 W TGP | |
| XMG Neo 17 @140 W TGP | |
| Tiny Tina's Wonderlands | |
| 3840x2160 Badass Preset (DX12) | |
| XMG Neo 15 @165 W TGP | |
| XMG Neo 17 @140 W TGP | |
| 2560x1440 Badass Preset (DX12) | |
| XMG Neo 15 @165 W TGP | |
| XMG Neo 17 @140 W TGP | |
| 1920x1080 Badass Preset (DX12) | |
| XMG Neo 15 @165 W TGP | |
| XMG Neo 17 @140 W TGP | |
| 1920x1080 High Preset (DX12) | |
| XMG Neo 15 @165 W TGP | |
| XMG Neo 17 @140 W TGP | |
| 1920x1080 Medium Preset (DX12) | |
| XMG Neo 15 @165 W TGP | |
| XMG Neo 17 @140 W TGP | |
| Ghostwire Tokyo | |
| 1920x1080 Highest Settings + Maximum Ray Tracing | |
| XMG Neo 15 @165 W TGP | |
| XMG Neo 17 @140 W TGP | |
| 3840x2160 Highest Settings | |
| XMG Neo 15 @165 W TGP | |
| XMG Neo 17 @140 W TGP | |
| 2560x1440 Highest Settings | |
| XMG Neo 15 @165 W TGP | |
| XMG Neo 17 @140 W TGP | |
| 1920x1080 Highest Settings | |
| XMG Neo 15 @165 W TGP | |
| XMG Neo 17 @140 W TGP | |
| 1920x1080 High Settings | |
| XMG Neo 15 @165 W TGP | |
| XMG Neo 17 @140 W TGP | |
| 1920x1080 Medium Settings | |
| XMG Neo 15 @165 W TGP | |
| XMG Neo 17 @140 W TGP | |
| Elden Ring | |
| 3840x2160 Maximum Preset | |
| XMG Neo 15 @165 W TGP | |
| XMG Neo 17 @140 W TGP | |
| 2560x1440 Maximum Preset | |
| XMG Neo 17 @140 W TGP | |
| XMG Neo 15 @165 W TGP | |
| 1920x1080 Maximum Preset | |
| XMG Neo 17 @140 W TGP | |
| XMG Neo 15 @165 W TGP | |
| 1920x1080 High Preset | |
| XMG Neo 17 @140 W TGP | |
| XMG Neo 15 @165 W TGP | |
| 1920x1080 Medium Preset | |
| XMG Neo 17 @140 W TGP | |
| XMG Neo 15 @165 W TGP | |
| Elex 2 | |
| 3840x2160 Ultra / On AA:SM AF:16x | |
| XMG Neo 15 @165 W TGP | |
| XMG Neo 17 @140 W TGP | |
| 2560x1440 Ultra / On AA:SM AF:16x | |
| XMG Neo 15 @165 W TGP | |
| XMG Neo 17 @140 W TGP | |
| 1920x1080 Ultra / On AA:SM AF:16x | |
| XMG Neo 15 @165 W TGP | |
| XMG Neo 17 @140 W TGP | |
| 1920x1080 High / On AA:FX AF:16x | |
| XMG Neo 17 @140 W TGP | |
| XMG Neo 15 @165 W TGP | |
| 1920x1080 Medium / On AA:FX AF:16x | |
| XMG Neo 17 @140 W TGP | |
| XMG Neo 15 @165 W TGP | |
| Cyberpunk 2077 1.6 | |
| 3840x2160 Ray Tracing Ultra Preset (DLSS off) | |
| XMG Neo 15 @165 W TGP | |
| XMG Neo 17 @140 W TGP | |
| 1920x1080 Ray Tracing Ultra Preset (DLSS off) | |
| XMG Neo 15 @165 W TGP | |
| XMG Neo 17 @140 W TGP | |
| 3840x2160 Ultra Preset | |
| XMG Neo 17 @140 W TGP | |
| 2560x1440 Ultra Preset | |
| XMG Neo 17 @140 W TGP | |
| 1920x1080 Ultra Preset | |
| XMG Neo 17 @140 W TGP | |
| 1920x1080 High Preset | |
| XMG Neo 17 @140 W TGP | |
| 1920x1080 Medium Preset | |
| XMG Neo 17 @140 W TGP | |
| GRID Legends | |
| 3840x2160 Ultra Preset | |
| XMG Neo 15 @165 W TGP | |
| XMG Neo 17 @140 W TGP | |
| 2560x1440 Ultra Preset | |
| XMG Neo 15 @165 W TGP | |
| XMG Neo 17 @140 W TGP | |
| 1920x1080 Ultra Preset | |
| XMG Neo 15 @165 W TGP | |
| XMG Neo 17 @140 W TGP | |
| 1920x1080 High Preset | |
| XMG Neo 15 @165 W TGP | |
| XMG Neo 17 @140 W TGP | |
| 1920x1080 Medium Preset | |
| XMG Neo 15 @165 W TGP | |
| XMG Neo 17 @140 W TGP | |
| Dying Light 2 | |
| 1920x1080 High Quality Raytracing | |
| XMG Neo 15 @165 W TGP | |
| XMG Neo 17 @140 W TGP | |
| 3840x2160 High Quality | |
| XMG Neo 15 @165 W TGP | |
| XMG Neo 17 @140 W TGP | |
| 2560x1440 High Quality | |
| XMG Neo 15 @165 W TGP | |
| XMG Neo 17 @140 W TGP | |
| 1920x1080 High Quality | |
| XMG Neo 15 @165 W TGP | |
| XMG Neo 17 @140 W TGP | |
| 1920x1080 Medium Quality | |
| XMG Neo 15 @165 W TGP | |
| XMG Neo 17 @140 W TGP | |
| Rainbow Six Extraction | |
| 3840x2160 Ultra Preset (with Fixed Resolution Quality) | |
| XMG Neo 15 @165 W TGP | |
| XMG Neo 17 @140 W TGP | |
| 2560x1440 Ultra Preset (with Fixed Resolution Quality) | |
| XMG Neo 15 @165 W TGP | |
| XMG Neo 17 @140 W TGP | |
| 1920x1080 Ultra Preset (with Fixed Resolution Quality) | |
| XMG Neo 15 @165 W TGP | |
| XMG Neo 17 @140 W TGP | |
| 1920x1080 High Preset (with Fixed Resolution Quality) | |
| XMG Neo 15 @165 W TGP | |
| XMG Neo 17 @140 W TGP | |
| 1920x1080 Medium Preset (with Fixed Resolution Quality) | |
| XMG Neo 15 @165 W TGP | |
| XMG Neo 17 @140 W TGP | |
| God of War | |
| 3840x2160 Ultra Preset | |
| MSI GE76 Raider | |
| XMG Neo 15 @165 W TGP | |
| XMG Neo 17 @140 W TGP | |
| 2560x1440 Ultra Preset | |
| MSI GE76 Raider | |
| XMG Neo 15 @165 W TGP | |
| XMG Neo 17 @140 W TGP | |
| 1920x1080 Ultra Preset | |
| MSI GE76 Raider | |
| XMG Neo 15 @165 W TGP | |
| XMG Neo 17 @140 W TGP | |
| 1920x1080 High Preset | |
| MSI GE76 Raider | |
| XMG Neo 15 @165 W TGP | |
| XMG Neo 17 @140 W TGP | |
| 1920x1080 Original Preset | |
| MSI GE76 Raider | |
| XMG Neo 15 @165 W TGP | |
| XMG Neo 17 @140 W TGP | |
| Halo Infinite | |
| 3840x2160 Ultra Preset | |
| MSI GE76 Raider | |
| XMG Neo 15 @165 W TGP | |
| XMG Neo 17 @140 W TGP | |
| 2560x1440 Ultra Preset | |
| MSI GE76 Raider | |
| XMG Neo 15 @165 W TGP | |
| XMG Neo 17 @140 W TGP | |
| 1920x1080 Ultra Preset | |
| MSI GE76 Raider | |
| XMG Neo 15 @165 W TGP | |
| XMG Neo 17 @140 W TGP | |
| 1920x1080 High Preset | |
| MSI GE76 Raider | |
| XMG Neo 15 @165 W TGP | |
| XMG Neo 17 @140 W TGP | |
| 1920x1080 Medium Preset | |
| MSI GE76 Raider | |
| XMG Neo 15 @165 W TGP | |
| XMG Neo 17 @140 W TGP | |
| Farming Simulator 22 | |
| 3840x2160 Very High Preset | |
| MSI GE76 Raider | |
| XMG Neo 15 @165 W TGP | |
| XMG Neo 17 @140 W TGP | |
| 2560x1440 Very High Preset | |
| MSI GE76 Raider | |
| XMG Neo 15 @165 W TGP | |
| XMG Neo 17 @140 W TGP | |
| 1920x1080 Very High Preset | |
| MSI GE76 Raider | |
| XMG Neo 15 @165 W TGP | |
| XMG Neo 17 @140 W TGP | |
| 1920x1080 High Preset | |
| MSI GE76 Raider | |
| XMG Neo 15 @165 W TGP | |
| XMG Neo 17 @140 W TGP | |
| 1920x1080 Medium Preset | |
| MSI GE76 Raider | |
| XMG Neo 17 @140 W TGP | |
| XMG Neo 15 @165 W TGP | |
| Battlefield 2042 | |
| 1920x1080 Ultra Preset + Ray Tracing | |
| MSI GE76 Raider | |
| XMG Neo 15 @165 W TGP | |
| XMG Neo 17 @140 W TGP | |
| 3840x2160 Ultra Preset | |
| MSI GE76 Raider | |
| XMG Neo 15 @165 W TGP | |
| XMG Neo 17 @140 W TGP | |
| 2560x1440 Ultra Preset | |
| MSI GE76 Raider | |
| XMG Neo 15 @165 W TGP | |
| XMG Neo 17 @140 W TGP | |
| 1920x1080 Ultra Preset | |
| MSI GE76 Raider | |
| XMG Neo 15 @165 W TGP | |
| XMG Neo 17 @140 W TGP | |
| 1920x1080 High Preset | |
| MSI GE76 Raider | |
| XMG Neo 15 @165 W TGP | |
| XMG Neo 17 @140 W TGP | |
| 1920x1080 Medium Preset | |
| XMG Neo 17 @140 W TGP | |
| MSI GE76 Raider | |
| XMG Neo 15 @165 W TGP | |
| Forza Horizon 5 | |
| 3840x2160 Extreme Preset | |
| MSI GE76 Raider | |
| XMG Neo 15 @165 W TGP | |
| XMG Neo 17 @140 W TGP | |
| 2560x1440 Extreme Preset | |
| MSI GE76 Raider | |
| XMG Neo 15 @165 W TGP | |
| XMG Neo 17 @140 W TGP | |
| 1920x1080 Extreme Preset | |
| MSI GE76 Raider | |
| XMG Neo 15 @165 W TGP | |
| XMG Neo 17 @140 W TGP | |
| 1920x1080 High Preset | |
| MSI GE76 Raider | |
| XMG Neo 15 @165 W TGP | |
| XMG Neo 17 @140 W TGP | |
| 1920x1080 Medium Preset | |
| MSI GE76 Raider | |
| XMG Neo 15 @165 W TGP | |
| XMG Neo 17 @140 W TGP | |
| 1920x1080 Low Preset | |
| XMG Neo 15 @165 W TGP | |
| XMG Neo 17 @140 W TGP | |
| Call of Duty Vanguard | |
| 3840x2160 Ultra Preset | |
| XMG Neo 15 @165 W TGP | |
| XMG Neo 17 @140 W TGP | |
| 2560x1440 Ultra Preset | |
| XMG Neo 15 @165 W TGP | |
| XMG Neo 17 @140 W TGP | |
| 1920x1080 Ultra Preset | |
| XMG Neo 15 @165 W TGP | |
| XMG Neo 17 @140 W TGP | |
| 1920x1080 High Preset | |
| XMG Neo 15 @165 W TGP | |
| XMG Neo 17 @140 W TGP | |
| 1920x1080 Medium Preset | |
| XMG Neo 17 @140 W TGP | |
| XMG Neo 15 @165 W TGP | |
| 1920x1080 Low Preset | |
| XMG Neo 17 @140 W TGP | |
| XMG Neo 15 @165 W TGP | |
| Riders Republic | |
| 3840x2160 Ultra Preset | |
| MSI GE76 Raider | |
| XMG Neo 15 @165 W TGP | |
| XMG Neo 17 @140 W TGP | |
| 2560x1440 Ultra Preset | |
| MSI GE76 Raider | |
| XMG Neo 15 @165 W TGP | |
| XMG Neo 17 @140 W TGP | |
| 1920x1080 Ultra Preset | |
| MSI GE76 Raider | |
| XMG Neo 15 @165 W TGP | |
| XMG Neo 17 @140 W TGP | |
| 1920x1080 High Preset | |
| MSI GE76 Raider | |
| XMG Neo 15 @165 W TGP | |
| XMG Neo 17 @140 W TGP | |
| 1920x1080 Medium Preset | |
| MSI GE76 Raider | |
| XMG Neo 15 @165 W TGP | |
| XMG Neo 17 @140 W TGP | |
| 1920x1080 Low Preset | |
| XMG Neo 15 @165 W TGP | |
| XMG Neo 17 @140 W TGP | |
| Guardians of the Galaxy | |
| 1920x1080 Ultra Preset + Ultra Ray-Tracing | |
| MSI GE76 Raider | |
| XMG Neo 15 @165 W TGP | |
| XMG Neo 17 @140 W TGP | |
| 3840x2160 Ultra Preset | |
| MSI GE76 Raider | |
| XMG Neo 15 @165 W TGP | |
| XMG Neo 17 @140 W TGP | |
| 2560x1440 Ultra Preset | |
| MSI GE76 Raider | |
| XMG Neo 15 @165 W TGP | |
| XMG Neo 17 @140 W TGP | |
| 1920x1080 Ultra Preset | |
| MSI GE76 Raider | |
| XMG Neo 15 @165 W TGP | |
| XMG Neo 17 @140 W TGP | |
| 1920x1080 High Preset | |
| MSI GE76 Raider | |
| XMG Neo 15 @165 W TGP | |
| XMG Neo 17 @140 W TGP | |
| 1920x1080 Medium Preset | |
| MSI GE76 Raider | |
| XMG Neo 15 @165 W TGP | |
| XMG Neo 17 @140 W TGP | |
| Alan Wake Remastered | |
| 3840x2160 High Preset | |
| MSI GE76 Raider | |
| XMG Neo 15 @165 W TGP | |
| XMG Neo 17 @140 W TGP | |
| 2560x1440 High Preset | |
| MSI GE76 Raider | |
| XMG Neo 15 @165 W TGP | |
| XMG Neo 17 @140 W TGP | |
| 1920x1080 High Preset | |
| MSI GE76 Raider | |
| XMG Neo 15 @165 W TGP | |
| XMG Neo 17 @140 W TGP | |
| 1920x1080 Medium Preset | |
| MSI GE76 Raider | |
| XMG Neo 15 @165 W TGP | |
| XMG Neo 17 @140 W TGP | |
| 1920x1080 Low Preset | |
| XMG Neo 15 @165 W TGP | |
| XMG Neo 17 @140 W TGP | |
| Back 4 Blood | |
| 3840x2160 Epic Preset (DX12) AA:T | |
| MSI GE76 Raider | |
| XMG Neo 15 @165 W TGP | |
| XMG Neo 17 @140 W TGP | |
| 2560x1440 Epic Preset (DX12) AA:T | |
| MSI GE76 Raider | |
| XMG Neo 15 @165 W TGP | |
| XMG Neo 17 @140 W TGP | |
| 1920x1080 Epic Preset (DX12) AA:T | |
| MSI GE76 Raider | |
| XMG Neo 15 @165 W TGP | |
| XMG Neo 17 @140 W TGP | |
| 1920x1080 High Preset (DX12) AA:T | |
| MSI GE76 Raider | |
| XMG Neo 15 @165 W TGP | |
| XMG Neo 17 @140 W TGP | |
| 1920x1080 Medium Preset (DX12) AA:FX | |
| MSI GE76 Raider | |
| XMG Neo 15 @165 W TGP | |
| XMG Neo 17 @140 W TGP | |
| 1920x1080 Low Preset (DX12) | |
| XMG Neo 15 @165 W TGP | |
| XMG Neo 17 @140 W TGP | |
| Far Cry 6 | |
| 1920x1080 Ultra Graphics Quality + HD Textures + DXR AA:T | |
| MSI GE76 Raider | |
| XMG Neo 15 @165 W TGP | |
| XMG Neo 17 @140 W TGP | |
| 3840x2160 Ultra Graphics Quality + HD Textures AA:T | |
| MSI GE76 Raider | |
| XMG Neo 15 @165 W TGP | |
| XMG Neo 17 @140 W TGP | |
| 2560x1440 Ultra Graphics Quality + HD Textures AA:T | |
| MSI GE76 Raider | |
| XMG Neo 15 @165 W TGP | |
| XMG Neo 17 @140 W TGP | |
| 1920x1080 Ultra Graphics Quality + HD Textures AA:T | |
| MSI GE76 Raider | |
| XMG Neo 15 @165 W TGP | |
| XMG Neo 17 @140 W TGP | |
| 1920x1080 High Graphics Quality AA:T | |
| MSI GE76 Raider | |
| XMG Neo 15 @165 W TGP | |
| XMG Neo 17 @140 W TGP | |
| 1920x1080 Medium Graphics Quality AA:SM | |
| MSI GE76 Raider | |
| XMG Neo 15 @165 W TGP | |
| XMG Neo 17 @140 W TGP | |
| 1920x1080 Low Graphics Quality | |
| XMG Neo 15 @165 W TGP | |
| XMG Neo 17 @140 W TGP | |
| FIFA 22 | |
| 3840x2160 Ultra Rendering Quality AA:4x MS | |
| XMG Neo 15 @165 W TGP | |
| XMG Neo 17 @140 W TGP | |
| 2560x1440 Ultra Rendering Quality AA:4x MS | |
| XMG Neo 15 @165 W TGP | |
| XMG Neo 17 @140 W TGP | |
| 1920x1080 Ultra Rendering Quality AA:4x MS | |
| XMG Neo 15 @165 W TGP | |
| XMG Neo 17 @140 W TGP | |
| 1920x1080 High Rendering Quality AA:2x MS | |
| XMG Neo 15 @165 W TGP | |
| XMG Neo 17 @140 W TGP | |
| 1920x1080 Medium Rendering Quality | |
| XMG Neo 17 @140 W TGP | |
| XMG Neo 15 @165 W TGP | |
| 1920x1080 Low Rendering Quality | |
| XMG Neo 15 @165 W TGP | |
| XMG Neo 17 @140 W TGP | |
| New World | |
| 3840x2160 Very High Video Quality | |
| MSI GE76 Raider | |
| XMG Neo 15 @165 W TGP | |
| XMG Neo 17 @140 W TGP | |
| 2560x1440 Very High Video Quality | |
| MSI GE76 Raider | |
| XMG Neo 15 @165 W TGP | |
| XMG Neo 17 @140 W TGP | |
| 1920x1080 Very High Video Quality | |
| MSI GE76 Raider | |
| XMG Neo 17 @140 W TGP | |
| XMG Neo 15 @165 W TGP | |
| 1920x1080 High Video Quality | |
| MSI GE76 Raider | |
| XMG Neo 17 @140 W TGP | |
| XMG Neo 15 @165 W TGP | |
| 1920x1080 Medium Video Quality | |
| MSI GE76 Raider | |
| XMG Neo 17 @140 W TGP | |
| XMG Neo 15 @165 W TGP | |
| 1920x1080 Low Video Quality | |
| XMG Neo 17 @140 W TGP | |
| XMG Neo 15 @165 W TGP | |
| Deathloop | |
| 3840x2160 Ultra Preset | |
| XMG Neo 15 @165 W TGP | |
| MSI GE76 Raider | |
| XMG Neo 17 @140 W TGP | |
| 2560x1440 Ultra Preset | |
| XMG Neo 15 @165 W TGP | |
| MSI GE76 Raider | |
| XMG Neo 17 @140 W TGP | |
| 1920x1080 Ultra Preset | |
| MSI GE76 Raider | |
| XMG Neo 15 @165 W TGP | |
| XMG Neo 17 @140 W TGP | |
| 1920x1080 High Preset | |
| MSI GE76 Raider | |
| XMG Neo 15 @165 W TGP | |
| XMG Neo 17 @140 W TGP | |
| 1920x1080 Medium Preset | |
| MSI GE76 Raider | |
| XMG Neo 15 @165 W TGP | |
| XMG Neo 17 @140 W TGP | |
| 1920x1080 Low Preset | |
| XMG Neo 17 @140 W TGP | |
| XMG Neo 15 @165 W TGP | |
| Monster Hunter Stories 2 | |
| 3840x2160 High Preset | |
| XMG Neo 15 @165 W TGP | |
| XMG Neo 17 @140 W TGP | |
| 2560x1440 High Preset | |
| XMG Neo 17 @140 W TGP | |
| XMG Neo 15 @165 W TGP | |
| 1920x1080 High Preset | |
| XMG Neo 17 @140 W TGP | |
| XMG Neo 15 @165 W TGP | |
| 1920x1080 Medium Preset | |
| XMG Neo 17 @140 W TGP | |
| XMG Neo 15 @165 W TGP | |
| 1920x1080 Low Preset | |
| XMG Neo 17 @140 W TGP | |
| XMG Neo 15 @165 W TGP | |
| F1 2021 | |
| 3840x2160 Ultra High Preset + Raytracing AA:T AF:16x | |
| MSI GE76 Raider | |
| 2560x1440 Ultra High Preset + Raytracing AA:T AF:16x | |
| MSI GE76 Raider | |
| 1920x1080 Ultra High Preset + Raytracing AA:T AF:16x | |
| MSI GE76 Raider | |
| 1920x1080 High Preset AA:T AF:16x | |
| MSI GE76 Raider | |
| 1920x1080 Medium Preset AA:T AF:16x | |
| MSI GE76 Raider | |
| Days Gone | |
| 3840x2160 Very High Preset | |
| MSI GE76 Raider | |
| 2560x1440 Very High Preset | |
| MSI GE76 Raider | |
| 1920x1080 Very High Preset | |
| MSI GE76 Raider | |
| 1920x1080 High Preset | |
| MSI GE76 Raider | |
| 1920x1080 Medium Preset | |
| MSI GE76 Raider | |
| Mass Effect Legendary Edition | |
| 3840x2160 On | |
| MSI GE76 Raider | |
| 2560x1440 On | |
| MSI GE76 Raider | |
| 1920x1080 On | |
| MSI GE76 Raider | |
| Resident Evil Village | |
| 1920x1080 Ray Tracing Preset | |
| MSI GE76 Raider | |
| 3840x2160 Max Preset | |
| MSI GE76 Raider | |
| 2560x1440 Max Preset | |
| MSI GE76 Raider | |
| 1920x1080 Max Preset | |
| MSI GE76 Raider | |
| 1920x1080 Prioritize Graphics Preset | |
| MSI GE76 Raider | |
| 1920x1080 Balanced Preset | |
| MSI GE76 Raider | |
| Outriders | |
| 3840x2160 Ultra Preset | |
| MSI GE76 Raider | |
| 2560x1440 Ultra Preset | |
| MSI GE76 Raider | |
| 1920x1080 Ultra Preset | |
| MSI GE76 Raider | |
| 1920x1080 High Preset | |
| MSI GE76 Raider | |
| 1920x1080 Medium Preset | |
| MSI GE76 Raider | |
| Hitman 3 | |
| 3840x2160 Maximum Settings AF:16x | |
| MSI GE76 Raider | |
| 2560x1440 Maximum Settings AF:16x | |
| MSI GE76 Raider | |
| 1920x1080 Maximum Settings AF:16x | |
| Schenker XMG Ultra 17 Rocket Lake | |
| MSI GE76 Raider | |
| 1920x1080 High Settings AF:16x | |
| Schenker XMG Ultra 17 Rocket Lake | |
| MSI GE76 Raider | |
| 1920x1080 Medium Settings AF:16x | |
| Schenker XMG Ultra 17 Rocket Lake | |
| MSI GE76 Raider | |
| 1920x1080 Minimum Settings | |
| Schenker XMG Ultra 17 Rocket Lake | |
| 1280x720 Minimum Settings | |
| Schenker XMG Ultra 17 Rocket Lake | |
| Cyberpunk 2077 1.0 | |
| 1920x1080 Ray Tracing Ultra Preset (DLSS off) | |
| MSI GE76 Raider | |
| Schenker XMG Ultra 17 Rocket Lake | |
| 3840x2160 Ultra Preset | |
| MSI GE76 Raider | |
| 2560x1440 Ultra Preset | |
| MSI GE76 Raider | |
| 1920x1080 Ultra Preset | |
| MSI GE76 Raider | |
| Schenker XMG Ultra 17 Rocket Lake | |
| 1920x1080 High Preset | |
| MSI GE76 Raider | |
| Schenker XMG Ultra 17 Rocket Lake | |
| 1920x1080 Medium Preset | |
| MSI GE76 Raider | |
| Schenker XMG Ultra 17 Rocket Lake | |
| 1920x1080 Low Preset | |
| Schenker XMG Ultra 17 Rocket Lake | |
| 1280x720 Low Preset | |
| Schenker XMG Ultra 17 Rocket Lake | |
| Immortals Fenyx Rising | |
| 1920x1080 Very High Preset | |
| Schenker XMG Ultra 17 Rocket Lake | |
| 1920x1080 High Preset | |
| Schenker XMG Ultra 17 Rocket Lake | |
| 1920x1080 Medium Preset | |
| Schenker XMG Ultra 17 Rocket Lake | |
| 1280x720 Very Low Preset | |
| Schenker XMG Ultra 17 Rocket Lake | |
| Crysis Remastered | |
| 3840x2160 Very High Preset AA:SM | |
| MSI GE76 Raider | |
| 2560x1440 Very High Preset AA:SM | |
| MSI GE76 Raider | |
| 1920x1080 Very High Preset AA:SM | |
| MSI GE76 Raider | |
| 1920x1080 High Preset AA:SM | |
| MSI GE76 Raider | |
| 1920x1080 Medium Preset | |
| MSI GE76 Raider | |
| Yakuza Like a Dragon | |
| 3840x2160 Ultra Preset | |
| MSI GE76 Raider | |
| 2560x1440 Ultra Preset | |
| MSI GE76 Raider | |
| 1920x1080 Ultra Preset | |
| MSI GE76 Raider | |
| 1920x1080 High Preset | |
| MSI GE76 Raider | |
| 1920x1080 Medium Preset | |
| MSI GE76 Raider | |
| Assassin´s Creed Valhalla | |
| 3840x2160 Ultra High Preset | |
| MSI GE76 Raider | |
| 2560x1440 Ultra High Preset | |
| MSI GE76 Raider | |
| 1920x1080 Ultra High Preset | |
| MSI GE76 Raider | |
| 1920x1080 High Preset | |
| MSI GE76 Raider | |
| 1920x1080 Medium Preset | |
| MSI GE76 Raider | |
| Dirt 5 | |
| 3840x2160 Ultra High Preset | |
| MSI GE76 Raider | |
| 2560x1440 Ultra High Preset | |
| MSI GE76 Raider | |
| 1920x1080 Ultra High Preset | |
| MSI GE76 Raider | |
| Schenker XMG Ultra 17 Rocket Lake | |
| 1920x1080 High Preset | |
| MSI GE76 Raider | |
| Schenker XMG Ultra 17 Rocket Lake | |
| 1920x1080 Medium Preset | |
| MSI GE76 Raider | |
| Schenker XMG Ultra 17 Rocket Lake | |
| 1280x720 Ultra Low Preset | |
| Schenker XMG Ultra 17 Rocket Lake | |
| Watch Dogs Legion | |
| 1920x1080 Ultra Preset + Ultra Ray Tracing (DX12) | |
| MSI GE76 Raider | |
| Schenker XMG Ultra 17 Rocket Lake | |
| 3840x2160 Ultra Preset (DX12) | |
| MSI GE76 Raider | |
| 2560x1440 Ultra Preset (DX12) | |
| MSI GE76 Raider | |
| 1920x1080 Ultra Preset (DX12) | |
| Schenker XMG Ultra 17 Rocket Lake | |
| MSI GE76 Raider | |
| 1920x1080 High Preset (DX12) | |
| MSI GE76 Raider | |
| Schenker XMG Ultra 17 Rocket Lake | |
| 1920x1080 Medium Preset (DX12) | |
| Schenker XMG Ultra 17 Rocket Lake | |
| MSI GE76 Raider | |
| 1280x720 Low Preset (DX12) | |
| Schenker XMG Ultra 17 Rocket Lake | |
| Star Wars Squadrons | |
| 3840x2160 Ultra Preset | |
| MSI GE76 Raider | |
| 2560x1440 Ultra Preset | |
| MSI GE76 Raider | |
| 1920x1080 Ultra Preset | |
| MSI GE76 Raider | |
| 1920x1080 High Preset | |
| MSI GE76 Raider | |
| 1920x1080 Medium Preset | |
| MSI GE76 Raider | |
| Mafia Definitive Edition | |
| 3840x2160 High Preset | |
| MSI GE76 Raider | |
| 2560x1440 High Preset | |
| MSI GE76 Raider | |
| 1920x1080 High Preset | |
| MSI GE76 Raider | |
| 1920x1080 Medium Preset | |
| MSI GE76 Raider | |
| Serious Sam 4 | |
| 3840x2160 Ultra (DX12) AA:2xMS | |
| MSI GE76 Raider | |
| 2560x1440 Ultra (DX12) AA:2xMS | |
| MSI GE76 Raider | |
| 1920x1080 Ultra (DX12) AA:2xMS | |
| Schenker XMG Ultra 17 Rocket Lake | |
| MSI GE76 Raider | |
| 1920x1080 High (DX12) | |
| Schenker XMG Ultra 17 Rocket Lake | |
| MSI GE76 Raider | |
| 1920x1080 Medium (DX12) | |
| MSI GE76 Raider | |
| Schenker XMG Ultra 17 Rocket Lake | |
| 1280x720 Lowest (DX12) | |
| Schenker XMG Ultra 17 Rocket Lake | |
| Strange Brigade | |
| 3840x2160 ultra AA:ultra AF:16 | |
| Alienware x17 RTX 3080 P48E | |
| 2560x1440 ultra AA:ultra AF:16 | |
| Alienware x17 RTX 3080 P48E | |
| 1920x1080 ultra AA:ultra AF:16 | |
| MSI GE76 Raider | |
| Schenker XMG NEO 17 GM7TG8S | |
| Alienware x17 RTX 3080 P48E | |
| Asus ROG Zephyrus S17 GX703HSD | |
| 1920x1080 high AA:high AF:8 | |
| MSI GE76 Raider | |
| Schenker XMG NEO 17 GM7TG8S | |
| Alienware x17 RTX 3080 P48E | |
| Asus ROG Zephyrus S17 GX703HSD | |
| 1920x1080 medium AA:medium AF:4 | |
| MSI GE76 Raider | |
| Schenker XMG NEO 17 GM7TG8S | |
| Alienware x17 RTX 3080 P48E | |
| Asus ROG Zephyrus S17 GX703HSD | |
| 1280x720 lowest AF:1 | |
| Schenker XMG NEO 17 GM7TG8S | |
| Asus ROG Zephyrus S17 GX703HSD | |
| Alienware x17 RTX 3080 P48E | |
| Death Stranding | |
| 3840x2160 Very High Preset | |
| MSI GE76 Raider | |
| 2560x1440 Very High Preset | |
| MSI GE76 Raider | |
| 1920x1080 Very High Preset | |
| MSI GE76 Raider | |
| 1920x1080 Default Preset | |
| MSI GE76 Raider | |
| 1920x1080 Medium Preset | |
| MSI GE76 Raider | |
| Gears Tactics | |
| 3840x2160 Ultra Preset | |
| MSI GE76 Raider | |
| 2560x1440 Ultra Preset | |
| MSI GE76 Raider | |
| 1920x1080 Ultra Preset | |
| MSI GE76 Raider | |
| 1920x1080 High Preset | |
| MSI GE76 Raider | |
| 1920x1080 Medium Preset | |
| MSI GE76 Raider | |
| Doom Eternal | |
| 3840x2160 Ultra Preset | |
| MSI GE76 Raider | |
| 2560x1440 Ultra Preset | |
| MSI GE76 Raider | |
| 1920x1080 Ultra Preset | |
| MSI GE76 Raider | |
| Schenker XMG Ultra 17 Rocket Lake | |
| 1920x1080 High Preset | |
| MSI GE76 Raider | |
| Schenker XMG Ultra 17 Rocket Lake | |
| 1920x1080 Medium Preset | |
| MSI GE76 Raider | |
| Schenker XMG Ultra 17 Rocket Lake | |
| 1280x720 Low Preset | |
| Schenker XMG Ultra 17 Rocket Lake | |
| Hunt Showdown | |
| 3840x2160 High Preset | |
| MSI GE76 Raider | |
| 2560x1440 High Preset | |
| MSI GE76 Raider | |
| 1920x1080 High Preset | |
| MSI GE76 Raider | |
| 1920x1080 Medium Preset | |
| MSI GE76 Raider | |
| Shadow of the Tomb Raider | |
| 2560x1440 Highest Preset AA:T | |
| Schenker XMG NEO 17 GM7TG8S | |
| Asus ROG Zephyrus S17 GX703HSD | |
| 1920x1080 Highest Preset AA:T | |
| Schenker XMG Ultra 17 Rocket Lake | |
| Schenker XMG NEO 17 GM7TG8S | |
| Asus ROG Zephyrus S17 GX703HSD | |
| 1920x1080 High Preset AA:SM | |
| Schenker XMG Ultra 17 Rocket Lake | |
| Asus ROG Zephyrus S17 GX703HSD | |
| Schenker XMG NEO 17 GM7TG8S | |
| 1920x1080 Medium Preset | |
| Schenker XMG Ultra 17 Rocket Lake | |
| Schenker XMG NEO 17 GM7TG8S | |
| Asus ROG Zephyrus S17 GX703HSD | |
| 1920x1080 Lowest Preset | |
| Schenker XMG Ultra 17 Rocket Lake | |
| Schenker XMG NEO 17 GM7TG8S | |
| Asus ROG Zephyrus S17 GX703HSD | |
| 1280x720 Lowest Preset | |
| Schenker XMG Ultra 17 Rocket Lake | |
| Schenker XMG NEO 17 GM7TG8S | |
| Asus ROG Zephyrus S17 GX703HSD | |
| Far Cry 5 | |
| 3840x2160 Ultra Preset AA:T | |
| Alienware x17 RTX 3080 P48E | |
| 2560x1440 Ultra Preset AA:T | |
| Schenker XMG NEO 17 GM7TG8S | |
| Asus ROG Zephyrus S17 GX703HSD | |
| Alienware x17 RTX 3080 P48E | |
| 1920x1080 Ultra Preset AA:T | |
| Schenker XMG Ultra 17 Rocket Lake | |
| Schenker XMG NEO 17 GM7TG8S | |
| Asus ROG Zephyrus S17 GX703HSD | |
| Alienware x17 RTX 3080 P48E | |
| 1920x1080 High Preset AA:T | |
| Schenker XMG Ultra 17 Rocket Lake | |
| Schenker XMG NEO 17 GM7TG8S | |
| Asus ROG Zephyrus S17 GX703HSD | |
| Alienware x17 RTX 3080 P48E | |
| 1920x1080 Medium Preset AA:T | |
| Schenker XMG Ultra 17 Rocket Lake | |
| Schenker XMG NEO 17 GM7TG8S | |
| Asus ROG Zephyrus S17 GX703HSD | |
| Alienware x17 RTX 3080 P48E | |
| 1920x1080 Low Preset AA:T | |
| Schenker XMG Ultra 17 Rocket Lake | |
| Schenker XMG NEO 17 GM7TG8S | |
| Asus ROG Zephyrus S17 GX703HSD | |
| Alienware x17 RTX 3080 P48E | |
| 1280x720 Low Preset AA:T | |
| Schenker XMG Ultra 17 Rocket Lake | |
| Asus ROG Zephyrus S17 GX703HSD | |
| Schenker XMG NEO 17 GM7TG8S | |
| Alienware x17 RTX 3080 P48E | |
| X-Plane 11.11 | |
| 3840x2160 high (fps_test=3) | |
| Alienware x17 RTX 3080 P48E | |
| 1920x1080 high (fps_test=3) | |
| Schenker XMG Ultra 17 Rocket Lake | |
| MSI GE76 Raider | |
| Asus ROG Zephyrus S17 GX703HSD | |
| Schenker XMG NEO 17 GM7TG8S | |
| Alienware x17 RTX 3080 P48E | |
| 1920x1080 med (fps_test=2) | |
| Schenker XMG Ultra 17 Rocket Lake | |
| MSI GE76 Raider | |
| Asus ROG Zephyrus S17 GX703HSD | |
| Schenker XMG NEO 17 GM7TG8S | |
| Alienware x17 RTX 3080 P48E | |
| 1280x720 low (fps_test=1) | |
| Schenker XMG Ultra 17 Rocket Lake | |
| MSI GE76 Raider | |
| Asus ROG Zephyrus S17 GX703HSD | |
| Schenker XMG NEO 17 GM7TG8S | |
| Alienware x17 RTX 3080 P48E | |
| Final Fantasy XV Benchmark | |
| 3840x2160 High Quality | |
| Alienware x17 RTX 3080 P48E | |
| 2560x1440 High Quality | |
| Alienware x17 RTX 3080 P48E | |
| 1920x1080 High Quality | |
| MSI GE76 Raider | |
| Alienware x17 RTX 3080 P48E | |
| 1920x1080 Standard Quality | |
| MSI GE76 Raider | |
| Asus ROG Zephyrus S17 GX703HSD | |
| Alienware x17 RTX 3080 P48E | |
| 1280x720 Lite Quality | |
| Alienware x17 RTX 3080 P48E | |
| Dota 2 Reborn | |
| 3840x2160 ultra (3/3) best looking | |
| Alienware x17 RTX 3080 P48E | |
| 1920x1080 ultra (3/3) best looking | |
| Schenker XMG Ultra 17 Rocket Lake | |
| MSI GE76 Raider | |
| Asus ROG Zephyrus S17 GX703HSD | |
| Alienware x17 RTX 3080 P48E | |
| Schenker XMG NEO 17 GM7TG8S | |
| 1920x1080 high (2/3) | |
| MSI GE76 Raider | |
| Schenker XMG Ultra 17 Rocket Lake | |
| Asus ROG Zephyrus S17 GX703HSD | |
| Alienware x17 RTX 3080 P48E | |
| Schenker XMG NEO 17 GM7TG8S | |
| 1366x768 med (1/3) | |
| MSI GE76 Raider | |
| Schenker XMG Ultra 17 Rocket Lake | |
| Schenker XMG NEO 17 GM7TG8S | |
| Alienware x17 RTX 3080 P48E | |
| Asus ROG Zephyrus S17 GX703HSD | |
| 1280x720 min (0/3) fastest | |
| MSI GE76 Raider | |
| Schenker XMG Ultra 17 Rocket Lake | |
| Schenker XMG NEO 17 GM7TG8S | |
| Asus ROG Zephyrus S17 GX703HSD | |
| Alienware x17 RTX 3080 P48E | |
| The Witcher 3 | |
| 3840x2160 Ultra Graphics & Postprocessing (HBAO+) | |
| Alienware x17 RTX 3080 P48E | |
| 3840x2160 High Graphics & Postprocessing (Nvidia HairWorks Off) | |
| Alienware x17 RTX 3080 P48E | |
| 1920x1080 Ultra Graphics & Postprocessing (HBAO+) | |
| MSI GE76 Raider | |
| Schenker XMG Ultra 17 Rocket Lake | |
| Schenker XMG NEO 17 GM7TG8S | |
| Asus ROG Zephyrus S17 GX703HSD | |
| Alienware x17 RTX 3080 P48E | |
| 1920x1080 High Graphics & Postprocessing (Nvidia HairWorks Off) | |
| MSI GE76 Raider | |
| Schenker XMG Ultra 17 Rocket Lake | |
| Schenker XMG NEO 17 GM7TG8S | |
| Asus ROG Zephyrus S17 GX703HSD | |
| Alienware x17 RTX 3080 P48E | |
| 1366x768 Medium Graphics & Postprocessing | |
| MSI GE76 Raider | |
| Schenker XMG Ultra 17 Rocket Lake | |
| Schenker XMG NEO 17 GM7TG8S | |
| Alienware x17 RTX 3080 P48E | |
| Asus ROG Zephyrus S17 GX703HSD | |
| 1920x1080 Medium Graphics & Postprocessing | |
| Schenker XMG NEO 17 GM7TG8S | |
| Asus ROG Zephyrus S17 GX703HSD | |
| 1024x768 Low Graphics & Postprocessing | |
| Schenker XMG Ultra 17 Rocket Lake | |
| Schenker XMG NEO 17 GM7TG8S | |
| Asus ROG Zephyrus S17 GX703HSD | |
| Alienware x17 RTX 3080 P48E | |
Abbiamo controllato le prestazioni 3D sostenute con il nostro test Witcher 3 (60 minuti). Il clock della GPU scende leggermente (come quello della CPU), ma non si nota la differenza. Il frame rate complessivo è stato molto stabile nel corso del test.
Witcher 3 FPS chart
| basso | medio | alto | ultra | QHD | 4K | |
|---|---|---|---|---|---|---|
| GTA V (2015) | 184 | 176 | 125 | |||
| The Witcher 3 (2015) | 384 | 247 | 126 | |||
| Dota 2 Reborn (2015) | 186 | 172 | 164 | 156 | ||
| Final Fantasy XV Benchmark (2018) | 171 | 131 | ||||
| X-Plane 11.11 (2018) | 155 | 133 | 109 | |||
| Strange Brigade (2018) | 312 | 251 | 221 | |||
| Hunt Showdown (2020) | 206 | 181 | 117 | 54.3 | ||
| Doom Eternal (2020) | 361 | 307 | 304 | 236 | 128 | |
| Gears Tactics (2020) | 295 | 205 | 154 | 103 | 58.9 | |
| Death Stranding (2020) | 152 | 151 | 150 | 130 | 78 | |
| Crysis Remastered (2020) | 199 | 103 | 71.4 | 60.9 | 38.1 | |
| Serious Sam 4 (2020) | 121 | 109 | 103 | 94.4 | 65.6 | |
| Mafia Definitive Edition (2020) | 158 | 151 | 108 | 58.6 | ||
| Star Wars Squadrons (2020) | 407 | 378 | 354 | 261 | 144 | |
| Watch Dogs Legion (2020) | 121 | 113 | 87 | 69 | 42 | |
| Dirt 5 (2020) | 170 | 141 | 117 | 93.1 | 60.9 | |
| Assassin´s Creed Valhalla (2020) | 135 | 103 | 93 | 74 | 50 | |
| Yakuza Like a Dragon (2020) | 162 | 160 | 143 | 107 | 54.8 | |
| Cyberpunk 2077 1.0 (2020) | 121 | 101 | 85.3 | 53.9 | 26.1 | |
| Hitman 3 (2021) | 213 | 197 | 189 | 136 | 76.1 | |
| Outriders (2021) | 160 | 155 | 153 | 111 | 57.4 | |
| Resident Evil Village (2021) | 248 | 232 | 197 | 135 | 70.9 | |
| Mass Effect Legendary Edition (2021) | 152 | 149 | 115 | |||
| Days Gone (2021) | 197 | 177 | 133 | 98.5 | 57.1 | |
| F1 2021 (2021) | 342 | 289 | 157 | 117 | 68 | |
| Deathloop (2021) | 143 | 133 | 112 | 80.2 | 44.4 | |
| New World (2021) | 129 | 122 | 115 | 94.9 | 50.9 | |
| Alan Wake Remastered (2021) | 157 | 155 | 149 | 89 | ||
| Far Cry 6 (2021) | 144 | 130 | 114 | 93 | 57 | |
| Back 4 Blood (2021) | 294 | 263 | 238 | 171 | 88.9 | |
| Guardians of the Galaxy (2021) | 157 | 156 | 155 | 136 | 75 | |
| Riders Republic (2021) | 163 | 138 | 129 | 98 | 56 | |
| Forza Horizon 5 (2021) | 155 | 142 | 95 | 82 | 61 | |
| Battlefield 2042 (2021) | 141 | 121 | 108 | 88.2 | 58.7 | |
| Farming Simulator 22 (2021) | 205 | 183 | 158 | 143 | 93.3 | |
| Halo Infinite (2021) | 171 | 147 | 141 | 104 | 59 | |
| God of War (2022) | 146 | 119 | 81.6 | 67.5 | 46.4 |
Emissioni
Rumore di sistema
Il rumore della ventola è un problema familiare per i portatili da gioco, e il GE76 sarà anche abbastanza rumoroso quando si gioca con la modalità Extreme Performance. 50 fino a 53 dB(A) sono chiaramente udibili, anche se la concorrenza è a volte ancora più rumorosa sotto carico massimo - nonostante i componenti più lenti.
Considerando il forte rumore della ventola, raccomandiamo la modalità Balanced per i giochi, dove il GE76 rimane sotto i 50 dB(A) e prende solo un piccolo colpo di prestazioni. Alcuni giochi funzioneranno bene anche con la modalità Silent, che in realtà è all'altezza del suo nome (meno di 40 dB(A)). Il sistema da 17 pollici è solitamente molto silenzioso mentre è inattivo (anche con la modalità Extreme Performance) se si può vivere con occasionali rampe di salita delle ventole.
Rumorosità
| Idle |
| 26 / 27 / 40 dB(A) |
| Sotto carico |
| 50 / 53 dB(A) |
 | ||
30 dB silenzioso 40 dB(A) udibile 50 dB(A) rumoroso |
||
min: | ||
| MSI GE76 Raider i9-12900HK, GeForce RTX 3080 Ti Laptop GPU | Schenker XMG NEO 17 GM7TG8S i7-11800H, GeForce RTX 3080 Laptop GPU | Alienware x17 RTX 3080 P48E i7-11800H, GeForce RTX 3080 Laptop GPU | Asus ROG Zephyrus S17 GX703HSD i9-11900H, GeForce RTX 3080 Laptop GPU | Schenker XMG Ultra 17 Rocket Lake i9-11900K, GeForce RTX 3080 Laptop GPU | |
|---|---|---|---|---|---|
| Noise | 14% | 12% | 17% | -18% | |
| off /ambiente * (dB) | 26 | 23 12% | 24.9 4% | 23 12% | 24 8% |
| Idle Minimum * (dB) | 26 | 23 12% | 24.9 4% | 23 12% | 30 -15% |
| Idle Average * (dB) | 27 | 23 15% | 24.9 8% | 23 15% | 31 -15% |
| Idle Maximum * (dB) | 40 | 23 43% | 29.6 26% | 23 43% | 57 -43% |
| Load Average * (dB) | 50 | 39.5 21% | 31.1 38% | 41 18% | 63 -26% |
| Witcher 3 ultra * (dB) | 53 | 54.5 -3% | 49.7 6% | 45 15% | 61 -15% |
| Load Maximum * (dB) | 53 | 55.09 -4% | 54.8 -3% | 52 2% | 63 -19% |
* ... Meglio usare valori piccoli
Temperatura
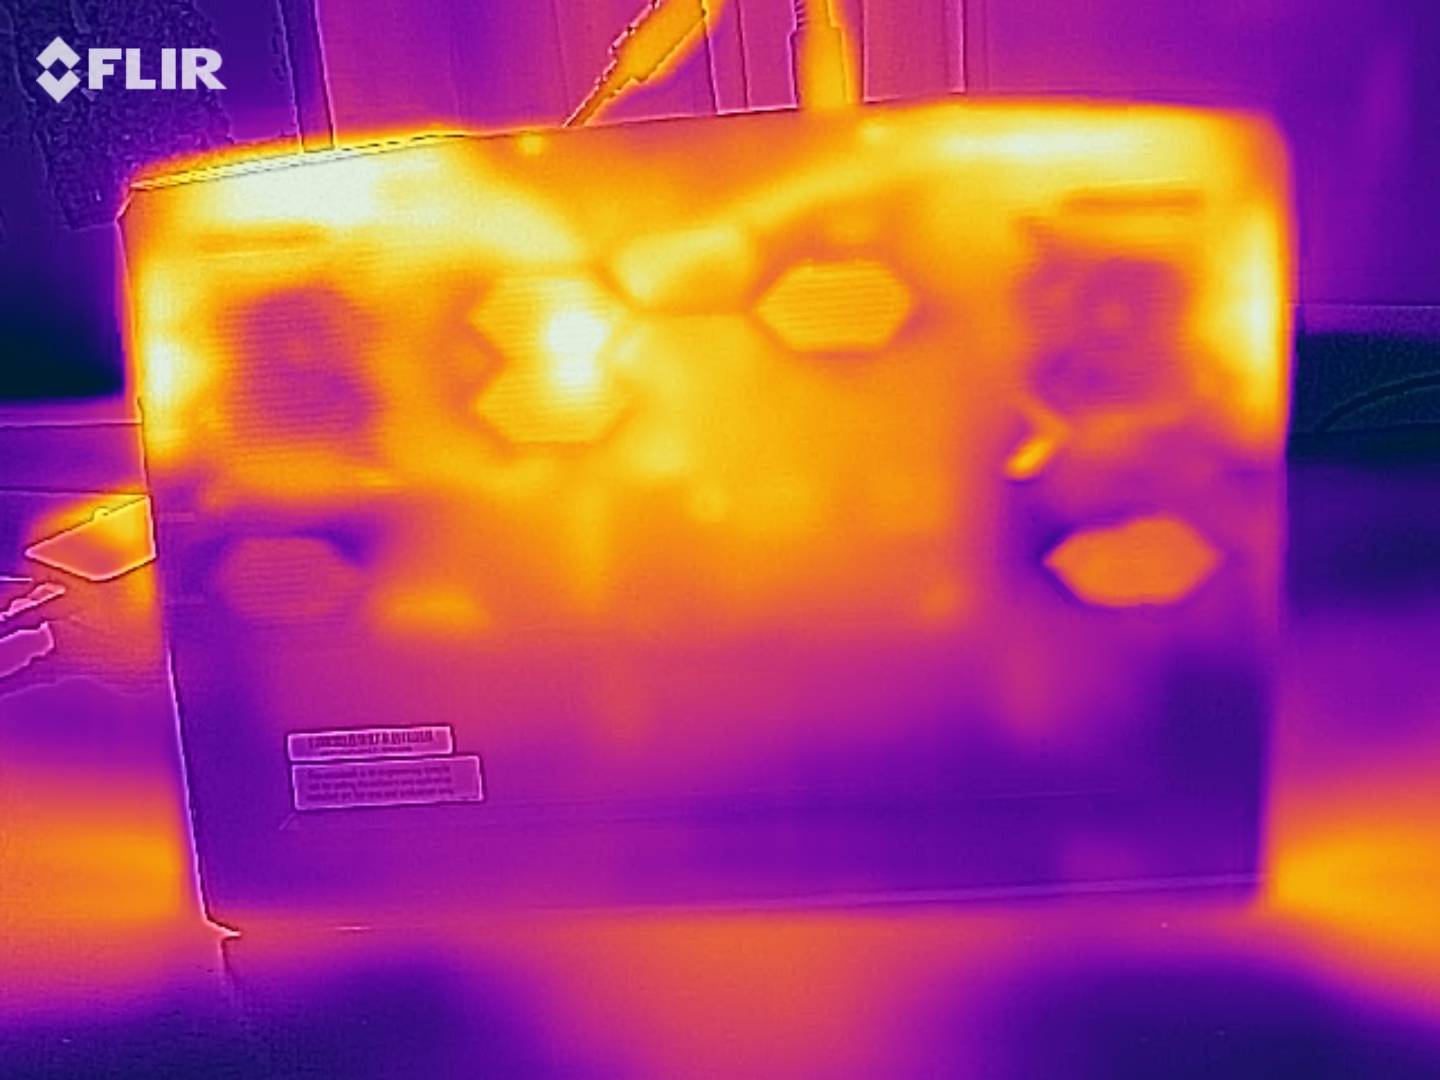
Anche se il GE76 può essere piuttosto rumoroso, pensiamo ancora che il sistema di raffreddamento sia un successo. Questo si basa sulle temperature moderate dello chassis. Mentre le misurazioni durante lo stress test con gli strumenti FurMark e Prime95 non sono molto rappresentative a causa del throttling della CPU, il test Witcher 3 è un indicatore migliore per le temperature durante le sessioni di gioco. Meno di 45 °C in alto e meno di 50 °C in basso sono sorprendentemente buoni per un portatile high-end così potente - specialmente considerando l'altezza dello chassis di meno di 3 cm. I componenti (CPU e GPU) si aggirano intorno agli 80 °C durante il test Witcher 3 - anche questo un risultato decente.
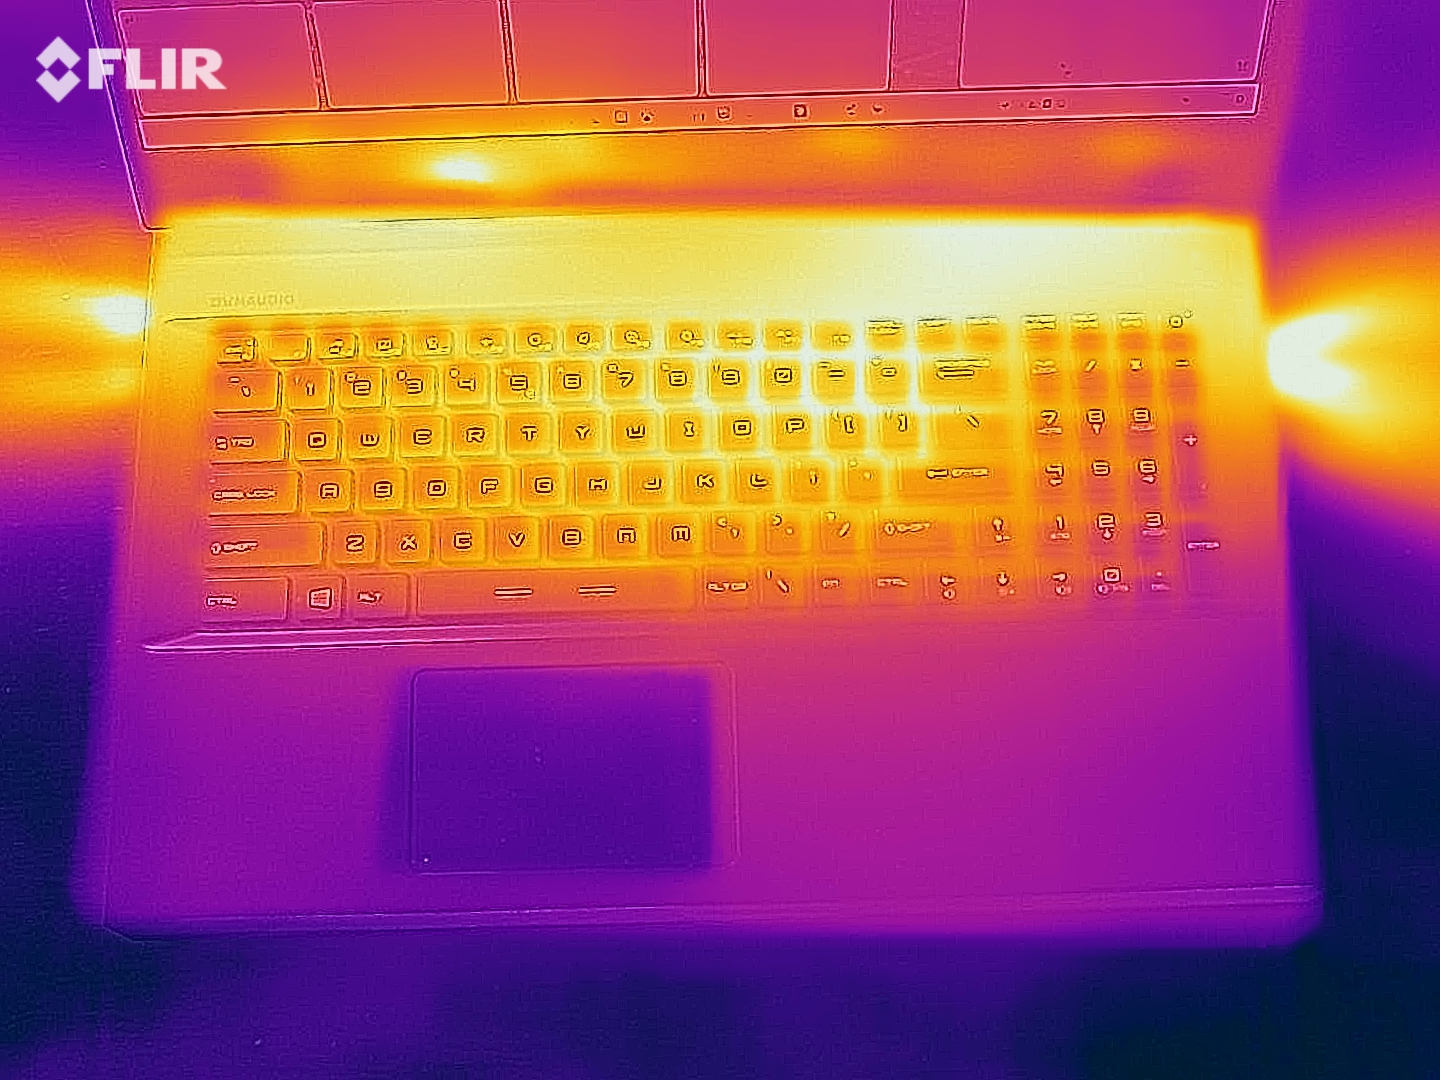
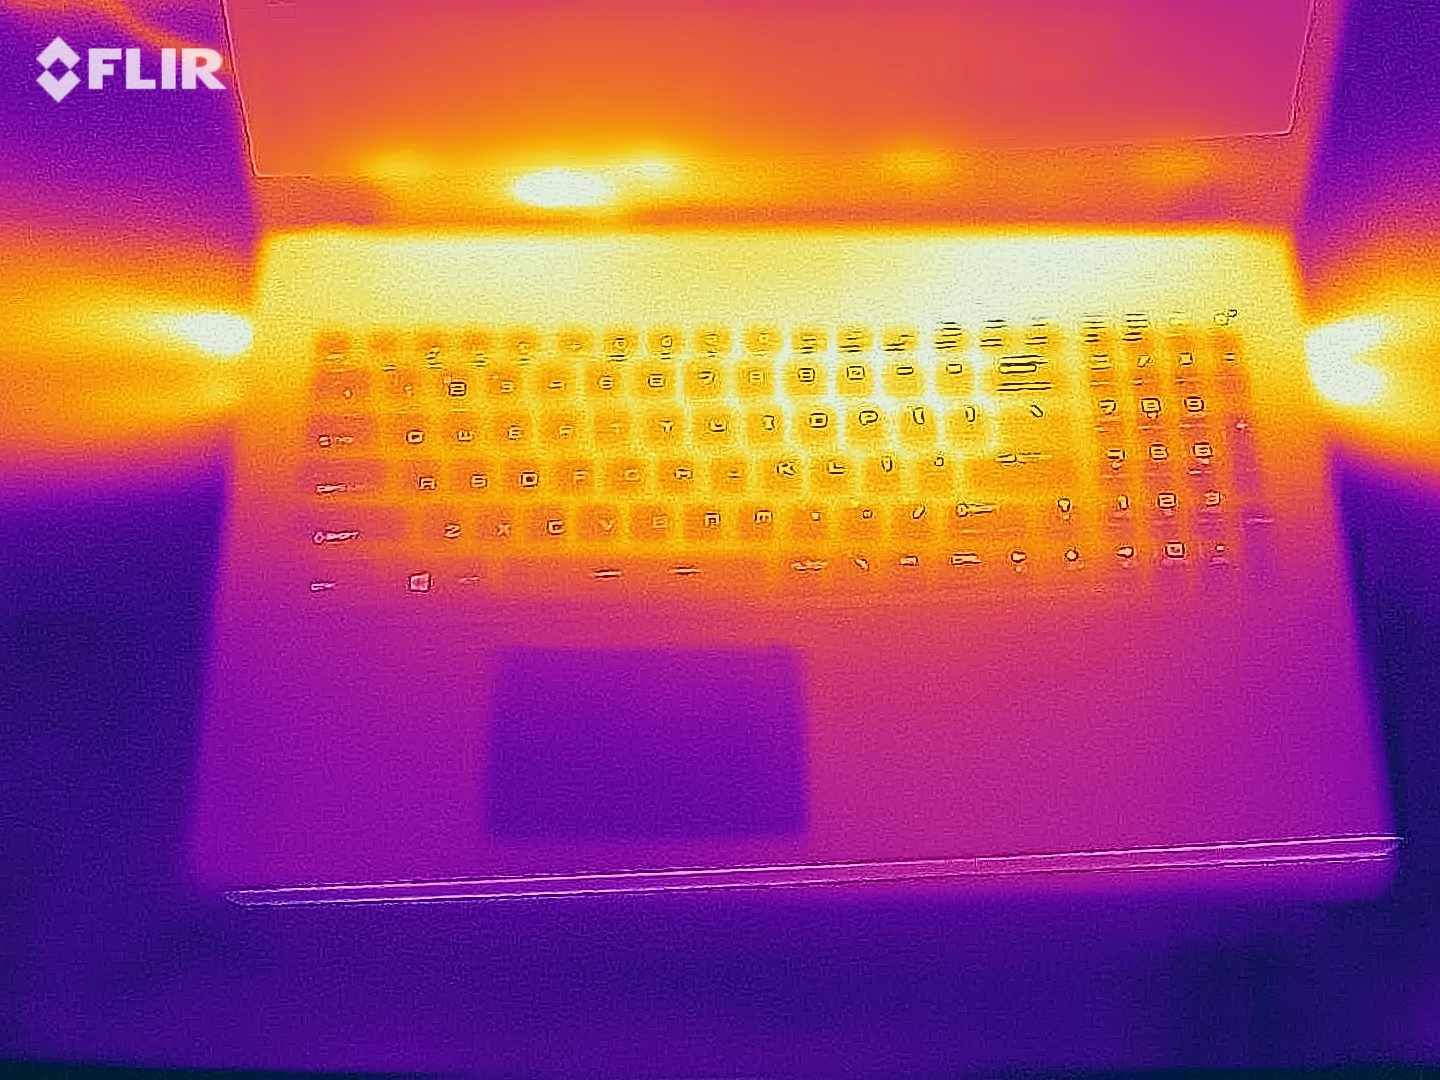
(±) La temperatura massima sul lato superiore è di 43 °C / 109 F, rispetto alla media di 40.4 °C / 105 F, che varia da 21.2 a 68.8 °C per questa classe Gaming.
(-) Il lato inferiore si riscalda fino ad un massimo di 47 °C / 117 F, rispetto alla media di 43.2 °C / 110 F
(+) In idle, la temperatura media del lato superiore è di 29.1 °C / 84 F, rispetto alla media deld ispositivo di 33.9 °C / 93 F.
(±) Riproducendo The Witcher 3, la temperatura media per il lato superiore e' di 37.6 °C / 100 F, rispetto alla media del dispositivo di 33.9 °C / 93 F.
(+) I poggiapolsi e il touchpad sono piu' freddi della temperatura della pelle con un massimo di 30 °C / 86 F e sono quindi freddi al tatto.
(±) La temperatura media della zona del palmo della mano di dispositivi simili e'stata di 28.8 °C / 83.8 F (-1.2 °C / -2.2 F).
| MSI GE76 Raider i9-12900HK, GeForce RTX 3080 Ti Laptop GPU | Schenker XMG NEO 17 GM7TG8S i7-11800H, GeForce RTX 3080 Laptop GPU | Alienware x17 RTX 3080 P48E i7-11800H, GeForce RTX 3080 Laptop GPU | Asus ROG Zephyrus S17 GX703HSD i9-11900H, GeForce RTX 3080 Laptop GPU | Schenker XMG Ultra 17 Rocket Lake i9-11900K, GeForce RTX 3080 Laptop GPU | |
|---|---|---|---|---|---|
| Heat | -15% | -9% | -13% | 3% | |
| Maximum Upper Side * (°C) | 43 | 51 -19% | 58.4 -36% | 59 -37% | 34 21% |
| Maximum Bottom * (°C) | 47 | 62 -32% | 49 -4% | 53 -13% | 43 9% |
| Idle Upper Side * (°C) | 33 | 35 -6% | 33.6 -2% | 35 -6% | 38 -15% |
| Idle Bottom * (°C) | 37 | 38 -3% | 34.6 6% | 35 5% | 39 -5% |
* ... Meglio usare valori piccoli
Altoparlanti
MSI GE76 Raider analisi audio
(+) | gli altoparlanti sono relativamente potenti (84 dB)
Bassi 100 - 315 Hz
(±) | bassi ridotti - in media 10.3% inferiori alla media
(±) | la linearità dei bassi è media (8.5% delta rispetto alla precedente frequenza)
Medi 400 - 2000 Hz
(±) | medi elevati - circa 6.8% superiore alla media
(+) | medi lineari (4.1% delta rispetto alla precedente frequenza)
Alti 2 - 16 kHz
(+) | Alti bilanciati - appena 2.7% dalla media
(+) | alti lineari (4.9% delta rispetto alla precedente frequenza)
Nel complesso 100 - 16.000 Hz
(+) | suono nel complesso lineare (13.5% differenza dalla media)
Rispetto alla stessa classe
» 19% di tutti i dispositivi testati in questa classe è stato migliore, 7% simile, 74% peggiore
» Il migliore ha avuto un delta di 6%, medio di 18%, peggiore di 132%
Rispetto a tutti i dispositivi testati
» 14% di tutti i dispositivi testati in questa classe è stato migliore, 4% similare, 82% peggiore
» Il migliore ha avuto un delta di 4%, medio di 24%, peggiore di 134%
Alienware x17 RTX 3080 P48E analisi audio
(+) | gli altoparlanti sono relativamente potenti (88 dB)
Bassi 100 - 315 Hz
(-) | quasi nessun basso - in media 23% inferiori alla media
(±) | la linearità dei bassi è media (9.8% delta rispetto alla precedente frequenza)
Medi 400 - 2000 Hz
(+) | medi bilanciati - solo only 2.7% rispetto alla media
(+) | medi lineari (4% delta rispetto alla precedente frequenza)
Alti 2 - 16 kHz
(+) | Alti bilanciati - appena 4.4% dalla media
(±) | la linearità degli alti è media (7% delta rispetto alla precedente frequenza)
Nel complesso 100 - 16.000 Hz
(±) | la linearità complessiva del suono è media (17.3% di differenza rispetto alla media
Rispetto alla stessa classe
» 47% di tutti i dispositivi testati in questa classe è stato migliore, 12% simile, 41% peggiore
» Il migliore ha avuto un delta di 6%, medio di 18%, peggiore di 132%
Rispetto a tutti i dispositivi testati
» 32% di tutti i dispositivi testati in questa classe è stato migliore, 8% similare, 59% peggiore
» Il migliore ha avuto un delta di 4%, medio di 24%, peggiore di 134%
Gestione dell'energia
Consumo di energia
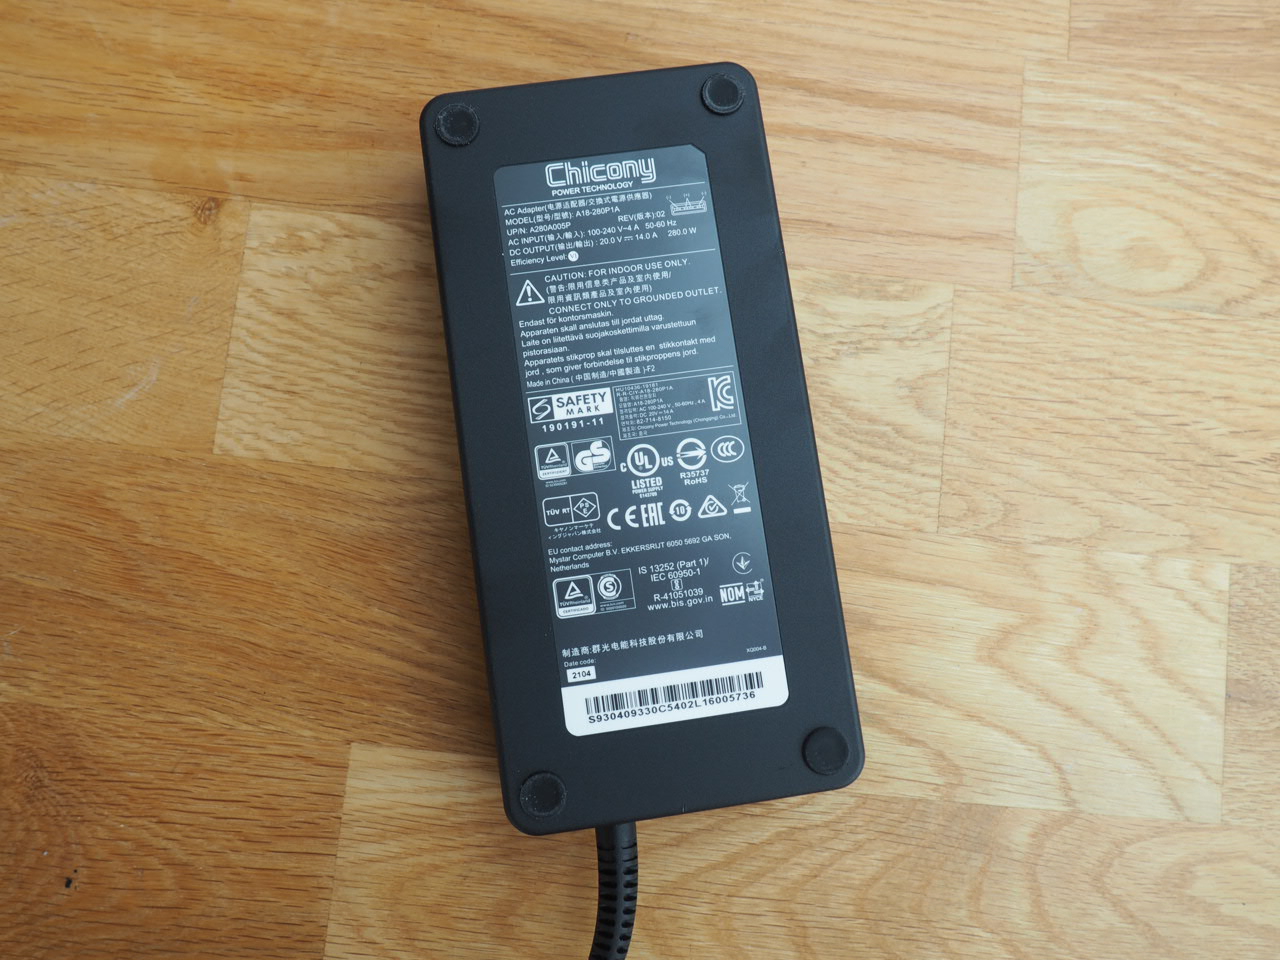
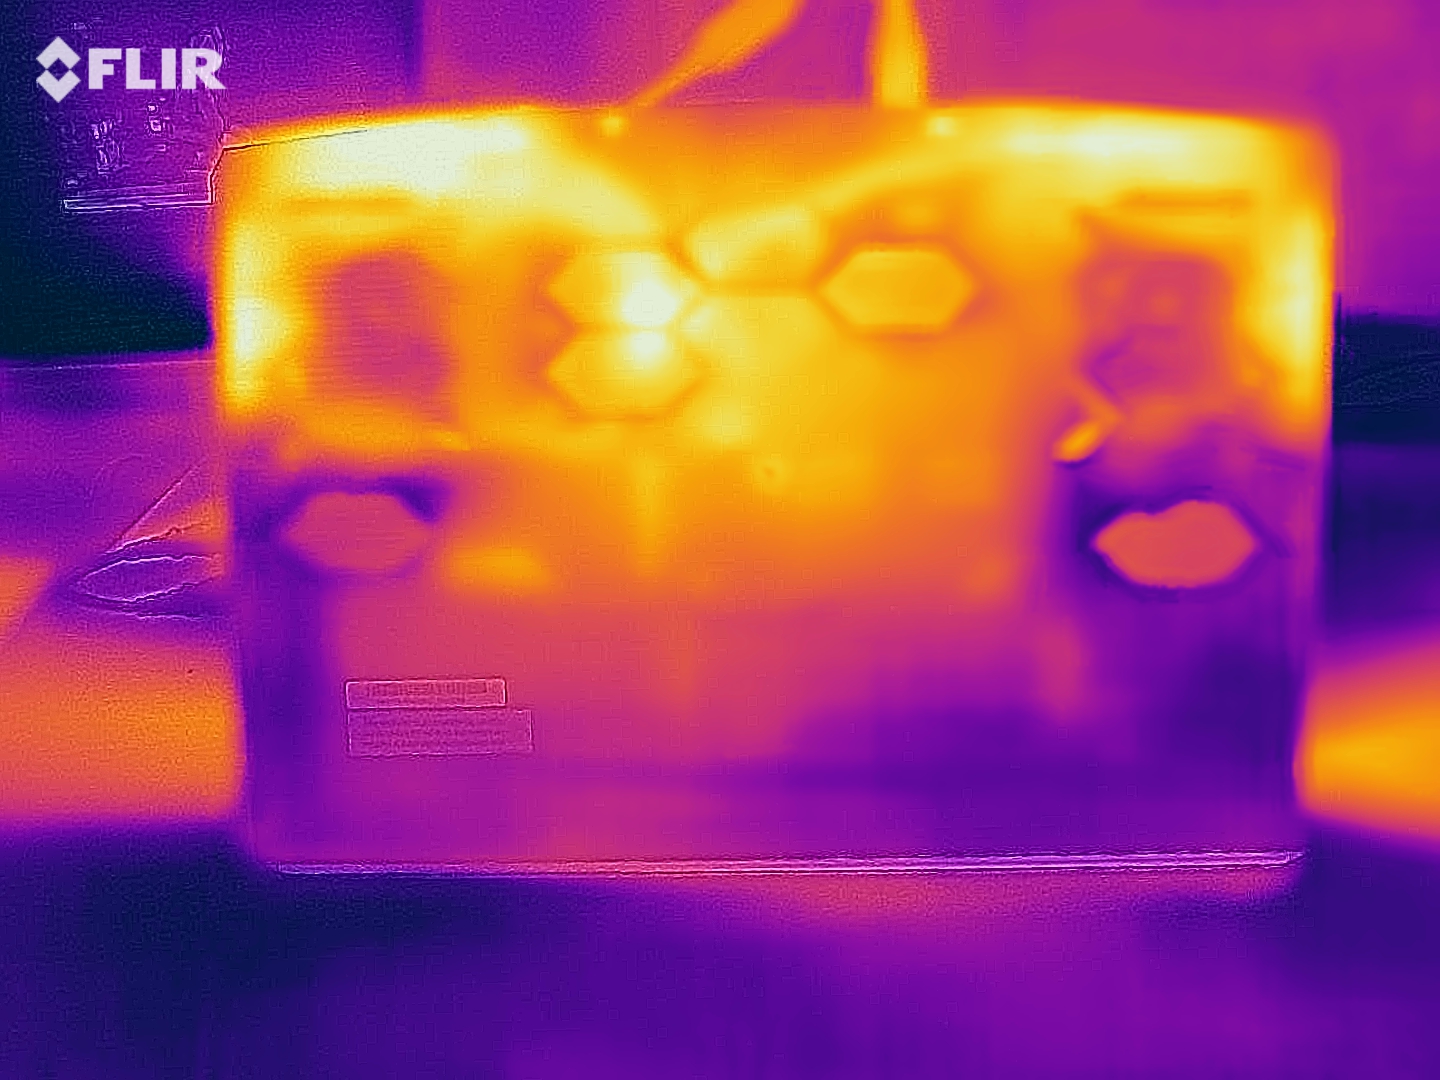
Il GE76 non consuma troppa energia mentre è inattivo, finché la commutazione grafica è accesa. da 12 a 28 Watts sono buoni risultati considerando l'hardware ed è anche più efficiente dei rivali. Abbiamo osservato tra 118 e 272 Watt durante le applicazioni 3D, quindi l'alimentatore da 280W incluso sembra essere sufficiente.
| Off / Standby | |
| Idle | |
| Sotto carico |
|
Leggenda:
min: | |
| MSI GE76 Raider i9-12900HK, GeForce RTX 3080 Ti Laptop GPU | Schenker XMG NEO 17 GM7TG8S i7-11800H, GeForce RTX 3080 Laptop GPU | Alienware x17 RTX 3080 P48E i7-11800H, GeForce RTX 3080 Laptop GPU | Asus ROG Zephyrus S17 GX703HSD i9-11900H, GeForce RTX 3080 Laptop GPU | Schenker XMG Ultra 17 Rocket Lake i9-11900K, GeForce RTX 3080 Laptop GPU | Media della classe Gaming | |
|---|---|---|---|---|---|---|
| Power Consumption | -11% | -13% | -17% | -158% | 2% | |
| Idle Minimum * (Watt) | 12 | 19 -58% | 10.2 15% | 21.7 -81% | 62 -417% | 13.1 ? -9% |
| Idle Average * (Watt) | 17 | 25 -47% | 21.2 -25% | 27 -59% | 64 -276% | 18.7 ? -10% |
| Idle Maximum * (Watt) | 28 | 28 -0% | 48.4 -73% | 33 -18% | 69 -146% | 24.4 ? 13% |
| Load Average * (Watt) | 118 | 105 11% | 118.7 -1% | 108 8% | 183 -55% | 108.1 ? 8% |
| Witcher 3 ultra * (Watt) | 252 | 223 12% | 249 1% | 195 23% | 297 -18% | |
| Load Maximum * (Watt) | 272 | 226 17% | 262 4% | 210 23% | 368 -35% | 254 ? 7% |
* ... Meglio usare valori piccoli
Power Consumption Witcher 3 / Stress test
Power Consumption external screen
Durata della batteria
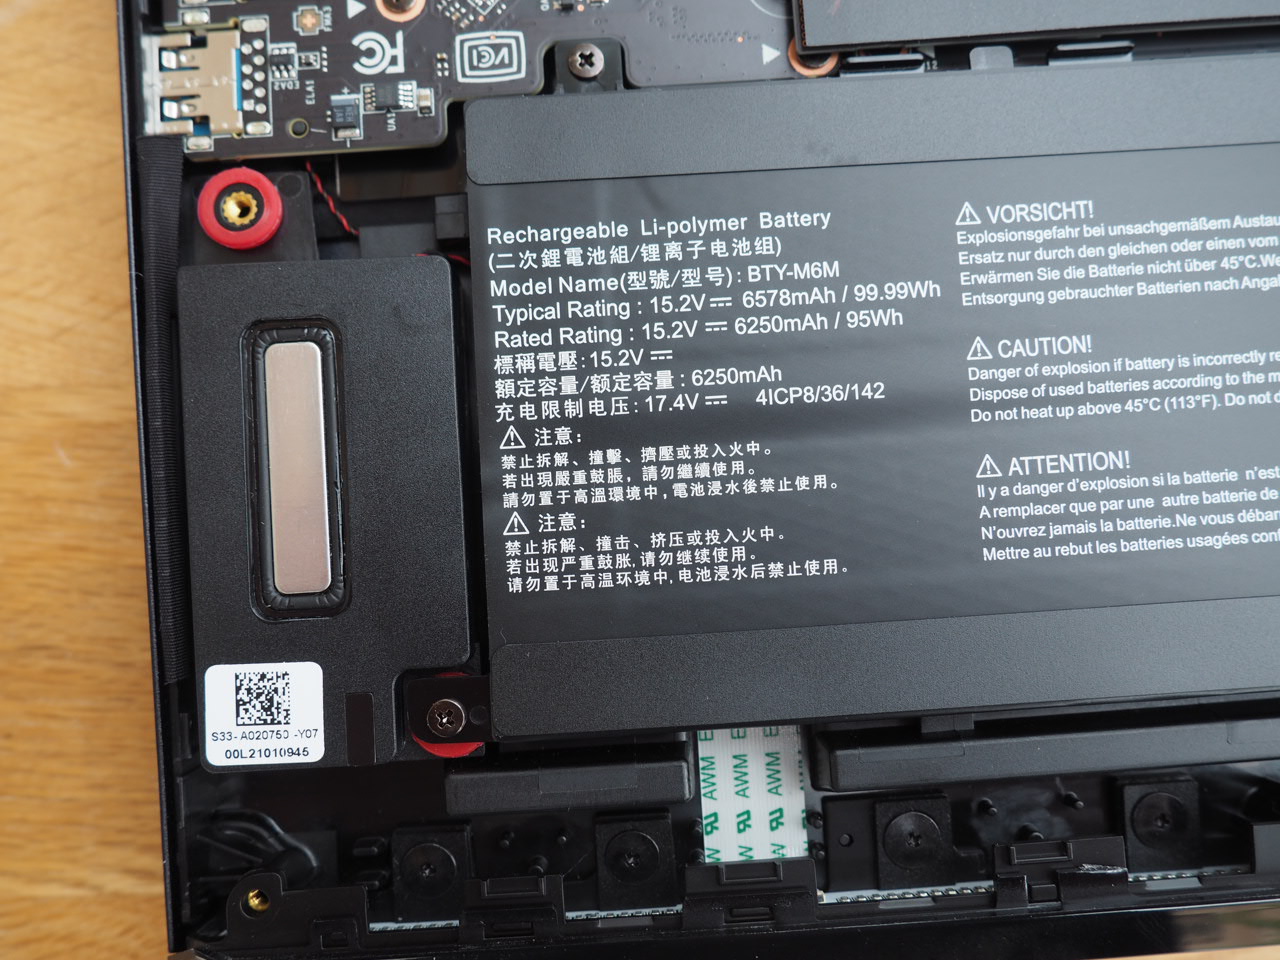
Uno sguardo al layout interno mostra che l'area sotto i poggiapolsi è quasi completamente occupata dalla batteria. MSI ancora una volta ha deciso di utilizzare un modello gigante da 99.9 Wh, che batte tutti i rivali - almeno sulla carta (62 fino a 97 Wh). L'autonomia della batteria, tuttavia, non può essere all'altezza. Sia l'Alienware x17 che l'Asus Zephyrus S17 gestiscono tempi più lunghi nel nostro test Wi-Fi (navigazione web a 150 nits), nonostante le batterie più piccole. Quasi 5 ore con la modalità Balanced performance è ancora un risultato rispettabile per l'unità di test da 17 pollici.
| MSI GE76 Raider i9-12900HK, GeForce RTX 3080 Ti Laptop GPU, 99.99 Wh | Schenker XMG NEO 17 GM7TG8S i7-11800H, GeForce RTX 3080 Laptop GPU, 62 Wh | Alienware x17 RTX 3080 P48E i7-11800H, GeForce RTX 3080 Laptop GPU, 87 Wh | Asus ROG Zephyrus S17 GX703HSD i9-11900H, GeForce RTX 3080 Laptop GPU, 90 Wh | Schenker XMG Ultra 17 Rocket Lake i9-11900K, GeForce RTX 3080 Laptop GPU, 97 Wh | Media della classe Gaming | |
|---|---|---|---|---|---|---|
| Autonomia della batteria | -27% | 16% | 47% | -65% | 38% | |
| WiFi v1.3 (h) | 5.1 | 3.7 -27% | 5.9 16% | 7.5 47% | 1.8 -65% | 7.04 ? 38% |
| H.264 (h) | 3.7 | 7.2 | 1.9 | 8.26 ? | ||
| Load (h) | 1.6 | 0.8 | 2.7 | 1.1 | 1.47 ? | |
| Reader / Idle (h) | 7 | 3 | 8.71 ? | |||
| Witcher 3 ultra (h) | 1 |
Pro
Contro
Verdetto
L'ultima versione dell'MSI GE76 Raider è ancora una volta un sogno per gli appassionati di gaming
Sì, MSI potrebbe migliorare alcuni aspetti (come la qualità della webcam), ma il produttore offre un pacchetto complessivo molto convincente ed equilibrato. Il più grande vantaggio è sicuramente l'immenso potenziale di prestazioni.
La combinazione diCore i9-12900HK,GeForce RTX 3080 Ti, 32 GB DDR5-RAM e le due NVMe-SSD offre un sacco di prestazioni per i prossimi due anni e molta potenza per le applicazioni 3D. La maggior parte dei titoli girerebbe ancora senza problemi su uno schermo esterno 4K con le impostazioni massime. Il pannello integrato a 360 Hz impressiona con tempi di risposta veloci e buona accuratezza dei colori.
Se il dispositivo è troppo rumoroso per voi nella modalità Extreme Performance, potete facilmente passare a un'altra impostazione di prestazioni tramite il software MSI Center. Il profilo Balanced è un buon compromesso tra frame rate e rumore della ventola nella nostra esperienza, e raccomandiamo le modalità Silent e Super Battery con commutazione grafica attiva per carichi di lavoro semplici o in viaggio, rispettivamente.
MSI GE76 Raider
- 01/24/2022 v7 (old)
Florian Glaser
Price comparison

