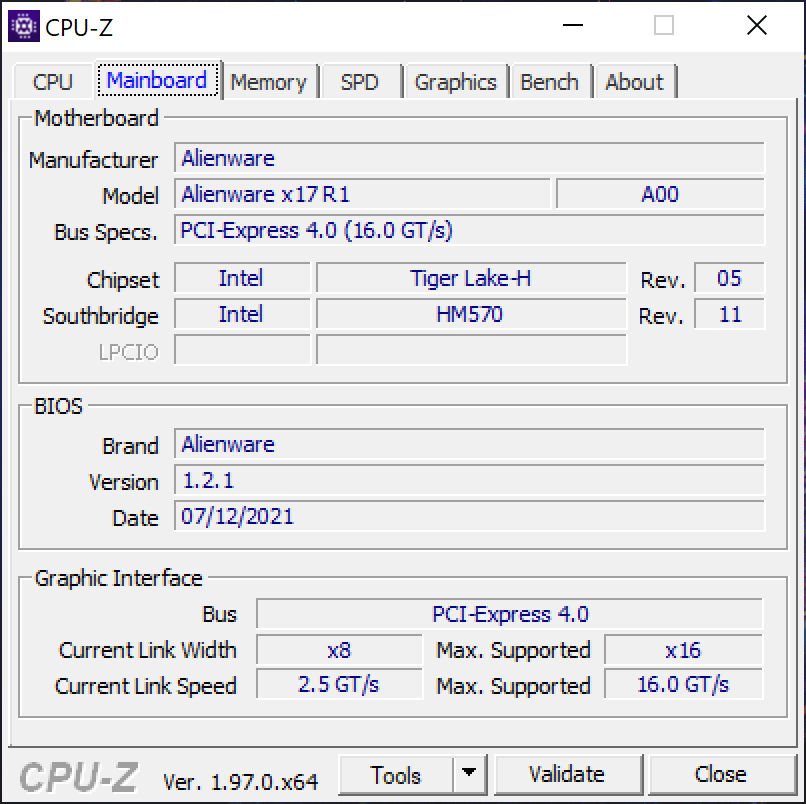
Recensione del portatile Alienware x17 R1 RTX 3080: Un nuovo inizio

La serie di laptop Alienware da 17,3 pollici ha avuto una valanga di cambiamenti negli ultimi anni. Dell ha introdotto un nuovissimo telaio Alienware m17 R1 nel 2019 solo per sostituirlo con un telaio m17 R2 completamente riprogettato solo un anno dopo, nel 2020. Per il 2021, il produttore ha introdotto un'altra riprogettazione completa del telaio per sostituire del tutto la serie m17 chiamata Alienware x17.
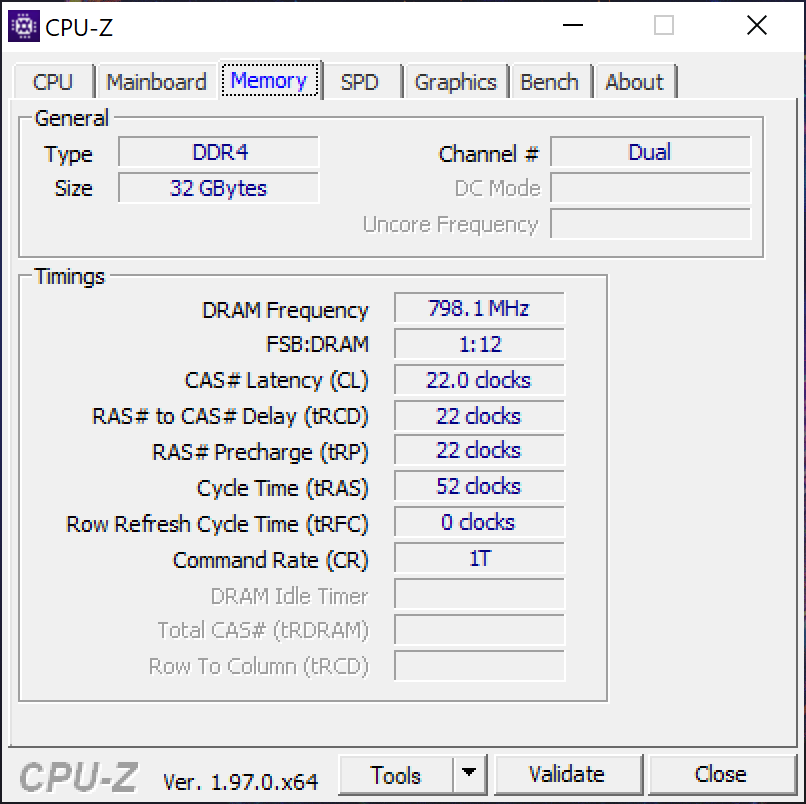
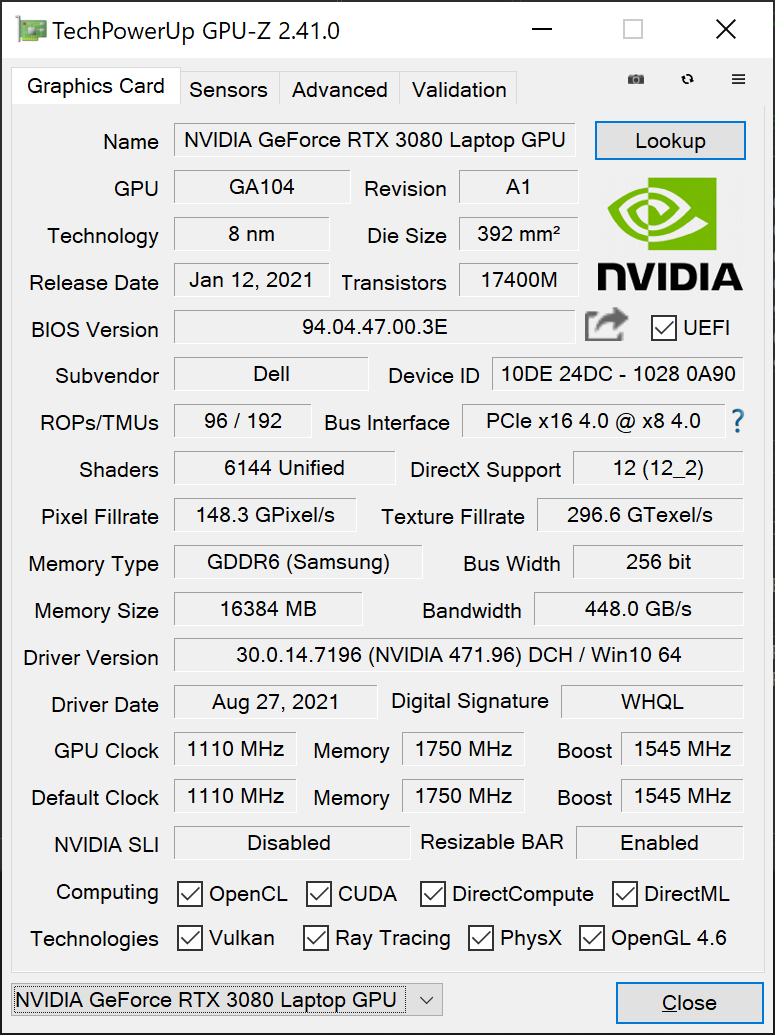
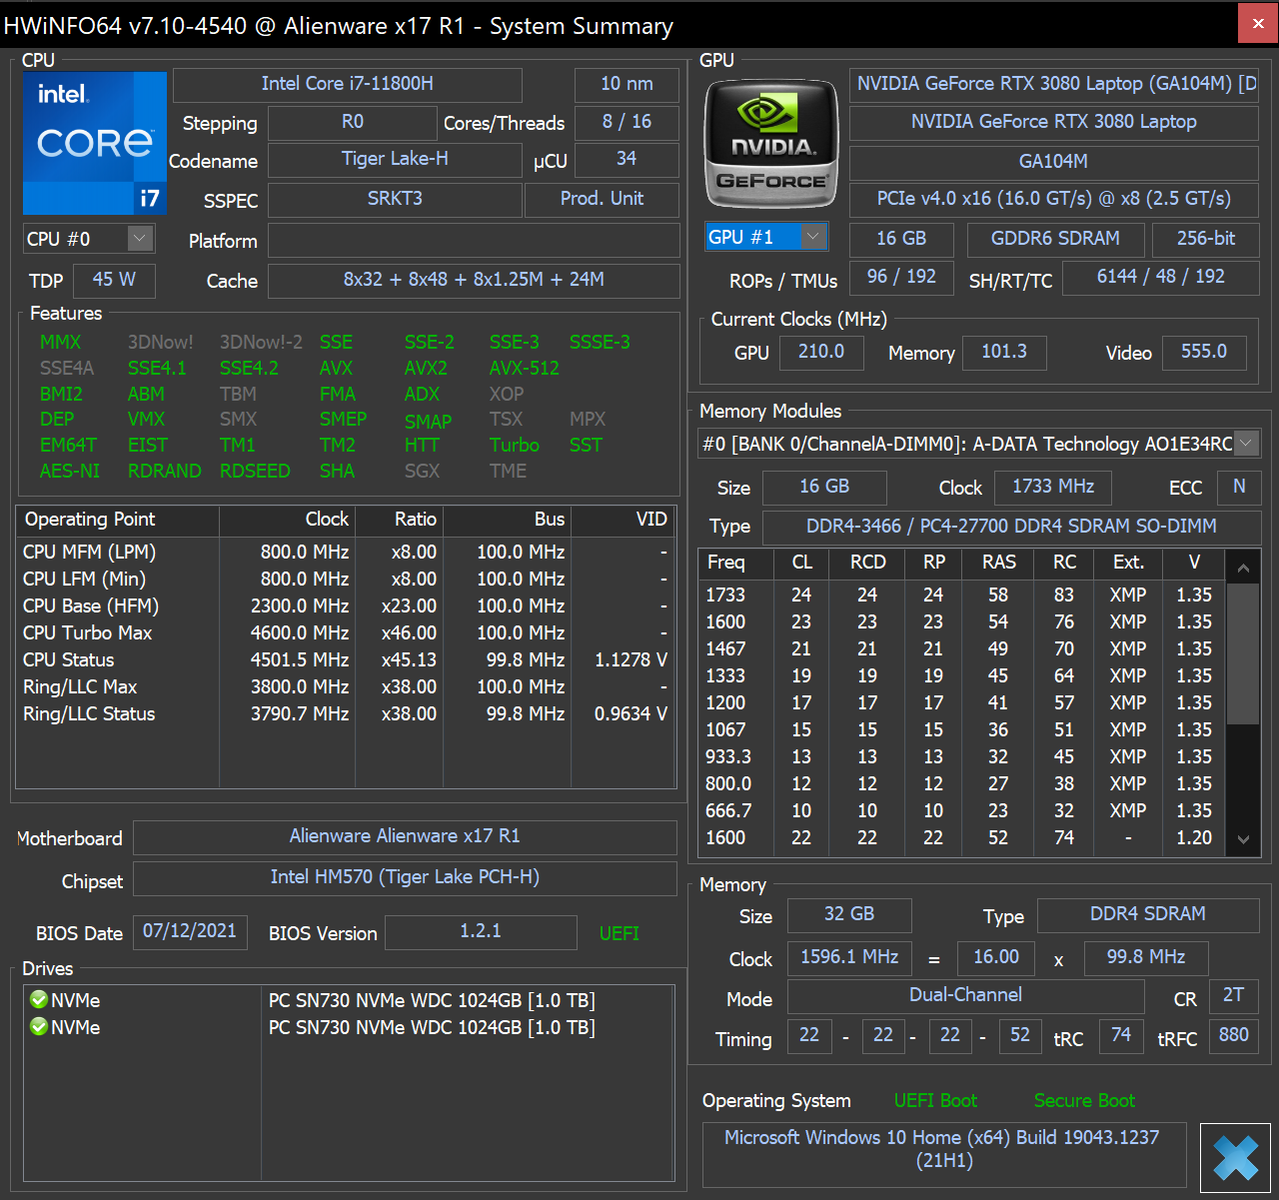
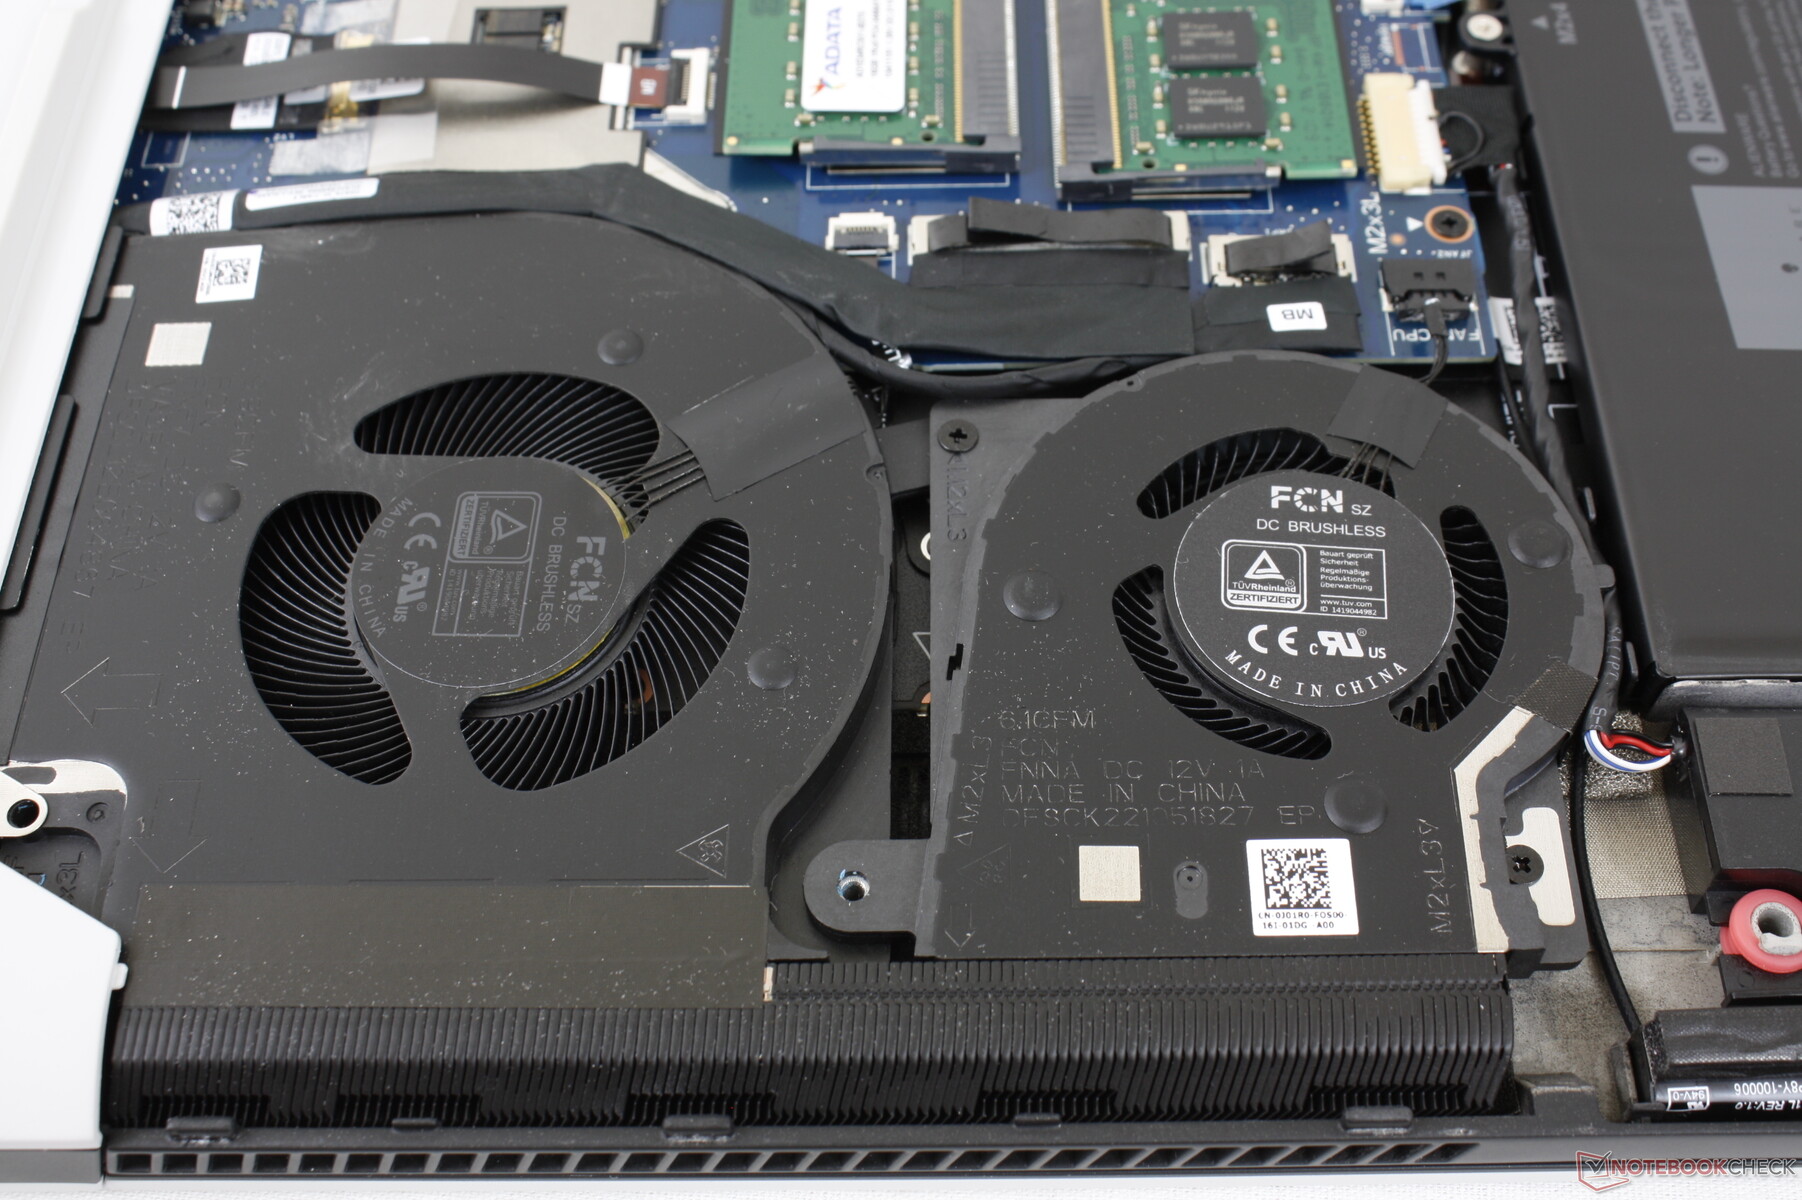
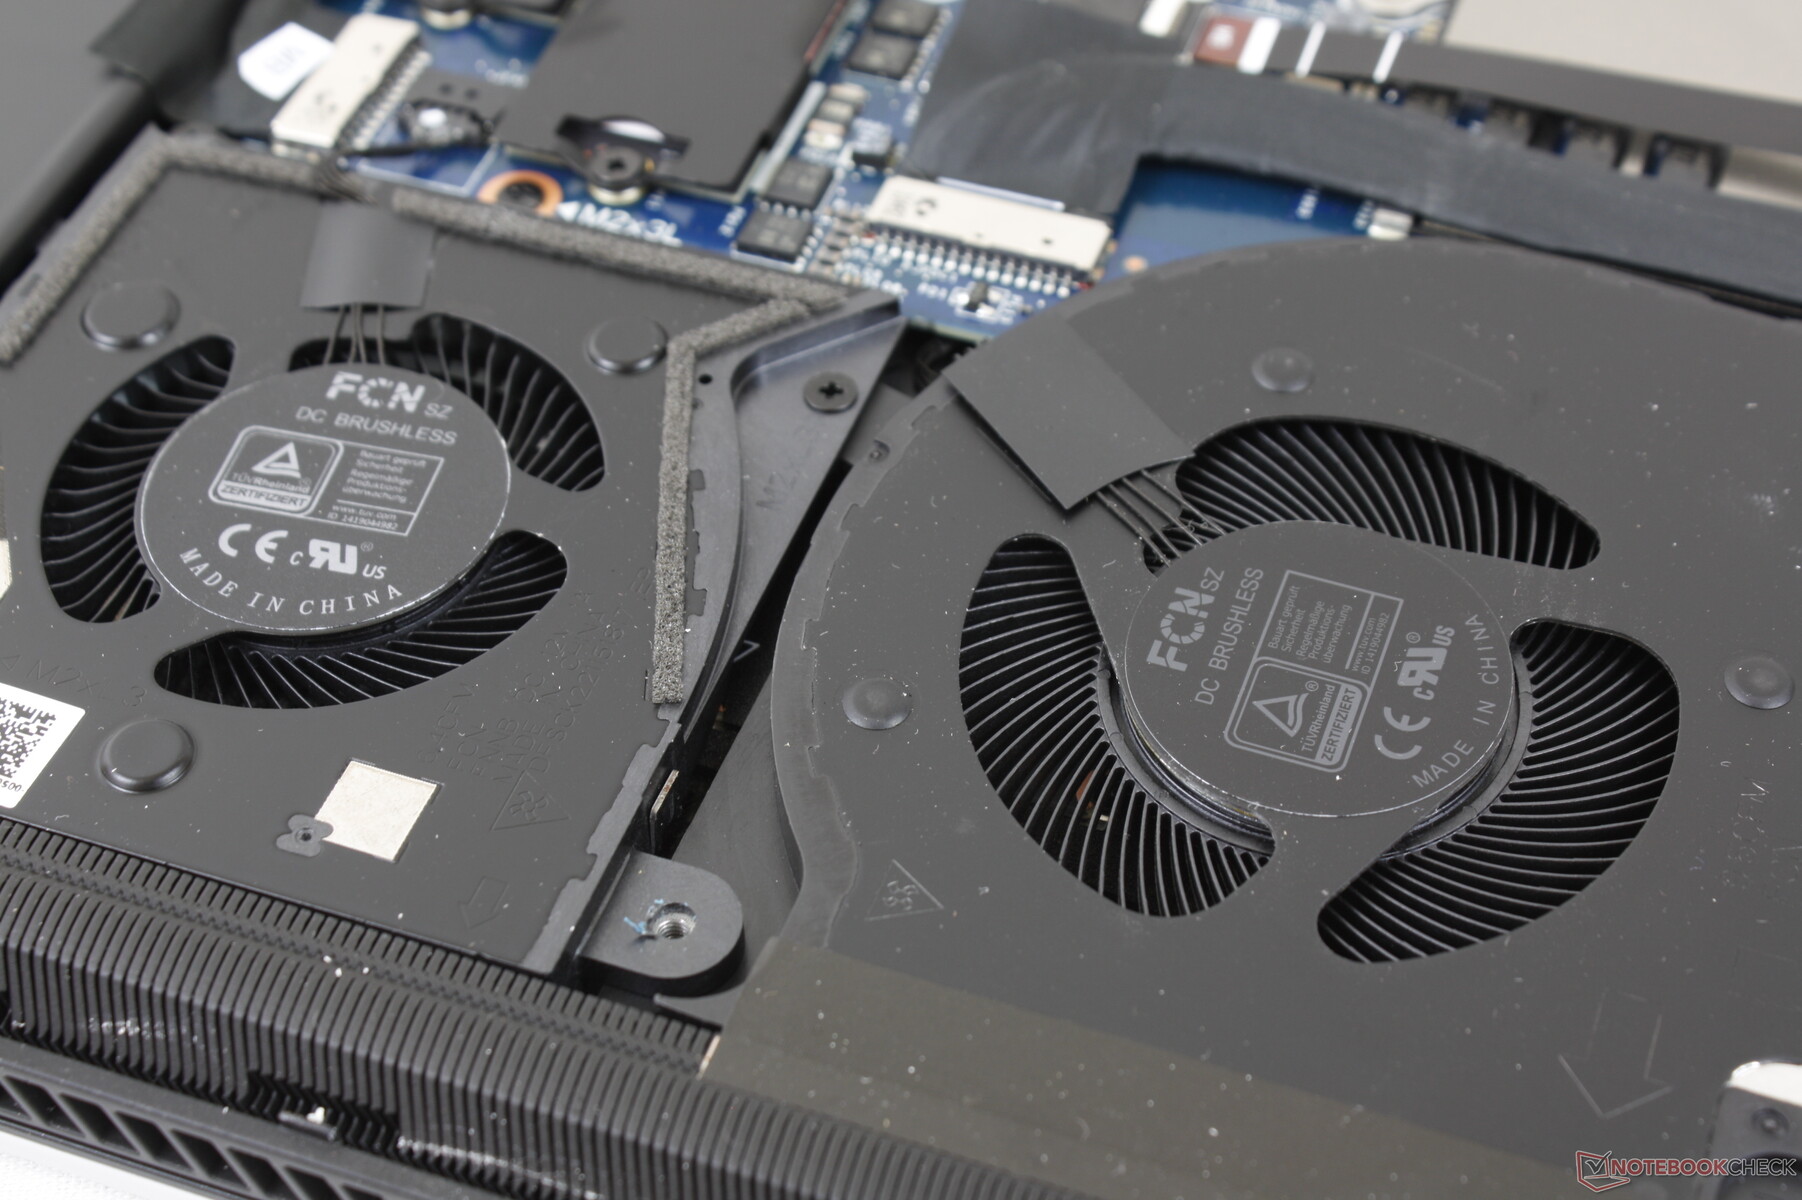
La nostra unità di test è una configurazione di fascia alta equipaggiata con la CPU Core i7-11800H, GeForce RTX 3080 GPU, display 4K UHD a 120 Hz, tasti meccanici CherryMX e 32 GB di RAM per circa 3200 dollari. Opzioni inferiori e superiori sono disponibili con la RTX 3060 o Core i9-11980HK rispettivamente. Forse la caratteristica più importante del nuovo telaio è la sua soluzione di raffreddamento ridisegnata che include più ventole di prima e una nuova pasta termica a base di gallio-silicone sopra la CPU. Una versione da 15.6 pollici è anche disponibile chiamata Alienware x15 R1
I concorrenti dell'Alienware x17 R1 includono altri portatili gaming ultrasottili da 17,3 pollici come l'MSI GS76, il Razer Blade 17, l'Asus ROG Zephyrus S17 e il Tongfang-based Maingear Vector Pro.
Altre recensioni di Dell:
Confronto con i potenziali concorrenti
Punteggio | Data | Modello | Peso | Altezza | Dimensione | Risoluzione | Prezzo |
|---|---|---|---|---|---|---|---|
| 89 % v7 (old) | 09/2021 | Alienware x17 RTX 3080 P48E i7-11800H, GeForce RTX 3080 Laptop GPU | 3.2 kg | 21.4 mm | 17.30" | 3840x2160 | |
| 85.3 % v7 (old) | 04/2021 | Alienware m17 R4 i9-10980HK, GeForce RTX 3080 Laptop GPU | 3 kg | 22 mm | 17.30" | 1920x1080 | |
| 89.4 % v7 (old) | 09/2021 | Razer Blade 17 RTX 3070 i7-11800H, GeForce RTX 3070 Laptop GPU | 2.8 kg | 19.9 mm | 17.30" | 1920x1080 | |
| 90.1 % v7 (old) | 07/2021 | Asus ROG Zephyrus S17 GX703HSD i9-11900H, GeForce RTX 3080 Laptop GPU | 2.8 kg | 19.9 mm | 17.30" | 2560x1440 | |
| 86.2 % v7 (old) | 09/2021 | MSI GS76 Stealth 11UH i9-11900H, GeForce RTX 3080 Laptop GPU | 2.4 kg | 20 mm | 17.30" | 3840x2160 | |
| 88 % v7 (old) | 05/2021 | Gigabyte Aero 17 HDR YD i9-11980HK, GeForce RTX 3080 Laptop GPU | 2.8 kg | 22 mm | 17.30" | 3840x2160 |
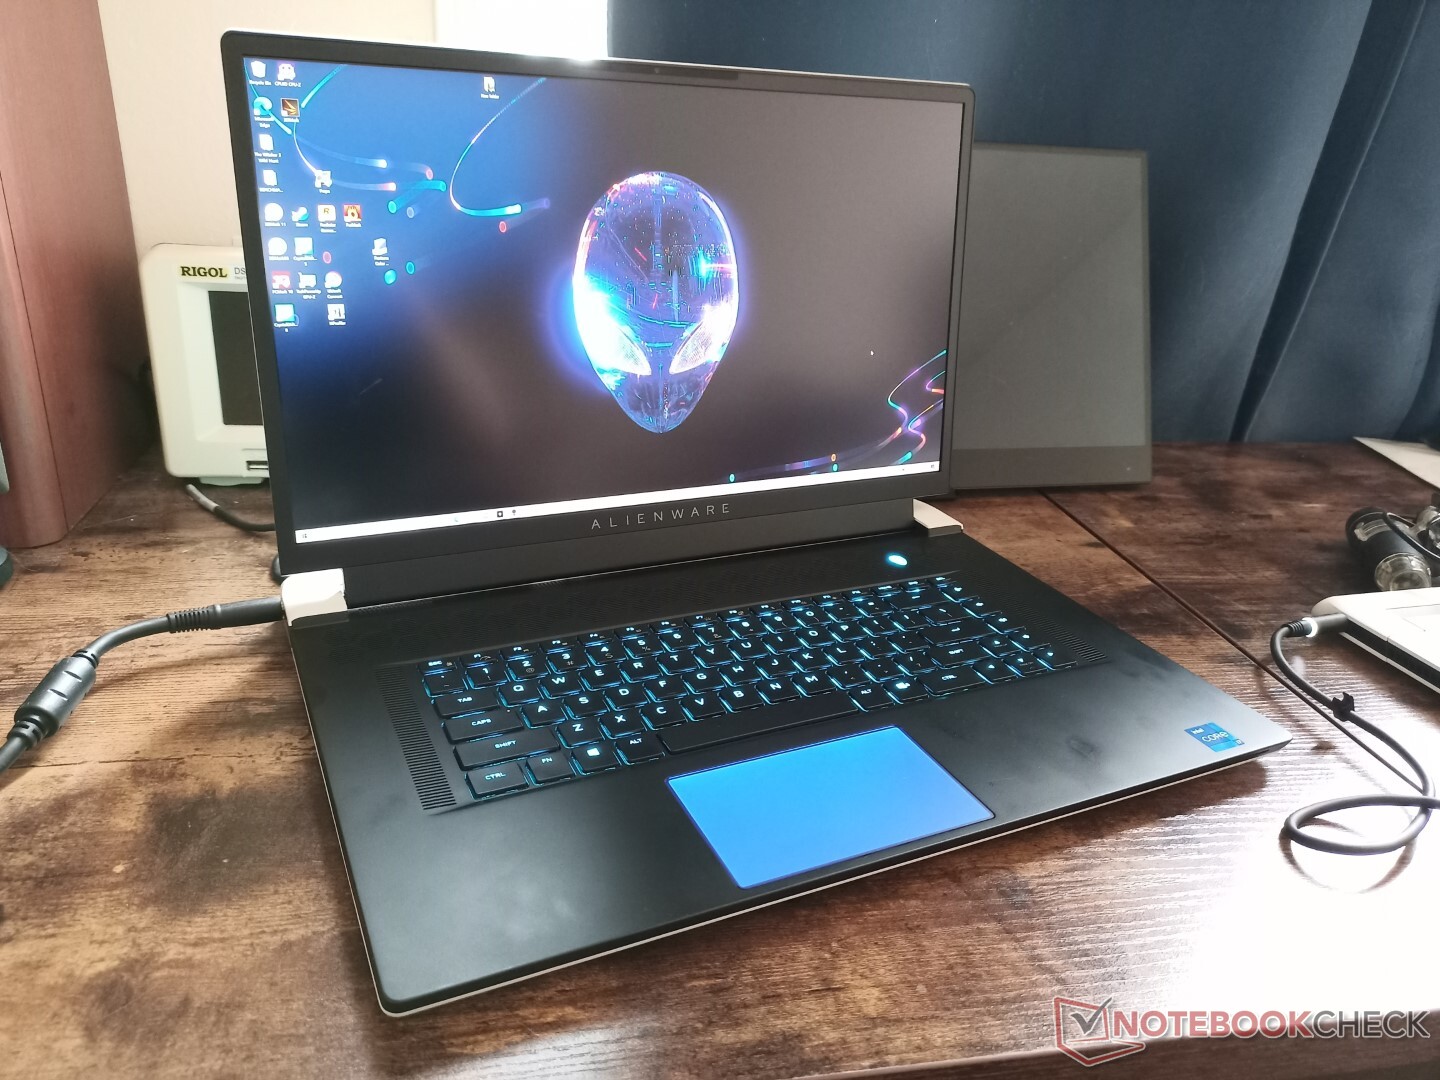
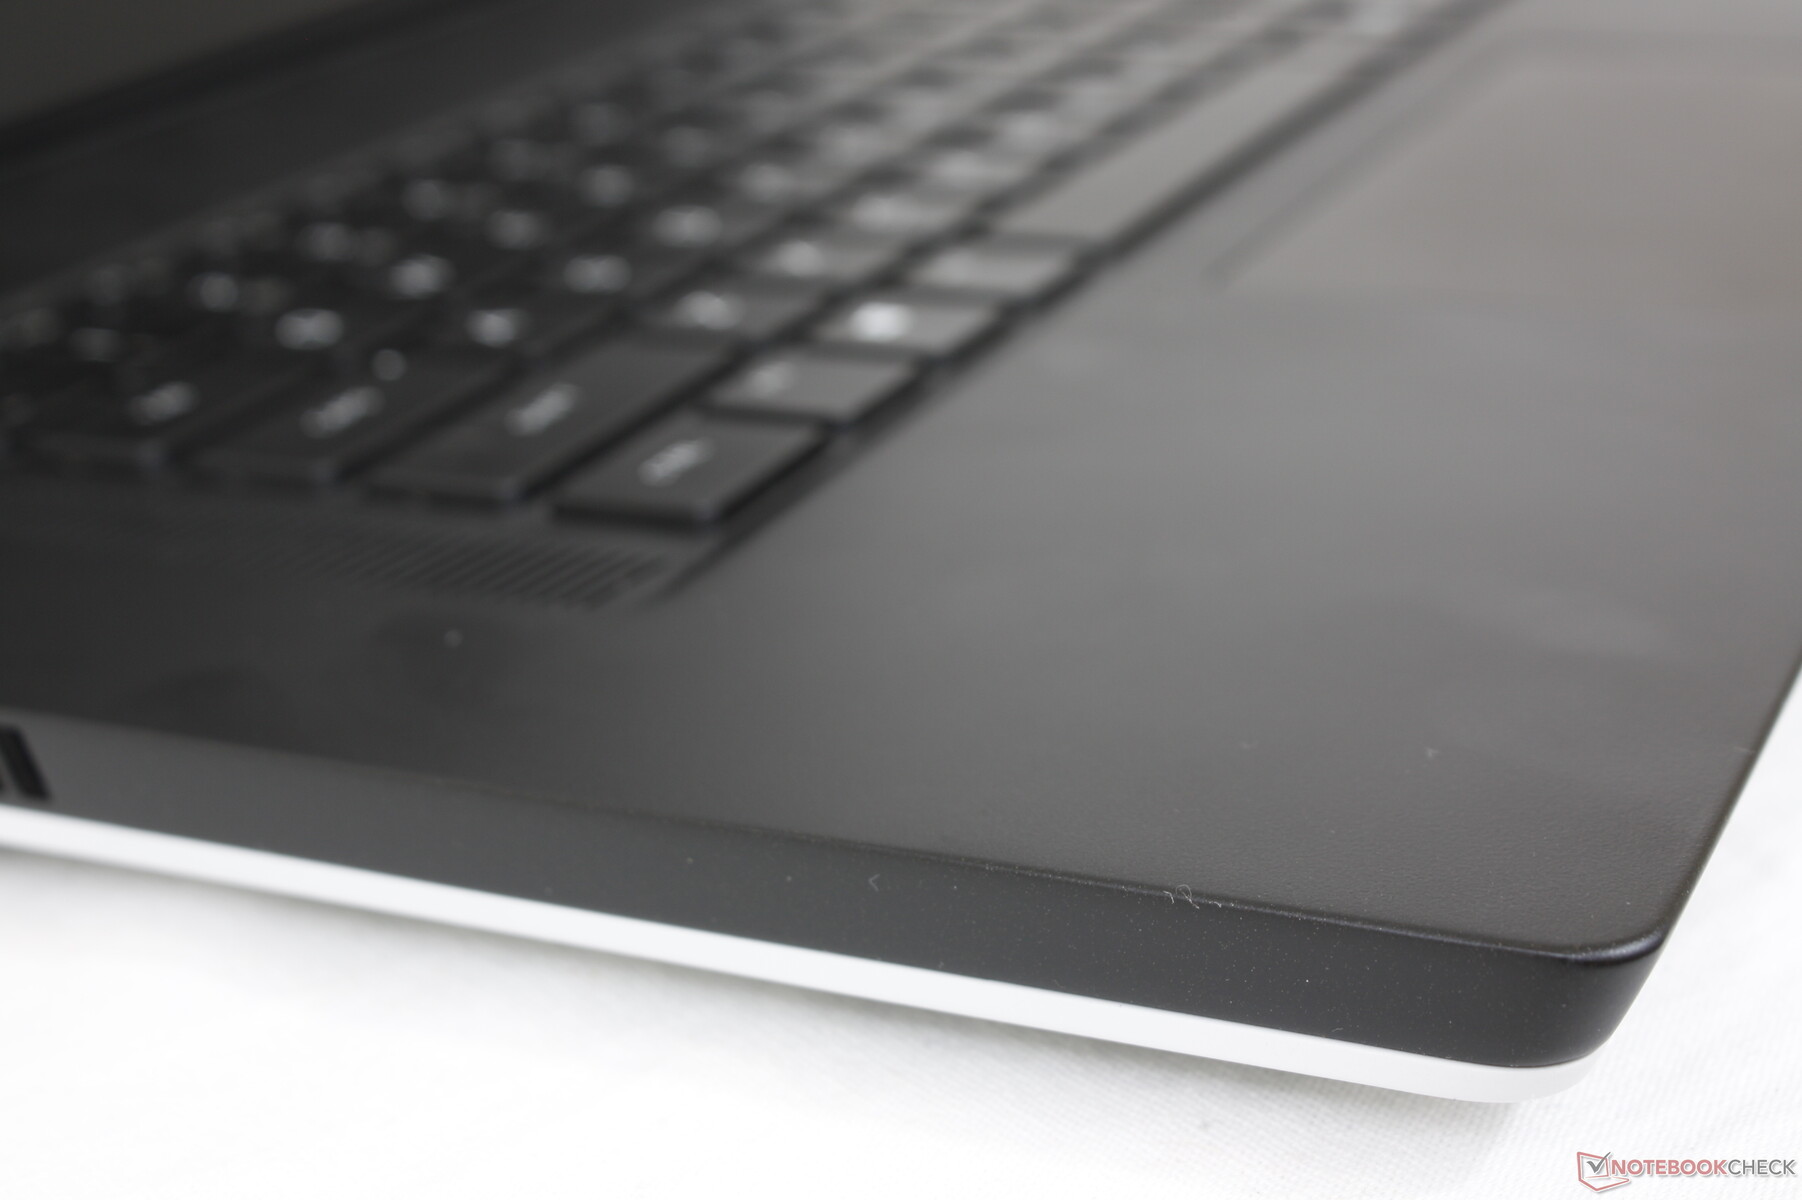
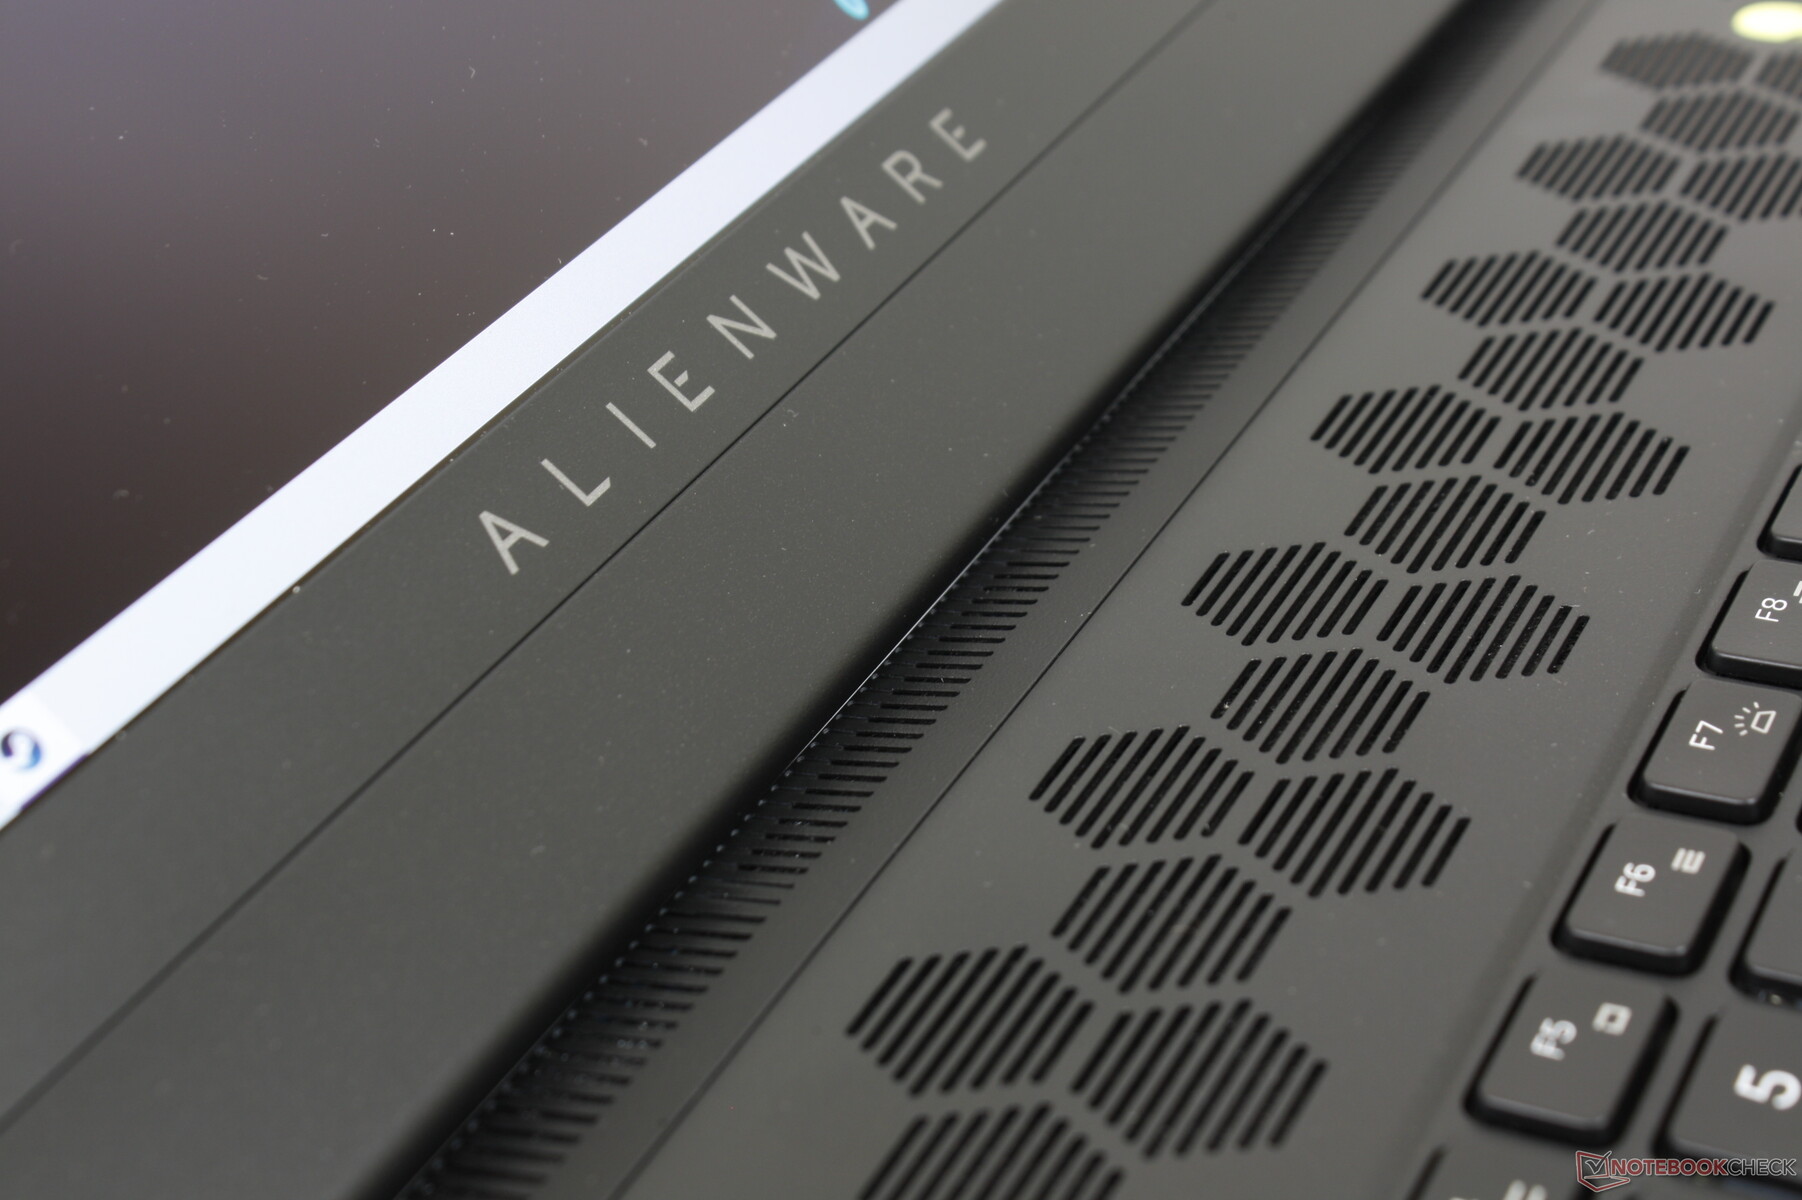
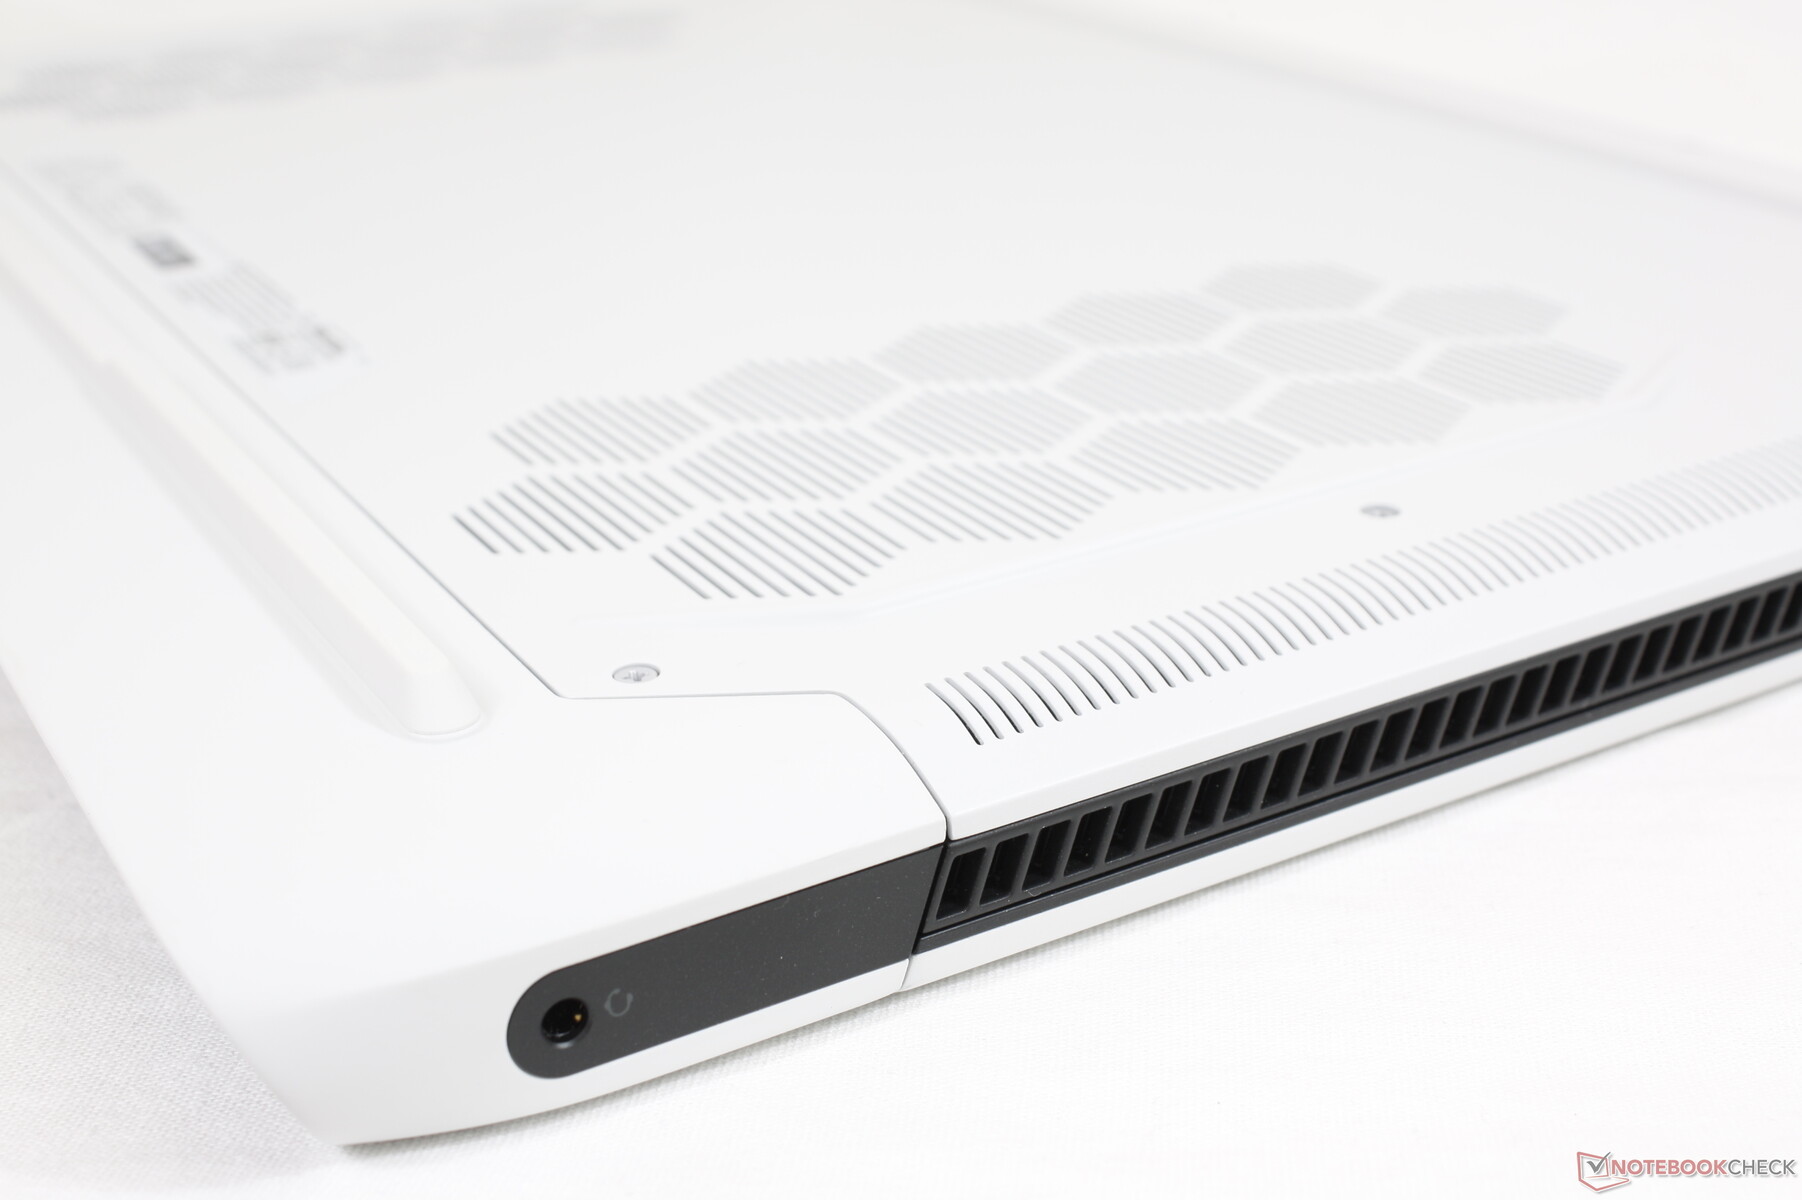
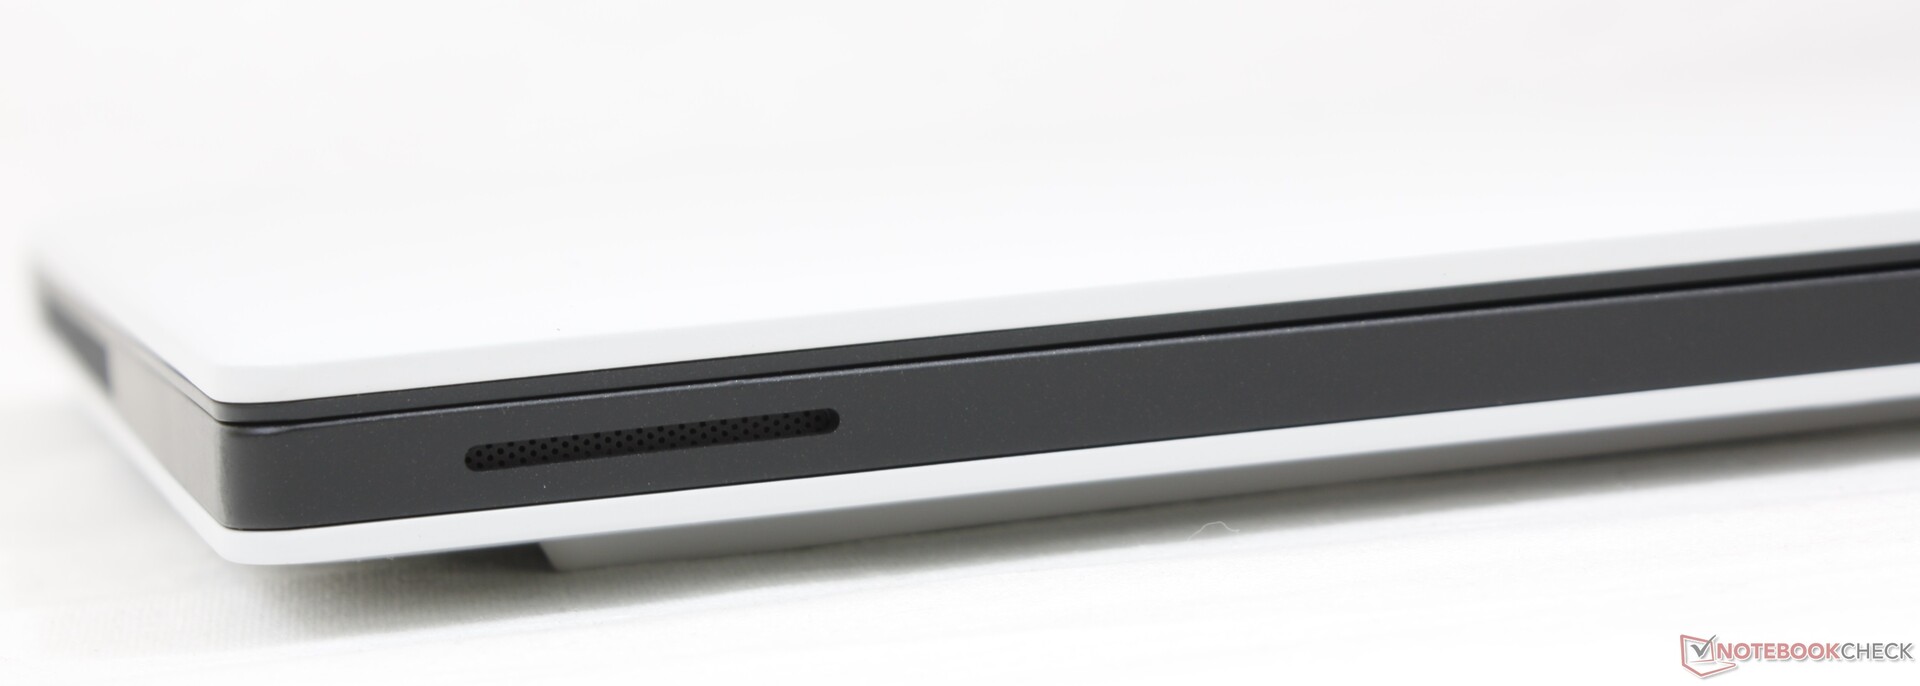
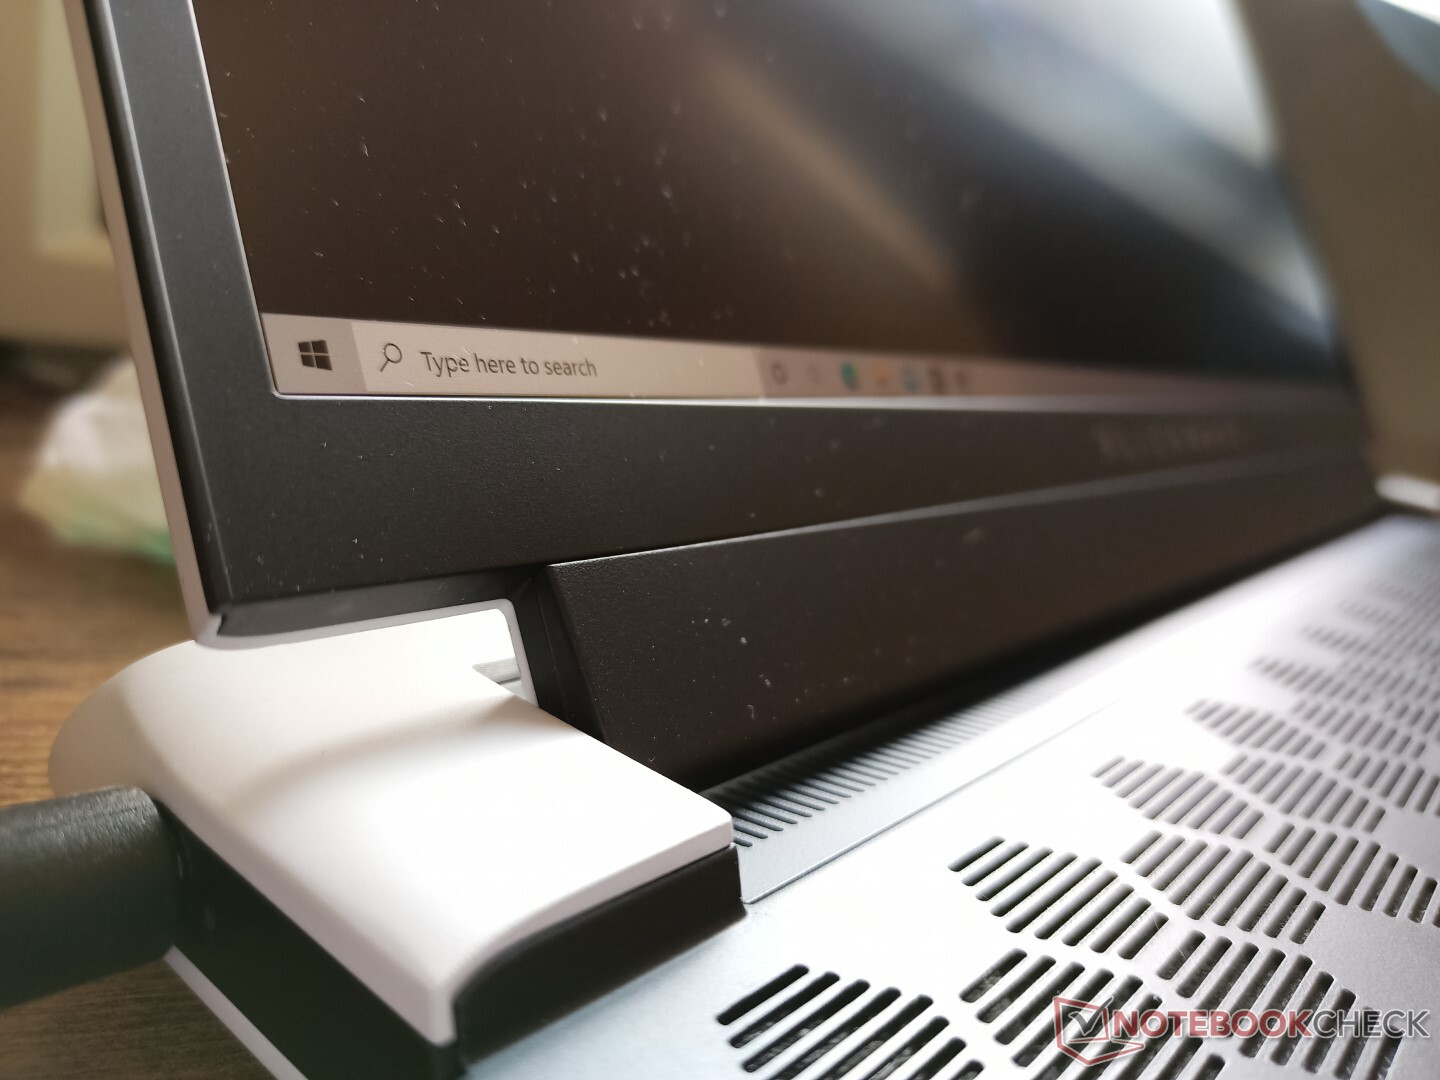
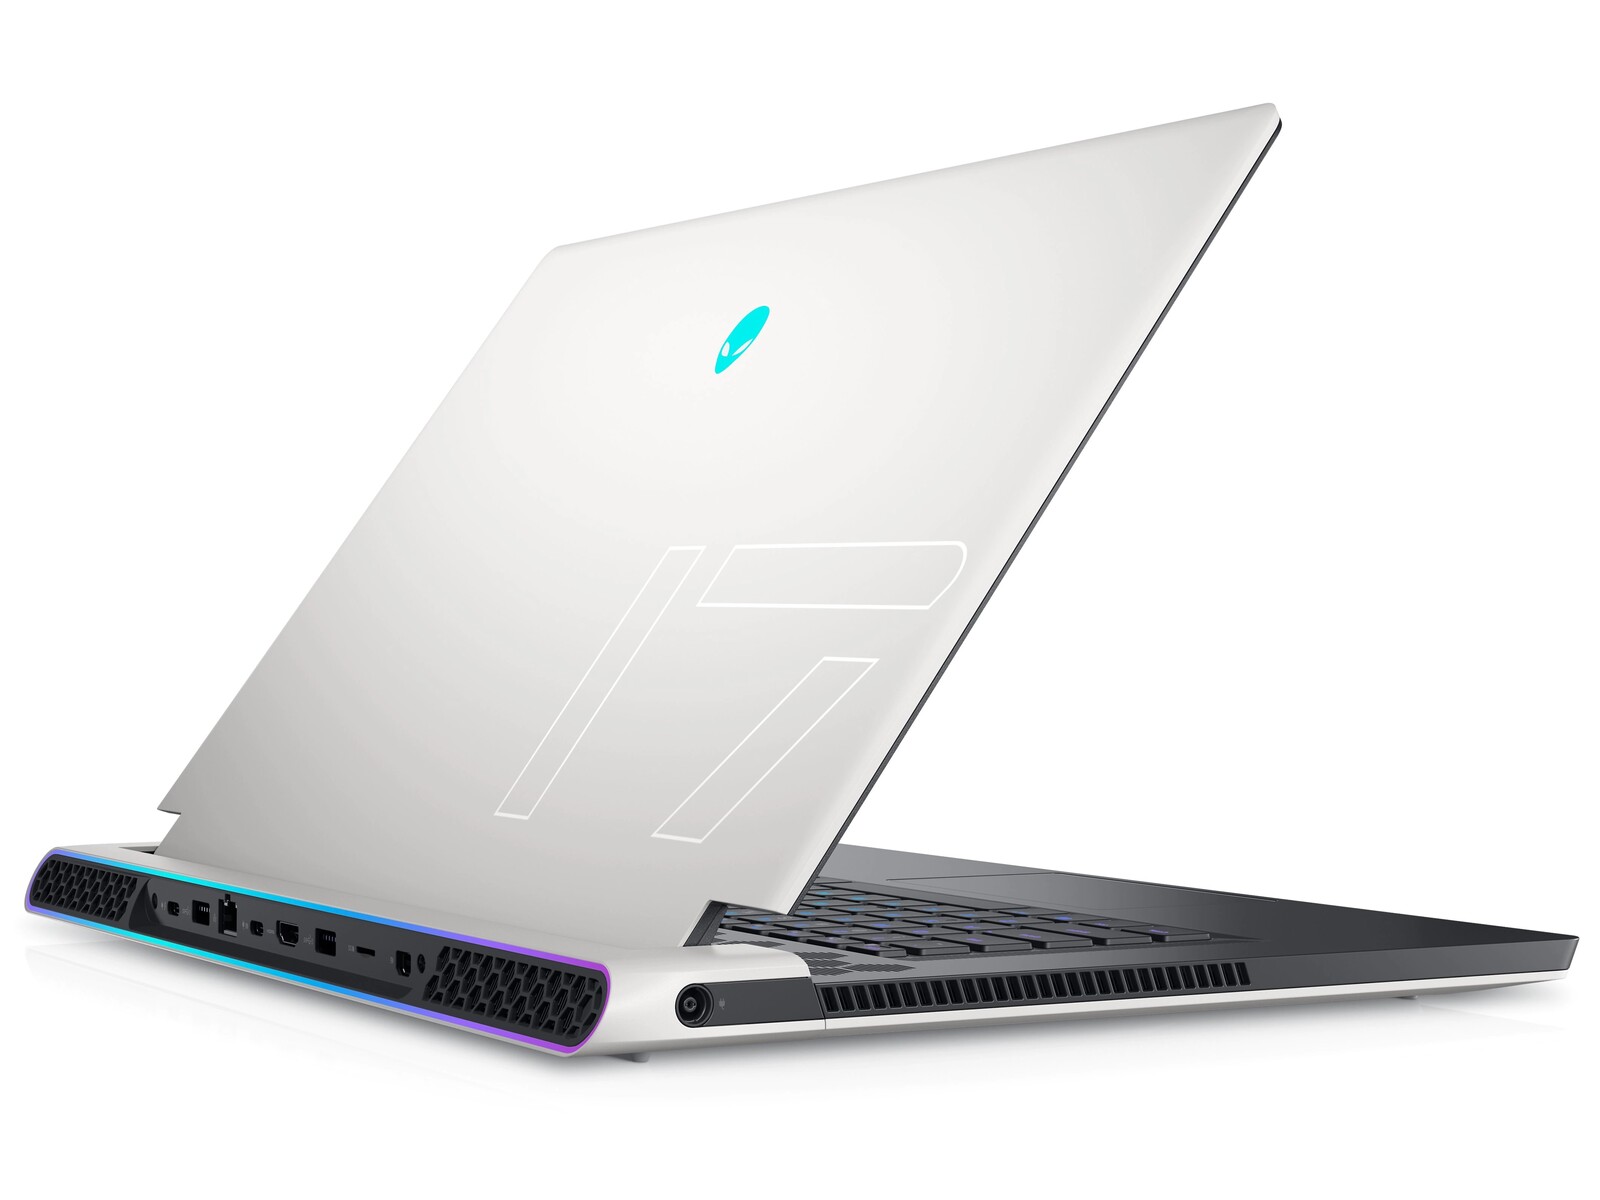
Case - Il ritorno di una leggenda
Il rinnovato design del telaio "Legend" utilizza simili plastiche soft-touch come sul m17 R2 ma in proporzioni diverse e generalmente più piatte per accentuare un look più sottile. Il pannello esterno bianco e le griglie a nido d'ape rimangono tutti, per esempio, mentre il piano della tastiera è ora nero e più nitido intorno ai bordi. La rigidità è ancora eccellente, specialmente intorno alla base, con pochissime deformazioni e nessuno scricchiolio di cui parlare.
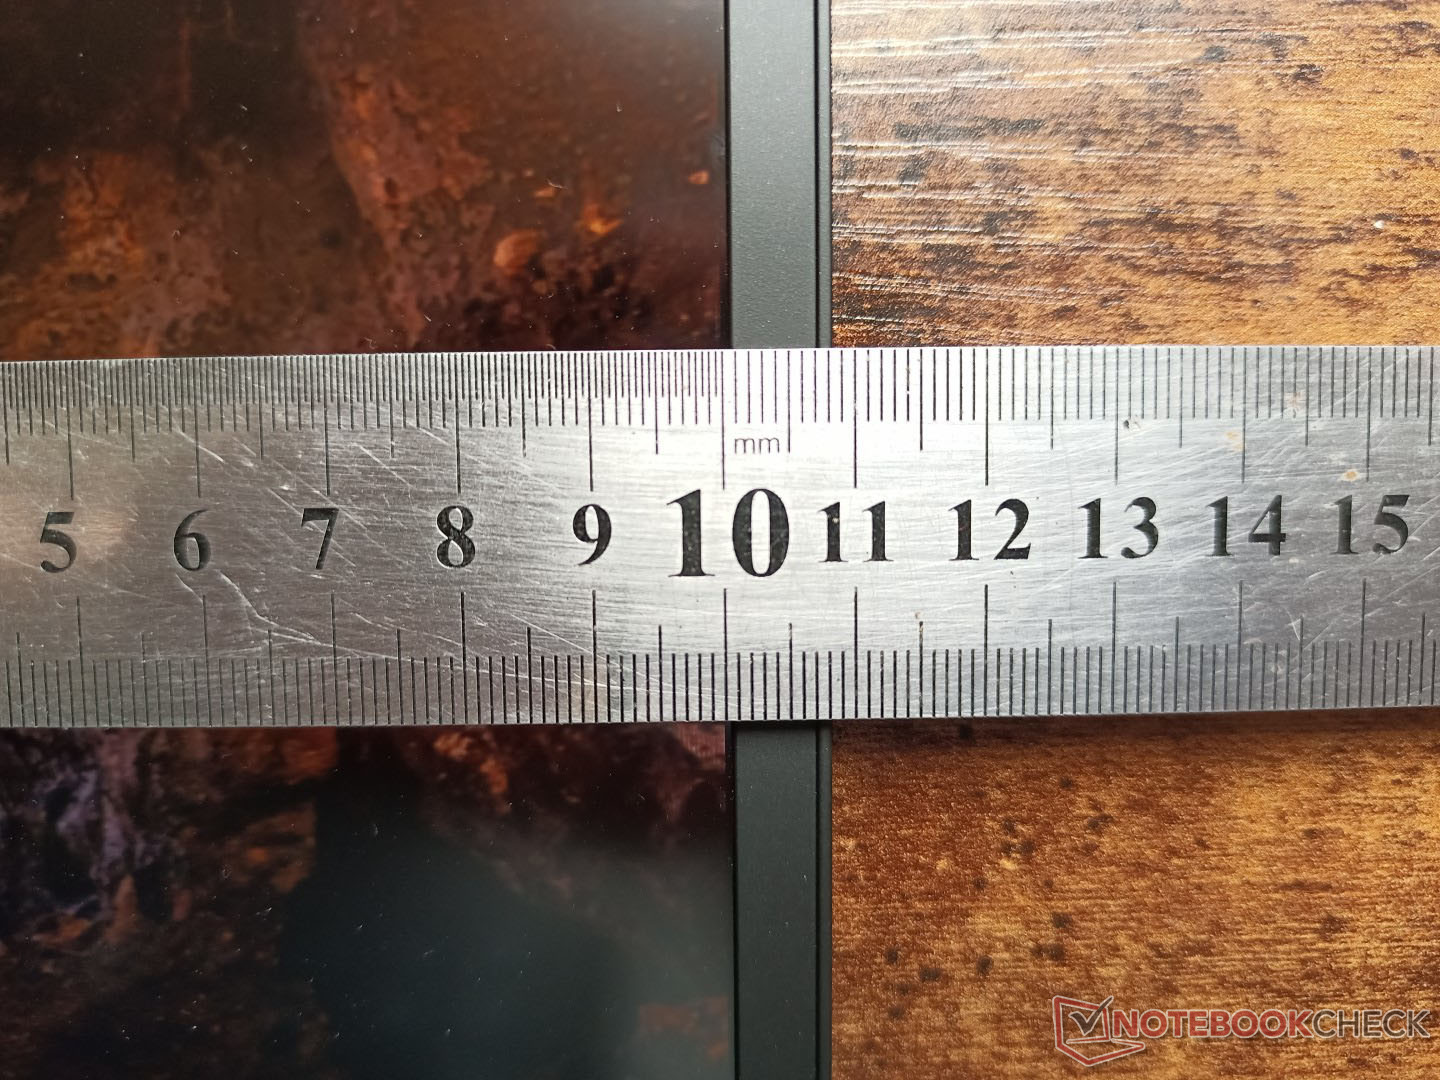
La cover si flette più di quella del Blade 17 ma non così tanto come nell'MSI GS75. Ha anche alcune delle cornici più spesse lungo il bordo inferiore per qualsiasi portatile da gaming da 17,3 pollici che abbiamo visto e che sono in parte responsabili dell'ingombro extra-large.
I portatili Alienware non hanno paura di essere grandi e l'x17 R1 è ancora un grande sistema a prescindere da quanto "sottile" Dell ami commercializzare il modello. La verità è che il sistema è notevolmente più grande e più pesante della maggior parte dei modelli concorrenti come MSI GS76, Blade 17, o Zephyrus S17. Anche il vecchio Alienware m17 R4 è più leggero dell'x17 R1 di circa 200 grammi nonostante i loro volumi quasi identici. Il peso aggiunto contribuisce ad una base più forte e più rigida, tuttavia.
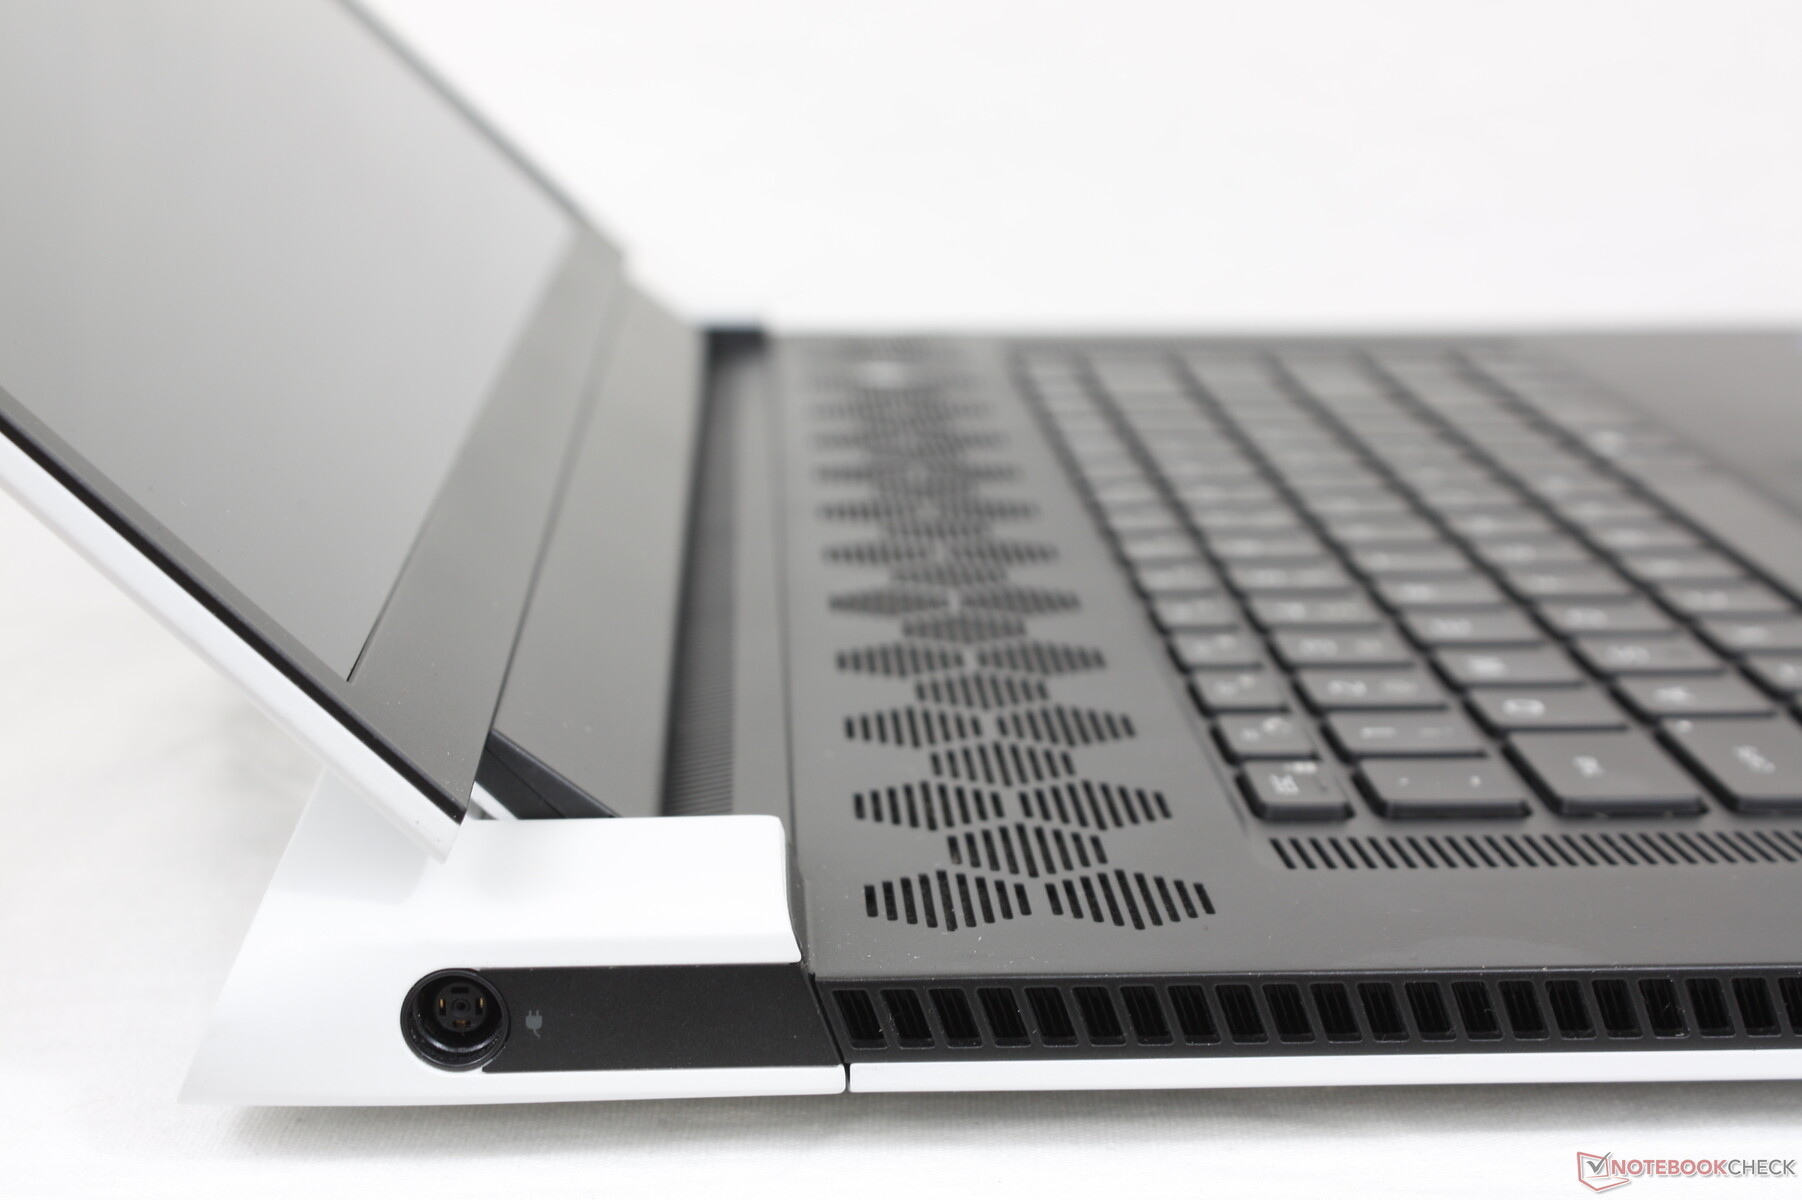
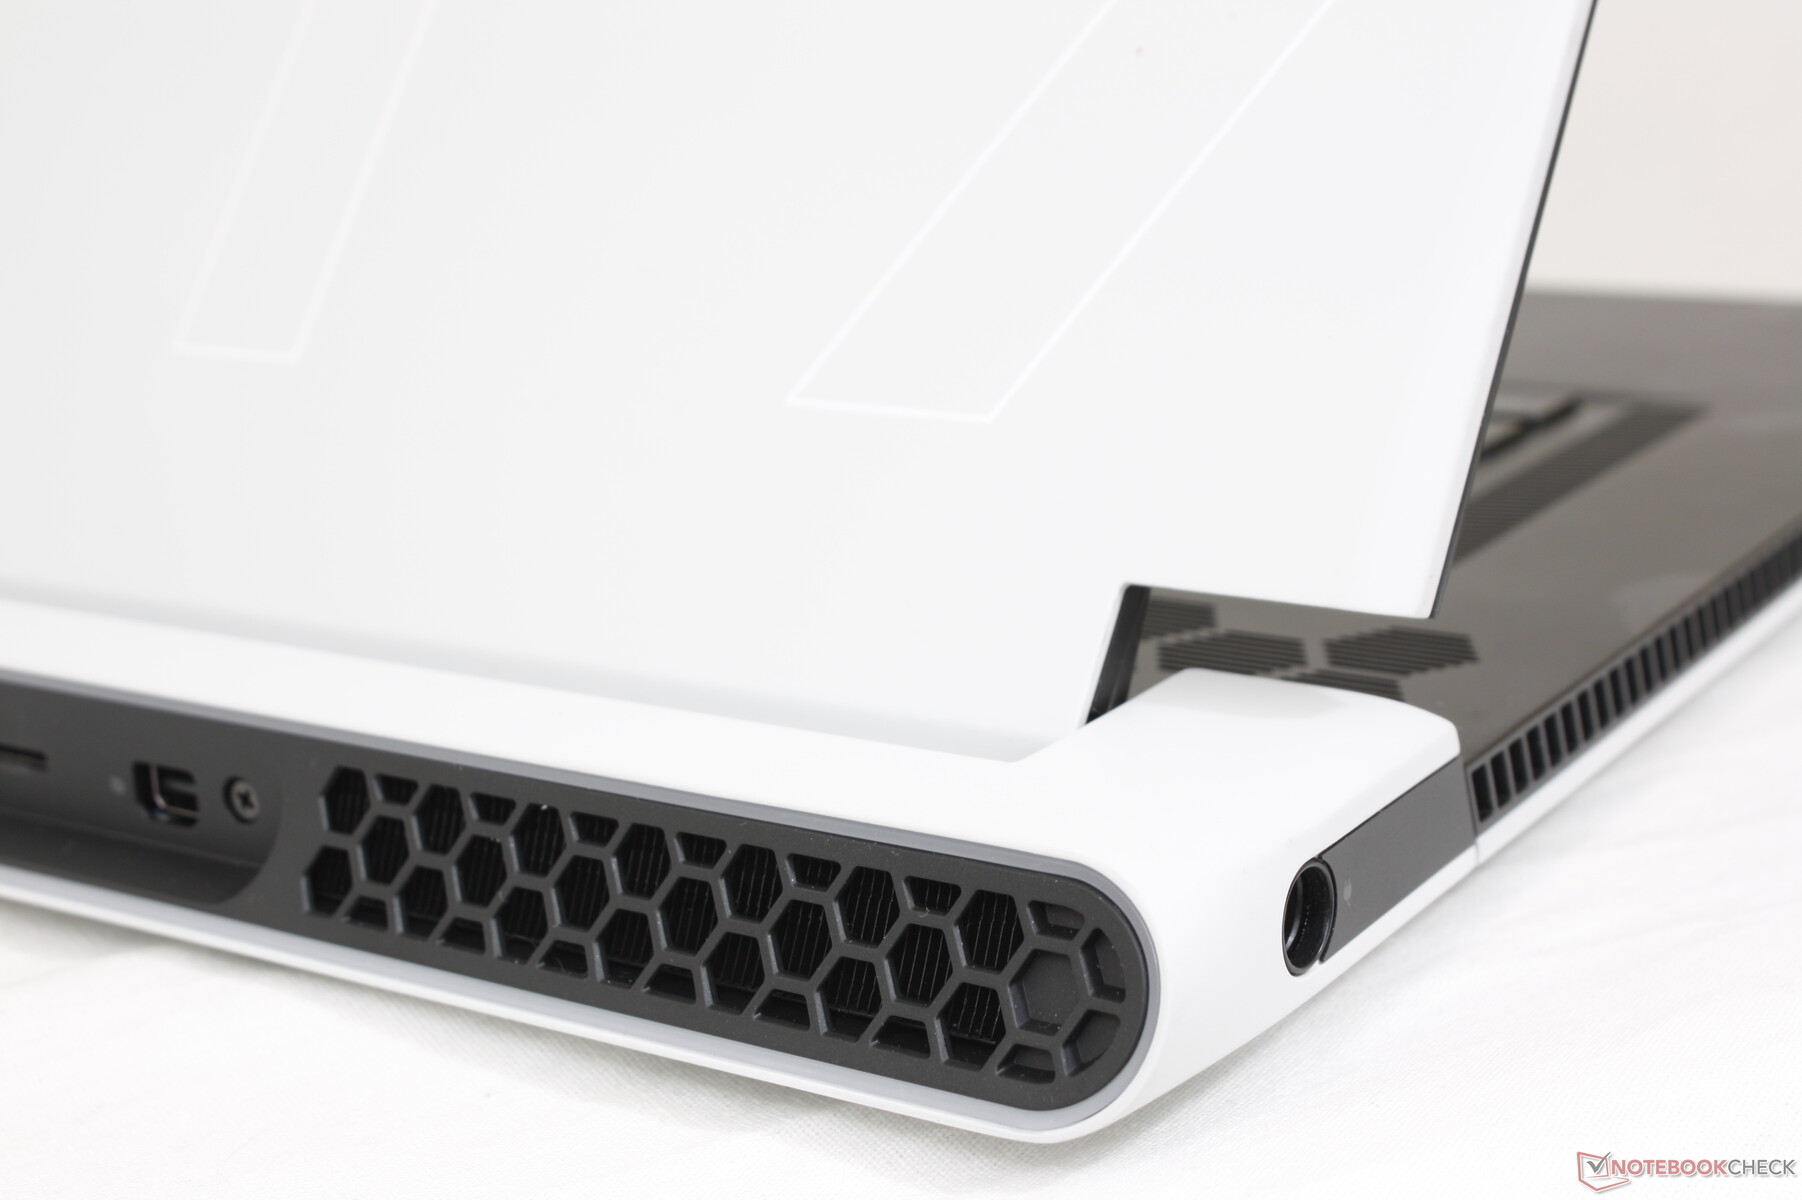
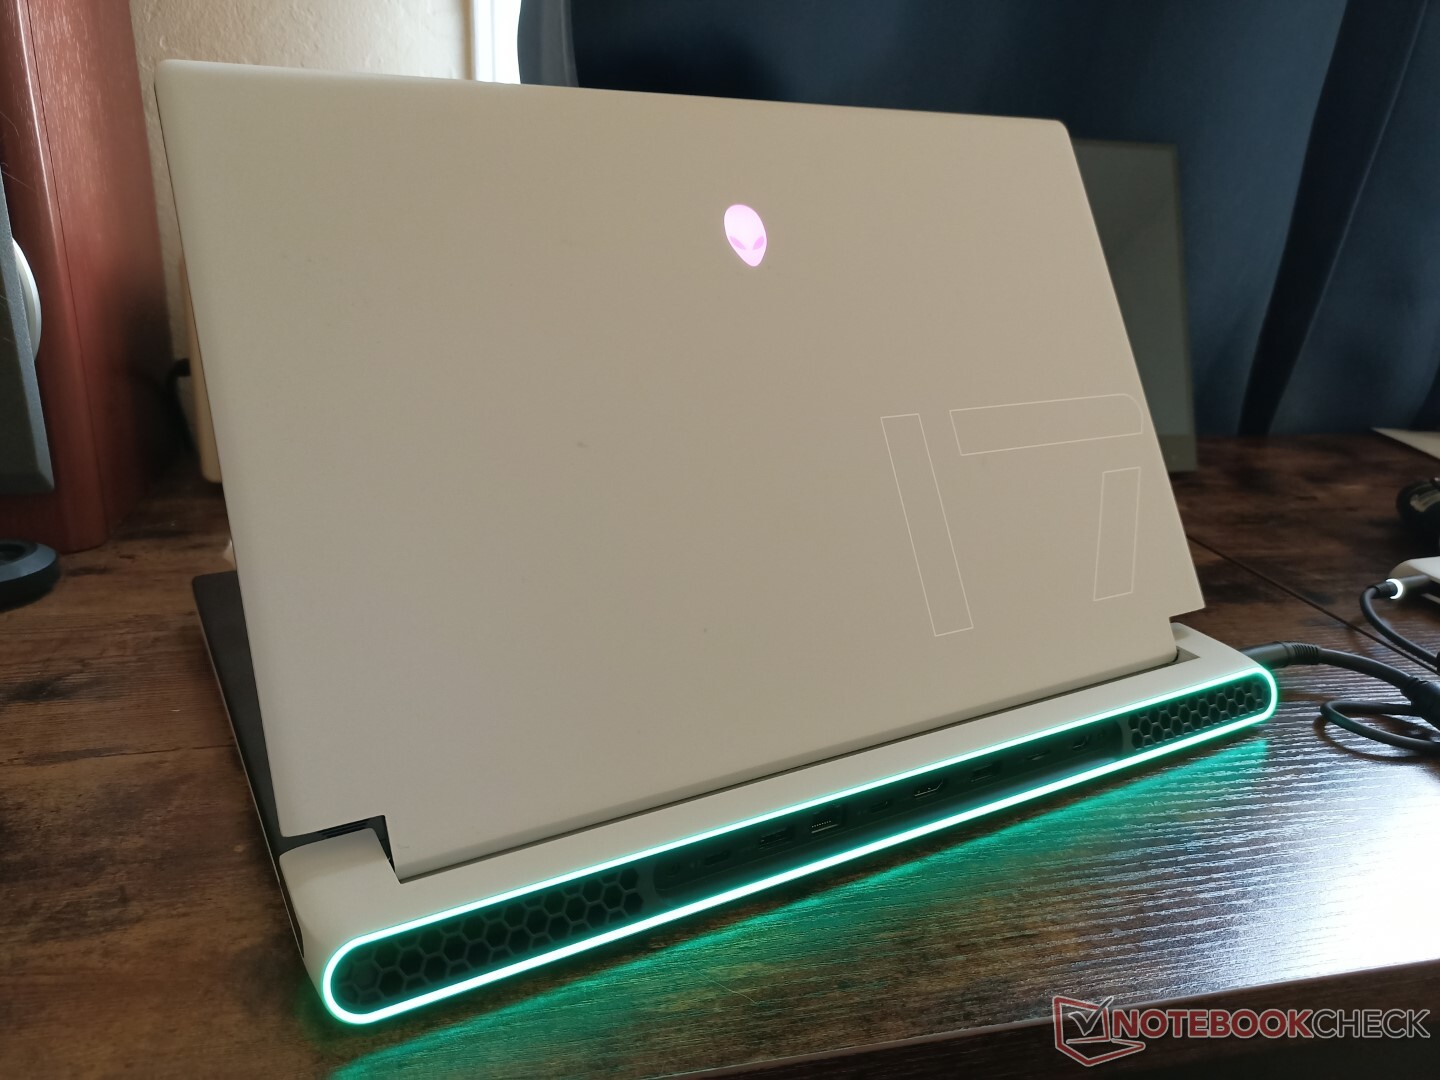
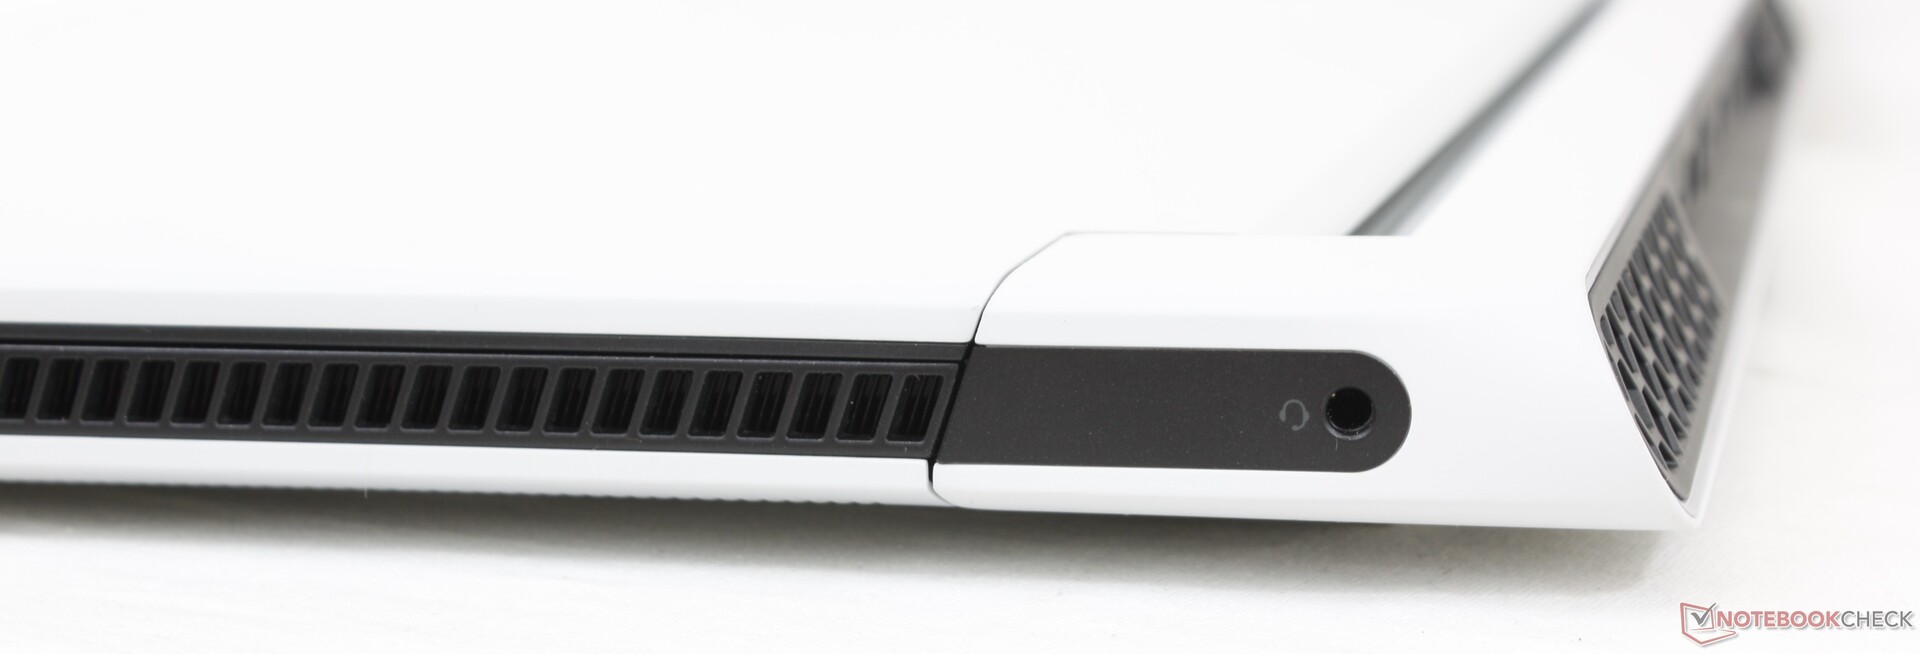
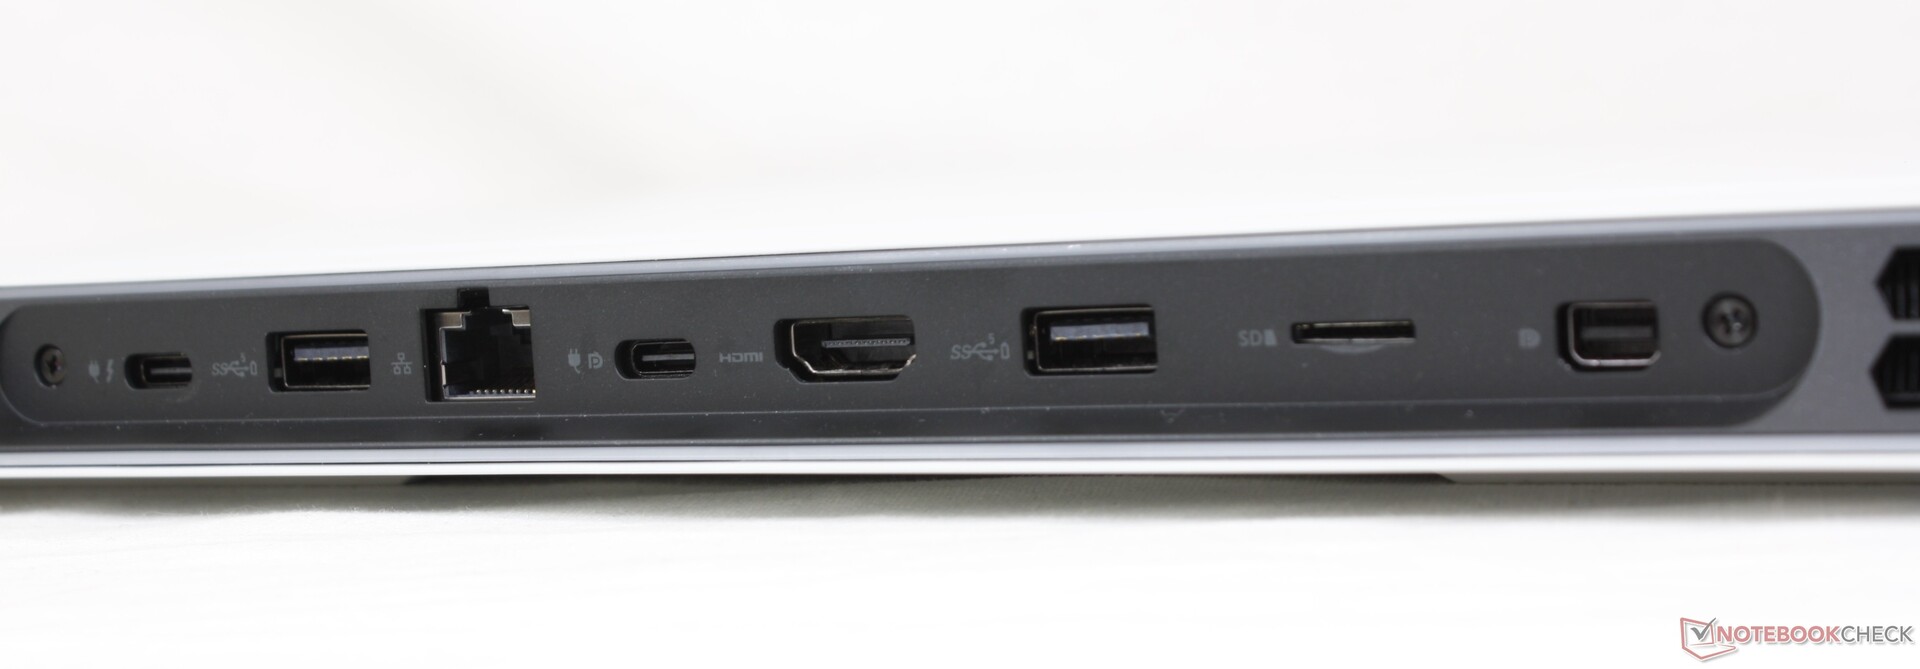
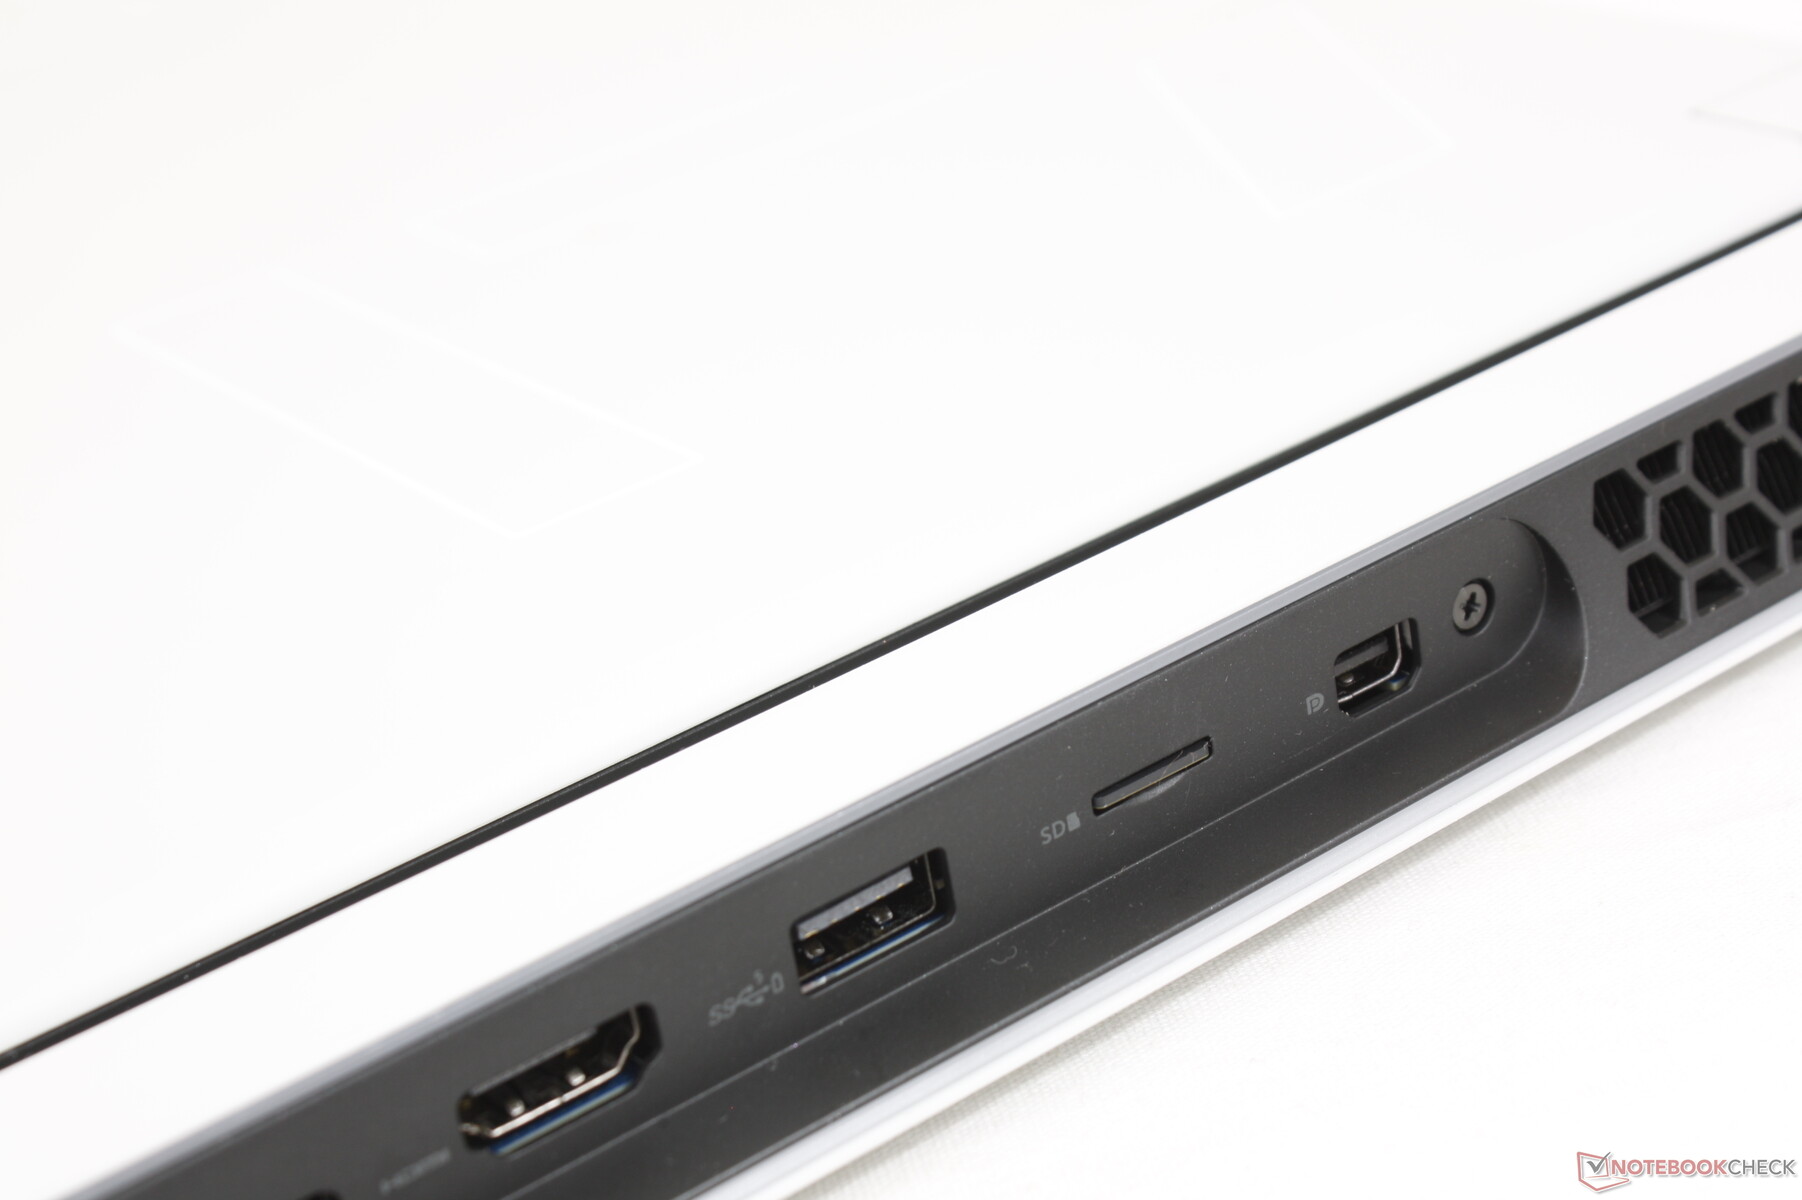
Connessioni - lungo tutta la parte posteriore
Le opzioni delle porte sono per lo più le stesse dell'Alienware m17 R4 dell'anno scorso, ma con alcuni importanti cambiamenti. La raramente usata porta proprietaria Graphics Amplifier, per esempio, è stata abbandonata in favore di una più comoda seconda porta USB-C. C'è anche una porta USB-A in meno con cui lavorare questa volta. Per il resto, tutte le altre porte sono tornate anche se ridisposte lungo la parte posteriore del telaio finendo per essere generalmente più difficili da raggiungere e vedere rispetto alla maggior parte degli altri portatili
Si noti che entrambe le porte USB-C supportano DisplayPort e Power Delivery, ma solo una è effettivamente compatibile con Thunderbolt 4.
Lettore di schede SD
Le velocità di trasferimento dal lettore MicroSD integrato sono molto veloci a quasi 250 MB/s con la nostra scheda di test UHS-II. Lo slot è un po' difficile da raggiungere perché è lungo la parte posteriore, ma è sicuramente meglio che non averne uno.
| SD Card Reader | |
| average JPG Copy Test (av. of 3 runs) | |
| Razer Blade 17 RTX 3070 (AV Pro V60) | |
| MSI GS76 Stealth 11UH (AV PRO microSD 128 GB V60) | |
| Alienware m17 R4 (AV PRO microSD 128 GB V60) | |
| Gigabyte Aero 17 HDR YD (AV PRO microSD 128 GB V60) | |
| Asus ROG Zephyrus S17 GX703HSD | |
| Alienware x17 RTX 3080 P48E (AV Pro V60) | |
| maximum AS SSD Seq Read Test (1GB) | |
| Asus ROG Zephyrus S17 GX703HSD | |
| Alienware x17 RTX 3080 P48E (AV Pro V60) | |
| Alienware m17 R4 (AV PRO microSD 128 GB V60) | |
| MSI GS76 Stealth 11UH (AV PRO microSD 128 GB V60) | |
| Razer Blade 17 RTX 3070 (AV Pro V60) | |
| Gigabyte Aero 17 HDR YD (AV PRO microSD 128 GB V60) | |
Comunicazioni
Il modulo Killer AX1675x abilitato al Wi-Fi 6E è saldato, proprio come lo era sul progetto m17 di ultima generazione. È interessante notare che il modulo WLAN è rimovibile sull'Alienware x15 anche se è un formato più piccolo da 15,6 pollici.
Webcam - IR, ma senza otturatore
La qualità della fotocamera non è realmente migliorata gen-to-gen, dato che il sistema è dotato solo di un sensore 720p. Alcuni altri portatili come il Razer Blade 17 sono passati a 1080p. Manca anche un otturatore per la webcam.

")
")
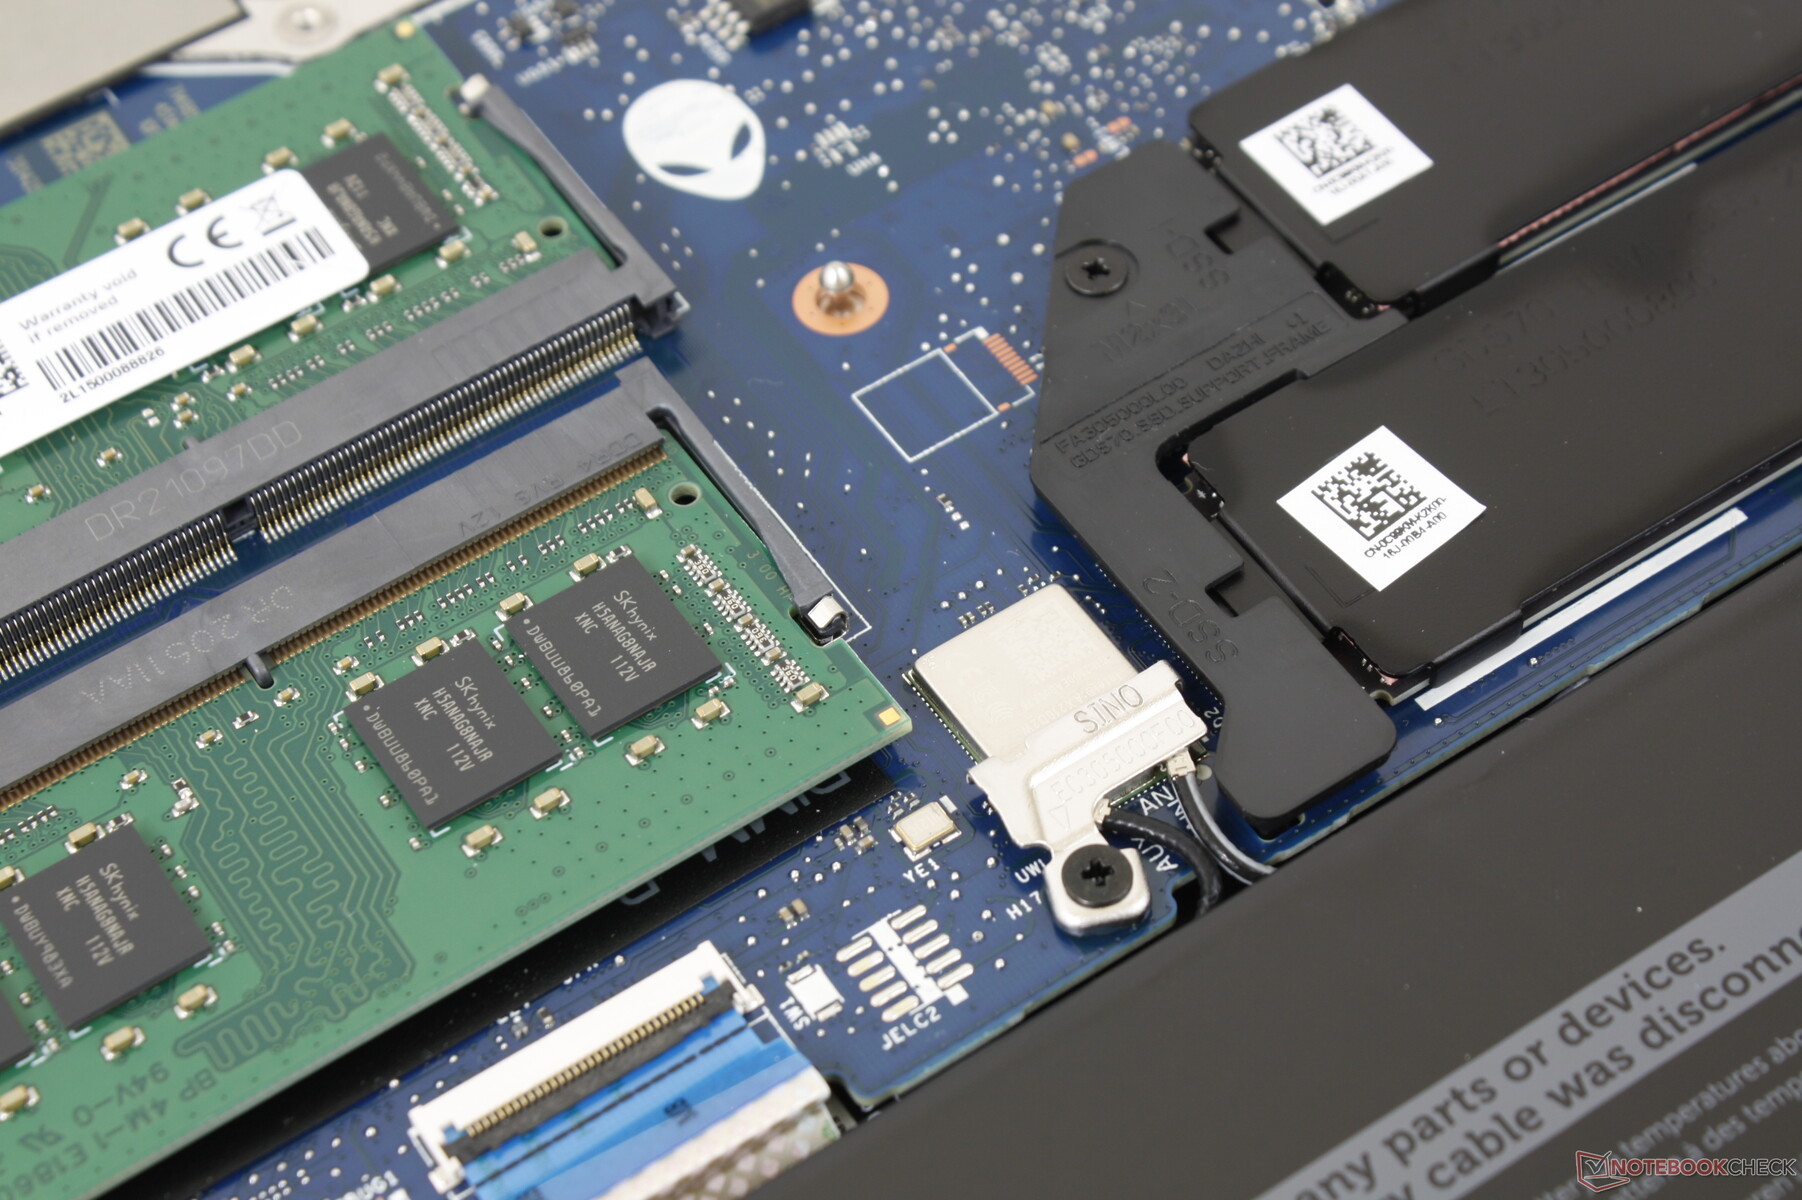
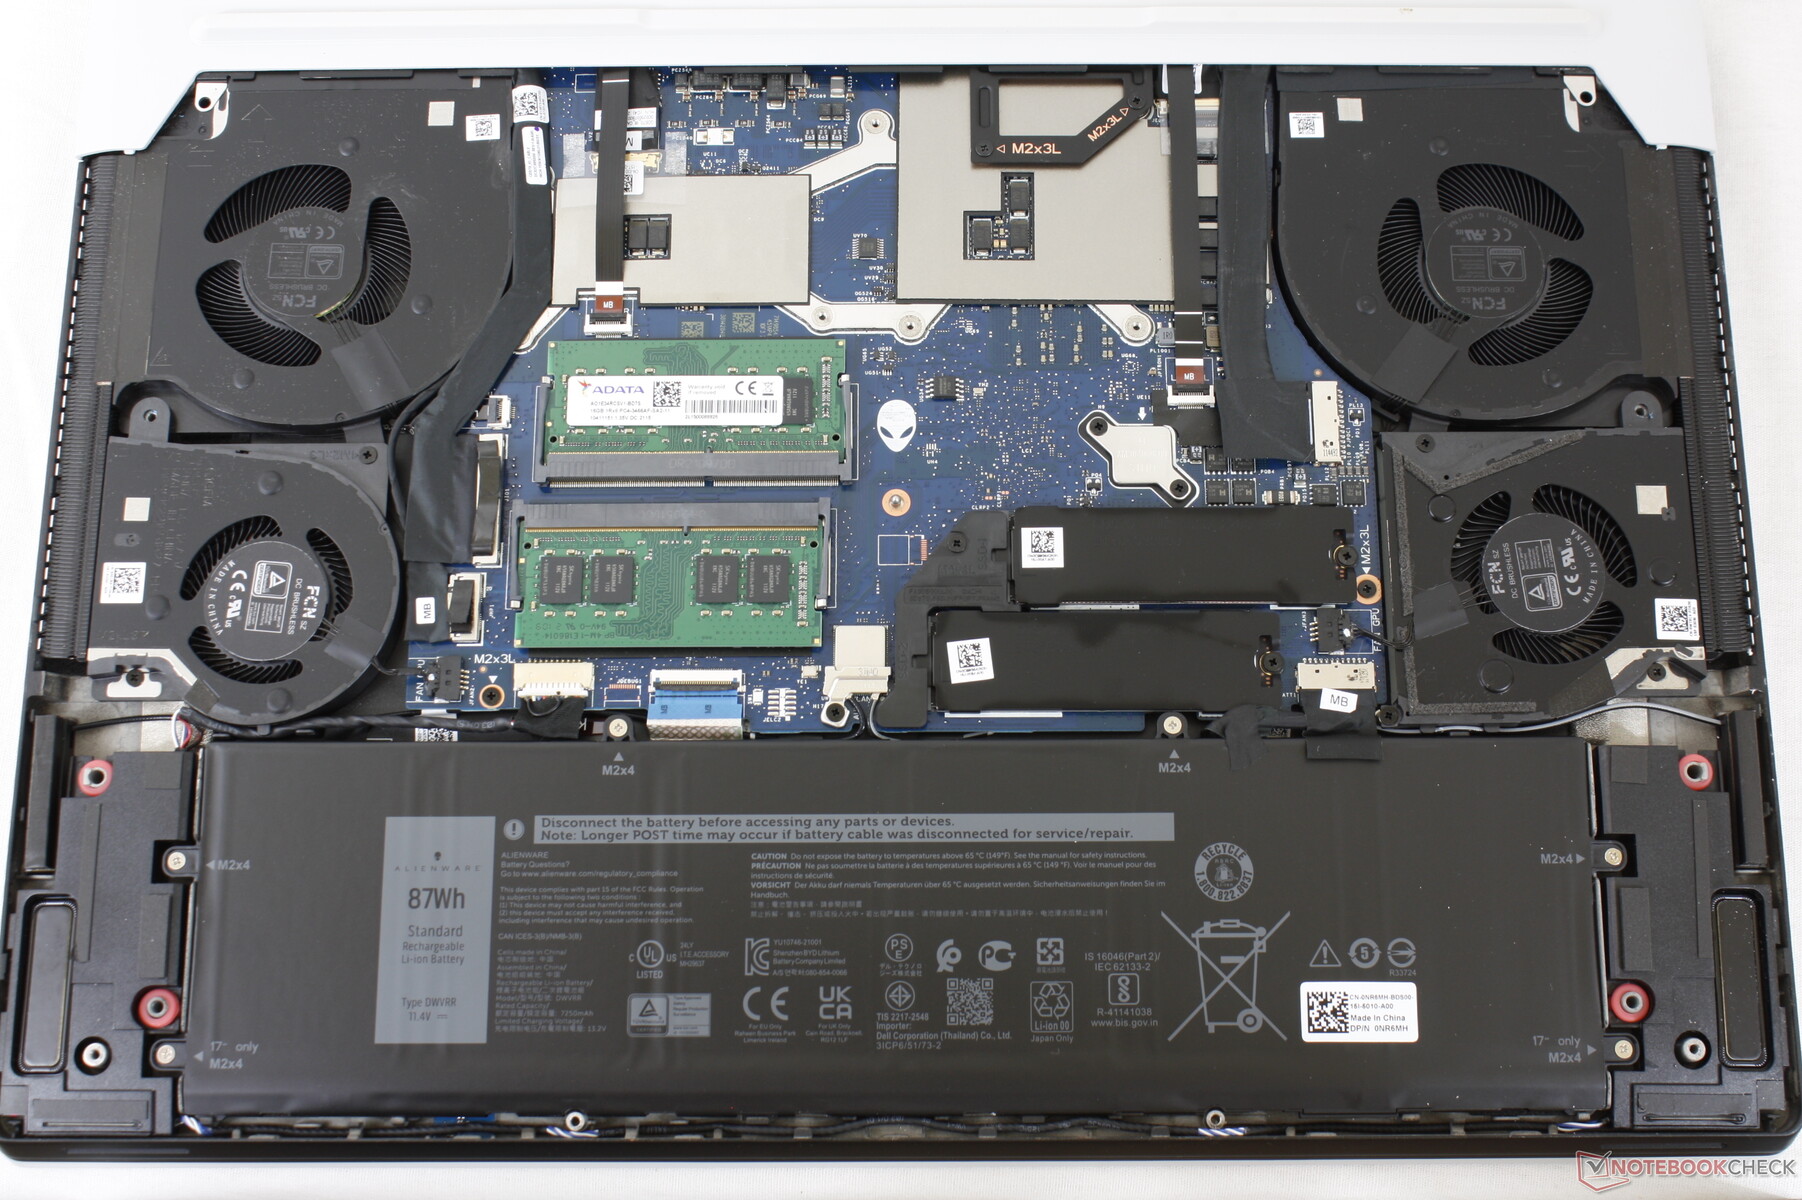
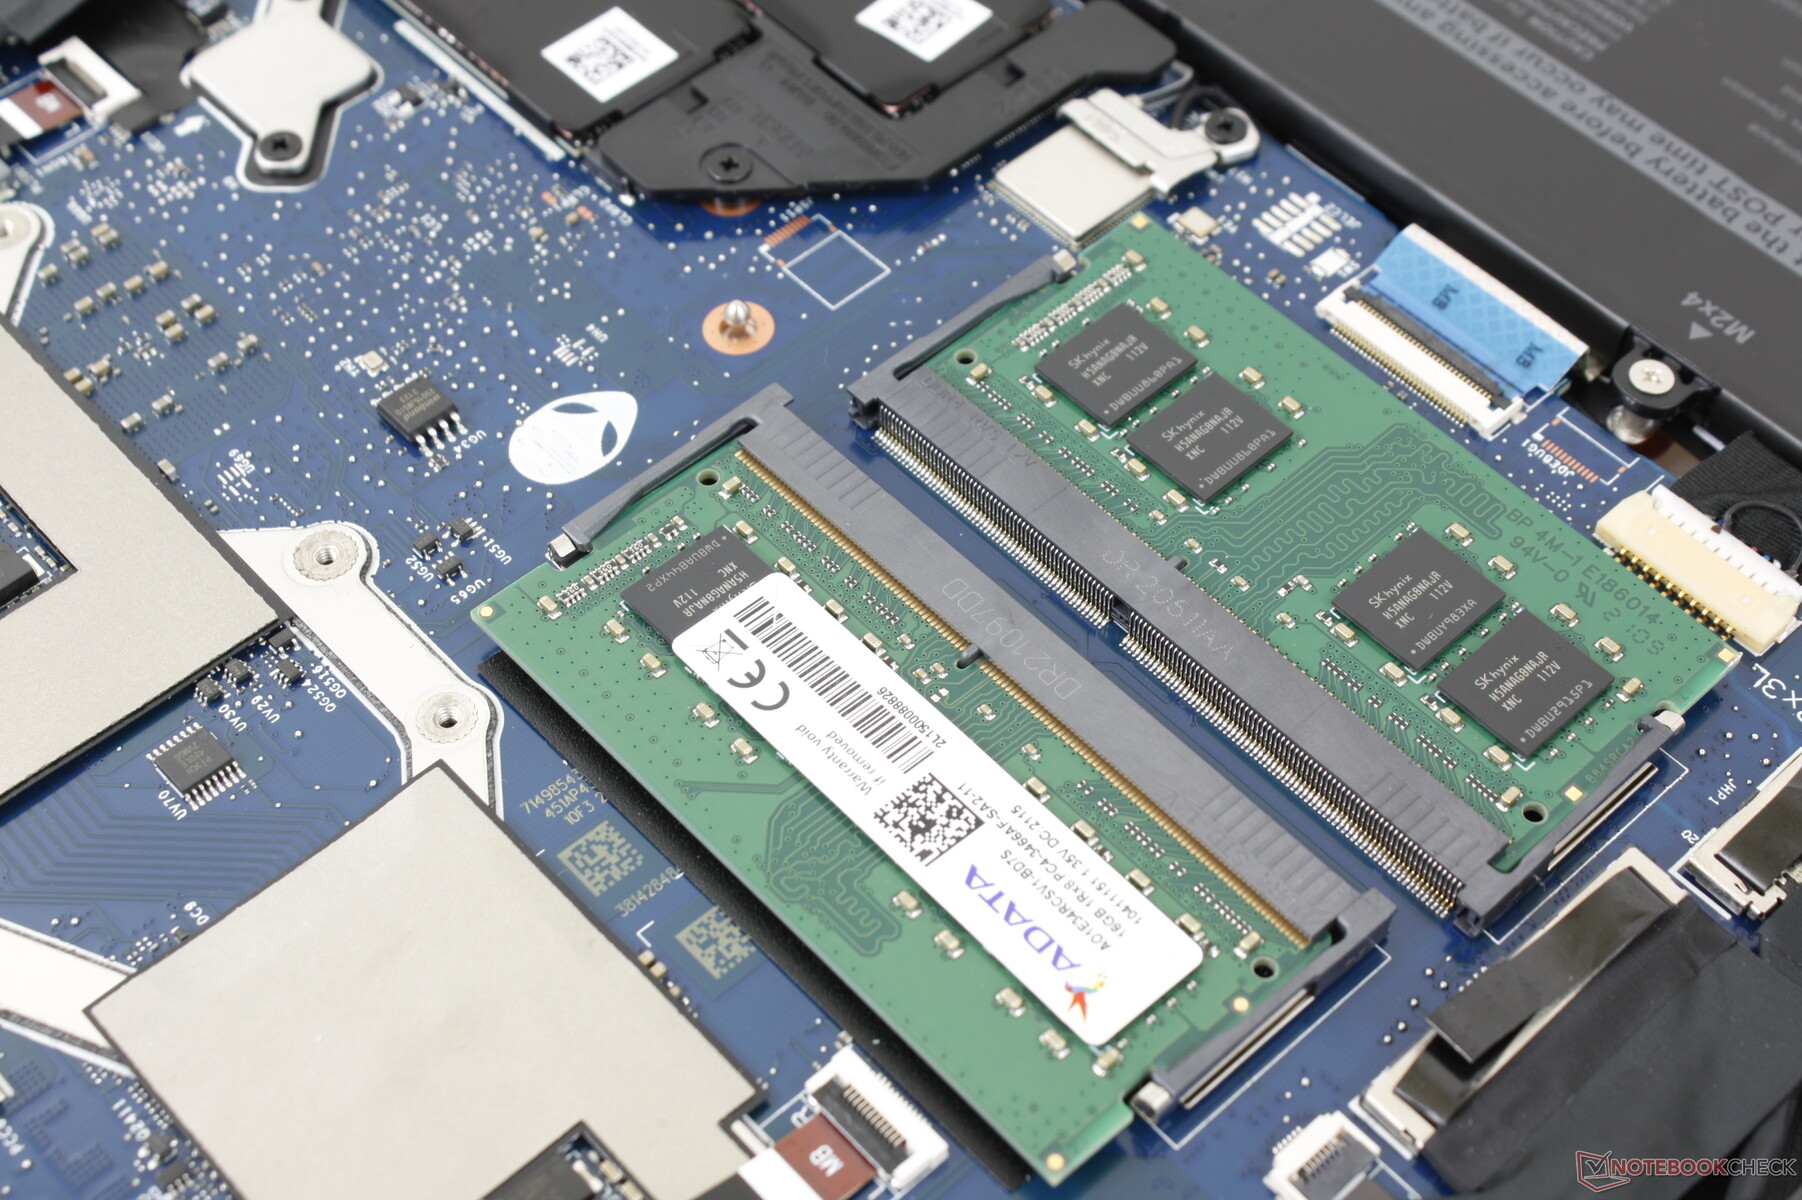
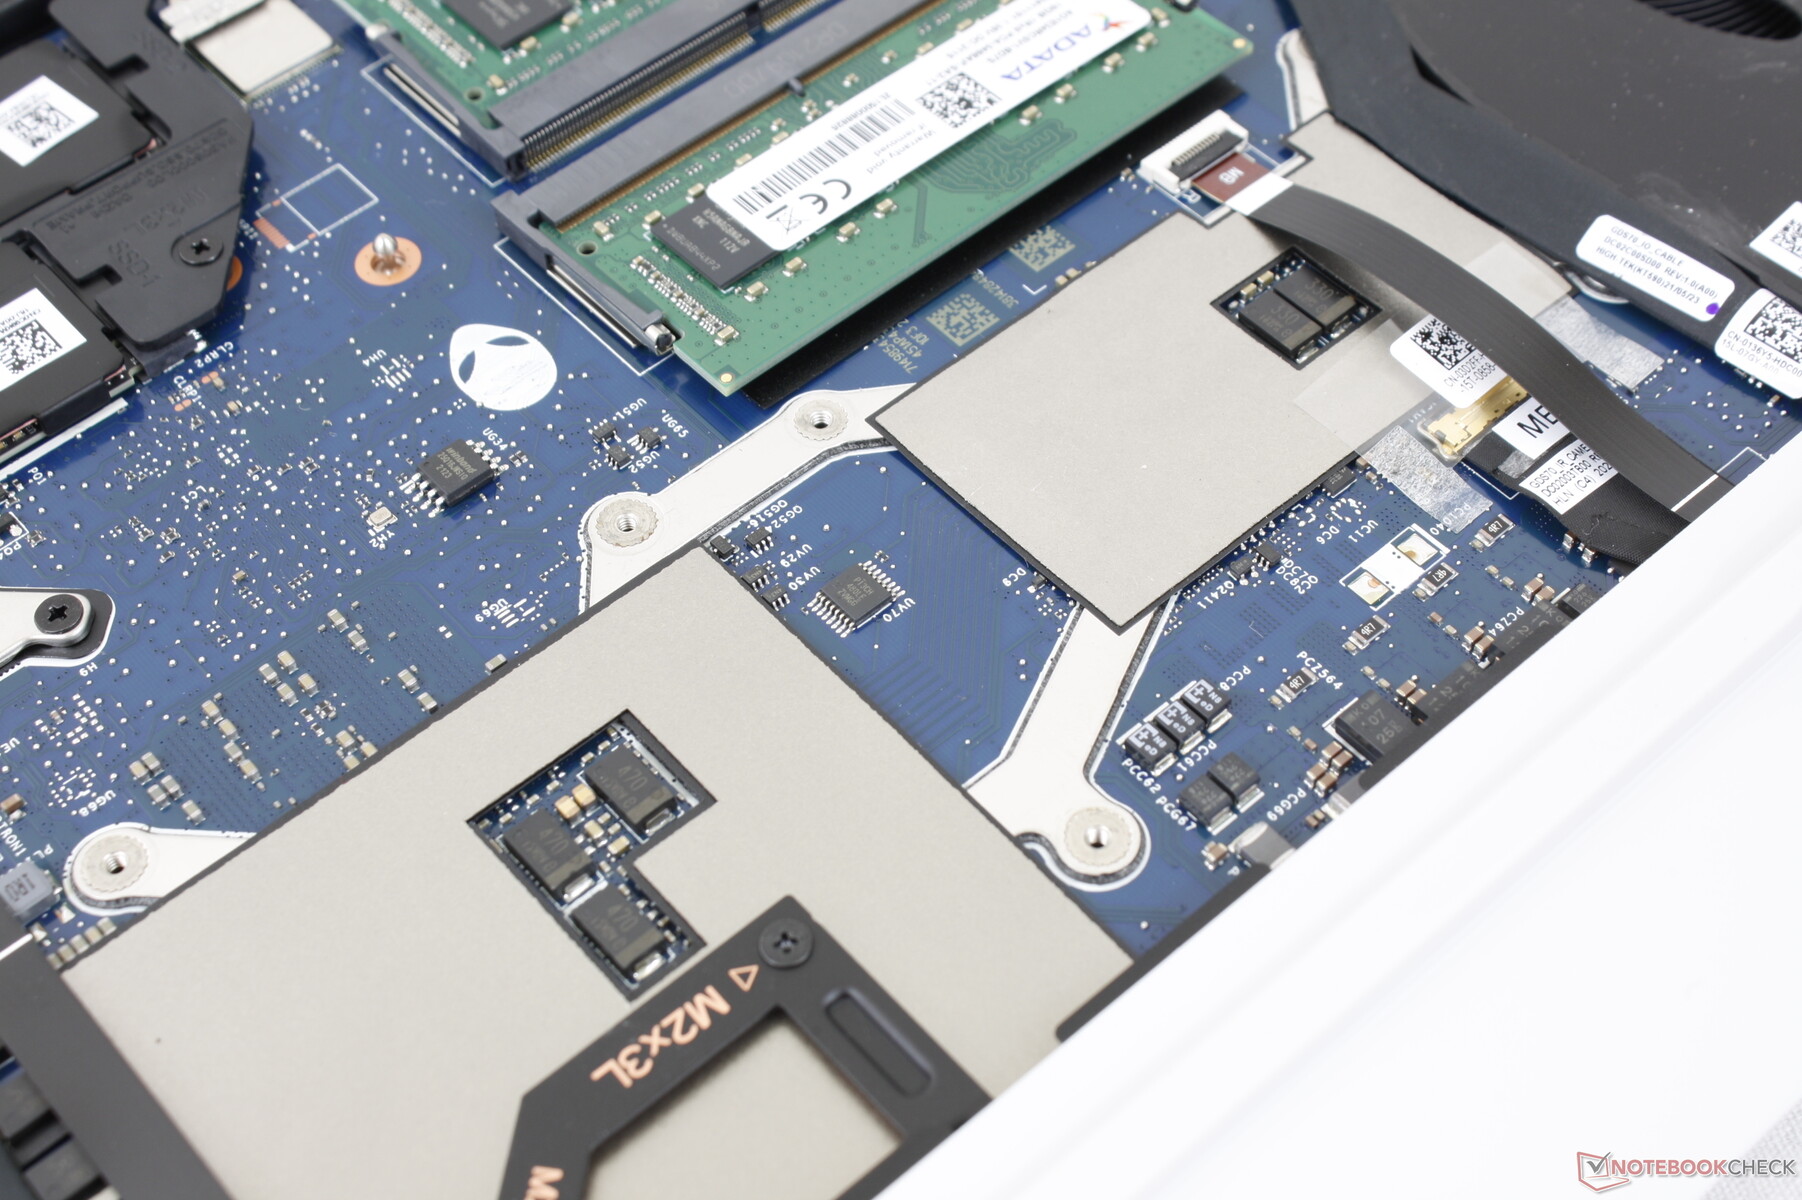
Manutenzione
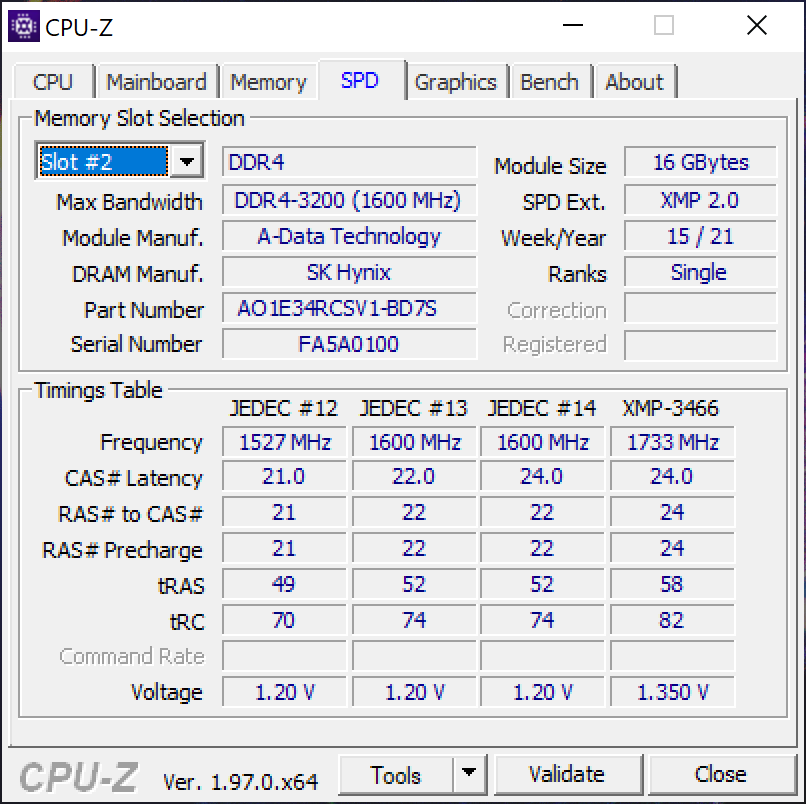
Il pannello inferiore si stacca facilmente con un cacciavite Philips e un bordo affilato. La RAM è ora espandibile tramite 2x slot SODIMM mentre sono saldati sul vecchio design m17 R2.
Accessori e garanzia
Non ci sono extra nella confezione al di fuori dell'adattatore AC e della documentazione. La garanzia limitata standard di un anno si applica con opzioni di estensione se acquistata direttamente da Dell.
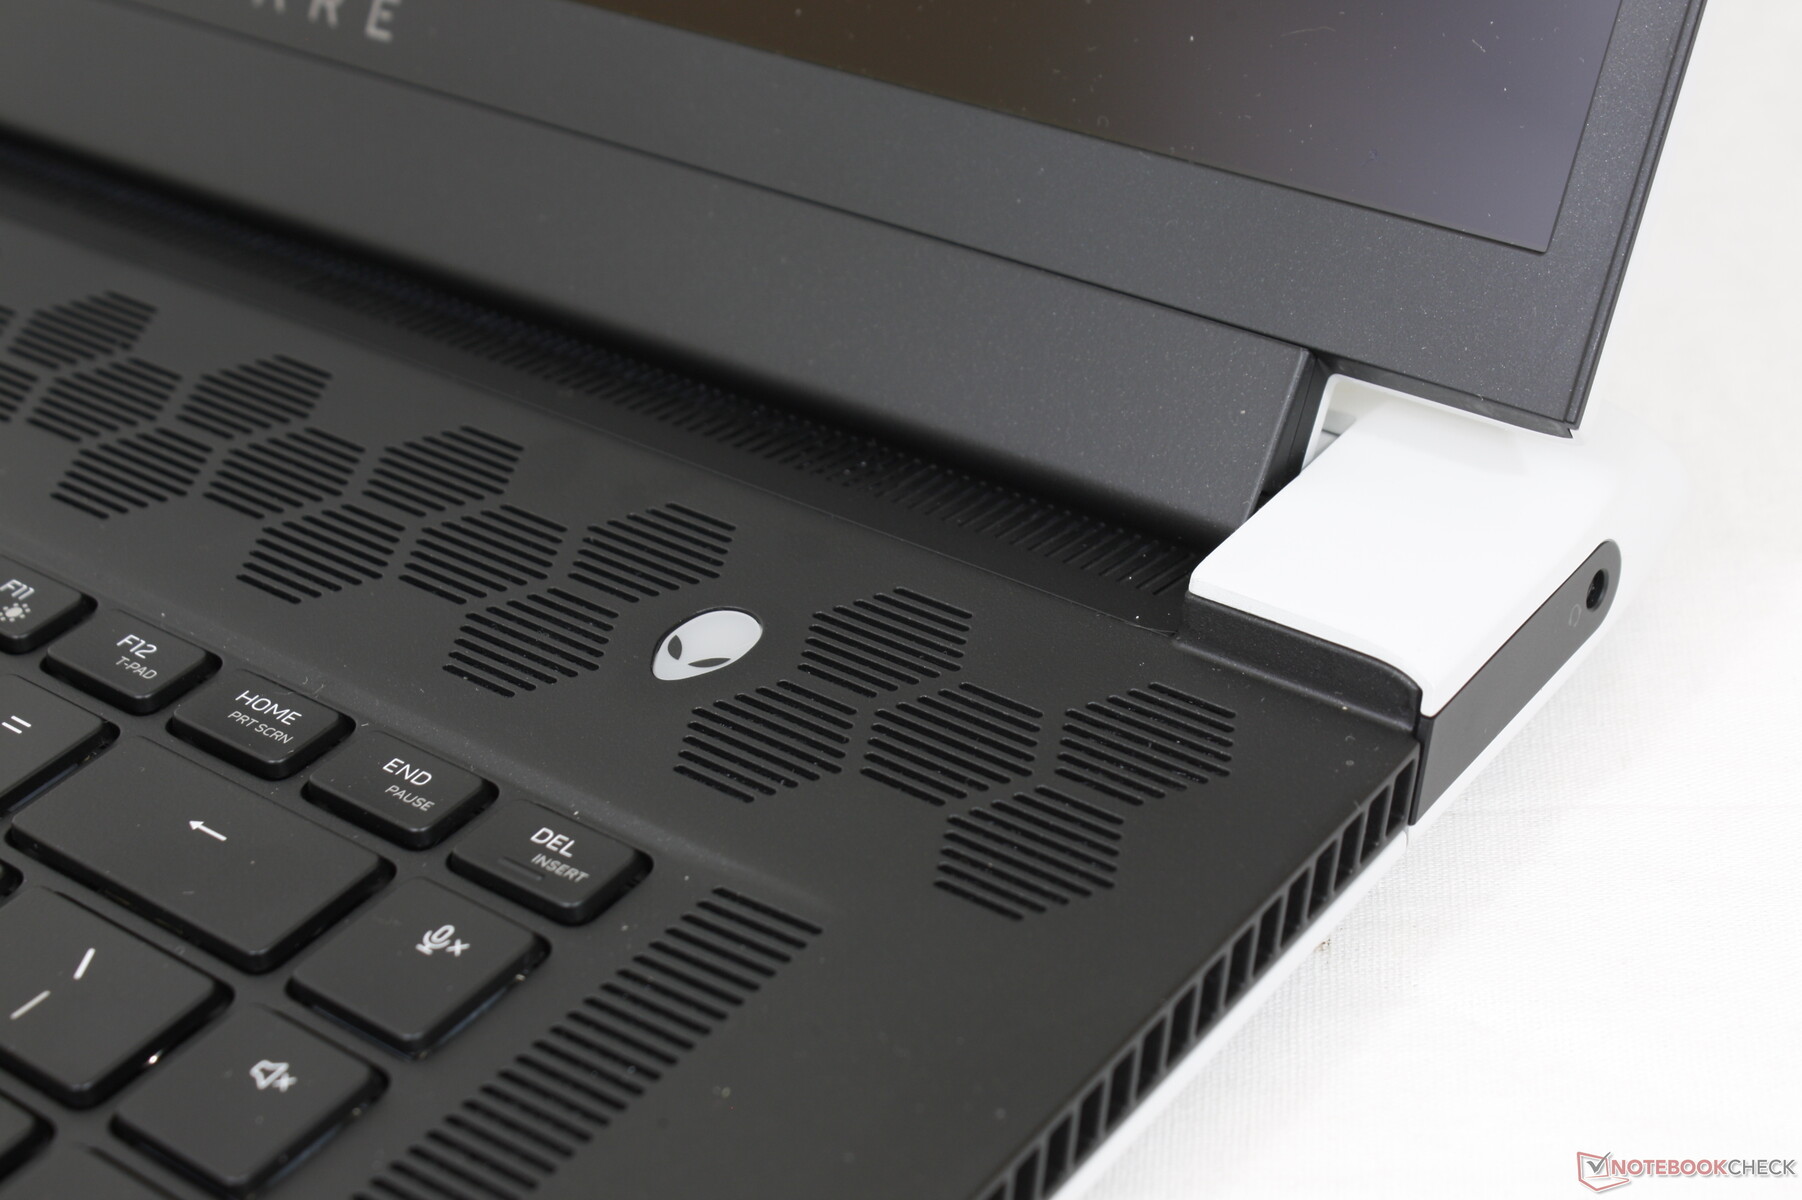
Dispositivi di input - CherryMX
Tastiera
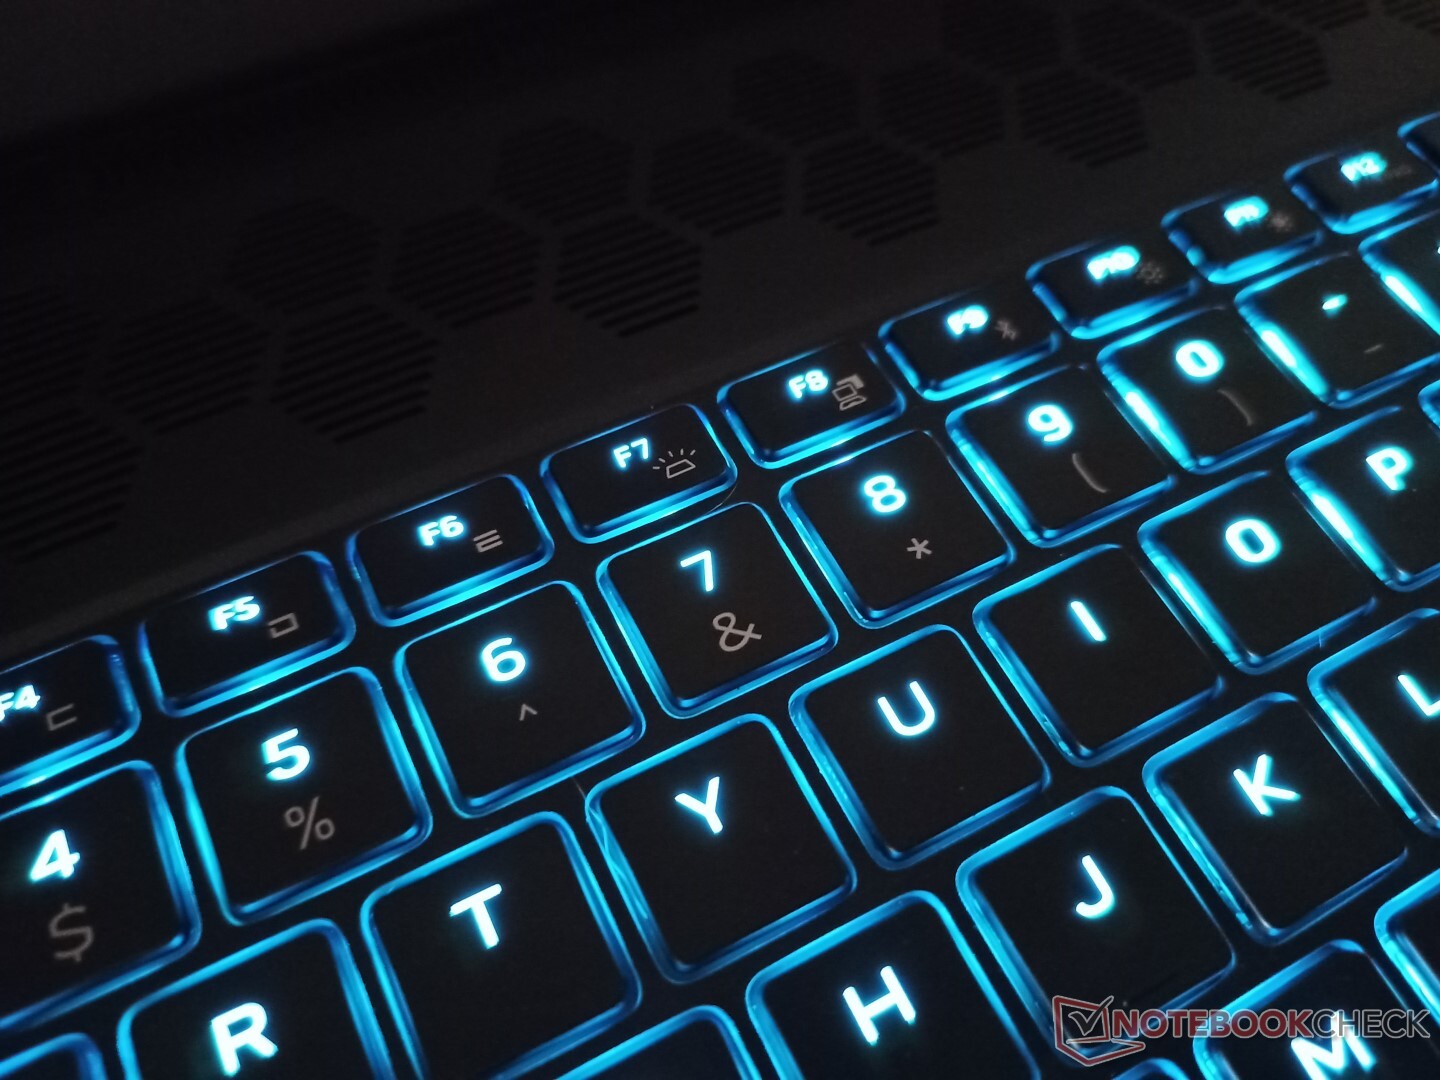
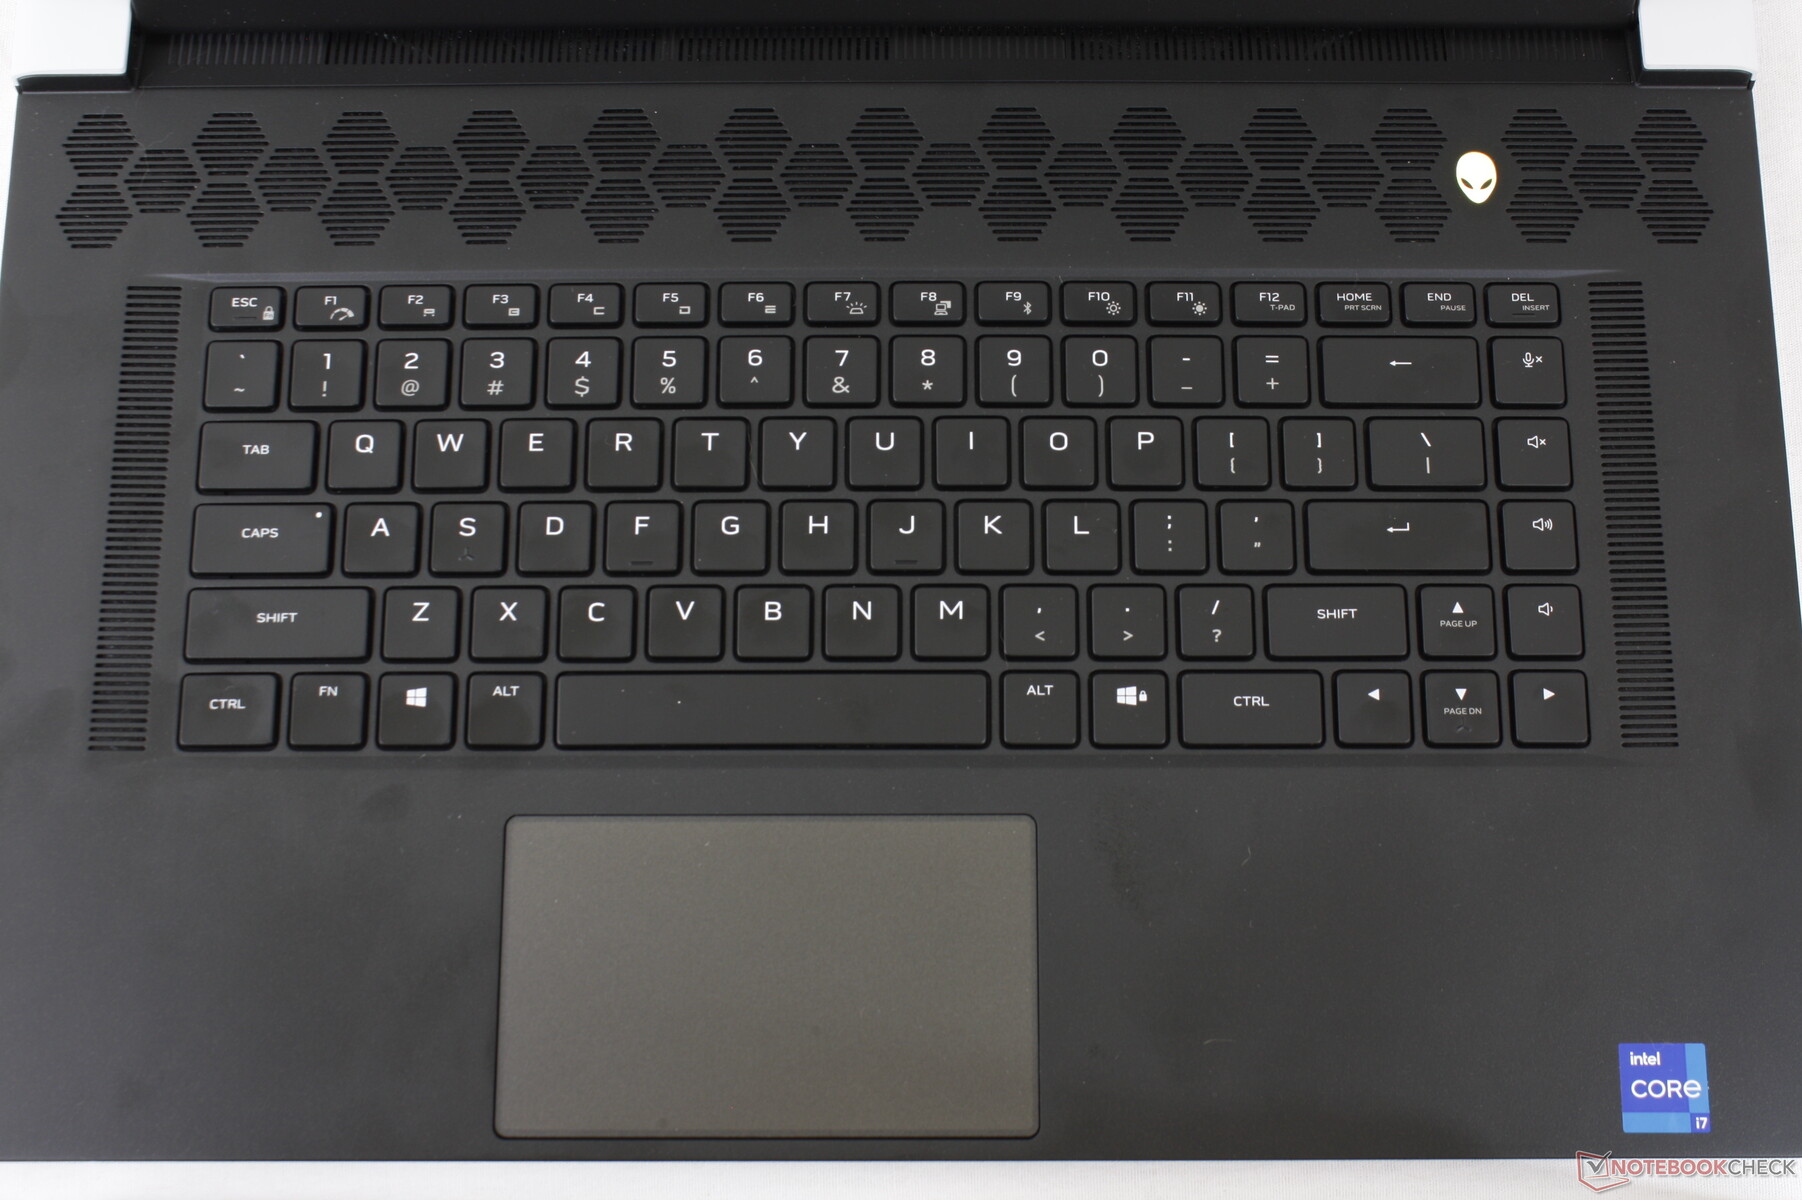
Introdotta sull'Alienware m17 R4 dello scorso anno, i tasti meccanici CherryMX a profilo ultra-basso sono tornati sull'x17 R1 come caratteristica opzionale. Inizialmente eravamo titubanti riguardo ai tasti, dato che gli switches meccanici o ottici sono stati per lo più mancanti sui portatili come l'MSI GT80 Titan, Razer Blade 15 2019, o Lenovo Legion Y920. Questi nuovi tasti CherryMX, tuttavia, stanno rapidamente diventando i nostri preferiti su qualsiasi portatile gaming. Il feedback è uniforme, più nitido e con una corsa più profonda e un clic più soddisfacente rispetto a computer portatili come il Razer Blade 17 o MSI GS76. I tasti RGB funzionano bene sia per l'elaborazione di testi che per il gaming, anche se al costo di un forte rumore acuto che i compagni di stanza o di classe potrebbero non apprezzare. In questi scenari, consigliamo invece di optare per le SKU con switches tradizionali a membrana.
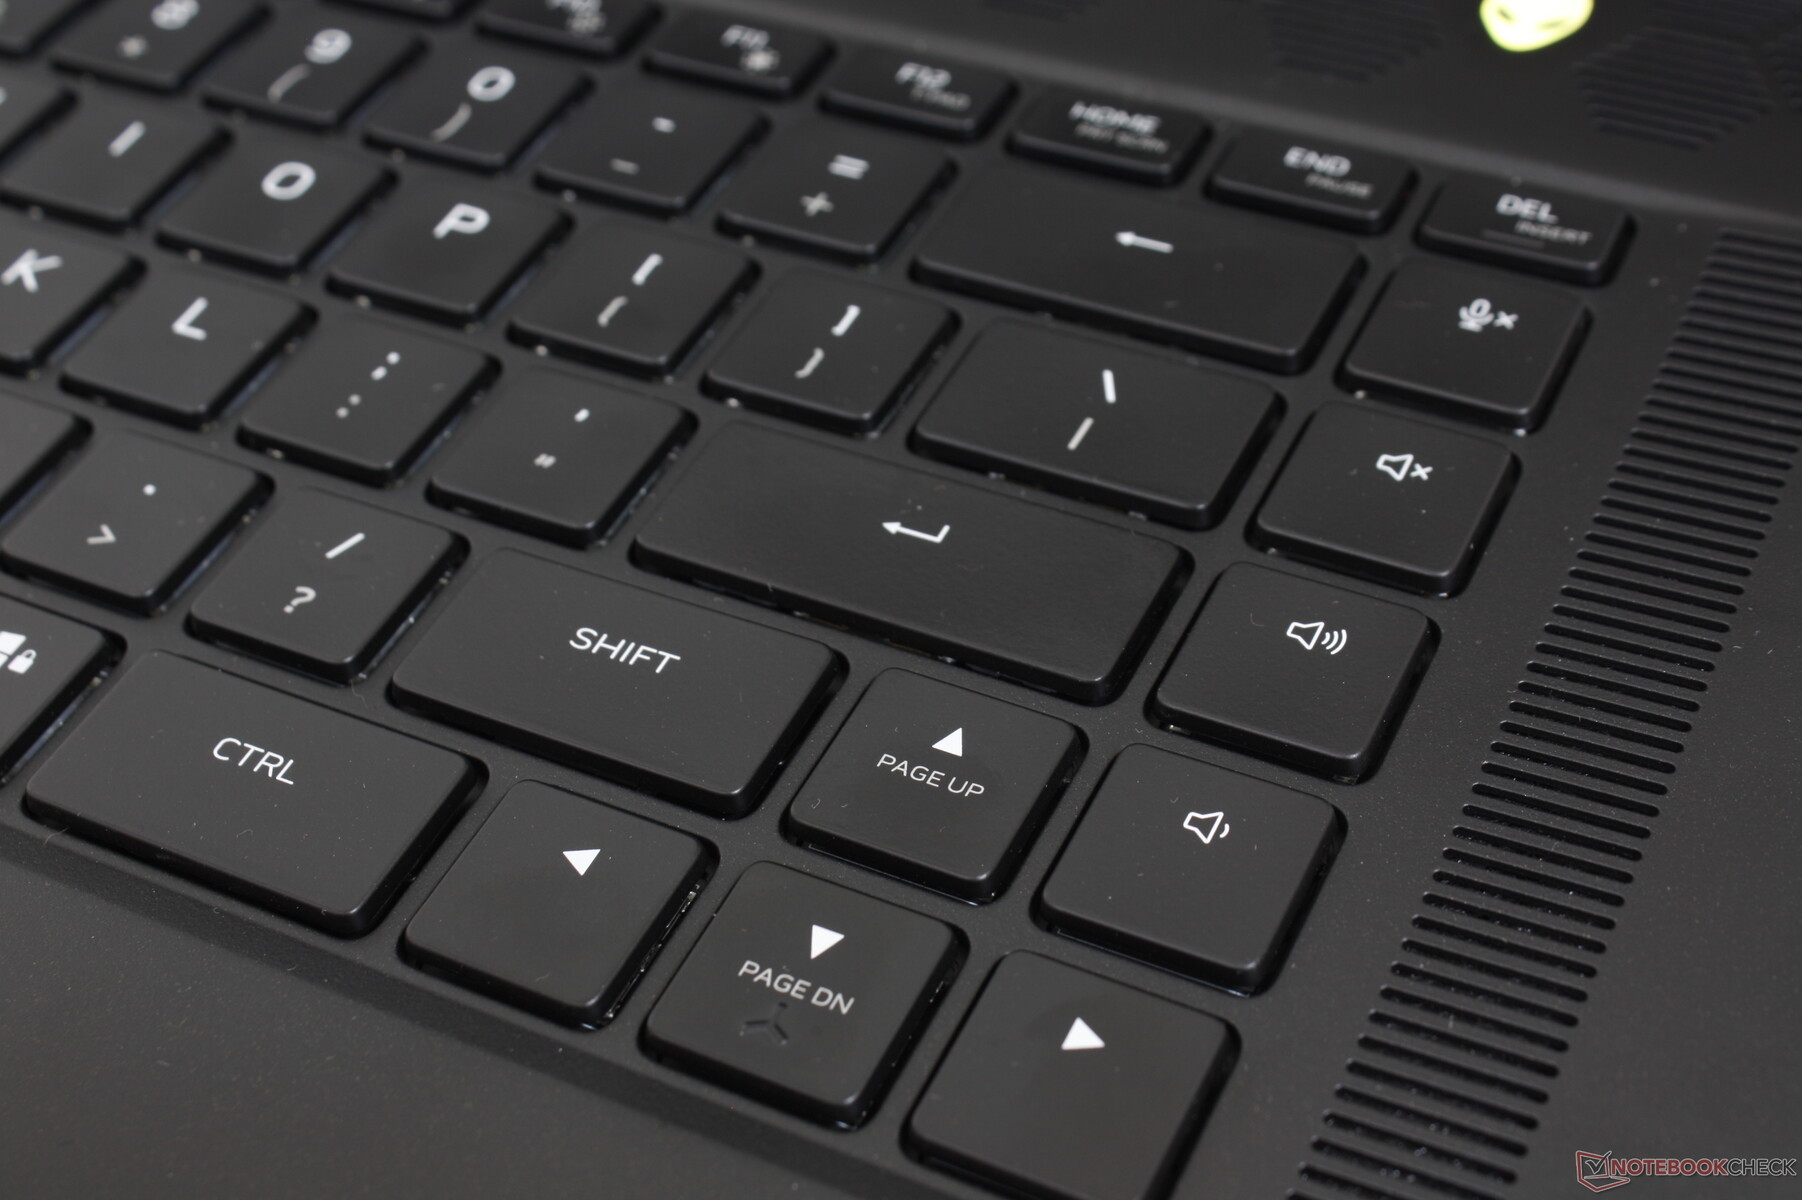
Forse la nostra più grande lamentela con la tastiera è che i simboli secondari sulla maggior parte dei tasti non sono retroilluminati. Così, i tasti per il controllo della luminosità, la schermata di stampa, la pausa, l'inserimento e altro ancora sono quasi impossibili da vedere se si lavora o si gioca sotto una scarsa illuminazione ambientale. Tutti i tasti e i simboli sono illuminati sul Blade 17 in confronto. Si noti che anche la prima fila di tasti funzione non è meccanica.
Touchpad
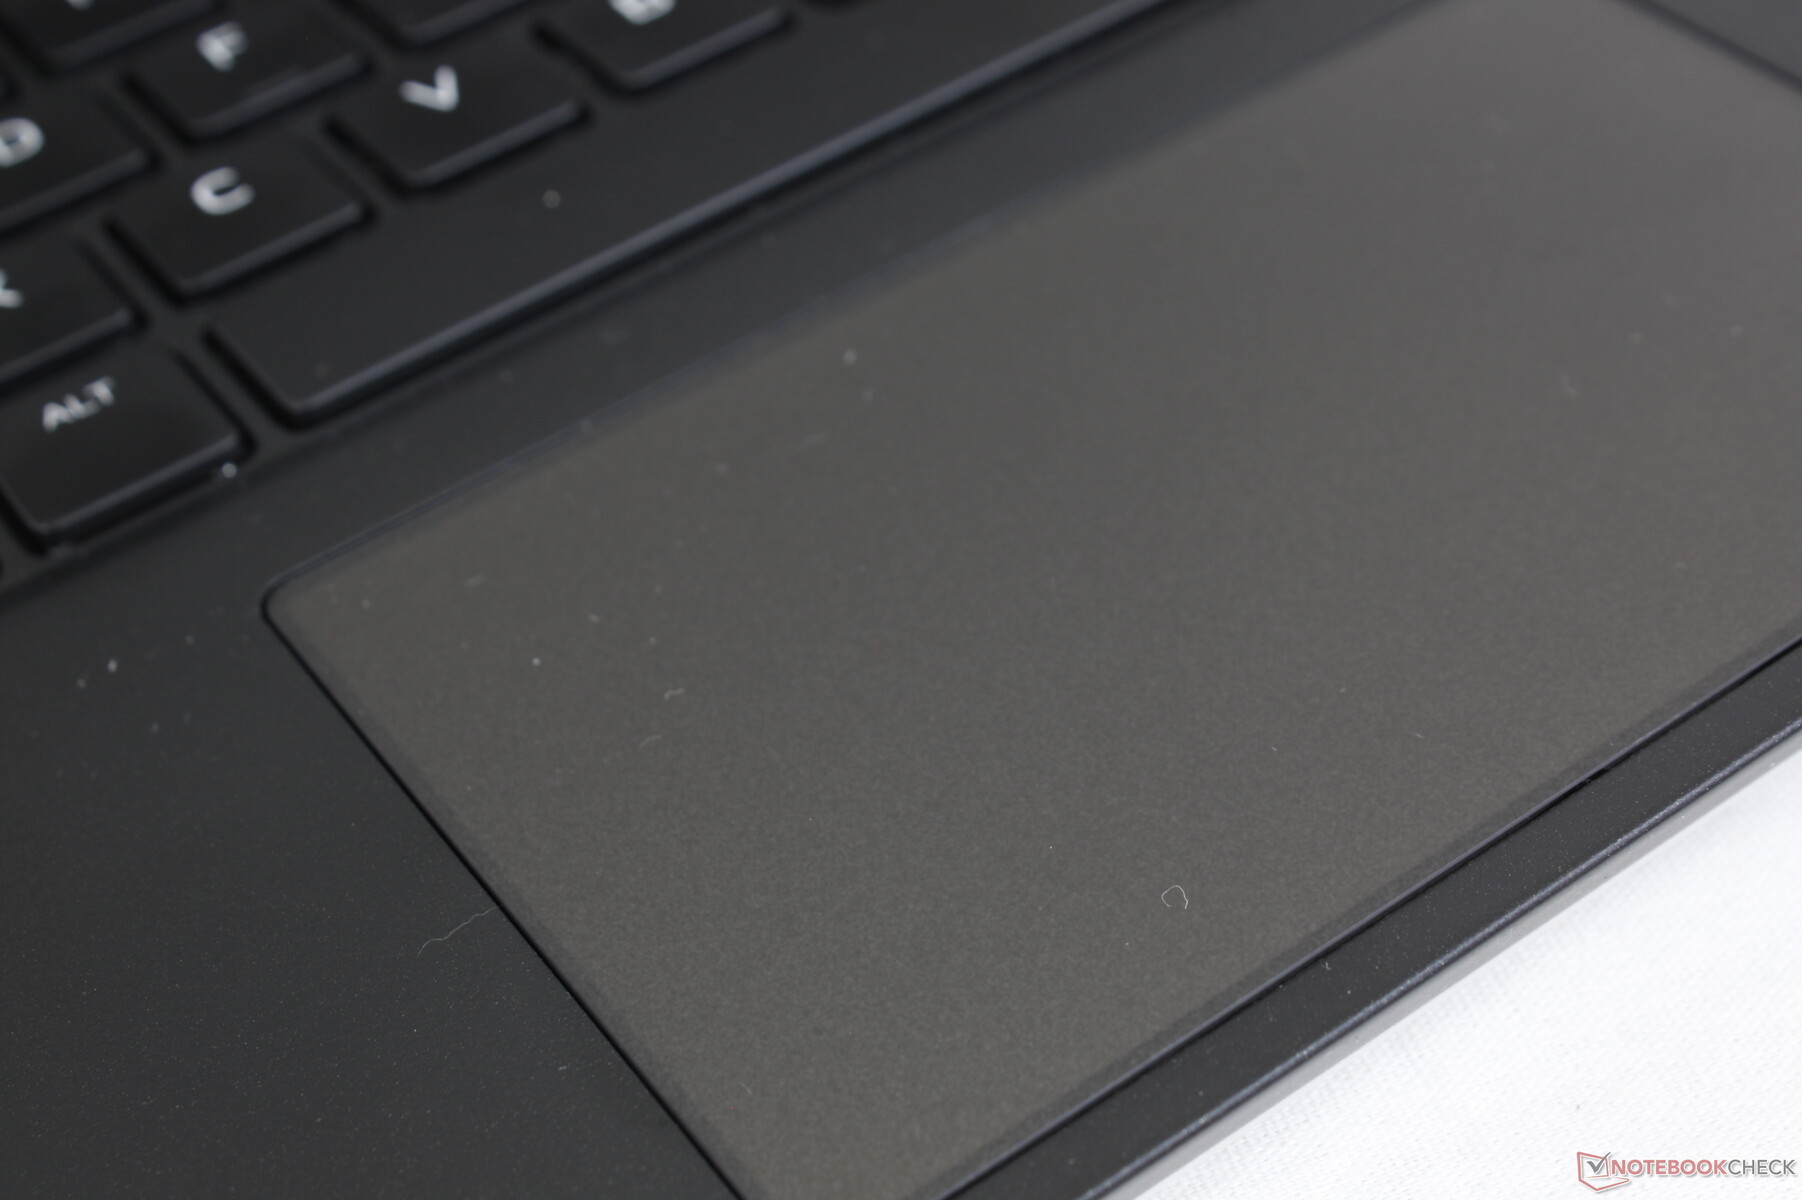
Il clickpad di Precision è relativamente piccolo a 11,3 x 6,8 cm rispetto ai 14 x 6,5 cm dell'MSI GS75. La sua superficie è abastanza liscia quando si scivola a velocità medie con solo un po' di appiccicosità a velocità più basse per click più precisi. La corsa è molto superficiale e il feedback è sul lato più morbido quando si preme verso il basso. Anche se una superficie maggiore avrebbe reso più facili gli input multi-touch, almeno il clickpad non è spugnoso come quello della serie Razer Blade.
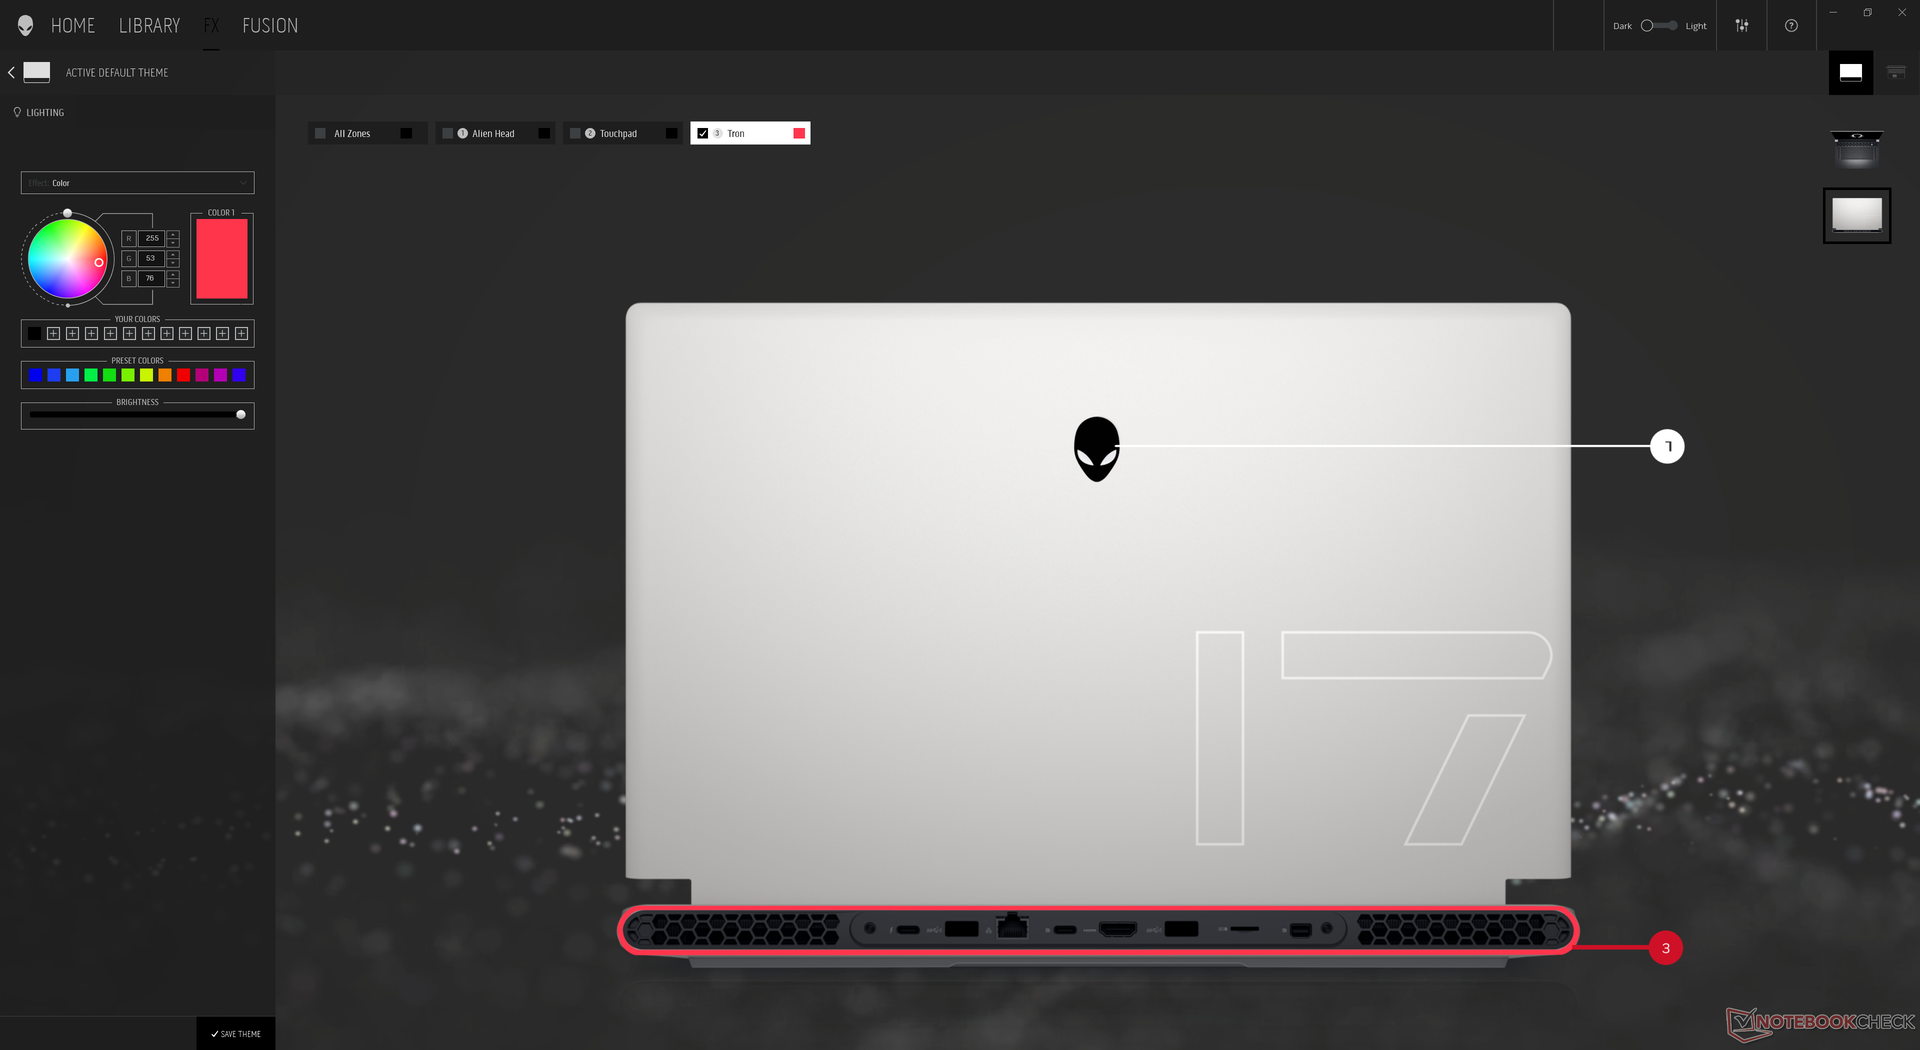
Dell offre una retroilluminazione RGB per il clickpad su alcune SKU che è un'opzione superficiale di ritorno dai vecchi portatili Alienware. Questa caratteristica non è disponibile sul più piccolo Alienware x15 R1 da 15.6 pollici.

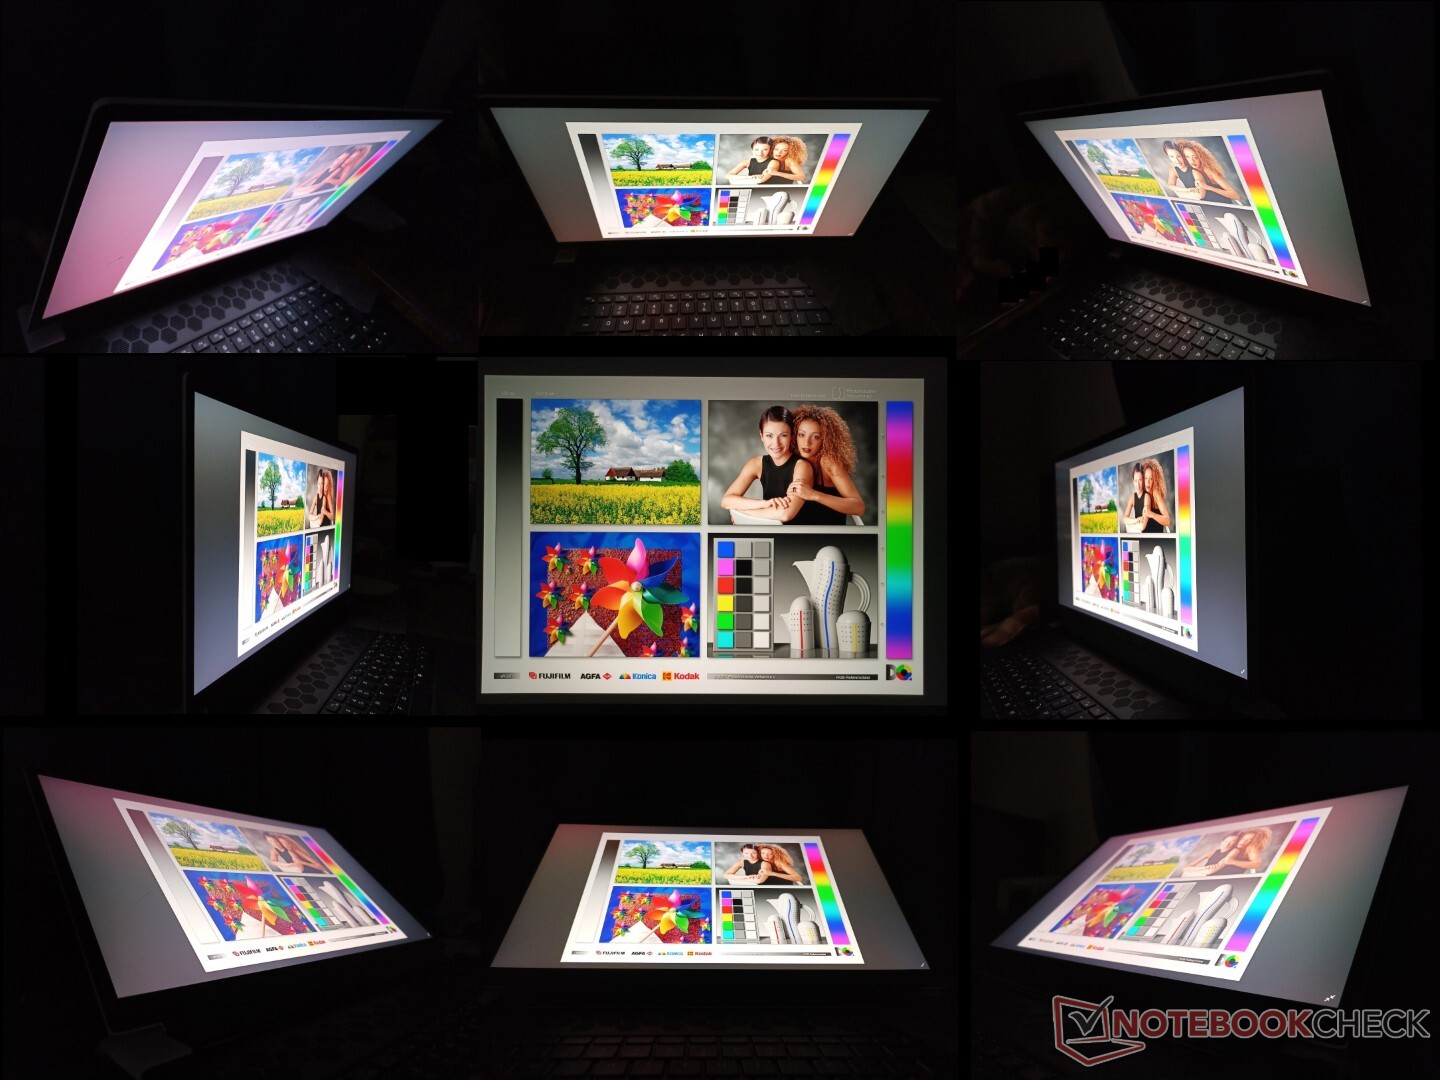
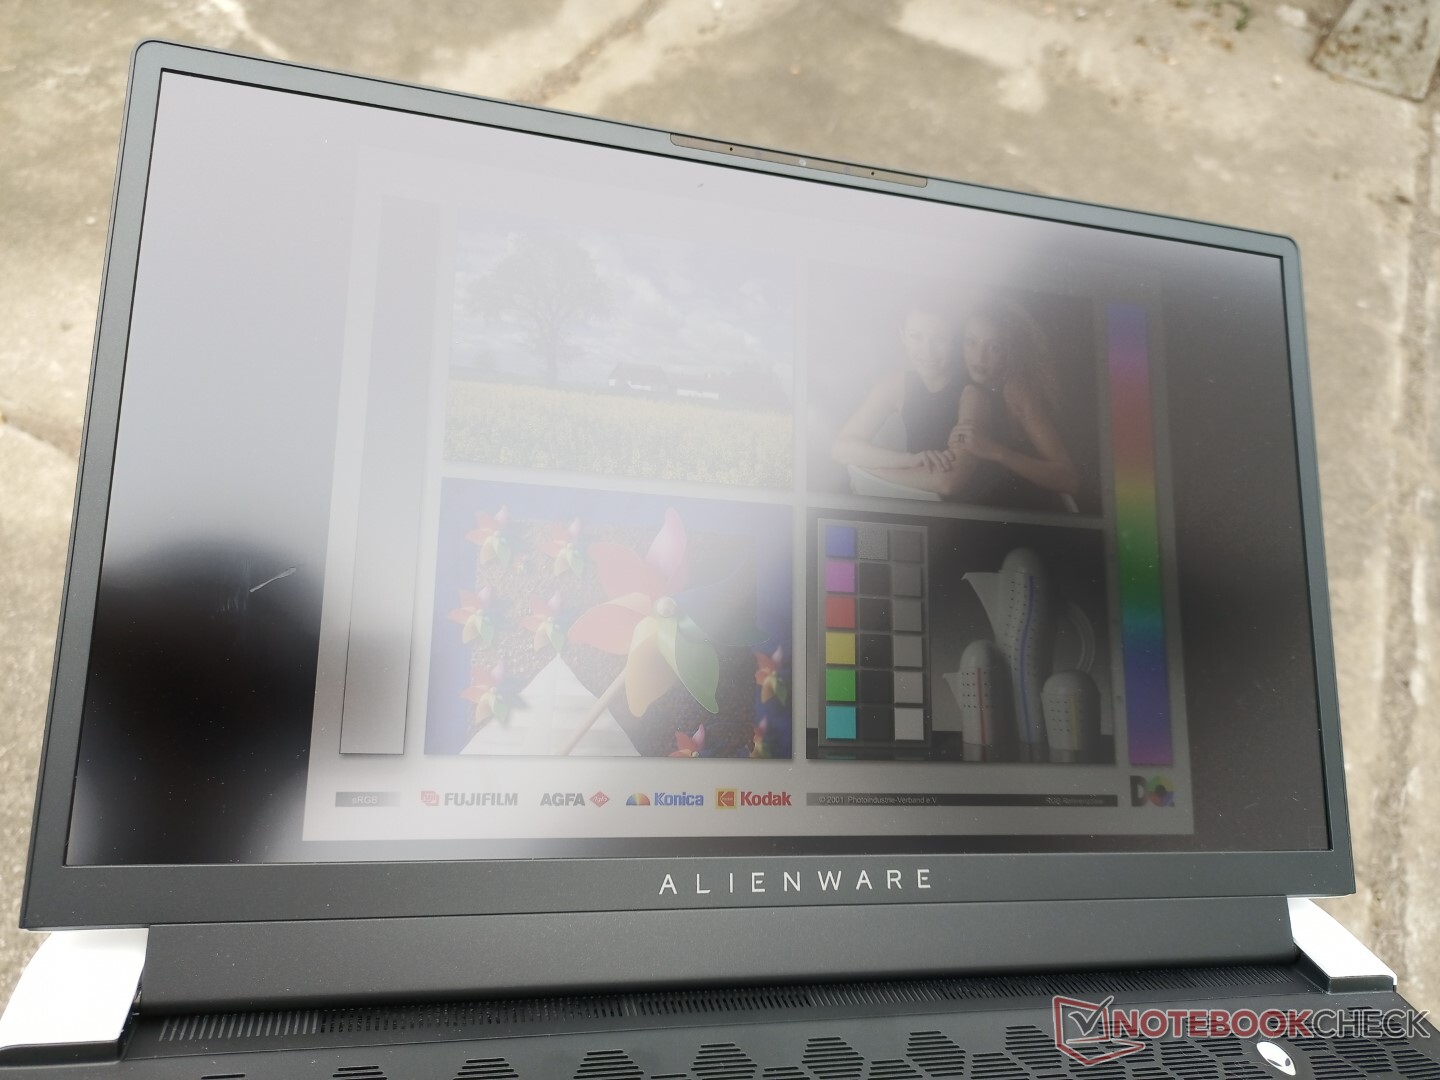
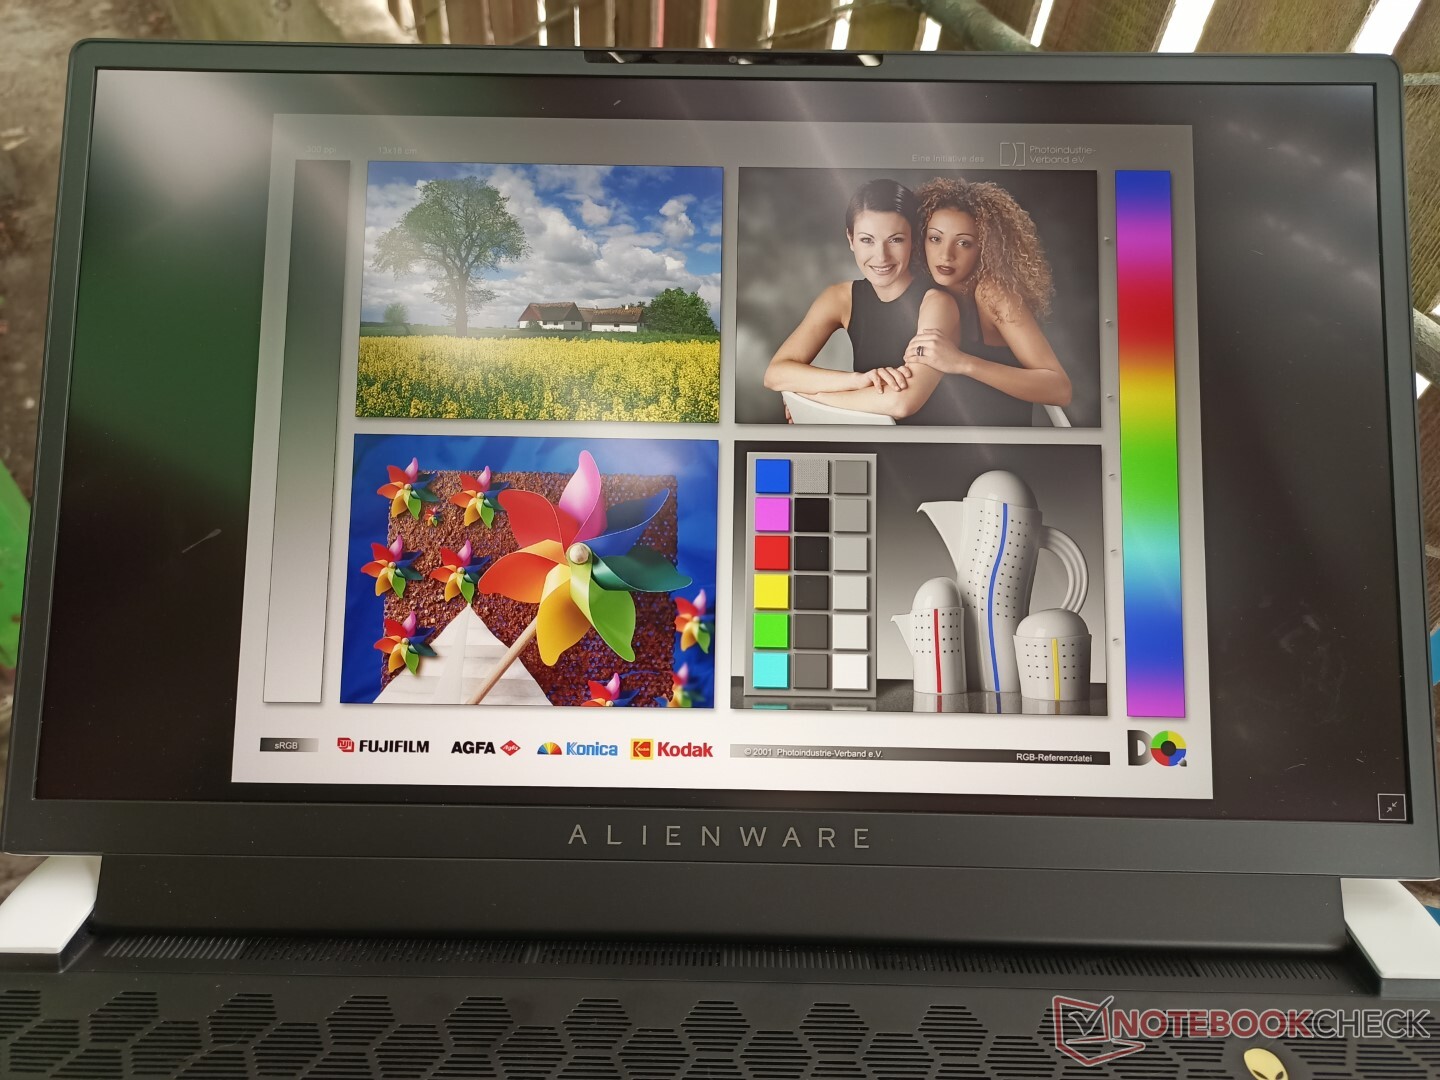
Display - 4K, 120 Hz, 100% AdobeRGB, 5 ms
Anche se il pannello AU Optronics B173ZAN può essere trovato su altri portatili come lo Schenker XMG Ultra 17, quello sul nostro Alienware ha un refresh rate nativo di 120 Hz invece di 60 Hz. Inoltre, i tempi di risposta nero-bianco e grigio-grigio sono molto veloci negli intervalli di una cifra e la luminosità massima è anche notevolmente più luminosa che sulla maggior parte degli altri portatili da gioco. l'MSI GS76 ha un pannello 4K simile con tempi di risposta ancora più veloci del nostro Alienware anche se al costo di una gamma più stretta. Questo rende il display Alienware uno dei pochi che abbiamo visto che apparentemente controlla tutte le caselle per quanto riguarda la frequenza di aggiornamento, la risoluzione, i tempi di risposta, la copertura dei colori e la luminosità.
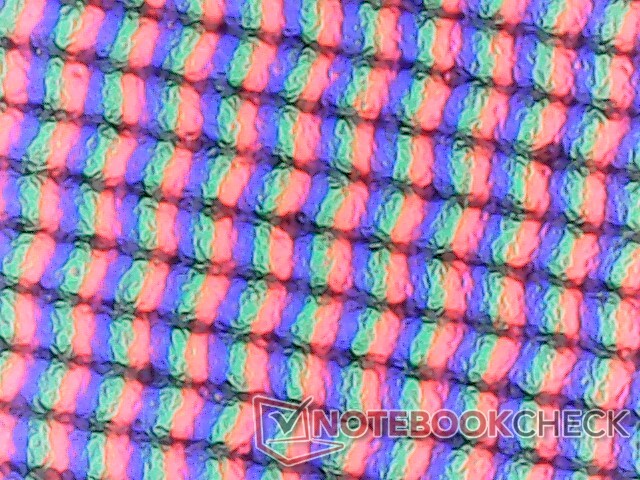
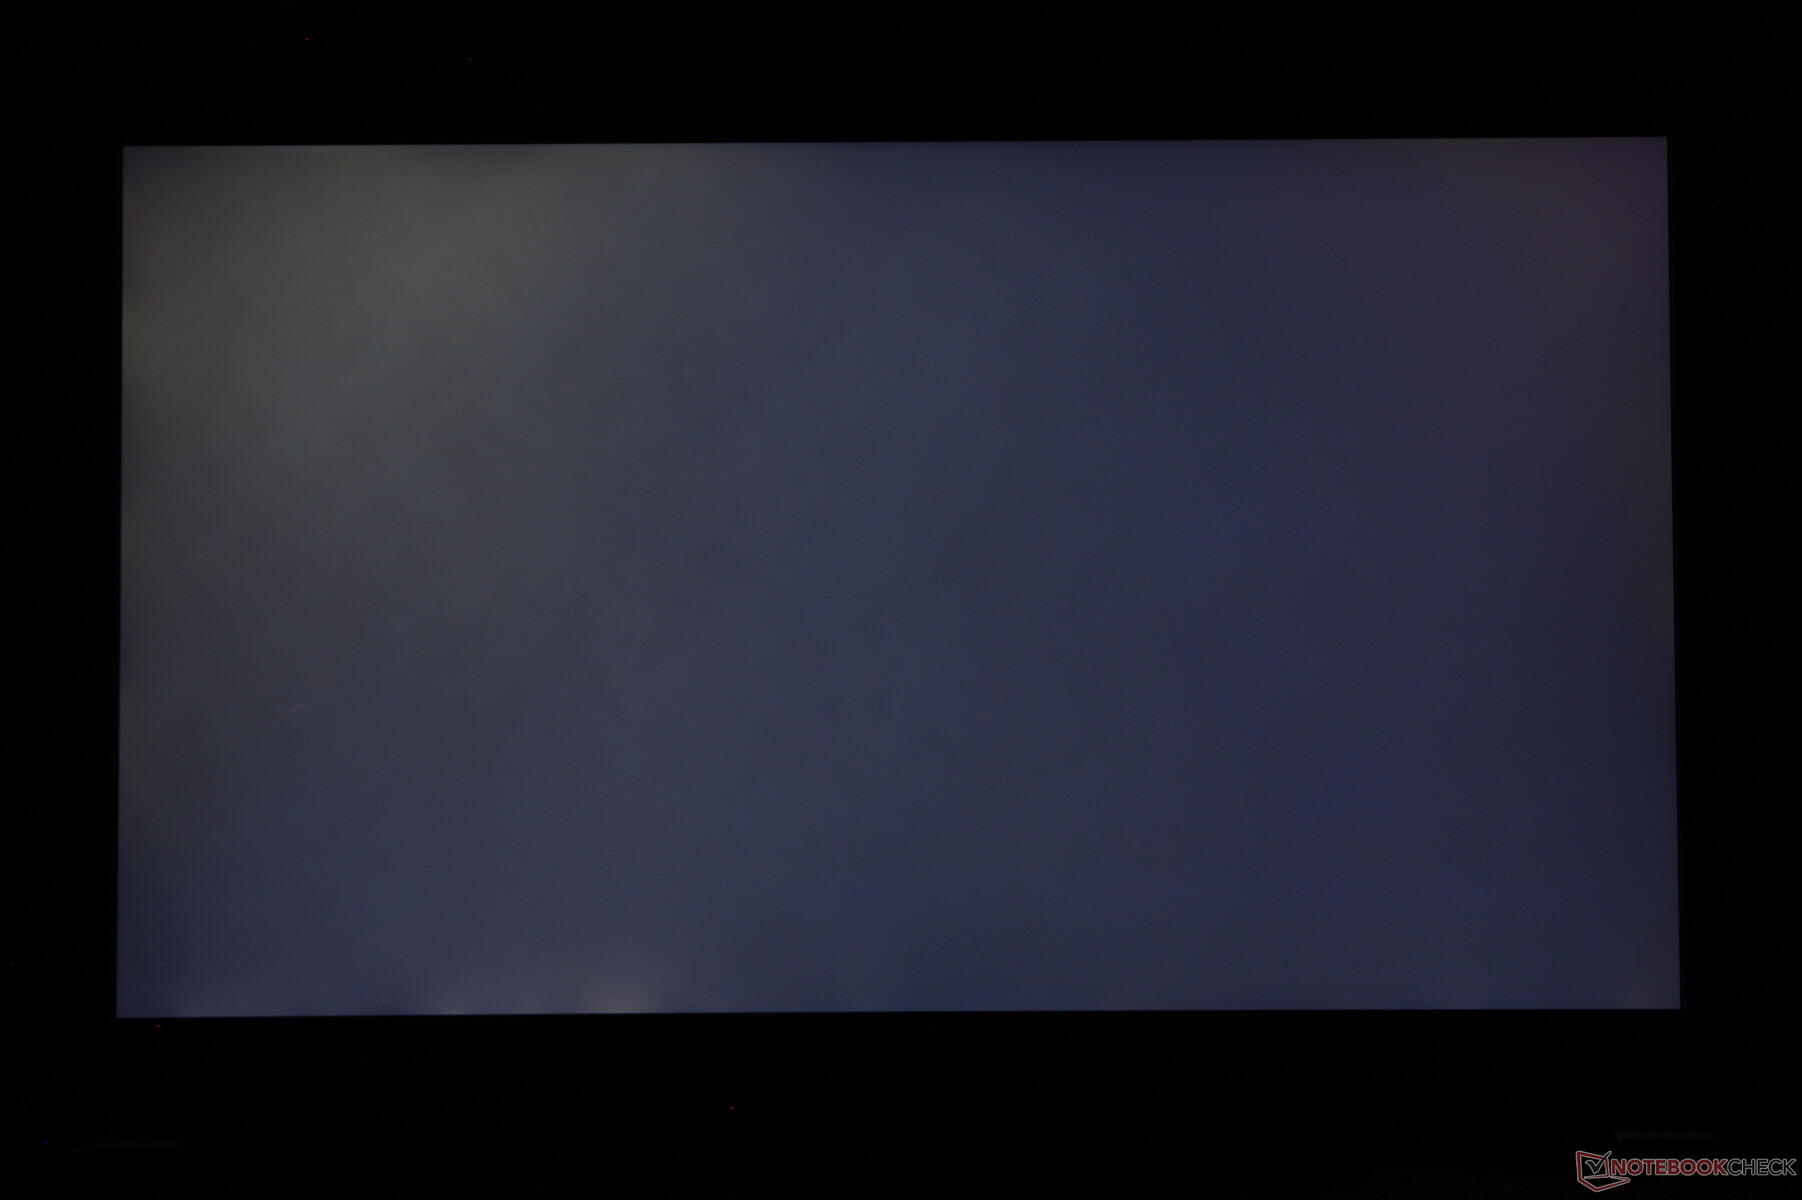
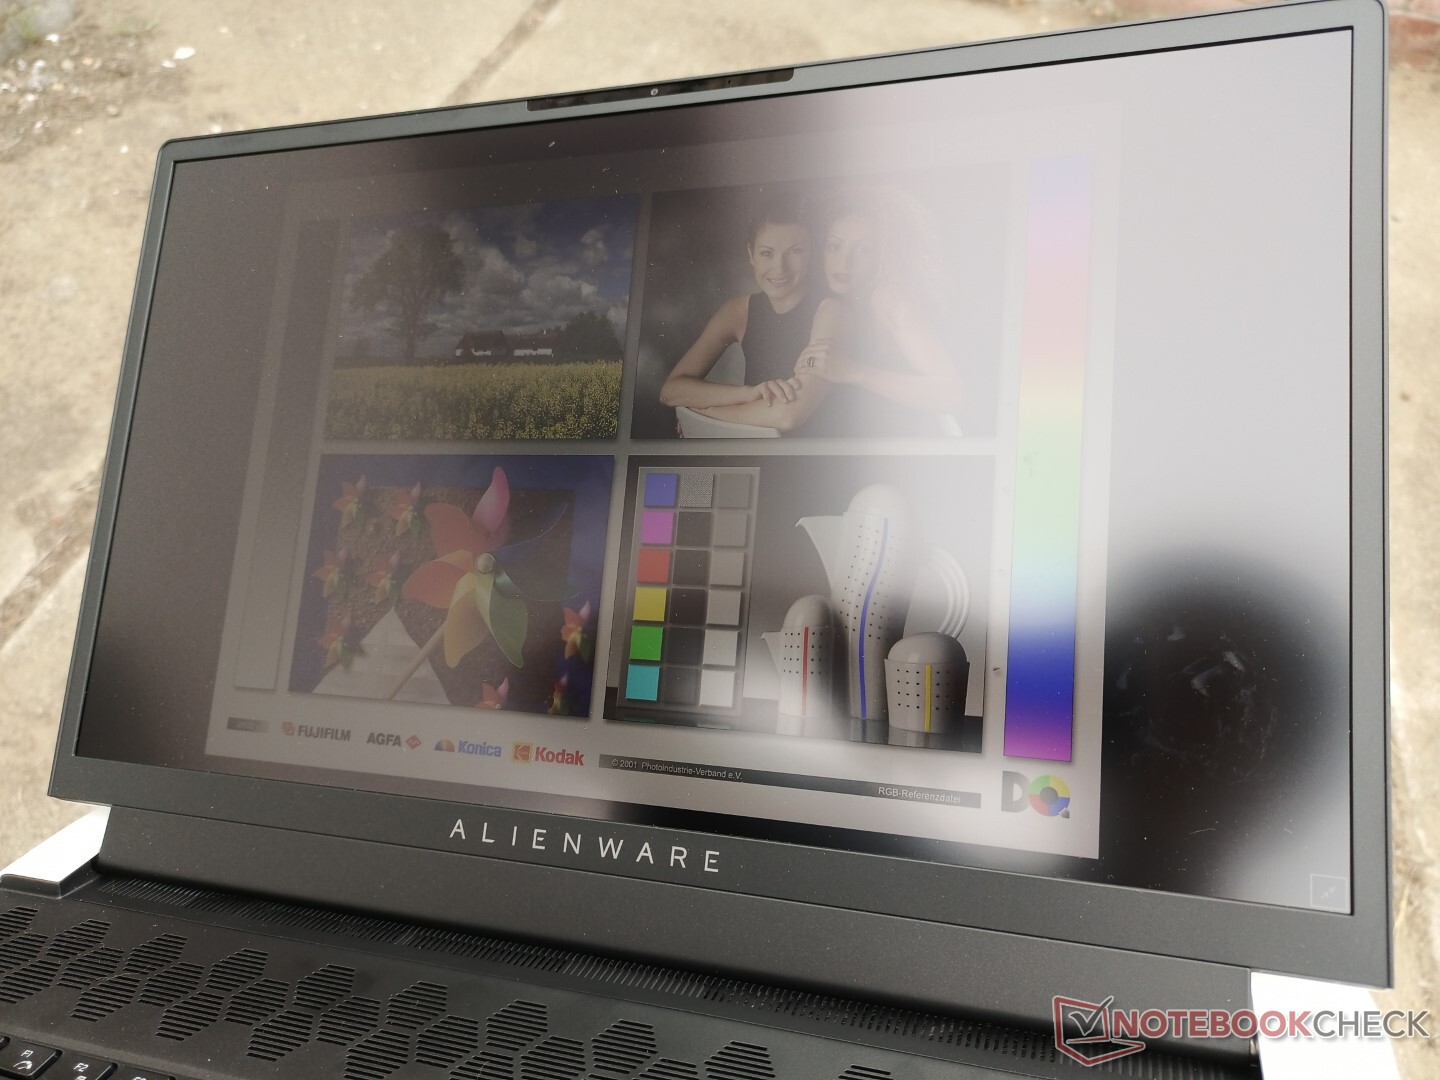
La sovrapposizione opaca è leggermente più granulosa di un'alternativa lucida e l'effetto bleeding della retroilluminazione avrebbe potuto essere migliore sulla nostra unità specifica. Le nostre misurazioni qui sotto riflettono solo il pannello 4K 120 Hz e non una qualsiasi delle altre opzioni di display disponibili per l'Alienware x17 che dovrebbero avere attributi diversi.
Si noti che Advanced Optimus è disponibile solo sulle SKU FHD 360 Hz. Altre versioni come la nostra hanno Optimus 1.0 con un'opzione GPU discreta manuale nel BIOS.
| |||||||||||||||||||||||||
Distribuzione della luminosità: 91 %
Al centro con la batteria: 438.7 cd/m²
Contrasto: 914:1 (Nero: 0.48 cd/m²)
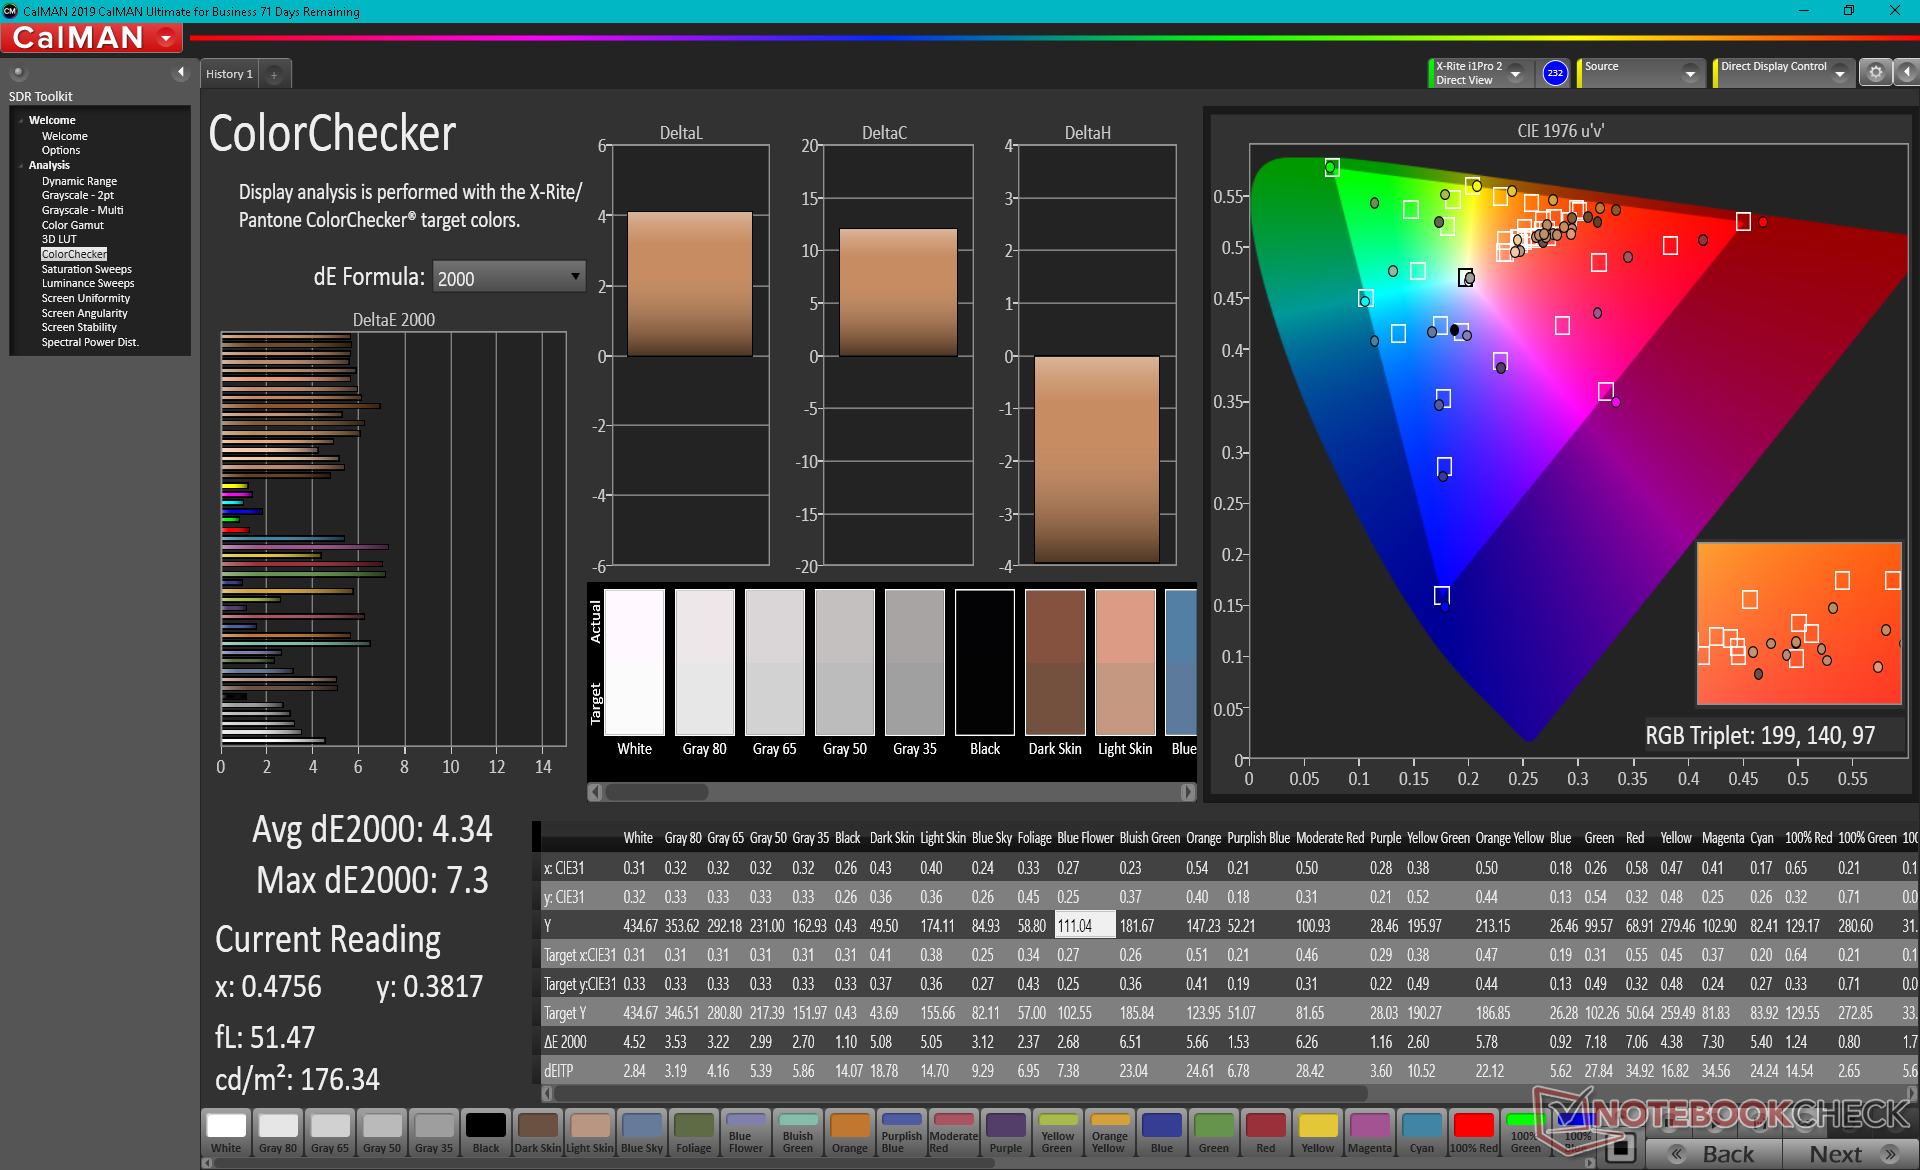
ΔE ColorChecker Calman: 4.34 | ∀{0.5-29.43 Ø4.71}
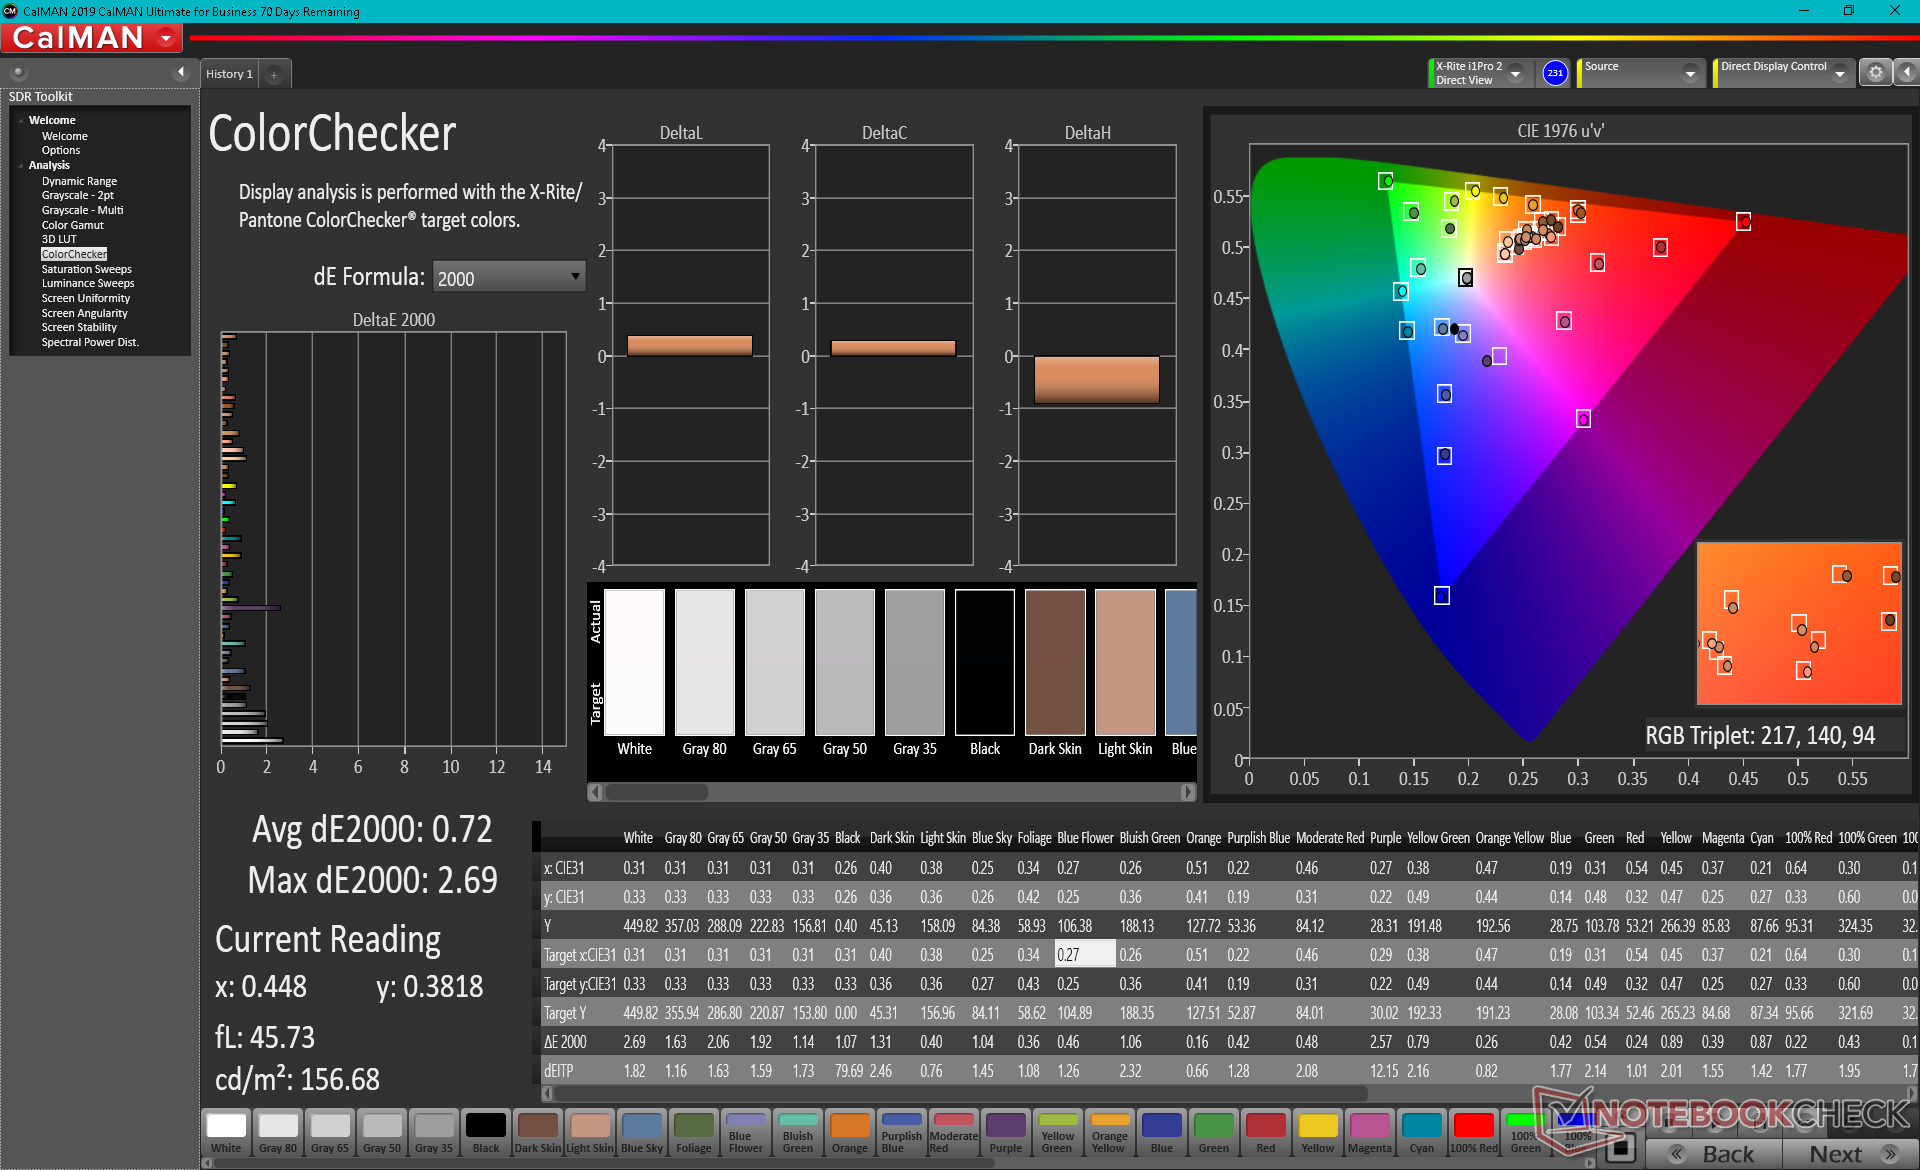
calibrated: 0.72
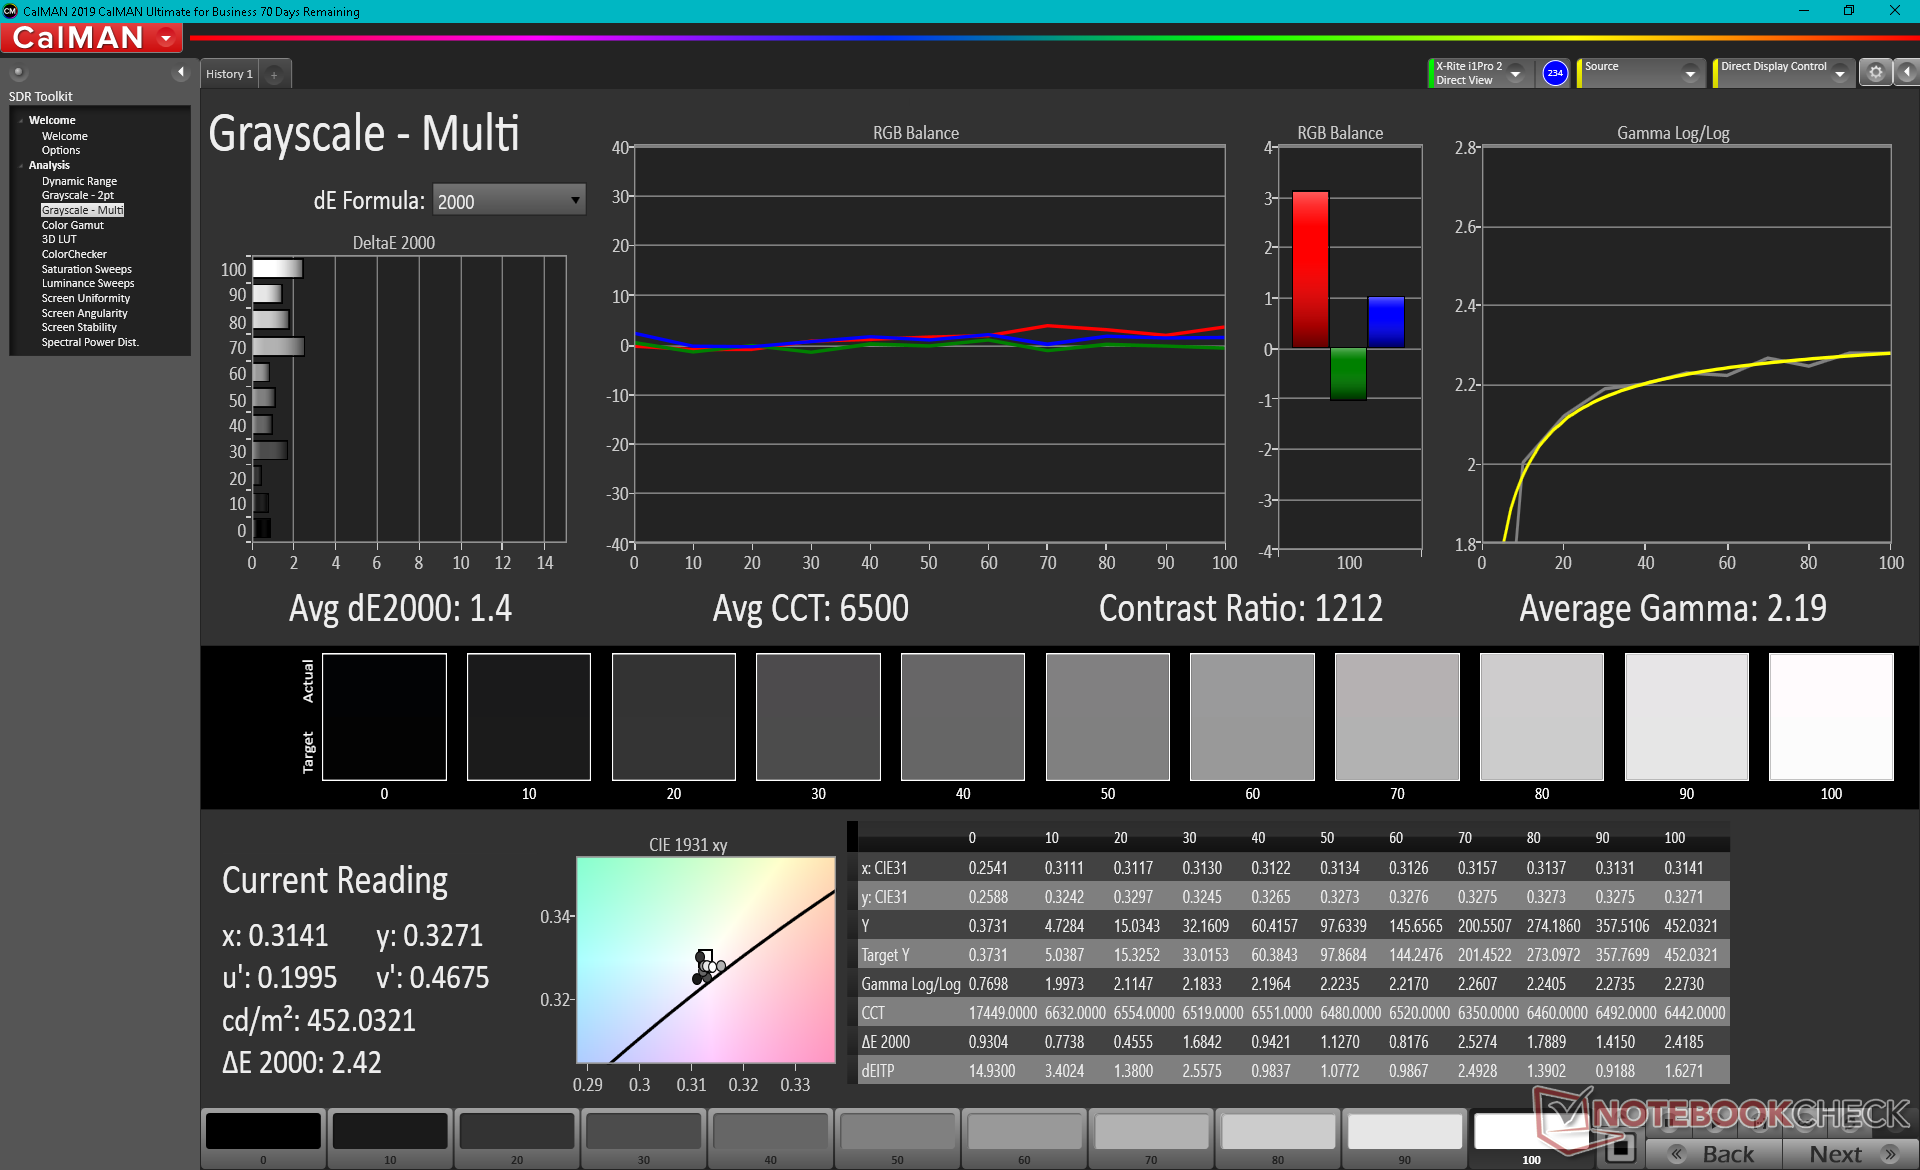
ΔE Greyscale Calman: 2.4 | ∀{0.09-98 Ø4.96}
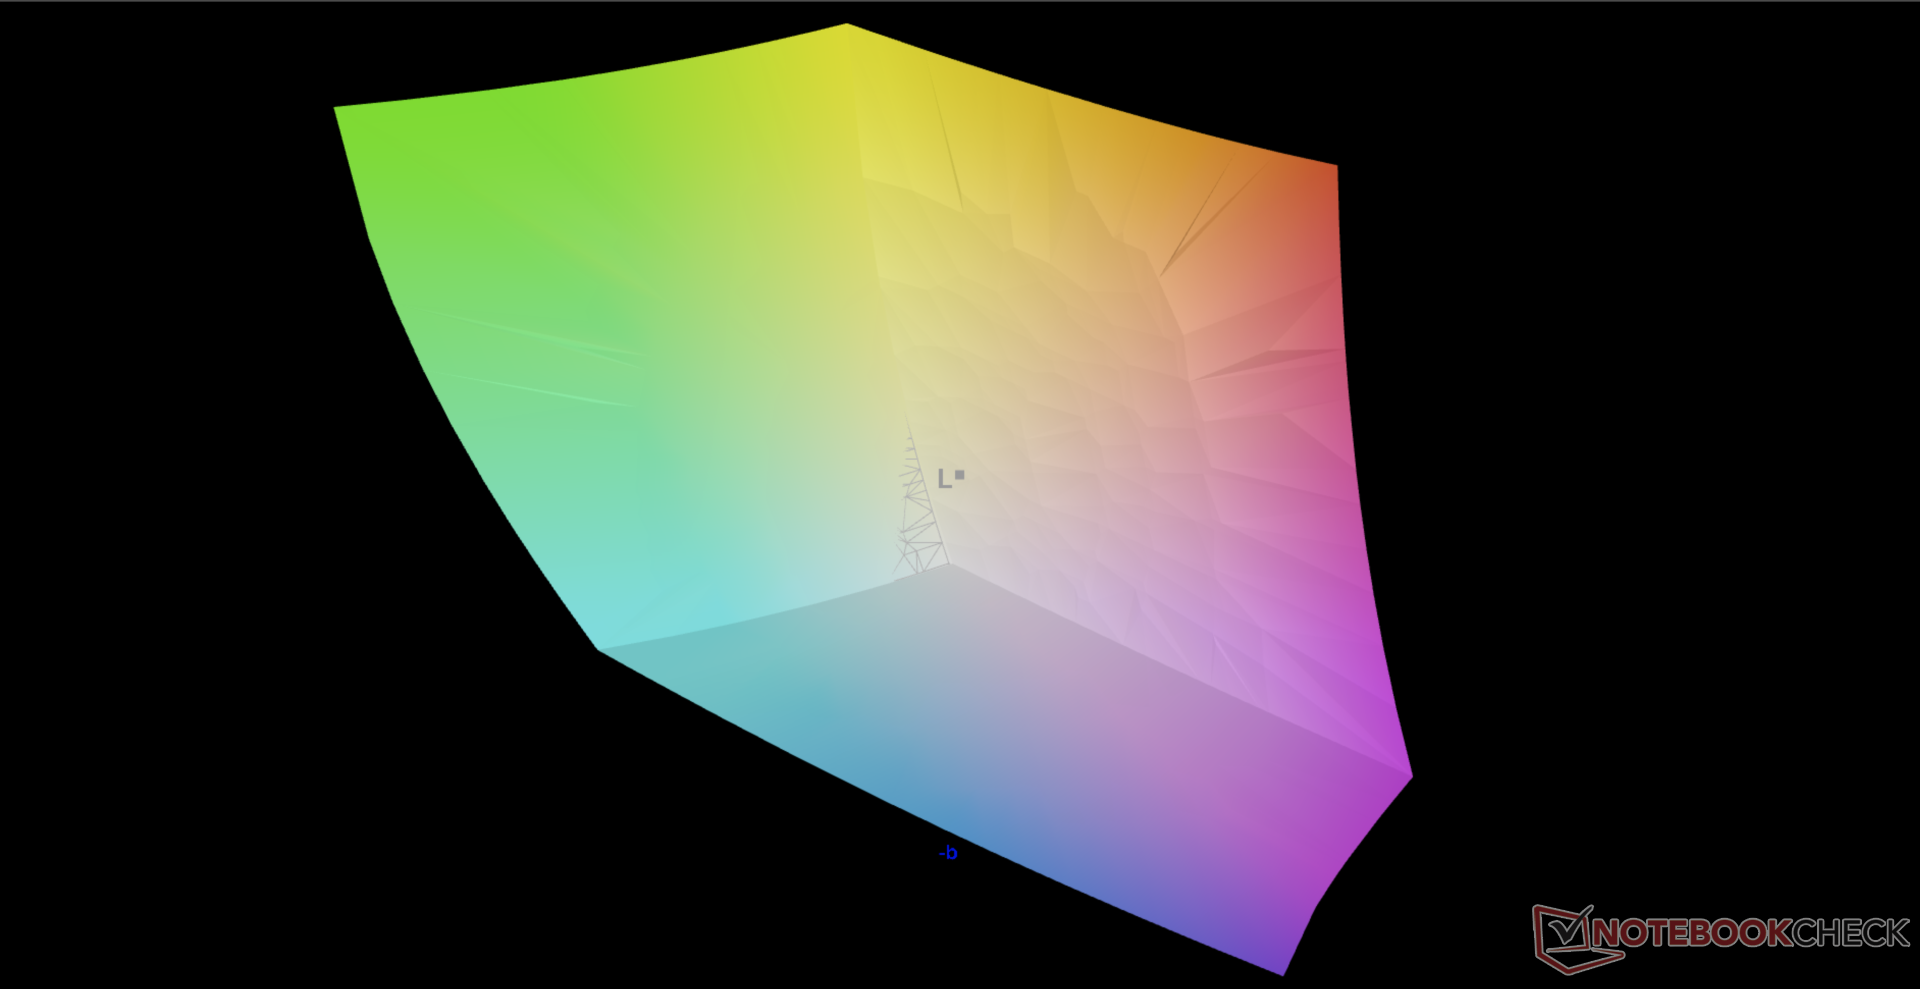
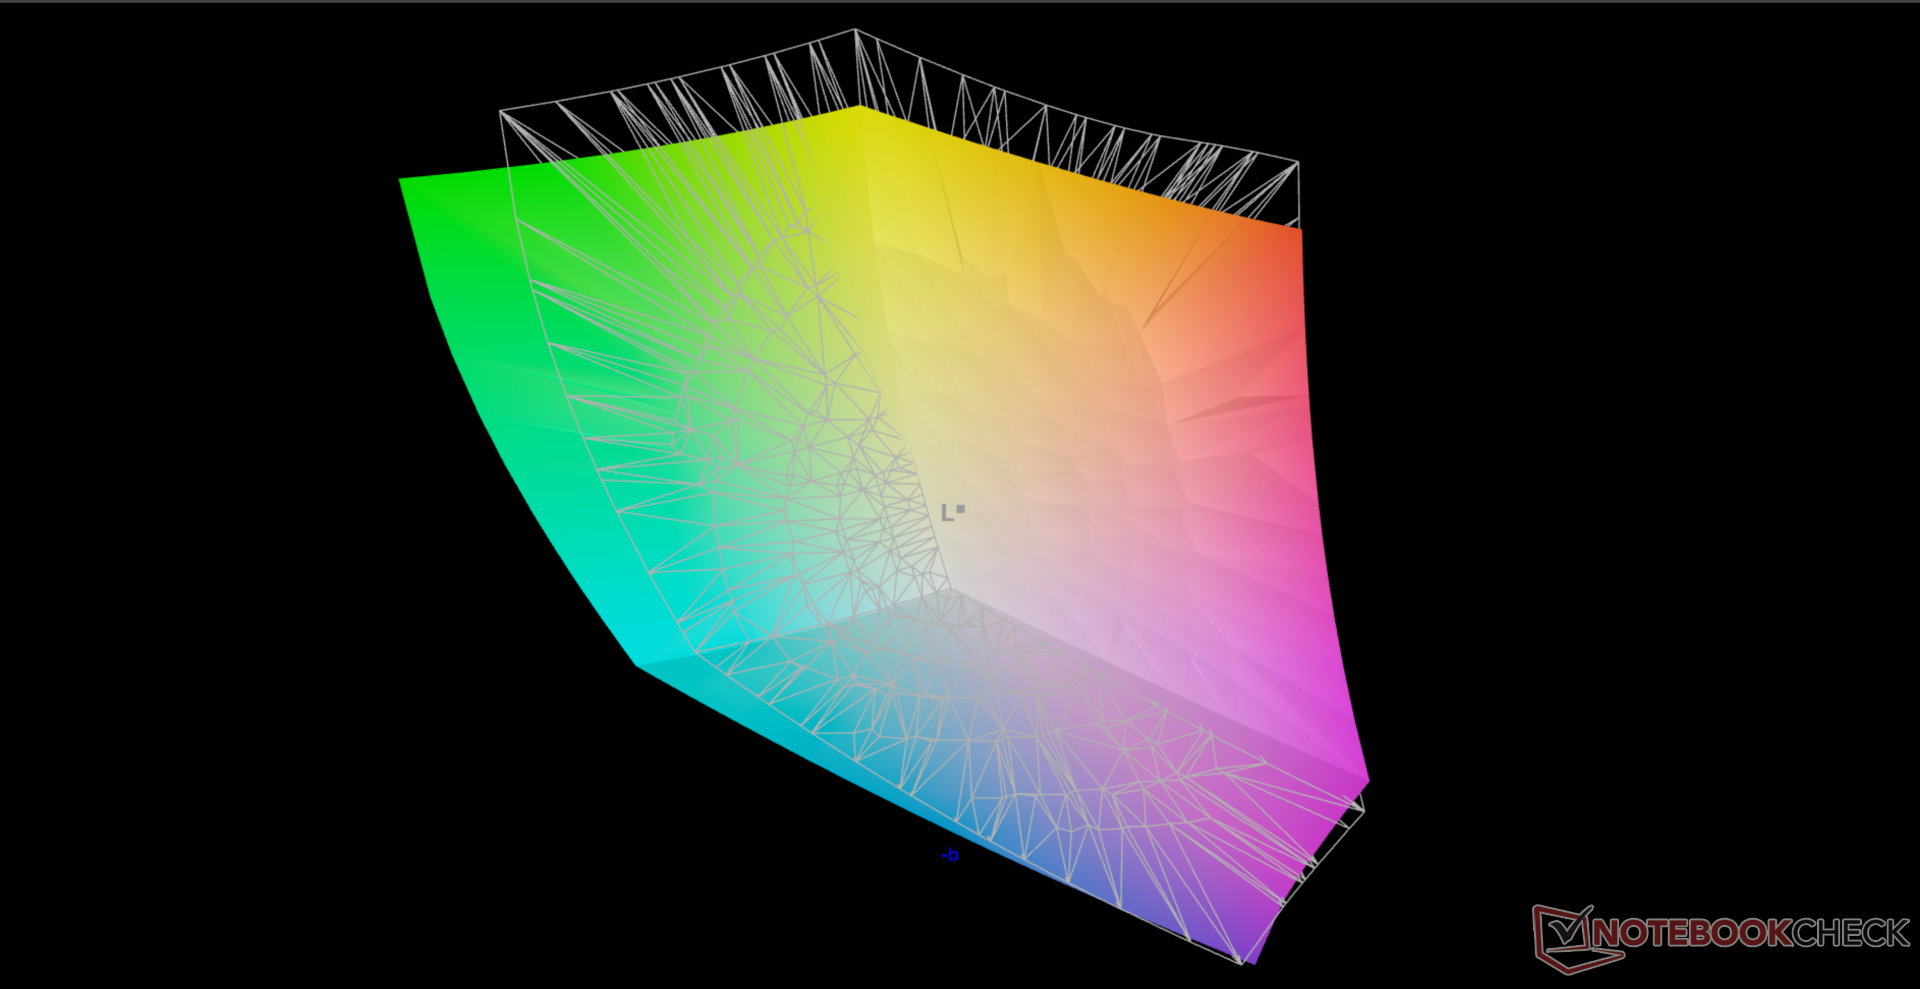
100% AdobeRGB 1998 (Argyll 3D)
100% sRGB (Argyll 3D)
88.3% Display P3 (Argyll 3D)
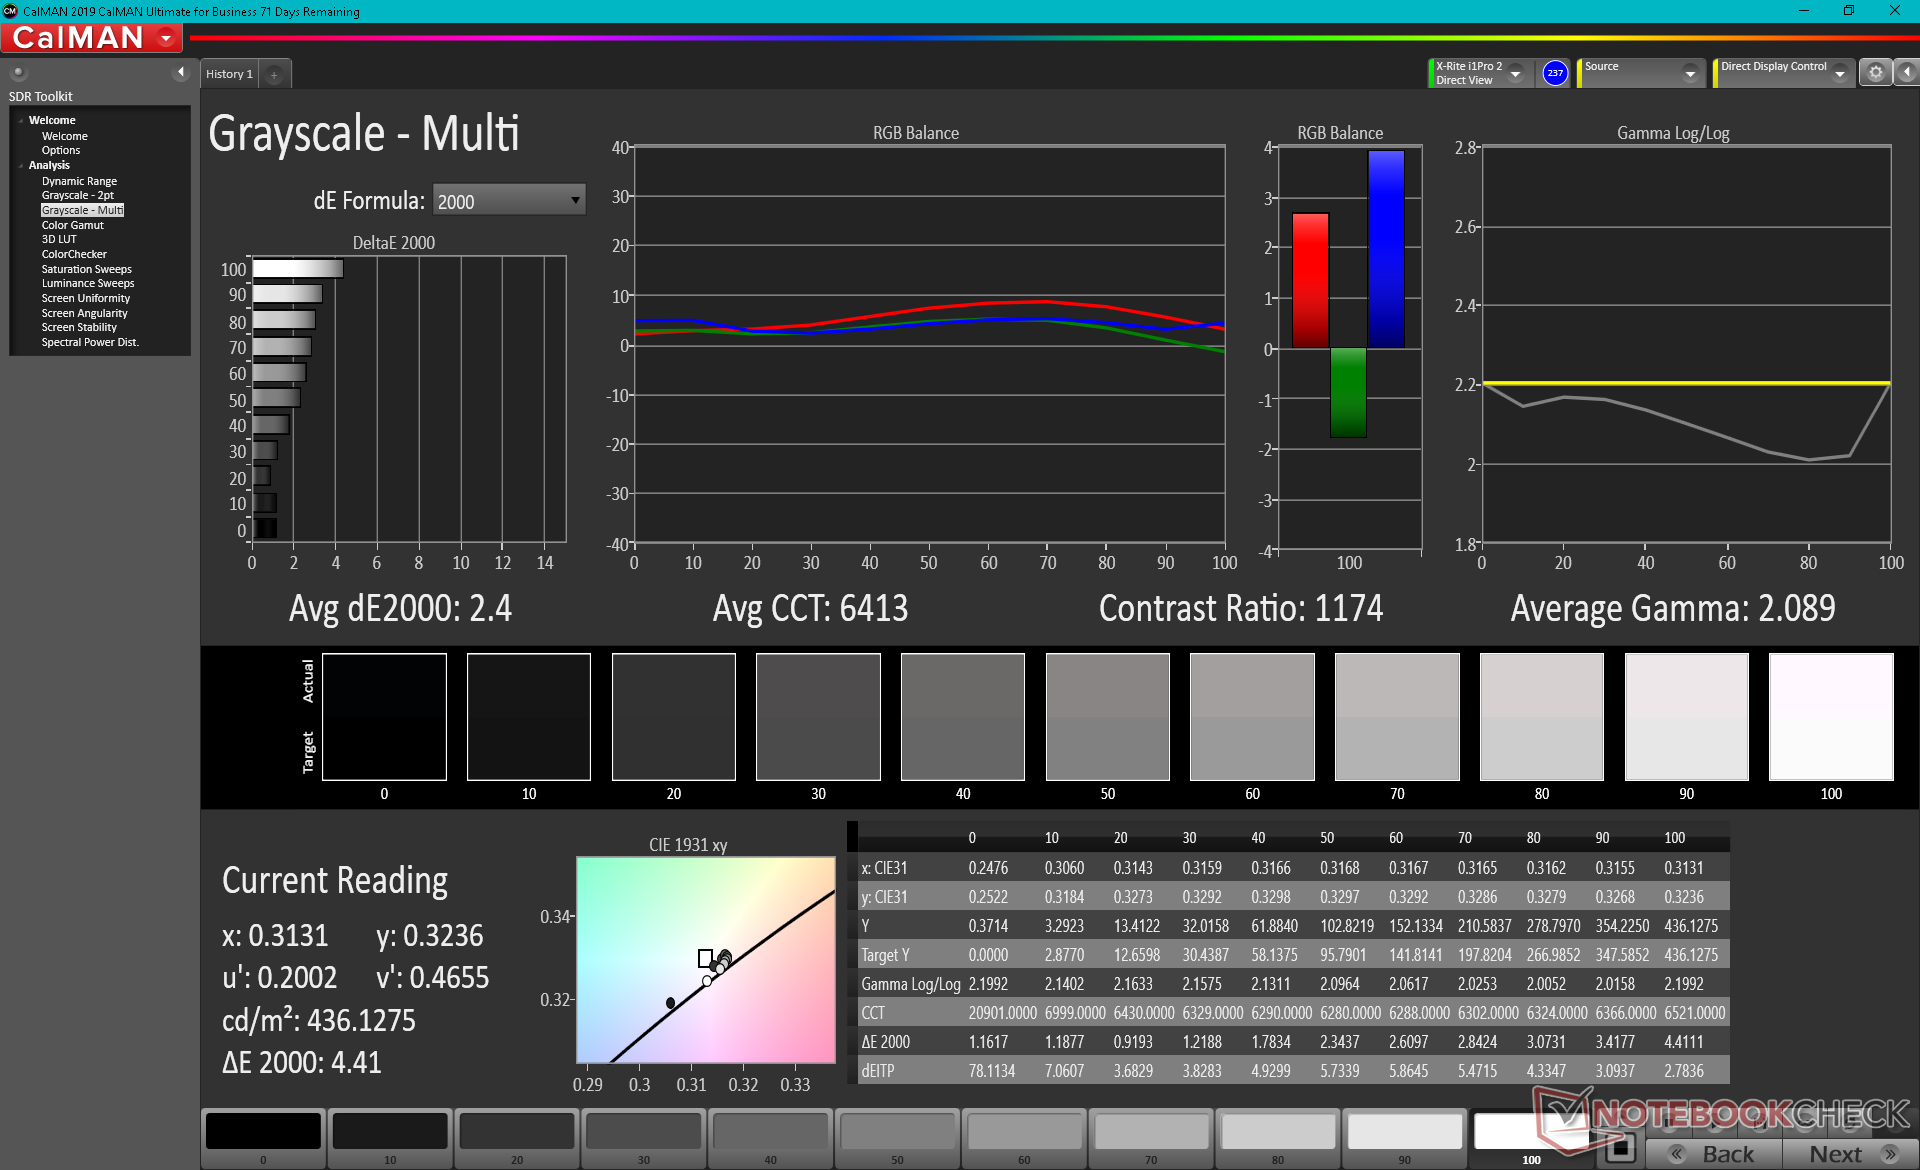
Gamma: 2.09
CCT: 6413 K
| Alienware x17 RTX 3080 P48E AU Optronics B173ZAN, IPS, 17.3", 3840x2160 | Alienware m17 R4 AU Optronics AUOEC91, IPS, 17.3", 1920x1080 | Razer Blade 17 RTX 3070 AU Optronics B173HAN05.4, IPS, 17.3", 1920x1080 | Asus ROG Zephyrus S17 GX703HSD BOE099D (BOE CQ NE173QHM-NY3), IPS, 17.3", 2560x1440 | MSI GS76 Stealth 11UH AUO B173ZAN06.1 (AUODE95), IPS, 17.3", 3840x2160 | Gigabyte Aero 17 HDR YD AU Optronics AUO329B, IPS, 17.3", 3840x2160 | |
|---|---|---|---|---|---|---|
| Display | -16% | -15% | -3% | -23% | -1% | |
| Display P3 Coverage (%) | 88.3 | 69.8 -21% | 71.7 -19% | 94.2 7% | 63 -29% | 86.9 -2% |
| sRGB Coverage (%) | 100 | 99.7 0% | 98.8 -1% | 98.7 -1% | 94.8 -5% | 100 0% |
| AdobeRGB 1998 Coverage (%) | 100 | 71.6 -28% | 73.6 -26% | 84.4 -16% | 65 -35% | 99.6 0% |
| Response Times | 10% | 43% | 45% | 39% | -206% | |
| Response Time Grey 50% / Grey 80% * (ms) | 14.4 ? | 13.2 ? 8% | 4.2 ? 71% | 4.8 67% | 8.8 ? 39% | 52 ? -261% |
| Response Time Black / White * (ms) | 10.4 ? | 9.2 ? 12% | 8.8 ? 15% | 8 23% | 6.4 ? 38% | 26 ? -150% |
| PWM Frequency (Hz) | ||||||
| Screen | 21% | -44% | -19% | 9% | 30% | |
| Brightness middle (cd/m²) | 438.7 | 305 -30% | 323.3 -26% | 322 -27% | 474 8% | 488 11% |
| Brightness (cd/m²) | 435 | 301 -31% | 315 -28% | 288 -34% | 454 4% | 467 7% |
| Brightness Distribution (%) | 91 | 93 2% | 91 0% | 72 -21% | 88 -3% | 86 -5% |
| Black Level * (cd/m²) | 0.48 | 0.19 60% | 0.33 31% | 0.3 37% | 0.46 4% | 0.33 31% |
| Contrast (:1) | 914 | 1605 76% | 980 7% | 1073 17% | 1030 13% | 1479 62% |
| Colorchecker dE 2000 * | 4.34 | 1.31 70% | 4.59 -6% | 3.05 30% | 1.5 65% | 1.23 72% |
| Colorchecker dE 2000 max. * | 7.3 | 2.32 68% | 10.82 -48% | 5.23 28% | 5.59 23% | 2.94 60% |
| Colorchecker dE 2000 calibrated * | 0.72 | 0.91 -26% | 1.4 -94% | 1.92 -167% | 0.86 -19% | 0.77 -7% |
| Greyscale dE 2000 * | 2.4 | 2.3 4% | 7.9 -229% | 3.11 -30% | 2.8 -17% | 1.5 37% |
| Gamma | 2.09 105% | 2.281 96% | 2.28 96% | 2.13 103% | 2.158 102% | 2.169 101% |
| CCT | 6413 101% | 6449 101% | 5941 109% | 6553 99% | 6597 99% | 6614 98% |
| Color Space (Percent of AdobeRGB 1998) (%) | 72 | 84 | 99 | |||
| Color Space (Percent of sRGB) (%) | 94 | 99 | 99 | |||
| Media totale (Programma / Settaggio) | 5% /
12% | -5% /
-25% | 8% /
-6% | 8% /
6% | -59% /
-10% |
* ... Meglio usare valori piccoli
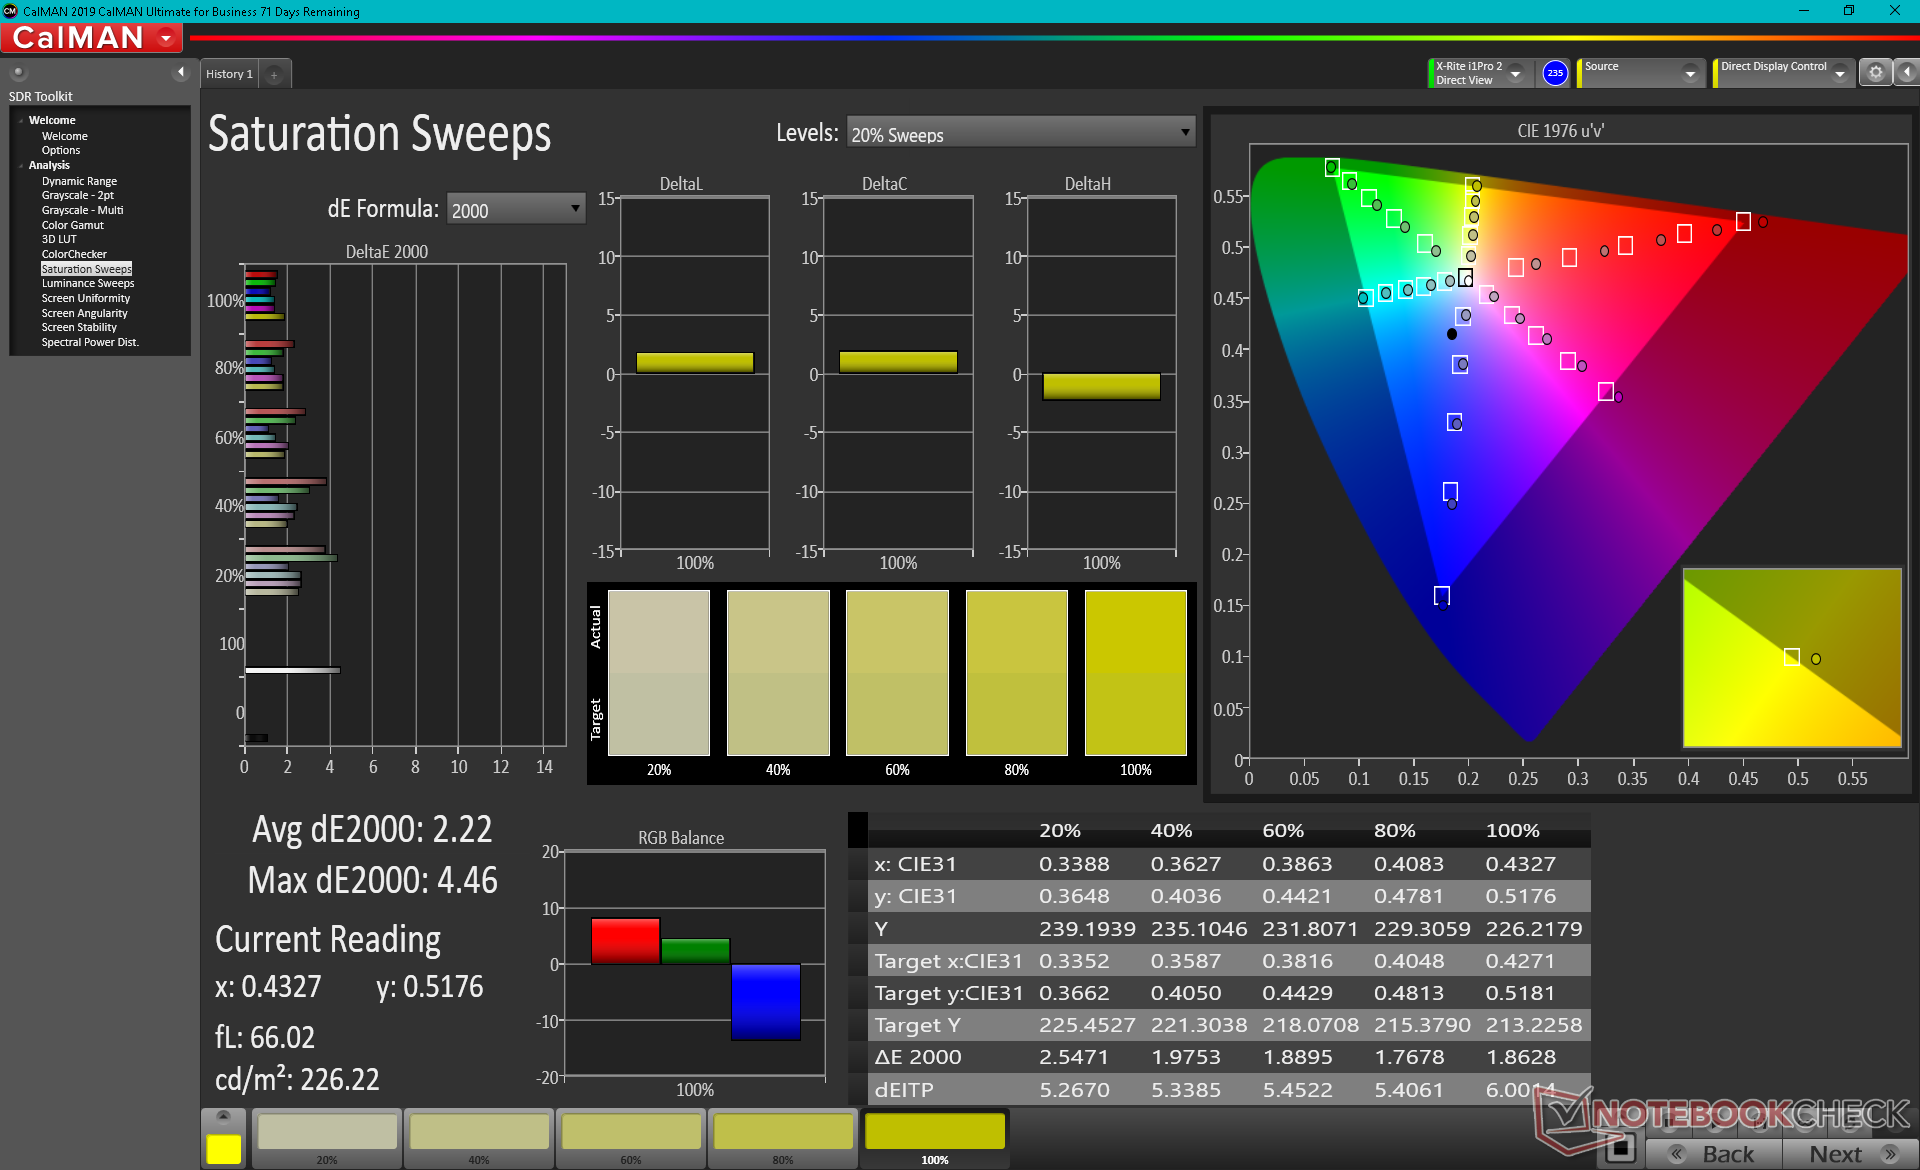
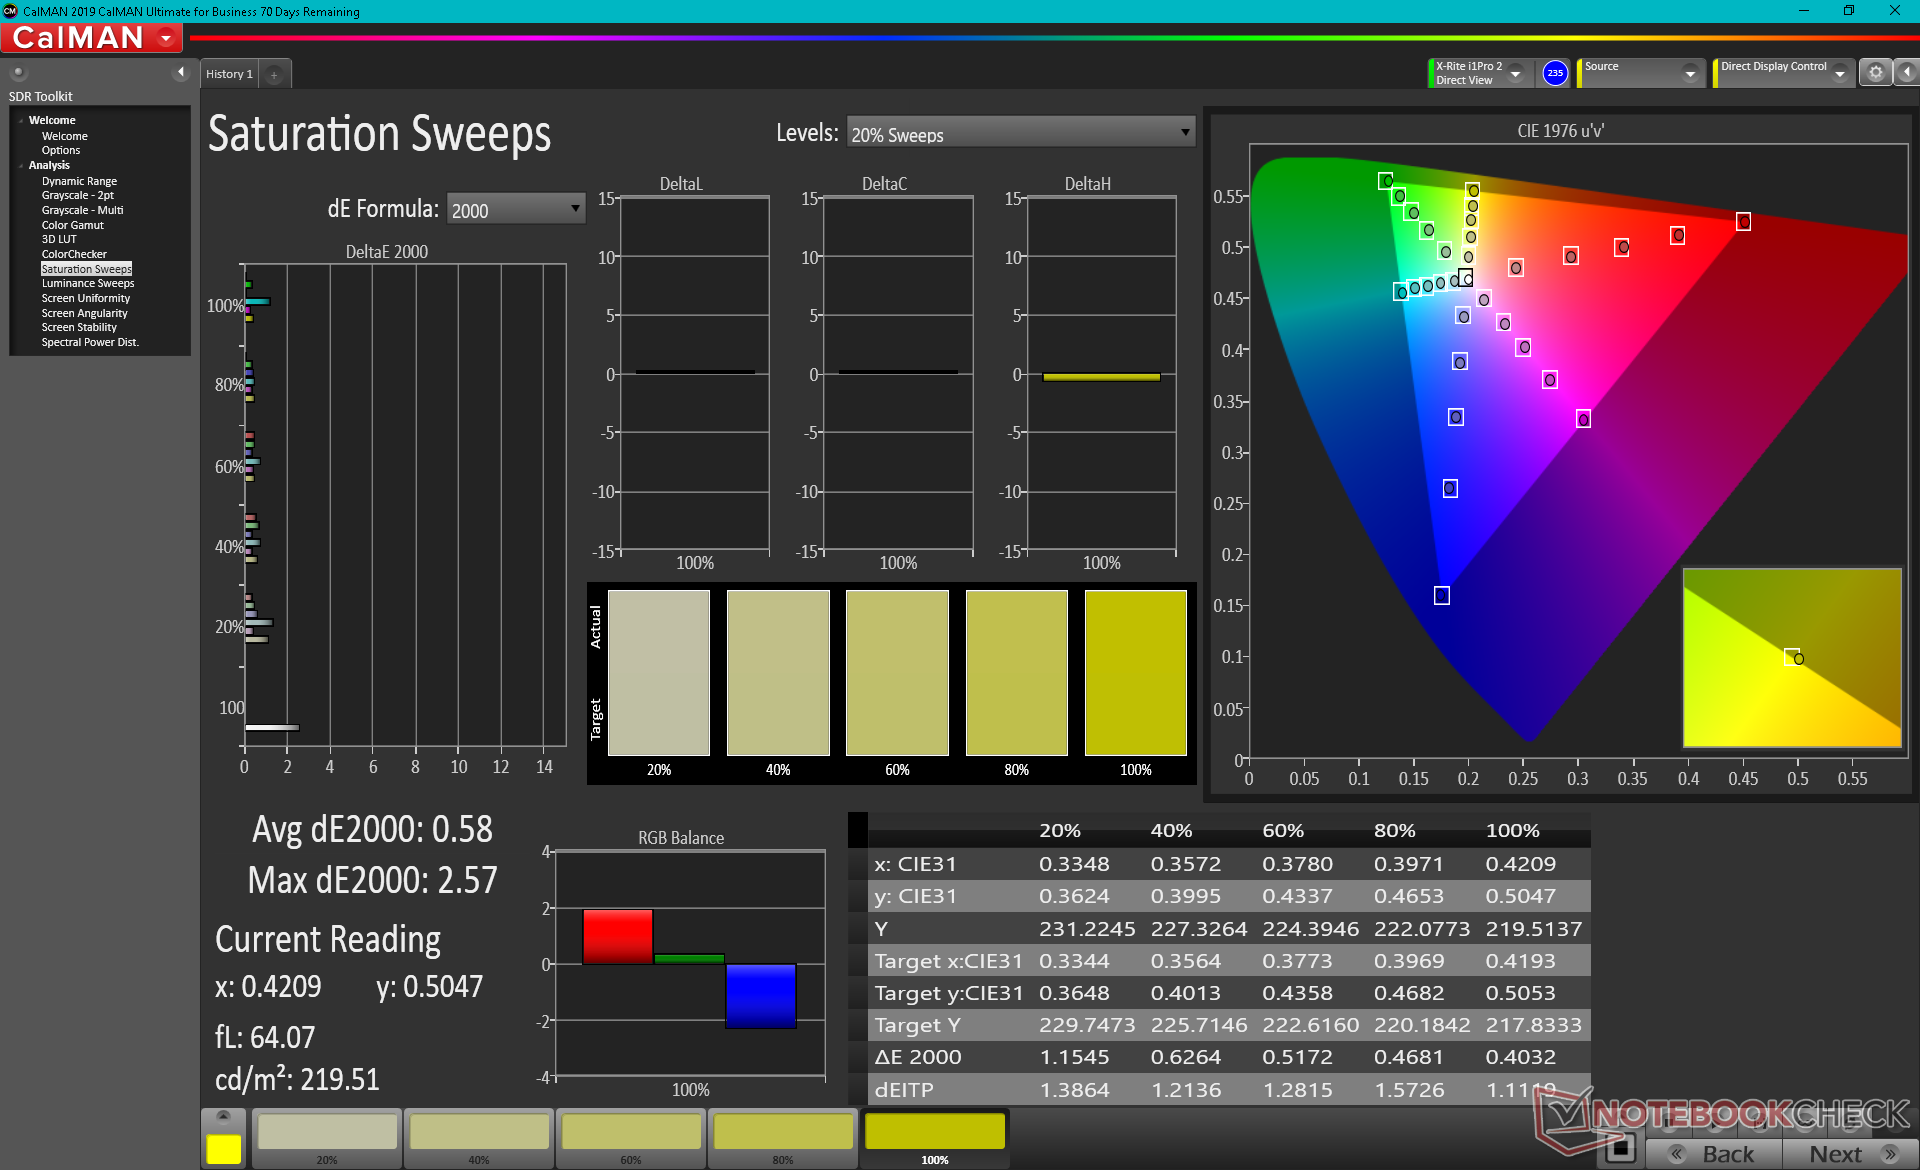
Lo spazio colore comprende tutti gli sRGB e AdobeRGB come pubblicizzato dal produttore, mentre la copertura DCI-P3 è di circa l'88%. I colori profondi, i tempi di risposta veloci e la velocità di aggiornamento rendono questo pannello 4K adatto sia per il gaming che per l'editing grafico.
Le misurazioni del colorimetro X-Rite mostrano che il display è calibrato decentemente con valori DeltaE medi della scala di grigi e del colore di appena 2,4 e 4,34, rispettivamente, se confrontati con lo standard AdobeRGB. Impostando il display su sRGB e poi calibrando i suoi colori si otterrebbero valori DeltaE eccellenti, inferiori a 2 su tutta la linea.
Tempi di risposta del Display
| ↔ Tempi di risposta dal Nero al Bianco | ||
|---|---|---|
| 10.4 ms ... aumenta ↗ e diminuisce ↘ combinato | ↗ 5.2 ms Incremento | 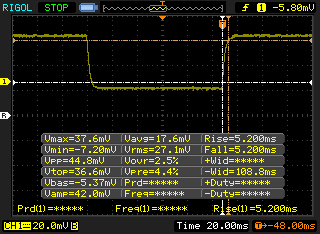 |
| ↘ 5.2 ms Calo | ||
| Lo schermo mostra buoni tempi di risposta durante i nostri tests, ma potrebbe essere troppo lento per i gamers competitivi. In confronto, tutti i dispositivi di test variano da 0.1 (minimo) a 240 (massimo) ms. » 28 % di tutti i dispositivi è migliore. Questo significa che i tempi di risposta rilevati sono migliori rispettto alla media di tutti i dispositivi testati (19.8 ms). | ||
| ↔ Tempo di risposta dal 50% Grigio all'80% Grigio | ||
| 14.4 ms ... aumenta ↗ e diminuisce ↘ combinato | ↗ 7.6 ms Incremento | 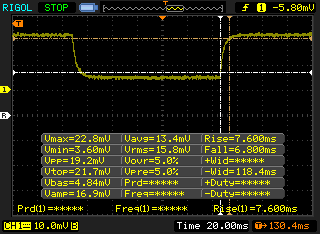 |
| ↘ 6.8 ms Calo | ||
| Lo schermo mostra buoni tempi di risposta durante i nostri tests, ma potrebbe essere troppo lento per i gamers competitivi. In confronto, tutti i dispositivi di test variano da 0.165 (minimo) a 636 (massimo) ms. » 28 % di tutti i dispositivi è migliore. Questo significa che i tempi di risposta rilevati sono migliori rispettto alla media di tutti i dispositivi testati (31 ms). | ||
Sfarfallio dello schermo / PWM (Pulse-Width Modulation)
| flickering dello schermo / PWM non rilevato | 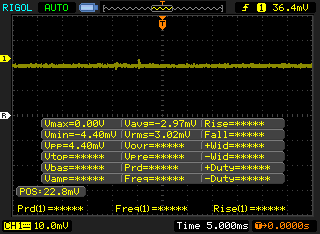 | ||
In confronto: 52 % di tutti i dispositivi testati non utilizza PWM per ridurre la luminosita' del display. Se è rilevato PWM, una media di 7757 (minimo: 5 - massimo: 343500) Hz è stata rilevata. | |||
La visibilità all'aperto è leggermente migliore rispetto a molti altri portatili gaming da 17,3 pollici, poiché il display opaco da 400 nit è più luminoso del tipico obiettivo da 300 nit. Il peso e le dimensioni pesanti sono difficili da ignorare, tuttavia, e quindi probabilmente vorrete lavorare su una scrivania piatta indipendentemente dall'ambiente.
Prestazioni - Velocità di clock del processore impressionanti
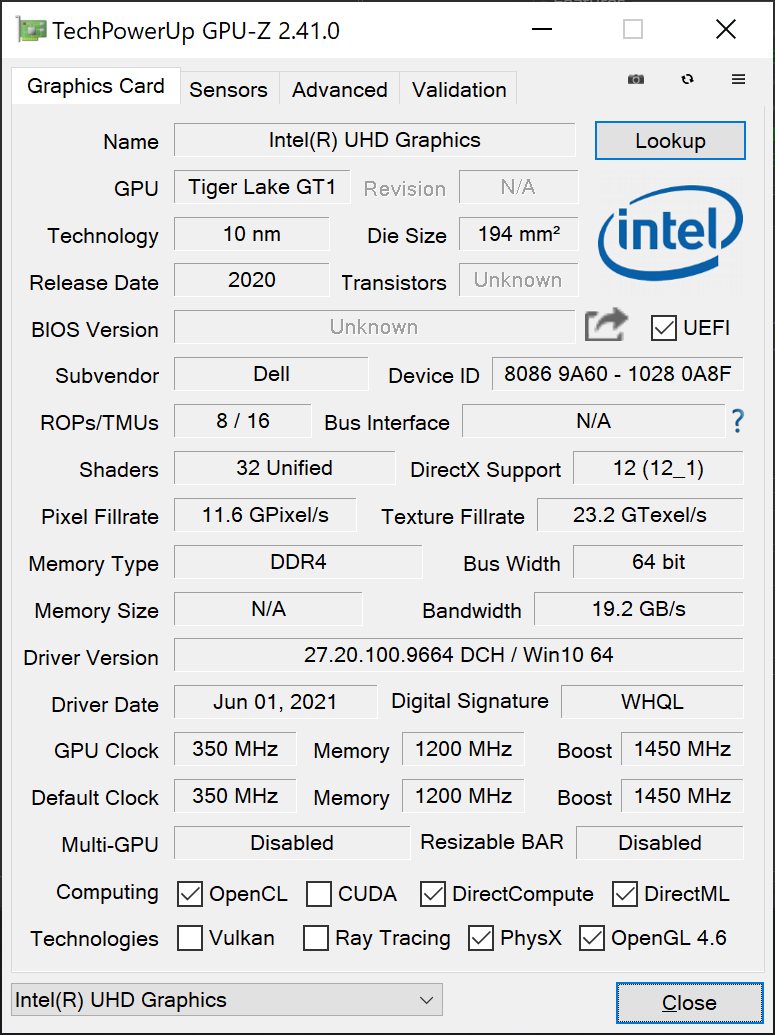
Due opzioni di CPU (Core i7-11800H, Core i9-11980HK) e tre opzioni grafiche GeForce (RTX 3060, RTX 3070, RTX 3080) sono disponibili. Non ci aspettiamo grandi differenze tra le due CPU, dal momento che il nostro i7-11800H sta già funzionando ben al di sopra dei 90° C quando è sotto carico, ma le tre GPU funzionano ciascuna a diversi obiettivi TGP di 130 W, 140 W e 165 W, rispettivamente. In confronto, la RTX 3080 nel Razer Blade 17 ha come obiettivo "solo" 130 W.
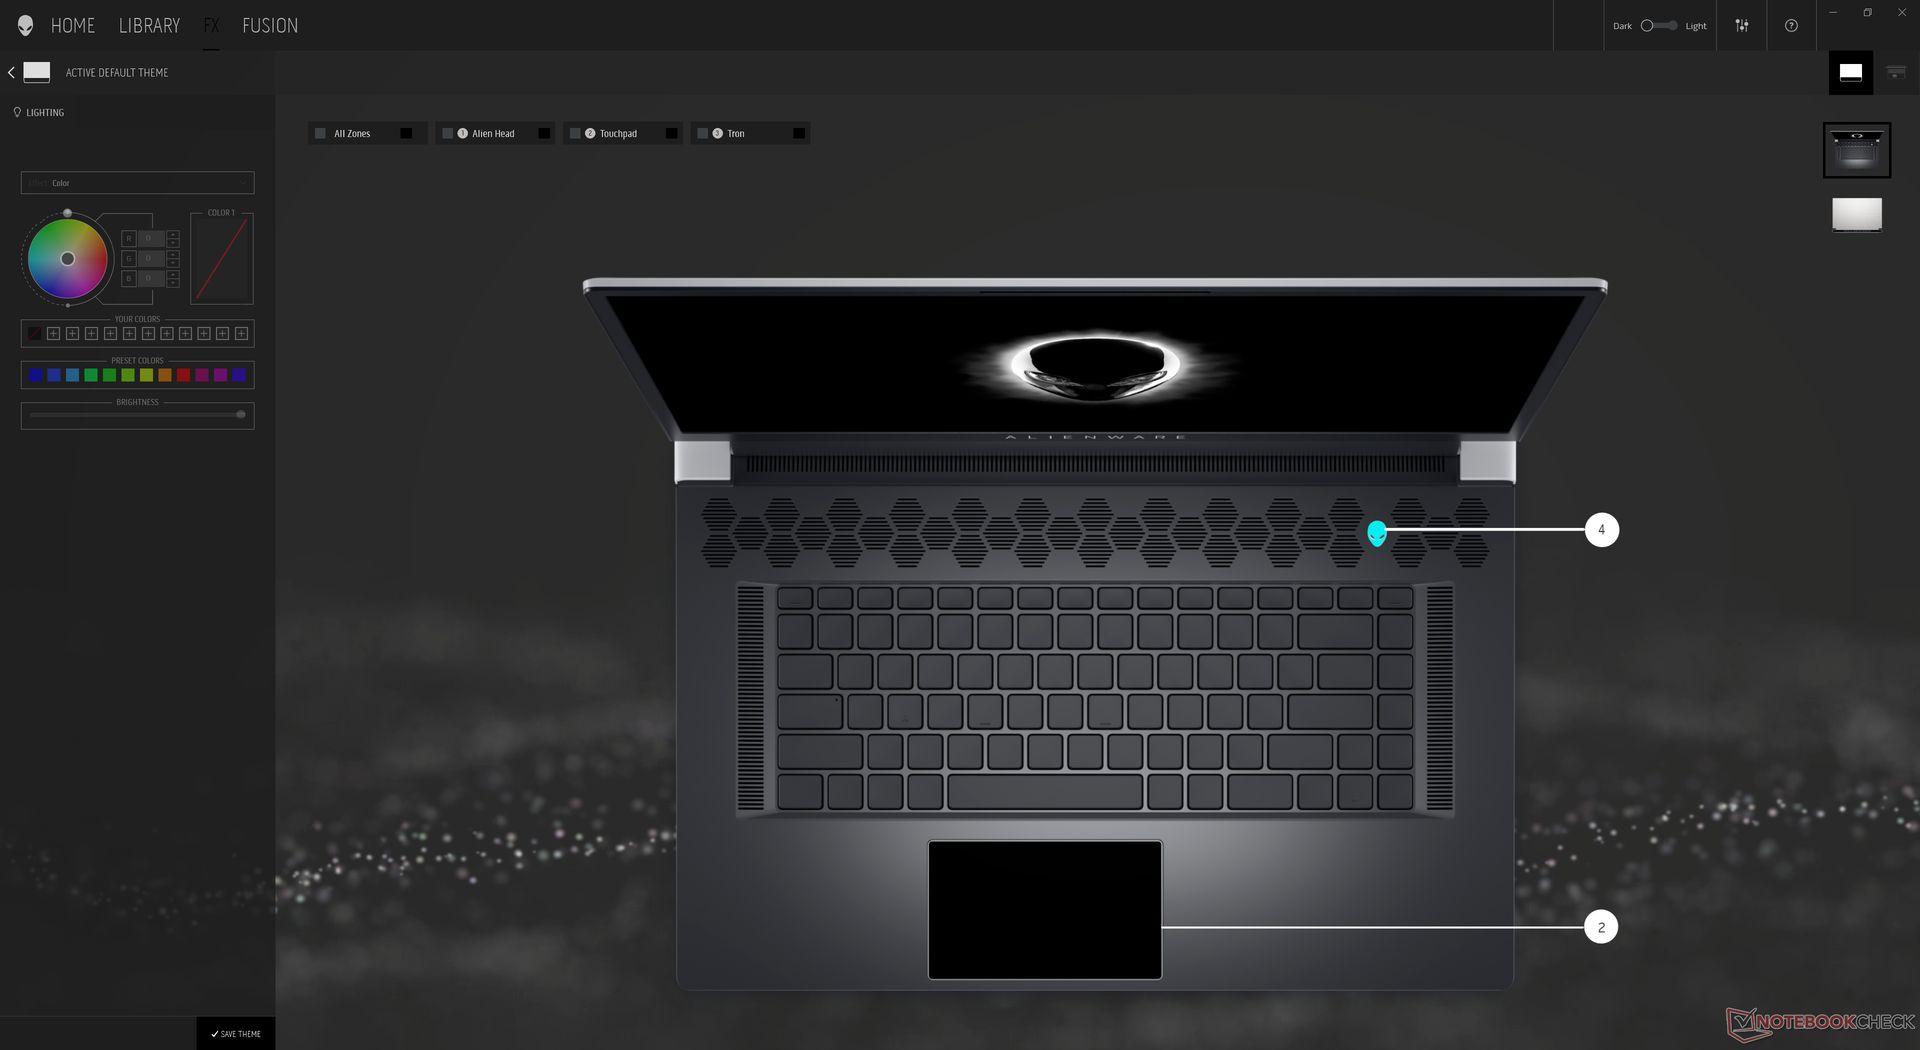
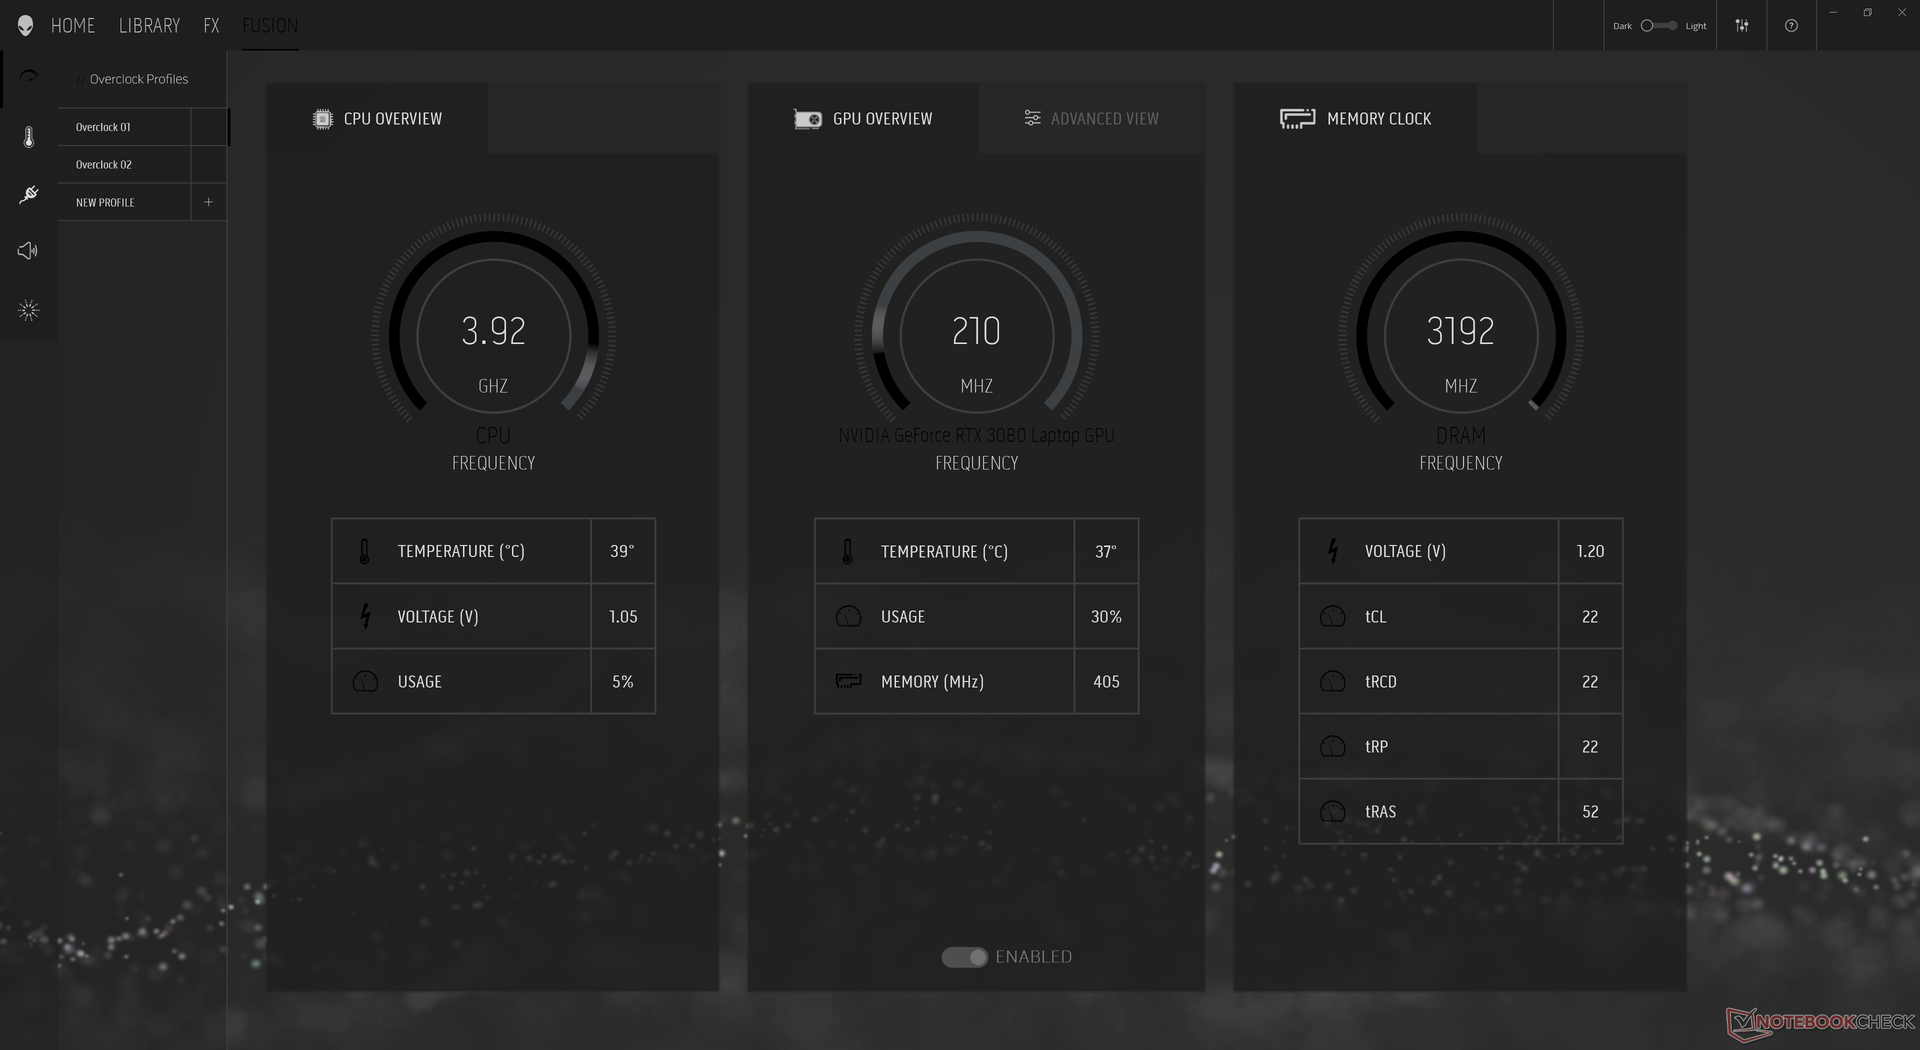
Il nostro sistema è stato impostato in modalità High Performance tramite il software Alienware Command Center prima di eseguire i nostri benchmark qui sotto per ottenere i punteggi più alti possibili. Raccomandiamo agli utenti di familiarizzare con questo software poiché tutte le caratteristiche di illuminazione e prestazioni si trovano qui. Inoltre, gli utenti possono impostare il sistema in modalità Optimus o GPU dedicata tramite il BIOS.
Advanced Optimus e quindi G-Sync sono supportati solo sulle SKU FHD a 360 Hz.
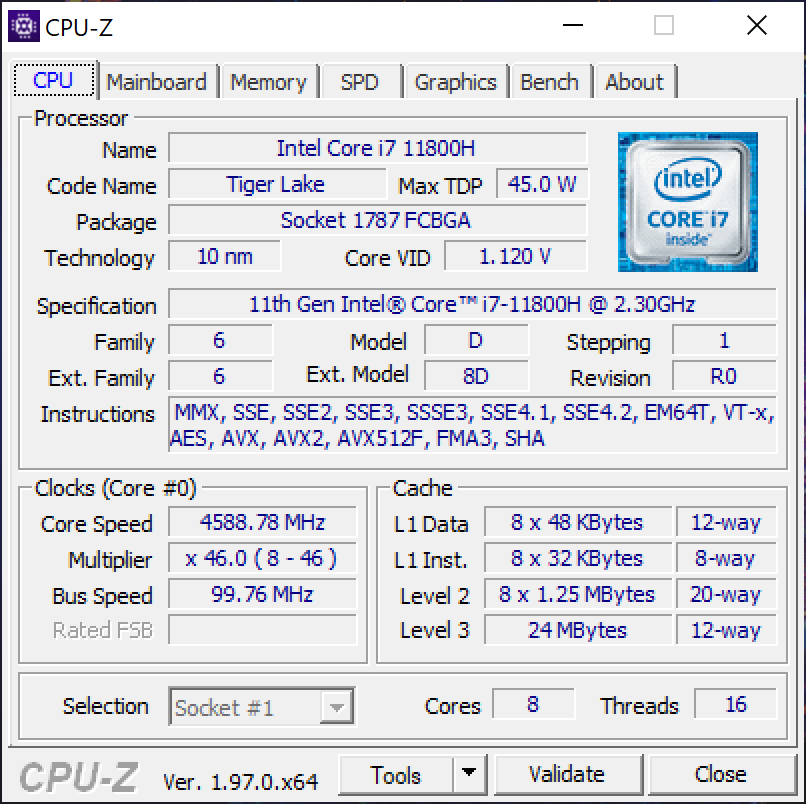
Processore
Le prestazioni della CPU sono eccezionali con punteggi CineBench xT che sono fino al 20 per cento più veloci rispetto alla media dei laptop nel nostro database con lo stesso Core i7-11800H CPU. Infatti, l'Alienware x17 è uno dei portatili più veloci che si possono trovare sul mercato con questo specifico processore. Le prestazioni più veloci del previsto del nostro sistema in realtà lo mettono leggermente davanti al Ryzen 9 5900HX o Core i9-11900K nei carichi multi-threaded anche se l'i7-11800H è generalmente indietro sulla maggior parte degli altri portatili.
Le alte prestazioni della CPU dell'Alienware possono essere attribuite agli obiettivi PL1 e PL2 molto alti di 165 W ciascuno (con una sostenibilità nel mondo reale da 98 W a 108 W) rispetto a 65 W e 90 W, rispettivamente, su altri portatili come il Razer Blade 17. Il sistema è anche eccellente nel mantenere elevati valori di clock Turbo Boost per periodi prolungati, come mostrato dal nostro test CineBench R15 xT loop qui sotto. Risultati di prestazioni così elevati non sono gratuiti, tuttavia, come dimostrano le nostre sezioni Stress Test e Consumo di energia.
Cinebench R15 Multi Loop
Cinebench R23: Multi Core | Single Core
Cinebench R15: CPU Multi 64Bit | CPU Single 64Bit
Blender: v2.79 BMW27 CPU
7-Zip 18.03: 7z b 4 -mmt1 | 7z b 4
Geekbench 5.5: Single-Core | Multi-Core
HWBOT x265 Benchmark v2.2: 4k Preset
LibreOffice : 20 Documents To PDF
R Benchmark 2.5: Overall mean
| Cinebench R23 / Multi Core | |
| Schenker XMG Ultra 17 Rocket Lake | |
| Alienware x17 RTX 3080 P48E | |
| Asus Strix Scar 17 G733QSA-XS99 | |
| MSI GS76 Stealth 11UH | |
| Asus ROG Strix G17 G713QE-RB74 | |
| Media Intel Core i7-11800H (6508 - 14088, n=48) | |
| Alienware m17 R4 | |
| Medion Erazer Beast X20 | |
| Cinebench R23 / Single Core | |
| Schenker XMG Ultra 17 Rocket Lake | |
| MSI GS76 Stealth 11UH | |
| Alienware x17 RTX 3080 P48E | |
| Asus Strix Scar 17 G733QSA-XS99 | |
| Media Intel Core i7-11800H (1386 - 1522, n=45) | |
| Asus ROG Strix G17 G713QE-RB74 | |
| Alienware m17 R4 | |
| Medion Erazer Beast X20 | |
| Geekbench 5.5 / Single-Core | |
| Schenker XMG Ultra 17 Rocket Lake | |
| MSI GS76 Stealth 11UH | |
| Media Intel Core i7-11800H (1429 - 1625, n=40) | |
| Asus Strix Scar 17 G733QSA-XS99 | |
| Alienware m17 R4 | |
| MSI GS75 10SF-609US | |
| Medion Erazer Beast X20 | |
| Eluktronics RP-17 | |
| Schenker XMG Pro 17 PB71RD-G | |
| Lenovo Legion 5 17IMH05 | |
* ... Meglio usare valori piccoli
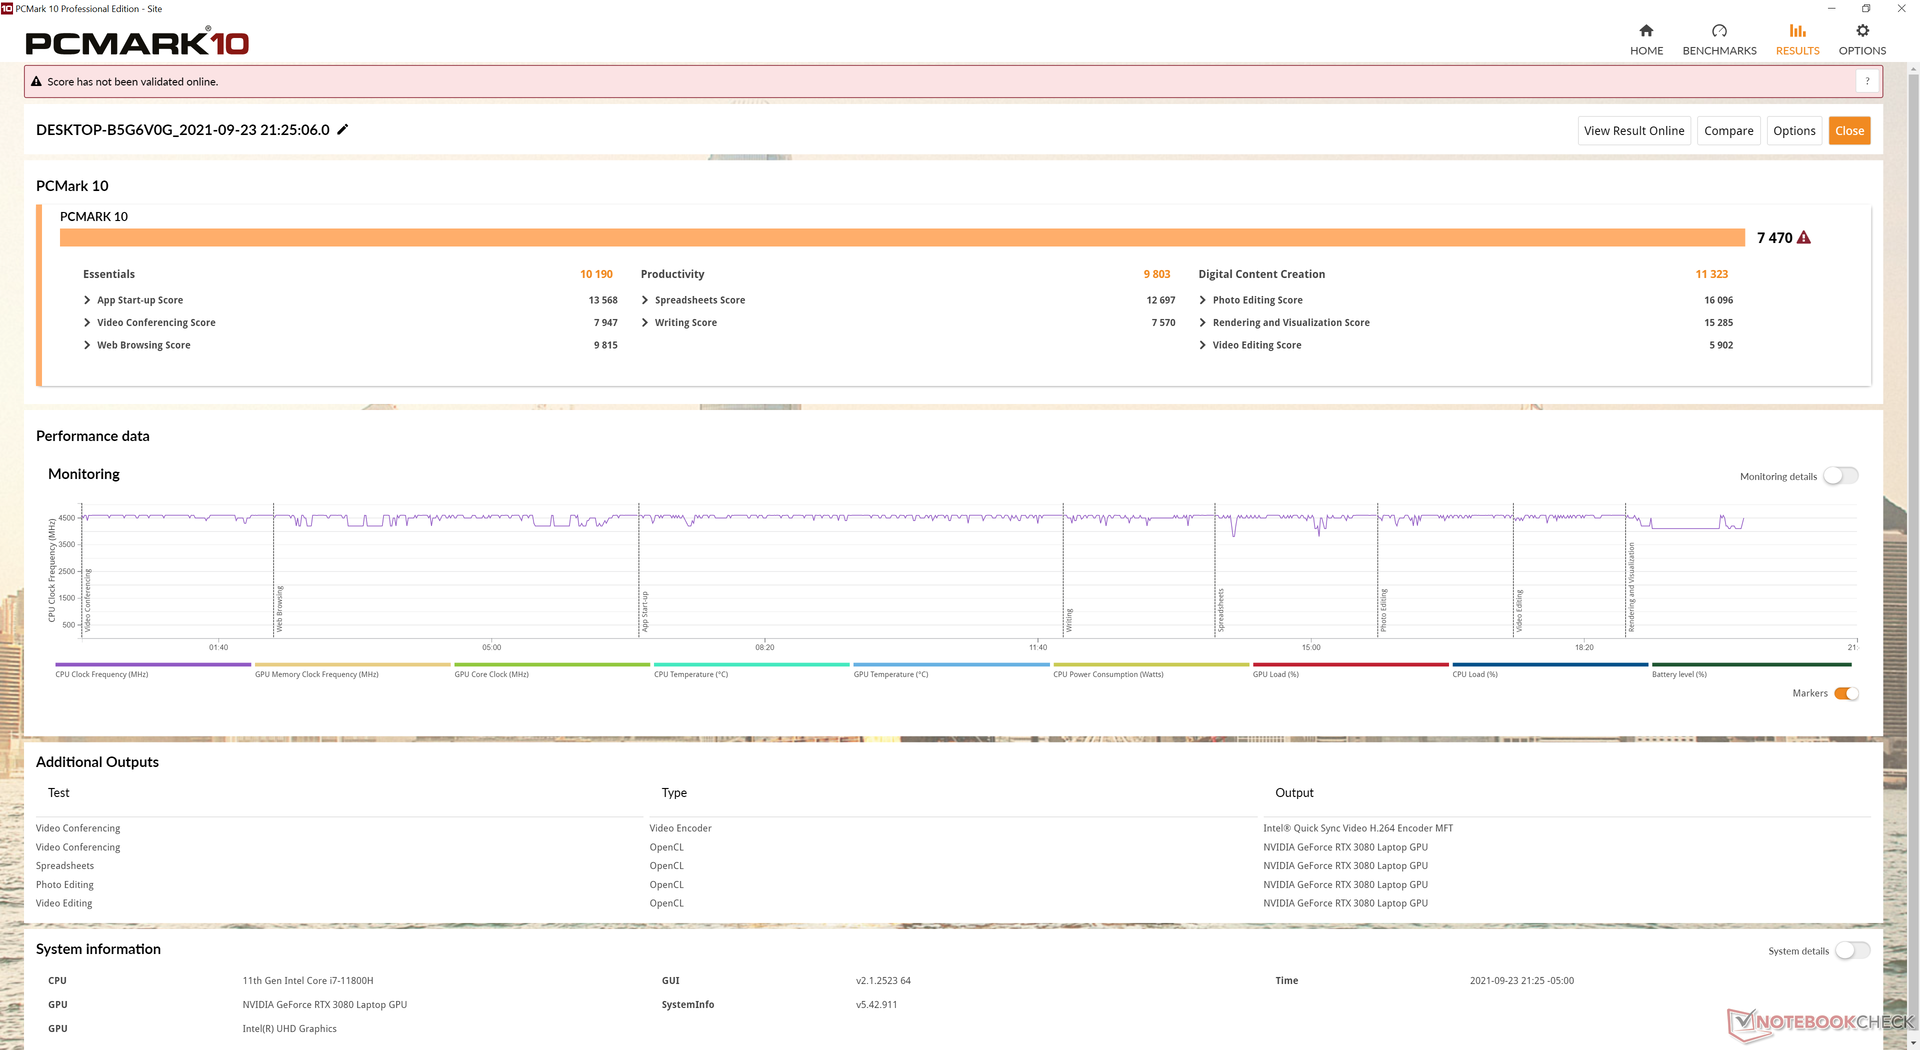
Prestazioni del sistema
I punteggi PCMark sono dove ci aspettiamo che siano rispetto ad altri portatili da gioco ad alte prestazioni. I risultati complessivi superano di poco il Razer Blade 17 equipaggiato con la stessa CPU e GPU.
| PCMark 10 / Score | |
| Alienware x17 RTX 3080 P48E | |
| Razer Blade 17 RTX 3070 | |
| Asus ROG Zephyrus S17 GX703HSD | |
| Media Intel Core i7-11800H, NVIDIA GeForce RTX 3080 Laptop GPU (6673 - 7470, n=11) | |
| Gigabyte Aero 17 HDR YD | |
| MSI GS76 Stealth 11UH | |
| Alienware m17 R4 | |
| PCMark 10 / Essentials | |
| Razer Blade 17 RTX 3070 | |
| Asus ROG Zephyrus S17 GX703HSD | |
| Media Intel Core i7-11800H, NVIDIA GeForce RTX 3080 Laptop GPU (9862 - 11064, n=11) | |
| Gigabyte Aero 17 HDR YD | |
| Alienware x17 RTX 3080 P48E | |
| MSI GS76 Stealth 11UH | |
| Alienware m17 R4 | |
| PCMark 10 / Productivity | |
| Alienware x17 RTX 3080 P48E | |
| Asus ROG Zephyrus S17 GX703HSD | |
| Razer Blade 17 RTX 3070 | |
| Media Intel Core i7-11800H, NVIDIA GeForce RTX 3080 Laptop GPU (8278 - 9803, n=11) | |
| Gigabyte Aero 17 HDR YD | |
| MSI GS76 Stealth 11UH | |
| Alienware m17 R4 | |
| PCMark 10 / Digital Content Creation | |
| Alienware x17 RTX 3080 P48E | |
| Razer Blade 17 RTX 3070 | |
| Asus ROG Zephyrus S17 GX703HSD | |
| Media Intel Core i7-11800H, NVIDIA GeForce RTX 3080 Laptop GPU (9881 - 11323, n=11) | |
| Gigabyte Aero 17 HDR YD | |
| MSI GS76 Stealth 11UH | |
| Alienware m17 R4 | |
| PCMark 10 Score | 7470 punti | |
Aiuto | ||
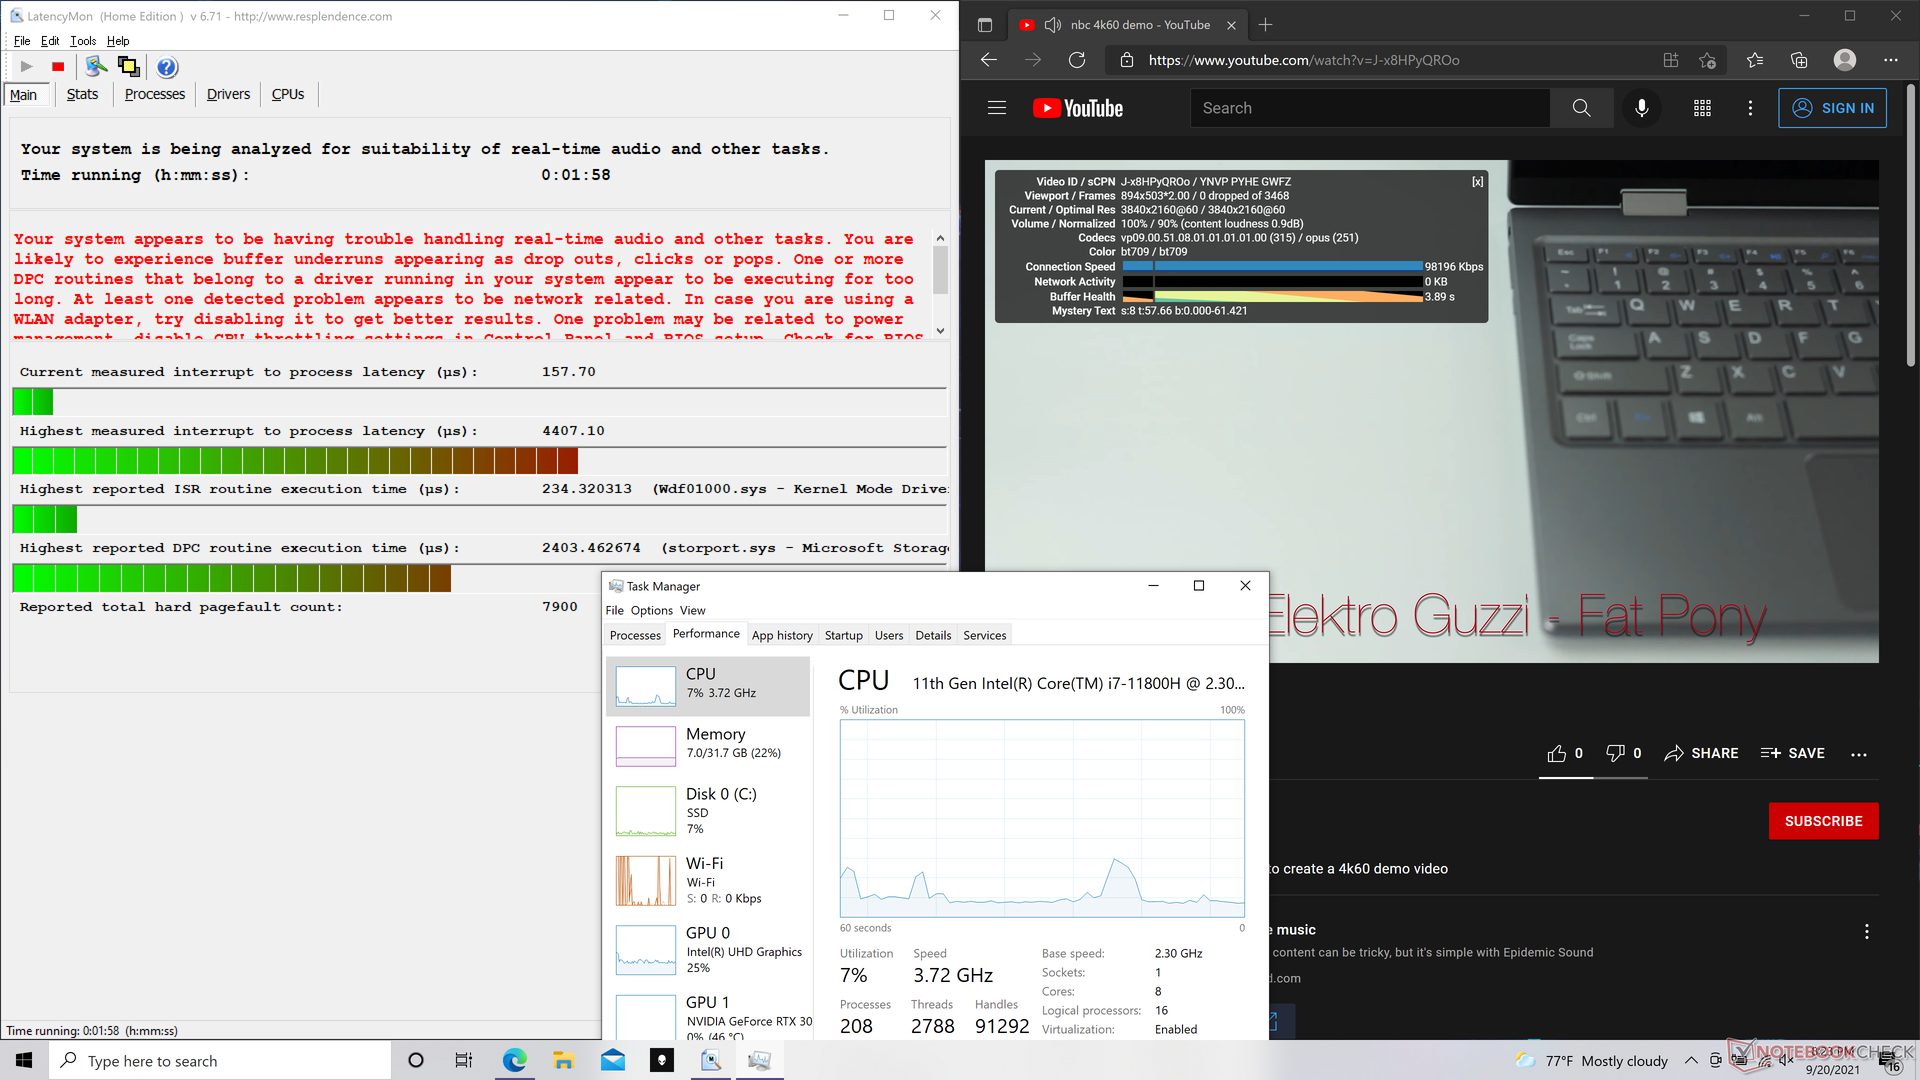
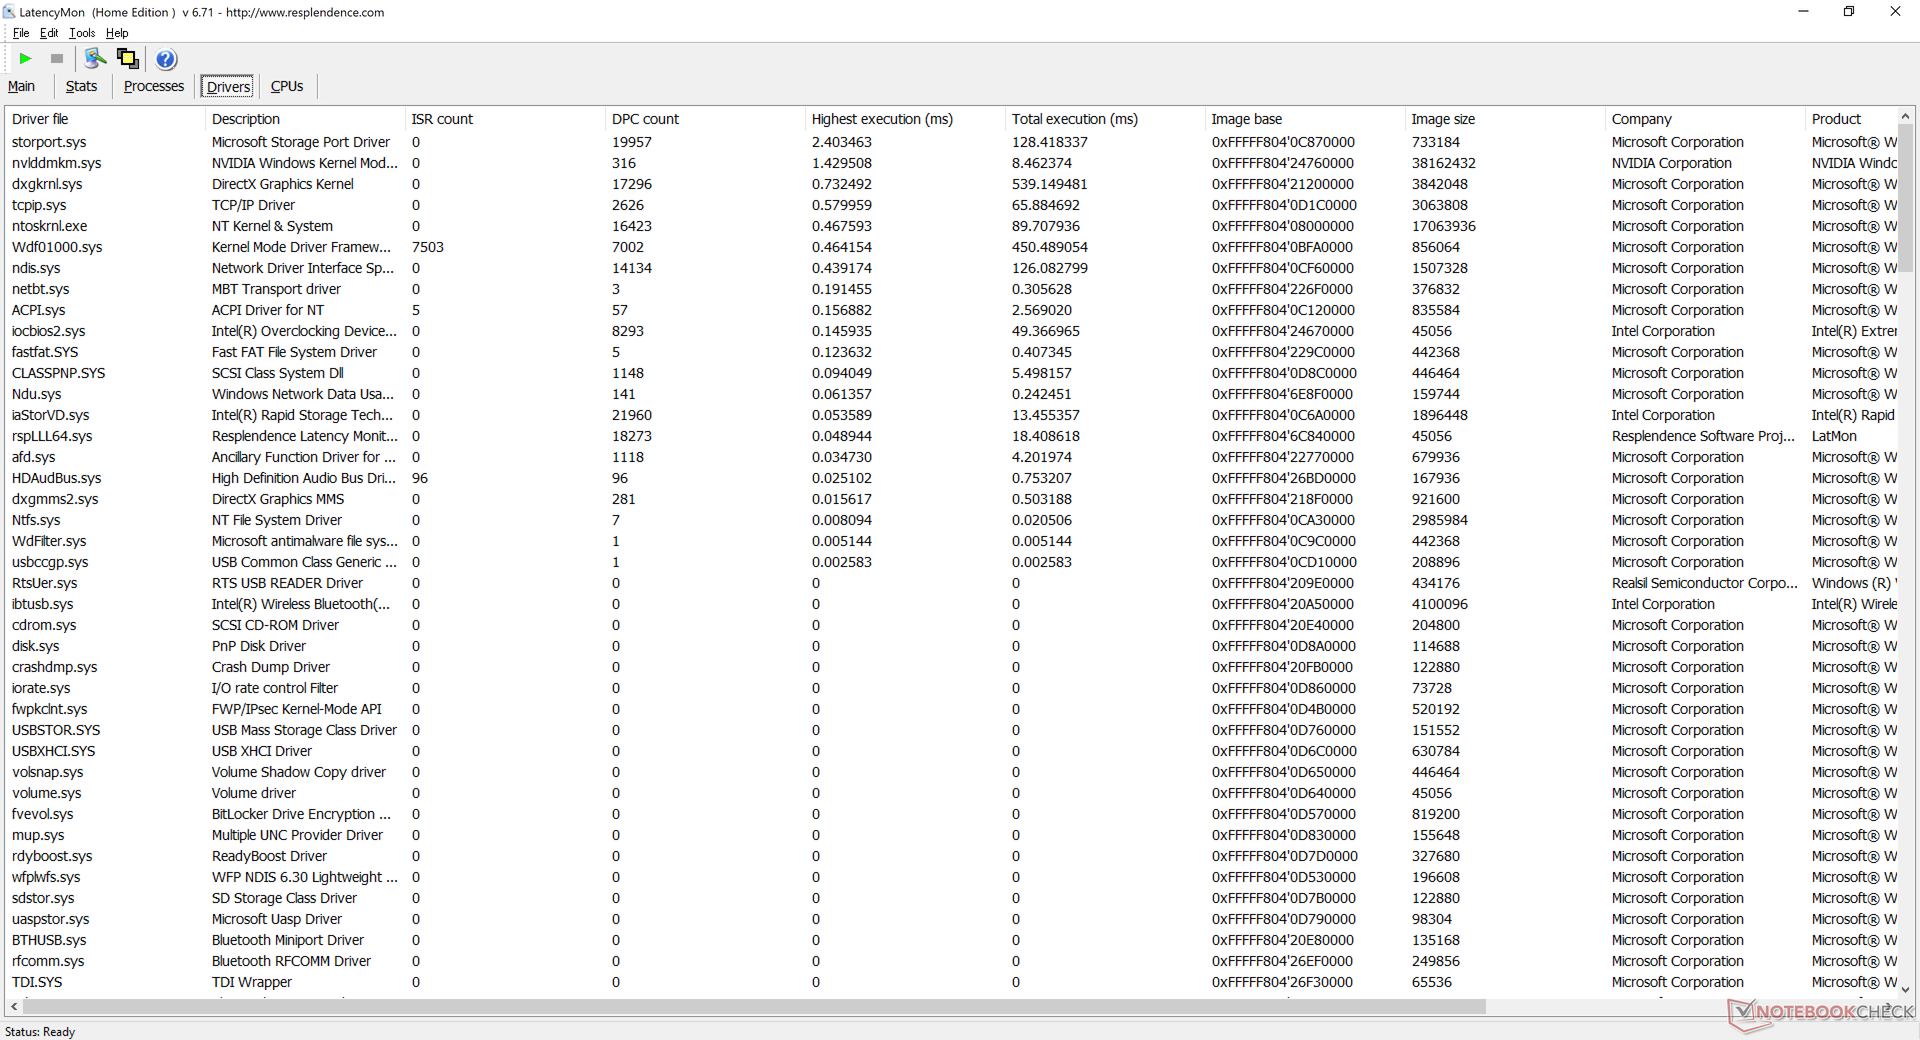
Latenza DPC
LatencyMon rivela problemi di latenza DPC quando si aprono più schede del browser sulla nostra homepage e quando si esegue lo stress Prime95. La riproduzione di video 4K a 60 FPS è per il resto perfetta senza perdita di fotogrammi.
| DPC Latencies / LatencyMon - interrupt to process latency (max), Web, Youtube, Prime95 | |
| Alienware x17 RTX 3080 P48E | |
| Gigabyte Aero 17 HDR YD | |
| Asus ROG Zephyrus S17 GX703HSD | |
| MSI GS76 Stealth 11UH | |
| Alienware m17 R4 | |
| Razer Blade 17 RTX 3070 | |
* ... Meglio usare valori piccoli
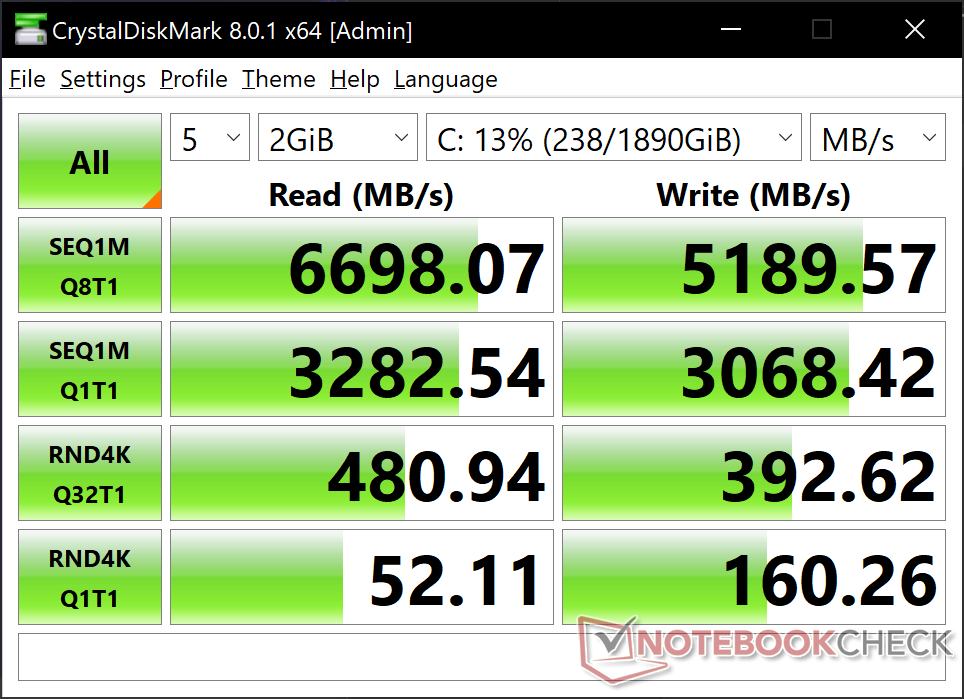
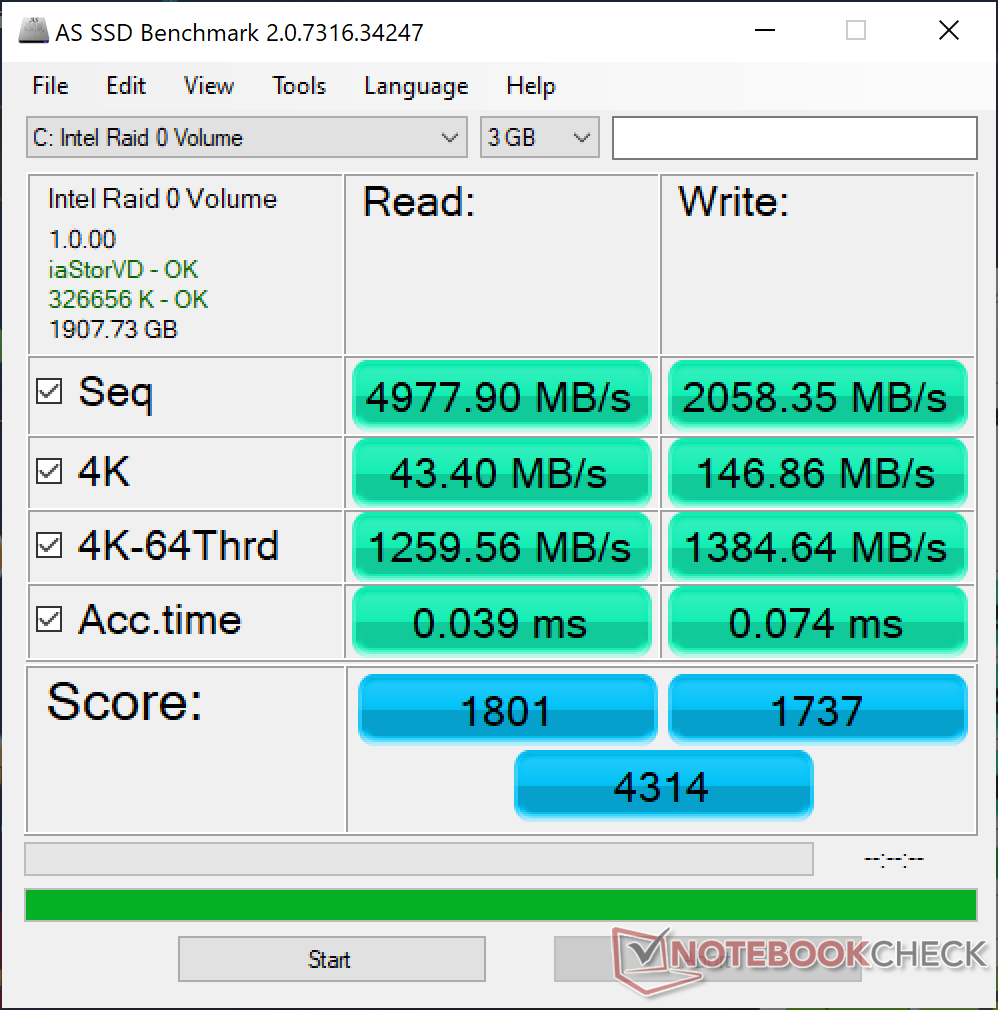
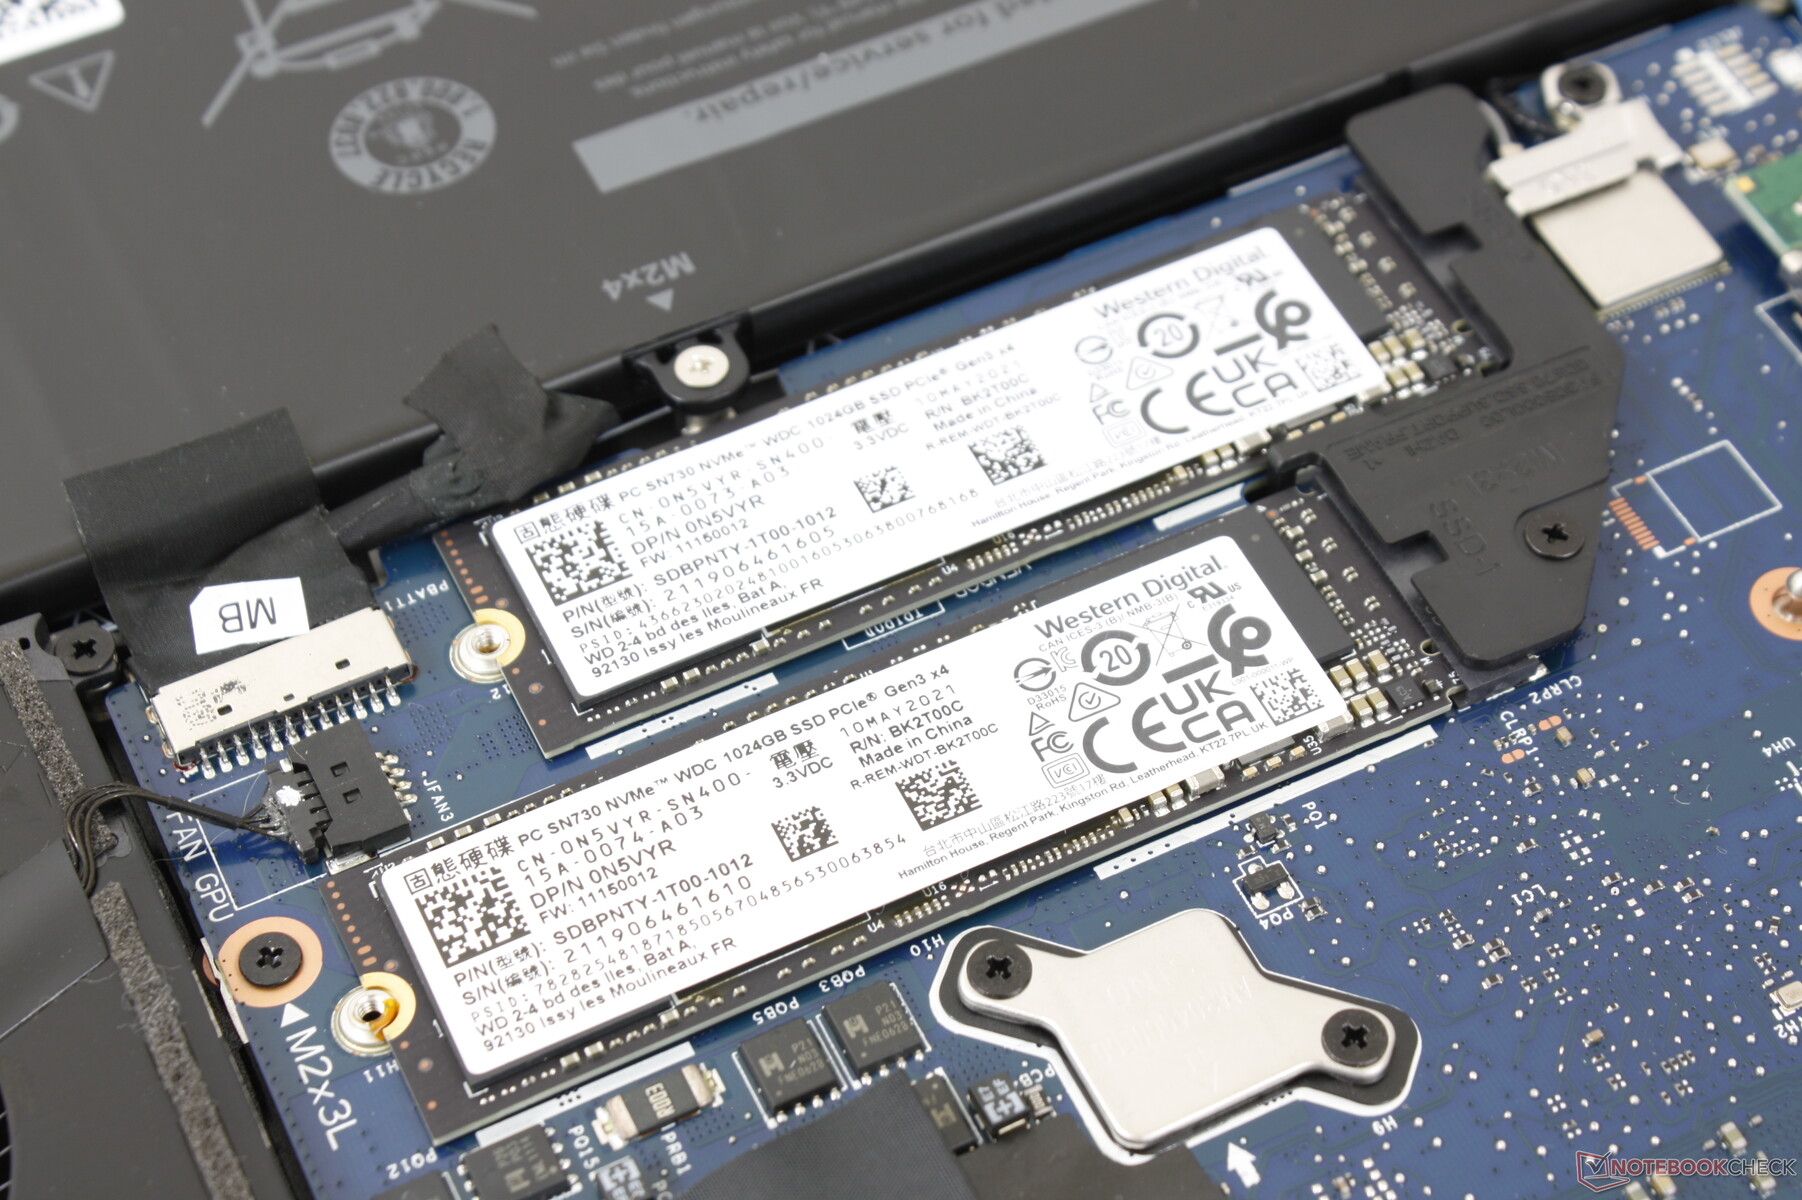
Dispositivi di archiviazione - Un PCIe4 e un PCIe3
La nostra unità di test è dotata di due SSD WD SN730 NVMe da 1 TB in RAID 0 per velocità di lettura e scrittura sequenziale fino a 6700 MB/s e 4300 MB/s, rispettivamente, risultando essere più veloce di qualsiasi singolo SSD PCIe3 disponibile. Tuttavia, un singolo Samsung PM9A1 SSD PCIe4 supererà ancora la nostra configurazione PCIe3 RAID 0. Dell dice che il sistema può supportare fino a un SSD PCIe4 se gli utenti vogliono installarne uno da soli.
| Alienware x17 RTX 3080 P48E 2x WDC PC SN730 SDBPNTY-1T00 (RAID 0) | Alienware m17 R4 2x Micron 2300 512 GB (RAID 0) | Razer Blade 17 RTX 3070 Samsung PM9A1 MZVL21T0HCLR | Asus ROG Zephyrus S17 GX703HSD Samsung PM9A1 MZVL22T0HBLB | MSI GS76 Stealth 11UH Samsung PM9A1 MZVL22T0HBLB | Gigabyte Aero 17 HDR YD Samsung PM9A1 MZVL2512HCJQ | |
|---|---|---|---|---|---|---|
| AS SSD | -12% | 52% | 67% | 68% | 66% | |
| Seq Read (MB/s) | 4978 | 2733 -45% | 5302 7% | 5085 2% | 5408 9% | 5438 9% |
| Seq Write (MB/s) | 2058 | 2822 37% | 3977 93% | 4434 115% | 3863 88% | 3904 90% |
| 4K Read (MB/s) | 43.4 | 45.04 4% | 55 27% | 80.3 85% | 52.7 21% | 56.2 29% |
| 4K Write (MB/s) | 146.9 | 88.4 -40% | 148.7 1% | 214.7 46% | 153.1 4% | 165.8 13% |
| 4K-64 Read (MB/s) | 1260 | 1388 10% | 2715 115% | 2573 104% | 2692 114% | 2489 98% |
| 4K-64 Write (MB/s) | 1385 | 1227 -11% | 3416 147% | 2972 115% | 3414 146% | 3480 151% |
| Access Time Read * (ms) | 0.039 | 0.079 -103% | 0.044 -13% | 0.018 54% | 0.046 -18% | 0.054 -38% |
| Access Time Write * (ms) | 0.074 | 0.095 -28% | 0.085 -15% | 0.02 73% | 0.027 64% | 0.026 65% |
| Score Read (Points) | 1801 | 1706 -5% | 3300 83% | 3161 76% | 3285 82% | 3089 72% |
| Score Write (Points) | 1737 | 1598 -8% | 3963 128% | 3631 109% | 3953 128% | 4036 132% |
| Score Total (Points) | 4314 | 4184 -3% | 8874 106% | 8380 94% | 8830 105% | 8620 100% |
| Copy ISO MB/s (MB/s) | 2009 | 2414 20% | 2710 35% | 3239 61% | ||
| Copy Program MB/s (MB/s) | 1099 | 1030 -6% | 1114 1% | 899 -18% | ||
| Copy Game MB/s (MB/s) | 1881 | 1991 6% | 2095 11% | 2171 15% | ||
| CrystalDiskMark 5.2 / 6 | -16% | 38% | 41% | 39% | 42% | |
| Write 4K (MB/s) | 159.2 | 93.1 -42% | 233.5 47% | 244.2 53% | 230.7 45% | 230.4 45% |
| Read 4K (MB/s) | 51.9 | 46.79 -10% | 90.1 74% | 89.8 73% | 87.9 69% | 91.6 76% |
| Write Seq (MB/s) | 3115 | 2853 -8% | 4263 37% | 4300 38% | 4216 35% | |
| Read Seq (MB/s) | 3298 | 2556 -22% | 4468 35% | 4392 33% | 4543 38% | |
| Write 4K Q32T1 (MB/s) | 392.6 | 475 21% | 538 37% | 607 55% | 582 48% | 667 70% |
| Read 4K Q32T1 (MB/s) | 474.7 | 529 11% | 703 48% | 658 39% | 730 54% | 728 53% |
| Write Seq Q32T1 (MB/s) | 4331 | 3331 -23% | 5097 18% | 5270 22% | 5152 19% | 5043 16% |
| Read Seq Q32T1 (MB/s) | 6746 | 3319 -51% | 7065 5% | 7091 5% | 7094 5% | 6821 1% |
| Write 4K Q8T8 (MB/s) | 2270 | |||||
| Read 4K Q8T8 (MB/s) | 2490 | |||||
| Media totale (Programma / Settaggio) | -14% /
-13% | 45% /
47% | 54% /
59% | 54% /
55% | 54% /
56% |
* ... Meglio usare valori piccoli

Throttling Disco: DiskSpd Read Loop, Queue Depth 8
Prestazioni della GPU - appena un po' più alte della media
Nonostante i 165 W di grafica RTX 3080, le prestazioni grezze sono solo dal 2% al 9% più veloci del laptop RTX 3080 medio nel nostro database, probabilmente a causa di rendimenti decrescenti a obiettivi TGP più elevati. Il vantaggio minore può essere visto anche quando si eseguono i giochi visto che i frame rates sono di nuovo solo pochi punti percentuali più alti in media. Tuttavia, la differenza di prestazioni diventa più pronunciata rispetto alla RTX 3080 da 90 W dell'MSI GS76, dove il nostro Alienware può essere circa dal 15% al 30% più veloce in alcuni titoli. Un pC desktop con grafica RTX 3080 supererà comunque qualsiasi portatile RTX 3080 di circa il 40-45%.
Da fermo con The Witcher 3 per più di un'ora mostra un frame rate stabile senza cali casuali che suggeriscono che non ci sia un'interruzione dell'attività in background durante il gioco, a differenza di quanto abbiamo osservato su alcuni vecchi modelli Alienware m15.
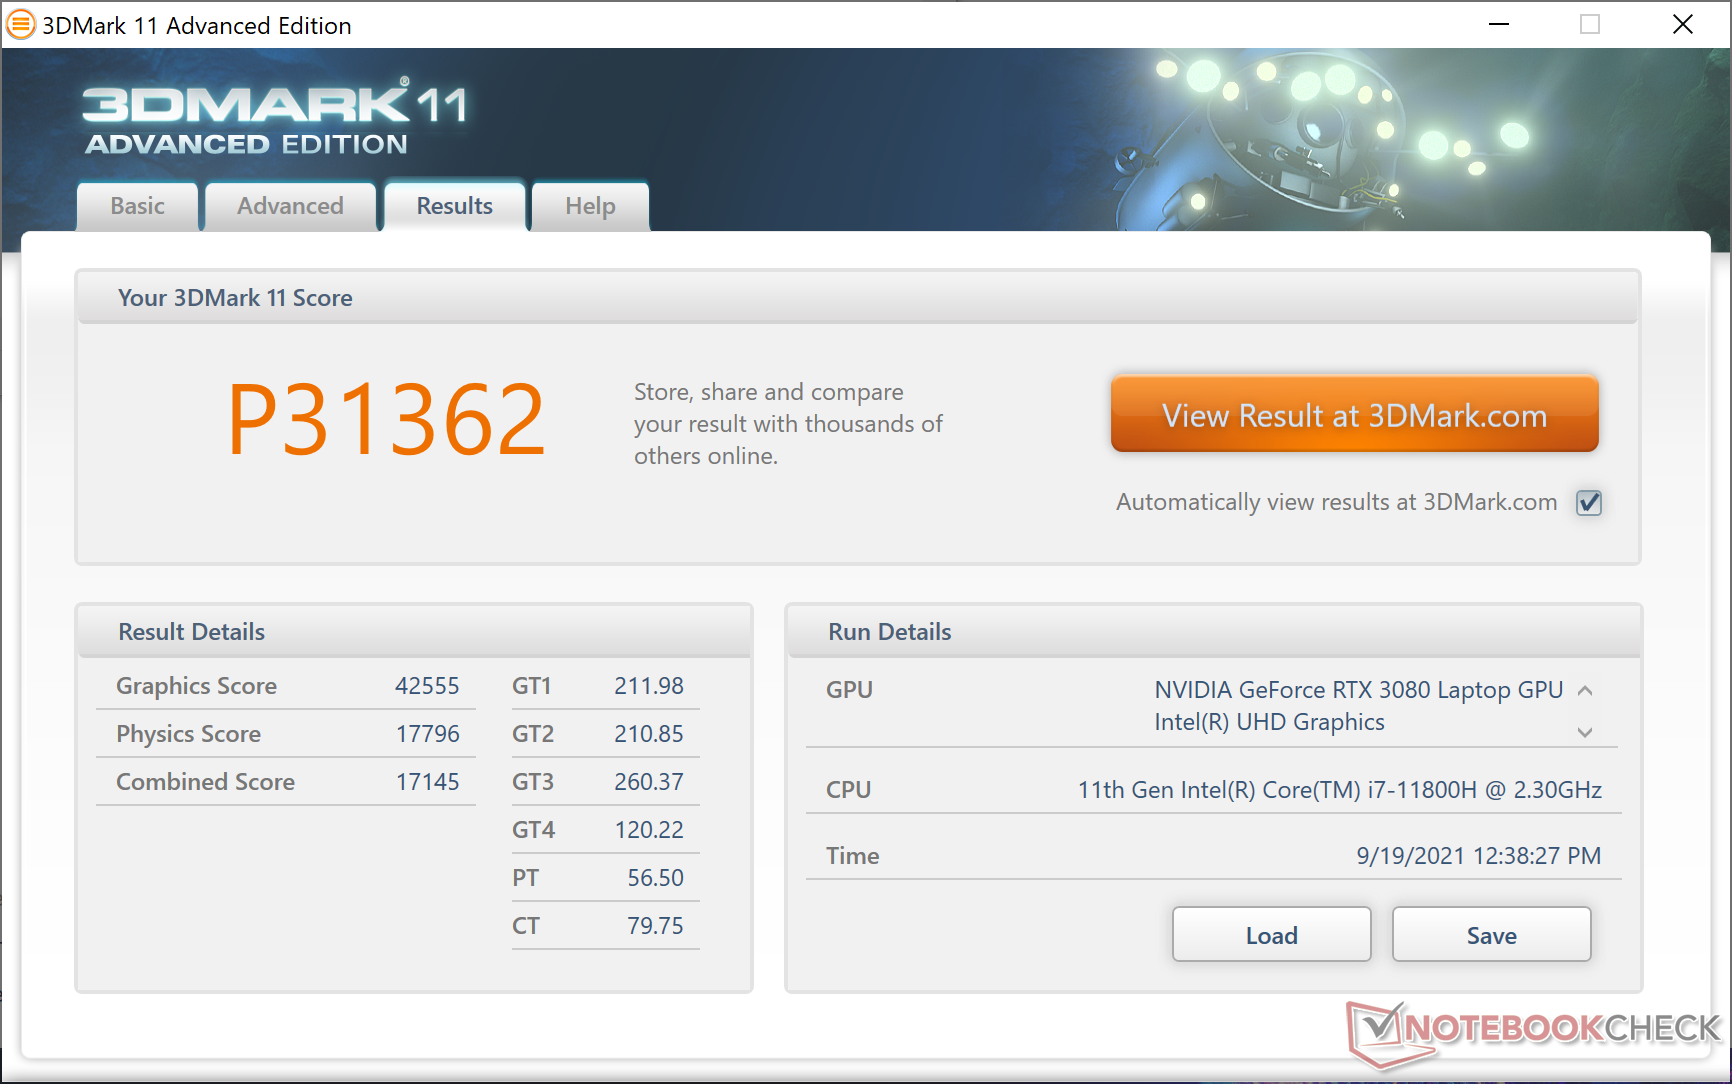

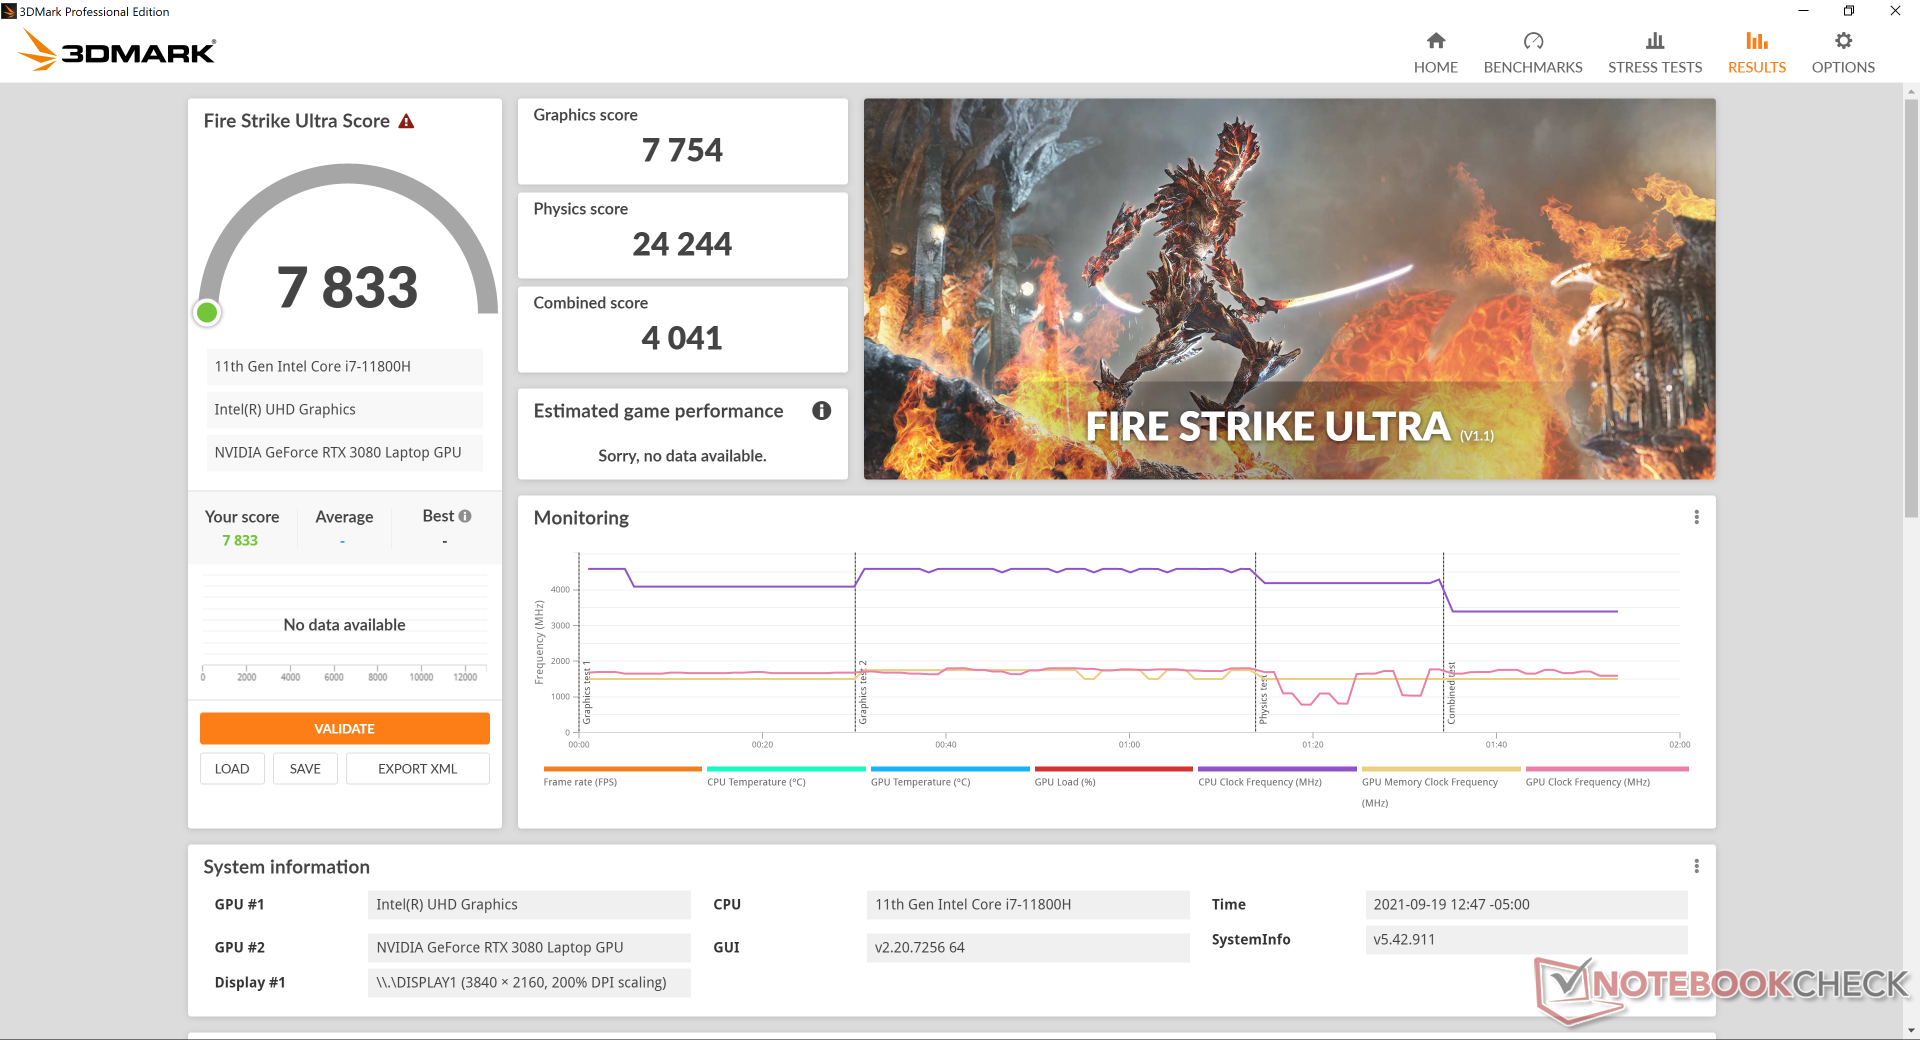
| 3DMark 11 Performance | 31362 punti | |
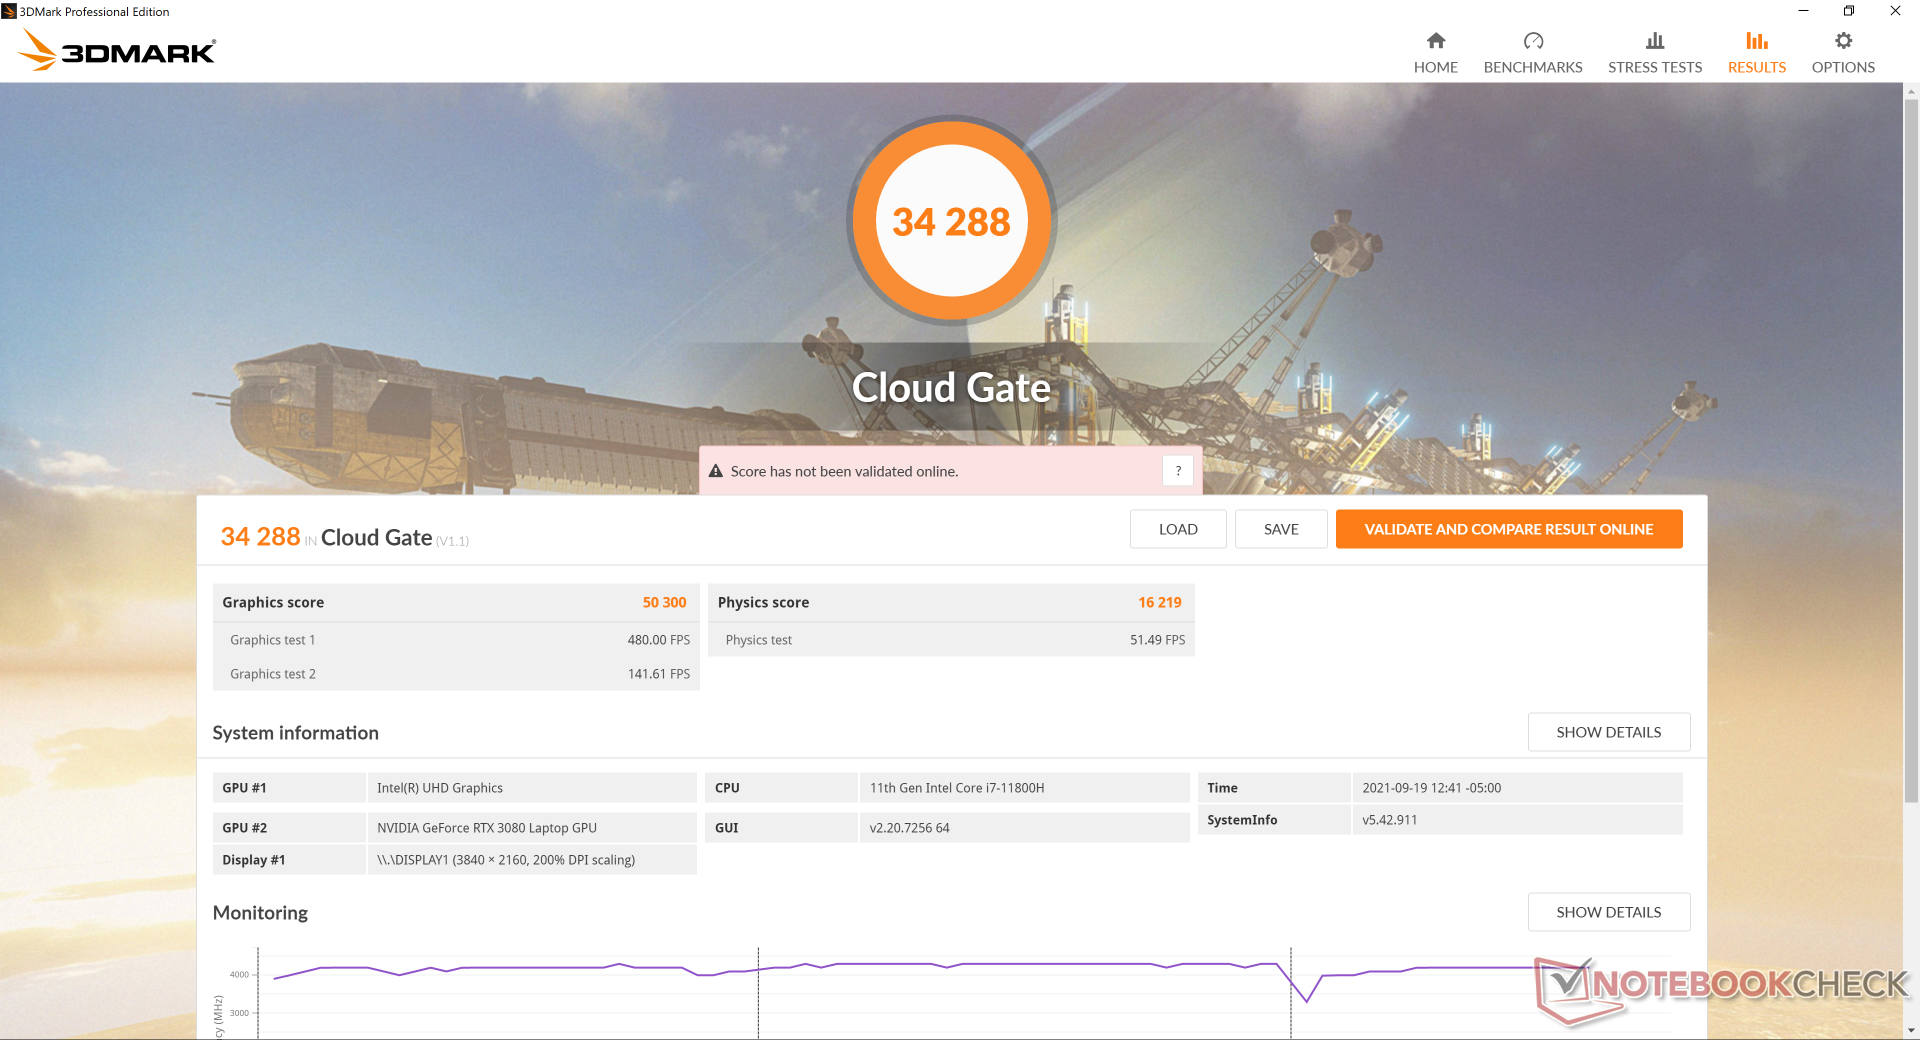
| 3DMark Cloud Gate Standard Score | 34288 punti | |
| 3DMark Fire Strike Score | 23159 punti | |
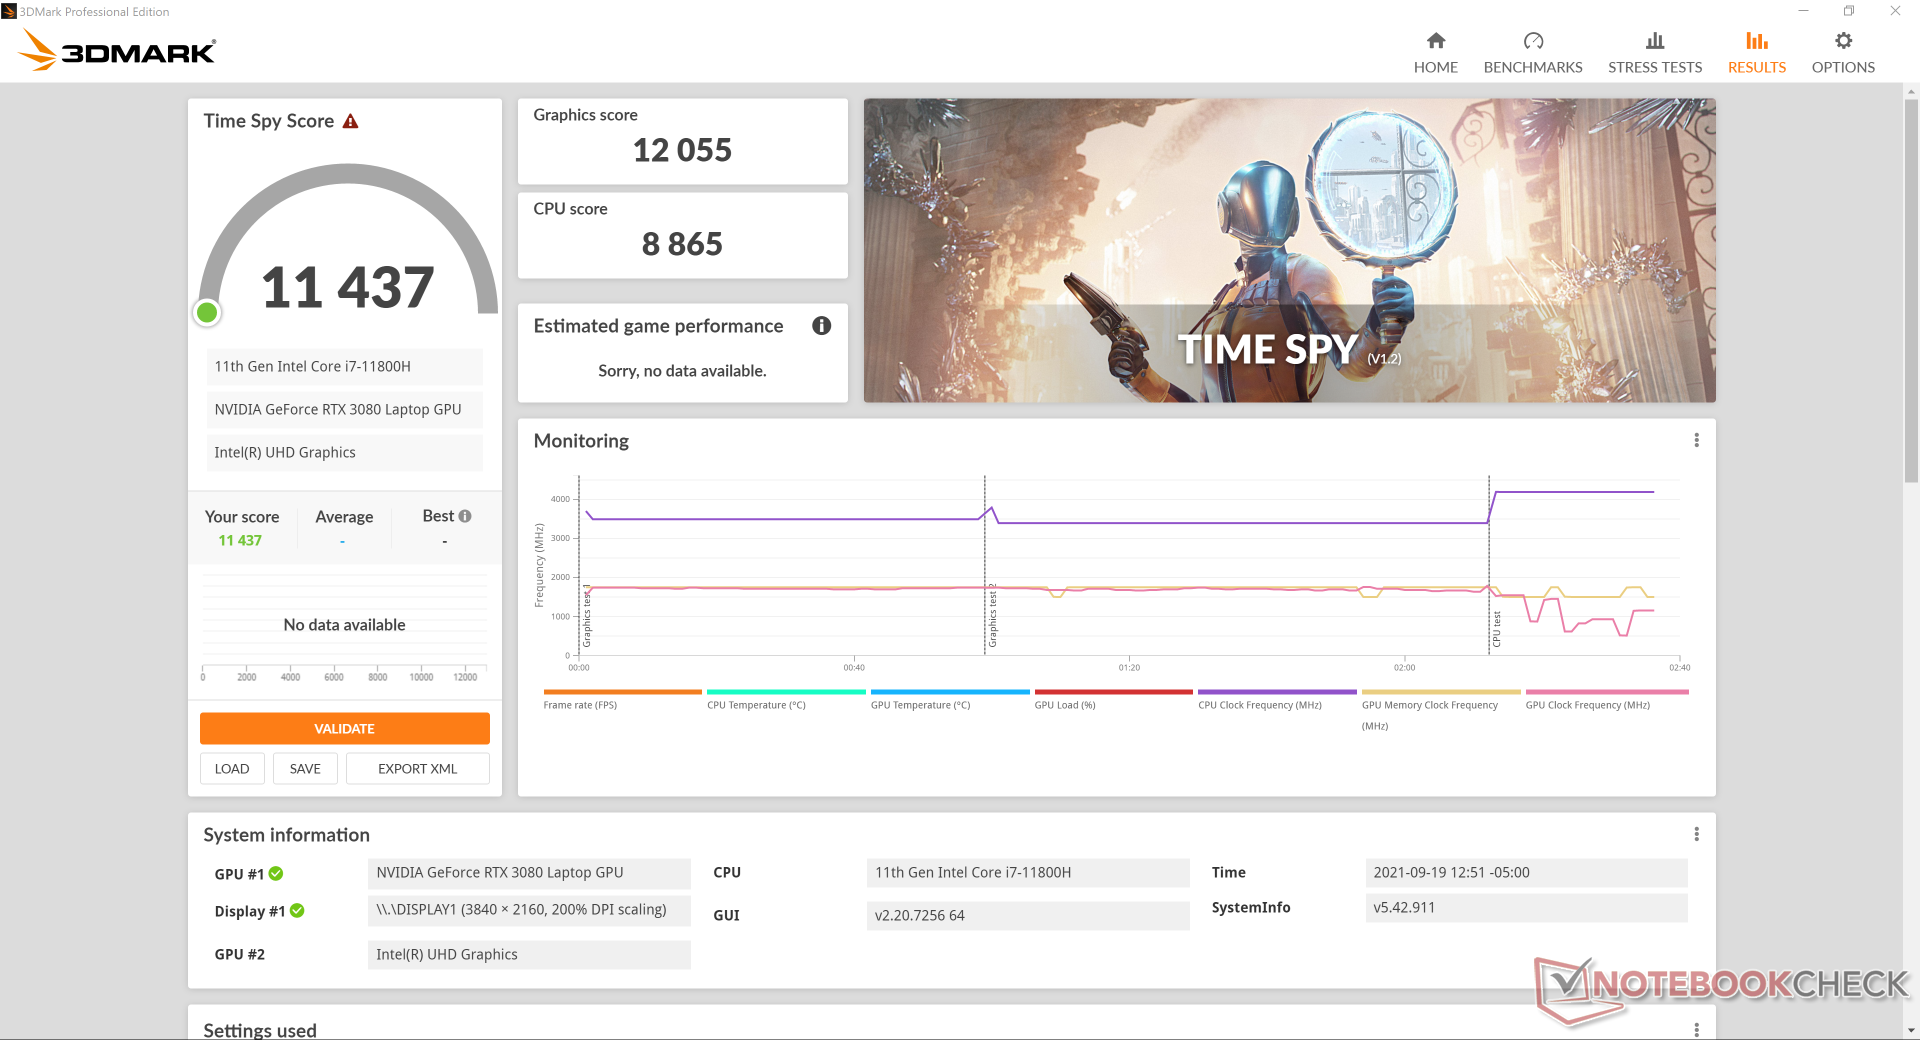
| 3DMark Time Spy Score | 11437 punti | |
Aiuto | ||
Grafico FPS The Witcher 3
| basso | medio | alto | ultra | QHD | 4K | |
|---|---|---|---|---|---|---|
| GTA V (2015) | 183 | 176 | 163 | 98.1 | 89.2 | 98.1 |
| The Witcher 3 (2015) | 370.2 | 294 | 192 | 105.2 | 80.2 | |
| Dota 2 Reborn (2015) | 164 | 148 | 143 | 135 | 111 | |
| Final Fantasy XV Benchmark (2018) | 181 | 134 | 106 | 81.8 | 50.8 | |
| X-Plane 11.11 (2018) | 118 | 99.3 | 79.7 | 56.9 | ||
| Far Cry 5 (2018) | 144 | 125 | 120 | 112 | 98 | 63 |
| Strange Brigade (2018) | 456 | 269 | 225 | 199 | 152 | 91.6 |
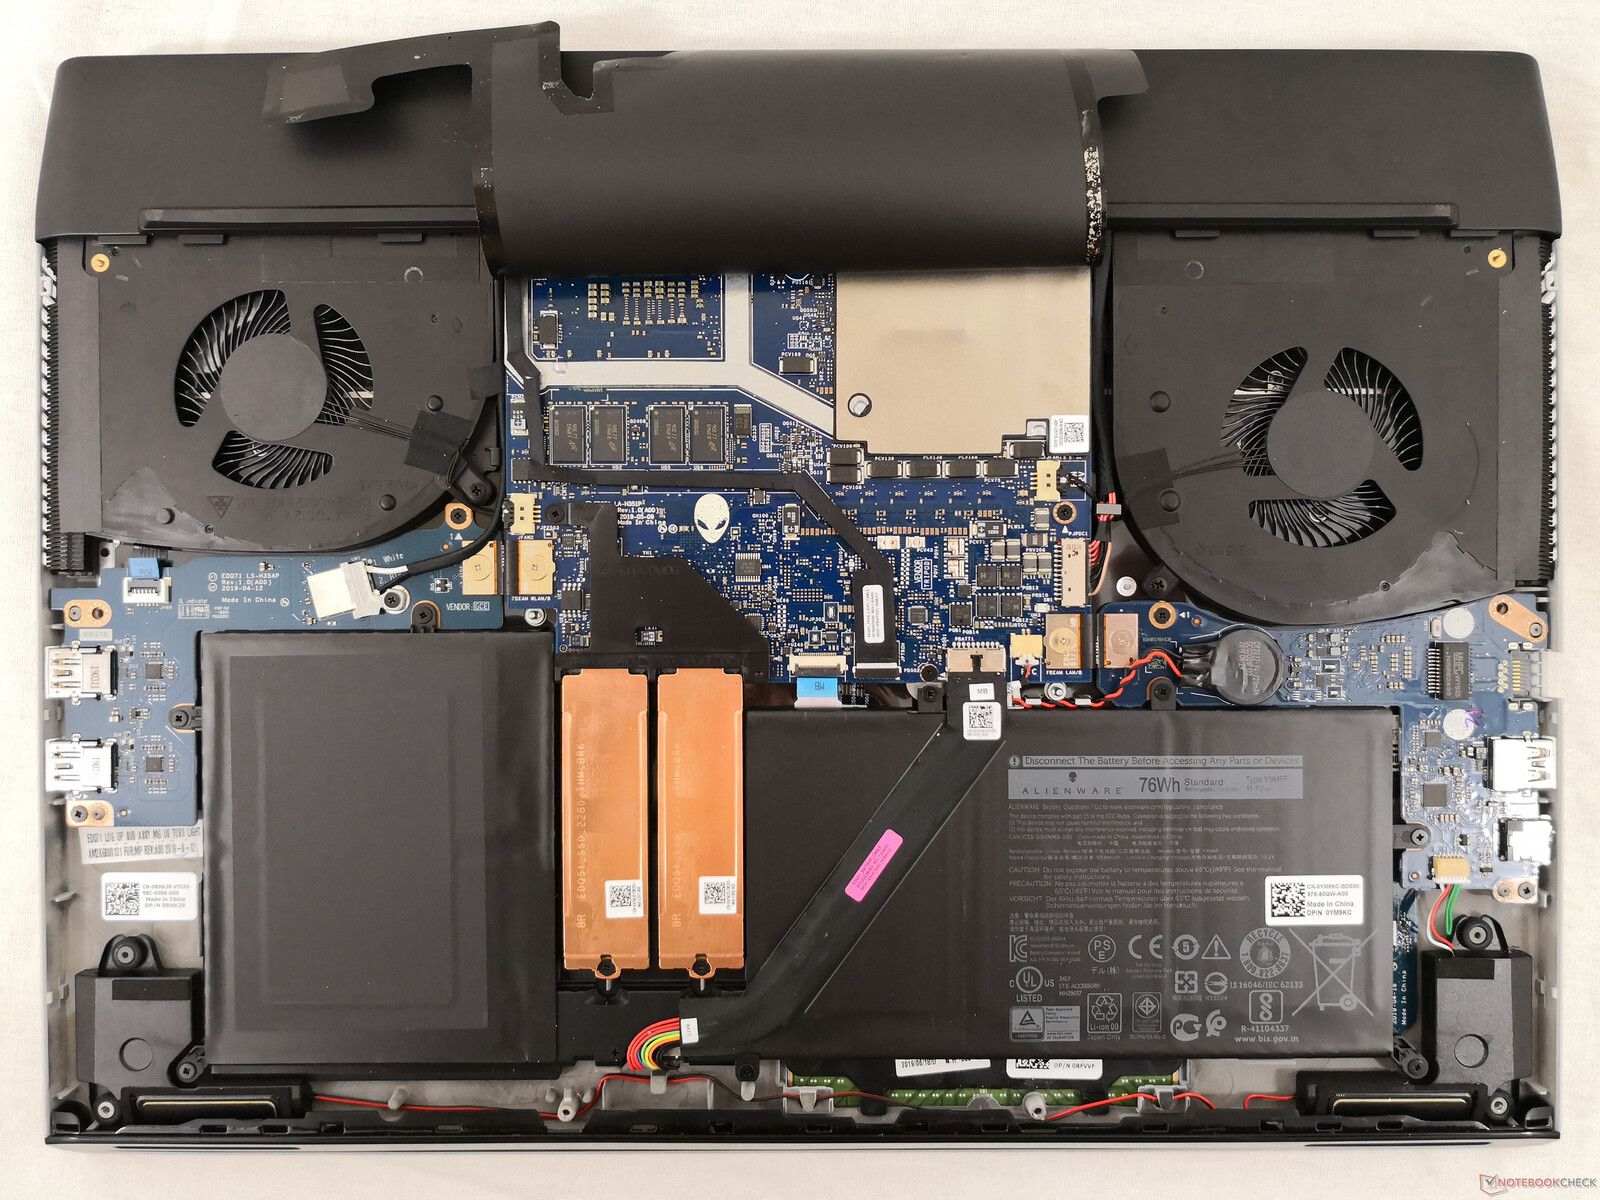
Emissioni
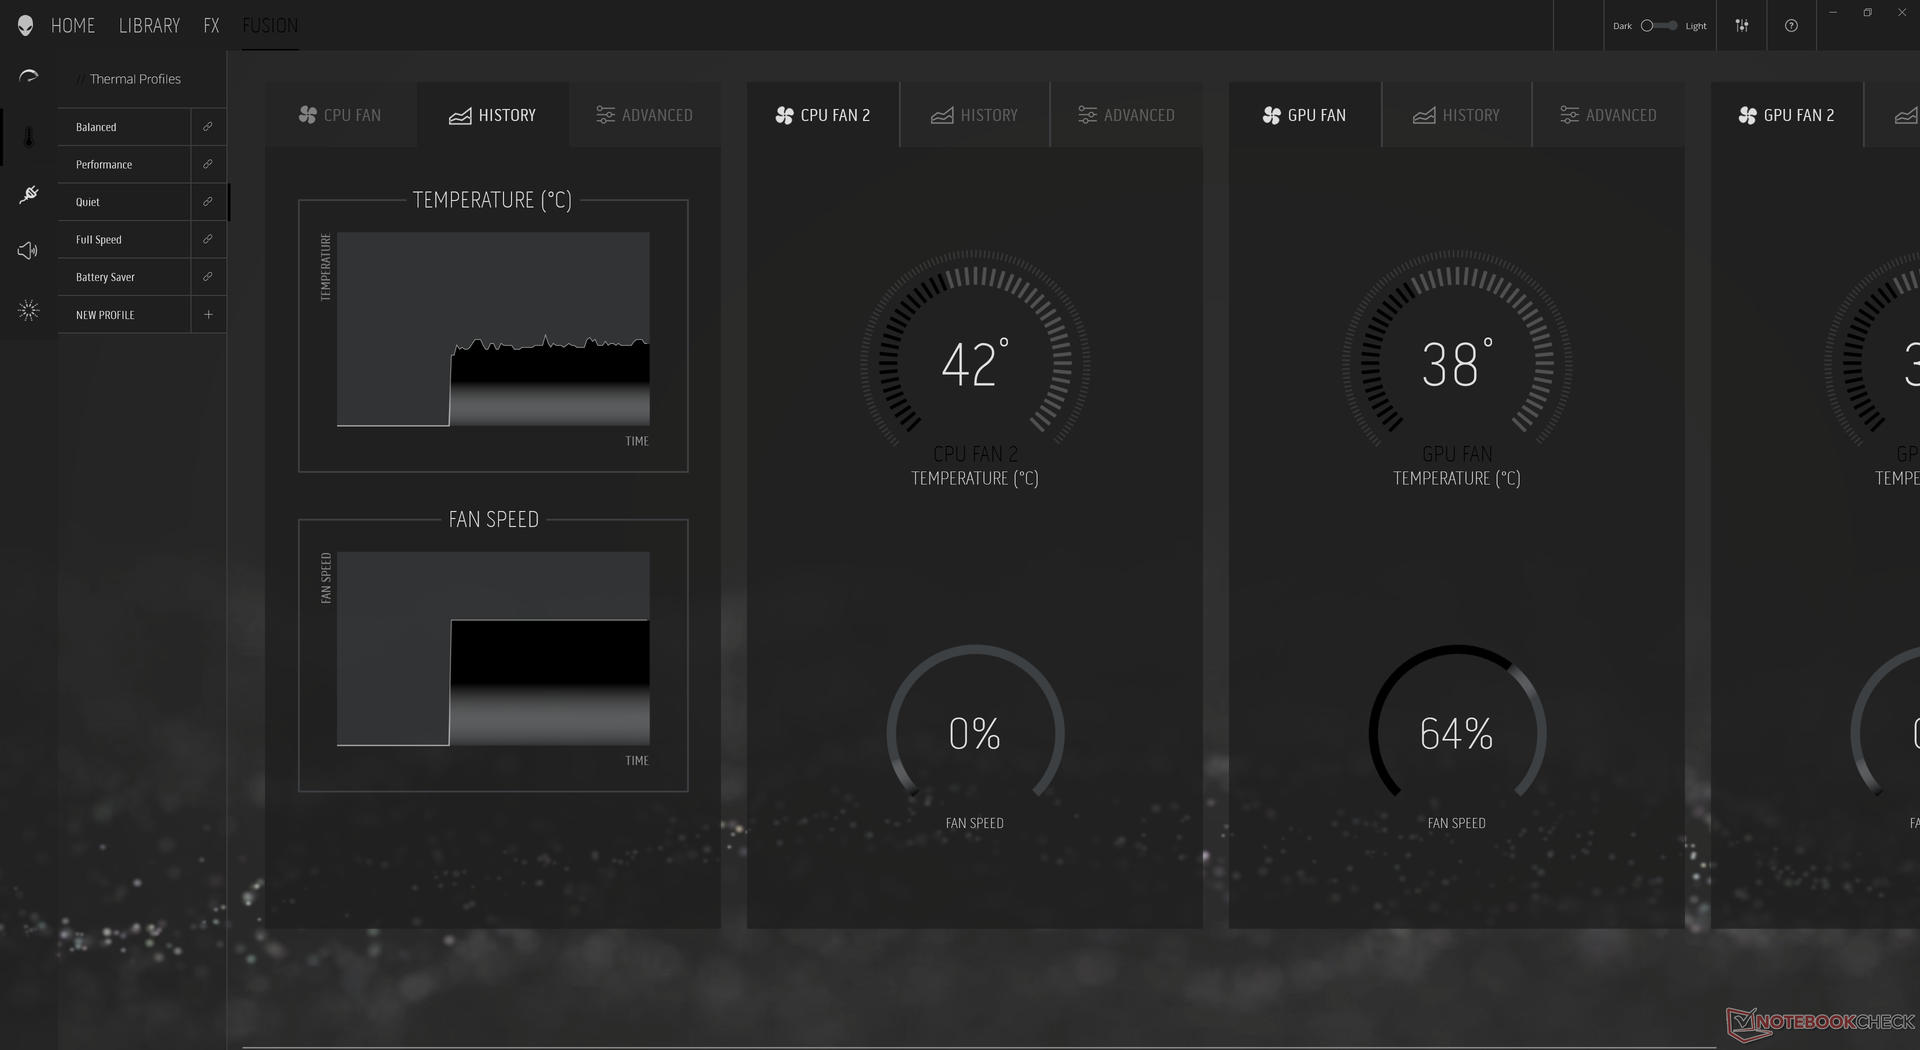
Rumore del sistema - Camera di vapore + pasta termica al gallio-silicone
Il rumore della ventola dipende molto dalle impostazioni dell'Alienware Command Center (Quiet, Performance, e Full Speed). Nonostante abbia due volte più ventole rispetto alla maggior parte degli altri portatili gaming l'Alienware x17 è generalmente molto silenzioso durante i carichi bassi come la navigazione o lo streaming video anche quando è impostato in modalità Performance. Siamo in grado di registrare un rumore della ventola di soli 31,3 dB(A) contro uno sfondo di 24,9 dB(A) quando si esegue 3DMark 06 per 90 secondi. Più a lungo, tuttavia, il rumore della ventola salirebbe a 43.8 dB(A) che è simile a quello che abbiamo registrato su altri portatili gaming.
L'esecuzione di The Witcher 3 in modalità Performance comporta un rumore costante della ventola di 49.7 dB(A). È interessante notare che questo livello rimarrebbe lo stesso anche quando è in modalità bilanciata e quindi i giocatori dovrebbero impostare il sistema in modalità Performance quando possibile. Impostando le ventole in modalità Full Speed, il rumore delle ventole aumenterà fino a 55 dB(A), indipendentemente dal carico sullo schermo. L'Alienware x17 è generalmente più silenzioso del Gigabyte Aero 17 o dell'ultima generazione m17 R4 durante i carichi bassi, ma sono quasi uguali una volta introdotti carichi più alti.
| Alienware x17 RTX 3080 P48E GeForce RTX 3080 Laptop GPU, i7-11800H, 2x WDC PC SN730 SDBPNTY-1T00 (RAID 0) | Alienware m17 R4 GeForce RTX 3080 Laptop GPU, i9-10980HK, 2x Micron 2300 512 GB (RAID 0) | Razer Blade 17 RTX 3070 GeForce RTX 3070 Laptop GPU, i7-11800H, Samsung PM9A1 MZVL21T0HCLR | Asus ROG Zephyrus S17 GX703HSD GeForce RTX 3080 Laptop GPU, i9-11900H, Samsung PM9A1 MZVL22T0HBLB | MSI GS76 Stealth 11UH GeForce RTX 3080 Laptop GPU, i9-11900H, Samsung PM9A1 MZVL22T0HBLB | Gigabyte Aero 17 HDR YD GeForce RTX 3080 Laptop GPU, i9-11980HK, Samsung PM9A1 MZVL2512HCJQ | |
|---|---|---|---|---|---|---|
| Noise | -6% | -3% | 4% | -10% | -20% | |
| off /ambiente * (dB) | 24.9 | 24 4% | 24.2 3% | 23 8% | 24 4% | 25 -0% |
| Idle Minimum * (dB) | 24.9 | 24 4% | 24.7 1% | 23 8% | 24 4% | 30 -20% |
| Idle Average * (dB) | 24.9 | 25 -0% | 24.7 1% | 23 8% | 25 -0% | 32 -29% |
| Idle Maximum * (dB) | 29.6 | 36 -22% | 24.7 17% | 23 22% | 42 -42% | 41 -39% |
| Load Average * (dB) | 31.1 | 45 -45% | 44.3 -42% | 41 -32% | 46 -48% | 43 -38% |
| Witcher 3 ultra * (dB) | 49.7 | 47 5% | 56.3 -13% | 45 9% | 48 3% | 51 -3% |
| Load Maximum * (dB) | 54.8 | 50 9% | 47.7 13% | 52 5% | 48 12% | 59 -8% |
* ... Meglio usare valori piccoli
Rumorosità
| Idle |
| 24.9 / 24.9 / 29.6 dB(A) |
| Sotto carico |
| 31.1 / 54.8 dB(A) |
 | ||
30 dB silenzioso 40 dB(A) udibile 50 dB(A) rumoroso |
||
min: | ||
Temperature
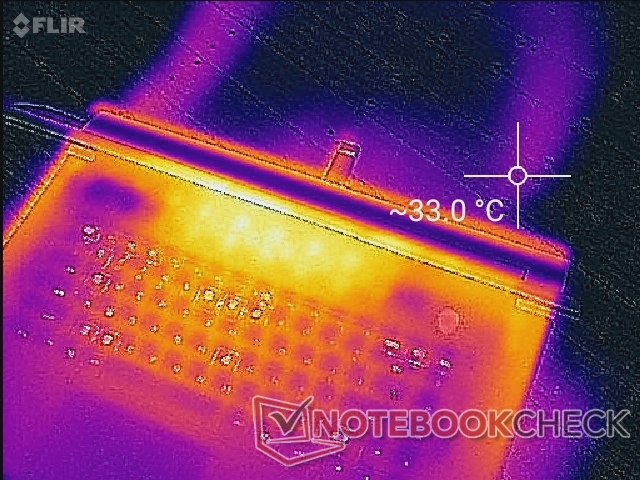
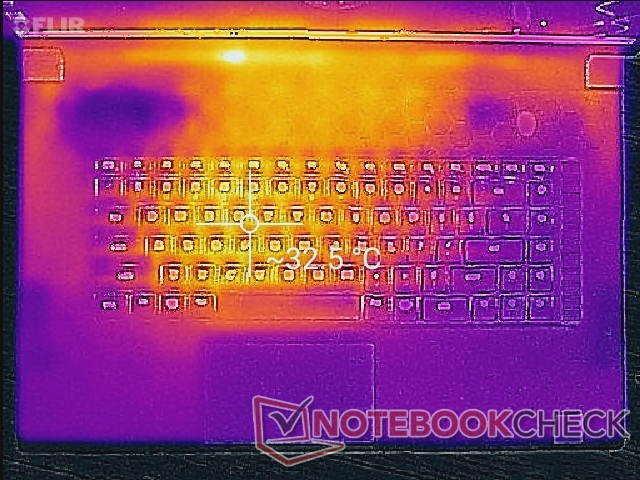
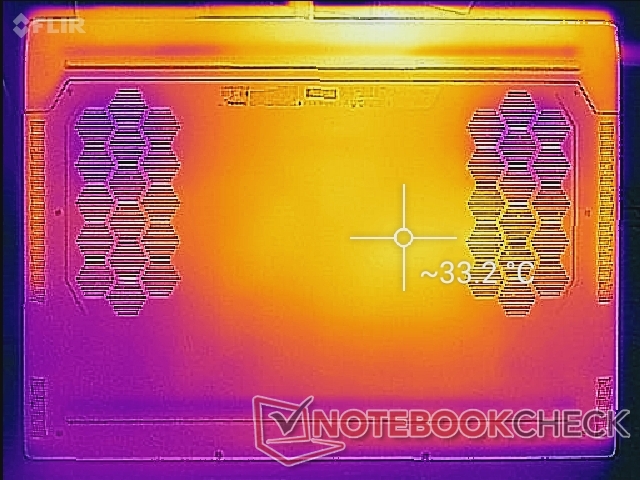
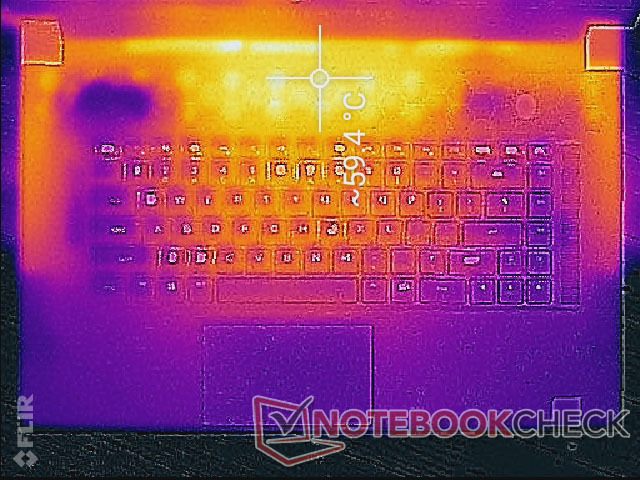
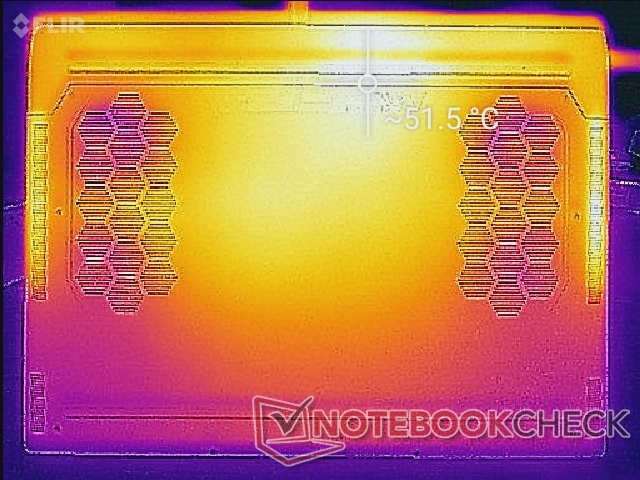
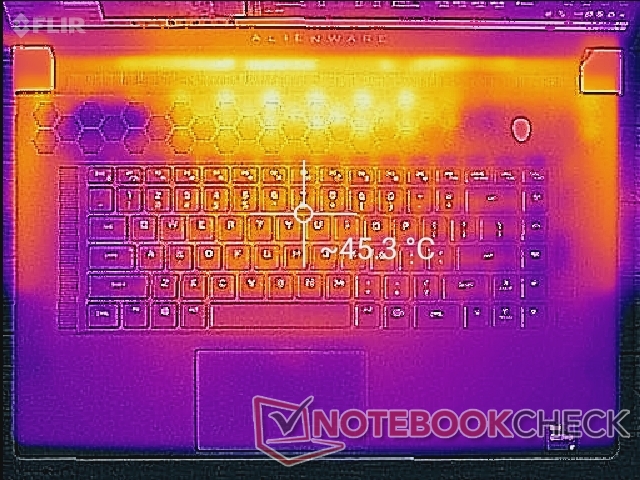
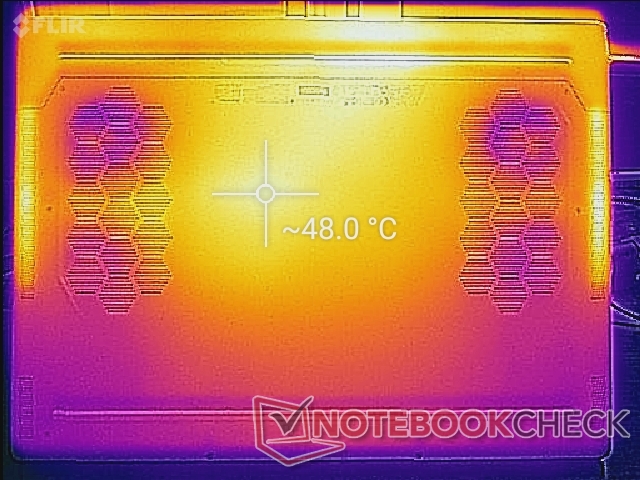
Le temperature di superficie quando sono inattive sono relativamente fresche sui palm rests mentre il centro e il fondo della tastiera possono essere notevolmente più caldi a circa 33° C ciascuno poiché le ventole sono a bassa velocità. Quando si gioca, i punti caldi possono arrivare a 59° C e 52° C sulla parte superiore e inferiore, rispettivamente, o anche 39° C lungo i bordi laterali della tastiera. Questi punti caldi sono generalmente lontani dai poggiapolsi e dalle dita degli utenti risultando essere meno fastidiosi durante il gaming, ma è sicuramente raccomandato di non bloccare nessuna delle numerose griglie di ventilazione intorno al sistema.
Le temperature complessive sono effettivamente più fresche di quelle che abbiamo osservato sull'Asus Zephyrus S17 probabilmente a causa delle dimensioni più spesse e più grandi del nostro telaio Alienware.
(-) La temperatura massima sul lato superiore è di 58.4 °C / 137 F, rispetto alla media di 40.4 °C / 105 F, che varia da 21.2 a 68.8 °C per questa classe Gaming.
(-) Il lato inferiore si riscalda fino ad un massimo di 49 °C / 120 F, rispetto alla media di 43.2 °C / 110 F
(+) In idle, la temperatura media del lato superiore è di 29.5 °C / 85 F, rispetto alla media deld ispositivo di 33.9 °C / 93 F.
(-) Riproducendo The Witcher 3, la temperatura media per il lato superiore e' di 41.4 °C / 107 F, rispetto alla media del dispositivo di 33.9 °C / 93 F.
(+) I poggiapolsi e il touchpad raggiungono la temperatura massima della pelle (32.4 °C / 90.3 F) e quindi non sono caldi.
(-) La temperatura media della zona del palmo della mano di dispositivi simili e'stata di 28.8 °C / 83.8 F (-3.6 °C / -6.5 F).
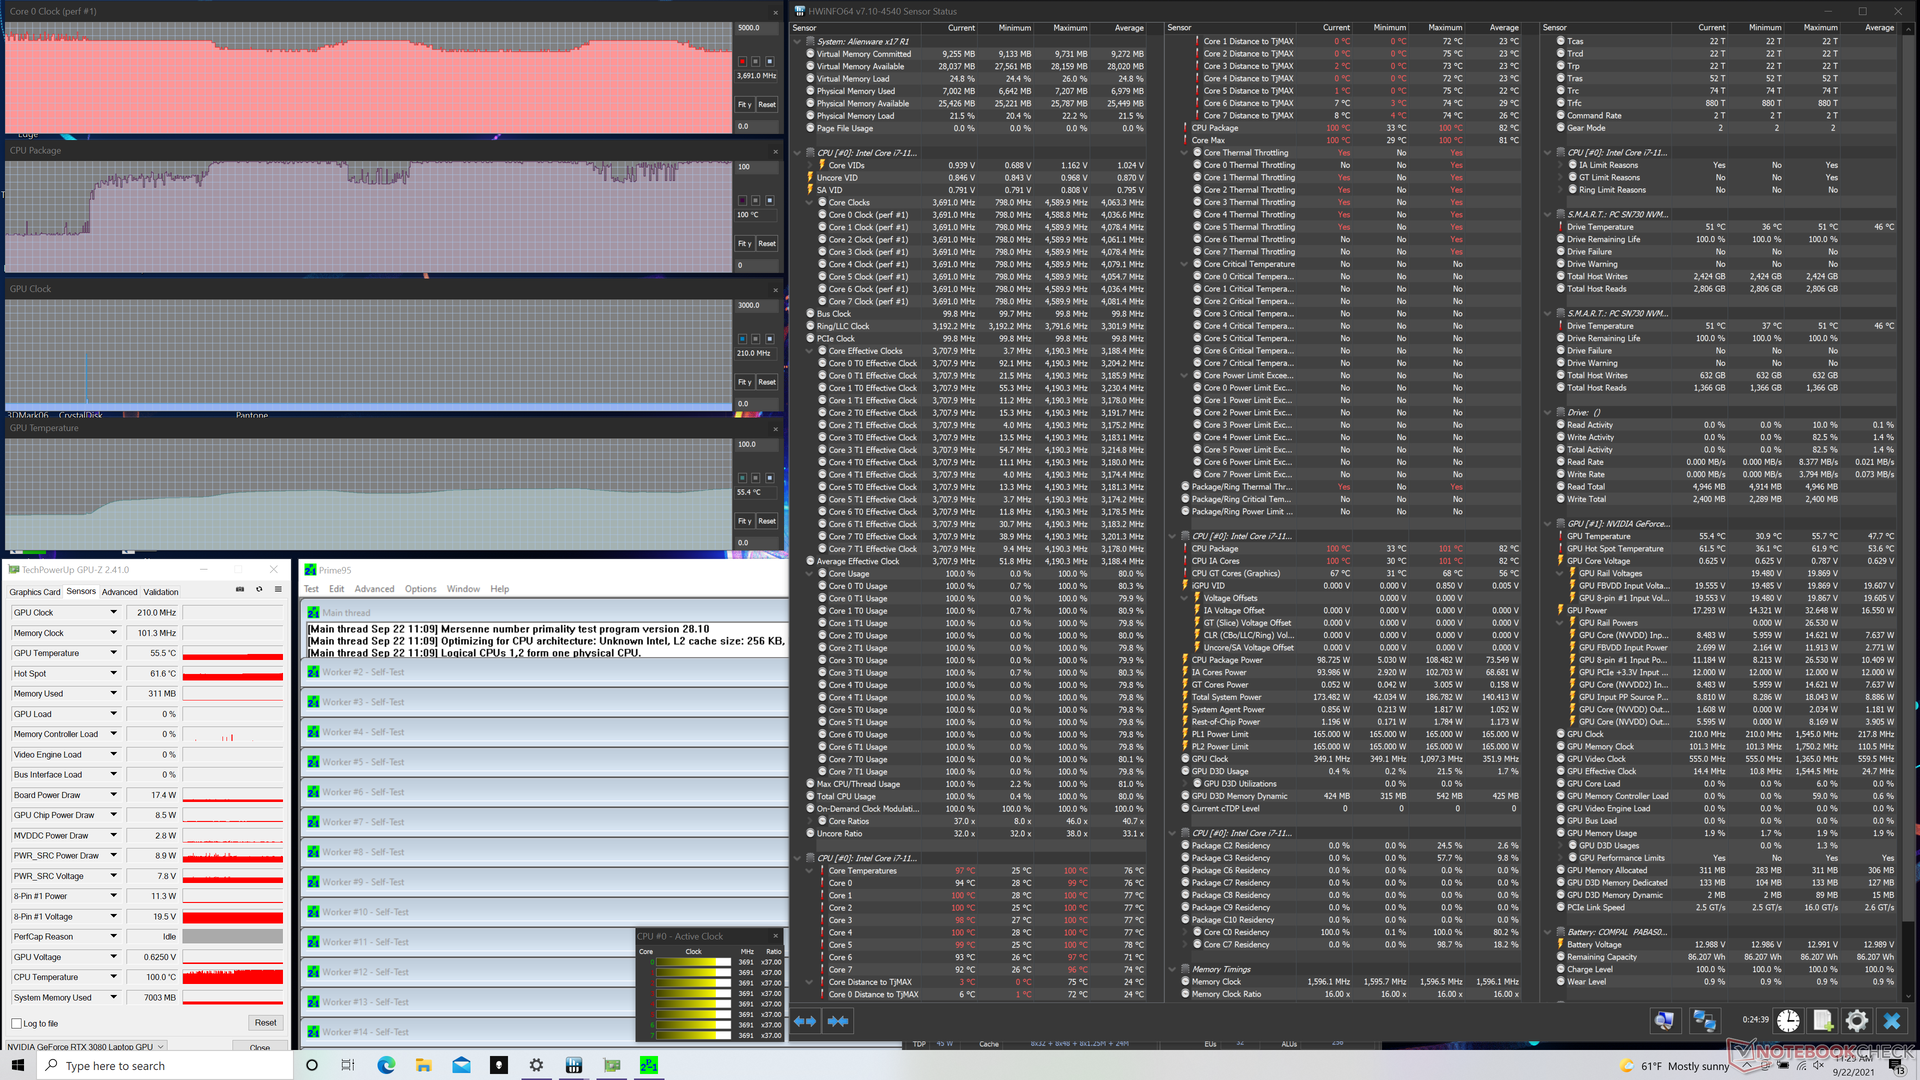
Stress test
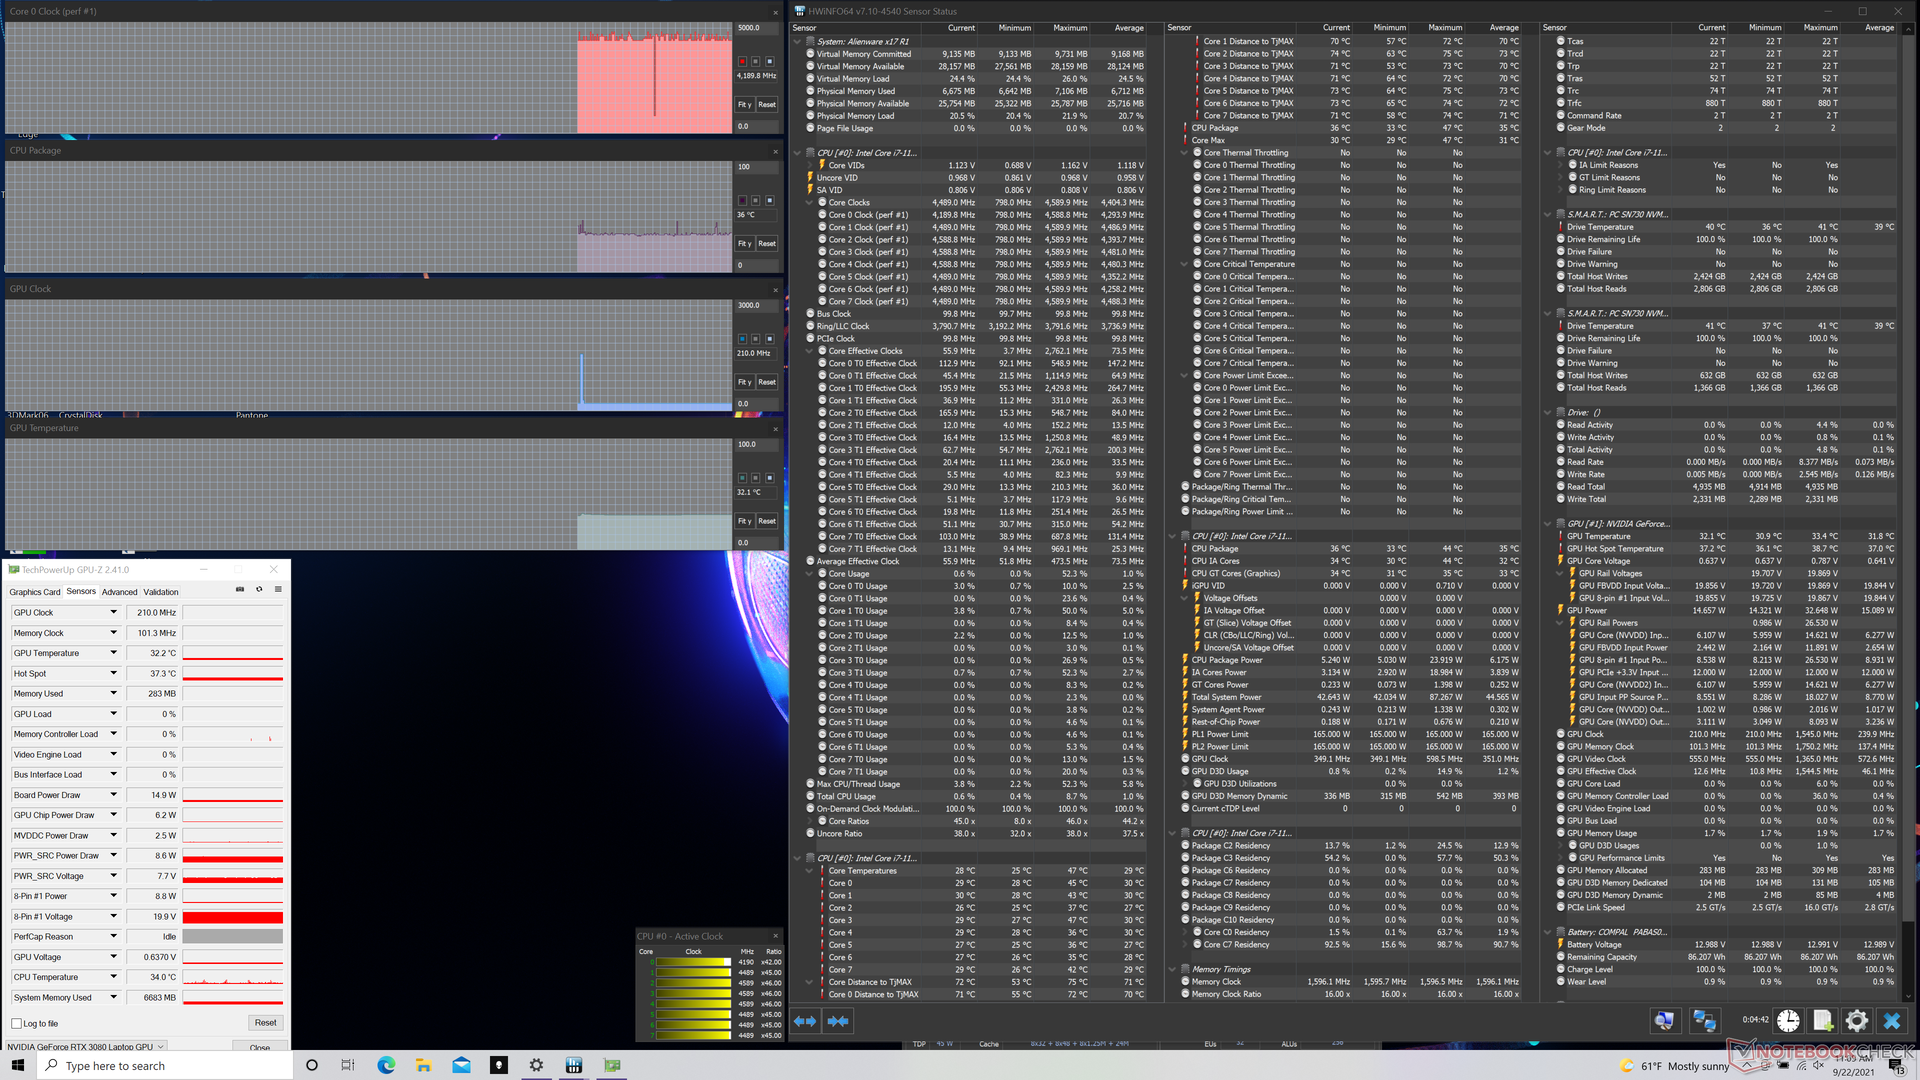
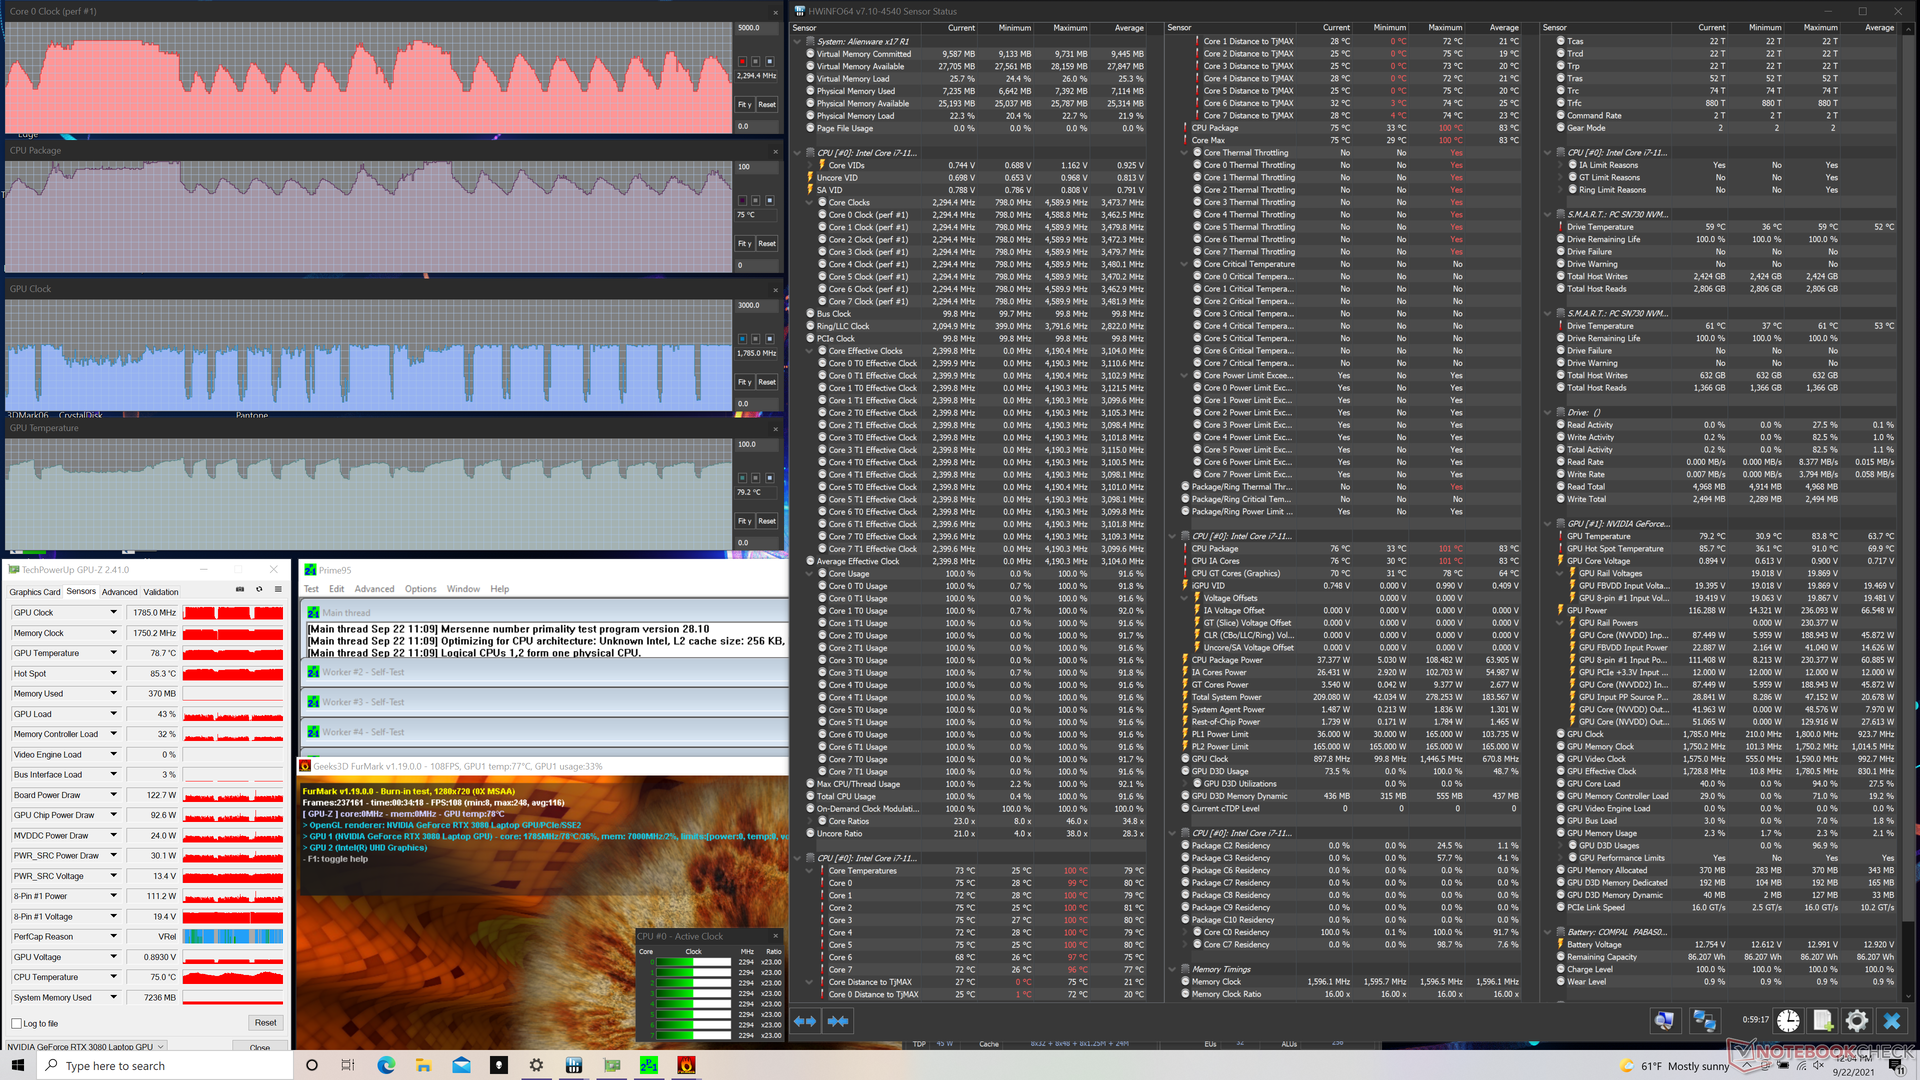
Sottoposta a stress con Prime95, la frequenza di clock della CPU e la temperatura passavano da 3,8 GHz a 4,2 GHz e da 85° C a 100° C ogni due minuti, valori molto alti in generale. Per confronto, il Razer Blade 17 è dotato dello stesso identico processore Core i7-11800H e tuttavia si stabilizzerebbe a soli 2,8 GHz e 78° C quando sottoposto alle stesse condizioni. Entrambe le frequenze di clock della CPU e della GPU si bloccano quando sono al 100% di utilizzo tramite Prime95 e FurMark.
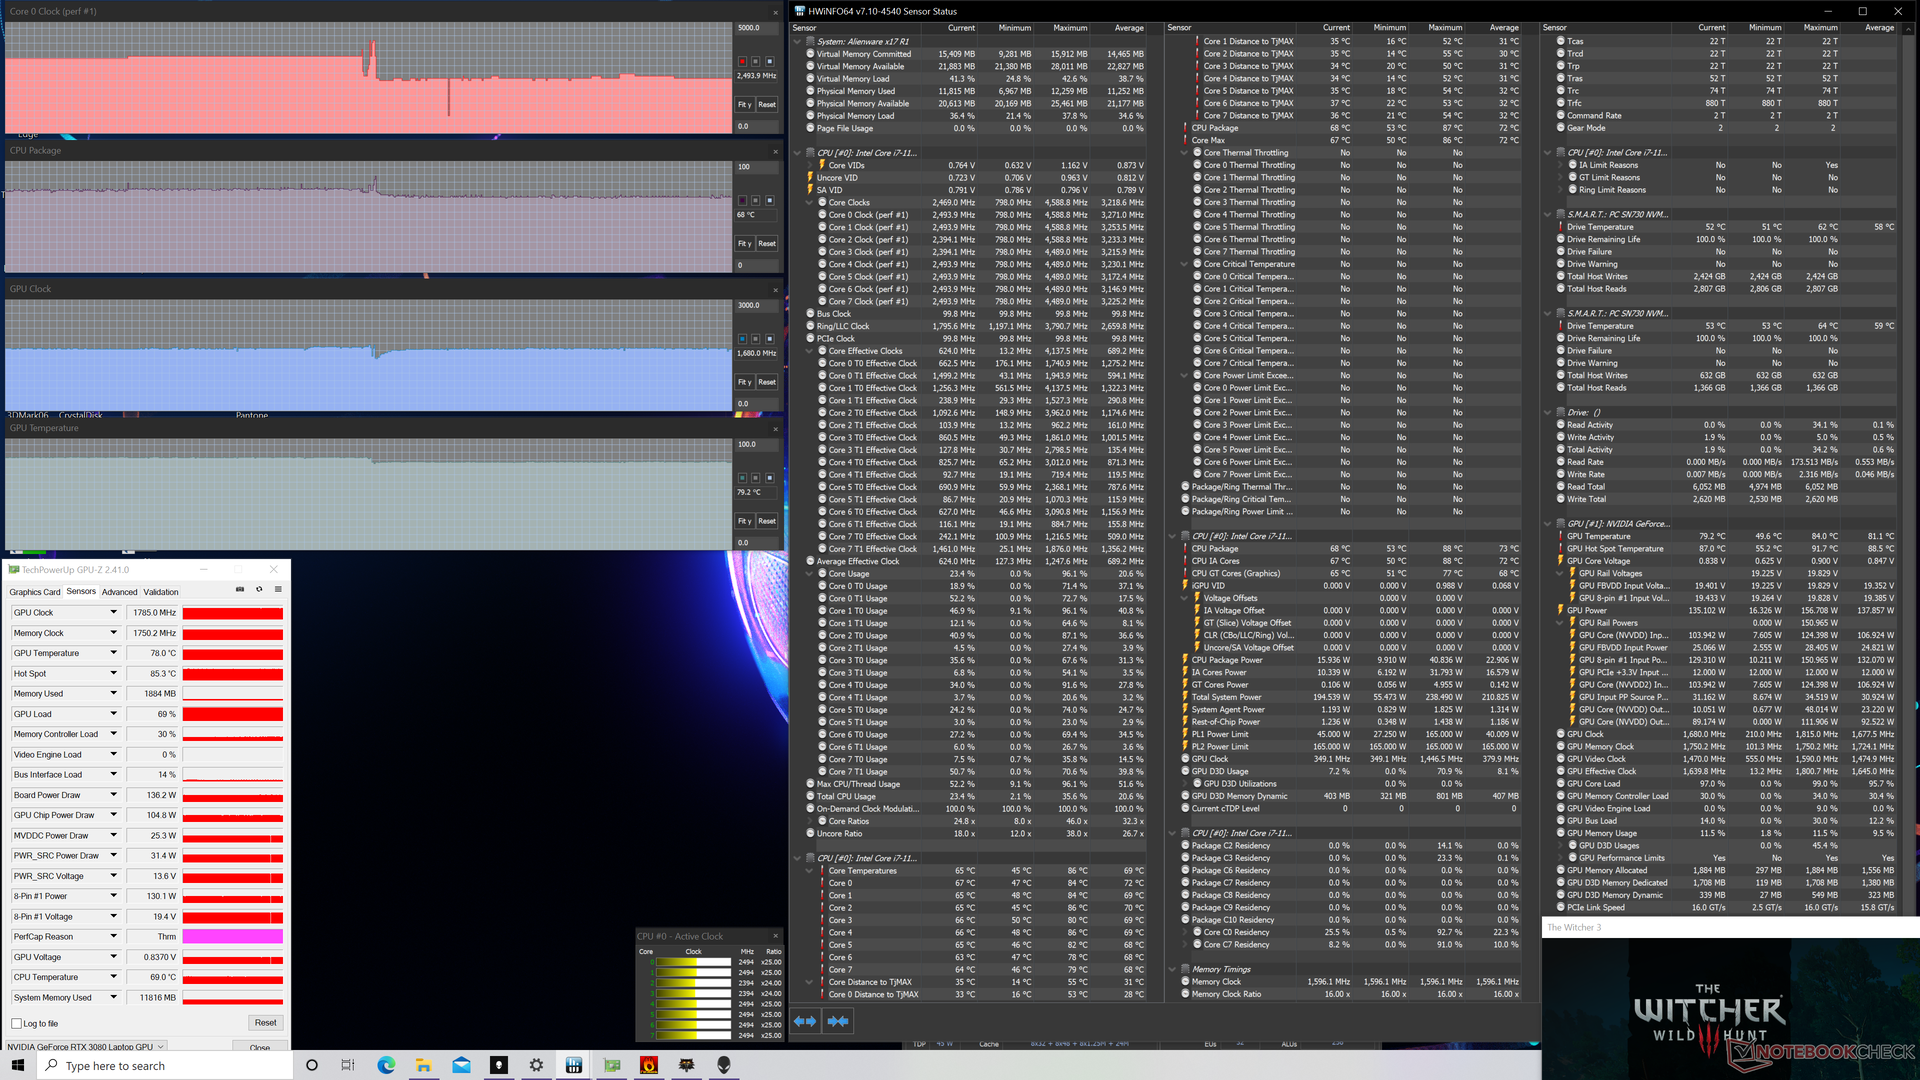
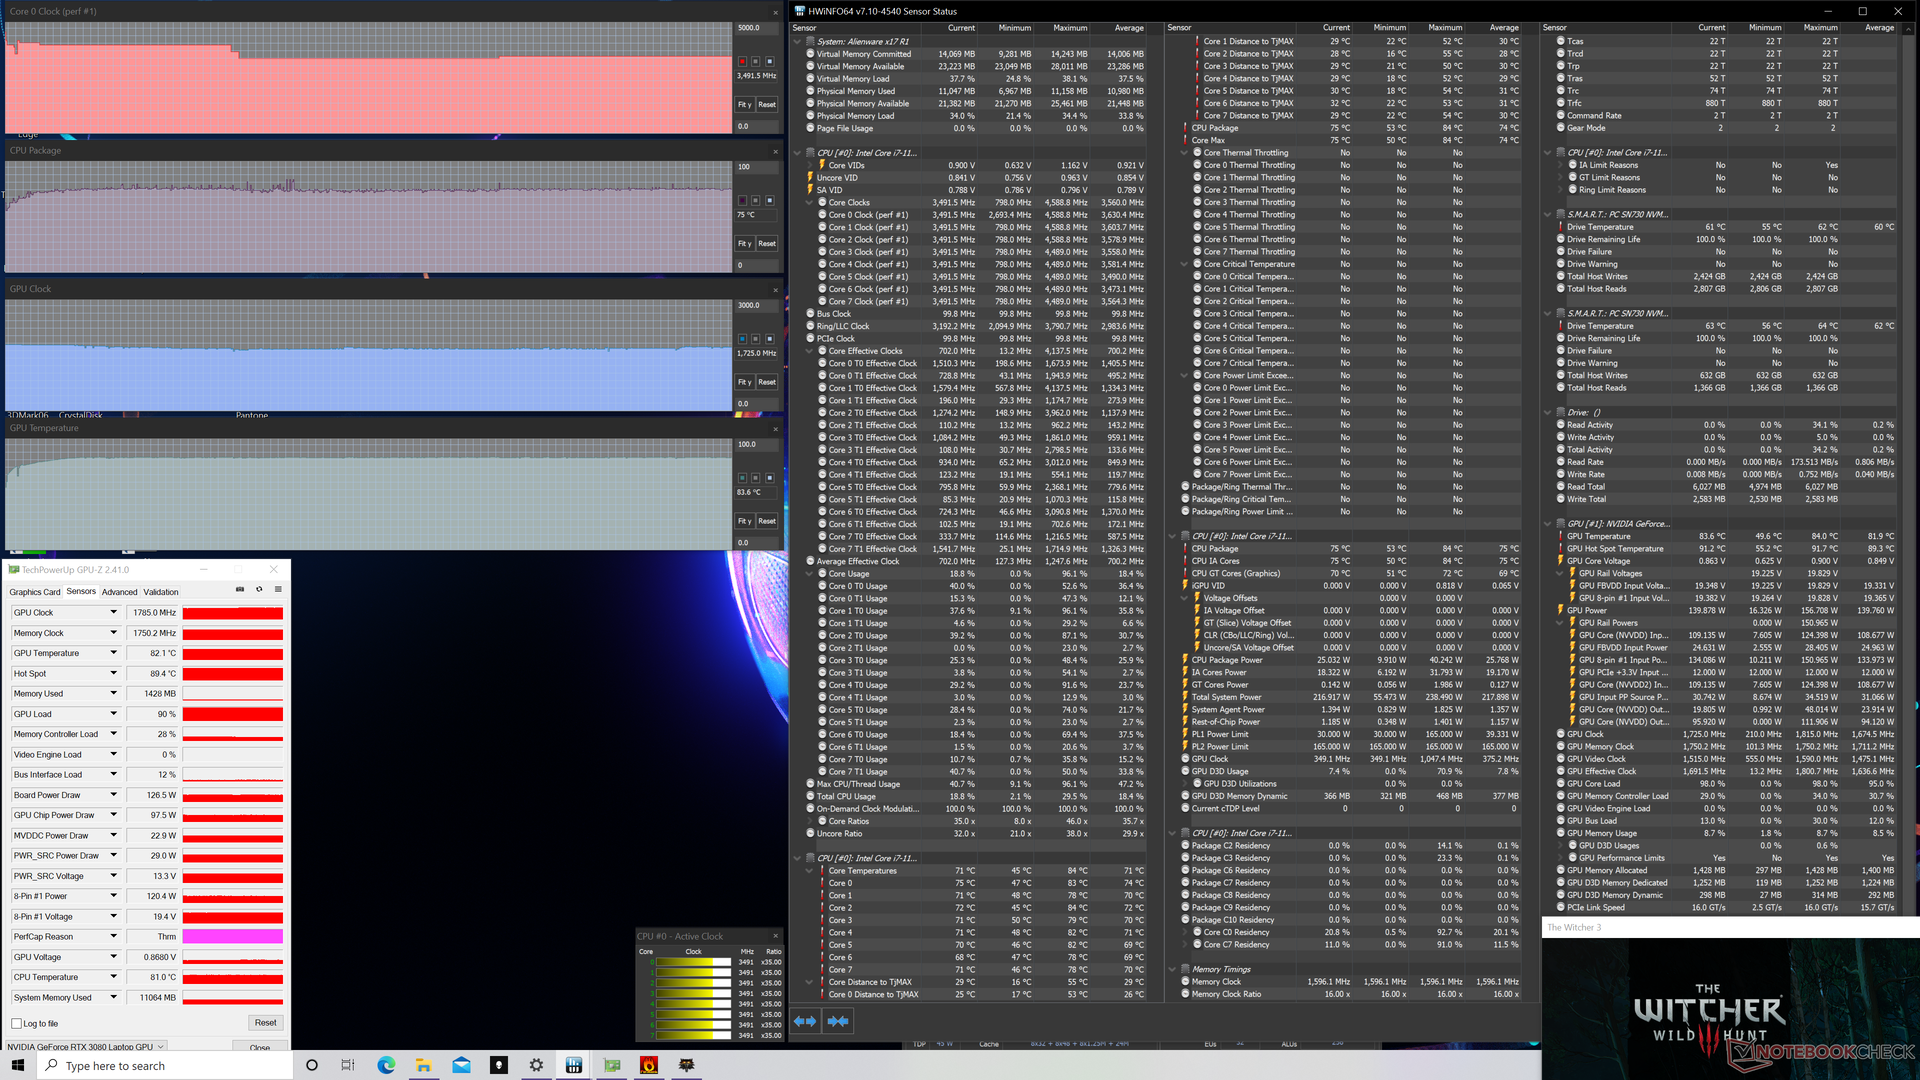
L'esecuzione di The Witcher 3 in modalità High Performance fa sì che la CPU e la GPU si stabilizzino rispettivamente a 3,5 GHz e 1785 MHz, con un consumo costante della scheda GPU di circa 145 W. Se in modalità Balanced, la frequenza di clock della CPU scende a soli 2,5 GHz mentre la frequenza di clock della GPU può scendere leggermente a 1680 MHz e un consumo di ~135 W. Se state giocando e volete il massimo dal vostro portatile, allora assicuratevi di attivare la modalità High Performance tramite il software Alienware. Le frequenze di clock della GPU sono più veloci del previsto in entrambi i casi se paragonate alla maggior parte degli altri portatili con la stessa GPU come il Maingear Vector Pro.
L'utilizzo della batteria limiterà le prestazioni grafiche. Un test su Fire Strike a batteria restituisce punteggi di Physics e Graphics di 24602 e 13281 punti, rispettivamente, rispetto a 22907 e 29194 punti quando è alimentato a rete.
| Clock della CPU (GHz)Clock della GPU(MHz)Temperatura media dellaCPU (°C)Temperaturamedia dellaGPU (°C) |
| Sistema inattivo |
| Stress Prime95 (modalità alte prestazioni) |
| Stress Prime95 + FurMark (modalità ad alte prestazioni) |
| Witcher 3 Stress (modalità bilanciata) |
| Witcher 3 Stress (Modalità ad alte prestazioni) |
Altoparlanti


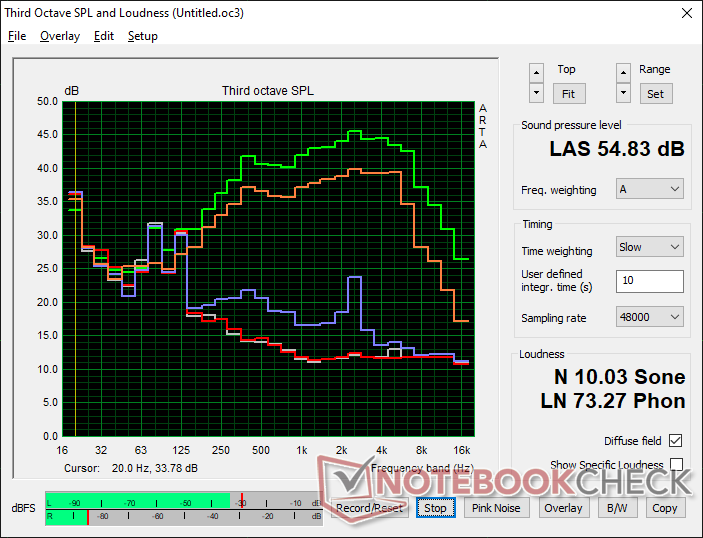
Alienware x17 RTX 3080 P48E analisi audio
(+) | gli altoparlanti sono relativamente potenti (88 dB)
Bassi 100 - 315 Hz
(-) | quasi nessun basso - in media 23% inferiori alla media
(±) | la linearità dei bassi è media (9.8% delta rispetto alla precedente frequenza)
Medi 400 - 2000 Hz
(+) | medi bilanciati - solo only 2.7% rispetto alla media
(+) | medi lineari (4% delta rispetto alla precedente frequenza)
Alti 2 - 16 kHz
(+) | Alti bilanciati - appena 4.4% dalla media
(±) | la linearità degli alti è media (7% delta rispetto alla precedente frequenza)
Nel complesso 100 - 16.000 Hz
(±) | la linearità complessiva del suono è media (17.3% di differenza rispetto alla media
Rispetto alla stessa classe
» 47% di tutti i dispositivi testati in questa classe è stato migliore, 12% simile, 41% peggiore
» Il migliore ha avuto un delta di 6%, medio di 18%, peggiore di 132%
Rispetto a tutti i dispositivi testati
» 32% di tutti i dispositivi testati in questa classe è stato migliore, 8% similare, 59% peggiore
» Il migliore ha avuto un delta di 4%, medio di 23%, peggiore di 134%
Apple MacBook 12 (Early 2016) 1.1 GHz analisi audio
(+) | gli altoparlanti sono relativamente potenti (83.6 dB)
Bassi 100 - 315 Hz
(±) | bassi ridotti - in media 11.3% inferiori alla media
(±) | la linearità dei bassi è media (14.2% delta rispetto alla precedente frequenza)
Medi 400 - 2000 Hz
(+) | medi bilanciati - solo only 2.4% rispetto alla media
(+) | medi lineari (5.5% delta rispetto alla precedente frequenza)
Alti 2 - 16 kHz
(+) | Alti bilanciati - appena 2% dalla media
(+) | alti lineari (4.5% delta rispetto alla precedente frequenza)
Nel complesso 100 - 16.000 Hz
(+) | suono nel complesso lineare (10.2% differenza dalla media)
Rispetto alla stessa classe
» 7% di tutti i dispositivi testati in questa classe è stato migliore, 2% simile, 90% peggiore
» Il migliore ha avuto un delta di 5%, medio di 18%, peggiore di 53%
Rispetto a tutti i dispositivi testati
» 5% di tutti i dispositivi testati in questa classe è stato migliore, 1% similare, 94% peggiore
» Il migliore ha avuto un delta di 4%, medio di 23%, peggiore di 134%
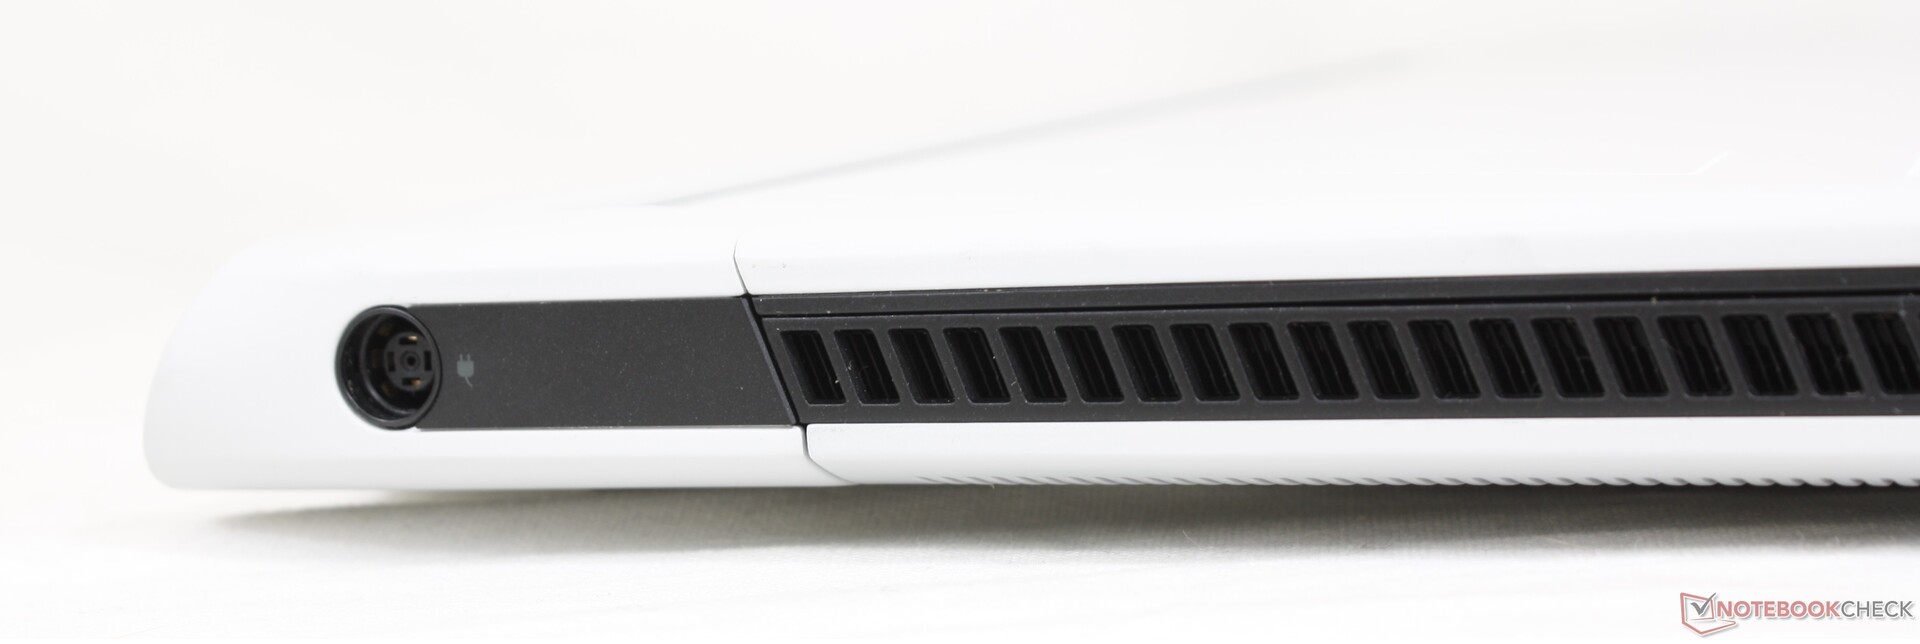
Consumo di energia
Consumo di energia - Bollette alte
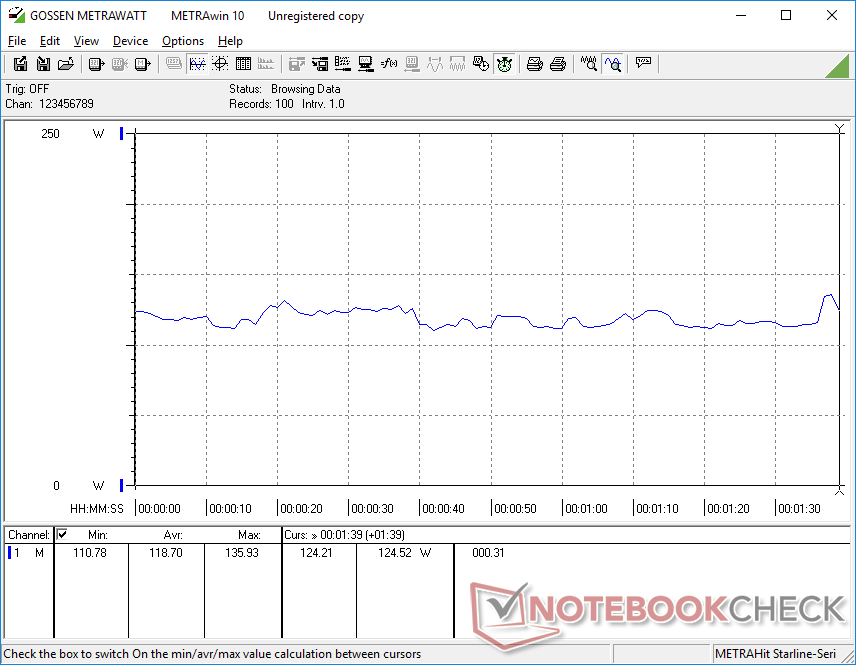
Dell ha migliorato il consumo energetico del sistema durante i bassi carichi rispetto al m17 R4, il che può spiegare la durata complessiva della batteria più lunga nella nostra prossima sezione. Il nostro sistema avrebbe disegnato solo 10 W quando era inattivo sul desktop con l'impostazione di luminosità minima risultando essere 4 volte più efficiente di quello che abbiamo registrato sul m17 R4 dell'anno scorso.
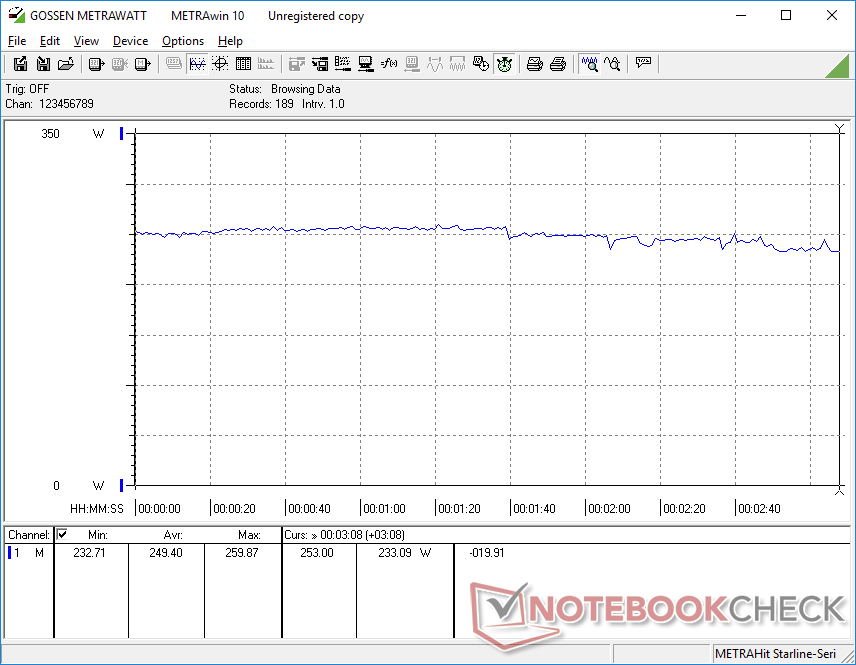
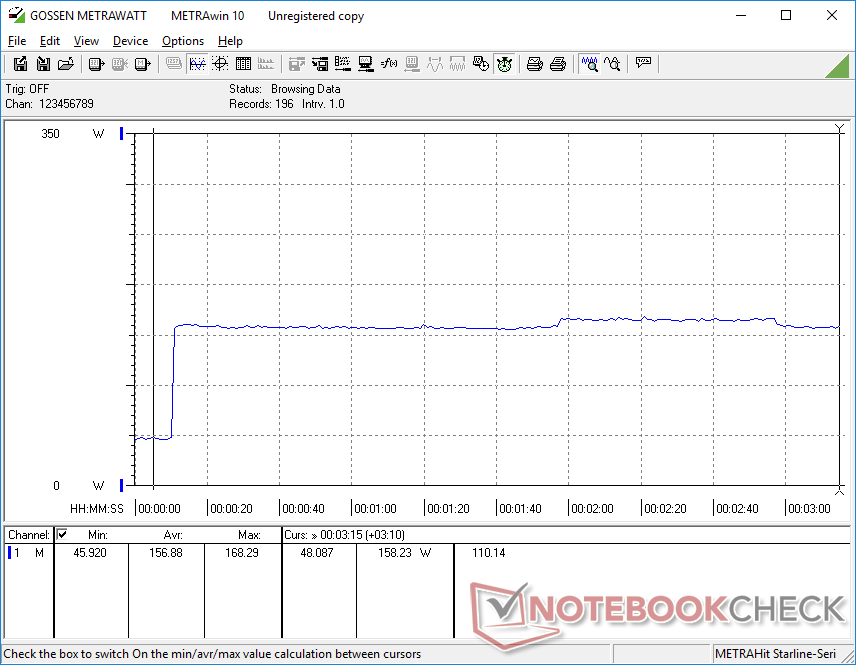
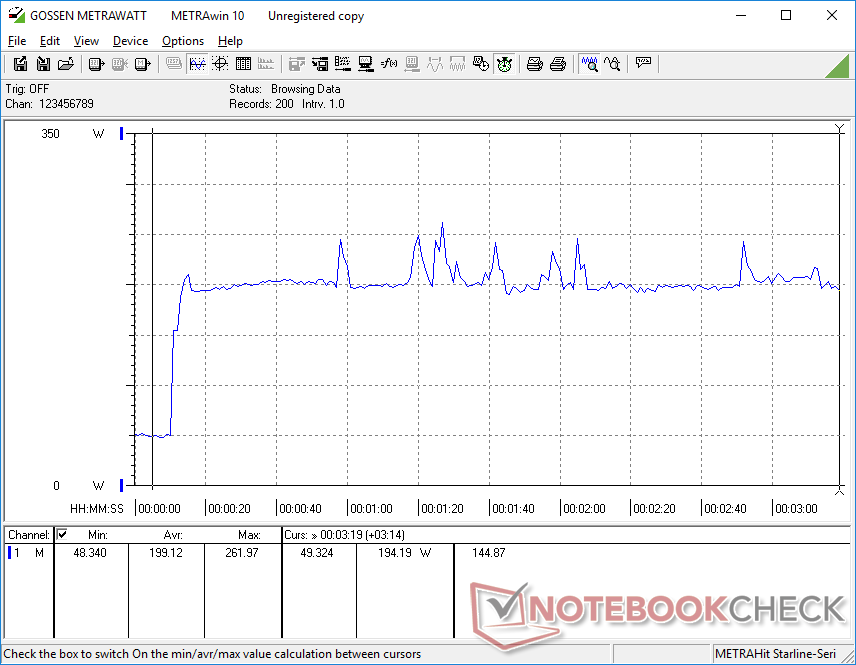
Il consumo di energia quando si gioca rimane più alto del solito, proprio come quello che abbiamo scoperto sulla serie m17. L'esecuzione di The Witcher 3 consumerebbe una media di 249 W rispetto ai soli 195 W o 156 W dell'Asus ROG Zephyrus S17 o MSI GS76, rispettivamente. Il più alto TDP della CPU e gli obiettivi TGP della GPU del sistema Alienware sono probabilmente responsabili delle sue maggiori richieste di energia.
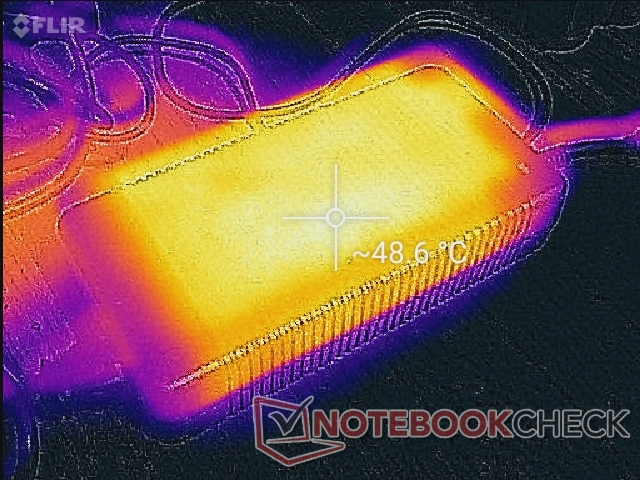
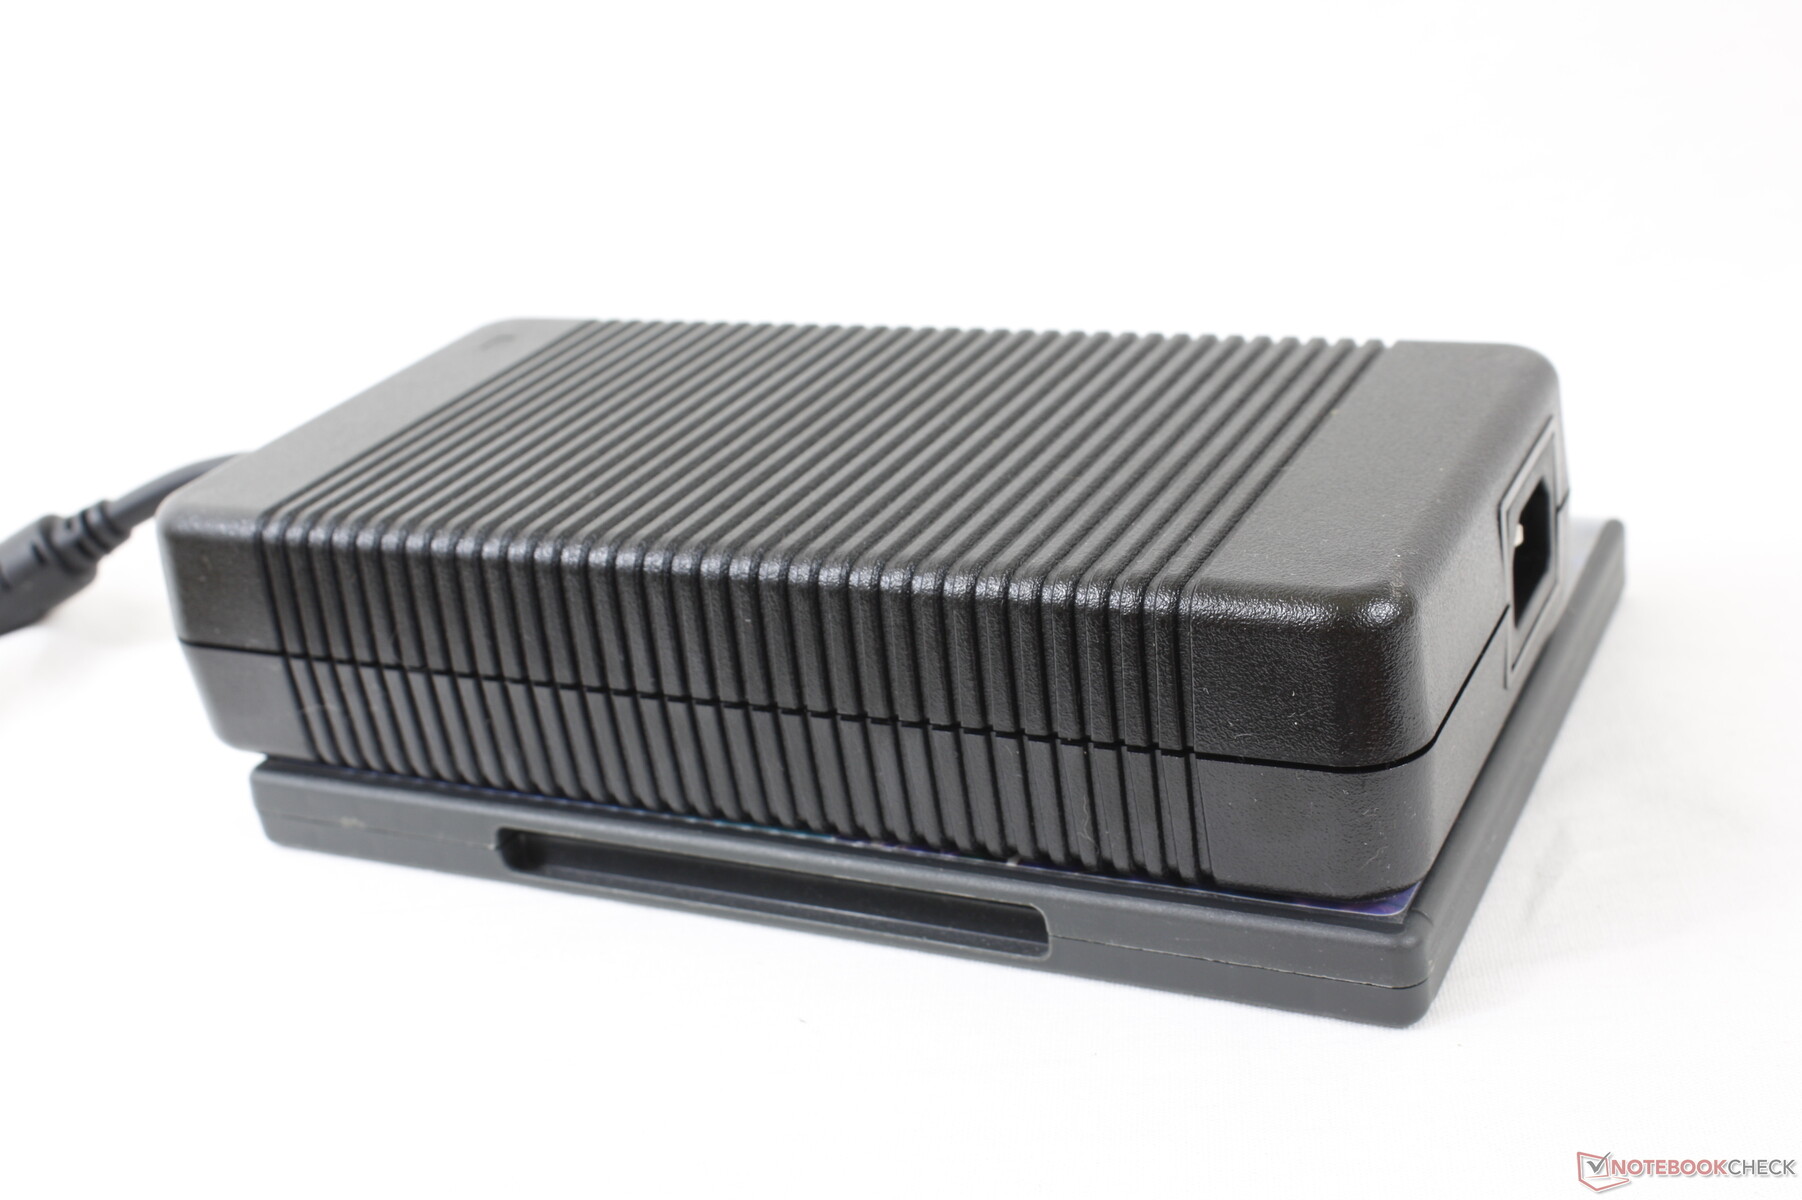
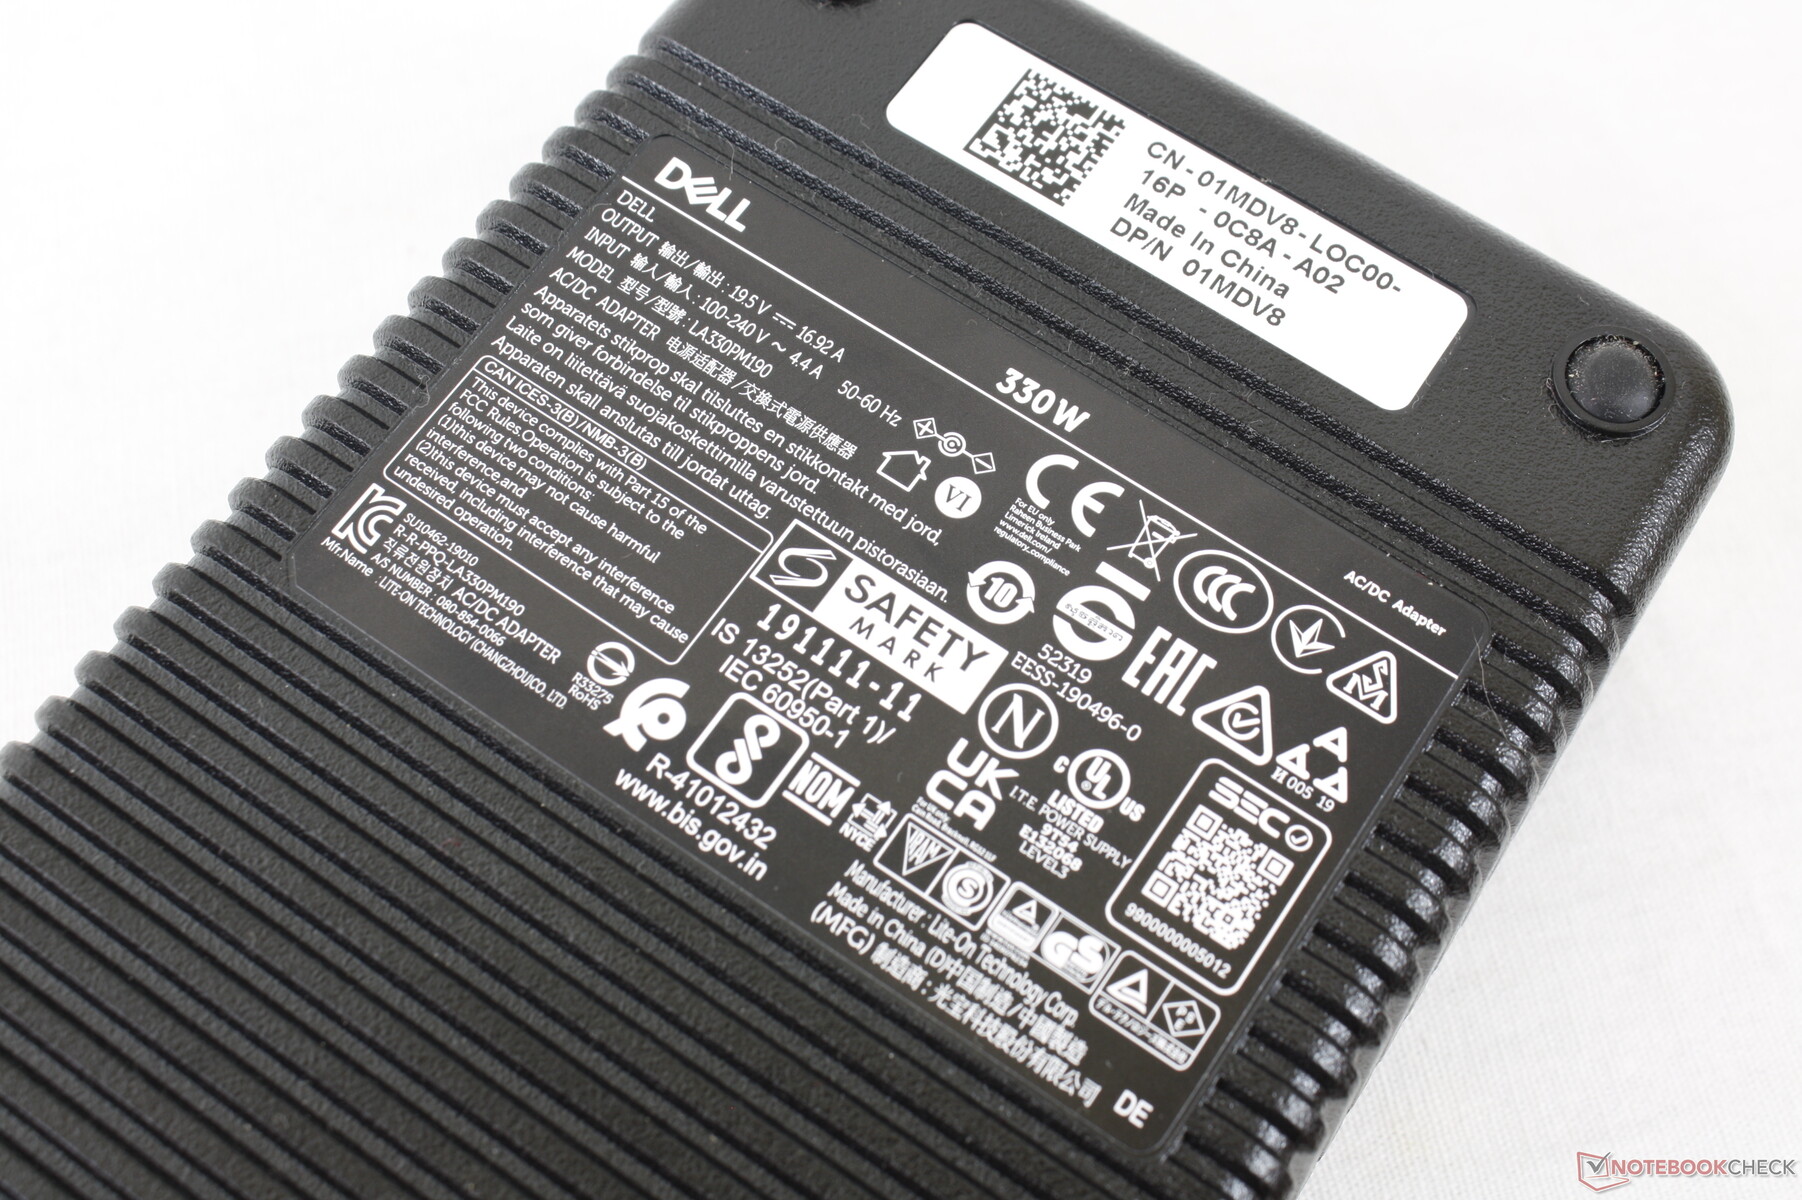
La nostra unità di test viene fornita con un grande e pesante (~20 x 9,9 x 4,3 cm, 1,5 kg) adattatore AC da 330 W rispetto ai più piccoli adattatori AC da 280 W o 230 W del ROG Zephyrus S17 o del Razer Blade 17, rispettivamente. Sospettiamo che l'adattatore AC sovradimensionato sia per supportare meglio i già citati obiettivi TDP e TGP del sistema, così come il tasso di carica della batteria durante il gaming. Dell offre un adattatore AC più piccolo da 240 W per le SKU RTX 3060 minori.
| Off / Standby | |
| Idle | |
| Sotto carico |
|
Leggenda:
min: | |
| Alienware x17 RTX 3080 P48E i7-11800H, GeForce RTX 3080 Laptop GPU, 2x WDC PC SN730 SDBPNTY-1T00 (RAID 0), IPS, 3840x2160, 17.3" | Alienware m17 R4 i9-10980HK, GeForce RTX 3080 Laptop GPU, 2x Micron 2300 512 GB (RAID 0), IPS, 1920x1080, 17.3" | Razer Blade 17 RTX 3070 i7-11800H, GeForce RTX 3070 Laptop GPU, Samsung PM9A1 MZVL21T0HCLR, IPS, 1920x1080, 17.3" | Asus ROG Zephyrus S17 GX703HSD i9-11900H, GeForce RTX 3080 Laptop GPU, Samsung PM9A1 MZVL22T0HBLB, IPS, 2560x1440, 17.3" | MSI GS76 Stealth 11UH i9-11900H, GeForce RTX 3080 Laptop GPU, Samsung PM9A1 MZVL22T0HBLB, IPS, 3840x2160, 17.3" | Gigabyte Aero 17 HDR YD i9-11980HK, GeForce RTX 3080 Laptop GPU, Samsung PM9A1 MZVL2512HCJQ, IPS, 3840x2160, 17.3" | |
|---|---|---|---|---|---|---|
| Power Consumption | -80% | -11% | -10% | 13% | -20% | |
| Idle Minimum * (Watt) | 10.2 | 42 -312% | 20.9 -105% | 21.7 -113% | 14 -37% | 25 -145% |
| Idle Average * (Watt) | 21.2 | 48 -126% | 25.1 -18% | 27 -27% | 19 10% | 28 -32% |
| Idle Maximum * (Watt) | 48.4 | 58 -20% | 45 7% | 33 32% | 31 36% | 40 17% |
| Load Average * (Watt) | 118.7 | 124 -4% | 102 14% | 108 9% | 97 18% | 114 4% |
| Witcher 3 ultra * (Watt) | 249 | 219 12% | 189 24% | 195 22% | 156 37% | 176 29% |
| Load Maximum * (Watt) | 262 | 337 -29% | 234.8 10% | 210 20% | 231 12% | 236 10% |
* ... Meglio usare valori piccoli
Consumo energetico The Witcher 3 / Stresstest
Durata della batteria - Non male per le dimensioni
L'autonomia era terribile sulla serie m17 di ultima generazione anche quando tutte le impostazioni delle prestazioni erano impostate al minimo. Fortunatamente, la durata della batteria è migliorata significativamente sull'x17 senza bisogno di aumentare la capacità della batteria. Gli utenti possono ora aspettarsi poco meno di 6 ore di utilizzo WLAN nel mondo reale rispetto a ~ 2,5 ore sul m17 R4 che è decente per un portatile gaming ad alte prestazioni. I risultati sono generalmente paragonabili all'MSI GS76 o al Gigabyte Aero 17 che sono dotati di batterie più grandi da 99 Wh.
La ricarica completa è molto veloce a circa 75 minuti con l'adattatore AC incluso.
| Alienware x17 RTX 3080 P48E i7-11800H, GeForce RTX 3080 Laptop GPU, 87 Wh | Alienware m17 R4 i9-10980HK, GeForce RTX 3080 Laptop GPU, 86 Wh | Razer Blade 17 RTX 3070 i7-11800H, GeForce RTX 3070 Laptop GPU, 70 Wh | Asus ROG Zephyrus S17 GX703HSD i9-11900H, GeForce RTX 3080 Laptop GPU, 90 Wh | MSI GS76 Stealth 11UH i9-11900H, GeForce RTX 3080 Laptop GPU, 99.9 Wh | Gigabyte Aero 17 HDR YD i9-11980HK, GeForce RTX 3080 Laptop GPU, 99 Wh | |
|---|---|---|---|---|---|---|
| Autonomia della batteria | -5% | 24% | 133% | 37% | 23% | |
| Reader / Idle (h) | 7 | 6.7 -4% | 9.9 41% | |||
| WiFi v1.3 (h) | 5.9 | 2.4 -59% | 5.2 -12% | 7.5 27% | 6.4 8% | 5.6 -5% |
| Load (h) | 0.8 | 1.2 50% | 1.5 88% | 2.7 238% | 1.3 63% | 1.2 50% |
| Witcher 3 ultra (h) | 1 |
Pro
Contro
Valutazione complessiva dell'Alienware x17 P48E - Più grande e più pesante per ovvie ragioni
Le caratteristiche più convincenti dell'Alienware x17 sono le prestazioni del suo processore e i tasti meccanici CherryMX. La CPU Core i7-11800H qui gira notevolmente rispetto ad altri portatili equipaggiati con lo stesso chip, mentre i tasti meccanici clicky sono tra i più comodi che abbiamo usato su qualsiasi portatile gaming.
L'Alienware x17 di Dell non ha paura di massimizzare le prestazioni anche se questo significa essere leggermente più grande e più pesante.
Tutte quelle prestazioni arrivano al costo della temperatura del core, del consumo energetico, delle dimensioni e del peso, come i modelli alternativi come il Razer Blade 17, l'MSI GS76 Stealth, o l'Asus ROG Zephyrus S17 sono tutti più piccoli, più leggeri e più efficienti dal punto di vista energetico, pur offrendo opzioni Intel e Nvidia simili. Questi sistemi tendono a funzionare un po' più lentamente, tuttavia, e quindi starà agli utenti bilanciare le prestazioni con le loro personali preferenze di portabilità. Se vi accontentate di prestazioni a livello della RTX 3060, allora il più leggero Razer o l'MSI possono essere l'opzione migliore, mentre i cacciatori di prestazioni RTX 3080 possono ottenere molto di più dall'Alienware x17 e dal suo sistema di raffreddamento relativamente più grande.
Prezzo e disponibilità
Diverse configurazioni dell'Alienware x17 R1 sono ora disponibili su Best Buy e Newegg a partire da $2399 USD al momento della recensione. In alternativa, gli utenti possono ordinare direttamente da Dell che naturalmente avrà più SKU e opzioni.
Alienware x17 RTX 3080 P48E
- 09/24/2021 v7 (old)
Allen Ngo
Price comparison
