Recensione del portatile Alienware x17 R2: Prestazioni di picco 175 W GeForce RTX 3080 Ti
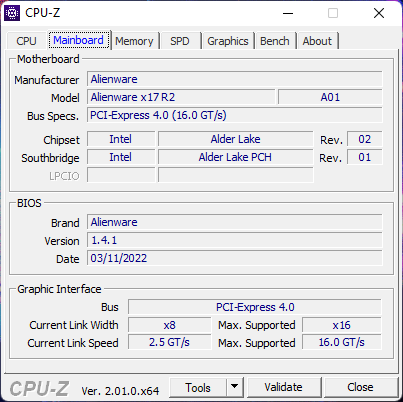
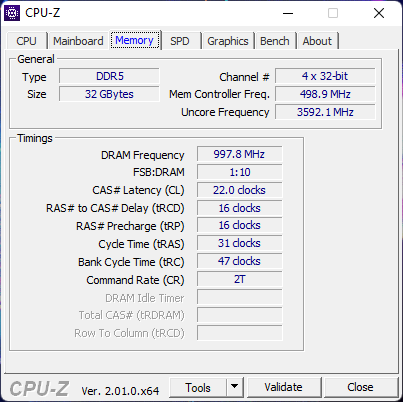
Dell ha introdotto la sua serie Alienware x17 alla fine dello scorso anno con un design dello chassis completamente nuovo per distinguerlo dalla serie Alienware m17 esistente. Per quest'anno, il produttore ha rinfrescato la lineup con il lancio dell'Alienware x17 R2 completo di CPU Intel Alder Lake-P di 12a generazione e GeForce RTX 3070/3080 Ti graphics per sostituire le opzioni Tiger Lake-H e RTX 3070/3080 dello scorso anno, rispettivamente. Sono presenti anche altri aggiornamenti tra cui la RAM più veloce (da DDR4-3466 a DDR5-4800), opzioni di visualizzazione più recenti e supporto per MUX e Advanced Optimus.
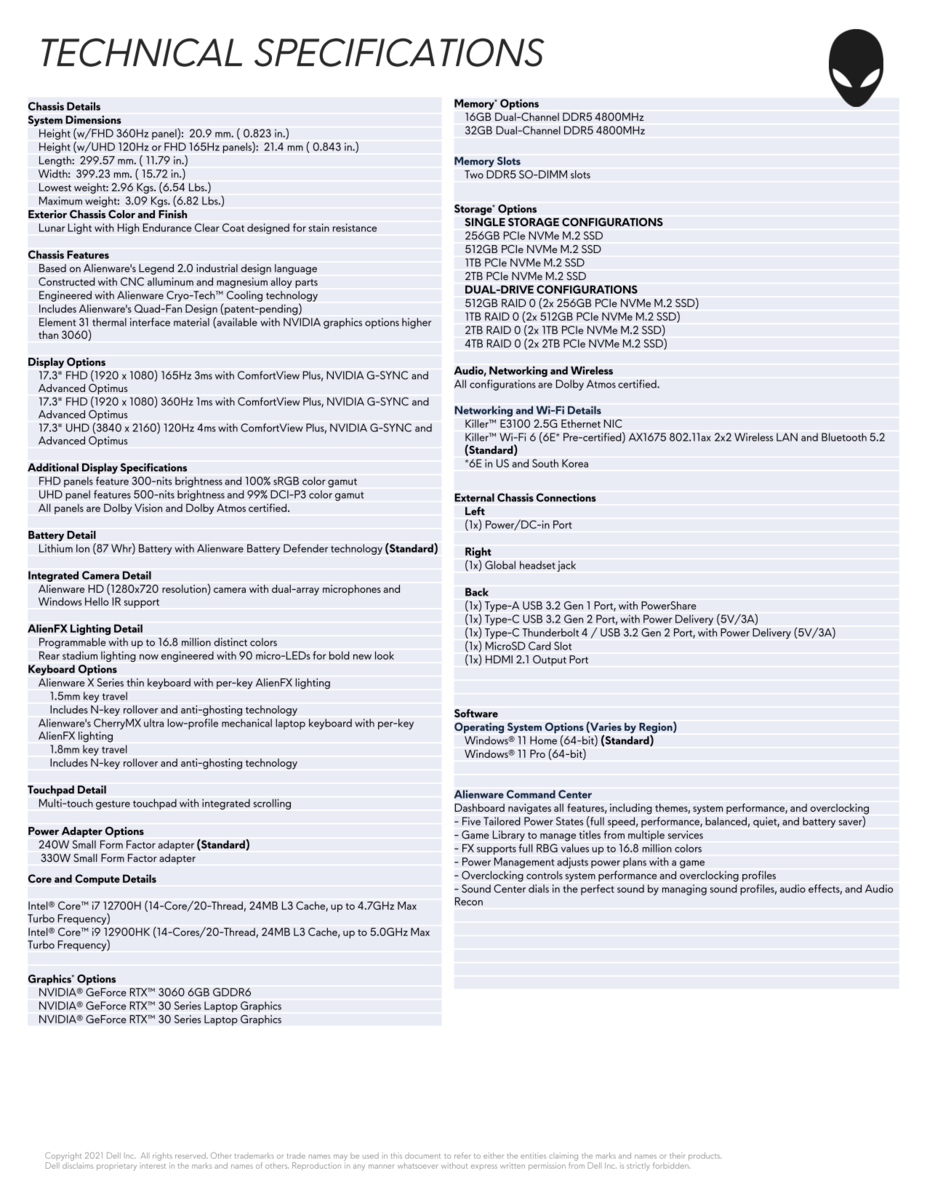
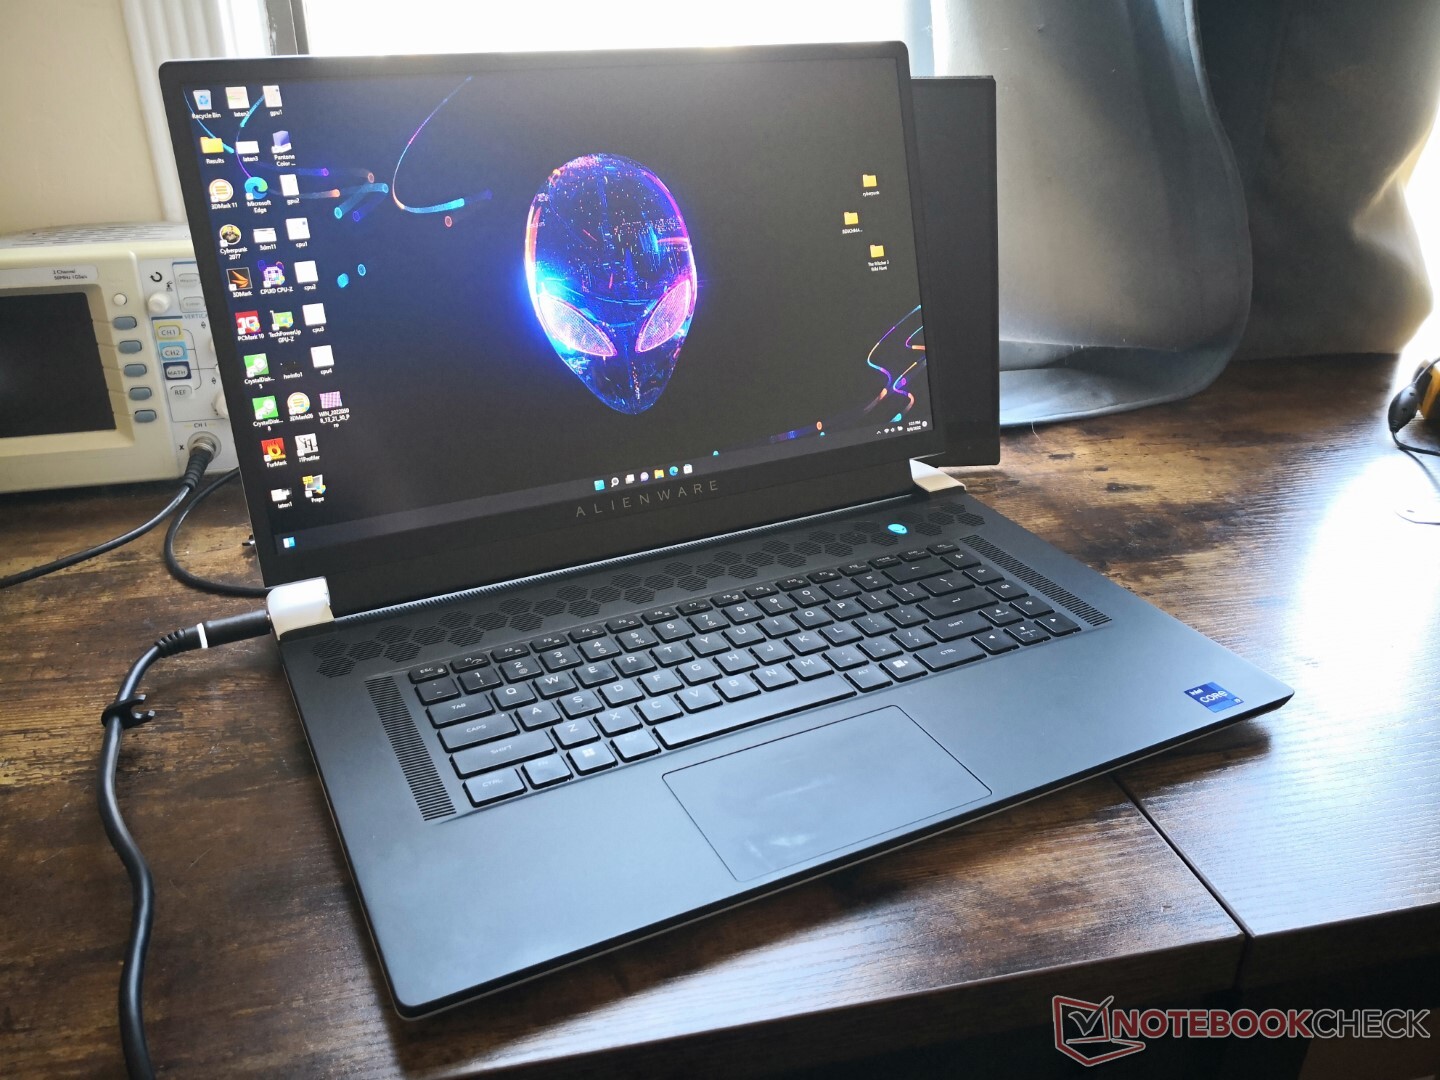
A parte gli aggiornamenti interni menzionati sopra, l'Alienware x17 R2 usa lo stesso telaio dell'Alienware x17 R1. Vi raccomandiamo di controllare la nostra recensione dell'x17 R1 in quanto i nostri commenti sul telaio, la tastiera meccanica Cherry e le porte sono rilevanti anche per l'x17 R2.
Vedere le specifiche tecniche ufficiali qui sotto per tutte le opzioni configurabili. La nostra unità di test specifica è una SKU di fascia alta con Core i9-12900HK, display 1080p a 360 Hz e grafica 175 W GeForce RTX 3080 Ti per poco meno di 4000 dollari. I concorrenti in questo spazio includono altri portatili da gioco ultrasottili da 17,3 pollici come il MSI GS77, Razer Blade 17e Asus Zephyrus S17.
Altre recensioni di Alienware:
Potenziali concorrenti a confronto
Punteggio | Data | Modello | Peso | Altezza | Dimensione | Risoluzione | Prezzo |
|---|---|---|---|---|---|---|---|
| 89.2 % v7 (old) | 05/2022 | Alienware x17 R2 P48E i9-12900HK, GeForce RTX 3080 Ti Laptop GPU | 3.1 kg | 20.9 mm | 17.30" | 1920x1080 | |
| 89 % v7 (old) | 09/2021 | Alienware x17 RTX 3080 P48E i7-11800H, GeForce RTX 3080 Laptop GPU | 3.2 kg | 21.4 mm | 17.30" | 3840x2160 | |
| 90.1 % v7 (old) | 07/2021 | Asus ROG Zephyrus S17 GX703HSD i9-11900H, GeForce RTX 3080 Laptop GPU | 2.8 kg | 19.9 mm | 17.30" | 2560x1440 | |
| 87.2 % v7 (old) | 04/2022 | MSI Stealth GS77 12UHS-083US i7-12700H, GeForce RTX 3080 Ti Laptop GPU | 2.9 kg | 20.8 mm | 17.30" | 2560x1440 | |
| 87.4 % v7 (old) | 10/2020 | MSI GT76 Titan DT 10SGS i9-10900K, GeForce RTX 2080 Super Mobile | 4.2 kg | 42 mm | 17.30" | 3840x2160 | |
| 83.2 % v7 (old) | 10/2021 | Gigabyte A7 X1 R9 5900HX, GeForce RTX 3070 Laptop GPU | 2.5 kg | 34 mm | 17.30" | 1920x1080 |
Caso
Anche se è commercializzato come un portatile da gioco ultrasottile, lo chassis dell'Alienware x17 R2 è ancora notevolmente più pesante e più grande di alternative come l'Asus Zephyrus S17, MSI GS77, o Razer Blade 17. In cambio, il sistema Alienware è in grado di trasportare una più potente GPU da 175 W, mentre la maggior parte degli altri portatili da gioco ultrasottili sono limitati a 140 W o meno.
Lettore di schede SD
| SD Card Reader | |
| average JPG Copy Test (av. of 3 runs) | |
| MSI GT76 Titan DT 10SGS (Toshiba Exceria Pro M501 UHS-II) | |
| Asus ROG Zephyrus S17 GX703HSD | |
| Alienware x17 R2 P48E (AV Pro V60) | |
| Alienware x17 RTX 3080 P48E (AV Pro V60) | |
| MSI Stealth GS77 12UHS-083US (AV Pro V60) | |
| maximum AS SSD Seq Read Test (1GB) | |
| Asus ROG Zephyrus S17 GX703HSD | |
| Alienware x17 RTX 3080 P48E (AV Pro V60) | |
| Alienware x17 R2 P48E (AV Pro V60) | |
| MSI GT76 Titan DT 10SGS (Toshiba Exceria Pro M501 UHS-II) | |
| MSI Stealth GS77 12UHS-083US (AV Pro V60) | |
Comunicazione
Webcam
La webcam rimane a 720p senza otturatore fisico per la privacy rispetto ai 1080p dell'ultimo Razer Blade 17. Windows Hello è supportato.

")
")
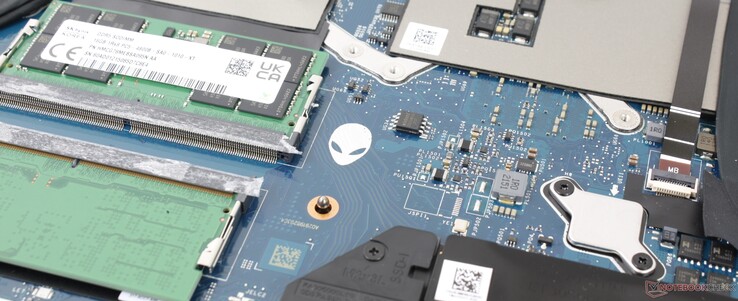
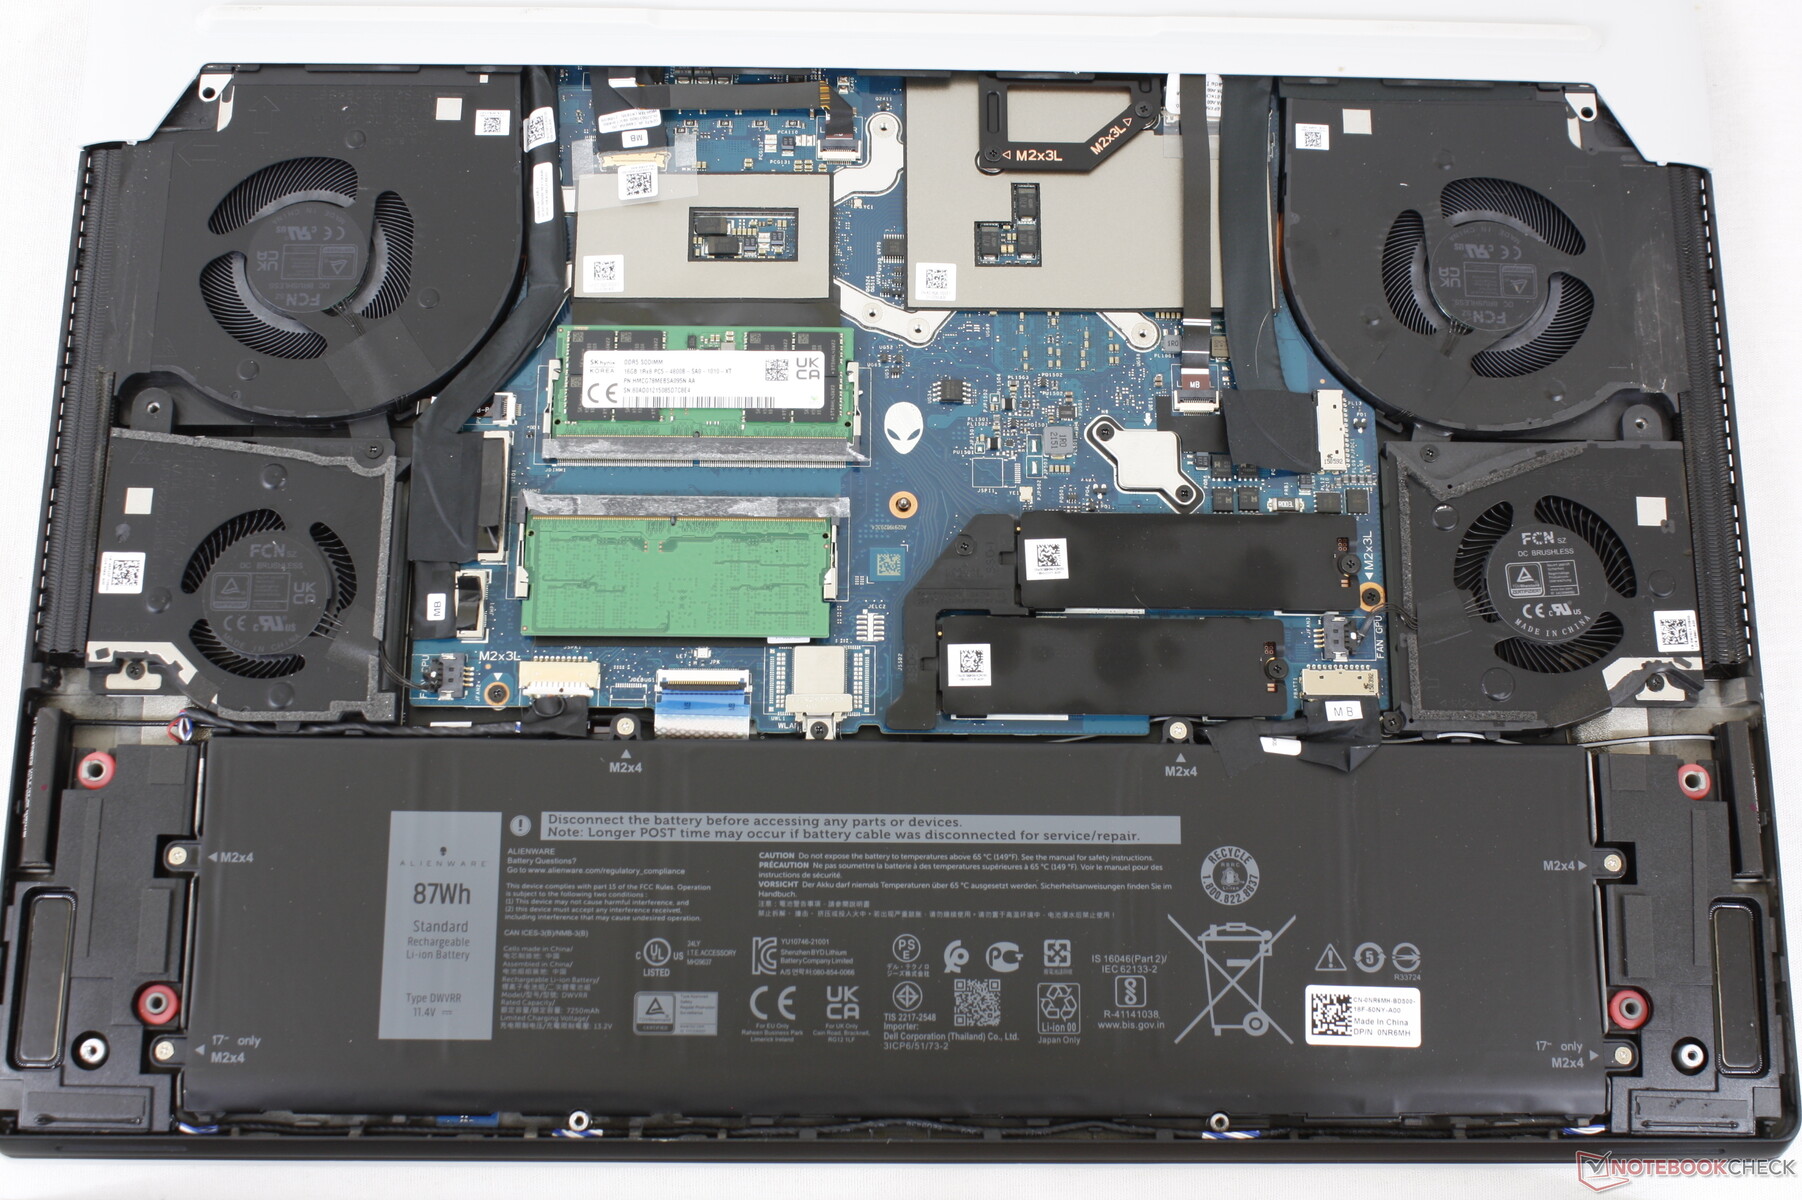
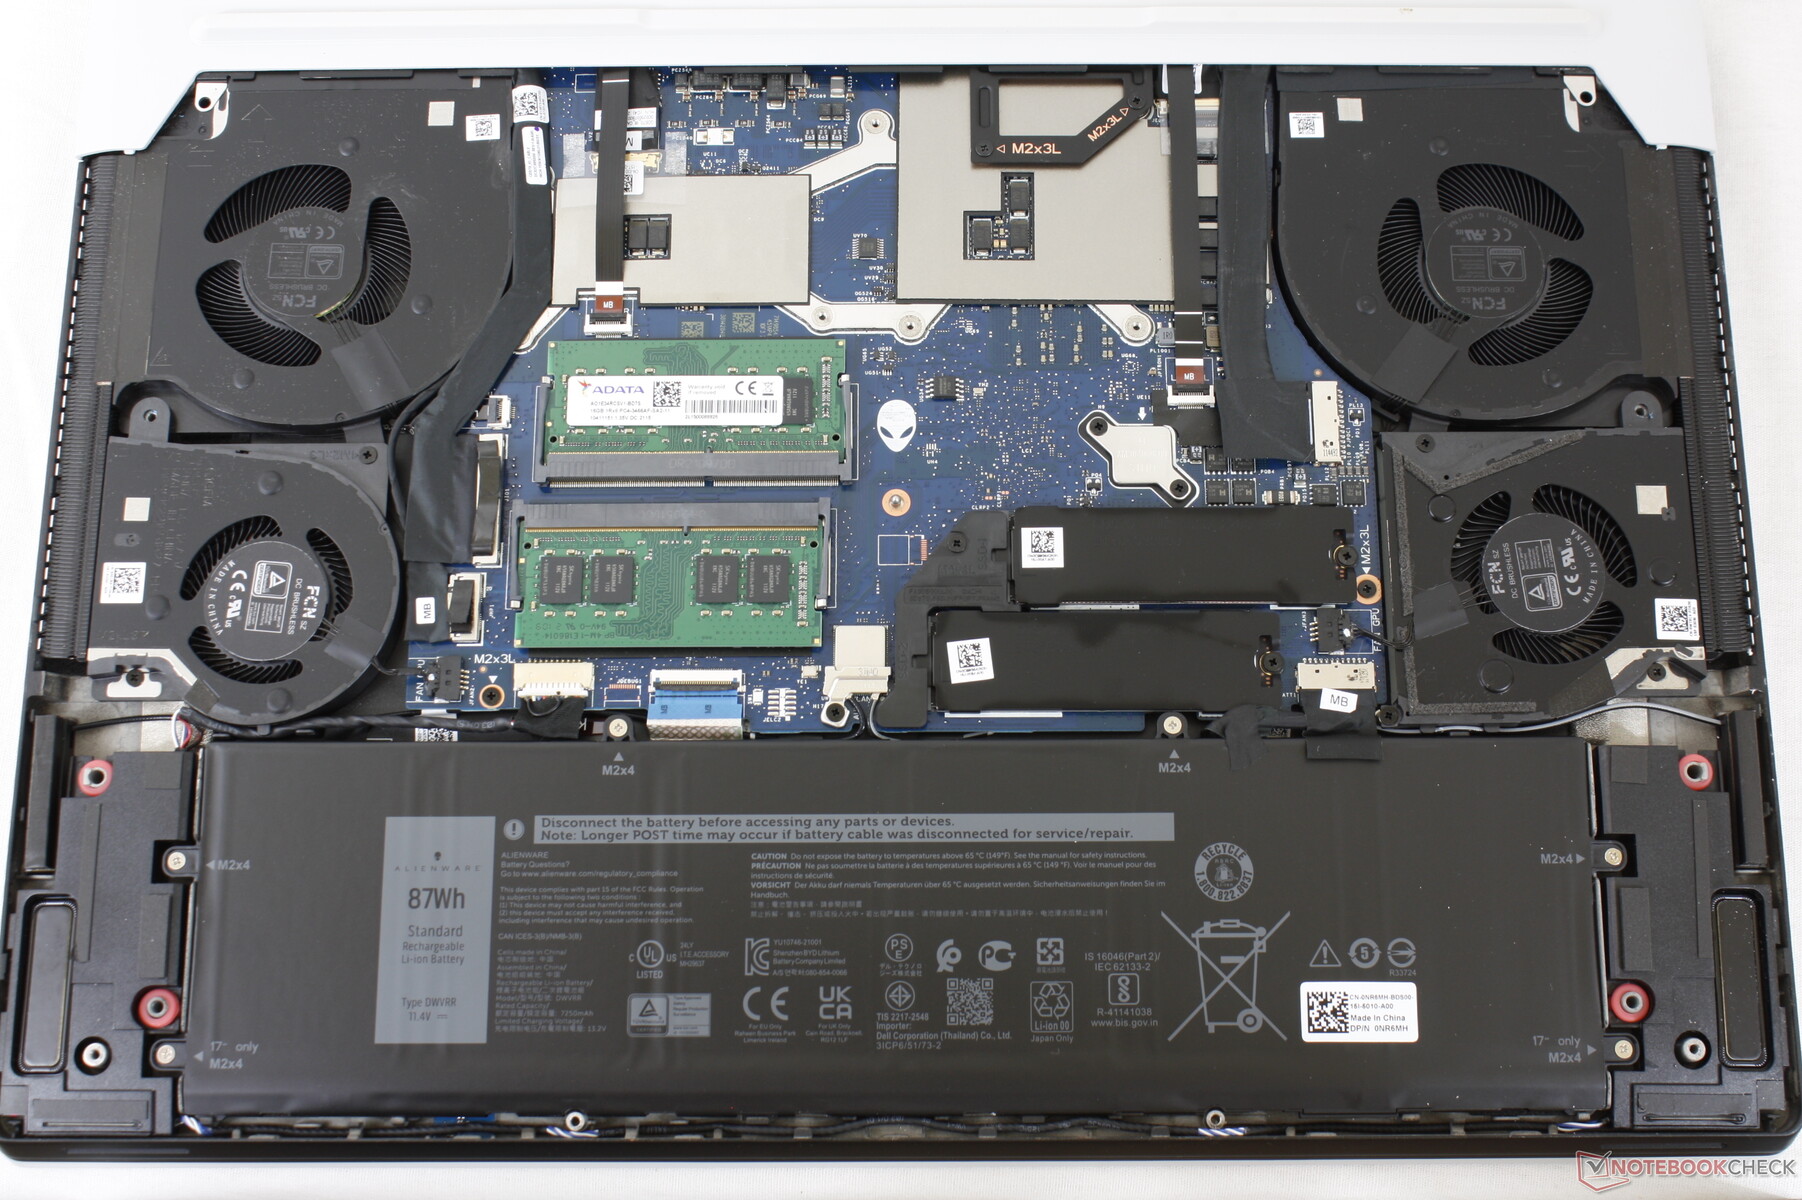
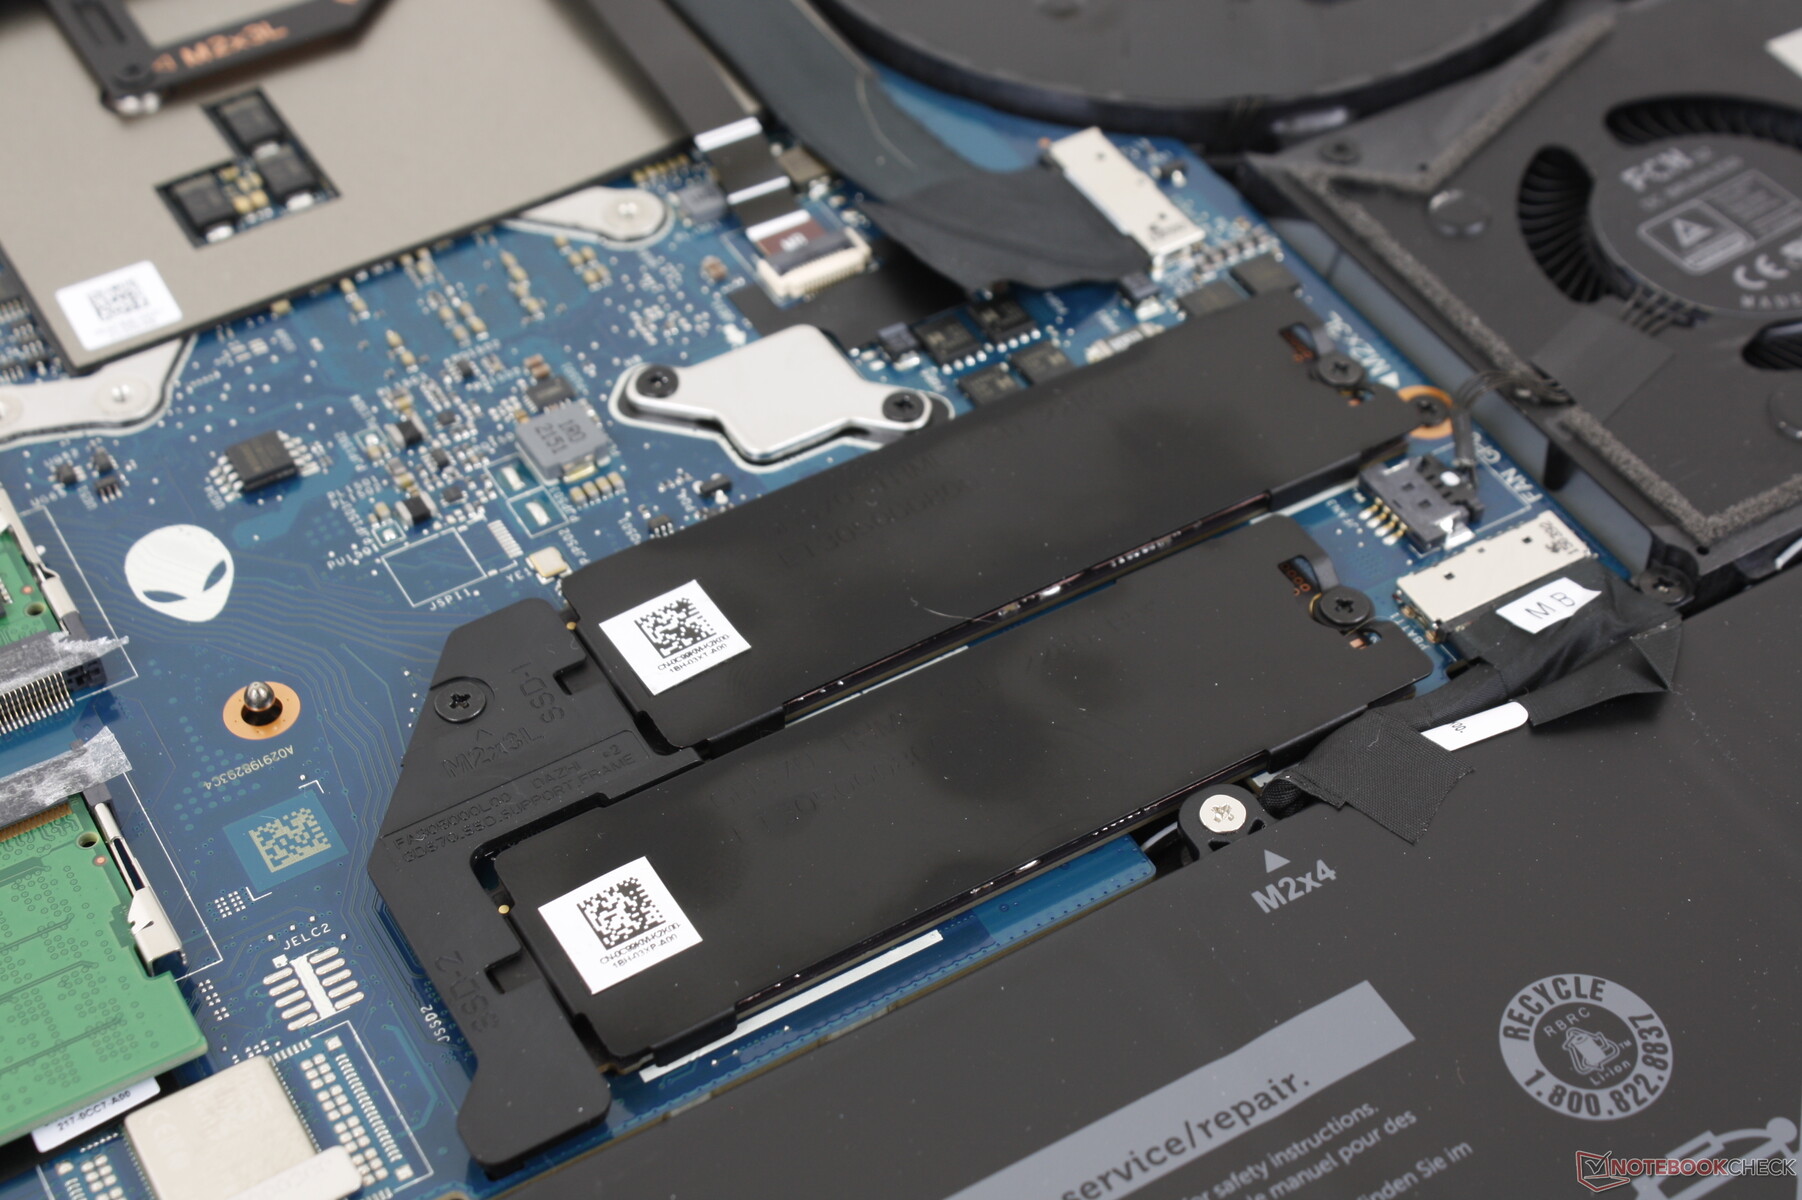
Manutenzione
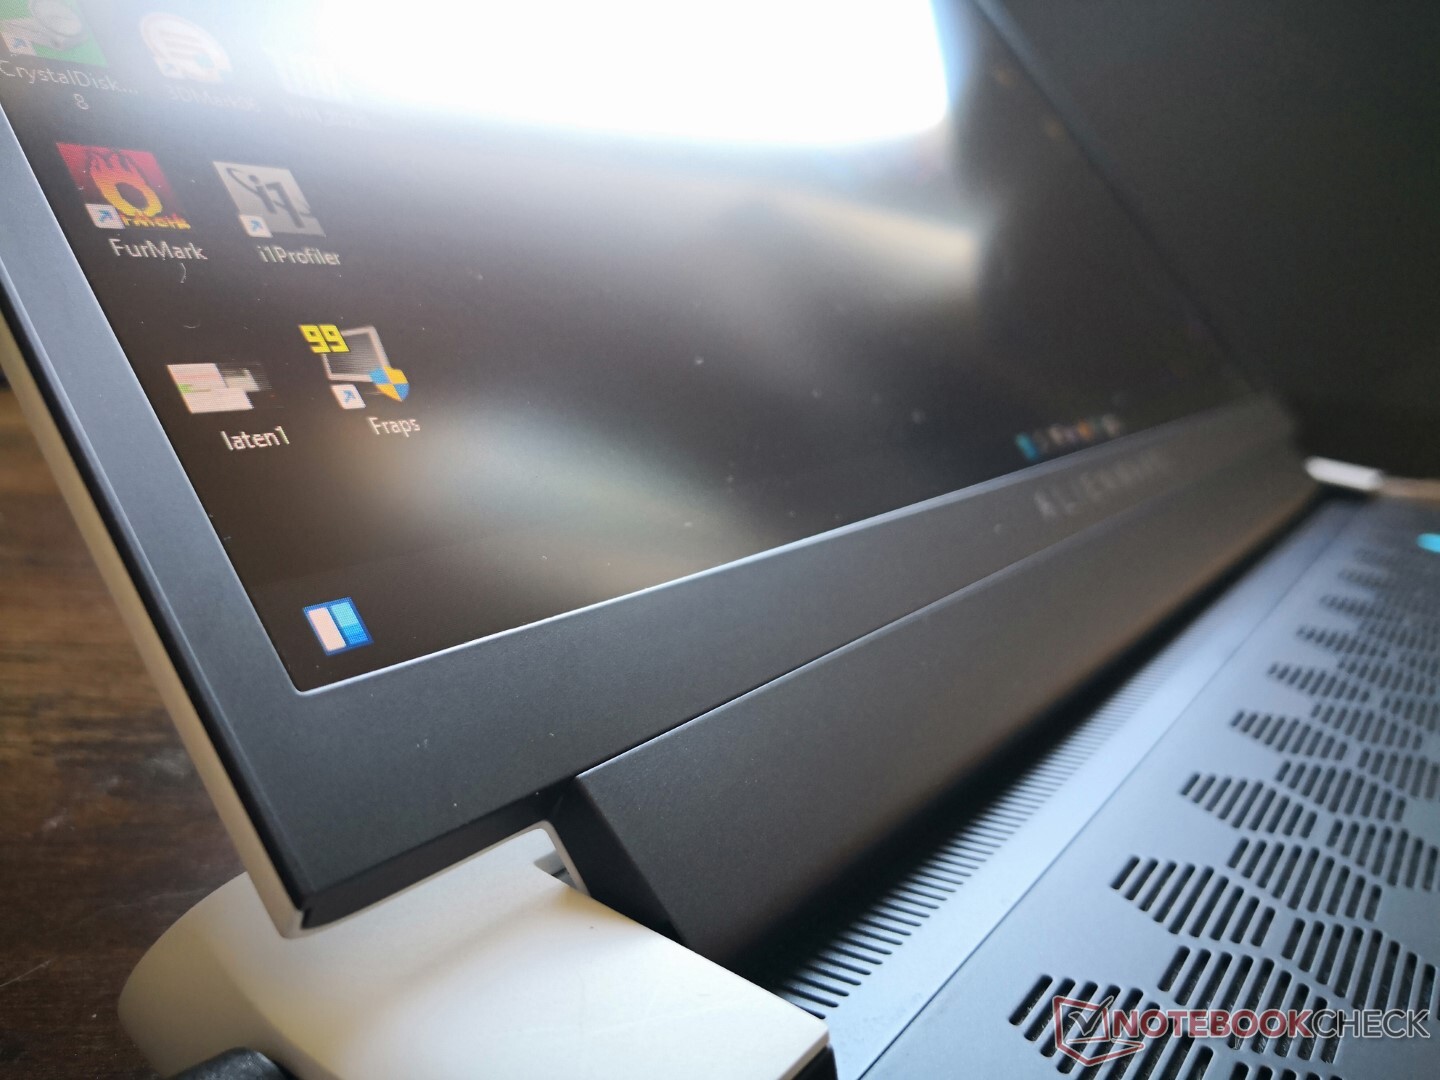
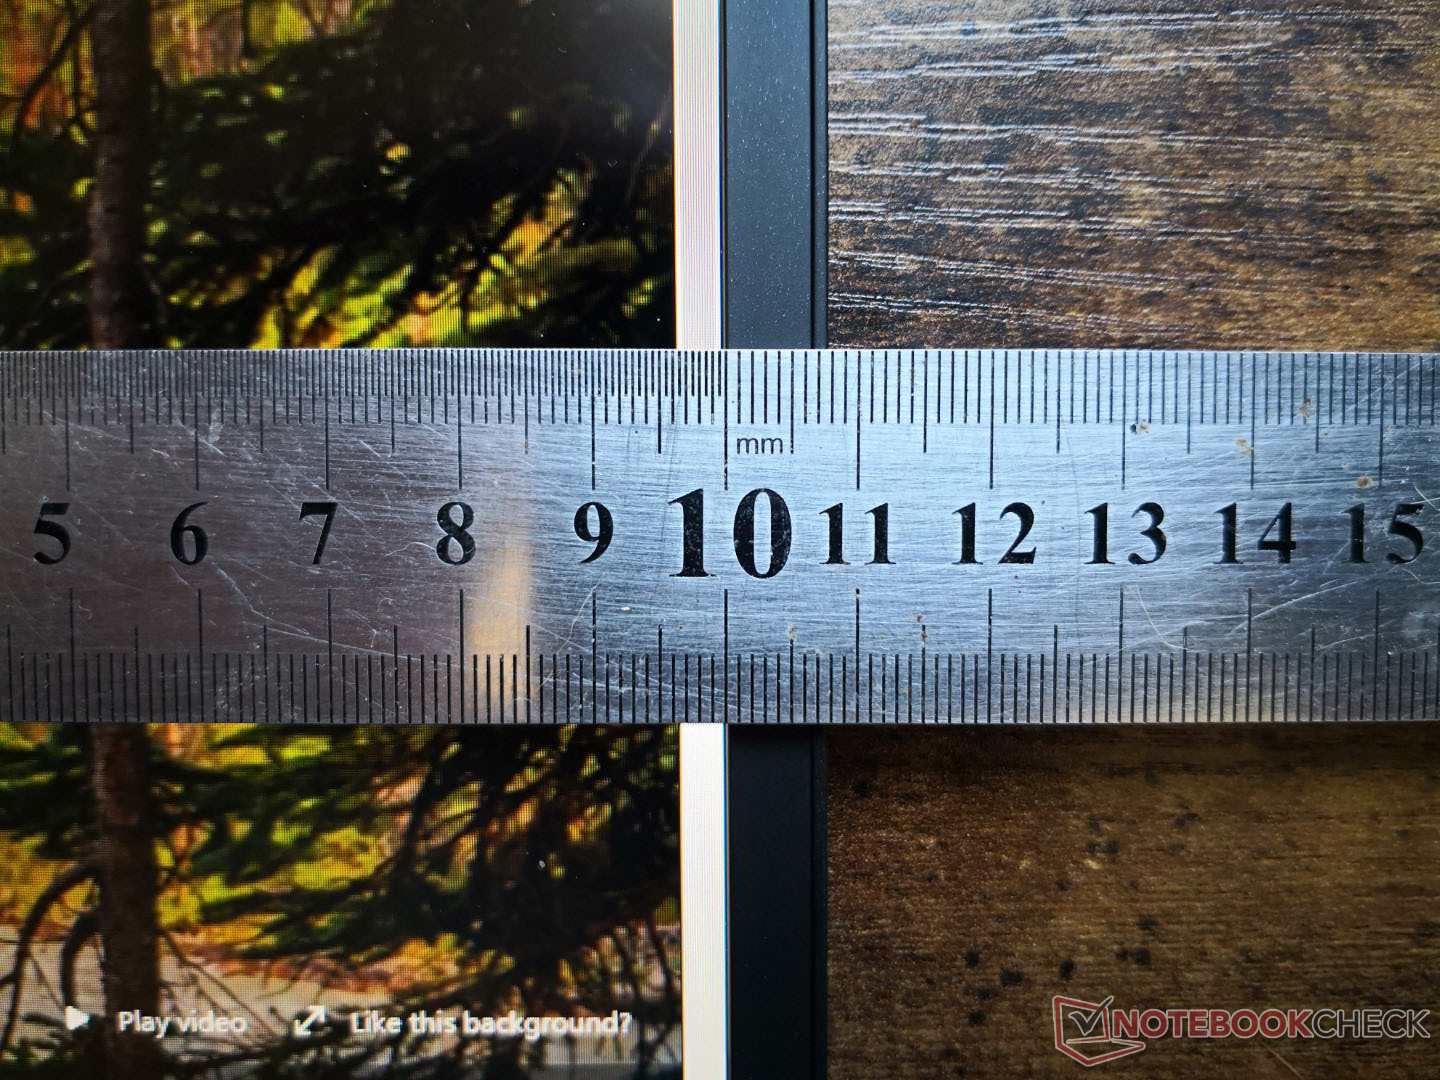
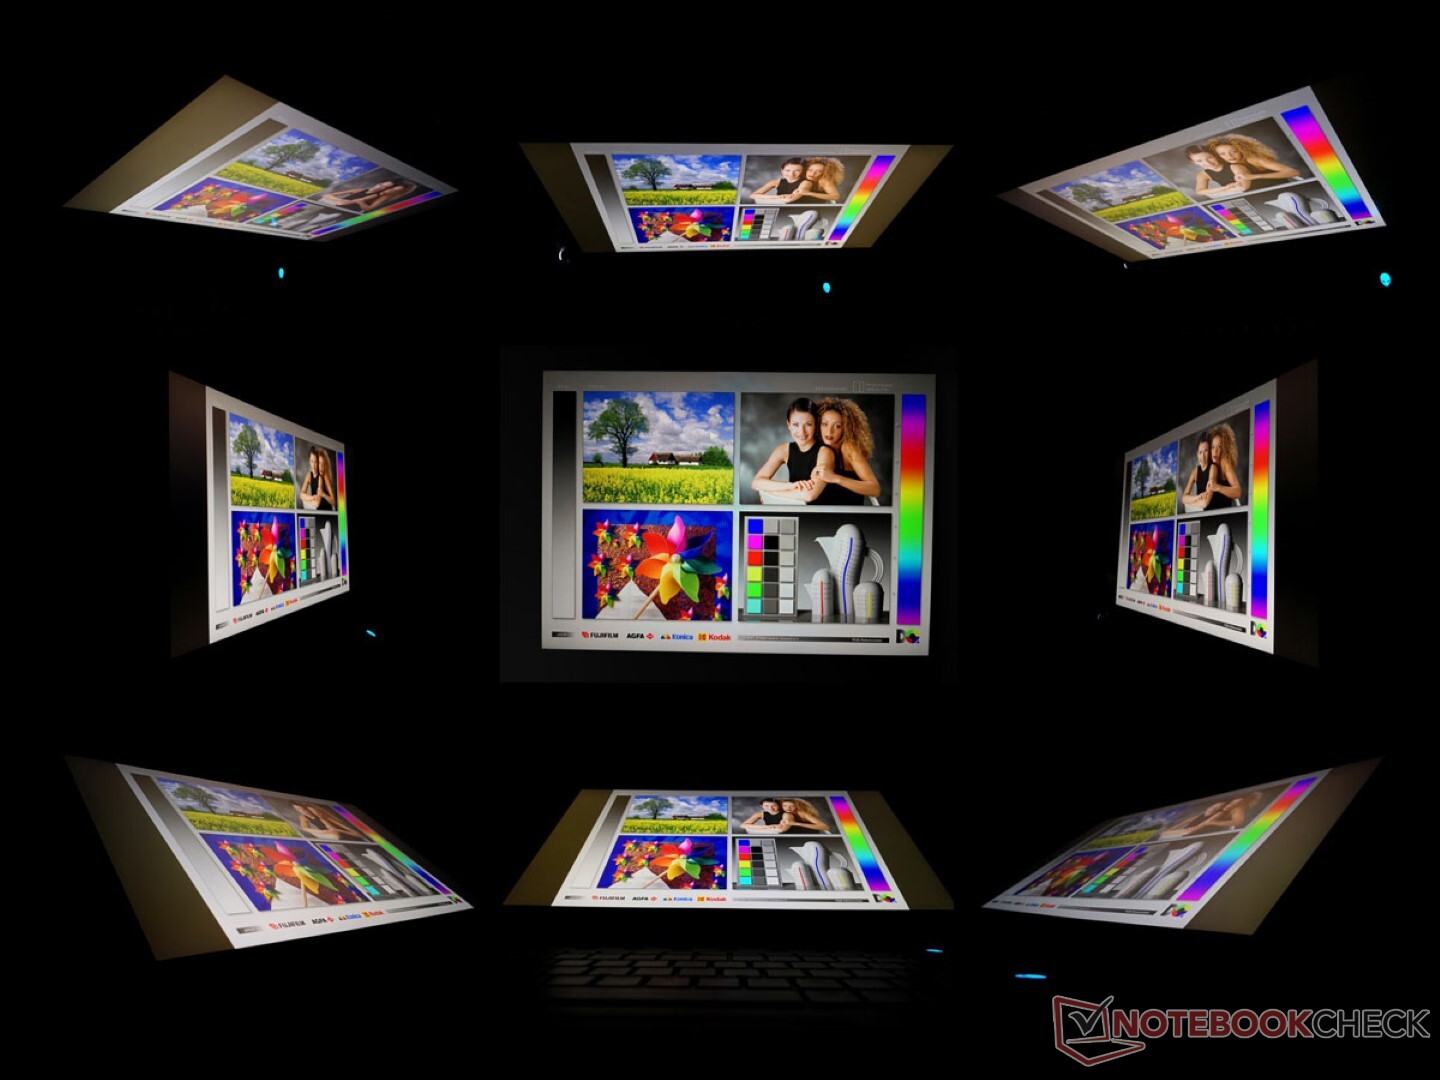
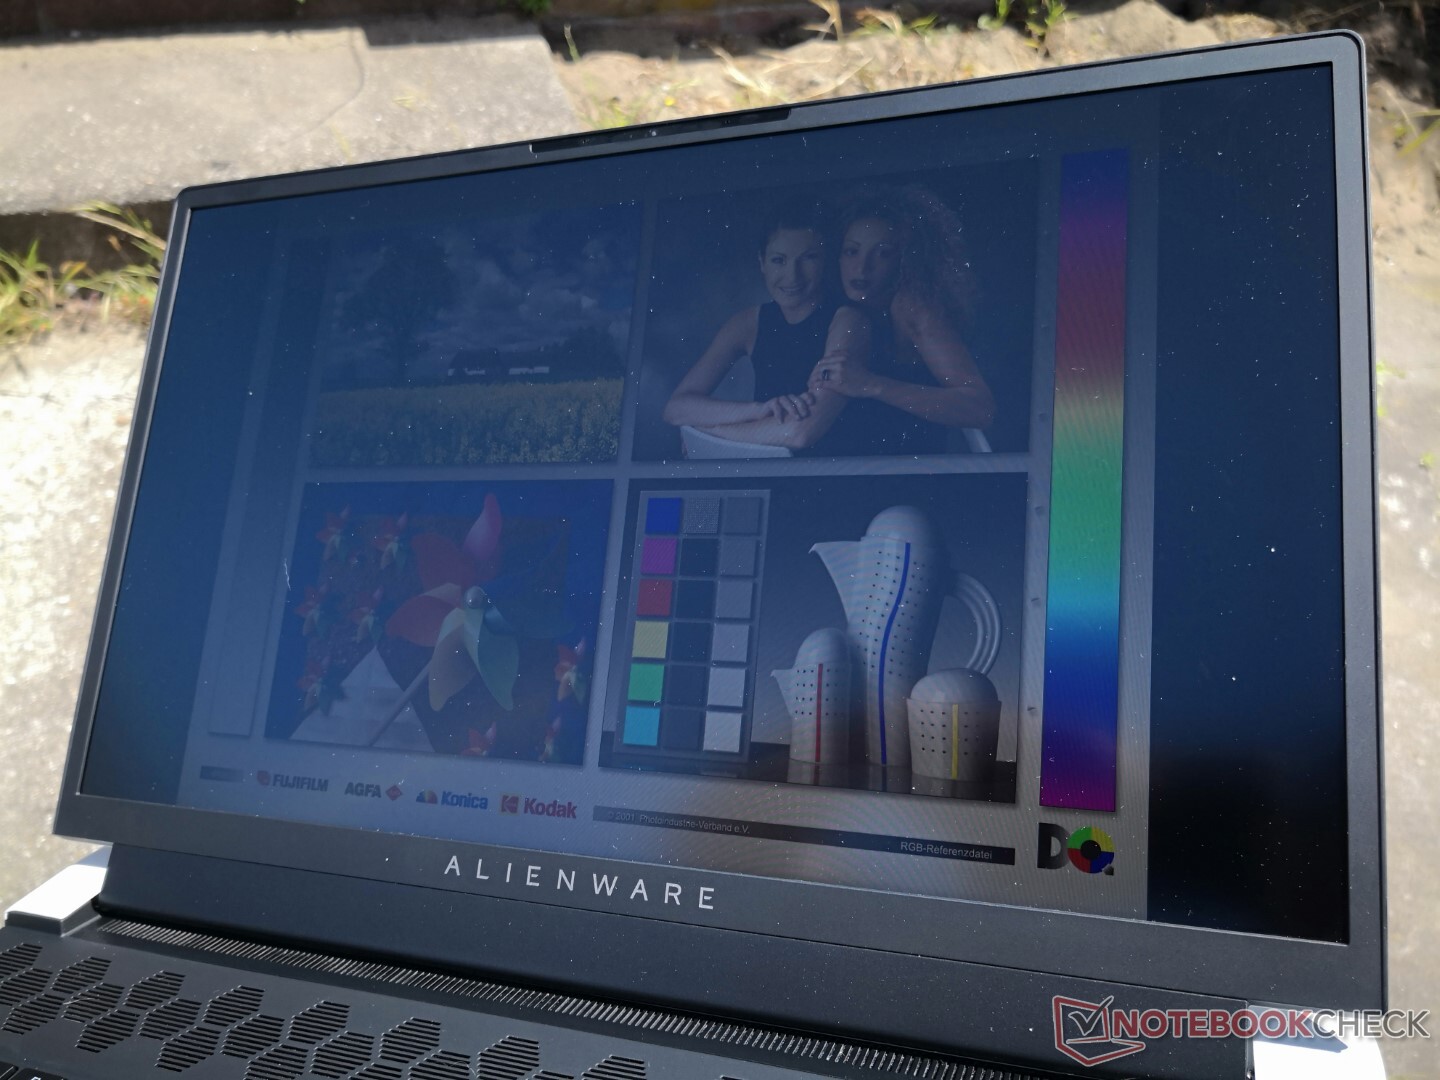
Visualizza
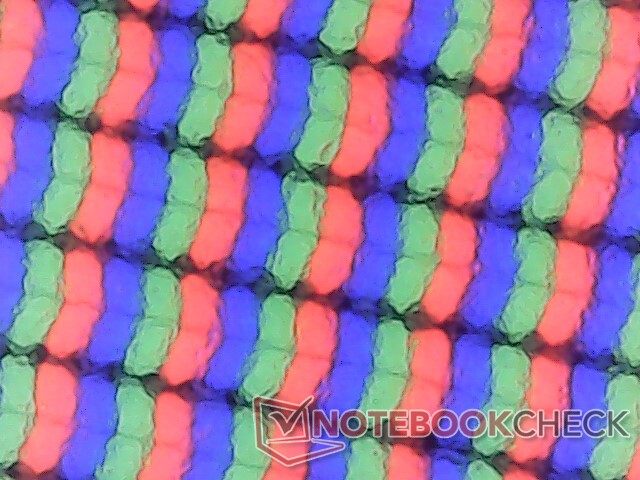
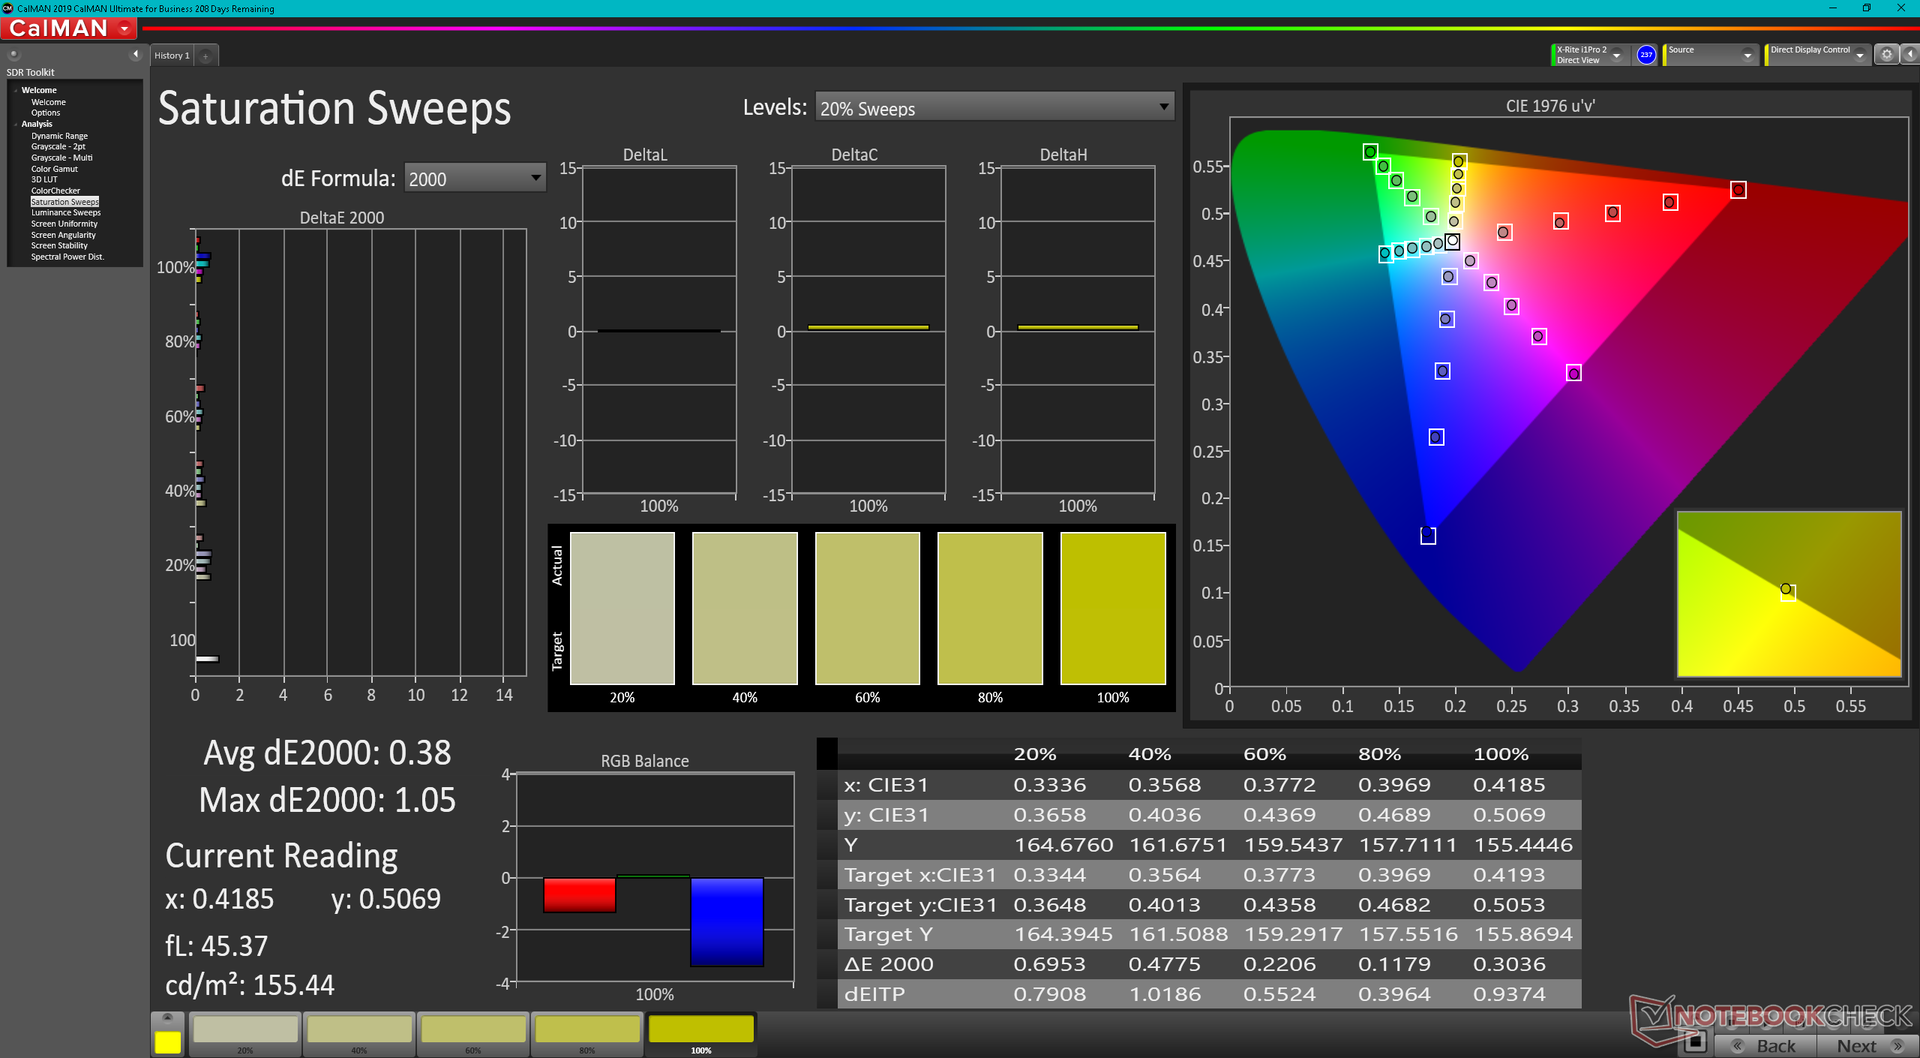
Il nostro pannello AU Optronics B173HAN IPS controlla quasi tutte le scatole tipiche, tra cui una velocità di aggiornamento di 360 Hz, tempi di risposta rapidi in bianco e nero e grigio, e una copertura completa sRGB per essere adatto sia al gioco che alla maggior parte dell'editing grafico. Altri produttori di laptop con opzioni di display da 17,3 pollici 1080p 360 Hz probabilmente useranno lo stesso pannello AU Optronics che si trova sul nostro Alienware. Un'opzione di fascia alta 4K 120 Hz è disponibile anche con supporto G-Sync.
Non ci sono attualmente opzioni OLED che avrebbero offerto una più ampia copertura del colore DCI-P3 e livelli di nero più profondi rispetto alla solita soluzione IPS.
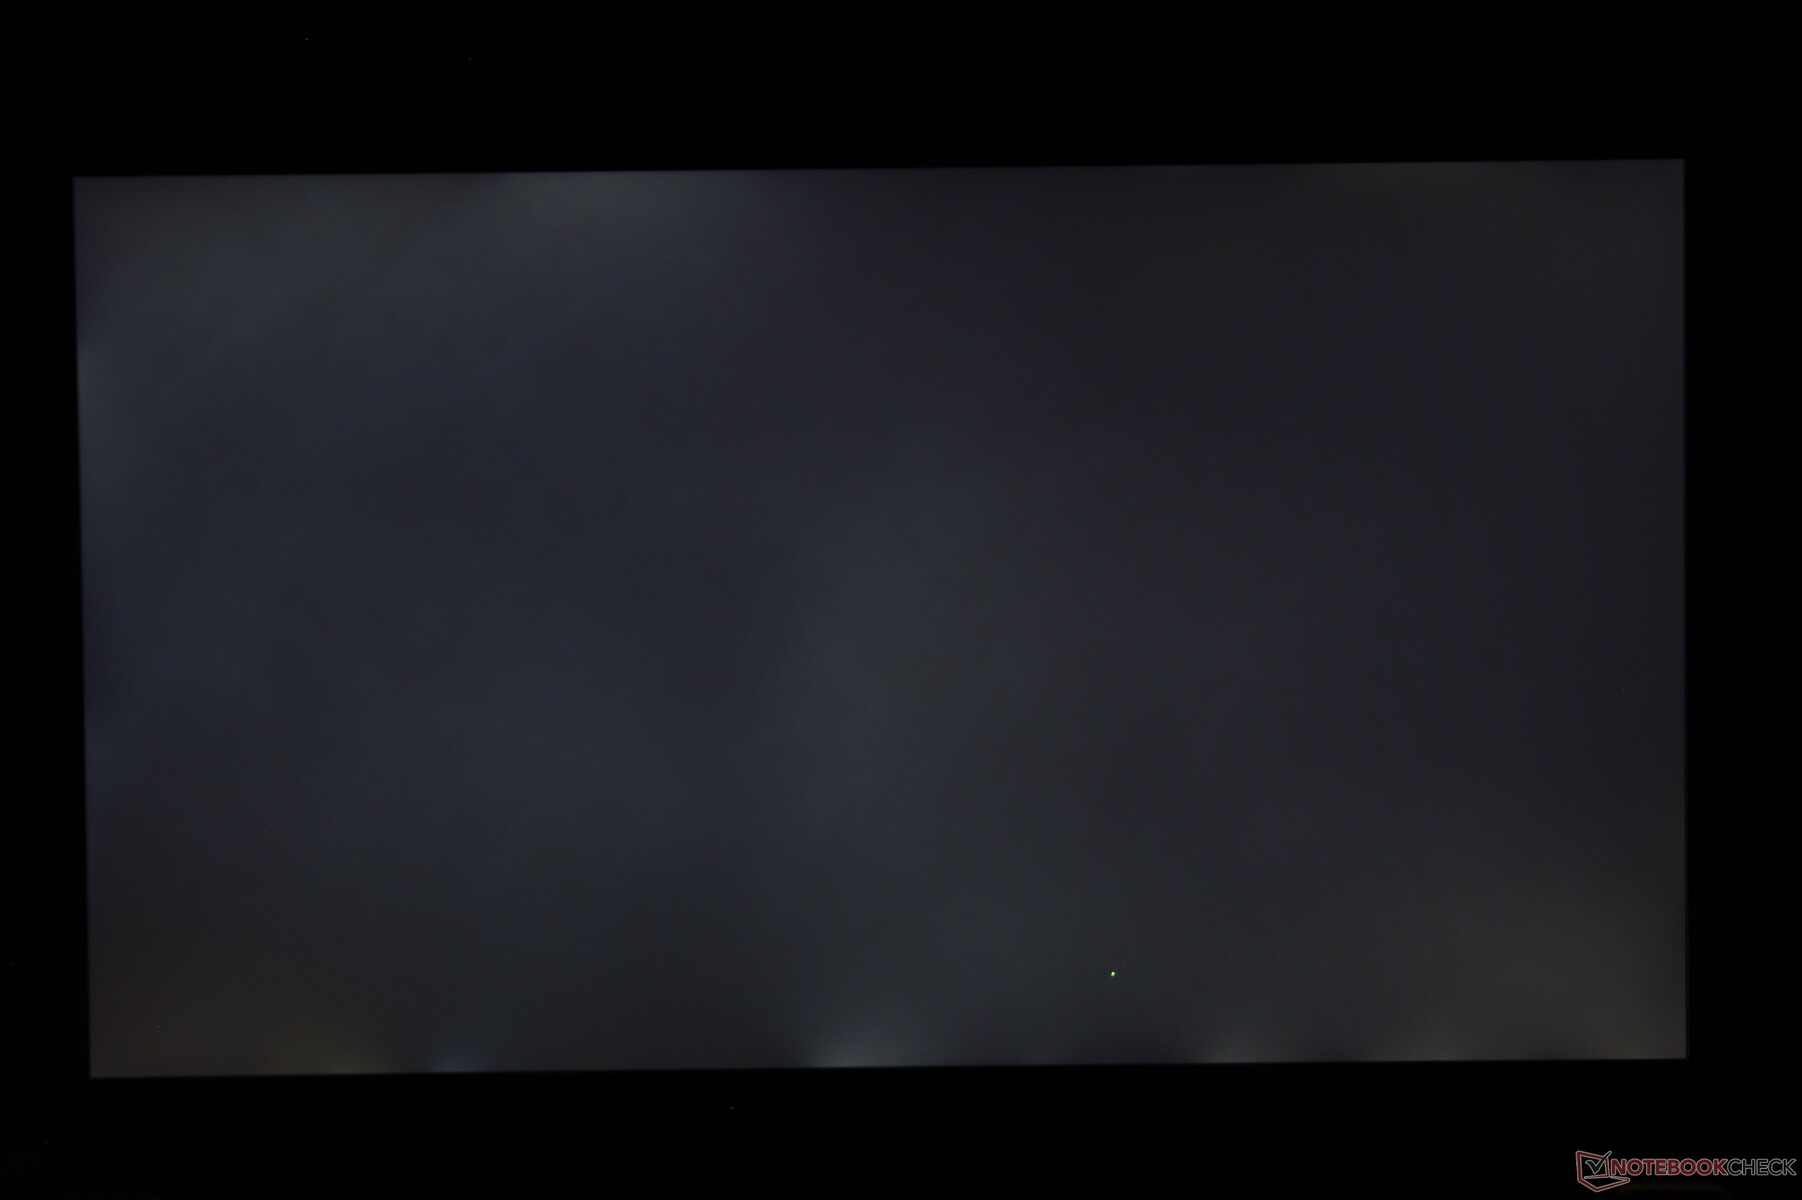
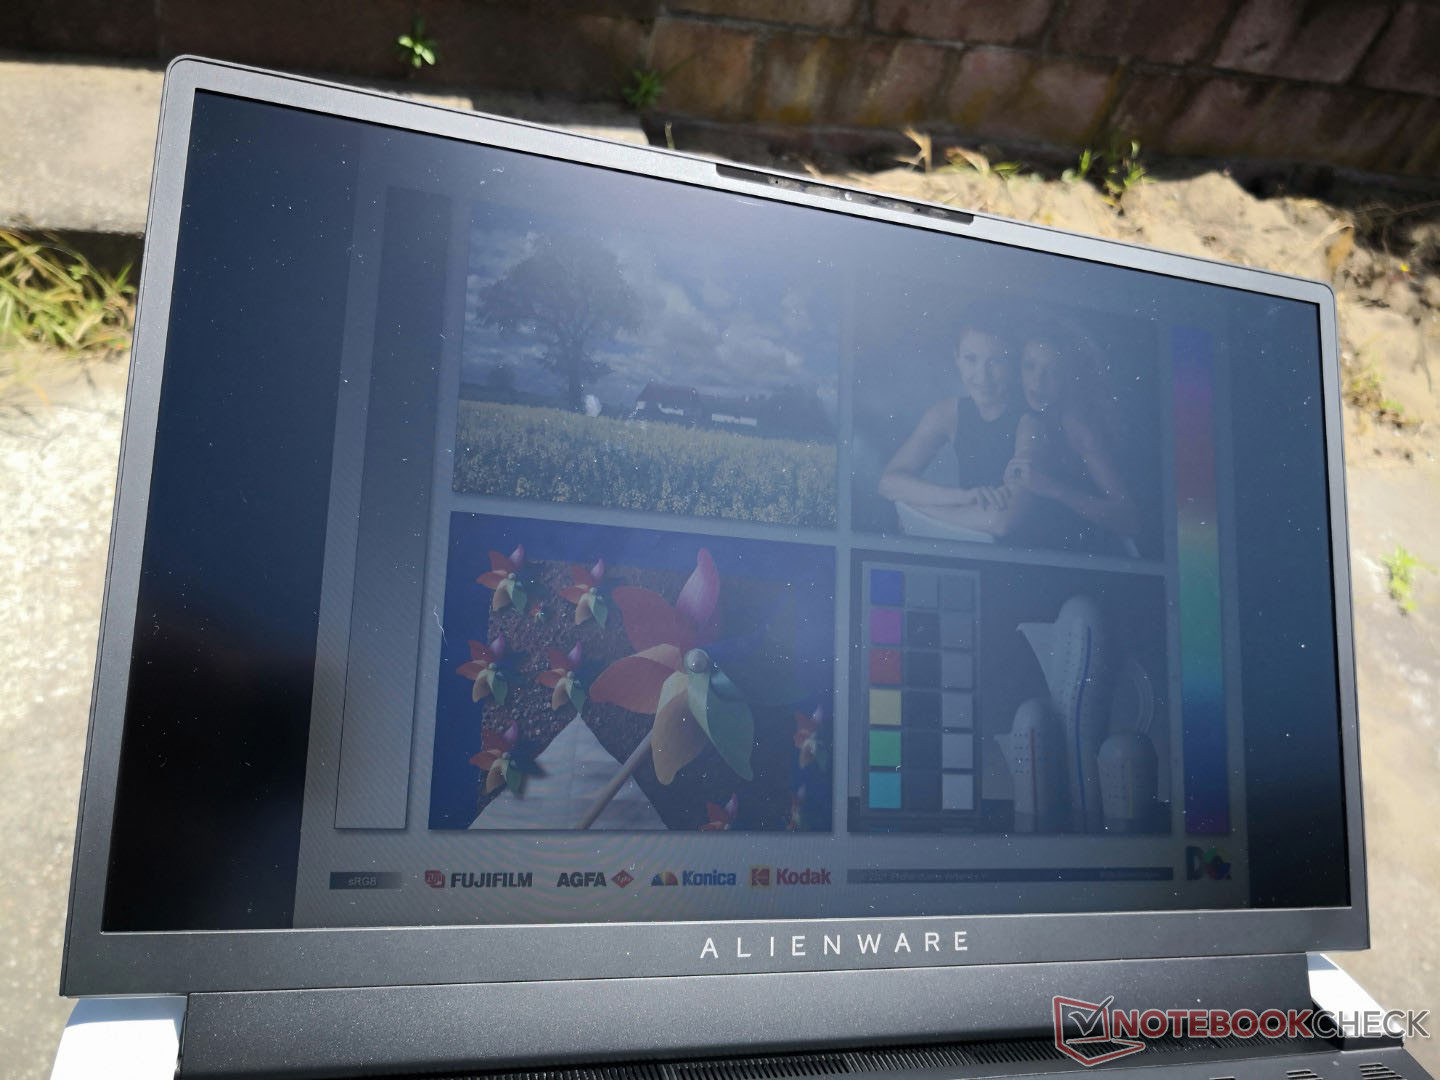
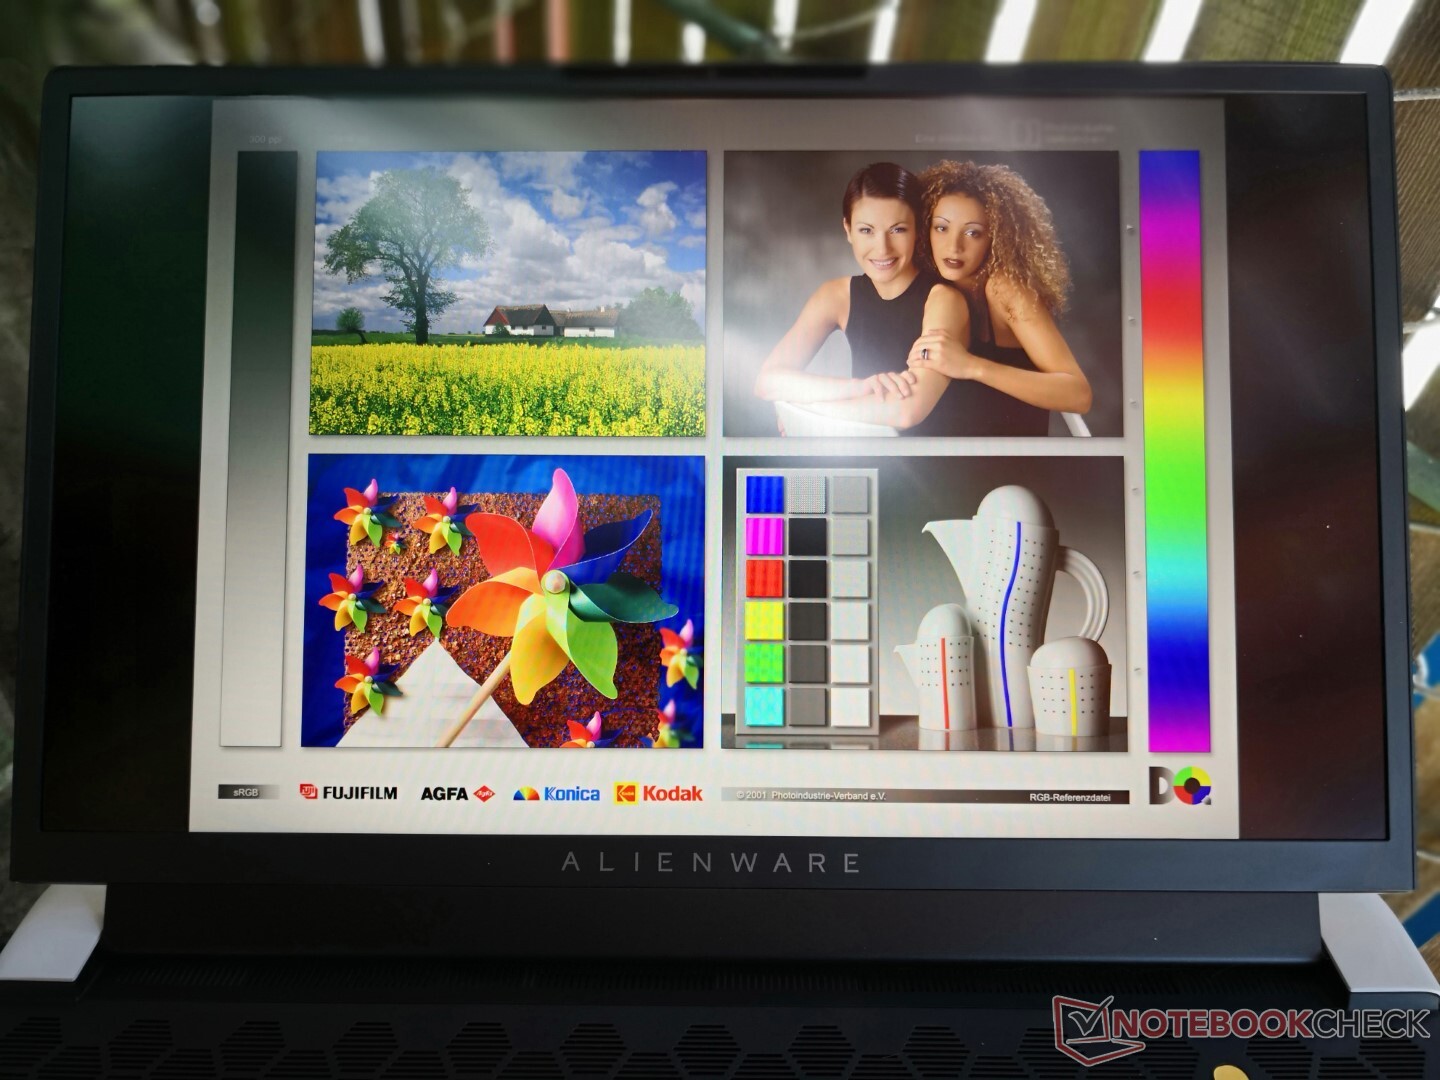
È interessante notare che il nostro pannello FHD non è così luminoso come il pannello 4K UHD dell'originale x17 R1. Siamo in grado di misurare una luminosità massima di 365 nits qui rispetto ai 439 nits del 4K x17 R1.
| |||||||||||||||||||||||||
Distribuzione della luminosità: 85 %
Al centro con la batteria: 365.4 cd/m²
Contrasto: 1260:1 (Nero: 0.29 cd/m²)
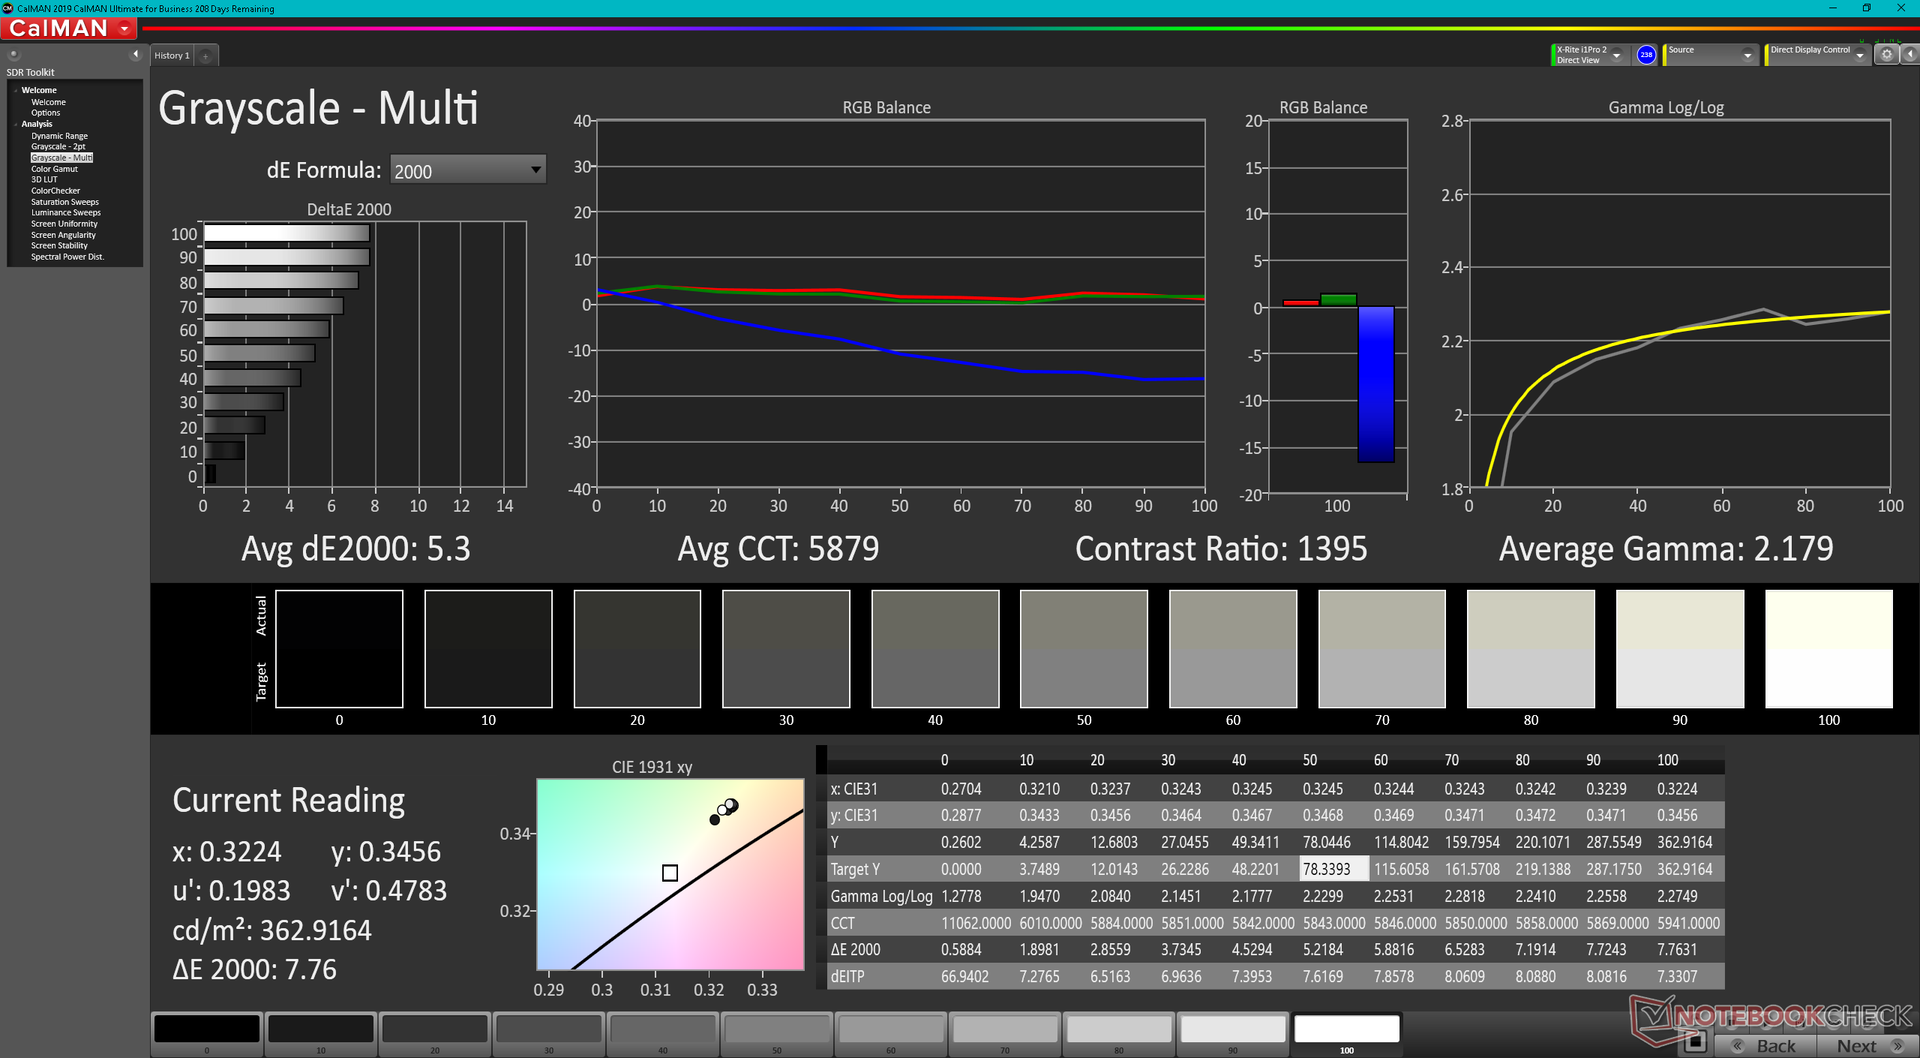
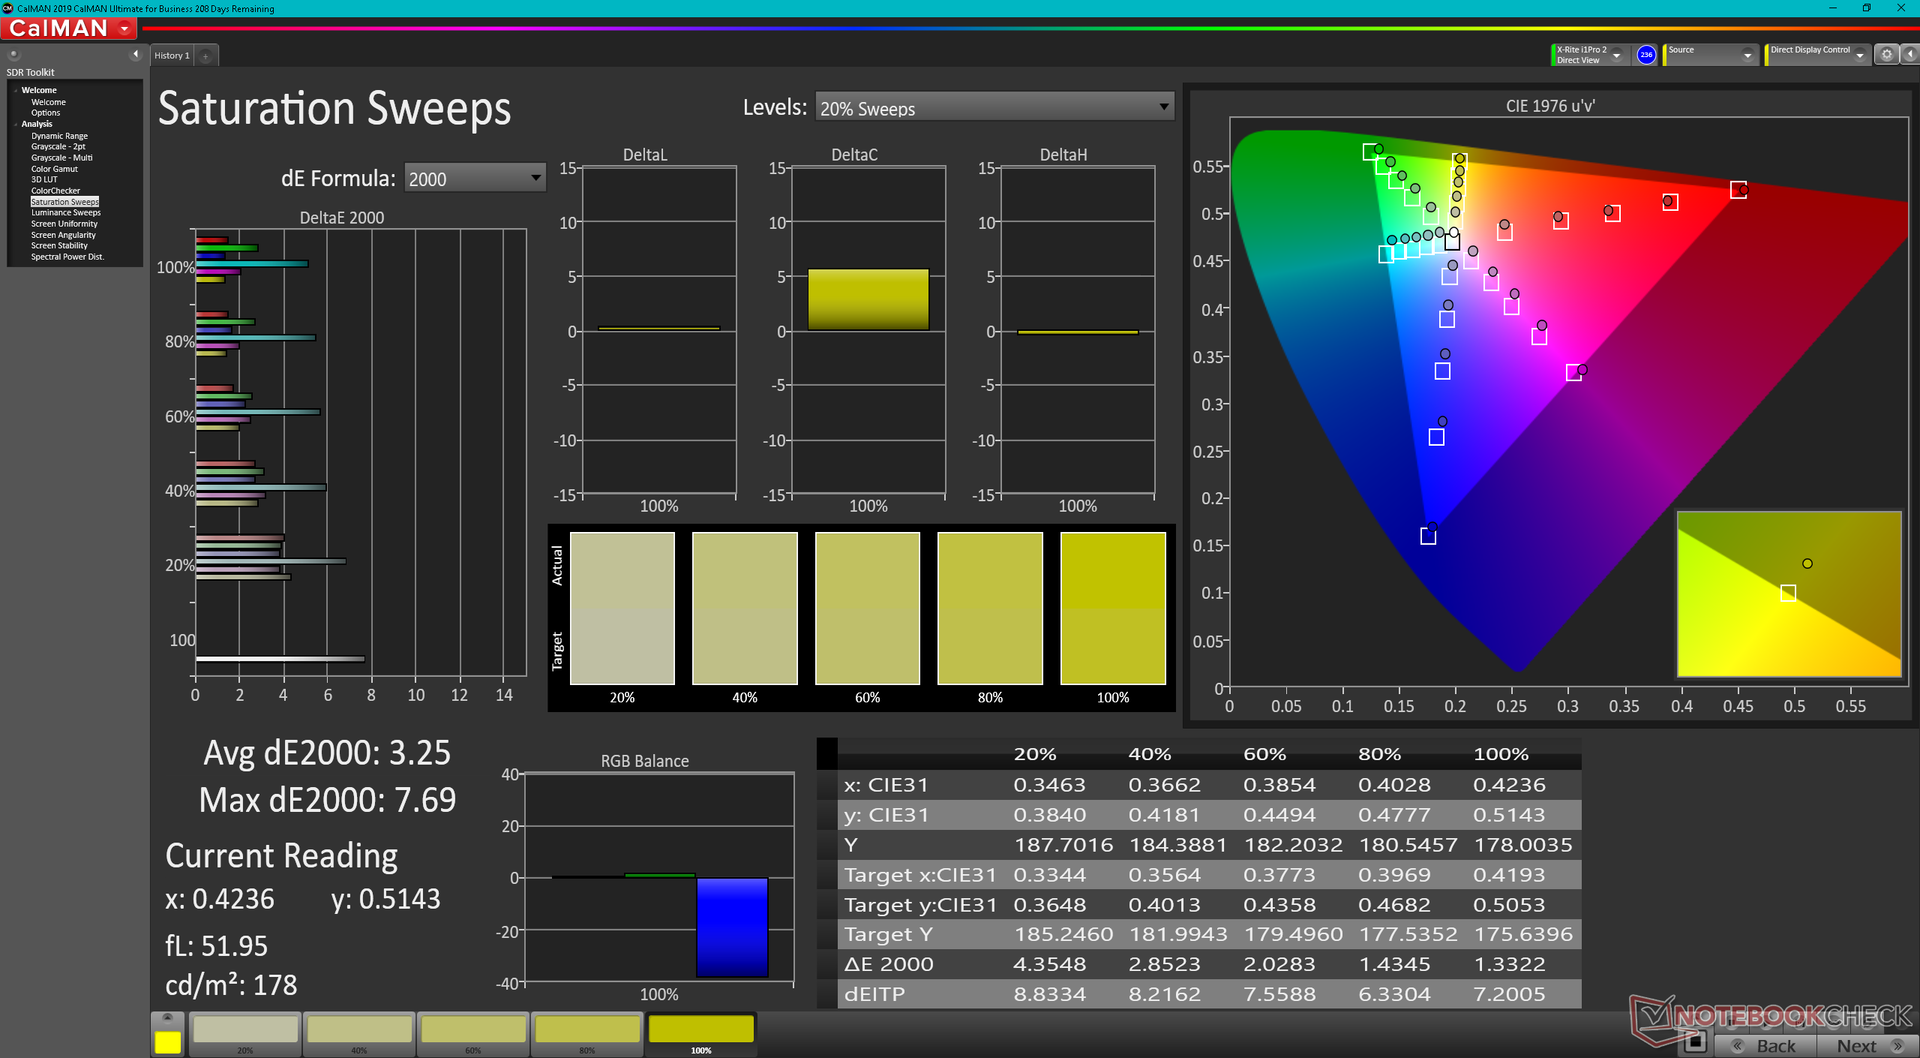
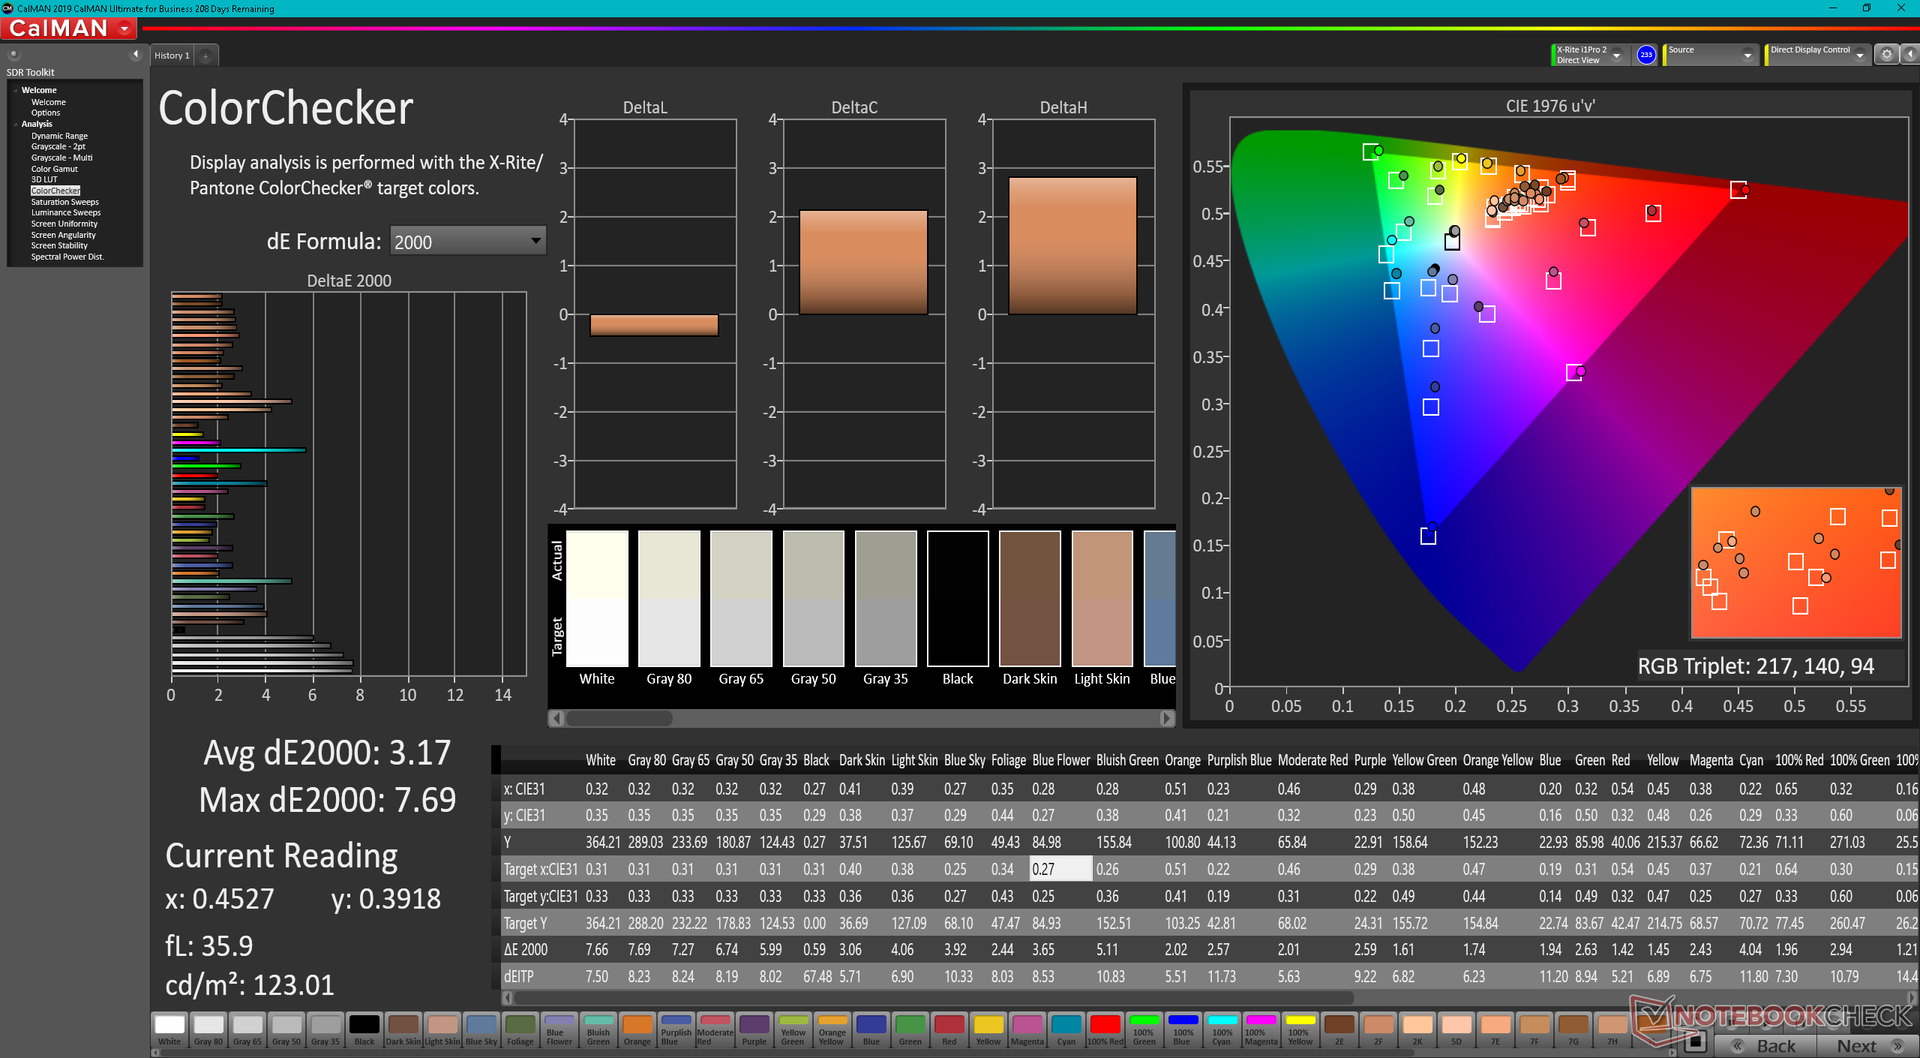
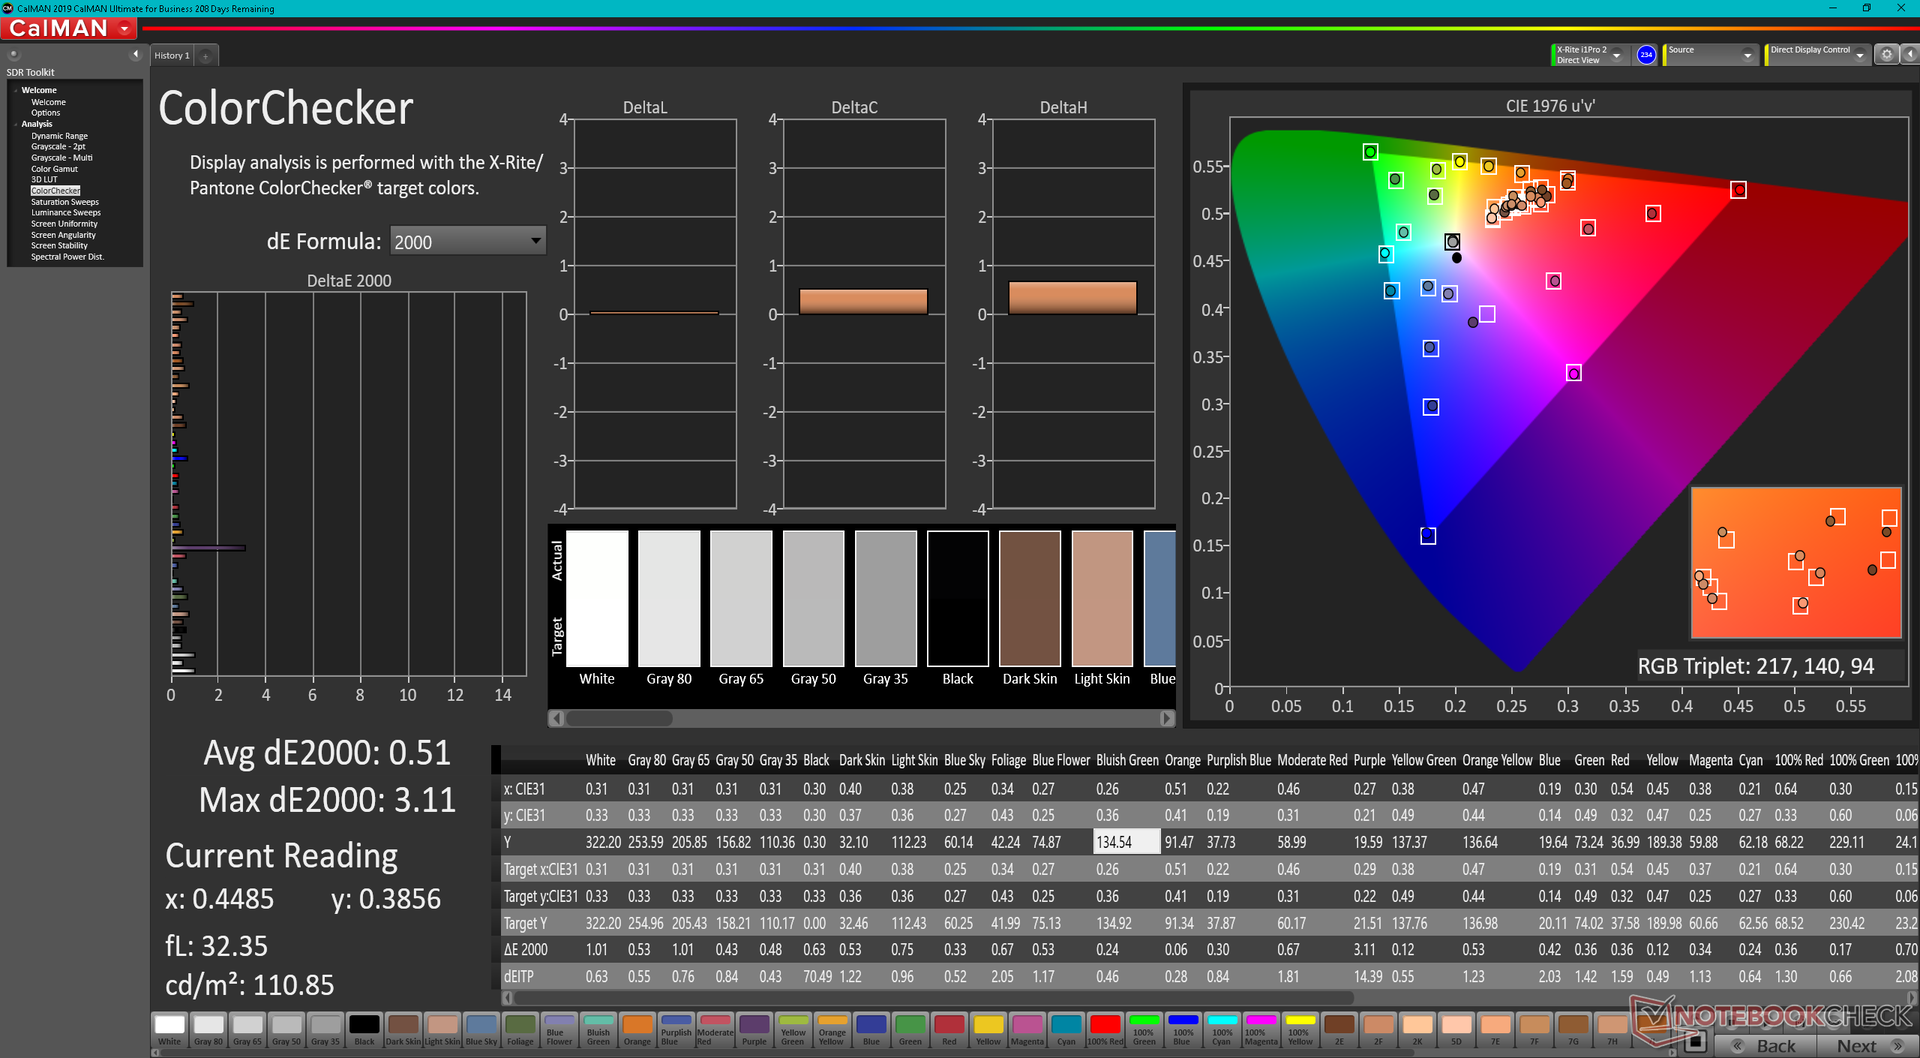
ΔE ColorChecker Calman: 3.17 | ∀{0.5-29.43 Ø4.71}
calibrated: 0.51
ΔE Greyscale Calman: 5.3 | ∀{0.09-98 Ø4.96}
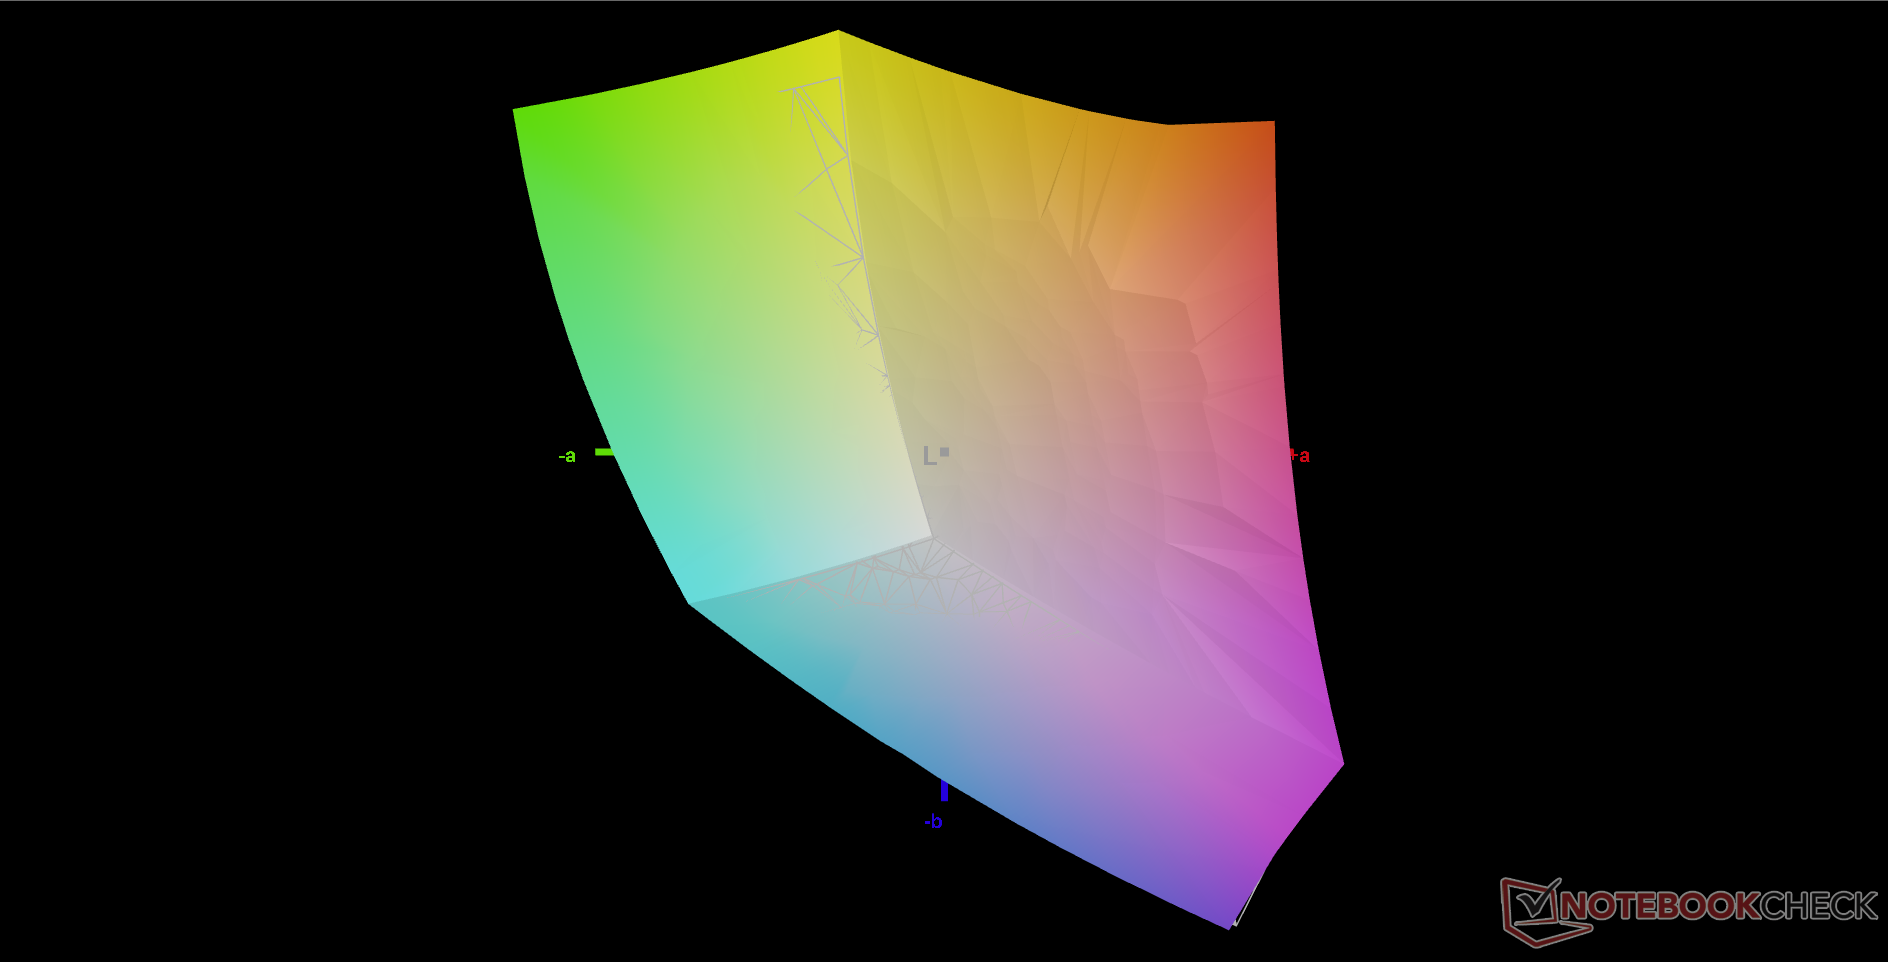
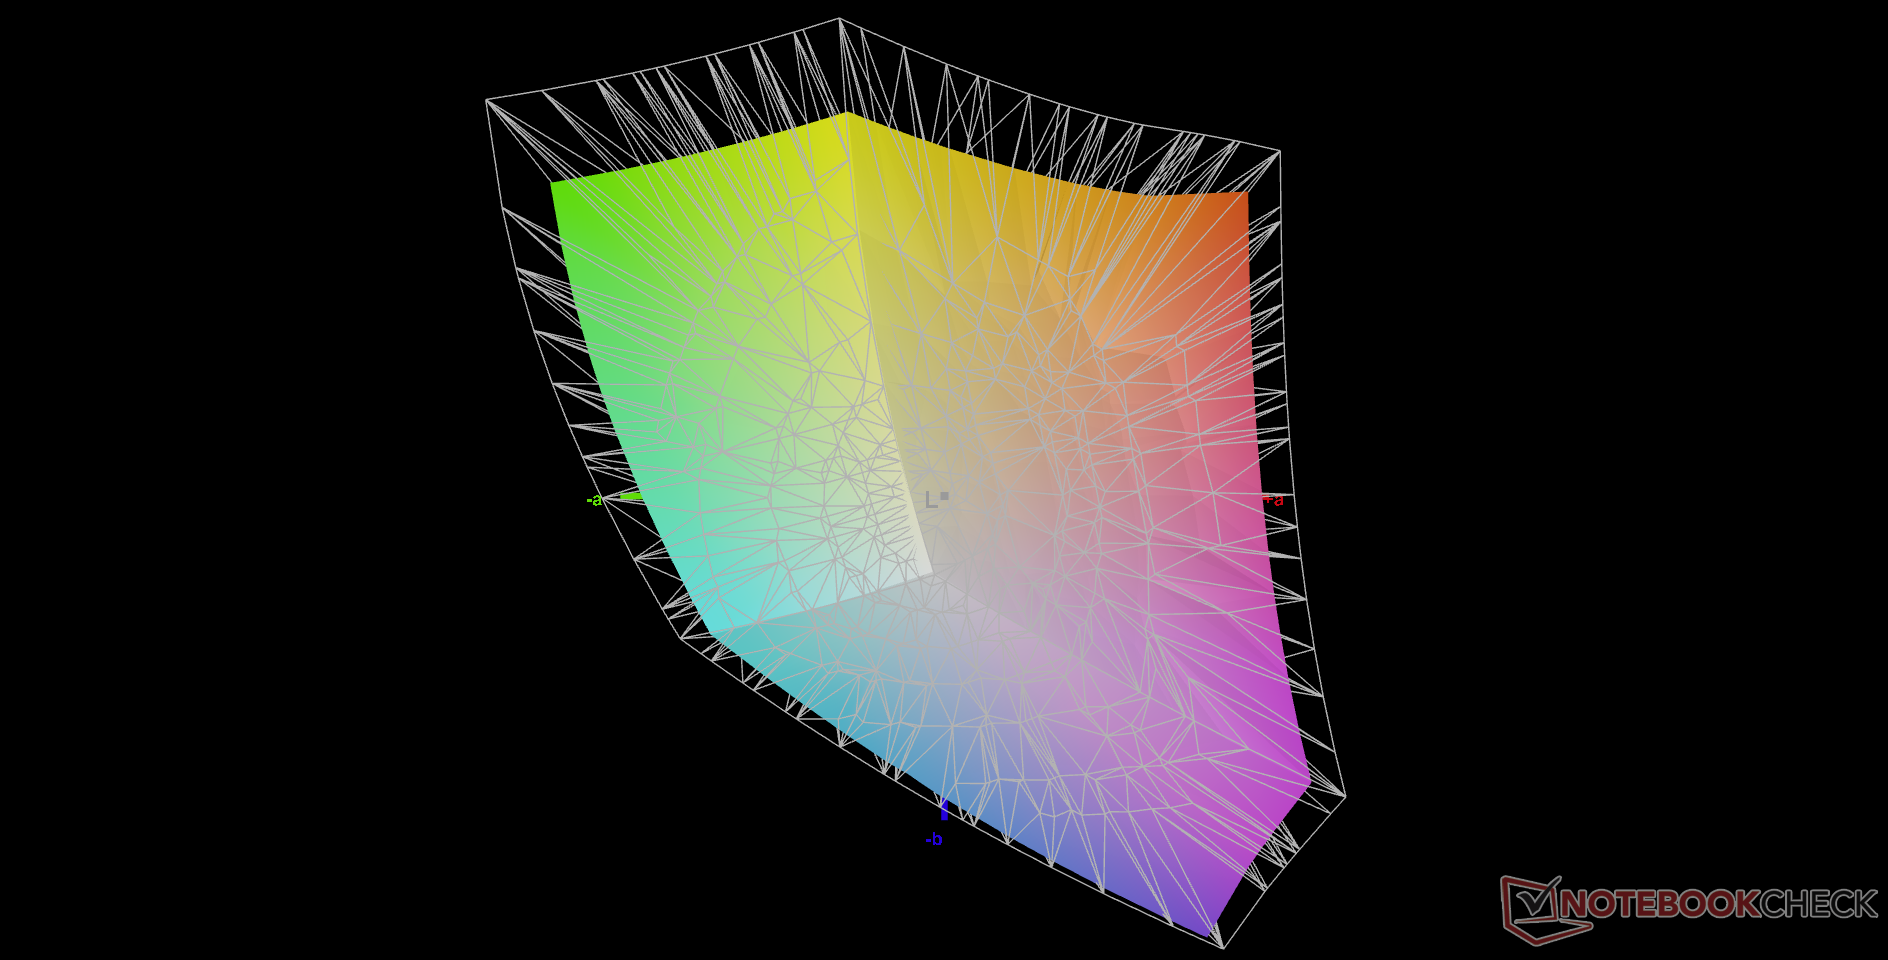
79.6% AdobeRGB 1998 (Argyll 3D)
99.8% sRGB (Argyll 3D)
79.2% Display P3 (Argyll 3D)
Gamma: 2.18
CCT: 5879 K
| Alienware x17 R2 P48E AU Optronics B173HAN, IPS, 1920x1080, 17.3" | Alienware x17 RTX 3080 P48E AU Optronics B173ZAN, IPS, 3840x2160, 17.3" | Asus ROG Zephyrus S17 GX703HSD BOE099D (BOE CQ NE173QHM-NY3), IPS, 2560x1440, 17.3" | MSI Stealth GS77 12UHS-083US BOE NE173QHM-NZ1, IPS, 2560x1440, 17.3" | MSI GT76 Titan DT 10SGS AU Optronics B173ZAN03.3, IPS, 3840x2160, 17.3" | Gigabyte A7 X1 AU Optronics AUO8E8D, IPS, 1920x1080, 17.3" | |
|---|---|---|---|---|---|---|
| Display | 12% | 8% | 10% | 8% | -17% | |
| Display P3 Coverage (%) | 79.2 | 88.3 11% | 94.2 19% | 96.2 21% | 82.5 4% | 61.5 -22% |
| sRGB Coverage (%) | 99.8 | 100 0% | 98.7 -1% | 99.7 0% | 98 -2% | 90.9 -9% |
| AdobeRGB 1998 Coverage (%) | 79.6 | 100 26% | 84.4 6% | 85.8 8% | 96.6 21% | 63.2 -21% |
| Response Times | -15% | 37% | -41% | -57% | -23% | |
| Response Time Grey 50% / Grey 80% * (ms) | 12.4 ? | 14.4 ? -16% | 4.8 61% | 17.6 ? -42% | 23.2 ? -87% | 16 ? -29% |
| Response Time Black / White * (ms) | 9.2 ? | 10.4 ? -13% | 8 13% | 12.8 ? -39% | 11.6 ? -26% | 10.8 ? -17% |
| PWM Frequency (Hz) | ||||||
| Screen | -6% | -29% | -12% | -55% | -39% | |
| Brightness middle (cd/m²) | 365.4 | 438.7 20% | 322 -12% | 334.8 -8% | 419.5 15% | 325 -11% |
| Brightness (cd/m²) | 344 | 435 26% | 288 -16% | 305 -11% | 413 20% | 318 -8% |
| Brightness Distribution (%) | 85 | 91 7% | 72 -15% | 79 -7% | 93 9% | 95 12% |
| Black Level * (cd/m²) | 0.29 | 0.48 -66% | 0.3 -3% | 0.34 -17% | 0.4 -38% | 0.29 -0% |
| Contrast (:1) | 1260 | 914 -27% | 1073 -15% | 985 -22% | 1049 -17% | 1121 -11% |
| Colorchecker dE 2000 * | 3.17 | 4.34 -37% | 3.05 4% | 4.1 -29% | 3.4 -7% | 4.33 -37% |
| Colorchecker dE 2000 max. * | 7.69 | 7.3 5% | 5.23 32% | 7.28 5% | 7.4 4% | 8.6 -12% |
| Colorchecker dE 2000 calibrated * | 0.51 | 0.72 -41% | 1.92 -276% | 3.28 -543% | 1.95 -282% | |
| Greyscale dE 2000 * | 5.3 | 2.4 55% | 3.11 41% | 5.6 -6% | 2 62% | 5.5 -4% |
| Gamma | 2.18 101% | 2.09 105% | 2.13 103% | 2.16 102% | 2.14 103% | 2.142 103% |
| CCT | 5879 111% | 6413 101% | 6553 99% | 6314 103% | 6858 95% | 7893 82% |
| Color Space (Percent of AdobeRGB 1998) (%) | 84 | 84.6 | ||||
| Color Space (Percent of sRGB) (%) | 99 | 97.9 | ||||
| Media totale (Programma / Settaggio) | -3% /
-4% | 5% /
-12% | -14% /
-11% | -35% /
-42% | -26% /
-32% |
* ... Meglio usare valori piccoli
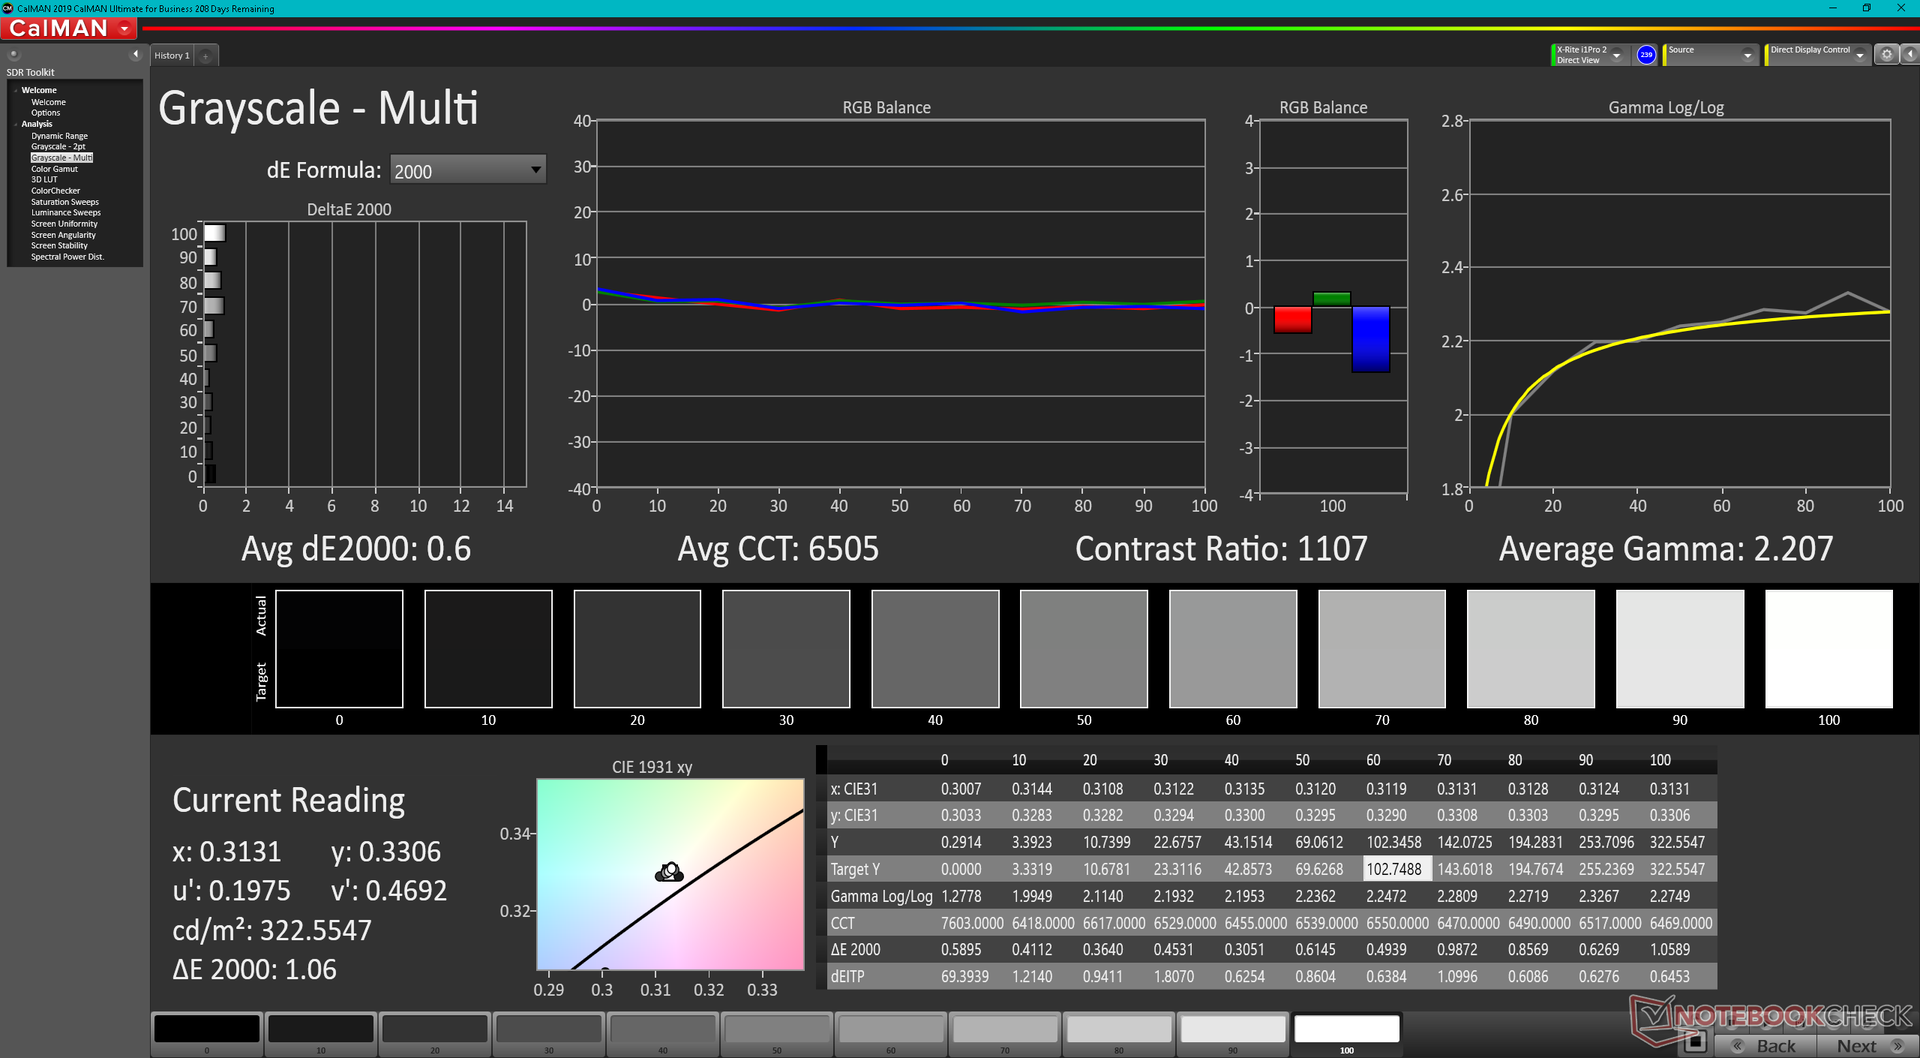
Il display non è calibrato molto bene fuori dalla scatola, soprattutto perché la temperatura del colore è eccessivamente calda. Una volta calibrato correttamente rispetto a sRGB, tuttavia, siamo in grado di ottenere valori medi di deltaE della scala di grigi e del colore fino a soli 0,6 e 0,51, rispettivamente.
Tempi di risposta del Display
| ↔ Tempi di risposta dal Nero al Bianco | ||
|---|---|---|
| 9.2 ms ... aumenta ↗ e diminuisce ↘ combinato | ↗ 5.2 ms Incremento | 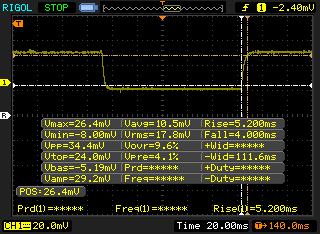 |
| ↘ 4 ms Calo | ||
| Lo schermo mostra veloci tempi di risposta durante i nostri tests e dovrebbe esere adatto al gaming In confronto, tutti i dispositivi di test variano da 0.1 (minimo) a 240 (massimo) ms. » 26 % di tutti i dispositivi è migliore. Questo significa che i tempi di risposta rilevati sono migliori rispettto alla media di tutti i dispositivi testati (19.8 ms). | ||
| ↔ Tempo di risposta dal 50% Grigio all'80% Grigio | ||
| 12.4 ms ... aumenta ↗ e diminuisce ↘ combinato | ↗ 6.4 ms Incremento | 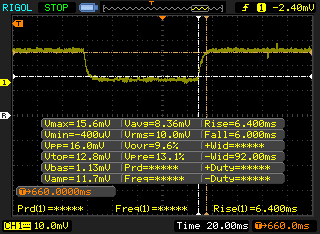 |
| ↘ 6 ms Calo | ||
| Lo schermo mostra buoni tempi di risposta durante i nostri tests, ma potrebbe essere troppo lento per i gamers competitivi. In confronto, tutti i dispositivi di test variano da 0.165 (minimo) a 636 (massimo) ms. » 26 % di tutti i dispositivi è migliore. Questo significa che i tempi di risposta rilevati sono migliori rispettto alla media di tutti i dispositivi testati (30.9 ms). | ||
Sfarfallio dello schermo / PWM (Pulse-Width Modulation)
| flickering dello schermo / PWM non rilevato | 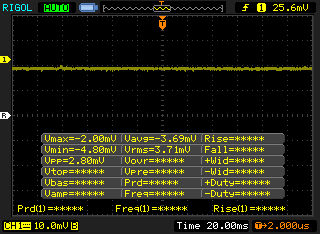 | ||
In confronto: 52 % di tutti i dispositivi testati non utilizza PWM per ridurre la luminosita' del display. Se è rilevato PWM, una media di 7741 (minimo: 5 - massimo: 343500) Hz è stata rilevata. | |||
Performance
Condizioni di test
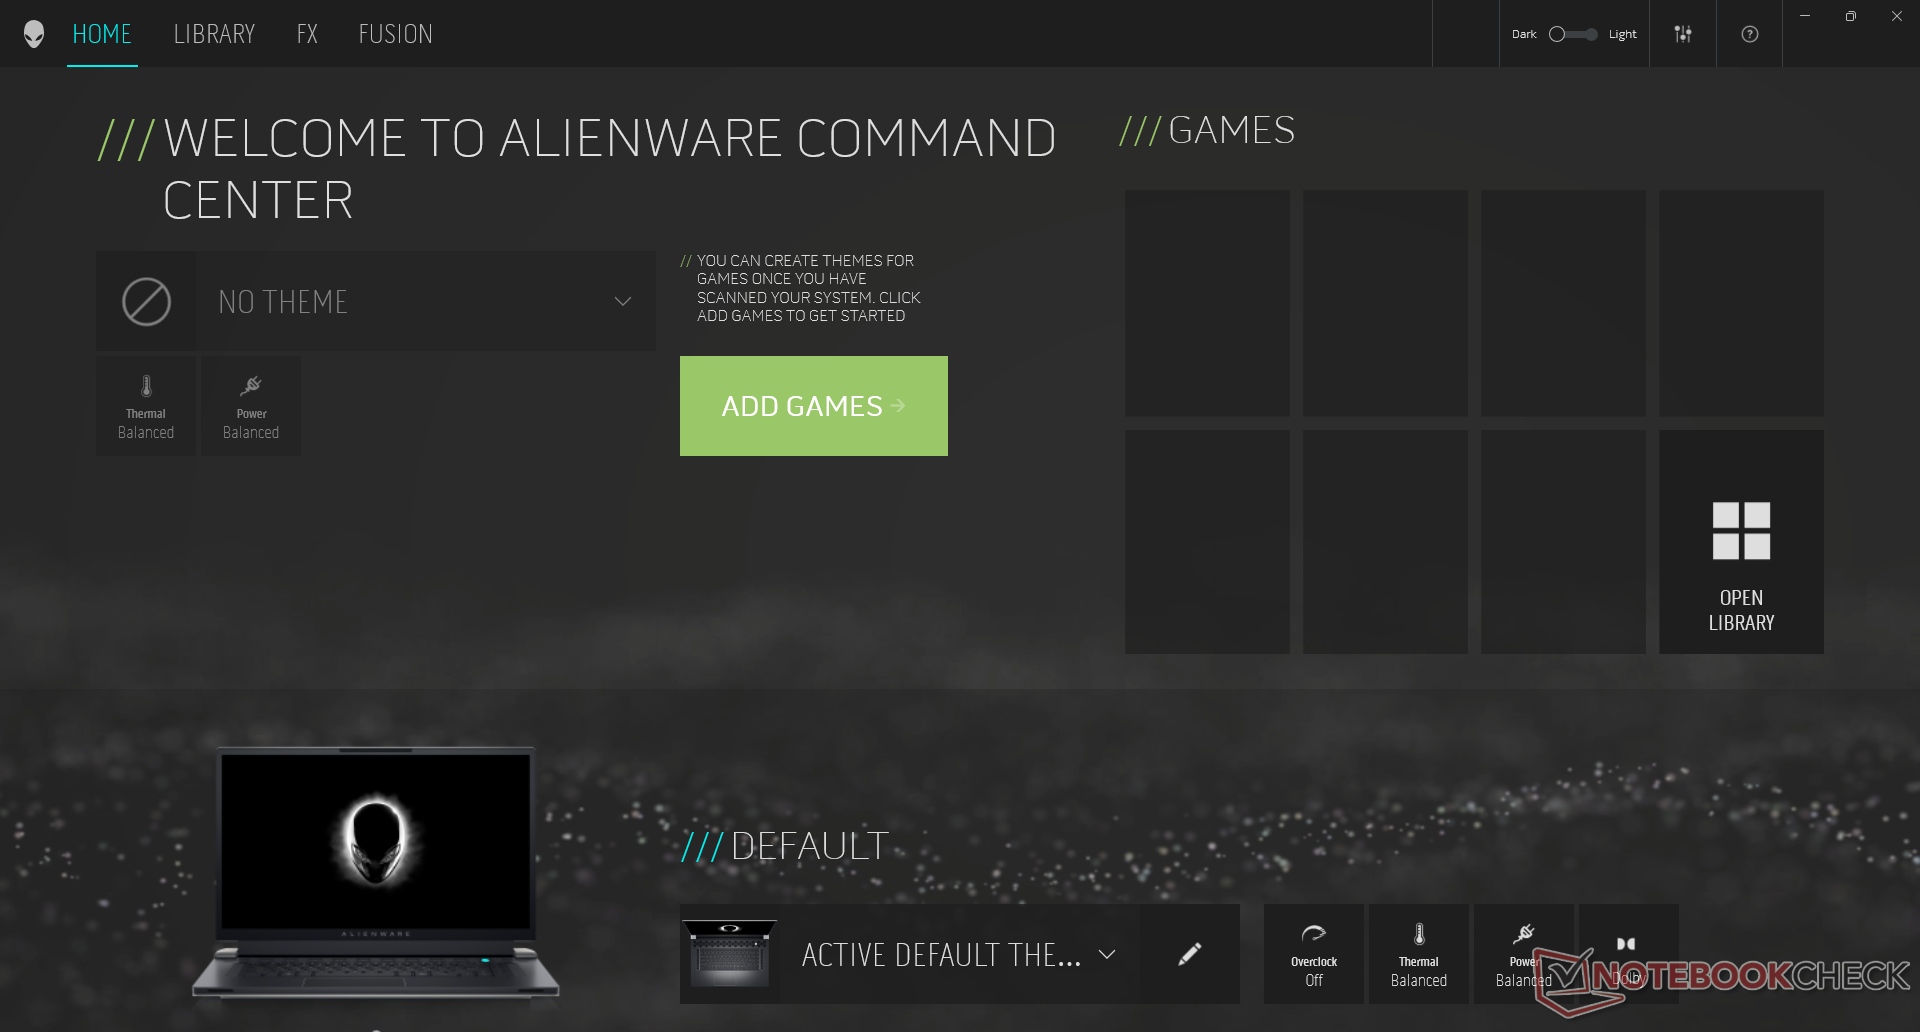
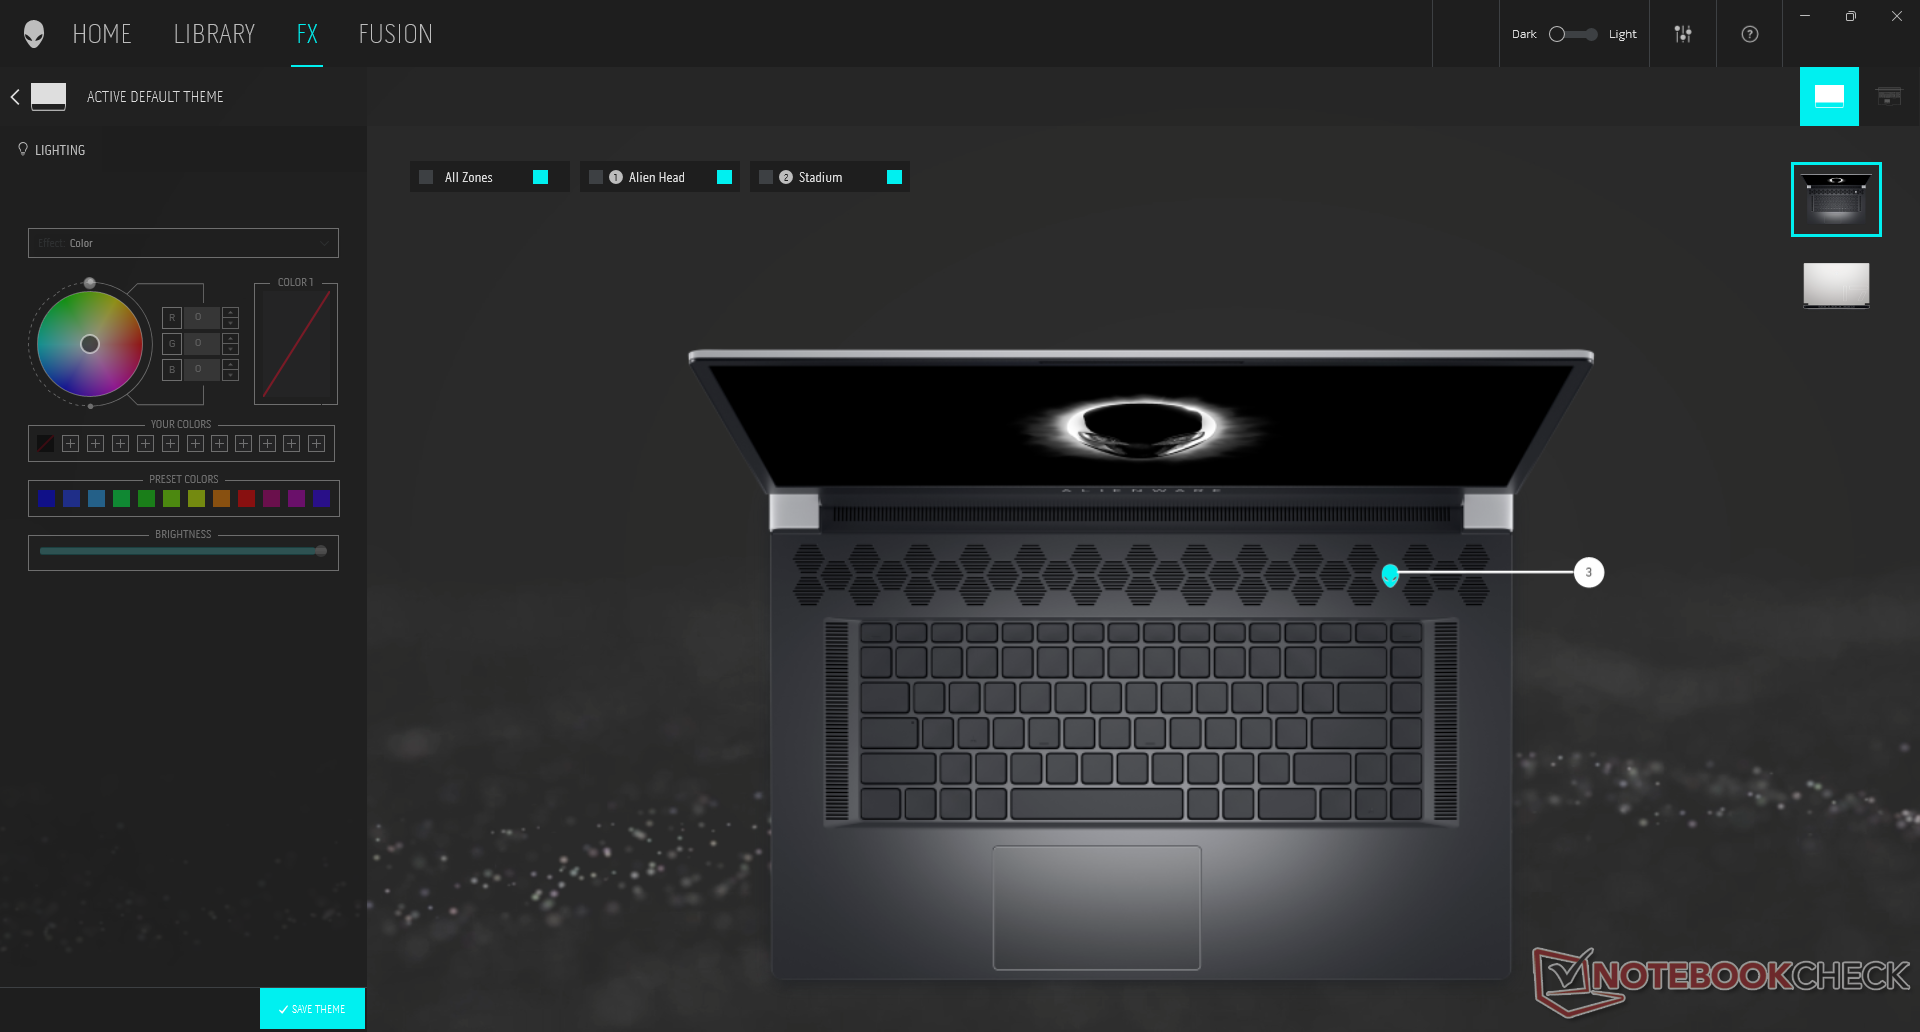
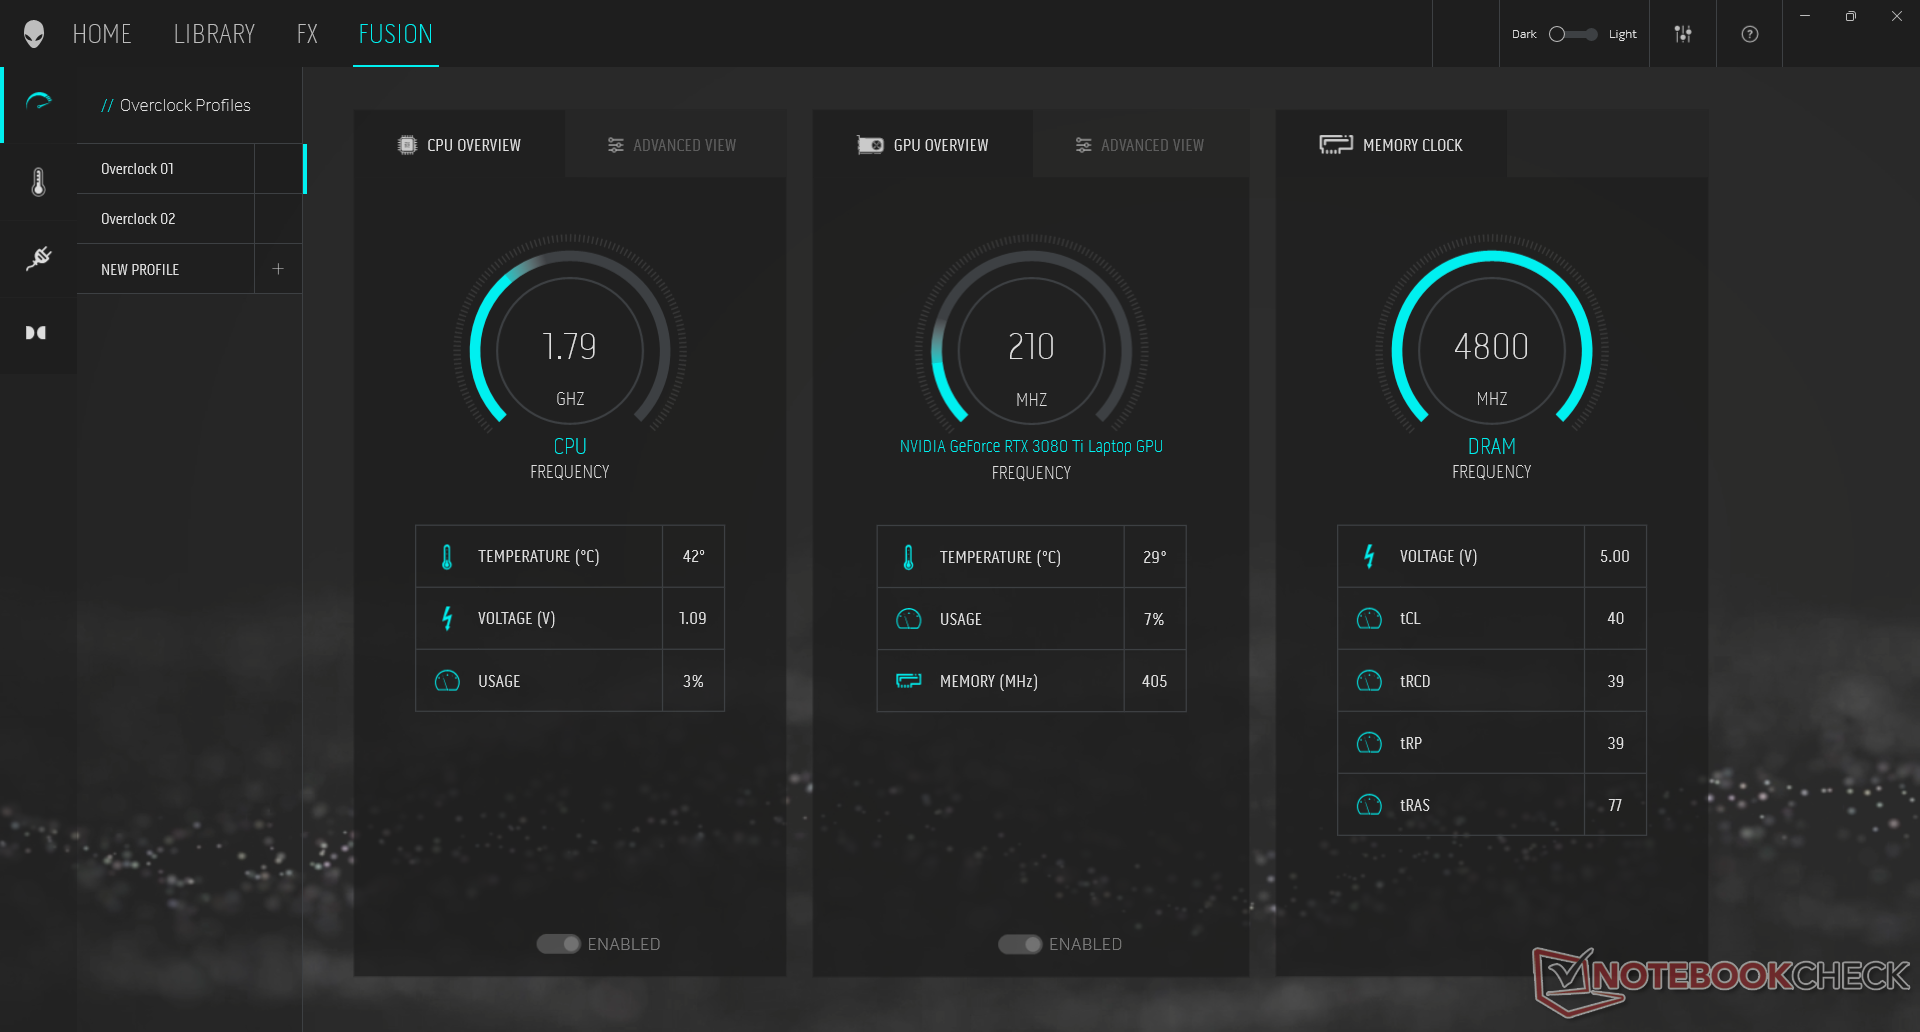
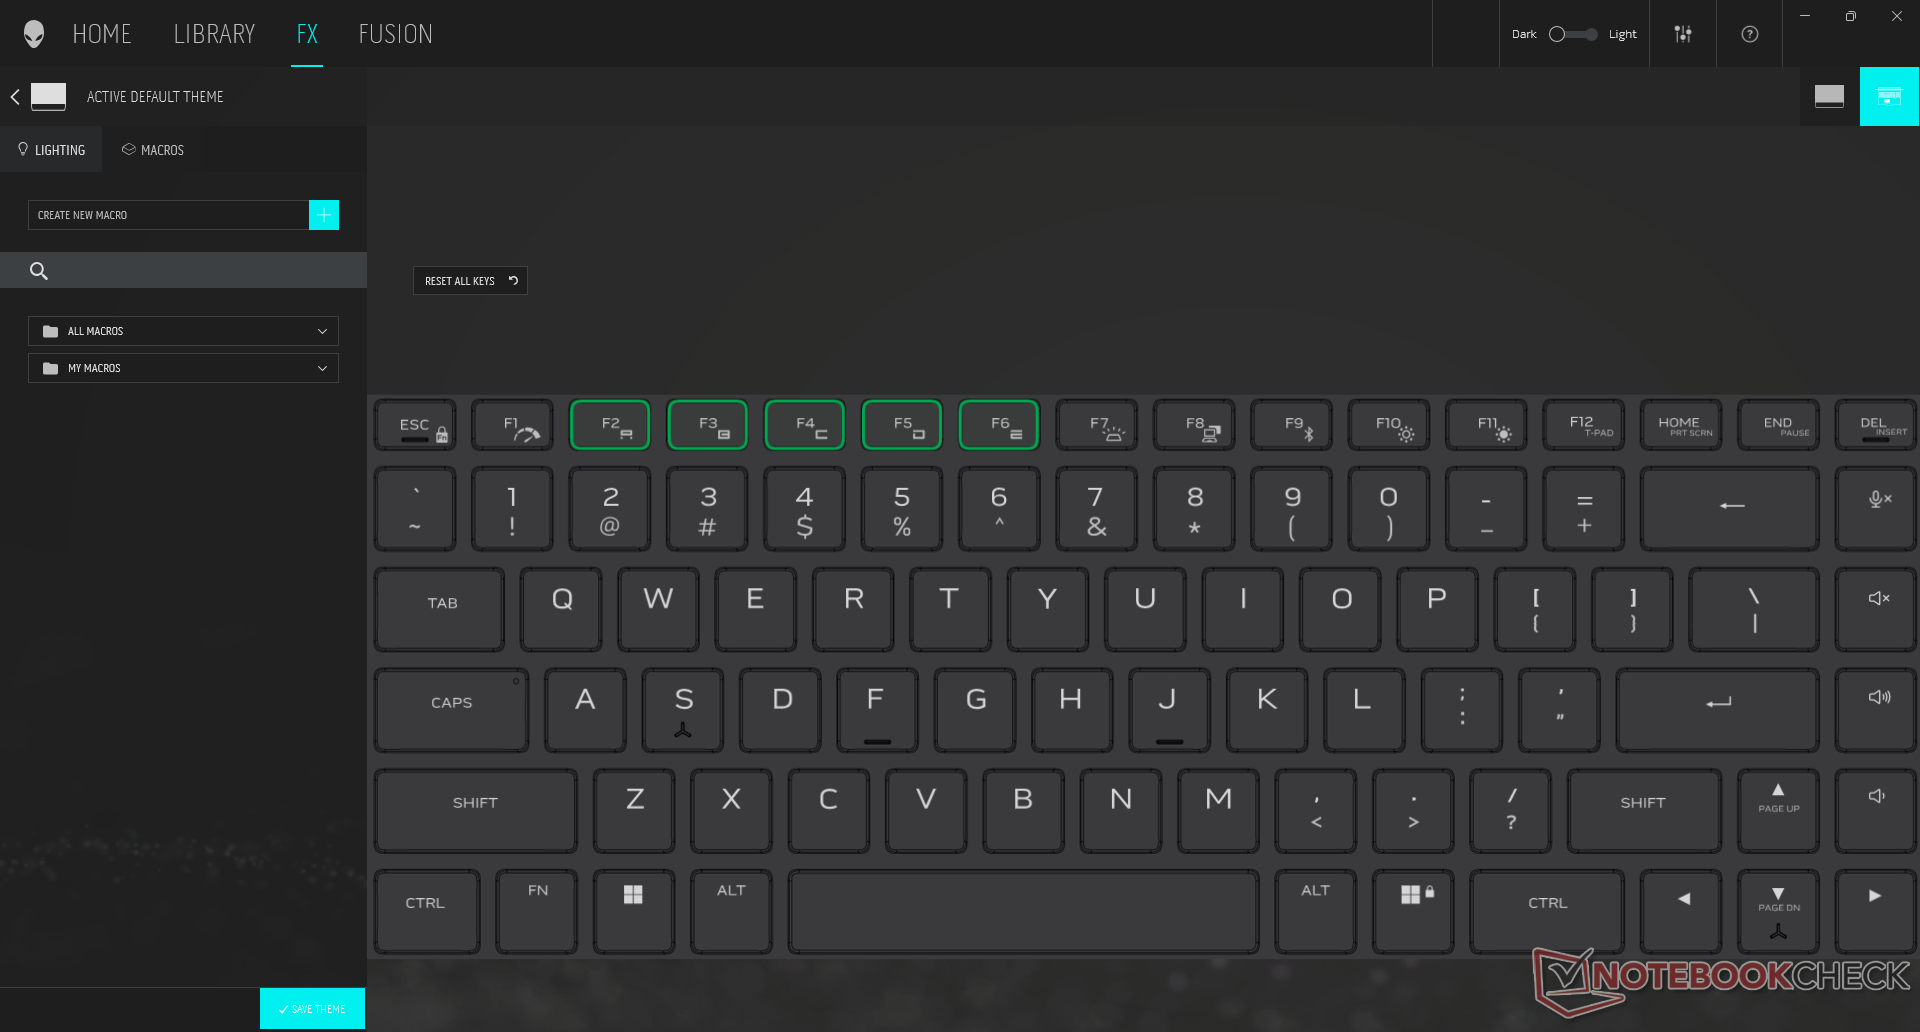
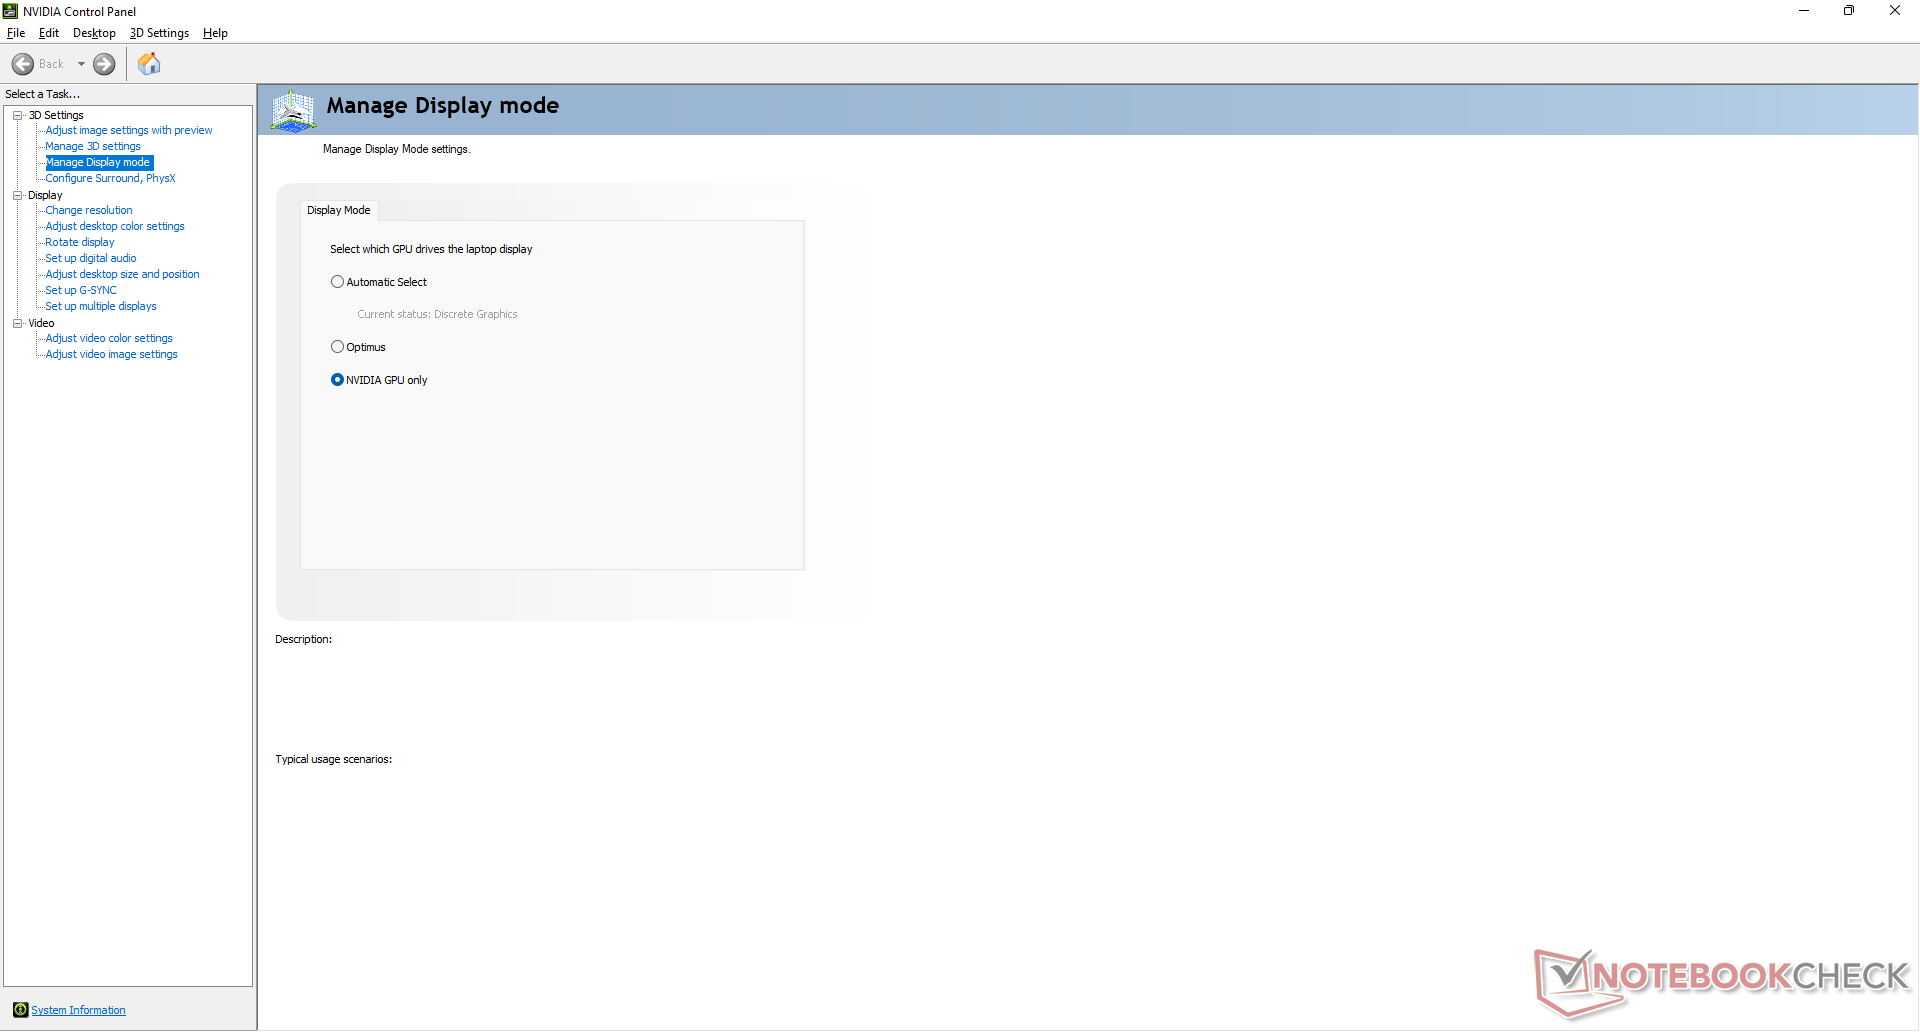
Abbiamo impostato la nostra unità in modalità High Performance e con la GPU discreta attiva prima di eseguire qualsiasi benchmark di prestazioni qui sotto per ottenere i punteggi più alti possibili. La modalità High Performance può essere facilmente attivata tramite Fn+F1 mentre l'interruttore MUX è accessibile tramite il pannello di controllo Nvidia. Consigliamo vivamente agli utenti di familiarizzare con il software Alienware Command Center in quanto i profili di alimentazione, le impostazioni RGB, il monitoraggio in tempo reale e altre caratteristiche si trovano qui.
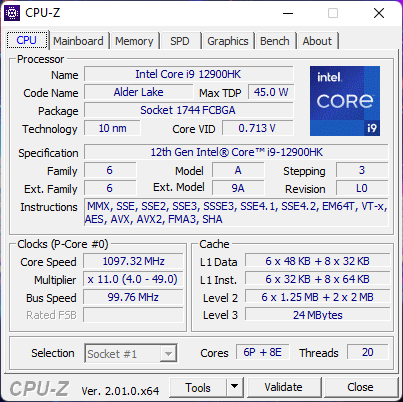
Processore
Le prestazioni della CPU grezza sono circa il 10-15% più veloci rispetto alla media dei laptop nel nostro database con lo stesso Core i9-12900HK. È una spinta decente rispetto al Core i7-12800H o rispetto al Core i7-11800H fino al 30 per cento ciascuno nei carichi di lavoro multi-threaded. L'ultima CPU Zen 3+ di AMD, il Ryzen 9 6900HXè anche costantemente più lento nei benchmark CineBench grezzi, ma supera il Core i9-12900HK in alcuni benchmark AIDA64.
Cinebench R15 Multi Loop
Cinebench R23: Multi Core | Single Core
Cinebench R15: CPU Multi 64Bit | CPU Single 64Bit
Blender: v2.79 BMW27 CPU
7-Zip 18.03: 7z b 4 | 7z b 4 -mmt1
Geekbench 5.5: Multi-Core | Single-Core
HWBOT x265 Benchmark v2.2: 4k Preset
LibreOffice : 20 Documents To PDF
R Benchmark 2.5: Overall mean
| Cinebench R20 / CPU (Multi Core) | |
| AMD Radeon RX 6800 XT | |
| Corsair One i300 | |
| Alienware x17 R2 P48E | |
| Media Intel Core i9-12900HK (1828 - 7366, n=14) | |
| Razer Blade 14 Ryzen 9 6900HX | |
| Alienware x17 RTX 3080 P48E | |
| Razer Blade 17 (i7-12800H, RTX 3070 Ti) | |
| Gigabyte A7 X1 | |
| Razer Blade Pro 17 2021 (QHD Touch) | |
| Lenovo Legion Y740-17IRHg-81UJ001VGE | |
| Cinebench R20 / CPU (Single Core) | |
| Corsair One i300 | |
| Alienware x17 R2 P48E | |
| Razer Blade 17 (i7-12800H, RTX 3070 Ti) | |
| Media Intel Core i9-12900HK (316 - 739, n=14) | |
| AMD Radeon RX 6800 XT | |
| Razer Blade 14 Ryzen 9 6900HX | |
| Alienware x17 RTX 3080 P48E | |
| Gigabyte A7 X1 | |
| Razer Blade Pro 17 2021 (QHD Touch) | |
| Lenovo Legion Y740-17IRHg-81UJ001VGE | |
| Cinebench R23 / Multi Core | |
| Corsair One i300 | |
| AMD Radeon RX 6800 XT | |
| Alienware x17 R2 P48E | |
| Media Intel Core i9-12900HK (4796 - 19282, n=14) | |
| Razer Blade 17 (i7-12800H, RTX 3070 Ti) | |
| Razer Blade 14 Ryzen 9 6900HX | |
| Alienware x17 RTX 3080 P48E | |
| Gigabyte A7 X1 | |
| Razer Blade Pro 17 2021 (QHD Touch) | |
| Cinebench R23 / Single Core | |
| Corsair One i300 | |
| Alienware x17 R2 P48E | |
| Razer Blade 17 (i7-12800H, RTX 3070 Ti) | |
| Media Intel Core i9-12900HK (819 - 1940, n=15) | |
| AMD Radeon RX 6800 XT | |
| Razer Blade 14 Ryzen 9 6900HX | |
| Alienware x17 RTX 3080 P48E | |
| Gigabyte A7 X1 | |
| Razer Blade Pro 17 2021 (QHD Touch) | |
| Cinebench R15 / CPU Multi 64Bit | |
| AMD Radeon RX 6800 XT | |
| Corsair One i300 | |
| Alienware x17 R2 P48E | |
| Razer Blade 17 (i7-12800H, RTX 3070 Ti) | |
| Media Intel Core i9-12900HK (965 - 2944, n=14) | |
| Razer Blade 14 Ryzen 9 6900HX | |
| Alienware x17 RTX 3080 P48E | |
| Gigabyte A7 X1 | |
| Razer Blade Pro 17 2021 (QHD Touch) | |
| Lenovo Legion Y740-17IRHg-81UJ001VGE | |
| Cinebench R15 / CPU Single 64Bit | |
| Corsair One i300 | |
| Alienware x17 R2 P48E | |
| Razer Blade 17 (i7-12800H, RTX 3070 Ti) | |
| AMD Radeon RX 6800 XT | |
| Razer Blade 14 Ryzen 9 6900HX | |
| Gigabyte A7 X1 | |
| Media Intel Core i9-12900HK (119 - 279, n=14) | |
| Alienware x17 RTX 3080 P48E | |
| Razer Blade Pro 17 2021 (QHD Touch) | |
| Lenovo Legion Y740-17IRHg-81UJ001VGE | |
| Blender / v2.79 BMW27 CPU | |
| Lenovo Legion Y740-17IRHg-81UJ001VGE | |
| Razer Blade Pro 17 2021 (QHD Touch) | |
| Gigabyte A7 X1 | |
| Media Intel Core i9-12900HK (172.5 - 483, n=13) | |
| Razer Blade 14 Ryzen 9 6900HX | |
| Razer Blade 17 (i7-12800H, RTX 3070 Ti) | |
| Alienware x17 RTX 3080 P48E | |
| Alienware x17 R2 P48E | |
| Corsair One i300 | |
| AMD Radeon RX 6800 XT | |
| 7-Zip 18.03 / 7z b 4 | |
| AMD Radeon RX 6800 XT | |
| Corsair One i300 | |
| Alienware x17 R2 P48E | |
| Razer Blade 17 (i7-12800H, RTX 3070 Ti) | |
| Razer Blade 14 Ryzen 9 6900HX | |
| Media Intel Core i9-12900HK (25736 - 75564, n=14) | |
| Gigabyte A7 X1 | |
| Alienware x17 RTX 3080 P48E | |
| Razer Blade Pro 17 2021 (QHD Touch) | |
| Lenovo Legion Y740-17IRHg-81UJ001VGE | |
| 7-Zip 18.03 / 7z b 4 -mmt1 | |
| AMD Radeon RX 6800 XT | |
| Corsair One i300 | |
| Razer Blade 14 Ryzen 9 6900HX | |
| Alienware x17 R2 P48E | |
| Razer Blade 17 (i7-12800H, RTX 3070 Ti) | |
| Gigabyte A7 X1 | |
| Media Intel Core i9-12900HK (2898 - 6186, n=14) | |
| Alienware x17 RTX 3080 P48E | |
| Razer Blade Pro 17 2021 (QHD Touch) | |
| Lenovo Legion Y740-17IRHg-81UJ001VGE | |
| Geekbench 5.5 / Multi-Core | |
| Corsair One i300 | |
| AMD Radeon RX 6800 XT | |
| Alienware x17 R2 P48E | |
| Razer Blade 17 (i7-12800H, RTX 3070 Ti) | |
| Media Intel Core i9-12900HK (5869 - 14294, n=13) | |
| Razer Blade 14 Ryzen 9 6900HX | |
| Razer Blade Pro 17 2021 (QHD Touch) | |
| Gigabyte A7 X1 | |
| Lenovo Legion Y740-17IRHg-81UJ001VGE | |
| Geekbench 5.5 / Single-Core | |
| Corsair One i300 | |
| Alienware x17 R2 P48E | |
| Razer Blade 17 (i7-12800H, RTX 3070 Ti) | |
| Media Intel Core i9-12900HK (843 - 1918, n=13) | |
| AMD Radeon RX 6800 XT | |
| Razer Blade 14 Ryzen 9 6900HX | |
| Gigabyte A7 X1 | |
| Razer Blade Pro 17 2021 (QHD Touch) | |
| Lenovo Legion Y740-17IRHg-81UJ001VGE | |
| HWBOT x265 Benchmark v2.2 / 4k Preset | |
| AMD Radeon RX 6800 XT | |
| Corsair One i300 | |
| Alienware x17 R2 P48E | |
| Razer Blade 14 Ryzen 9 6900HX | |
| Alienware x17 RTX 3080 P48E | |
| Media Intel Core i9-12900HK (5.33 - 21.6, n=14) | |
| Razer Blade 17 (i7-12800H, RTX 3070 Ti) | |
| Gigabyte A7 X1 | |
| Razer Blade Pro 17 2021 (QHD Touch) | |
| Lenovo Legion Y740-17IRHg-81UJ001VGE | |
| LibreOffice / 20 Documents To PDF | |
| Gigabyte A7 X1 | |
| AMD Radeon RX 6800 XT | |
| Razer Blade 14 Ryzen 9 6900HX | |
| Media Intel Core i9-12900HK (34.8 - 89.1, n=14) | |
| Alienware x17 RTX 3080 P48E | |
| Razer Blade Pro 17 2021 (QHD Touch) | |
| Razer Blade 17 (i7-12800H, RTX 3070 Ti) | |
| Alienware x17 R2 P48E | |
| Corsair One i300 | |
| R Benchmark 2.5 / Overall mean | |
| Lenovo Legion Y740-17IRHg-81UJ001VGE | |
| Razer Blade Pro 17 2021 (QHD Touch) | |
| Alienware x17 RTX 3080 P48E | |
| Media Intel Core i9-12900HK (0.4155 - 0.994, n=14) | |
| Gigabyte A7 X1 | |
| Razer Blade 14 Ryzen 9 6900HX | |
| AMD Radeon RX 6800 XT | |
| Razer Blade 17 (i7-12800H, RTX 3070 Ti) | |
| Alienware x17 R2 P48E | |
| Corsair One i300 | |
* ... Meglio usare valori piccoli
AIDA64: FP32 Ray-Trace | FPU Julia | CPU SHA3 | CPU Queen | FPU SinJulia | FPU Mandel | CPU AES | CPU ZLib | FP64 Ray-Trace | CPU PhotoWorxx
| Performance rating | |
| Razer Blade 14 Ryzen 9 6900HX | |
| Gigabyte A7 X1 | |
| Alienware x17 R2 P48E | |
| MSI Stealth GS77 12UHS-083US | |
| Media Intel Core i9-12900HK | |
| AIDA64 / FP32 Ray-Trace | |
| Razer Blade 14 Ryzen 9 6900HX | |
| Gigabyte A7 X1 | |
| Alienware x17 R2 P48E | |
| Media Intel Core i9-12900HK (2677 - 13948, n=15) | |
| MSI Stealth GS77 12UHS-083US | |
| AIDA64 / FPU Julia | |
| Razer Blade 14 Ryzen 9 6900HX | |
| Gigabyte A7 X1 | |
| Media Intel Core i9-12900HK (12762 - 70764, n=15) | |
| Alienware x17 R2 P48E | |
| MSI Stealth GS77 12UHS-083US | |
| AIDA64 / CPU SHA3 | |
| Alienware x17 R2 P48E | |
| Razer Blade 14 Ryzen 9 6900HX | |
| Gigabyte A7 X1 | |
| MSI Stealth GS77 12UHS-083US | |
| Media Intel Core i9-12900HK (841 - 3504, n=15) | |
| AIDA64 / CPU Queen | |
| Alienware x17 R2 P48E | |
| Razer Blade 14 Ryzen 9 6900HX | |
| Gigabyte A7 X1 | |
| MSI Stealth GS77 12UHS-083US | |
| Media Intel Core i9-12900HK (60202 - 107161, n=15) | |
| AIDA64 / FPU SinJulia | |
| Razer Blade 14 Ryzen 9 6900HX | |
| Gigabyte A7 X1 | |
| Alienware x17 R2 P48E | |
| MSI Stealth GS77 12UHS-083US | |
| Media Intel Core i9-12900HK (3225 - 10402, n=15) | |
| AIDA64 / FPU Mandel | |
| Razer Blade 14 Ryzen 9 6900HX | |
| Gigabyte A7 X1 | |
| Alienware x17 R2 P48E | |
| Media Intel Core i9-12900HK (7417 - 34233, n=15) | |
| MSI Stealth GS77 12UHS-083US | |
| AIDA64 / CPU AES | |
| Razer Blade 14 Ryzen 9 6900HX | |
| Gigabyte A7 X1 | |
| Alienware x17 R2 P48E | |
| MSI Stealth GS77 12UHS-083US | |
| Media Intel Core i9-12900HK (32382 - 112498, n=15) | |
| AIDA64 / CPU ZLib | |
| Alienware x17 R2 P48E | |
| MSI Stealth GS77 12UHS-083US | |
| Media Intel Core i9-12900HK (314 - 1209, n=15) | |
| Razer Blade 14 Ryzen 9 6900HX | |
| Gigabyte A7 X1 | |
| AIDA64 / FP64 Ray-Trace | |
| Razer Blade 14 Ryzen 9 6900HX | |
| Gigabyte A7 X1 | |
| Alienware x17 R2 P48E | |
| Media Intel Core i9-12900HK (1501 - 7616, n=15) | |
| MSI Stealth GS77 12UHS-083US | |
| AIDA64 / CPU PhotoWorxx | |
| MSI Stealth GS77 12UHS-083US | |
| Media Intel Core i9-12900HK (24446 - 42462, n=15) | |
| Alienware x17 R2 P48E | |
| Razer Blade 14 Ryzen 9 6900HX | |
| Gigabyte A7 X1 | |
Prestazioni del sistema
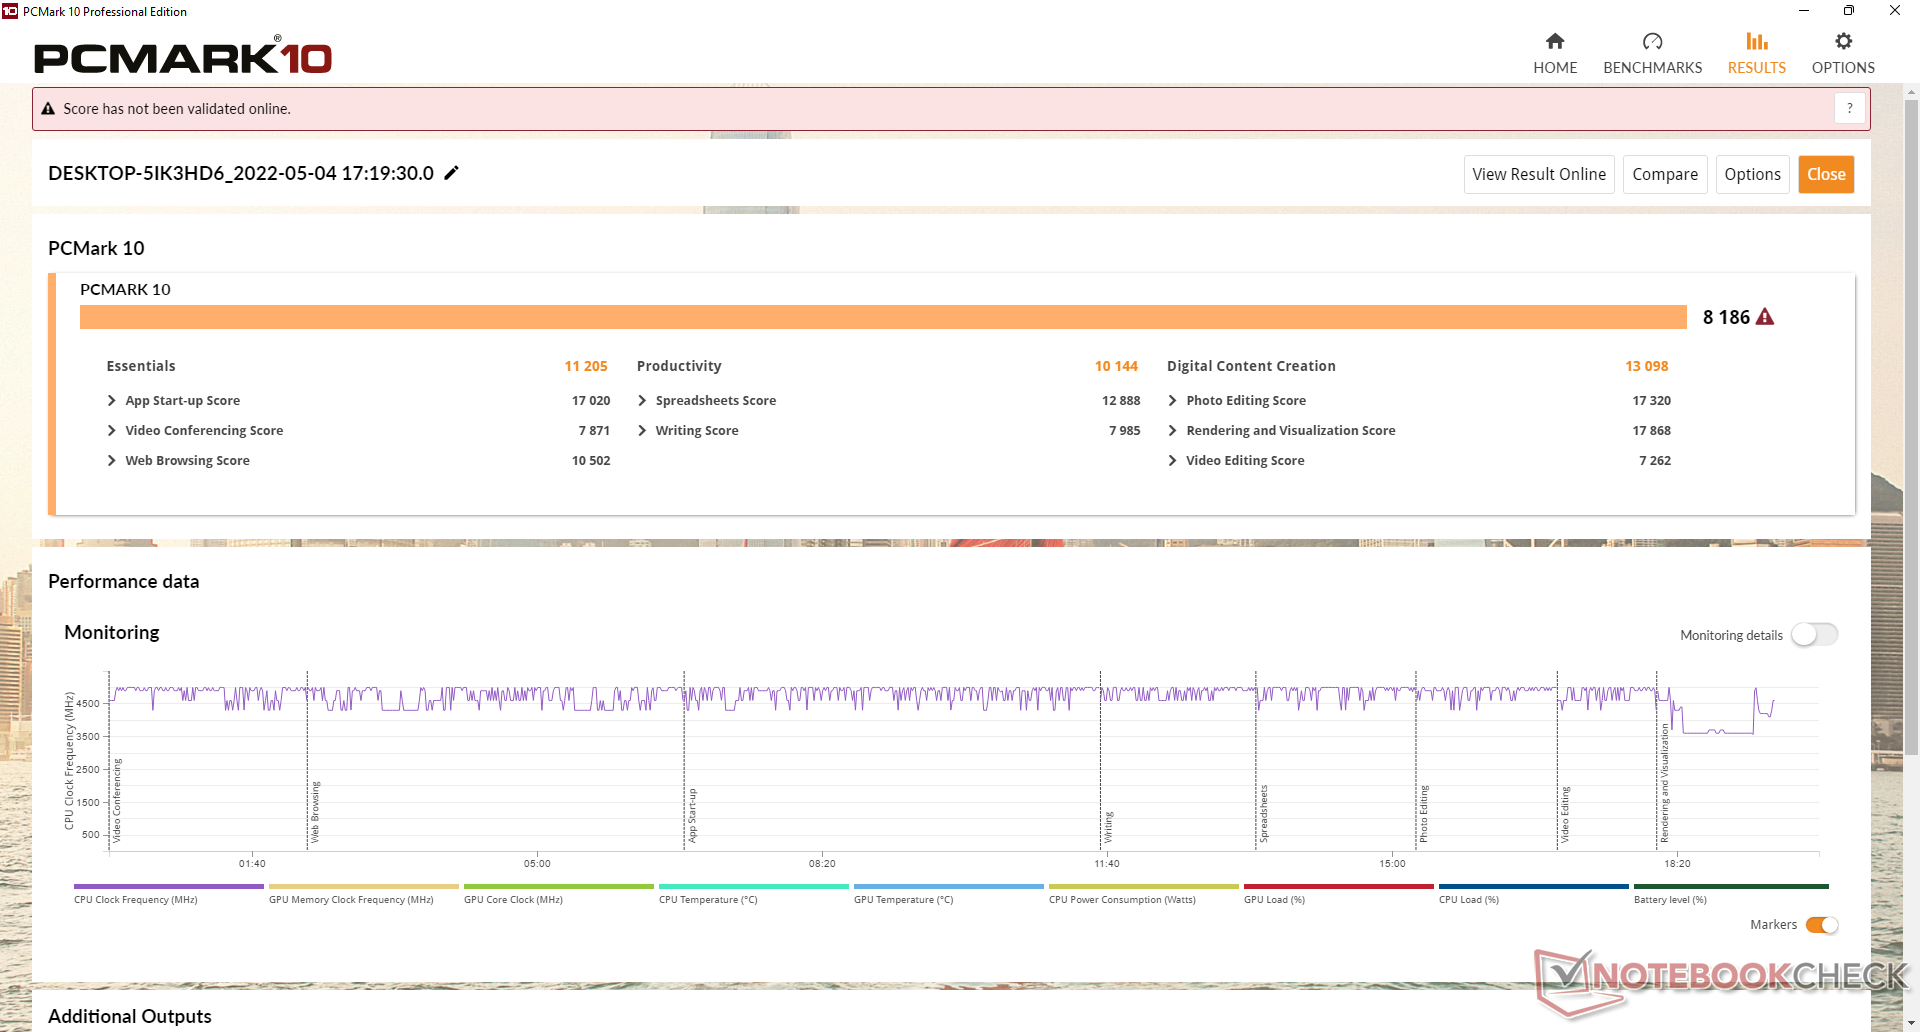
I risultati di PCMark sono costantemente superiori a quelli che abbiamo registrato sull'x17 R1 dell'anno scorso con margini relativamente piccoli.
Vale la pena notare che il portatile consuma un sacco di energia anche quando è in standby o in modalità sleep. Siamo in grado di registrare un consumo di quasi 12 W quando in modalità sleep rispetto a <2 W sulla maggior parte degli altri portatili. Inoltre, le ventole nella nostra unità di test sarebbero a volte attive anche quando sono in modalità sleep e l'unità avrebbe a volte problemi a svegliarsi correttamente.
CrossMark: Overall | Productivity | Creativity | Responsiveness
| PCMark 10 / Score | |
| Alienware x17 R2 P48E | |
| Media Intel Core i9-12900HK, NVIDIA GeForce RTX 3080 Ti Laptop GPU (7149 - 8186, n=5) | |
| Alienware x17 RTX 3080 P48E | |
| MSI Stealth GS77 12UHS-083US | |
| MSI GT76 Titan DT 10SGS | |
| Asus ROG Zephyrus S17 GX703HSD | |
| Gigabyte A7 X1 | |
| PCMark 10 / Essentials | |
| Alienware x17 R2 P48E | |
| Media Intel Core i9-12900HK, NVIDIA GeForce RTX 3080 Ti Laptop GPU (9870 - 11205, n=5) | |
| Asus ROG Zephyrus S17 GX703HSD | |
| MSI GT76 Titan DT 10SGS | |
| MSI Stealth GS77 12UHS-083US | |
| Alienware x17 RTX 3080 P48E | |
| Gigabyte A7 X1 | |
| PCMark 10 / Productivity | |
| Alienware x17 R2 P48E | |
| Media Intel Core i9-12900HK, NVIDIA GeForce RTX 3080 Ti Laptop GPU (9173 - 10422, n=5) | |
| Alienware x17 RTX 3080 P48E | |
| MSI Stealth GS77 12UHS-083US | |
| Gigabyte A7 X1 | |
| Asus ROG Zephyrus S17 GX703HSD | |
| MSI GT76 Titan DT 10SGS | |
| PCMark 10 / Digital Content Creation | |
| Alienware x17 R2 P48E | |
| Media Intel Core i9-12900HK, NVIDIA GeForce RTX 3080 Ti Laptop GPU (10951 - 13098, n=5) | |
| MSI GT76 Titan DT 10SGS | |
| Alienware x17 RTX 3080 P48E | |
| MSI Stealth GS77 12UHS-083US | |
| Asus ROG Zephyrus S17 GX703HSD | |
| Gigabyte A7 X1 | |
| CrossMark / Overall | |
| Alienware x17 R2 P48E | |
| Media Intel Core i9-12900HK, NVIDIA GeForce RTX 3080 Ti Laptop GPU (970 - 2138, n=5) | |
| CrossMark / Productivity | |
| Alienware x17 R2 P48E | |
| Media Intel Core i9-12900HK, NVIDIA GeForce RTX 3080 Ti Laptop GPU (921 - 2038, n=5) | |
| CrossMark / Creativity | |
| Alienware x17 R2 P48E | |
| Media Intel Core i9-12900HK, NVIDIA GeForce RTX 3080 Ti Laptop GPU (1007 - 2210, n=5) | |
| CrossMark / Responsiveness | |
| Media Intel Core i9-12900HK, NVIDIA GeForce RTX 3080 Ti Laptop GPU (1012 - 2234, n=5) | |
| Alienware x17 R2 P48E | |
| PCMark 10 Score | 8186 punti | |
Aiuto | ||
| AIDA64 / Memory Copy | |
| MSI Stealth GS77 12UHS-083US | |
| Media Intel Core i9-12900HK (42967 - 62959, n=15) | |
| Alienware x17 R2 P48E | |
| Gigabyte A7 X1 | |
| AIDA64 / Memory Read | |
| MSI Stealth GS77 12UHS-083US | |
| Media Intel Core i9-12900HK (44419 - 66989, n=15) | |
| Alienware x17 R2 P48E | |
| Gigabyte A7 X1 | |
| AIDA64 / Memory Write | |
| MSI Stealth GS77 12UHS-083US | |
| Media Intel Core i9-12900HK (42144 - 65268, n=15) | |
| Alienware x17 R2 P48E | |
| Gigabyte A7 X1 | |
| AIDA64 / Memory Latency | |
| Alienware x17 R2 P48E | |
| MSI Stealth GS77 12UHS-083US | |
| Gigabyte A7 X1 | |
| Media Intel Core i9-12900HK (79.9 - 109, n=15) | |
| Asus ROG Zephyrus S17 GX703HSD | |
| Alienware x17 RTX 3080 P48E | |
* ... Meglio usare valori piccoli
Latenza DPC
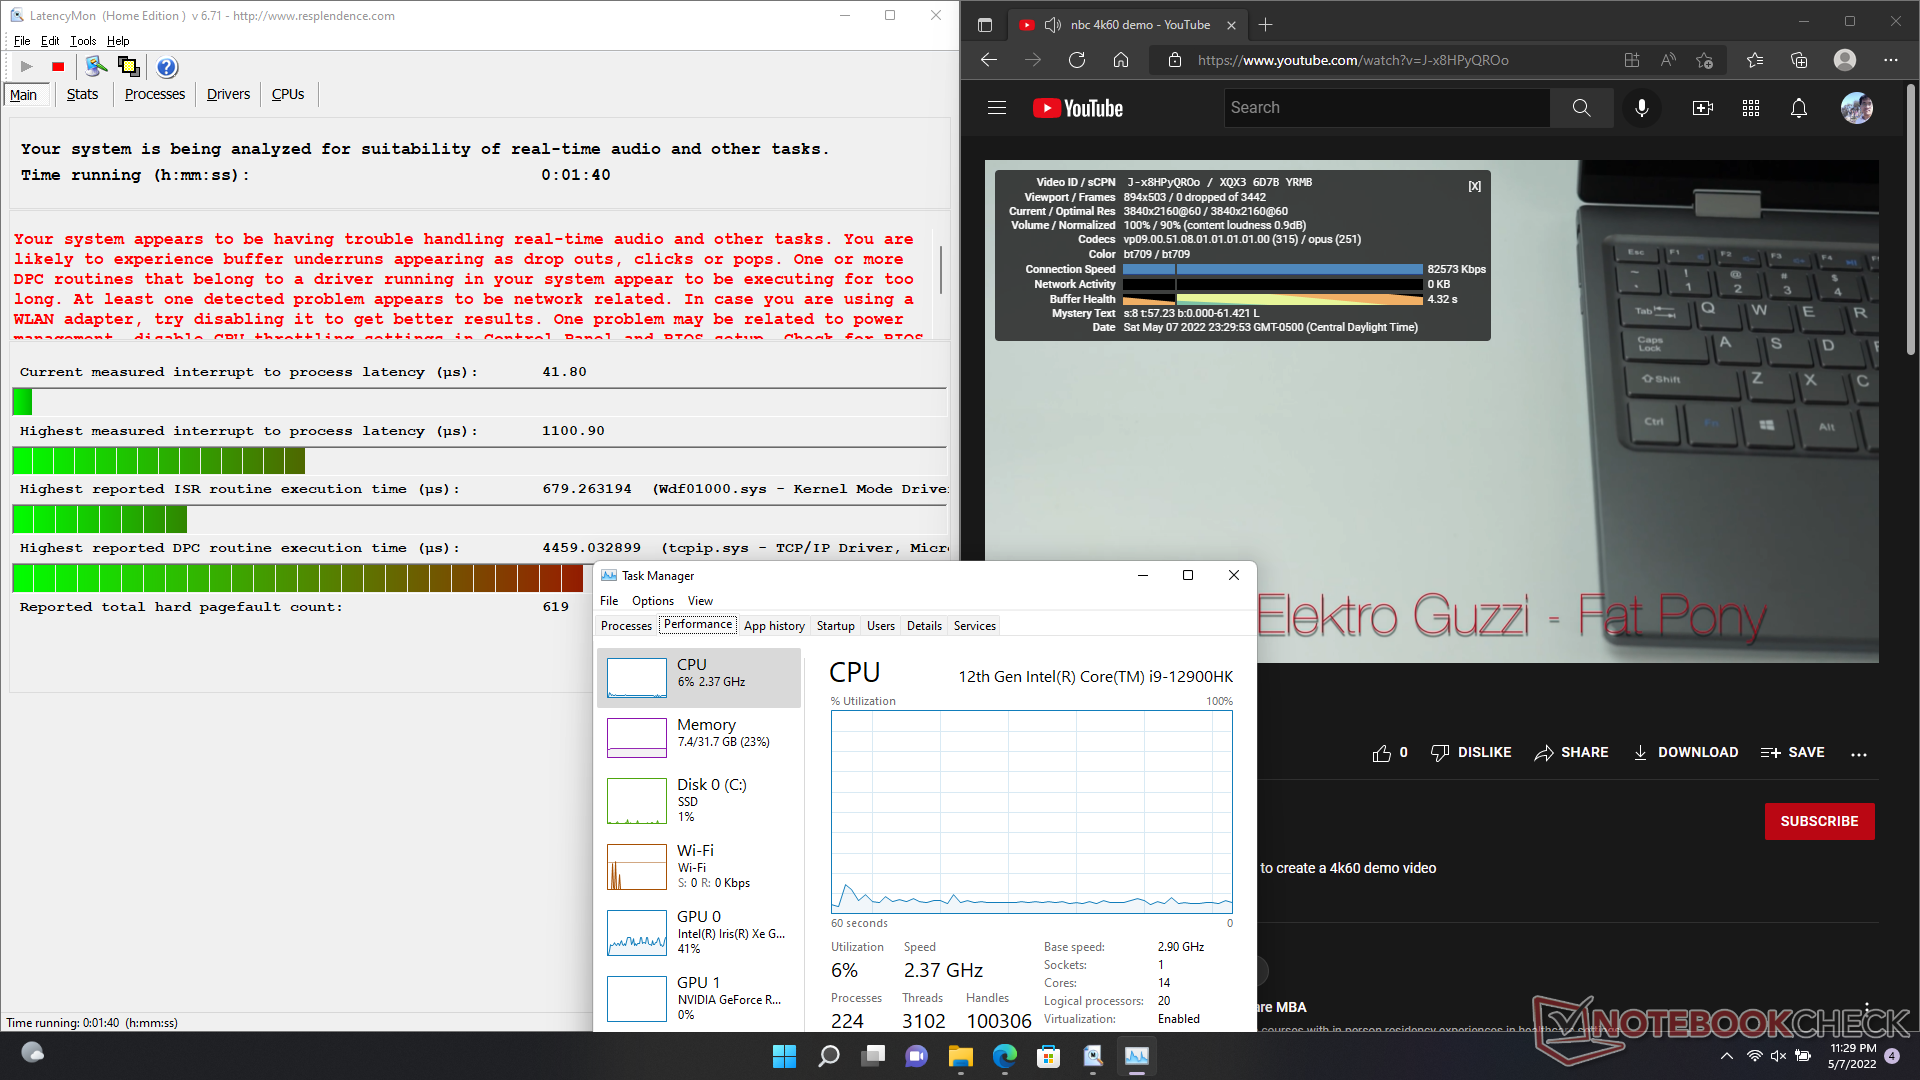
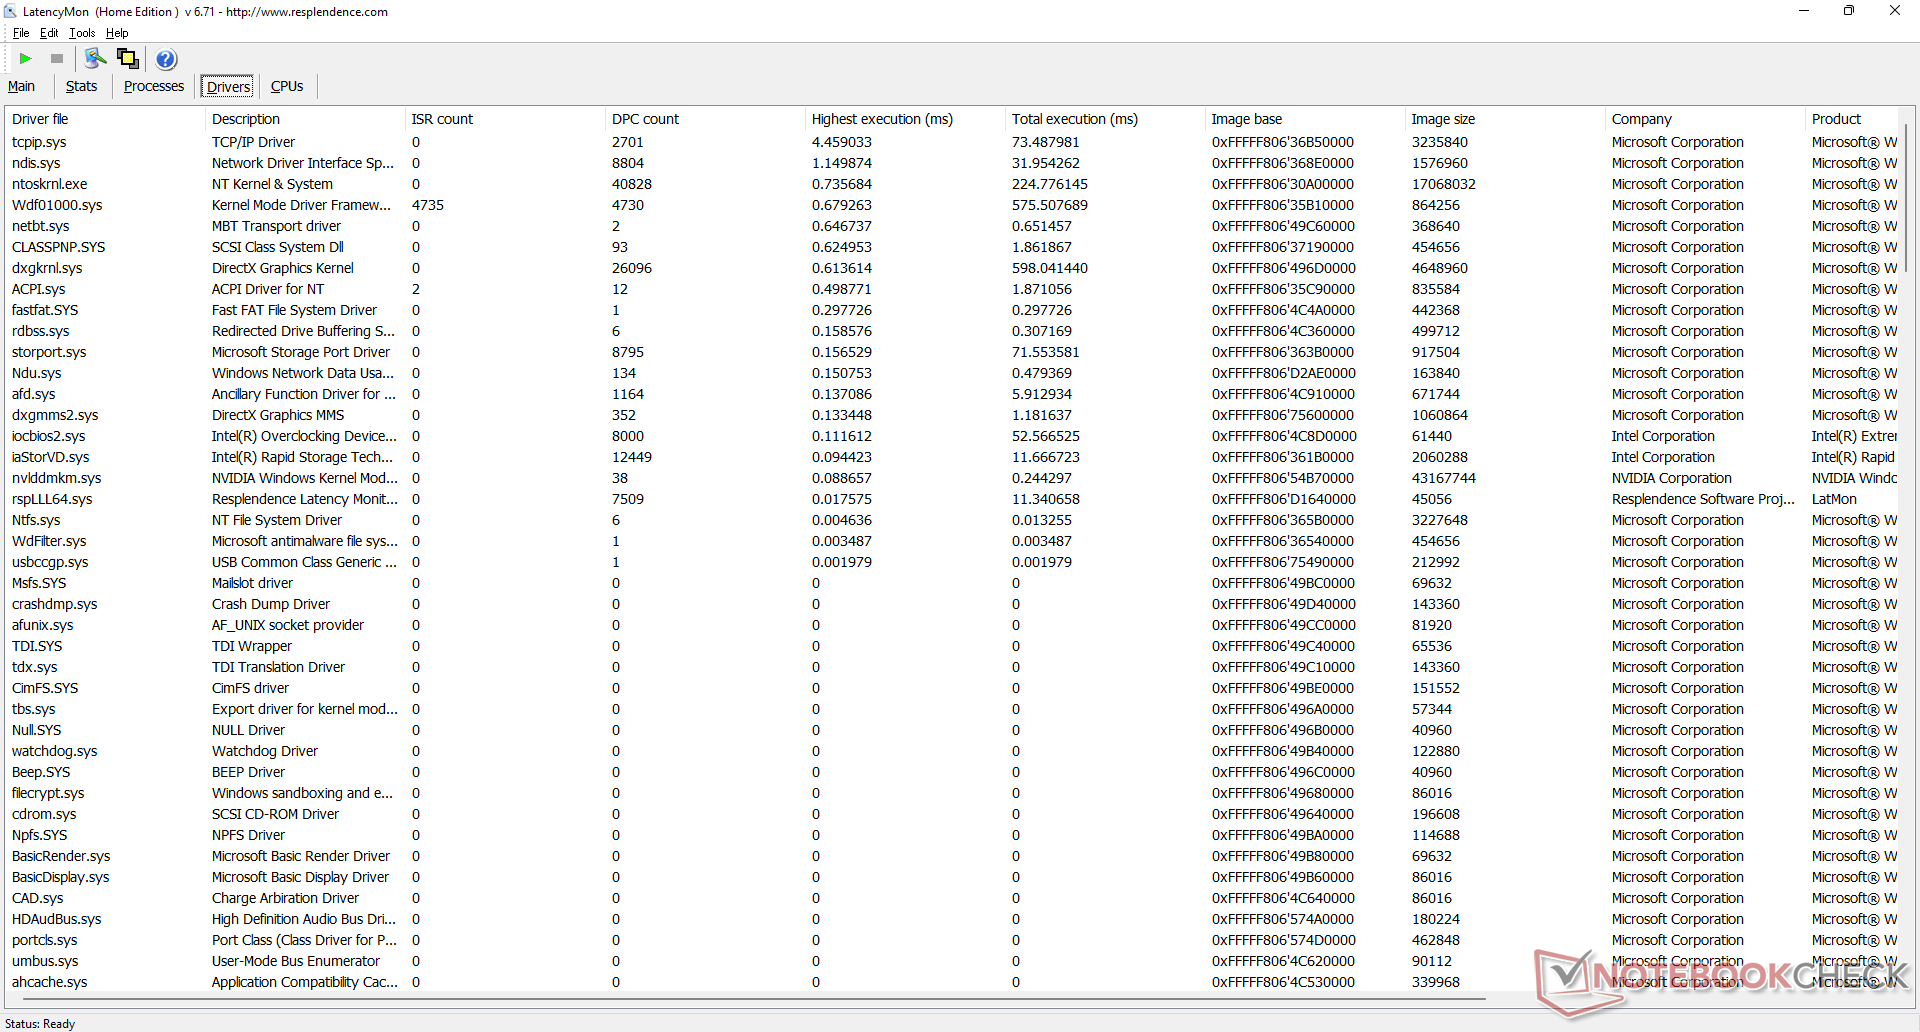
LatencyMon rivela problemi di DPC quando si aprono più schede del browser della homepage. la riproduzione di video 4K a 60 FPS è altrimenti fluida e senza alcun calo di frame.
| DPC Latencies / LatencyMon - interrupt to process latency (max), Web, Youtube, Prime95 | |
| MSI GT76 Titan DT 10SGS | |
| Alienware x17 RTX 3080 P48E | |
| MSI Stealth GS77 12UHS-083US | |
| Asus ROG Zephyrus S17 GX703HSD | |
| Alienware x17 R2 P48E | |
| Gigabyte A7 X1 | |
* ... Meglio usare valori piccoli
Dispositivi di archiviazione
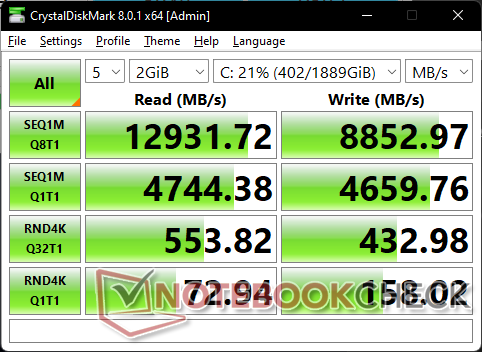
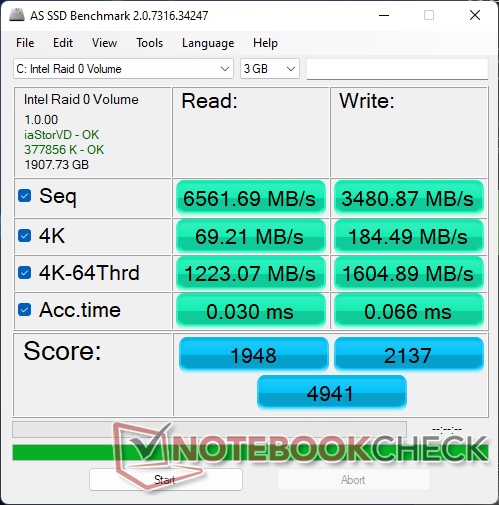

* ... Meglio usare valori piccoli
Disk Throttling: DiskSpd Read Loop, Queue Depth 8
Prestazioni della GPU
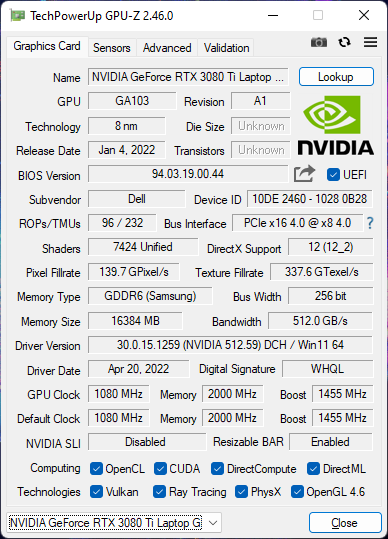
Con il suo obiettivo TGP molto alto di 175 W, le prestazioni grafiche sono una delle più veloci su qualsiasi portatile da gioco. Il 2022 Razer Blade 15per esempio, viene fornito con la stessa GeForce RTX 3080 Ti GPU anche se con un obiettivo TGP più basso di 110 W per prestazioni dal 25 al 30 per cento più lente. Simili deficit possono essere osservati quando si confronta la GPU dell'Alienware con la stessa GPU della MSI GS77 pure. Quando combinato con la CPU più veloce della media, gli utenti possono aspettarsi frame rate leggermente più alti rispetto alla maggior parte degli altri portatili da gioco equipaggiati con GeForce RTX 3080 graphics.
La RTX 3080 Ti mobile nel nostro Alienware x17 R2 è più simile alla desktop GeForce RTX 3070. A rTX 3080 Ti per desktop può ancora offrire quasi il 50 per cento di prestazioni più veloci della nostra versione mobile Alienware.
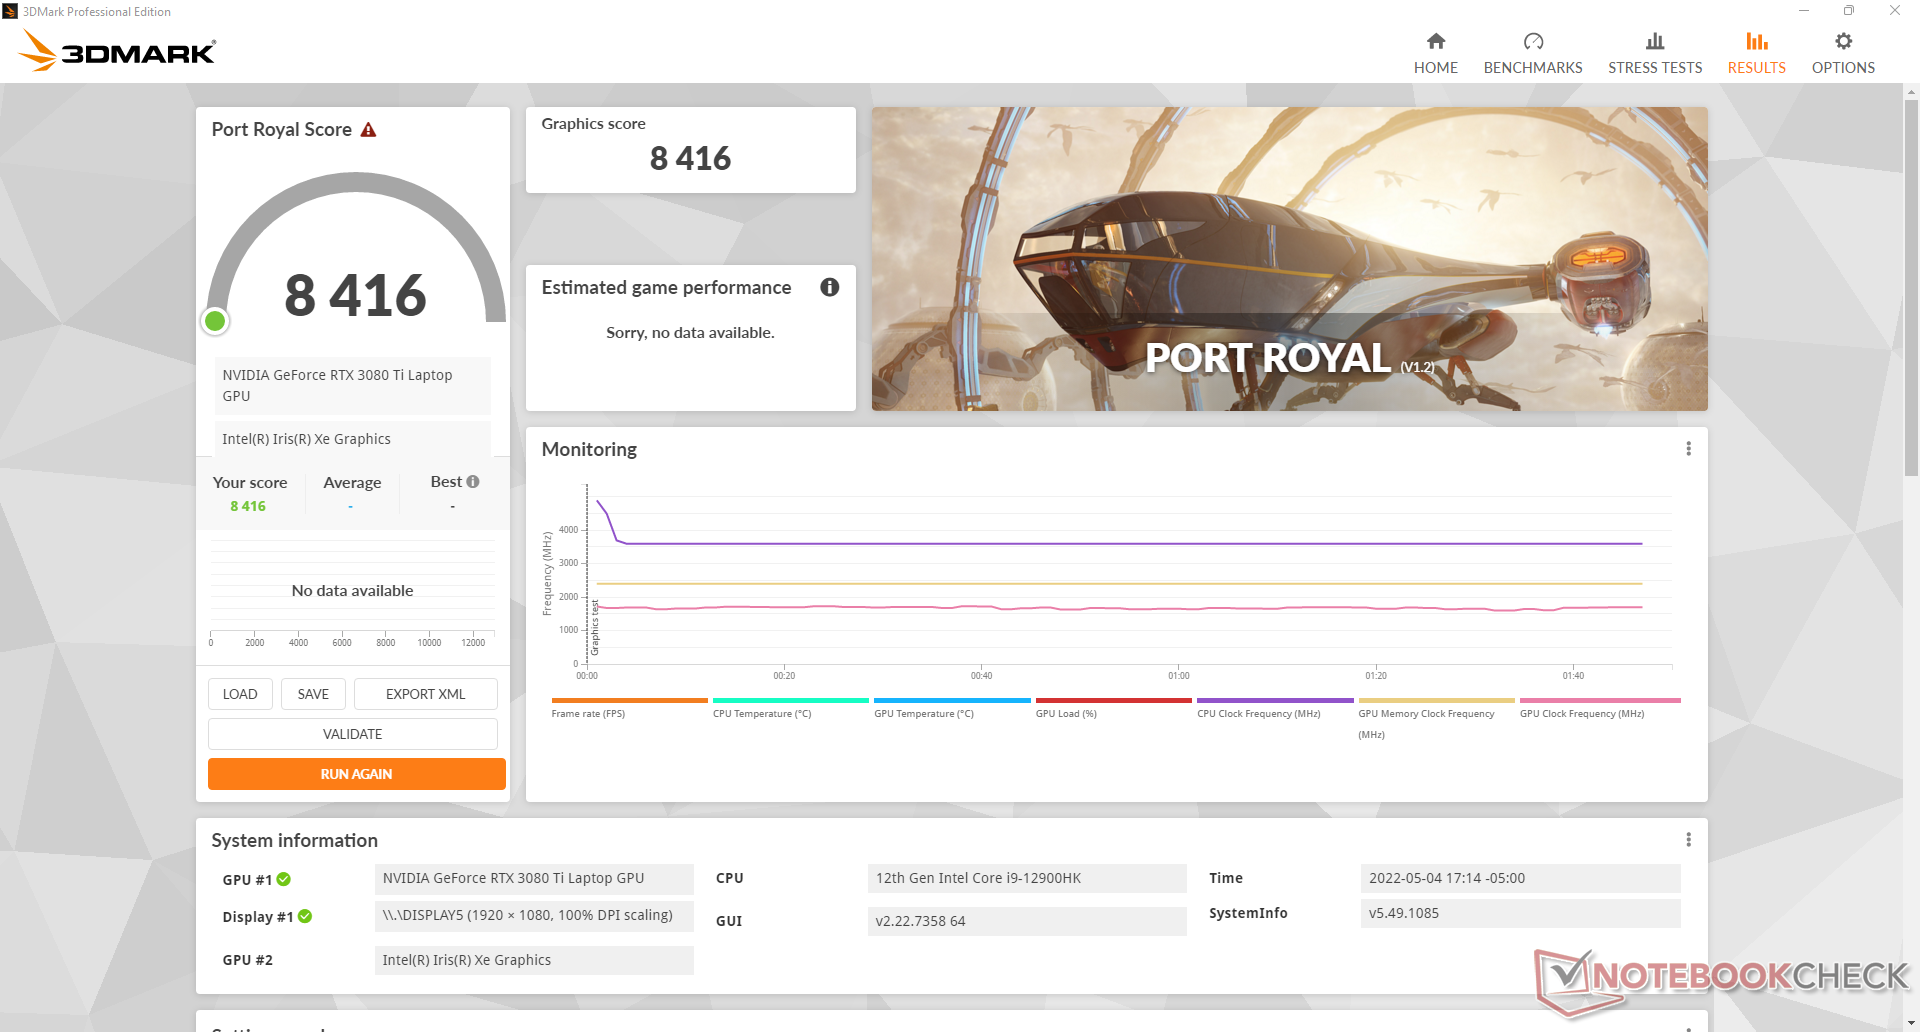
Tenete a mente che le prestazioni grafiche sono più lente se si esegue in modalità bilanciata invece della modalità a ventola massima. Fire Strike Il punteggio grafico sarebbe di circa l'8-9 per cento più basso quando è sul profilo di alimentazione Balanced.
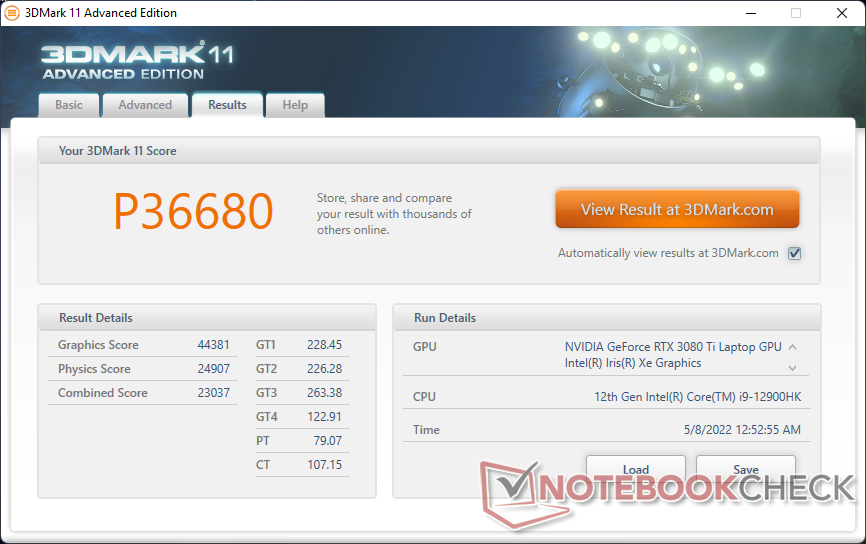
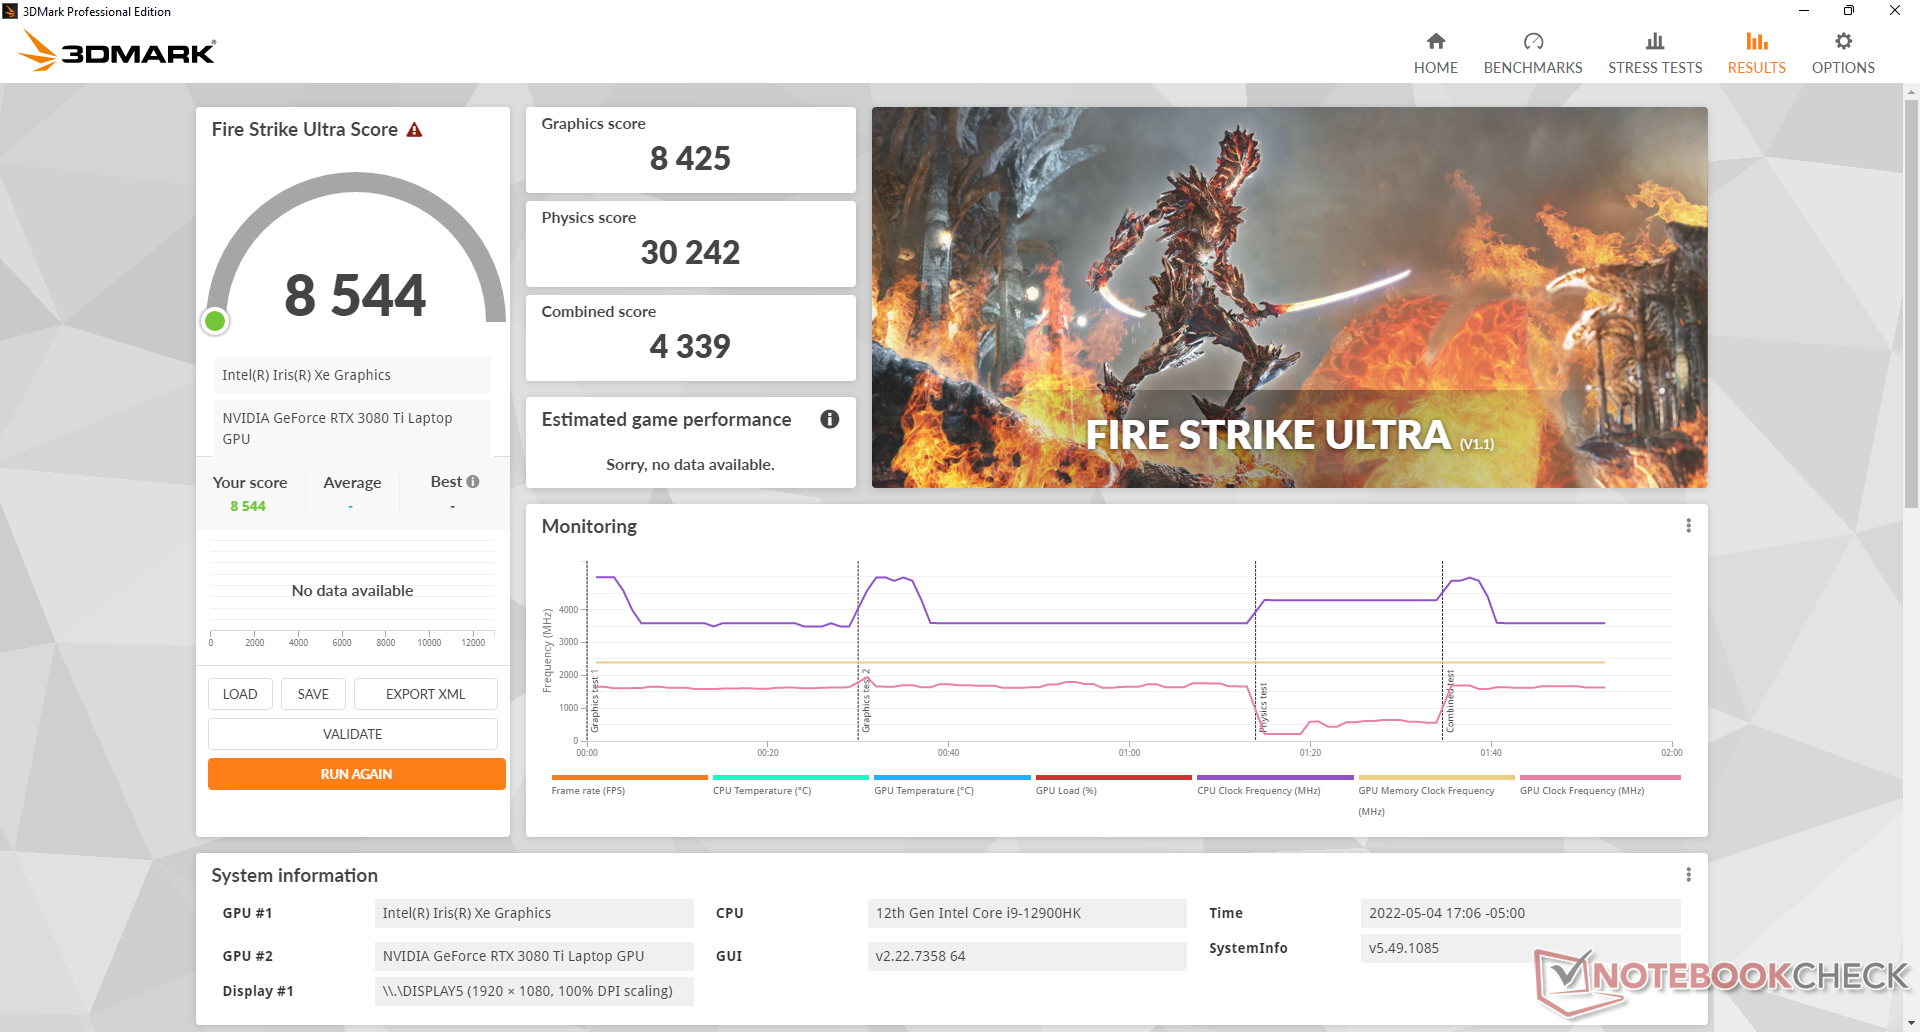
| 3DMark 11 Performance | 36680 punti | |
| 3DMark Cloud Gate Standard Score | 63911 punti | |
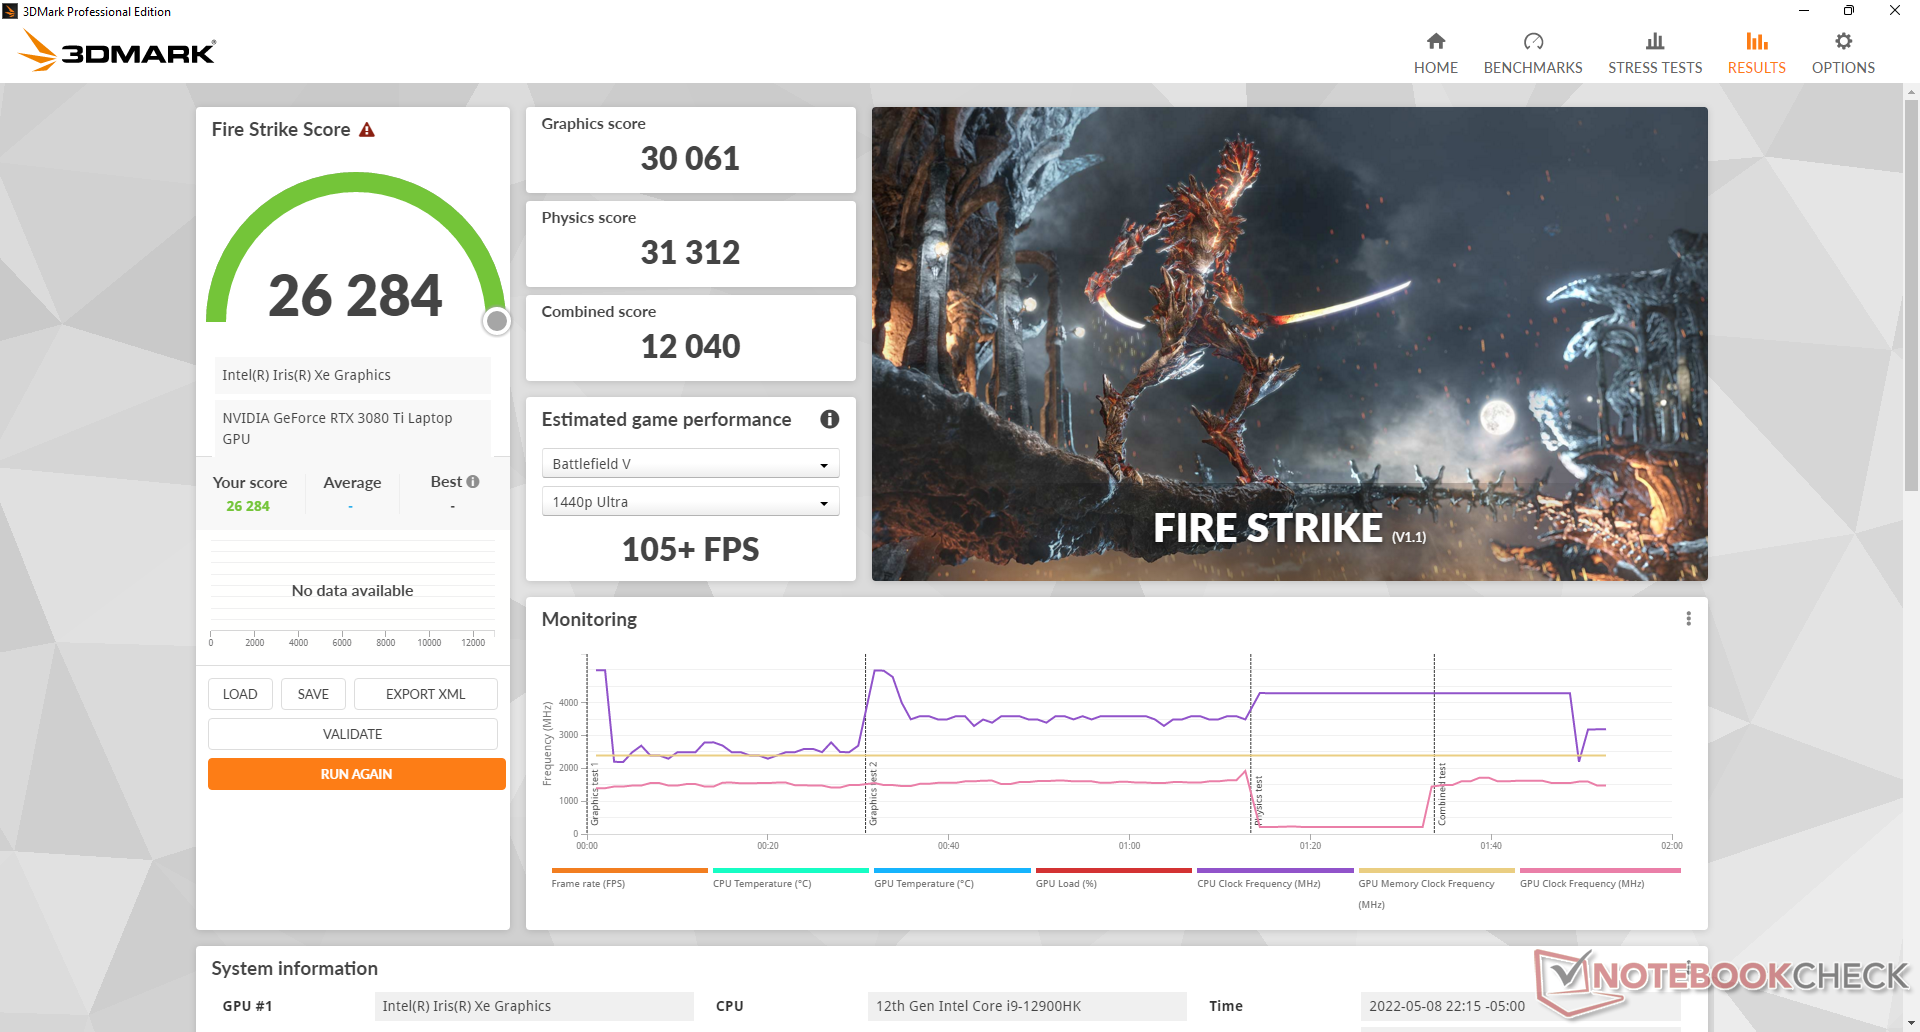
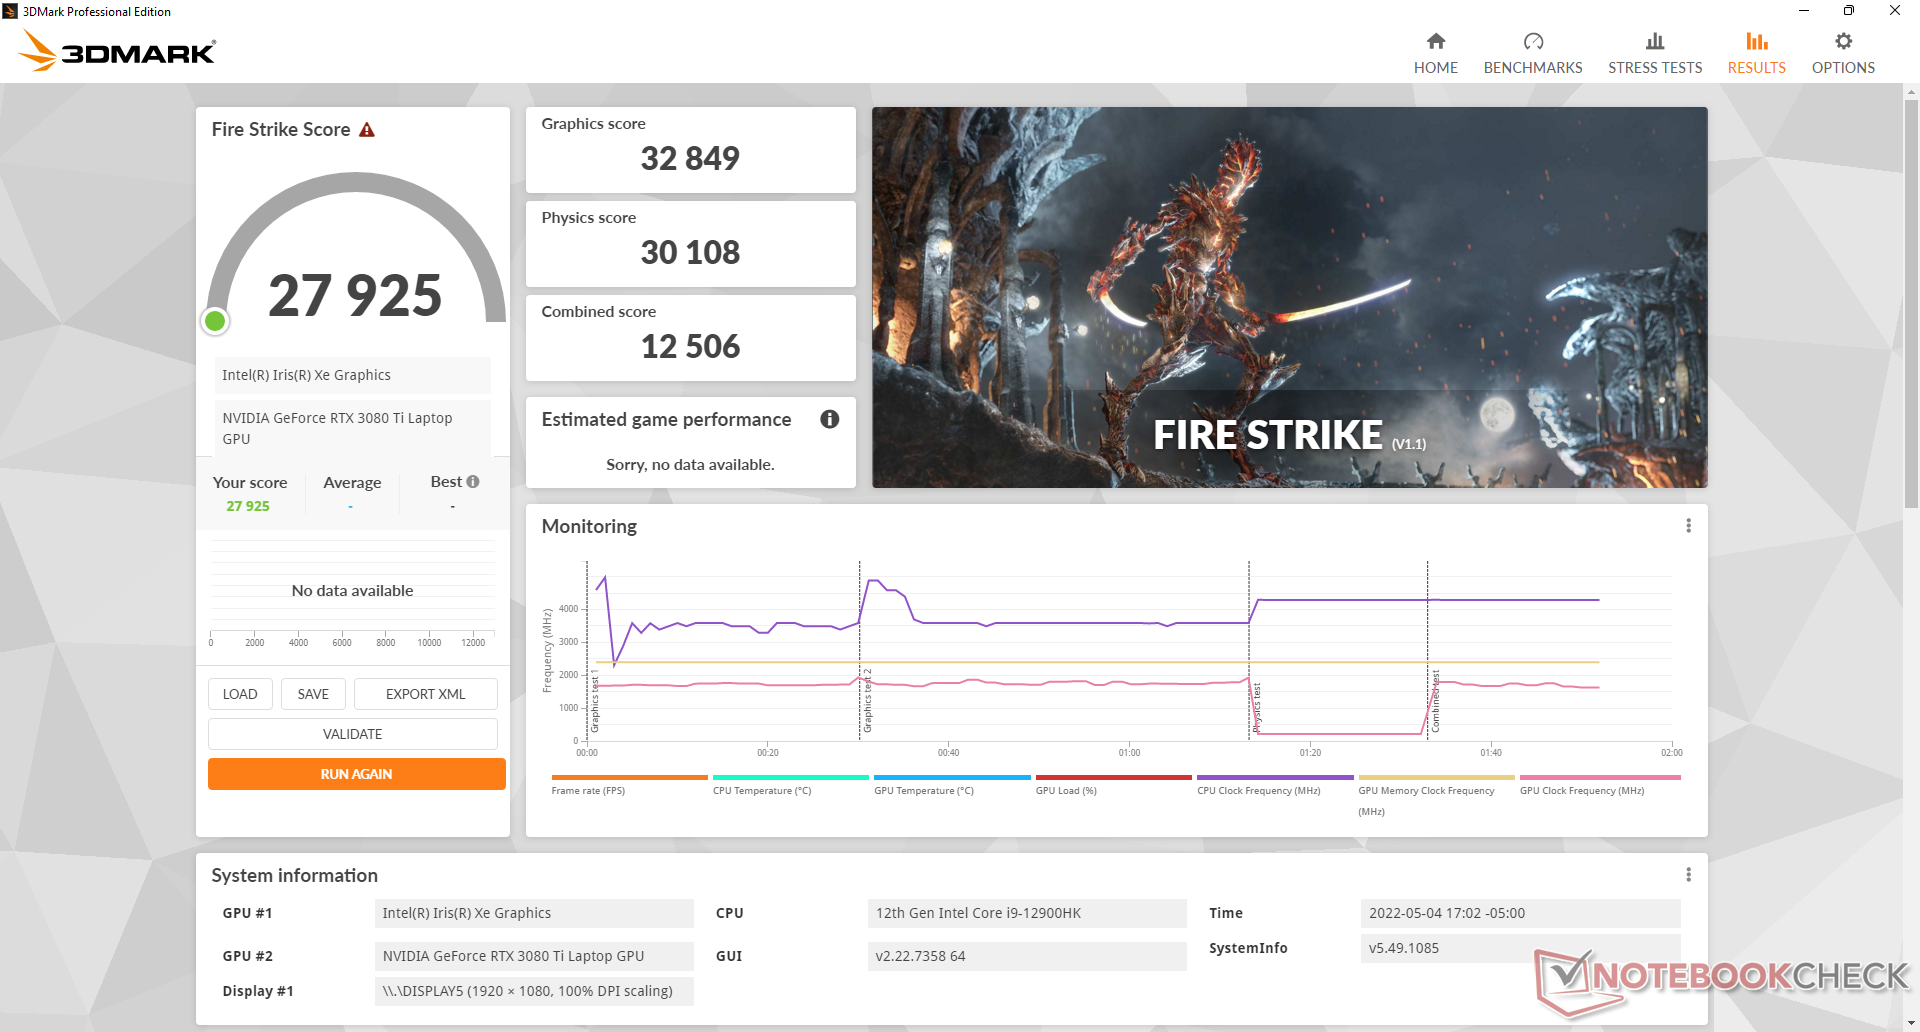
| 3DMark Fire Strike Score | 27925 punti | |
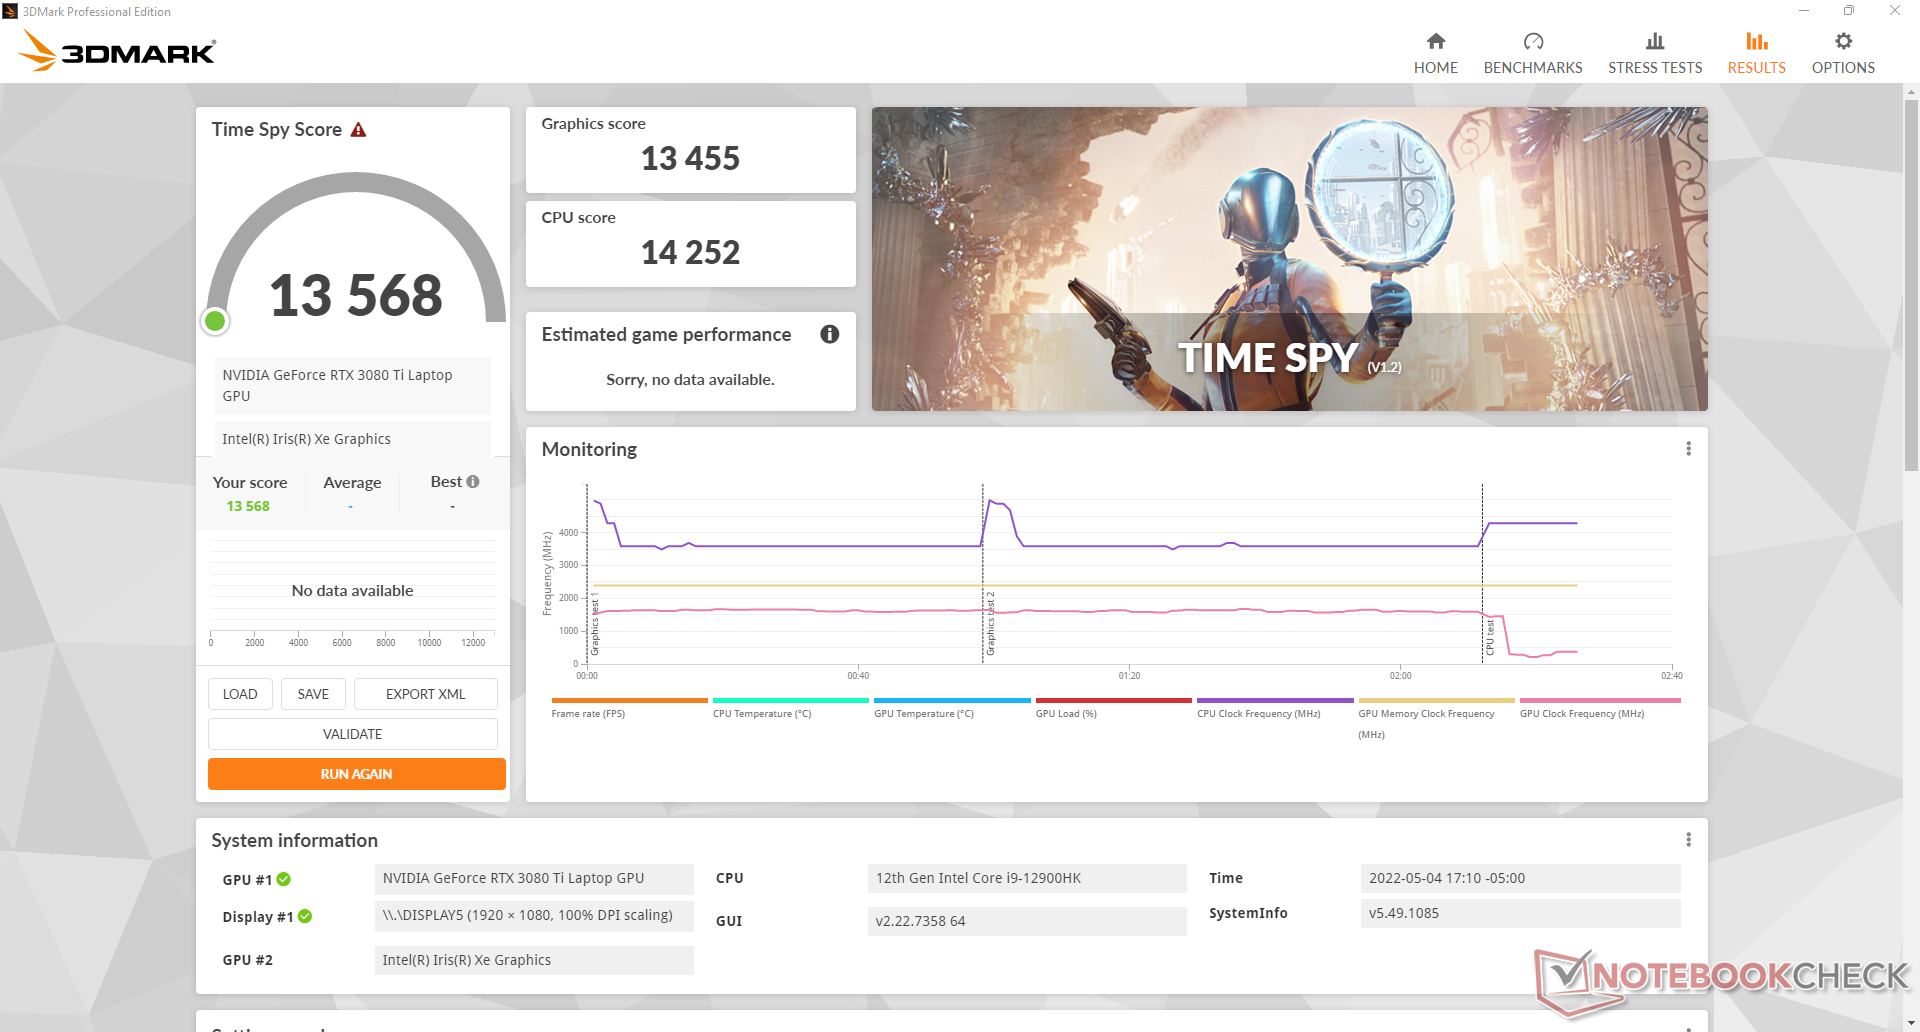
| 3DMark Time Spy Score | 13568 punti | |
Aiuto | ||
Witcher 3 FPS Chart
| basso | medio | alto | ultra | |
|---|---|---|---|---|
| GTA V (2015) | 187 | 185.1 | 180.8 | 126.3 |
| The Witcher 3 (2015) | 500.9 | 388.5 | 267.7 | 128 |
| Dota 2 Reborn (2015) | 186.1 | 172.3 | 166.6 | 158.9 |
| Final Fantasy XV Benchmark (2018) | 215 | 167.8 | 127.8 | |
| X-Plane 11.11 (2018) | 161 | 143.9 | 112.9 | |
| Strange Brigade (2018) | 474 | 300 | 243 | 213 |
| Cyberpunk 2077 1.6 (2022) | 167.7 | 142 | 116.2 | 115.7 |
Emissioni
Rumore di sistema
Il rumore della ventola dipende dalle impostazioni dell'Alienware Command Center. Le ventole dell'Alienware tendono a pulsare frequentemente quando sono in modalità Balanced o superiore e quindi la modalità Quiet è raccomandata quando si naviga, si inviano email o si fa streaming. La nostra unità raramente andrebbe oltre i 32 dB(A) durante l'esecuzione di tali carichi poco impegnativi per essere evidente ma non fastidiosa.
Quando si gioca in modalità bilanciata, il rumore della ventola si stabilizza a circa 43,3 dB(A) contro i 52,5 dB(A) della modalità massima. Gli utenti potrebbero voler giocare in modalità Balanced per il rumore della ventola significativamente più silenzioso nonostante il deficit di prestazioni che comporta.
Rumorosità
| Idle |
| 23.1 / 23.1 / 23.1 dB(A) |
| Sotto carico |
| 31.9 / 52.5 dB(A) |
 | ||
30 dB silenzioso 40 dB(A) udibile 50 dB(A) rumoroso |
||
min: | ||
| Alienware x17 R2 P48E GeForce RTX 3080 Ti Laptop GPU, i9-12900HK, 2x Samsung PM9A1 1TB (RAID 0) | Alienware x17 RTX 3080 P48E GeForce RTX 3080 Laptop GPU, i7-11800H, 2x WDC PC SN730 SDBPNTY-1T00 (RAID 0) | Asus ROG Zephyrus S17 GX703HSD GeForce RTX 3080 Laptop GPU, i9-11900H, Samsung PM9A1 MZVL22T0HBLB | MSI Stealth GS77 12UHS-083US GeForce RTX 3080 Ti Laptop GPU, i7-12700H, Micron 3400 1TB MTFDKBA1T0TFH | MSI GT76 Titan DT 10SGS GeForce RTX 2080 Super Mobile, i9-10900K, 2x WDC PC SN730 SDBPNTY-1T00 (RAID 0) | Gigabyte A7 X1 GeForce RTX 3070 Laptop GPU, R9 5900HX, ESR512GTLCG-EAC-4 | |
|---|---|---|---|---|---|---|
| Noise | -7% | -2% | -8% | -18% | -28% | |
| off /ambiente * (dB) | 22.7 | 24.9 -10% | 23 -1% | 24.5 -8% | 26.4 -16% | 24 -6% |
| Idle Minimum * (dB) | 23.1 | 24.9 -8% | 23 -0% | 24.5 -6% | 27.5 -19% | 25 -8% |
| Idle Average * (dB) | 23.1 | 24.9 -8% | 23 -0% | 24.5 -6% | 27.5 -19% | 29 -26% |
| Idle Maximum * (dB) | 23.1 | 29.6 -28% | 23 -0% | 30.8 -33% | 29.8 -29% | 35 -52% |
| Load Average * (dB) | 31.9 | 31.1 3% | 41 -29% | 34.6 -8% | 30.9 3% | 58 -82% |
| Witcher 3 ultra * (dB) | 52.5 | 49.7 5% | 45 14% | 46.2 12% | 60.7 -16% | 57 -9% |
| Load Maximum * (dB) | 52.5 | 54.8 -4% | 52 1% | 56.8 -8% | 66.6 -27% | 59 -12% |
* ... Meglio usare valori piccoli
Temperatura
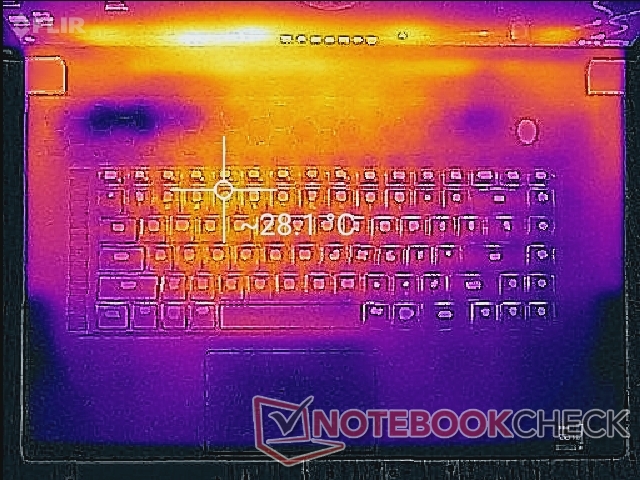
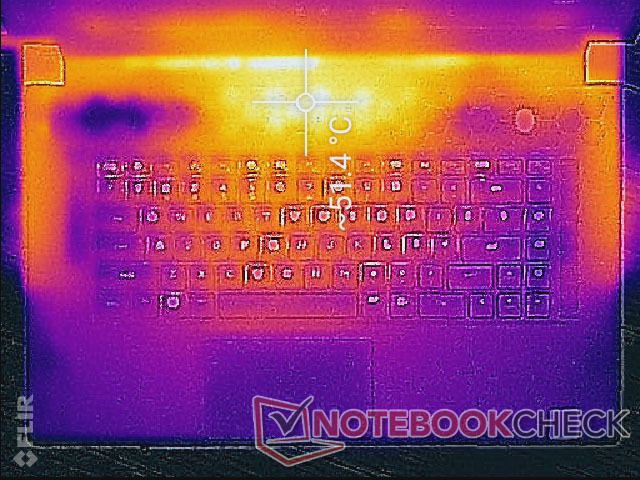
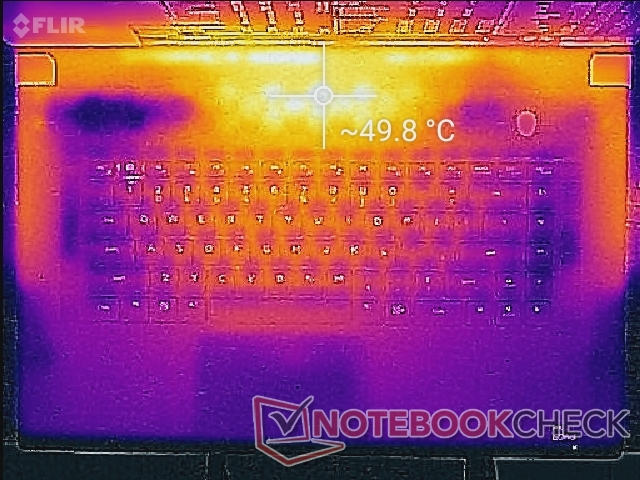
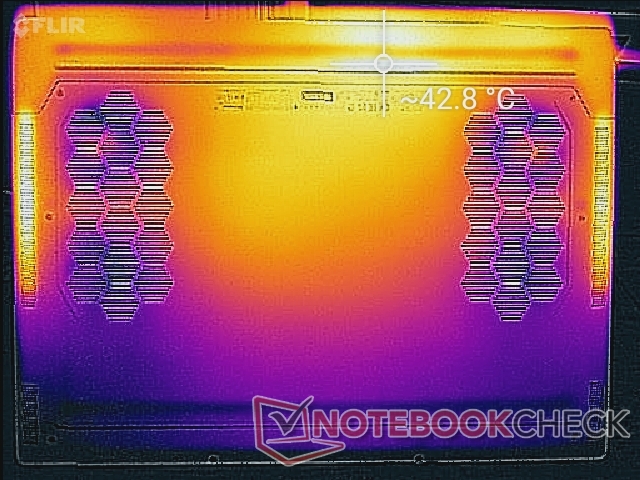
Le temperature di superficie sono generalmente più fresche di quanto ci aspettassimo, dati i livelli estremi di prestazioni a cui punta Dell con un design così sottile. I punti caldi possono raggiungere oltre 45 C o 50 C quando si eseguono carichi elevati, ma queste aree sono verso la parte posteriore dello chassis e lontano dai tasti della tastiera e dai poggiapolsi. Il sistema è caldo, ma mai in modo fastidioso durante il gioco.
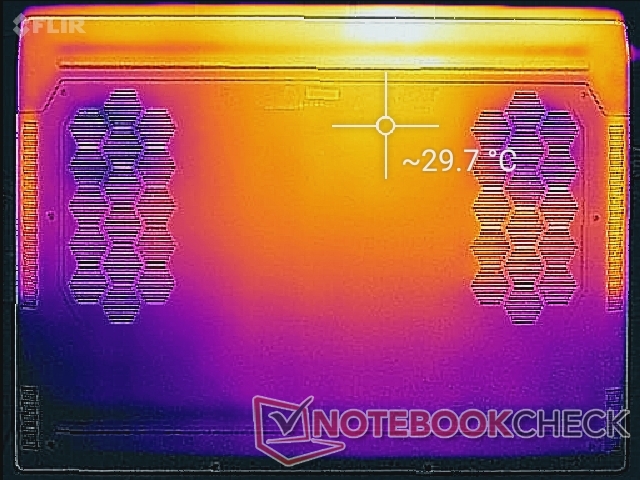
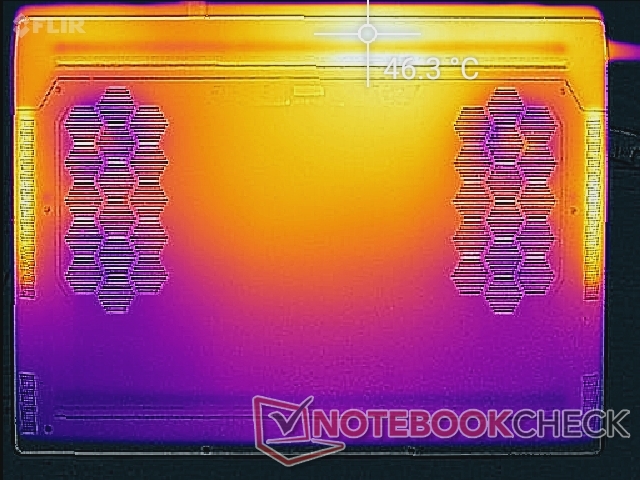
Tenete a mente che ci sono molte griglie di ventilazione su quasi tutti i lati del sistema. Con le temperature della CPU che raggiungono un livello così alto quando sono sotto carico, sarà importante non bloccare nessuna apertura quando possibile.
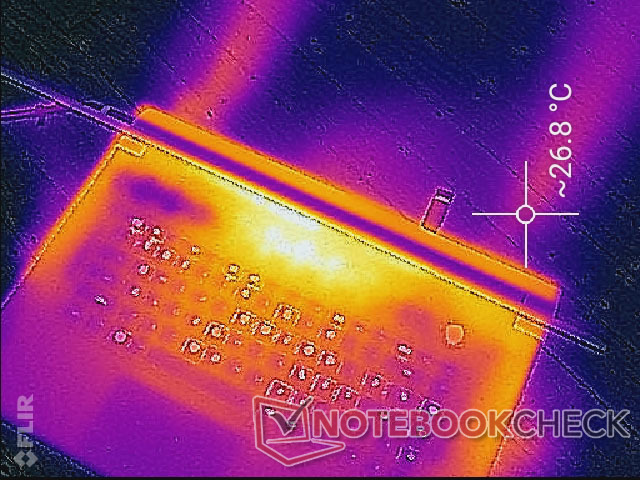
(-) La temperatura massima sul lato superiore è di 49.6 °C / 121 F, rispetto alla media di 40.4 °C / 105 F, che varia da 21.2 a 68.8 °C per questa classe Gaming.
(±) Il lato inferiore si riscalda fino ad un massimo di 42.4 °C / 108 F, rispetto alla media di 43.2 °C / 110 F
(+) In idle, la temperatura media del lato superiore è di 26.1 °C / 79 F, rispetto alla media deld ispositivo di 33.9 °C / 93 F.
(±) Riproducendo The Witcher 3, la temperatura media per il lato superiore e' di 34.7 °C / 94 F, rispetto alla media del dispositivo di 33.9 °C / 93 F.
(+) I poggiapolsi e il touchpad sono piu' freddi della temperatura della pelle con un massimo di 29.2 °C / 84.6 F e sono quindi freddi al tatto.
(±) La temperatura media della zona del palmo della mano di dispositivi simili e'stata di 28.8 °C / 83.8 F (-0.4 °C / -0.8 F).
| Alienware x17 R2 P48E Intel Core i9-12900HK, NVIDIA GeForce RTX 3080 Ti Laptop GPU | Alienware x17 RTX 3080 P48E Intel Core i7-11800H, NVIDIA GeForce RTX 3080 Laptop GPU | Asus ROG Zephyrus S17 GX703HSD Intel Core i9-11900H, NVIDIA GeForce RTX 3080 Laptop GPU | MSI Stealth GS77 12UHS-083US Intel Core i7-12700H, NVIDIA GeForce RTX 3080 Ti Laptop GPU | MSI GT76 Titan DT 10SGS Intel Core i9-10900K, NVIDIA GeForce RTX 2080 Super Mobile | Gigabyte A7 X1 AMD Ryzen 9 5900HX, NVIDIA GeForce RTX 3070 Laptop GPU | |
|---|---|---|---|---|---|---|
| Heat | -14% | -18% | -16% | 7% | 2% | |
| Maximum Upper Side * (°C) | 49.6 | 58.4 -18% | 59 -19% | 50.6 -2% | 36.4 27% | 44 11% |
| Maximum Bottom * (°C) | 42.4 | 49 -16% | 53 -25% | 59.6 -41% | 43 -1% | 49 -16% |
| Idle Upper Side * (°C) | 29.2 | 33.6 -15% | 35 -20% | 30 -3% | 28 4% | 27 8% |
| Idle Bottom * (°C) | 32 | 34.6 -8% | 35 -9% | 37.4 -17% | 33.4 -4% | 30 6% |
* ... Meglio usare valori piccoli
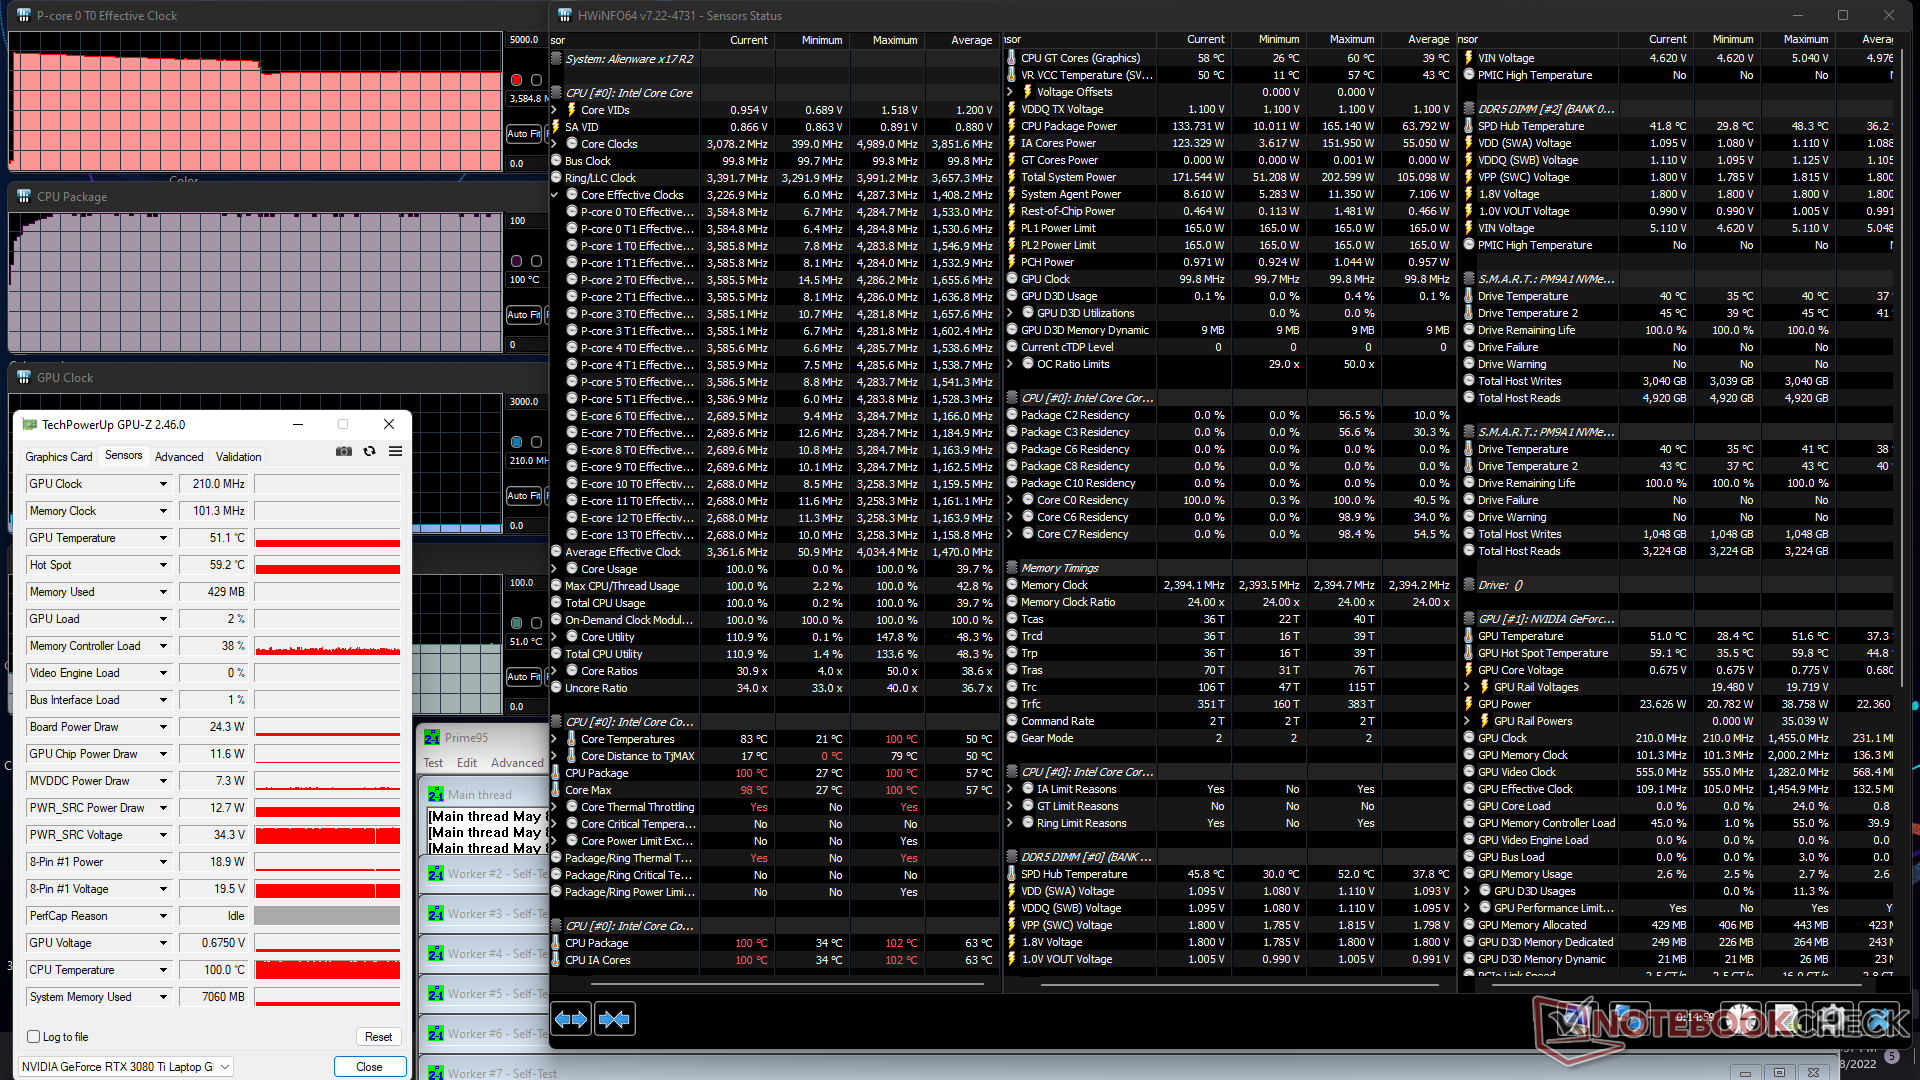
Test di stress
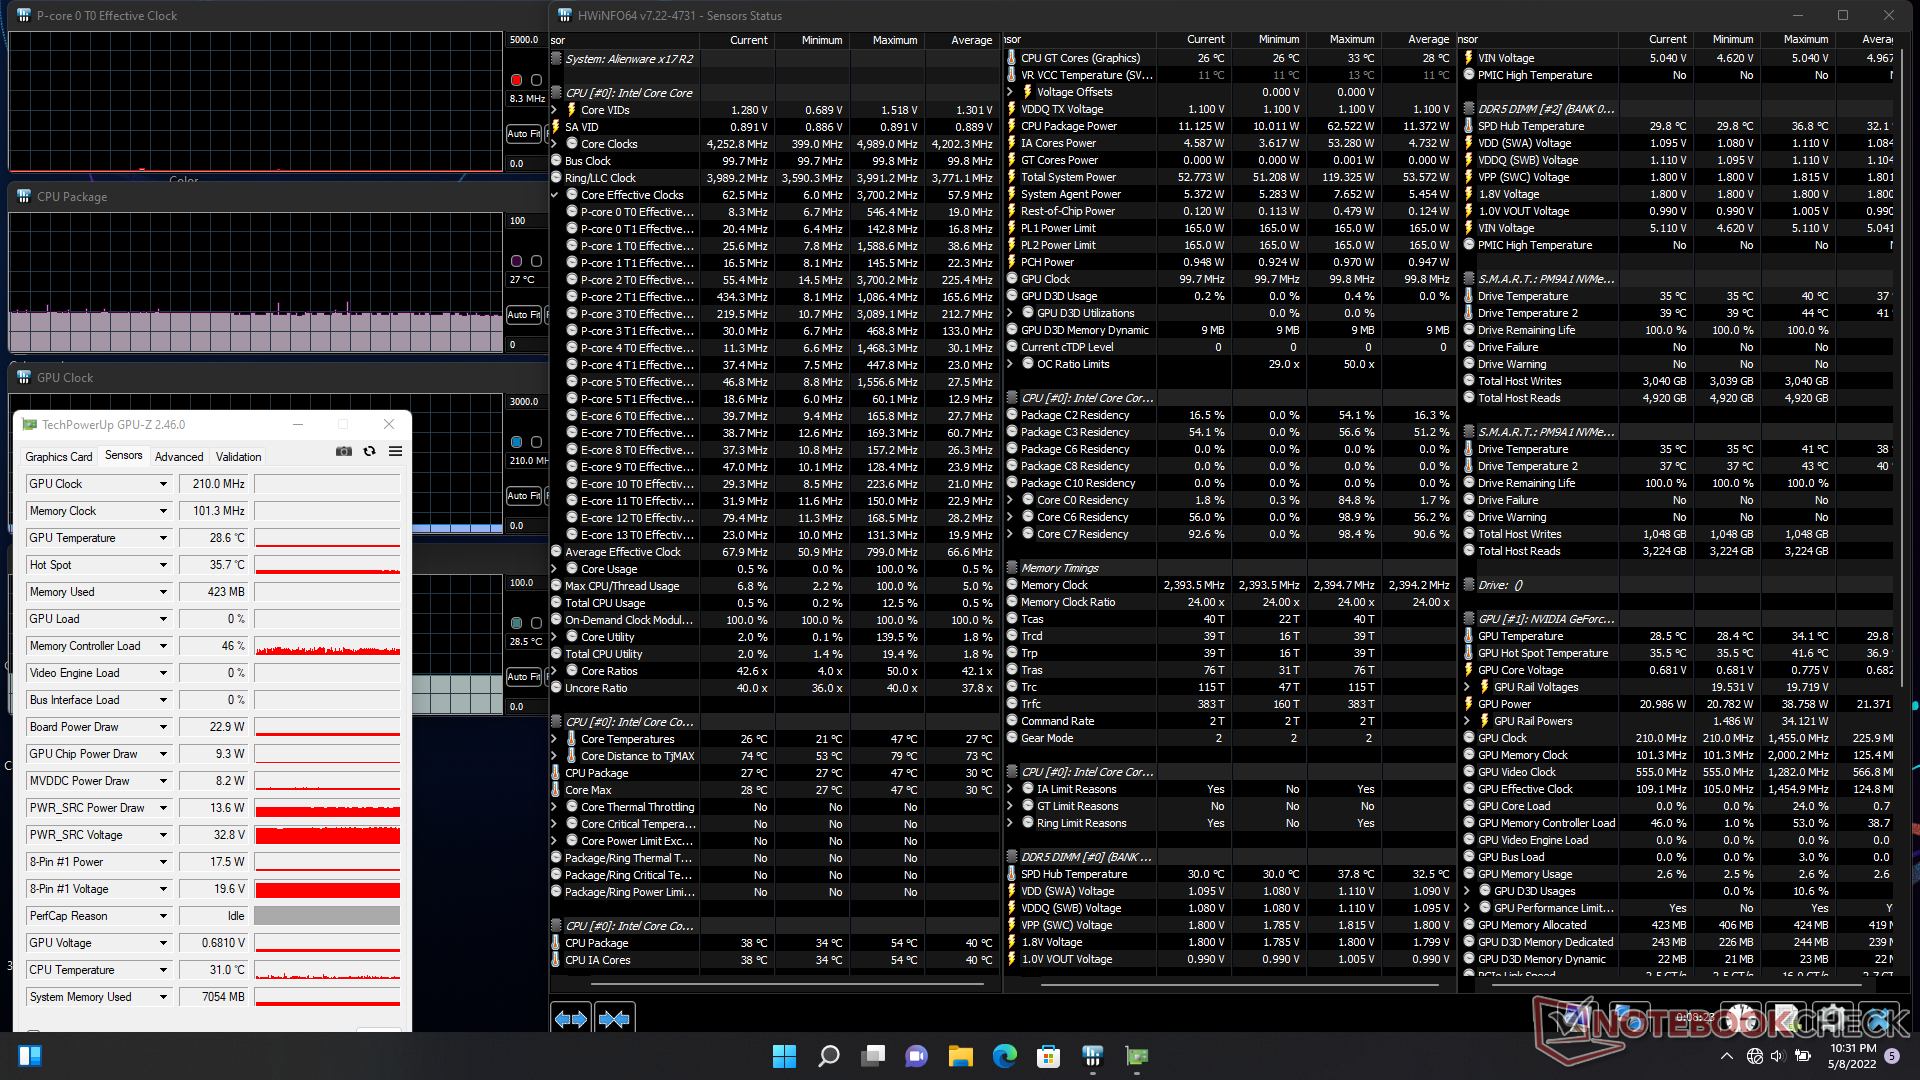
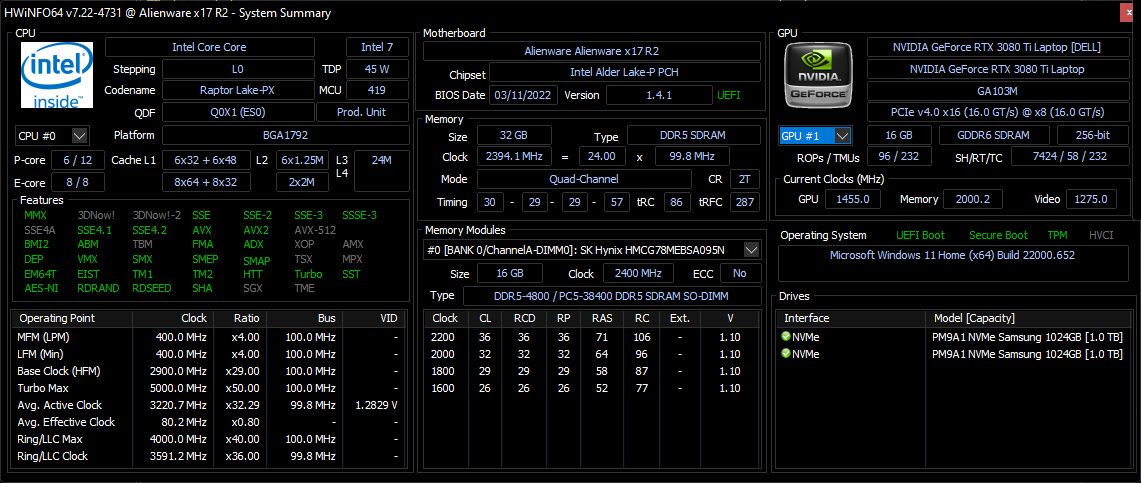
Durante l'esecuzione di Prime95, la frequenza di clock della CPU saliva a 4,3 GHz solo per un paio di secondi prima di raggiungere una temperatura del core di 100 C. Alla fine la frequenza di clock si stabilizzava a 3,6 GHz mantenendo una temperatura del core appena sotto i 100 C. Nel frattempo, l'assorbimento di potenza del pacchetto CPU arrivava a 165 W durante l'inizio del test prima di stabilizzarsi a 134 W a causa delle limitazioni termiche. È chiaro che la CPU sta funzionando il più velocemente possibile dati i limiti della soluzione di raffreddamento Alienware. In confronto, il Core i7-12700H nell'MSI GS77 si stabilizzerebbe ad un range più lento di 2,7 - 3 GHz in condizioni simili.
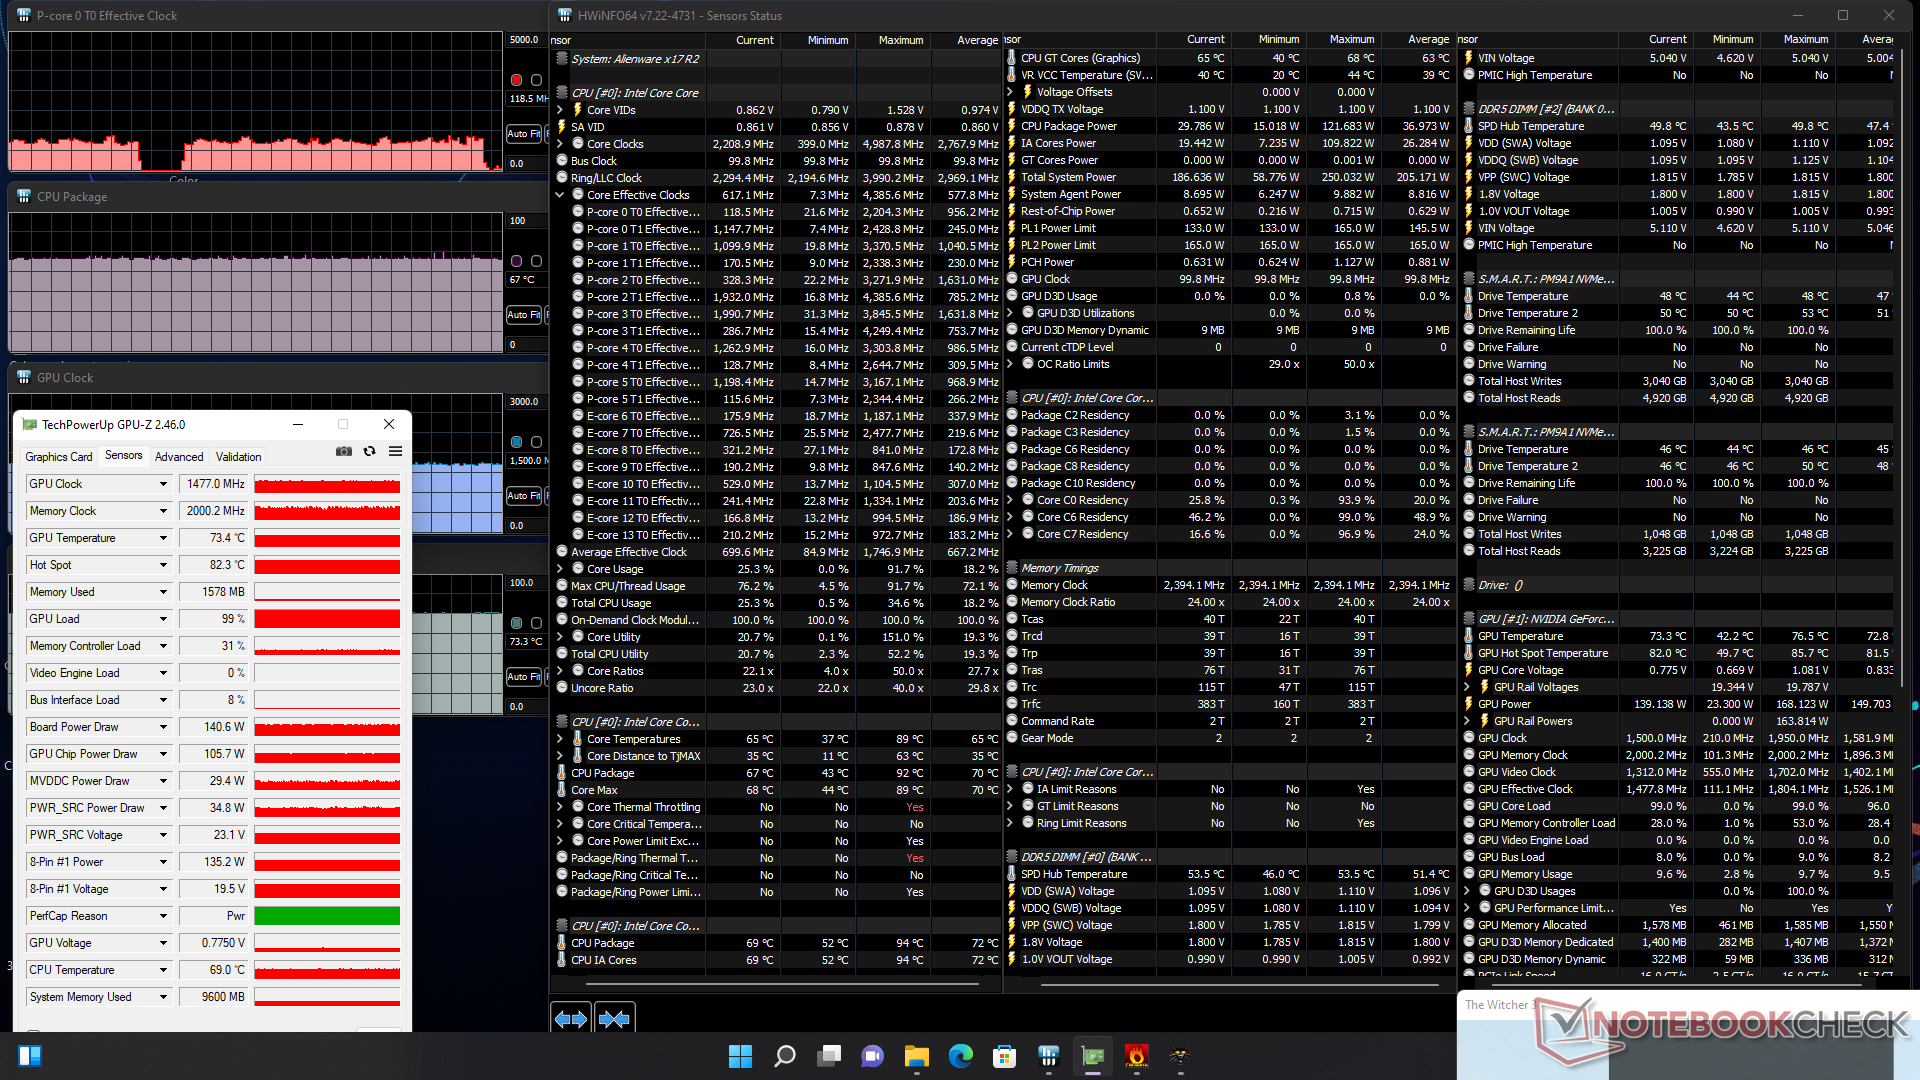
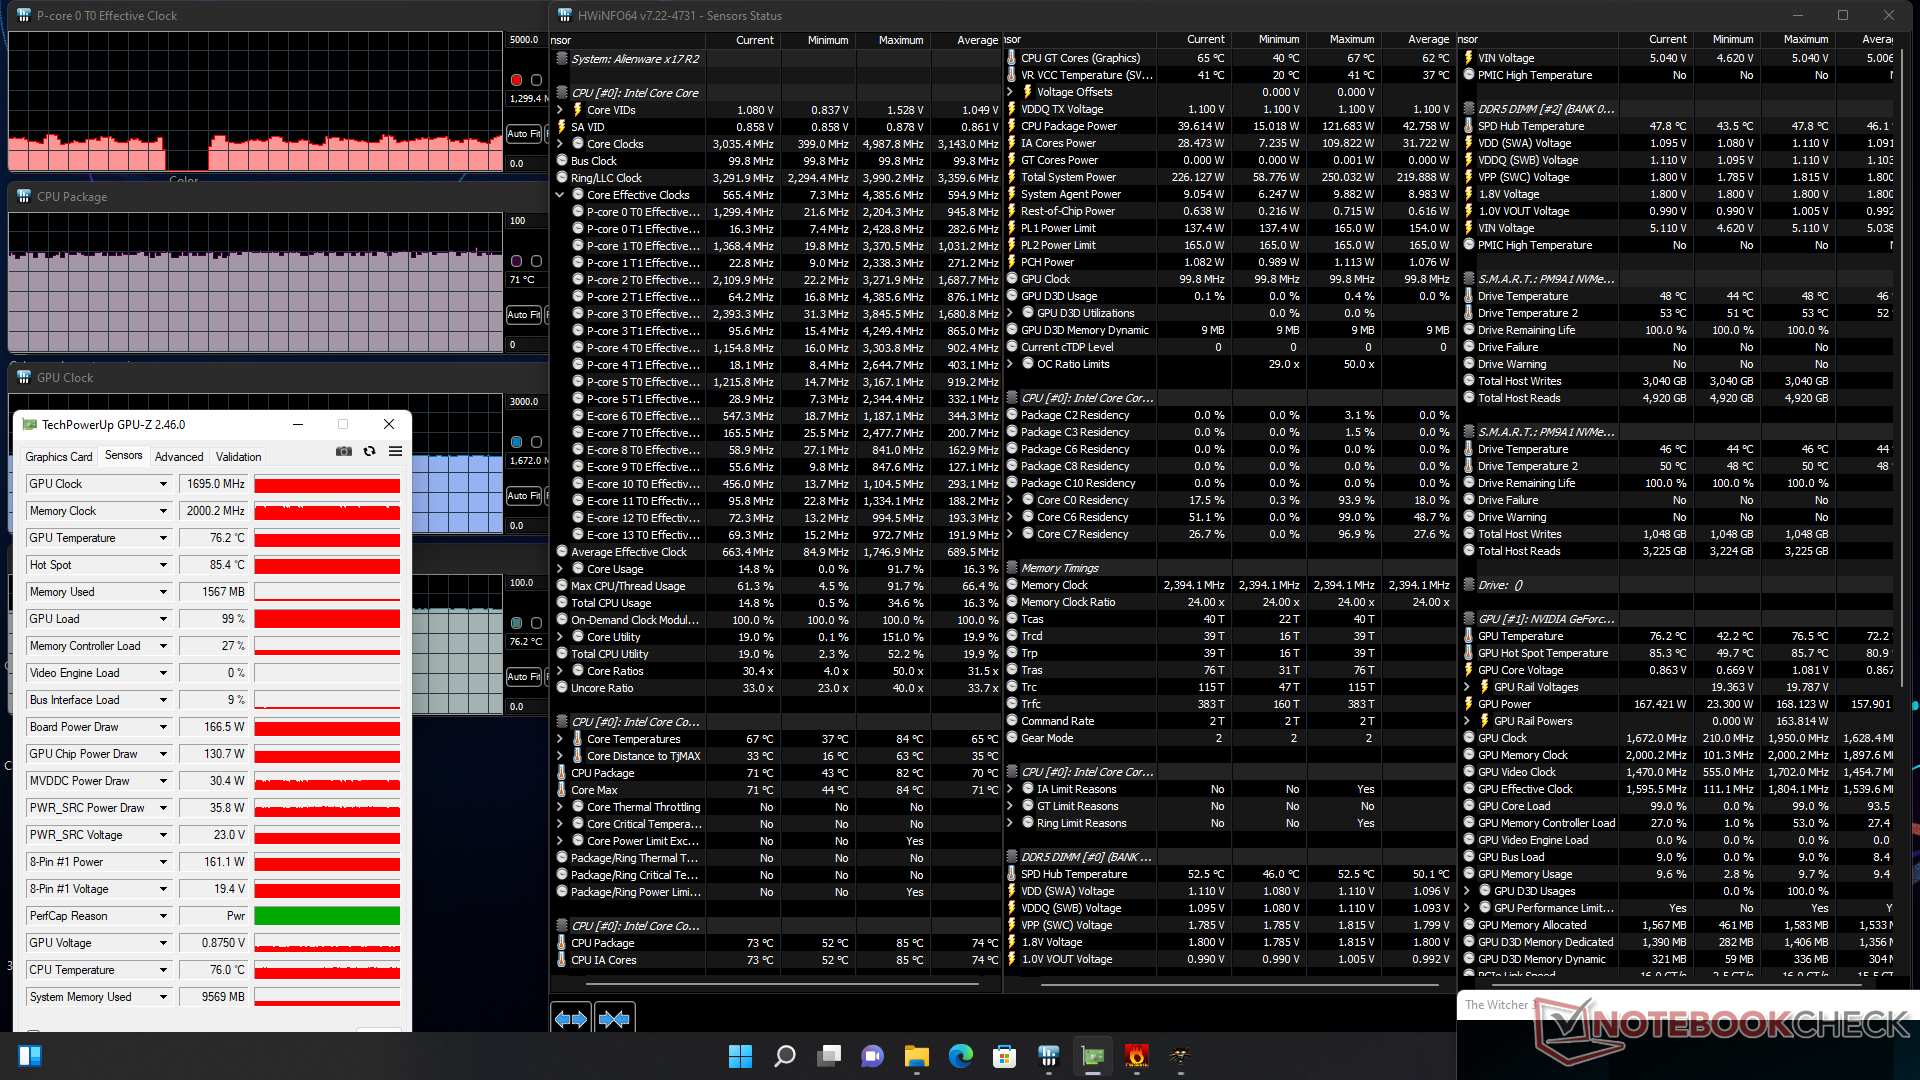
La frequenza di clock della GPU, il clock della memoria e l'assorbimento della scheda si stabilizzerebbero rispettivamente a 1695 MHz, 2000 MHz e 167 W, quando si usa Witcher 3 in modalità ventola massima. Se in modalità bilanciata, il clock della GPU e l'assorbimento della scheda scendono a 1477 MHz e 141 W, rispettivamente. Quindi, gli utenti devono sopportare la modalità di massimo rumore della ventola se vogliono il pieno potenziale di prestazioni della x17 R2. Eseguendo questo stesso test sulla MSI GS77 si otterrebbe una frequenza di clock della GPU più lenta e un clock della memoria di 1432 MHz e 1750 MHz, rispettivamente.
Il funzionamento a batteria limita significativamente le prestazioni. Un test su Fire Strike con le batterie restituirebbe punteggi di Fisica e Grafica di 27369 e 12095 punti, rispettivamente, rispetto a 30108 e 32849 punti con l'alimentazione di rete.
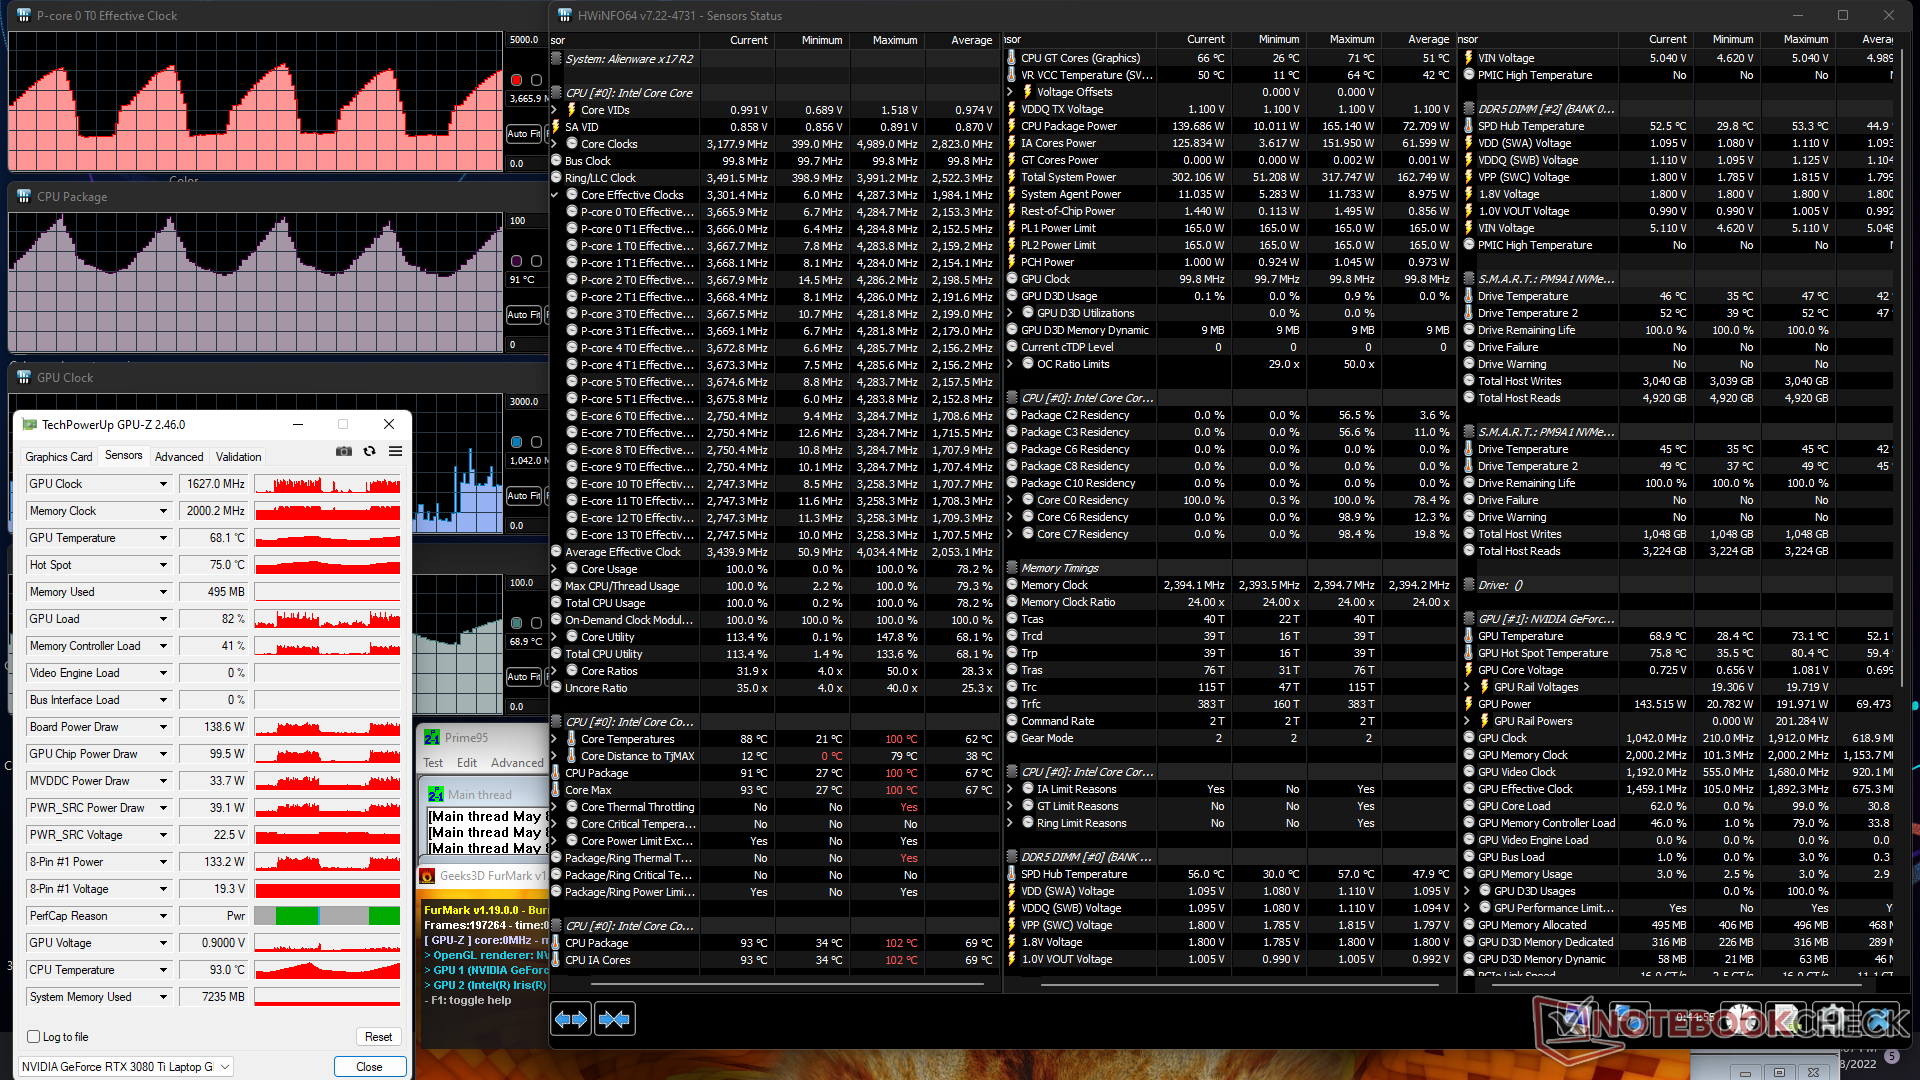
| Clock della CPU (GHz) | Clock della GPU (MHz) | Temperatura media della CPU (°C) | Temperatura media della GPU (°C) | |
| Sistema inattivo (modalità ventola massima) | -- | -- | 27 | 29 |
| Prime95 Stress (modalità ventola massima) | 3.6 | -- | -- | 100 |
| Prime95 + FurMark Stress (Modalità ventola massima) | 1.4 - 3.7 | 337 - 1770 | 53 - 100 | 49 - 71 |
| Witcher 3 Stress(Modalità bilanciata) | ~0,6 | 1477 | 67 | 73 |
| Witcher 3 Sollecitazione (Modalità massima del ventilatore) | ~1,3 | 1695 | 71 | 76 |
Altoparlanti
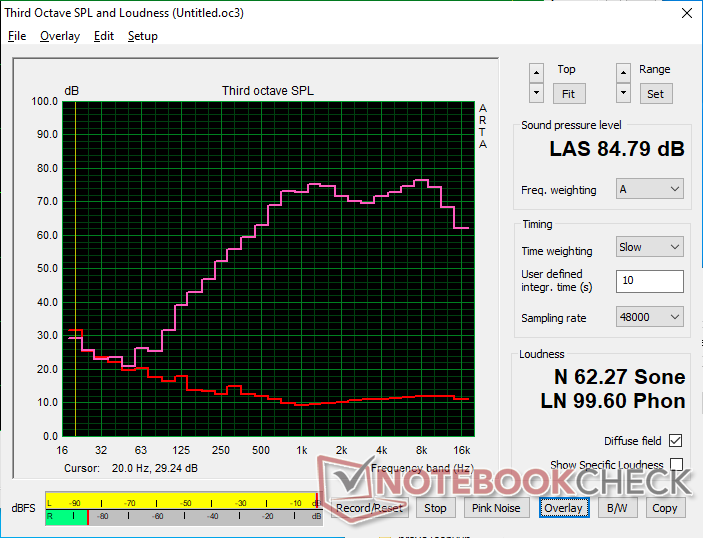
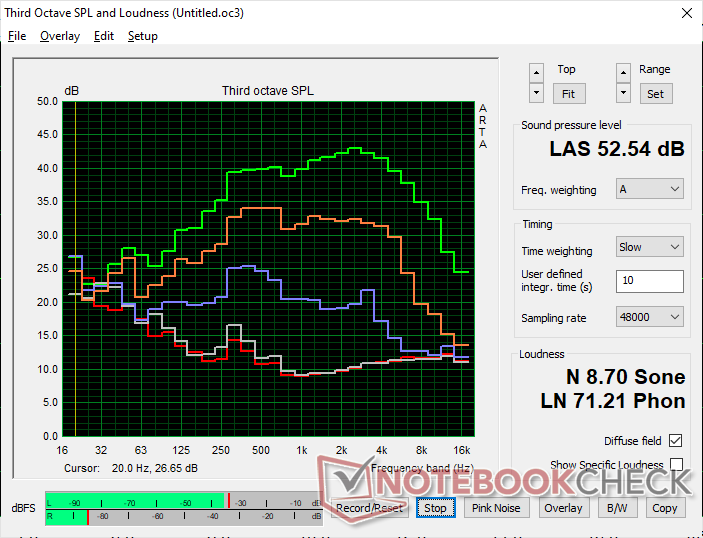
Alienware x17 R2 P48E analisi audio
(+) | gli altoparlanti sono relativamente potenti (84.3 dB)
Bassi 100 - 315 Hz
(±) | bassi ridotti - in media 9.7% inferiori alla media
(+) | bassi in lineaa (5.5% delta rispetto alla precedente frequenza)
Medi 400 - 2000 Hz
(+) | medi bilanciati - solo only 1.6% rispetto alla media
(+) | medi lineari (3% delta rispetto alla precedente frequenza)
Alti 2 - 16 kHz
(±) | alti elevati - circa 5% superiori alla media
(±) | la linearità degli alti è media (7.6% delta rispetto alla precedente frequenza)
Nel complesso 100 - 16.000 Hz
(+) | suono nel complesso lineare (9.3% differenza dalla media)
Rispetto alla stessa classe
» 3% di tutti i dispositivi testati in questa classe è stato migliore, 2% simile, 95% peggiore
» Il migliore ha avuto un delta di 6%, medio di 18%, peggiore di 132%
Rispetto a tutti i dispositivi testati
» 3% di tutti i dispositivi testati in questa classe è stato migliore, 1% similare, 96% peggiore
» Il migliore ha avuto un delta di 4%, medio di 23%, peggiore di 134%
Apple MacBook Pro 16 2021 M1 Pro analisi audio
(+) | gli altoparlanti sono relativamente potenti (84.7 dB)
Bassi 100 - 315 Hz
(+) | bassi buoni - solo 3.8% dalla media
(+) | bassi in lineaa (5.2% delta rispetto alla precedente frequenza)
Medi 400 - 2000 Hz
(+) | medi bilanciati - solo only 1.3% rispetto alla media
(+) | medi lineari (2.1% delta rispetto alla precedente frequenza)
Alti 2 - 16 kHz
(+) | Alti bilanciati - appena 1.9% dalla media
(+) | alti lineari (2.7% delta rispetto alla precedente frequenza)
Nel complesso 100 - 16.000 Hz
(+) | suono nel complesso lineare (4.6% differenza dalla media)
Rispetto alla stessa classe
» 0% di tutti i dispositivi testati in questa classe è stato migliore, 0% simile, 100% peggiore
» Il migliore ha avuto un delta di 5%, medio di 17%, peggiore di 45%
Rispetto a tutti i dispositivi testati
» 0% di tutti i dispositivi testati in questa classe è stato migliore, 0% similare, 100% peggiore
» Il migliore ha avuto un delta di 4%, medio di 23%, peggiore di 134%
Gestione dell'energia
Consumo di energia
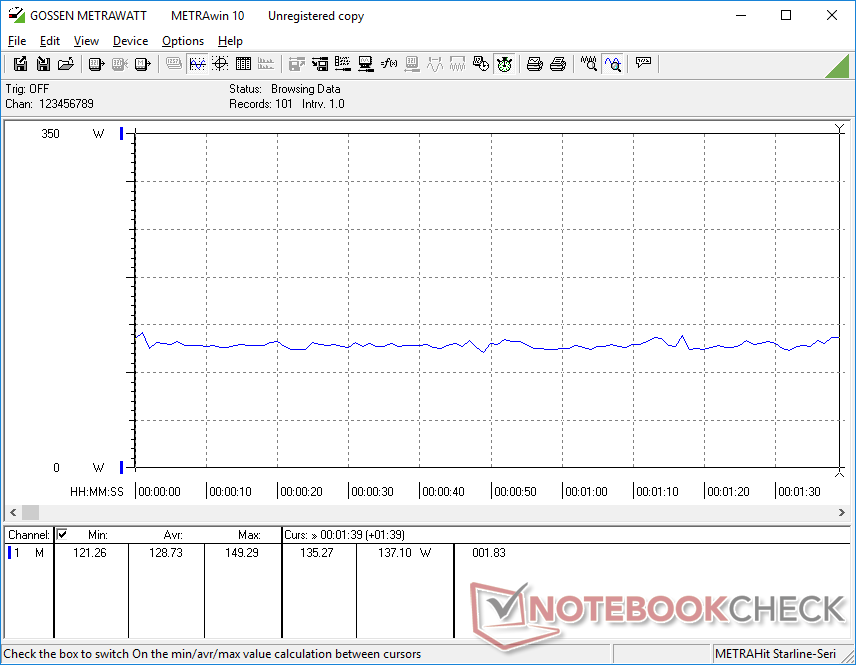
I portatili Alienware sono sempre stati più affamati di energia rispetto alle alternative concorrenti e l'x17 R2 non è diverso. Semplicemente inattivo sul desktop può richiedere fino a 60 W quando impostato in modalità High Performance, che è più della maggior parte degli Ultrabook della serie U sotto carico. Il consumo molto elevato è probabilmente responsabile della scarsa durata della batteria registrata nella prossima sezione.
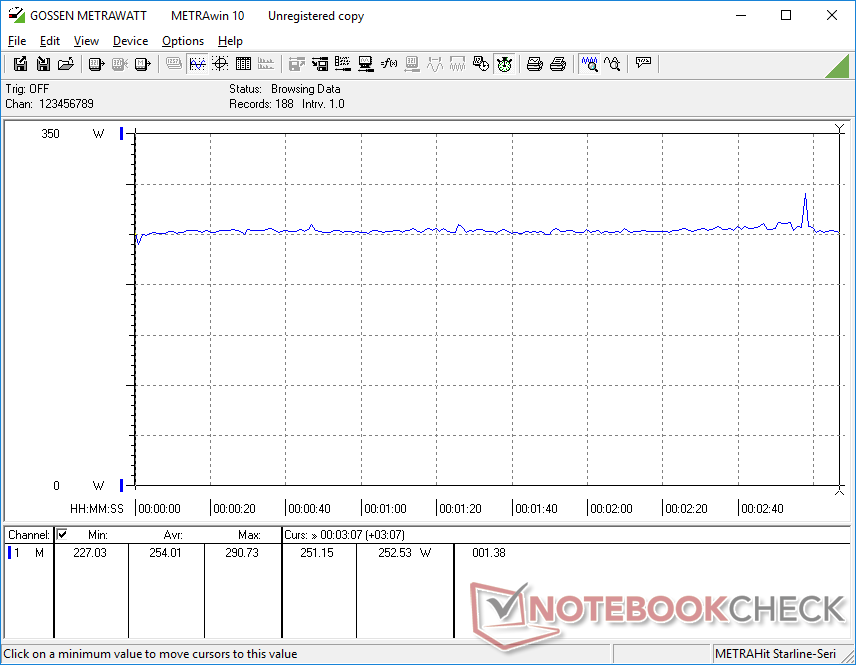
L'esecuzione di Witcher 3 consuma il 54 per cento di energia in più rispetto al MSI GS77, anche se entrambi sono dotati di CPU Core-H di 12a generazione e la stessa GPU GeForce RTX 3080 Ti. In cambio, il sistema Alienware è in grado di offrire fino al 15 per cento e 25 per cento di prestazioni della CPU e prestazioni grafiche più veloci, rispettivamente, rispetto al concorrente MSI.
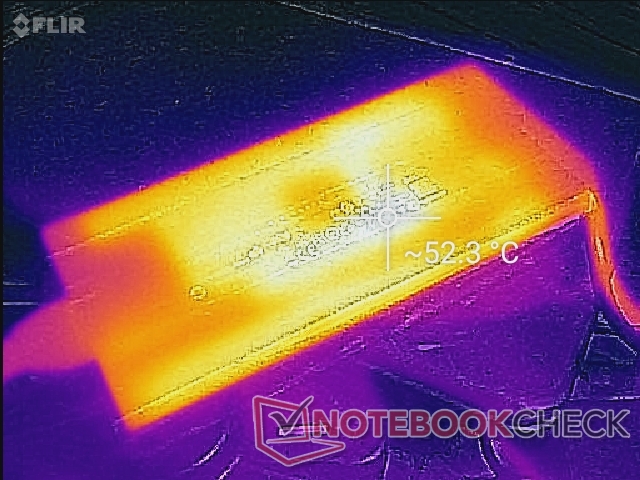
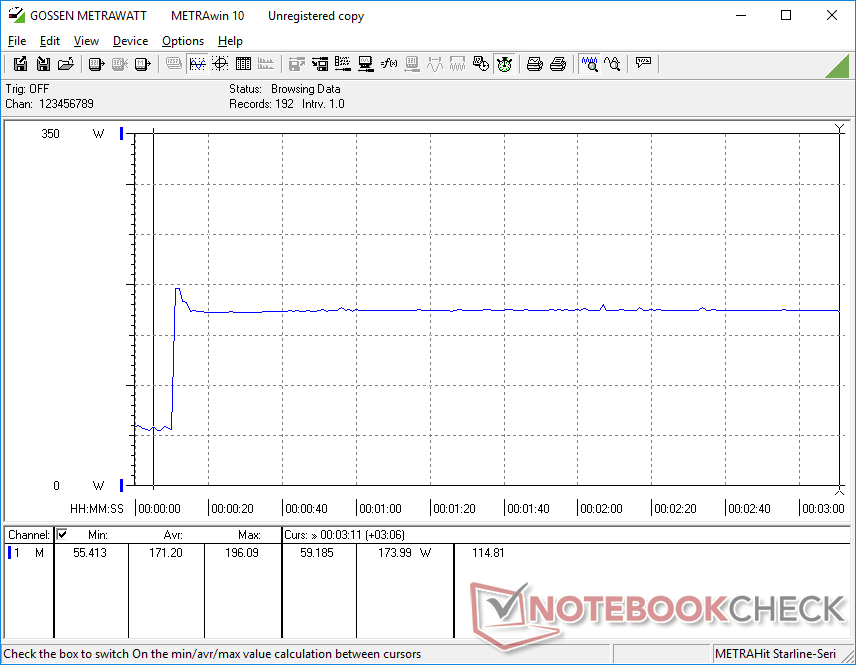
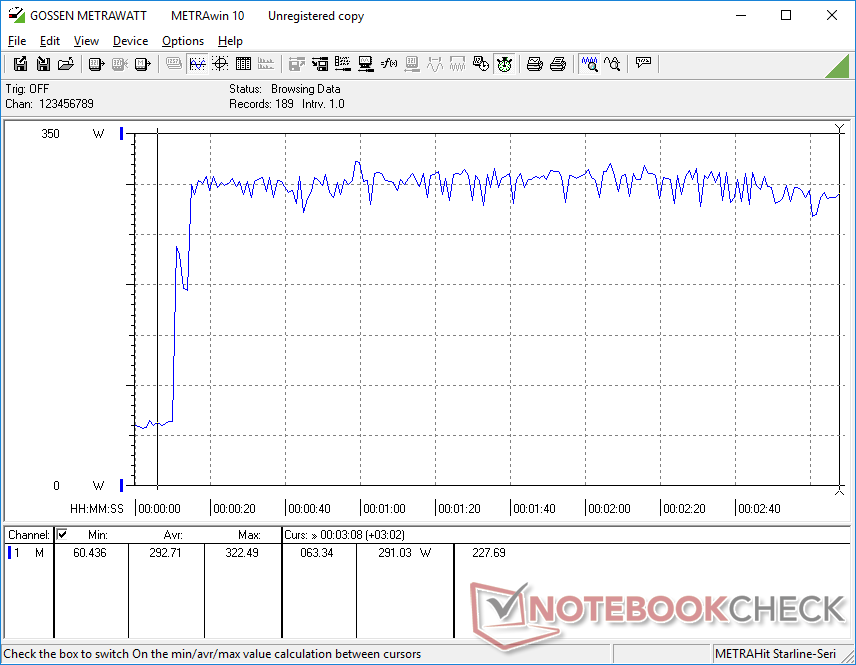
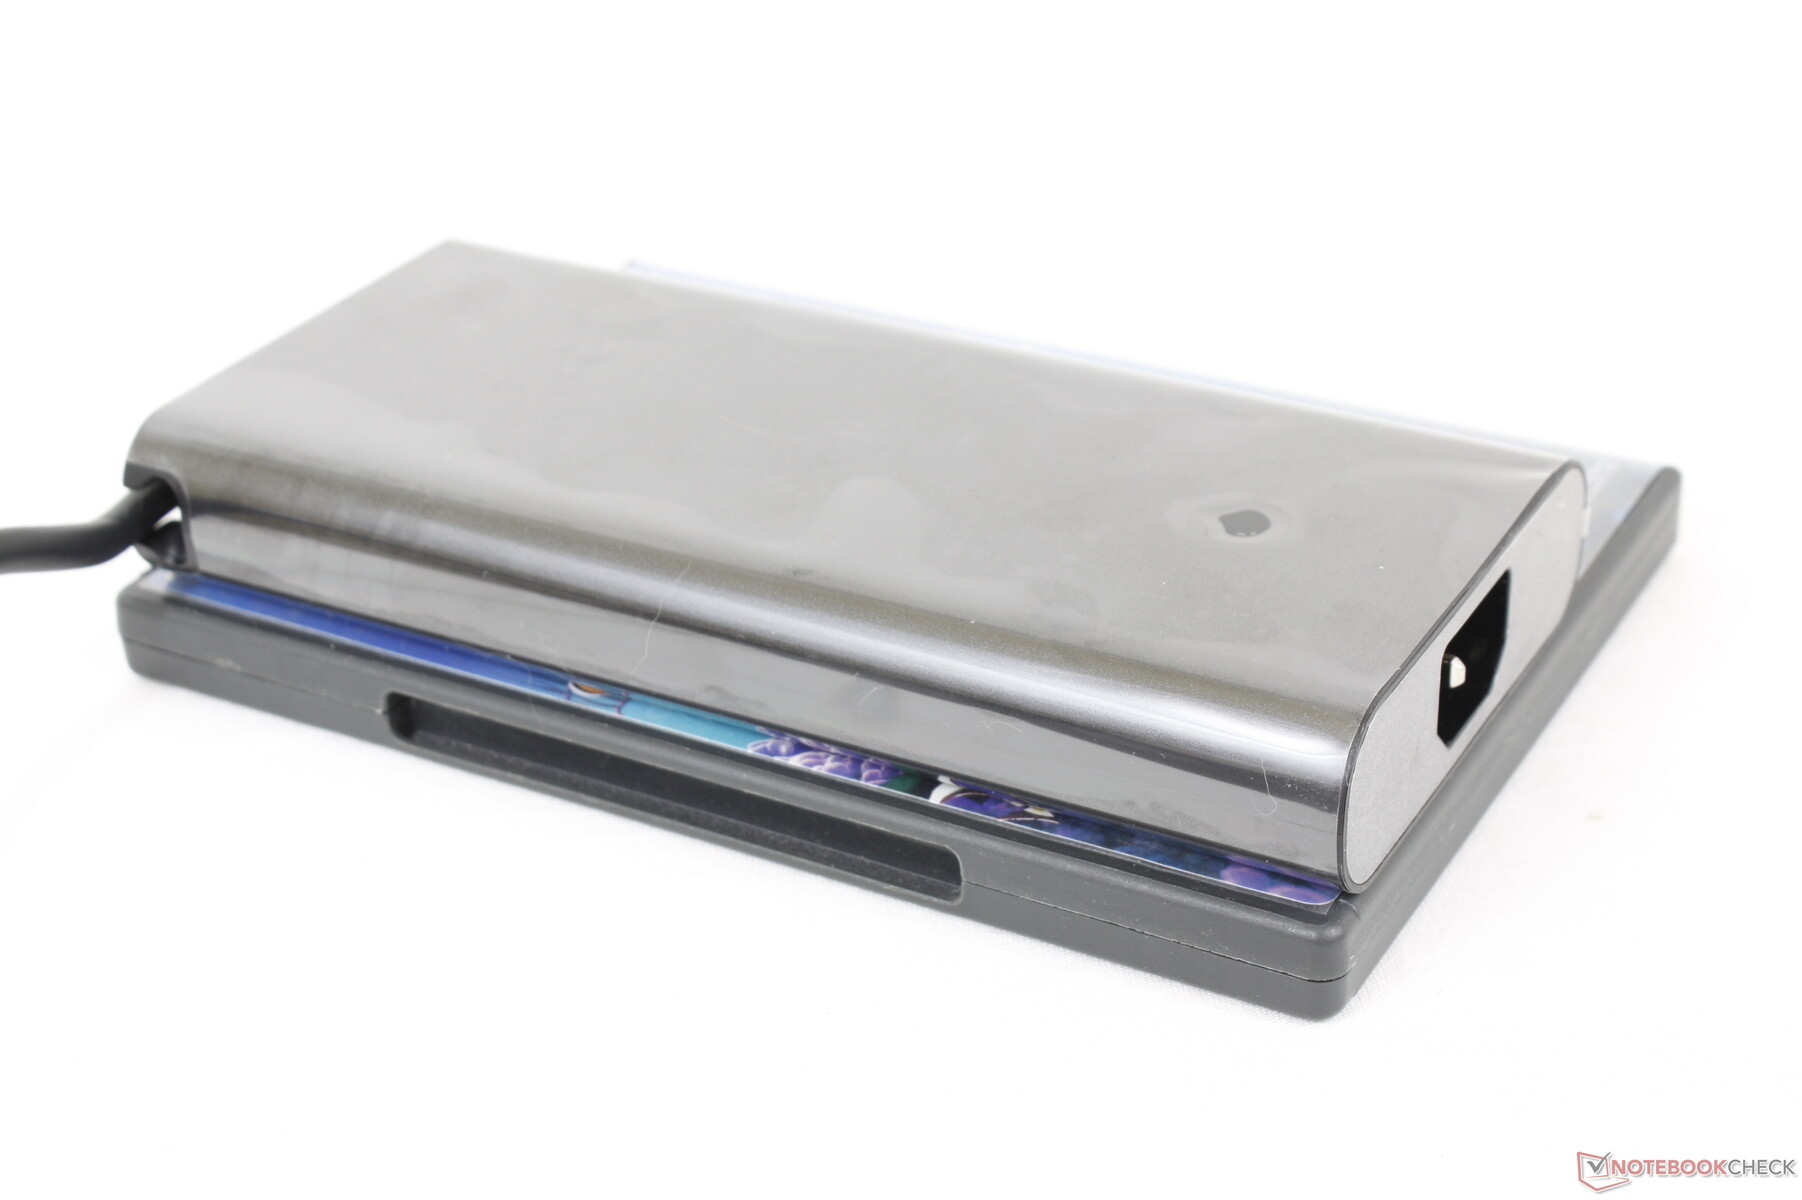
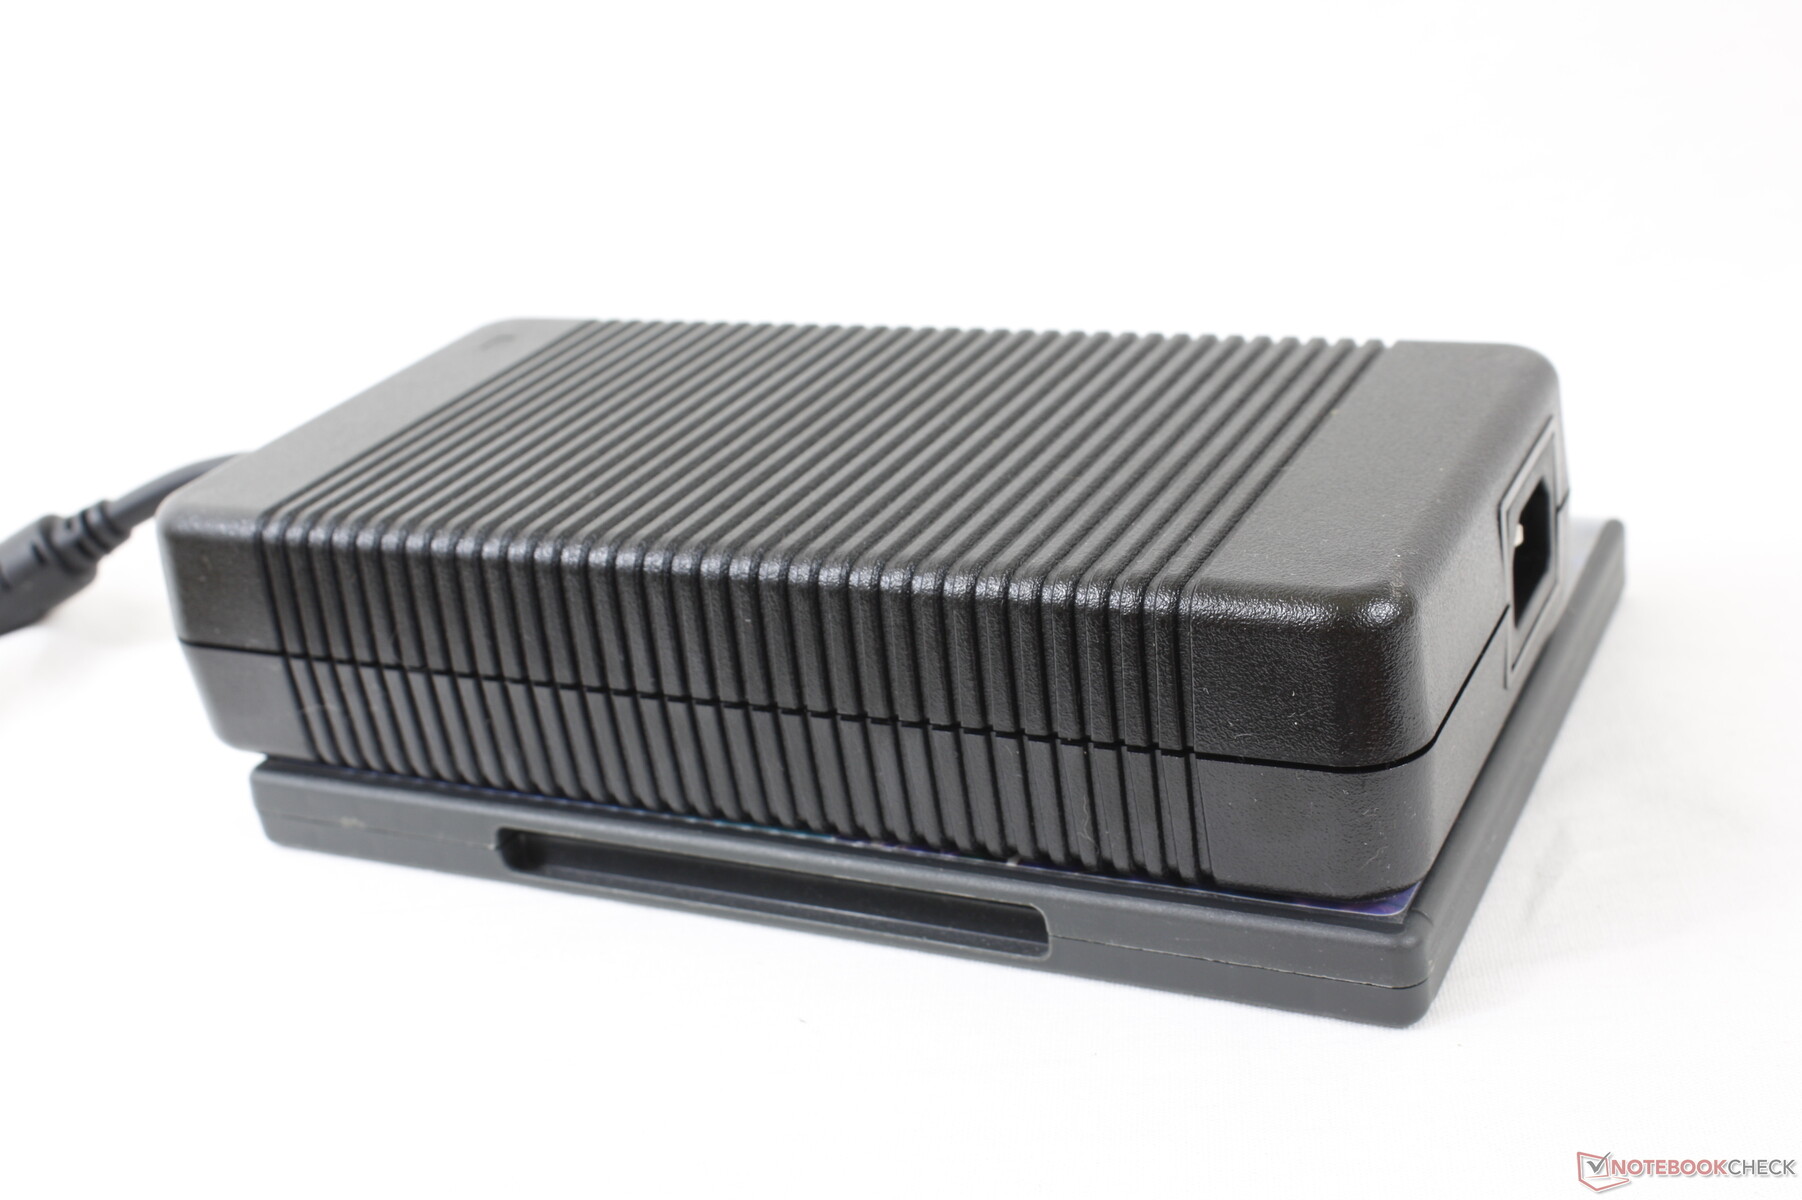
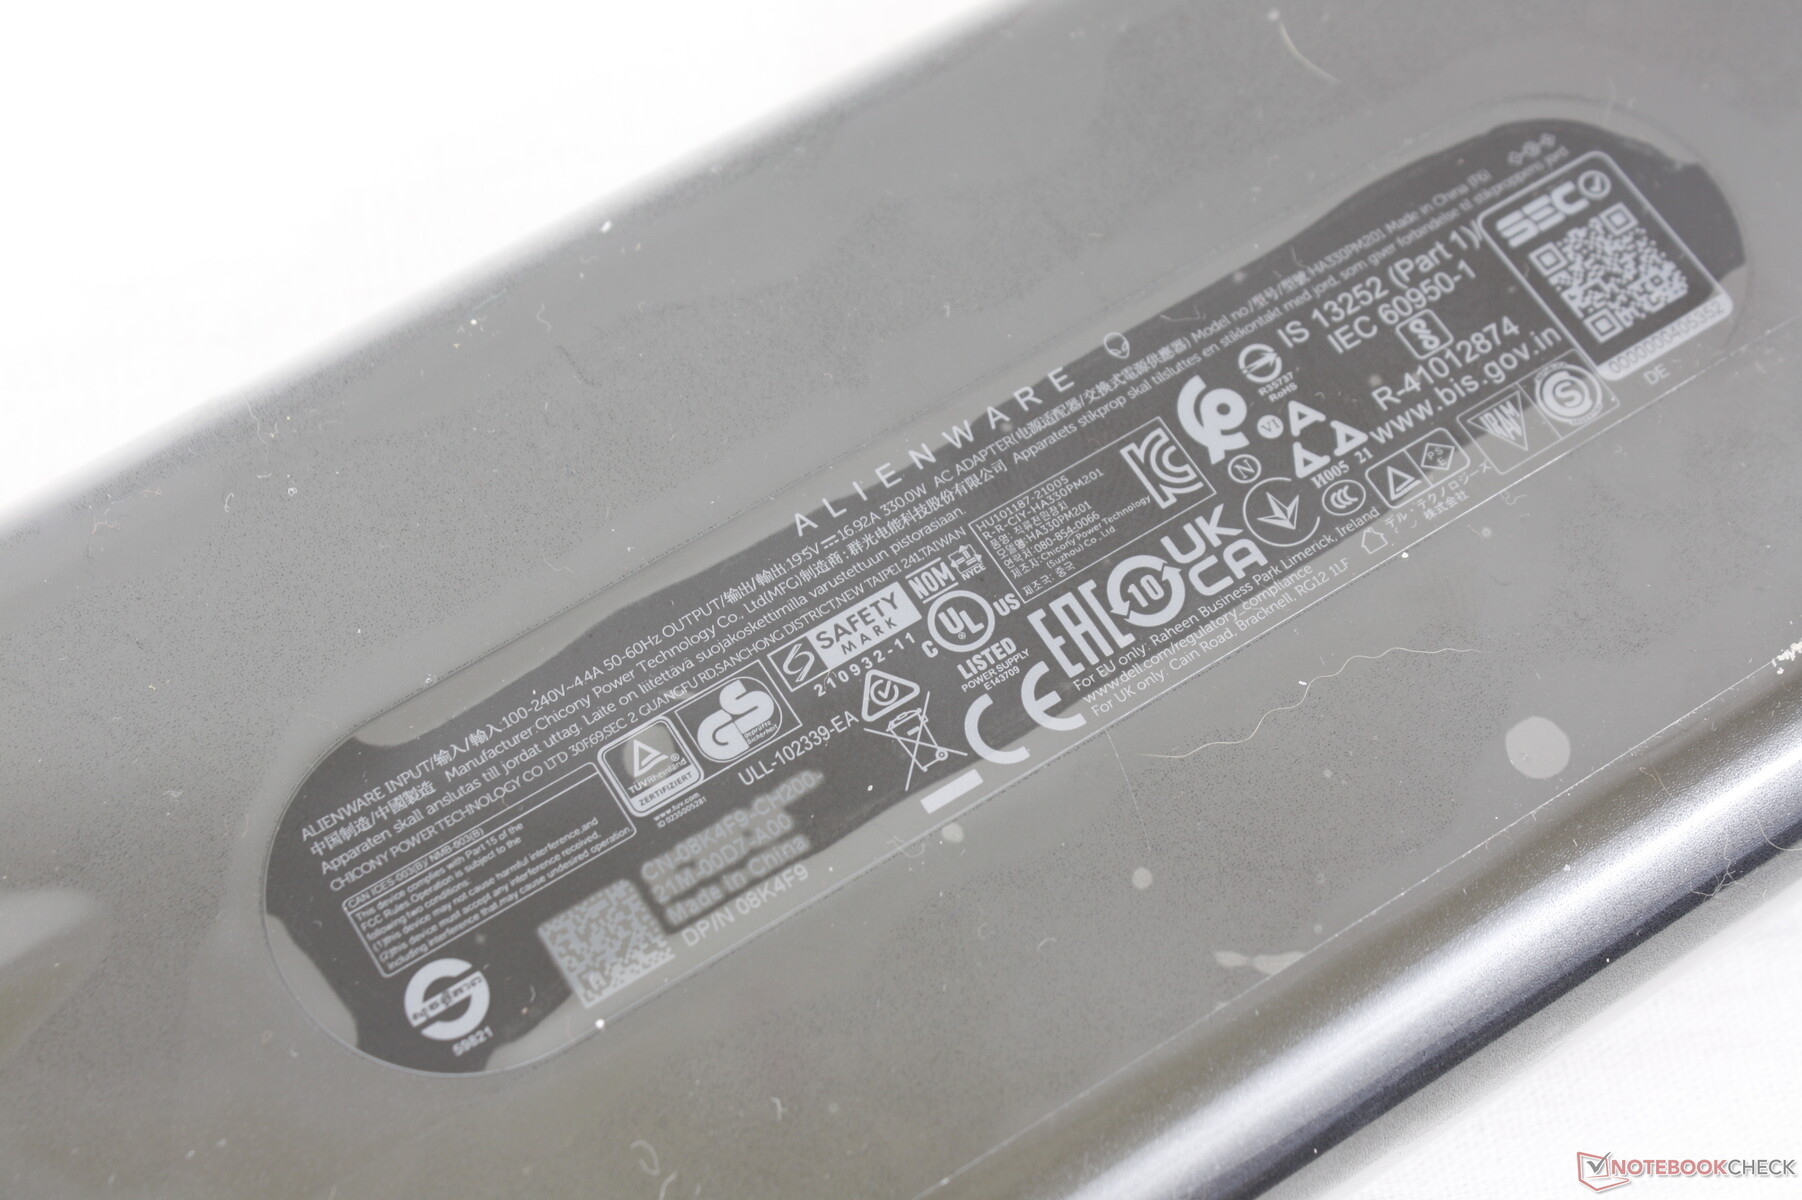
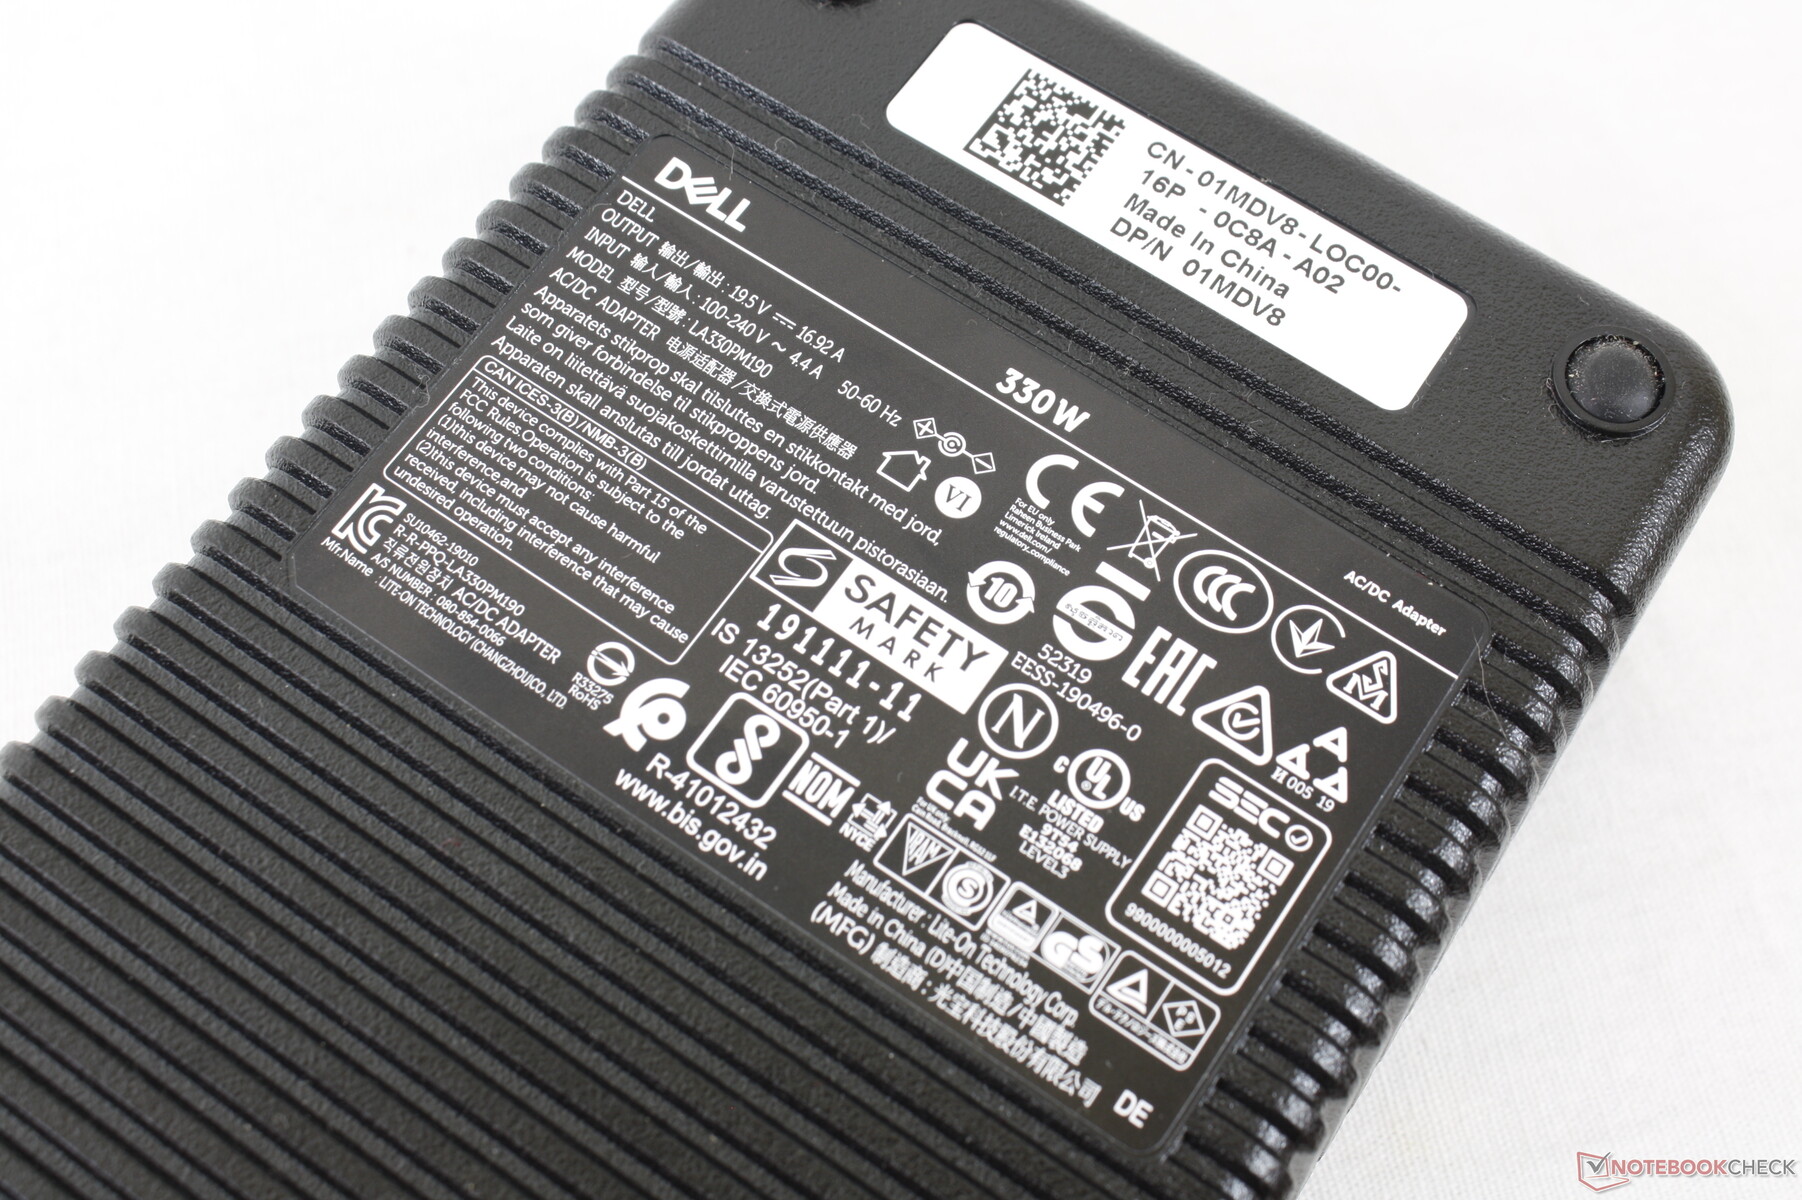
Siamo in grado di registrare un consumo massimo di 323 W dall'adattatore AC da 330 W quando sia la CPU che la GPU sono al 100% di utilizzo. L'adattatore AC è più piccolo questa volta rispetto a quello fornito con il x17 R1 dell'anno scorso (~18.3 x 8.7 x 2.5 cm contro ~20 x 9.9 x 4.3 cm). Si noti che la maggior parte degli altri portatili da gioco vengono spediti con adattatori AC più piccoli, ben al di sotto dei 280 W. Le configurazioni minori dell'Alienware x17 R2 possono venire con adattatori AC ancora più piccoli.
| Off / Standby | |
| Idle | |
| Sotto carico |
|
Leggenda:
min: | |
| Alienware x17 R2 P48E i9-12900HK, GeForce RTX 3080 Ti Laptop GPU, 2x Samsung PM9A1 1TB (RAID 0), IPS, 1920x1080, 17.3" | Alienware x17 RTX 3080 P48E i7-11800H, GeForce RTX 3080 Laptop GPU, 2x WDC PC SN730 SDBPNTY-1T00 (RAID 0), IPS, 3840x2160, 17.3" | Asus ROG Zephyrus S17 GX703HSD i9-11900H, GeForce RTX 3080 Laptop GPU, Samsung PM9A1 MZVL22T0HBLB, IPS, 2560x1440, 17.3" | MSI Stealth GS77 12UHS-083US i7-12700H, GeForce RTX 3080 Ti Laptop GPU, Micron 3400 1TB MTFDKBA1T0TFH, IPS, 2560x1440, 17.3" | MSI GT76 Titan DT 10SGS i9-10900K, GeForce RTX 2080 Super Mobile, 2x WDC PC SN730 SDBPNTY-1T00 (RAID 0), IPS, 3840x2160, 17.3" | Gigabyte A7 X1 R9 5900HX, GeForce RTX 3070 Laptop GPU, ESR512GTLCG-EAC-4, IPS, 1920x1080, 17.3" | |
|---|---|---|---|---|---|---|
| Power Consumption | 22% | 22% | 30% | -15% | 38% | |
| Idle Minimum * (Watt) | 24.1 | 10.2 58% | 21.7 10% | 20 17% | 25.9 -7% | 12 50% |
| Idle Average * (Watt) | 28.5 | 21.2 26% | 27 5% | 21.4 25% | 38 -33% | 14 51% |
| Idle Maximum * (Watt) | 60 | 48.4 19% | 33 45% | 27 55% | 53.2 11% | 19 68% |
| Load Average * (Watt) | 128.7 | 118.7 8% | 108 16% | 100.5 22% | 123.8 4% | 118 8% |
| Witcher 3 ultra * (Watt) | 254 | 249 2% | 195 23% | 165 35% | 312.5 -23% | 205 19% |
| Load Maximum * (Watt) | 323 | 262 19% | 210 35% | 247.1 23% | 459.8 -42% | 229 29% |
* ... Meglio usare valori piccoli
Power Consumption Witcher 3 / Stresstest
Power Consumption external Monitor
Durata della batteria
I tempi di funzionamento della batteria sono tra i peggiori che abbiamo visto su qualsiasi portatile da gioco. Anche inattivo sul desktop con l'impostazione di luminosità più bassa, il profilo energetico più basso e la grafica Optimus attiva durerà solo poco meno di 4 ore. Aspettatevi solo 2 ore di navigazione WLAN nel mondo reale rispetto alle oltre 7 ore dell'Asus ROG Zephyrus S17.
La ricarica da vuoto a piena capacità richiede circa 100 minuti. Gli utenti possono anche ricaricare con adattatori USB-C di terze parti.
| Alienware x17 R2 P48E i9-12900HK, GeForce RTX 3080 Ti Laptop GPU, 87 Wh | Alienware x17 RTX 3080 P48E i7-11800H, GeForce RTX 3080 Laptop GPU, 87 Wh | Asus ROG Zephyrus S17 GX703HSD i9-11900H, GeForce RTX 3080 Laptop GPU, 90 Wh | MSI Stealth GS77 12UHS-083US i7-12700H, GeForce RTX 3080 Ti Laptop GPU, 99 Wh | MSI GT76 Titan DT 10SGS i9-10900K, GeForce RTX 2080 Super Mobile, 90 Wh | Gigabyte A7 X1 R9 5900HX, GeForce RTX 3070 Laptop GPU, 48.96 Wh | |
|---|---|---|---|---|---|---|
| Autonomia della batteria | 91% | 257% | 154% | 20% | 93% | |
| Reader / Idle (h) | 3.9 | 7 79% | 10.8 177% | |||
| WiFi v1.3 (h) | 2 | 5.9 195% | 7.5 275% | 6.2 210% | 2.4 20% | 4.7 135% |
| Load (h) | 0.8 | 0.8 0% | 2.7 238% | 1.4 75% | 1.2 50% | |
| H.264 (h) | 7.2 | |||||
| Witcher 3 ultra (h) | 1 |
Pro
Contro
Verdetto - TGP più alto significa prestazioni più elevate
Quando Nvidia ha annunciato la GeForce RTX 3080 Ti per i computer portatili, siamo rimasti delusi nello scoprire che alcuni modelli avrebbero puntato a valutazioni TGP molto basse, solo circa 100 W. Mentre un tale approccio avrebbe permesso di realizzare design super-sottili, ha anche sacrificato le prestazioni lungo la strada, in quanto la GPU sarebbe stata effettivamente underclockata. L'Alienware x17 R2 riconosce questo compromesso e punta invece a un TGP significativamente più alto di 175 W per un aumento delle prestazioni di circa il 30 per cento rispetto ai portatili che girano con il ~100 W GeForce RTX 3080 Ti come il Razer Blade 15 o Gigabyte Aero YE5. Risultati simili possono essere trovati anche attraverso la CPU. Questo singolo aspetto dell'Alienware è forse il più grande fattore di differenziazione tra esso e altri portatili da gioco ultrasottili.
Naturalmente, l'approccio "prestazioni a tutti i costi" ha degli svantaggi. Il consumo di energia, in particolare, è alle stelle e la durata della batteria ne risente, anche quando le prestazioni sono al minimo. Il sistema è anche notevolmente più pesante e più grande, rispettivamente, di altri portatili da gioco ultrasottili anche se lo chassis è ancora considerato ultrasottile. Anche il posizionamento delle porte richiede un po' di tempo per abituarsi.
se volete massimizzare le prestazioni senza accontentarvi di enormi portatili da gioco come la Serie MSI GT, Asus ROG serie Chimerao il Alienware Area-51m serie, allora l'Alienware x17 R2 e la sua tastiera meccanica sorprendentemente soddisfacente sono da considerare.
Prezzo e disponibilità
L'Alienware x17 R2 è ora in spedizione su Amazon in più SKU anche se nessuna è la nostra esatta configurazione. In alternativa, gli utenti possono acquistare direttamente da Dell.
Alienware x17 R2 P48E
- 05/11/2022 v7 (old)
Allen Ngo
Price comparison

