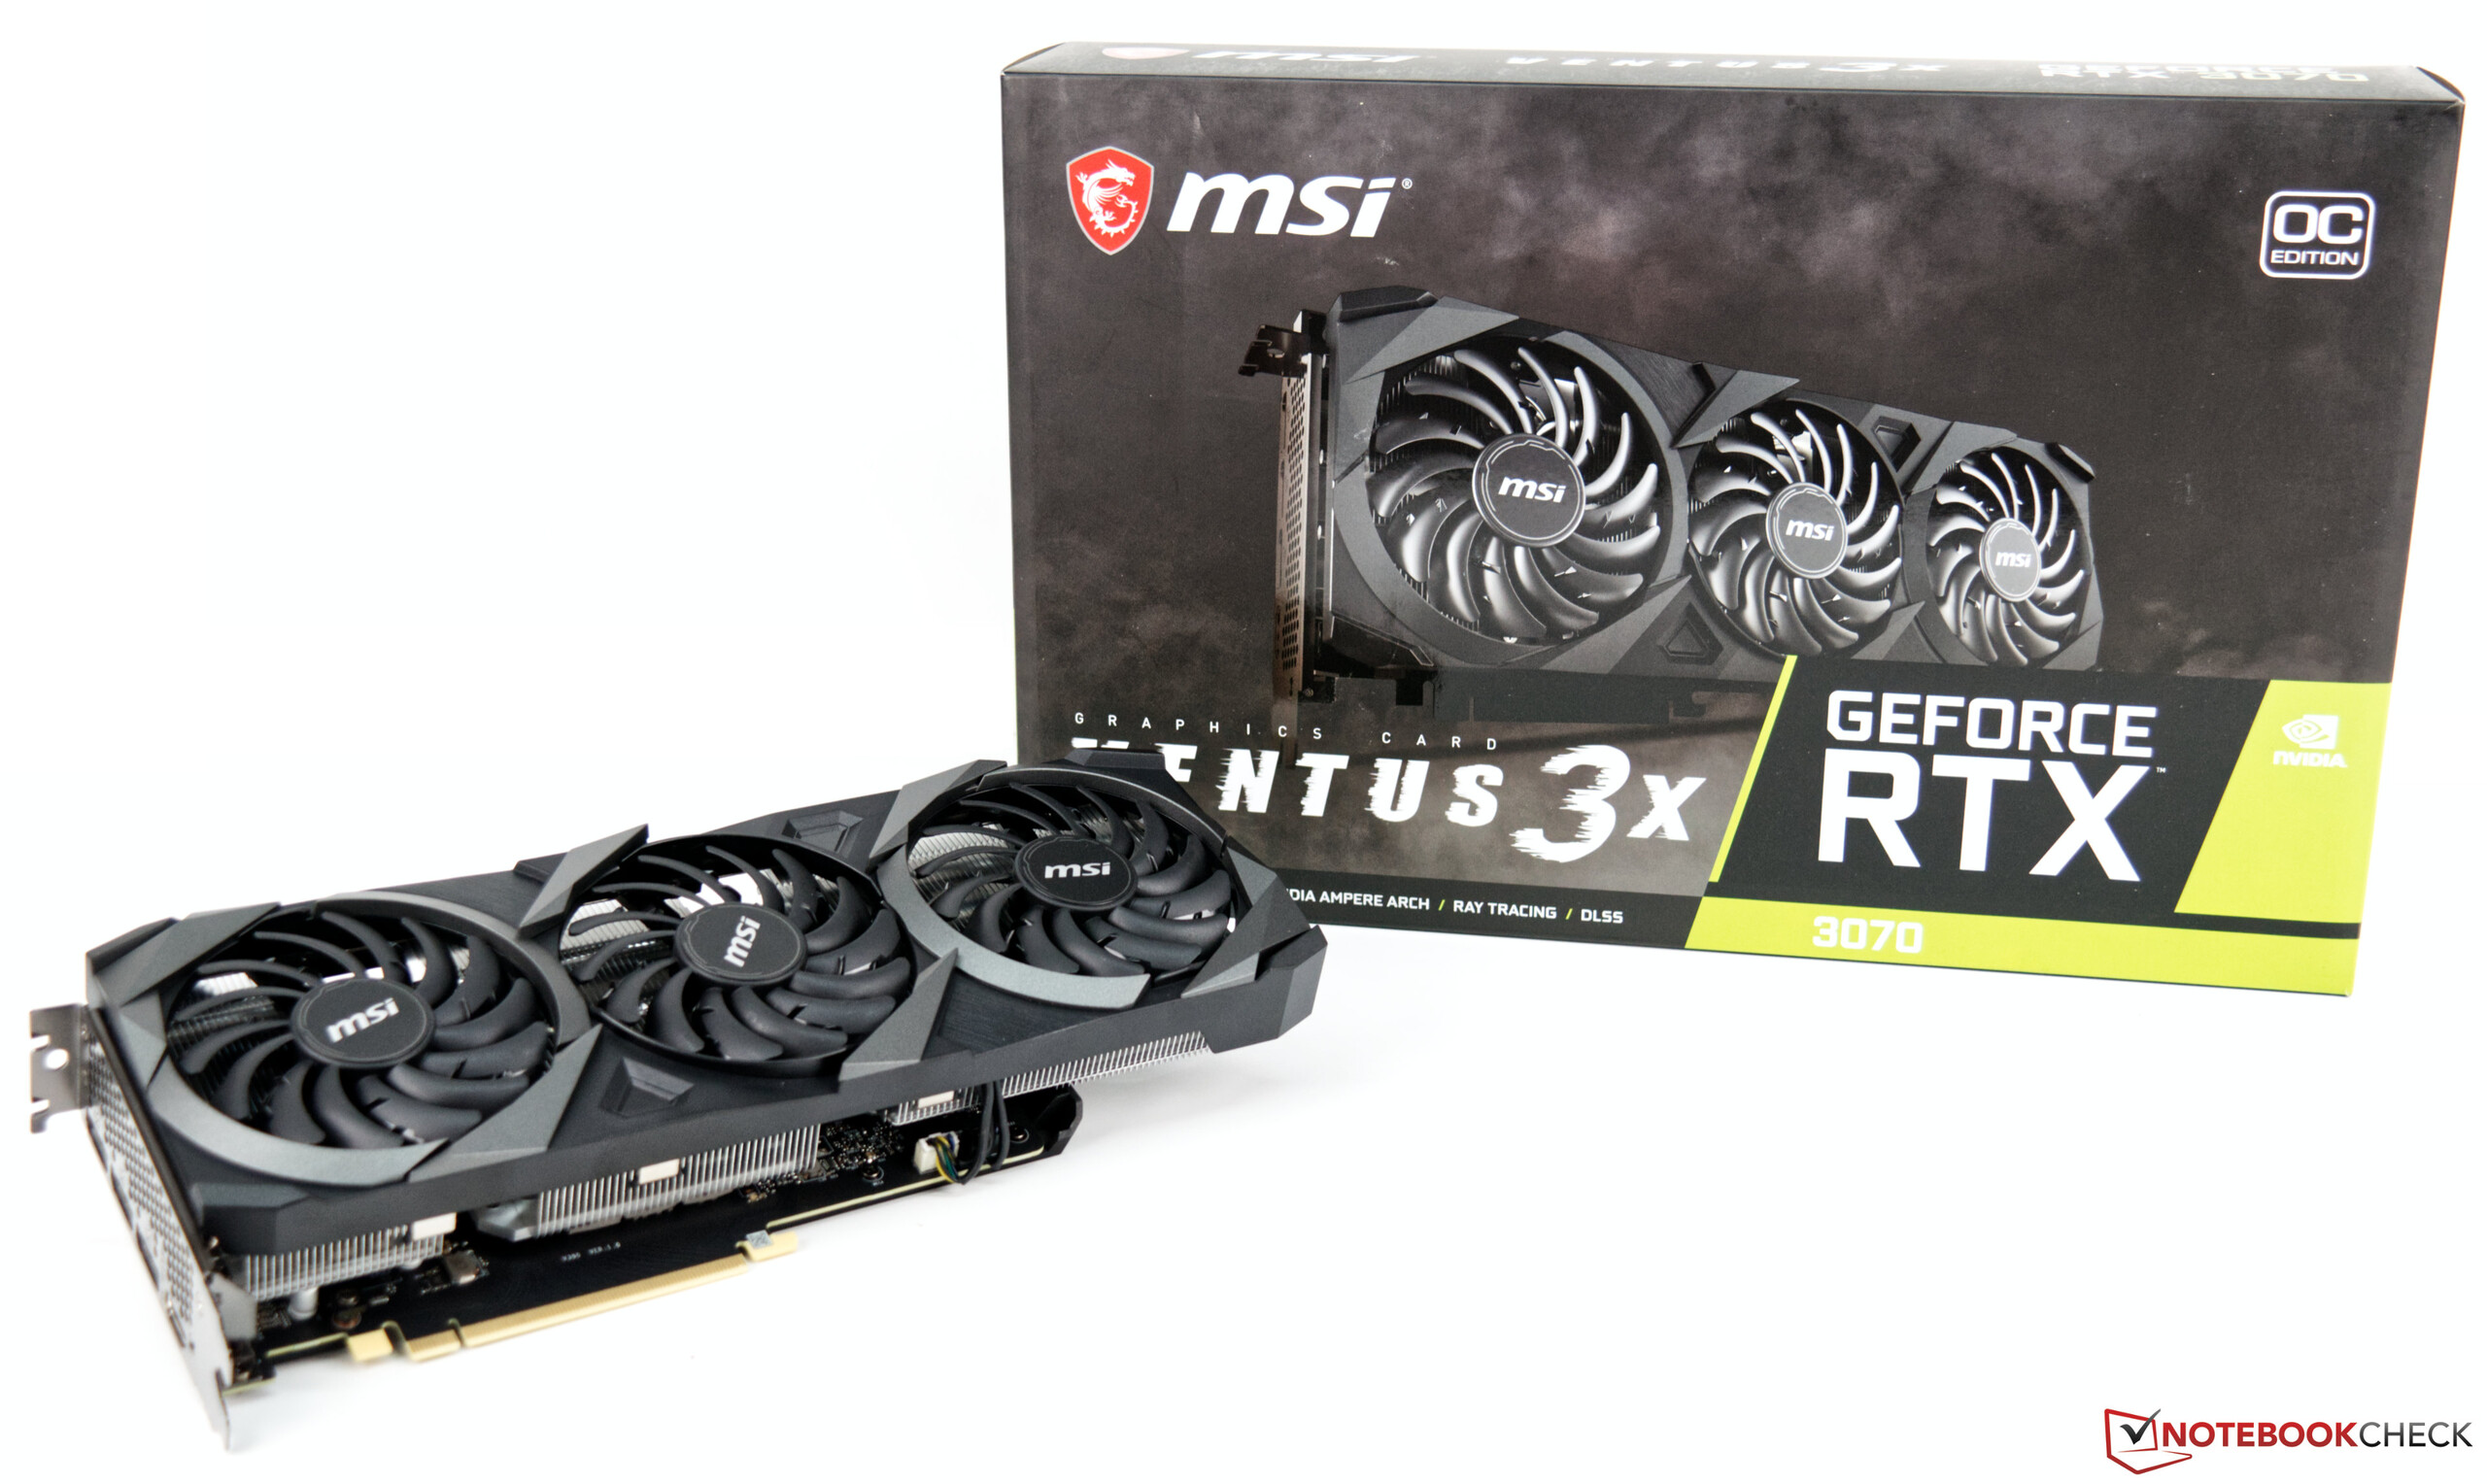
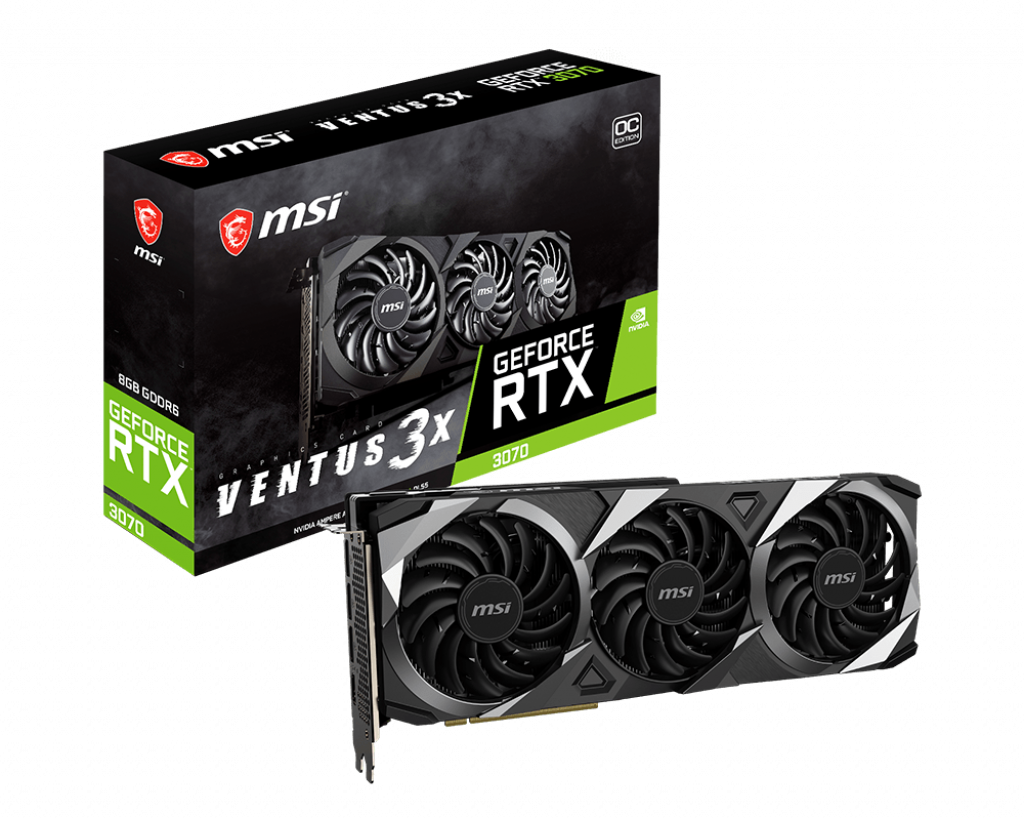
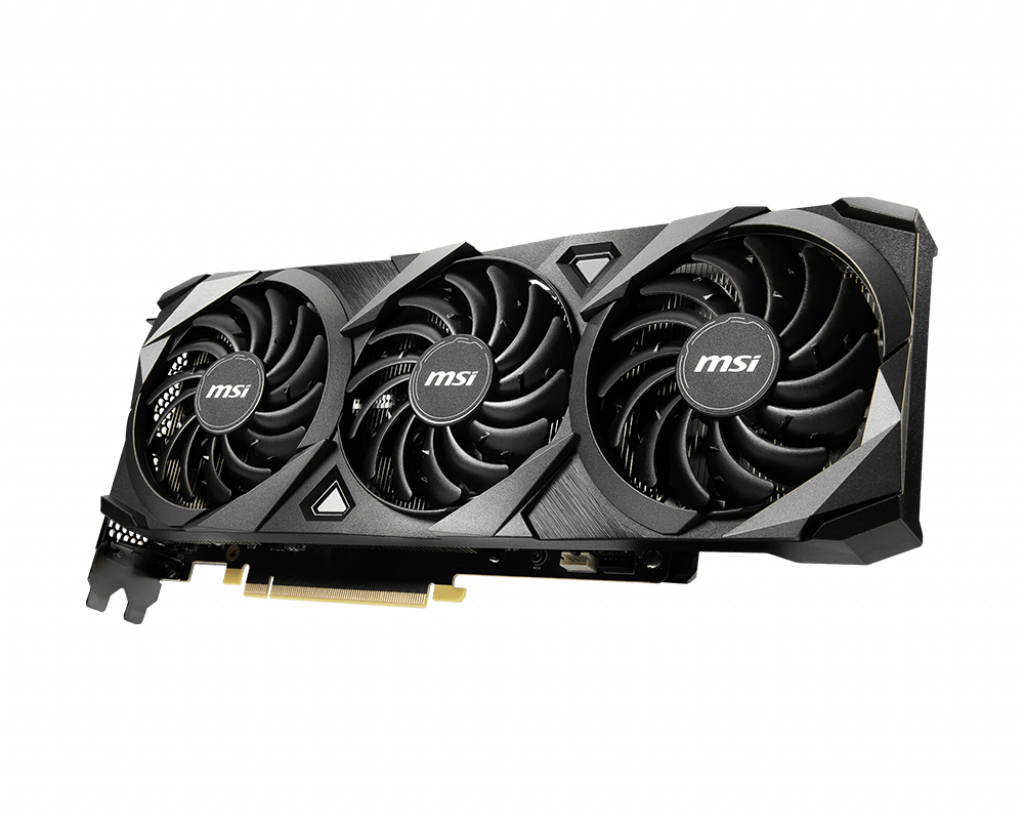
Recensione della scheda grafica desktop MSI GeForce RTX 3070 Ventus 3X OC

Abbiamo già testato le nuove schede grafiche RTX 3000. Tuttavia, con l'MSI GeForce RTX 3070 Ventus 3X OC, abbiamo testato un rappresentante relativamente economico della nuova serie Ampere. Con un prezzo di soli 529 Euro (~$642), il modello personalizzato non è molto più costoso del modello di riferimento di Nvidia (499 Euros/~$606). Tuttavia, la situazione tesa del mercato garantisce ancora una disponibilità molto bassa e quindi anche il prezzo d'acquisto è estremamente elevato, tanto che al momento del test vengono richiesti prezzi a partire da 800 Euro (~$971) per modelli stock. Questa è una situazione molto frustrante se attualmente si vuole acquistare un nuovo sistema di gioco per giocare a nuovi blockbuster come il Cyberpunk 2077.
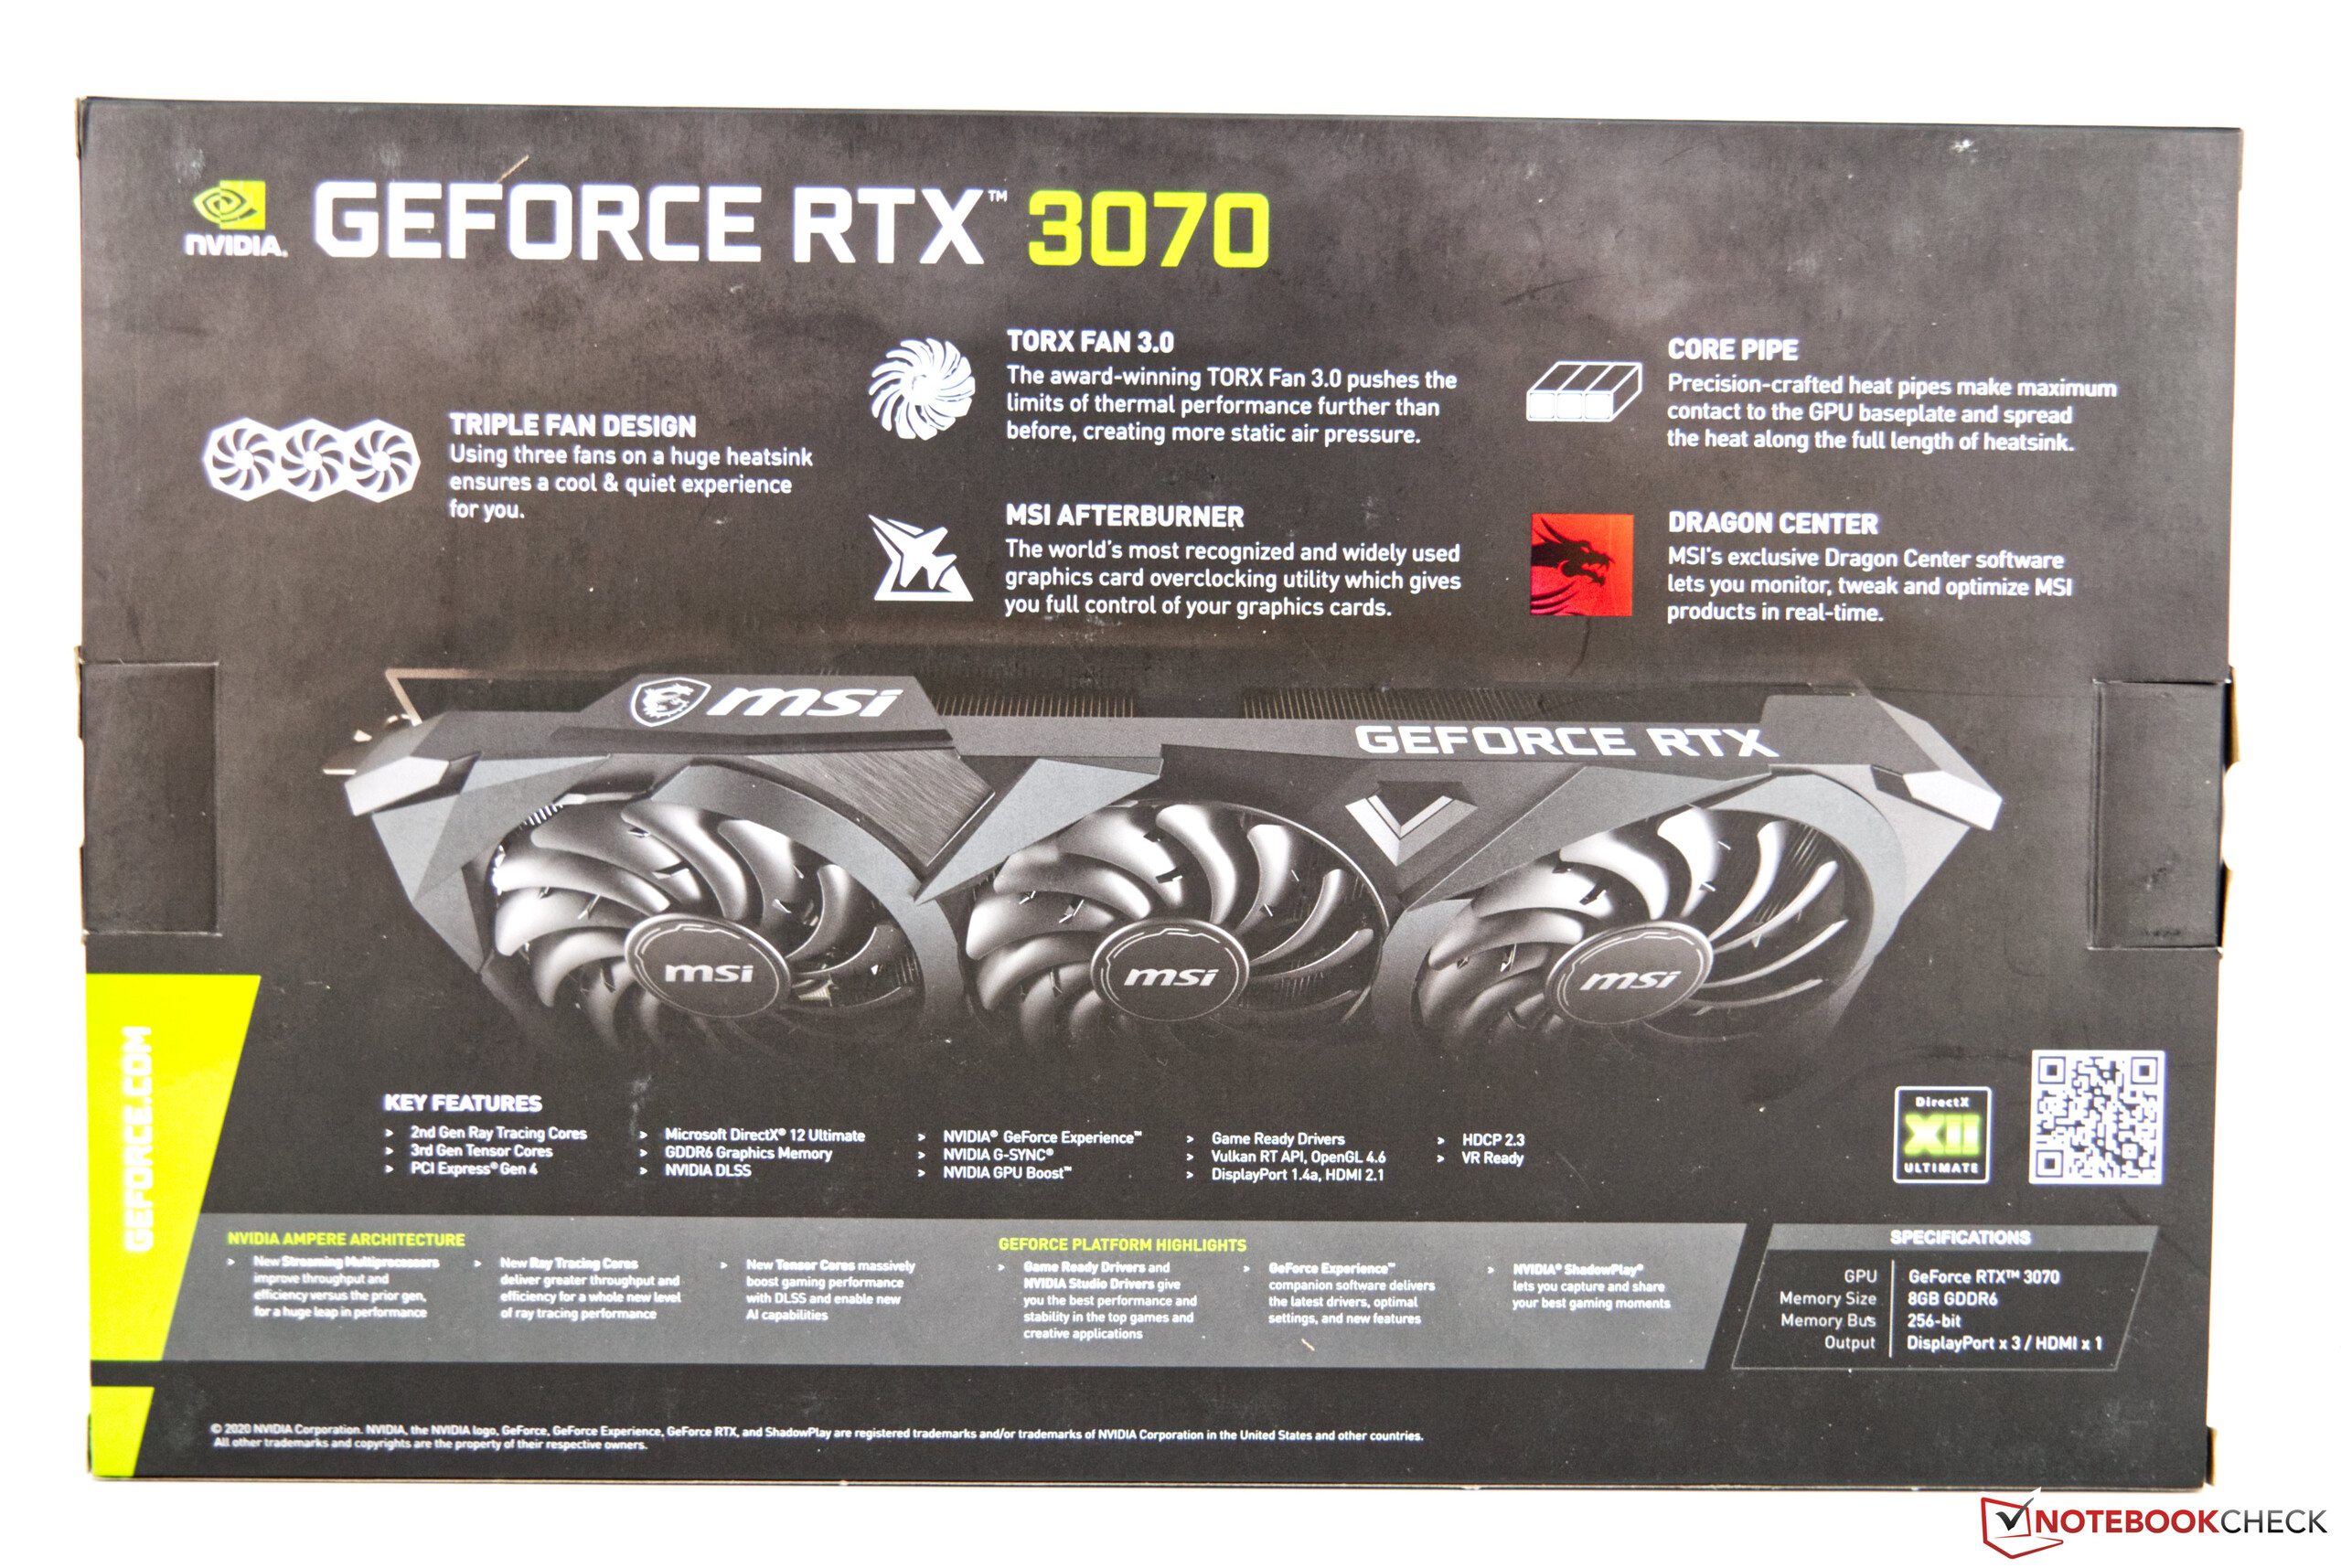
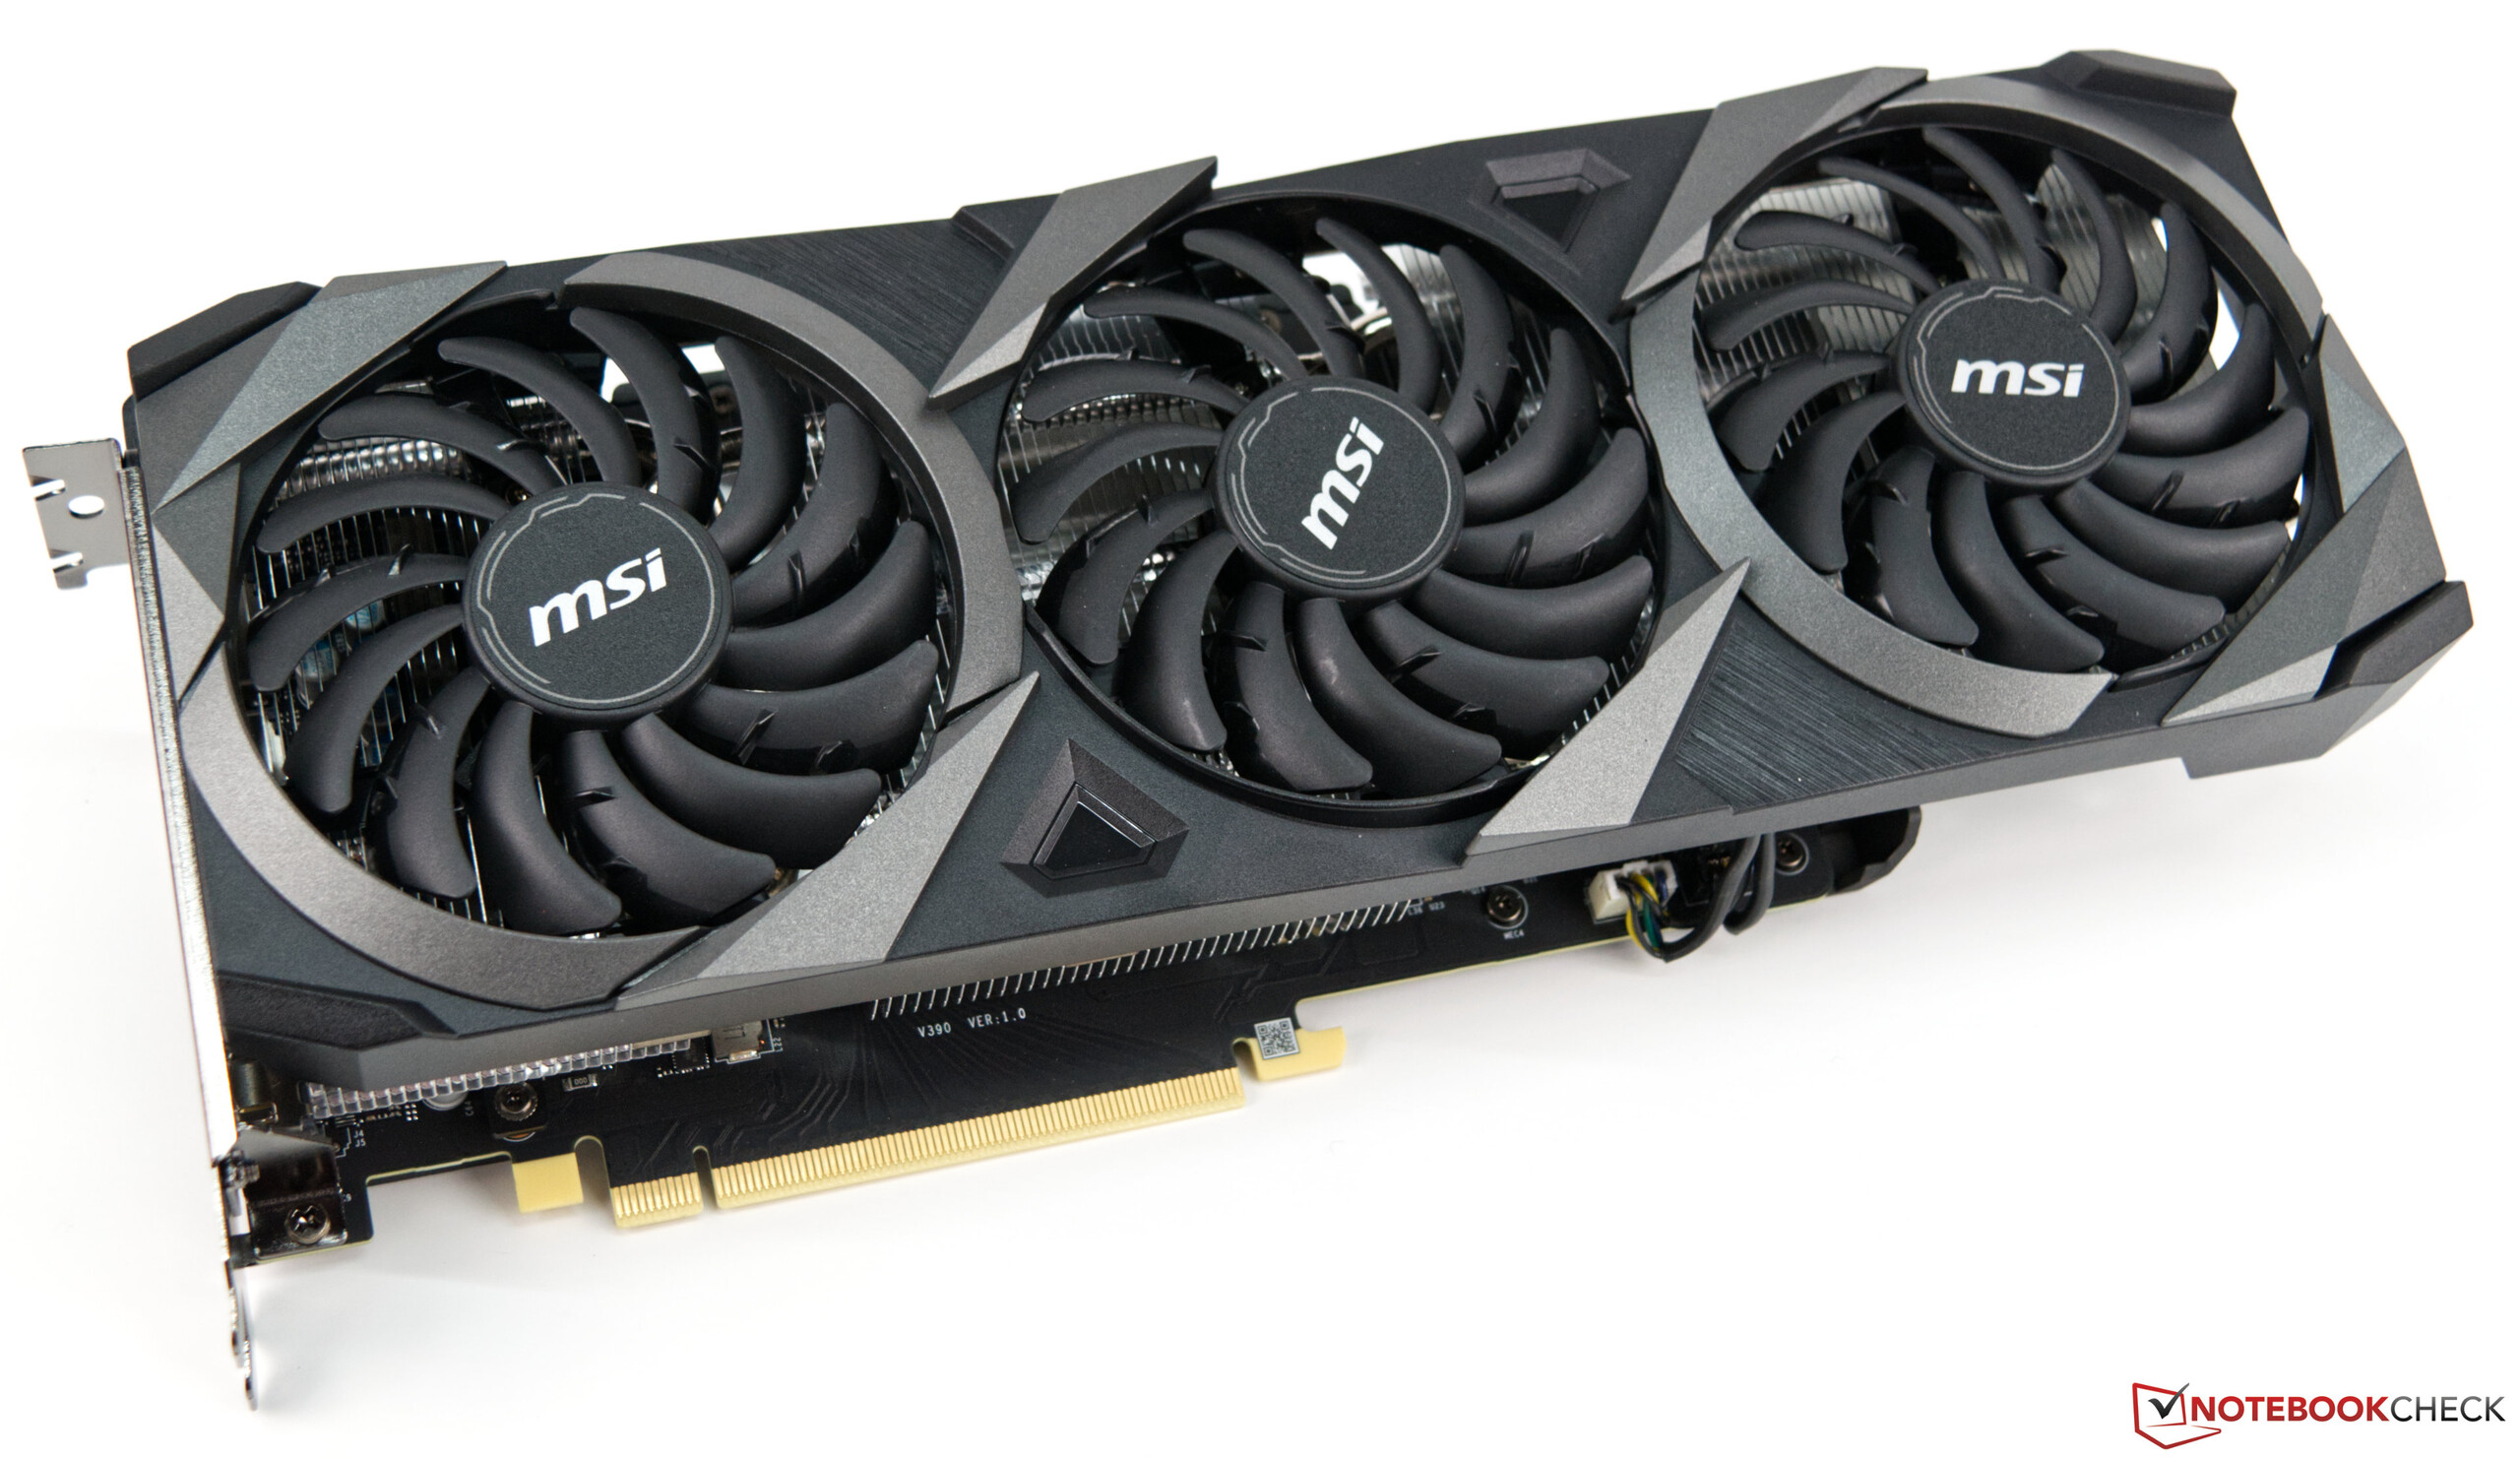
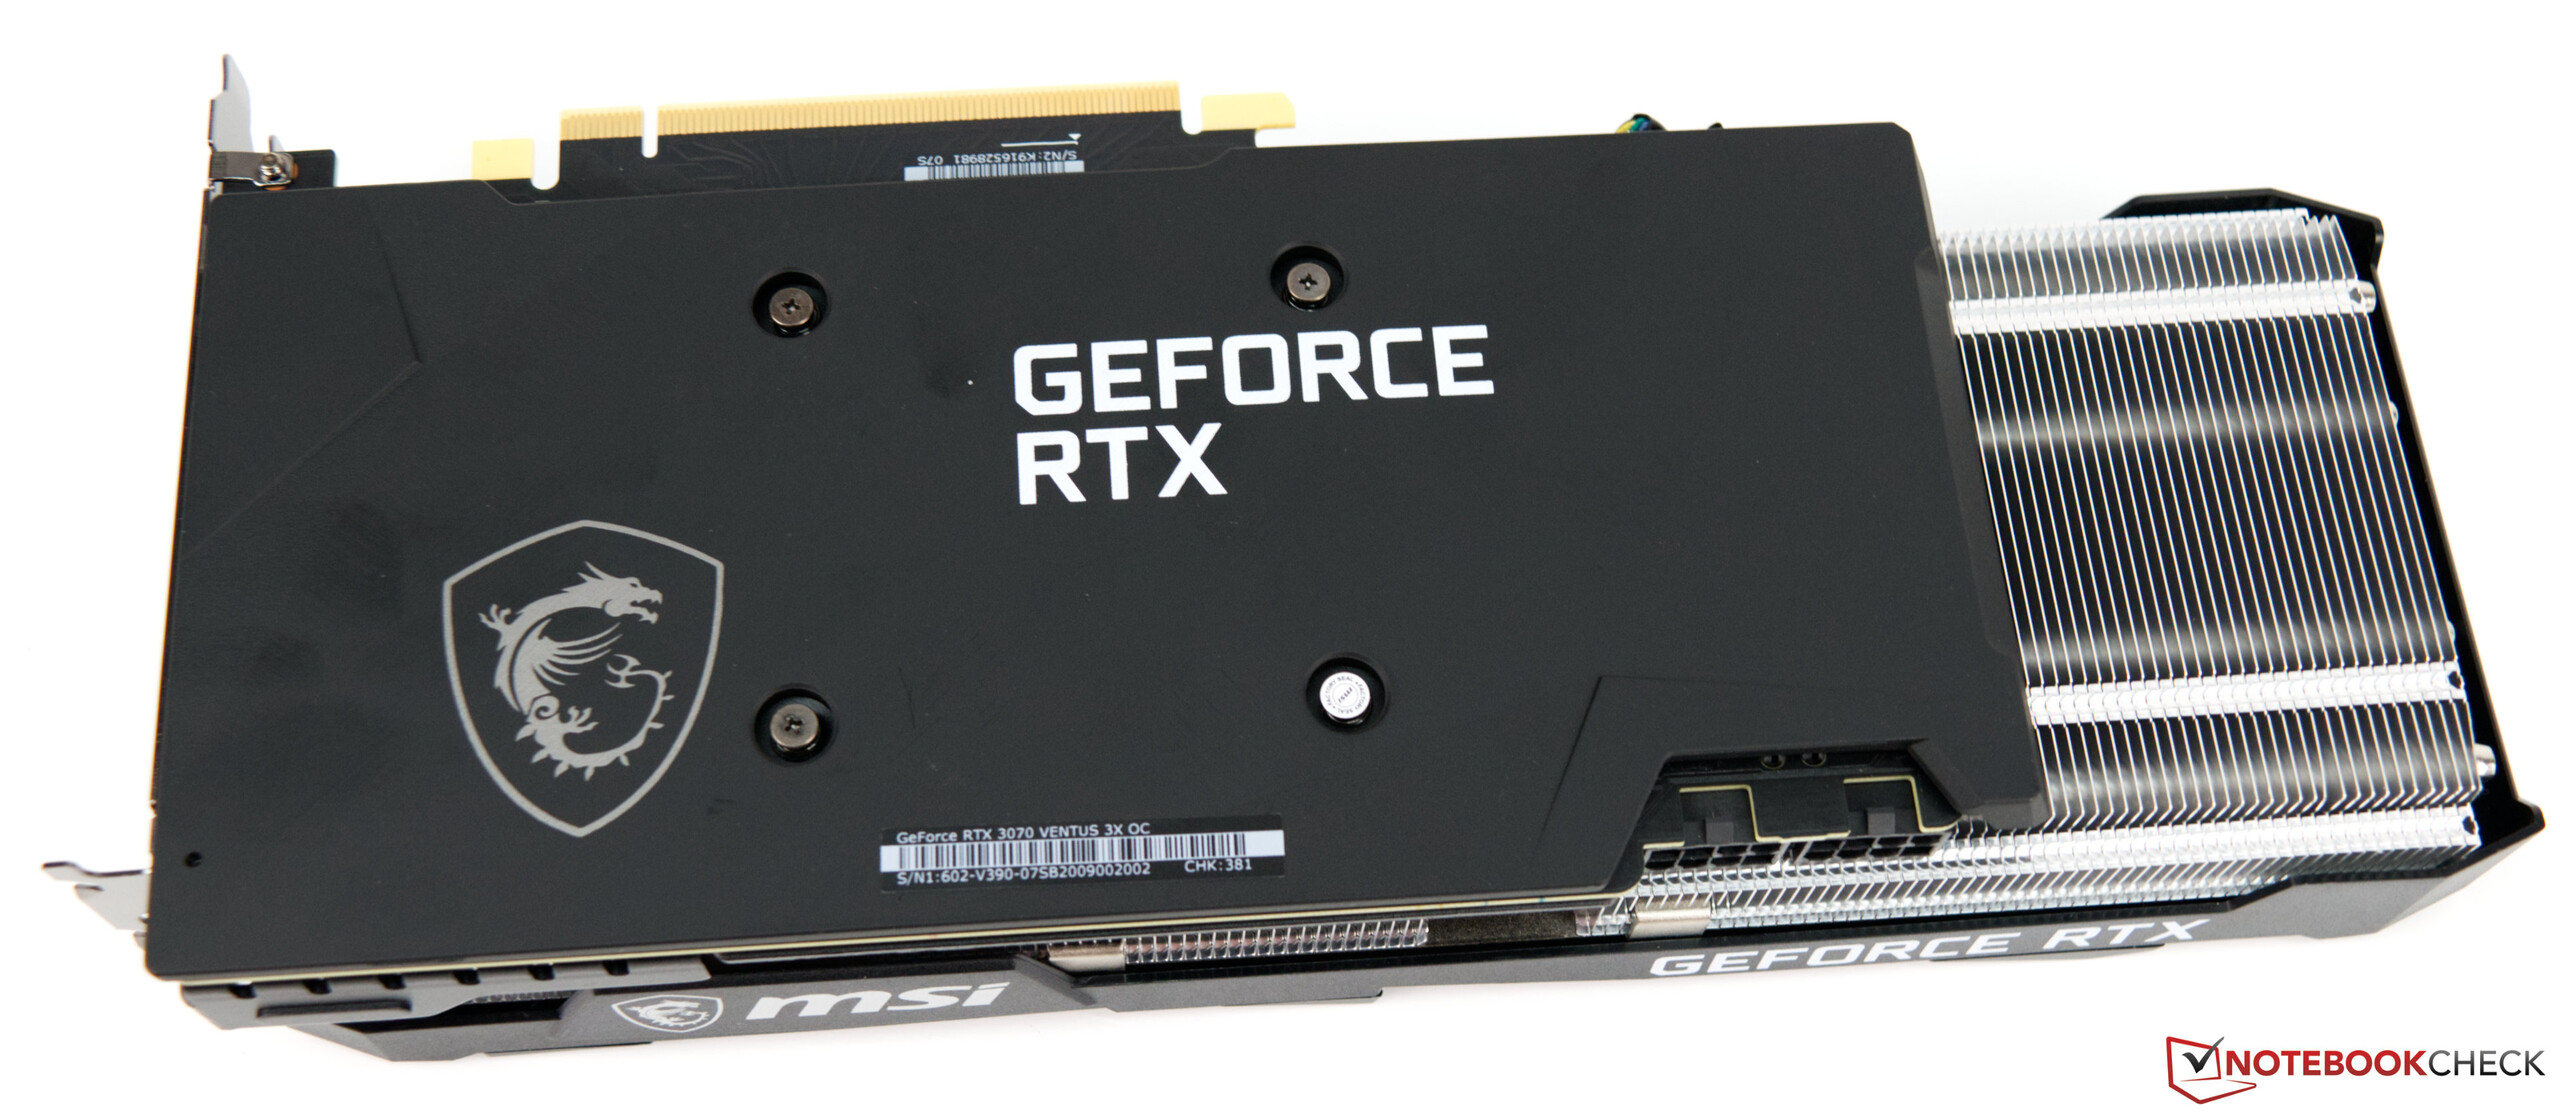
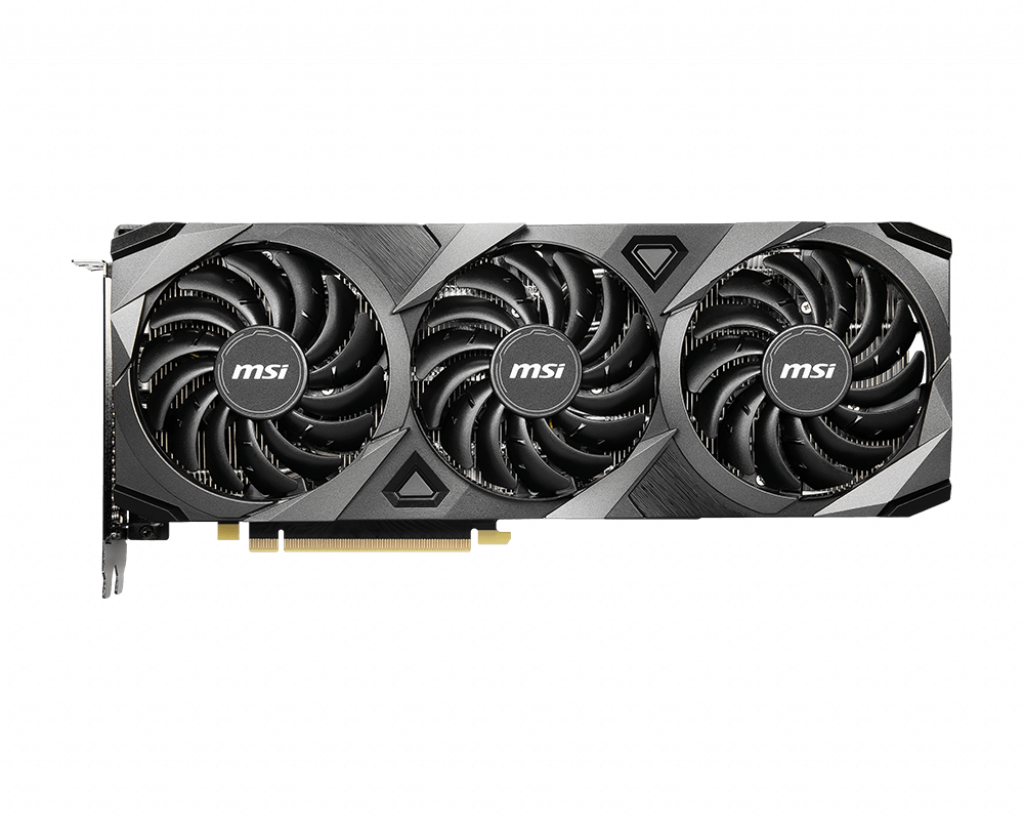
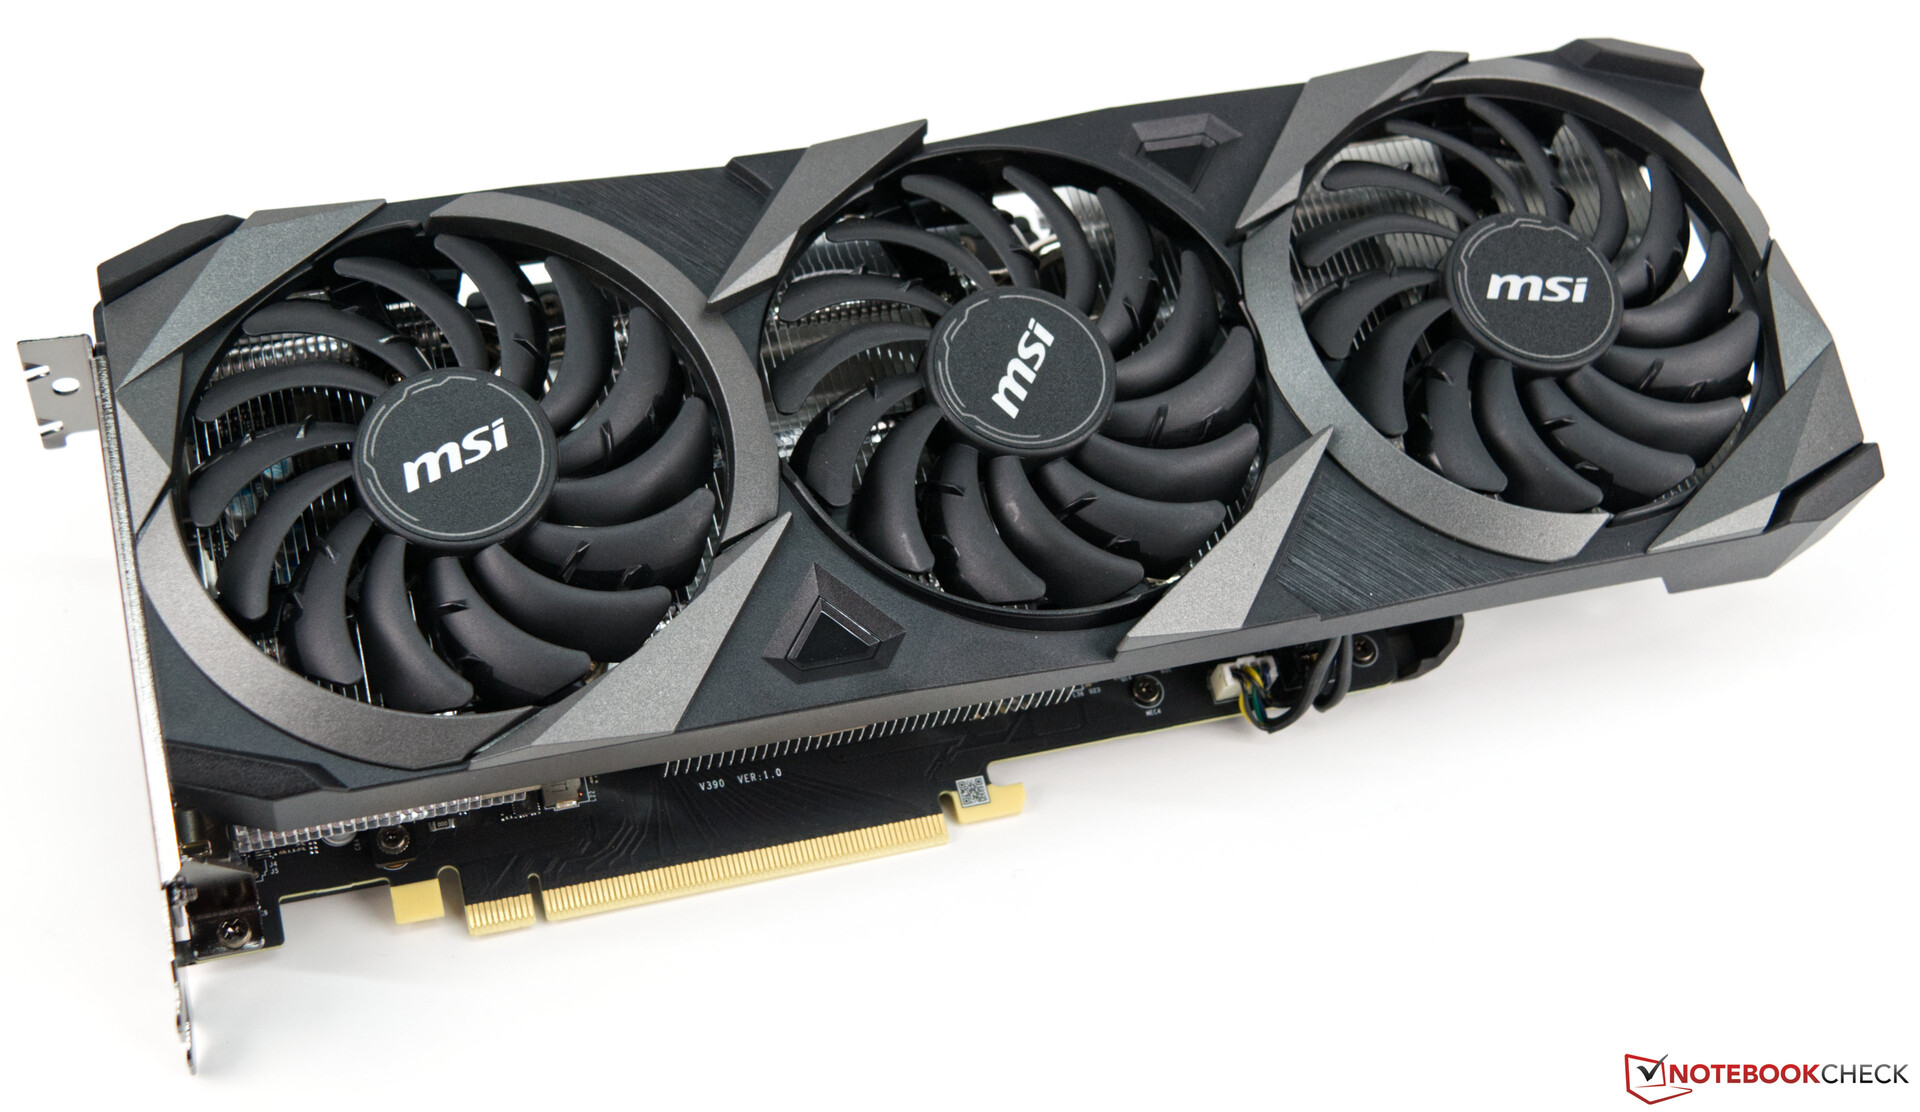
Fortunatamente, la scarsa disponibilità non influisce sulle prestazioni e il modello di MSI è stato abbastanza convincente nel test. E chi può fare a meno di tutte gli effetti luminosi RGB dovrebbe dare un'occhiata più da vicino alla serie Ventus 3X. L'MSI GeForce RTX 3070 Ventus 3X OC ha un grande dissipatore con tre ventole assiali, ma stanno completamente fermi in modalità 2D e a basso carico e quindi non causano alcuna rumorosità. Ma anche sotto carico, questa scheda grafica non diventa mai rumorosa. Il modello può utilizzare un massimo di 220 watt, che è esattamente lo stesso dell'edizione Founders. Il modello della gamma Gaming X Trio che abbiamo pure testato recentemente è stato equipaggiato con un BIOS da 240 watt. Arriveremo a ciò che questo significa, in ultima analisi, per le prestazioni più avanti nella recensione.
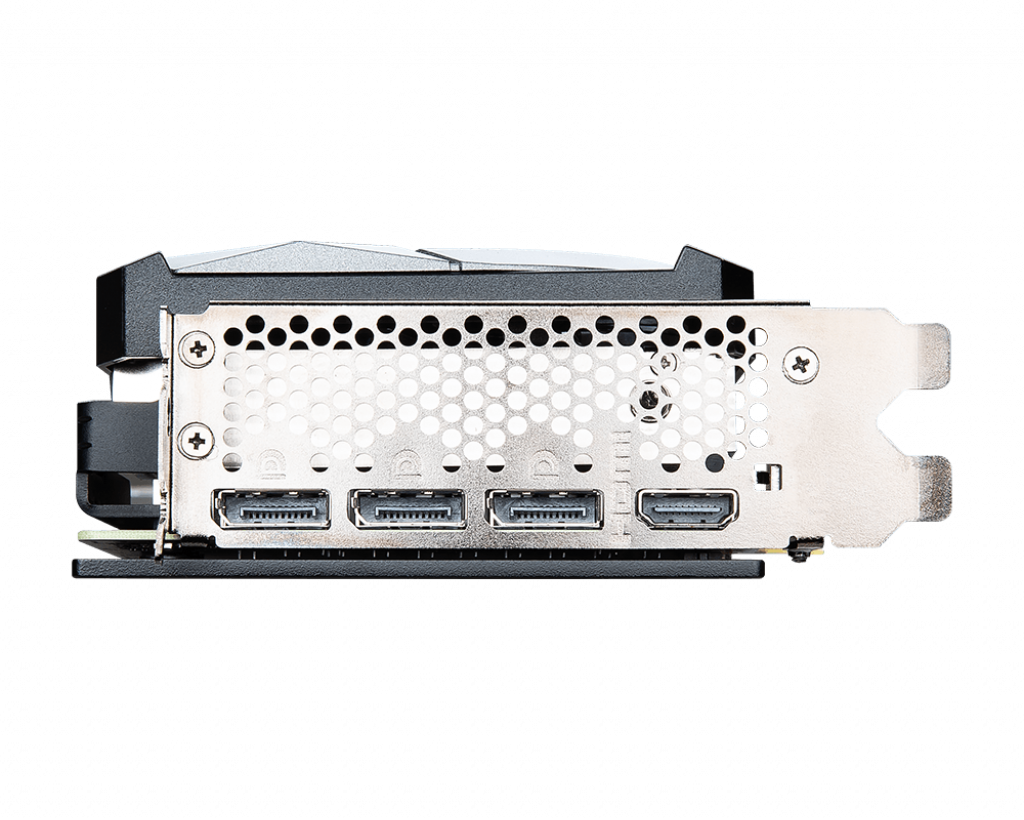
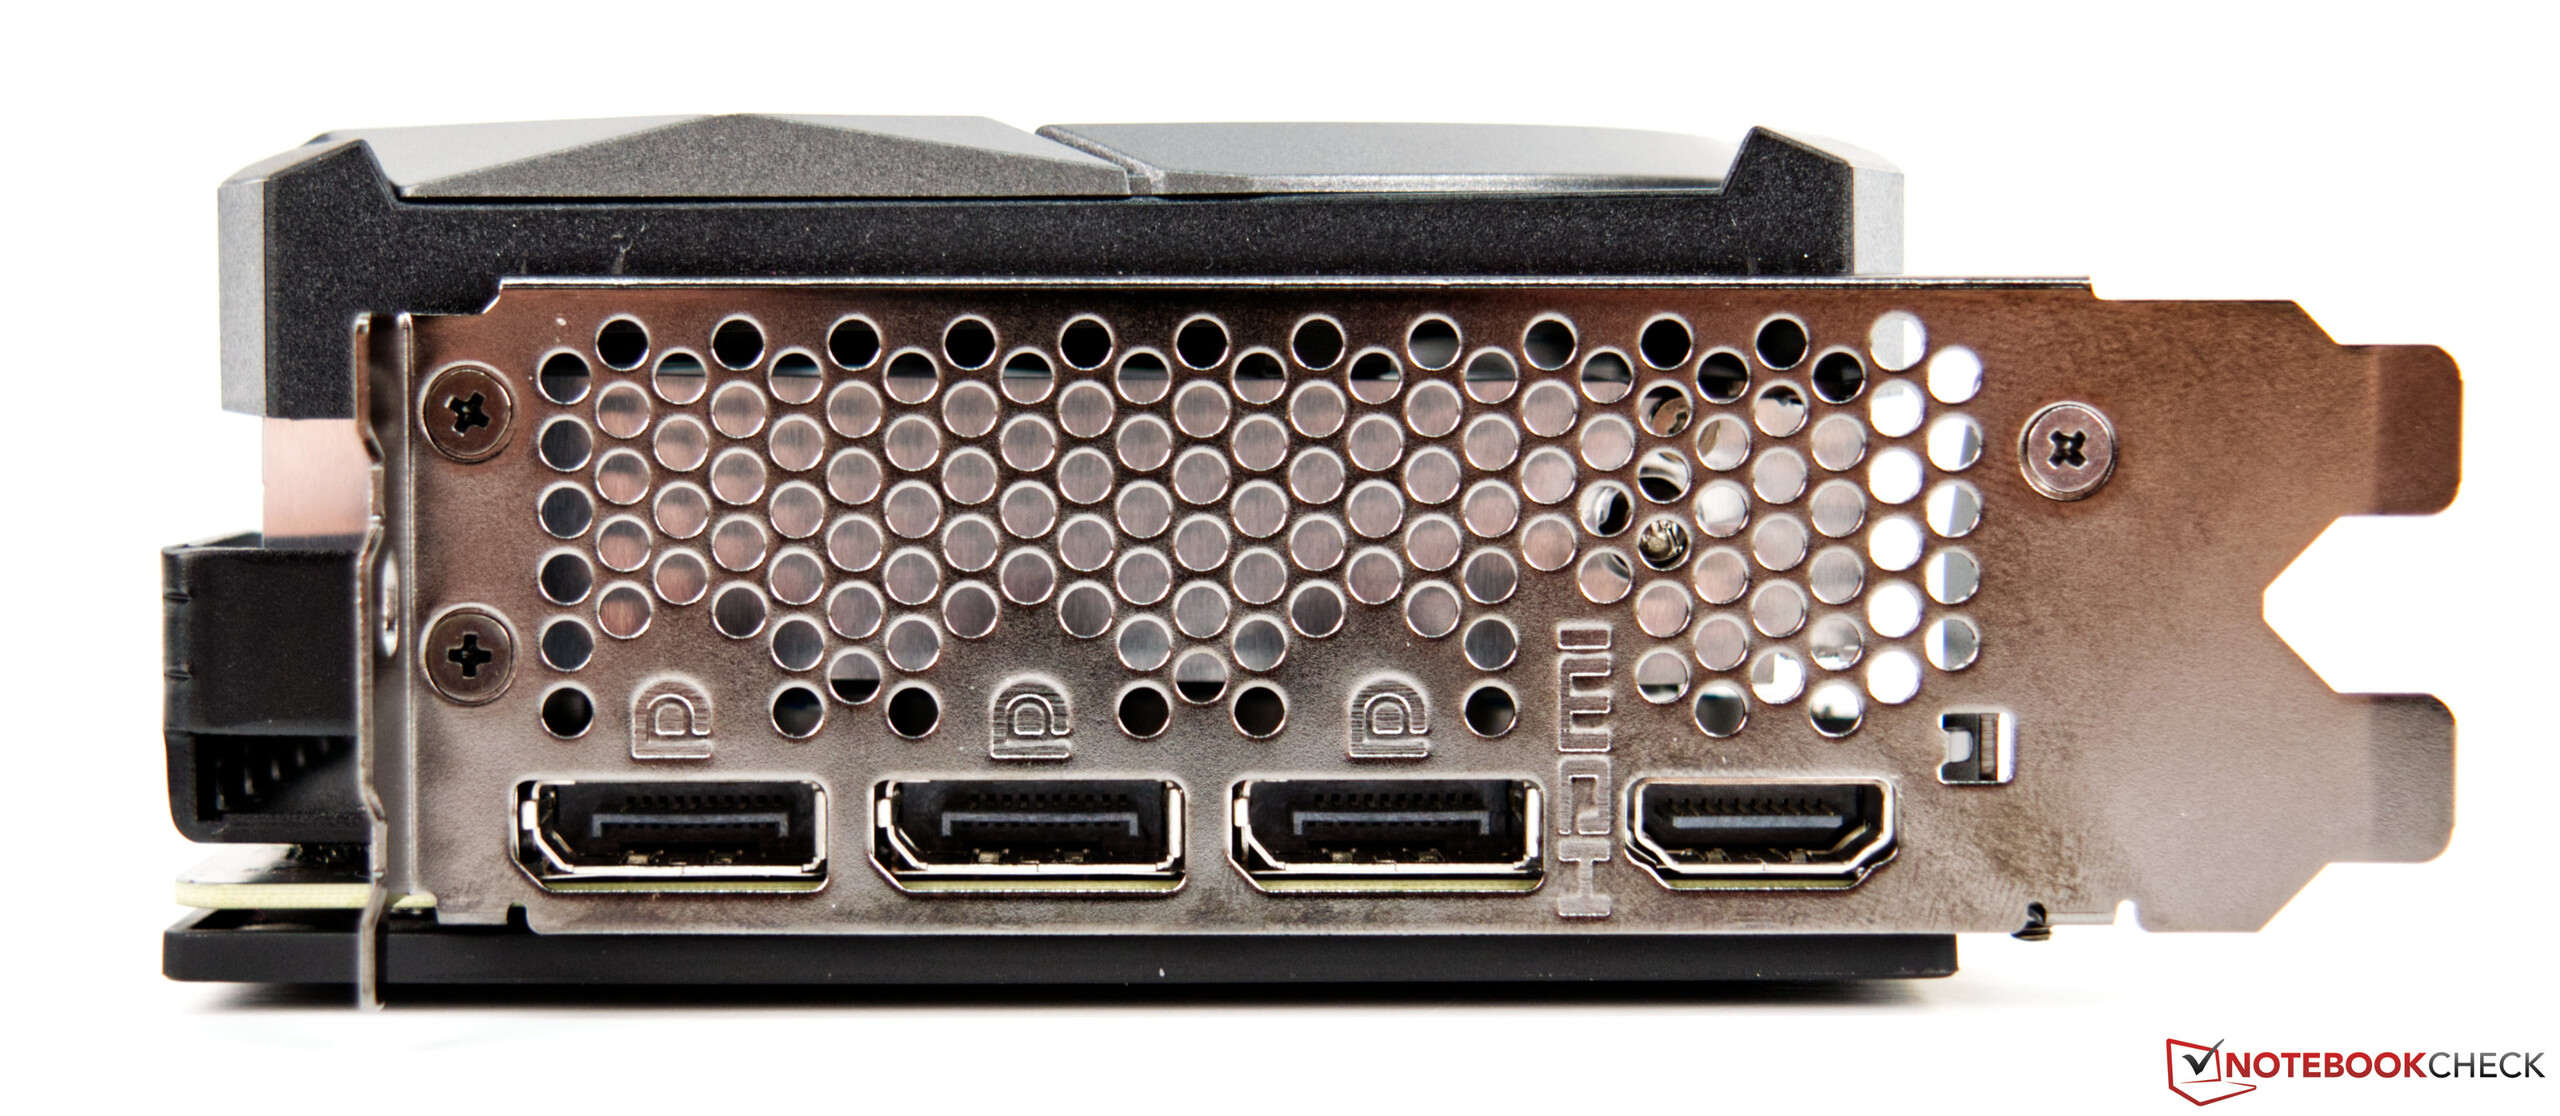
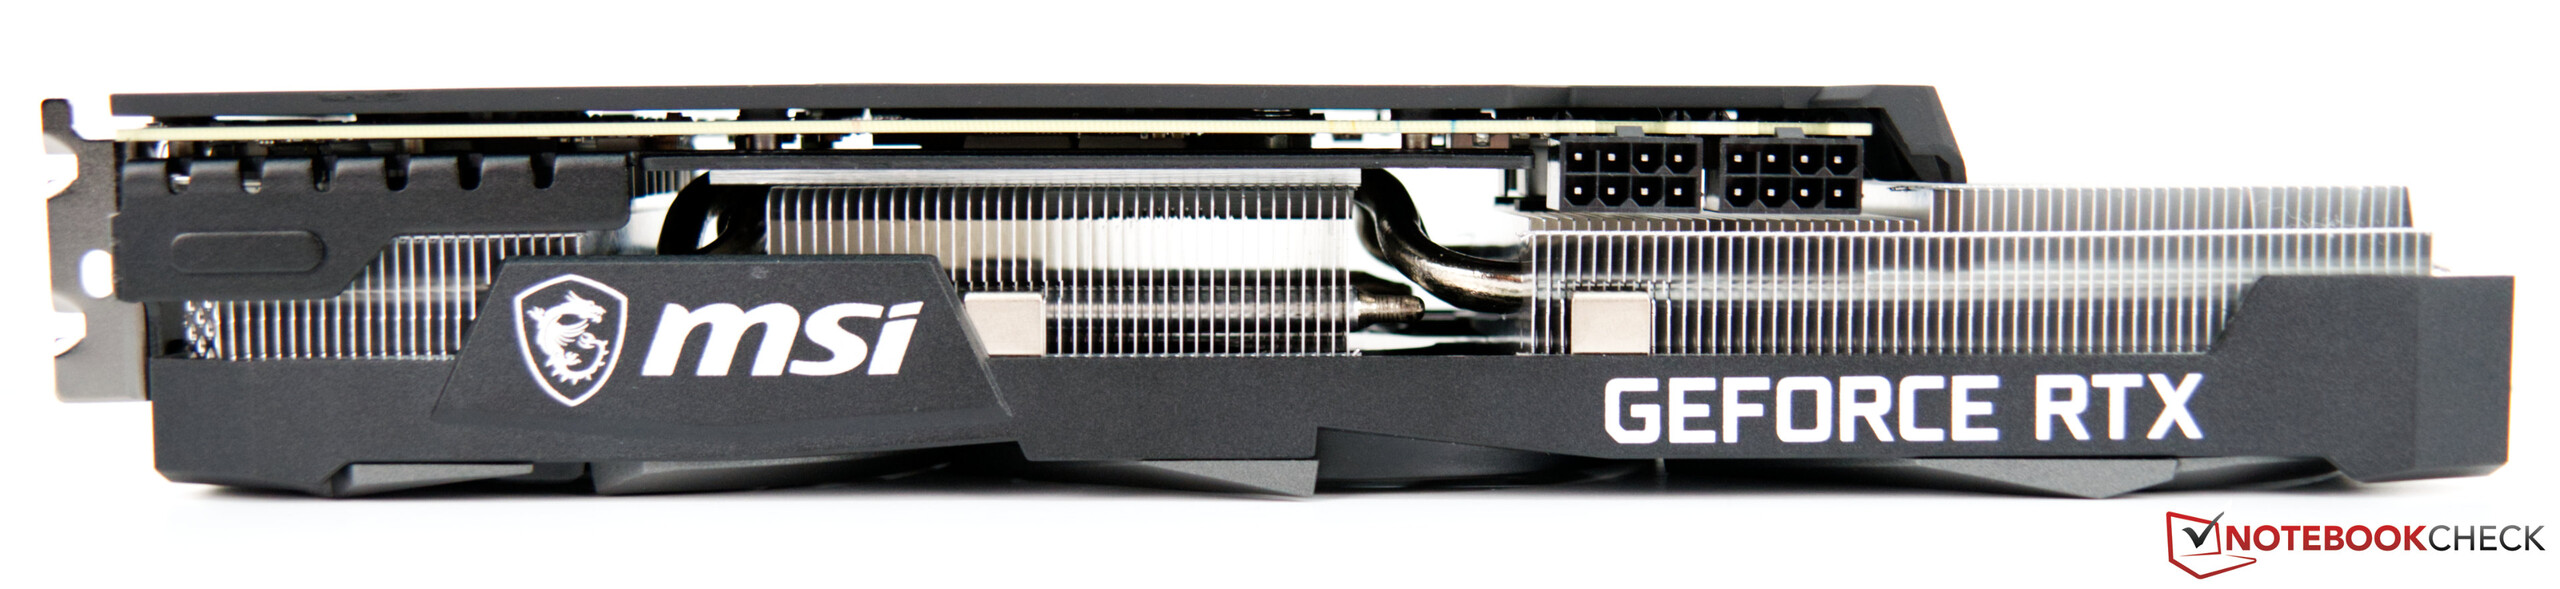
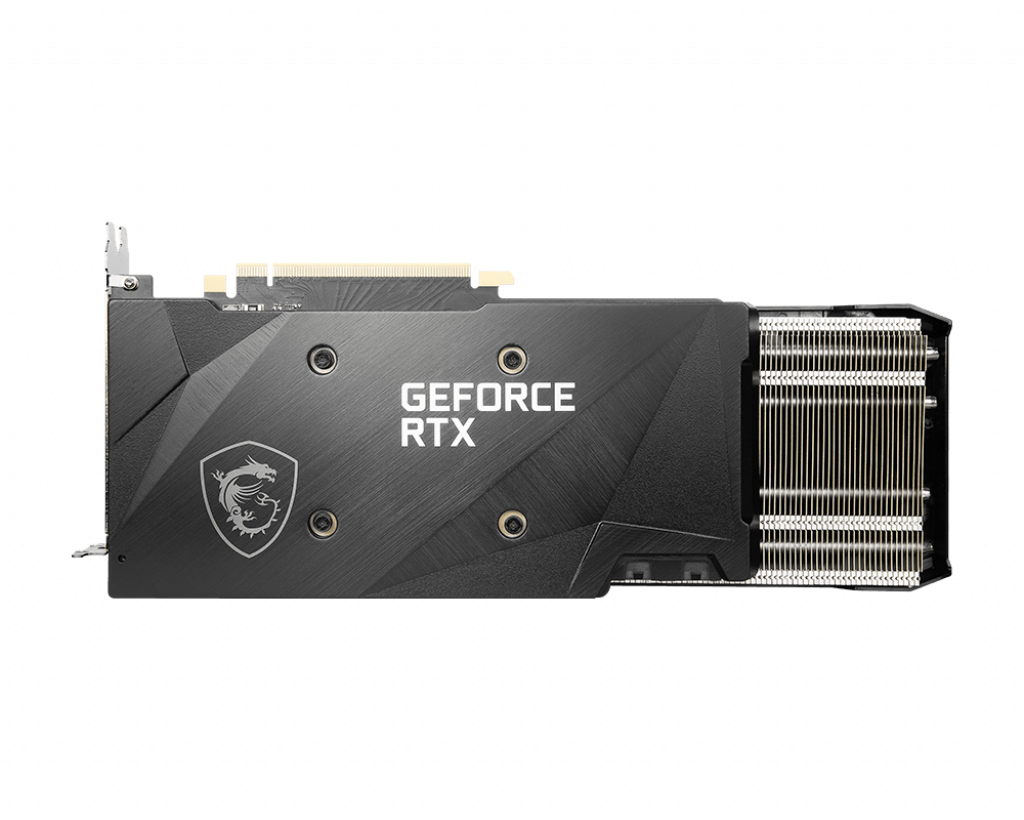
Tuttavia, con poco meno di 31 centimetri (~12.2 in), il nostro modello di prova è solo leggermente più corto dell'MSI GeForce RTX 3070 Gaming X Trio, il che significa che dovreste anche controllare se questo modello si adatta al case prima di acquistarlo. Inoltre, l'MSI GeForce RTX 3070 Ventus 3X OC è dotato di due connettori di alimentazione a 8 pin e all'esterno possono essere usati contemporaneamente fino a quattro monitor. Per questo, c'è un HDMI con l'ultimo standard (2.1) e tre porte DisplayPort (1.4a).

Confronto di RTX 3080 con altre GPU NVIDIA
| Caratteristiche | RTX 3090 FE | RTX 3080 FE | MSI RTX3070 | RTX 3070 FE | Titan RTX | RTX 2080 Ti | RTX 2080 | RTX 2080 | RTX 2070 S |
| Chip | GA102 | GA102 | GA104 | GA104 | TU102 | TU102 | TU104 | TU104 | |
| Processo FinFET | 8 nm | 8 nm | 8 nm | 12 nm | 12 nm | 12 nm | 12 nm | 12 nm | 12 nm |
| CUDA Cores | 10,496 | 8.704 | 5.888 | 5.888 | 4.608 | 4.352 | 2.944 | 2.560 | |
| TextureUnits | 328 | 272 | 184 | 184 | 288 | 272 | 184 | 160 | |
| Nuclei di Tensori | 328 3a Gen. | 272 3a Gen. | 1843a Gen. | 184 3a Gen. | 184 3a Gen. | 576 2a Gen. | 544 2a Gen. | 368 2a Gen. | 320 2a Gen. |
| RTCores | 82 | 68 | 46 | 46 | 72 | 68 | 46 | 40 | |
| Clock base GPU | 1.395 MHz | 1.440 MHz | 1.440 MHz | 1.500 MHz | 1.350 MHz | 1.350 MHz | 1.350 MHz | 1.515 MHz | 1.605 MHz |
| GPU Boost Clock | 1.695 MHz | 1.710 MHz | 1.750 MHz | 1.750 MHz | 1.770 MHz | 1.545 MHz | 1.710 MHz | 1.770 MHz | |
| Memory Bus | 384-bit | 320-bit | 256-bit | 384-bit | 352-bit | 256-bit | 256-bit | ||
| Larghezza di banda di memoria | 936 GB/s | 760 GB/s | 448 GB/s | 448 GB/s | 672 GB/s | 616 GB/s | 448 GB/s | 448 GB/s | 448 GB/s |
| Memoria video | 24 GB GDDR6X | 10 GB GDDR6X | 8 GB GDDR6X | 8 GB GDDR6 | 24 GB GDDR6 | 24 GB GDDR6 | 11 GB GDDR6 | 8 GB GDDR6 | 8 GB GDDR6 |
| Potenza assorbita | 350 W | 320 W | 220W | 280 W | 250 W | 215 W | 215 W |
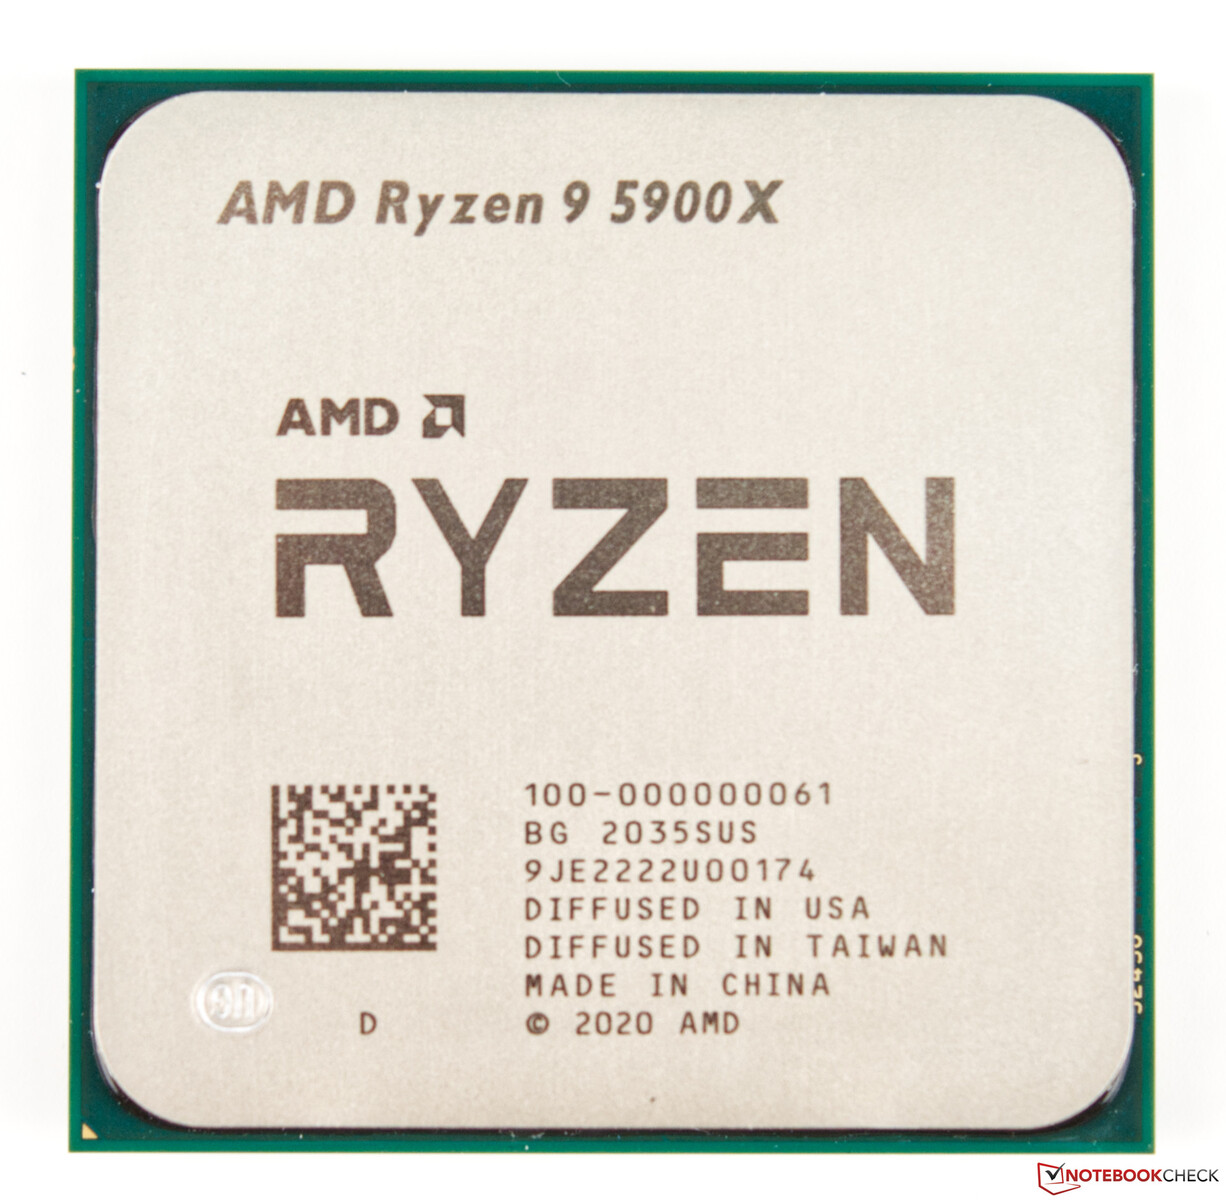
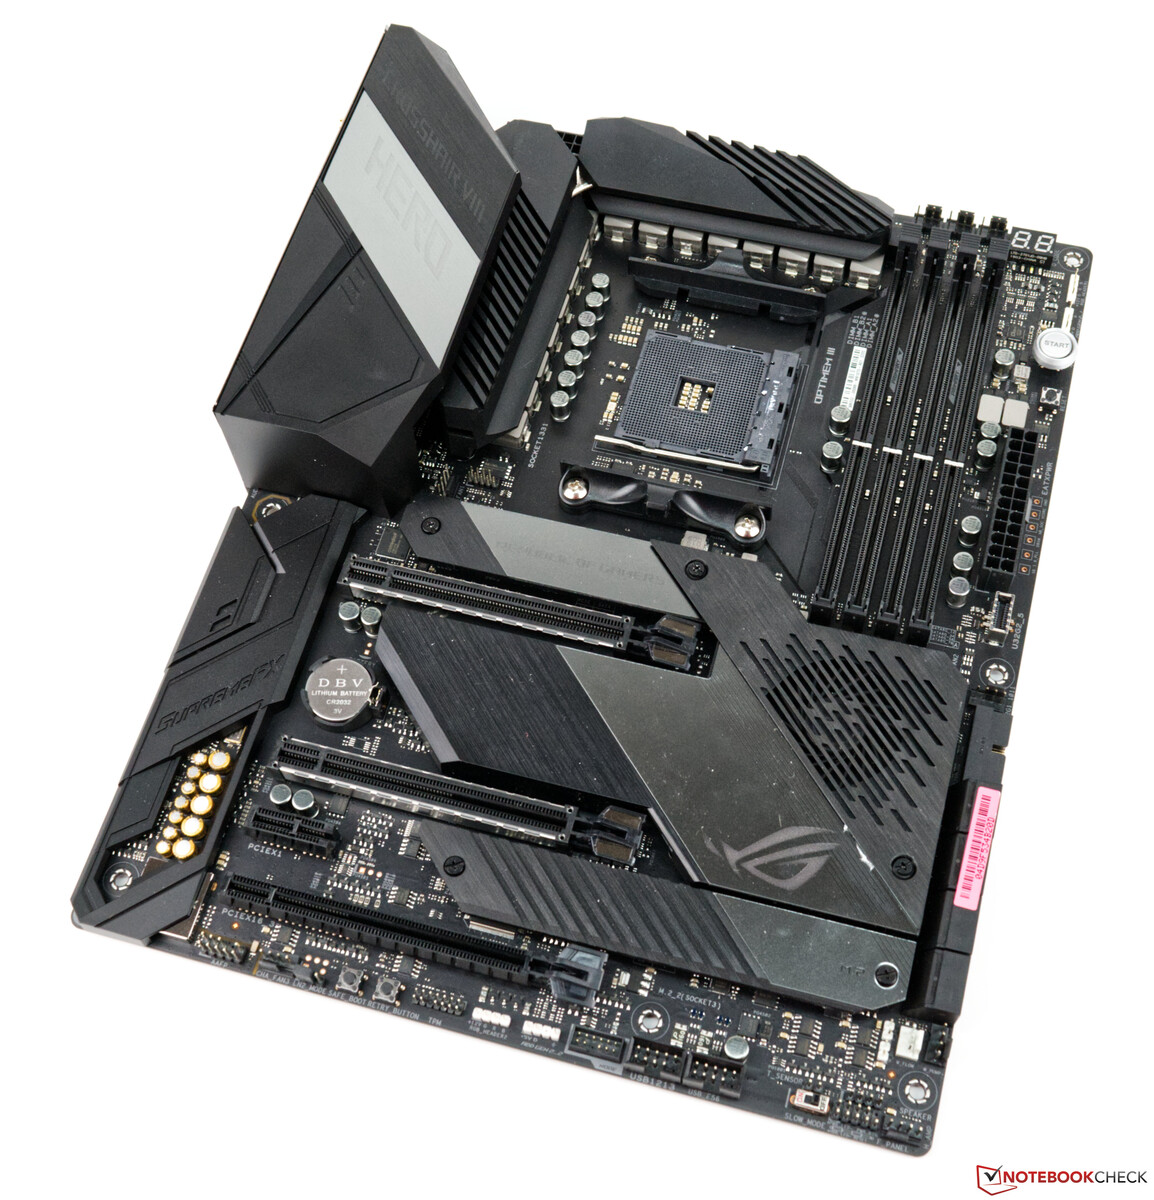
Il nostro sistema di test con AMD Ryzen 9 5900X come base
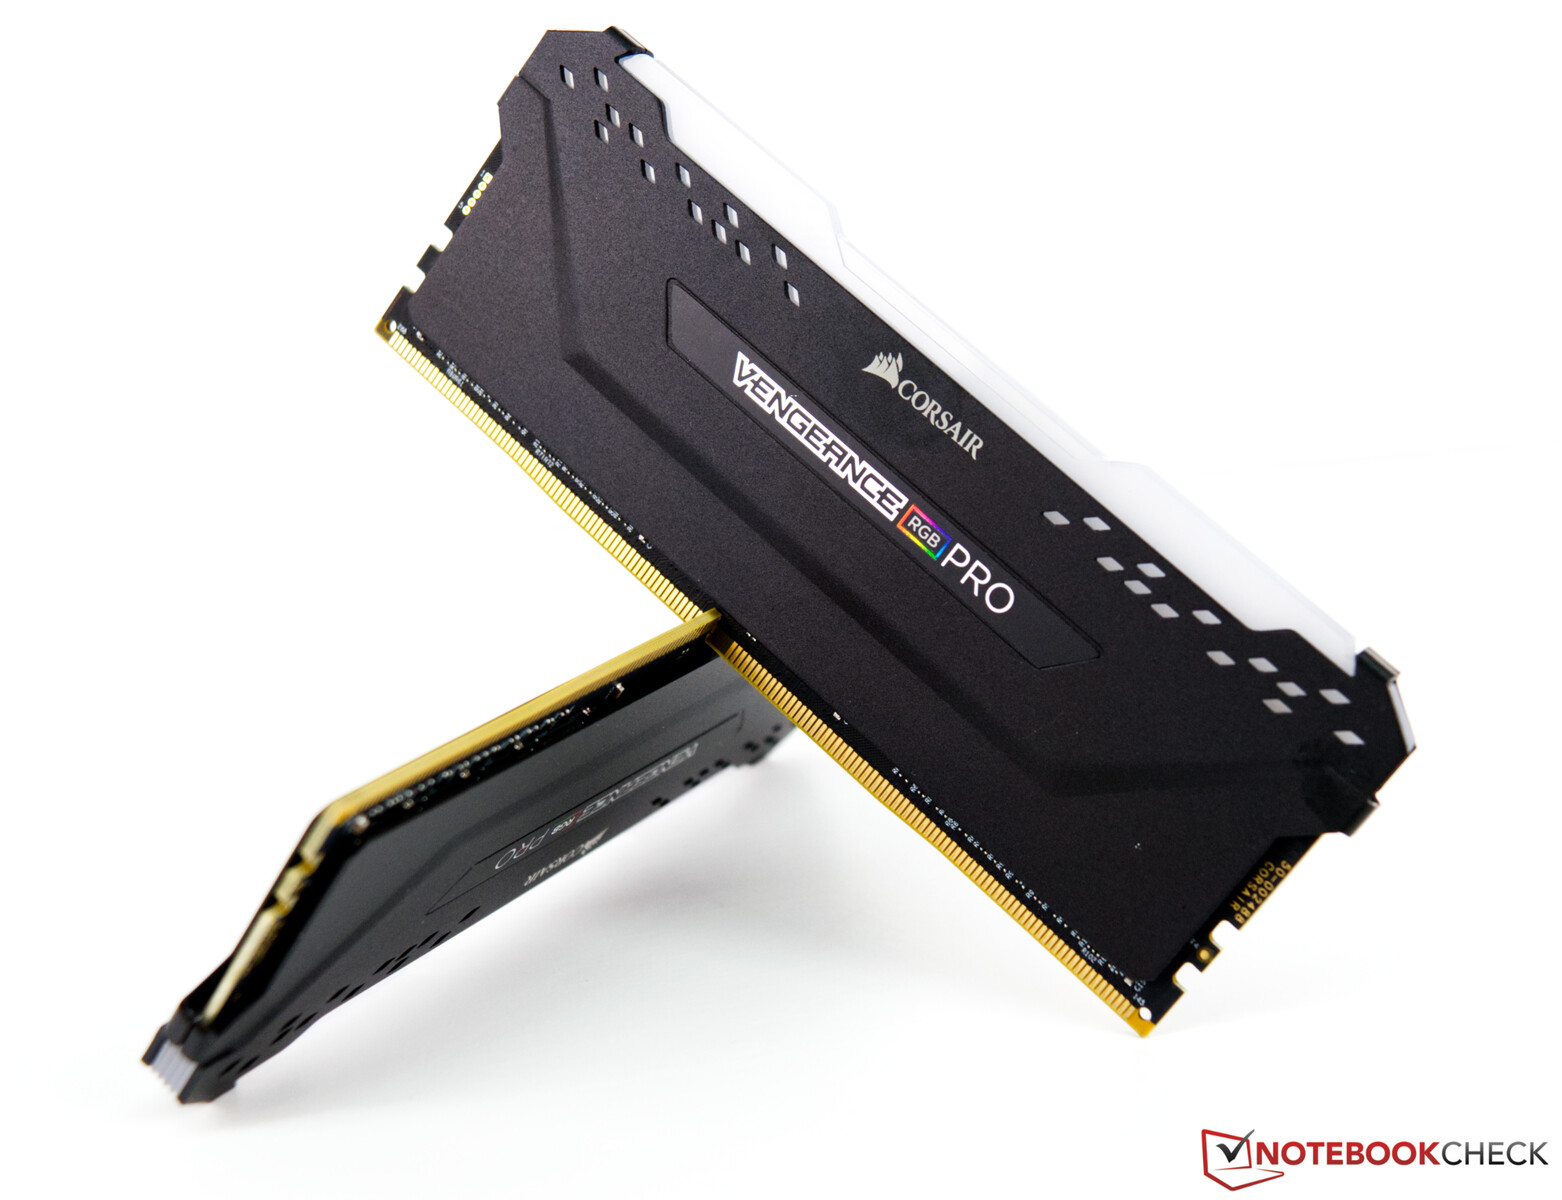
L'attuale piattaforma AMD basata sul Crosshair VIII di Asus X570 ROG funge da sistema di test. La CPU (AMD Ryzen 9 5900X) offre buone prestazioni della CPU e per il raffreddamento utilizziamo un AIO (Alphacool Eisbear Aurora 360mm). La memoria di lavoro di 32 GB proviene da Corsair e da orologi con 4000 MHz. Utilizziamo l'Acer Predator XB321HK come monitor. Questo non ci limita per la sua capacità UHD. Ringraziamo AMD per averci fornito la piattaforma di test e Corsair per il kit RAM.
Utilizziamo il seguente sistema per i benchmarks e test:
- Lian Li O11 Dynamic
- AMD Ryzen 9 5900X
- MSI GeForce RTX 3070 Ventus 3X OC(driver Nvidia 460.89)
- Asus X570 ROG Crosshair VIII Hero WiFi (BIOS 2402, impostazioni predefinite, XMP 1 per DDR4-4000)
- Corsair RM1000X 1000 watt adattatore di alimentazione da 1000 watt
- Corsair Vengeance RGB Pro DDR4-4000 kit di memoria 2 x 16 GB
- Corsair MP600 2TB M.2 SSD PCIe-4.0 M.2
- Crucial MX500 2TB (per i giochi)
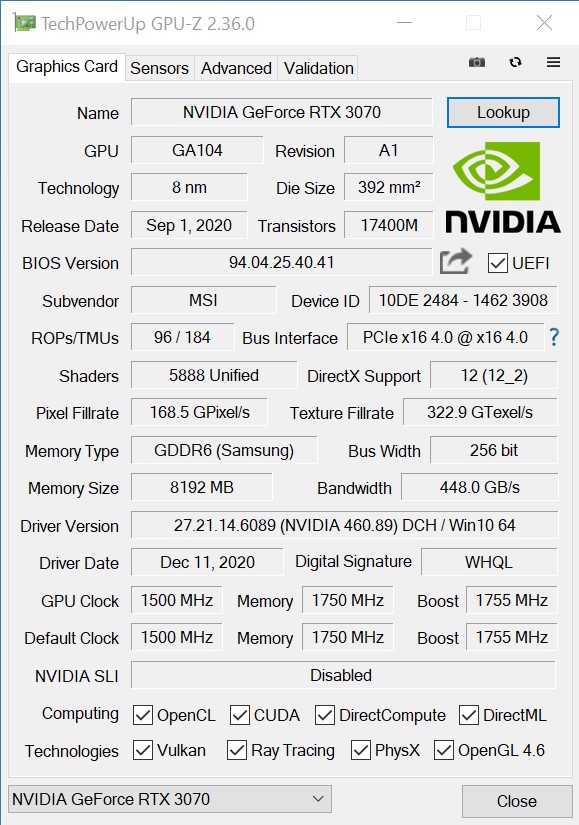
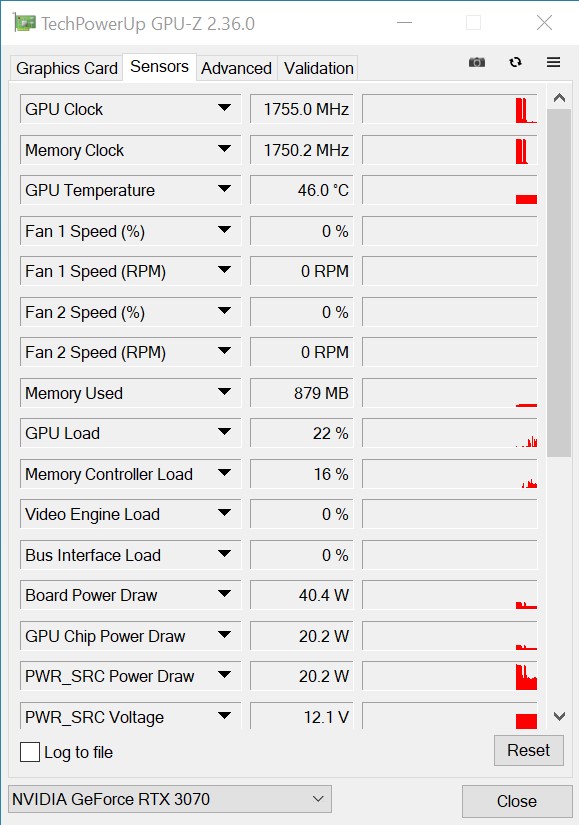
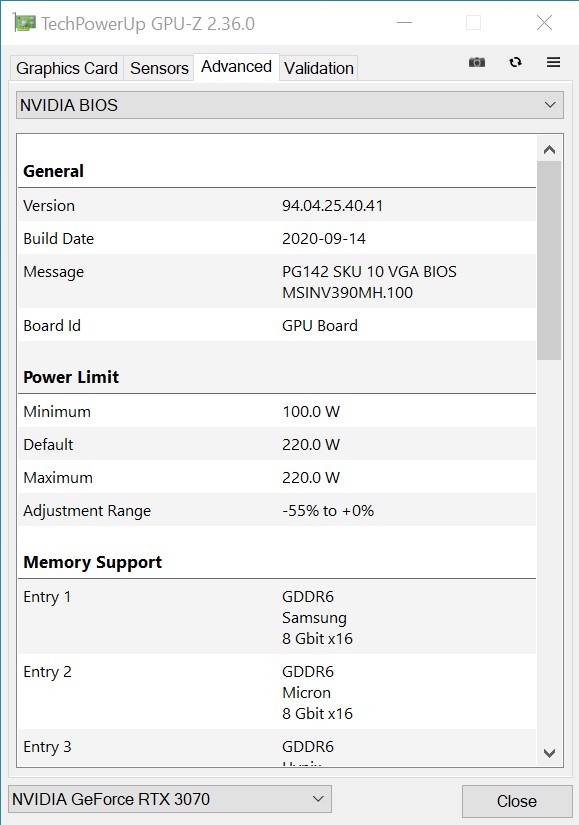
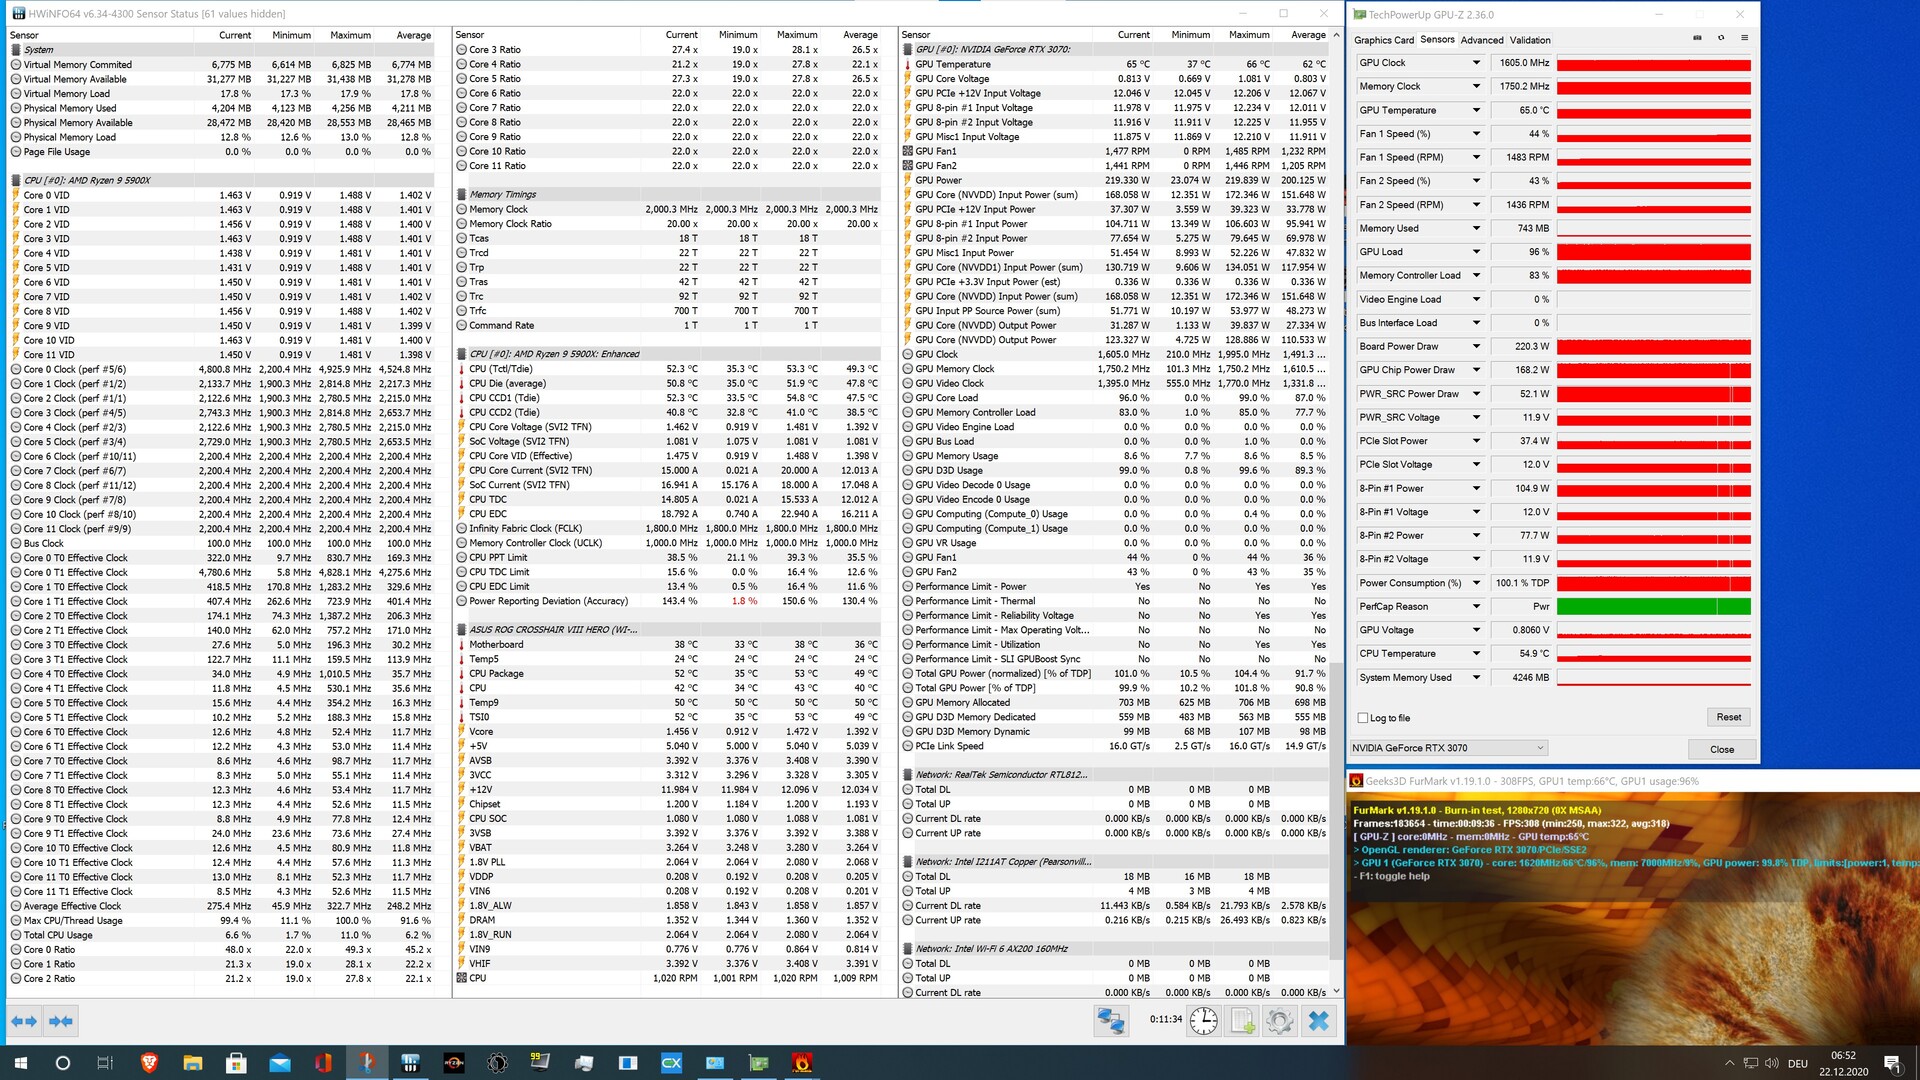
Valori clock dell'MSI GeForce RTX 3070 Ventus 3X OC
Come accennato all'inizio, i valori click dell'MSI GeForce RTX 3070 Ventus 3X OC sono alla pari con quelle della Nvidia's Founders Edition. Lo stesso vale per il limite di potenza, che è di 220 watt per l'intera scheda grafica. Inoltre, il target di potenza non può essere aumentato ulteriormente nel nostro modello di prova.
Benchmarks sintetici
Abbiamo una prima impressione delle prestazioni dell'MSI GeForce RTX 3070 Ventus 3X OC nei benchmarks sintetici. Come si può già vedere dai dati tecnici, il nostro modello di test si colloca dietro alla GeForce RTX 3070 Gaming X Trio, anche se il divario è solo minimo e appena misurabile. L'RTX 3070 si comporta molto bene rispetto alla GeForce RTX 2080 Ti, che abbiamo testato come versione personalizzata di KFA2, e può quasi sempre battere il modello di punta della generazione precedente.
| 3DMark 03 Standard | 136483 punti | |
| 3DMark 05 Standard | 34535 punti | |
| 3DMark 06 Standard Score | 35659 punti | |
| 3DMark Vantage P Result | 62128 punti | |
| 3DMark 11 Performance | 26565 punti | |
| 3DMark Ice Storm Standard Score | 197964 punti | |
| 3DMark Cloud Gate Standard Score | 48366 punti | |
| 3DMark Fire Strike Score | 20451 punti | |
| 3DMark Fire Strike Extreme Score | 12092 punti | |
| 3DMark Time Spy Score | 8797 punti | |
Aiuto | ||
Gaming Benchmarks
Nei nostri test di gioco, l'MSI GeForce RTX 3070 Ventus 3X OC fa un lavoro leggermente migliore rispetto ai benchmark sintetici, il che significa che il modello Gaming X Trio è stato battuto in alcuni test. Entrambi i modelli MSI sono quindi più vicini tra loro e sono praticamente altrettanto veloci. Il nostro modello di test può battere anche l'RTX 2080 Ti. Tuttavia, la GeForce RTX 3070 Ventus 3X OC si esaurisce in risoluzioni molto alte, quindi il vecchio modello di punta qui è in vantaggio. L'RTX 3070 GeForce è adatta solo in misura limitata per il gaming 4K perché i frame rates variano molto da gioco a gioco. L'MSI GeForce RTX 3070 Ventus 3X OC ha a volte problemi di fluidità di gioco nel 2160p con i giochi più recenti. Per questo motivo riteniamo che questa scheda grafica sia più adatta per i giochi a 1440p. Qui, l'MSI GeForce RTX 3070 Ventus 3X OC funziona bene e può sempre portare buoni frame rates sullo schermo nei giochi che abbiamo testato.
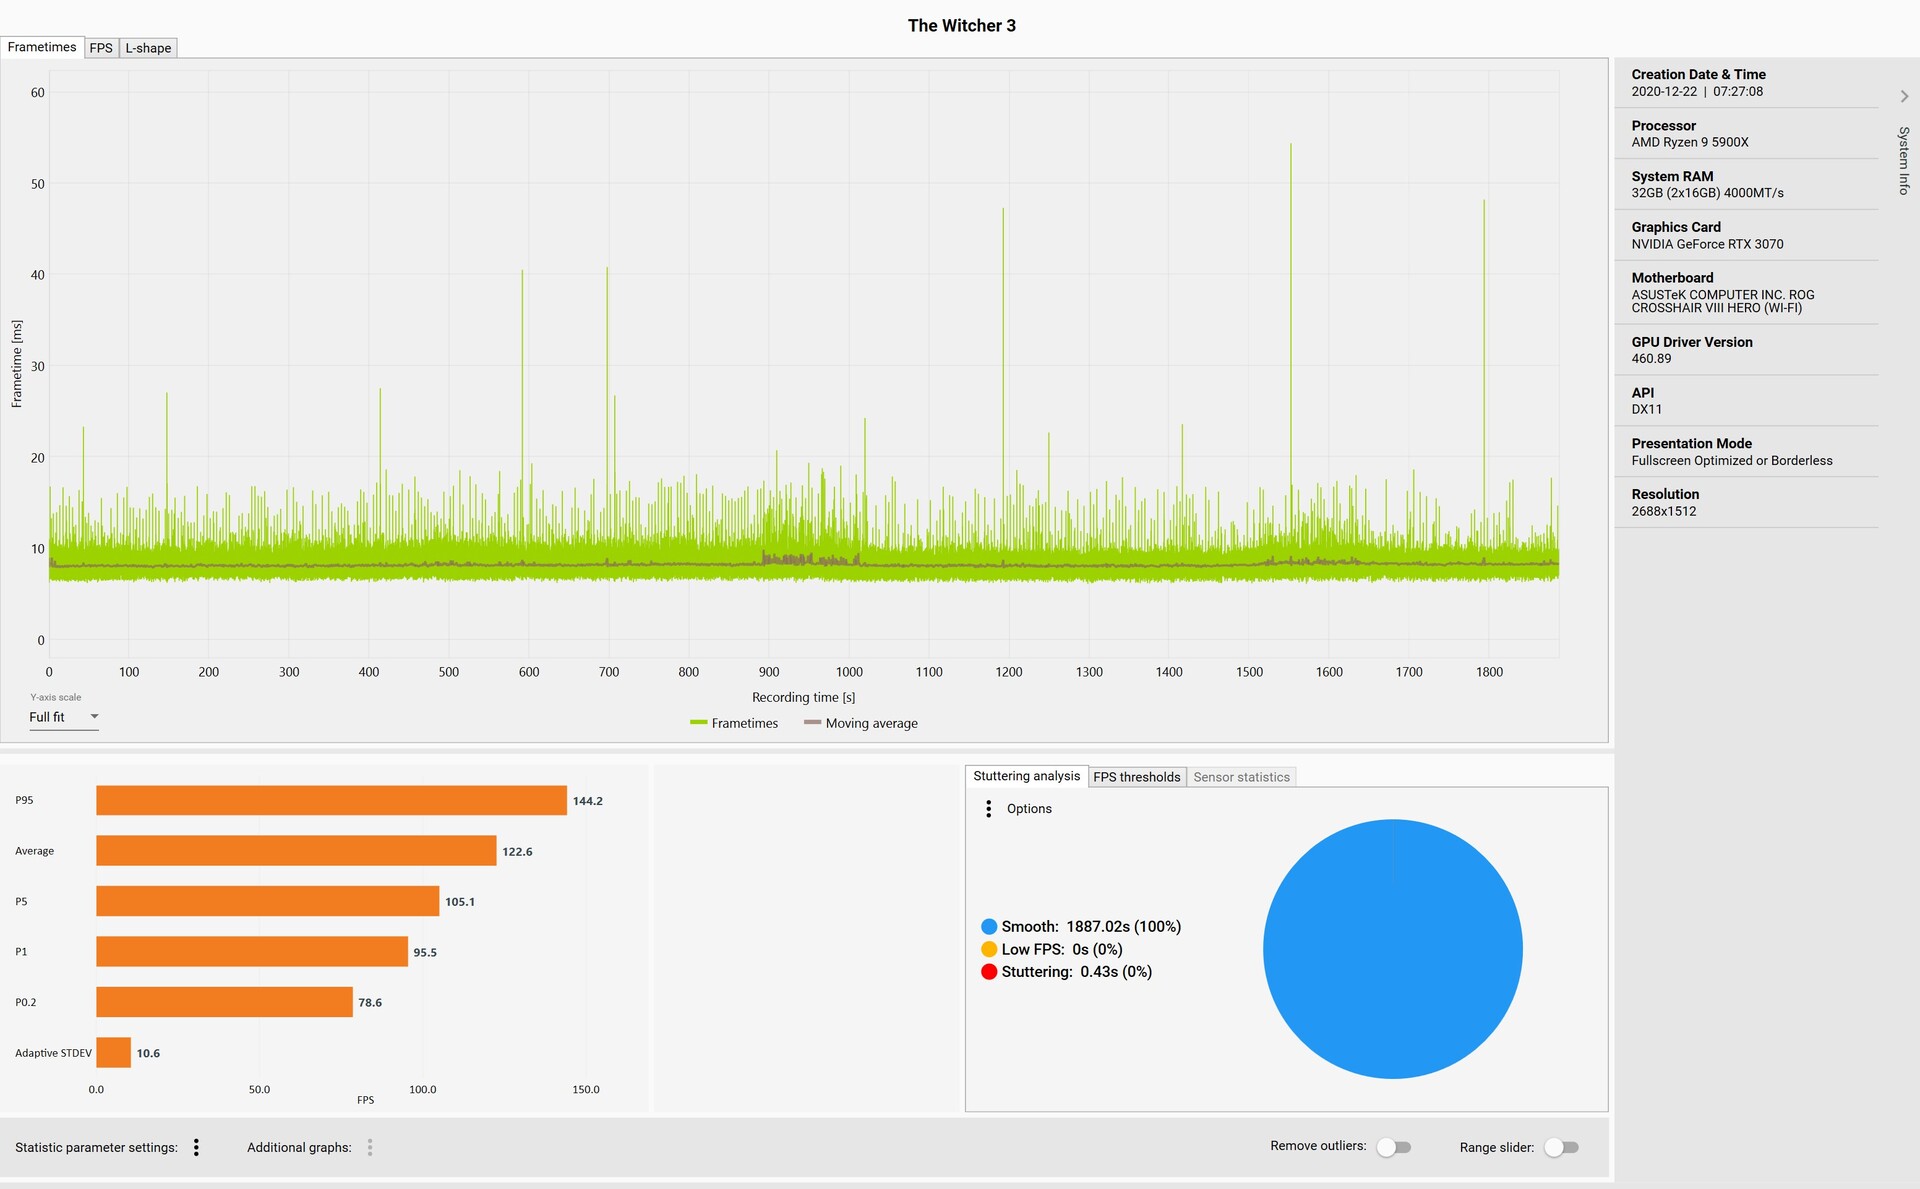
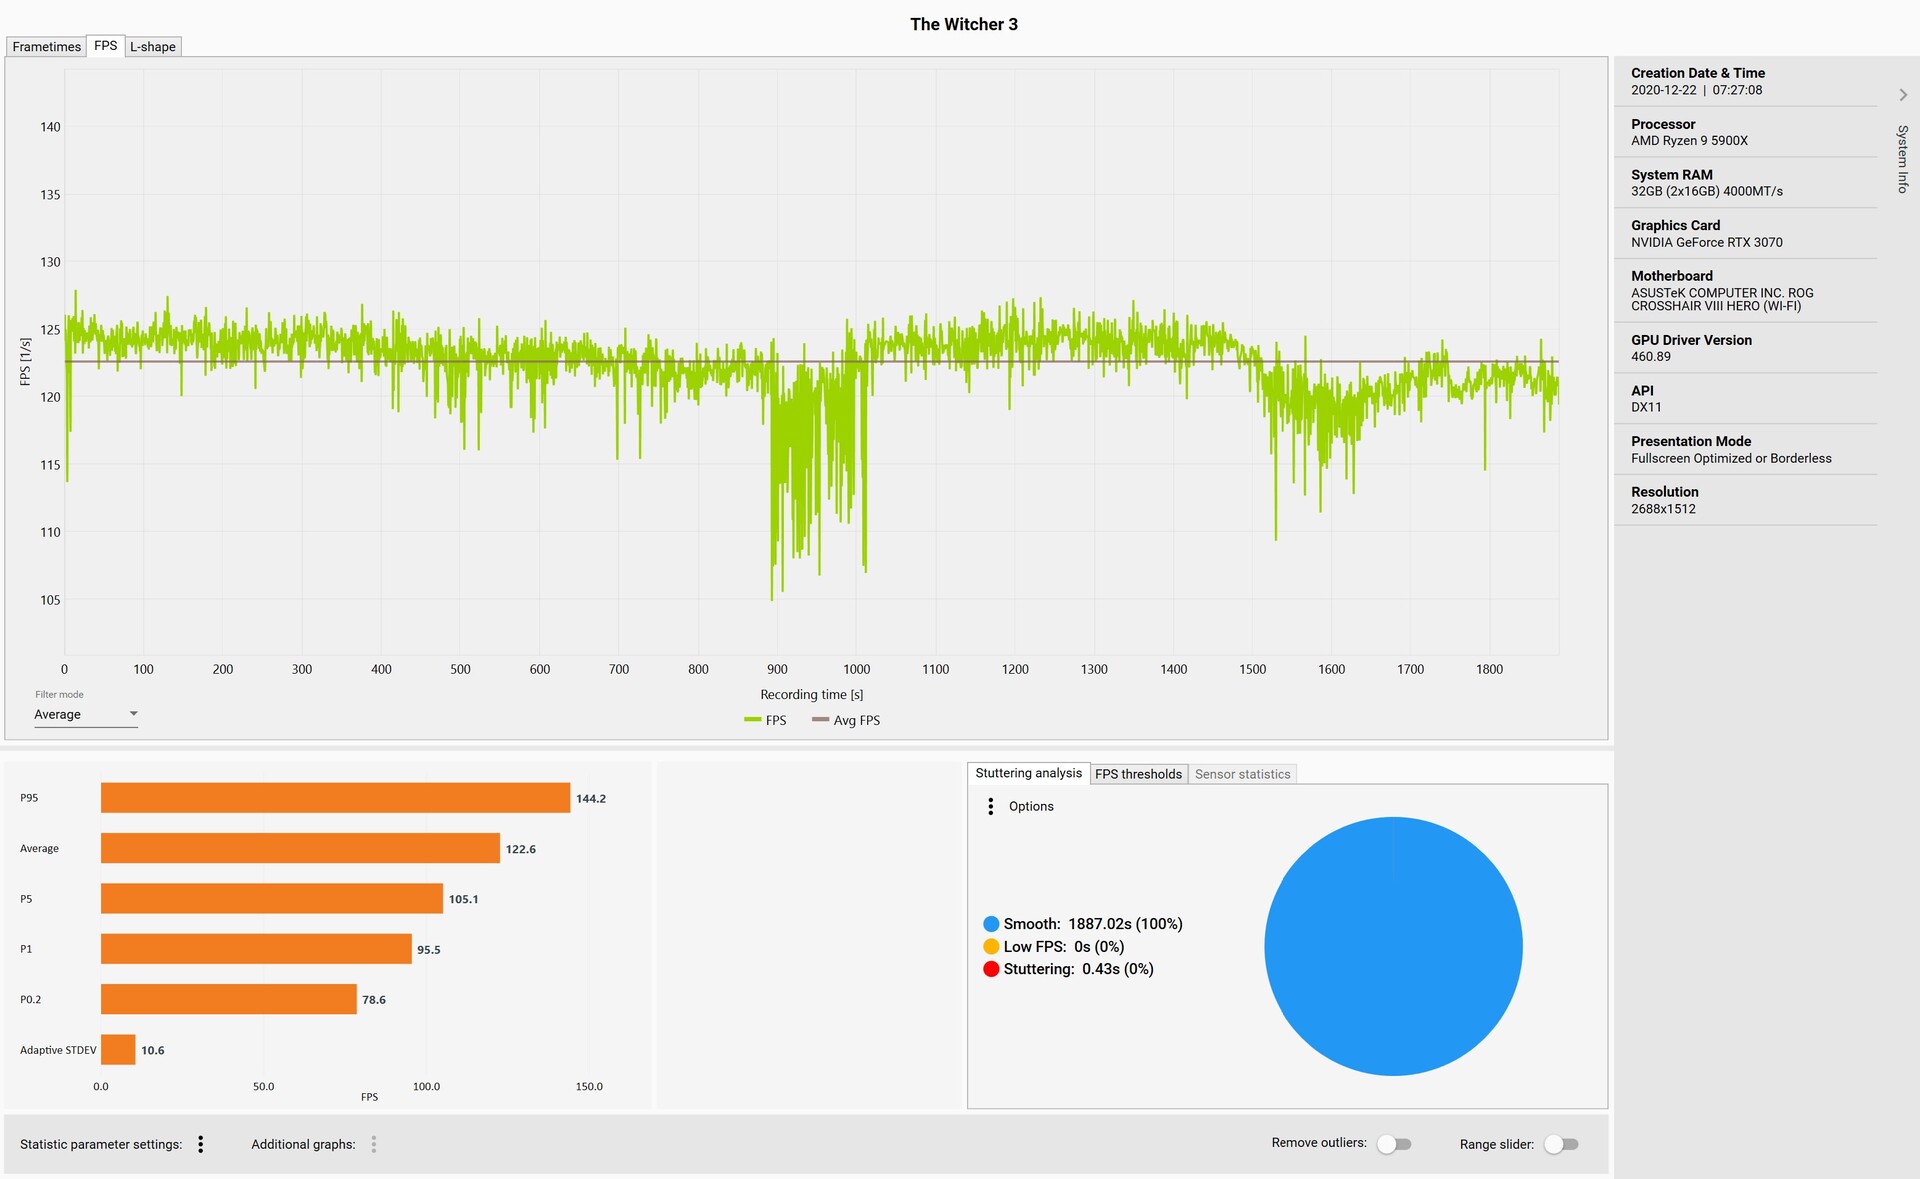
Chi gioca prevalentemente in 1080p o 1440p sarà abbastanza soddisfatto delle prestazioni dell'MSI GeForce RTX 3070 Ventus 3X OC. Tuttavia, la VRAM da 8 GB lascia un sapore amaro se si vuole essere preparati per il futuro. Ciononostante, gli 8 GB di VRAM sono ancora sufficienti al momento. Come sempre, utilizziamo il gioco The Witcher 3 (1080p Ultra Preset) per i tempi e il frame rates. Durante la registrazione abbiamo notato solo qualche latenza più alta di tanto in tanto, ma non hanno influito in modo significativo sul gameplay. Inoltre il frame rate è relativamente costante nel tempo. Ci sono alcuni cali di frame nel mezzo e alla fine, ma questo non influisce sulla fluidità del gameplay, dato che ci sono sempre almeno 105 FPS.
| F1 2020 | |
| 3840x2160 Ultra High Preset AA:T AF:16x | |
| MSI GeForce RTX 3090 Suprim X | |
| AMD Radeon RX 6800 XT | |
| ASUS GeForce RTX 3080 ROG STRIX OC GAMING | |
| MSI GeForce RTX 3070 Gaming X Trio | |
| MSI GeForce RTX 3070 Ventus 3X OC | |
| 2560x1440 Ultra High Preset AA:T AF:16x | |
| MSI GeForce RTX 3090 Suprim X | |
| AMD Radeon RX 6800 XT | |
| ASUS GeForce RTX 3080 ROG STRIX OC GAMING | |
| MSI GeForce RTX 3070 Gaming X Trio | |
| MSI GeForce RTX 3070 Ventus 3X OC | |
| Borderlands 3 | |
| 3840x2160 Badass Overall Quality (DX11) | |
| MSI GeForce RTX 3090 Suprim X | |
| ASUS GeForce RTX 3080 ROG STRIX OC GAMING | |
| AMD Radeon RX 6800 XT | |
| MSI GeForce RTX 3070 Gaming X Trio | |
| MSI GeForce RTX 3070 Ventus 3X OC | |
| KFA2 GeForce RTX 2080 Ti EX | |
| 2560x1440 Badass Overall Quality (DX11) | |
| MSI GeForce RTX 3090 Suprim X | |
| ASUS GeForce RTX 3080 ROG STRIX OC GAMING | |
| AMD Radeon RX 6800 XT | |
| KFA2 GeForce RTX 2080 Ti EX | |
| MSI GeForce RTX 3070 Gaming X Trio | |
| MSI GeForce RTX 3070 Ventus 3X OC | |
| Red Dead Redemption 2 | |
| 3840x2160 Maximum Settings | |
| MSI GeForce RTX 3090 Suprim X | |
| ASUS GeForce RTX 3080 ROG STRIX OC GAMING | |
| AMD Radeon RX 6800 XT | |
| MSI GeForce RTX 3070 Gaming X Trio | |
| MSI GeForce RTX 3070 Ventus 3X OC | |
| 2560x1440 Maximum Settings | |
| MSI GeForce RTX 3090 Suprim X | |
| AMD Radeon RX 6800 XT | |
| ASUS GeForce RTX 3080 ROG STRIX OC GAMING | |
| MSI GeForce RTX 3070 Gaming X Trio | |
| MSI GeForce RTX 3070 Ventus 3X OC | |
| Mafia Definitive Edition | |
| 3840x2160 High Preset | |
| MSI GeForce RTX 3090 Suprim X | |
| ASUS GeForce RTX 3080 ROG STRIX OC GAMING | |
| AMD Radeon RX 6800 XT | |
| MSI GeForce RTX 3070 Gaming X Trio | |
| MSI GeForce RTX 3070 Ventus 3X OC | |
| 2560x1440 High Preset | |
| MSI GeForce RTX 3090 Suprim X | |
| ASUS GeForce RTX 3080 ROG STRIX OC GAMING | |
| AMD Radeon RX 6800 XT | |
| MSI GeForce RTX 3070 Gaming X Trio | |
| MSI GeForce RTX 3070 Ventus 3X OC | |
| Watch Dogs Legion | |
| 3840x2160 Ultra Preset (DX12) | |
| MSI GeForce RTX 3090 Suprim X | |
| ASUS GeForce RTX 3080 ROG STRIX OC GAMING | |
| AMD Radeon RX 6800 XT | |
| MSI GeForce RTX 3070 Ventus 3X OC | |
| MSI GeForce RTX 3070 Gaming X Trio | |
| 2560x1440 Ultra Preset (DX12) | |
| MSI GeForce RTX 3090 Suprim X | |
| AMD Radeon RX 6800 XT | |
| ASUS GeForce RTX 3080 ROG STRIX OC GAMING | |
| MSI GeForce RTX 3070 Ventus 3X OC | |
| MSI GeForce RTX 3070 Gaming X Trio | |
| The Witcher 3 | |
| 3840x2160 High Graphics & Postprocessing (Nvidia HairWorks Off) | |
| MSI GeForce RTX 3090 Suprim X | |
| ASUS GeForce RTX 3080 ROG STRIX OC GAMING | |
| AMD Radeon RX 6800 XT | |
| KFA2 GeForce RTX 2080 Ti EX | |
| MSI GeForce RTX 3070 Ventus 3X OC | |
| MSI GeForce RTX 3070 Gaming X Trio | |
| Nvidia GeForce RTX 2080 Super | |
| MSI RTX 2080 Gaming X Trio | |
| Nvidia GeForce RTX 2070 Super | |
| MSI RTX 2070 Gaming Z 8G | |
| Nvidia GeForce RTX 2060 Super | |
| AMD Radeon VII | |
| AMD Radeon RX 5700 XT | |
| MSI RTX 2060 Gaming Z 6G | |
| AMD Radeon RX Vega 64 | |
| AMD Radeon RX 5700 | |
| 1920x1080 Ultra Graphics & Postprocessing (HBAO+) | |
| MSI GeForce RTX 3090 Suprim X | |
| AMD Radeon RX 6800 XT | |
| ASUS GeForce RTX 3080 ROG STRIX OC GAMING | |
| KFA2 GeForce RTX 2080 Ti EX | |
| MSI GeForce RTX 3070 Gaming X Trio | |
| MSI GeForce RTX 3070 Ventus 3X OC | |
| MSI RTX 2080 Gaming X Trio | |
| Nvidia GeForce RTX 2080 Super | |
| Nvidia GeForce RTX 2070 Super | |
| AMD Radeon RX 5700 XT | |
| MSI RTX 2070 Gaming Z 8G | |
| AMD Radeon RX 5700 | |
| Nvidia GeForce RTX 2060 Super | |
| AMD Radeon RX Vega 64 | |
| AMD Radeon VII | |
| MSI RTX 2060 Gaming Z 6G | |
| basso | medio | alto | ultra | QHD | 4K | |
|---|---|---|---|---|---|---|
| GTA V (2015) | 184 | 175 | 170 | 108 | 98.3 | 117 |
| The Witcher 3 (2015) | 407 | 363 | 176 | 121 | 90.9 | |
| Dota 2 Reborn (2015) | 171 | 157 | 153.6 | 136.3 | 128.5 | |
| Rise of the Tomb Raider (2016) | 226 | 159 | 156 | 151 | 80.9 | |
| Final Fantasy XV Benchmark (2018) | 209 | 159 | 122 | 94.1 | 57.6 | |
| X-Plane 11.11 (2018) | 141 | 123 | 95.4 | 84.3 | ||
| Far Cry 5 (2018) | 184 | 161 | 154 | 143 | 125 | 70 |
| Strange Brigade (2018) | 413 | 302 | 251 | 222 | 166 | 96.8 |
| Shadow of the Tomb Raider (2018) | 200 | 176 | 168 | 160 | 116 | 63.5 |
| Battlefield V (2018) | 188.9 | 154.3 | 137.4 | 125.2 | 106.8 | 70.9 |
| Apex Legends (2019) | 144 | 144 | 144 | 144 | 144 | 106 |
| Far Cry New Dawn (2019) | 152 | 135 | 130 | 116 | 107 | 72 |
| Metro Exodus (2019) | 193 | 148 | 117 | 93.7 | 74.8 | 48.6 |
| Anno 1800 (2019) | 170 | 147 | 100 | 52 | 50.5 | 35 |
| Control (2019) | 238 | 149 | 117 | 79.8 | 41 | |
| Borderlands 3 (2019) | 134 | 123 | 94.5 | 95.3 | 75.1 | 43.8 |
| Star Wars Jedi Fallen Order (2019) | 130 | 128 | 128 | 125 | 70.1 | |
| Red Dead Redemption 2 (2019) | 156.5 | 149 | 112.8 | 76.2 | 63.4 | 42.1 |
| Hunt Showdown (2020) | 174 | 152 | 137 | 128 | 74.2 | |
| Doom Eternal (2020) | 246 | 246 | 244 | 237 | 208 | 116 |
| F1 2020 (2020) | 327 | 268 | 252 | 181 | 143 | 88.7 |
| Death Stranding (2020) | 224 | 190 | 173 | 170 | 126 | 74.1 |
| Horizon Zero Dawn (2020) | 189 | 153 | 138 | 124 | 104 | 61 |
| Crysis Remastered (2020) | 221 | 182 | 97.7 | 75.8 | 64.3 | 38.9 |
| Serious Sam 4 (2020) | 148.8 | 122 | 120.9 | 99 | 92 | 66.6 |
| Mafia Definitive Edition (2020) | 184 | 140 | 132 | 98.1 | 55.2 | |
| Star Wars Squadrons (2020) | 437 | 344 | 333 | 312 | 228 | 136 |
| FIFA 21 (2020) | 203 | 195 | 200 | 191 | 193 | 194 |
| Watch Dogs Legion (2020) | 122 | 118 | 112 | 86 | 66.3 | 39.2 |
| Dirt 5 (2020) | 179 | 122 | 106 | 89.3 | 75.9 | 54.7 |
| Assassin´s Creed Valhalla (2020) | 133 | 103 | 87 | 80 | 65 | 42 |
| Call of Duty Black Ops Cold War (2020) | 141 | 133 | 117 | 95.7 | 83 | 50.2 |
| Yakuza Like a Dragon (2020) | 109 | 109 | 116 | 111 | 96 | 51.7 |
| Immortals Fenyx Rising (2020) | 115 | 92 | 83 | 81 | 68 | 50 |
| Cyberpunk 2077 1.0 (2020) | 132 | 108 | 92.4 | 81 | 54.8 | 27.9 |
Prestazioni di calcolo
In LuxMark e ComputeMark, la nostra GeForce RTX 3070 Ventus 3X OC perde il duello interno MSI. Il TDP più basso e il Boost più basso portano a una sconfitta sul filo del rasoio. Tuttavia, il modello economico non deve nascondersi perché i risultati del benchmark sono complessivamente di buon livello. Le soluzioni grafiche professionali, come i modelli Quadro o Fire Pro, offrono prestazioni significativamente più elevate nell'area di calcolo grazie alle unità adattate.
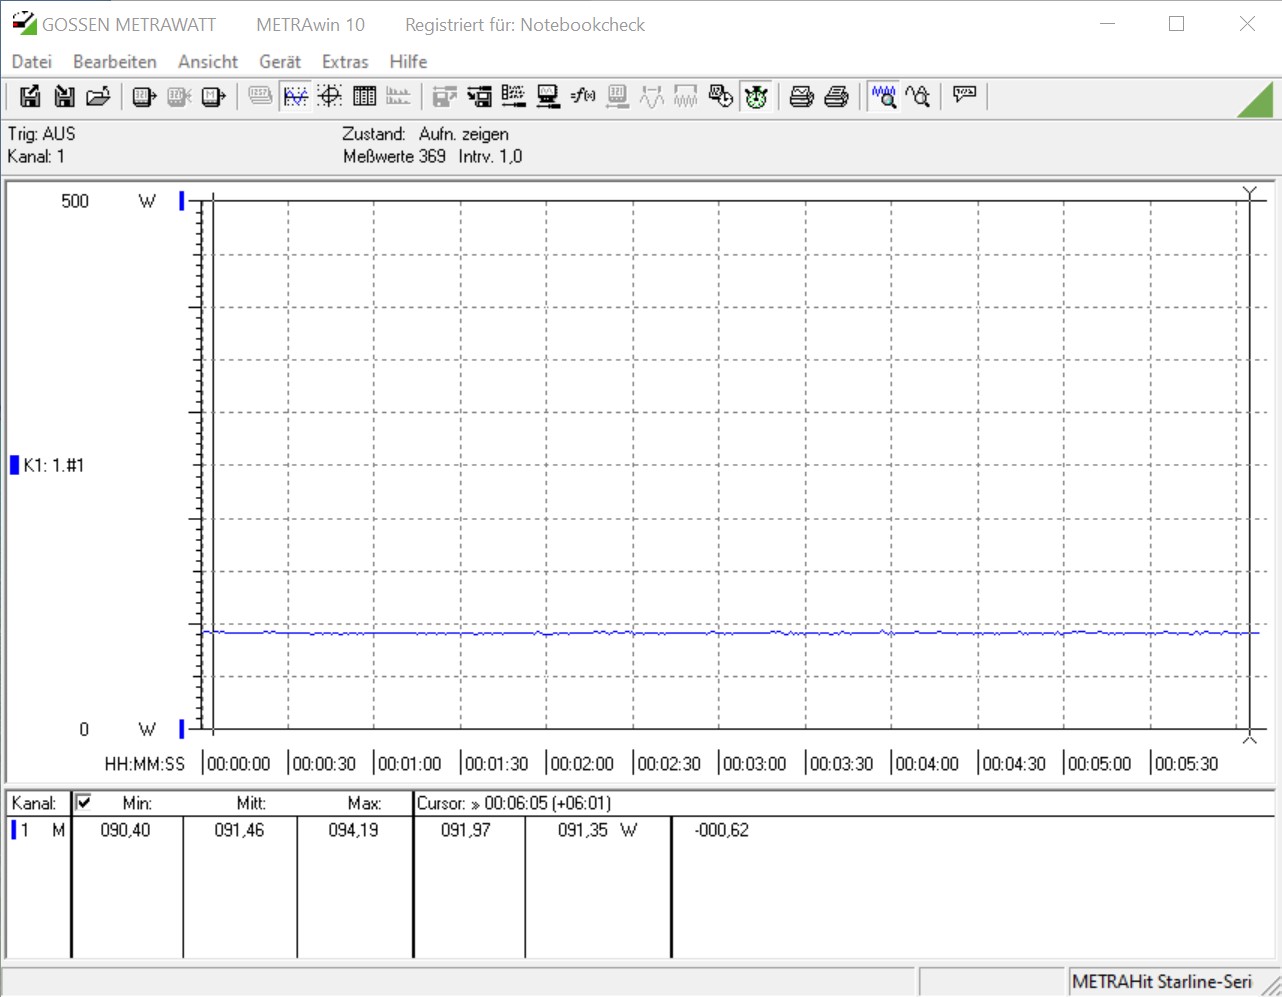
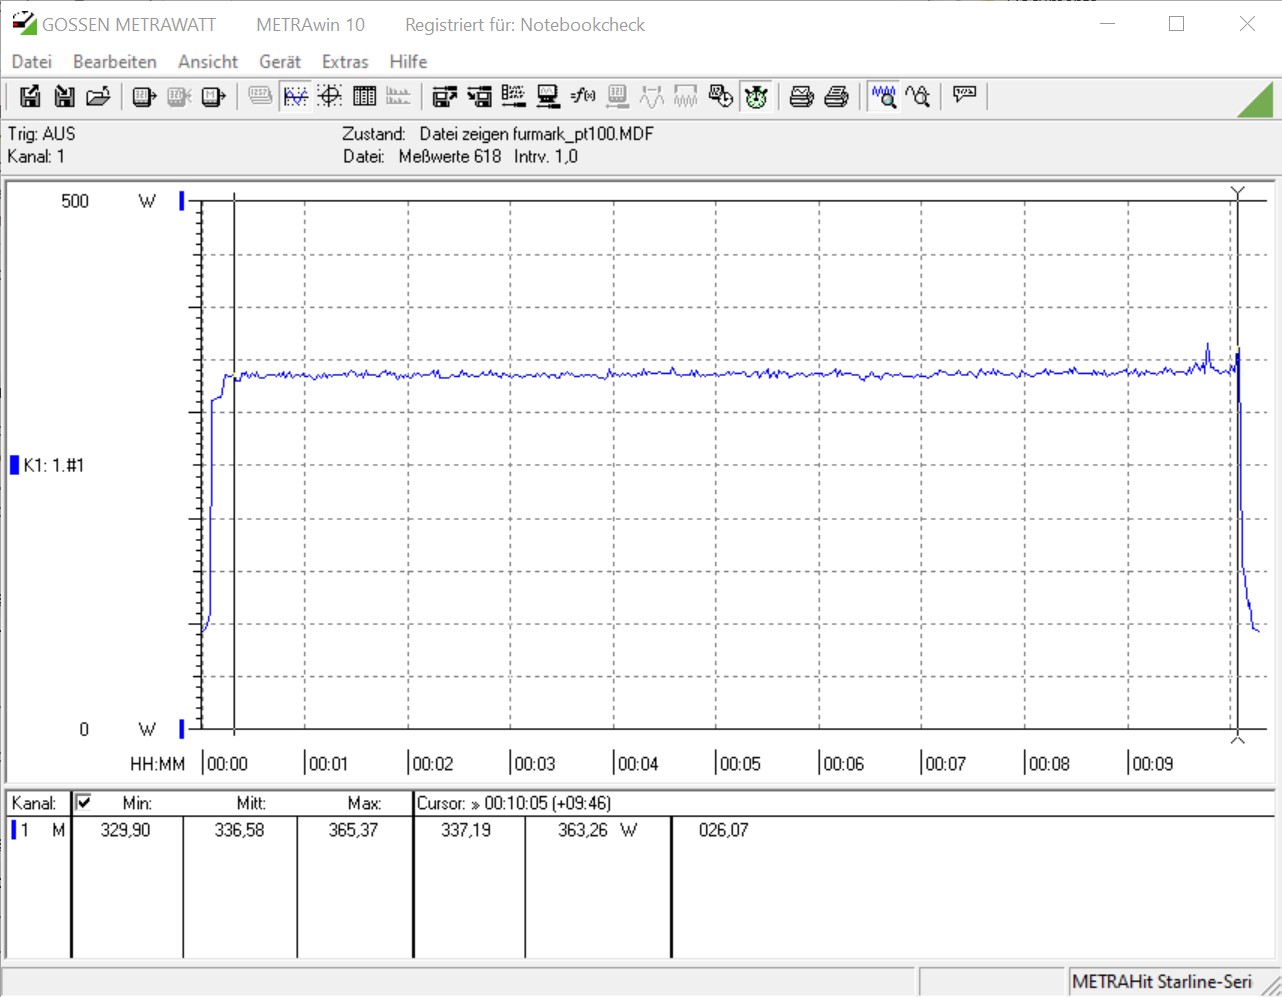
Emissioni dell'MSI GeForce RTX 3070 Ventus 3X OC
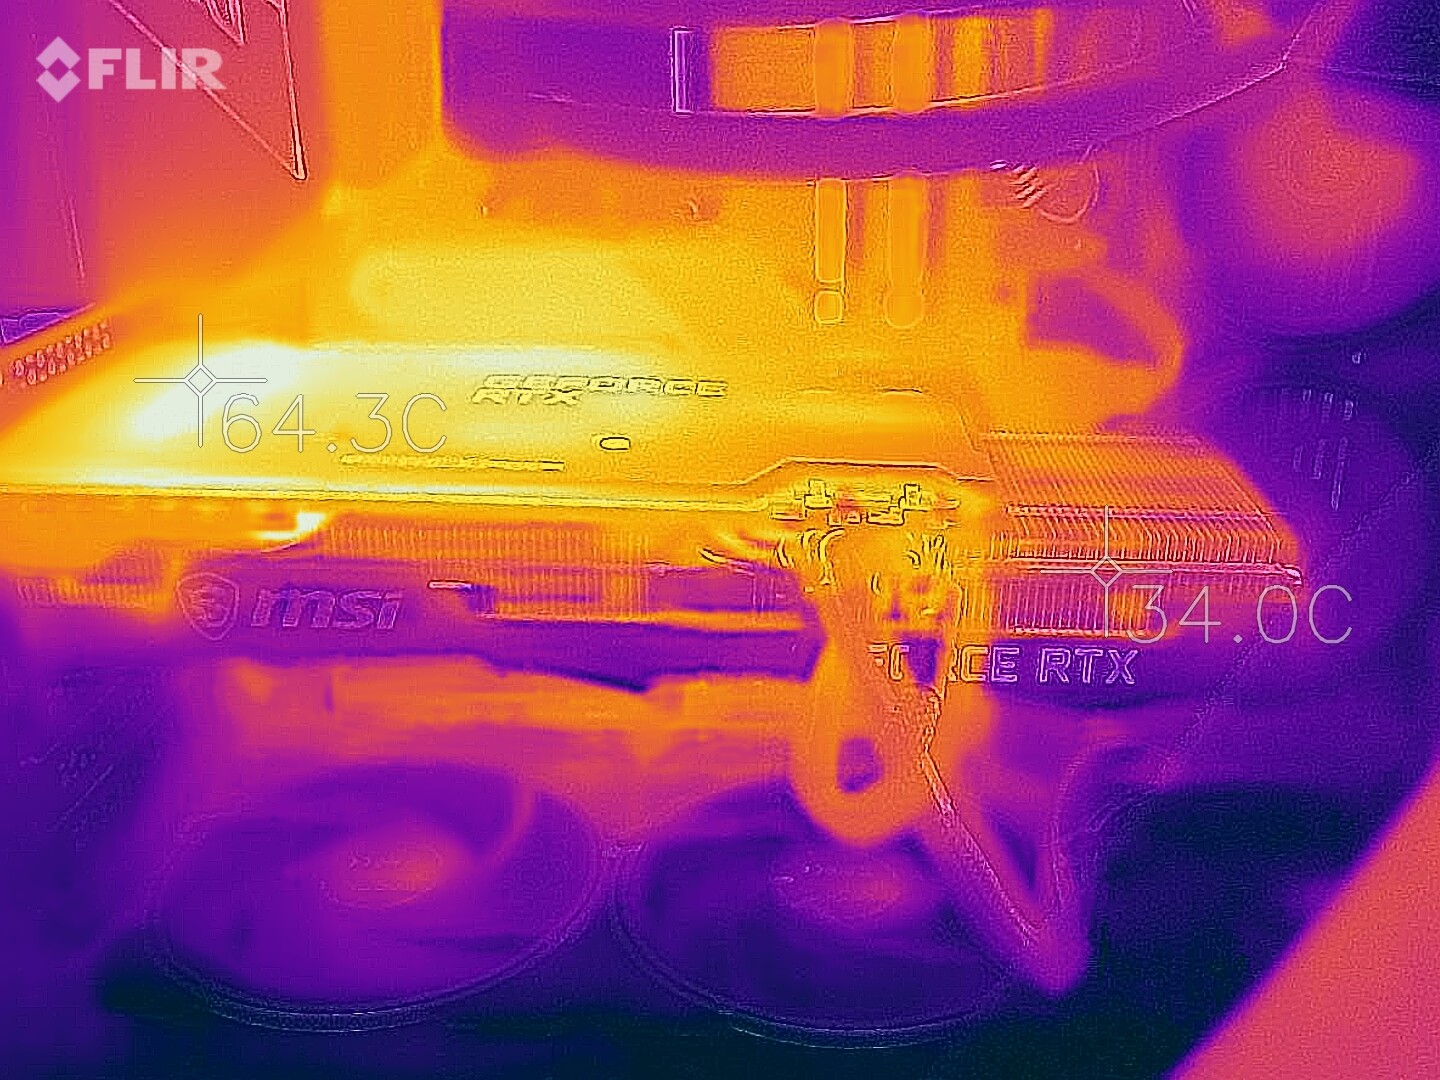
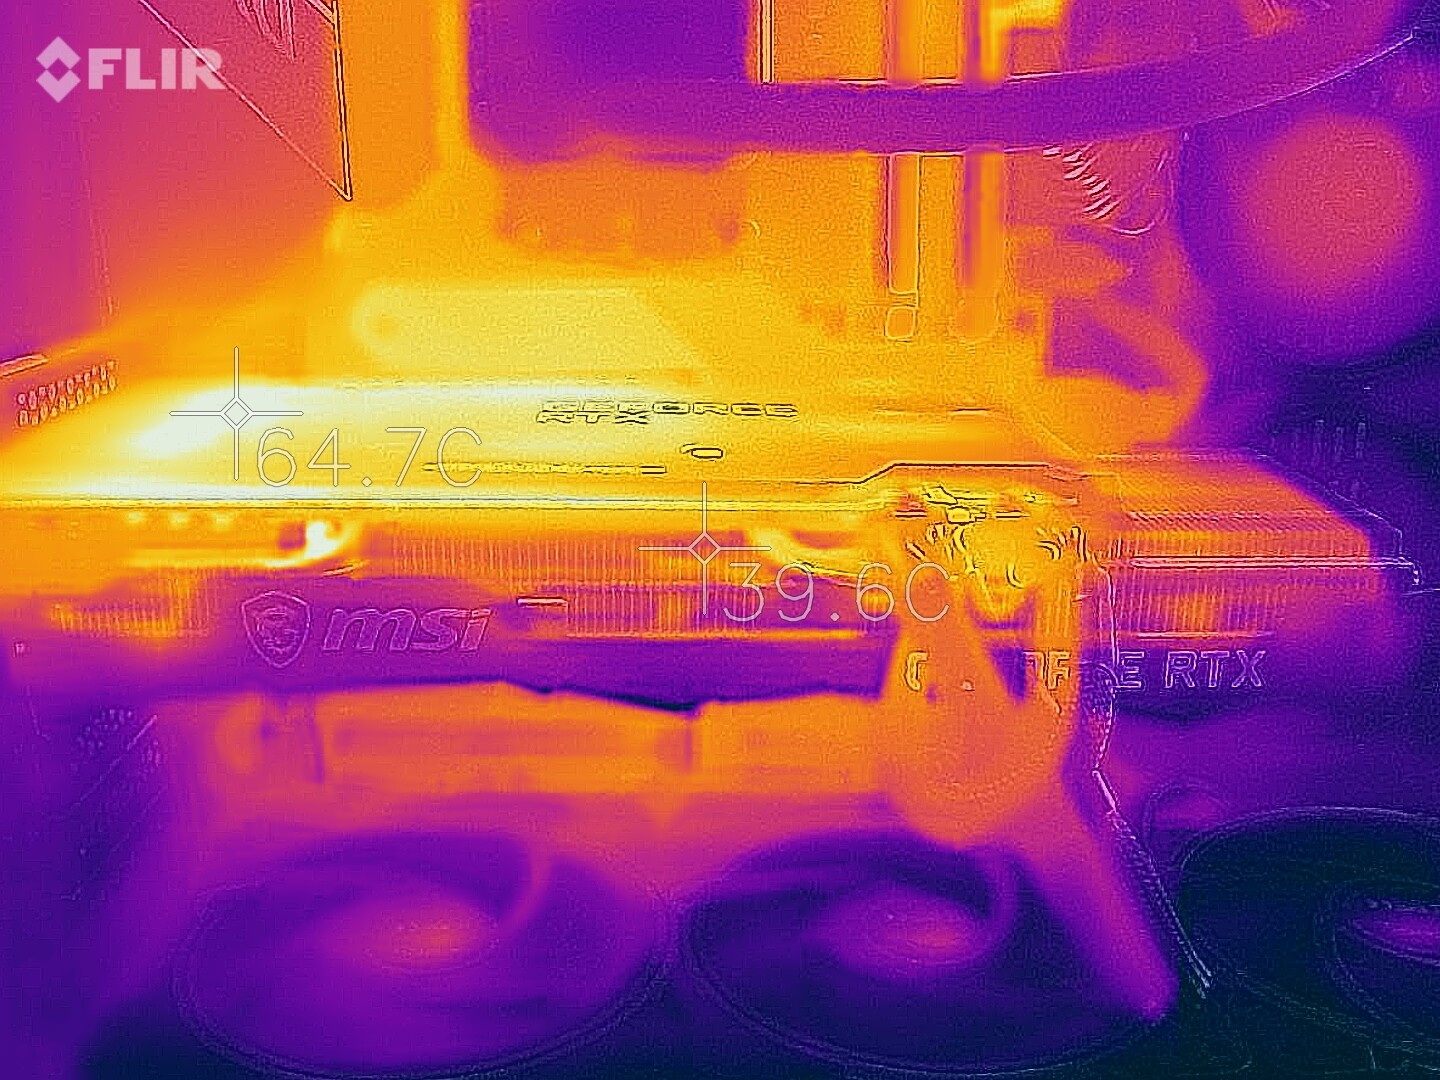
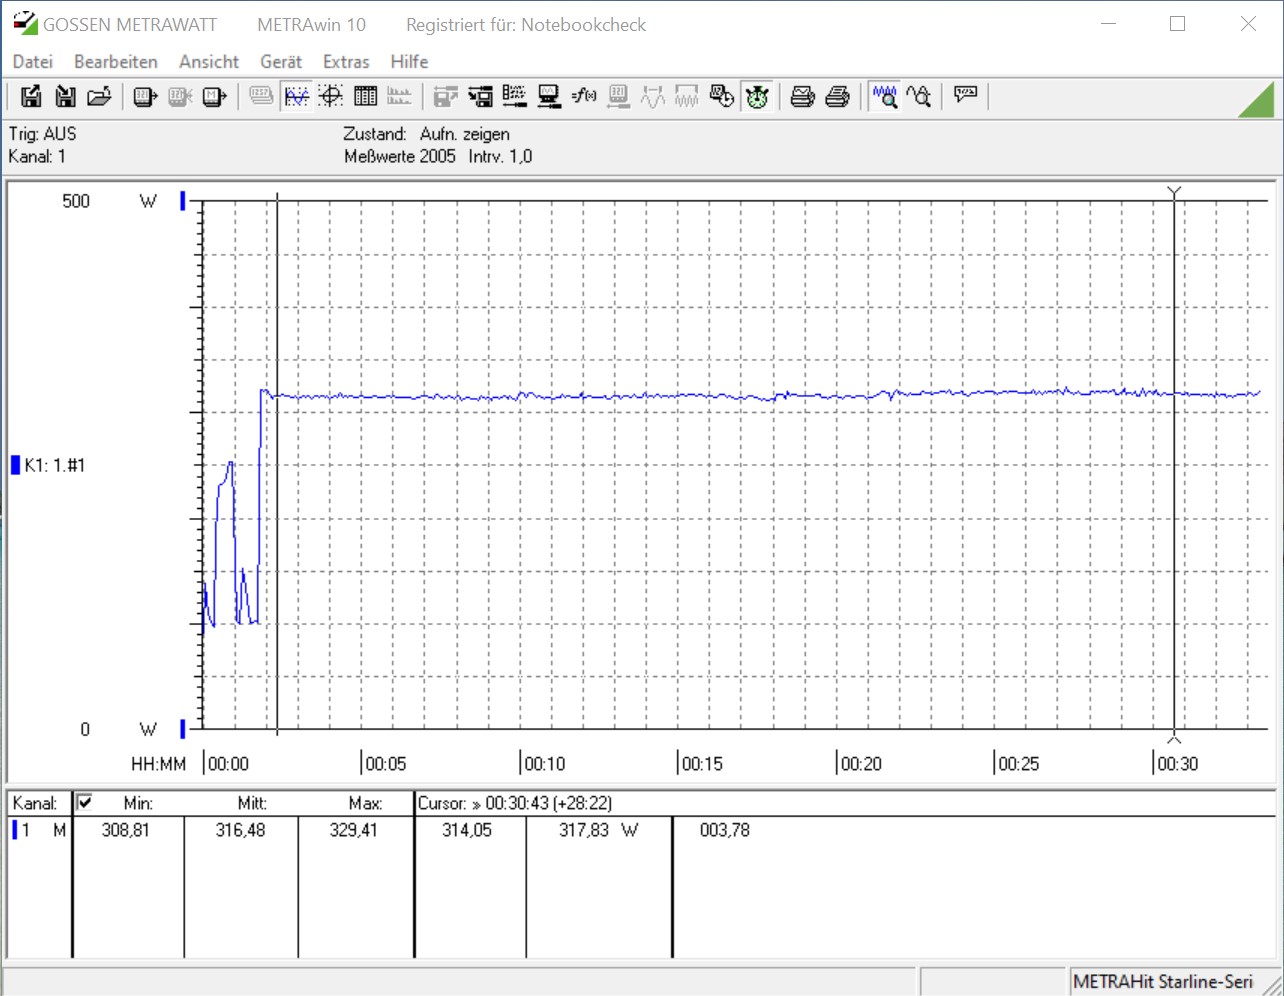
La GeForce RTX 3070 Ventus 3X OC di MSI può convincere tutti in termini di emissioni. Secondo il produttore, la scheda grafica è leggermente più frugale di una GeForce RTX 2080 Ti con 220 watt e alla pari con il modello di fascia alta della generazione Turing in termini di prestazioni. Nel nostro sistema di test, questo significa un consumo di potenza a vuoto di 91 watt e una media di 336 watt nello stress test. Abbiamo anche misurato una media di soli 316 watt durante il gaming, che è un risultato davvero buono in confronto.
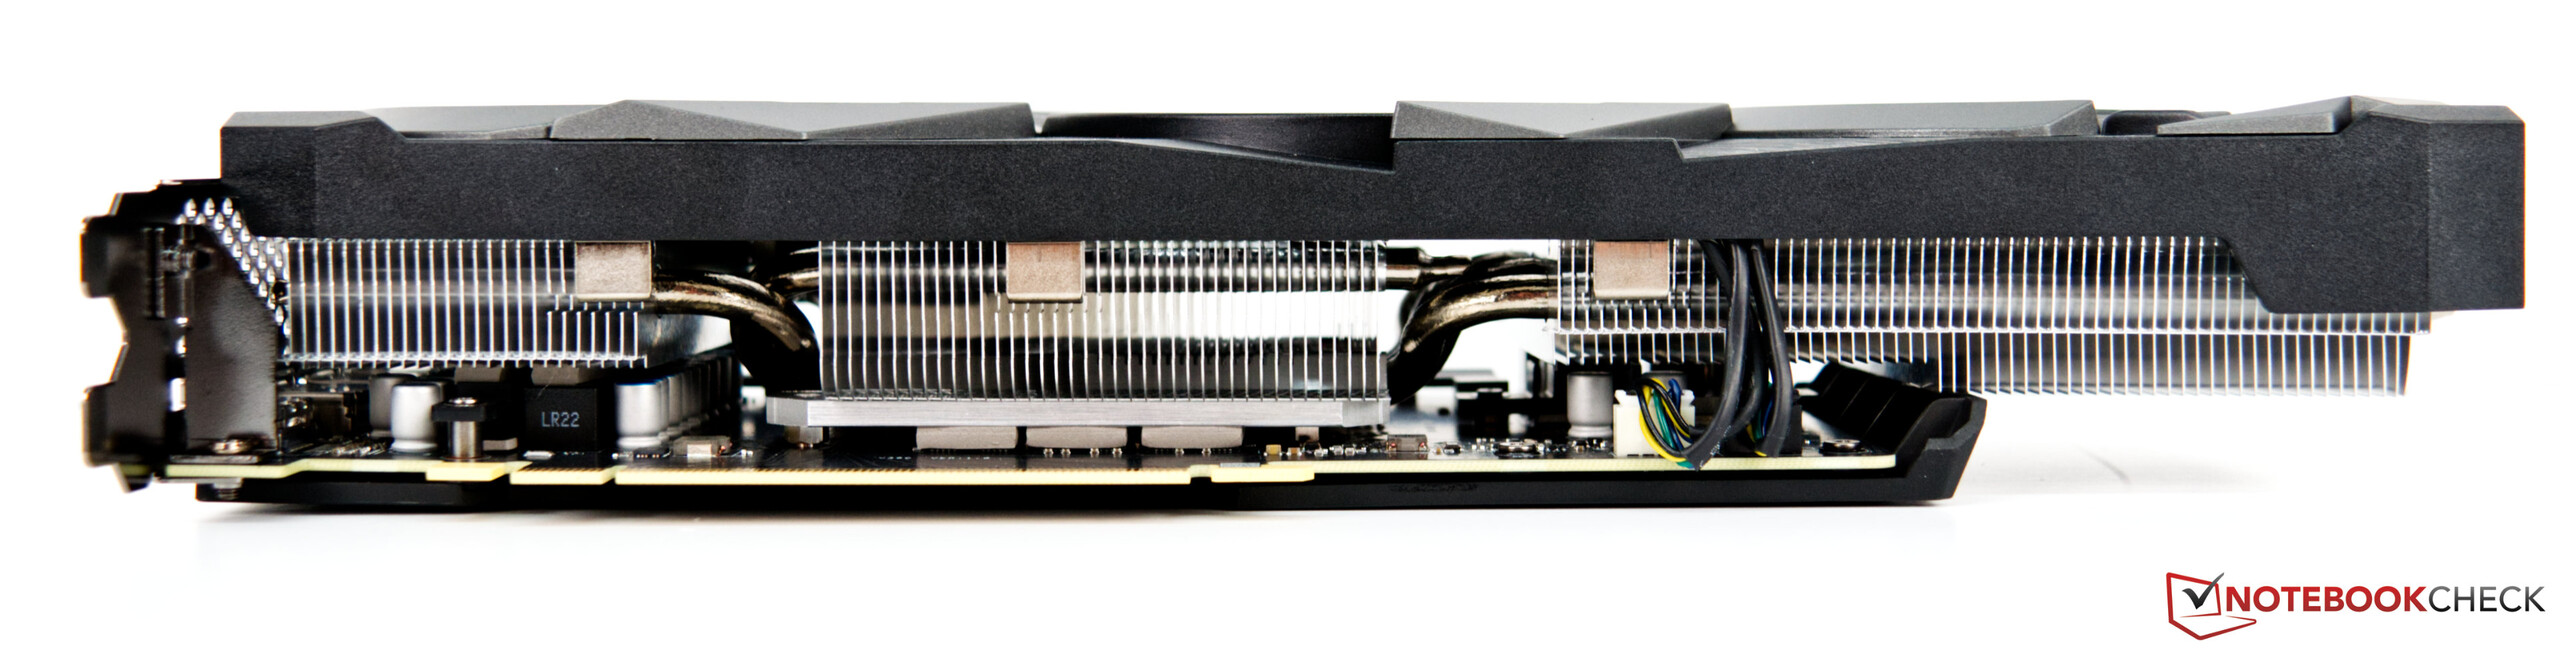
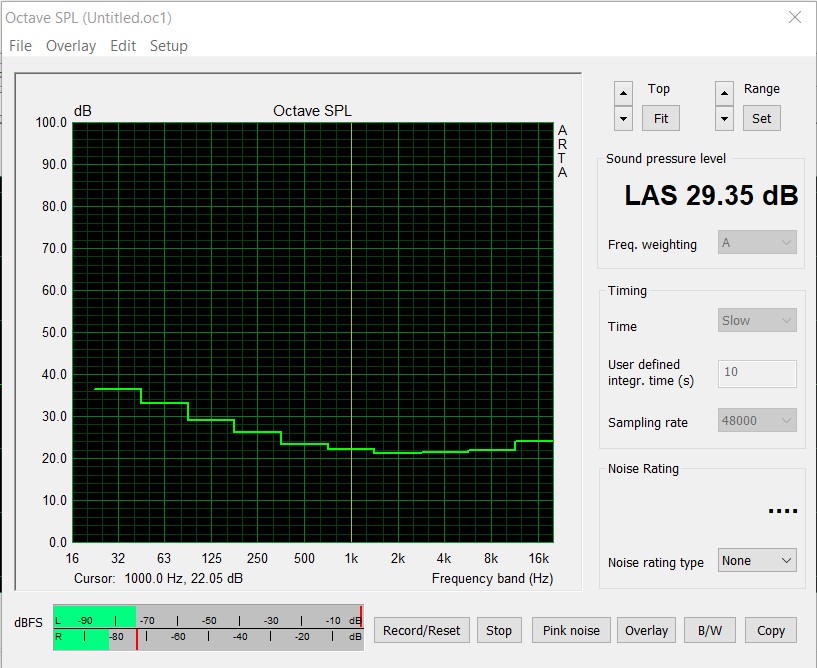
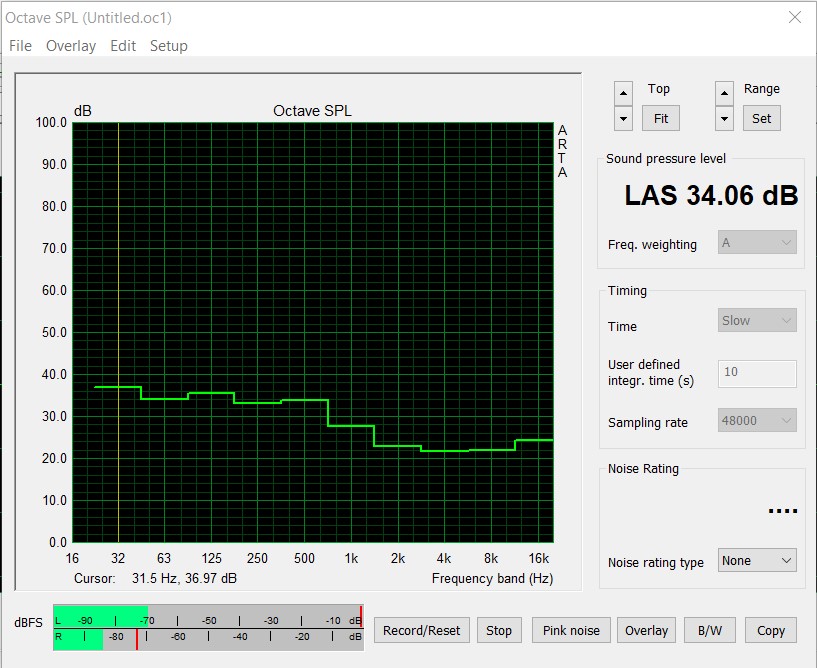
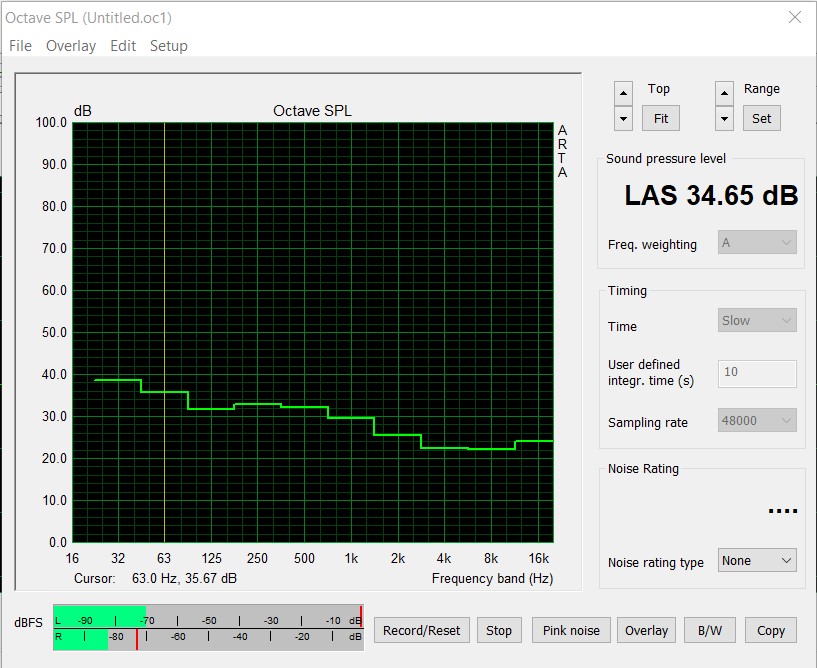
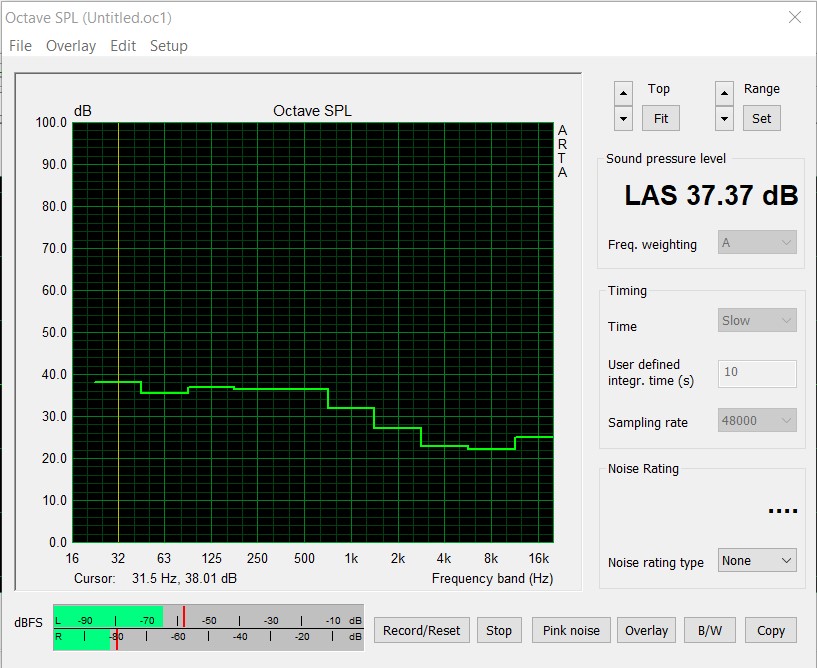
In termini di emissioni acustiche, anchel'MSI GeForce RTX 3070 Ventus 3X OC è altamente raccomandabile. Durante lo stress test, abbiamo misurato 34,6 dB(A) ad una distanza di 20 centimetri (~8 in) dal case. Qui, abbiamo spento tutte le ventole del caso per registrare solo la scheda grafica. Se riaccendiamo le ventole del case, il livello di rumore aumenta a 37,3 dB(A) durante lo stress test, che è comunque un ottimo risultato. La velocità delle ventole della scheda grafica è stata di poco inferiore a 1.500 giri al minuto, che corrisponde al 44%. Con un massimo di 65 °C (149 °F), il nostro modello di prova è rimasto relativamente fresco anche sotto carico. Anche se il sistema di raffreddamento installato sembra un po' economico rispetto alla variante Gaming X Trio, ha ottenuto ottimi risultati con RTX 3070 Ventus 3X OC.
* ... Meglio usare valori piccoli
Pro
Contro
Conclusione - Veloce, silenziosa e con basse emissioni
L'MSI GeForce RTX 3070 Ventus 3X OC è una scheda grafica moderna e veloce senza molti fronzoli ed è anche abbastanza veloce per gestire tutti i titoli attuali nel 1440p. Questo modello domina parzialmente anche le partite in 4K, anche se qui bisogna guardare di partita in partita.
Se si confrontano le prestazioni con la generazione Turing, la GeForce RTX 3070 è alla pari con una GeForce RTX 2080 Ti, che è stato offerta con un prezzo di 1.249 Euro (~$1516) al momento del rilascio. Per il nostro modello di MSI, il prezzo è ora di 529 Euro (~$642). Purtroppo, questi prezzi sono solo indicativi al momento, perché la situazione del mercato è molto tesa dall'uscita delle nuove schede grafiche Ampere. Questo naturalmente ha un impatto sul prezzo, che è poco meno di 800 Euro (~$971) per il nostro modello di prova al momento del test. Quindi, se non avete assolutamente bisogno di una nuova scheda grafica, dovreste avere pazienza fino a quando Nvidia e i partners della scheda non saranno in grado di consegnare le schede grafiche in quantità sufficiente. Solo allora ci si può aspettare che la situazione attuale si semplifichi. D'altra parte, le cose non sembrano andare meglio per AMD.
Con l'MSI GeForce RTX 3070 Ventus 3X OC, si ottiene una scheda grafica Ampere veloce e moderna che convince in termini di emissioni.
Ma torniamo alla scheda grafica. Nel complesso, l'MSI GeForce RTX 3070 Ventus 3X OC offre una buona performance e può anche convincere completamente in termini di emissioni. La modalità fan-stop assicura un funzionamento silenzioso a basso carico, che piacerà ai fanatici del silenzio.
L'unico vero punto critico che possiamo citare è il prezzo. Tuttavia, si dovrebbe tenere conto anche della lunghezza della scheda grafica, perché in questo caso si potrebbero escludere i case compatti. Se state pensando di acquistare una RTX 3070, dovreste almeno scegliere un modello da 750 watt per l'alimentazione.
Tutti i benchmarks e i valori di prova dell'RTX 3070 si trovano sulla pagina della scheda grafica del sito GeForce RTX 3070 (continuamente aggiornato).
