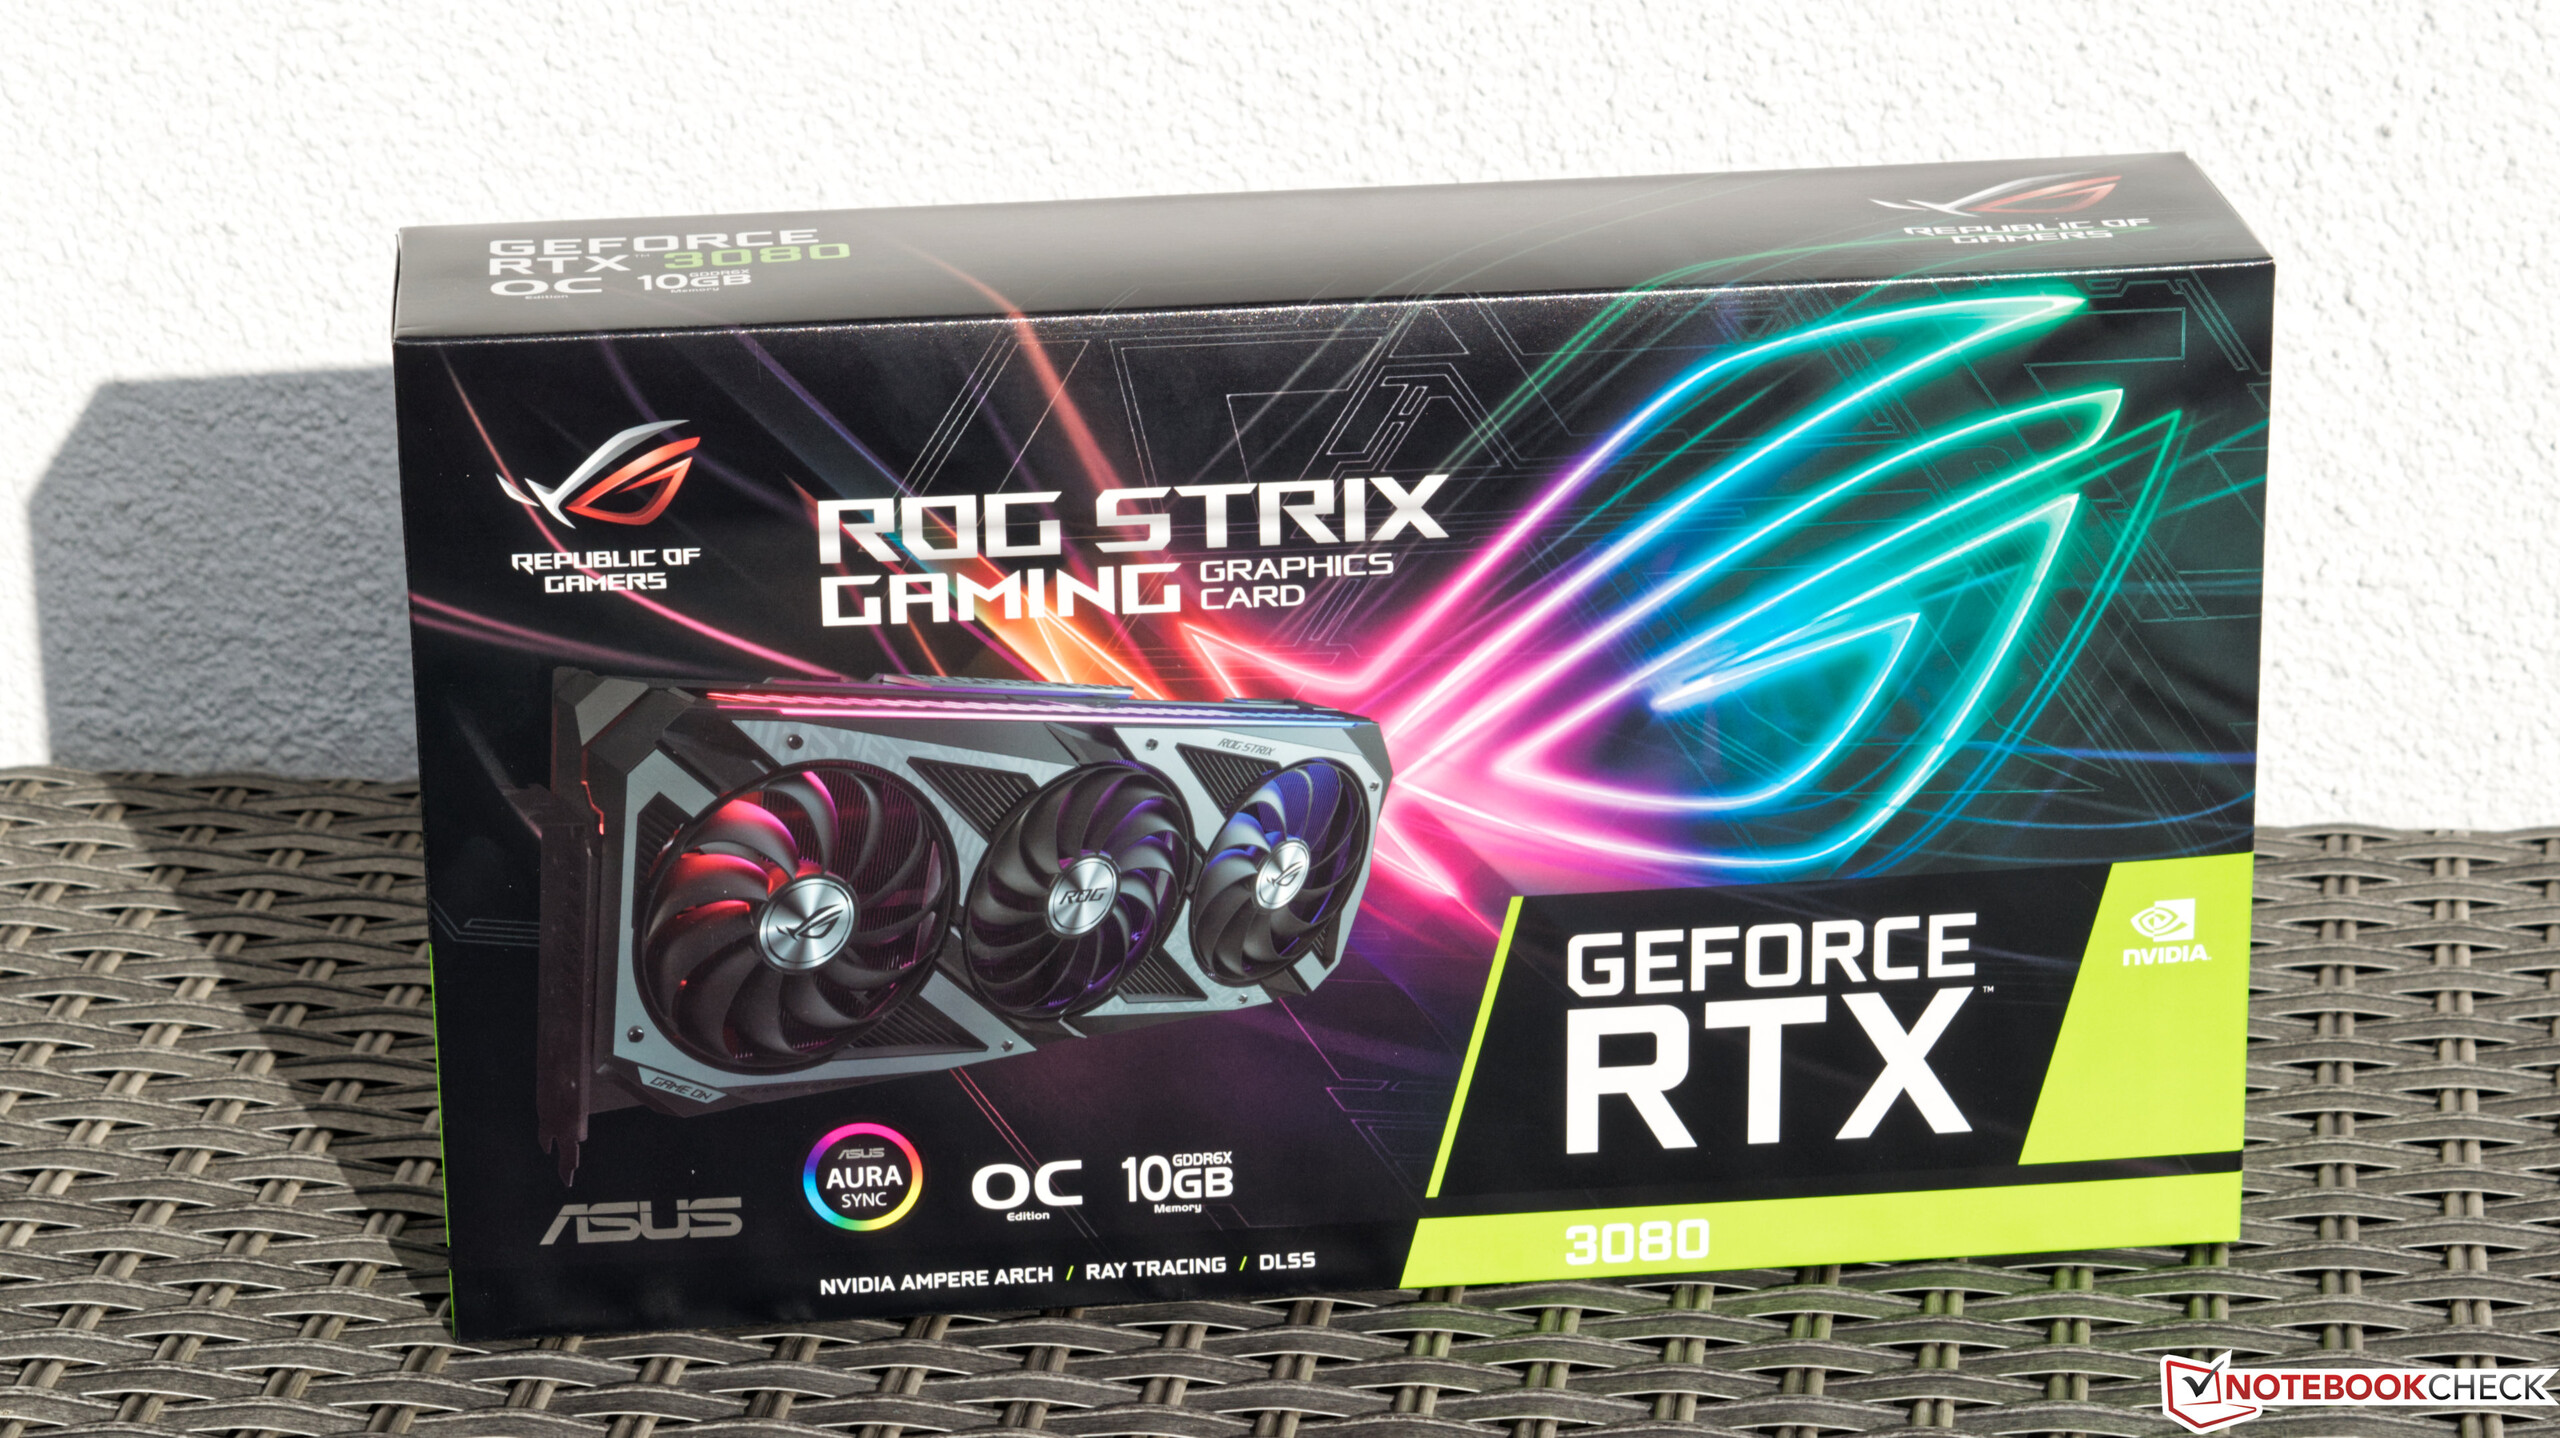
Recensione della GPU desktop Asus GeForce RTX 3080 ROG Strix Gaming OC
Il segmento dei server ha iniziato a beneficiare della nuova architettura Ampere delle schede grafiche Nvidia all'inizio del 2020. Circa sei mesi dopo, sono seguiti i modelli consumer, che dovrebbero portare una ventata d'aria fresca al mercato delle schede grafiche desktop. Tuttavia, dopo l'introduzione della nuova serie RTX 3000, il disincanto è stato molto grande, perché il gran numero di ordini non era e non è ancora in grado di essere completamente coperto.
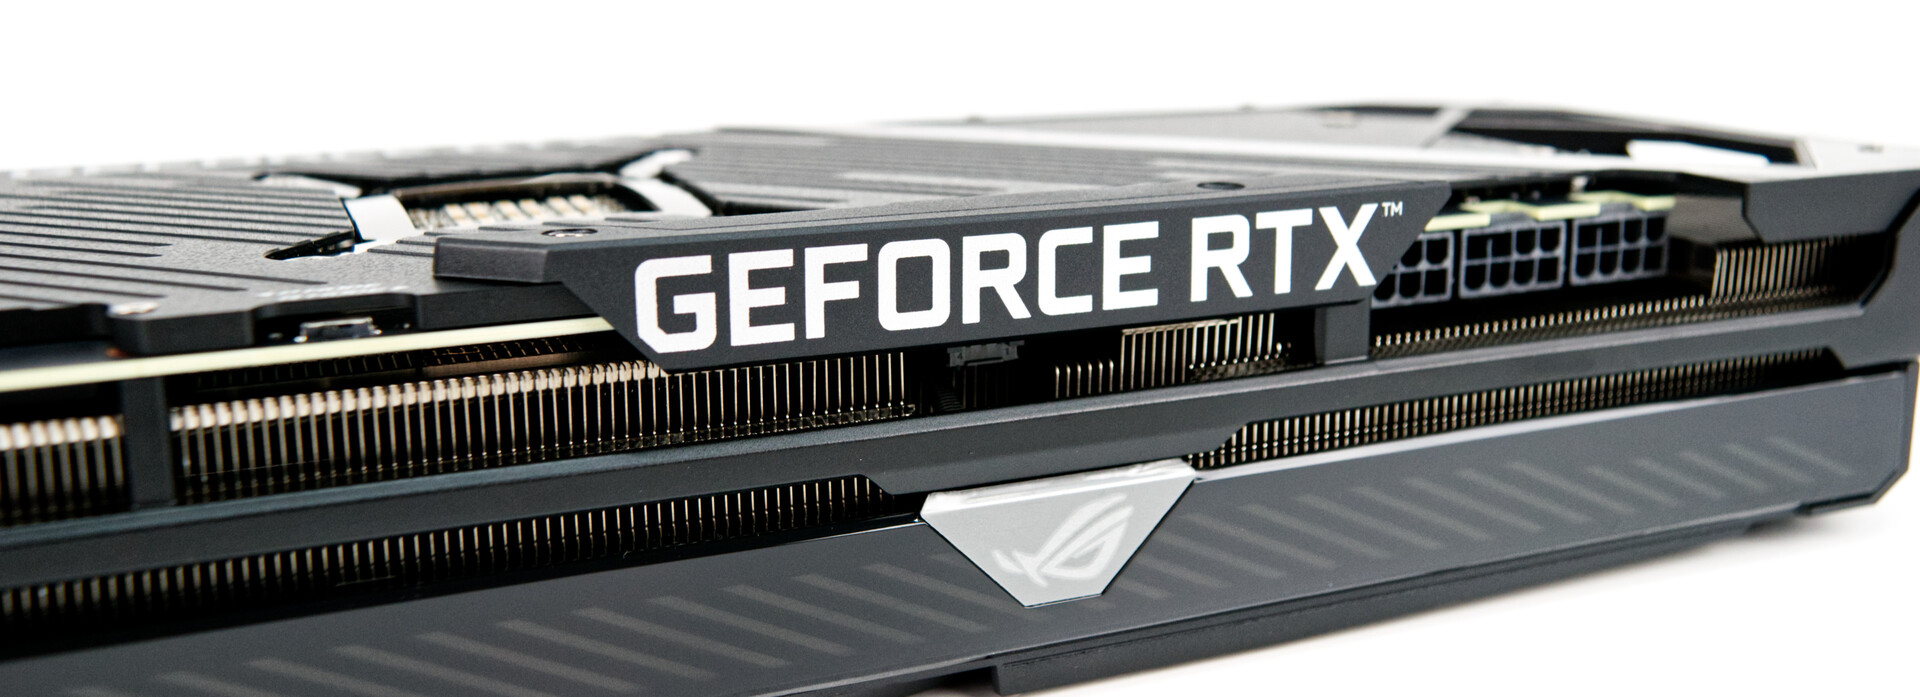
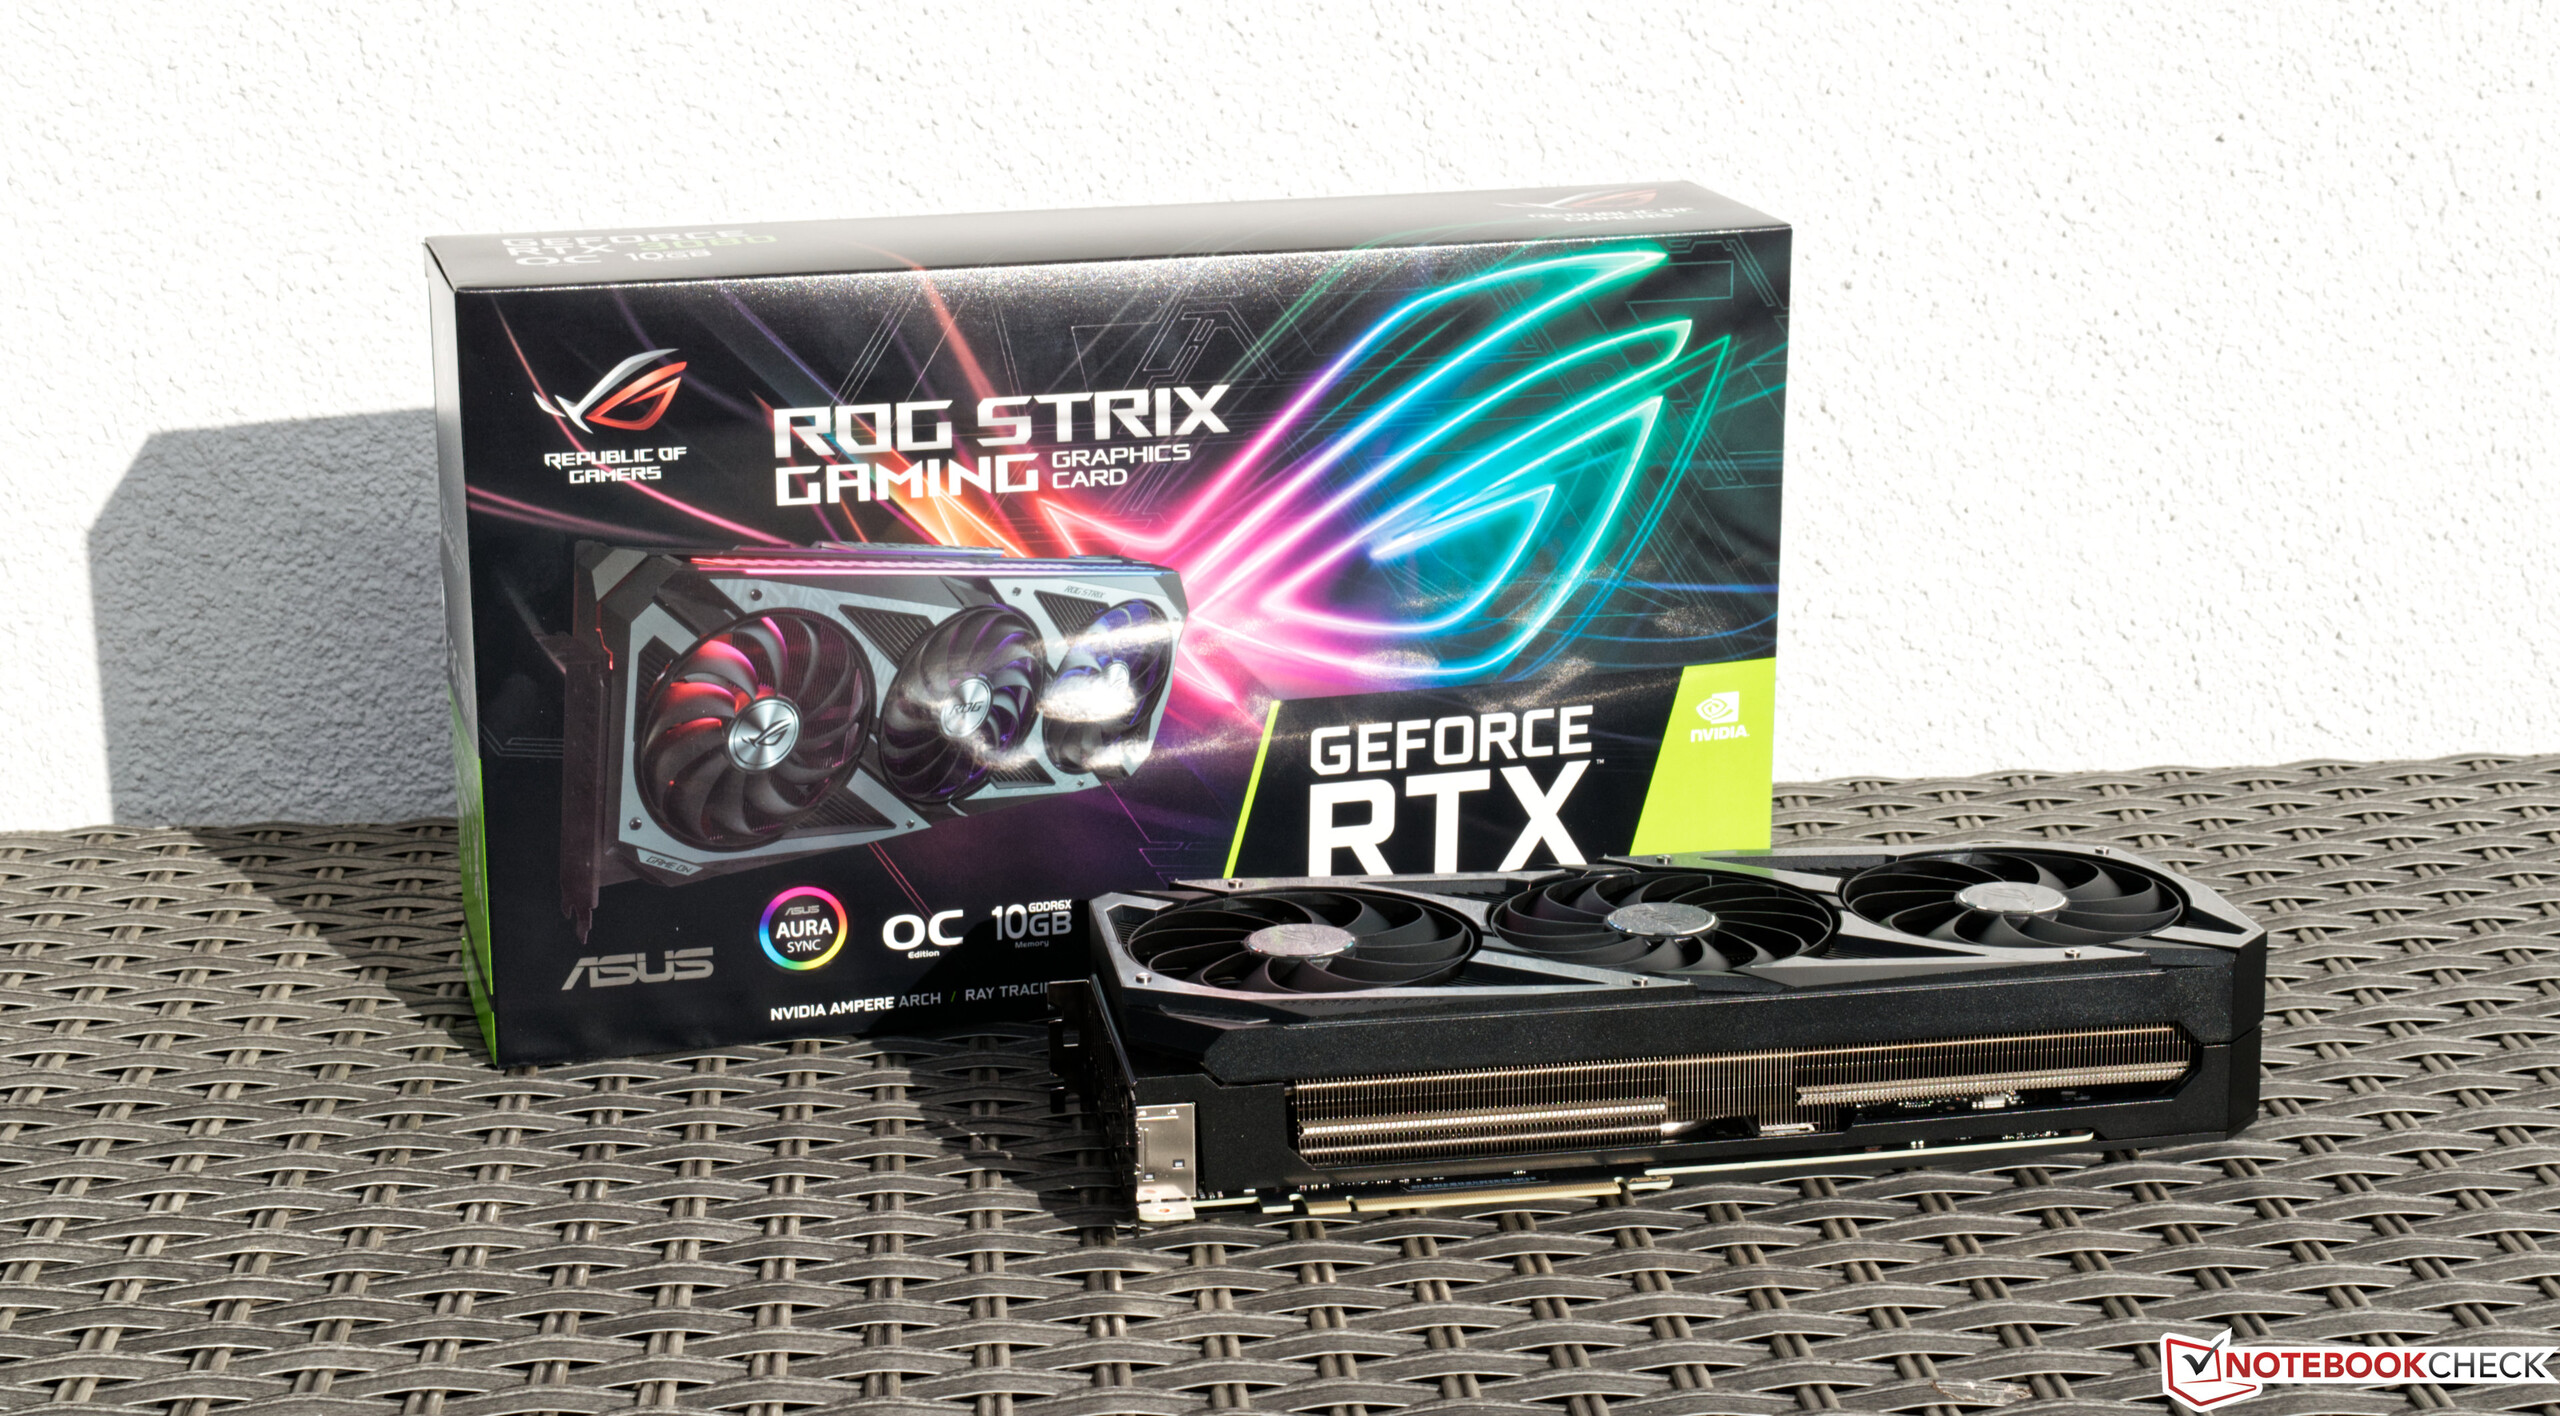
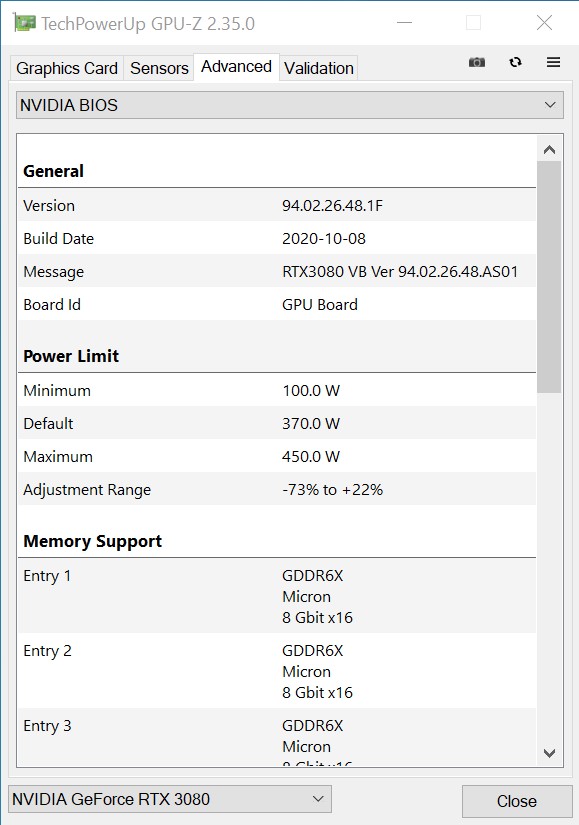
Coloro che sono stati in grado di assicurarsi un modello delle nuove schede grafiche Nvidia saranno ricompensati con ottime prestazioni; possiamo rivelarlo con molto anticipo. Per questa recensione, tuttavia, abbiamo ricevuto un modello di prova da Asus, che si differenzia notevolmente dall'edizione dei Founders. Ma nulla è cambiato per quanto riguarda la base del chip GA102 Ampere. Lo stesso vale per il VRAM, che è identico a 10 GB GDDR6X su tutti i modelli RTX 3080. Asus concede alla GeForce RTX 3080 ROG Strix Gaming OC un po' più di margine di manovra quando si tratta di potenziare, però - parliamo di quasi 200 MHz rispetto alla Nvidia's Founders Edition.
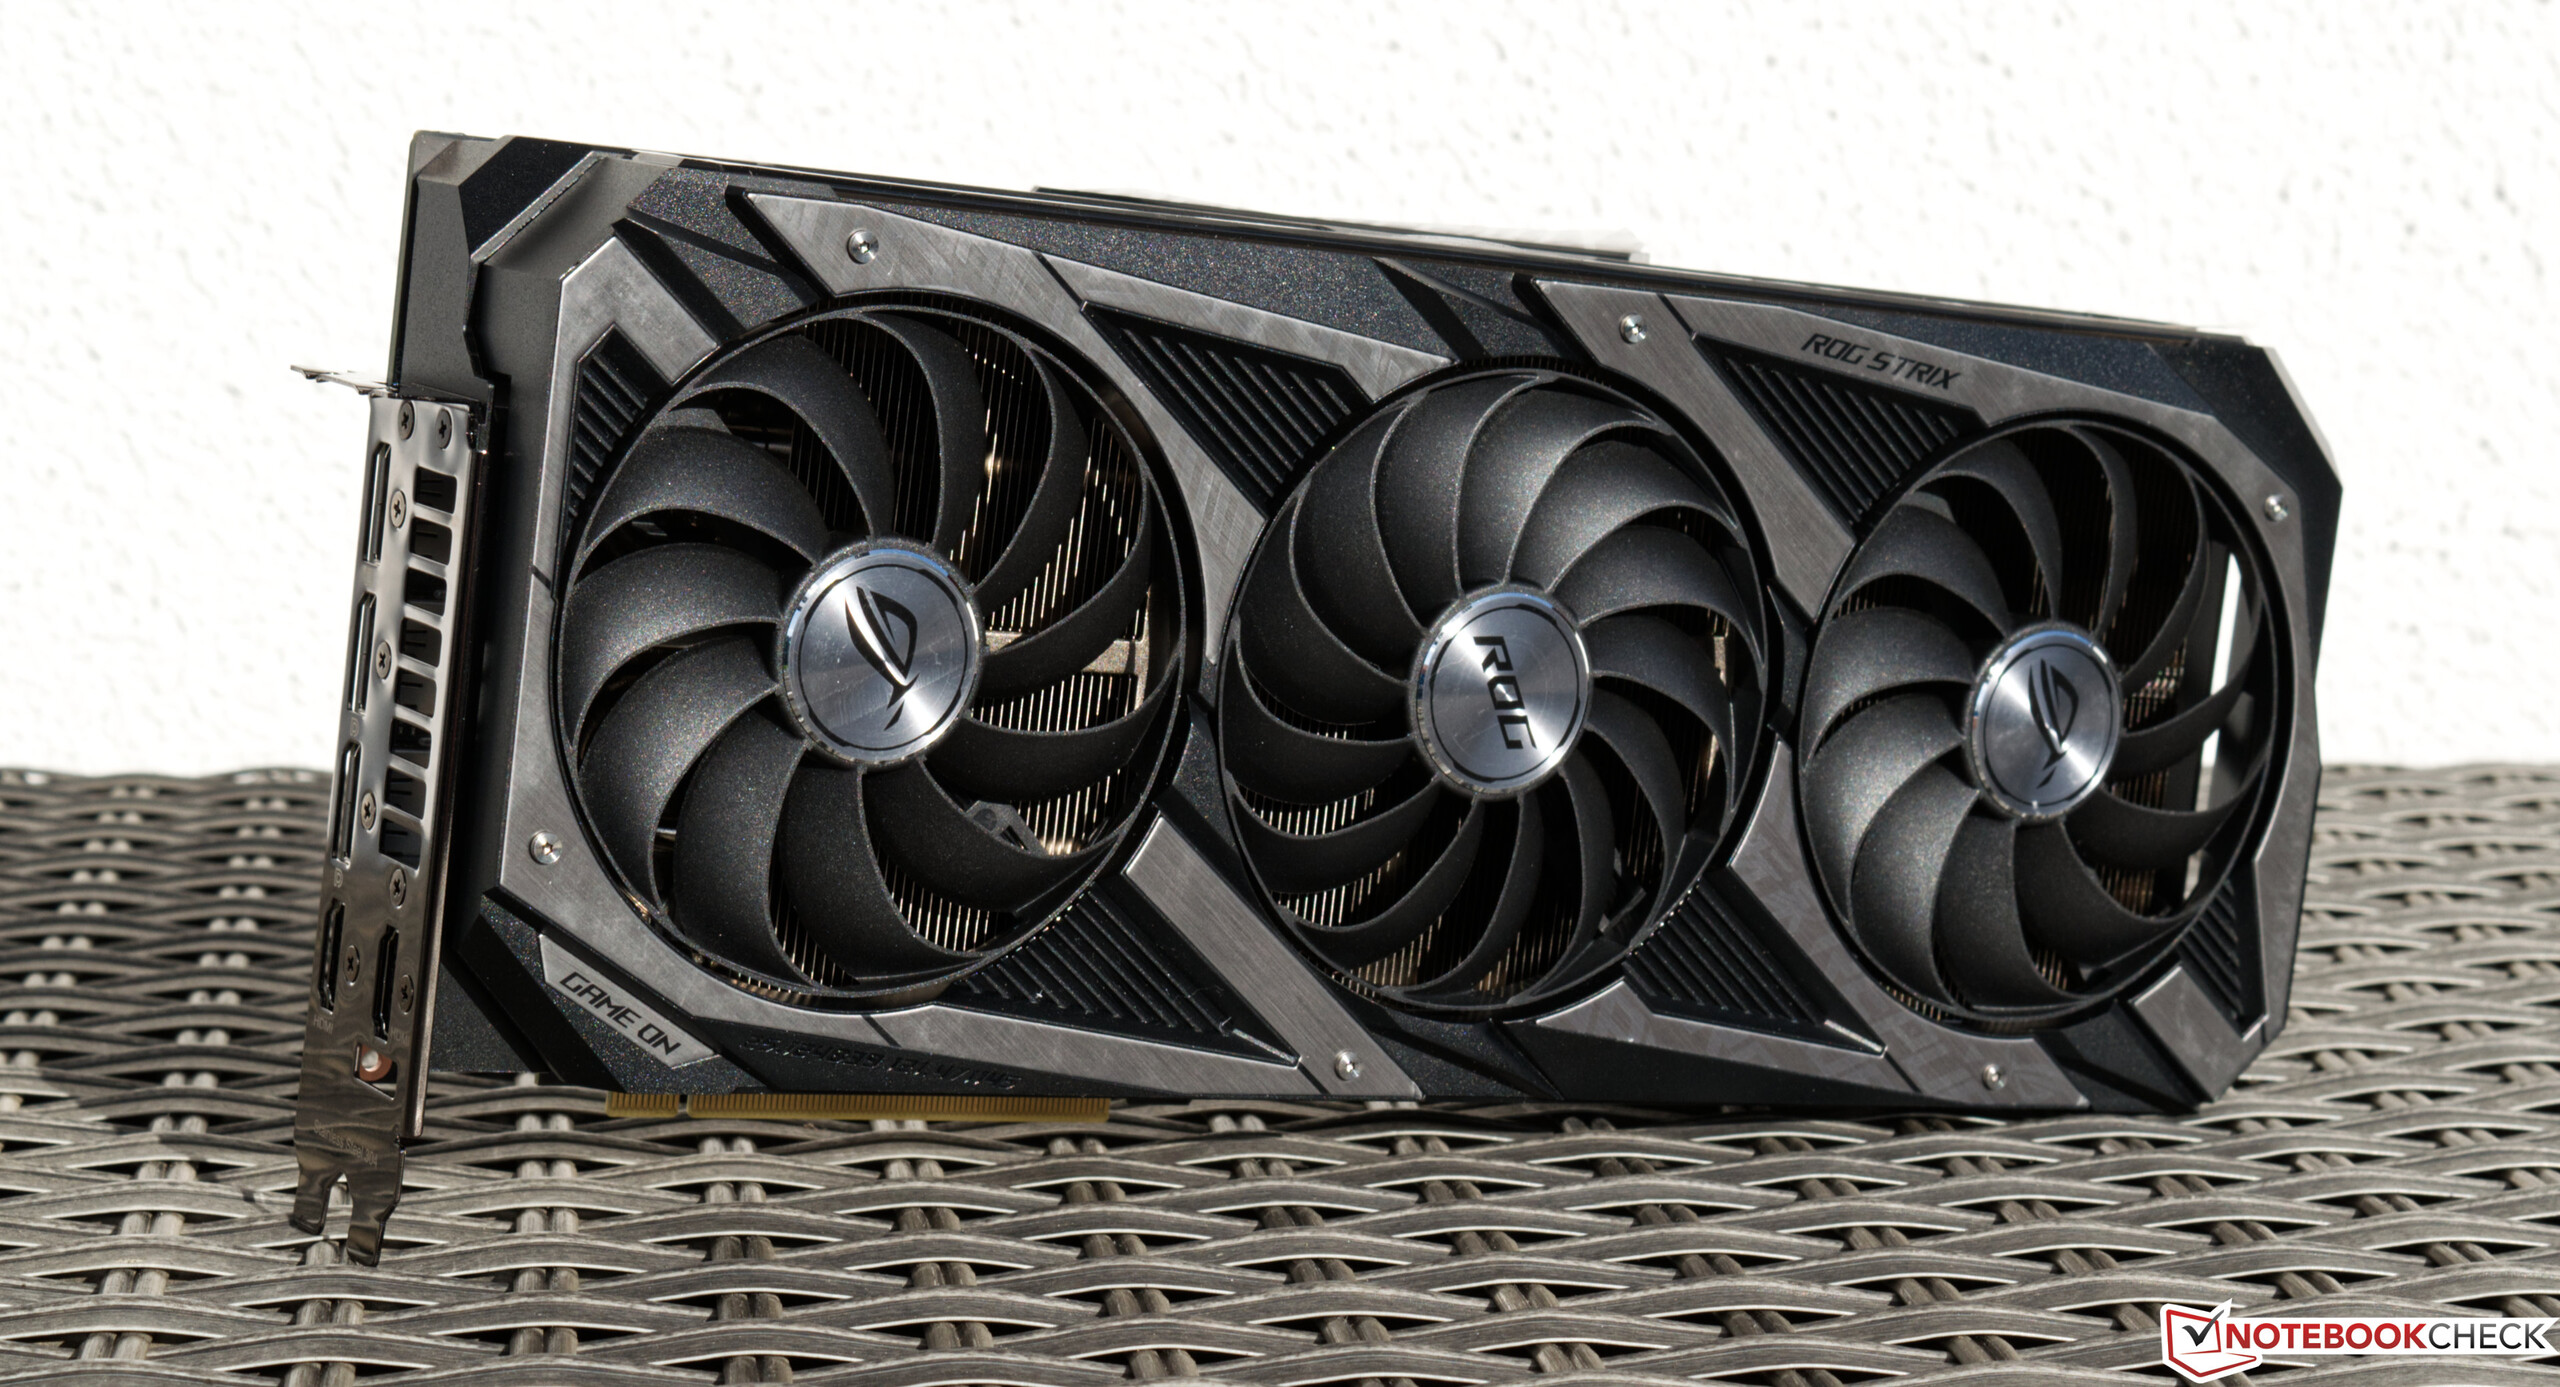
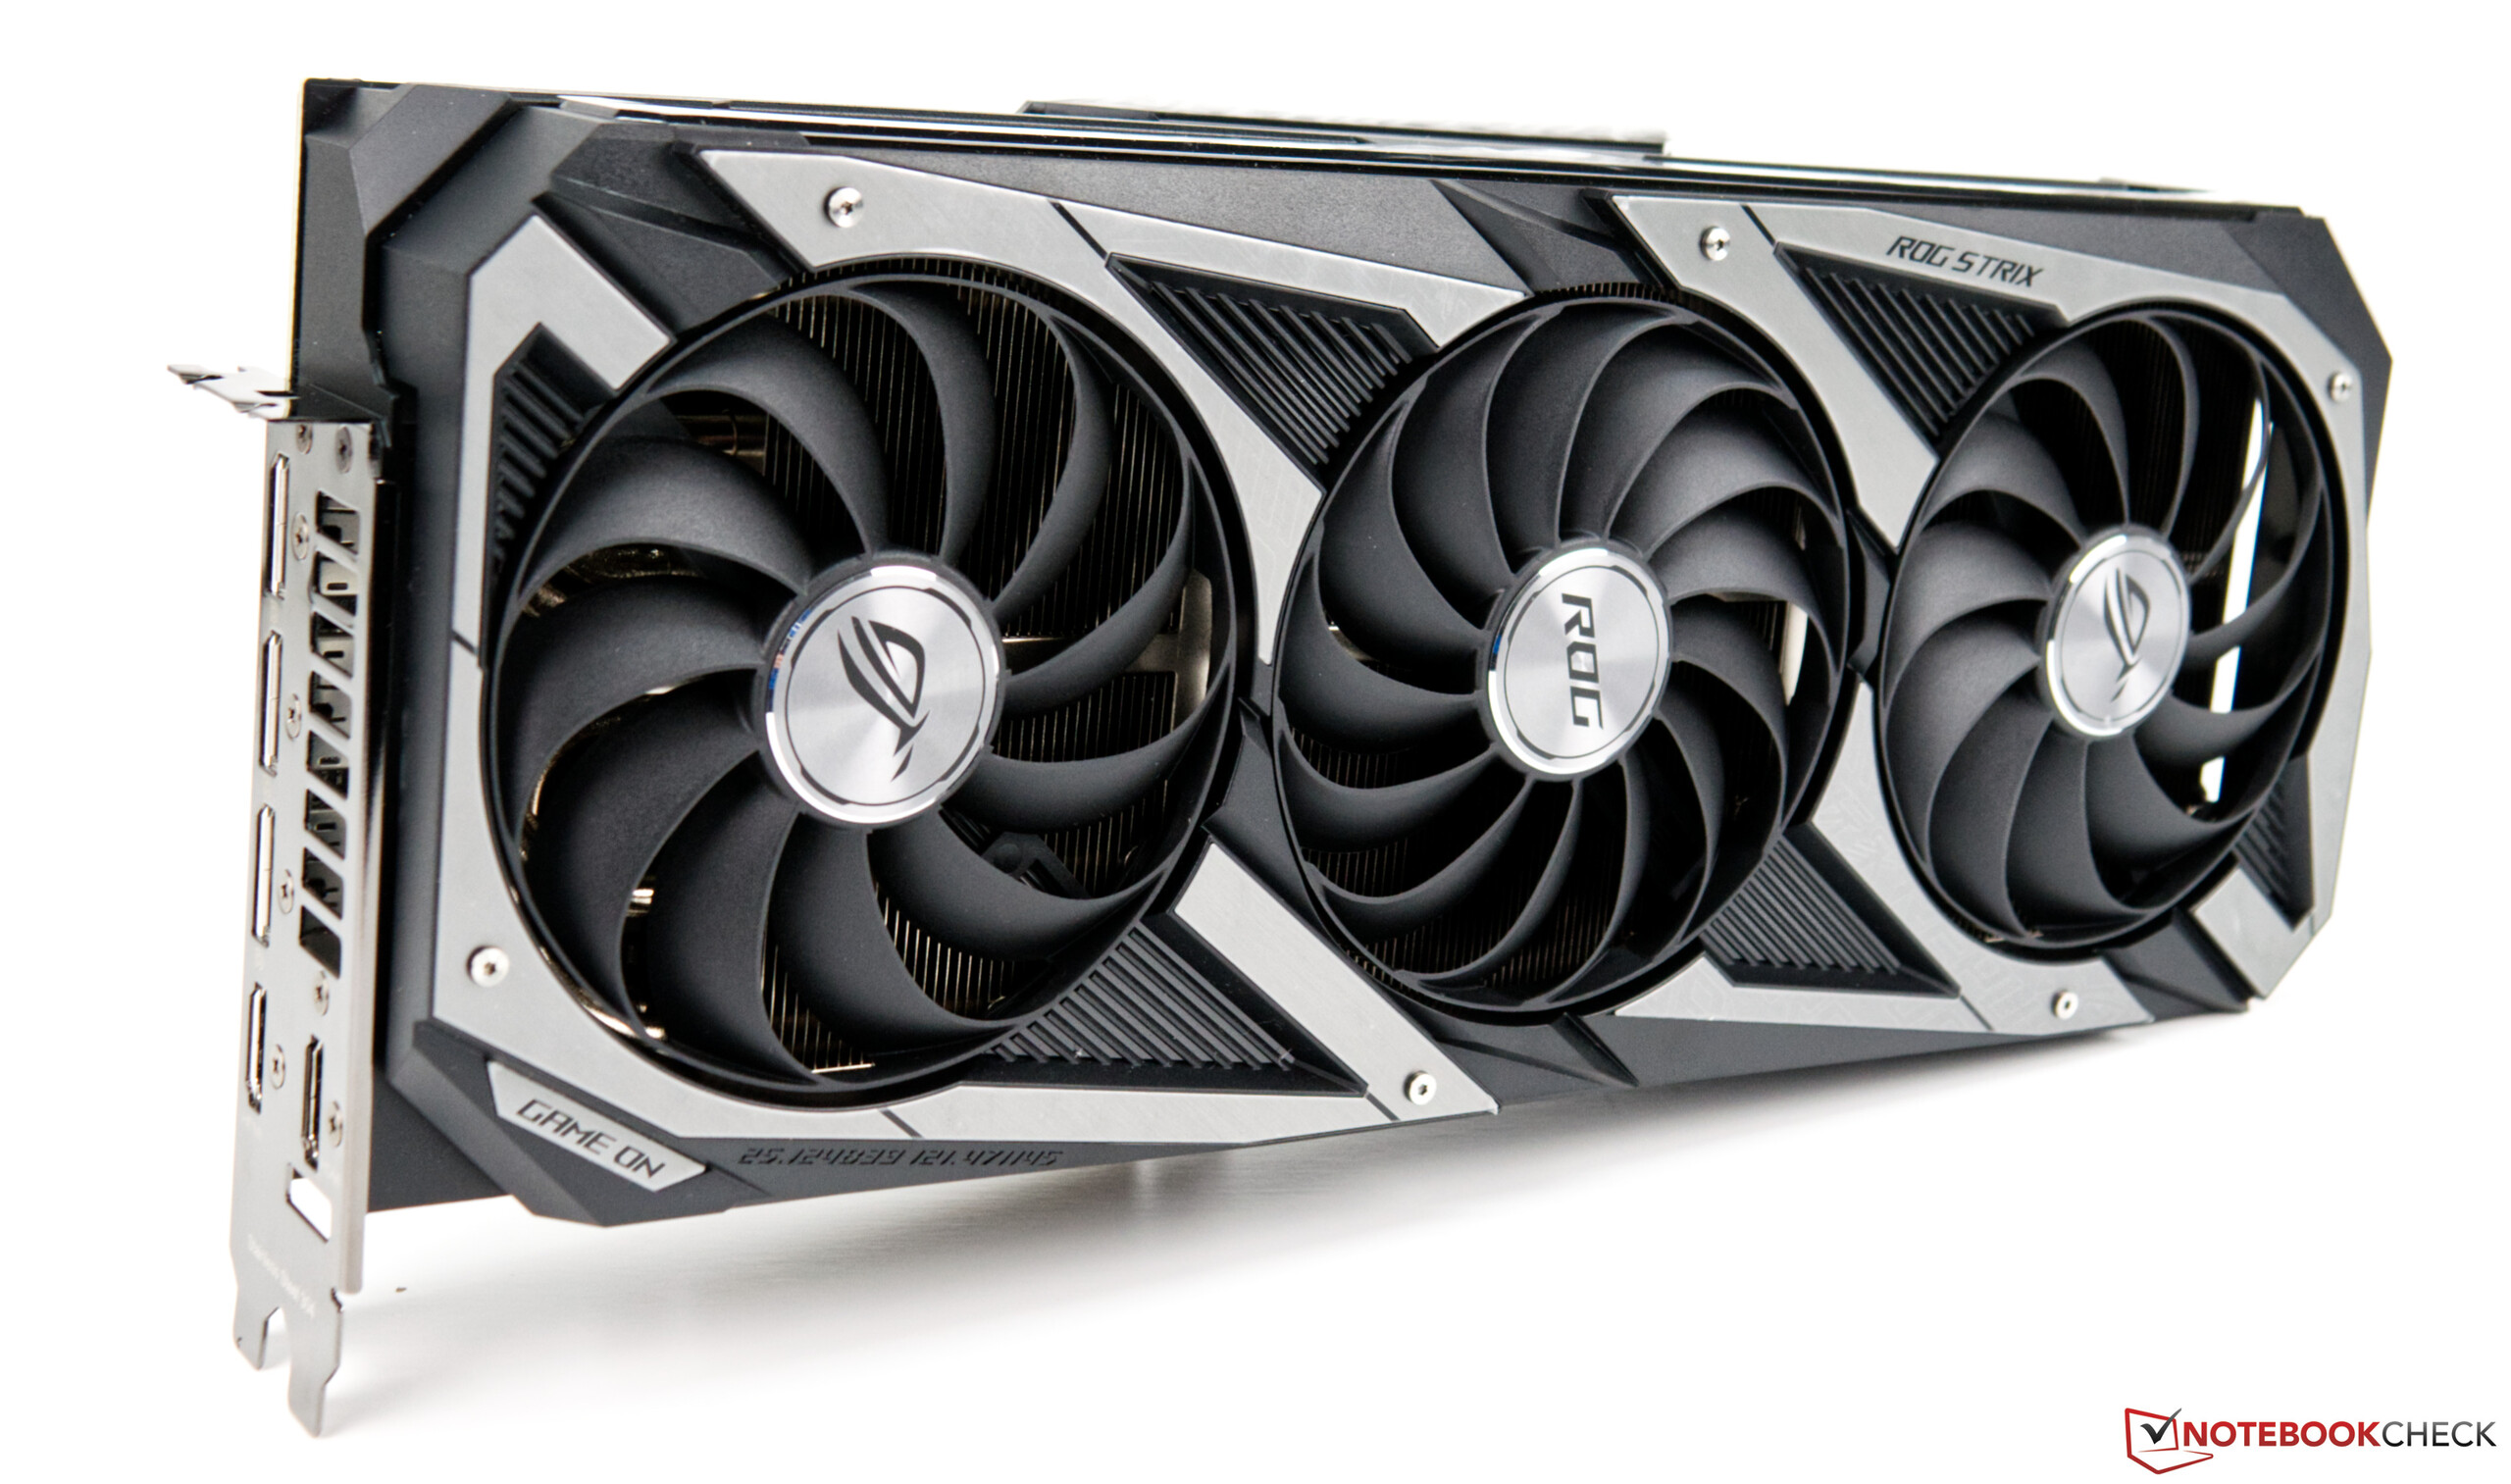
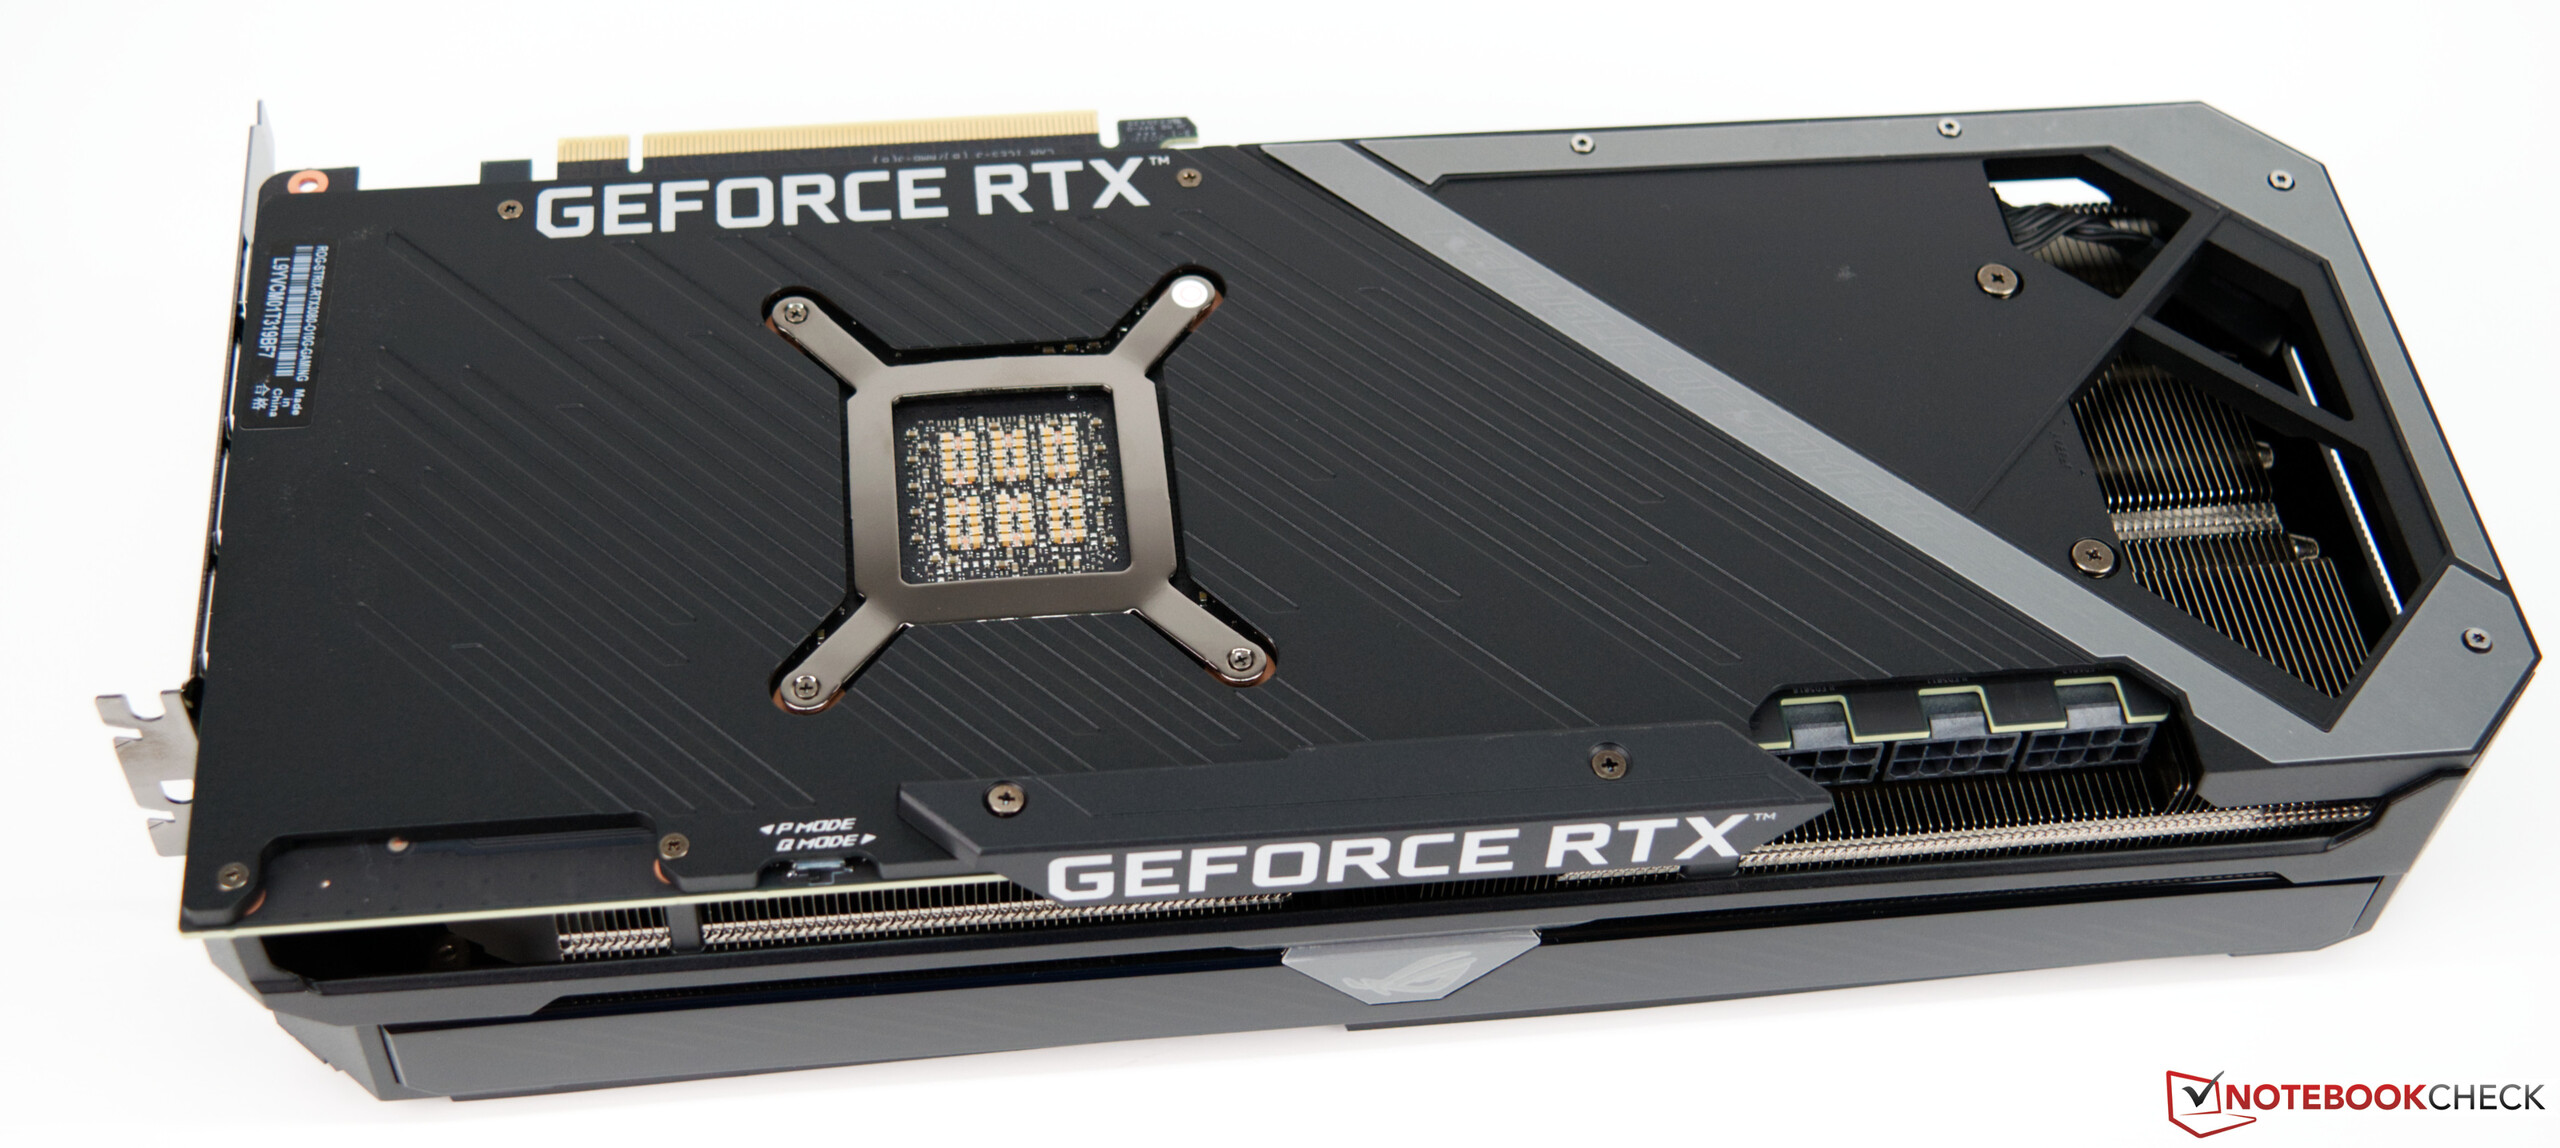
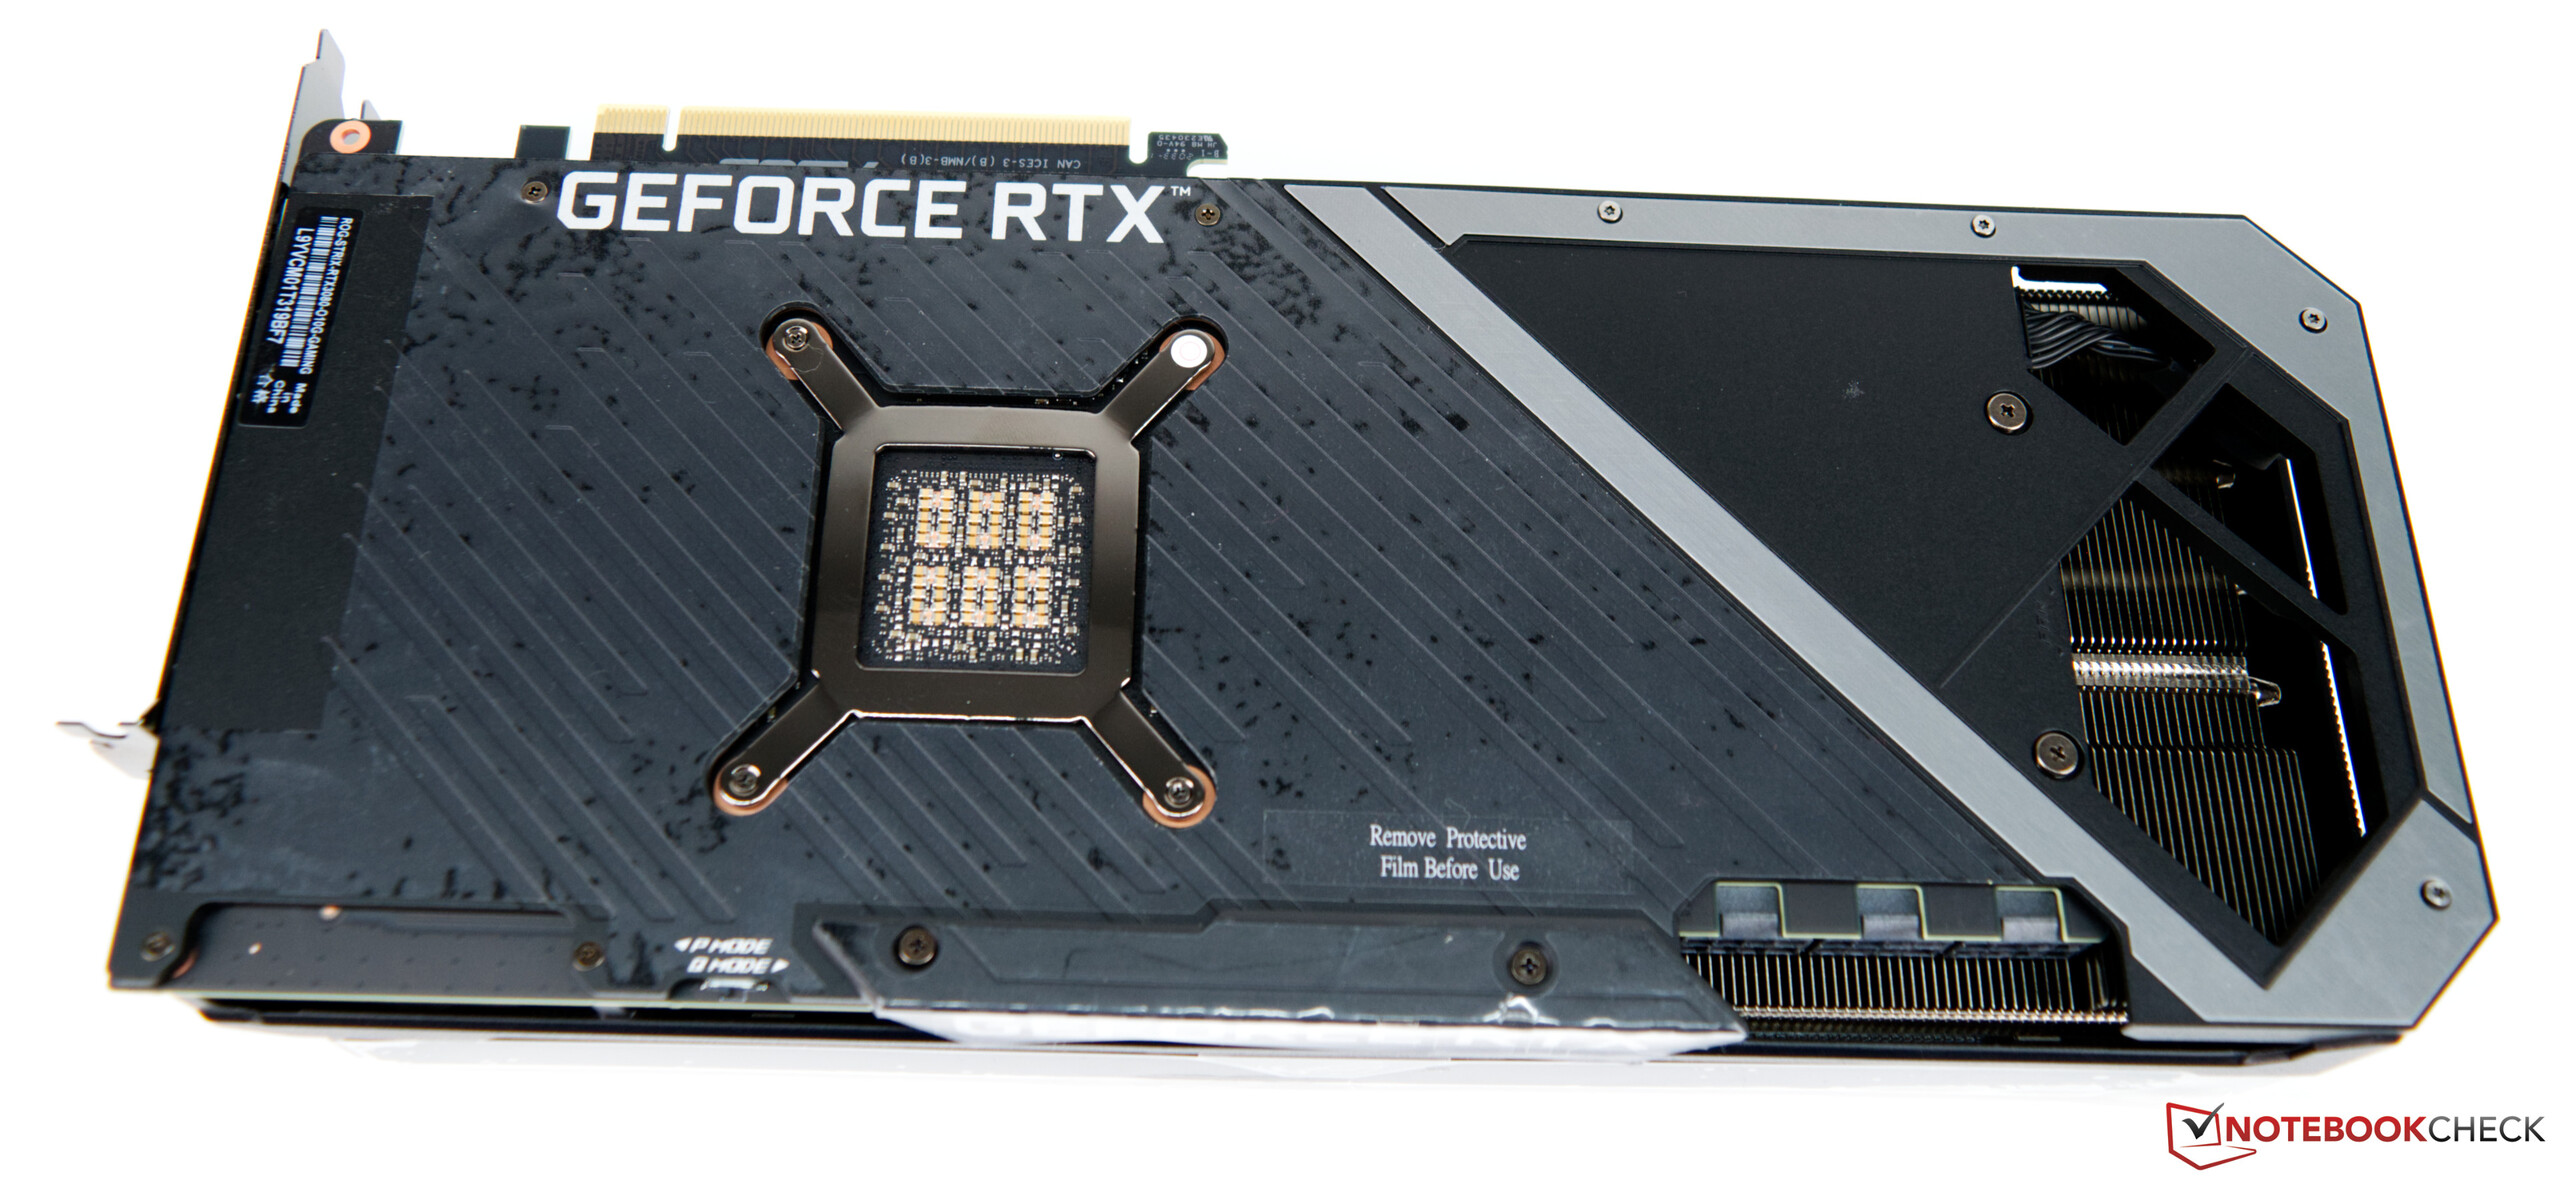
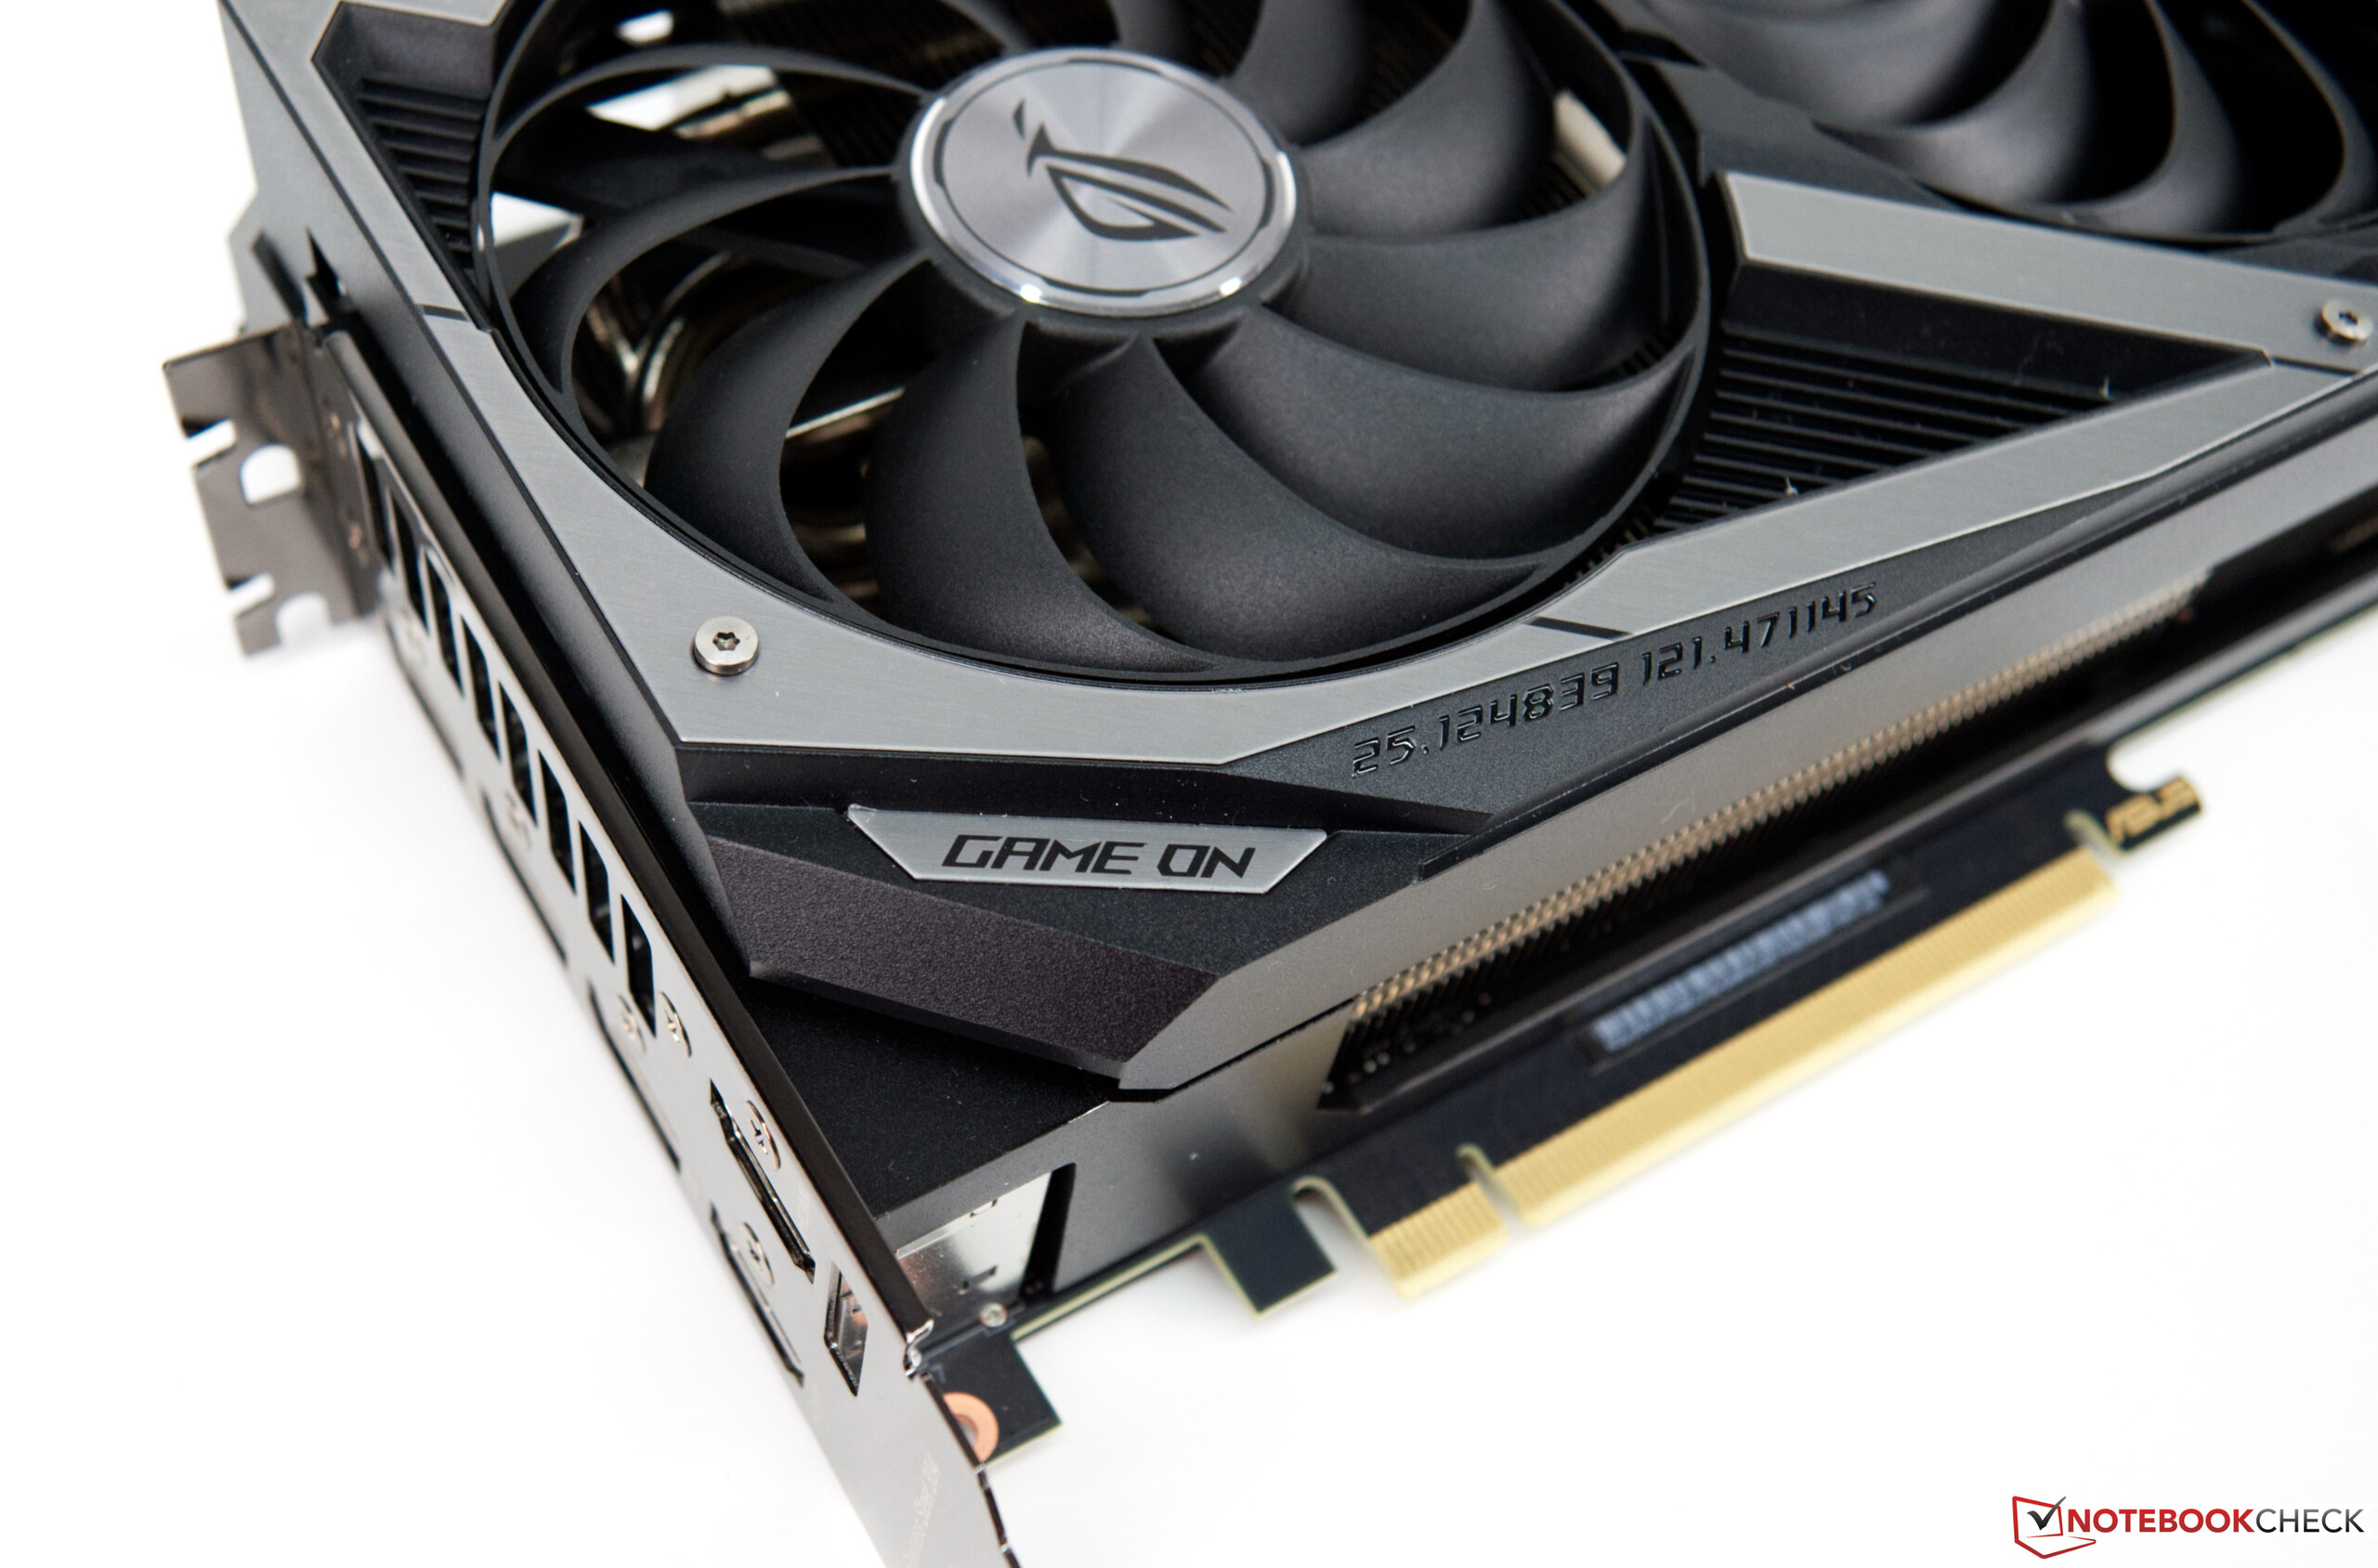
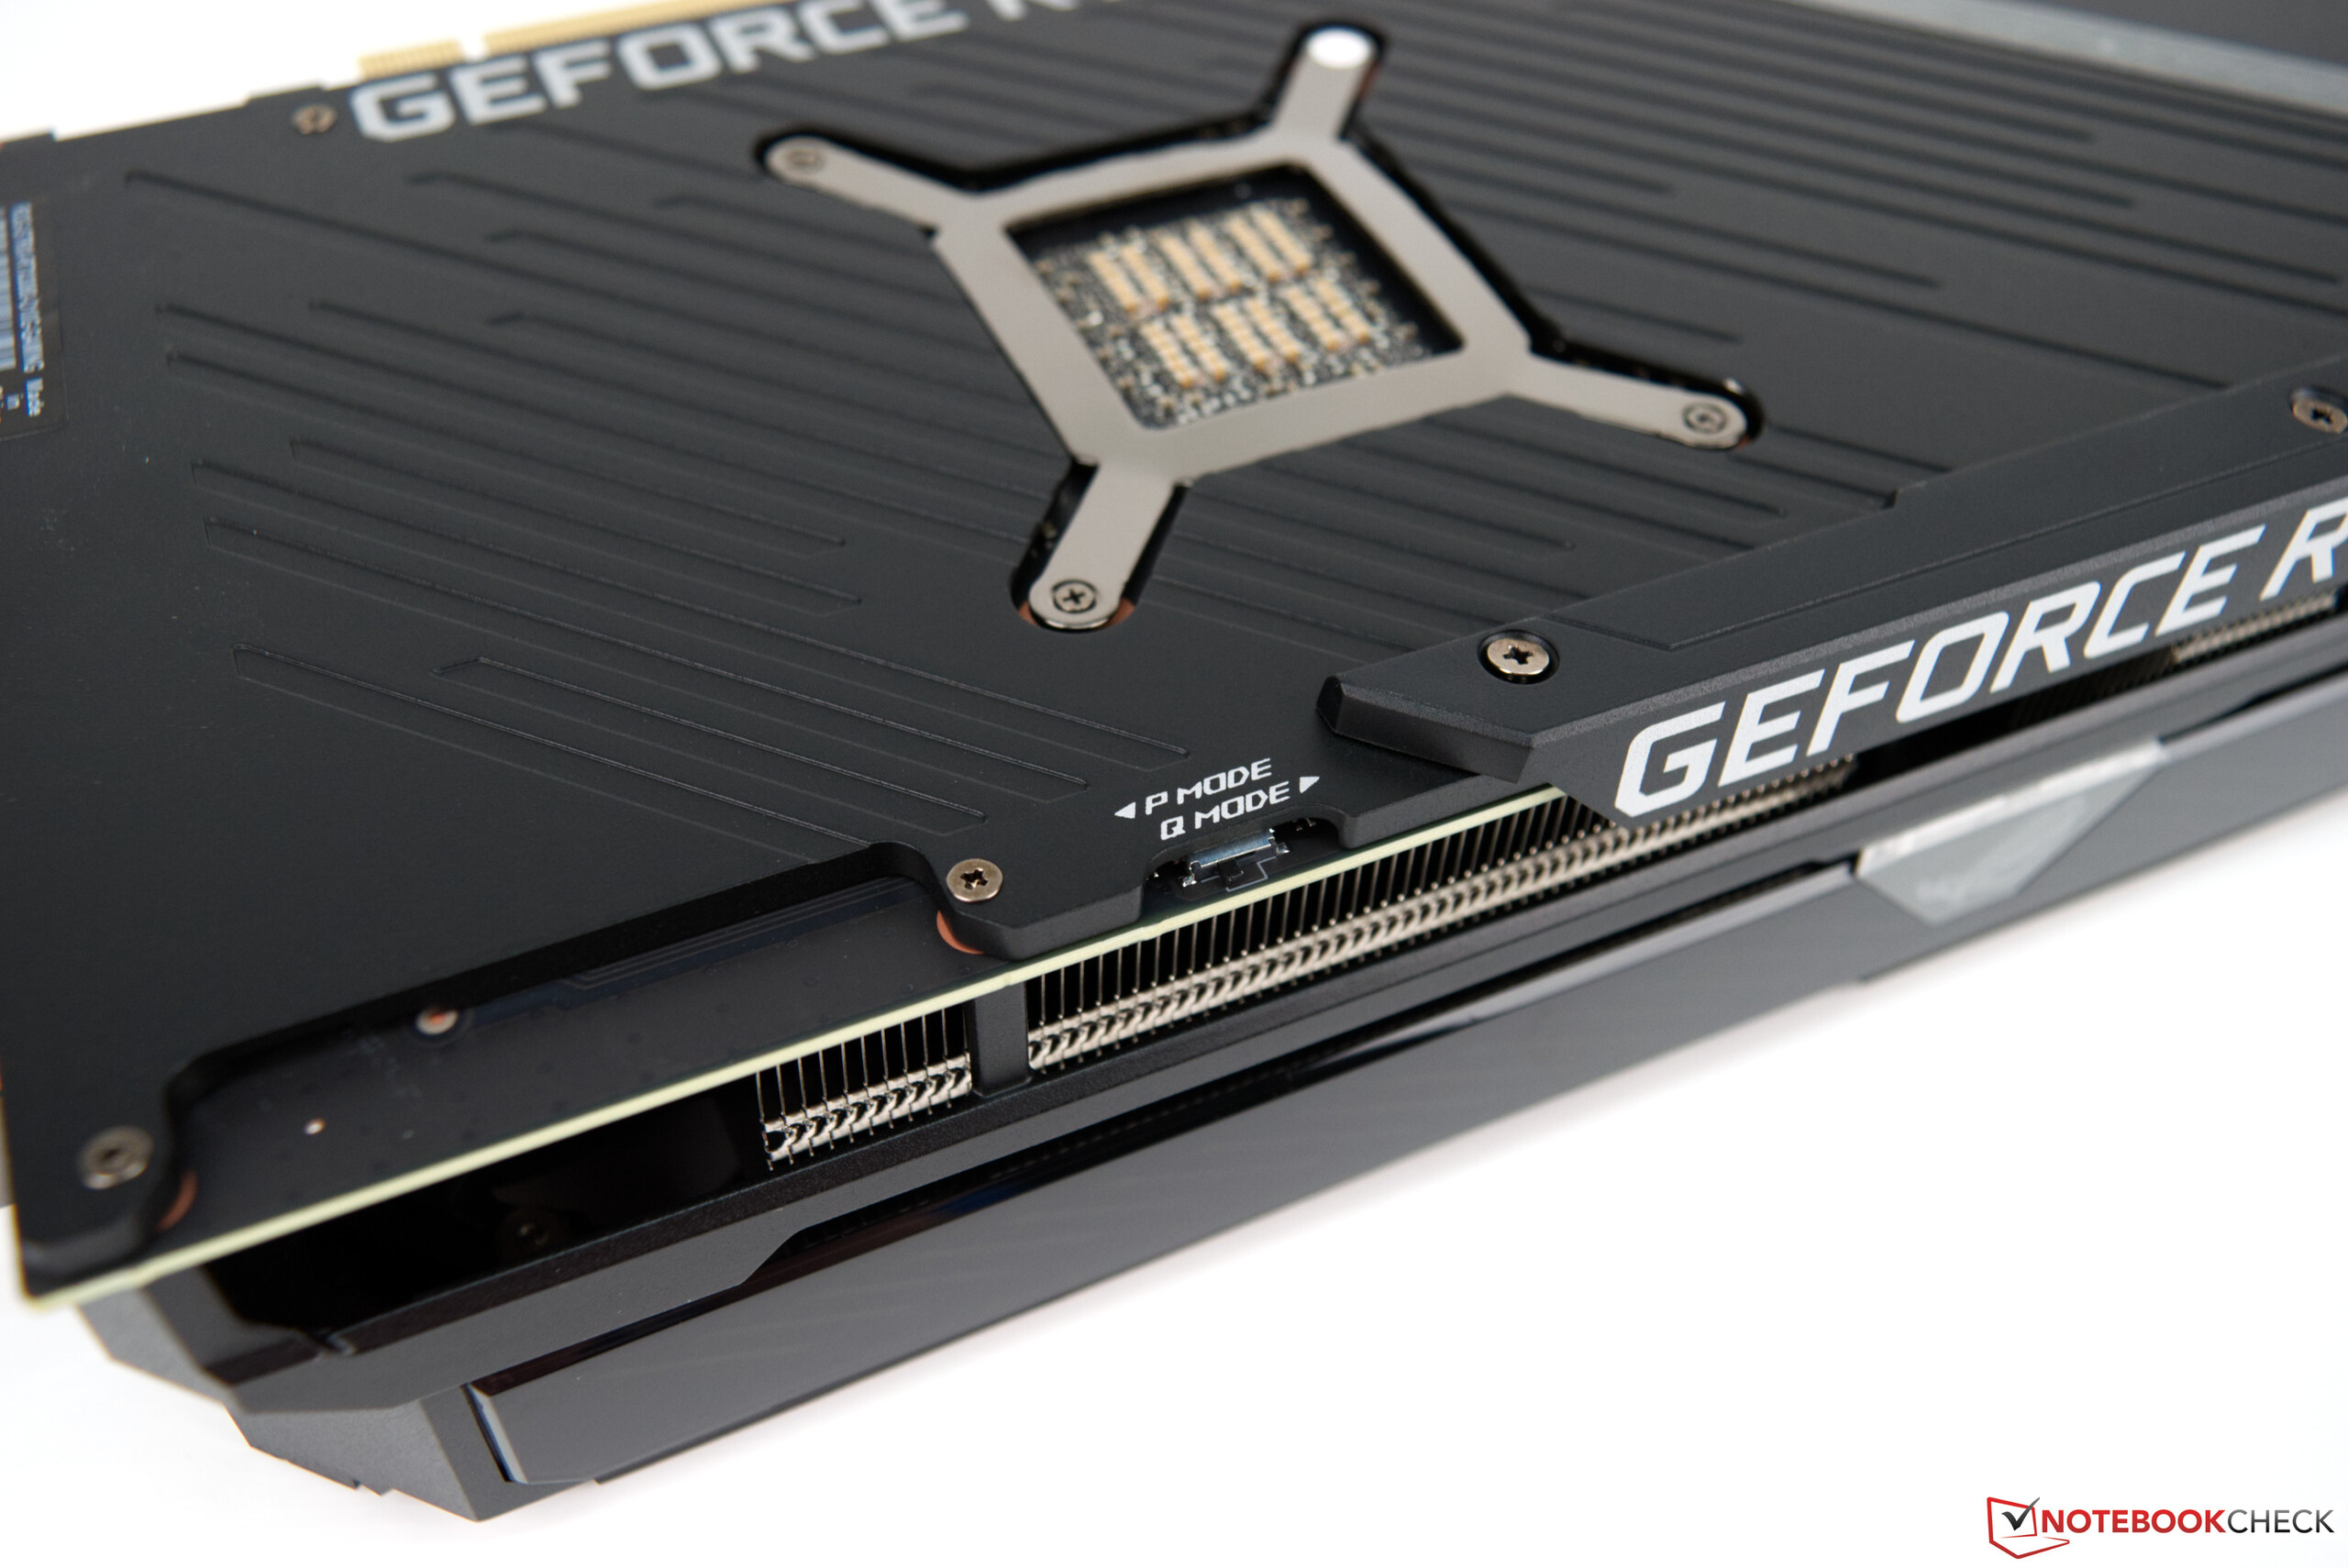
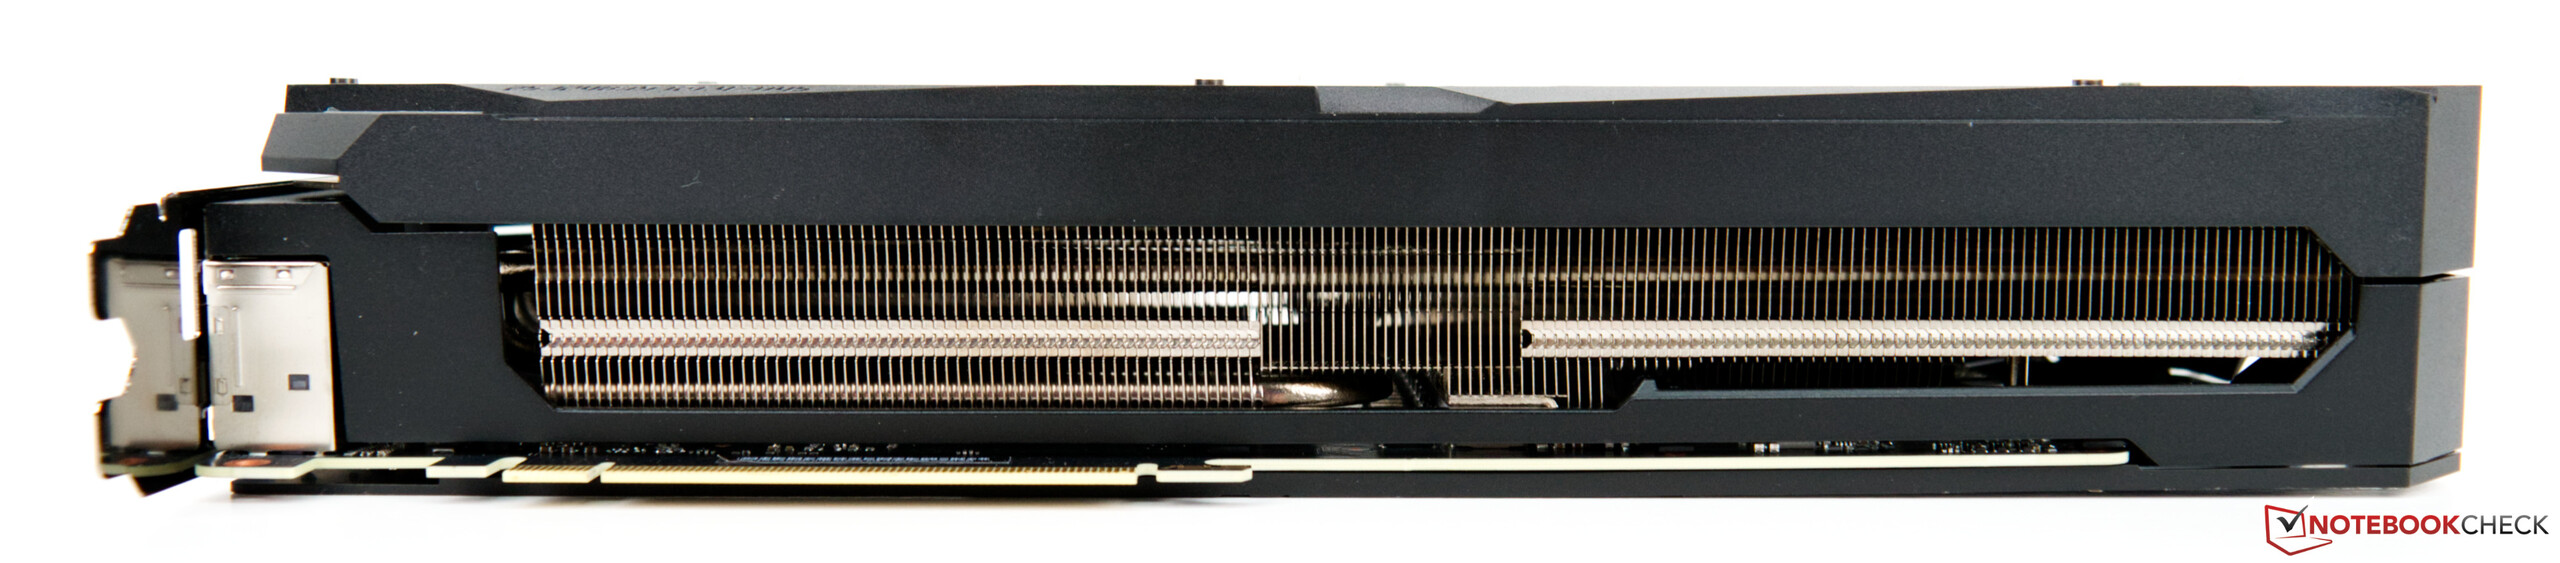
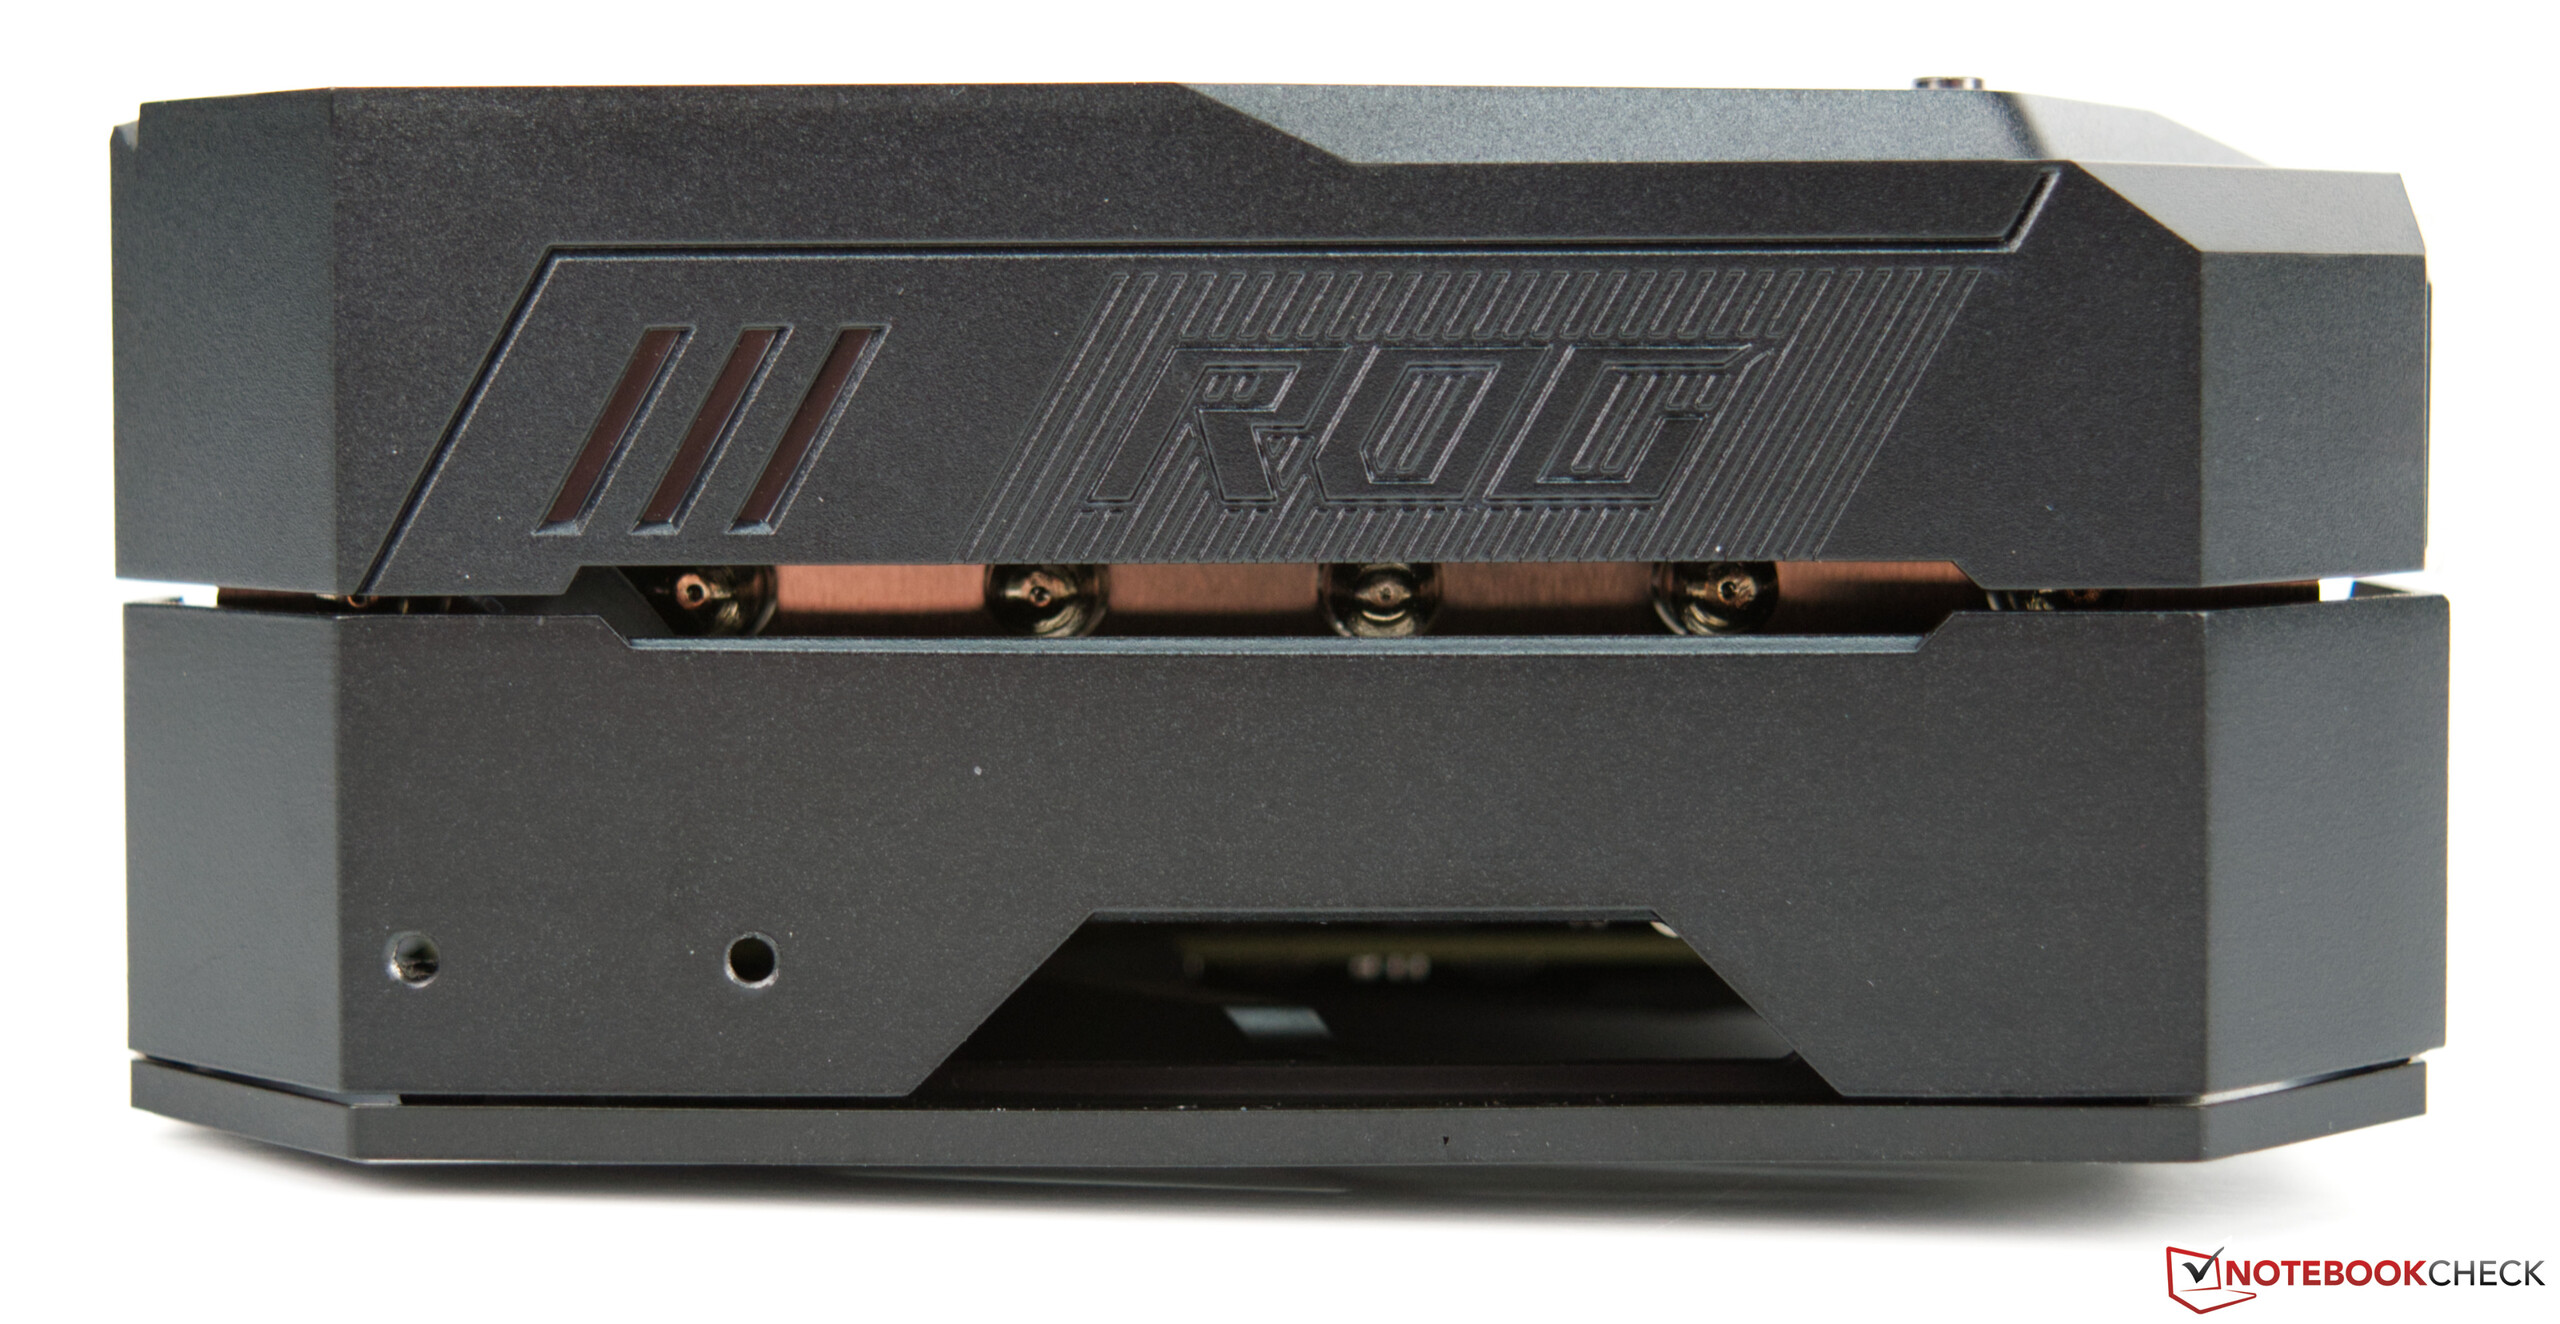
Inoltre, Asus ha dato al suo modello di punta RTX 3080 un raffreddatore a triplo slot molto potente. Nel complesso, la scheda grafica misura poco meno di 32 centimetri, cosa di cui bisogna assolutamente tener conto quando si acquista questa GPU. Non tutti i case offrono così tanto spazio per un simile mostro di scheda grafica.
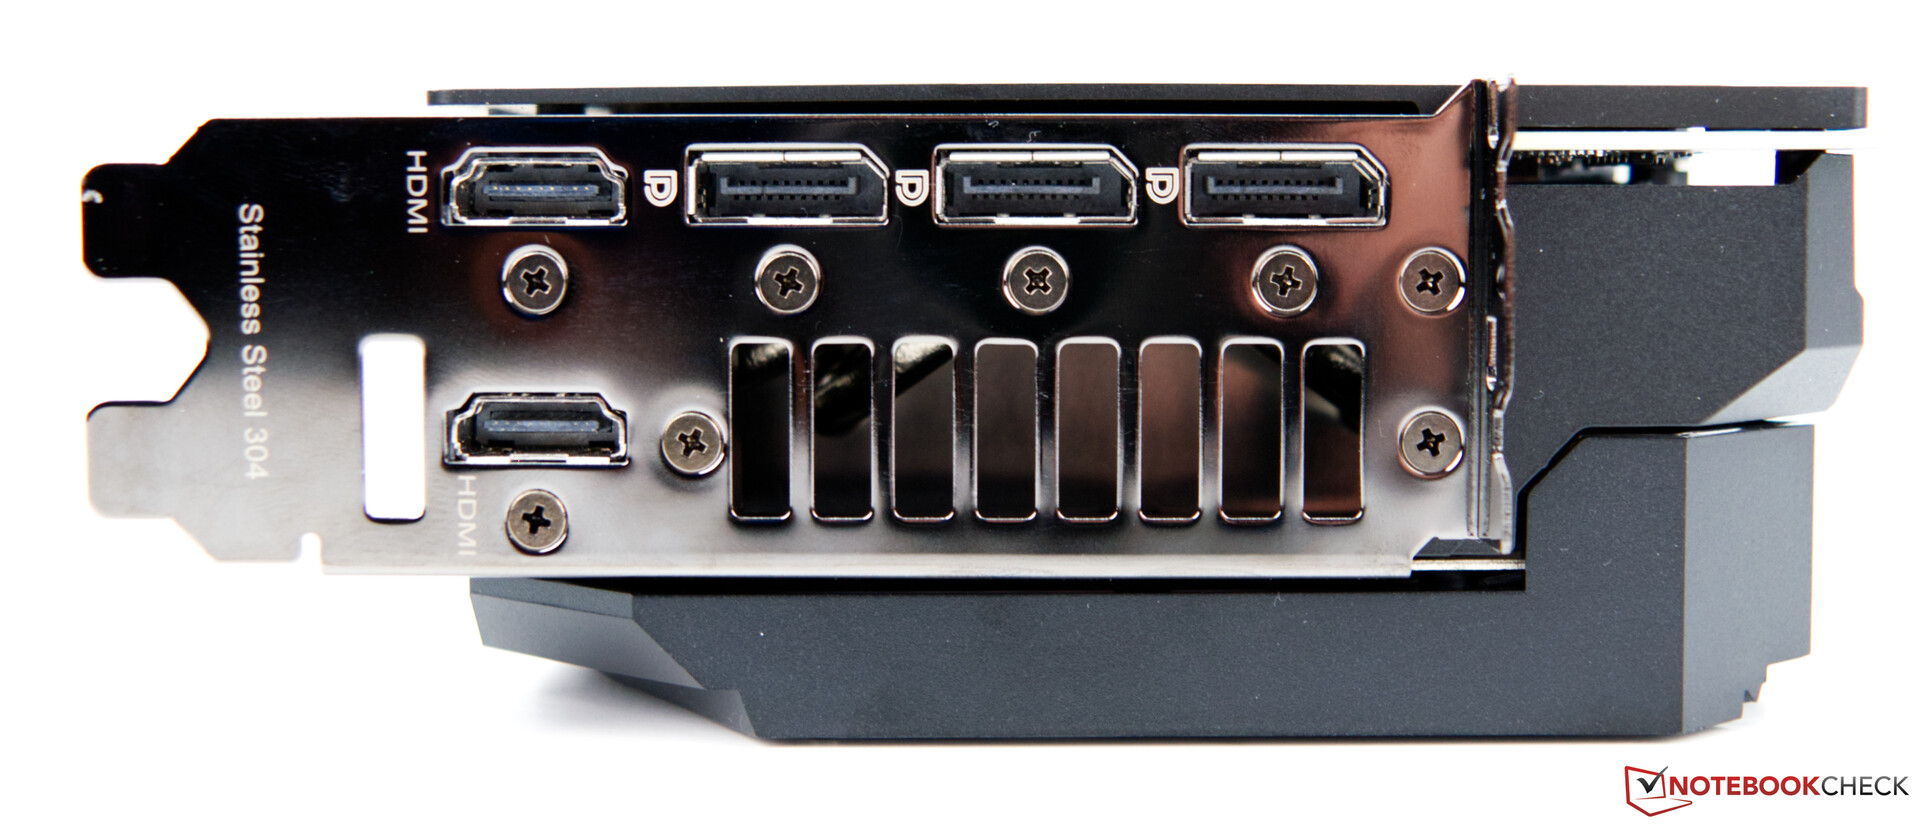
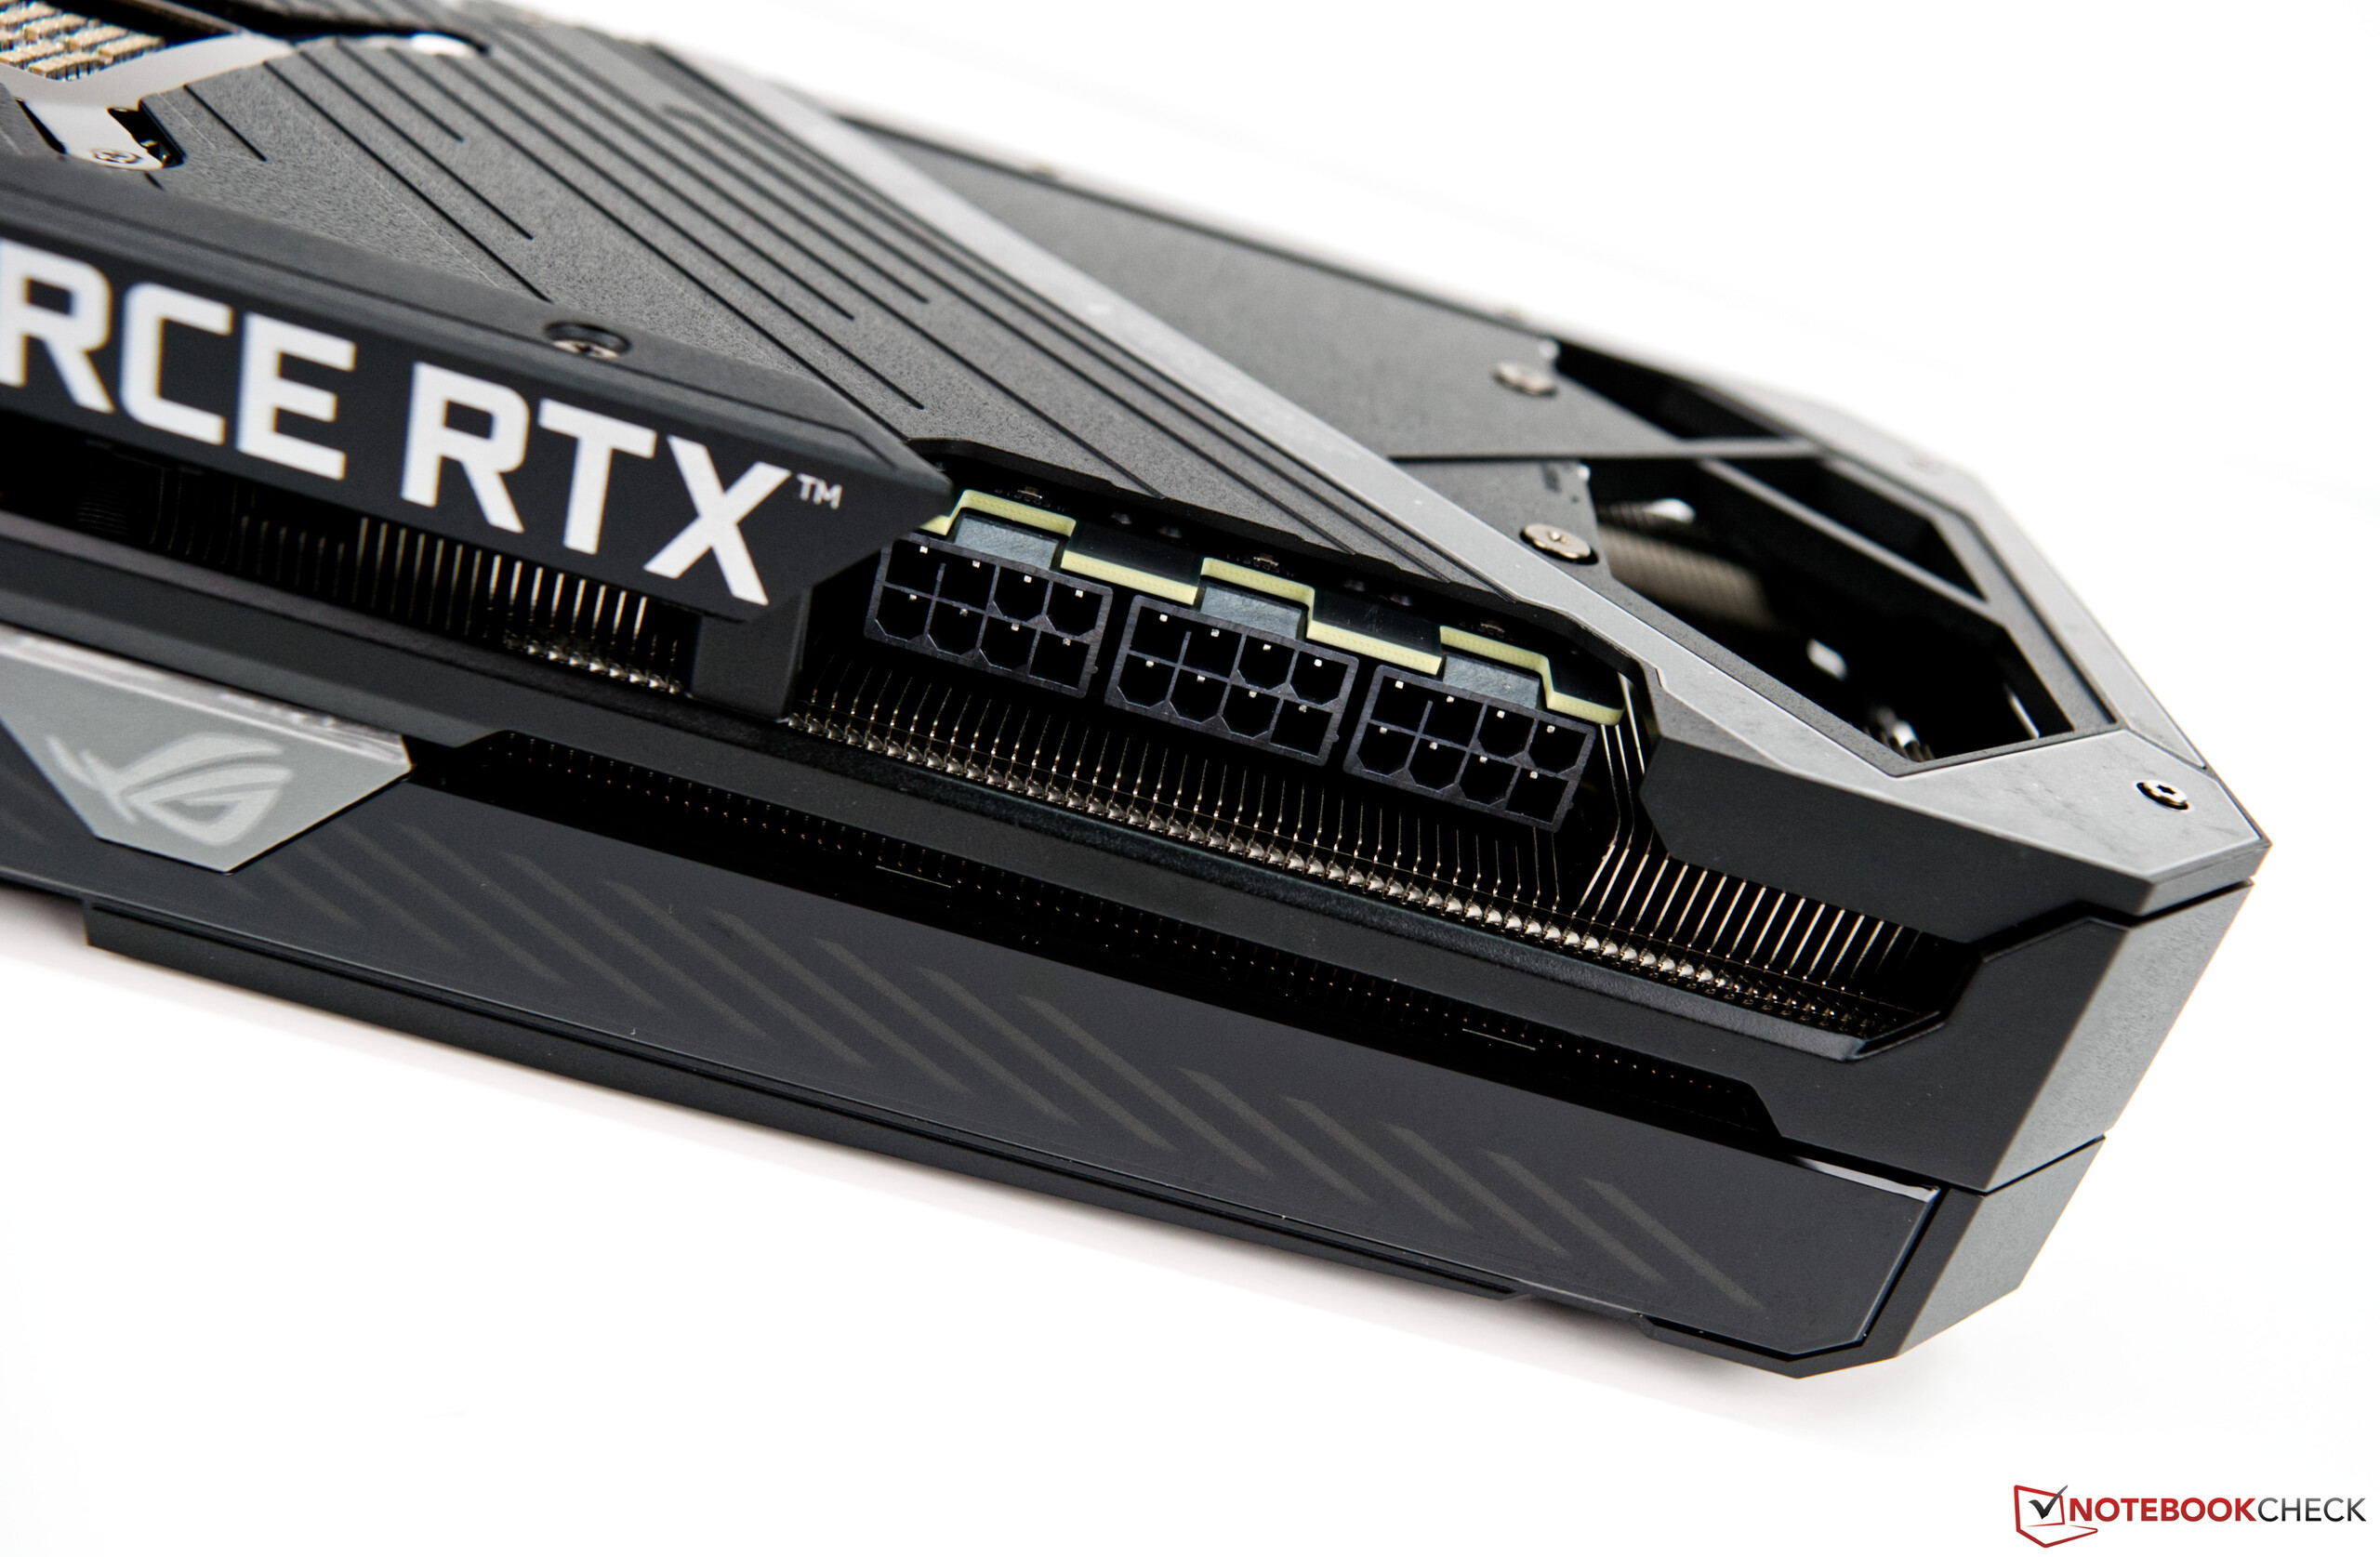
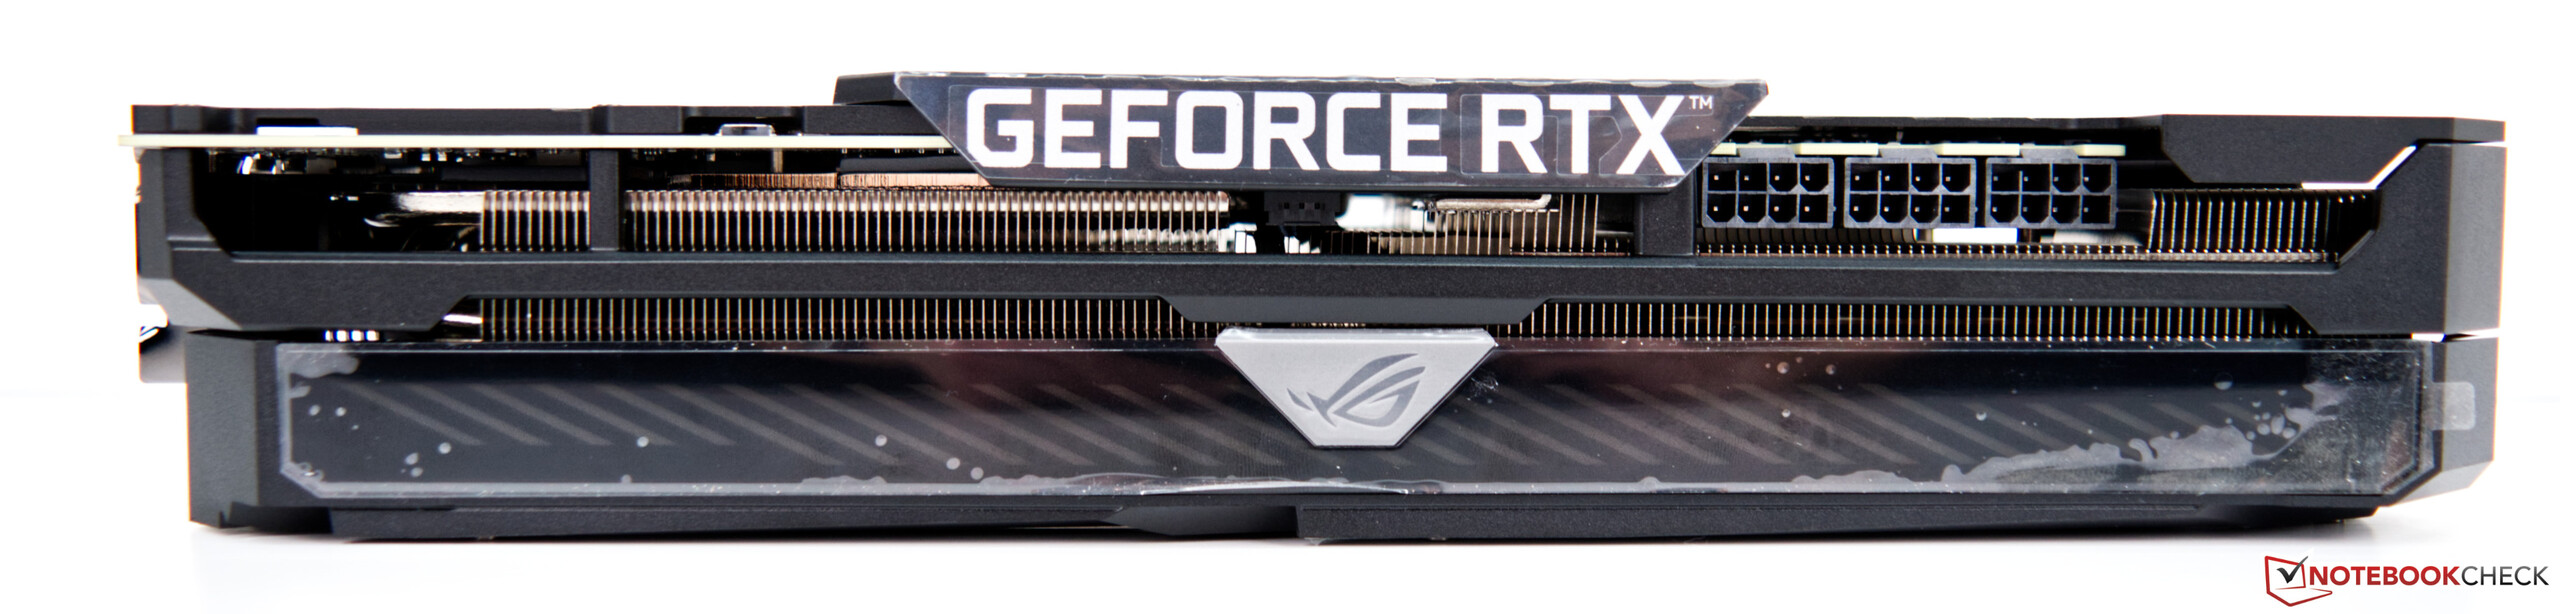
Asus segue il vecchio percorso familiare quando si tratta di alimentazione e non punta sul connettore a 12 pin che Nvidia utilizza con le sue schede RTX 3000. La GeForce RTX 3080 ROG Strix Gaming OC richiede tre connettori a 8 pin per il suo funzionamento. Di conseguenza, un alimentatore robusto è inevitabile, e la Asus stessa parla di almeno 850 watt. È possibile collegare contemporaneamente fino a quattro monitors esterni. A questo scopo, la GPU è dotata di HDMI che supporta l'ultimo standard (2.1) e di connessioni DisplayPort (1.4a).

RTX 3080 rispetto ad altre GPU NVIDIA
| Specifica | RTX 3090 | RTX3080 (Asus ROG) | RTX 3080 FE | RTX 3070 FE | Titan RTX | TITAN X Pascal | RTX 2080 Ti | RTX 2080 |
| Chip | GA102 | GA102 | GA102 | GA104 | TU102 | GP102 | TU102 | TU104 |
| Processo FinFET | 8 nm | 8nm | 8 nm | 8 nm | 8 nm | 8 nm | 12 nm | 16 nm |
| CUDA cores | 10,496 | 8,704 | 8,704 | 5,888 | 4,608 | 3,584 | 4,352 | 2,944 |
| Textureunits | 328 | 272 | 272 | 184 | 288 | 224 | 272 | 184 |
| Tensor Cores | 328 3° Gen. | 272 3° Gen. | 272 3° Gen. | 184 3° Gen. | 184 3° Gen. | 576 2° Gen. | - | 544 2° Gen. |
| RTCores | 82 | 68 | 68 | 46 | 72 | - | 68 | 46 |
| Clock base GPU | 1.395 MHz | 1.440 MHz | 1.440 MHz | 1.440 MHz | 1.500 MHz | 1.350 MHz | 1.417 MHz | 1.350 MHz |
| Clock GPU boost clock | 1.695 MHz | 1.905 MHz | 1.710 MHz | 1.725 MHz | 1.770 MHz | 1.531 MHz | 1.545 MHz | 1.710 MHz |
| Memoriabus | 384-bit | 320-bit | 320-bit | 256-bit | 384-bit | 384-bit | 352-bit | 256-bit |
| Larghezza di banda di memoria | 936 GB/s | 760GB/s | 760 GB/s | 448 GB/s | 672 GB/s | 480,4 GB/s | 616 GB/s | 448 GB/s |
| Memoria video | 24 GB GDDR6X | 10GB GDDR6X | 10 GB GDDR6X | 10 GB GDDR6X | 8 GB GDDR6 | 24 GB GDDR6 | 12 GB GDDR5X | 11 GB GDDR6 |
| Potenza assorbita | 350 W | 320W | 320 W | 220 W | 220 W | 280 W | 250 W | 250 W |
Il nostro sistema di test con AMD Ryzen 9 3900X come base
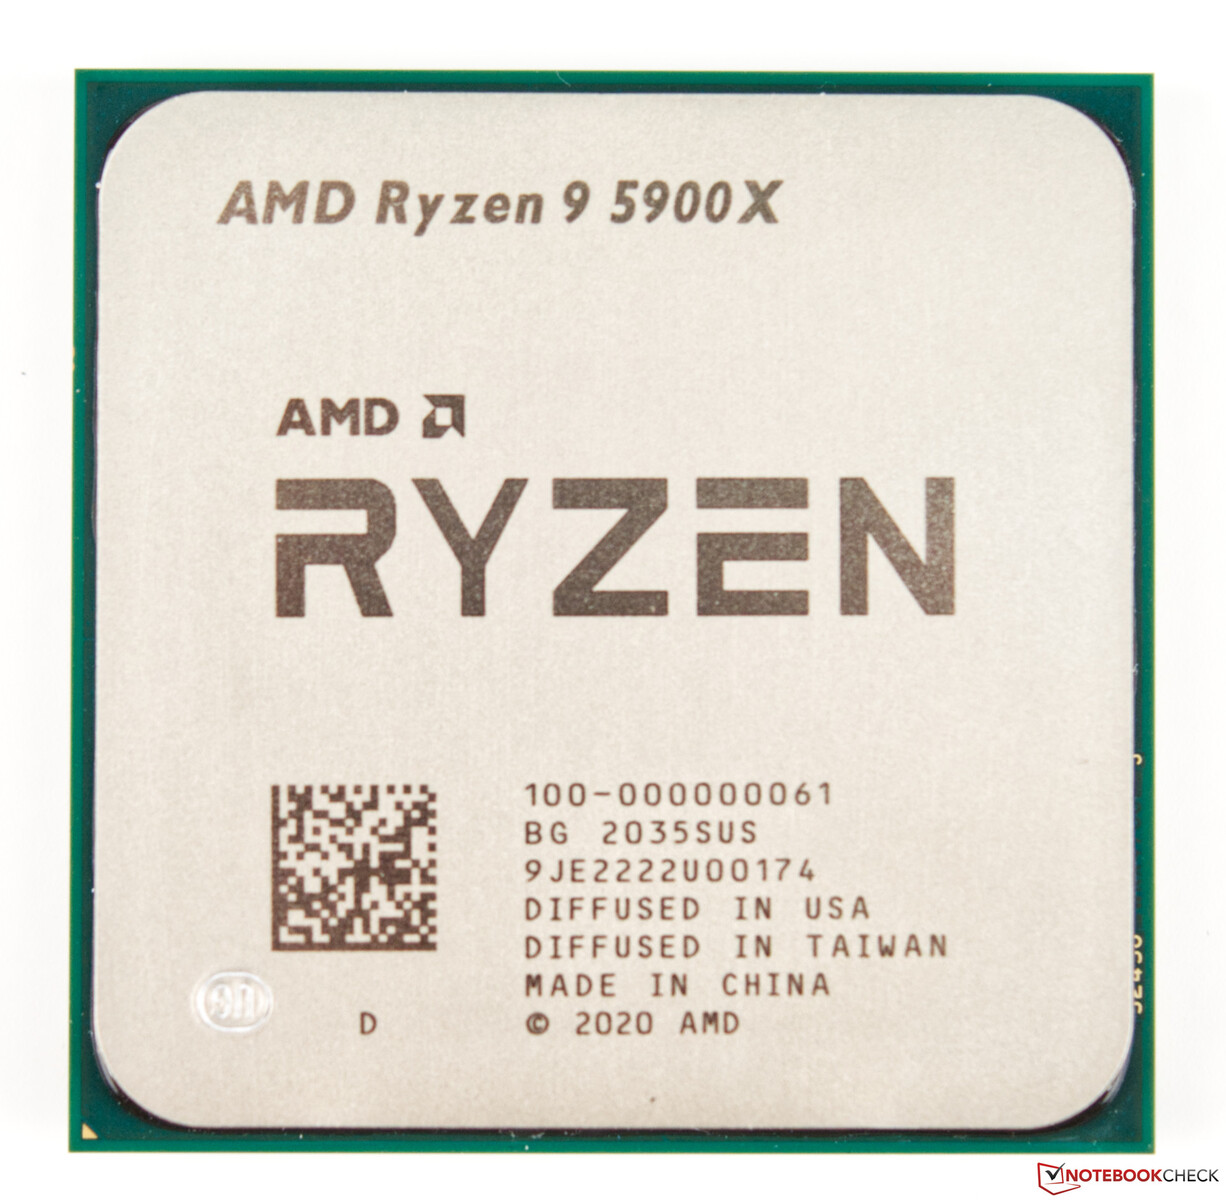
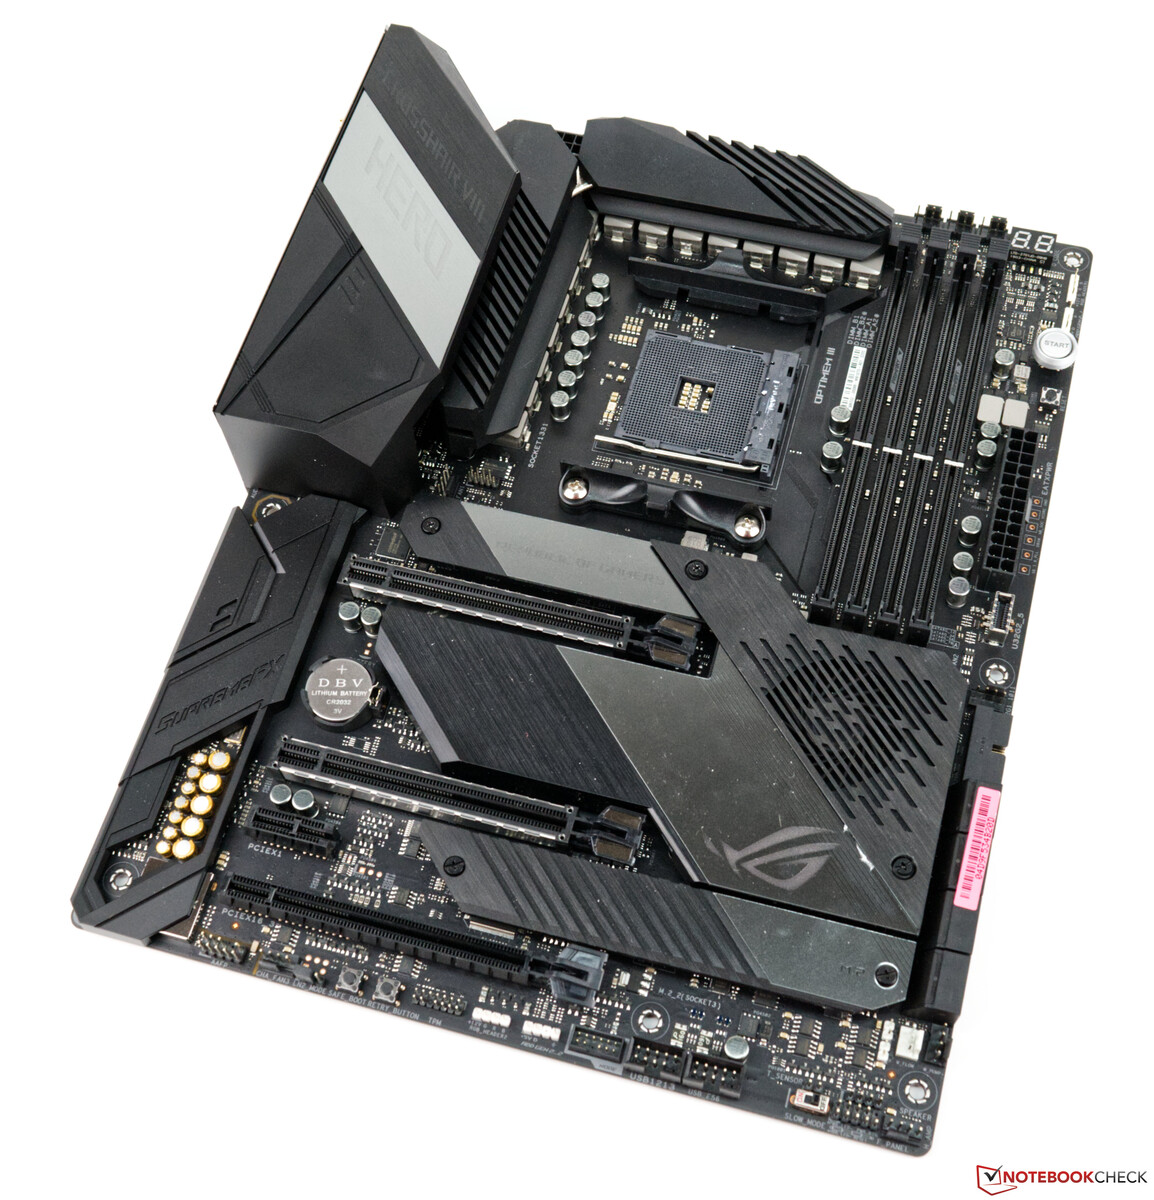
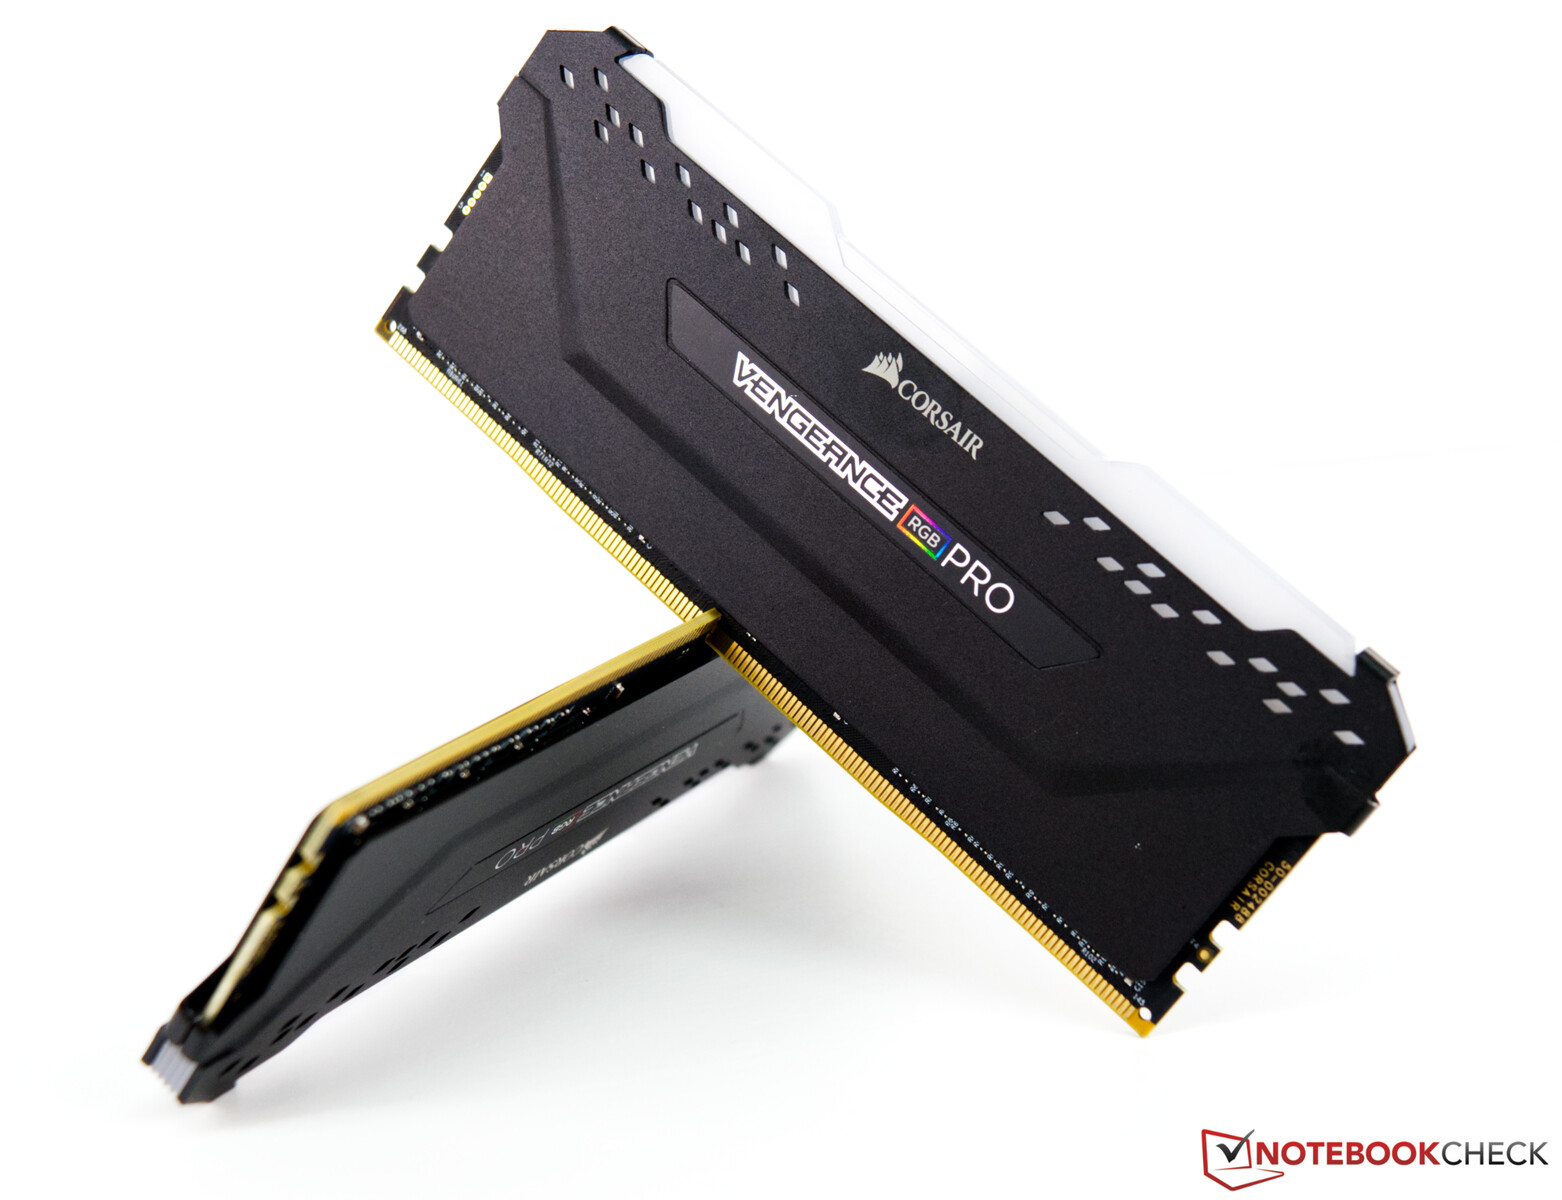
L'attuale piattaforma AMD basata sul Crosshair VIII di Asus X570 ROG funge da sistema di test. La CPU (AMD Ryzen 9 5900X) offre buone prestazioni, e per il raffreddamento abbiamo utilizzato un AIO (Alphacool Eisbaer 280cmm). I 32 GB di RAM provengono da Corsair e clock da 4.000 MHz. Come monitor, usiamo l'Acer Predator XB321HK. Non ci limita grazie alla sua capacità UHD. A questo punto vorremmo ringraziare AMD per averci fornito la piattaforma di test e Corsair per il kit di RAM.
Per i prossimi benchmarks e test, utilizziamo il seguente sistema
- Corsair Carbide Air 540 ATX Cube
- AMD Ryzen 9 5900X
- Asus GeForce RTX 3080 ROG Strix Gaming OC (driverNvidia457.09)
- Asus X570 ROG Crosshair VIII (BIOS 2402, impostazioni predefinite, XMP 1 per DDR4 4000)
- Alimentatore Corsair RM1000X 1000 watt
- Corsair Vengeance RGB Pro DDR4 4000 2x 16 GB RAMkit
- Corsair MP600 2 TB M.2 PCIe 4.0 SSD
- Crucial MX500 2 TB (per i giochi)
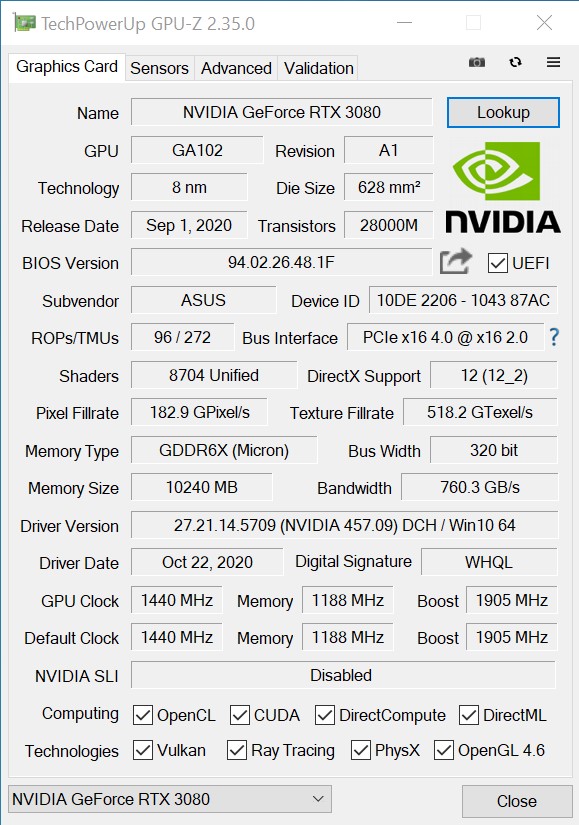
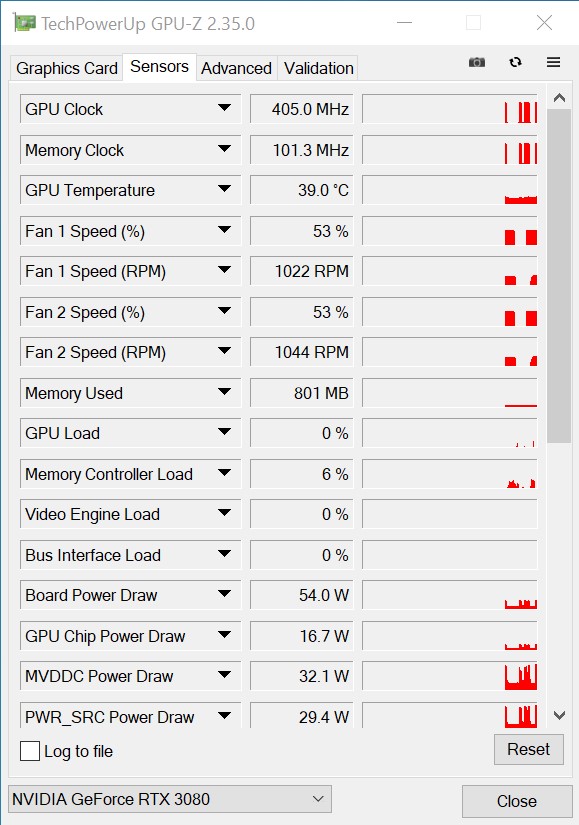
Le velocità di clock dell'Asus GeForce RTX 3080 ROG Strix Gaming OC
A 1.440 MHz, la velocità di clock di base dell'Asus GeForce RTX 3080 ROG Strix Gaming OC è rimasta invariata rispetto al modello di riferimento. Tuttavia, Asus prende un percorso diverso quando si tratta della velocità di clock boost e permette al suo modello di raggiungere una velocità considerevolmente più elevata fino a 1.905 MHz. Questo clock rate può essere mantenuto senza problemi anche sotto carico e di solito viene addirittura superato. Inoltre, l'Asus permette anche un target di potenza più elevato fino al 21%. Di conseguenza, la GeForce RTX 3080 ROG Strix Gaming OC può anche funzionare in modo stabile a oltre i 2 GHz. In termini di VRAM, ora c'è la GDDR6X invece della GDDR6, che era usata in precedenza, anche se 10 GB dovrebbero essere sufficienti ora rispetto alla RTX 2080 Ti. Al momento, solo la GeForce RTX 3090 dell'attuale serie Ampere offre più memoria grafica.

Benchmarks sintetici
Nei benchmarks sintetici, l'Asus GeForce RTX 3080 ROG Strix Gaming OC inizia già a mostrare il suo potenziale in modo abbastanza chiaro. Solo la GeForce RTX 3090 offre maggiori prestazioni; lo abbiamo già esaminato nella configurazione del nostro partner Zotac. Rispetto alla GeForce RTX 2080 Ti, il nostro modello di prova può distinguersi con un vantaggio di circa il 30%. La più costosa Nvidia Titan RTX riesce ad occupare solo il terzo posto nel nostro confronto e non riesce a tenere il passo con la GeForce RTX 3080.
A differenza della Founders Edition, Asus ha una struttura di raffreddamento migliore nella GeForce RTX 3080 ROG Strix Gaming OC, che si traduce in un leggero vantaggio in termini di prestazioni rispetto al modello di riferimento.
| Unigine Superposition | |
| 1280x720 720p Low | |
| Titan RTX | |
| Asus GeForce RTX 3080 ROG Strix Gaming OC | |
| 1920x1080 1080p High | |
| GeForce RTX 3090 | |
| Asus GeForce RTX 3080 ROG Strix Gaming OC | |
| Titan RTX | |
| 1920x1080 1080p Extreme | |
| GeForce RTX 3090 | |
| Asus GeForce RTX 3080 ROG Strix Gaming OC | |
| Titan RTX | |
| 3840x2160 4k Optimized | |
| GeForce RTX 3090 | |
| Asus GeForce RTX 3080 ROG Strix Gaming OC | |
| Titan RTX | |
| 7680x4320 8k Optimized | |
| GeForce RTX 3090 | |
| Asus GeForce RTX 3080 ROG Strix Gaming OC | |
| Titan RTX | |
| 3DMark 05 Standard | 46192 punti | |
| 3DMark 06 Standard Score | 44255 punti | |
| 3DMark Vantage P Result | 93066 punti | |
| 3DMark 11 Performance | 32211 punti | |
| 3DMark Ice Storm Standard Score | 238949 punti | |
| 3DMark Cloud Gate Standard Score | 75364 punti | |
| 3DMark Fire Strike Score | 33440 punti | |
| 3DMark Fire Strike Extreme Score | 20455 punti | |
| 3DMark Time Spy Score | 15712 punti | |
Aiuto | ||
Gaming benchmarks
I test di gaming effettuati rivelano che la GeForce RTX 3080 è più adatta alle alte risoluzioni. Quasi tutti i giochi che abbiamo testato possono essere usati a 2160p senza problemi. Tuttavia, ci sono giochi specifici, come Flight Simulator 2020, dove anche la GeForce RTX 3080 raggiunge i suoi limiti. La nuova scheda grafica mostra il vantaggio maggiore quando supera i 1080p. Se non si gioca ad alte risoluzioni, l'acquisto di una RTX 3080 non è attualmente conveniente.
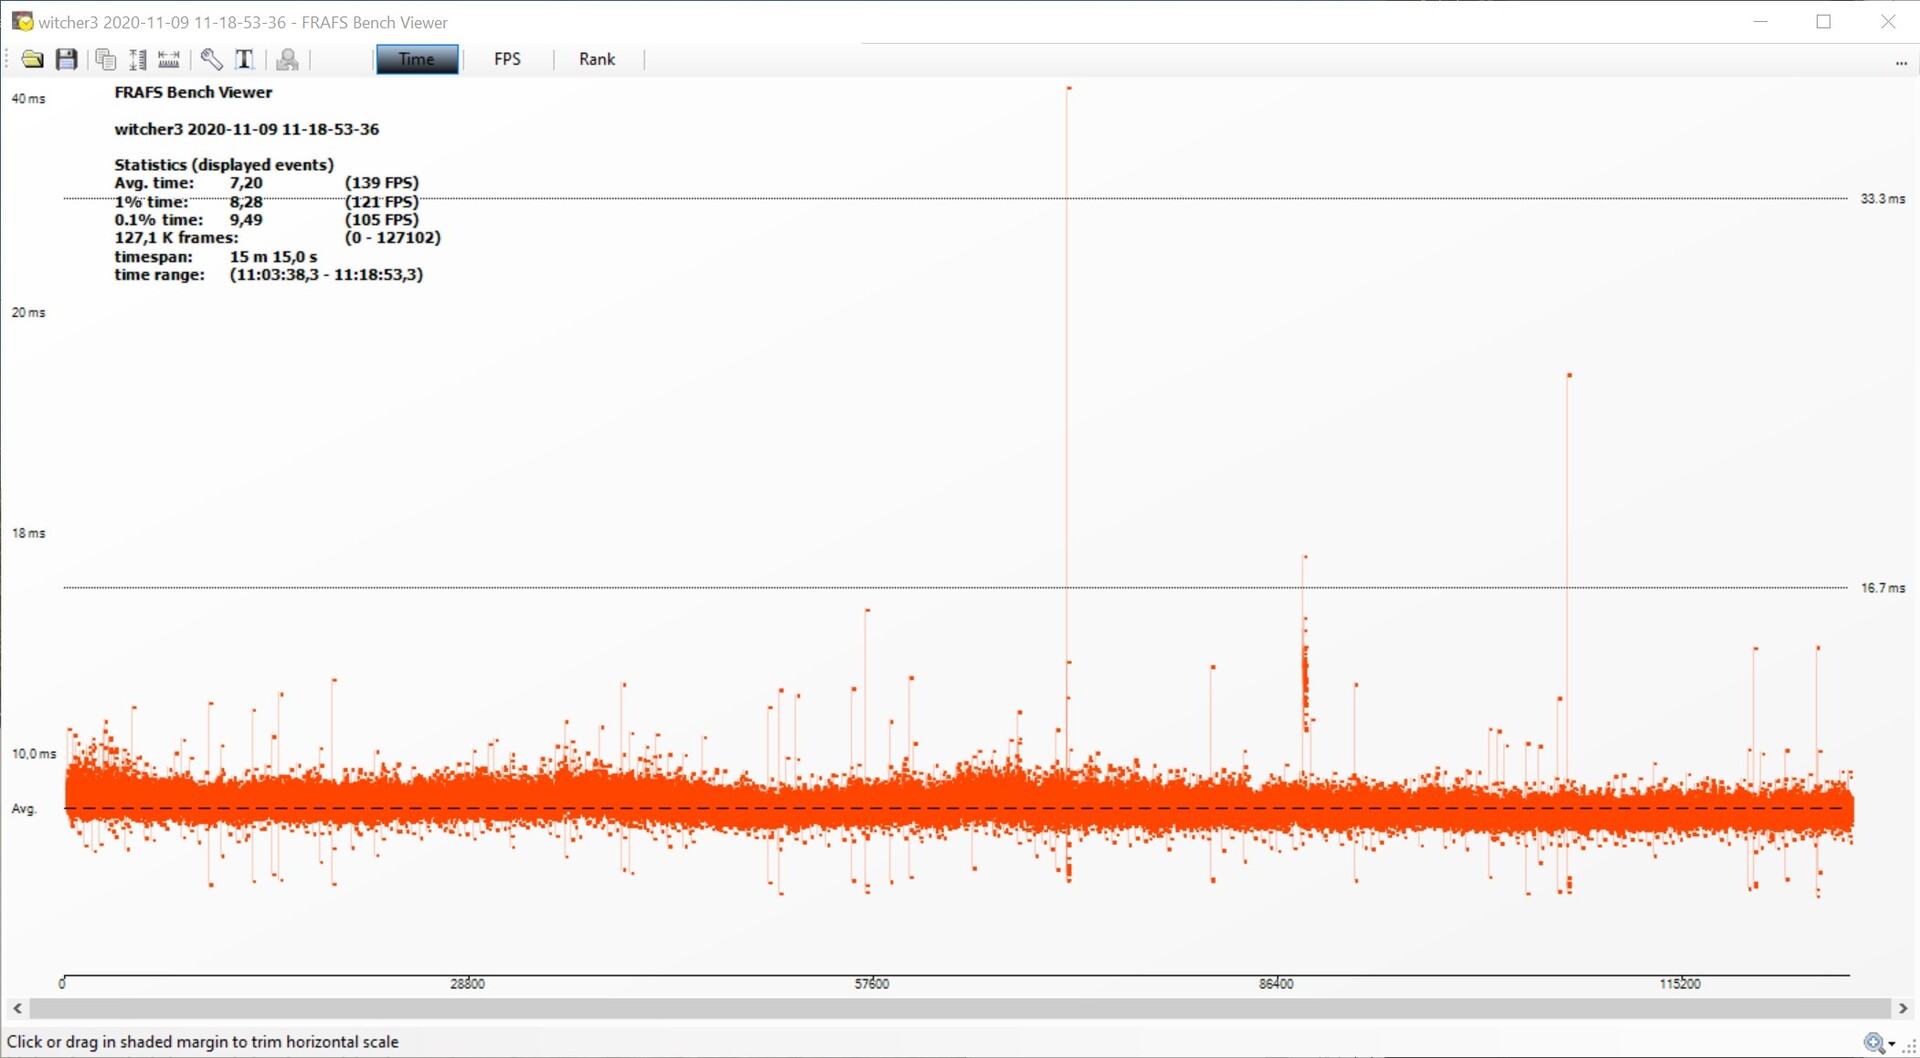
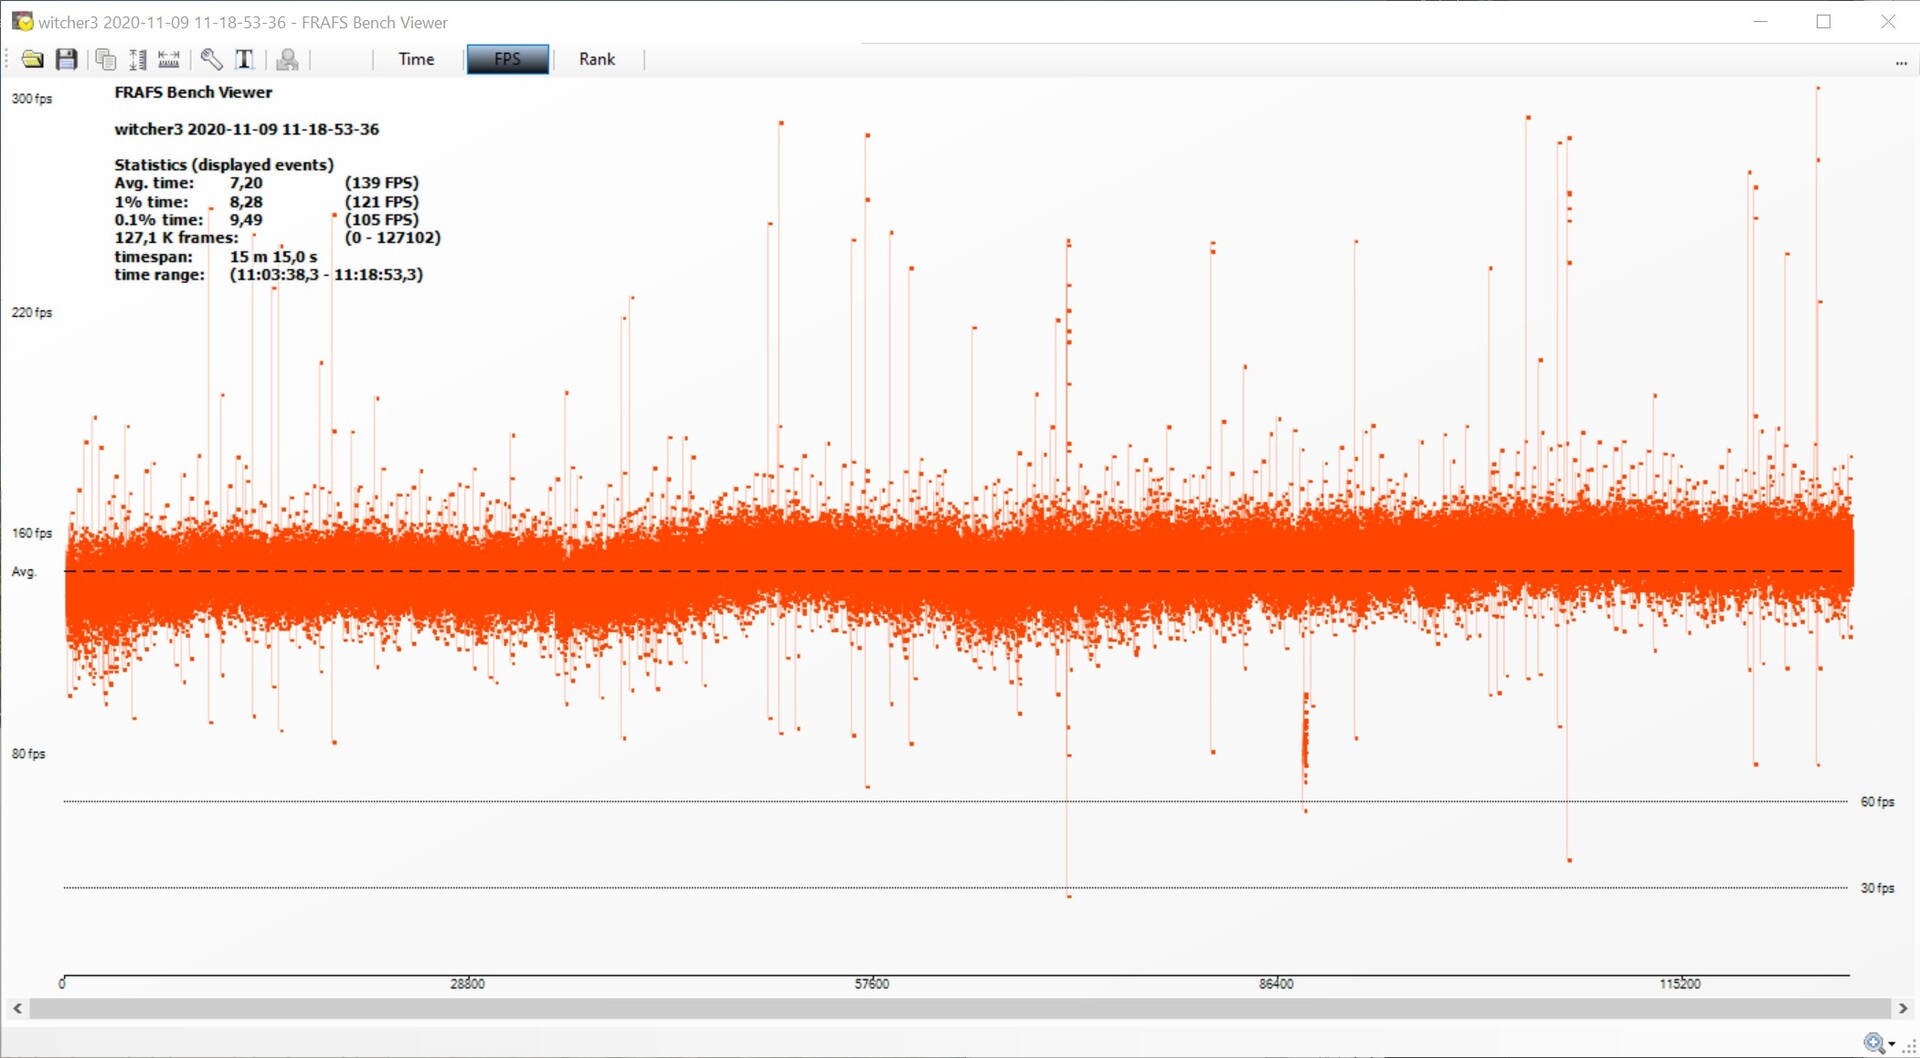
Ma il gaming senza problemi è garantito con l'Asus GeForce RTX 3080 ROG Strix Gaming OC. Abbiamo esaminato la progressione del frame e anche i tempi del gioco The Witcher 3
(Ultra preset) e non abbiamo trovato alcuna anomalia degna di nota. Abbiamo documentato i singoli eventi. Tuttavia, a 139 FPS, la fluidità del gioco è sicuramente garantita.
The Witcher 3 progressione frame rates - Ultra preset
| F1 2020 - 3840x2160 Ultra High Preset AA:T AF:16x | |
| GeForce RTX 3090 | |
| Asus GeForce RTX 3080 ROG Strix Gaming OC | |
| Titan RTX | |
| Borderlands 3 - 3840x2160 Badass Overall Quality (DX11) | |
| GeForce RTX 3090 | |
| Asus GeForce RTX 3080 ROG Strix Gaming OC | |
| Titan RTX | |
| Titan RTX | |
| GeForce RTX 2080 Ti (Desktop) | |
| Red Dead Redemption 2 - 3840x2160 Maximum Settings | |
| GeForce RTX 3090 | |
| Asus GeForce RTX 3080 ROG Strix Gaming OC | |
| Titan RTX | |
| Rise of the Tomb Raider - 3840x2160 High Preset AA:FX AF:4x | |
| Asus GeForce RTX 3080 ROG Strix Gaming OC | |
| GeForce RTX 2080 Ti (Desktop) | |
| GeForce RTX 2080 Super (Desktop) | |
| GeForce RTX 2080 (Desktop) | |
| GeForce RTX 2070 Super (Desktop) | |
| GeForce RTX 2070 (Desktop) | |
| Radeon VII | |
| GeForce RTX 2060 Super (Desktop) | |
| RX Vega 64 | |
| GeForce RTX 2060 (Desktop) | |
| basso | medio | alto | ultra | QHD | 4K | |
|---|---|---|---|---|---|---|
| GTA V (2015) | 187 | 187 | 184 | 130 | 122 | 136 |
| The Witcher 3 (2015) | 427 | 375 | 286 | 152 | 115 | |
| Dota 2 Reborn (2015) | 216.6 | 197.1 | 184.4 | 168.7 | 159.1 | |
| Rise of the Tomb Raider (2016) | 327 | 231 | 217 | 217 | 107 | |
| Final Fantasy XV Benchmark (2018) | 228 | 205 | 156 | 124 | 76.1 | |
| X-Plane 11.11 (2018) | 165 | 153 | 123 | 105 | ||
| Far Cry 5 (2018) | 184 | 162 | 155 | 145 | 137 | 95 |
| Strange Brigade (2018) | 567 | 416 | 336 | 289 | 220 | 135 |
| Shadow of the Tomb Raider (2018) | 227 | 206 | 198 | 185 | 147 | 83.9 |
| Battlefield V (2018) | 192 | 178 | 163 | 152 | 132 | 94.2 |
| Apex Legends (2019) | 144 | 144 | 144 | 144 | 144 | 143 |
| Far Cry New Dawn (2019) | 150 | 132 | 127 | 115 | 110 | 89 |
| Metro Exodus (2019) | 212 | 155 | 143 | 111 | 92.2 | 64.1 |
| The Division 2 (2019) | 240 | 197 | 168 | 140 | 107 | 65 |
| Anno 1800 (2019) | 142 | 139 | 99.3 | 54.1 | 52.5 | 46.3 |
| Rage 2 (2019) | 294 | 209 | 182 | 180 | 134 | 72.1 |
| Control (2019) | 240 | 196 | 155 | 106 | 56.2 | |
| Borderlands 3 (2019) | 165 | 143 | 129 | 128 | 103 | 61.5 |
| Star Wars Jedi Fallen Order (2019) | 134 | 132 | 133 | 132 | 92.9 | |
| Red Dead Redemption 2 (2019) | 167 | 154 | 135 | 96 | 81 | 56 |
| Hunt Showdown (2020) | 236 | 173 | 172 | 155 | 95.8 | |
| Doom Eternal (2020) | 283 | 277 | 270 | 268 | 248 | 153 |
| F1 2020 (2020) | 367 | 255 | 239 | 185 | 155 | 118 |
| Horizon Zero Dawn (2020) | 164 | 151 | 147 | 141 | 133 | 95 |
| Flight Simulator 2020 (2020) | 115 | 97.4 | 79.9 | 62.8 | 55.6 | 37.3 |
| Serious Sam 4 (2020) | 182.5 | 148.6 | 138.1 | 135.2 | 124.8 | 117 |
| Mafia Definitive Edition (2020) | 199 | 184 | 169 | 137 | 78.2 | |
| Star Wars Squadrons (2020) | 586 | 433 | 379 | 358 | 266 | 169 |
| FIFA 21 (2020) | 306 | 312 | 293 | 295 | 295 | 284 |
| Watch Dogs Legion (2020) | 147 | 146 | 125 | 103 | 81.6 | 54.1 |
| Dirt 5 (2020) | 176 | 121 | 111 | 111 | 69.1 | 55.3 |
Prestazioni di calcolo
In LuxMark e ComputeMark, l'Asus GeForce RTX 3080 ROG Strix Gaming OC ottiene un punteggio significativamente migliore rispetto ai vecchi modelli di confronto. I test SPECviewperf sono rivolti principalmente alle workstations. Qui, i modelli Quadro e FirePro offrono spesso maggiori prestazioni grazie alle ottimizzazioni dei driver. La Nvidia Titan RTX ha una posizione speciale in questo caso, poiché è identica nella costruzione alla RTX 6000 della serie Quadro. Nel complesso, qui offre le migliori prestazioni, anche se le nuove schede grafiche Ampere offrono valori migliori nelle singole discipline.
Emissioni dell'Asus GeForce RTX 3080 ROG Strix Gaming OC
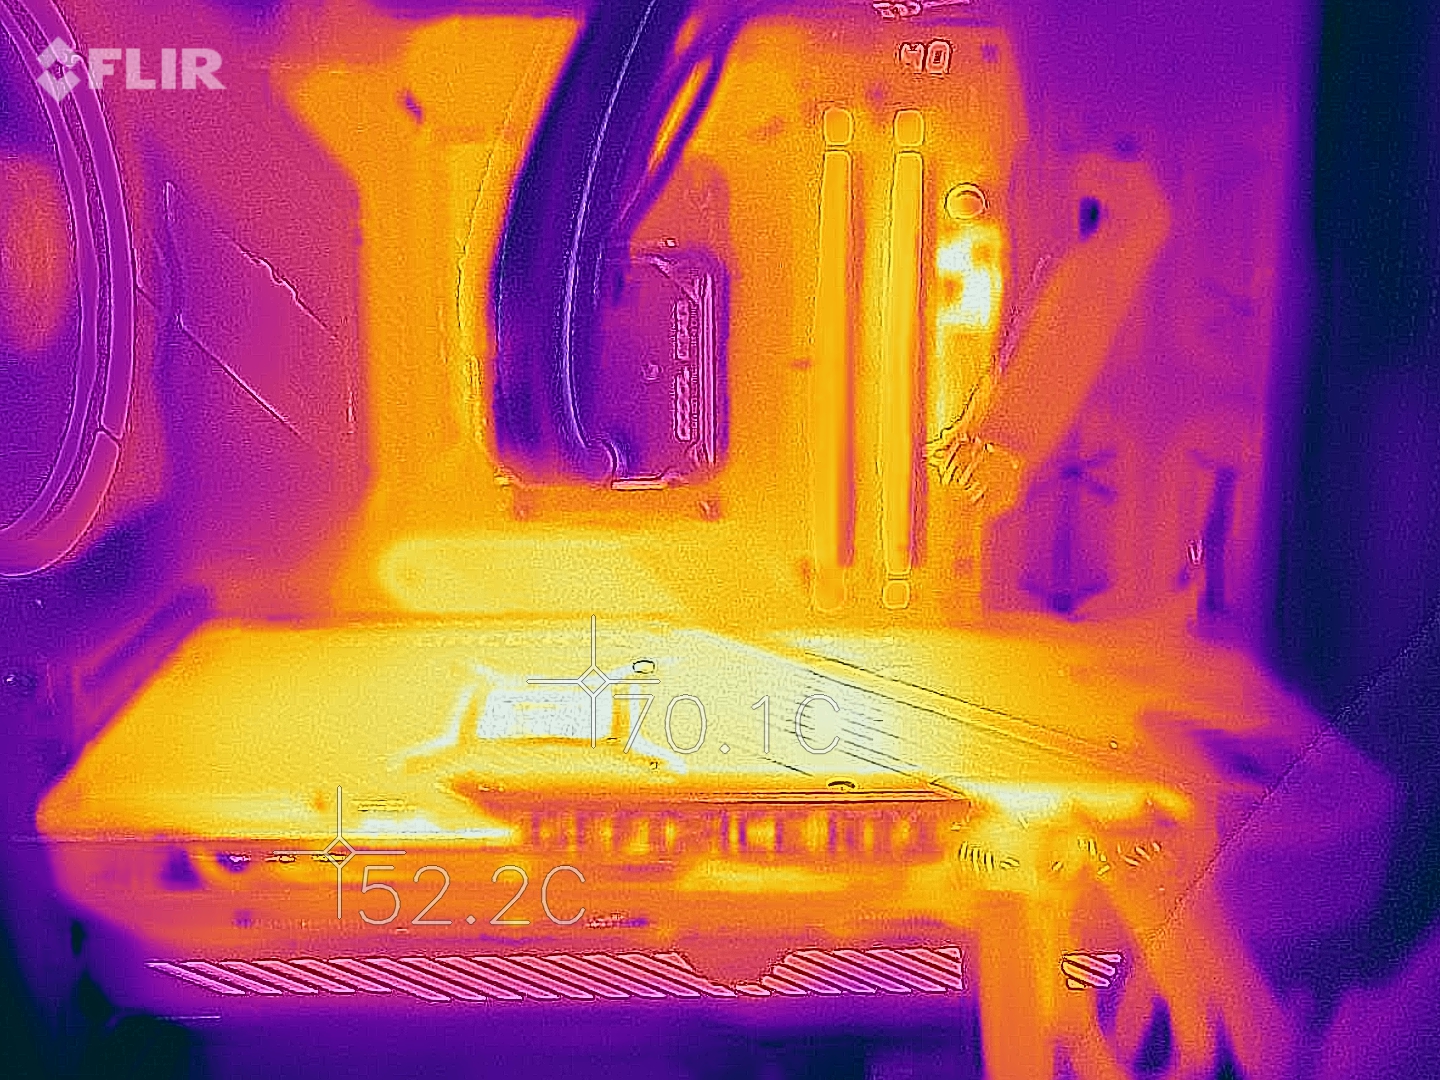

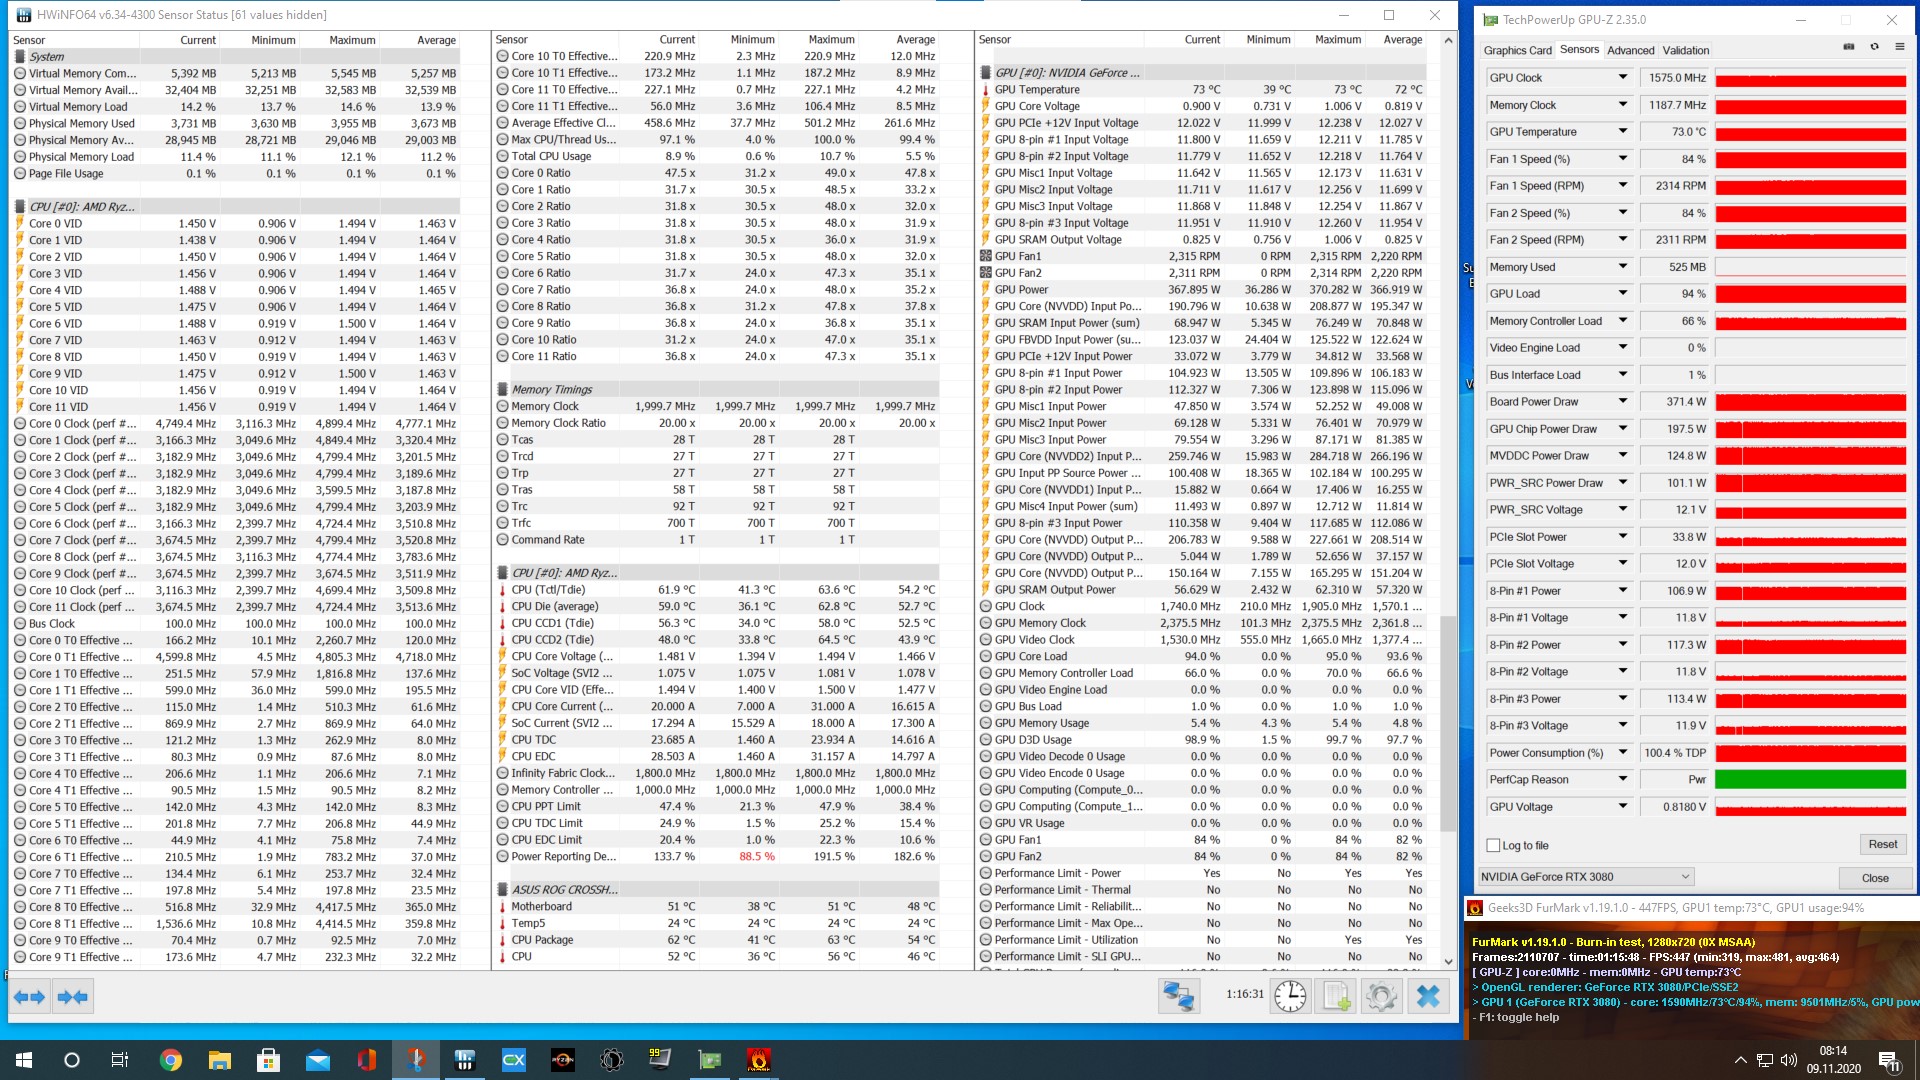
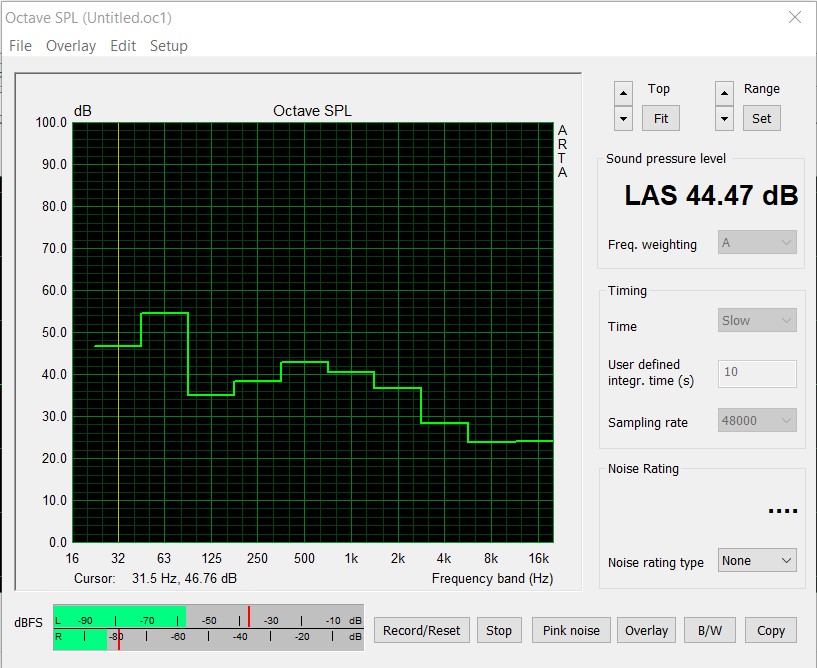
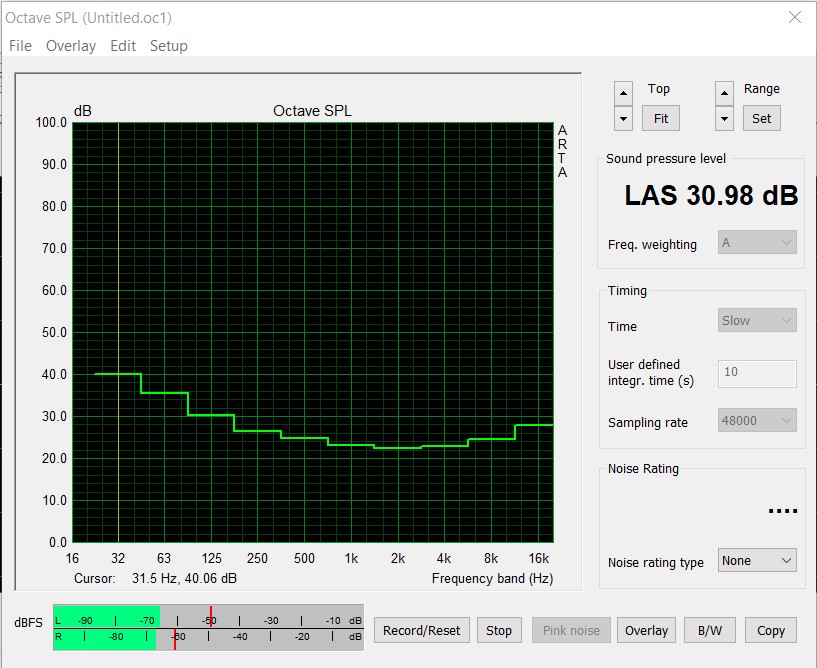
La Asus GeForce RTX 3080 ROG Strix Gaming OC non è affatto una scheda grafica a risparmio energetico. Ma con un TDP di 320 watt, è alla pari con la Founders Edition. Il raffreddatore estremamente sporgente è ventilato da tre ventole assiali, e questo è stato compensato con buone temperature nel test. Vale la pena ricordare che la ventola centrale ruota in direzione opposta rispetto alle due laterali. Nella prova di stress a case chiuso, la scheda grafica è arrivata fino a 73 °C (~163 °F), che può essere sicuramente considerato un ottimo risultato. Inoltre, il livello di rumore non è troppo alto, anche quando le ventole ruotano a ben 2.300 giri al minuto. Con il nostro sistema di misura, siamo stati in grado di rilevare circa 44 dB(A). Nell'uso a vuoto, la scheda grafica è completamente silenziosa grazie alla modalità di arresto delle ventole. Un basso rumore elettronico si verifica di tanto in tanto non appena i frame rates nei menu superano i 1.000. In generale, il problema non è così presente sulla Asus GeForce RTX 3080 ROG Strix Gaming OC come lo è su altre schede grafiche che abbiamo già testato.
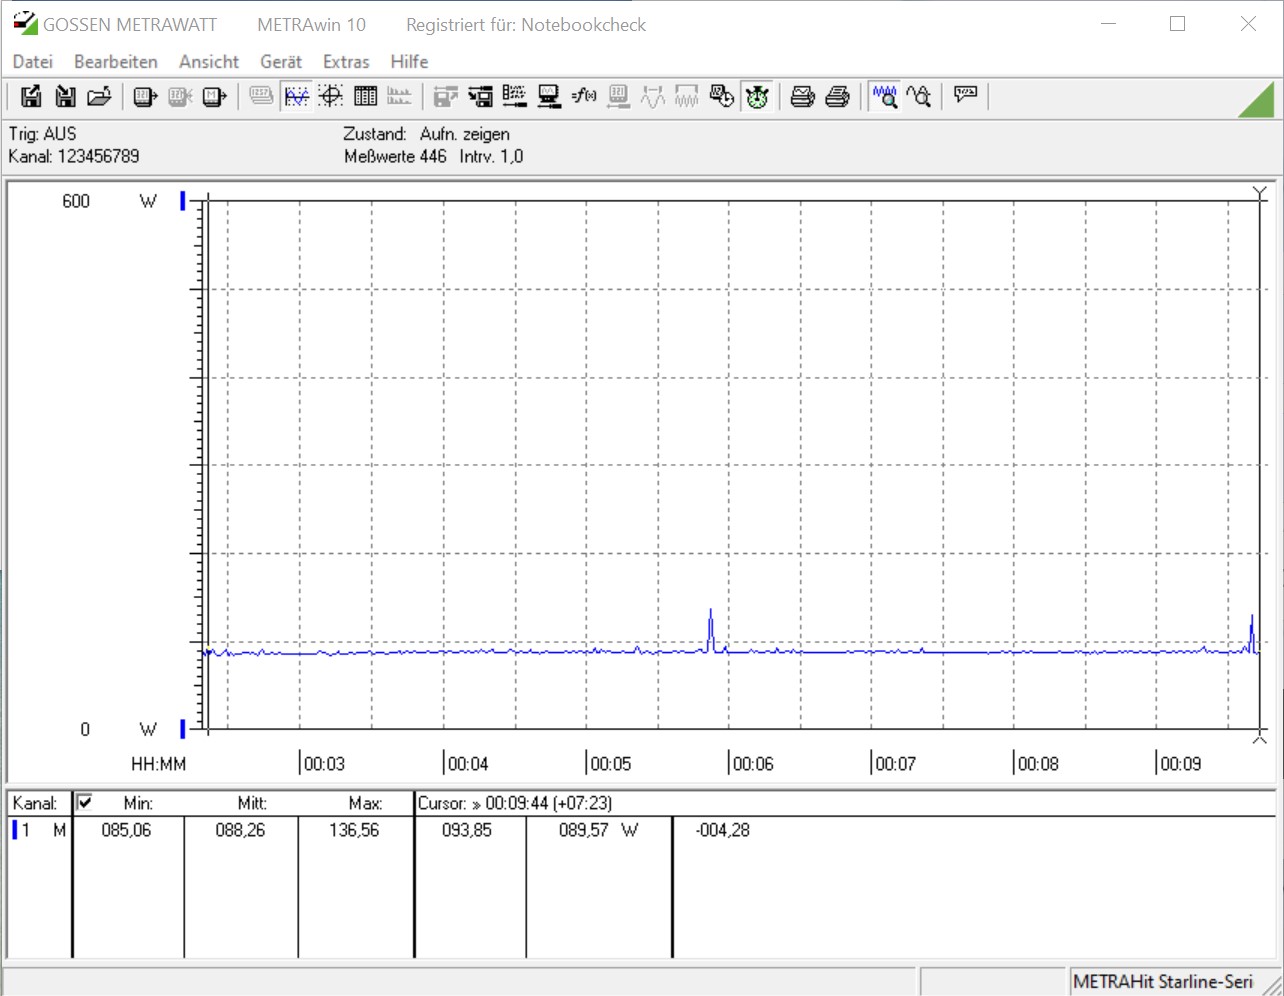
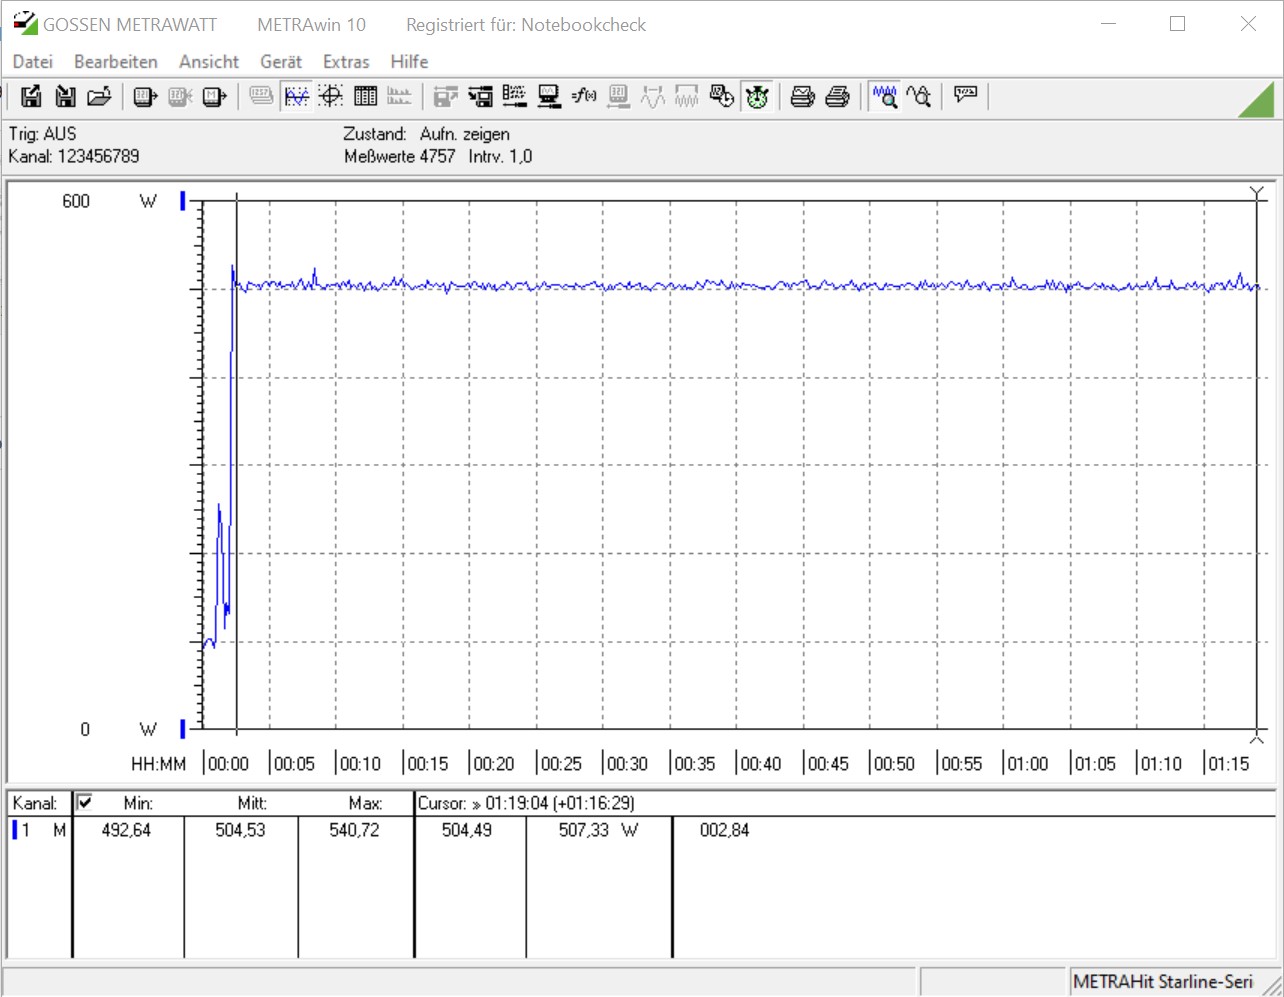
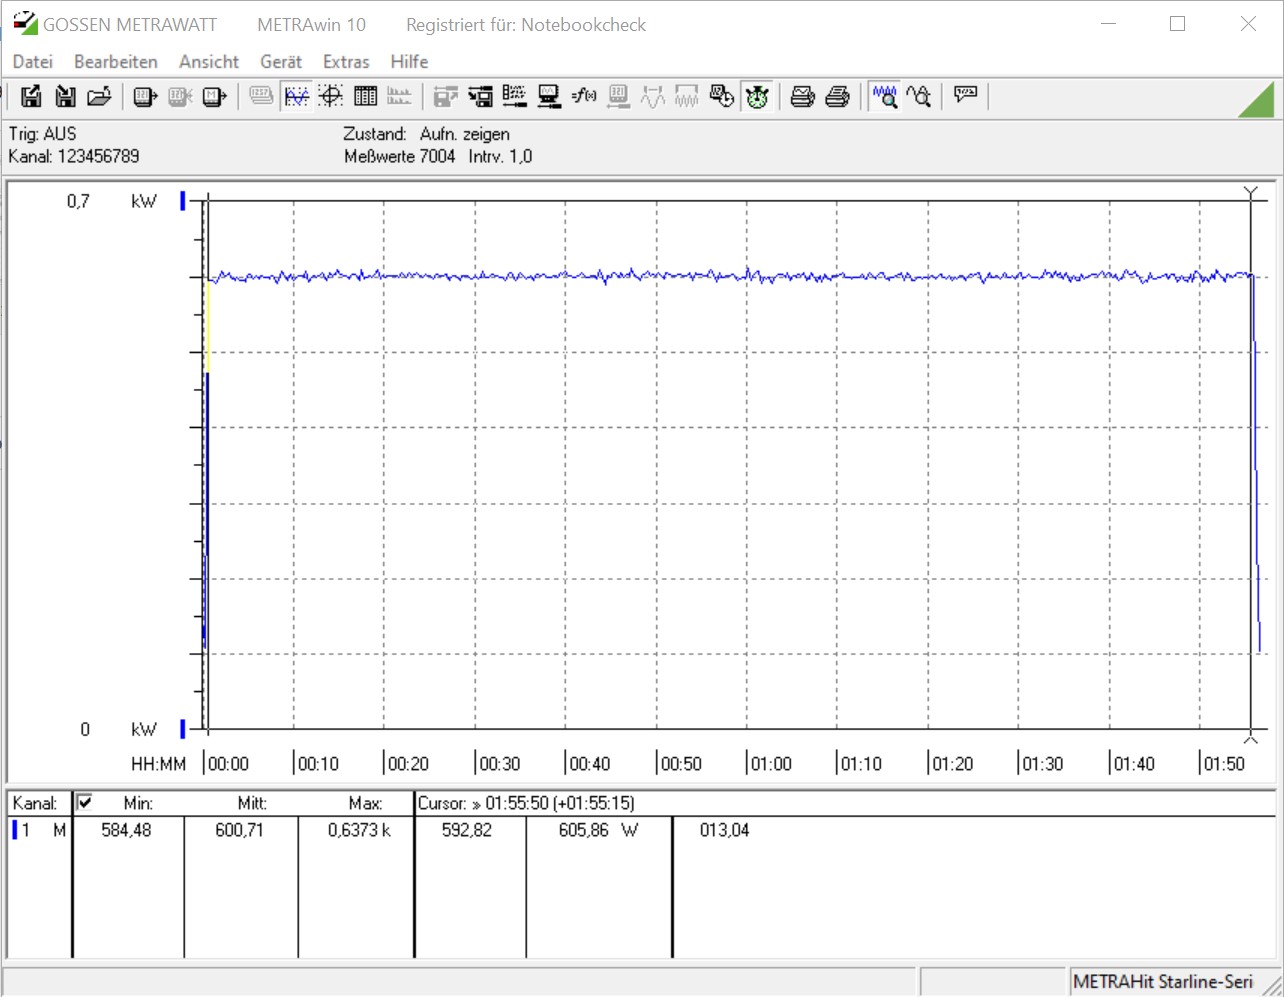
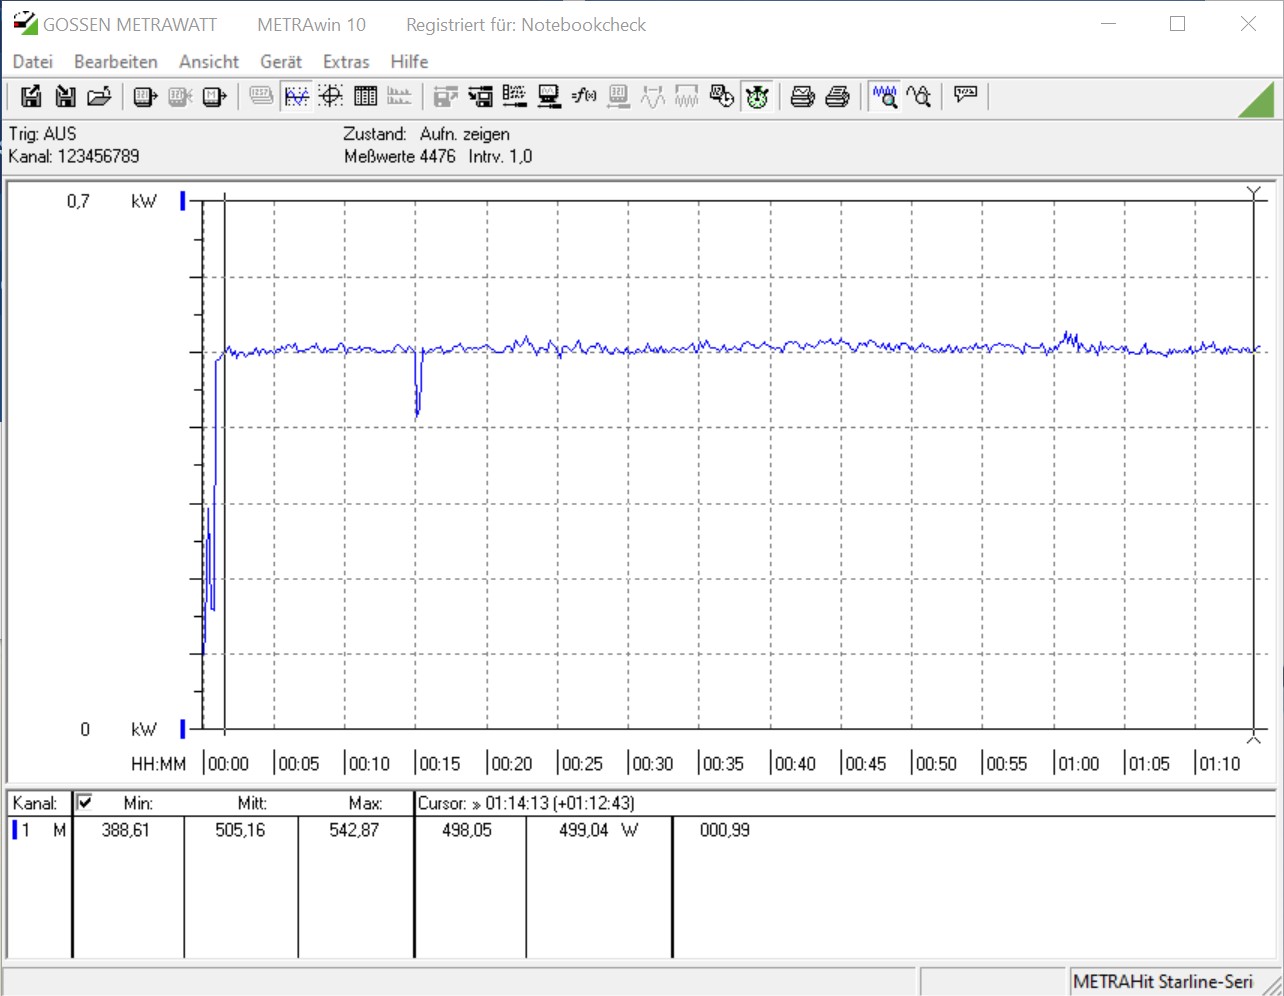
La GeForce RTX 3080 è piuttosto affamata di energia in termini di consumo energetico. Basta guardare la scheda grafica per capire che in questo caso è necessaria una forte unità di alimentazione, poiché la Asus GeForce RTX 3080 ROG Strix Gaming OC richiede tre connessioni di alimentazione a 8 pin. Con circa 505 watt, abbiamo misurato valori quasi identici per l'intero sistema sotto carico, sia nello stress test che nella prova di gaming. Se ora aumentiamo l'obiettivo di potenza al 121%, il nostro dispositivo di misura mostra poco più di 600 watt nello stress test. Di conseguenza, non sorprende che la Asus specifichi una raccomandazione di alimentazione di almeno 850 watt.
| Power Consumption | |
| 1920x1080 The Witcher 3 ultra (external Monitor) | |
| ASUS GeForce RTX 3080 ROG STRIX OC GAMING (Idle: 88.3 W) | |
| KFA2 GeForce RTX 2080 Ti EX (Idle: 100.5 W) | |
| AMD Radeon RX Vega 64 (Idle: 74.3 W) | |
| MSI RTX 2080 Gaming X Trio (Idle: 87.78 W) | |
| Nvidia GeForce RTX 2080 Super (Idle: 78.87 W) | |
| AMD Radeon RX 5700 XT (Idle: 69.8 W) | |
| Nvidia GeForce RTX 2070 Super (96.8 fps, Idle: 80.5 W) | |
| MSI RTX 2070 Gaming Z 8G (Idle: 73.3 W) | |
| AMD Radeon VII (Idle: 81.39 W) | |
| Nvidia GeForce RTX 2060 Super (82.7 fps, Idle: 77.12 W) | |
| AMD Radeon RX 5700 (84.2 fps, Idle: 64.5 W) | |
| MSI RTX 2060 Gaming Z 6G (Idle: 74.66 W) | |
| 1280x720 FurMark 1.19 GPU Stress Test (external Monitor) | |
| ASUS GeForce RTX 3080 ROG STRIX OC GAMING (Idle: 88.3 W) | |
| AMD Radeon VII (Idle: 81.39 W) | |
| MSI RTX 2080 Gaming X Trio | |
| KFA2 GeForce RTX 2080 Ti EX (Idle: 100.5 W) | |
| Nvidia GeForce RTX 2080 Super (Idle: 78.87 W) | |
| MSI RTX 2070 Gaming Z 8G (Idle: 73.3 W) | |
| AMD Radeon RX 5700 XT (239 fps, Idle: 69.8 W) | |
| Nvidia GeForce RTX 2070 Super (283 fps, Idle: 80.5 W) | |
| MSI RTX 2060 Gaming Z 6G (Idle: 74.66 W) | |
| Nvidia GeForce RTX 2060 Super (237 fps, Idle: 77.12 W) | |
| AMD Radeon RX 5700 (207 fps, Idle: 64.5 W) | |
* ... Meglio usare valori piccoli
Pro
Contro
Giudizio Complessivo - Veloce e silenziosa sotto carico

Con la GeForce RTX 3080 ROG Strix Gaming OC, Asus ha senza dubbio una scheda grafica molto veloce sul mercato. Tutti i giochi più recenti possono essere giocati senza problemi con essa. Ma questa scheda grafica inizia a sentirsi bene solo quando va oltre una risoluzione nativa di 1080p. L'attuale generazione Ampere si distingue chiaramente da Turing. Se si aggiungono DLSS o Ray Tracing in cima, il vantaggio della nuova architettura diventa ancora più grande. Tuttavia, gli utenti devono convivere con gli svantaggi rispetto ad un RTX 2080 Ti in termini di VRAM, perché a 10 GB sull'RTX 3080, questo è più piccolo rispetto al 2080 Ti (11 GB). A lungo termine, però, questo potrebbe diventare la rovina dell'RTX 3080, perché AMD ha già annunciato i suoi tre modelli di punta della serie 6000 e qui utilizza costantemente 16 GB di VRAM. Il mulino delle voci di Nvidia sta ronzando, e un RTX3080 Ti con più shader e 20 GB di VRAM dovrebbe già essere in funzione.
Ma a cosa serve una scheda grafica veloce se non è disponibile per l'acquisto? Nvidia, e quindi anche i suoi partner di bordo, hanno già sprecato molto potenziale in questo caso, perché la domanda non può ancora essere soddisfatta. Secondo i rapporti interni, questa situazione dovrebbe continuare fino al 2021.
La Asus GeForce RTX 3080 ROG Strix Gaming OC di Asus GeForce RTX 3080 è una delle schede grafiche RTX 3080 più veloci, dotata anche di un buon raffreddamento. L'unità di raffreddamento ben congegnata è convincente, e con la discreta illuminazione RGB, c'è anche qualcosa su cui rifarsi gli occhi.
Chi è già riuscito a mettere le mani su un modello RTX 3080 sarà ricompensato con una buona potenza grafica. Ma questo si traduce anche in un elevato consumo di energia, che deve essere considerato al momento dell'acquisto. La corretta scelta dell'alimentatore è importante in questo caso per non soffrire di brutti crash di sistema sotto carico. Asus raccomanda un alimentatore da almeno 850 watt per il nostro campione di prova.
L'Asus GeForce RTX 3080 ROG Strix Gaming OC di Asus GeForce RTX 3080 ROG ha attualmente un prezzo di 999 Euro (~$1.185). Sono 300 Euro (~$356) in più rispetto al MSRP della Founders Edition; ma le piccole quantità spingono i prezzi estremamente alti, tanto che anche la Founders Edition è in parte offerta a più di 1.000 Euro (~$1.186). Il nostro consiglio è, quindi, di aspettare e vedere cosa fa la concorrenza, in modo da non rimpiangere la decisione di acquisto in seguito.
Tutti i valori di riferimento e i valori di prova per RTX 3080 si trovano sulsito della scheda grafica della GeForce RTX 3080 (regolarmente aggiornata).
