Recensione della Zotac Gaming GeForce RTX 3090 Trinity — Annuncia l'alba del gaming 8K
Introduzione
Il lancio di Ampere di NVIDIA quest'anno sarà ricordato per diversi motivi. La generazione di Turing ha dovuto accettare una buona parte delle critiche non solo per il colpo alle performance che è risultato dal ray-tracing, ma anche per i prezzi esorbitanti delle schede al lancio. NVIDIA sperava di rimediare a molti dei problemi iniziali di Turing con Ampere, e le recensioni iniziali dell'RTX 3080 sono state ampiamente positive, sia che si trattasse di guadagni significativi rispetto all'RTX 2080 o dei prezzi più ragionevoli dell'ammiraglia RTX 3080 Founders Edition.
Anche se la RTX 3080 viene commercializzata da NVIDIA come scheda grafica di punta di Ampere, non è ancora una scheda di classe Titan quando si tratta di essere la migliore in assoluto sia per i creatori che per i giocatori. È qui che entra in gioco la RTX 3090. L'RTX 3090 è stata classificata come il successore del Titan RTX. In precedenza, se avete mai desiderato un Titan, l'unica scheda disponibile era la Founders Edition direttamente da NVIDIA. Quest'anno, il design della RTX 3090 è stato esternalizzato anche ai partners della scheda aggiuntiva (AiB), il che significa maggiore varietà e migliore disponibilità. Anche se non siamo sicuri che NVIDIA lancerà una scheda con il nome Titan al momento, l'RTX 3090 da parte sua surclassa la Titan RTX in termini di specifiche e prestazioni.
La RTX 3090 vanta 35,6 shaders di picco FP32 TFLOPs (contro i 16,3 della Titan RTX), 69,5 ray-tracing TFLOPs (contro i 49,2 della Titan RTX) e 284,7 Tensor TFLOPs quando si usa la funzione Sparsity per l'inferenza AI. Le specifiche complete sono riassunte nella tabella sottostante.
Confronto della RTX 3090 con altr GPUs NVIDIA
| Specifiche | RTX 3090 | RTX 3080 | Titan RTX | TITAN X Pascal | RTX 2080 Ti | RTX 2080 | RTX 2070 | GTX 1080 Ti |
| Chip | GA102 | GA102 | TU102 | GP102 | TU102 | TU104 | TU106 | GP102 |
| Processo FinFET | 8 nm | 8 nm | 12 nm | 16 nm | 12 nm | 12 nm | 12 nm | 16 nm |
| CUDA cores | 10,496 | 8,704 | 4,608 | 3,584 | 4,352 | 2,944 | 2,304 | 3,584 |
| Texture Units | 328 | 272 | 288 | 224 | 272 | 184 | 144 | 224 |
| Tensor Cores | 328 3rd gen | 272 | 576 2nd gen | - | 544 | 368 | 288 | - |
| RT Cores | 82 | 68 | 72 | - | 68 | 46 | 36 | - |
| GPU Base Clock | 1,395 MHz | 1,440 MHz | 1,350 MHz | 1,417 MHz | 1,350 MHz | 1,515 MHz | 1,410 MHz | 1,481 MHz |
| GPU Boost Clock | 1,695 MHz | 1,710 MHz | 1,770 MHz | 1,531 MHz | 1,545 MHz | 1,710 MHz | 1,620 MHz | 1,582 MHz |
| Memory Bus | 384-bit | 320-bit | 384-bit | 384-bit | 352-bit | 256-bit | 256-bit | 352-bit |
| Memory Bandwidth | 936 GB/s | 760 GB/s | 672 GB/s | 480.4 GB/s | 616 GB/s | 448 GB/s | 448 GB/s | 484.4 GB/s |
| Memoria Video | 24 GB GDDR6X | 10 GB GDDR6X | 24 GB GDDR6 | 12 GB GDDR5X | 11 GB GDDR6 | 8 GB GDDR6 | 8 GB GDDR6 | 11 GB GDDR5X |
| Consumo Energetico | 350 W | 320 W | 280 W | 250 W | 250 W | 215 W | 175 W | 215 W |
Con un prezzo di 1.499 dollari, la RTX 3090 Founders Edition non è una scheda per tutti. È destinata ai creatori che, secondo i termini di NVIDIA, "comprendono il valore di un frame buffer più grande". Certo, si può giocare su questa cosa abbastanza bene, ma il vero valore di questa scheda sta nel gaming a 4K 144 Hz, e ora, a 8K 30 Hz e oltre di refresh rates.
Un tour della Zotac Gaming GeForce RTX 3090 Trinity
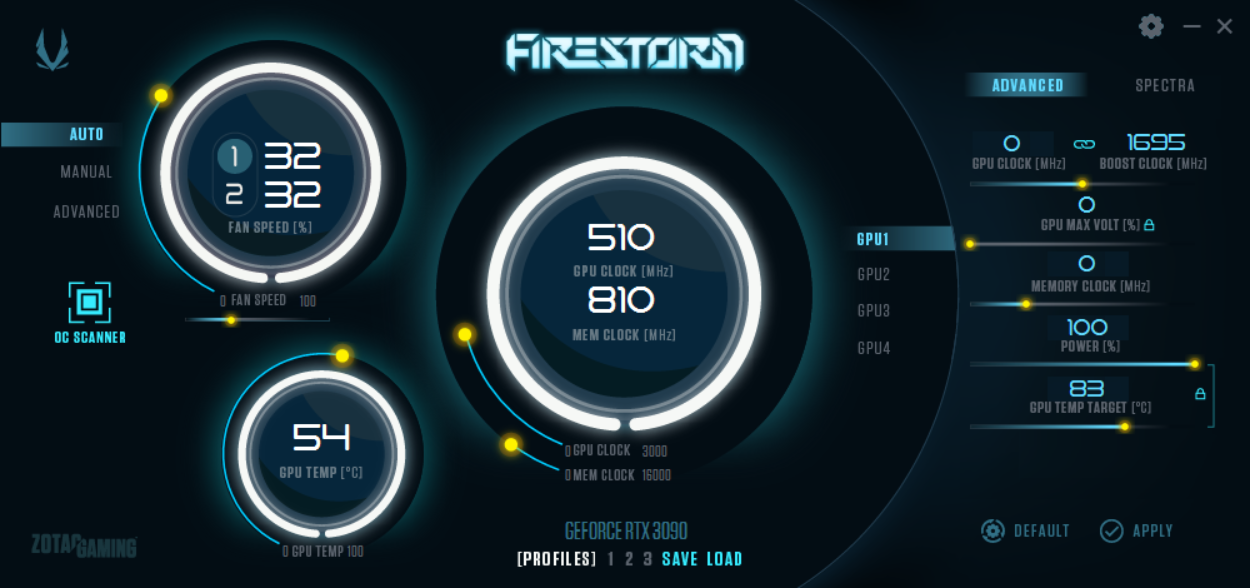
Per questa recensione, useremo la scheda Zotac Gaming GeForce RTX 3090 Trinity AiB. La Zotac RTX 3090 utilizza un PCB personalizzato, e il suo design si differenzia molto dalla RTX 3090 Founders Edition. La scheda utilizza un sistema di raffreddamento a tripla ventola, che Zotac chiama IceStorm 2.0. RTX 3090 Trinity presenta anche un design a 11 pale e tre gruppi di dissipatori ad alette in alluminio con sette tubi di calore in rame. L'azienda afferma che le nuove ventole contribuiscono ad aumentare il flusso d'aria del 10% rispetto alla generazione precedente. Le rotazioni delle ventole possono essere regolate in modo indipendente nell'utilità FireStorm, ora aggiornata, che consente anche un discreto overclocking; le ventole si fermano completamente durante il funzionamento a vuoto.
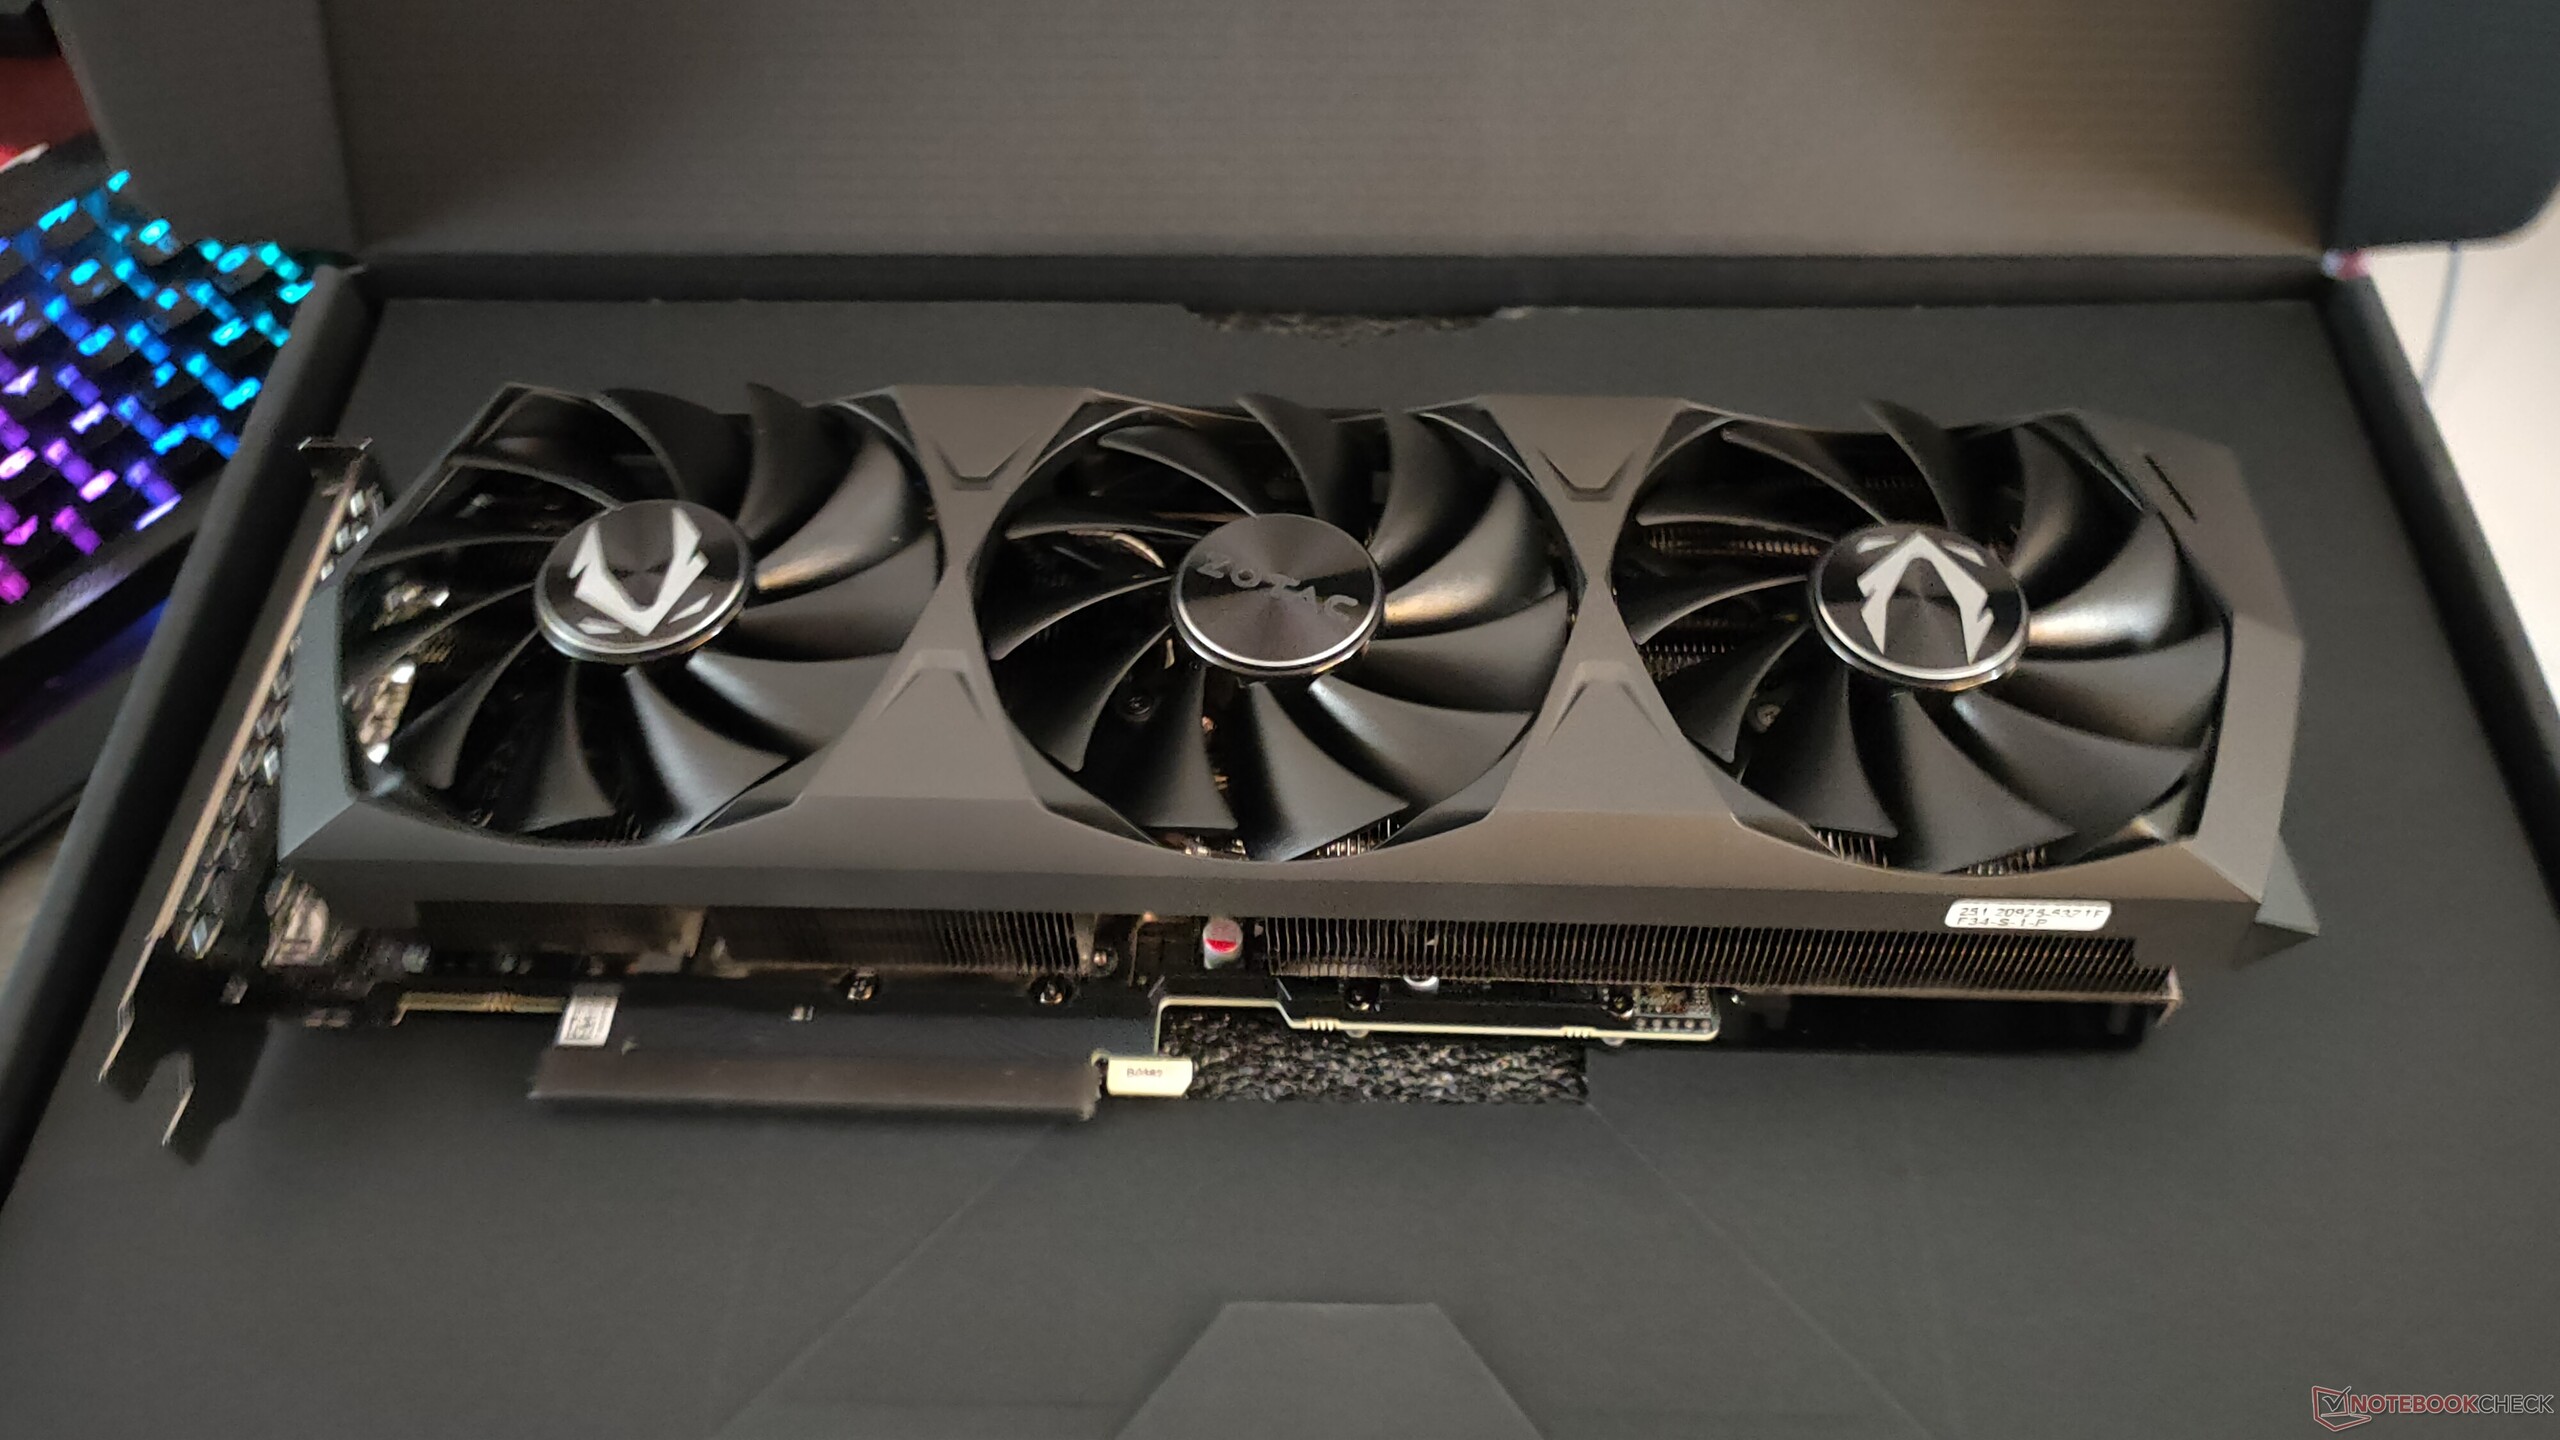
La RTX 3090 Founders Edition è una gigantesca GPU che occupa tre slot PCIe. In confronto, Zotac RTX 3090 Trinity è la vostra normale scheda a 2,5 slot, il che significa che non dovrete sacrificare l'espansione PCIe nella maggior parte delle schede ATX. Detto questo, la scheda è più lunga del normale a 12,5 pollici e supera anche leggermente la lunghezza della scheda E-ATX del nostro test.
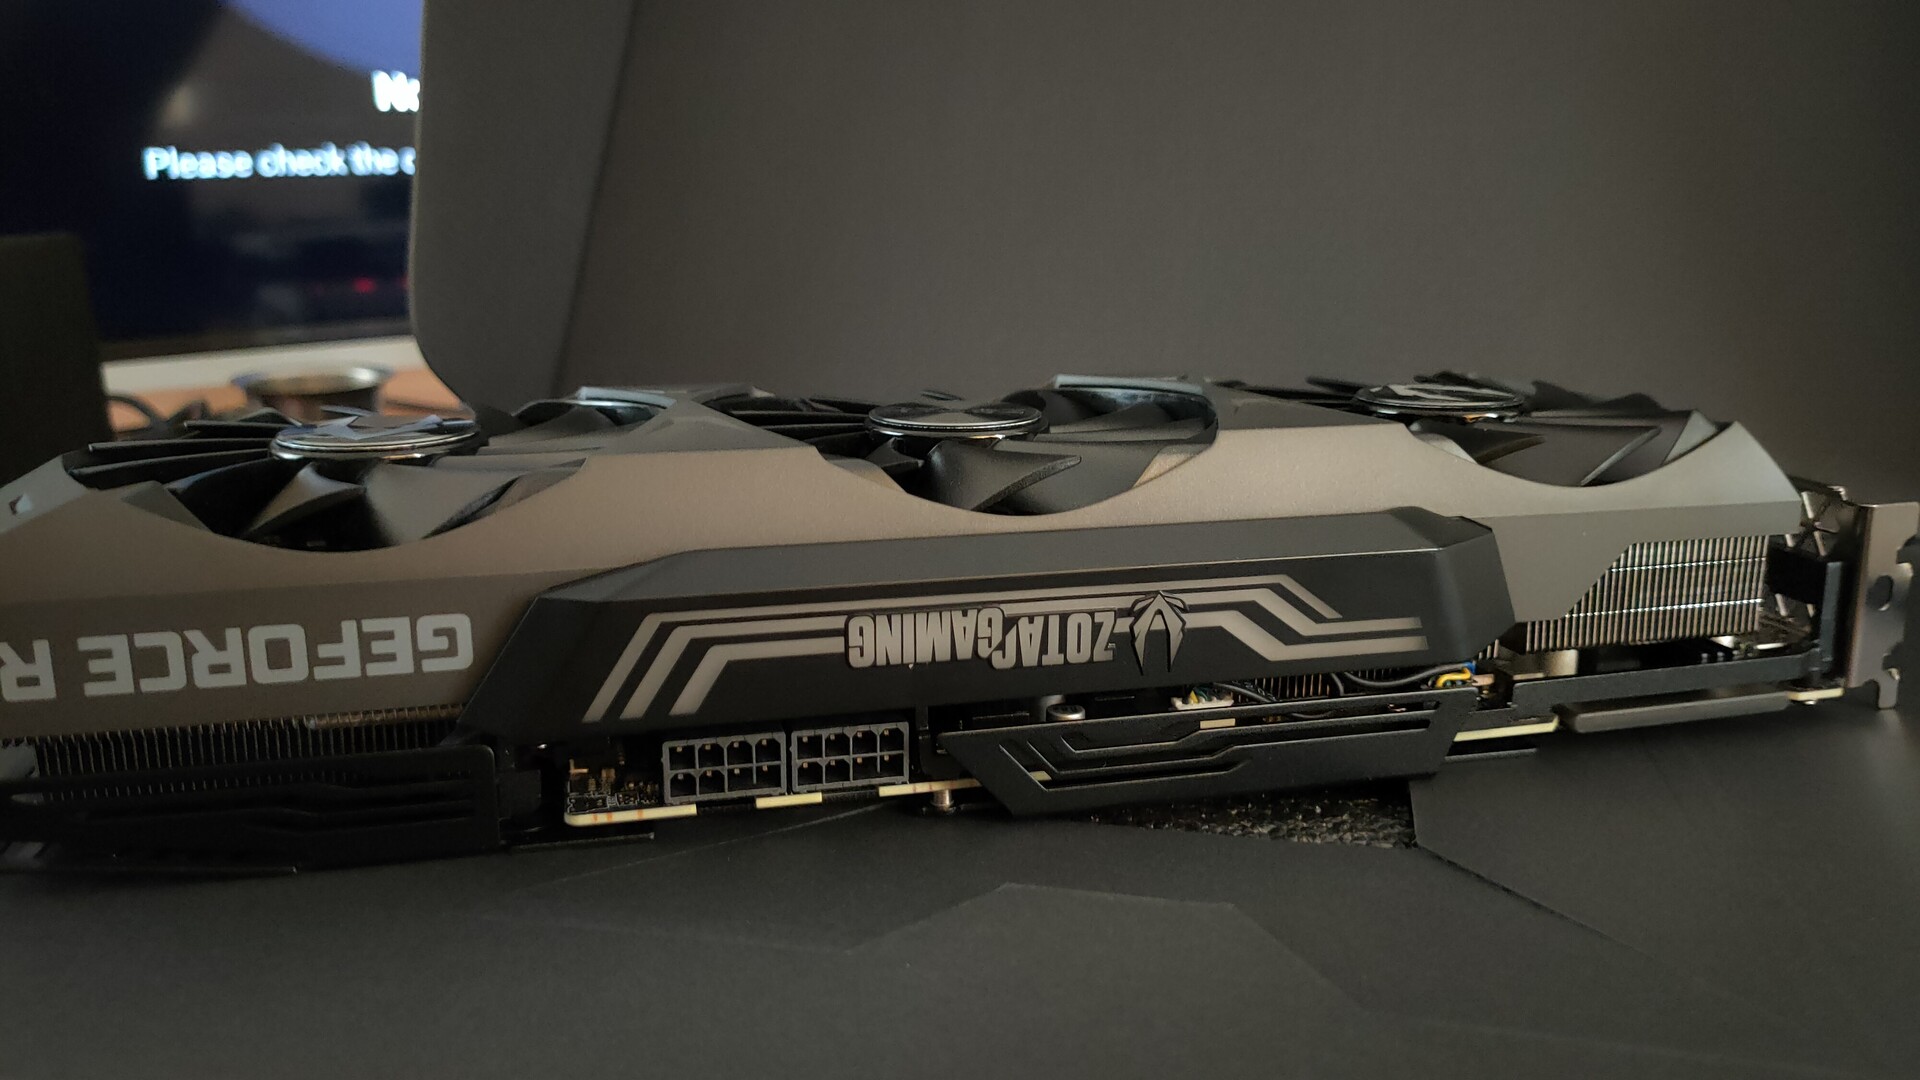
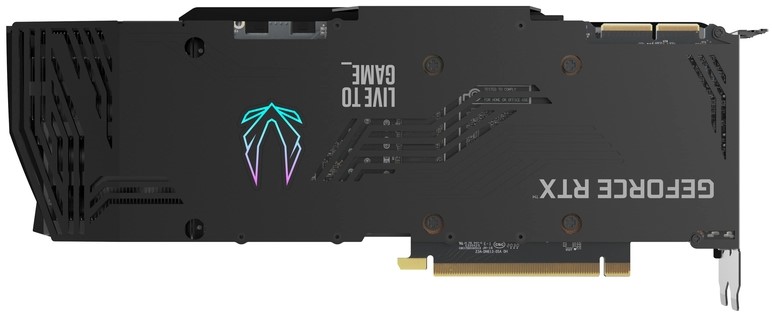
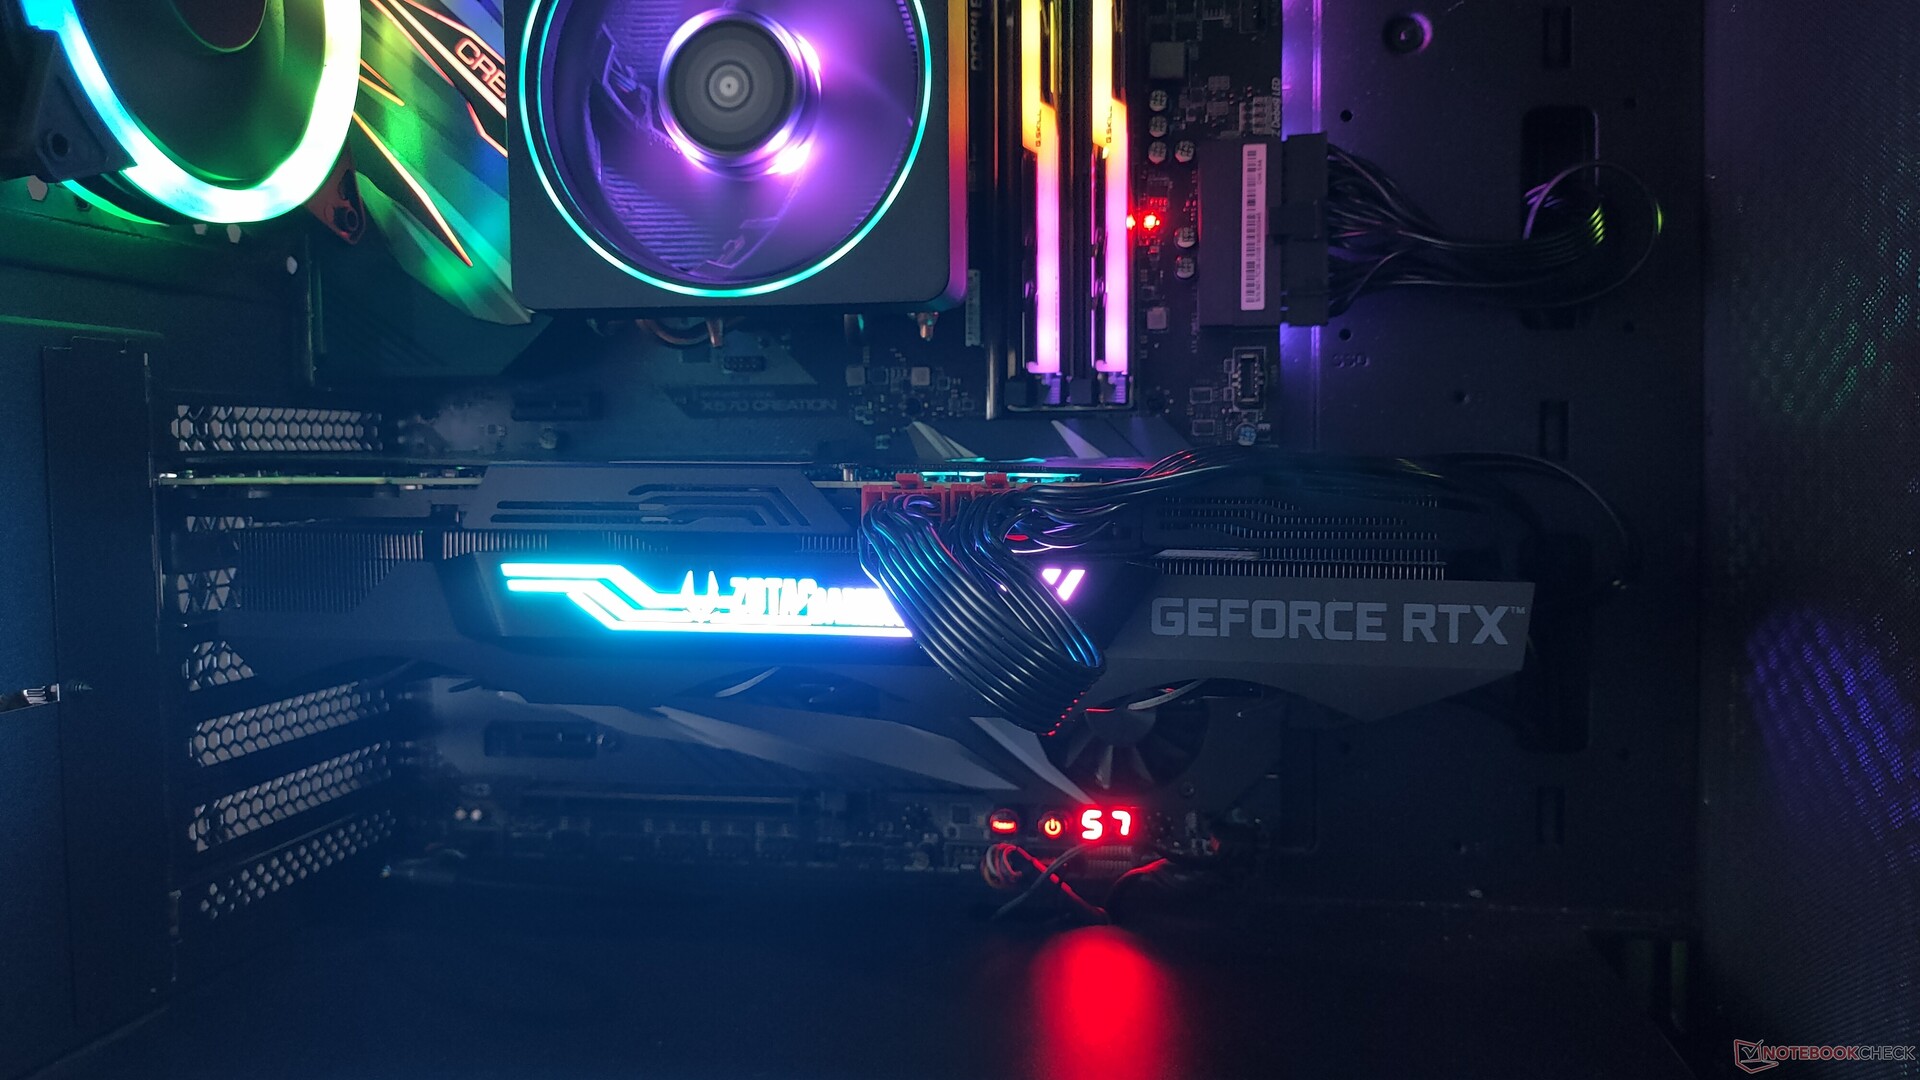
Con la decisione di NVIDIA di abbandonare il connettore USB Type-C VirtuaLink in questa generazione, abbiamo ottenuto l'array standard di tre porte DisplayPort 1.4a e una porta HDMI 2.1 che supporta fino a 8K 60 Hz in uscita. Verso la parte superiore della scheda, troviamo l'area del logo Zotac Gaming RGB, i cui effetti possono essere personalizzati nell'utility FireStorm. Si tratta di una cosa standard con le schede AiB, ma sarebbe stato bello se anche l'etichetta GeForce RTX fosse stata illuminata, dato che molti vorrebbero mostrare le loro pregiate schede RTX nelle loro costruzioni. L'RTX 3090 Trinity offre piastre frontali e posteriori in metallo pressofuso. Mentre la piastra posteriore è costruita bene per la maggior parte, sembrava un po' fragile quando si va verso la fine della scheda. La piastra posteriore sfoggia il logo Zotac che è dotato di illuminazione a LED ARGB.
NVIDIA si è costantemente allontanata dal continuare lo SLI/NVLink per i giocatori. Nella generazione Ampere, l'RTX 3090 è per ora l'unica scheda consumer con un connettore NVLink.
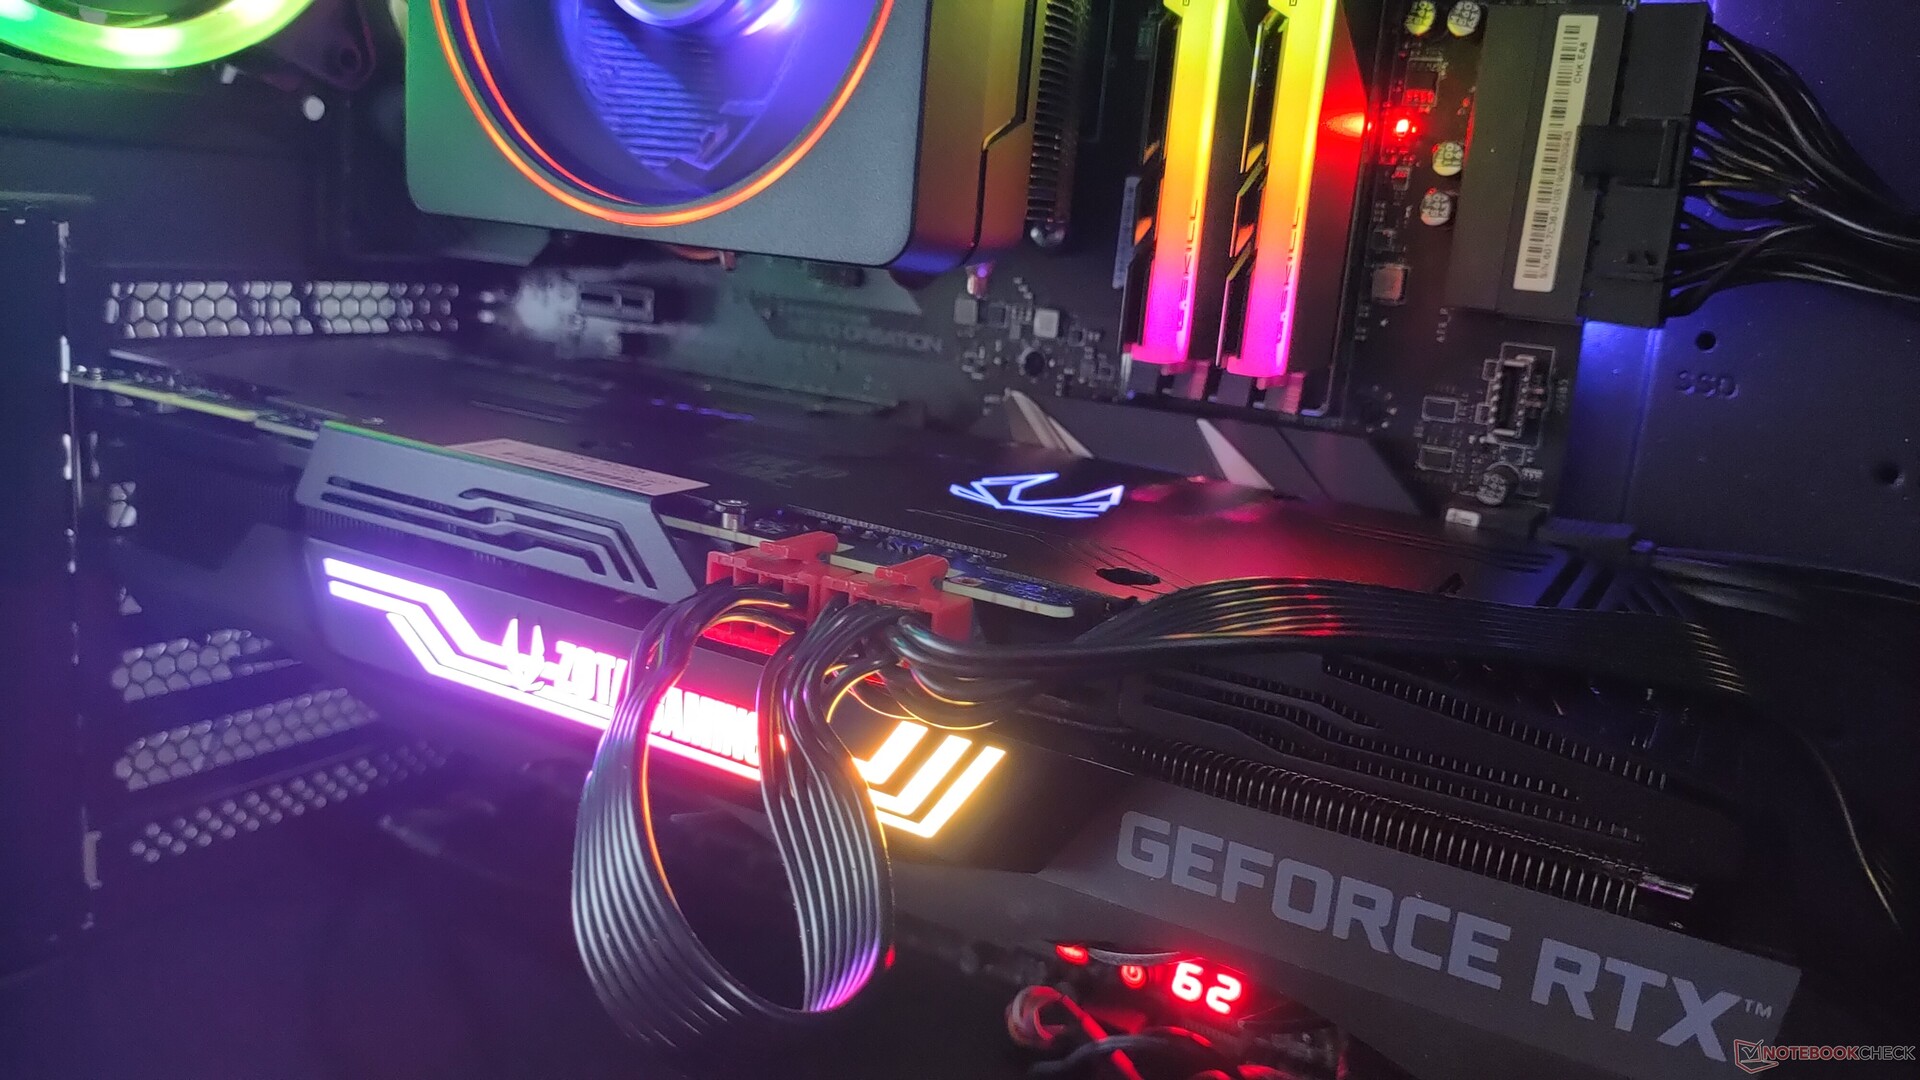
Come tutte le altre schede Ampere AiB che abbiamo visto finora, l'RTX 3090 Trinity utilizza connettori standard doppi a 8 pin invece della nuova variante a 12 pin della Founders Edition. Una particolarità della RTX 3090 Trinity è il posizionamento dei doppi connettori di alimentazione a 8 pin - sono posizionati più verso il centro della scheda rispetto al solito bordo destro. Questo rende il contatto con loro con cavi di alimentazione PCIe di lunghezza regolare un po' ingombrante e può richiedere l'acquisto di un cavo più lungo.
La GeForce Gaming GeForce RTX 3090 Trinity di Zotac Gaming cota al dettaglio per 1.694,73 dollari.
Nota: a causa della scarsità di unità disponibili sia da NVIDIA che da AiBs, la nostra recensione della RTX 3080 seguirà a breve. Per ora, laddove necessario, abbiamo preso in considerazione i punteggi della recensione di Hardwareluxx.de dell'eccellente RTX 3080 Founders Edition per i confronti.
Non abbiamo potuto ottenere la RTX 3090 Founders Edition ma NVIDIA India ci ha fornito la Zotac Gaming GeForce RTX 3090 Trinity per i test. Abbiamo fatto del nostro meglio per ospitare il maggior numero possibile di test all'interno della breve durata della recensione per dare ai nostri lettori un'idea di base del tipo di prestazioni che ci si può aspettare da questa GPU. Altri test e articoli sono attesi nei prossimi giorni.
Sistema di test
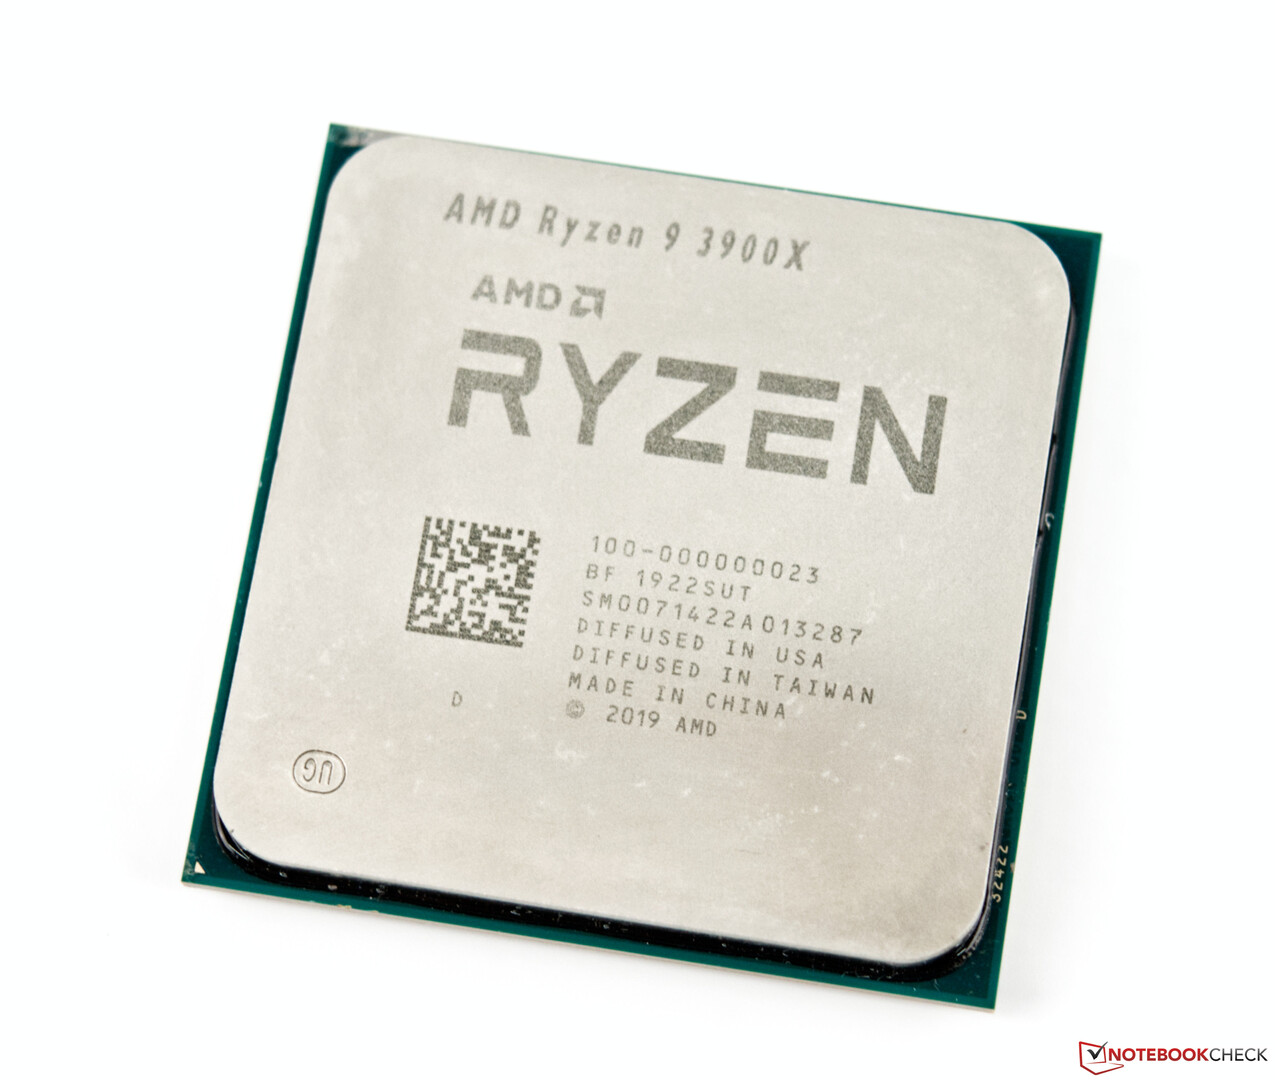
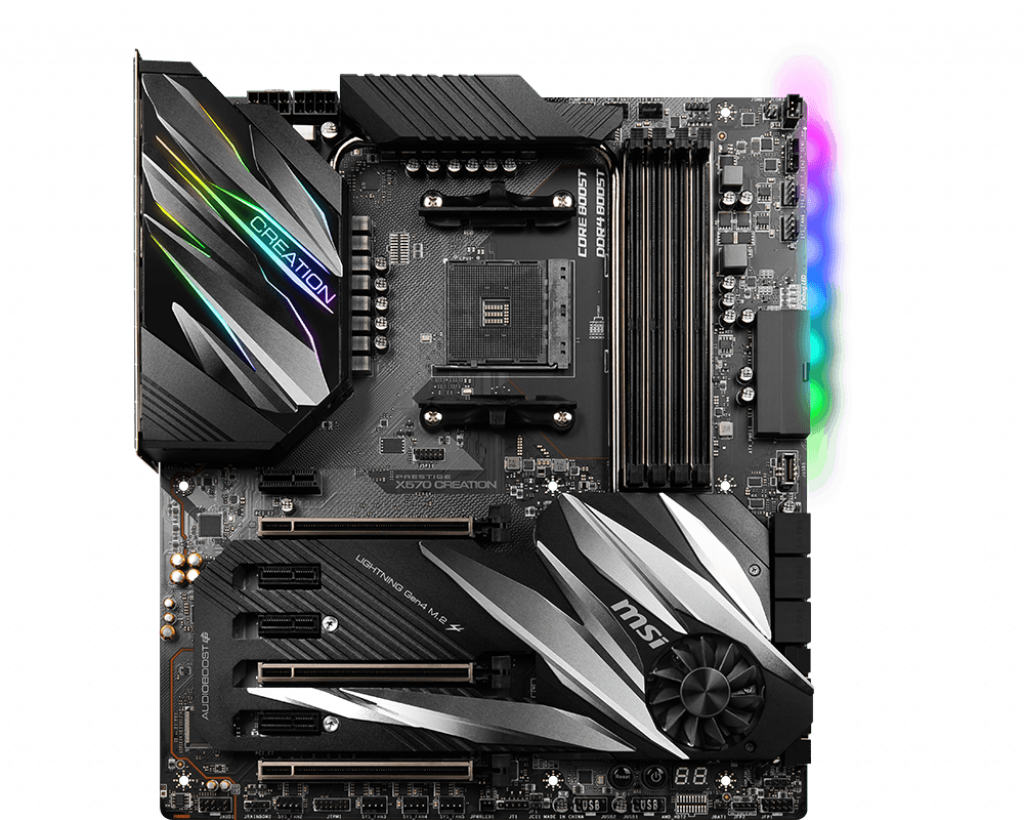
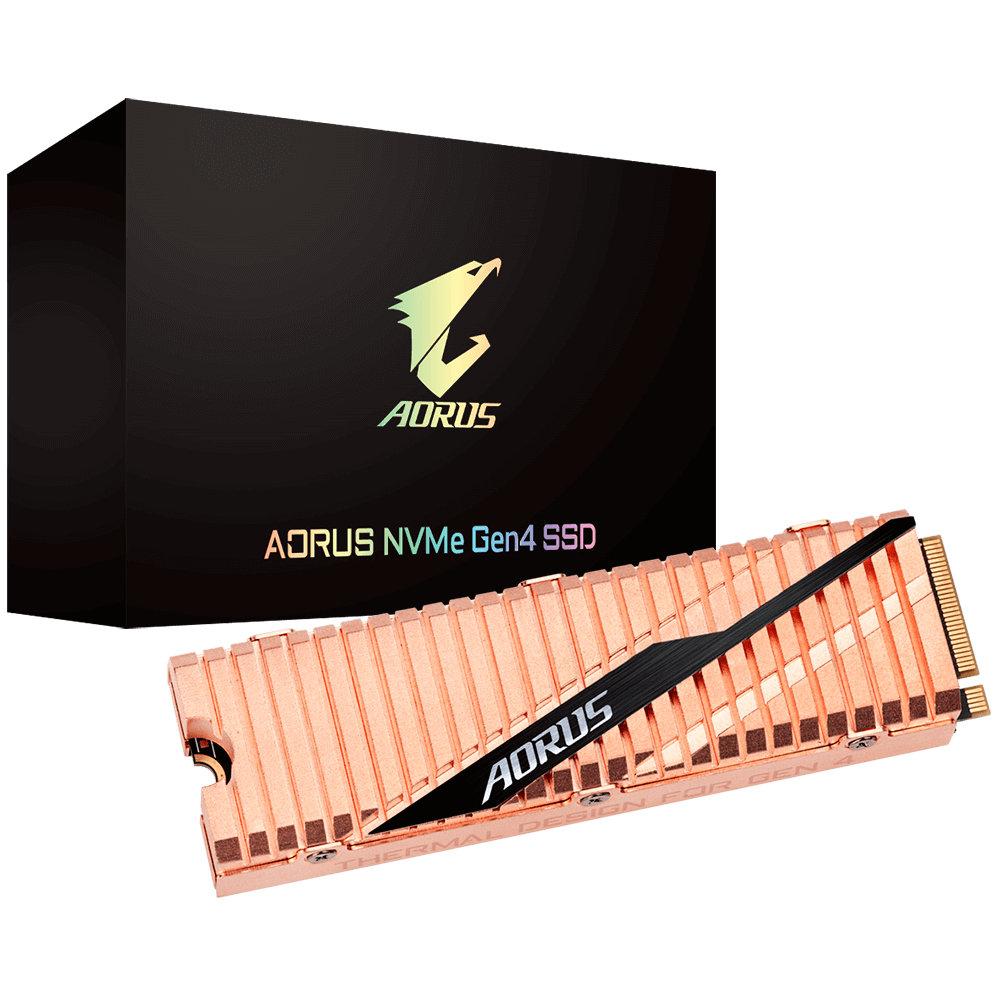
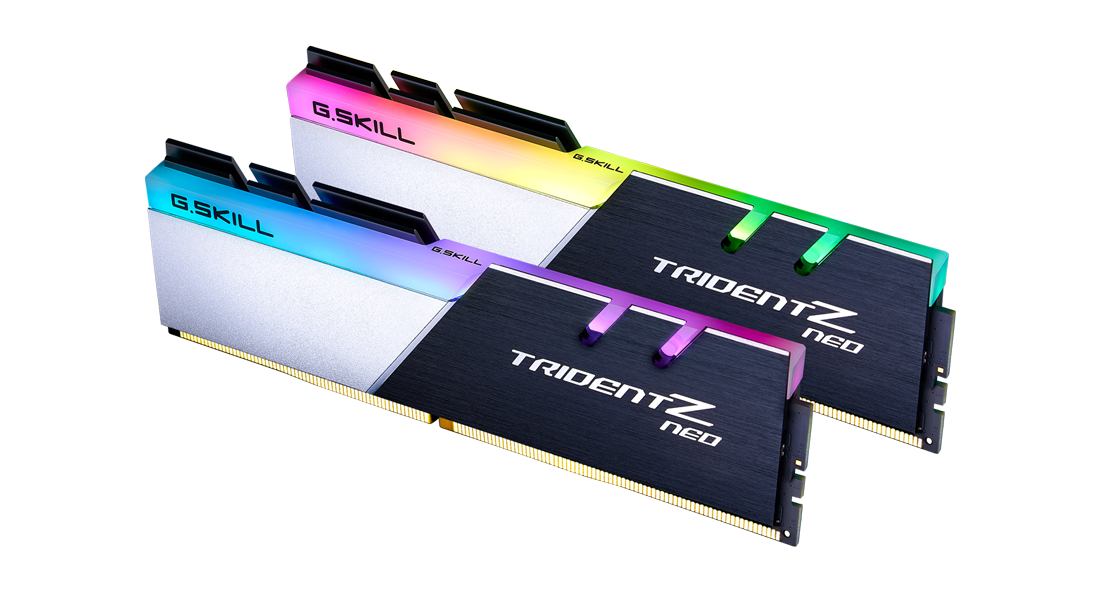
Il nostro sistema di test si basa sulla piattaforma AMD Ryzen 3000 X570. Abbiamo utilizzato una CPU AMD Ryzen 9 3900X su una scheda madre MSI Prestige X570 Creation. La CPU è stata accoppiata con 32 GB (16 GB x2) di G.SKILL Trident Z Neo DDR4-3600 RAM con timings 16-19-19-39. Windows 10 2004 con gli ultimi aggiornamenti cumulativi (Build 19041.508) è stato installato su un SSD Gigabyte Aorus NVMe Gen4 da 1 TB mentre 2x SSD da 1 TB ciascuno Crucial MX500 SATA sono stati utilizzati per eseguire benchmarks e giochi. Il sistema è stato raffreddato ad aria utilizzando il sistema di raffreddamento Wraith Prism di serie di AMD. Per consentire un migliore flusso d'aria, i test sono stati eseguiti con il pannello laterale temperato del case (Antec NX800) rimosso.
Tutti i drivers, incluso il BIOS (AGESA Combo 1.0.8.1) e VGA (456.38) sono stati aggiornati alle ultime versioni disponibili prima del benchmarking.
Abbiamo accoppiato l'RTX 3090 Trinity ad una smart TV OnePlus U Series 55U1 (revisione pratica in arrivo) che funziona a 4K 60 Hz nativi. L'uscita a colori è stata impostata su Full 32-bit RGB nel pannello di controllo NVIDIA e il ridimensionamento di Windows è stato impostato al 100%.
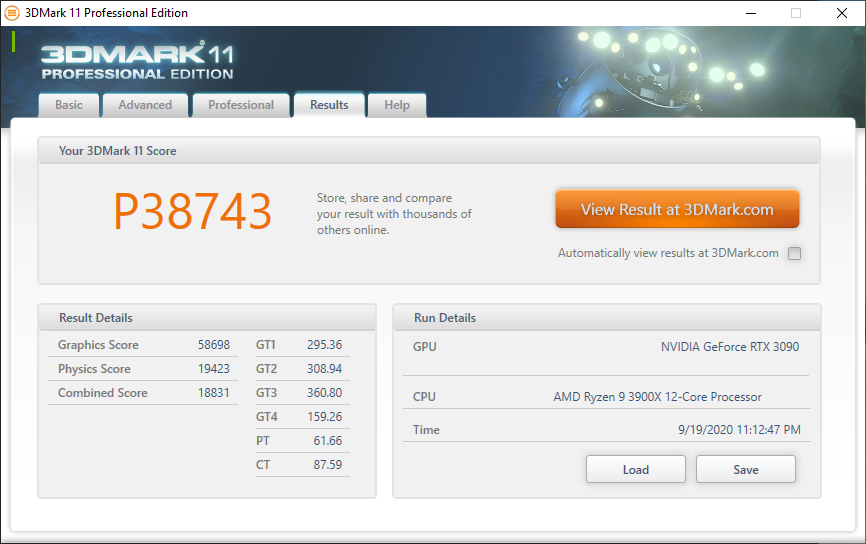
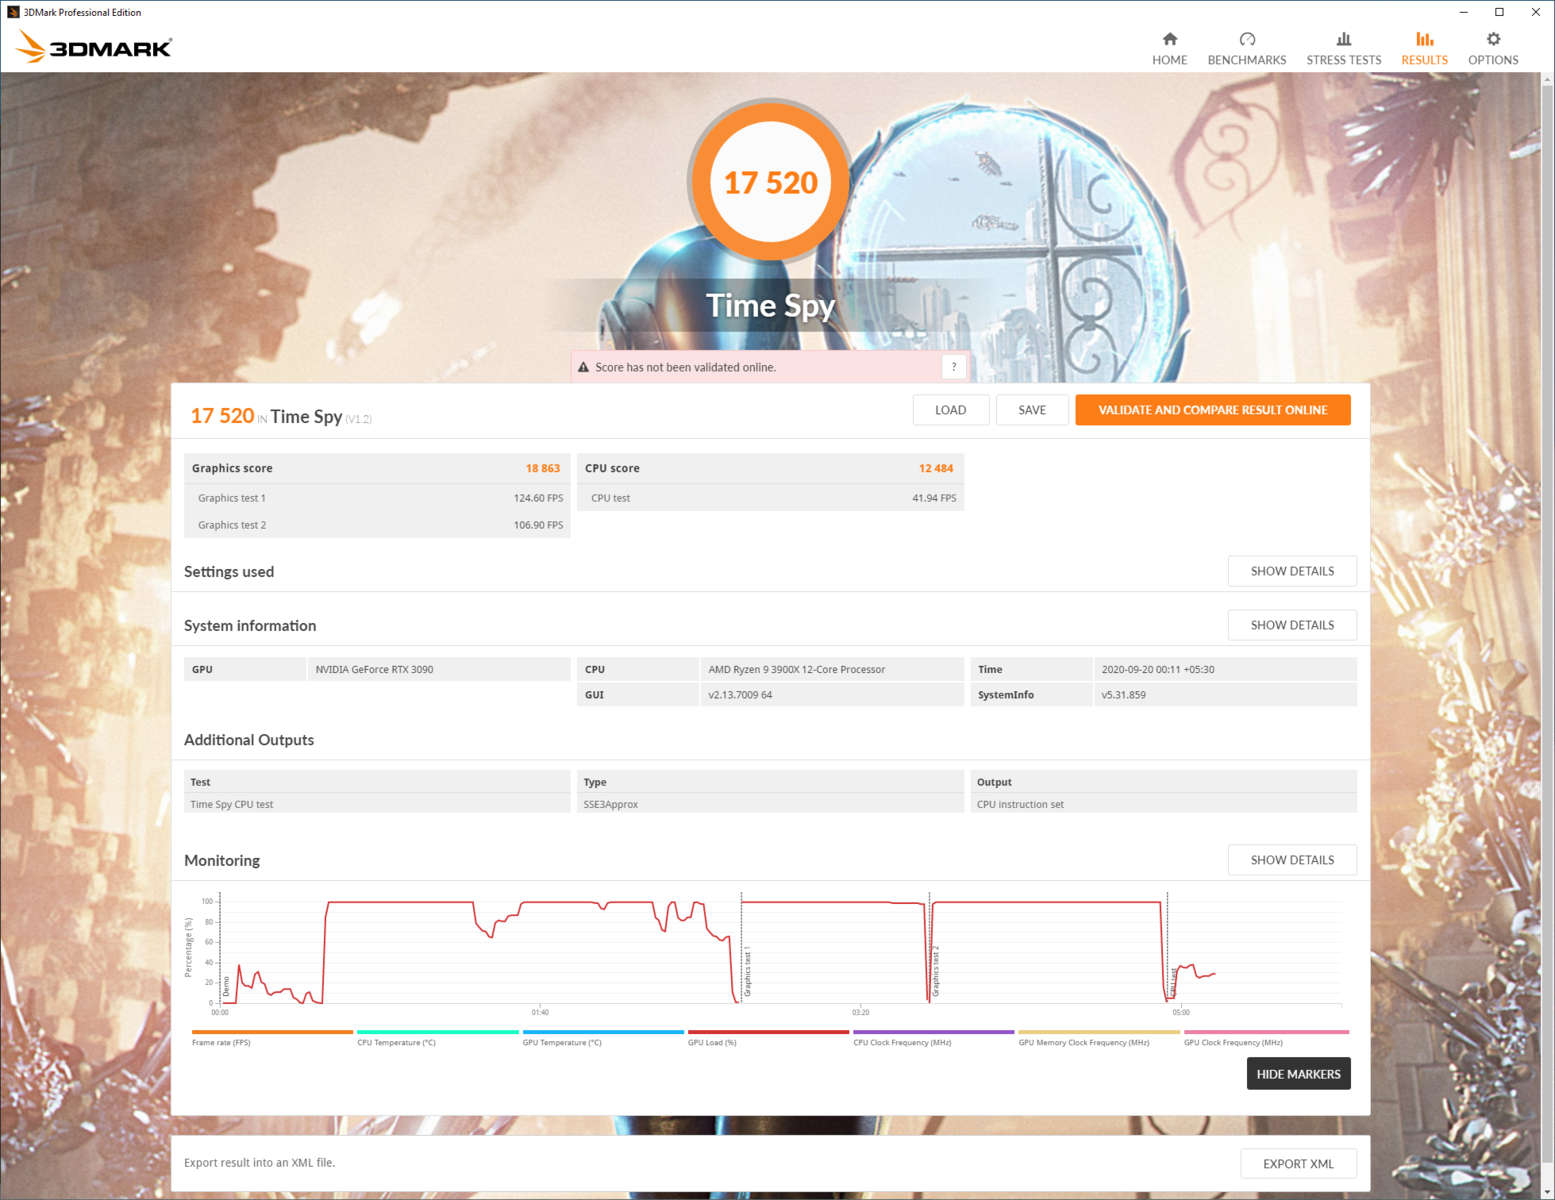
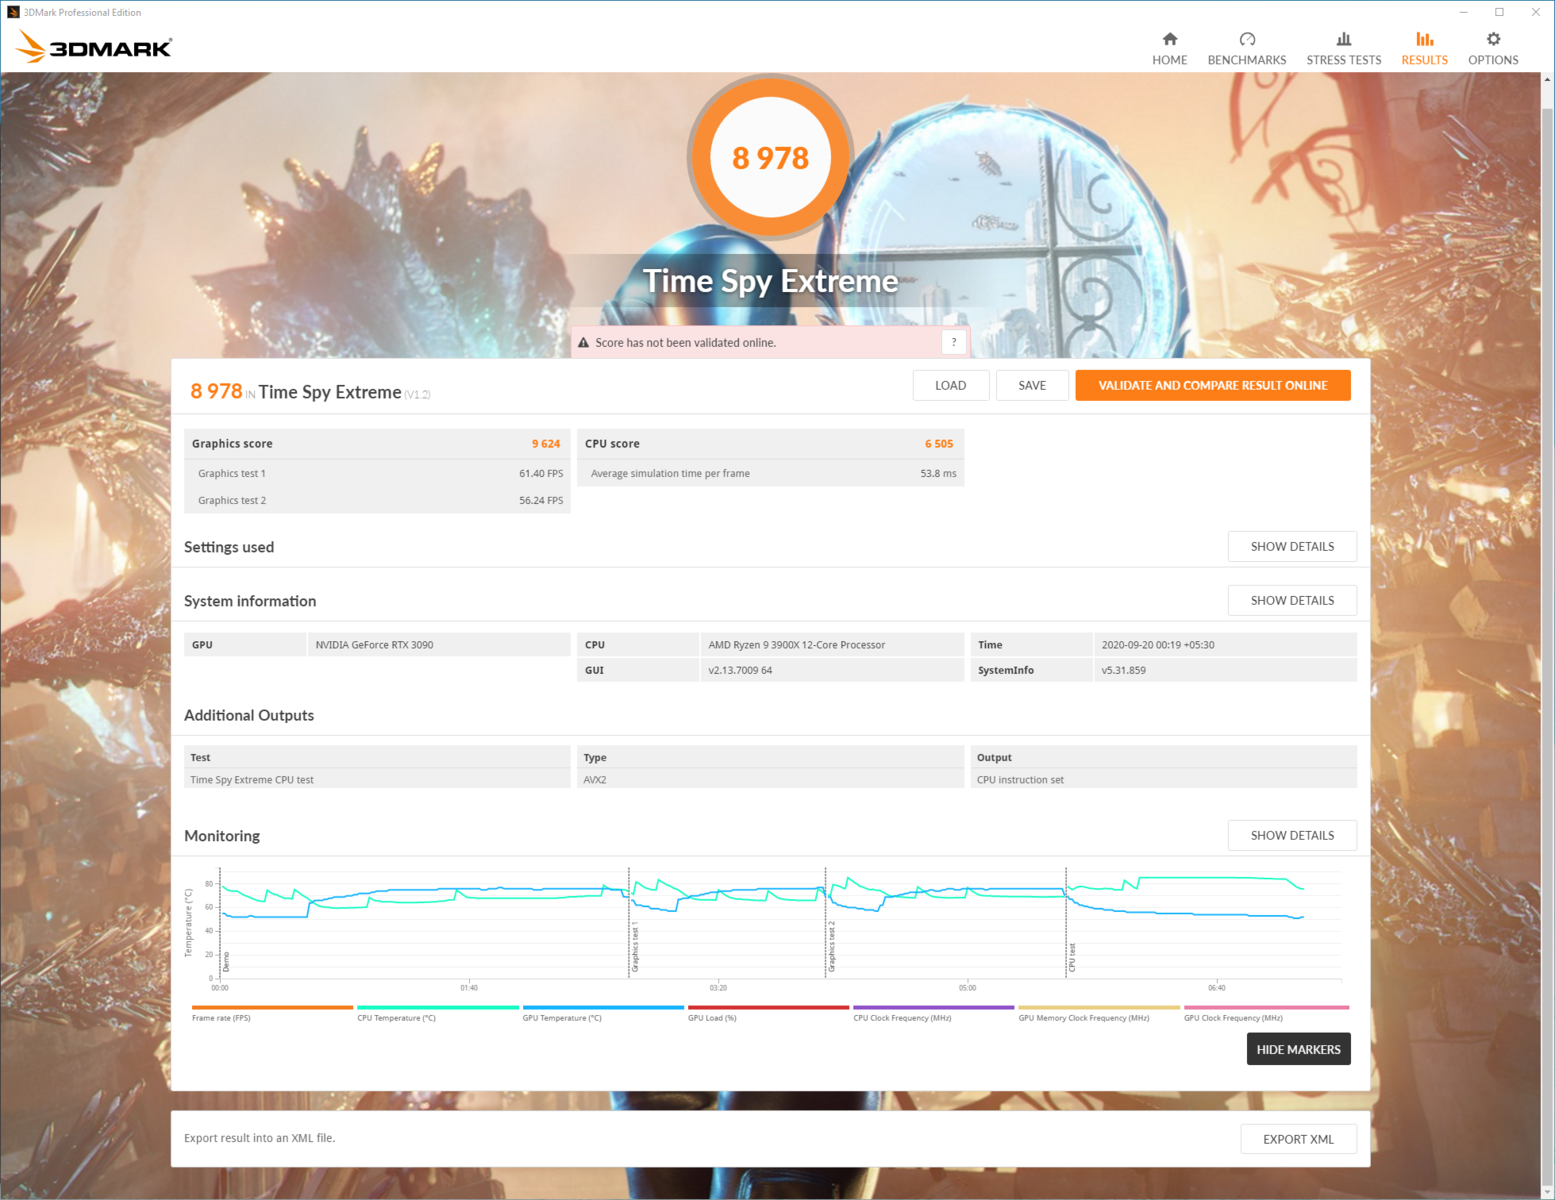
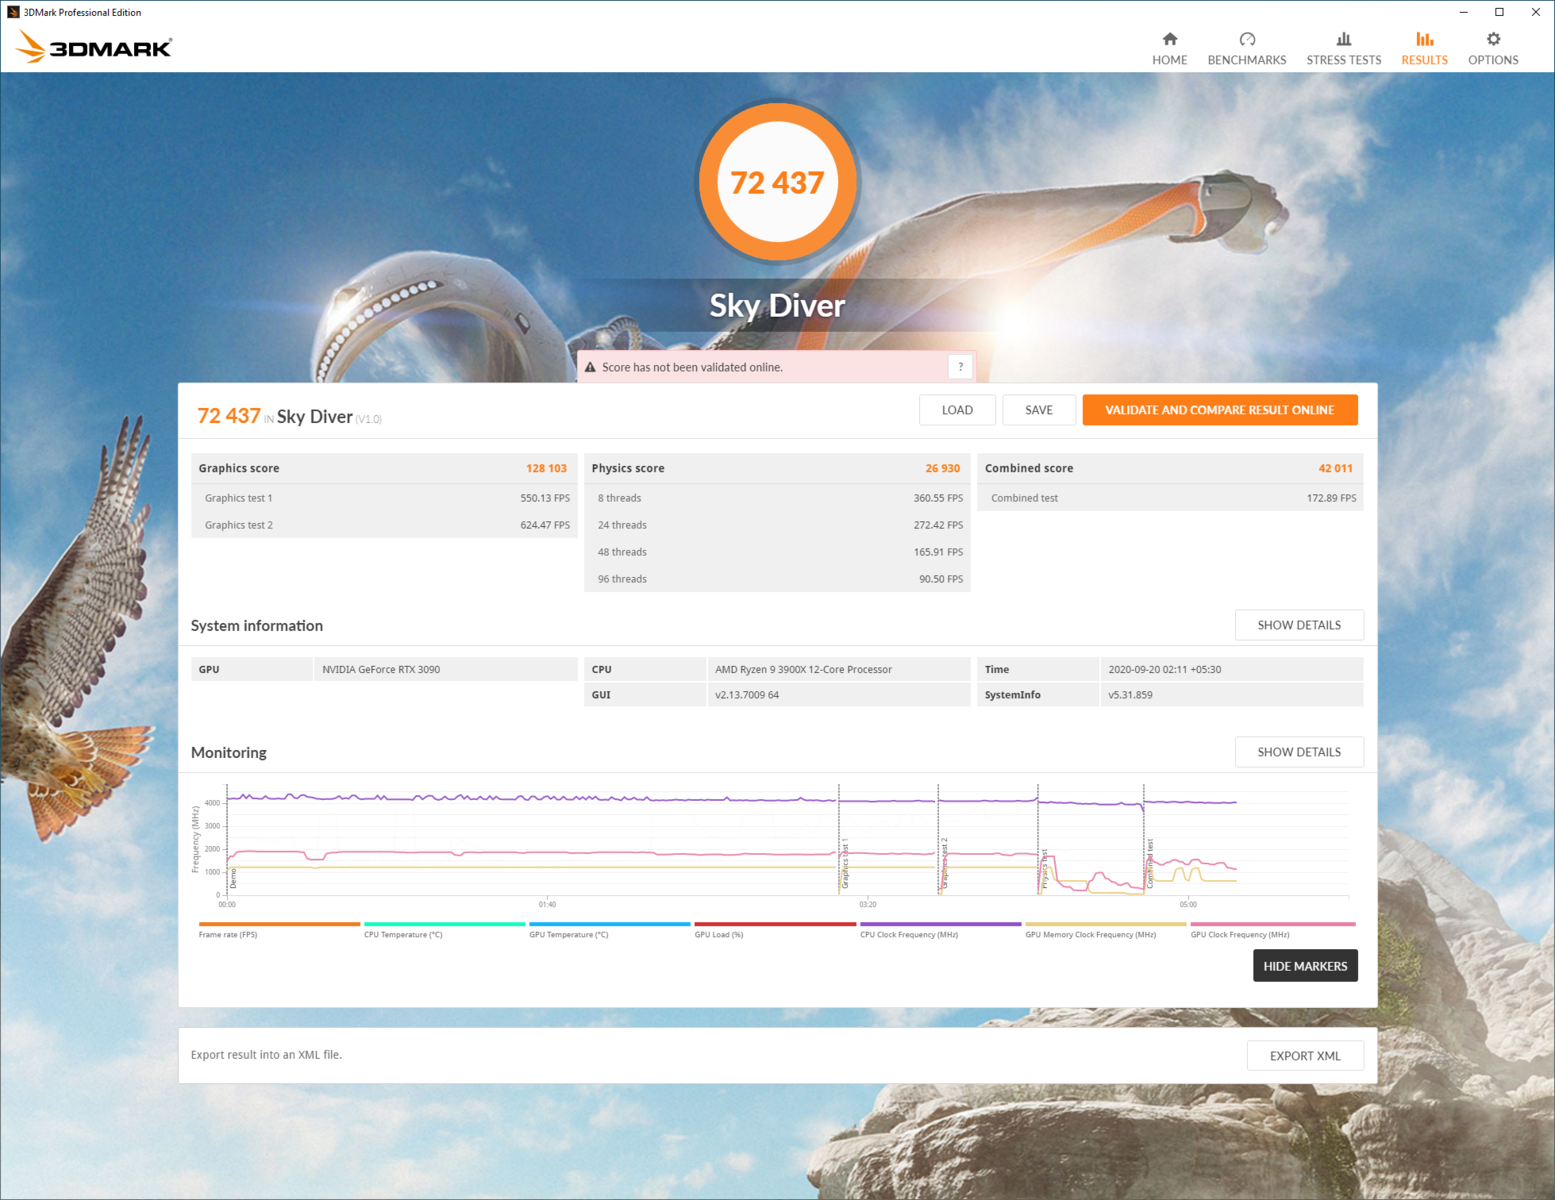
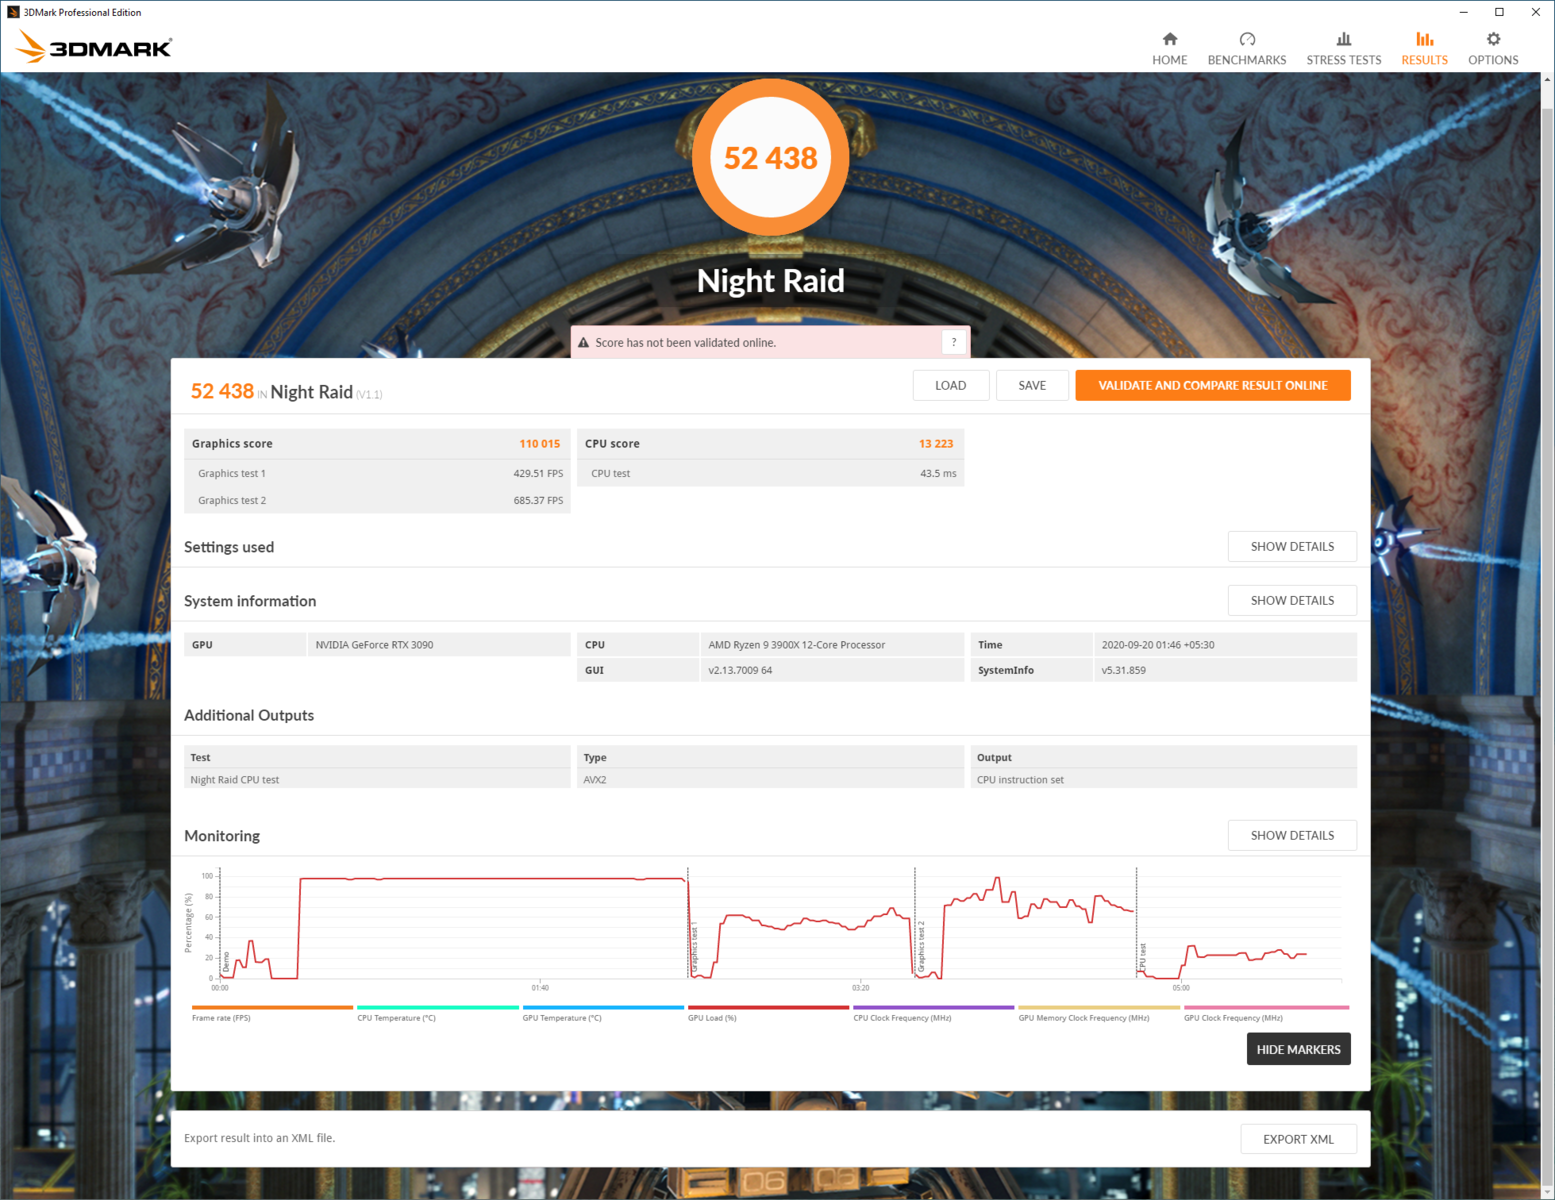
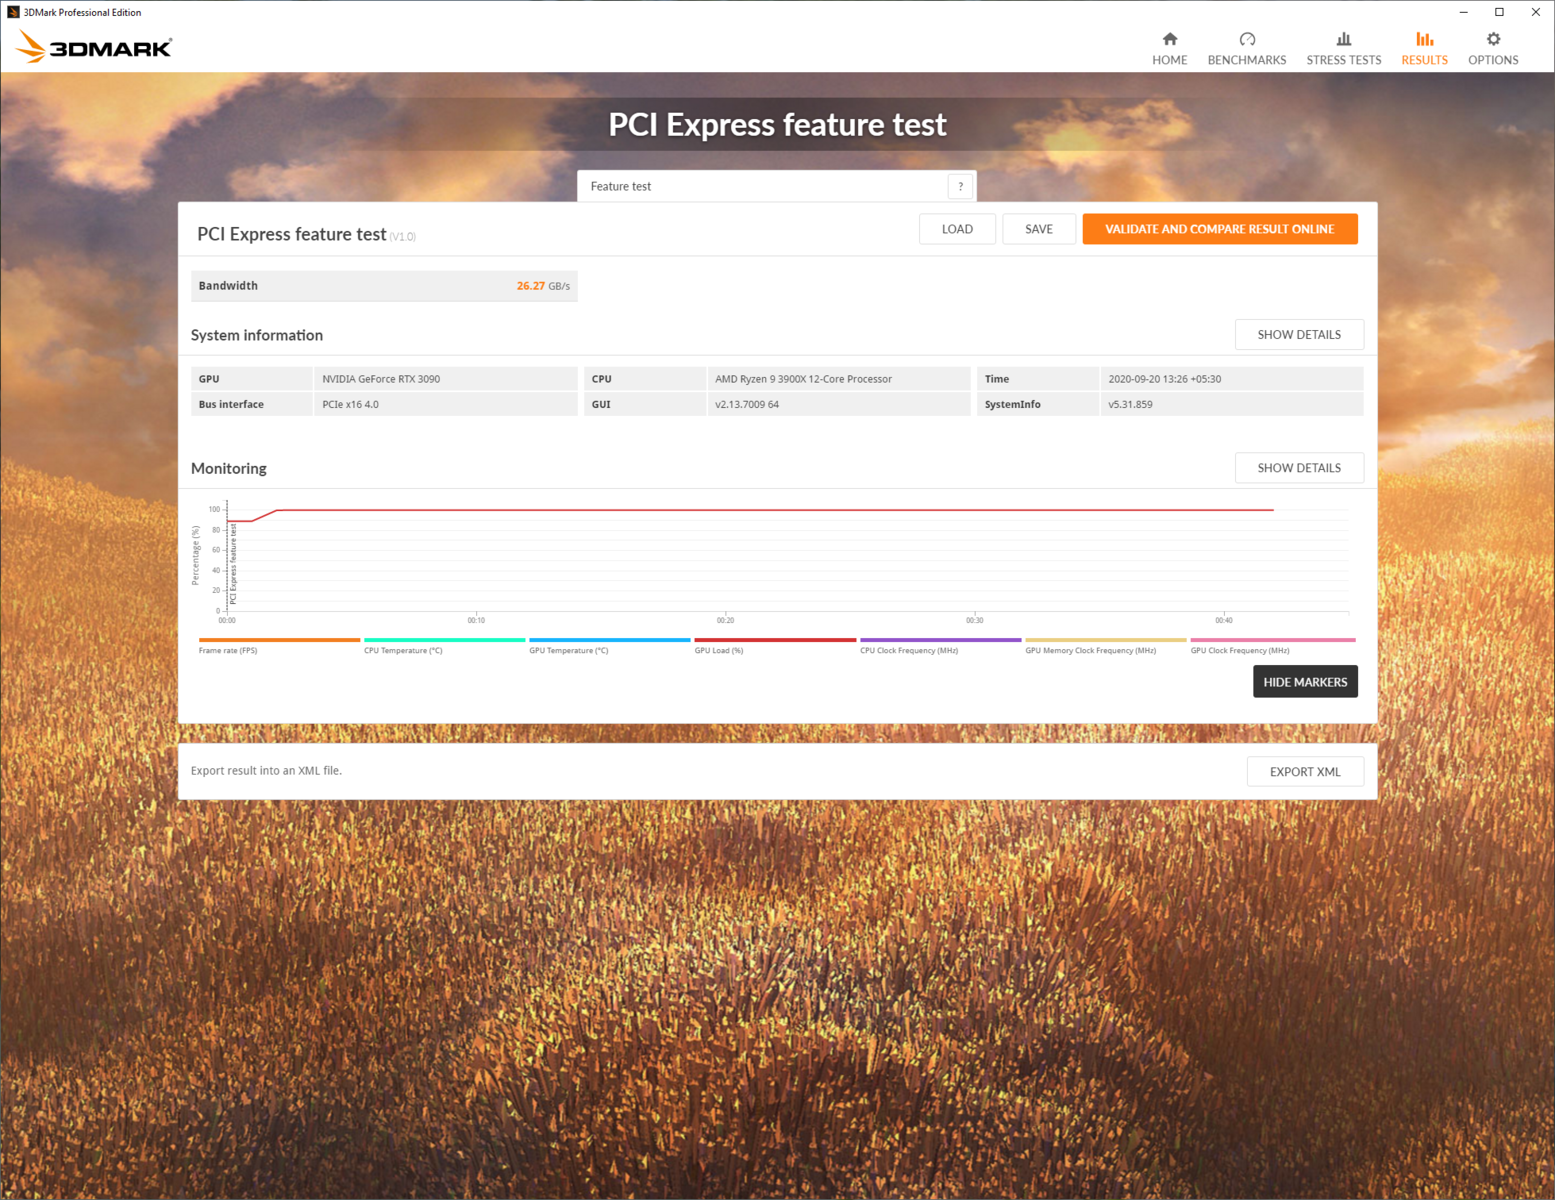
Benchmarks sintetici
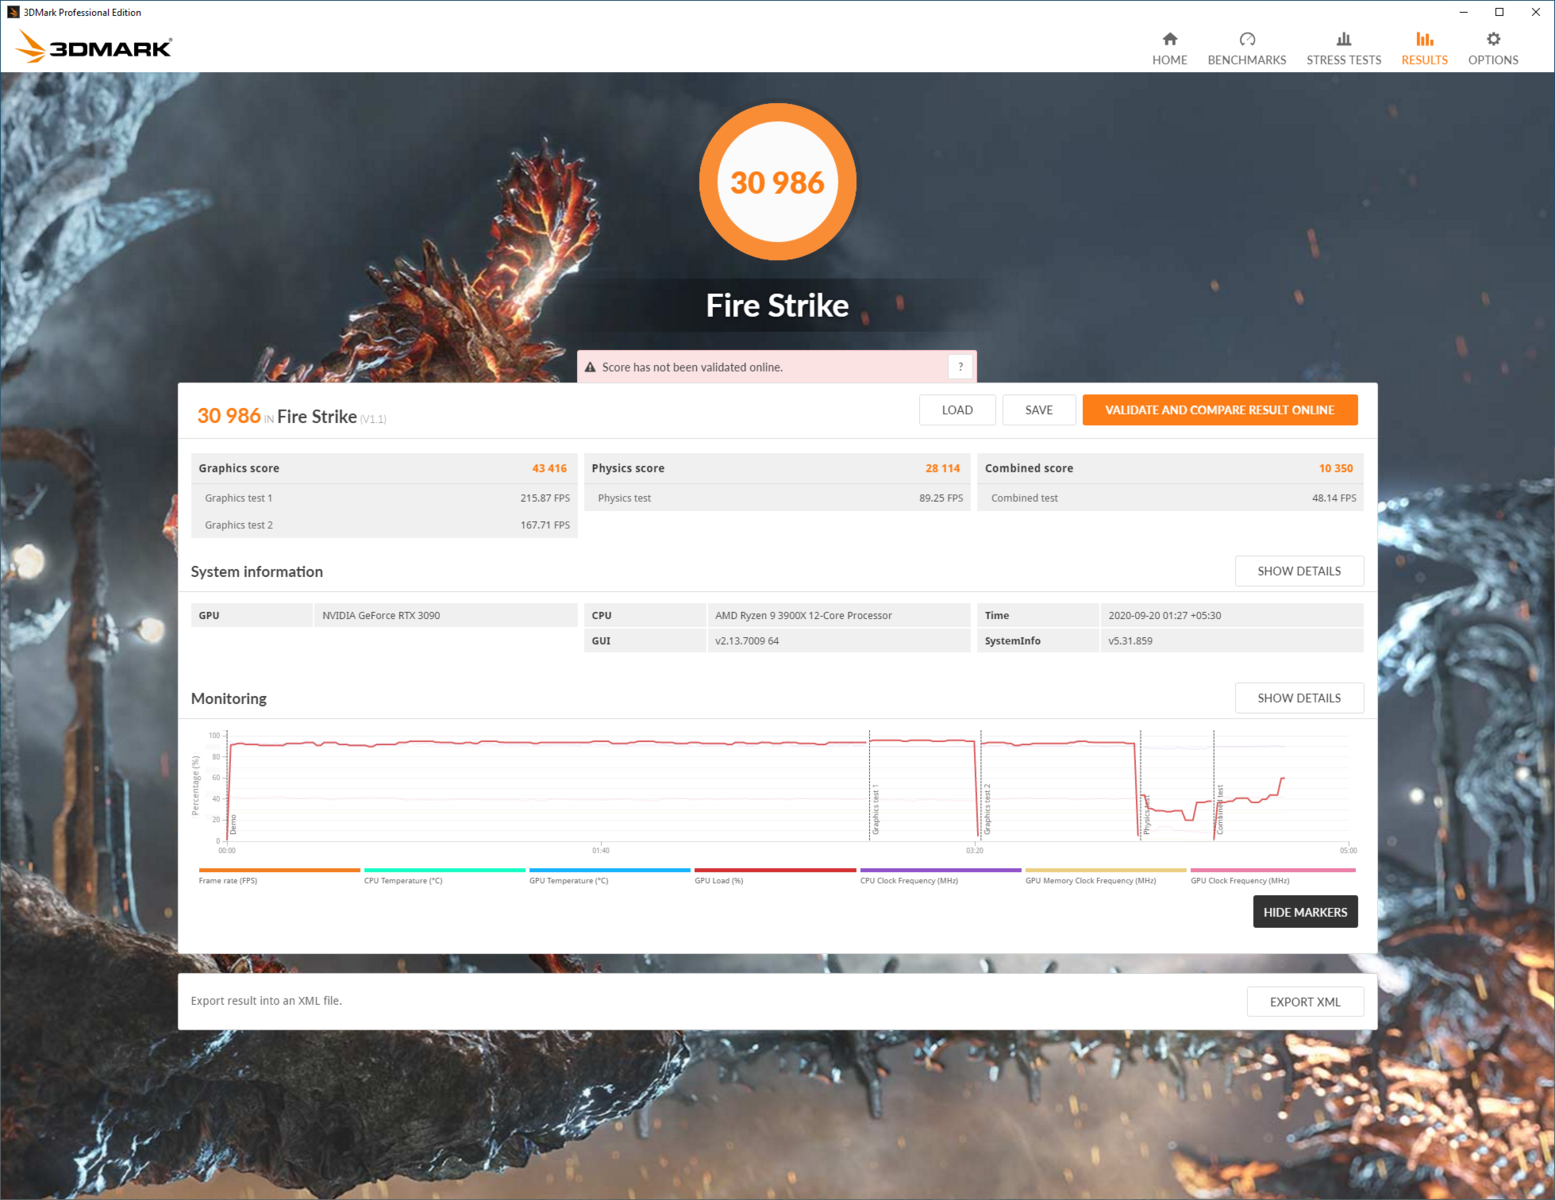
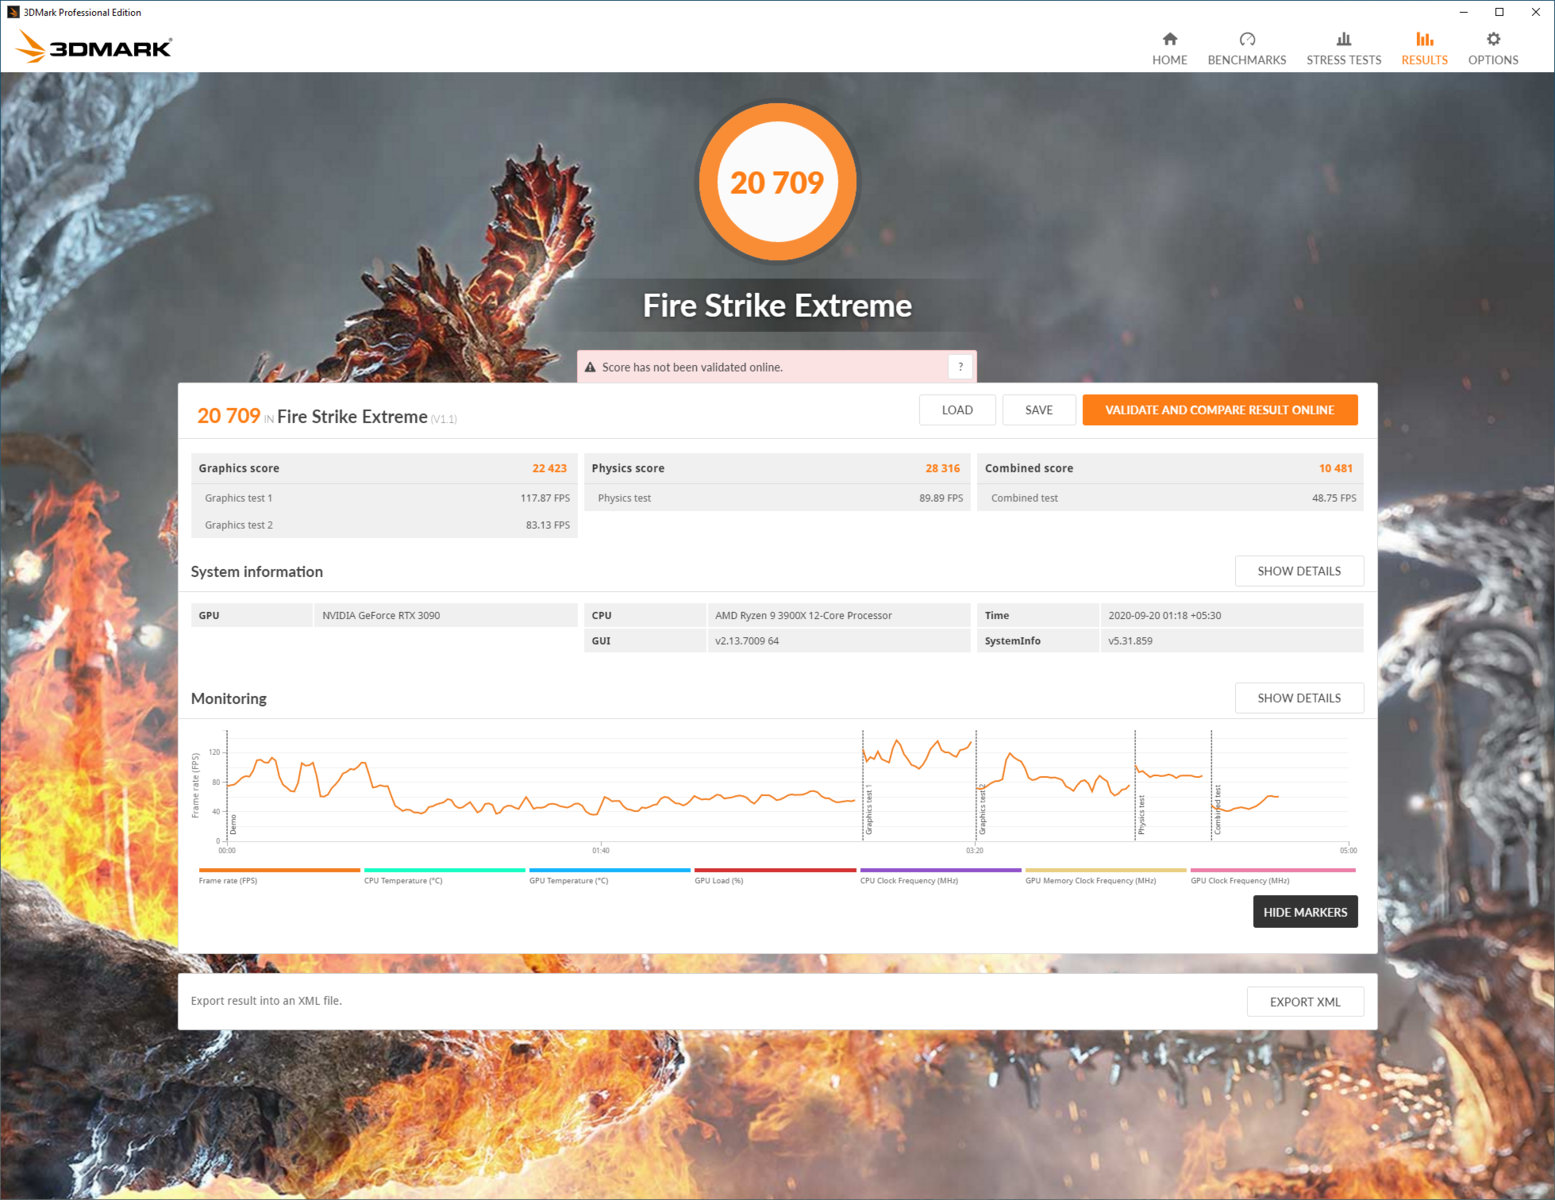
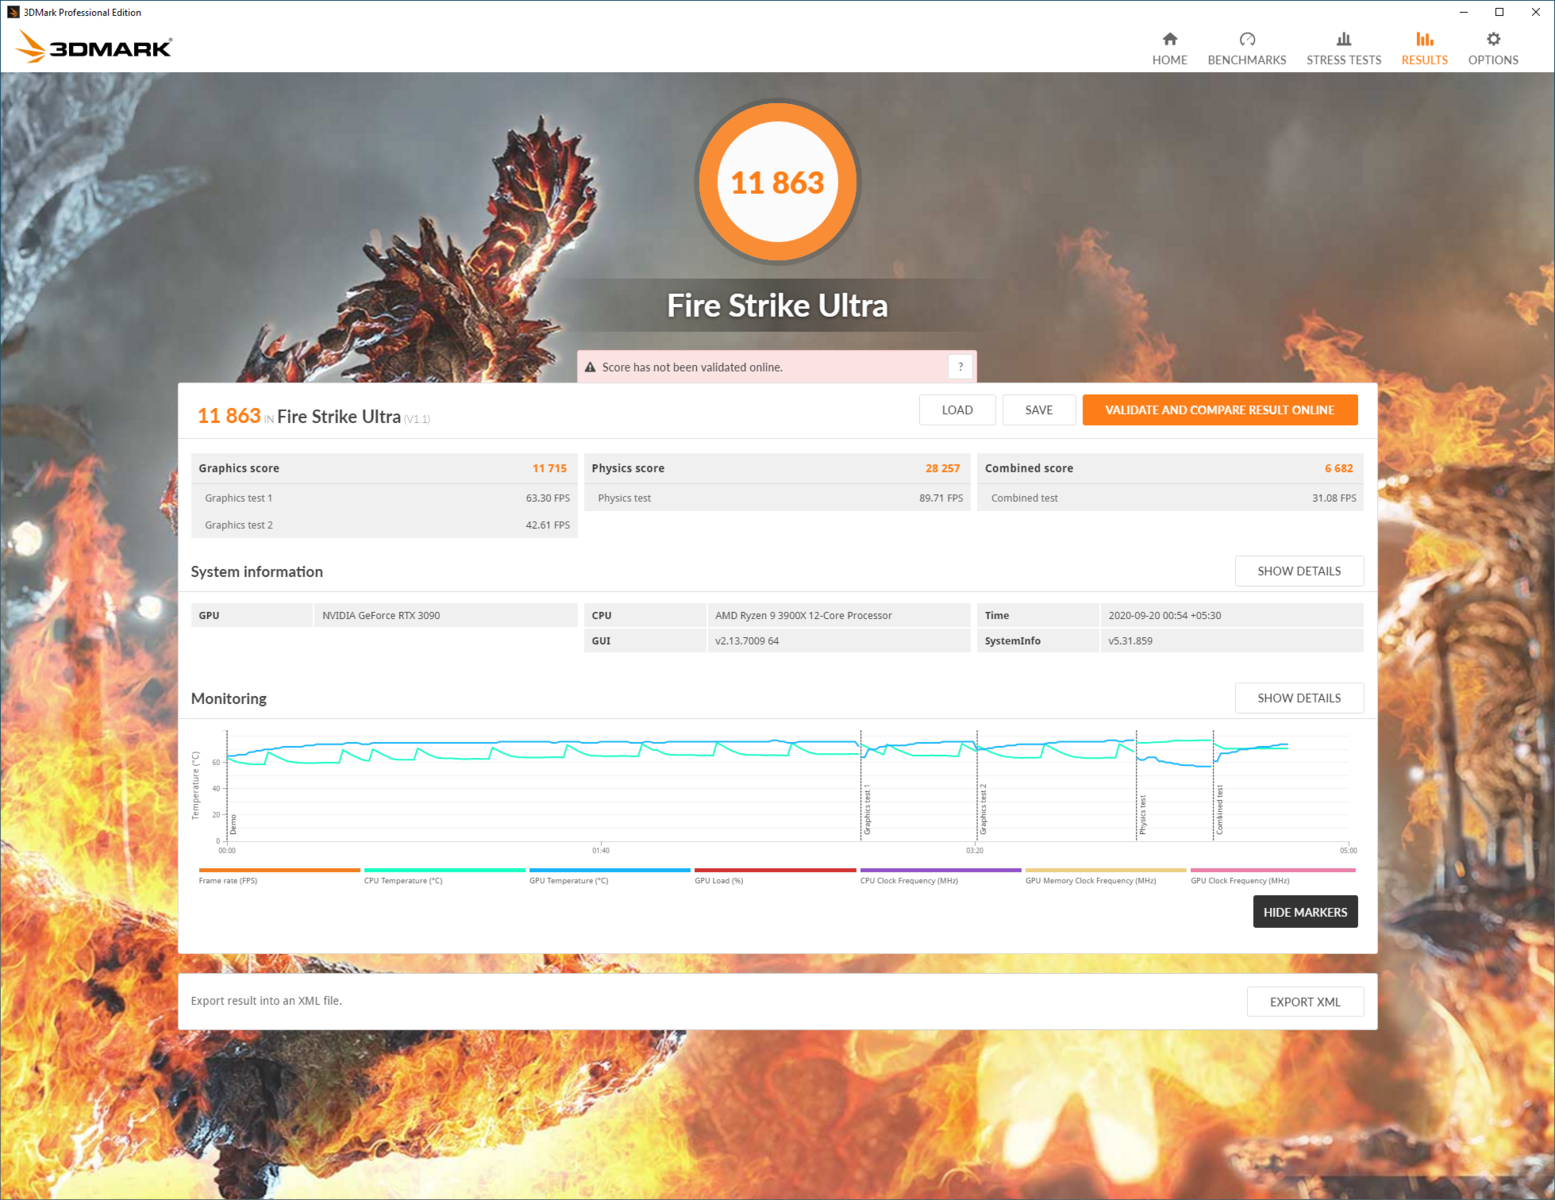
Abbiamo utilizzato i benchmarks 3DMark e Unigine per testare le prestazioni della RTX 3090 con carichi sintetici. Vediamo che la RTX 3090 offre i migliori guadagni nei benchmarks con risoluzioni di 1440p e superiori. In Fire Strike Ultra, per esempio, vediamo un buon 36% di vantaggio sulla Titan RTX. La RTX 3090 è anche avanti alla Titan RTX del 31% in Fire Strike Extreme. Tuttavia, rispetto alla RTX 3080 (20.834 punti da Hardwareluxx), la differenza è solo del 7% circa.
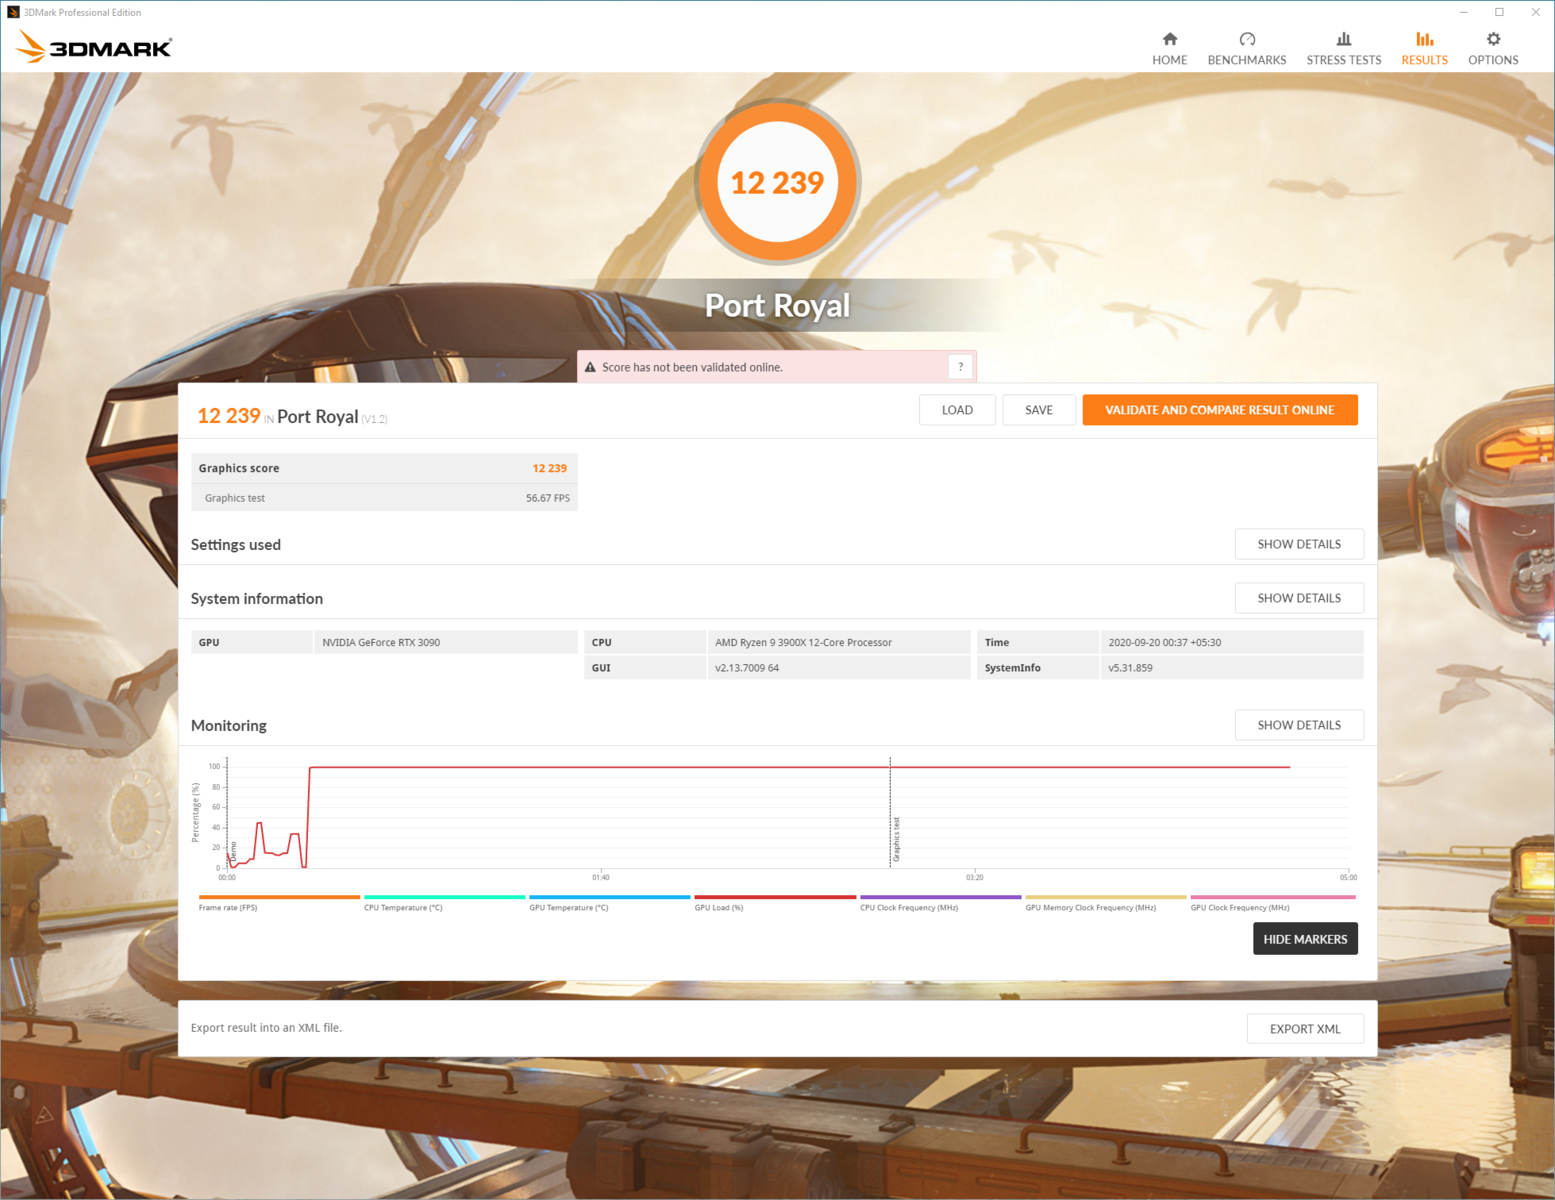
Nel benchmark di Port Royal che testa le prestazioni di ray-tracing, vediamo che la RTX 3090 ha ottenuto punteggi quasi 1,5 volte più alti rispetto alla RTX 2080 Ti. Ancora una volta, tuttavia, la RTX 3090 offre solo un aumento effettivo di circa il 7,25% rispetto alla RTX 3080 (11.426 punti da Hardwareluxx).
In Unigine, vediamo guadagni fino al 36% nel benchmark Valley 1.0 e fino al 31% in Heaven 4.0. Si noti che la RTX 2080 Ti è in grado di offrire prestazioni migliori rispetto alla Titan RTX. Unigine Superposition è un benchmark più esigente e vediamo che la RTX 3090 Trinity è in grado di raggiungere un forte 33% di vantaggio sia nei preset ottimizzati 4K che 8K.
Una cosa che è abbastanza evidente da questi test sintetici è che non c'è molto stimolo a scegliere una RTX 3090 rispetto ad una RTX 3080, poiché la differenza di prestazioni sarà al massimo del 7-8% circa. Detto questo, se si effettua l'upgrade da una precedente scheda Titan, la RTX 3090 offre dei vantaggi tangibili, soprattutto a risoluzioni più alte.
| 3DMark | |
| 2560x1440 Port Royal Graphics | |
| NVIDIA GeForce RTX 3090 | |
| NVIDIA Titan RTX | |
| NVIDIA GeForce RTX 2080 Ti (Desktop) | |
| NVIDIA GeForce RTX 2080 Super (Desktop) | |
| NVIDIA Titan X Pascal | |
| 2560x1440 Time Spy Graphics | |
| NVIDIA GeForce RTX 3090 | |
| NVIDIA Titan RTX | |
| NVIDIA GeForce RTX 2080 Ti (Desktop) | |
| NVIDIA GeForce RTX 2080 Super (Desktop) | |
| NVIDIA Titan X Pascal | |
| AMD Radeon RX 5700 XT (Desktop) | |
| 3840x2160 Fire Strike Ultra Graphics | |
| NVIDIA GeForce RTX 3090 | |
| NVIDIA Titan RTX | |
| NVIDIA GeForce RTX 2080 Ti (Desktop) | |
| NVIDIA Titan X Pascal | |
| NVIDIA GeForce RTX 2080 Super (Desktop) | |
| AMD Radeon RX 5700 XT (Desktop) | |
| Fire Strike Extreme Graphics | |
| NVIDIA GeForce RTX 3090 | |
| NVIDIA Titan RTX | |
| NVIDIA GeForce RTX 2080 Ti (Desktop) | |
| NVIDIA Titan X Pascal | |
| NVIDIA GeForce RTX 2080 Super (Desktop) | |
| AMD Radeon RX 5700 XT (Desktop) | |
| 1920x1080 Fire Strike Graphics | |
| NVIDIA GeForce RTX 3090 | |
| NVIDIA Titan RTX | |
| NVIDIA GeForce RTX 2080 Ti (Desktop) | |
| NVIDIA GeForce RTX 2080 Super (Desktop) | |
| AMD Radeon RX 5700 XT (Desktop) | |
| NVIDIA Titan X Pascal | |
| 3DMark 11 - 1280x720 Performance GPU | |
| NVIDIA GeForce RTX 3090 | |
| NVIDIA Titan RTX | |
| NVIDIA GeForce RTX 2080 Ti (Desktop) | |
| NVIDIA GeForce RTX 2080 Super (Desktop) | |
| NVIDIA Titan X Pascal | |
| AMD Radeon RX 5700 XT (Desktop) | |
| Unigine Valley 1.0 - 1920x1080 Extreme HD DirectX AA:x8 | |
| NVIDIA GeForce RTX 3090 | |
| NVIDIA Titan RTX | |
| NVIDIA GeForce RTX 2080 Ti (Desktop) | |
| NVIDIA Titan X Pascal | |
| NVIDIA GeForce RTX 2080 Super (Desktop) | |
| AMD Radeon RX 5700 XT (Desktop) | |
| Unigine Heaven 4.0 - Extreme Preset DX11 | |
| NVIDIA GeForce RTX 3090 | |
| NVIDIA Titan RTX | |
| NVIDIA GeForce RTX 2080 Ti (Desktop) | |
| NVIDIA GeForce RTX 2080 Super (Desktop) | |
| NVIDIA Titan X Pascal | |
| AMD Radeon RX 5700 XT (Desktop) | |
| Unigine Superposition | |
| 7680x4320 8k Optimized | |
| NVIDIA GeForce RTX 3090 | |
| NVIDIA Titan RTX | |
| NVIDIA Titan X Pascal | |
| AMD Radeon RX 5700 XT (Desktop) | |
| 3840x2160 4k Optimized | |
| NVIDIA GeForce RTX 3090 | |
| NVIDIA Titan RTX | |
| NVIDIA Titan X Pascal | |
| AMD Radeon RX 5700 XT (Desktop) | |
| 1920x1080 1080p Extreme | |
| NVIDIA GeForce RTX 3090 | |
| NVIDIA Titan RTX | |
| NVIDIA Titan X Pascal | |
| AMD Radeon RX 5700 XT (Desktop) | |
| 1920x1080 1080p High | |
| NVIDIA GeForce RTX 3090 | |
| NVIDIA Titan RTX | |
| NVIDIA Titan X Pascal | |
| AMD Radeon RX 5700 XT (Desktop) | |
Compute benchmarks
La RTX 3090 Trinity brilla nei benchmarks di calcolo offrendo un elevato vantaggio del 74% nel QJuliaRayTrace di ComputeMark e un punteggio complessivo del 61% nel benchmark rispetto alla Titan RTX. Nei test di LuxMark Room e Sala, che prevedono l'uso intensivo di GPU, la RTX 3090 ha ottenuto un facile margine del 25% e del 36% rispetto alla Titan RTX. I carichi di lavoro che fanno uso di calcoli estesi su GPU dovrebbero, quindi, trarre buoni vantaggi dall'aggiornamento a questa scheda.
| ComputeMark v2.1 | |
| 1024x600 Normal, Score | |
| NVIDIA GeForce RTX 3090 | |
| NVIDIA Titan RTX | |
| NVIDIA GeForce RTX 2080 Ti (Desktop) | |
| NVIDIA GeForce RTX 2080 Super (Desktop) | |
| 1024x600 Normal, Fluid 3DTex | |
| NVIDIA GeForce RTX 3090 | |
| NVIDIA Titan RTX | |
| NVIDIA GeForce RTX 2080 Ti (Desktop) | |
| NVIDIA GeForce RTX 2080 Super (Desktop) | |
| 1024x600 Normal, Fluid 2DTexArr | |
| NVIDIA GeForce RTX 3090 | |
| NVIDIA Titan RTX | |
| NVIDIA GeForce RTX 2080 Ti (Desktop) | |
| NVIDIA GeForce RTX 2080 Super (Desktop) | |
| 1024x600 Normal, Mandel Vector | |
| NVIDIA GeForce RTX 3090 | |
| NVIDIA Titan RTX | |
| NVIDIA GeForce RTX 2080 Ti (Desktop) | |
| NVIDIA GeForce RTX 2080 Super (Desktop) | |
| 1024x600 Normal, Mandel Scalar | |
| NVIDIA GeForce RTX 3090 | |
| NVIDIA Titan RTX | |
| NVIDIA GeForce RTX 2080 Ti (Desktop) | |
| NVIDIA GeForce RTX 2080 Super (Desktop) | |
| 1024x600 Normal, QJuliaRayTrace | |
| NVIDIA GeForce RTX 3090 | |
| NVIDIA Titan RTX | |
| NVIDIA GeForce RTX 2080 Ti (Desktop) | |
| NVIDIA GeForce RTX 2080 Super (Desktop) | |
| LuxMark v2.0 64Bit | |
| Sala GPUs-only | |
| NVIDIA GeForce RTX 3090 | |
| NVIDIA Titan RTX | |
| NVIDIA GeForce RTX 2080 Ti (Desktop) | |
| NVIDIA GeForce RTX 2080 Super (Desktop) | |
| Room GPUs-only | |
| NVIDIA GeForce RTX 3090 | |
| NVIDIA Titan RTX | |
| NVIDIA GeForce RTX 2080 Ti (Desktop) | |
| NVIDIA GeForce RTX 2080 Super (Desktop) | |
| Geekbench 5.5 | |
| OpenCL Score | |
| NVIDIA GeForce RTX 3090 | |
| Vulkan Score 5.5 | |
| NVIDIA GeForce RTX 3090 | |
Applicazioni professionali
NVIDIA vorrebbe che i professionisti del settore medico, automobilistico e del 3D-rendering utilizzassero idealmente la sua linea Quadro. Le schede Quadro basate su ampere non sono ancora state annunciate e ci aspettiamo che superino facilmente le prestazioni della RTX 3090. La RTX 3090 utilizza drivers GeForce, che non sono certificati per l'uso in applicazioni professionali. Tuttavia, con la disponibilità di 24 GB di VRAM GDDR6X e un core Ampere al top della gamma, la possibilità di usare la RTX 3090 in questi scenari non può essere completamente esclusa. Vediamo risultati interessanti nel nostro confronto con la Titan RTX e altre schede NVIDIA.
In SPECviewperf 12, i migliori guadagni sono stati visti con i carichi di lavoro di Maya e 3DS Max con Showcase che offrono chiari vantaggi anche rispetto alla Titan RTX. Tuttavia, l'RTX 3090 ha preso una buona batosta in test come Solidworks, Catia, Siemens NX, ecc.
Allo stesso modo, in SPECviewperf 13, Maya, 3DS Max, Creo e Showcase hanno mostrato buoni miglioramenti, mentre il resto dei punteggi è andato male anche rispetto alla Titan X Pascal.
Questo potrebbe essere dovuto in gran parte ai drivers e all'ottimizzazione, e ci aspettiamo che i punteggi migliorino con il tempo. Detto questo, l'apprezzabile incremento delle prestazioni di 3DS Max e Maya sarà interessante per coloro che si occupano di modeling 3D, in quanto in grado di raccogliere buoni risultati senza dover necessariamente investire in una scheda Quadro più costosa.
| NVIDIA GeForce RTX 3090 GeForce RTX 3090, R9 3900X | NVIDIA Titan RTX Titan RTX, R7 2700X, ADATA Premier Pro SP900NS38 512 GB | NVIDIA Titan X Pascal Titan X Pascal, TR 1950X, Samsung SM951 MZHPV512HDGL m.2 PCI-e | NVIDIA GeForce RTX 2080 Ti (Desktop) GeForce RTX 2080 Ti (Desktop), R9 3900X, Corsair MP600 | NVIDIA GeForce RTX 2080 Super (Desktop) GeForce RTX 2080 Super (Desktop), R7 2700X | NVIDIA Quadro M5000M Quadro M5000M, E3-1505M v5, Toshiba NVMe THNSN5256GPU7 | |
|---|---|---|---|---|---|---|
| SPECviewperf 12 | 222% | 145% | -16% | -27% | 39% | |
| 1900x1060 Solidworks (sw-03) (fps) | 77.1 | 139.6 81% | 77.1 0% | 78.4 2% | 70.8 -8% | 101 31% |
| 1900x1060 Siemens NX (snx-02) (fps) | 13.03 | 256.3 1867% | 206.8 1487% | 12.16 -7% | 12.26 -6% | 86.9 567% |
| 1900x1060 Showcase (showcase-01) (fps) | 237 | 191.6 -19% | 137 -42% | 175.6 -26% | 143.6 -39% | 44.14 -81% |
| 1900x1060 Medical (medical-01) (fps) | 80.9 | 87 8% | 79.6 -2% | 48.61 -40% | 45 -44% | 31.35 -61% |
| 1900x1060 Maya (maya-04) (fps) | 170 | 132.8 -22% | 79.7 -53% | 177.8 5% | 134.8 -21% | 69.6 -59% |
| 1900x1060 Energy (energy-01) (fps) | 24.81 | 28.12 13% | 19.78 -20% | 15.86 -36% | 13.09 -47% | 6.86 -72% |
| 1900x1060 Creo (creo-01) (fps) | 69.4 | 106.3 53% | 75.4 9% | 63.1 -9% | 52.7 -24% | 81.3 17% |
| 1900x1060 Catia (catia-04) (fps) | 132 | 178.1 35% | 100.3 -24% | 118.5 -10% | 104.2 -21% | 94.4 -28% |
| 1900x1060 3ds Max (3dsmax-05) (fps) | 329 | 268.2 -18% | 151.9 -54% | 258.1 -22% | 225.8 -31% | |
| SPECviewperf 13 | 206% | 132% | -15% | -27% | ||
| Solidworks (sw-04) (fps) | 108 | 132.9 23% | 82.1 -24% | 111.8 4% | 99.6 -8% | |
| Siemens NX (snx-03) (fps) | 23.62 | 462.4 1858% | 370.9 1470% | 21.99 -7% | 21.94 -7% | |
| Showcase (showcase-02) (fps) | 237 | 192 -19% | 136.8 -42% | 180.4 -24% | 144.5 -39% | |
| Medical (medical-02) (fps) | 102 | 89.3 -12% | 71.4 -30% | 82.1 -20% | 71.6 -30% | |
| Maya (maya-05) (fps) | 433 | 367.8 -15% | 236.5 -45% | 386.6 -11% | 328.7 -24% | |
| Energy (energy-02) (fps) | 44.36 | 51.9 17% | 32.46 -27% | 31.52 -29% | 23.78 -46% | |
| Creo (creo-02) (fps) | 328 | 307.6 -6% | 185.2 -44% | 286.5 -13% | 220.1 -33% | |
| Catia (catia-05) (fps) | 203 | 260.4 28% | 161.4 -20% | 178.8 -12% | 157.7 -22% | |
| 3ds Max (3dsmax-06) (fps) | 333 | 268.7 -19% | 153.4 -54% | 269.4 -19% | 227.8 -32% | |
| Media totale (Programma / Settaggio) | 214% /
214% | 139% /
138% | -16% /
-15% | -27% /
-27% | 39% /
39% |
Editing 8K con DaVinci Resolve
Blackmagicdesign DaVinci Resolve ha recentemente ricevuto un aggiornamento (versione 16.2.7) per supportare le più recenti GPU Ampere, e NVIDIA ci ha fornito un progetto 8K REDCODE RAW e una licenza Resolve Studio limitata nel tempo per valutare le prestazioni della RTX 3090 nelle funzioni Decode e Debayer di Resolve e lo scorrimento fluido della timeline 8K durante l'applicazione degli effetti Motion Blur e Temporal Noise Reduction.
Per questo test, Resolve è stato impostato per utilizzare i CUDA cores della RTX 3090 e l'opzione di decodifica GPU per Decompressione e Debayer. Temporal Noise Reduction è stato impostato di default su cinque fotogrammi e la stima del movimento è stata impostata su "Better". È stato applicato un valore di Motion Blur di 50. NVIDIA ha dichiarato che anche una RTX 3080 mostrerà un errore di elaborazione dell'immagine a causa della quantità limitata di VRAM.
Come si può vedere nel nostro video qui sotto, questa attività utilizza già quasi 16 GB di memoria video e la scheda assorbe circa 280 W. È interessante notare che il GPU Boost sembra consentire un incremento superiore alla media fino a 1.920 MHz con una temperatura complessiva di circa 71 °C.
L'esportazione del clip RAW di 17 secondi ha richiesto circa 1:30 minuti e ha consumato quasi 18 GB di VRAM. In effetti, anche la riproduzione del file MP4 8K esportato sembrava consumare la stessa quantità di memoria, anche se con un utilizzo della GPU inferiore di ~35%.
Benchmarks gaming
NVIDIA non ha mai realmente classificato la RTX 3090 come scheda da gioco. Tuttavia, diversi benchmarks di gioco della RTX 3090 che sono riusciti a trapelare negli ultimi giorni hanno causato una certa costernazione tra i giocatori che si aspettavano un significativo incremento di fps rispetto alla RTX 3080. Infatti, NVIDIA ha dichiarato ufficialmente che ci si può aspettare che la RTX 3090 offra appena il 10-15% di frame in più rispetto alla RTX 3080. Anche se questo è vero, c'è effettivamente un beneficio per i giocatori che si aggiornano da una Titan RTX o anche dalla RTX 2080 Ti, specialmente quando si gioca a 4k e oltre le risoluzioni.
Coloro che desiderano estrarre ogni singolo frame dai giochi dovrebbero idealmente accoppiare la RTX 3090 con l'Intel Comet Lake-S Core i9-10900K, specialmente a risoluzioni più basse per minimizzare eventuali colli di bottiglia. A risoluzioni superiori a 1440p, il sistema AMD è abbastanza in grado di aiutarvi ad ottenere il massimo dalla RTX 3090.
| Borderlands 3 | |
| 3840x2160 Badass Overall Quality (DX11) | |
| NVIDIA GeForce RTX 3090 | |
| NVIDIA Titan RTX | |
| NVIDIA GeForce RTX 2080 Ti (Desktop) | |
| NVIDIA Titan RTX | |
| NVIDIA GeForce RTX 2080 Super (Desktop) | |
| NVIDIA Titan X Pascal | |
| AMD Radeon RX 5700 XT (Desktop) | |
| 2560x1440 Badass Overall Quality (DX11) | |
| NVIDIA GeForce RTX 3090 | |
| NVIDIA Titan RTX | |
| NVIDIA Titan RTX | |
| NVIDIA GeForce RTX 2080 Ti (Desktop) | |
| NVIDIA GeForce RTX 2080 Super (Desktop) | |
| NVIDIA Titan X Pascal | |
| AMD Radeon RX 5700 XT (Desktop) | |
| 1920x1080 Badass Overall Quality (DX11) | |
| NVIDIA GeForce RTX 3090 | |
| NVIDIA Titan RTX | |
| NVIDIA Titan RTX | |
| NVIDIA GeForce RTX 2080 Ti (Desktop) | |
| NVIDIA GeForce RTX 2080 Super (Desktop) | |
| NVIDIA Titan X Pascal | |
| AMD Radeon RX 5700 XT (Desktop) | |
| 1920x1080 High Overall Quality (DX11) | |
| NVIDIA GeForce RTX 2080 Ti (Desktop) | |
| NVIDIA Titan RTX | |
| NVIDIA Titan RTX | |
| NVIDIA GeForce RTX 3090 | |
| NVIDIA GeForce RTX 2080 Super (Desktop) | |
| NVIDIA Titan X Pascal | |
| AMD Radeon RX 5700 XT (Desktop) | |
| Gears Tactics | |
| 3840x2160 Ultra Preset | |
| NVIDIA GeForce RTX 3090 | |
| NVIDIA Titan RTX | |
| NVIDIA GeForce RTX 2080 Super (Desktop) | |
| NVIDIA Titan X Pascal | |
| AMD Radeon RX 5700 XT (Desktop) | |
| 2560x1440 Ultra Preset | |
| NVIDIA GeForce RTX 3090 | |
| NVIDIA Titan RTX | |
| NVIDIA GeForce RTX 2080 Super (Desktop) | |
| NVIDIA Titan X Pascal | |
| AMD Radeon RX 5700 XT (Desktop) | |
| 1920x1080 Ultra Preset | |
| NVIDIA Titan RTX | |
| NVIDIA GeForce RTX 3090 | |
| NVIDIA GeForce RTX 2080 Super (Desktop) | |
| NVIDIA Titan X Pascal | |
| AMD Radeon RX 5700 XT (Desktop) | |
| 1920x1080 High Preset | |
| NVIDIA GeForce RTX 2080 Super (Desktop) | |
| NVIDIA Titan RTX | |
| NVIDIA GeForce RTX 3090 | |
| NVIDIA Titan X Pascal | |
| AMD Radeon RX 5700 XT (Desktop) | |
| Total War: Three Kingdoms | |
| 3840x2160 Ultra (incl textures) | |
| NVIDIA GeForce RTX 3090 | |
| NVIDIA Titan RTX | |
| NVIDIA GeForce RTX 2080 Super (Desktop) | |
| NVIDIA Titan X Pascal | |
| AMD Radeon RX 5700 XT (Desktop) | |
| 2560x1440 Ultra (incl textures) | |
| NVIDIA GeForce RTX 3090 | |
| NVIDIA Titan RTX | |
| NVIDIA GeForce RTX 2080 Super (Desktop) | |
| NVIDIA Titan X Pascal | |
| AMD Radeon RX 5700 XT (Desktop) | |
| 1920x1080 Ultra (incl textures) | |
| NVIDIA GeForce RTX 3090 | |
| NVIDIA Titan RTX | |
| NVIDIA GeForce RTX 2080 Super (Desktop) | |
| NVIDIA Titan X Pascal | |
| AMD Radeon RX 5700 XT (Desktop) | |
| 1920x1080 High (incl textures) | |
| NVIDIA GeForce RTX 3090 | |
| NVIDIA Titan RTX | |
| NVIDIA GeForce RTX 2080 Super (Desktop) | |
| NVIDIA Titan X Pascal | |
| AMD Radeon RX 5700 XT (Desktop) | |
| Death Stranding | |
| 3840x2160 Very High Preset | |
| NVIDIA GeForce RTX 3090 | |
| NVIDIA Titan RTX | |
| NVIDIA GeForce RTX 2080 Super (Desktop) | |
| NVIDIA Titan X Pascal | |
| AMD Radeon RX 5700 XT (Desktop) | |
| 2560x1440 Very High Preset | |
| NVIDIA Titan RTX | |
| NVIDIA GeForce RTX 3090 | |
| NVIDIA GeForce RTX 2080 Super (Desktop) | |
| NVIDIA Titan X Pascal | |
| AMD Radeon RX 5700 XT (Desktop) | |
| 1920x1080 Very High Preset | |
| NVIDIA GeForce RTX 3090 | |
| NVIDIA Titan RTX | |
| NVIDIA GeForce RTX 2080 Super (Desktop) | |
| AMD Radeon RX 5700 XT (Desktop) | |
| NVIDIA Titan X Pascal | |
| 1920x1080 Default Preset | |
| NVIDIA GeForce RTX 3090 | |
| NVIDIA Titan RTX | |
| NVIDIA GeForce RTX 2080 Super (Desktop) | |
| AMD Radeon RX 5700 XT (Desktop) | |
| NVIDIA Titan X Pascal | |
| Dirt Rally 2.0 | |
| 3840x2160 Ultra Preset AA:T AF:16x | |
| NVIDIA GeForce RTX 3090 | |
| 2560x1440 Ultra Preset AA:T AF:16x | |
| NVIDIA GeForce RTX 3090 | |
| 1920x1080 Ultra Preset AA:T AF:16x | |
| NVIDIA GeForce RTX 3090 | |
| 1920x1080 High Preset AA:T AF:8x | |
| NVIDIA GeForce RTX 3090 | |
| Shadow of the Tomb Raider | |
| 3840x2160 Highest Preset AA:T | |
| NVIDIA GeForce RTX 3090 | |
| NVIDIA Titan RTX | |
| NVIDIA Titan RTX | |
| NVIDIA Titan RTX | |
| NVIDIA Titan X Pascal | |
| 2560x1440 Highest Preset AA:T | |
| NVIDIA GeForce RTX 3090 | |
| NVIDIA Titan RTX | |
| NVIDIA Titan RTX | |
| 1920x1080 Highest Preset AA:T | |
| NVIDIA GeForce RTX 3090 | |
| NVIDIA GeForce RTX 3090 | |
| NVIDIA GeForce RTX 3090 | |
| NVIDIA Titan RTX | |
| NVIDIA Titan RTX | |
| NVIDIA Titan RTX | |
| AMD Radeon RX 5700 XT (Desktop) | |
| NVIDIA Titan X Pascal | |
| 1920x1080 High Preset AA:SM | |
| NVIDIA GeForce RTX 3090 | |
| NVIDIA GeForce RTX 3090 | |
| NVIDIA Titan RTX | |
| NVIDIA Titan RTX | |
| NVIDIA Titan RTX | |
| NVIDIA Titan X Pascal | |
| F1 2020 | |
| 3840x2160 Ultra High Preset AA:T AF:16x | |
| NVIDIA GeForce RTX 3090 | |
| NVIDIA Titan RTX | |
| NVIDIA GeForce RTX 2080 Super (Desktop) | |
| AMD Radeon RX 5700 XT (Desktop) | |
| NVIDIA Titan X Pascal | |
| 2560x1440 Ultra High Preset AA:T AF:16x | |
| NVIDIA GeForce RTX 3090 | |
| NVIDIA Titan RTX | |
| NVIDIA GeForce RTX 2080 Super (Desktop) | |
| AMD Radeon RX 5700 XT (Desktop) | |
| NVIDIA Titan X Pascal | |
| 1920x1080 Ultra High Preset AA:T AF:16x | |
| NVIDIA GeForce RTX 3090 | |
| NVIDIA Titan RTX | |
| NVIDIA GeForce RTX 2080 Super (Desktop) | |
| AMD Radeon RX 5700 XT (Desktop) | |
| NVIDIA Titan X Pascal | |
| 1920x1080 High Preset AA:T AF:16x | |
| NVIDIA Titan RTX | |
| NVIDIA GeForce RTX 3090 | |
| NVIDIA GeForce RTX 2080 Super (Desktop) | |
| AMD Radeon RX 5700 XT (Desktop) | |
| NVIDIA Titan X Pascal | |
| Doom Eternal | |
| 3840x2160 Ultra Preset | |
| NVIDIA GeForce RTX 3090 | |
| NVIDIA Titan RTX | |
| NVIDIA GeForce RTX 2080 Super (Desktop) | |
| AMD Radeon RX 5700 XT (Desktop) | |
| NVIDIA Titan X Pascal | |
| 2560x1440 Ultra Preset | |
| NVIDIA GeForce RTX 3090 | |
| NVIDIA Titan RTX | |
| NVIDIA GeForce RTX 2080 Super (Desktop) | |
| AMD Radeon RX 5700 XT (Desktop) | |
| NVIDIA Titan X Pascal | |
| 1920x1080 Ultra Preset | |
| NVIDIA GeForce RTX 3090 | |
| NVIDIA Titan RTX | |
| NVIDIA GeForce RTX 2080 Super (Desktop) | |
| NVIDIA Titan X Pascal | |
| AMD Radeon RX 5700 XT (Desktop) | |
| 1920x1080 High Preset | |
| NVIDIA GeForce RTX 3090 | |
| NVIDIA Titan RTX | |
| NVIDIA GeForce RTX 2080 Super (Desktop) | |
| NVIDIA Titan X Pascal | |
| AMD Radeon RX 5700 XT (Desktop) | |
| GRID 2019 | |
| 3840x2160 Ultra High Preset | |
| NVIDIA GeForce RTX 3090 | |
| NVIDIA Titan RTX | |
| NVIDIA GeForce RTX 2080 Super (Desktop) | |
| AMD Radeon RX 5700 XT (Desktop) | |
| NVIDIA Titan X Pascal | |
| 2560x1440 Ultra High Preset | |
| NVIDIA Titan RTX | |
| NVIDIA GeForce RTX 3090 | |
| NVIDIA GeForce RTX 2080 Super (Desktop) | |
| NVIDIA Titan X Pascal | |
| AMD Radeon RX 5700 XT (Desktop) | |
| 1920x1080 Ultra High Preset | |
| NVIDIA Titan RTX | |
| NVIDIA GeForce RTX 3090 | |
| NVIDIA GeForce RTX 2080 Super (Desktop) | |
| NVIDIA Titan X Pascal | |
| AMD Radeon RX 5700 XT (Desktop) | |
| 1920x1080 High Preset | |
| NVIDIA Titan RTX | |
| NVIDIA Titan X Pascal | |
| NVIDIA GeForce RTX 2080 Super (Desktop) | |
| AMD Radeon RX 5700 XT (Desktop) | |
| NVIDIA GeForce RTX 3090 | |
| Hitman 2 | |
| 3840x2160 Ultra AF:16x | |
| NVIDIA GeForce RTX 3090 | |
| NVIDIA Titan RTX | |
| NVIDIA Titan X Pascal | |
| 2560x1440 Ultra AF:16x | |
| NVIDIA GeForce RTX 3090 | |
| 1920x1080 Ultra AF:16x | |
| NVIDIA GeForce RTX 3090 | |
| NVIDIA Titan RTX | |
| NVIDIA Titan X Pascal | |
| 1920x1080 High AF:8x | |
| NVIDIA GeForce RTX 3090 | |
| NVIDIA Titan RTX | |
| NVIDIA Titan X Pascal | |
| Horizon Zero Dawn | |
| 3840x2160 Ultimate Quality | |
| NVIDIA GeForce RTX 3090 | |
| NVIDIA Titan RTX | |
| NVIDIA GeForce RTX 2080 Super (Desktop) | |
| AMD Radeon RX 5700 XT (Desktop) | |
| NVIDIA Titan X Pascal | |
| 2560x1440 Ultimate Quality | |
| NVIDIA GeForce RTX 3090 | |
| NVIDIA Titan RTX | |
| NVIDIA GeForce RTX 2080 Super (Desktop) | |
| AMD Radeon RX 5700 XT (Desktop) | |
| NVIDIA Titan X Pascal | |
| 1920x1080 Ultimate Quality | |
| NVIDIA GeForce RTX 3090 | |
| NVIDIA Titan RTX | |
| NVIDIA GeForce RTX 2080 Super (Desktop) | |
| AMD Radeon RX 5700 XT (Desktop) | |
| NVIDIA Titan X Pascal | |
| 1920x1080 Favor Quality | |
| NVIDIA GeForce RTX 3090 | |
| NVIDIA Titan RTX | |
| NVIDIA GeForce RTX 2080 Super (Desktop) | |
| AMD Radeon RX 5700 XT (Desktop) | |
| NVIDIA Titan X Pascal | |
| Anno 1800 | |
| 3840x2160 Ultra Graphics Quality (DX11) | |
| NVIDIA GeForce RTX 3090 | |
| NVIDIA GeForce RTX 2080 Ti (Desktop) | |
| 2560x1440 Ultra Graphics Quality (DX11) | |
| NVIDIA GeForce RTX 3090 | |
| NVIDIA GeForce RTX 2080 Ti (Desktop) | |
| 1920x1080 Ultra Graphics Quality (DX11) | |
| NVIDIA GeForce RTX 3090 | |
| AMD Radeon RX 5700 XT (Desktop) | |
| NVIDIA GeForce RTX 2080 Ti (Desktop) | |
| 1920x1080 High Graphics Quality (DX11) | |
| NVIDIA GeForce RTX 3090 | |
| NVIDIA GeForce RTX 2080 Ti (Desktop) | |
| Assassin´s Creed Odyssey | |
| 3840x2160 Ultra High Preset | |
| NVIDIA GeForce RTX 3090 | |
| NVIDIA Titan RTX | |
| NVIDIA Titan X Pascal | |
| 2560x1440 Ultra High Preset | |
| NVIDIA GeForce RTX 3090 | |
| 1920x1080 Ultra High Preset | |
| NVIDIA GeForce RTX 3090 | |
| NVIDIA Titan RTX | |
| NVIDIA Titan X Pascal | |
| 1920x1080 High Preset | |
| NVIDIA GeForce RTX 3090 | |
| NVIDIA Titan RTX | |
| NVIDIA Titan X Pascal | |
| Far Cry 5 | |
| 3840x2160 Ultra Preset AA:T | |
| NVIDIA GeForce RTX 3090 | |
| NVIDIA Titan RTX | |
| NVIDIA GeForce RTX 2080 Ti (Desktop) | |
| NVIDIA Titan RTX | |
| NVIDIA Titan RTX | |
| NVIDIA Titan X Pascal | |
| 2560x1440 Ultra Preset AA:T | |
| NVIDIA GeForce RTX 3090 | |
| NVIDIA GeForce RTX 2080 Ti (Desktop) | |
| NVIDIA Titan RTX | |
| NVIDIA Titan RTX | |
| 1920x1080 Ultra Preset AA:T | |
| NVIDIA GeForce RTX 2080 Ti (Desktop) | |
| NVIDIA GeForce RTX 3090 | |
| NVIDIA Titan RTX | |
| NVIDIA Titan RTX | |
| AMD Radeon RX 5700 XT (Desktop) | |
| NVIDIA Titan RTX | |
| NVIDIA Titan X Pascal | |
| 1920x1080 High Preset AA:T | |
| NVIDIA GeForce RTX 2080 Ti (Desktop) | |
| NVIDIA GeForce RTX 3090 | |
| NVIDIA Titan RTX | |
| NVIDIA Titan RTX | |
| NVIDIA Titan RTX | |
| NVIDIA Titan X Pascal | |
| Far Cry New Dawn | |
| 3840x2160 Ultra Preset | |
| NVIDIA GeForce RTX 3090 | |
| NVIDIA Titan RTX | |
| NVIDIA GeForce RTX 2080 Ti (Desktop) | |
| NVIDIA Titan RTX | |
| 2560x1440 Ultra Preset | |
| NVIDIA GeForce RTX 3090 | |
| NVIDIA GeForce RTX 2080 Ti (Desktop) | |
| NVIDIA Titan RTX | |
| NVIDIA Titan RTX | |
| 1920x1080 Ultra Preset | |
| NVIDIA GeForce RTX 3090 | |
| NVIDIA Titan RTX | |
| AMD Radeon RX 5700 XT (Desktop) | |
| NVIDIA GeForce RTX 2080 Ti (Desktop) | |
| NVIDIA Titan RTX | |
| 1920x1080 High Preset | |
| NVIDIA GeForce RTX 3090 | |
| NVIDIA Titan RTX | |
| NVIDIA GeForce RTX 2080 Ti (Desktop) | |
| NVIDIA Titan RTX | |
| Call of Duty Modern Warfare 2019 | |
| 3840x2160 Maximum Settings with Raytracing AA:T2X Filmic SM | |
| NVIDIA GeForce RTX 3090 | |
| NVIDIA Titan RTX | |
| NVIDIA GeForce RTX 2080 Super (Desktop) | |
| NVIDIA Titan X Pascal | |
| 1920x1080 Maximum Settings with Raytracing AA:T2X Filmic SM | |
| NVIDIA Titan RTX | |
| NVIDIA GeForce RTX 3090 | |
| NVIDIA GeForce RTX 2080 Super (Desktop) | |
| NVIDIA Titan X Pascal | |
| 3840x2160 Maximum Settings AA:T2X Filmic SM | |
| NVIDIA GeForce RTX 3090 | |
| NVIDIA Titan RTX | |
| NVIDIA GeForce RTX 2080 Super (Desktop) | |
| NVIDIA Titan X Pascal | |
| AMD Radeon RX 5700 XT (Desktop) | |
| 2560x1440 Maximum Settings AA:T2X Filmic SM | |
| NVIDIA GeForce RTX 3090 | |
| NVIDIA Titan RTX | |
| NVIDIA GeForce RTX 2080 Super (Desktop) | |
| NVIDIA Titan X Pascal | |
| AMD Radeon RX 5700 XT (Desktop) | |
| 1920x1080 Maximum Settings AA:T2X Filmic SM | |
| NVIDIA Titan RTX | |
| NVIDIA GeForce RTX 3090 | |
| NVIDIA GeForce RTX 2080 Super (Desktop) | |
| NVIDIA Titan X Pascal | |
| AMD Radeon RX 5700 XT (Desktop) | |
| 1920x1080 High Settings AA:1X SM | |
| NVIDIA Titan RTX | |
| NVIDIA GeForce RTX 3090 | |
| NVIDIA GeForce RTX 2080 Super (Desktop) | |
| NVIDIA Titan X Pascal | |
| AMD Radeon RX 5700 XT (Desktop) | |
| The Division 2 | |
| 3840x2160 Ultra Preset | |
| NVIDIA GeForce RTX 3090 | |
| NVIDIA GeForce RTX 2080 Ti (Desktop) | |
| 2560x1440 Ultra Preset | |
| NVIDIA GeForce RTX 3090 | |
| NVIDIA GeForce RTX 2080 Ti (Desktop) | |
| 1920x1080 Ultra Preset | |
| NVIDIA GeForce RTX 3090 | |
| NVIDIA GeForce RTX 2080 Ti (Desktop) | |
| 1920x1080 High Preset | |
| NVIDIA GeForce RTX 3090 | |
| NVIDIA GeForce RTX 2080 Ti (Desktop) | |
| Battlefield V | |
| 1920x1080 Ultra Preset DXR | |
| NVIDIA GeForce RTX 3090 | |
| 3840x2160 Ultra Preset | |
| NVIDIA GeForce RTX 3090 | |
| NVIDIA GeForce RTX 3090 | |
| NVIDIA Titan RTX | |
| NVIDIA Titan X Pascal | |
| 2560x1440 Ultra Preset | |
| NVIDIA GeForce RTX 3090 | |
| 1920x1080 Ultra Preset | |
| NVIDIA GeForce RTX 3090 | |
| NVIDIA Titan RTX | |
| NVIDIA Titan X Pascal | |
| 1920x1080 High Preset | |
| NVIDIA GeForce RTX 3090 | |
| NVIDIA Titan RTX | |
| NVIDIA Titan X Pascal | |
| Star Wars Jedi Fallen Order | |
| 3840x2160 Epic Preset | |
| NVIDIA GeForce RTX 3090 | |
| NVIDIA Titan RTX | |
| NVIDIA GeForce RTX 2080 Ti (Desktop) | |
| NVIDIA GeForce RTX 2080 Super (Desktop) | |
| NVIDIA Titan X Pascal | |
| AMD Radeon RX 5700 XT (Desktop) | |
| 2560x1440 Epic Preset | |
| NVIDIA Titan RTX | |
| NVIDIA GeForce RTX 2080 Super (Desktop) | |
| NVIDIA GeForce RTX 2080 Ti (Desktop) | |
| NVIDIA GeForce RTX 3090 | |
| NVIDIA Titan X Pascal | |
| AMD Radeon RX 5700 XT (Desktop) | |
| 1920x1080 Epic Preset | |
| NVIDIA Titan RTX | |
| NVIDIA GeForce RTX 2080 Super (Desktop) | |
| NVIDIA Titan X Pascal | |
| AMD Radeon RX 5700 XT (Desktop) | |
| NVIDIA GeForce RTX 2080 Ti (Desktop) | |
| NVIDIA GeForce RTX 3090 | |
| 1920x1080 High Preset | |
| NVIDIA Titan RTX | |
| NVIDIA GeForce RTX 2080 Super (Desktop) | |
| NVIDIA Titan X Pascal | |
| AMD Radeon RX 5700 XT (Desktop) | |
| NVIDIA GeForce RTX 2080 Ti (Desktop) | |
| NVIDIA GeForce RTX 3090 | |
| Red Dead Redemption 2 | |
| 3840x2160 Maximum Settings | |
| NVIDIA GeForce RTX 3090 | |
| NVIDIA GeForce RTX 2080 Ti (Desktop) | |
| NVIDIA Titan RTX | |
| NVIDIA GeForce RTX 2080 Super (Desktop) | |
| AMD Radeon RX 5700 XT (Desktop) | |
| NVIDIA Titan X Pascal | |
| 2560x1440 Maximum Settings | |
| NVIDIA GeForce RTX 3090 | |
| NVIDIA Titan RTX | |
| NVIDIA GeForce RTX 2080 Ti (Desktop) | |
| NVIDIA GeForce RTX 2080 Super (Desktop) | |
| AMD Radeon RX 5700 XT (Desktop) | |
| NVIDIA Titan X Pascal | |
| 1920x1080 Maximum Settings | |
| NVIDIA GeForce RTX 3090 | |
| NVIDIA Titan RTX | |
| NVIDIA GeForce RTX 2080 Ti (Desktop) | |
| NVIDIA GeForce RTX 2080 Super (Desktop) | |
| AMD Radeon RX 5700 XT (Desktop) | |
| NVIDIA Titan X Pascal | |
| 1920x1080 High Settings | |
| NVIDIA GeForce RTX 3090 | |
| NVIDIA Titan RTX | |
| NVIDIA GeForce RTX 2080 Ti (Desktop) | |
| NVIDIA GeForce RTX 2080 Super (Desktop) | |
| AMD Radeon RX 5700 XT (Desktop) | |
| NVIDIA Titan X Pascal | |
| GTA V | |
| 3840x2160 High/On (Advanced Graphics Off) AA:FX AF:8x | |
| NVIDIA GeForce RTX 3090 | |
| NVIDIA Titan RTX | |
| NVIDIA Titan X Pascal | |
| 3840x2160 Highest AA:4xMSAA + FX AF:16x | |
| NVIDIA GeForce RTX 3090 | |
| 2560x1440 Highest AA:4xMSAA + FX AF:16x | |
| NVIDIA GeForce RTX 3090 | |
| 1920x1080 Highest AA:4xMSAA + FX AF:16x | |
| NVIDIA Titan RTX | |
| NVIDIA Titan X Pascal | |
| NVIDIA GeForce RTX 3090 | |
| 1920x1080 High/On (Advanced Graphics Off) AA:2xMSAA + FX AF:8x | |
| NVIDIA GeForce RTX 3090 | |
| NVIDIA Titan RTX | |
| NVIDIA Titan X Pascal | |
| Metro Exodus | |
| 1920x1080 Ultra Quality DXR AF:16x | |
| NVIDIA Titan RTX | |
| NVIDIA GeForce RTX 3090 | |
| NVIDIA Titan RTX | |
| NVIDIA GeForce RTX 2080 Ti (Desktop) | |
| 3840x2160 Ultra Quality AF:16x | |
| NVIDIA GeForce RTX 3090 | |
| NVIDIA Titan RTX | |
| NVIDIA Titan RTX | |
| NVIDIA GeForce RTX 2080 Ti (Desktop) | |
| 2560x1440 Ultra Quality AF:16x | |
| NVIDIA GeForce RTX 3090 | |
| NVIDIA Titan RTX | |
| NVIDIA Titan RTX | |
| NVIDIA GeForce RTX 2080 Ti (Desktop) | |
| 1920x1080 Ultra Quality AF:16x | |
| NVIDIA GeForce RTX 3090 | |
| NVIDIA Titan RTX | |
| NVIDIA Titan RTX | |
| NVIDIA GeForce RTX 2080 Ti (Desktop) | |
| 1920x1080 High Quality AF:16x | |
| NVIDIA GeForce RTX 3090 | |
| NVIDIA Titan RTX | |
| NVIDIA Titan RTX | |
| NVIDIA GeForce RTX 2080 Ti (Desktop) | |
| Forza Horizon 4 | |
| 3840x2160 Ultra Preset AA:2xMS | |
| NVIDIA GeForce RTX 3090 | |
| NVIDIA Titan RTX | |
| NVIDIA Titan RTX | |
| NVIDIA GeForce RTX 2080 Ti (Desktop) | |
| NVIDIA Titan RTX | |
| NVIDIA Titan X Pascal | |
| 2560x1440 Ultra Preset AA:2xMS | |
| NVIDIA GeForce RTX 3090 | |
| NVIDIA Titan RTX | |
| NVIDIA Titan RTX | |
| NVIDIA GeForce RTX 2080 Ti (Desktop) | |
| 1920x1080 Ultra Preset AA:2xMS | |
| NVIDIA Titan RTX | |
| NVIDIA GeForce RTX 2080 Ti (Desktop) | |
| NVIDIA GeForce RTX 3090 | |
| NVIDIA Titan RTX | |
| AMD Radeon RX 5700 XT (Desktop) | |
| NVIDIA Titan RTX | |
| NVIDIA Titan X Pascal | |
| 1920x1080 High Preset AA:2xMS | |
| NVIDIA Titan RTX | |
| NVIDIA GeForce RTX 2080 Ti (Desktop) | |
| NVIDIA GeForce RTX 3090 | |
| NVIDIA Titan RTX | |
| NVIDIA Titan RTX | |
| NVIDIA Titan X Pascal | |
| Control | |
| 1920x1080 High Quality Preset & High Ray Tracing Preset (DX12) | |
| NVIDIA GeForce RTX 3090 | |
| NVIDIA GeForce RTX 2080 Ti (Desktop) | |
| NVIDIA GeForce RTX 2080 Super (Desktop) | |
| NVIDIA Titan X Pascal | |
| 3840x2160 High Quality Preset | |
| NVIDIA GeForce RTX 3090 | |
| NVIDIA GeForce RTX 2080 Ti (Desktop) | |
| NVIDIA GeForce RTX 2080 Super (Desktop) | |
| AMD Radeon RX 5700 XT (Desktop) | |
| NVIDIA Titan X Pascal | |
| 2560x1440 High Quality Preset | |
| NVIDIA GeForce RTX 3090 | |
| NVIDIA GeForce RTX 2080 Ti (Desktop) | |
| NVIDIA GeForce RTX 2080 Super (Desktop) | |
| NVIDIA Titan X Pascal | |
| AMD Radeon RX 5700 XT (Desktop) | |
| 1920x1080 High Quality Preset | |
| NVIDIA GeForce RTX 3090 | |
| NVIDIA GeForce RTX 2080 Ti (Desktop) | |
| NVIDIA GeForce RTX 2080 Super (Desktop) | |
| AMD Radeon RX 5700 XT (Desktop) | |
| NVIDIA Titan X Pascal | |
| basso | medio | alto | ultra | QHD | 4K | |
|---|---|---|---|---|---|---|
| GTA V (2015) | 165 | 104 | 99.3 | 152 | ||
| Far Cry 5 (2018) | 139 | 129 | 121 | 120 | 101 | |
| Shadow of the Tomb Raider (2018) | 148 | 148 | 145 | 137 | 89.3 | |
| Forza Horizon 4 (2018) | 175 | 175 | 166 | 164 | 147 | |
| Assassin´s Creed Odyssey (2018) | 138 | 121 | 92 | 82 | 65 | |
| Hitman 2 (2018) | 102 | 93.6 | 95.1 | 91.4 | 91.2 | |
| Battlefield V (2018) | 184 | 188 | 187 | 178 | 130 | |
| Far Cry New Dawn (2019) | 122 | 115 | 104 | 102 | 92 | |
| Metro Exodus (2019) | 139 | 123 | 108 | 102 | 71.7 | |
| Dirt Rally 2.0 (2019) | 171 | 166 | 150 | 137 | 93 | |
| The Division 2 (2019) | 183 | 157 | 140 | 120 | 71.9 | |
| Anno 1800 (2019) | 116 | 87.7 | 51.5 | 53 | 53.2 | |
| Total War: Three Kingdoms (2019) | 172.7 | 135.5 | 123.5 | 100 | 51.4 | |
| Control (2019) | 223 | 174 | 118 | 61.8 | ||
| Borderlands 3 (2019) | 134 | 124 | 117 | 109 | 71.5 | |
| GRID 2019 (2019) | 178 | 116 | 129 | 106 | 91.2 | |
| Call of Duty Modern Warfare 2019 (2019) | 177 | 169 | 169 | 149 | 96.4 | |
| Star Wars Jedi Fallen Order (2019) | 104 | 100 | 97.4 | 101 | 87.1 | |
| Red Dead Redemption 2 (2019) | 152 | 143 | 110 | 91.9 | 61.9 | |
| Doom Eternal (2020) | 393 | 330 | 282 | 271 | 182 | |
| Gears Tactics (2020) | 206.4 | 144.9 | 123 | 121.8 | 74.5 | |
| F1 2020 (2020) | 248 | 245 | 227 | 204 | 133 | |
| Death Stranding (2020) | 184 | 178 | 173 | 107 | 164 | |
| Horizon Zero Dawn (2020) | 158 | 147 | 138 | 126 | 82 |
Gaming 8K
Anche se il gaming 4K non è ancora diventato estremmente diffuso, NVIDIA sta già lanciando la RTX 3090 come scheda che può abilmente gestire ii giochi in8K. Non solo il gioco in 8K, ma la RTX 3090 può anche catturare simultaneamente video a 8K 30 fps per la riproduzione o la trasmissione. Le GPU Ampere sono dotate di un decoder hardware per il nuovo codec AV1, che dovrebbe aiutare a codificare/decodificare in modo più efficiente i flussi 8K che utilizzano meno banda passante localmente o sui social media come YouTube. Si noti che attualmente sono disponibili solo pochi TV 8K, e sarebbe anche necessario un cavo HDMI 2.1 in grado di gestire tutta la larghezza di banda.
NVIDIA raccomanda un Intel Core i9-9900K, 64 GB DDR4-3200 RAM, un SSD NVMe, e un alimentatore 850 W, 80 Plus Gold PSU come specifiche minime richieste per giocare in 8K utilizzando la RTX 3090. Sul lato TV, i modelli attualmente supportati includono le serie LG Nano099, Nano098, Nano097 e Nano095, le serie Samsung Q900T e Q800T (aggiornamenti firmware in arrivo) e Sony Master Series Z9H.
Il nostro setup utilizza un televisore OnePlus 55U1 4K HDR. Al fine di testare come la RTX 3090 si sarebbe comportato nei benchmarks 8K, abbiamo utilizzato la funzione Dynamic Super Resolution (DSR) di NVIDIA per abilitare l'elaborazione 8K sulla GPU. La risoluzione predefinita 8K è considerata di 7680x4320 nel rapporto d'aspetto 16:9 che produce 33,18 milioni di pixel. Tuttavia, il OnePlus 55U1 offre una risoluzione di 8192x4320 in un rapporto d'aspetto 256:135, che produce circa 35,39 milioni di pixel.
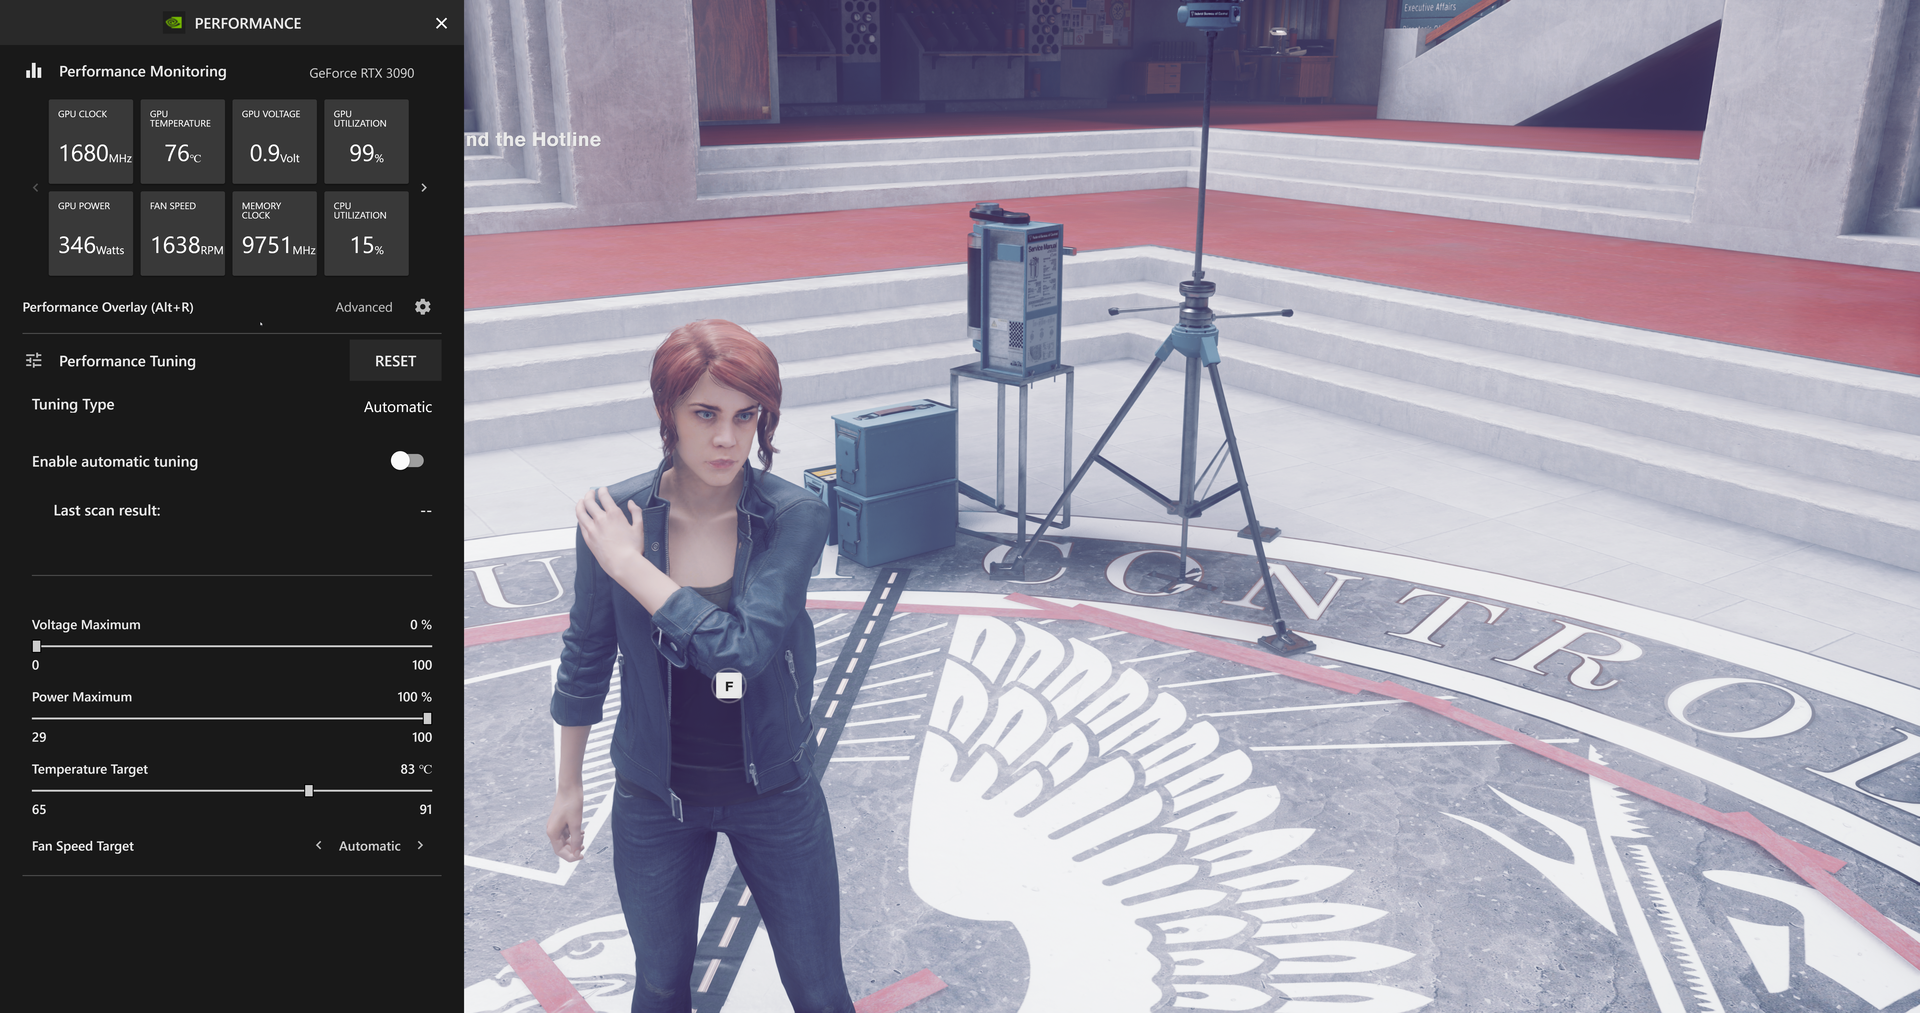
Il gioco è stato registrato utilizzando il più recente software NVIDIA ShadowPlay, fornito con GeForce Experience Beta v3.20.5. La più recente GeForce Experience Beta aggiunge anche nuovi strumenti di monitoraggio delle prestazioni e di ottimizzazione delle GPU, quasi a negare la necessità di software di terze parti per l'overclocking.
In sostanza, abbiamo raggiunto i 2,21 milioni di pixel in più rispetto alle specifiche. La Zotac RTX 3090 Trinity potrebbe superare la maggior parte dei test senza il minimo intoppo, come si può vedere qui sotto.
Non tutti i giochi saranno in grado di girare in modo nativo a 8K senza stress, però. NVIDIA usa DLSS 2.0 come mezzo per ottenere un gioco stabile a 8K 30 o, a volte, anche a 8K 60 fps. Discuteremo di più su DLSS 2.0 in un articolo dedicato a breve. In breve, il DLSS riproduce la scena sulla GPU a una risoluzione più bassa, ma utilizza l'intelligenza artificiale per scalare la scena senza una notevole perdita di qualità rispetto alla risoluzione nativa del display.
Ci è stato fornito un accesso beta privato per Control, Death Stranding e Wolfenstein: Youngblood che permettono di utilizzare la nuova modalità DLSS 2.0 Ultra Performance. Doom Eternal e Forza Horizon 4 sono stati eseguiti con risoluzioni native 8K (DSR) in quanto non dispongono ancora del supporto DLSS. Una cosa che vorremmo sottolineare in questa sede è che, sebbene NVIDIA abbia raccomandato l'abilitazione dell'HDR, abbiamo avuto problemi nell'abilitare la modalità HDR in Windows su OnePlus 55U1. Pertanto, il gameplay è stato registrato con HDR disattivato.
Controllo 8K con DLSS ed RTX
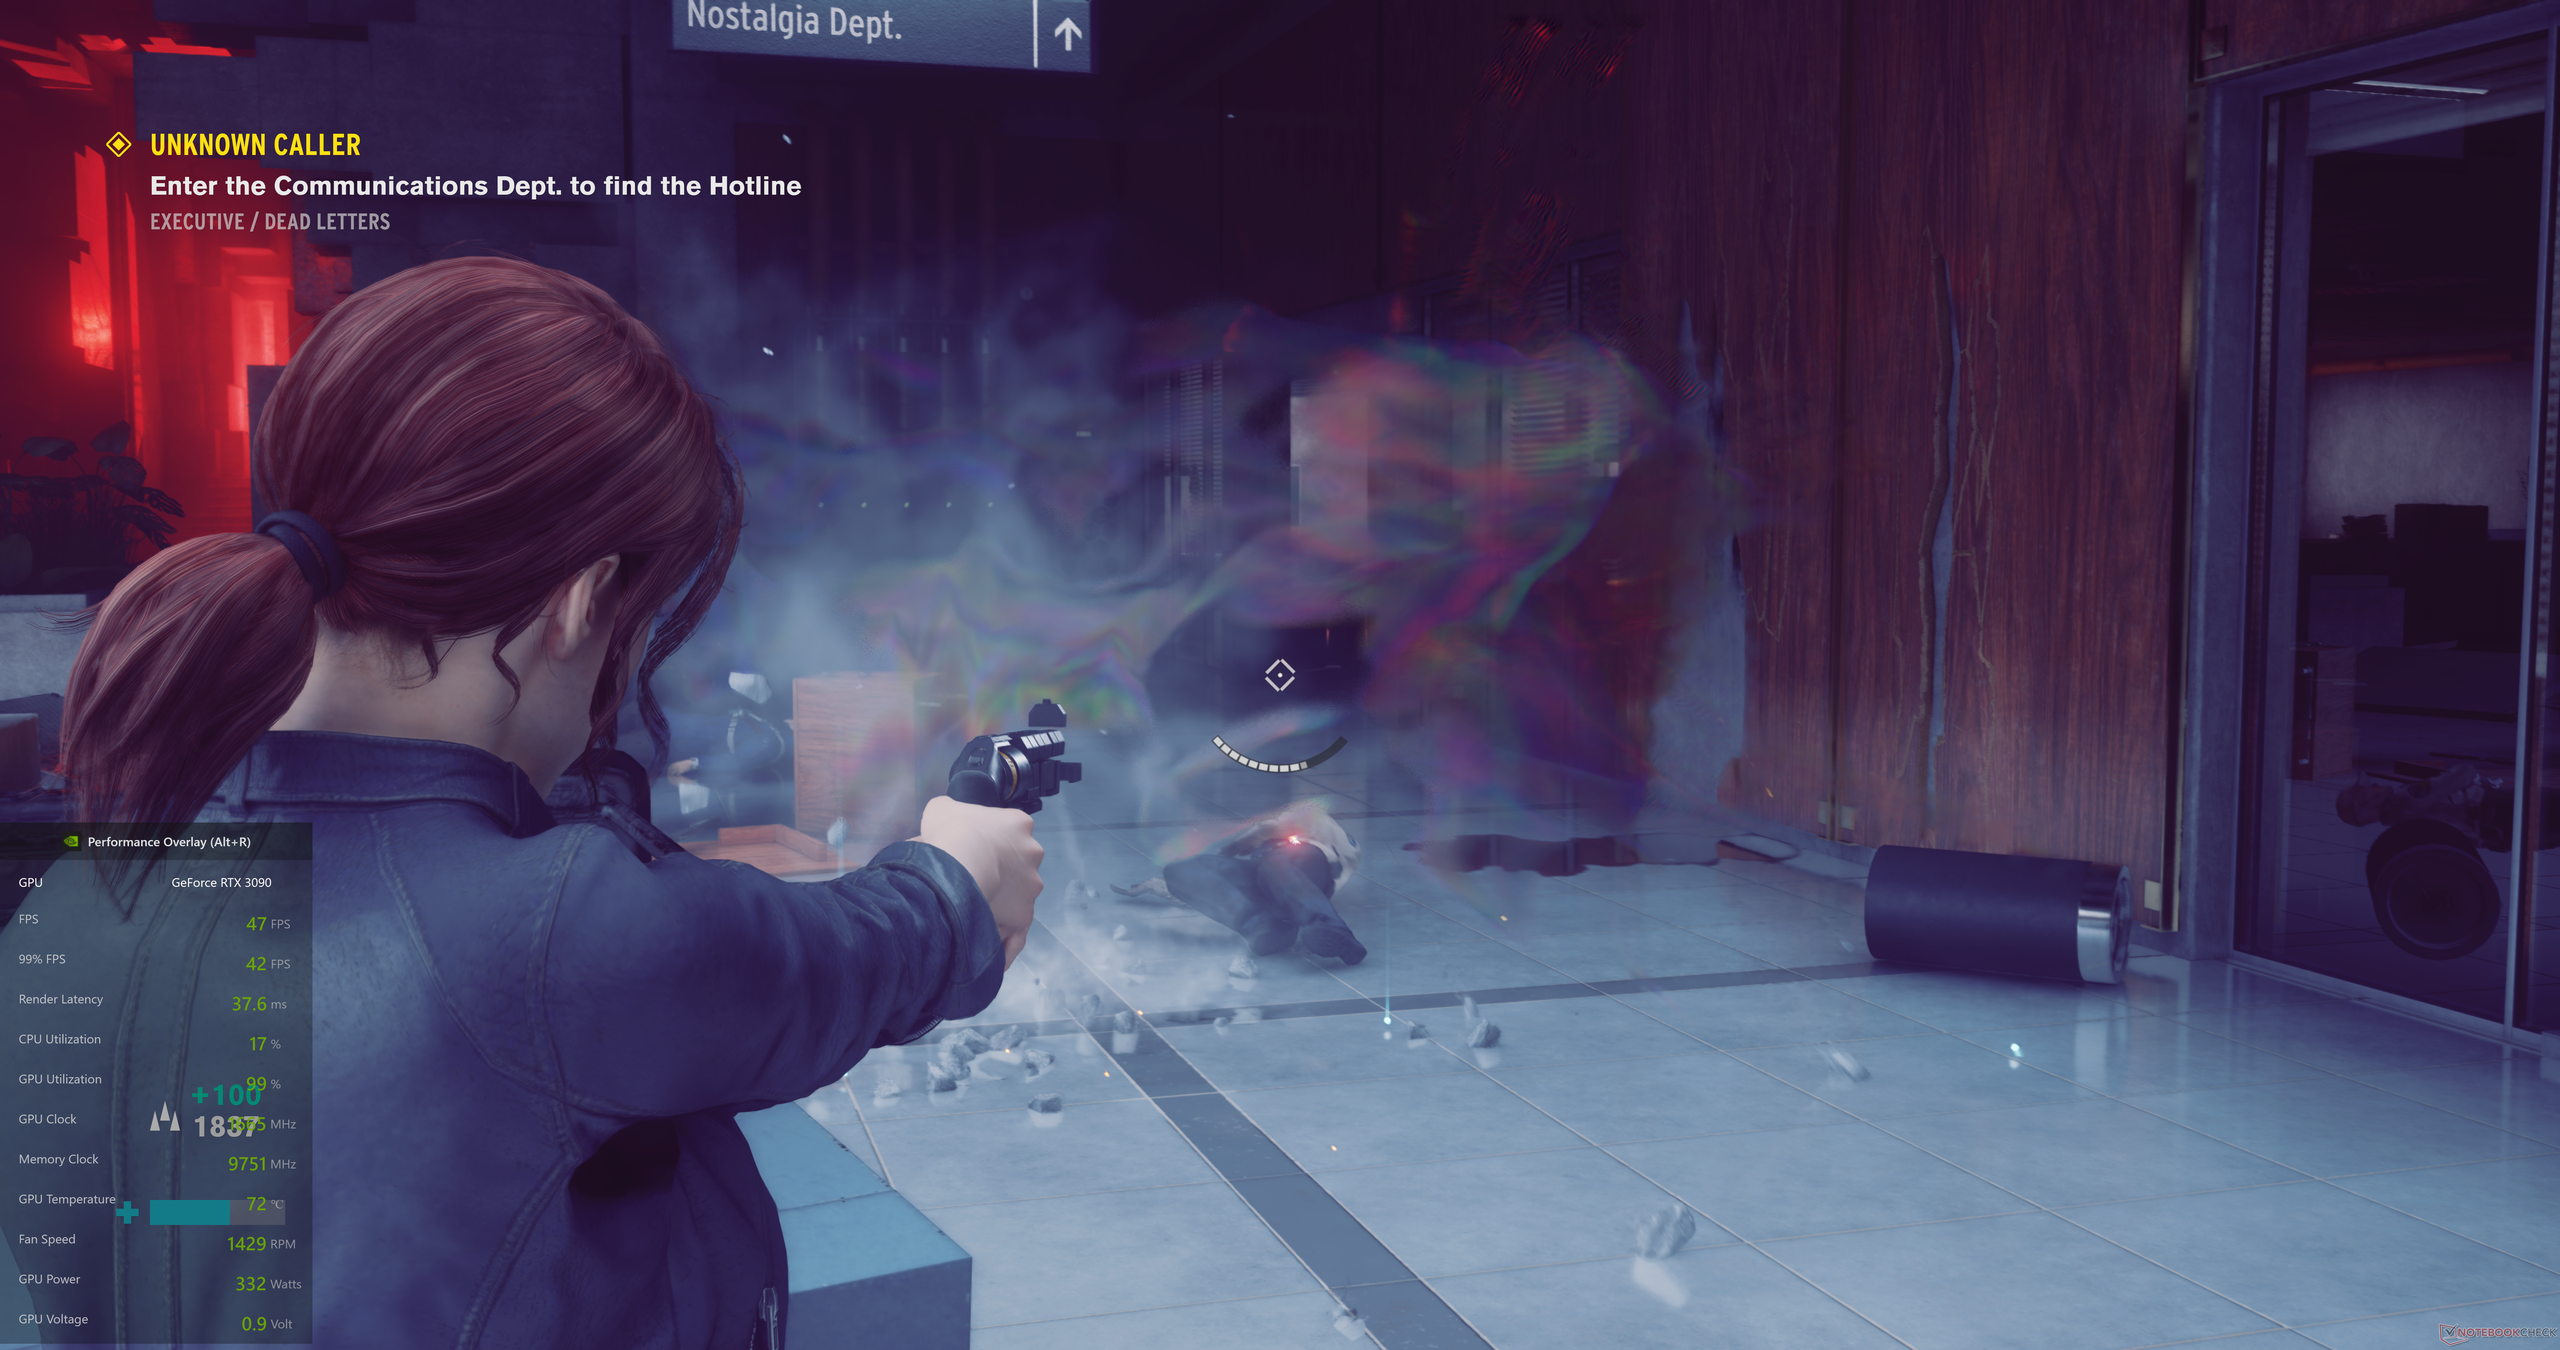
Control è stato un forte sostenitore delle caratteristiche RTX e DLSS nella generazione Turing e con Ampere queste caratteristiche hanno ricevuto un impulso. Abbiamo testato Control alla risoluzione 8K utilizzando una risoluzione di rendering 1440p con DLSS abilitato e preset Ray Tracing impostato su High. Il Gameplay è stato registrato utilizzando l'ultima versione beta di ShadowPlay a 8K 30 fps con un bitrate di 100 Mbps.
Un problema che abbiamo osservato con l'attuale beta di ShadowPlay è che non registra la nuova sovrapposizione delle prestazioni di GeForce Experience insieme al video. Pertanto, abbiamo dovuto usare un'alternativa come il contatore FPS nella Xbox Game Bar per mostrare le statistiche di sistema. Tuttavia, abbiamo fatto delle screencaps per dare un'idea dei parametri della GPU durante il gameplay.
Come potete vedere qui sotto, il modello dei personaggi è estremamente dettagliato a 8K e siamo stati in grado di raggiungere quasi 50 fps con molta azione nella scena. L'elaborazione è decisamente ad alta intensità di potenza e la RTX 3090 raggiunge quasi il suo limite di potenza di 350 W durante la corsa. Abbiamo anche osservato un utilizzo VRAM di circa 13 GB. Guardate il gameplay qui sotto.
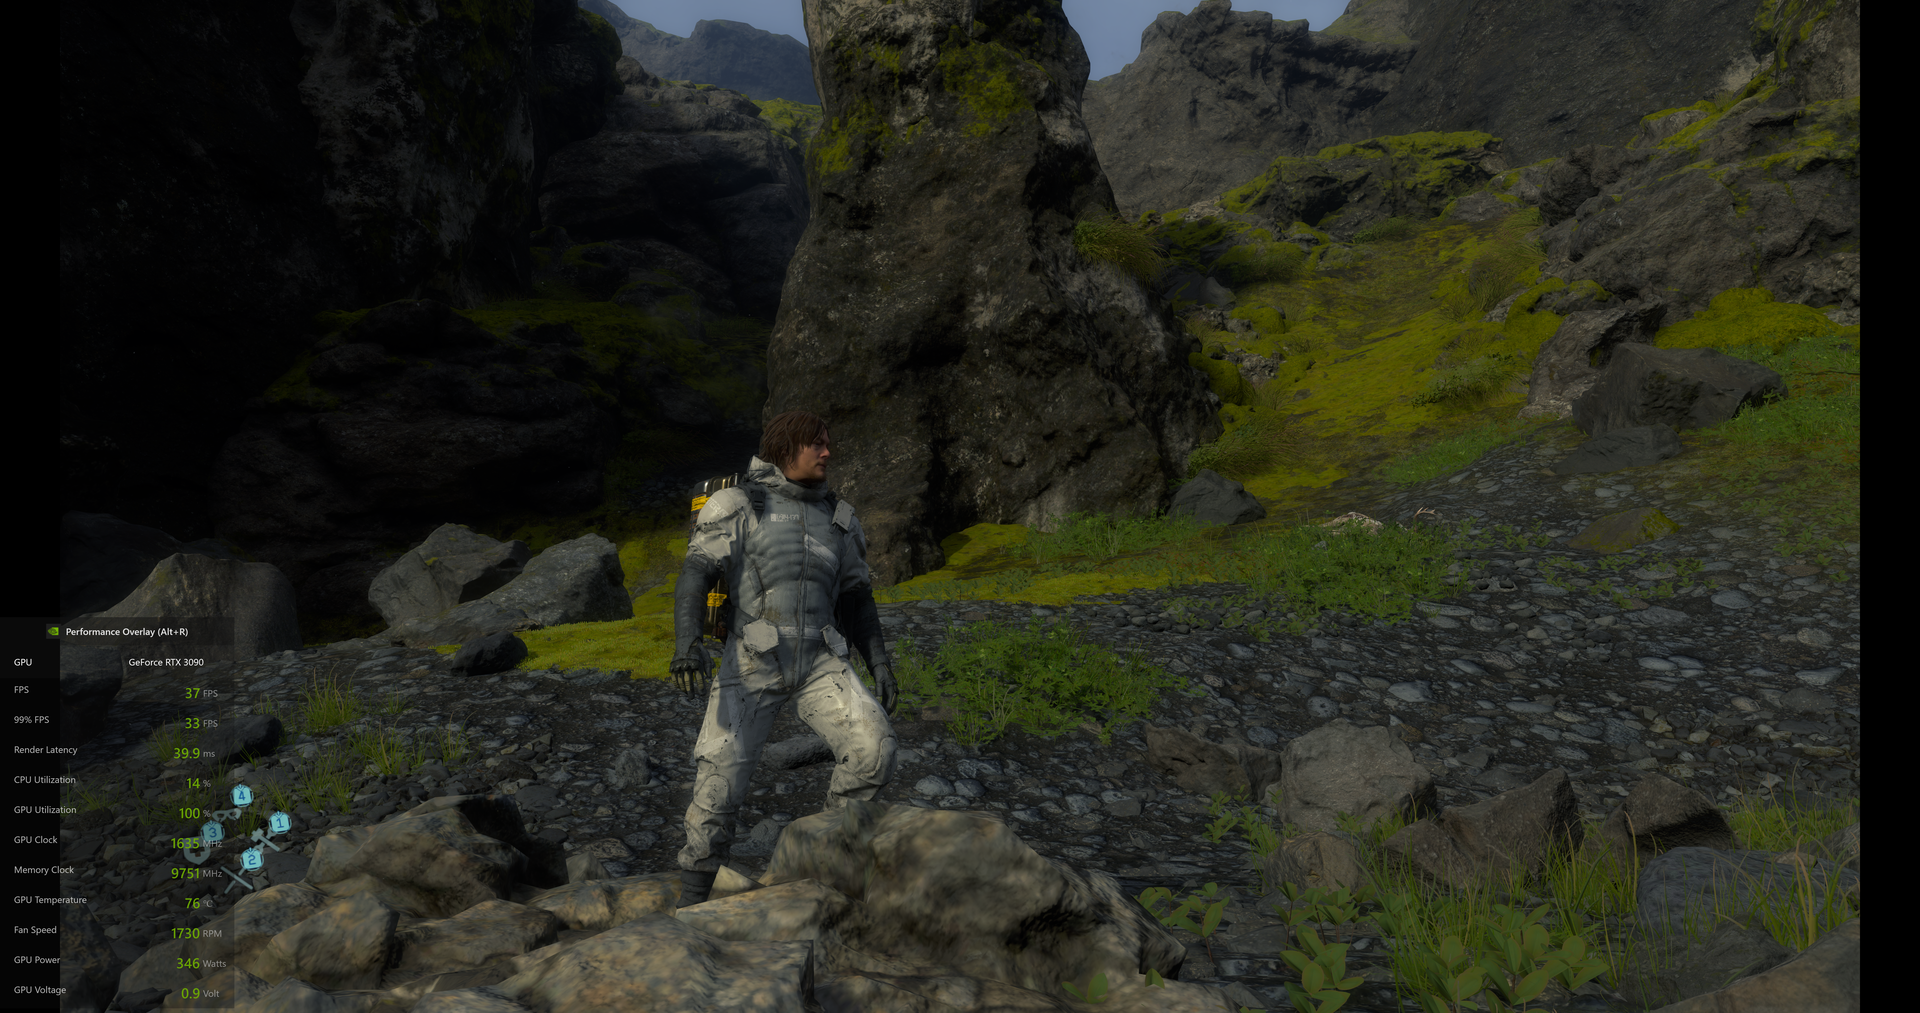
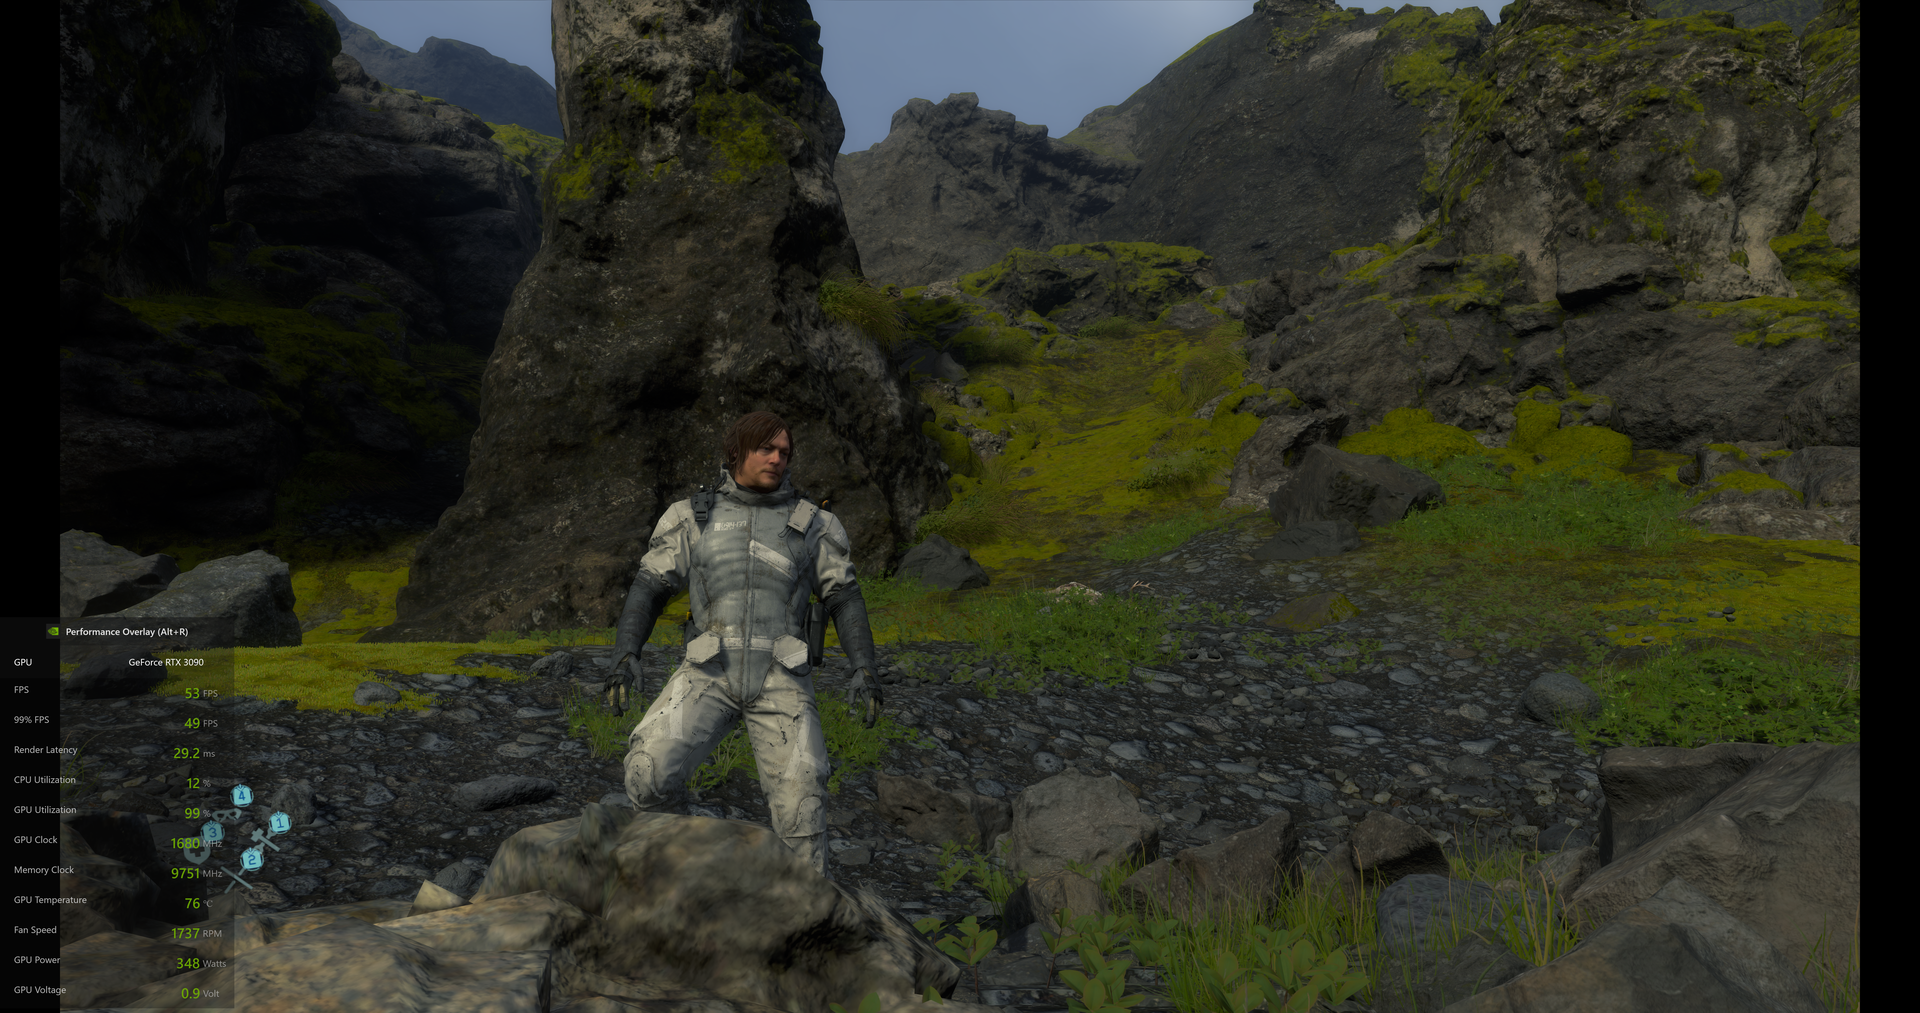
Death Stranding 8K con DLSS
Death Stranding beneficia molto della DLSS e ha un aspetto magnifico in 8K. Senza DLSS acceso, potremmo raggiungere circa 37 fps in 8K DSR. Questo valore sale fino a un meraviglioso 70 fps quando il DLSS è abilitato in modalità Ultra Performance. Abbiamo notato che alcune delle texture delle rocce avevano una superficie blanda. Inizialmente pensavamo che fosse un problema di DLSS, ma lo stesso si è visto anche nel 4K nativo senza DLSS. Il video del gioco è incorporato qui sotto. Notate che la colonna sonora è stata silenziata per evitare potenziali rivendicazioni di copyright.
Wolfenstein: Youngblood 4K nativo con DLSS e RTX On
Wolfenstein: Youngblood ha introdotto il supporto per le funzionalità di RTX durante il CES di quest'anno. Abbiamo provato a far funzionare il gioco a 8K DSR, ma non ci ha permesso di superare la risoluzione oltre i 4K. Tuttavia, siamo riusciti a raggiungere fino a 200 fps a 4K nativo con RTX e DLSS Ultra Performance mode abilitata.
Doom Eternal nativo 8K DSR
Uno dei primi giochi che NVIDIA ha mostrato durante il lancio della RTX 3080 è stato Doom Eternal. Abbiamo già visto nel confronto di gioco di cui sopra come la RTX 3090 offra prestazioni eccellenti in questo gioco a 4K Ultra Preset. Abbiamo eseguito Doom Eternal a 8K DSR nell'Ultra Preset con Resolution Scaling disabilitato e le statistiche di sistema impostate su Ultra Nightmare. Anche se il gioco riesce a raggiungere i 60 fps a volte, lo sweet spot è compreso tra i 47 e i 55 fps a seconda dell'azione della scena.
Forza Horizon 4 8K DSR
Forza Horizon 4 ha offerto un'esperienza coinvolgente giocando con le impostazioni 8K High. Abbiamo analizzato il benchmark integrato e abbiamo scoperto che la RTX 3090 Trinity può raggiungere una media di 64 fps, che è davvero buona. Anche nelle impostazioni High, la grafica era spettacolare e i dettagli minori come la forma dell'acqua sulla macchina, le persone sui marciapiedi, il fogliame e altri elementi avevano un livello di dettaglio estremo.
Emissioni
Abbiamo potuto fare solo alcuni test limitati delle temperature e dei prelievi di potenza della scheda e la maggior parte di essi erano osservazioni in gioco o di calcolo del carico di lavoro. Nonostante non sia stato utilizzato il nuovo design più fresco della Founders Edition, l'implementazione di Zotac con tripla ventola IceStorm 2.0 è stata finora molto buona. Le ventole si fermano completamente quando sono inattive e iniziano ad accelerare solo dopo circa 57 °C nel profilo di default delle ventole. La scheda è impostata per il throttling termico una volta raggiunti gli 83 °C. Durante la maggior parte del nostro benchmarking, la RTX 3090 Trinity è rimasta ben all'interno della soglia degli 80 °C anche a pieno carico. La GPU assorbe tutta la potenza di 350 W, ma è una potenza ben spesa date le sue capacità. Non vediamo l'ora di testare ulteriormente le capacità termiche e di overclocking della RTX 3090 in un futuro articolo.
Valutazione Complessiva della GPU Zotac Gaming GeForce RTX 3090 Trinity

NVIDIA è riuscita a ottenere un grande successo con il lancio di Ampere, grazie alla rapidità con cui il primo lotto di schede è stato esaurito. Anche se l'azienda sta lanciando la RTX 3080 come GPU gaming di punta, il vero mostro è la RTX 3090. Con una scheda tecnica degna di bava e prestazioni che mostra buoni miglioramenti su tutta la linea rispetto alla Titan RTX nei test sintetici e di gioco, la RTX 3090 sembra avvincente. Ma è per tutti?
Anche secondo NVIDIA, la RTX 3090 è destinata principalmente ai creatori di contenuti esigenti che possono fare buon uso di tutti i 24 GB VRAM disponibili. Detto questo, abbiamo trovato una certa regressione nelle prestazioni delle applicazioni professionali, misurata da SPECviewperf. Se questa situazione migliorerà con i futuri driver è qualcosa da tenere d'occhio. NVIDIA non ha ancora ufficializzato la linea Quadro, ma la RTX 3090 sembra sicuramente offrire un'alternativa decente e meno costosa al momento, se si vuole far passare le tendenze dei prezzi precedenti.
I creatori che hanno bisogno di lavorare su asset 8K troveranno nella NVIDIA GeForce RTX 3090 un'eccellente compagna. Lo stesso vale per coloro che amano che i loro PC producano il massimo dei frame possibili con impostazioni 4K High o Ultra. I giocatori abituali mainstream si troveranno meglio altrove.
Sembra che abbiamo raggiunto un tetto di prestazioni con la maggior parte dei motori di gioco attuali. La nostra recensione della RTX 3080 è in arrivo, ma alcuni dei numeri già pubblicati sembrano suggerire che i giocatori sono meglio serviti con la RTX 3080 quando si tratta di ottenere una migliore performance in rapporto al prezzo. Detto questo, con la RTX 3090, otterrete una scheda che può gestire un gaming da 8K senza troppi problemi allo stesso costo di una RTX 2080 Ti al lancio. I giocatori che sono anche desiderosi di spingere i frame rate elevati a 4K High o anche le impostazioni Ultra possono trovare un investimento nella RTX 3090 che vale il costo iniziale. Le recenti voci che indicano la probabile disponibilità di una versione della RTX 3080 da 20 GB indicano che più VRAM è una specifica sicura per le GPU che arriveranno.
La nostra unità Zotac Gaming GeForce RTX 3090 Trinity si è comportata in modo ammirevole in tutti i test senza sudare troppo. Il raffreddamento è eccellente e le ventole non sono troppo rumorose anche sotto carico. Ci sono alcune cose che Zotac è in grado di correggere, come l'offerta del connettore di alimentazione in un luogo più accessibile e l'utilizzo di una piastra posteriore più robusta. Per il resto, la scheda ha un ottimo aspetto ed è in realtà un risparmio di spazio rispetto al design a 3 slot della Founders Edition. Riteniamo che la Zotac RTX 3090 Trinity possa essere considerata una buona prospettiva se si decide di puntare al massimo e di scegliere la RTX 3090.
Tutto sommato, sembra che NVIDIA abbia fissato ancora una volta l'asticella alta con la GeForce RTX 3090. I piani di AMD con la RDNA2 sono ancora sfuggenti, tranne che per una sbirciatina a una delle schede della scorsa settimana, e l'azienda dovrà tirare fuori un coniglio dal cappello magico se ha in mente di affrontare la RTX 3090 a testa alta.
Price comparison
