Notebookcheck Logo

Recensione del PC desktop Zotac Magnus One con Core i7 e GeForce RTX 3070

Sistema gaming compatto! Zotac realizza computer molto compatti da un po' di tempo. Con la serie Magnus One, ora c'è un altro rappresentante per quanto riguarda i sistemi gaming compatti. Le prestazioni non sono state trascurate, dal momento che la GeForce RTX 3070 è una scheda grafica desktop a tutti gli effetti ed offre tanta potenza. Questa recensione del Magnus One di Zotac rivelerà cos'altro ha da offrire il sistema.

Con la nuova serie Magnus One, Zotac introduce un altro computer gaming compatto al suo portafoglio. Tuttavia, va detto subito che lo Zotac Magnus One è un sistema barebone. Ciò significa che la RAM, la memoria di massa e anche il sistema operativo devono essere acquistati separatamente. Un approccio simile è adottato da Zotac con il suo ZBOX Magnus, che però è ancora più compatto.

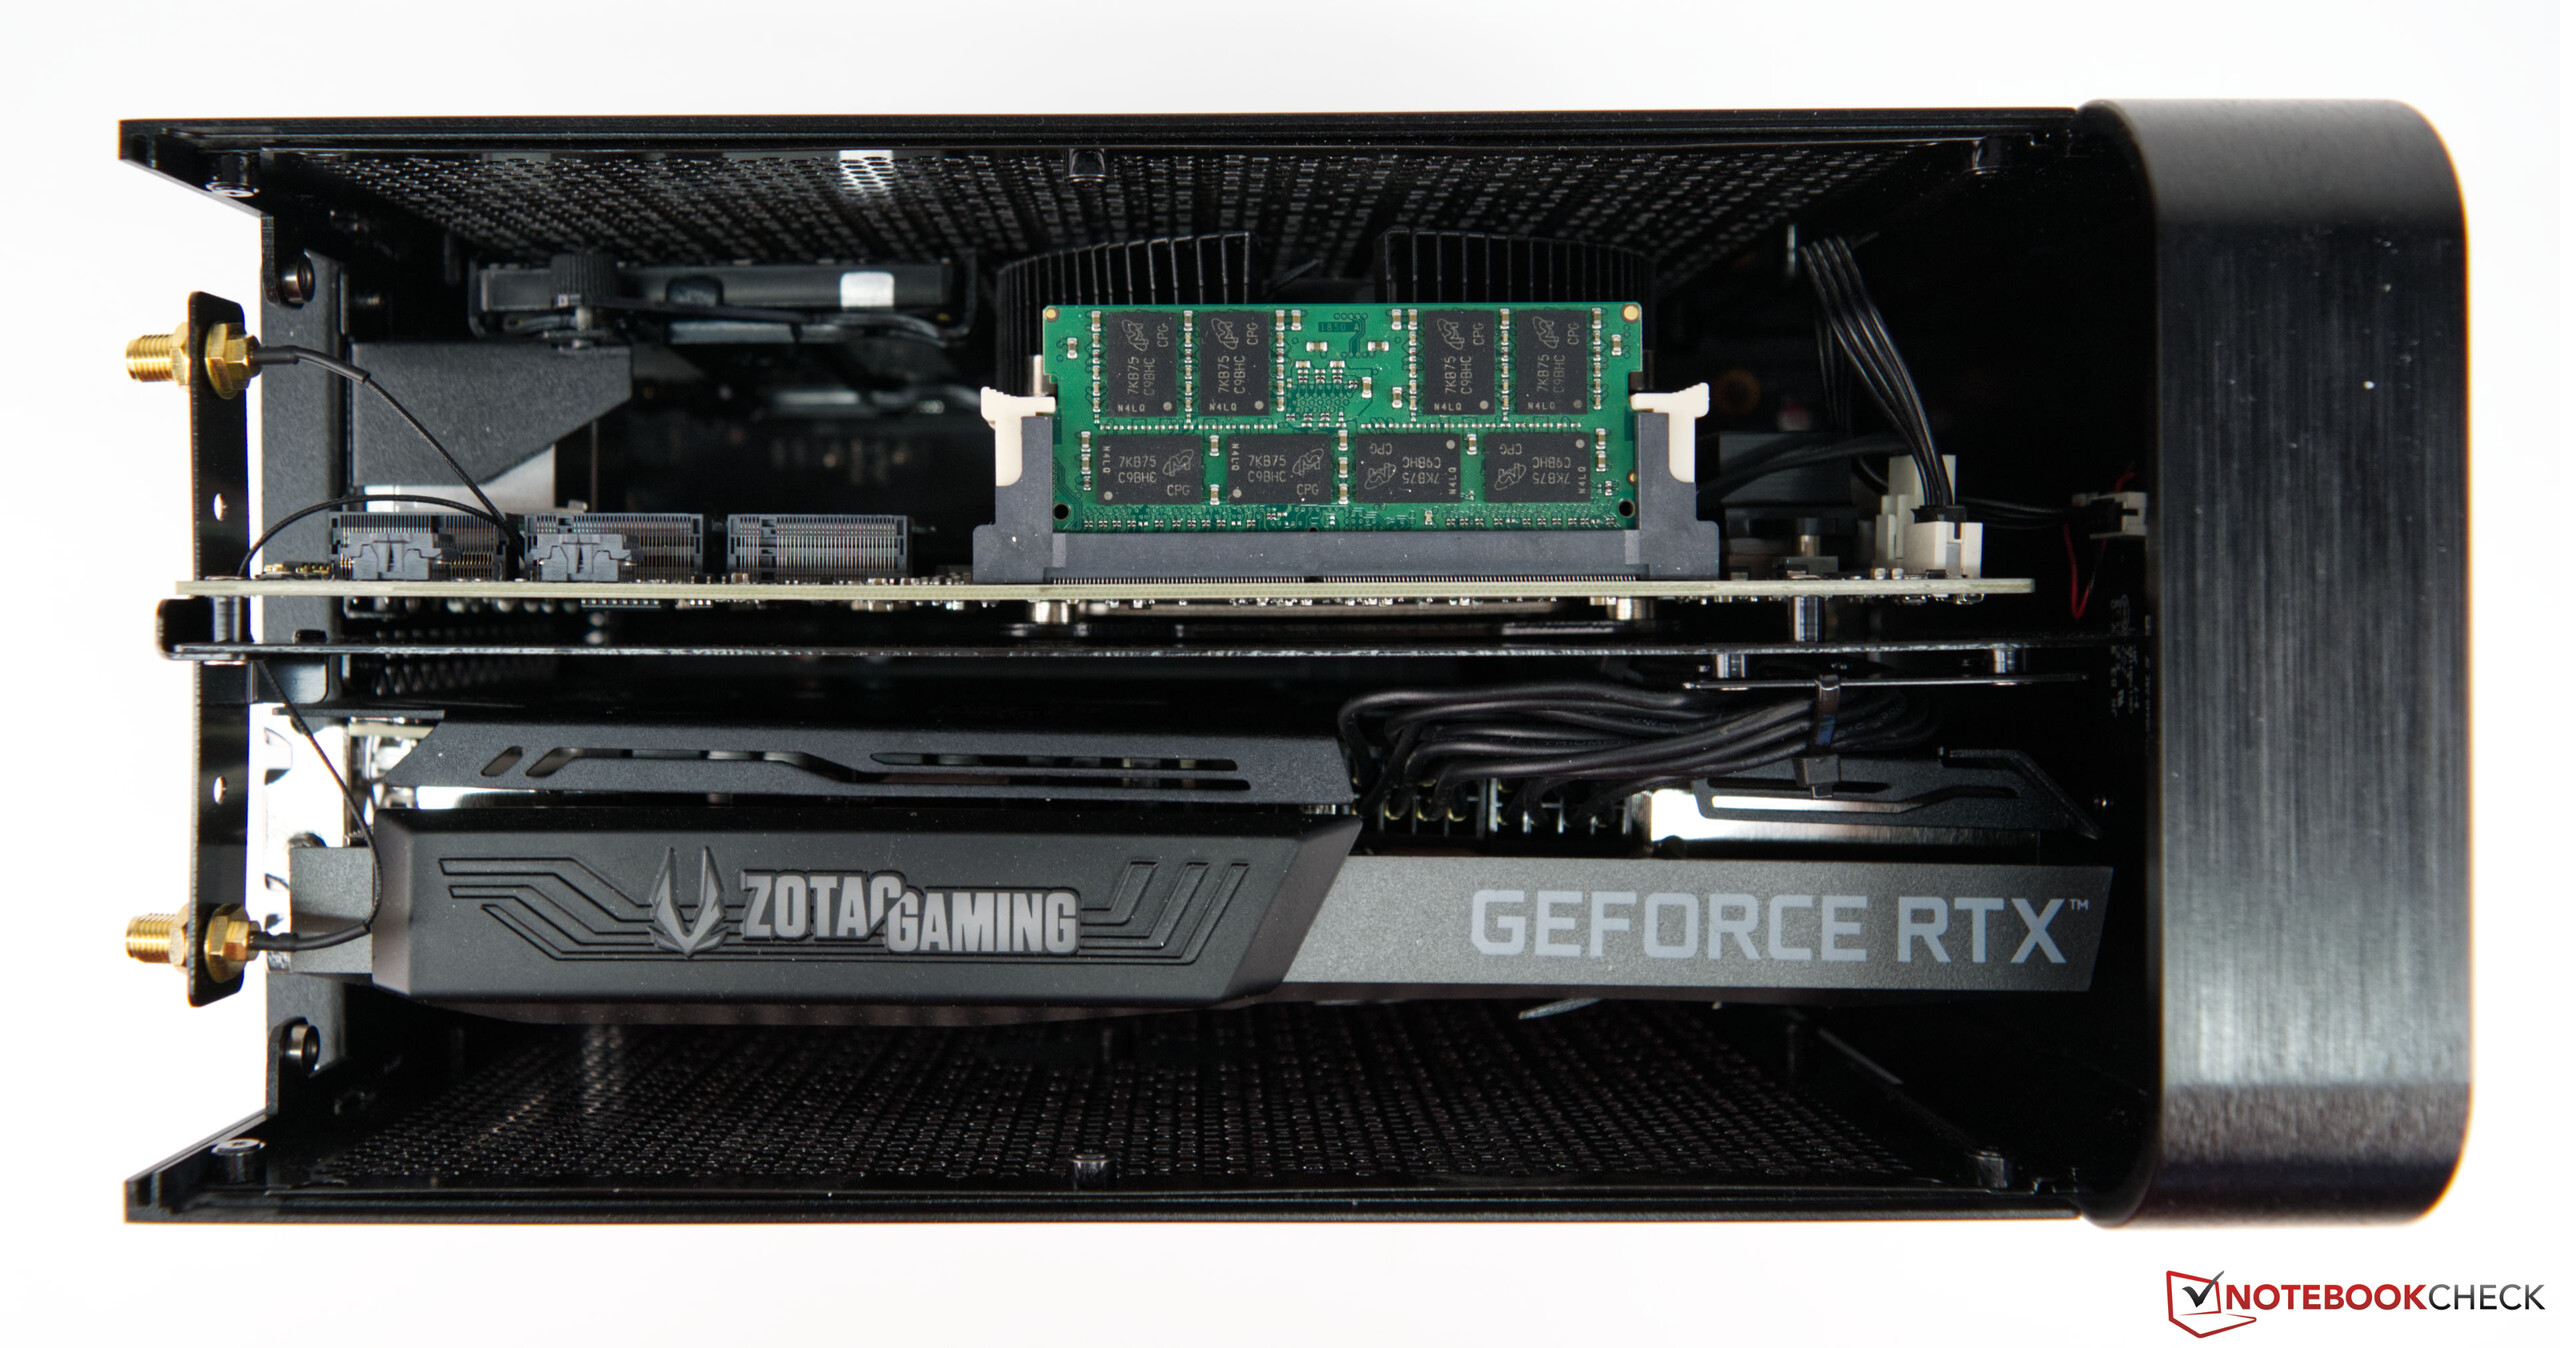
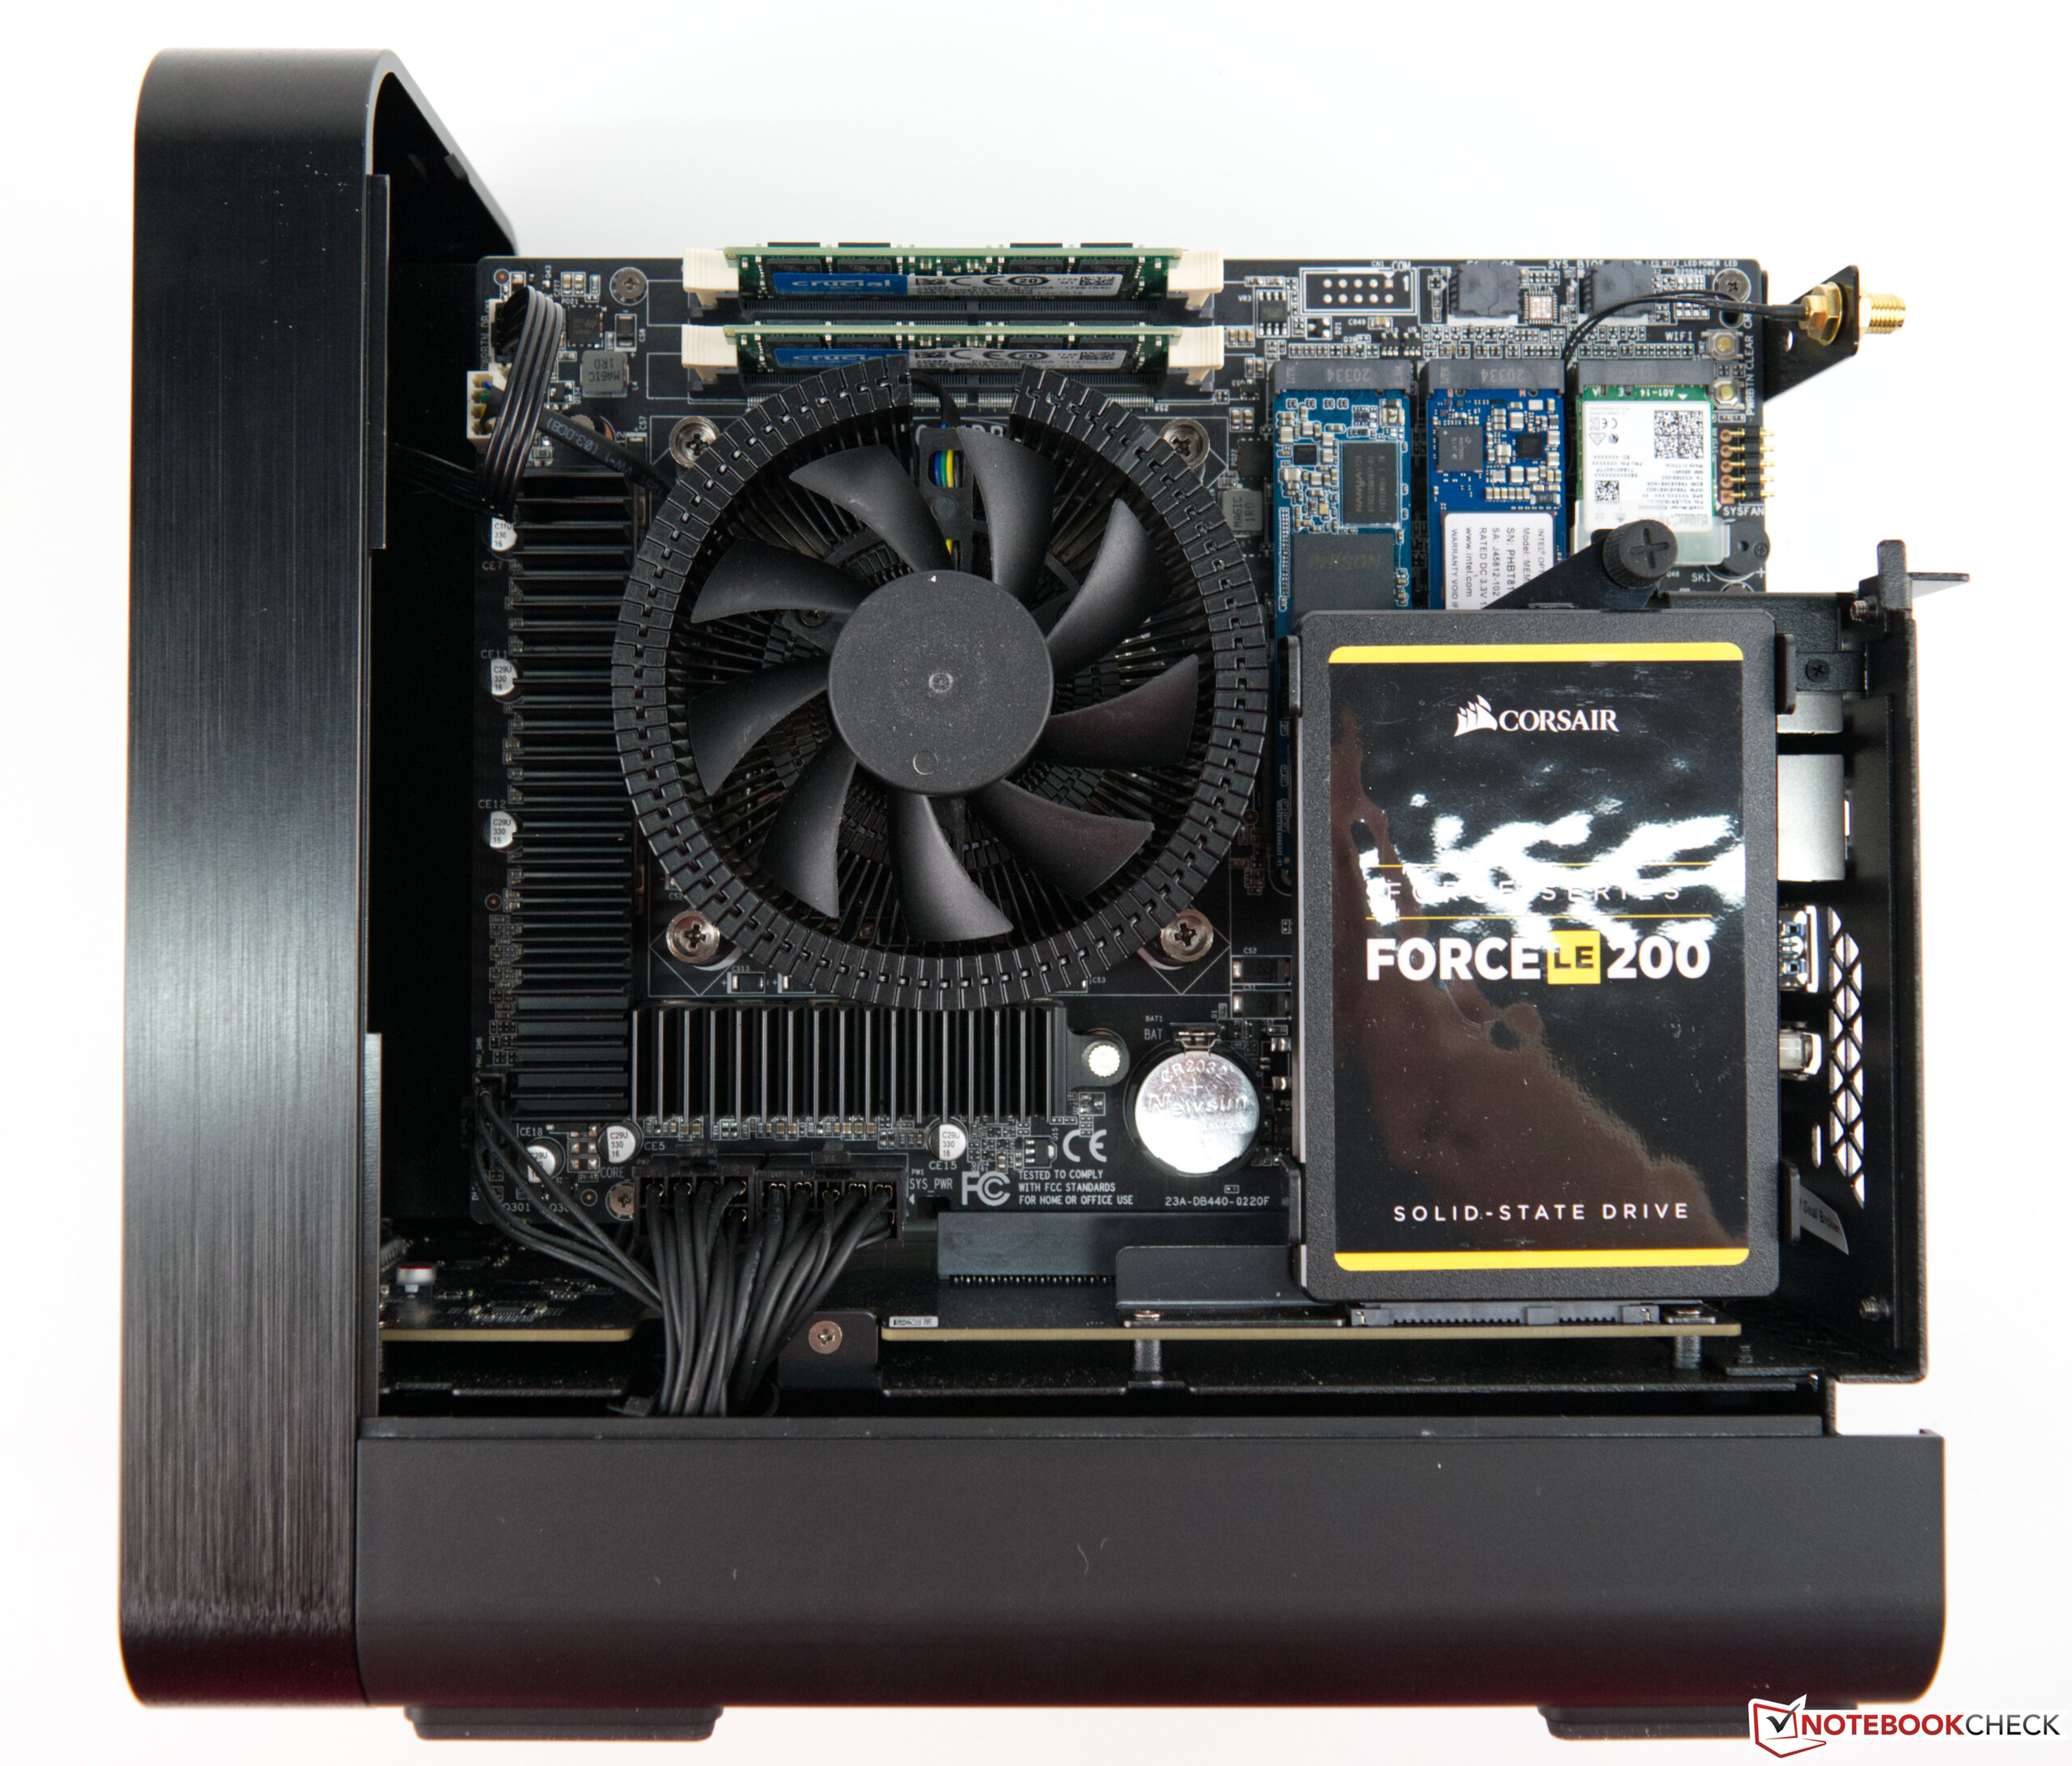
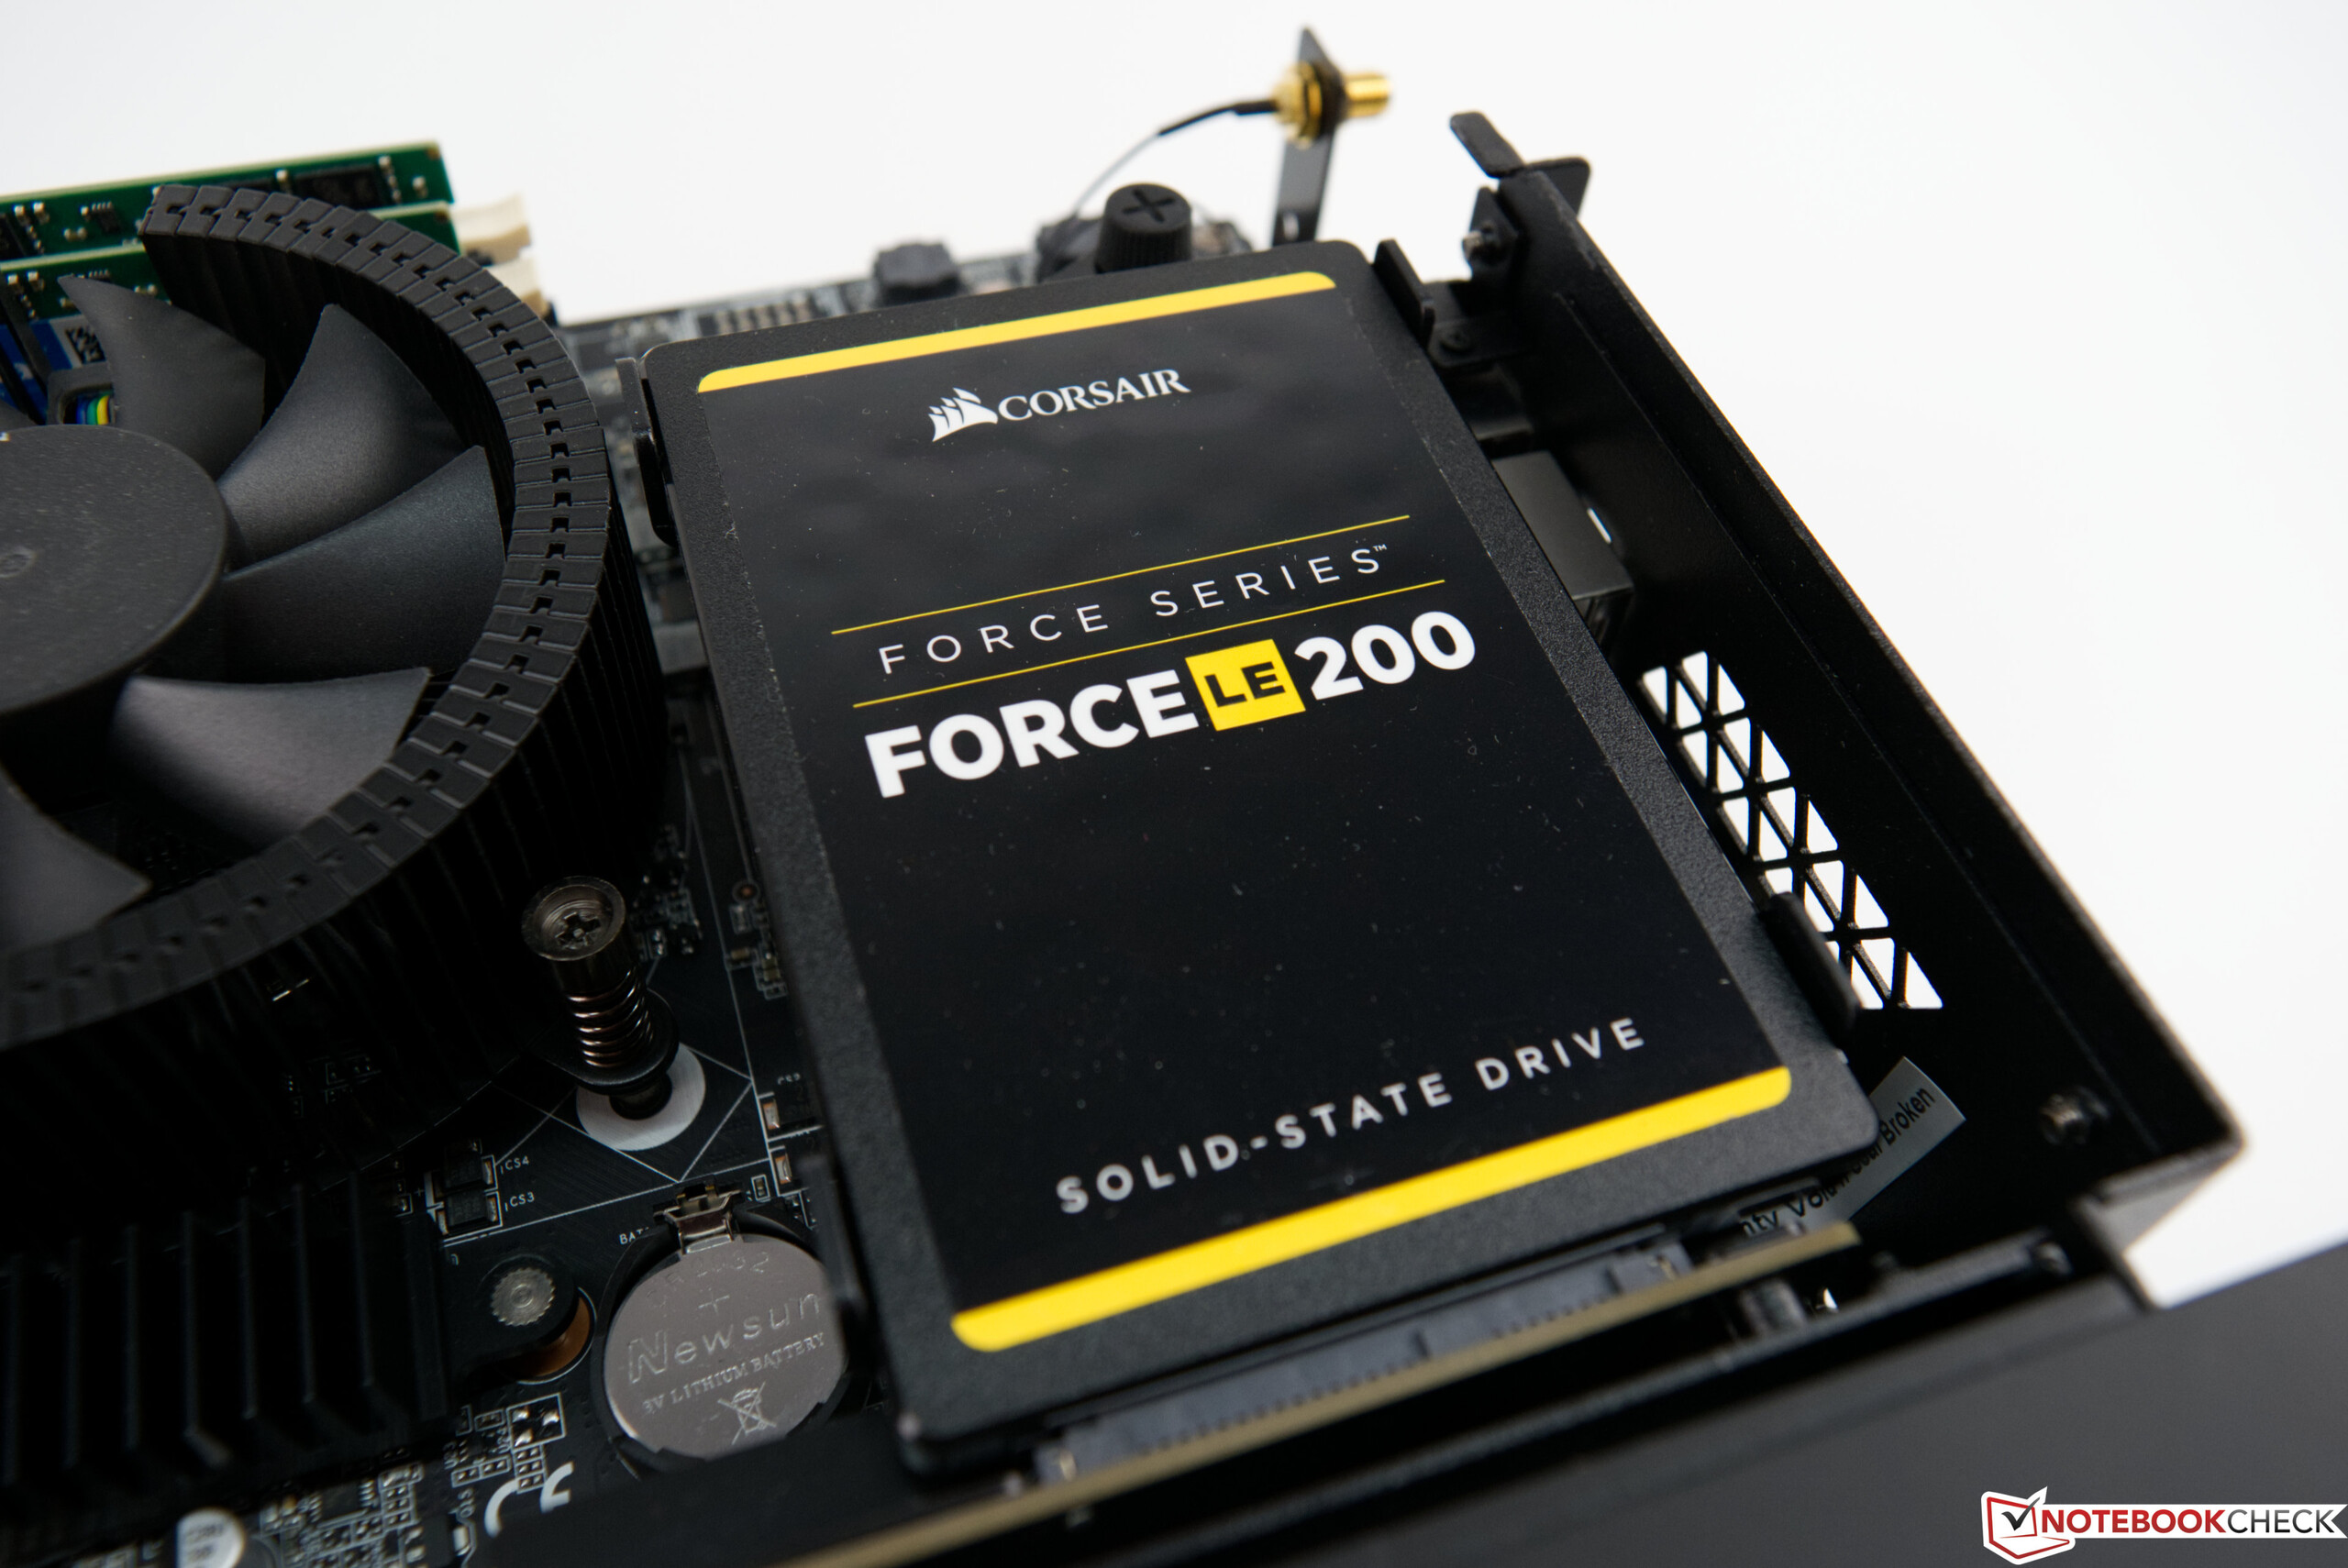
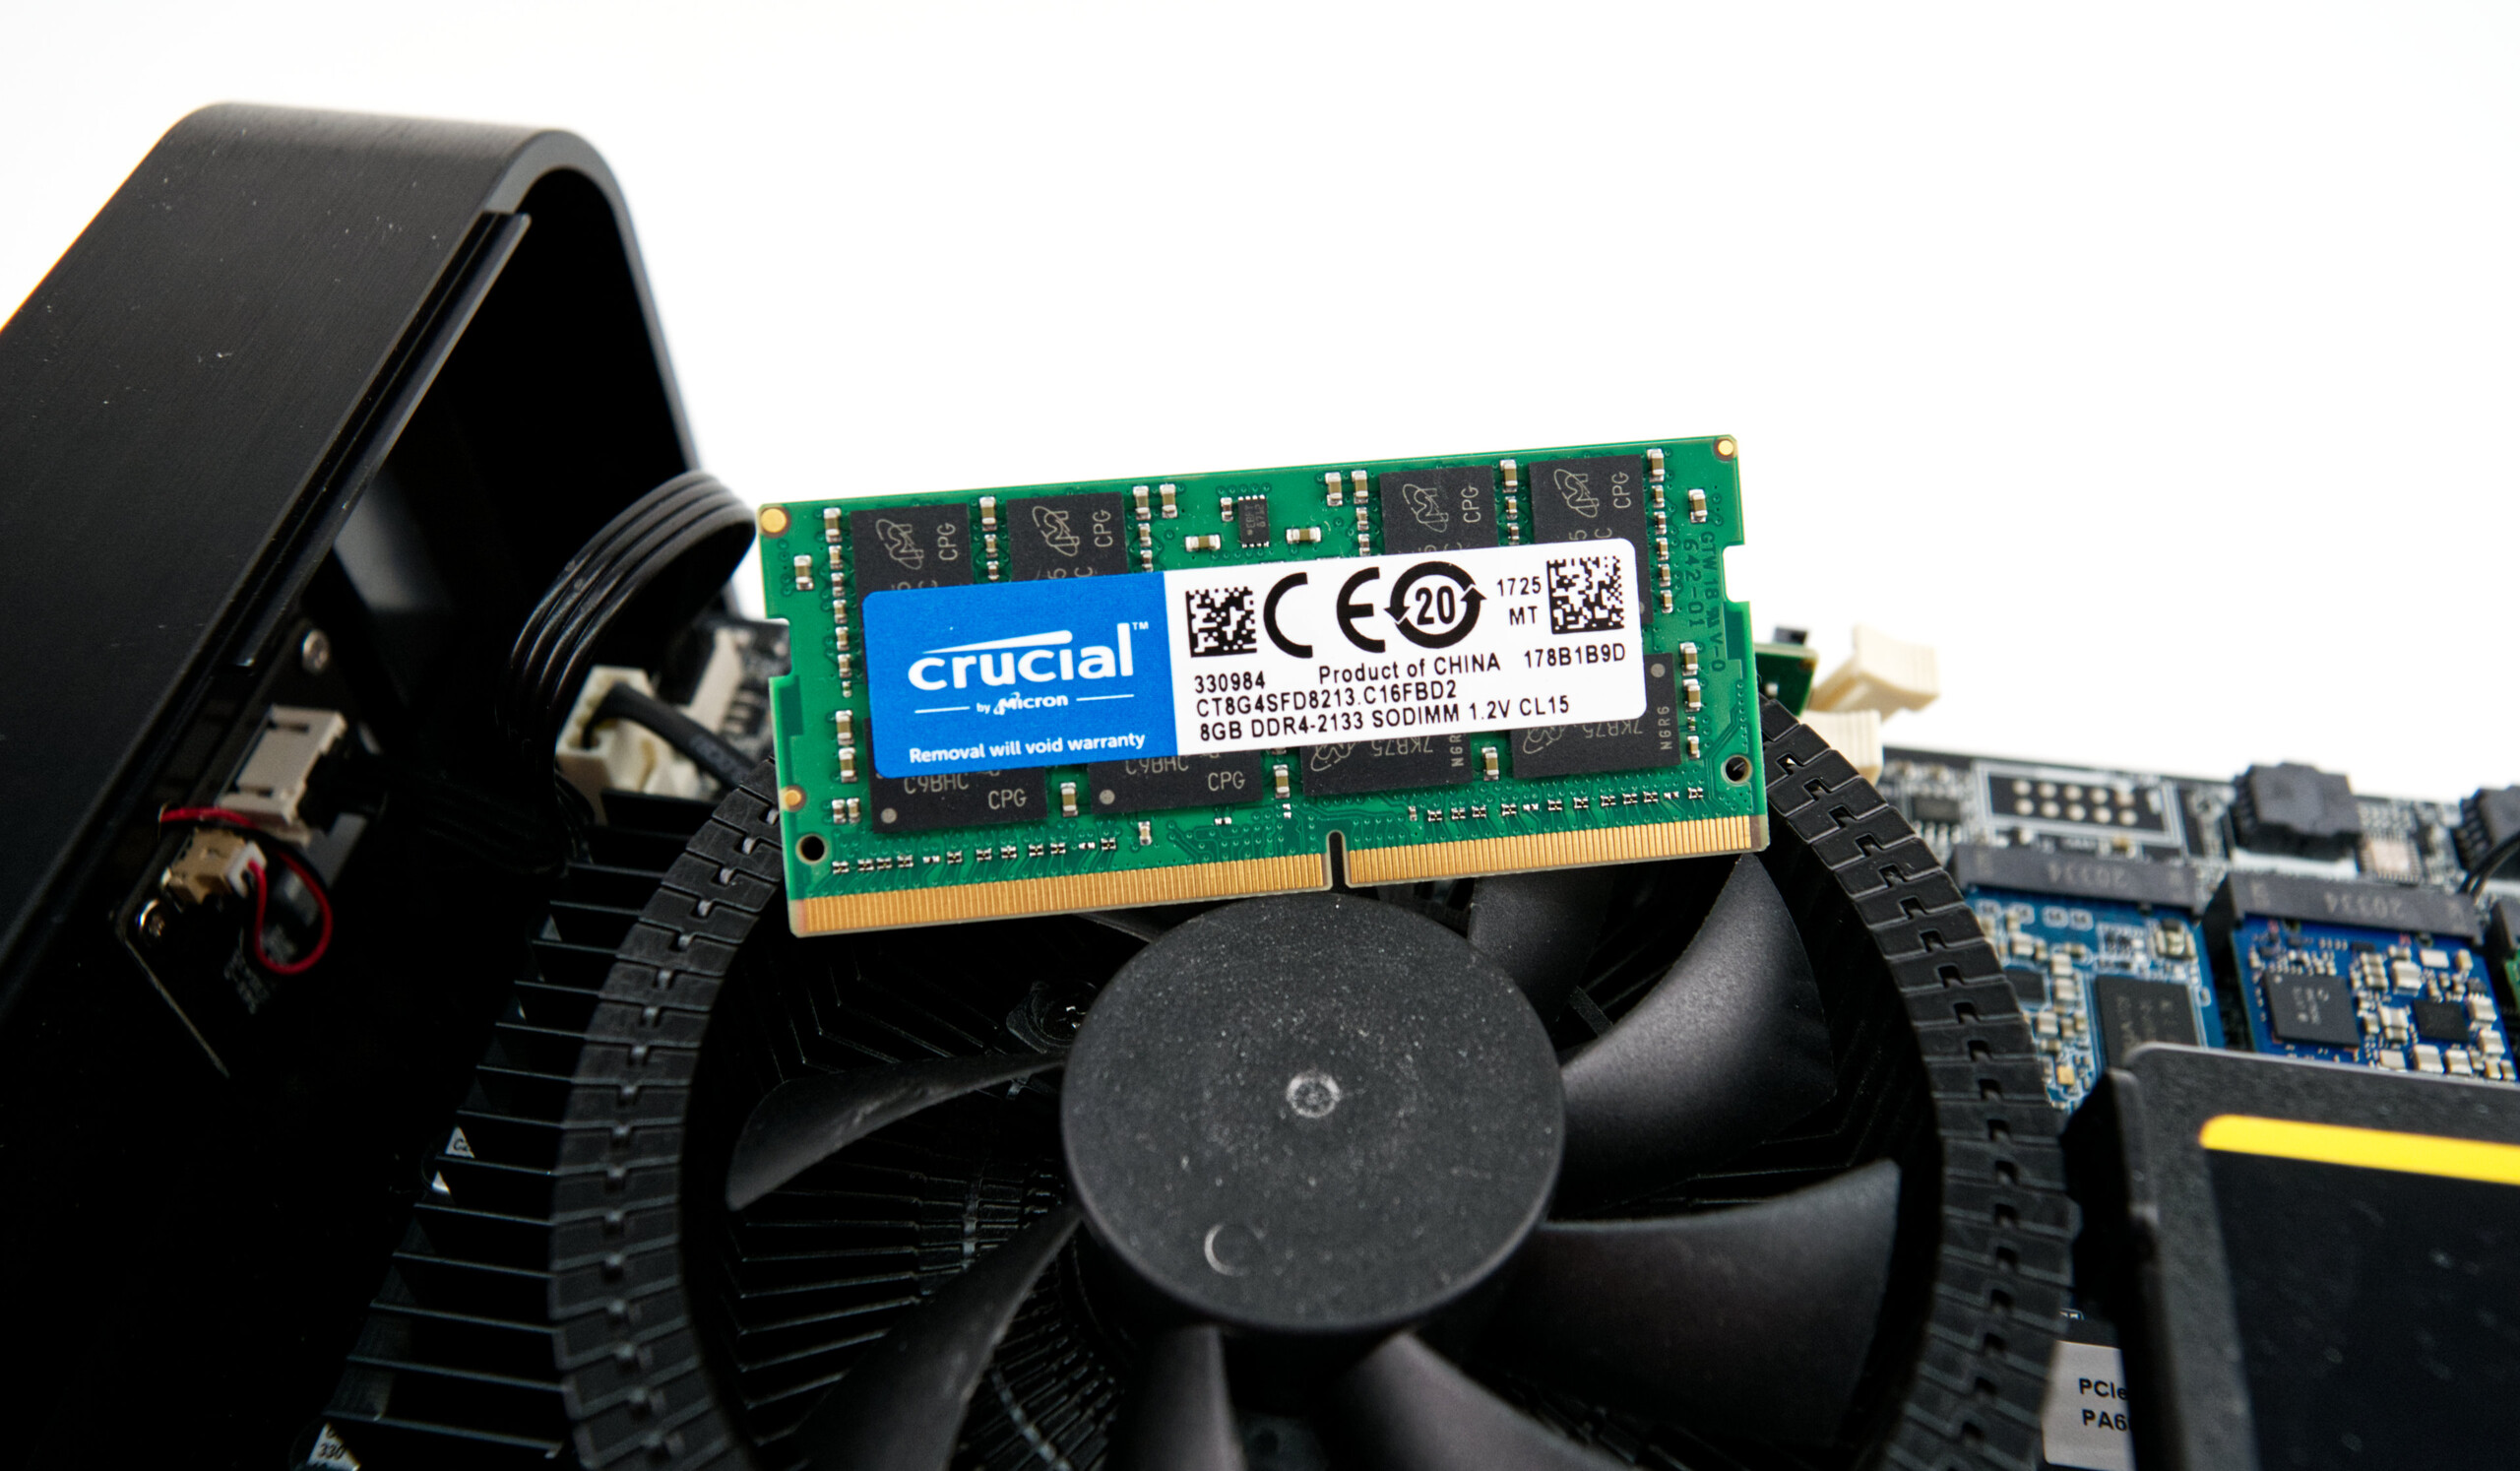
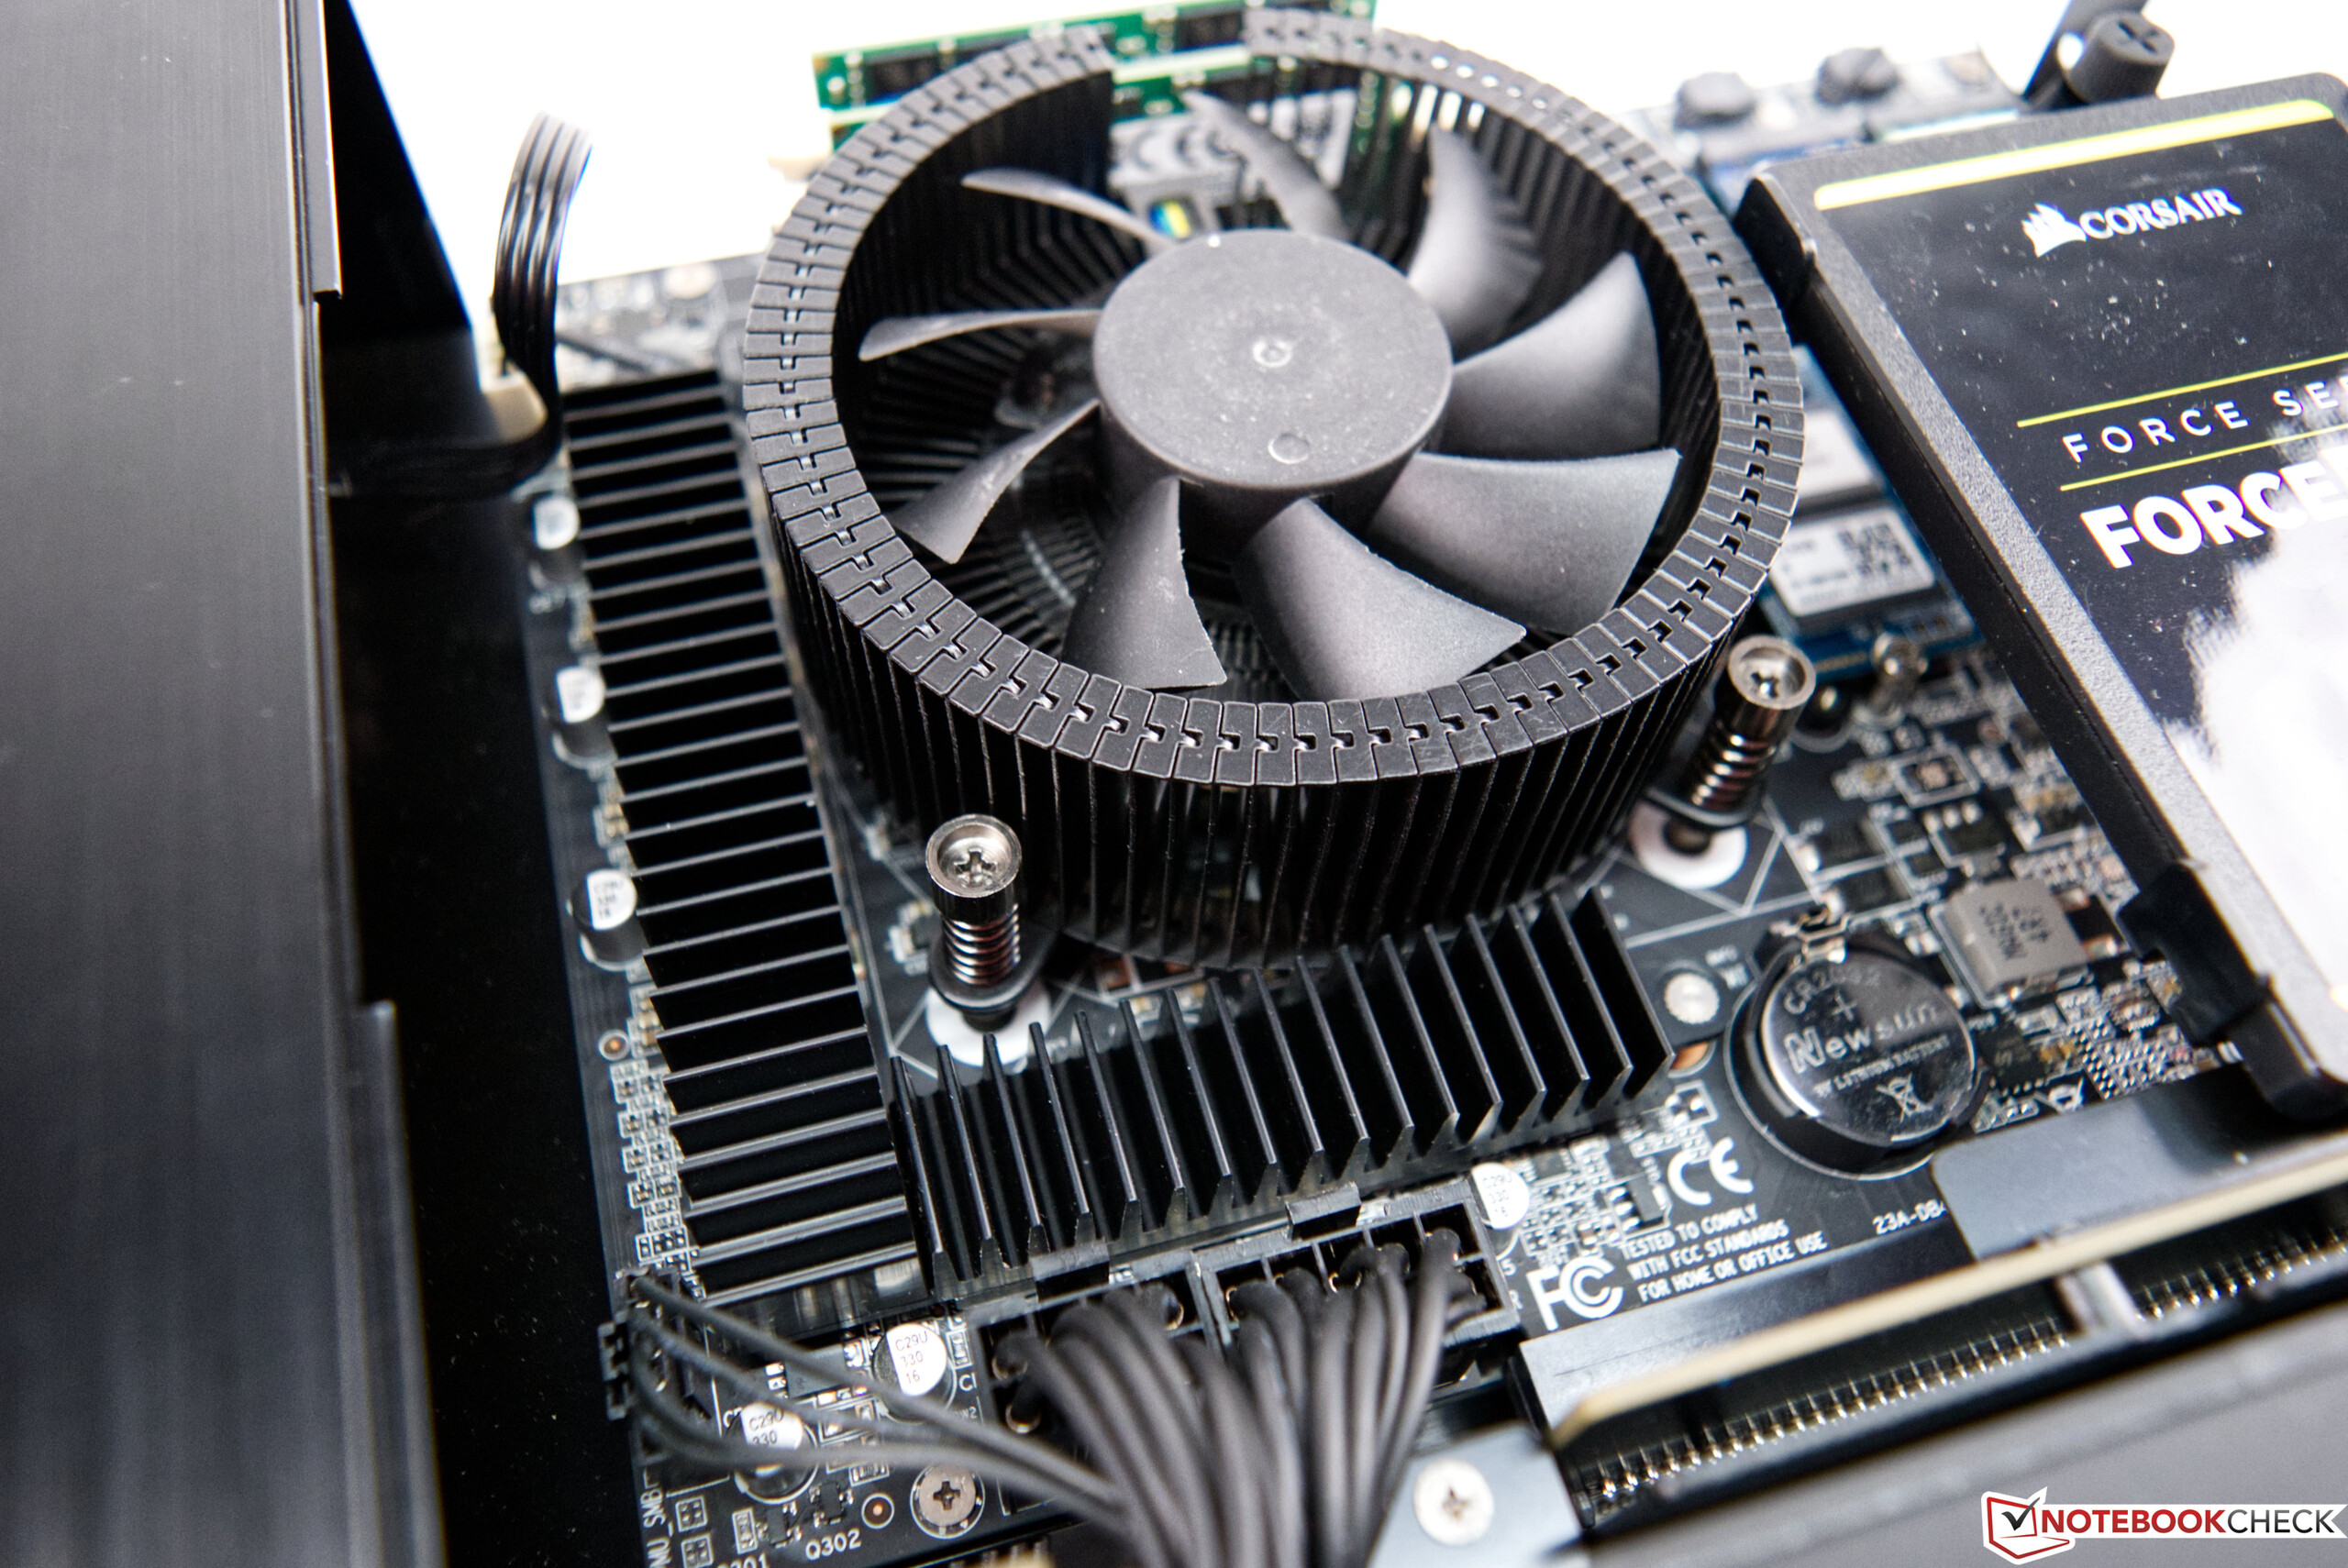
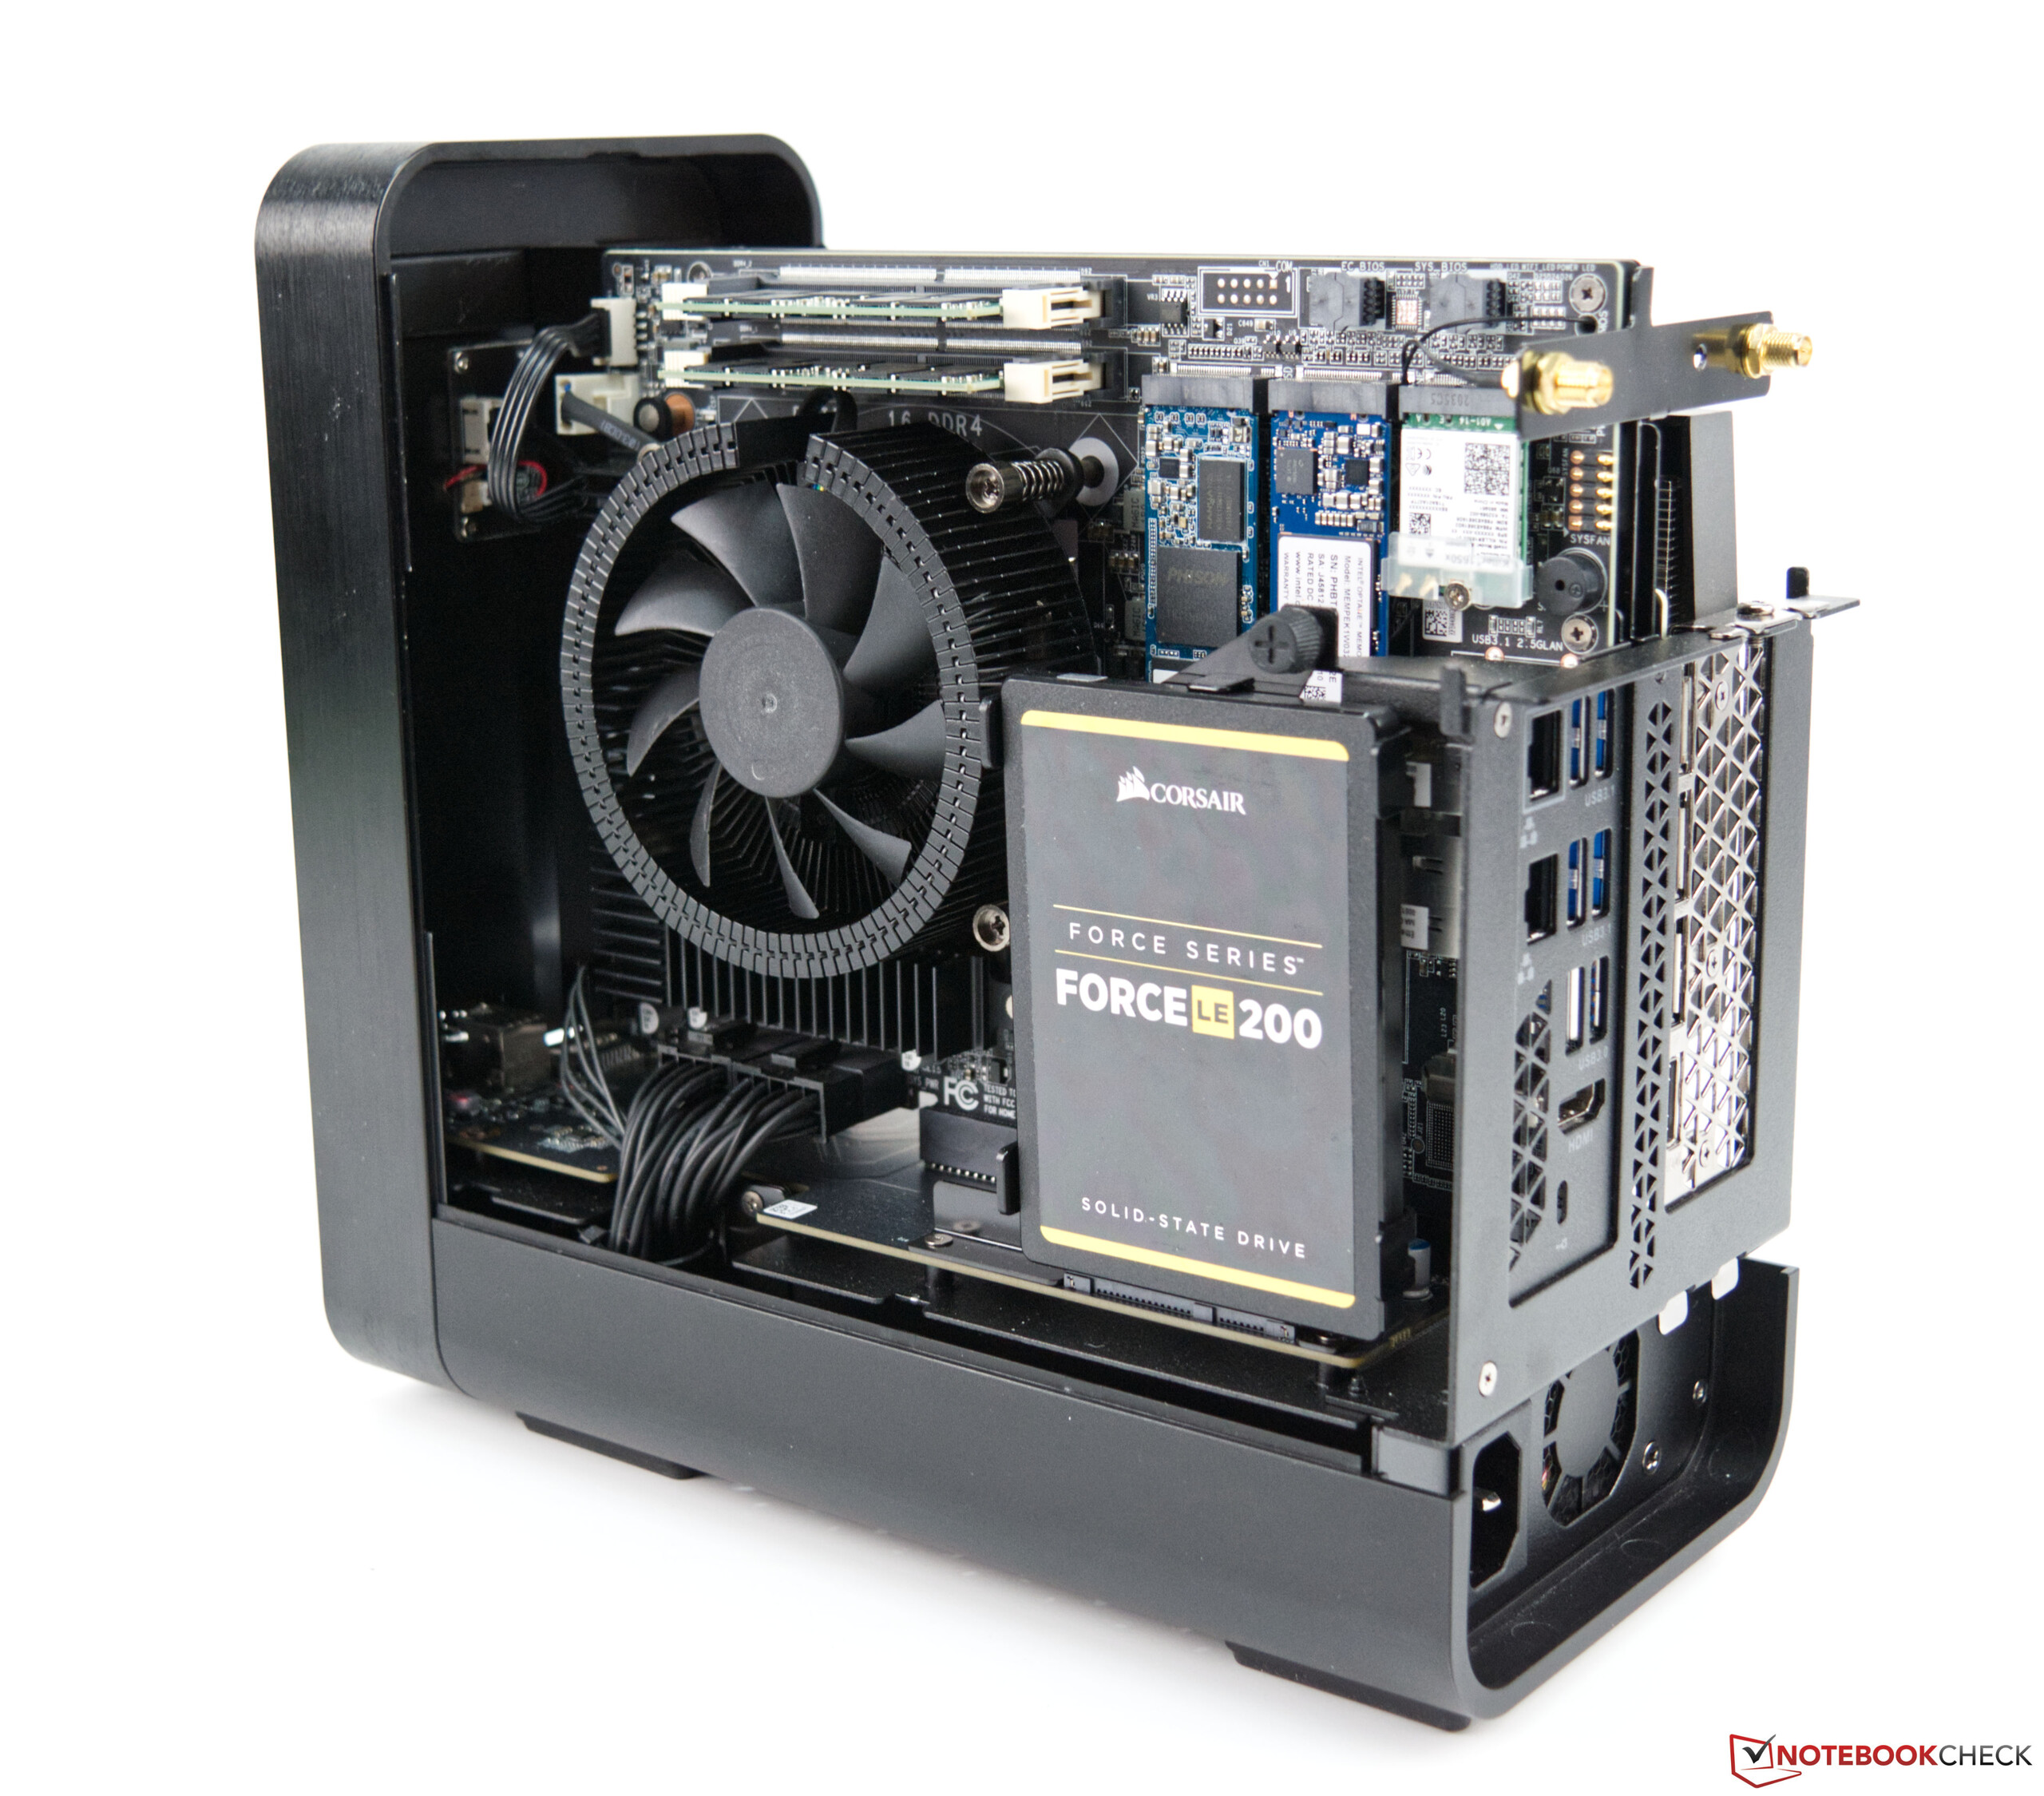
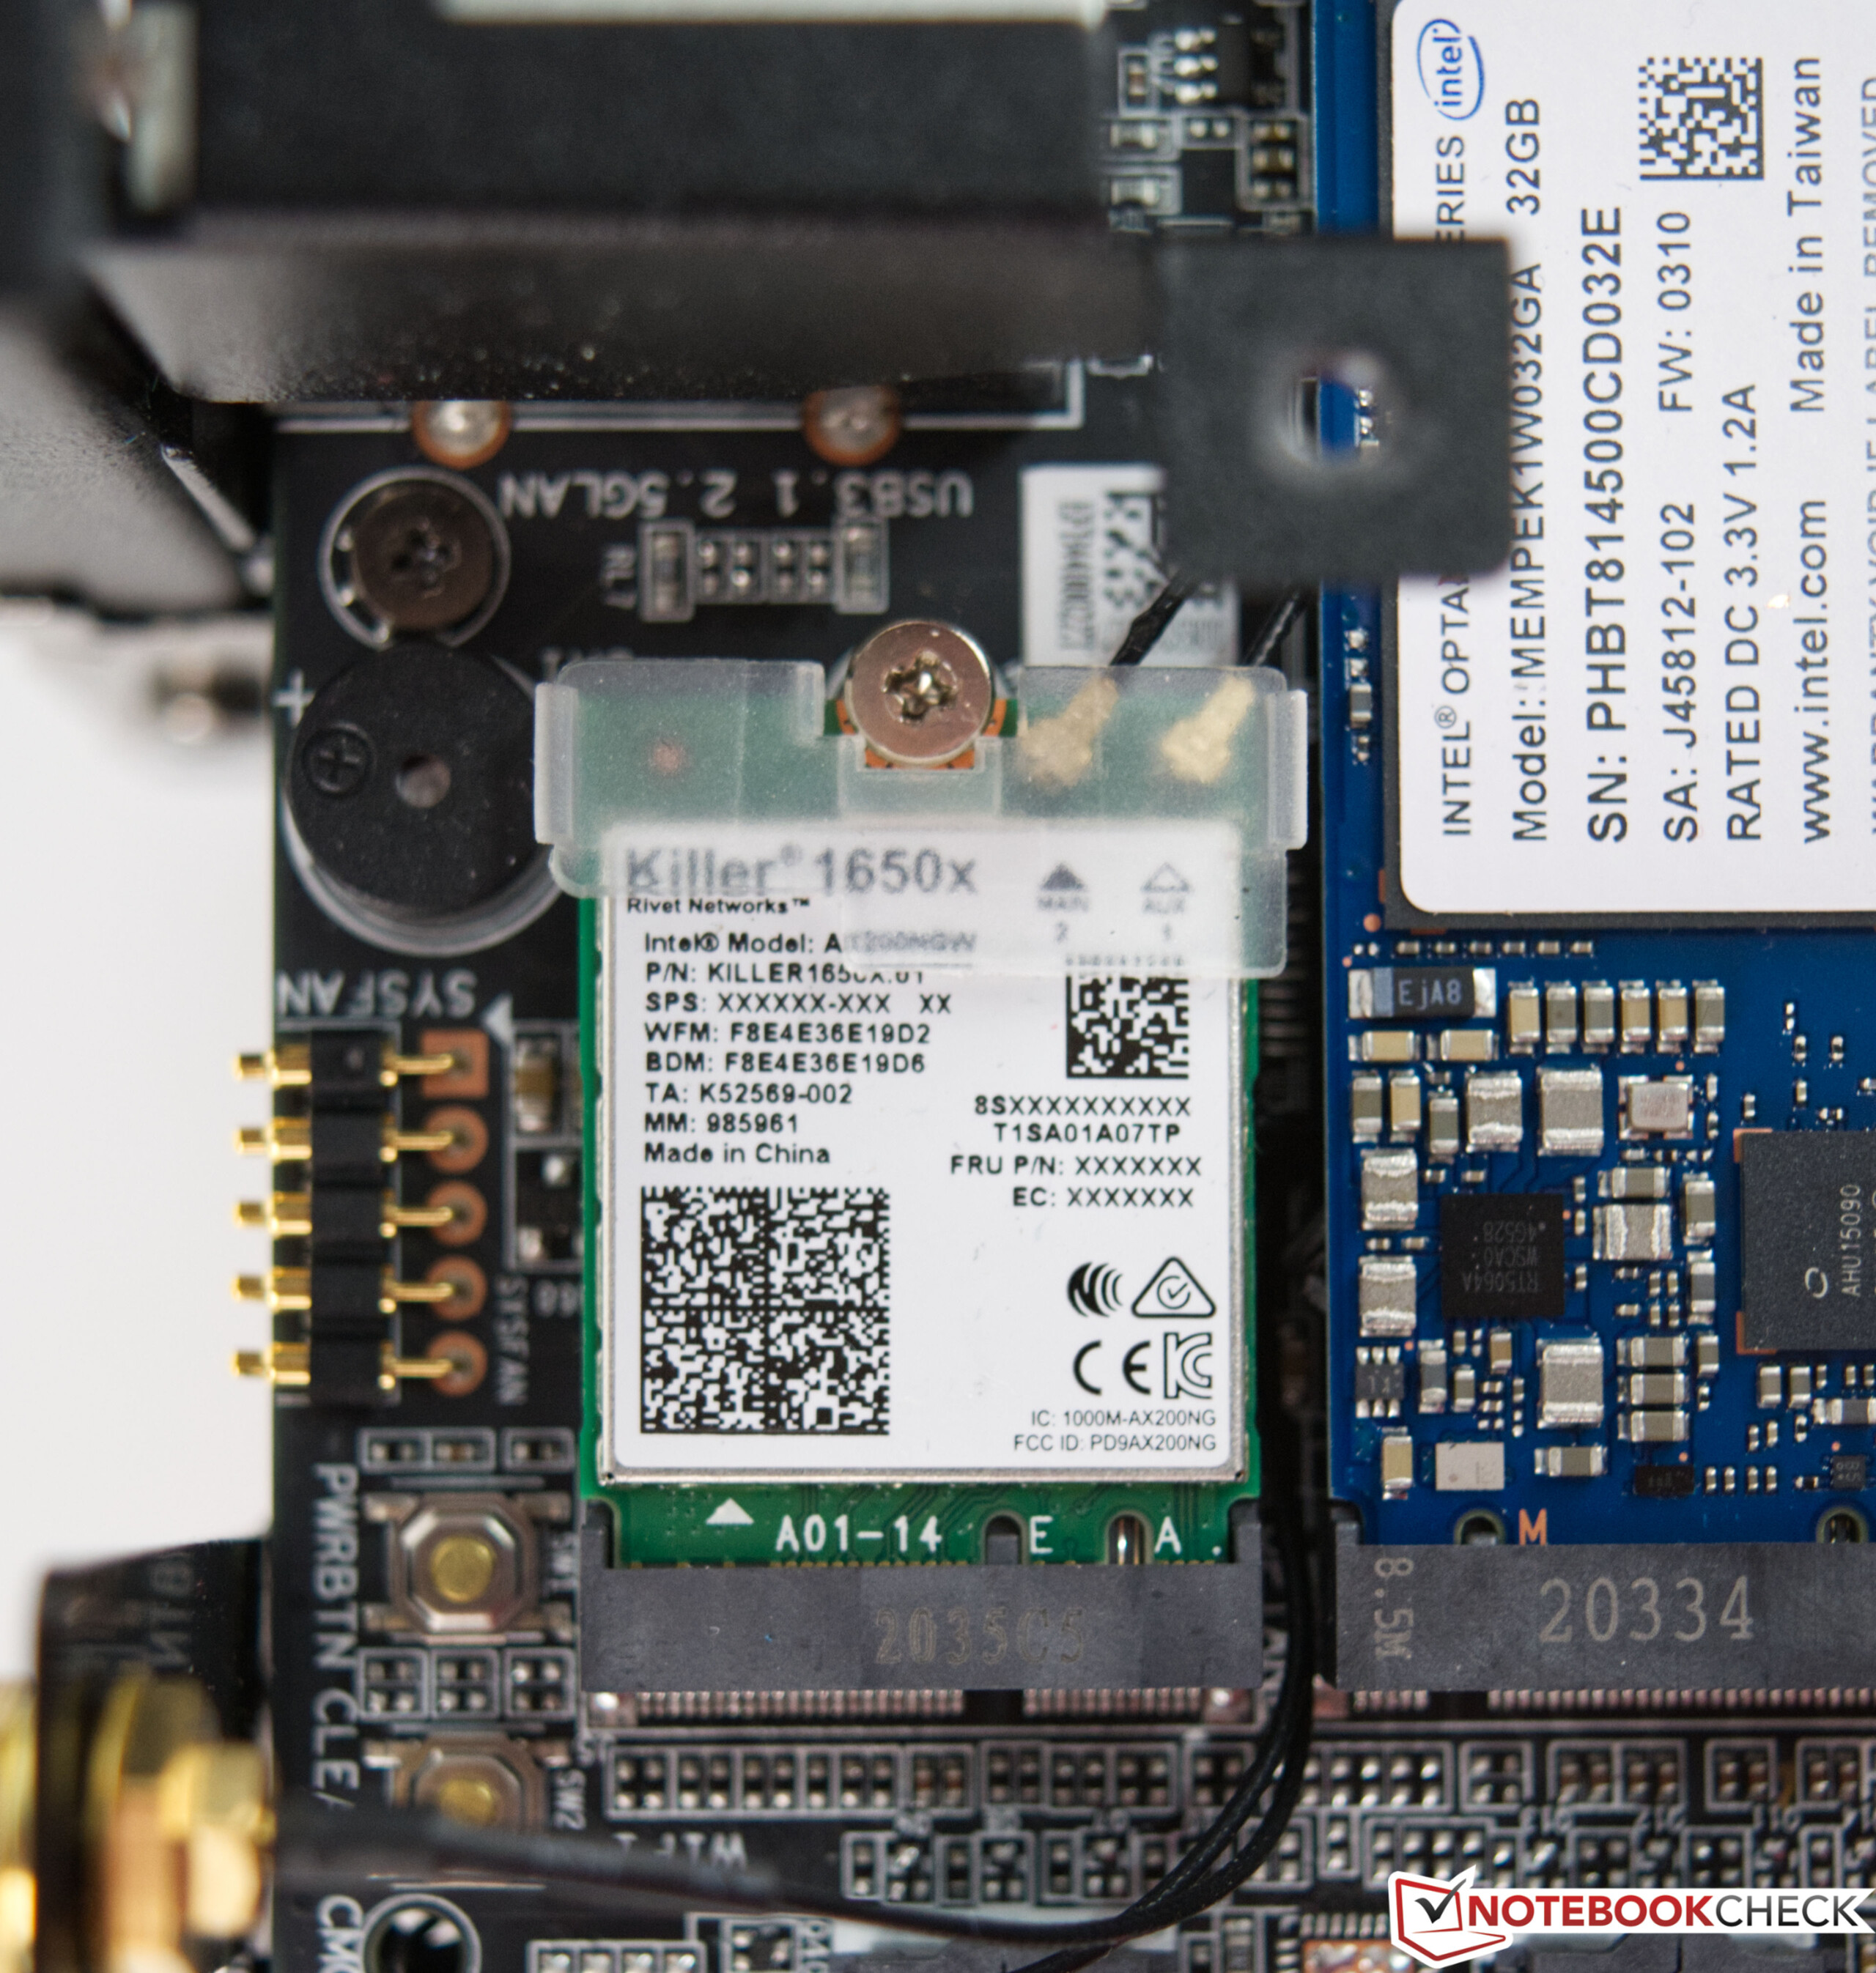
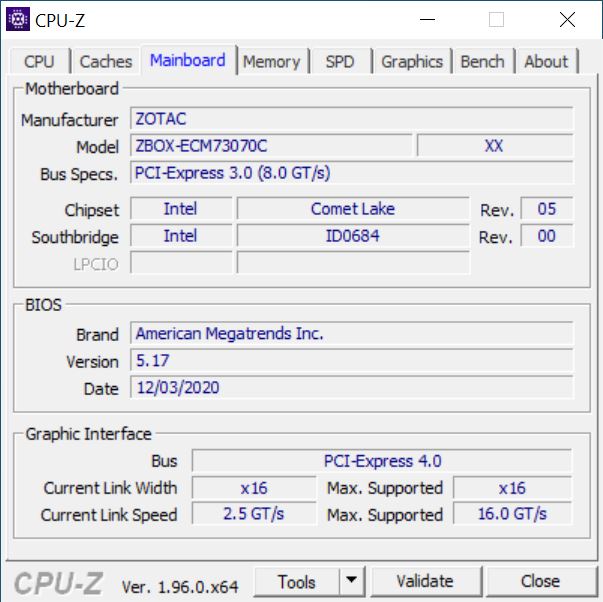
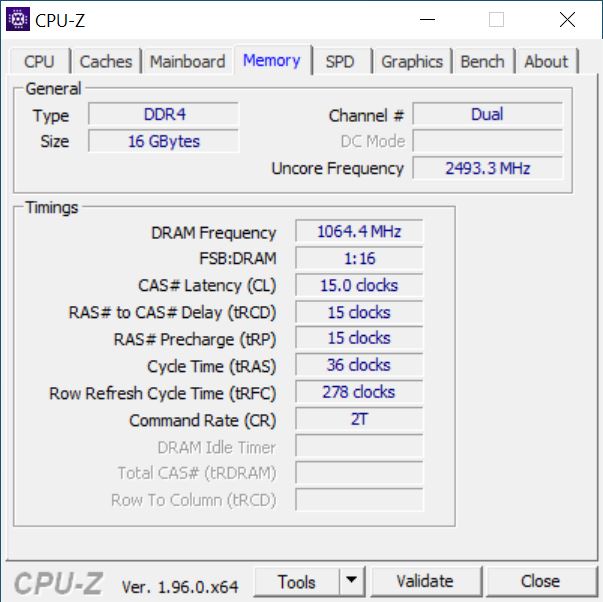
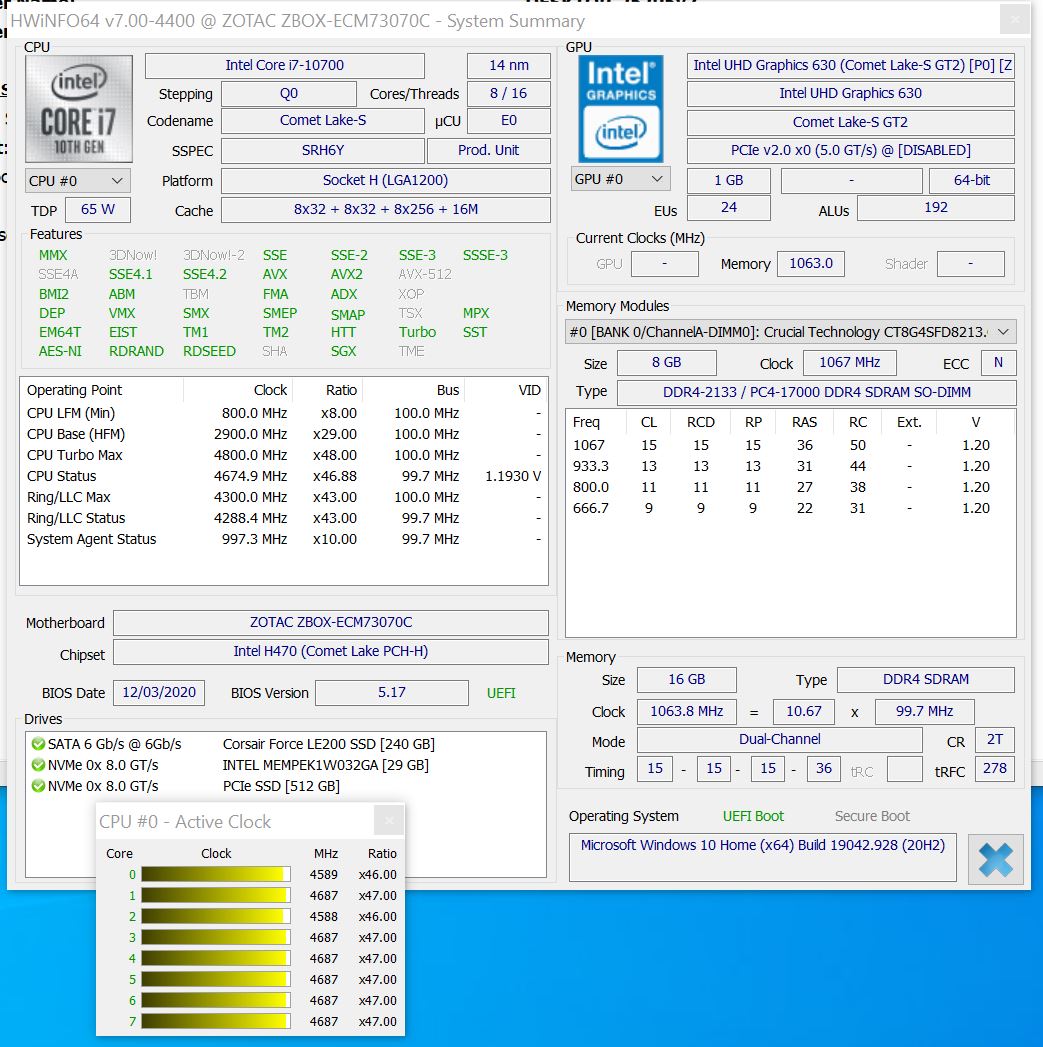
Il case molto compatto include tutto il necessario per un PC gaming completo. Anche l'alimentatore è all'interno del case, e non ha bisogno di essere collegato separatamente come nel MEK Mini. Una piattaforma appositamente sviluppata basata sul socket 1200 di Intel serve come base. Con l'Intel Core i7-10700, si ottiene un processore ragionevolmente moderno che fa bene il suo lavoro, dato che anche i compiti più impegnativi possono essere gestiti molto bene con i suoi 8 cores e 16 threads. Il modello da 65 watt è una buona scelta, perché lo sviluppo di calore non dovrebbe essere trascurato. Inoltre, il sistema è dotato di una Zotac GeForce RTX 3070. A causa dello spazio limitato, Zotac ha deciso di utilizzare un modulo SO-DIMM per la RAM, che si trova principalmente nei computer portatili. È possibile scegliere tra una variante convenzionale da 2,5" o una variante M.2 per la memoria di massa. Tuttavia, è anche possibile combinare entrambi. Gli slots non interferiscono tra loro.

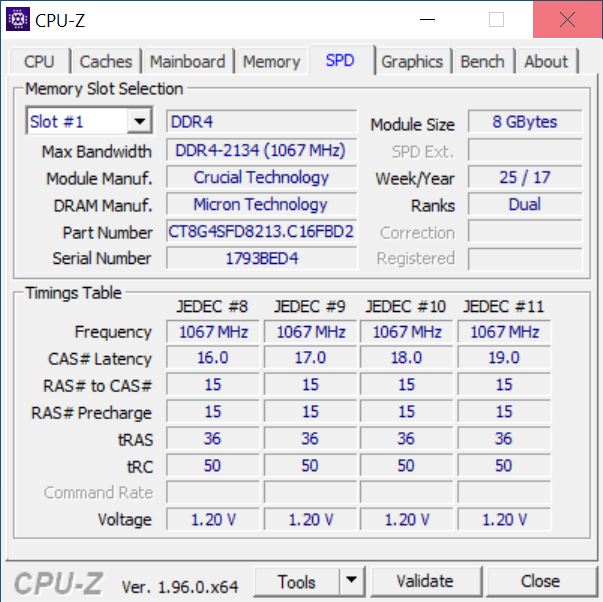
Zotac ci ha fornito un Magnus One con 16 GB di RAM DDR4 e SSD che offrono un totale di 750 GB di spazio di archiviazione. Il sistema barebone con GeForce RTX 3070 è ufficialmente offerto da Zotac ad un prezzo di 1.499 euro (~$1.825). Tuttavia, i modelli disponibili sono offerti ad un prezzo superiore (a partire da 1.650 euro (~$2.009)) al momento del test, che è legato ai bassi livelli di stock delle schede grafiche.

Zotac Magnus One
Zotac Magnus One
Zotac Magnus One
Zotac Magnus One
Zotac Magnus One
Zotac Magnus One
Zotac Magnus One
Zotac Magnus One
Zotac Magnus One
Zotac Magnus One
Zotac Magnus One
Zotac Magnus One
Zotac Magnus One
Zotac Magnus One
Zotac Magnus One
Zotac Magnus One
Zotac Magnus One

Benchmarks del processore

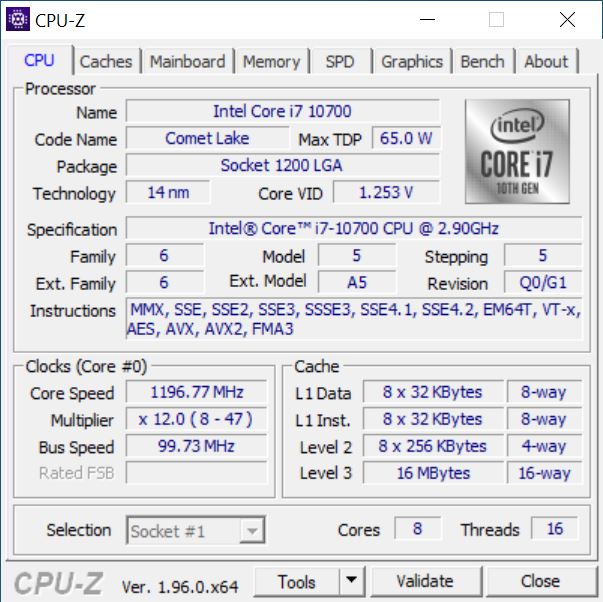
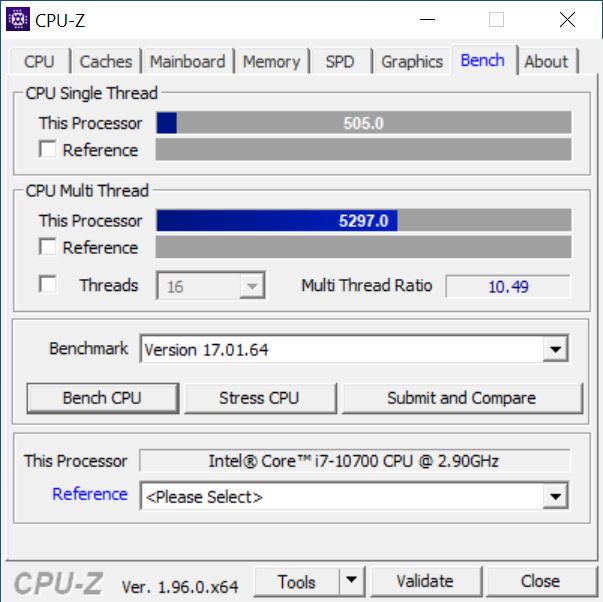
L'Intel Core i7-10700 è un processore octa-core con un TDP di 65 watt. La velocità di clock di base è di 2,9 GHz e la velocità massima di boost è specificata a 4,8 GHz. Il Core i7-10700 raggiunge un solido risultato nello Zotac Magnus One, non lasciando spazio per altro a causa della compattezza di quest'ultimo. Tuttavia, il sistema si comporta bene e può ampiamente lasciare indietro l'Intel Core i7-9700K nei test multithread. Nei test single-core, l'Intel Core i7-10700 nel nostro sistema di test è in qualche modo alla pari con l'Intel Core i5-10600K.

Per ulteriori confronti e benchmarks, facciamo riferimento alla nostra tabella di confronto delle CPU quiProcessori per portatili - Benchmark.

CPU-Z
CPU-Z
CPU-Z
CPU-Z
CPU-Z
CPU-Z
CPU-Z
GPU-Z
GPU-Z
HWiNFO
Utilità Intel Extreme
Intel Extreme Utility (benchmark)
Cinebench R15
CPU Single 64Bit
AMD Ryzen 7 5800X, AMD Ryzen 7 5800X
R7 5800X, 3800 MHz
266 Points +36%
AMD Ryzen 5 5600X, AMD Ryzen 5 5600X
R5 5600X, 3700 MHz
254 Points +30%
Intel Core i9-10900K, Intel Core i9-10900K
i9-10900K, 3700 MHz
224 Points +14%
Intel Core i7-9700K, AMD Radeon RX Vega 64, Intel Core i7-9700K
i7-9700K, 3600 MHz
208 Points +6%
Intel Core i5-10600K, Intel Core i5-10600K
i5-10600K, 4100 MHz
205 Points +5%
Corsair One i160, Intel Core i9-9900K
i9-9900K, 3600 MHz
203 Points +4%
Zotac Magnus One (ECM73070C), Intel Core i7-10700
i7-10700, 2900 MHz
196 Points
Intel Core i5-10400F, Intel Core i5-10400F
i5-10400F, 2900 MHz
180 Points -8%
CPU Multi 64Bit
Intel Core i9-10900K, Intel Core i9-10900K
i9-10900K, 3700 MHz
2620 Points +80%
AMD Ryzen 7 5800X, AMD Ryzen 7 5800X
R7 5800X, 3800 MHz
2616 Points +80%
Corsair One i160, Intel Core i9-9900K
i9-9900K, 3600 MHz
1987 Points +37%
AMD Ryzen 5 5600X, AMD Ryzen 5 5600X
R5 5600X, 3700 MHz
1968 Points +35%
Zotac Magnus One (ECM73070C), Intel Core i7-10700
i7-10700, 2900 MHz
1455 Points
Intel Core i5-10600K, Intel Core i5-10600K
i5-10600K, 4100 MHz
1452 Points 0%
Intel Core i7-9700K, AMD Radeon RX Vega 64, Intel Core i7-9700K
i7-9700K, 3600 MHz
1433 Points -2%
Intel Core i5-10400F, Intel Core i5-10400F
i5-10400F, 2900 MHz
1332 Points -8%
Cinebench R20
CPU (Single Core)
AMD Ryzen 7 5800X, AMD Ryzen 7 5800X
R7 5800X, 3800 MHz
625 Points
AMD Ryzen 5 5600X, AMD Ryzen 5 5600X
R5 5600X, 3700 MHz
601 Points
Intel Core i9-10900K, Intel Core i9-10900K
i9-10900K, 3700 MHz
532 Points
Corsair One i160, Intel Core i9-9900K
i9-9900K, 3600 MHz
495 Points
Intel Core i7-9700K, AMD Radeon RX Vega 64, Intel Core i7-9700K
i7-9700K, 3600 MHz
475 Points
Intel Core i5-10600K, Intel Core i5-10600K
i5-10600K, 4100 MHz
464 Points
Intel Core i5-10400F, Intel Core i5-10400F
i5-10400F, 2900 MHz
438 Points
CPU (Multi Core)
Intel Core i9-10900K, Intel Core i9-10900K
i9-10900K, 3700 MHz
6381 Points
AMD Ryzen 7 5800X, AMD Ryzen 7 5800X
R7 5800X, 3800 MHz
6068 Points
Corsair One i160, Intel Core i9-9900K
i9-9900K, 3600 MHz
4816 Points
AMD Ryzen 5 5600X, AMD Ryzen 5 5600X
R5 5600X, 3700 MHz
4567 Points
Intel Core i5-10600K, Intel Core i5-10600K
i5-10600K, 4100 MHz
3443 Points
Intel Core i7-9700K, AMD Radeon RX Vega 64, Intel Core i7-9700K
i7-9700K, 3600 MHz
3250 Points
Intel Core i5-10400F, Intel Core i5-10400F
i5-10400F, 2900 MHz
3201 Points
Cinebench R11.5
CPU Single 64Bit
AMD Ryzen 7 5800X, AMD Ryzen 7 5800X
R7 5800X, 3800 MHz
3.09 Points +37%
AMD Ryzen 5 5600X, AMD Ryzen 5 5600X
R5 5600X, 3700 MHz
2.95 Points +31%
Intel Core i9-10900K, Intel Core i9-10900K
i9-10900K, 3700 MHz
2.56 Points +13%
Intel Core i7-9700K, AMD Radeon RX Vega 64, Intel Core i7-9700K
i7-9700K, 3600 MHz
2.37 Points +5%
Corsair One i160, Intel Core i9-9900K
i9-9900K, 3600 MHz
2.33 Points +3%
Zotac Magnus One (ECM73070C), Intel Core i7-10700
i7-10700, 2900 MHz
2.26 Points
Intel Core i5-10600K, Intel Core i5-10600K
i5-10600K, 4100 MHz
2.19 Points -3%
Intel Core i5-10400F, Intel Core i5-10400F
i5-10400F, 2900 MHz
2.03 Points -10%
CPU Multi 64Bit
AMD Ryzen 7 5800X, AMD Ryzen 7 5800X
R7 5800X, 3800 MHz
29.31 Points +76%
Intel Core i9-10900K, Intel Core i9-10900K
i9-10900K, 3700 MHz
29.03 Points +74%
Corsair One i160, Intel Core i9-9900K
i9-9900K, 3600 MHz
21.76 Points +30%
AMD Ryzen 5 5600X, AMD Ryzen 5 5600X
R5 5600X, 3700 MHz
21.75 Points +30%
Zotac Magnus One (ECM73070C), Intel Core i7-10700
i7-10700, 2900 MHz
16.7 Points
Intel Core i7-9700K, AMD Radeon RX Vega 64, Intel Core i7-9700K
i7-9700K, 3600 MHz
15.83 Points -5%
Intel Core i5-10600K, Intel Core i5-10600K
i5-10600K, 4100 MHz
15.76 Points -6%
Intel Core i5-10400F, Intel Core i5-10400F
i5-10400F, 2900 MHz
14.39 Points -14%
Cinebench R10
Rendering Single CPUs 64Bit
AMD Ryzen 7 5800X, AMD Ryzen 7 5800X
R7 5800X, 3800 MHz
13039 Points +32%
AMD Ryzen 5 5600X, AMD Ryzen 5 5600X
R5 5600X, 3700 MHz
12563 Points +27%
Intel Core i9-10900K, Intel Core i9-10900K
i9-10900K, 3700 MHz
10625 Points +7%
Corsair One i160, Intel Core i9-9900K
i9-9900K, 3600 MHz
10167 Points +3%
Zotac Magnus One (ECM73070C), Intel Core i7-10700
i7-10700, 2900 MHz
9898 Points
Intel Core i7-9700K, AMD Radeon RX Vega 64, Intel Core i7-9700K
i7-9700K, 3600 MHz
9774 Points -1%
Intel Core i5-10600K, Intel Core i5-10600K
i5-10600K, 4100 MHz
9594 Points -3%
Intel Core i5-10400F, Intel Core i5-10400F
i5-10400F, 2900 MHz
8849 Points -11%
Rendering Multiple CPUs 64Bit
AMD Ryzen 7 5800X, AMD Ryzen 7 5800X
R7 5800X, 3800 MHz
83426 Points +59%
Intel Core i9-10900K, Intel Core i9-10900K
i9-10900K, 3700 MHz
80495 Points +53%
AMD Ryzen 5 5600X, AMD Ryzen 5 5600X
R5 5600X, 3700 MHz
69545 Points +32%
Corsair One i160, Intel Core i9-9900K
i9-9900K, 3600 MHz
63009 Points +20%
Intel Core i7-9700K, AMD Radeon RX Vega 64, Intel Core i7-9700K
i7-9700K, 3600 MHz
53600 Points +2%
Zotac Magnus One (ECM73070C), Intel Core i7-10700
i7-10700, 2900 MHz
52577 Points
Intel Core i5-10600K, Intel Core i5-10600K
i5-10600K, 4100 MHz
51816 Points -1%
Intel Core i5-10400F, Intel Core i5-10400F
i5-10400F, 2900 MHz
47901 Points -9%
Blender - v2.79 BMW27 CPU
Intel Core i3-10100, Intel Core i3-10100
i3-10100, 3600 MHz
495.1 Seconds * -57%
Intel Core i5-10400F, Intel Core i5-10400F
i5-10400F, 2900 MHz
332.4 Seconds * -5%
Zotac Magnus One (ECM73070C), Intel Core i7-10700
i7-10700, 2900 MHz
315.4 Seconds *
Intel Core i7-9700K, AMD Radeon RX Vega 64, Intel Core i7-9700K
i7-9700K, 3600 MHz
307 Seconds * +3%
Intel Core i5-10600K, Intel Core i5-10600K
i5-10600K, 4100 MHz
302.4 Seconds * +4%
AMD Ryzen 5 5600X, AMD Ryzen 5 5600X
R5 5600X, 3700 MHz
260.2 Seconds * +18%
Corsair One i160, Intel Core i9-9900K
i9-9900K, 3600 MHz
223.8 Seconds * +29%
AMD Ryzen 7 5800X, AMD Ryzen 7 5800X
R7 5800X, 3800 MHz
196.8 Seconds * +38%
Intel Core i9-10900K, Intel Core i9-10900K
i9-10900K, 3700 MHz
167.3 Seconds * +47%
wPrime 2.10
32m
Intel Core i5-10400F, Intel Core i5-10400F
i5-10400F, 2900 MHz
6.25 s * -92%
Intel Core i5-10600K, Intel Core i5-10600K
i5-10600K, 4100 MHz
4.648 s * -43%
Intel Core i7-9700K, AMD Radeon RX Vega 64, Intel Core i7-9700K
i7-9700K, 3600 MHz
4.491 s * -38%
AMD Ryzen 5 5600X, AMD Ryzen 5 5600X
R5 5600X, 3700 MHz
3.891 s * -19%
Intel Core i9-10900K, Intel Core i9-10900K
i9-10900K, 3700 MHz
3.582 s * -10%
Corsair One i160, Intel Core i9-9900K
i9-9900K, 3600 MHz
3.276 s * -1%
Zotac Magnus One (ECM73070C), Intel Core i7-10700
i7-10700, 2900 MHz
3.257 s *
AMD Ryzen 7 5800X, AMD Ryzen 7 5800X
R7 5800X, 3800 MHz
3.037 s * +7%
1024m
Intel Core i5-10400F, Intel Core i5-10400F
i5-10400F, 2900 MHz
134.7 s * -13%
Intel Core i7-9700K, AMD Radeon RX Vega 64, Intel Core i7-9700K
i7-9700K, 3600 MHz
120.5 s * -1%
Zotac Magnus One (ECM73070C), Intel Core i7-10700
i7-10700, 2900 MHz
119.5 s *
AMD Ryzen 5 5600X, AMD Ryzen 5 5600X
R5 5600X, 3700 MHz
113.9 s * +5%
Intel Core i5-10600K, Intel Core i5-10600K
i5-10600K, 4100 MHz
113.2 s * +5%
Corsair One i160, Intel Core i9-9900K
i9-9900K, 3600 MHz
91.3 s * +24%
AMD Ryzen 7 5800X, AMD Ryzen 7 5800X
R7 5800X, 3800 MHz
86.1 s * +28%
Intel Core i9-10900K, Intel Core i9-10900K
i9-10900K, 3700 MHz
66.3 s * +45%
X264 HD Benchmark 4.0
Pass 1
AMD Ryzen 7 5800X, AMD Ryzen 7 5800X
R7 5800X, 3800 MHz
339 (338min - 341max) fps +44%
AMD Ryzen 5 5600X, AMD Ryzen 5 5600X
R5 5600X, 3700 MHz
320 (319min - 321max) fps +36%
Intel Core i9-10900K, Intel Core i9-10900K
i9-10900K, 3700 MHz
289.5 (289min - 291max) fps +23%
Intel Core i7-9700K, AMD Radeon RX Vega 64, Intel Core i7-9700K
i7-9700K, 3600 MHz
270 (270min - 271max) fps +14%
Corsair One i160, Intel Core i9-9900K
i9-9900K, 3600 MHz
267.5 (267min - 268max) fps +13%
Intel Core i5-10600K, Intel Core i5-10600K
i5-10600K, 4100 MHz
251.5 (250min - 253max) fps +7%
Zotac Magnus One (ECM73070C), Intel Core i7-10700
i7-10700, 2900 MHz
236 (235min - 257max) fps
Intel Core i5-10400F, Intel Core i5-10400F
i5-10400F, 2900 MHz
228.5 (228min - 231max) fps -3%
Pass 2
AMD Ryzen 7 5800X, AMD Ryzen 7 5800X
R7 5800X, 3800 MHz
152 (151min - 152max) fps +79%
Intel Core i9-10900K, Intel Core i9-10900K
i9-10900K, 3700 MHz
149 (149min - 149max) fps +76%
Corsair One i160, Intel Core i9-9900K
i9-9900K, 3600 MHz
117.5 (117min - 118max) fps +39%
AMD Ryzen 5 5600X, AMD Ryzen 5 5600X
R5 5600X, 3700 MHz
117 (117min - 117max) fps +38%
Intel Core i7-9700K, AMD Radeon RX Vega 64, Intel Core i7-9700K
i7-9700K, 3600 MHz
94.8 (94.7min - 95max) fps +12%
Intel Core i5-10600K, Intel Core i5-10600K
i5-10600K, 4100 MHz
88.2 (88min - 88.2max) fps +4%
Zotac Magnus One (ECM73070C), Intel Core i7-10700
i7-10700, 2900 MHz
84.8 (84.6min - 105max) fps
Intel Core i5-10400F, Intel Core i5-10400F
i5-10400F, 2900 MHz
81.2 (81min - 81.3max) fps -4%
WinRAR - Result
AMD Ryzen 7 5800X, AMD Ryzen 7 5800X
R7 5800X, 3800 MHz
15604 KB/s +138%
AMD Ryzen 5 5600X, AMD Ryzen 5 5600X
R5 5600X, 3700 MHz
13282 KB/s +103%
Intel Core i9-10900K, Intel Core i9-10900K
i9-10900K, 3700 MHz
9739 KB/s +49%
Corsair One i160, Intel Core i9-9900K
i9-9900K, 3600 MHz
7621 KB/s +16%
Intel Core i7-9700K, AMD Radeon RX Vega 64, Intel Core i7-9700K
i7-9700K, 3600 MHz
7396 KB/s +13%
Zotac Magnus One (ECM73070C), Intel Core i7-10700
i7-10700, 2900 MHz
6555 KB/s
Intel Core i5-10600K, Intel Core i5-10600K
i5-10600K, 4100 MHz
6536 KB/s 0%
TrueCrypt
AES Mean 100MB
AMD Ryzen 7 5800X, AMD Ryzen 7 5800X
R7 5800X, 3800 MHz
15 GB/s +46%
Intel Core i9-10900K, Intel Core i9-10900K
i9-10900K, 3700 MHz
14.6 GB/s +42%
Corsair One i160, Intel Core i9-9900K
i9-9900K, 3600 MHz
11.5 GB/s +12%
AMD Ryzen 5 5600X, AMD Ryzen 5 5600X
R5 5600X, 3700 MHz
10.7 GB/s +4%
Zotac Magnus One (ECM73070C), Intel Core i7-10700
i7-10700, 2900 MHz
10.3 GB/s
Intel Core i7-9700K, AMD Radeon RX Vega 64, Intel Core i7-9700K
i7-9700K, 3600 MHz
8.1 GB/s -21%
Intel Core i5-10600K, Intel Core i5-10600K
i5-10600K, 4100 MHz
8 GB/s -22%
Twofish Mean 100MB
Intel Core i9-10900K, Intel Core i9-10900K
i9-10900K, 3700 MHz
2.6 GB/s +44%
AMD Ryzen 7 5800X, AMD Ryzen 7 5800X
R7 5800X, 3800 MHz
2 GB/s +11%
Corsair One i160, Intel Core i9-9900K
i9-9900K, 3600 MHz
1.9 GB/s +6%
Zotac Magnus One (ECM73070C), Intel Core i7-10700
i7-10700, 2900 MHz
1.8 GB/s
AMD Ryzen 5 5600X, AMD Ryzen 5 5600X
R5 5600X, 3700 MHz
1.5 GB/s -17%
Intel Core i5-10600K, Intel Core i5-10600K
i5-10600K, 4100 MHz
1.4 GB/s -22%
Intel Core i7-9700K, AMD Radeon RX Vega 64, Intel Core i7-9700K
i7-9700K, 3600 MHz
1.3 GB/s -28%
Serpent Mean 100MB
Intel Core i9-10900K, Intel Core i9-10900K
i9-10900K, 3700 MHz
1.5 GB/s +36%
AMD Ryzen 7 5800X, AMD Ryzen 7 5800X
R7 5800X, 3800 MHz
1.3 GB/s +18%
Corsair One i160, Intel Core i9-9900K
i9-9900K, 3600 MHz
1.1 GB/s 0%
Zotac Magnus One (ECM73070C), Intel Core i7-10700
i7-10700, 2900 MHz
1.1 GB/s
AMD Ryzen 5 5600X, AMD Ryzen 5 5600X
R5 5600X, 3700 MHz
0.938 GB/s -15%
Intel Core i5-10600K, Intel Core i5-10600K
i5-10600K, 4100 MHz
0.82 GB/s -25%
Intel Core i7-9700K, AMD Radeon RX Vega 64, Intel Core i7-9700K
i7-9700K, 3600 MHz
0.774 GB/s -30%
Geekbench 5.5
Multi-Core
Intel Core i9-10900K, Intel Core i9-10900K
i9-10900K, 3700 MHz
11414 Points +40%
AMD Ryzen 7 5800X, AMD Ryzen 7 5800X
R7 5800X, 3800 MHz
11354 Points +39%
AMD Ryzen 5 5600X, AMD Ryzen 5 5600X
R5 5600X, 3700 MHz
8980 Points +10%
Zotac Magnus One (ECM73070C), Intel Core i7-10700
i7-10700, 2900 MHz
8173 Points
Intel Core i7-9700K, AMD Radeon RX Vega 64, Intel Core i7-9700K
i7-9700K, 3600 MHz
7440 Points -9%
Intel Core i5-10600K, Intel Core i5-10600K
i5-10600K, 4100 MHz
7248 Points -11%
Intel Core i5-10400F, Intel Core i5-10400F
i5-10400F, 2900 MHz
6372 Points -22%
Intel Core i5-10400F, Intel Core i5-10400F
i5-10400F, 2900 MHz
6358 Points -22%
Intel Core i3-10100, Intel Core i3-10100
i3-10100, 3600 MHz
4740 Points -42%
Single-Core
AMD Ryzen 7 5800X, AMD Ryzen 7 5800X
R7 5800X, 3800 MHz
1665 Points +28%
AMD Ryzen 5 5600X, AMD Ryzen 5 5600X
R5 5600X, 3700 MHz
1657 Points +28%
Intel Core i9-10900K, Intel Core i9-10900K
i9-10900K, 3700 MHz
1449 Points +12%
Intel Core i7-9700K, AMD Radeon RX Vega 64, Intel Core i7-9700K
i7-9700K, 3600 MHz
1300 Points 0%
Zotac Magnus One (ECM73070C), Intel Core i7-10700
i7-10700, 2900 MHz
1299 Points
Intel Core i5-10600K, Intel Core i5-10600K
i5-10600K, 4100 MHz
1286 Points -1%
Intel Core i5-10400F, Intel Core i5-10400F
i5-10400F, 2900 MHz
1223 Points -6%
Intel Core i5-10400F, Intel Core i5-10400F
i5-10400F, 2900 MHz
1217 Points -6%
Intel Core i3-10100, Intel Core i3-10100
i3-10100, 3600 MHz
1171 Points -10%
Geekbench 5.0
5.0 Multi-Core
Intel Core i9-10900K, Intel Core i9-10900K
i9-10900K, 3700 MHz
11407 Points +39%
AMD Ryzen 7 5800X, AMD Ryzen 7 5800X
R7 5800X, 3800 MHz
11246 Points +37%
AMD Ryzen 5 5600X, AMD Ryzen 5 5600X
R5 5600X, 3700 MHz
8926 Points +9%
Zotac Magnus One (ECM73070C), Intel Core i7-10700
i7-10700, 2900 MHz
8196 Points
Intel Core i5-10600K, Intel Core i5-10600K
i5-10600K, 4100 MHz
7237 Points -12%
Intel Core i5-10400F, Intel Core i5-10400F
i5-10400F, 2900 MHz
6349 Points -23%
Intel Core i3-10100, Intel Core i3-10100
i3-10100, 3600 MHz
4724 Points -42%
5.0 Single-Core
AMD Ryzen 7 5800X, AMD Ryzen 7 5800X
R7 5800X, 3800 MHz
1673 Points +28%
AMD Ryzen 5 5600X, AMD Ryzen 5 5600X
R5 5600X, 3700 MHz
1587 Points +22%
Intel Core i9-10900K, Intel Core i9-10900K
i9-10900K, 3700 MHz
1440 Points +10%
Zotac Magnus One (ECM73070C), Intel Core i7-10700
i7-10700, 2900 MHz
1304 Points
Intel Core i5-10600K, Intel Core i5-10600K
i5-10600K, 4100 MHz
1281 Points -2%
Intel Core i5-10400F, Intel Core i5-10400F
i5-10400F, 2900 MHz
1217 Points -7%
Intel Core i3-10100, Intel Core i3-10100
i3-10100, 3600 MHz
1167 Points -11%
Geekbench 4.4
64 Bit Single-Core Score
AMD Ryzen 7 5800X, AMD Ryzen 7 5800X
R7 5800X, 3800 MHz
7333 Points +28%
AMD Ryzen 5 5600X, AMD Ryzen 5 5600X
R5 5600X, 3700 MHz
6953 Points +21%
Intel Core i9-10900K, Intel Core i9-10900K
i9-10900K, 3700 MHz
6348 Points +11%
Intel Core i7-9700K, AMD Radeon RX Vega 64, Intel Core i7-9700K
i7-9700K, 3600 MHz
6043 Points +6%
Corsair One i160, Intel Core i9-9900K
i9-9900K, 3600 MHz
6014 Points +5%
Intel Core i5-10600K, Intel Core i5-10600K
i5-10600K, 4100 MHz
5821 Points +2%
Zotac Magnus One (ECM73070C), Intel Core i7-10700
i7-10700, 2900 MHz
5726 Points
Intel Core i5-10400F, Intel Core i5-10400F
i5-10400F, 2900 MHz
5587 Points -2%
Intel Core i3-10100, Intel Core i3-10100
i3-10100, 3600 MHz
5494 Points -4%
64 Bit Multi-Core Score
AMD Ryzen 7 5800X, AMD Ryzen 7 5800X
R7 5800X, 3800 MHz
44131 Points +37%
Intel Core i9-10900K, Intel Core i9-10900K
i9-10900K, 3700 MHz
43058 Points +34%
AMD Ryzen 5 5600X, AMD Ryzen 5 5600X
R5 5600X, 3700 MHz
35617 Points +11%
Corsair One i160, Intel Core i9-9900K
i9-9900K, 3600 MHz
33892 Points +5%
Zotac Magnus One (ECM73070C), Intel Core i7-10700
i7-10700, 2900 MHz
32174 Points
Intel Core i7-9700K, AMD Radeon RX Vega 64, Intel Core i7-9700K
i7-9700K, 3600 MHz
29659 Points -8%
Intel Core i5-10600K, Intel Core i5-10600K
i5-10600K, 4100 MHz
28391 Points -12%
Intel Core i5-10400F, Intel Core i5-10400F
i5-10400F, 2900 MHz
25403 Points -21%
Intel Core i3-10100, Intel Core i3-10100
i3-10100, 3600 MHz
18622 Points -42%
3DMark 11 - 1280x720 Performance Physics
AMD Ryzen 7 5800X, AMD Ryzen 7 5800X
R7 5800X, 3800 MHz
23381 Points +51%
Intel Core i9-10900K, Intel Core i9-10900K
i9-10900K, 3700 MHz
22140 Points +43%
AMD Ryzen 5 5600X, AMD Ryzen 5 5600X
R5 5600X, 3700 MHz
19649 Points +27%
Corsair One i160, Intel Core i9-9900K
i9-9900K, 3600 MHz
19169 Points +24%
Intel Core i7-9700K, AMD Radeon RX Vega 64, Intel Core i7-9700K
i7-9700K, 3600 MHz
16091 Points +4%
Intel Core i5-10600K, Intel Core i5-10600K
i5-10600K, 4100 MHz
15961 Points +3%
Zotac Magnus One (ECM73070C), Intel Core i7-10700
i7-10700, 2900 MHz
15497 Points
Intel Core i5-10400F, Intel Core i5-10400F
i5-10400F, 2900 MHz
14539 Points -6%
7-Zip 18.03
7z b 4
AMD Ryzen 7 5800X, AMD Ryzen 7 5800X
R7 5800X, 3800 MHz
74306 MIPS +73%
Intel Core i9-10900K, Intel Core i9-10900K
i9-10900K, 3700 MHz
70968 MIPS +65%
AMD Ryzen 5 5600X, AMD Ryzen 5 5600X
R5 5600X, 3700 MHz
56607 MIPS +32%
Corsair One i160, Intel Core i9-9900K
i9-9900K, 3600 MHz
53166 MIPS +24%
Zotac Magnus One (ECM73070C), Intel Core i7-10700
i7-10700, 2900 MHz
43007 MIPS
Intel Core i5-10600K, Intel Core i5-10600K
i5-10600K, 4100 MHz
40379 MIPS -6%
Intel Core i5-10400F, Intel Core i5-10400F
i5-10400F, 2900 MHz
36731 MIPS -15%
Intel Core i3-10100, Intel Core i3-10100
i3-10100, 3600 MHz
24319 MIPS -43%
7z b 4 -mmt1
AMD Ryzen 7 5800X, AMD Ryzen 7 5800X
R7 5800X, 3800 MHz
6970 MIPS +32%
AMD Ryzen 5 5600X, AMD Ryzen 5 5600X
R5 5600X, 3700 MHz
6594 MIPS +25%
Intel Core i9-10900K, Intel Core i9-10900K
i9-10900K, 3700 MHz
5954 MIPS +12%
Corsair One i160, Intel Core i9-9900K
i9-9900K, 3600 MHz
5311 MIPS 0%
Zotac Magnus One (ECM73070C), Intel Core i7-10700
i7-10700, 2900 MHz
5293 MIPS
Intel Core i5-10600K, Intel Core i5-10600K
i5-10600K, 4100 MHz
5289 MIPS 0%
Intel Core i5-10400F, Intel Core i5-10400F
i5-10400F, 2900 MHz
5064 MIPS -4%
Intel Core i3-10100, Intel Core i3-10100
i3-10100, 3600 MHz
4797 MIPS -9%
HWBOT x265 Benchmark v2.2 - 4k Preset
Intel Core i9-10900K, Intel Core i9-10900K
i9-10900K, 3700 MHz
21 fps +81%
AMD Ryzen 7 5800X, AMD Ryzen 7 5800X
R7 5800X, 3800 MHz
20.8 fps +79%
Corsair One i160, Intel Core i9-9900K
i9-9900K, 3600 MHz
15.8 fps +36%
AMD Ryzen 5 5600X, AMD Ryzen 5 5600X
R5 5600X, 3700 MHz
15.7 fps +35%
Intel Core i7-9700K, AMD Radeon RX Vega 64, Intel Core i7-9700K
i7-9700K, 3600 MHz
13 fps +12%
Intel Core i5-10600K, Intel Core i5-10600K
i5-10600K, 4100 MHz
12.2 fps +5%
Zotac Magnus One (ECM73070C), Intel Core i7-10700
i7-10700, 2900 MHz
11.6 fps
Intel Core i5-10400F, Intel Core i5-10400F
i5-10400F, 2900 MHz
11.2 fps -3%
Intel Core i3-10100, Intel Core i3-10100
i3-10100, 3600 MHz
7.7 fps -34%
R Benchmark 2.5 - Overall mean
Intel Core i3-10100, Intel Core i3-10100
i3-10100, 3600 MHz
0.652 sec * -11%
Intel Core i5-10400F, Intel Core i5-10400F
i5-10400F, 2900 MHz
0.618 sec * -5%
Intel Core i5-10600K, Intel Core i5-10600K
i5-10600K, 4100 MHz
0.593 sec * -1%
Zotac Magnus One (ECM73070C), Intel Core i7-10700
i7-10700, 2900 MHz
0.588 sec *
Intel Core i9-10900K, Intel Core i9-10900K
i9-10900K, 3700 MHz
0.528 sec * +10%
AMD Ryzen 5 5600X, AMD Ryzen 5 5600X
R5 5600X, 3700 MHz
0.4778 sec * +19%
AMD Ryzen 7 5800X, AMD Ryzen 7 5800X
R7 5800X, 3800 MHz
0.4509 sec * +23%
LibreOffice - 20 Documents To PDF
Intel Core i9-10900K, Intel Core i9-10900K
i9-10900K, 3700 MHz
76 s * -28%
Zotac Magnus One (ECM73070C), Intel Core i7-10700
i7-10700, 2900 MHz
59.5 s *
Intel Core i3-10100, Intel Core i3-10100
i3-10100, 3600 MHz
58.1 s * +2%
Intel Core i5-10400F, Intel Core i5-10400F
i5-10400F, 2900 MHz
57.1 s * +4%
Intel Core i5-10600K, Intel Core i5-10600K
i5-10600K, 4100 MHz
46.06 s * +23%
AMD Ryzen 5 5600X, AMD Ryzen 5 5600X
R5 5600X, 3700 MHz
45.14 s * +24%
AMD Ryzen 7 5800X, AMD Ryzen 7 5800X
R7 5800X, 3800 MHz
43.31 s * +27%
WebXPRT 3 - Overall
AMD Ryzen 7 5800X, AMD Ryzen 7 5800X
R7 5800X, 3800 MHz
296 Points +21%
AMD Ryzen 5 5600X, AMD Ryzen 5 5600X
R5 5600X, 3700 MHz
286 Points +17%
Intel Core i9-10900K, Intel Core i9-10900K
i9-10900K, 3700 MHz
255 Points +5%
Zotac Magnus One (ECM73070C), Intel Core i7-10700
i7-10700, 2900 MHz
244 Points
Intel Core i5-10600K, Intel Core i5-10600K
i5-10600K, 4100 MHz
239 Points -2%
Intel Core i5-10400F, Intel Core i5-10400F
i5-10400F, 2900 MHz
215 Points -12%
Intel Core i3-10100, Intel Core i3-10100
i3-10100, 3600 MHz
213 Points -13%
Mozilla Kraken 1.1 - Total
Intel Core i5-10400F, Intel Core i5-10400F
i5-10400F, 2900 MHz
849 ms * -13%
Intel Core i3-10100, Intel Core i3-10100
i3-10100, 3600 MHz
838 ms * -11%
Intel Core i5-10600K, Intel Core i5-10600K
i5-10600K, 4100 MHz
760 ms * -1%
Zotac Magnus One (ECM73070C), Intel Core i7-10700
i7-10700, 2900 MHz
752 ms *
Intel Core i9-10900K, Intel Core i9-10900K
i9-10900K, 3700 MHz
709 ms * +6%
AMD Ryzen 5 5600X, AMD Ryzen 5 5600X
R5 5600X, 3700 MHz
578 ms * +23%
AMD Ryzen 7 5800X, AMD Ryzen 7 5800X
R7 5800X, 3800 MHz
558 ms * +26%
3DMark
3840x2160 Fire Strike Ultra Physics
Intel Core i3-10100, Intel Core i3-10100
i3-10100, 3600 MHz
34056 Points +58%
AMD Ryzen 7 5800X, AMD Ryzen 7 5800X
R7 5800X, 3800 MHz
31095 Points +44%
Intel Core i9-10900K, Intel Core i9-10900K
i9-10900K, 3700 MHz
29374 Points +36%
AMD Ryzen 5 5600X, AMD Ryzen 5 5600X
R5 5600X, 3700 MHz
26038 Points +21%
Corsair One i160, Intel Core i9-9900K
i9-9900K, 3600 MHz
24544 Points +14%
Zotac Magnus One (ECM73070C), Intel Core i7-10700
i7-10700, 2900 MHz
21542 Points
Intel Core i5-10600K, Intel Core i5-10600K
i5-10600K, 4100 MHz
19942 Points -7%
Intel Core i7-9700K, AMD Radeon RX Vega 64, Intel Core i7-9700K
i7-9700K, 3600 MHz
18796 Points -13%
Intel Core i5-10400F, Intel Core i5-10400F
i5-10400F, 2900 MHz
18082 Points -16%
1920x1080 Fire Strike Physics
Intel Core i3-10100, Intel Core i3-10100
i3-10100, 3600 MHz
35894 Points +79%
AMD Ryzen 7 5800X, AMD Ryzen 7 5800X
R7 5800X, 3800 MHz
30938 Points +54%
Intel Core i9-10900K, Intel Core i9-10900K
i9-10900K, 3700 MHz
29805 Points +48%
AMD Ryzen 5 5600X, AMD Ryzen 5 5600X
R5 5600X, 3700 MHz
25990 Points +29%
Corsair One i160, Intel Core i9-9900K
i9-9900K, 3600 MHz
24697 Points +23%
Zotac Magnus One (ECM73070C), Intel Core i7-10700
i7-10700, 2900 MHz
20080 Points
Intel Core i5-10600K, Intel Core i5-10600K
i5-10600K, 4100 MHz
20040 Points 0%
Intel Core i7-9700K, AMD Radeon RX Vega 64, Intel Core i7-9700K
i7-9700K, 3600 MHz
18780 Points -6%
2560x1440 Time Spy CPU
Intel Core i9-10900K, Intel Core i9-10900K
i9-10900K, 3700 MHz
14326 Points +67%
AMD Ryzen 7 5800X, AMD Ryzen 7 5800X
R7 5800X, 3800 MHz
11599 Points +35%
Corsair One i160, Intel Core i9-9900K
i9-9900K, 3600 MHz
10867 Points +27%
AMD Ryzen 5 5600X, AMD Ryzen 5 5600X
R5 5600X, 3700 MHz
8911 Points +4%
Zotac Magnus One (ECM73070C), Intel Core i7-10700
i7-10700, 2900 MHz
8580 Points
Intel Core i7-9700K, AMD Radeon RX Vega 64, Intel Core i7-9700K
i7-9700K, 3600 MHz
8349 Points -3%
Intel Core i5-10600K, Intel Core i5-10600K
i5-10600K, 4100 MHz
8290 Points -3%
Intel Core i5-10400F, Intel Core i5-10400F
i5-10400F, 2900 MHz
7548 Points -12%
Intel Core i3-10100, Intel Core i3-10100
i3-10100, 3600 MHz
5333 Points -38%

* ... Meglio usare valori piccoli

Zotac Magnus One nel Cinebench R15 multi-loop

L'Intel Core i7-10700 mostra un leggero calo di prestazioni dopo la prima esecuzione, ma diventa sempre più stabile nel corso del test. Tuttavia, le prestazioni sono di alto livello con una media di 1.338 punti.

1184.71284.71384.7Tooltip
Zotac Magnus One (ECM73070C): Ø1338 (1184.66-1454.54)

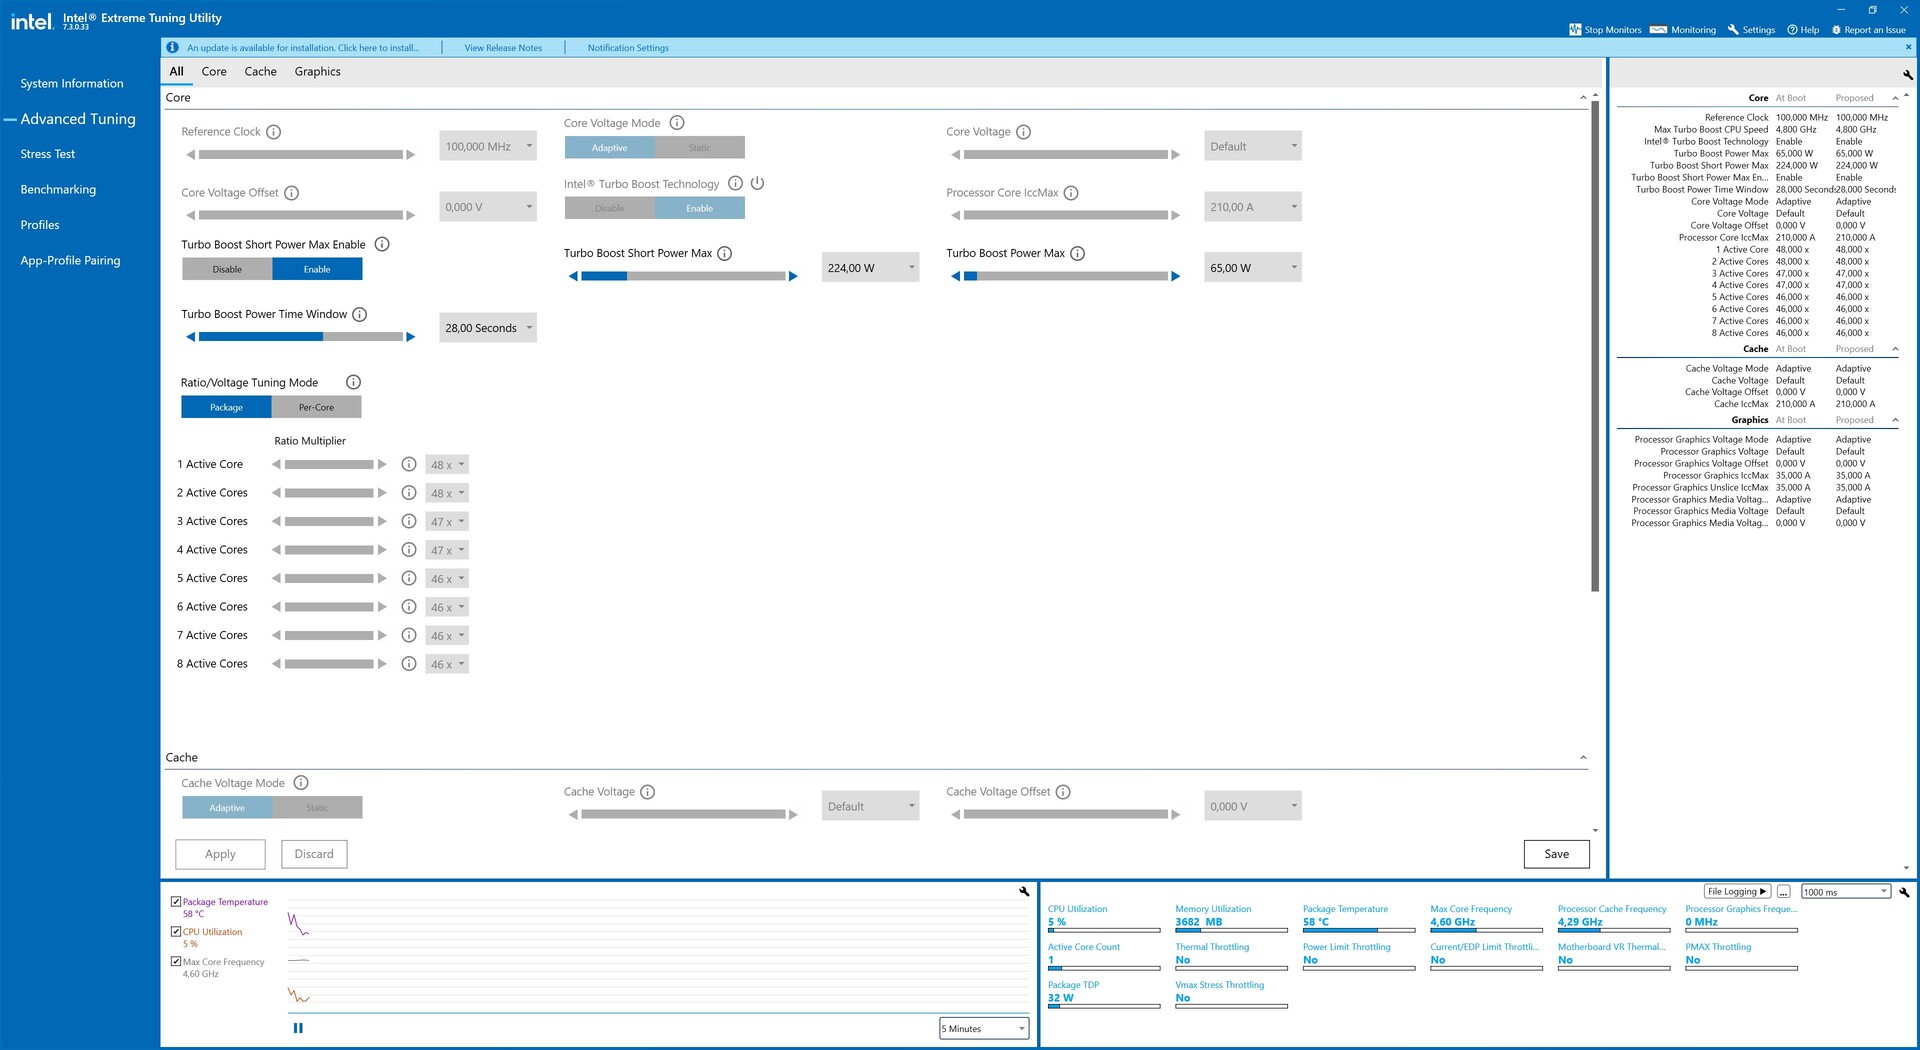
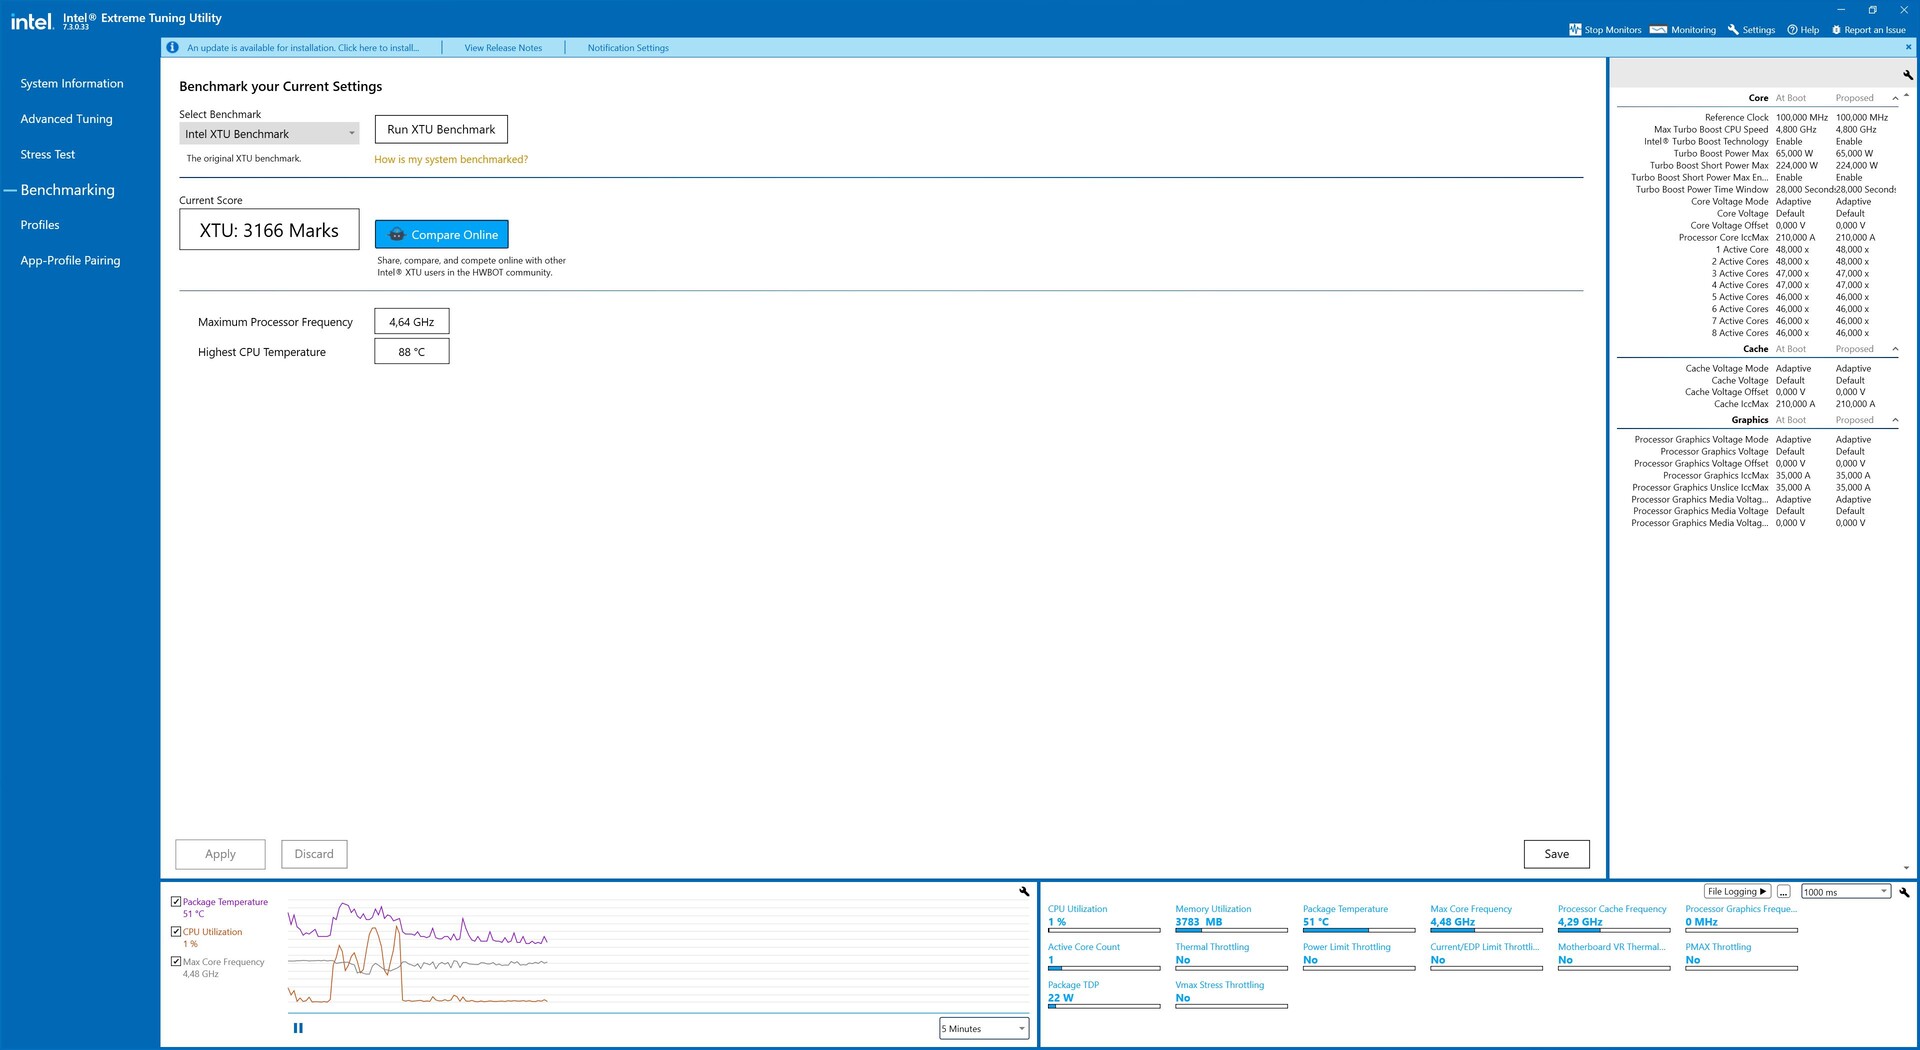
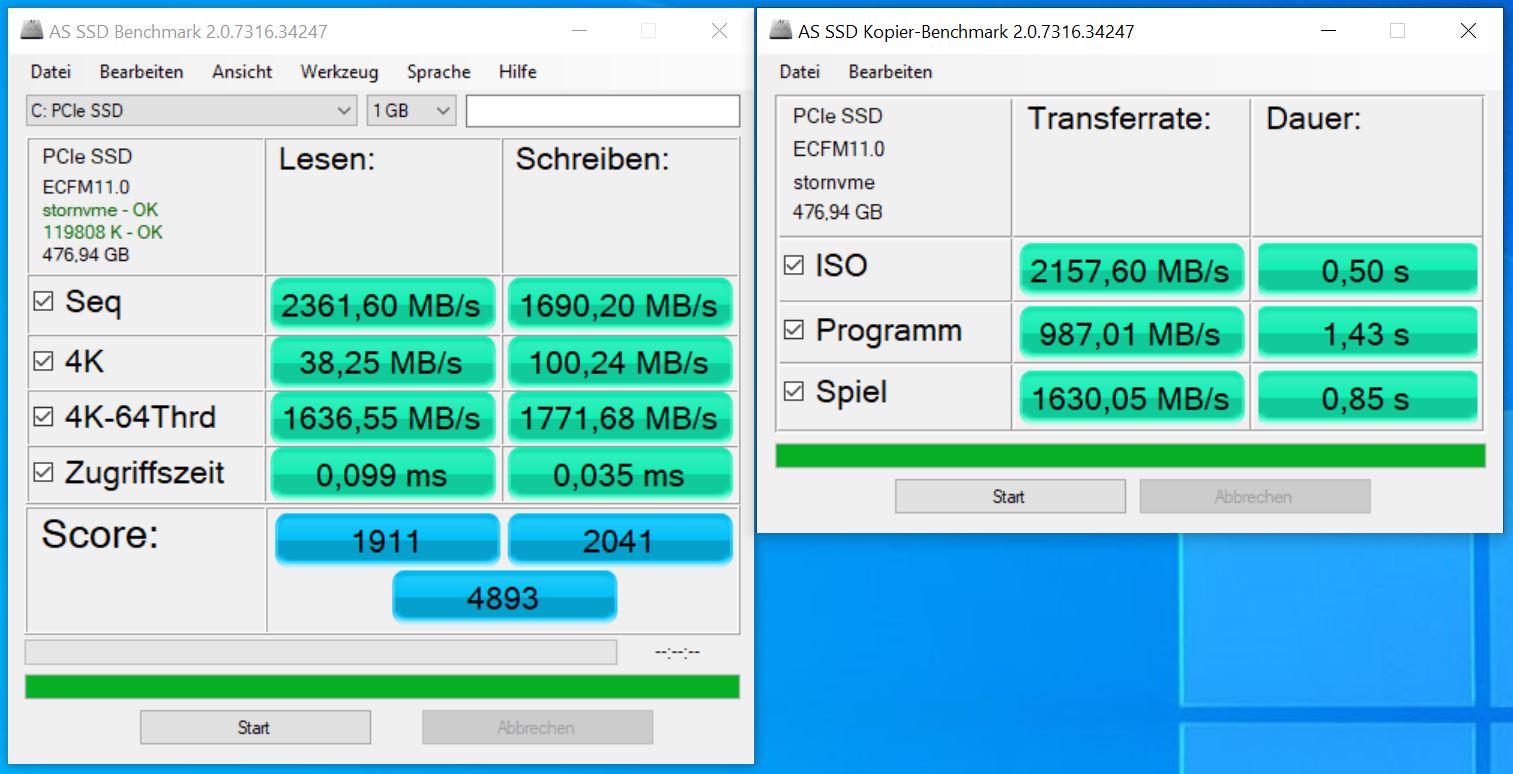
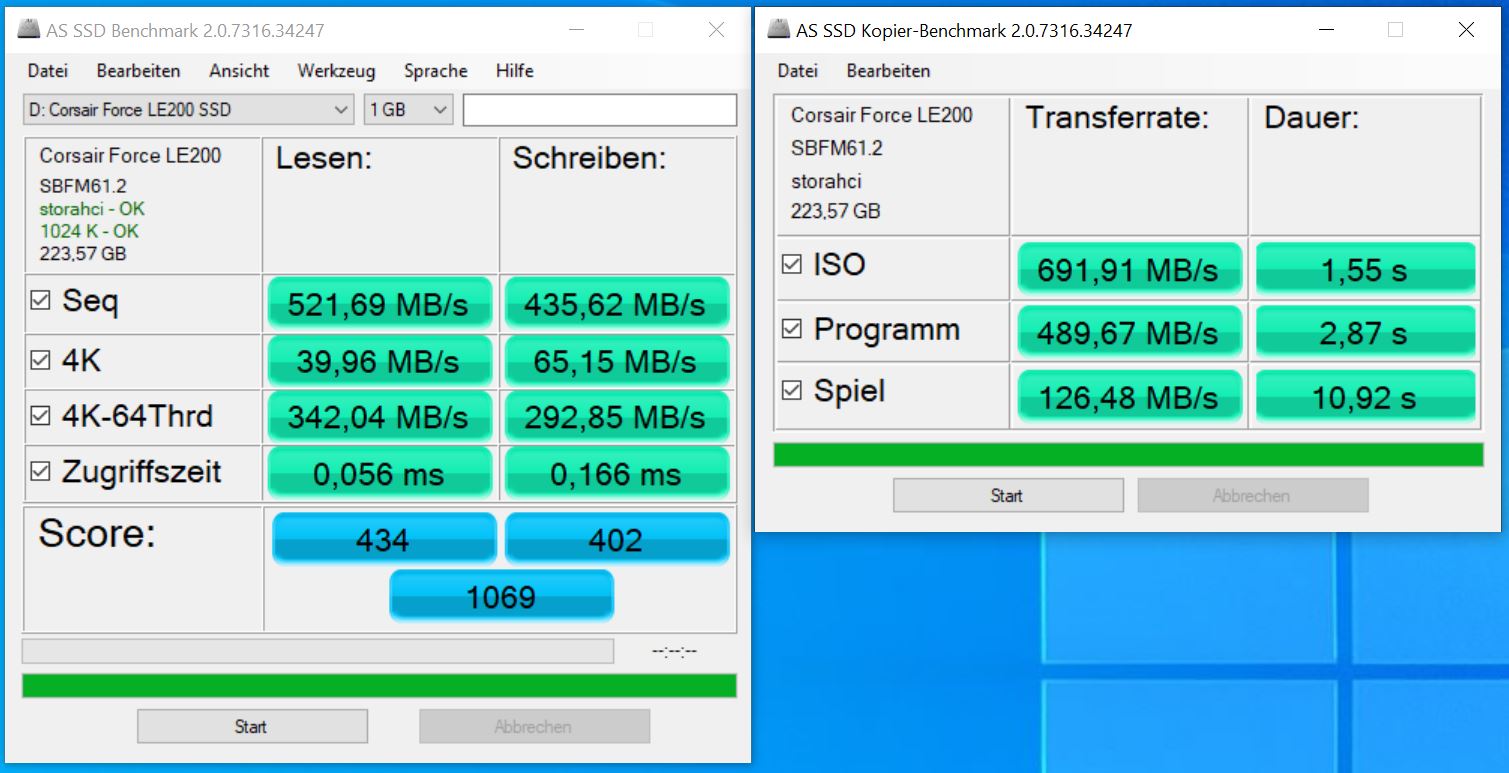
Prestazioni con le applicazioni

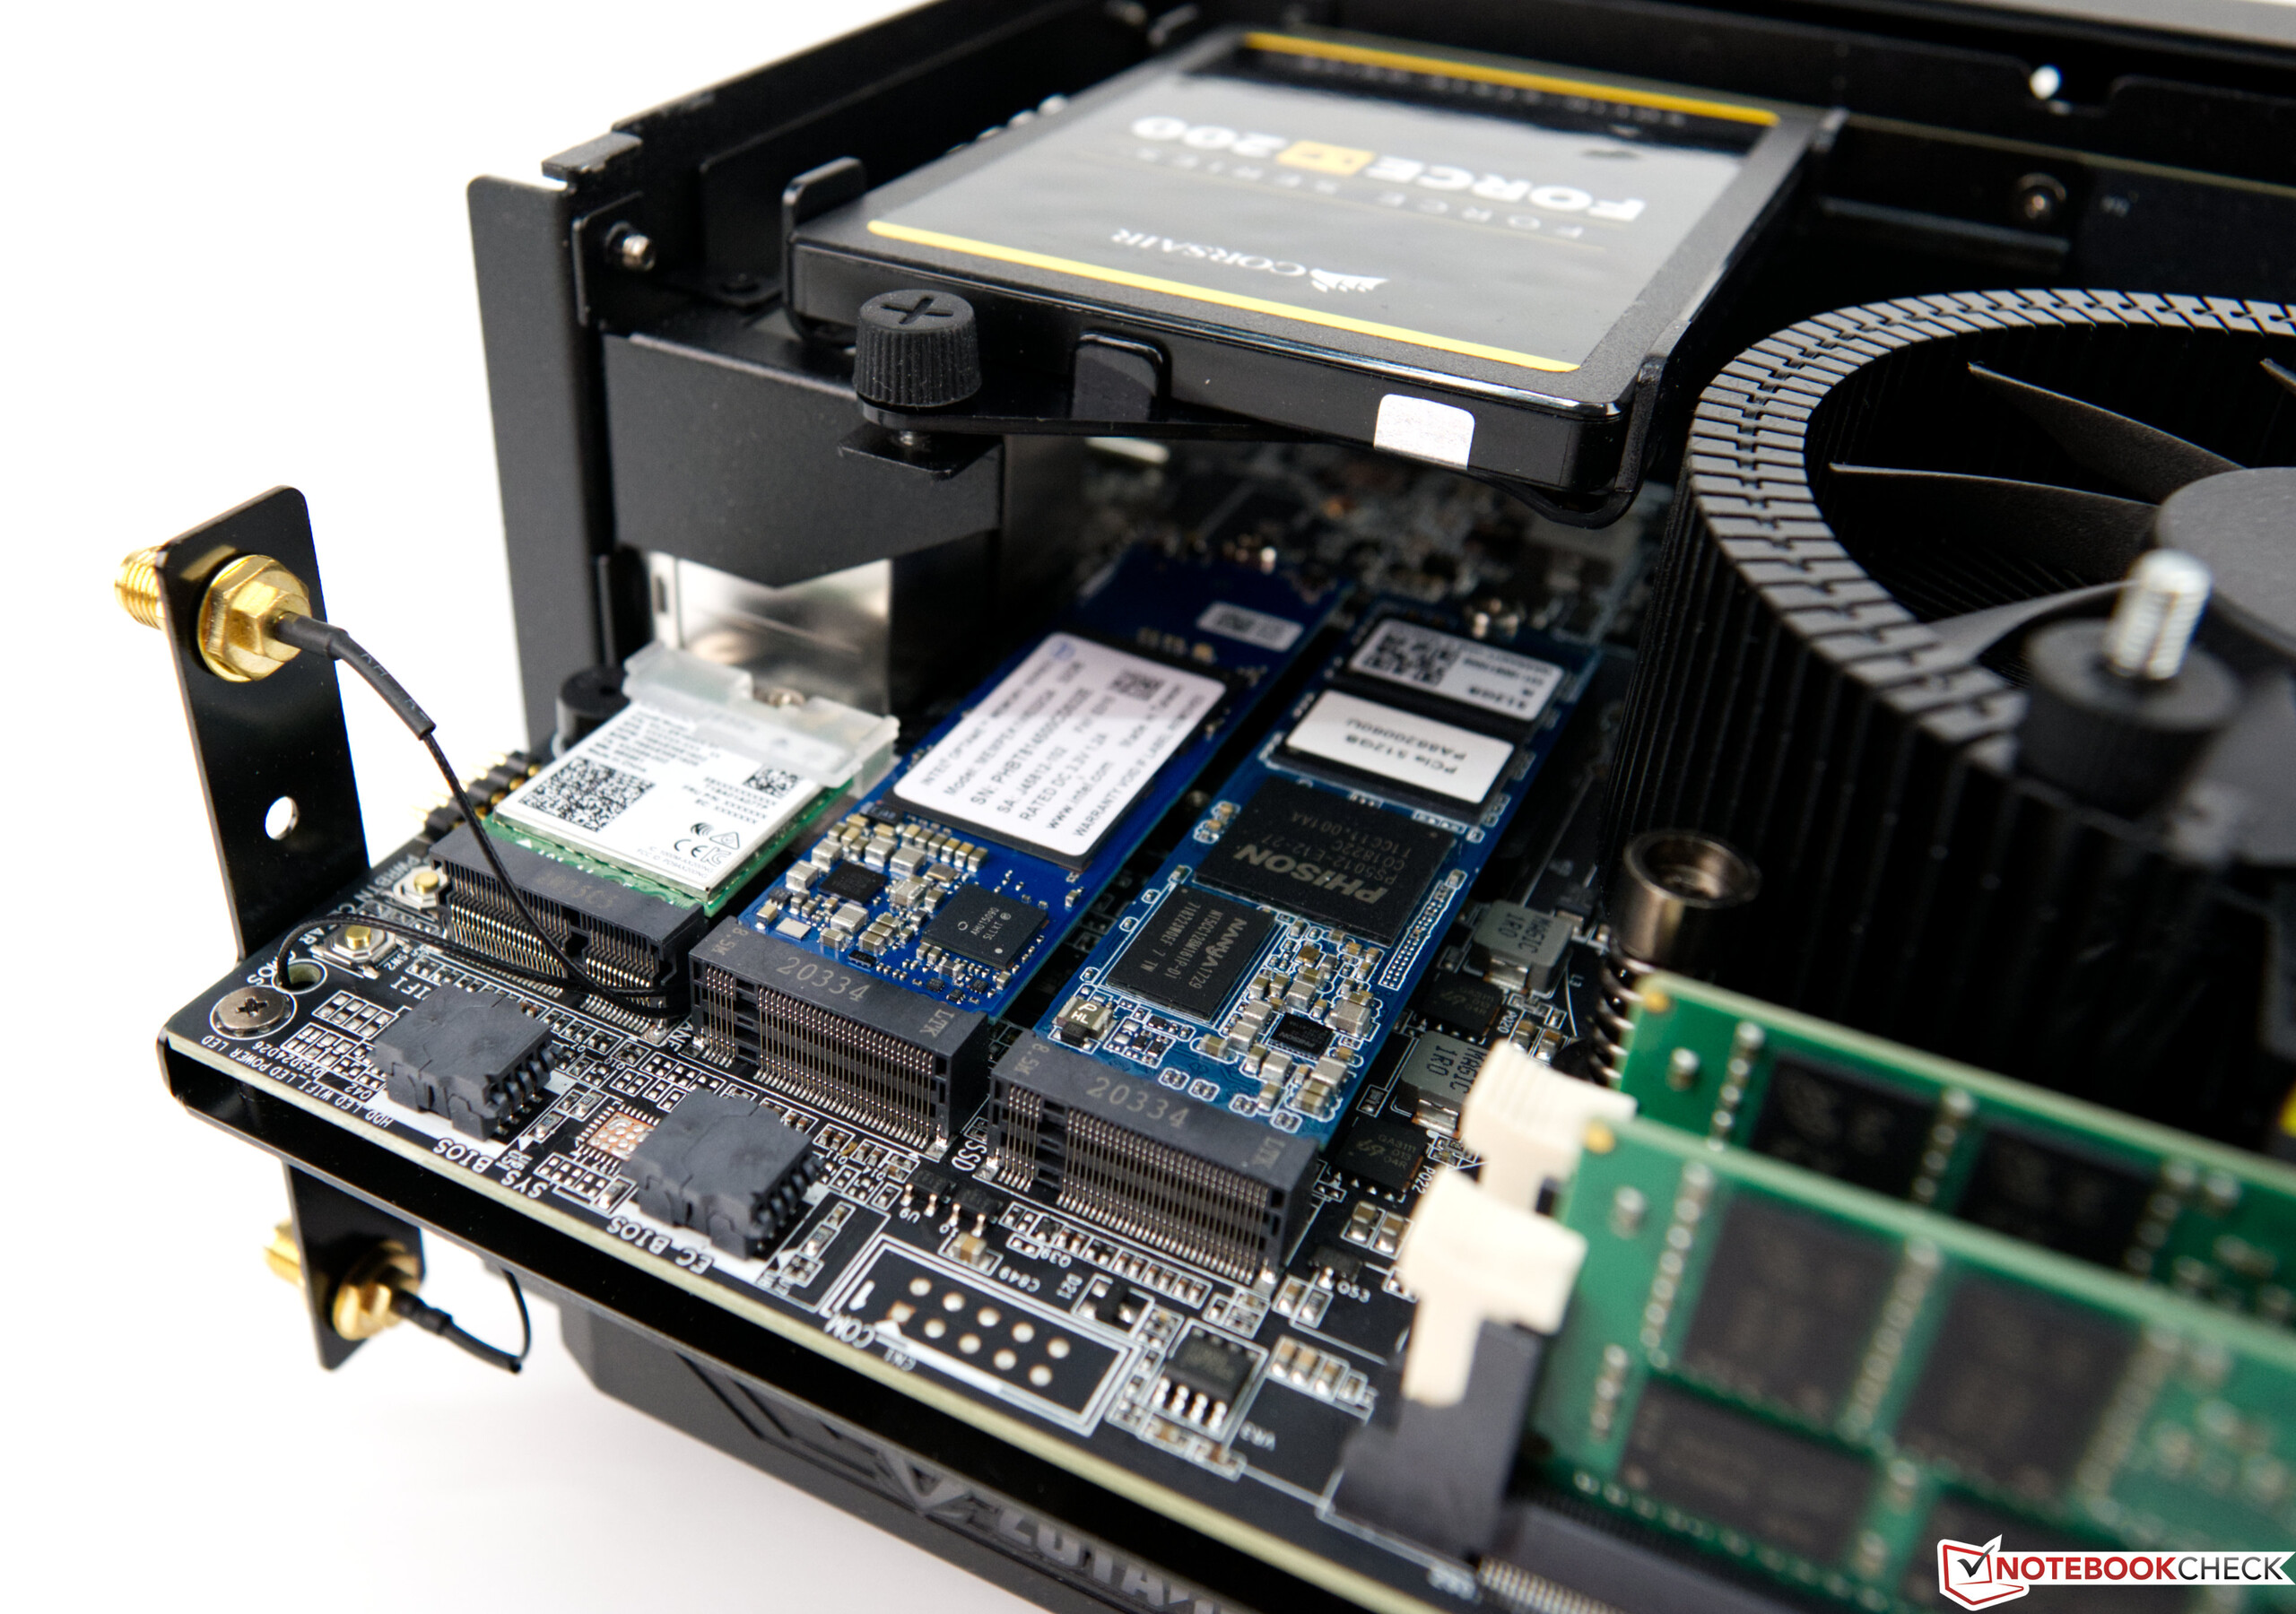
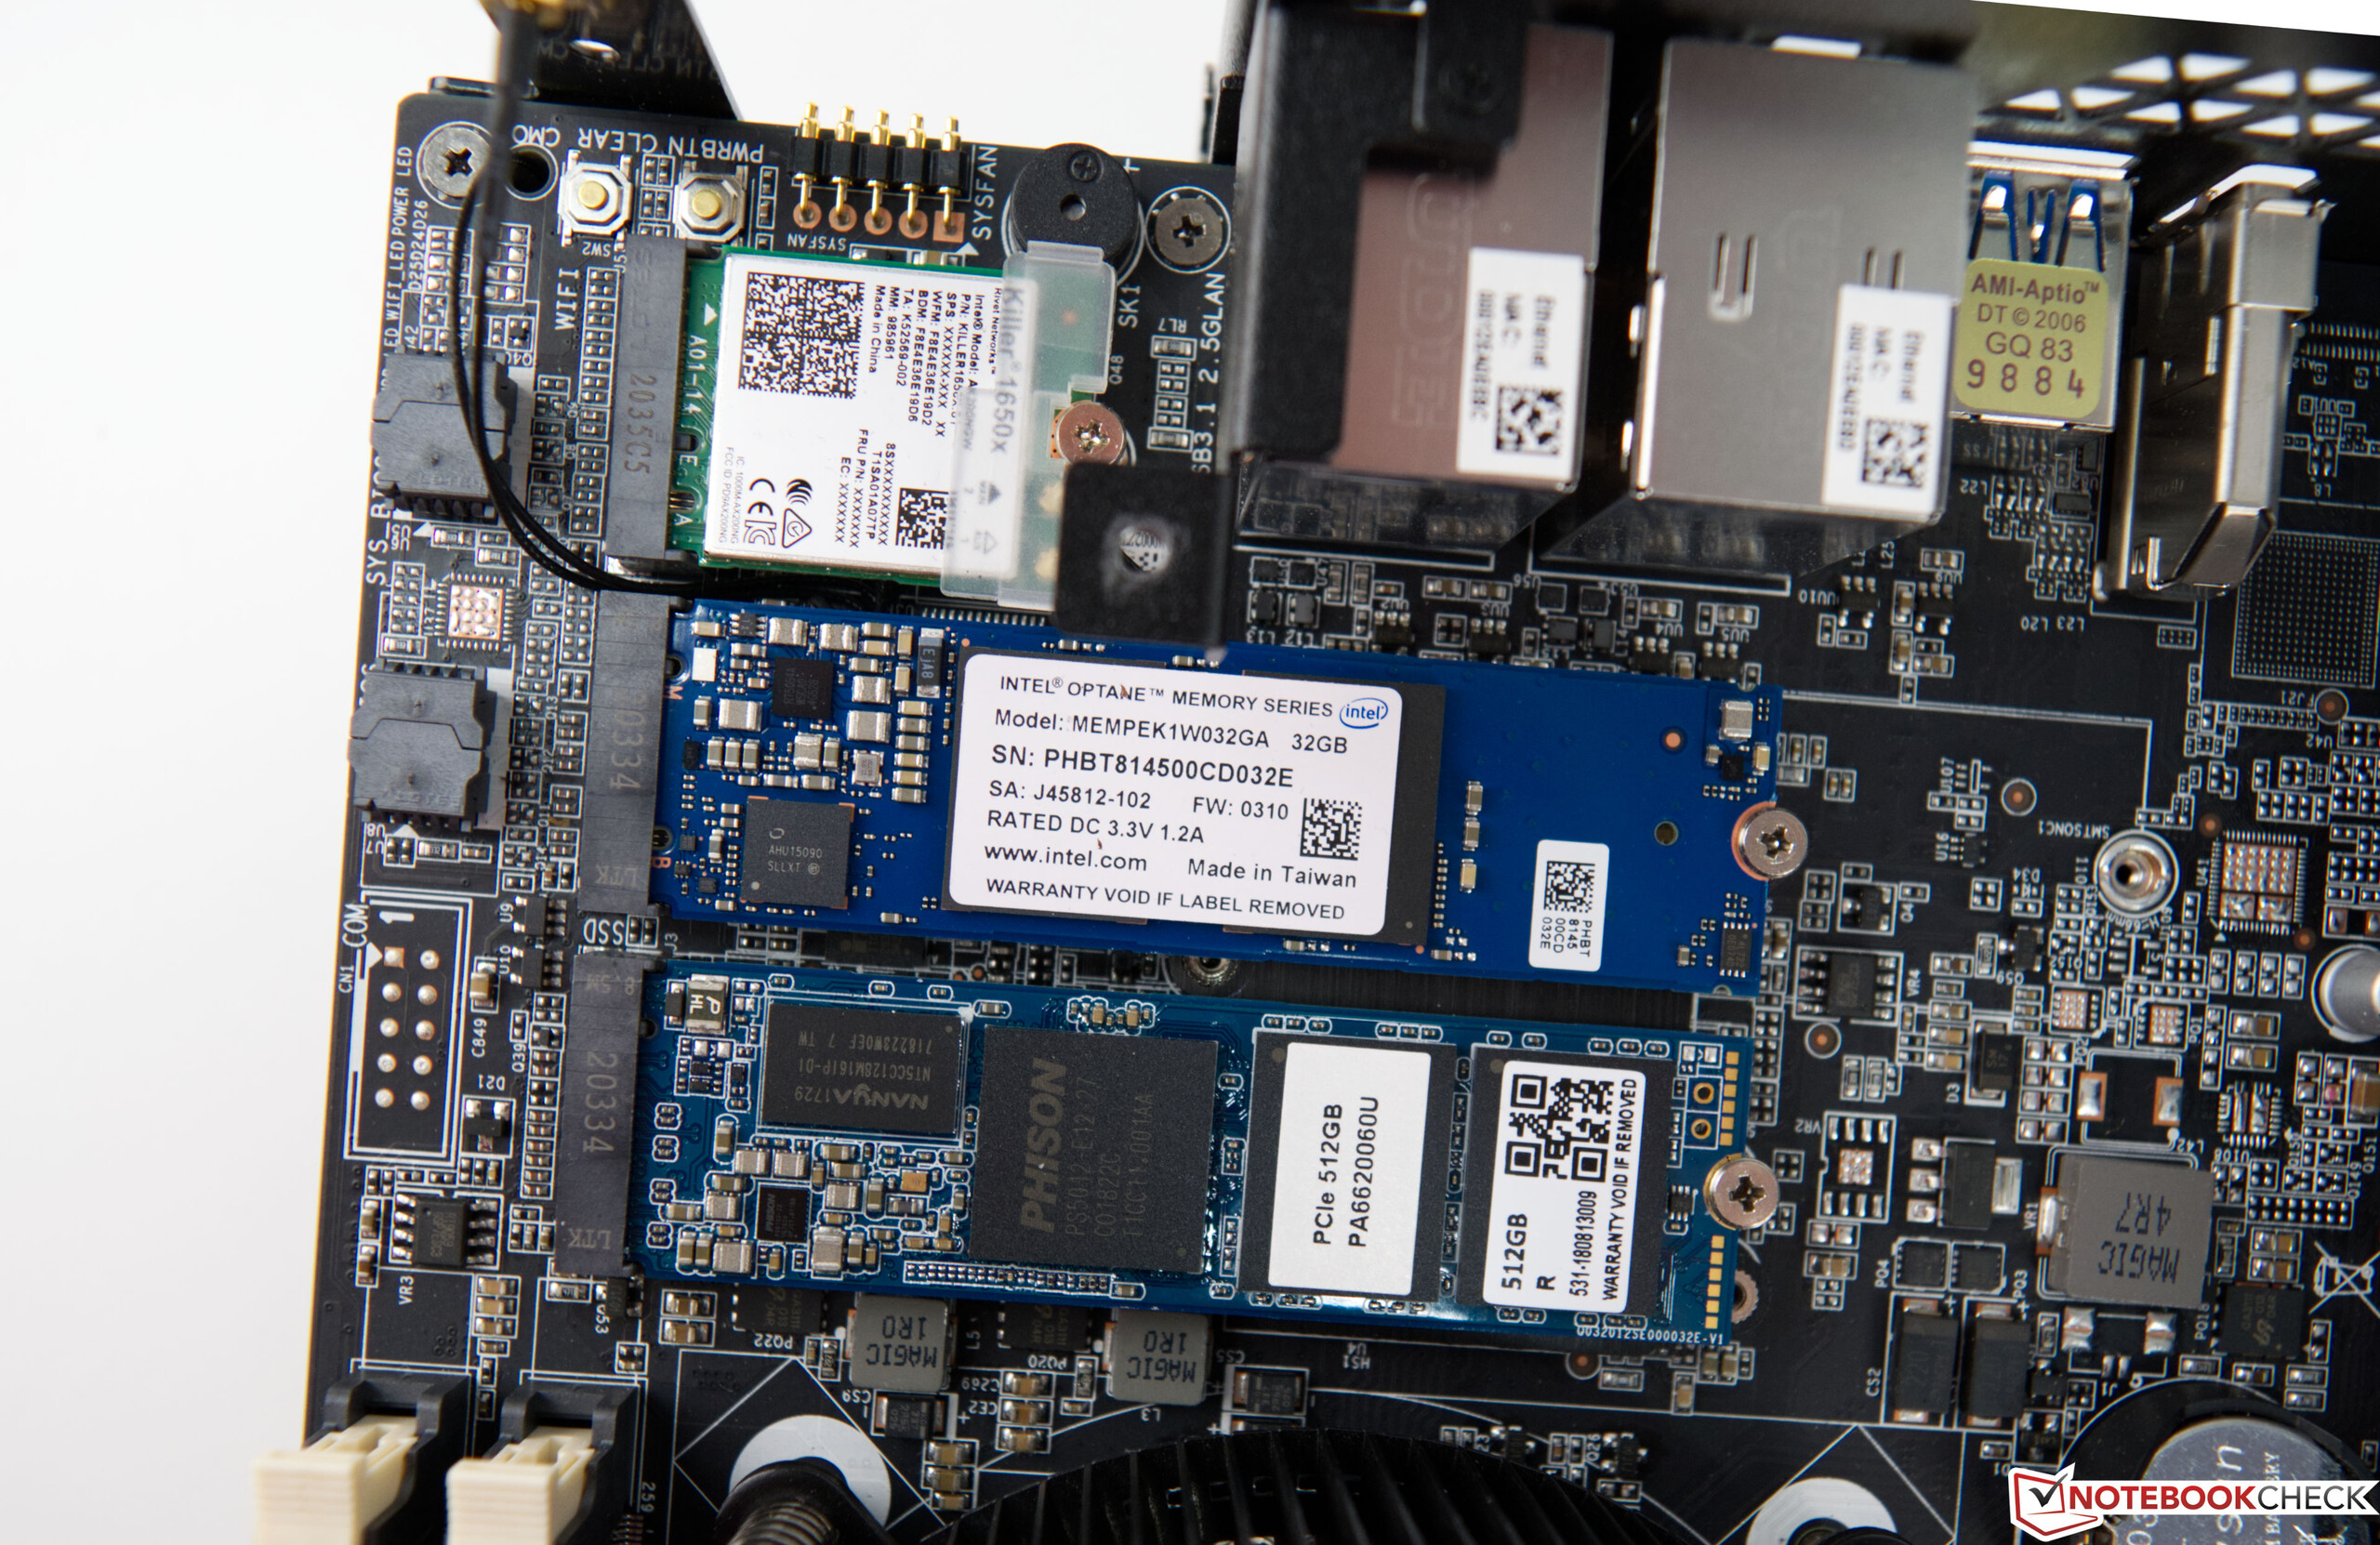
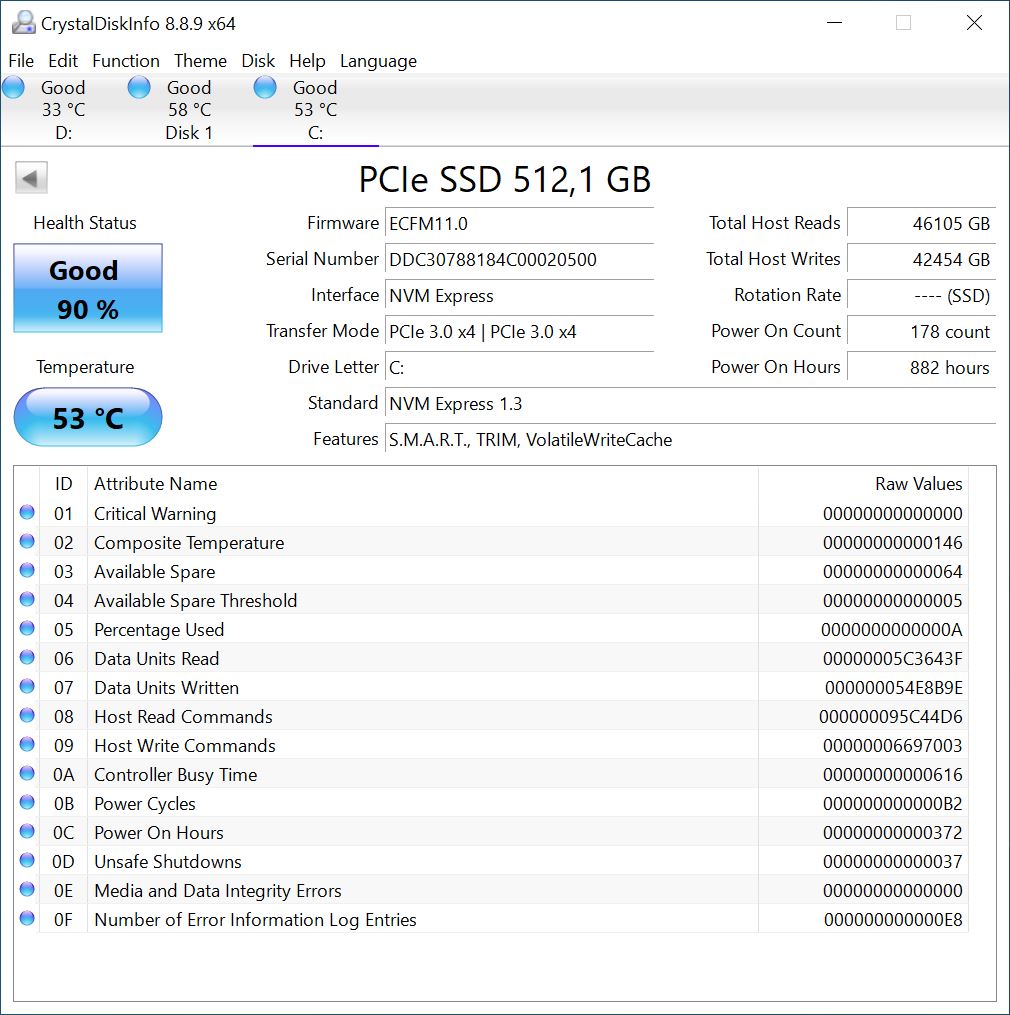
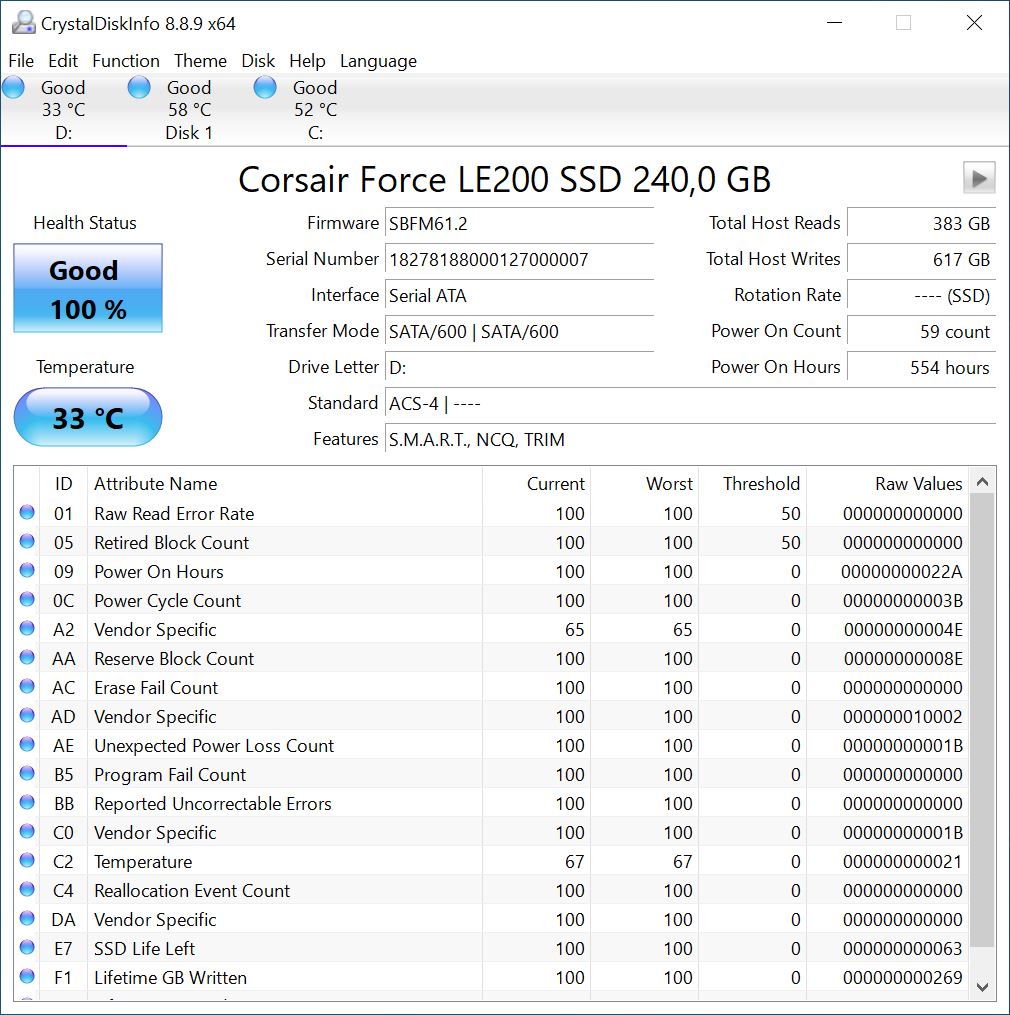
La nostra configurazione di prova del Magnus One raggiunge valori relativamente buoni nei nostri benchmarks applicativi. Tuttavia, ci aspettavamo prestazioni migliori a causa dei componenti integrati. Rispetto agli altri nostri sistemi di test, il Magnus One è spesso rimasto indietro. Ci piace il fatto che non abbia un hard disk convenzionale. Tuttavia, gli utenti hanno la libertà di scegliere il tipo di dispositivo di archiviazione di massa che vogliono utilizzare. Gli screenshots allegati danno un'idea delle prestazioni che ci si può aspettare. Un totale di tre dispositivi di archiviazione di massa può essere ospitato nel case.

AS SSD PCIe SSD (512 GB)
AS SSD SATA SSD (240 GB)
CDI PCIe SSD (512 GB)
CDI SATA SSD (240 GB)
PCMark 10
Score
AMD Ryzen 5 5600X, AMD Ryzen 5 5600X
NVIDIA Titan RTX
8270 Points +27%
AMD Ryzen 7 5800X, AMD Ryzen 7 5800X
NVIDIA Titan RTX
8252 Points +27%
Intel Core i3-10100, Intel Core i3-10100
NVIDIA Titan RTX
7926 Points +22%
Intel Core i9-10900K, Intel Core i9-10900K
NVIDIA Titan RTX
7641 Points +18%
Intel Core i5-10600K, Intel Core i5-10600K
NVIDIA Titan RTX
7279 Points +12%
Intel Core i7-9700K, AMD Radeon RX Vega 64, Intel Core i7-9700K
AMD Radeon RX Vega 64
6797 Points +5%
Intel Core i5-10400F, Intel Core i5-10400F
NVIDIA Titan RTX
6551 Points +1%
Zotac Magnus One (ECM73070C), Intel Core i7-10700
NVIDIA GeForce RTX 3070
6499 Points
Digital Content Creation
Intel Core i3-10100, Intel Core i3-10100
NVIDIA Titan RTX
14158 Points +39%
AMD Ryzen 7 5800X, AMD Ryzen 7 5800X
NVIDIA Titan RTX
13130 Points +29%
Intel Core i9-10900K, Intel Core i9-10900K
NVIDIA Titan RTX
12754 Points +26%
AMD Ryzen 5 5600X, AMD Ryzen 5 5600X
NVIDIA Titan RTX
12414 Points +22%
Intel Core i5-10600K, Intel Core i5-10600K
NVIDIA Titan RTX
11150 Points +10%
Zotac Magnus One (ECM73070C), Intel Core i7-10700
NVIDIA GeForce RTX 3070
10161 Points
Intel Core i5-10400F, Intel Core i5-10400F
NVIDIA Titan RTX
9845 Points -3%
Intel Core i7-9700K, AMD Radeon RX Vega 64, Intel Core i7-9700K
AMD Radeon RX Vega 64
9206 Points -9%
Productivity
AMD Ryzen 7 5800X, AMD Ryzen 7 5800X
NVIDIA Titan RTX
11069 Points +49%
AMD Ryzen 5 5600X, AMD Ryzen 5 5600X
NVIDIA Titan RTX
10963 Points +47%
Intel Core i3-10100, Intel Core i3-10100
NVIDIA Titan RTX
9414 Points +26%
Intel Core i5-10600K, Intel Core i5-10600K
NVIDIA Titan RTX
9361 Points +26%
Intel Core i7-9700K, AMD Radeon RX Vega 64, Intel Core i7-9700K
AMD Radeon RX Vega 64
9332 Points +25%
Intel Core i9-10900K, Intel Core i9-10900K
NVIDIA Titan RTX
9057 Points +22%
Intel Core i5-10400F, Intel Core i5-10400F
NVIDIA Titan RTX
8191 Points +10%
Zotac Magnus One (ECM73070C), Intel Core i7-10700
NVIDIA GeForce RTX 3070
7447 Points
Essentials
AMD Ryzen 7 5800X, AMD Ryzen 7 5800X
NVIDIA Titan RTX
11386 Points +16%
AMD Ryzen 5 5600X, AMD Ryzen 5 5600X
NVIDIA Titan RTX
11280 Points +15%
Intel Core i9-10900K, Intel Core i9-10900K
NVIDIA Titan RTX
10483 Points +6%
Intel Core i3-10100, Intel Core i3-10100
NVIDIA Titan RTX
10138 Points +3%
Intel Core i5-10600K, Intel Core i5-10600K
NVIDIA Titan RTX
10028 Points +2%
Intel Core i7-9700K, AMD Radeon RX Vega 64, Intel Core i7-9700K
AMD Radeon RX Vega 64
9922 Points +1%
Zotac Magnus One (ECM73070C), Intel Core i7-10700
NVIDIA GeForce RTX 3070
9846 Points
Intel Core i5-10400F, Intel Core i5-10400F
NVIDIA Titan RTX
9465 Points -4%
SPECviewperf 12
1900x1060 Solidworks (sw-03)
AMD Ryzen 7 5800X, AMD Ryzen 7 5800X
NVIDIA Titan RTX
199.1 fps +142%
AMD Ryzen 5 5600X, AMD Ryzen 5 5600X
NVIDIA Titan RTX
194 fps +136%
Intel Core i9-10900K, Intel Core i9-10900K
NVIDIA Titan RTX
172.2 fps +109%
Intel Core i5-10600K, Intel Core i5-10600K
NVIDIA Titan RTX
158.2 fps +92%
Intel Core i3-10100, Intel Core i3-10100
NVIDIA Titan RTX
153.8 fps +87%
Intel Core i5-10400F, Intel Core i5-10400F
NVIDIA Titan RTX
146.7 fps +78%
Intel Core i7-9700K, AMD Radeon RX Vega 64, Intel Core i7-9700K
AMD Radeon RX Vega 64
82.5 fps 0%
Zotac Magnus One (ECM73070C), Intel Core i7-10700
NVIDIA GeForce RTX 3070
82.3 fps
1900x1060 Siemens NX (snx-02)
Intel Core i3-10100, Intel Core i3-10100
NVIDIA Titan RTX
268 fps +2133%
AMD Ryzen 7 5800X, AMD Ryzen 7 5800X
NVIDIA Titan RTX
266.3 fps +2119%
AMD Ryzen 5 5600X, AMD Ryzen 5 5600X
NVIDIA Titan RTX
266 fps +2117%
Intel Core i9-10900K, Intel Core i9-10900K
NVIDIA Titan RTX
263.3 fps +2094%
Intel Core i5-10400F, Intel Core i5-10400F
NVIDIA Titan RTX
260.2 fps +2068%
Intel Core i5-10600K, Intel Core i5-10600K
NVIDIA Titan RTX
259.1 fps +2059%
Intel Core i7-9700K, AMD Radeon RX Vega 64, Intel Core i7-9700K
AMD Radeon RX Vega 64
28.85 fps +140%
Zotac Magnus One (ECM73070C), Intel Core i7-10700
NVIDIA GeForce RTX 3070
12 fps
1900x1060 Showcase (showcase-01)
Intel Core i5-10600K, Intel Core i5-10600K
NVIDIA Titan RTX
196.1 fps +19%
Intel Core i5-10400F, Intel Core i5-10400F
NVIDIA Titan RTX
194.2 fps +18%
Intel Core i3-10100, Intel Core i3-10100
NVIDIA Titan RTX
193.3 fps +17%
Intel Core i9-10900K, Intel Core i9-10900K
NVIDIA Titan RTX
192.4 fps +17%
AMD Ryzen 5 5600X, AMD Ryzen 5 5600X
NVIDIA Titan RTX
191.9 fps +16%
AMD Ryzen 7 5800X, AMD Ryzen 7 5800X
NVIDIA Titan RTX
190.6 fps +16%
Zotac Magnus One (ECM73070C), Intel Core i7-10700
NVIDIA GeForce RTX 3070
165 fps
Intel Core i7-9700K, AMD Radeon RX Vega 64, Intel Core i7-9700K
AMD Radeon RX Vega 64
115.1 fps -30%
1900x1060 Medical (medical-01)
Intel Core i5-10600K, Intel Core i5-10600K
NVIDIA Titan RTX
94.6 fps +93%
Intel Core i9-10900K, Intel Core i9-10900K
NVIDIA Titan RTX
94.5 fps +93%
Intel Core i5-10400F, Intel Core i5-10400F
NVIDIA Titan RTX
94.3 fps +92%
Intel Core i3-10100, Intel Core i3-10100
NVIDIA Titan RTX
92.5 fps +89%
AMD Ryzen 7 5800X, AMD Ryzen 7 5800X
NVIDIA Titan RTX
88.4 fps +80%
AMD Ryzen 5 5600X, AMD Ryzen 5 5600X
NVIDIA Titan RTX
88.3 fps +80%
Intel Core i7-9700K, AMD Radeon RX Vega 64, Intel Core i7-9700K
AMD Radeon RX Vega 64
51 fps +4%
Zotac Magnus One (ECM73070C), Intel Core i7-10700
NVIDIA GeForce RTX 3070
49 fps
1900x1060 Maya (maya-04)
AMD Ryzen 7 5800X, AMD Ryzen 7 5800X
NVIDIA Titan RTX
233.8 fps +17%
AMD Ryzen 5 5600X, AMD Ryzen 5 5600X
NVIDIA Titan RTX
226 fps +13%
Zotac Magnus One (ECM73070C), Intel Core i7-10700
NVIDIA GeForce RTX 3070
200 fps
Intel Core i9-10900K, Intel Core i9-10900K
NVIDIA Titan RTX
188.7 fps -6%
Intel Core i5-10600K, Intel Core i5-10600K
NVIDIA Titan RTX
169.4 fps -15%
Intel Core i3-10100, Intel Core i3-10100
NVIDIA Titan RTX
161.9 fps -19%
Intel Core i5-10400F, Intel Core i5-10400F
NVIDIA Titan RTX
155.1 fps -22%
Intel Core i7-9700K, AMD Radeon RX Vega 64, Intel Core i7-9700K
AMD Radeon RX Vega 64
84.1 fps -58%
1900x1060 Energy (energy-01)
Intel Core i5-10600K, Intel Core i5-10600K
NVIDIA Titan RTX
28.77 fps +120%
Intel Core i9-10900K, Intel Core i9-10900K
NVIDIA Titan RTX
28.72 fps +119%
Intel Core i5-10400F, Intel Core i5-10400F
NVIDIA Titan RTX
28.62 fps +118%
Intel Core i3-10100, Intel Core i3-10100
NVIDIA Titan RTX
28.54 fps +118%
AMD Ryzen 7 5800X, AMD Ryzen 7 5800X
NVIDIA Titan RTX
27.85 fps +113%
AMD Ryzen 5 5600X, AMD Ryzen 5 5600X
NVIDIA Titan RTX
27.75 fps +112%
Zotac Magnus One (ECM73070C), Intel Core i7-10700
NVIDIA GeForce RTX 3070
13.1 fps
Intel Core i7-9700K, AMD Radeon RX Vega 64, Intel Core i7-9700K
AMD Radeon RX Vega 64
5.21 fps -60%
1900x1060 Creo (creo-01)
AMD Ryzen 7 5800X, AMD Ryzen 7 5800X
NVIDIA Titan RTX
175.2 fps +185%
AMD Ryzen 5 5600X, AMD Ryzen 5 5600X
NVIDIA Titan RTX
169.7 fps +176%
Intel Core i9-10900K, Intel Core i9-10900K
NVIDIA Titan RTX
157.2 fps +156%
Intel Core i5-10600K, Intel Core i5-10600K
NVIDIA Titan RTX
142.7 fps +132%
Intel Core i3-10100, Intel Core i3-10100
NVIDIA Titan RTX
135.8 fps +121%
Intel Core i5-10400F, Intel Core i5-10400F
NVIDIA Titan RTX
133.6 fps +117%
Intel Core i7-9700K, AMD Radeon RX Vega 64, Intel Core i7-9700K
AMD Radeon RX Vega 64
62.5 fps +2%
Zotac Magnus One (ECM73070C), Intel Core i7-10700
NVIDIA GeForce RTX 3070
61.5 fps
1900x1060 Catia (catia-04)
AMD Ryzen 7 5800X, AMD Ryzen 7 5800X
NVIDIA Titan RTX
267.4 fps +129%
AMD Ryzen 5 5600X, AMD Ryzen 5 5600X
NVIDIA Titan RTX
263.4 fps +125%
Intel Core i9-10900K, Intel Core i9-10900K
NVIDIA Titan RTX
225.2 fps +92%
Intel Core i5-10600K, Intel Core i5-10600K
NVIDIA Titan RTX
215.5 fps +84%
Intel Core i3-10100, Intel Core i3-10100
NVIDIA Titan RTX
207.7 fps +78%
Intel Core i5-10400F, Intel Core i5-10400F
NVIDIA Titan RTX
197.8 fps +69%
Intel Core i7-9700K, AMD Radeon RX Vega 64, Intel Core i7-9700K
AMD Radeon RX Vega 64
158.6 fps +36%
Zotac Magnus One (ECM73070C), Intel Core i7-10700
NVIDIA GeForce RTX 3070
117 fps
1900x1060 3ds Max (3dsmax-05)
AMD Ryzen 5 5600X, AMD Ryzen 5 5600X
NVIDIA Titan RTX
299.9 fps +41%
Intel Core i9-10900K, Intel Core i9-10900K
NVIDIA Titan RTX
297.4 fps +40%
Intel Core i5-10600K, Intel Core i5-10600K
NVIDIA Titan RTX
296.9 fps +39%
AMD Ryzen 7 5800X, AMD Ryzen 7 5800X
NVIDIA Titan RTX
296 fps +39%
Intel Core i5-10400F, Intel Core i5-10400F
NVIDIA Titan RTX
291.3 fps +37%
Intel Core i3-10100, Intel Core i3-10100
NVIDIA Titan RTX
288.4 fps +35%
Zotac Magnus One (ECM73070C), Intel Core i7-10700
NVIDIA GeForce RTX 3070
213 fps
Intel Core i7-9700K, AMD Radeon RX Vega 64, Intel Core i7-9700K
AMD Radeon RX Vega 64
130.8 fps -39%
SPECviewperf 13
Solidworks (sw-04)
AMD Ryzen 7 5800X, AMD Ryzen 7 5800X
NVIDIA Titan RTX
199.9 fps +75%
AMD Ryzen 5 5600X, AMD Ryzen 5 5600X
NVIDIA Titan RTX
195.1 fps +71%
Intel Core i9-10900K, Intel Core i9-10900K
NVIDIA Titan RTX
166.2 fps +46%
Intel Core i5-10600K, Intel Core i5-10600K
NVIDIA Titan RTX
153.9 fps +35%
Intel Core i3-10100, Intel Core i3-10100
NVIDIA Titan RTX
148.1 fps +30%
Intel Core i5-10400F, Intel Core i5-10400F
NVIDIA Titan RTX
141.6 fps +24%
Zotac Magnus One (ECM73070C), Intel Core i7-10700
NVIDIA GeForce RTX 3070
114 fps
Intel Core i7-9700K, AMD Radeon RX Vega 64, Intel Core i7-9700K
AMD Radeon RX Vega 64
100.5 fps -12%
Siemens NX (snx-03)
Intel Core i3-10100, Intel Core i3-10100
NVIDIA Titan RTX
482.9 fps +2105%
AMD Ryzen 7 5800X, AMD Ryzen 7 5800X
NVIDIA Titan RTX
481.9 fps +2100%
AMD Ryzen 5 5600X, AMD Ryzen 5 5600X
NVIDIA Titan RTX
480.1 fps +2092%
Intel Core i9-10900K, Intel Core i9-10900K
NVIDIA Titan RTX
472.9 fps +2059%
Intel Core i5-10600K, Intel Core i5-10600K
NVIDIA Titan RTX
469.1 fps +2042%
Intel Core i5-10400F, Intel Core i5-10400F
NVIDIA Titan RTX
467.8 fps +2036%
Intel Core i7-9700K, AMD Radeon RX Vega 64, Intel Core i7-9700K
AMD Radeon RX Vega 64
51.5 fps +135%
Zotac Magnus One (ECM73070C), Intel Core i7-10700
NVIDIA GeForce RTX 3070
21.9 fps
Showcase (showcase-02)
Intel Core i5-10600K, Intel Core i5-10600K
NVIDIA Titan RTX
195.1 fps +18%
Intel Core i9-10900K, Intel Core i9-10900K
NVIDIA Titan RTX
194.1 fps +18%
Intel Core i5-10400F, Intel Core i5-10400F
NVIDIA Titan RTX
193.9 fps +18%
Intel Core i3-10100, Intel Core i3-10100
NVIDIA Titan RTX
193.2 fps +17%
AMD Ryzen 7 5800X, AMD Ryzen 7 5800X
NVIDIA Titan RTX
192 fps +16%
AMD Ryzen 5 5600X, AMD Ryzen 5 5600X
NVIDIA Titan RTX
190.8 fps +16%
Zotac Magnus One (ECM73070C), Intel Core i7-10700
NVIDIA GeForce RTX 3070
165 fps
Intel Core i7-9700K, AMD Radeon RX Vega 64, Intel Core i7-9700K
AMD Radeon RX Vega 64
115 fps -30%
Medical (medical-02)
AMD Ryzen 7 5800X, AMD Ryzen 7 5800X
NVIDIA Titan RTX
90.8 fps +16%
AMD Ryzen 5 5600X, AMD Ryzen 5 5600X
NVIDIA Titan RTX
90.6 fps +16%
Intel Core i3-10100, Intel Core i3-10100
NVIDIA Titan RTX
90 fps +15%
Intel Core i5-10600K, Intel Core i5-10600K
NVIDIA Titan RTX
89.7 fps +15%
Intel Core i9-10900K, Intel Core i9-10900K
NVIDIA Titan RTX
88.7 fps +13%
Intel Core i5-10400F, Intel Core i5-10400F
NVIDIA Titan RTX
87.3 fps +11%
Zotac Magnus One (ECM73070C), Intel Core i7-10700
NVIDIA GeForce RTX 3070
78.3 fps
Intel Core i7-9700K, AMD Radeon RX Vega 64, Intel Core i7-9700K
AMD Radeon RX Vega 64
38.31 fps -51%
Maya (maya-05)
AMD Ryzen 7 5800X, AMD Ryzen 7 5800X
NVIDIA Titan RTX
459.6 fps +25%
AMD Ryzen 5 5600X, AMD Ryzen 5 5600X
NVIDIA Titan RTX
453.6 fps +24%
Intel Core i9-10900K, Intel Core i9-10900K
NVIDIA Titan RTX
405.9 fps +11%
Intel Core i3-10100, Intel Core i3-10100
NVIDIA Titan RTX
388 fps +6%
Intel Core i5-10600K, Intel Core i5-10600K
NVIDIA Titan RTX
387.5 fps +6%
Zotac Magnus One (ECM73070C), Intel Core i7-10700
NVIDIA GeForce RTX 3070
367 fps
Intel Core i5-10400F, Intel Core i5-10400F
NVIDIA Titan RTX
364.3 fps -1%
Intel Core i7-9700K, AMD Radeon RX Vega 64, Intel Core i7-9700K
AMD Radeon RX Vega 64
199.5 fps -46%
Energy (energy-02)
Intel Core i5-10600K, Intel Core i5-10600K
NVIDIA Titan RTX
53.3 fps +89%
Intel Core i9-10900K, Intel Core i9-10900K
NVIDIA Titan RTX
53.2 fps +89%
Intel Core i5-10400F, Intel Core i5-10400F
NVIDIA Titan RTX
53 fps +88%
AMD Ryzen 7 5800X, AMD Ryzen 7 5800X
NVIDIA Titan RTX
52.3 fps +85%
AMD Ryzen 5 5600X, AMD Ryzen 5 5600X
NVIDIA Titan RTX
52.2 fps +85%
Intel Core i3-10100, Intel Core i3-10100
NVIDIA Titan RTX
52.2 fps +85%
Zotac Magnus One (ECM73070C), Intel Core i7-10700
NVIDIA GeForce RTX 3070
28.2 fps
Intel Core i7-9700K, AMD Radeon RX Vega 64, Intel Core i7-9700K
AMD Radeon RX Vega 64
7.55 fps -73%
Creo (creo-02)
AMD Ryzen 7 5800X, AMD Ryzen 7 5800X
NVIDIA Titan RTX
353.3 fps +47%
AMD Ryzen 5 5600X, AMD Ryzen 5 5600X
NVIDIA Titan RTX
350 fps +45%
Intel Core i3-10100, Intel Core i3-10100
NVIDIA Titan RTX
338.7 fps +41%
Intel Core i9-10900K, Intel Core i9-10900K
NVIDIA Titan RTX
336.3 fps +40%
Intel Core i5-10600K, Intel Core i5-10600K
NVIDIA Titan RTX
331.7 fps +38%
Intel Core i5-10400F, Intel Core i5-10400F
NVIDIA Titan RTX
328.5 fps +36%
Zotac Magnus One (ECM73070C), Intel Core i7-10700
NVIDIA GeForce RTX 3070
241 fps
Intel Core i7-9700K, AMD Radeon RX Vega 64, Intel Core i7-9700K
AMD Radeon RX Vega 64
108.9 fps -55%
Catia (catia-05)
AMD Ryzen 5 5600X, AMD Ryzen 5 5600X
NVIDIA Titan RTX
427.8 fps +150%
AMD Ryzen 7 5800X, AMD Ryzen 7 5800X
NVIDIA Titan RTX
415.1 fps +143%
Intel Core i9-10900K, Intel Core i9-10900K
NVIDIA Titan RTX
362.1 fps +112%
Intel Core i5-10600K, Intel Core i5-10600K
NVIDIA Titan RTX
341.7 fps +100%
Intel Core i3-10100, Intel Core i3-10100
NVIDIA Titan RTX
324.6 fps +90%
Intel Core i5-10400F, Intel Core i5-10400F
NVIDIA Titan RTX
314.8 fps +84%
Intel Core i7-9700K, AMD Radeon RX Vega 64, Intel Core i7-9700K
AMD Radeon RX Vega 64
236 fps +38%
Zotac Magnus One (ECM73070C), Intel Core i7-10700
NVIDIA GeForce RTX 3070
171 fps
3ds Max (3dsmax-06)
AMD Ryzen 5 5600X, AMD Ryzen 5 5600X
NVIDIA Titan RTX
298.8 fps +40%
AMD Ryzen 7 5800X, AMD Ryzen 7 5800X
NVIDIA Titan RTX
297.6 fps +40%
Intel Core i5-10600K, Intel Core i5-10600K
NVIDIA Titan RTX
294.4 fps +38%
Intel Core i9-10900K, Intel Core i9-10900K
NVIDIA Titan RTX
292.5 fps +37%
Intel Core i5-10400F, Intel Core i5-10400F
NVIDIA Titan RTX
288.3 fps +35%
Intel Core i3-10100, Intel Core i3-10100
NVIDIA Titan RTX
288.2 fps +35%
Zotac Magnus One (ECM73070C), Intel Core i7-10700
NVIDIA GeForce RTX 3070
213 fps
Intel Core i7-9700K, AMD Radeon RX Vega 64, Intel Core i7-9700K
AMD Radeon RX Vega 64
131 fps -38%

3D e prestazioni gaming

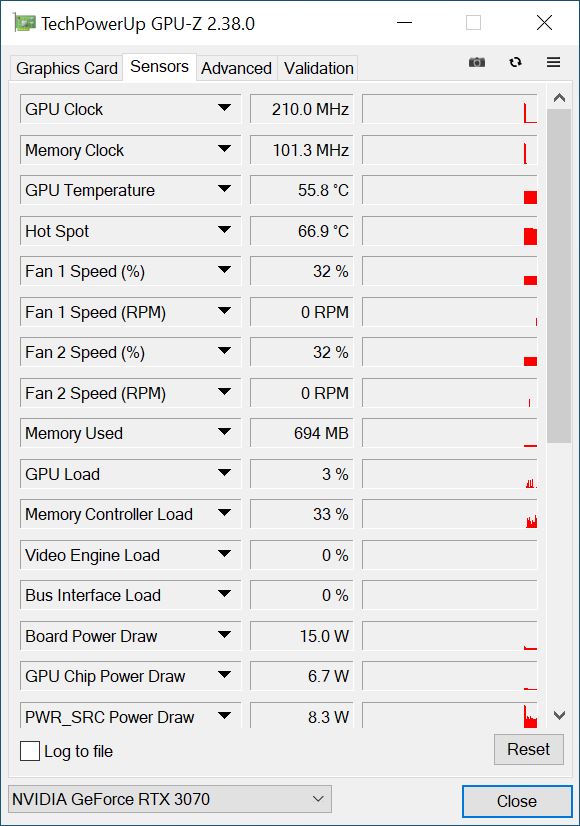
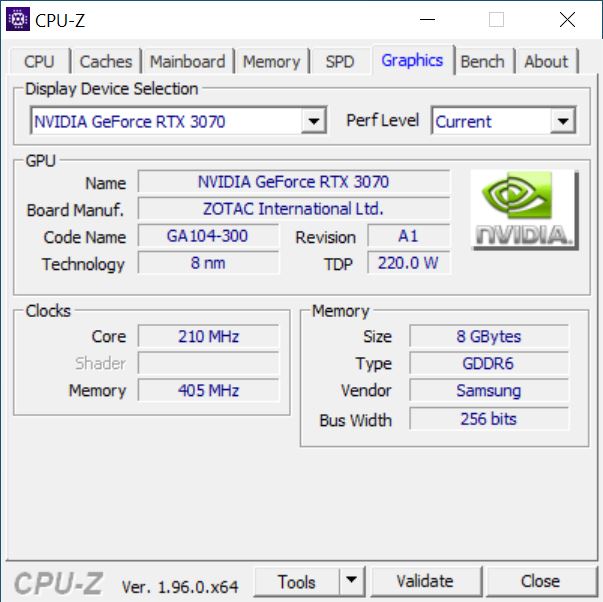
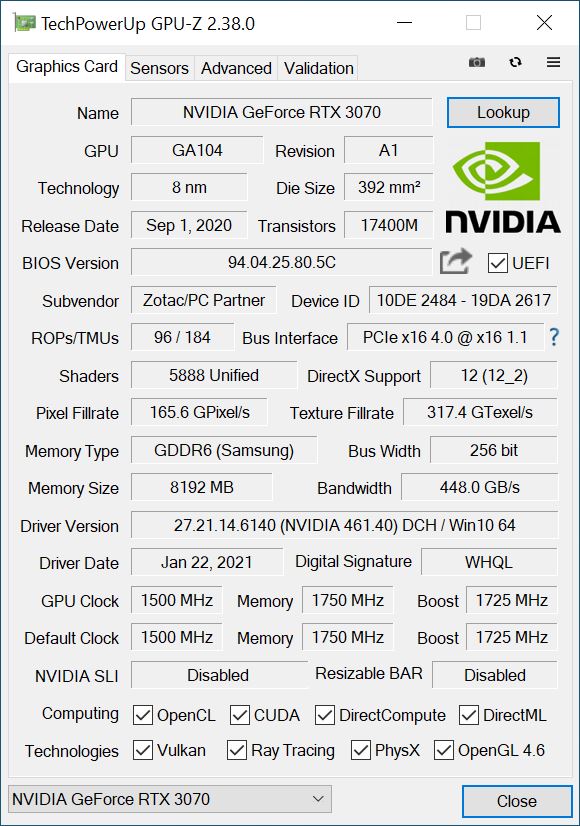
Una Nvidia GeForce RTX 3070 che proviene direttamente dal portafoglio interno di Zotac è responsabile delle buone prestazioni 3D. Il sistema ha fornito buone performance nel test e ha ottenuto un punteggio complessivo leggermente migliore rispetto ai test precedenti che hanno esaminato solo la CPU. In termini di prestazioni pure, il Magnus One con GeForce RTX 3070 si posiziona proprio dietro il nostro sistema di test basato sul leggermente più veloce AMD Ryzen 9 5900X e l'MSI GeForce RTX 3070 Ventus 3X. Tuttavia, le prestazioni leggermente inferiori non possono essere descritte come degne di nota. Tuttavia, la RTX 3070 ha vita facile quando si tratta della generazione precedente dotata di RTX 2070 Super. Un miglioramento fino al 30% delle prestazioni è possibile, ed è sicuramente percepibile anche quando si gioca. L'equipaggiamento del Magnus One permette certamente di godere di molti giochi a 2160p, anche se il gaming a 1440p dovrebbe essere l'obiettivo principale.

Per ulteriori confronti e benchmarks riguardanti le prestazioni della RTX 3070, controllate la nostra tabella di confronto delle GPU.

Borderlands 3 - 1920x1080 Badass Overall Quality (DX11)
Zotac Magnus One (ECM73070C)
NVIDIA GeForce RTX 3070, i7-10700, Phison 512GB PA6620060U
98.8 fps
MSI GeForce RTX 3070 Ventus 3X
NVIDIA GeForce RTX 3070, R9 5900X, Intel Optane 905P 480GB 2.5
95.3 fps -4%
Media NVIDIA GeForce RTX 2070 Super (Desktop)
  (74.3 - 86, n=5)
80.9 fps -18%
Nvidia GeForce RTX 2070 Super
GeForce RTX 2070 Super (Desktop), R9 3900X
79.4 fps -20%
KFA2 GeForce RTX 2070 Super Work The Frames
GeForce RTX 2070 Super (Desktop), R9 3900X
79 fps -20%
Media NVIDIA GeForce RTX 2070 (Desktop)
  (70.9 - 74.4, n=2)
72.7 fps -26%
Media NVIDIA GeForce RTX 2060 Super (Desktop)
  (68.6 - 74.1, n=4)
71.2 fps -28%
Metro Exodus - 1920x1080 Ultra Quality AF:16x
MSI GeForce RTX 3070 Ventus 3X
NVIDIA GeForce RTX 3070, R9 5900X, Intel Optane 905P 480GB 2.5
93.7 (46.52min - 161.6max) fps +1%
Zotac Magnus One (ECM73070C)
NVIDIA GeForce RTX 3070, i7-10700, Phison 512GB PA6620060U
93.1 (45.73min - 151.06max) fps
Media NVIDIA GeForce RTX 2070 Super (Desktop)
  (67.8 - 79.1, n=5)
72.3 fps -22%
KFA2 GeForce RTX 2070 Super Work The Frames
GeForce RTX 2070 Super (Desktop), R9 3900X
70 (33min - 128max) fps -25%
Nvidia GeForce RTX 2070 Super
GeForce RTX 2070 Super (Desktop), R7 2700X
67.8 (36min - 110max) fps -27%
Media NVIDIA GeForce RTX 2060 Super (Desktop)
  (58 - 67.4, n=4)
62.3 fps -33%
Media NVIDIA GeForce RTX 2070 (Desktop)
  (33.4 - 62.8, n=4)
54.4 fps -42%
Far Cry New Dawn - 1920x1080 Ultra Preset
MSI GeForce RTX 3070 Ventus 3X
NVIDIA GeForce RTX 3070, R9 5900X, Intel Optane 905P 480GB 2.5
116 (77min - 187max) fps +22%
Media NVIDIA GeForce RTX 2070 Super (Desktop)
  (80 - 133, n=5)
105.6 fps +11%
Media NVIDIA GeForce RTX 2060 Super (Desktop)
  (85 - 121, n=4)
105.5 fps +11%
KFA2 GeForce RTX 2070 Super Work The Frames
GeForce RTX 2070 Super (Desktop), R9 3900X
98 (69min - 151max) fps +3%
Zotac Magnus One (ECM73070C)
NVIDIA GeForce RTX 3070, i7-10700, Phison 512GB PA6620060U
95 (66min - 149max) fps
Media NVIDIA GeForce RTX 2070 (Desktop)
  (79 - 94, n=3)
87.7 fps -8%
Nvidia GeForce RTX 2070 Super
GeForce RTX 2070 Super (Desktop), R7 2700X
87 (63min - 135max) fps -8%
Far Cry 5 - 1920x1080 Ultra Preset AA:T
MSI GeForce RTX 3070 Ventus 3X
NVIDIA GeForce RTX 3070, R9 5900X, Intel Optane 905P 480GB 2.5
143 (108min - 192max) fps +22%
Media NVIDIA GeForce RTX 2070 Super (Desktop)
  (99 - 148, n=5)
121.8 fps +4%
Zotac Magnus One (ECM73070C)
NVIDIA GeForce RTX 3070, i7-10700, Phison 512GB PA6620060U
117 (89min - 155max) fps
Media NVIDIA GeForce RTX 2060 Super (Desktop)
  (99 - 130, n=4)
116.3 fps -1%
KFA2 GeForce RTX 2070 Super Work The Frames
GeForce RTX 2070 Super (Desktop), R9 3900X
110 (86min - 143max) fps -6%
Media NVIDIA GeForce RTX 2070 (Desktop)
  (86 - 105, n=4)
99.8 fps -15%
Nvidia GeForce RTX 2070 Super
GeForce RTX 2070 Super (Desktop), R7 2700X
99 (76min - 132max) fps -15%
X-Plane 11.11 - 1920x1080 high (fps_test=3)
Media NVIDIA GeForce RTX 2060 Super (Desktop)
  (77 - 158.2, n=4)
120 fps +32%
Media NVIDIA GeForce RTX 2070 Super (Desktop)
  (66.8 - 157.3, n=6)
104.8 fps +15%
MSI GeForce RTX 3070 Ventus 3X
NVIDIA GeForce RTX 3070, R9 5900X, Intel Optane 905P 480GB 2.5
95.4 fps +5%
Media NVIDIA GeForce RTX 2070 (Desktop)
  ()
92.7 fps +2%
KFA2 GeForce RTX 2070 Super Work The Frames
GeForce RTX 2070 Super (Desktop), R9 3900X
91.9 fps +1%
Zotac Magnus One (ECM73070C)
NVIDIA GeForce RTX 3070, i7-10700, Phison 512GB PA6620060U
91 fps
Nvidia GeForce RTX 2070 Super
GeForce RTX 2070 Super (Desktop), R7 2700X
76 fps -16%
Final Fantasy XV Benchmark - 1920x1080 High Quality
MSI GeForce RTX 3070 Ventus 3X
NVIDIA GeForce RTX 3070, R9 5900X, Intel Optane 905P 480GB 2.5
122 fps +9%
Zotac Magnus One (ECM73070C)
NVIDIA GeForce RTX 3070, i7-10700, Phison 512GB PA6620060U
112 fps
Media NVIDIA GeForce RTX 2070 Super (Desktop)
  (75.5 - 120, n=6)
99.5 fps -11%
Nvidia GeForce RTX 2070 Super
GeForce RTX 2070 Super (Desktop), R7 2700X
89 (45min - 141max) fps -21%
Media NVIDIA GeForce RTX 2060 Super (Desktop)
  (79 - 93.8, n=4)
86.4 fps -23%
Media NVIDIA GeForce RTX 2070 (Desktop)
  (60.8 - 90.6, n=5)
81.9 fps -27%
KFA2 GeForce RTX 2070 Super Work The Frames
GeForce RTX 2070 Super (Desktop), R9 3900X
75.5 (49min - 135max) fps -33%
Dota 2 Reborn - 1920x1080 ultra (3/3) best looking
Media NVIDIA GeForce RTX 2060 Super (Desktop)
  (109.8 - 241, n=4)
180.3 fps +39%
Media NVIDIA GeForce RTX 2070 Super (Desktop)
  (103.2 - 236, n=6)
154.6 fps +19%
KFA2 GeForce RTX 2070 Super Work The Frames
GeForce RTX 2070 Super (Desktop), R9 3900X
136.7 (117.4min) fps +5%
MSI GeForce RTX 3070 Ventus 3X
NVIDIA GeForce RTX 3070, R9 5900X, Intel Optane 905P 480GB 2.5
136.3 (108.9min) fps +5%
Media NVIDIA GeForce RTX 2070 (Desktop)
  ()
130.3 fps 0%
Zotac Magnus One (ECM73070C)
NVIDIA GeForce RTX 3070, i7-10700, Phison 512GB PA6620060U
129.7 (113.4min) fps
Nvidia GeForce RTX 2070 Super
GeForce RTX 2070 Super (Desktop), R7 2700X
107.7 (90.5min) fps -17%
The Witcher 3 - 1920x1080 Ultra Graphics & Postprocessing (HBAO+)
MSI GeForce RTX 3070 Ventus 3X
NVIDIA GeForce RTX 3070, R9 5900X, Intel Optane 905P 480GB 2.5
121 (112min - 134max) fps 0%
Zotac Magnus One (ECM73070C)
NVIDIA GeForce RTX 3070, i7-10700, Phison 512GB PA6620060U
121 fps
Media NVIDIA GeForce RTX 2070 Super (Desktop)
  (95.6 - 109.6, n=6)
100.9 fps -17%
KFA2 GeForce RTX 2070 Super Work The Frames
GeForce RTX 2070 Super (Desktop), R9 3900X
99.4 (89min - 109max) fps -18%
Nvidia GeForce RTX 2070 Super
GeForce RTX 2070 Super (Desktop), R7 2700X
97 (83min - 109max) fps -20%
Media NVIDIA GeForce RTX 2060 Super (Desktop)
  (79 - 91.1, n=5)
84.8 fps -30%
Media NVIDIA GeForce RTX 2070 (Desktop)
  (40.9 - 95, n=5)
79.2 fps -35%
3DMark
Fire Strike Extreme Graphics
MSI GeForce RTX 3070 Ventus 3X
NVIDIA GeForce RTX 3070, R9 5900X, Intel Optane 905P 480GB 2.5
15722 Points +1%
Zotac Magnus One (ECM73070C)
NVIDIA GeForce RTX 3070, i7-10700, Phison 512GB PA6620060U
15597 Points
KFA2 GeForce RTX 2070 Super Work The Frames
GeForce RTX 2070 Super (Desktop), R9 3900X
11976 Points -23%
Nvidia GeForce RTX 2070 Super
GeForce RTX 2070 Super (Desktop), R9 3900X
11951 Points -23%
Media NVIDIA GeForce RTX 2070 Super (Desktop)
  (11382 - 12044, n=7)
11850 Points -24%
Nvidia GeForce RTX 2070 Super
GeForce RTX 2070 Super (Desktop), R7 2700X
11634 Points -25%
Media NVIDIA GeForce RTX 2070 (Desktop)
  (9979 - 11423, n=5)
10987 Points -30%
Media NVIDIA GeForce RTX 2060 Super (Desktop)
  (10182 - 10726, n=6)
10498 Points -33%
1920x1080 Fire Strike Graphics
MSI GeForce RTX 3070 Ventus 3X
NVIDIA GeForce RTX 3070, R9 5900X, Intel Optane 905P 480GB 2.5
31020 Points +3%
Zotac Magnus One (ECM73070C)
NVIDIA GeForce RTX 3070, i7-10700, Phison 512GB PA6620060U
30090 Points
Media NVIDIA GeForce RTX 2070 Super (Desktop)
  (22819 - 25799, n=8)
24645 Points -18%
Nvidia GeForce RTX 2070 Super
GeForce RTX 2070 Super (Desktop), R9 3900X
24640 Points -18%
KFA2 GeForce RTX 2070 Super Work The Frames
GeForce RTX 2070 Super (Desktop), R9 3900X
24637 Points -18%
Nvidia GeForce RTX 2070 Super
GeForce RTX 2070 Super (Desktop), R7 2700X
24151 Points -20%
Media NVIDIA GeForce RTX 2070 (Desktop)
  (16770 - 24242, n=6)
21999 Points -27%
Media NVIDIA GeForce RTX 2060 Super (Desktop)
  (20522 - 22764, n=7)
21970 Points -27%
2560x1440 Time Spy Graphics
MSI GeForce RTX 3070 Ventus 3X
NVIDIA GeForce RTX 3070, R9 5900X, Intel Optane 905P 480GB 2.5
13111 Points +3%
Zotac Magnus One (ECM73070C)
NVIDIA GeForce RTX 3070, i7-10700, Phison 512GB PA6620060U
12668 Points
Nvidia GeForce RTX 2070 Super
GeForce RTX 2070 Super (Desktop), R7 2700X
10094 Points -20%
KFA2 GeForce RTX 2070 Super Work The Frames
GeForce RTX 2070 Super (Desktop), R9 3900X
9871 Points -22%
Media NVIDIA GeForce RTX 2070 Super (Desktop)
  (9564 - 10094, n=8)
9846 Points -22%
Nvidia GeForce RTX 2070 Super
GeForce RTX 2070 Super (Desktop), R9 3900X
9623 Points -24%
Media NVIDIA GeForce RTX 2070 (Desktop)
  (7445 - 9656, n=6)
8952 Points -29%
Media NVIDIA GeForce RTX 2060 Super (Desktop)
  (8396 - 8795, n=7)
8631 Points -32%
3DMark 11
1280x720 Performance GPU
MSI GeForce RTX 3070 Ventus 3X
NVIDIA GeForce RTX 3070, R9 5900X, Intel Optane 905P 480GB 2.5
43005 Points +5%
Zotac Magnus One (ECM73070C)
NVIDIA GeForce RTX 3070, i7-10700, Phison 512GB PA6620060U
40950 Points
Nvidia GeForce RTX 2070 Super
GeForce RTX 2070 Super (Desktop), R9 3900X
35377 Points -14%
Media NVIDIA GeForce RTX 2070 Super (Desktop)
  (33257 - 37235, n=7)
34830 Points -15%
Nvidia GeForce RTX 2070 Super
GeForce RTX 2070 Super (Desktop), R7 2700X
33293 Points -19%
KFA2 GeForce RTX 2070 Super Work The Frames
GeForce RTX 2070 Super (Desktop), R9 3900X
33257 Points -19%
Media NVIDIA GeForce RTX 2070 (Desktop)
  (22174 - 32373, n=7)
29866 Points -27%
Media NVIDIA GeForce RTX 2060 Super (Desktop)
  (29148 - 30099, n=6)
29642 Points -28%
1280x720 Performance
MSI GeForce RTX 3070 Ventus 3X
NVIDIA GeForce RTX 3070, R9 5900X, Intel Optane 905P 480GB 2.5
33248 Points +14%
Zotac Magnus One (ECM73070C)
NVIDIA GeForce RTX 3070, i7-10700, Phison 512GB PA6620060U
29057 Points
Nvidia GeForce RTX 2070 Super
GeForce RTX 2070 Super (Desktop), R9 3900X
28994 Points 0%
Media NVIDIA GeForce RTX 2070 Super (Desktop)
  (24879 - 35274, n=7)
28582 Points -2%
KFA2 GeForce RTX 2070 Super Work The Frames
GeForce RTX 2070 Super (Desktop), R9 3900X
27896 Points -4%
Media NVIDIA GeForce RTX 2060 Super (Desktop)
  (22211 - 30486, n=6)
26110 Points -10%
Nvidia GeForce RTX 2070 Super
GeForce RTX 2070 Super (Desktop), R7 2700X
25183 Points -13%
Media NVIDIA GeForce RTX 2070 (Desktop)
  (15341 - 27206, n=7)
23703 Points -18%
Unigine Superposition
1280x720 720p Low
Media NVIDIA GeForce RTX 2070 Super (Desktop)
  (26742 - 45424, n=3)
38495 Points +41%
Media NVIDIA GeForce RTX 2060 Super (Desktop)
  (26634 - 40961, n=3)
35859 Points +31%
MSI GeForce RTX 3070 Ventus 3X
NVIDIA GeForce RTX 3070, R9 5900X, Intel Optane 905P 480GB 2.5
34602 Points +27%
Zotac Magnus One (ECM73070C)
NVIDIA GeForce RTX 3070, i7-10700, Phison 512GB PA6620060U
27330 Points
Nvidia GeForce RTX 2070 Super
GeForce RTX 2070 Super (Desktop), R9 3900X
26742 Points -2%
1920x1080 1080p High
MSI GeForce RTX 3070 Ventus 3X
NVIDIA GeForce RTX 3070, R9 5900X, Intel Optane 905P 480GB 2.5
17244 Points +1%
Zotac Magnus One (ECM73070C)
NVIDIA GeForce RTX 3070, i7-10700, Phison 512GB PA6620060U
17054 Points
Media NVIDIA GeForce RTX 2070 Super (Desktop)
  (13655 - 13832, n=3)
13765 Points -19%
Nvidia GeForce RTX 2070 Super
GeForce RTX 2070 Super (Desktop), R9 3900X
13655 Points -20%
Media NVIDIA GeForce RTX 2060 Super (Desktop)
  (11421 - 11785, n=3)
11649 Points -32%
1920x1080 1080p Extreme
MSI GeForce RTX 3070 Ventus 3X
NVIDIA GeForce RTX 3070, R9 5900X, Intel Optane 905P 480GB 2.5
8365 Points +1%
Zotac Magnus One (ECM73070C)
NVIDIA GeForce RTX 3070, i7-10700, Phison 512GB PA6620060U
8276 Points
Media NVIDIA GeForce RTX 2070 Super (Desktop)
  (6161 - 6178, n=3)
6169 Points -25%
Nvidia GeForce RTX 2070 Super
GeForce RTX 2070 Super (Desktop), R9 3900X
6167 Points -25%
Media NVIDIA GeForce RTX 2060 Super (Desktop)
  (5049 - 5143, n=3)
5105 Points -38%
3840x2160 4k Optimized
MSI GeForce RTX 3070 Ventus 3X
NVIDIA GeForce RTX 3070, R9 5900X, Intel Optane 905P 480GB 2.5
10673 Points +1%
Zotac Magnus One (ECM73070C)
NVIDIA GeForce RTX 3070, i7-10700, Phison 512GB PA6620060U
10544 Points
Nvidia GeForce RTX 2070 Super
GeForce RTX 2070 Super (Desktop), R9 3900X
8111 Points -23%
Media NVIDIA GeForce RTX 2070 Super (Desktop)
  (8096 - 8111, n=3)
8101 Points -23%
Media NVIDIA GeForce RTX 2060 Super (Desktop)
  (6747 - 6863, n=3)
6811 Points -35%
7680x4320 8k Optimized
MSI GeForce RTX 3070 Ventus 3X
NVIDIA GeForce RTX 3070, R9 5900X, Intel Optane 905P 480GB 2.5
4639 Points +1%
Zotac Magnus One (ECM73070C)
NVIDIA GeForce RTX 3070, i7-10700, Phison 512GB PA6620060U
4587 Points
Nvidia GeForce RTX 2070 Super
GeForce RTX 2070 Super (Desktop), R9 3900X
3434 Points -25%
Media NVIDIA GeForce RTX 2070 Super (Desktop)
  (3419 - 3435, n=3)
3429 Points -25%
Media NVIDIA GeForce RTX 2060 Super (Desktop)
  (2873 - 2914, n=3)
2900 Points -37%
basso medio alto ultraQHD4K
GTA V (2015) 180 173 161 95.6 91.6 110
The Witcher 3 (2015) 367 316 235 121 84
Dota 2 Reborn (2015) 164.2 143.8 138.2 129.7 127.4
Final Fantasy XV Benchmark (2018) 167 146 112 89.2 54.8
X-Plane 11.11 (2018) 124 110 91 78.8
Far Cry 5 (2018) 150 133 126 117 112 70
Strange Brigade (2018) 430 311 253 222 165 97.1
Far Cry New Dawn (2019) 126 110 106 95 92 70
Metro Exodus (2019) 166 136 116 93.1 76.1 49
Borderlands 3 (2019) 149 132 118 98.8 75.5 42.7

Emissioni

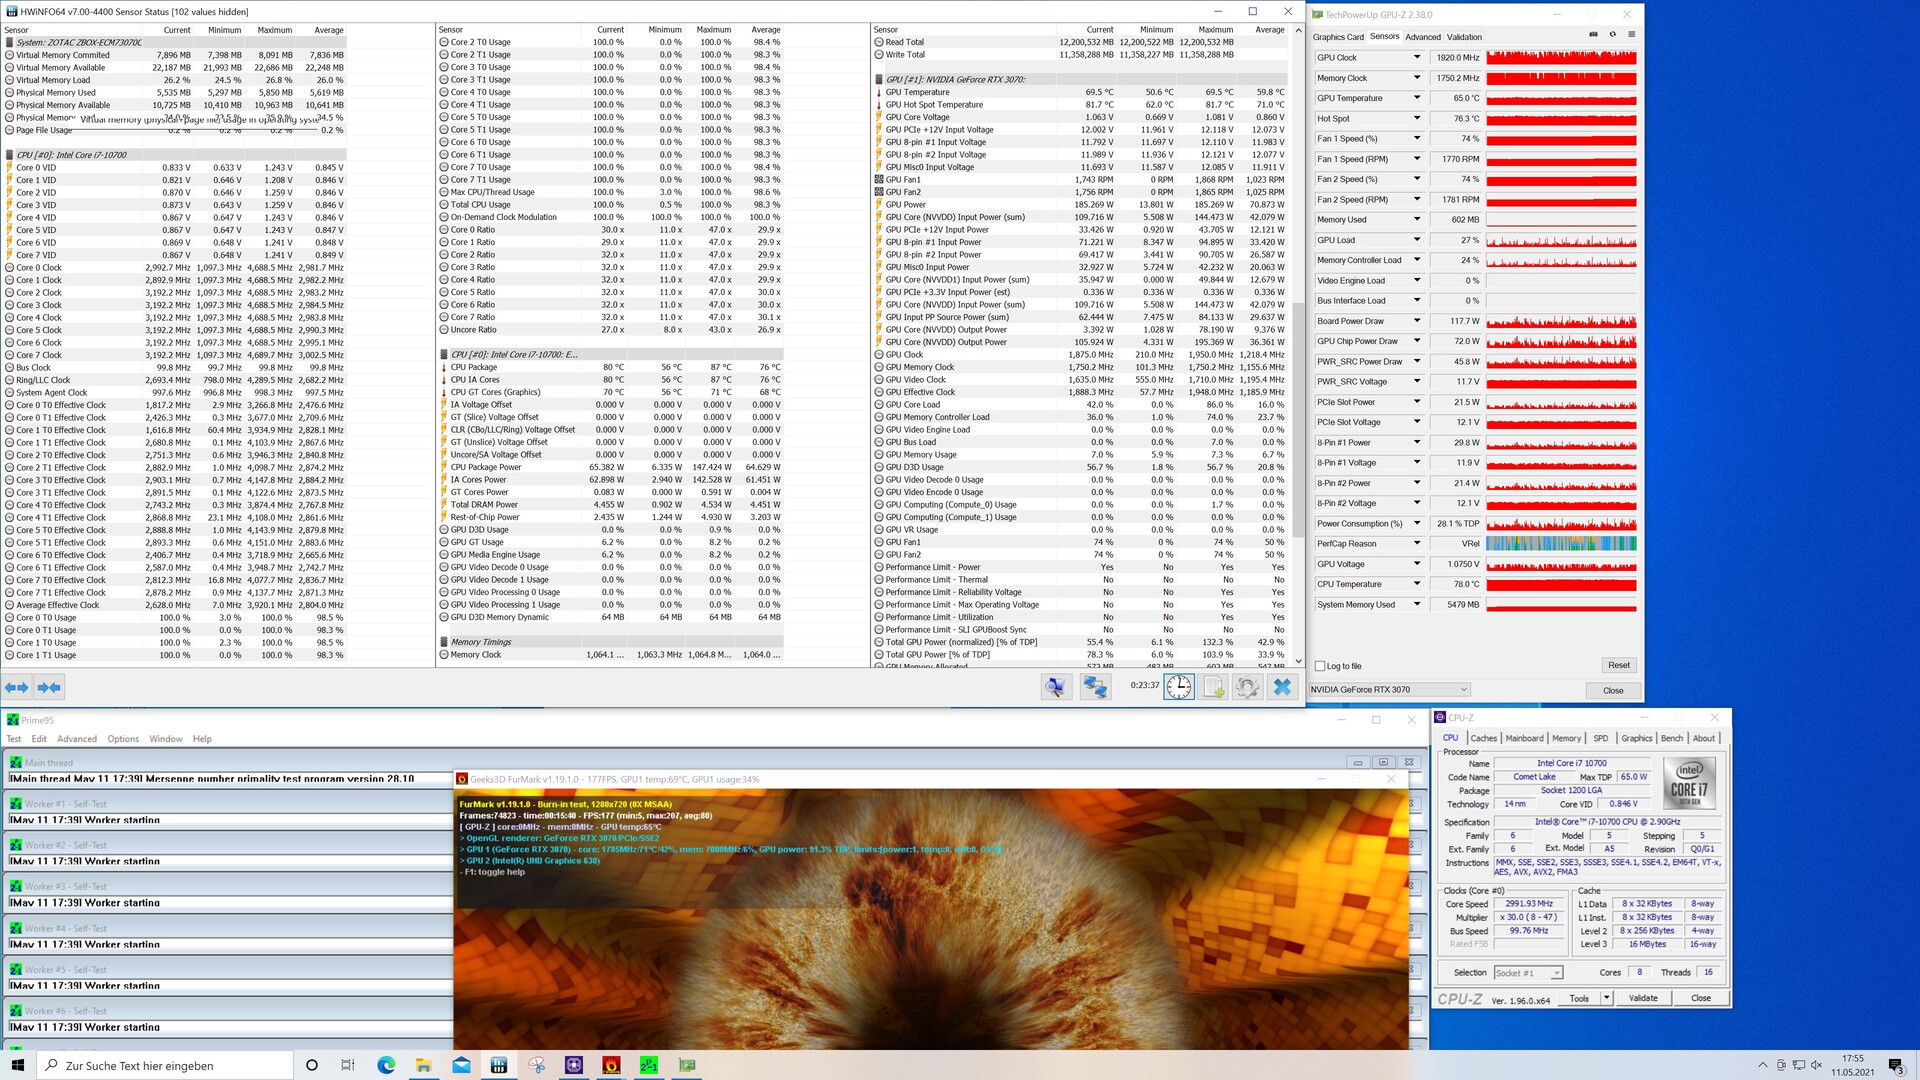
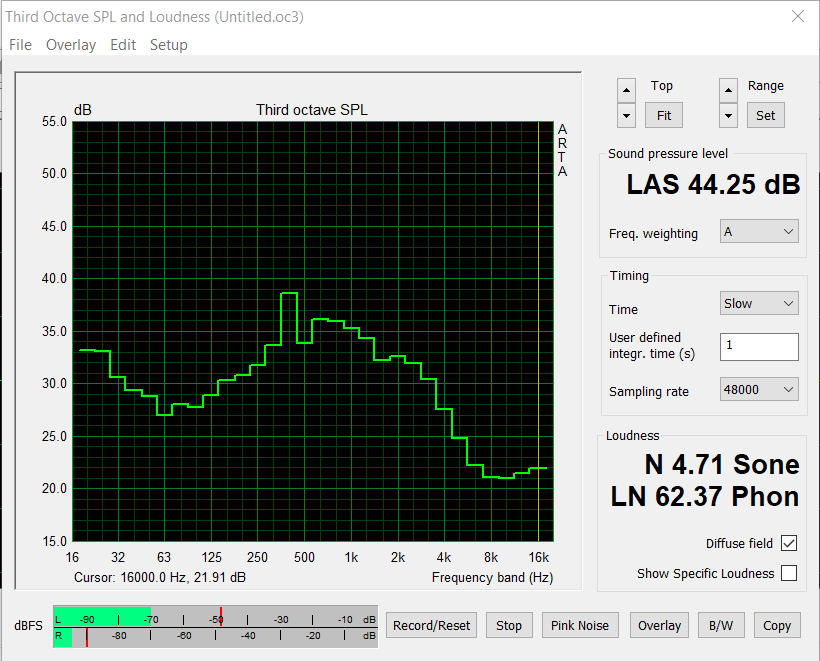
Lo Zotac Magnus One durante lo stress test

Zotac Magnus One durante lo stress test

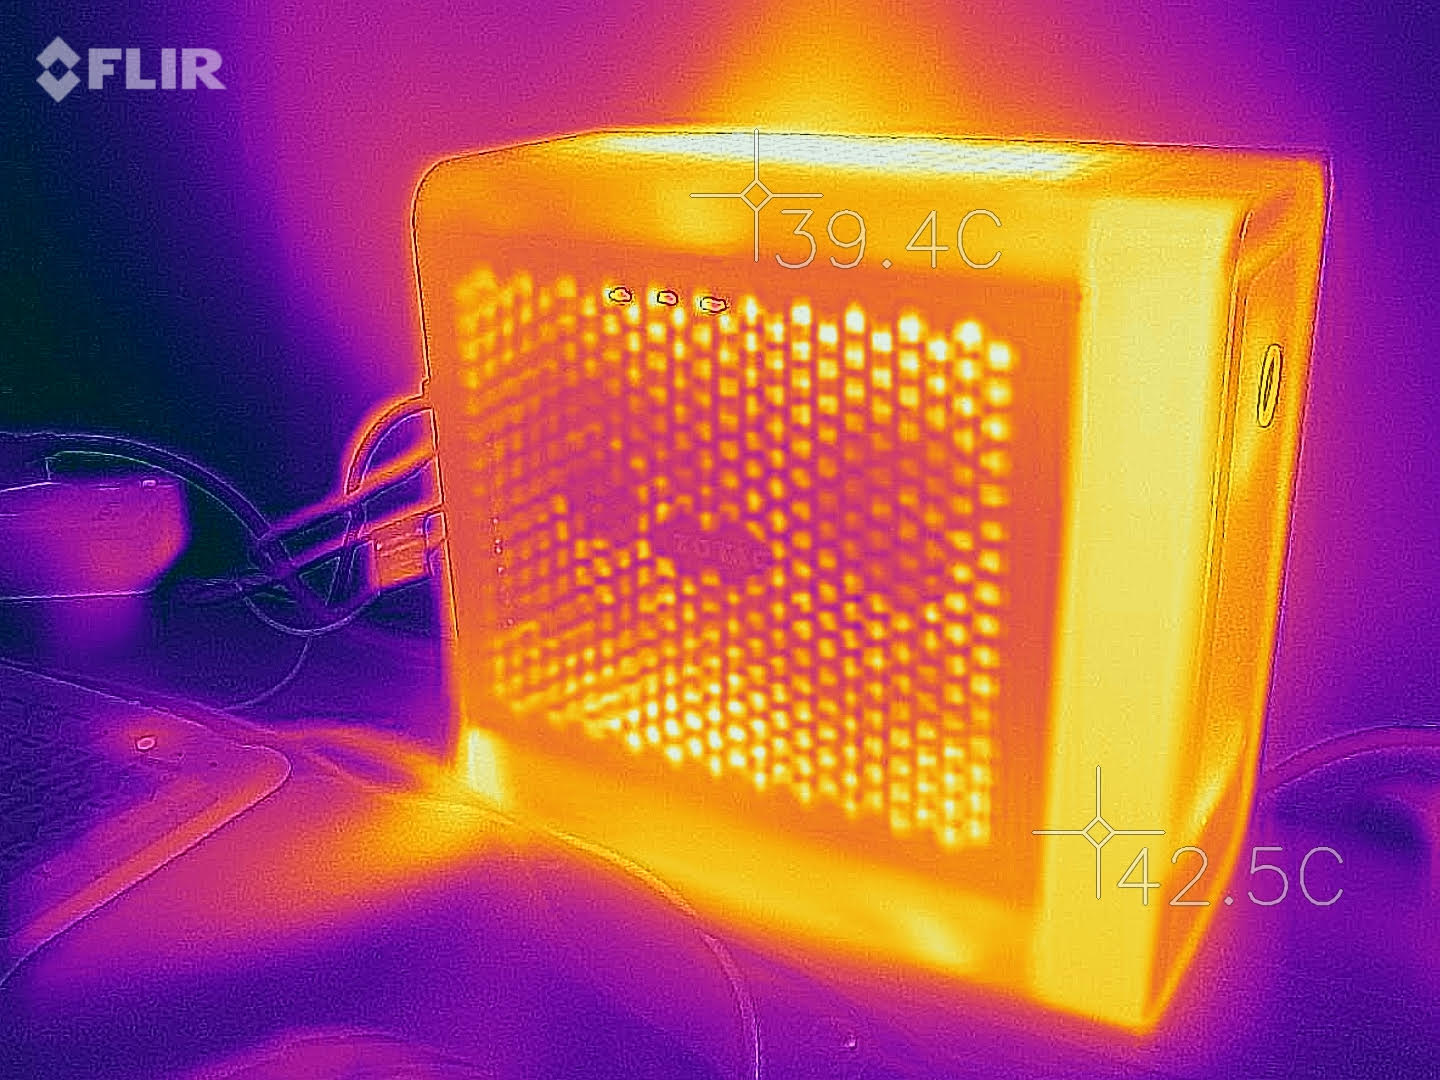
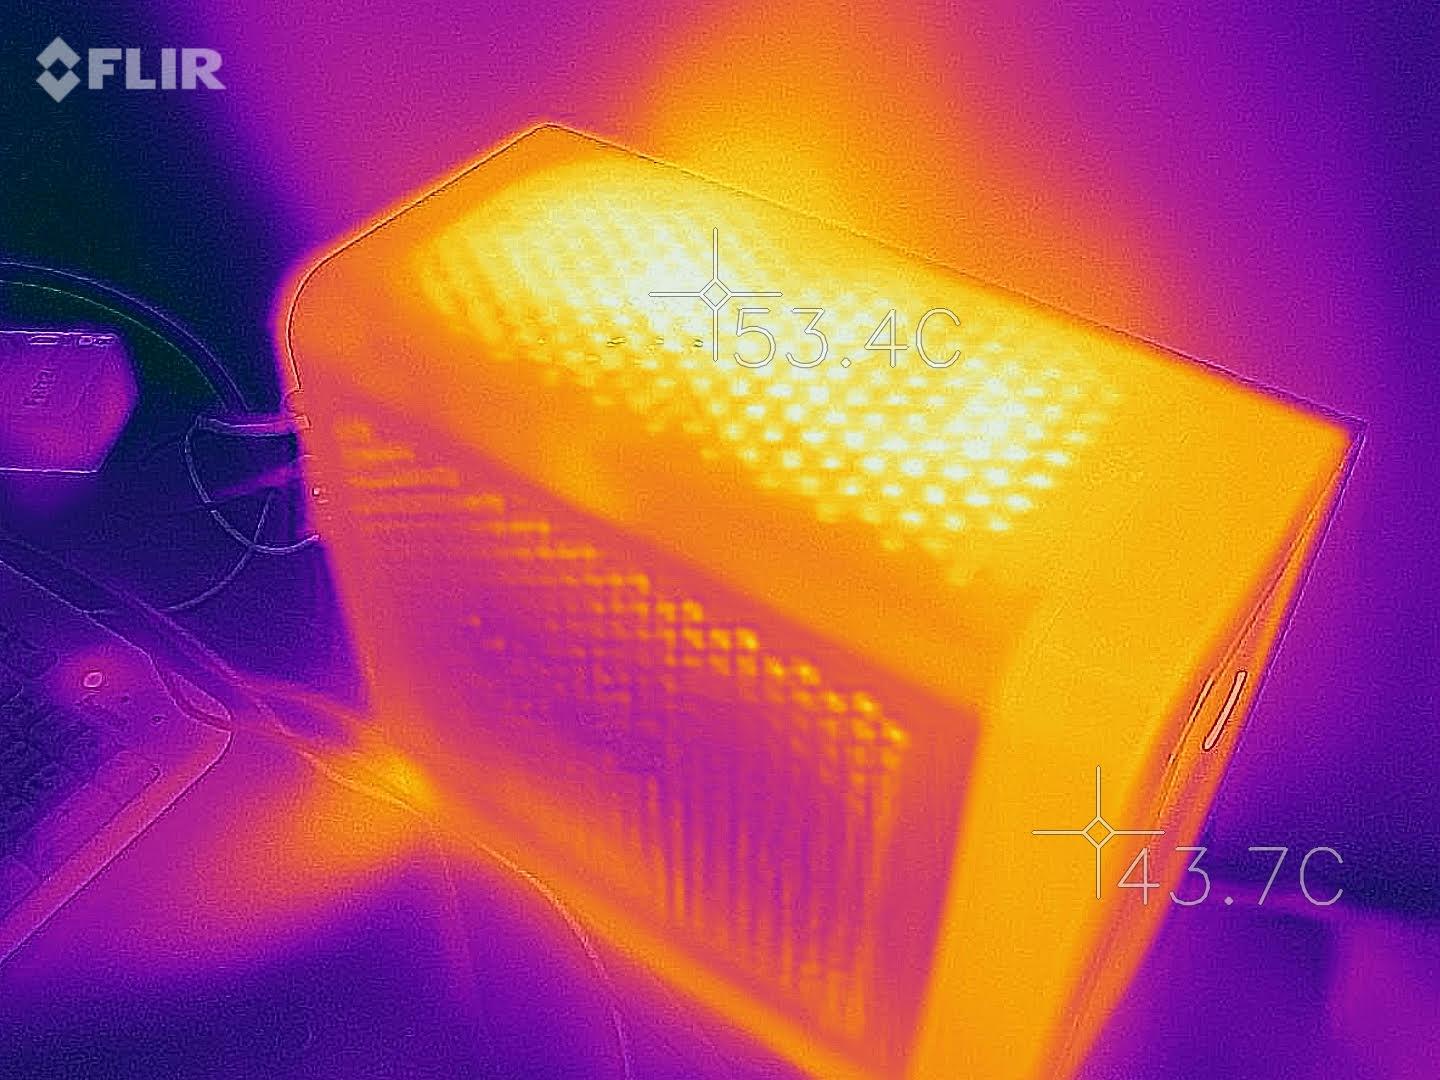
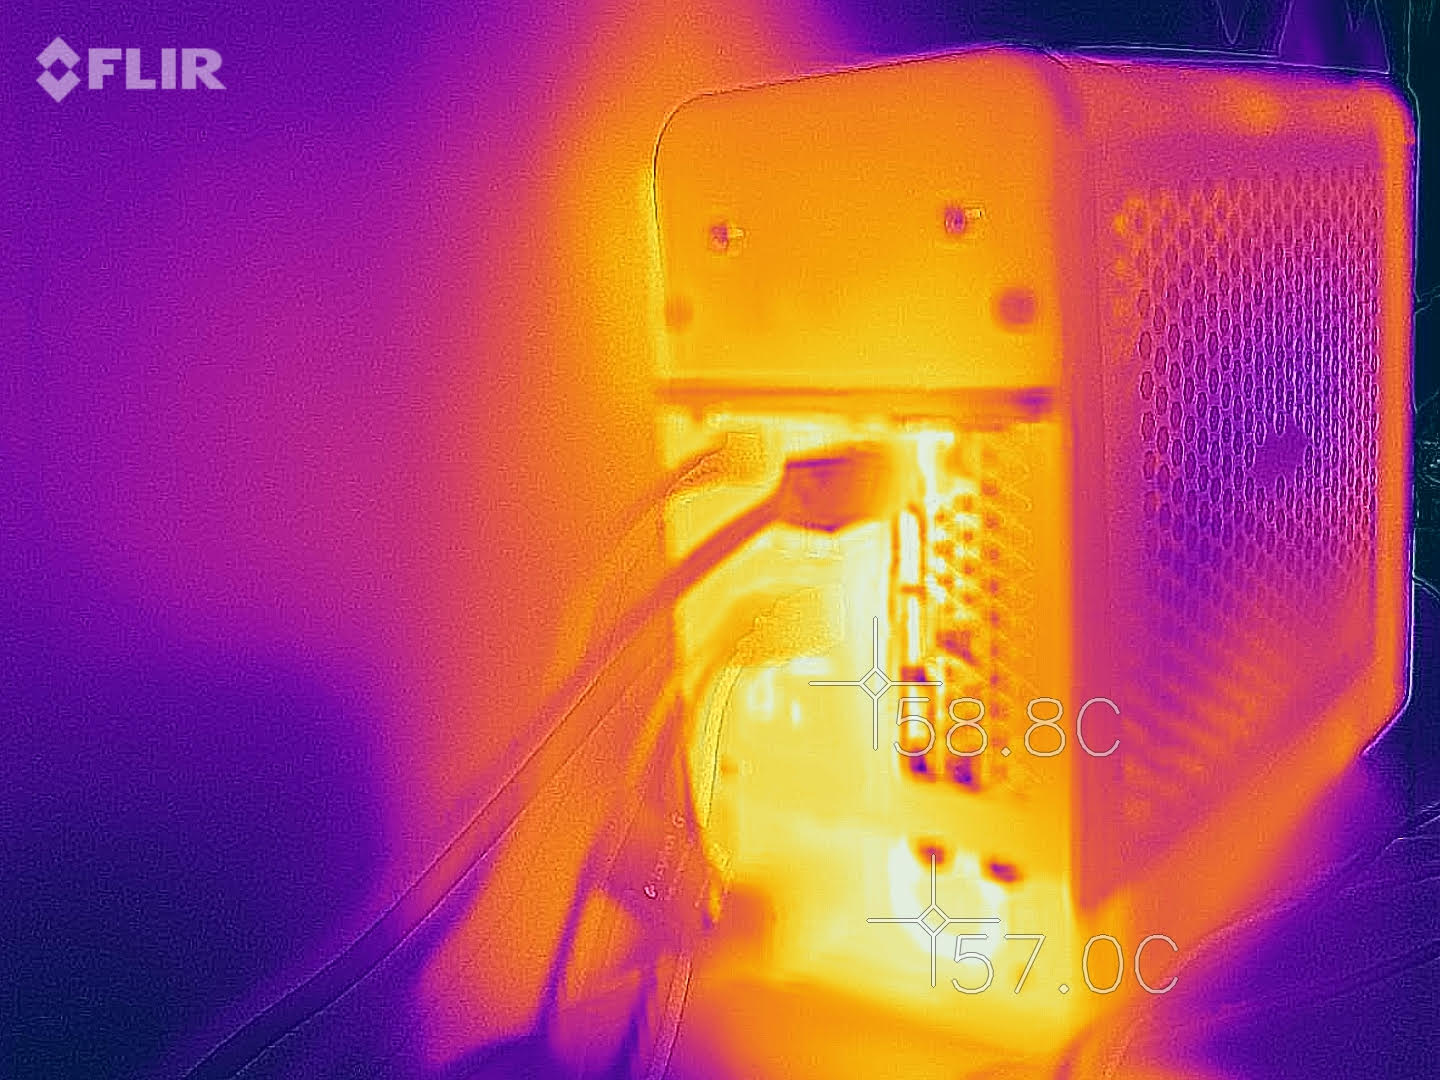
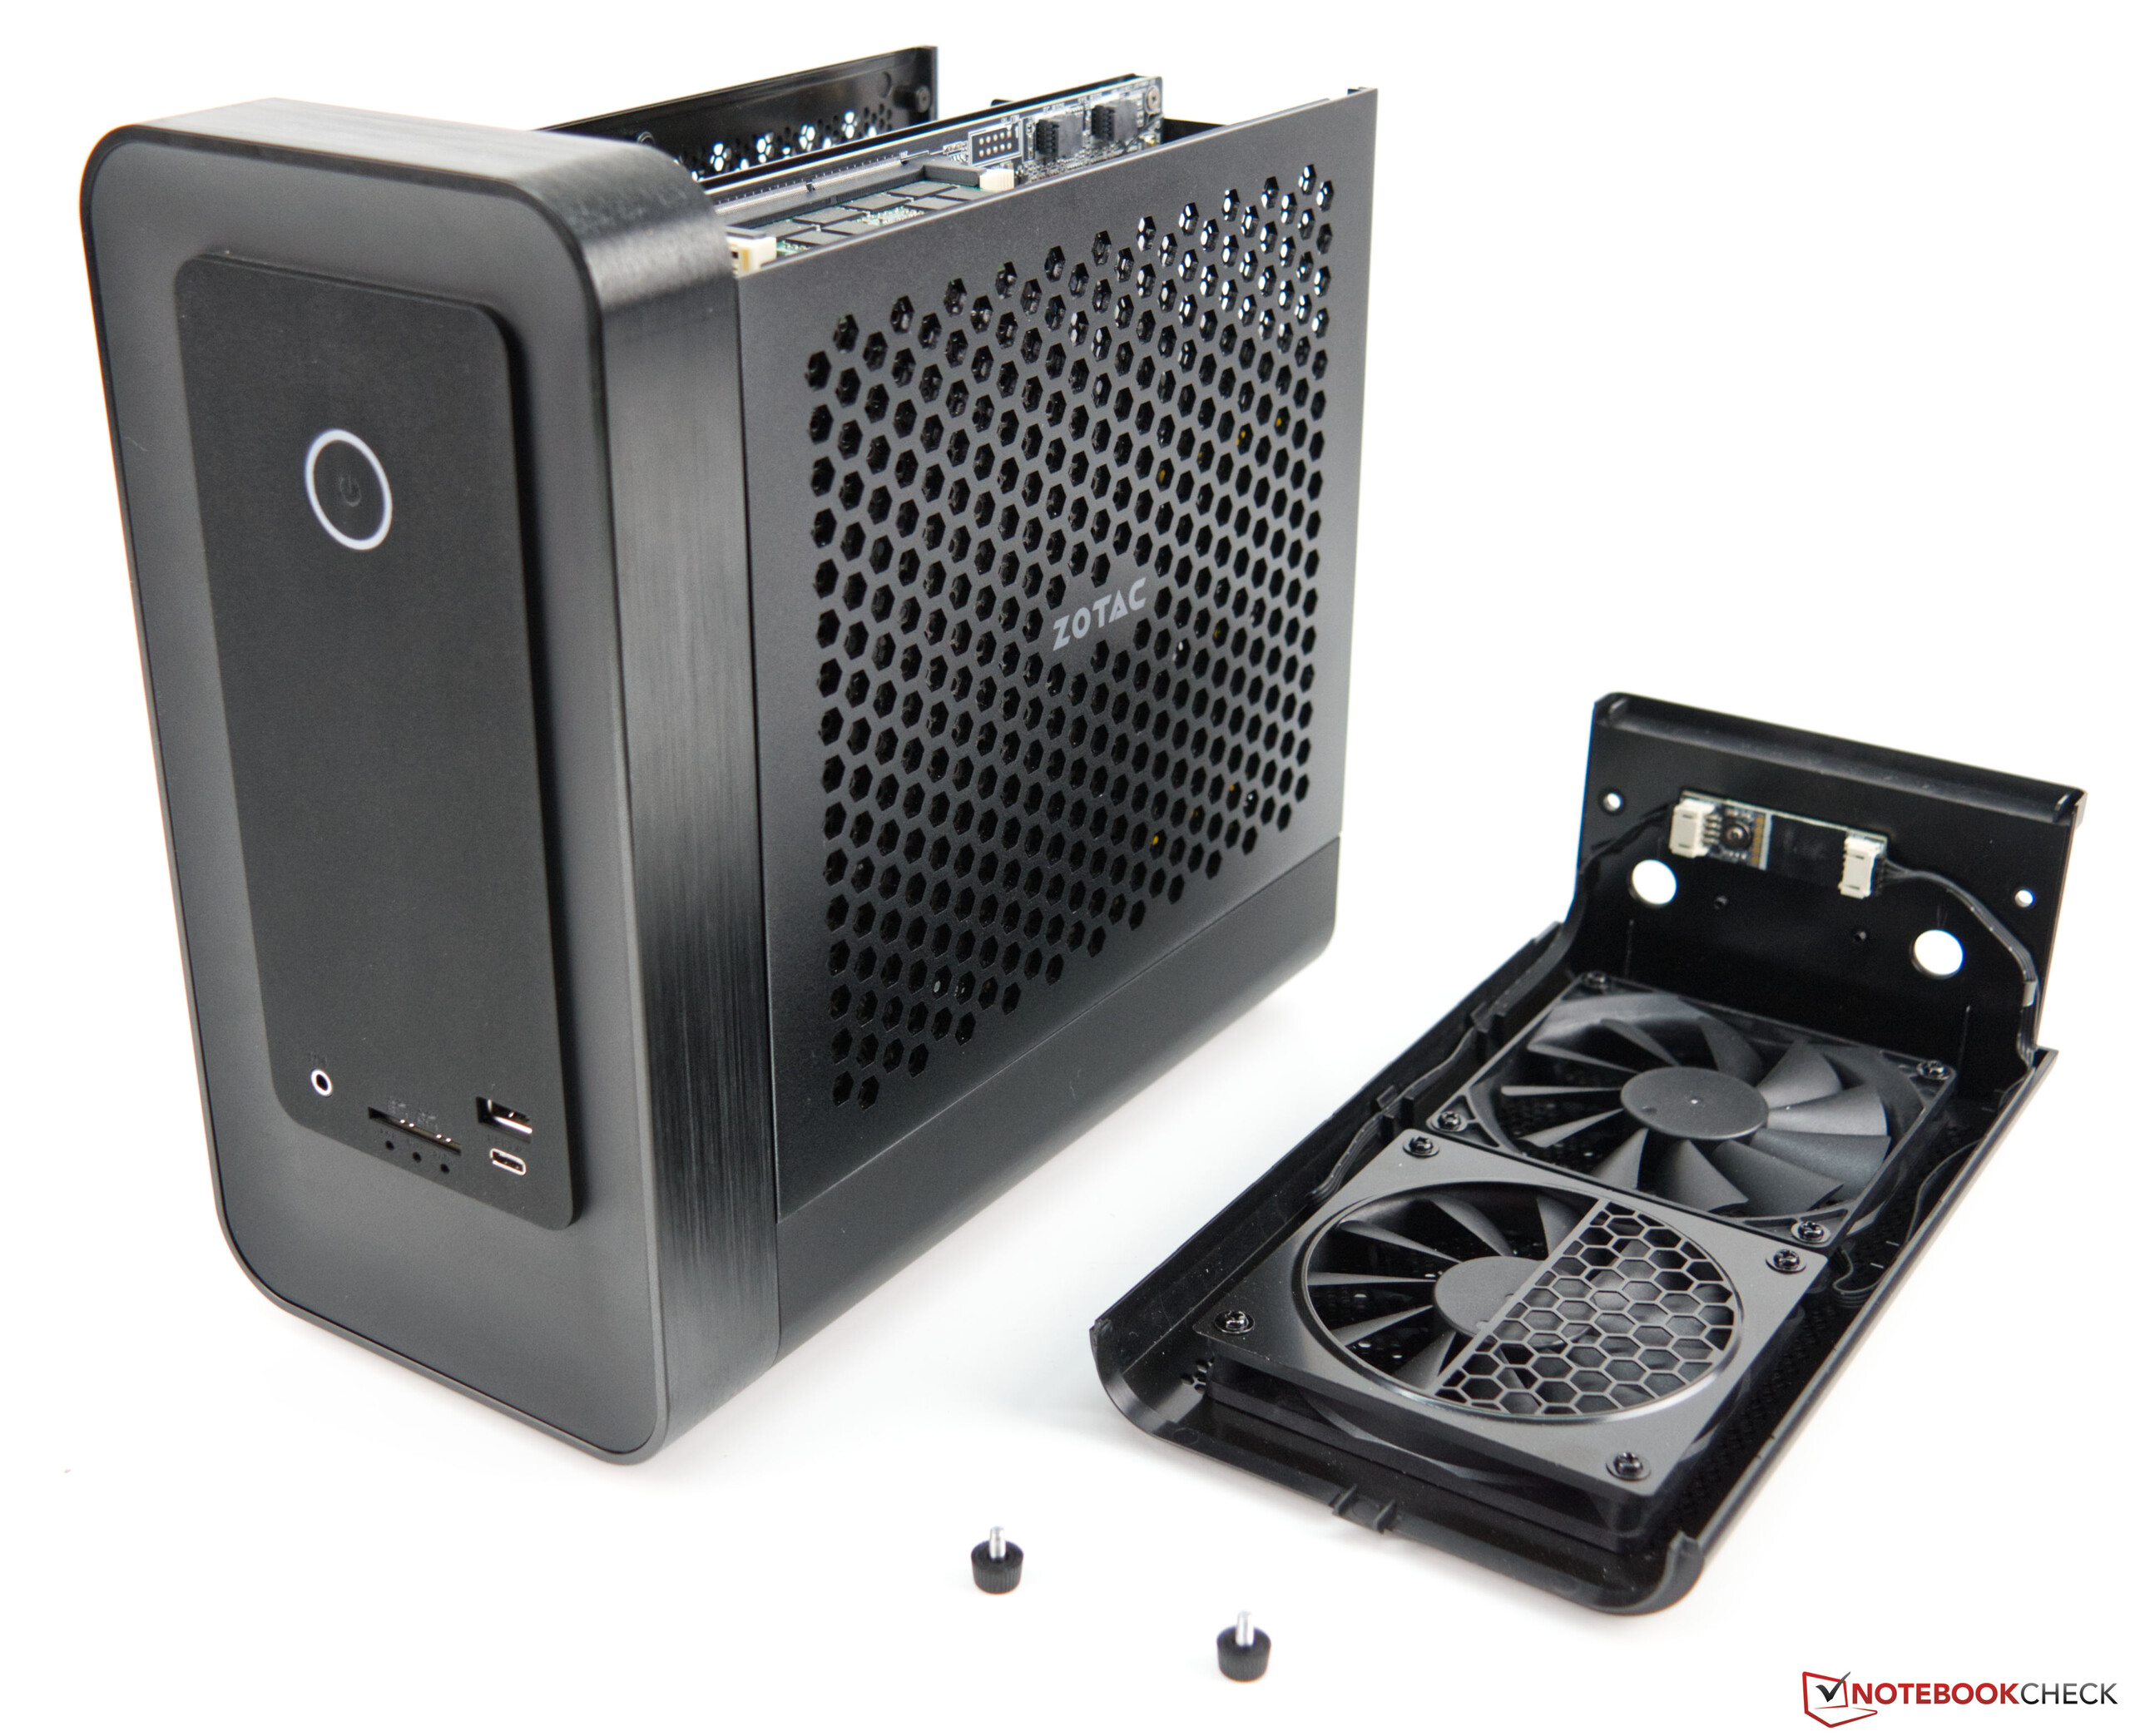
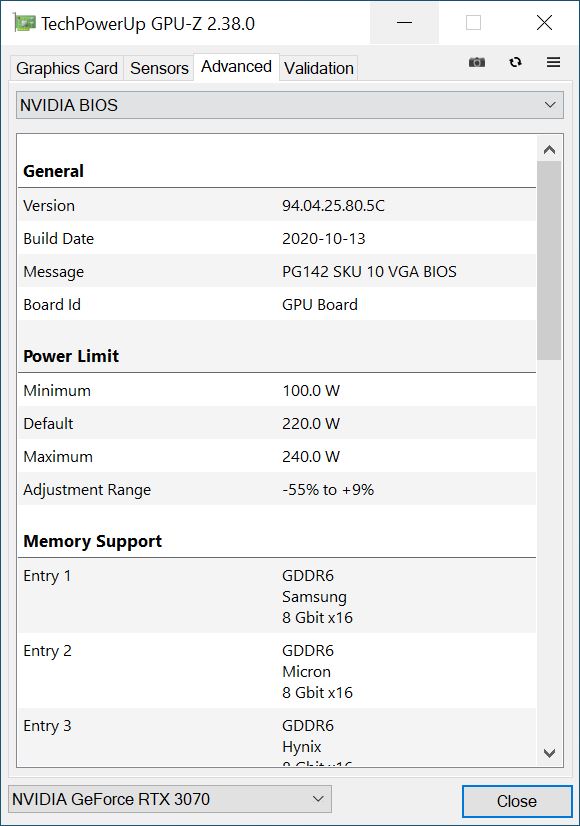
Il design compatto richiede un sistema di raffreddamento intelligente. Zotac usa il cosiddetto "effetto camino" qui e installa due ventole nella parte superiore che trasportano bene il calore residuo risultante fuori dal case. Tuttavia, l'Intel Core i7-10700 si riscalda fino a un massimo di 87 °C (~187 °F) durante lo stress test. Inoltre, la temperatura della GeForce RTX 3070 è salita fino a quasi 81 °C (~178 °F) durantelo stress test. Tutto questo è ancora entro limiti accettabili, e non c'è motivo di preoccuparsi. Anche durante lunghe sessioni di gaming, non ci sono stati cali di prestazioni degni di nota che indicherebbero che le temperature erano troppo alte.

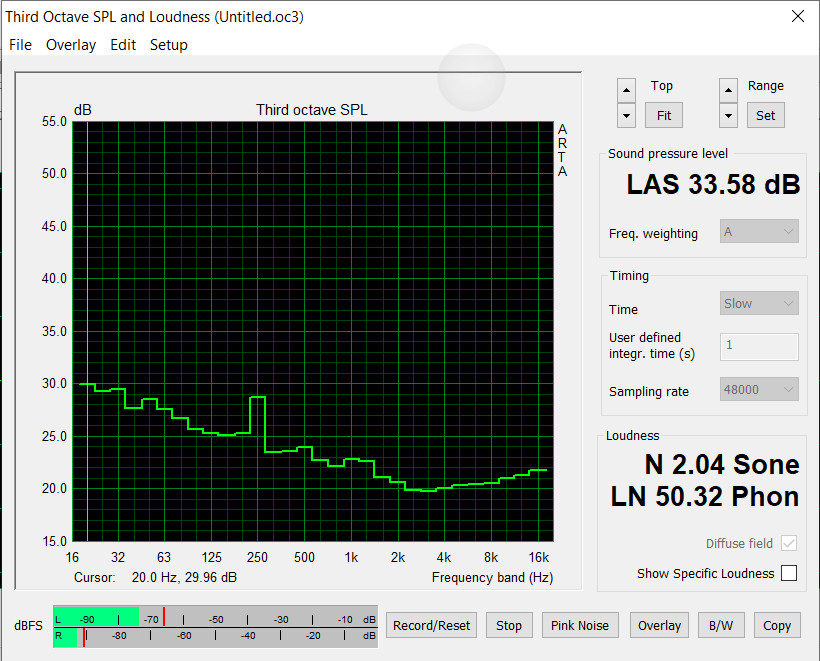
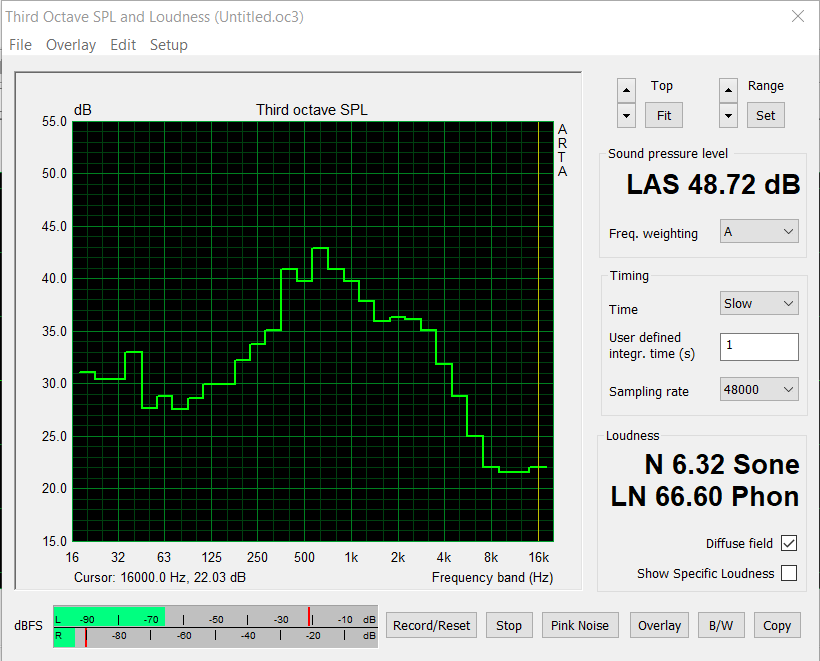
Per un sistema desktop, tuttavia, il Magnus One è chiaramente udibile sotto carico a causa della sua situazione di raffreddamento. Abbiamo misurato solo 33,5 dB(A) nell'uso inattivo, anche se è diventato considerevolmente più rumoroso arrivando a 48,7 dB(A) durante il gaming. Il livello di rumore era un po' più basso nello stress test a 44.2 dB(A). A questo punto, vorremmo fare una nota positiva sul fatto che non abbiamo notato alcun rumore di ventola ad alta frequenza o rumori elettronici.

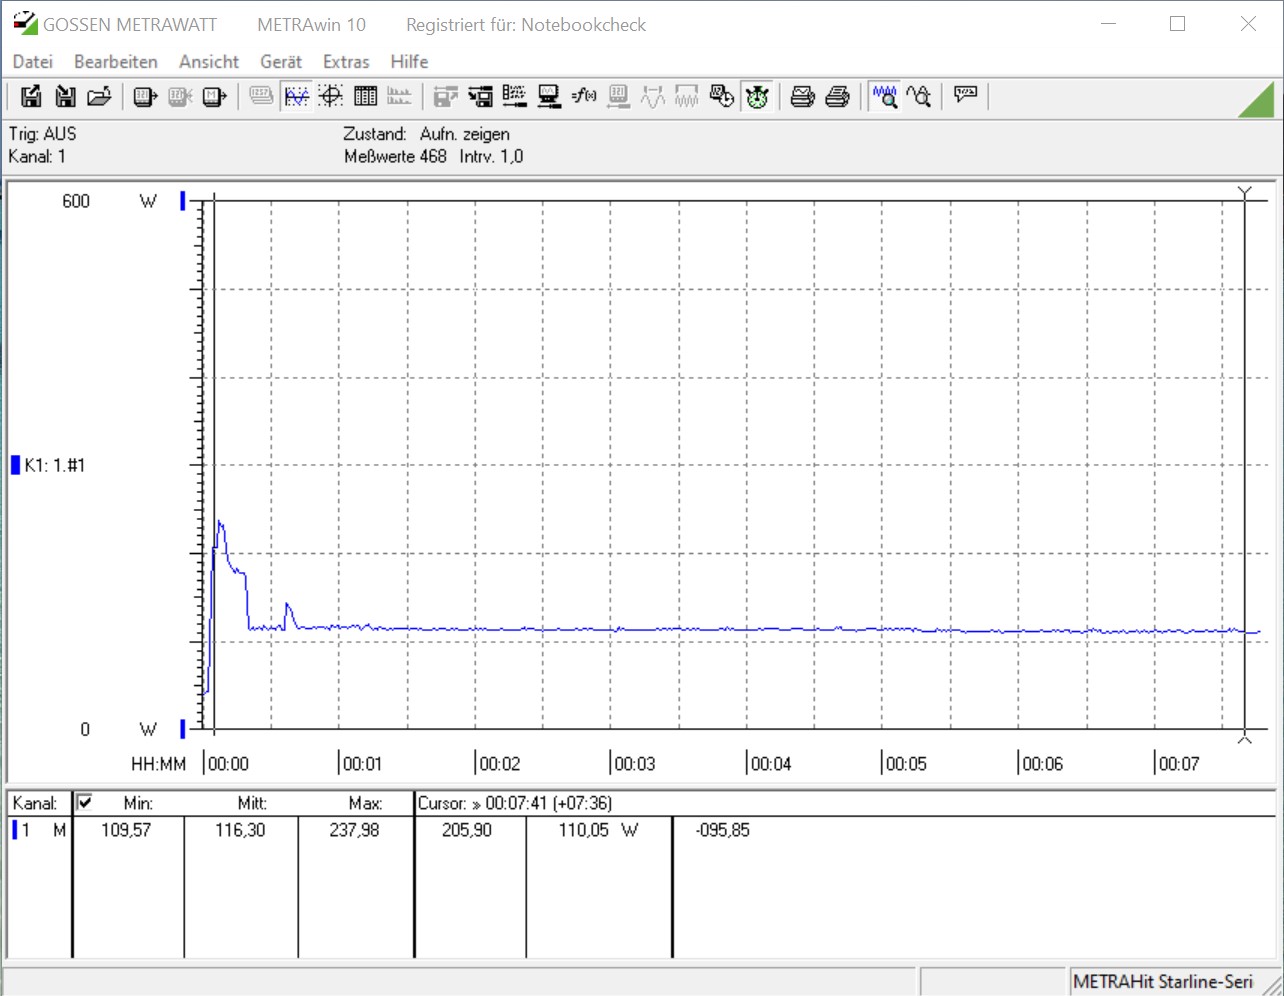
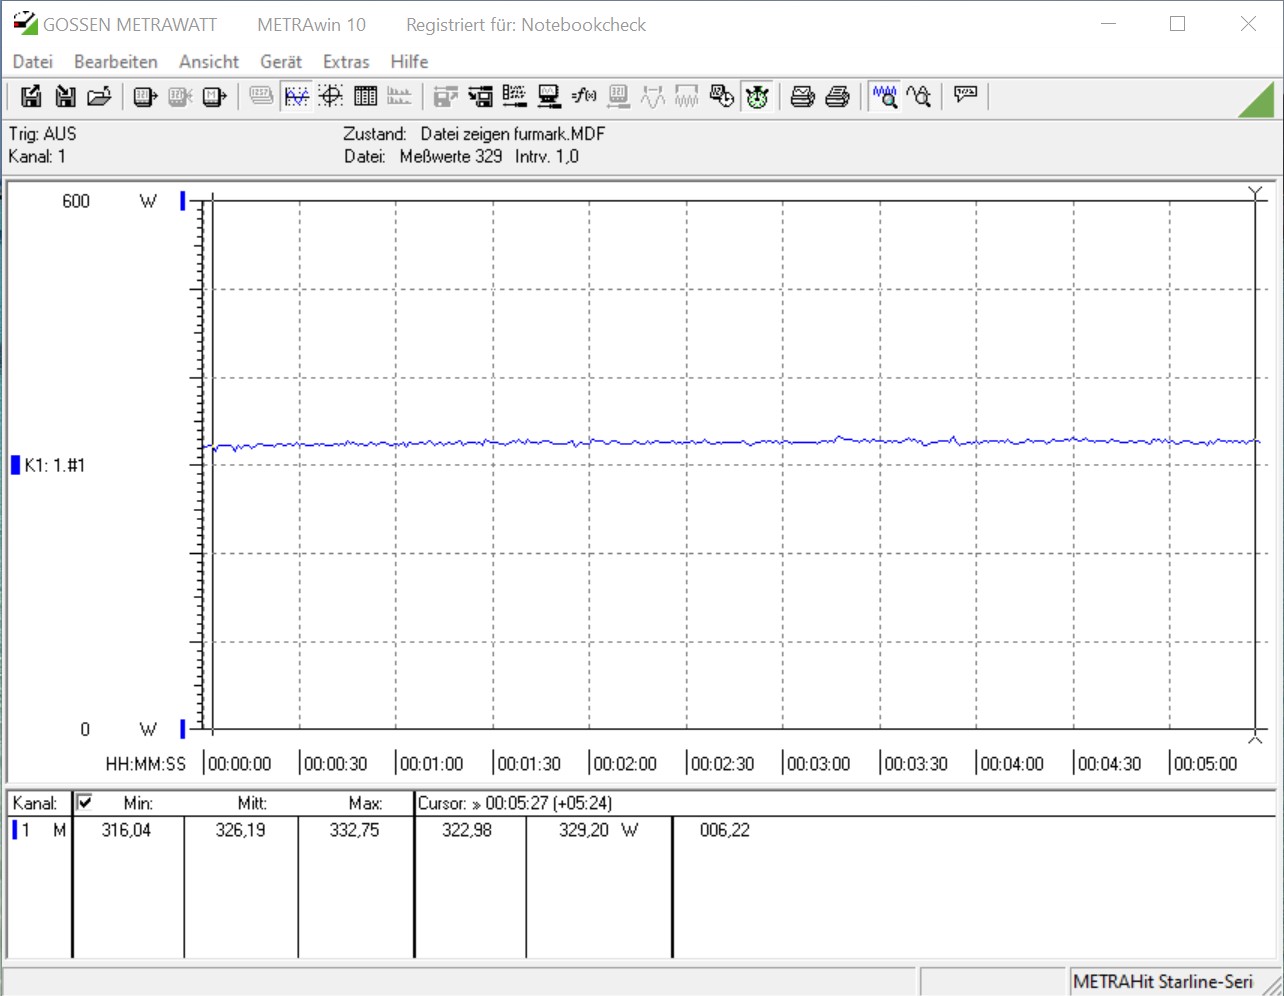
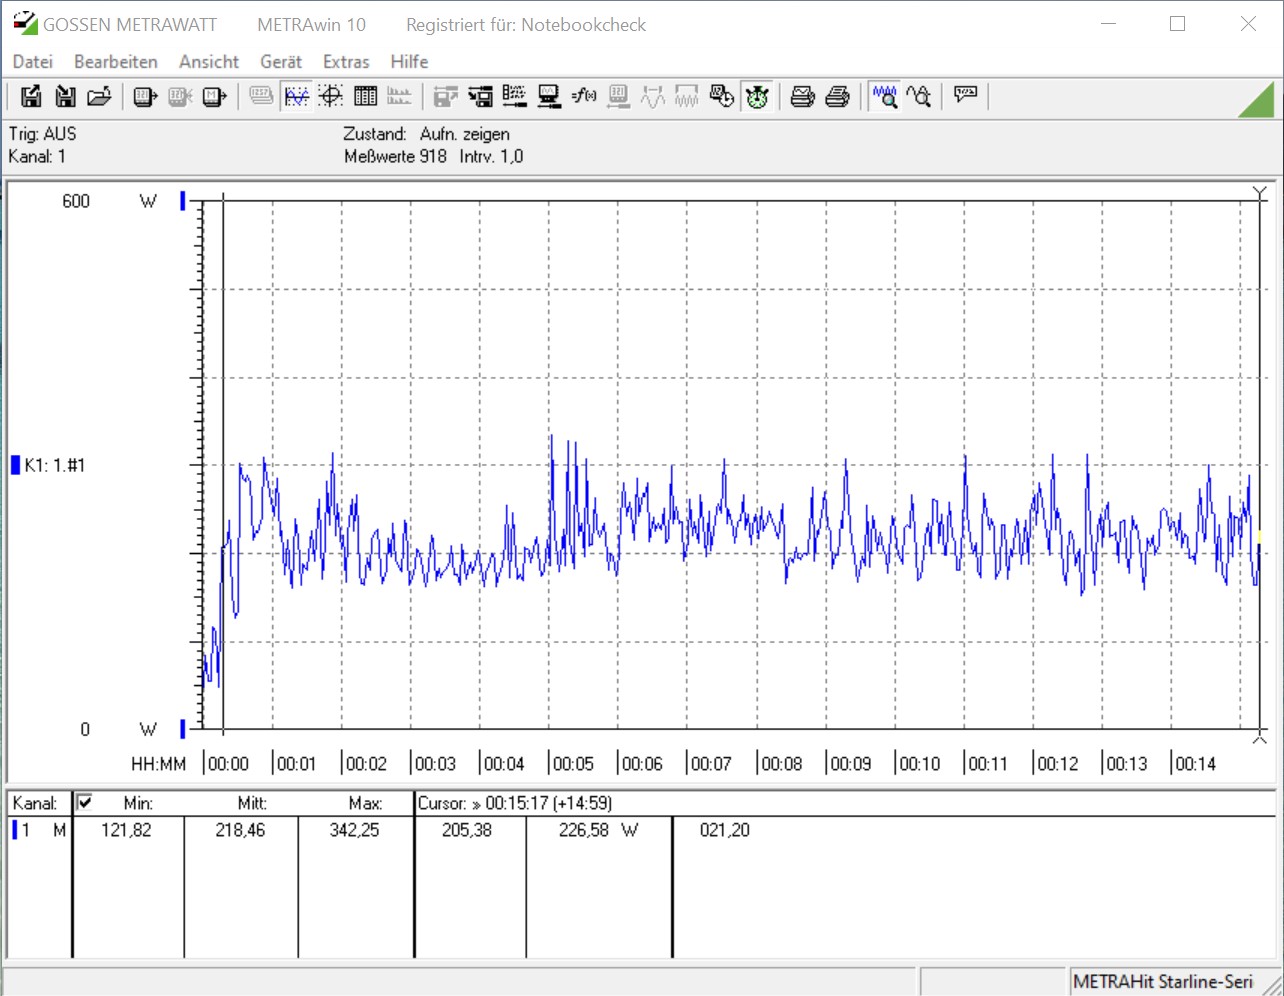
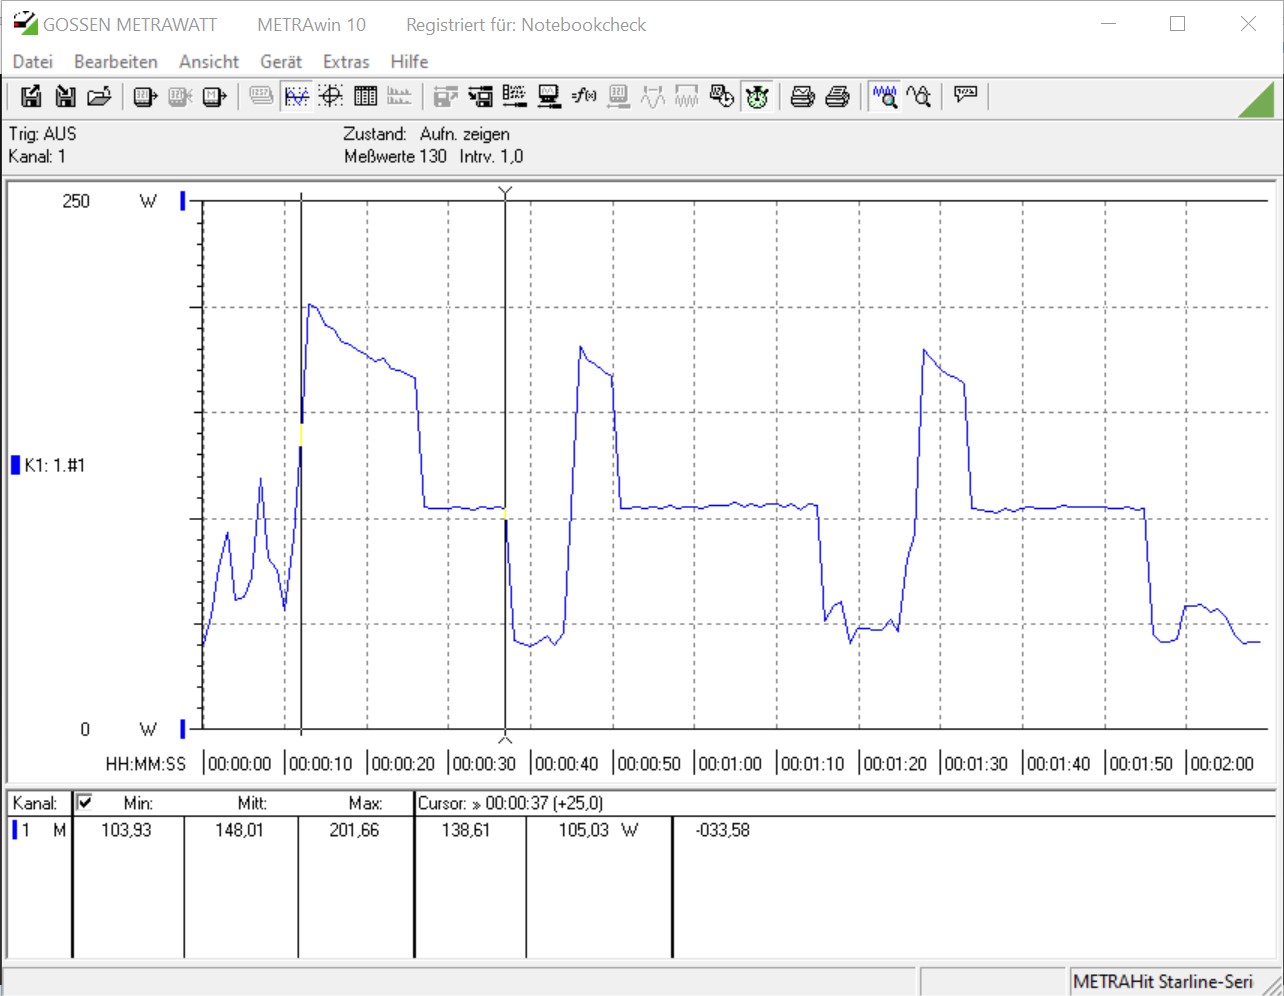
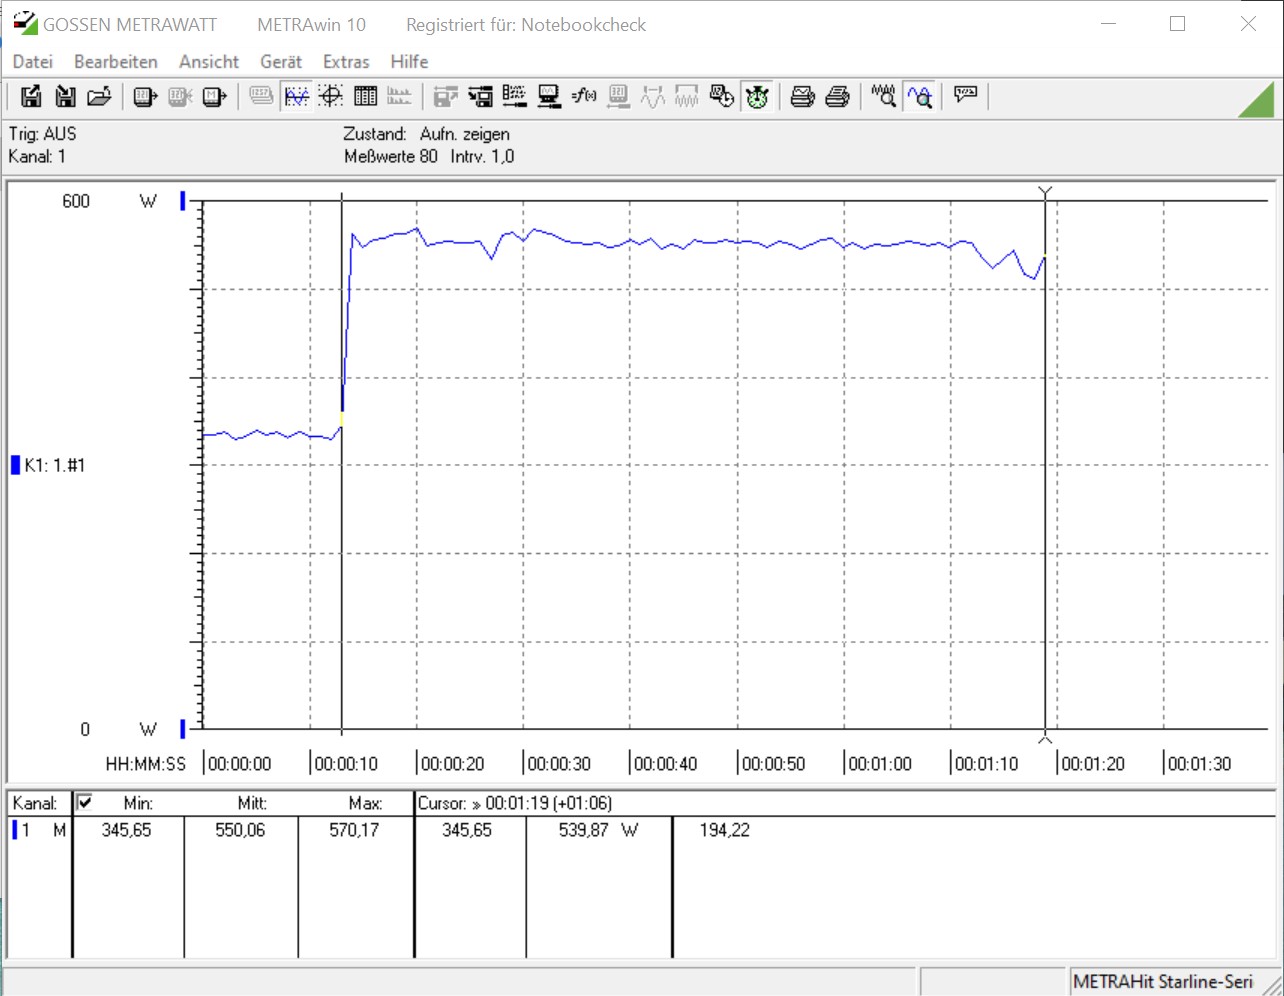
Da un lato, il Magnus One è relativamente parsimonioso in termini di consumo energetico, ma d'altra parte, è anche molto affamato di energia quando si tratta di giocare. Il nostro strumento di misurazione ha mostrato una media di 550 watt nel test per il gaming. L'alimentatore installato è da 500 watt. Tuttavia, non ci sono stati crash durante il test che indichino un sovraccarico.

Power Consumption
1920x1080 The Witcher 3 ultra (external Monitor)
Zotac Magnus One (ECM73070C)
NVIDIA GeForce RTX 3070, i7-10700, Phison 512GB PA6620060U (Idle: 37.6 W)
550 (346min - 570max) Watt *
AMD Ryzen 7 5800X
NVIDIA Titan RTX, R7 5800X, Intel Optane 905P 480GB 2.5 (Idle: 77.5 W)
418.7 (403min - 452max) Watt * +24%
AMD Ryzen 5 5600X
NVIDIA Titan RTX, R5 5600X, Intel Optane 905P 480GB 2.5 (Idle: 79.23 W)
409.2 (381min - 434max) Watt * +26%
Intel Core i5-10600K
NVIDIA Titan RTX, i5-10600K (Idle: 52.2 W)
386.9 (380min - 404max) Watt * +30%
Intel Core i7-9700K, AMD Radeon RX Vega 64
RX Vega 64, i7-9700K
365.3 (316min - 388max) Watt * +34%
MSI GeForce RTX 3070 Ventus 3X
NVIDIA GeForce RTX 3070, R9 5900X, Intel Optane 905P 480GB 2.5 (Idle: 91.46 W)
316.5 (309min - 329max) Watt * +42%
Prime95 V2810 Stress (external Monitor)
AMD Ryzen 7 5800X
NVIDIA Titan RTX, R7 5800X, Intel Optane 905P 480GB 2.5 (Idle: 77.5 W)
242.3 (222min - 254max) Watt * -108%
Intel Core i7-9700K, AMD Radeon RX Vega 64
RX Vega 64, i7-9700K
222.4 (193min - 249max) Watt * -91%
Intel Core i5-10600K
NVIDIA Titan RTX, i5-10600K (Idle: 52.2 W)
204.4 (191min - 261max) Watt * -76%
AMD Ryzen 5 5600X
NVIDIA Titan RTX, R5 5600X, Intel Optane 905P 480GB 2.5 (Idle: 79.23 W)
175.8 (170min - 179max) Watt * -51%
Zotac Magnus One (ECM73070C)
NVIDIA GeForce RTX 3070, i7-10700, Phison 512GB PA6620060U (Idle: 37.6 W)
116.3 (110min - 238max) Watt *
Cinebench R15 Multi (external Monitor)
AMD Ryzen 7 5800X
NVIDIA Titan RTX, R7 5800X, Intel Optane 905P 480GB 2.5 (Idle: 77.5 W)
220.7 (219min - 222max) Watt * -49%
Intel Core i7-9700K, AMD Radeon RX Vega 64
RX Vega 64, i7-9700K
202.6 (190min - 207max) Watt * -37%
Intel Core i5-10600K
NVIDIA Titan RTX, i5-10600K (Idle: 52.2 W)
172.5 (170min - 176max) Watt * -17%
AMD Ryzen 5 5600X
NVIDIA Titan RTX, R5 5600X, Intel Optane 905P 480GB 2.5 (Idle: 79.23 W)
170.1 (165min - 210max) Watt * -15%
Zotac Magnus One (ECM73070C)
NVIDIA GeForce RTX 3070, i7-10700, Phison 512GB PA6620060U (Idle: 37.6 W)
148 (104min - 202max) Watt *
Temperatures - CPU Temperature Prime95
AMD Ryzen 7 5800X
NVIDIA Titan RTX, R7 5800X, Intel Optane 905P 480GB 2.5
90.6 °C
Intel Core i5-10600K
NVIDIA Titan RTX, i5-10600K
70 °C

* ... Meglio usare valori piccoli

Consumo energetico inattivo
Consumo di energia Prime95
Consumo di energia FurMark
Consumo energetico di Prime95 e FurMark
Cinebench R15 Multi consumo energetico
Il consumo di energia in The Witcher 3
Prime95 e FurMark stress test
Rumore di sistema (inattivo)
Rumore di sistema (Prime95 e FurMark)
Rumore di sistema (The Witcher 3)


Rumorosità

Idle
33.58 / / dB(A)
Sotto carico
44.25 / 48.72 dB(A)
  red to green bar
 
 
30 dB
silenzioso
40 dB(A)
udibile
50 dB(A)
rumoroso
 
min: dark, med: mid, max: light   Earthworks M23R, Arta (15 cm di distanza)   Rumorosità ambientale: 30 dB(A)

Pro

+ case stabile e di alta qualità
+ design sobrio e moderno
+ adatto per 1440p
+ molte porte
+ spazio per tre dispositivi di archiviazione di massa
+ rTX 3070 completa (versione desktop)

Contro

- solo un alimentatore da 500 watt
- si fa sentire sotto carico

Valutazione complessiva - Buone prestazioni e buona connettività

Recensione dello Zotac Magnus One, fornito da Zotac Germania

Il Magnus One di Zotac è un dispositivo compatto che offre ottime prestazioni nel più piccolo degli spazi. Si noti che questo è un sistema barebone dove la RAM, la memoria di massa e il sistema operativo non rientrano nel prezzo di 1.499 euro (~$1.825). Tuttavia, al momento del test, i prezzi di strada realistici partono da 1.650 euro (~$2.009) in su. Gli utenti che possono ottenere il Magnus One ad un buon prezzo potrebbero anche ottenere un affare, dato che la sola GeForce RTX 3070 costa già considerevolmente più di 1.000 euro (~$1.218). L'Intel Core i7-10700 non è l'ultima versione dei processori Core, ma questo non è un problema nell'uso quotidiano. Tutto sommato, il piccolo Core i7-10700, che non è stato limitato in termini di TDP, si adatta bene al sistema complessivo. Tuttavia, il Magnus One ottiene punteggi migliori nei nostri benchmarks 3D e di gioco che nei test della CPU dedicata. AMD è in qualche modo meglio posizionata qui con la serie Ryzen 5000. Forse Zotac prenderà in considerazione lo sviluppo di un sistema basato anche su AMD.

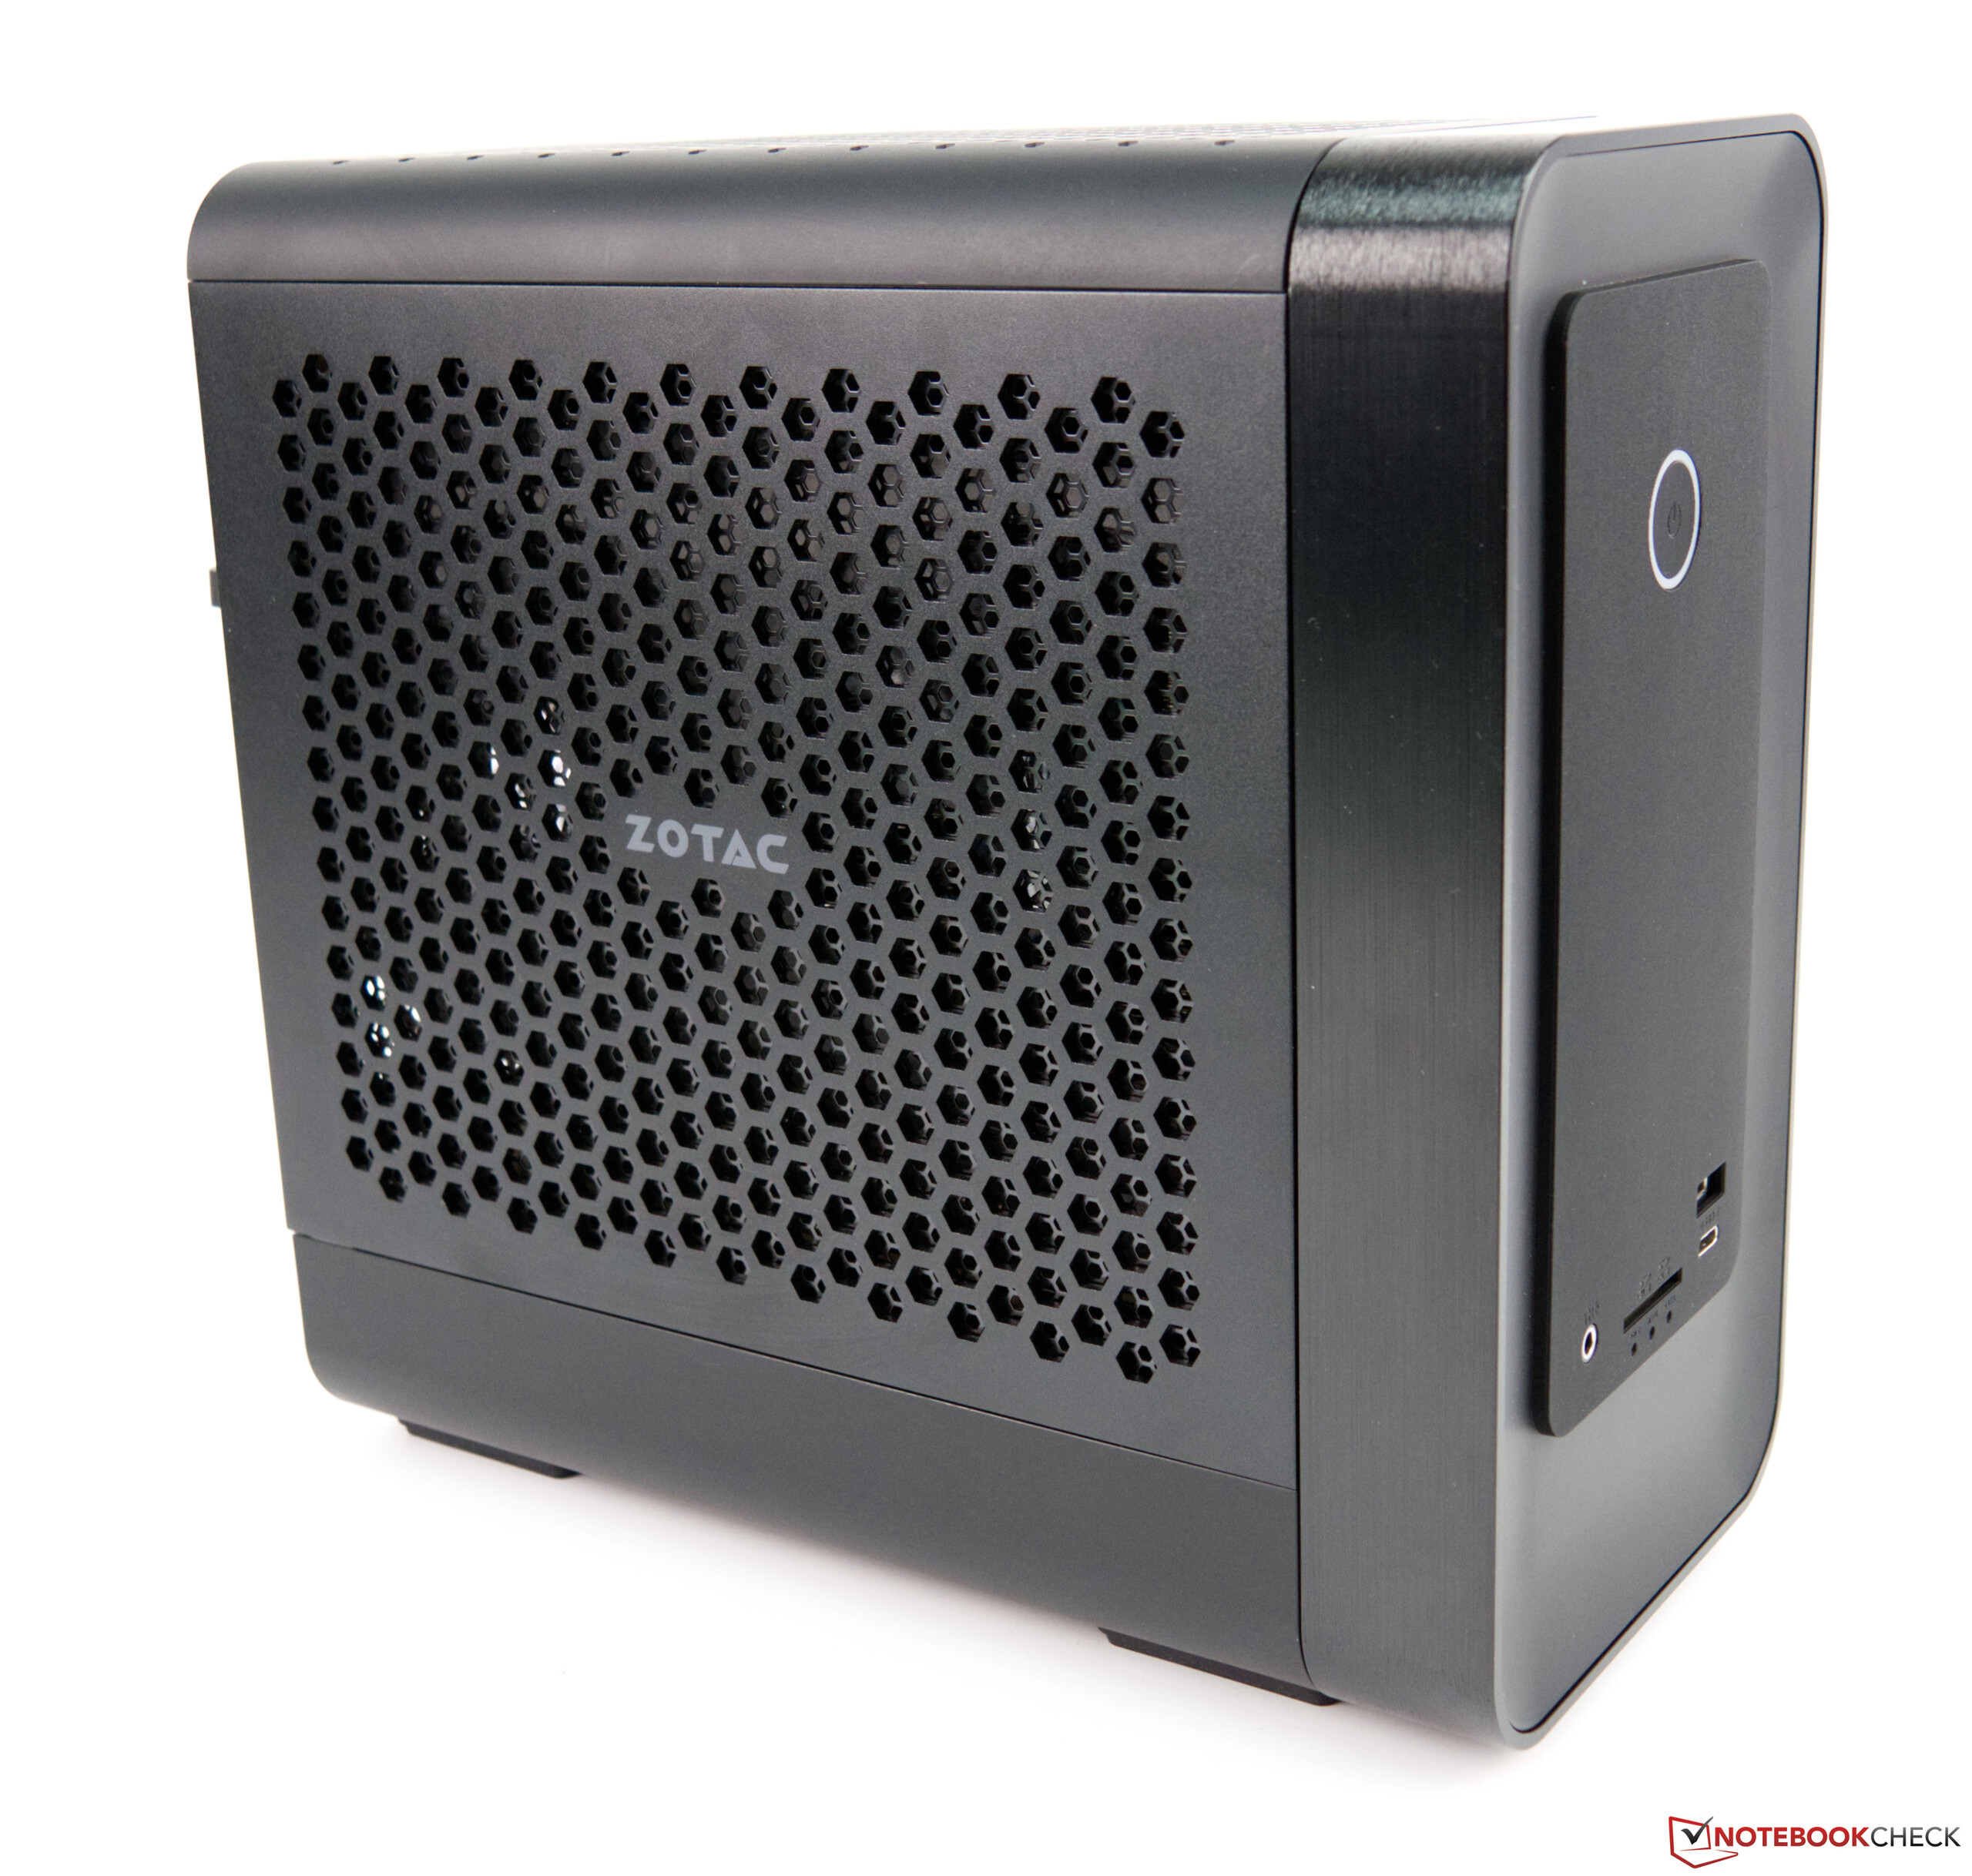
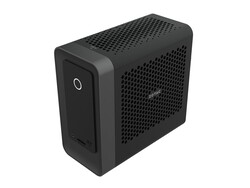
Il Magnus One è un sistema potente e compatto che attira l'attenzione anche senza RGB.

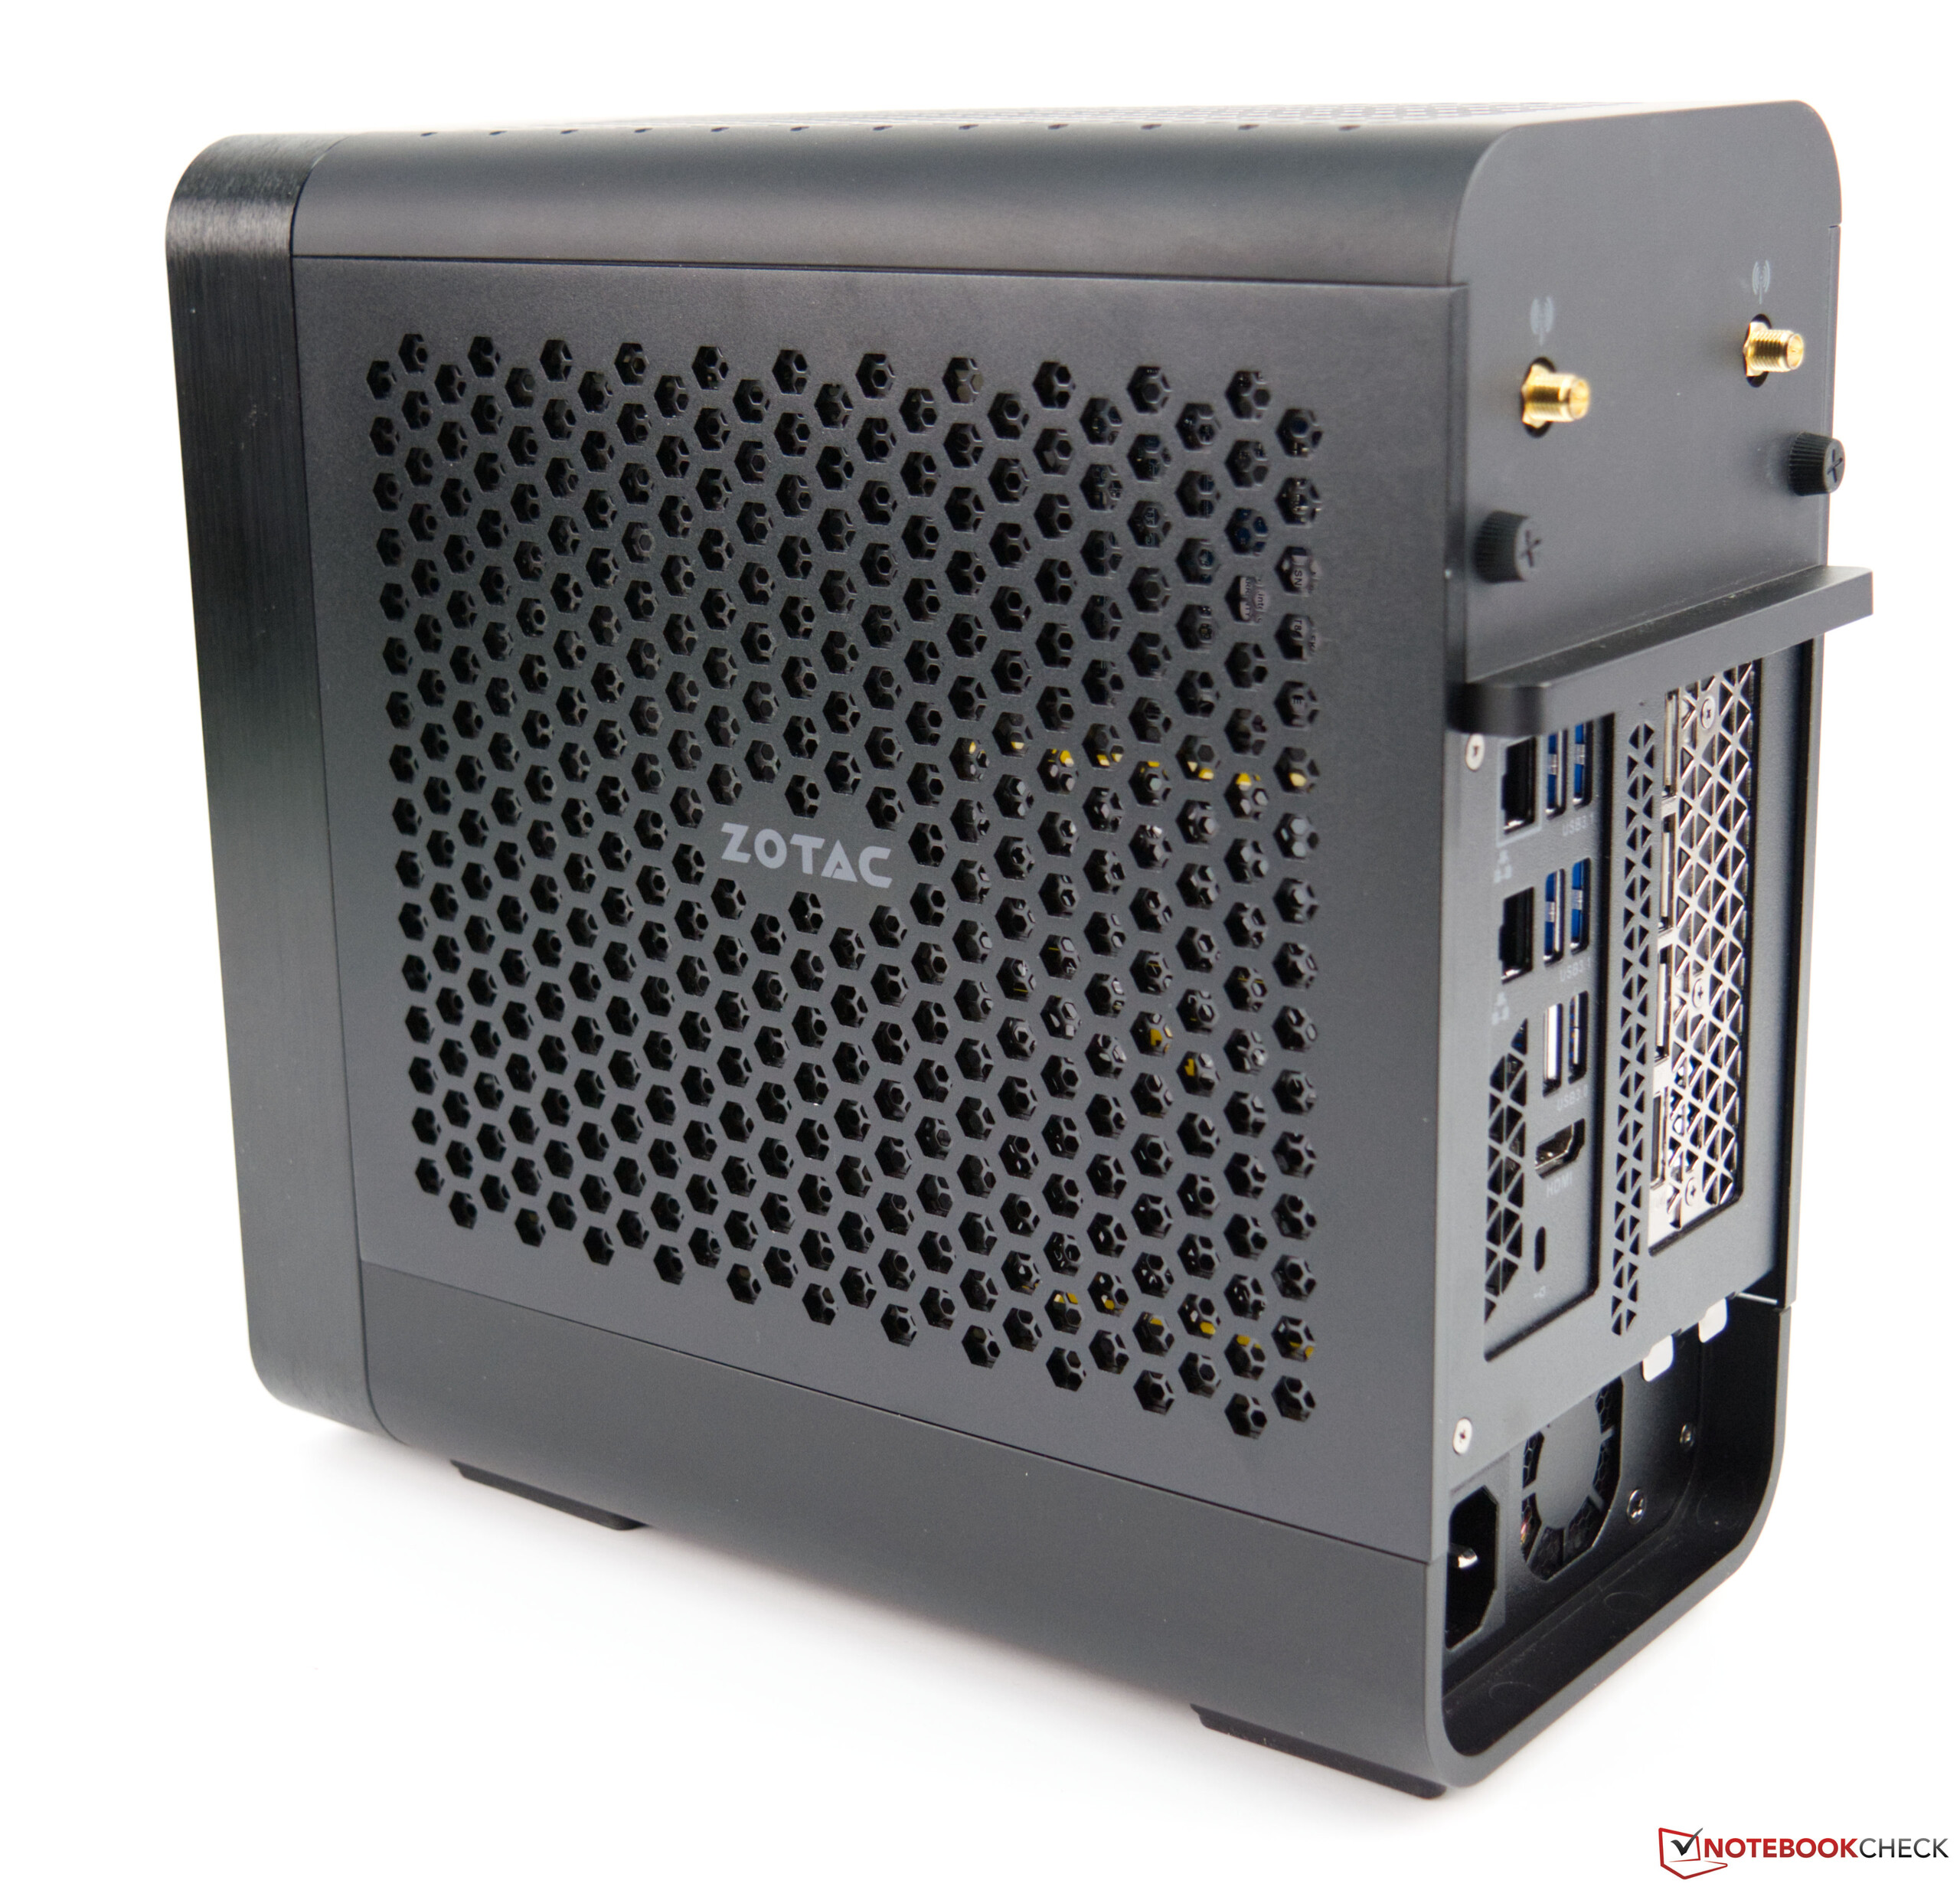
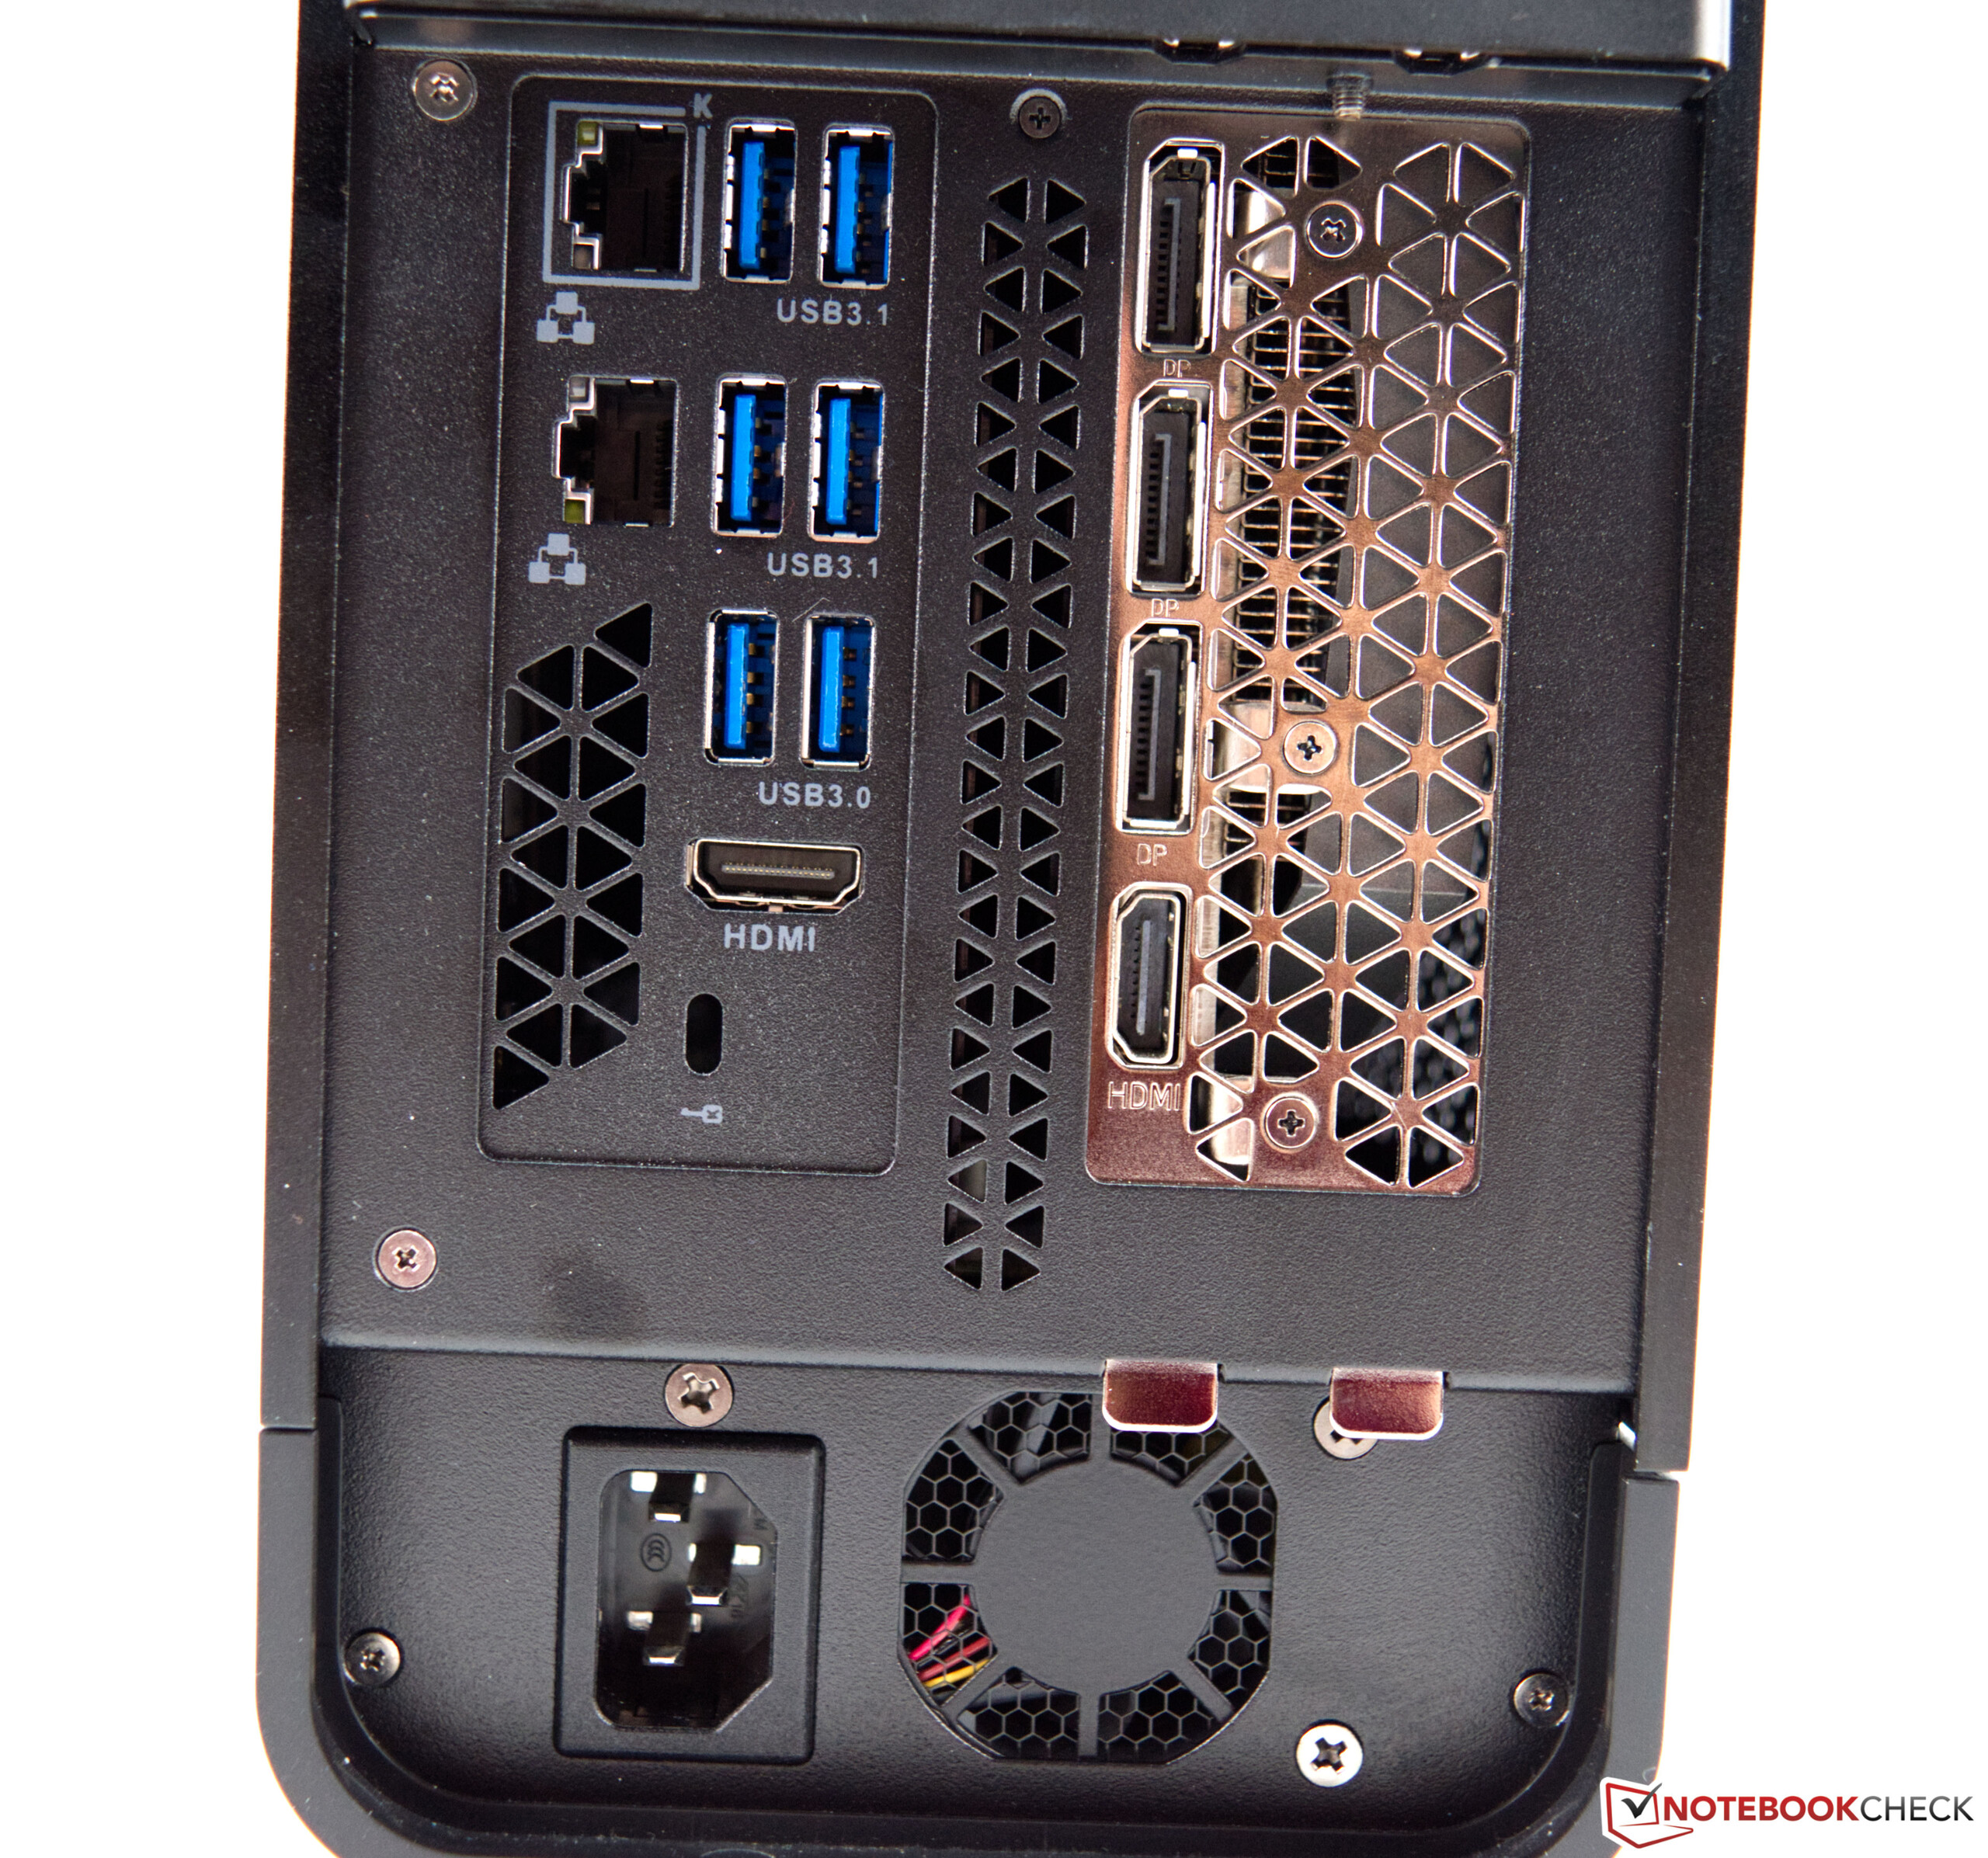
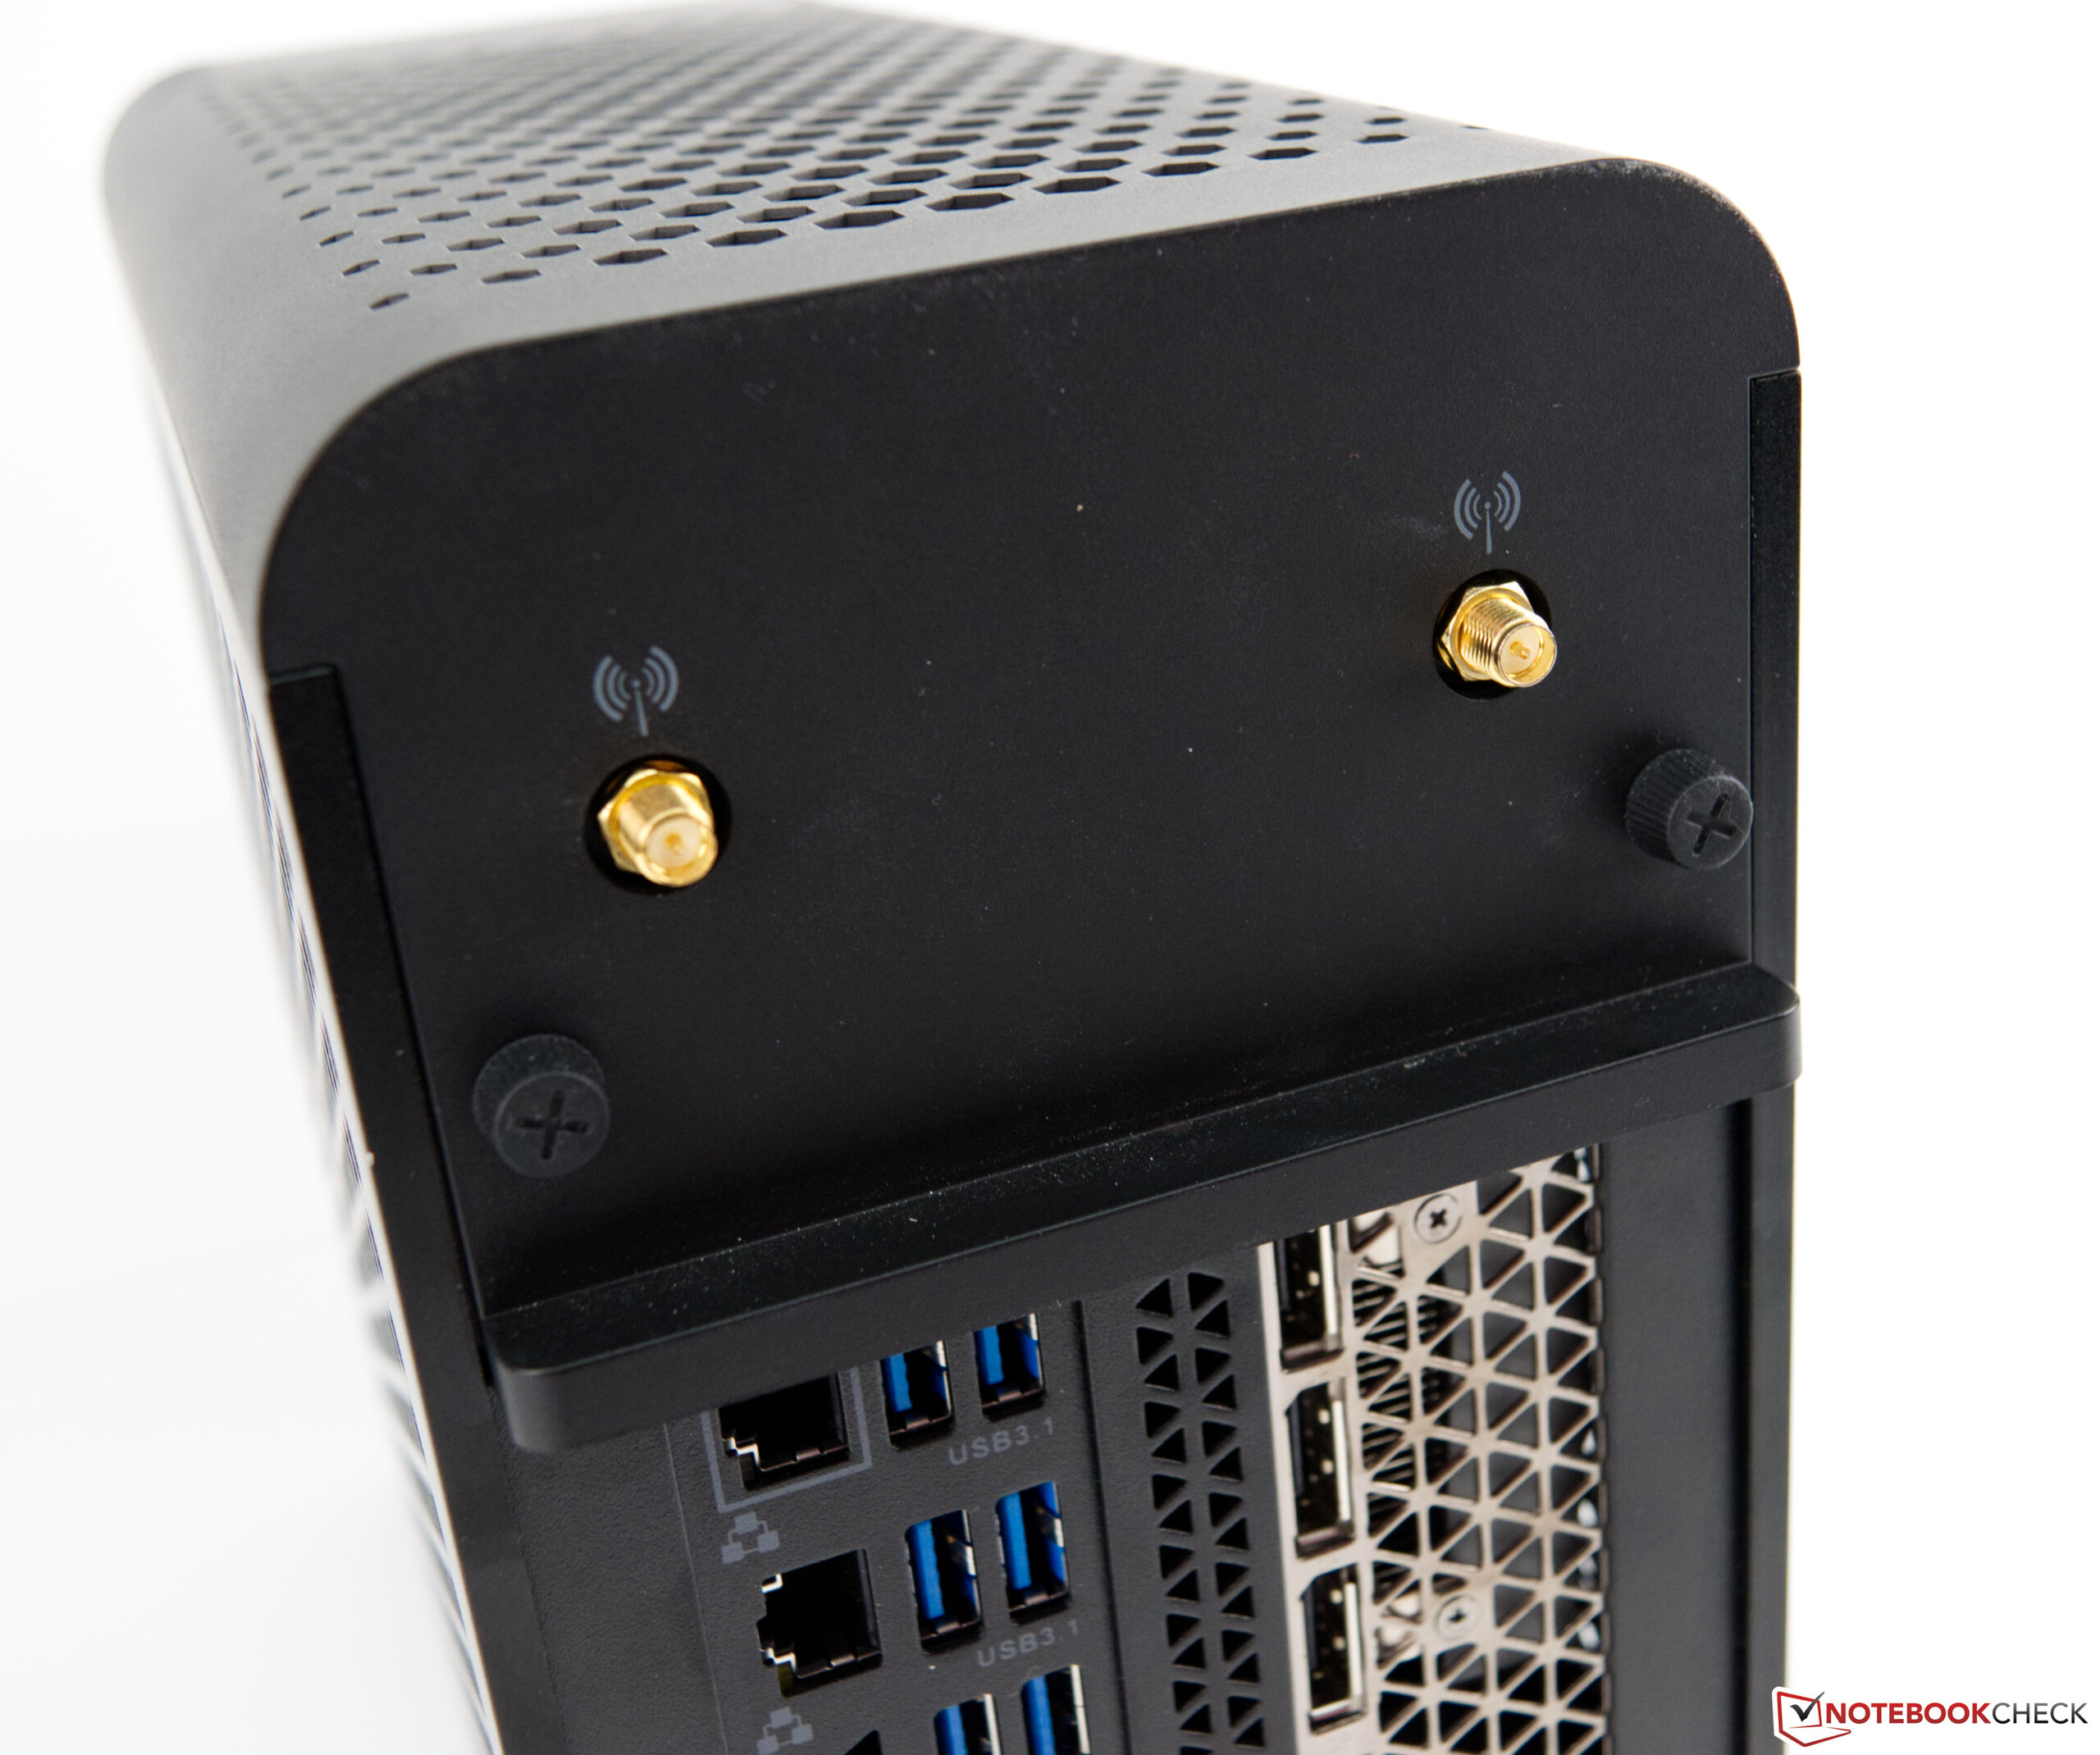
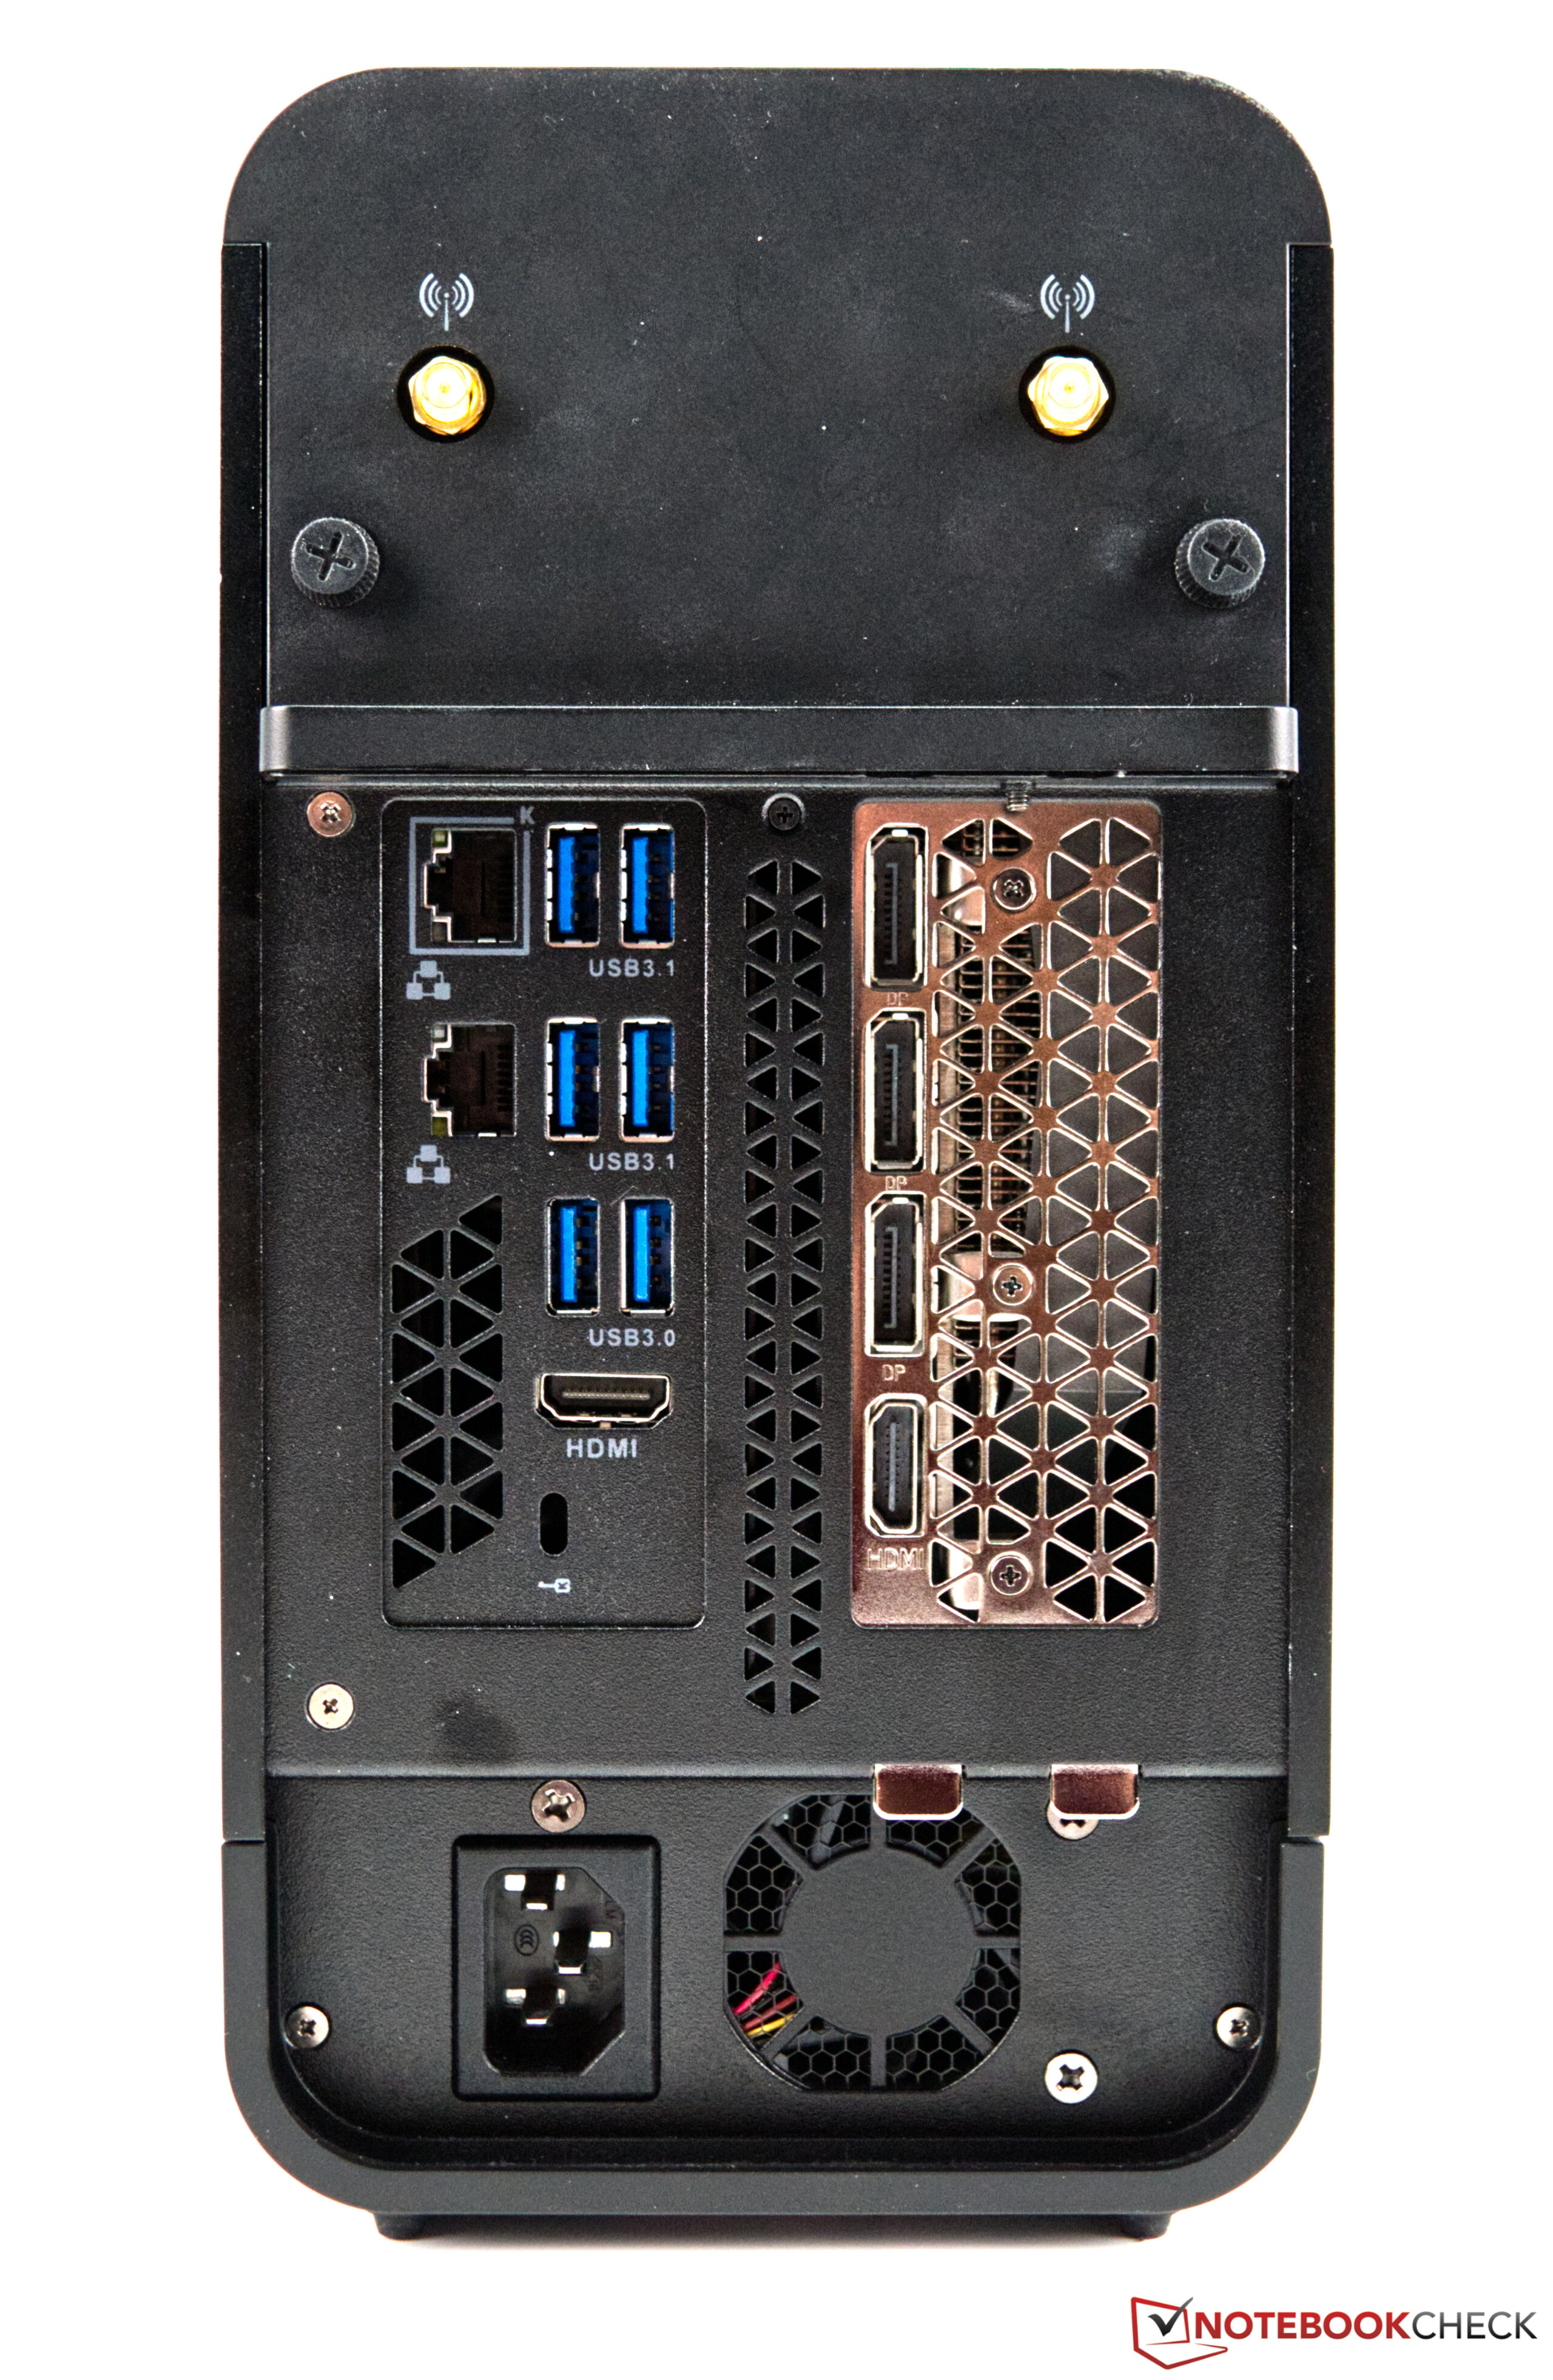
Il case del PC ha un bell'aspetto senza tanti fronzoli, e anche gli effetti RGB sono stati completamente evitati. Questa non è necessariamente una cosa negativa, perché molti utenti cercano un case sobrio, e Zotac è riuscita a creare questo con il Magnus One. Inoltre, la scelta dei materiali è molto buona, dato che il case è per lo più in metallo. Anche la selezione delle porte è versatile e non lascia quasi nulla da desiderare. Tuttavia, dobbiamo criticare il raffreddamento un po' invadente sotto carico.

Non ci sono molte alternative allo Zotac Magnus One, però, poiché i produttori popolari di solito si concentrano su sistemi completi. Per un confronto, tuttavia, si può dare un'occhiata alla serie MSI MEG Trident X. Offre una configurazione simile in un case attraente e compatto.

Please share our article, every link counts!
> Recensioni e prove di notebook, tablets e smartphones > Recensioni e prove > Recensioni e prove > Recensione del PC desktop Zotac Magnus One con Core i7 e GeForce RTX 3070
Sebastian Bade, 2021-06-11 (Update: 2021-06-11)