Notebookcheck Logo

Recensione del PC desktop Zotac MEK MINI con Core i7 e GeForce RTX 2070 Super

Una piccola centrale elettrica! Quando si tratta di piccoli PC, Zotac è ben noto a molti. Con il MEK MINI, il produttore offre prestazioni di gioco decenti nel più piccolo degli spazi e rinuncia quasi completamente all'uso di componenti per laptop. Abbiamo dato un'occhiata più da vicino a ciò che il piccolo PC è in grado di fare e lo abbiamo riassunto per voi in questa recensione.
Zotac MEK MINI (fonte: Zotac)

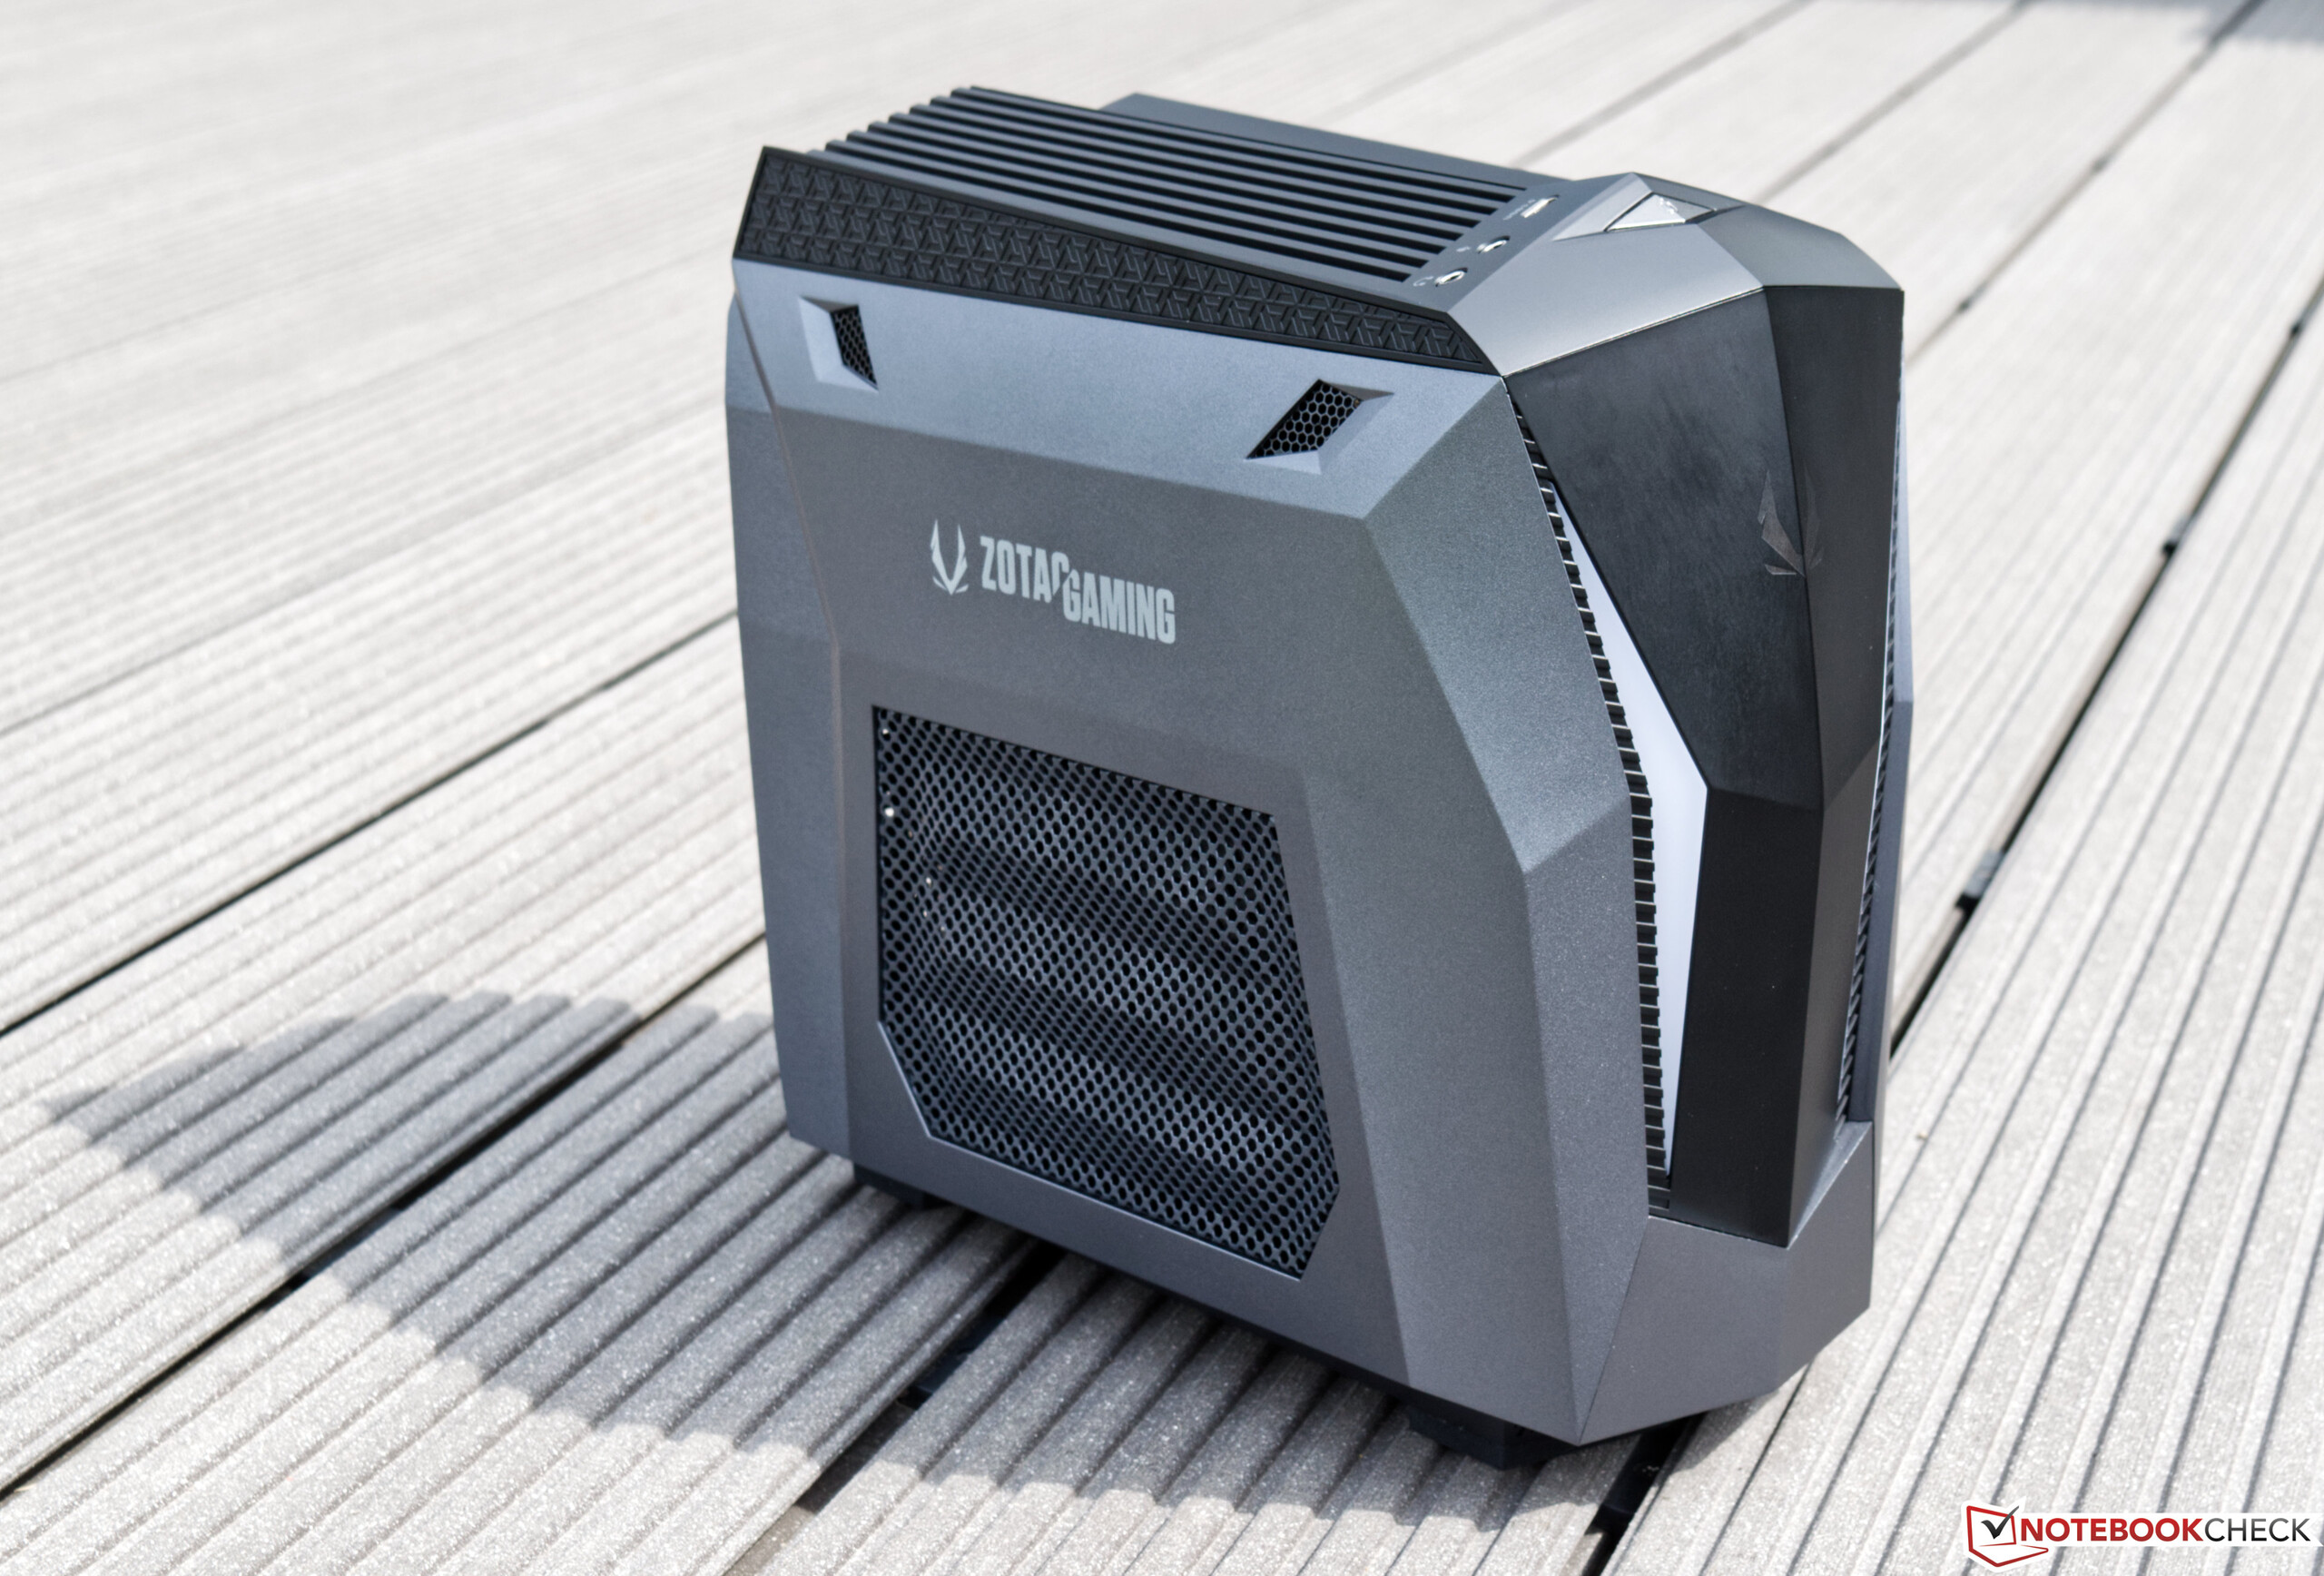
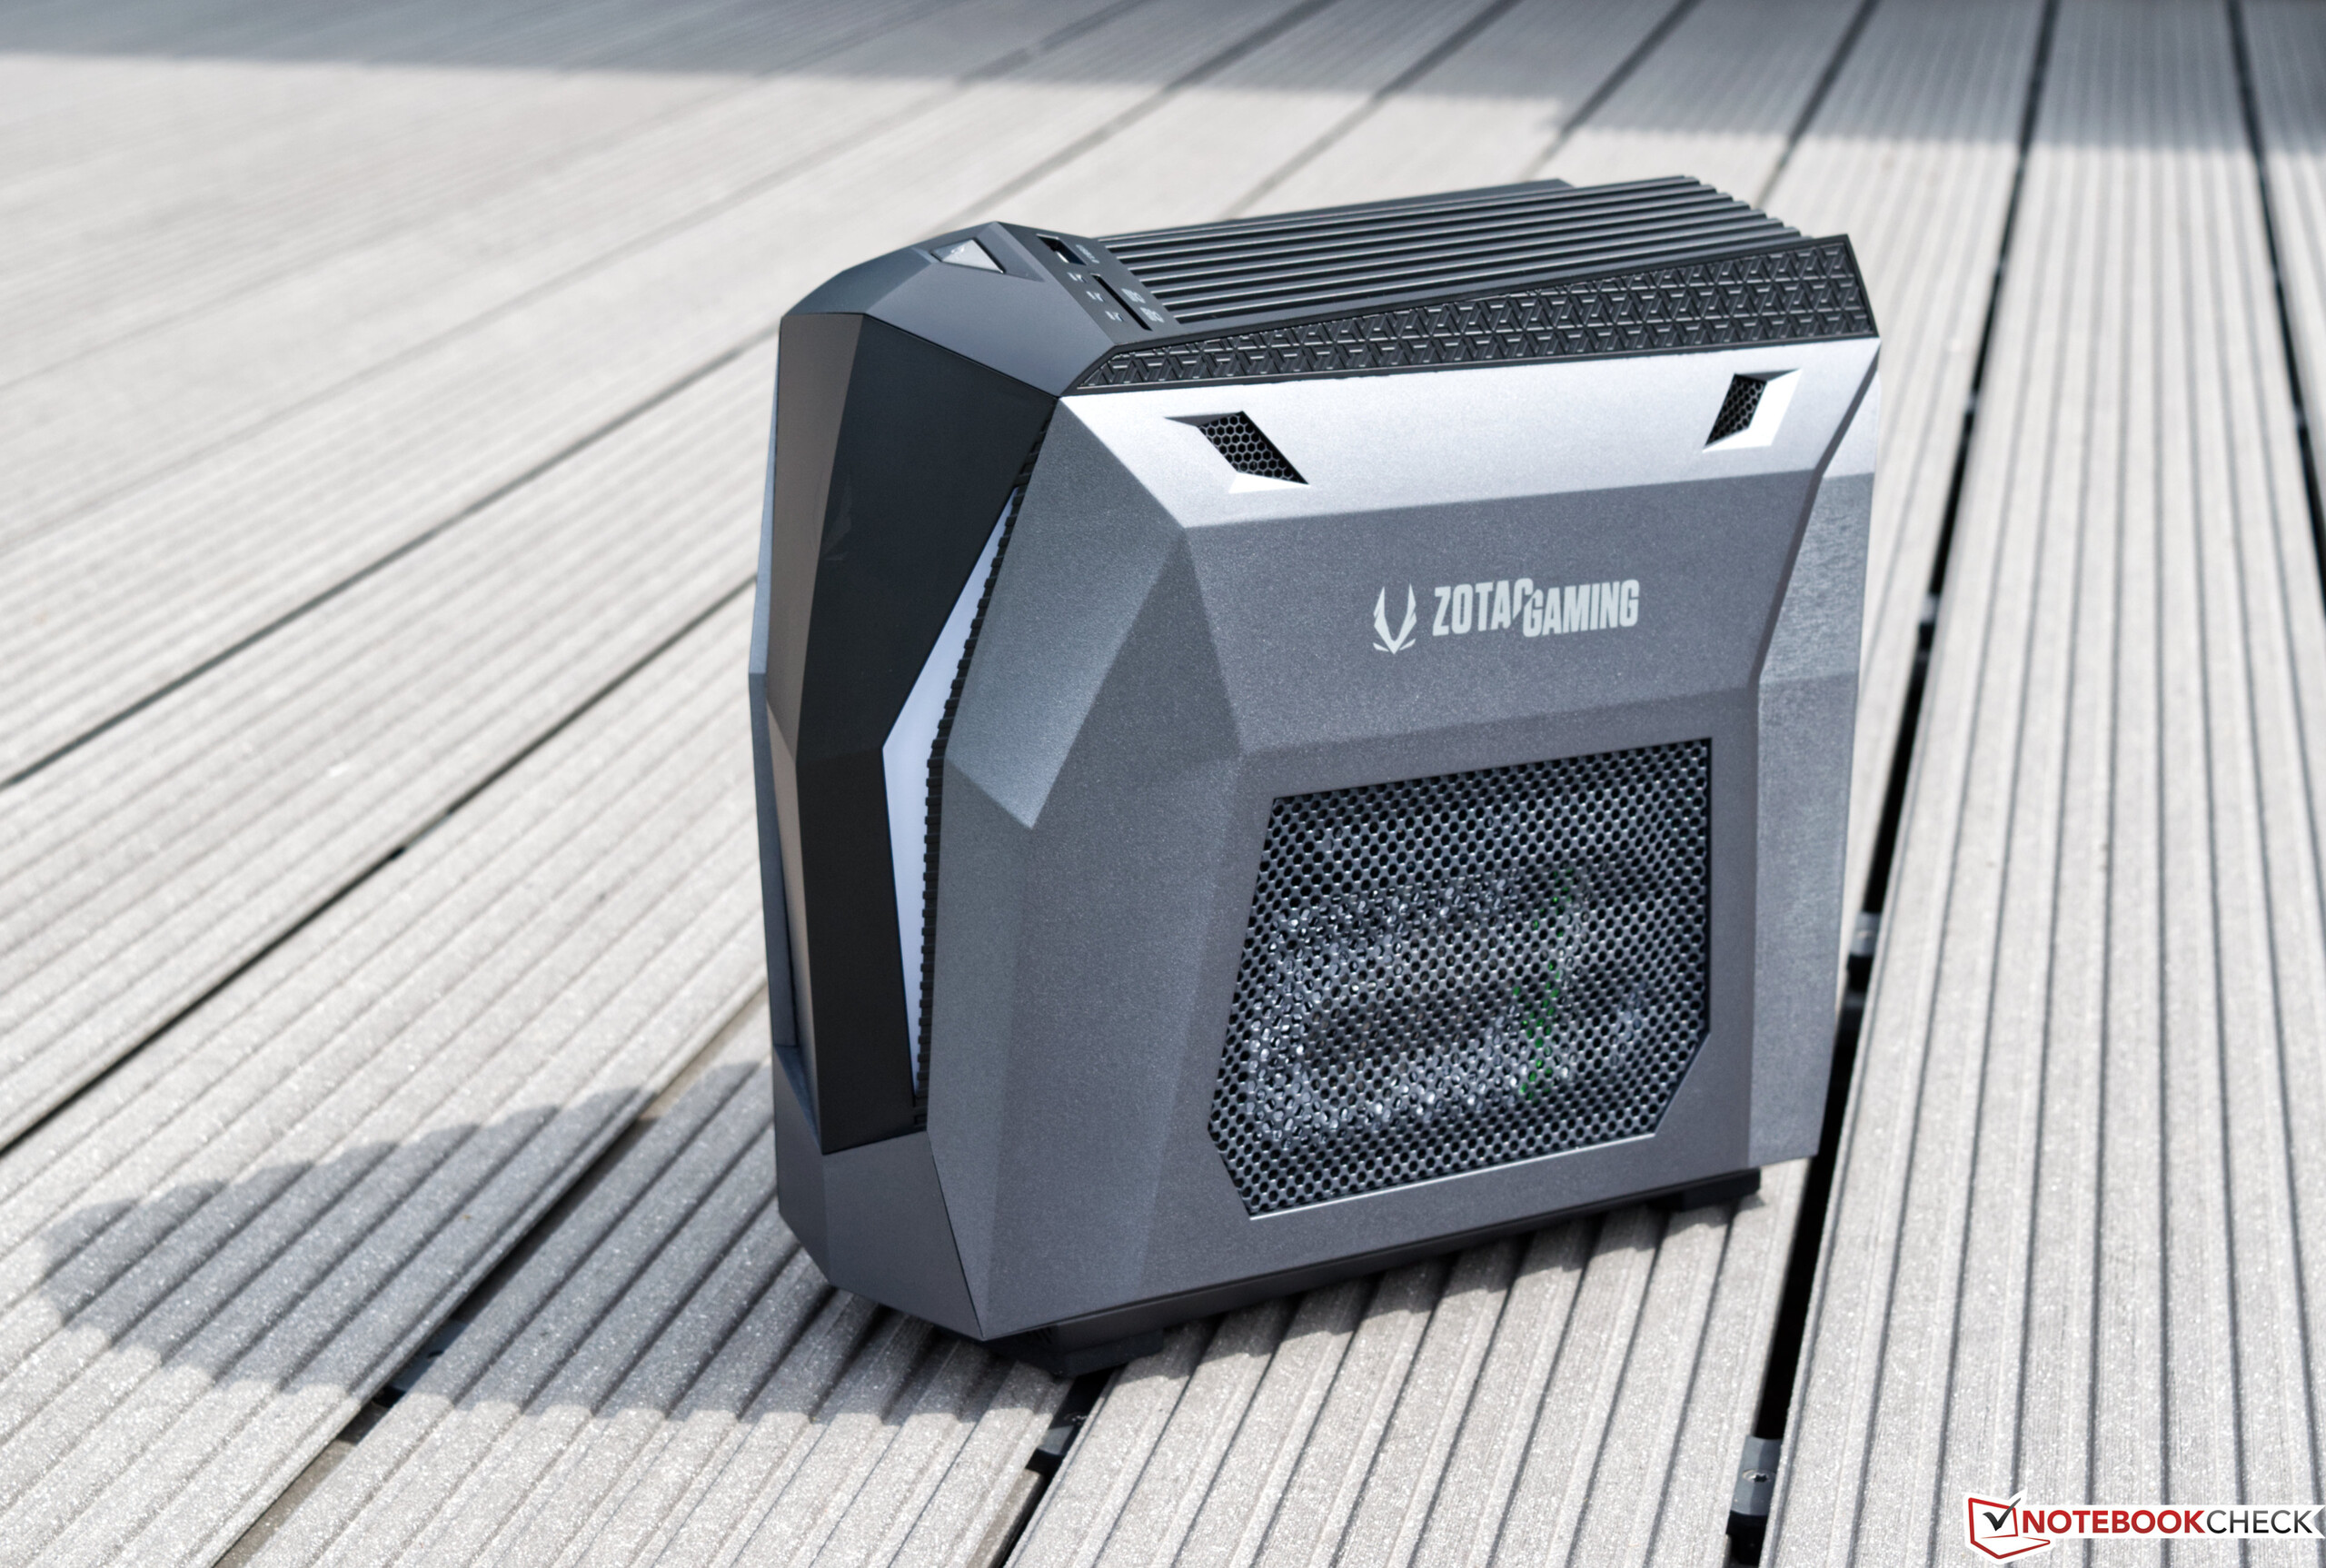
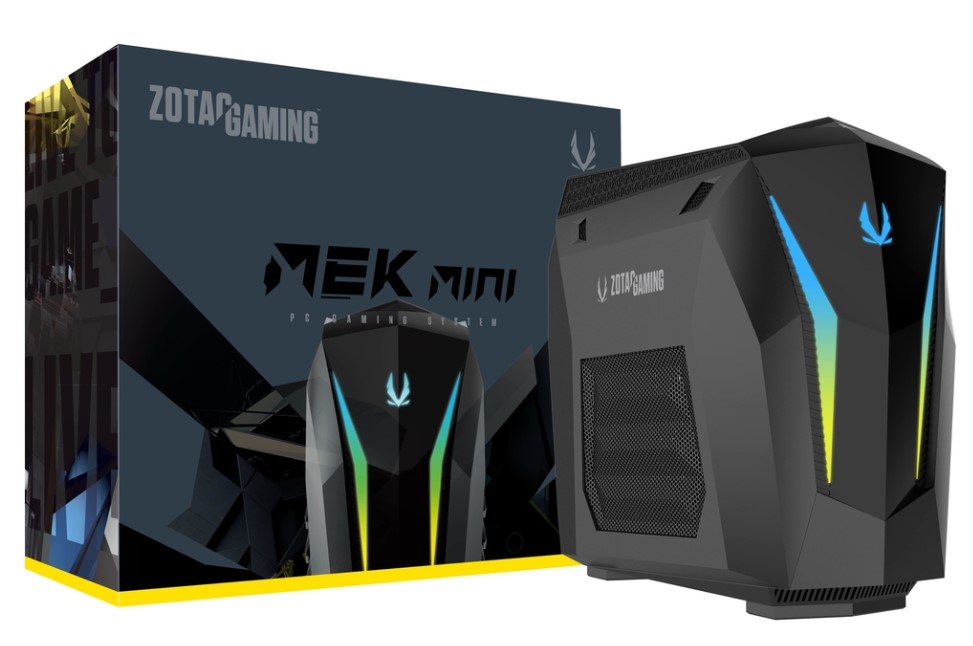
Lo Zotac MEK MINI, presentato al pubblico per la prima volta al Computex 2018, è stato sviluppato a partire da uno studio concettuale. All'epoca, ancora senza le schede RTX Super e basato sull'ottava generazione di processori Intel Core, questo PC gaming, che ha una dimensione di soli 9,2 litri, festeggiava il suo debutto. Nella nuova edizione, Zotac ha dato questo compatto computer un piccolo miglioramento delle prestazioni con la 9a generazione di CPU Core di Intel e le schede RTX Super di Nvidia.

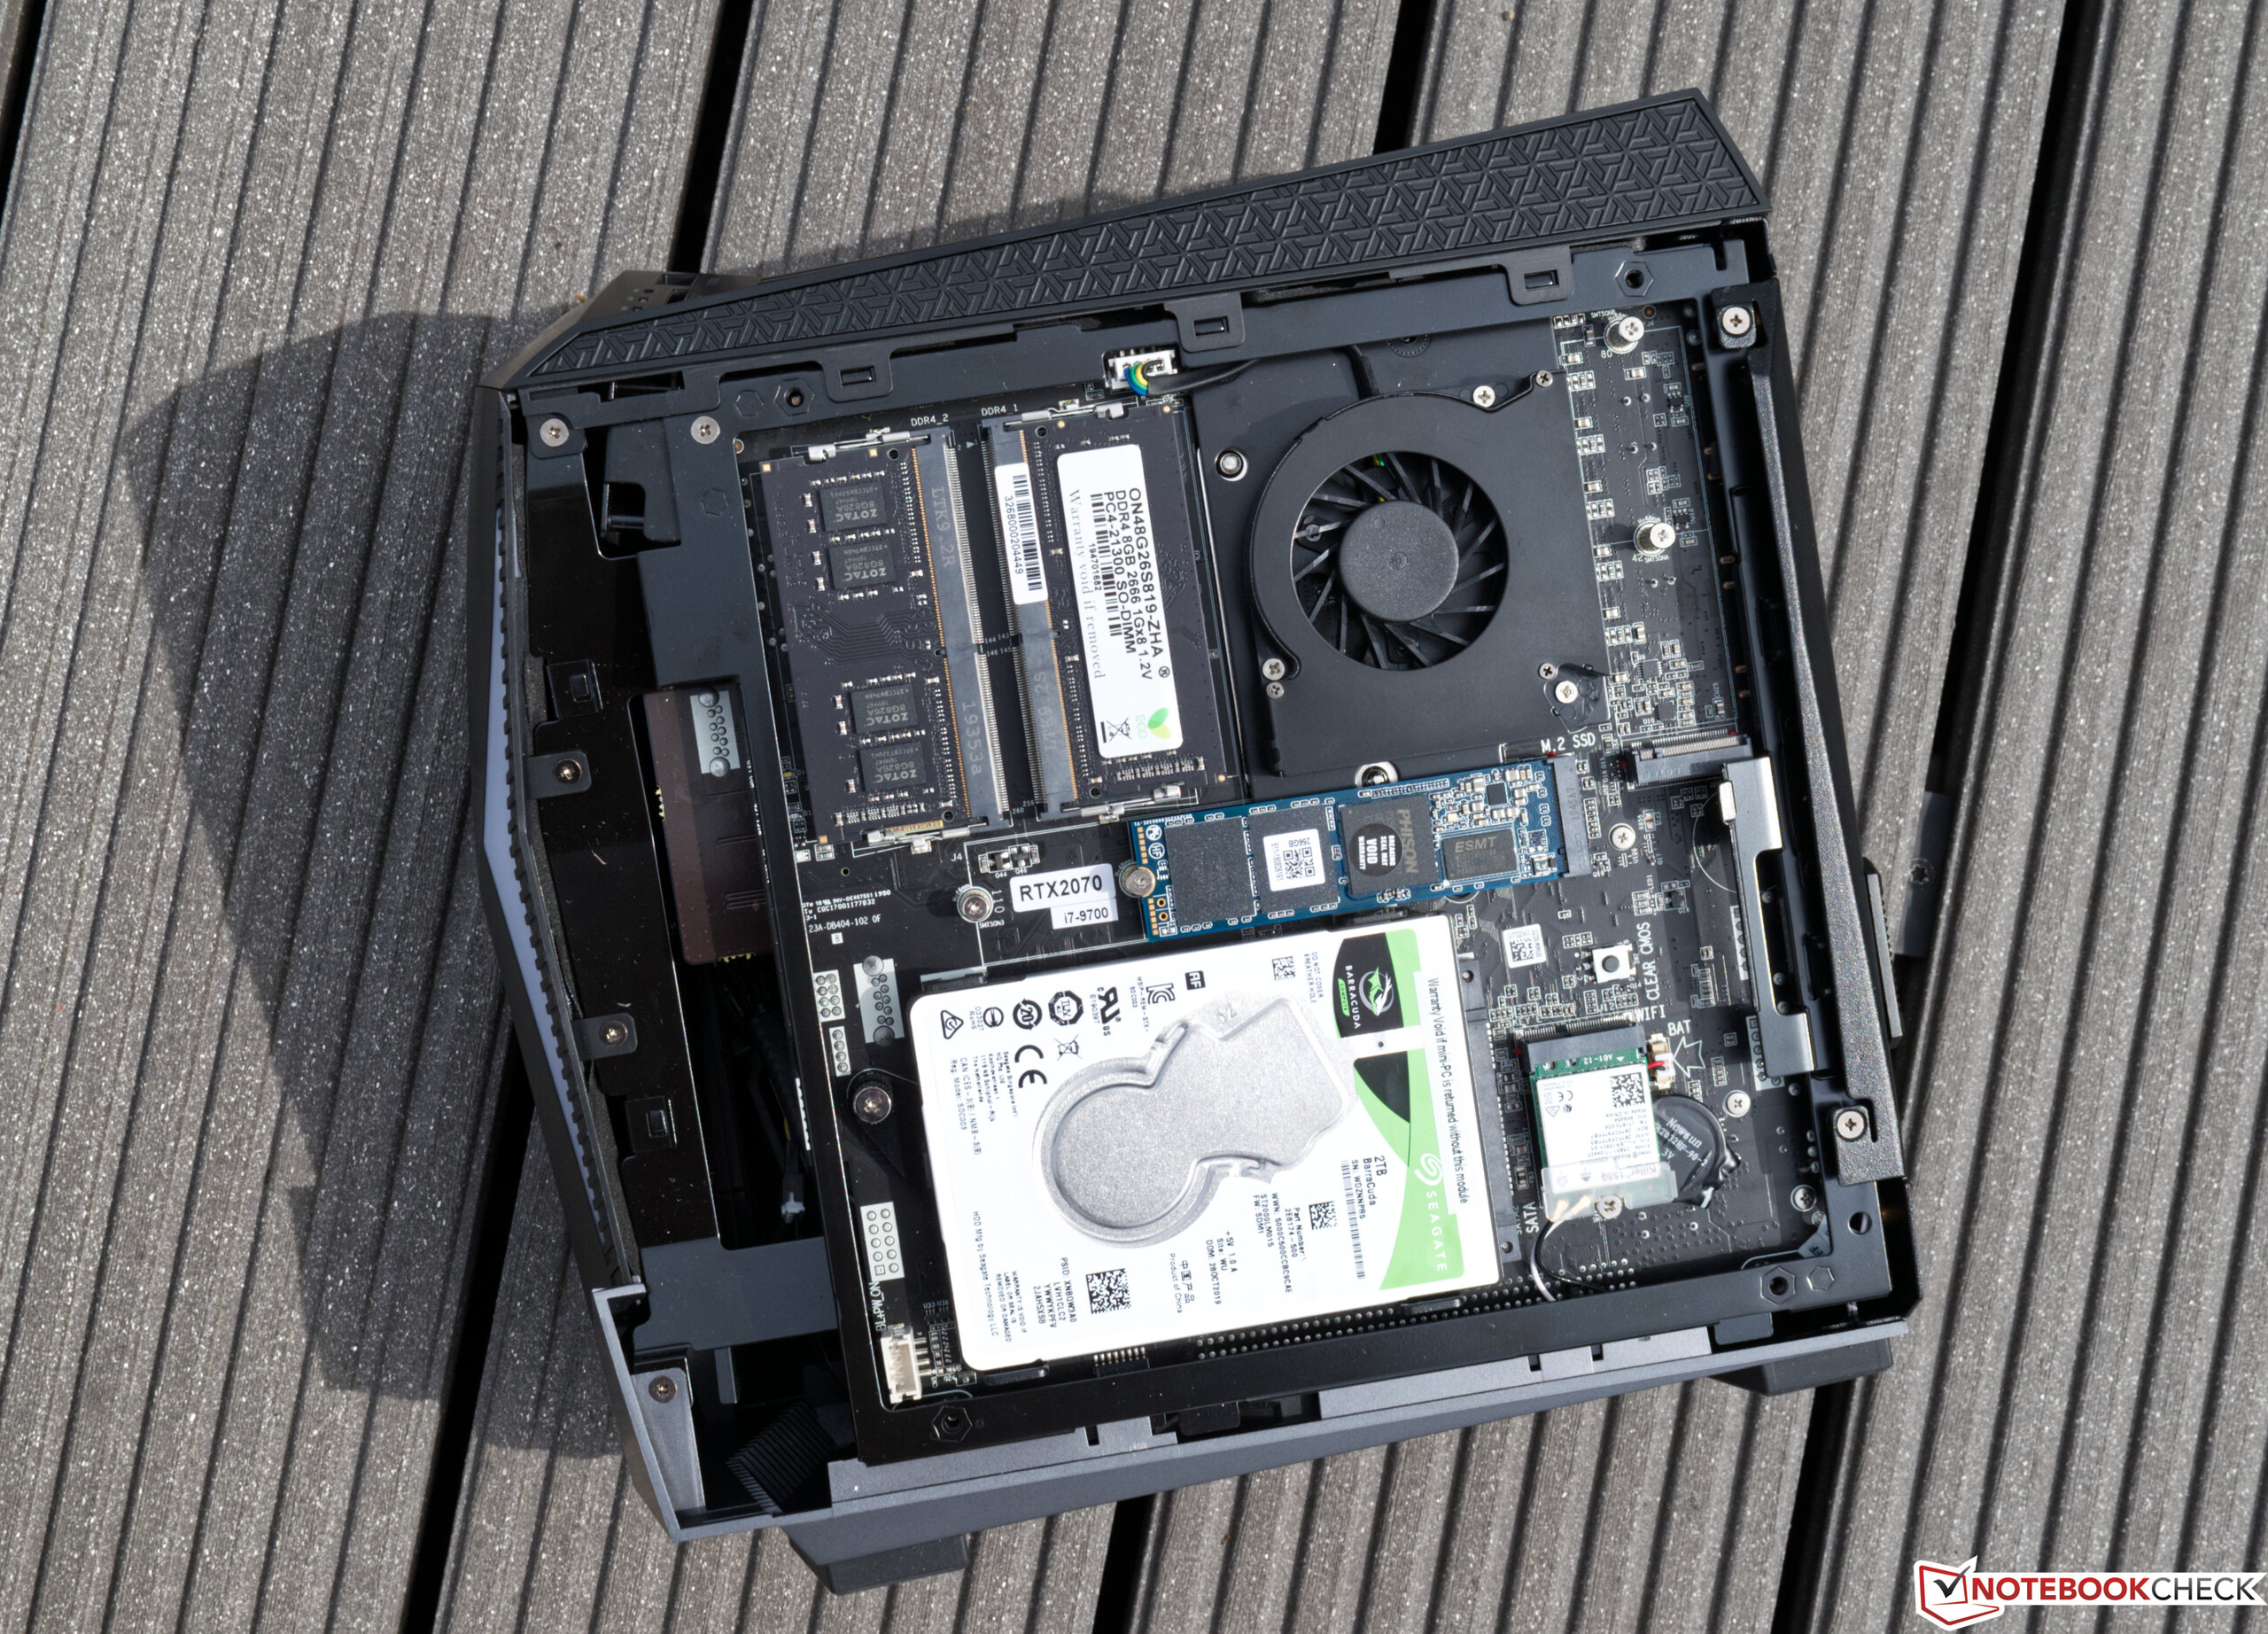
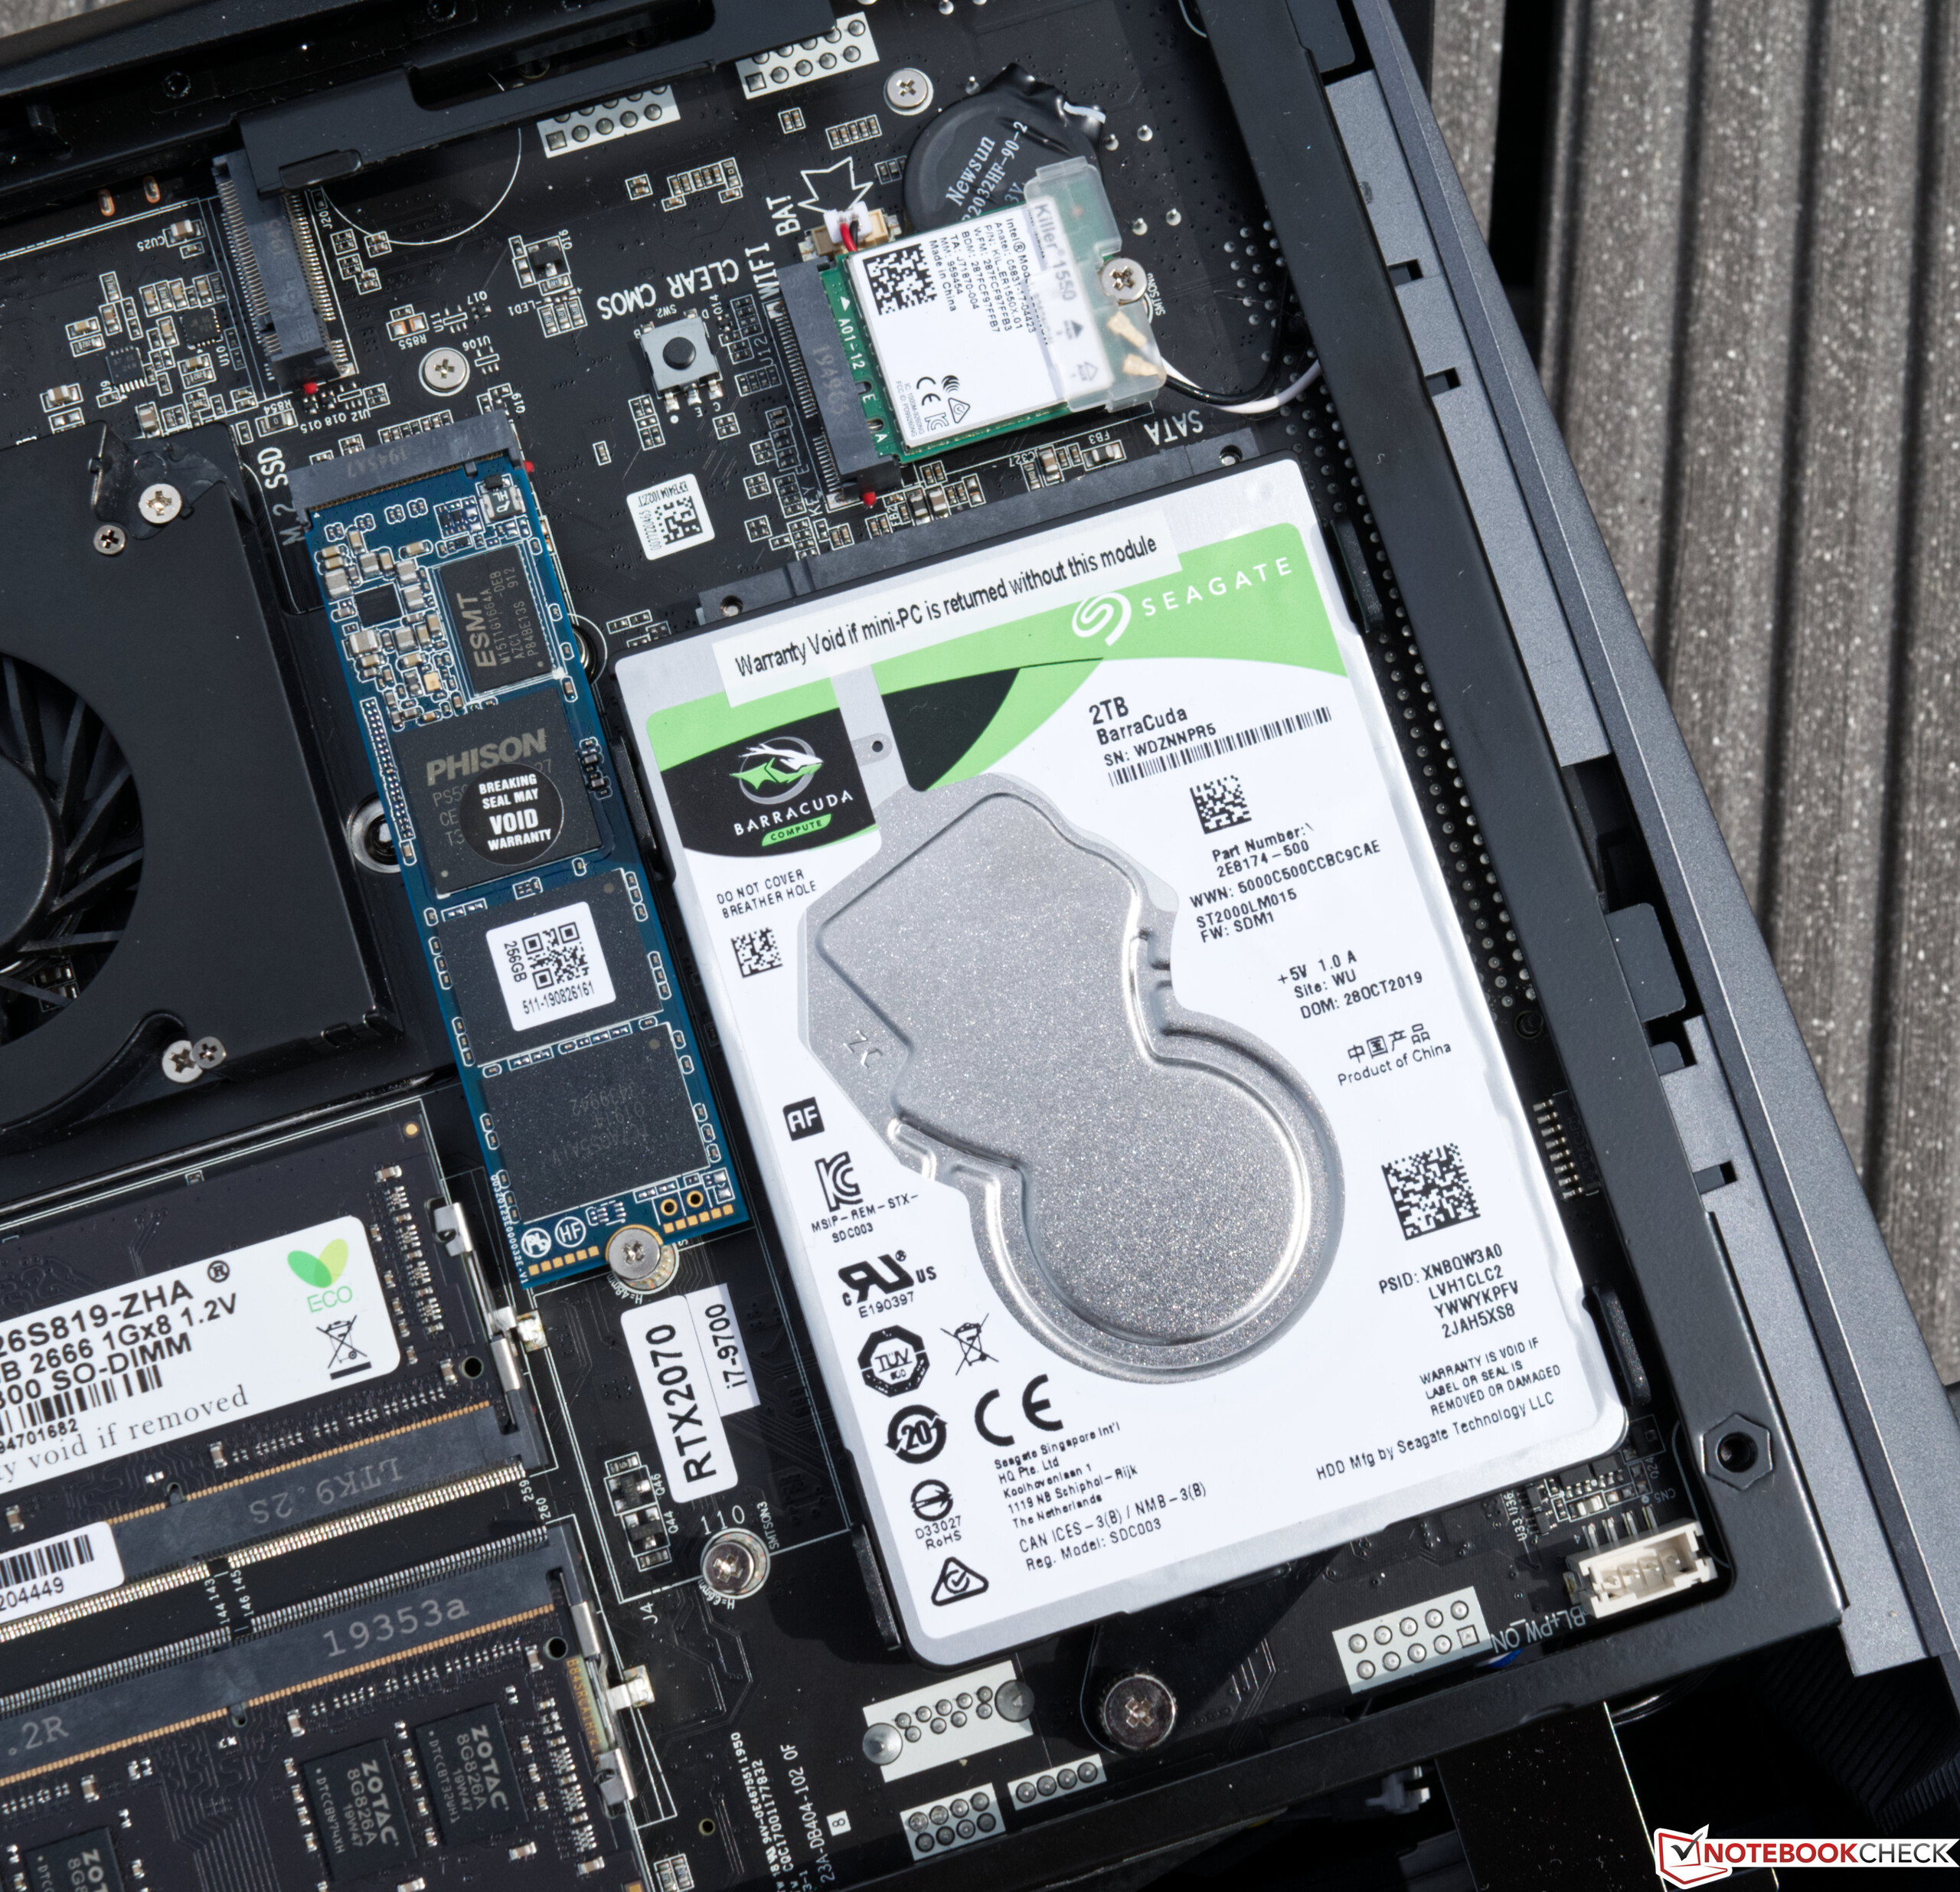
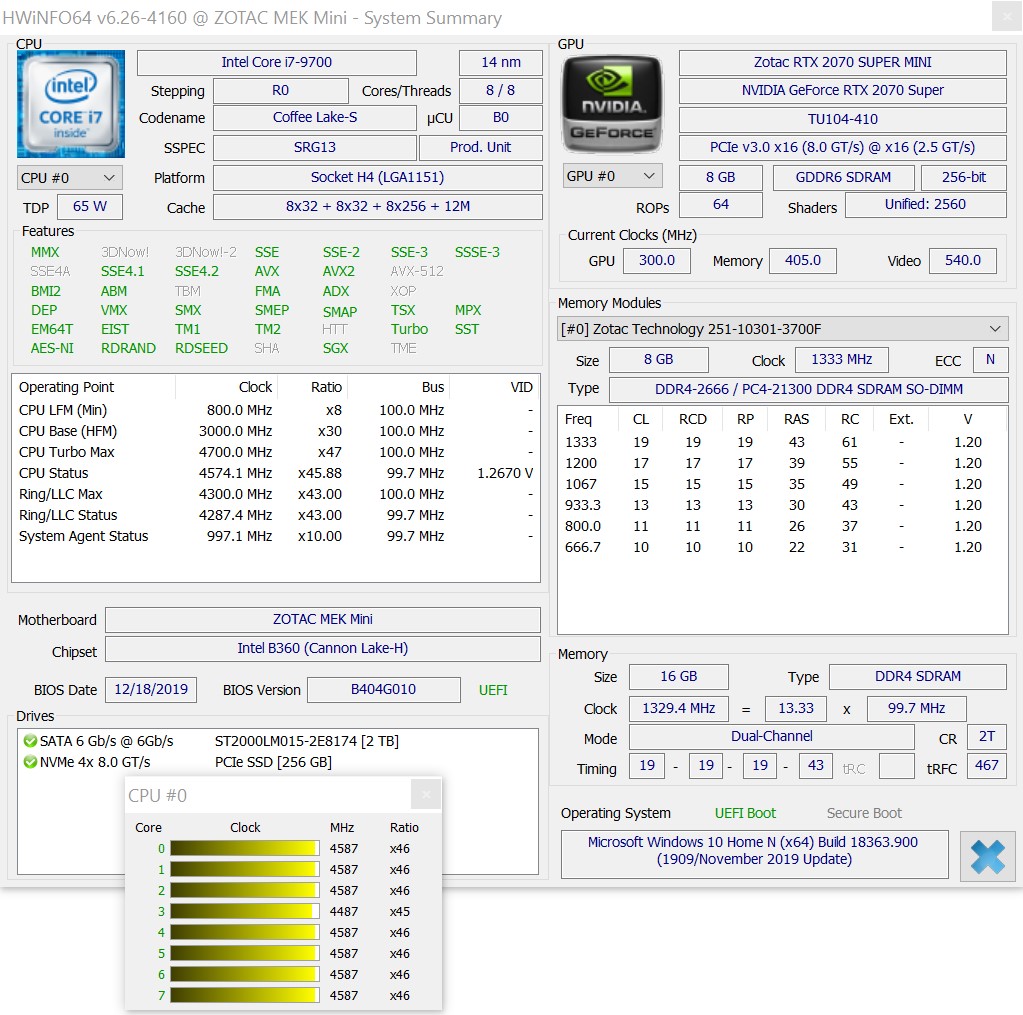
Per il nostro test, abbiamo il più veloce dei due modelli Zotac MEK MINI disponibili. Si basa su un Intel Core i7-9700 e su una GeForce RTX 2070 Super, anch'essa proveniente da Zotac come variante mini. Si tratta di componenti per desktop, che possono anche essere aggiornati con un po' di capacità. Inoltre, gli acquirenti avranno 16 GB di RAM DDR4 e una combinazione di storage di SSD (240 GB) e HDD (2 TB). In questo modo l'apparecchio è completamente pronto all'uso e non deve essere dotato dei componenti più necessari come in un sistema barebone. Al momento del test, il nostro modello di prova costa quasi 1.500 Euro (~$1.683). La versione più economica del MEK MINI ha attualmente un prezzo di 1.100 Euro (~$1.234). Tuttavia, alcuni compromessi devono essere fatti in termini di prestazioni e di conservazione.

Zotac MEK MINI in dettaglio

Produttore / Descrizione Zotac MEK MINI RTX 2070 Super Zotac MEK Mini RTX 2060 Super
Prezzo (al momento del test) 1,500 Euro 1,100 Euro
Dimensioni 260.8 x 136 x 258.8 mm (W x D x H) 9.18 L 260.8 x 136 x 258.8 mm (W x D x H) 9.18 L
CPU Intel Core i7-9700 Intel Core i5-9400F
GPU Nvidia GeForce RTX 2070 Super Nvidia GeForce RTX 2060 Super
RAM 16 GB (2x 8 GB DDR4 2666) 16 GB (2x 8 GB DDR4 2666)
SSD 1x 240 GB M.2 SSD 1x 240 GB M.2 SSD
HDD 1x 2 TB 2.5-inch HDD 1x 1 TB 2.5-inch HDD
Alimentatore 2x 330 W 2x 230 W

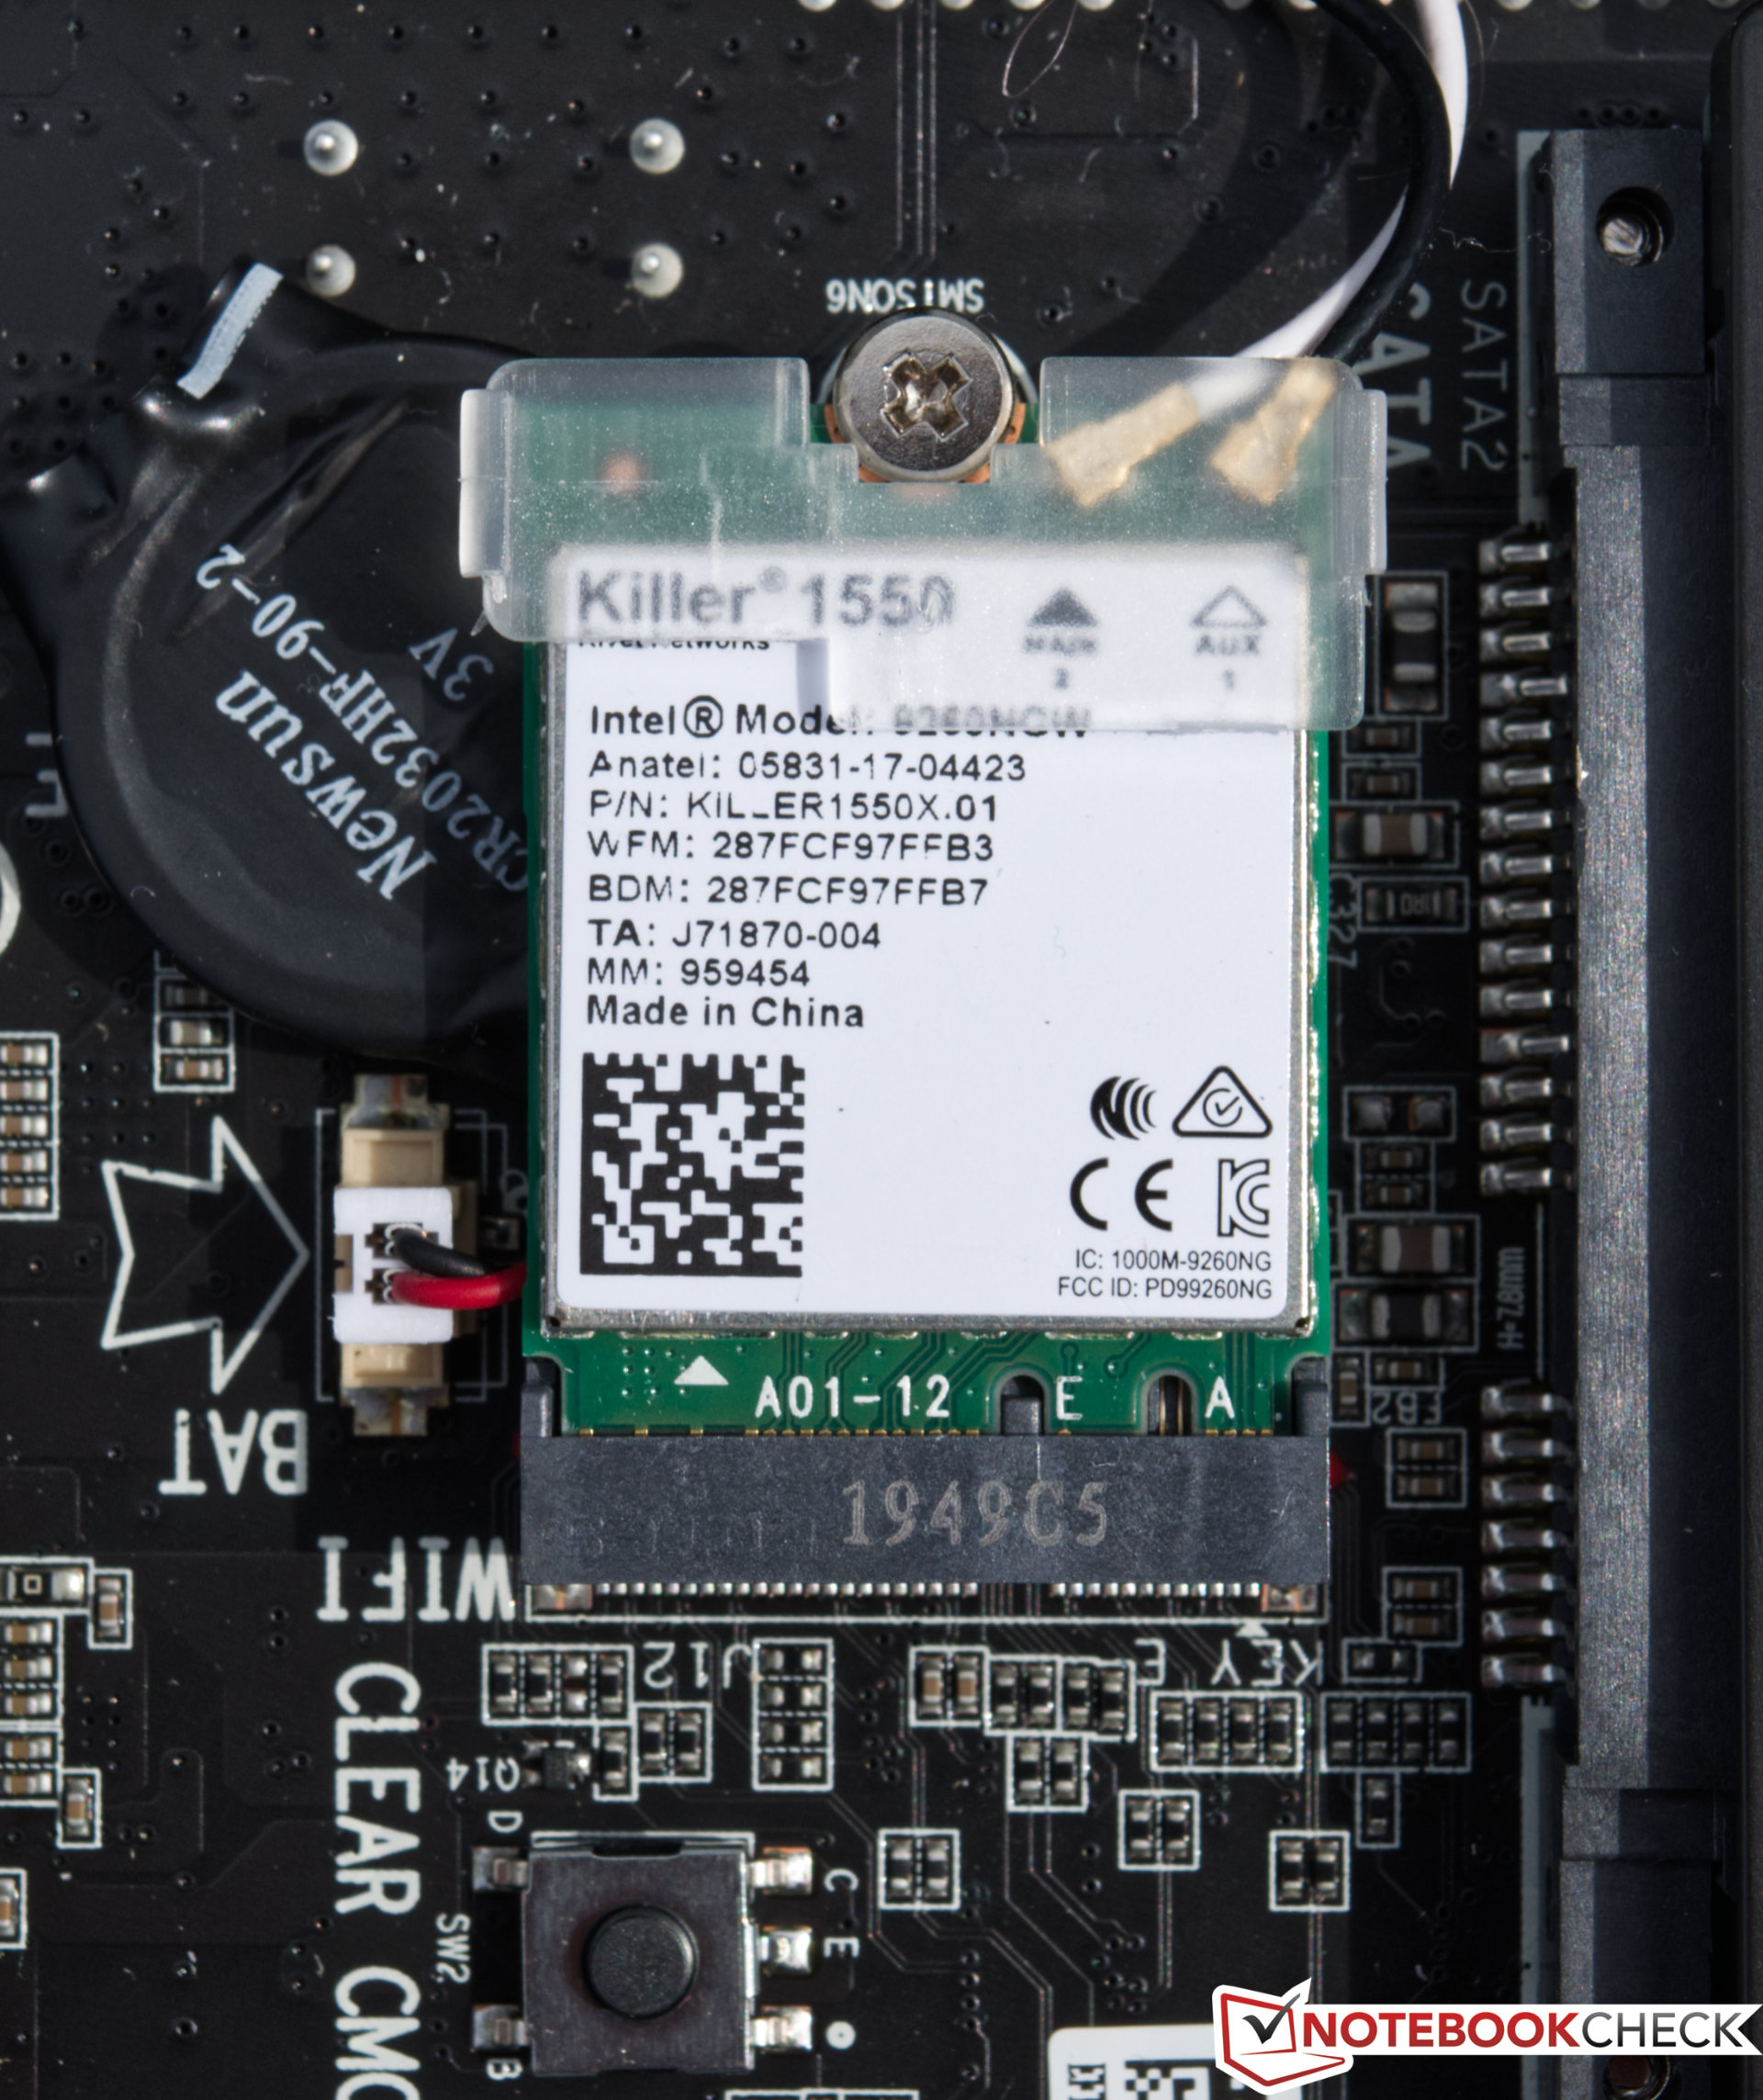
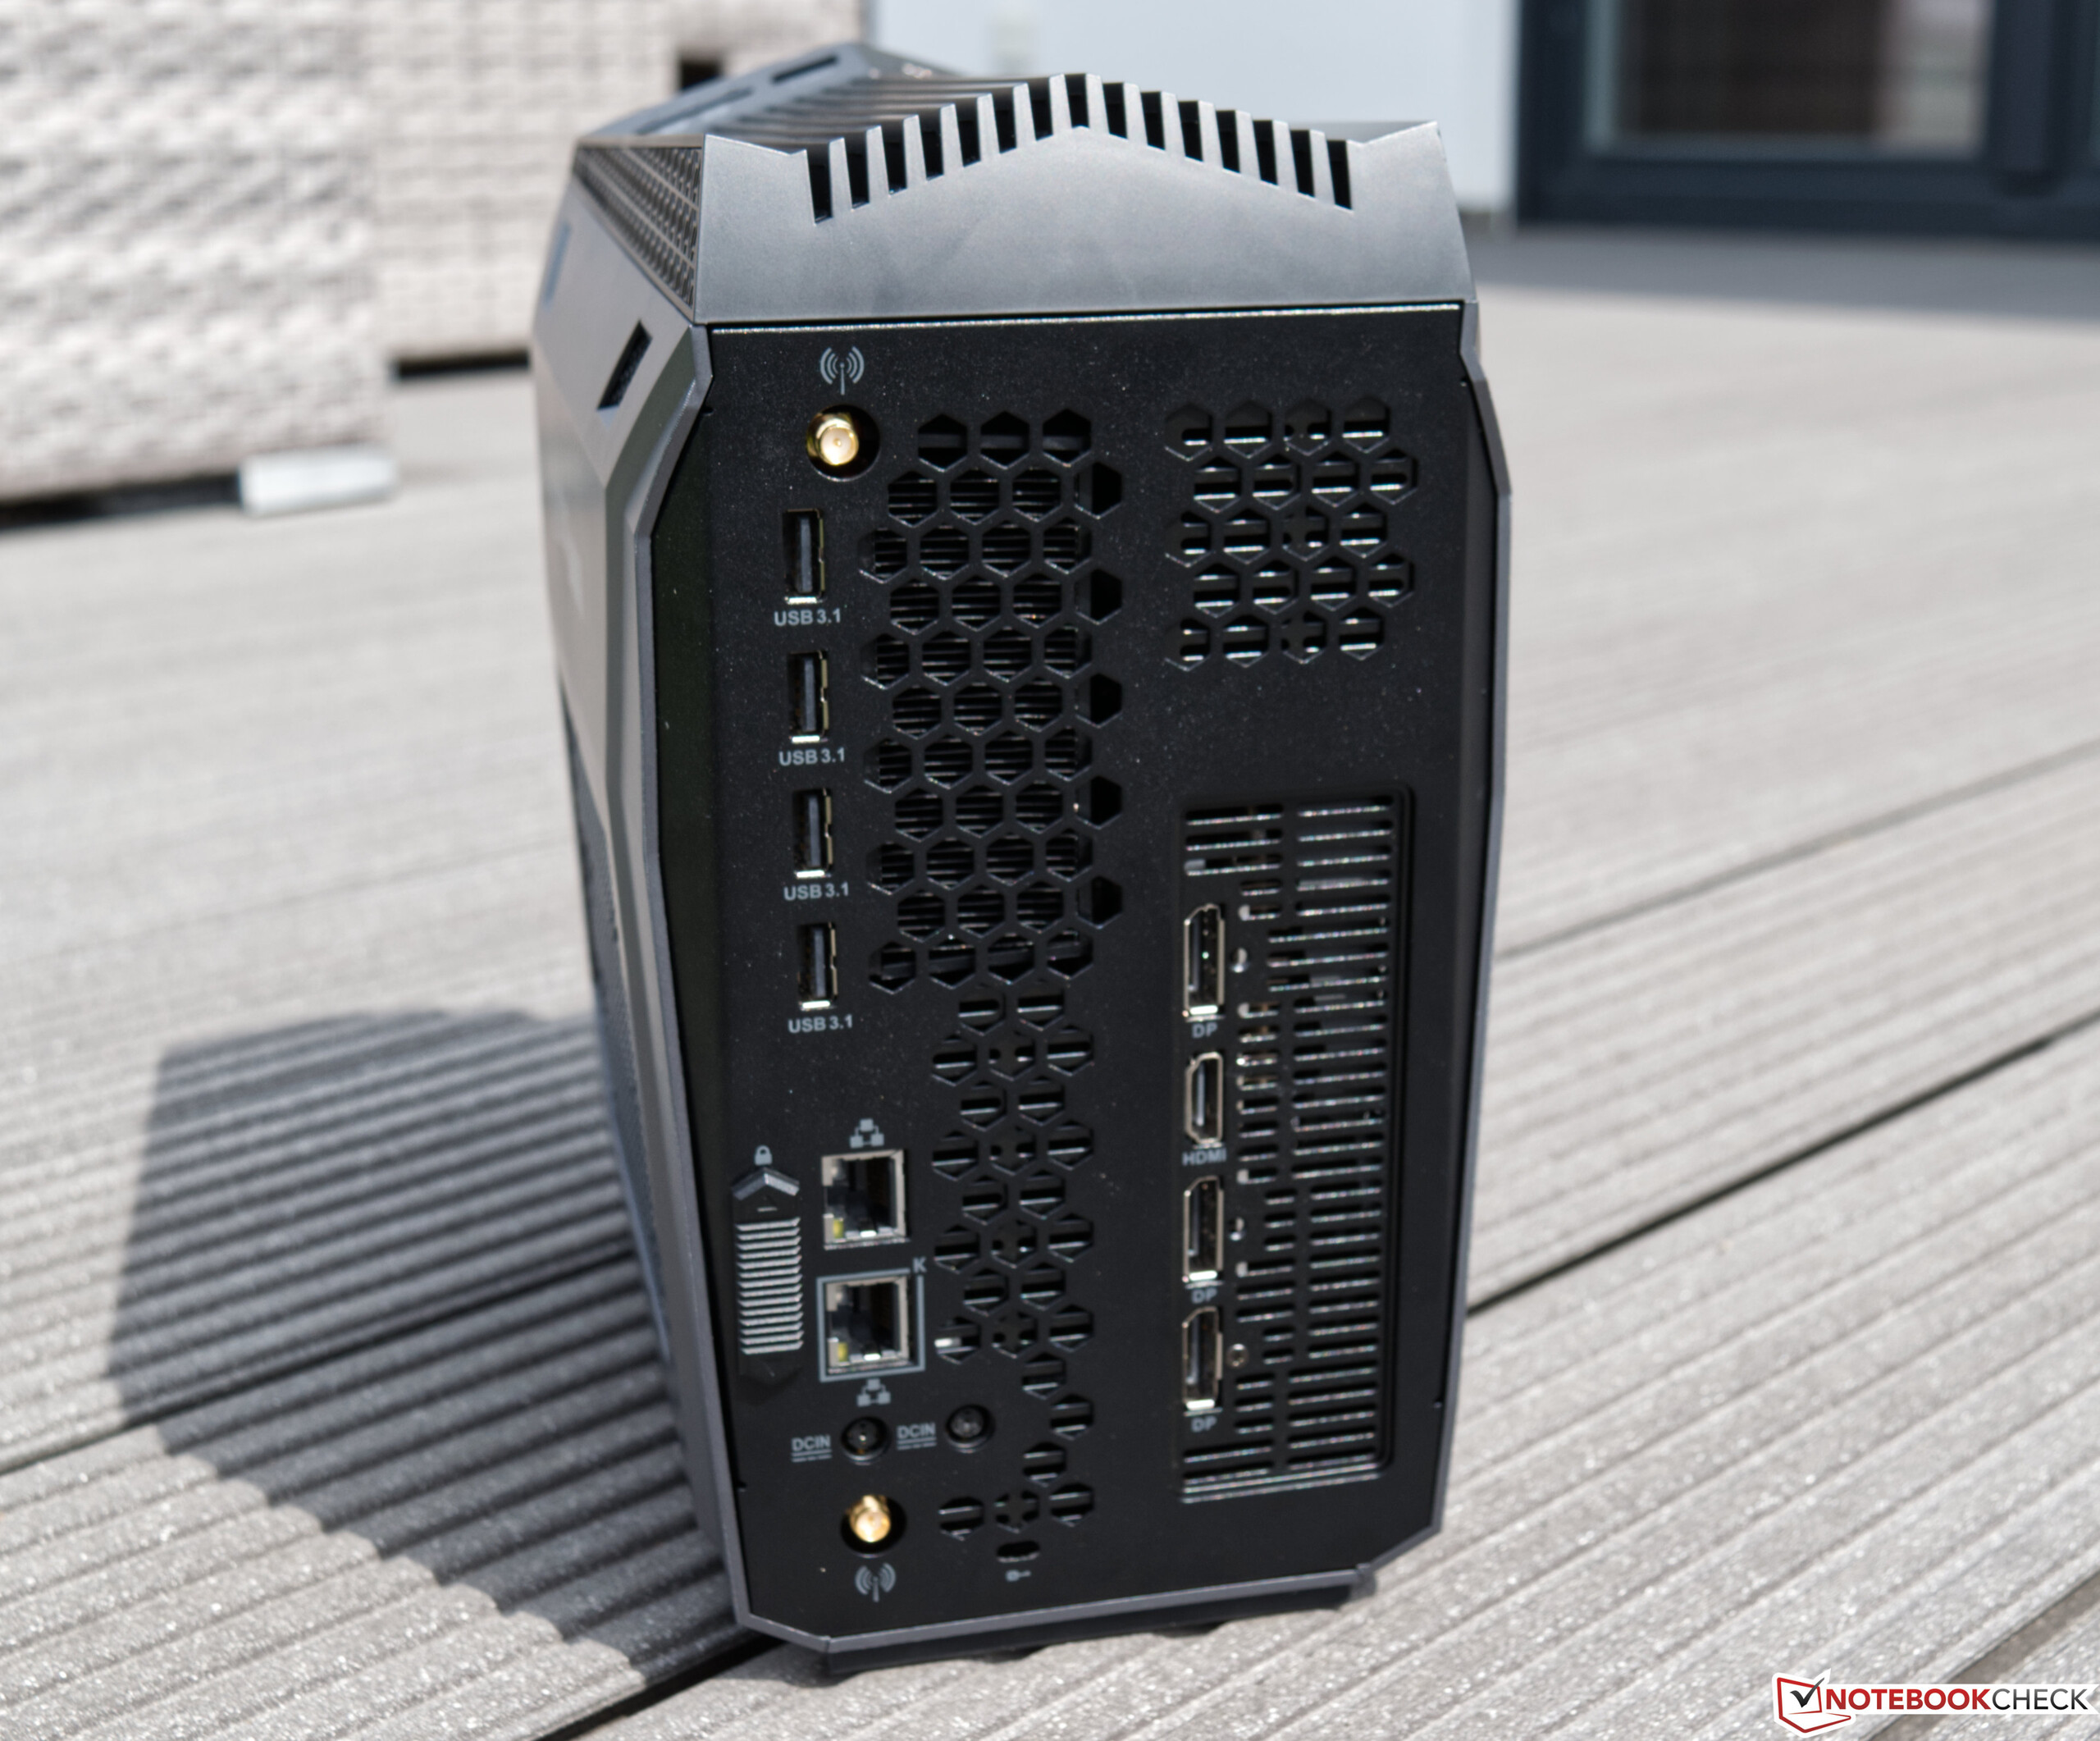
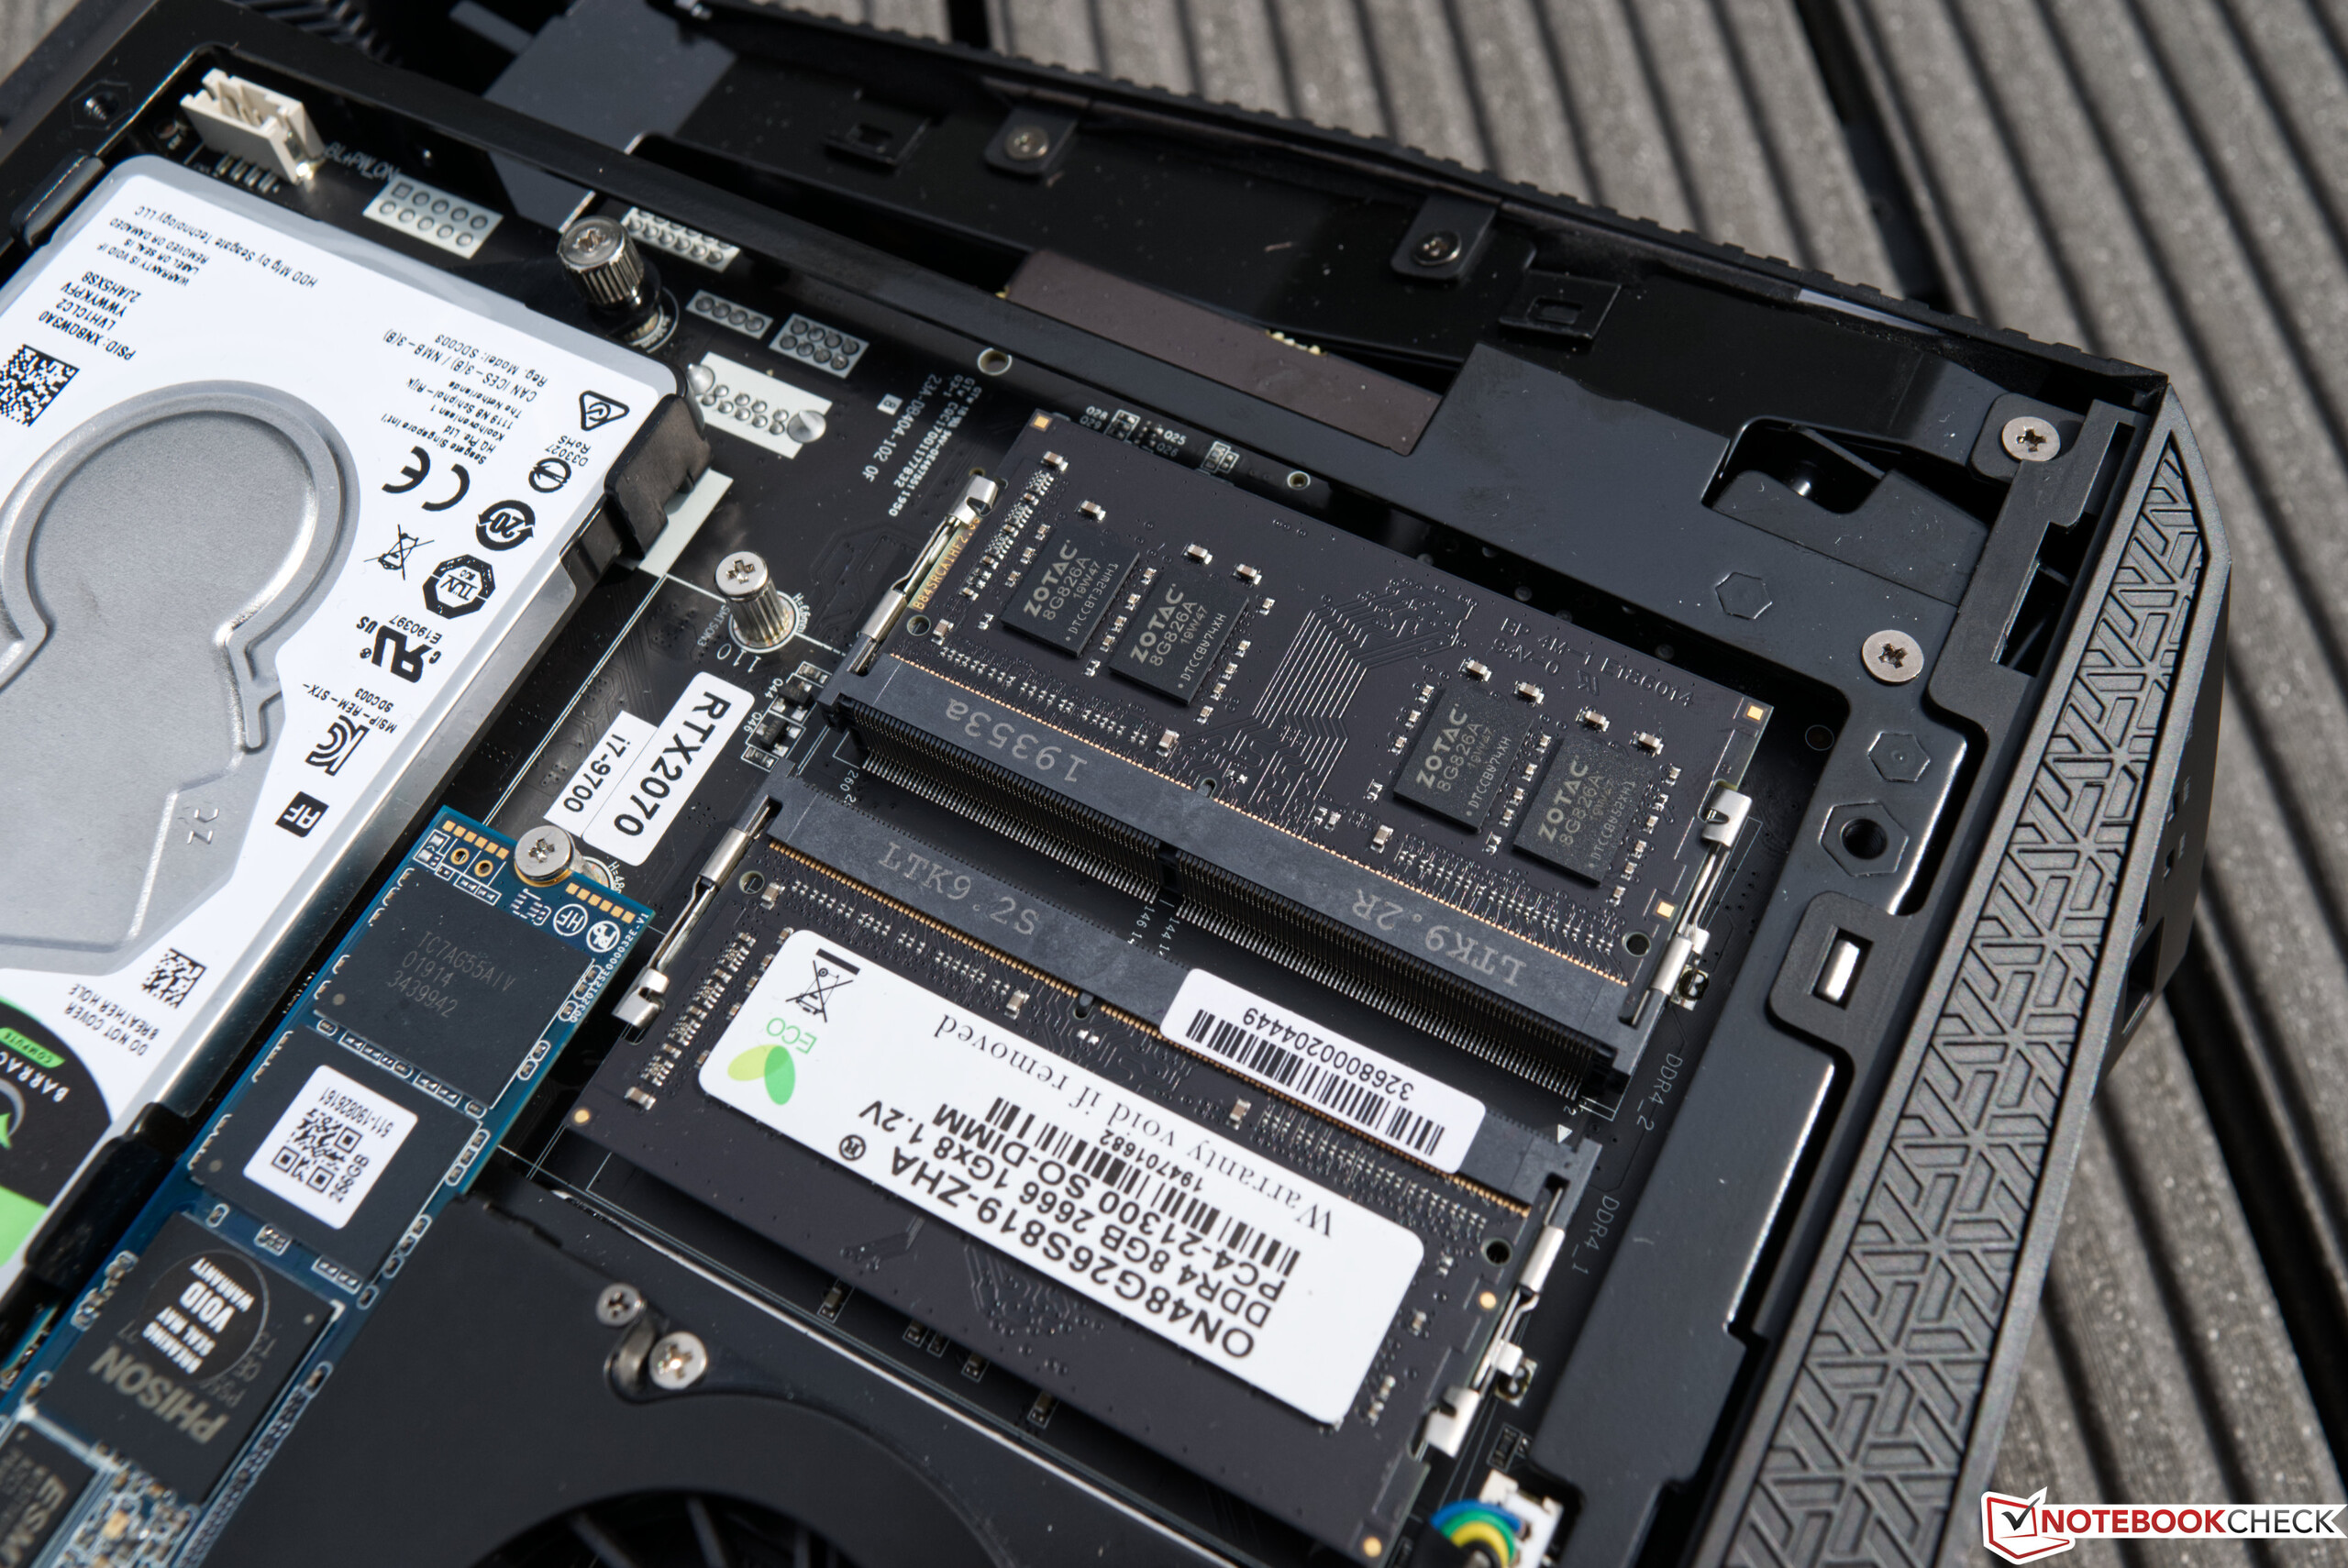
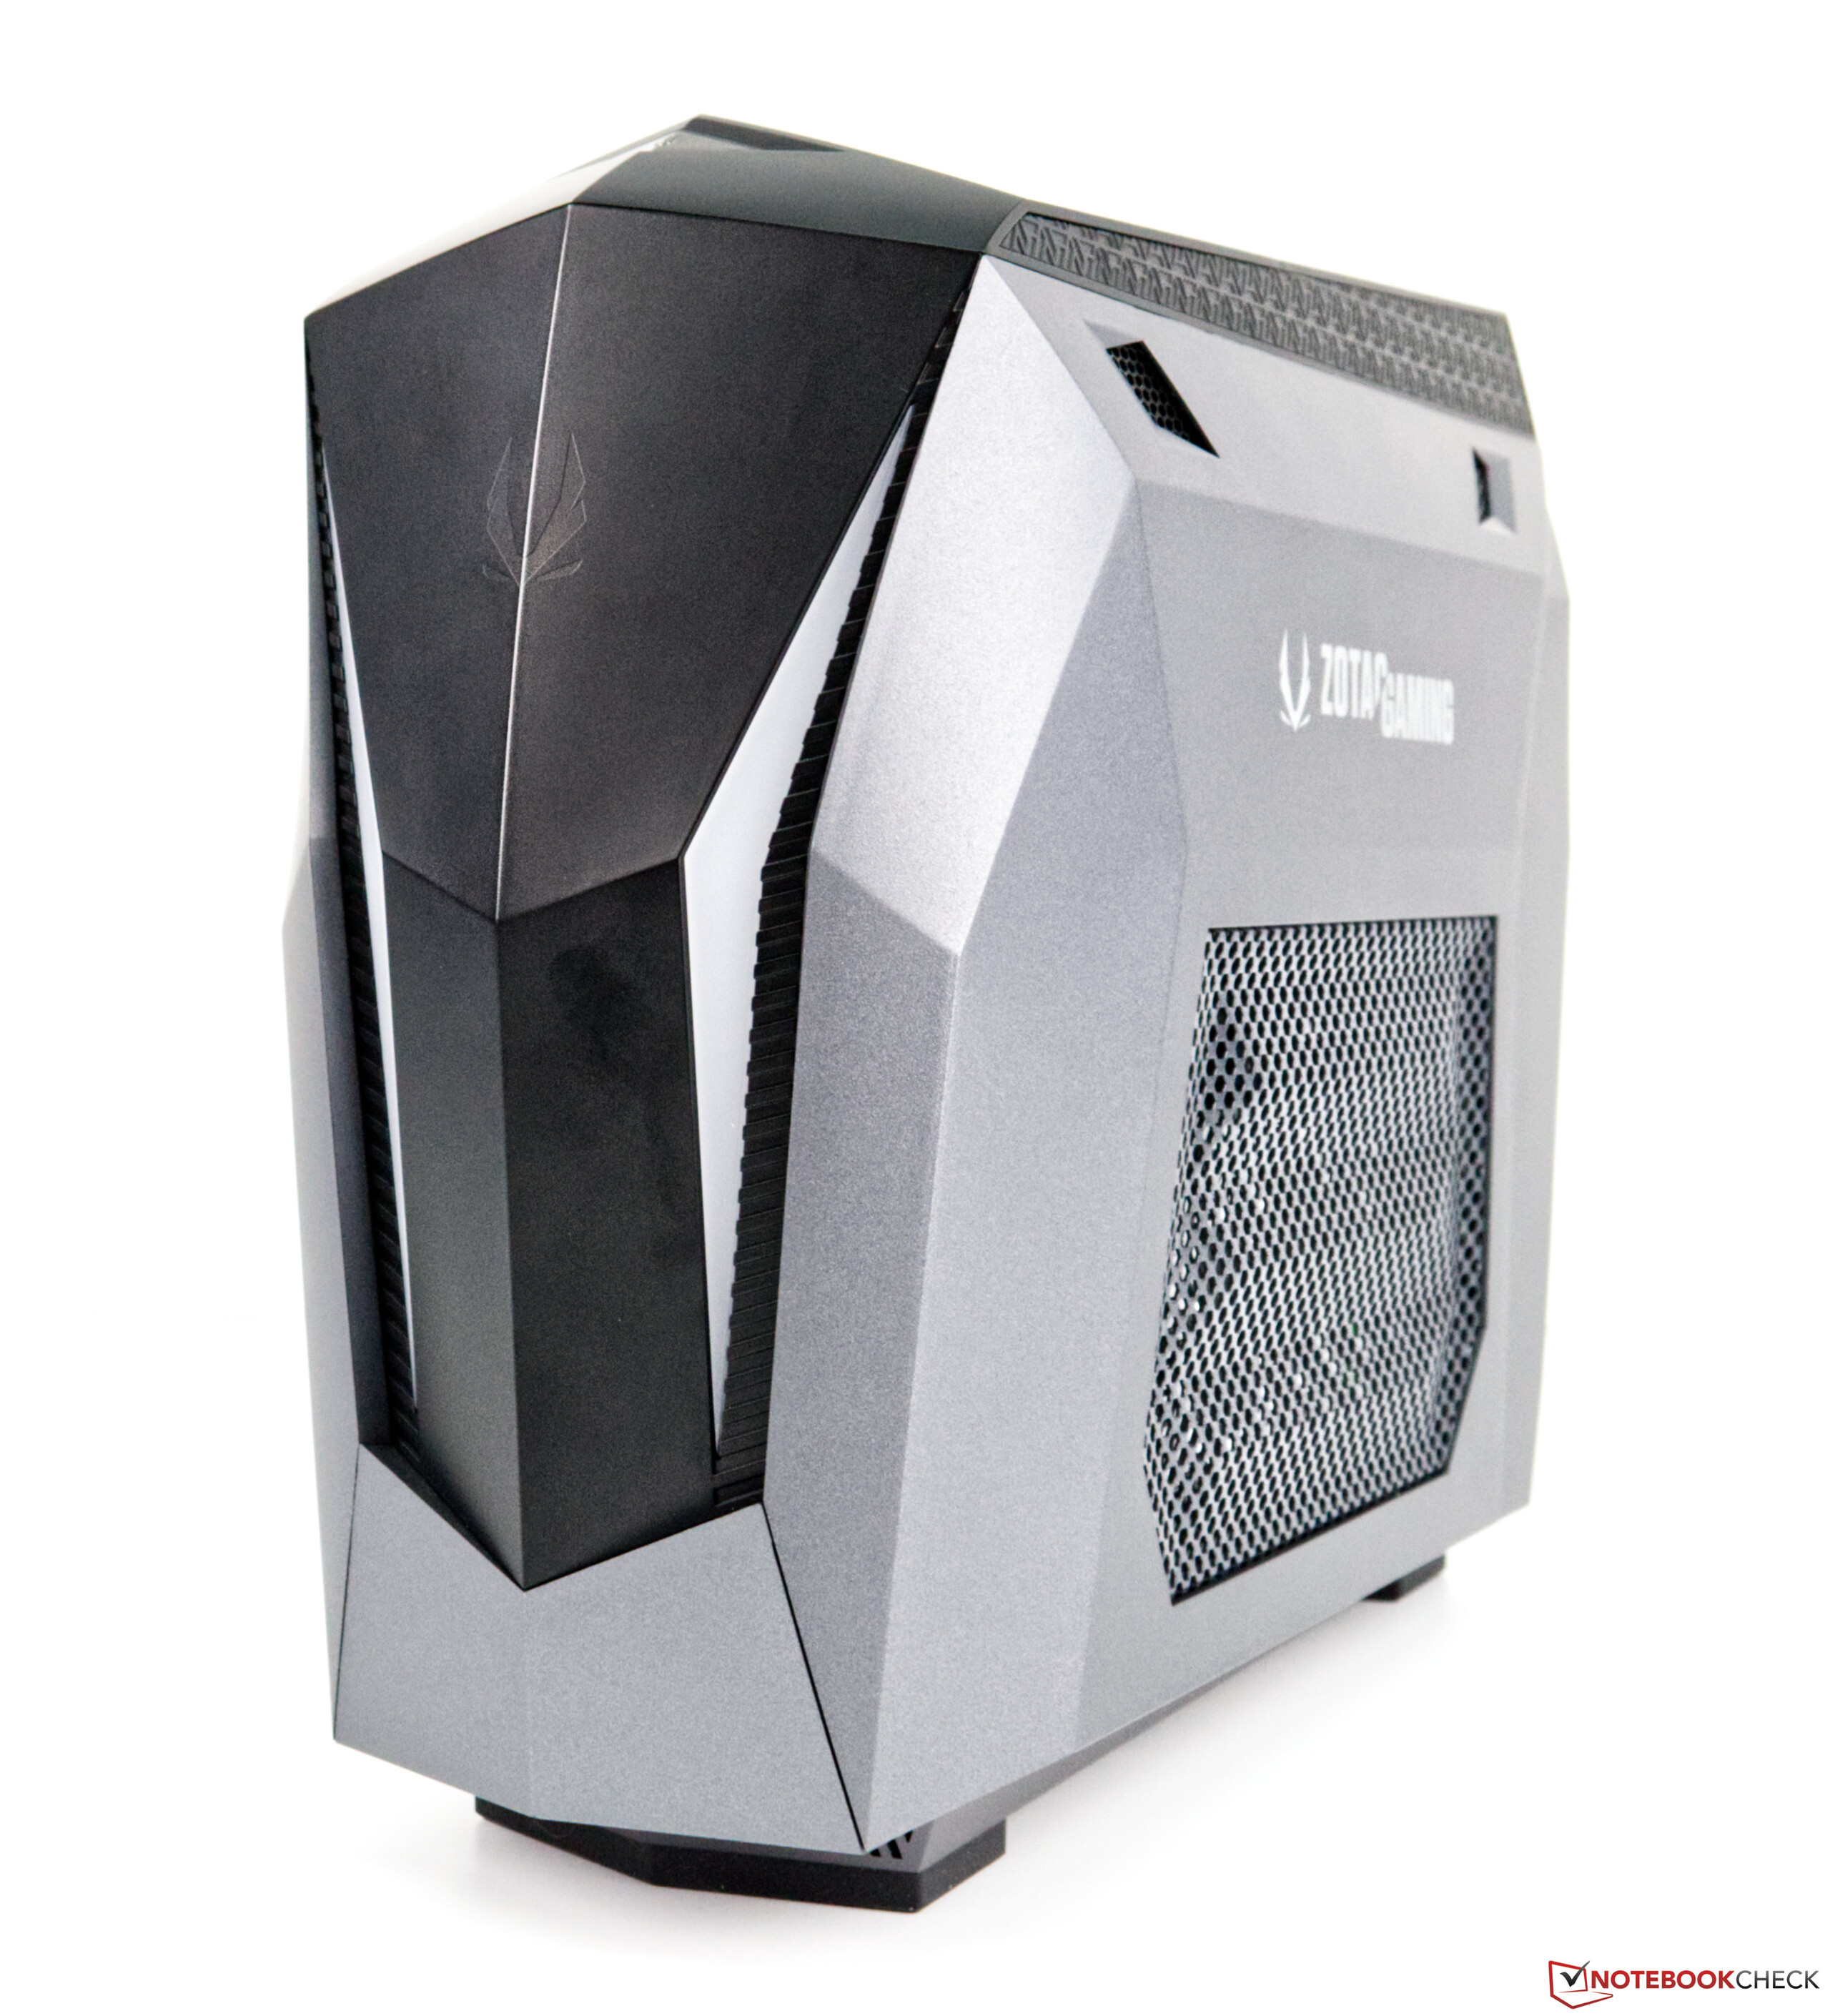
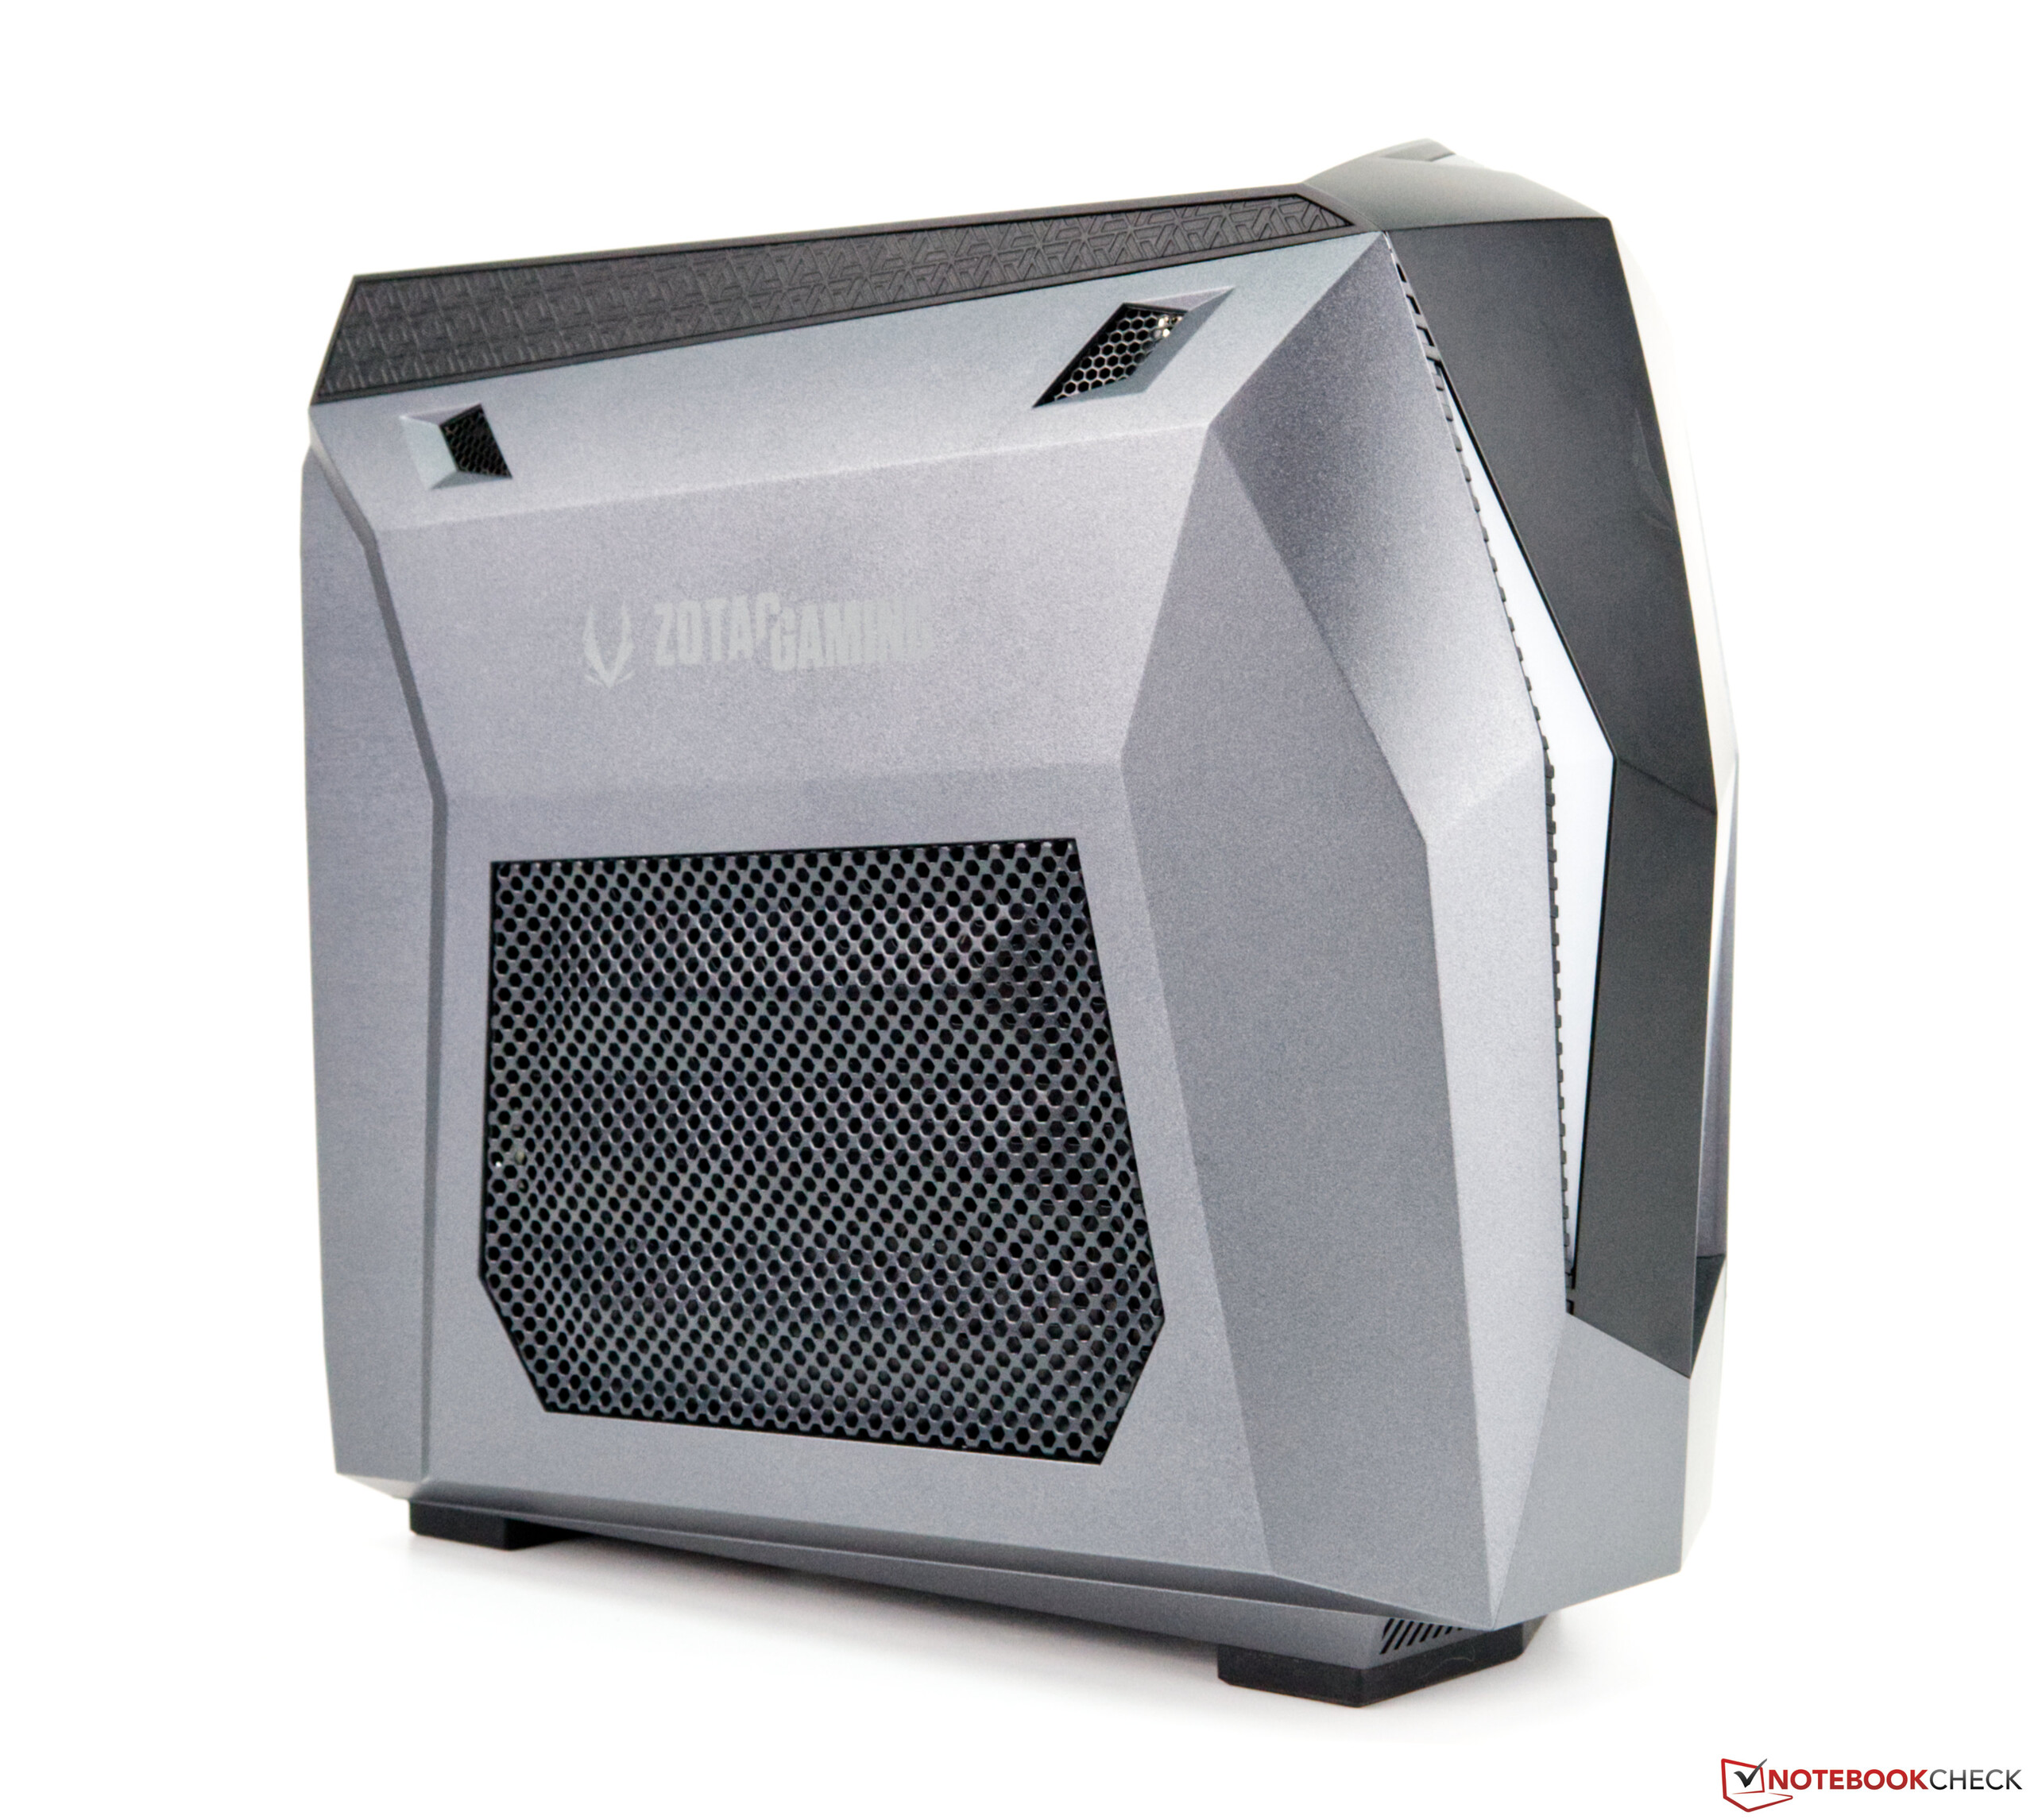
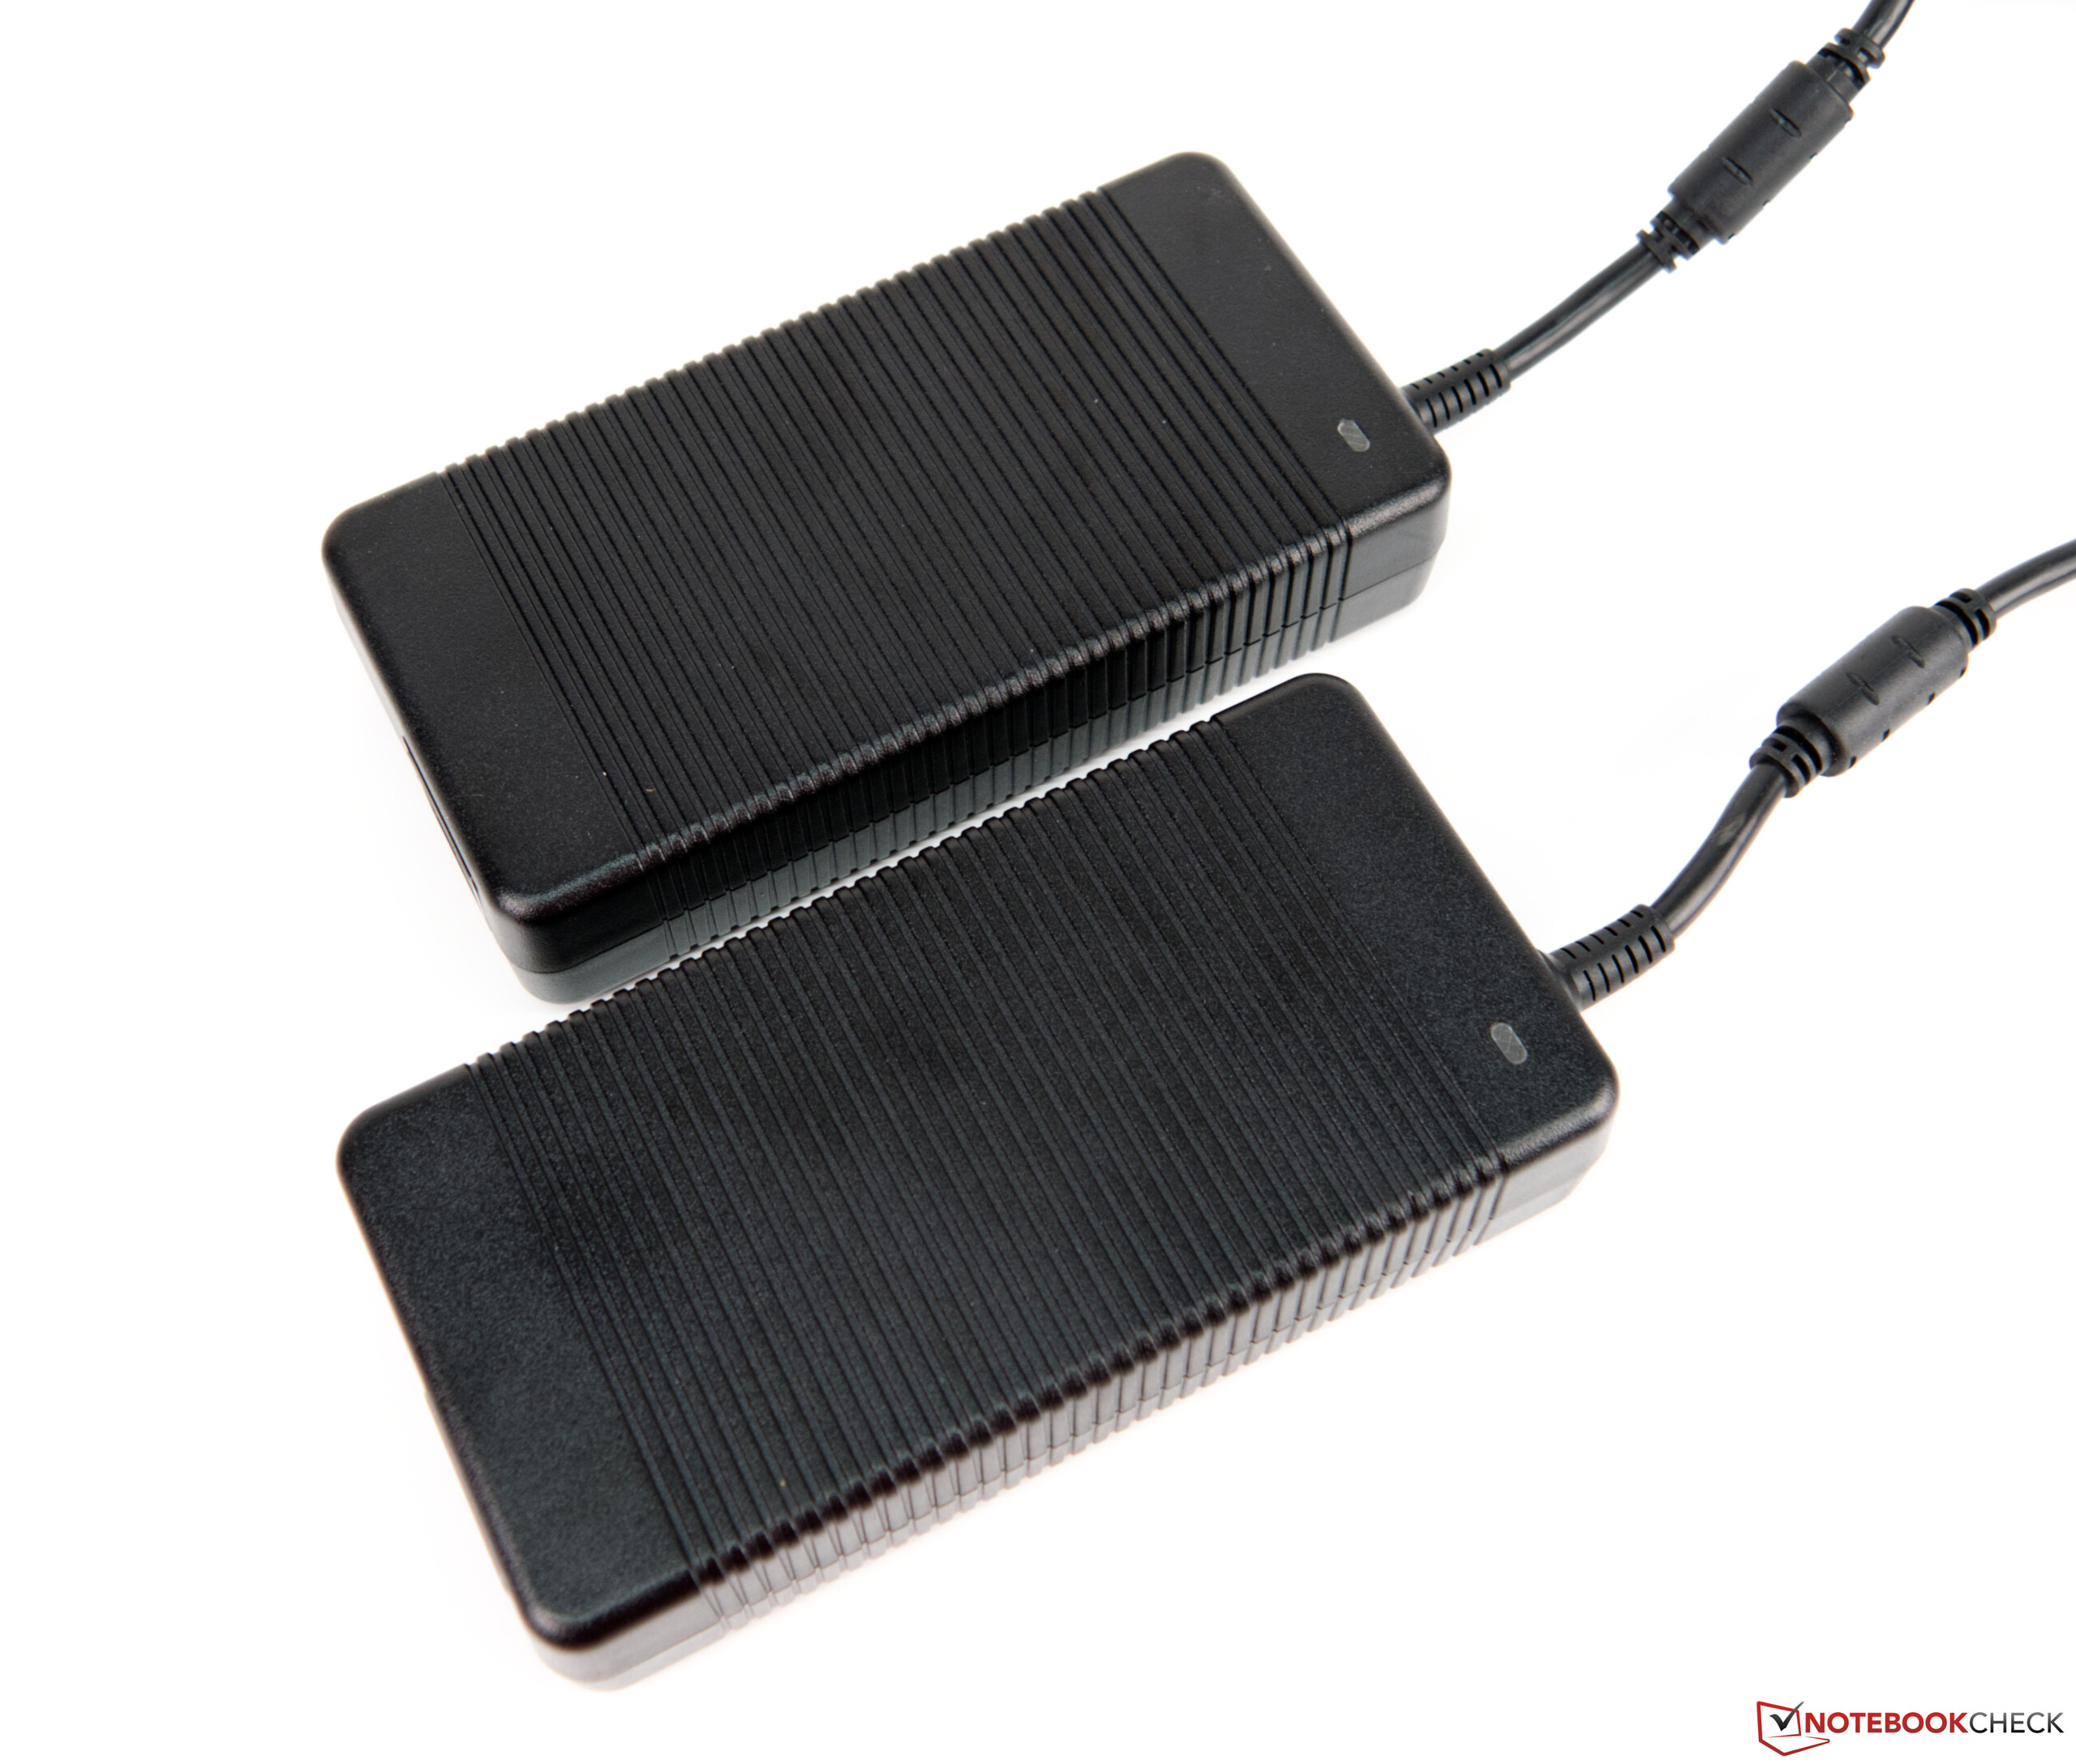
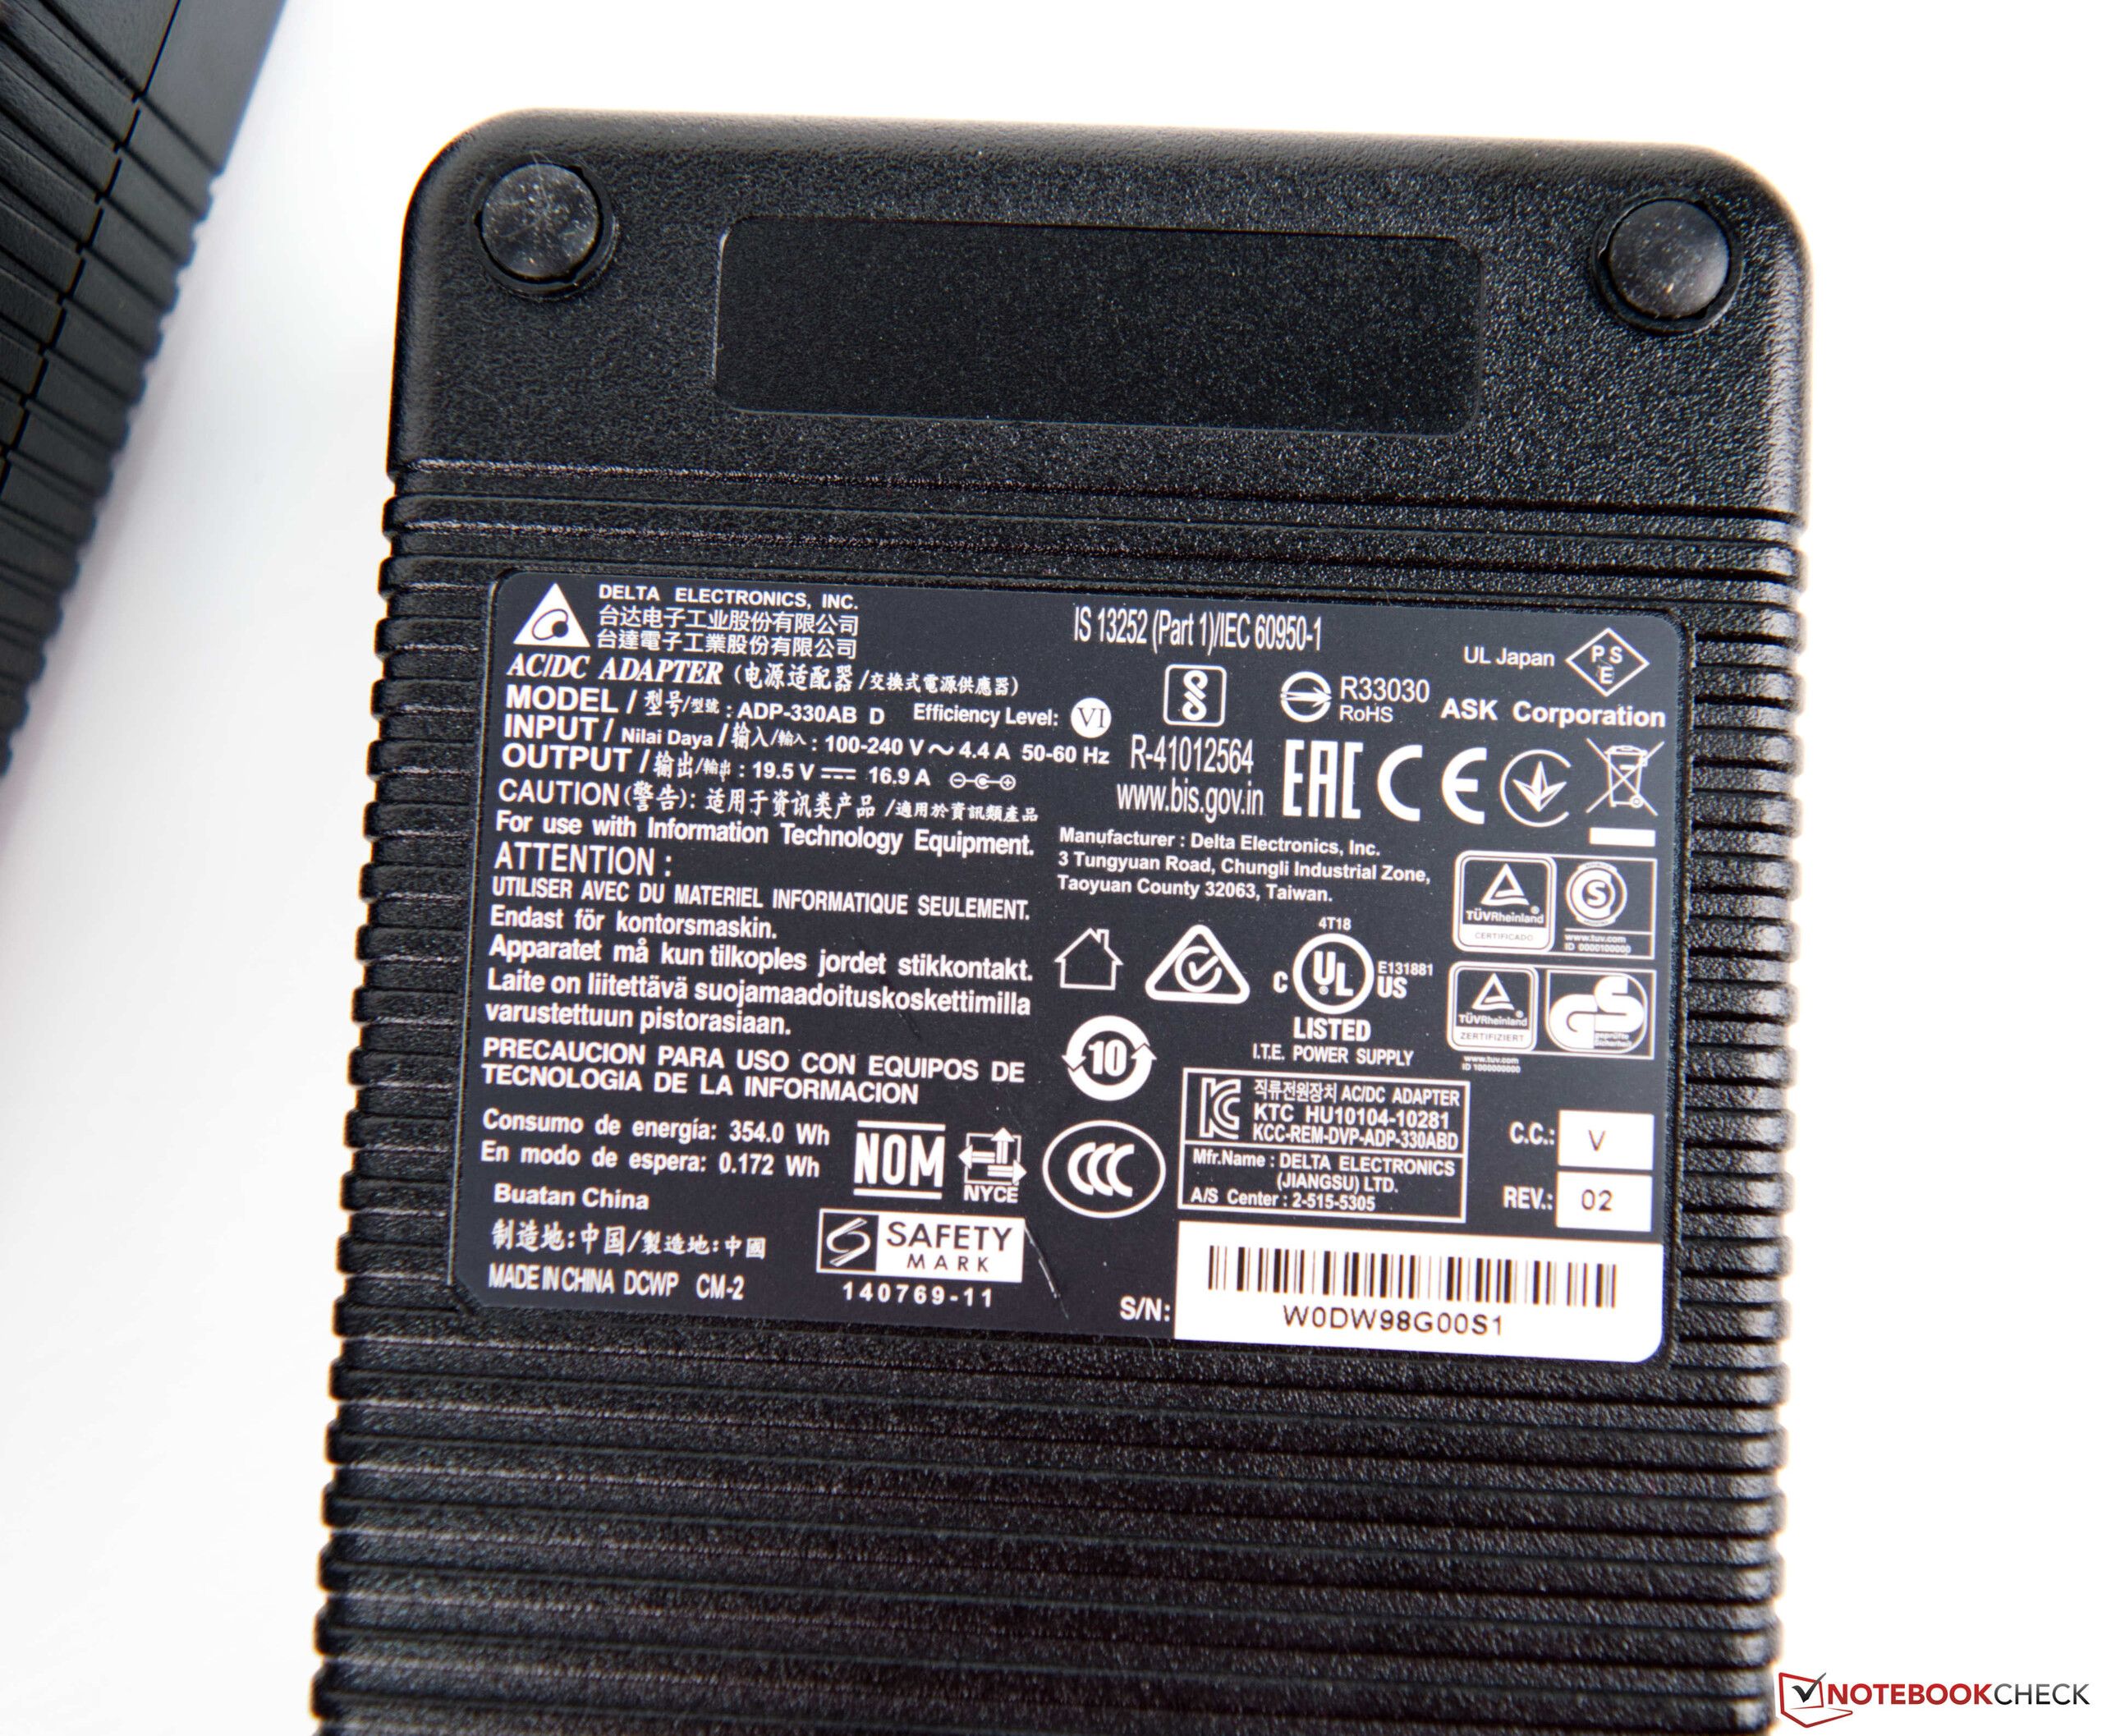
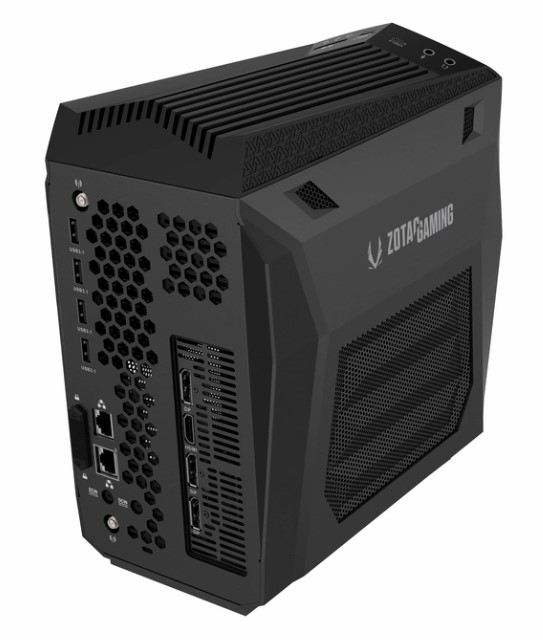
Le dimensioni esterne sono molto ridotte a 136 x 259 x 261 millimetri (L x A x P) se si considera che si tratta di un PC per il gaming. Tuttavia, il produttore bara un po' in questo caso, dato che non c'è un alimentatore integrato nel case. Questo si trova all'esterno ed è doppio. Il nostro modello viene fornito con due alimentatori da 330 watt, e la versione un po' più debole del MEK MINI necessita di 2x 230 watt. Dal punto di vista estetico, l'apparecchio ha un aspetto moderno e si può aspirare aria fresca a sufficienza per raffreddare i componenti installati attraverso le griglie di ventilazione laterali. Visto dalla parte anteriore, il pannello laterale destro può essere facilmente e rapidamente rimosso senza attrezzi per accedere alla RAM o ai dispositivi di archiviazione. Ma chi vuole rimuovere rapidamente la scheda grafica avrà una brutta sorpresa, dato che quasi tutto il dispositivo deve essere smontato.

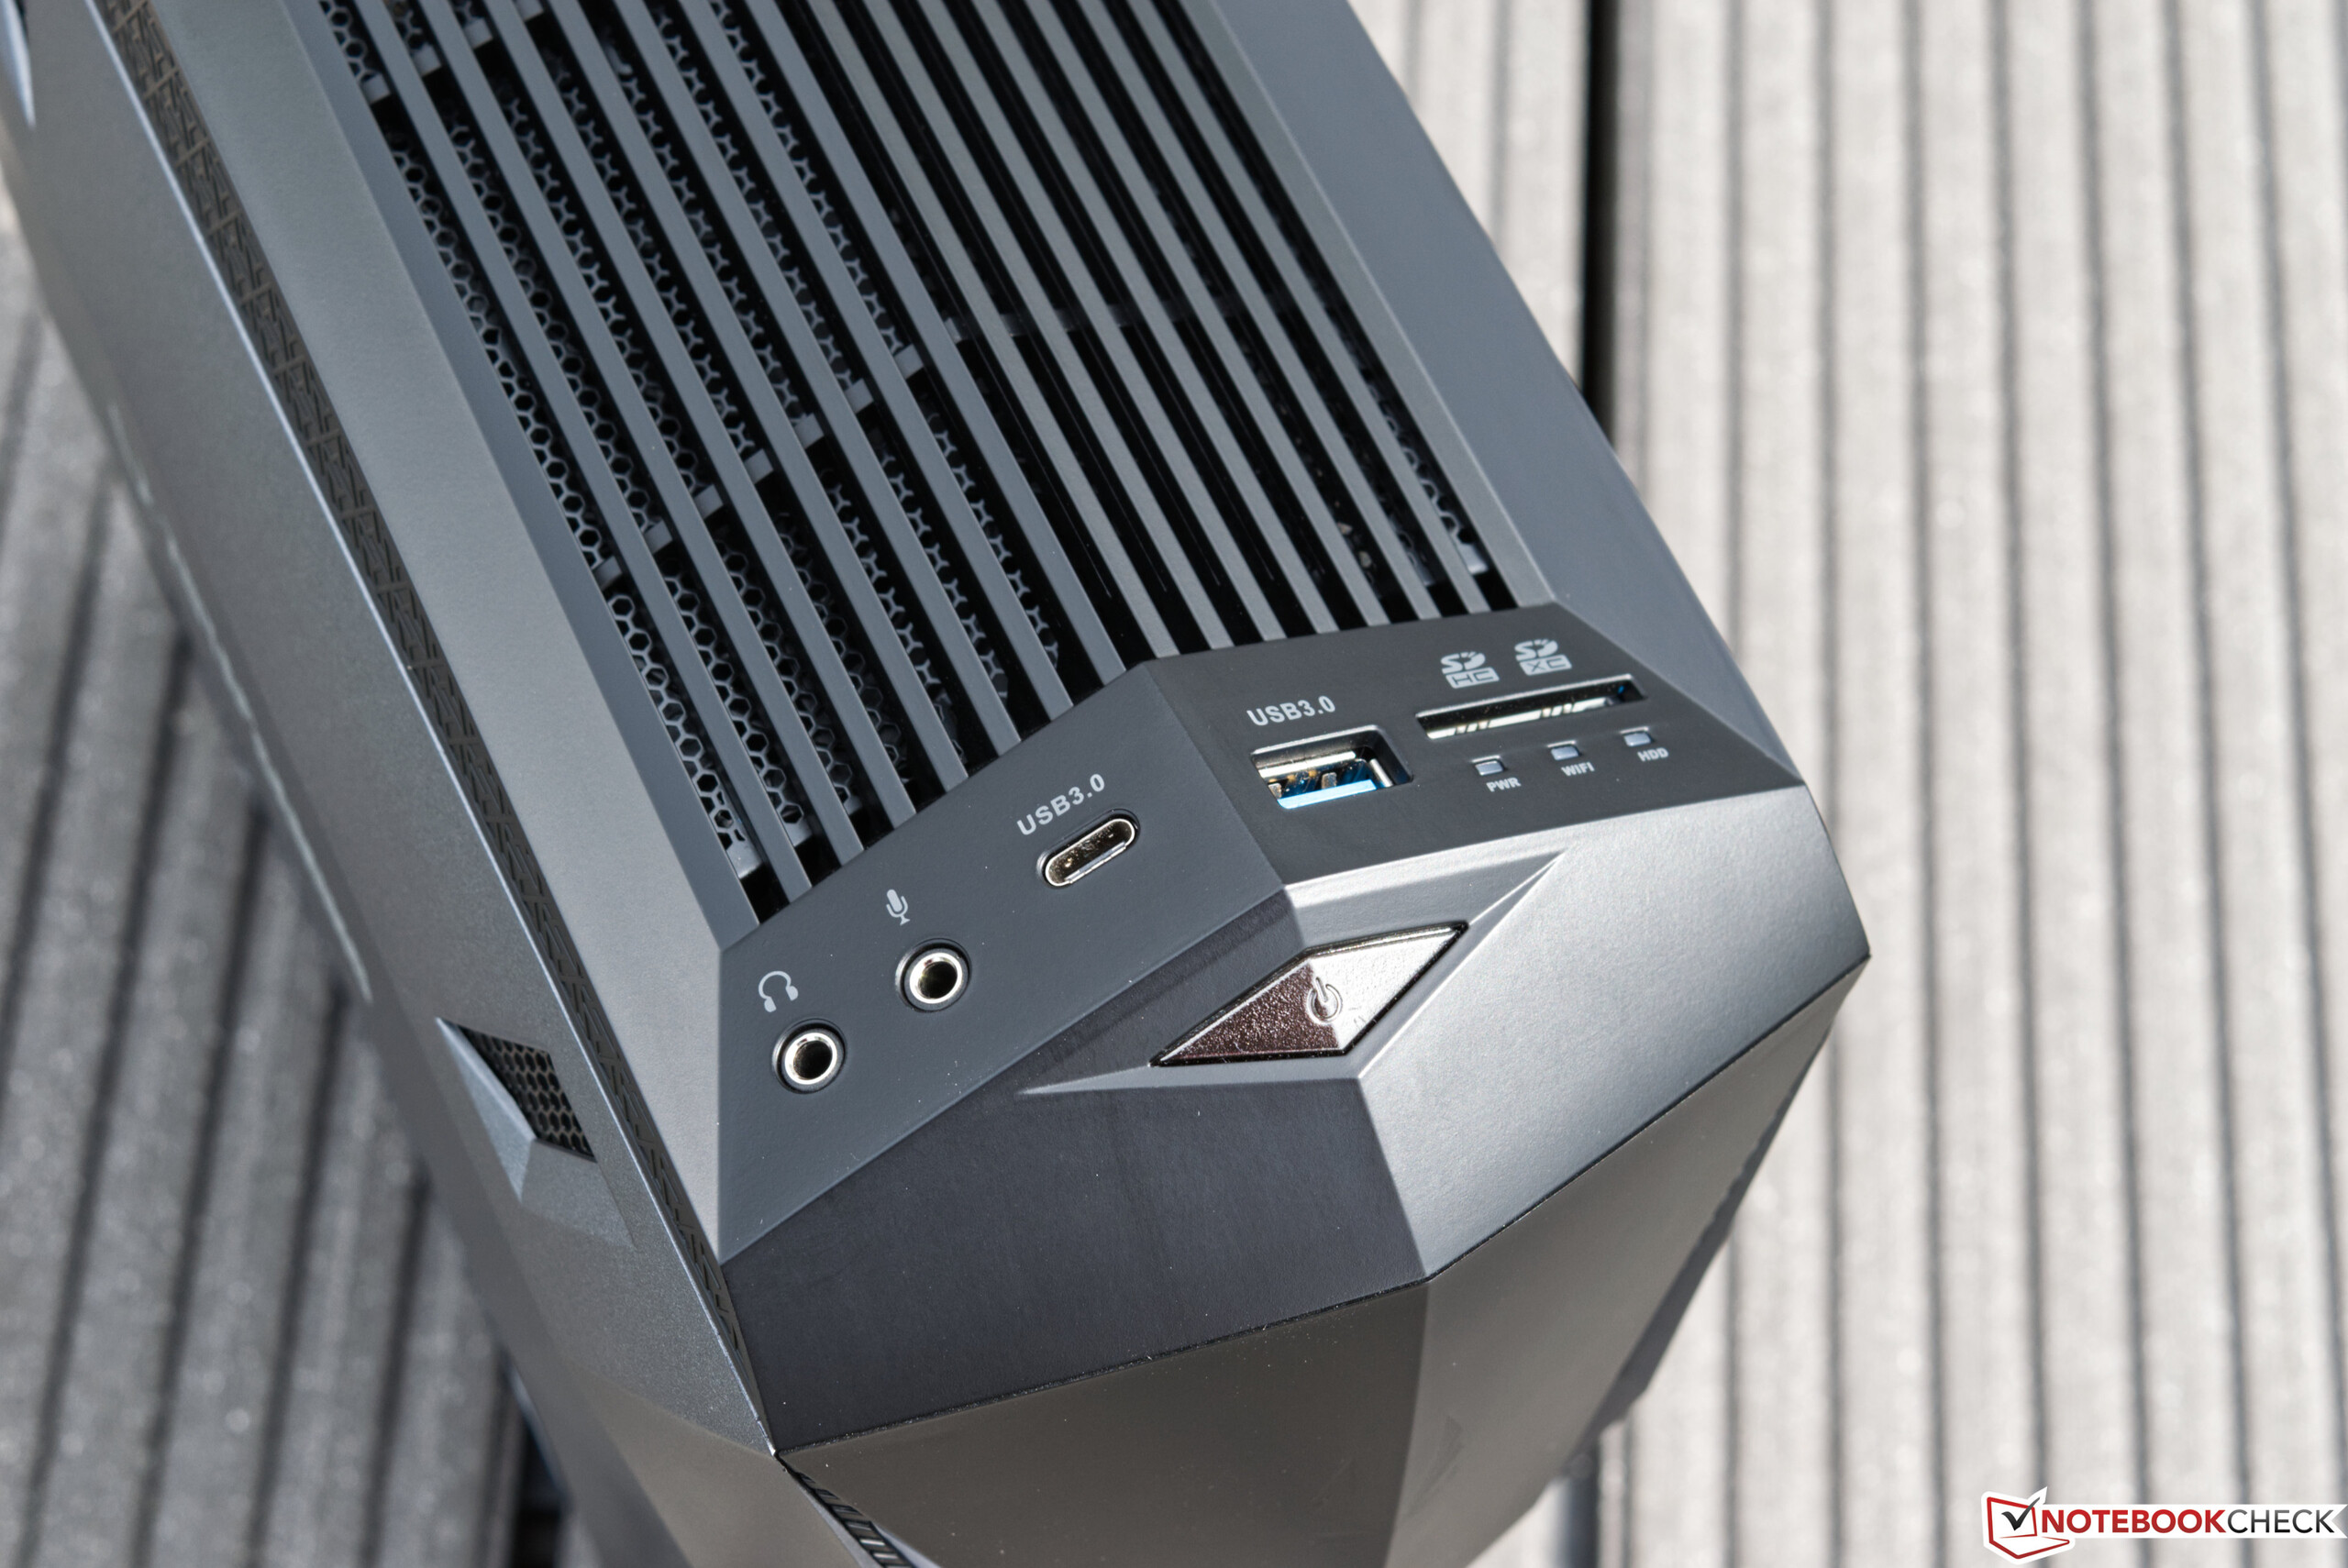
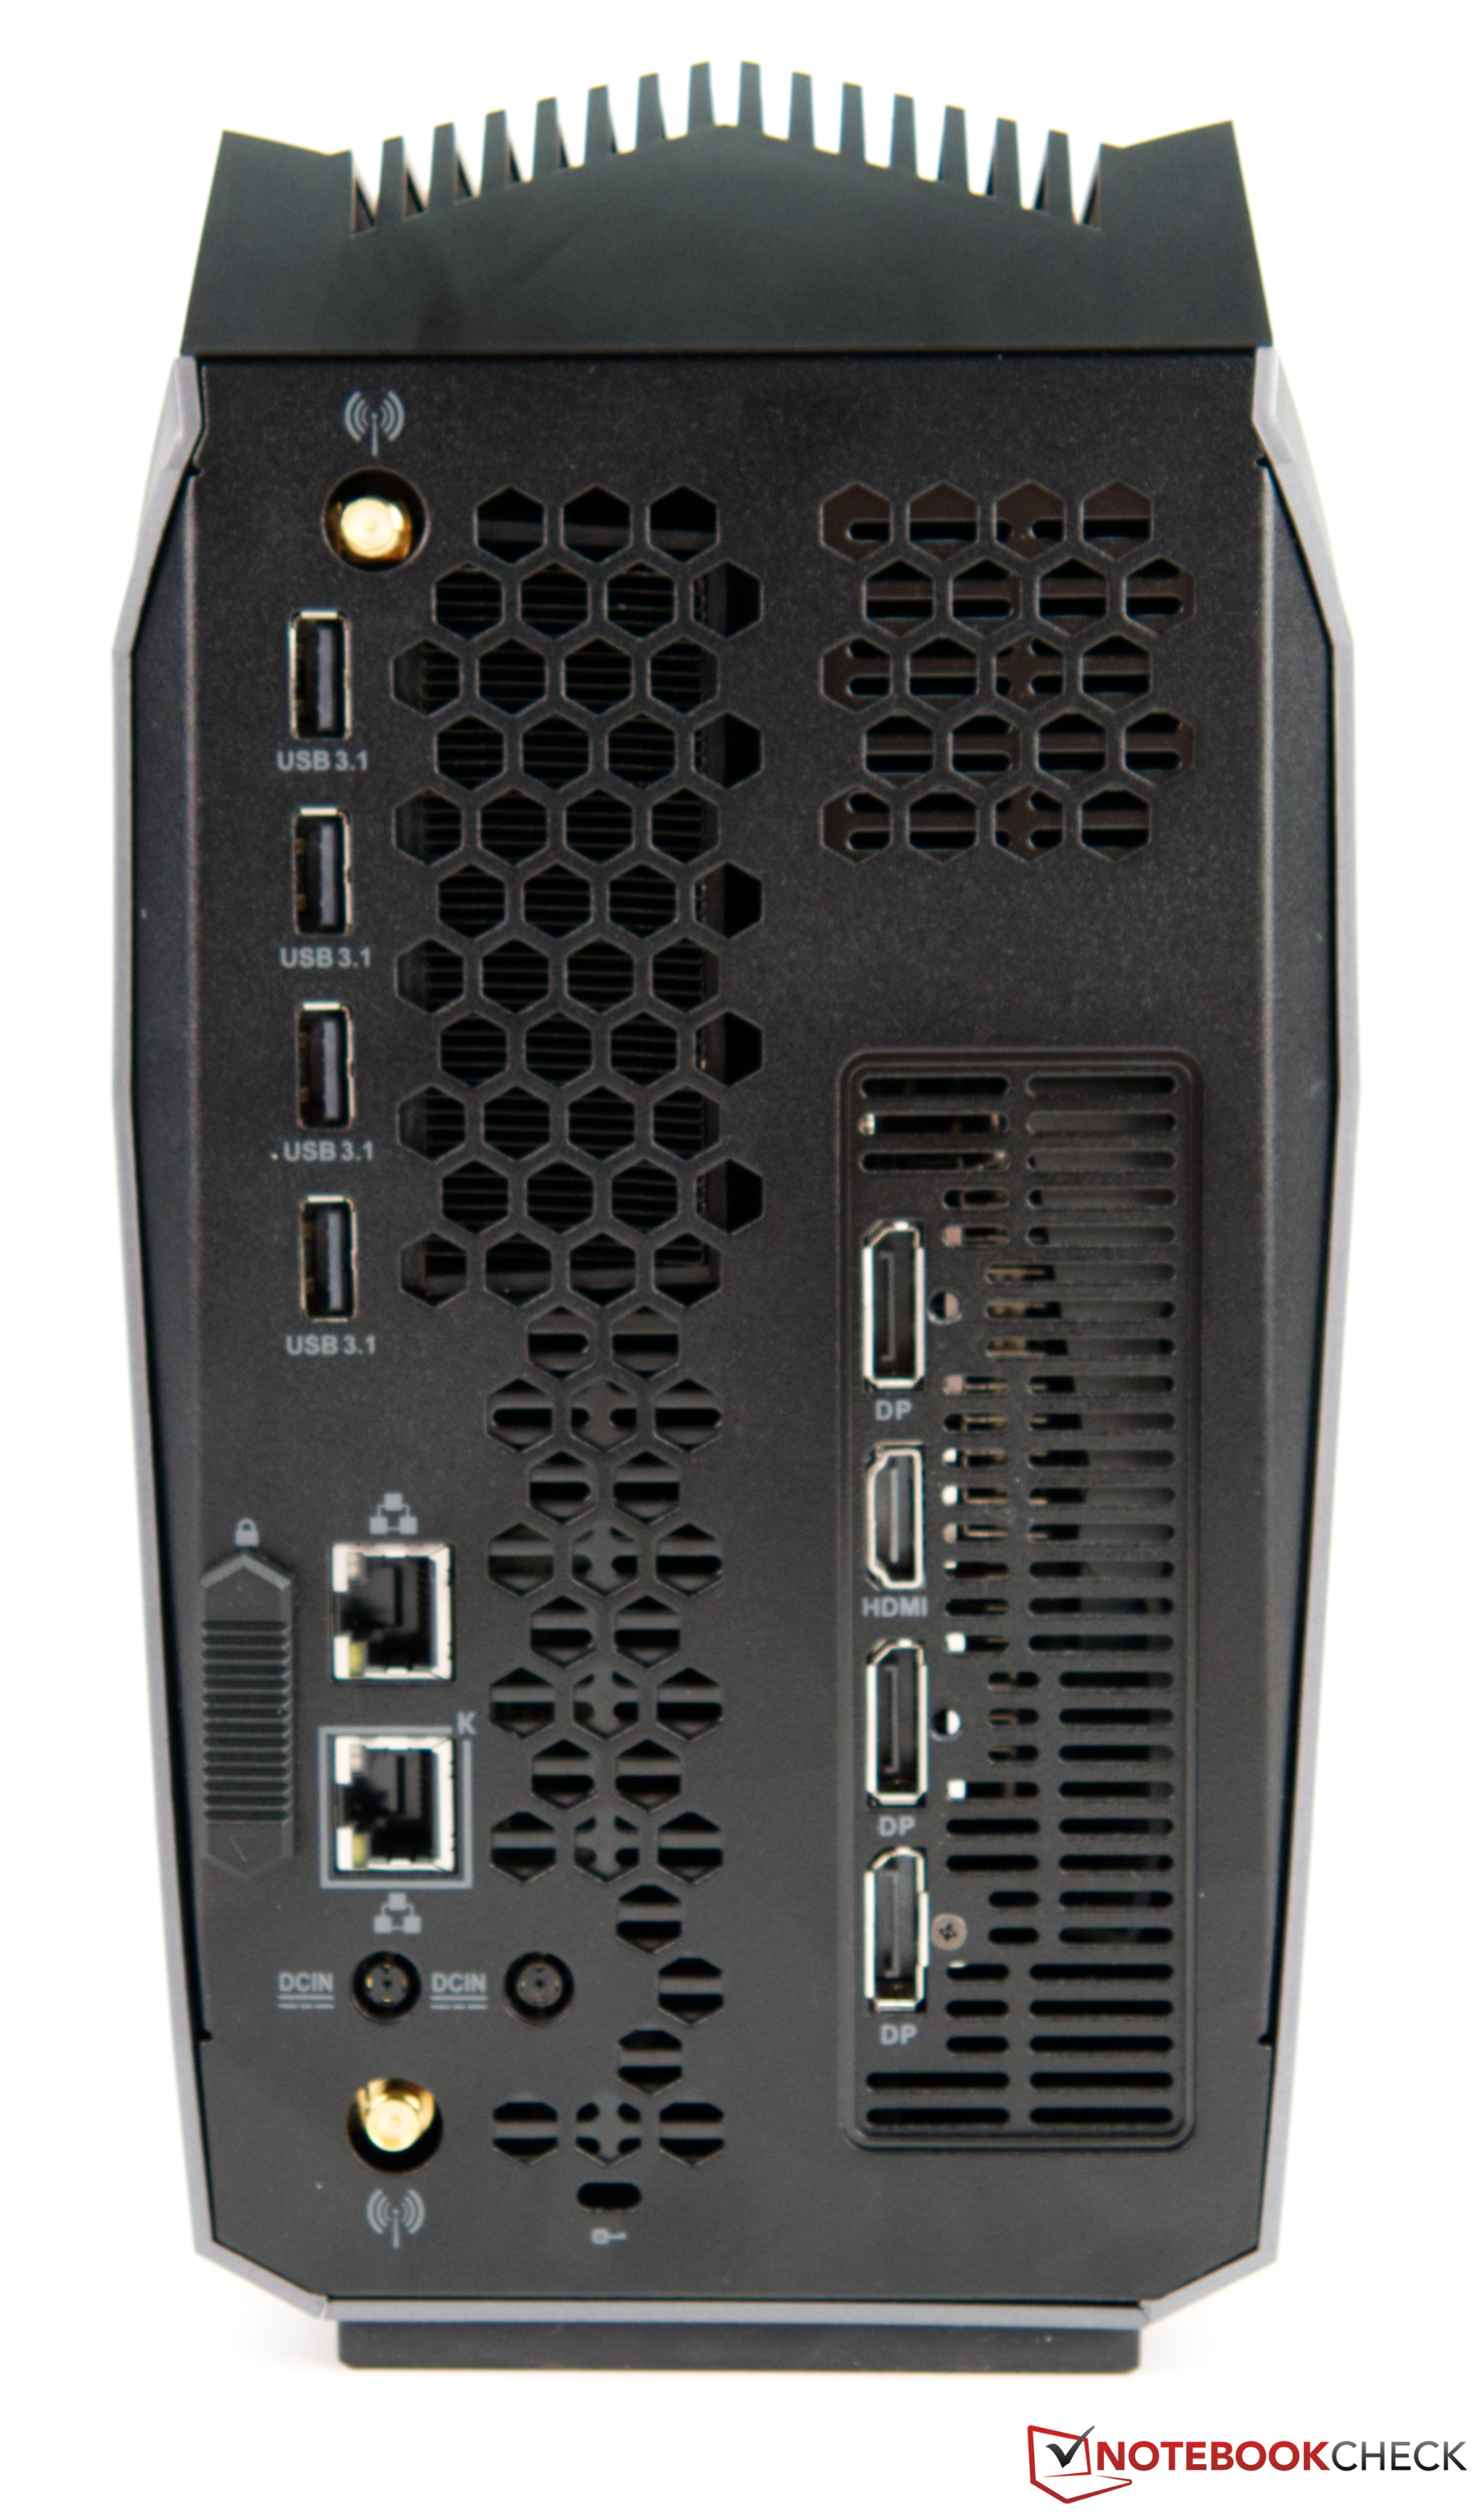
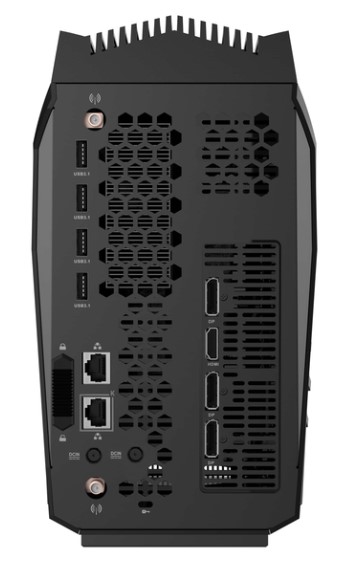
Per quanto riguarda le porte, esse includono tutto ciò che il vostro cuore desidera. La maggior parte delle connessioni esterne si trovano sul retro. Ma è anche possibile inserire rapidamente una chiavetta USB o una scheda SD nella parte superiore del lato anteriore.

Zotac MEK MINI
Zotac MEK MINI
Zotac MEK MINI
Zotac MEK MINI
Zotac MEK MINI
Zotac MEK MINI
Zotac MEK MINI
Zotac MEK MINI
Zotac MEK MINI
Zotac MEK MINI
Zotac MEK MINI
Zotac MEK MINI
Zotac MEK MINI
Zotac MEK MINI
Zotac MEK MINI
Zotac MEK MINI
Zotac MEK MINI
Zotac MEK MINI (fonte: Zotac)

Benchmarks processore

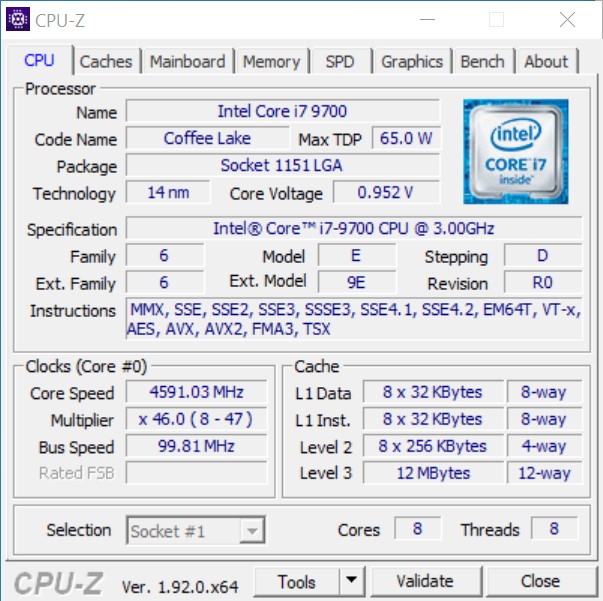
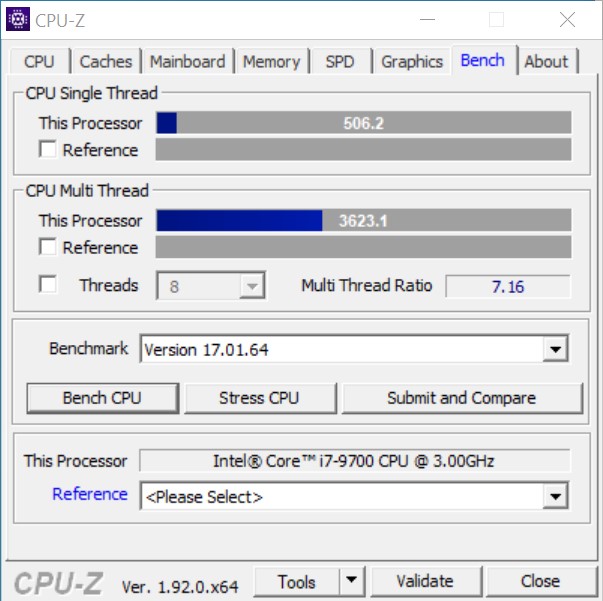
L'Intel Core i7-9700 è un processore octa-core con un TDP di 65 watt. La velocità di clock di base è di 3,0 GHz, e la velocità massima di boost è specificata a 4,7 GHz. Nel nostro modello di prova, il Core i7-9700 raggiunge un risultato che era prevedibile. È più veloce dell'Intel Core i5-9600K e leggermente più lento di un Intel Core i7-9700K. Poiché Zotac offre il MEK MINI nella configurazione più economica con un Intel Core i5-9400F, lo abbiamo anche incluso nel confronto. Di conseguenza, le prestazioni previste con il modello più economico possono essere dedotte qui.

Per ulteriori confronti e benchmarks, vi indichiamo la nostra tabella di confronto delle CPU.

CPU-Z
CPU-Z
CPU-Z
CPU-Z
CPU-Z
CPU-Z
CPU-Z
HWiNFO
Intel Extreme Utility
Intel Extreme Utility (benchmark)


Cinebench R15
CPU Single 64Bit
Intel Core i9-10900K, Intel Core i9-10900K
i9-10900K, 3700 MHz
224 Points +13%
AMD Ryzen 9 3950X, AMD Ryzen 9 3950X
R9 3950X, 3500 MHz
209 Points +5%
Intel Core i7-9700K, AMD Radeon RX Vega 64, Intel Core i7-9700K
i7-9700K, 3600 MHz
208 Points +5%
Intel Core i5-10600K, Intel Core i5-10600K
i5-10600K, 4100 MHz
205 Points +3%
Corsair One i160, Intel Core i9-9900K
i9-9900K, 3600 MHz
203 Points +2%
Zotac MEK Mini (RTX 2070 Super), Intel Core i7-9700
i7-9700, 3000 MHz
199 Points
Intel Core i5-9600K, AMD Radeon RX Vega 64, Intel Core i5-9600K
i5-9600K, 3700 MHz
193 Points -3%
Intel Core i5 9400F, Intel Core i5-9400F
i5-9400F, 2900 MHz
173 Points -13%
Intel Core i3 9100F, Intel Core i3-9100F
i3-9100F, 3600 MHz
171 Points -14%
CPU Multi 64Bit
AMD Ryzen 9 3950X, AMD Ryzen 9 3950X
R9 3950X, 3500 MHz
4002 Points +219%
Intel Core i9-10900K, Intel Core i9-10900K
i9-10900K, 3700 MHz
2620 Points +109%
Corsair One i160, Intel Core i9-9900K
i9-9900K, 3600 MHz
1987 Points +58%
Intel Core i5-10600K, Intel Core i5-10600K
i5-10600K, 4100 MHz
1452 Points +16%
Intel Core i7-9700K, AMD Radeon RX Vega 64, Intel Core i7-9700K
i7-9700K, 3600 MHz
1433 Points +14%
Zotac MEK Mini (RTX 2070 Super), Intel Core i7-9700
i7-9700, 3000 MHz
1254 Points
Intel Core i5-9600K, AMD Radeon RX Vega 64, Intel Core i5-9600K
i5-9600K, 3700 MHz
1094 Points -13%
Intel Core i5 9400F, Intel Core i5-9400F
i5-9400F, 2900 MHz
984 Points -22%
Intel Core i3 9100F, Intel Core i3-9100F
i3-9100F, 3600 MHz
634 Points -49%
Cinebench R20
CPU (Single Core)
Intel Core i9-10900K, Intel Core i9-10900K
i9-10900K, 3700 MHz
532 Points +12%
AMD Ryzen 9 3950X, AMD Ryzen 9 3950X
R9 3950X, 3500 MHz
520 Points +10%
Corsair One i160, Intel Core i9-9900K
i9-9900K, 3600 MHz
495 Points +4%
Intel Core i7-9700K, AMD Radeon RX Vega 64, Intel Core i7-9700K
i7-9700K, 3600 MHz
475 Points 0%
Zotac MEK Mini (RTX 2070 Super), Intel Core i7-9700
i7-9700, 3000 MHz
474 Points
Intel Core i5-10600K, Intel Core i5-10600K
i5-10600K, 4100 MHz
464 Points -2%
Intel Core i5 9400F, Intel Core i5-9400F
i5-9400F, 2900 MHz
416 Points -12%
Intel Core i3 9100F, Intel Core i3-9100F
i3-9100F, 3600 MHz
414 Points -13%
CPU (Multi Core)
AMD Ryzen 9 3950X, AMD Ryzen 9 3950X
R9 3950X, 3500 MHz
9075 Points +214%
Intel Core i9-10900K, Intel Core i9-10900K
i9-10900K, 3700 MHz
6381 Points +121%
Corsair One i160, Intel Core i9-9900K
i9-9900K, 3600 MHz
4816 Points +67%
Intel Core i5-10600K, Intel Core i5-10600K
i5-10600K, 4100 MHz
3443 Points +19%
Intel Core i7-9700K, AMD Radeon RX Vega 64, Intel Core i7-9700K
i7-9700K, 3600 MHz
3250 Points +12%
Zotac MEK Mini (RTX 2070 Super), Intel Core i7-9700
i7-9700, 3000 MHz
2892 Points
Intel Core i5 9400F, Intel Core i5-9400F
i5-9400F, 2900 MHz
2378 Points -18%
Intel Core i3 9100F, Intel Core i3-9100F
i3-9100F, 3600 MHz
1175 Points -59%
Cinebench R11.5
CPU Single 64Bit
Intel Core i9-10900K, Intel Core i9-10900K
i9-10900K, 3700 MHz
2.56 Points +14%
Intel Core i7-9700K, AMD Radeon RX Vega 64, Intel Core i7-9700K
i7-9700K, 3600 MHz
2.37 Points +5%
AMD Ryzen 9 3950X, AMD Ryzen 9 3950X
R9 3950X, 3500 MHz
2.37 Points +5%
Corsair One i160, Intel Core i9-9900K
i9-9900K, 3600 MHz
2.33 Points +4%
Zotac MEK Mini (RTX 2070 Super), Intel Core i7-9700
i7-9700, 3000 MHz
2.25 Points
Intel Core i5-9600K, AMD Radeon RX Vega 64, Intel Core i5-9600K
i5-9600K, 3700 MHz
2.24 Points 0%
Intel Core i5-10600K, Intel Core i5-10600K
i5-10600K, 4100 MHz
2.19 Points -3%
Intel Core i3 9100F, Intel Core i3-9100F
i3-9100F, 3600 MHz
1.95 Points -13%
Intel Core i5 9400F, Intel Core i5-9400F
i5-9400F, 2900 MHz
1.95 Points -13%
CPU Multi 64Bit
AMD Ryzen 9 3950X, AMD Ryzen 9 3950X
R9 3950X, 3500 MHz
43.68 Points +202%
Intel Core i9-10900K, Intel Core i9-10900K
i9-10900K, 3700 MHz
29.03 Points +101%
Corsair One i160, Intel Core i9-9900K
i9-9900K, 3600 MHz
21.76 Points +51%
Intel Core i7-9700K, AMD Radeon RX Vega 64, Intel Core i7-9700K
i7-9700K, 3600 MHz
15.83 Points +10%
Intel Core i5-10600K, Intel Core i5-10600K
i5-10600K, 4100 MHz
15.76 Points +9%
Zotac MEK Mini (RTX 2070 Super), Intel Core i7-9700
i7-9700, 3000 MHz
14.44 Points
Intel Core i5 9400F, Intel Core i5-9400F
i5-9400F, 2900 MHz
11.27 Points -22%
Intel Core i5-9600K, AMD Radeon RX Vega 64, Intel Core i5-9600K
i5-9600K, 3700 MHz
10.98 Points -24%
Intel Core i3 9100F, Intel Core i3-9100F
i3-9100F, 3600 MHz
5.38 Points -63%
Cinebench R10
Rendering Single CPUs 64Bit
Intel Core i9-10900K, Intel Core i9-10900K
i9-10900K, 3700 MHz
10625 Points +8%
AMD Ryzen 9 3950X, AMD Ryzen 9 3950X
R9 3950X, 3500 MHz
10580 Points +8%
Corsair One i160, Intel Core i9-9900K
i9-9900K, 3600 MHz
10167 Points +3%
Zotac MEK Mini (RTX 2070 Super), Intel Core i7-9700
i7-9700, 3000 MHz
9840 Points
Intel Core i7-9700K, AMD Radeon RX Vega 64, Intel Core i7-9700K
i7-9700K, 3600 MHz
9774 Points -1%
Intel Core i5-10600K, Intel Core i5-10600K
i5-10600K, 4100 MHz
9594 Points -2%
Intel Core i5-9600K, AMD Radeon RX Vega 64, Intel Core i5-9600K
i5-9600K, 3700 MHz
9318 Points -5%
Intel Core i3 9100F, Intel Core i3-9100F
i3-9100F, 3600 MHz
8472 Points -14%
Intel Core i5 9400F, Intel Core i5-9400F
i5-9400F, 2900 MHz
8182 Points -17%
Rendering Multiple CPUs 64Bit
AMD Ryzen 9 3950X, AMD Ryzen 9 3950X
R9 3950X, 3500 MHz
86232 Points +74%
Intel Core i9-10900K, Intel Core i9-10900K
i9-10900K, 3700 MHz
80495 Points +62%
Corsair One i160, Intel Core i9-9900K
i9-9900K, 3600 MHz
63009 Points +27%
Intel Core i7-9700K, AMD Radeon RX Vega 64, Intel Core i7-9700K
i7-9700K, 3600 MHz
53600 Points +8%
Intel Core i5-10600K, Intel Core i5-10600K
i5-10600K, 4100 MHz
51816 Points +4%
Zotac MEK Mini (RTX 2070 Super), Intel Core i7-9700
i7-9700, 3000 MHz
49666 Points
Intel Core i5 9400F, Intel Core i5-9400F
i5-9400F, 2900 MHz
40065 Points -19%
Intel Core i5-9600K, AMD Radeon RX Vega 64, Intel Core i5-9600K
i5-9600K, 3700 MHz
39494 Points -20%
Intel Core i3 9100F, Intel Core i3-9100F
i3-9100F, 3600 MHz
21908 Points -56%
Blender - v2.79 BMW27 CPU
Intel Core i3 9100F, Intel Core i3-9100F
i3-9100F, 3600 MHz
687 Seconds * -77%
Intel Core i5 9400F, Intel Core i5-9400F
i5-9400F, 2900 MHz
468.5 Seconds * -21%
Intel Core i5-9600K, AMD Radeon RX Vega 64, Intel Core i5-9600K
i5-9600K, 3700 MHz
444.4 Seconds * -14%
Zotac MEK Mini (RTX 2070 Super), Intel Core i7-9700
i7-9700, 3000 MHz
388.7 Seconds *
Intel Core i7-9700K, AMD Radeon RX Vega 64, Intel Core i7-9700K
i7-9700K, 3600 MHz
307 Seconds * +21%
Intel Core i5-10600K, Intel Core i5-10600K
i5-10600K, 4100 MHz
302.4 Seconds * +22%
Corsair One i160, Intel Core i9-9900K
i9-9900K, 3600 MHz
223.8 Seconds * +42%
Intel Core i9-10900K, Intel Core i9-10900K
i9-10900K, 3700 MHz
167.3 Seconds * +57%
AMD Ryzen 9 3950X, AMD Ryzen 9 3950X
R9 3950X, 3500 MHz
125.8 Seconds * +68%
wPrime 2.10
32m
Intel Core i3 9100F, Intel Core i3-9100F
i3-9100F, 3600 MHz
11.81 s * -147%
Intel Core i5 9400F, Intel Core i5-9400F
i5-9400F, 2900 MHz
6.757 s * -41%
Intel Core i5-9600K, AMD Radeon RX Vega 64, Intel Core i5-9600K
i5-9600K, 3700 MHz
6.033 s * -26%
Zotac MEK Mini (RTX 2070 Super), Intel Core i7-9700
i7-9700, 3000 MHz
4.785 s *
Intel Core i5-10600K, Intel Core i5-10600K
i5-10600K, 4100 MHz
4.648 s * +3%
Intel Core i7-9700K, AMD Radeon RX Vega 64, Intel Core i7-9700K
i7-9700K, 3600 MHz
4.491 s * +6%
AMD Ryzen 9 3950X, AMD Ryzen 9 3950X
R9 3950X, 3500 MHz
4.112 s * +14%
Intel Core i9-10900K, Intel Core i9-10900K
i9-10900K, 3700 MHz
3.582 s * +25%
Corsair One i160, Intel Core i9-9900K
i9-9900K, 3600 MHz
3.276 s * +32%
1024m
Intel Core i3 9100F, Intel Core i3-9100F
i3-9100F, 3600 MHz
345.9 s * -122%
Intel Core i5 9400F, Intel Core i5-9400F
i5-9400F, 2900 MHz
198.7 s * -28%
Intel Core i5-9600K, AMD Radeon RX Vega 64, Intel Core i5-9600K
i5-9600K, 3700 MHz
176.2 s * -13%
Zotac MEK Mini (RTX 2070 Super), Intel Core i7-9700
i7-9700, 3000 MHz
155.8 s *
Intel Core i7-9700K, AMD Radeon RX Vega 64, Intel Core i7-9700K
i7-9700K, 3600 MHz
120.5 s * +23%
Intel Core i5-10600K, Intel Core i5-10600K
i5-10600K, 4100 MHz
113.2 s * +27%
Corsair One i160, Intel Core i9-9900K
i9-9900K, 3600 MHz
91.3 s * +41%
Intel Core i9-10900K, Intel Core i9-10900K
i9-10900K, 3700 MHz
66.3 s * +57%
AMD Ryzen 9 3950X, AMD Ryzen 9 3950X
R9 3950X, 3500 MHz
44.86 s * +71%
X264 HD Benchmark 4.0
Pass 1
Intel Core i9-10900K, Intel Core i9-10900K
i9-10900K, 3700 MHz
289.5 (289min - 291max) fps +17%
Intel Core i7-9700K, AMD Radeon RX Vega 64, Intel Core i7-9700K
i7-9700K, 3600 MHz
270 (270min - 271max) fps +9%
Corsair One i160, Intel Core i9-9900K
i9-9900K, 3600 MHz
267.5 (267min - 268max) fps +8%
AMD Ryzen 9 3950X, AMD Ryzen 9 3950X
R9 3950X, 3500 MHz
265 (265min - 266max) fps +7%
Intel Core i5-10600K, Intel Core i5-10600K
i5-10600K, 4100 MHz
251.5 (250min - 253max) fps +2%
Intel Core i5-9600K, AMD Radeon RX Vega 64, Intel Core i5-9600K
i5-9600K, 3700 MHz
250 (250min - 250max) fps +1%
Zotac MEK Mini (RTX 2070 Super), Intel Core i7-9700
i7-9700, 3000 MHz
247.5 (247min - 252max) fps
Intel Core i5 9400F, Intel Core i5-9400F
i5-9400F, 2900 MHz
234 (233min - 234max) fps -5%
Intel Core i3 9100F, Intel Core i3-9100F
i3-9100F, 3600 MHz
218 (217min - 218max) fps -12%
Pass 2
AMD Ryzen 9 3950X, AMD Ryzen 9 3950X
R9 3950X, 3500 MHz
168 (168min - 169max) fps +116%
Intel Core i9-10900K, Intel Core i9-10900K
i9-10900K, 3700 MHz
149 (149min - 149max) fps +92%
Corsair One i160, Intel Core i9-9900K
i9-9900K, 3600 MHz
117.5 (117min - 118max) fps +51%
Intel Core i7-9700K, AMD Radeon RX Vega 64, Intel Core i7-9700K
i7-9700K, 3600 MHz
94.8 (94.7min - 95max) fps +22%
Intel Core i5-10600K, Intel Core i5-10600K
i5-10600K, 4100 MHz
88.2 (88min - 88.2max) fps +14%
Zotac MEK Mini (RTX 2070 Super), Intel Core i7-9700
i7-9700, 3000 MHz
77.6 (77.3min - 79.4max) fps
Intel Core i5-9600K, AMD Radeon RX Vega 64, Intel Core i5-9600K
i5-9600K, 3700 MHz
68.8 (68.3min - 69max) fps -11%
Intel Core i5 9400F, Intel Core i5-9400F
i5-9400F, 2900 MHz
64 (63.9min - 64.1max) fps -18%
Intel Core i3 9100F, Intel Core i3-9100F
i3-9100F, 3600 MHz
44.35 (44.3min - 44.6max) fps -43%
WinRAR - Result
Intel Core i9-10900K, Intel Core i9-10900K
i9-10900K, 3700 MHz
9739 KB/s +40%
Corsair One i160, Intel Core i9-9900K
i9-9900K, 3600 MHz
7621 KB/s +10%
AMD Ryzen 9 3950X, AMD Ryzen 9 3950X
R9 3950X, 3500 MHz
7409 KB/s +7%
Intel Core i7-9700K, AMD Radeon RX Vega 64, Intel Core i7-9700K
i7-9700K, 3600 MHz
7396 KB/s +6%
Zotac MEK Mini (RTX 2070 Super), Intel Core i7-9700
i7-9700, 3000 MHz
6945 KB/s
Intel Core i5-10600K, Intel Core i5-10600K
i5-10600K, 4100 MHz
6536 KB/s -6%
Intel Core i5-9600K, AMD Radeon RX Vega 64, Intel Core i5-9600K
i5-9600K, 3700 MHz
5903 KB/s -15%
Intel Core i5 9400F, Intel Core i5-9400F
i5-9400F, 2900 MHz
5794 KB/s -17%
Intel Core i3 9100F, Intel Core i3-9100F
i3-9100F, 3600 MHz
4052 KB/s -42%
TrueCrypt
AES Mean 100MB
Intel Core i9-10900K, Intel Core i9-10900K
i9-10900K, 3700 MHz
14.6 GB/s +92%
Corsair One i160, Intel Core i9-9900K
i9-9900K, 3600 MHz
11.5 GB/s +51%
AMD Ryzen 9 3950X, AMD Ryzen 9 3950X
R9 3950X, 3500 MHz
10.8 GB/s +42%
Intel Core i7-9700K, AMD Radeon RX Vega 64, Intel Core i7-9700K
i7-9700K, 3600 MHz
8.1 GB/s +7%
Intel Core i5-10600K, Intel Core i5-10600K
i5-10600K, 4100 MHz
8 GB/s +5%
Zotac MEK Mini (RTX 2070 Super), Intel Core i7-9700
i7-9700, 3000 MHz
7.6 GB/s
Intel Core i5-9600K, AMD Radeon RX Vega 64, Intel Core i5-9600K
i5-9600K, 3700 MHz
5.6 GB/s -26%
Intel Core i5 9400F, Intel Core i5-9400F
i5-9400F, 2900 MHz
5.2 GB/s -32%
Intel Core i3 9100F, Intel Core i3-9100F
i3-9100F, 3600 MHz
3 GB/s -61%
Twofish Mean 100MB
AMD Ryzen 9 3950X, AMD Ryzen 9 3950X
R9 3950X, 3500 MHz
3.6 GB/s +177%
Intel Core i9-10900K, Intel Core i9-10900K
i9-10900K, 3700 MHz
2.6 GB/s +100%
Corsair One i160, Intel Core i9-9900K
i9-9900K, 3600 MHz
1.9 GB/s +46%
Intel Core i5-10600K, Intel Core i5-10600K
i5-10600K, 4100 MHz
1.4 GB/s +8%
Intel Core i7-9700K, AMD Radeon RX Vega 64, Intel Core i7-9700K
i7-9700K, 3600 MHz
1.3 GB/s 0%
Zotac MEK Mini (RTX 2070 Super), Intel Core i7-9700
i7-9700, 3000 MHz
1.3 GB/s
Intel Core i5 9400F, Intel Core i5-9400F
i5-9400F, 2900 MHz
0.86 GB/s -34%
Intel Core i5-9600K, AMD Radeon RX Vega 64, Intel Core i5-9600K
i5-9600K, 3700 MHz
0.629 GB/s -52%
Intel Core i3 9100F, Intel Core i3-9100F
i3-9100F, 3600 MHz
0.5 GB/s -62%
Serpent Mean 100MB
AMD Ryzen 9 3950X, AMD Ryzen 9 3950X
R9 3950X, 3500 MHz
2.3 GB/s +197%
Intel Core i9-10900K, Intel Core i9-10900K
i9-10900K, 3700 MHz
1.5 GB/s +94%
Corsair One i160, Intel Core i9-9900K
i9-9900K, 3600 MHz
1.1 GB/s +42%
Intel Core i5-10600K, Intel Core i5-10600K
i5-10600K, 4100 MHz
0.82 GB/s +6%
Zotac MEK Mini (RTX 2070 Super), Intel Core i7-9700
i7-9700, 3000 MHz
0.775 GB/s
Intel Core i7-9700K, AMD Radeon RX Vega 64, Intel Core i7-9700K
i7-9700K, 3600 MHz
0.774 GB/s 0%
Intel Core i5 9400F, Intel Core i5-9400F
i5-9400F, 2900 MHz
0.51 GB/s -34%
Intel Core i5-9600K, AMD Radeon RX Vega 64, Intel Core i5-9600K
i5-9600K, 3700 MHz
0.43 GB/s -45%
Intel Core i3 9100F, Intel Core i3-9100F
i3-9100F, 3600 MHz
0.32 GB/s -59%
Geekbench 5.5
Multi-Core
AMD Ryzen 9 3950X, AMD Ryzen 9 3950X
R9 3950X, 3500 MHz
12363 Points +75%
Intel Core i9-10900K, Intel Core i9-10900K
i9-10900K, 3700 MHz
11414 Points +62%
Intel Core i7-9700K, AMD Radeon RX Vega 64, Intel Core i7-9700K
i7-9700K, 3600 MHz
7440 Points +5%
Intel Core i5-10600K, Intel Core i5-10600K
i5-10600K, 4100 MHz
7248 Points +3%
Zotac MEK Mini (RTX 2070 Super), Intel Core i7-9700
i7-9700, 3000 MHz
7060 Points
Intel Core i5-9600K, AMD Radeon RX Vega 64, Intel Core i5-9600K
i5-9600K, 3700 MHz
5855 Points -17%
Intel Core i5 9400F, Intel Core i5-9400F
i5-9400F, 2900 MHz
5715 Points -19%
Intel Core i3 9100F, Intel Core i3-9100F
i3-9100F, 3600 MHz
4074 Points -42%
Single-Core
Intel Core i9-10900K, Intel Core i9-10900K
i9-10900K, 3700 MHz
1449 Points +10%
Zotac MEK Mini (RTX 2070 Super), Intel Core i7-9700
i7-9700, 3000 MHz
1312 Points
AMD Ryzen 9 3950X, AMD Ryzen 9 3950X
R9 3950X, 3500 MHz
1306 Points 0%
Intel Core i7-9700K, AMD Radeon RX Vega 64, Intel Core i7-9700K
i7-9700K, 3600 MHz
1300 Points -1%
Intel Core i5-10600K, Intel Core i5-10600K
i5-10600K, 4100 MHz
1286 Points -2%
Intel Core i5-9600K, AMD Radeon RX Vega 64, Intel Core i5-9600K
i5-9600K, 3700 MHz
1217 Points -7%
Intel Core i3 9100F, Intel Core i3-9100F
i3-9100F, 3600 MHz
1152 Points -12%
Intel Core i5 9400F, Intel Core i5-9400F
i5-9400F, 2900 MHz
1139 Points -13%
Geekbench 5.0
5.0 Multi-Core
AMD Ryzen 9 3950X, AMD Ryzen 9 3950X
R9 3950X, 3500 MHz
12976 Points +84%
Intel Core i9-10900K, Intel Core i9-10900K
i9-10900K, 3700 MHz
11407 Points +62%
Intel Core i5-10600K, Intel Core i5-10600K
i5-10600K, 4100 MHz
7237 Points +3%
Zotac MEK Mini (RTX 2070 Super), Intel Core i7-9700
i7-9700, 3000 MHz
7060 Points
Intel Core i5 9400F, Intel Core i5-9400F
i5-9400F, 2900 MHz
5698 Points -19%
Intel Core i3 9100F, Intel Core i3-9100F
i3-9100F, 3600 MHz
4060 Points -42%
5.0 Single-Core
Intel Core i9-10900K, Intel Core i9-10900K
i9-10900K, 3700 MHz
1440 Points +11%
AMD Ryzen 9 3950X, AMD Ryzen 9 3950X
R9 3950X, 3500 MHz
1315 Points +1%
Zotac MEK Mini (RTX 2070 Super), Intel Core i7-9700
i7-9700, 3000 MHz
1300 Points
Intel Core i5-10600K, Intel Core i5-10600K
i5-10600K, 4100 MHz
1281 Points -1%
Intel Core i3 9100F, Intel Core i3-9100F
i3-9100F, 3600 MHz
1146 Points -12%
Intel Core i5 9400F, Intel Core i5-9400F
i5-9400F, 2900 MHz
1132 Points -13%
Geekbench 4.4
64 Bit Single-Core Score
Intel Core i9-10900K, Intel Core i9-10900K
i9-10900K, 3700 MHz
6348 Points +10%
Intel Core i7-9700K, AMD Radeon RX Vega 64, Intel Core i7-9700K
i7-9700K, 3600 MHz
6043 Points +5%
Corsair One i160, Intel Core i9-9900K
i9-9900K, 3600 MHz
6014 Points +4%
Intel Core i5-9600K, AMD Radeon RX Vega 64, Intel Core i5-9600K
i5-9600K, 3700 MHz
5916 Points +2%
Intel Core i5-10600K, Intel Core i5-10600K
i5-10600K, 4100 MHz
5821 Points +1%
Zotac MEK Mini (RTX 2070 Super), Intel Core i7-9700
i7-9700, 3000 MHz
5777 Points
AMD Ryzen 9 3950X, AMD Ryzen 9 3950X
R9 3950X, 3500 MHz
5749 Points 0%
Intel Core i5 9400F, Intel Core i5-9400F
i5-9400F, 2900 MHz
5347 Points -7%
Intel Core i3 9100F, Intel Core i3-9100F
i3-9100F, 3600 MHz
5301 Points -8%
64 Bit Multi-Core Score
AMD Ryzen 9 3950X, AMD Ryzen 9 3950X
R9 3950X, 3500 MHz
48962 Points +81%
Intel Core i9-10900K, Intel Core i9-10900K
i9-10900K, 3700 MHz
43058 Points +59%
Corsair One i160, Intel Core i9-9900K
i9-9900K, 3600 MHz
33892 Points +25%
Intel Core i7-9700K, AMD Radeon RX Vega 64, Intel Core i7-9700K
i7-9700K, 3600 MHz
29659 Points +10%
Intel Core i5-10600K, Intel Core i5-10600K
i5-10600K, 4100 MHz
28391 Points +5%
Zotac MEK Mini (RTX 2070 Super), Intel Core i7-9700
i7-9700, 3000 MHz
27040 Points
Intel Core i5-9600K, AMD Radeon RX Vega 64, Intel Core i5-9600K
i5-9600K, 3700 MHz
23810 Points -12%
Intel Core i5 9400F, Intel Core i5-9400F
i5-9400F, 2900 MHz
21830 Points -19%
Intel Core i3 9100F, Intel Core i3-9100F
i3-9100F, 3600 MHz
15937 Points -41%
3DMark 11 - 1280x720 Performance Physics
Intel Core i9-10900K, Intel Core i9-10900K
i9-10900K, 3700 MHz
22140 Points +59%
AMD Ryzen 9 3950X, AMD Ryzen 9 3950X
R9 3950X, 3500 MHz
21016 Points +51%
Corsair One i160, Intel Core i9-9900K
i9-9900K, 3600 MHz
19169 Points +38%
Intel Core i7-9700K, AMD Radeon RX Vega 64, Intel Core i7-9700K
i7-9700K, 3600 MHz
16091 Points +15%
Intel Core i5-10600K, Intel Core i5-10600K
i5-10600K, 4100 MHz
15961 Points +15%
Zotac MEK Mini (RTX 2070 Super), Intel Core i7-9700
i7-9700, 3000 MHz
13939 Points
Intel Core i5-9600K, AMD Radeon RX Vega 64, Intel Core i5-9600K
i5-9600K, 3700 MHz
11938 Points -14%
Intel Core i5 9400F, Intel Core i5-9400F
i5-9400F, 2900 MHz
11185 Points -20%
Intel Core i3 9100F, Intel Core i3-9100F
i3-9100F, 3600 MHz
8742 Points -37%
7-Zip 18.03
7z b 4
AMD Ryzen 9 3950X, AMD Ryzen 9 3950X
R9 3950X, 3500 MHz
99467 MIPS +197%
Intel Core i9-10900K, Intel Core i9-10900K
i9-10900K, 3700 MHz
70968 MIPS +112%
Corsair One i160, Intel Core i9-9900K
i9-9900K, 3600 MHz
53166 MIPS +59%
Intel Core i5-10600K, Intel Core i5-10600K
i5-10600K, 4100 MHz
40379 MIPS +20%
Zotac MEK Mini (RTX 2070 Super), Intel Core i7-9700
i7-9700, 3000 MHz
33539 MIPS
Intel Core i5 9400F, Intel Core i5-9400F
i5-9400F, 2900 MHz
25639 MIPS -24%
Intel Core i3 9100F, Intel Core i3-9100F
i3-9100F, 3600 MHz
17150 MIPS -49%
7z b 4 -mmt1
Intel Core i9-10900K, Intel Core i9-10900K
i9-10900K, 3700 MHz
5954 MIPS +15%
AMD Ryzen 9 3950X, AMD Ryzen 9 3950X
R9 3950X, 3500 MHz
5340 MIPS +3%
Corsair One i160, Intel Core i9-9900K
i9-9900K, 3600 MHz
5311 MIPS +2%
Intel Core i5-10600K, Intel Core i5-10600K
i5-10600K, 4100 MHz
5289 MIPS +2%
Zotac MEK Mini (RTX 2070 Super), Intel Core i7-9700
i7-9700, 3000 MHz
5186 MIPS
Intel Core i3 9100F, Intel Core i3-9100F
i3-9100F, 3600 MHz
4682 MIPS -10%
Intel Core i5 9400F, Intel Core i5-9400F
i5-9400F, 2900 MHz
4678 MIPS -10%
HWBOT x265 Benchmark v2.2 - 4k Preset
Intel Core i9-10900K, Intel Core i9-10900K
i9-10900K, 3700 MHz
21 fps +100%
Corsair One i160, Intel Core i9-9900K
i9-9900K, 3600 MHz
15.8 fps +50%
AMD Ryzen 9 3950X, AMD Ryzen 9 3950X
R9 3950X, 3500 MHz
15.8 fps +50%
Intel Core i7-9700K, AMD Radeon RX Vega 64, Intel Core i7-9700K
i7-9700K, 3600 MHz
13 fps +24%
Intel Core i5-10600K, Intel Core i5-10600K
i5-10600K, 4100 MHz
12.2 fps +16%
Zotac MEK Mini (RTX 2070 Super), Intel Core i7-9700
i7-9700, 3000 MHz
10.5 fps
Intel Core i5 9400F, Intel Core i5-9400F
i5-9400F, 2900 MHz
9.07 fps -14%
Intel Core i5-9600K, AMD Radeon RX Vega 64, Intel Core i5-9600K
i5-9600K, 3700 MHz
8.02 fps -24%
Intel Core i3 9100F, Intel Core i3-9100F
i3-9100F, 3600 MHz
6.12 fps -42%
R Benchmark 2.5 - Overall mean
Intel Core i5 9400F, Intel Core i5-9400F
i5-9400F, 2900 MHz
0.667 sec * -11%
Intel Core i3 9100F, Intel Core i3-9100F
i3-9100F, 3600 MHz
0.66 sec * -9%
Zotac MEK Mini (RTX 2070 Super), Intel Core i7-9700
i7-9700, 3000 MHz
0.603 sec *
Intel Core i5-10600K, Intel Core i5-10600K
i5-10600K, 4100 MHz
0.593 sec * +2%
Intel Core i9-10900K, Intel Core i9-10900K
i9-10900K, 3700 MHz
0.528 sec * +12%
AMD Ryzen 9 3950X, AMD Ryzen 9 3950X
R9 3950X, 3500 MHz
0.524 sec * +13%
LibreOffice - 20 Documents To PDF
Intel Core i9-10900K, Intel Core i9-10900K
i9-10900K, 3700 MHz
76 s * -56%
Intel Core i3 9100F, Intel Core i3-9100F
i3-9100F, 3600 MHz
64.3 s * -32%
Intel Core i5 9400F, Intel Core i5-9400F
i5-9400F, 2900 MHz
58.9 s * -21%
AMD Ryzen 9 3950X, AMD Ryzen 9 3950X
R9 3950X, 3500 MHz
53.6 s * -10%
Zotac MEK Mini (RTX 2070 Super), Intel Core i7-9700
i7-9700, 3000 MHz
48.73 s *
Intel Core i5-10600K, Intel Core i5-10600K
i5-10600K, 4100 MHz
46.06 s * +5%
WebXPRT 3 - Overall
Intel Core i9-10900K, Intel Core i9-10900K
i9-10900K, 3700 MHz
255 Points +10%
AMD Ryzen 9 3950X, AMD Ryzen 9 3950X
R9 3950X, 3500 MHz
239 Points +3%
Intel Core i5-10600K, Intel Core i5-10600K
i5-10600K, 4100 MHz
239 Points +3%
Zotac MEK Mini (RTX 2070 Super), Intel Core i7-9700
i7-9700, 3000 MHz
232 Points
Intel Core i5 9400F, Intel Core i5-9400F
i5-9400F, 2900 MHz
211 Points -9%
Intel Core i3 9100F, Intel Core i3-9100F
i3-9100F, 3600 MHz
204 Points -12%
Mozilla Kraken 1.1 - Total
Intel Core i5 9400F, Intel Core i5-9400F
i5-9400F, 2900 MHz
867 ms * -10%
Intel Core i3 9100F, Intel Core i3-9100F
i3-9100F, 3600 MHz
866 ms * -10%
Zotac MEK Mini (RTX 2070 Super), Intel Core i7-9700
i7-9700, 3000 MHz
790 ms *
Intel Core i5-10600K, Intel Core i5-10600K
i5-10600K, 4100 MHz
760 ms * +4%
Intel Core i9-10900K, Intel Core i9-10900K
i9-10900K, 3700 MHz
709 ms * +10%
AMD Ryzen 9 3950X, AMD Ryzen 9 3950X
R9 3950X, 3500 MHz
706 ms * +11%
3DMark
3840x2160 Fire Strike Ultra Physics
AMD Ryzen 9 3950X, AMD Ryzen 9 3950X
R9 3950X, 3500 MHz
31881 Points +93%
Intel Core i9-10900K, Intel Core i9-10900K
i9-10900K, 3700 MHz
29374 Points +77%
Corsair One i160, Intel Core i9-9900K
i9-9900K, 3600 MHz
24544 Points +48%
Intel Core i5-10600K, Intel Core i5-10600K
i5-10600K, 4100 MHz
19942 Points +20%
Intel Core i7-9700K, AMD Radeon RX Vega 64, Intel Core i7-9700K
i7-9700K, 3600 MHz
18796 Points +14%
Zotac MEK Mini (RTX 2070 Super), Intel Core i7-9700
i7-9700, 3000 MHz
16553 Points
Intel Core i5-9600K, AMD Radeon RX Vega 64, Intel Core i5-9600K
i5-9600K, 3700 MHz
13739 Points -17%
Intel Core i5 9400F, Intel Core i5-9400F
i5-9400F, 2900 MHz
12651 Points -24%
Intel Core i3 9100F, Intel Core i3-9100F
i3-9100F, 3600 MHz
8946 Points -46%
1920x1080 Fire Strike Physics
AMD Ryzen 9 3950X, AMD Ryzen 9 3950X
R9 3950X, 3500 MHz
32004 Points +95%
Intel Core i9-10900K, Intel Core i9-10900K
i9-10900K, 3700 MHz
29805 Points +82%
Corsair One i160, Intel Core i9-9900K
i9-9900K, 3600 MHz
24697 Points +51%
Intel Core i5-10600K, Intel Core i5-10600K
i5-10600K, 4100 MHz
20040 Points +22%
Intel Core i7-9700K, AMD Radeon RX Vega 64, Intel Core i7-9700K
i7-9700K, 3600 MHz
18780 Points +15%
Zotac MEK Mini (RTX 2070 Super), Intel Core i7-9700
i7-9700, 3000 MHz
16387 Points
Intel Core i5-9600K, AMD Radeon RX Vega 64, Intel Core i5-9600K
i5-9600K, 3700 MHz
13701 Points -16%
Intel Core i5 9400F, Intel Core i5-9400F
i5-9400F, 2900 MHz
12616 Points -23%
Intel Core i3 9100F, Intel Core i3-9100F
i3-9100F, 3600 MHz
8958 Points -45%
2560x1440 Time Spy CPU
Intel Core i9-10900K, Intel Core i9-10900K
i9-10900K, 3700 MHz
14326 Points +109%
AMD Ryzen 9 3950X, AMD Ryzen 9 3950X
R9 3950X, 3500 MHz
12404 Points +81%
Corsair One i160, Intel Core i9-9900K
i9-9900K, 3600 MHz
10867 Points +58%
Intel Core i7-9700K, AMD Radeon RX Vega 64, Intel Core i7-9700K
i7-9700K, 3600 MHz
8349 Points +22%
Intel Core i5-10600K, Intel Core i5-10600K
i5-10600K, 4100 MHz
8290 Points +21%
Zotac MEK Mini (RTX 2070 Super), Intel Core i7-9700
i7-9700, 3000 MHz
6867 Points
Intel Core i5-9600K, AMD Radeon RX Vega 64, Intel Core i5-9600K
i5-9600K, 3700 MHz
6071 Points -12%
Intel Core i5 9400F, Intel Core i5-9400F
i5-9400F, 2900 MHz
5777 Points -16%
Intel Core i3 9100F, Intel Core i3-9100F
i3-9100F, 3600 MHz
4218 Points -39%

* ... Meglio usare valori piccoli

Il Zotac MEK MINI nel Cinebench R15 multi-loop

Grazie al design molto compatto, è molto interessante il modo in cui l'Intel Core i7-9700 si comporta nel multi-loop Cinebench R15. Dopo la prima esecuzione, dove il Turbo poteva ancora essere pienamente utilizzato, le prestazioni diventano un po' strozzate. Tuttavia, con una media di 1.226 punti, le prestazioni sono ancora ad alto livello.

1219.71229.71239.71249.7Tooltip
Zotac MEK Mini (RTX 2070 Super): Ø1226 (1219.7-1254.78)

Prestazioni con le Applicazioni

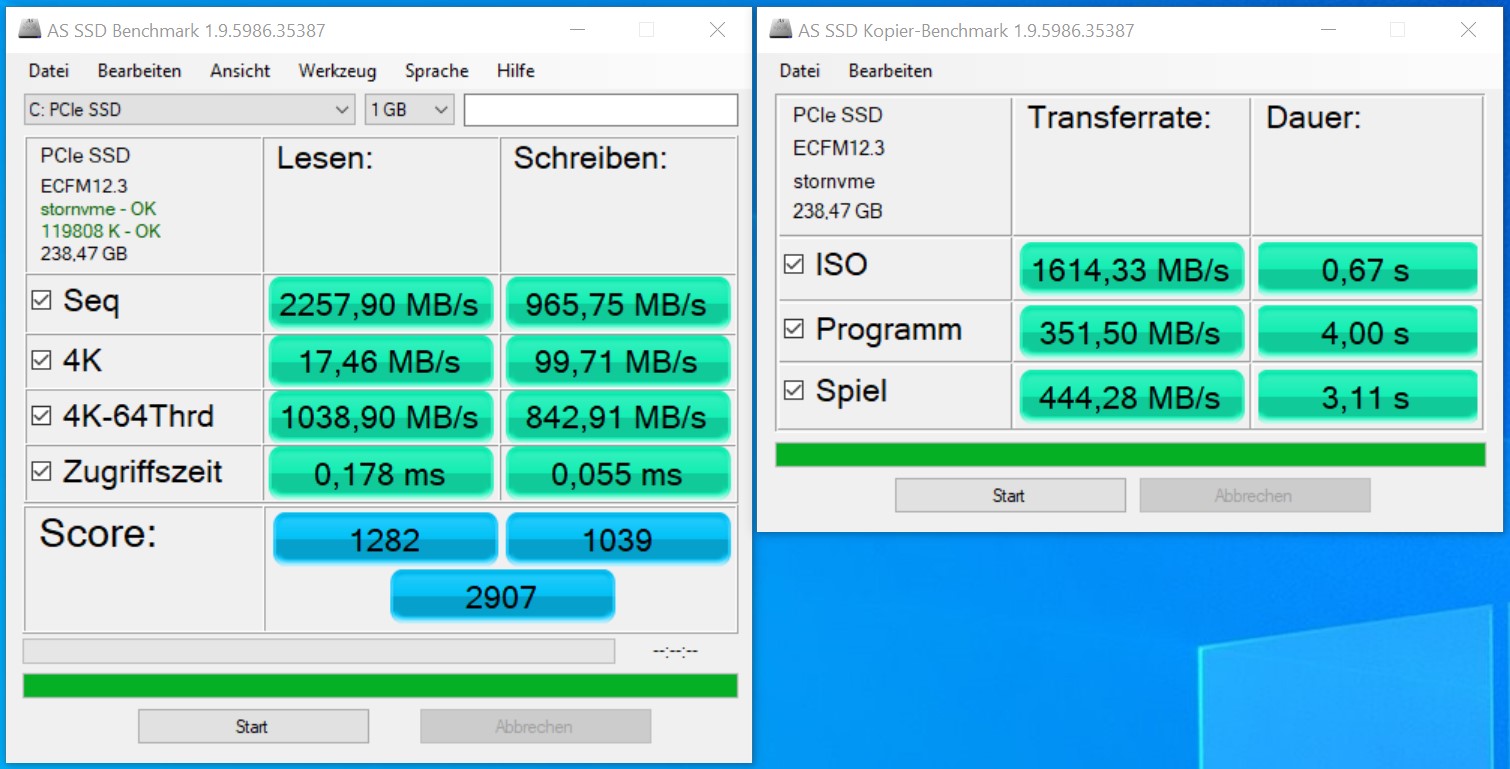
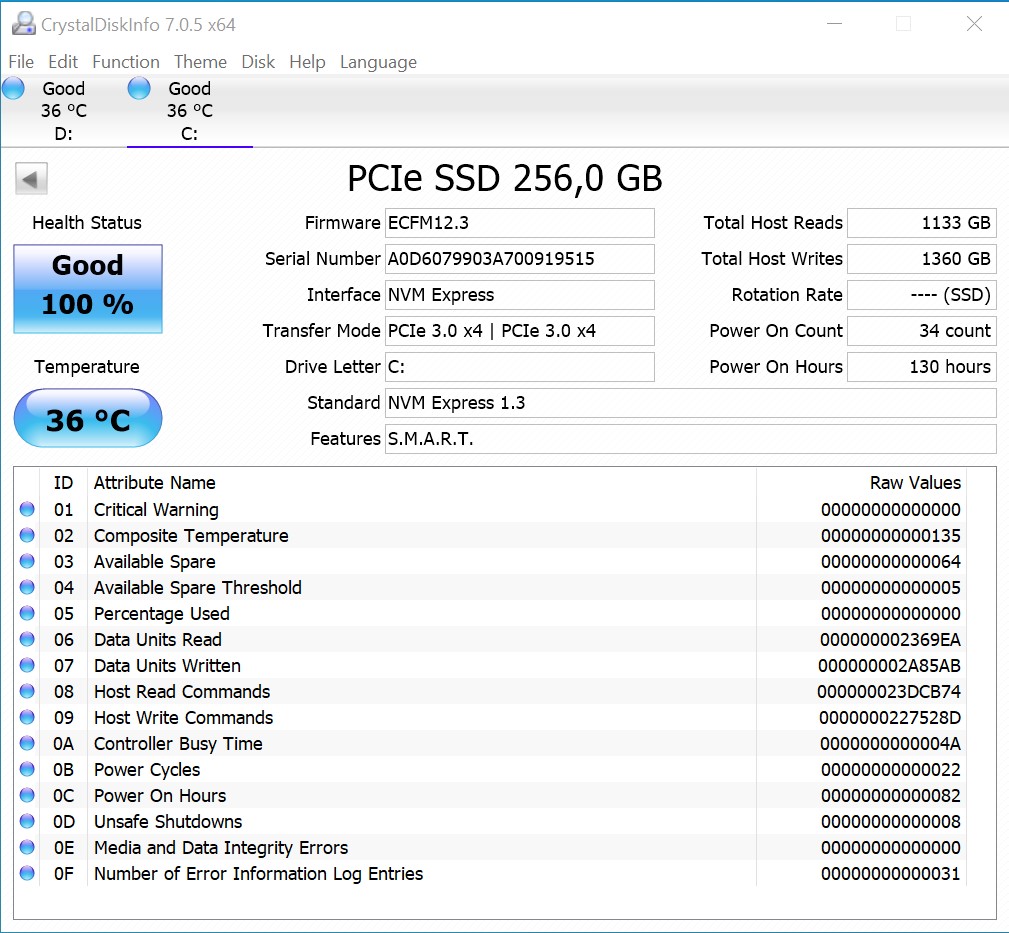
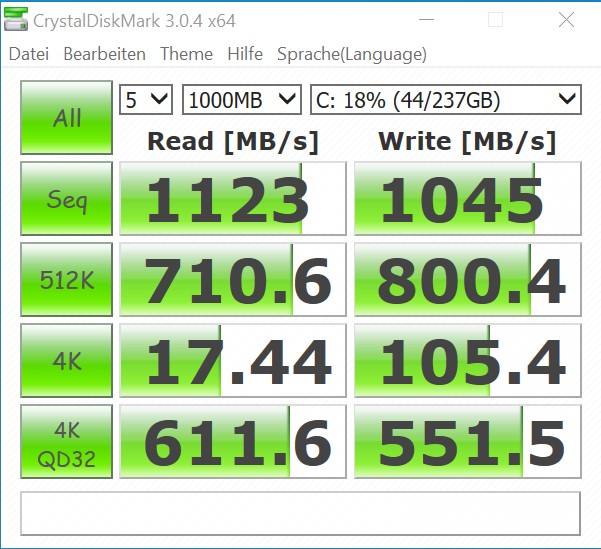
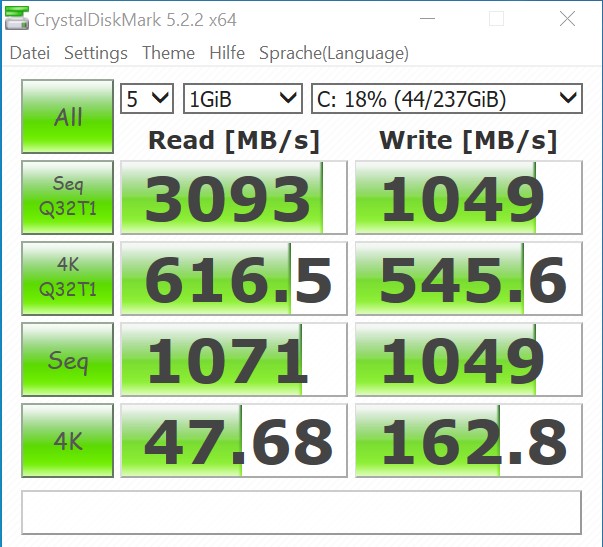
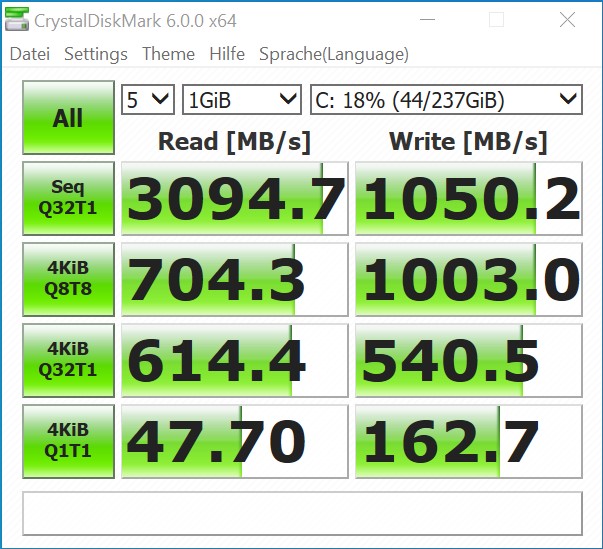
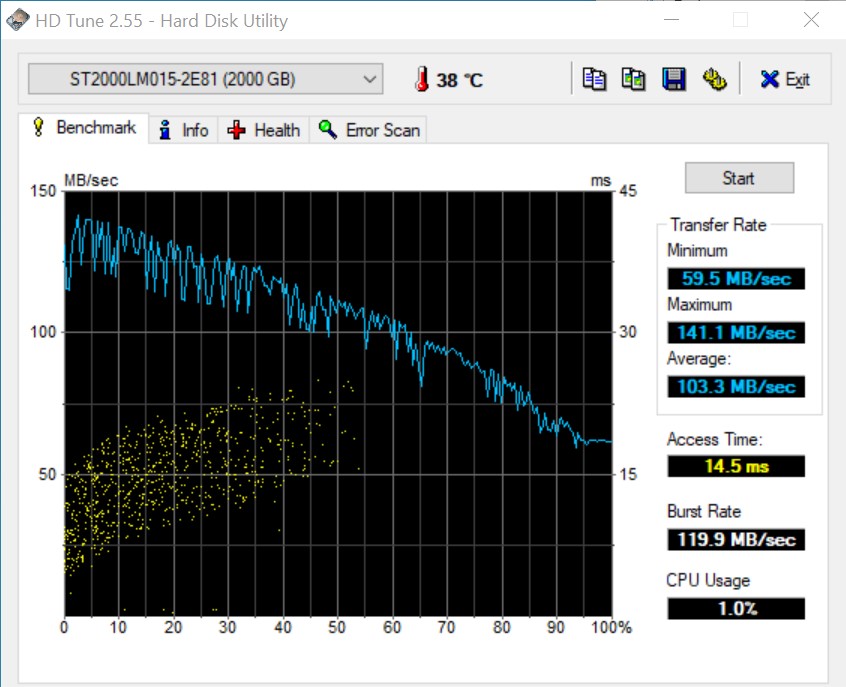
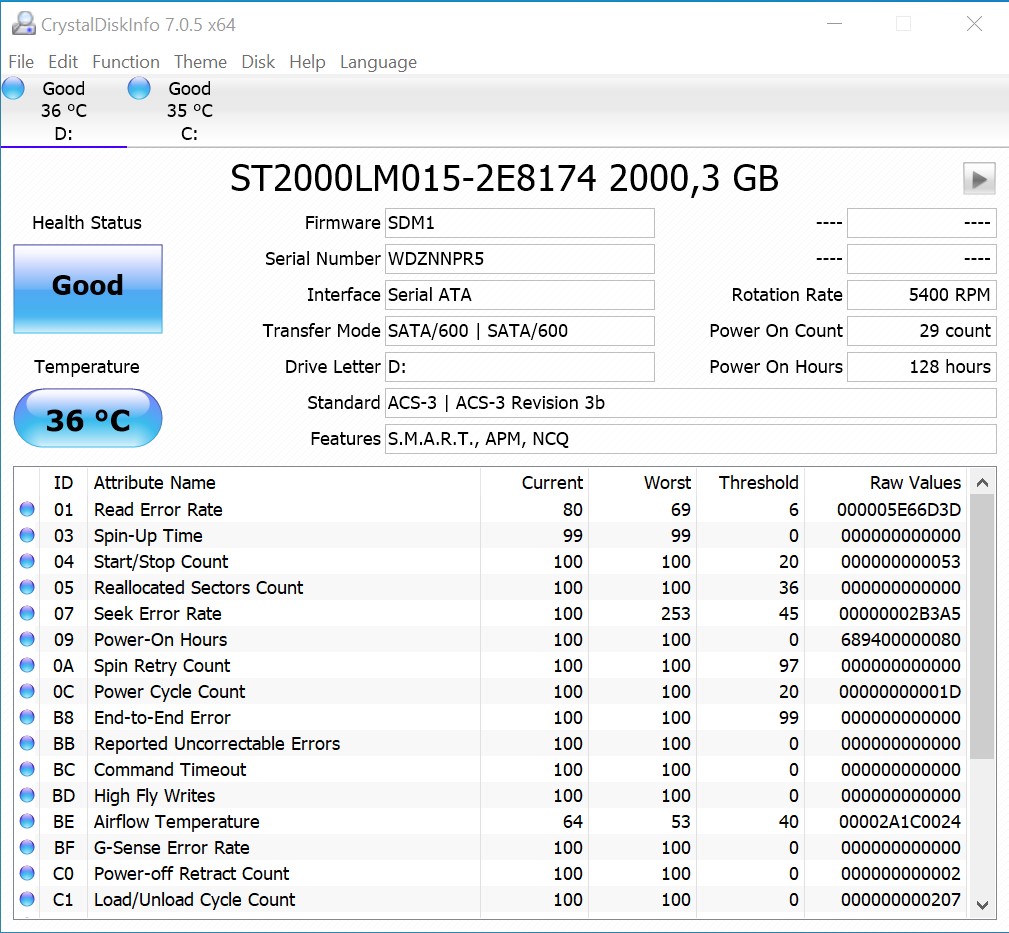
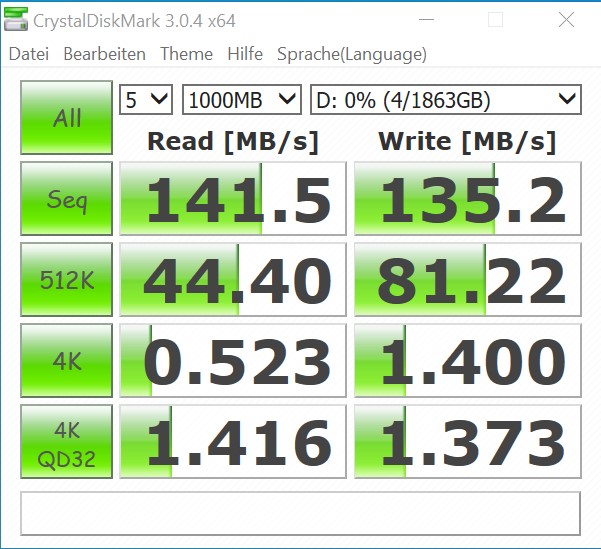
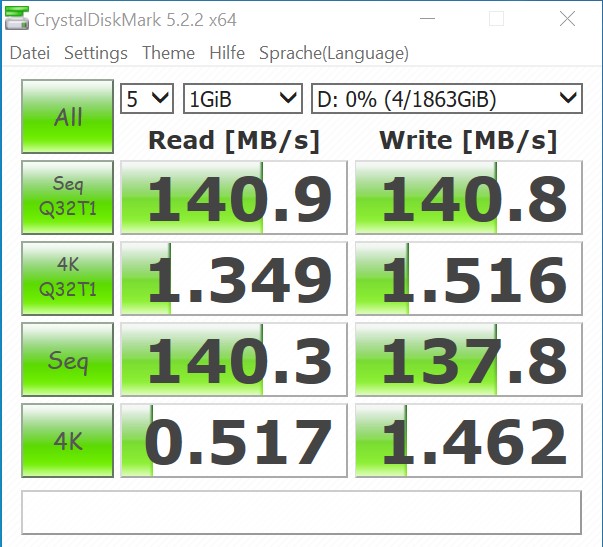
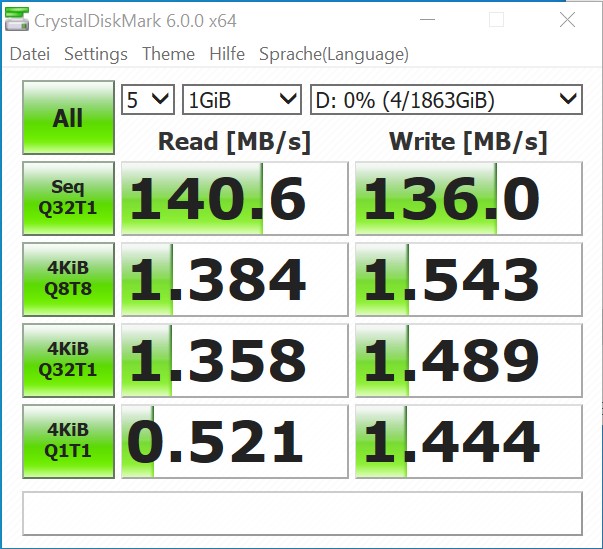
Il MEK MINI raggiunge buoni valori nei nostri benchmarks con le applicazioni anche se gli altri dispositivi di confronto raggiungono risultati migliori; ciò è dovuto al fatto che in alcuni casi è stata utilizzata una scheda grafica molto più potente. Ciononostante, il lavoro con il MEK MINI durante il periodo di prova è stato piacevole. Grazie all'uso di un SSD e di un HDD, il sistema è pronto per l'uso e offre, tuttavia, sufficiente spazio di memoria sull'HDD da 2 TB. Se questo spazio non è sufficiente, è possibile sostituire il dispositivo di memorizzazione esistente o installare un altro SSD M.2.

AS SSD PCIe SSD (240 GB)
CDI PCIe SSD (240 GB)
CDM 3 PCIe SSD (240 GB)
CDM 5 PCIe SSD (240 GB)
CDM 6 PCIe SSD (240 GB)
HD Tune (2 TB HDD)
CDI (2 TB HDD)
CDM 3 (2 TB HDD)
CDM 5 (2 TB HDD)
CDM 6 (2 TB HDD)
PCMark 10 - Score
AMD Ryzen 9 3950X, AMD Ryzen 9 3950X
NVIDIA Titan RTX
7869 Points +24%
Intel Core i9-10900K, Intel Core i9-10900K
NVIDIA Titan RTX
7641 Points +20%
Corsair One i160, Intel Core i9-9900K
NVIDIA GeForce RTX 2080 Ti (Desktop)
7329 Points +15%
Intel Core i5-10600K, Intel Core i5-10600K
NVIDIA Titan RTX
7279 Points +15%
Intel Core i7-9700K, AMD Radeon RX Vega 64, Intel Core i7-9700K
AMD Radeon RX Vega 64
6797 Points +7%
Intel Core i5 9400F, Intel Core i5-9400F
NVIDIA Titan RTX
6671 Points +5%
Zotac MEK Mini (RTX 2070 Super), Intel Core i7-9700
NVIDIA GeForce RTX 2070 Super (Desktop)
6351 Points
Intel Core i3 9100F, Intel Core i3-9100F
NVIDIA Titan RTX
6278 Points -1%
Intel Core i5-9600K, AMD Radeon RX Vega 64, Intel Core i5-9600K
AMD Radeon RX Vega 64
6261 Points -1%
PCMark 8
Work Score Accelerated v2
AMD Ryzen 9 3950X, AMD Ryzen 9 3950X
NVIDIA Titan RTX
5388 Points +7%
Corsair One i160, Intel Core i9-9900K
NVIDIA GeForce RTX 2080 Ti (Desktop)
5296 Points +6%
Intel Core i7-9700K, AMD Radeon RX Vega 64, Intel Core i7-9700K
AMD Radeon RX Vega 64
5168 Points +3%
Intel Core i5-10600K, Intel Core i5-10600K
NVIDIA Titan RTX
5148 Points +3%
Intel Core i9-10900K, Intel Core i9-10900K
NVIDIA Titan RTX
5115 Points +2%
Intel Core i3 9100F, Intel Core i3-9100F
NVIDIA Titan RTX
5019 Points 0%
Zotac MEK Mini (RTX 2070 Super), Intel Core i7-9700
NVIDIA GeForce RTX 2070 Super (Desktop)
5014 Points
Intel Core i5 9400F, Intel Core i5-9400F
NVIDIA Titan RTX
5011 Points 0%
Intel Core i5-9600K, AMD Radeon RX Vega 64, Intel Core i5-9600K
AMD Radeon RX Vega 64
4983 Points -1%
Creative Score Accelerated v2
Corsair One i160, Intel Core i9-9900K
NVIDIA GeForce RTX 2080 Ti (Desktop)
10550 Points +14%
AMD Ryzen 9 3950X, AMD Ryzen 9 3950X
NVIDIA Titan RTX
10402 Points +13%
Intel Core i5-10600K, Intel Core i5-10600K
NVIDIA Titan RTX
10349 Points +12%
Intel Core i9-10900K, Intel Core i9-10900K
NVIDIA Titan RTX
10245 Points +11%
Intel Core i5 9400F, Intel Core i5-9400F
NVIDIA Titan RTX
9871 Points +7%
Intel Core i3 9100F, Intel Core i3-9100F
NVIDIA Titan RTX
9578 Points +4%
Zotac MEK Mini (RTX 2070 Super), Intel Core i7-9700
NVIDIA GeForce RTX 2070 Super (Desktop)
9214 Points
Intel Core i7-9700K, AMD Radeon RX Vega 64, Intel Core i7-9700K
AMD Radeon RX Vega 64
8344 Points -9%
Intel Core i5-9600K, AMD Radeon RX Vega 64, Intel Core i5-9600K
AMD Radeon RX Vega 64
8057 Points -13%
Home Score Accelerated v2
Corsair One i160, Intel Core i9-9900K
NVIDIA GeForce RTX 2080 Ti (Desktop)
5418 Points +9%
AMD Ryzen 9 3950X, AMD Ryzen 9 3950X
NVIDIA Titan RTX
5404 Points +9%
Intel Core i5-10600K, Intel Core i5-10600K
NVIDIA Titan RTX
5212 Points +5%
Intel Core i9-10900K, Intel Core i9-10900K
NVIDIA Titan RTX
5185 Points +4%
Intel Core i5 9400F, Intel Core i5-9400F
NVIDIA Titan RTX
5049 Points +2%
Intel Core i3 9100F, Intel Core i3-9100F
NVIDIA Titan RTX
5001 Points +1%
Zotac MEK Mini (RTX 2070 Super), Intel Core i7-9700
NVIDIA GeForce RTX 2070 Super (Desktop)
4973 Points
Intel Core i7-9700K, AMD Radeon RX Vega 64, Intel Core i7-9700K
AMD Radeon RX Vega 64
4859 Points -2%
Intel Core i5-9600K, AMD Radeon RX Vega 64, Intel Core i5-9600K
AMD Radeon RX Vega 64
4740 Points -5%
SPECviewperf 12
1900x1060 Solidworks (sw-03)
Intel Core i9-10900K, Intel Core i9-10900K
NVIDIA Titan RTX
172.2 fps +136%
Intel Core i5-10600K, Intel Core i5-10600K
NVIDIA Titan RTX
158.2 fps +116%
AMD Ryzen 9 3950X, AMD Ryzen 9 3950X
NVIDIA Titan RTX
157.6 fps +116%
Intel Core i5 9400F, Intel Core i5-9400F
NVIDIA Titan RTX
146.5 fps +100%
Intel Core i3 9100F, Intel Core i3-9100F
NVIDIA Titan RTX
143.3 fps +96%
Corsair One i160, Intel Core i9-9900K
NVIDIA GeForce RTX 2080 Ti (Desktop)
83.7 fps +15%
Intel Core i7-9700K, AMD Radeon RX Vega 64, Intel Core i7-9700K
AMD Radeon RX Vega 64
82.5 fps +13%
Intel Core i5-9600K, AMD Radeon RX Vega 64, Intel Core i5-9600K
AMD Radeon RX Vega 64
79.3 fps +8%
Zotac MEK Mini (RTX 2070 Super), Intel Core i7-9700
NVIDIA GeForce RTX 2070 Super (Desktop)
73.1 fps
1900x1060 Siemens NX (snx-02)
Intel Core i9-10900K, Intel Core i9-10900K
NVIDIA Titan RTX
263.3 fps +2137%
Intel Core i5-10600K, Intel Core i5-10600K
NVIDIA Titan RTX
259.1 fps +2101%
Intel Core i3 9100F, Intel Core i3-9100F
NVIDIA Titan RTX
255.4 fps +2070%
AMD Ryzen 9 3950X, AMD Ryzen 9 3950X
NVIDIA Titan RTX
254.8 fps +2065%
Intel Core i5 9400F, Intel Core i5-9400F
NVIDIA Titan RTX
241.6 fps +1953%
Intel Core i7-9700K, AMD Radeon RX Vega 64, Intel Core i7-9700K
AMD Radeon RX Vega 64
28.85 fps +145%
Intel Core i5-9600K, AMD Radeon RX Vega 64, Intel Core i5-9600K
AMD Radeon RX Vega 64
28.51 fps +142%
Corsair One i160, Intel Core i9-9900K
NVIDIA GeForce RTX 2080 Ti (Desktop)
12.72 fps +8%
Zotac MEK Mini (RTX 2070 Super), Intel Core i7-9700
NVIDIA GeForce RTX 2070 Super (Desktop)
11.77 fps
1900x1060 Showcase (showcase-01)
Intel Core i5-10600K, Intel Core i5-10600K
NVIDIA Titan RTX
196.1 fps +57%
Intel Core i9-10900K, Intel Core i9-10900K
NVIDIA Titan RTX
192.4 fps +54%
Intel Core i5 9400F, Intel Core i5-9400F
NVIDIA Titan RTX
189.8 fps +52%
AMD Ryzen 9 3950X, AMD Ryzen 9 3950X
NVIDIA Titan RTX
188.3 fps +51%
Intel Core i3 9100F, Intel Core i3-9100F
NVIDIA Titan RTX
186.2 fps +49%
Corsair One i160, Intel Core i9-9900K
NVIDIA GeForce RTX 2080 Ti (Desktop)
182.3 fps +46%
Zotac MEK Mini (RTX 2070 Super), Intel Core i7-9700
NVIDIA GeForce RTX 2070 Super (Desktop)
124.6 fps
Intel Core i5-9600K, AMD Radeon RX Vega 64, Intel Core i5-9600K
AMD Radeon RX Vega 64
115.3 fps -7%
Intel Core i7-9700K, AMD Radeon RX Vega 64, Intel Core i7-9700K
AMD Radeon RX Vega 64
115.1 fps -8%
1900x1060 Medical (medical-01)
Intel Core i5-10600K, Intel Core i5-10600K
NVIDIA Titan RTX
94.6 fps +126%
Intel Core i9-10900K, Intel Core i9-10900K
NVIDIA Titan RTX
94.5 fps +125%
Intel Core i3 9100F, Intel Core i3-9100F
NVIDIA Titan RTX
92.2 fps +120%
AMD Ryzen 9 3950X, AMD Ryzen 9 3950X
NVIDIA Titan RTX
88.1 fps +110%
Intel Core i5 9400F, Intel Core i5-9400F
NVIDIA Titan RTX
87.6 fps +109%
Corsair One i160, Intel Core i9-9900K
NVIDIA GeForce RTX 2080 Ti (Desktop)
56.6 fps +35%
Intel Core i7-9700K, AMD Radeon RX Vega 64, Intel Core i7-9700K
AMD Radeon RX Vega 64
51 fps +22%
Intel Core i5-9600K, AMD Radeon RX Vega 64, Intel Core i5-9600K
AMD Radeon RX Vega 64
50.1 fps +20%
Zotac MEK Mini (RTX 2070 Super), Intel Core i7-9700
NVIDIA GeForce RTX 2070 Super (Desktop)
41.92 fps
1900x1060 Maya (maya-04)
Corsair One i160, Intel Core i9-9900K
NVIDIA GeForce RTX 2080 Ti (Desktop)
190.9 fps +27%
Intel Core i9-10900K, Intel Core i9-10900K
NVIDIA Titan RTX
188.7 fps +26%
AMD Ryzen 9 3950X, AMD Ryzen 9 3950X
NVIDIA Titan RTX
172.2 fps +15%
Intel Core i5-10600K, Intel Core i5-10600K
NVIDIA Titan RTX
169.4 fps +13%
Intel Core i5 9400F, Intel Core i5-9400F
NVIDIA Titan RTX
158.5 fps +6%
Zotac MEK Mini (RTX 2070 Super), Intel Core i7-9700
NVIDIA GeForce RTX 2070 Super (Desktop)
150.2 fps
Intel Core i3 9100F, Intel Core i3-9100F
NVIDIA Titan RTX
147.2 fps -2%
Intel Core i7-9700K, AMD Radeon RX Vega 64, Intel Core i7-9700K
AMD Radeon RX Vega 64
84.1 fps -44%
Intel Core i5-9600K, AMD Radeon RX Vega 64, Intel Core i5-9600K
AMD Radeon RX Vega 64
80.3 fps -47%
1900x1060 Energy (energy-01)
Intel Core i5-10600K, Intel Core i5-10600K
NVIDIA Titan RTX
28.77 fps +145%
Intel Core i9-10900K, Intel Core i9-10900K
NVIDIA Titan RTX
28.72 fps +145%
Intel Core i3 9100F, Intel Core i3-9100F
NVIDIA Titan RTX
28.64 fps +144%
AMD Ryzen 9 3950X, AMD Ryzen 9 3950X
NVIDIA Titan RTX
28.18 fps +140%
Intel Core i5 9400F, Intel Core i5-9400F
NVIDIA Titan RTX
28.17 fps +140%
Corsair One i160, Intel Core i9-9900K
NVIDIA GeForce RTX 2080 Ti (Desktop)
16.72 fps +43%
Intel Core i5-9600K, AMD Radeon RX Vega 64, Intel Core i5-9600K
AMD Radeon RX Vega 64
12.64 fps +8%
Zotac MEK Mini (RTX 2070 Super), Intel Core i7-9700
NVIDIA GeForce RTX 2070 Super (Desktop)
11.72 fps
Intel Core i7-9700K, AMD Radeon RX Vega 64, Intel Core i7-9700K
AMD Radeon RX Vega 64
5.21 fps -56%
1900x1060 Creo (creo-01)
Intel Core i9-10900K, Intel Core i9-10900K
NVIDIA Titan RTX
157.2 fps +198%
Intel Core i5-10600K, Intel Core i5-10600K
NVIDIA Titan RTX
142.7 fps +171%
AMD Ryzen 9 3950X, AMD Ryzen 9 3950X
NVIDIA Titan RTX
134.8 fps +156%
Intel Core i5 9400F, Intel Core i5-9400F
NVIDIA Titan RTX
132.8 fps +152%
Intel Core i3 9100F, Intel Core i3-9100F
NVIDIA Titan RTX
127.7 fps +142%
Corsair One i160, Intel Core i9-9900K
NVIDIA GeForce RTX 2080 Ti (Desktop)
72.2 fps +37%
Intel Core i7-9700K, AMD Radeon RX Vega 64, Intel Core i7-9700K
AMD Radeon RX Vega 64
62.5 fps +19%
Intel Core i5-9600K, AMD Radeon RX Vega 64, Intel Core i5-9600K
AMD Radeon RX Vega 64
60.8 fps +15%
Zotac MEK Mini (RTX 2070 Super), Intel Core i7-9700
NVIDIA GeForce RTX 2070 Super (Desktop)
52.7 fps
1900x1060 Catia (catia-04)
Intel Core i9-10900K, Intel Core i9-10900K
NVIDIA Titan RTX
225.2 fps +131%
AMD Ryzen 9 3950X, AMD Ryzen 9 3950X
NVIDIA Titan RTX
218.4 fps +124%
Intel Core i5-10600K, Intel Core i5-10600K
NVIDIA Titan RTX
215.5 fps +121%
Intel Core i5 9400F, Intel Core i5-9400F
NVIDIA Titan RTX
205.1 fps +110%
Intel Core i3 9100F, Intel Core i3-9100F
NVIDIA Titan RTX
182.1 fps +87%
Intel Core i7-9700K, AMD Radeon RX Vega 64, Intel Core i7-9700K
AMD Radeon RX Vega 64
158.6 fps +63%
Intel Core i5-9600K, AMD Radeon RX Vega 64, Intel Core i5-9600K
AMD Radeon RX Vega 64
157.1 fps +61%
Corsair One i160, Intel Core i9-9900K
NVIDIA GeForce RTX 2080 Ti (Desktop)
120.8 fps +24%
Zotac MEK Mini (RTX 2070 Super), Intel Core i7-9700
NVIDIA GeForce RTX 2070 Super (Desktop)
97.6 fps
1900x1060 3ds Max (3dsmax-05)
Intel Core i9-10900K, Intel Core i9-10900K
NVIDIA Titan RTX
297.4 fps +44%
Intel Core i5-10600K, Intel Core i5-10600K
NVIDIA Titan RTX
296.9 fps +44%
AMD Ryzen 9 3950X, AMD Ryzen 9 3950X
NVIDIA Titan RTX
274.5 fps +33%
Corsair One i160, Intel Core i9-9900K
NVIDIA GeForce RTX 2080 Ti (Desktop)
271.8 fps +31%
Intel Core i3 9100F, Intel Core i3-9100F
NVIDIA Titan RTX
268.1 fps +30%
Intel Core i5 9400F, Intel Core i5-9400F
NVIDIA Titan RTX
257.7 fps +25%
Zotac MEK Mini (RTX 2070 Super), Intel Core i7-9700
NVIDIA GeForce RTX 2070 Super (Desktop)
206.8 fps
Intel Core i7-9700K, AMD Radeon RX Vega 64, Intel Core i7-9700K
AMD Radeon RX Vega 64
130.8 fps -37%
Intel Core i5-9600K, AMD Radeon RX Vega 64, Intel Core i5-9600K
AMD Radeon RX Vega 64
128.9 fps -38%
SPECviewperf 13
Solidworks (sw-04)
Intel Core i9-10900K, Intel Core i9-10900K
NVIDIA Titan RTX
166.2 fps +65%
Intel Core i5-10600K, Intel Core i5-10600K
NVIDIA Titan RTX
153.9 fps +52%
AMD Ryzen 9 3950X, AMD Ryzen 9 3950X
NVIDIA Titan RTX
153.2 fps +52%
Intel Core i5 9400F, Intel Core i5-9400F
NVIDIA Titan RTX
144.8 fps +43%
Intel Core i3 9100F, Intel Core i3-9100F
NVIDIA Titan RTX
137.2 fps +36%
Corsair One i160, Intel Core i9-9900K
NVIDIA GeForce RTX 2080 Ti (Desktop)
116.3 fps +15%
Zotac MEK Mini (RTX 2070 Super), Intel Core i7-9700
NVIDIA GeForce RTX 2070 Super (Desktop)
101 fps
Intel Core i7-9700K, AMD Radeon RX Vega 64, Intel Core i7-9700K
AMD Radeon RX Vega 64
100.5 fps 0%
Intel Core i5-9600K, AMD Radeon RX Vega 64, Intel Core i5-9600K
AMD Radeon RX Vega 64
97 fps -4%
Siemens NX (snx-03)
Intel Core i9-10900K, Intel Core i9-10900K
NVIDIA Titan RTX
472.9 fps +2135%
Intel Core i5-10600K, Intel Core i5-10600K
NVIDIA Titan RTX
469.1 fps +2117%
Intel Core i3 9100F, Intel Core i3-9100F
NVIDIA Titan RTX
462.9 fps +2088%
AMD Ryzen 9 3950X, AMD Ryzen 9 3950X
NVIDIA Titan RTX
460 fps +2074%
Intel Core i5 9400F, Intel Core i5-9400F
NVIDIA Titan RTX
436.5 fps +1963%
Intel Core i7-9700K, AMD Radeon RX Vega 64, Intel Core i7-9700K
AMD Radeon RX Vega 64
51.5 fps +143%
Intel Core i5-9600K, AMD Radeon RX Vega 64, Intel Core i5-9600K
AMD Radeon RX Vega 64
51.4 fps +143%
Corsair One i160, Intel Core i9-9900K
NVIDIA GeForce RTX 2080 Ti (Desktop)
23.03 fps +9%
Zotac MEK Mini (RTX 2070 Super), Intel Core i7-9700
NVIDIA GeForce RTX 2070 Super (Desktop)
21.16 fps
Showcase (showcase-02)
Intel Core i5-10600K, Intel Core i5-10600K
NVIDIA Titan RTX
195.1 fps +54%
Intel Core i9-10900K, Intel Core i9-10900K
NVIDIA Titan RTX
194.1 fps +53%
Intel Core i5 9400F, Intel Core i5-9400F
NVIDIA Titan RTX
188.5 fps +49%
Intel Core i3 9100F, Intel Core i3-9100F
NVIDIA Titan RTX
186.9 fps +48%
AMD Ryzen 9 3950X, AMD Ryzen 9 3950X
NVIDIA Titan RTX
186.8 fps +48%
Corsair One i160, Intel Core i9-9900K
NVIDIA GeForce RTX 2080 Ti (Desktop)
182.6 fps +44%
Zotac MEK Mini (RTX 2070 Super), Intel Core i7-9700
NVIDIA GeForce RTX 2070 Super (Desktop)
126.5 fps
Intel Core i5-9600K, AMD Radeon RX Vega 64, Intel Core i5-9600K
AMD Radeon RX Vega 64
115.4 fps -9%
Intel Core i7-9700K, AMD Radeon RX Vega 64, Intel Core i7-9700K
AMD Radeon RX Vega 64
115 fps -9%
Medical (medical-02)
AMD Ryzen 9 3950X, AMD Ryzen 9 3950X
NVIDIA Titan RTX
90.3 fps +46%
Intel Core i5-10600K, Intel Core i5-10600K
NVIDIA Titan RTX
89.7 fps +45%
Intel Core i3 9100F, Intel Core i3-9100F
NVIDIA Titan RTX
89.1 fps +44%
Intel Core i5 9400F, Intel Core i5-9400F
NVIDIA Titan RTX
88.9 fps +44%
Intel Core i9-10900K, Intel Core i9-10900K
NVIDIA Titan RTX
88.7 fps +44%
Corsair One i160, Intel Core i9-9900K
NVIDIA GeForce RTX 2080 Ti (Desktop)
85 fps +38%
Zotac MEK Mini (RTX 2070 Super), Intel Core i7-9700
NVIDIA GeForce RTX 2070 Super (Desktop)
61.8 fps
Intel Core i7-9700K, AMD Radeon RX Vega 64, Intel Core i7-9700K
AMD Radeon RX Vega 64
38.31 fps -38%
Intel Core i5-9600K, AMD Radeon RX Vega 64, Intel Core i5-9600K
AMD Radeon RX Vega 64
38.09 fps -38%
Maya (maya-05)
Intel Core i9-10900K, Intel Core i9-10900K
NVIDIA Titan RTX
405.9 fps +105%
Corsair One i160, Intel Core i9-9900K
NVIDIA GeForce RTX 2080 Ti (Desktop)
402 fps +103%
AMD Ryzen 9 3950X, AMD Ryzen 9 3950X
NVIDIA Titan RTX
394.9 fps +99%
Intel Core i5-10600K, Intel Core i5-10600K
NVIDIA Titan RTX
387.5 fps +96%
Intel Core i3 9100F, Intel Core i3-9100F
NVIDIA Titan RTX
368 fps +86%
Intel Core i5 9400F, Intel Core i5-9400F
NVIDIA Titan RTX
365.8 fps +85%
Intel Core i7-9700K, AMD Radeon RX Vega 64, Intel Core i7-9700K
AMD Radeon RX Vega 64
199.5 fps +1%
Zotac MEK Mini (RTX 2070 Super), Intel Core i7-9700
NVIDIA GeForce RTX 2070 Super (Desktop)
198.1 fps
Intel Core i5-9600K, AMD Radeon RX Vega 64, Intel Core i5-9600K
AMD Radeon RX Vega 64
196.1 fps -1%
Energy (energy-02)
Intel Core i5 9400F, Intel Core i5-9400F
NVIDIA Titan RTX
53.5 fps +132%
Intel Core i5-10600K, Intel Core i5-10600K
NVIDIA Titan RTX
53.3 fps +131%
Intel Core i9-10900K, Intel Core i9-10900K
NVIDIA Titan RTX
53.2 fps +130%
AMD Ryzen 9 3950X, AMD Ryzen 9 3950X
NVIDIA Titan RTX
52.4 fps +127%
Intel Core i3 9100F, Intel Core i3-9100F
NVIDIA Titan RTX
52.3 fps +126%
Corsair One i160, Intel Core i9-9900K
NVIDIA GeForce RTX 2080 Ti (Desktop)
31.93 fps +38%
Zotac MEK Mini (RTX 2070 Super), Intel Core i7-9700
NVIDIA GeForce RTX 2070 Super (Desktop)
23.1 fps
Intel Core i5-9600K, AMD Radeon RX Vega 64, Intel Core i5-9600K
AMD Radeon RX Vega 64
15.2 fps -34%
Intel Core i7-9700K, AMD Radeon RX Vega 64, Intel Core i7-9700K
AMD Radeon RX Vega 64
7.55 fps -67%
Creo (creo-02)
Intel Core i9-10900K, Intel Core i9-10900K
NVIDIA Titan RTX
336.3 fps +92%
Intel Core i5-10600K, Intel Core i5-10600K
NVIDIA Titan RTX
331.7 fps +90%
AMD Ryzen 9 3950X, AMD Ryzen 9 3950X
NVIDIA Titan RTX
328.8 fps +88%
Intel Core i5 9400F, Intel Core i5-9400F
NVIDIA Titan RTX
311.4 fps +78%
Intel Core i3 9100F, Intel Core i3-9100F
NVIDIA Titan RTX
309.3 fps +77%
Corsair One i160, Intel Core i9-9900K
NVIDIA GeForce RTX 2080 Ti (Desktop)
286.1 fps +63%
Zotac MEK Mini (RTX 2070 Super), Intel Core i7-9700
NVIDIA GeForce RTX 2070 Super (Desktop)
175 fps
Intel Core i5-9600K, AMD Radeon RX Vega 64, Intel Core i5-9600K
AMD Radeon RX Vega 64
109.5 fps -37%
Intel Core i7-9700K, AMD Radeon RX Vega 64, Intel Core i7-9700K
AMD Radeon RX Vega 64
108.9 fps -38%
Catia (catia-05)
Intel Core i9-10900K, Intel Core i9-10900K
NVIDIA Titan RTX
362.1 fps +156%
AMD Ryzen 9 3950X, AMD Ryzen 9 3950X
NVIDIA Titan RTX
355.2 fps +151%
Intel Core i5-10600K, Intel Core i5-10600K
NVIDIA Titan RTX
341.7 fps +141%
Intel Core i5 9400F, Intel Core i5-9400F
NVIDIA Titan RTX
333.5 fps +135%
Intel Core i3 9100F, Intel Core i3-9100F
NVIDIA Titan RTX
290.3 fps +105%
Intel Core i7-9700K, AMD Radeon RX Vega 64, Intel Core i7-9700K
AMD Radeon RX Vega 64
236 fps +67%
Intel Core i5-9600K, AMD Radeon RX Vega 64, Intel Core i5-9600K
AMD Radeon RX Vega 64
233.5 fps +65%
Corsair One i160, Intel Core i9-9900K
NVIDIA GeForce RTX 2080 Ti (Desktop)
177.3 fps +25%
Zotac MEK Mini (RTX 2070 Super), Intel Core i7-9700
NVIDIA GeForce RTX 2070 Super (Desktop)
141.7 fps
3ds Max (3dsmax-06)
Intel Core i5-10600K, Intel Core i5-10600K
NVIDIA Titan RTX
294.4 fps +43%
Intel Core i9-10900K, Intel Core i9-10900K
NVIDIA Titan RTX
292.5 fps +43%
AMD Ryzen 9 3950X, AMD Ryzen 9 3950X
NVIDIA Titan RTX
274.5 fps +34%
Intel Core i3 9100F, Intel Core i3-9100F
NVIDIA Titan RTX
266.9 fps +30%
Corsair One i160, Intel Core i9-9900K
NVIDIA GeForce RTX 2080 Ti (Desktop)
265.9 fps +30%
Intel Core i5 9400F, Intel Core i5-9400F
NVIDIA Titan RTX
258.9 fps +26%
Zotac MEK Mini (RTX 2070 Super), Intel Core i7-9700
NVIDIA GeForce RTX 2070 Super (Desktop)
205.2 fps
Intel Core i7-9700K, AMD Radeon RX Vega 64, Intel Core i7-9700K
AMD Radeon RX Vega 64
131 fps -36%
Intel Core i5-9600K, AMD Radeon RX Vega 64, Intel Core i5-9600K
AMD Radeon RX Vega 64
130.4 fps -36%

Prestazioni 3D e gaming

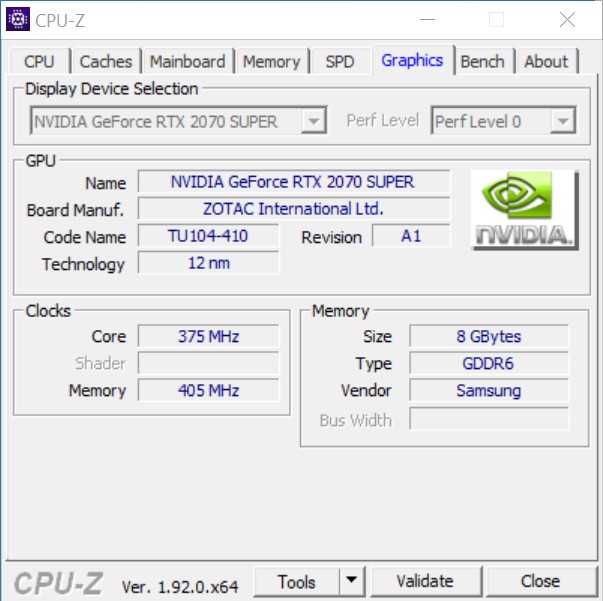
La Nvidia GeForce RTX 2070 Super integrata, che viene qui utilizzata sotto forma di una vera e propria variante desktop, fornisce buone prestazioni 3D. Più precisamente, il modello integrato è una versione mini, che il produttore Zotac offre anche nel mercato al dettaglio. Guardando i risultati, è chiaro che la versione mini della RTX 2070 Super funziona più o meno alla stessa velocità della Nvidia's Founders Edition. Il modello di KFA2, che abbiamo anche recensito, ha una velocità più elevata. Non possiamo però confermare una notevole differenza di prestazioni. Di conseguenza, se si vuole acquistare un MEK MINI, si può godere di giochi moderni con risoluzione QHD e il massimo dei dettagli. Se preferite risoluzioni ancora più alte, dovrete vivere con livelli di dettaglio più bassi per generare frame rate giocabili. Una risoluzione di 1080p dovrebbe essere preferita con il MEK MINI un po' più economico che viene fornito con RTX 2060 Super.

Se lo state considerando e volete scambiare la scheda grafica, dovete essere consapevoli che, prima di tutto, la dimensione è un fattore decisivo; in secondo luogo, la massima dissipazione di potenza specificata dal TDP di 250 watt non deve essere superata per la scheda grafica.

Potete trovare ulteriori confronti e benchmarks nella nostra tabella di confronto delle GPU.

Borderlands 3 - 1920x1080 Badass Overall Quality (DX11)
Media NVIDIA GeForce RTX 2070 Super (Desktop)
  (74.3 - 86, n=5)
80.9 fps +9%
Nvidia GeForce RTX 2070 Super
GeForce RTX 2070 Super (Desktop), R9 3900X
79.4 fps +7%
KFA2 GeForce RTX 2070 Super Work The Frames
GeForce RTX 2070 Super (Desktop), R9 3900X
79 fps +6%
Zotac MEK Mini (RTX 2070 Super)
GeForce RTX 2070 Super (Desktop), i7-9700
74.3 fps
Media NVIDIA GeForce RTX 2070 (Desktop)
  (70.9 - 74.4, n=2)
72.7 fps -2%
Media NVIDIA GeForce RTX 2060 Super (Desktop)
  (68.6 - 74.1, n=4)
71.2 fps -4%
Metro Exodus - 1920x1080 Ultra Quality AF:16x
Media NVIDIA GeForce RTX 2070 Super (Desktop)
  (67.8 - 79.1, n=5)
72.3 fps +6%
KFA2 GeForce RTX 2070 Super Work The Frames
GeForce RTX 2070 Super (Desktop), R9 3900X
70 (33min - 128max) fps +2%
Zotac MEK Mini (RTX 2070 Super)
GeForce RTX 2070 Super (Desktop), i7-9700
68.4 (35.76min - 117.04max) fps
Nvidia GeForce RTX 2070 Super
GeForce RTX 2070 Super (Desktop), R7 2700X
67.8 (36min - 110max) fps -1%
Media NVIDIA GeForce RTX 2060 Super (Desktop)
  (58 - 67.4, n=4)
62.3 fps -9%
Media NVIDIA GeForce RTX 2070 (Desktop)
  (33.4 - 62.8, n=4)
54.4 fps -20%
Far Cry New Dawn - 1920x1080 Ultra Preset
Media NVIDIA GeForce RTX 2070 Super (Desktop)
  (80 - 133, n=5)
105.6 fps +32%
Media NVIDIA GeForce RTX 2060 Super (Desktop)
  (85 - 121, n=4)
105.5 fps +32%
KFA2 GeForce RTX 2070 Super Work The Frames
GeForce RTX 2070 Super (Desktop), R9 3900X
98 (69min - 151max) fps +23%
Media NVIDIA GeForce RTX 2070 (Desktop)
  (79 - 94, n=3)
87.7 fps +10%
Nvidia GeForce RTX 2070 Super
GeForce RTX 2070 Super (Desktop), R7 2700X
87 (63min - 135max) fps +9%
Zotac MEK Mini (RTX 2070 Super)
GeForce RTX 2070 Super (Desktop), i7-9700
80 (59min - 120max) fps
Forza Horizon 4 - 1920x1080 Ultra Preset AA:2xMS
KFA2 GeForce RTX 2070 Super Work The Frames
GeForce RTX 2070 Super (Desktop), R9 3900X
153 fps 0%
Zotac MEK Mini (RTX 2070 Super)
GeForce RTX 2070 Super (Desktop), i7-9700
153 fps
Media NVIDIA GeForce RTX 2070 Super (Desktop)
  (129 - 153, n=3)
145 fps -5%
Nvidia GeForce RTX 2070 Super
GeForce RTX 2070 Super (Desktop), R7 2700X
129 fps -16%
Media NVIDIA GeForce RTX 2060 Super (Desktop)
  (110 - 129, n=2)
119.5 fps -22%
Media NVIDIA GeForce RTX 2070 (Desktop)
  (106 - 118, n=4)
111 fps -27%
Far Cry 5 - 1920x1080 Ultra Preset AA:T
Media NVIDIA GeForce RTX 2070 Super (Desktop)
  (99 - 148, n=5)
121.8 fps +12%
Media NVIDIA GeForce RTX 2060 Super (Desktop)
  (99 - 130, n=4)
116.3 fps +7%
KFA2 GeForce RTX 2070 Super Work The Frames
GeForce RTX 2070 Super (Desktop), R9 3900X
110 (86min - 143max) fps +1%
Zotac MEK Mini (RTX 2070 Super)
GeForce RTX 2070 Super (Desktop), i7-9700
109 (85min - 146max) fps
Media NVIDIA GeForce RTX 2070 (Desktop)
  (86 - 105, n=4)
99.8 fps -8%
Nvidia GeForce RTX 2070 Super
GeForce RTX 2070 Super (Desktop), R7 2700X
99 (76min - 132max) fps -9%
X-Plane 11.11 - 1920x1080 high (fps_test=3)
Media NVIDIA GeForce RTX 2060 Super (Desktop)
  (77 - 158.2, n=4)
120 fps +32%
Media NVIDIA GeForce RTX 2070 Super (Desktop)
  (66.8 - 157.3, n=6)
104.8 fps +15%
Media NVIDIA GeForce RTX 2070 (Desktop)
 
92.7 fps +2%
KFA2 GeForce RTX 2070 Super Work The Frames
GeForce RTX 2070 Super (Desktop), R9 3900X
91.9 fps +1%
Zotac MEK Mini (RTX 2070 Super)
GeForce RTX 2070 Super (Desktop), i7-9700
91.1 fps
Nvidia GeForce RTX 2070 Super
GeForce RTX 2070 Super (Desktop), R7 2700X
76 fps -17%
Final Fantasy XV Benchmark - 1920x1080 High Quality
Media NVIDIA GeForce RTX 2070 Super (Desktop)
  (75.5 - 120, n=6)
99.5 fps +3%
Zotac MEK Mini (RTX 2070 Super)
GeForce RTX 2070 Super (Desktop), i7-9700
96.9 (59min - 150max) fps
Nvidia GeForce RTX 2070 Super
GeForce RTX 2070 Super (Desktop), R7 2700X
89 (45min - 141max) fps -8%
Media NVIDIA GeForce RTX 2060 Super (Desktop)
  (79 - 93.8, n=4)
86.4 fps -11%
Media NVIDIA GeForce RTX 2070 (Desktop)
  (60.8 - 90.6, n=5)
81.9 fps -15%
KFA2 GeForce RTX 2070 Super Work The Frames
GeForce RTX 2070 Super (Desktop), R9 3900X
75.5 (49min - 135max) fps -22%
Dota 2 Reborn - 1920x1080 ultra (3/3) best looking
Media NVIDIA GeForce RTX 2060 Super (Desktop)
  (109.8 - 241, n=4)
180.3 fps +50%
Media NVIDIA GeForce RTX 2070 Super (Desktop)
  (103.2 - 236, n=6)
154.6 fps +28%
KFA2 GeForce RTX 2070 Super Work The Frames
GeForce RTX 2070 Super (Desktop), R9 3900X
136.7 (117.4min) fps +14%
Media NVIDIA GeForce RTX 2070 (Desktop)
 
130.3 fps +8%
Zotac MEK Mini (RTX 2070 Super)
GeForce RTX 2070 Super (Desktop), i7-9700
120.4 (106.9min) fps
Nvidia GeForce RTX 2070 Super
GeForce RTX 2070 Super (Desktop), R7 2700X
107.7 (90.5min) fps -11%
The Witcher 3 - 1920x1080 Ultra Graphics & Postprocessing (HBAO+)
Media NVIDIA GeForce RTX 2070 Super (Desktop)
  (95.6 - 109.6, n=6)
100.9 fps +6%
KFA2 GeForce RTX 2070 Super Work The Frames
GeForce RTX 2070 Super (Desktop), R9 3900X
99.4 (89min - 109max) fps +4%
Nvidia GeForce RTX 2070 Super
GeForce RTX 2070 Super (Desktop), R7 2700X
97 (83min - 109max) fps +1%
Zotac MEK Mini (RTX 2070 Super)
GeForce RTX 2070 Super (Desktop), i7-9700
95.6 (87min - 105max) fps
Media NVIDIA GeForce RTX 2060 Super (Desktop)
  (79 - 91.1, n=5)
84.8 fps -11%
Media NVIDIA GeForce RTX 2070 (Desktop)
  (40.9 - 95, n=5)
79.2 fps -17%
3DMark
Fire Strike Extreme Graphics
KFA2 GeForce RTX 2070 Super Work The Frames
GeForce RTX 2070 Super (Desktop), R9 3900X
11976 Points +5%
Nvidia GeForce RTX 2070 Super
GeForce RTX 2070 Super (Desktop), R9 3900X
11951 Points +5%
Media NVIDIA GeForce RTX 2070 Super (Desktop)
  (11382 - 12044, n=7)
11850 Points +4%
Nvidia GeForce RTX 2070 Super
GeForce RTX 2070 Super (Desktop), R7 2700X
11634 Points +2%
Zotac MEK Mini (RTX 2070 Super)
GeForce RTX 2070 Super (Desktop), i7-9700
11382 Points
Media NVIDIA GeForce RTX 2070 (Desktop)
  (9979 - 11423, n=5)
10987 Points -3%
Media NVIDIA GeForce RTX 2060 Super (Desktop)
  (10182 - 10726, n=6)
10498 Points -8%
1920x1080 Fire Strike Graphics
Media NVIDIA GeForce RTX 2070 Super (Desktop)
  (22819 - 25799, n=8)
24645 Points +8%
Nvidia GeForce RTX 2070 Super
GeForce RTX 2070 Super (Desktop), R9 3900X
24640 Points +8%
KFA2 GeForce RTX 2070 Super Work The Frames
GeForce RTX 2070 Super (Desktop), R9 3900X
24637 Points +8%
Nvidia GeForce RTX 2070 Super
GeForce RTX 2070 Super (Desktop), R7 2700X
24151 Points +6%
Zotac MEK Mini (RTX 2070 Super)
GeForce RTX 2070 Super (Desktop), i7-9700
22819 Points
Media NVIDIA GeForce RTX 2070 (Desktop)
  (16770 - 24242, n=6)
21999 Points -4%
Media NVIDIA GeForce RTX 2060 Super (Desktop)
  (20522 - 22764, n=7)
21970 Points -4%
2560x1440 Time Spy Graphics
Nvidia GeForce RTX 2070 Super
GeForce RTX 2070 Super (Desktop), R7 2700X
10094 Points +6%
KFA2 GeForce RTX 2070 Super Work The Frames
GeForce RTX 2070 Super (Desktop), R9 3900X
9871 Points +3%
Media NVIDIA GeForce RTX 2070 Super (Desktop)
  (9564 - 10094, n=8)
9846 Points +3%
Nvidia GeForce RTX 2070 Super
GeForce RTX 2070 Super (Desktop), R9 3900X
9623 Points +1%
Zotac MEK Mini (RTX 2070 Super)
GeForce RTX 2070 Super (Desktop), i7-9700
9564 Points
Media NVIDIA GeForce RTX 2070 (Desktop)
  (7445 - 9656, n=6)
8952 Points -6%
Media NVIDIA GeForce RTX 2060 Super (Desktop)
  (8396 - 8795, n=7)
8631 Points -10%
3DMark 11
1280x720 Performance GPU
Nvidia GeForce RTX 2070 Super
GeForce RTX 2070 Super (Desktop), R9 3900X
35377 Points +5%
Media NVIDIA GeForce RTX 2070 Super (Desktop)
  (33257 - 37235, n=7)
34830 Points +4%
Zotac MEK Mini (RTX 2070 Super)
GeForce RTX 2070 Super (Desktop), i7-9700
33626 Points
Nvidia GeForce RTX 2070 Super
GeForce RTX 2070 Super (Desktop), R7 2700X
33293 Points -1%
KFA2 GeForce RTX 2070 Super Work The Frames
GeForce RTX 2070 Super (Desktop), R9 3900X
33257 Points -1%
Media NVIDIA GeForce RTX 2070 (Desktop)
  (22174 - 32373, n=7)
29866 Points -11%
Media NVIDIA GeForce RTX 2060 Super (Desktop)
  (29148 - 30099, n=6)
29642 Points -12%
1280x720 Performance
Nvidia GeForce RTX 2070 Super
GeForce RTX 2070 Super (Desktop), R9 3900X
28994 Points +16%
Media NVIDIA GeForce RTX 2070 Super (Desktop)
  (24879 - 35274, n=7)
28582 Points +15%
KFA2 GeForce RTX 2070 Super Work The Frames
GeForce RTX 2070 Super (Desktop), R9 3900X
27896 Points +12%
Media NVIDIA GeForce RTX 2060 Super (Desktop)
  (22211 - 30486, n=6)
26110 Points +5%
Nvidia GeForce RTX 2070 Super
GeForce RTX 2070 Super (Desktop), R7 2700X
25183 Points +1%
Zotac MEK Mini (RTX 2070 Super)
GeForce RTX 2070 Super (Desktop), i7-9700
24956 Points
Media NVIDIA GeForce RTX 2070 (Desktop)
  (15341 - 27206, n=7)
23703 Points -5%
basso medio alto ultraQHD4K
BioShock Infinite (2013) 374.6 334.9 314.5 184.2
The Witcher 3 (2015) 335 268 169 95.6 65.5
Dota 2 Reborn (2015) 147.3 134 128.7 120.4 120
Rise of the Tomb Raider (2016) 311 200 169 142 67
Final Fantasy XV Benchmark (2018) 170 128 96.9 41.6
X-Plane 11.11 (2018) 122 110 91.1 79.4
Far Cry 5 (2018) 144 122 116 109 93 53
Shadow of the Tomb Raider (2018) 140 127 122 114 82 44
Forza Horizon 4 (2018) 202 174 172 153 125 84
Far Cry New Dawn (2019) 120 93 90 80 83 55
Metro Exodus (2019) 177 112 87.2 68.4 54.9 36
F1 2019 (2019) 245 215 169 146 115 71
Control (2019) 235 114 88 56.9 29.2
Borderlands 3 (2019) 129 111 91.1 74.3 53.7 29.5

Emissioni

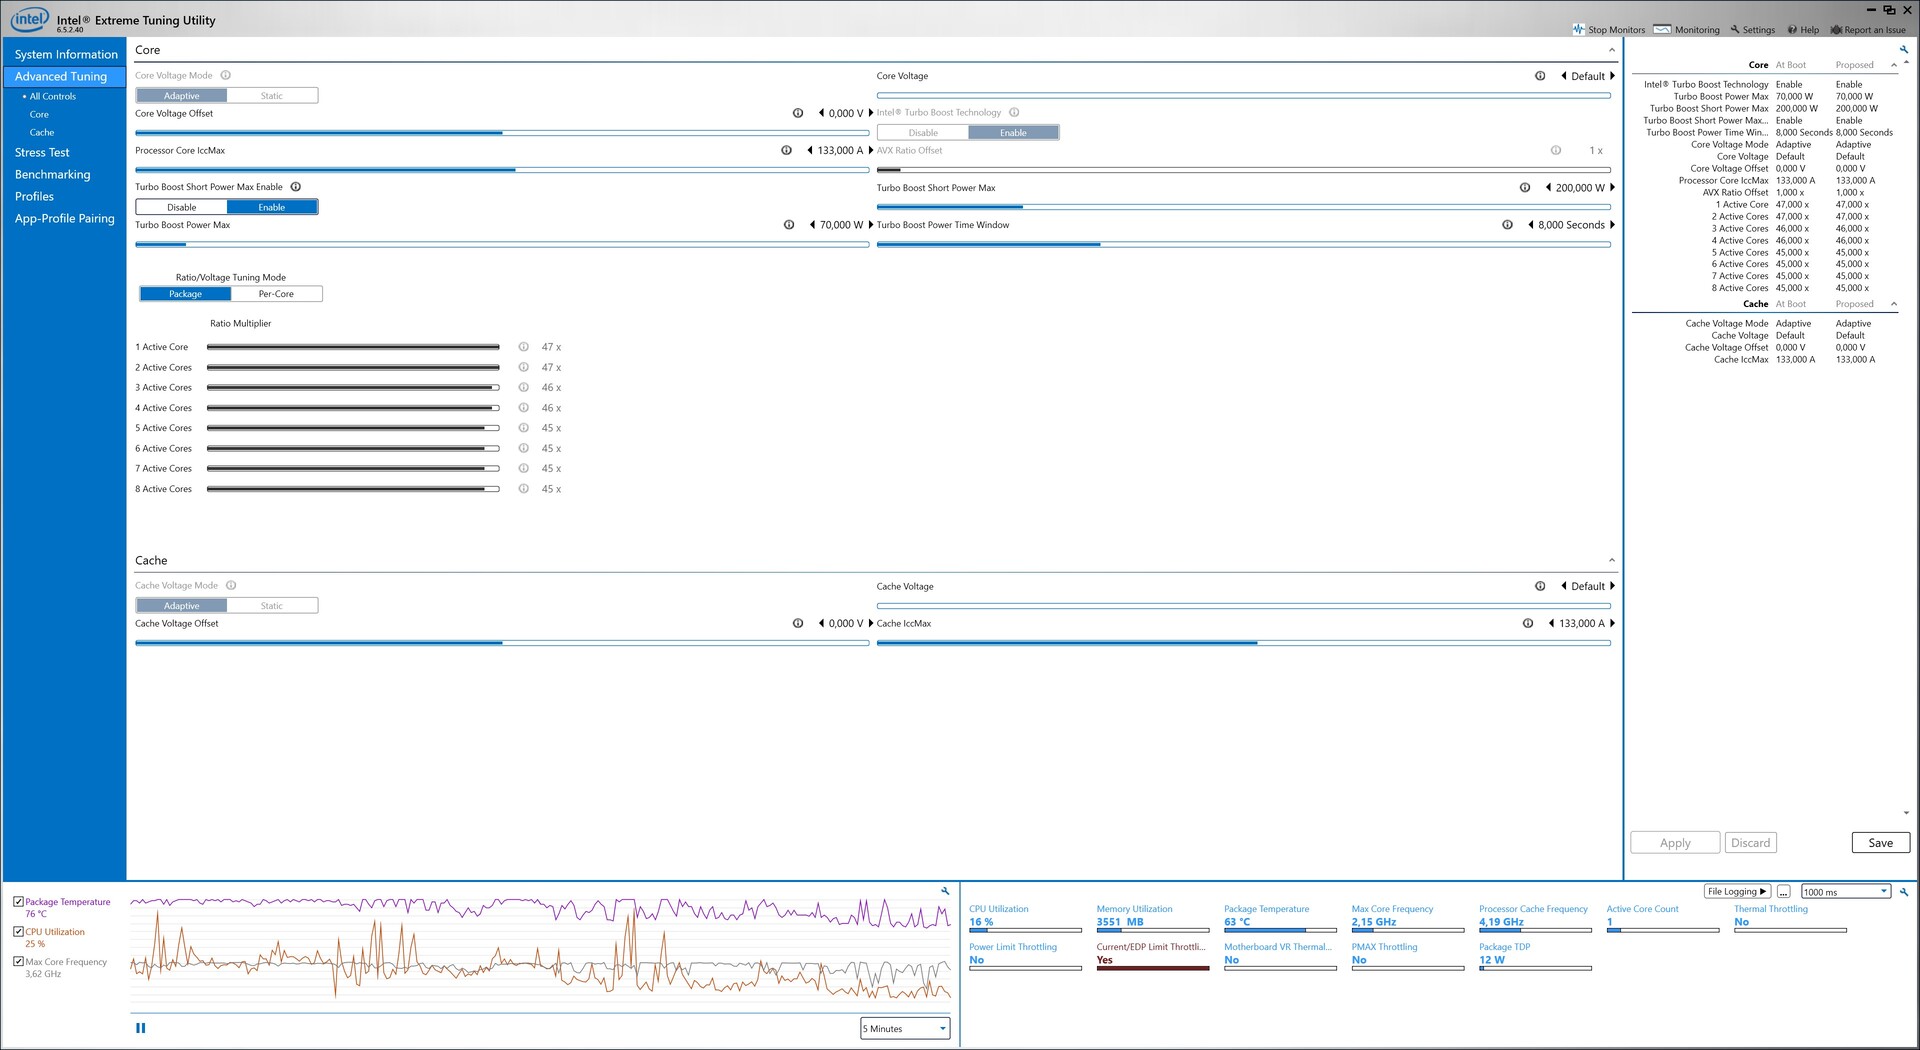
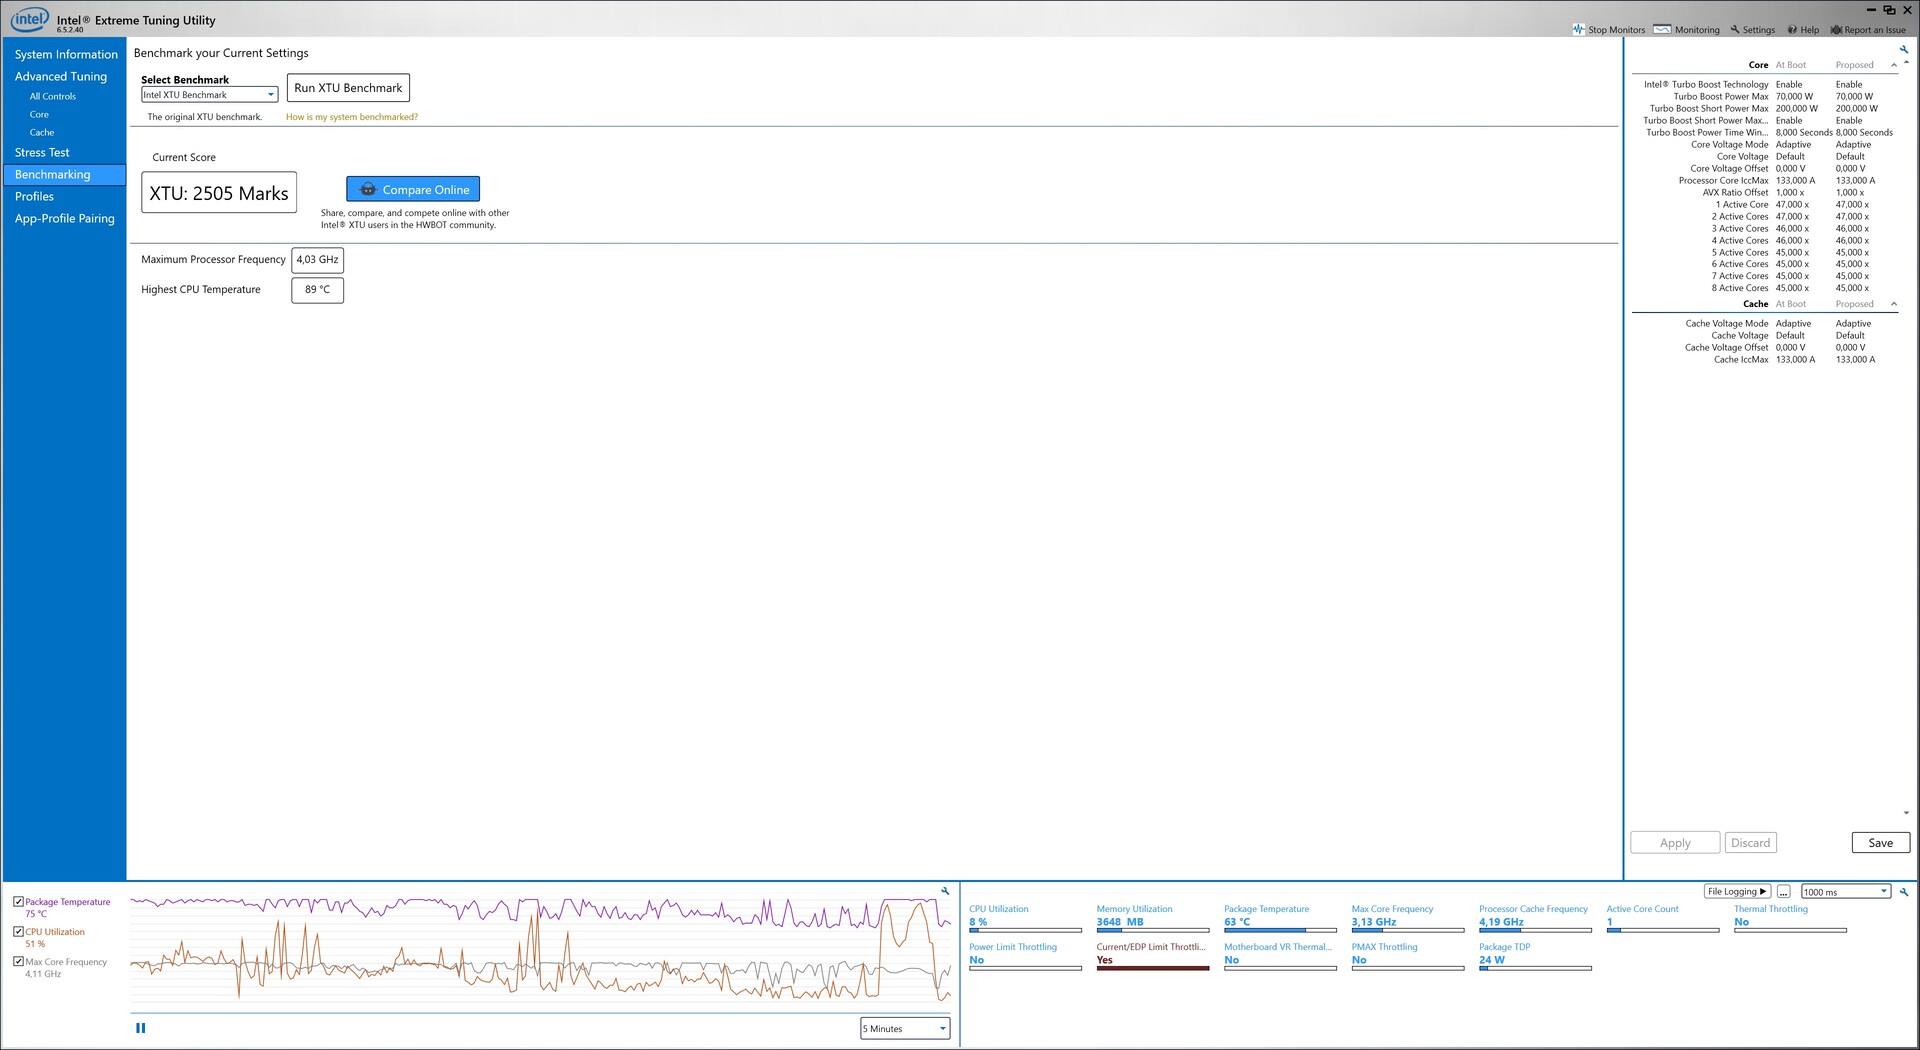
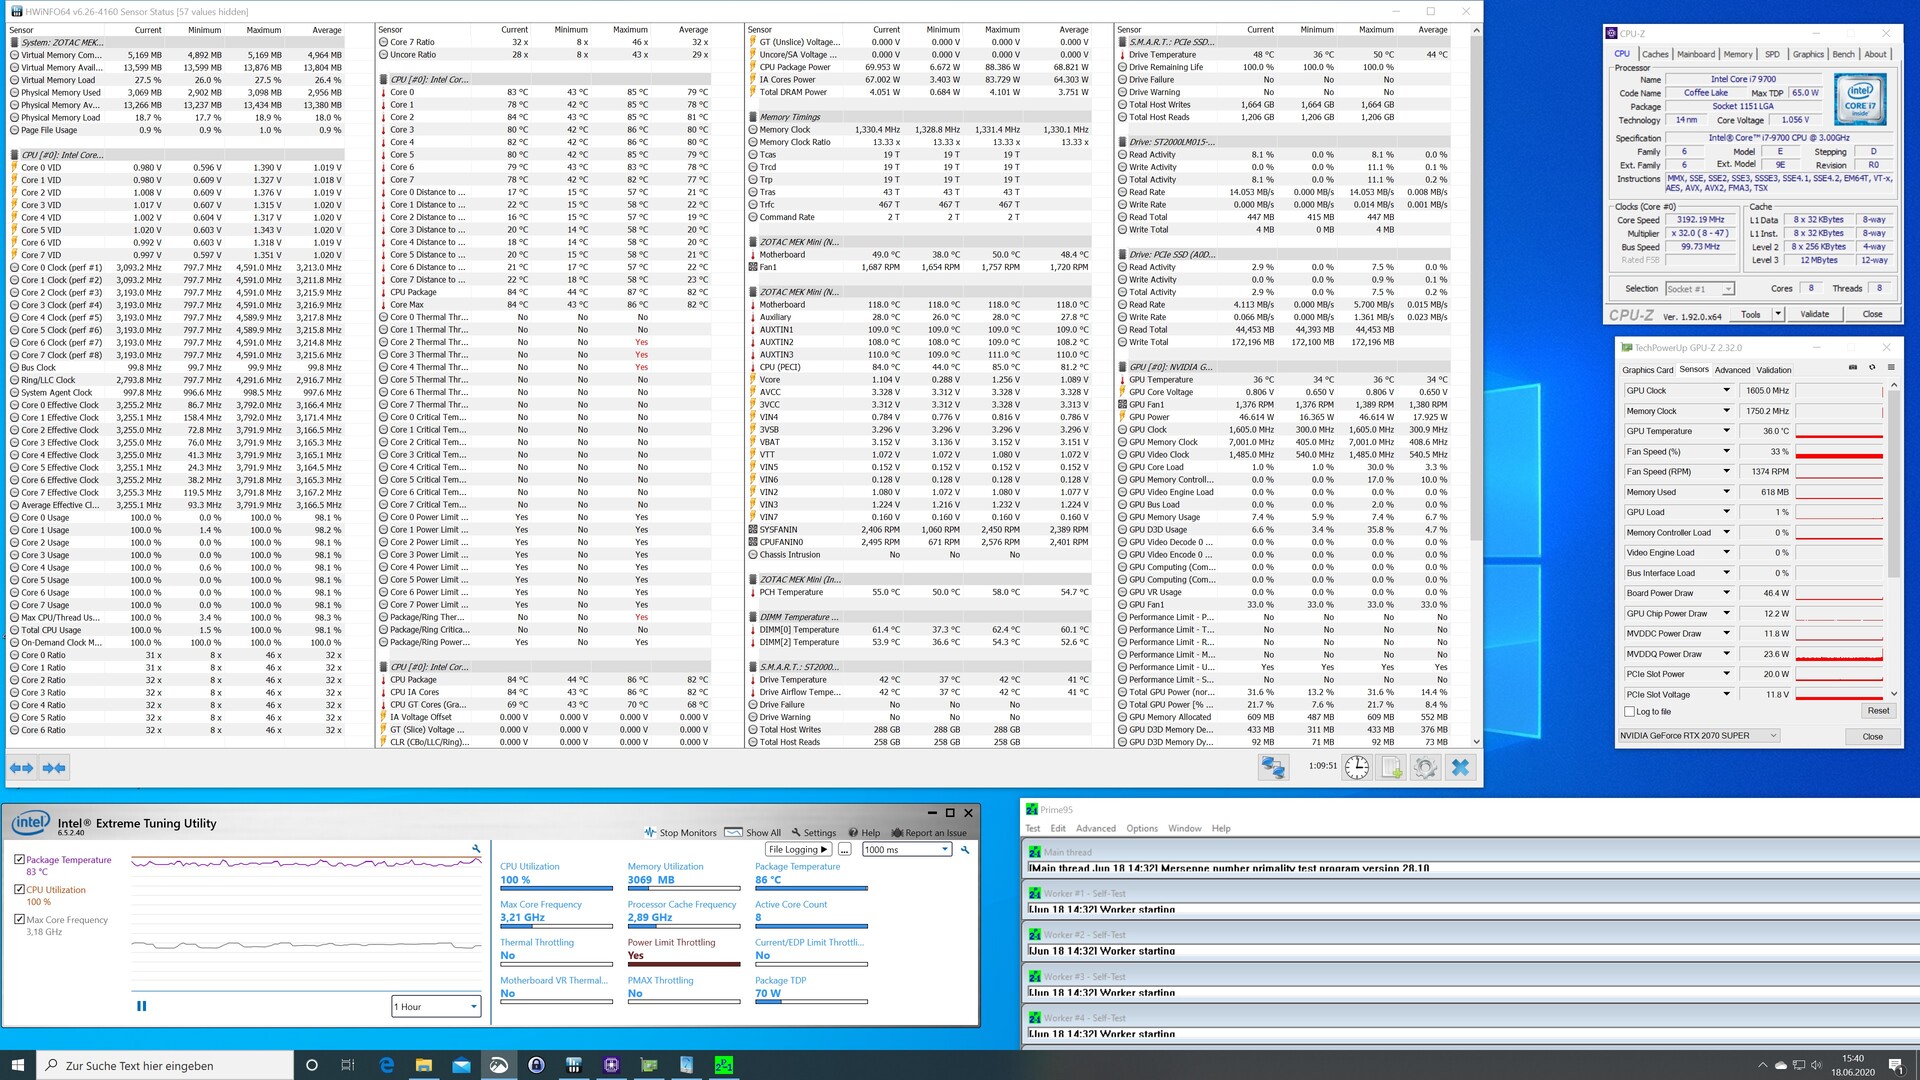
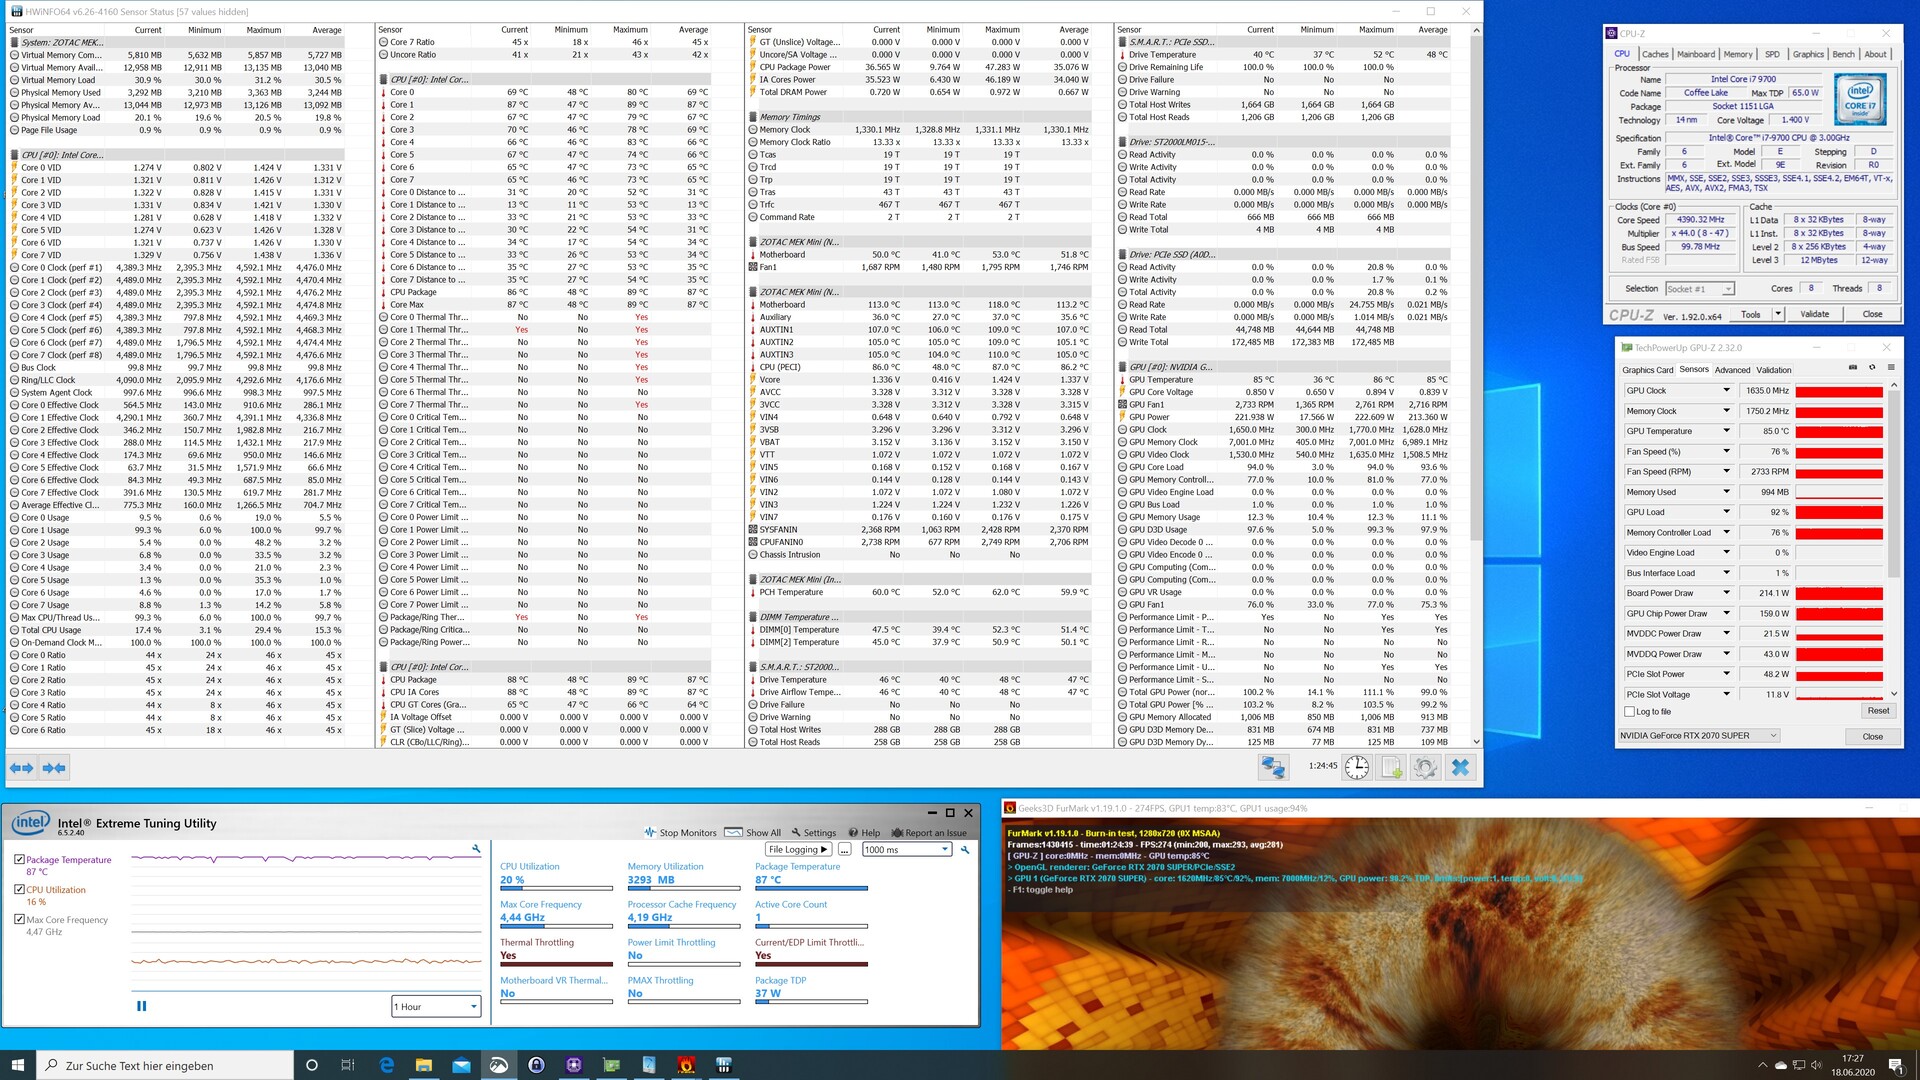
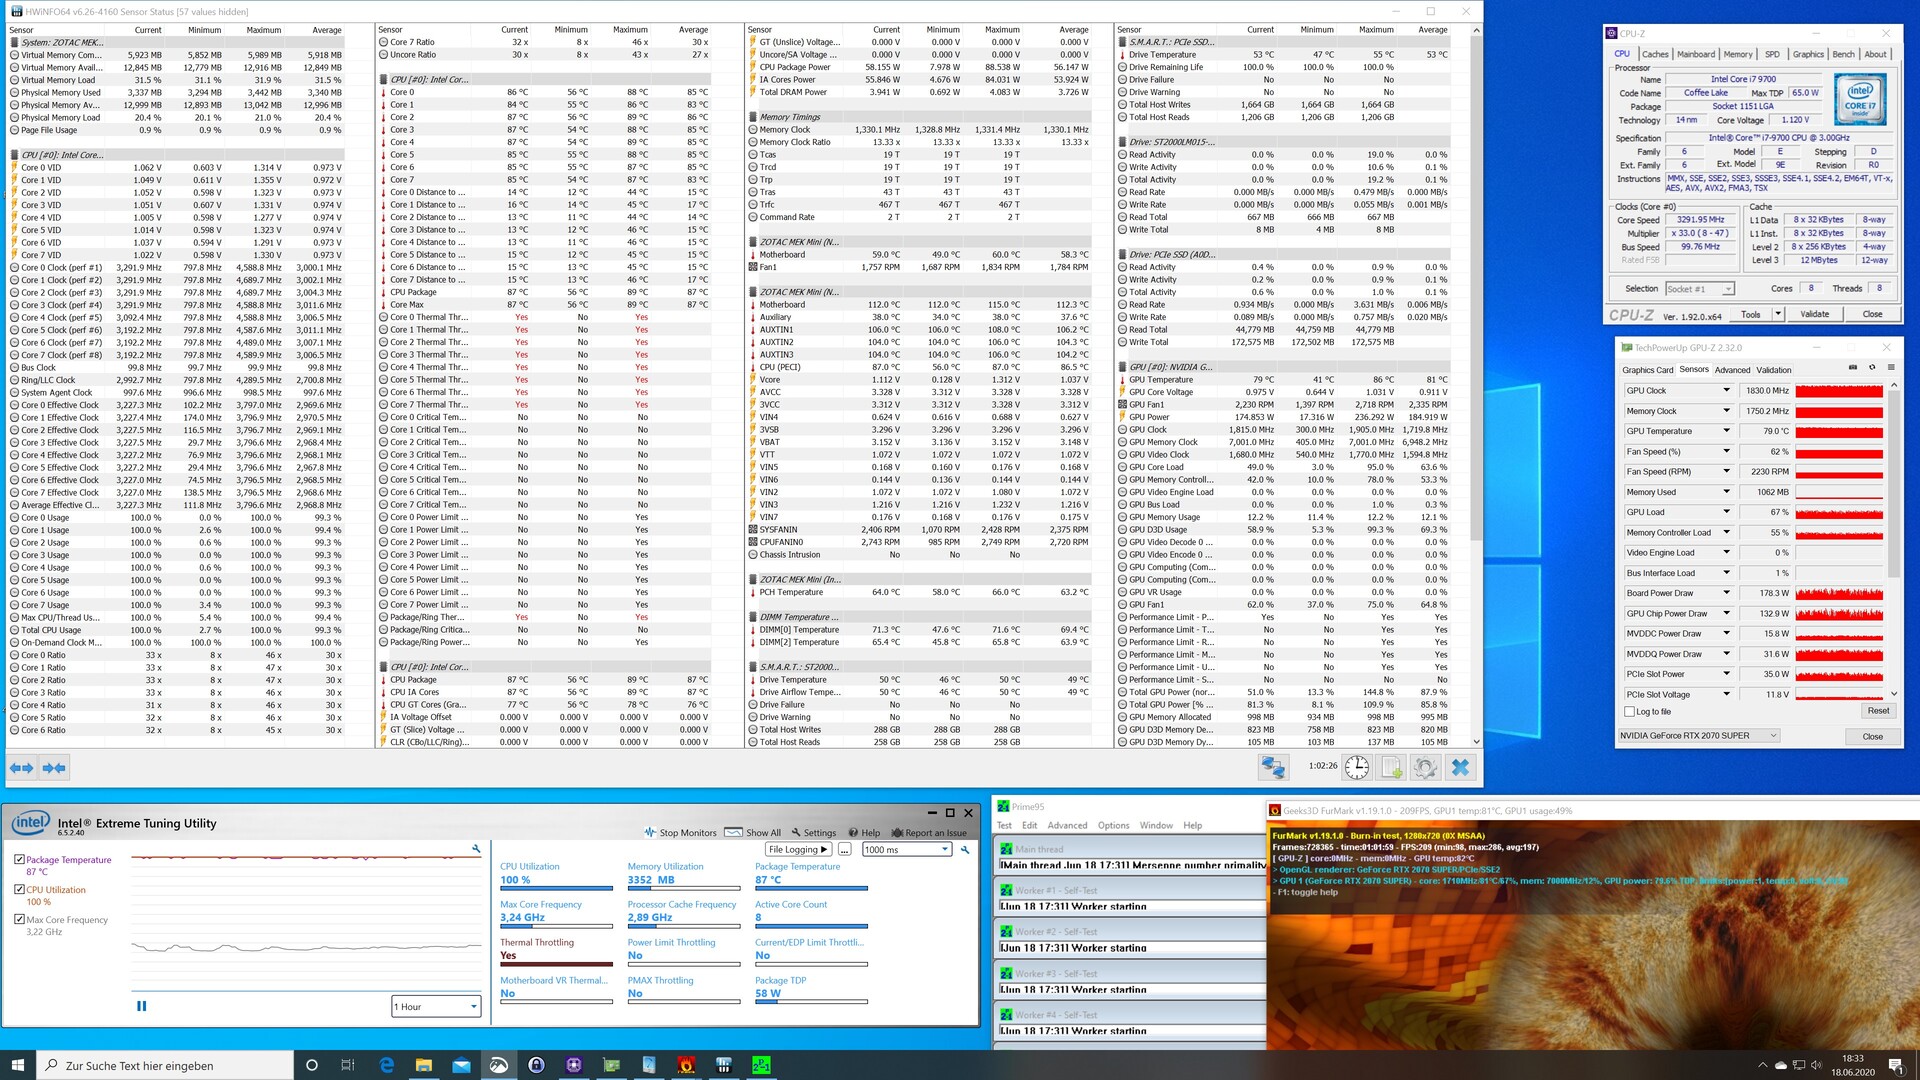
Il Zotac MEK MINI durante lo stress test

Lo Zotac MEK MINI durante lo stress test

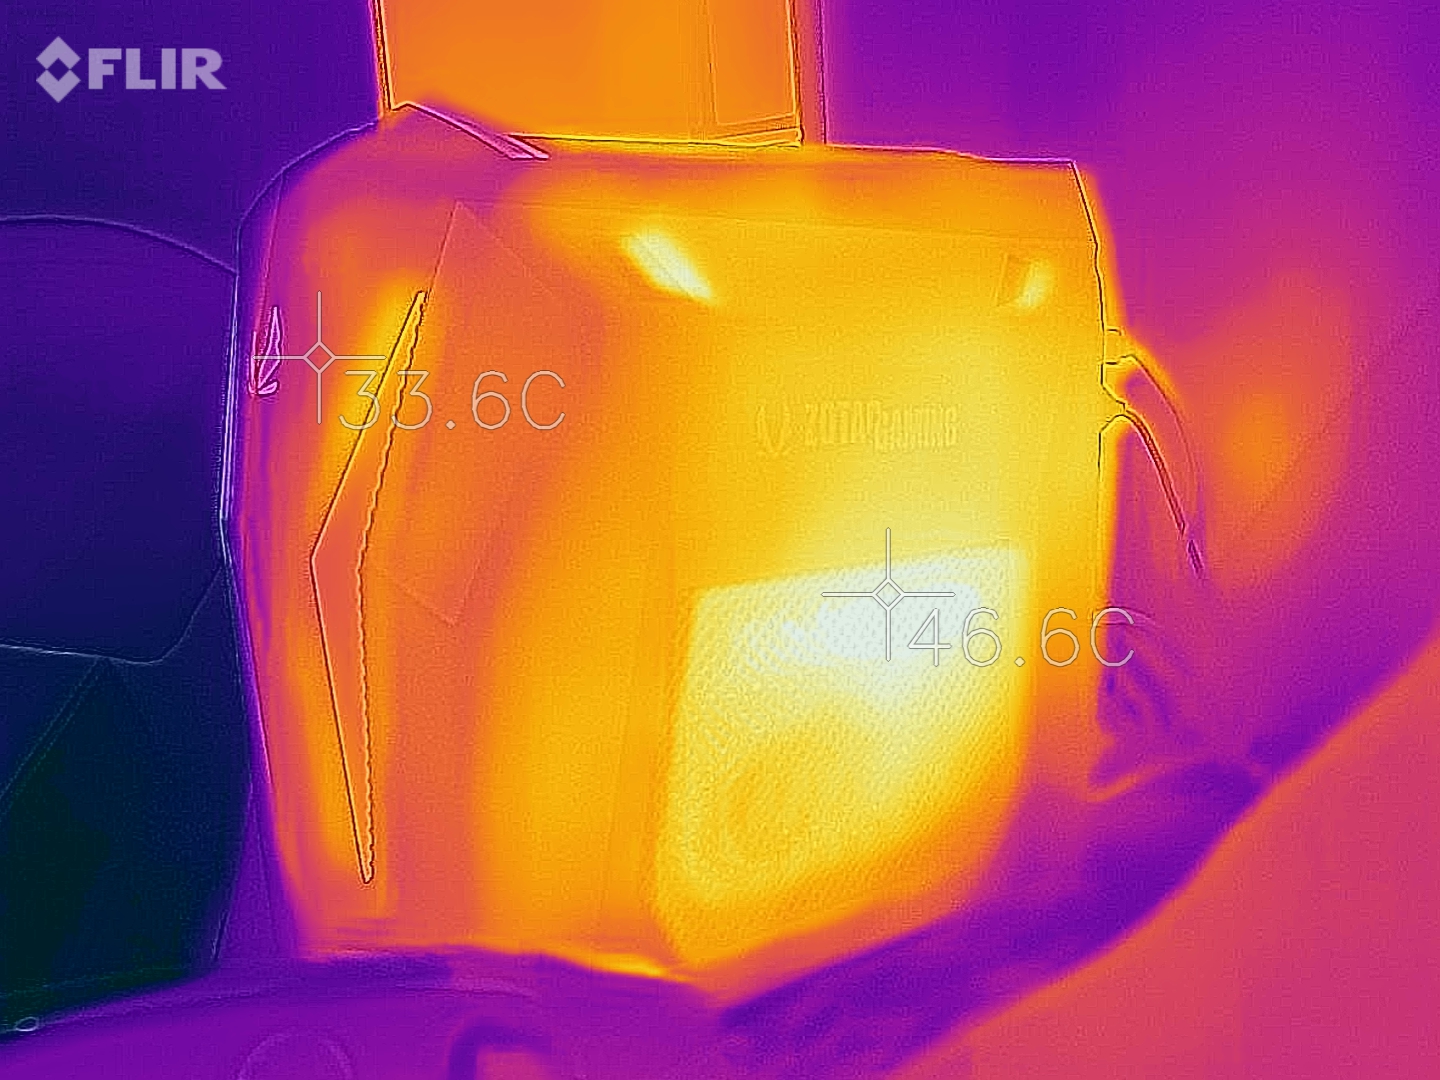
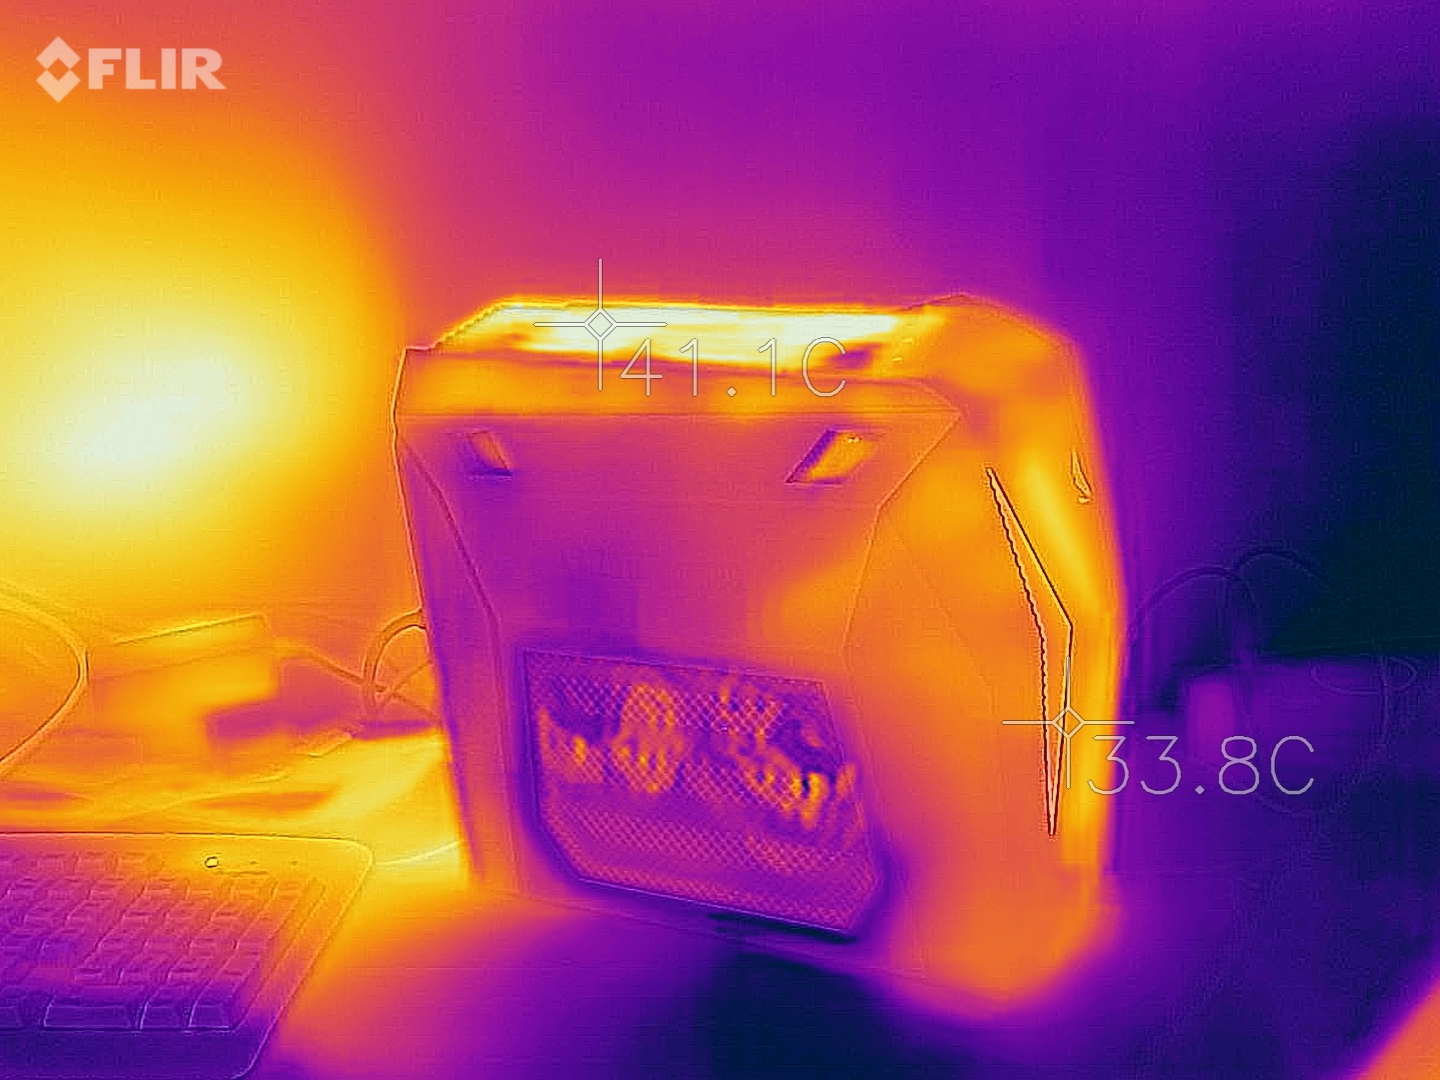
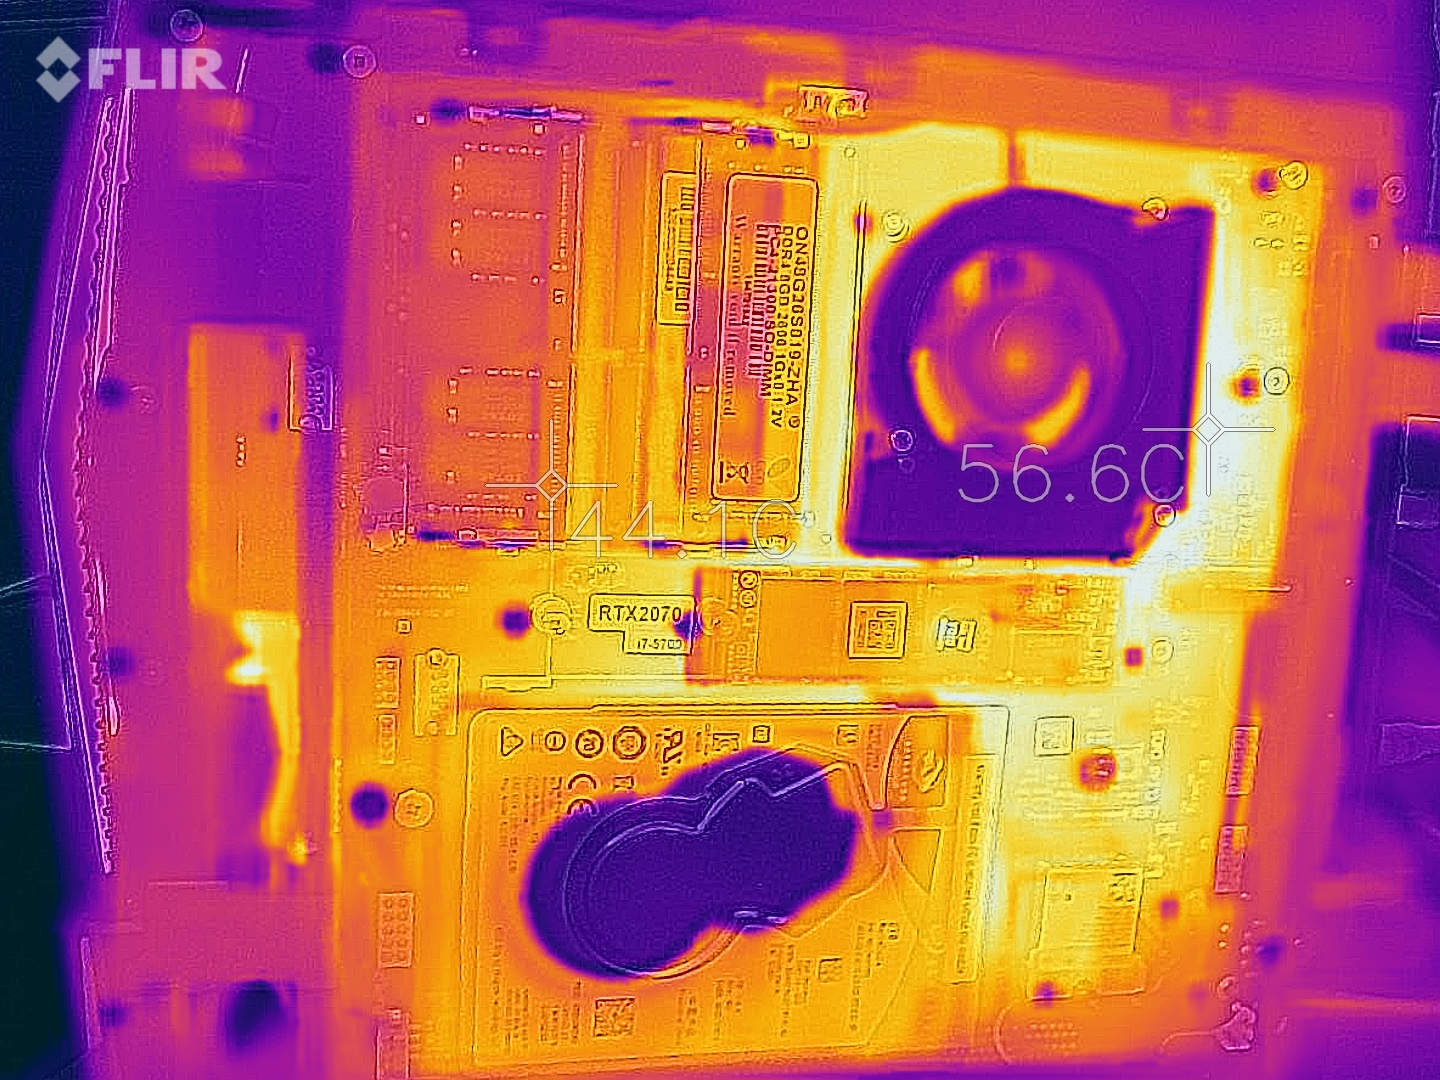
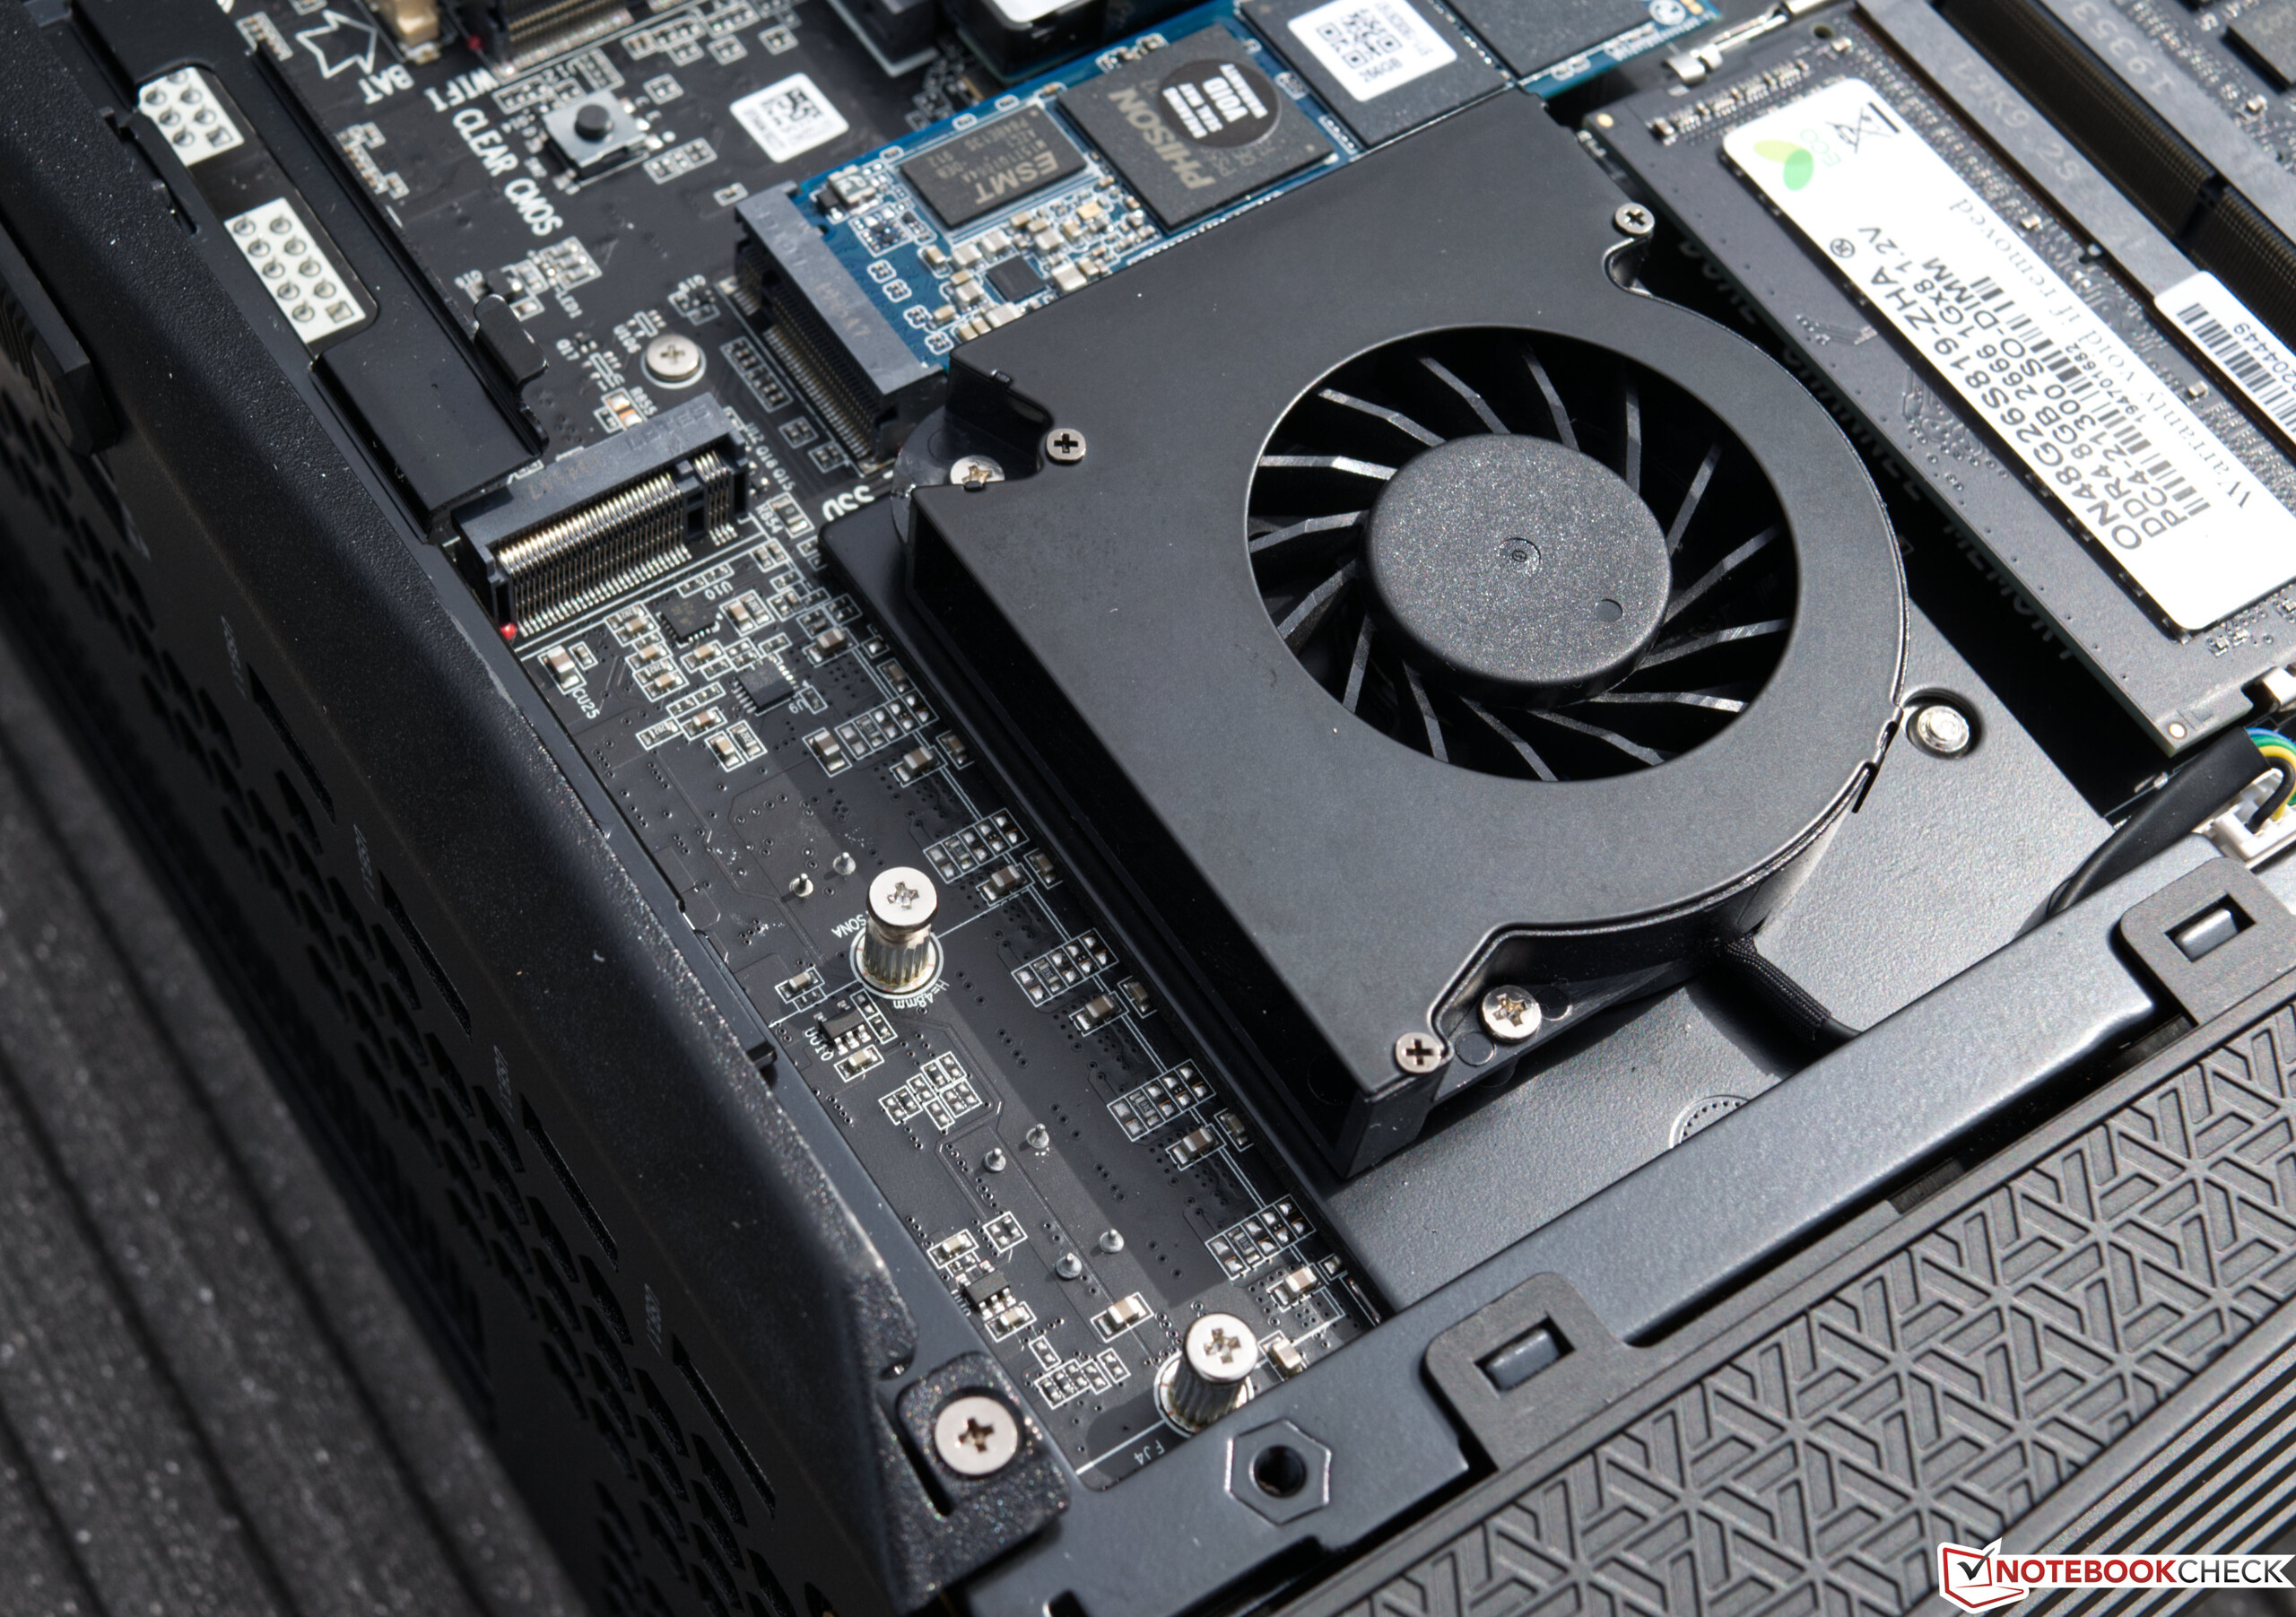
Come altri piccoli mini PC, anche Zotac sfrutta l'effetto camino quando si tratta di raffreddare. L'aria fredda viene aspirata in basso e ai lati e poi spinta di nuovo fuori attraverso la parte superiore e posteriore. Tuttavia, l'Intel Core i7-9700 raggiunge una temperatura di 89 °C (192 °F) durante lo stress test. Il sistema di raffreddamento raggiunge i suoi limiti in questo scenario estremo, che si riflette anche nel volume complessivo del sistema. Abbiamo notato 53,8 dB(A) nello stress test. Di conseguenza, il dispositivo è chiaramente udibile anche se le ventole vengono rapidamente rallentate dopo il completamento del test. Il volume misurato è stato di soli 49,77 dB(A) durante il gaming. Questi sono valori che altrimenti si vedono solo nei computer portatili gaming. A causa delle prestazioni in questo piccolo case, si deve purtroppo convivere con un aumento dell'emissione di rumore.

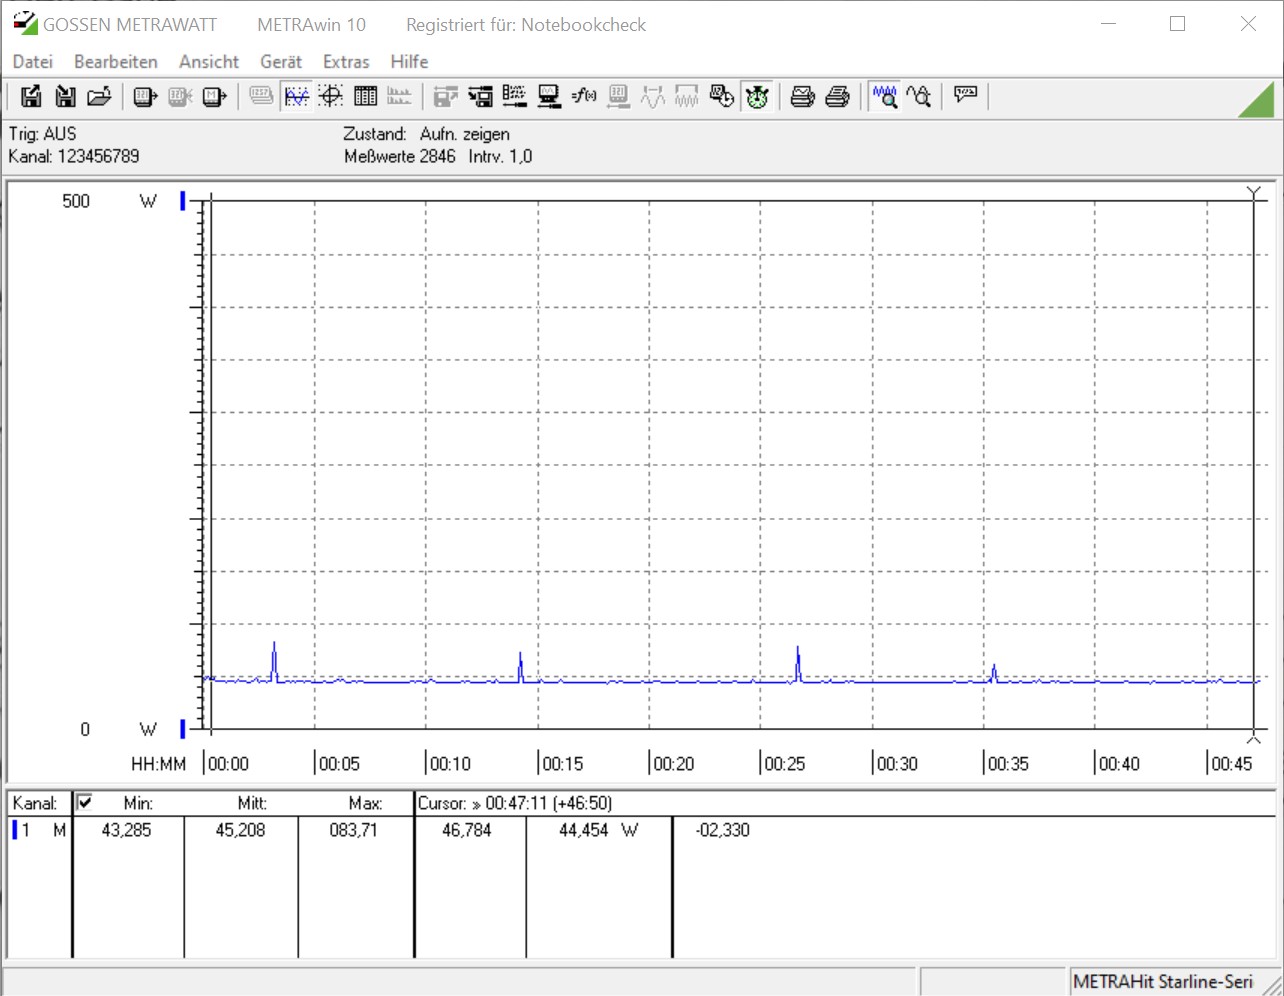
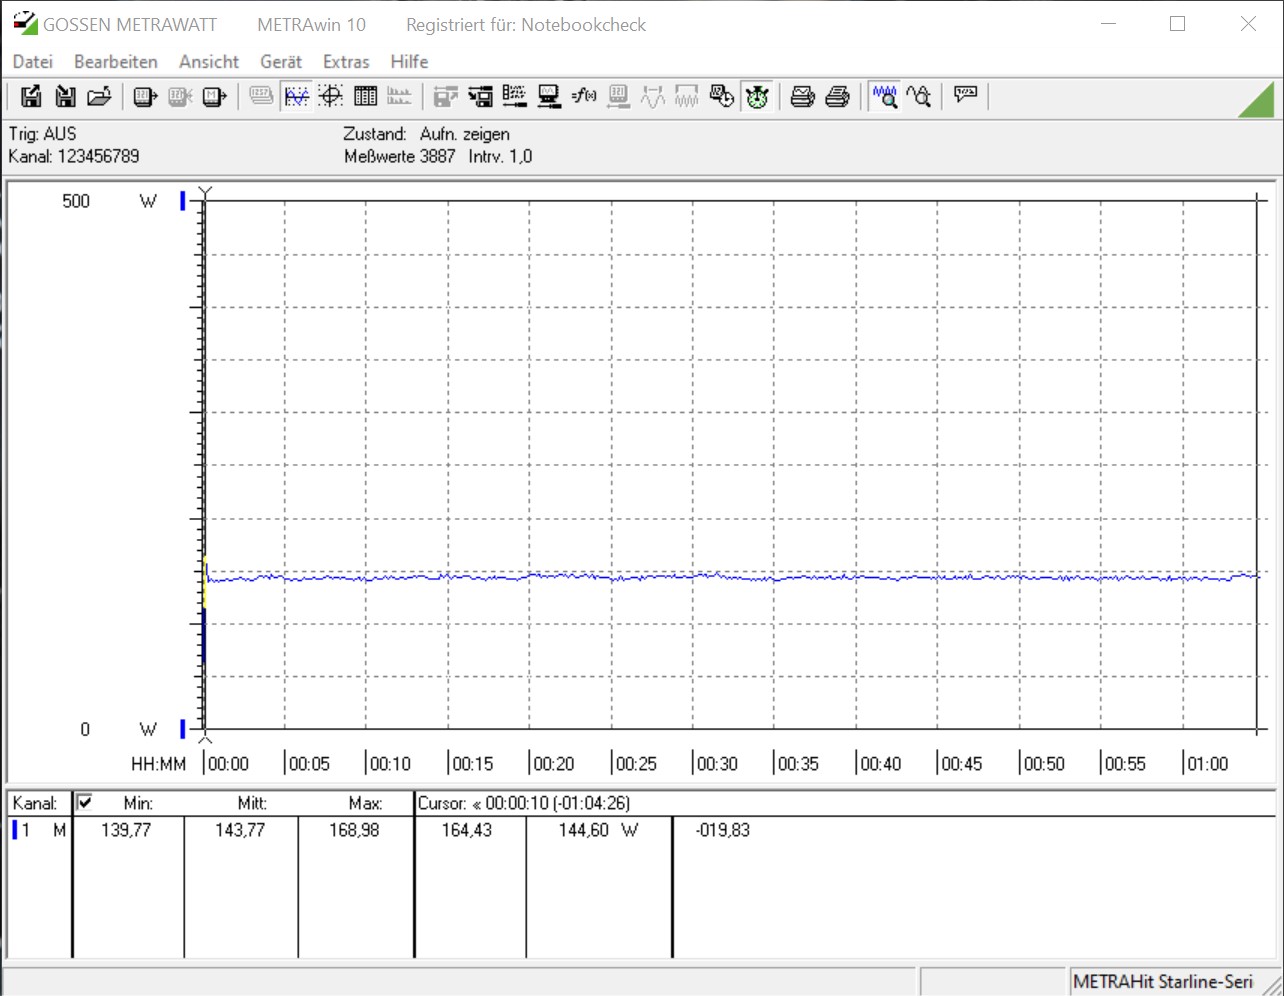
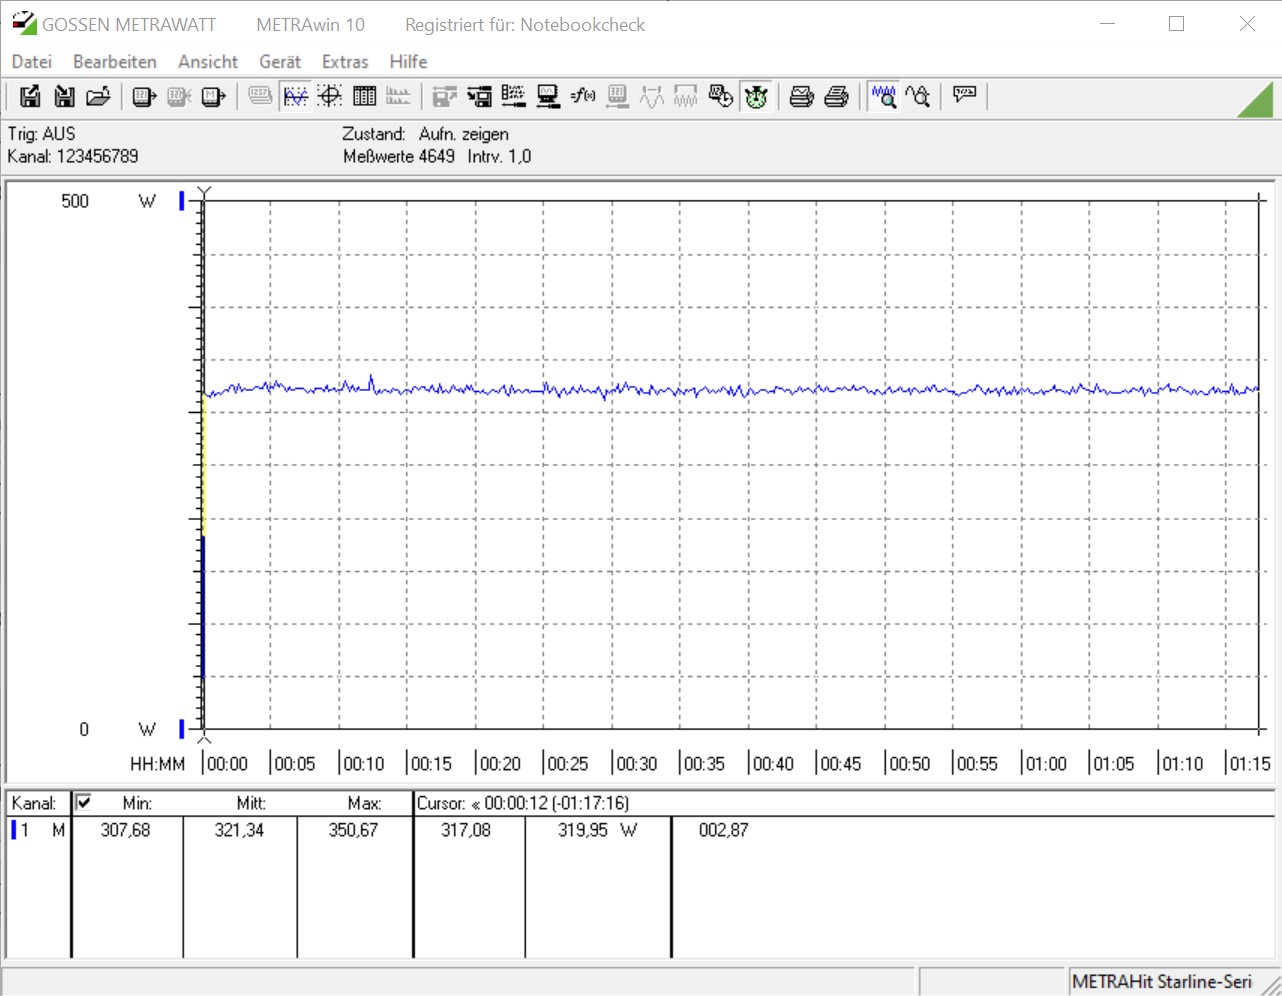
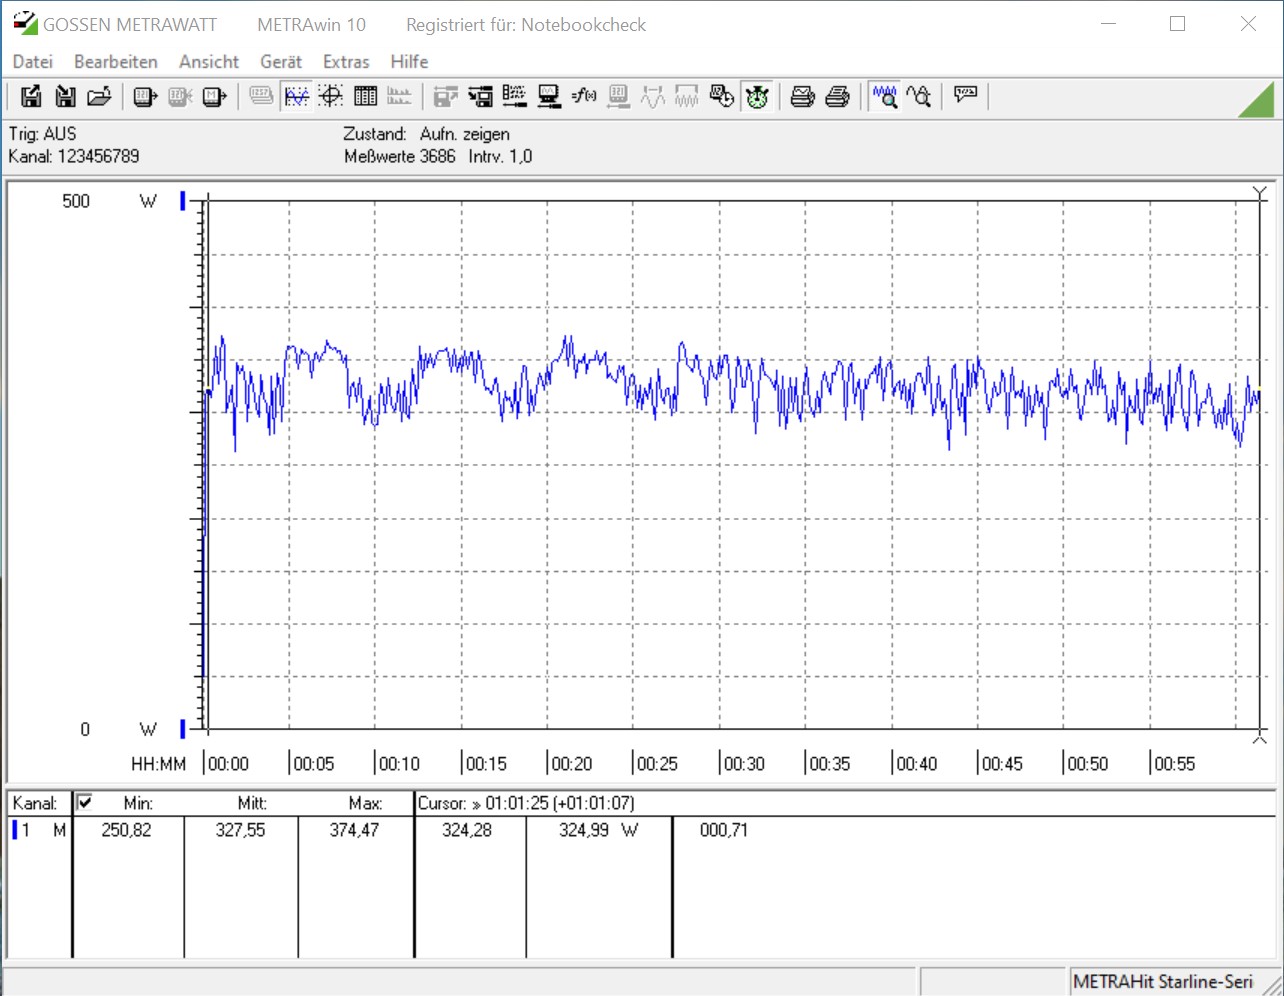
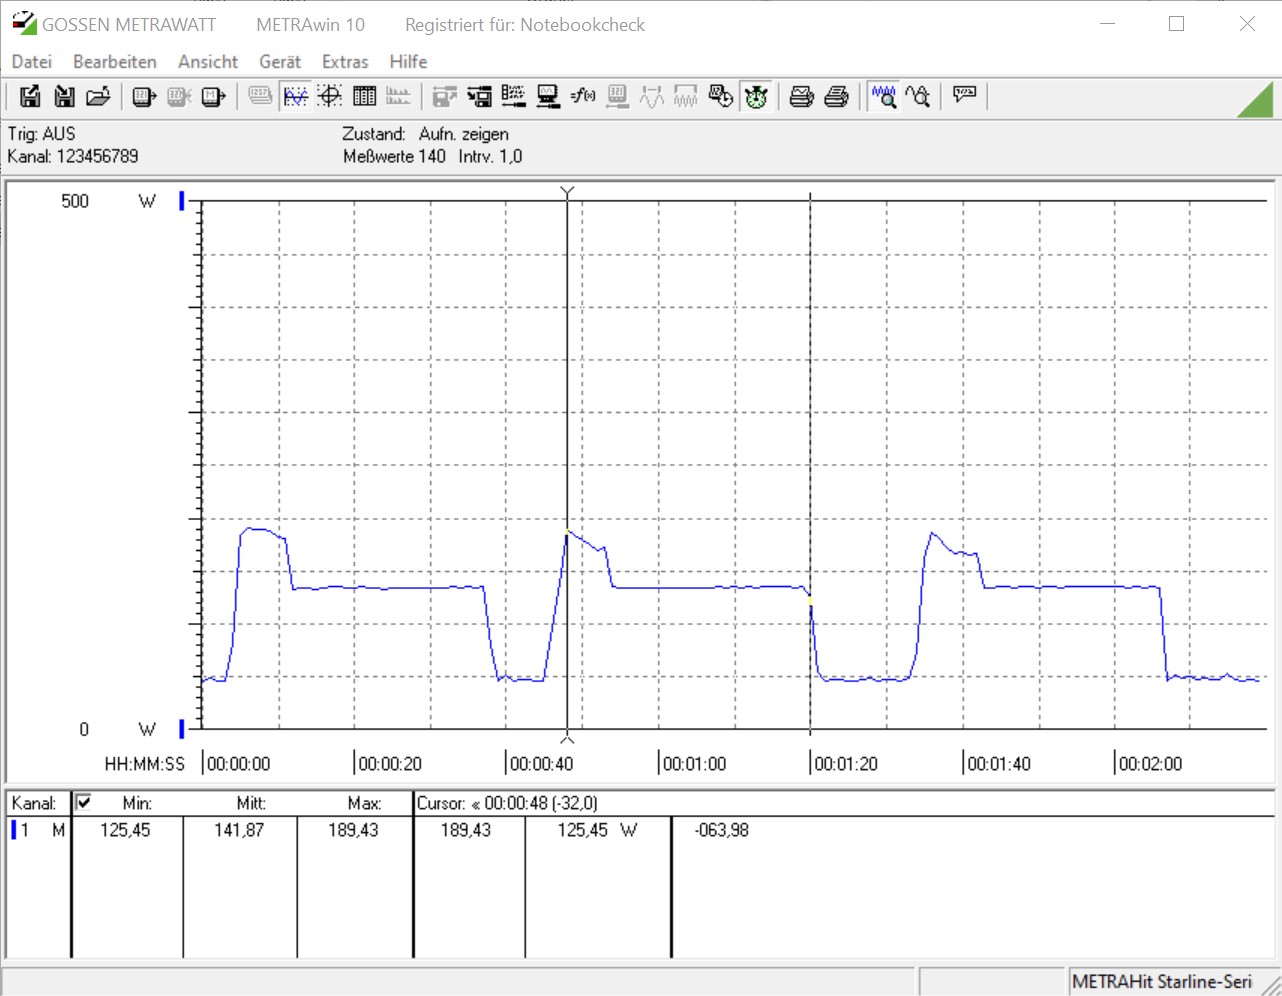
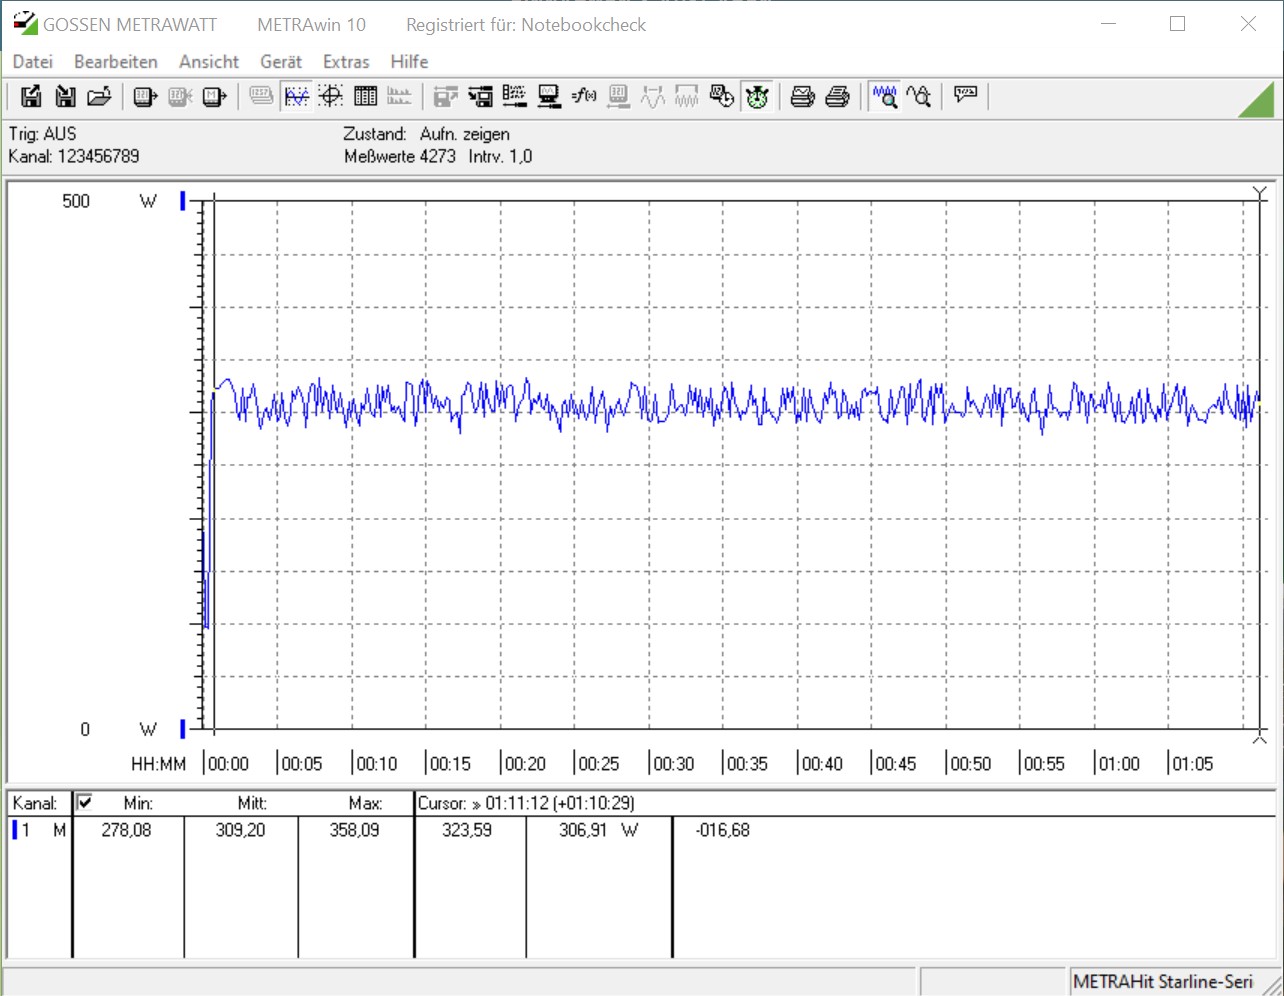
Per quanto riguarda il consumo di energia, nei nostri test il Zotac MEK MINI ha ottenuto punti con un consumo moderato. Il sistema ha bisogno di ben 45 watt per l'utilizzo a vuoto. Tuttavia, questo aumenta fino a 327 watt in media nel test di stress. Ai valori di picco, misuriamo anche 374 watt, che però non è un problema per i due alimentatori da 330 watt. Con 309 watt durante i giochi, il sistema è solo minimamente più efficiente dal punto di vista energetico rispetto allo stress test.

Se si guarda la tabella di confronto, va notato che qui sono state usate diverse CPU e GPU, che sono in parte specificate a un TDP significativamente più alto.

Power Consumption
1920x1080 The Witcher 3 ultra (external Monitor)
AMD Ryzen 9 3950X
NVIDIA Titan RTX, R9 3950X, Intel Optane 905P 480GB 2.5 (Idle: 95 W)
423.6 (400min - 442max) Watt * -37%
Intel Core i9-10900K
NVIDIA Titan RTX, i9-10900K, WDC PC SN720 SDAQNTW-512G (Idle: 52.3 W)
396.2 (380min - 475max) Watt * -28%
Intel Core i5-10600K
NVIDIA Titan RTX, i5-10600K (Idle: 52.2 W)
386.9 (380min - 404max) Watt * -25%
Intel Core i5 9400F
NVIDIA Titan RTX, i5-9400F (Idle: 57 W)
379.5 (292min - 402max) Watt * -23%
Nvidia GeForce RTX 2070 Super
GeForce RTX 2070 Super (Desktop), R9 3900X (Idle: 92.6 W)
376.7 (365min - 396max) Watt * -22%
KFA2 GeForce RTX 2070 Super Work The Frames
GeForce RTX 2070 Super (Desktop), R9 3900X (Idle: 94 W)
372 (360min - 388max) Watt * -20%
Intel Core i3 9100F
NVIDIA Titan RTX, i3-9100F (Idle: 56 W)
370.5 (209min - 390max) Watt * -20%
Intel Core i7-9700K, AMD Radeon RX Vega 64
RX Vega 64, i7-9700K
365.3 (316min - 388max) Watt * -18%
Intel Core i5-9600K, AMD Radeon RX Vega 64
RX Vega 64, i5-9600K
363.7 (403min) Watt * -18%
Corsair One i160
GeForce RTX 2080 Ti (Desktop), i9-9900K, Samsung PM961 NVMe MZVLW512HMJP (Idle: 51.5 W)
359 (348min - 374max) Watt * -16%
Nvidia GeForce RTX 2070 Super
GeForce RTX 2070 Super (Desktop), R7 2700X (96.8 fps, Idle: 80.5 W)
344.7 (335min - 370max) Watt * -11%
Zotac MEK Mini (RTX 2070 Super)
GeForce RTX 2070 Super (Desktop), i7-9700 (Idle: 45.2 W)
309.2 (278min - 358max) Watt *
Prime95 V2810 Stress (external Monitor)
Intel Core i9-10900K
NVIDIA Titan RTX, i9-10900K, WDC PC SN720 SDAQNTW-512G (Idle: 52.3 W)
275.7 (254min - 385max) Watt * -92%
Intel Core i7-9700K, AMD Radeon RX Vega 64
RX Vega 64, i7-9700K
222.4 (193min - 249max) Watt * -55%
Intel Core i5-10600K
NVIDIA Titan RTX, i5-10600K (Idle: 52.2 W)
204.4 (191min - 261max) Watt * -42%
AMD Ryzen 9 3950X
NVIDIA Titan RTX, R9 3950X, Intel Optane 905P 480GB 2.5 (Idle: 95 W)
198.8 (185min - 240max) Watt * -38%
Intel Core i5-9600K, AMD Radeon RX Vega 64
RX Vega 64, i5-9600K
145.9 (143min - 155max) Watt * -1%
Zotac MEK Mini (RTX 2070 Super)
GeForce RTX 2070 Super (Desktop), i7-9700 (Idle: 45.2 W)
143.8 (140min - 169max) Watt *
Intel Core i3 9100F
NVIDIA Titan RTX, i3-9100F (Idle: 56 W)
139 (119min - 148max) Watt * +3%
Intel Core i5 9400F
NVIDIA Titan RTX, i5-9400F (Idle: 57 W)
131.6 (122min - 187max) Watt * +8%
Cinebench R15 Multi (external Monitor)
Intel Core i9-10900K
NVIDIA Titan RTX, i9-10900K, WDC PC SN720 SDAQNTW-512G (Idle: 52.3 W)
268.5 (265min - 270max) Watt * -89%
AMD Ryzen 9 3950X
NVIDIA Titan RTX, R9 3950X, Intel Optane 905P 480GB 2.5 (Idle: 95 W)
219.5 (218min - 225max) Watt * -55%
Intel Core i7-9700K, AMD Radeon RX Vega 64
RX Vega 64, i7-9700K
202.6 (190min - 207max) Watt * -43%
Intel Core i5-10600K
NVIDIA Titan RTX, i5-10600K (Idle: 52.2 W)
172.5 (170min - 176max) Watt * -22%
Zotac MEK Mini (RTX 2070 Super)
GeForce RTX 2070 Super (Desktop), i7-9700 (Idle: 45.2 W)
141.9 (125min - 189max) Watt *
Intel Core i5-9600K, AMD Radeon RX Vega 64
RX Vega 64, i5-9600K
134 (132min - 135max) Watt * +6%
Intel Core i5 9400F
NVIDIA Titan RTX, i5-9400F (Idle: 57 W)
122.5 (121min - 125max) Watt * +14%
Intel Core i3 9100F
NVIDIA Titan RTX, i3-9100F (Idle: 56 W)
101.5 (100min - 104max) Watt * +28%
Temperatures - CPU Temperature Prime95
Intel Core i9-10900K
NVIDIA Titan RTX, i9-10900K, WDC PC SN720 SDAQNTW-512G
88 °C +7%
AMD Ryzen 9 3950X
NVIDIA Titan RTX, R9 3950X, Intel Optane 905P 480GB 2.5
83.8 °C +2%
Zotac MEK Mini (RTX 2070 Super)
GeForce RTX 2070 Super (Desktop), i7-9700
82 °C
Intel Core i3 9100F
NVIDIA Titan RTX, i3-9100F
75 °C -9%
Intel Core i5-10600K
NVIDIA Titan RTX, i5-10600K
70 °C -15%
Intel Core i5 9400F
NVIDIA Titan RTX, i5-9400F
61 °C -26%

* ... Meglio usare valori piccoli

Consumo energetico - Idle
Consumo energetico - Prime95
Consumo energetico - FurMark
Consumo energetico - Prime95 and FurMark
Consumo energetico - Cinebench R15 Multi test
Consumo energetico - The Witcher 3
Stress test - solo Prime95
Stress test - solo FurMark
Stress test - Prime95 e FurMark


Pro

+ case compatto
+ design moderno con illuminazione RGB
+ abbastanza veloce per il gioco 1440p
+ molti porte
+ 16 GB di RAM
+ spazio per tre dispositivi di memorizzazione

Contro

- due alimentatori esterni
- chiaramente udibile sotto carico
- costruzione complicata - la scheda grafica non può essere rimossa rapidamente

Giudizio Complessivo - Prestazioni elevate

Recensione dello Zotac MEK MINI. Dispositivo fornito da Zotac Germany.

Con il MEK MINI di Zotac, gli acquirenti ottengono un pacchetto completamente pronto per l'uso. A differenza di vari PC barebone, che devono essere dotati di RAM, memoria e scheda grafica, il modello Zotac si presenta sotto forma di MEK MINI. Come già detto, il sistema è disponibile in due configurazioni di base. In linea di massima, si può dire che il modello meno costoso è piuttosto rivolto ai gamers che giocano principalmente a 1080p, mentre il modello di punta offre prestazioni sufficienti per il gioco a 1440p.

Il MEK MINI è stato in grado di segnare punti nel nostro test con un prestazioni di gioco e di lavoro solide, e la mancanza di volume nel caso non influisce negativamente sulla piccola centrale elettrica in termini di prestazioni. Al contrario, il volume del sistema, chiaramente udibile sotto carico, ne favorisce le prestazioni. Normalmente raggiungiamo questi valori solo nelle nostre misurazioni con i portatili da gioco. 

Il MEK MINI è esteticamente ben fatto e offre ottime prestazioni di gioco nonostante le sue dimensioni compatte.

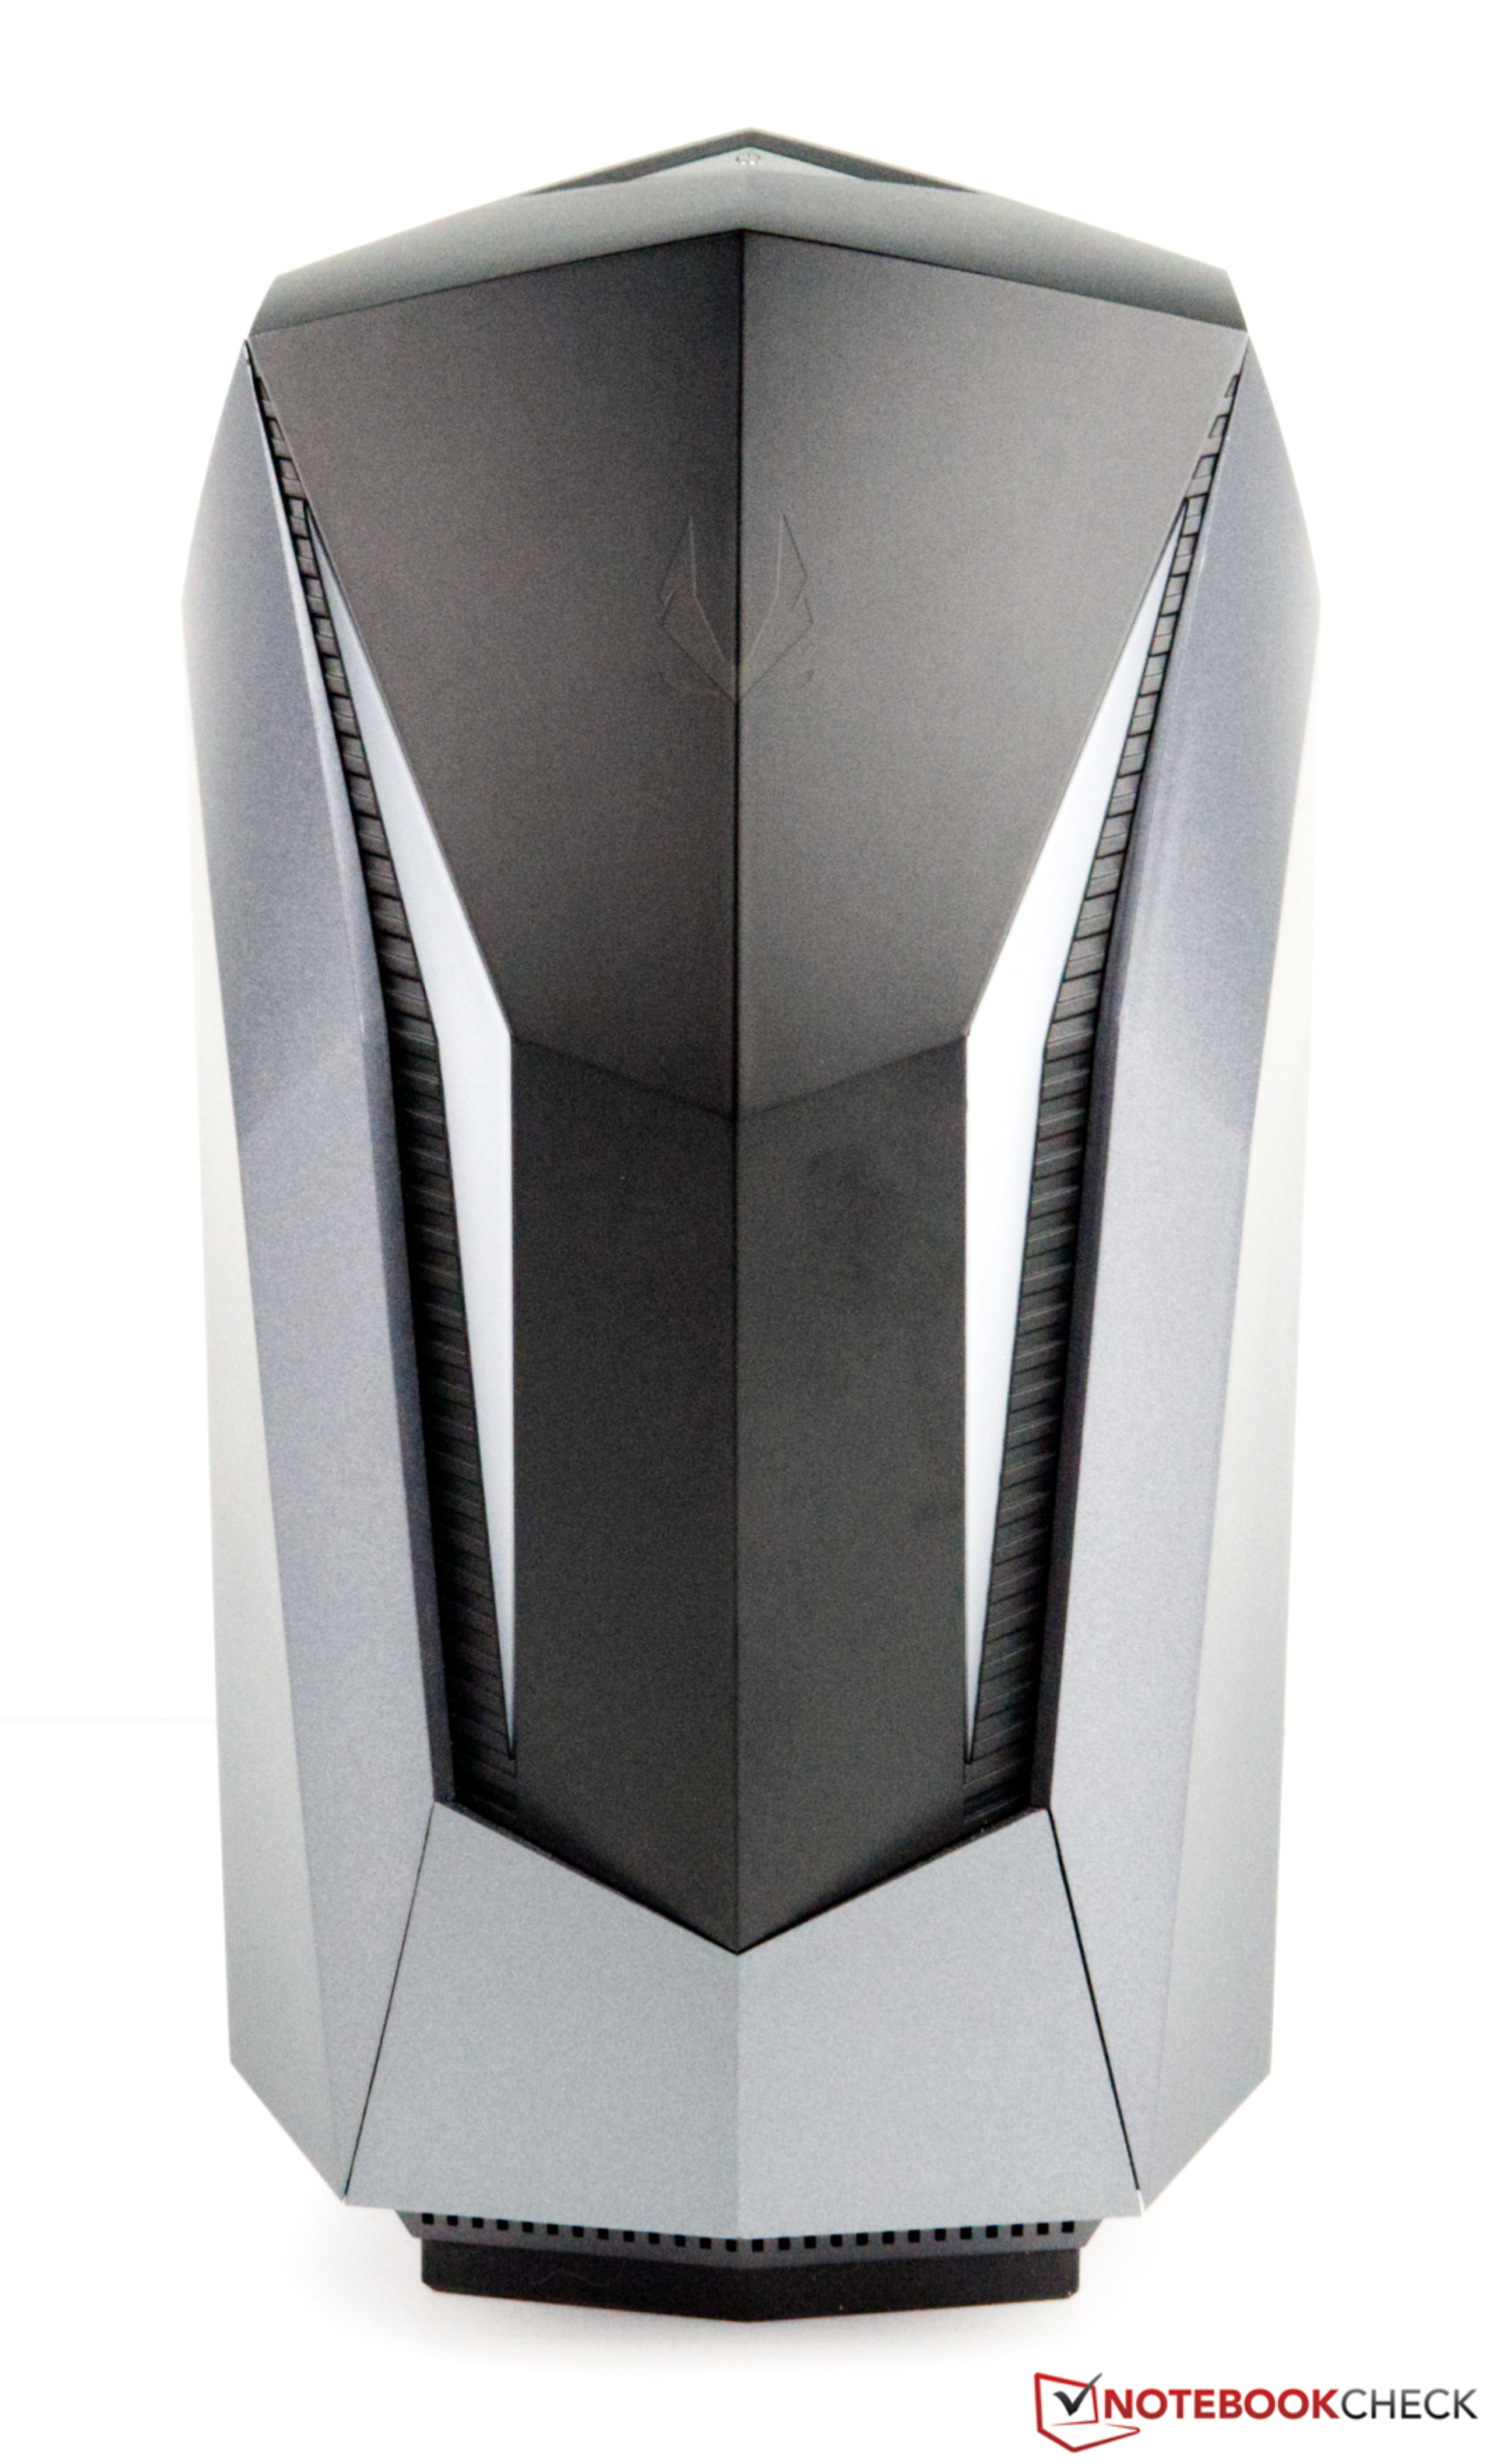
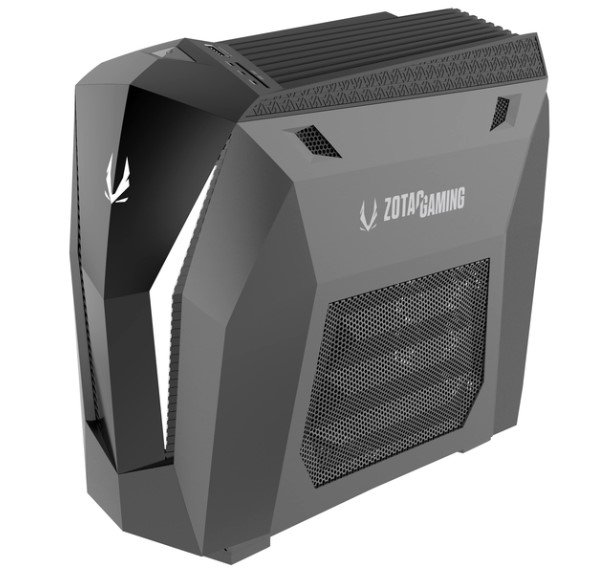
Naturalmente, anche l'aspetto non dovrebbe essere trascurato, perché questo piccolo PC attira rapidamente l'attenzione con la sua discreta illuminazione RGB sul davanti. Il case da 9,18 litri, che è principalmente in plastica, ha un design esteticamente accattivante; tuttavia, la manutenibilità del PC ne risente un po' perché quasi tutto il dispositivo deve essere smontato per arrivare alla scheda grafica. Sarebbe stato molto più facile se entrambi i lati potessero essere facilmente rimossi. Questo funziona abbastanza bene sul lato destro per accedere alla RAM e alla memoria.

In sintesi, tuttavia, si può dire che Zotac è rimasto coerente con MEK MINI ed è riuscito nuovamente ad offrire, accanto ai modelli ZBOX, un PC pre-costruito adatto al gioco che utilizza componenti desktop completi per la CPU e la GPU. Inoltre, il produttore fornisce due utili programmi, Spectra e Firestorm, per regolare le ventole della scheda grafica o controllare il sistema di illuminazione sul fronte. Il prezzo del modello di punta è ancora entro un range ragionevole a poco meno di 1.500 Euro (~$1.683), anche se si deve accettare un piccolo premio di prezzo rispetto a una costruzione personalizzata.

Pricecompare

Please share our article, every link counts!
> Recensioni e prove di notebook, tablets e smartphones > Recensioni e prove > Recensioni e prove > Recensione del PC desktop Zotac MEK MINI con Core i7 e GeForce RTX 2070 Super
Sebastian Bade, 2020-06-30 (Update: 2020-06-30)