Recensione delle AMD Ryzen 3 3100 e Ryzen 3 3300X con 4 cores e 8 threads
Il semplice giocatore non ha necessariamente bisogno di una CPU con 12 o 16 cores, che viene offerta come modello di punta per la piattaforma AM4. Sono invece sufficienti quattro cores con un'elevata frequenza di clock. Questo è stato l'argomento che ha contato fino ad oggi. Intel è sempre stata un passo avanti rispetto ad AMD in questo senso grazie all'IPC molto migliore, ma la situazione è cambiata un po' con l'introduzione dell'architettura Zen2. AMD è stata in grado di recuperare notevolmente il ritardo e anche le CPU entry-level beneficiano ora di questi vantaggi.
A differenza di Intel, queste CPU offrono anche SMT, il che significa che un totale di 8 threads possono essere elaborati contemporaneamente, perché sia il Ryzen 3 3100 che il Ryzen 3 3300X sono nativamente processori quad-core. Resta da vedere come si comporteranno le nuove CPU AMD rispetto ai già annunciati processori Comet Lake, perché anche Intel ha imparato una lezione e sta usando Hyper-Threading su quasi tutti i nuovi processori.
AMD ha messo Intel sotto pressione ultimamente, il che ha avuto un impatto anche sui prezzi. AMD continua su questa strada, e il Ryzen 3 3100X costa poco meno di 110 Euro (~$119) al lancio, anche se il Ryzen 3 3300X costa solo circa 20 Euro (~$22) in più a poco meno di 130 Euro (~$141). Questa è una chiara dichiarazione di guerra contro Intel, dato che l'Intel Core i5-9400F costa circa 160 Euro (~$173) al momento della revisione.
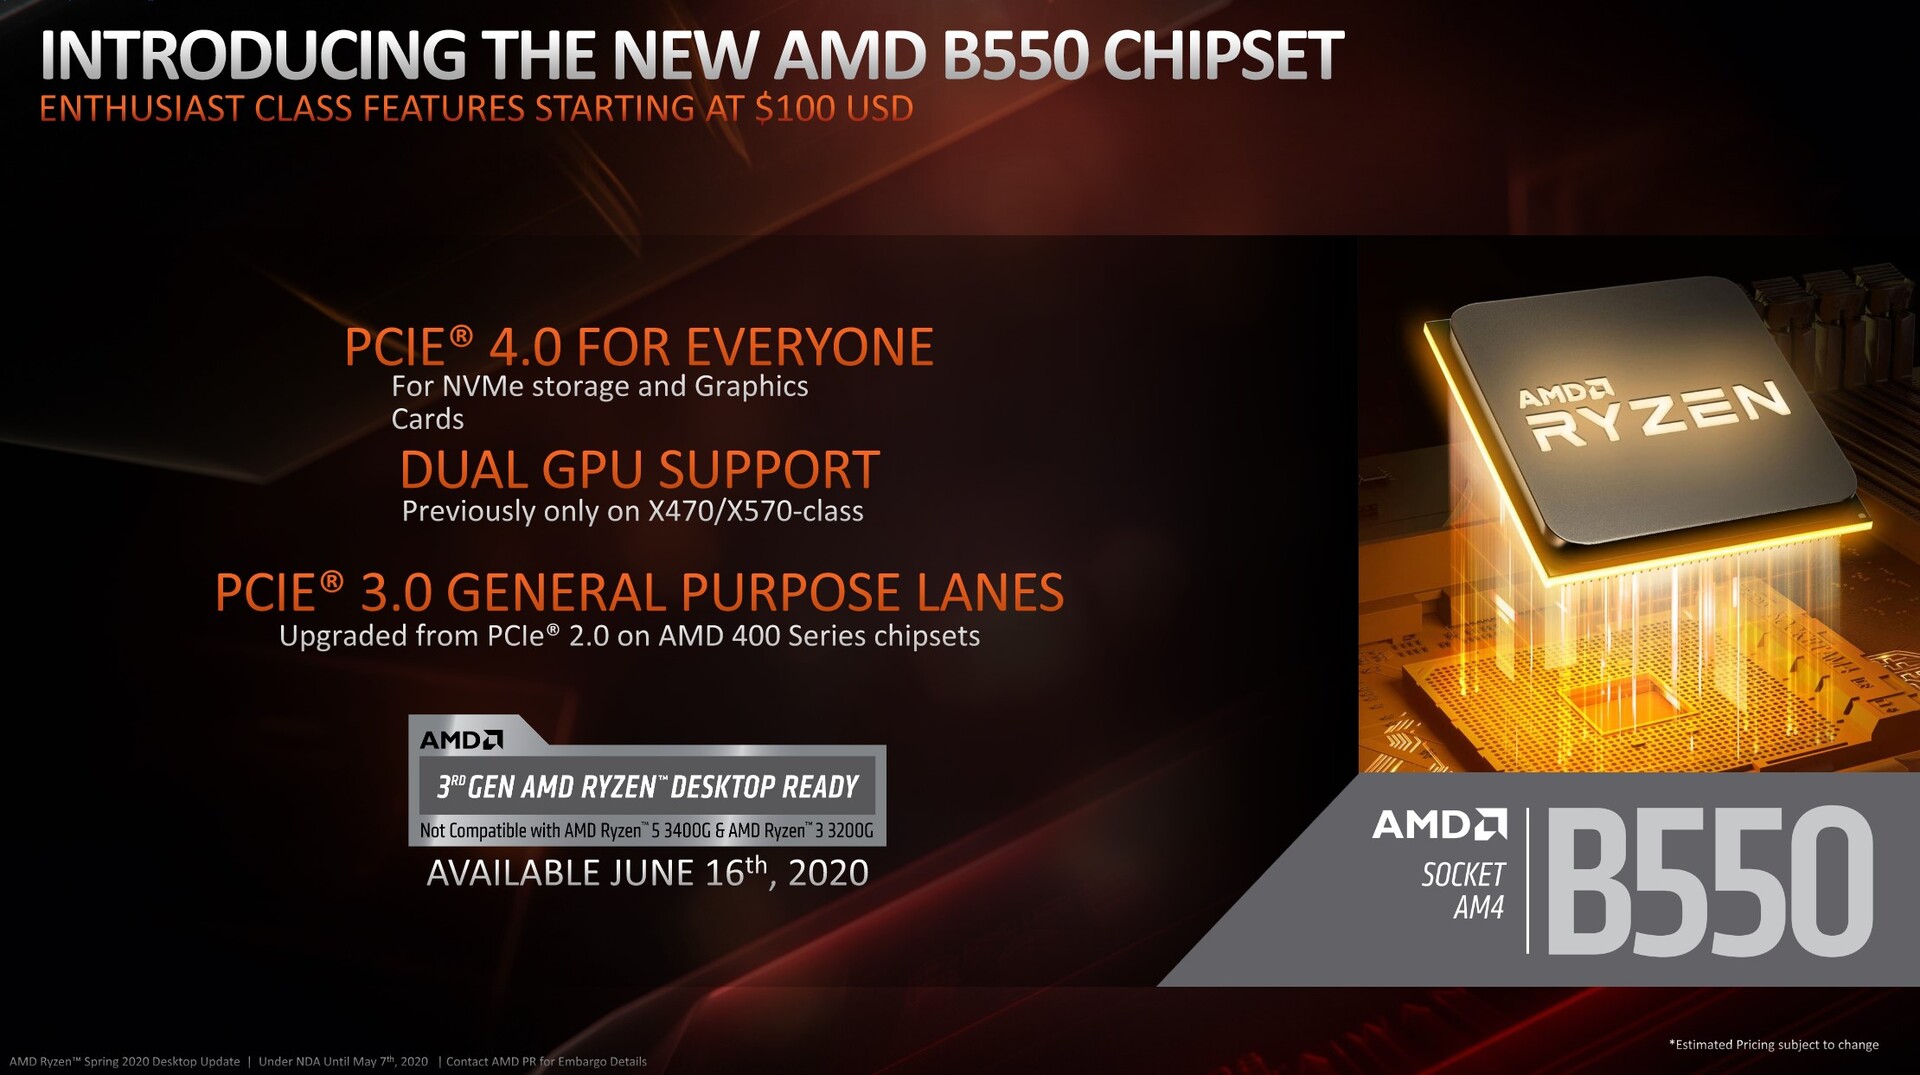
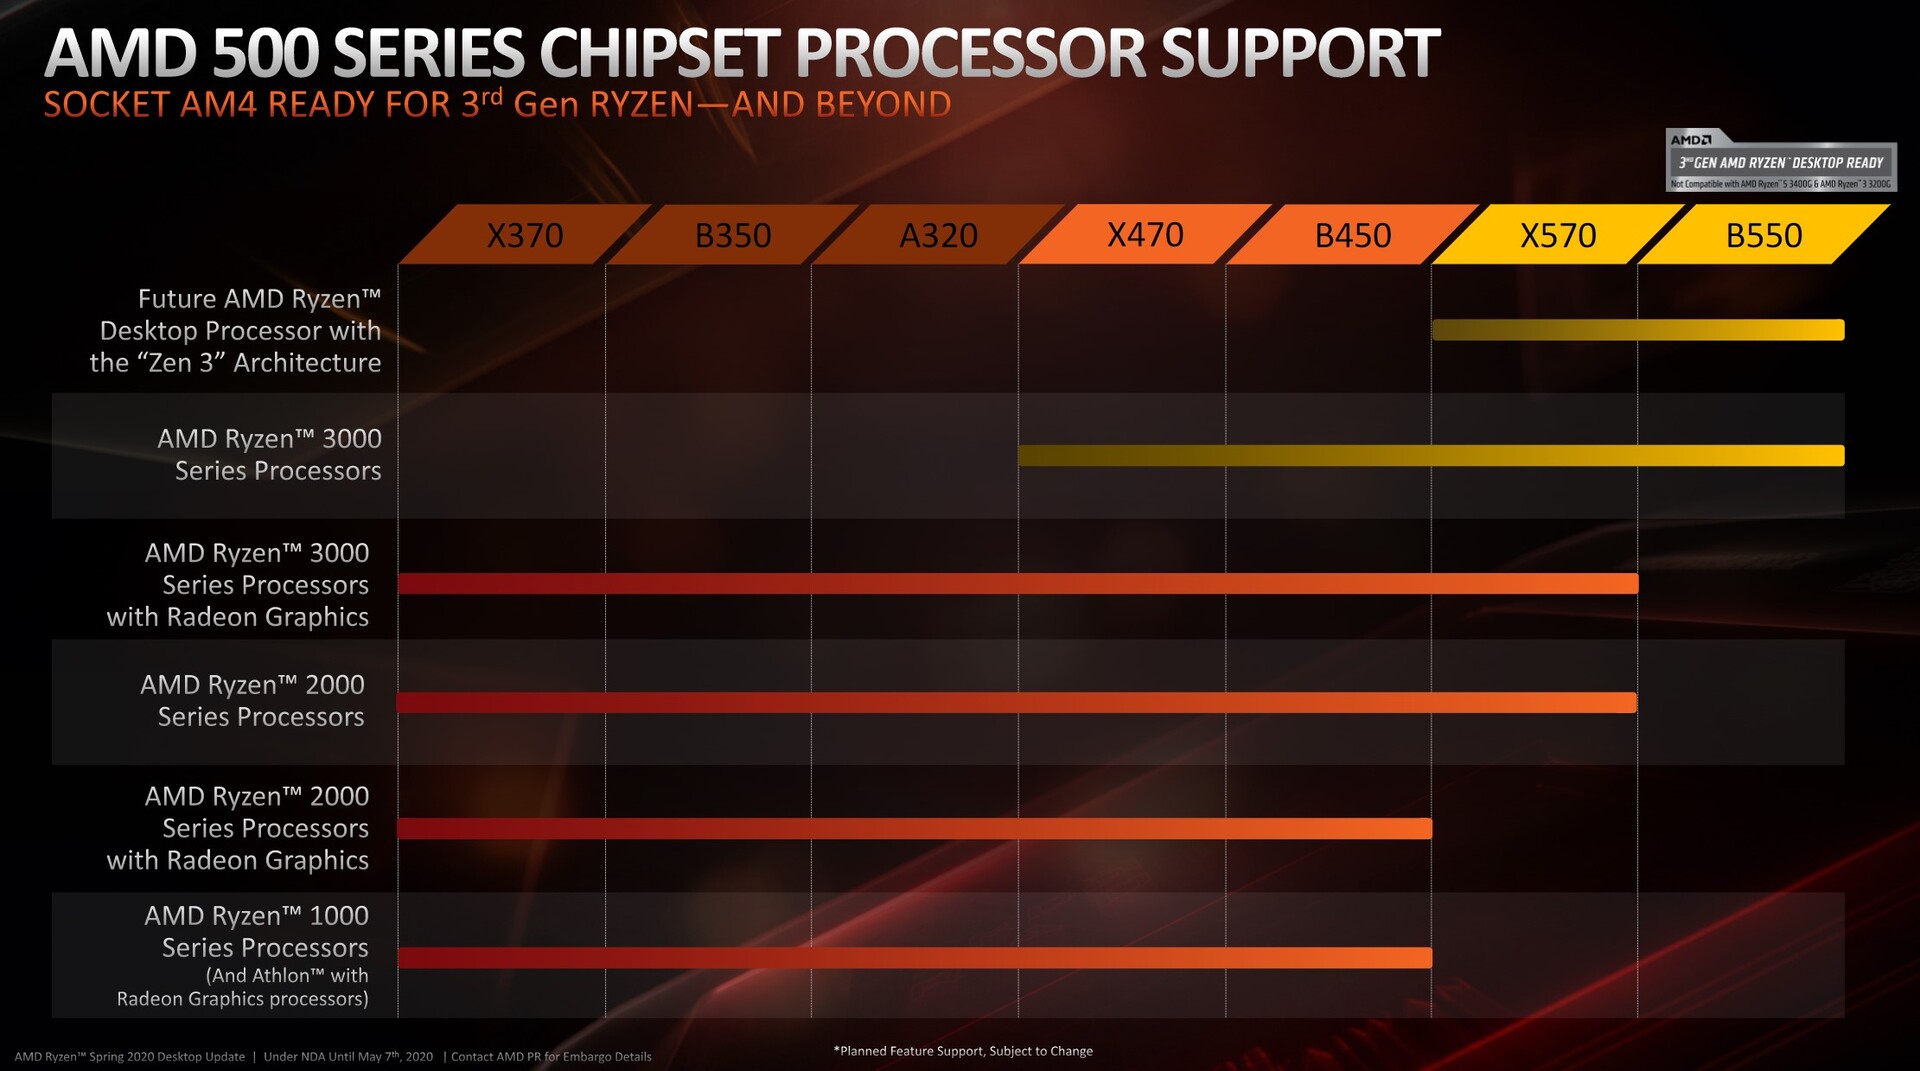
Se si vuole utilizzare la nuova serie Ryzen 3 3000, non è necessario installare una costosa scheda X570. Con il rilascio dei due nuovi modelli Ryzen, AMD ha introdotto anche il chipset B550, che permette di avere schede madri molto più economiche. Ma se si possiede ancora una scheda madre con il chipset X470 o B450, si è fortunati perché questi sono compatibili anche dopo un aggiornamento del BIOS. I futuri processori Zen3 saranno supportati solo dai chipset più recenti in quel momento.
Panoramica processori AMD Ryzen
| Modello | Cores/ Threads |
Velocità clock base | Velocità clock Turbo | L3 cache | TDP | Prezzo lancio |
|---|---|---|---|---|---|---|
| Ryzen R9 3900X | 12/24 | 3.8 GHz | 4.6 GHz | 64 MB | 105 Watt | 529 Euro |
| Ryzen R7 3800X | 8/16 | 3.9 GHz | 4.5 GHz | 32 MB | 105 Watt | 429 Euro |
| Ryzen R7 3700X | 8/16 | 3.6 GHz | 4.4 GHz | 32 MB | 65 Watt | 349 Euro |
| Ryzen R5 3600X | 6/12 | 3.8 GHz | 4.4 GHz | 32 MB | 95 Watt | 265 Euro |
| Ryzen R5 3600 | 6/12 | 3.6 GHz | 4.2 GHz | 32 MB | 65 Watt | 209 Euro |
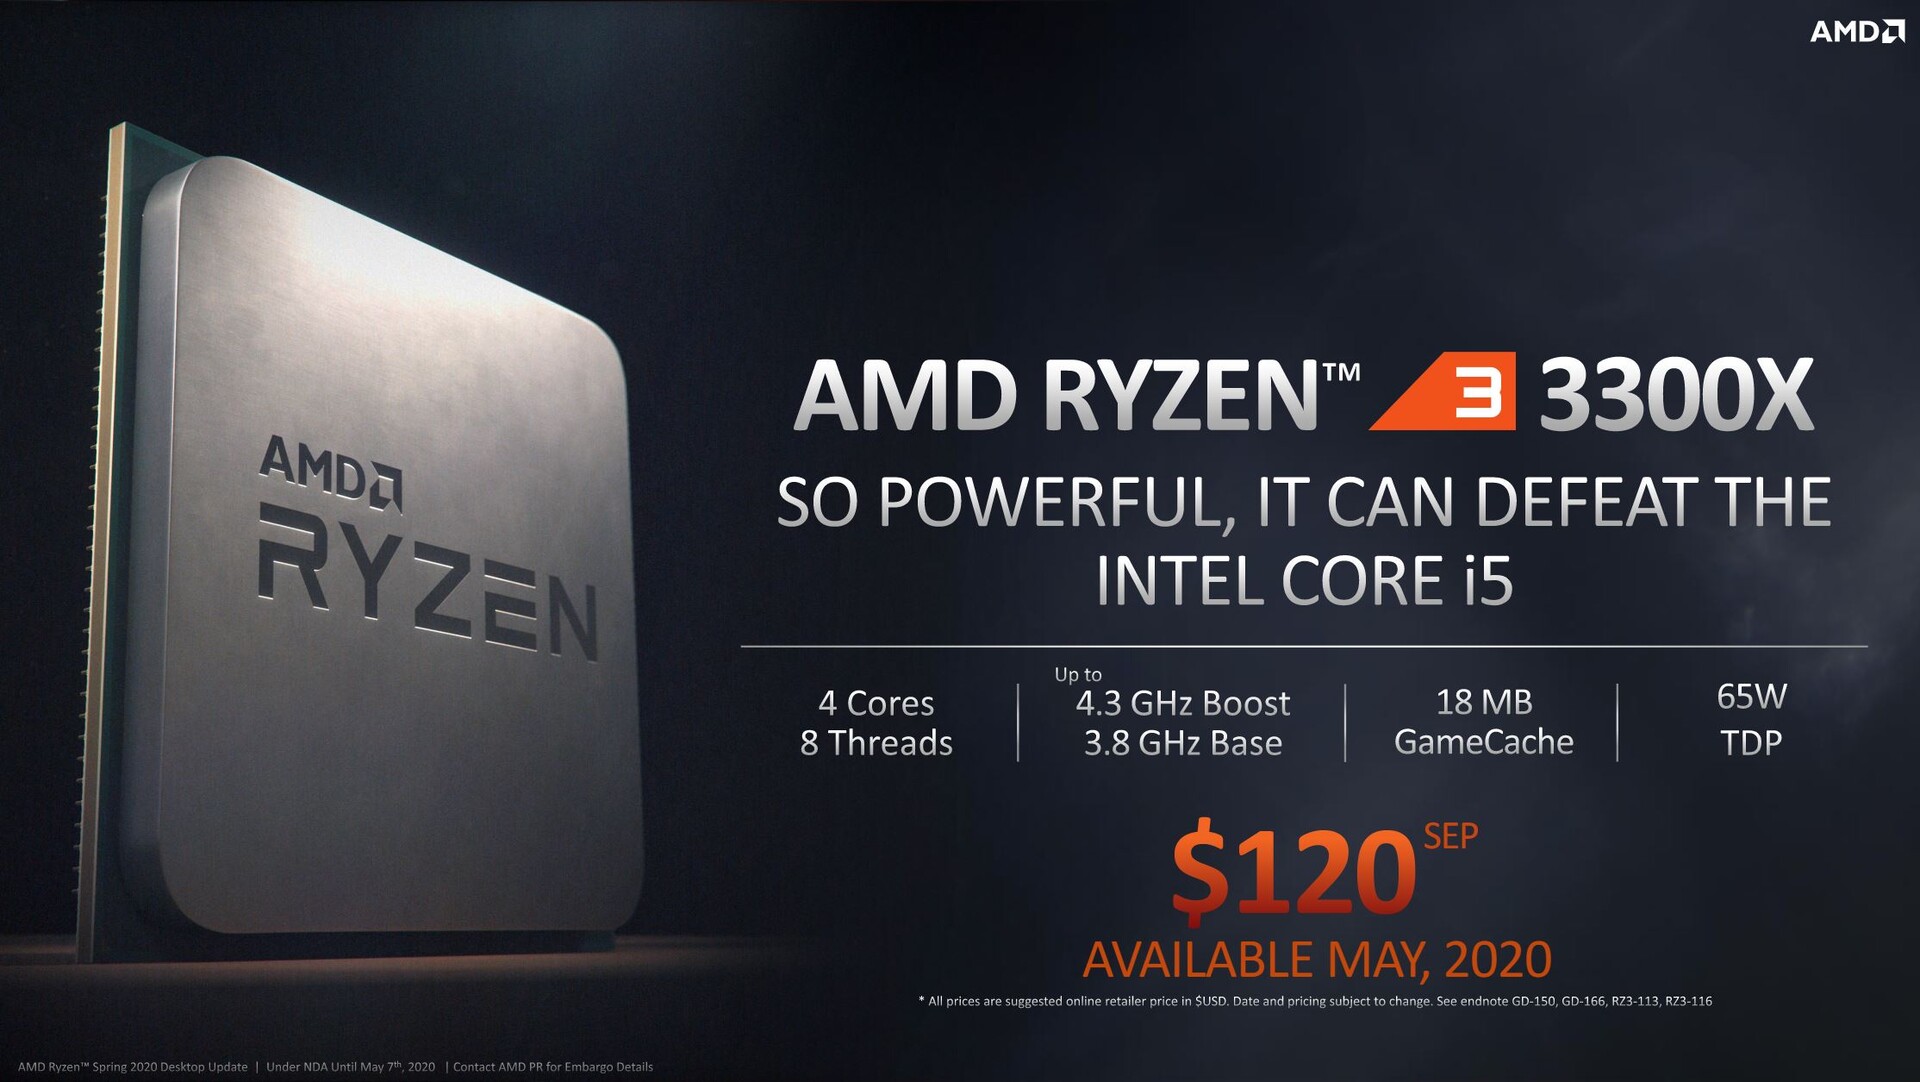
| Ryzen R3 3300X | 4/8 | 3.8 GHz | 4.3 GHz | 16 MB | 65 Watt | 129 Euro |
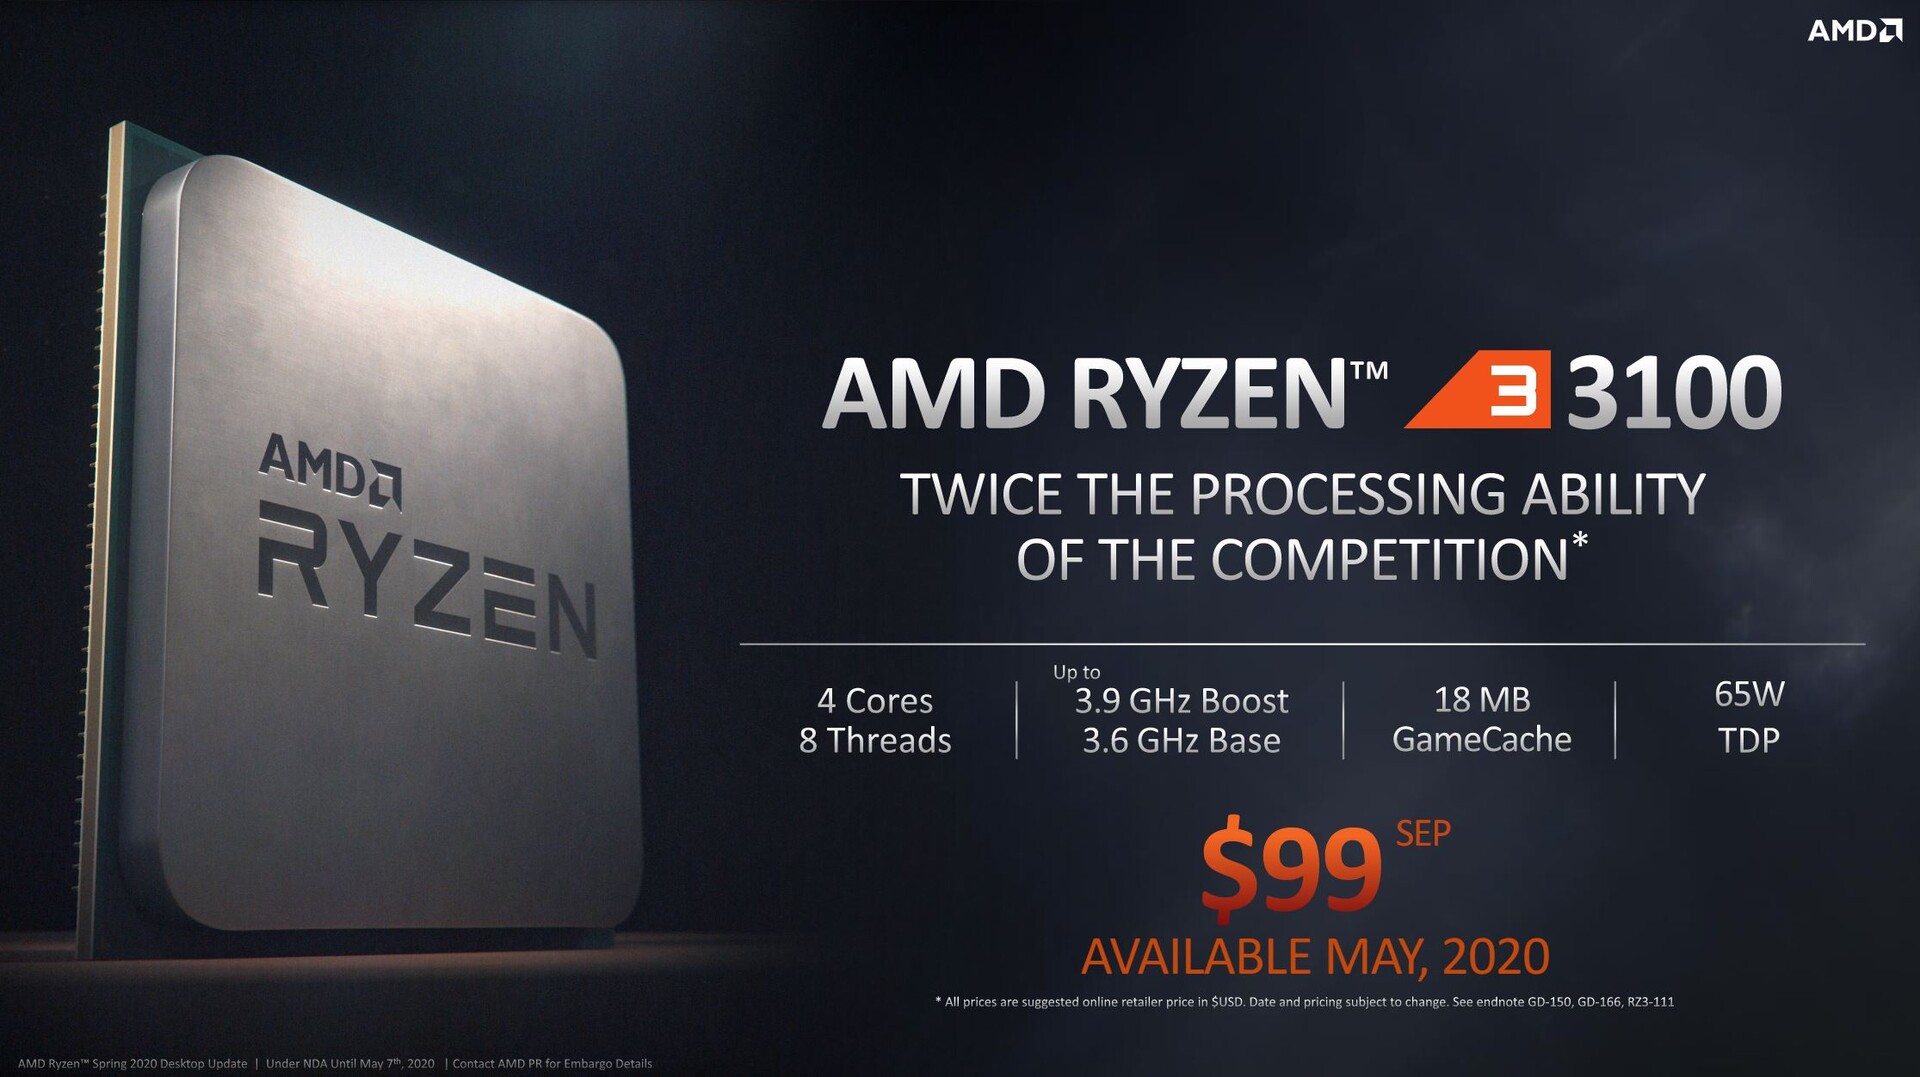
| Ryzen R3 3100 | 4/8 | 3.6 GHz | 3.9 GHz | 16 MB | 65 Watt | 109 Euro |
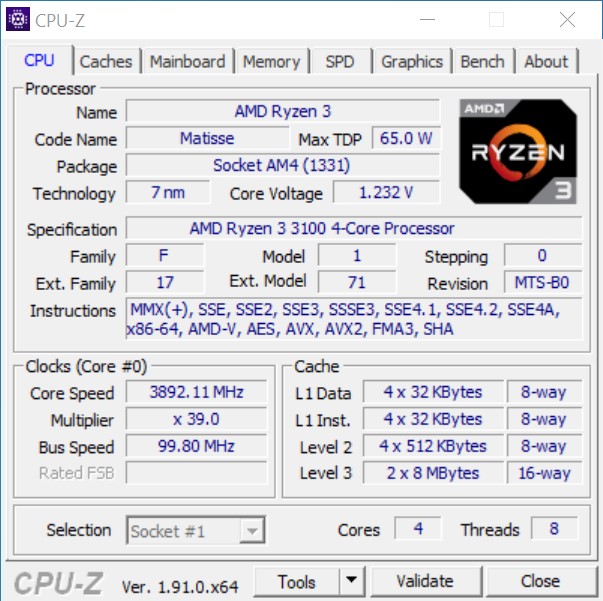
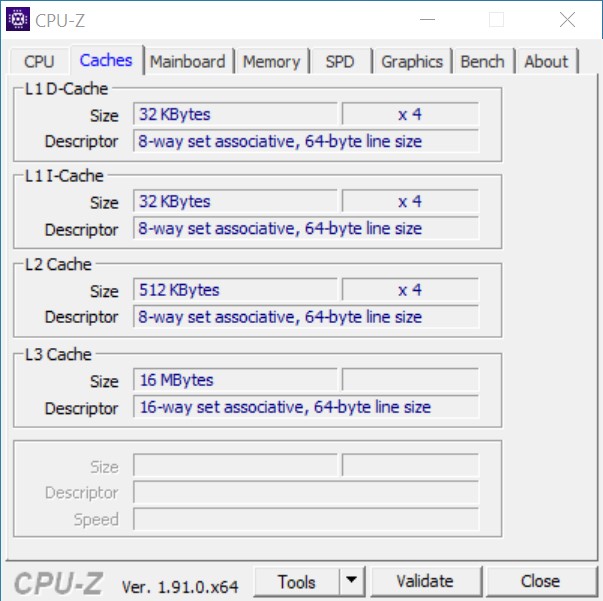
AMD Ryzen 3 3100 ed AMD Ryzen 3 3300X in dettaglio
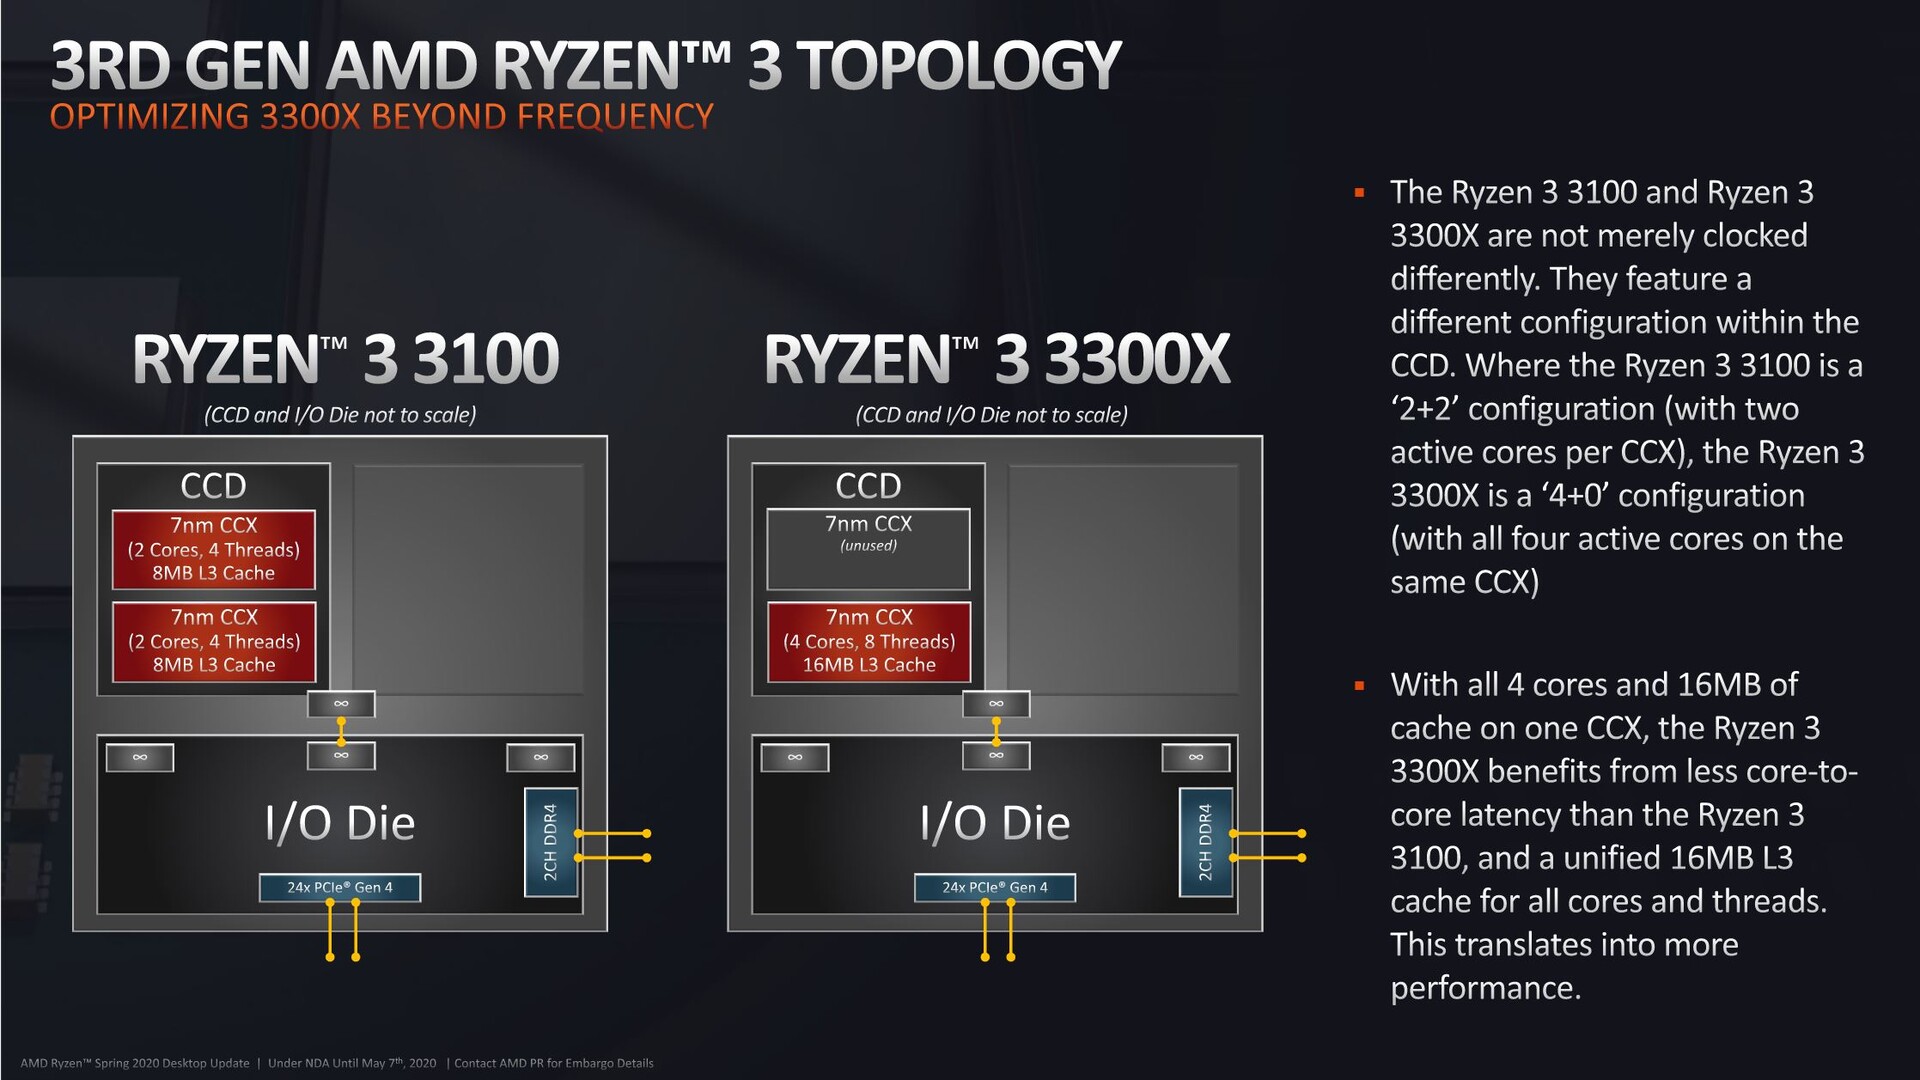
Come già detto, entrambi i modelli Ryzen 3 utilizzano quattro cores Zen2, compreso SMT (simultaneous multithreading). Tuttavia, ci sono chiare differenze nella progettazione e nell'uso dei cores nativi. Il grafico fornito da AMD mostra che il Ryzen 3 3100 ha due cluster CCX attivi con due cores attivi ciascuno. Un cluster CCX ha un massimo di quattro cores, come nel caso del Ryzen 3 3300X, che ha un solo cluster CCX attivo.
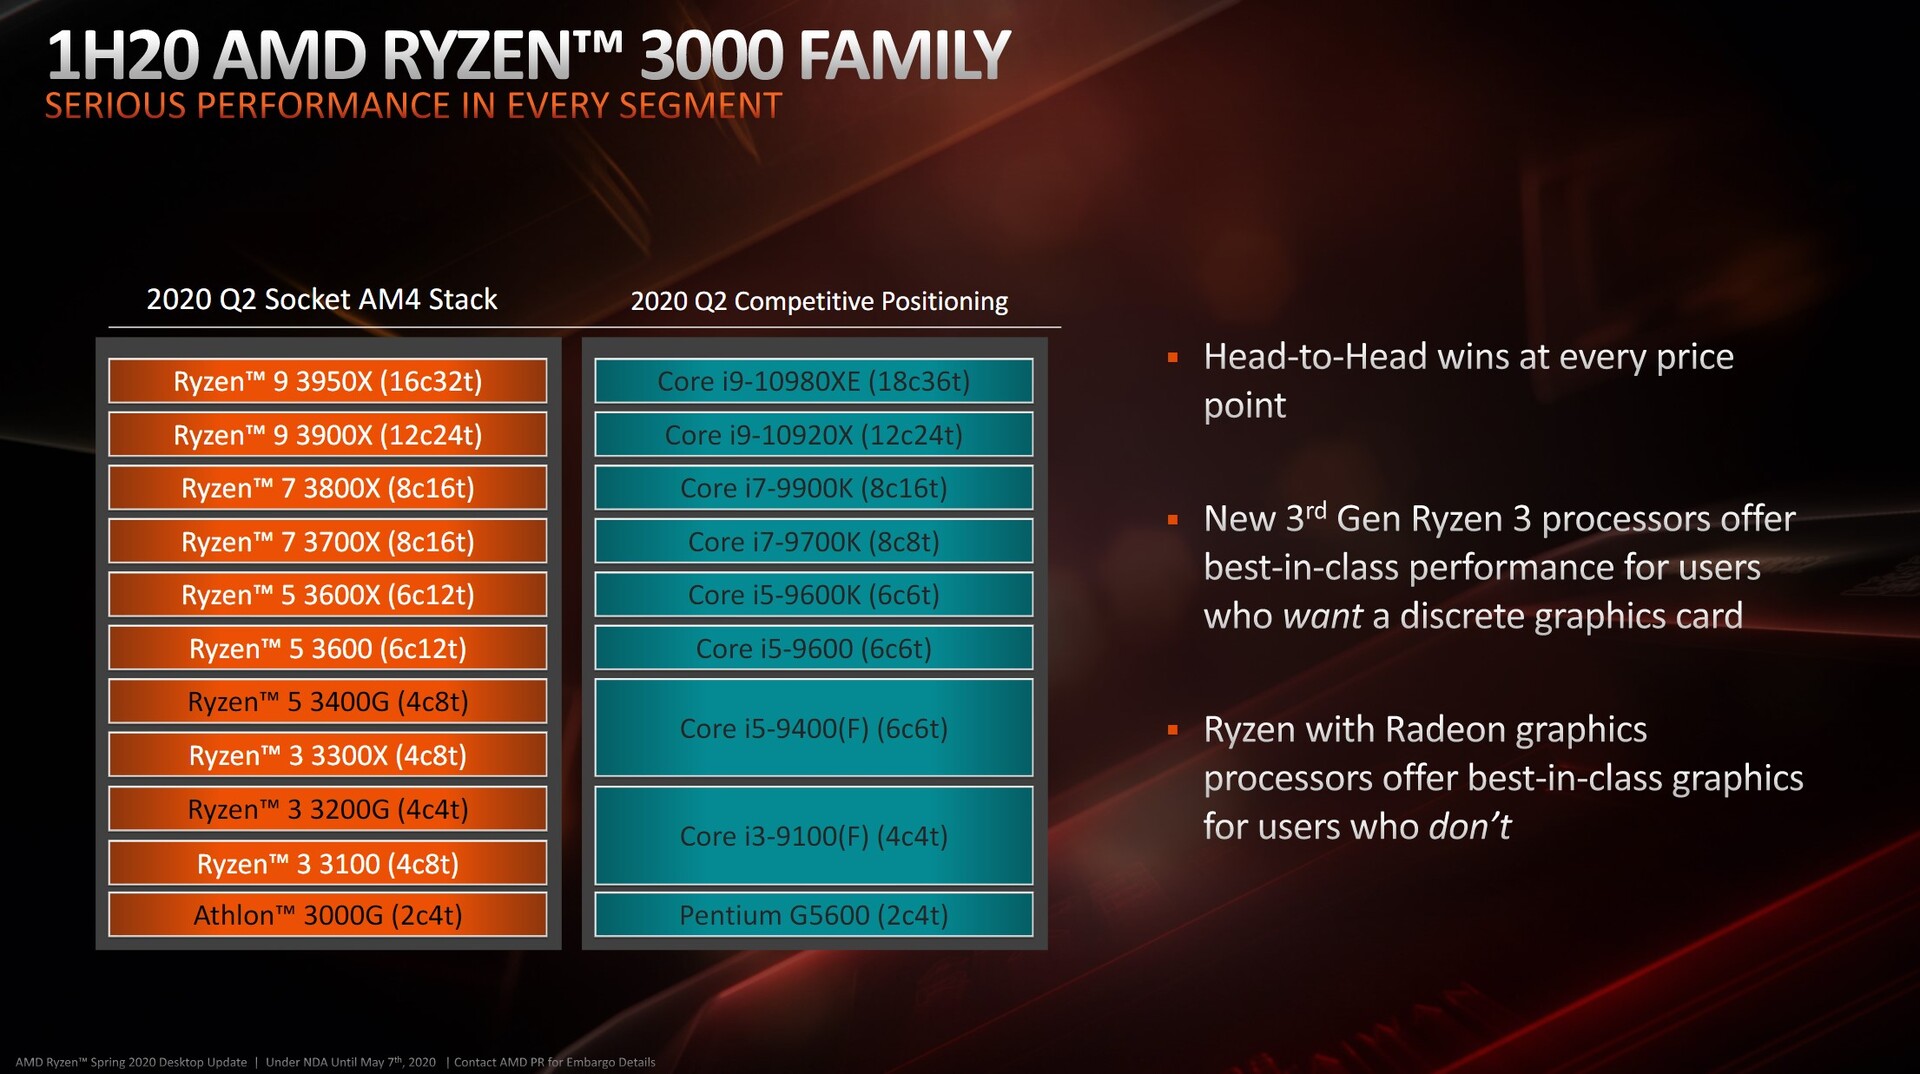
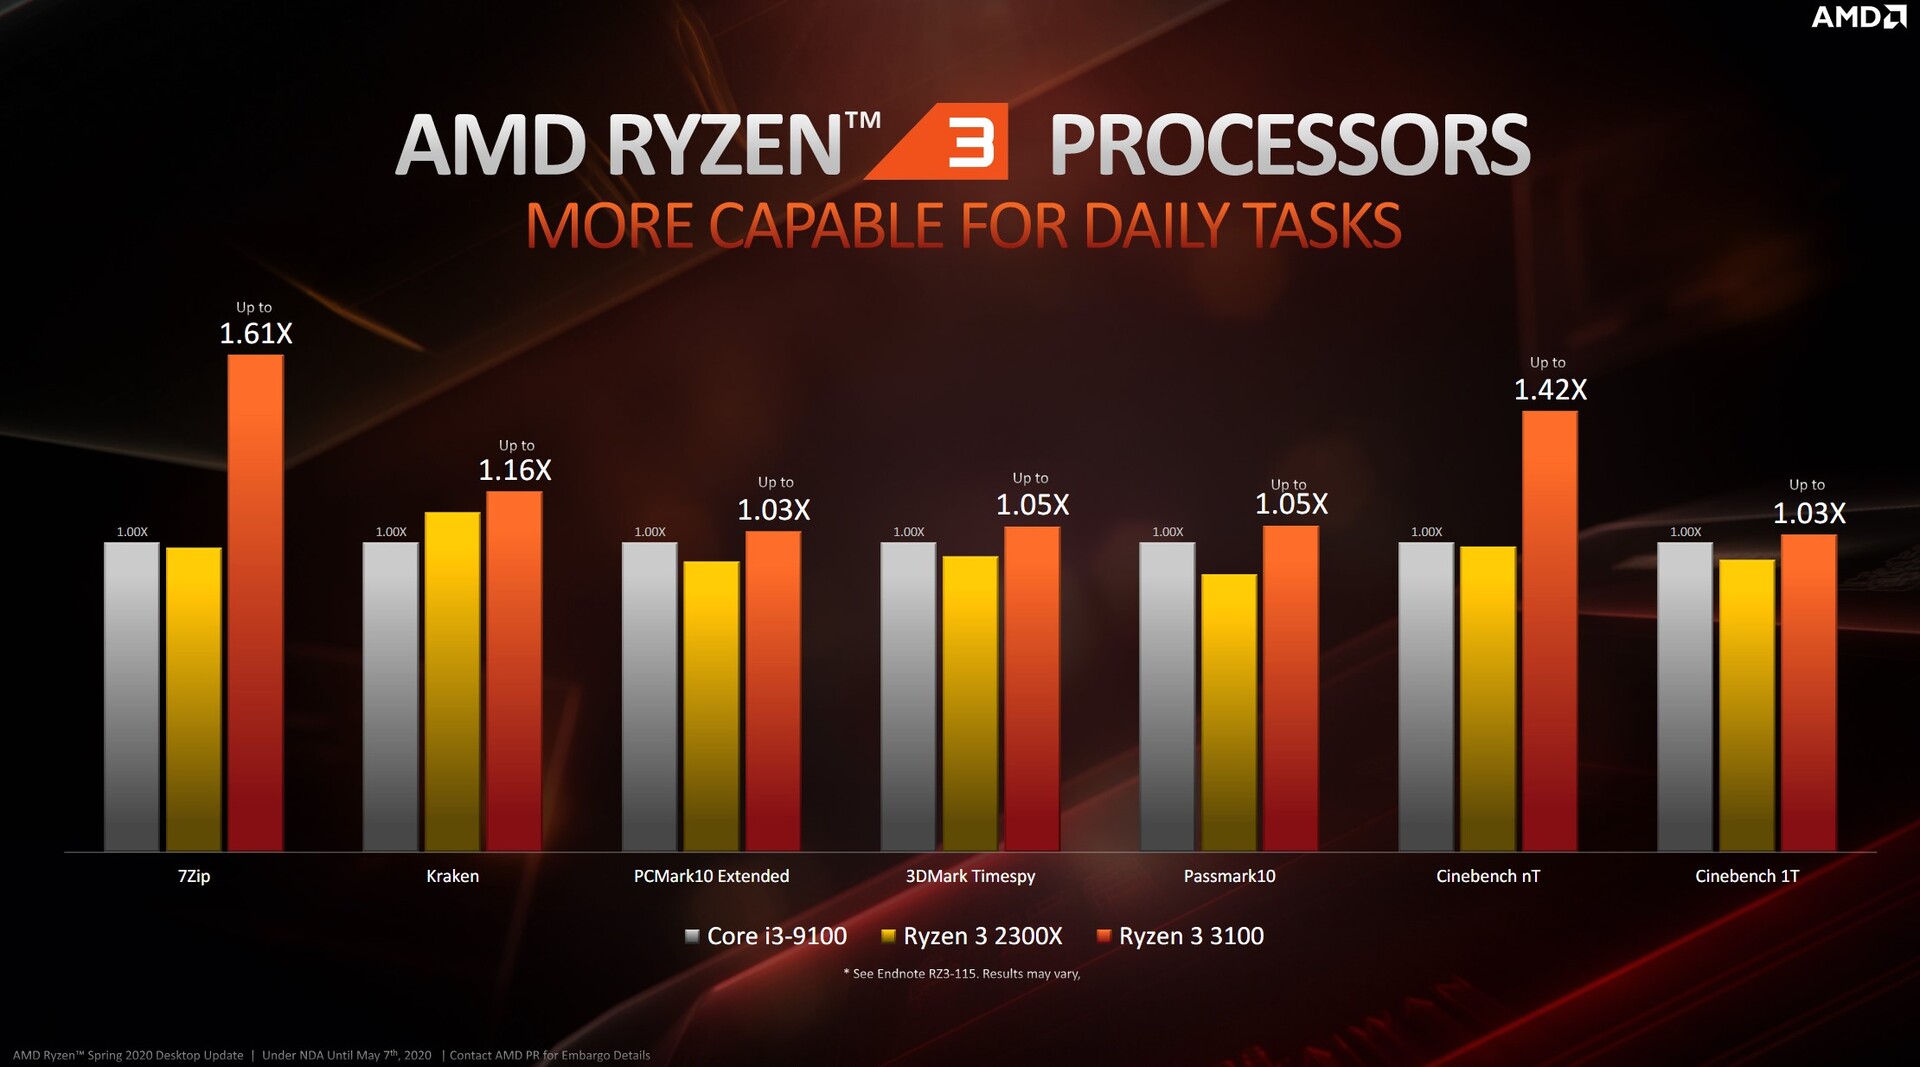
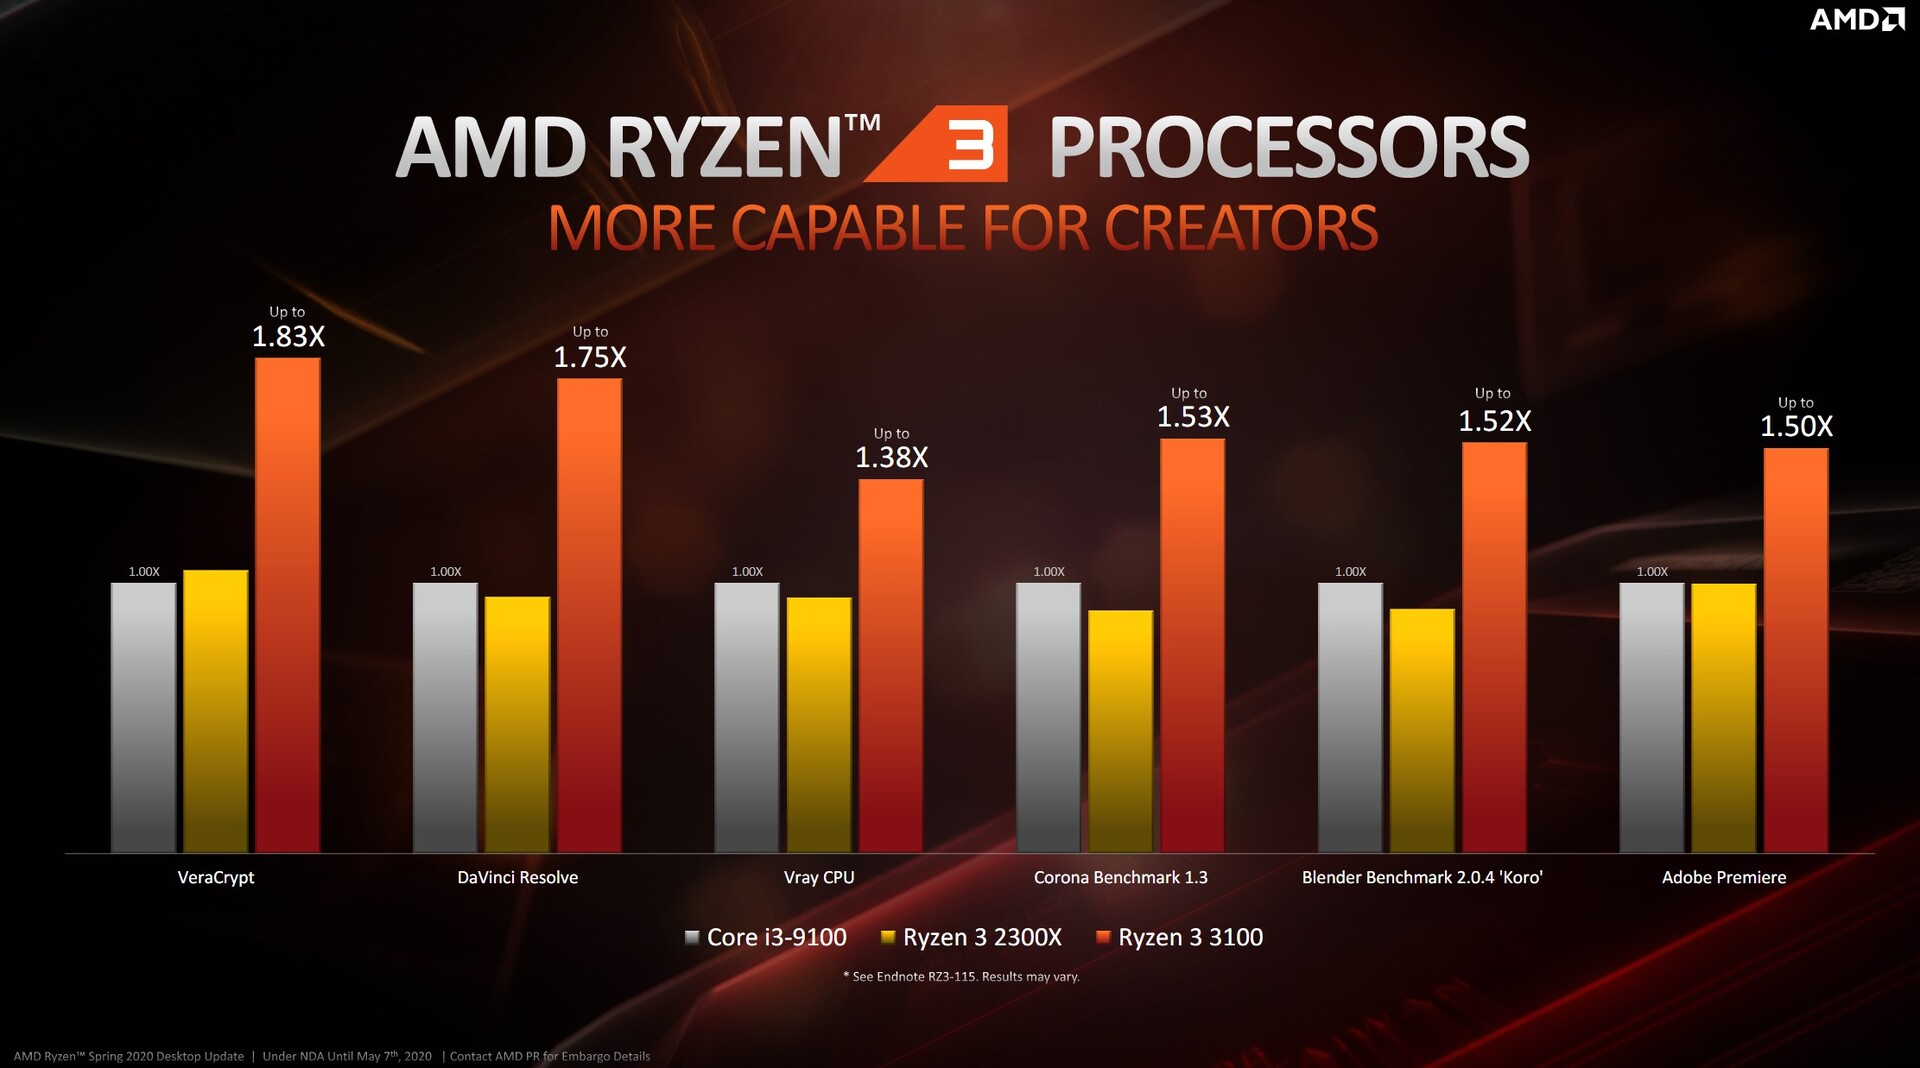
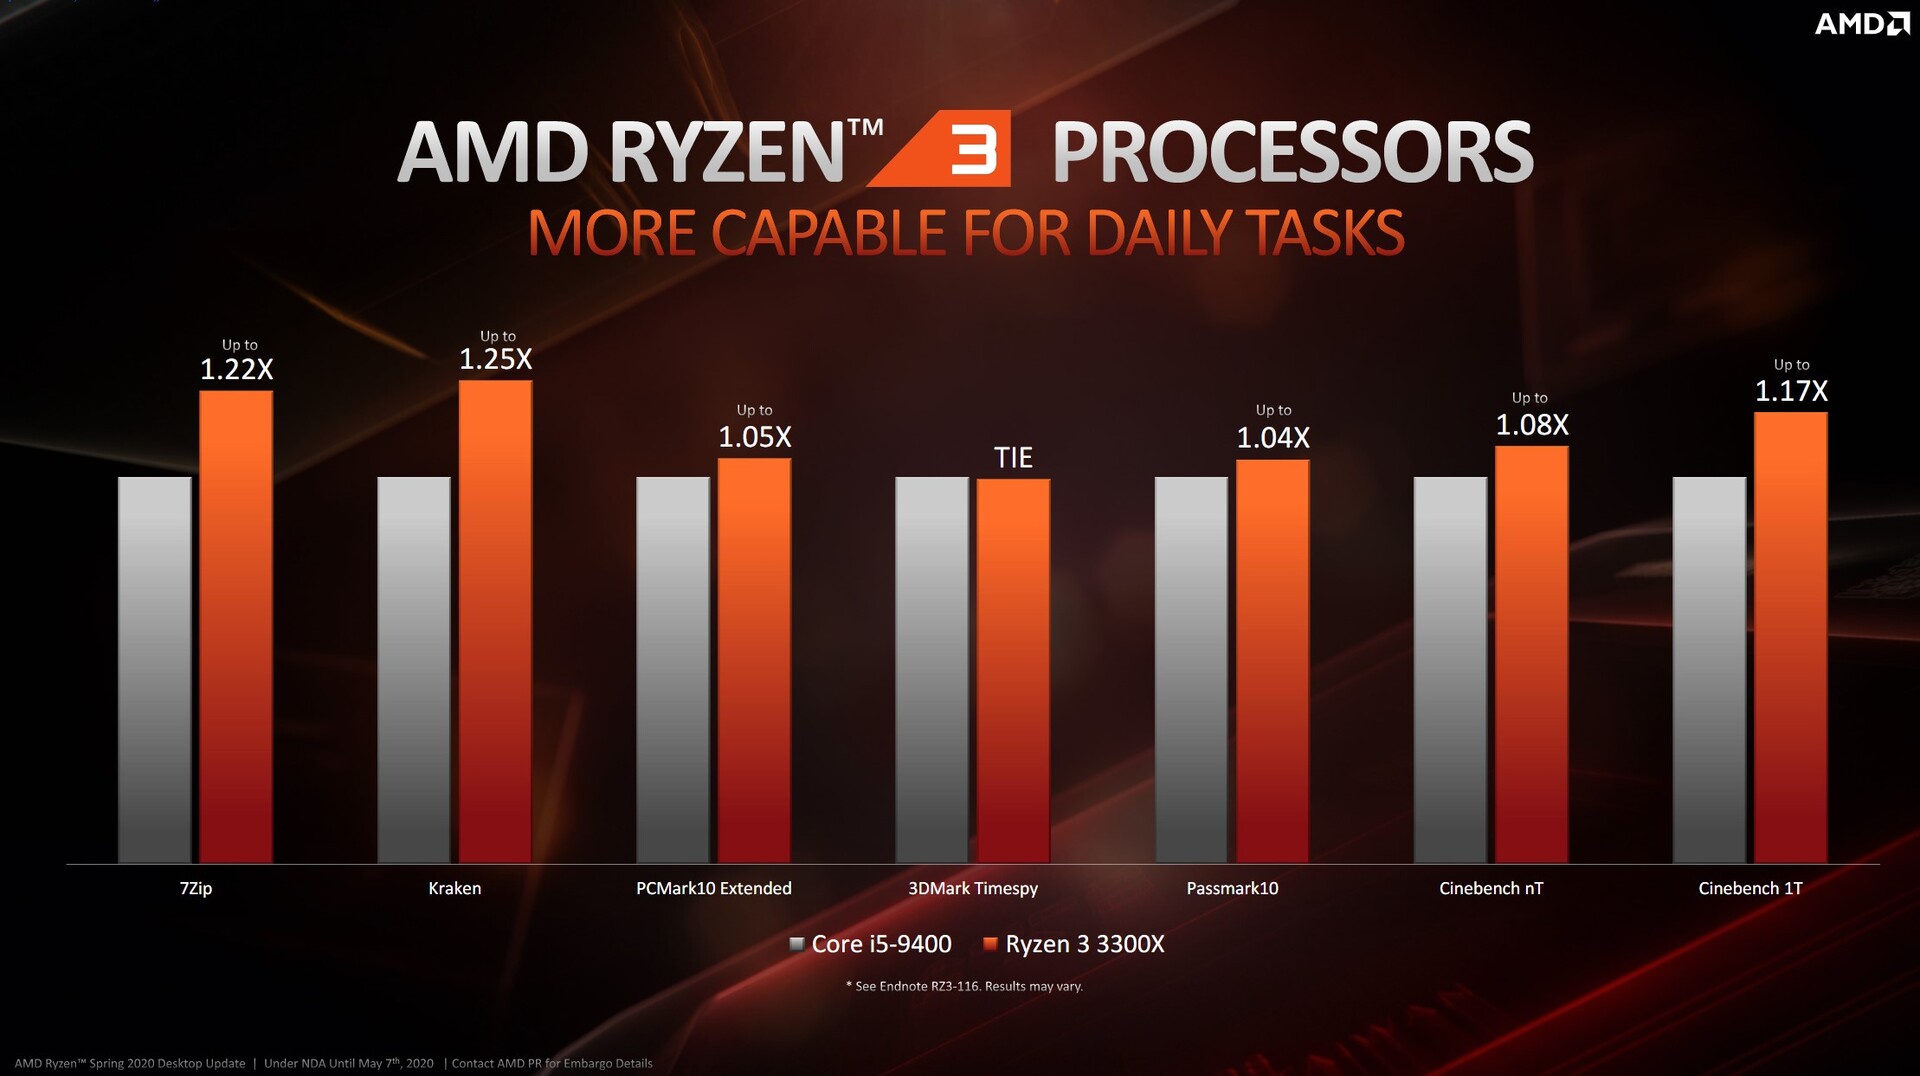
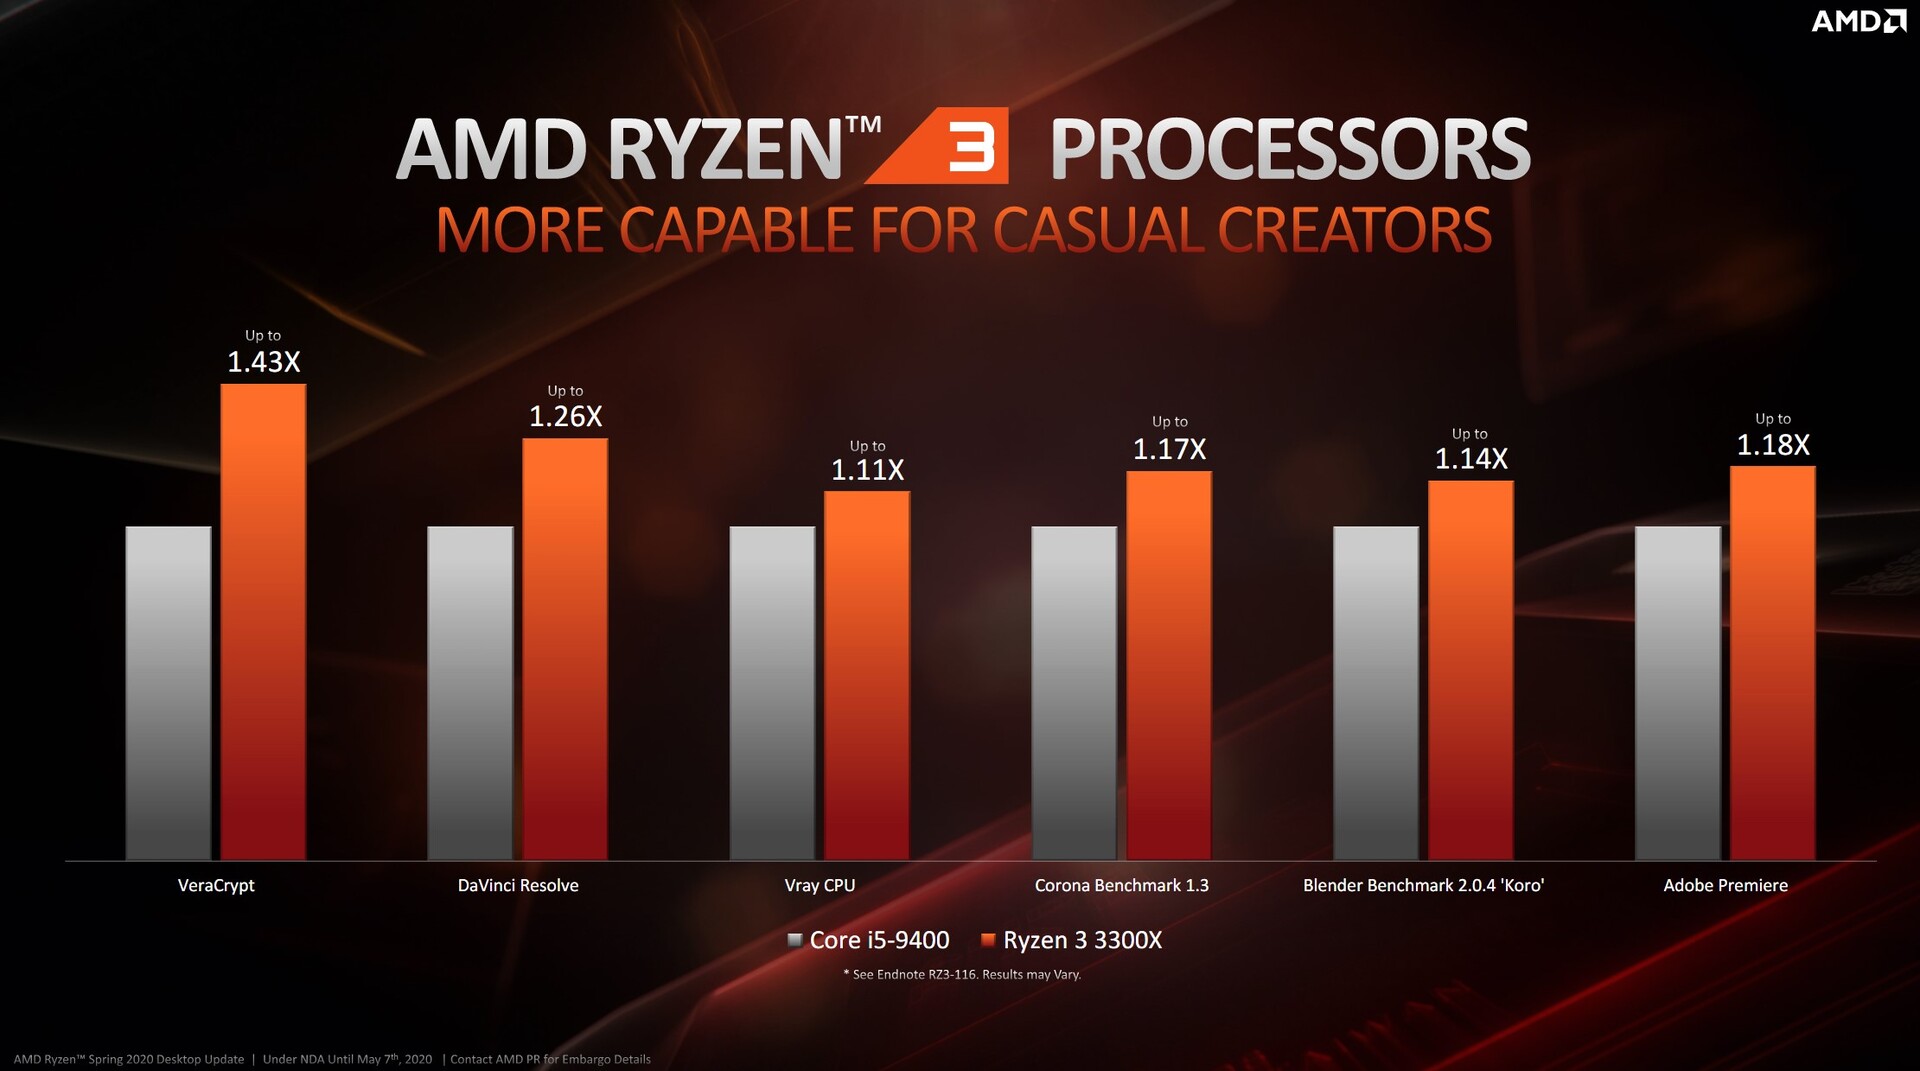
Inoltre, i due processori si differenziano per le loro velocità di clock, il che aiuta anche a definire le diverse classi di prestazioni. Tuttavia, AMD specifica un TDP identico di 65 watt per entrambi i processori. La stessa AMD ha creato una classifica in termini di prezzo-prestazioni, che ci ha portato a utilizzare i diretti concorrenti (Intel Core i3-9100F e Intel Core i5-9400F) per questo test.
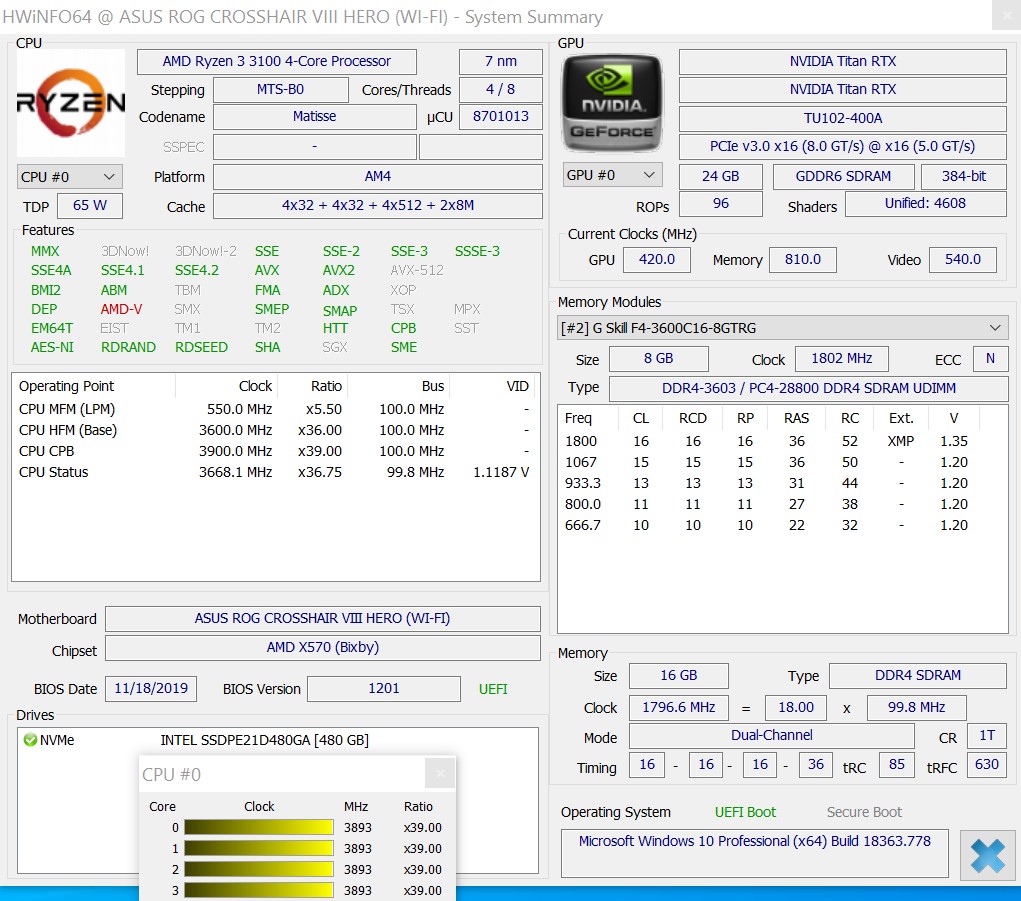
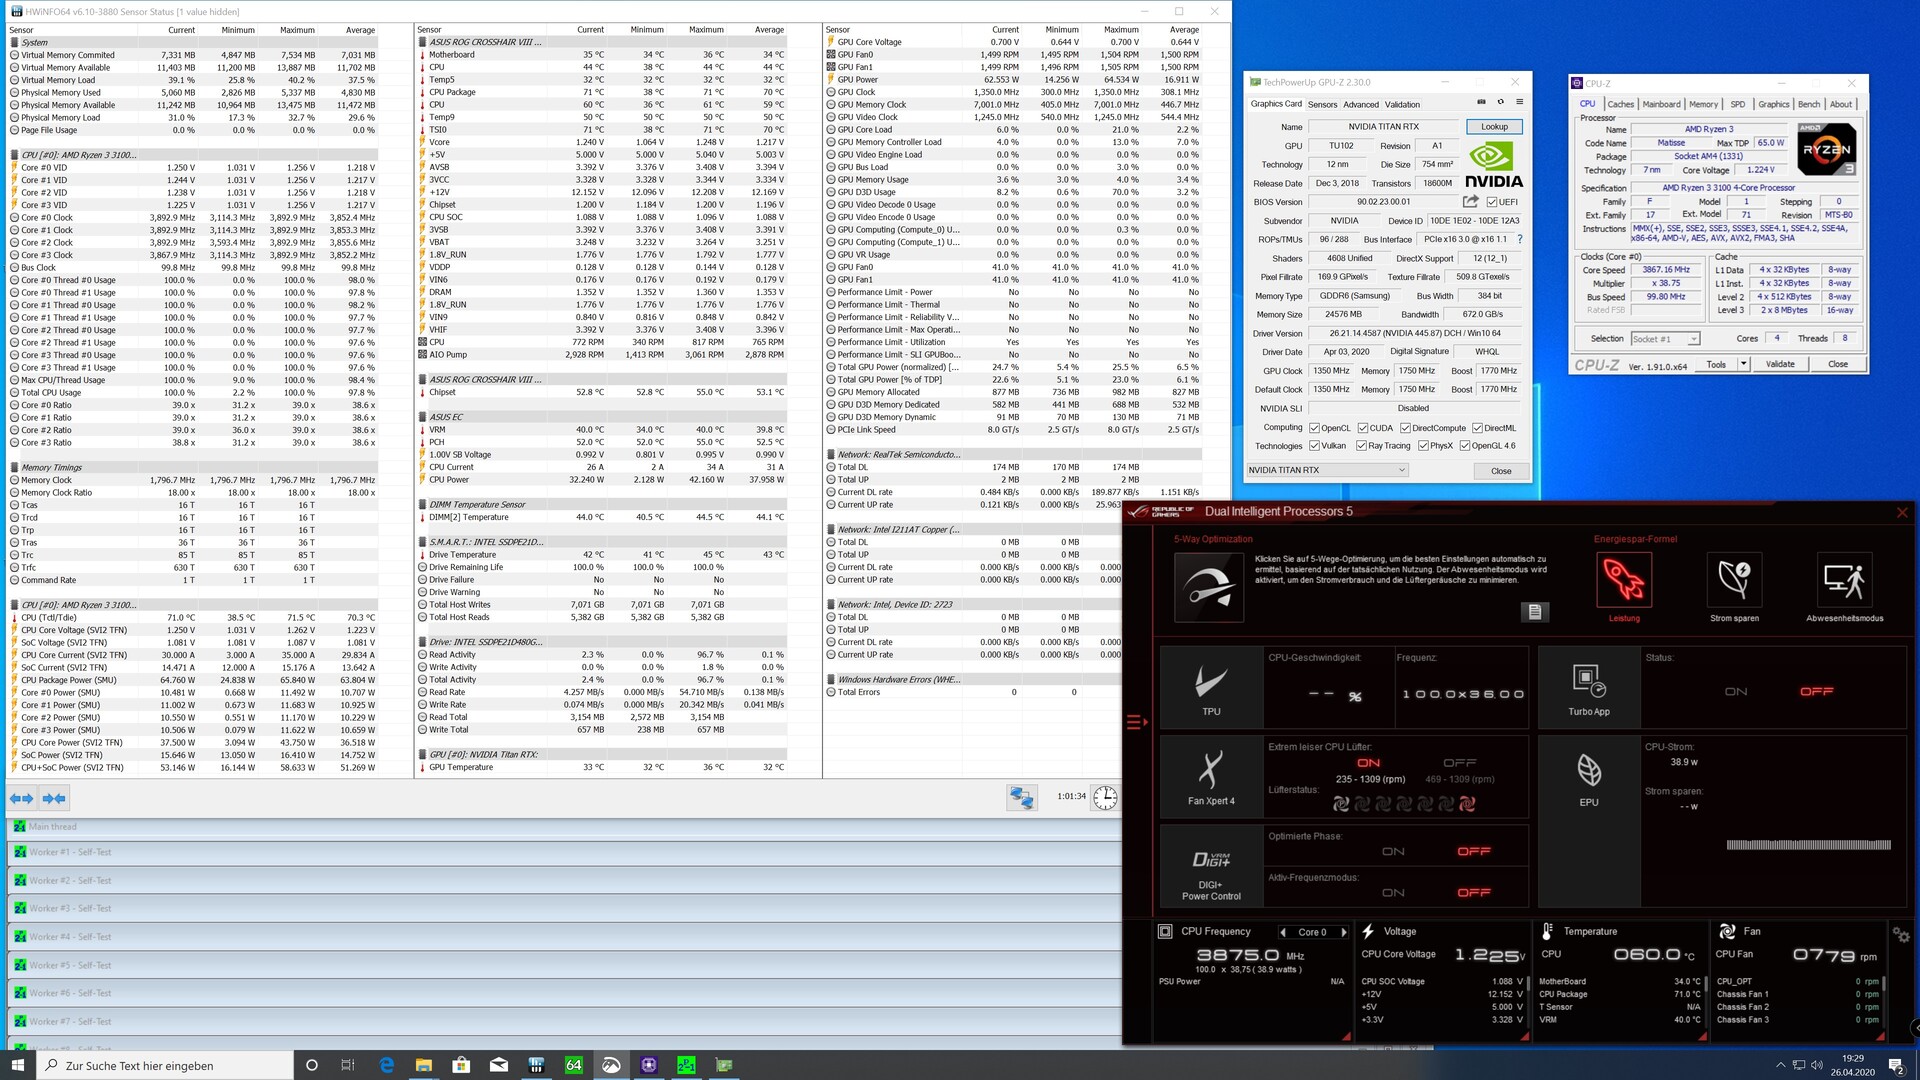
Sistema di Test in dettaglio - AMD vs. Intel
Utilizziamo il seguente sistema per benchmarks e tests:
- Raijintek Pean Benchtable
- AMD Ryzen 3 3100 / AMD Ryzen 3 3300X
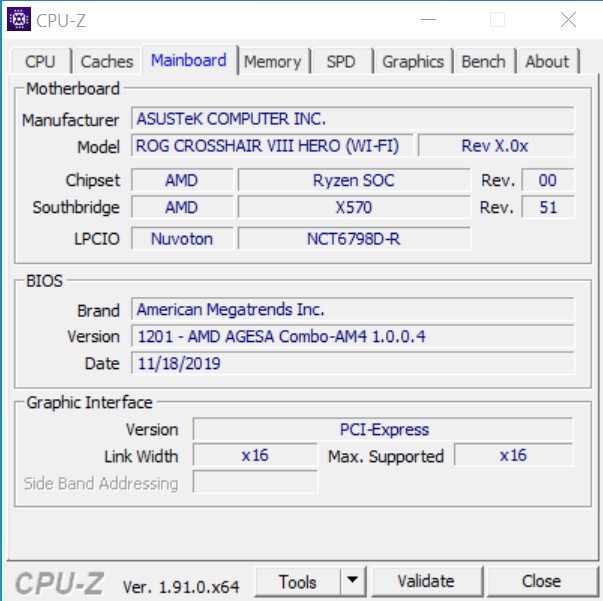
- Asus ROG Crosshair VIII Hero X570
- Intel Core i3-9100F / Intel Core i5-9400F
- Asus ROG Strix Z390E-Gaming
- Alphacool Eisbaer 280 AiO
- Nvidia Titan RTX
- Alimentatore Corsair RM1000X
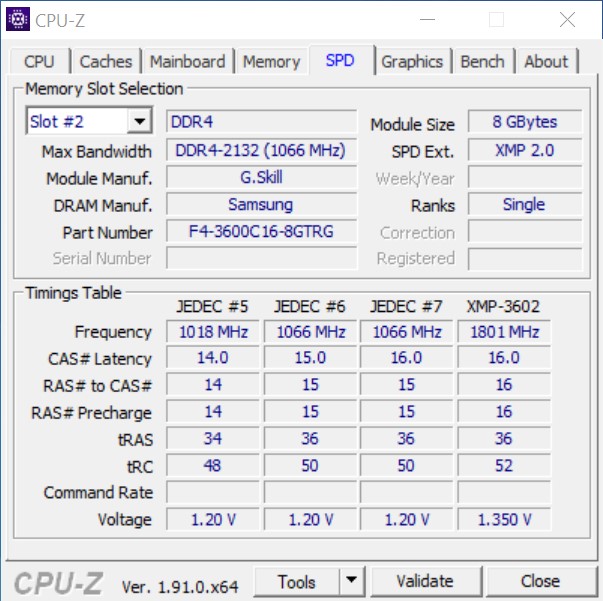
- G.Skill Trident Z Royal gold DDR4-3600 memory kit (2 x 8 GB), set to DDR4-3600 CL16-16-16-36
- Intel Optane 905P 480 GB PCIe SSD
- Microsoft Windows 10 Professional 64-bit (versione 1909)
I componenti forniti per questo test, come la scheda madre, la RAM e le CPU, provengono direttamente da AMD. Vorremmo anche ringraziare Asus per averci prestato la scheda madre Z390, che funge da base per Intel. Il sistema di raffreddamento proviene da Alphacool, che avevamo già ampiamente esaminato, e il caso è stato realizzato in collaborazione con Caseking.
Benchmarks processore
Quando si guarda solo ai benchmarks della CPU, AMD Ryzen 3 3300X imposta chiaramente il tono. Tuttavia, l'Intel Core i5-9400F può giocare i suoi punti di forza nei test Geekbench Multi e si spinge facilmente davanti ad AMD Ryzen 3 3300X. I sei cores di calcolo fisici dell'Intel Core i5 sembrano dare un po' i loro frutti in questo caso. Nel complesso, il processore nativo hexa-core non riesce ad emergere contro l'AMD Ryzen 3 3300X. L'Intel Core i3-9100F deve accontentarsi dell'ultimo posto in quasi tutti i test. Qui è chiaramente dimostrato che un processore quad-core senza HT viene distrutto senza pietà nei sistemi moderni. Questo sottolinea ancora una volta il passo che AMD ha fatto con il nuovo Ryzen 3 e che anche Intel seguirà nel prossimo futuro.
AMD Ryzen 3 3100


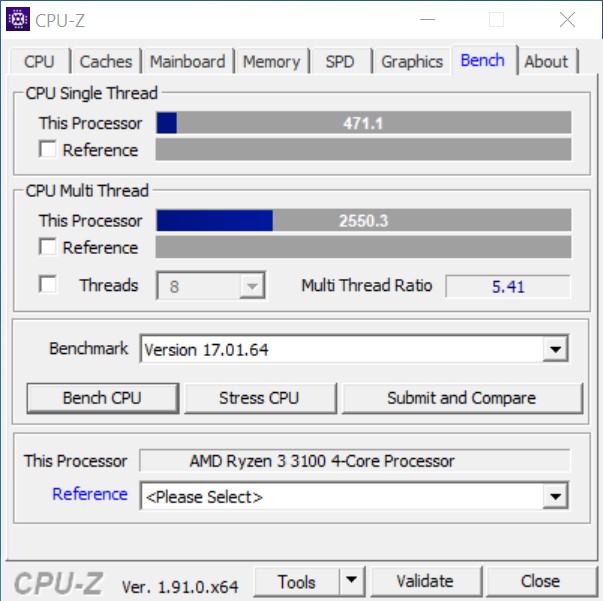
AMD Ryzen 3 3300X


| Performance rating - Percent | |
| Media Intel Core i7-7740X | |
| AMD Ryzen 3 3300X | |
| Intel Core i5-9400F | |
| AMD Ryzen 3 3100 | |
| AMD Ryzen 5 1600 | |
| Intel Core i3-9100F | |
| Cinebench R10 | |
| Rendering Single CPUs 64Bit | |
| AMD Ryzen 3 3300X | |
| Media Intel Core i7-7740X (n=1) | |
| AMD Ryzen 3 3100 | |
| Intel Core i3-9100F | |
| Intel Core i5-9400F | |
| AMD Ryzen 5 1600 | |
| Rendering Multiple CPUs 64Bit | |
| AMD Ryzen 5 1600 | |
| AMD Ryzen 3 3300X | |
| Intel Core i5-9400F | |
| Media Intel Core i7-7740X (n=1) | |
| AMD Ryzen 3 3100 | |
| Intel Core i3-9100F | |
| Blender - v2.79 BMW27 CPU | |
| Intel Core i3-9100F | |
| AMD Ryzen 3 3100 | |
| Intel Core i5-9400F | |
| Media Intel Core i7-7740X (n=1) | |
| AMD Ryzen 3 3300X | |
| AMD Ryzen 5 1600 | |
| WinRAR - Result | |
| AMD Ryzen 3 3300X | |
| Media Intel Core i7-7740X (n=1) | |
| Intel Core i5-9400F | |
| AMD Ryzen 3 3100 | |
| AMD Ryzen 5 1600 | |
| Intel Core i3-9100F | |
| Geekbench 4.4 | |
| 64 Bit Single-Core Score | |
| Media Intel Core i7-7740X (n=1) | |
| AMD Ryzen 3 3300X | |
| Intel Core i5-9400F | |
| Intel Core i3-9100F | |
| AMD Ryzen 3 3100 | |
| AMD Ryzen 5 1600 | |
| 64 Bit Multi-Core Score | |
| Intel Core i5-9400F | |
| AMD Ryzen 5 1600 | |
| AMD Ryzen 3 3300X | |
| Media Intel Core i7-7740X (n=1) | |
| AMD Ryzen 3 3100 | |
| Intel Core i3-9100F | |
| 3DMark 11 - 1280x720 Performance Physics | |
| AMD Ryzen 3 3300X | |
| Media Intel Core i7-7740X (12196 - 12488, n=6) | |
| AMD Ryzen 5 1600 | |
| Intel Core i5-9400F | |
| AMD Ryzen 3 3100 | |
| Intel Core i3-9100F | |
| HWBOT x265 Benchmark v2.2 - 4k Preset | |
| Intel Core i5-9400F | |
| Media Intel Core i7-7740X (n=1) | |
| AMD Ryzen 3 3300X | |
| AMD Ryzen 3 3100 | |
| AMD Ryzen 5 1600 | |
| Intel Core i3-9100F | |
| R Benchmark 2.5 - Overall mean | |
| Intel Core i5-9400F | |
| Intel Core i3-9100F | |
| AMD Ryzen 5 1600 | |
| AMD Ryzen 3 3100 | |
| Media Intel Core i7-7740X (n=1) | |
| AMD Ryzen 3 3300X | |
| LibreOffice - 20 Documents To PDF | |
| AMD Ryzen 5 1600 | |
| Intel Core i3-9100F | |
| AMD Ryzen 3 3100 | |
| Intel Core i5-9400F | |
| Media Intel Core i7-7740X (n=1) | |
| AMD Ryzen 3 3300X | |
| WebXPRT 3 - Overall | |
| Media Intel Core i7-7740X (247 - 265, n=2) | |
| AMD Ryzen 3 3300X | |
| Intel Core i5-9400F | |
| AMD Ryzen 3 3100 | |
| Intel Core i3-9100F | |
| AMD Ryzen 5 1600 | |
| Mozilla Kraken 1.1 - Total | |
| AMD Ryzen 5 1600 | |
| Intel Core i5-9400F | |
| Intel Core i3-9100F | |
| AMD Ryzen 3 3100 | |
| Media Intel Core i7-7740X (n=1) | |
| AMD Ryzen 3 3300X | |
| 3DMark | |
| 3840x2160 Fire Strike Ultra Physics | |
| AMD Ryzen 5 1600 | |
| AMD Ryzen 3 3300X | |
| Media Intel Core i7-7740X (n=1) | |
| AMD Ryzen 3 3100 | |
| Intel Core i5-9400F | |
| Intel Core i3-9100F | |
| 1920x1080 Fire Strike Physics | |
| AMD Ryzen 5 1600 | |
| AMD Ryzen 3 3300X | |
| Media Intel Core i7-7740X (13230 - 14523, n=7) | |
| AMD Ryzen 3 3100 | |
| Intel Core i5-9400F | |
| Intel Core i3-9100F | |
| 2560x1440 Time Spy CPU | |
| AMD Ryzen 5 1600 | |
| Intel Core i5-9400F | |
| Media Intel Core i7-7740X (5632 - 5792, n=7) | |
| AMD Ryzen 3 3300X | |
| AMD Ryzen 3 3100 | |
| Intel Core i3-9100F | |
* ... Meglio usare valori piccoli
I soggetti del test nel multi-loop Cinebench R15
Durante lo stress test con il multi loop Cinebench R15, l'AiO quasi sovradimensionato assicura che tutte le misurazioni rimangano stabili. Entrambi i modelli Ryzen 3 possono addirittura battere la concorrenza di Intel in questo test. Anche il Core i5-9400F con i suoi sei cores deve ammettere la sconfitta al piccolo Ryzen 3 3100 con solo quattro cores. Il nuovo Ryzen 5 1600 (in 12 nm) è chiaramente in testa alla classifica grazie ai suoi sei core, tra cui SMT.
Prestazioni con le applicazioni
Nella vita di tutti i giorni, entrambi i sistemi funzionano bene e molto velocemente. Ma nei dettagli, si possono vedere le sfumature che la piattaforma Zen2 ha da offrire. Rispetto al popolare AMD Ryzen 5 1600, che ha vissuto un revival con Zen+, i nuovi processori Zen2 possono chiaramente distinguersi. Anche Intel è stata sempre più sotto pressione a causa delle innovazioni di AMD. Ma con Comet Lake-S, i successori delle CPU Coffee Lake-R sono già nei blocchi di partenza.
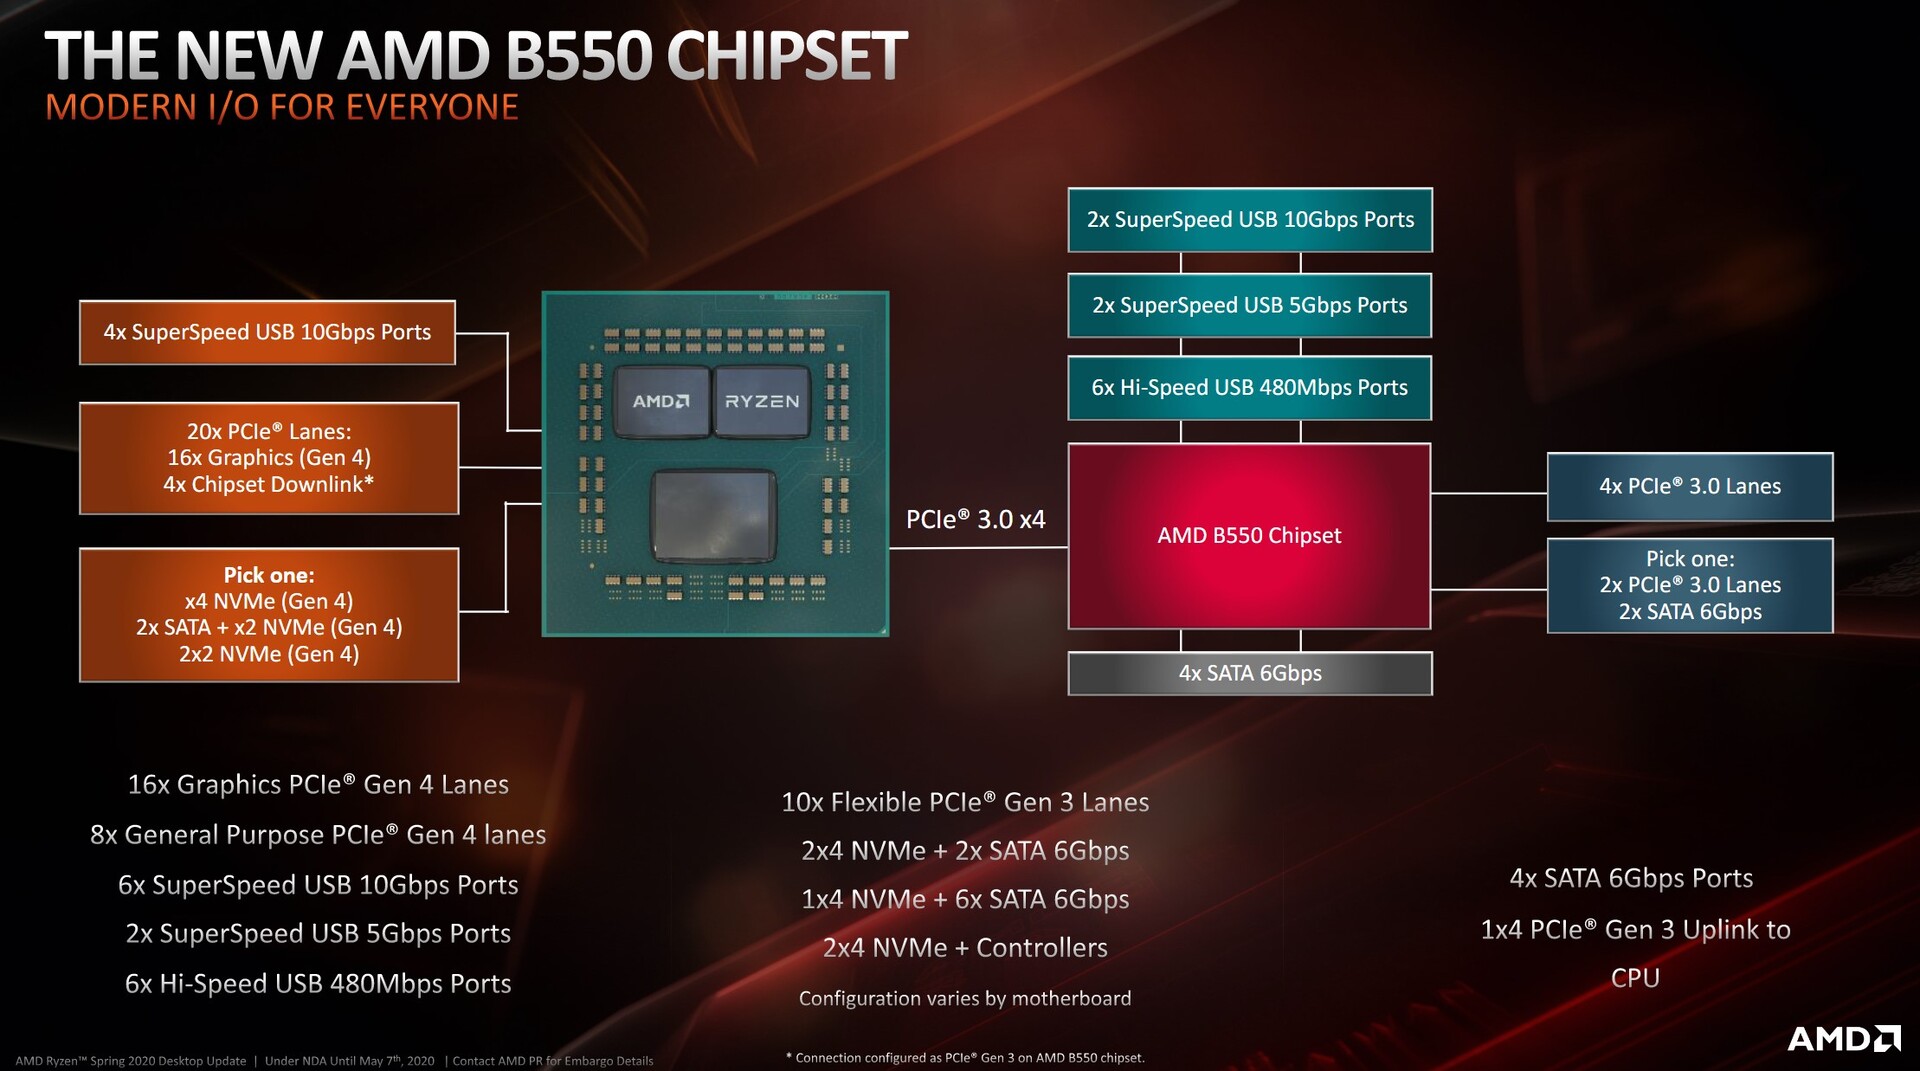
Come argomento di acquisto imbattibile, AMD può ancora segnare punti con il PCI Express 4.0, perché Intel non supporta quest'ultimo con Comet Lake-S. Inoltre, il nuovo chipset B550 assicura che anche i sistemi più economici possano accedere al nuovo standard.
| PCMark 10 - Score | |
| AMD Ryzen 3 3300X | |
| Intel Core i5-9400F | |
| AMD Ryzen 3 3100 | |
| Intel Core i3-9100F | |
| AMD Ryzen 5 1600 | |
| PCMark 8 | |
| Work Score Accelerated v2 | |
| AMD Ryzen 3 3300X | |
| Intel Core i3-9100F | |
| Intel Core i5-9400F | |
| AMD Ryzen 3 3100 | |
| AMD Ryzen 5 1600 | |
| Creative Score Accelerated v2 | |
| AMD Ryzen 3 3300X | |
| Intel Core i5-9400F | |
| AMD Ryzen 3 3100 | |
| Intel Core i3-9100F | |
| AMD Ryzen 5 1600 | |
| Home Score Accelerated v2 | |
| AMD Ryzen 3 3300X | |
| Intel Core i5-9400F | |
| Intel Core i3-9100F | |
| AMD Ryzen 3 3100 | |
| AMD Ryzen 5 1600 | |
| Performance rating - Percent | |
| AMD Ryzen 3 3300X | |
| Intel Core i5-9400F | |
| AMD Ryzen 5 1600 | |
| AMD Ryzen 3 3100 | |
| Intel Core i3-9100F | |
| 3DMark 11 | |
| 1280x720 Performance | |
| AMD Ryzen 3 3300X | |
| Intel Core i5-9400F | |
| AMD Ryzen 5 1600 | |
| AMD Ryzen 3 3100 | |
| Intel Core i3-9100F | |
| 1280x720 Performance GPU | |
| Intel Core i3-9100F | |
| Intel Core i5-9400F | |
| AMD Ryzen 3 3300X | |
| AMD Ryzen 5 1600 | |
| AMD Ryzen 3 3100 | |
| 3DMark | |
| 1920x1080 Fire Strike Score | |
| AMD Ryzen 3 3300X | |
| Intel Core i5-9400F | |
| AMD Ryzen 5 1600 | |
| AMD Ryzen 3 3100 | |
| Intel Core i3-9100F | |
| 1920x1080 Fire Strike Graphics | |
| Intel Core i3-9100F | |
| Intel Core i5-9400F | |
| AMD Ryzen 3 3100 | |
| AMD Ryzen 3 3300X | |
| AMD Ryzen 5 1600 | |
| 3840x2160 Fire Strike Ultra Score | |
| AMD Ryzen 3 3300X | |
| Intel Core i5-9400F | |
| AMD Ryzen 5 1600 | |
| AMD Ryzen 3 3100 | |
| Intel Core i3-9100F | |
| 2560x1440 Time Spy Graphics | |
| Intel Core i5-9400F | |
| AMD Ryzen 3 3300X | |
| Intel Core i3-9100F | |
| AMD Ryzen 5 1600 | |
| AMD Ryzen 3 3100 | |
| 2560x1440 Time Spy Score | |
| Intel Core i5-9400F | |
| AMD Ryzen 5 1600 | |
| AMD Ryzen 3 3300X | |
| AMD Ryzen 3 3100 | |
| Intel Core i3-9100F | |
Le nuove CPUs Ryzen nel gaming test
A differenza dei benchmark delle CPU, qui si dimostra che AMD non è così superiore nei test di gioco effettuati. Intel è anche ben posizionata con i vecchi Core i3 e Core i5, e soprattutto l'Intel Core i5-9400F potrebbe produrre i frame rate più alti nei nostri test di gioco. Il vantaggio in termini di prestazioni si riduce con risoluzioni più elevate, poiché la scheda grafica diventa sempre più il fattore decisivo in questo caso. Tuttavia, è evidente che la più recente architettura Zen2 ha un chiaro vantaggio prestazionale rispetto a Zen+. La Ryzen 5 1600 offre sei cores proprio come il Core i5-9400F. Grazie all'IPC inferiore, il Ryzen 5 è quasi sempre all'ultimo posto.
| Performance rating - Percent | |
| Intel Core i5 9400F | |
| AMD Ryzen 3 3300X | |
| Intel Core i3 9100F | |
| AMD Ryzen 3 3100 | |
| AMD Ryzen 5 1600 (12nm) | |
| Borderlands 3 | |
| 1280x720 Very Low Overall Quality (DX11) | |
| Intel Core i5 9400F | |
| AMD Ryzen 3 3300X | |
| Intel Core i3 9100F | |
| AMD Ryzen 3 3100 | |
| AMD Ryzen 5 1600 (12nm) | |
| 1920x1080 Badass Overall Quality (DX11) | |
| Intel Core i5 9400F | |
| AMD Ryzen 3 3300X | |
| Intel Core i3 9100F | |
| AMD Ryzen 3 3100 | |
| AMD Ryzen 5 1600 (12nm) | |
| Metro Exodus | |
| 1280x720 Low Quality AF:4x | |
| Intel Core i5 9400F | |
| AMD Ryzen 3 3300X | |
| AMD Ryzen 3 3100 | |
| AMD Ryzen 5 1600 (12nm) | |
| Intel Core i3 9100F | |
| 1920x1080 Ultra Quality AF:16x | |
| Intel Core i5 9400F | |
| AMD Ryzen 3 3300X | |
| AMD Ryzen 3 3100 | |
| AMD Ryzen 5 1600 (12nm) | |
| Intel Core i3 9100F | |
| Far Cry New Dawn | |
| 1280x720 Low Preset | |
| Intel Core i5 9400F | |
| AMD Ryzen 3 3300X | |
| Intel Core i3 9100F | |
| AMD Ryzen 5 1600 (12nm) | |
| AMD Ryzen 3 3100 | |
| 1920x1080 Ultra Preset | |
| Intel Core i5 9400F | |
| Intel Core i3 9100F | |
| AMD Ryzen 3 3300X | |
| AMD Ryzen 3 3100 | |
| AMD Ryzen 5 1600 (12nm) | |
| Forza Horizon 4 | |
| 1280x720 Very Low Preset | |
| Intel Core i5 9400F | |
| AMD Ryzen 3 3300X | |
| Intel Core i3 9100F | |
| AMD Ryzen 3 3100 | |
| AMD Ryzen 5 1600 (12nm) | |
| 1920x1080 Ultra Preset AA:2xMS | |
| Intel Core i5 9400F | |
| AMD Ryzen 3 3300X | |
| Intel Core i3 9100F | |
| AMD Ryzen 3 3100 | |
| AMD Ryzen 5 1600 (12nm) | |
| Shadow of the Tomb Raider | |
| 1280x720 Lowest Preset | |
| Intel Core i5 9400F | |
| AMD Ryzen 3 3300X | |
| Intel Core i3 9100F | |
| AMD Ryzen 3 3100 | |
| AMD Ryzen 5 1600 (12nm) | |
| 1920x1080 Highest Preset AA:T | |
| Intel Core i5 9400F | |
| AMD Ryzen 3 3300X | |
| AMD Ryzen 3 3100 | |
| AMD Ryzen 5 1600 (12nm) | |
| Intel Core i3 9100F | |
| Far Cry 5 | |
| 1280x720 Low Preset AA:T | |
| AMD Ryzen 3 3300X | |
| Intel Core i5 9400F | |
| AMD Ryzen 3 3100 | |
| AMD Ryzen 5 1600 (12nm) | |
| Intel Core i3 9100F | |
| 1920x1080 Ultra Preset AA:T | |
| Intel Core i5 9400F | |
| AMD Ryzen 3 3300X | |
| AMD Ryzen 3 3100 | |
| AMD Ryzen 5 1600 (12nm) | |
| Intel Core i3 9100F | |
| X-Plane 11.11 | |
| 1280x720 low (fps_test=1) | |
| Intel Core i5 9400F | |
| AMD Ryzen 3 3300X | |
| Intel Core i3 9100F | |
| AMD Ryzen 3 3100 | |
| AMD Ryzen 5 1600 (12nm) | |
| 1920x1080 high (fps_test=3) | |
| Intel Core i5 9400F | |
| AMD Ryzen 3 3300X | |
| Intel Core i3 9100F | |
| AMD Ryzen 3 3100 | |
| AMD Ryzen 5 1600 (12nm) | |
| Final Fantasy XV Benchmark | |
| 1280x720 Lite Quality | |
| Intel Core i5 9400F | |
| AMD Ryzen 3 3300X | |
| AMD Ryzen 3 3100 | |
| AMD Ryzen 5 1600 (12nm) | |
| Intel Core i3 9100F | |
| 1920x1080 High Quality | |
| Intel Core i5 9400F | |
| AMD Ryzen 3 3300X | |
| AMD Ryzen 5 1600 (12nm) | |
| AMD Ryzen 3 3100 | |
| Intel Core i3 9100F | |
| Dota 2 Reborn | |
| 1280x720 min (0/3) fastest | |
| Intel Core i5 9400F | |
| Intel Core i3 9100F | |
| AMD Ryzen 3 3300X | |
| AMD Ryzen 5 1600 (12nm) | |
| AMD Ryzen 3 3100 | |
| 1920x1080 ultra (3/3) best looking | |
| Intel Core i5 9400F | |
| Intel Core i3 9100F | |
| AMD Ryzen 3 3300X | |
| AMD Ryzen 5 1600 (12nm) | |
| AMD Ryzen 3 3100 | |
| The Witcher 3 | |
| 1024x768 Low Graphics & Postprocessing | |
| Intel Core i5 9400F | |
| AMD Ryzen 3 3300X | |
| AMD Ryzen 5 1600 (12nm) | |
| AMD Ryzen 3 3100 | |
| Intel Core i3 9100F | |
| 1920x1080 Ultra Graphics & Postprocessing (HBAO+) | |
| Intel Core i5 9400F | |
| AMD Ryzen 5 1600 (12nm) | |
| AMD Ryzen 3 3300X | |
| Intel Core i3 9100F | |
| AMD Ryzen 3 3100 | |
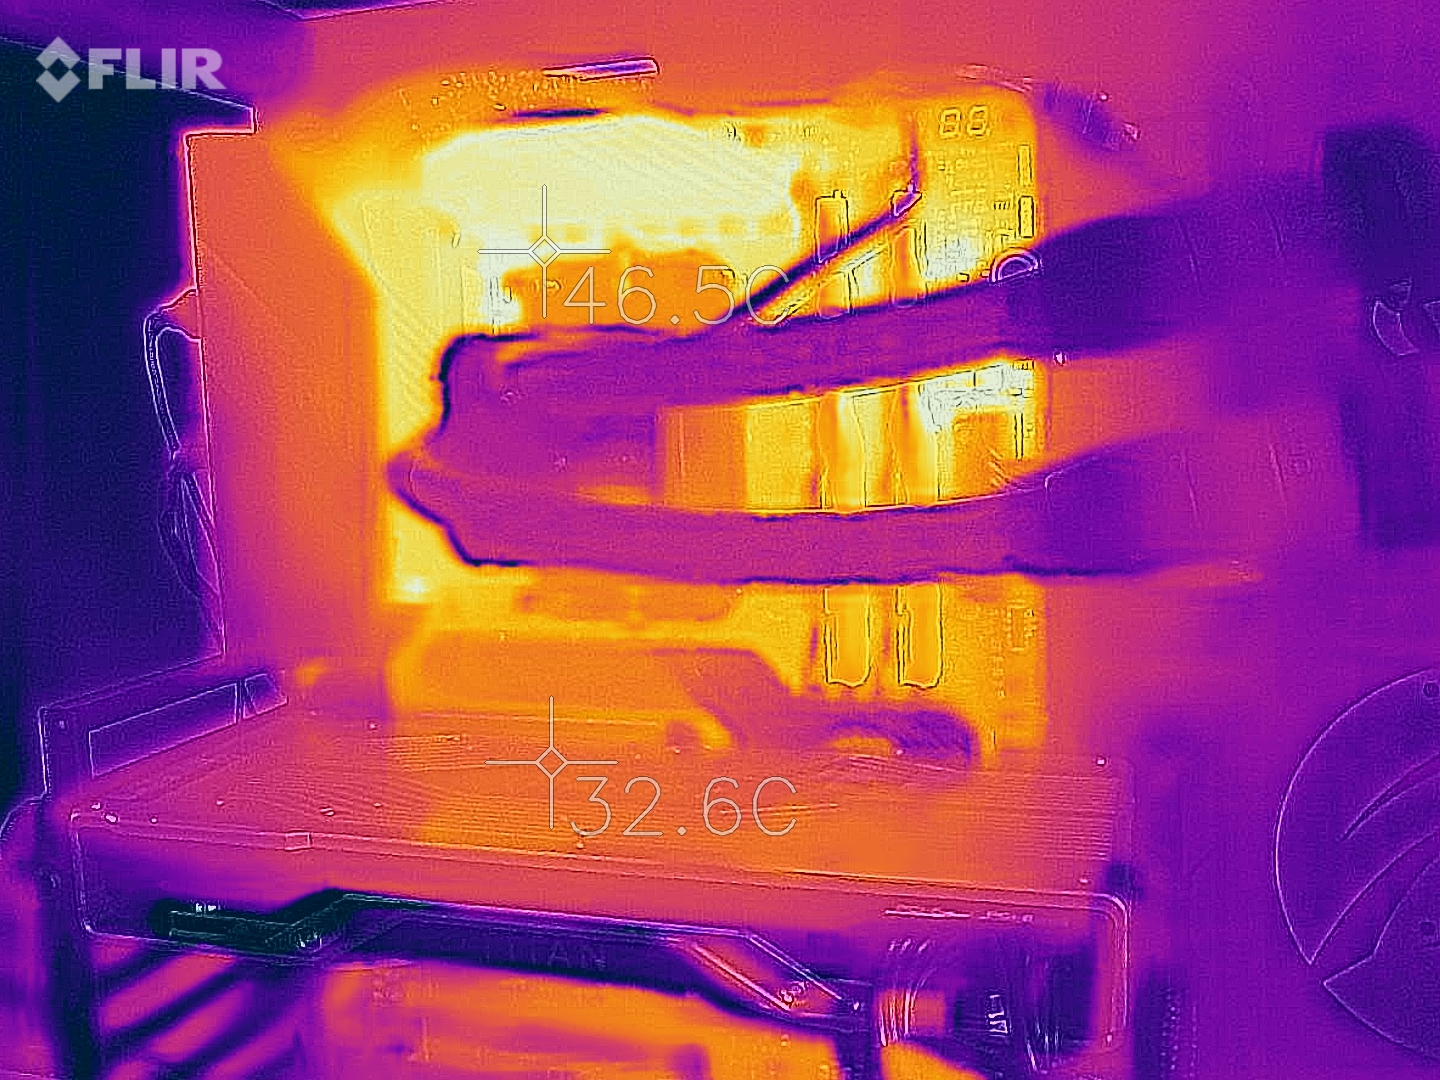
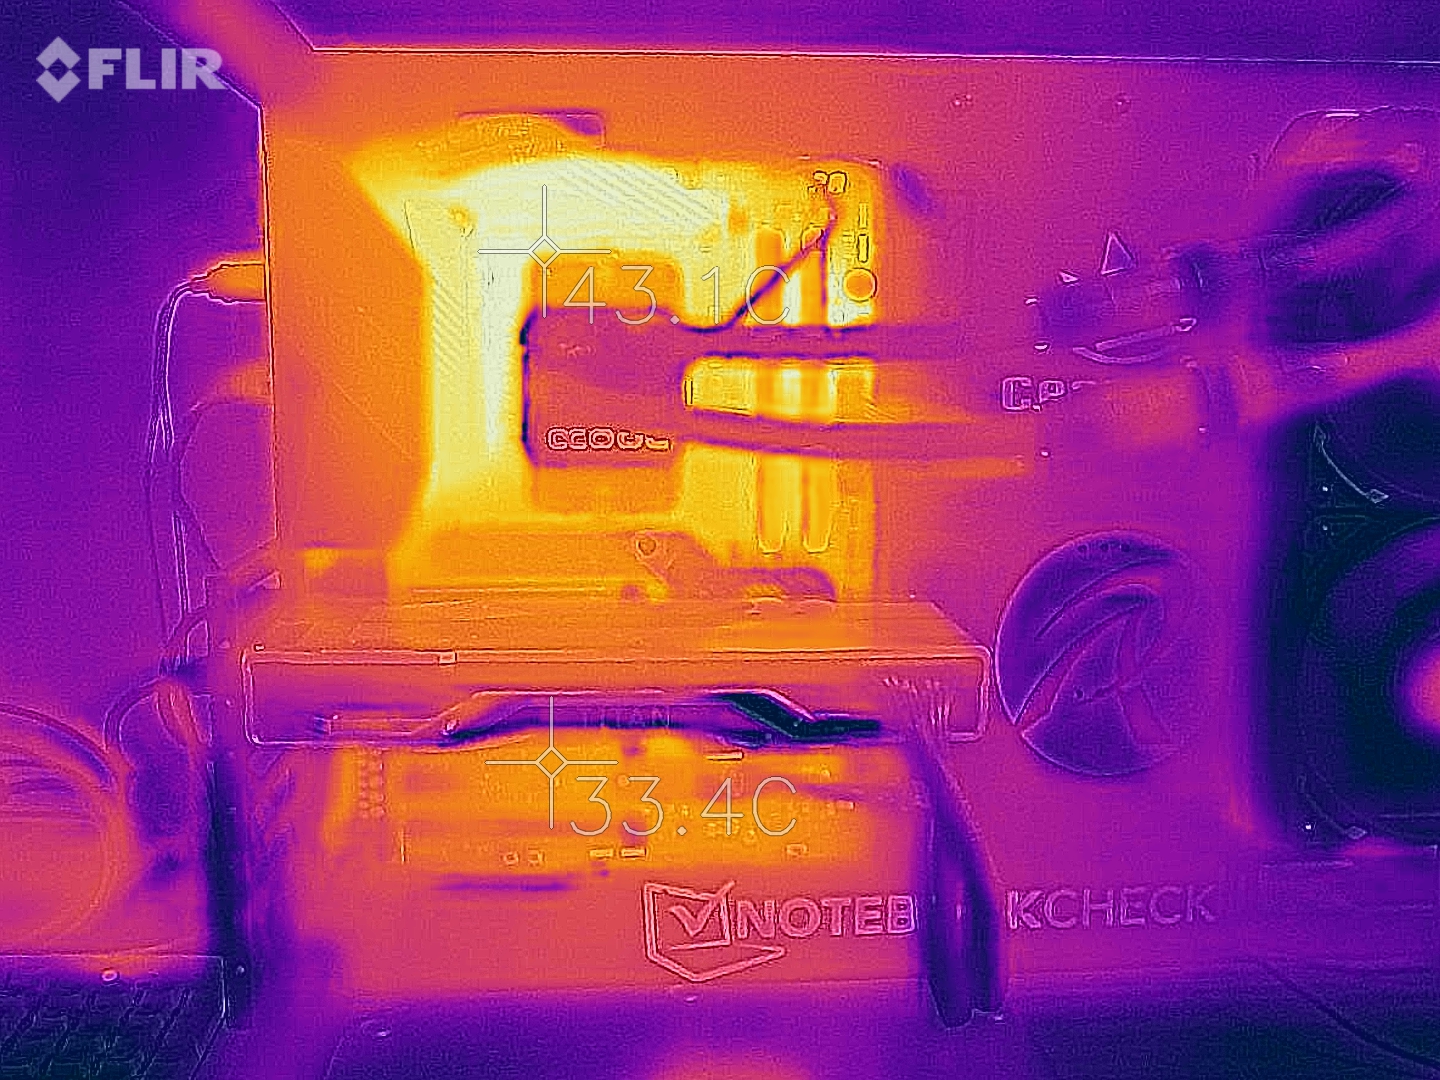
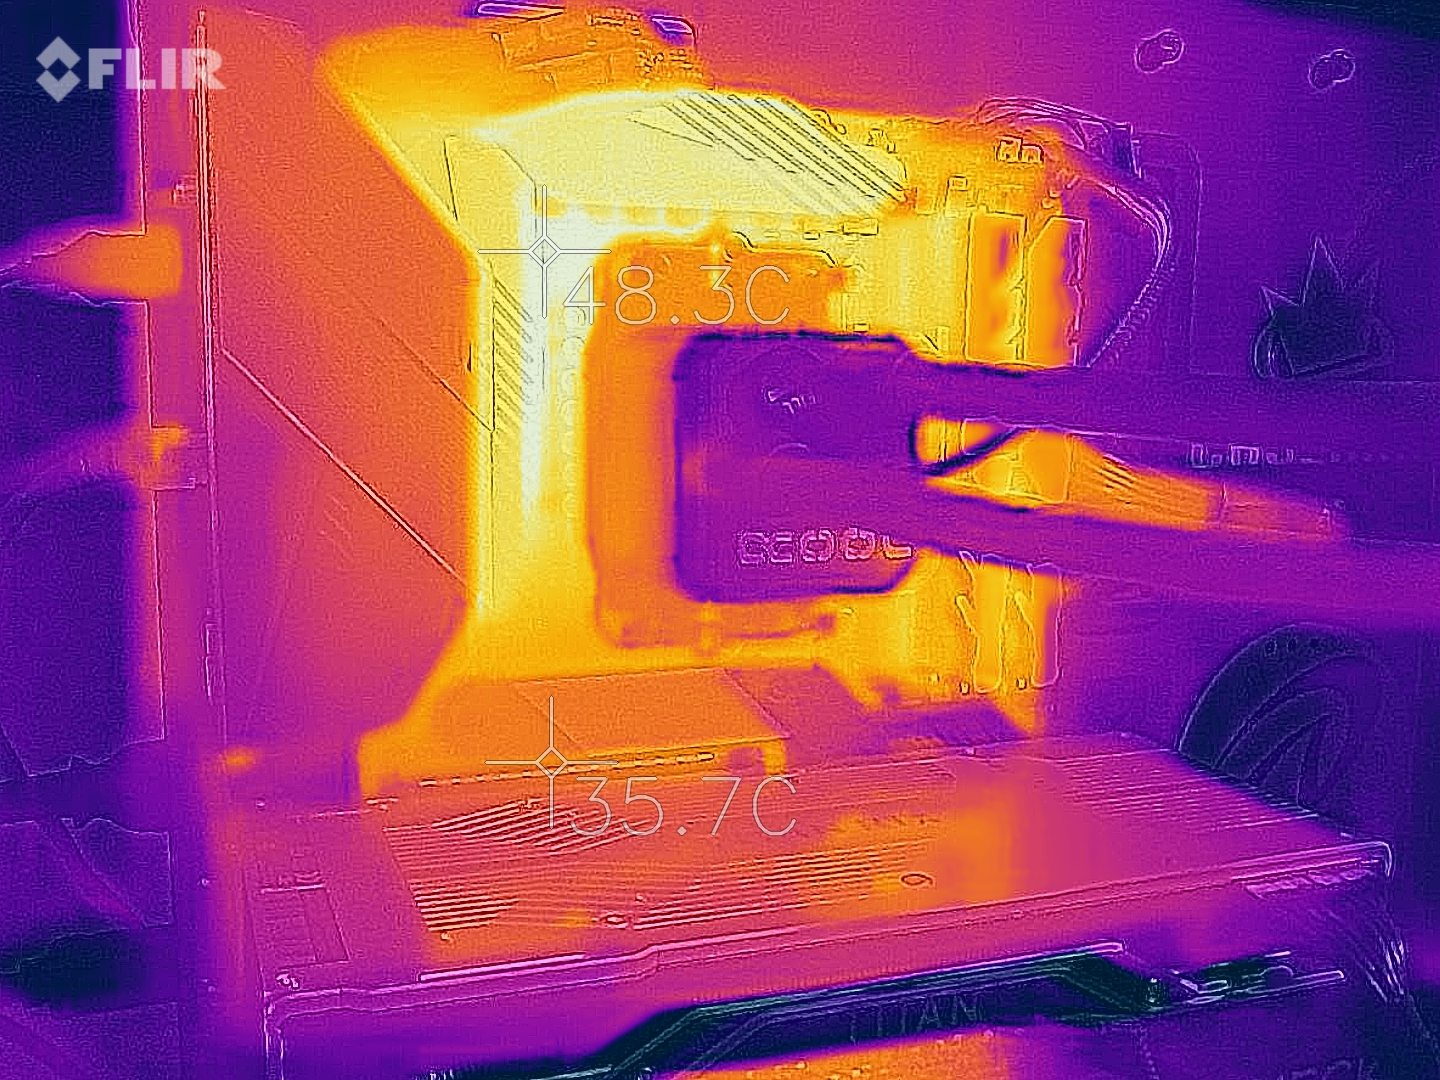
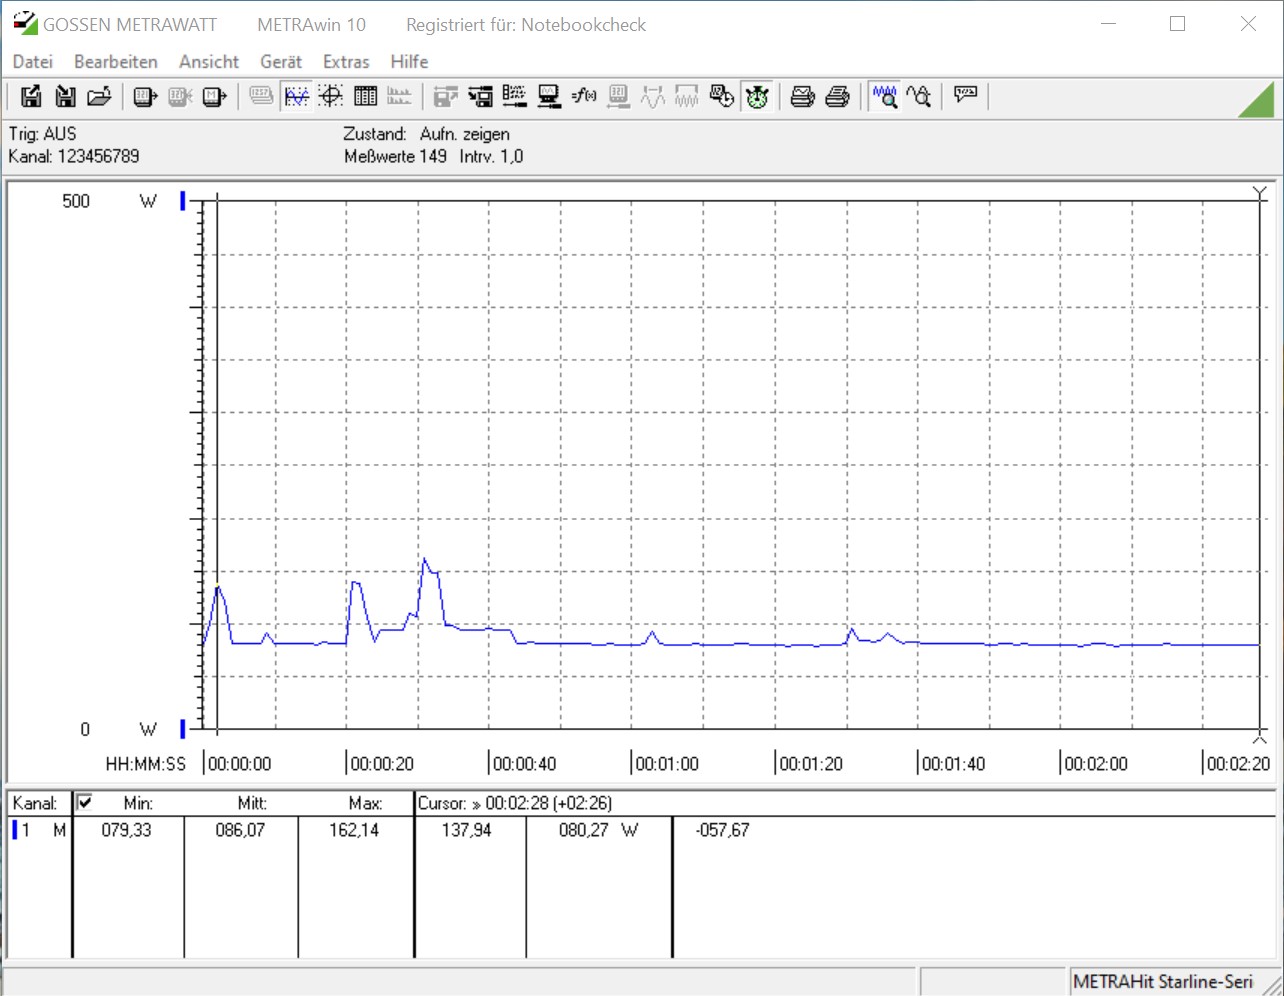
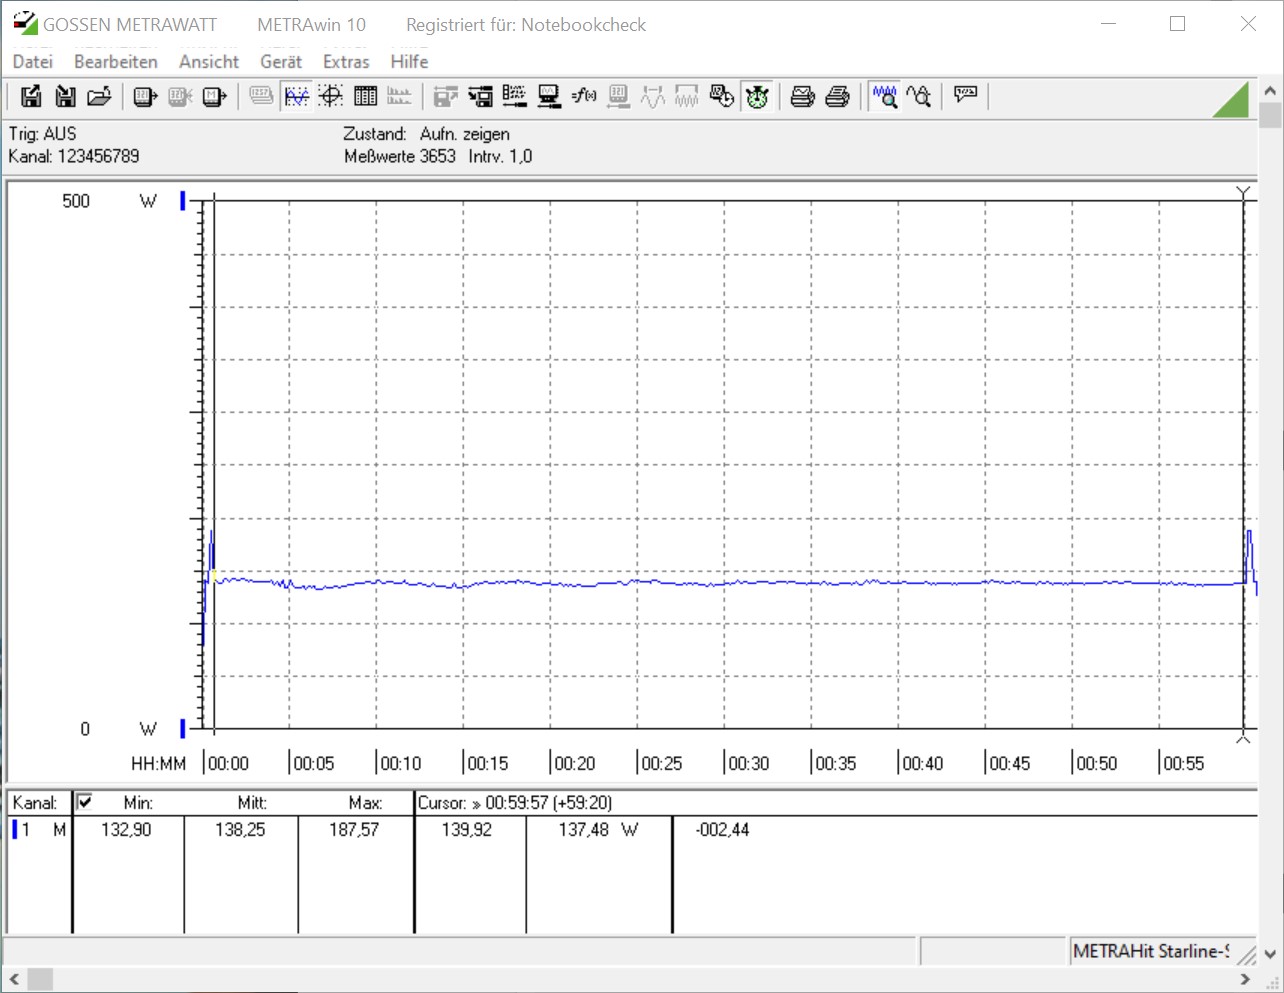
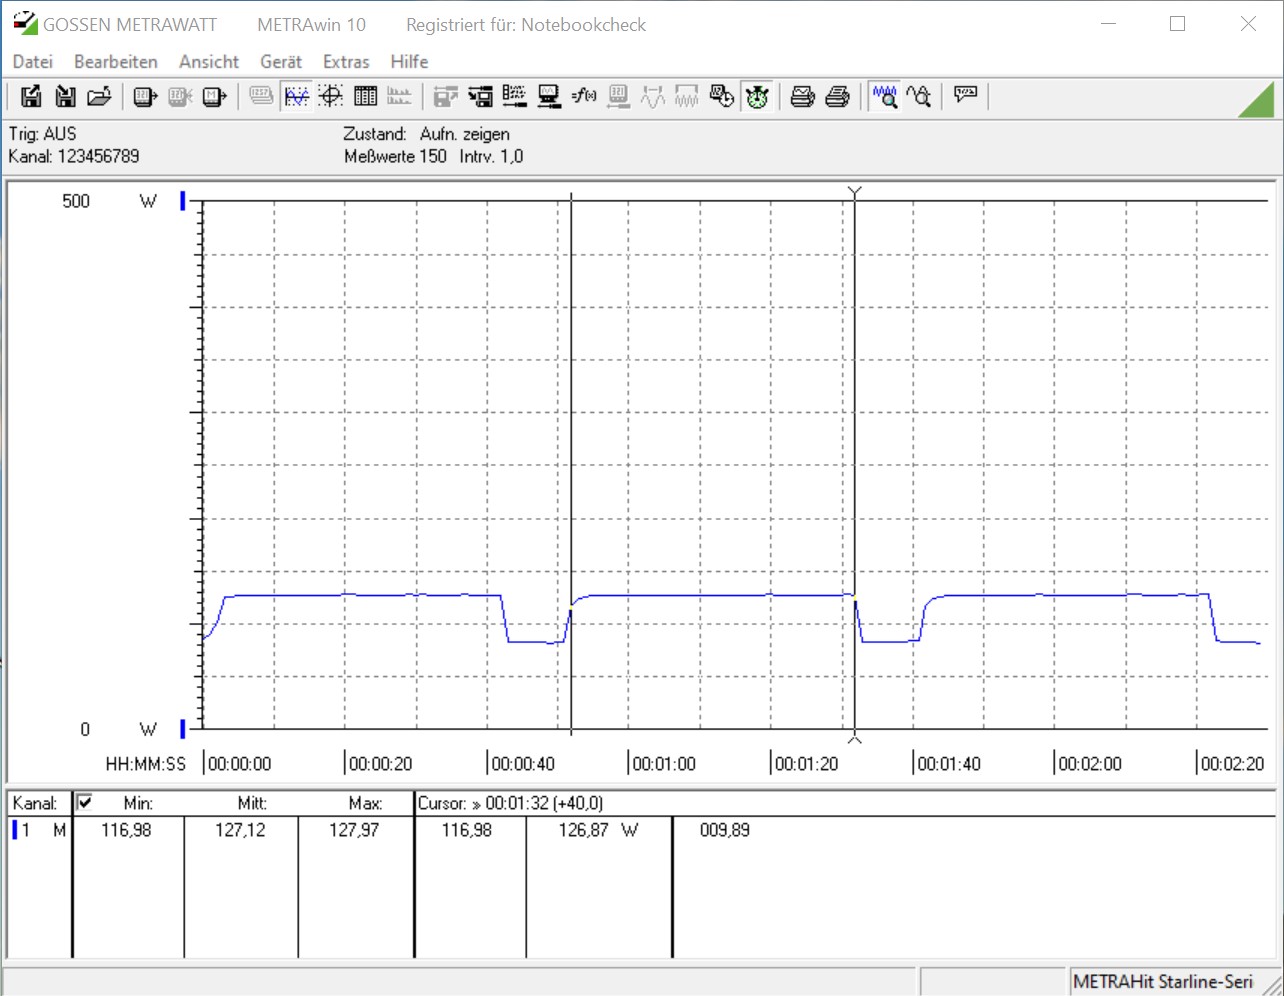
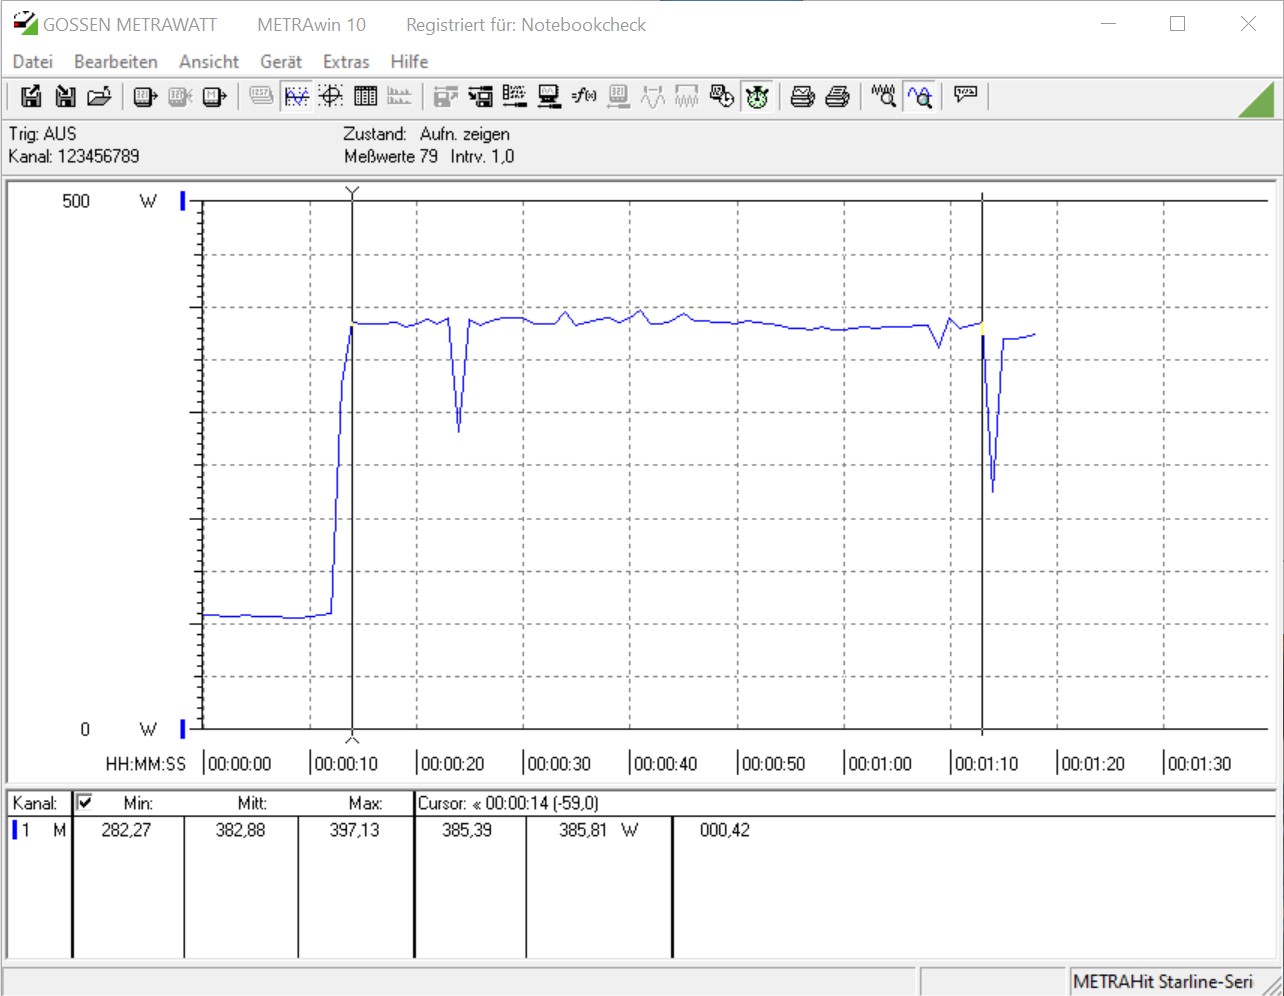
Consumo Energetico - Quanto sono efficienti dal punto di vista energetico le nuove CPU quad-core?
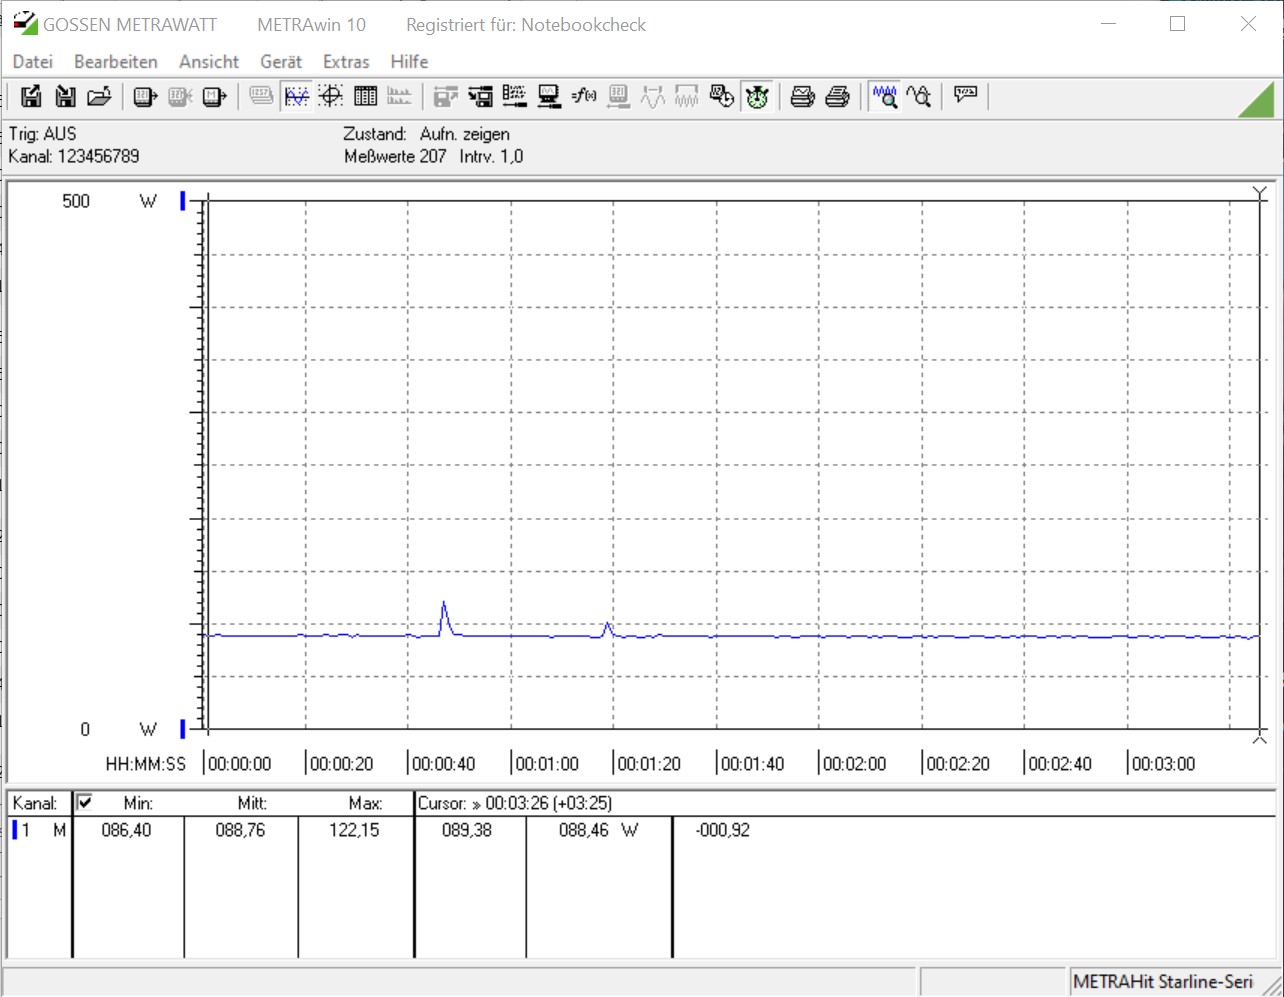
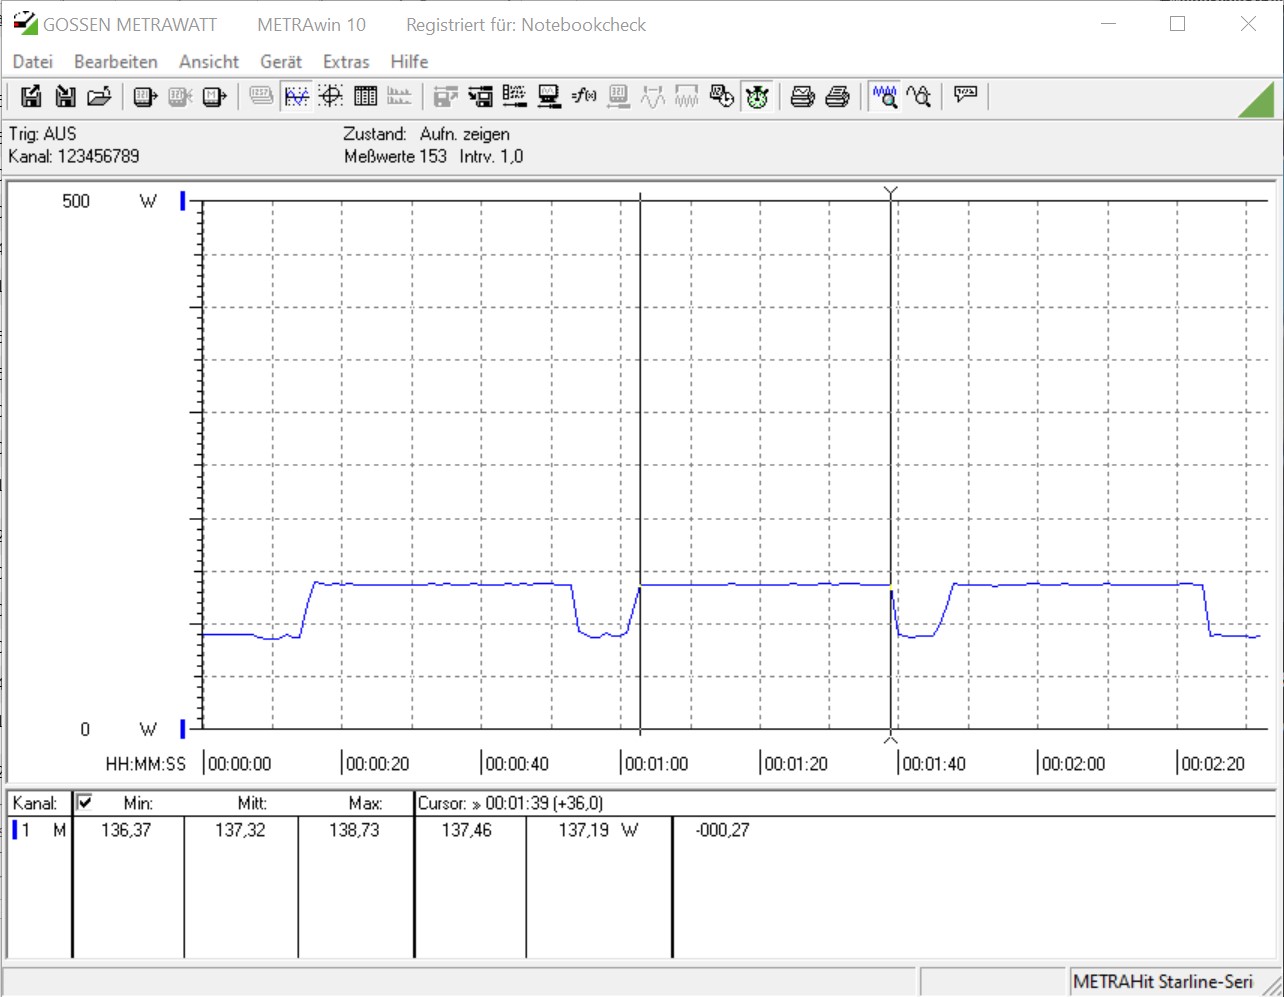
Secondo AMD, entrambi i nuovi modelli Ryzen 3 hanno un TDP massimo di 65 watt, che è stato soddisfatto anche nel test di stress della nostra recensione. Tuttavia, AMD deve ancora lavorare sulla modalità di inattività se l'azienda vuole mettere Intel sotto pressione. Con 86 e 88 watt, il sistema AMD consuma senza carico quasi 30 watt in più di energia rispetto alla nostra piattaforma Intel. Anche la scheda madre e le corrispondenti impostazioni del BIOS giocano un ruolo importante in questa valutazione, quindi non si dovrebbe dare la colpa solo alle CPU AMD per il maggior consumo di energia.
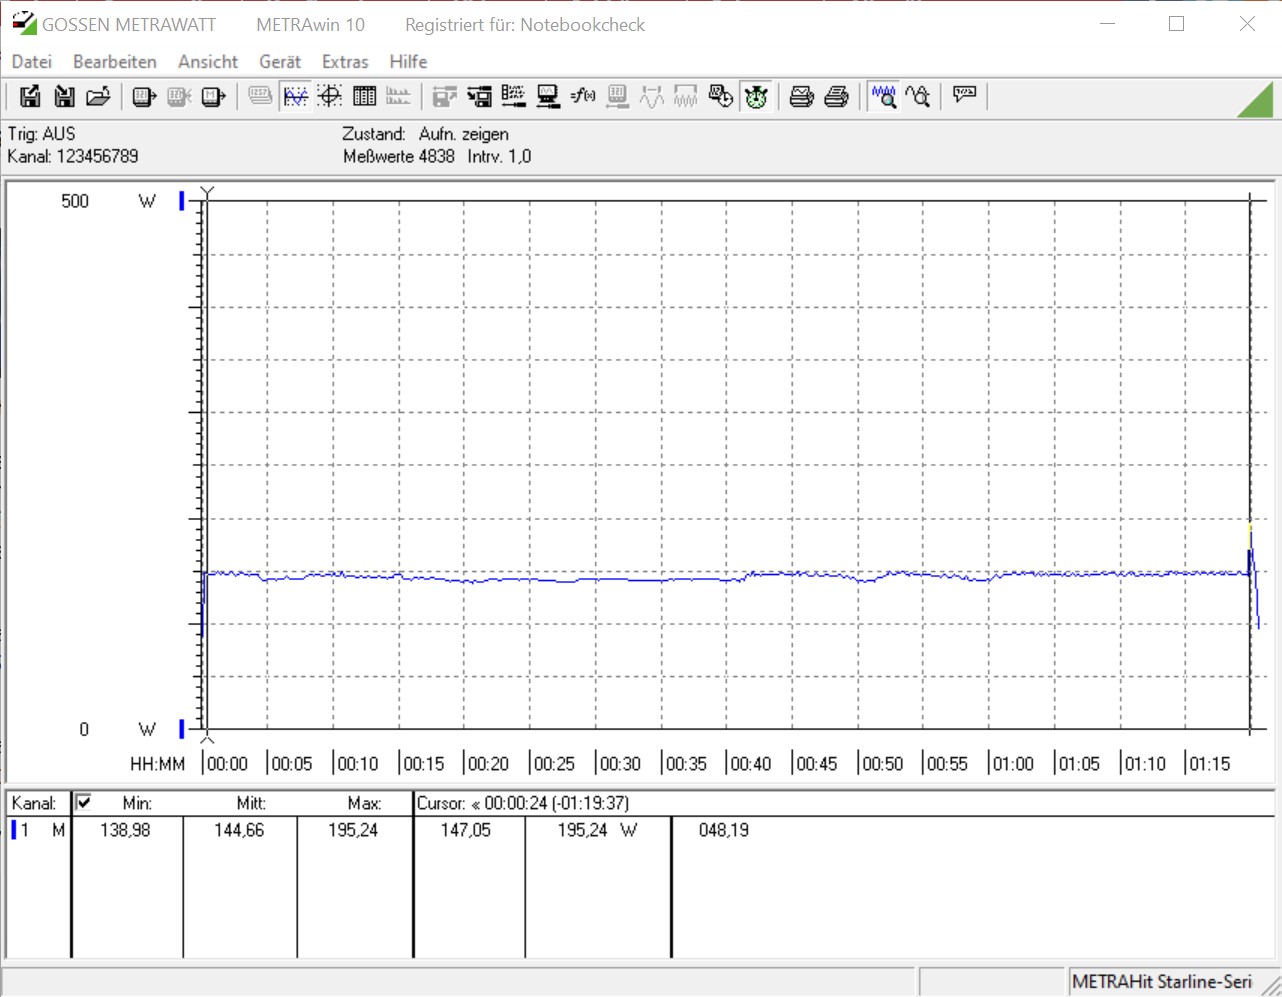
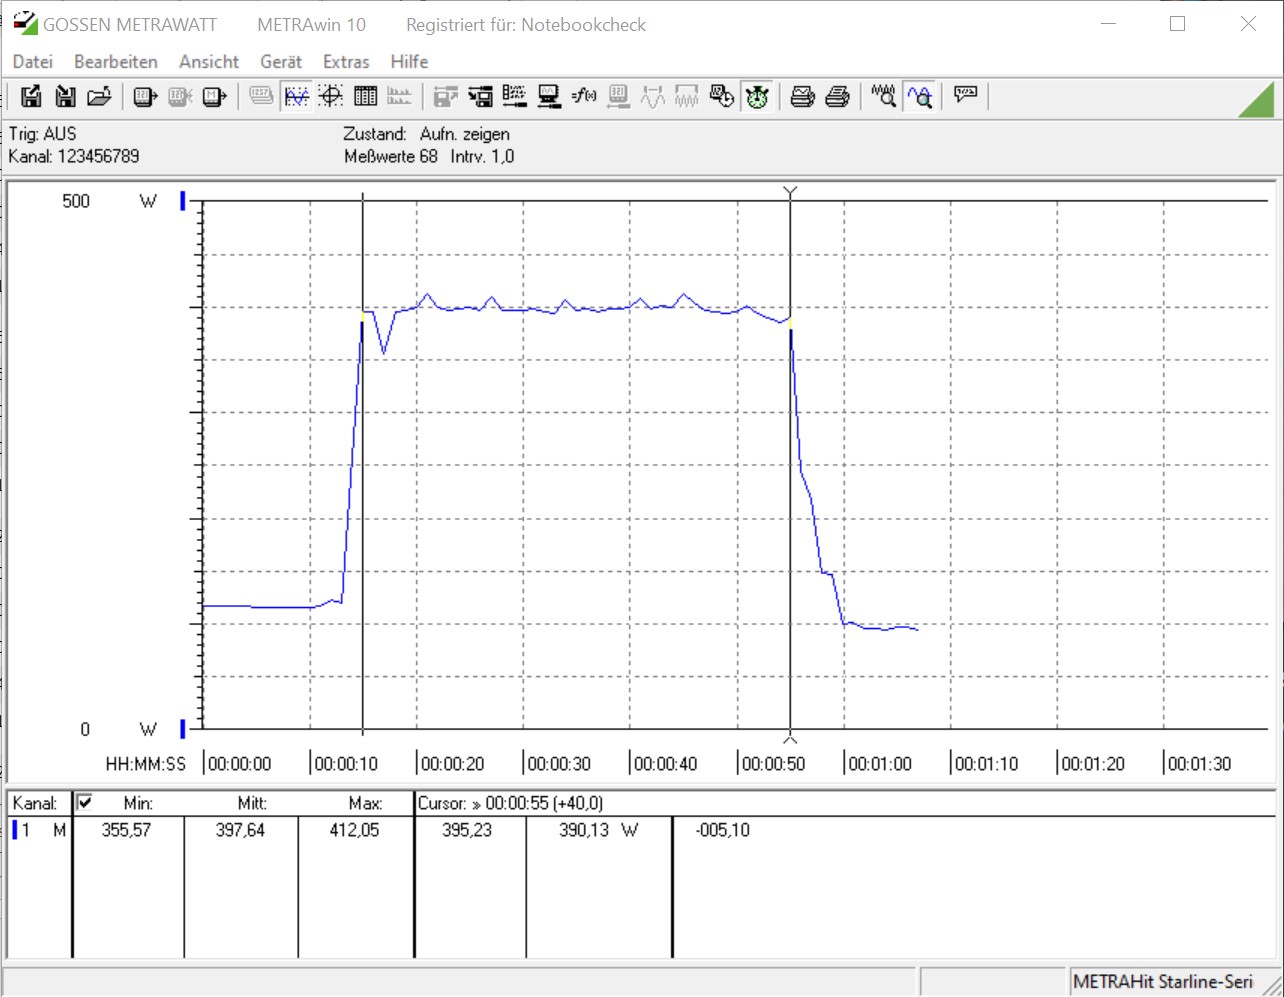
In pratica, AMD Ryzen 3 3100 è un po' più efficiente dal punto di vista energetico rispetto ad AMD Ryzen 3 3300X. Tuttavia, Intel dimostra a questo punto che la sua gestione dell'alimentazione funziona abbastanza bene. Quando si gioca a giochi in cui la scheda grafica (Nvidia Titan RTX con circa 280 watt) rappresenta la maggior parte, tutti i sistemi sono vicini l'uno all'altro.
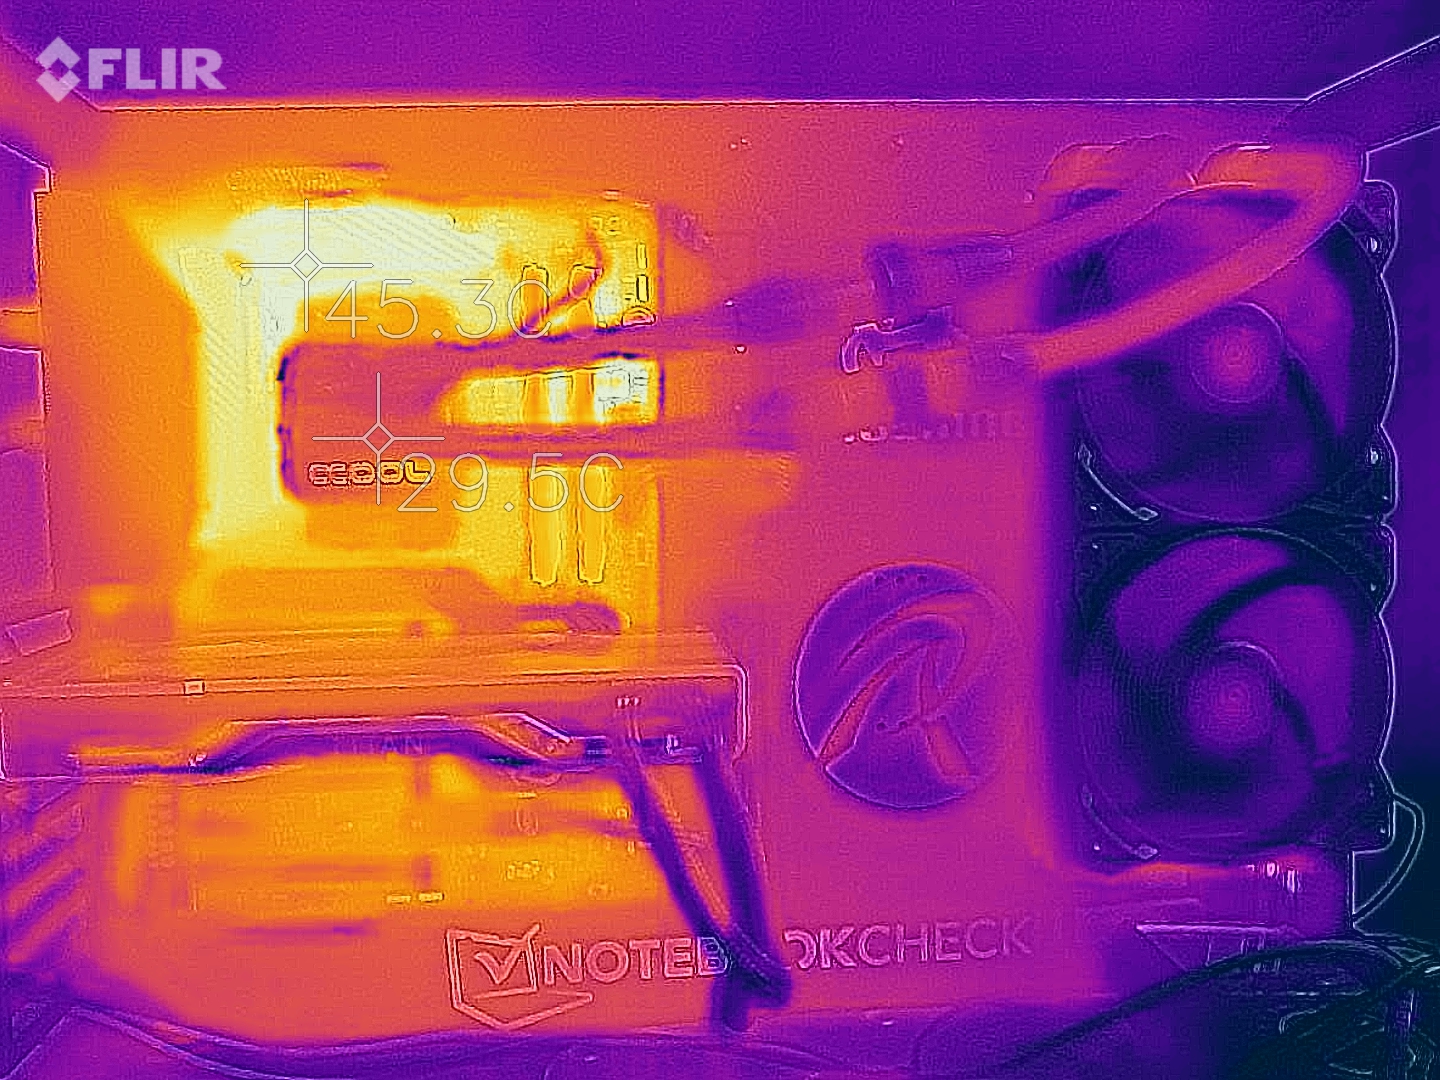
Le temperature misurate nello stress test sono sempre in intervalli acritici grazie all'Alphacool Eisbaer 280 AiO. L'AMD Ryzen 3 3300X è stato il più caldo a 77,5 °C (~172 °F). Dal momento che solo un cluster CCX è attivo qui, il calore è concentrato su un'area più piccola, che è probabilmente anche la ragione per cui il processore è diventato un po 'più caldo rispetto al Ryzen AMD 3 3100 (70,3 ° C (~ 159 °F)) nel test.
Nota: l'intero sistema di prova è stato considerato senza un monitor per determinare i valori di consumo energetico.
| Power Consumption | |
| 1920x1080 The Witcher 3 ultra (external Monitor) | |
| AMD Ryzen 5 1600 (12nm) (Idle: 85.9 W) | |
| AMD Ryzen 3 3300X (Idle: 88.8 W) | |
| AMD Ryzen 3 3100 (Idle: 86 W) | |
| Intel Core i5 9400F (Idle: 57 W) | |
| Intel Core i3 9100F (Idle: 56 W) | |
| Prime95 V2810 Stress (external Monitor) | |
| AMD Ryzen 5 1600 (12nm) (Idle: 85.9 W) | |
| AMD Ryzen 3 3300X (Idle: 88.8 W) | |
| Intel Core i3 9100F (Idle: 56 W) | |
| AMD Ryzen 3 3100 (Idle: 86 W) | |
| Intel Core i5 9400F (Idle: 57 W) | |
| Cinebench R15 Multi (external Monitor) | |
| AMD Ryzen 5 1600 (12nm) (Idle: 85.9 W) | |
| AMD Ryzen 3 3300X (Idle: 88.8 W) | |
| AMD Ryzen 3 3100 (Idle: 86 W) | |
| Intel Core i5 9400F (Idle: 57 W) | |
| Intel Core i3 9100F (Idle: 56 W) | |
| Temperatures - CPU Temperature Prime95 | |
| AMD Ryzen 3 3300X | |
| Intel Core i3 9100F | |
| AMD Ryzen 3 3100 | |
| AMD Ryzen 5 1600 (12nm) | |
| Intel Core i5 9400F | |
* ... Meglio usare valori piccoli
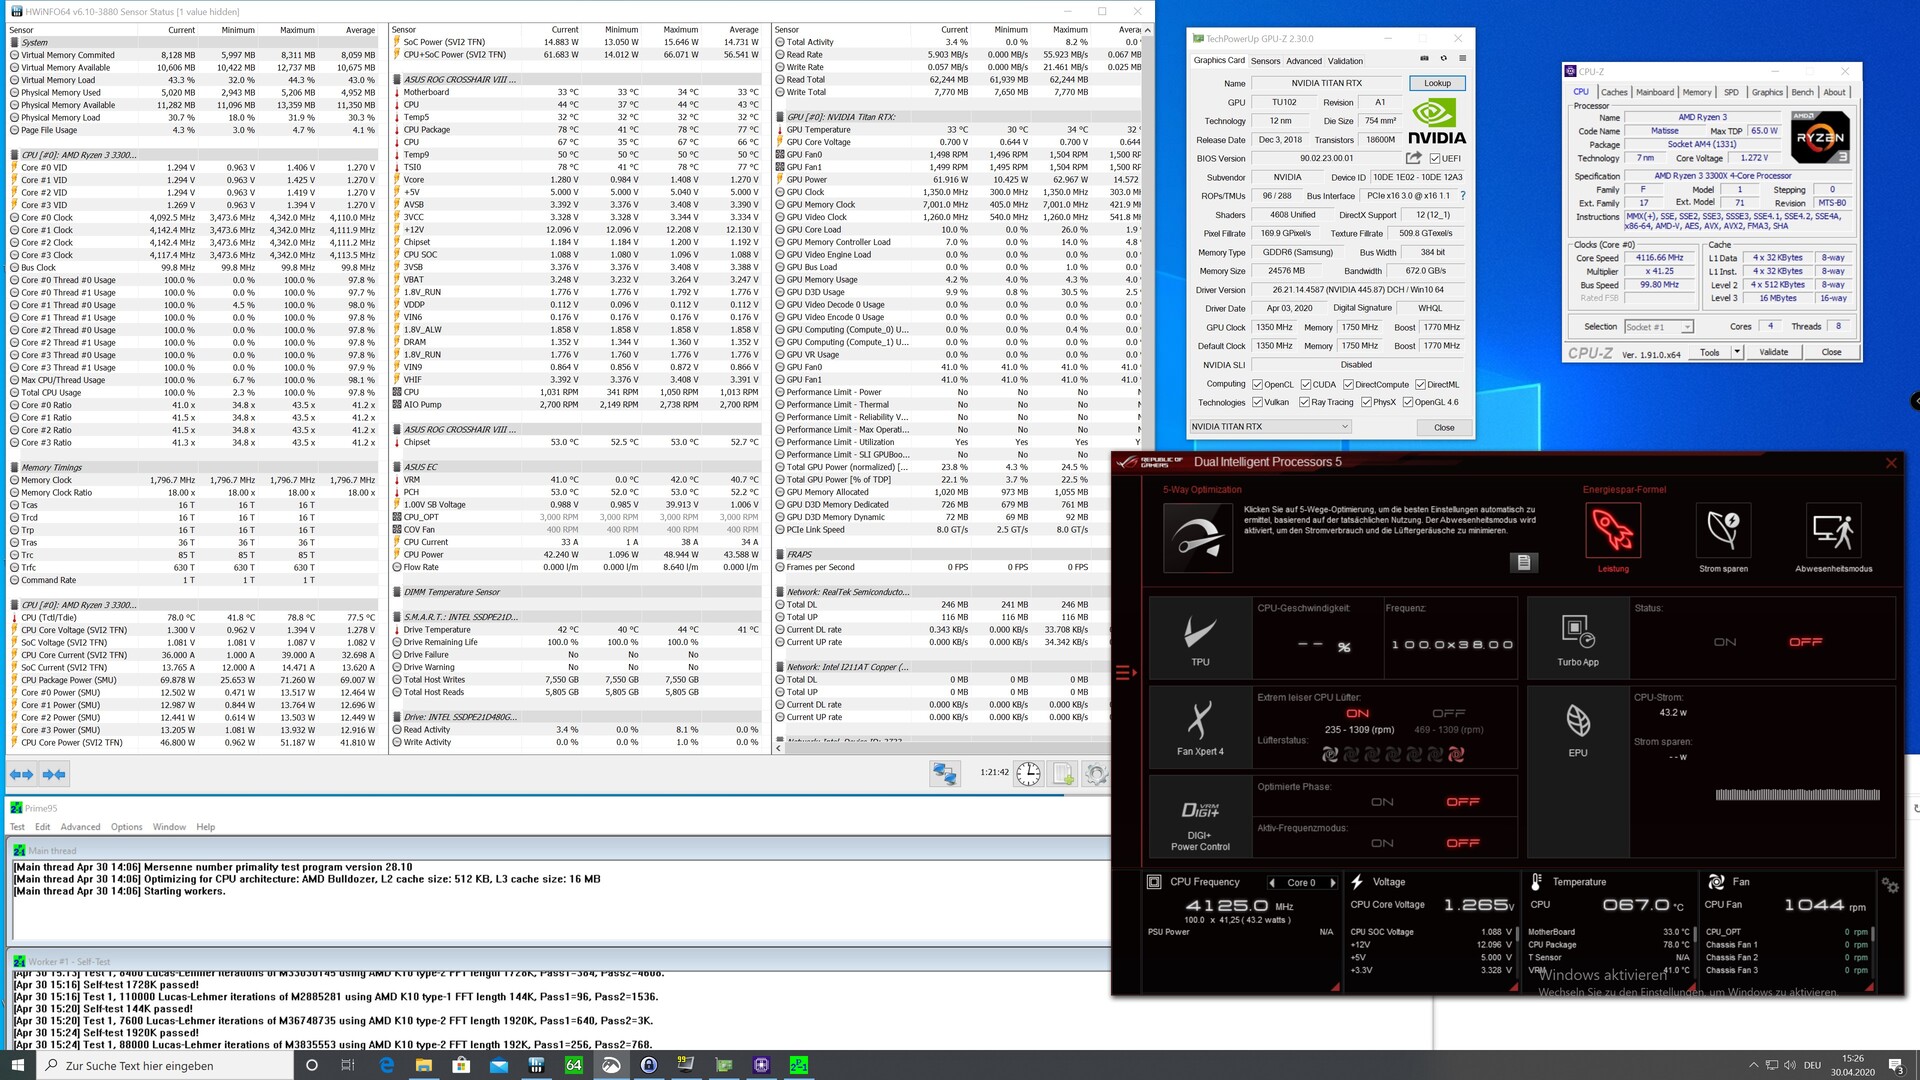
Overclocking - Estrazione del potere nascosto
Se si vuole spremere un po' più di prestazioni dal processore, l'unica opzione rimasta è l'overclocking. Lo abbiamo fatto anche con i due modelli Ryzen 3 e siamo stati in grado di ottenere un aumento delle prestazioni fino al 14%. L'AMD Ryzen 3 3100 fa il salto di prestazioni più grande grazie alla minore velocità di clock di base.
Entrambi i processori possono essere gestiti a 4,4 GHz su tutti i cores senza problemi e con poco sforzo. Tuttavia, un funzionamento stabile non era più possibile a 4,5 GHz. Questo richiede un raffreddamento sufficiente a garantire una certa stabilità. La Nvidia Titan RTX utilizzata nel test non ha potuto però beneficiare delle migliori prestazioni della CPU.
| Performance rating - Percent | |
| AMD Ryzen 3 3300X @ 4.4 GHz | |
| AMD Ryzen 3 3300X | |
| AMD Ryzen 3 3100 @ 4.4 GHz | |
| AMD Ryzen 5 1600 (12nm) | |
| Intel Core i5 9400F | |
| AMD Ryzen 3 3100 | |
| Intel Core i3 9100F | |
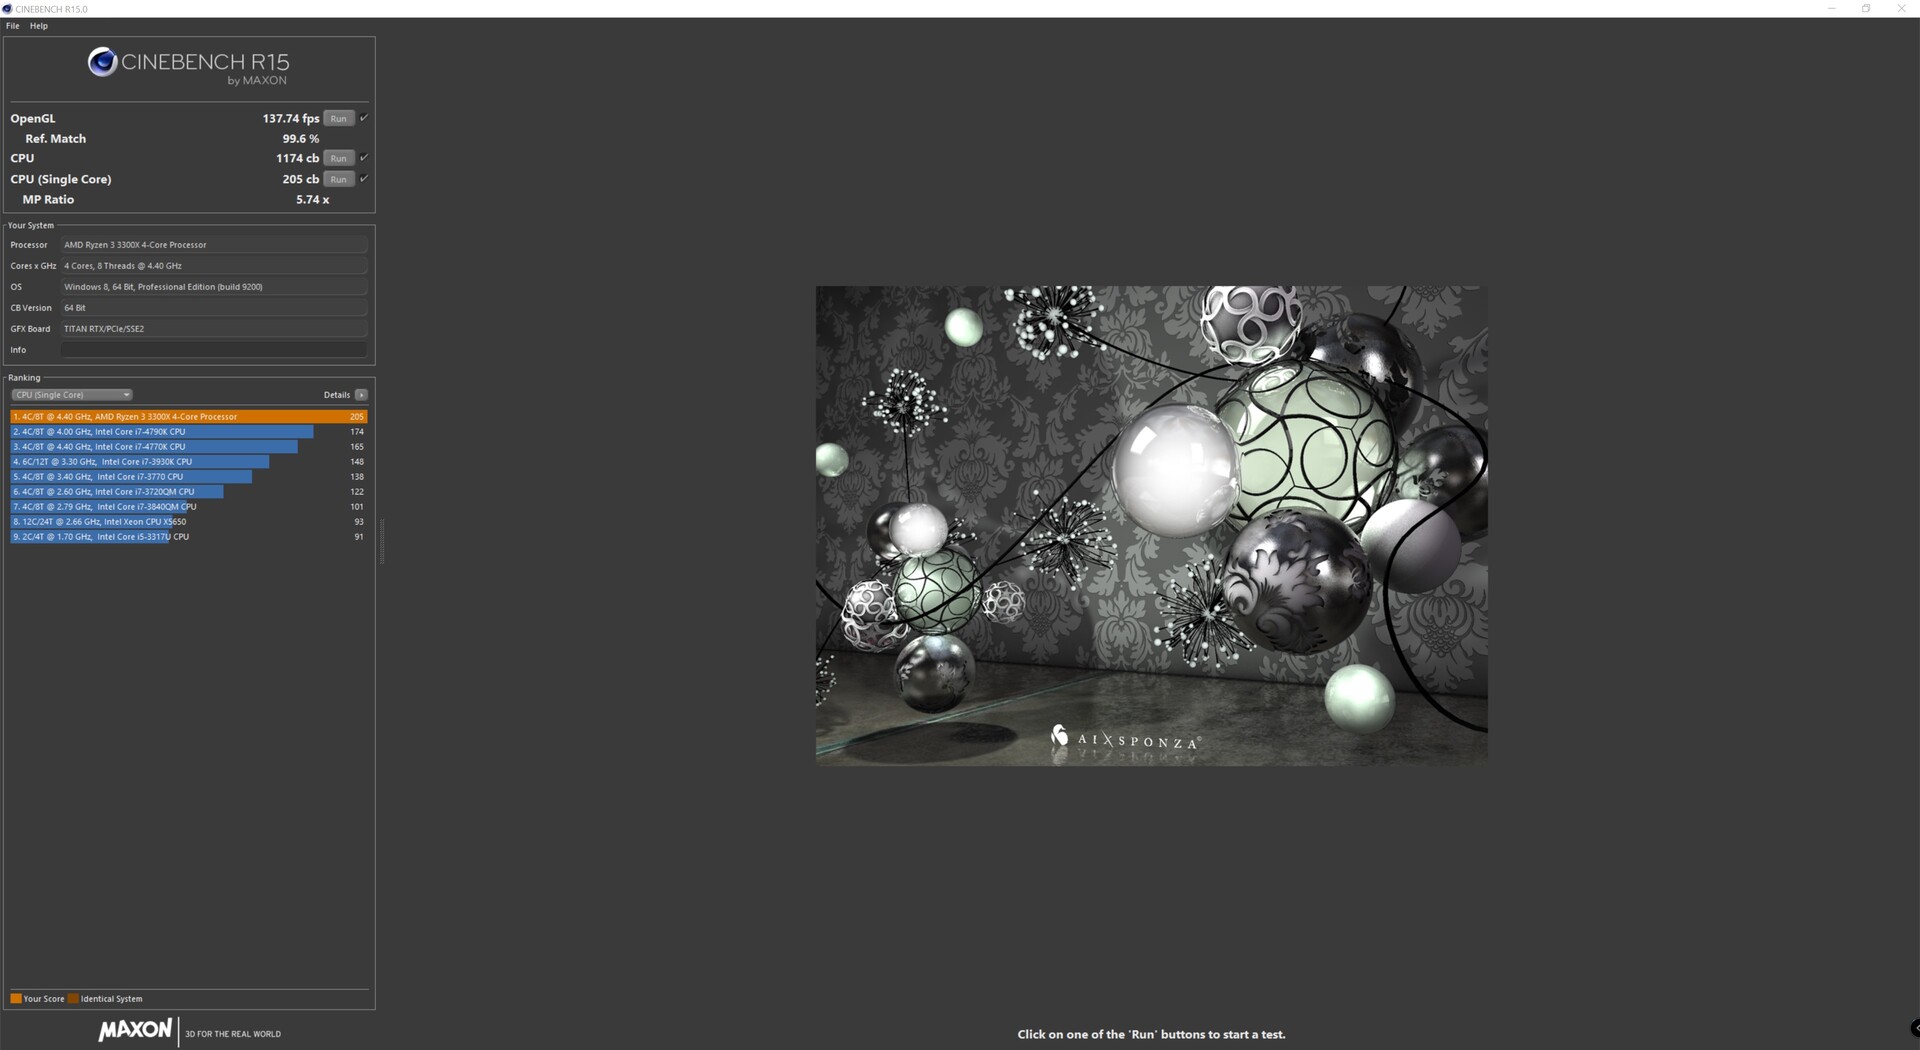
| Cinebench R15 | |
| CPU Single 64Bit | |
| AMD Ryzen 3 3300X @ 4.4 GHz | |
| AMD Ryzen 3 3100 @ 4.4 GHz | |
| AMD Ryzen 3 3300X | |
| AMD Ryzen 3 3100 | |
| Intel Core i5 9400F | |
| Intel Core i3 9100F | |
| AMD Ryzen 5 1600 (12nm) | |
| CPU Multi 64Bit | |
| AMD Ryzen 5 1600 (12nm) | |
| AMD Ryzen 3 3300X @ 4.4 GHz | |
| AMD Ryzen 3 3100 @ 4.4 GHz | |
| AMD Ryzen 3 3300X | |
| AMD Ryzen 3 3100 | |
| Intel Core i5 9400F | |
| Intel Core i3 9100F | |
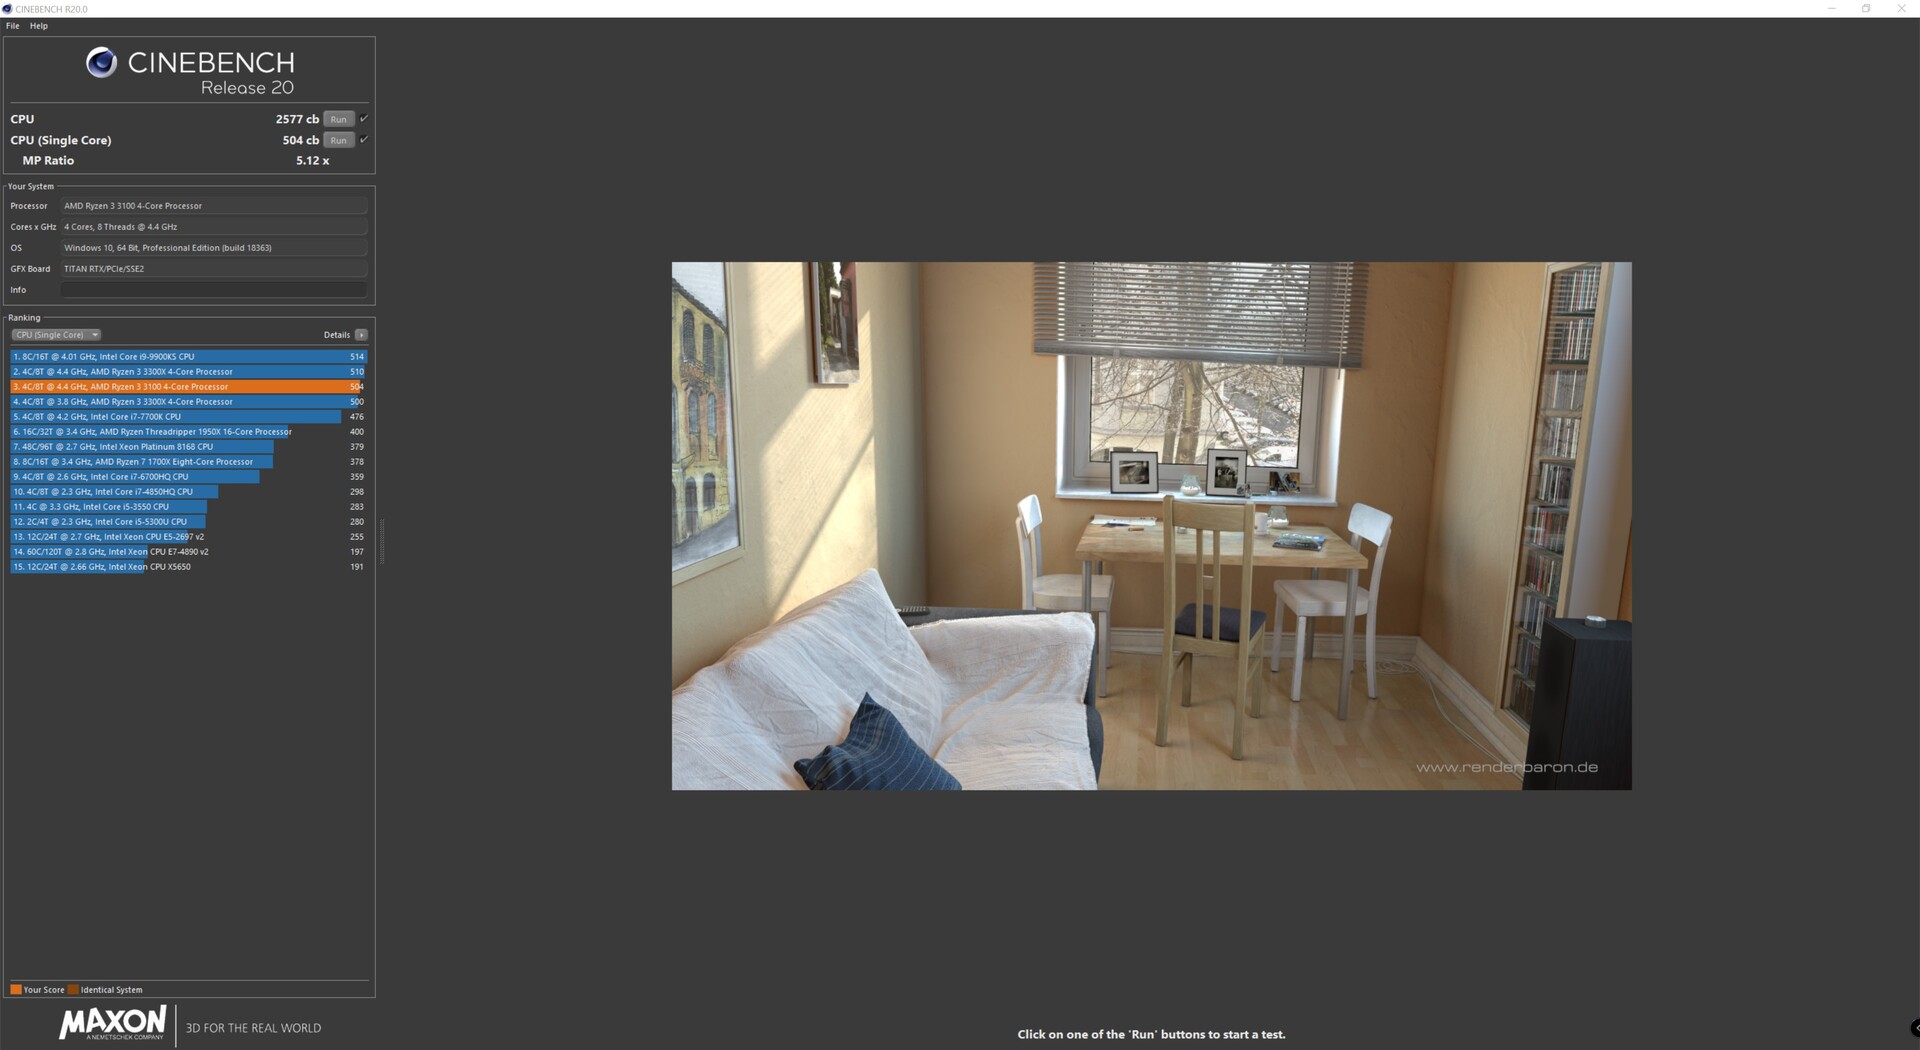
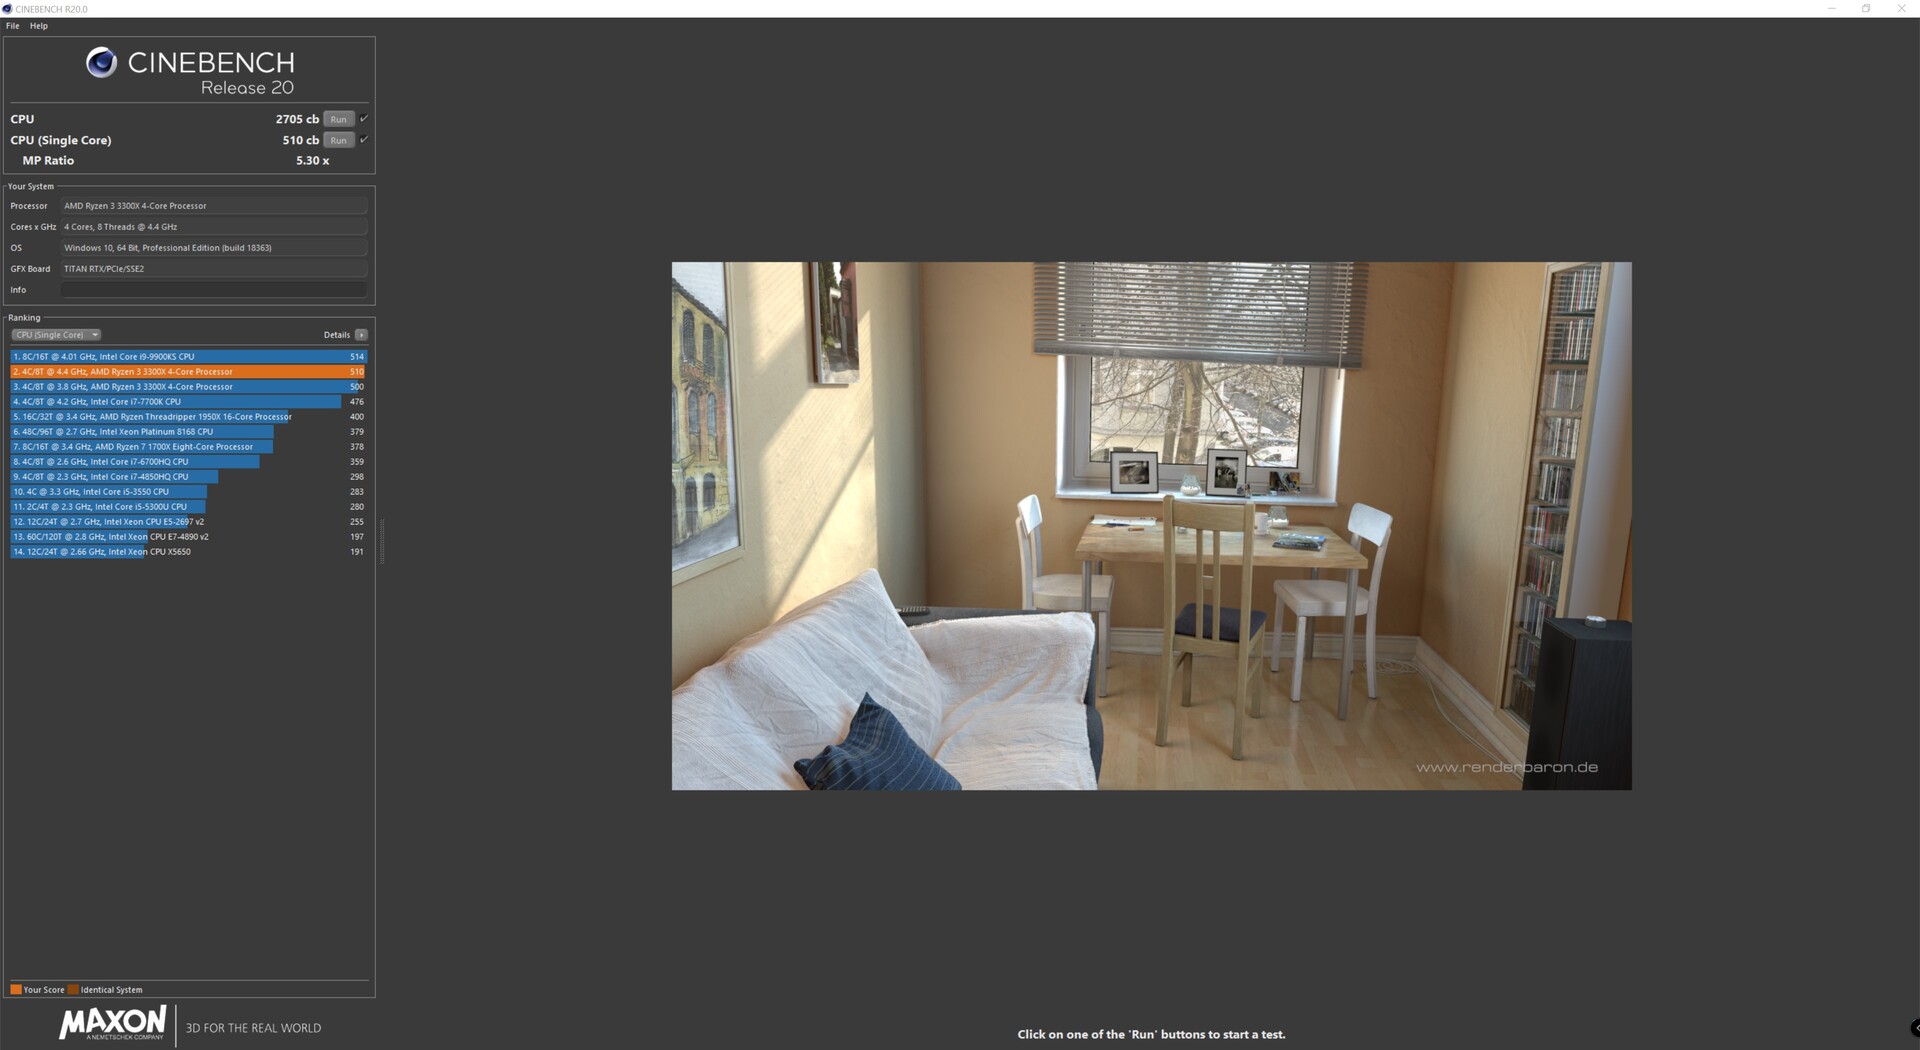
| Cinebench R20 | |
| CPU (Single Core) | |
| AMD Ryzen 3 3300X @ 4.4 GHz | |
| AMD Ryzen 3 3100 @ 4.4 GHz | |
| AMD Ryzen 3 3300X | |
| AMD Ryzen 3 3100 | |
| Intel Core i5 9400F | |
| Intel Core i3 9100F | |
| AMD Ryzen 5 1600 (12nm) | |
| CPU (Multi Core) | |
| AMD Ryzen 3 3300X @ 4.4 GHz | |
| AMD Ryzen 5 1600 (12nm) | |
| AMD Ryzen 3 3100 @ 4.4 GHz | |
| AMD Ryzen 3 3300X | |
| Intel Core i5 9400F | |
| AMD Ryzen 3 3100 | |
| Intel Core i3 9100F | |
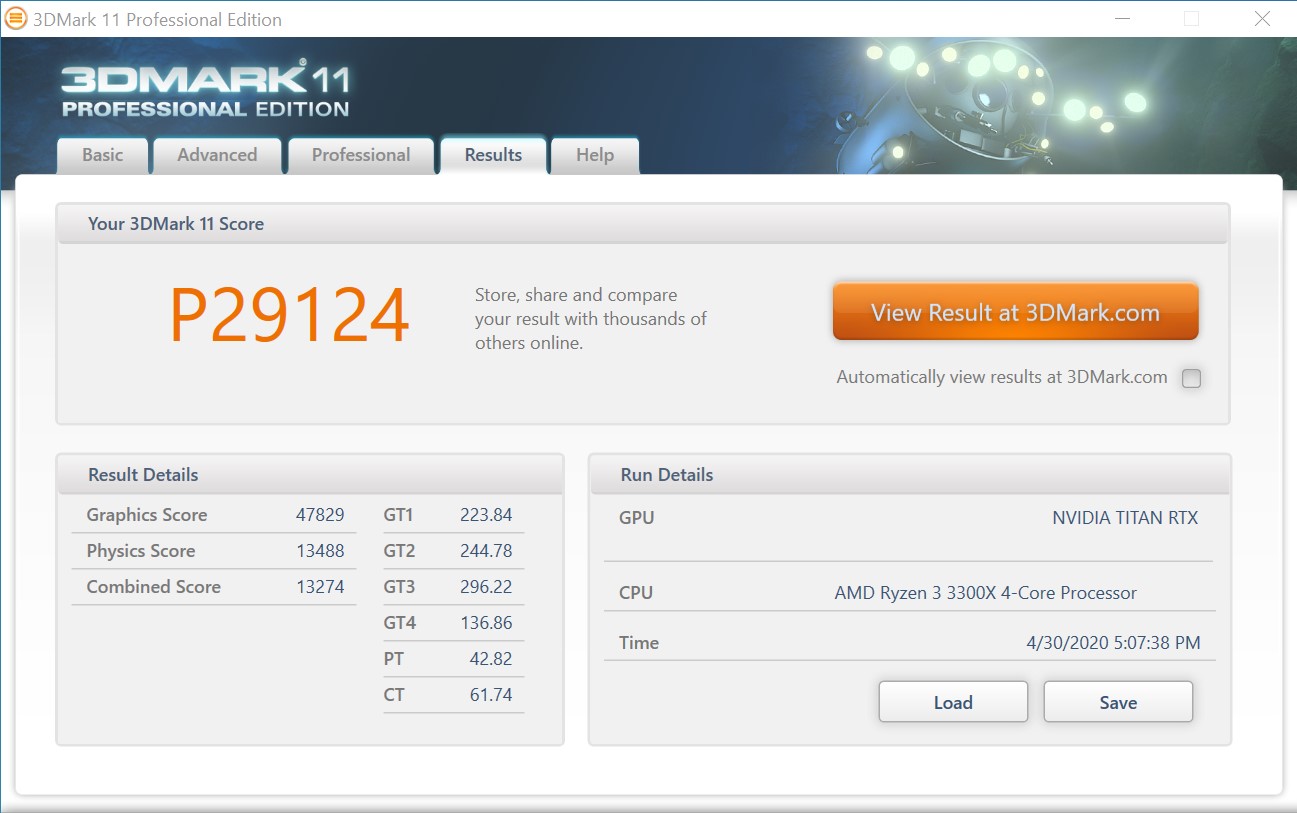
| 3DMark 11 | |
| 1280x720 Performance | |
| AMD Ryzen 3 3300X @ 4.4 GHz | |
| AMD Ryzen 3 3300X | |
| AMD Ryzen 3 3100 @ 4.4 GHz | |
| Intel Core i5 9400F | |
| AMD Ryzen 5 1600 (12nm) | |
| AMD Ryzen 3 3100 | |
| Intel Core i3 9100F | |
| 1280x720 Performance GPU | |
| Intel Core i3 9100F | |
| Intel Core i5 9400F | |
| AMD Ryzen 3 3300X | |
| AMD Ryzen 3 3100 @ 4.4 GHz | |
| AMD Ryzen 3 3300X @ 4.4 GHz | |
| AMD Ryzen 5 1600 (12nm) | |
| AMD Ryzen 3 3100 | |
| 1280x720 Performance Physics | |
| AMD Ryzen 3 3300X @ 4.4 GHz | |
| AMD Ryzen 3 3300X | |
| AMD Ryzen 5 1600 (12nm) | |
| AMD Ryzen 3 3100 @ 4.4 GHz | |
| Intel Core i5 9400F | |
| AMD Ryzen 3 3100 | |
| Intel Core i3 9100F | |
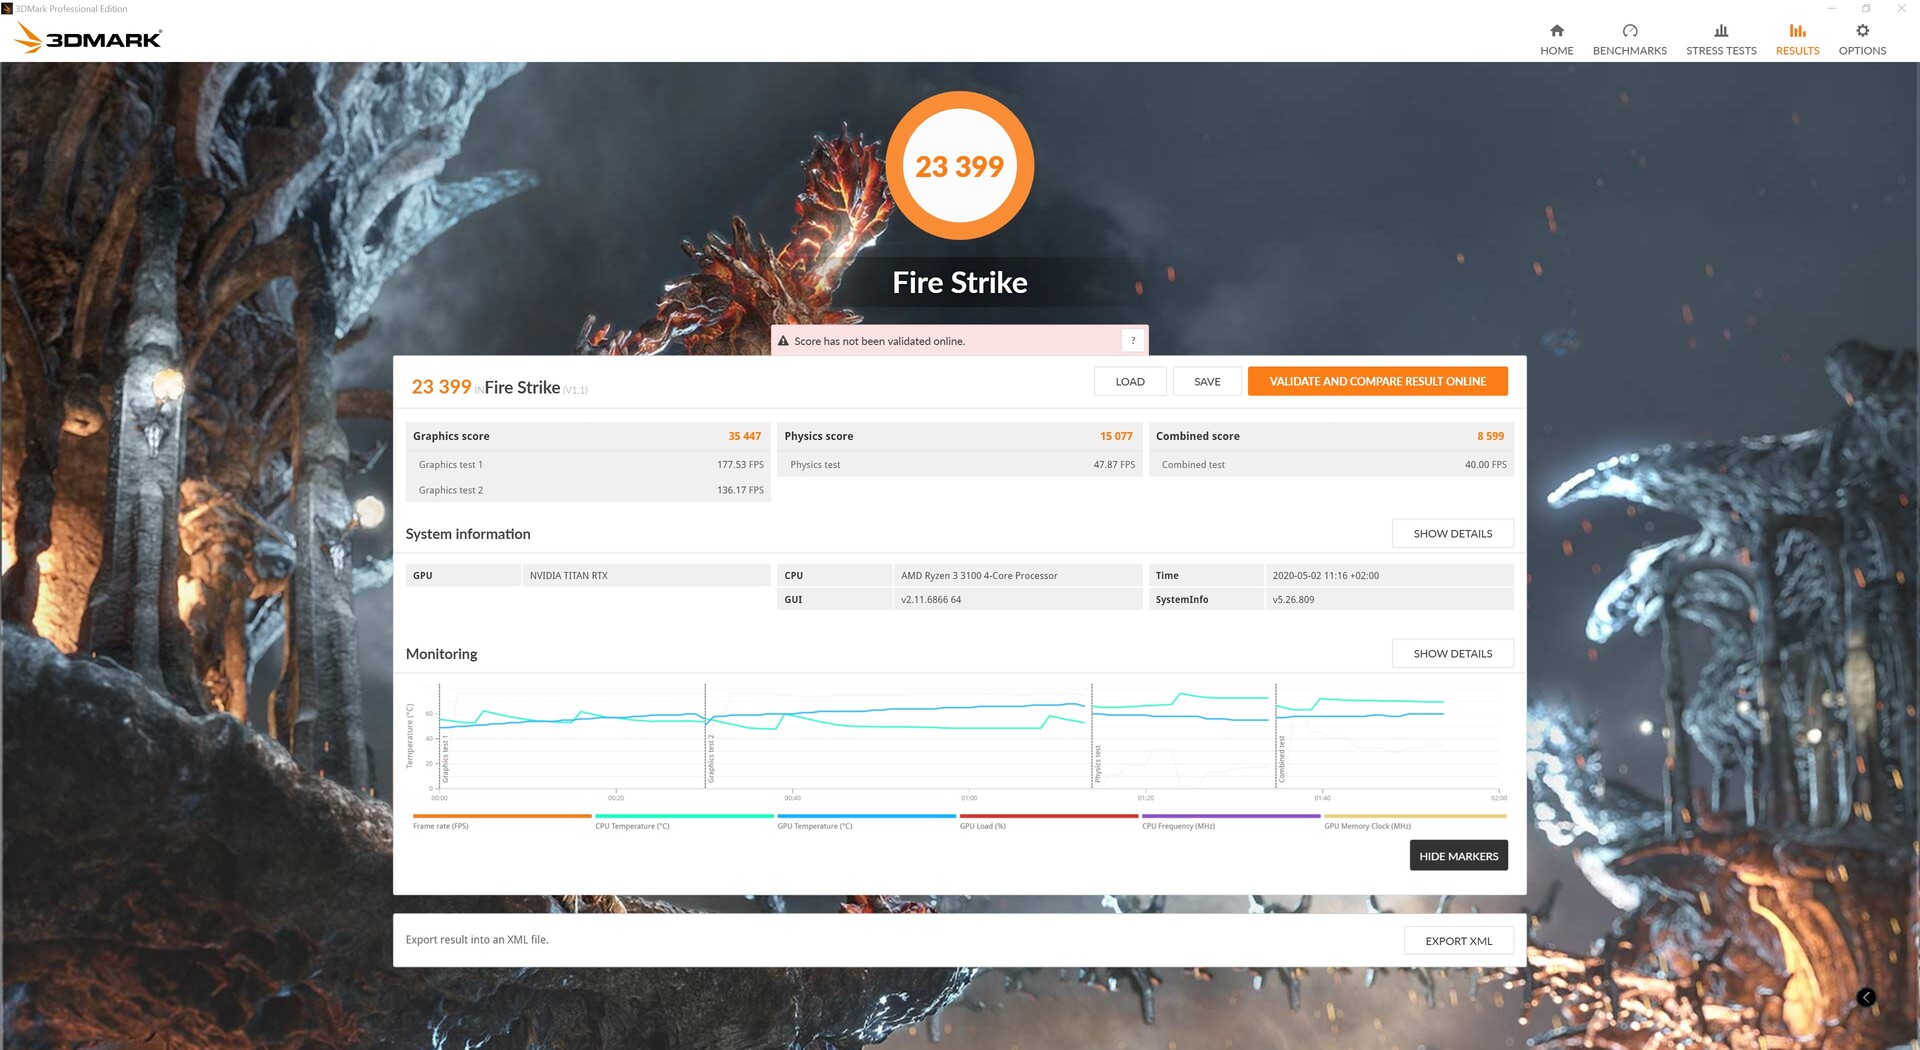
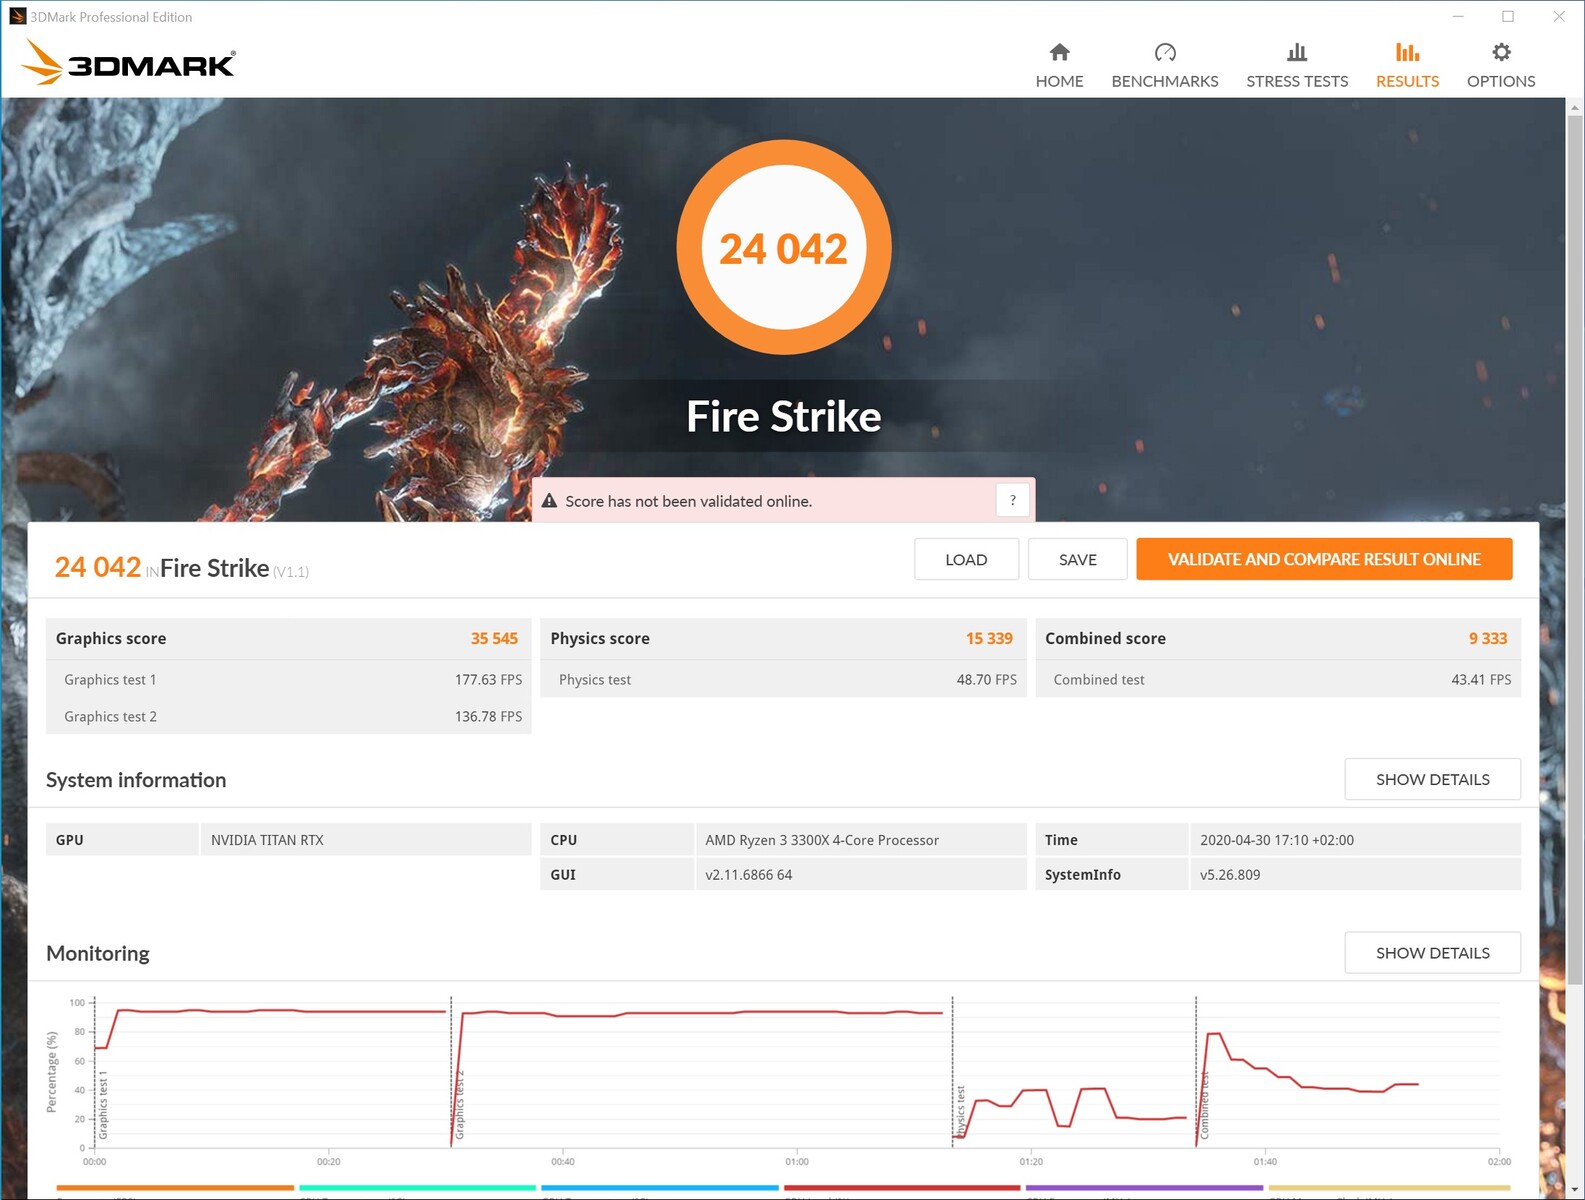
| 3DMark | |
| 1920x1080 Fire Strike Score | |
| AMD Ryzen 3 3300X @ 4.4 GHz | |
| AMD Ryzen 3 3300X | |
| AMD Ryzen 3 3100 @ 4.4 GHz | |
| Intel Core i5 9400F | |
| AMD Ryzen 5 1600 (12nm) | |
| AMD Ryzen 3 3100 | |
| Intel Core i3 9100F | |
| 1920x1080 Fire Strike Graphics | |
| Intel Core i3 9100F | |
| Intel Core i5 9400F | |
| AMD Ryzen 3 3100 | |
| AMD Ryzen 3 3300X @ 4.4 GHz | |
| AMD Ryzen 3 3100 @ 4.4 GHz | |
| AMD Ryzen 3 3300X | |
| AMD Ryzen 5 1600 (12nm) | |
| 1920x1080 Fire Strike Physics | |
| AMD Ryzen 5 1600 (12nm) | |
| AMD Ryzen 3 3300X @ 4.4 GHz | |
| AMD Ryzen 3 3100 @ 4.4 GHz | |
| AMD Ryzen 3 3300X | |
| AMD Ryzen 3 3100 | |
| Intel Core i5 9400F | |
| Intel Core i3 9100F | |
Ryzen 3 3100 @ 4.4 GHz


Ryzen 3 3300X @ 4.4 GHz
Pro
Contro
Giudizio Complessivo - Molte performance e prezzo contenuto
Con il nuovo Ryzen 3, AMD mostra ancora una volta cosa è possibile fare con Zen2. Rispetto alla precedente generazione basata su Zen+, le prestazioni sono aumentate in modo significativo. Inoltre, Intel è andata sempre più sotto pressione, ma questo potrebbe cambiare di nuovo presto perché Comet Lake-S è già ai blocchi di partenza. Per questo motivo, si potrebbe quasi pensare che AMD abbia dormito un po' durante l'inizio della nuova generazione Ryzen 3, dato che Zen2 è sul mercato da un po' di tempo. Ma AMD può ancora contare su PCI Express 4.0 come punto di forza, dato che la decima generazione di Intel non lo supporterà. Il fatto che Ryzen 3 sia ora equipaggiato anche con SMT non solo ci fa piacere, ma è stato richiesto per molto tempo. Questo permette di ottenere alcuni punti percentuali nel confronto delle prestazioni, che AMD spesso vince con i nuovi processori rispetto a Intel.
La versione economica dei nuovi processori Ryzen 3 si è rivelata un vero vincitore in termini di prezzo e prestazioni grazie alle sue buone capacità di overclocking.
Entrambi i modelli Ryzen sono veloci in termini di prestazioni pure, anche se i sei cores nativi dell'Intel Core i5-9400F forniscono frame rates leggermente migliori nei giochi. Entrambi i modelli sono vicini tra loro per quanto riguarda il prezzo e sono notevolmente più economici rispetto all'Intel Core i5-9400F. L'AMD Ryzen 3 3100 parte da 109 Euro (~$118) e offre una solida performance per ottenere un sistema veloce e funzionante. A causa della minore velocità di base e del turbo clock, il Ryzen 3 3100 manca un po' di IPC rispetto al Ryzen 3 3300X, così che il Ryzen 3 3300X ha raggiunto frame rate significativamente migliori nei giochi insieme al Nvidia Titan RTX. Si devono pagare solo 20 Euro (~$22) in più per il modello più veloce, cosa che riteniamo giustificabile.
Tuttavia, entrambi i modelli ricevono una raccomandazione d'acquisto perché offrono ottime performance senza bucare il portafogli. Inoltre, ci sono buone capacità di overclocking del Ryzen 3 3100, che può raggiungere le prestazioni di un Ryzen 3 3300X con alcune abili regolazioni. Il potenziale di overclocking del Ryzen 3 3300X è notevolmente inferiore.
