Un secondo sguardo al Vermeer - recensione delle AMD Ryzen 9 5950X e AMD Ryzen 5 5600X
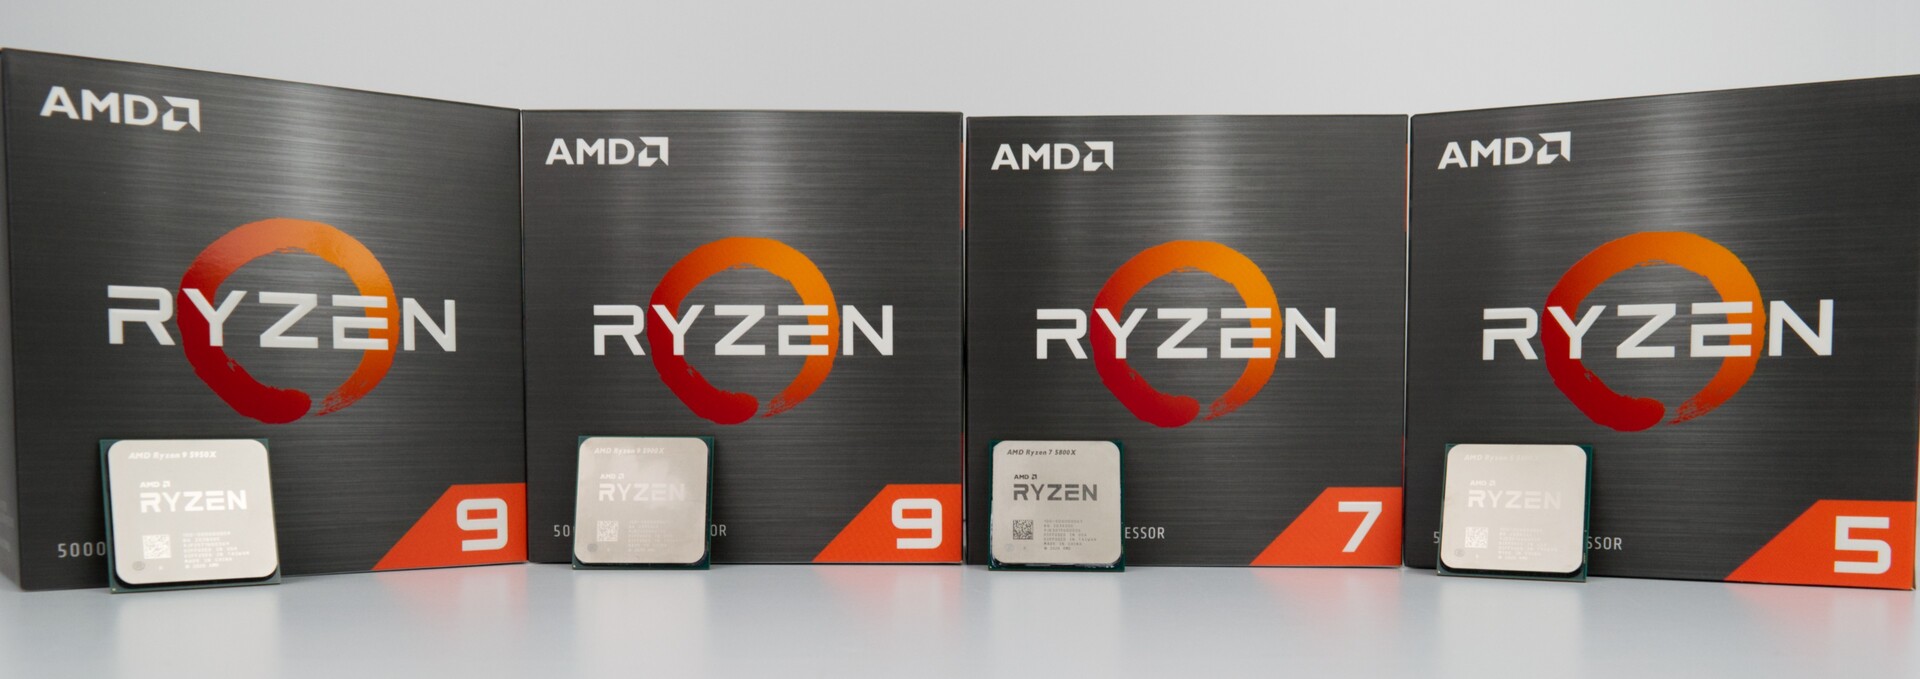
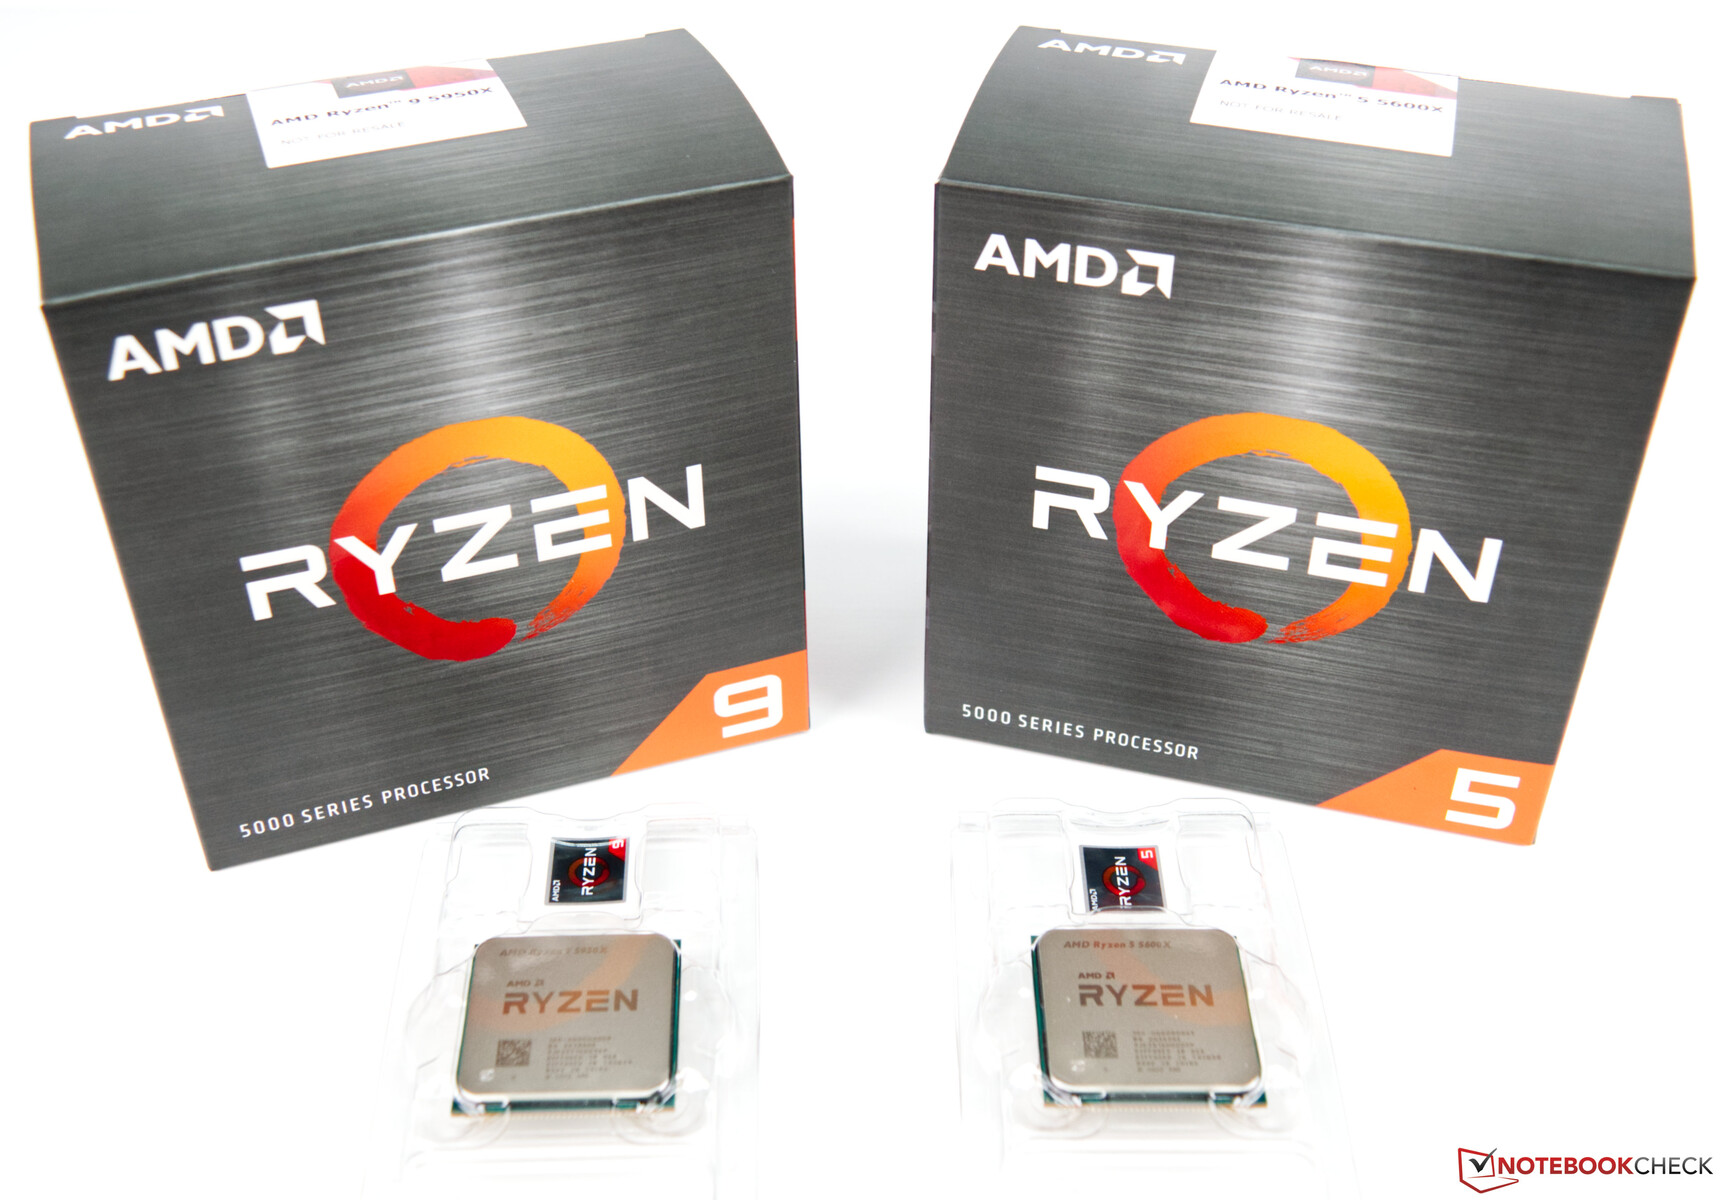
Dopo aver testato in precedenza in modo approfondito l'AMD Ryzen 9 5900X e l'AMD Ryzen 7 5800X, in questa recensione daremo un'occhiata all'AMD Ryzen 9 5950X e all'AMD Ryzen 5 5600X. Con questi processori, AMD estende la parte superiore e inferiore della nuova serie Vermeer nel suo nuovo portafoglio.
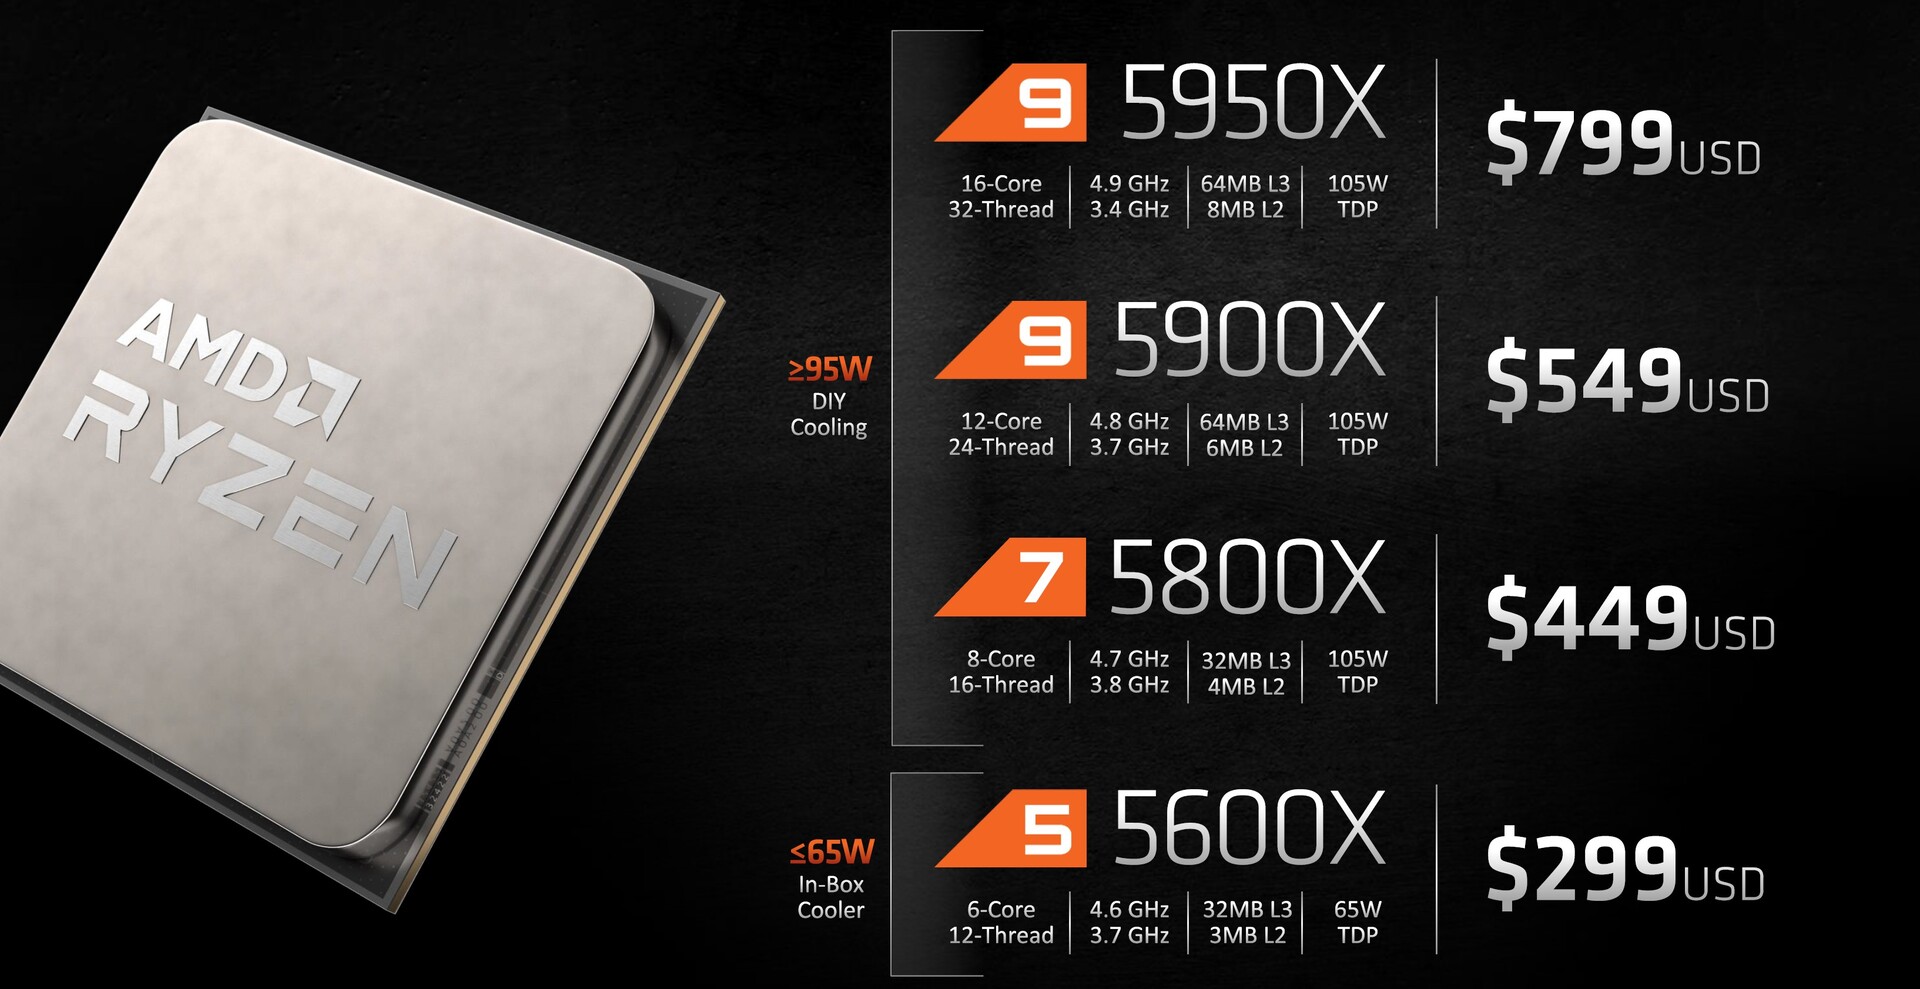
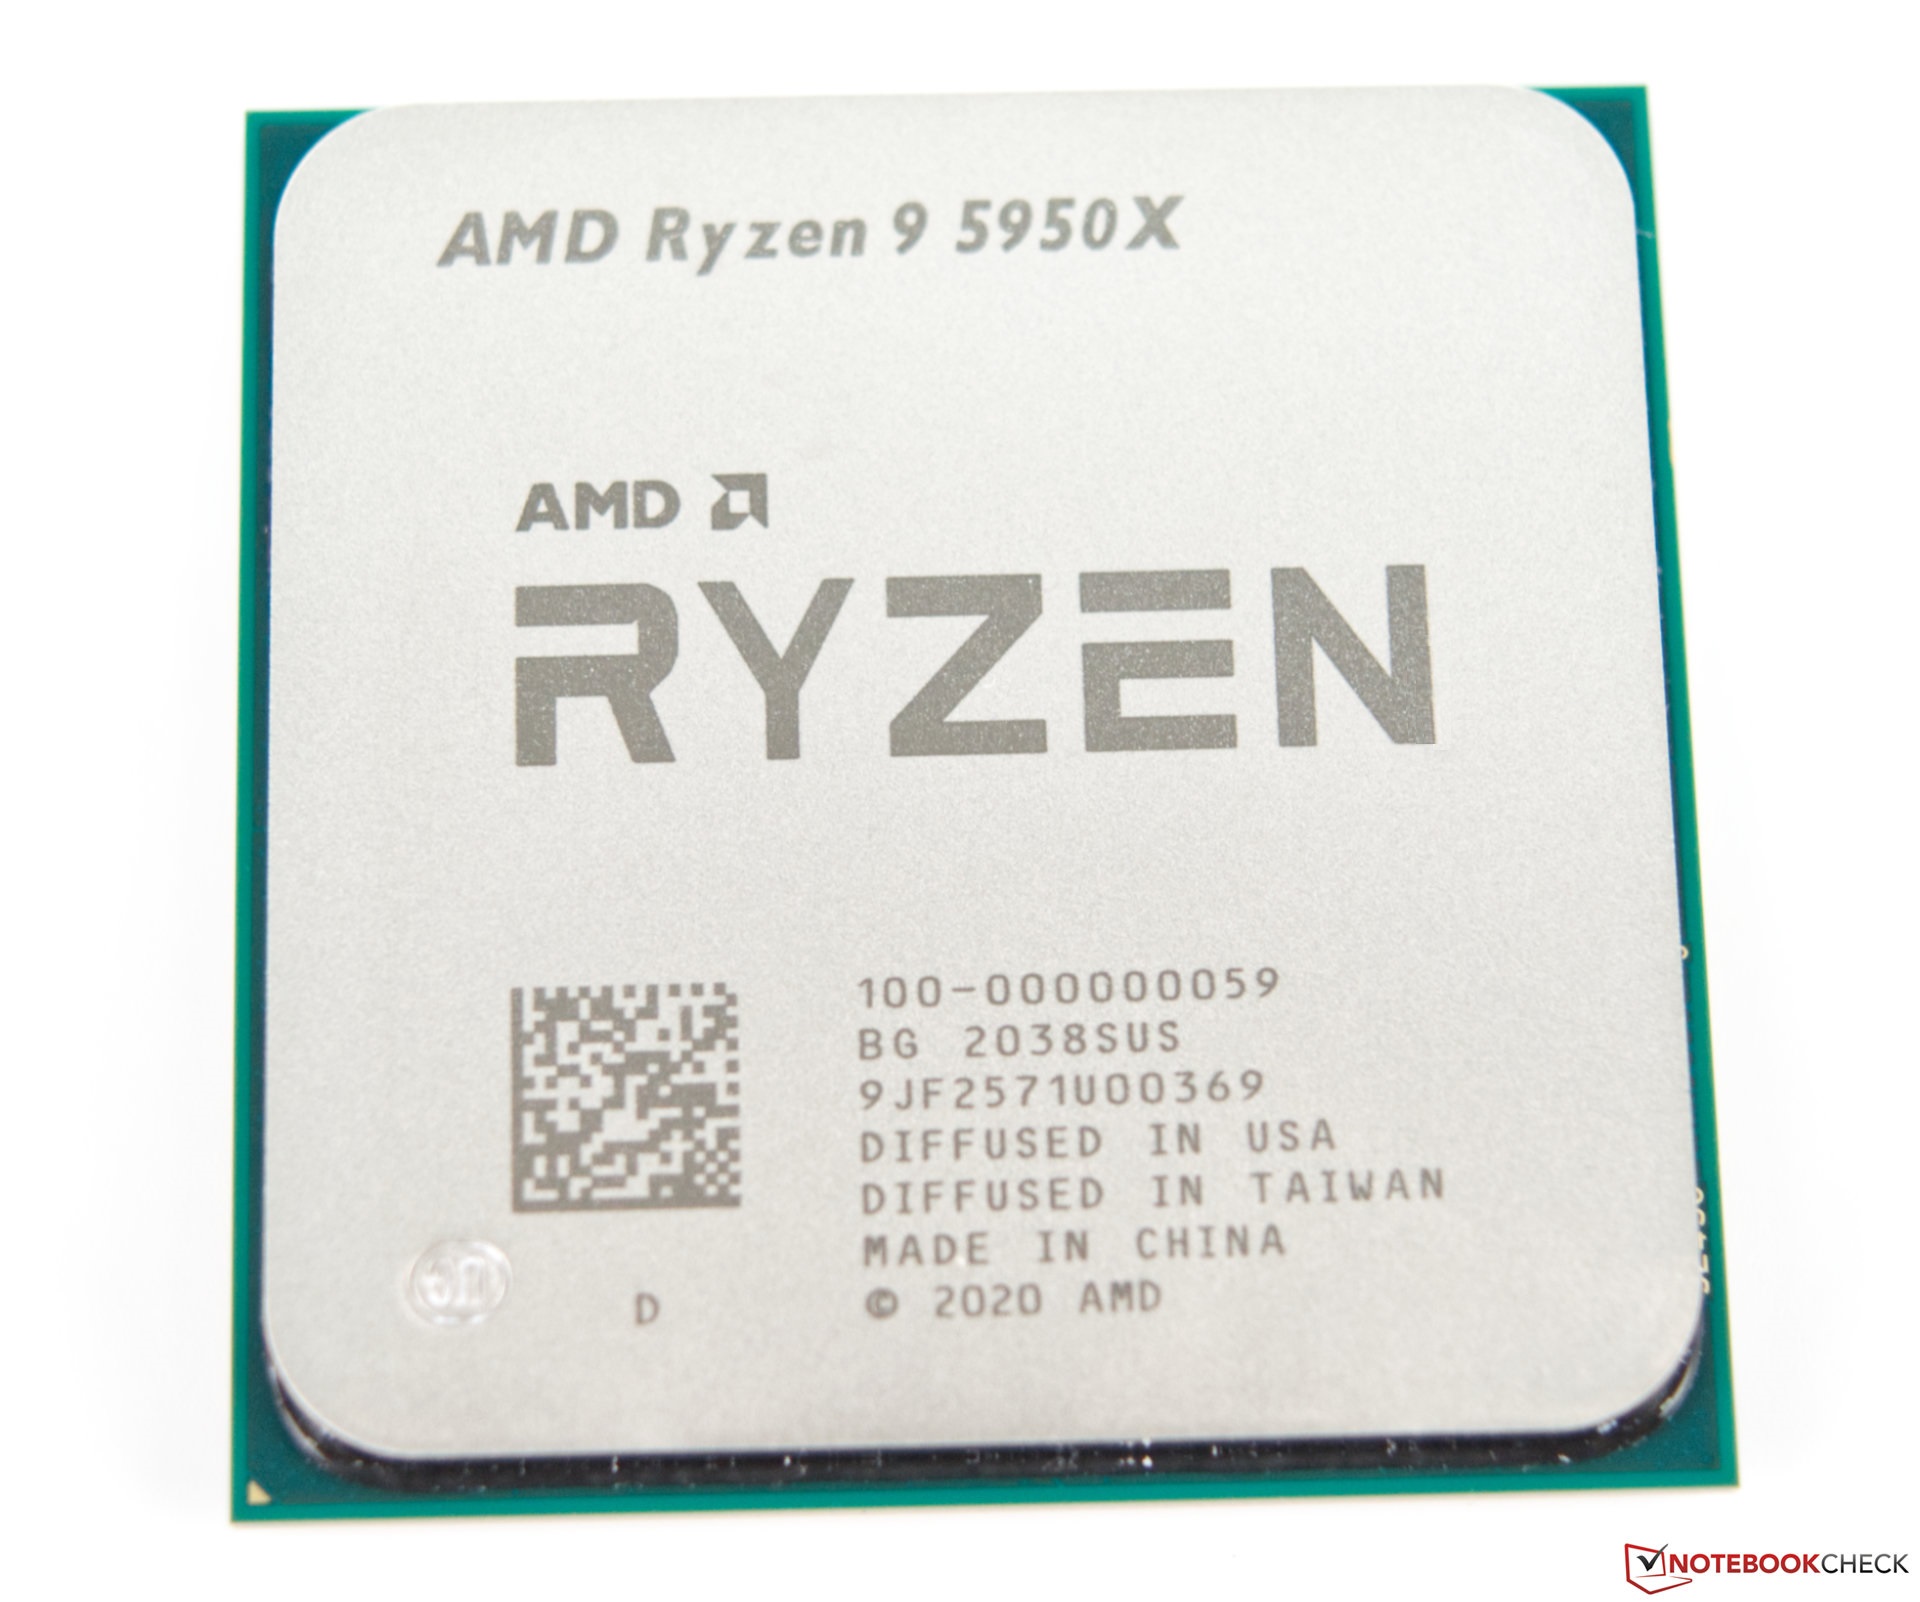
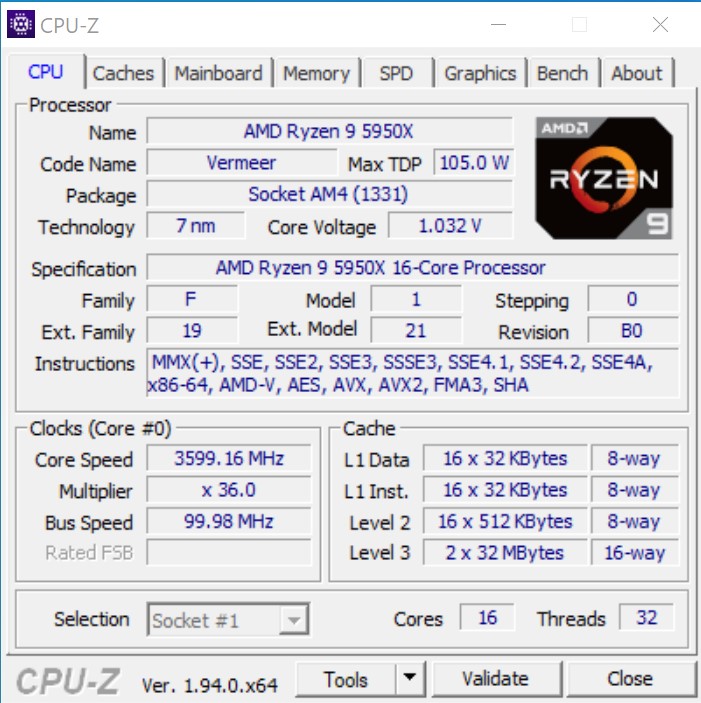
L'AMD Ryzen 9 5950X è il successore dell'AMD Ryzen 9 3950X e offre anche 16 cores e 32 threads. Le numerose innovazioni dell'architettura Vermeer promettono anche un discreto salto di prestazioni. Allo stesso tempo, il nuovo modello di punta non consuma più energia del suo predecessore, poiché AMD specifica anche un TDP di 105 watt. Se questo valore si rifletta anche nella realtà, lo spiegheremo in seguito.
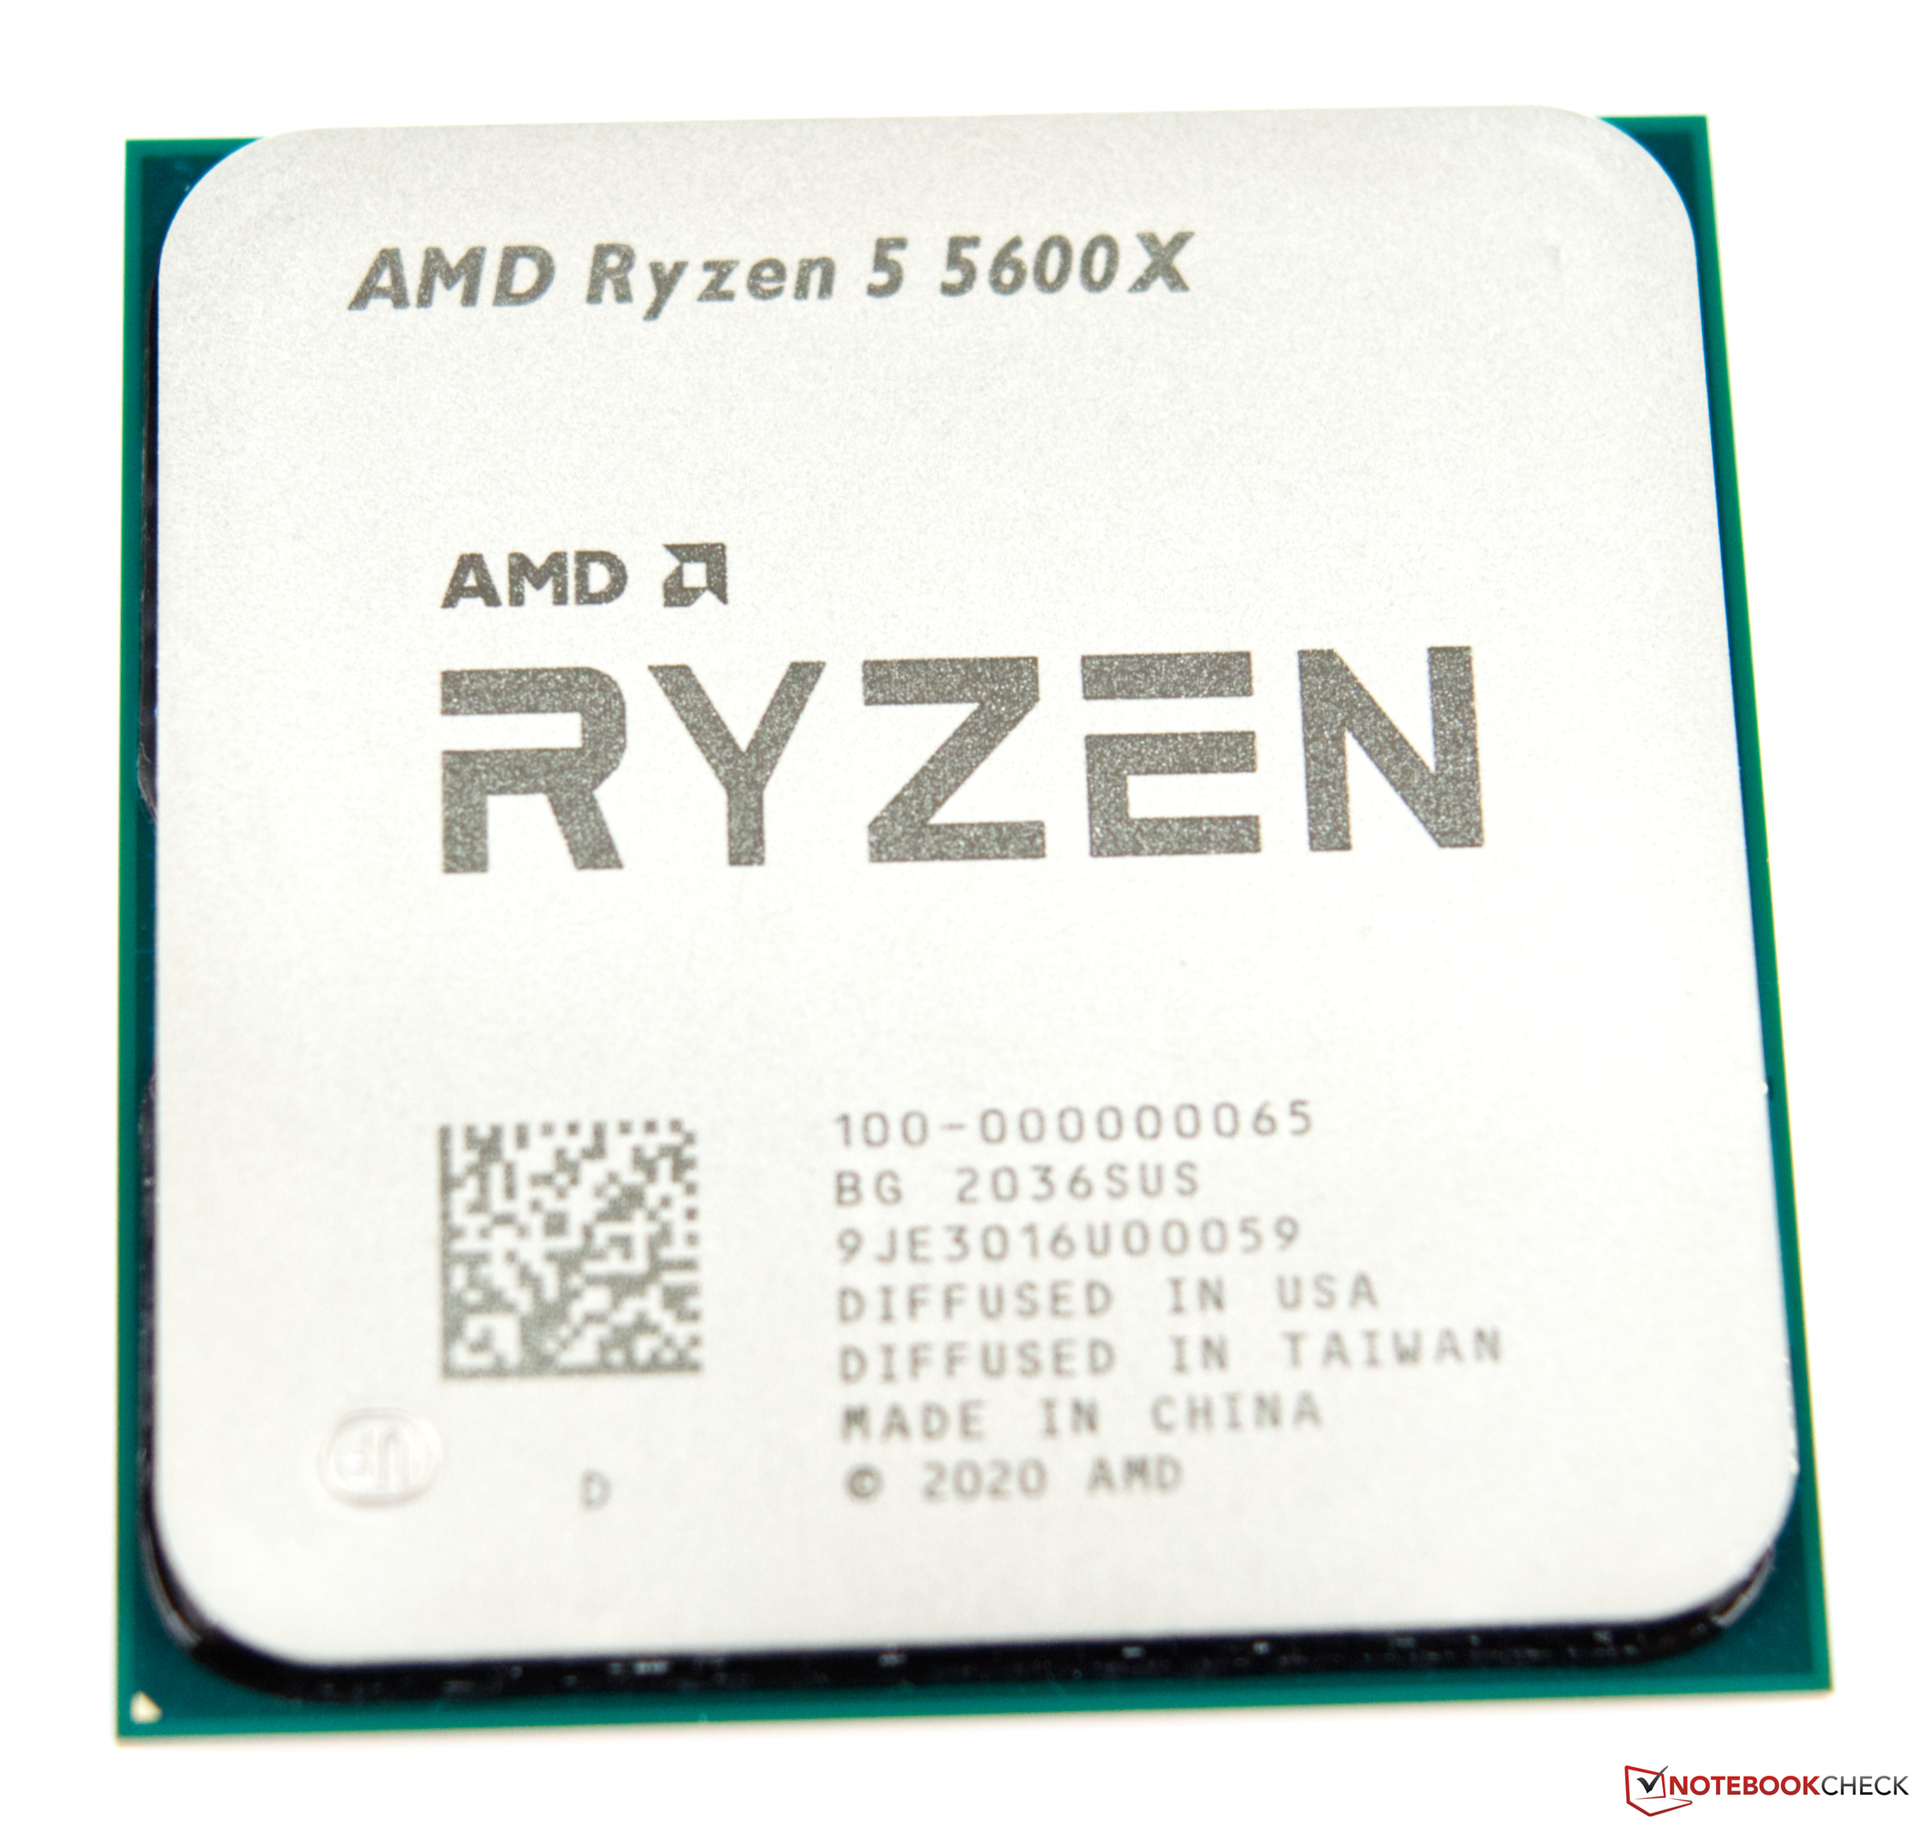
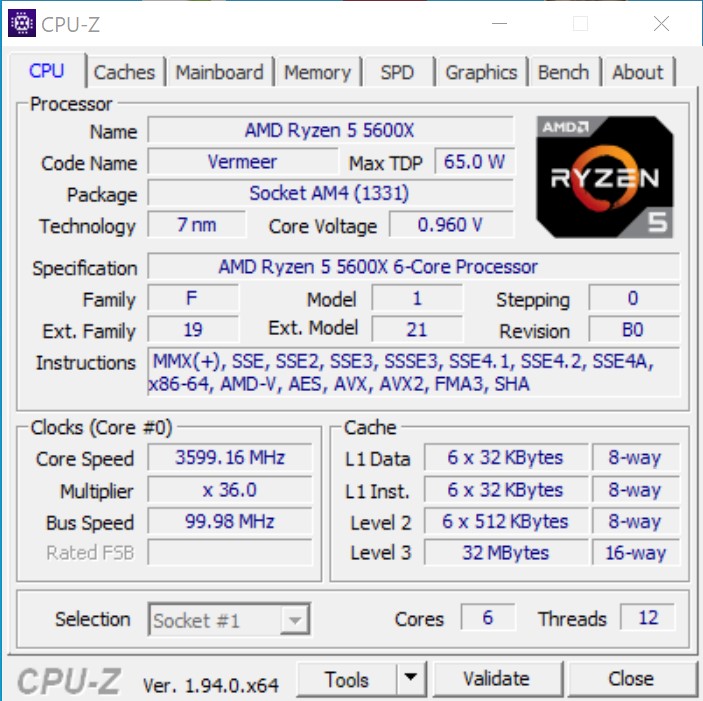
Infine, l'AMD Ryzen 5 5600X non è solo il più piccolo Ryzen con 6 cores e 12 threads, ma con un TDP di 65 watt, anche il più efficiente, se si confrontano le specifiche puramente tecniche.
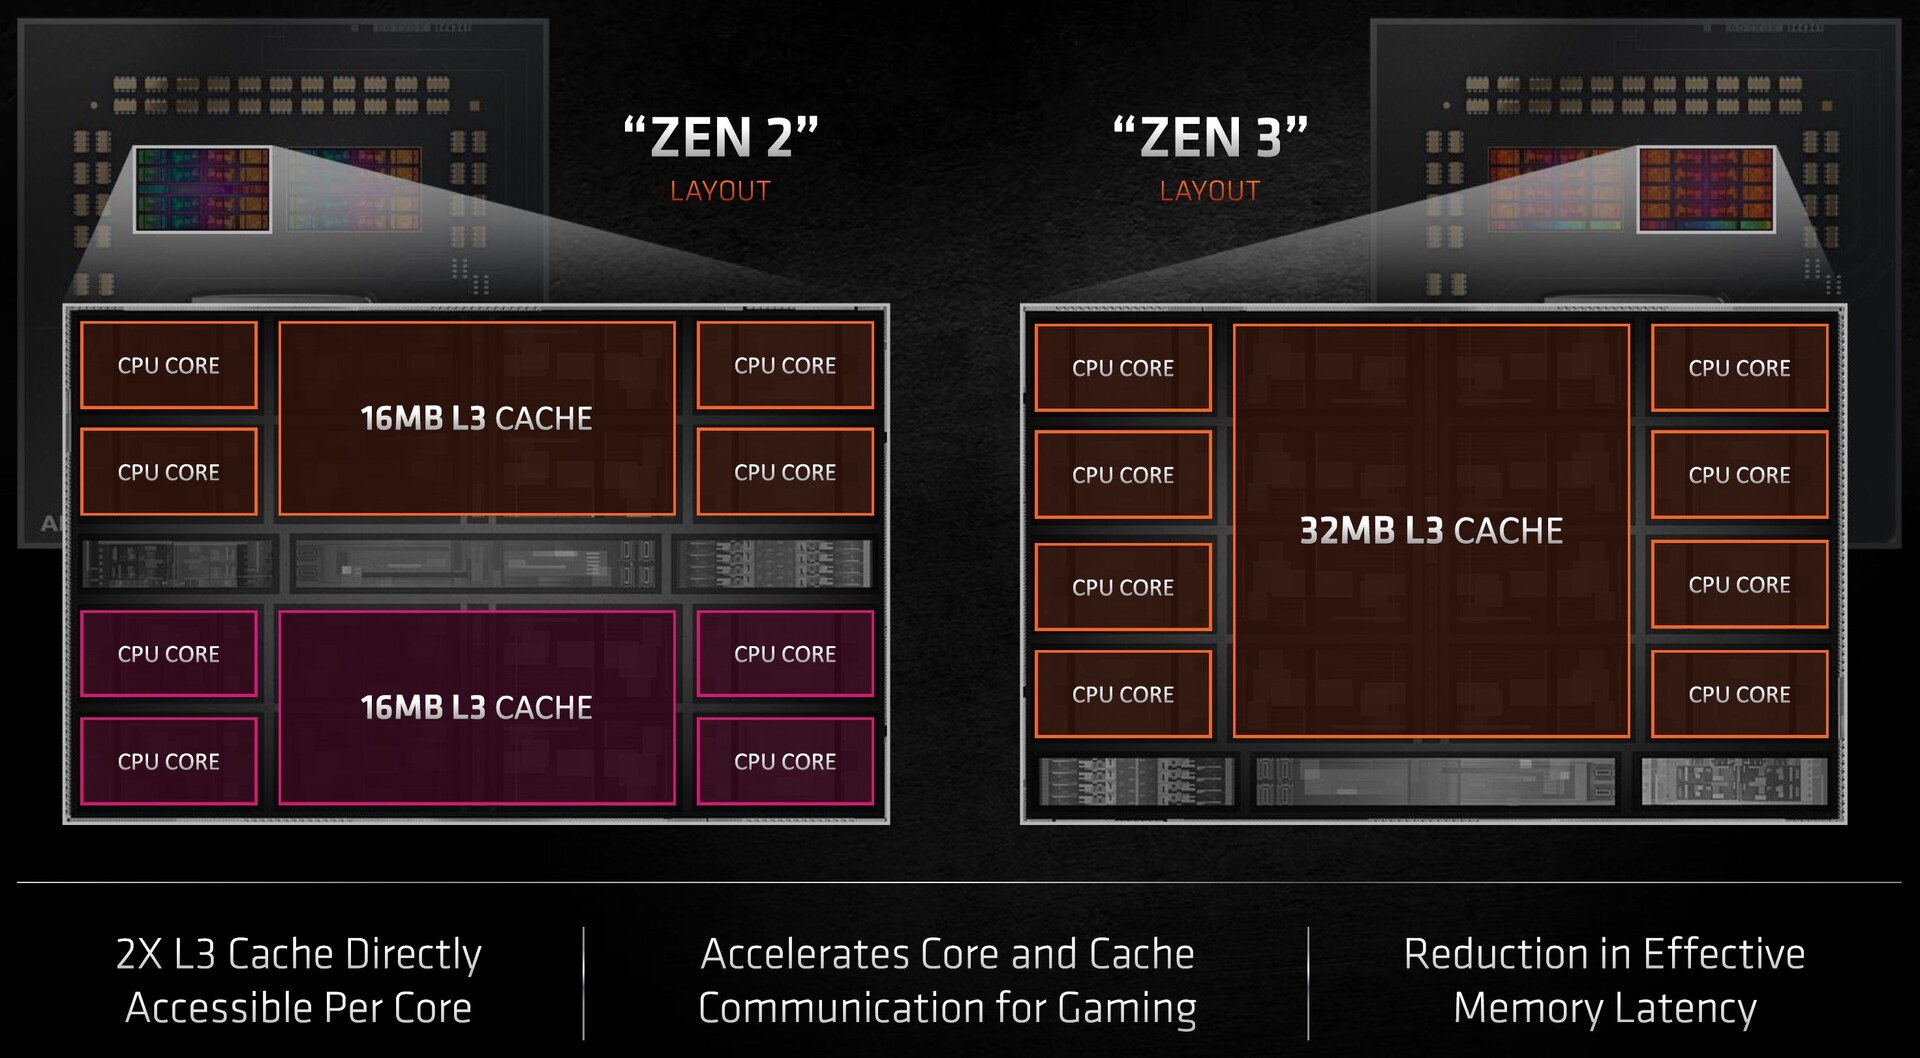
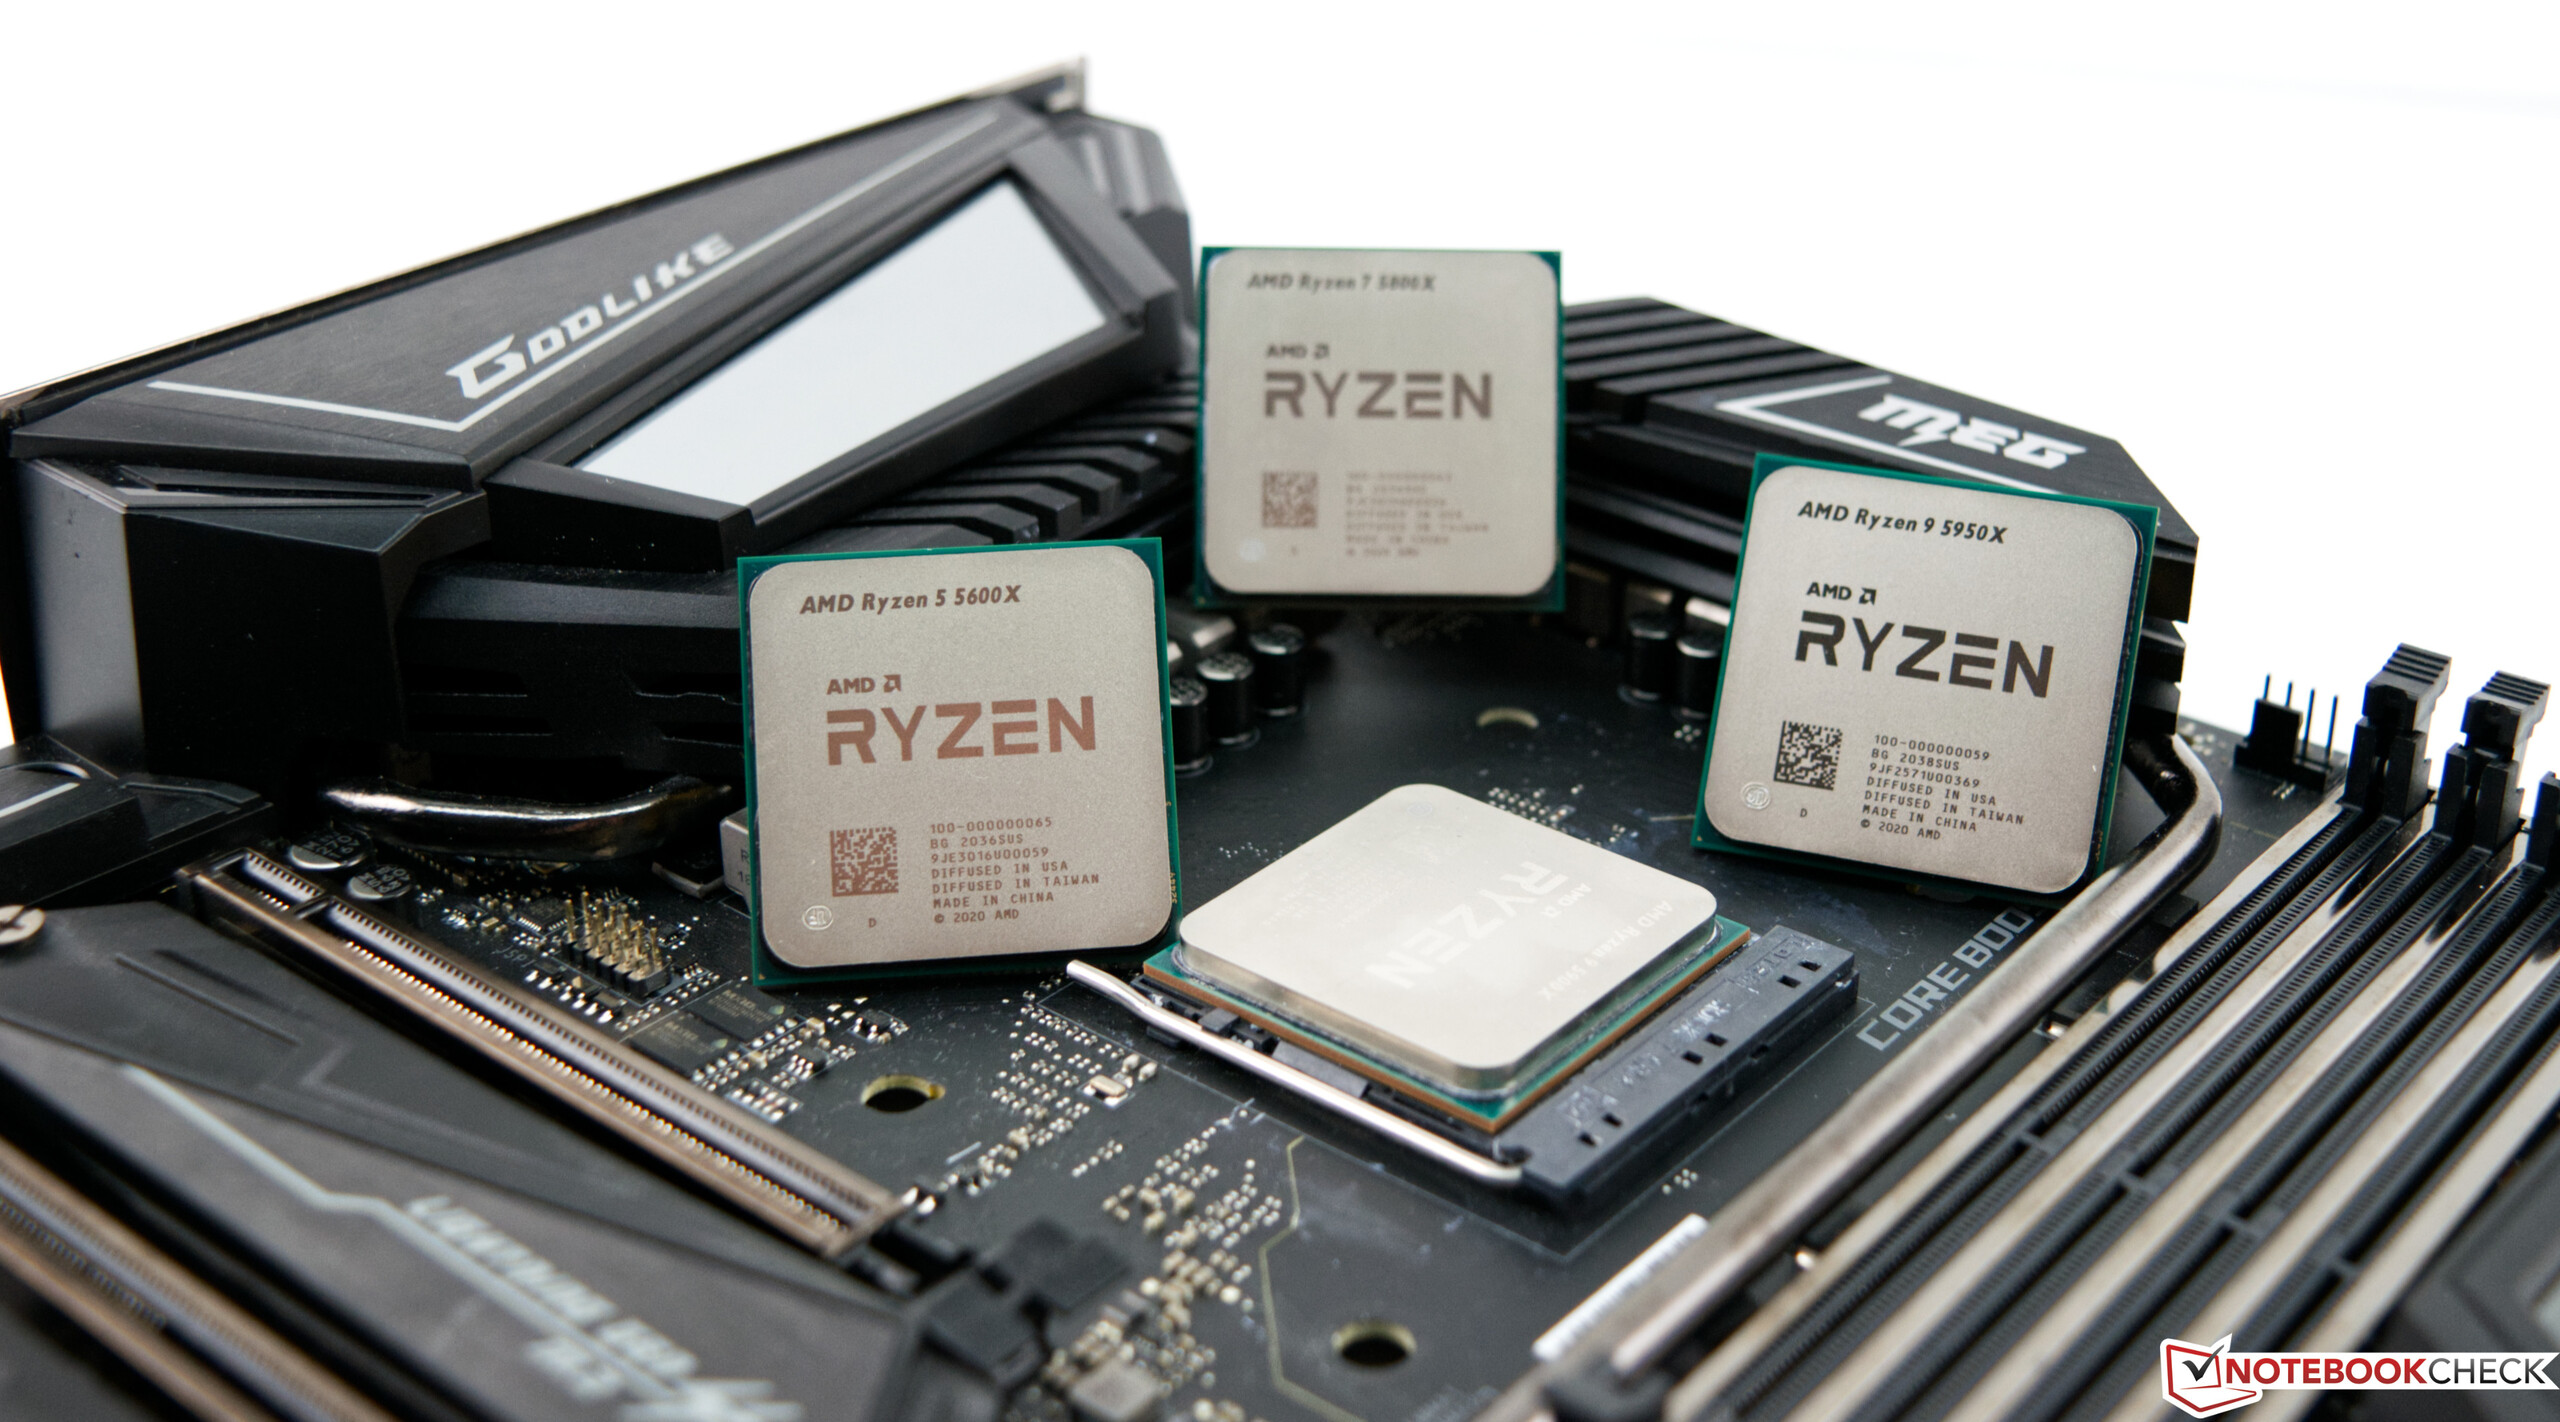
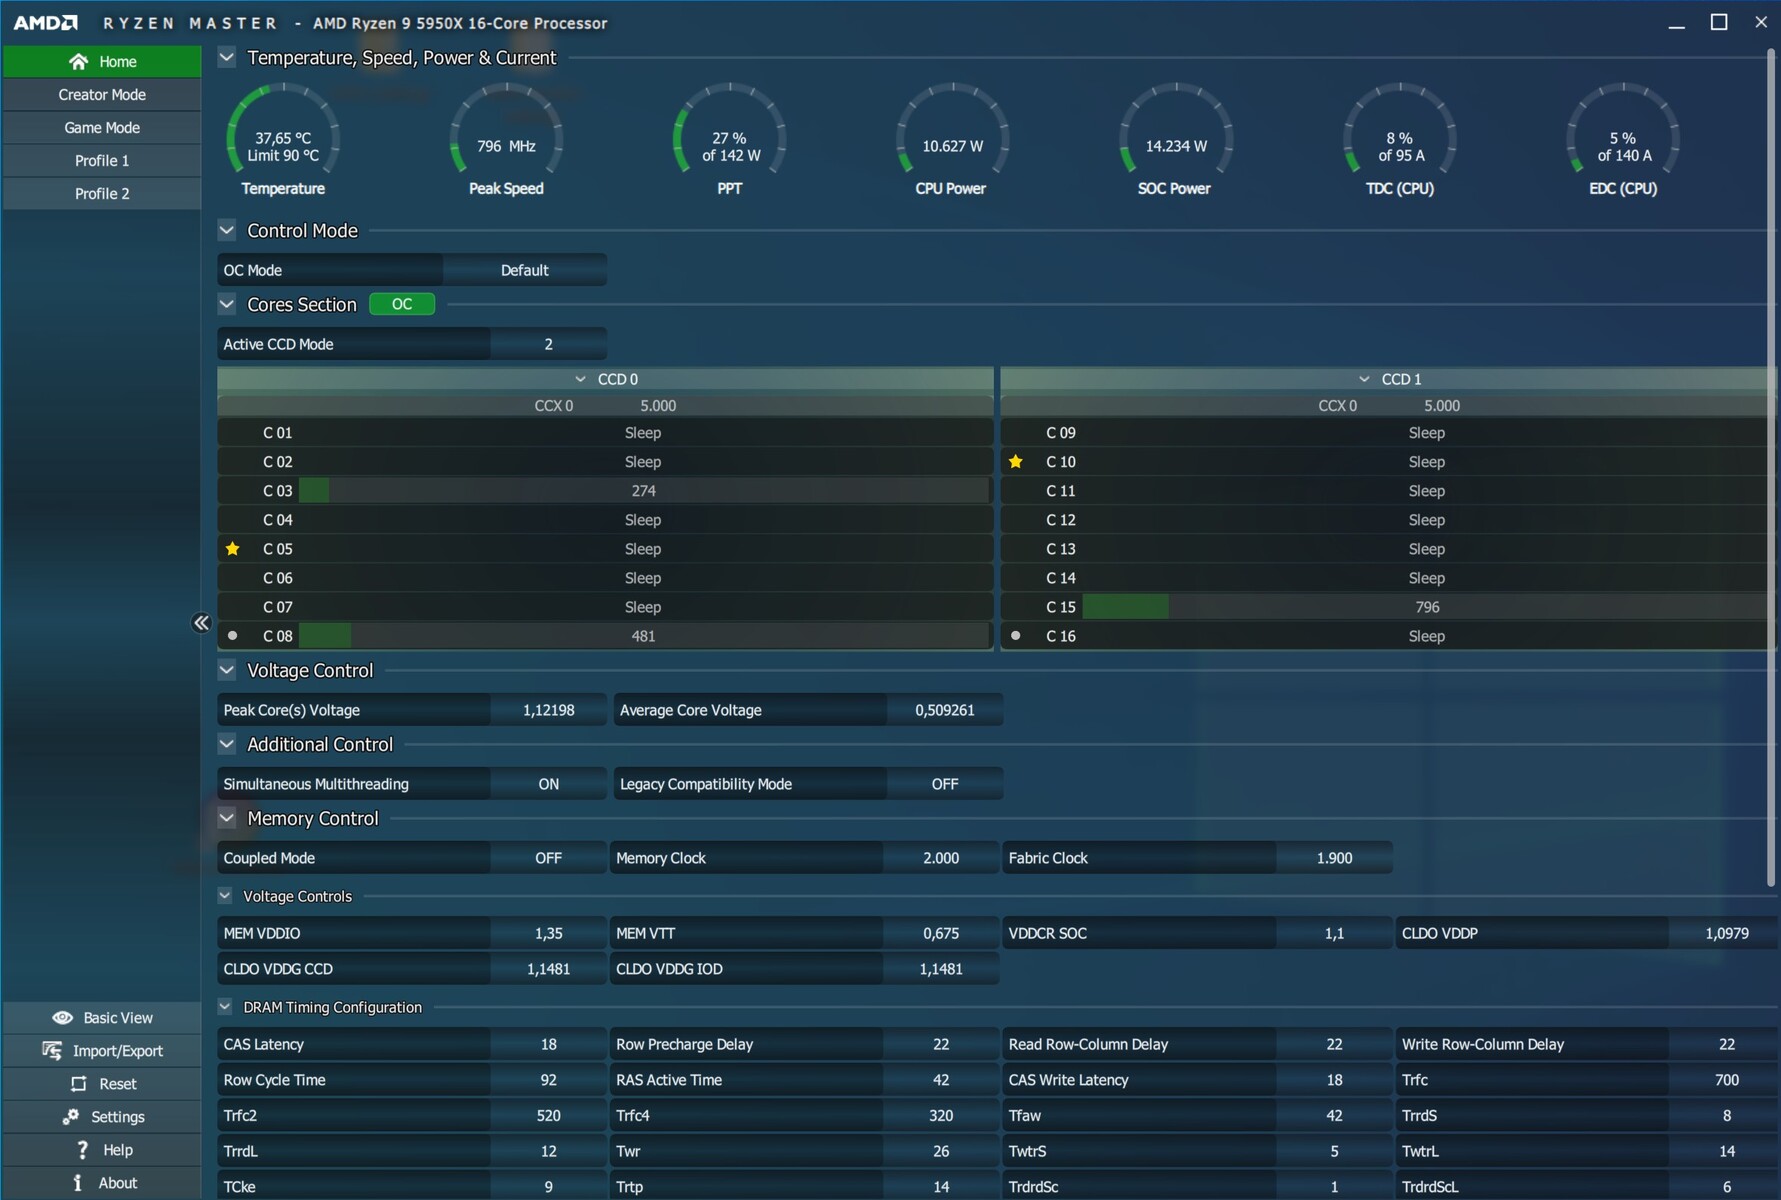
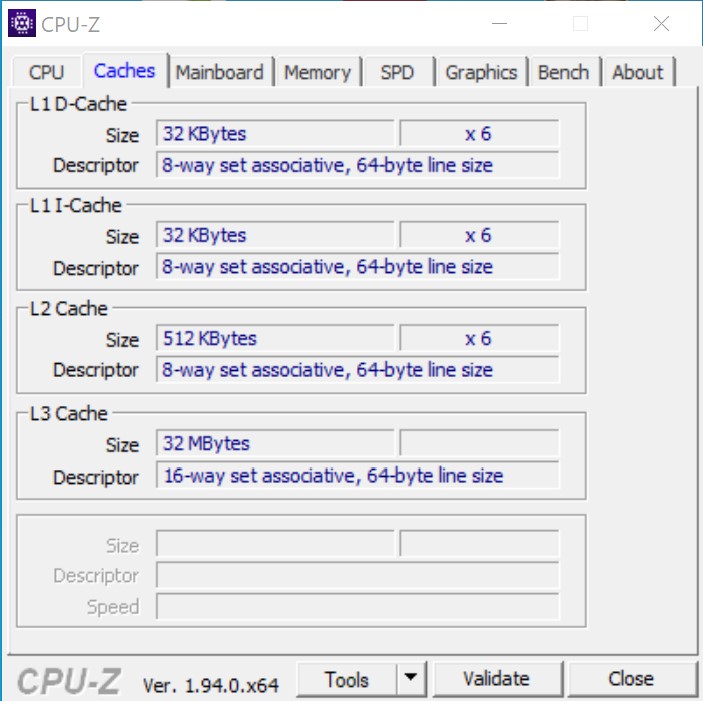
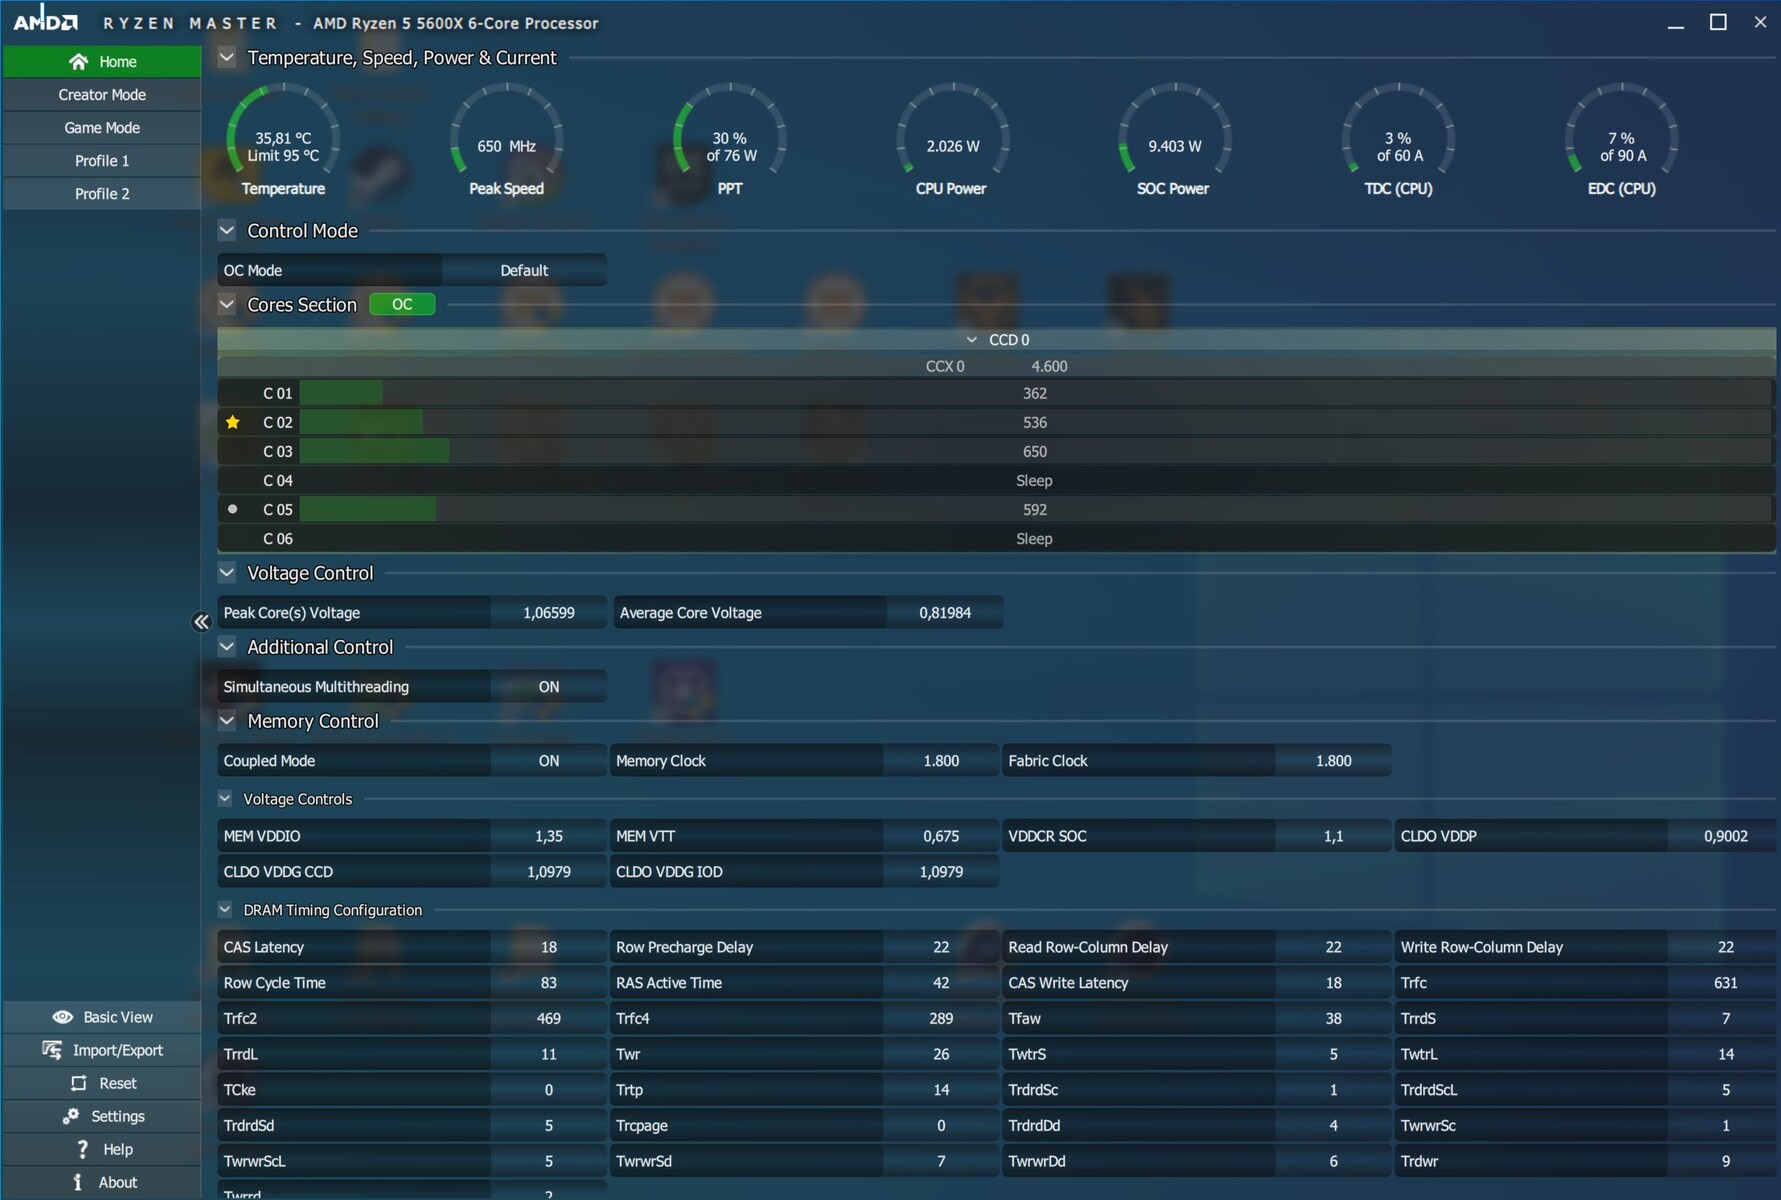
In termini di composizione interna, come modello di punta, il Ryzen 9 5950X utilizza 2 CCD con 8 cores ciascuno. Nel Ryzen 5 5600X sono attivi solo 6 cores di un CCD. Rispetto a Intel (PL2 250 watt), il modello di punta è anche significativamente più efficiente a 142 watt quando si utilizza il PL2. Abbiamo già valutato in questo test altre innovazioni dell'architettura Zen-3.
Panoramica dei processori AMD Ryzen
| Modello | Cores/Threads | Velocità del clock | Velocità Turbo | L3 Cache | TDP | Prezzo di lancio |
|---|---|---|---|---|---|---|
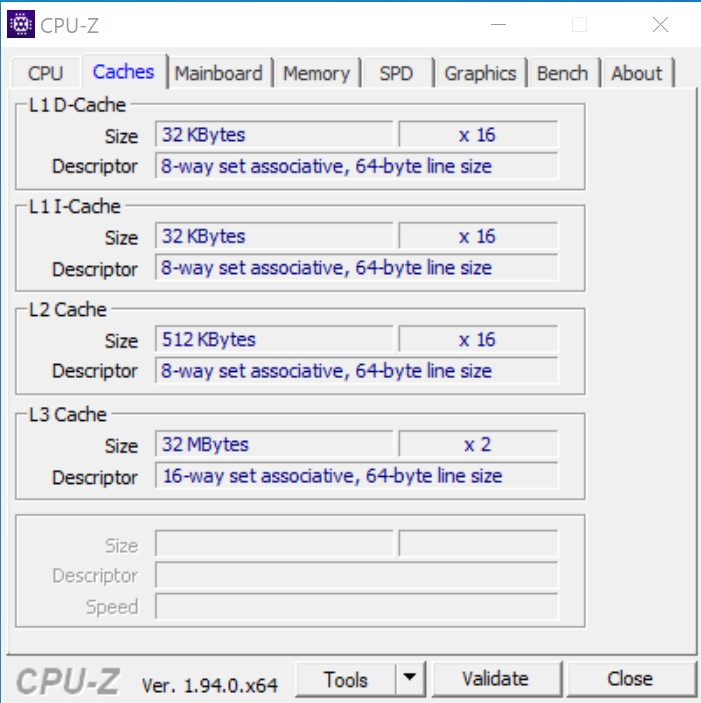
| Ryzen 9 5950X | 16/32 | 3,4 GHz | 4,9 GHz | 64MB | 105Watt | 799USD |
| Ryzen 9 3950X | 16/32 | 3,5 GHz | 4,7 GHz | 64 MB | 105 Watt | 749 USD |
| Ryzen 9 5900X | 12/24 | 3,7 GHz | 4,8 GHz | 64MB | 105Watt | 549USD |
| Ryzen 9 3900XT | 12/24 | 3,8 GHz | 4,7 GHz | 64 MB | 105 Watt | 499 USD |
| Ryzen 9 3900X | 12/24 | 3,8 GHz | 4,6 GHz | 64 MB | 105 Watt | 499 USD |
| Ryzen 7 5800X | 8/16 | 3,8 GHz | 4,7 GHz | 32 MB | 105Watt | 449USD |
| Ryzen 7 3800XT | 8/16 | 3,9 GHz | 4,7 GHz | 32 MB | 105 Watt | 399 USD |
| Ryzen 7 3800X | 8/16 | 3,9 GHz | 4,5 GHz | 32 MB | 105 Watt | 399 USD |
| Ryzen 7 3700X | 8/16 | 3,6 GHz | 4,4 GHz | 32 MB | 65 Watt | 329 USD |
| Ryzen 5 5600X | 6/12 | 3,7 GHz | 4,6 GHz | 32MB | 65Watt | 299USD |
| Ryzen 5 3600XT | 6/12 | 3,8 GHz | 4,5 GHz | 32 MB | 95 Watt | 249 USD |
| Ryzen 5 3600X | 6/12 | 3,8 GHz | 4,4 GHz | 32 MB | 95 Watt | 229 USD |
| Ryzen 5 3600 | 6/12 | 3,6 GHz | 4,2 GHz | 32 MB | 65 Watt | 199 USD |
Dettagli del nostro sistema di test
Utilizziamo il seguente sistema per i benchmarks:
- Raijintek Pean Benchtable
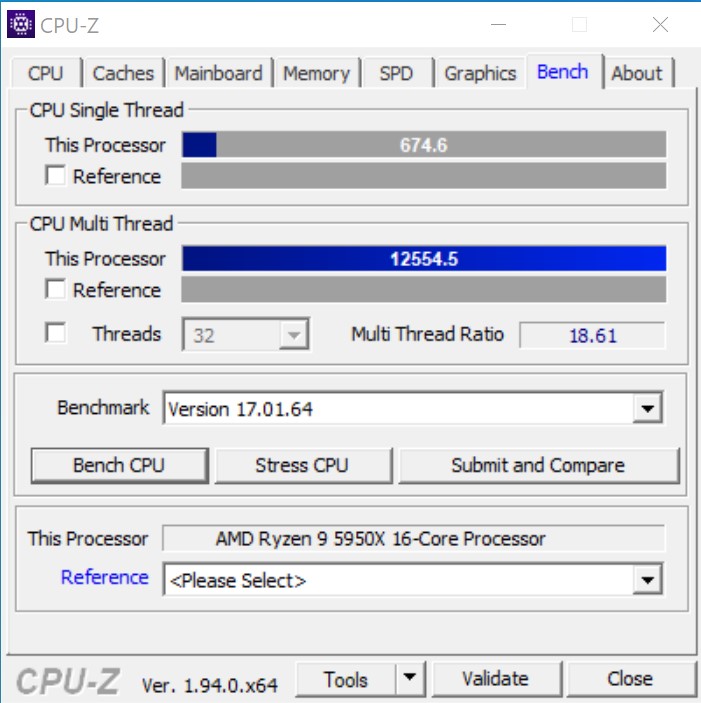
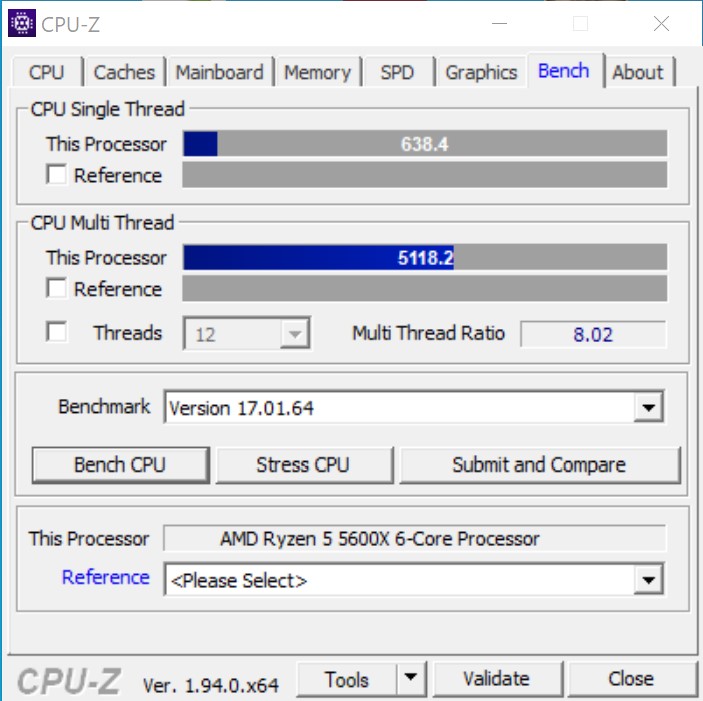
- AMD Ryzen 9 5950X, AMD Ryzen 5 5600X
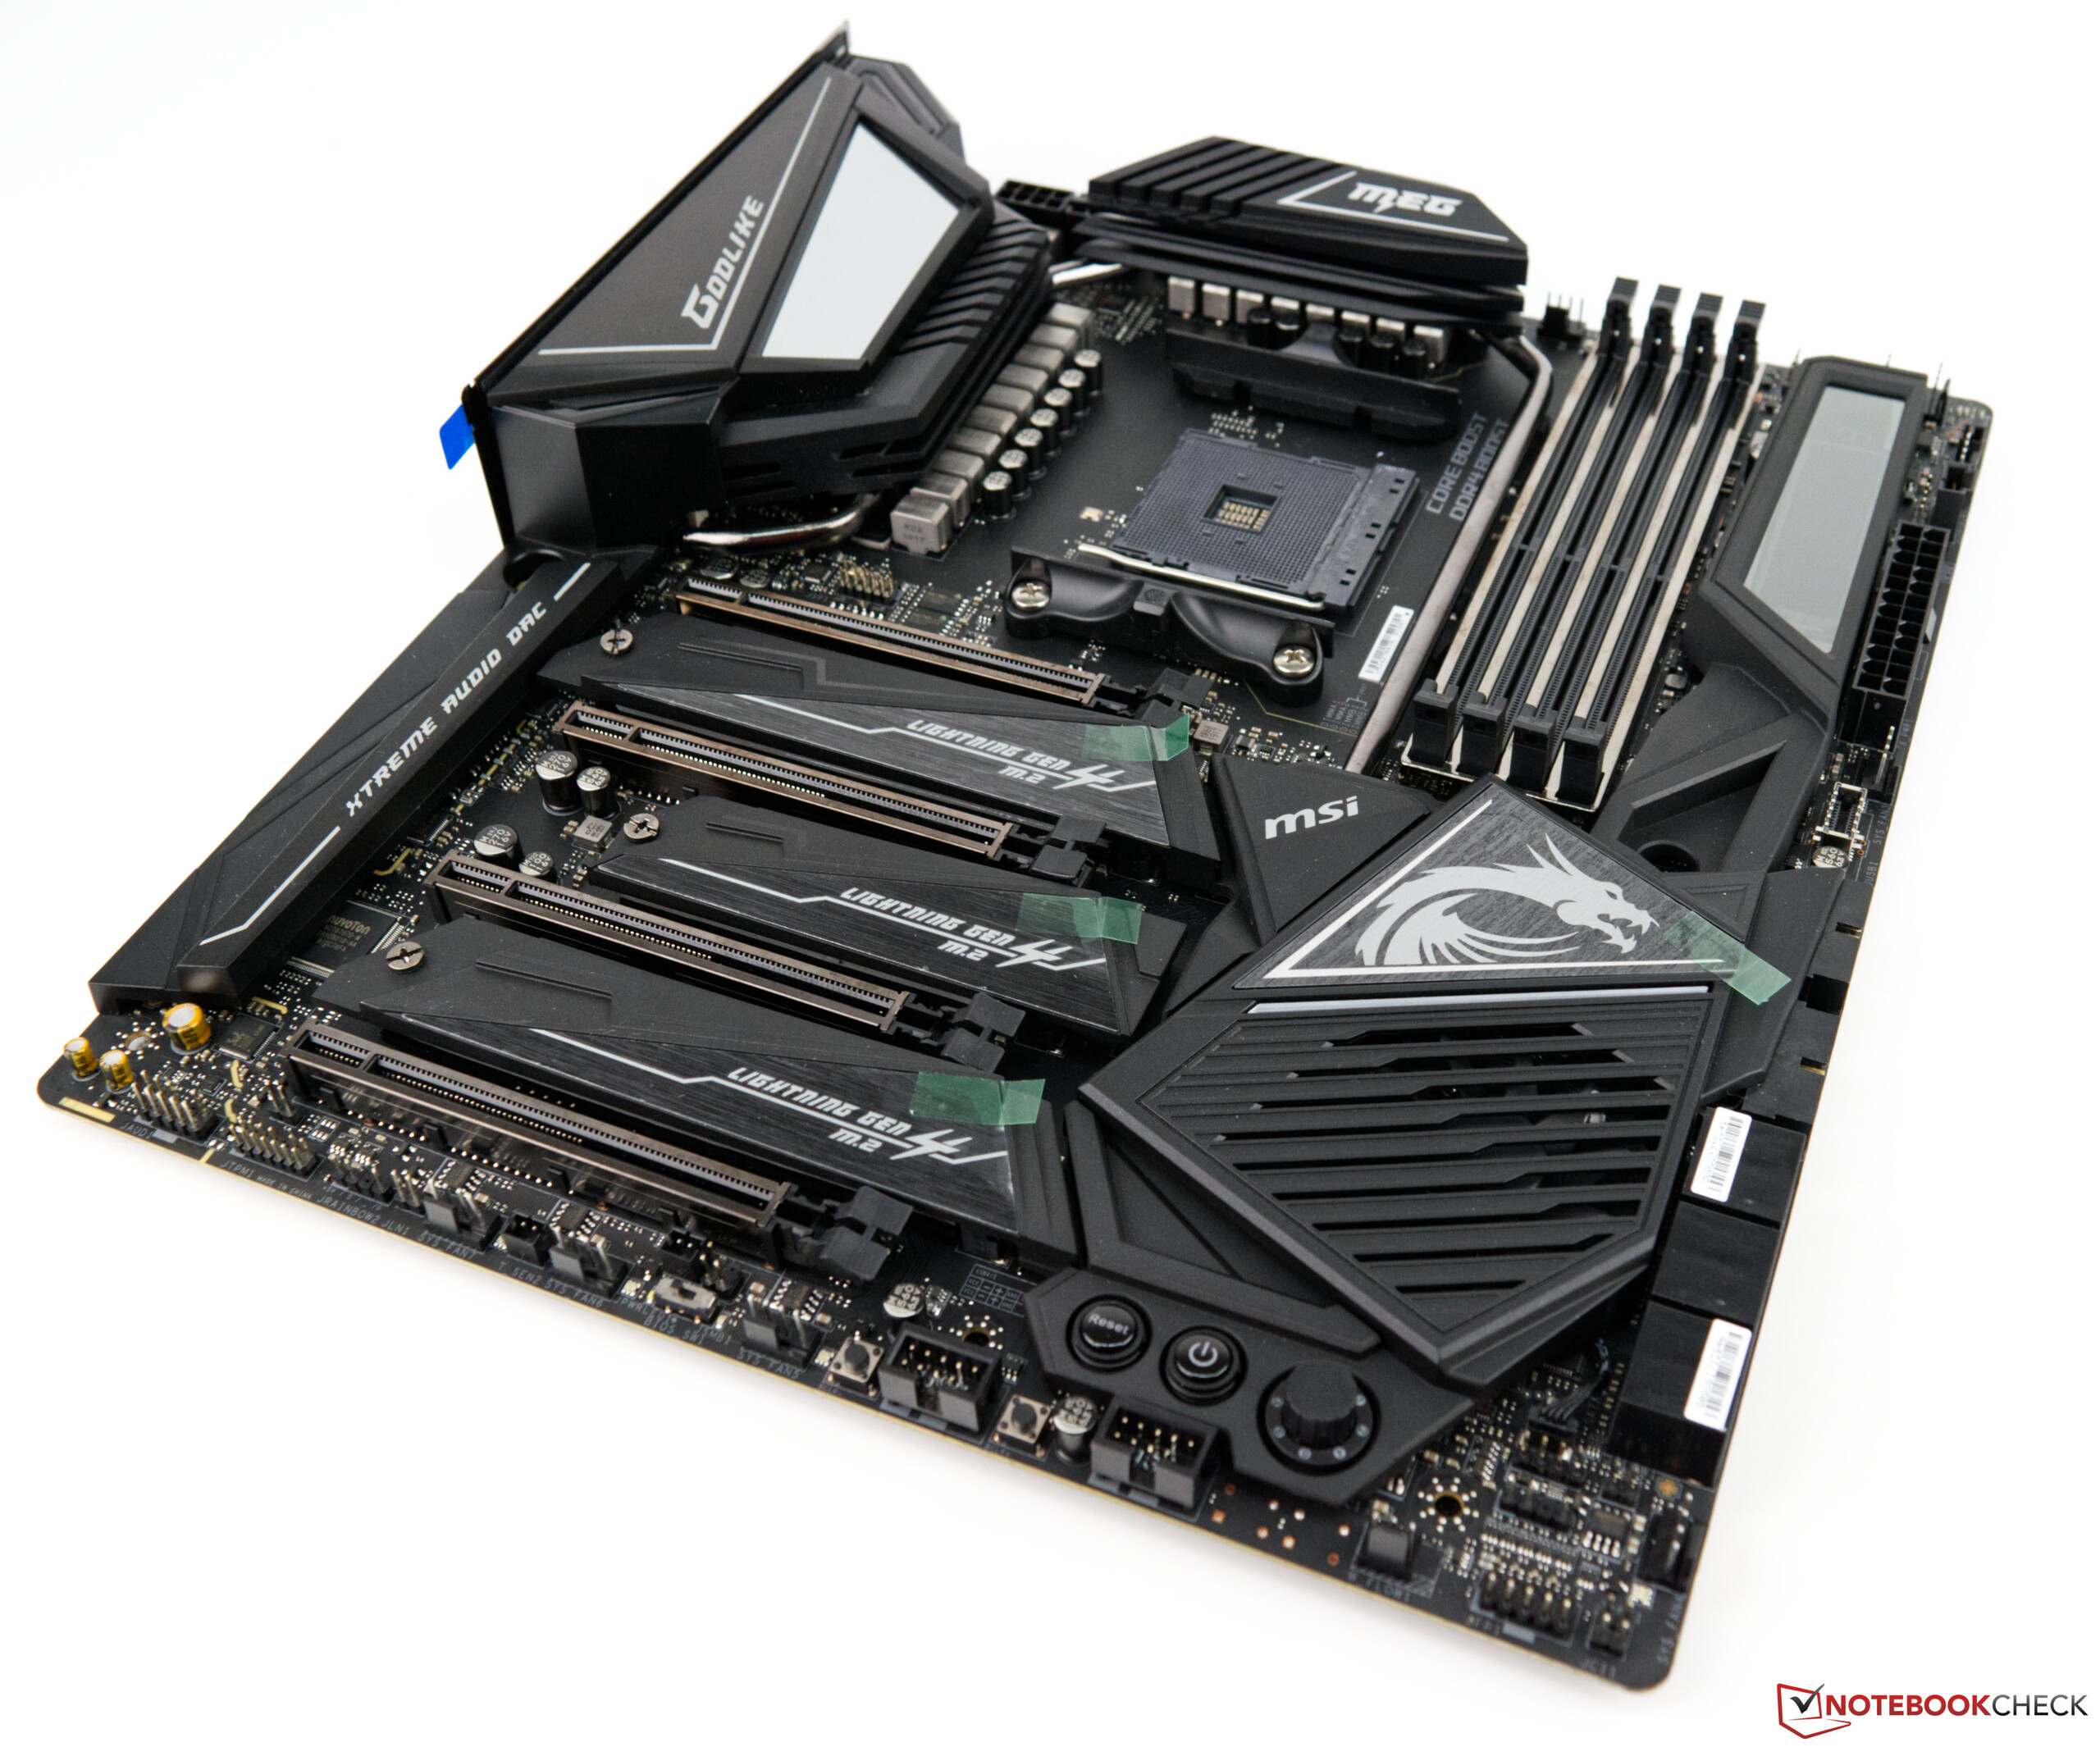
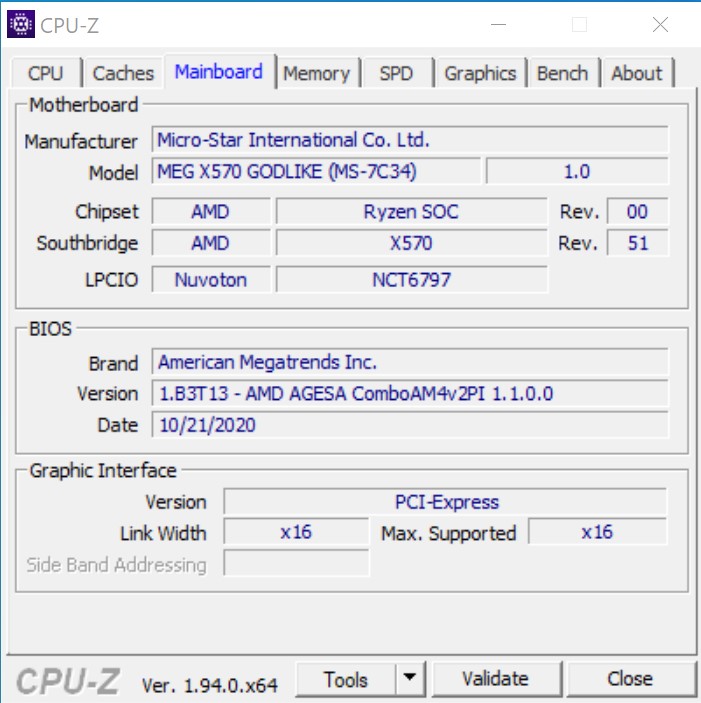
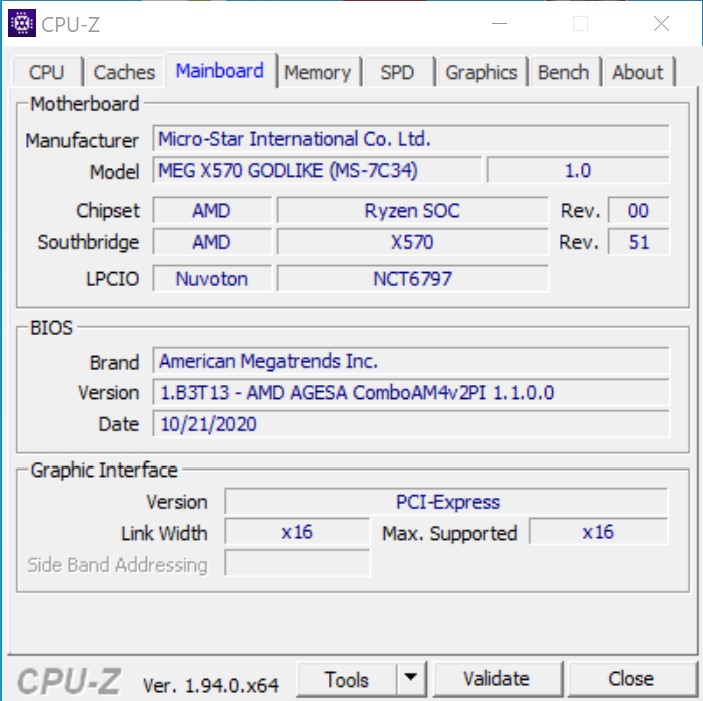
- MSI MEG X570 Godlike
- Alphacool Eisbear 280 AiO
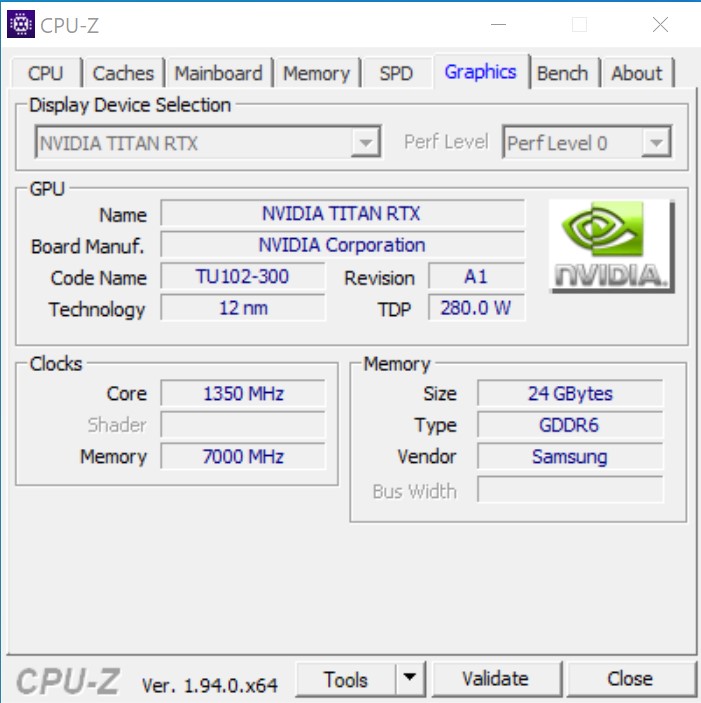
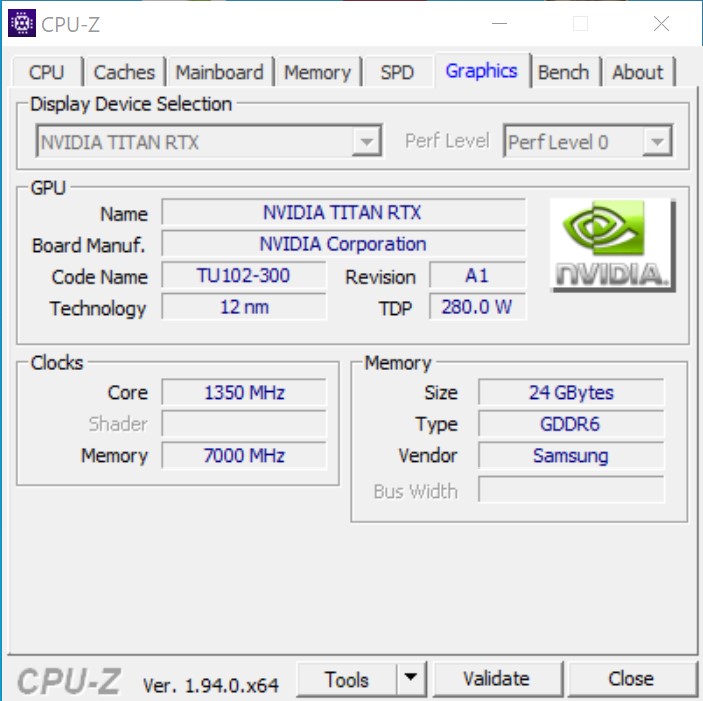
- Nvidia Titan RTX
- Alimentatore Corsair HX 1200i
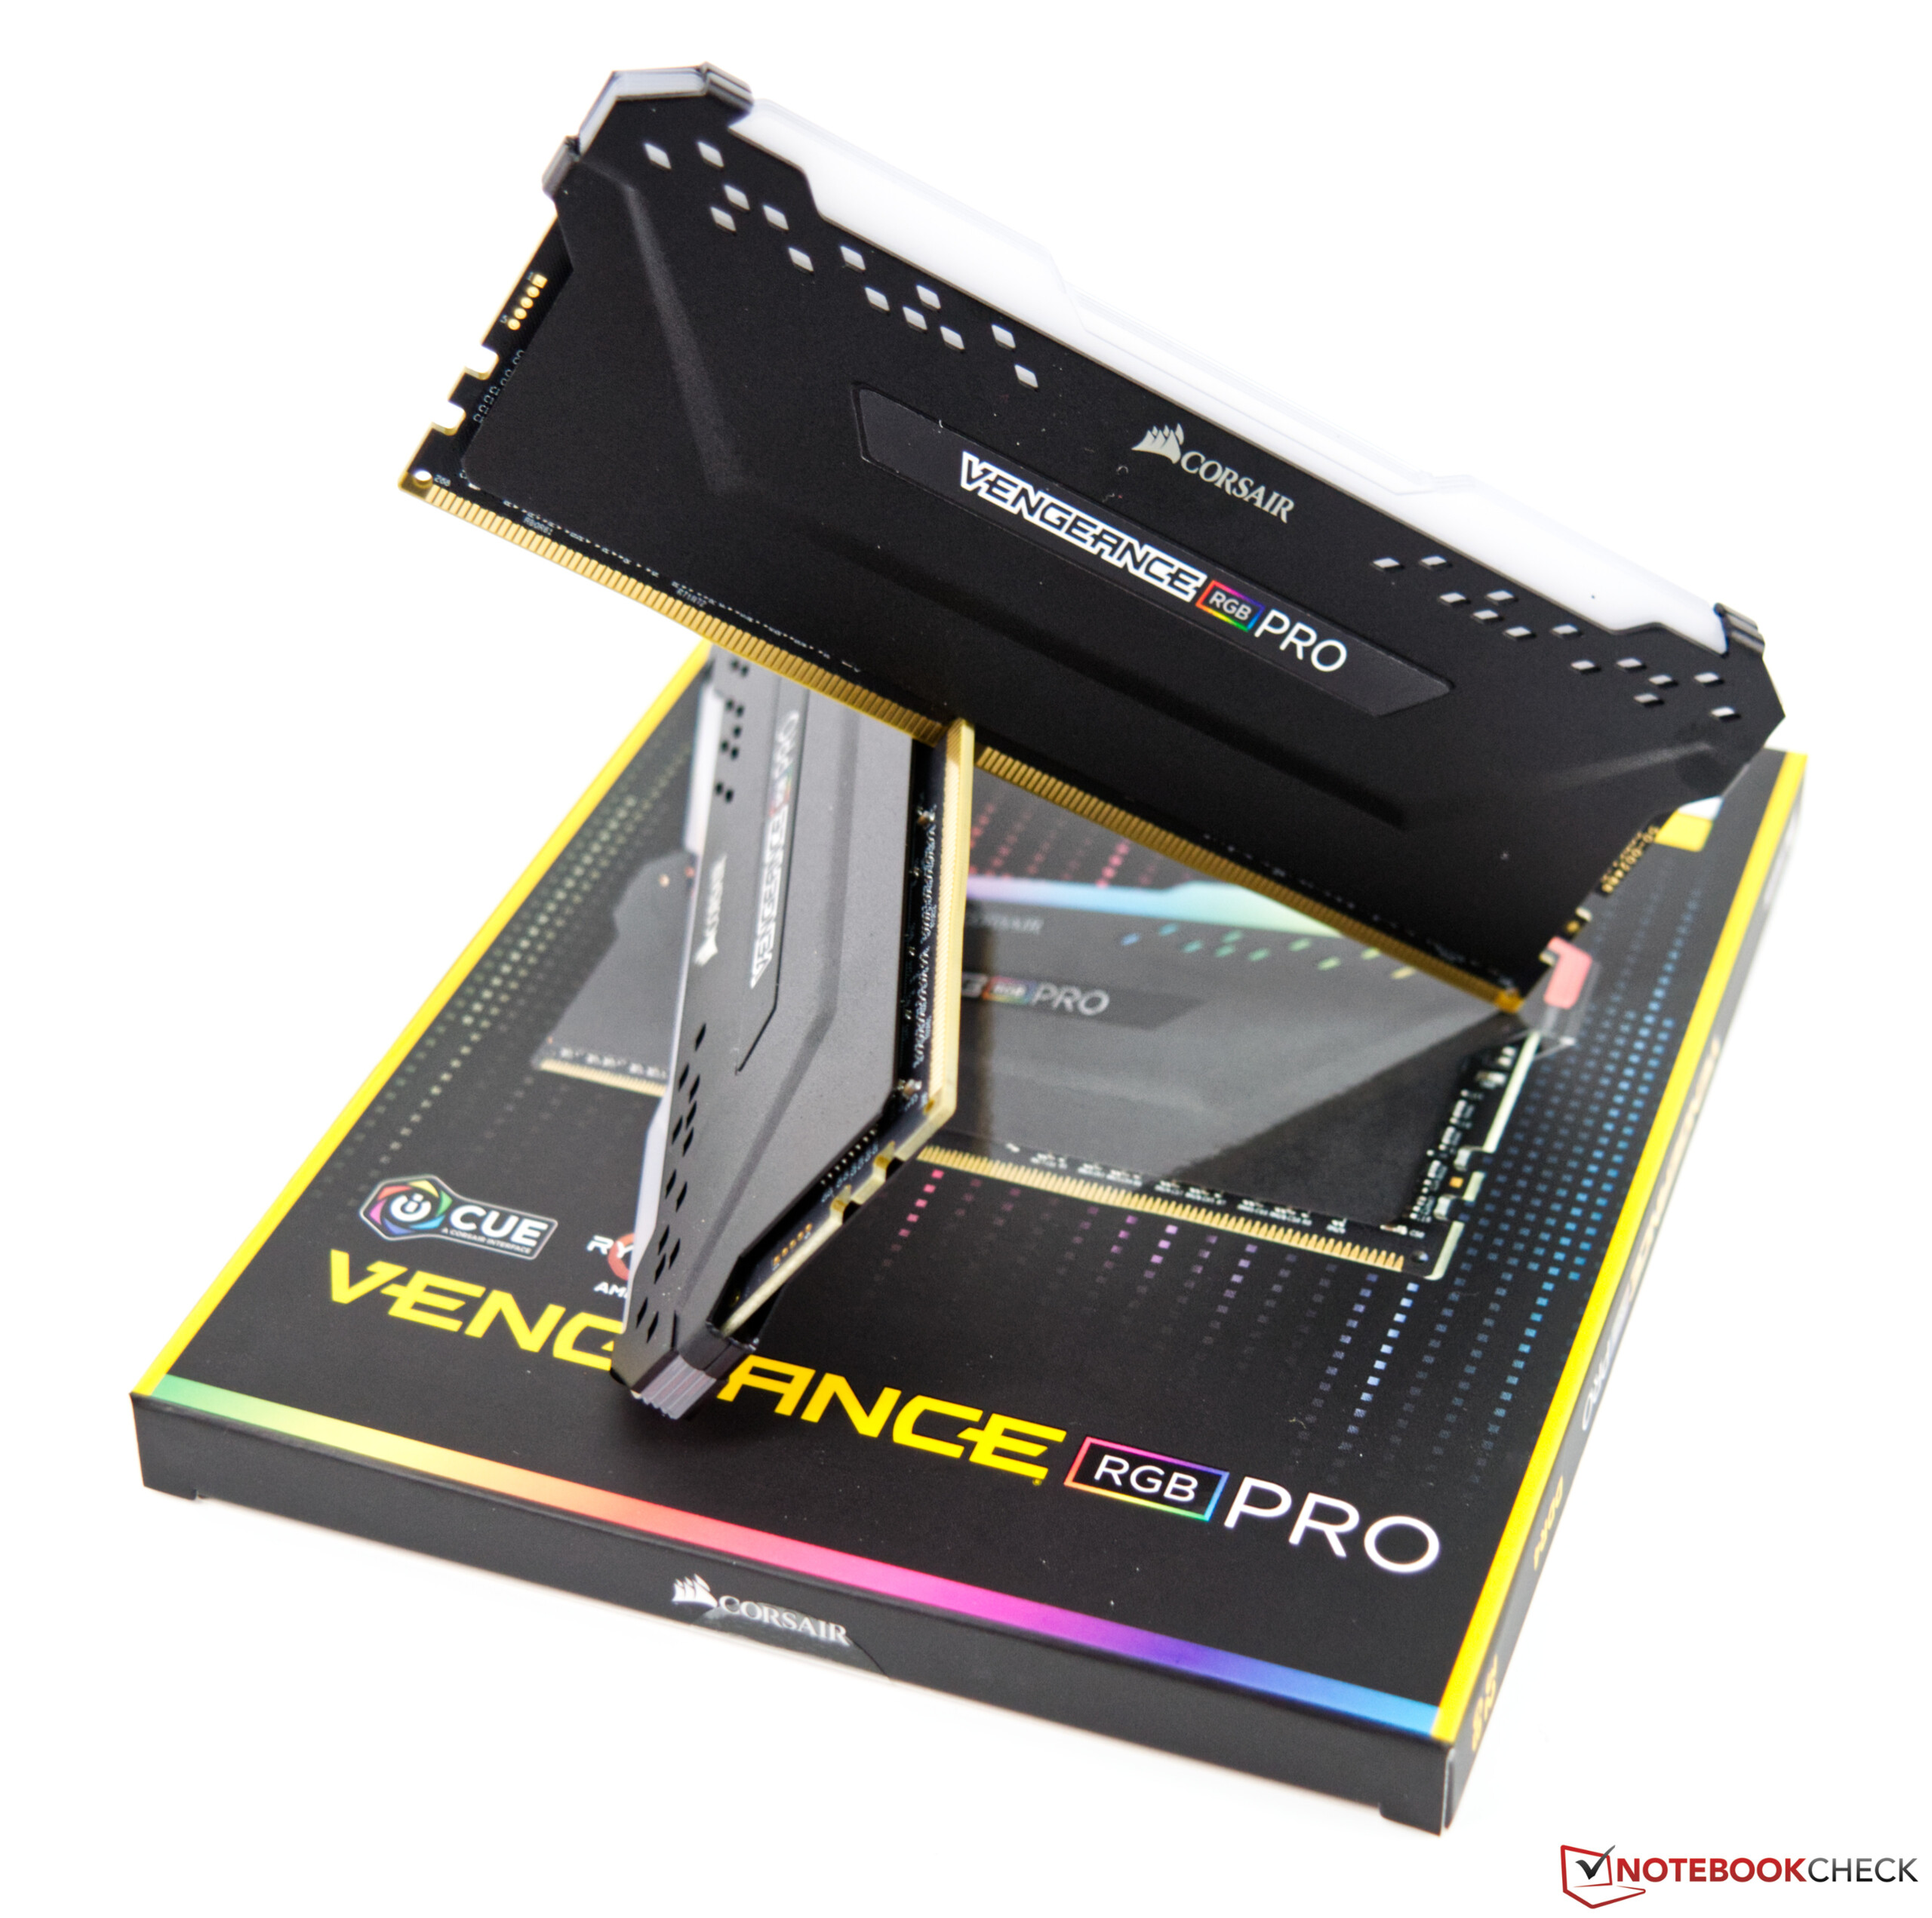
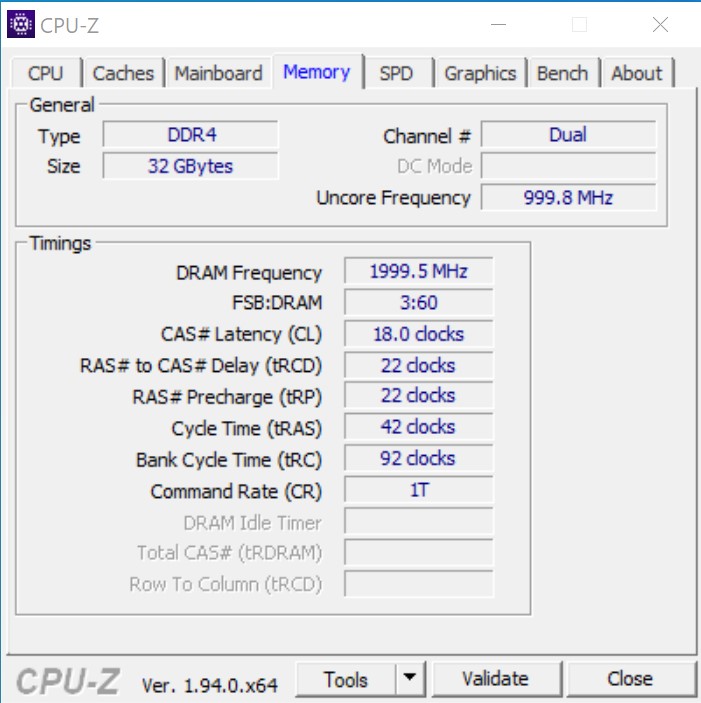
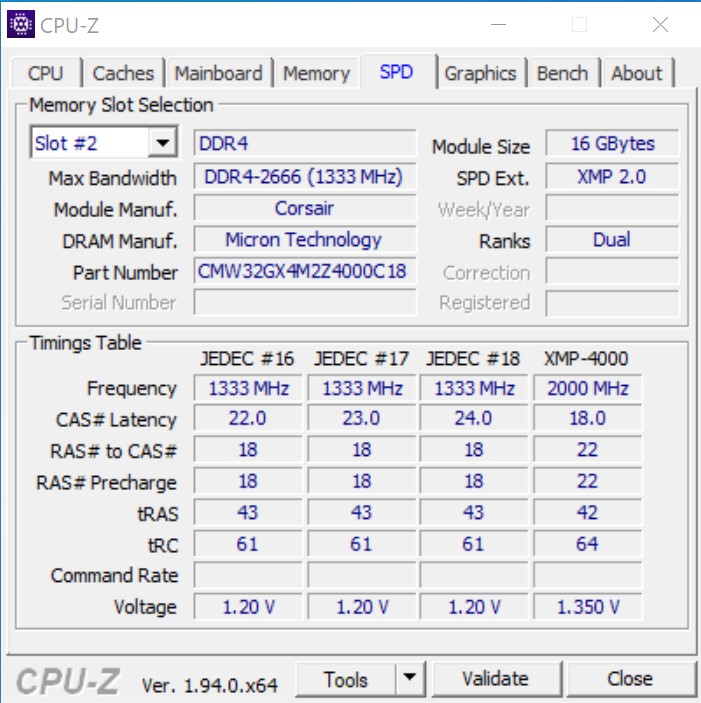
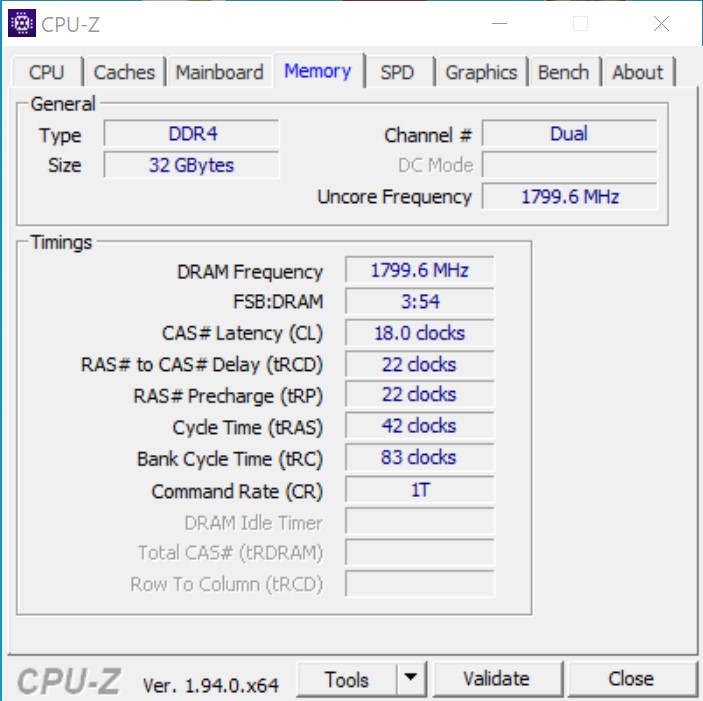
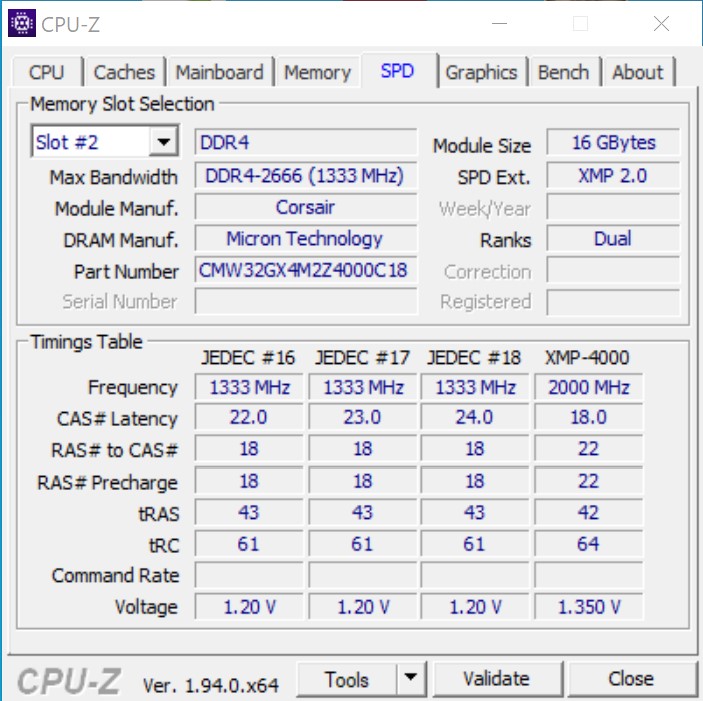
- Corsair Vengeance RGB Pro DDR4-4000 kit di archiviazione 2 x 16 GB
- SSD Intel Optane 905P 480GB PCIe
- Microsoft Windows 10 Professional 64-Bit (Versione 2004)
A questo punto vorremmo ringraziare Caseking per averci prestato la Raijintek Pean, anch'essa personalizzata con incisioni laser. AMD Direct ha fornito la scheda madre, che è stata inclusa nel kit per la stampa sul rilascio dei processori AMD Ryzen 9 3900X e AMD Ryzen 7 3700X Zen 2. Come raffreddamento, utilizziamo l'Alphacool Eisbear 280 che Alphacool ci ha fornito.Vorremmo anche ringraziare Corsair per il suo supporto alla memoria di lavoro


Benchmarks del processore
Abbiamo già potuto constatare che le innovazioni dell'architettura Zen 3 hanno avuto successo. Con il processore a 16 cores, AMD sta ora alzando ancora una volta la posta in gioco, non solo aumentando le prestazioni multi-core. Grazie al Boost più elevato, anche le prestazioni single-core sono aumentate rispetto all'AMD Ryzen 9 5900X. Il processore non si ferma a 4,9 GHz ma spesso supera addirittura il limite dei 5 GHz. Come previsto, l'AMD Ryzen 5 5600X si colloca dietro ai suoi fratelli maggiori. Tuttavia, le prestazioni del processore a 6 cores non devono essere sottovalutate, poiché spesso supera anche l'Intel Core i9-10900K nel confronto single core. Nelle prestazioni multi-core, è quasi sufficiente avvicinarsi all'AMD Ryzen 7 3700X, anche se questo offre due core in più.
Potete trovare ulteriori benchmarks sui processori qui
AMD Ryzen 9 5950X
AMD Ryzen 5 5600X
| Blender - v2.79 BMW27 CPU | |
| AMD Ryzen 3 3300X | |
| AMD Ryzen 5 5600X | |
| AMD Ryzen 7 5800X | |
| AMD Ryzen 7 3700X | |
| Intel Core i9-10900K | |
| AMD Ryzen 9 3900X | |
| AMD Ryzen 9 5900X | |
| AMD Ryzen 9 3950X | |
| AMD Ryzen 9 5950X | |
| WinRAR - Result | |
| AMD Ryzen 7 5800X | |
| AMD Ryzen 9 5900X | |
| AMD Ryzen 5 5600X | |
| AMD Ryzen 9 5950X | |
| Intel Core i9-10900K | |
| AMD Ryzen 9 3900X | |
| AMD Ryzen 7 3700X | |
| AMD Ryzen 9 3950X | |
| AMD Ryzen 3 3300X | |
| 3DMark 11 - 1280x720 Performance Physics | |
| AMD Ryzen 9 5950X | |
| AMD Ryzen 9 5900X | |
| AMD Ryzen 7 5800X | |
| Intel Core i9-10900K | |
| AMD Ryzen 9 3950X | |
| AMD Ryzen 5 5600X | |
| AMD Ryzen 9 3900X | |
| AMD Ryzen 7 3700X | |
| AMD Ryzen 3 3300X | |
| HWBOT x265 Benchmark v2.2 - 4k Preset | |
| AMD Ryzen 9 5950X | |
| AMD Ryzen 9 5900X | |
| Intel Core i9-10900K | |
| AMD Ryzen 9 3900X | |
| AMD Ryzen 7 5800X | |
| AMD Ryzen 9 3950X | |
| AMD Ryzen 5 5600X | |
| AMD Ryzen 7 3700X | |
| AMD Ryzen 3 3300X | |
| R Benchmark 2.5 - Overall mean | |
| AMD Ryzen 9 3900X | |
| AMD Ryzen 3 3300X | |
| Intel Core i9-10900K | |
| AMD Ryzen 9 3950X | |
| AMD Ryzen 5 5600X | |
| AMD Ryzen 9 5950X | |
| AMD Ryzen 9 5900X | |
| AMD Ryzen 7 5800X | |
| LibreOffice - 20 Documents To PDF | |
| Intel Core i9-10900K | |
| AMD Ryzen 9 3900X | |
| AMD Ryzen 9 3950X | |
| AMD Ryzen 3 3300X | |
| AMD Ryzen 9 5900X | |
| AMD Ryzen 9 5950X | |
| AMD Ryzen 5 5600X | |
| AMD Ryzen 7 5800X | |
| WebXPRT 3 - Overall | |
| AMD Ryzen 7 5800X | |
| AMD Ryzen 9 5950X | |
| AMD Ryzen 5 5600X | |
| AMD Ryzen 9 5900X | |
| Intel Core i9-10900K | |
| AMD Ryzen 9 3950X | |
| AMD Ryzen 3 3300X | |
| Mozilla Kraken 1.1 - Total | |
| AMD Ryzen 3 3300X | |
| Intel Core i9-10900K | |
| AMD Ryzen 9 3950X | |
| AMD Ryzen 5 5600X | |
| AMD Ryzen 9 5900X | |
| AMD Ryzen 7 5800X | |
| AMD Ryzen 9 5950X | |
* ... Meglio usare valori piccoli
Stress test con il Cinebench R15 Multi Loop
Nella prova di carico con il multi loop Cinebench R15, né l'AMD Ryzen 9 5950X né l'AMD Ryzen 5 5600X hanno problemi. L'AiO integrato insieme al radiatore da 280 mm (11 in) non hanno problemi a raffreddare in modo affidabile i processori. A proposito, è notevolmente più facile raffreddare l'AMD Ryzen 5 5600X grazie al suo minore consumo energetico.
Prestazioni gaming dei processori Ryzen 3000
Dal 11/5/2020, è ufficiale che AMD offre la CPU di gioco più veloce a questo punto. Tuttavia, l'AMD Ryzen 9 5950X è ancora in grado di spremere qualche FPS in più dalla Nvidia Titan RTX in alcuni giochi. Tuttavia, questo non fa una notevole differenza per il divertimento del gioco. Con l'aumento della risoluzione e delle impostazioni di qualità, i vantaggi delle CPU iniziano a fondersi, così che anche l'AMD Ryzen 5 5600X è in grado di tenere il passo con l'AMD Ryzen 9 5950X. Se siete preoccupati solo per le prestazioni di gioco, al momento non state commettendo alcun errore se decidete per il processore entry-level. I creatori di contenuti così come gli streamer, per esempio, sono in grado di andare d'accordo senza un PC separato per lo streaming, se scelgono AMD Ryzen 9 5950X. Questo offre risorse sufficienti per gestire anche lo streaming online oltre al puro gioco.
| 3DMark 11 - 1280x720 Performance GPU | |
| Intel Core i7-10700K | |
| Intel Core i9-10900K | |
| AMD Ryzen 9 5950X | |
| AMD Ryzen 7 5800X | |
| AMD Ryzen 5 5600X | |
| AMD Ryzen 7 3800XT | |
| AMD Ryzen 3 3300X | |
| AMD Ryzen 9 5900X | |
| AMD Ryzen 3 3100 | |
| AMD Ryzen 9 3950X | |
| AMD Ryzen 5 1600 | |
| AMD Ryzen 3 3100 | |
| AMD Ryzen 9 3900X | |
| AMD Ryzen 7 2700X | |
| Unigine Heaven 4.0 | |
| Extreme Preset DX11 | |
| AMD Ryzen 9 5900X | |
| AMD Ryzen 9 5950X | |
| AMD Ryzen 7 5800X | |
| AMD Ryzen 9 3900X | |
| AMD Ryzen 5 5600X | |
| AMD Ryzen 7 2700X | |
| Extreme Preset OpenGL | |
| AMD Ryzen 7 5800X | |
| AMD Ryzen 9 5900X | |
| AMD Ryzen 9 5950X | |
| AMD Ryzen 9 3900X | |
| AMD Ryzen 5 5600X | |
| AMD Ryzen 7 2700X | |
| Unigine Valley 1.0 | |
| 1920x1080 Extreme HD Preset OpenGL AA:x8 | |
| AMD Ryzen 9 5900X | |
| AMD Ryzen 7 5800X | |
| AMD Ryzen 9 5950X | |
| AMD Ryzen 5 5600X | |
| AMD Ryzen 9 3900X | |
| AMD Ryzen 7 2700X | |
| 1920x1080 Extreme HD DirectX AA:x8 | |
| AMD Ryzen 9 5950X | |
| AMD Ryzen 9 5900X | |
| AMD Ryzen 7 5800X | |
| AMD Ryzen 5 5600X | |
| AMD Ryzen 9 3900X | |
| AMD Ryzen 7 2700X | |
| Unigine Superposition | |
| 1280x720 720p Low | |
| AMD Ryzen 7 5800X | |
| AMD Ryzen 5 5600X | |
| AMD Ryzen 9 5950X | |
| AMD Ryzen 9 5900X | |
| AMD Ryzen 9 3900X | |
| 1920x1080 1080p Extreme | |
| AMD Ryzen 9 5900X | |
| AMD Ryzen 7 5800X | |
| AMD Ryzen 9 5950X | |
| AMD Ryzen 5 5600X | |
| AMD Ryzen 9 3900X | |
| 7680x4320 8k Optimized | |
| AMD Ryzen 9 5900X | |
| AMD Ryzen 5 5600X | |
| AMD Ryzen 7 5800X | |
| AMD Ryzen 9 5950X | |
| AMD Ryzen 9 3900X | |
Ryzen 9 5950X con Nvidia Titan RTX
| basso | medio | alto | ultra | QHD | 4K | |
|---|---|---|---|---|---|---|
| GTA V (2015) | 187 | 186 | 182 | 121 | 113 | 134 |
| The Witcher 3 (2015) | 594 | 420 | 271 | 141 | 102 | |
| Dota 2 Reborn (2015) | 214.5 | 192.3 | 193.3 | 179.2 | 161.6 | |
| Final Fantasy XV Benchmark (2018) | 225 | 183 | 141 | 105 | 63.4 | |
| X-Plane 11.11 (2018) | 168 | 152 | 117 | 101 | ||
| Far Cry 5 (2018) | 201 | 174 | 166 | 154 | 137 | 80 |
| Strange Brigade (2018) | 604 | 350 | 286 | 241 | 183 | 110 |
| Shadow of the Tomb Raider (2018) | 225.1 | 184.2 | 177.9 | 166.1 | 120.1 | 66.4 |
| Far Cry New Dawn (2019) | 165 | 142 | 123 | 115 | 82 | |
| Metro Exodus (2019) | 232 | 172 | 133 | 106 | 86.1 | 56.4 |
| Borderlands 3 (2019) | 217 | 182 | 141 | 117 | 84.4 | 46.6 |
Ryzen 5 5600X con Nvidia Titan RTX
| basso | medio | alto | ultra | QHD | 4K | |
|---|---|---|---|---|---|---|
| GTA V (2015) | 187 | 186 | 181 | 118 | 109 | 133 |
| The Witcher 3 (2015) | 570 | 413 | 268 | 139 | 101 | |
| Dota 2 Reborn (2015) | 228.9 | 200.7 | 191 | 180 | 168.3 | |
| Final Fantasy XV Benchmark (2018) | 225 | 179 | 138 | 104 | 63.2 | |
| X-Plane 11.11 (2018) | 172 | 156 | 123 | 105 | ||
| Far Cry 5 (2018) | 200 | 171 | 166 | 153 | 135 | 80 |
| Strange Brigade (2018) | 643 | 351 | 286 | 243 | 184 | 110 |
| Shadow of the Tomb Raider (2018) | 217 | 185 | 178 | 165 | 121 | 66.5 |
| Far Cry New Dawn (2019) | 164 | 144 | 136 | 123 | 116 | 81 |
| Metro Exodus (2019) | 236 | 172 | 133 | 107 | 85.4 | 54.6 |
| Borderlands 3 (2019) | 214 | 177 | 138 | 115 | 83.9 | 46.5 |
Prestazioni dell'applicazione
Come abbiamo già visto nei benchmark delle CPU, tutti i nuovi processori Vermeer sono su un'ottima traiettoria in termini di prestazioni. Questo si riflette anche nei nostri test di applicazione e di rendering. L'intero sistema funziona molto velocemente, anche se l'SSD non utilizza il più recente standard PCI Express 4.0. Tuttavia, nell'uso quotidiano questo non è uno svantaggio, dato che l'Intel Optane 905P appartiene ancora agli SSD PCIe più veloci.
Nel PCMark 10, l'AMD Ryzen 9 5950X è in grado di essere in testa e di ottenere un piccolo vantaggio del 4% rispetto all'AMD Ryzen 9 5900X. Il più piccolo Ryzen 5 5600X è a livello dell'AMD Ryzen 7 5800X, ma chiaramente migliore del vecchio modello di punta, l'AMD Ryzen 9 3950X. I processori Intel si trovano solo al centro classifica con uno svantaggio del 15% rispetto al Ryzen 9 5950X.
Nei test di rendering, il risultato complessivo sembra più confuso, poiché la scheda grafica è il fattore limitante in questo caso. Tuttavia, è possibile vedere in alcuni test che con un numero crescente di core, anche le prestazioni aumentano, anche se il numero di core della CPU non ha importanza in alcuni carichi di lavoro. Qui bisogna valutare attentamente ciò che è più importante per voi, se non siete disposti a scegliere sempre il modello di punta.
* ... Meglio usare valori piccoli
Consumo di energia
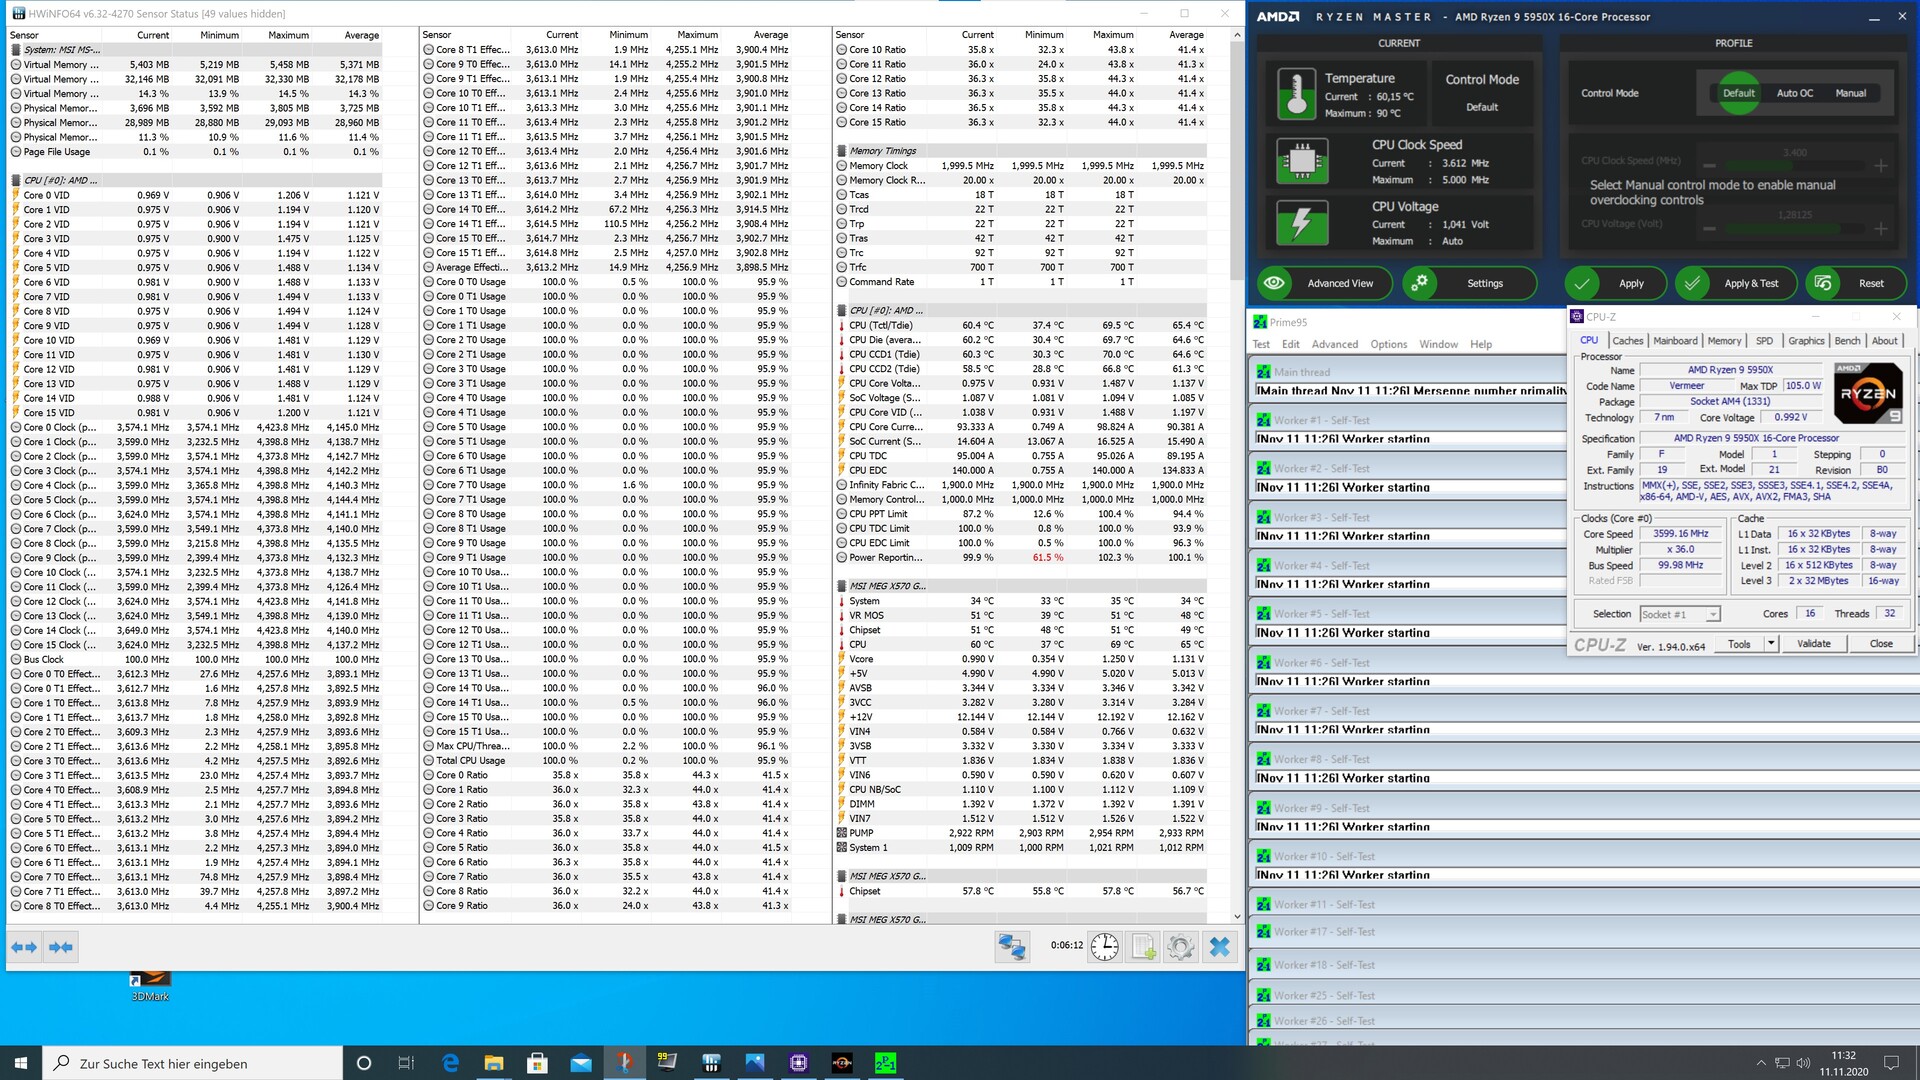
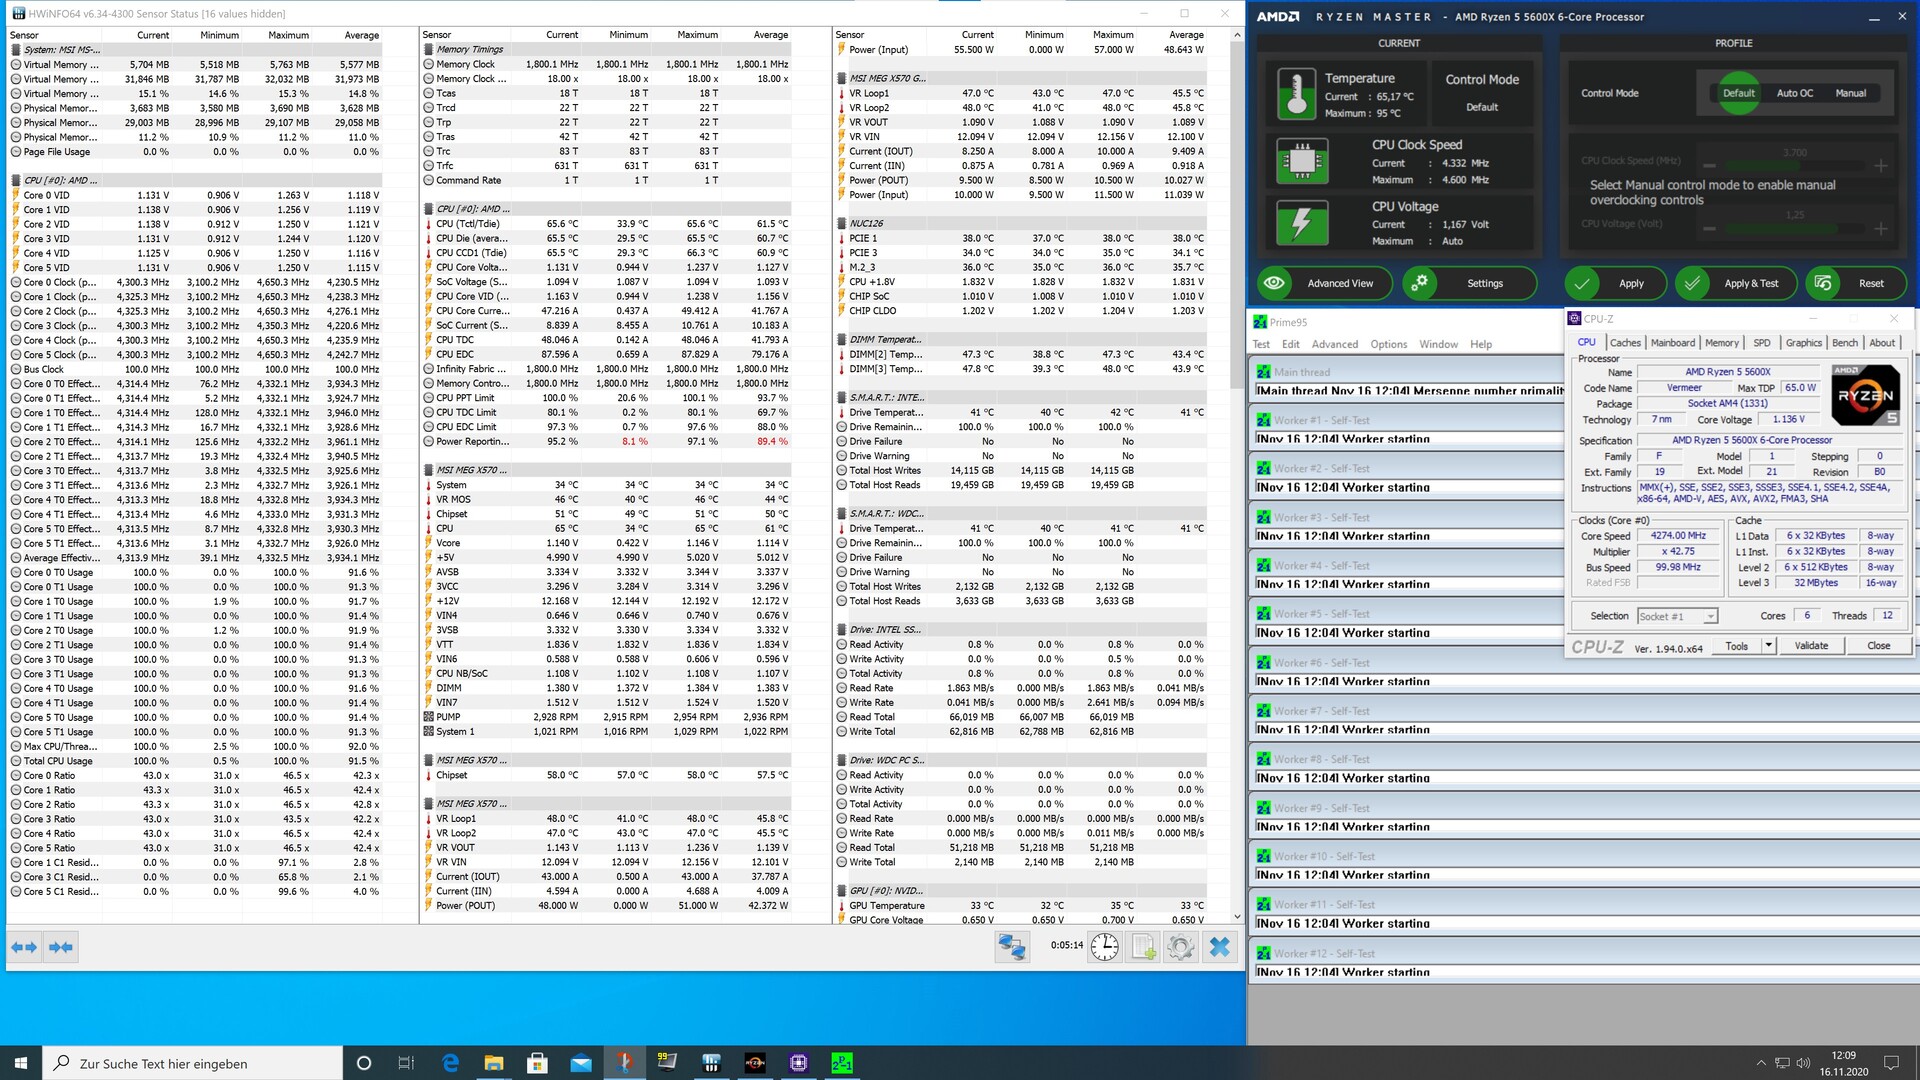
Come già in precedenza per il Ryzen 9 5900X e il Ryzen 7 5800X, AMD specifica anche un TDP di 105 watt per il Ryzen 9 5950X. Con questo, rimane all'interno delle specifiche della piattaforma X570, poiché AMD non ha introdotto un nuovo chipset con la generazione Vermeer. Tuttavia, alla fine i 105 watt non sono sufficienti, poiché il limite di potenza della CPU è di 142 watt, che il processore a 16 cores consuma sotto carico.
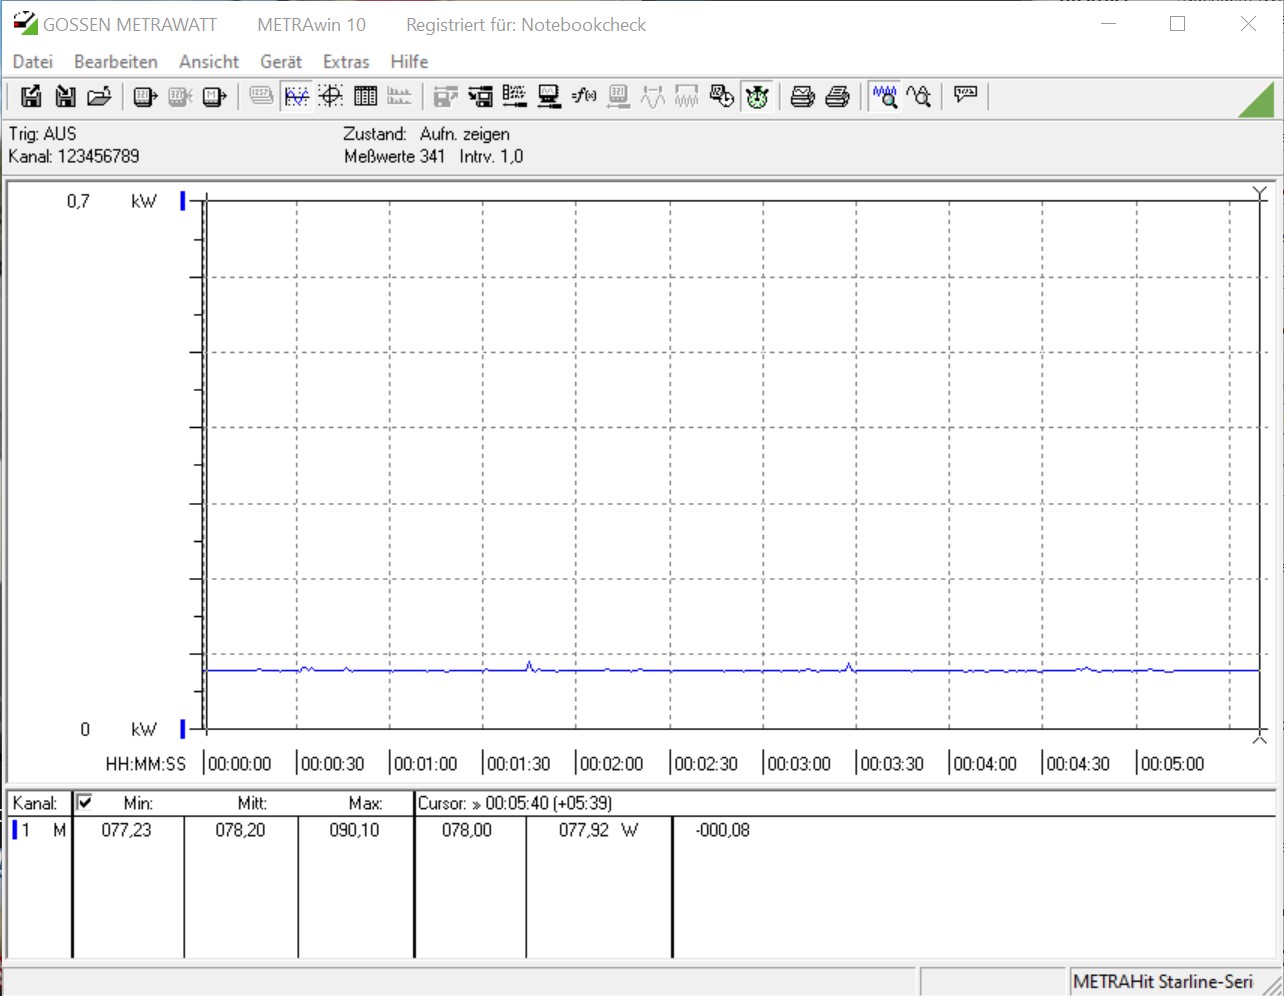
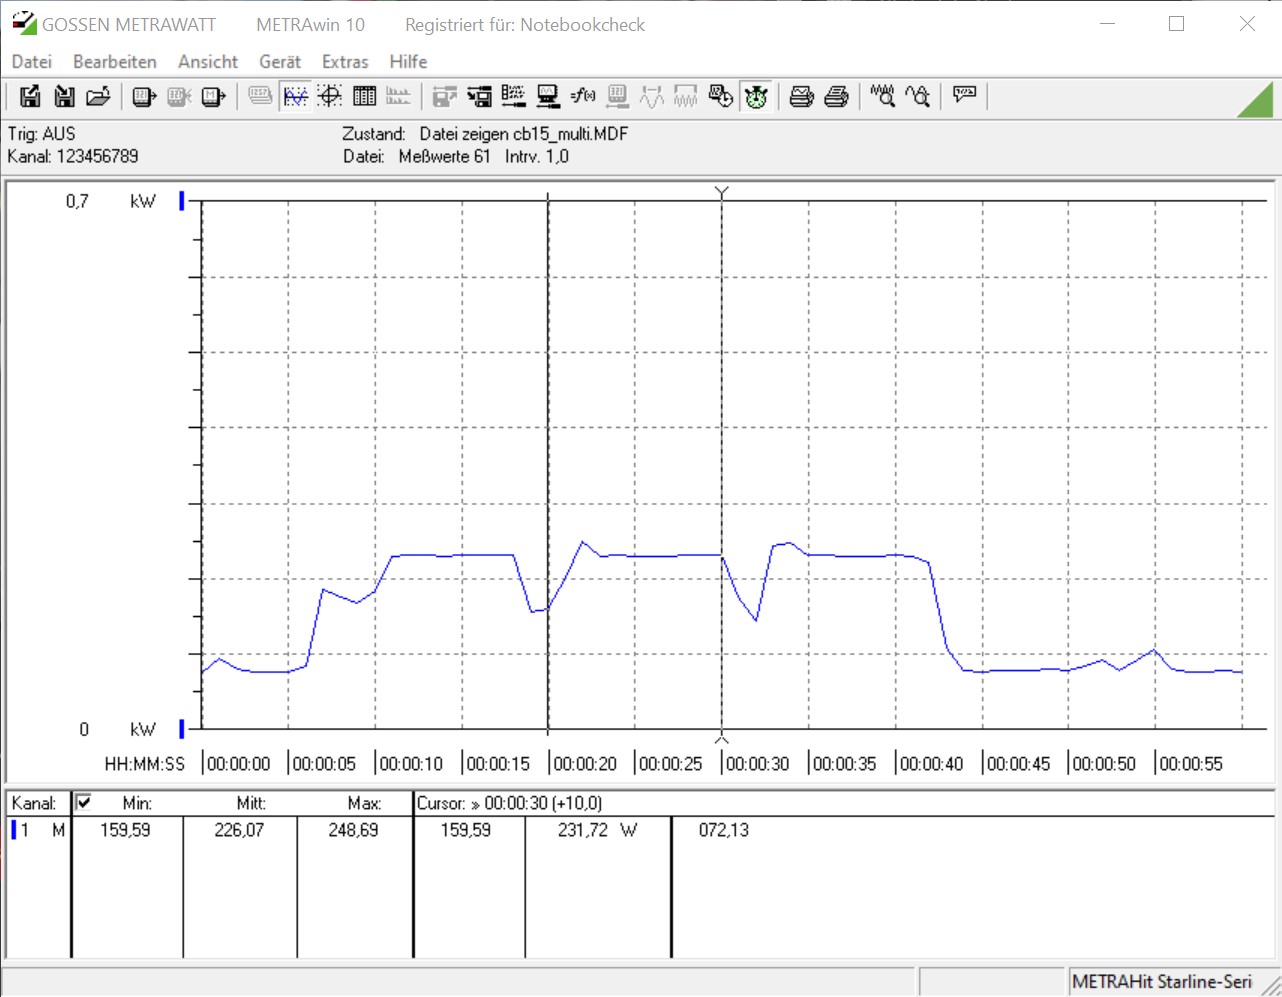
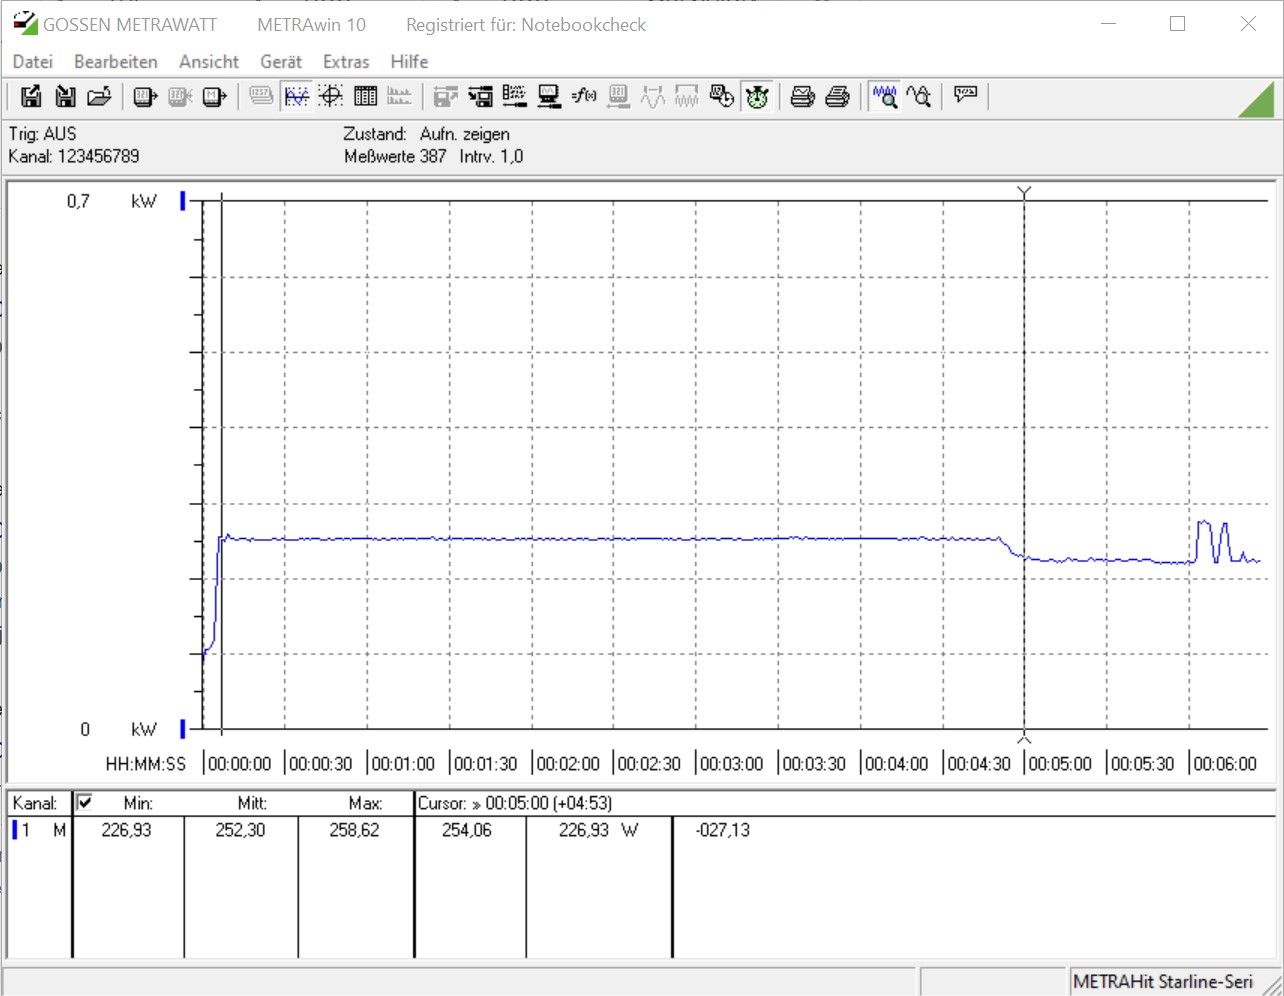
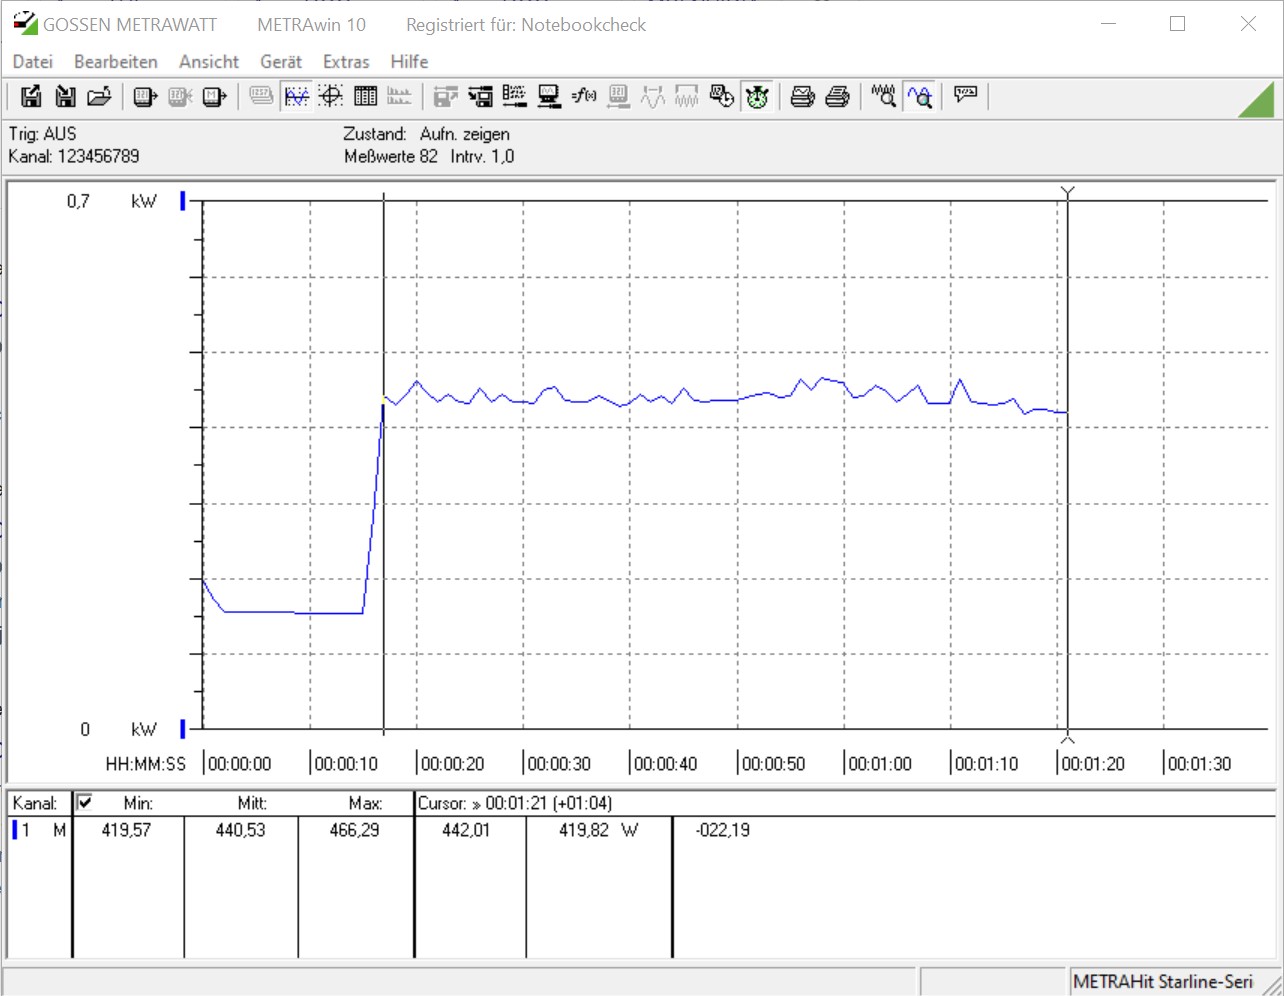
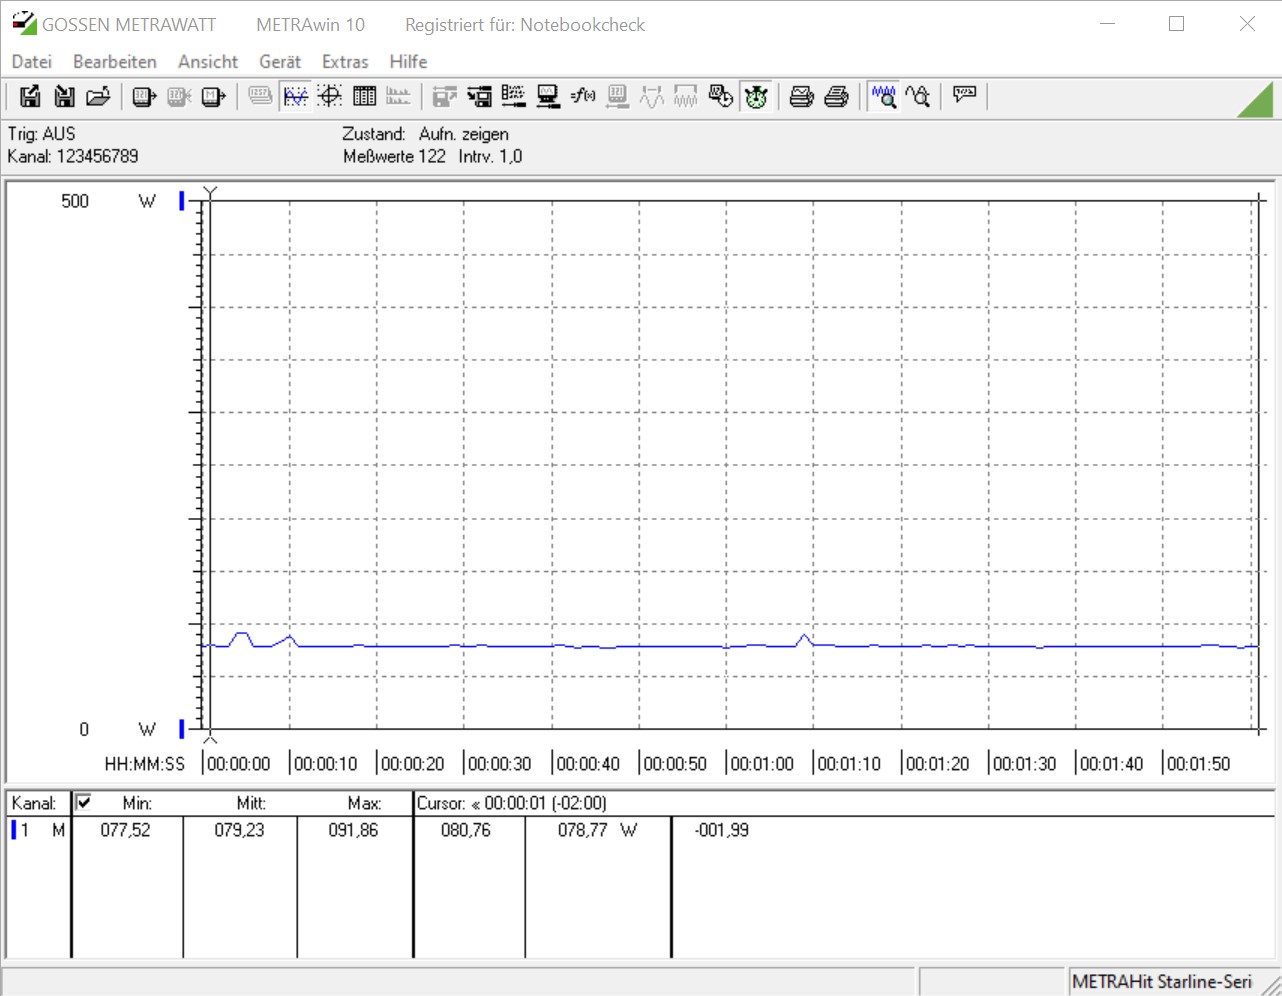
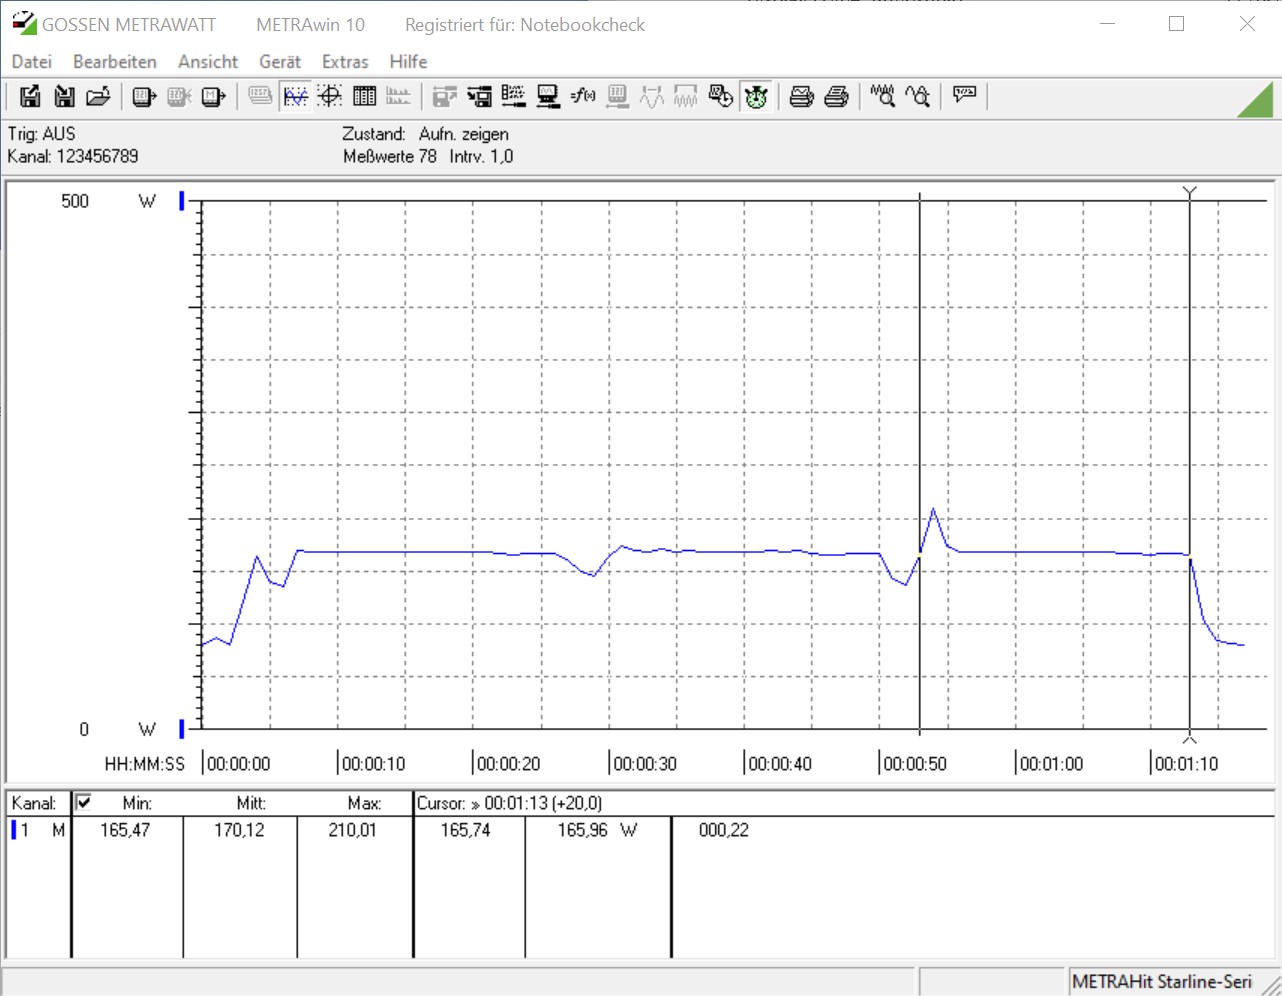
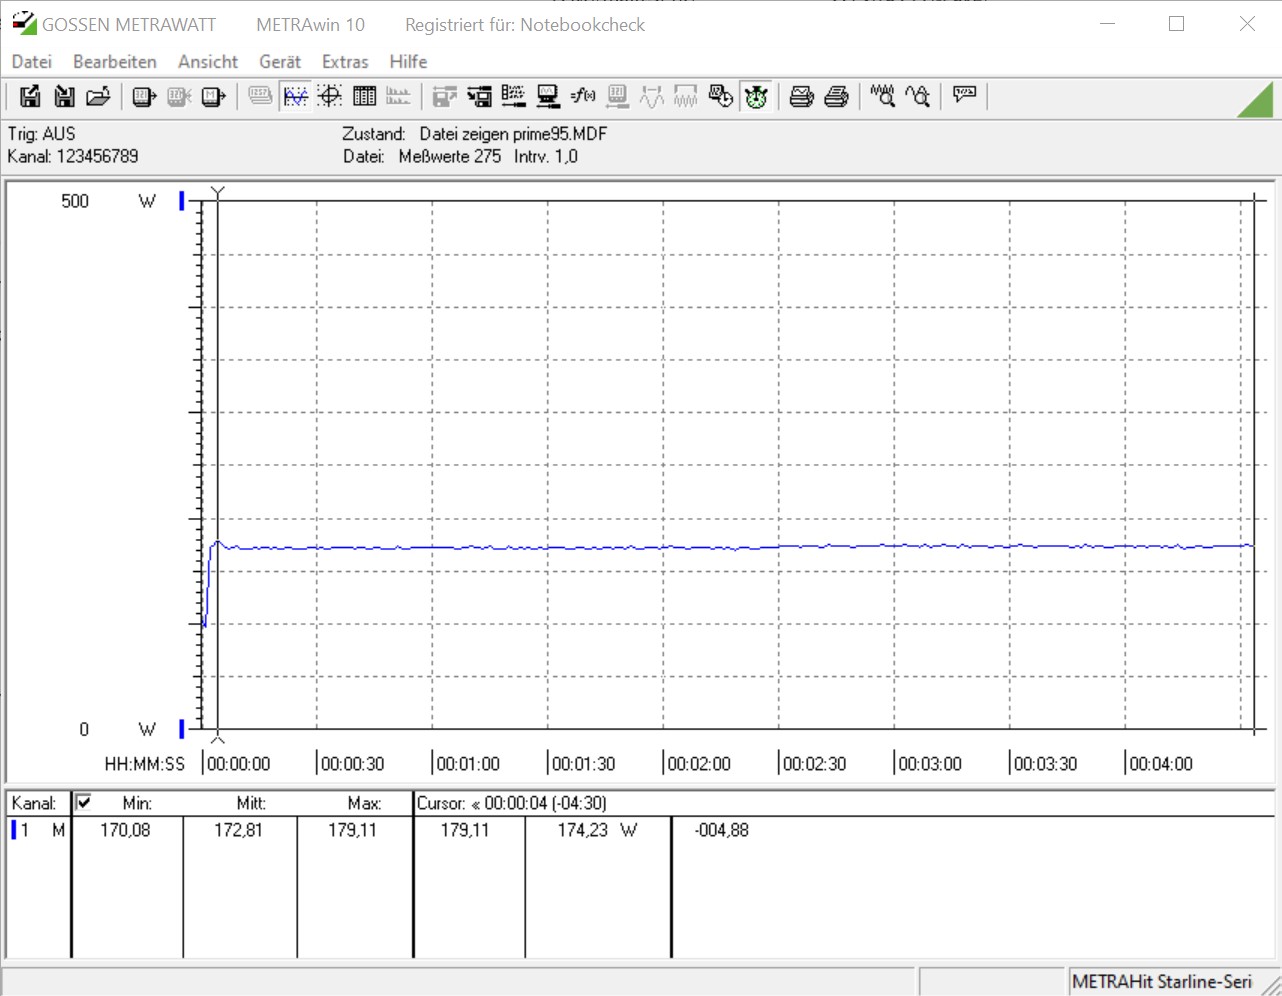
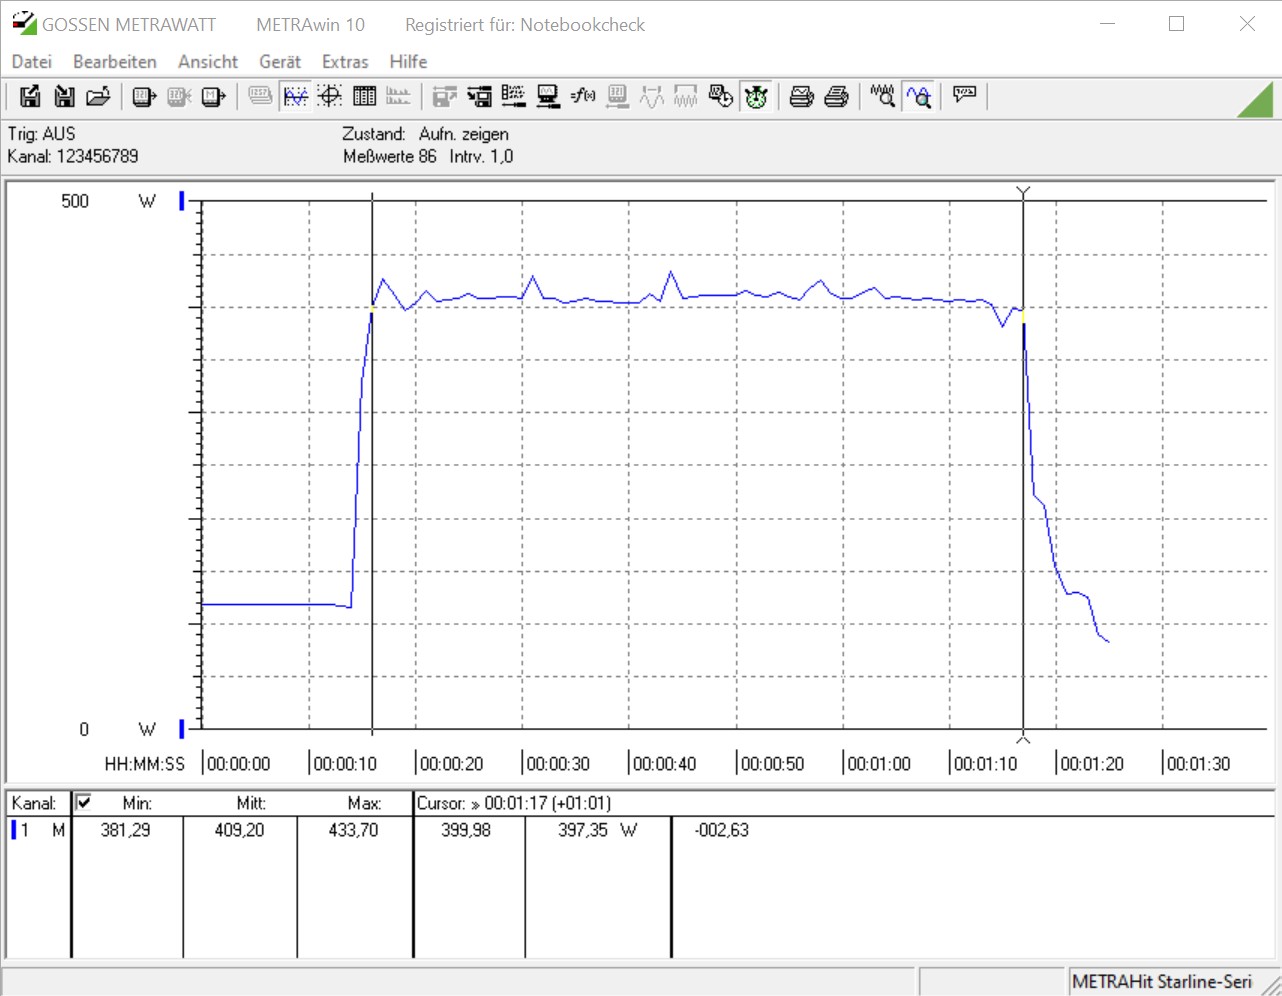
Senza carico, non ci sono cambiamenti rispetto alle altre due CPU Vermeer, e misuriamo poco meno di 80 watt tra la presa e l'alimentazione con il nostro dispositivo di misura. Sotto carico, il consumo aumenta. Nel test multiplo Cinebench R15 determiniamo 226 watt per il processore a 16 cores. Con il Ryzen 5 5600X, il consumo del sistema di prova è di 170 watt nello stesso test. Questo è un buon risultato per entrambi i candidati. Durante il gioco, l'AMD Ryzen 9 5950X è in testa con 440 watt. Tuttavia, con 439 watt, il nostro sistema di test con AMD Ryzen 5 5900X non è molto più frugale. Con l'AMD Ryzen 5 5600X, il consumo energetico scende leggermente di circa 30 watt. Tuttavia, a pieno carico bisogna anche calcolare circa 280 watt per la scheda grafica, che ha sempre un ruolo importante durante il test di gioco.
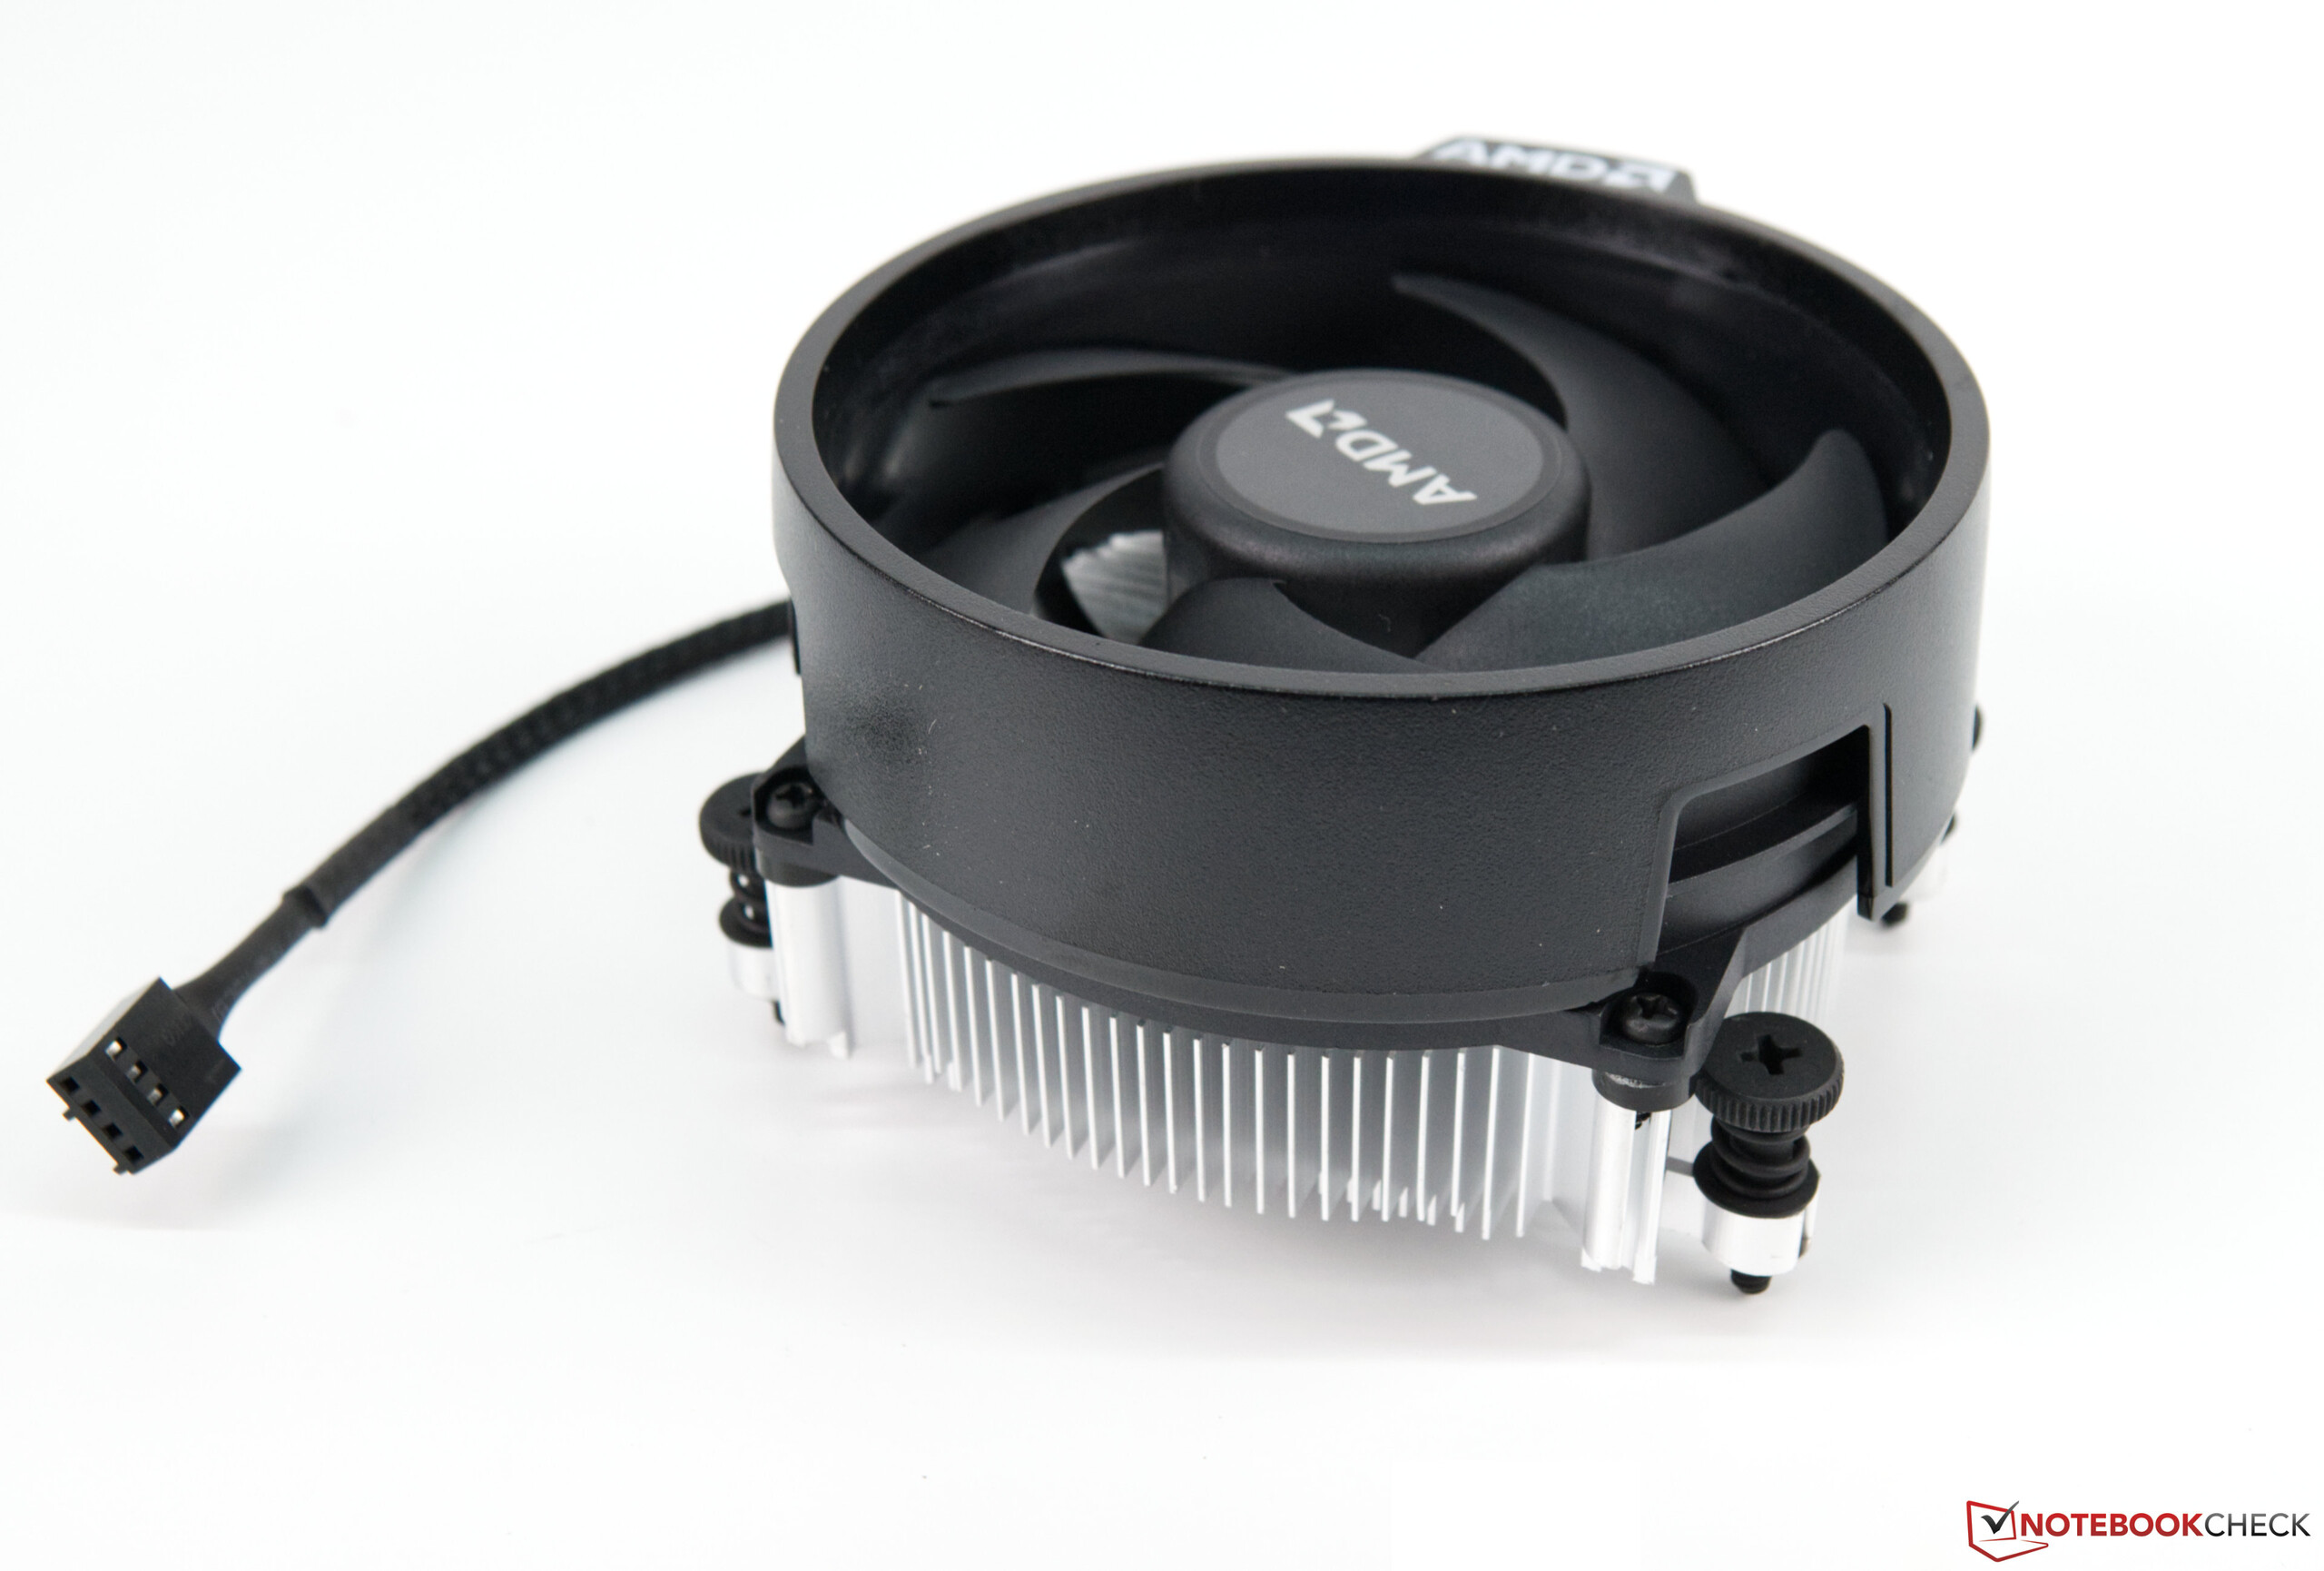
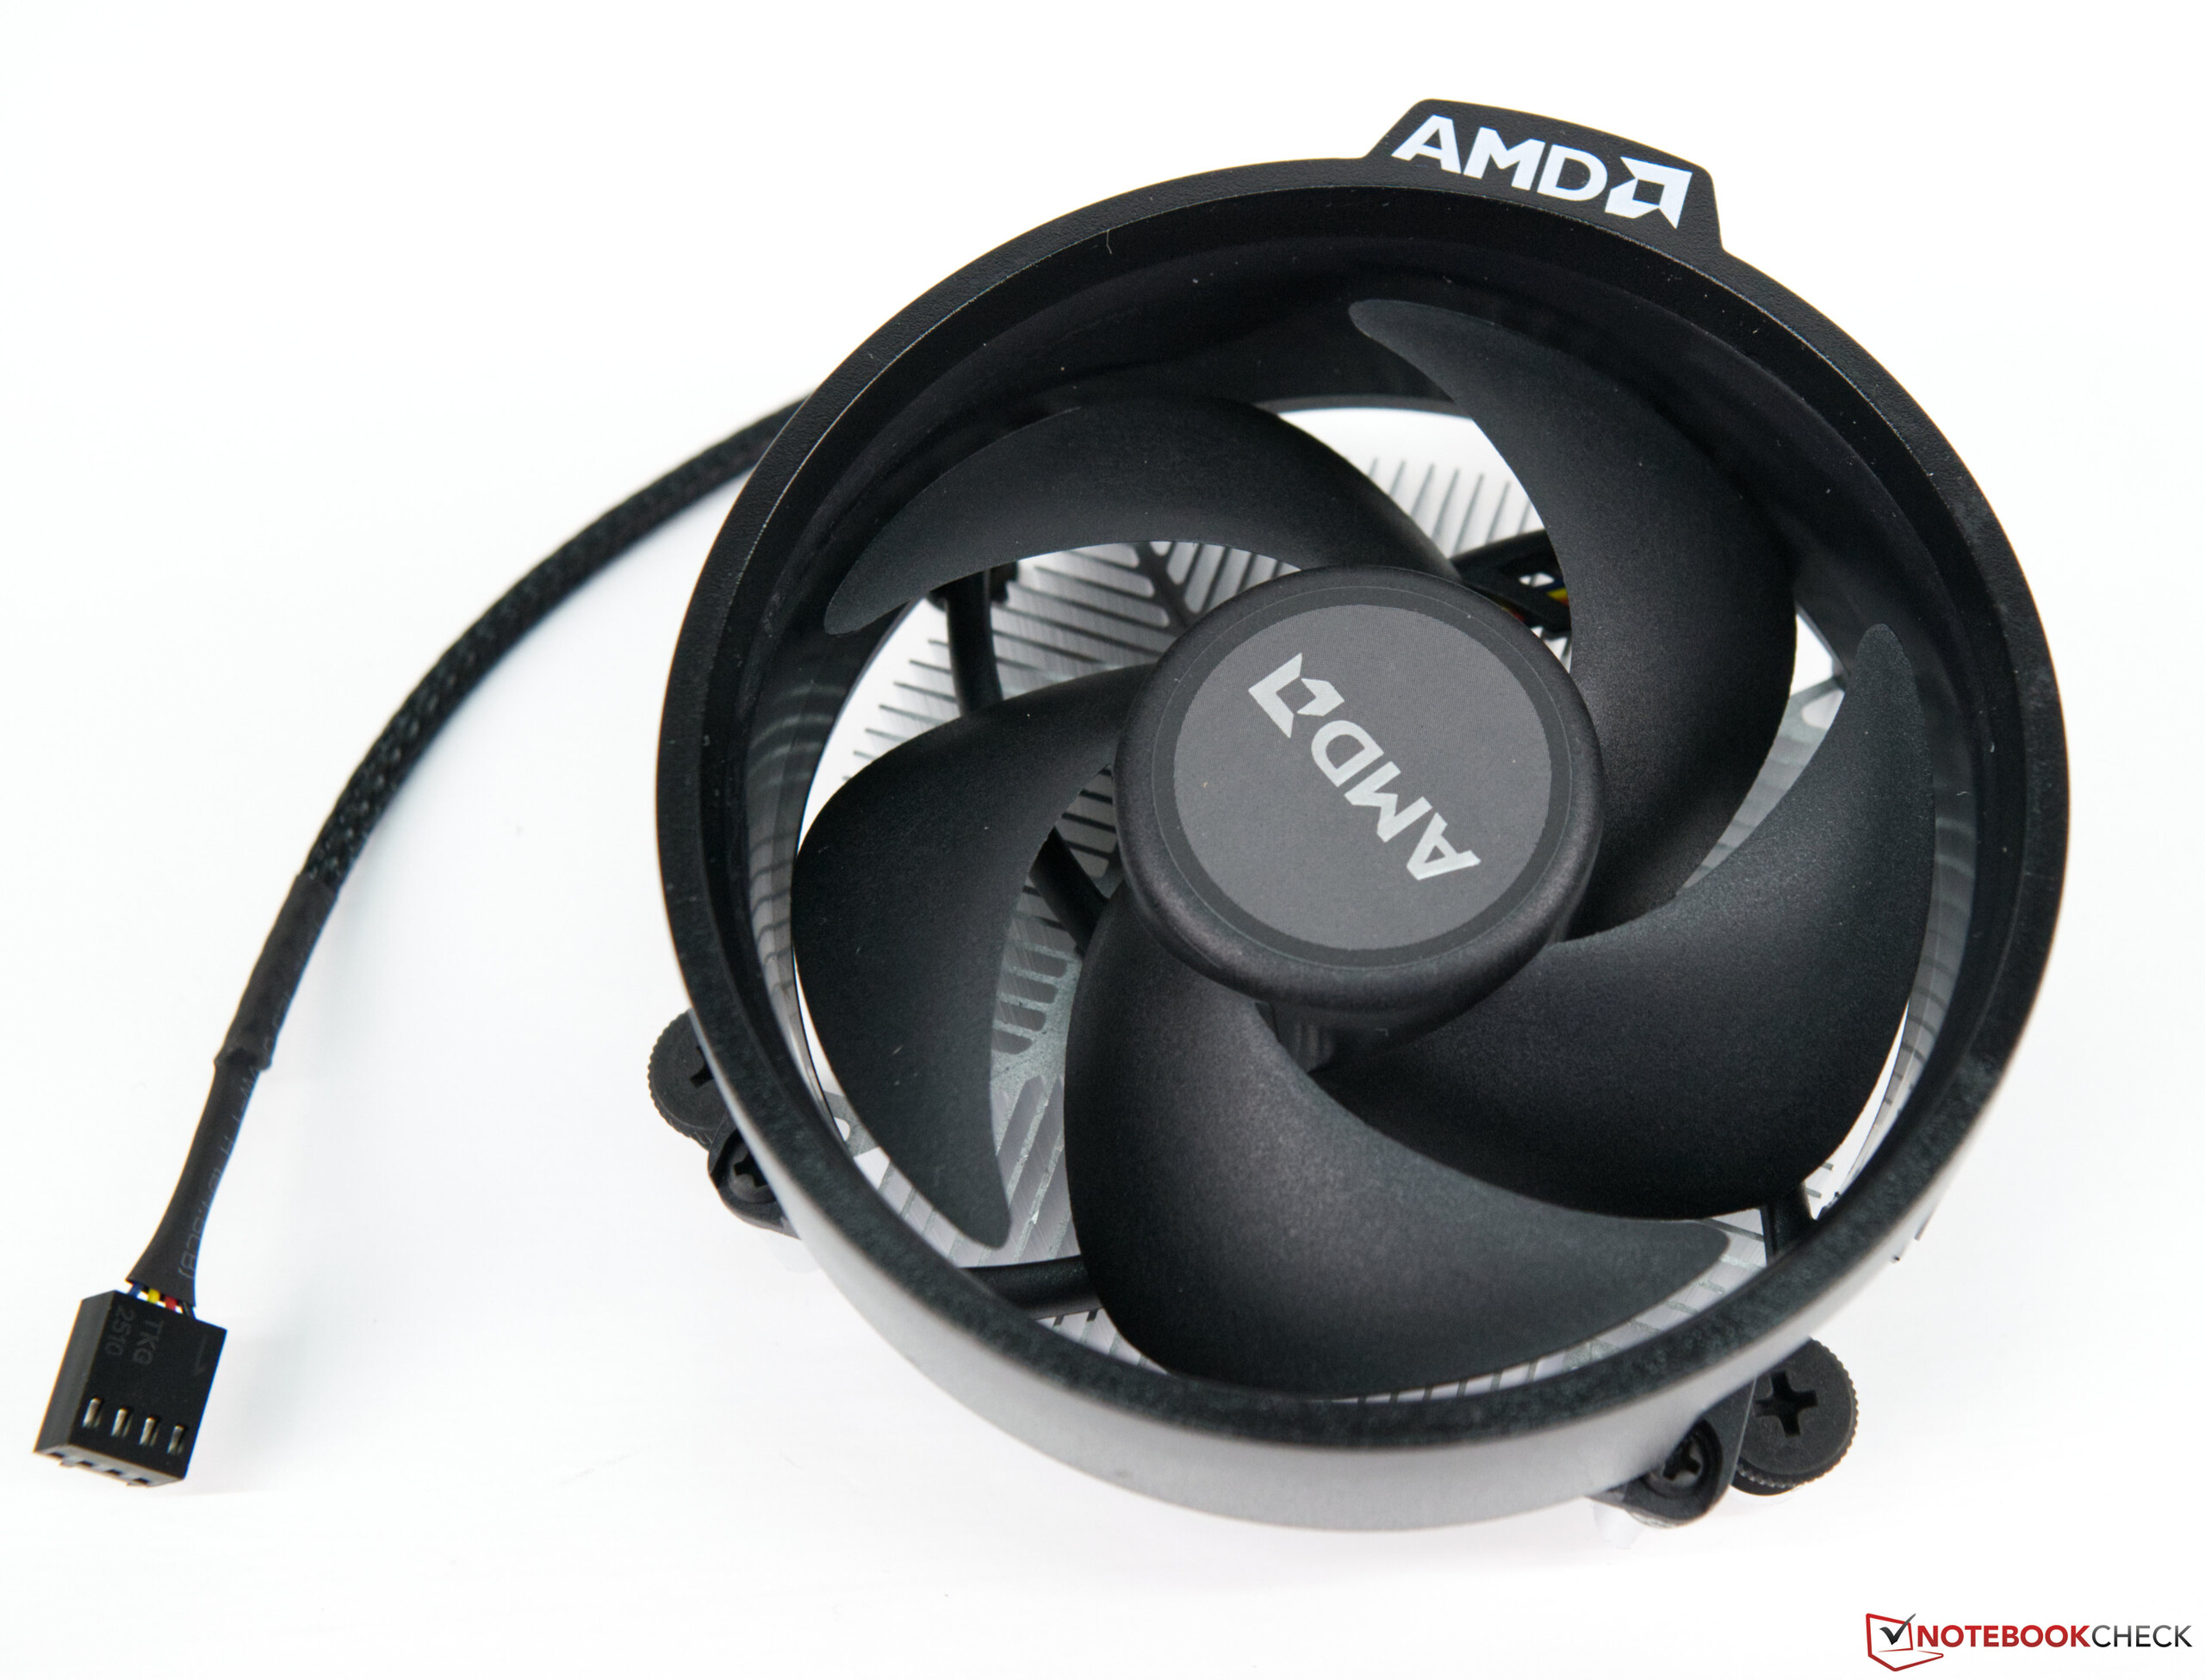
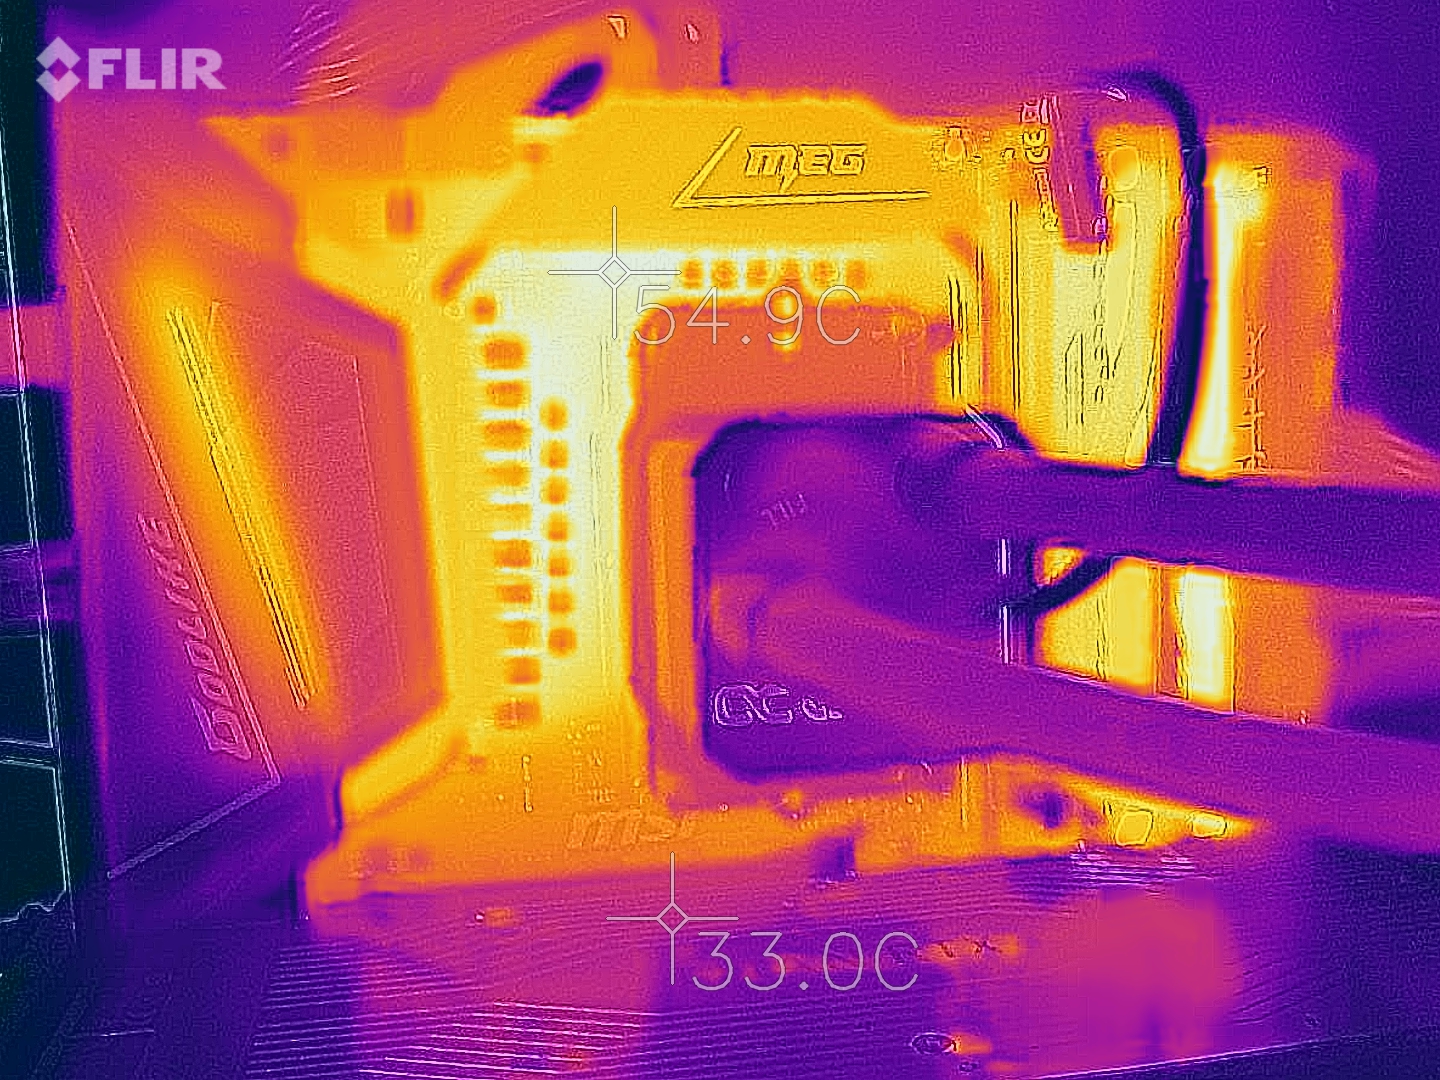
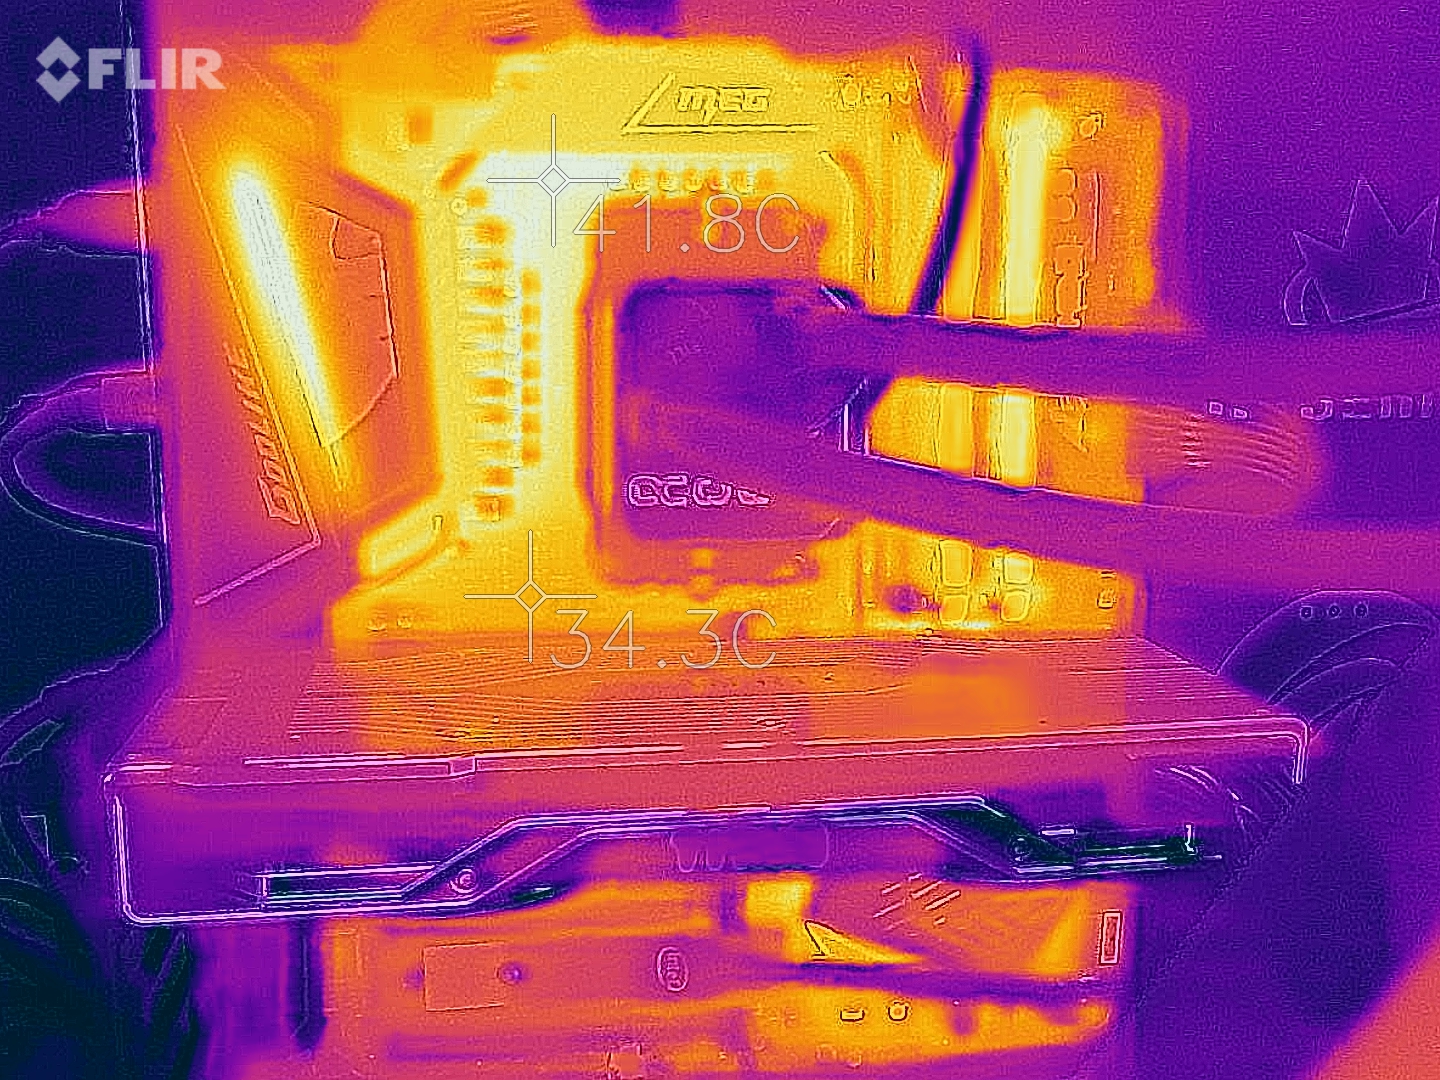
Non ci sono preoccupazioni riguardo alle temperature. Nel test di stress, la Ryzen 9 5950X ha raggiunto appena 70 °C (158 °F), anche se la Ryzen 5 5600X è rimasta leggermente più fredda a quasi 66 °C (151 °F). Quindi l'AiO di Alphacool che è stato utilizzato non ha alcun problema a mantenere il modello di punta a livello affidabile. AMD include un piccolo raffreddatoe in box con il Ryzen 5 5600X.
AMD Ryzen 9 5950X
AMD Ryzen 5 5600X
| Power Consumption / The Witcher 3 ultra (external Monitor) | |
| AMD Ryzen 9 5950X, NVIDIA Titan RTX (Idle: 78 W) | |
| AMD Ryzen 9 5900X, NVIDIA Titan RTX (Idle: 78.1 W) | |
| AMD Ryzen 7 2700X, NVIDIA Titan RTX | |
| AMD Ryzen 9 3950X, NVIDIA Titan RTX (Idle: 95 W) | |
| AMD Ryzen 9 3900X, NVIDIA Titan RTX (Idle: 87.4 W) | |
| AMD Ryzen 7 5800X, NVIDIA Titan RTX (Idle: 77.5 W) | |
| AMD Ryzen 7 3800XT, NVIDIA Titan RTX (Idle: 96.1 W) | |
| AMD Ryzen 5 5600X, NVIDIA Titan RTX (Idle: 79.23 W) | |
| AMD Ryzen 5 1600, NVIDIA Titan RTX (Idle: 85.9 W) | |
| Intel Core i7-10700K, NVIDIA Titan RTX (Idle: 67.7 W) | |
| AMD Ryzen 3 3300X, NVIDIA Titan RTX (Idle: 88.8 W) | |
| Intel Core i9-10900K, NVIDIA Titan RTX (Idle: 52.3 W) | |
| AMD Ryzen 3 3100, NVIDIA Titan RTX (Idle: 86 W) | |
| Power Consumption / Prime95 V2810 Stress (external Monitor) | |
| Intel Core i9-10900K, NVIDIA Titan RTX (Idle: 52.3 W) | |
| AMD Ryzen 9 5950X, NVIDIA Titan RTX (Idle: 78 W) | |
| AMD Ryzen 7 5800X, NVIDIA Titan RTX (Idle: 77.5 W) | |
| AMD Ryzen 9 5900X, NVIDIA Titan RTX (Idle: 78.1 W) | |
| Intel Core i7-10700K, NVIDIA Titan RTX (Idle: 67.7 W) | |
| AMD Ryzen 9 3950X, NVIDIA Titan RTX (Idle: 95 W) | |
| AMD Ryzen 9 3900X, NVIDIA Titan RTX (Idle: 87.4 W) | |
| AMD Ryzen 7 3800XT, NVIDIA Titan RTX (Idle: 96.1 W) | |
| AMD Ryzen 5 1600, NVIDIA Titan RTX (Idle: 85.9 W) | |
| AMD Ryzen 5 5600X, NVIDIA Titan RTX (Idle: 79.23 W) | |
| AMD Ryzen 3 3300X, NVIDIA Titan RTX (Idle: 88.8 W) | |
| AMD Ryzen 3 3100, NVIDIA Titan RTX (Idle: 86 W) | |
| Power Consumption / Cinebench R15 Multi (external Monitor) | |
| Intel Core i9-10900K, NVIDIA Titan RTX (Idle: 52.3 W) | |
| AMD Ryzen 9 5900X, NVIDIA Titan RTX (Idle: 78.1 W) | |
| AMD Ryzen 9 5950X, NVIDIA Titan RTX (Idle: 78 W) | |
| AMD Ryzen 7 5800X, NVIDIA Titan RTX (Idle: 77.5 W) | |
| AMD Ryzen 9 3950X, NVIDIA Titan RTX (Idle: 95 W) | |
| AMD Ryzen 9 3900X, NVIDIA Titan RTX (Idle: 87.4 W) | |
| Intel Core i7-10700K, NVIDIA Titan RTX (Idle: 67.7 W) | |
| AMD Ryzen 7 3800XT, NVIDIA Titan RTX (Idle: 96.1 W) | |
| AMD Ryzen 5 5600X, NVIDIA Titan RTX (Idle: 79.23 W) | |
| AMD Ryzen 5 1600, NVIDIA Titan RTX (Idle: 85.9 W) | |
| AMD Ryzen 3 3300X, NVIDIA Titan RTX (Idle: 88.8 W) | |
| AMD Ryzen 3 3100, NVIDIA Titan RTX (Idle: 86 W) | |
| Power Consumption / Cinebench R20 Multi (external Monitor) | |
| AMD Ryzen 9 5950X, NVIDIA Titan RTX (78) | |
| AMD Ryzen 5 5600X, NVIDIA Titan RTX (79.23) | |
| Power Consumption / Cinebench R20 Single (external Monitor) | |
| AMD Ryzen 9 5950X, NVIDIA Titan RTX (78) | |
| AMD Ryzen 5 5600X, NVIDIA Titan RTX (79.23) | |
* ... Meglio usare valori piccoli
Pro
Contro
Giudizio Complessivo - l'AMD Ryzen 5000 è molto veloce
Dopo la prima recensione della nuova serie Ryzen 5000, siamo già stati positivamente sorpresi dalle prestazioni. La precedente debolezza delle prestazioni single-core rispetto a Intel appartiene al passato, dopo l'introduzione della nuova famiglia Ryzen 5000. Anche il piccolo Ryzen 5 5600X è in grado di superare facilmente un Intel Core i9-10900K. Allo stesso tempo, dobbiamo aspettare se di vedere Intel sia in grado di ribattere con la Rocket Lake nel prossimo futuro.
Ma fino ad allora, AMD è in grado di indossare la corona della CPU gaming più veloce. Lo abbiamo già attestato per AMD Ryzen 9 5900X. L'AMD Ryzen 9 5950X è addirittura in grado di migliorare questo aspetto in termini di prestazioni single thread. Tuttavia, nient'altro è in grado di tenere il passo con l'AMD Ryzen 9 5950X in termini di prestazioni multi-thread. AMD declassa persino chiaramente l'AMD Ryzen 9 3950X.
Riguardo al prezzo, il modello di punta è attualmente quotato a 899 Euro (~$1063). Si tratta di 100 Euro (~$118) in più rispetto al prezzo di vendita consigliato all'introduzione, a causa dell'attuale mancanza di disponibilità. Per il modello entry-level, la disponibilità non sembra molto migliore, con il risultato che i prezzi attuali sono molto più alti del prezzo al dettaglio consigliato di 299 Euro (~$353). Chi pensa di acquistare un nuovo Ryzen 5000 dovrebbe pianificare a lungo termine a questo punto, dato che attualmente è troppo costoso. Una volta che le scorte nei negozi si sono un po' riprese, i prezzi dovrebbero tornare a livelli più ragionevoli. Ma per ora, c'è ancorra qualche problema di disponibilità. Anche le nuove schede grafiche AMD Radeon RX 6800 non sono disponibili, e le cose non sembrano diverse nemmeno per le schede GeForce RTX 3000 di Nvidia.
AMD innalza il livello della CPU gaming più potente a un nuovo step, e le velocità di clock specificate vengono quasi sempre superate in modo significativo.
I fortunati che riescono ancora ad impadronirsi di una delle nuove CPU Ryzen potranno confermare il notevole aumento delle prestazioni. Tuttavia, ognuno deve decidere da solo su quale CPU sia quella giusta per lui. Se si tratta di una semplice questione di gioco, l'AMD Ryzen 5 5600X è sufficiente. Ma se si vuole fare anche l'elaborazione video, vale la pena utilizzare l'AMD Ryzen 7 5800X. E per i creatori di contenuti, vale la pena acquistare i modelli Ryzen 9, che possono anche sostituire un ulteriore PC in streaming.
