Recensione della CPU Desktop AMD Ryzen 7 3800XT: refresh Matisse per il socket AM4
Conosciamo l'architettura Zen2 da quasi un anno esatto. I vantaggi del design del chipset sono evidenti e prima che la Zen3 sostituisca la Zen2, AMD ha introdotto tre nuovi processori basati sull'architettura Zen2. L'ammiraglia, l'AMD Ryzen 9 3950X, rimane la stessa. I processori a 12, 8 e 6 cores hanno tuttavia subito varie modifiche della velocità di clock. Nello schema di denominazione, ai nuovi modelli Ryzen viene assegnato un XT, che indica le CPU aggiornate.
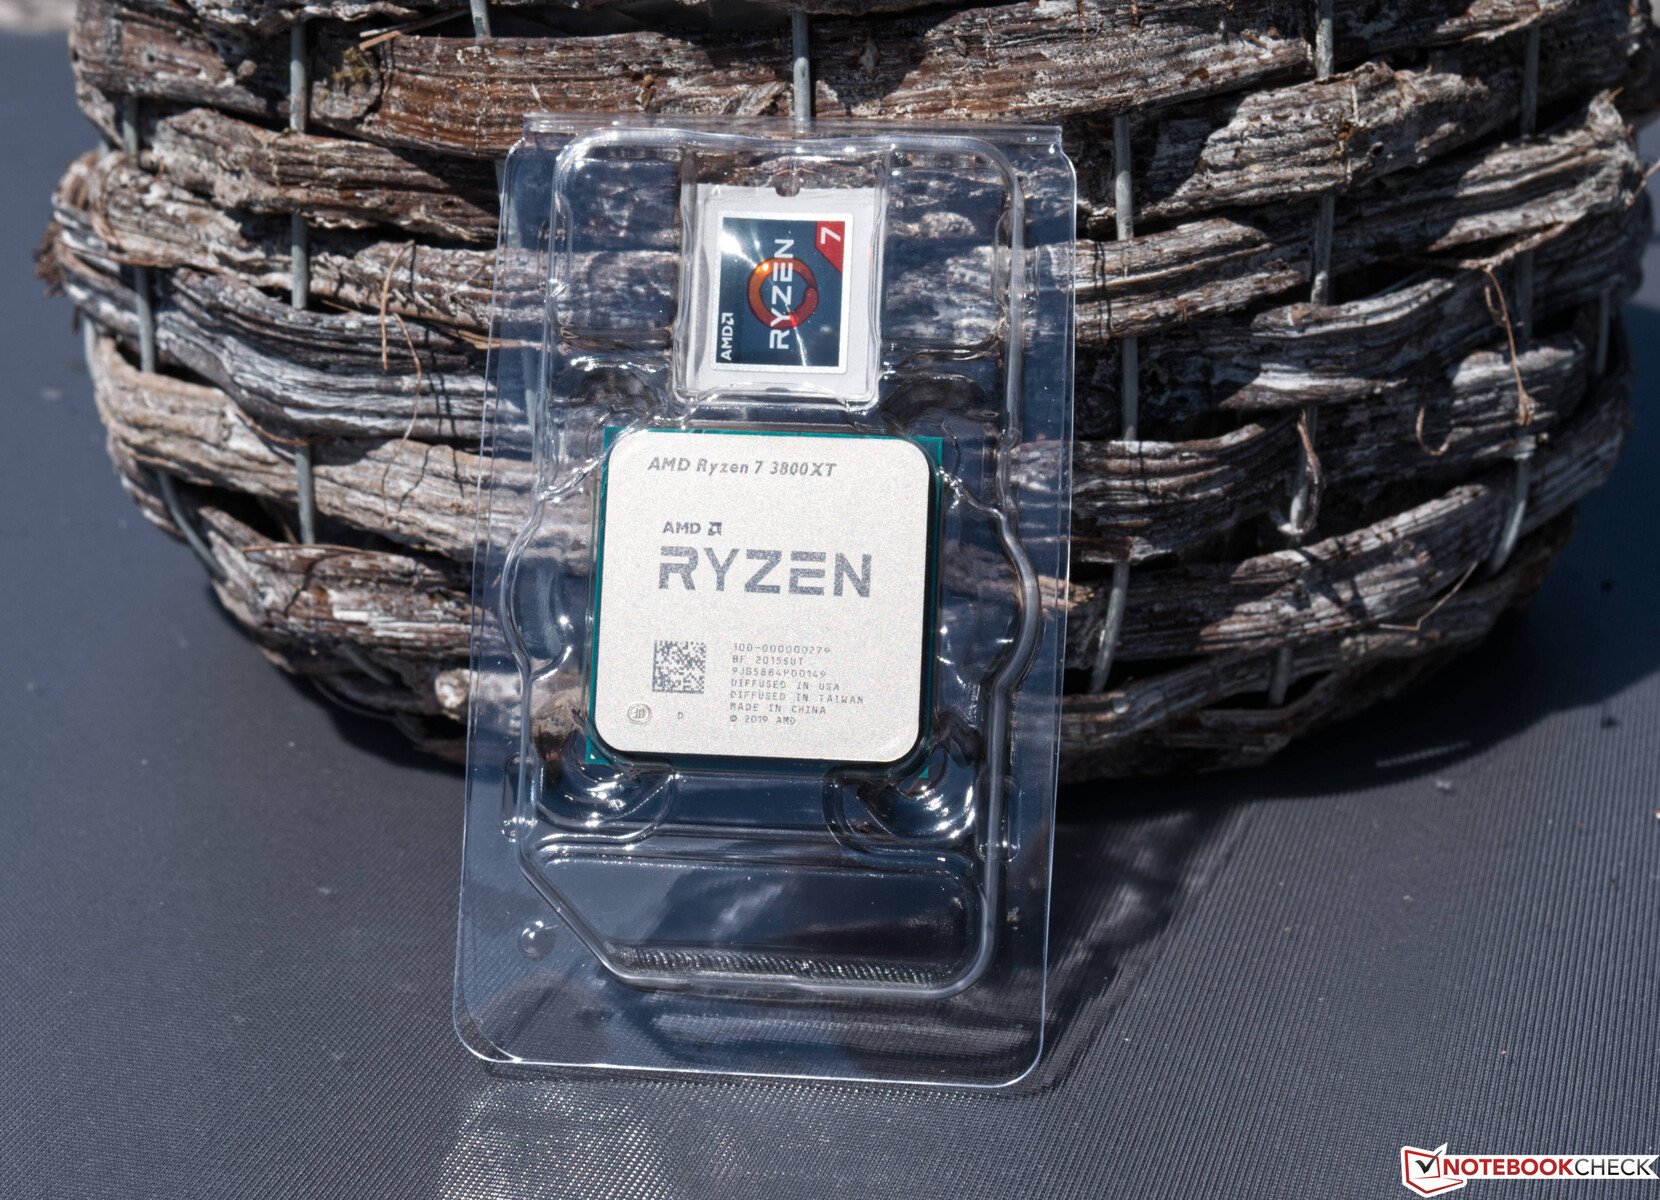
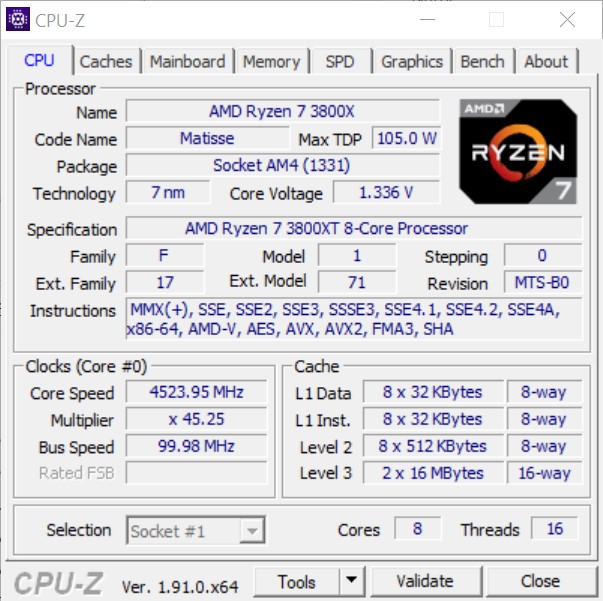
Nella nostra recensione, abbiamo dato un'occhiata più da vicino all'AMD Ryzen 7 3800XT con i suoi 8-cores e 16-threads e l'abbiamo lasciata competere con gli attuali modelli dei suoi stessi ranghi e con gli attuali processori Intel per un confronto diretto. AMD non modifica il clock base del Ryzen 7 3800XT rispetto al Ryzen 7 3800X. Solo il clock boost è stato aumentato di 200 MHz, in modo da poter raggiungere i 4,7 GHz. Sul Ryzen 5 3600XT e sul Ryzen 9 3900XT, l'aumento del boost massimo è di soli 100 MHz, il che significa meno differenza di prestazioni rispetto ai modelli non XT.
Il nostro modello ha un prezzo di 419 Euro (~$475). Il Ryzen 5 3600XT AMD costa 259 Euro (~$293), mentre 529 Euro (~$599) sono necessari per il modello 12-cores.
Uno sguardo ai processori AMD Ryzen
| Modello | Cores / Threads | Clock Base | Turbo clock | L3 cache | TDP | Prezzo di lancio |
|---|---|---|---|---|---|---|
| Ryzen R9 3950X | 16/32 | 3.5 GHz | 4.7 GHz | 64 MB | 105 watts | €819/~$923 |
| Ryzen R9 3900XT | 12/24 | 3.8 GHz | 4.7 GHz | 64 MB | 105 watts | €529/~$597 |
| Ryzen R9 3900X | 12/24 | 3.8 GHz | 4.6 GHz | 64 MB | 105 watts | €529/~$597 |
| Ryzen R7 3800XT | 8/16 | 3.9 GHz | 4.7 GHz | 32 MB | 105 watts | €419/~$473 |
| Ryzen R7 3800X | 8/16 | 3.9 GHz | 4.5 GHz | 32 MB | 105 watts | €429/~$484 |
| Ryzen R7 3700X | 8/16 | 3.6 GHz | 4.4 GHz | 32 MB | 65 watts | €349/~$394 |
| Ryzen R5 3600XT | 6/12 | 3.8 GHz | 4.5 GHz | 32 MB | 95 watts | €259/~$292 |
| Ryzen R5 3600X | 6/12 | 3.8 GHz | 4.4 GHz | 32 MB | 95 watts | €265/~$299 |
| Ryzen R5 3600 | 6/12 | 3.6 GHz | 4.2 GHz | 32 MB | 65 watts | €209/~$236 |
| Ryzen R3 3300X | 4/8 | 3.8 GHz | 4.3 GHz | 16 MB | 65 watts | €129/~$146 |
| Ryzen R3 3100 | 4/8 | 3.6 GHz | 3.9 GHz | 16 MB | 65 watts | €109/~$123 |
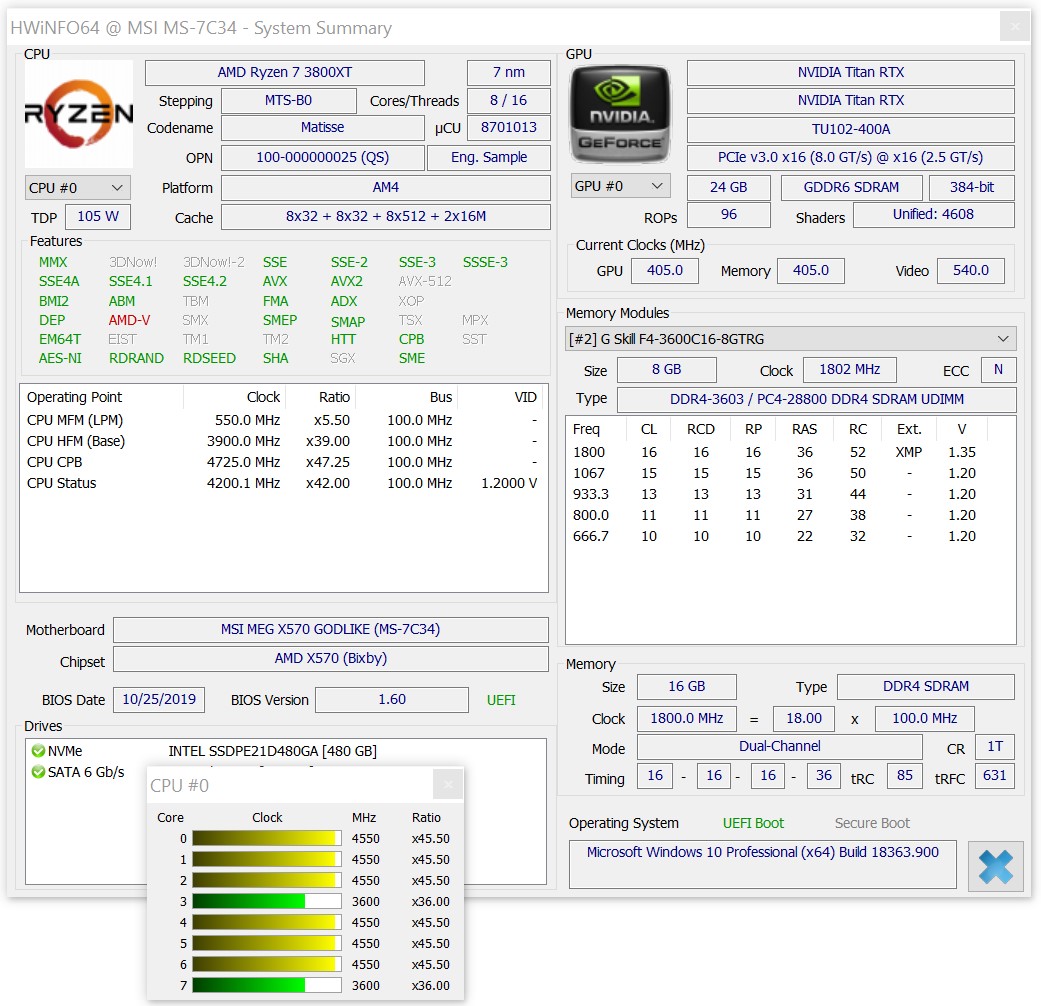
Dettagli sul nostro sistema
Abbiamo utilizzato il seguente hardware per il nostro sistema di test:
- Raijintek Pean Benchtable
- AMD Ryzen 7 3800XT
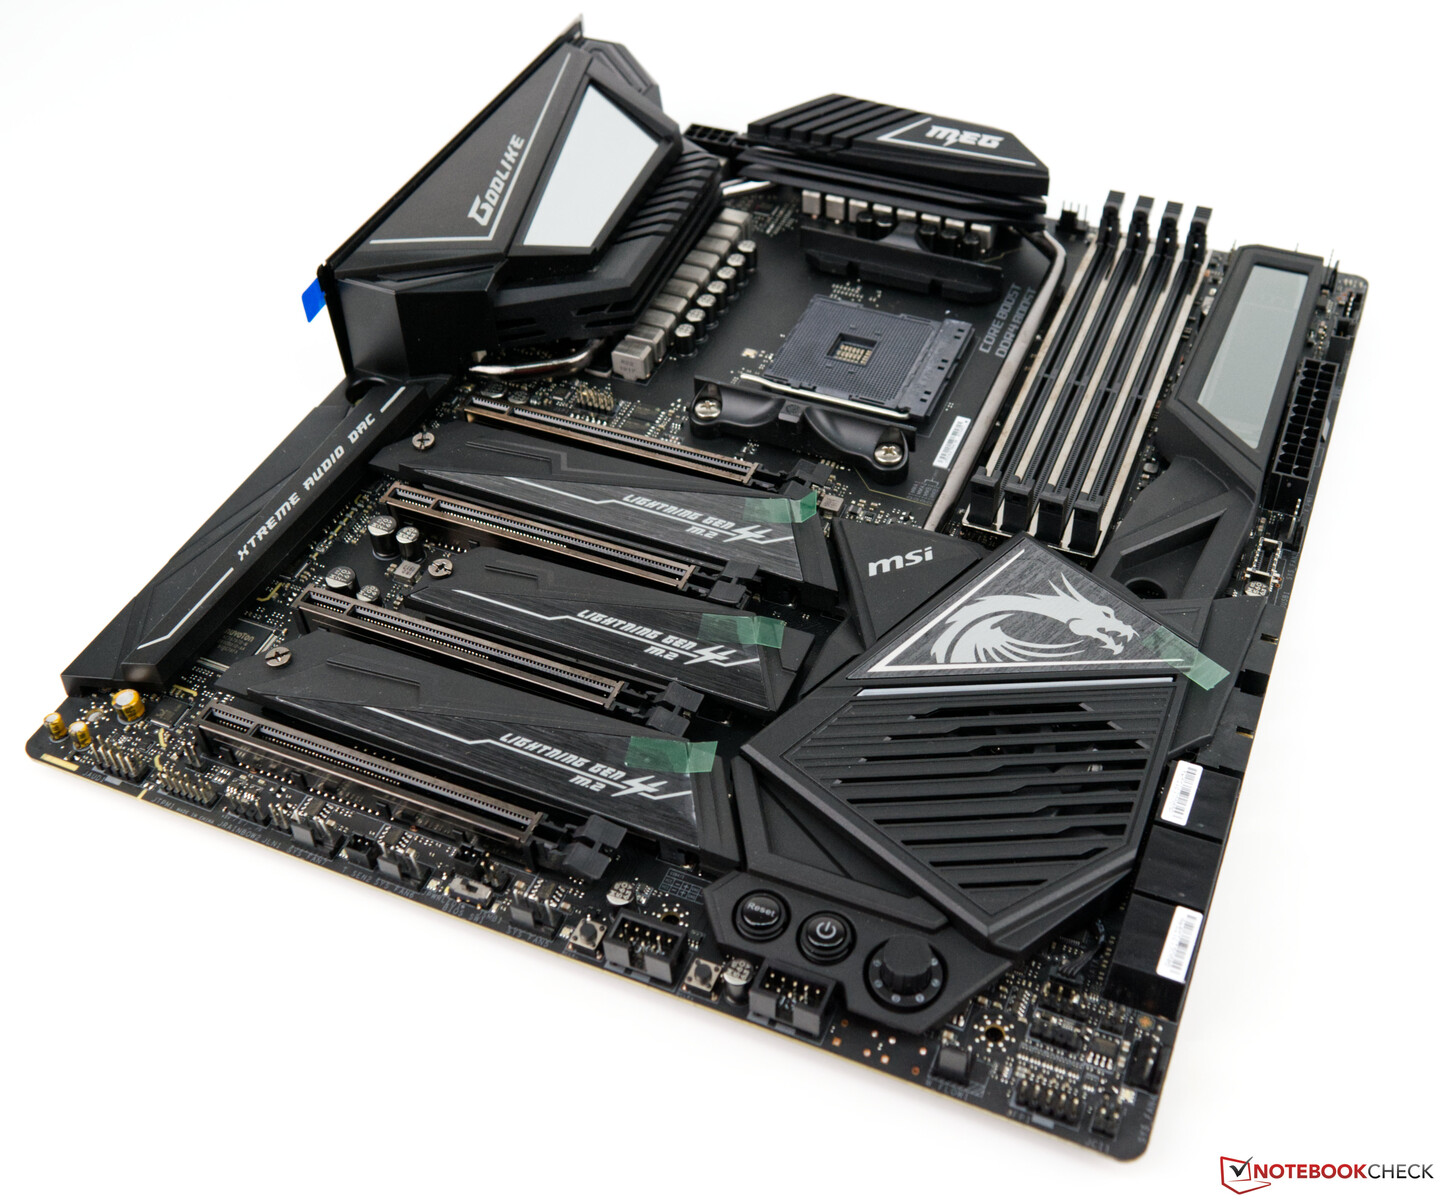
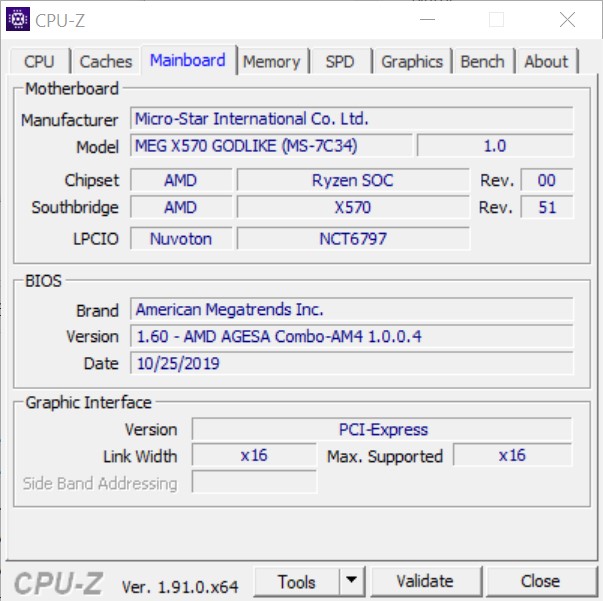
- MSI MEG X570 Godlike
- Alphacool Eisbear 280 AiO
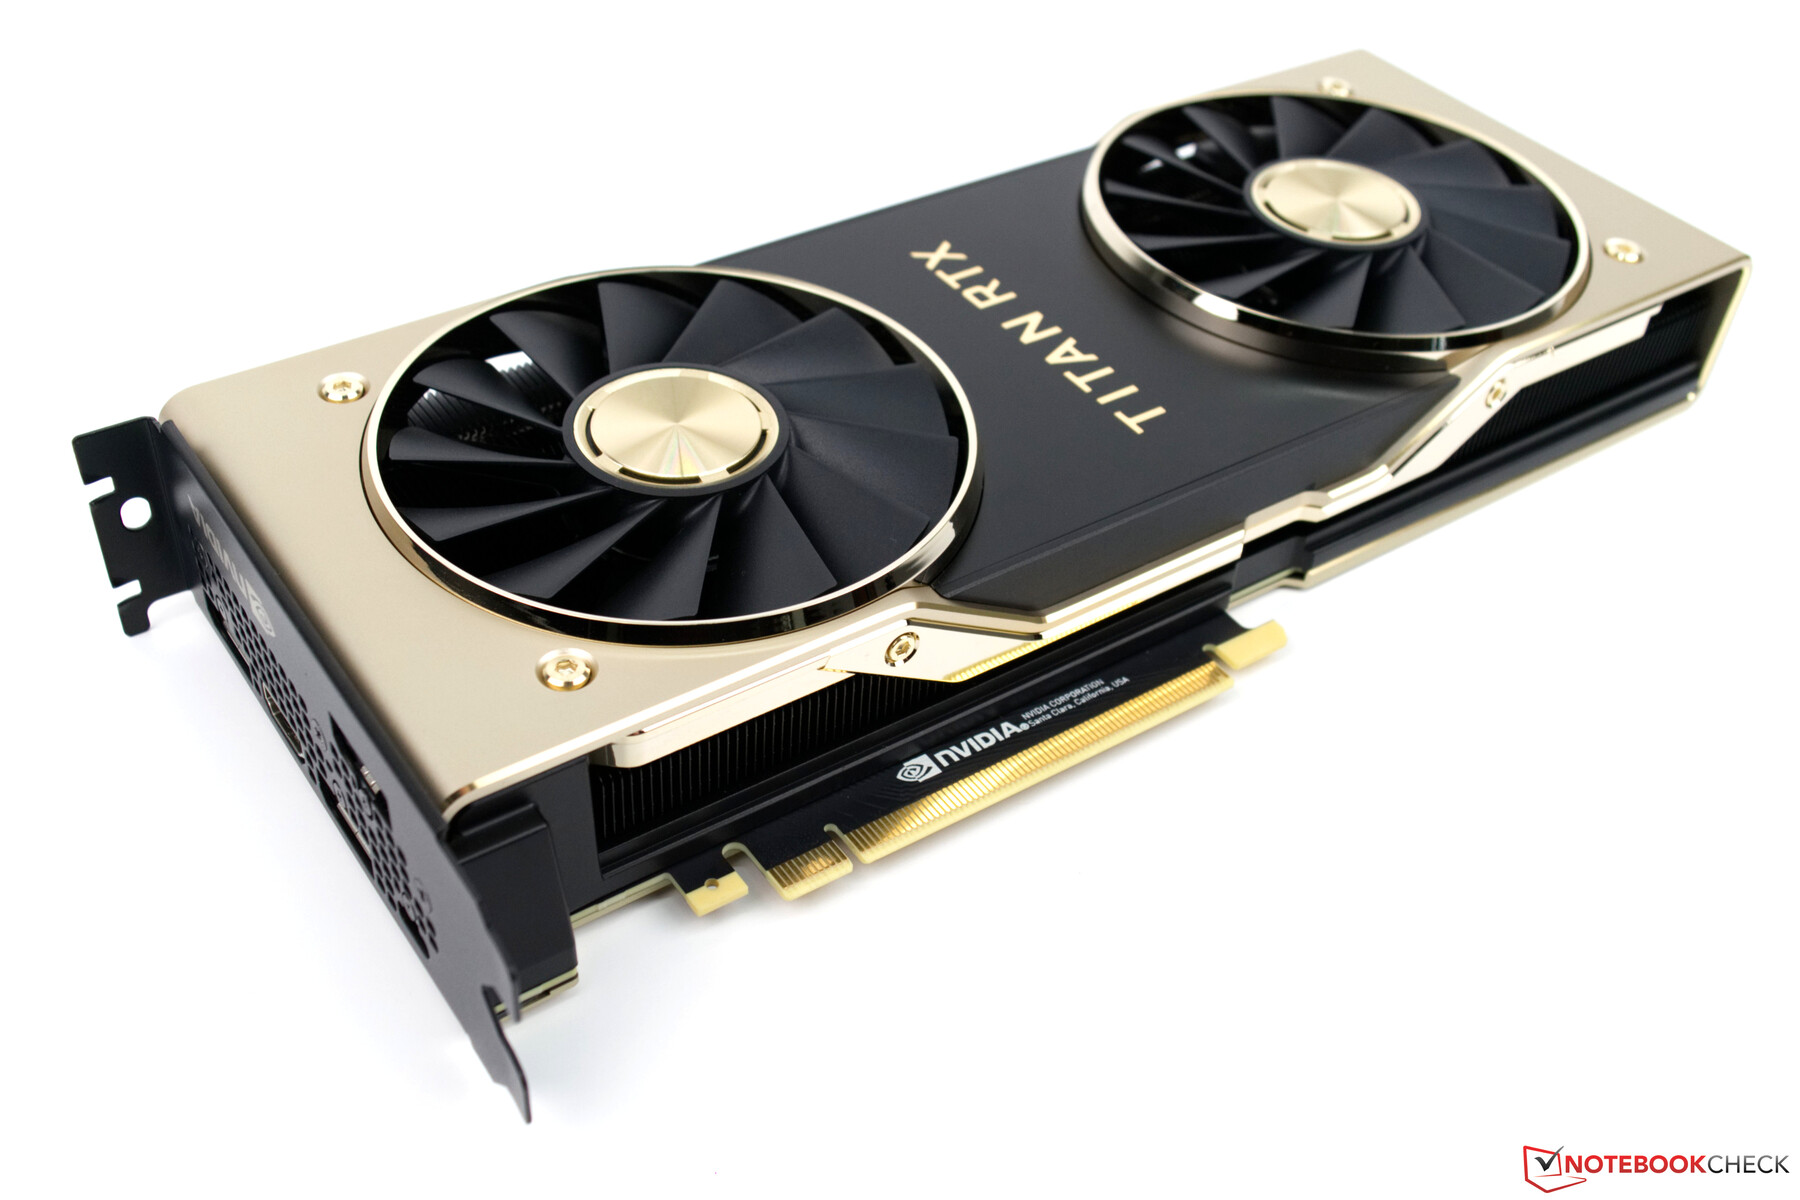
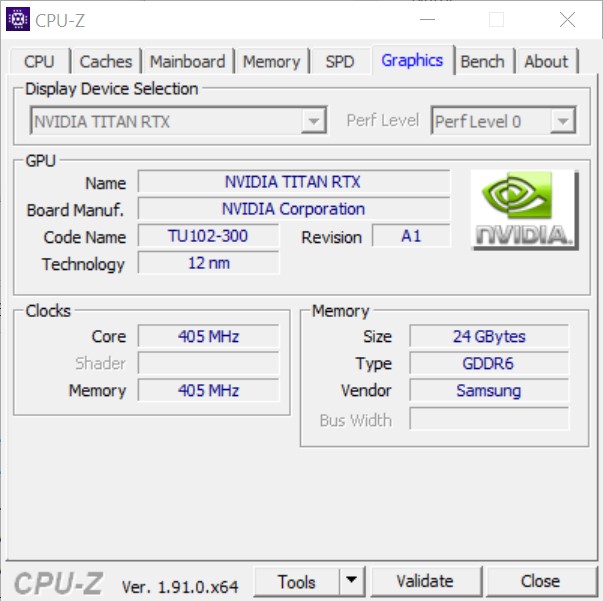
- Nvidia Titan RTX
- Alimentatore Corsair RM 1000X
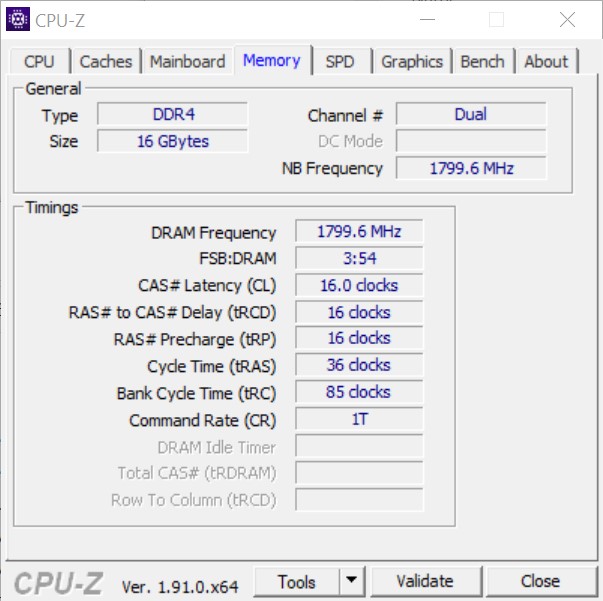
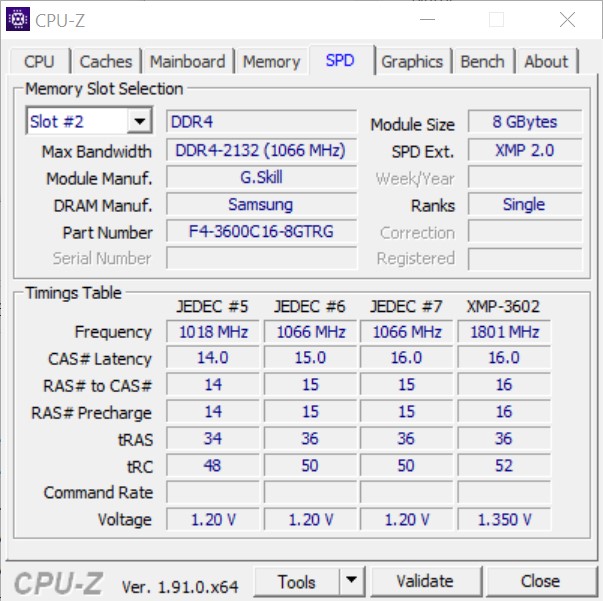
- G-Skill Trident Z Royal gold DDR4-3600 memory kit 2 x 8 GB, con DDR4-3600 CL16-16-16-36
- SSD-PCIe Intel Optane 905P 480GB
- Microsoft Windows 10 Professional 64-Bit (Versione 1909)
Ringraziamo Caseking per averci prestato la Raijintek Pean, fornita con incisioni laser personalizzate. La scheda madre e la RAM provengono direttamente da AMD e sono state incluse nel kit stampa per il rilascio dei processori Zen2 AMD Ryzen 9 3900X e AMD Ryzen 7 3700X. Come sistema di raffreddamento utilizziamo l'Alphacool Eisbear 280, fornito dalla stessa Alphacool.

Benchmarks del processore
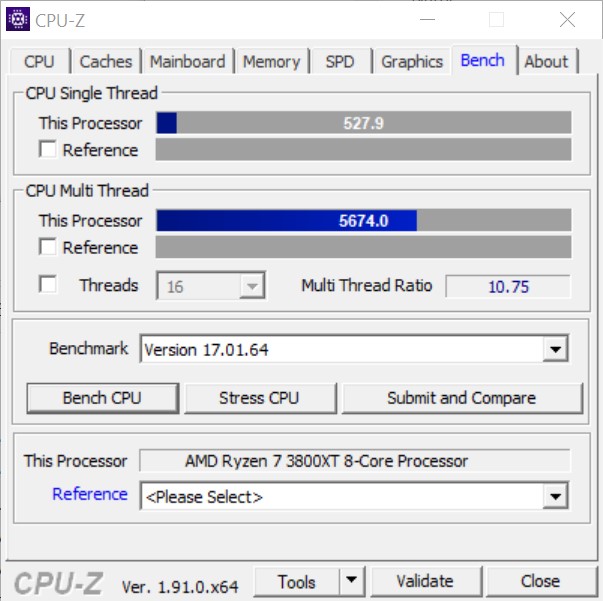
Nel benchmark della CPU, l'AMD Ryzen 7 3800XT batte l'Intel Core i7-9700K. Tuttavia, questo confronto, che la stessa AMD usa nel suo briefing di prodotto, non è del tutto corretto a nostro avviso, perché il Core i7-9700K offre solo 8 threads con 8 cores. Piuttosto, vale la pena di fare un confronto con un Intel Core i9-9900K perché il prezzo è simile. Il Ryzen 7 3800XT ha anche in questo caso il vantaggio, anche se il punto per le migliori prestazioni del singolo core va a Intel. Il Ryzen 7 3800XT non può però competere con un Intel Core i9-10900K. La velocità di clock estremamente elevata dell'ammiraglia Intel in combinazione con 10 cores offre prestazioni migliori, ma ha anche i suoi svantaggi (parola chiave: TDP).
L'AMD Ryzen 7 3800X ha avuto difficoltà a confermare il suo diritto di esistere accanto al molto più economico Ryzen 7 3700X. A causa dell'ormai più alto valore di clock boost, il ruolo del Ryzen 7 3800XT è ora un po' più chiaro, anche se il vantaggio in termini di prestazioni rispetto al Ryzen 7 3700X è ancora solo di pochi punti percentuali.
| R Benchmark 2.5 - Overall mean | |
| Intel Core i5-10600K | |
| AMD Ryzen 9 3900X | |
| AMD Ryzen 3 3300X | |
| Intel Core i9-10900K | |
| AMD Ryzen 9 3950X | |
| AMD Ryzen 7 3800XT | |
| LibreOffice - 20 Documents To PDF | |
| Intel Core i9-10900K | |
| AMD Ryzen 9 3900X | |
| AMD Ryzen 9 3950X | |
| AMD Ryzen 3 3300X | |
| Intel Core i5-10600K | |
| AMD Ryzen 7 3800XT | |
| WebXPRT 3 - Overall | |
| Intel Core i9-10900K | |
| AMD Ryzen 7 3800XT | |
| AMD Ryzen 9 3950X | |
| Intel Core i5-10600K | |
| AMD Ryzen 3 3300X | |
| Mozilla Kraken 1.1 - Total | |
| Intel Core i5-10600K | |
| AMD Ryzen 3 3300X | |
| Intel Core i9-10900K | |
| AMD Ryzen 9 3950X | |
| AMD Ryzen 7 3800XT | |
* ... Meglio usare valori piccoli
Stress test con Cinebench R15 multi loop
Il nostro test da sforzo, il Cinebench R15 multi loop non pone alcun problema per l'AMD Ryzen 7 3800XT. L'AiO integrato insieme al dissipatore da 280 millimetri (11") può raffreddare in modo affidabile l'AMD Ryzen 7 3800XT senza difficoltà.
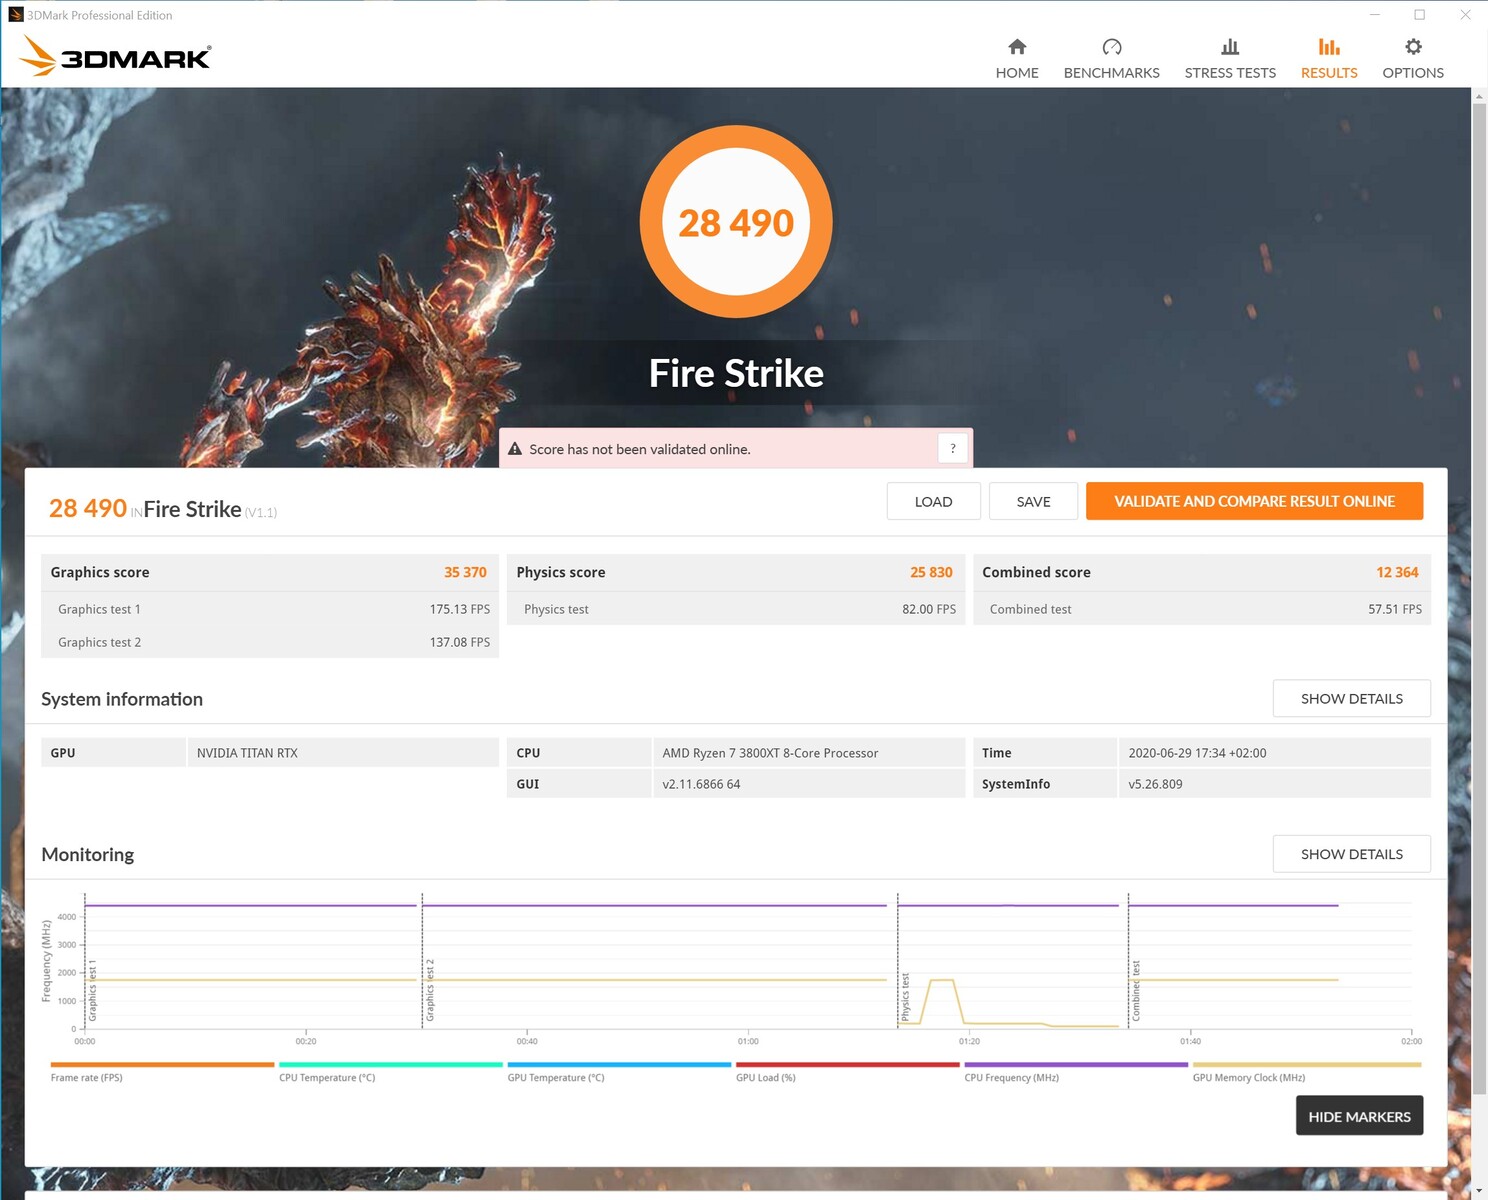
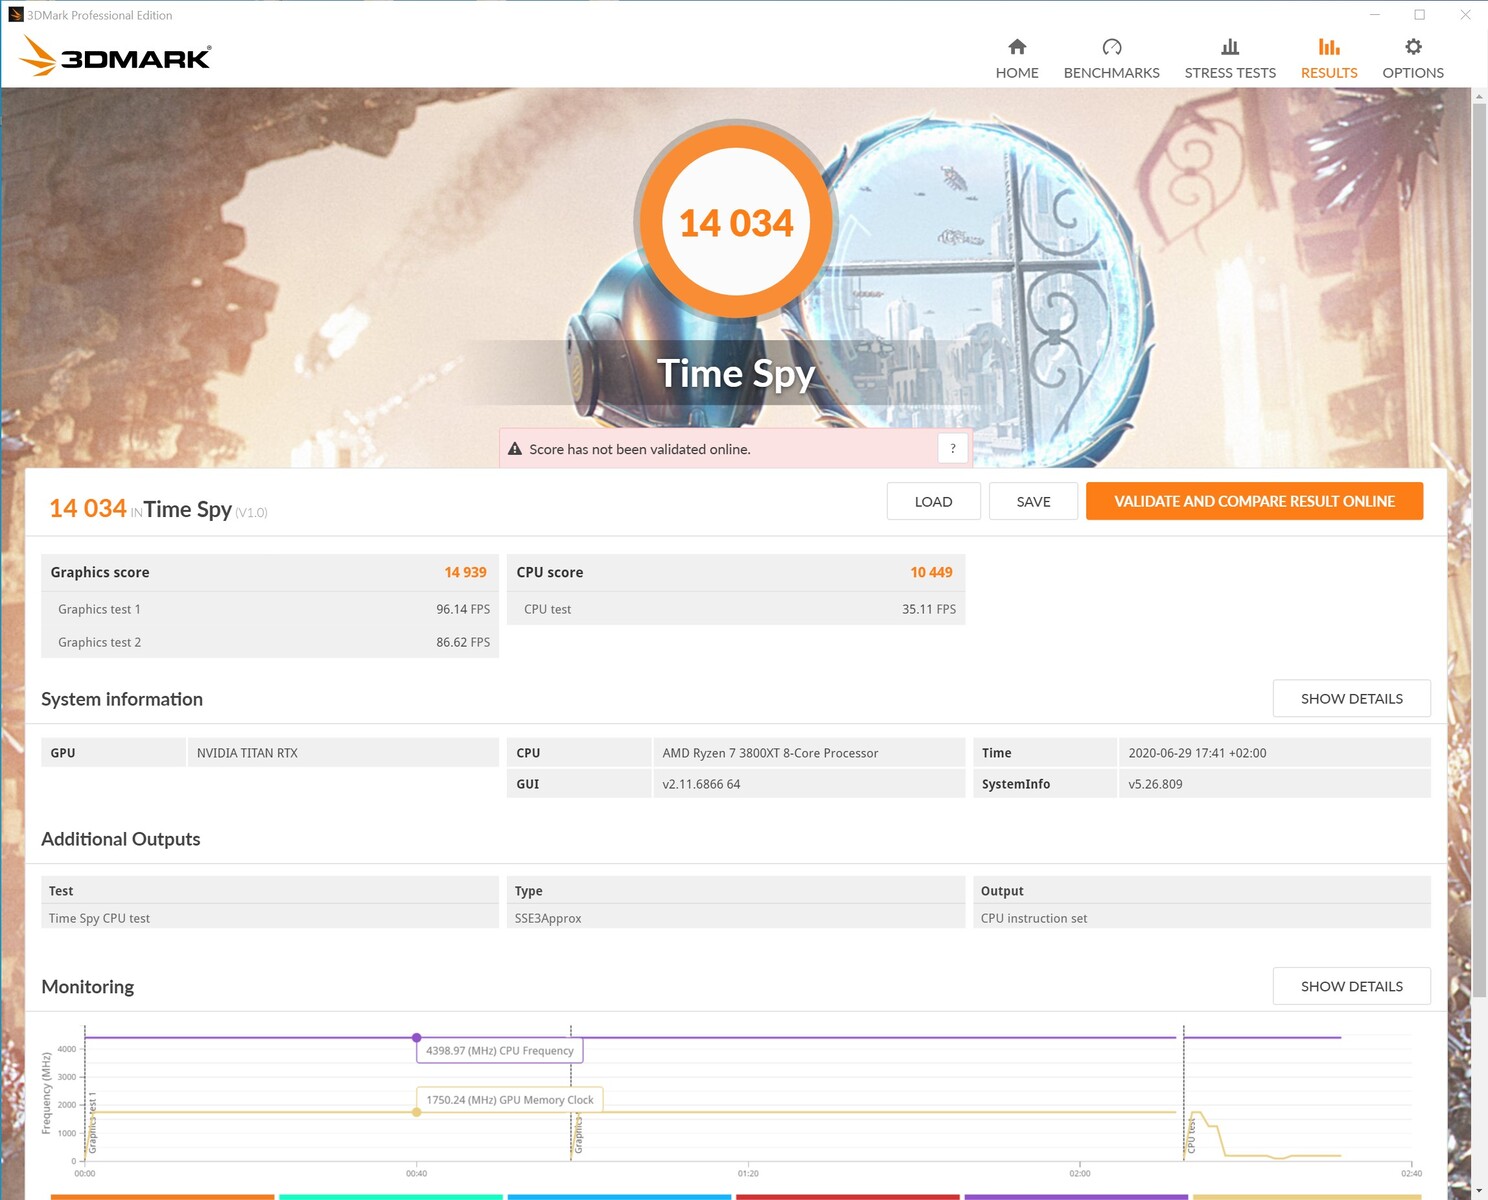
Prestazioni con le applicazioni
Molte applicazioni sono abbastanza efficienti con un massimo di 8 cores. Oltre a ciò, un numero di cores più alto aumenta solo leggermente le prestazioni, come si può vedere nel confronto con l'AMD Ryzen 9 3950X. L'ammiraglia significativamente più costosa è solo tre punti percentuali in più rispetto al Ryzen 7 3800XT e alla pari nei benchmarks 3D sintetici. Anche il poco costoso Ryzen 3 3300X può tenere il passo con la stessa configurazione della GPU. Intel riesce ad ottenere un piccolo, ma nel nostro caso non particolarmente significativo, vantaggio.
Prestazioni Gaming
L'AMD Ryzen 7 3800XT è sicuramente adatto ad un sistema gaming puro. Tuttavia, dovete sapere che Intel ha le migliori CPU gaming sul mercato con gli attuali processori Comet Lake S. In risoluzioni più alte e con il massimo dei dettagli, tuttavia, il vantaggio delle CPU Intel rispetto ai modelli Ryzen di AMD diminuisce. In combinazione con la nostra Nvidia Titan RTX (paragonabile ad una RTX 2080 Ti), anche i titoli più moderni possono essere goduti al massimo dei dettagli. Tuttavia, con l'aumento del carico grafico, la CPU gioca un ruolo minore. Se però si vuole trasmettere in streaming allo stesso tempo, gli 8 cores saranno utili.
| Borderlands 3 | |
| 1280x720 Very Low Overall Quality (DX11) | |
| Intel Core i9-10900K | |
| Intel Core i5-10600K | |
| Intel Core i9-9900KS, Nvidia Titan RTX | |
| AMD Ryzen 9 3900X | |
| AMD Ryzen 9 3950X | |
| AMD Ryzen 7 3800XT | |
| AMD Ryzen 3 3300X | |
| AMD Radeon RX Vega 64 | |
| AMD Ryzen 3 3100 | |
| 1920x1080 Badass Overall Quality (DX11) | |
| Intel Core i9-10900K | |
| AMD Ryzen 7 3800XT | |
| Intel Core i5-10600K | |
| Intel Core i9-9900KS, Nvidia Titan RTX | |
| AMD Ryzen 9 3900X | |
| AMD Ryzen 9 3950X | |
| AMD Ryzen 3 3300X | |
| AMD Ryzen 3 3100 | |
| AMD Radeon RX Vega 64 | |
| Metro Exodus | |
| 1280x720 Low Quality AF:4x | |
| Intel Core i9-10900K | |
| Intel Core i5-10600K | |
| Intel Core i9-9900KS, Nvidia Titan RTX | |
| AMD Ryzen 7 3800XT | |
| AMD Ryzen 9 3900X | |
| AMD Ryzen 3 3300X | |
| AMD Ryzen 9 3950X | |
| AMD Ryzen 3 3100 | |
| 1920x1080 Ultra Quality AF:16x | |
| Intel Core i9-10900K | |
| Intel Core i5-10600K | |
| Intel Core i9-9900KS, Nvidia Titan RTX | |
| AMD Ryzen 3 3300X | |
| AMD Ryzen 7 3800XT | |
| AMD Ryzen 9 3900X | |
| AMD Ryzen 9 3950X | |
| AMD Ryzen 3 3100 | |
| X-Plane 11.11 | |
| 1280x720 low (fps_test=1) | |
| Intel Core i9-10900K | |
| Intel Core i9-9900KS, Nvidia Titan RTX | |
| Intel Core i5-10600K | |
| AMD Ryzen 7 3800XT | |
| AMD Ryzen 9 3900X | |
| AMD Ryzen 9 3950X | |
| AMD Ryzen 3 3300X | |
| AMD Ryzen 3 3100 | |
| AMD Radeon RX Vega 64 | |
| AMD Radeon RX Vega 64 | |
| 1920x1080 high (fps_test=3) | |
| Intel Core i9-9900KS, Nvidia Titan RTX | |
| Intel Core i9-10900K | |
| Intel Core i5-10600K | |
| AMD Ryzen 7 3800XT | |
| AMD Ryzen 9 3900X | |
| AMD Ryzen 9 3950X | |
| AMD Ryzen 3 3300X | |
| AMD Ryzen 3 3100 | |
| AMD Radeon RX Vega 64 | |
| AMD Radeon RX Vega 64 | |
| Dota 2 Reborn | |
| 1280x720 min (0/3) fastest | |
| Intel Core i9-10900K | |
| Intel Core i9-9900KS, Nvidia Titan RTX | |
| Intel Core i5-10600K | |
| AMD Ryzen 7 3800XT | |
| AMD Radeon RX Vega 64 | |
| AMD Ryzen 9 3900X | |
| AMD Radeon RX Vega 64 | |
| AMD Ryzen 9 3950X | |
| AMD Ryzen 3 3300X | |
| AMD Ryzen 3 3100 | |
| 1920x1080 ultra (3/3) best looking | |
| Intel Core i9-10900K | |
| Intel Core i9-9900KS, Nvidia Titan RTX | |
| Intel Core i5-10600K | |
| AMD Radeon RX Vega 64 | |
| AMD Ryzen 7 3800XT | |
| AMD Ryzen 9 3900X | |
| AMD Radeon RX Vega 64 | |
| AMD Ryzen 9 3950X | |
| AMD Ryzen 3 3300X | |
| AMD Ryzen 3 3100 | |
Intel Core i9-10900K + Nvidia Titan RTX
| basso | medio | alto | ultra | QHD | 4K | |
|---|---|---|---|---|---|---|
| The Witcher 3 (2015) | 388 | 348 | 252 | 139 | 103 | |
| Dota 2 Reborn (2015) | 169.8 | 151.6 | 151.2 | 139.7 | 138.1 | |
| Final Fantasy XV Benchmark (2018) | 189 | 161 | 118 | 59.3 | ||
| X-Plane 11.11 (2018) | 131 | 118 | 96 | 82.8 | ||
| Far Cry 5 (2018) | 148 | 129 | 122 | 115 | 110 | 78 |
| Shadow of the Tomb Raider (2018) | 154 | 145 | 142 | 138 | 118 | 66.8 |
| Forza Horizon 4 (2018) | 210 | 185 | 184 | 173 | 157 | 112 |
| Far Cry New Dawn (2019) | 132 | 115 | 111 | 101 | 97 | 76 |
| Metro Exodus (2019) | 169 | 142 | 121 | 99.3 | 80.2 | 52.3 |
| Borderlands 3 (2019) | 151 | 138 | 124 | 116 | 93.1 | 52.8 |
Consumo energetico - più efficiente dell'Intel
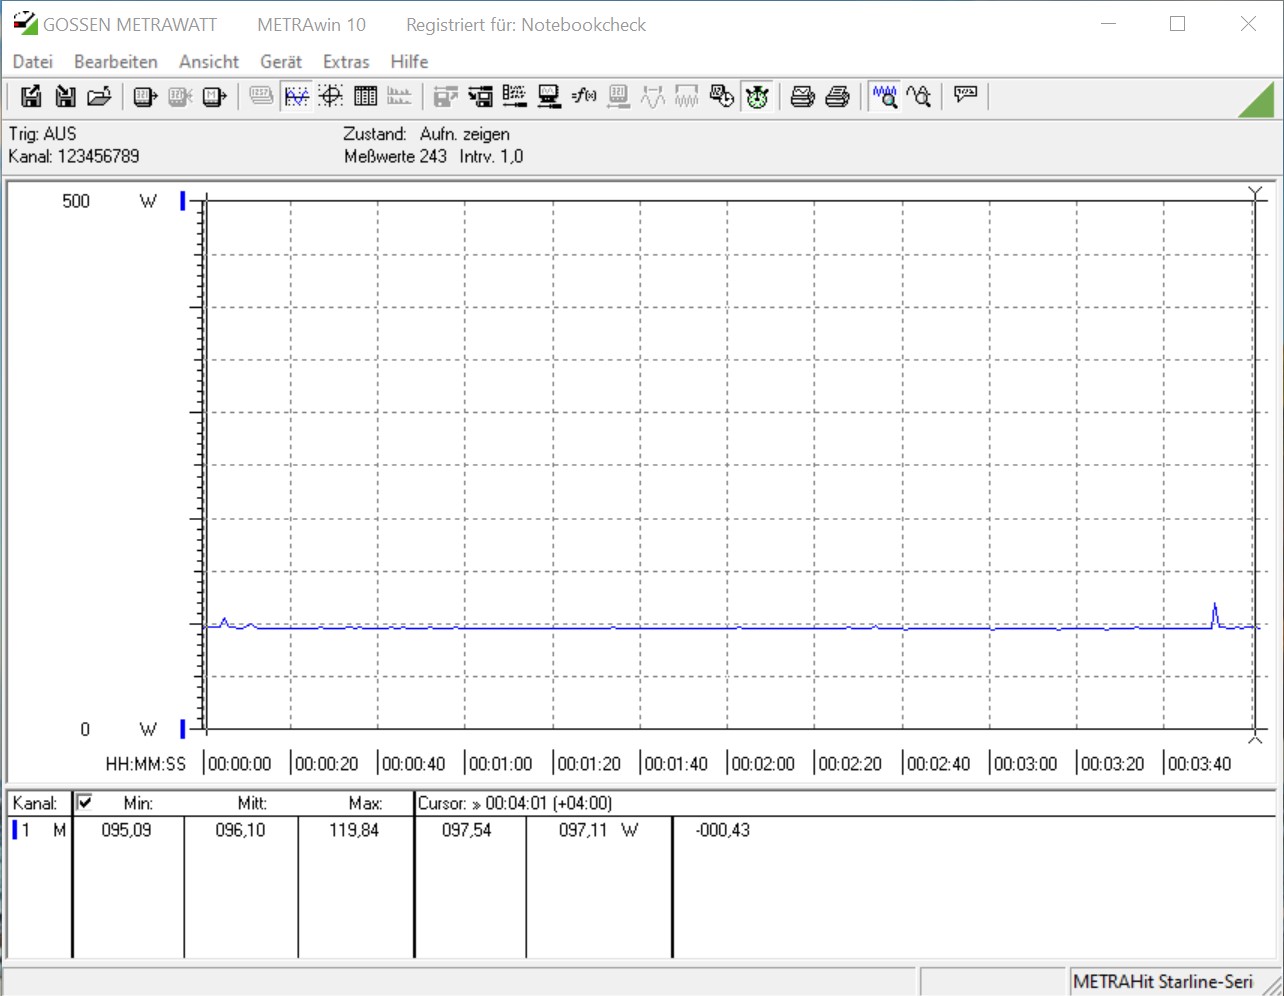
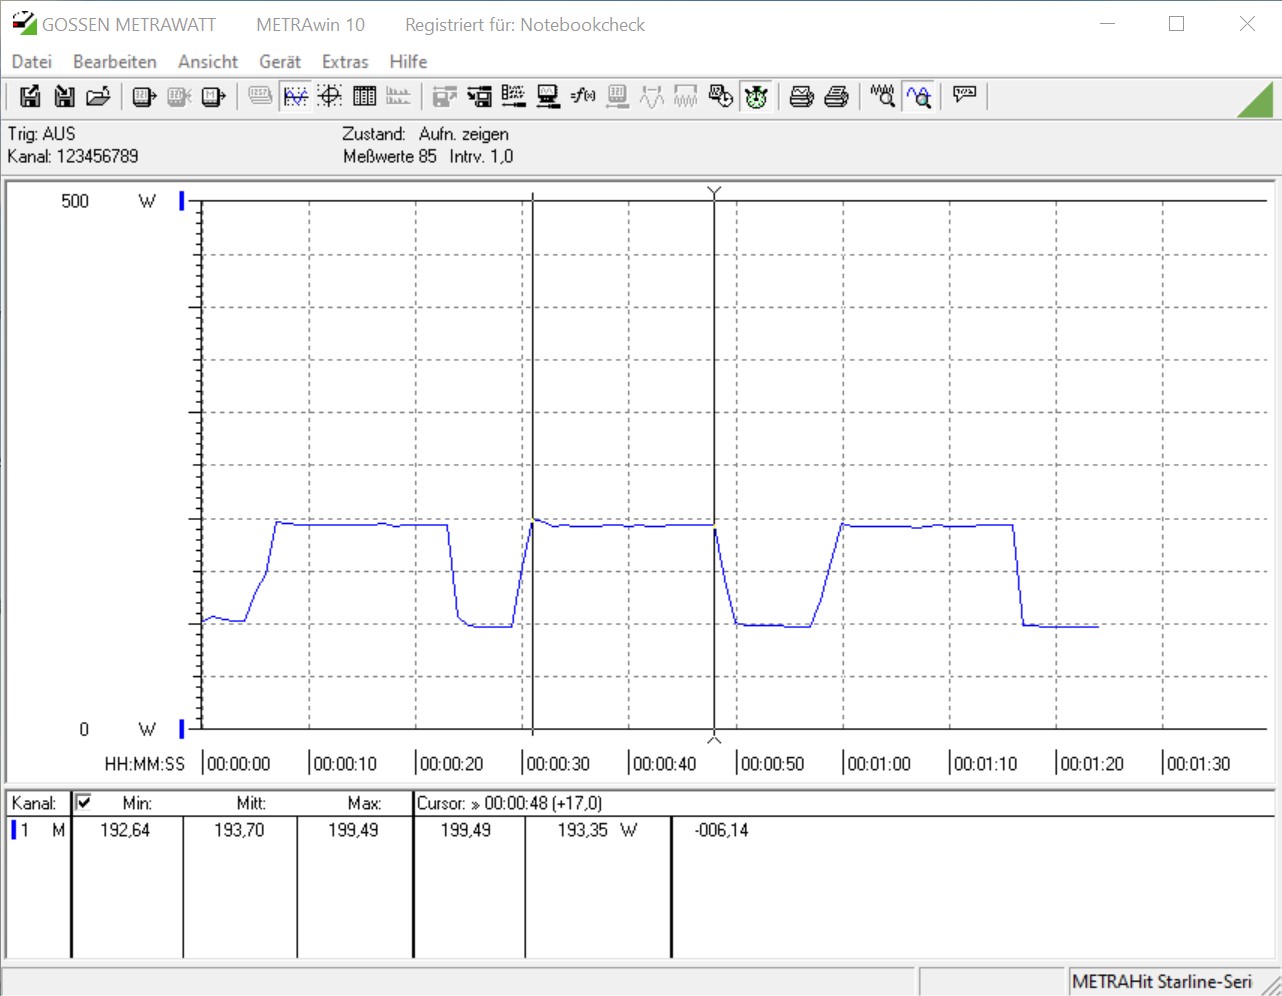
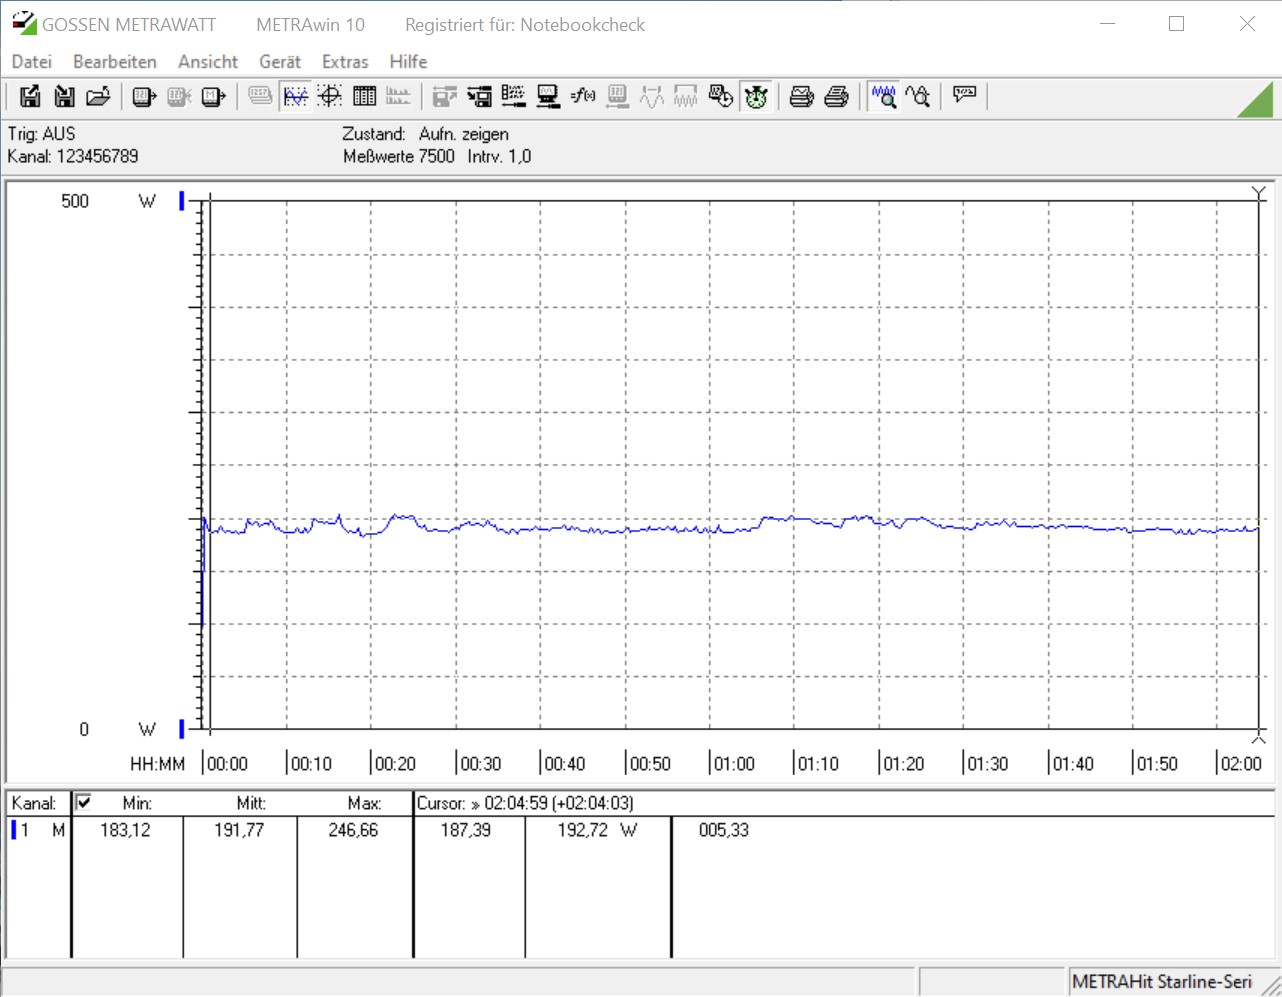
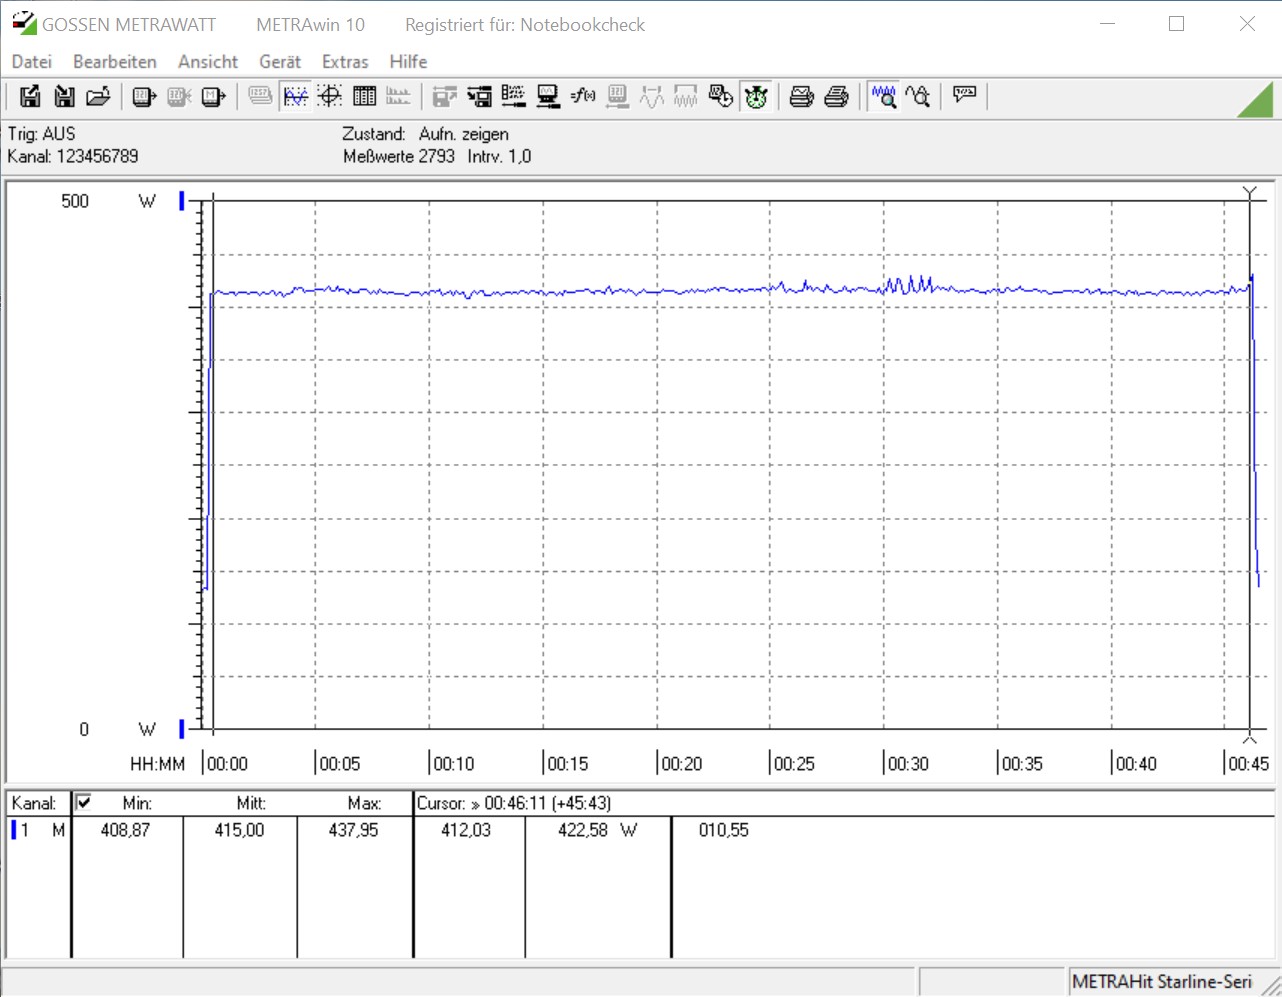
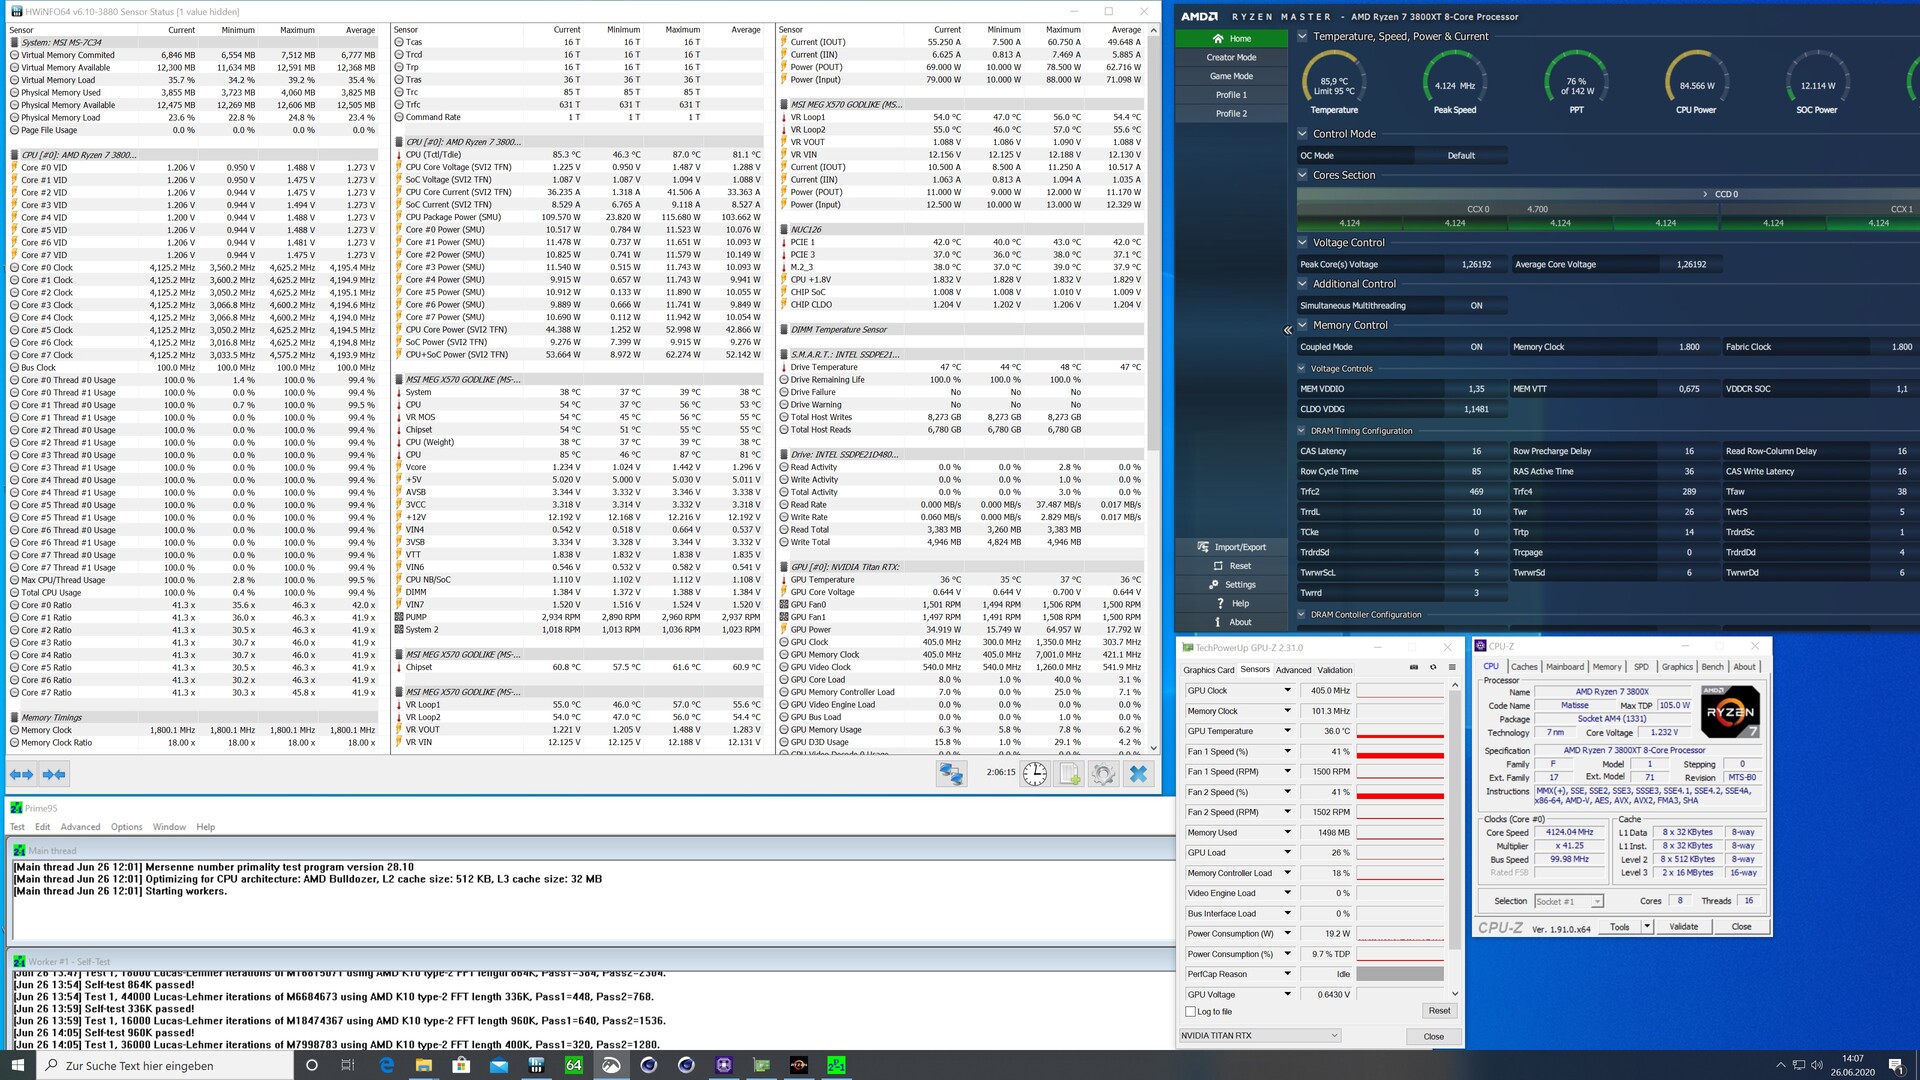
AMD indica un TDP di 105 watt per il Ryzen 7 3800XT. Lo stesso che per i due modelli Ryzen 9. Tuttavia, sappiamo che in determinate circostanze questo limite TDP può essere superato. Intel fa lo stesso e permette anche fino a 250 watt nel Core i9-10900K. Nel nostro stress test con Prime95 (v.28.10), HWiNFO mostra un massimo di 115 watt per la CPU. Il consumo medio si è livellato a 103,7 watt. Per l'intero sistema abbiamo misurato 191,8 watt durante la prova di sforzo, che è leggermente inferiore rispetto al Ryzen 9 3900X. Il consumo sale a 415 watt durante il gaming a causa del carico supplementare sulla GPU. Rispetto ai due modelli Ryzen 9, il Ryzen 7 3800XT non consuma molto meno.
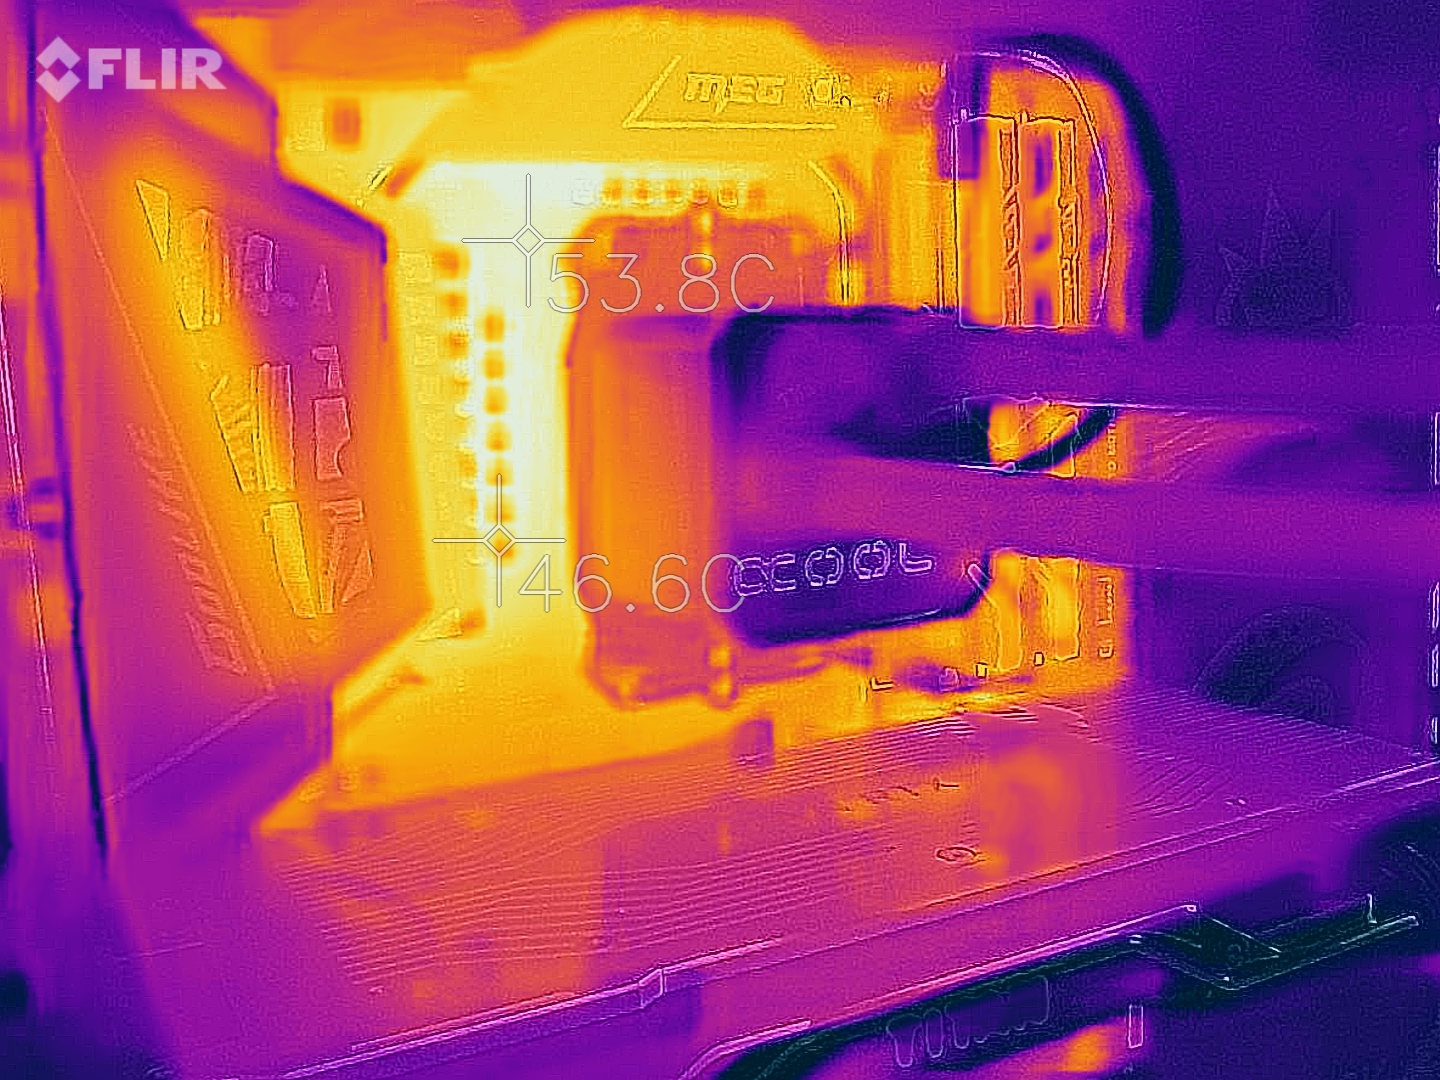
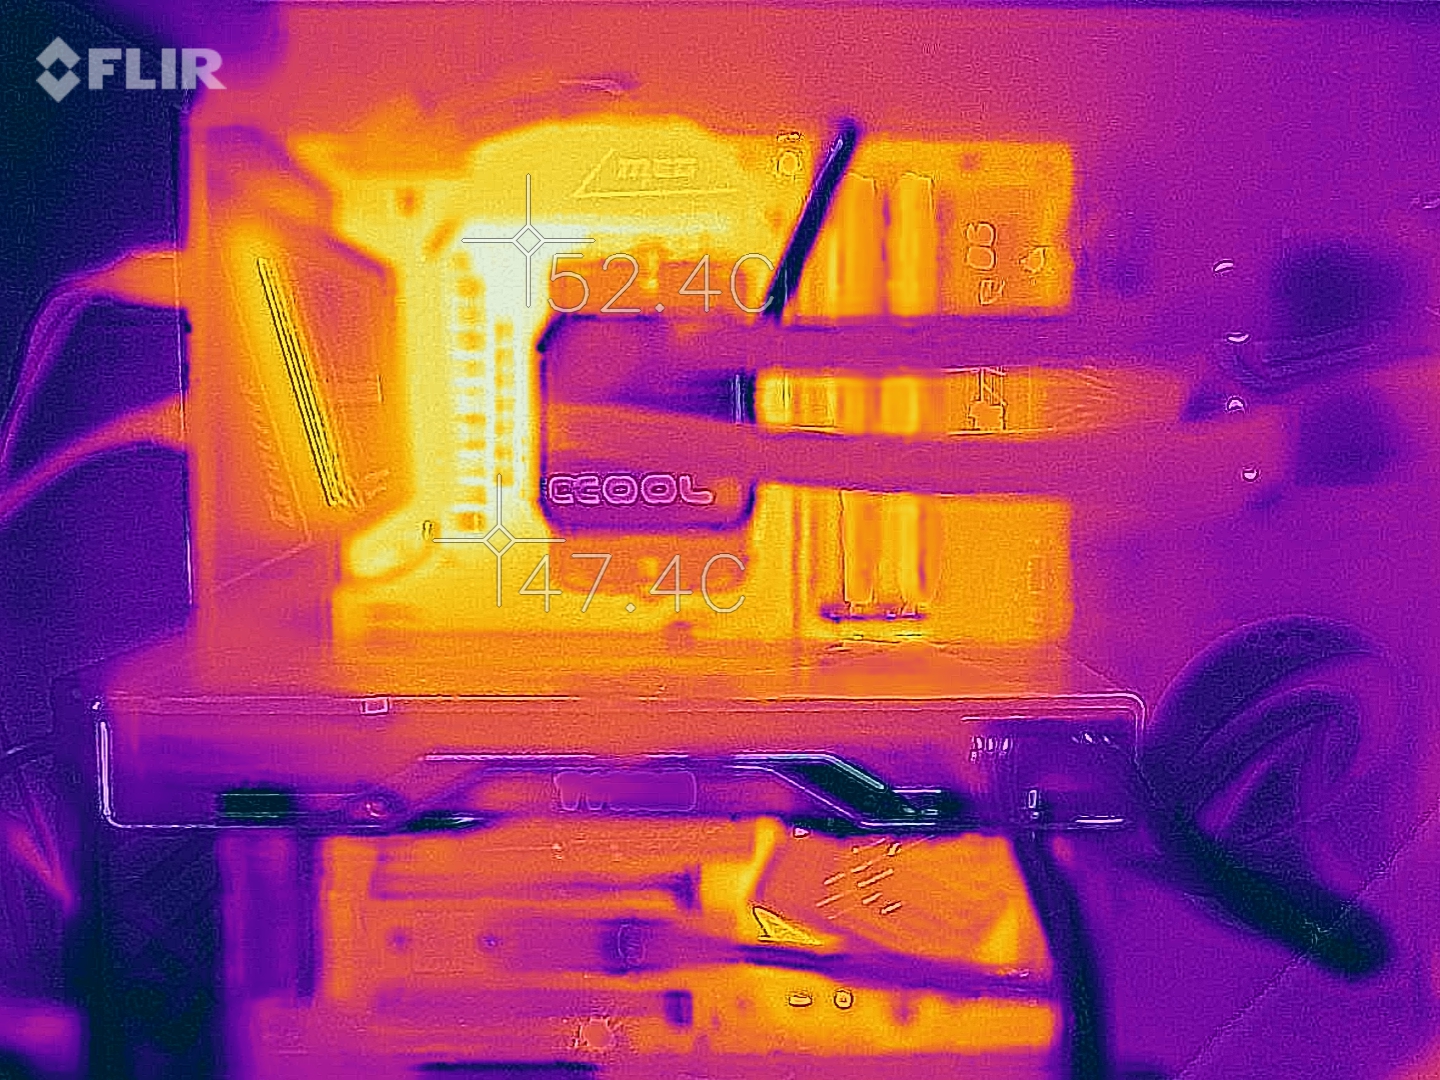
Le temperature della CPU sono state misurate in una configurazione di test aperta sul nostro banco di prova. Nonostante il ben dimensionato AiO di Alphacool, la temperatura massima della CPU durante lo stress test è stata di 87 °C (188,6 °F). Dato che AMD vende il Ryzen 7 3800X senza ventola, l'acquisto di questa CPU dovrebbe comportare la necessità di considerare anche un potente sistema di raffreddamento.
* ... Meglio usare valori piccoli
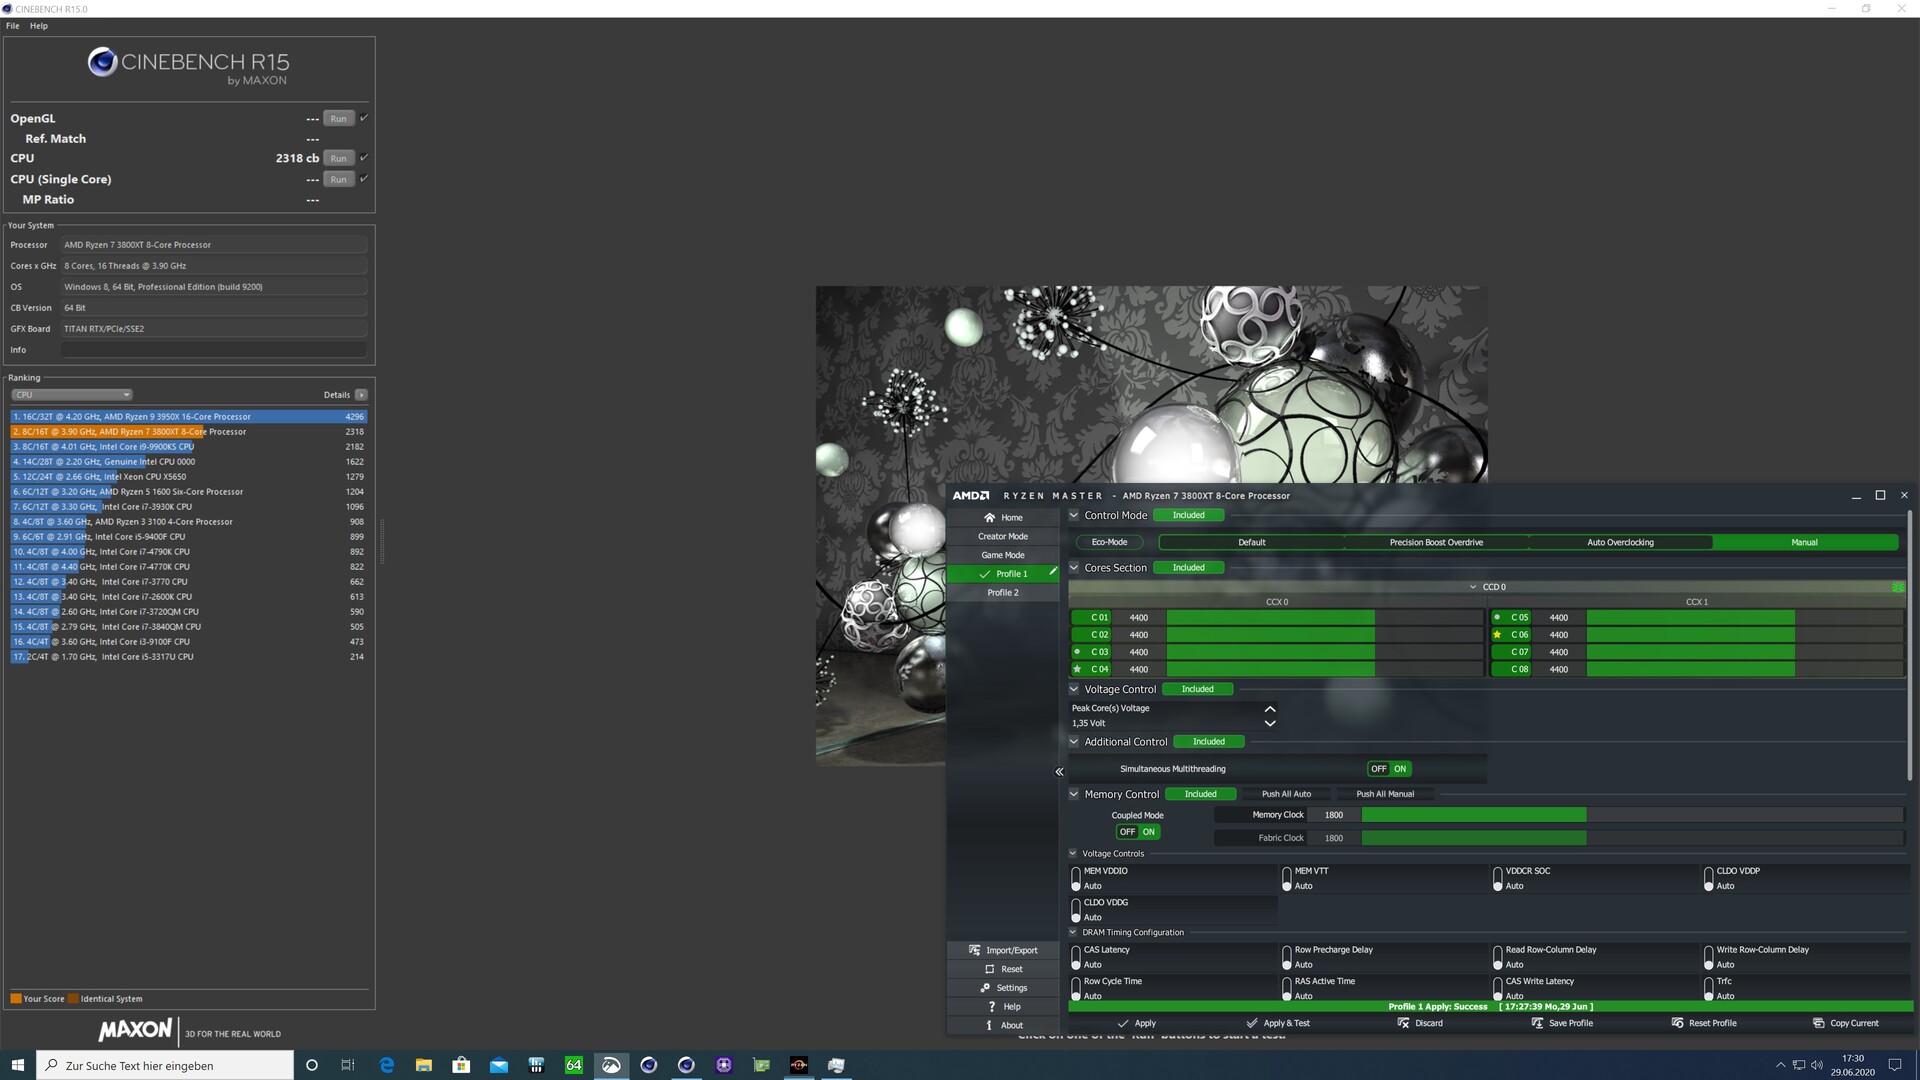
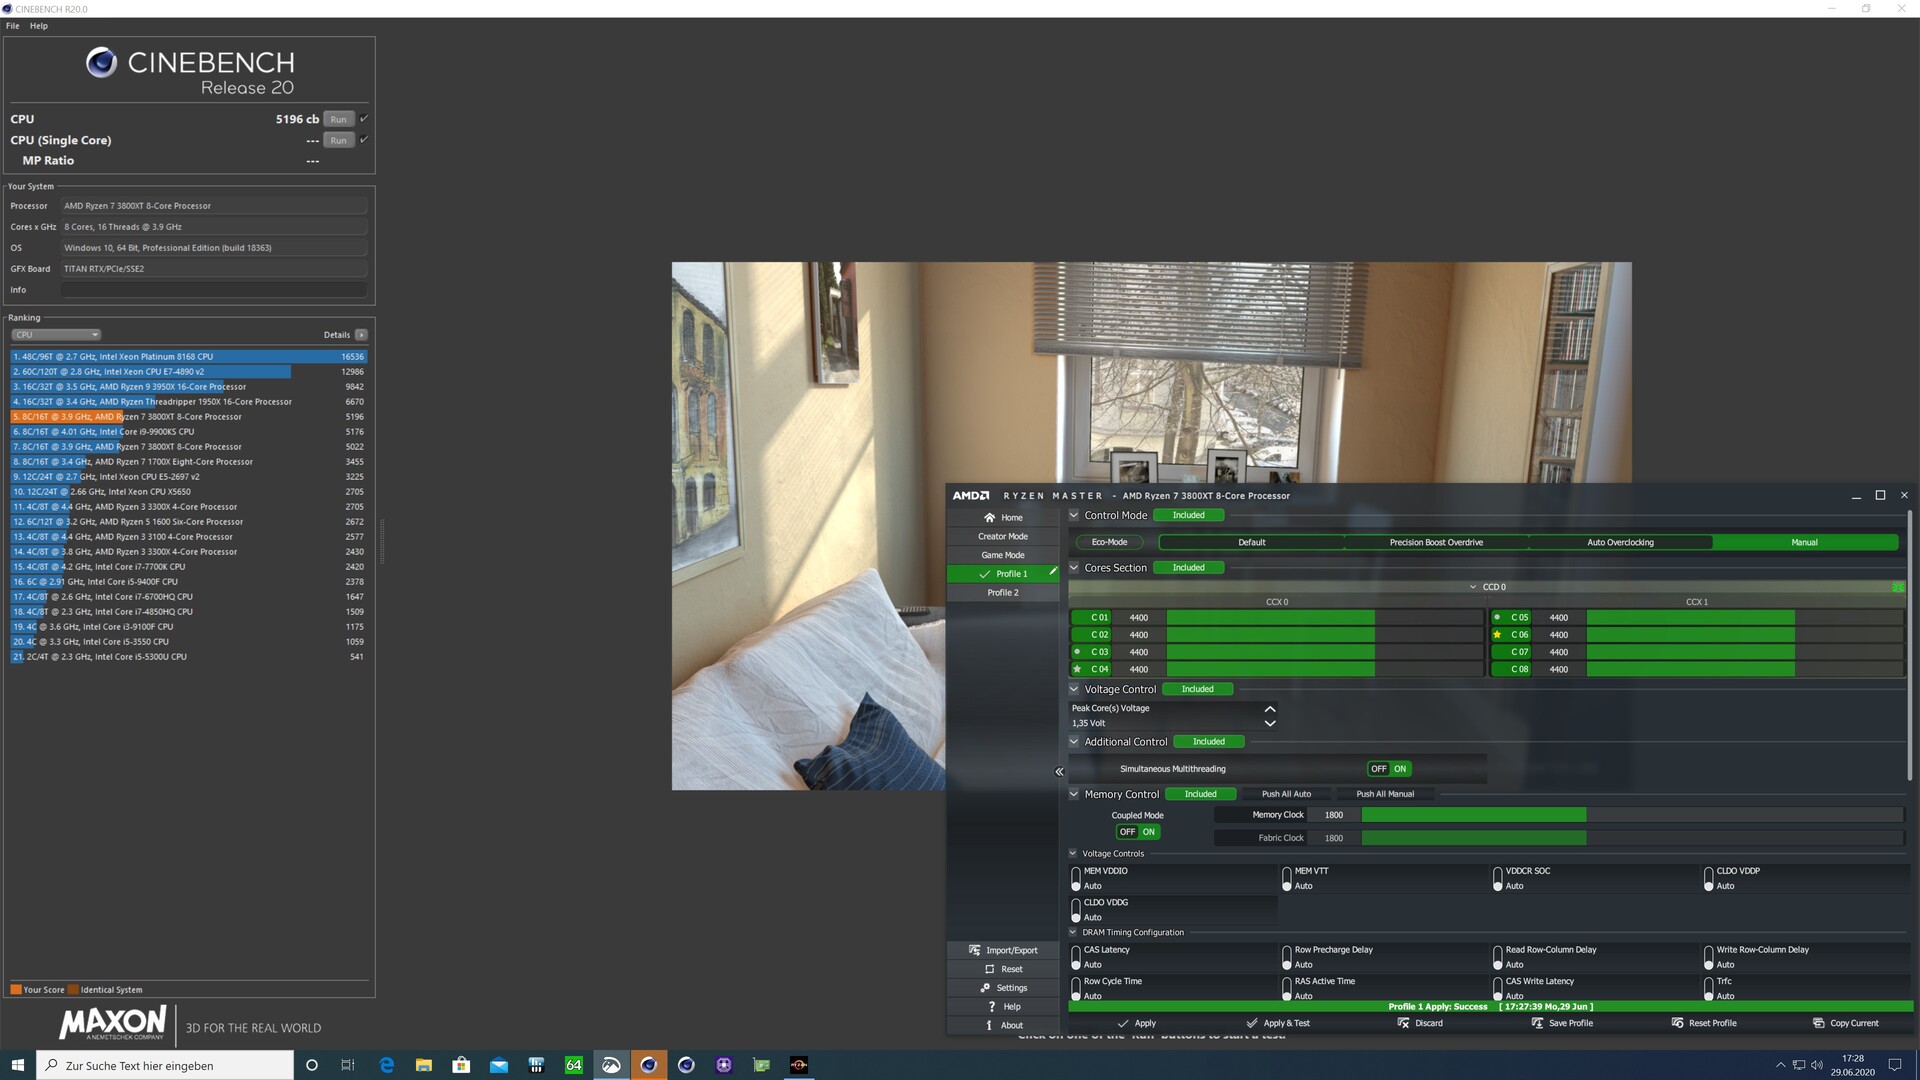
Overclocking - non raccomandato
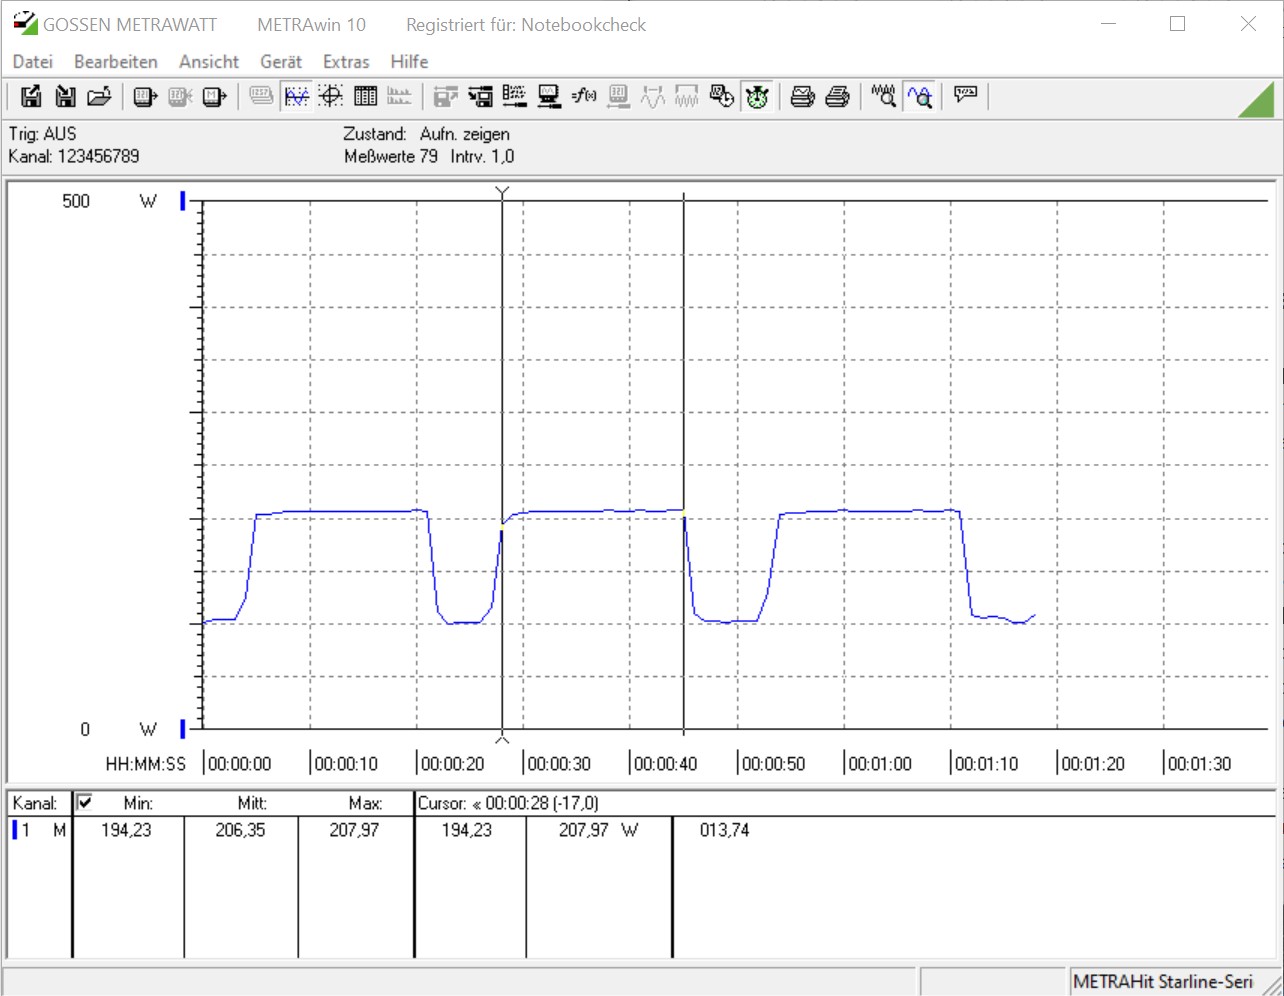
Anche se l'AMD Ryzen 7 3800XT offre già ottime prestazioni, molti vogliono sfruttare un po' di più la loro CPU con l'aiuto dell'overclocking. Con Ryzen Master si possono facilmente overcloccare i processori AMD Ryzen dall'interno di Windows. Tuttavia, si deve sapere che questo invaliderà tutte le garanzie. Inoltre, il PBO (Precision Boost Overdrive) è disattivato, il che non permette più il turbo massimo di 4,7 GHz e quindi ha un impatto negativo sulle prestazioni del single-thread. Nel nostro caso siamo stati in grado di far funzionare l'AMD Ryzen 7 3800XT a 4,4 GHz su tutti e otto i cores senza grande sforzo. L'aumento delle prestazioni può essere misurato, ma non si nota. Allo stesso modo, la tensione ha dovuto essere leggermente aumentata, il che si traduce in un consumo energetico leggermente superiore. Precisamente, il consumo di energia del sistema è aumentato di 13 watt nel multi benchmark Cinebench R15, fino a 206 watt.
Si sconsiglia il funzionamento continuo al di fuori delle specifiche indicate per i motivi sopra citati. L'aumento previsto delle prestazioni è semplicemente troppo basso.
Pro
Contro
Giudizio Complessivo - il prezzo sarà decisivo per la vittoria o la sconfitta!
L'AMD Ryzen 7 3800XT succede all'AMD Ryzen 7 3800X, che a causa del suo difficile posizionamento non è ancora riuscito a distinguersi dalla folla. Anche l'aggiornamento della Ryzen 7 3800X dovrà convivere con questi pregiudizi. Nel nostro test, quest CPU 8-cores offre buone prestazioni, che si colloca tra il Ryzen 7 3700X e il Ryzen 9 3900X. C'era da aspettarselo. Allo stesso tempo, il TDP più alto rispetto al Ryzen 7 3700X è ancora un punto critico nella scelta di una CPU a 8 cores di AMD. Il TDP più alto di 40 watt del Ryzen 7 3800XT di AMD rispetto al Ryzen 7 3700X non riflette un notevole aumento delle prestazioni. L'aumento del turbo fino a 4,7 GHz andrà a vantaggio soprattutto delle applicazioni single-thread.
L'AMD Ryzen 7 3800XT è una CPU gaming veloce, che continuerà ad avere difficoltà ad attrarre acquirenti a causa del suo prezzo.
AMD richiede 529 Euro (~$599) per questa CPU, che secondo noi è almeno 100 Euro di troppo se si guarda alle prestazioni in relazione a questo prezzo. Il Ryzen 7 3800X è ora disponibile a soli 310 Euro (~$351), che non gioca esattamente a favore del Ryzen 7 3800XT.
Nel complesso, AMD fa solo una minima manutenzione del prodotto con i processori XT. La domanda sorge spontanea: perché questi processori vengono rilasciati ora, visto che il lancio dello Zen3 è previsto per quest'anno, stando alel voci che circolano.