Recensione dell'AMD Ryzen 9 3950X - l'ammiraglia per il socket AM4
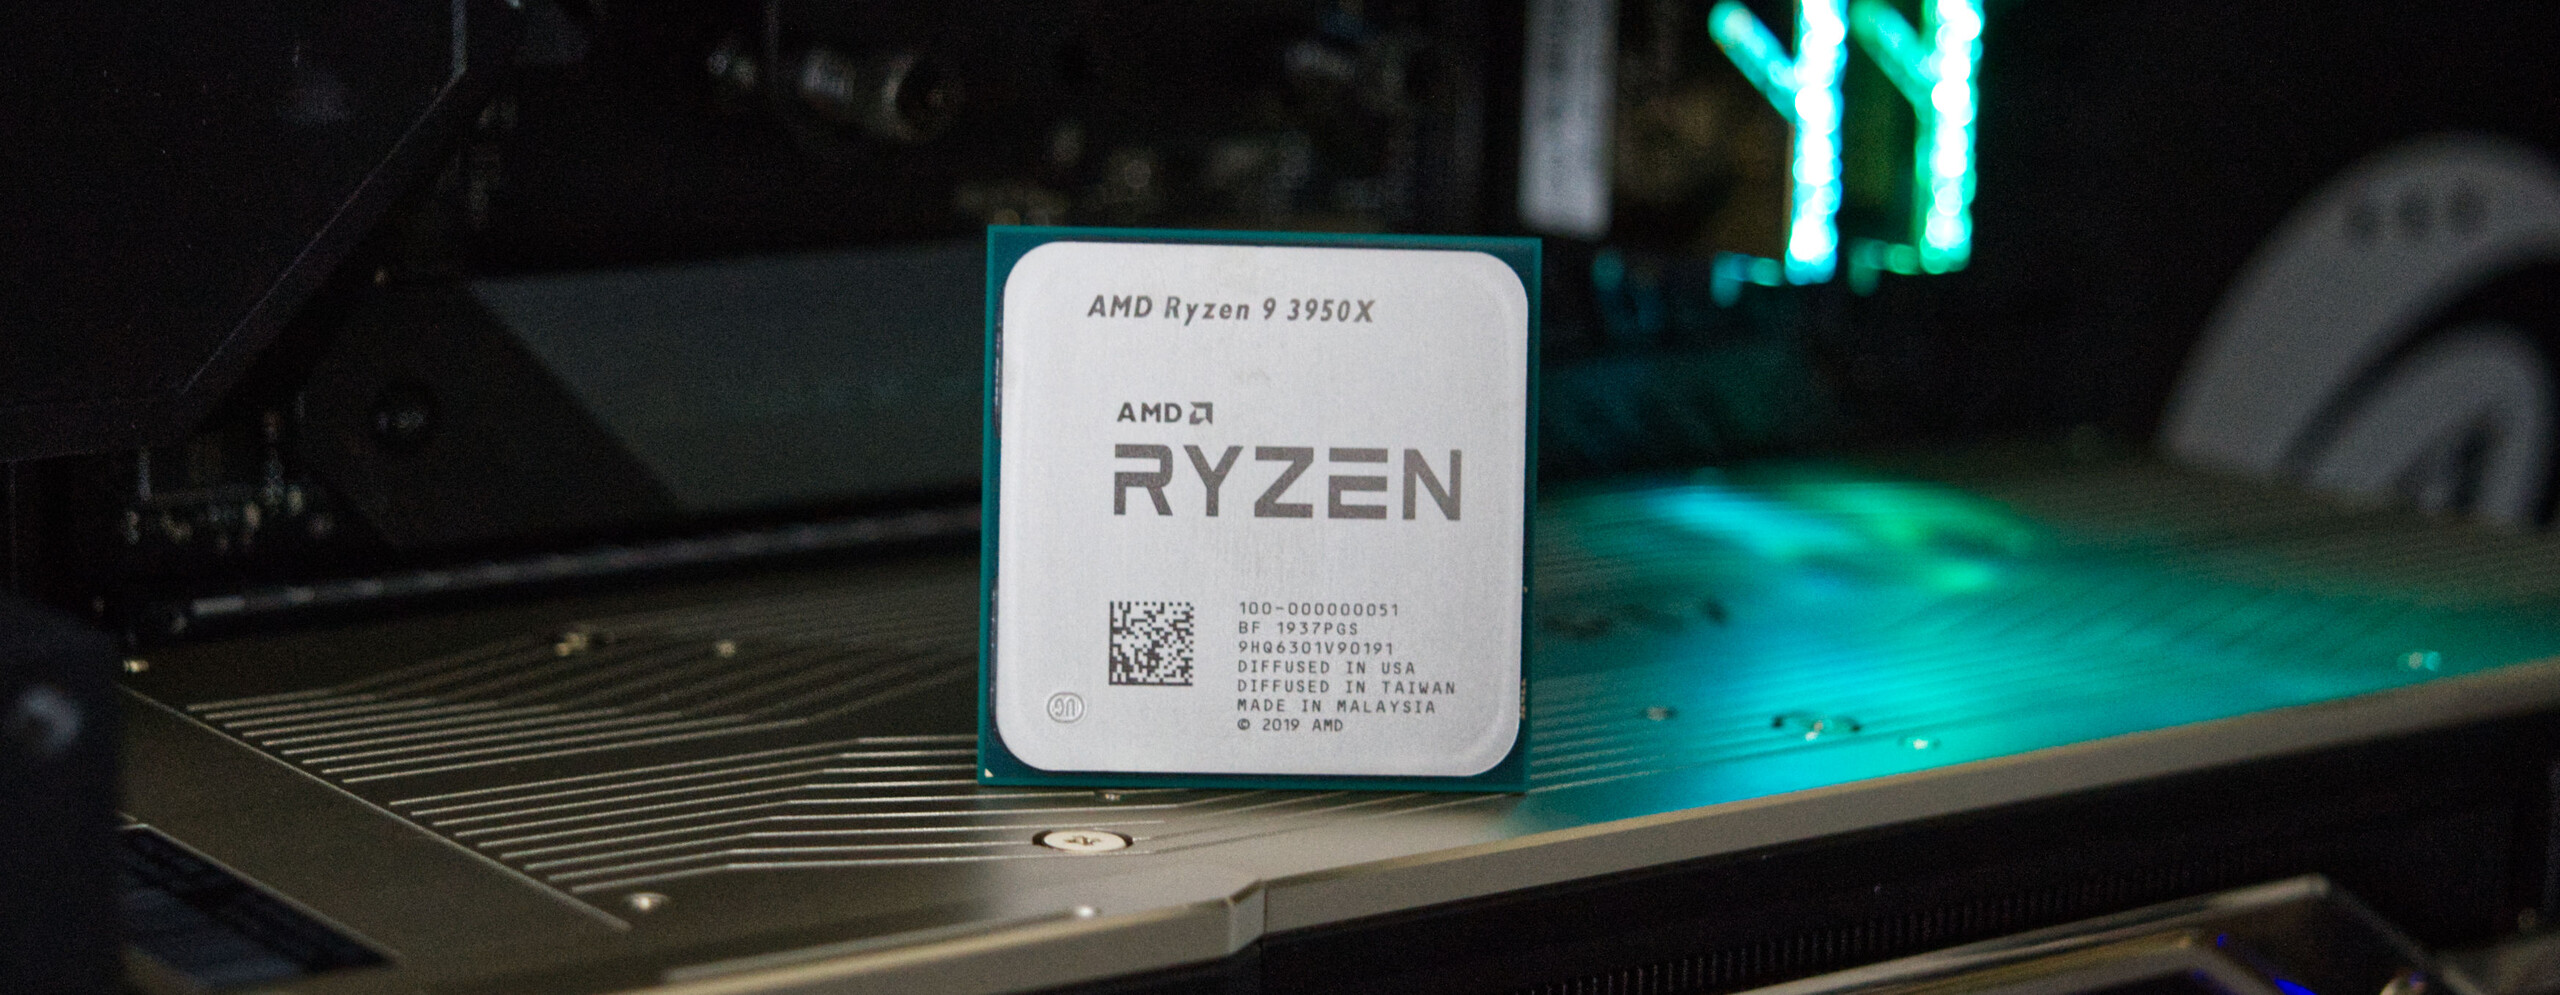
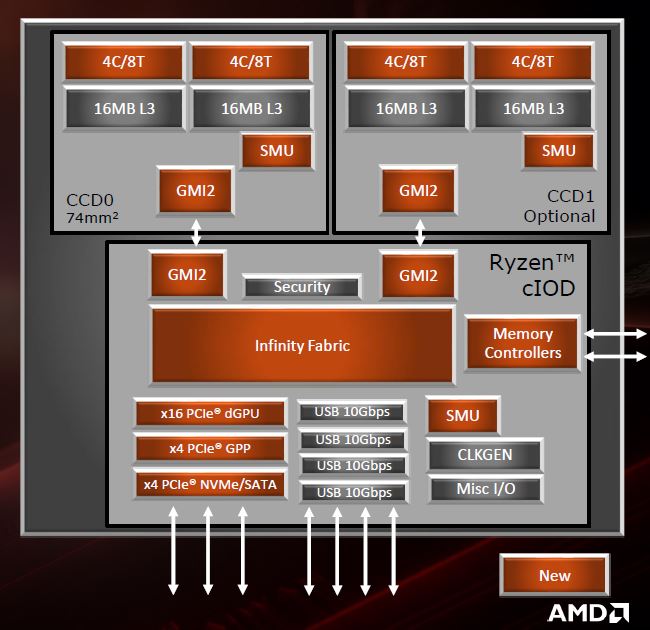
Abbiamo già spiegato di cosa è capace la nuova architettura Zen2 in varie recensioni. Con l'AMD Ryzen 9 3950X ci concentriamo ora sul modello di punta della piattaforma AM4. Il design del chip di nuova concezione consente ad AMD di ospitare fino a 16 cores su una sola scheda. Due cluster CCD sono completamente equipaggiati con due moduli CCX ciascuno, il che significa che ci sono un totale di 16 cores di calcolo attivi. Grazie a SMT, il Ryzen 9 3950X può gestire fino a 32 threads in parallelo, il che è particolarmente vantaggioso per le applicazioni multithreaded. Rispetto al Ryzen 9 3900X leggermente più piccolo, il processore a 16 cores ha solo una velocità di clock di base di 3,5 GHz invece di 3,9 GHz. Tuttavia, il 3950X aumenta di 100 MHz con una velocità fino a 4,7 GHz, che è un piccolo vantaggio per le applicazioni single-threaded.
Con un TDP di 105 watt, la configurazione completa si colloca sullo stesso livello del processore a 12 cores. In pratica, tuttavia, diventa rapidamente evidente che 105 watt non sono la fine della storia se le restrizioni nell'UEFI sono disattivate.
Al lancio sul mercato nel novembre dello scorso anno, il prezzo si aggirava intorno agli 820 Euro (~$887). Da allora, è sceso un po', ma al momento di condurre la nostra recensione bisogna ancora fare i conti con il pagamento di 770 Euro (~$833) per il modello di punta. Una sottostruttura decente sotto forma di scheda madre con il chipset X570 dovrebbe essere disponibile per poter utilizzare le nuove funzionalità come il PCI Express 4.0.
Panoramica dei processori AMD Ryzen
| Modello | Cores / Threads |
Base clock speed | Turbo clock speed | L3 cache | TDP | Prezzo di lancio |
|---|---|---|---|---|---|---|
| Ryzen R9 3950X | 16/32 | 3.5 GHz | 4.7 GHz | 64 MB | 105 Watt | 819 Euro |
| Ryzen R9 3900X | 12/24 | 3.8 GHz | 4.6 GHz | 64 MB | 105 Watt | 529 Euro |
| Ryzen R7 3800X | 8/16 | 3.9 GHz | 4.5 GHz | 32 MB | 105 Watt | 429 Euro |
| Ryzen R7 3700X | 8/16 | 3.6 GHz | 4.4 GHz | 32 MB | 65 Watt | 349 Euro |
| Ryzen R5 3600X | 6/12 | 3.8 GHz | 4.4 GHz | 32 MB | 95 Watt | 265 Euro |
| Ryzen R5 3600 | 6/12 | 3.6 GHz | 4.2 GHz | 32 MB | 65 Watt | 209 Euro |
| Ryzen R3 3300X | 4/8 | 3.8 GHz | 4.3 GHz | 16 MB | 65 Watt | 129 Euro |
| Ryzen R3 3100 | 4/8 | 3.6 GHz | 3.9 GHz | 16 MB | 65 Watt | 109 Euro |
Dettaglio sistema di Test - AMD vs. Intel
Utilizziamo il seguente sistema per i successivi benchmark e test:
- Raijintek Pean Benchtable
- AMD Ryzen 9 3950X
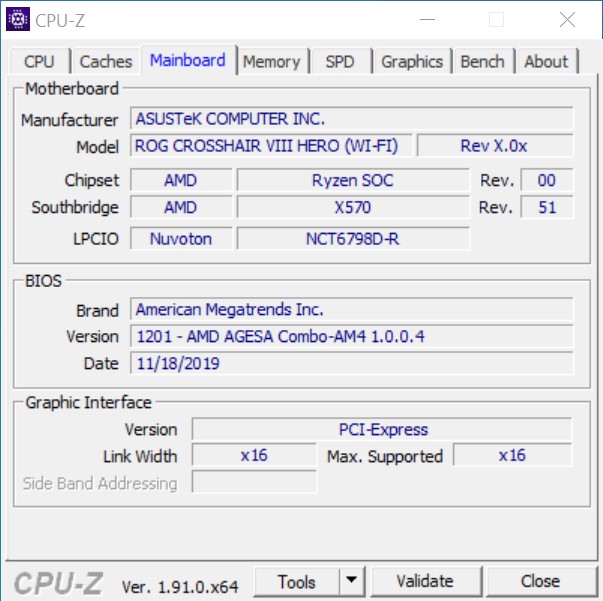
- Asus ROG Crosshair VIII Hero X570
- Alphacool Eisbaer 280 AiO
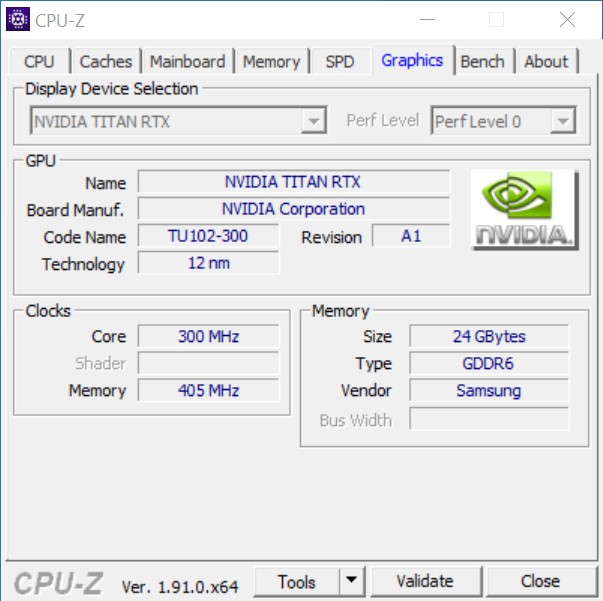
- Nvidia Titan RTX
- alimentatore Corsair RM 1000X
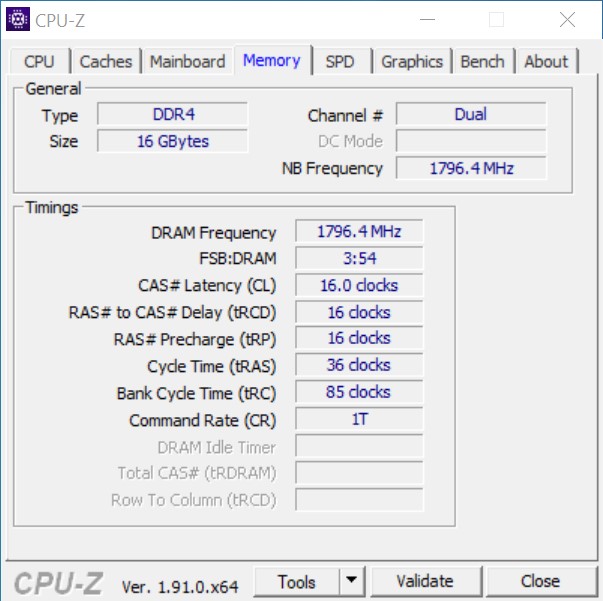
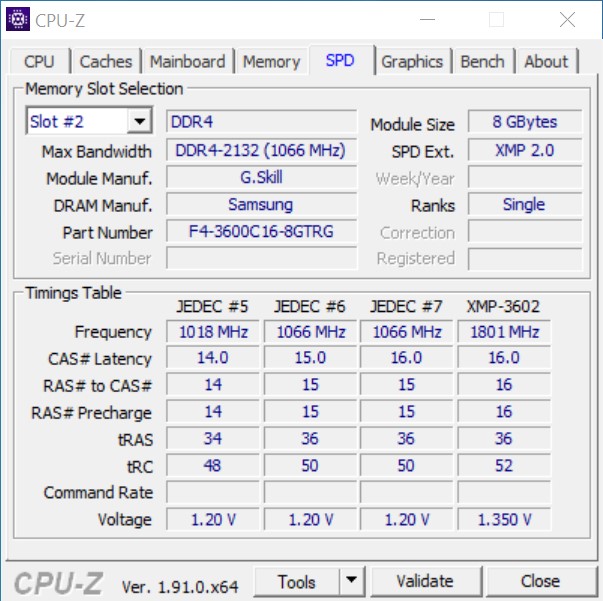
- G.Skill Trident Z Royal gold DDR4-3600 memory kit (2 x 8 GB), set to DDR4-3600 CL16-16-16-36
- Intel Optane 905P 480 GB PCIe SSD
- Microsoft Windows 10 Professional 64-bit (Versions 1909)
A questo punto vorremmo ringraziare Caseking per averci fornito l'AMD Ryzen 9 3950X. Anche il Raijintek Pean è di Caseking ed è stato personalizzato con l'incisione laser. La scheda madre e la RAM sono state fornite direttamente da AMD e sono state incluse nella cartella stampa per il rilascio dell'AMD Ryzen 9 3900X. Come raffreddamento utilizziamo l'Alphacool Eisbaer 280, che ci ha fornito Alphacool.
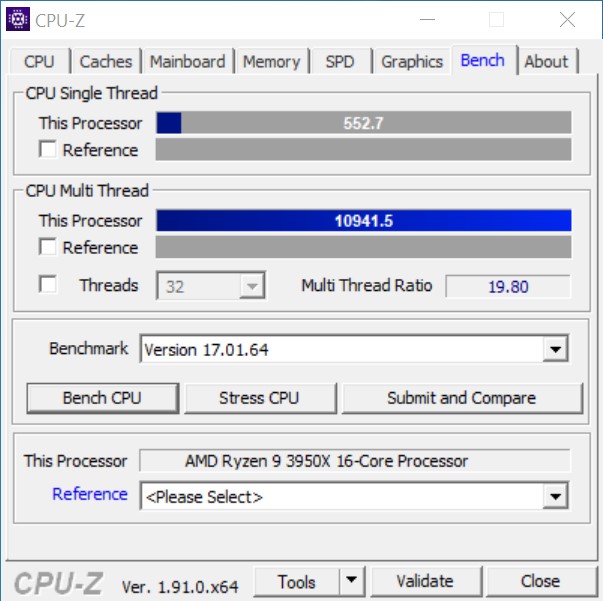
Benchmarks Processore
Se diamo un'occhiata più da vicino ai benchmarks delle CPU pure, diventa chiaro che l'AMD Ryzen 9 3950X è ancora una volta significativamente più veloce dell'AMD Ryzen 9 3900X. Ciò è chiaramente dovuto ai suoi otto threads aggiuntivi. Ma anche nelle prestazioni single-core, il nostro modello di test risulta essere nettamente più veloce del processore a 12 core. Ciononostante, Intel è in testa al popolare benchmark Cinebench R15 con il Core i9-9900KS, seguito da vicino dal Core i9-9900K. AMD è chiaramente superiore a Intel nelle applicazioni multithreaded grazie al doppio numero di unità di calcolo.
| Cinebench R20 | |
| CPU (Single Core) | |
| AMD Ryzen 9 3950X | |
| AMD Ryzen 9 3900X | |
| Intel Core i9-9900KS | |
| AMD Ryzen 7 3700X | |
| AMD Ryzen 3 3300X | |
| CPU (Multi Core) | |
| AMD Ryzen 9 3950X | |
| AMD Ryzen 9 3900X | |
| Intel Core i9-9900KS | |
| AMD Ryzen 7 3700X | |
| AMD Ryzen 3 3300X | |
| Cinebench R10 | |
| Rendering Single CPUs 64Bit | |
| Intel Core i9-9900KS | |
| AMD Ryzen 9 3950X | |
| AMD Ryzen 9 3900X | |
| Intel Core i9-9900K | |
| AMD Ryzen 3 3300X | |
| AMD Ryzen 7 3700X | |
| Rendering Multiple CPUs 64Bit | |
| AMD Ryzen 9 3950X | |
| AMD Ryzen 9 3900X | |
| Intel Core i9-9900KS | |
| AMD Ryzen 7 3700X | |
| Intel Core i9-9900K | |
| AMD Ryzen 3 3300X | |
| Blender - v2.79 BMW27 CPU | |
| AMD Ryzen 3 3300X | |
| Intel Core i9-9900K | |
| Intel Core i9-9900KS | |
| AMD Ryzen 7 3700X | |
| AMD Ryzen 9 3900X | |
| AMD Ryzen 9 3950X | |
| WinRAR - Result | |
| Intel Core i9-9900KS | |
| Intel Core i9-9900K | |
| AMD Ryzen 9 3900X | |
| AMD Ryzen 7 3700X | |
| AMD Ryzen 9 3950X | |
| AMD Ryzen 3 3300X | |
| Geekbench 5.5 | |
| Multi-Core | |
| AMD Ryzen 9 3950X | |
| AMD Ryzen 9 3900X | |
| AMD Ryzen 7 3700X | |
| AMD Ryzen 3 3300X | |
| Single-Core | |
| AMD Ryzen 9 3950X | |
| AMD Ryzen 7 3700X | |
| AMD Ryzen 3 3300X | |
| AMD Ryzen 9 3900X | |
| Geekbench 5.0 | |
| 5.0 Multi-Core | |
| AMD Ryzen 9 3950X | |
| AMD Ryzen 9 3900X | |
| AMD Ryzen 3 3300X | |
| 5.0 Single-Core | |
| AMD Ryzen 9 3950X | |
| AMD Ryzen 3 3300X | |
| AMD Ryzen 9 3900X | |
| Geekbench 4.4 | |
| 64 Bit Single-Core Score | |
| Intel Core i9-9900K | |
| Intel Core i9-9900KS | |
| AMD Ryzen 9 3900X | |
| AMD Ryzen 7 3700X | |
| AMD Ryzen 3 3300X | |
| AMD Ryzen 9 3950X | |
| 64 Bit Multi-Core Score | |
| AMD Ryzen 9 3950X | |
| AMD Ryzen 9 3900X | |
| Intel Core i9-9900KS | |
| AMD Ryzen 7 3700X | |
| Intel Core i9-9900K | |
| AMD Ryzen 3 3300X | |
| 3DMark 11 - 1280x720 Performance Physics | |
| AMD Ryzen 9 3950X | |
| Intel Core i9-9900KS | |
| AMD Ryzen 9 3900X | |
| AMD Ryzen 7 3700X | |
| AMD Ryzen 3 3300X | |
| HWBOT x265 Benchmark v2.2 - 4k Preset | |
| AMD Ryzen 9 3900X | |
| Intel Core i9-9900KS | |
| Intel Core i9-9900K | |
| AMD Ryzen 9 3950X | |
| AMD Ryzen 7 3700X | |
| AMD Ryzen 3 3300X | |
| R Benchmark 2.5 - Overall mean | |
| AMD Ryzen 9 3900X | |
| AMD Ryzen 3 3300X | |
| AMD Ryzen 9 3950X | |
| LibreOffice - 20 Documents To PDF | |
| AMD Ryzen 9 3900X | |
| AMD Ryzen 9 3950X | |
| AMD Ryzen 3 3300X | |
| WebXPRT 3 - Overall | |
| AMD Ryzen 9 3950X | |
| AMD Ryzen 3 3300X | |
| Mozilla Kraken 1.1 - Total | |
| AMD Ryzen 3 3300X | |
| AMD Ryzen 9 3950X | |
| 3DMark | |
| 3840x2160 Fire Strike Ultra Physics | |
| AMD Ryzen 9 3950X | |
| AMD Ryzen 9 3900X | |
| Intel Core i9-9900KS | |
| Intel Core i9-9900K | |
| AMD Ryzen 7 3700X | |
| AMD Ryzen 3 3300X | |
| 1920x1080 Fire Strike Physics | |
| AMD Ryzen 9 3950X | |
| AMD Ryzen 9 3900X | |
| Intel Core i9-9900KS | |
| Intel Core i9-9900K | |
| AMD Ryzen 7 3700X | |
| AMD Ryzen 3 3300X | |
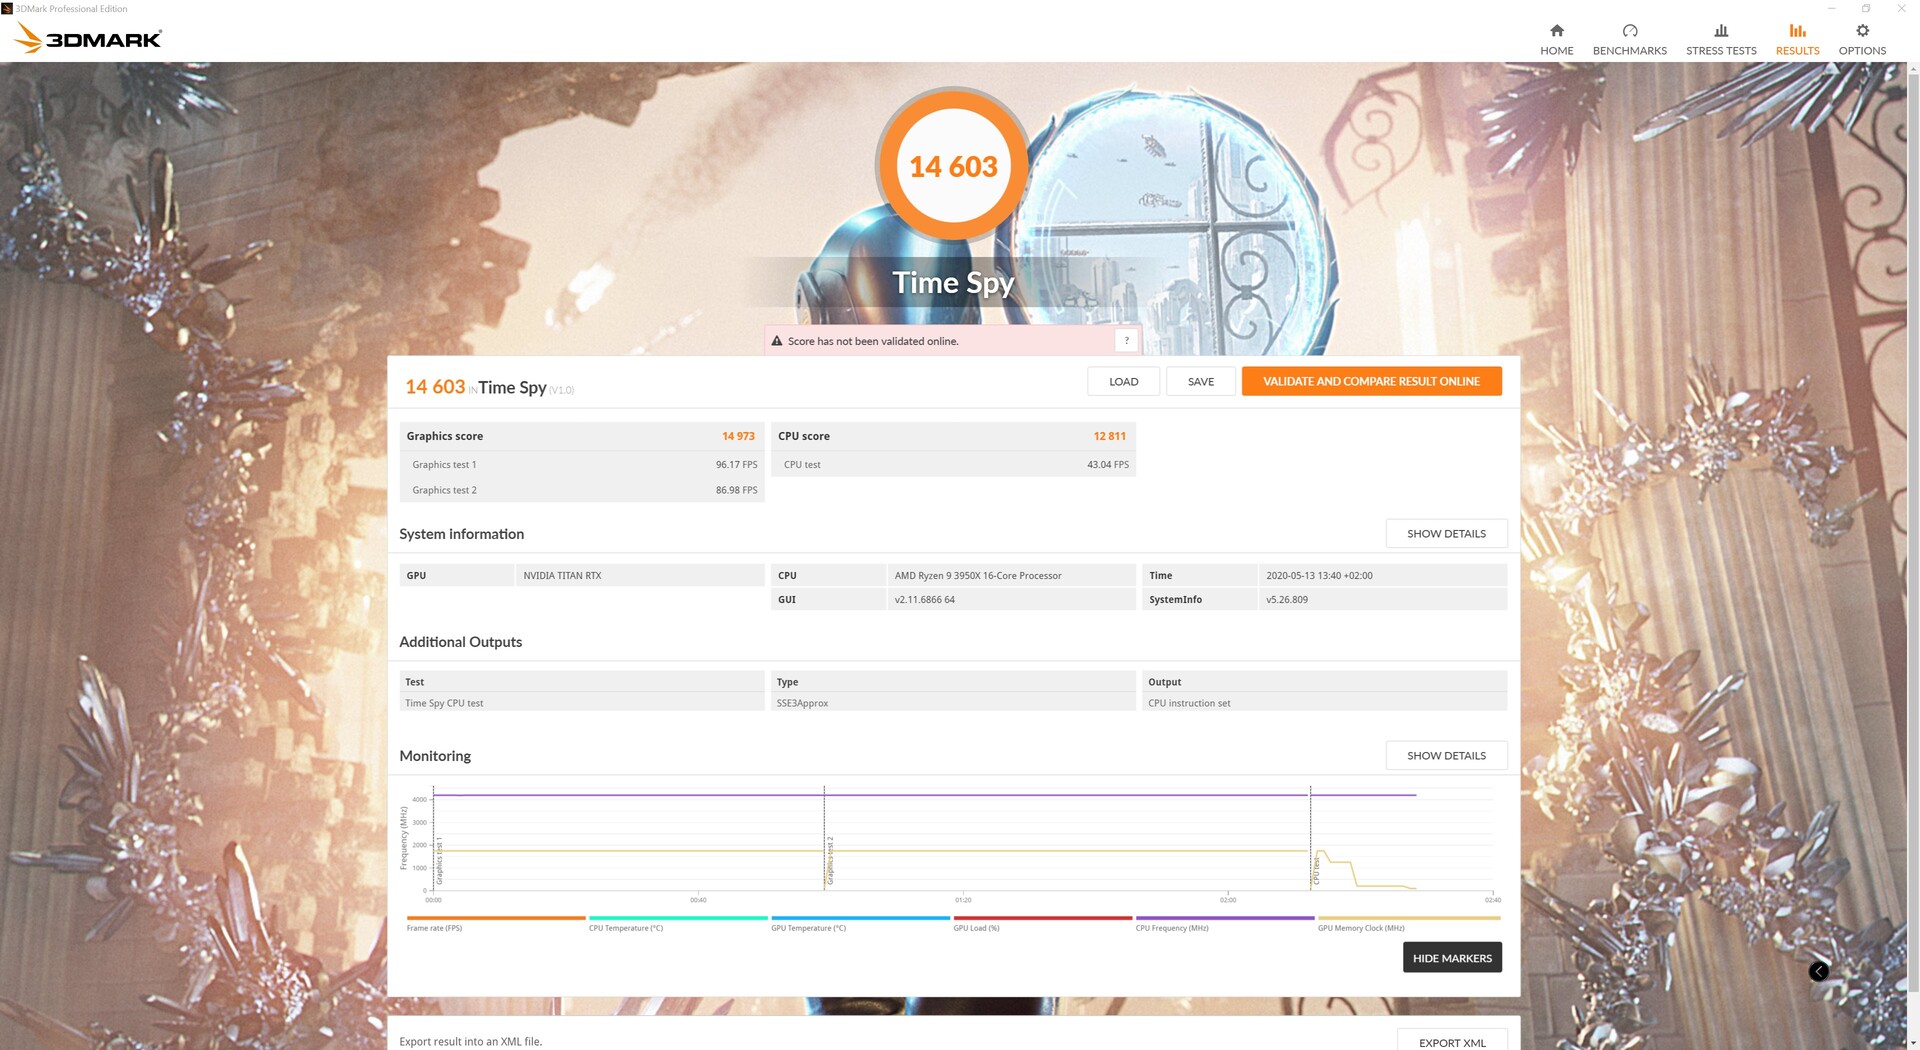
| 2560x1440 Time Spy CPU | |
| AMD Ryzen 9 3950X | |
| AMD Ryzen 9 3900X | |
| Intel Core i9-9900KS | |
| Intel Core i9-9900K | |
| AMD Ryzen 7 3700X | |
| AMD Ryzen 3 3300X | |
* ... Meglio usare valori piccoli
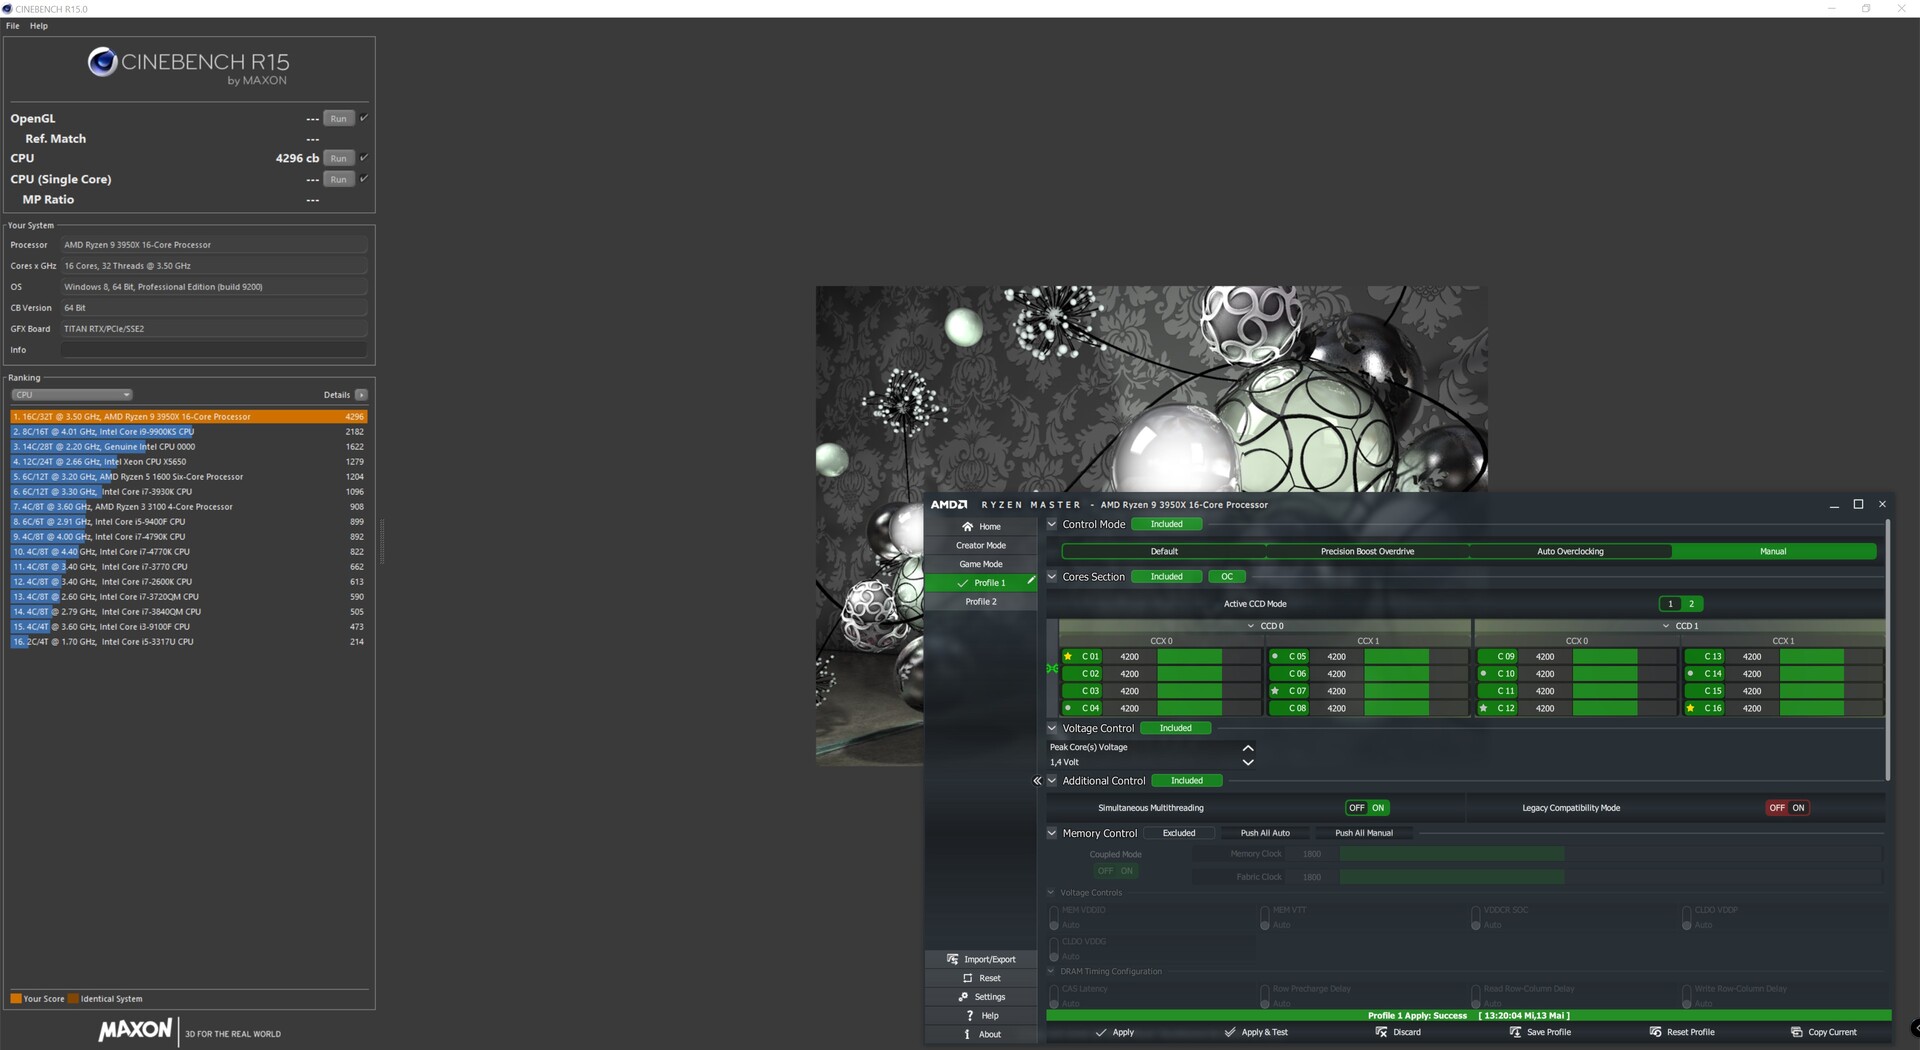
Con 16 cores nel Cinebench R15 multi-loop
Il nostro modello di prova non ha difficoltà nella prima prova di carico estremo con il multi loop Cinebench R15. L'AiO integrato con il dissipatore da 280 millimetri non ha alcun problema a raffreddare l'AMD Ryzen 9 3950X in modo affidabile.
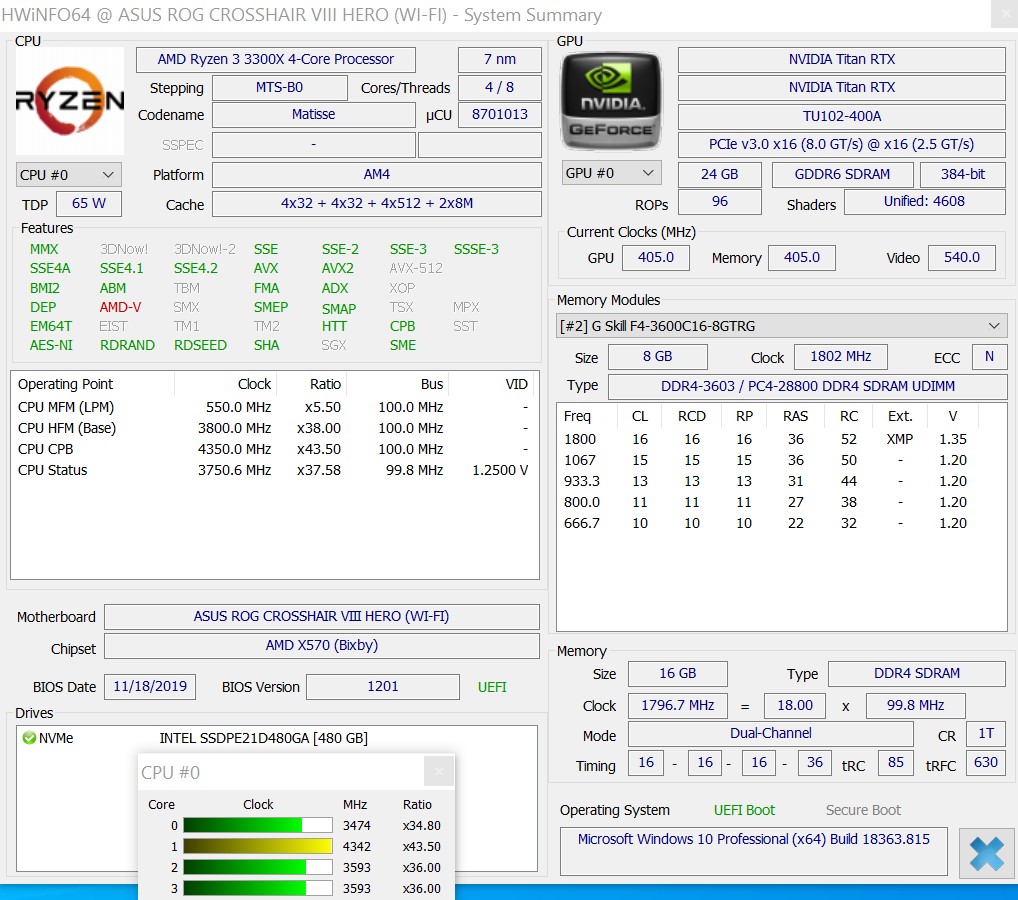
Prestazioni con le applicazioni
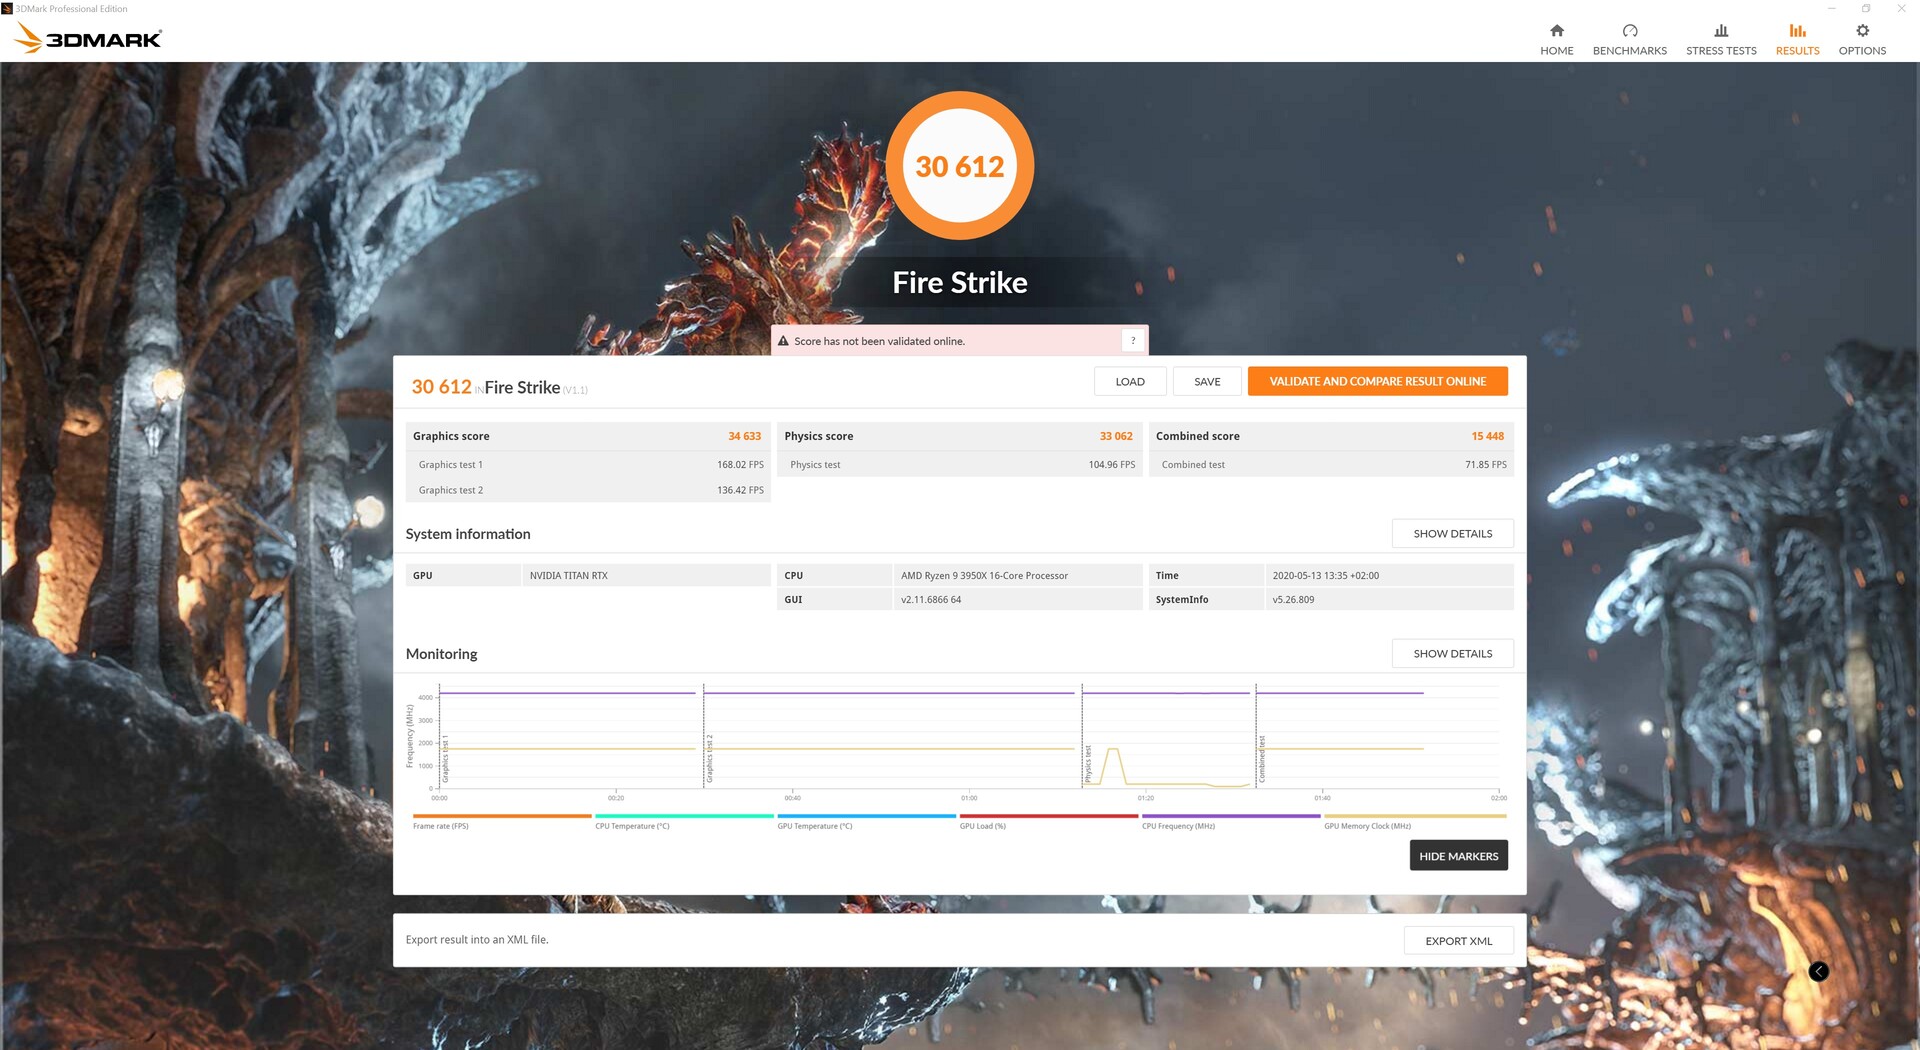
Molte applicazioni non beneficiano di questa quantità di cores come dimostrato dal nostro test. L'AMD Ryzen 9 3950X è quasi alla pari con l'Intel Core i9-9900KS. Lo stesso vale per i benchmarks 3D sintetici. Anche questi non beneficiano dei cores aggiuntivi di AMD Ryzen 9 3950X. Anche il recentemente testato AMD Ryzen 3 3300X può tenere molto bene il passo con l'ammiraglia qui.
| Performance rating - Percent | |
| Intel Core i9-9900KS | |
| AMD Ryzen 9 3950X | |
| AMD Ryzen 3 3300X | |
| PCMark 10 - Score | |
| Intel Core i9-9900KS | |
| AMD Ryzen 9 3950X | |
| AMD Ryzen 3 3300X | |
| PCMark 8 | |
| Work Score Accelerated v2 | |
| AMD Ryzen 9 3950X | |
| Intel Core i9-9900KS | |
| AMD Ryzen 3 3300X | |
| Creative Score Accelerated v2 | |
| Intel Core i9-9900KS | |
| AMD Ryzen 9 3950X | |
| AMD Ryzen 3 3300X | |
| Home Score Accelerated v2 | |
| Intel Core i9-9900KS | |
| AMD Ryzen 3 3300X | |
| AMD Ryzen 9 3950X | |
| 3DMark 11 | |
| 1280x720 Performance | |
| Intel Core i9-9900KS | |
| AMD Ryzen 9 3950X | |
| AMD Ryzen 3 3300X | |
| 1280x720 Performance GPU | |
| Intel Core i9-9900KS | |
| AMD Ryzen 3 3300X | |
| AMD Ryzen 9 3950X | |
| 3DMark | |
| 1920x1080 Fire Strike Score | |
| AMD Ryzen 9 3950X | |
| Intel Core i9-9900KS | |
| AMD Ryzen 3 3300X | |
| 1920x1080 Fire Strike Graphics | |
| Intel Core i9-9900KS | |
| AMD Ryzen 3 3300X | |
| AMD Ryzen 9 3950X | |
| 3840x2160 Fire Strike Ultra Score | |
| Intel Core i9-9900KS | |
| AMD Ryzen 9 3950X | |
| AMD Ryzen 3 3300X | |
| 3840x2160 Fire Strike Ultra Graphics | |
| AMD Ryzen 3 3300X | |
| Intel Core i9-9900KS | |
| AMD Ryzen 9 3950X | |
| 2560x1440 Time Spy Score | |
| Intel Core i9-9900KS | |
| AMD Ryzen 9 3950X | |
| AMD Ryzen 3 3300X | |
| 2560x1440 Time Spy Graphics | |
| AMD Ryzen 3 3300X | |
| Intel Core i9-9900KS | |
| AMD Ryzen 9 3950X | |
| SPECviewperf 12 | |
| 1900x1060 Solidworks (sw-03) | |
| AMD Ryzen 9 3950X | |
| AMD Ryzen 3 3300X | |
| Intel Core i9-9900KS | |
| 1900x1060 Siemens NX (snx-02) | |
| AMD Ryzen 9 3950X | |
| Intel Core i9-9900KS | |
| AMD Ryzen 3 3300X | |
| 1900x1060 Showcase (showcase-01) | |
| Intel Core i9-9900KS | |
| AMD Ryzen 3 3300X | |
| AMD Ryzen 9 3950X | |
| 1900x1060 Medical (medical-01) | |
| Intel Core i9-9900KS | |
| AMD Ryzen 9 3950X | |
| AMD Ryzen 3 3300X | |
| 1900x1060 Maya (maya-04) | |
| Intel Core i9-9900KS | |
| AMD Ryzen 9 3950X | |
| AMD Ryzen 3 3300X | |
| 1900x1060 Energy (energy-01) | |
| Intel Core i9-9900KS | |
| AMD Ryzen 9 3950X | |
| AMD Ryzen 3 3300X | |
| 1900x1060 Creo (creo-01) | |
| Intel Core i9-9900KS | |
| AMD Ryzen 9 3950X | |
| AMD Ryzen 3 3300X | |
| 1900x1060 Catia (catia-04) | |
| Intel Core i9-9900KS | |
| AMD Ryzen 9 3950X | |
| AMD Ryzen 3 3300X | |
| 1900x1060 3ds Max (3dsmax-05) | |
| Intel Core i9-9900KS | |
| AMD Ryzen 9 3950X | |
| AMD Ryzen 3 3300X | |
| SPECviewperf 13 | |
| Solidworks (sw-04) | |
| AMD Ryzen 9 3950X | |
| Intel Core i9-9900KS | |
| AMD Ryzen 3 3300X | |
| Siemens NX (snx-03) | |
| AMD Ryzen 9 3950X | |
| Intel Core i9-9900KS | |
| AMD Ryzen 3 3300X | |
| Showcase (showcase-02) | |
| Intel Core i9-9900KS | |
| AMD Ryzen 3 3300X | |
| AMD Ryzen 9 3950X | |
| Medical (medical-02) | |
| AMD Ryzen 9 3950X | |
| AMD Ryzen 3 3300X | |
| Intel Core i9-9900KS | |
| Maya (maya-05) | |
| Intel Core i9-9900KS | |
| AMD Ryzen 9 3950X | |
| AMD Ryzen 3 3300X | |
| Energy (energy-02) | |
| AMD Ryzen 3 3300X | |
| AMD Ryzen 9 3950X | |
| Intel Core i9-9900KS | |
| Creo (creo-02) | |
| AMD Ryzen 9 3950X | |
| Intel Core i9-9900KS | |
| AMD Ryzen 3 3300X | |
| Catia (catia-05) | |
| AMD Ryzen 9 3950X | |
| Intel Core i9-9900KS | |
| AMD Ryzen 3 3300X | |
| 3ds Max (3dsmax-06) | |
| Intel Core i9-9900KS | |
| AMD Ryzen 9 3950X | |
| AMD Ryzen 3 3300X | |
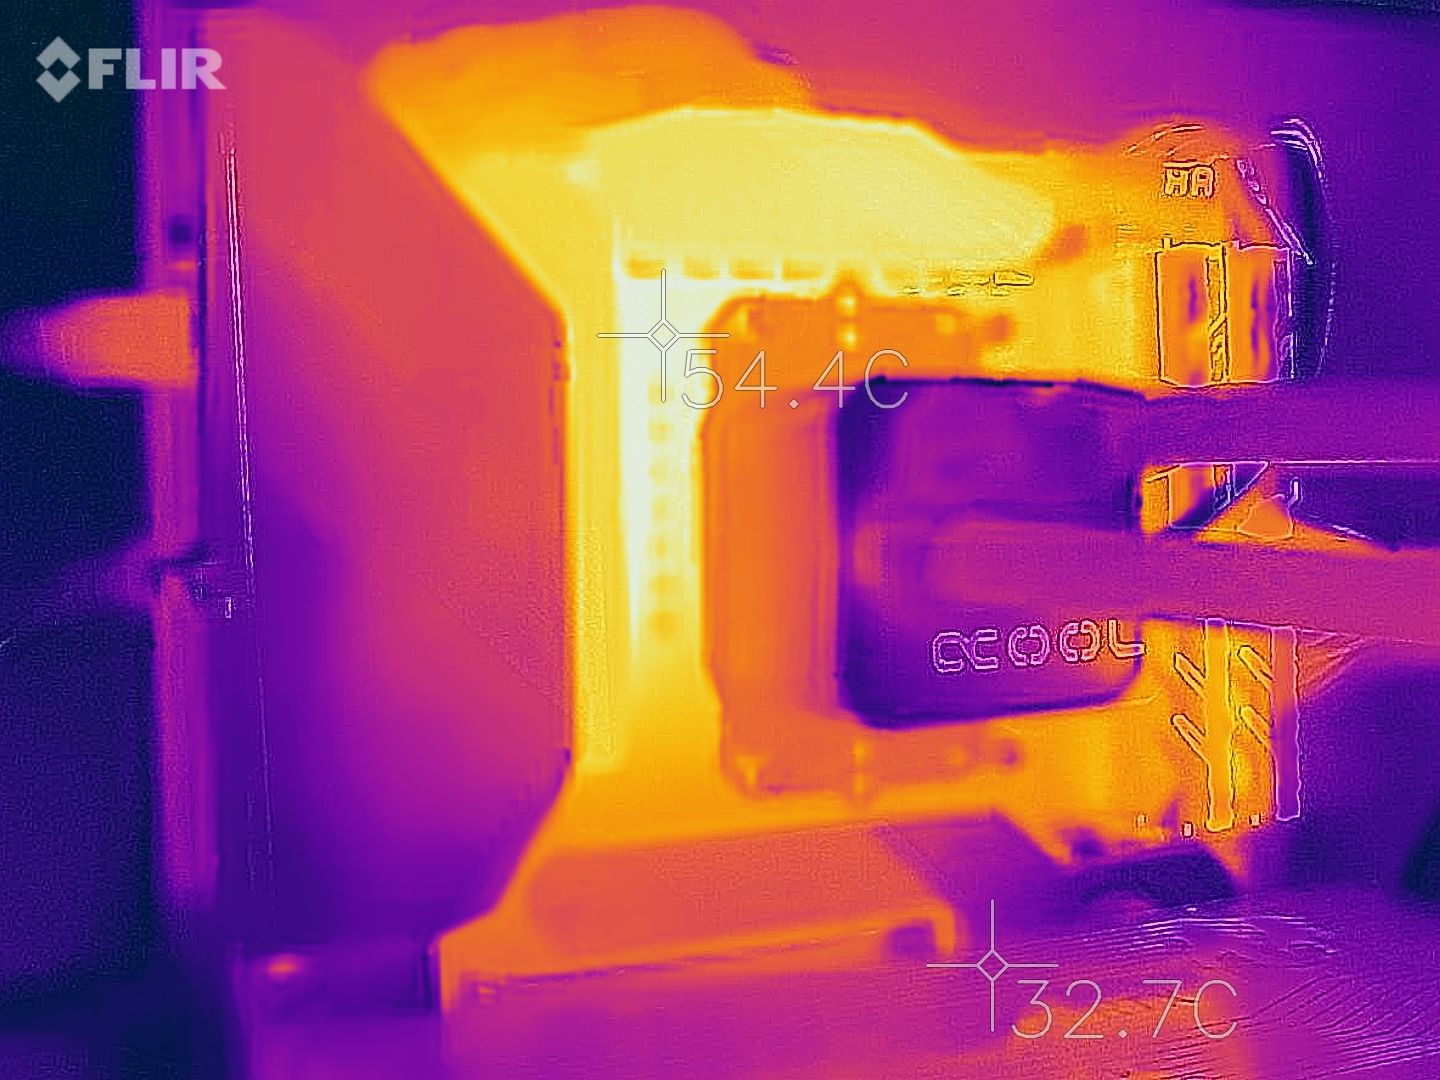
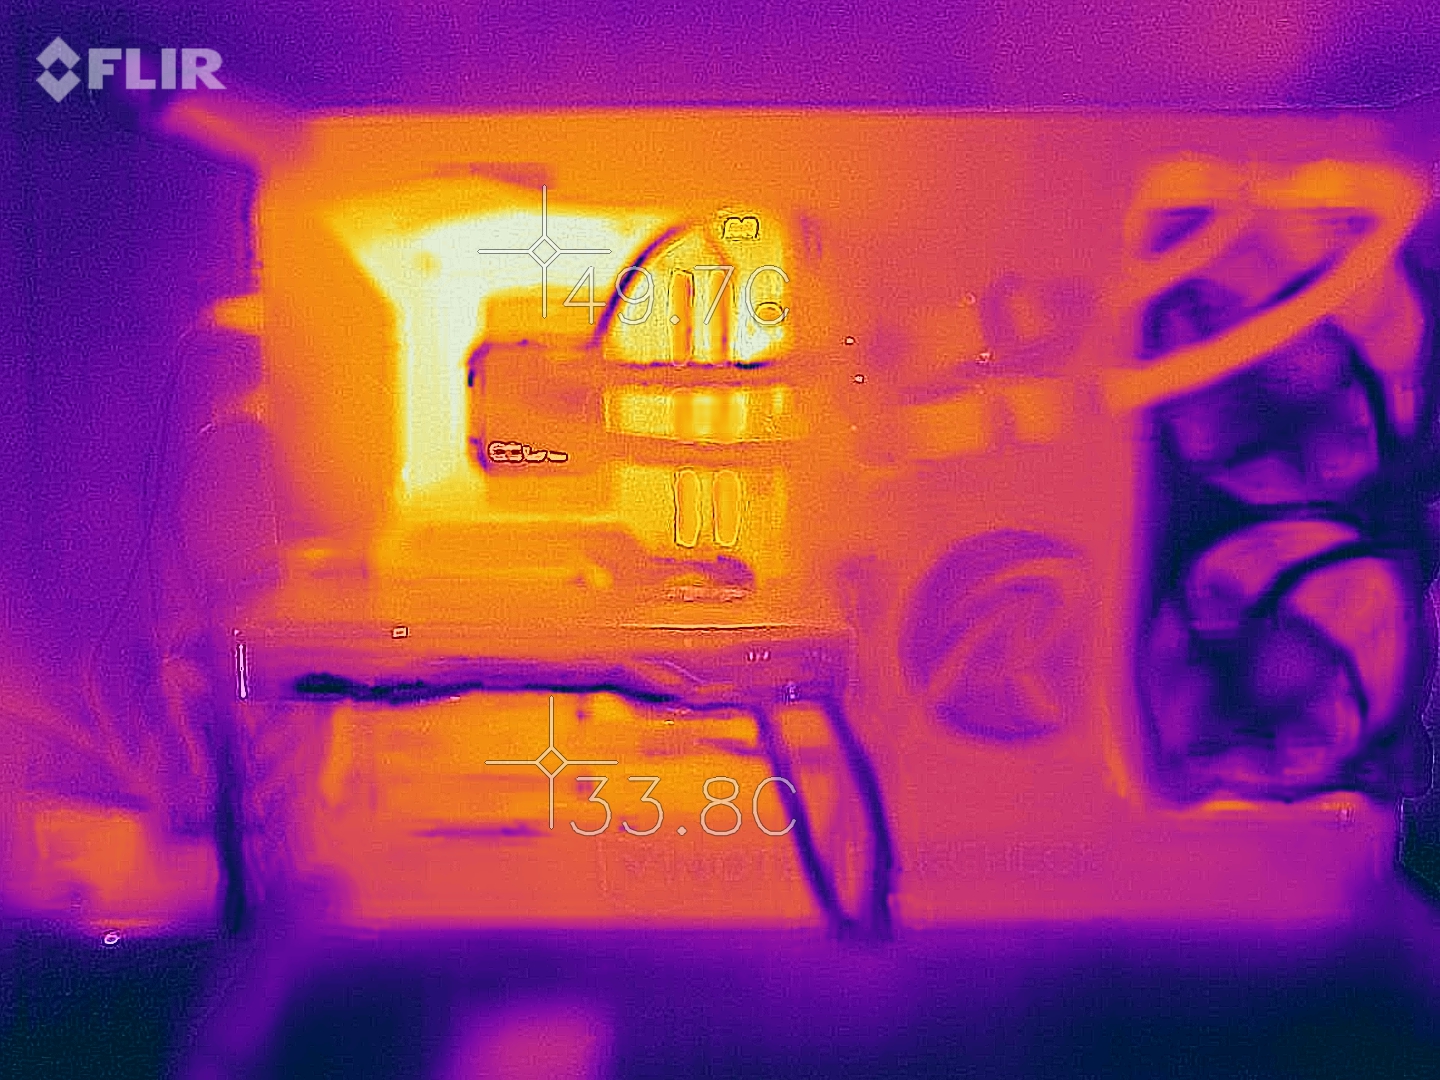
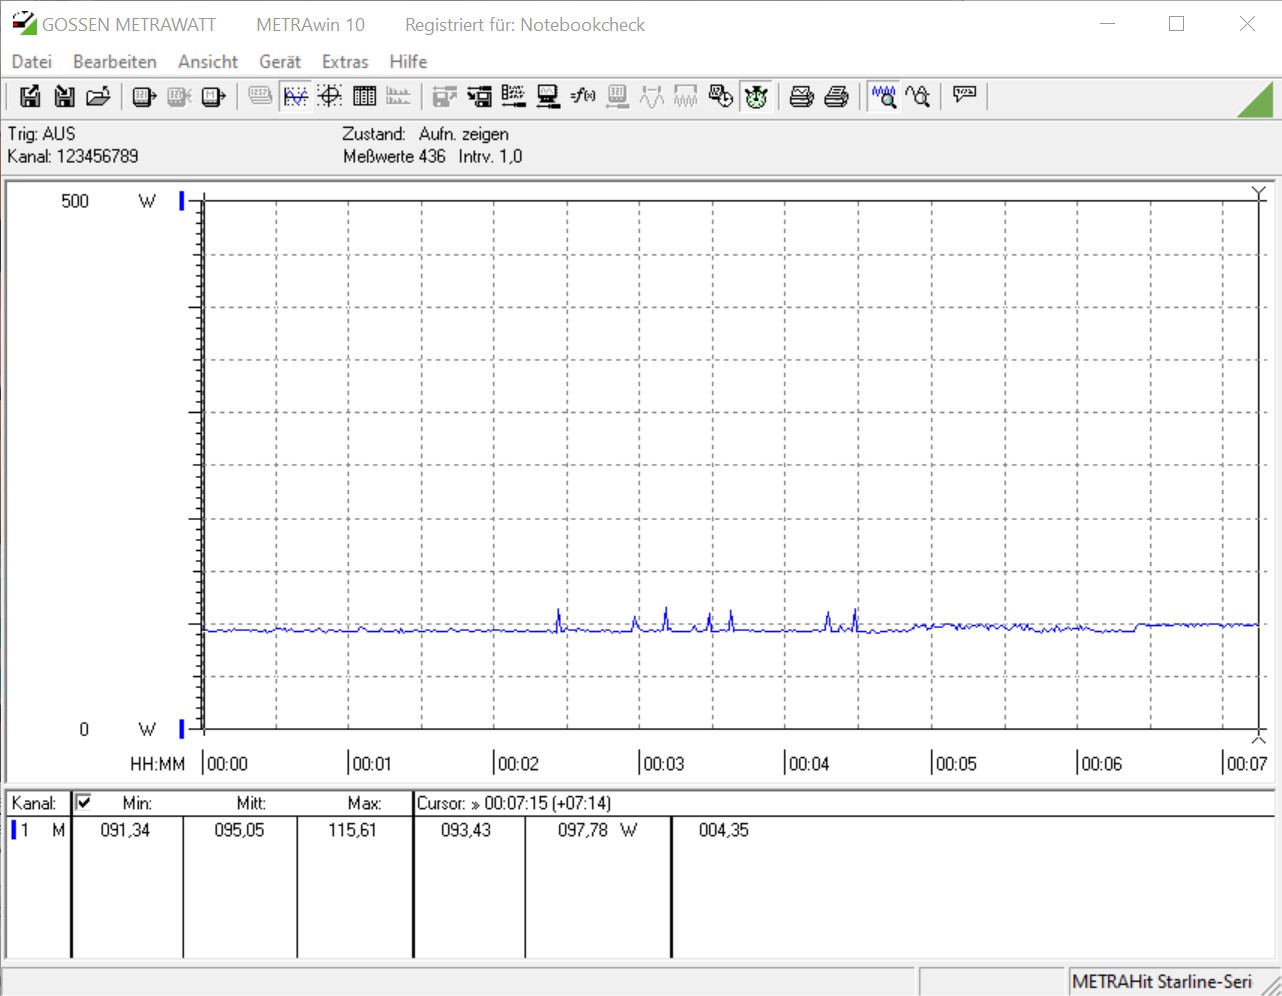
Consumo Energetico - Efficiente con le impostazioni base
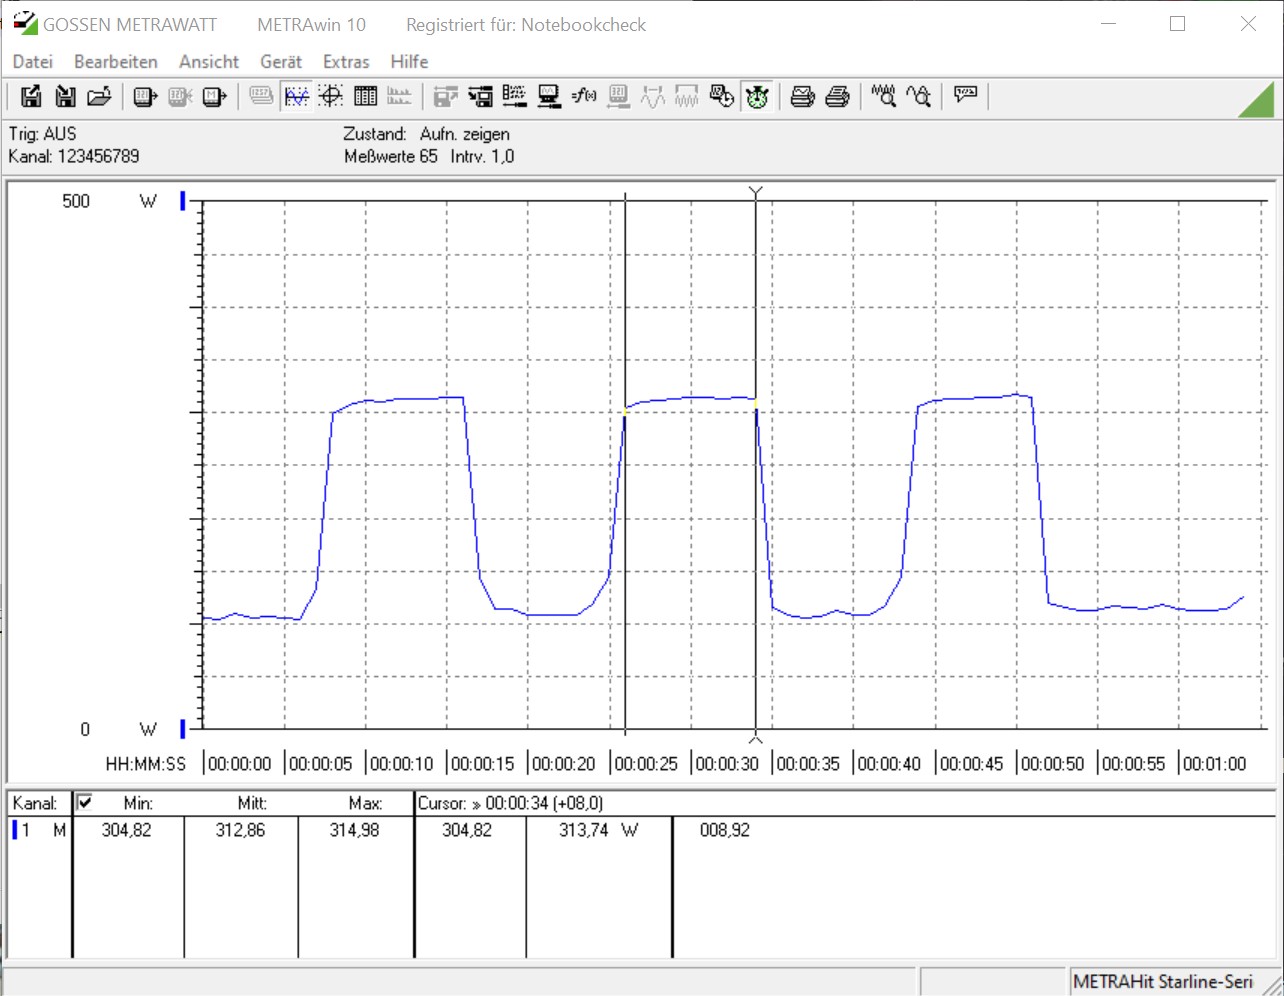
Che AMD Ryzen 9 3950X non sia un processore ad alta efficienza energetica dovrebbe diventare rapidamente chiaro quando si guardano i dati tecnici. Tuttavia, AMD specifica un TDP di soli 105 watt per il processore di punta, proprio come per il Ryzen 9 3900X. Tuttavia, di solito questo viene superato e nello stress test, che abbiamo effettuato con Prime95, la CPU da sola è arrivata fino a 140 watt. Questo è in linea con le specifiche del produttore per l'intero pacchetto di CPU. Per l'intero sistema senza monitor, nello stress test abbiamo misurato poco meno di 199 watt, che è significativamente inferiore a quello dell'Intel Core i9-9900KS (circa 260 watt).
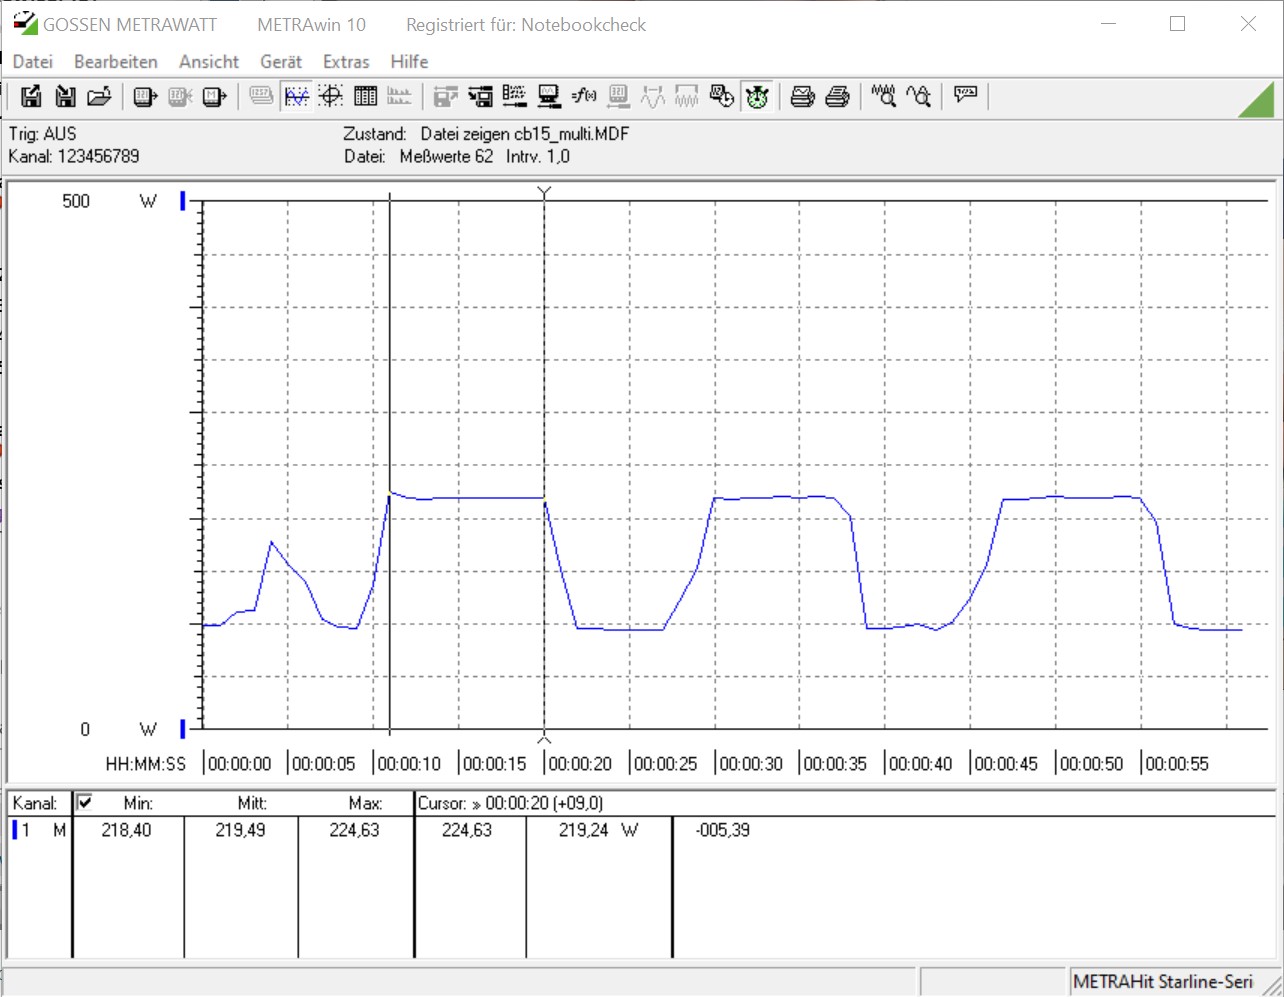
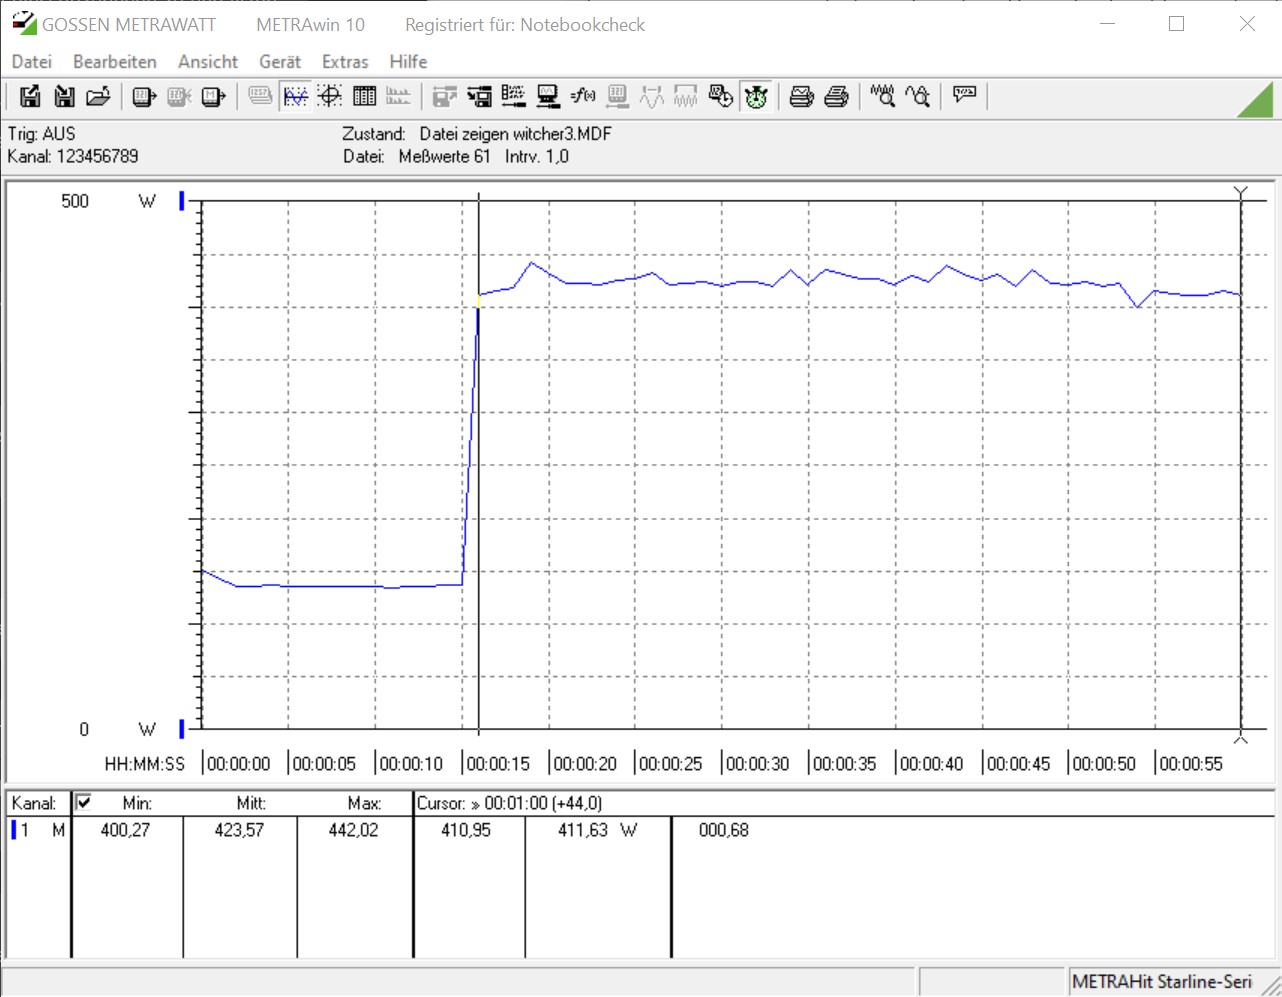
Il sistema AMD è anche del 35% più parsimonioso nel popolare test Cinebench R15 Multi, anche se il nostro sistema di test AMD consuma quasi 50 watt in più di energia senza carico. Tuttavia, lo abbiamo visto più spesso in altri modelli della serie AMD Ryzen 3000. Il produttore deve apportare miglioramenti in futuro in questo senso per poter battere la Intel. Il nostro sistema di prova con l'AMD Ryzen 9 3950X è però il più affamato di energia quando si gioca, e sforza l'alimentatore con quasi 424 watt. Le due controparti Intel sono un po' più economiche in questo caso, anche se non di molto.
In termini di temperature sotto carico, si dovrebbe assolutamente usare un potente sistema di raffreddamento. Anche l'AiO che abbiamo usato non può impedire che l'AMD Ryzen 9 3950X si riscaldi fino a 84 °C (~183 °F) nella nostra configurazione di prova aperta. Ma questo è solo il valore di picco durante lo stress test. In media, la temperatura della CPU si è mantenuta ad un piacevole livello di 68 °C (~154 °F).
Nota: Il consumo di energia determinato si riferisce sempre e solo al sistema di prova senza monitor.
* ... Meglio usare valori piccoli
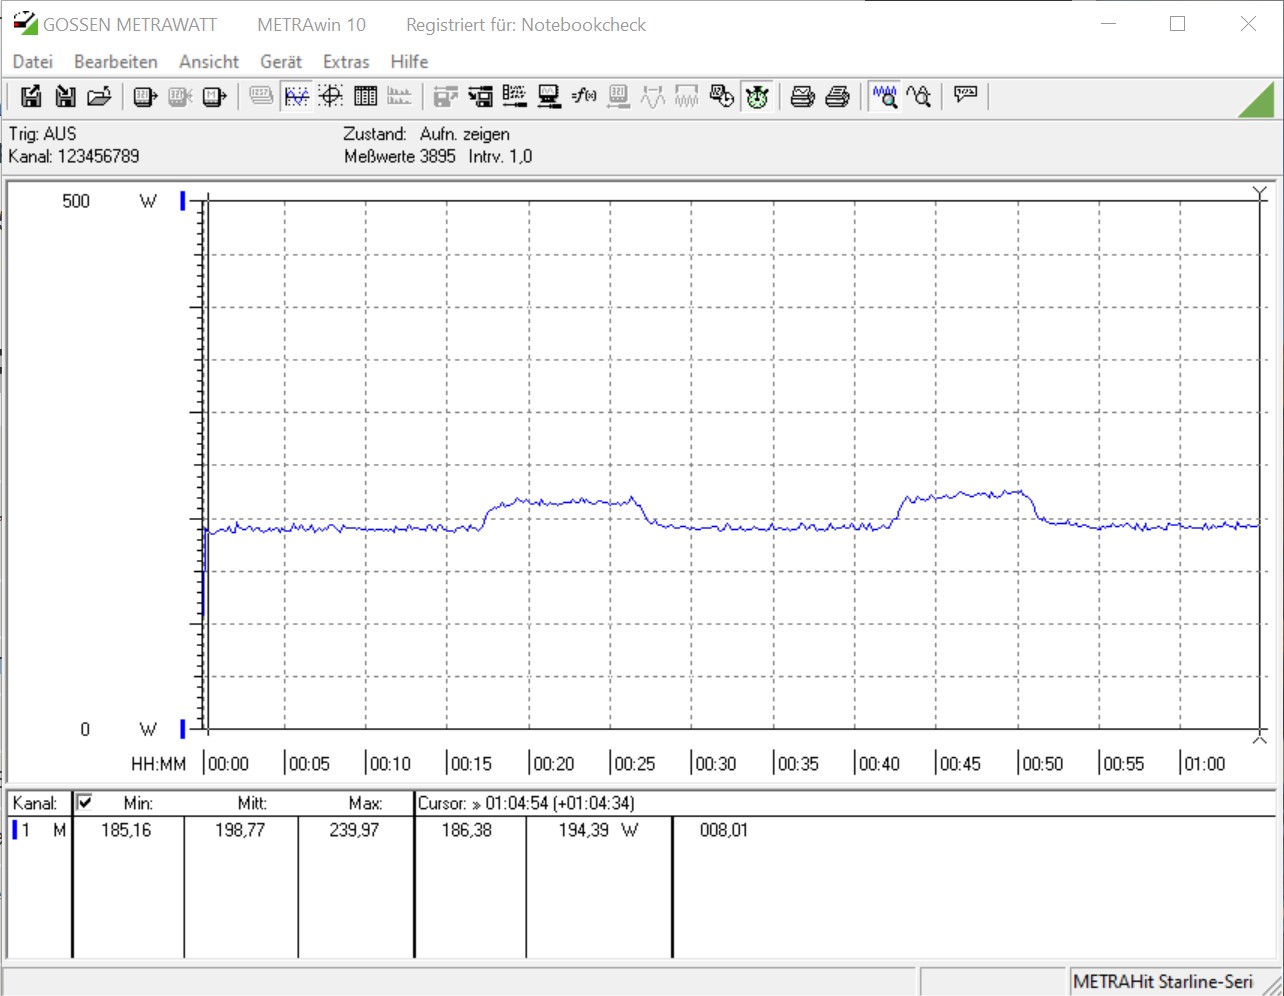

Overclocking - Distruzione dell'efficienza
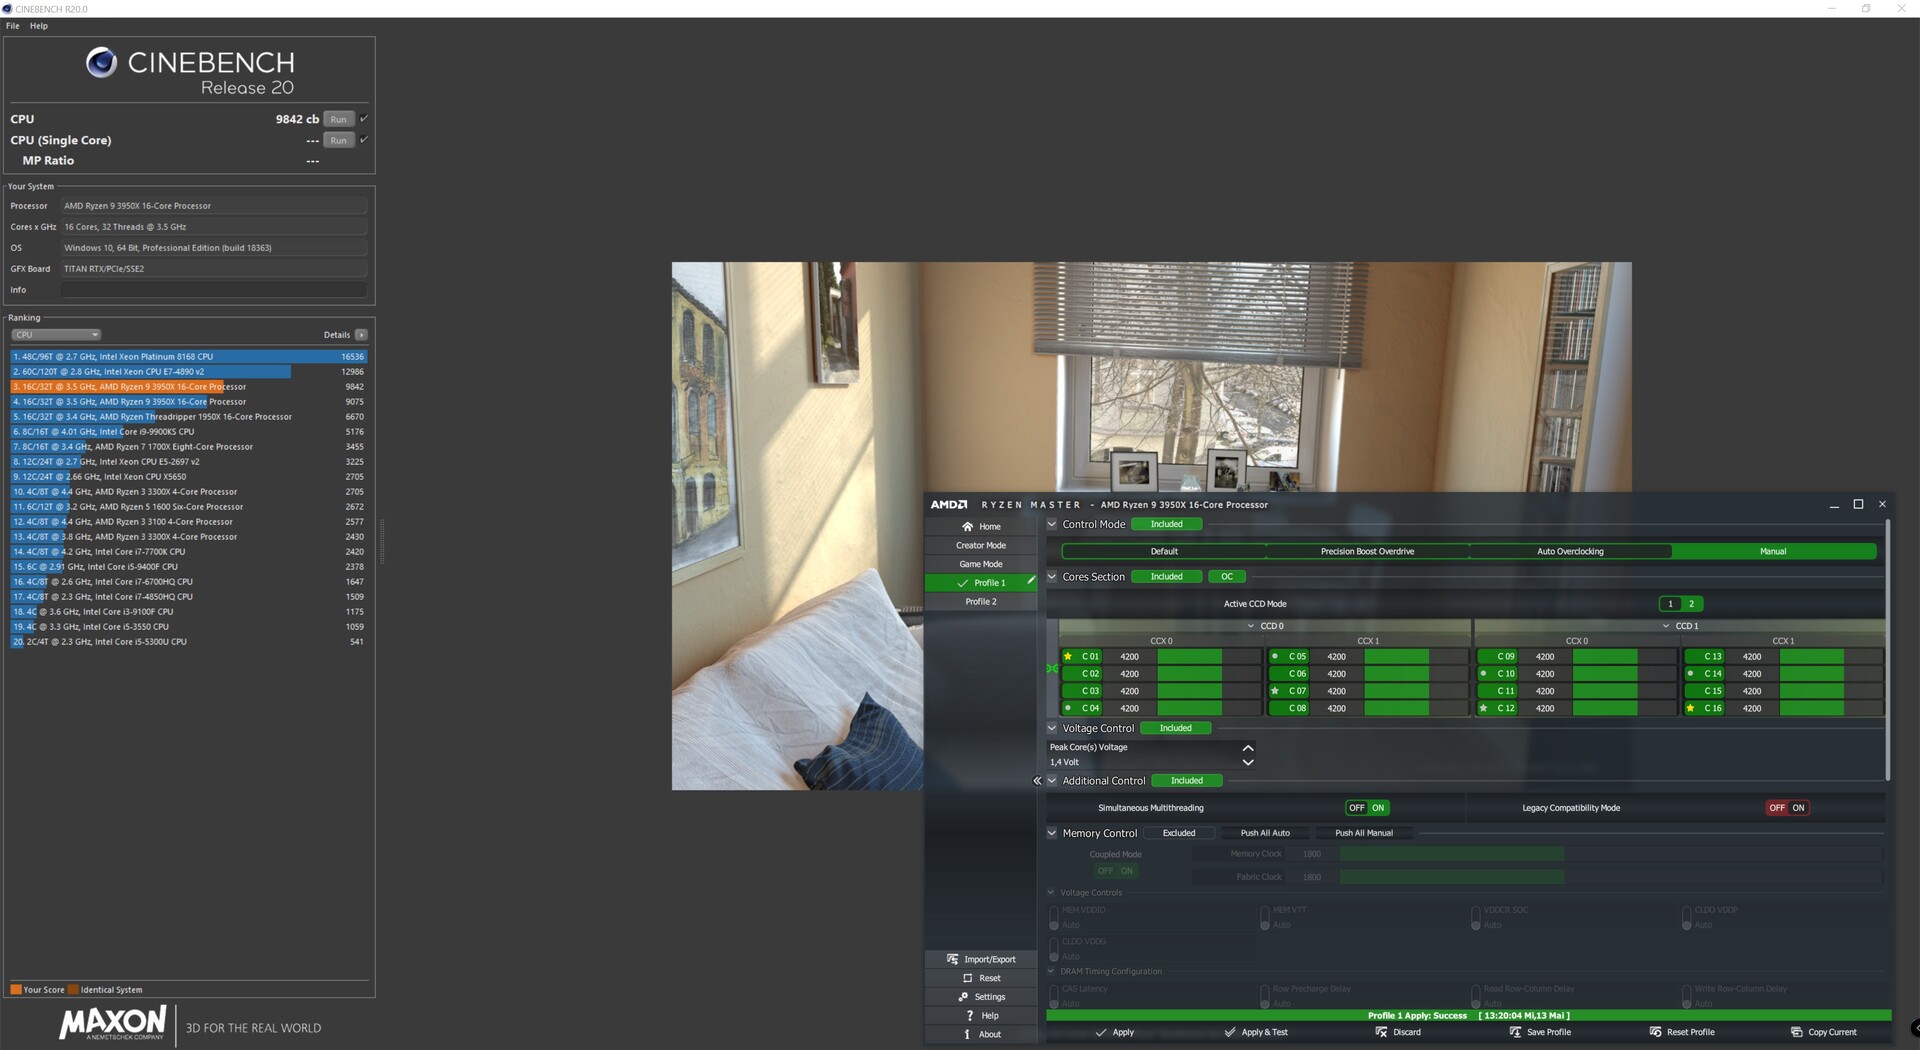
Anche l'AMD Ryzen 9 3950X può essere overcloccato con pochi semplici passi. Lo abbiamo fatto con lo strumento Ryzen Master e siamo stati in grado di ottenere un funzionamento stabile a 4,2 GHz su tutti i 16 cores. Di conseguenza, si ottiene tra il 5% e il 10% di potenza in più, ma questo si traduce anche in un aumento esponenziale del consumo di energia. Nel nostro caso, questo significa un consumo di potenza superiore di 100 watt nel test Cinebench R15 Multi.
Poiché il PBO (Precision Boost Overdrive) è disabilitato dall'overclocking, il processore non aumenta più a 4,7 GHz, cosa che si può ottenere con le impostazioni di serie quando un core viene caricato. Se si vuole ancora effettuare l'overclocking di AMD Ryzen 9 3950X, si deve essere consapevoli che questo annullerà la garanzia del processore e che è necessaria una soluzione di raffreddamento molto potente. Dal punto di vista dell'utente puro, non ha senso overcloccare il processore già molto veloce.
Pro
Contro
Giudizio Complessivo - 16 cores - Meglio avere che desiderare

La famiglia AMD Ryzen 3000 si distingue nel complesso per la buona efficienza energetica quando i processori vengono fatti funzionare entro le loro specifiche. Con l'AMD Ryzen 9 3950X, AMD ha introdotto un processore a 16 cores per il popolare socket AM4, che può essere utilizzato anche sulle vecchie schede madri X370. Gli utenti che decidono di mettere sul tavolo poco meno di 770 euro (~$833) per il processore saranno ricompensati con prestazioni al top. L'AMD Ryzen 9 3950X si fa onore soprattutto nelle applicazioni multithread, ma è anche in grado di padroneggiare molto bene i giochi, e il divario rispetto a Intel può essere sempre più colmato.
Intel è ancora la prima scelta quando si tratta di prestazioni gaming pure. Ma in tempi in cui chiunque può diventare rapidamente un creatore di contenuti con Twitch e YouTube, il processore AMD è ancora una volta un passo avanti, poiché il gaming e lo streaming su un PC può essere fatto senza problemi grazie ai 16 cores e ai 32 threads.
Coloro che possono usare il processore AMD Ryzen 9 3950X, possono sedersi e rilassarsi mentre saltano fiduciosamente la prossima generazione di CPU.
Lo stesso è possibile con l'AMD Ryzen 9 3900X con 12 cores e 24 thread. Ma se si vuole quel po' di prestazioni extra, l'unica opzione è AMD Ryzen 9 3950X. Quest'ultimo è un po' più veloce nei test. Alla fine, gli utenti devono decidere da soli cosa vogliono fare con il loro PC per prendere una decisione di acquisto. Con un AMD Ryzen 9 3950X nelle vostre mani, sarete in grado di superare bene i prossimi anni per poi poter fare un ragionevole salto allo Zen4Lo stesso è possibile con l'AMD Ryzen 9 3900X con 12 cores e 24 thread. Ma se si vuole quel po' di prestazioni extra, l'unica opzione è AMD Ryzen 9 3950X. Quest'ultimo è un po' più veloce nei test. Alla fine, gli utenti devono decidere da soli cosa vogliono fare con il loro PC per prendere una decisione di acquisto. Con un AMD Ryzen 9 3950X nelle vostre mani, sarete in grado di superare bene i prossimi anni per poi poter fare un ragionevole salto allo Zen4.
