Notebookcheck Logo

Recensione dell'MSI GeForce RTX 2080 Ti Gaming X Trio Desktop GPU: La scheda grafica GeForce più veloce in circolazione

High-end con un prezzo elevato. La GeForce RTX 2080 Ti continua a sedere in cima allo stock di prodotti RTX 20 di NVIDIA, nonostante l'azienda abbia già dato un lifting al resto della serie. Abbiamo messo alla prova RTX 2080 Ti sotto forma di un MSI per vedere come la scheda si comporta e come si confronta con altre GPU di fascia alta.
GPU-Z
GPU-Z
Uno sguardo alle porte sul retro dell'MSI GeForce RTX 2080 Ti Gaming X Trio

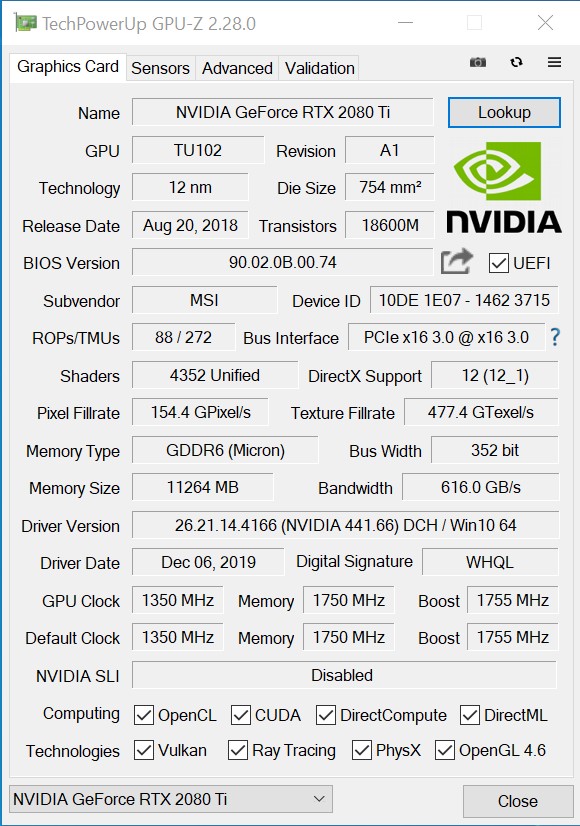
Attualmente esiste una sola opzione nel mercato delle GPU desktop di fascia alta e si chiama NVIDIA. Se il denaro non è un problema e si è alla ricerca di una nuova scheda grafica per desktop, allora ci si può trovare ad utilizzare le migliori GPU sul mercato. La nostra unità di prova MSI si colloca all'interno di questo settore, con la GeForce RTX 2080 Ti Gaming X Trio basata sulla TU102, una GPU Turing che NVIDIA produce in un processo a 12 nm. Solo la TITAN RTX ha lo stesso chip della RTX 2080 Ti, anche se NVIDIA limita la gamma completa di 4.608 unità shader della TU102 alla prima. Al contrario, RTX 2080 Ti deve accontentarsi di 4.352 shader, cosa che MSI ha compensato aumentando leggermente i limiti di performance del suo Gaming X Trio. La scheda ha un TDP più alto di 40 W rispetto all'RTX 2080 Ti Founders Edition, per esempio, permettendo al Gaming X Trio di raggiungere il picco di 300 W sulle impostazioni di fabbrica sotto carico massimo. L'aumento del consumo energetico rispetto all'RTX 2080 Ti Founders Edition è il motivo per cui si consiglia di abbinare il Gaming X Trio con un'alimentazione di almeno 650 W. Un'occhiata più da vicino alla scheda personalizzata di MSI rivela che il Gaming X Trio non è una normale RTX 2080 Ti.

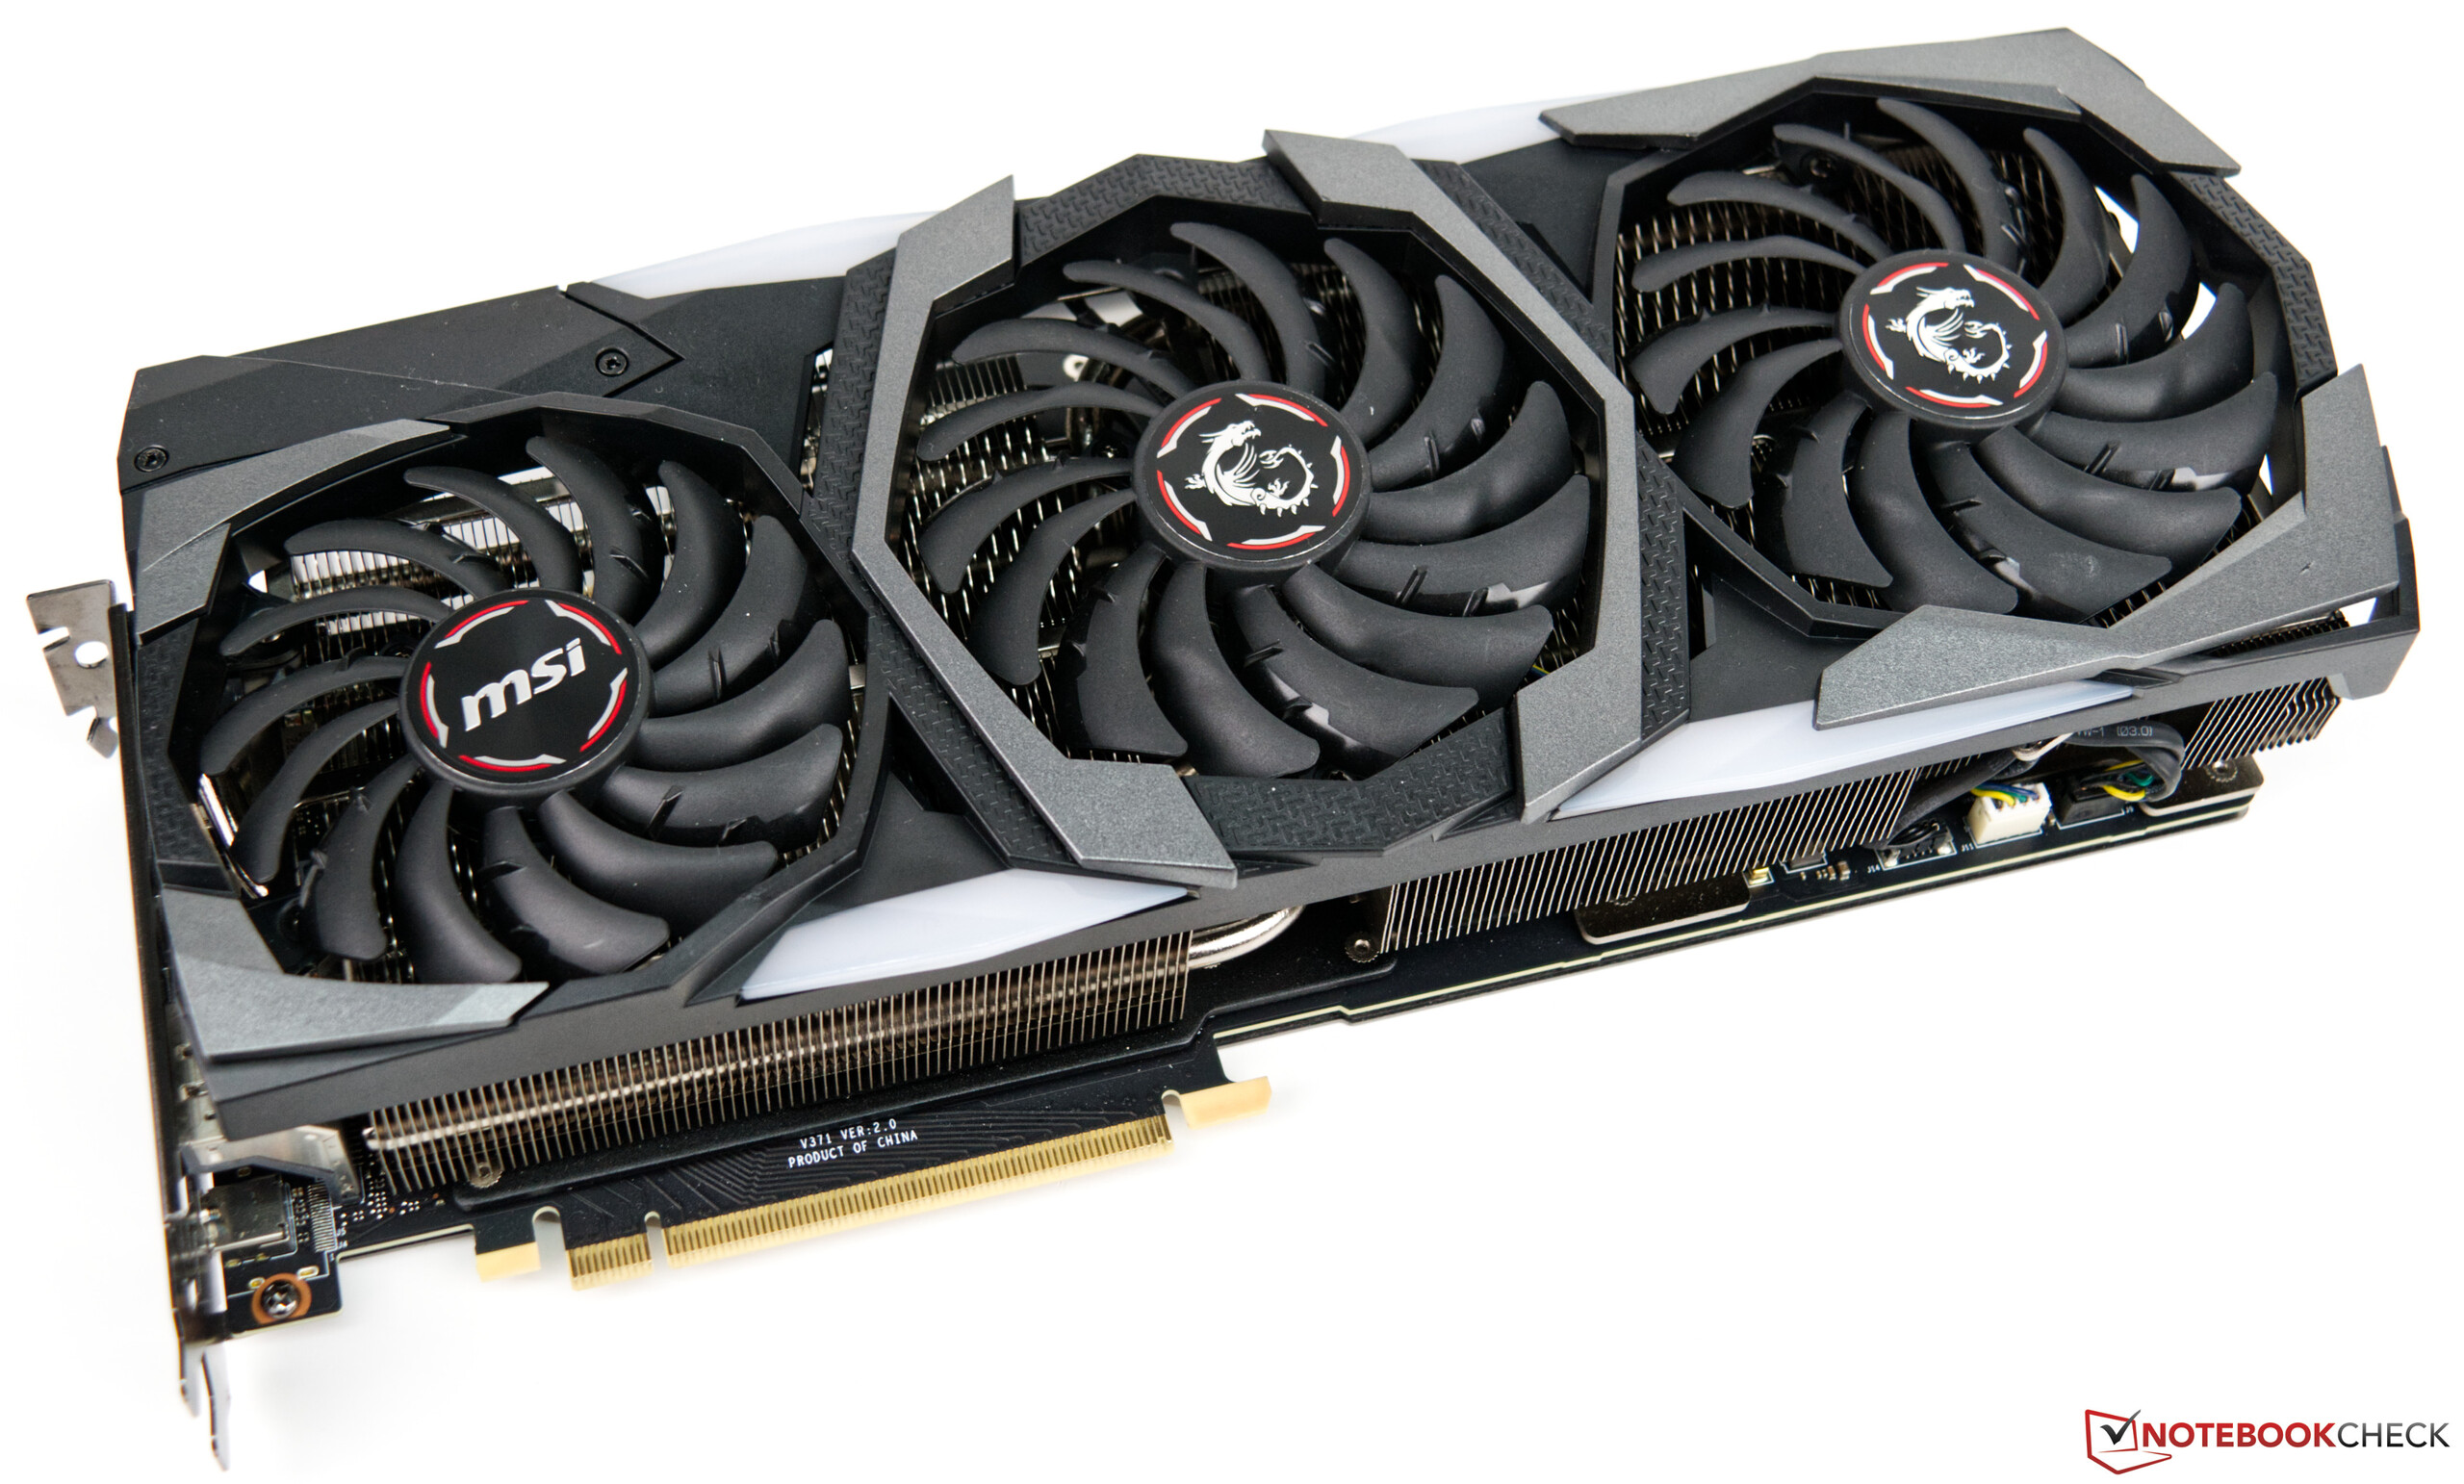
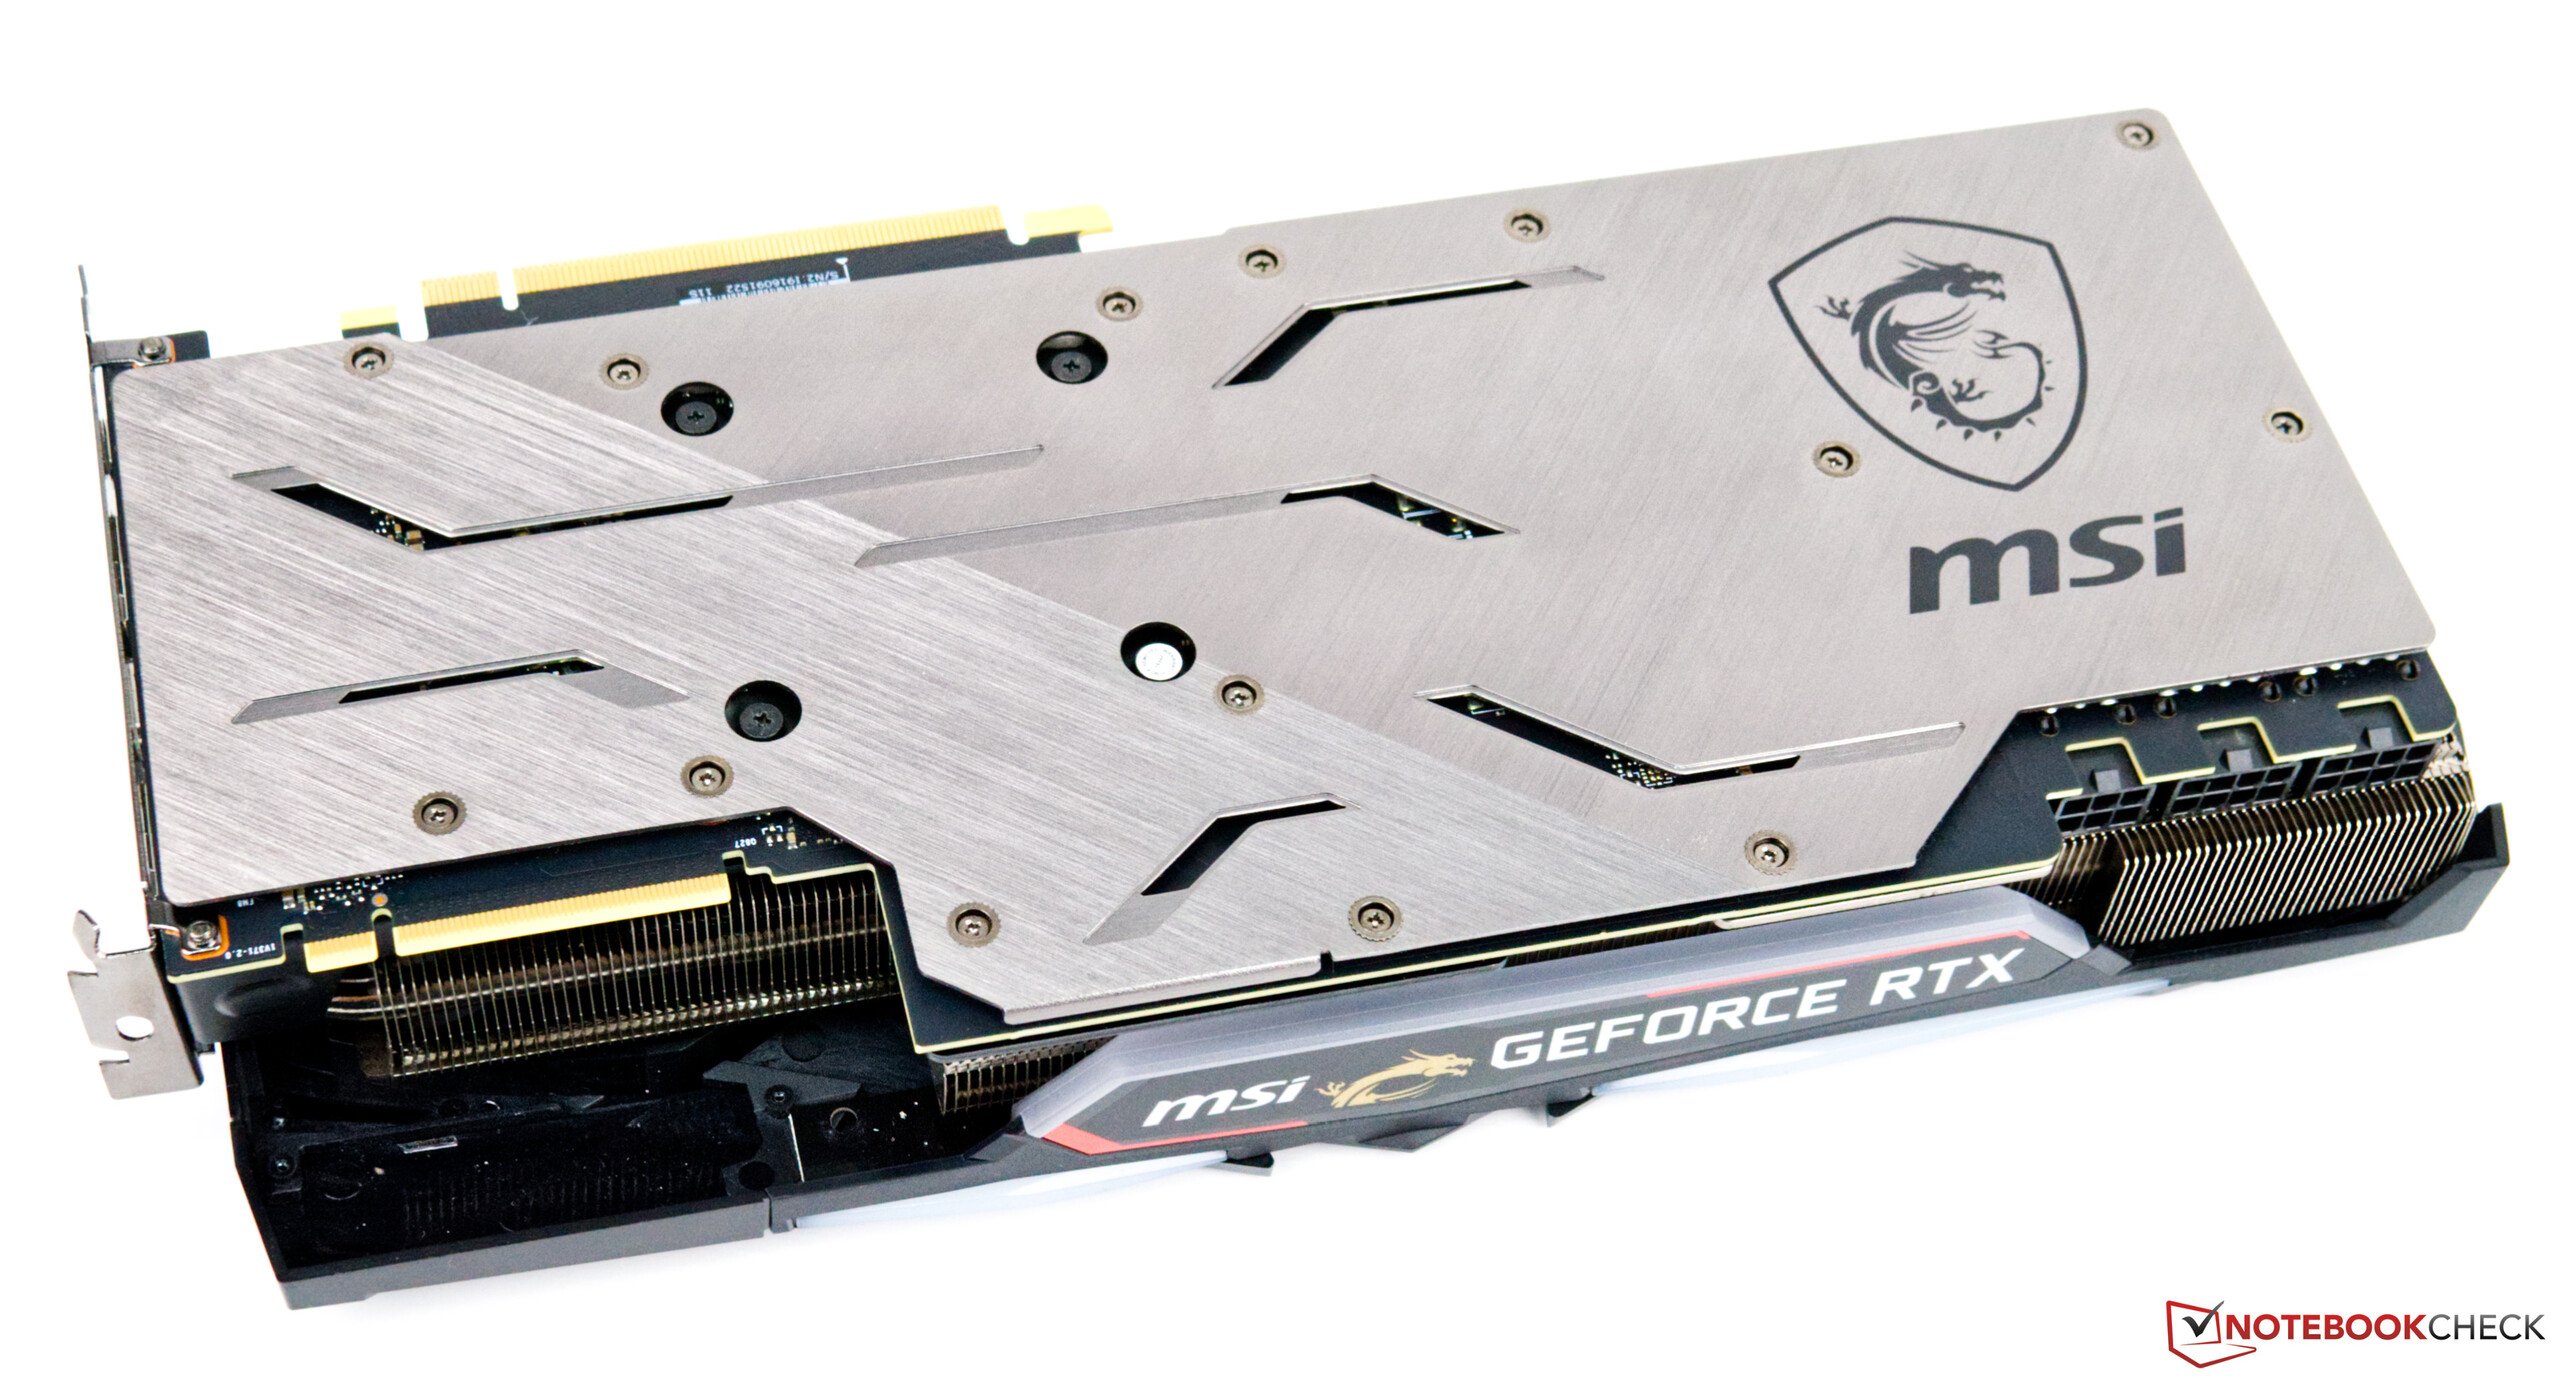
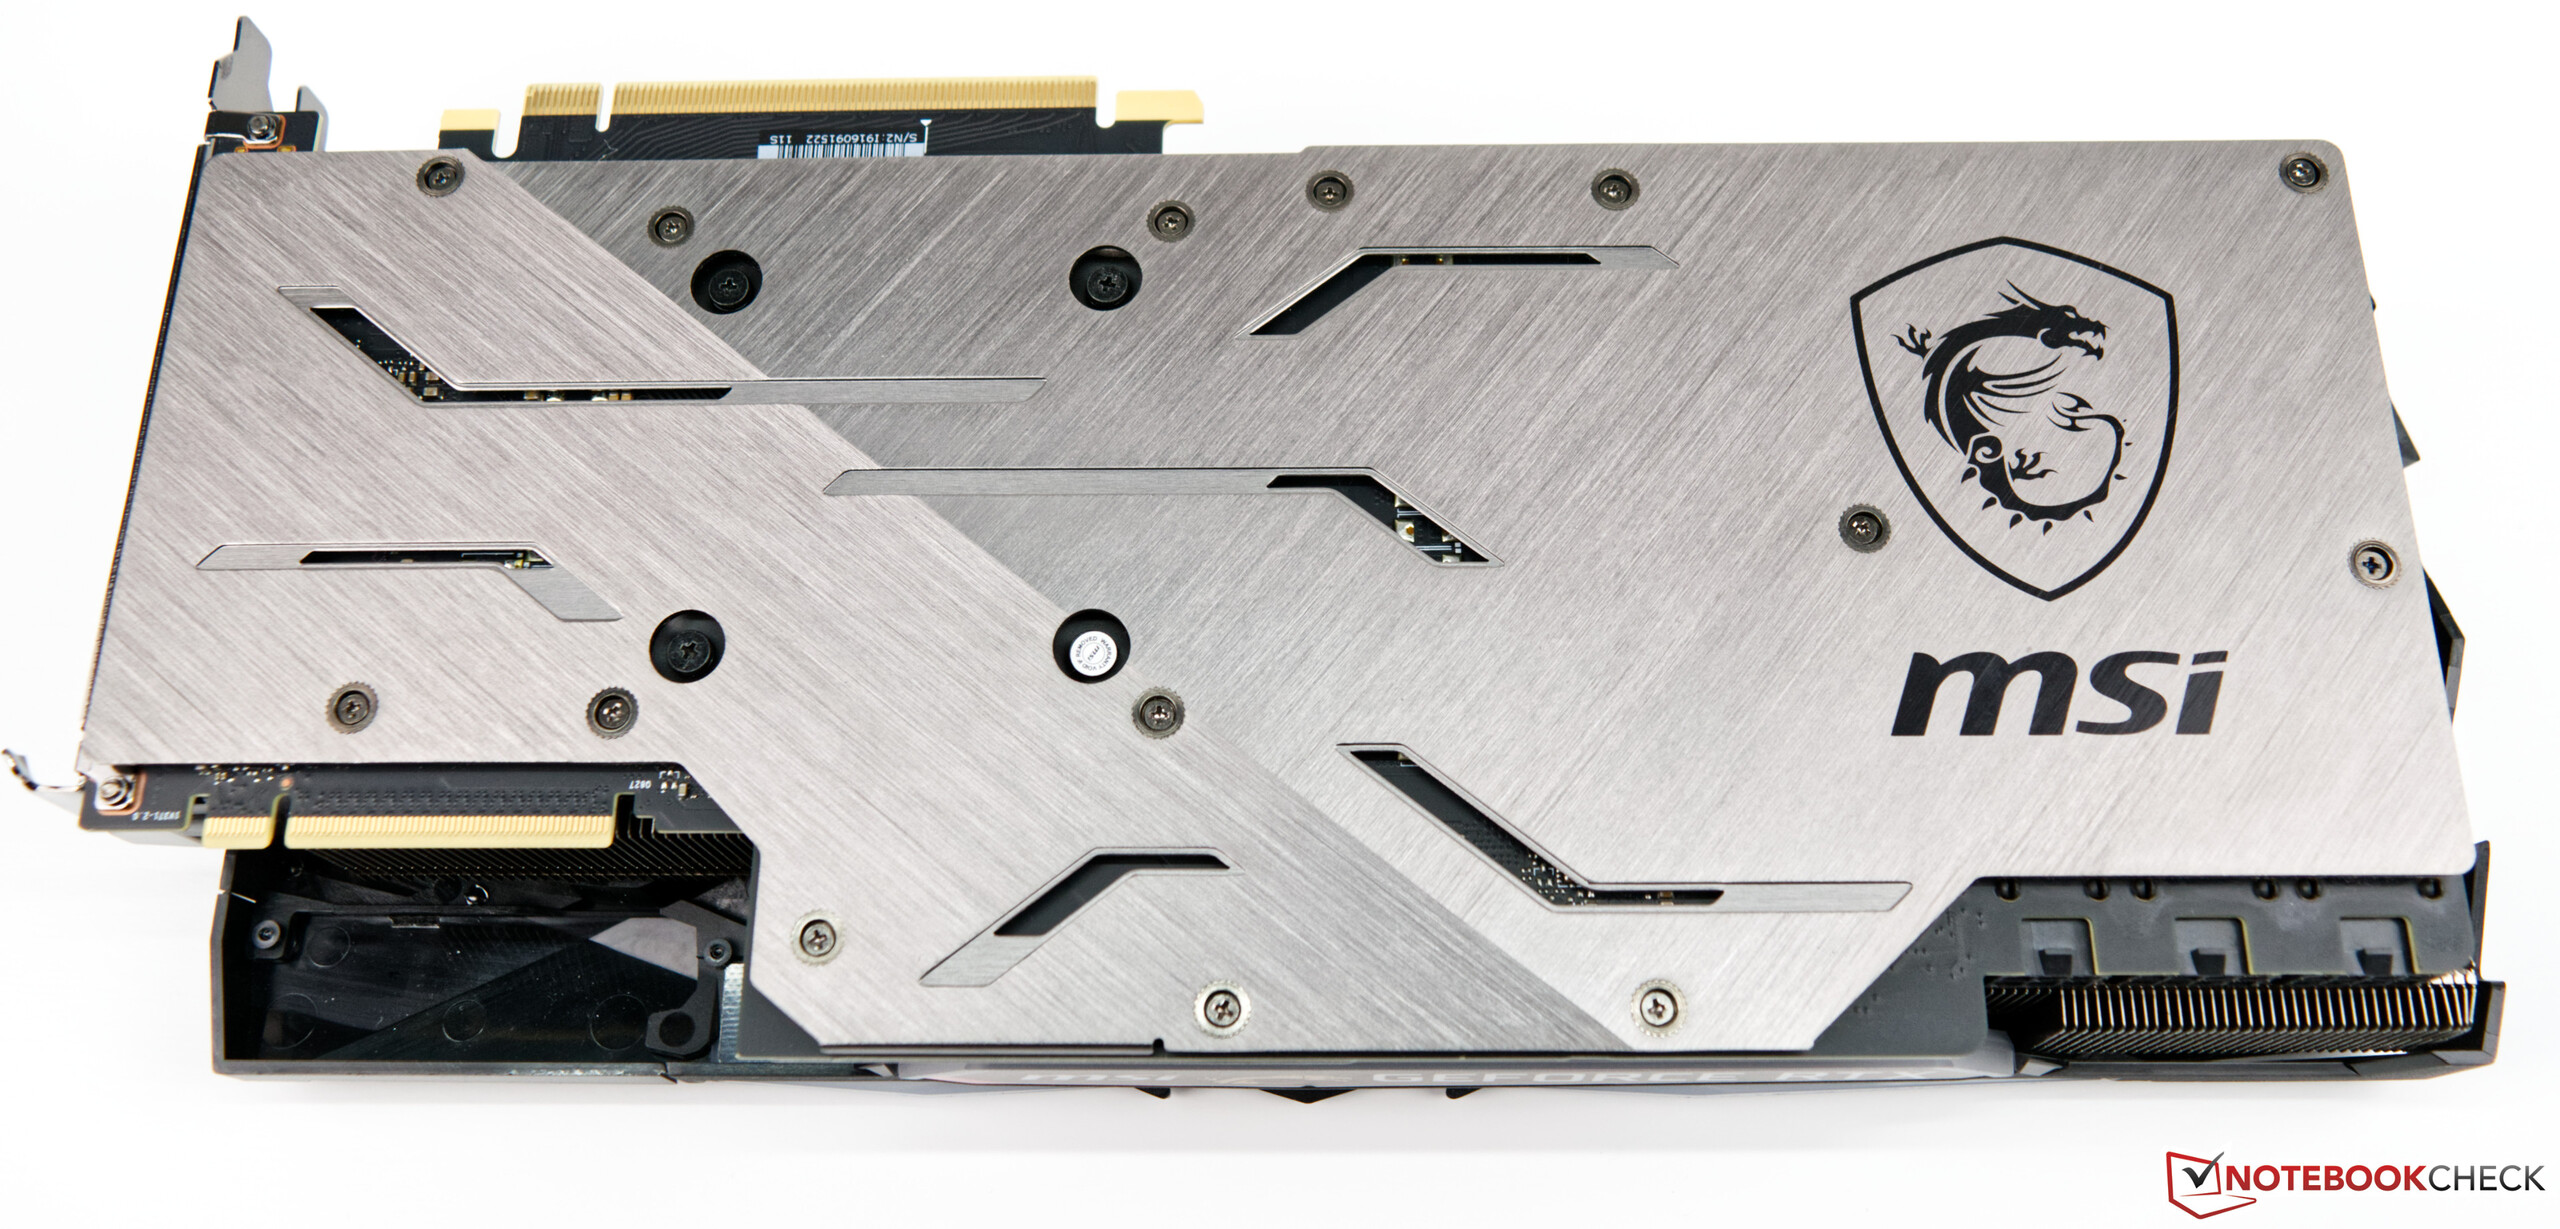
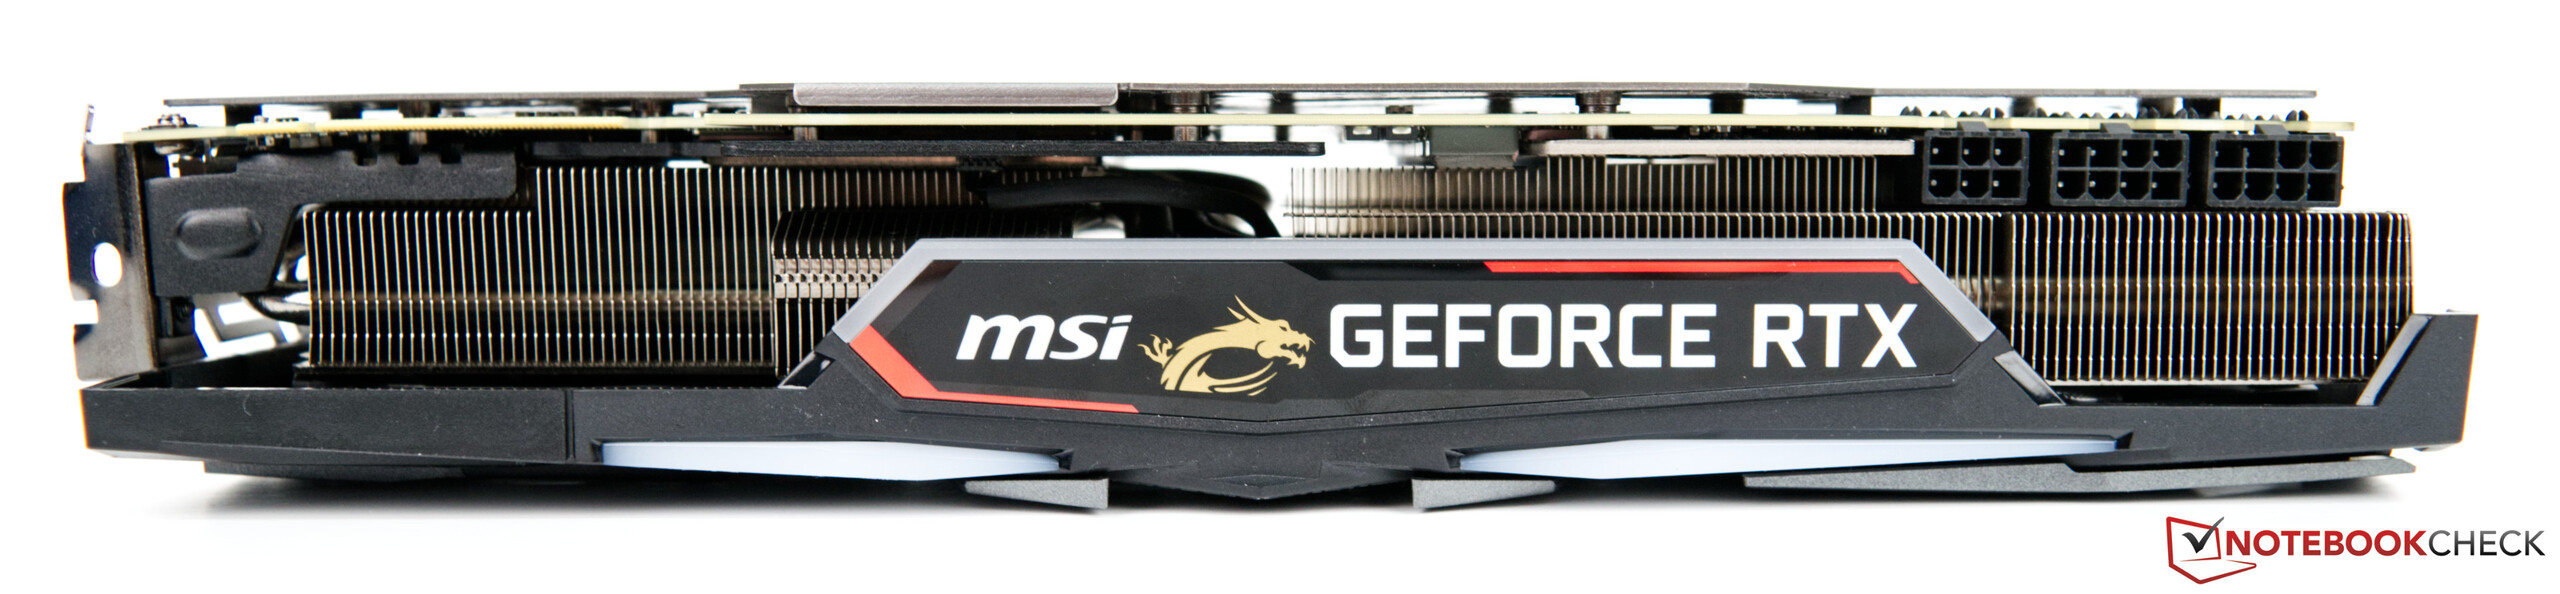
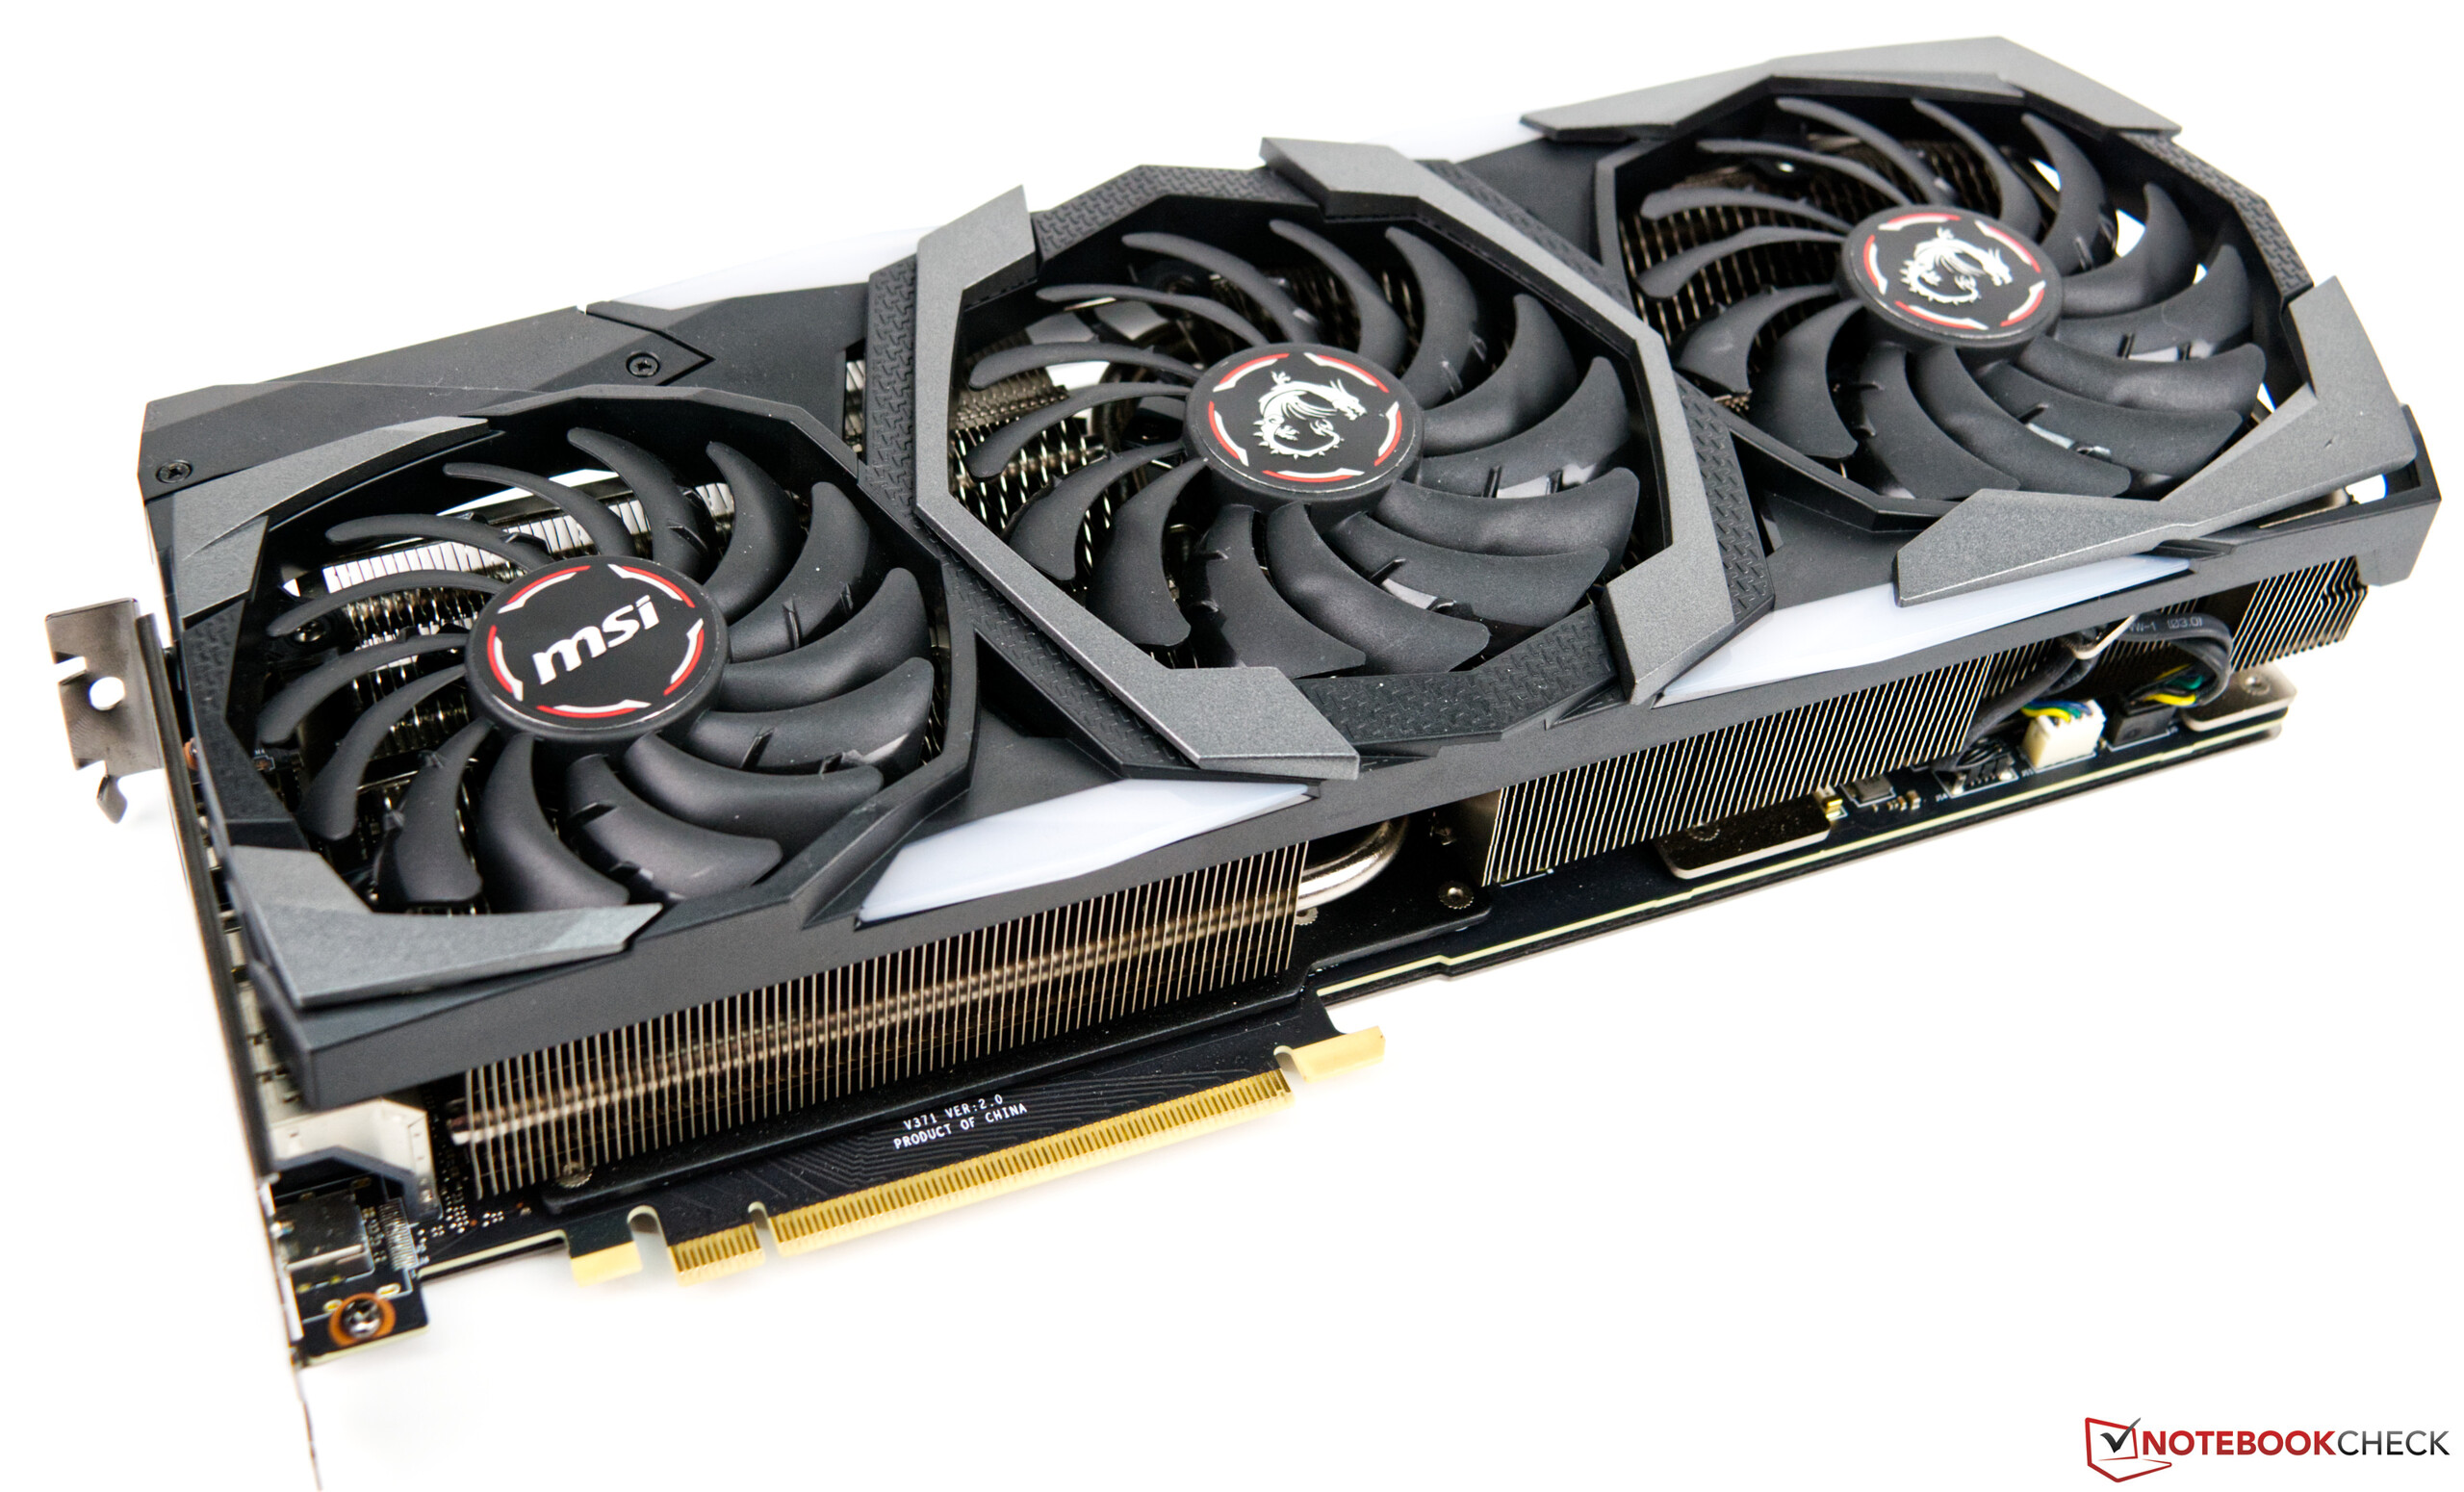
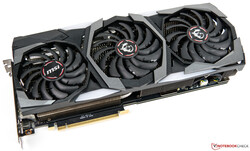
La prima cosa da notare è la sua enorme dimensione, con la scheda che occupa tre slot PCIe. Corrispondentemente, vi raccomandiamo di controllare se questo mostro si adatta al vostro case prima di acquistarlo. Non bisogna nemmeno sottovalutare la sua lunghezza di 32,7 cm.

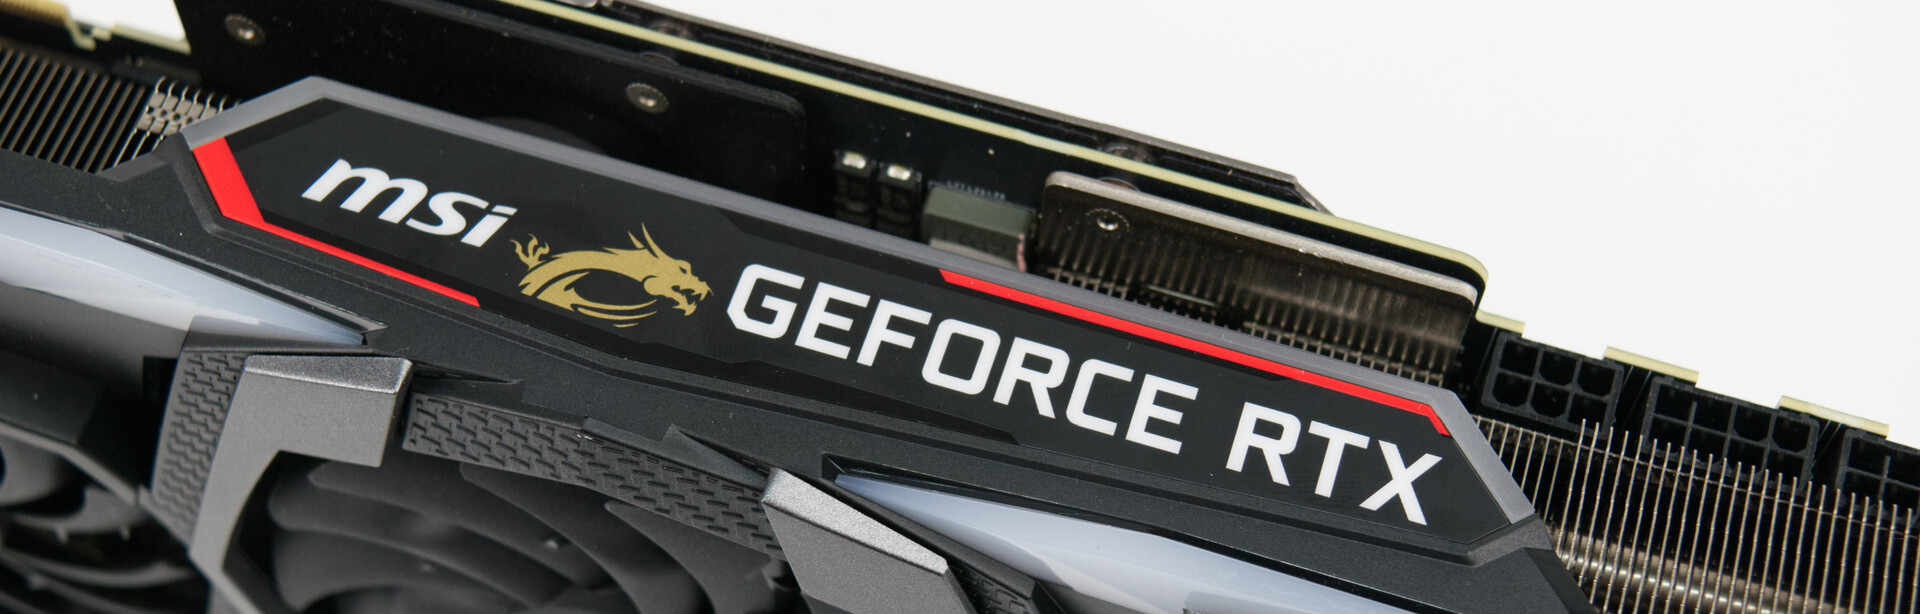
Al momento del test, l'MSI GeForce RTX 2080 Ti Gaming X Trio viene venduto al dettaglio a 1.289 euro. Questo prezzo fa del Gaming X Trio uno degli esempi più costosi della serie RTX 2080 Ti. In confronto, la KFA2 GeForce RTX 2080 Ti EX costa circa 150 euro in meno rispetto alla nostra attuale unità di test. Tuttavia, la NVIDIA Founders Edition costa 1.259 €, che non è molto meno rispetto al Gaming Trio X considerando che la fabbrica MSI sovraclocca quest'ultimo. Chi sceglie il modello MSI sarà ricompensato con una scheda grafica di alta qualità che dovrebbe anche attirare l'attenzione con la sua illuminazione RGB integrata.

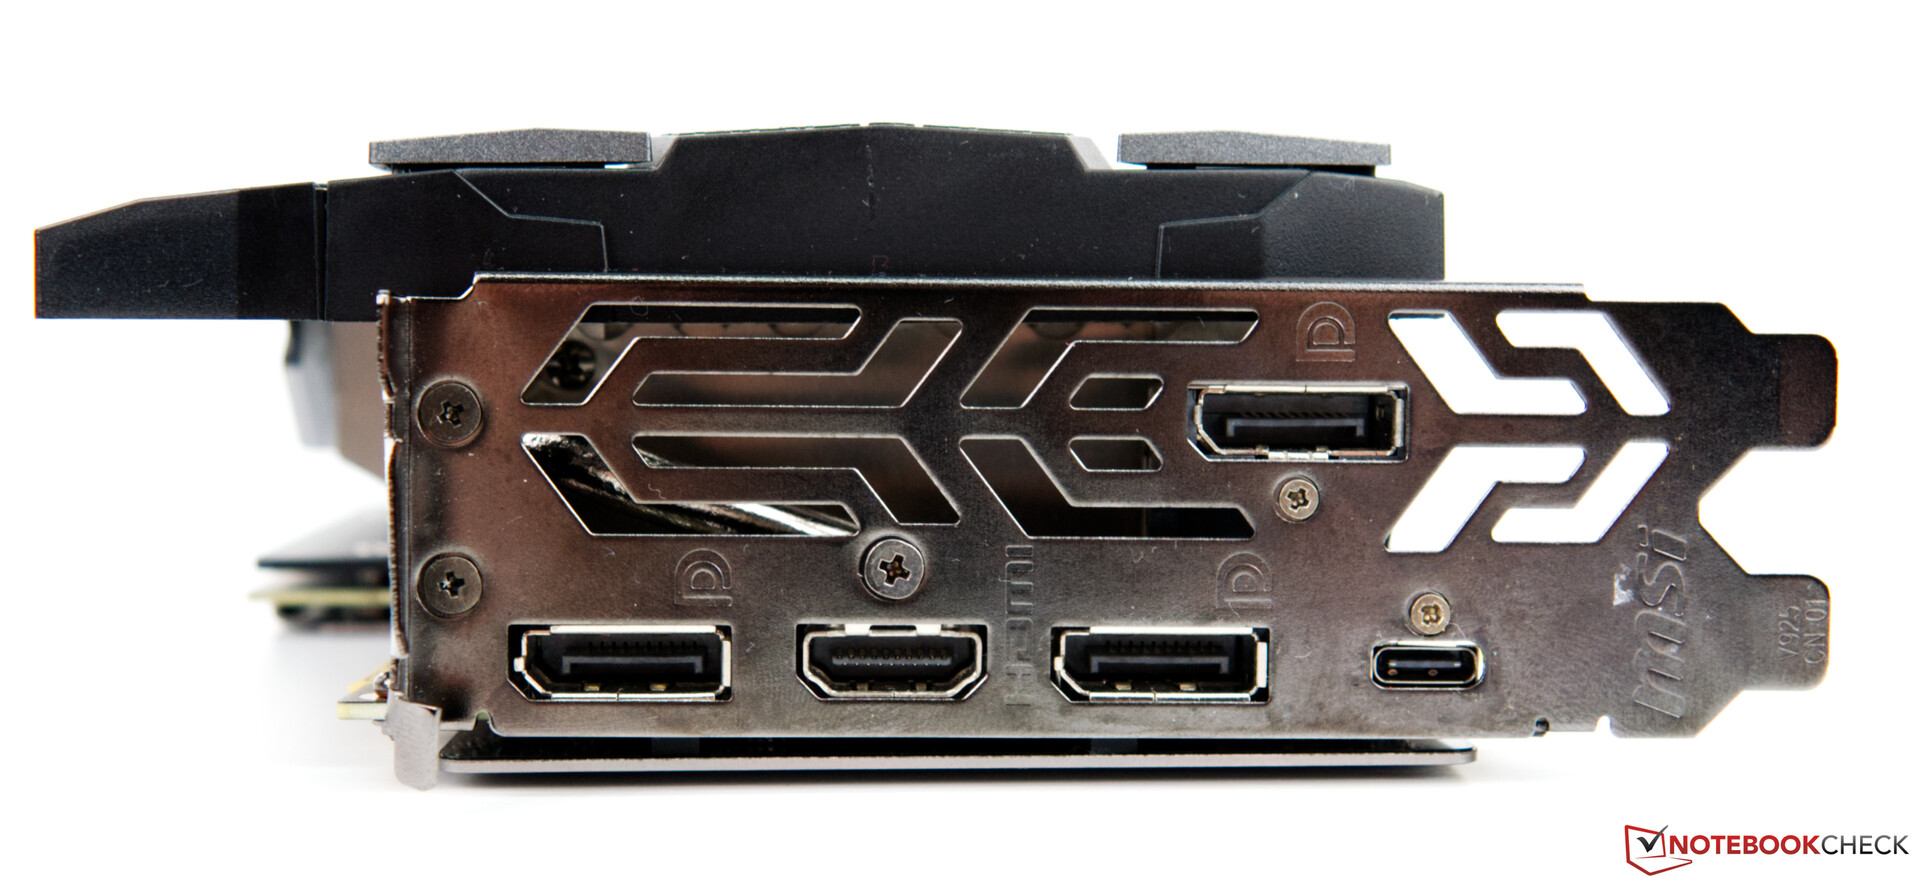
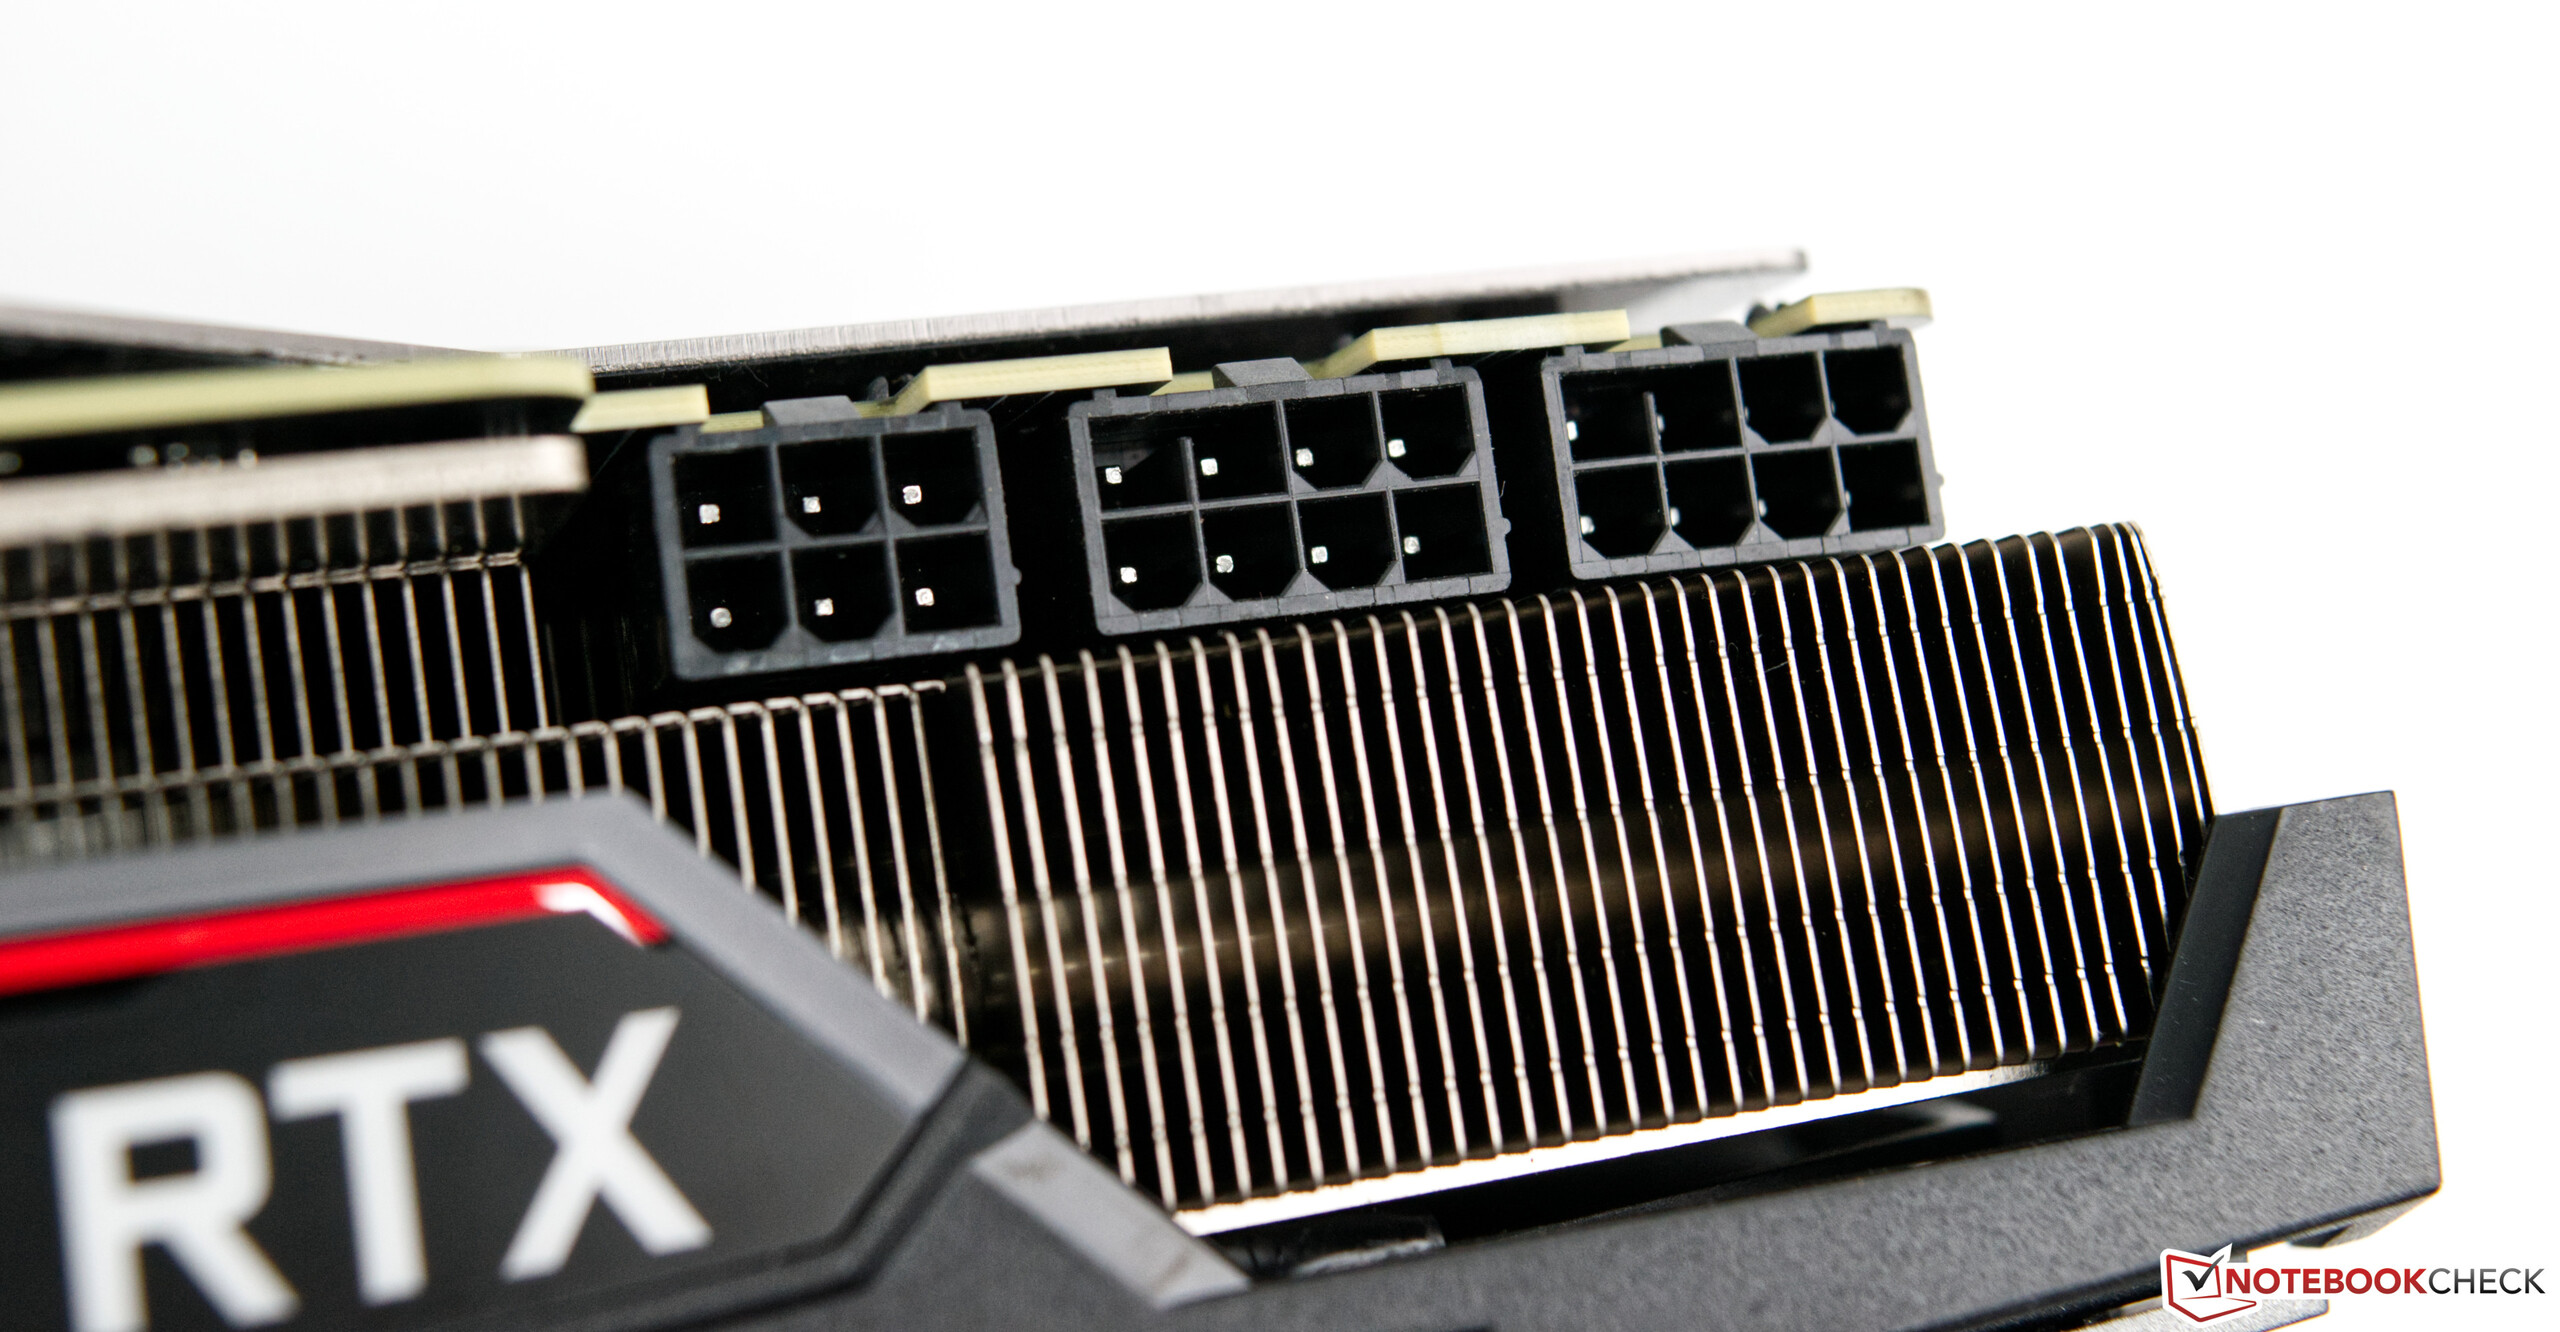
Dal punto di vista della connessione, il Gaming X Trio offre tutto ciò di cui la maggior parte dei giocatori avrà bisogno. MSI ha incluso tre porte DisplayPort, una HDMI e una singola USB Type-C, la cui combinazione è diventata ormai quasi uno standard tra le GPU desktop di fascia alta. L'abbondanza di porte rende il Gaming X Trio ideale anche per una configurazione multi-monitor. Internamente, il 300 W richiede un connettore di alimentazione a 6 pin, insieme a due connettori a 8 pin.

Panoramica serie NVIDIA Turing

Specifiche RTX 2060 RTX 2060 SUPER RTX 2070 RTX 2070 SUPER RTX 2080 RTX 2080 SUPER RTX 2080 Ti MSI RTX 2080 Ti TITAN RTX
Chip TU106 TU106 TU106 TU104 TU104 TU104 TU102 TU102 TU102
FinFET process 12 nm 12 nm 12 nm 12 nm 12 nm 12 nm 12 nm 12 nm 12 nm
CUDA core 1,920 2,176 2,304 2,560 2,944 3,072 4,352 4,352 4,608
Texture units 120 136 144 160 184 192 272 272 288
Tensor cores 240 272 288 320 368 384 544 544 572
RT Cores 30 34 36 40 46 48 68 68 72
GPU base clock 1,365 MHz 1,470 MHz 1,410 MHz 1,605 MHz 1,515 MHz 1,650 MHz 1,350 MHz 1,350 MHz 1,350 MHz
GPU boost clock 1,680 MHz 1,650 MHz 1,620 MHz 1,770 MHz 1,710 MHz 1,815 MHz 1,545 MHz 1,755 MHz 1,770 MHz
Memory bus 192-bit 256-bit 256-bit 256-bit 256-bit 256-bit 352-bit 352-bit 384-bit
Memory bandwidth 336 GB/s 448 GB/s 448 GB/s 448 GB/s 448 GB/s 496.1 GB/s 616 GB/s 616 GB/s 672 GB/s
VRAM 6 GB GDDR6 8 GB GDDR6 8 GB GDDR6 8 GB GDDR6 8 GB GDDR6 8 GB GDDR6 11 GB GDDR6 11 GB GDDR6 24 GB GDDR6
TDP 160 W 175 W 175 W 215 W 215 W 250 W 260 W 300 W 280 W

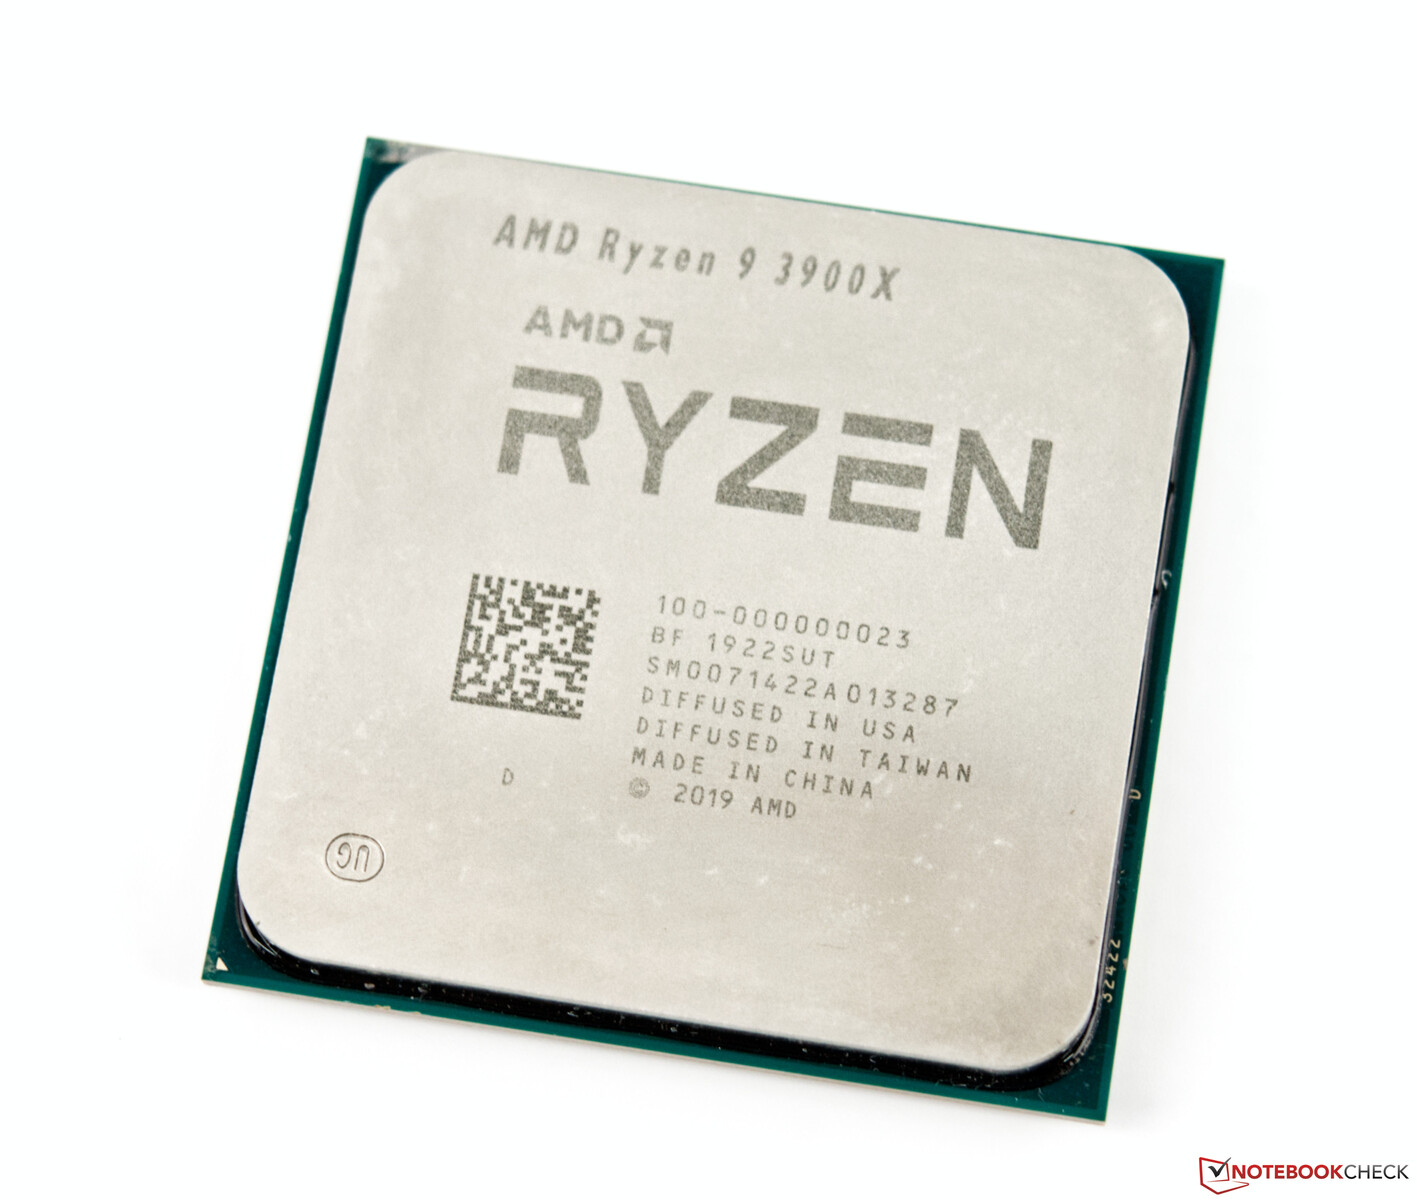
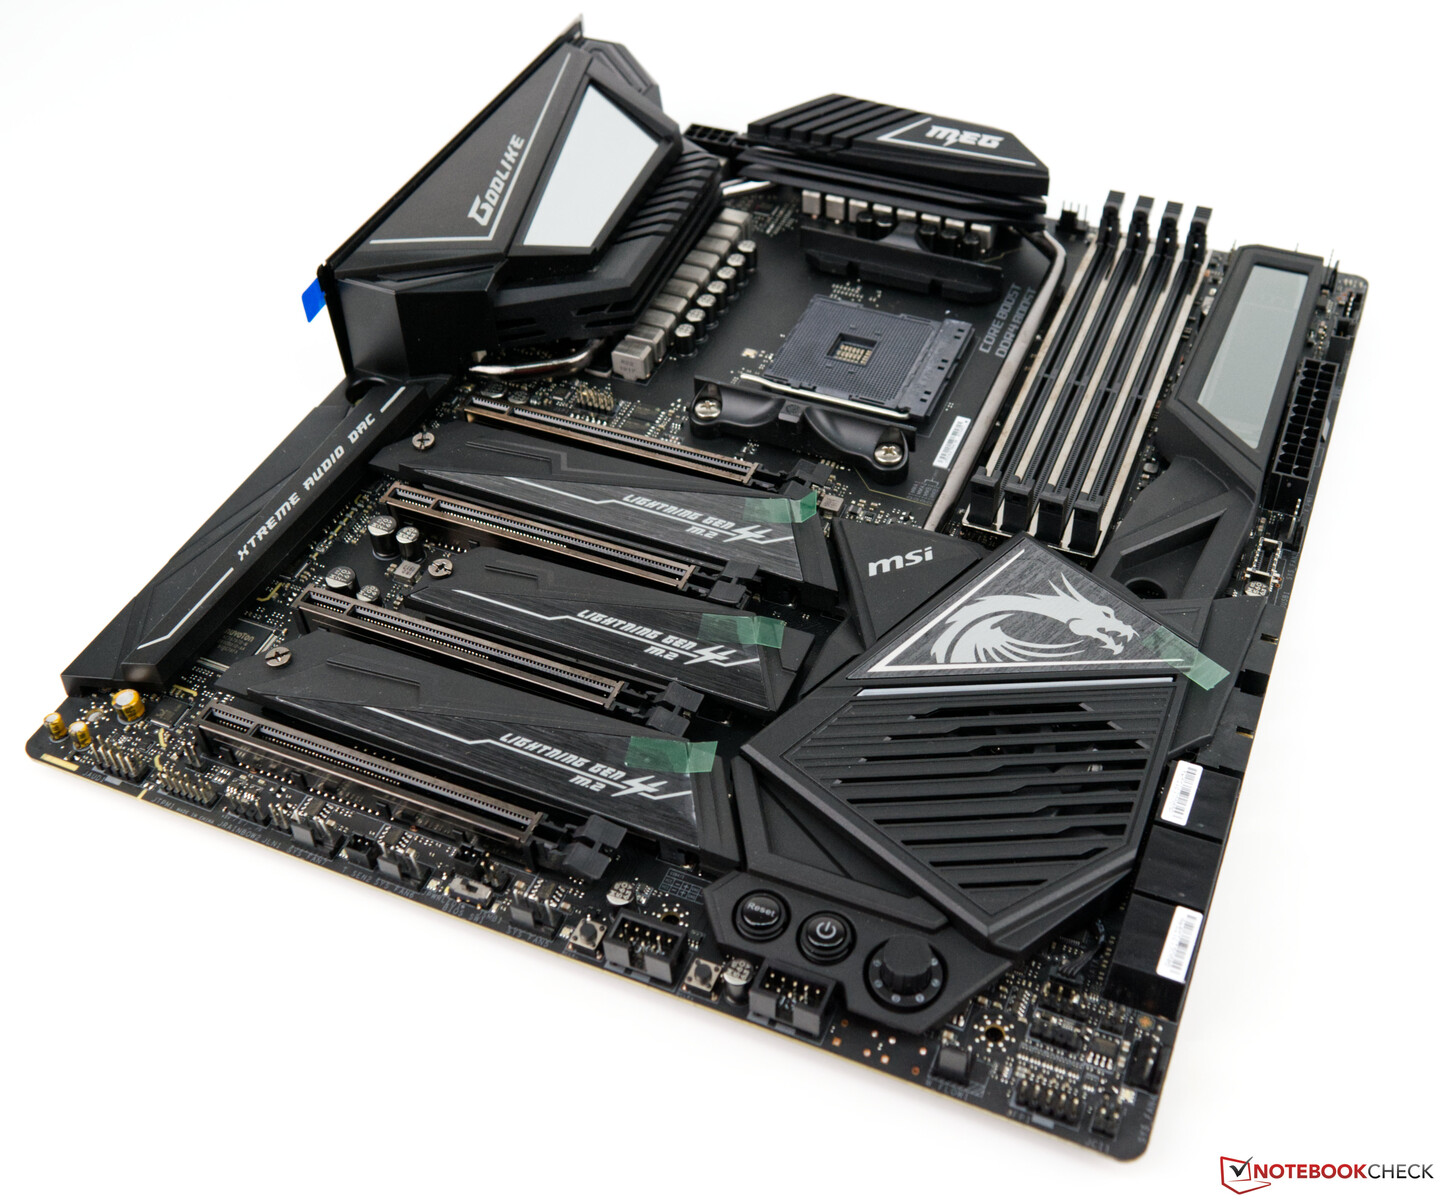
Sistema di Test - AMD Ryzen 9 3900X come base

Abbiamo accoppiato la Gaming X Trio con una scheda madre MSI MEG X570 Godlike e un processore AMD Ryzen 9 3900X per i nostri test. Il Ryzen 9 3900X offre buone prestazioni, come abbiamo scoperto nella nostra recensione all'inizio di quest'anno, e ha utilizzato un Alphacool Eisbaer 280 AIO per raffreddarlo. Abbiamo anche usato 16 GB di RAM G-Skill Trident Z Royal Gold RAM che abbiamo lasciato a 3.600 MHz su CL16-16-16-36. Infine, abbiamo eseguito tutti i nostri benchmarks e test su un Acer Predator XB321HK, un monitor 4K che abbiamo usato in molte delle nostre recensioni dei giochi.

Un ringraziamento ad AMD per averci gentilmente fornito questa piattaforma di test.

AMD Ryzen 9 3900X
MSI MEG X570 Godlike
G-Skill Trident Z Royal Gold DDR4-3600

Per i nostri test e i nostri benchmarks abbiamo utilizzato il seguente hardware:

Case Corsair Carbide Air 540 ATX Cube
CPU AMD Ryzen 9 3900X
GPU MSI GeForce RTX 2080 Ti Gaming X Trio
CPU cooler Alphacool Eisbear 280
RAM G-Skill Trident Z Royal Gold DDR4-3600 2 x 8 GB (DDR4-3600 CL16-16-16-36)
Motherboard MSI MEG X570 Godlike (BIOS 1.20, Default Settings, XMP 1 for DDR4-3600 CL16)
Monitor Acer Predator XB321HK 4K
Alimentatore Corsair RM 1000X
SSD Corsair MP600 2 TB M.2 PCIe 4.0 SSD
SSD Crucial MX500 2 TB - for games
OS Microsoft Windows 10 Professional 64-Bit (Version 1903)
Drivers NVIDIA 441.66

Velocità Clock - Un clock boost significativamente più alto rispetto alle velocità di riferimento

Mentre il clock di base a 1.350 MHz del Gaming X Trio corrisponde a quello del modello di riferimento di NVIDIA, il primo diverge dal clock di base del secondo. A 1.755 MHz, il Gaming X Trio offre un clock boost superiore di 210 MHz rispetto al Founders Edition, che è associato al suo maggiore consumo energetico. Il Gaming X Trio consuma 40 W in più con impostazioni base rispetto alla Founders Edition, come abbiamo detto prima, il che spiega la necessità di un potente dissipatore di calore. Non ci sono però differenze con il VRAM. Il Gaming X Trio ha 11 GB di GDDR6 come il fratello della sua Founder Edition, che funziona anche a 1.750 MHz. In effetti, il VRAM funziona a 14 GHz. Combinando questo con un bus a 352 bit si ottiene una larghezza di banda di memoria di 616 GB/s.
L'MSI permette di aumentare del 10% la potenza del Gaming X Trio, con un TDP massimo di 330 W. Nella sezione Overclocking di questa recensione sono illustrati i vantaggi di questo aumento del PT.

GPU-Z
GPU-Z
GPU-Z
GPU-Z
GPU-Z
GPU-Z

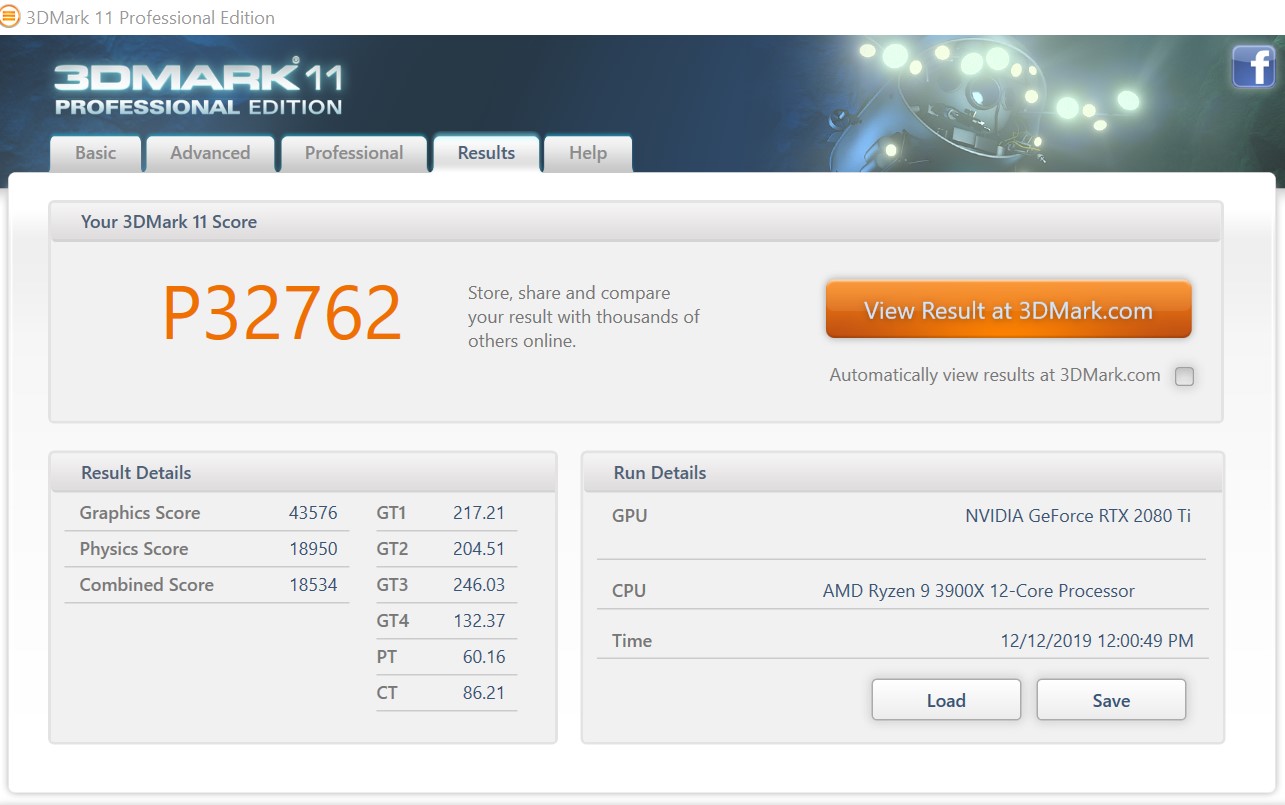
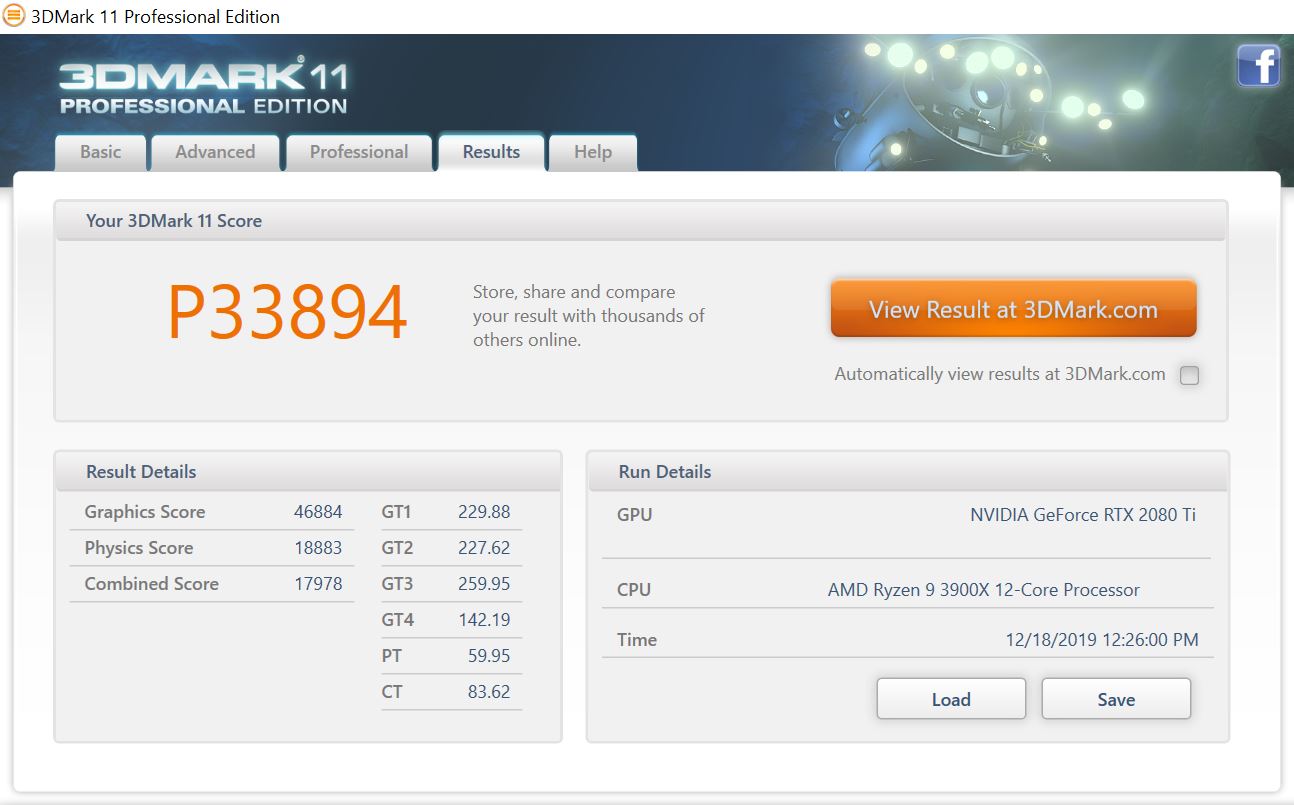
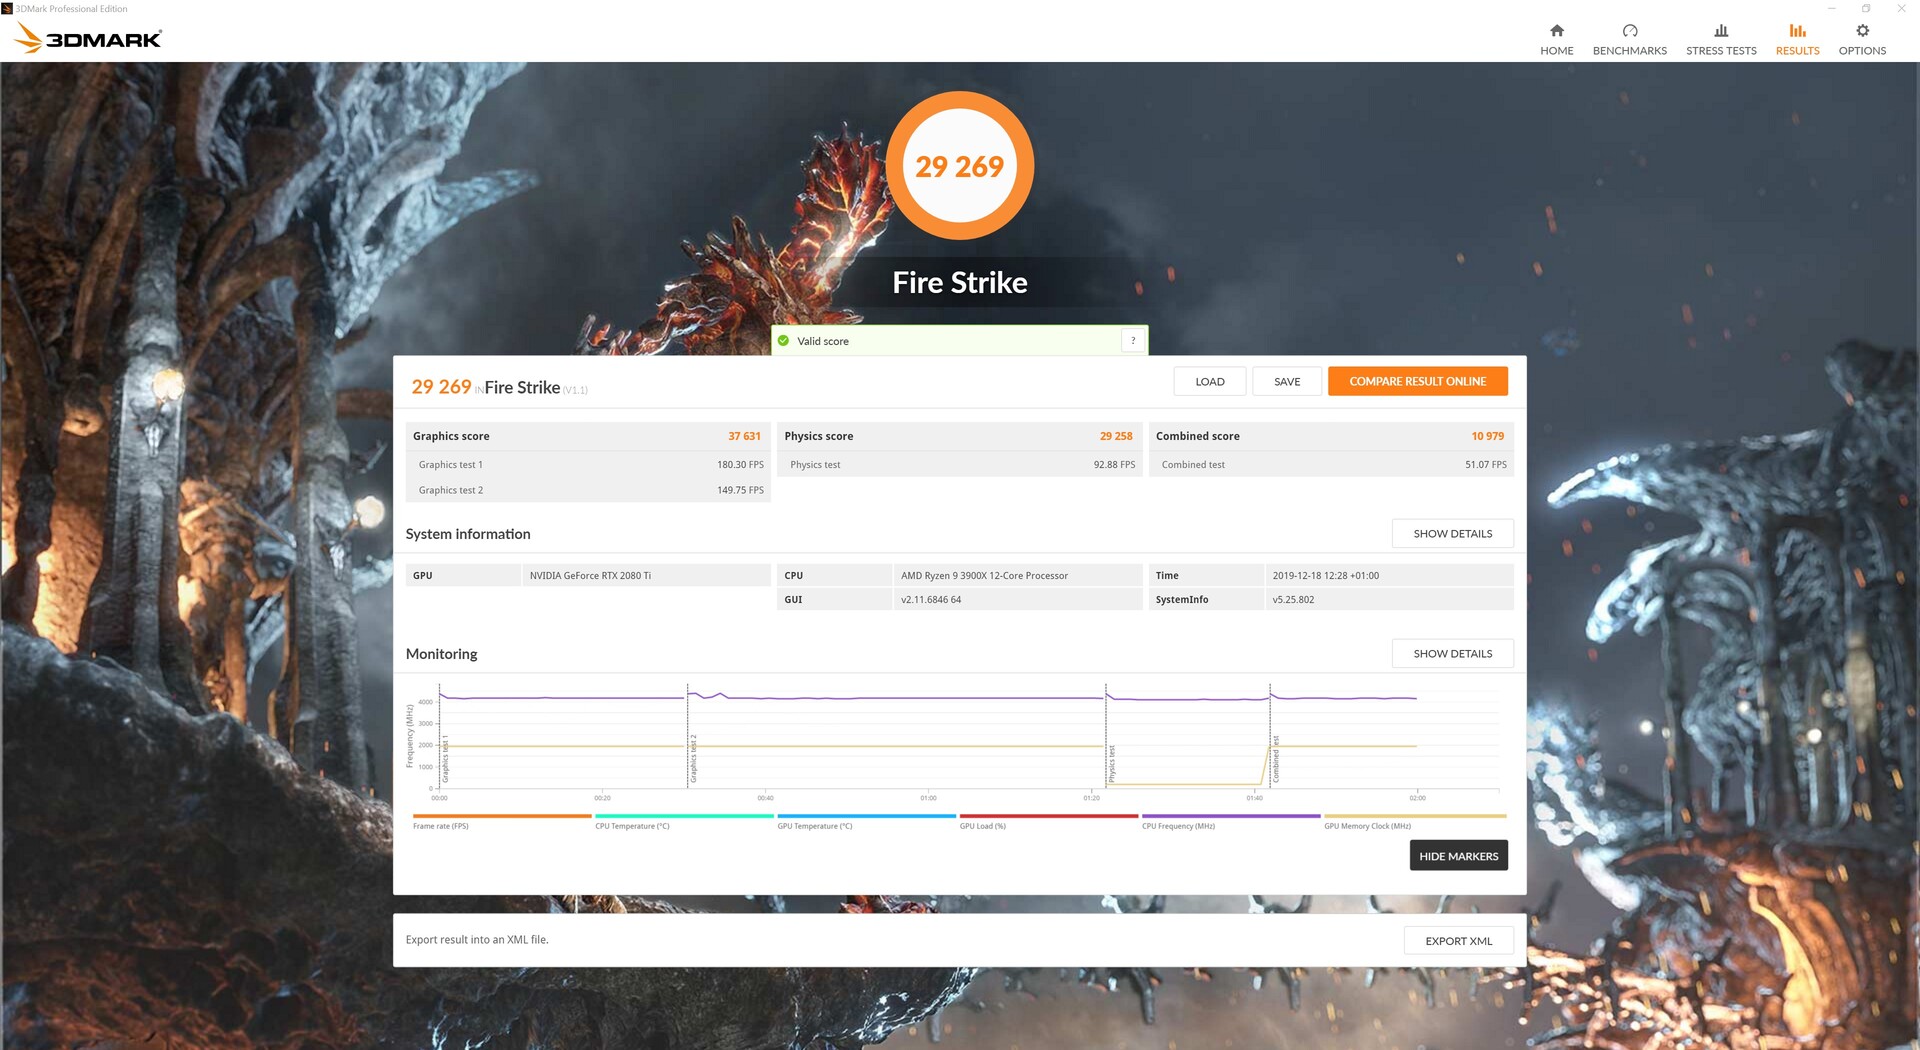
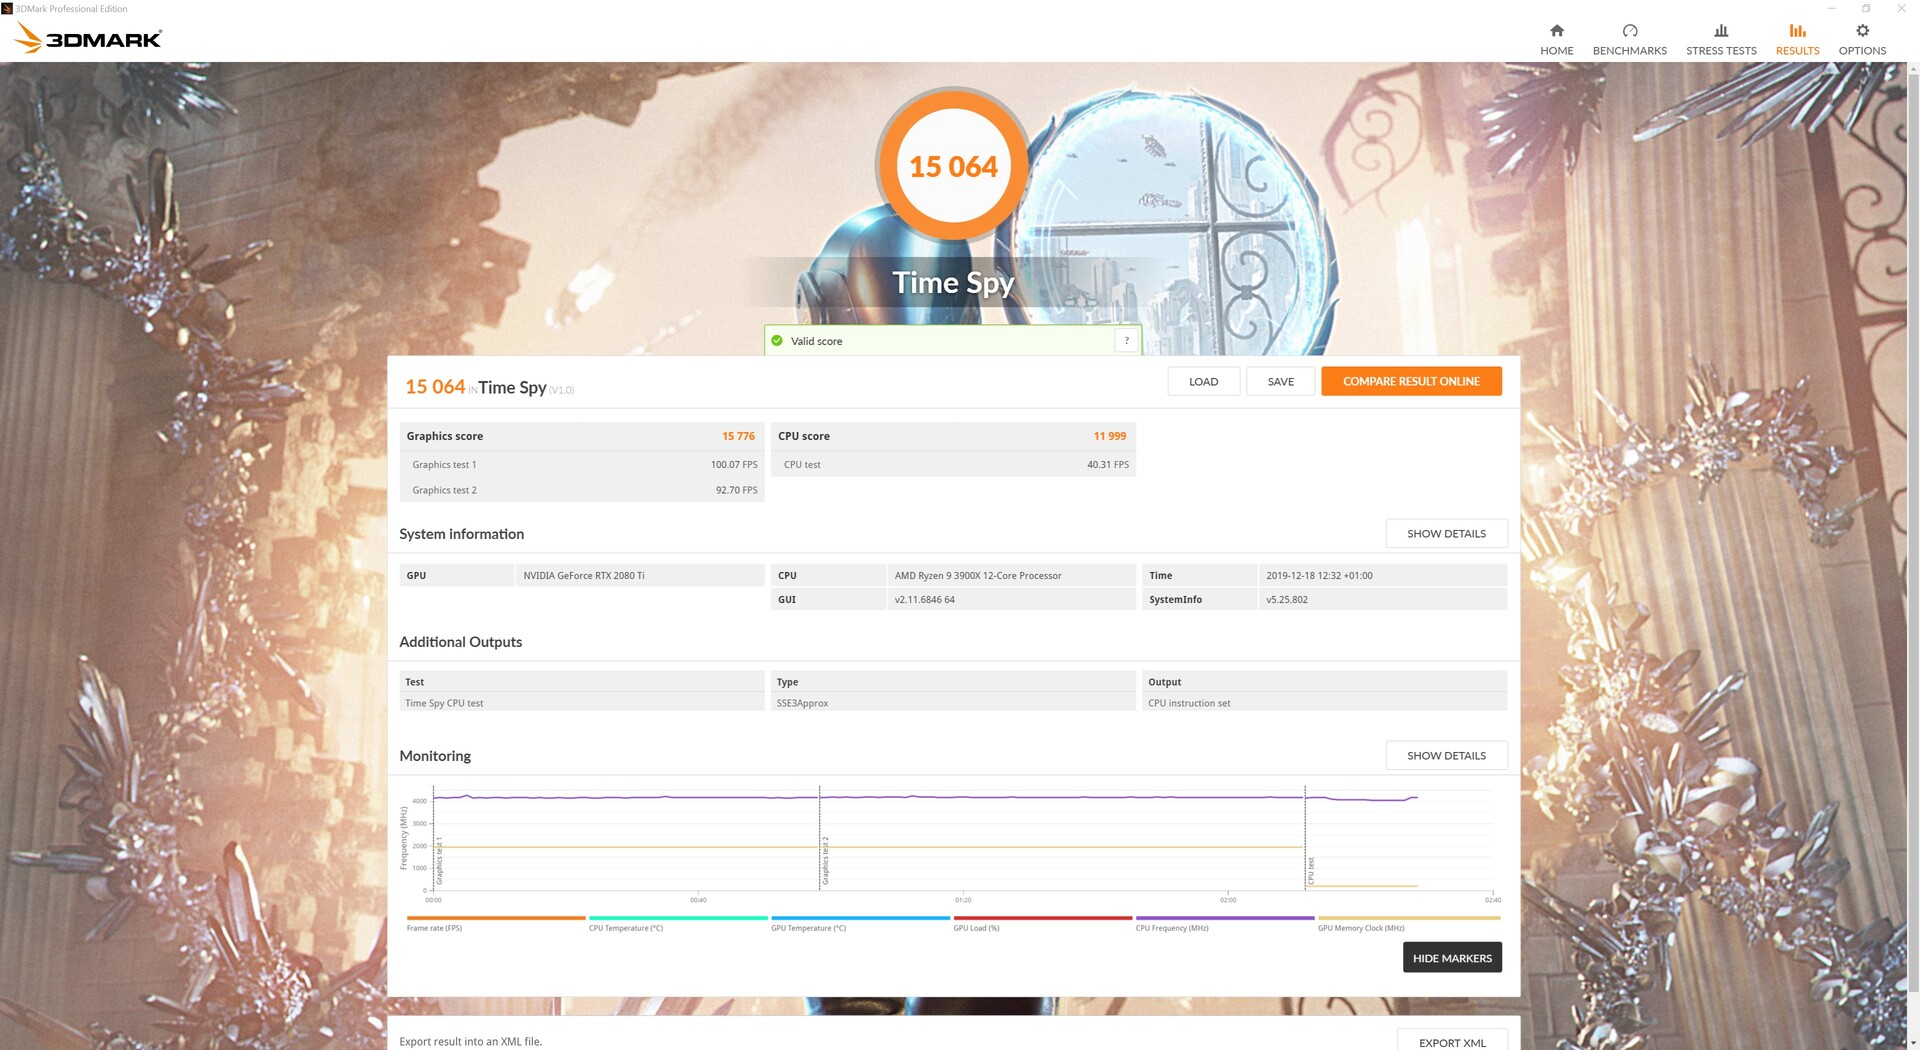
Synthetic Benchmarks

I benchmarks sintetici rivelano già il potenziale del Gaming X Trio. In breve, la nostra unità di prova supera di poco le prestazioni della KFA2 GeForce RTX 20 Ti EX, mentre si avvicina addirittura al TITAN RTX nominalmente più veloce.

Il Gaming X Trio rende leggero anche il lavoro della serie RTX 20 SUPER. La GeForce RTX 2080 SUPER, per esempio, è circa il 20% più lenta della nostra unità di prova nei benchmarks sintetici, con RTX 2070 SUPER e RTX 2060 SUPER ancora più indietro. Neanche AMD può competere in questa classe di prestazioni. La scheda grafica AMD più veloce nelle nostre tabelle di confronto è la Radeon VII, ma è bloccata a duellare con l'RTX 2070 SUPER piuttosto che con il Gaming X Trio.

Performance Rating - Percent
AMD Ryzen 9 3900X
100 pt
MSI RTX 2080 Ti Gaming X Trio
97.4 pt
KFA2 GeForce RTX 2080 Ti EX
94 pt
Nvidia GeForce RTX 2080 Super
76.8 pt
MSI RTX 2080 Gaming X Trio
76.5 pt
Nvidia GeForce RTX 2070 Super
69.3 pt
AMD Radeon VII
67.6 pt
MSI RTX 2070 Gaming Z 8G
65.2 pt
AMD Radeon RX 5700 XT
64.6 pt
Nvidia GeForce RTX 2060 Super
62.3 pt
AMD Radeon RX Vega 64 -4!
60.6 pt
AMD Radeon RX 5700
58.1 pt
MSI RTX 2060 Gaming Z 6G
53.9 pt
3DMark
1920x1080 Fire Strike Graphics
AMD Ryzen 9 3900X
34757 Points +2%
MSI RTX 2080 Ti Gaming X Trio
33935 Points
KFA2 GeForce RTX 2080 Ti EX
32081 Points -5%
MSI RTX 2080 Gaming X Trio
27620 Points -19%
AMD Radeon VII
27476 Points -19%
Nvidia GeForce RTX 2080 Super
27075 Points -20%
AMD Radeon RX 5700 XT
25383 Points -25%
Nvidia GeForce RTX 2070 Super
24151 Points -29%
MSI RTX 2070 Gaming Z 8G
22999 Points -32%
AMD Radeon RX 5700
22457 Points -34%
AMD Radeon RX Vega 64
22338 Points -34%
Nvidia GeForce RTX 2060 Super
21970 Points -35%
MSI RTX 2060 Gaming Z 6G
19338 Points -43%
Fire Strike Extreme Graphics
AMD Ryzen 9 3900X
17288 Points +3%
MSI RTX 2080 Ti Gaming X Trio
16790 Points
KFA2 GeForce RTX 2080 Ti EX
15603 Points -7%
AMD Radeon VII
13388 Points -20%
MSI RTX 2080 Gaming X Trio
13355 Points -20%
Nvidia GeForce RTX 2080 Super
12968 Points -23%
AMD Radeon RX 5700 XT
12209 Points -27%
Nvidia GeForce RTX 2070 Super
11634 Points -31%
MSI RTX 2070 Gaming Z 8G
11021 Points -34%
AMD Radeon RX 5700
10876 Points -35%
AMD Radeon RX Vega 64
10758 Points -36%
Nvidia GeForce RTX 2060 Super
10481 Points -38%
MSI RTX 2060 Gaming Z 6G
9097 Points -46%
3840x2160 Fire Strike Ultra Graphics
AMD Ryzen 9 3900X
8726 Points +5%
MSI RTX 2080 Ti Gaming X Trio
8274 Points
KFA2 GeForce RTX 2080 Ti EX
7925 Points -4%
AMD Radeon VII
6837 Points -17%
MSI RTX 2080 Gaming X Trio
6513 Points -21%
Nvidia GeForce RTX 2080 Super
6500 Points -21%
AMD Radeon RX 5700 XT
5955 Points -28%
Nvidia GeForce RTX 2070 Super
5786 Points -30%
MSI RTX 2070 Gaming Z 8G
5450 Points -34%
AMD Radeon RX Vega 64
5441 Points -34%
AMD Radeon RX 5700
5292 Points -36%
Nvidia GeForce RTX 2060 Super
5175 Points -37%
MSI RTX 2060 Gaming Z 6G
4244 Points -49%
2560x1440 Time Spy Graphics
AMD Ryzen 9 3900X
14686 Points +1%
MSI RTX 2080 Ti Gaming X Trio
14492 Points
KFA2 GeForce RTX 2080 Ti EX
13744 Points -5%
Nvidia GeForce RTX 2080 Super
11477 Points -21%
MSI RTX 2080 Gaming X Trio
11294 Points -22%
Nvidia GeForce RTX 2070 Super
10094 Points -30%
MSI RTX 2070 Gaming Z 8G
9236 Points -36%
AMD Radeon VII
8803 Points -39%
Nvidia GeForce RTX 2060 Super
8795 Points -39%
AMD Radeon RX 5700 XT
8673 Points -40%
MSI RTX 2060 Gaming Z 6G
7732 Points -47%
AMD Radeon RX 5700
7675 Points -47%
AMD Radeon RX Vega 64
7183 Points -50%
3DMark 11 - 1280x720 Performance GPU
KFA2 GeForce RTX 2080 Ti EX
45050 Points +3%
AMD Ryzen 9 3900X
44917 Points +3%
MSI RTX 2080 Ti Gaming X Trio
43576 Points
MSI RTX 2080 Gaming X Trio
37989 Points -13%
Nvidia GeForce RTX 2080 Super
37958 Points -13%
AMD Radeon VII
37881 Points -13%
AMD Radeon RX 5700 XT
35715 Points -18%
Nvidia GeForce RTX 2070 Super
33293 Points -24%
AMD Radeon RX 5700
31570 Points -28%
MSI RTX 2070 Gaming Z 8G
31260 Points -28%
Nvidia GeForce RTX 2060 Super
29605 Points -32%
AMD Radeon RX Vega 64
29285 Points -33%
MSI RTX 2060 Gaming Z 6G
26413 Points -39%
Unigine Heaven 4.0
Extreme Preset OpenGL
AMD Ryzen 9 3900X
214.4 fps +1%
MSI RTX 2080 Ti Gaming X Trio
212.5 fps
KFA2 GeForce RTX 2080 Ti EX
204.4 fps -4%
Nvidia GeForce RTX 2080 Super
167.5 fps -21%
MSI RTX 2080 Gaming X Trio
161.4 fps -24%
Nvidia GeForce RTX 2070 Super
153.5 fps -28%
MSI RTX 2070 Gaming Z 8G
139 fps -35%
Nvidia GeForce RTX 2060 Super
132.3 fps -38%
MSI RTX 2060 Gaming Z 6G
115.8 fps -46%
AMD Radeon RX 5700 XT
110.2 fps -48%
AMD Radeon VII
109 fps -49%
AMD Radeon RX 5700
100.7 fps -53%
Extreme Preset DX11
AMD Ryzen 9 3900X
232.7 fps +3%
MSI RTX 2080 Ti Gaming X Trio
225.8 fps
KFA2 GeForce RTX 2080 Ti EX
215.2 fps -5%
MSI RTX 2080 Gaming X Trio
176.5 fps -22%
Nvidia GeForce RTX 2080 Super
175.2 fps -22%
Nvidia GeForce RTX 2070 Super
160.1 fps -29%
MSI RTX 2070 Gaming Z 8G
149.3 fps -34%
Nvidia GeForce RTX 2060 Super
141.7 fps -37%
AMD Radeon VII
140.3 fps -38%
AMD Radeon RX 5700 XT
132.5 fps -41%
MSI RTX 2060 Gaming Z 6G
124.1 fps -45%
AMD Radeon RX 5700
119.9 fps -47%
Unigine Valley 1.0
1920x1080 Extreme HD DirectX AA:x8
AMD Ryzen 9 3900X
167.4 fps +3%
MSI RTX 2080 Ti Gaming X Trio
163 fps
KFA2 GeForce RTX 2080 Ti EX
159.4 fps -2%
Nvidia GeForce RTX 2080 Super
120.2 fps -26%
MSI RTX 2080 Gaming X Trio
119.6 fps -27%
Nvidia GeForce RTX 2070 Super
113.7 fps -30%
MSI RTX 2070 Gaming Z 8G
111.5 fps -32%
AMD Radeon VII
108.5 fps -33%
Nvidia GeForce RTX 2060 Super
106.9 fps -34%
AMD Radeon RX 5700 XT
106.3 fps -35%
AMD Radeon RX 5700
99.3 fps -39%
MSI RTX 2060 Gaming Z 6G
91.2 fps -44%
1920x1080 Extreme HD Preset OpenGL AA:x8
AMD Ryzen 9 3900X
150.9 fps +2%
MSI RTX 2080 Ti Gaming X Trio
147.8 fps
KFA2 GeForce RTX 2080 Ti EX
145.1 fps -2%
Nvidia GeForce RTX 2080 Super
114.5 fps -23%
MSI RTX 2080 Gaming X Trio
110.5 fps -25%
Nvidia GeForce RTX 2070 Super
105.6 fps -29%
MSI RTX 2070 Gaming Z 8G
101 fps -32%
Nvidia GeForce RTX 2060 Super
98.3 fps -33%
AMD Radeon RX 5700 XT
89.1 fps -40%
MSI RTX 2060 Gaming Z 6G
83.6 fps -43%
AMD Radeon RX 5700
82.7 fps -44%
AMD Radeon VII
81.3 fps -45%
3DMark 05 Standard
52681 punti
3DMark 06 Standard Score
44434 punti
3DMark Vantage P Result
83556 punti
3DMark 11 Performance
32762 punti
3DMark Ice Storm Standard Score
212266 punti
3DMark Cloud Gate Standard Score
54334 punti
3DMark Fire Strike Score
26845 punti
3DMark Fire Strike Extreme Score
16405 punti
3DMark Time Spy Score
14057 punti
Aiuto

Gaming Benchmarks - Una scheda grafica con capacità QHD e UHD

The Witcher 3: tempi di risposta – ultra preset
The Witcher 3: Framerates – ultra preset

Come previsto, il Gaming X Trio si comporta molto bene nei nostri benchmarks di gioco. Quasi tutti i giochi possono essere visualizzati al massimo dei dettagli e in 4K, anche se alcuni titoli come Anno 1800 e Red Dead Redemption 2 scendono sotto i 60 FPS. Una media di 36 e 42 FPS rispettivamente sarà comunque fluida, secondo noi.

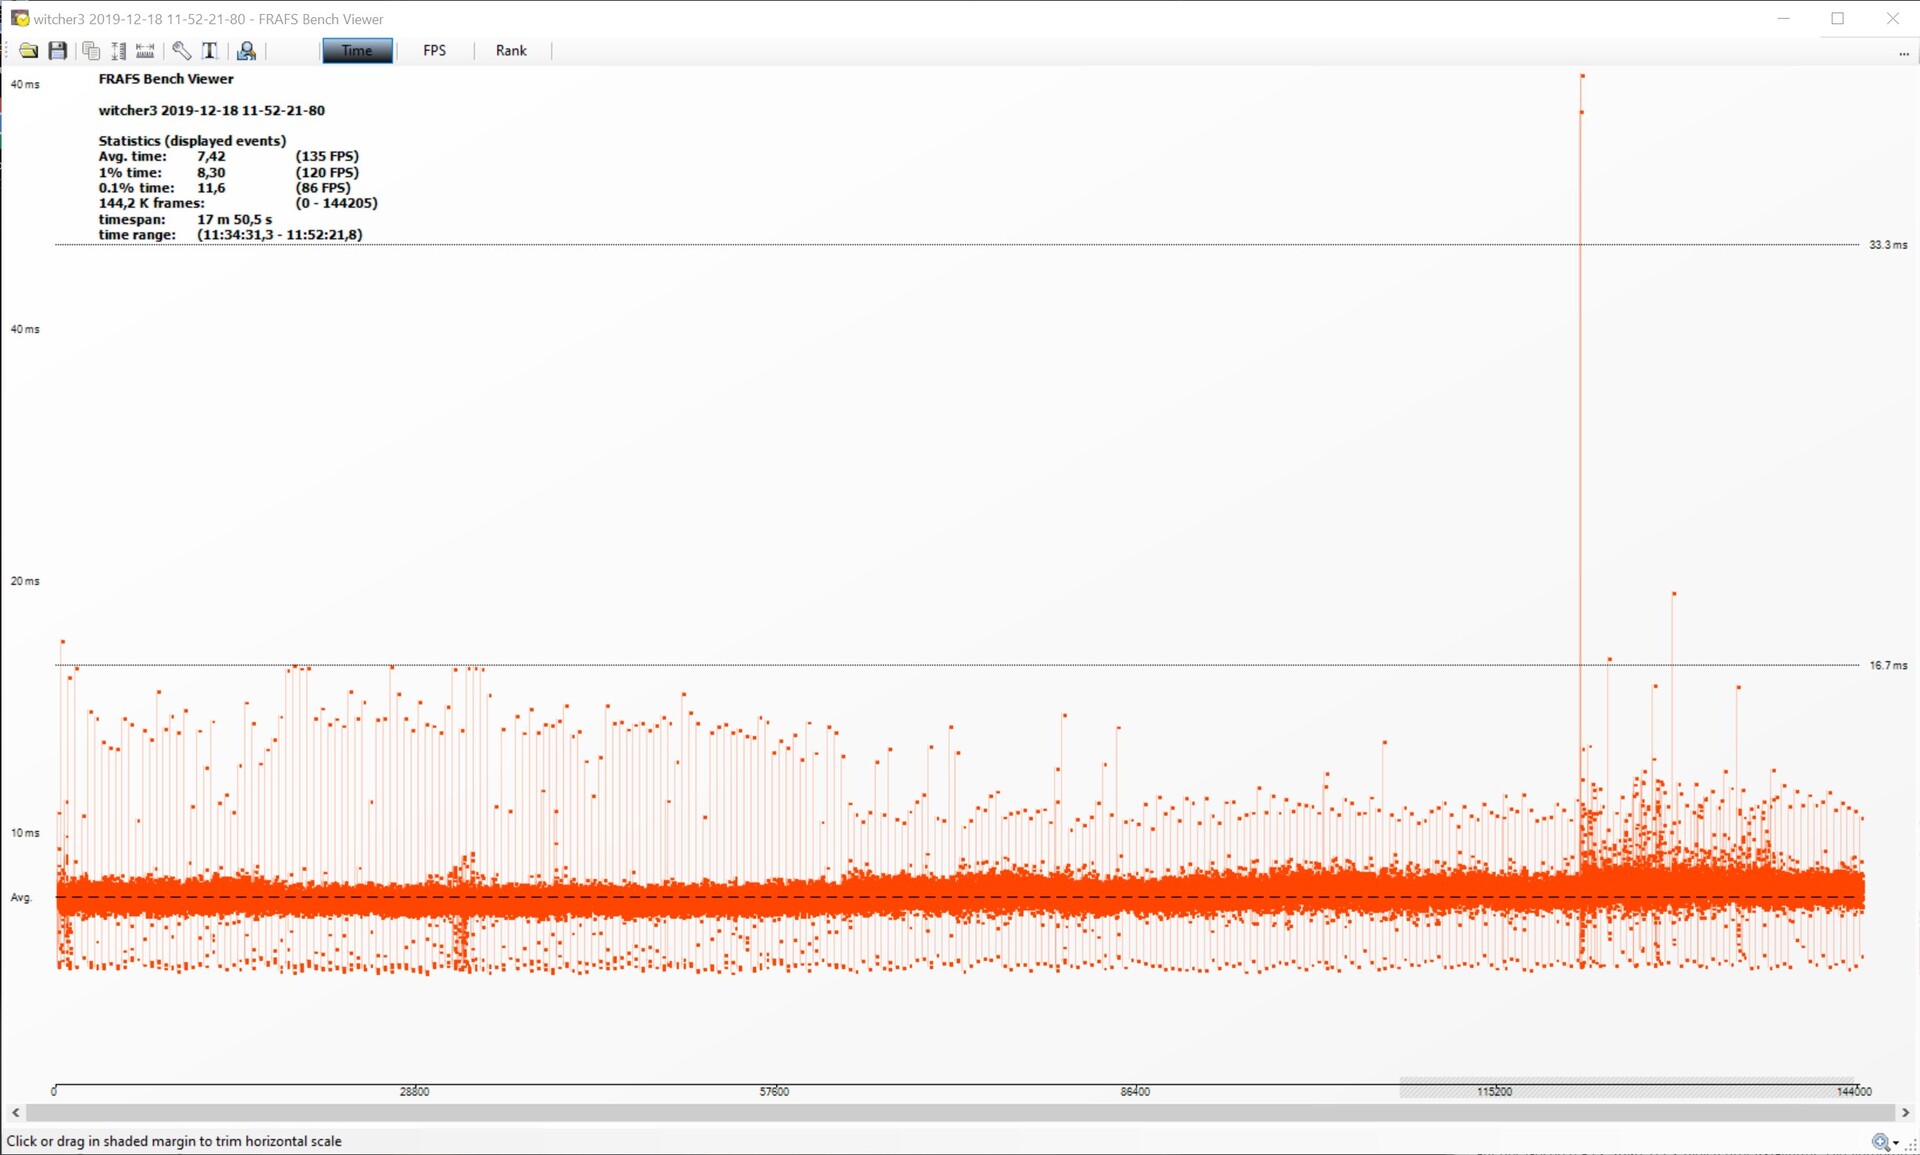
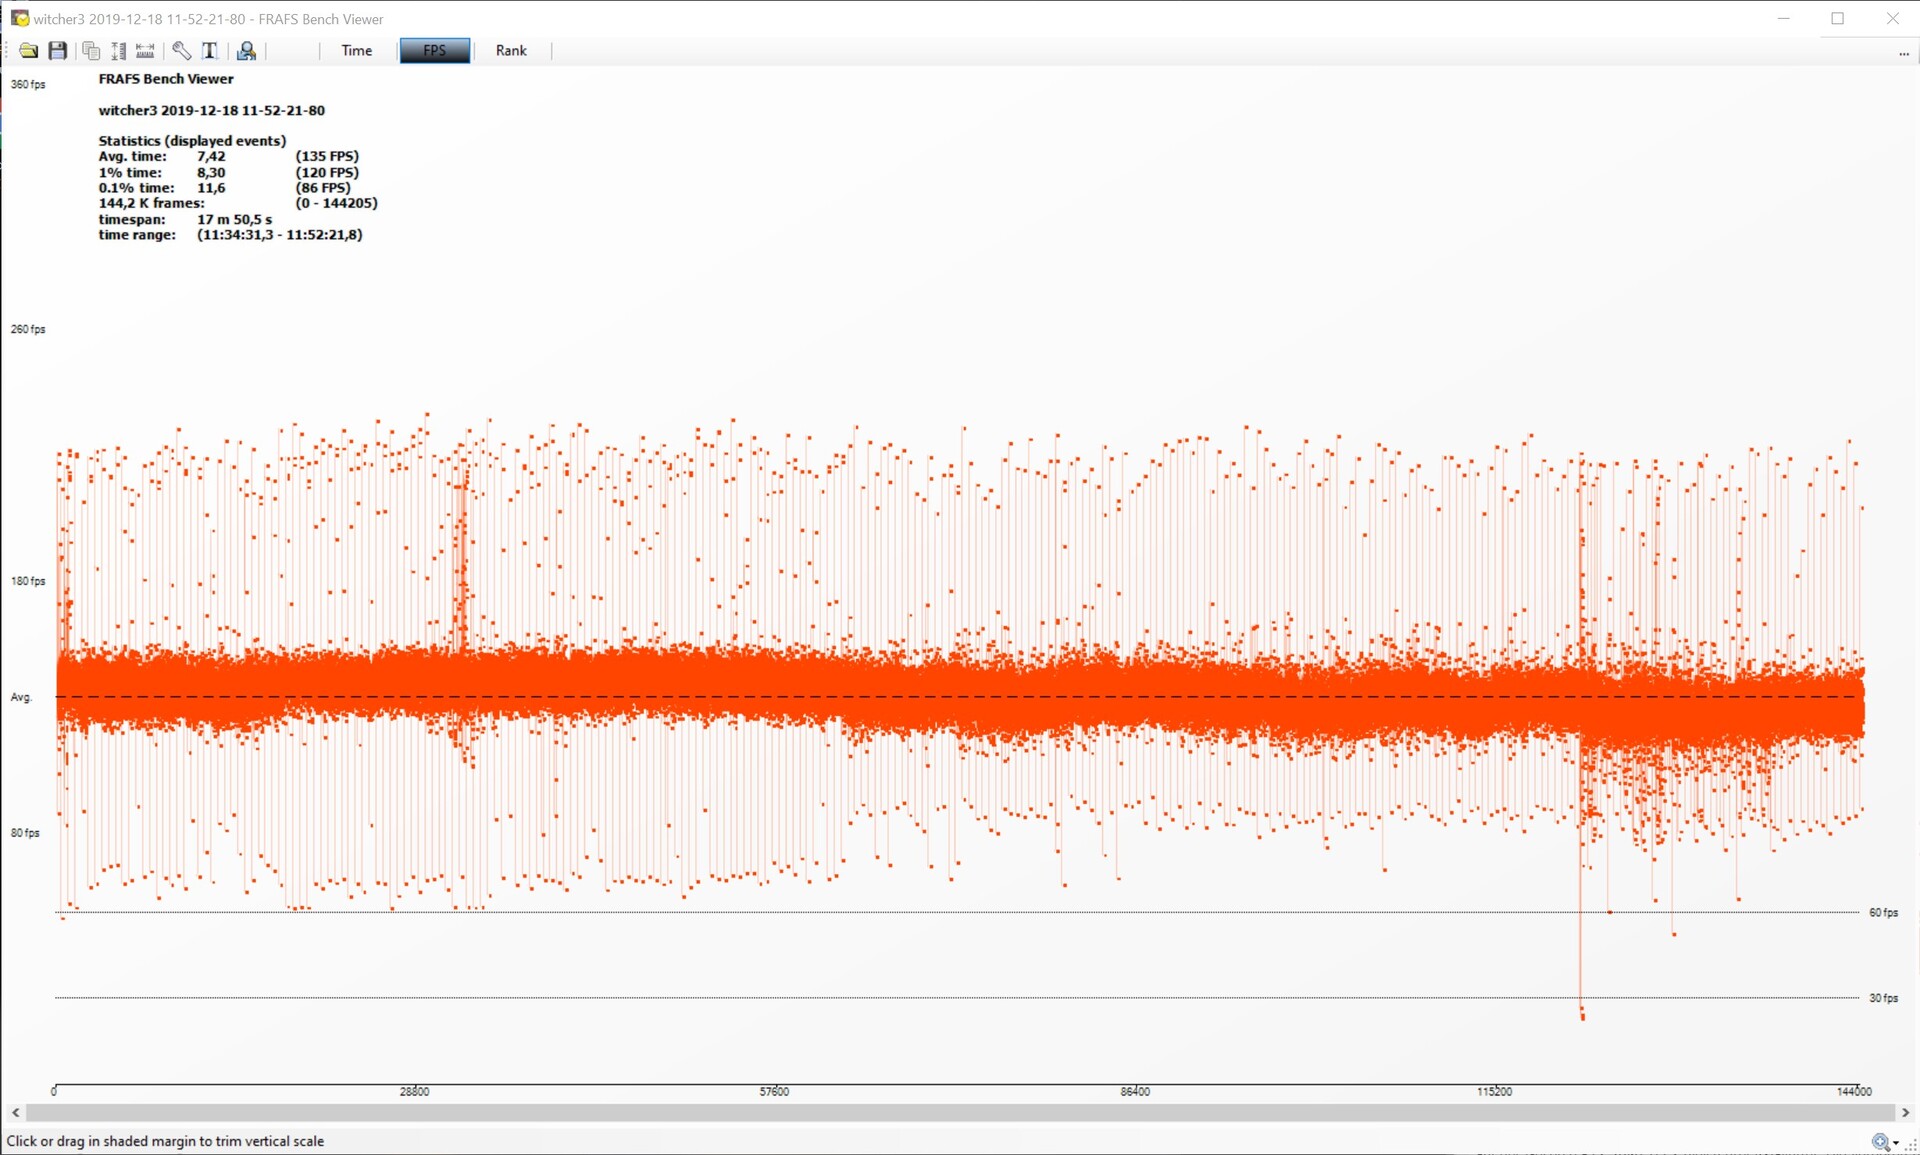
I frametime e i framerate della nostra unità di prova per una sessione prolungata sono piuttosto ordinari. Abbiamo notato alcuni picchi e abbassamenti durante i nostri test, ma questi sono molto brevi, quindi non si dovrebbe notare alcun sussulto o scatto quando si gioca. Abbiamo verificato questo fatto eseguendo The Witcher 3 sull'ultra preset a 1080p, i cui risultati sono visibili nei grafici a destra e sotto. Il Gaming X Trio passa da un massimo iniziale di 140 FPS a circa 130 FPS alla fine del nostro test di resistenza con un minimo di 122 FPS. Una media di 135 FPS è comunque un risultato al top e dimostra che il Gaming X Trio offre un framerate fluido anche durante le sessioni di gioco prolungate.

The Witcher 3: Framerates – ultra preset

05101520253035404550556065707580859095100105110115120125130135Tooltip
MSI RTX 2080 Ti Gaming X Trio GeForce RTX 2080 Ti (Desktop), R9 3900X: Ø134.7 (122-140)
basso medio alto ultraQHD4K
The Witcher 3 (2015) 380 335 247 136 101
Dota 2 Reborn (2015) 129.5 134.5 146.2 136.4 133.4
For Honor (2017) 370 273 262 210 100
X-Plane 11.11 (2018) 128 115 93 81
Far Cry 5 (2018) 154 136 130 122 117 78
Forza Horizon 4 (2018) 206 182 181 169 150 111
Far Cry New Dawn (2019) 130 108 104 95 98 77
Metro Exodus (2019) 142 122 105 93 76 51
Anthem (2019) 90 107 104 99 99 70
The Division 2 (2019) 201 172 147 125 97 57
Anno 1800 (2019) 102 101 75 40.7 38.3 36.1
Rage 2 (2019) 329 207 180 174 119 61
F1 2019 (2019) 287 257 201 174 146 97
Control (2019) 240 169 132 89 45.8
Borderlands 3 (2019) 162 142 127 109 83 47
Star Wars Jedi Fallen Order (2019) 106 106 104 105 73
Red Dead Redemption 2 (2019) 127 119 103 76 63 42.3

Prestazioni di calcolo - MSI ha la misura del KFA2

Il maggiore boost del clock del Gaming X Trio permette al Gaming X Trio di superare la sua controparte KFA2 nei benchmarks di calcolo. Come prima, però, la TITAN RTX è occasionalmente in testa alla nostra attuale unità di prova con un ampio margine. Prestazioni perfette, tuttavia, possono essere raggiunte solo con la serie Quadro o Firepro ottimizzata per i driver.

LuxMark v2.0 64Bit
Room GPUs-only
Nvidia Titan RTX
NVIDIA Titan RTX, R7 2700X, ADATA Premier Pro SP900NS38 512 GB
4643 Samples/s +3%
MSI RTX 2080 Ti Gaming X Trio
GeForce RTX 2080 Ti (Desktop), R9 3900X
4494 Samples/s
KFA2 GeForce RTX 2080 Ti EX
GeForce RTX 2080 Ti (Desktop), R9 3900X, Corsair MP600
4429 Samples/s -1%
AMD Radeon VII
Radeon VII, R7 2700X
3477 Samples/s -23%
MSI RTX 2080 Gaming X Trio
GeForce RTX 2080 (Desktop), R7 2700X
3453 Samples/s -23%
Nvidia GeForce RTX 2080 Super
GeForce RTX 2080 Super (Desktop), R7 2700X
3430 Samples/s -24%
Nvidia GeForce RTX 2070 Super
GeForce RTX 2070 Super (Desktop), R7 2700X
3404 Samples/s -24%
MSI RTX 2070 Gaming Z 8G
GeForce RTX 2070 (Desktop), R7 2700X
3300 Samples/s -27%
Nvidia GeForce RTX 2060 Super
GeForce RTX 2060 Super (Desktop), R7 2700X
3274 Samples/s -27%
MSI RTX 2060 Gaming Z 6G
GeForce RTX 2060 (Desktop), R7 2700X
2586 Samples/s -42%
AMD Radeon RX 5700 XT
Radeon RX 5700 XT (Desktop), R7 2700X
2104 Samples/s -53%
AMD Radeon RX 5700
Radeon RX 5700 (Desktop), R7 2700X
1856 Samples/s -59%
Sala GPUs-only
Nvidia Titan RTX
NVIDIA Titan RTX, R7 2700X, ADATA Premier Pro SP900NS38 512 GB
10799 Samples/s +5%
MSI RTX 2080 Ti Gaming X Trio
GeForce RTX 2080 Ti (Desktop), R9 3900X
10291 Samples/s
KFA2 GeForce RTX 2080 Ti EX
GeForce RTX 2080 Ti (Desktop), R9 3900X, Corsair MP600
9999 Samples/s -3%
MSI RTX 2080 Gaming X Trio
GeForce RTX 2080 (Desktop), R7 2700X
7928 Samples/s -23%
Nvidia GeForce RTX 2080 Super
GeForce RTX 2080 Super (Desktop), R7 2700X
7878 Samples/s -23%
Nvidia GeForce RTX 2070 Super
GeForce RTX 2070 Super (Desktop), R7 2700X
7594 Samples/s -26%
MSI RTX 2070 Gaming Z 8G
GeForce RTX 2070 (Desktop), R7 2700X
7179 Samples/s -30%
Nvidia GeForce RTX 2060 Super
GeForce RTX 2060 Super (Desktop), R7 2700X
6980 Samples/s -32%
AMD Radeon VII
Radeon VII, R7 2700X
6869 Samples/s -33%
AMD Radeon RX 5700 XT
Radeon RX 5700 XT (Desktop), R7 2700X
6188 Samples/s -40%
MSI RTX 2060 Gaming Z 6G
GeForce RTX 2060 (Desktop), R7 2700X
5655 Samples/s -45%
AMD Radeon RX 5700
Radeon RX 5700 (Desktop), R7 2700X
5312 Samples/s -48%
ComputeMark v2.1
1024x600 Normal, QJuliaRayTrace
AMD Ryzen 9 3900X
NVIDIA Titan RTX, R9 3900X, Corsair MP600
9698 Points 0%
MSI RTX 2080 Ti Gaming X Trio
GeForce RTX 2080 Ti (Desktop), R9 3900X
9690 Points
Nvidia Titan RTX
NVIDIA Titan RTX, R7 2700X, ADATA Premier Pro SP900NS38 512 GB
9418 Points -3%
KFA2 GeForce RTX 2080 Ti EX
GeForce RTX 2080 Ti (Desktop), R9 3900X, Corsair MP600
9104 Points -6%
MSI RTX 2080 Gaming X Trio
GeForce RTX 2080 (Desktop), R7 2700X
7283 Points -25%
Nvidia GeForce RTX 2080 Super
GeForce RTX 2080 Super (Desktop), R7 2700X
7258 Points -25%
Nvidia GeForce RTX 2070 Super
GeForce RTX 2070 Super (Desktop), R7 2700X
6155 Points -36%
AMD Radeon VII
Radeon VII, R7 2700X
5878 Points -39%
AMD Radeon RX 5700 XT
Radeon RX 5700 XT (Desktop), R7 2700X
5761 Points -41%
MSI RTX 2070 Gaming Z 8G
GeForce RTX 2070 (Desktop), R7 2700X
5747 Points -41%
Nvidia GeForce RTX 2060 Super
GeForce RTX 2060 Super (Desktop), R7 2700X
5271 Points -46%
MSI RTX 2060 Gaming Z 6G
GeForce RTX 2060 (Desktop), R7 2700X
4903 Points -49%
AMD Radeon RX 5700
Radeon RX 5700 (Desktop), R7 2700X
4703 Points -51%
1024x600 Normal, Mandel Scalar
AMD Radeon VII
Radeon VII, R7 2700X
6312 Points +1%
MSI RTX 2080 Ti Gaming X Trio
GeForce RTX 2080 Ti (Desktop), R9 3900X
6226 Points
AMD Ryzen 9 3900X
NVIDIA Titan RTX, R9 3900X, Corsair MP600
6169 Points -1%
Nvidia Titan RTX
NVIDIA Titan RTX, R7 2700X, ADATA Premier Pro SP900NS38 512 GB
5977 Points -4%
KFA2 GeForce RTX 2080 Ti EX
GeForce RTX 2080 Ti (Desktop), R9 3900X, Corsair MP600
5679 Points -9%
AMD Radeon RX 5700 XT
Radeon RX 5700 XT (Desktop), R7 2700X
4869 Points -22%
MSI RTX 2080 Gaming X Trio
GeForce RTX 2080 (Desktop), R7 2700X
4526 Points -27%
Nvidia GeForce RTX 2080 Super
GeForce RTX 2080 Super (Desktop), R7 2700X
4525 Points -27%
AMD Radeon RX 5700
Radeon RX 5700 (Desktop), R7 2700X
4043 Points -35%
Nvidia GeForce RTX 2070 Super
GeForce RTX 2070 Super (Desktop), R7 2700X
3782 Points -39%
MSI RTX 2070 Gaming Z 8G
GeForce RTX 2070 (Desktop), R7 2700X
3514 Points -44%
Nvidia GeForce RTX 2060 Super
GeForce RTX 2060 Super (Desktop), R7 2700X
3185 Points -49%
MSI RTX 2060 Gaming Z 6G
GeForce RTX 2060 (Desktop), R7 2700X
2982 Points -52%
1024x600 Normal, Mandel Vector
AMD Ryzen 9 3900X
NVIDIA Titan RTX, R9 3900X, Corsair MP600
5090 Points +1%
MSI RTX 2080 Ti Gaming X Trio
GeForce RTX 2080 Ti (Desktop), R9 3900X
5037 Points
Nvidia Titan RTX
NVIDIA Titan RTX, R7 2700X, ADATA Premier Pro SP900NS38 512 GB
4944 Points -2%
AMD Radeon VII
Radeon VII, R7 2700X
4714 Points -6%
KFA2 GeForce RTX 2080 Ti EX
GeForce RTX 2080 Ti (Desktop), R9 3900X, Corsair MP600
4695 Points -7%
AMD Radeon RX 5700 XT
Radeon RX 5700 XT (Desktop), R7 2700X
4246 Points -16%
MSI RTX 2080 Gaming X Trio
GeForce RTX 2080 (Desktop), R7 2700X
3892 Points -23%
Nvidia GeForce RTX 2080 Super
GeForce RTX 2080 Super (Desktop), R7 2700X
3835 Points -24%
AMD Radeon RX 5700
Radeon RX 5700 (Desktop), R7 2700X
3532 Points -30%
Nvidia GeForce RTX 2070 Super
GeForce RTX 2070 Super (Desktop), R7 2700X
3358 Points -33%
MSI RTX 2070 Gaming Z 8G
GeForce RTX 2070 (Desktop), R7 2700X
3169 Points -37%
Nvidia GeForce RTX 2060 Super
GeForce RTX 2060 Super (Desktop), R7 2700X
2939 Points -42%
MSI RTX 2060 Gaming Z 6G
GeForce RTX 2060 (Desktop), R7 2700X
2800 Points -44%
1024x600 Normal, Fluid 2DTexArr
AMD Ryzen 9 3900X
NVIDIA Titan RTX, R9 3900X, Corsair MP600
3751 Points +6%
Nvidia Titan RTX
NVIDIA Titan RTX, R7 2700X, ADATA Premier Pro SP900NS38 512 GB
3691 Points +4%
MSI RTX 2080 Ti Gaming X Trio
GeForce RTX 2080 Ti (Desktop), R9 3900X
3539 Points
KFA2 GeForce RTX 2080 Ti EX
GeForce RTX 2080 Ti (Desktop), R9 3900X, Corsair MP600
3444 Points -3%
Nvidia GeForce RTX 2080 Super
GeForce RTX 2080 Super (Desktop), R7 2700X
2655 Points -25%
MSI RTX 2080 Gaming X Trio
GeForce RTX 2080 (Desktop), R7 2700X
2482 Points -30%
Nvidia GeForce RTX 2070 Super
GeForce RTX 2070 Super (Desktop), R7 2700X
2331 Points -34%
AMD Radeon VII
Radeon VII, R7 2700X
2248 Points -36%
MSI RTX 2070 Gaming Z 8G
GeForce RTX 2070 (Desktop), R7 2700X
2221 Points -37%
Nvidia GeForce RTX 2060 Super
GeForce RTX 2060 Super (Desktop), R7 2700X
2064 Points -42%
AMD Radeon RX 5700 XT
Radeon RX 5700 XT (Desktop), R7 2700X
1960 Points -45%
AMD Radeon RX 5700
Radeon RX 5700 (Desktop), R7 2700X
1810 Points -49%
MSI RTX 2060 Gaming Z 6G
GeForce RTX 2060 (Desktop), R7 2700X
1801 Points -49%
1024x600 Normal, Fluid 3DTex
AMD Ryzen 9 3900X
NVIDIA Titan RTX, R9 3900X, Corsair MP600
3962 Points +8%
Nvidia Titan RTX
NVIDIA Titan RTX, R7 2700X, ADATA Premier Pro SP900NS38 512 GB
3877 Points +6%
MSI RTX 2080 Ti Gaming X Trio
GeForce RTX 2080 Ti (Desktop), R9 3900X
3653 Points
AMD Radeon VII
Radeon VII, R7 2700X
3646 Points 0%
KFA2 GeForce RTX 2080 Ti EX
GeForce RTX 2080 Ti (Desktop), R9 3900X, Corsair MP600
3589 Points -2%
Nvidia GeForce RTX 2080 Super
GeForce RTX 2080 Super (Desktop), R7 2700X
2736 Points -25%
MSI RTX 2080 Gaming X Trio
GeForce RTX 2080 (Desktop), R7 2700X
2588 Points -29%
Nvidia GeForce RTX 2070 Super
GeForce RTX 2070 Super (Desktop), R7 2700X
2456 Points -33%
MSI RTX 2070 Gaming Z 8G
GeForce RTX 2070 (Desktop), R7 2700X
2380 Points -35%
AMD Radeon RX 5700 XT
Radeon RX 5700 XT (Desktop), R7 2700X
2349 Points -36%
AMD Radeon RX 5700
Radeon RX 5700 (Desktop), R7 2700X
2294 Points -37%
Nvidia GeForce RTX 2060 Super
GeForce RTX 2060 Super (Desktop), R7 2700X
2289 Points -37%
MSI RTX 2060 Gaming Z 6G
GeForce RTX 2060 (Desktop), R7 2700X
1889 Points -48%
1024x600 Normal, Score
AMD Ryzen 9 3900X
NVIDIA Titan RTX, R9 3900X, Corsair MP600
28670 Points +2%
MSI RTX 2080 Ti Gaming X Trio
GeForce RTX 2080 Ti (Desktop), R9 3900X
28145 Points
Nvidia Titan RTX
NVIDIA Titan RTX, R7 2700X, ADATA Premier Pro SP900NS38 512 GB
27907 Points -1%
KFA2 GeForce RTX 2080 Ti EX
GeForce RTX 2080 Ti (Desktop), R9 3900X, Corsair MP600
26510 Points -6%
AMD Radeon VII
Radeon VII, R7 2700X
22798 Points -19%
Nvidia GeForce RTX 2080 Super
GeForce RTX 2080 Super (Desktop), R7 2700X
21009 Points -25%
MSI RTX 2080 Gaming X Trio
GeForce RTX 2080 (Desktop), R7 2700X
20771 Points -26%
AMD Radeon RX 5700 XT
Radeon RX 5700 XT (Desktop), R7 2700X
19184 Points -32%
Nvidia GeForce RTX 2070 Super
GeForce RTX 2070 Super (Desktop), R7 2700X
18083 Points -36%
MSI RTX 2070 Gaming Z 8G
GeForce RTX 2070 (Desktop), R7 2700X
17031 Points -39%
AMD Radeon RX 5700
Radeon RX 5700 (Desktop), R7 2700X
16383 Points -42%
Nvidia GeForce RTX 2060 Super
GeForce RTX 2060 Super (Desktop), R7 2700X
15749 Points -44%
MSI RTX 2060 Gaming Z 6G
GeForce RTX 2060 (Desktop), R7 2700X
14375 Points -49%
SPECviewperf 13
Solidworks (sw-04)
AMD Ryzen 9 3900X
NVIDIA Titan RTX, R9 3900X, Corsair MP600
149.9 fps +32%
Nvidia Titan RTX
NVIDIA Titan RTX, R7 2700X, ADATA Premier Pro SP900NS38 512 GB
132.9 fps +17%
AMD Radeon RX 5700 XT
Radeon RX 5700 XT (Desktop), R7 2700X
114.4 fps +1%
MSI RTX 2080 Ti Gaming X Trio
GeForce RTX 2080 Ti (Desktop), R9 3900X
113.2 fps
KFA2 GeForce RTX 2080 Ti EX
GeForce RTX 2080 Ti (Desktop), R9 3900X, Corsair MP600
111.8 fps -1%
AMD Radeon RX 5700
Radeon RX 5700 (Desktop), R7 2700X
101.8 fps -10%
MSI RTX 2080 Gaming X Trio
GeForce RTX 2080 (Desktop), R7 2700X
100.3 fps -11%
Nvidia GeForce RTX 2080 Super
GeForce RTX 2080 Super (Desktop), R7 2700X
99.6 fps -12%
AMD Radeon VII
Radeon VII, R7 2700X
95.1 fps -16%
Nvidia GeForce RTX 2070 Super
GeForce RTX 2070 Super (Desktop), R7 2700X
93.3 fps -18%
MSI RTX 2070 Gaming Z 8G
GeForce RTX 2070 (Desktop), R7 2700X
86.7 fps -23%
MSI RTX 2060 Gaming Z 6G
GeForce RTX 2060 (Desktop), R7 2700X
83.4 fps -26%
Nvidia GeForce RTX 2060 Super
GeForce RTX 2060 Super (Desktop), R7 2700X
75.7 fps -33%
Siemens NX (snx-03)
AMD Ryzen 9 3900X
NVIDIA Titan RTX, R9 3900X, Corsair MP600
477.8 fps +2028%
Nvidia Titan RTX
NVIDIA Titan RTX, R7 2700X, ADATA Premier Pro SP900NS38 512 GB
462.4 fps +1960%
AMD Radeon RX 5700 XT
Radeon RX 5700 XT (Desktop), R7 2700X
61.3 fps +173%
AMD Radeon RX 5700
Radeon RX 5700 (Desktop), R7 2700X
60.5 fps +169%
AMD Radeon VII
Radeon VII, R7 2700X
37.03 fps +65%
MSI RTX 2080 Ti Gaming X Trio
GeForce RTX 2080 Ti (Desktop), R9 3900X
22.45 fps
KFA2 GeForce RTX 2080 Ti EX
GeForce RTX 2080 Ti (Desktop), R9 3900X, Corsair MP600
21.99 fps -2%
Nvidia GeForce RTX 2080 Super
GeForce RTX 2080 Super (Desktop), R7 2700X
21.94 fps -2%
MSI RTX 2080 Gaming X Trio
GeForce RTX 2080 (Desktop), R7 2700X
21.7 fps -3%
Nvidia GeForce RTX 2070 Super
GeForce RTX 2070 Super (Desktop), R7 2700X
20.71 fps -8%
MSI RTX 2070 Gaming Z 8G
GeForce RTX 2070 (Desktop), R7 2700X
15.6 fps -31%
Nvidia GeForce RTX 2060 Super
GeForce RTX 2060 Super (Desktop), R7 2700X
15.46 fps -31%
MSI RTX 2060 Gaming Z 6G
GeForce RTX 2060 (Desktop), R7 2700X
14.99 fps -33%
Showcase (showcase-02)
Nvidia Titan RTX
NVIDIA Titan RTX, R7 2700X, ADATA Premier Pro SP900NS38 512 GB
192 fps +7%
AMD Ryzen 9 3900X
NVIDIA Titan RTX, R9 3900X, Corsair MP600
191.8 fps +7%
KFA2 GeForce RTX 2080 Ti EX
GeForce RTX 2080 Ti (Desktop), R9 3900X, Corsair MP600
180.4 fps +1%
MSI RTX 2080 Ti Gaming X Trio
GeForce RTX 2080 Ti (Desktop), R9 3900X
179.5 fps
Nvidia GeForce RTX 2080 Super
GeForce RTX 2080 Super (Desktop), R7 2700X
144.5 fps -19%
AMD Radeon RX 5700 XT
Radeon RX 5700 XT (Desktop), R7 2700X
137.6 fps -23%
Nvidia GeForce RTX 2070 Super
GeForce RTX 2070 Super (Desktop), R7 2700X
127.3 fps -29%
AMD Radeon RX 5700
Radeon RX 5700 (Desktop), R7 2700X
127 fps -29%
Nvidia GeForce RTX 2060 Super
GeForce RTX 2060 Super (Desktop), R7 2700X
116.8 fps -35%
MSI RTX 2060 Gaming Z 6G
GeForce RTX 2060 (Desktop), R7 2700X
101.6 fps -43%
Medical (medical-02)
AMD Ryzen 9 3900X
NVIDIA Titan RTX, R9 3900X, Corsair MP600
90 fps +6%
Nvidia Titan RTX
NVIDIA Titan RTX, R7 2700X, ADATA Premier Pro SP900NS38 512 GB
89.3 fps +5%
MSI RTX 2080 Ti Gaming X Trio
GeForce RTX 2080 Ti (Desktop), R9 3900X
84.8 fps
AMD Radeon RX 5700 XT
Radeon RX 5700 XT (Desktop), R7 2700X
82.8 fps -2%
KFA2 GeForce RTX 2080 Ti EX
GeForce RTX 2080 Ti (Desktop), R9 3900X, Corsair MP600
82.1 fps -3%
AMD Radeon VII
Radeon VII, R7 2700X
77.9 fps -8%
Nvidia GeForce RTX 2080 Super
GeForce RTX 2080 Super (Desktop), R7 2700X
71.6 fps -16%
MSI RTX 2080 Gaming X Trio
GeForce RTX 2080 (Desktop), R7 2700X
71 fps -16%
AMD Radeon RX 5700
Radeon RX 5700 (Desktop), R7 2700X
67.5 fps -20%
Nvidia GeForce RTX 2070 Super
GeForce RTX 2070 Super (Desktop), R7 2700X
63.8 fps -25%
MSI RTX 2070 Gaming Z 8G
GeForce RTX 2070 (Desktop), R7 2700X
57.7 fps -32%
Nvidia GeForce RTX 2060 Super
GeForce RTX 2060 Super (Desktop), R7 2700X
54.5 fps -36%
MSI RTX 2060 Gaming Z 6G
GeForce RTX 2060 (Desktop), R7 2700X
49.1 fps -42%
Maya (maya-05)
AMD Ryzen 9 3900X
NVIDIA Titan RTX, R9 3900X, Corsair MP600
394.9 fps +1%
MSI RTX 2080 Ti Gaming X Trio
GeForce RTX 2080 Ti (Desktop), R9 3900X
392.1 fps
KFA2 GeForce RTX 2080 Ti EX
GeForce RTX 2080 Ti (Desktop), R9 3900X, Corsair MP600
386.6 fps -1%
Nvidia Titan RTX
NVIDIA Titan RTX, R7 2700X, ADATA Premier Pro SP900NS38 512 GB
367.8 fps -6%
Nvidia GeForce RTX 2080 Super
GeForce RTX 2080 Super (Desktop), R7 2700X
328.7 fps -16%
Nvidia GeForce RTX 2070 Super
GeForce RTX 2070 Super (Desktop), R7 2700X
290.4 fps -26%
MSI RTX 2070 Gaming Z 8G
GeForce RTX 2070 (Desktop), R7 2700X
275.3 fps -30%
Nvidia GeForce RTX 2060 Super
GeForce RTX 2060 Super (Desktop), R7 2700X
262.4 fps -33%
MSI RTX 2060 Gaming Z 6G
GeForce RTX 2060 (Desktop), R7 2700X
247 fps -37%
AMD Radeon RX 5700 XT
Radeon RX 5700 XT (Desktop), R7 2700X
220.3 fps -44%
AMD Radeon VII
Radeon VII, R7 2700X
212.6 fps -46%
AMD Radeon RX 5700
Radeon RX 5700 (Desktop), R7 2700X
185.2 fps -53%
Energy (energy-02)
AMD Ryzen 9 3900X
NVIDIA Titan RTX, R9 3900X, Corsair MP600
52.3 fps +59%
Nvidia Titan RTX
NVIDIA Titan RTX, R7 2700X, ADATA Premier Pro SP900NS38 512 GB
51.9 fps +58%
AMD Radeon VII
Radeon VII, R7 2700X
35.05 fps +7%
MSI RTX 2080 Ti Gaming X Trio
GeForce RTX 2080 Ti (Desktop), R9 3900X
32.91 fps
KFA2 GeForce RTX 2080 Ti EX
GeForce RTX 2080 Ti (Desktop), R9 3900X, Corsair MP600
31.52 fps -4%
AMD Radeon RX 5700 XT
Radeon RX 5700 XT (Desktop), R7 2700X
26.82 fps -19%
AMD Radeon RX 5700
Radeon RX 5700 (Desktop), R7 2700X
24.55 fps -25%
Nvidia GeForce RTX 2080 Super
GeForce RTX 2080 Super (Desktop), R7 2700X
23.78 fps -28%
Nvidia GeForce RTX 2070 Super
GeForce RTX 2070 Super (Desktop), R7 2700X
23.76 fps -28%
MSI RTX 2070 Gaming Z 8G
GeForce RTX 2070 (Desktop), R7 2700X
22.33 fps -32%
Nvidia GeForce RTX 2060 Super
GeForce RTX 2060 Super (Desktop), R7 2700X
21.81 fps -34%
MSI RTX 2060 Gaming Z 6G
GeForce RTX 2060 (Desktop), R7 2700X
7.62 fps -77%
Creo (creo-02)
AMD Ryzen 9 3900X
NVIDIA Titan RTX, R9 3900X, Corsair MP600
339.2 fps +17%
Nvidia Titan RTX
NVIDIA Titan RTX, R7 2700X, ADATA Premier Pro SP900NS38 512 GB
307.6 fps +6%
MSI RTX 2080 Ti Gaming X Trio
GeForce RTX 2080 Ti (Desktop), R9 3900X
291.1 fps
KFA2 GeForce RTX 2080 Ti EX
GeForce RTX 2080 Ti (Desktop), R9 3900X, Corsair MP600
286.5 fps -2%
MSI RTX 2080 Gaming X Trio
GeForce RTX 2080 (Desktop), R7 2700X
220.3 fps -24%
Nvidia GeForce RTX 2080 Super
GeForce RTX 2080 Super (Desktop), R7 2700X
220.1 fps -24%
MSI RTX 2070 Gaming Z 8G
GeForce RTX 2070 (Desktop), R7 2700X
184.2 fps -37%
Nvidia GeForce RTX 2060 Super
GeForce RTX 2060 Super (Desktop), R7 2700X
172.5 fps -41%
Nvidia GeForce RTX 2070 Super
GeForce RTX 2070 Super (Desktop), R7 2700X
171 fps -41%
MSI RTX 2060 Gaming Z 6G
GeForce RTX 2060 (Desktop), R7 2700X
169.8 fps -42%
AMD Radeon RX 5700 XT
Radeon RX 5700 XT (Desktop), R7 2700X
157 fps -46%
AMD Radeon RX 5700
Radeon RX 5700 (Desktop), R7 2700X
116.7 fps -60%
AMD Radeon VII
Radeon VII, R7 2700X
115.7 fps -60%
Catia (catia-05)
AMD Ryzen 9 3900X
NVIDIA Titan RTX, R9 3900X, Corsair MP600
339.4 fps +88%
Nvidia Titan RTX
NVIDIA Titan RTX, R7 2700X, ADATA Premier Pro SP900NS38 512 GB
260.4 fps +44%
AMD Radeon RX 5700 XT
Radeon RX 5700 XT (Desktop), R7 2700X
242.8 fps +35%
AMD Radeon VII
Radeon VII, R7 2700X
239.2 fps +33%
AMD Radeon RX 5700
Radeon RX 5700 (Desktop), R7 2700X
209.2 fps +16%
MSI RTX 2080 Ti Gaming X Trio
GeForce RTX 2080 Ti (Desktop), R9 3900X
180.3 fps
KFA2 GeForce RTX 2080 Ti EX
GeForce RTX 2080 Ti (Desktop), R9 3900X, Corsair MP600
178.8 fps -1%
Nvidia GeForce RTX 2080 Super
GeForce RTX 2080 Super (Desktop), R7 2700X
157.7 fps -13%
Nvidia GeForce RTX 2070 Super
GeForce RTX 2070 Super (Desktop), R7 2700X
146.3 fps -19%
MSI RTX 2070 Gaming Z 8G
GeForce RTX 2070 (Desktop), R7 2700X
118.6 fps -34%
Nvidia GeForce RTX 2060 Super
GeForce RTX 2060 Super (Desktop), R7 2700X
114.6 fps -36%
MSI RTX 2060 Gaming Z 6G
GeForce RTX 2060 (Desktop), R7 2700X
108.2 fps -40%
3ds Max (3dsmax-06)
AMD Ryzen 9 3900X
NVIDIA Titan RTX, R9 3900X, Corsair MP600
285.1 fps +5%
MSI RTX 2080 Ti Gaming X Trio
GeForce RTX 2080 Ti (Desktop), R9 3900X
272.4 fps
KFA2 GeForce RTX 2080 Ti EX
GeForce RTX 2080 Ti (Desktop), R9 3900X, Corsair MP600
269.4 fps -1%
Nvidia Titan RTX
NVIDIA Titan RTX, R7 2700X, ADATA Premier Pro SP900NS38 512 GB
268.7 fps -1%
Nvidia GeForce RTX 2080 Super
GeForce RTX 2080 Super (Desktop), R7 2700X
227.8 fps -16%
Nvidia GeForce RTX 2070 Super
GeForce RTX 2070 Super (Desktop), R7 2700X
212.4 fps -22%
MSI RTX 2070 Gaming Z 8G
GeForce RTX 2070 (Desktop), R7 2700X
207.3 fps -24%
Nvidia GeForce RTX 2060 Super
GeForce RTX 2060 Super (Desktop), R7 2700X
199.4 fps -27%
MSI RTX 2060 Gaming Z 6G
GeForce RTX 2060 (Desktop), R7 2700X
184.4 fps -32%
AMD Radeon RX 5700 XT
Radeon RX 5700 XT (Desktop), R7 2700X
175.6 fps -36%
AMD Radeon VII
Radeon VII, R7 2700X
168.5 fps -38%
AMD Radeon RX 5700
Radeon RX 5700 (Desktop), R7 2700X
157 fps -42%
SPECviewperf 12
1900x1060 Solidworks (sw-03)
AMD Ryzen 9 3900X
NVIDIA Titan RTX, R9 3900X, Corsair MP600
153.8 fps +94%
Nvidia Titan RTX
NVIDIA Titan RTX, R7 2700X, ADATA Premier Pro SP900NS38 512 GB
139.6 fps +76%
AMD Radeon RX 5700 XT
Radeon RX 5700 XT (Desktop), R7 2700X
89.6 fps +13%
MSI RTX 2080 Ti Gaming X Trio
GeForce RTX 2080 Ti (Desktop), R9 3900X
79.3 fps
AMD Radeon RX 5700
Radeon RX 5700 (Desktop), R7 2700X
79.2 fps 0%
KFA2 GeForce RTX 2080 Ti EX
GeForce RTX 2080 Ti (Desktop), R9 3900X, Corsair MP600
78.4 fps -1%
AMD Radeon VII
Radeon VII, R7 2700X
75.9 fps -4%
Nvidia GeForce RTX 2080 Super
GeForce RTX 2080 Super (Desktop), R7 2700X
70.8 fps -11%
MSI RTX 2080 Gaming X Trio
GeForce RTX 2080 (Desktop), R7 2700X
70.1 fps -12%
Nvidia GeForce RTX 2070 Super
GeForce RTX 2070 Super (Desktop), R7 2700X
65.4 fps -18%
MSI RTX 2070 Gaming Z 8G
GeForce RTX 2070 (Desktop), R7 2700X
60.6 fps -24%
Nvidia GeForce RTX 2060 Super
GeForce RTX 2060 Super (Desktop), R7 2700X
58.9 fps -26%
MSI RTX 2060 Gaming Z 6G
GeForce RTX 2060 (Desktop), R7 2700X
57.6 fps -27%
1900x1060 Siemens NX (snx-02)
AMD Ryzen 9 3900X
NVIDIA Titan RTX, R9 3900X, Corsair MP600
264.9 fps +2036%
Nvidia Titan RTX
NVIDIA Titan RTX, R7 2700X, ADATA Premier Pro SP900NS38 512 GB
256.3 fps +1967%
AMD Radeon RX 5700 XT
Radeon RX 5700 XT (Desktop), R7 2700X
35.27 fps +184%
AMD Radeon RX 5700
Radeon RX 5700 (Desktop), R7 2700X
33.5 fps +170%
AMD Radeon VII
Radeon VII, R7 2700X
20.54 fps +66%
MSI RTX 2080 Ti Gaming X Trio
GeForce RTX 2080 Ti (Desktop), R9 3900X
12.4 fps
Nvidia GeForce RTX 2080 Super
GeForce RTX 2080 Super (Desktop), R7 2700X
12.26 fps -1%
KFA2 GeForce RTX 2080 Ti EX
GeForce RTX 2080 Ti (Desktop), R9 3900X, Corsair MP600
12.16 fps -2%
MSI RTX 2080 Gaming X Trio
GeForce RTX 2080 (Desktop), R7 2700X
12.08 fps -3%
Nvidia GeForce RTX 2070 Super
GeForce RTX 2070 Super (Desktop), R7 2700X
11.44 fps -8%
MSI RTX 2070 Gaming Z 8G
GeForce RTX 2070 (Desktop), R7 2700X
8.63 fps -30%
Nvidia GeForce RTX 2060 Super
GeForce RTX 2060 Super (Desktop), R7 2700X
8.57 fps -31%
MSI RTX 2060 Gaming Z 6G
GeForce RTX 2060 (Desktop), R7 2700X
8.35 fps -33%
1900x1060 Showcase (showcase-01)
Nvidia Titan RTX
NVIDIA Titan RTX, R7 2700X, ADATA Premier Pro SP900NS38 512 GB
191.6 fps +7%
AMD Ryzen 9 3900X
NVIDIA Titan RTX, R9 3900X, Corsair MP600
190.9 fps +7%
MSI RTX 2080 Ti Gaming X Trio
GeForce RTX 2080 Ti (Desktop), R9 3900X
179.2 fps
KFA2 GeForce RTX 2080 Ti EX
GeForce RTX 2080 Ti (Desktop), R9 3900X, Corsair MP600
175.6 fps -2%
Nvidia GeForce RTX 2080 Super
GeForce RTX 2080 Super (Desktop), R7 2700X
143.6 fps -20%
AMD Radeon RX 5700 XT
Radeon RX 5700 XT (Desktop), R7 2700X
137.8 fps -23%
Nvidia GeForce RTX 2070 Super
GeForce RTX 2070 Super (Desktop), R7 2700X
128.2 fps -28%
AMD Radeon RX 5700
Radeon RX 5700 (Desktop), R7 2700X
126.9 fps -29%
Nvidia GeForce RTX 2060 Super
GeForce RTX 2060 Super (Desktop), R7 2700X
116.9 fps -35%
MSI RTX 2060 Gaming Z 6G
GeForce RTX 2060 (Desktop), R7 2700X
101 fps -44%
1900x1060 Medical (medical-01)
Nvidia Titan RTX
NVIDIA Titan RTX, R7 2700X, ADATA Premier Pro SP900NS38 512 GB
87 fps +70%
AMD Ryzen 9 3900X
NVIDIA Titan RTX, R9 3900X, Corsair MP600
86.4 fps +69%
AMD Radeon VII
Radeon VII, R7 2700X
52.3 fps +2%
MSI RTX 2080 Ti Gaming X Trio
GeForce RTX 2080 Ti (Desktop), R9 3900X
51.1 fps
KFA2 GeForce RTX 2080 Ti EX
GeForce RTX 2080 Ti (Desktop), R9 3900X, Corsair MP600
48.61 fps -5%
AMD Radeon RX 5700 XT
Radeon RX 5700 XT (Desktop), R7 2700X
46.9 fps -8%
Nvidia GeForce RTX 2080 Super
GeForce RTX 2080 Super (Desktop), R7 2700X
45 fps -12%
MSI RTX 2080 Gaming X Trio
GeForce RTX 2080 (Desktop), R7 2700X
44.89 fps -12%
Nvidia GeForce RTX 2070 Super
GeForce RTX 2070 Super (Desktop), R7 2700X
42.65 fps -17%
AMD Radeon RX 5700
Radeon RX 5700 (Desktop), R7 2700X
40.97 fps -20%
MSI RTX 2070 Gaming Z 8G
GeForce RTX 2070 (Desktop), R7 2700X
39.61 fps -22%
Nvidia GeForce RTX 2060 Super
GeForce RTX 2060 Super (Desktop), R7 2700X
38 fps -26%
MSI RTX 2060 Gaming Z 6G
GeForce RTX 2060 (Desktop), R7 2700X
35.22 fps -31%
1900x1060 Maya (maya-04)
MSI RTX 2080 Ti Gaming X Trio
GeForce RTX 2080 Ti (Desktop), R9 3900X
180.8 fps
KFA2 GeForce RTX 2080 Ti EX
GeForce RTX 2080 Ti (Desktop), R9 3900X, Corsair MP600
177.8 fps -2%
AMD Ryzen 9 3900X
NVIDIA Titan RTX, R9 3900X, Corsair MP600
153.8 fps -15%
MSI RTX 2080 Gaming X Trio
GeForce RTX 2080 (Desktop), R7 2700X
148.7 fps -18%
Nvidia GeForce RTX 2060 Super
GeForce RTX 2060 Super (Desktop), R7 2700X
146.3 fps -19%
MSI RTX 2070 Gaming Z 8G
GeForce RTX 2070 (Desktop), R7 2700X
146.2 fps -19%
Nvidia GeForce RTX 2080 Super
GeForce RTX 2080 Super (Desktop), R7 2700X
134.8 fps -25%
Nvidia Titan RTX
NVIDIA Titan RTX, R7 2700X, ADATA Premier Pro SP900NS38 512 GB
132.8 fps -27%
MSI RTX 2060 Gaming Z 6G
GeForce RTX 2060 (Desktop), R7 2700X
127.4 fps -30%
Nvidia GeForce RTX 2070 Super
GeForce RTX 2070 Super (Desktop), R7 2700X
125.1 fps -31%
AMD Radeon VII
Radeon VII, R7 2700X
88.1 fps -51%
AMD Radeon RX 5700 XT
Radeon RX 5700 XT (Desktop), R7 2700X
86.5 fps -52%
AMD Radeon RX 5700
Radeon RX 5700 (Desktop), R7 2700X
73.3 fps -59%
1900x1060 Energy (energy-01)
Nvidia Titan RTX
NVIDIA Titan RTX, R7 2700X, ADATA Premier Pro SP900NS38 512 GB
28.12 fps +69%
AMD Ryzen 9 3900X
NVIDIA Titan RTX, R9 3900X, Corsair MP600
27.81 fps +67%
MSI RTX 2080 Ti Gaming X Trio
GeForce RTX 2080 Ti (Desktop), R9 3900X
16.68 fps
AMD Radeon VII
Radeon VII, R7 2700X
16.63 fps 0%
KFA2 GeForce RTX 2080 Ti EX
GeForce RTX 2080 Ti (Desktop), R9 3900X, Corsair MP600
15.86 fps -5%
Nvidia GeForce RTX 2080 Super
GeForce RTX 2080 Super (Desktop), R7 2700X
13.09 fps -22%
AMD Radeon RX 5700 XT
Radeon RX 5700 XT (Desktop), R7 2700X
12.72 fps -24%
MSI RTX 2080 Gaming X Trio
GeForce RTX 2080 (Desktop), R7 2700X
12.52 fps -25%
Nvidia GeForce RTX 2070 Super
GeForce RTX 2070 Super (Desktop), R7 2700X
11.96 fps -28%
AMD Radeon RX 5700
Radeon RX 5700 (Desktop), R7 2700X
11.53 fps -31%
MSI RTX 2070 Gaming Z 8G
GeForce RTX 2070 (Desktop), R7 2700X
11.27 fps -32%
Nvidia GeForce RTX 2060 Super
GeForce RTX 2060 Super (Desktop), R7 2700X
11.07 fps -34%
MSI RTX 2060 Gaming Z 6G
GeForce RTX 2060 (Desktop), R7 2700X
9.19 fps -45%
1900x1060 Creo (creo-01)
AMD Ryzen 9 3900X
NVIDIA Titan RTX, R9 3900X, Corsair MP600
133.9 fps +112%
Nvidia Titan RTX
NVIDIA Titan RTX, R7 2700X, ADATA Premier Pro SP900NS38 512 GB
106.3 fps +68%
AMD Radeon RX 5700 XT
Radeon RX 5700 XT (Desktop), R7 2700X
66.9 fps +6%
MSI RTX 2080 Ti Gaming X Trio
GeForce RTX 2080 Ti (Desktop), R9 3900X
63.3 fps
KFA2 GeForce RTX 2080 Ti EX
GeForce RTX 2080 Ti (Desktop), R9 3900X, Corsair MP600
63.1 fps 0%
AMD Radeon RX 5700
Radeon RX 5700 (Desktop), R7 2700X
60.2 fps -5%
AMD Radeon VII
Radeon VII, R7 2700X
55.4 fps -12%
Nvidia GeForce RTX 2080 Super
GeForce RTX 2080 Super (Desktop), R7 2700X
52.7 fps -17%
MSI RTX 2080 Gaming X Trio
GeForce RTX 2080 (Desktop), R7 2700X
52.5 fps -17%
Nvidia GeForce RTX 2070 Super
GeForce RTX 2070 Super (Desktop), R7 2700X
47.4 fps -25%
MSI RTX 2070 Gaming Z 8G
GeForce RTX 2070 (Desktop), R7 2700X
45.67 fps -28%
MSI RTX 2060 Gaming Z 6G
GeForce RTX 2060 (Desktop), R7 2700X
44.45 fps -30%
Nvidia GeForce RTX 2060 Super
GeForce RTX 2060 Super (Desktop), R7 2700X
43.87 fps -31%
1900x1060 Catia (catia-04)
AMD Ryzen 9 3900X
NVIDIA Titan RTX, R9 3900X, Corsair MP600
214.3 fps +78%
Nvidia Titan RTX
NVIDIA Titan RTX, R7 2700X, ADATA Premier Pro SP900NS38 512 GB
178.1 fps +48%
AMD Radeon VII
Radeon VII, R7 2700X
159.1 fps +32%
AMD Radeon RX 5700 XT
Radeon RX 5700 XT (Desktop), R7 2700X
158.8 fps +32%
AMD Radeon RX 5700
Radeon RX 5700 (Desktop), R7 2700X
135.7 fps +13%
MSI RTX 2080 Ti Gaming X Trio
GeForce RTX 2080 Ti (Desktop), R9 3900X
120.6 fps
KFA2 GeForce RTX 2080 Ti EX
GeForce RTX 2080 Ti (Desktop), R9 3900X, Corsair MP600
118.5 fps -2%
MSI RTX 2080 Gaming X Trio
GeForce RTX 2080 (Desktop), R7 2700X
109.4 fps -9%
Nvidia GeForce RTX 2080 Super
GeForce RTX 2080 Super (Desktop), R7 2700X
104.2 fps -14%
Nvidia GeForce RTX 2070 Super
GeForce RTX 2070 Super (Desktop), R7 2700X
96.3 fps -20%
MSI RTX 2070 Gaming Z 8G
GeForce RTX 2070 (Desktop), R7 2700X
81.9 fps -32%
Nvidia GeForce RTX 2060 Super
GeForce RTX 2060 Super (Desktop), R7 2700X
77.1 fps -36%
MSI RTX 2060 Gaming Z 6G
GeForce RTX 2060 (Desktop), R7 2700X
74.8 fps -38%
1900x1060 3ds Max (3dsmax-05)
AMD Ryzen 9 3900X
NVIDIA Titan RTX, R9 3900X, Corsair MP600
283 fps +4%
MSI RTX 2080 Ti Gaming X Trio
GeForce RTX 2080 Ti (Desktop), R9 3900X
272.7 fps
Nvidia Titan RTX
NVIDIA Titan RTX, R7 2700X, ADATA Premier Pro SP900NS38 512 GB
268.2 fps -2%
KFA2 GeForce RTX 2080 Ti EX
GeForce RTX 2080 Ti (Desktop), R9 3900X, Corsair MP600
258.1 fps -5%
MSI RTX 2080 Gaming X Trio
GeForce RTX 2080 (Desktop), R7 2700X
234.1 fps -14%
Nvidia GeForce RTX 2080 Super
GeForce RTX 2080 Super (Desktop), R7 2700X
225.8 fps -17%
Nvidia GeForce RTX 2070 Super
GeForce RTX 2070 Super (Desktop), R7 2700X
211.8 fps -22%
MSI RTX 2070 Gaming Z 8G
GeForce RTX 2070 (Desktop), R7 2700X
207.2 fps -24%
Nvidia GeForce RTX 2060 Super
GeForce RTX 2060 Super (Desktop), R7 2700X
201.5 fps -26%
MSI RTX 2060 Gaming Z 6G
GeForce RTX 2060 (Desktop), R7 2700X
183.6 fps -33%
AMD Radeon RX 5700 XT
Radeon RX 5700 XT (Desktop), R7 2700X
173.8 fps -36%
AMD Radeon VII
Radeon VII, R7 2700X
166.9 fps -39%
AMD Radeon RX 5700
Radeon RX 5700 (Desktop), R7 2700X
155.7 fps -43%
SiSoft Sandra 2016
Image Processing
AMD Radeon VII
Radeon VII, R7 2700X
2800 MPix/s +41%
MSI RTX 2080 Ti Gaming X Trio
GeForce RTX 2080 Ti (Desktop), R9 3900X
1988 MPix/s
KFA2 GeForce RTX 2080 Ti EX
GeForce RTX 2080 Ti (Desktop), R9 3900X, Corsair MP600
1959 MPix/s -1%
Nvidia GeForce RTX 2080 Super
GeForce RTX 2080 Super (Desktop), R7 2700X
1430 MPix/s -28%
MSI RTX 2080 Gaming X Trio
GeForce RTX 2080 (Desktop), R7 2700X
1380 MPix/s -31%
Nvidia GeForce RTX 2070 Super
GeForce RTX 2070 Super (Desktop), R7 2700X
1250 MPix/s -37%
MSI RTX 2070 Gaming Z 8G
GeForce RTX 2070 (Desktop), R7 2700X
1150 MPix/s -42%
Nvidia GeForce RTX 2060 Super
GeForce RTX 2060 Super (Desktop), R7 2700X
1110 MPix/s -44%
AMD Radeon RX 5700 XT
Radeon RX 5700 XT (Desktop), R7 2700X
919 MPix/s -54%
MSI RTX 2060 Gaming Z 6G
GeForce RTX 2060 (Desktop), R7 2700X
912 MPix/s -54%
AMD Radeon RX 5700
Radeon RX 5700 (Desktop), R7 2700X
775 MPix/s -61%
GP Cryptography (Higher Security AES256+SHA2-512)
MSI RTX 2080 Ti Gaming X Trio
GeForce RTX 2080 Ti (Desktop), R9 3900X
148.9 GB/s
KFA2 GeForce RTX 2080 Ti EX
GeForce RTX 2080 Ti (Desktop), R9 3900X, Corsair MP600
129.3 GB/s -13%
MSI RTX 2080 Gaming X Trio
GeForce RTX 2080 (Desktop), R7 2700X
101.8 GB/s -32%
AMD Radeon VII
Radeon VII, R7 2700X
99.2 GB/s -33%
Nvidia GeForce RTX 2080 Super
GeForce RTX 2080 Super (Desktop), R7 2700X
95.7 GB/s -36%
Nvidia GeForce RTX 2070 Super
GeForce RTX 2070 Super (Desktop), R7 2700X
88.4 GB/s -41%
MSI RTX 2070 Gaming Z 8G
GeForce RTX 2070 (Desktop), R7 2700X
75.4 GB/s -49%
Nvidia GeForce RTX 2060 Super
GeForce RTX 2060 Super (Desktop), R7 2700X
74.6 GB/s -50%
MSI RTX 2060 Gaming Z 6G
GeForce RTX 2060 (Desktop), R7 2700X
63.8 GB/s -57%
GP Financial Analysis (FP High/Double Precision)
AMD Radeon VII
Radeon VII, R7 2700X
1130 KOPT/s +437%
MSI RTX 2080 Ti Gaming X Trio
GeForce RTX 2080 Ti (Desktop), R9 3900X
210.6 KOPT/s
KFA2 GeForce RTX 2080 Ti EX
GeForce RTX 2080 Ti (Desktop), R9 3900X, Corsair MP600
206.8 KOPT/s -2%
MSI RTX 2080 Gaming X Trio
GeForce RTX 2080 (Desktop), R7 2700X
159.4 KOPT/s -24%
Nvidia GeForce RTX 2080 Super
GeForce RTX 2080 Super (Desktop), R7 2700X
151.5 KOPT/s -28%
Nvidia GeForce RTX 2070 Super
GeForce RTX 2070 Super (Desktop), R7 2700X
124.7 KOPT/s -41%
MSI RTX 2070 Gaming Z 8G
GeForce RTX 2070 (Desktop), R7 2700X
121.3 KOPT/s -42%
Nvidia GeForce RTX 2060 Super
GeForce RTX 2060 Super (Desktop), R7 2700X
105.3 KOPT/s -50%
MSI RTX 2060 Gaming Z 6G
GeForce RTX 2060 (Desktop), R7 2700X
99.1 KOPT/s -53%
AMD Radeon RX 5700 XT
Radeon RX 5700 XT (Desktop), R7 2700X
24 KOPT/s -89%
AMD Radeon RX 5700
Radeon RX 5700 (Desktop), R7 2700X
20.81 KOPT/s -90%

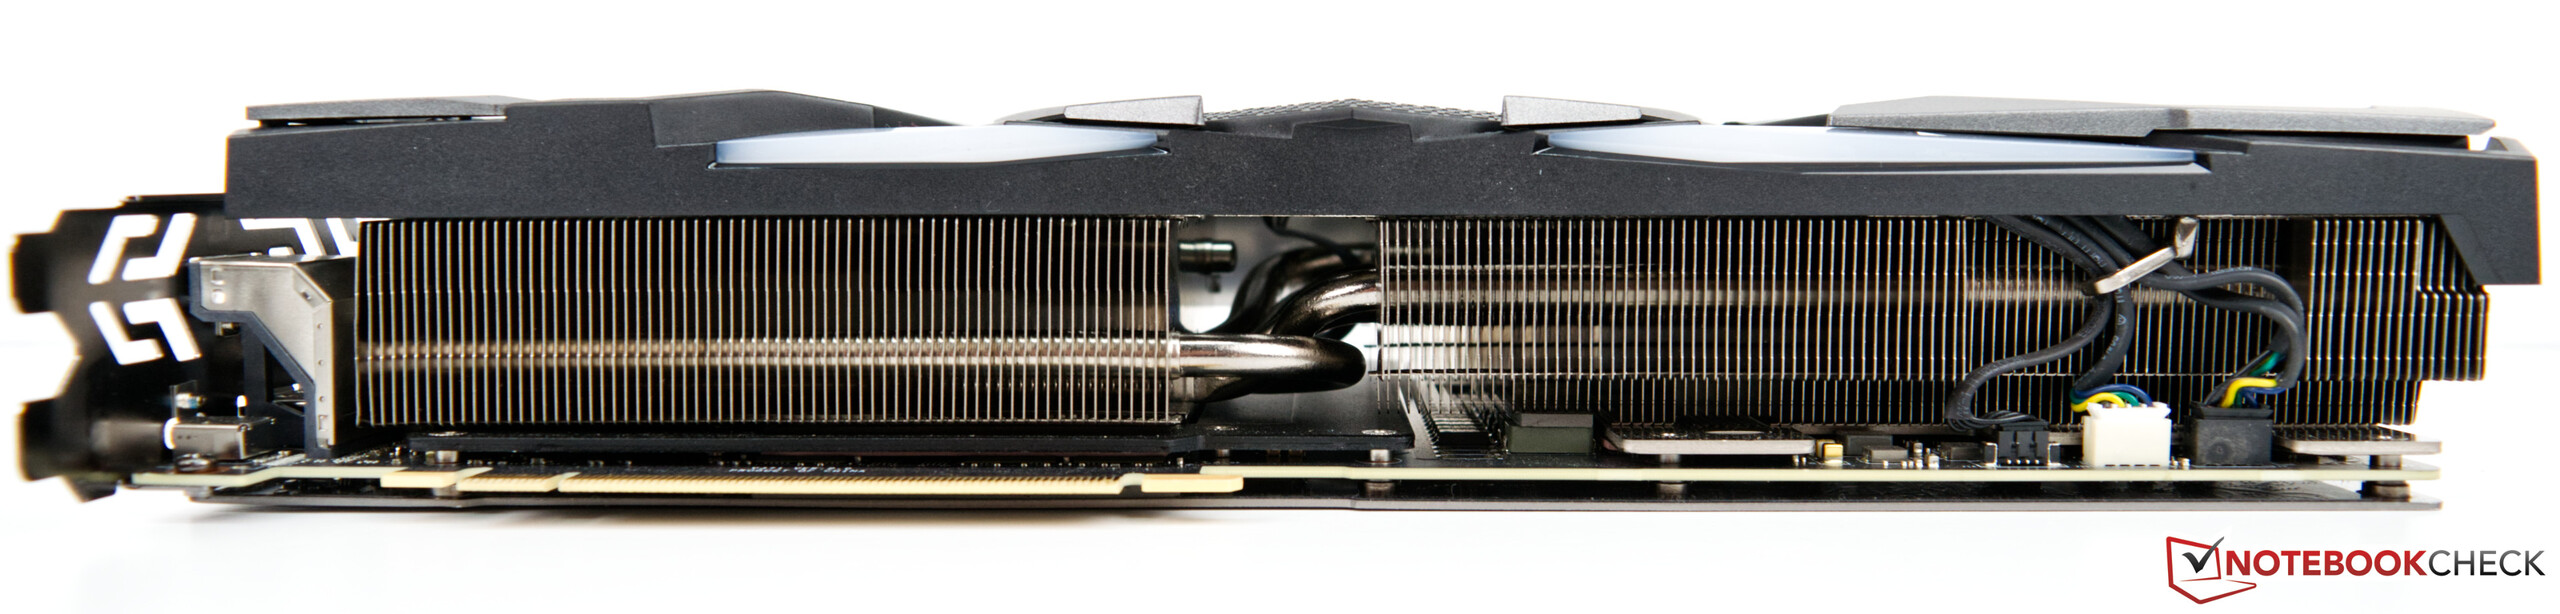
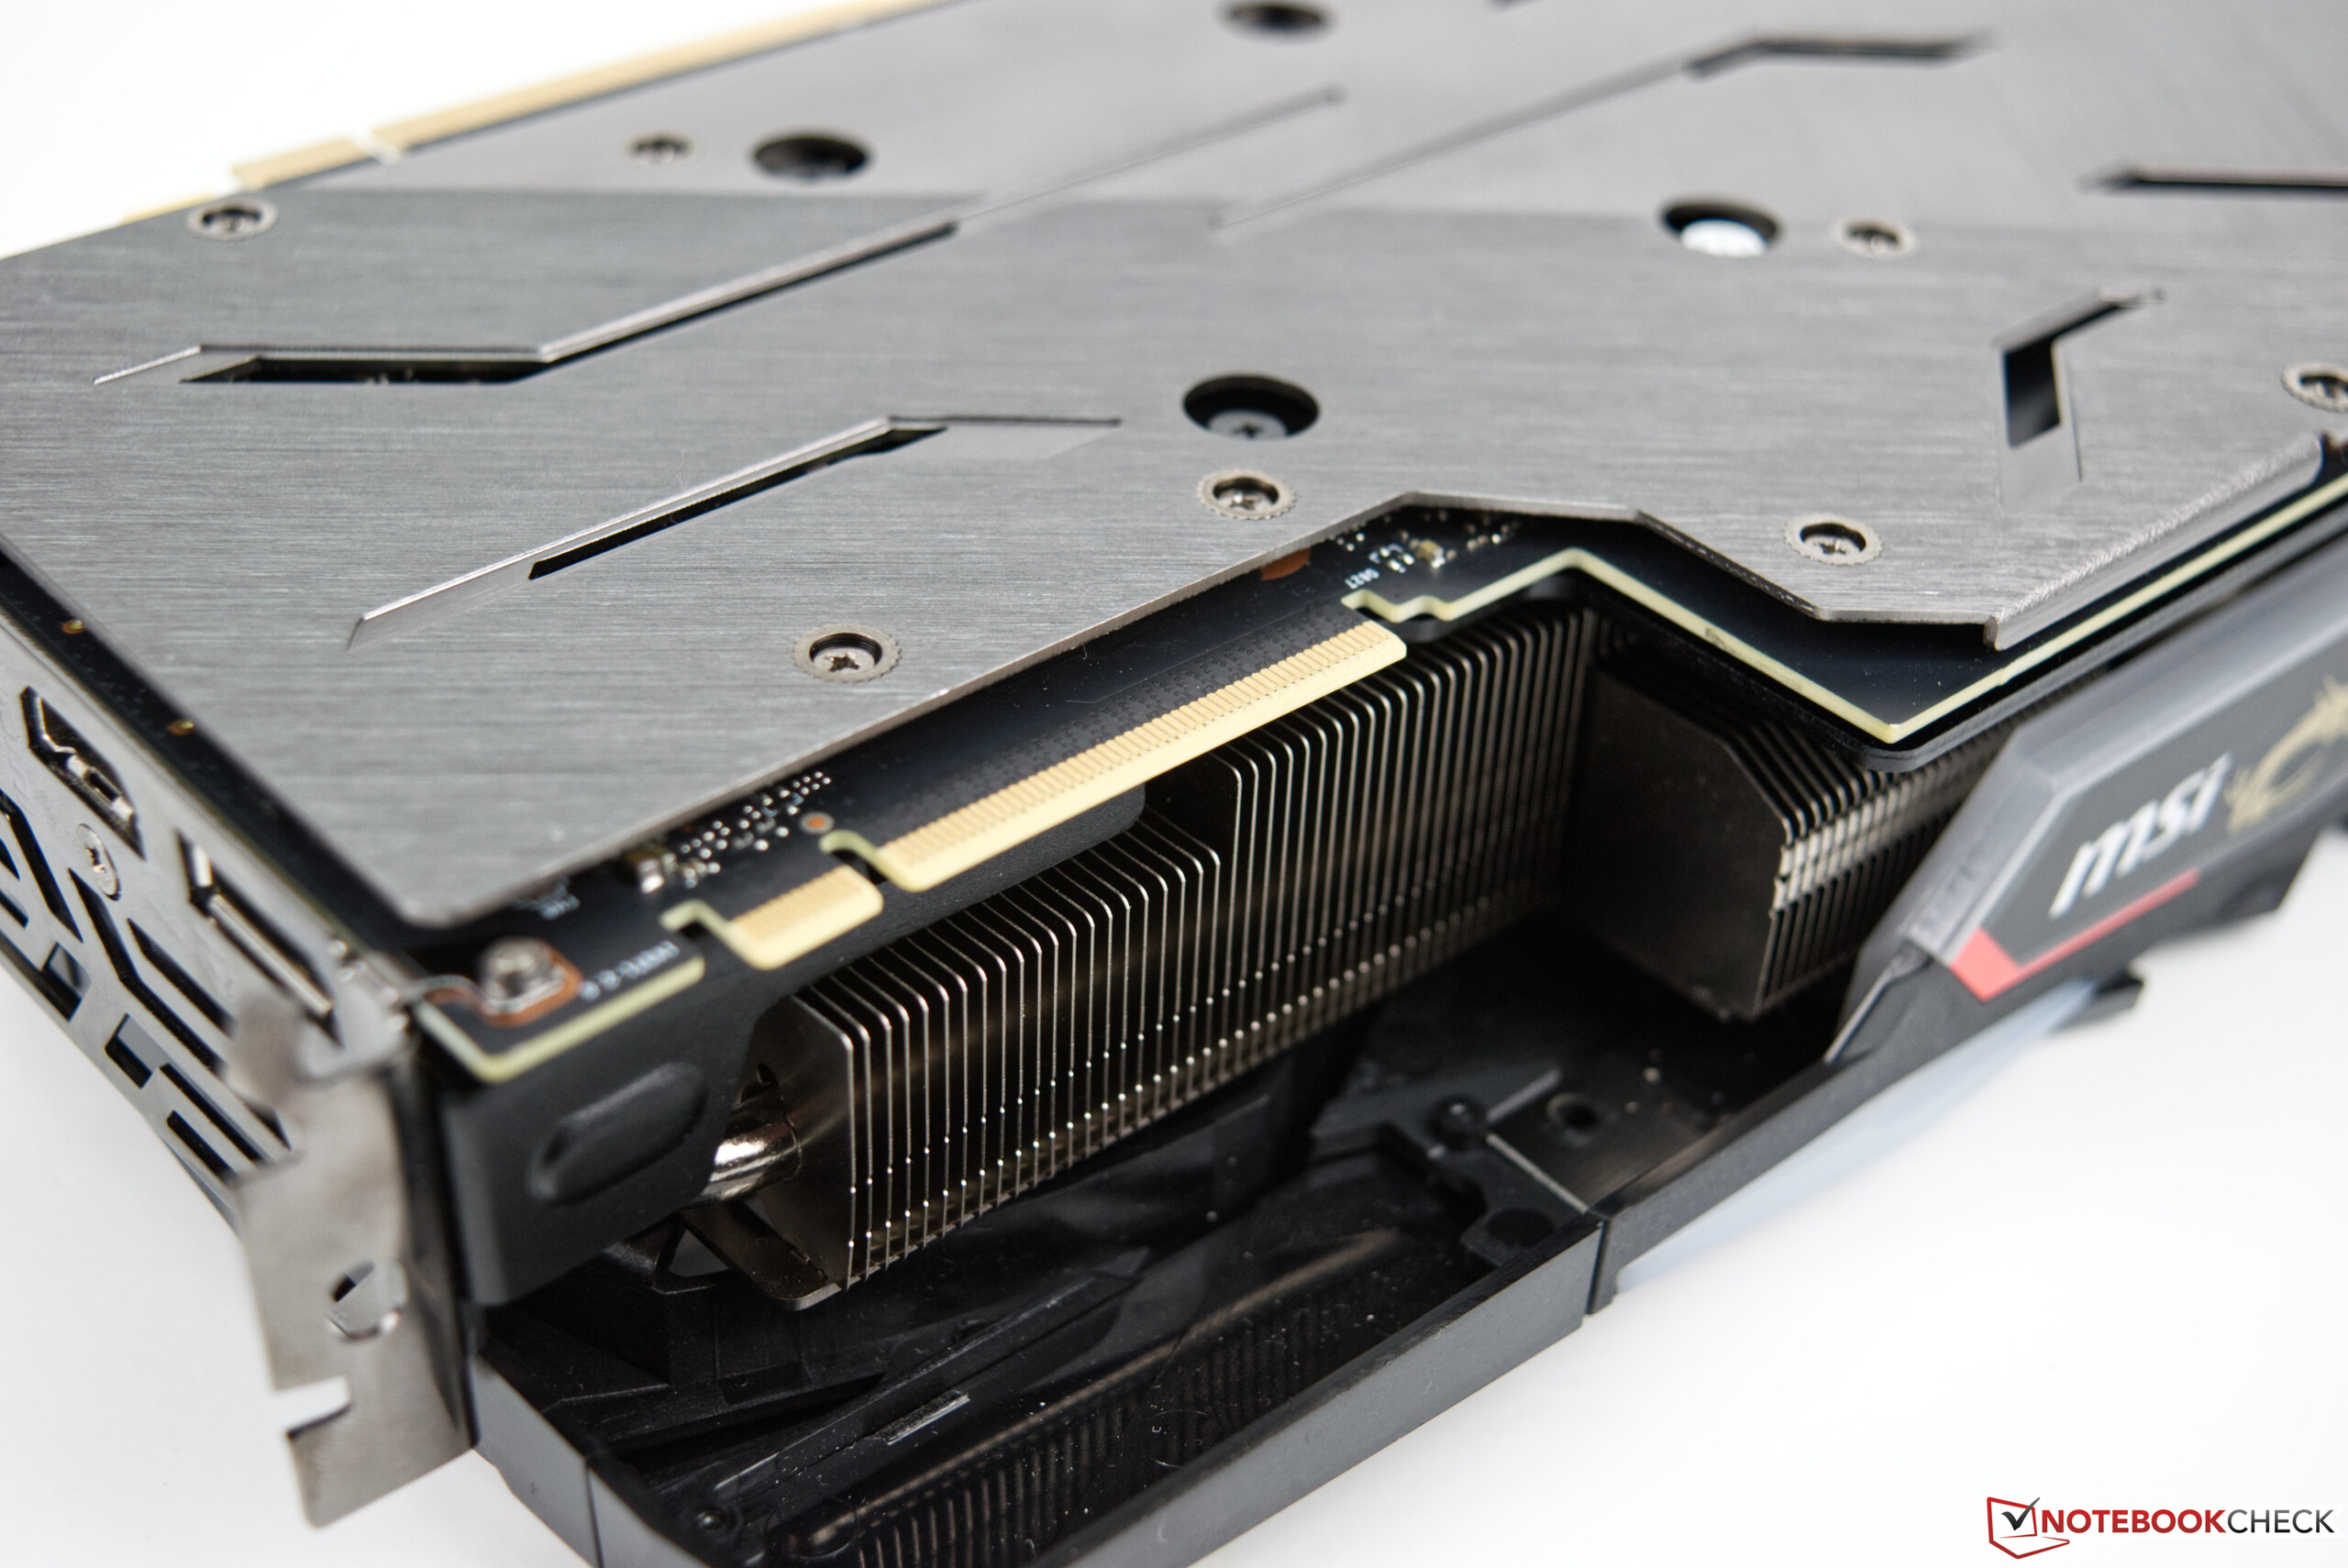
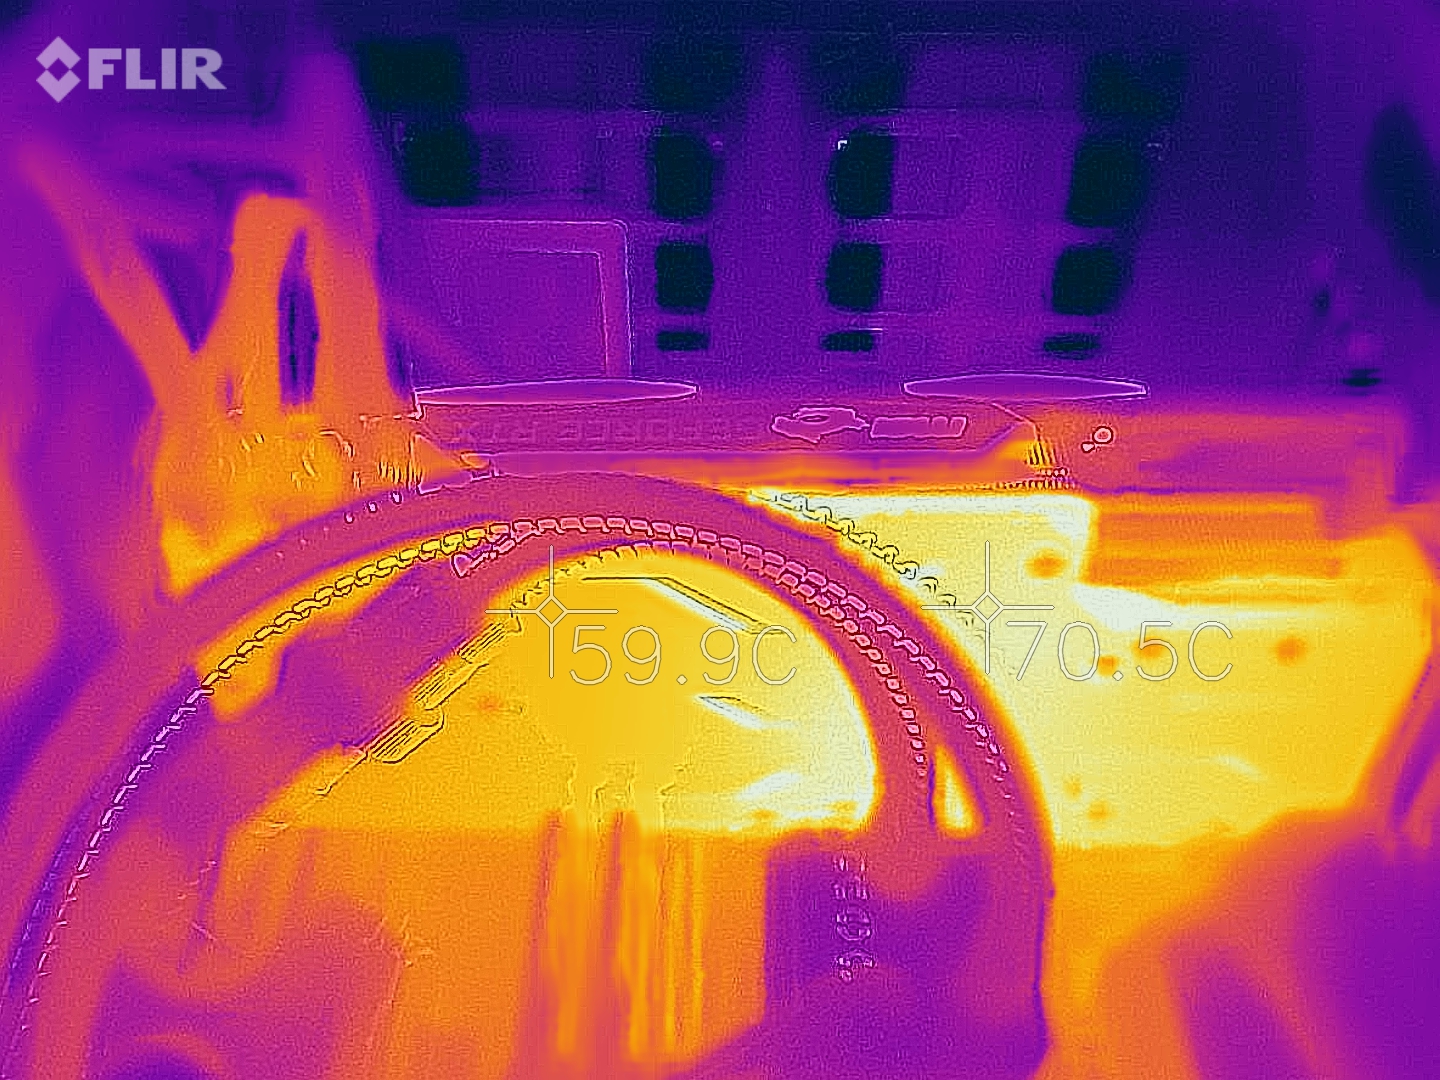
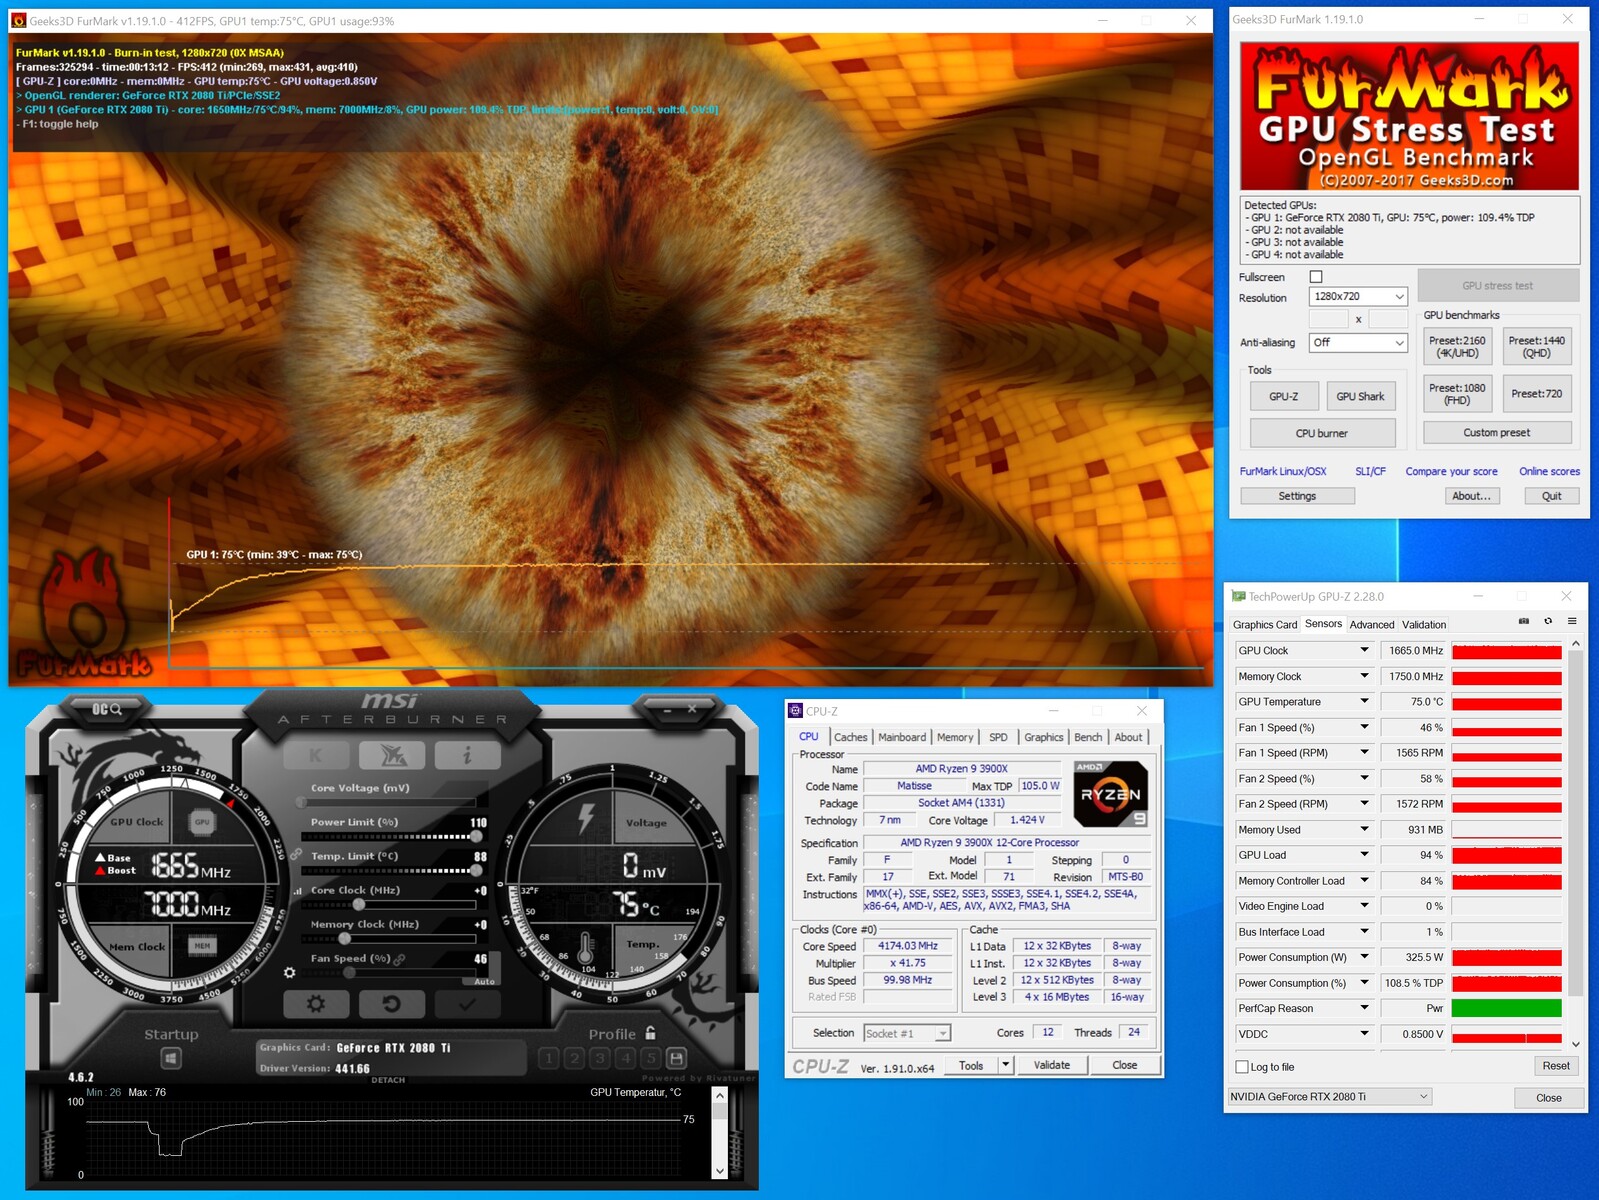
Emissioni - Il consumo energetico relativamente elevato consente di ottenere temperature e rumorositò basse sotto carico

Mappa termica dell'MSI GeForce RTX 2080 Ti Gaming X Trio durante una prova di stress (PT 100%)

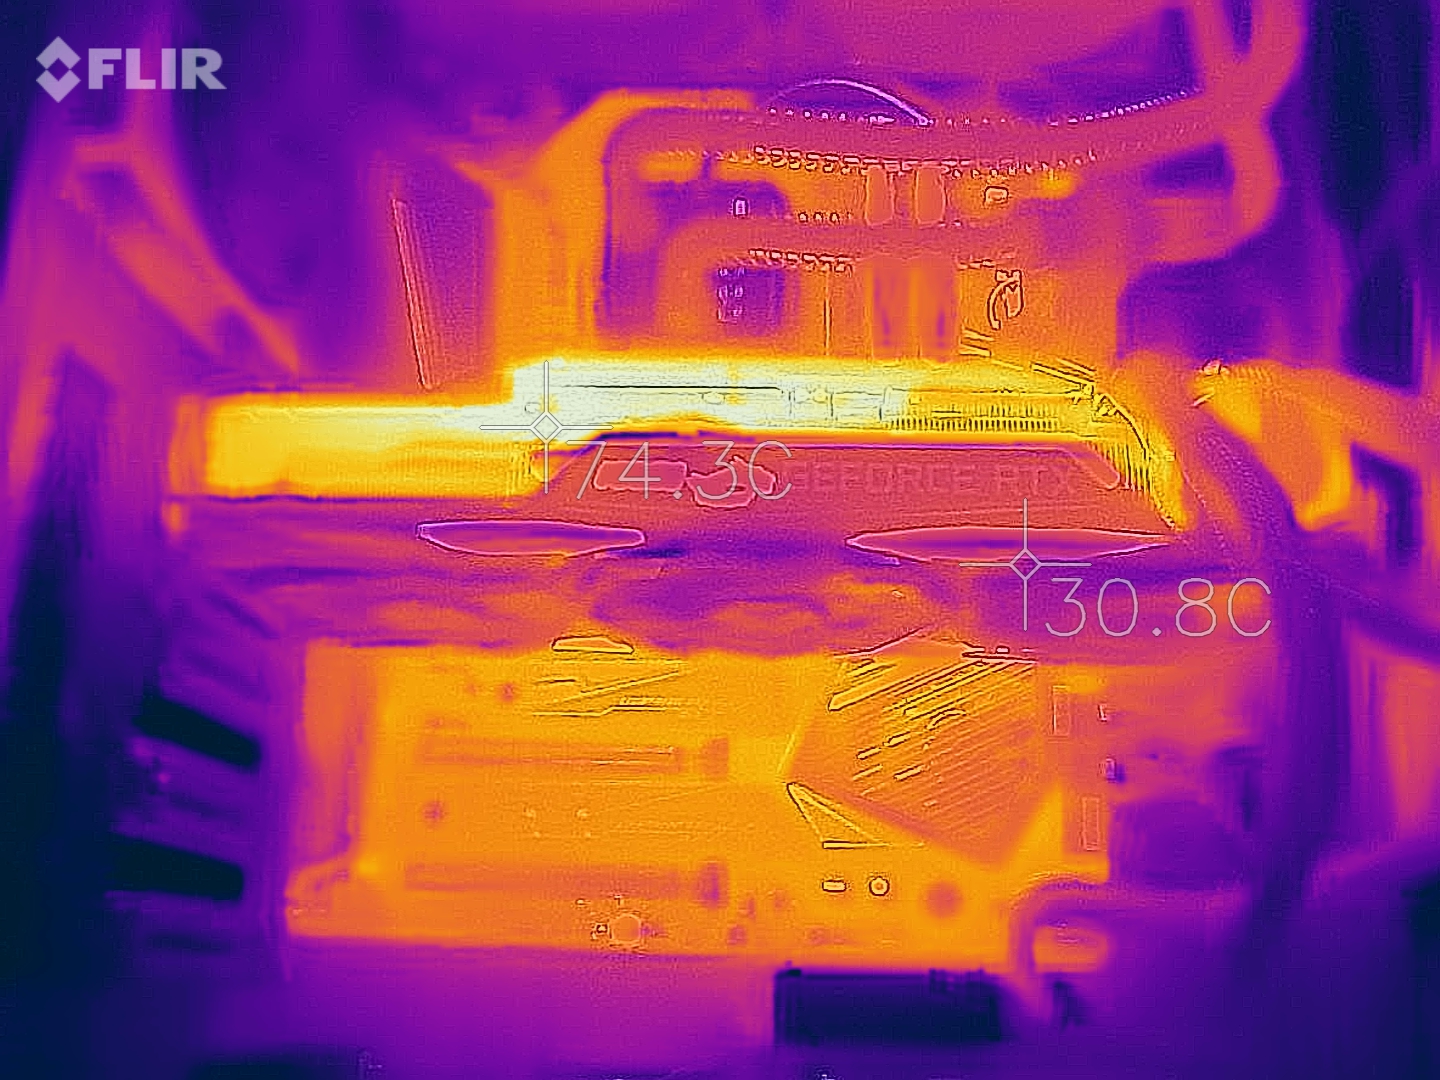
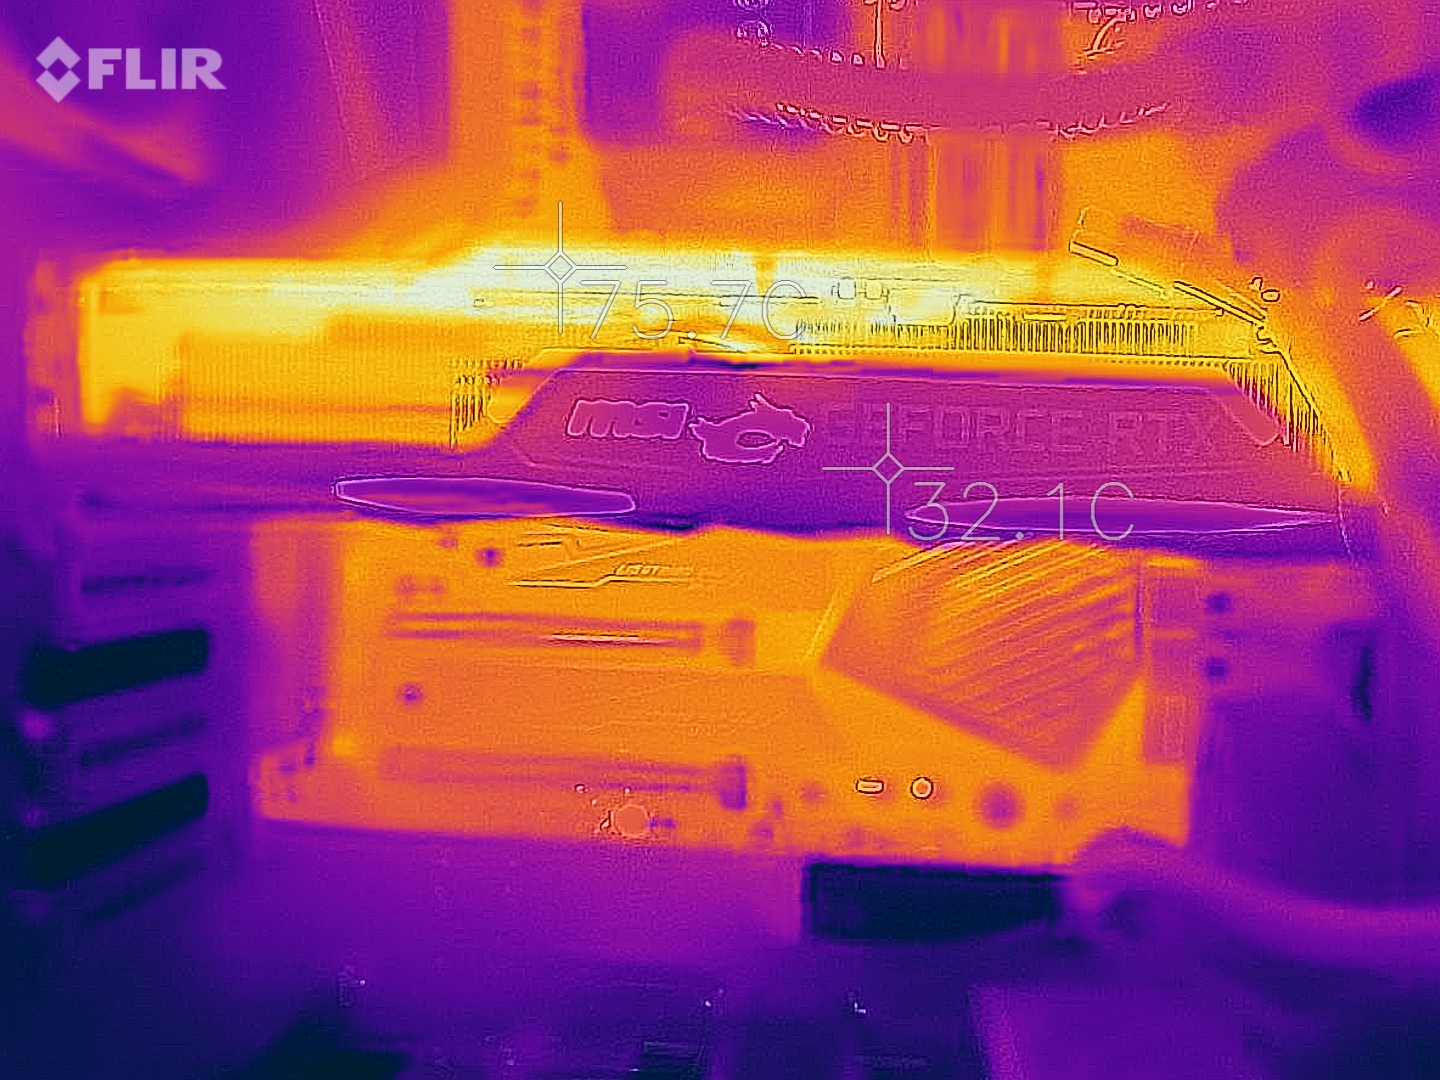
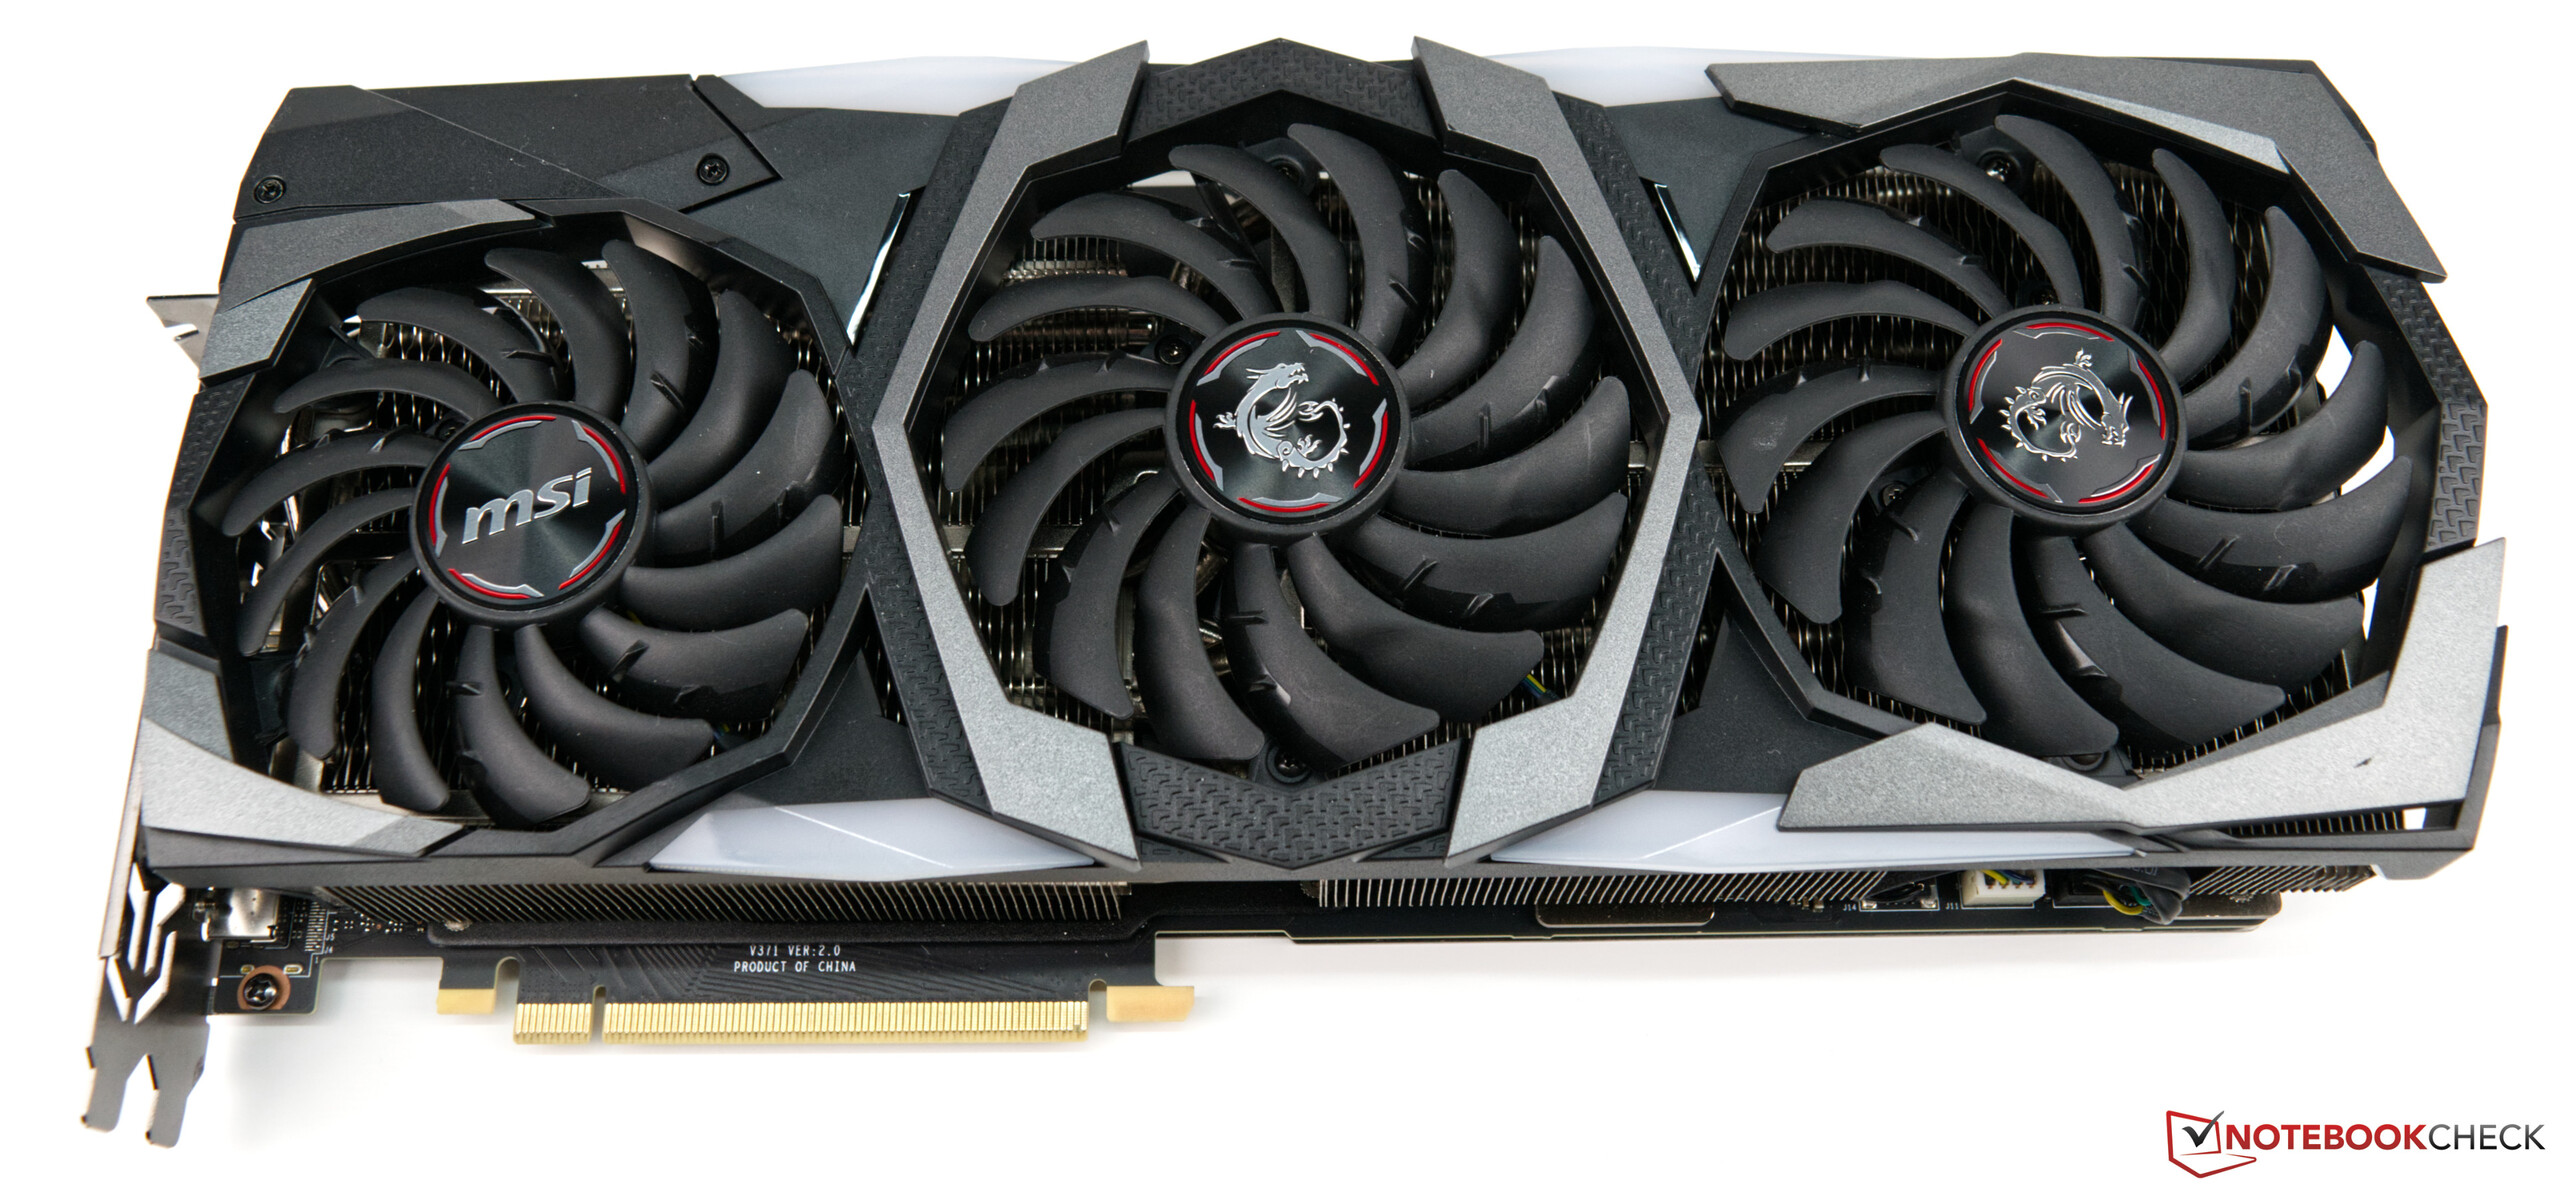
MSI non ha esattamente aderito alle specifiche della NVIDIA RTX 2080 Ti con il Gaming X Trio. Questo non solo è vero per il sistema di raffreddamento con cui l'azienda ha equipaggiato la scheda, ma si riflette anche nel suo consumo energetico. A differenza di NVIDIA e della sua Founders Edition, MSI ha equipaggiato il Gaming X Trio con tre ventole assiali.

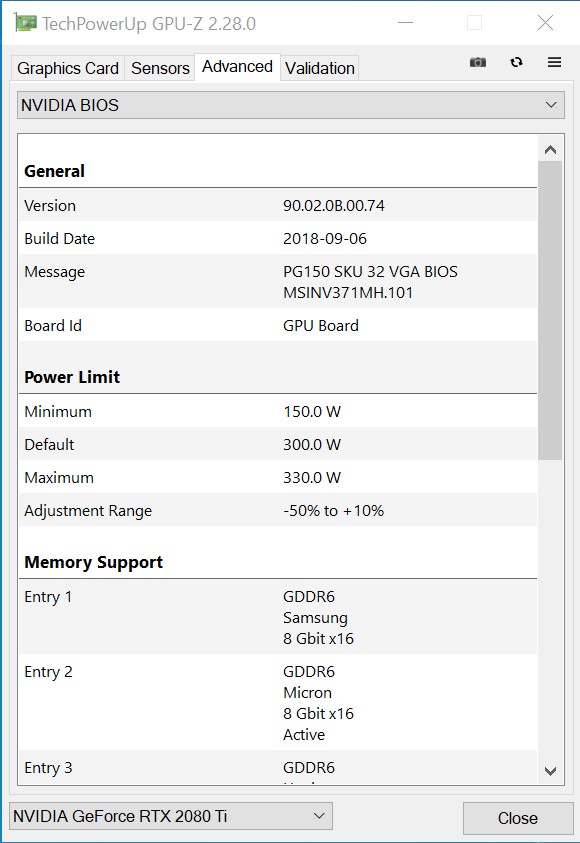
Nel frattempo, la GPU può consumare fino a 300 W sotto carico, 40 W in più rispetto alla Founders Edition a 260 W. Anche il PT del Gaming X Trio può essere aumentato del 10%, ottenendo un TDP massimo di 330 W.
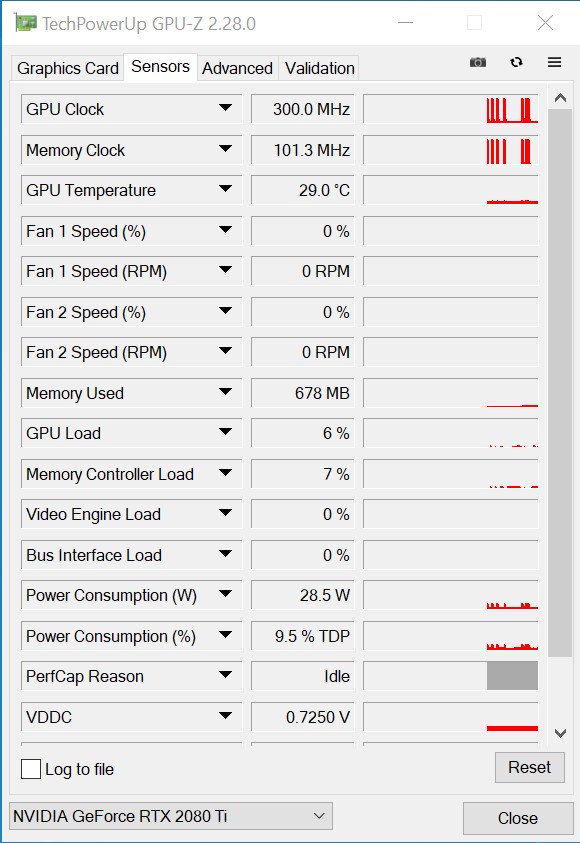
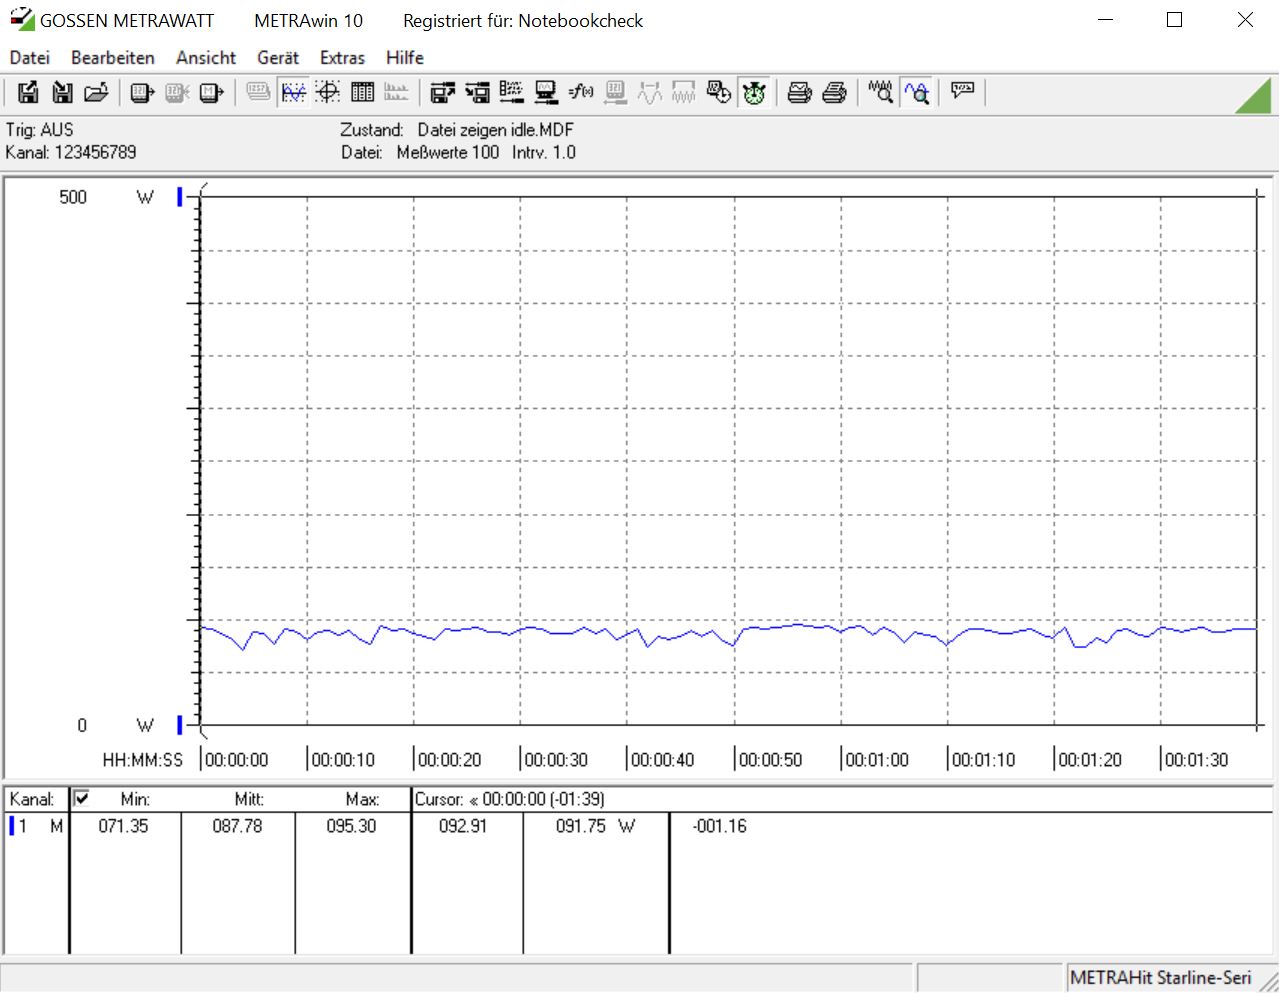
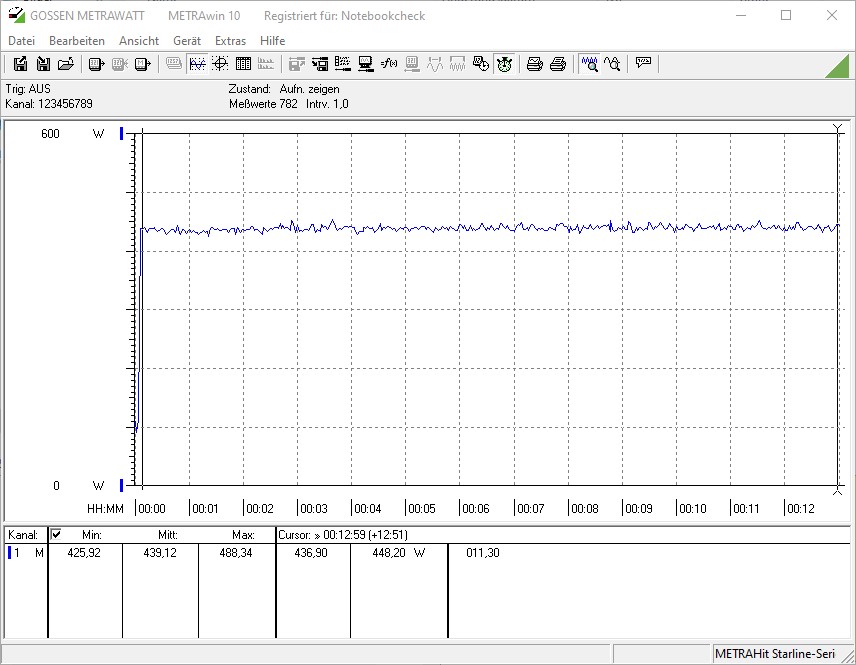
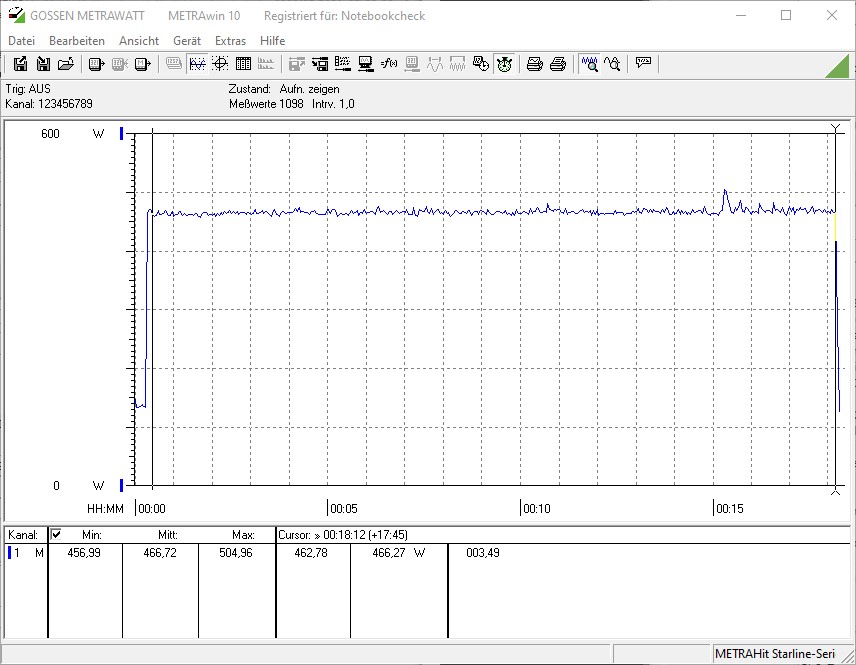
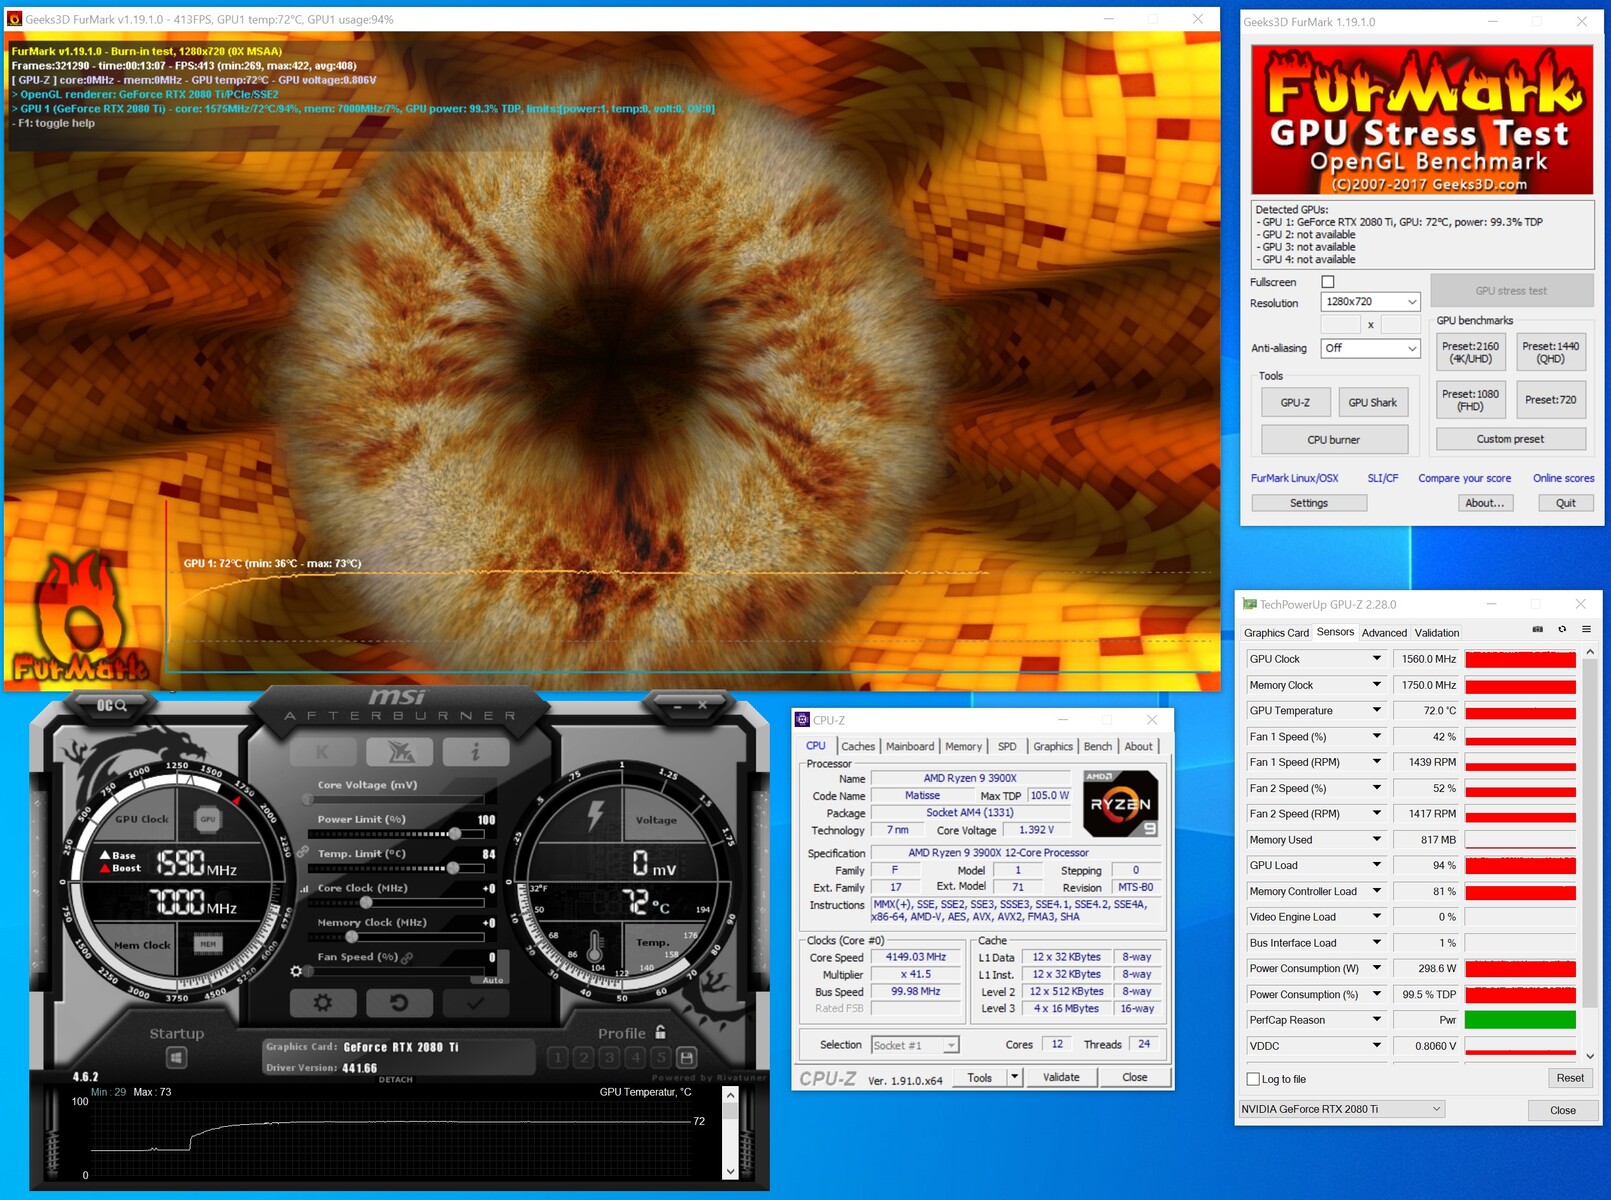
Abbiamo misurato il nostro test consumando 87,8 W al minimo e fino a 488 W durante un test di stress FurMark. Il sistema ha consumato in media 439,12 W durante questo test, per riferimento. Questi valori non includono quanto ha consumato anche il nostro monitor. La GPU-Z lo conferma ed evidenzia che la GPU consuma circa 300 W da sola. L'utilità conferma anche che la scheda consuma 330 W al 110% di PT. Questo valore oscilla però ripetutamente. Per inciso, il sistema di raffreddamento di dimensioni generose gestisce bene le temperature del core. La nostra unità di prova ha registrato una media di 72° C sotto carico al 100% di PT, mentre l'aumento del PT del 10% ha portato a un aumento della temperatura del core di soli 3° C.

Nota: Abbiamo condotto tutti questi test in un case chiuso per replicare al meglio come il Gaming X Trio dovrebbe funzionare nella maggior parte dei sistemi.

Consumo energetico sistema di test (idle)
Consumo energetico sistema di test durante uno stress test FurMark PT 100%
Consumo energetico sistema di test durante uno stress test FurMark PT 110%
Consumo energetico sistema di test durante la riproduzione di The Witcher 3 in ultra preset
Informazioni di sistema durante lo stress test FurMark PT 100%
Informazioni di sistema durante lo stress test FurMark PT 110%
 
 
Power Consumption
1920x1080 The Witcher 3 ultra (external Monitor)
MSI RTX 2080 Ti Gaming X Trio
GeForce RTX 2080 Ti (Desktop), R9 3900X (Idle: 87.8 W)
466.7 (457min - 505max) Watt *
KFA2 GeForce RTX 2080 Ti EX
GeForce RTX 2080 Ti (Desktop), R9 3900X, Corsair MP600 (Idle: 100.5 W)
438.8 (431min - 463max) Watt * +6%
AMD Radeon RX Vega 64
RX Vega 64, R7 2700X (Idle: 74.3 W)
408 Watt * +13%
MSI RTX 2080 Gaming X Trio
GeForce RTX 2080 (Desktop), R7 2700X (Idle: 87.78 W)
404.7 (389min - 421max) Watt * +13%
Nvidia GeForce RTX 2080 Super
GeForce RTX 2080 Super (Desktop), R7 2700X (Idle: 78.87 W)
382.8 (360min - 410max) Watt * +18%
AMD Radeon RX 5700 XT
Radeon RX 5700 XT (Desktop), R7 2700X (Idle: 69.8 W)
348.7 (341min - 359max) Watt * +25%
Nvidia GeForce RTX 2070 Super
GeForce RTX 2070 Super (Desktop), R7 2700X (96.8 fps, Idle: 80.5 W)
344.7 (335min - 370max) Watt * +26%
MSI RTX 2070 Gaming Z 8G
GeForce RTX 2070 (Desktop), R7 2700X (Idle: 73.3 W)
342.9 (329min - 355max) Watt * +27%
AMD Radeon VII
Radeon VII, R7 2700X (Idle: 81.39 W)
339 (306min - 359max) Watt * +27%
Nvidia GeForce RTX 2060 Super
GeForce RTX 2060 Super (Desktop), R7 2700X (82.7 fps, Idle: 77.12 W)
298.2 (293min - 322max) Watt * +36%
AMD Radeon RX 5700
Radeon RX 5700 (Desktop), R7 2700X (84.2 fps, Idle: 64.5 W)
295.9 (284min - 304max) Watt * +37%
MSI RTX 2060 Gaming Z 6G
GeForce RTX 2060 (Desktop), R7 2700X (Idle: 74.66 W)
288.8 (284min - 299max) Watt * +38%
1280x720 FurMark 1.19 GPU Stress Test (external Monitor)
MSI RTX 2080 Ti Gaming X Trio
GeForce RTX 2080 Ti (Desktop), R9 3900X (Idle: 87.8 W)
439.1 (426min - 488max) Watt *
AMD Radeon VII
Radeon VII, R7 2700X (Idle: 81.39 W)
417.8 (399min - 446max) Watt * +5%
MSI RTX 2080 Gaming X Trio
GeForce RTX 2080 (Desktop), R7 2700X
402.2 (320min - 423max) Watt * +8%
KFA2 GeForce RTX 2080 Ti EX
GeForce RTX 2080 Ti (Desktop), R9 3900X, Corsair MP600 (Idle: 100.5 W)
400.8 (354min - 432max) Watt * +9%
Nvidia GeForce RTX 2080 Super
GeForce RTX 2080 Super (Desktop), R7 2700X (Idle: 78.87 W)
376.8 (331min - 409max) Watt * +14%
MSI RTX 2070 Gaming Z 8G
GeForce RTX 2070 (Desktop), R7 2700X (Idle: 73.3 W)
343 (336min - 382max) Watt * +22%
AMD Radeon RX 5700 XT
Radeon RX 5700 XT (Desktop), R7 2700X (239 fps, Idle: 69.8 W)
326.6 (313min - 351max) Watt * +26%
Nvidia GeForce RTX 2070 Super
GeForce RTX 2070 Super (Desktop), R7 2700X (283 fps, Idle: 80.5 W)
326 (315min - 348max) Watt * +26%
MSI RTX 2060 Gaming Z 6G
GeForce RTX 2060 (Desktop), R7 2700X (Idle: 74.66 W)
295.2 (148min - 331max) Watt * +33%
Nvidia GeForce RTX 2060 Super
GeForce RTX 2060 Super (Desktop), R7 2700X (237 fps, Idle: 77.12 W)
281.4 (275min - 321max) Watt * +36%
AMD Radeon RX 5700
Radeon RX 5700 (Desktop), R7 2700X (207 fps, Idle: 64.5 W)
280.5 (271min - 312max) Watt * +36%

* ... Meglio usare valori piccoli

Overclocking - Tanto potenziale grazie a un TDP da 330 W

Se non siete ancora soddisfatti delle performance del Gaming X Trio, allora ne ha ancora di più nel suo armadietto come abbiamo accennato prima. Come regola generale, il 110% di PT corrisponde a un miglioramento del 10% delle prestazioni.
Siamo stati in grado di aumentare stabilmente il boost del clock della nostra unità di prova di 150 MHz. Un aumento di 800 MHz sul VRAM si è dimostrato possibile.
Dovrebbe andare da sé che il Gaming X Trio è già una scheda grafica veloce fuori dagli schemi, quindi non è necessario fare affidamento sull'overclocking nella maggior parte dei casi. Tuttavia, è bene avere alcune riserve a portata di mano in caso di necessità.

3DMark 11 (impostazioni di stock)
3DMark Fire Strike (impostazioni di stock)
3DMark Time Spy (impostazioni di stock)
3DMark 11 (GPU + 150 MHz, VRAM + 800 MHz)
3DMark Fire Strike (GPU + 150 MHz, VRAM + 800 MHz)
3DMark Time Spy (GPU + 150 MHz, VRAM + 800 MHz)

Pro

+ abbastanza potente per il gaming QHD (UWQHD) e UHD
+ 11 GB di GDDR6 VRAM
+ basato su un'architettura moderna
+ relativamente fresco e silenzioso sotto carico
+ DLSS e ray-tracing
+ ampio margine di manovra per l'overclocking
+ 36 mesi di garanzia

Contro

- relativamente lunga (controllare prima la compatibilità del case)
- elevato consumo di energia
- costosa

Giudizio Complessivo - Una GPU top con prestazioni di livello

Recensioni dell'MSI GeForce RTX 2080 Ti Gaming X Trio desktop GPU. Dispositivo di test cortesemente fornito da MSI.

Nel complesso, se state cercando la scheda grafica desktop più veloce sul mercato, prima o poi vi imbatterete nella GeForce RTX 2080 Ti. La Gaming X Trio è una delle versioni più veloci della serie, cosa che la nostra unità di prova ha confermato durante i nostri test. Anche se la Gaming X Trio è estremamente costosa a 1.300 euro, è notevolmente più economica della TITAN RTX, che NVIDIA non rivolge ai giocatori.

La nostra unità di prova rimane tranquilla quando spinge a 330 W, sottolineando l'efficacia dell'enorme dissipatore di calore e dei tre ventilatori assiali con cui MSI ha equipaggiato il Gaming X Trio. C'è anche RGB a bordo per tenere gli occhi occupati.

    La MSI GeForce RTX 2080 Ti Gaming X Trio, è una scheda grafica estremamente veloce progettata per il giocatore di fascia alta senza compromessi.

Nonostante tutto, il prezzo della Gaming X Trio può scoraggiare alcune persone. Le versioni più economiche della RTX 2080 Ti partono da poco meno di 1.000 euro, rendendo la scheda MSI un acquisto relativamente costoso. In definitiva, bisogna giudicare se l'overclocking di fabbrica e l'illuminazione RGB giustificano o meno il sovrapprezzo.

In breve, la MSI GeForce RTX 2080 Ti Gaming X Trio di MSI ha dimostrato il suo potenziale. La scheda ha funzionato bene durante i nostri test, ed è una delle poche opzioni per i giocatori 4K. Vorremmo elogiare la garanzia di 36 mesi che MSI include anche, che è più lunga di molti dei suoi concorrenti.

Consultate la nostra pagina GeForce RTX 2080 Ti, continuamente aggiornata, per un elenco completo dei benchmarks di riferimento e dei risultati dei test.

Please share our article, every link counts!
> Recensioni e prove di notebook, tablets e smartphones > Recensioni e prove > Recensioni e prove > Recensione dell'MSI GeForce RTX 2080 Ti Gaming X Trio Desktop GPU: La scheda grafica GeForce più veloce in circolazione
Sebastian Bade, 2019-12-22 (Update: 2021-03-12)