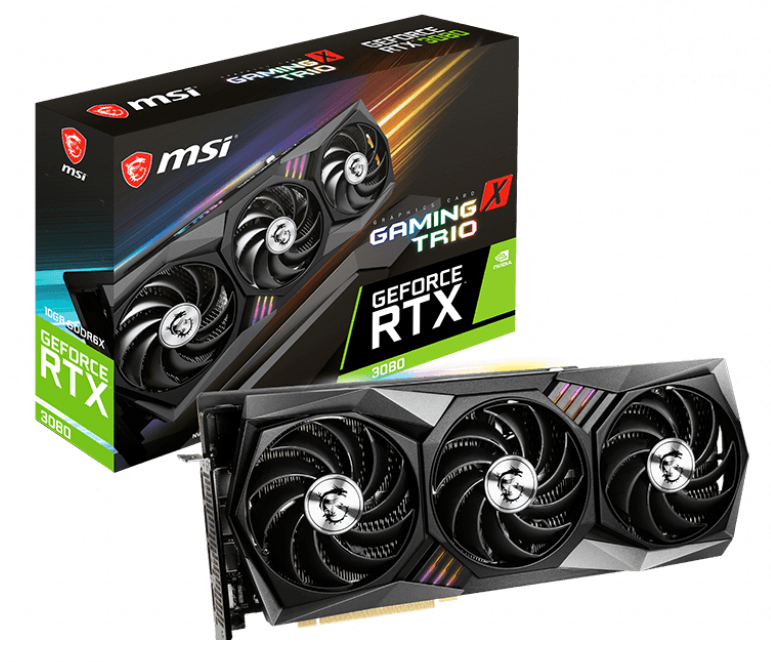
Recensione della scheda grafica Desktop MSI GeForce RTX 3080 Gaming X Trio 10G
Con l'MSI GeForce RTX 3080 Gaming X Trio, testiamo il secondo modello più veloce della serie RTX 3080 di MSI. Solo la nuova serie SuprimX essere in grado di superarlo in termini di prestazioni. In ogni caso, questo è ciò che indicano le specifiche tecniche.
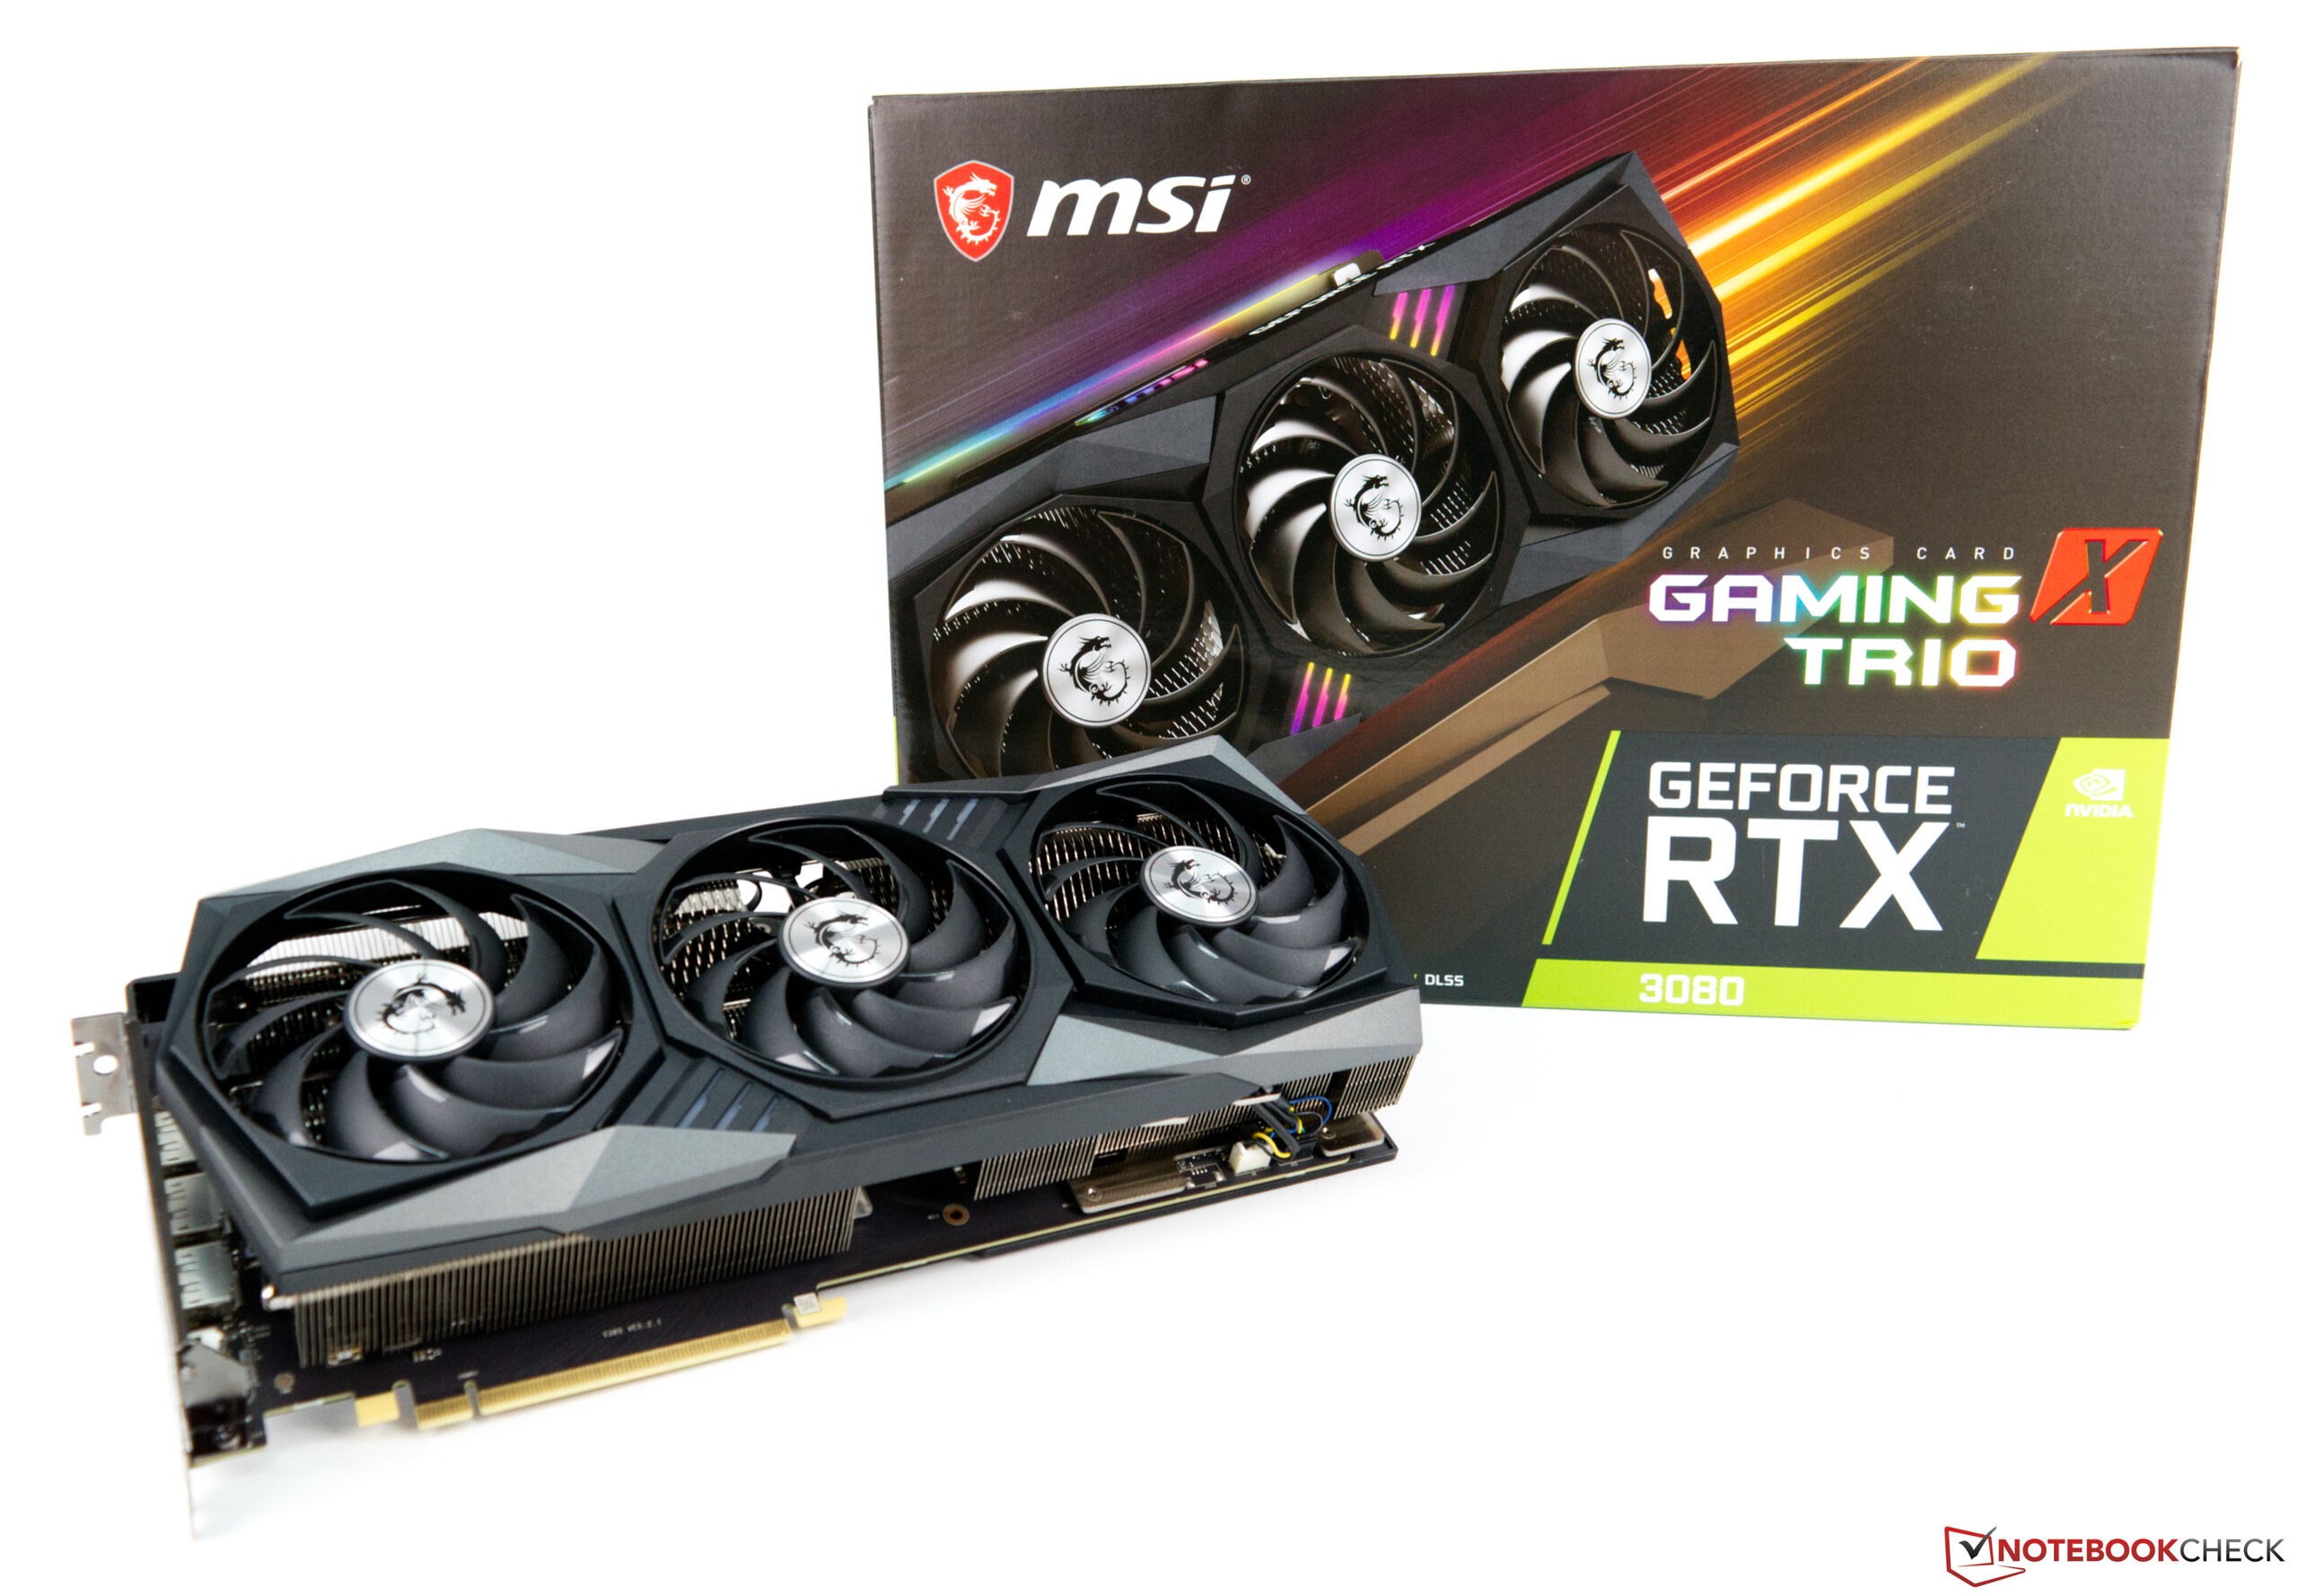
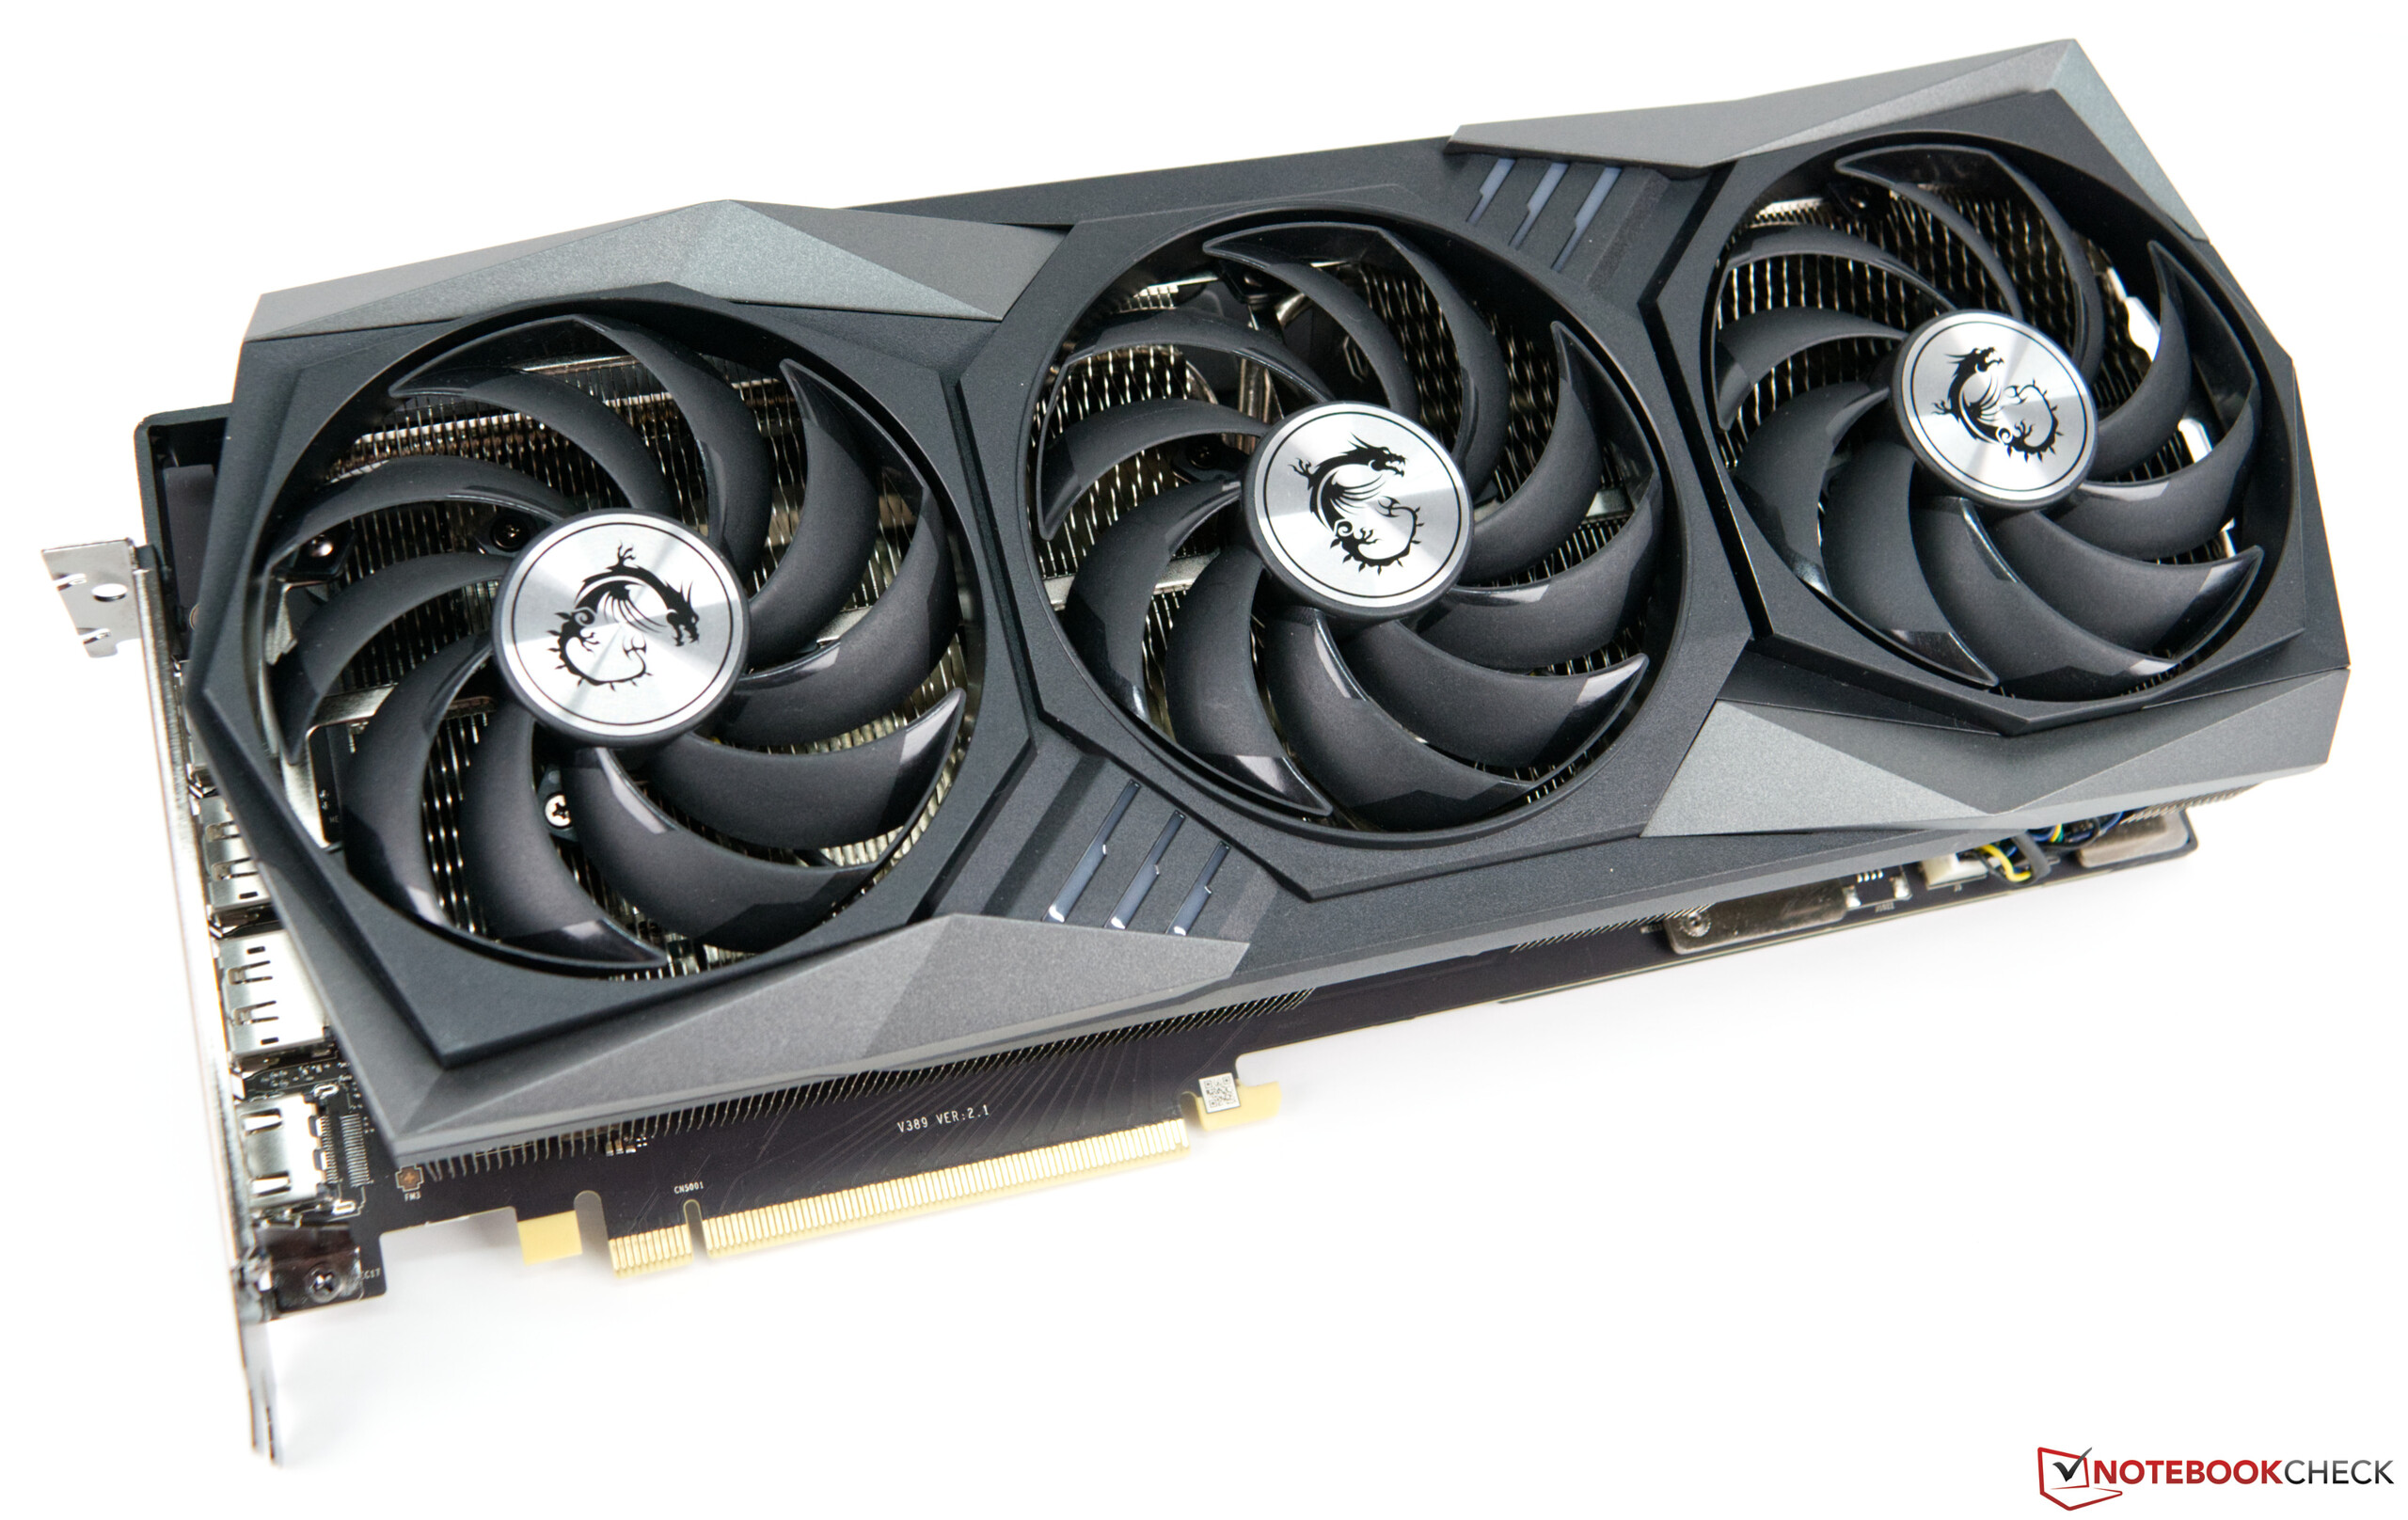
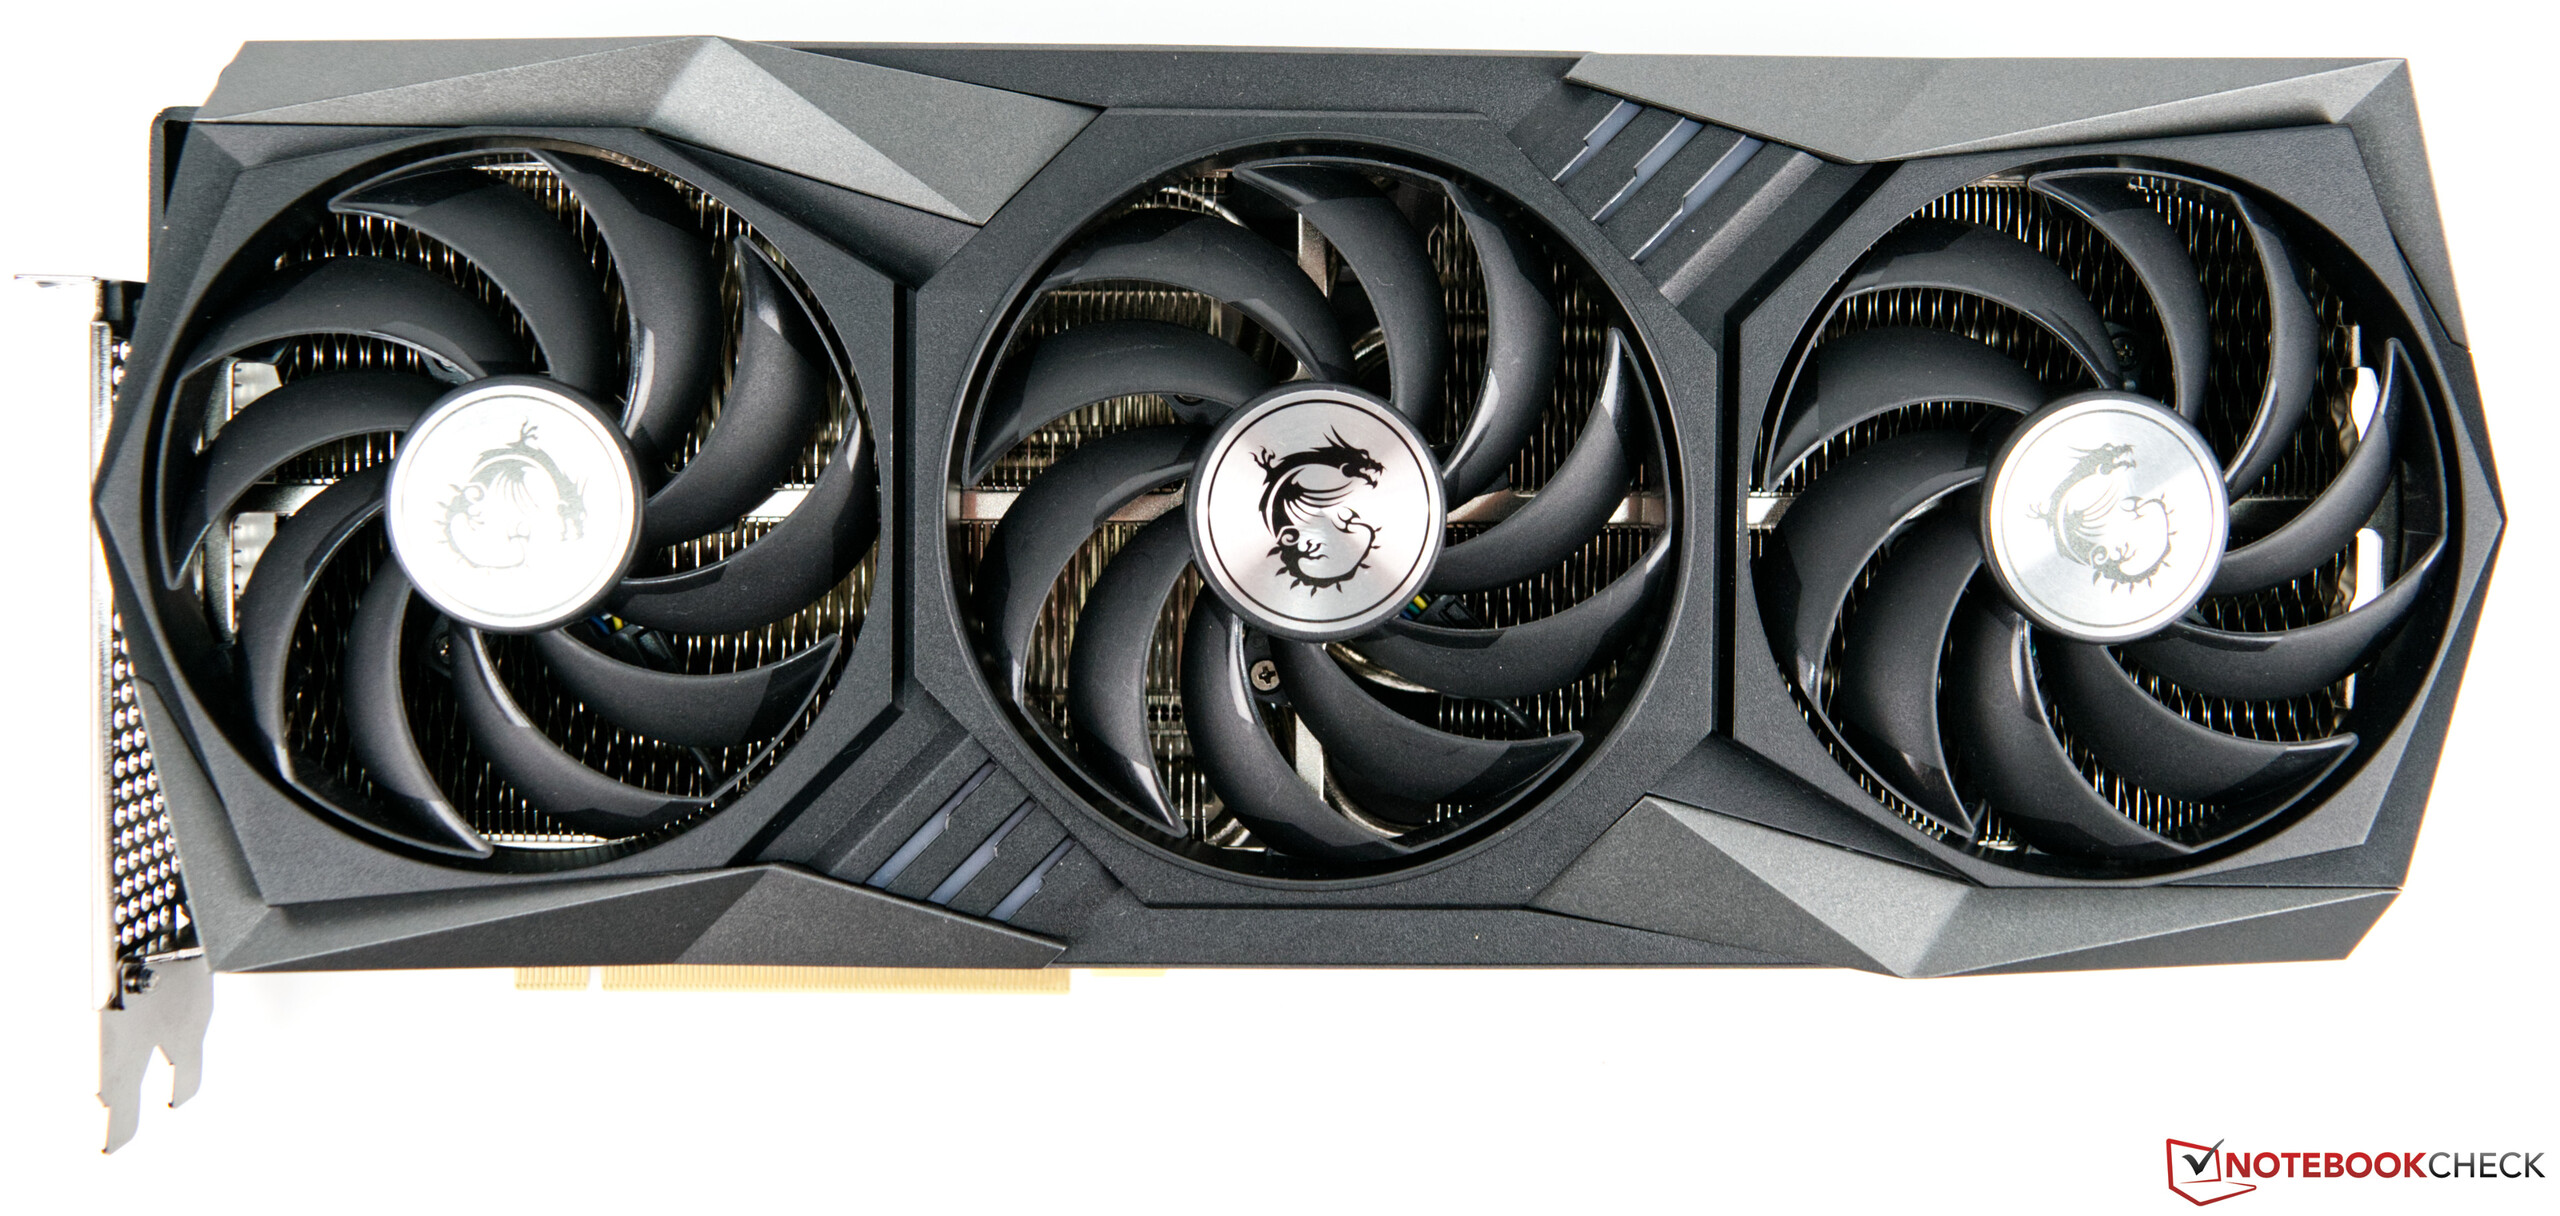
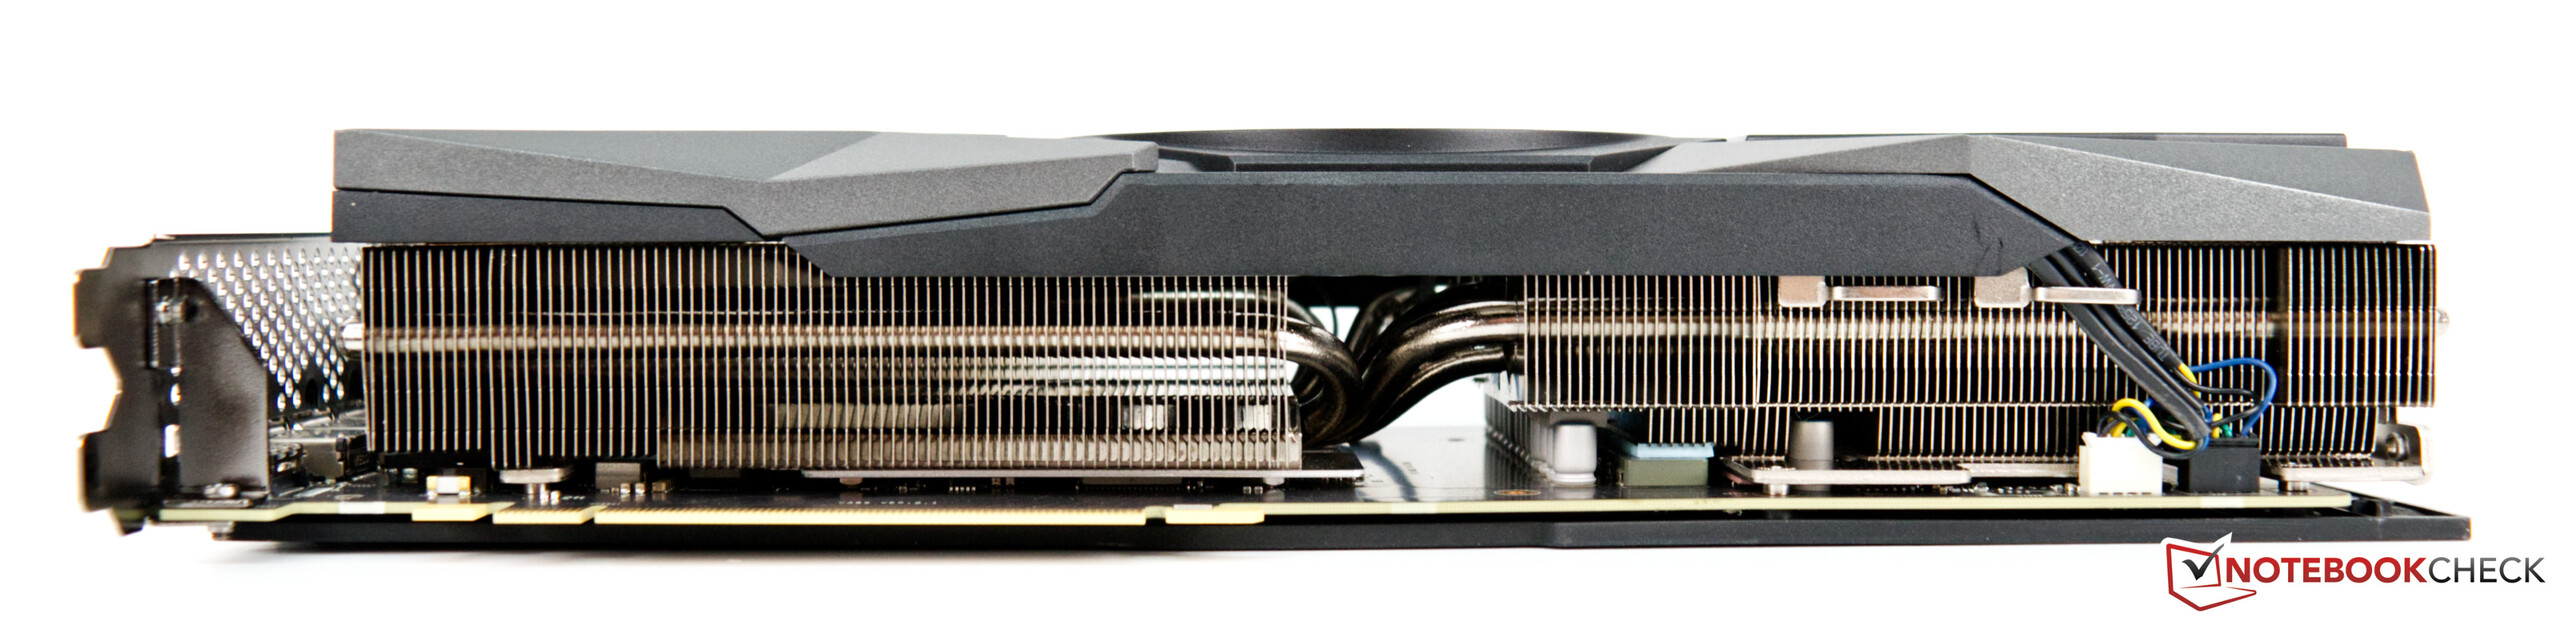
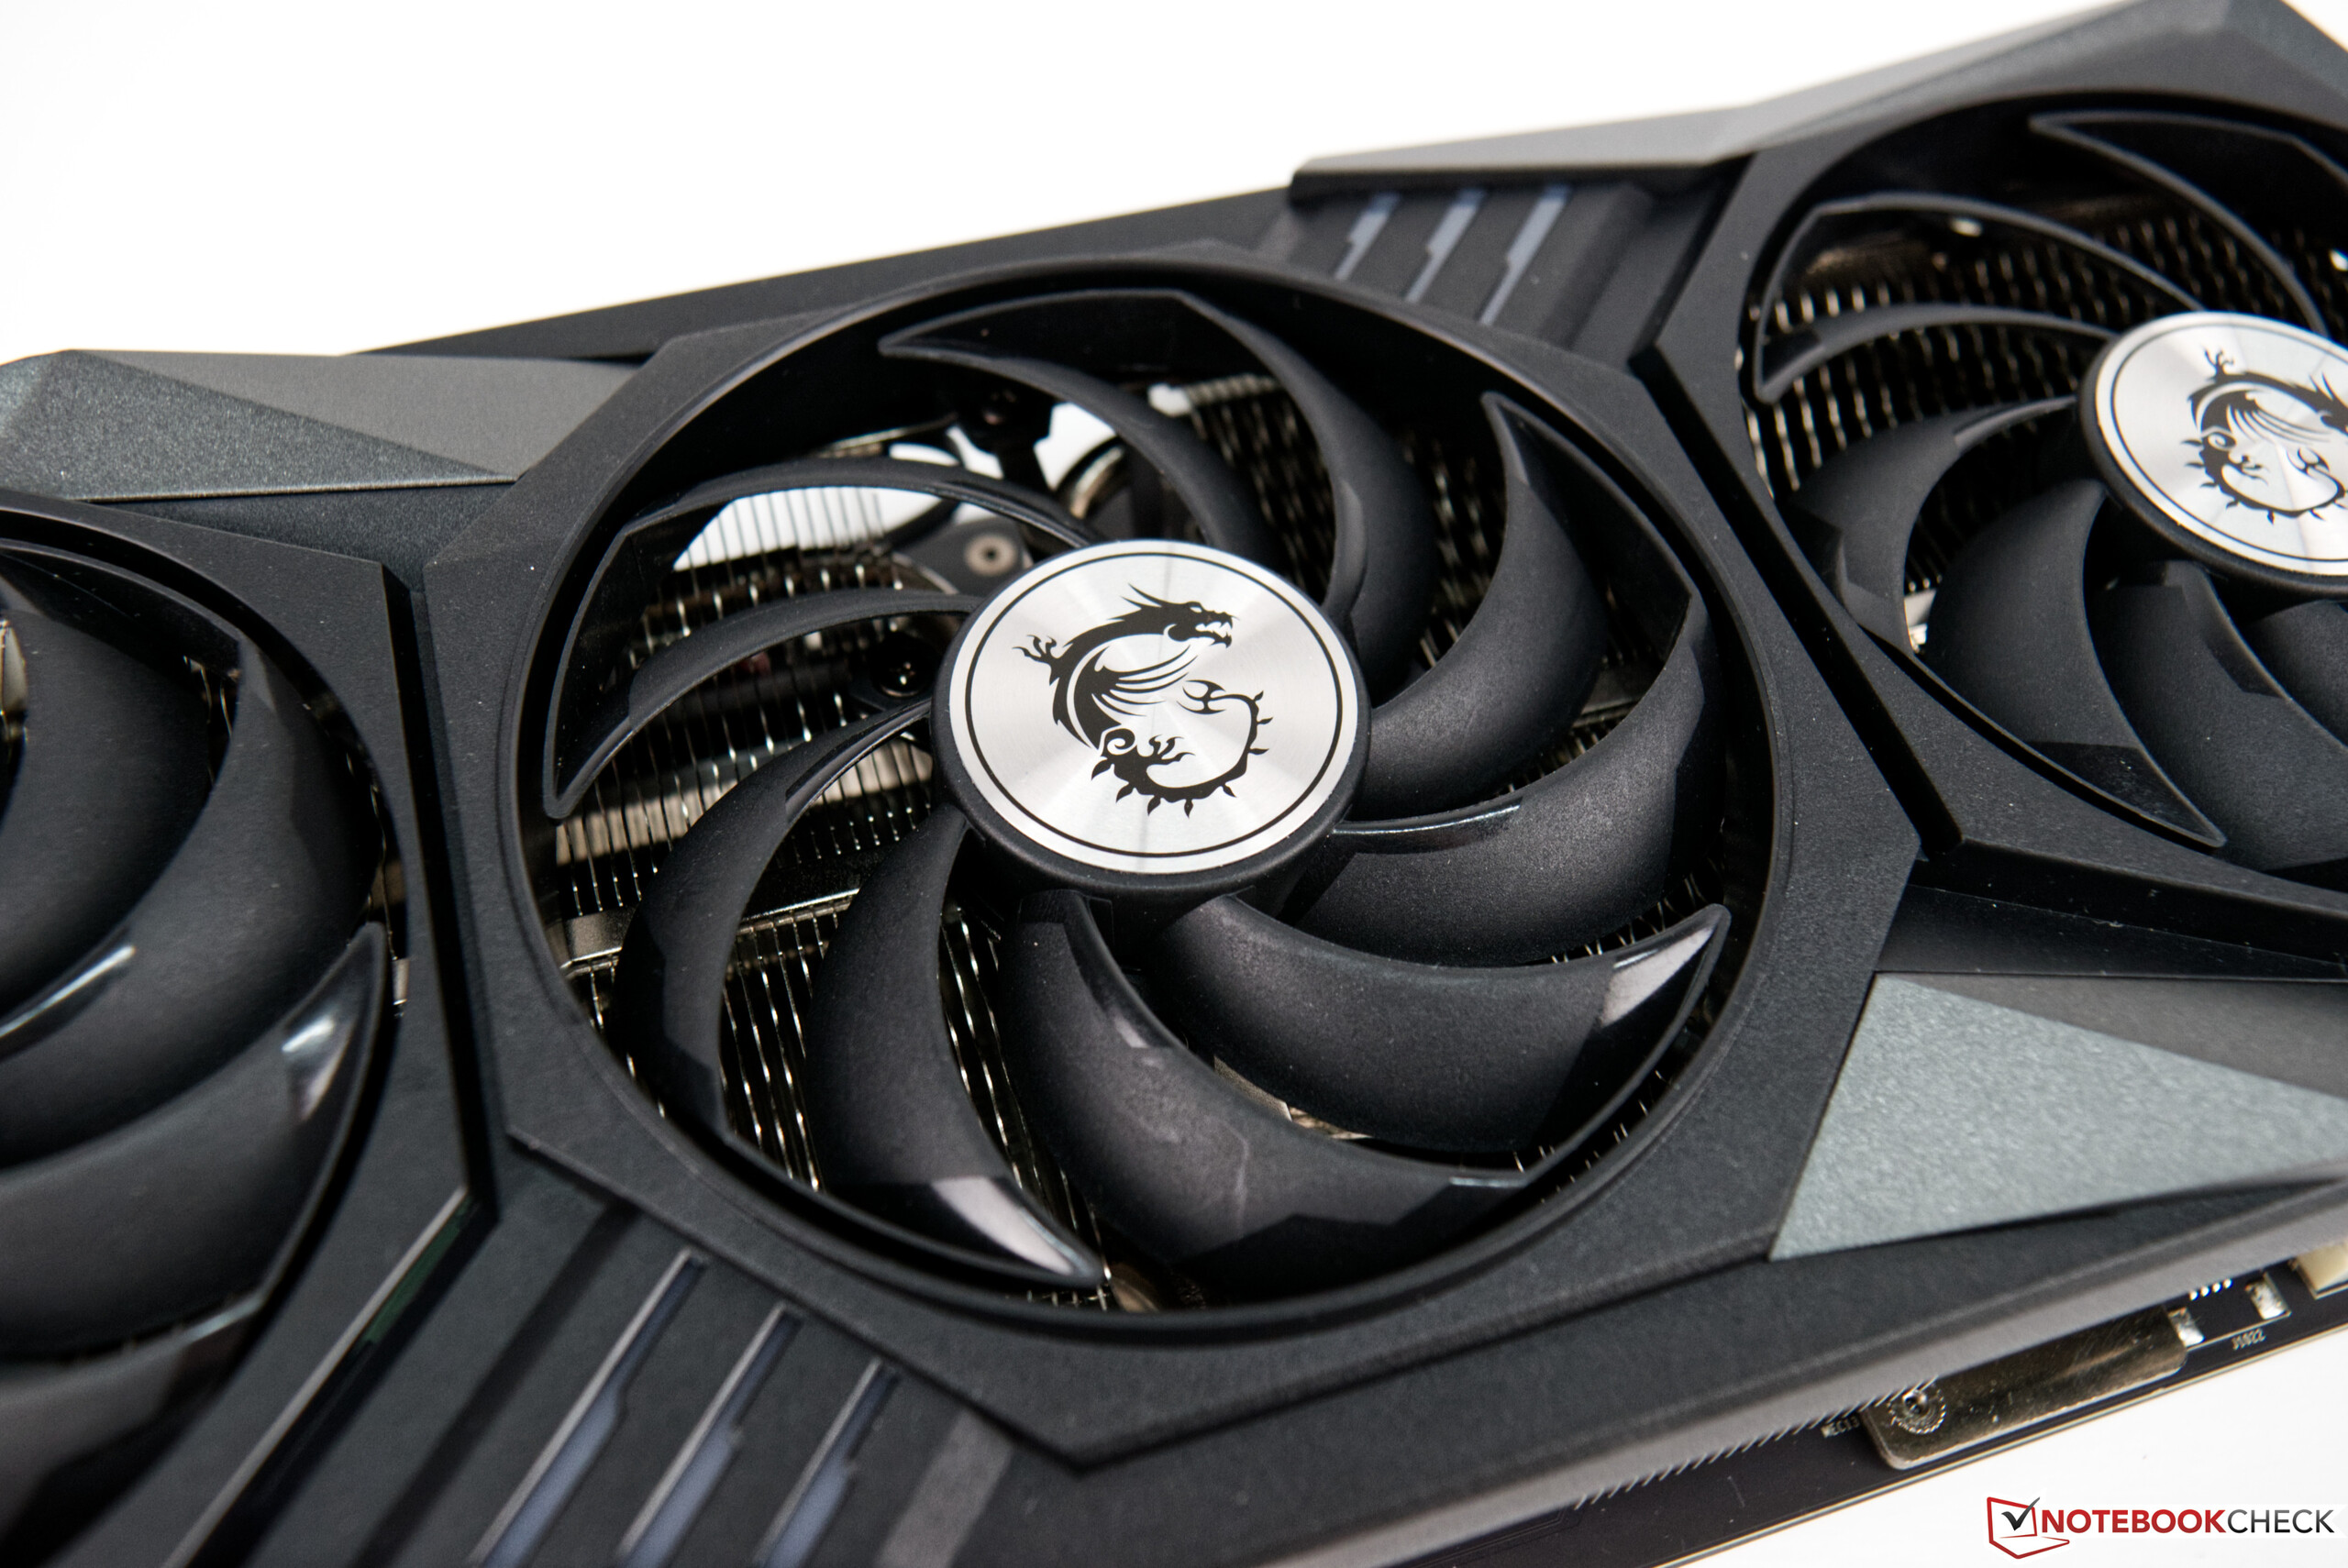
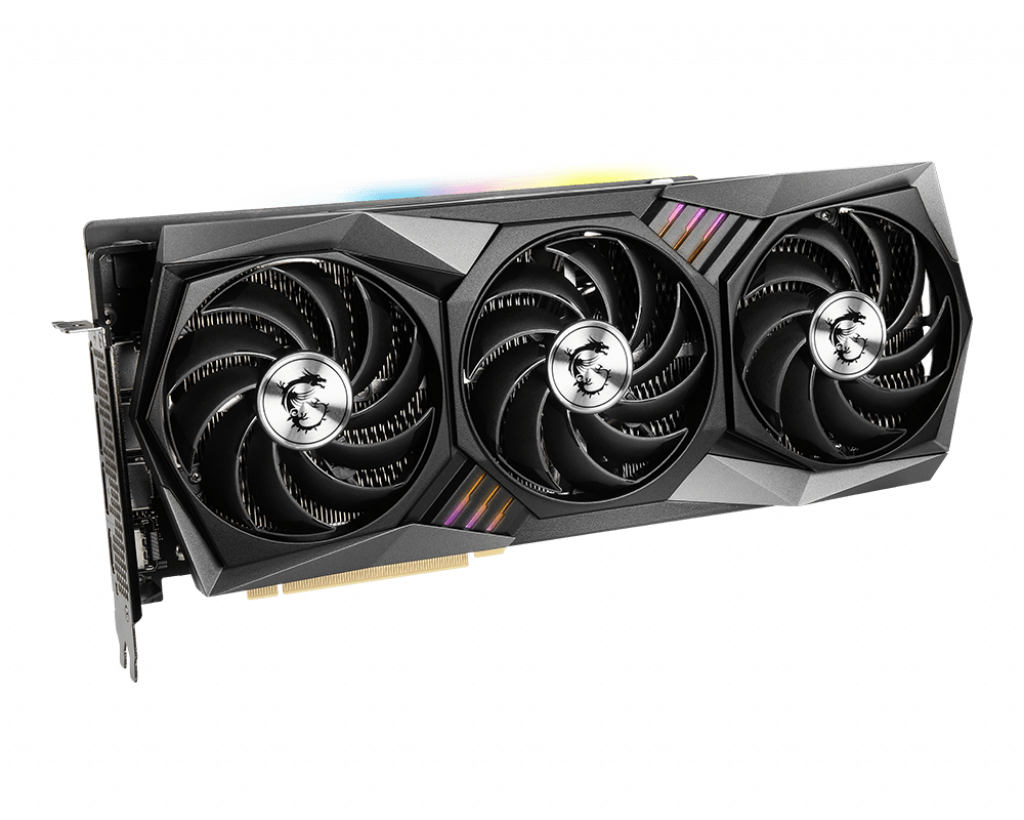
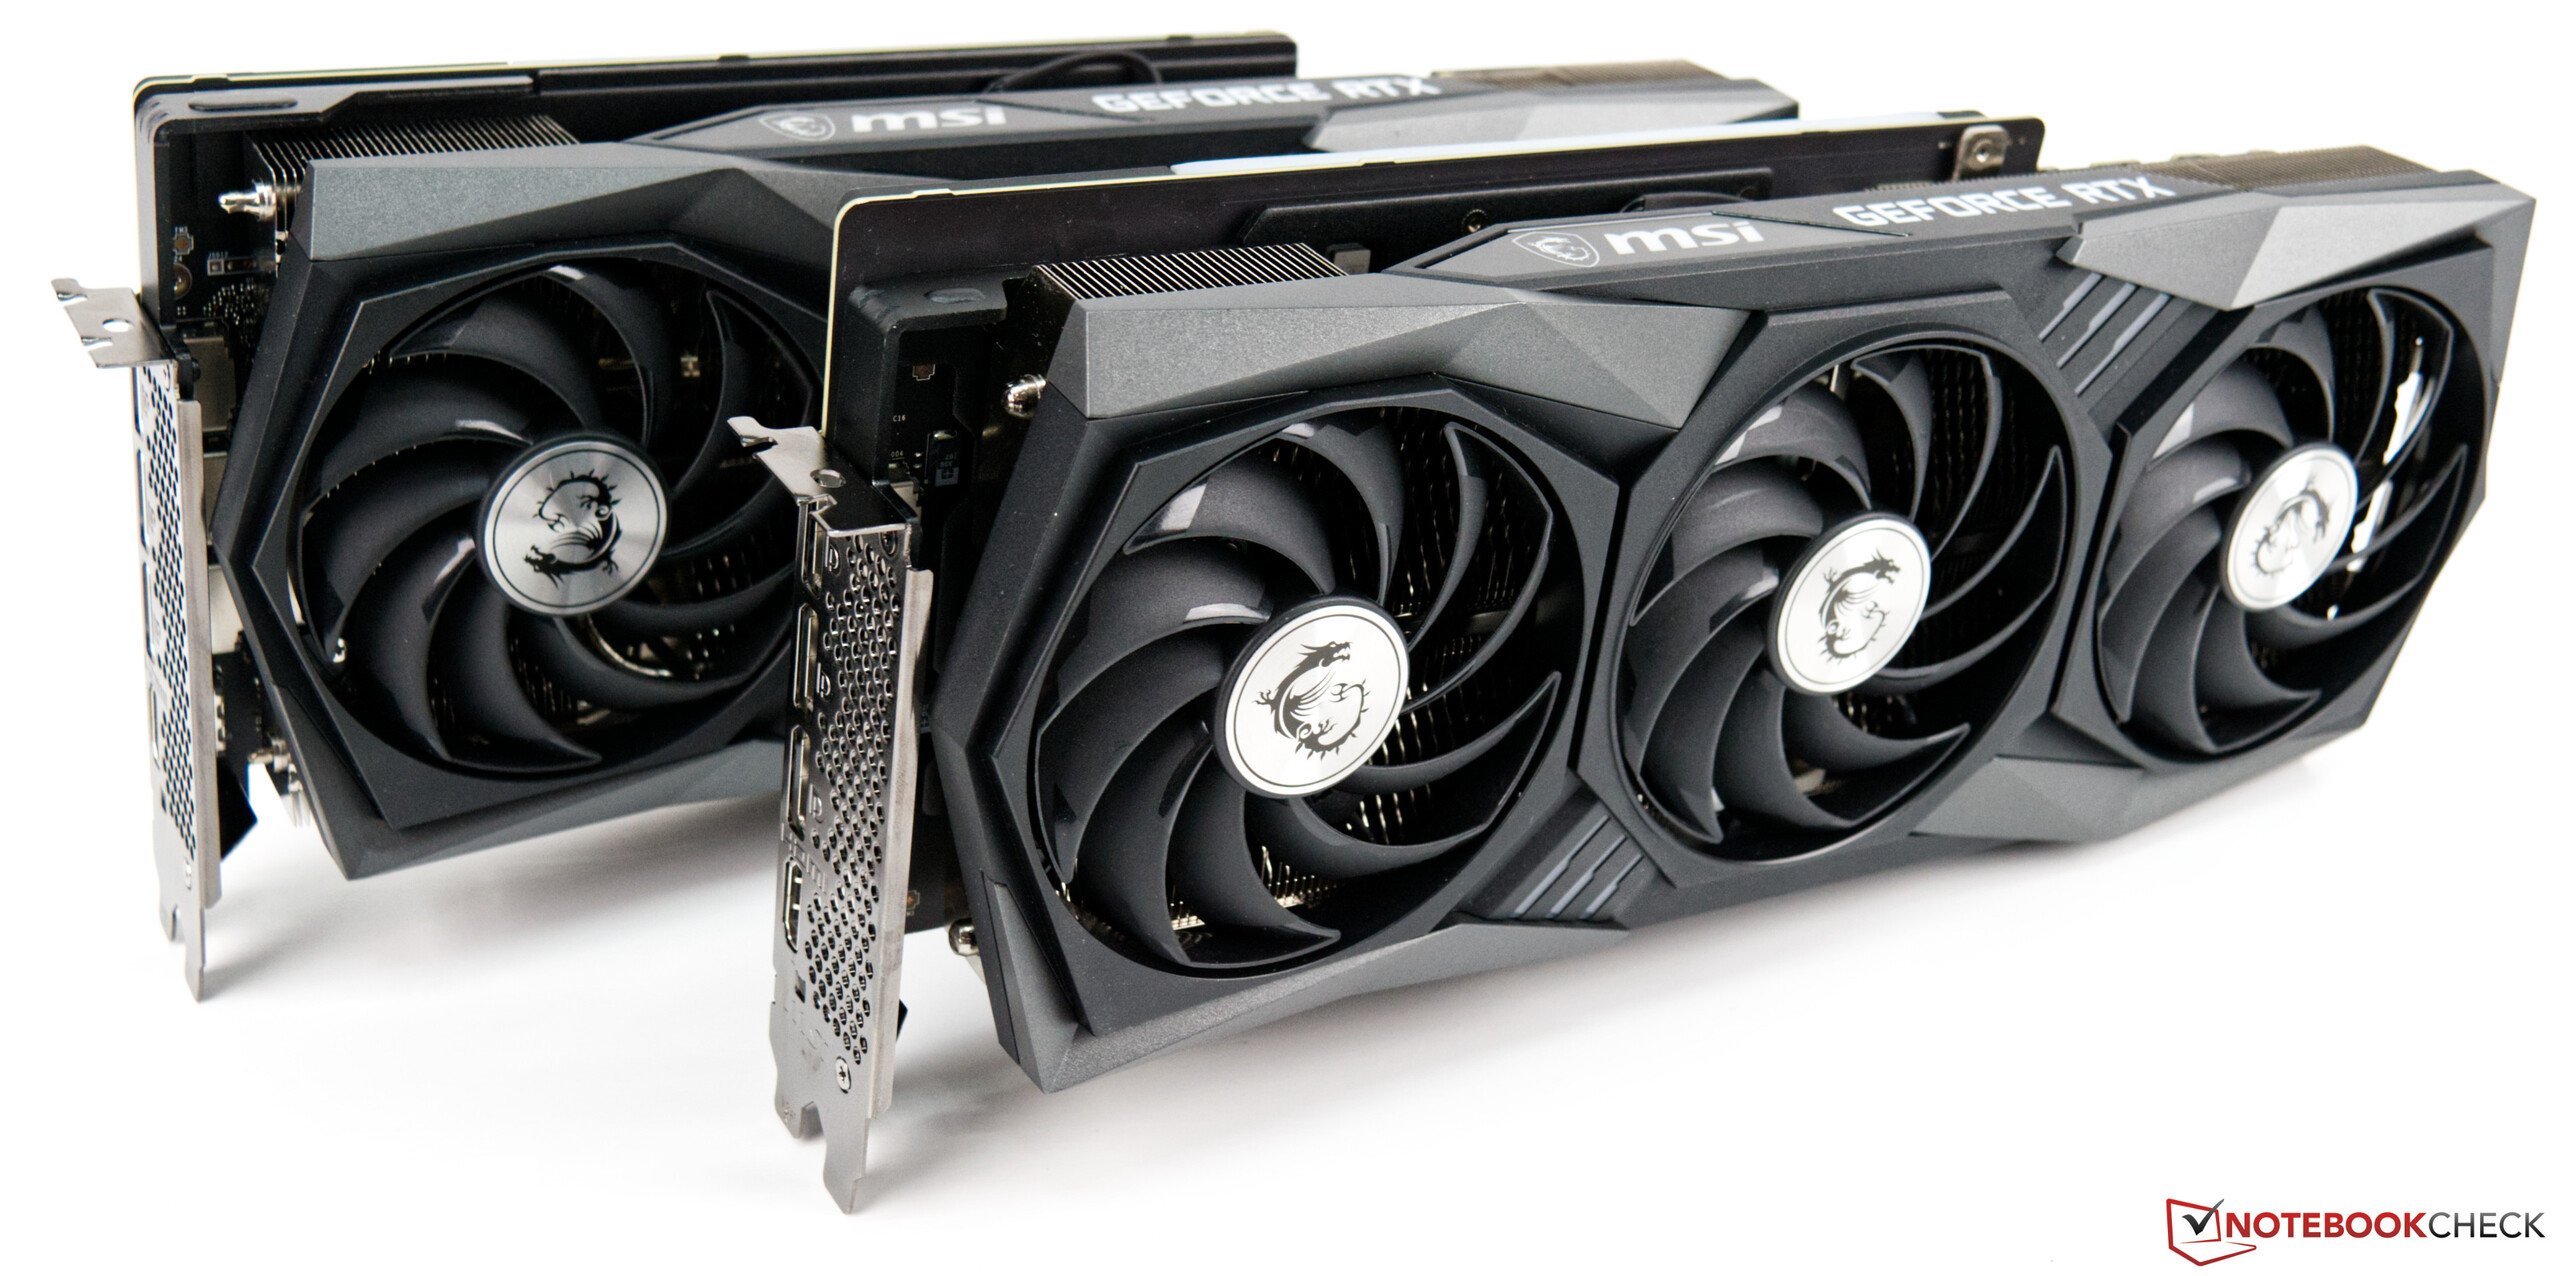
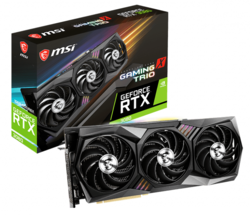
Il nostro modello di test dell'MSI sembra un po' superato rispetto al nuovo modello Suprim X. Tuttavia, la serie Gaming X Trio si è affermata bene negli ultimi anni e ha sempre ottenuto ottime prestazioni dai chip grafici grazie all'eccellente sistema di raffreddamento. Un altro fattore importante per questo aspetto è che MSI aumenta anche il TDP e non utilizza il modello di riferimento come linea guida. Con un ben 32 centimetri, l'MSI GeForce RTX 3080 Gaming X Trio è molto lunga e non si adatta a tutti i case, cosa di cui bisogna assolutamente tenere conto al momento dell'acquisto.
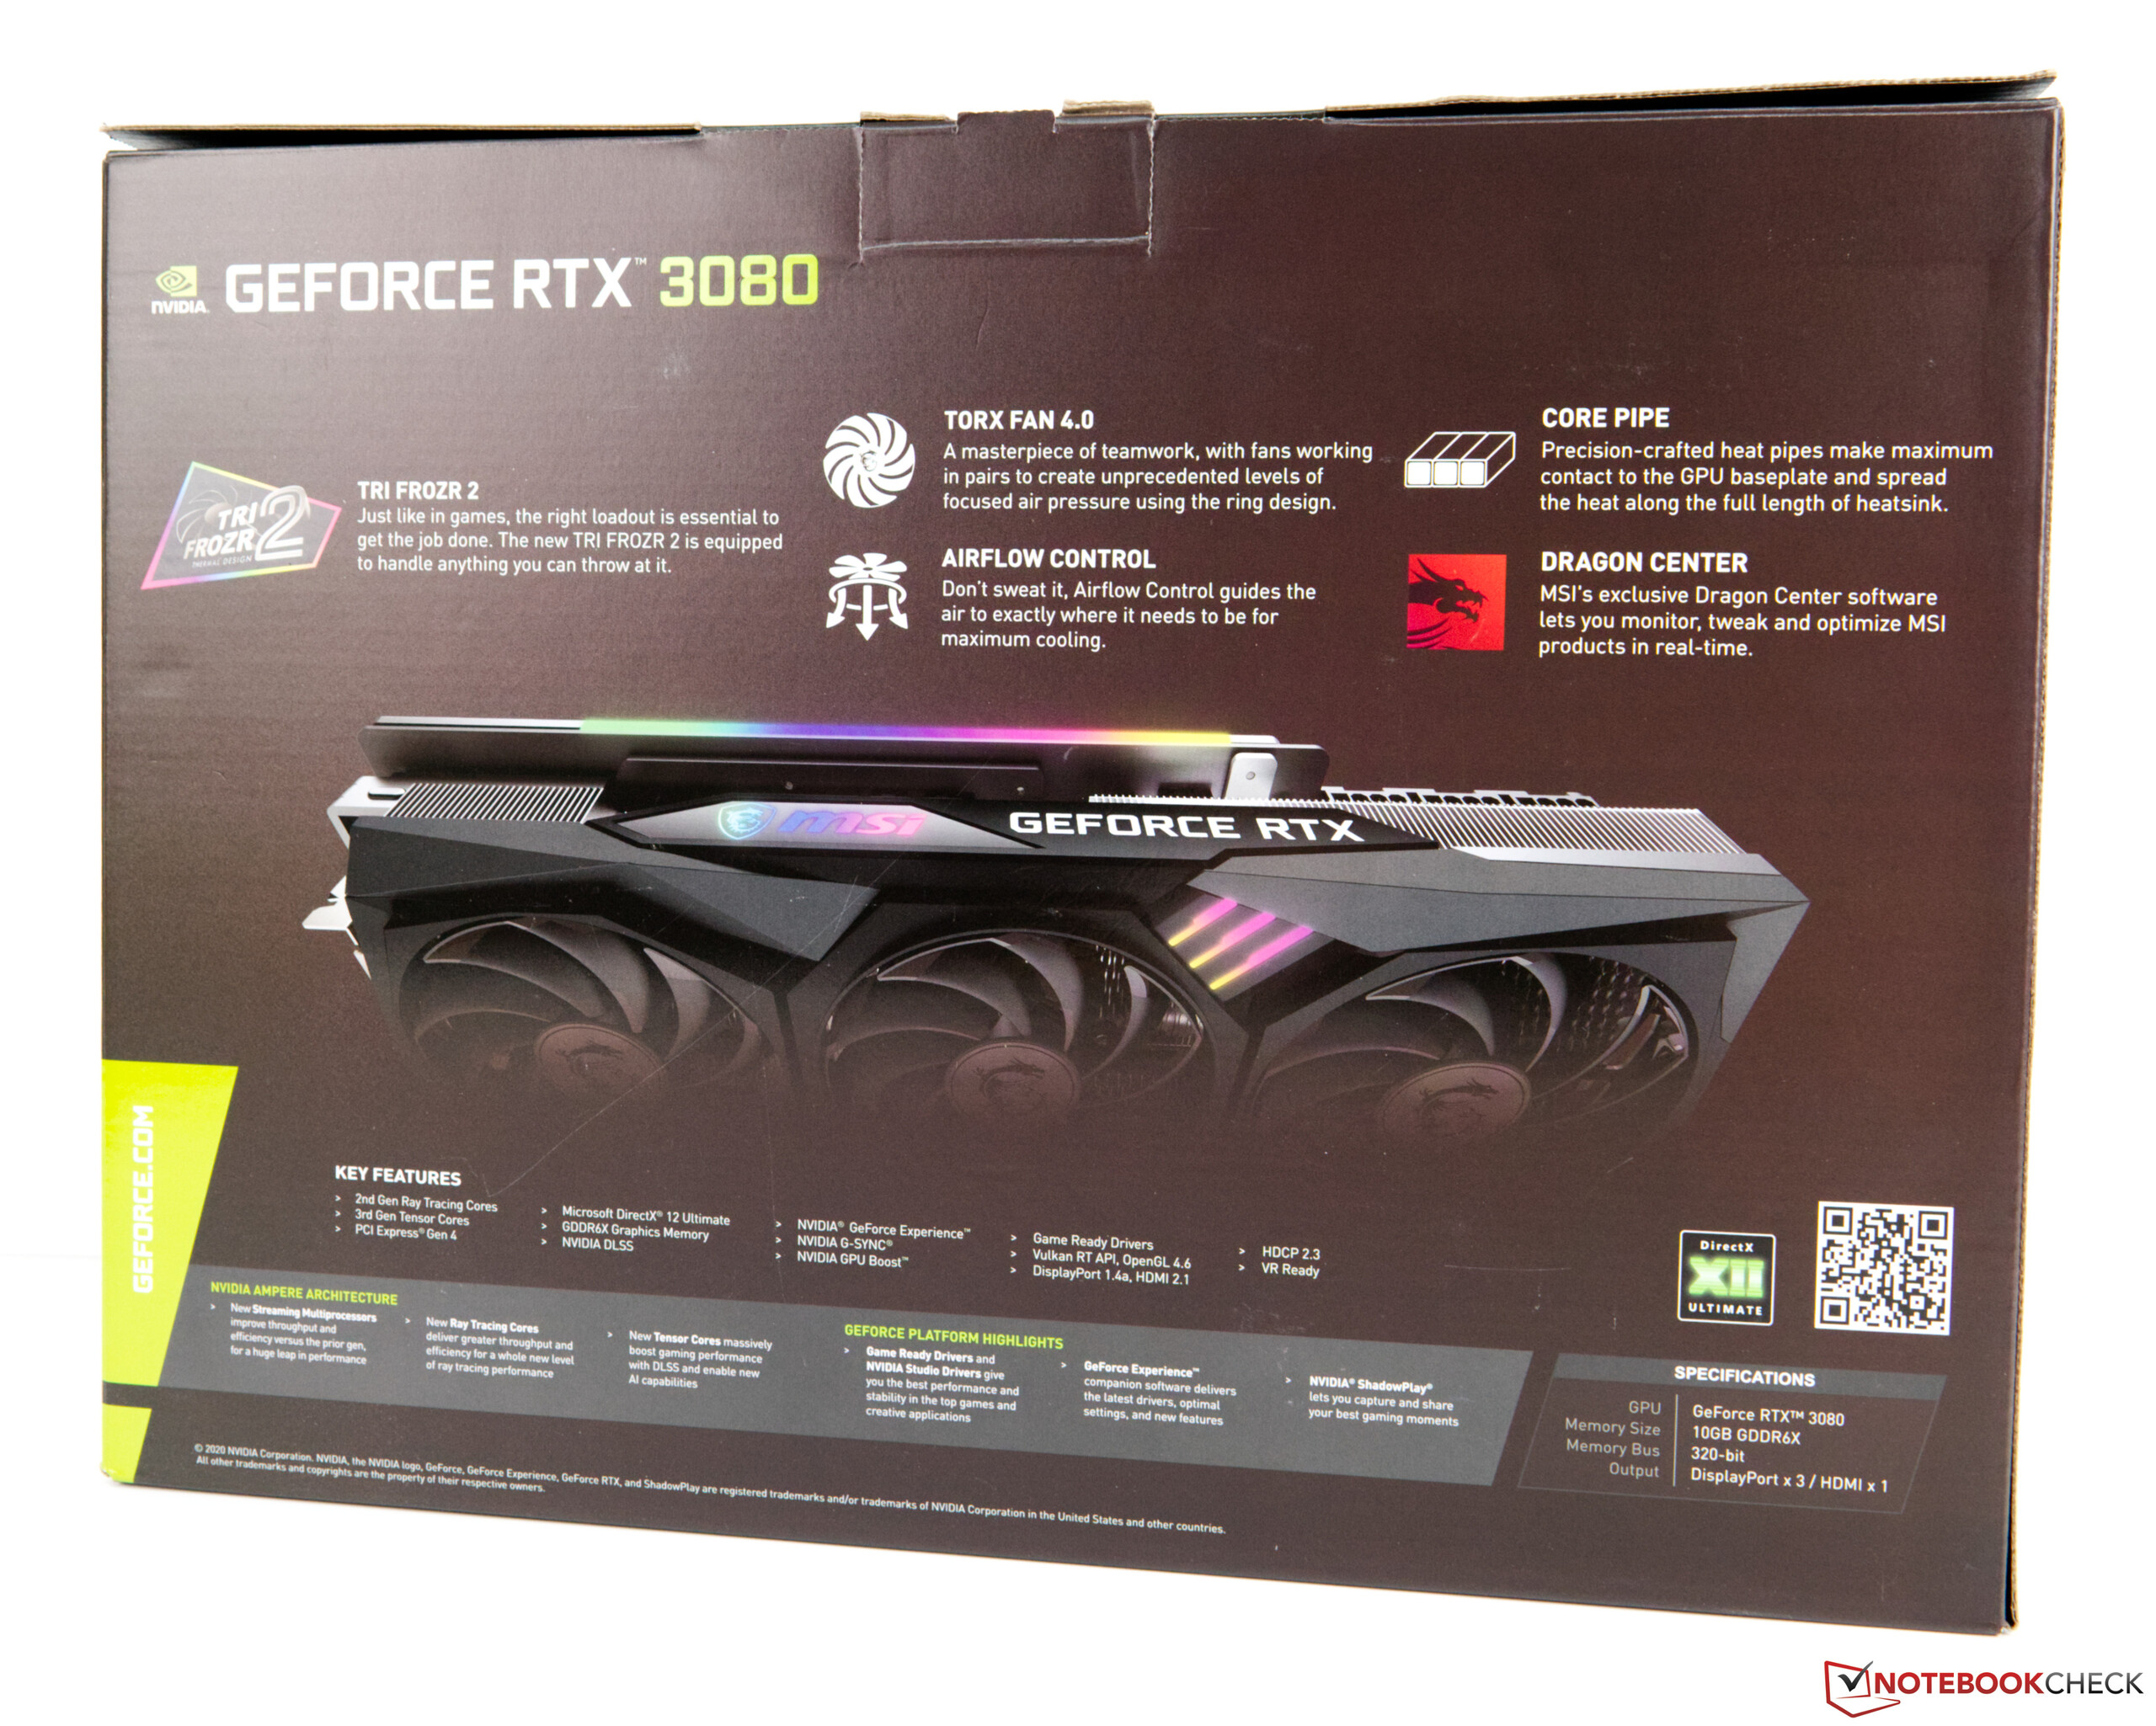
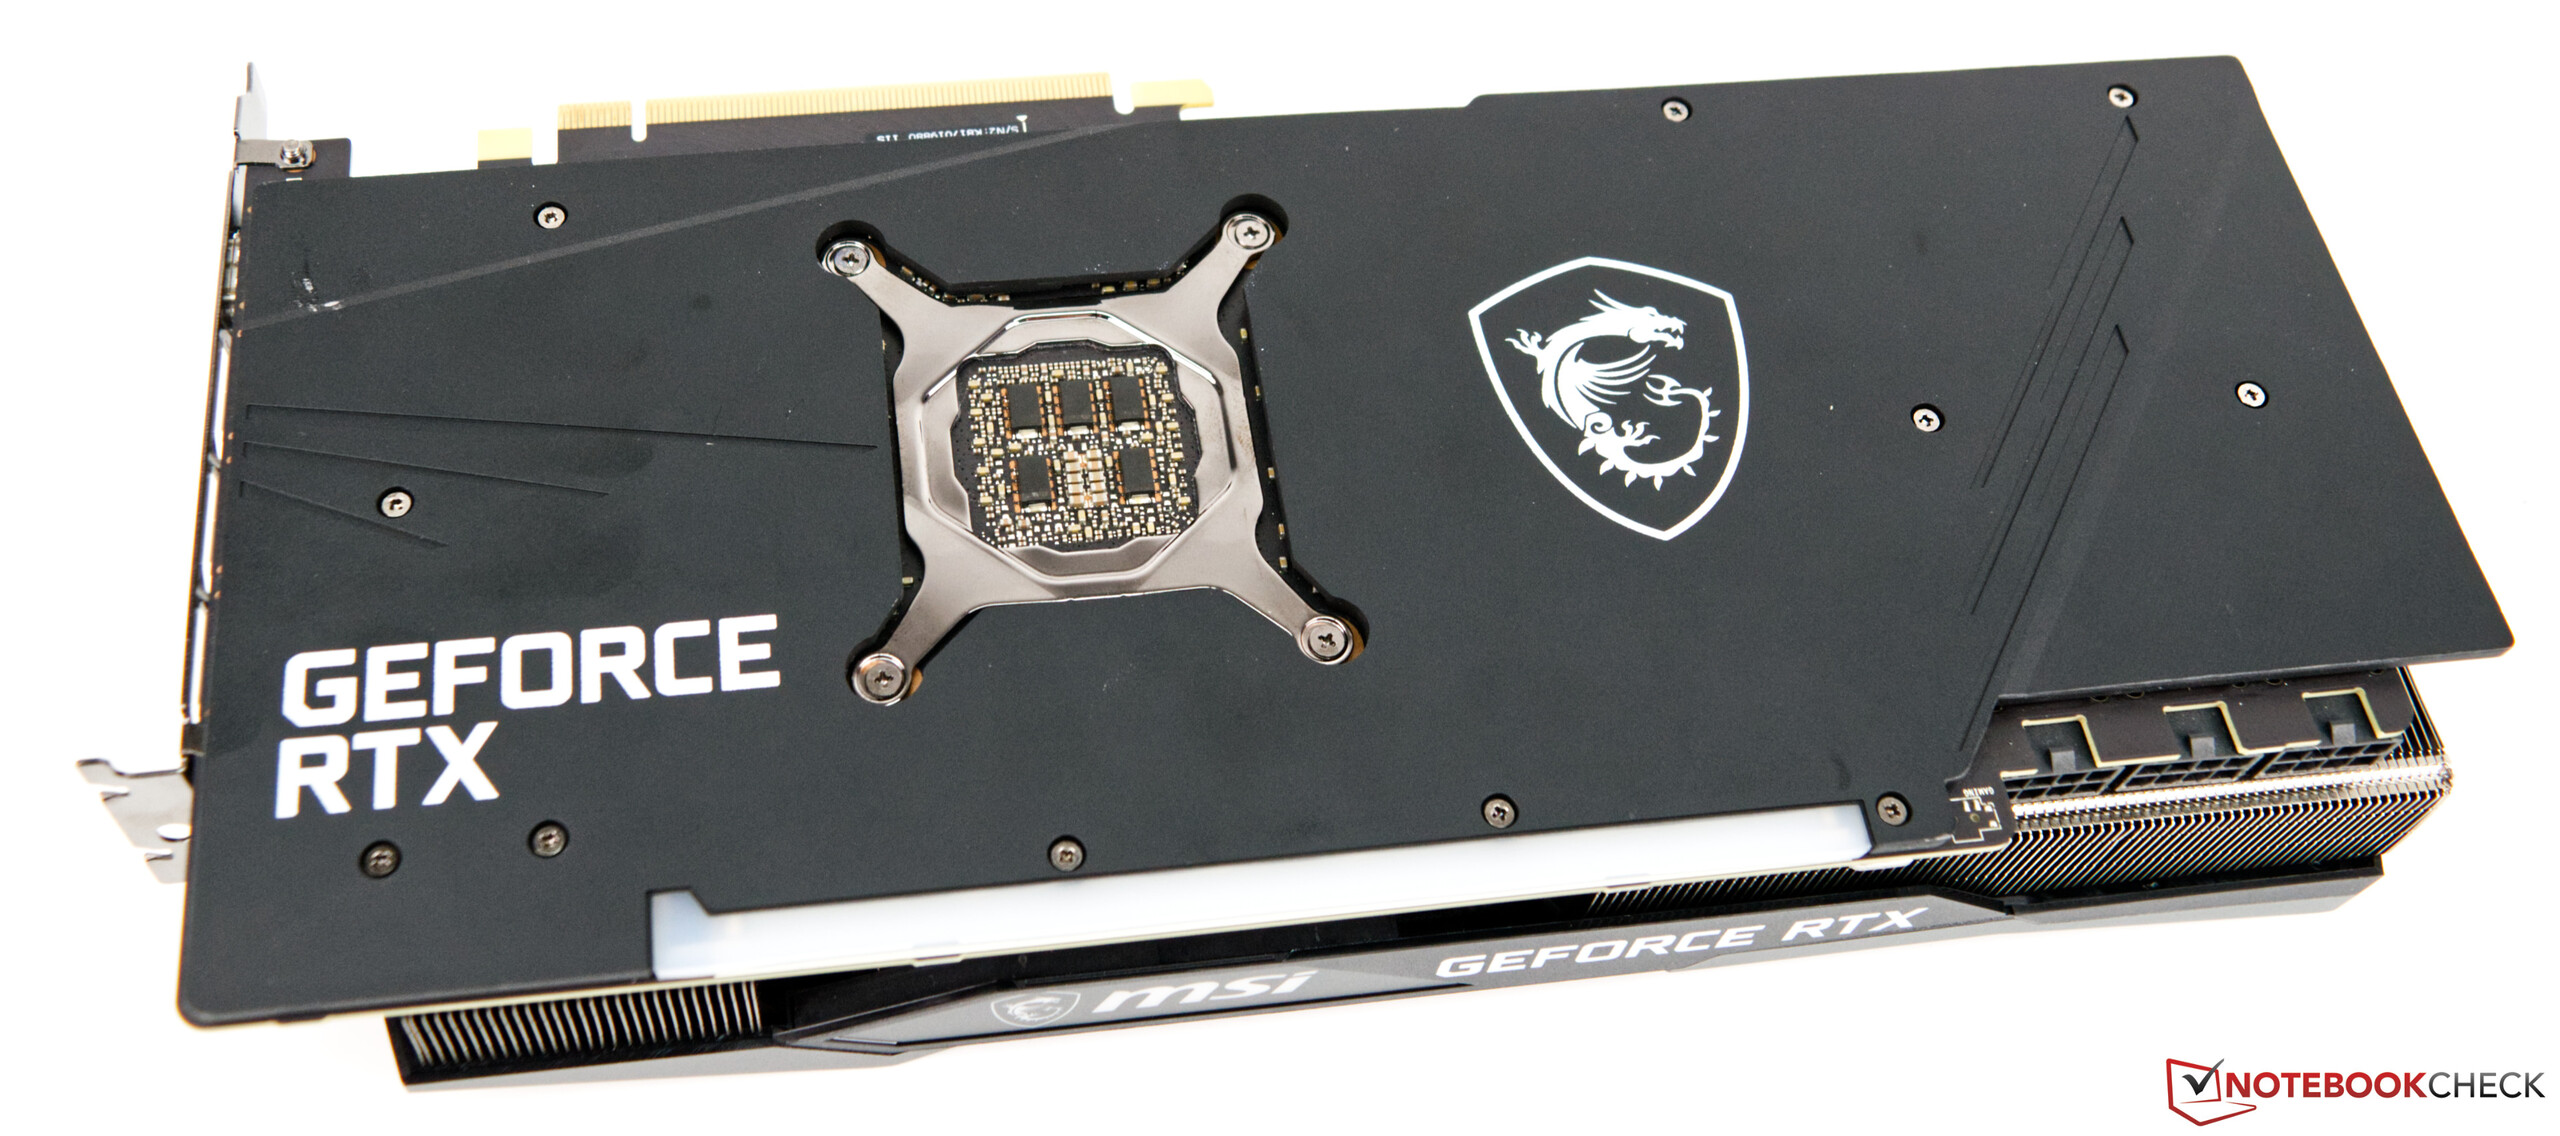
La costruzione è ad un livello molto alto. Purtroppo la piastra posteriore è solo in plastica e non in alluminio come al solito. La superficie avrebbe potuto essere utilizzata come dissipatore di calore aggiuntivo. Ma il calore non è un problema con l'MSI GeForce RTX 3080 Gaming X Trio come abbiamo scoperto nel test. L'illuminazione RGB è ovviamente un must, e attira l'attenzione quando il case ha una finestra laterale.
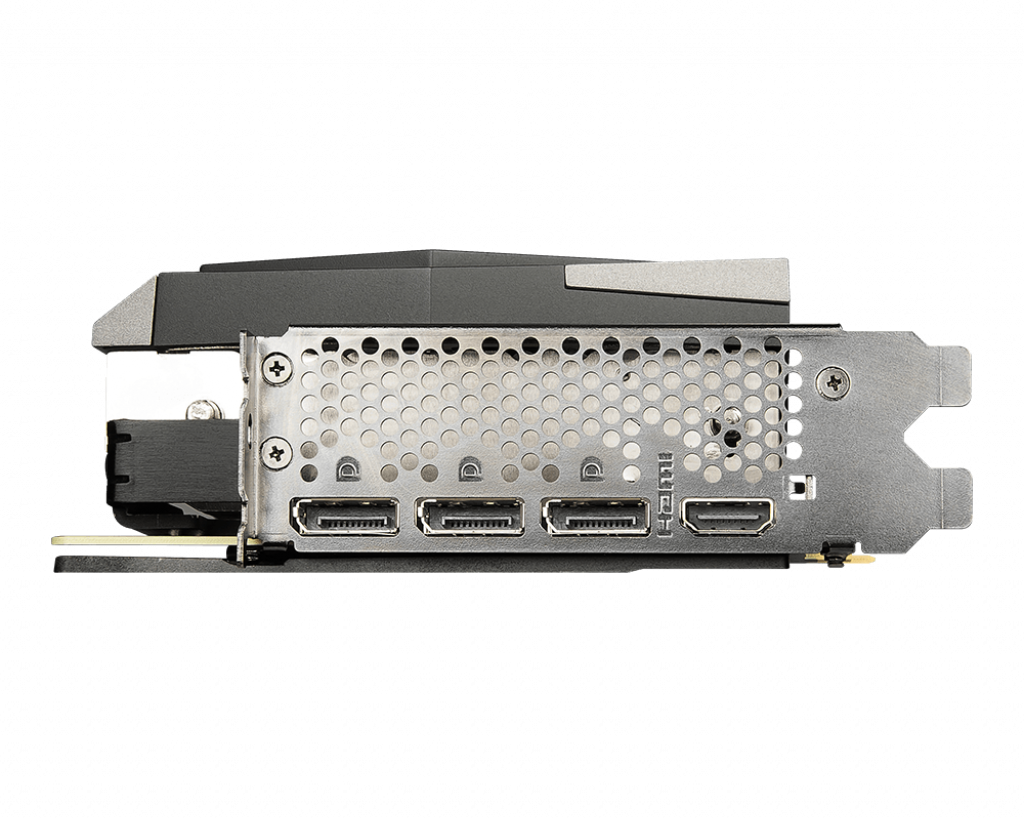
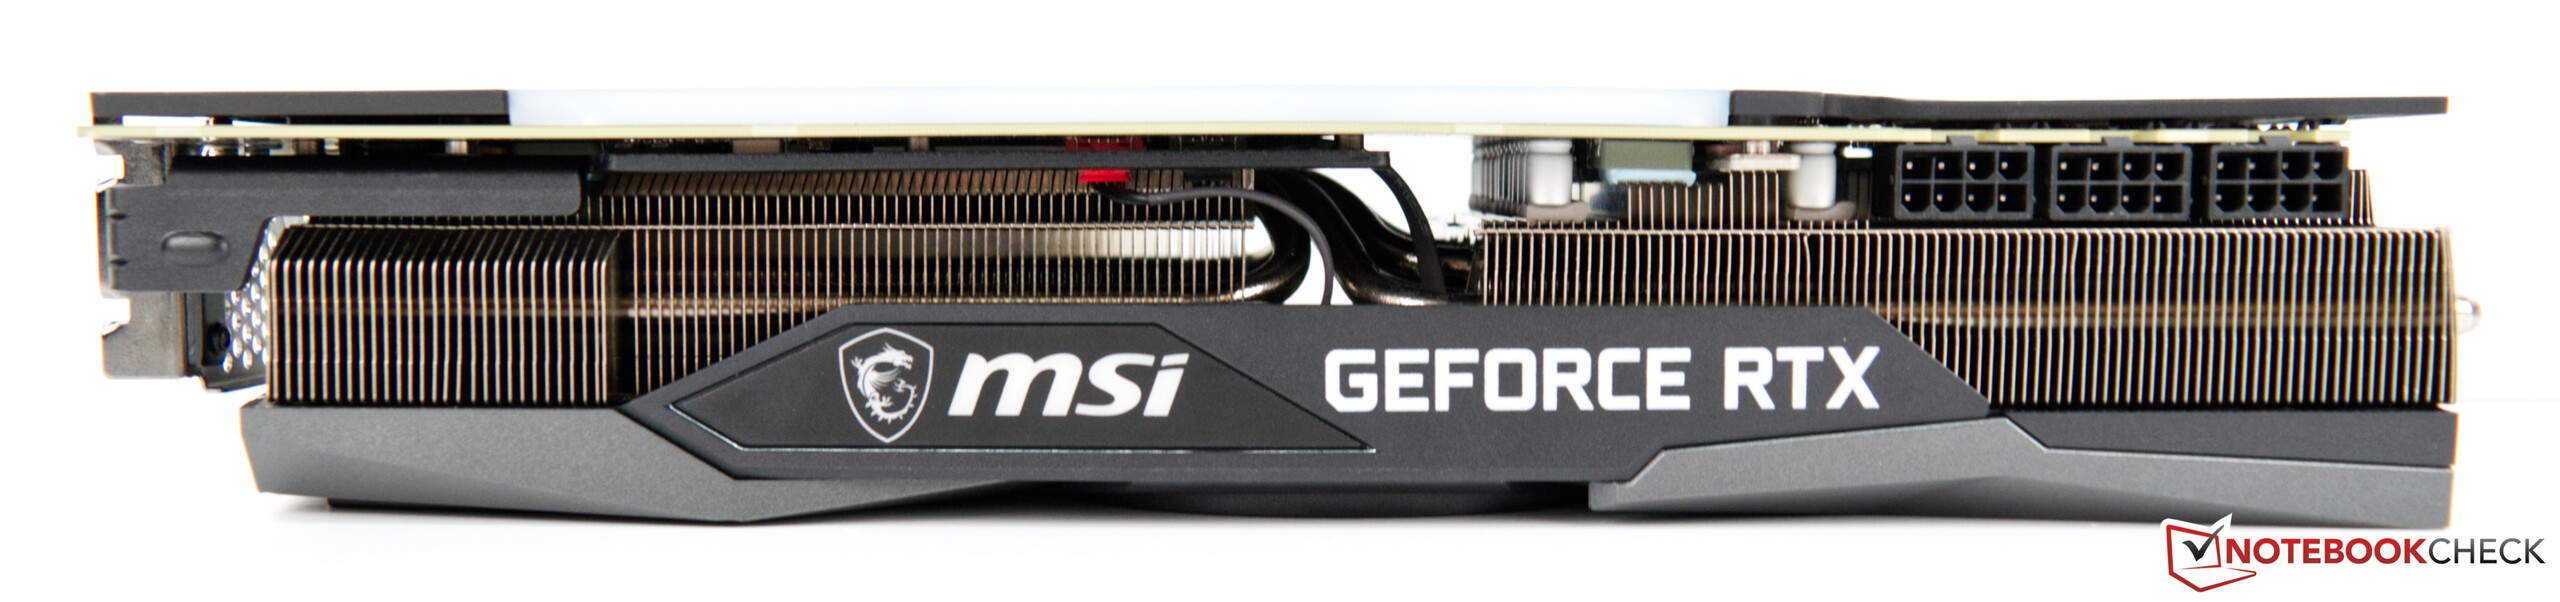
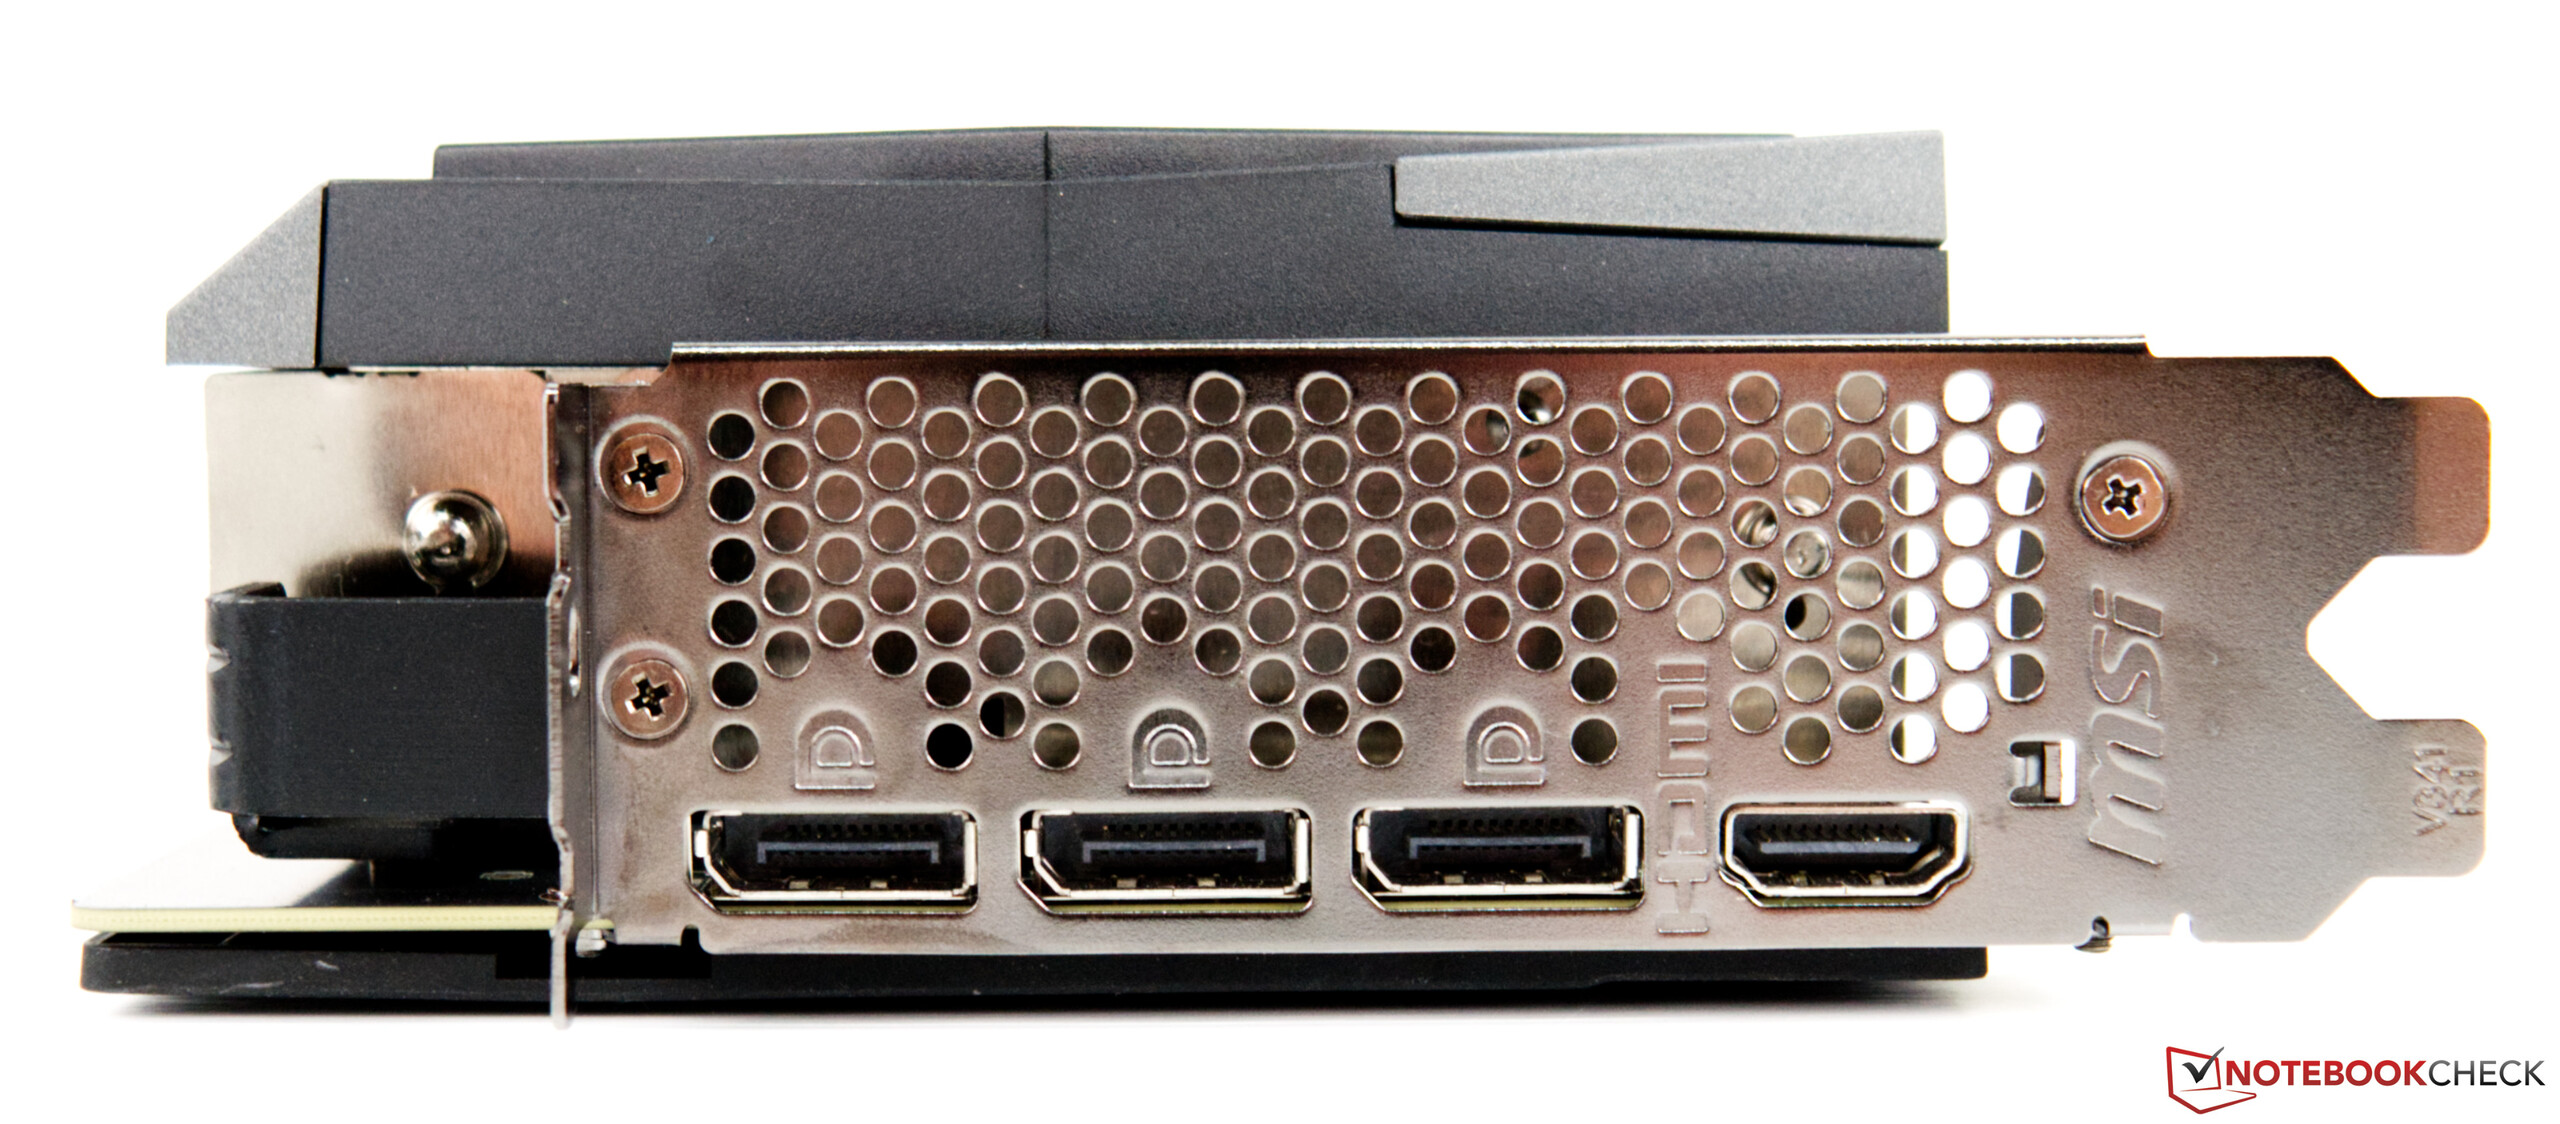
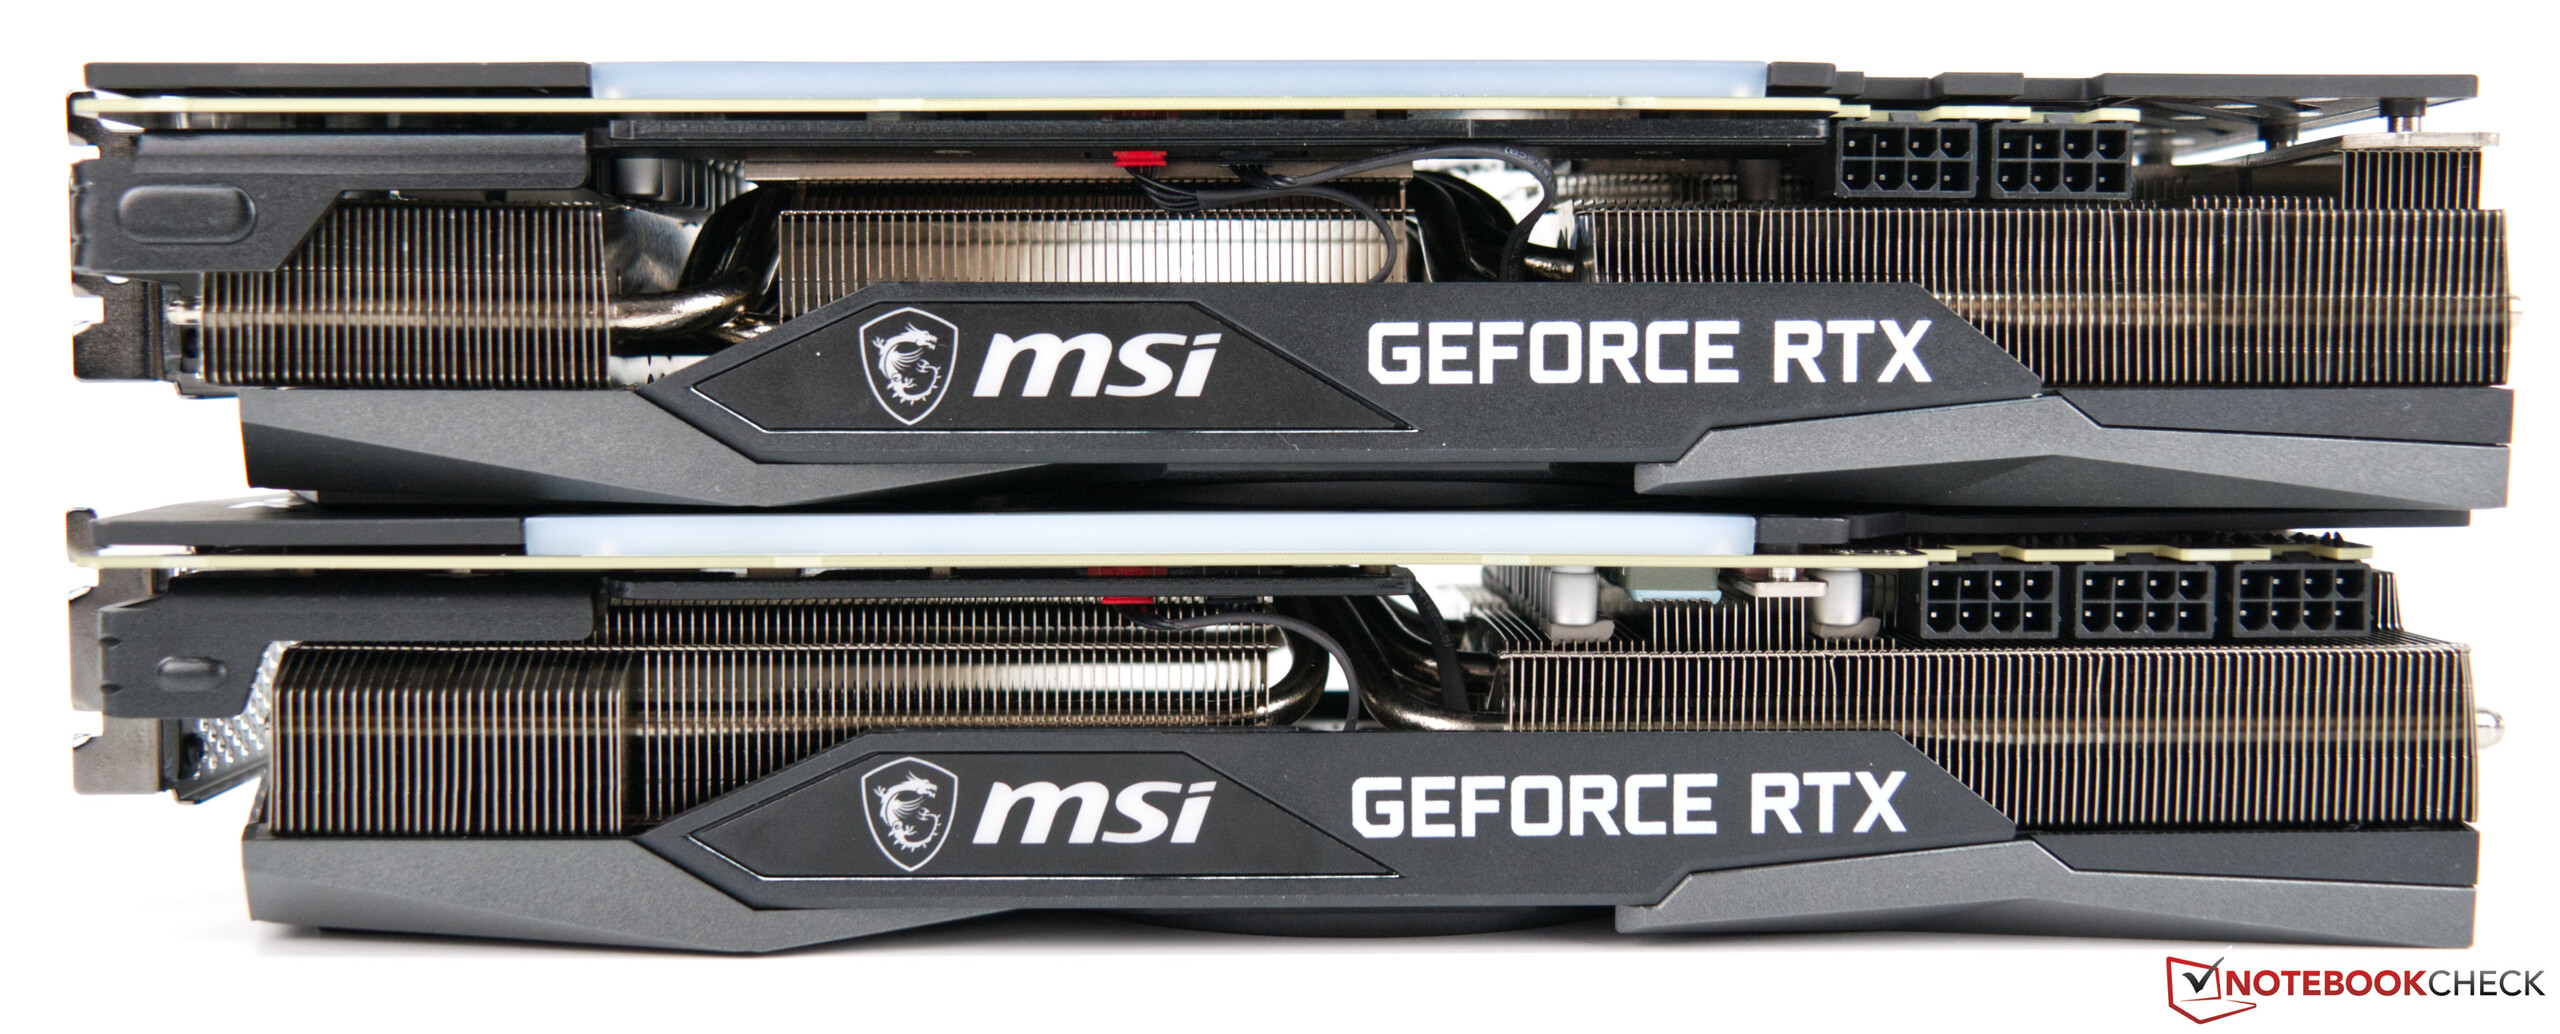
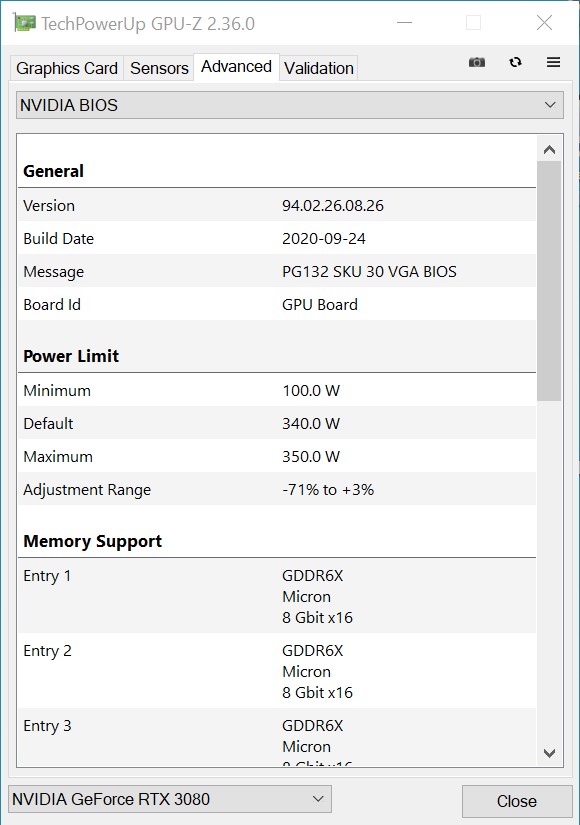
Abbiamo già accennato al maggiore consumo energetico e, per essere più precisi, la scheda grafica ha a disposizione fino a 340 watt. Il modello di riferimento arriva solo 320 watt. Allo stesso tempo, questo significa una maggiore stabilità e una maggiore velocità di clock boost sotto carico. Per alimentare la scheda grafica con sufficiente potenza, essa richiede tre connettori di alimentazione a 8 pin internamente, il che significa che MSI non utilizza il connettore a 12 pin del modello di riferimento. Esternamente, la scheda grafica offre una porta HDMI 2.1 e tre connessioni DisplayPort 1.4a. Questo permette all'MSI GeForce RTX 3080 Gaming X Trio di trasmettere in 8K a 60 Hz o 4K a 120 Hz. Siamo stati in grado di confermarlo nel test.


RTX 3080 rispetto ad altre GPU NVIDIA
| Specifiche | RTX 3090 | RTX3080 (Gaming X Trio) | RTX 3080 FE | RTX 3070 FE | Titan RTX | TITAN X Pascal | RTX 2080 Ti | RTX 2080 |
| Chip | GA102 | GA102 | GA102 | GA104 | TU102 | GP102 | TU102 | TU104 |
| Processo FinFET | 8 nm | 8nm | 8 nm | 8 nm | 8 nm | 8 nm | 12 nm | 16 nm |
| CUDA cores | 10,496 | 8,704 | 8,704 | 5,888 | 4,608 | 3,584 | 4,352 | 2,944 |
| Textureunits | 328 | 272 | 272 | 184 | 288 | 224 | 272 | 184 |
| Tensor Cores | 328 3° Gen. | 272 3° Gen. | 272 3° Gen. | 184 3° Gen. | 184 3° Gen. | 576 2° Gen. | - | 544 2° Gen. |
| RTcores | 82 | 68 | 68 | 46 | 72 | - | 68 | 46 |
| Clock base GPU | 1.395 MHz | 1.440 MHz | 1.440 MHz | 1.440 MHz | 1.500 MHz | 1.350 MHz | 1.417 MHz | 1.350 MHz |
| GPU boost clock | 1.695 MHz | 1.815 MHz | 1.710 MHz | 1.750 MHz | 1.770 MHz | 1.531 MHz | 1.545 MHz | 1.710 MHz |
| Memoriabus | 384-bit | 320-bit | 320-bit | 256-bit | 384-bit | 384-bit | 352-bit | 256-bit |
| Larghezza di banda di memoria | 936 GB/s | 760GB/s | 760 GB/s | 448 GB/s | 672 GB/s | 480,4 GB/s | 616 GB/s | 448 GB/s |
| Memoria video | 24 GB GDDR6X | 10GB GDDR6X | 10 GB GDDR6X | 10 GB GDDR6X | 8 GB GDDR6 | 24 GB GDDR6 | 12 GB GDDR5X | 11 GB GDDR6 |
| Potenza assorbita | 350 W | 340W | 320 W | 220 W | 220 W | 280 W | 250 W | 250 W |
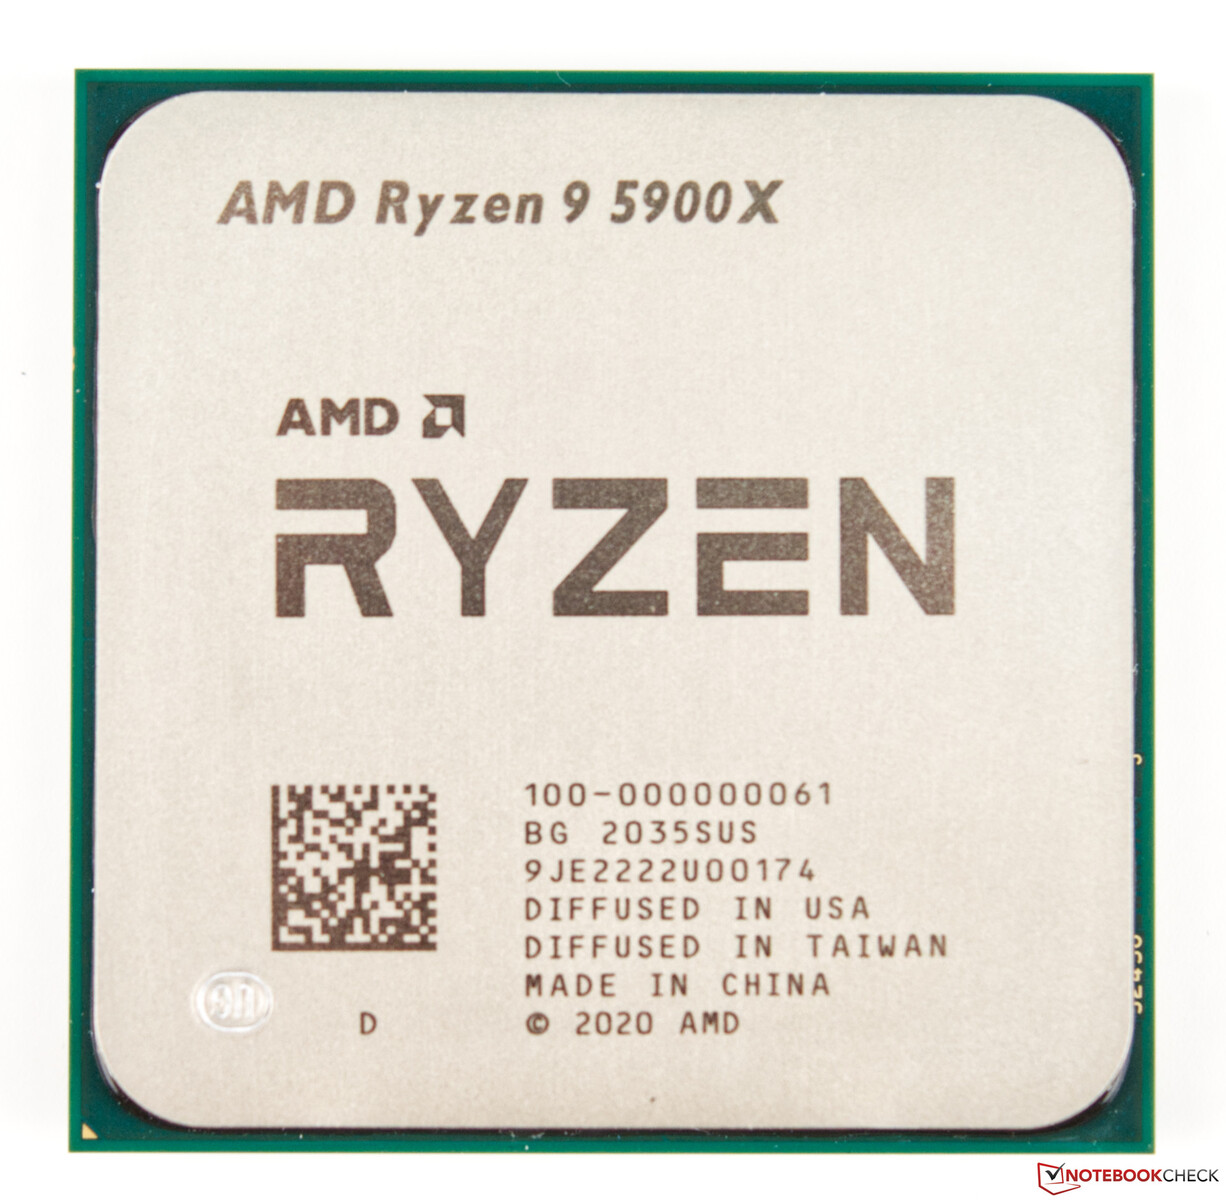
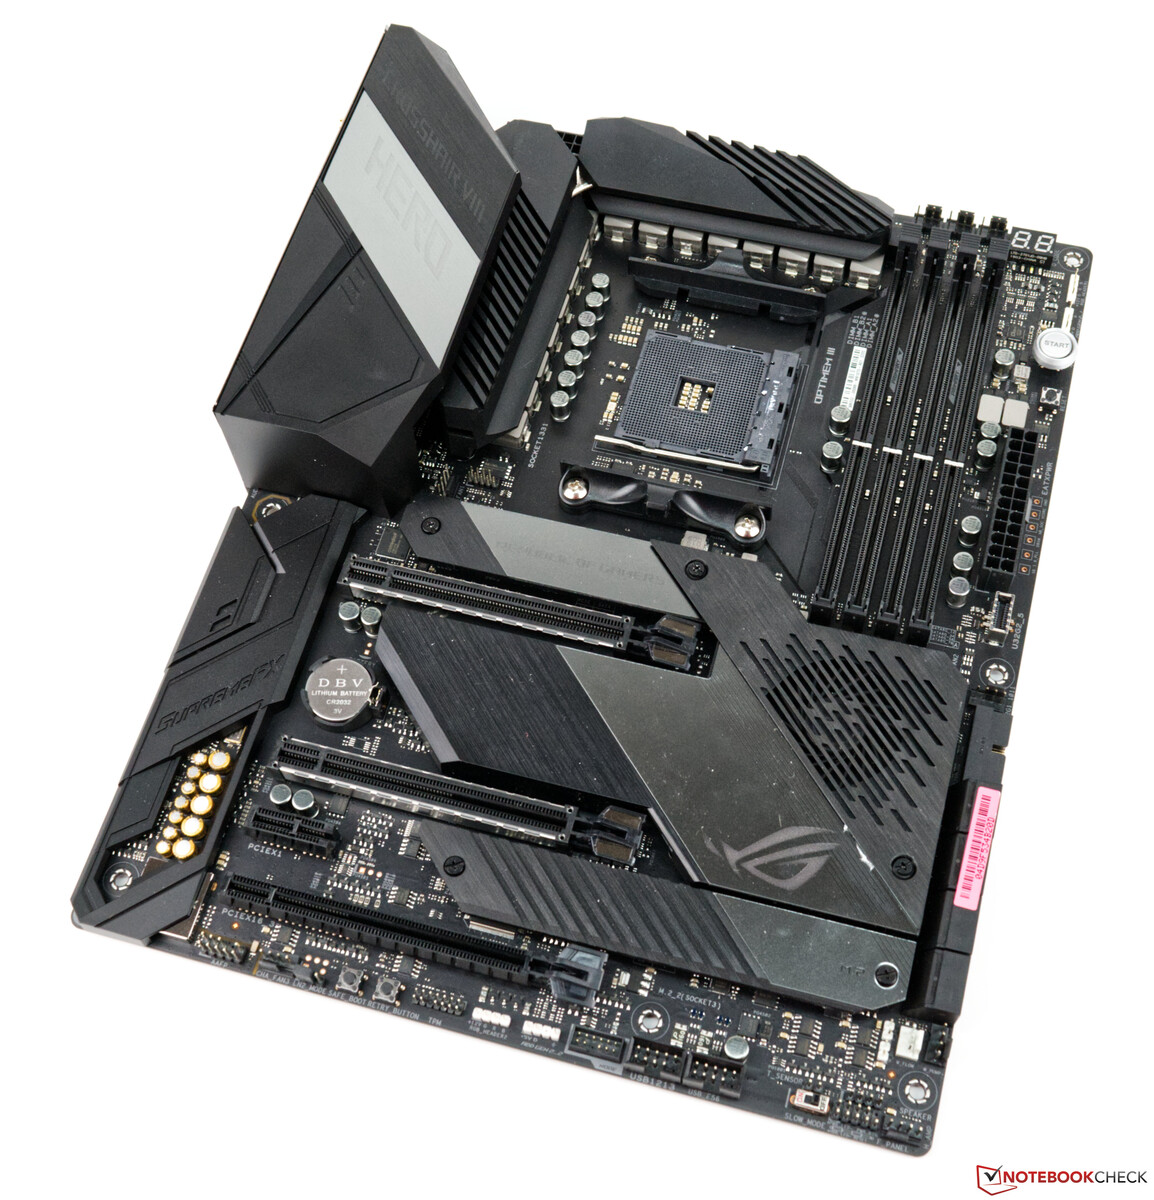
Il nostro sistema di test con AMD Ryzen 9 5900X come base
L'attuale piattaforma AMD basata sul Crosshair VIII di Asus X570 ROG funge da sistema di test. La CPU (AMD Ryzen 9 5900X) offre buone prestazioni della CPU, e noi usiamo un AIO (Alphacool Eisbaer Aurora 360mm) per il raffreddamento. I 32 GB di RAM sono della Corsair e clocks da 4.000 MHz. Utilizziamo l'Acer Predator XB321HK come monitor. Non ci sono limiti per la sua capacità UHD. A riguardo dobbiamo ringraziare AMD per averci fornito la piattaforma di test e Corsair per il kit di RAM.
Per i benchmarks e test, utilizziamo il seguente sistema
- Lian Li O11 Dynamic
- AMD Ryzen 9 5900X
- MSI GeForce RTX 3080 Gaming X Trio (driverNvidia460.79)
- Asus X570 ROG Crosshair VIII Hero Wi-Fi (BIOS 2402, impostazioni predefinite, XMP 1 per DDR4-4000)
- Alimentatore Corsair RM1000X da 1.000 watt
- Corsair Vengeance RGB Pro DDR4-4000 2x 16 GB RAM kit
- Corsair MP600 2 TB M.2 PCIe 4.0 SSD
- Crucial MX500 2 TB (per i giochi)
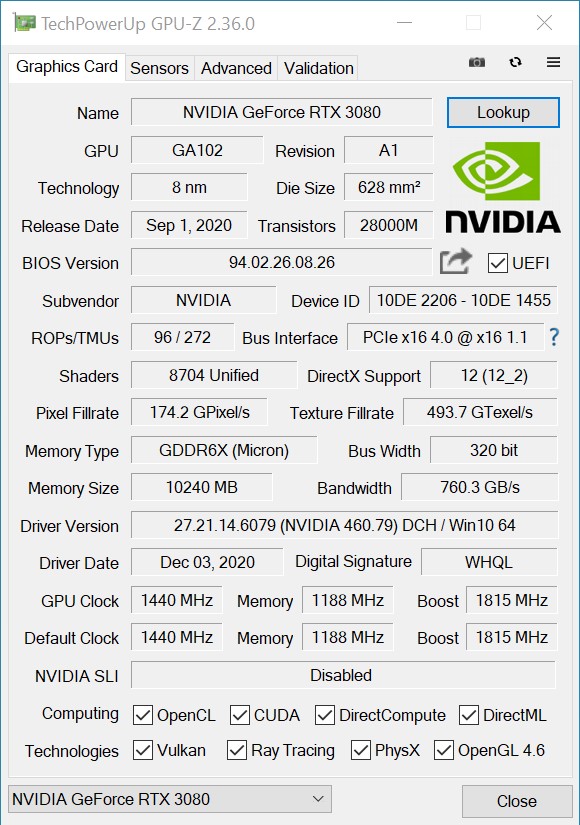
Velocità di clock dell'MSI GeForce RTX 3080 Gaming X Trio
Nulla è cambiato in termini di velocità di clock di base, perché anche l'MSI GeForce RTX 3080 Gaming X Trio ha un clock da 1.440 MHz. Tuttavia, ci sono delle deviazioni nella velocità di clock boost rispetto al modello di riferimento. Il modello MSI offre ben 100 MHz. Ciononostante, Asus ha offerto una velocità di clock boost ancora più elevata con l'RTX 3080 ROG Strix Gaming OC. Scoprirete cosa significa esattamente questo nella recensione più in basso. MSI rimane fedele al modello di riferimento anche in termini di VRAM, il che significa, al contrario, che anche la larghezza di banda della memoria di 760 GB/s rimane invariata.
Benchmarks sintetici
Nei benchmarks sintetici, la GeForce RTX 3080 Gaming X Trio combatte con la GeForce RTX 3080 ROG Strix Gaming OC. A volte l'MSI è in vantaggio, a volte il modello di Asus è in testa. Tuttavia, entrambi i modelli sono dietro la GeForce RTX 3090 che abbiamo recentemente rivisto sotto forma di Suprim X di MSI. Rispetto ad una GeForce RTX 2080 Ti la GeForce RTX 3080 Gaming X Trio può distinguersi con un vantaggio di circa il 30%. La GeForce RTX 3070 è circa altrettanto veloce al momento. La costosa Nvidia Titan RTX può leggermente superare una GeForce RTX 2080 Ti, ma non riesce a raggiungere le prestazioni della GeForce RTX 3080.
| Unigine Superposition | |
| 1280x720 720p Low | |
| Titan RTX | |
| Radeon RX 6800 XT | |
| GeForce RTX 3090 | |
| MSI GeForce RTX 3080 Gaming X Trio | |
| GeForce RTX 3070 | |
| GeForce RTX 3080 | |
| 1920x1080 1080p High | |
| GeForce RTX 3090 | |
| Radeon RX 6800 XT | |
| MSI GeForce RTX 3080 Gaming X Trio | |
| GeForce RTX 3080 | |
| Titan RTX | |
| GeForce RTX 3070 | |
| 1920x1080 1080p Extreme | |
| GeForce RTX 3090 | |
| MSI GeForce RTX 3080 Gaming X Trio | |
| GeForce RTX 3080 | |
| Radeon RX 6800 XT | |
| Titan RTX | |
| GeForce RTX 3070 | |
| 3840x2160 4k Optimized | |
| GeForce RTX 3090 | |
| MSI GeForce RTX 3080 Gaming X Trio | |
| GeForce RTX 3080 | |
| Radeon RX 6800 XT | |
| Titan RTX | |
| GeForce RTX 3070 | |
| 7680x4320 8k Optimized | |
| GeForce RTX 3090 | |
| MSI GeForce RTX 3080 Gaming X Trio | |
| GeForce RTX 3080 | |
| Titan RTX | |
| Radeon RX 6800 XT | |
| GeForce RTX 3070 | |
| 3DMark 03 Standard | 136483 punti | |
| 3DMark 05 Standard | 34535 punti | |
| 3DMark 06 Standard Score | 35659 punti | |
| 3DMark Vantage P Result | 62128 punti | |
| 3DMark 11 Performance | 26565 punti | |
| 3DMark Ice Storm Standard Score | 197964 punti | |
| 3DMark Cloud Gate Standard Score | 48366 punti | |
| 3DMark Fire Strike Score | 20451 punti | |
| 3DMark Fire Strike Extreme Score | 12092 punti | |
| 3DMark Time Spy Score | 8797 punti | |
Aiuto | ||
Benchmarks gaming
I test di gioco che abbiamo condotto mostrano ottime prestazioni nei giochi moderni. Tuttavia, la GeForce RTX 3080 richiede risoluzioni elevate per non essere rallentata dal limite della CPU. Rispetto ad Asus, il nostro modello di prova di MSI deve spesso occupare un posto in secondo piano, anche se il divario è molto ridotto e può anche essere considerato un margine di tolleranza. Nel complesso, entrambi i modelli sono ugualmente veloci. Solo il modello GeForce RTX 3090 offre più FPS ad alta risoluzione. Rispetto ad AMD, Nvidia può affermarsi sull'RTX 3080 in alcuni giochi. Ma AMD può anche tenere il passo con la Radeon RX 6800 XT, e a seconda del gioco, AMD può posizionarsi direttamente dietro la GeForce RTX 3090 con la sua nuova scheda grafica.
Considerando solo le prestazioni di gioco pure, possiamo raccomandare l'MSI GeForce RTX 3080 Gaming X Trio senza alcuna limitazione. Tuttavia, la VRAM un po' bassa lascia ancora un retrogusto amaro, e purtroppo questo non contribuisce a far sì che la GPU sia ben equipaggiata a lungo termine. Ciononostante, i 10 GB di VRAM sono ancora sufficienti per gestire sullo schermo frame rates giocabili in 2160p. La GeForce RTX 3080 potrebbe però avere un periodo più difficile in futuro.
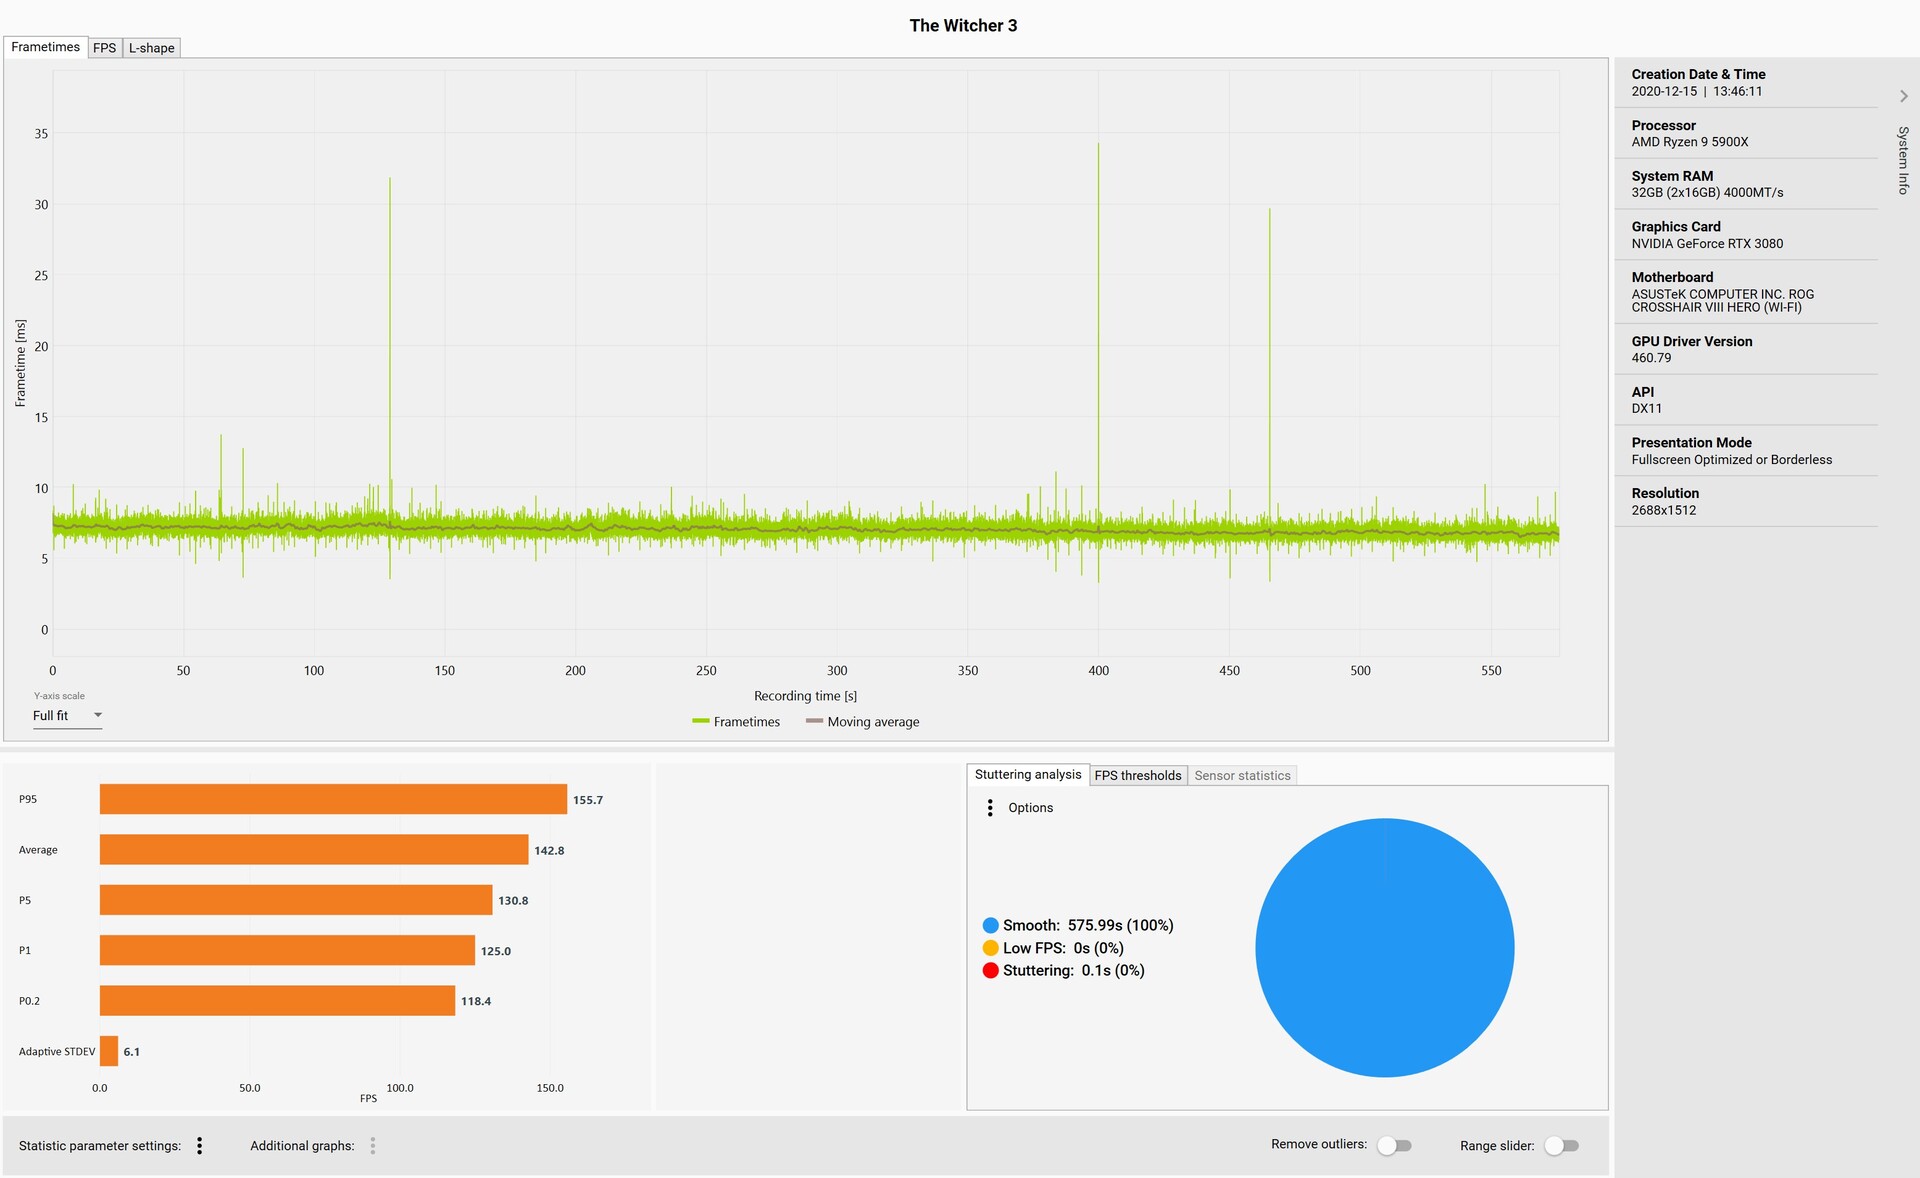
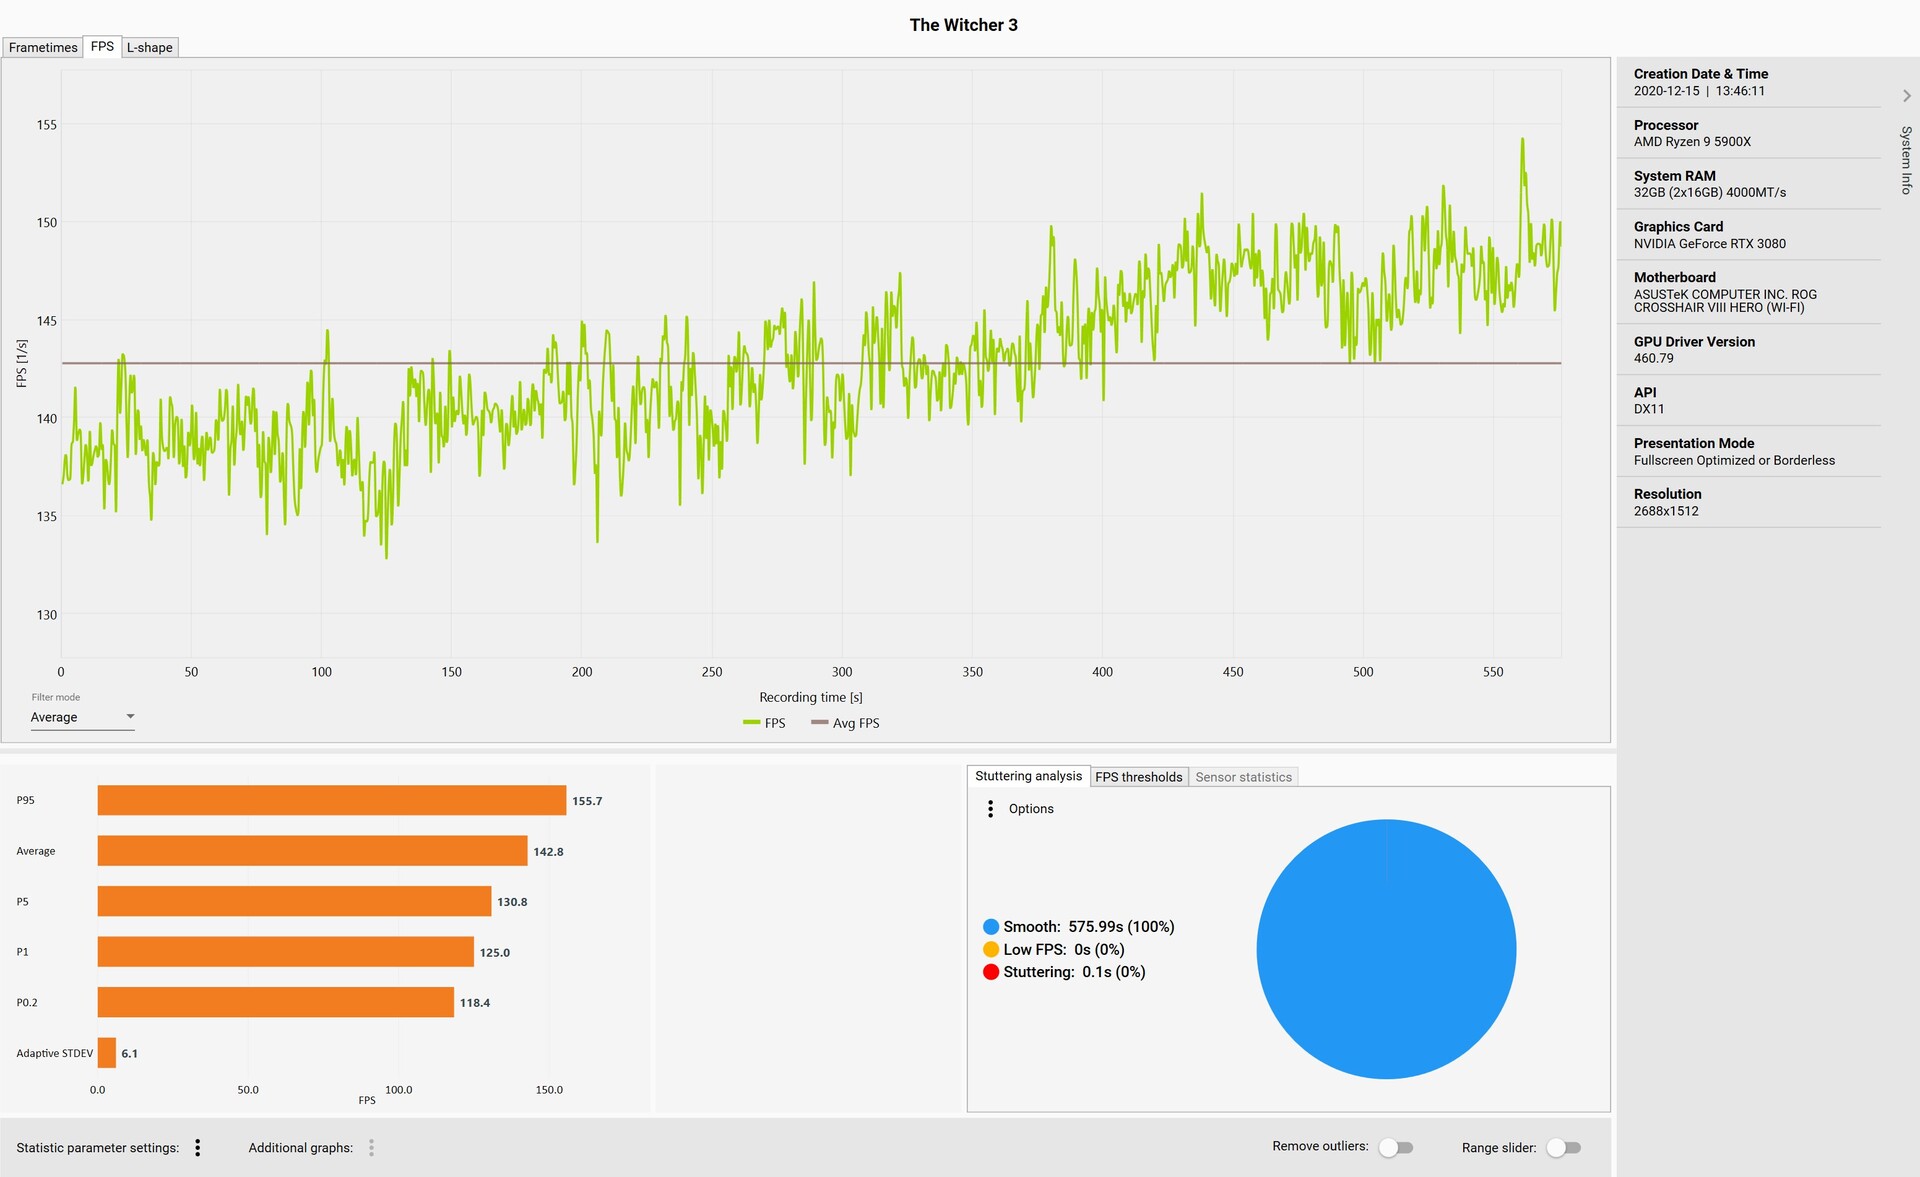
Utilizziamo The Witcher 3 (Ultra preset) come esempio per la progressione dei fotogrammi e i tempi dei fotogrammi. I dati registrati non hanno mostrato anomalie negative. Sono visibili singoli problemi, ma in questo caso non hanno influito sulla fluidità del gioco.
| F1 2020 - 3840x2160 Ultra High Preset AA:T AF:16x | |
| GeForce RTX 3090 | |
| Radeon RX 6800 XT | |
| GeForce RTX 3080 | |
| MSI GeForce RTX 3080 Gaming X Trio | |
| Titan RTX | |
| GeForce RTX 3070 | |
| Borderlands 3 - 3840x2160 Badass Overall Quality (DX11) | |
| GeForce RTX 3090 | |
| MSI GeForce RTX 3080 Gaming X Trio | |
| GeForce RTX 3080 | |
| Radeon RX 6800 XT | |
| Titan RTX | |
| Titan RTX | |
| GeForce RTX 3070 | |
| GeForce RTX 2080 Ti (Desktop) | |
| Red Dead Redemption 2 - 3840x2160 Maximum Settings | |
| GeForce RTX 3090 | |
| MSI GeForce RTX 3080 Gaming X Trio | |
| GeForce RTX 3080 | |
| Radeon RX 6800 XT | |
| GeForce RTX 3070 | |
| Titan RTX | |
| Rise of the Tomb Raider - 3840x2160 High Preset AA:FX AF:4x | |
| GeForce RTX 3090 | |
| MSI GeForce RTX 3080 Gaming X Trio | |
| GeForce RTX 3080 | |
| Radeon RX 6800 XT | |
| GeForce RTX 2080 Ti (Desktop) | |
| GeForce RTX 3070 | |
| GeForce RTX 2080 Super (Desktop) | |
| GeForce RTX 2080 (Desktop) | |
| GeForce RTX 2070 Super (Desktop) | |
| GeForce RTX 2070 (Desktop) | |
| Radeon VII | |
| GeForce RTX 2060 Super (Desktop) | |
| RX Vega 64 | |
| GeForce RTX 2060 (Desktop) | |
| Shadow of the Tomb Raider - 3840x2160 Highest Preset AA:T | |
| GeForce RTX 3090 | |
| MSI GeForce RTX 3080 Gaming X Trio | |
| GeForce RTX 3080 | |
| Radeon RX 6800 XT | |
| Titan RTX | |
| Titan RTX | |
| GeForce RTX 3070 | |
| GeForce RTX 2080 Ti (Desktop) | |
| GeForce RTX 2080 Super (Desktop) | |
| GeForce RTX 2080 (Desktop) | |
| Radeon VII | |
| GeForce RTX 2070 Super (Desktop) | |
| GeForce RTX 2070 (Desktop) | |
| Radeon RX 5700 XT (Desktop) | |
| GeForce RTX 2060 Super (Desktop) | |
| Radeon RX 5700 (Desktop) | |
| GeForce RTX 2060 (Desktop) | |
| RX Vega 64 | |
| Mafia Definitive Edition - 3840x2160 High Preset | |
| GeForce RTX 3090 | |
| GeForce RTX 3080 | |
| MSI GeForce RTX 3080 Gaming X Trio | |
| Titan RTX | |
| Radeon RX 6800 XT | |
| GeForce RTX 3070 | |
| Watch Dogs Legion - 3840x2160 Ultra Preset (DX12) | |
| GeForce RTX 3090 | |
| GeForce RTX 3080 | |
| MSI GeForce RTX 3080 Gaming X Trio | |
| Radeon RX 6800 XT | |
| Titan RTX | |
| GeForce RTX 3070 | |
| The Witcher 3 - 3840x2160 High Graphics & Postprocessing (Nvidia HairWorks Off) | |
| GeForce RTX 3090 | |
| GeForce RTX 3080 | |
| MSI GeForce RTX 3080 Gaming X Trio | |
| Radeon RX 6800 XT | |
| Titan RTX | |
| Titan RTX | |
| GeForce RTX 2080 Ti (Desktop) | |
| GeForce RTX 3070 | |
| GeForce RTX 2080 Super (Desktop) | |
| GeForce RTX 2080 (Desktop) | |
| GeForce RTX 2070 Super (Desktop) | |
| GeForce RTX 2070 (Desktop) | |
| GeForce RTX 2060 Super (Desktop) | |
| Radeon VII | |
| Radeon RX 5700 XT (Desktop) | |
| GeForce RTX 2060 (Desktop) | |
| RX Vega 64 | |
| Radeon RX 5700 (Desktop) | |
| basso | medio | alto | ultra | QHD | 4K | |
|---|---|---|---|---|---|---|
| GTA V (2015) | 182 | 175 | 169 | 104 | 101 | 150 |
| The Witcher 3 (2015) | 446 | 413 | 320 | 145 | 114 | |
| Dota 2 Reborn (2015) | 124.1 | 113.2 | 109.3 | 101.1 | 98 | |
| Rise of the Tomb Raider (2016) | 388 | 300 | 273 | 233 | 114 | |
| Final Fantasy XV Benchmark (2018) | 148 | 132 | 113 | 91 | 66 | |
| X-Plane 11.11 (2018) | 163 | 153 | 122.5 | 104.8 | ||
| Far Cry 5 (2018) | 175 | 152 | 144 | 135 | 132 | 93 |
| Strange Brigade (2018) | 426 | 350 | 315 | 285 | 218 | 134 |
| Shadow of the Tomb Raider (2018) | 191 | 181 | 186 | 177 | 152 | 87.9 |
| Battlefield V (2018) | 187.3 | 165.8 | 148.6 | 137.9 | 116.1 | 87.2 |
| Apex Legends (2019) | 144 | 144 | 144 | 144 | 144 | 140 |
| Far Cry New Dawn (2019) | 143 | 125 | 120 | 108 | 103 | 88 |
| Metro Exodus (2019) | 220 | 181 | 60.2 | 116 | 97.4 | 65.9 |
| Anno 1800 (2019) | 137 | 135 | 93.9 | 54 | 52.4 | 43.2 |
| Control (2019) | 235 | 185 | 151 | 105 | 56.7 | |
| Borderlands 3 (2019) | 147 | 127 | 120 | 117 | 95.7 | 61.9 |
| Star Wars Jedi Fallen Order (2019) | 128 | 127 | 129 | 128 | 97.2 | |
| Red Dead Redemption 2 (2019) | 152.1 | 149.5 | 141.9 | 103 | 86.4 | 56.4 |
| Hunt Showdown (2020) | 260 | 232 | 228 | 188 | 107 | |
| Doom Eternal (2020) | 305 | 302 | 291 | 290 | 277 | 167 |
| F1 2020 (2020) | 321 | 288 | 249 | 179 | 146 | 114 |
| Death Stranding (2020) | 232 | 219 | 208 | 202 | 163 | 98.7 |
| Horizon Zero Dawn (2020) | 198 | 180 | 164 | 144 | 128 | 82 |
| Crysis Remastered (2020) | 227 | 157 | 98.9 | 62.1 | 59.9 | 49.2 |
| Serious Sam 4 (2020) | 161 | 125.2 | 121.7 | 114.3 | 112.8 | 112.7 |
| Mafia Definitive Edition (2020) | 182 | 159 | 144 | 127 | 78.1 | |
| Star Wars Squadrons (2020) | 360 | 392 | 362 | 362 | 274 | 175 |
| FIFA 21 (2020) | 170 | 184 | 182 | 181 | 199 | 195 |
| Watch Dogs Legion (2020) | 122 | 121 | 113 | 99.3 | 81.1 | 53.5 |
| Dirt 5 (2020) | 186 | 134 | 112 | 97 | 85.5 | 65.7 |
| Assassin´s Creed Valhalla (2020) | 136 | 111 | 96 | 88 | 76 | 52 |
| Call of Duty Black Ops Cold War (2020) | 235 | 201 | 173 | 127 | 104 | 65.6 |
| Yakuza Like a Dragon (2020) | 121 | 116 | 118 | 110 | 112 | 72.4 |
| Immortals Fenyx Rising (2020) | 143 | 121 | 109 | 80 | 74 | 57 |
| Cyberpunk 2077 1.0 (2020) | 132 | 128 | 116 | 103 | 72.5 | 38.9 |
Prestazioni di calcolo
In LuxMark e ComputeMark, l'MSI GeForce RTX 3080 Gaming X Trio è spesso un po' più avanti dell'Asus GeForce RTX 3080 ROG Strix Gaming OC. Tuttavia, si ottiene un notevole incremento delle prestazioni solo quando si utilizza la più veloce GeForce RTX 3090. Solo le schede grafiche professionali come i modelli Quadro o FirePro sono in grado di offrire prestazioni ancora più elevate.
Emissioni dell'MSI GeForce RTX 3080 Gaming X Trio
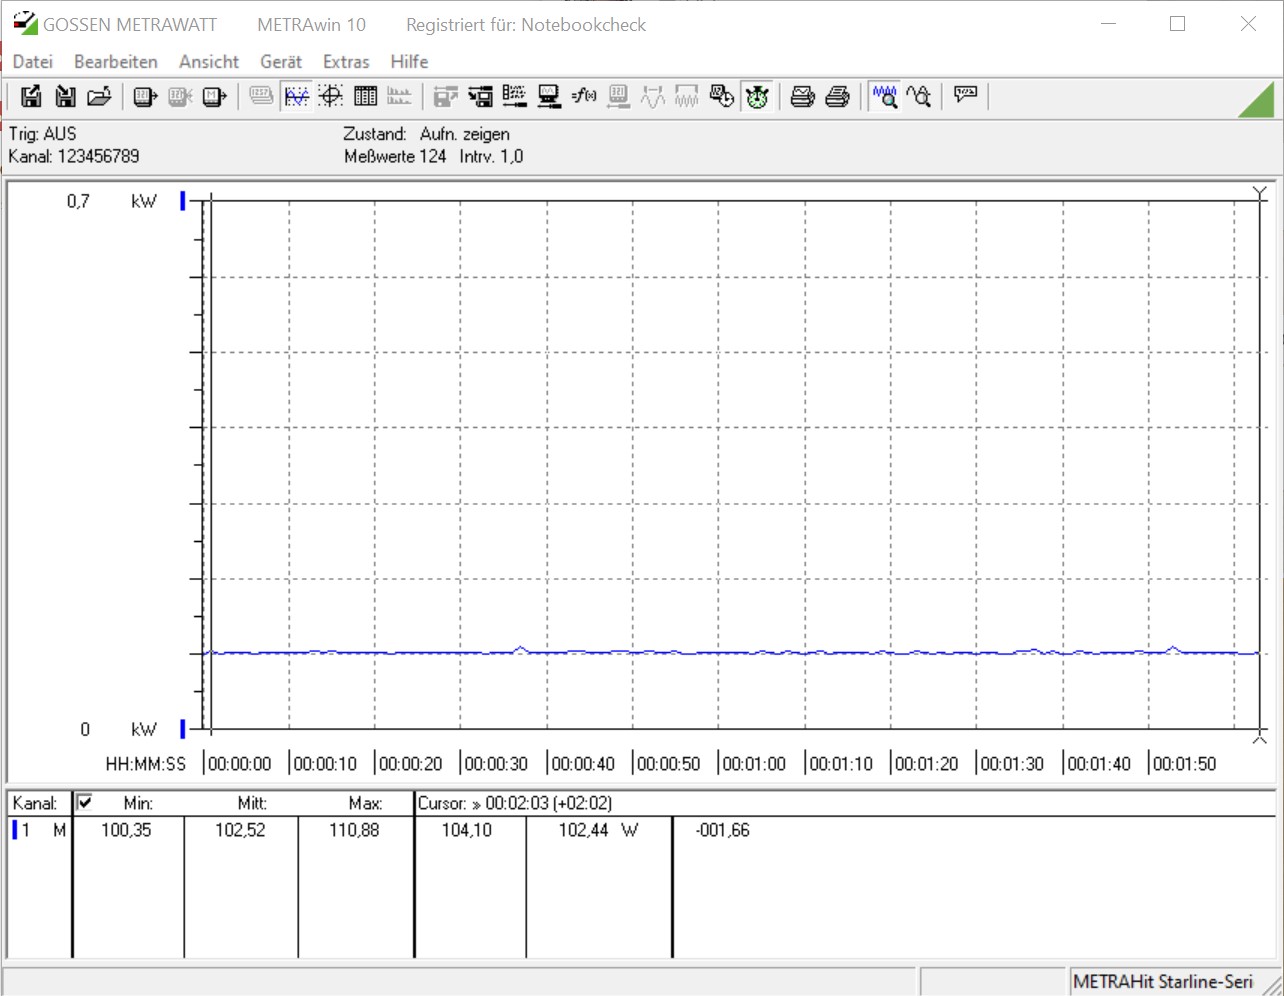
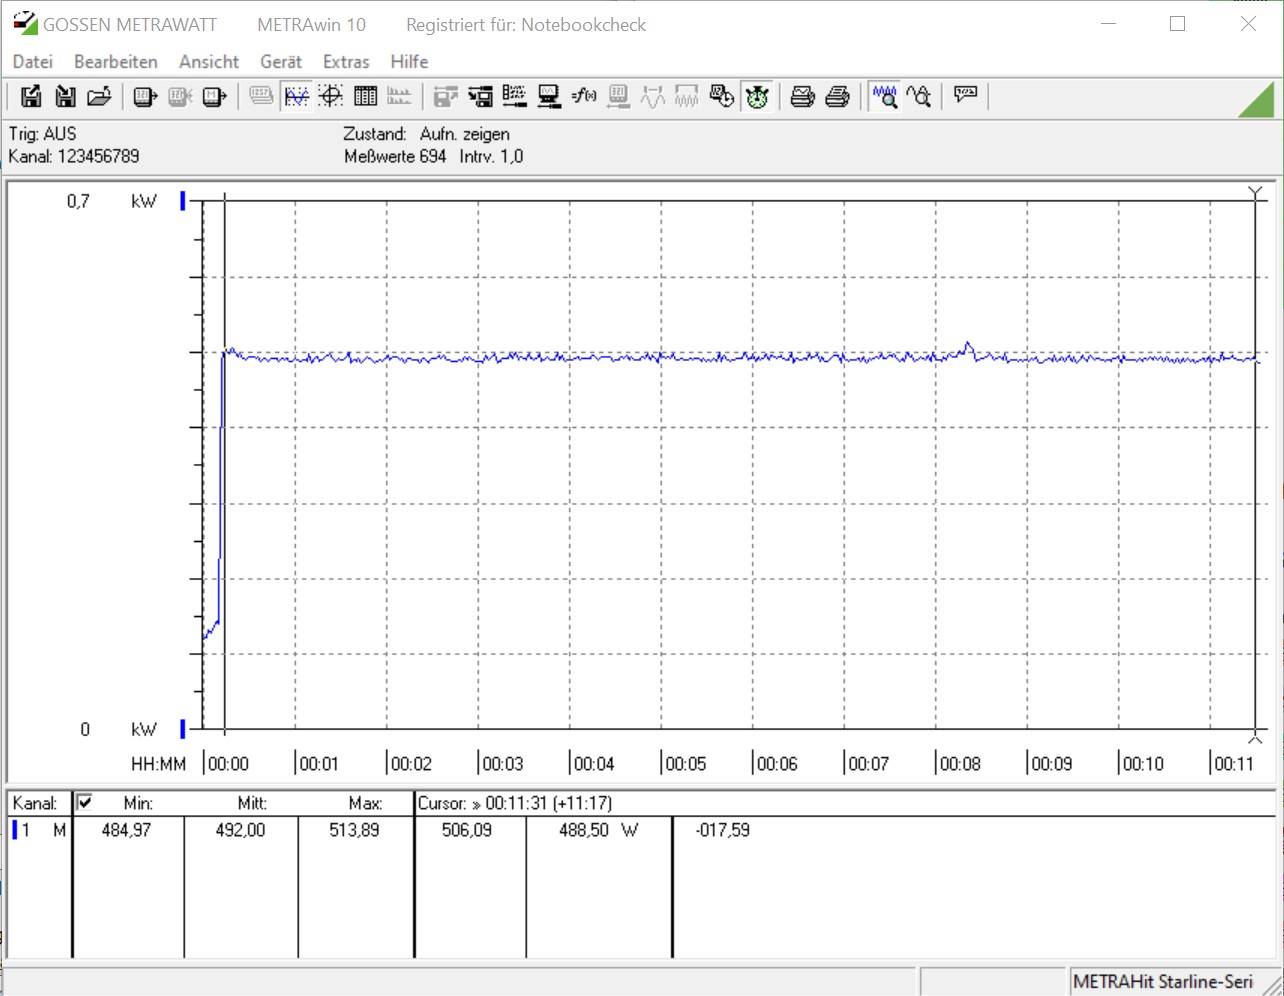
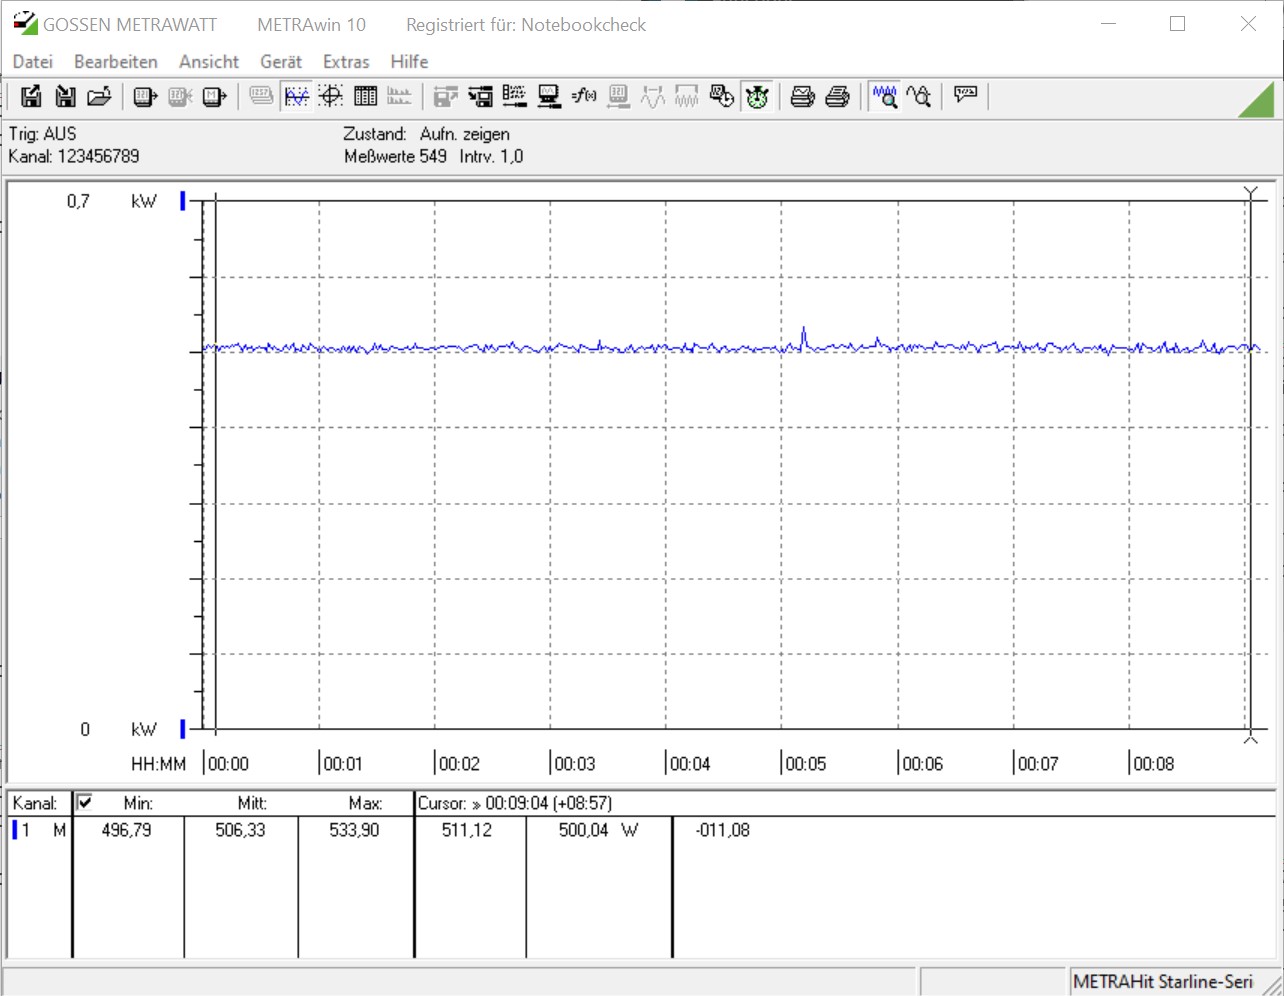
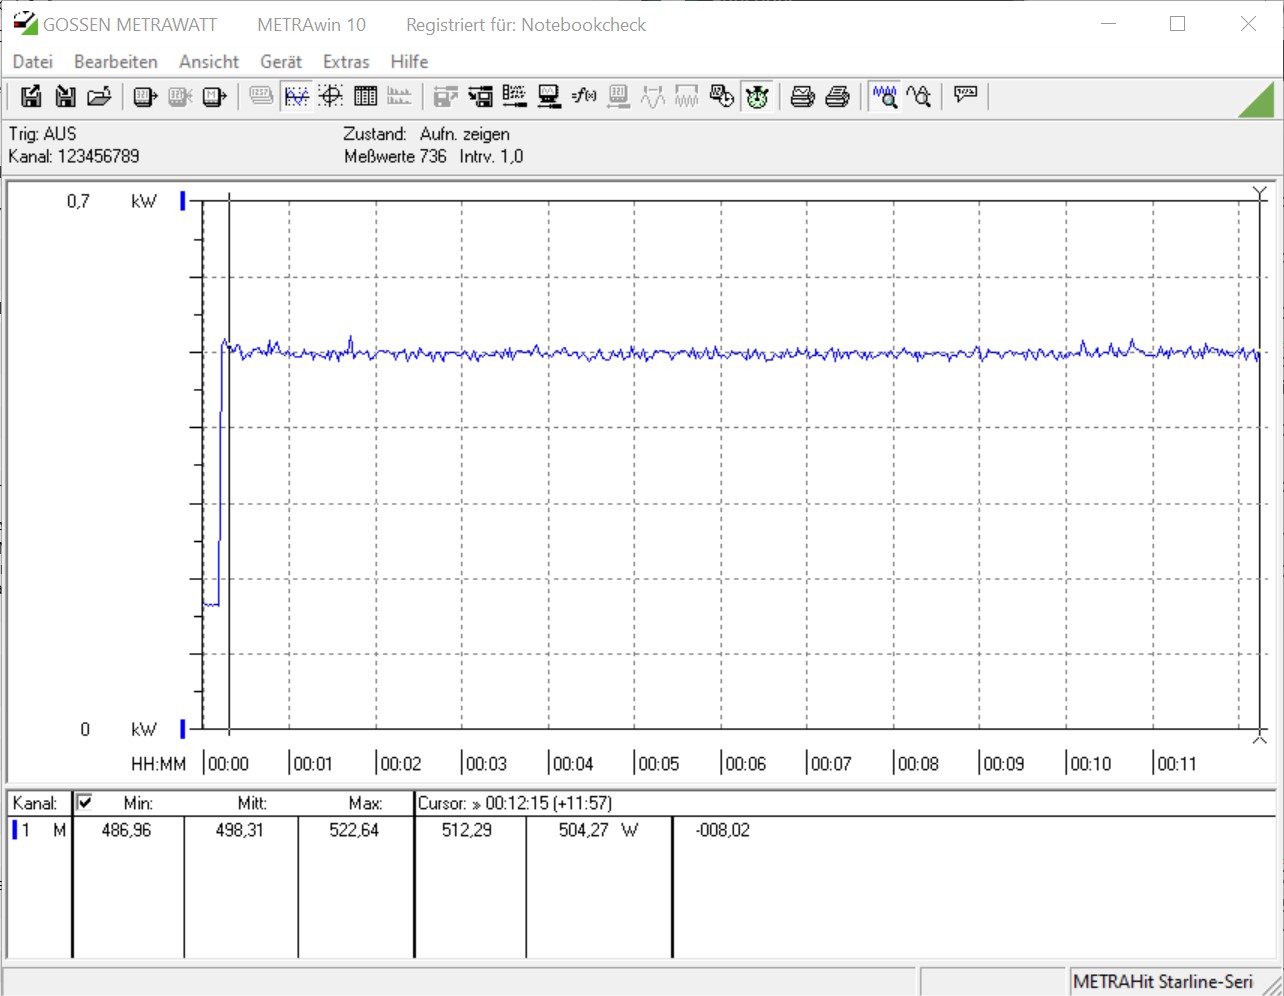
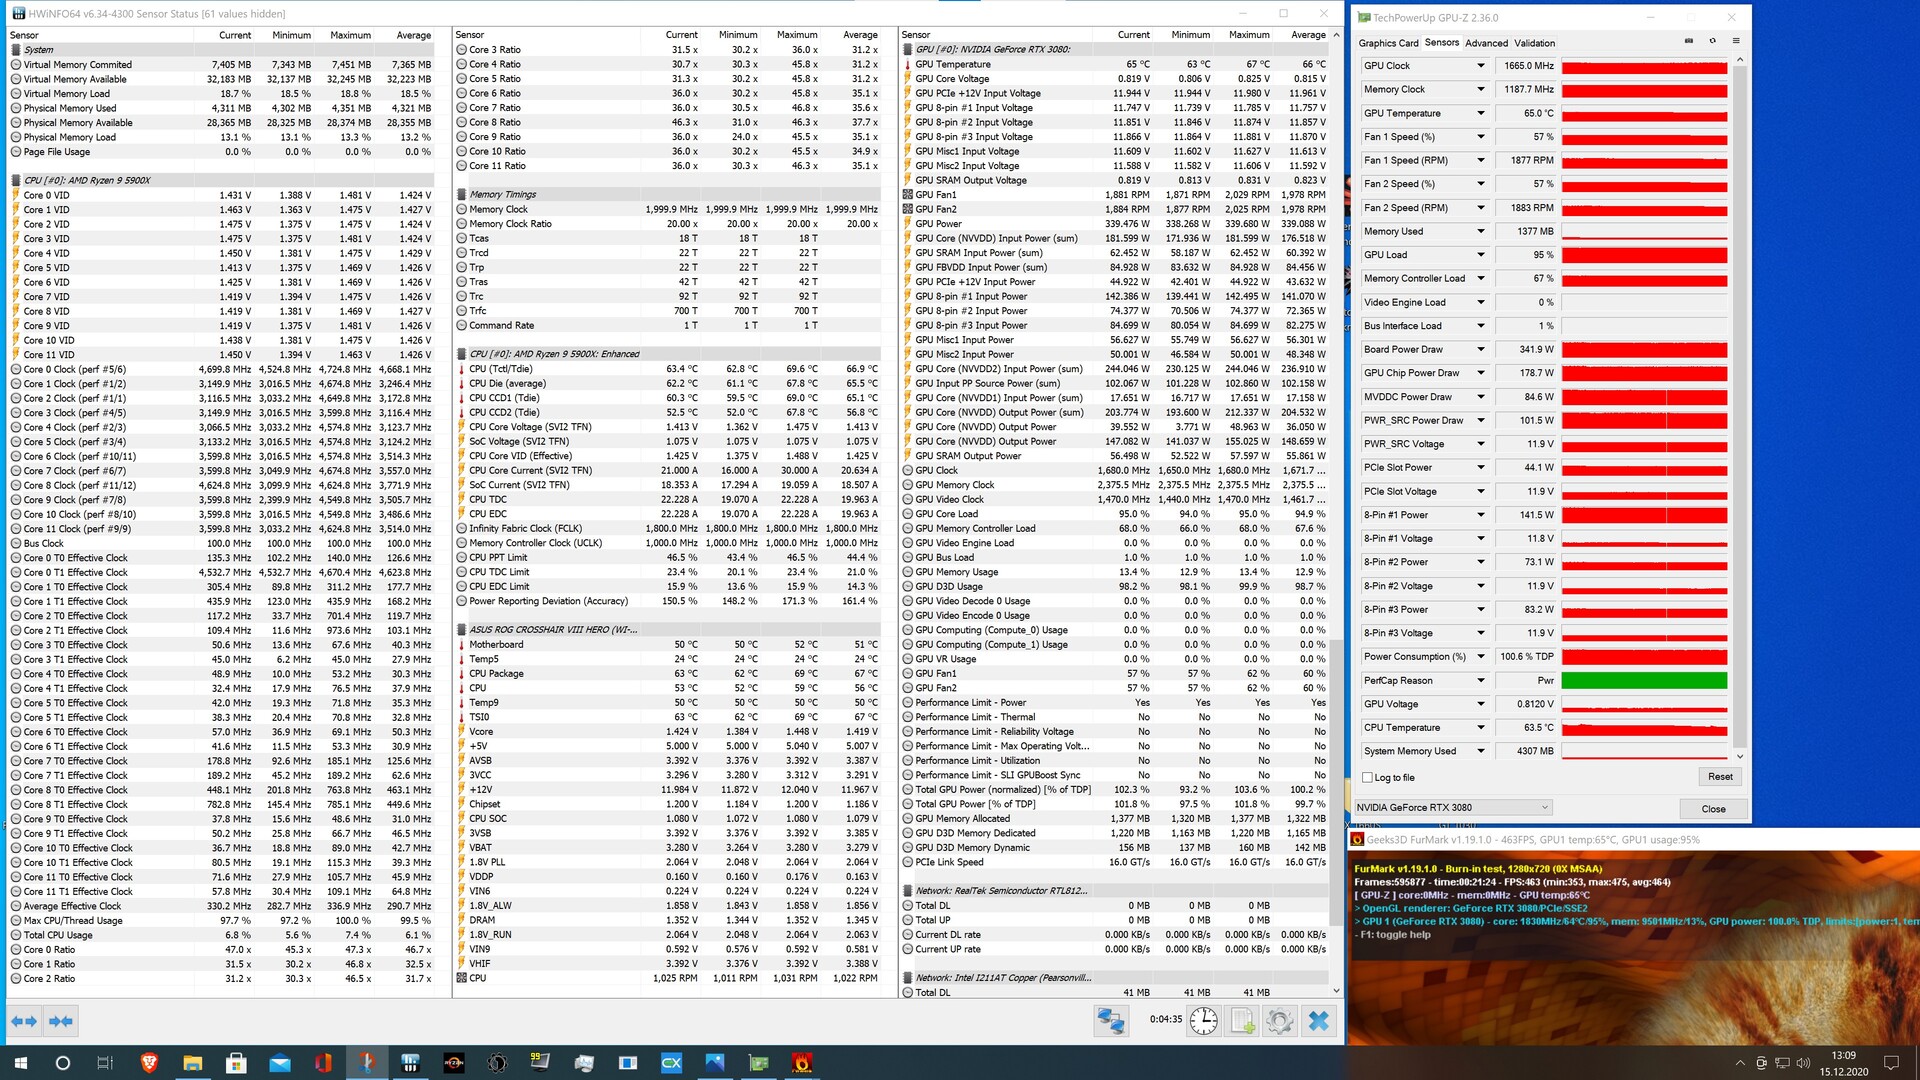
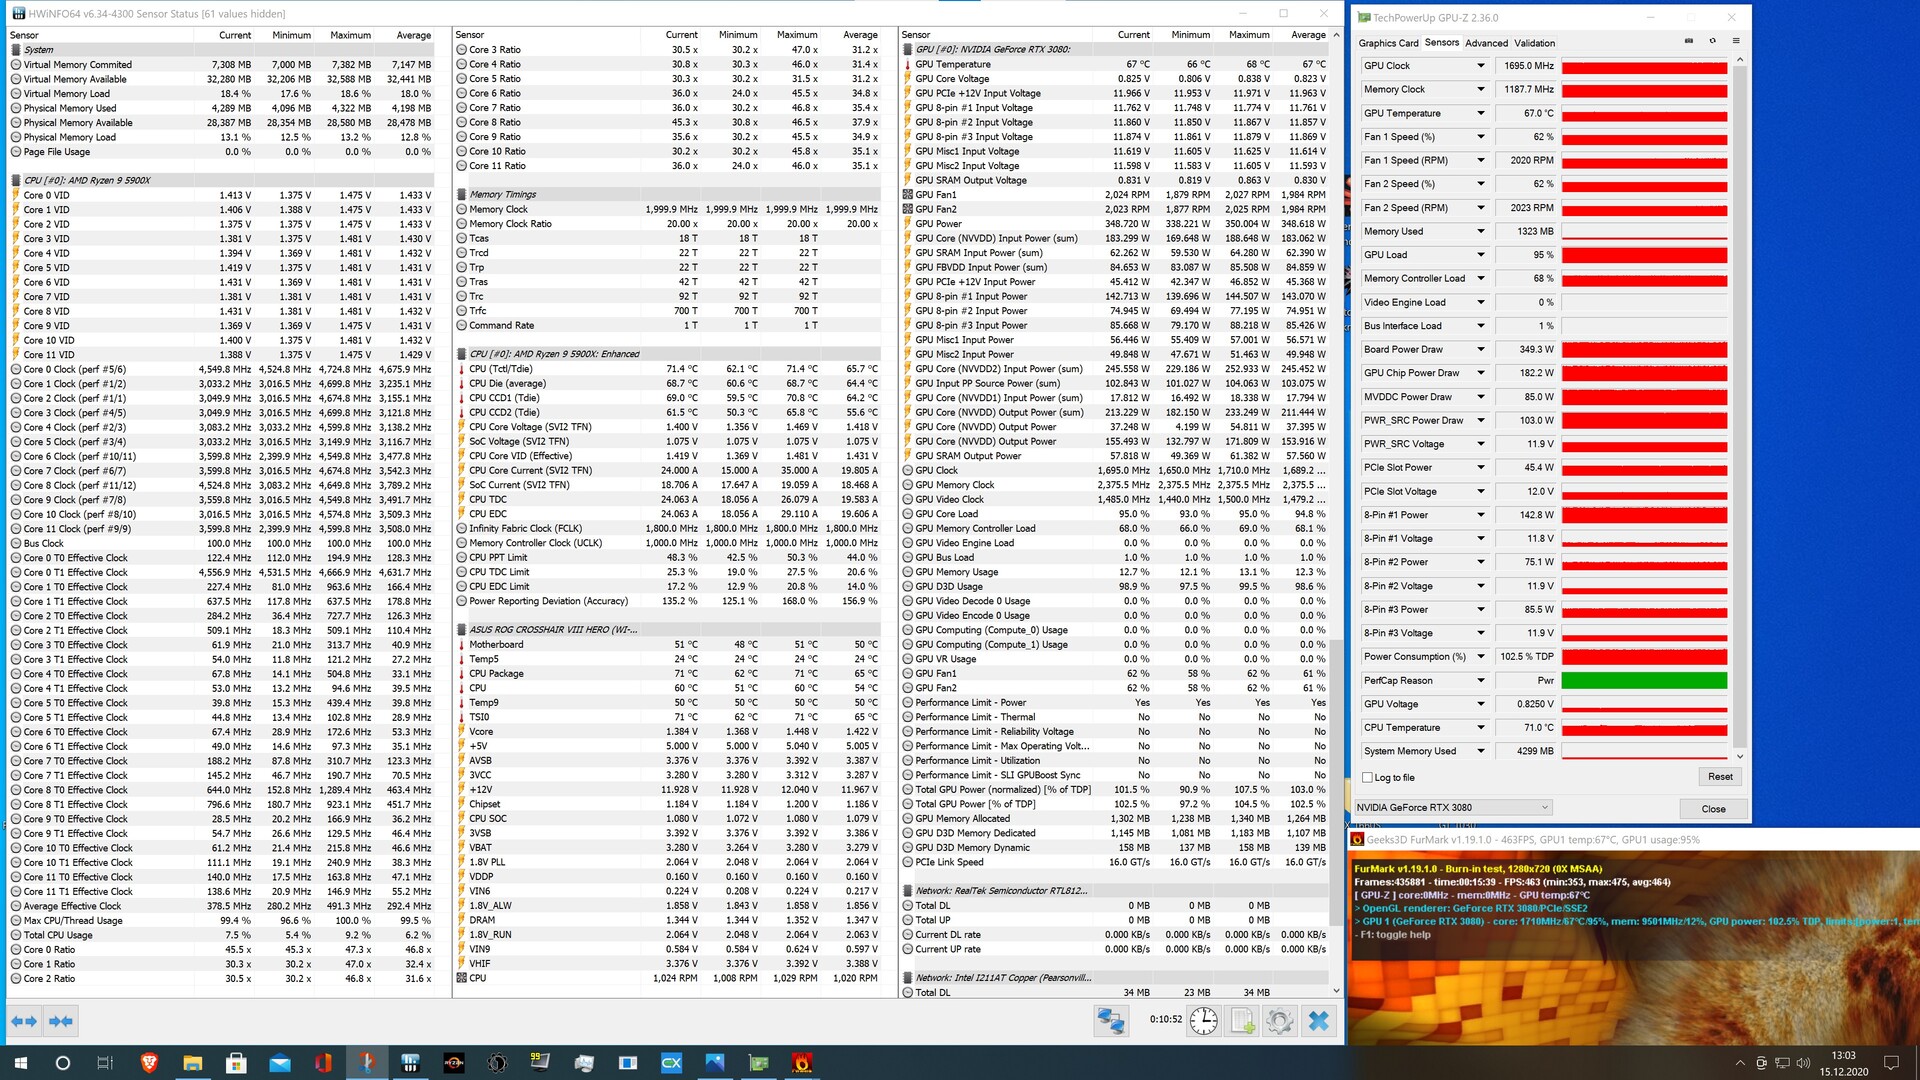
In termini di emissioni, dovrebbe essere chiaro a tutti gli utenti che una scheda grafica di fascia alta non stabilirà alcun record in termini di consumo energetico. Abbiamo visto di recente dove tutto questo può portare quando abbiamo esaminato l'MSI GeForce RTX 3090 Suprim X. Il sistema con l'MSI GeForce RTX Gaming X Trio non assorbe energia dalla presa di corrente in modo così drammatico. Tuttavia, sono ancora poco meno di 500 watt che il nostro dispositivo di prova ha mostrato in media durante il gaming. La controparte di Asus ha addirittura raggiunto poco più di 500 watt. Pertanto, un potente alimentatore è obbligatorio quando si acquista questa scheda grafica. La raccomandazione di MSI per un funzionamento senza problemi è un alimentatore da 750 watt. Il nostro alimentatore da 1.000 watt di Corsair non ha avuto problemi e non ci sono stati crashes sotto carico.
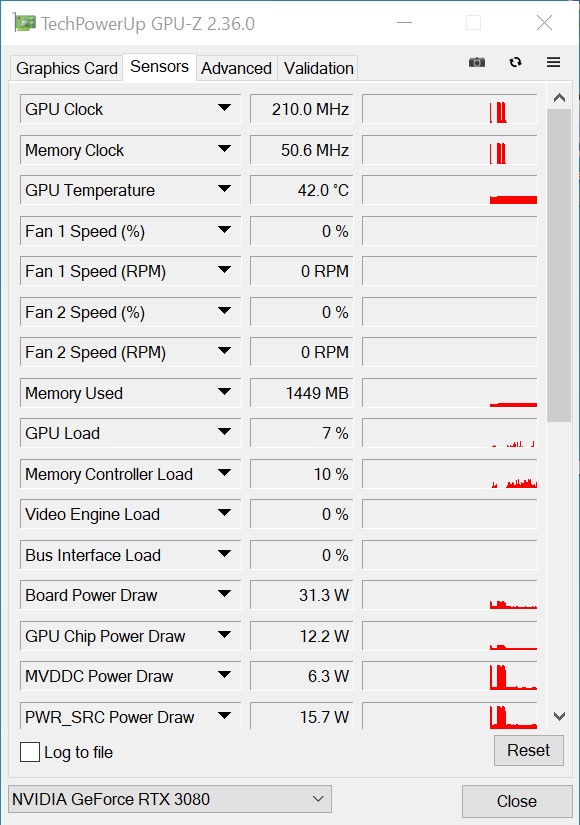
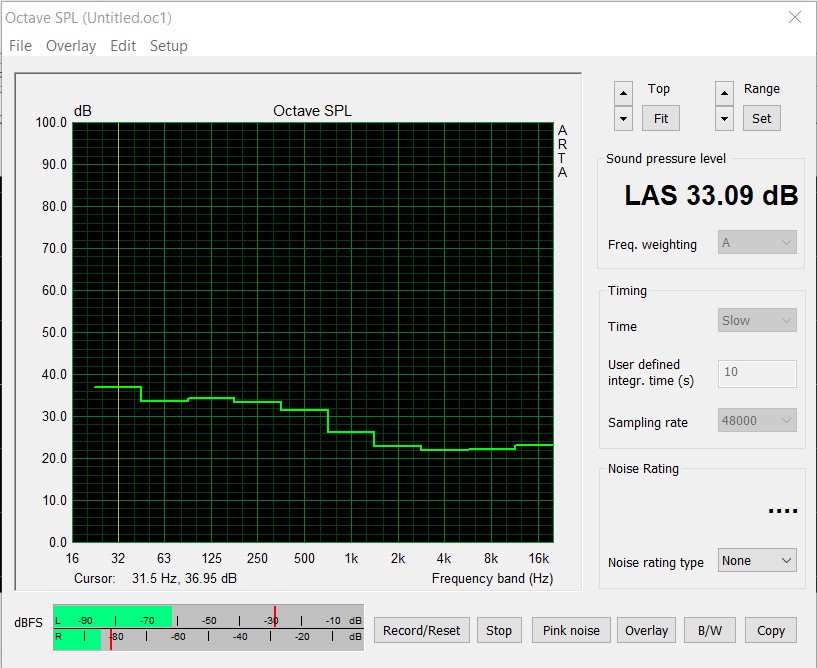
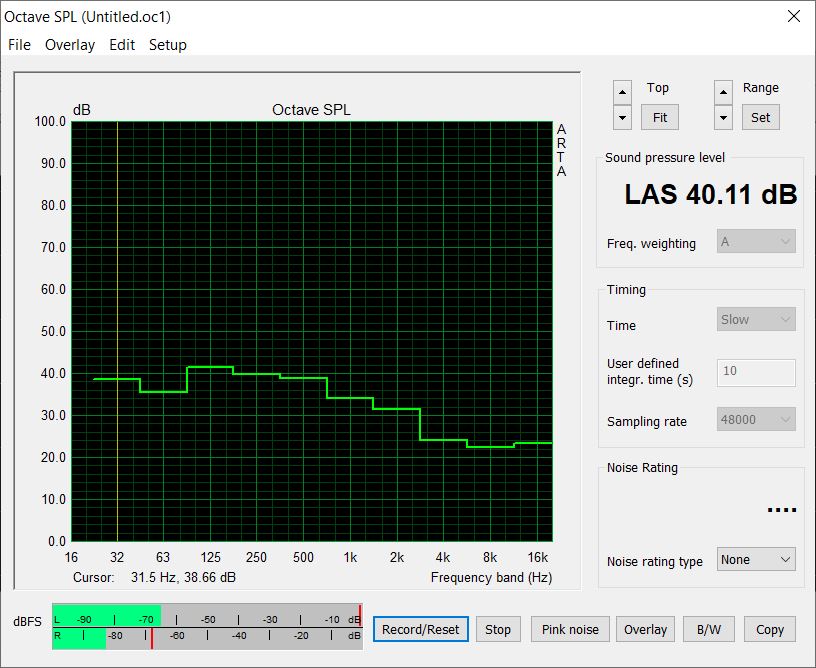
MSI ha fatto centro in termini di rumorosità con il sistema di raffreddamento installato. In modalità 2D o a basso carico, le ventole sono rimaste ferme, e quindi abbiamo potuto misurare le ventole del case solo in caso di utilizzo a vuoto. Ad una distanza di circa 20 centimetri accanto al case, il livello di rumore era di 33 dB(A). Durante lo stress test, la scheda grafica era silenziosamente udibile ad una misura di 40 dB(A). Se si aumenta anche l'obiettivo di potenza, il livello di rumore aumenta leggermente, il che si riflette anche nei giri della ventola. Le tre ventole assiali devono compiere quasi 200 giri al minuto in più per rinfrescare la scheda grafica. Nell'uso normale, la velocità della ventola è compresa tra 1.800 e 1.900 giri al minuto.
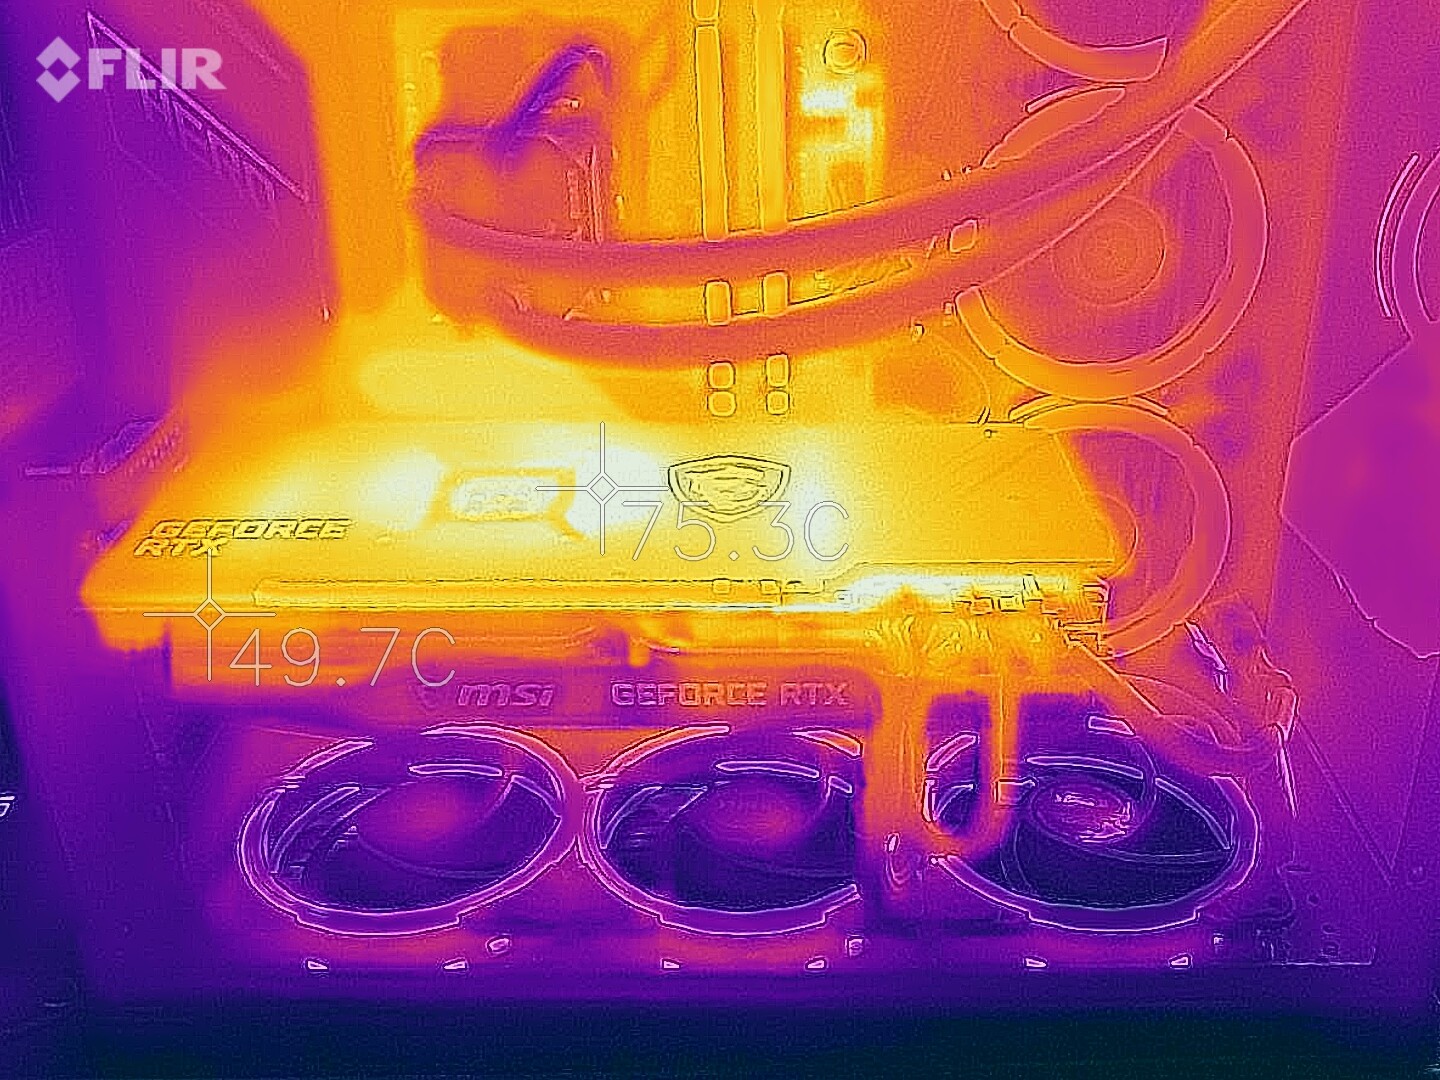
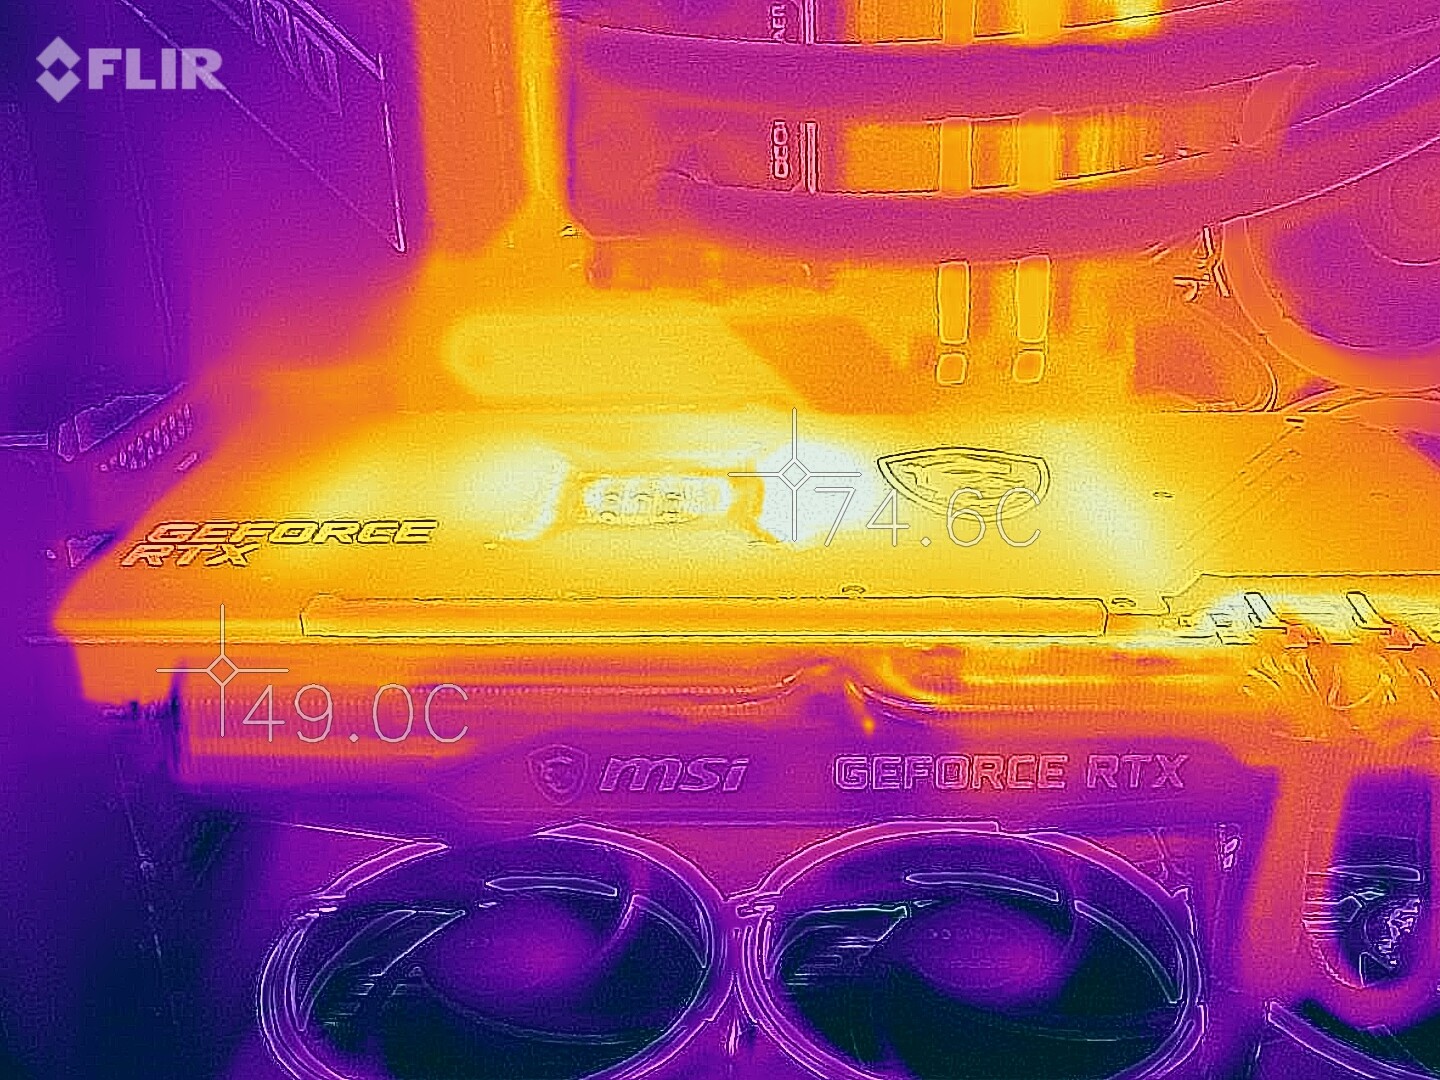
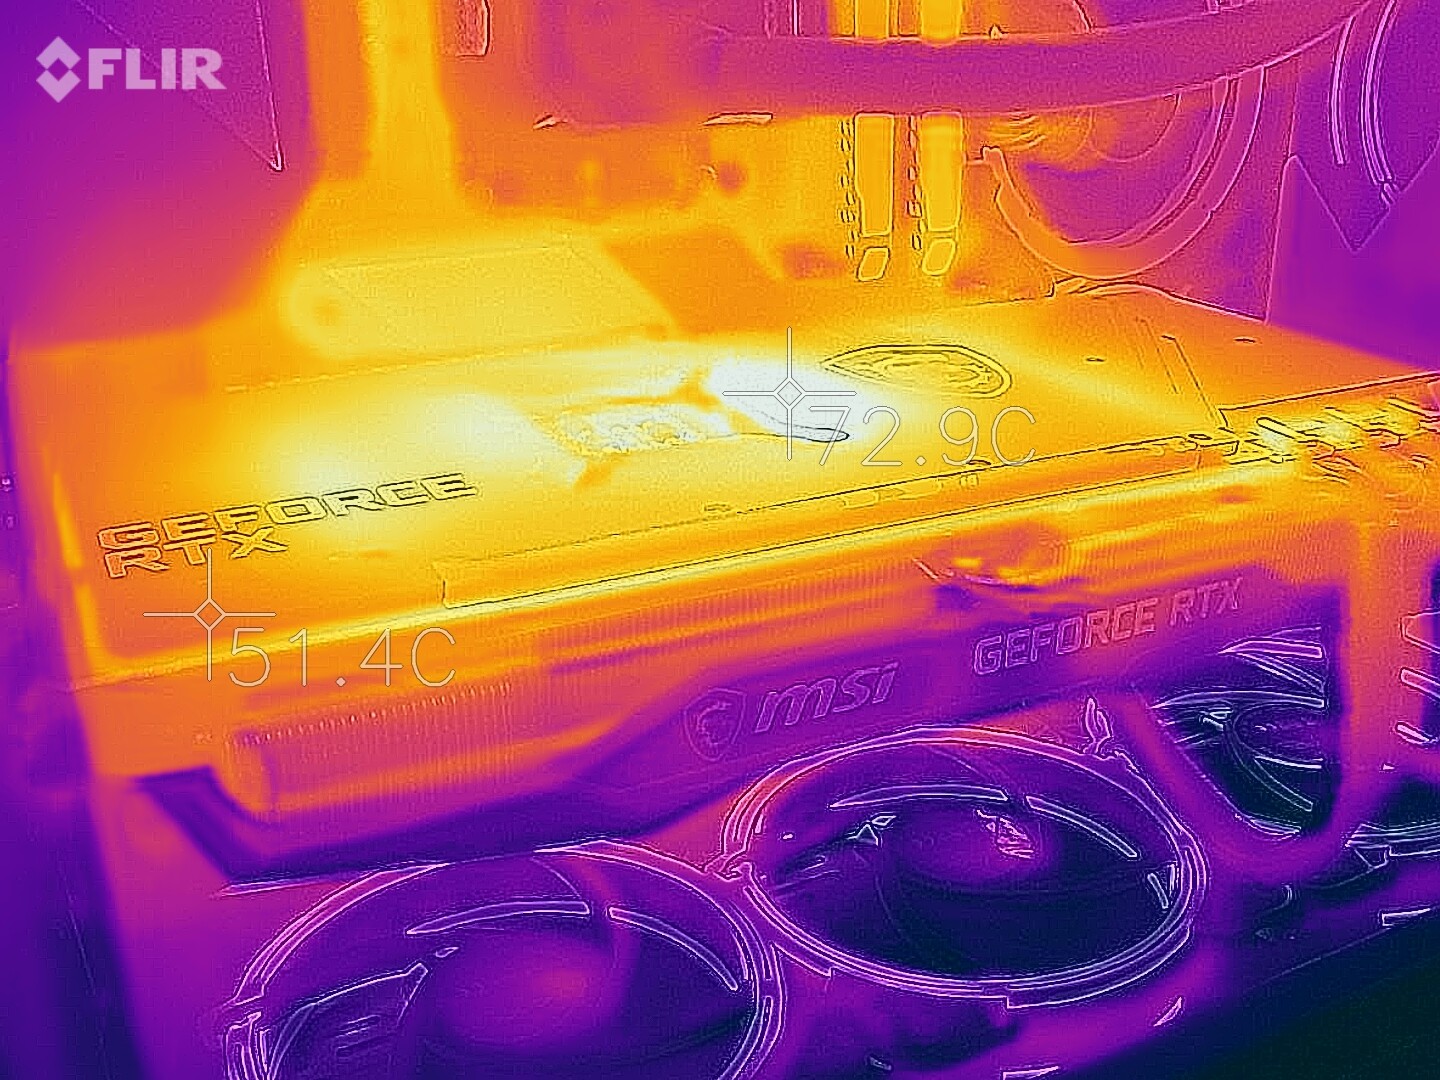
Non ci sono problemi di calore con l'MSI Geforce RTX Gaming X Trio. La temperatura massima della GPU era di 68 °C (~154 °F) nel target di potenza superiore. La temperatura scende di un grado quando la scheda grafica viene utilizzata con le impostazioni di fabbrica.

* ... Meglio usare valori piccoli
Pro
Contro
Giudizio Complessivo - sched grafica RTX 3080 potente con un buon raffreddamento
MSI estende la sua nota serie di schede grafiche di gioco con il Trio RTX 3080 Gaming X Trio GeForce. In termini di prestazioni pure, questa scheda grafica non deve nascondersi dietro la concorrenza ed è alla pari con un Asus GeForce RTX 3080 ROG Strix Gaming OC, che ha una velocità di spinta ancora maggiore secondo la scheda tecnica. Tuttavia, MSI regola anche la velocità di clock rispetto al modello di riferimento e la aumenta di 105 MHz fino a 1.815 MHz. Tuttavia, questo è quasi sempre superato sotto carico, il che è anche dovuto all'ottimo raffreddamento. Grazie alla modalità a ventola zero, l'MSI GeForce RTX 3080 Gaming X Trio è addirittura silenziosa in modalità 2D o a basso carico; anche sotto carico, le tre grandi ventole producono solo un rumore basso, che non dà fastidio.
Con l'AMD Radeon RX 6800 XT Nvidia ha ora un serio avversario nel settore dell'alta gamma. La GeForce RTX 3080 è circa altrettanto veloce quando si confrontano le prestazioni. Solo quando vengono utilizzate caratteristiche speciali come il ray-tracing, preferibilmente in combinazione con DLSS, i modelli GeForce possono guadagnare terreno. L'unico punto critico che rimane è l'elevato consumo di energia sotto carico. Tuttavia, la concorrenza di AMD non è molto più efficiente con un TGP di 300 watt.
L'MSI GeForce RTX 3080 Gaming X Trio è una scheda grafica RTX 3080 molto veloce che rimane anche abbastanza fredda sotto carico.
Chi ha bisogno di una scheda grafica di questo tipo? Beh, se guardiamo a giochi recenti come Cyberpunk 2077, non è quasi possibile evitare una RTX 3080 potente se non si vogliono necessariamente sacrificare i dettagli. I giochi un po' più vecchi, invece, richiedono risoluzioni elevate per non rimanere costantemente bloccati nel limite della CPU. Pertanto, chi gioca principalmente a 2160p o anche a 1440p (UWQHD) può prendere in considerazione l'acquisto di una GeForce RTX 3080. Ma questo ci porta al punto successivo: La disponibilità. Al momento è ancora quasi impossibile acquistare una RTX 3080 GeForce, perché la disponibilità è stata molto scarsa sin dalla sua uscita. Inoltre, i modelli disponibili sono estremamente costosi. MSI indica un prezzo di 769 Euro (~$943) per la GeForce RTX 3080 Gaming X Trio. Tuttavia, il prezzo effettivo al dettaglio, se un modello è disponibile, è di 1.000 Euro (~$1.223) o anche superiore. Questo è uno scenario che probabilmente andrà avanti per un po' di tempo, perché nessuno può dire quando la situazione si semplificherà.
