Recensione del laptop MSI Stealth 15M GeForce RTX: Grafica più veloce di Dell XPS 15, HP Spectre x360 o Asus ZenBook
Da non confondere con l'MSI GS66 Stealth da 15,6 pollici, l'MSI Stealth 15M da 15,6 pollici è un modello completamente diverso progettato per creatori di contenuti, ufficio o uso professionale. È nella stessa categoria dell'esistente serie di portatili MSI Prestige, Creator, Summit o Modern, ma con importanti differenze di specifiche.
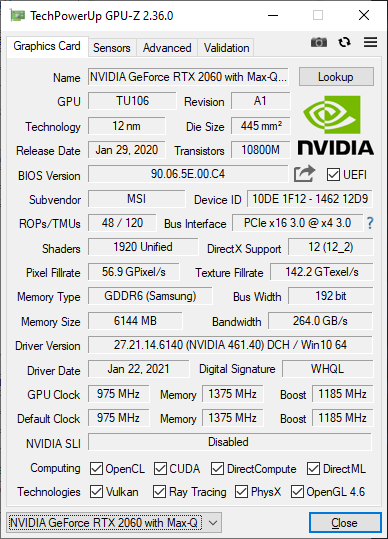
La caratteristica distintiva dello Stealth 15M è la sua veloce scheda grafica GeForce RTX 2060 Max-Q o RTX 3060 abbinata a una CPU di 11a generazione Core serie U. La maggior parte degli altri portatili in questa categoria sono limitati alla sola scheda grafica Geforce GTX o MX e sono invece dotati di CPU Core serie H come il Dell XPS 15, HP Spectre x360 15, o Asus ZenBook 15. Il sistema MSI offrirà quindi prestazioni grafiche significativamente migliori rispetto alla maggior parte dei suoi immediati concorrenti - almeno sulla carta. Il suo concorrente più stretto è l'HP Envy 15 del 2020 che è dotato della stessa GPU RTX 2060 Max-Q ma di un processore Core H ancora più veloce.
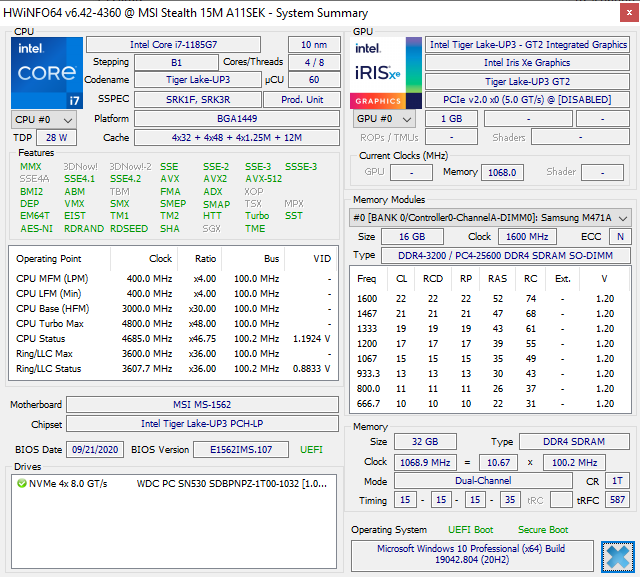
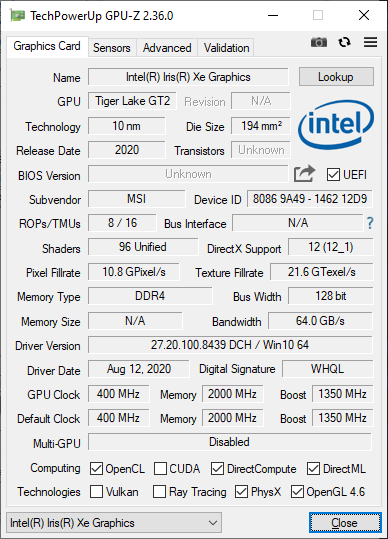
La nostra configurazione di oggi è dotata di CPU Tiger Lake Core i7-1185G7, 32 GB di RAM, GeForce RTX 2060 Max-Q GPU, 60 Hz FHD display ed SSD NVMe da 1 TB che ha un costo di circa $1500 USD al dettaglio. Le versioni aggiornate per le quali è previsto il lancio nel marzo 2021 saranno invece dotate di CPU Core i7-11375H, display 144 Hz e GPU GeForce RTX 3060. Tutte le opzioni finora hanno un display a risoluzione fissa di 1080p.
Altre recensioni di MSI:
Potenziali concorrenti a confronto
Punteggio | Data | Modello | Peso | Altezza | Dimensione | Risoluzione | Prezzo |
|---|---|---|---|---|---|---|---|
| 82.4 % v7 (old) | 02/2021 | MSI Stealth 15M A11SEK i7-1185G7, GeForce RTX 2060 Max-Q | 1.7 kg | 16.15 mm | 15.60" | 1920x1080 | |
| 85 % v7 (old) | 01/2020 | HP Spectre X360 15-5ZV31AV i7-10510U, GeForce MX250 | 2.1 kg | 19.3 mm | 15.60" | 3840x2160 | |
| 90.1 % v7 (old) | 06/2020 | Dell XPS 15 9500 Core i7 4K UHD i7-10875H, GeForce GTX 1650 Ti Mobile | 2 kg | 18 mm | 15.60" | 3840x2400 | |
| 86.6 % v7 (old) | 02/2021 | Lenovo ThinkPad T15p-20TN0006GE i7-10750H, GeForce GTX 1050 Mobile | 2.2 kg | 22.7 mm | 15.60" | 3840x2160 | |
| 87 % v7 (old) | 12/2020 | Asus ZenBook UX535-M01440 i7-10750H, GeForce GTX 1650 Ti Max-Q | 2 kg | 20 mm | 15.60" | 3840x2160 | |
| 85.2 % v7 (old) | 11/2019 | MSI Prestige 15 A10SC i7-10710U, GeForce GTX 1650 Max-Q | 1.7 kg | 16 mm | 15.60" | 3840x2160 |
Case
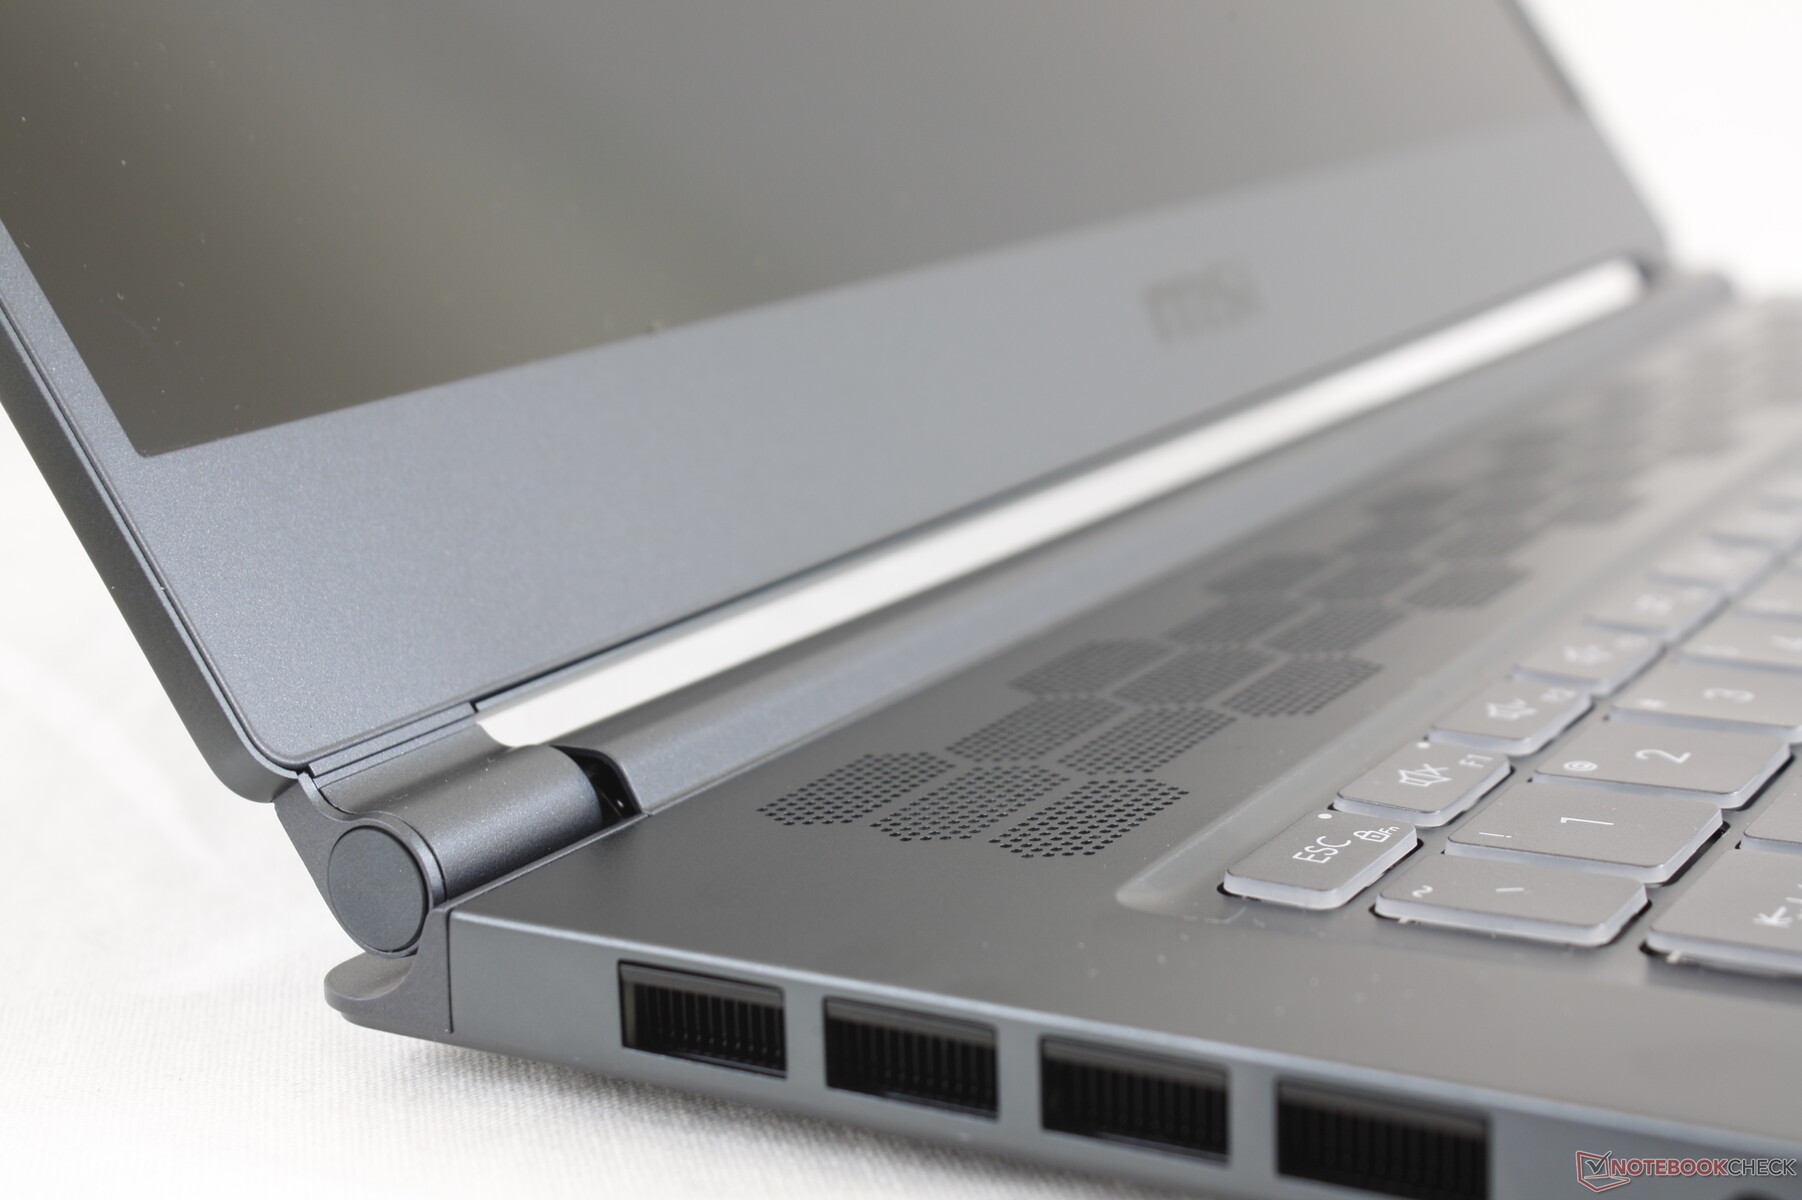
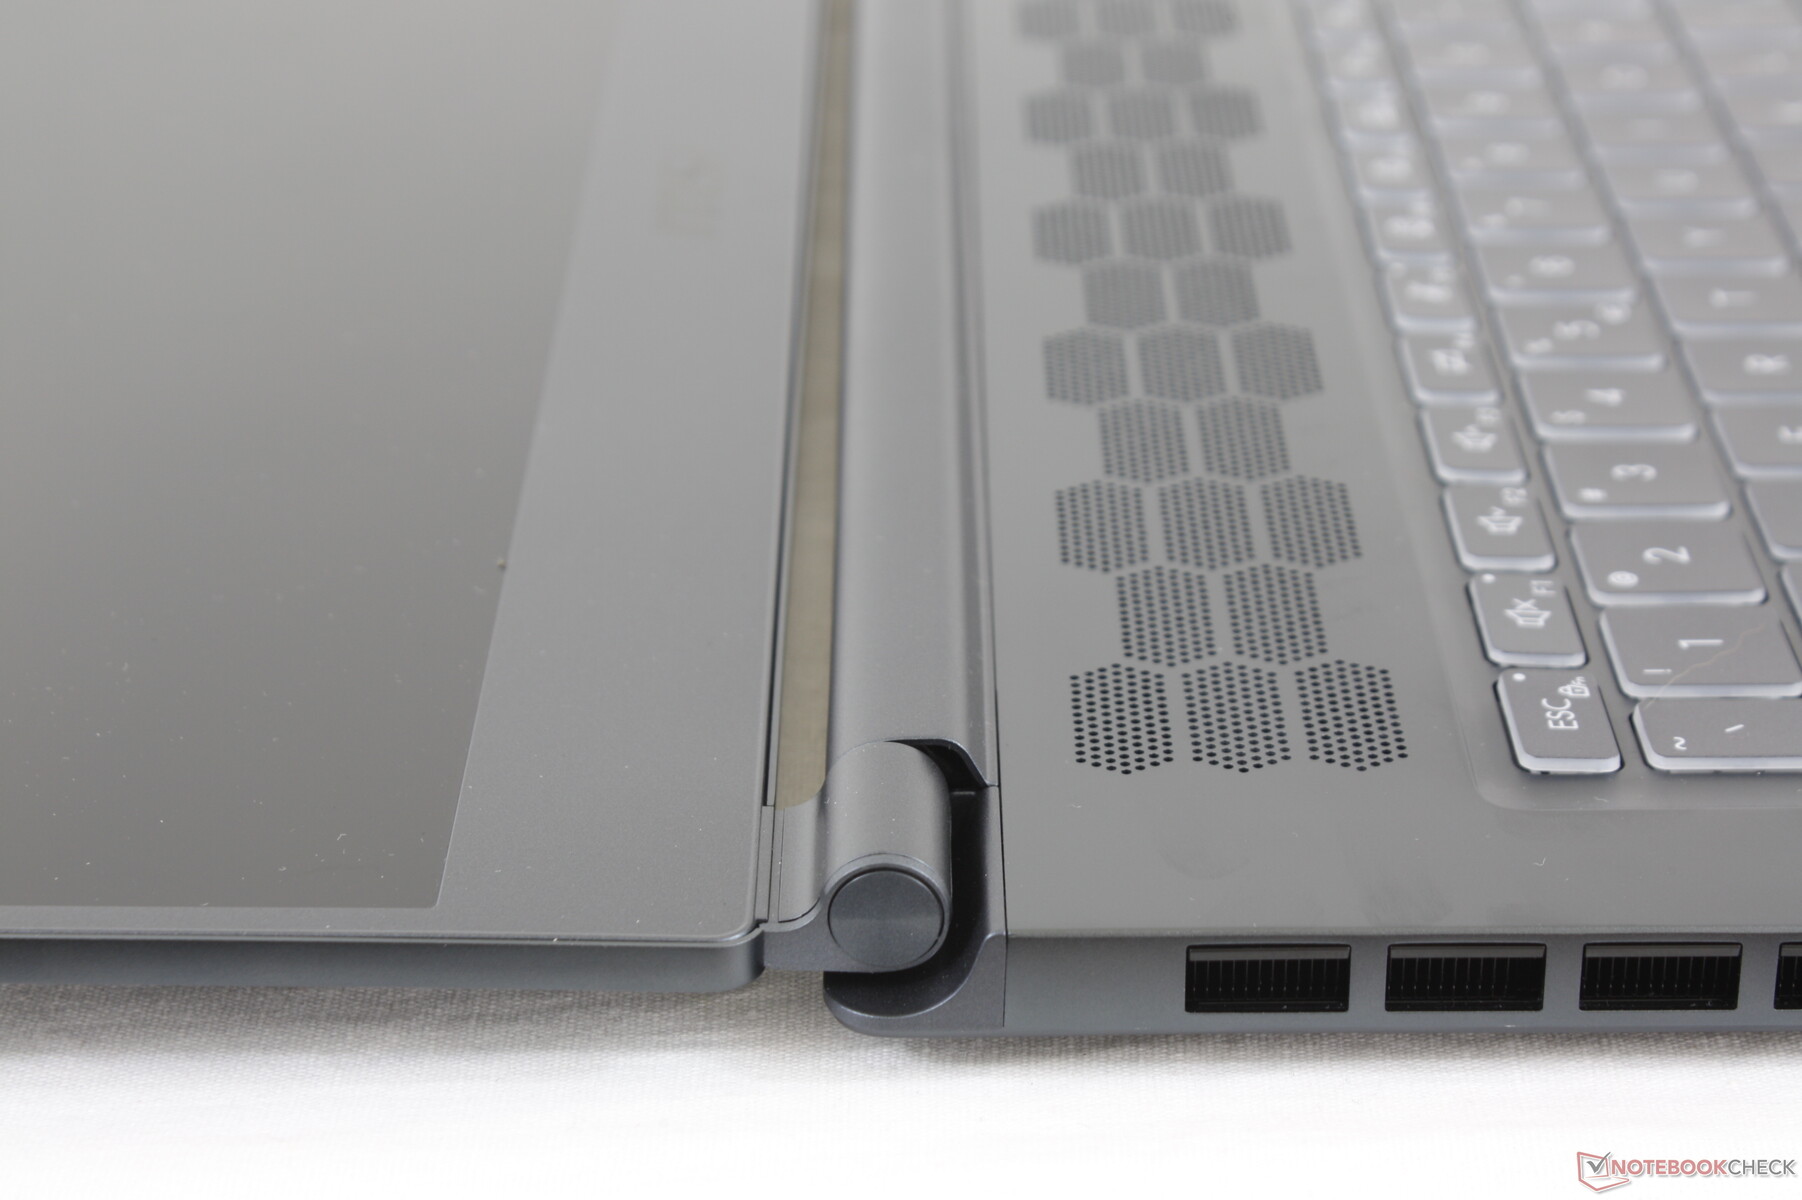
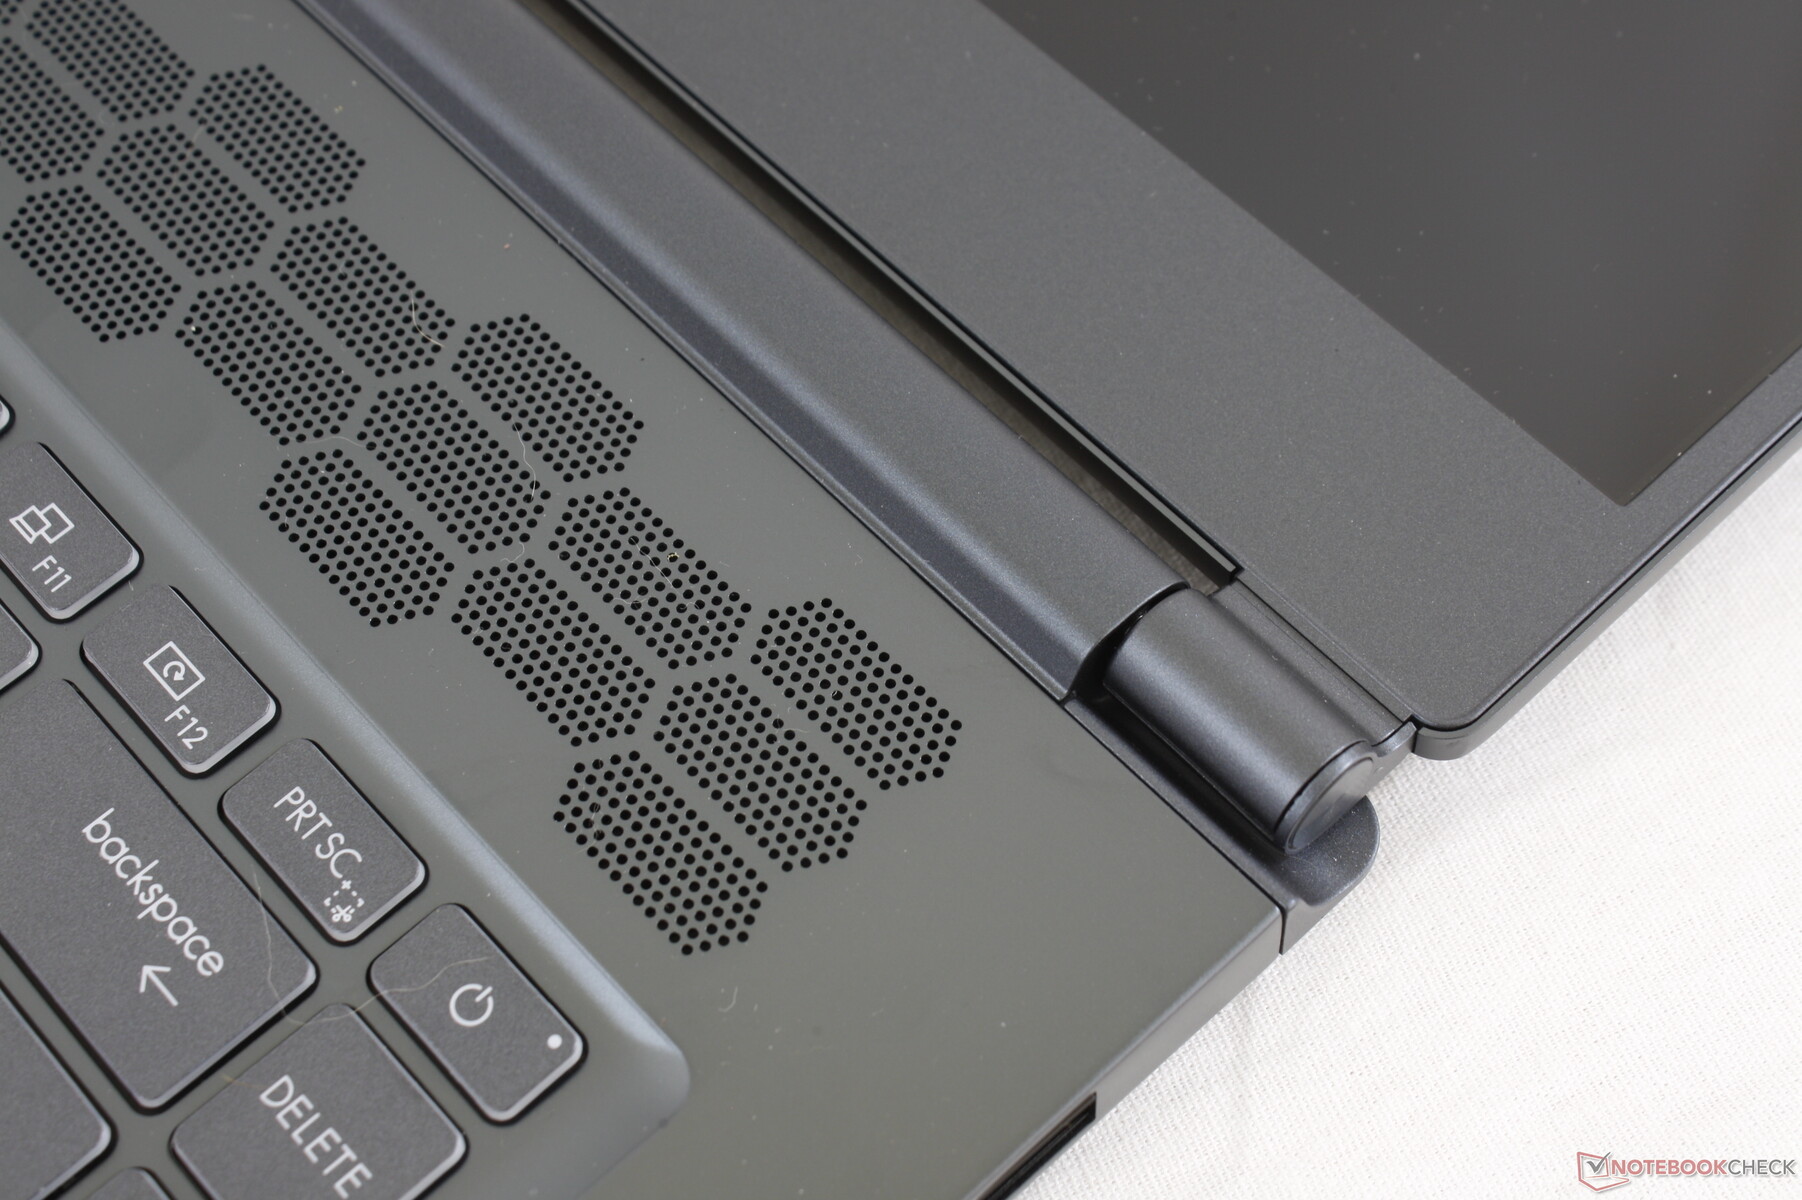
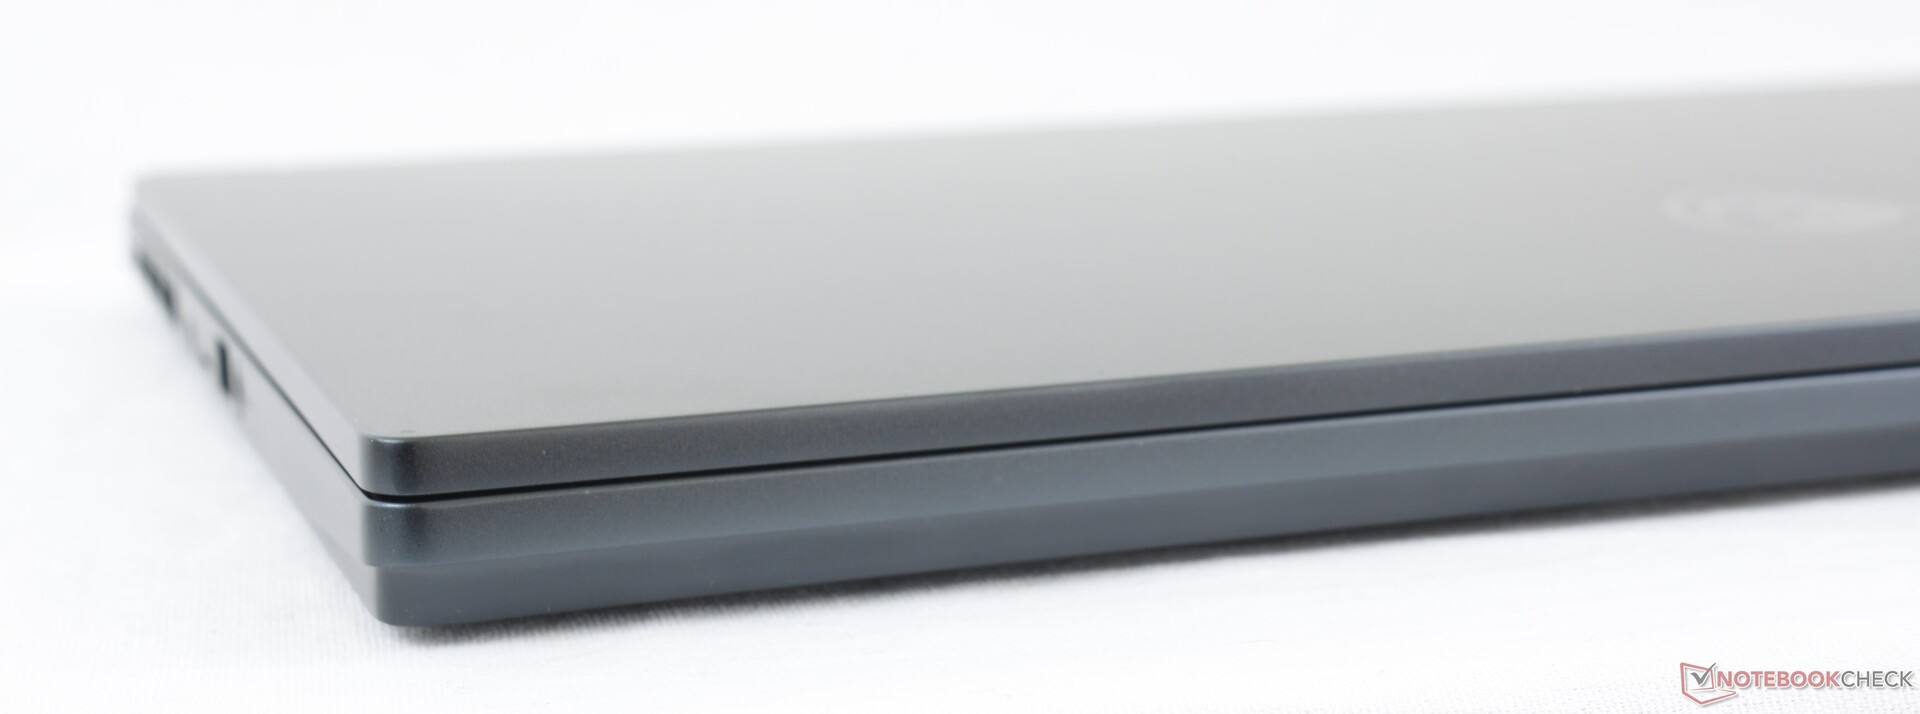
Il design del telaio è diverso dai modelli Modern, Creator e Prestige. Anche così, lo Stealth 15M usa materiali simili per il telaio in metallo per un look e una sensazione simili. Questo significa anche che soffre degli stessi vantaggi e svantaggi nel bene e nel male. Il suo design sottile ed elegante è senza dubbio attraente, ma la base e la cover sono molto più inclini a flettersi rispetto all'XPS 15, Envy 15, Spectre x360 15, e la maggior parte degli altri portatili multimediali da 15.6 pollici di punta. Non abbiamo molta fiducia sl fatto che le deboli cerniere possano durare più di un paio d'anni.
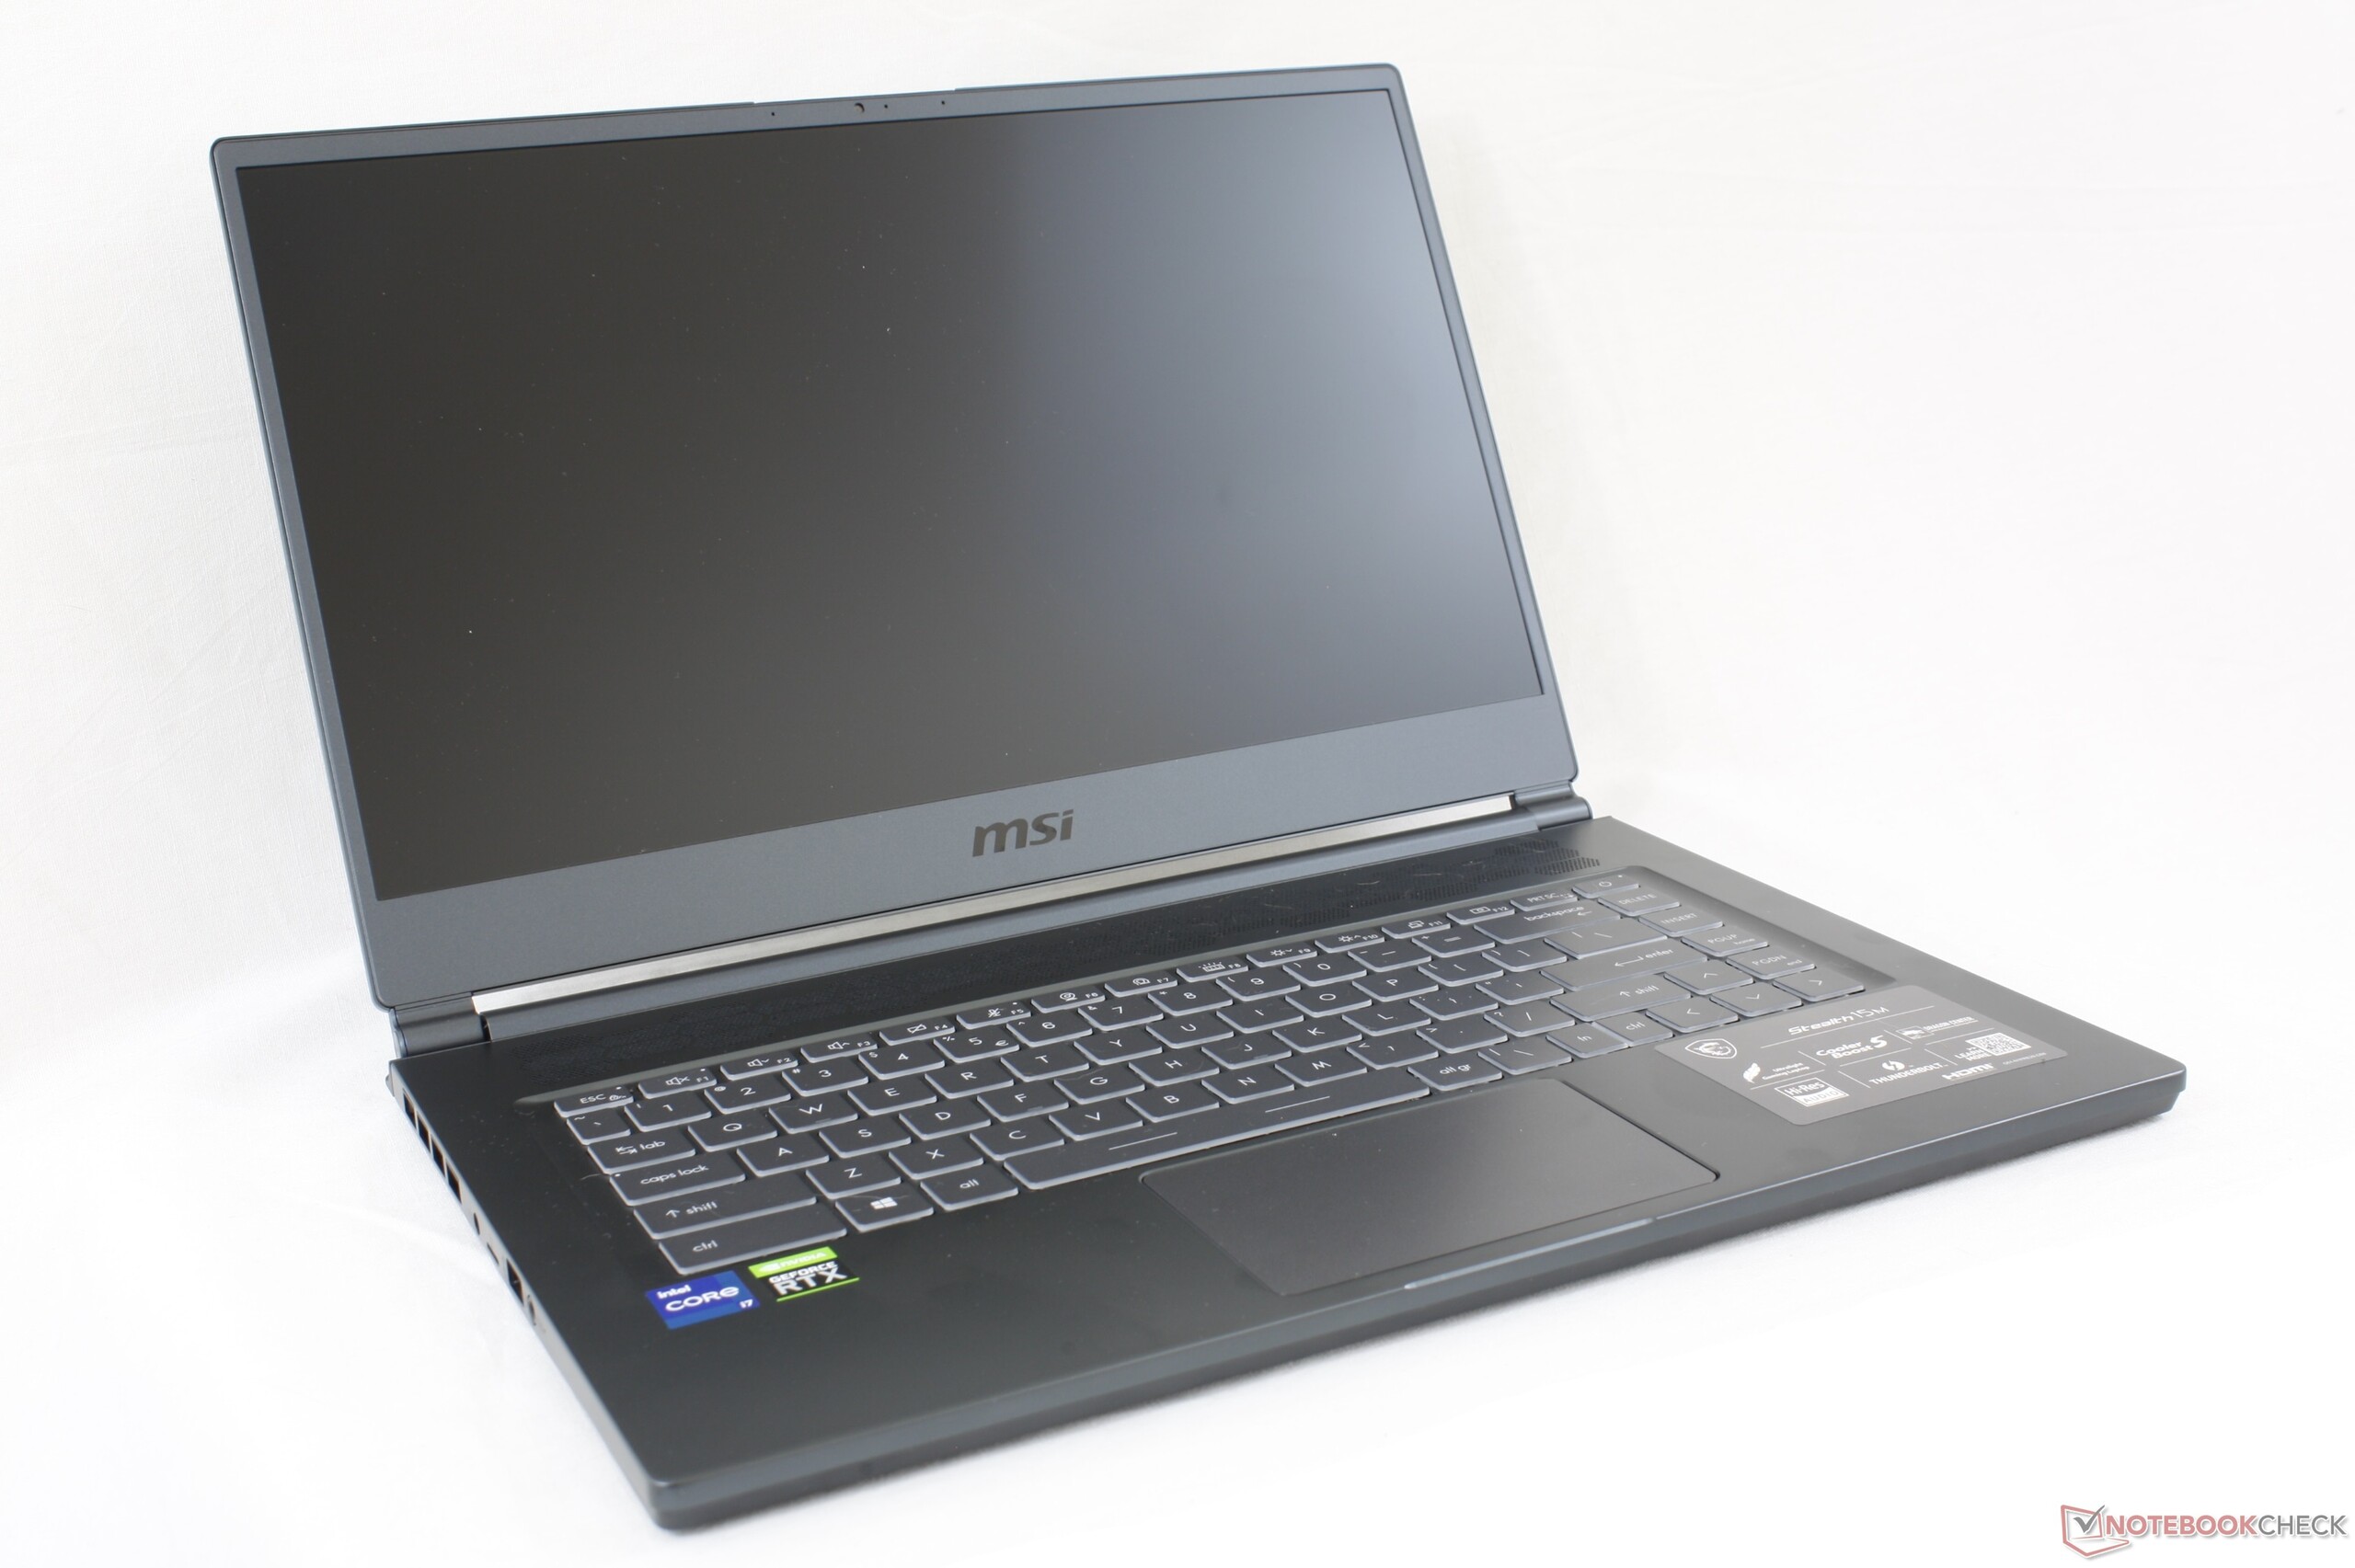
Il peso ridotto è una caratteristica importante dello Stealth 15M, dato che il sistema è circa 300 g più leggero di molti dei suoi concorrenti da 15,6 pollici, incluso l'XPS 15. Ciò che rende la differenza di peso più notevole è che l'MSI è anche dotato di opzioni grafiche significativamente più veloci di qualsiasi di queste alternative più pesanti. C'è tanta potenza a fronte di un peso contenuto.
Le dimensioni complessive dell'MSI maggiori sia dell'XPS 15 che del Prestige 15 a causa della cornice inferiore più spessa.
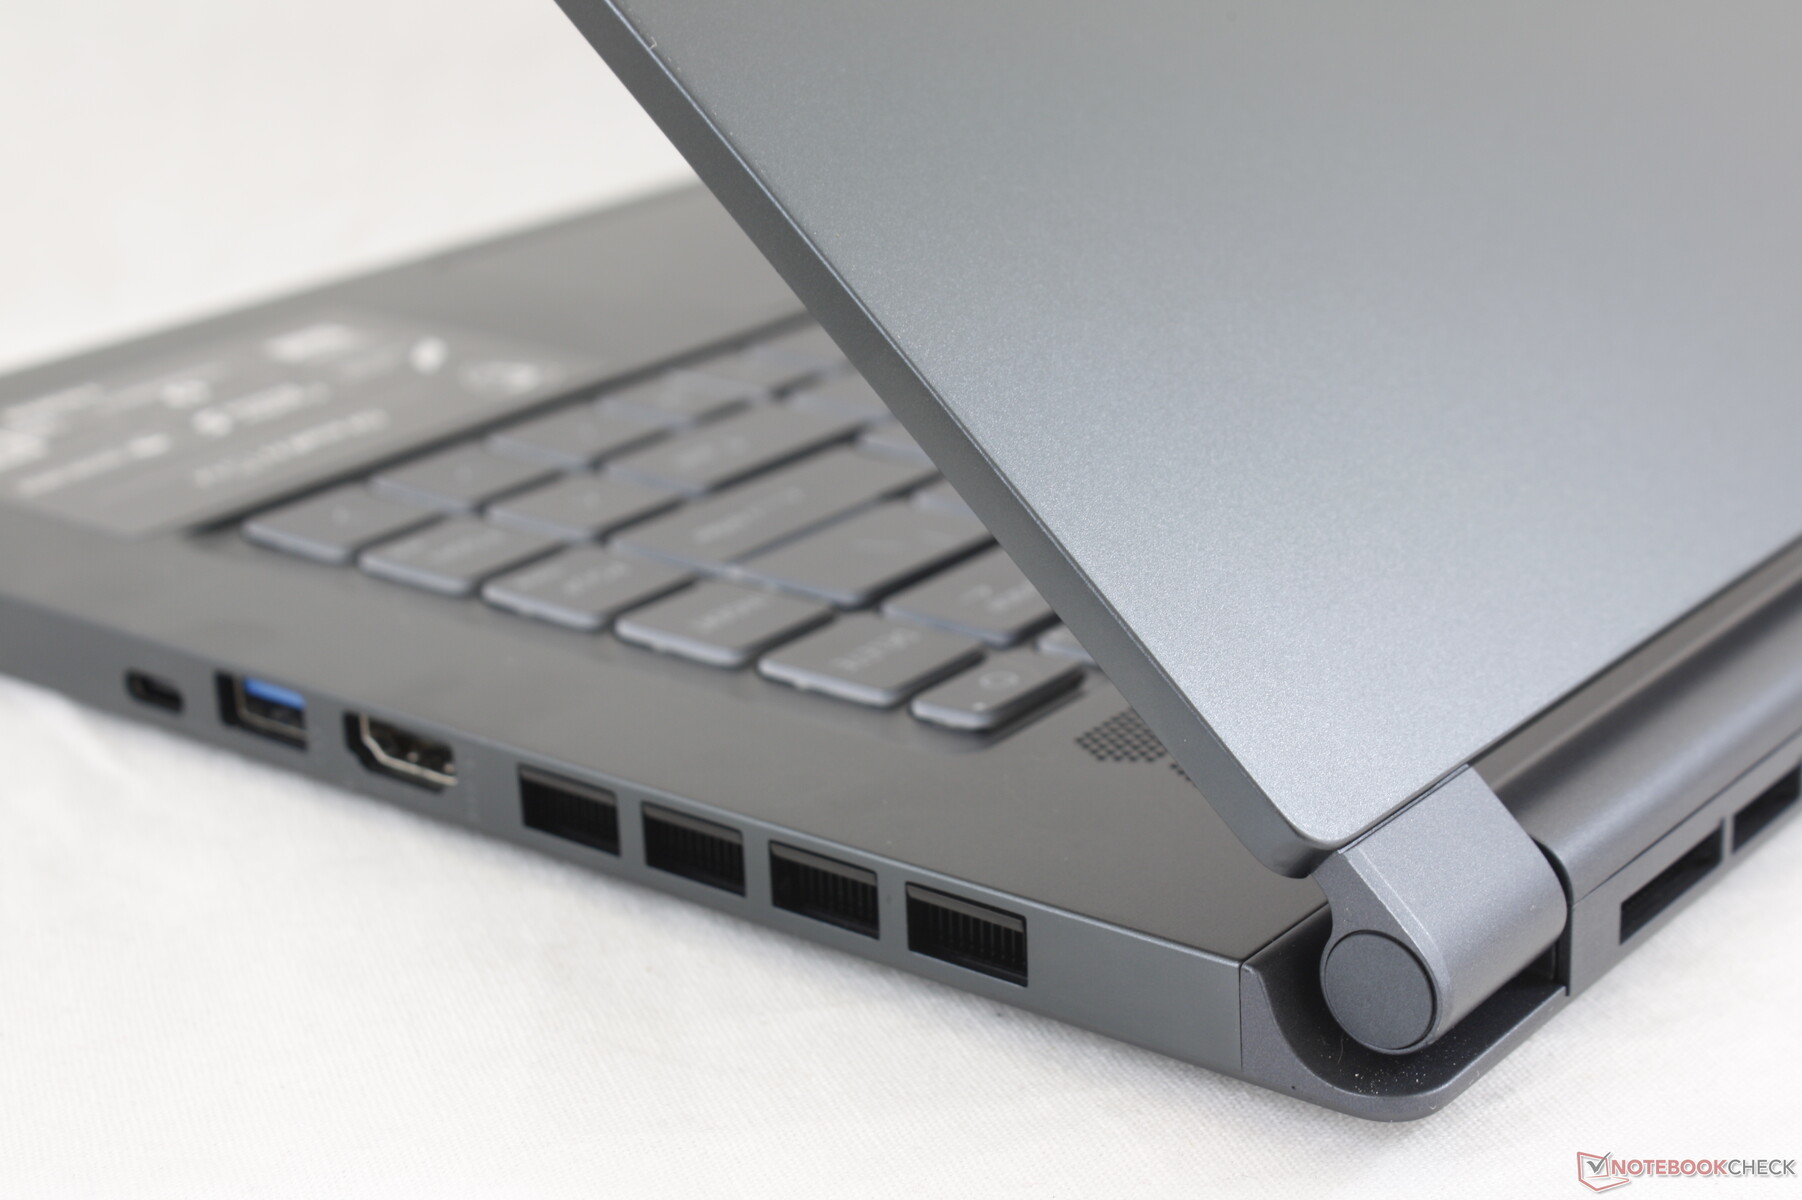
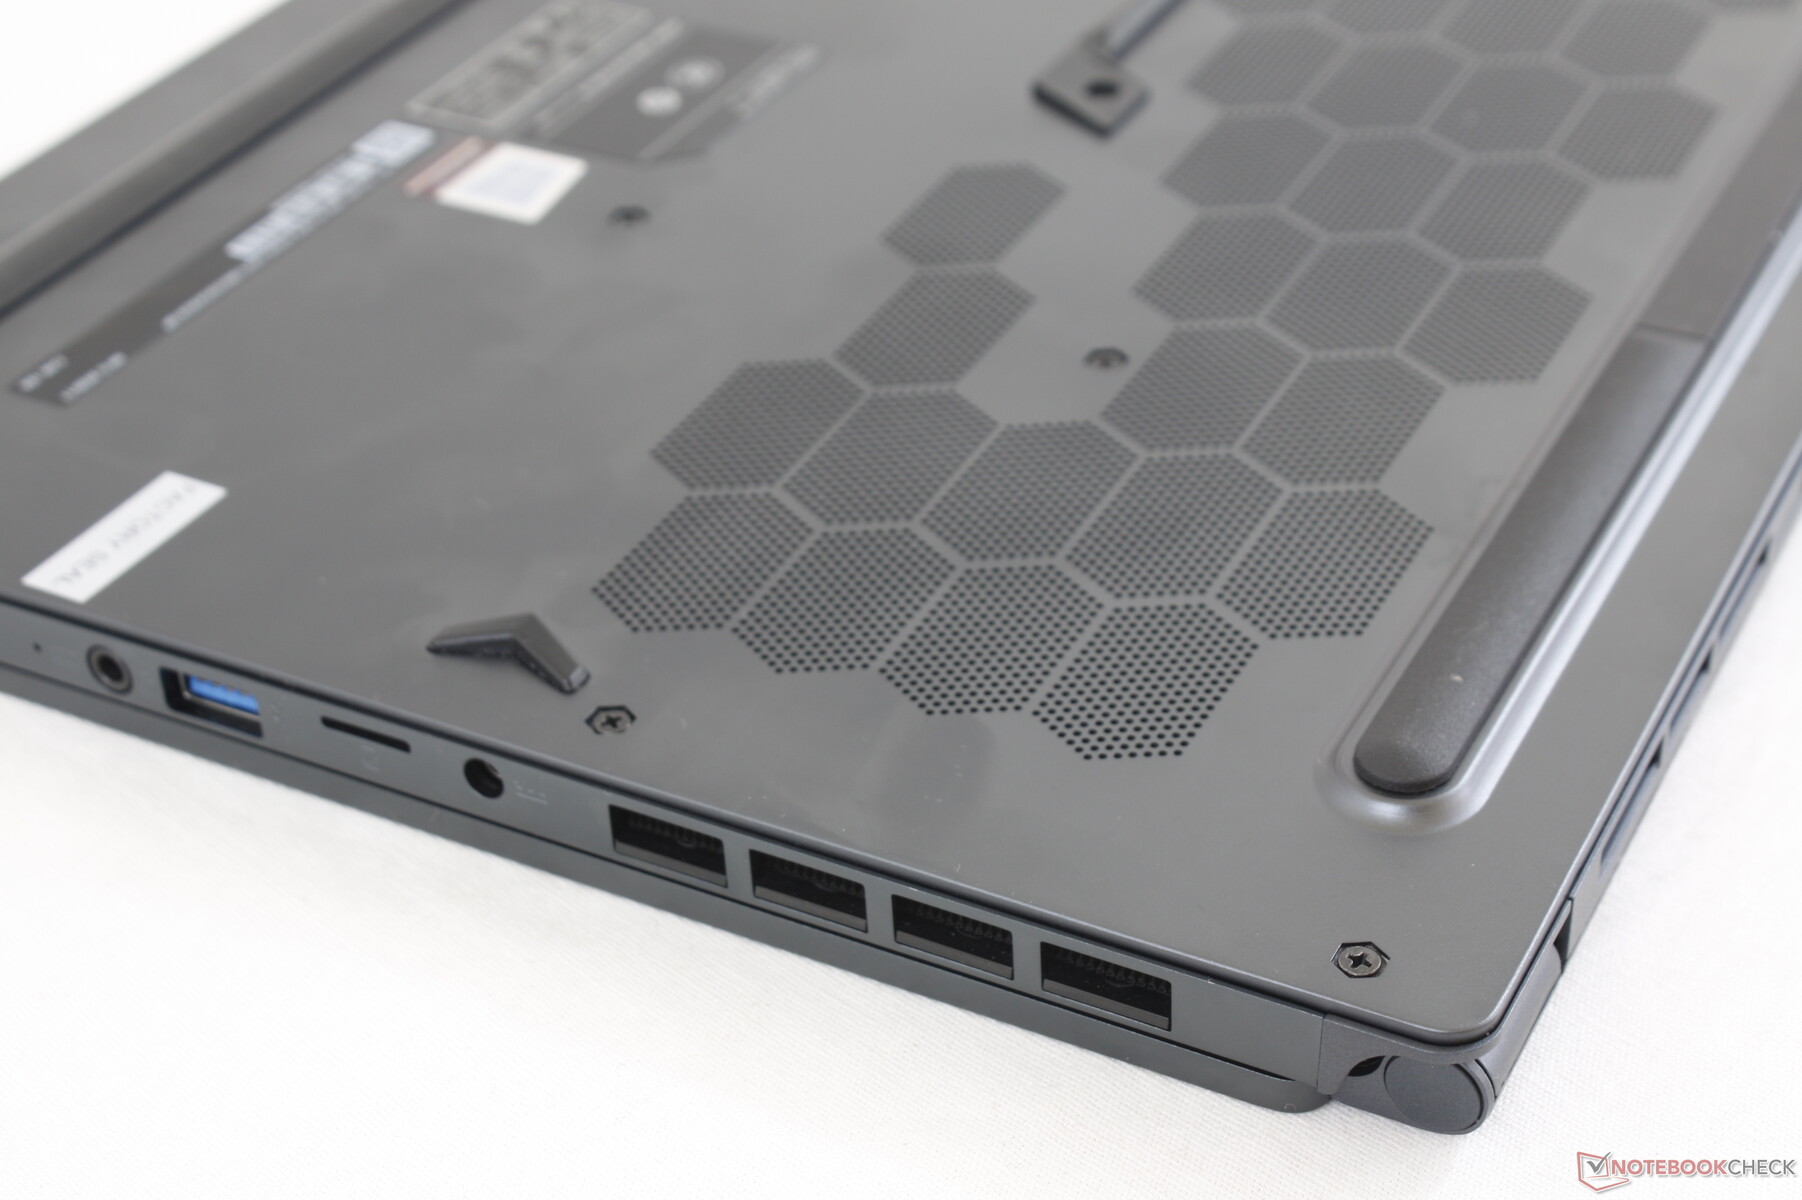
Connessioni
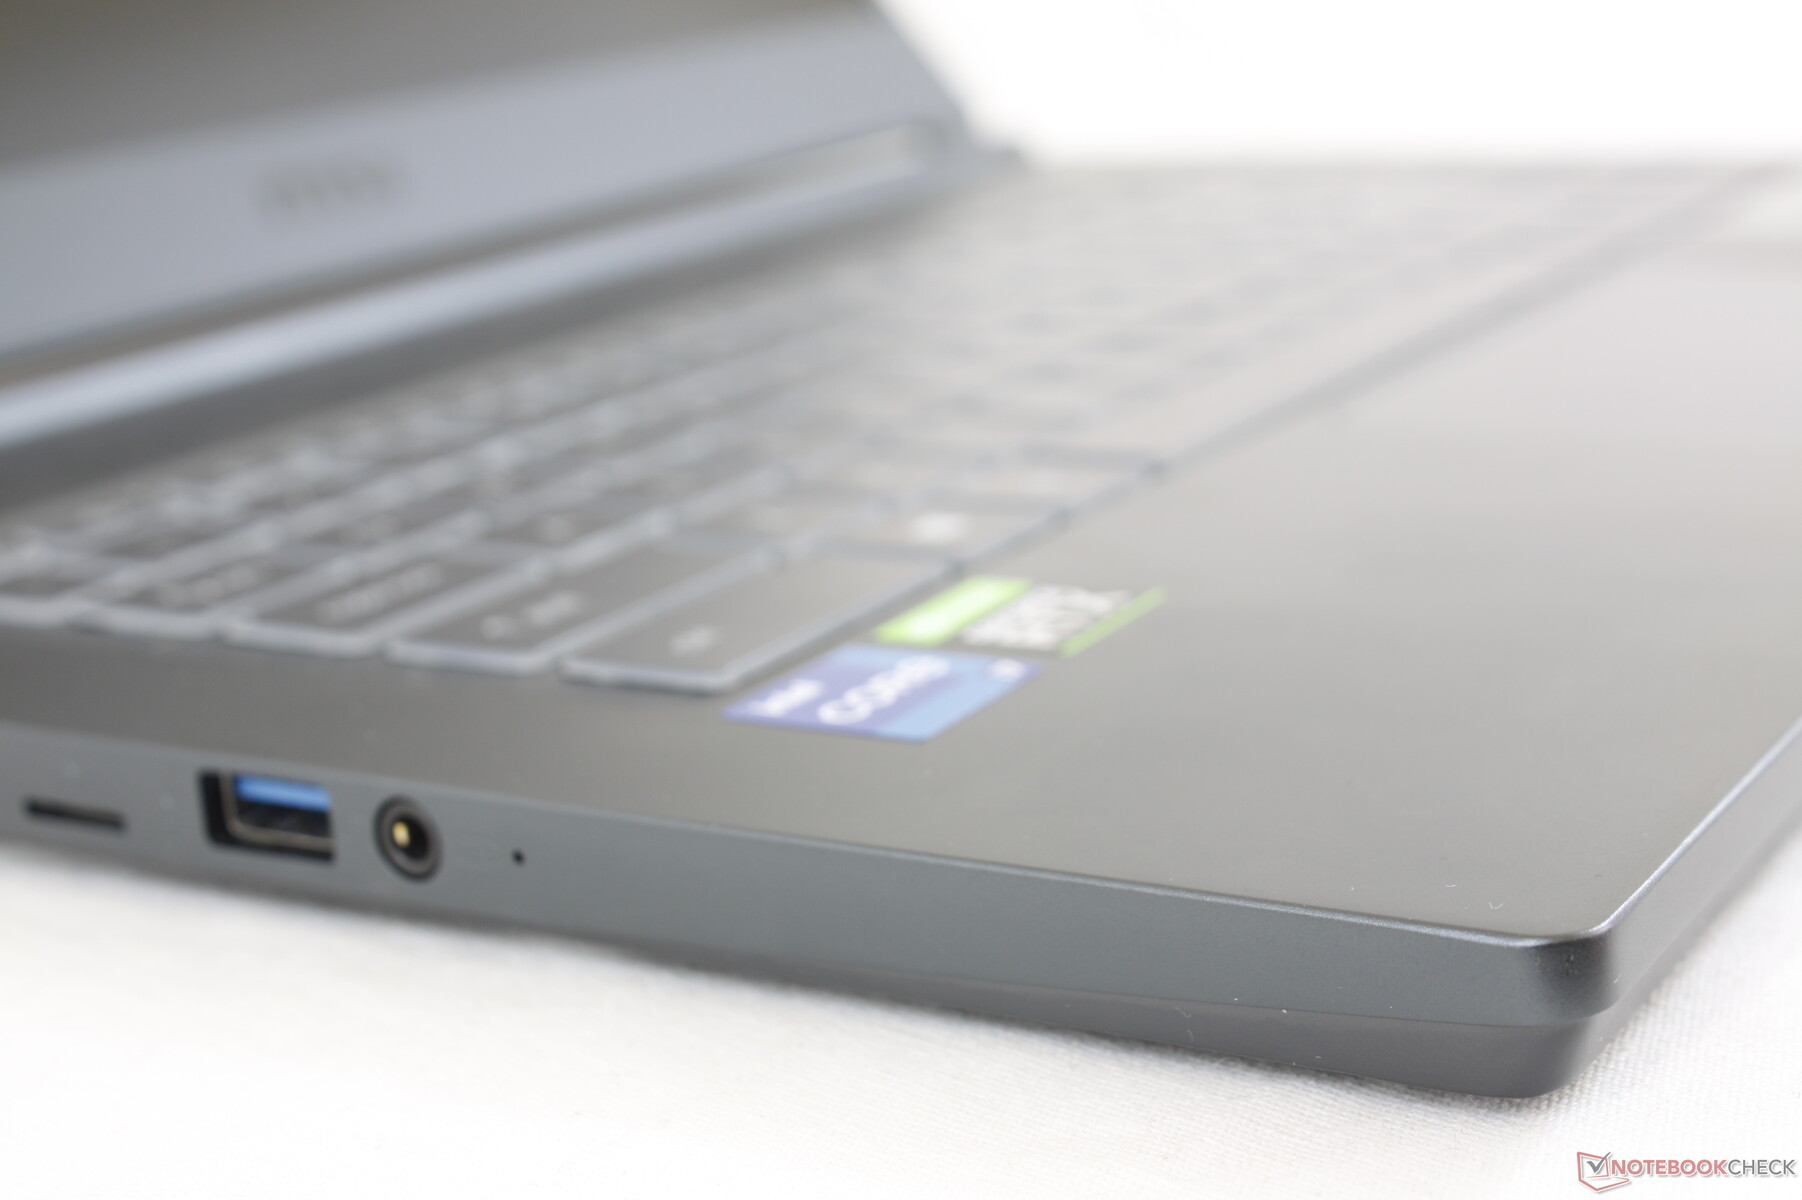
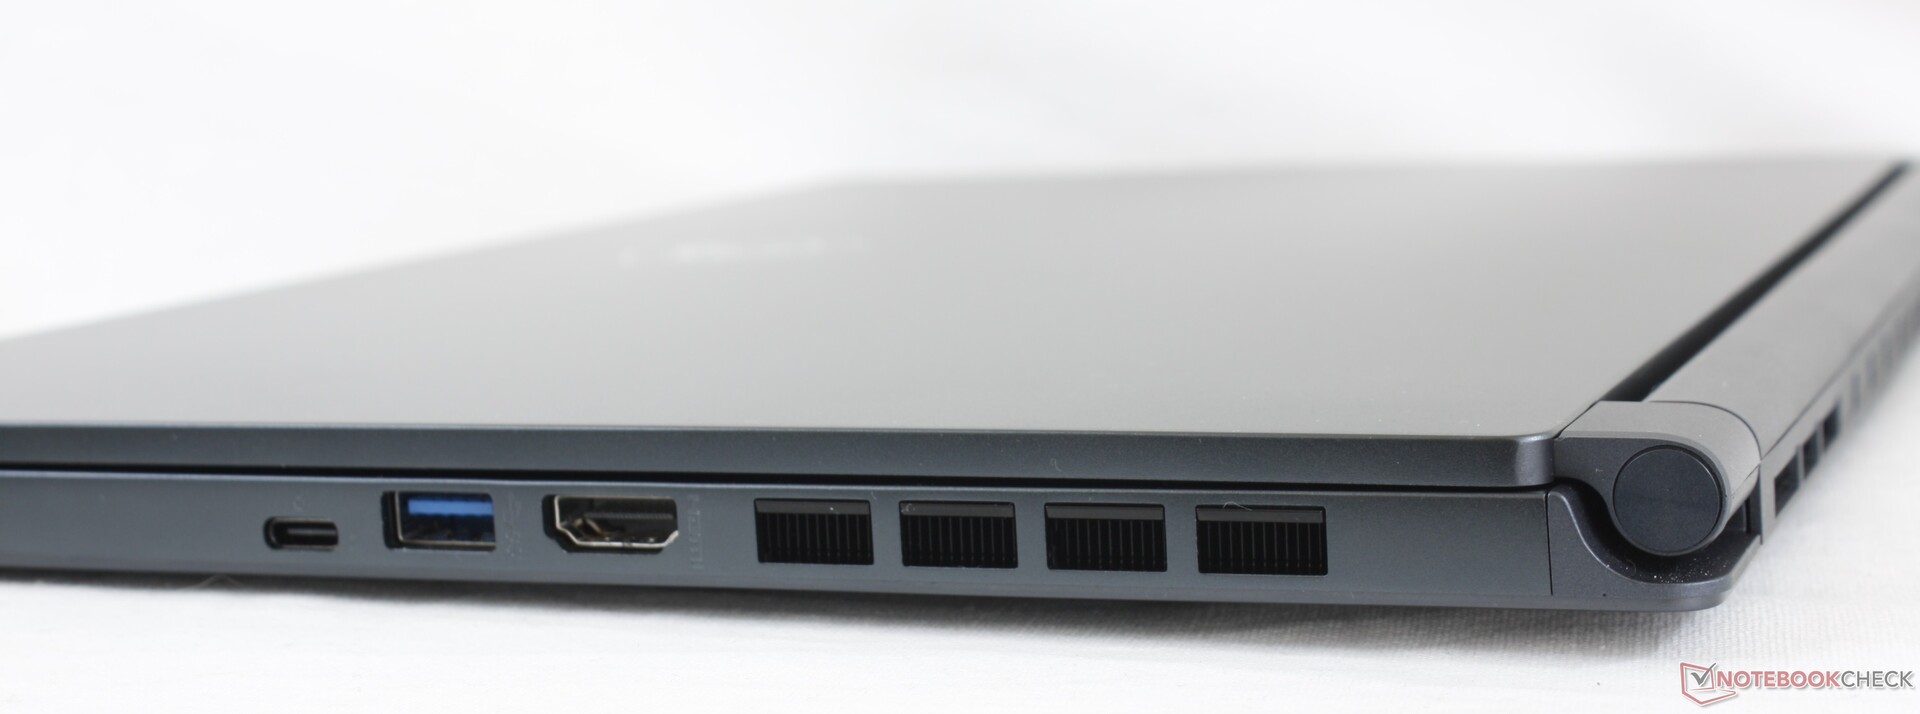
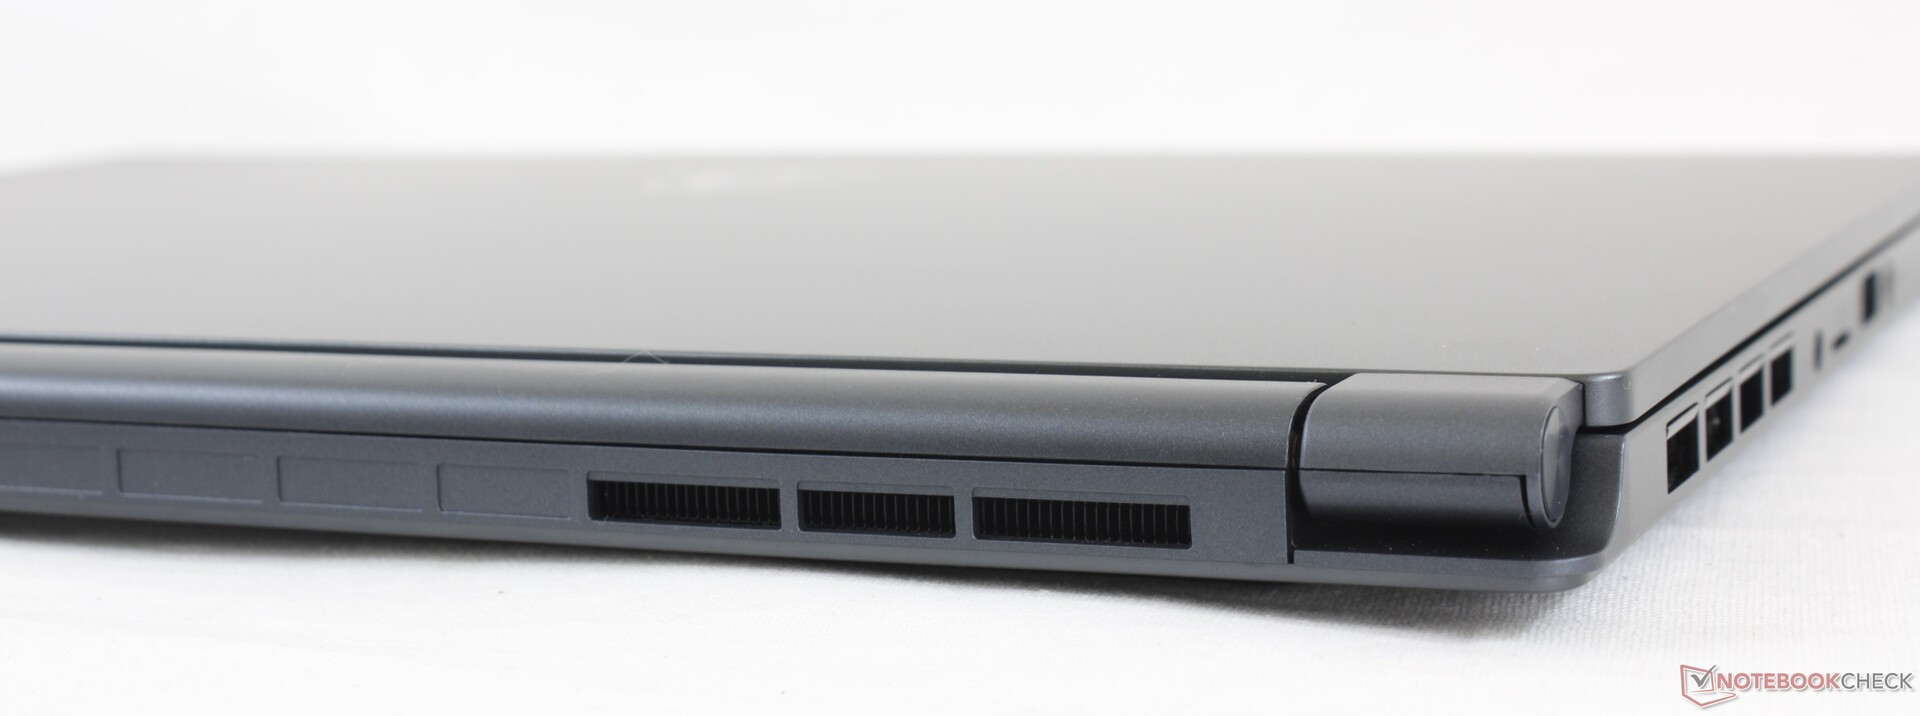
Le opzioni delle porte sono simili a quelle del Prestige 15, ma con una porta proprietaria di ricarica al posto di una delle porte USB-C. MSI probabilmente non poteva contare completamente sulla ricarica USB-C qui a causa della maggiore richiesta di potenza della GeForce RTX 2060 Max-Q rispetto alla GTX 1650 Max-Q del modello Prestige. Le porte sono molto ravvicinate ambo i lati.
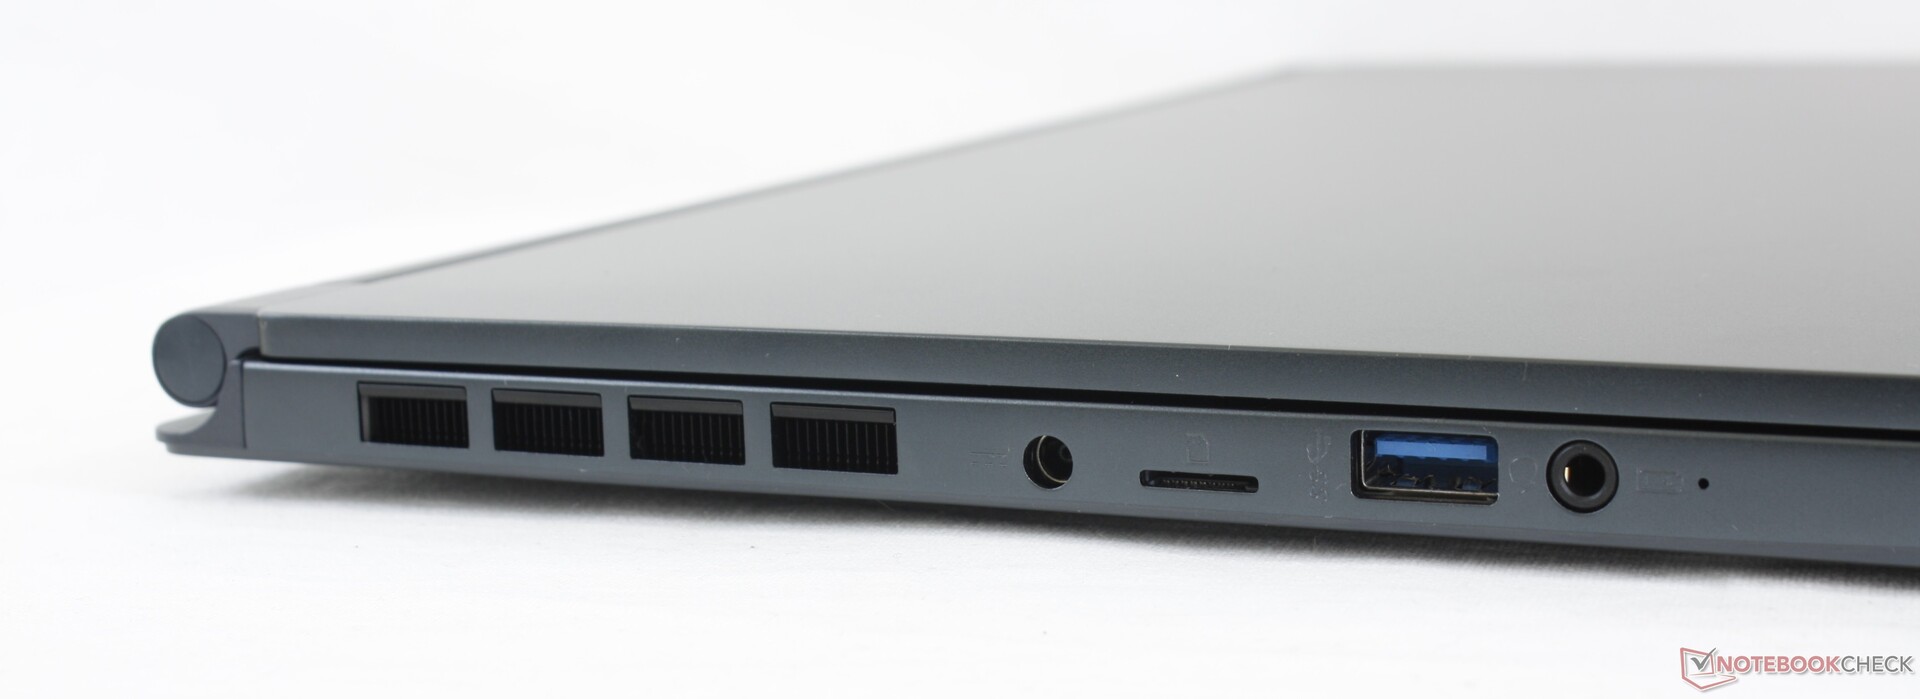
Lettore di schede SD
Il lettore MicroSD a molla offre velocità di trasferimento molto veloci di circa 200 MB/s. Spostare 1 GB di immagini dalla nostra scheda di test UHS-II al desktop richiede circa 6 secondi.
| SD Card Reader | |
| average JPG Copy Test (av. of 3 runs) | |
| Dell XPS 15 9500 Core i7 4K UHD (Toshiba Exceria Pro SDXC 64 GB UHS-II) | |
| MSI Stealth 15M A11SEK (Toshiba Exceria Pro M501 microSDXC 32GB) | |
| HP Spectre X360 15-5ZV31AV (Toshiba Exceria Pro M501 UHS-II) | |
| MSI Prestige 15 A10SC (Toshiba Exceria Pro M501 UHS-II) | |
| Lenovo ThinkPad T15p-20TN0006GE (Toshiba Exceria Pro SDXC 64 GB UHS-II) | |
| Asus ZenBook UX535-M01440 (Toshiba Exceria Pro M501 microSDXC 64GB) | |
| maximum AS SSD Seq Read Test (1GB) | |
| MSI Stealth 15M A11SEK (Toshiba Exceria Pro M501 microSDXC 32GB) | |
| Dell XPS 15 9500 Core i7 4K UHD (Toshiba Exceria Pro SDXC 64 GB UHS-II) | |
| MSI Prestige 15 A10SC (Toshiba Exceria Pro M501 UHS-II) | |
| HP Spectre X360 15-5ZV31AV (Toshiba Exceria Pro M501 UHS-II) | |
| Lenovo ThinkPad T15p-20TN0006GE (Toshiba Exceria Pro SDXC 64 GB UHS-II) | |
| Asus ZenBook UX535-M01440 (Toshiba Exceria Pro M501 microSDXC 64GB) | |
Comunicazioni
Un Intel AX201 è di serie per la connessione Wi-Fi 6 e Bluetooth 5.1. Non abbiamo riscontrato problemi quando accoppiato al nostro router di prova Netgear RAX200, anche se la velocità di trasmissione è molto più lenta del previsto.
Webcam


Manutenzione
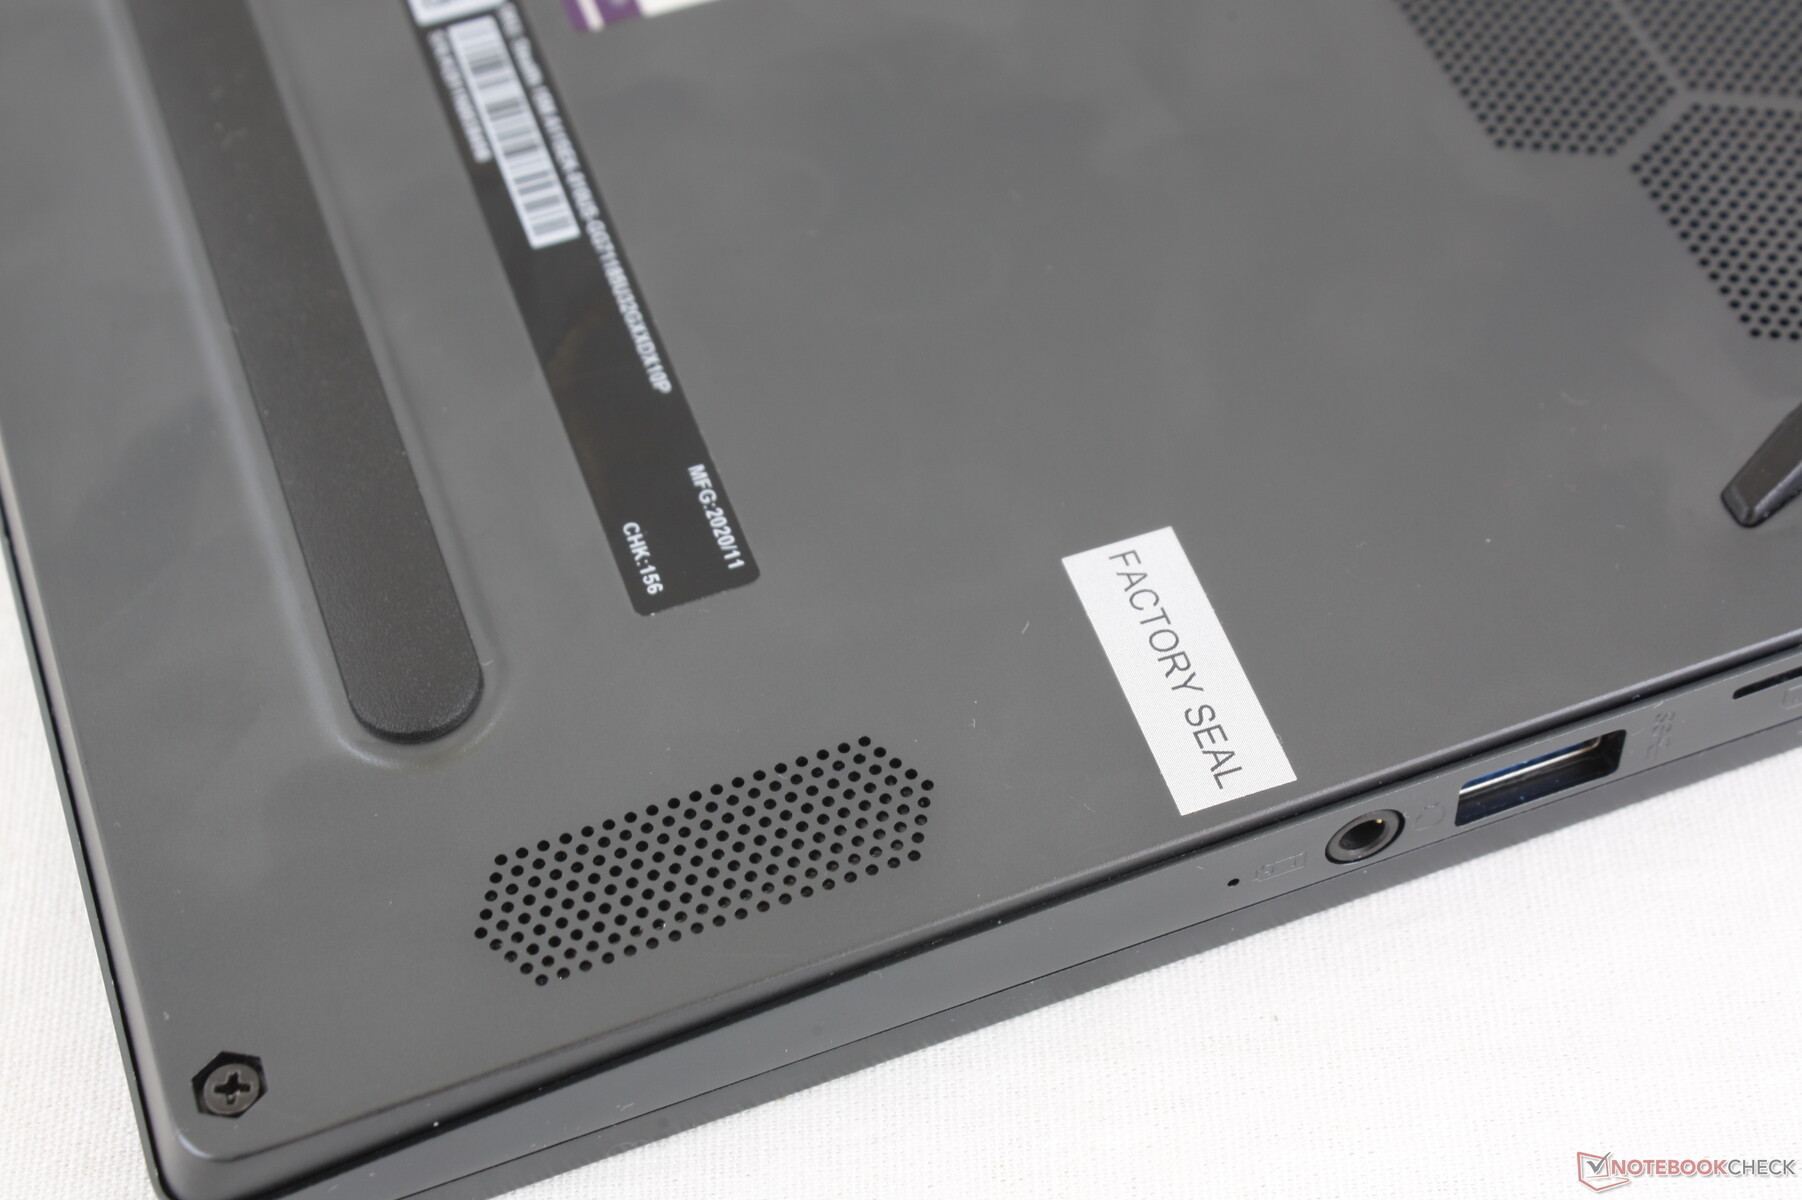
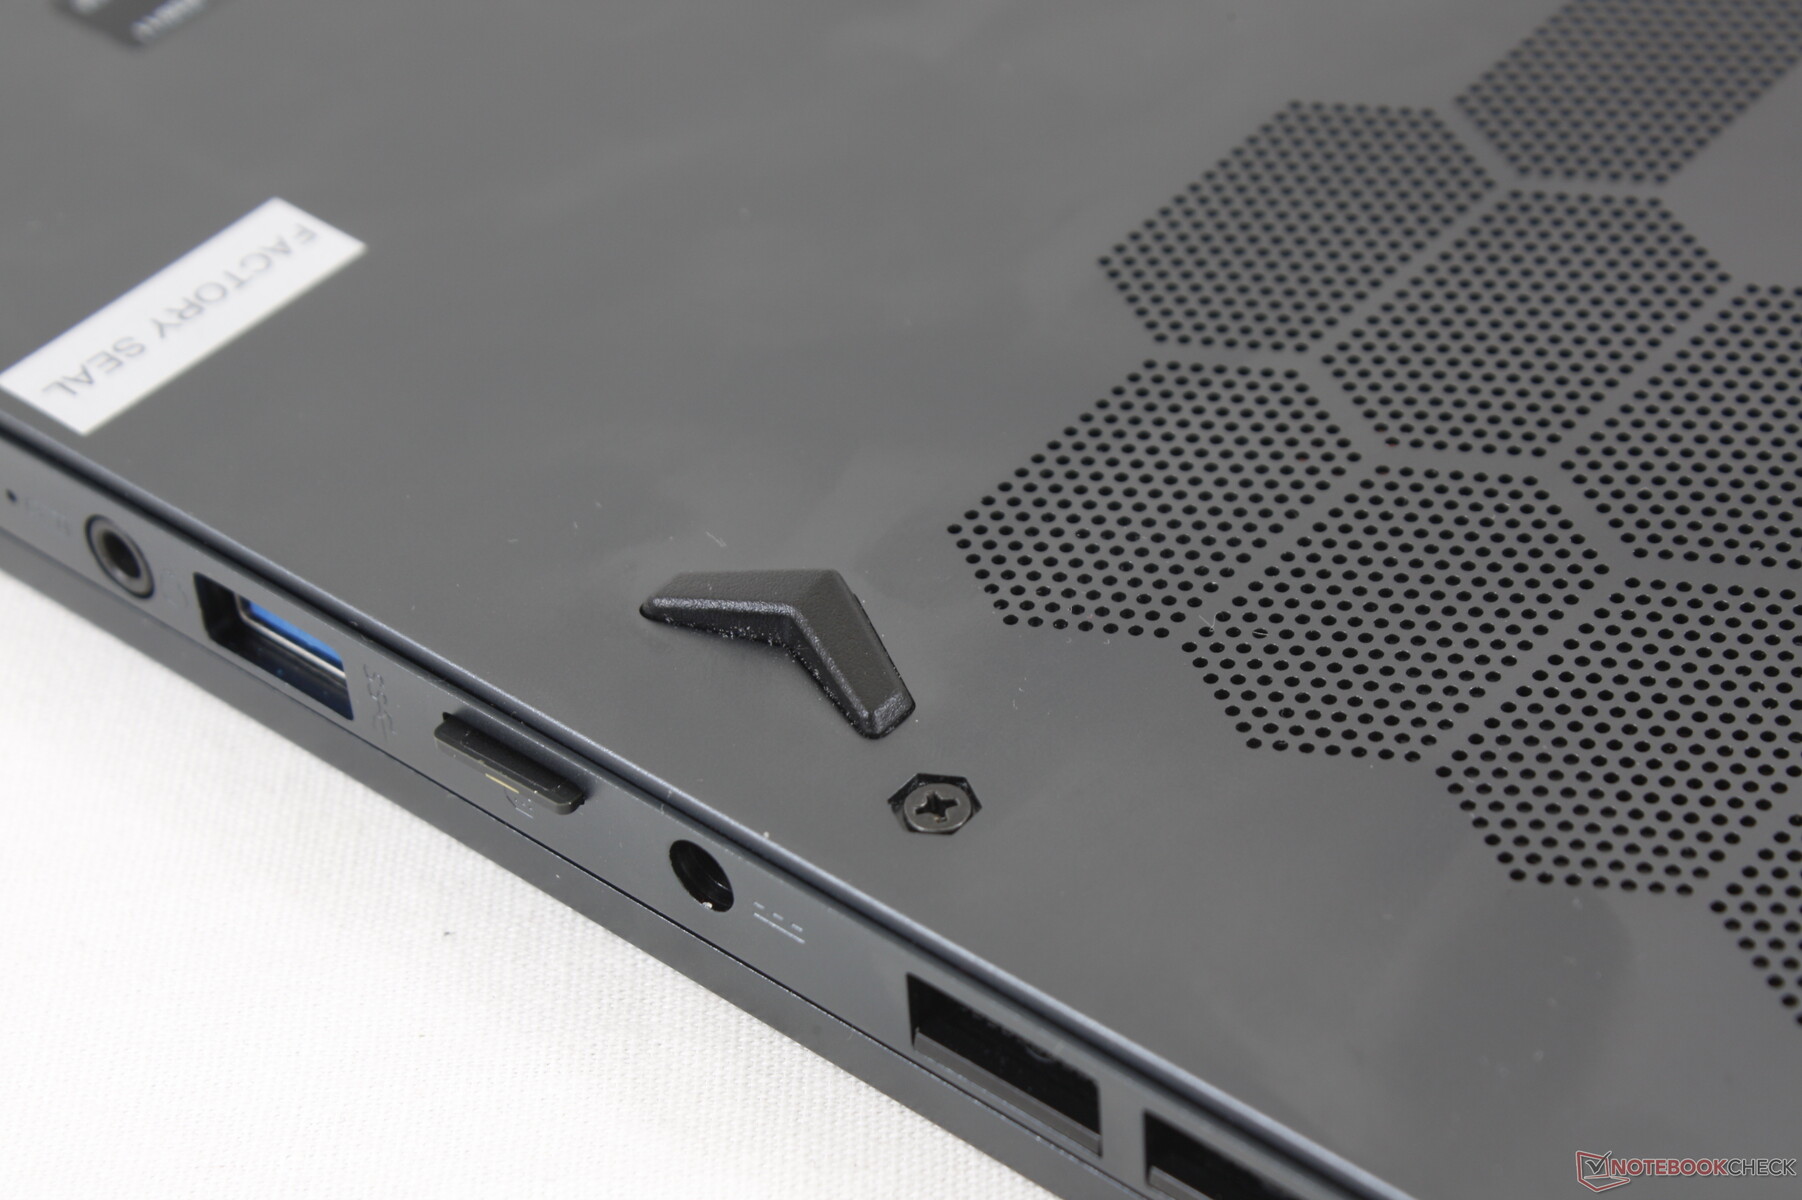
Nonostante le nostre lamentele, MSI continua a scoraggiare gli aggiornamenti da parte degli utenti con un adesivo 'sigillo di fabbrica' sopra una delle viti della piastra inferiore. Reclamare la garanzia o la restituzione può essere difficile perché i venditori possono usare il sigillo rotto contro di voi.
Accessori e garanzia
La cofezione di vendita include un adattatore da USB-A a RJ-45 insieme alla documentazione e all'adattatore Ac. Non c'è un panno di velluto per la pulizia a differenza della confezione del GS66.
Una garanzia del produttore di due anni è standard.
Dispositivi di input
Tastiera
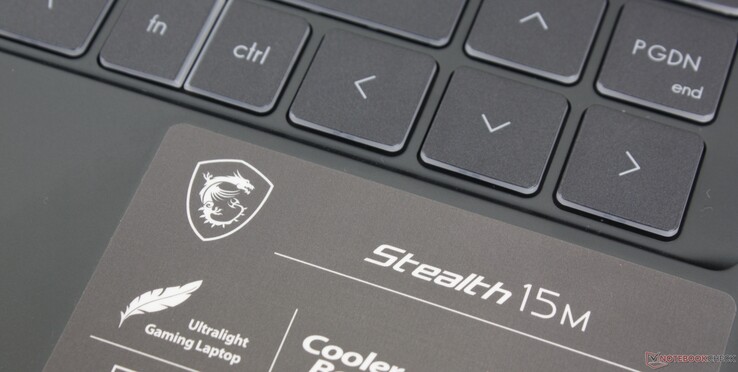
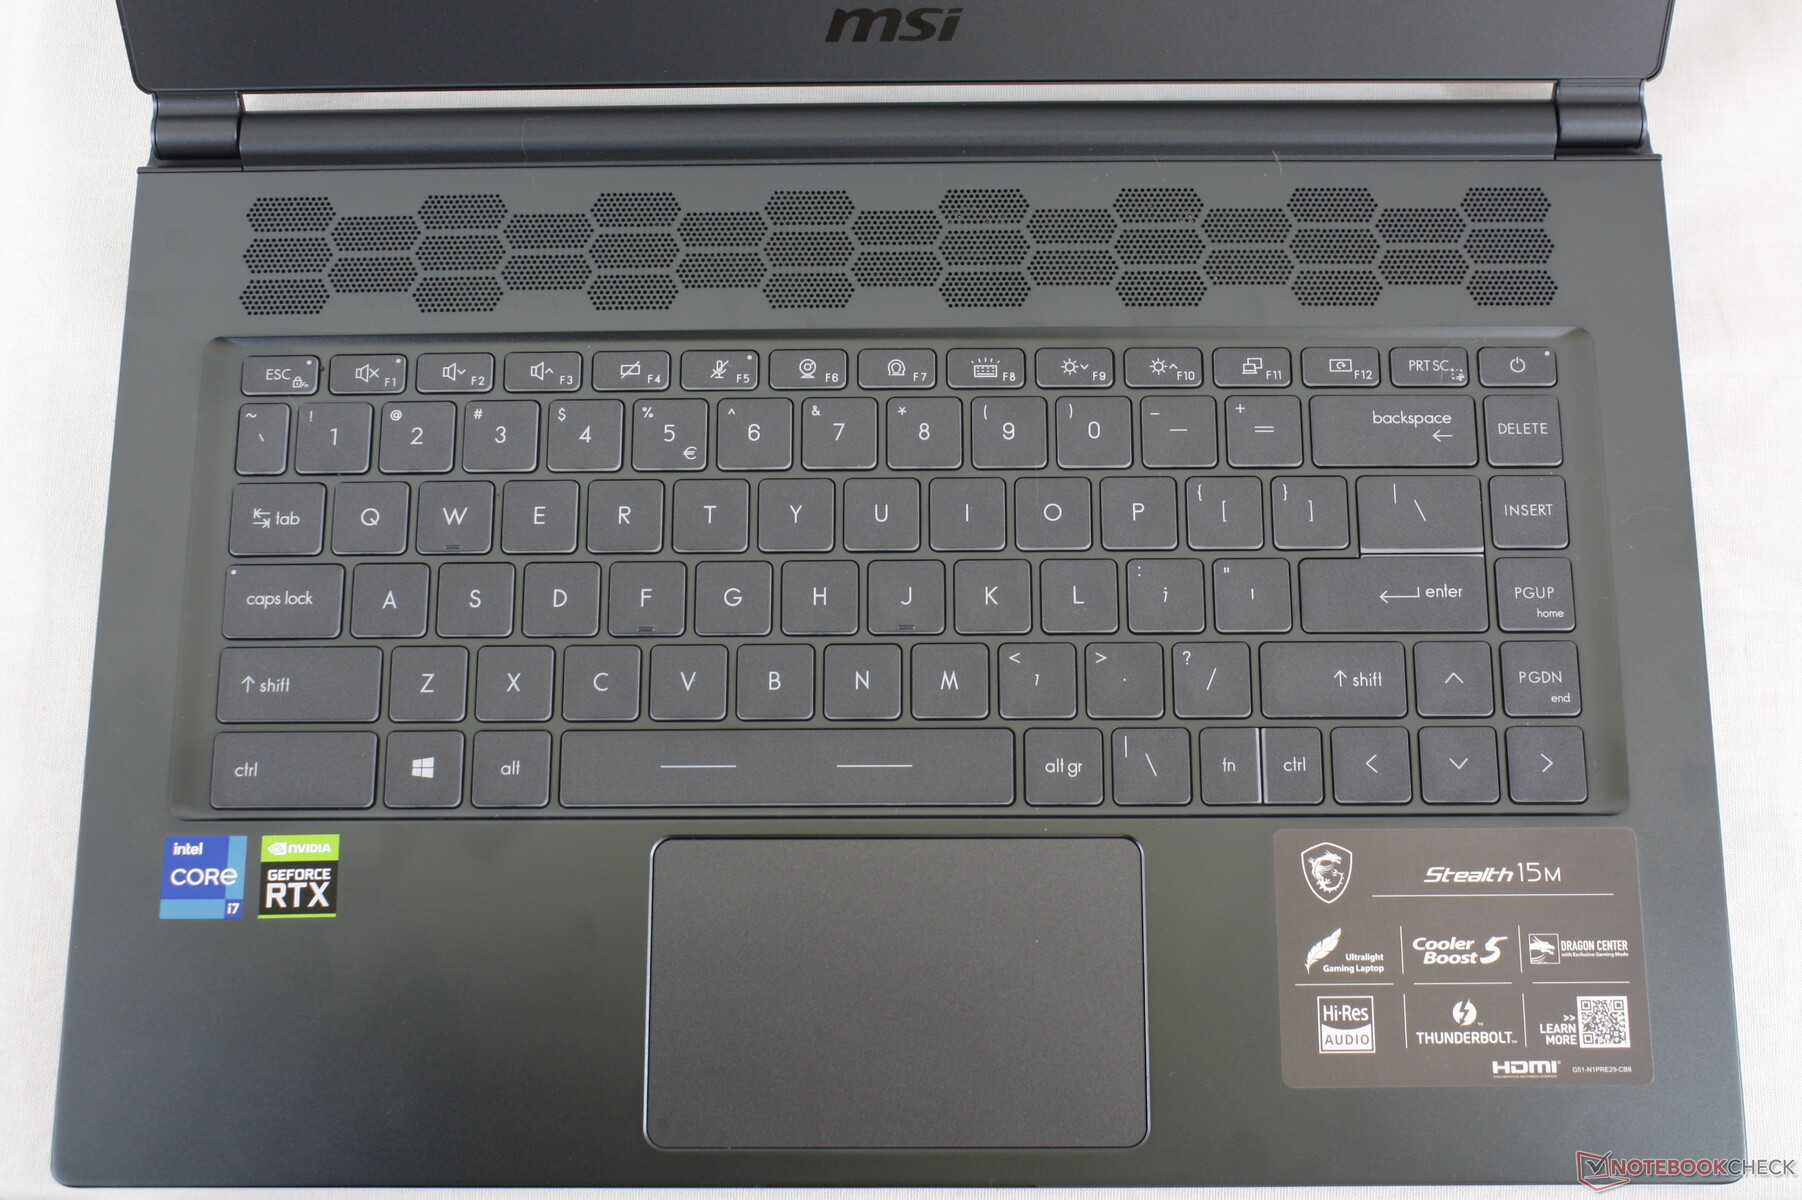
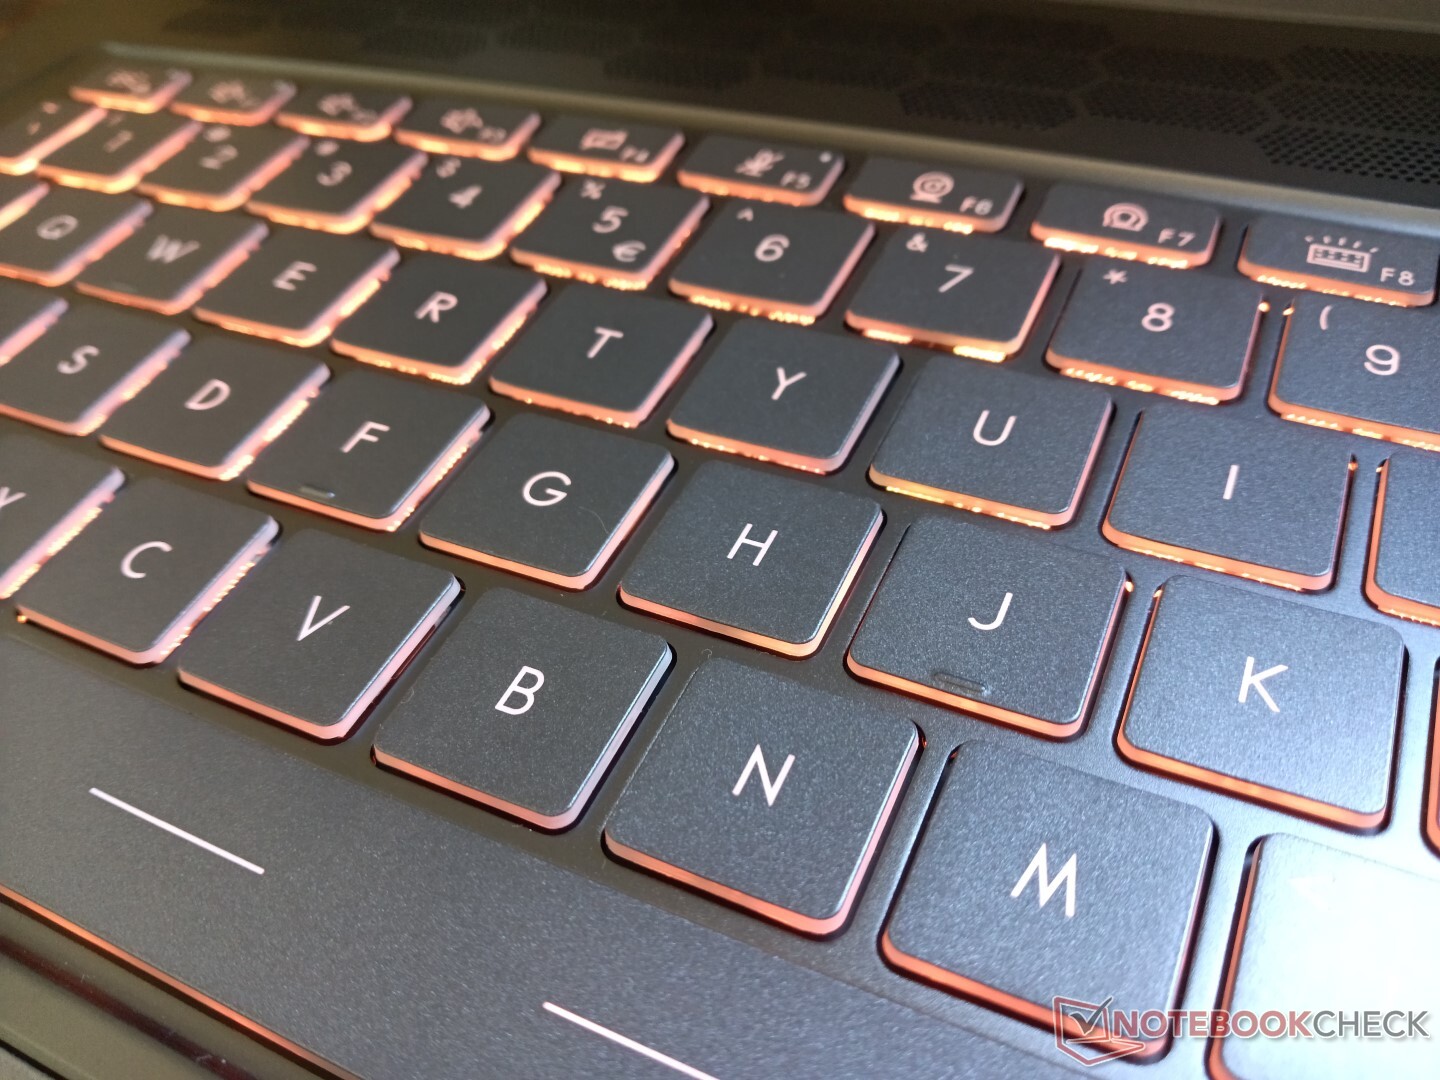
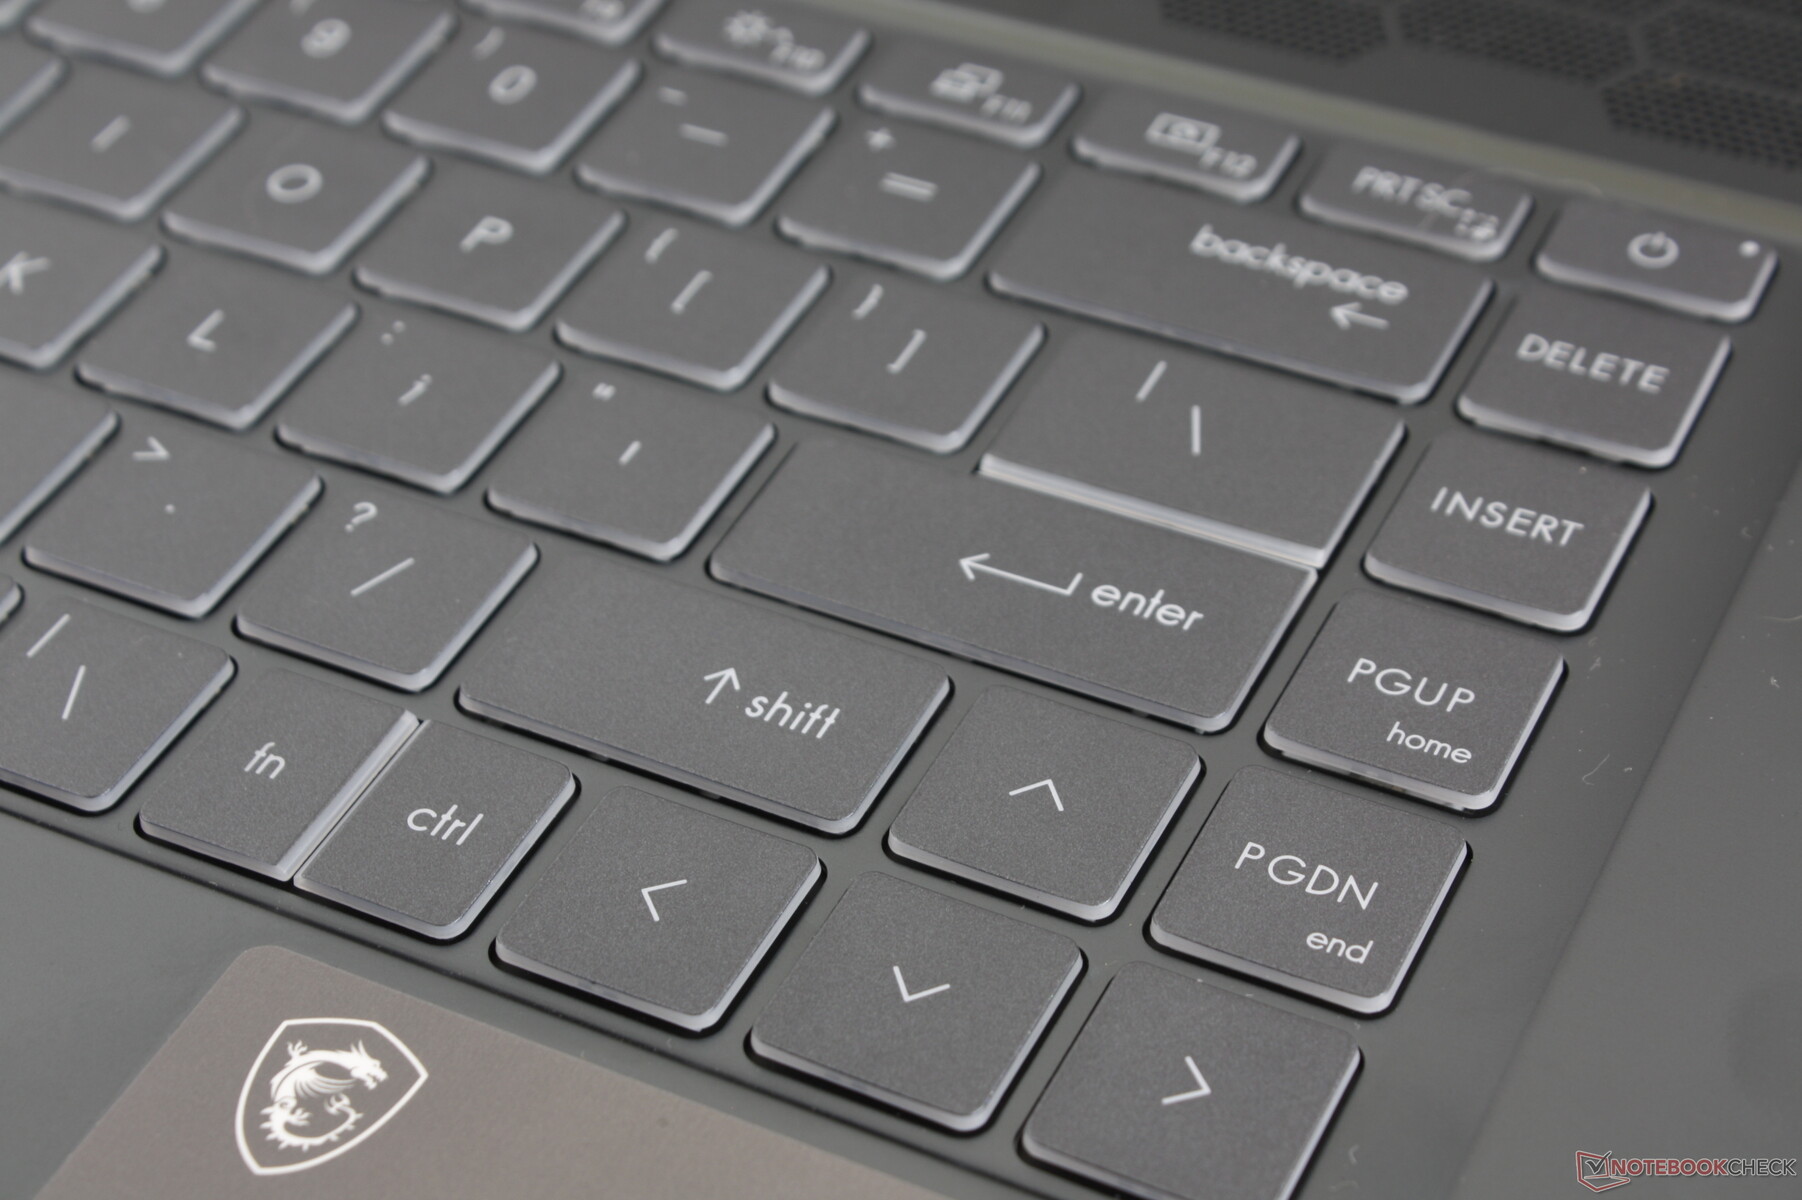
Il feedback e il layout della tastiera sono identici a quelli del Prestige 15, tranne che per i tasti FN/Ctrl divisi in basso a destra. Quindi, i nostri commenti sulla tastiera del Prestige valgono anche in questo caso, compresi i tasti leggeri e poco profondi rispetto ai tasti più solidi dell'HP Spectre o del Lenovo ThinkPad. Gli utenti abituati a digitare su un Asus ZenBook o VivoBook troveranno un'esperienza di digitazione familiare sullo Stealth 15.
A differenza di MSI Prestige, Modern, o Creator, la retroilluminazione della tastiera qui è compatibile con i colori RGB tramite MSI Mystic Light. Le opzioni sono limitate a una sola zona in contrasto con le impostazioni RGB per tasto della serie GS66.
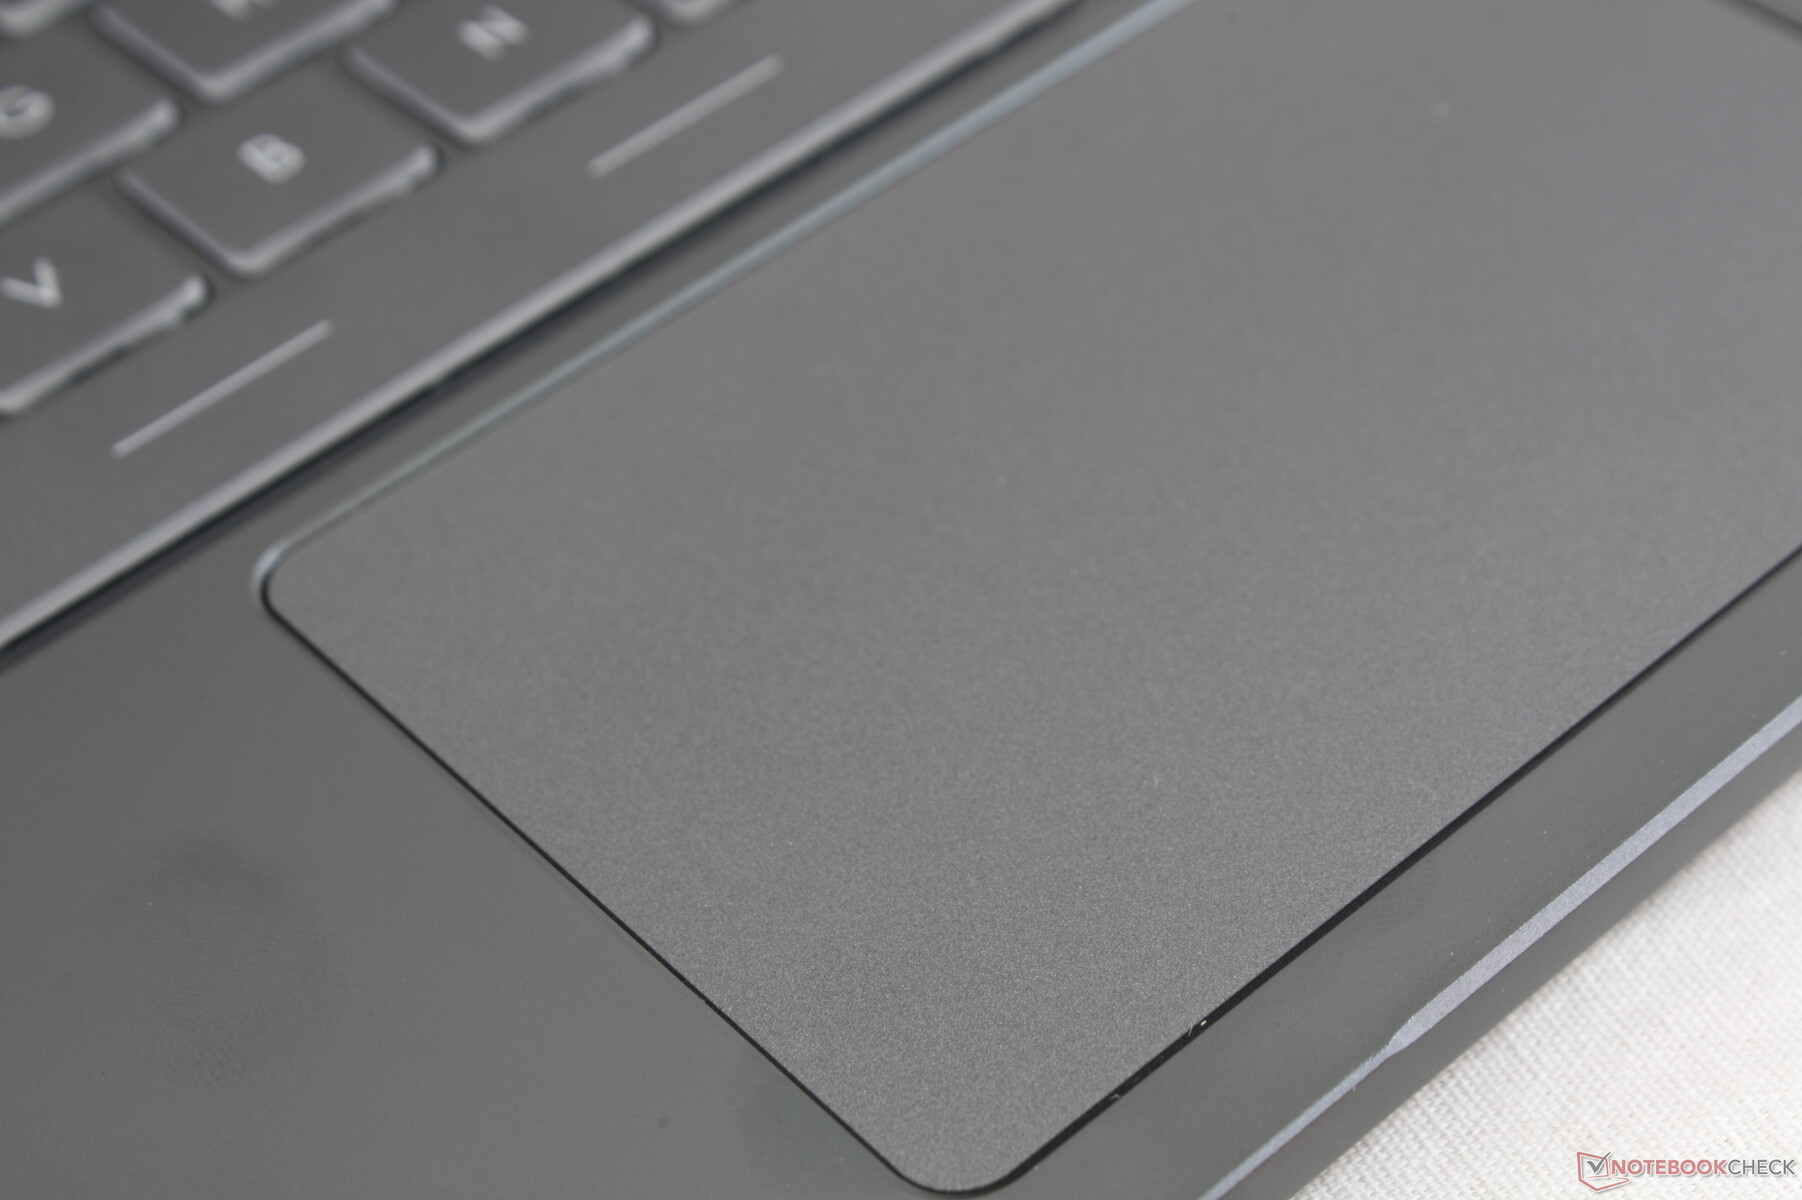
Touchpad
Il clickpad (10,5 x 6,5 cm) è più piccolo di quello dell'XPS 15 (15,1 x 9 cm) o dell'HP Spectre x360 15 (12 x 6 cm). Il controllo del cursore è fluido con quasi nessun attrito anche se si scivola molto lentamente sulla superficie. I suoi pulsanti clickpad integrati, tuttavia, sono spugnosi e difficili da usare per lunghi periodi. Un mouse esterno è altamente raccomandato se avete bisogno di fare molti click.
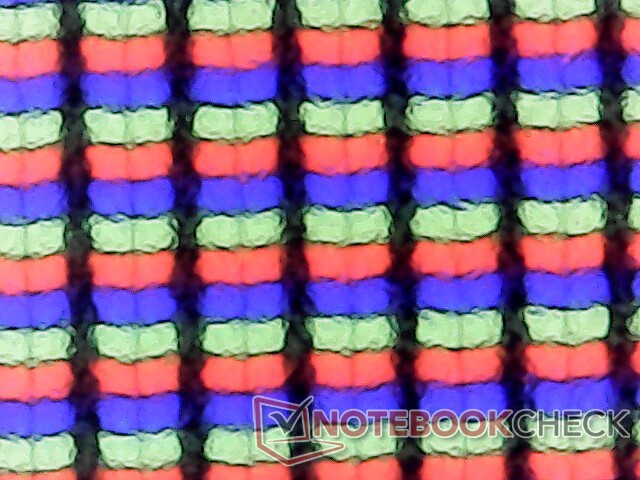
Display
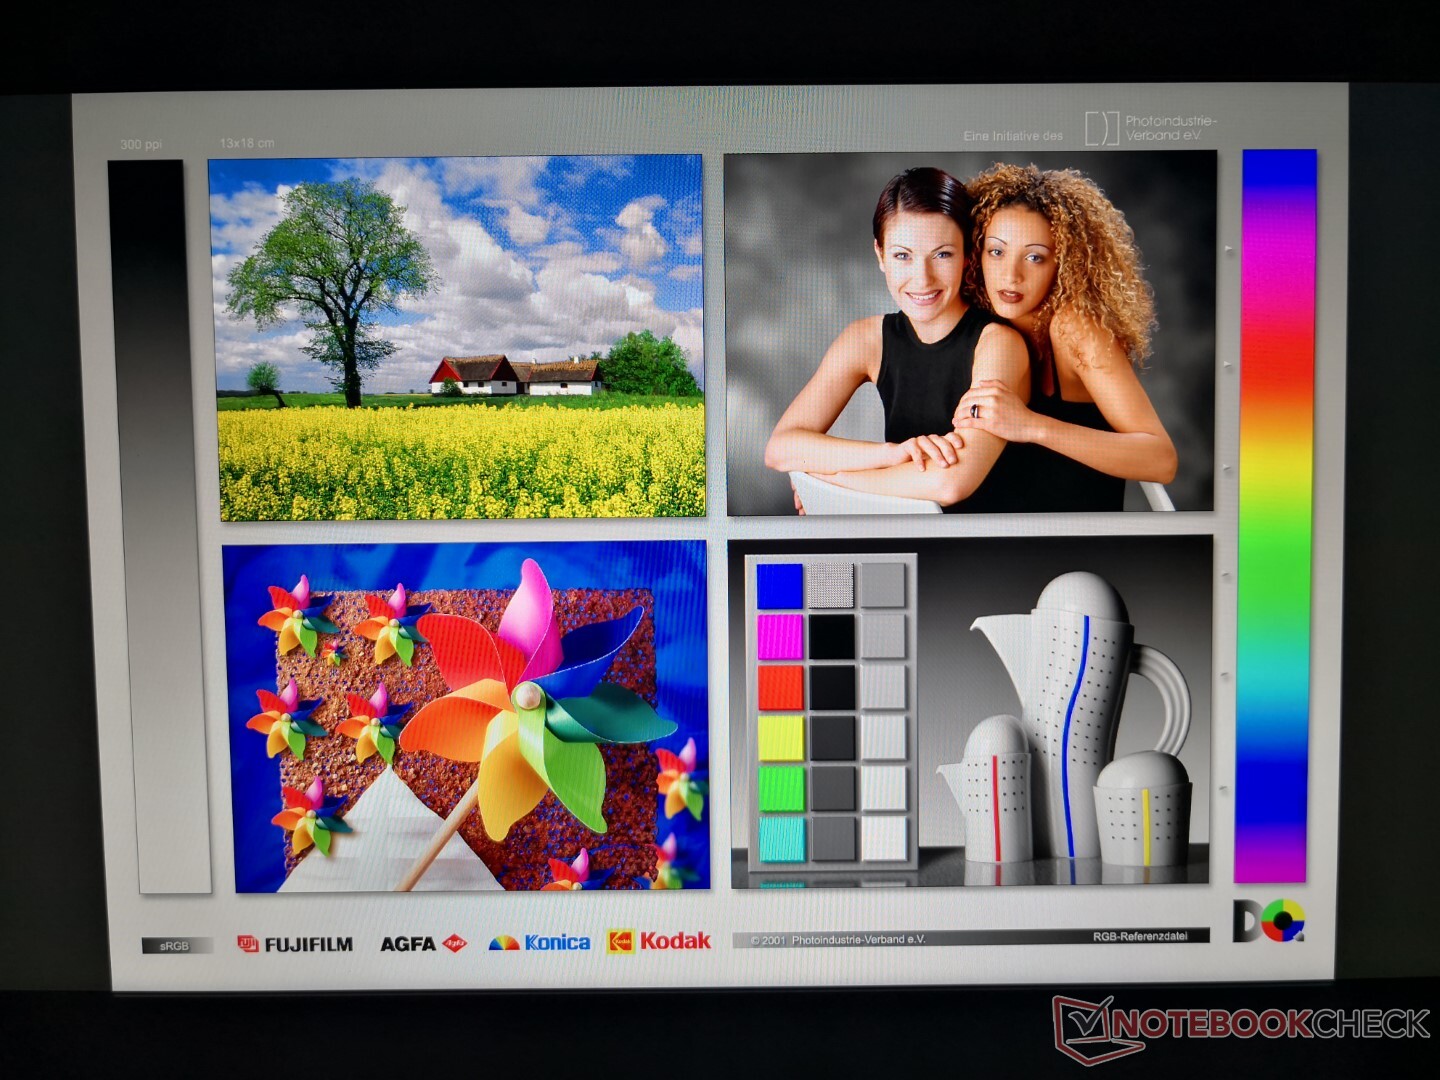
Lo Stealth 15M è dotato dello stesso pannello IPS 60 Hz Chi Mei N156HCE-EN1 che si trova sui Lenovo ThinkPad P52, Yoga 720-15IKB, Asus ZenBook Pro UX550, e anche il Modern 15 di MSI. Caratteristiche innate come il rapporto di contrasto decente, lo spazio colore, i tempi di risposta in bianco e nero, e la qualità visiva complessiva sono quindi abbastanza simili tra questi sistemi, specialmente con il Modern 15.
Un notevole svantaggio del display è la sua mediocre luminosità massima di soli 279 nits. Anche se utile per le condizioni interne, questo è molto più basso della maggior parte degli altri portatili multimediali da 15.6 pollici nella stessa fascia di prezzo, come mostrato dalla tabella qui sotto.


| |||||||||||||||||||||||||
Distribuzione della luminosità: 82 %
Al centro con la batteria: 279 cd/m²
Contrasto: 872:1 (Nero: 0.32 cd/m²)
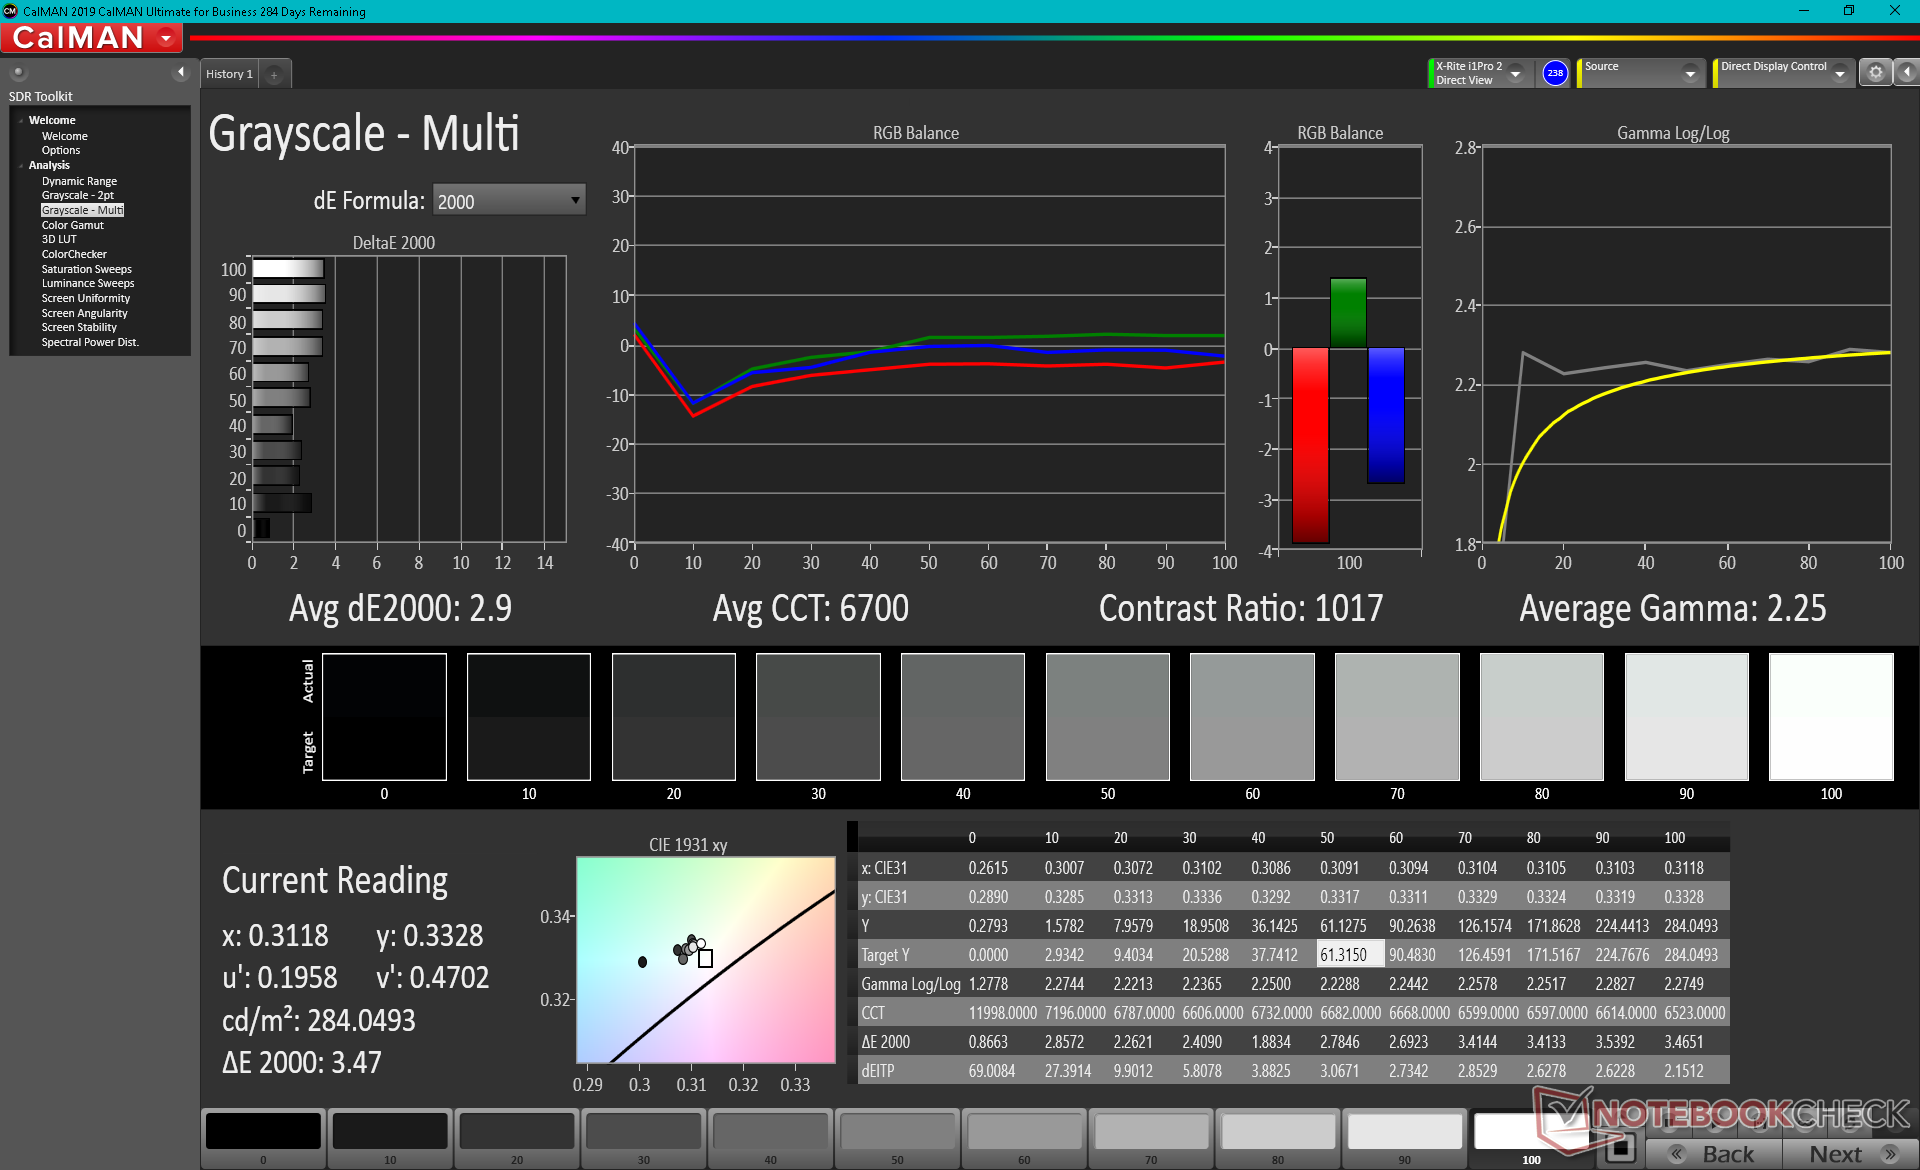
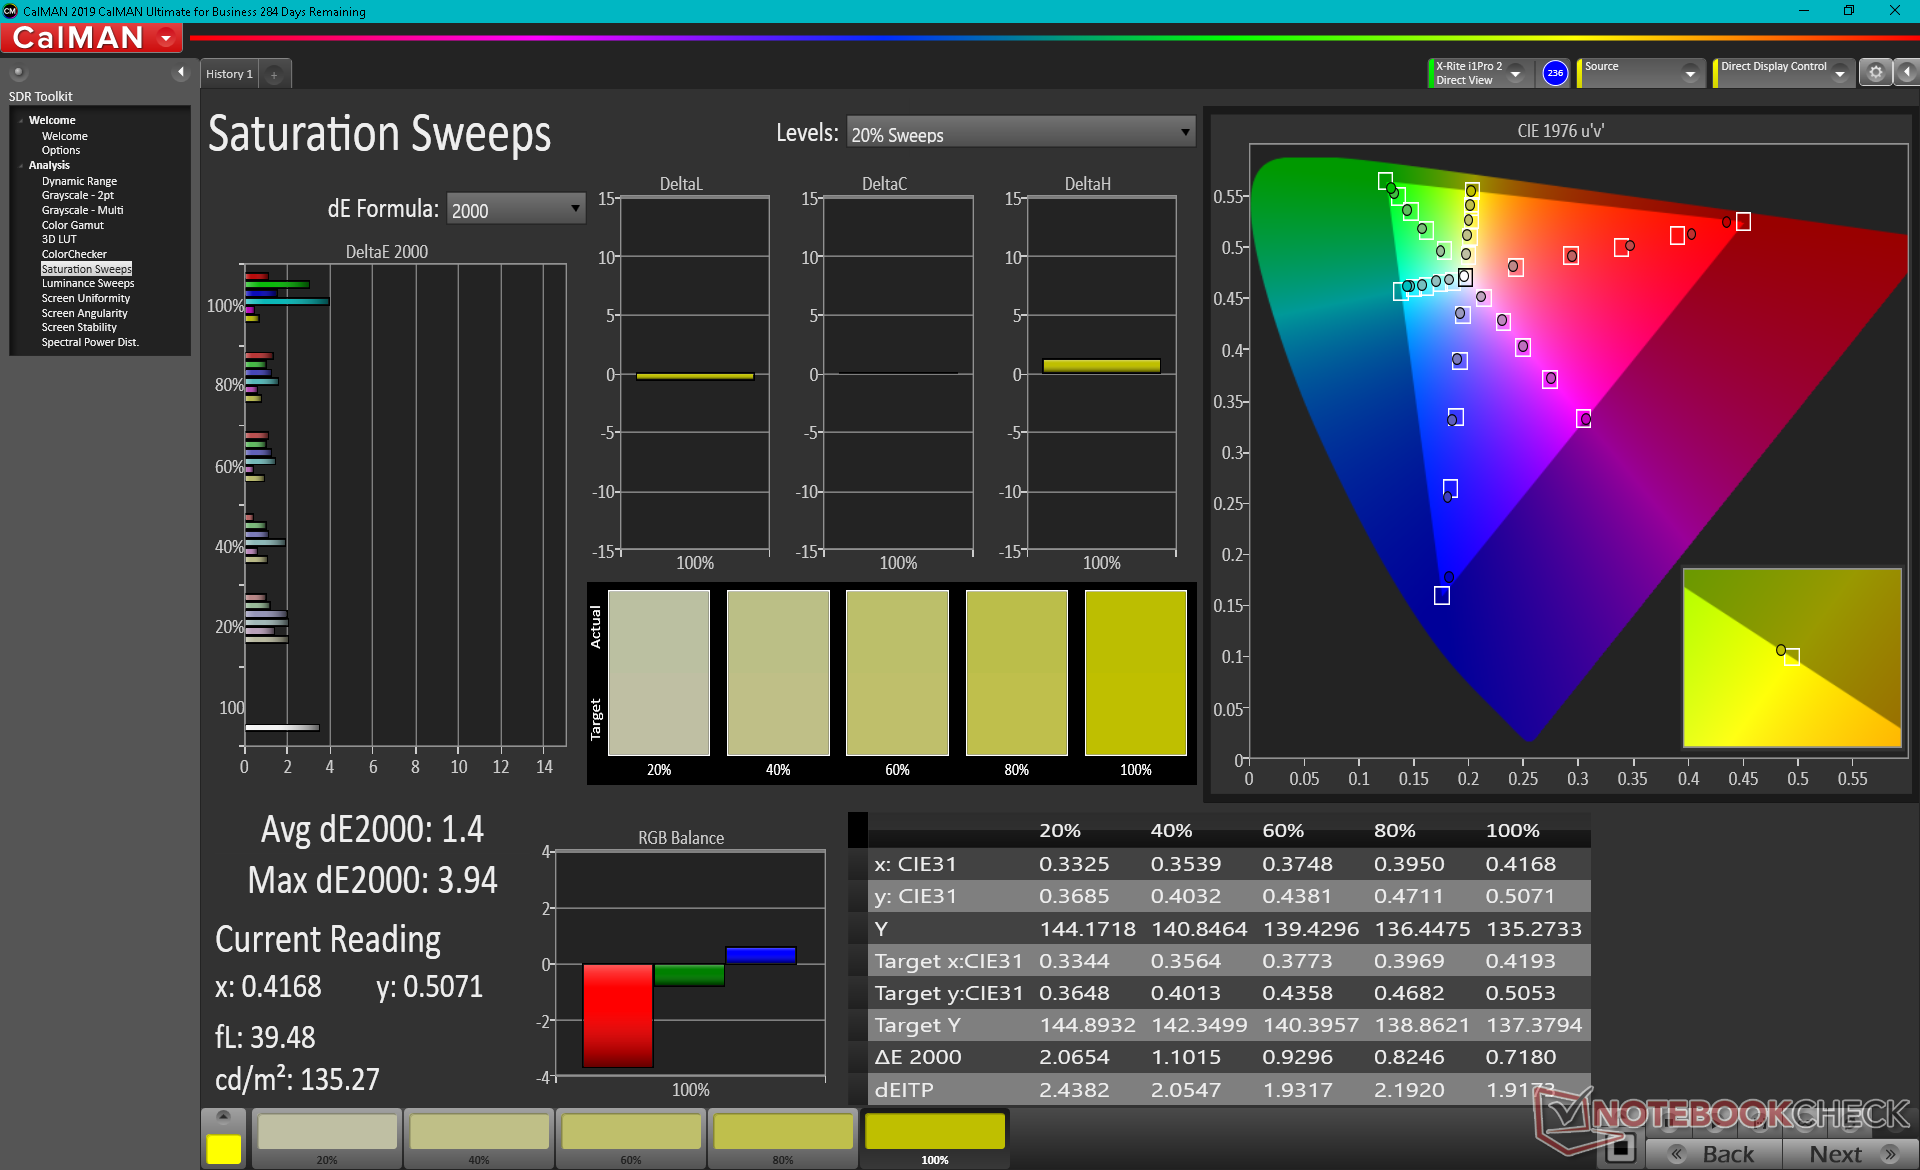
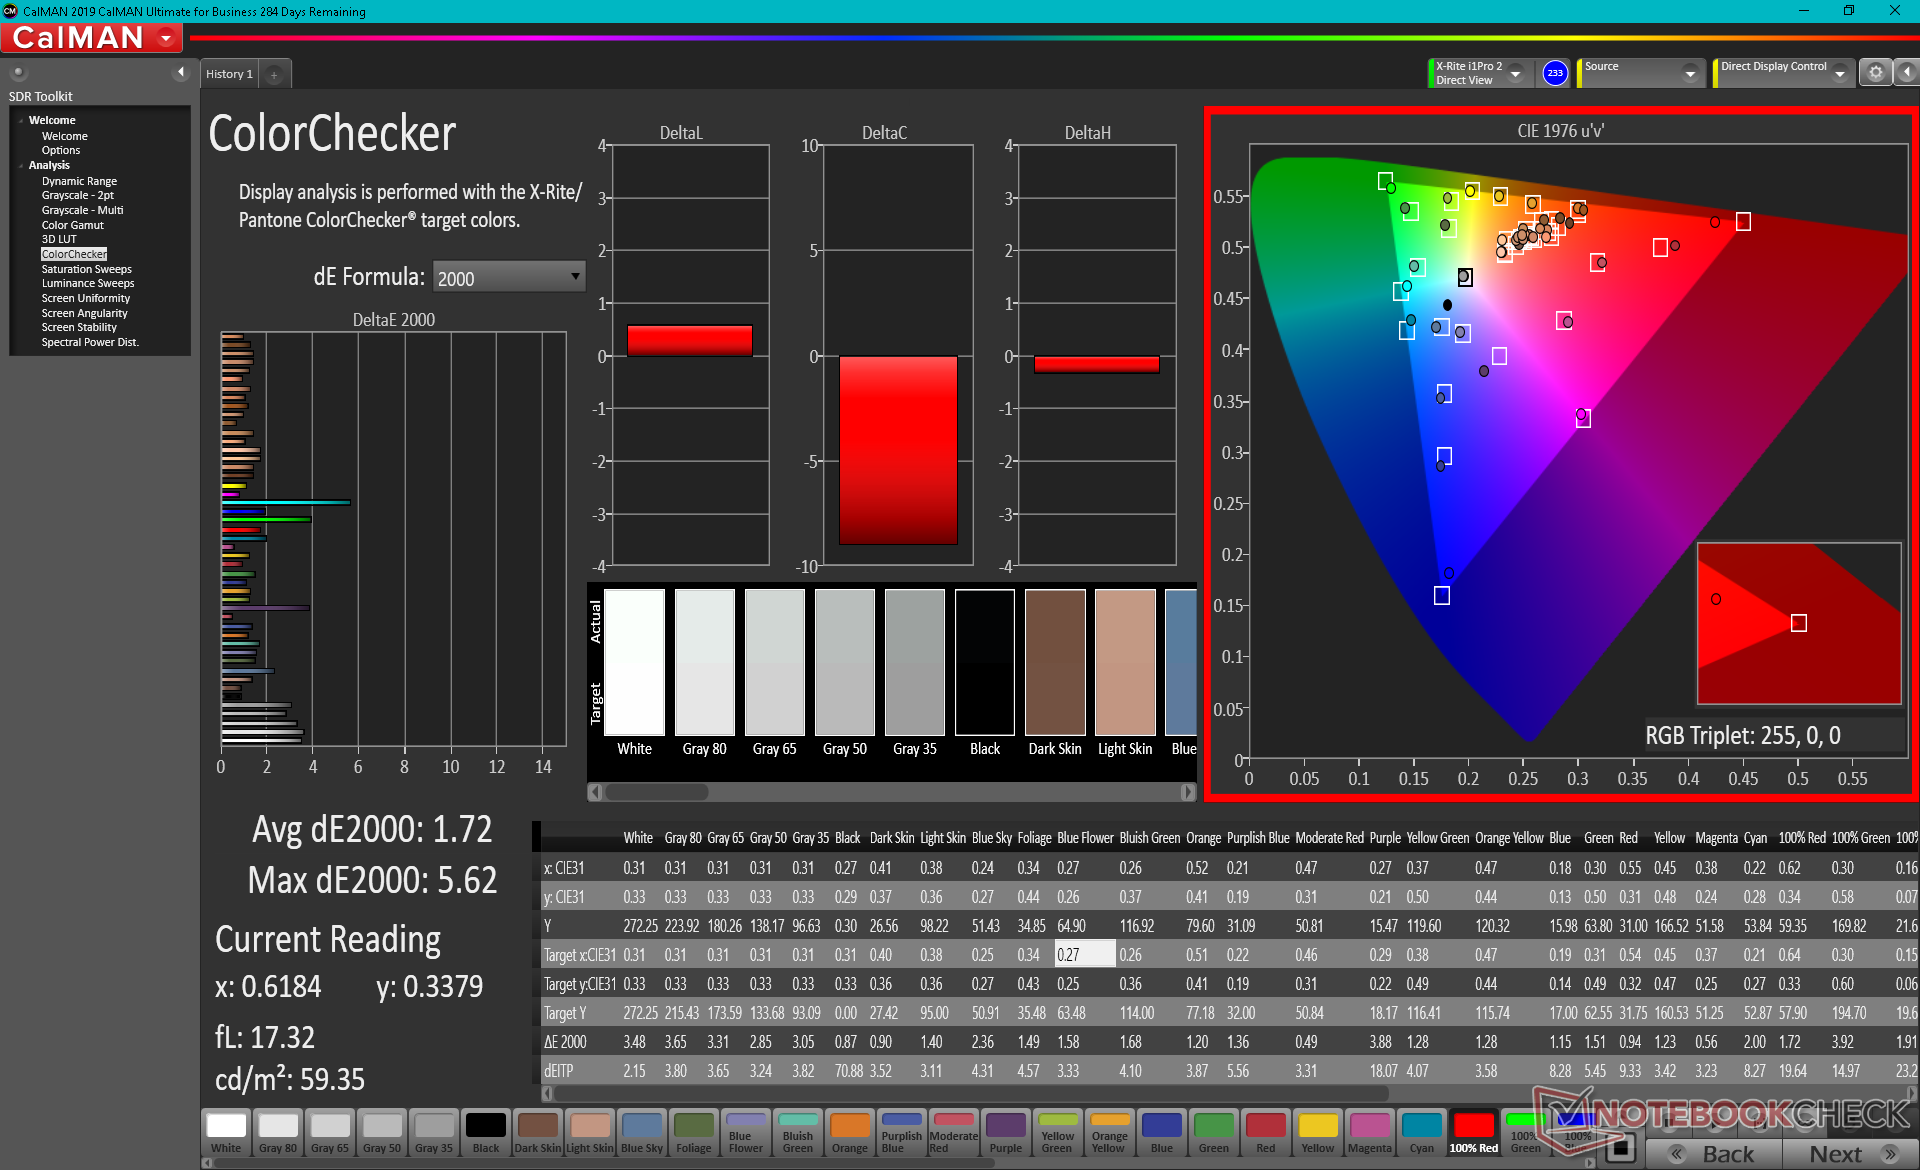
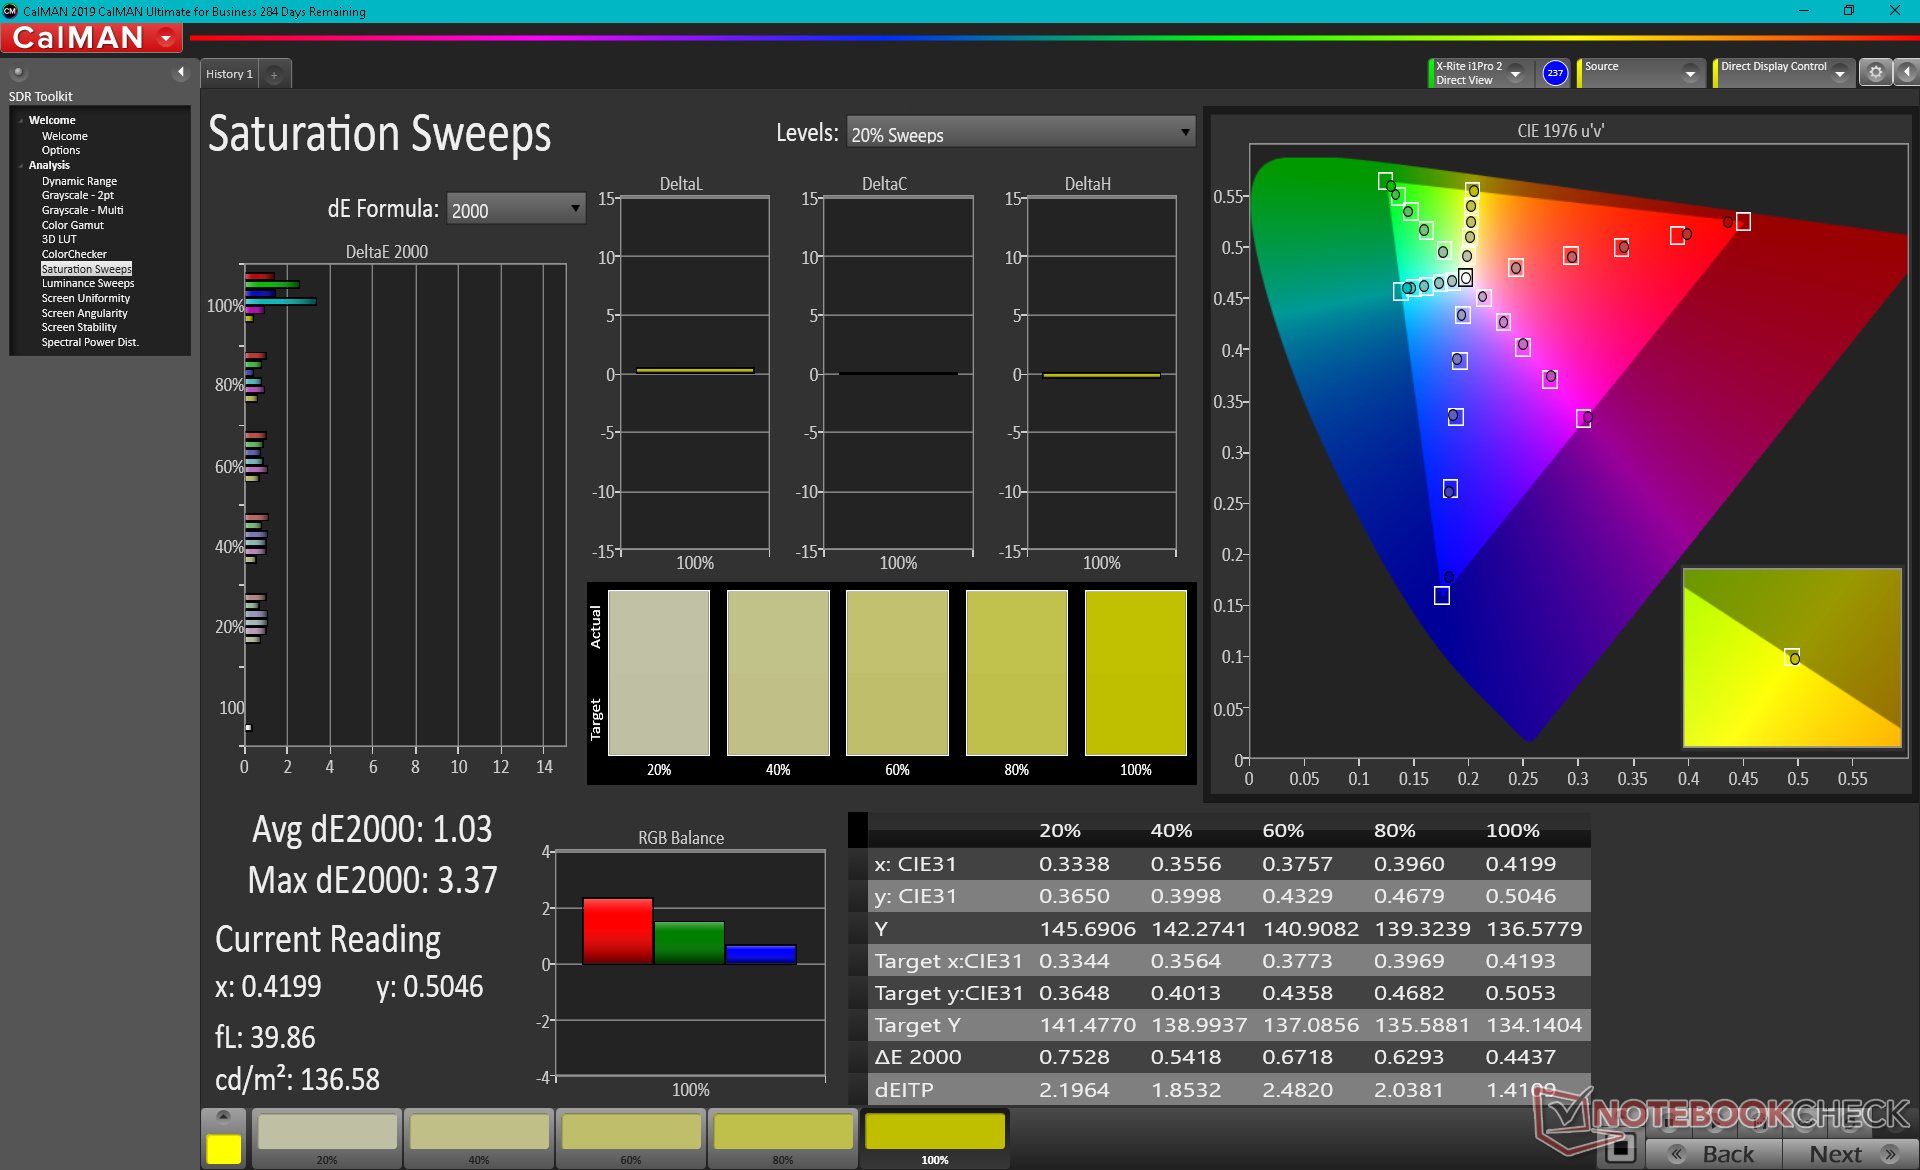
ΔE ColorChecker Calman: 1.72 | ∀{0.5-29.43 Ø4.71}
calibrated: 1.39
ΔE Greyscale Calman: 2.9 | ∀{0.09-98 Ø4.96}
93.2% sRGB (Argyll 1.6.3 3D)
59% AdobeRGB 1998 (Argyll 1.6.3 3D)
64.1% AdobeRGB 1998 (Argyll 3D)
93.4% sRGB (Argyll 3D)
62% Display P3 (Argyll 3D)
Gamma: 2.3
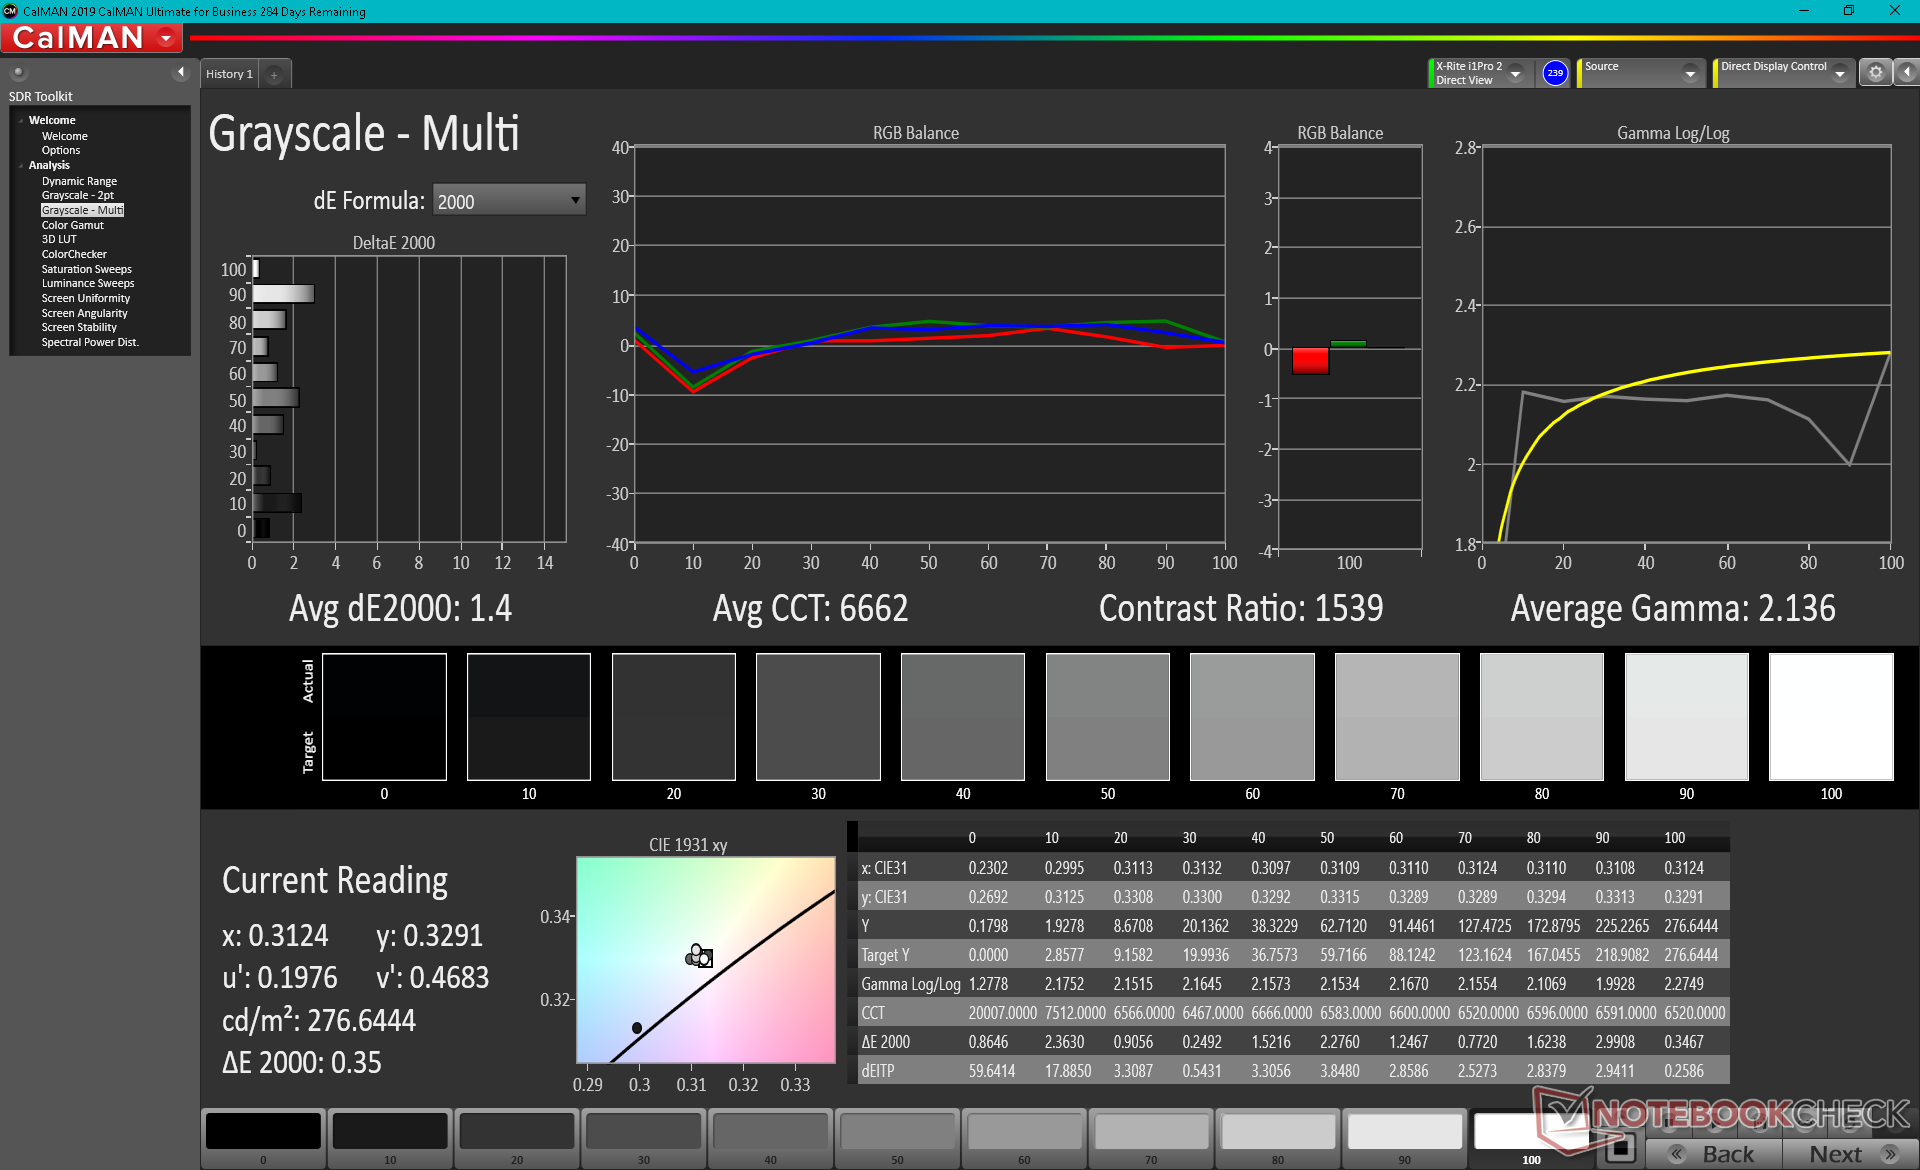
CCT: 6700 K
| MSI Stealth 15M A11SEK Chi Mei N156HCE-EN1, IPS, 15.6", 1920x1080 | Dell XPS 15 9500 Core i7 4K UHD Sharp LQ156R1, IPS, 15.6", 3840x2400 | Lenovo ThinkPad T15p-20TN0006GE MNF601EA1-1, IPS LED, 15.6", 3840x2160 | Asus ZenBook UX535-M01440 BOE0866, IPS, 15.6", 3840x2160 | MSI Prestige 15 A10SC Sharp LQ156D1JW42, IPS, 15.6", 3840x2160 | HP Envy 15-ep0098nr Samsung SDC4145, AMOLED, 15.6", 3840x2160 | |
|---|---|---|---|---|---|---|
| Display | 36% | 33% | 9% | 29% | 35% | |
| Display P3 Coverage (%) | 62 | 89.7 45% | 86.8 40% | 68.8 11% | 82 32% | 88.5 43% |
| sRGB Coverage (%) | 93.4 | 100 7% | 99.3 6% | 99.5 7% | 98.3 5% | 100 7% |
| AdobeRGB 1998 Coverage (%) | 64.1 | 99.8 56% | 98.5 54% | 70.1 9% | 96.2 50% | 99.9 56% |
| Response Times | -4% | 27% | 31% | -22% | 95% | |
| Response Time Grey 50% / Grey 80% * (ms) | 47.6 ? | 54 ? -13% | 41.6 ? 13% | 34 ? 29% | 60 ? -26% | 0.8 ? 98% |
| Response Time Black / White * (ms) | 35.2 ? | 33.2 ? 6% | 21.2 ? 40% | 24 ? 32% | 41.2 ? -17% | 2.7 ? 92% |
| PWM Frequency (Hz) | 25000 ? | 26040 ? | 242.7 ? | |||
| Screen | -6% | 54% | 12% | -5% | -36% | |
| Brightness middle (cd/m²) | 279 | 557.9 100% | 595 113% | 402 44% | 464.5 66% | 374.3 34% |
| Brightness (cd/m²) | 252 | 541 115% | 594 136% | 375 49% | 451 79% | 379 50% |
| Brightness Distribution (%) | 82 | 91 11% | 94 15% | 84 2% | 92 12% | 91 11% |
| Black Level * (cd/m²) | 0.32 | 0.39 -22% | 0.32 -0% | 0.35 -9% | 0.5 -56% | |
| Contrast (:1) | 872 | 1431 64% | 1859 113% | 1149 32% | 929 7% | |
| Colorchecker dE 2000 * | 1.72 | 4.54 -164% | 1.2 30% | 2.47 -44% | 3.36 -95% | 5.47 -218% |
| Colorchecker dE 2000 max. * | 5.62 | 7.92 -41% | 2.5 56% | 4.32 23% | 7.06 -26% | 8.22 -46% |
| Colorchecker dE 2000 calibrated * | 1.39 | 3.82 -175% | 1 28% | 2.36 -70% | 3.42 -146% | 4.61 -232% |
| Greyscale dE 2000 * | 2.9 | 3.2 -10% | 1.4 52% | 2.26 22% | 1.3 55% | 2.3 21% |
| Gamma | 2.3 96% | 1.99 111% | 2.1 105% | 2.49 88% | 2.14 103% | 2.09 105% |
| CCT | 6700 97% | 6451 101% | 6492 100% | 6285 103% | 6596 99% | 6340 103% |
| Color Space (Percent of AdobeRGB 1998) (%) | 59 | 89.5 52% | 85.3 45% | 99 68% | 84.8 44% | 87.8 49% |
| Color Space (Percent of sRGB) (%) | 93.2 | 100 7% | 99.2 6% | 98.3 5% | 100 7% | |
| Media totale (Programma / Settaggio) | 9% /
2% | 38% /
47% | 17% /
14% | 1% /
-1% | 31% /
-2% |
* ... Meglio usare valori piccoli
Il pannello copre quasi tutto l'sRGB e circa il 60% dell'AdobeRGB che è standard sulla maggior parte degli Ultrabooks di punta con display 1080p. Altri portatili con opzioni di display 4K come il Prestige 15 di MSI di solito offrono colori più profondi puntando invece su AdobeRGB.
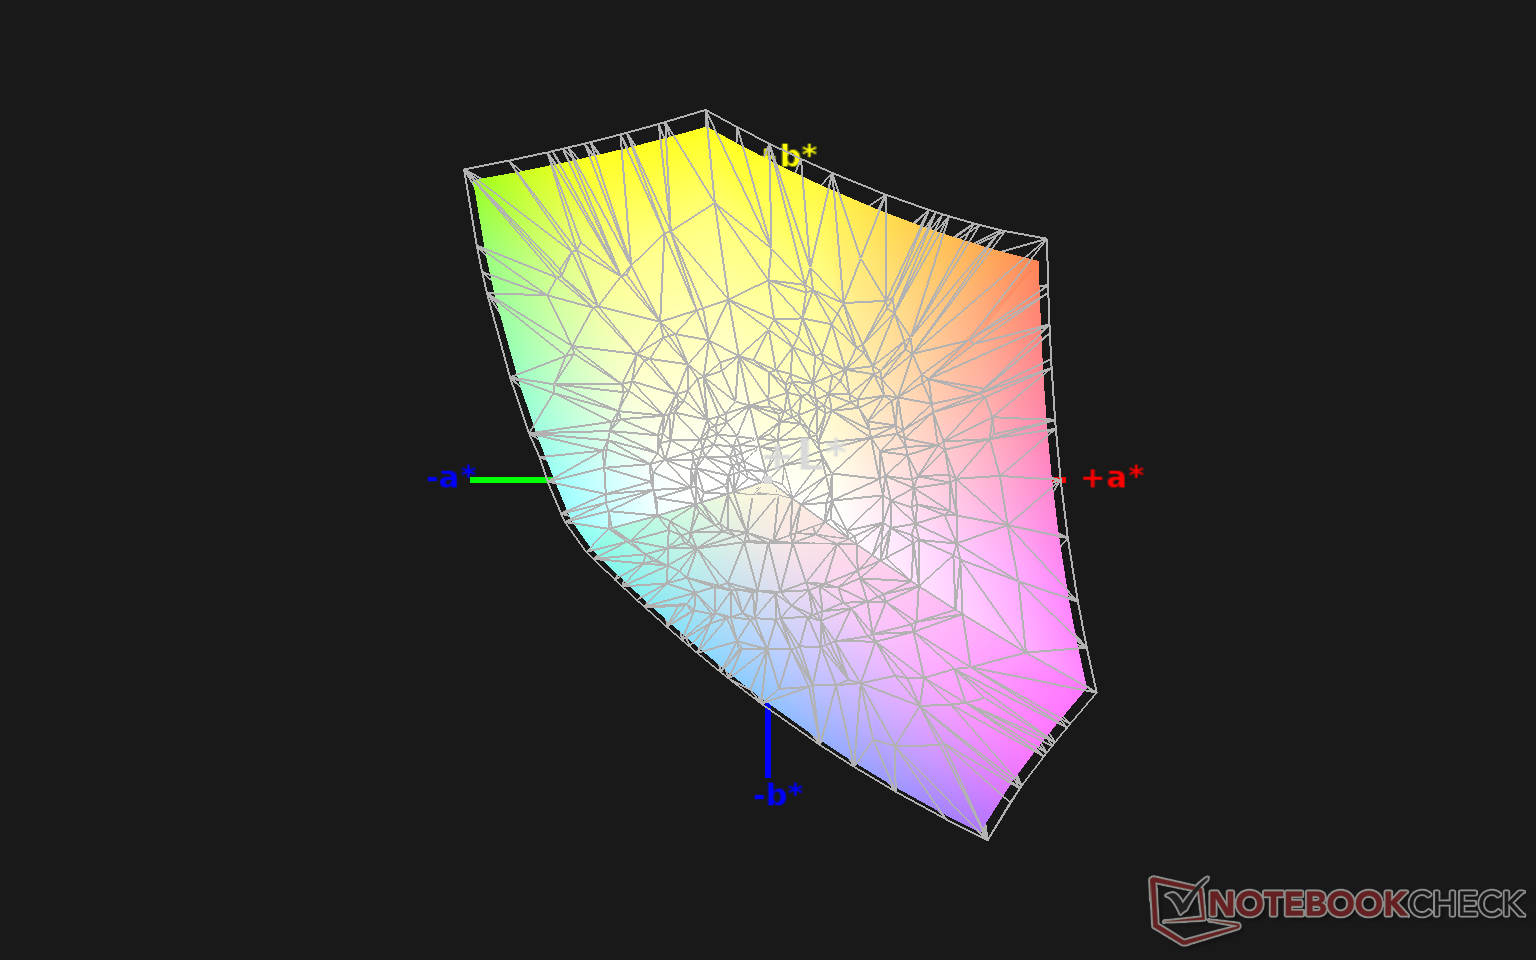
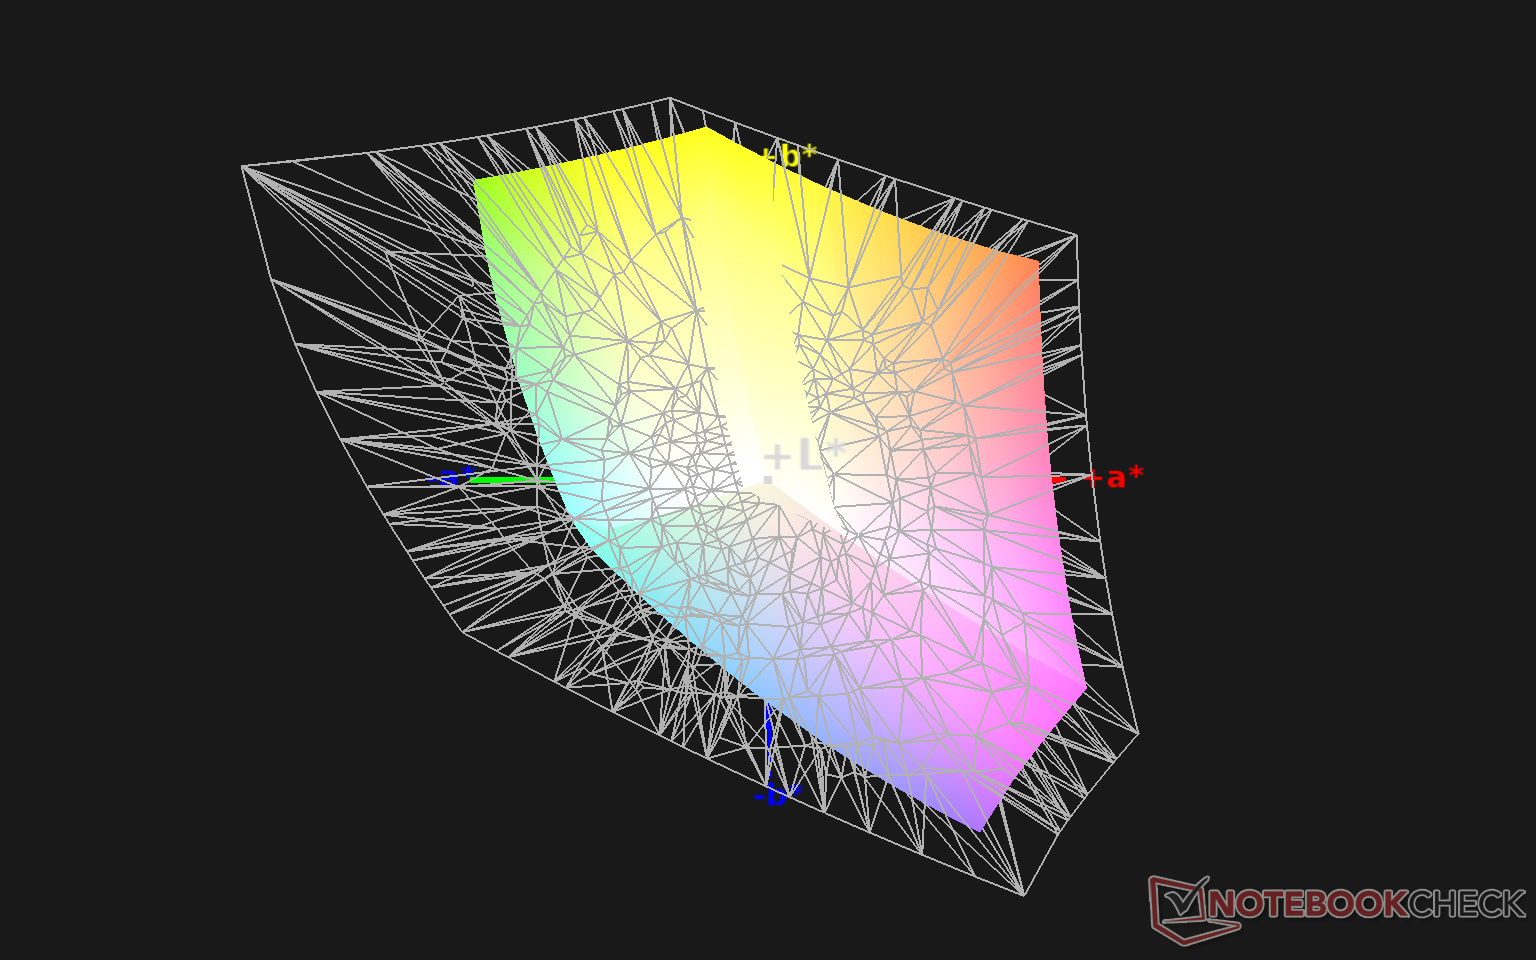
Il sistema è ben calibrato con valori medi di scala di grigi e ColorChecker deltaE di appena 2,9 e 1,72, rispettivamente. Calibrando ulteriormente il display con il nostro colorimetro X-Rite migliora le medie solo marginalmente. È interessante notare che i colori alzavola e verde sono rappresentati in modo più impreciso di tutti gli altri colori con ampi margini anche dopo la calibrazione.
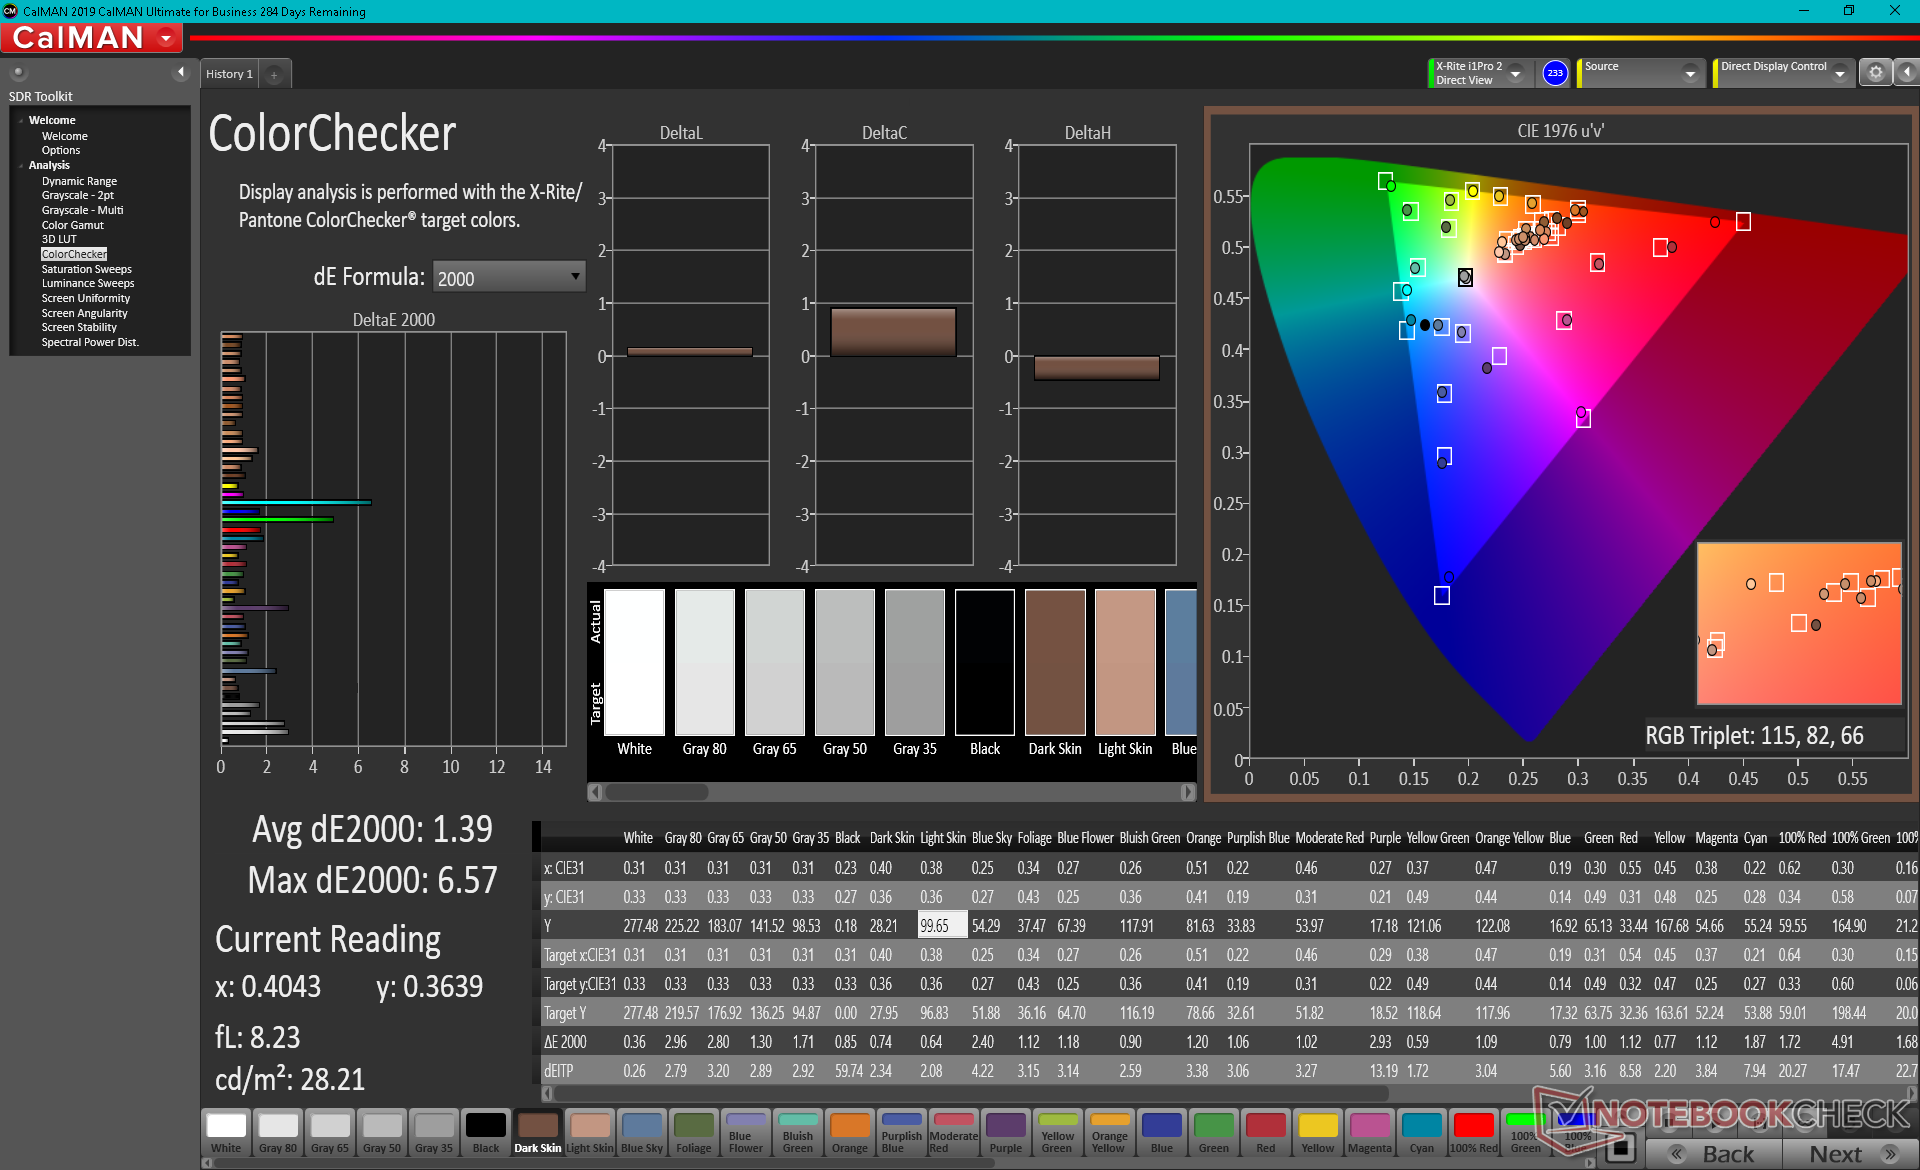
Tempi di risposta del Display
| ↔ Tempi di risposta dal Nero al Bianco | ||
|---|---|---|
| 35.2 ms ... aumenta ↗ e diminuisce ↘ combinato | ↗ 22 ms Incremento | 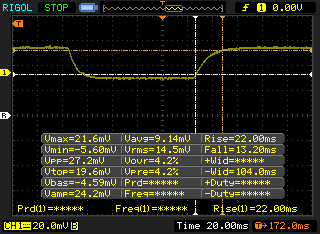 |
| ↘ 13.2 ms Calo | ||
| Lo schermo mostra tempi di risposta lenti nei nostri tests e sarà insoddisfacente per i gamers. In confronto, tutti i dispositivi di test variano da 0.1 (minimo) a 240 (massimo) ms. » 93 % di tutti i dispositivi è migliore. Questo significa che i tempi di risposta rilevati sono peggiori rispetto alla media di tutti i dispositivi testati (19.8 ms). | ||
| ↔ Tempo di risposta dal 50% Grigio all'80% Grigio | ||
| 47.6 ms ... aumenta ↗ e diminuisce ↘ combinato | ↗ 25.2 ms Incremento | 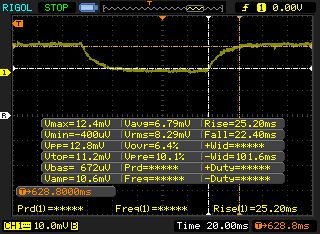 |
| ↘ 22.4 ms Calo | ||
| Lo schermo mostra tempi di risposta lenti nei nostri tests e sarà insoddisfacente per i gamers. In confronto, tutti i dispositivi di test variano da 0.165 (minimo) a 636 (massimo) ms. » 82 % di tutti i dispositivi è migliore. Questo significa che i tempi di risposta rilevati sono peggiori rispetto alla media di tutti i dispositivi testati (30.9 ms). | ||
Sfarfallio dello schermo / PWM (Pulse-Width Modulation)
| flickering dello schermo / PWM rilevato | 25000 Hz | ≤ 25 % settaggio luminosita' |  |
Il display sfarfalla a 25000 Hz (Probabilmente a causa dell'uso di PWM) Flickering rilevato ad una luminosita' di 25 % o inferiore. Non dovrebbe verificarsi flickering o PWM sopra questo valore di luminosita'. La frequenza di 25000 Hz è abbastanza alta, quindi la maggioranza degli utenti sensibili al PWM non dovrebbero notare alcun flickering. In confronto: 52 % di tutti i dispositivi testati non utilizza PWM per ridurre la luminosita' del display. Se è rilevato PWM, una media di 7741 (minimo: 5 - massimo: 343500) Hz è stata rilevata. | |||
La visibilità all'aperto è semplicemente media a causa del livello di luminosità massima relativamente debole. Questo è un peccato perché il design leggero del telaio potrebbe effettivamente incoraggiare i proprietari a utilizzare lo Stealth 15M all'aperto più spesso.
Performance
Il sistema MSI è unico in quanto gli utenti hanno la possibilità di accoppiare la GPU GeForce RTX 2060 Max-Q con una CPU della serie Core U invece della più comune serie Core H. Le ultime configurazioni sono dotate di processori ancora più veloci tra cui l'11° gen Core i7-11375H e Nvidia Ampere GeForce RTX 3060 per sostituire le vecchie CPU di 10° gen e le GPU Turing.
La nostra unità è stata impostata in modalità Extreme Performance tramite MSI Dragon Center prima di eseguire qualsiasi benchmark di prestazioni.
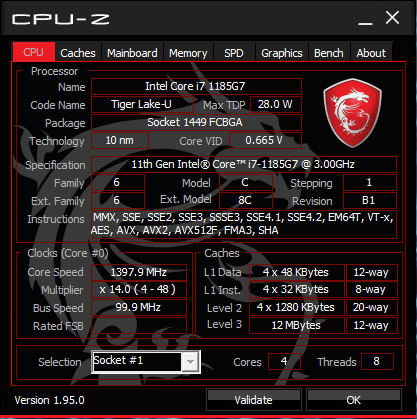
Processore
Della dozzina di portatili che abbiamo testato finora con la stessa CPU Core i7-1185G7, il nostro Stealth 15M è uno dei più veloci con punteggi CineBench xT che sono dal 12 al 16% superiori alla media. Le sue eccellenti prestazioni possono essere attribuite alla buona sostenibilità del Turbo Boost della CPU come mostrato dal nostro grafico qui sotto. Il Summit E15 dotato con la stessa CPU, per esempio, girerebbe circa il 15% più lento del nostro Stealth 15M dopo aver tenuto conto di qualsiasi strozzatura delle prestazioni su entrambi i sistemi. Le prestazioni single-thread sono ancora più impressionanti con punteggi CineBench che superano anche il Corei7-10875H.
Le prestazioni complessive multi-thread sono ancora dal 23 al 27% più lente rispetto all'octa-core Core i7-10875H o all'hexa-core Core i7-10750H che si trovano nella maggior parte dei portatili ad alte prestazioni.
Cinebench R15: CPU Multi 64Bit | CPU Single 64Bit
Blender: v2.79 BMW27 CPU
7-Zip 18.03: 7z b 4 -mmt1 | 7z b 4
Geekbench 5.5: Single-Core | Multi-Core
HWBOT x265 Benchmark v2.2: 4k Preset
LibreOffice : 20 Documents To PDF
R Benchmark 2.5: Overall mean
Cinebench R15: CPU Multi 64Bit | CPU Single 64Bit
Blender: v2.79 BMW27 CPU
7-Zip 18.03: 7z b 4 -mmt1 | 7z b 4
Geekbench 5.5: Single-Core | Multi-Core
HWBOT x265 Benchmark v2.2: 4k Preset
LibreOffice : 20 Documents To PDF
R Benchmark 2.5: Overall mean
* ... Meglio usare valori piccoli
Prestazioni di sistema
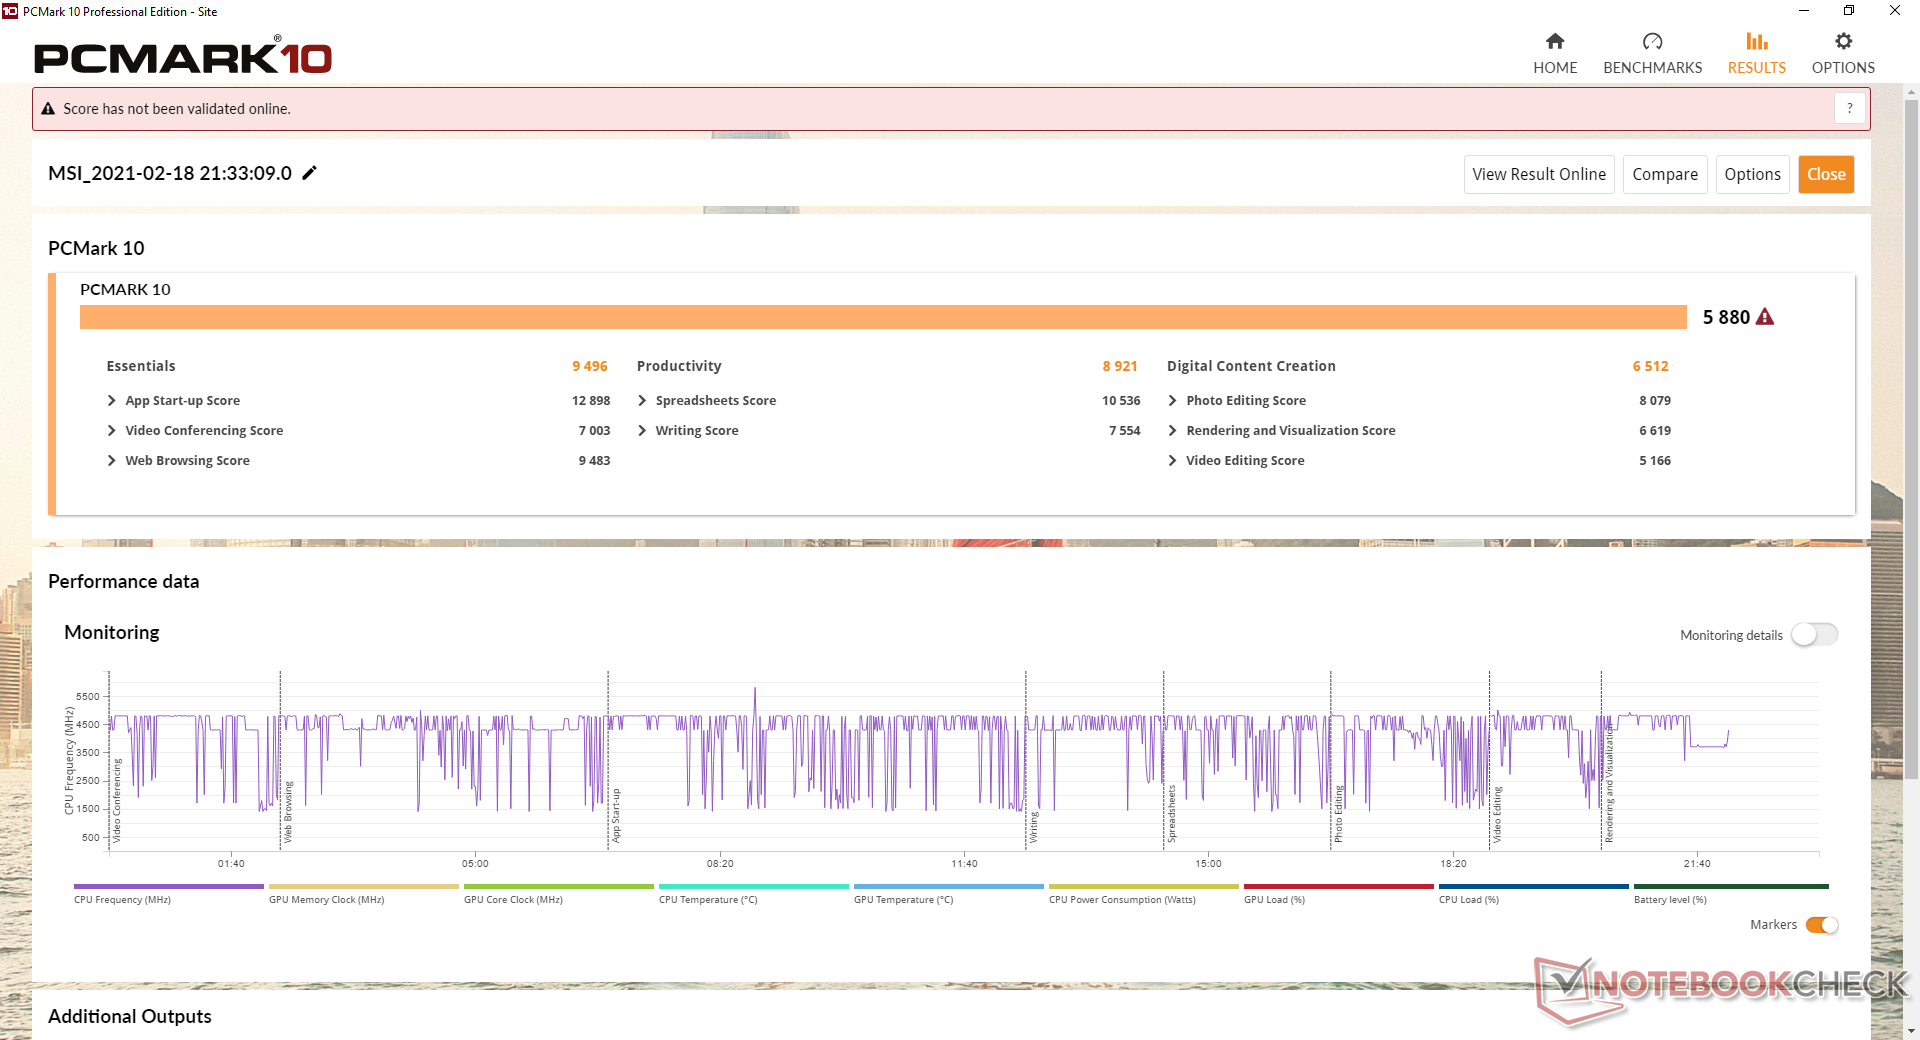
I benchmarks PCMark sono superiori alla maggior parte degli altri portatili multimediali Core serie H grazie alla più veloce GPU GeForce RTX e alle alte prestazioni per watt della CPU.
Non abbiamo riscontrato alcun problema software durante il nostro tempo con l'unità di test. I proprietari dovrebbero acquisire familiarità con il software MSI Dragon Center in quanto è un centro di controllo per la maggior parte delle impostazioni del sistema.
| PCMark 10 Score | 5880 punti | |
Aiuto | ||
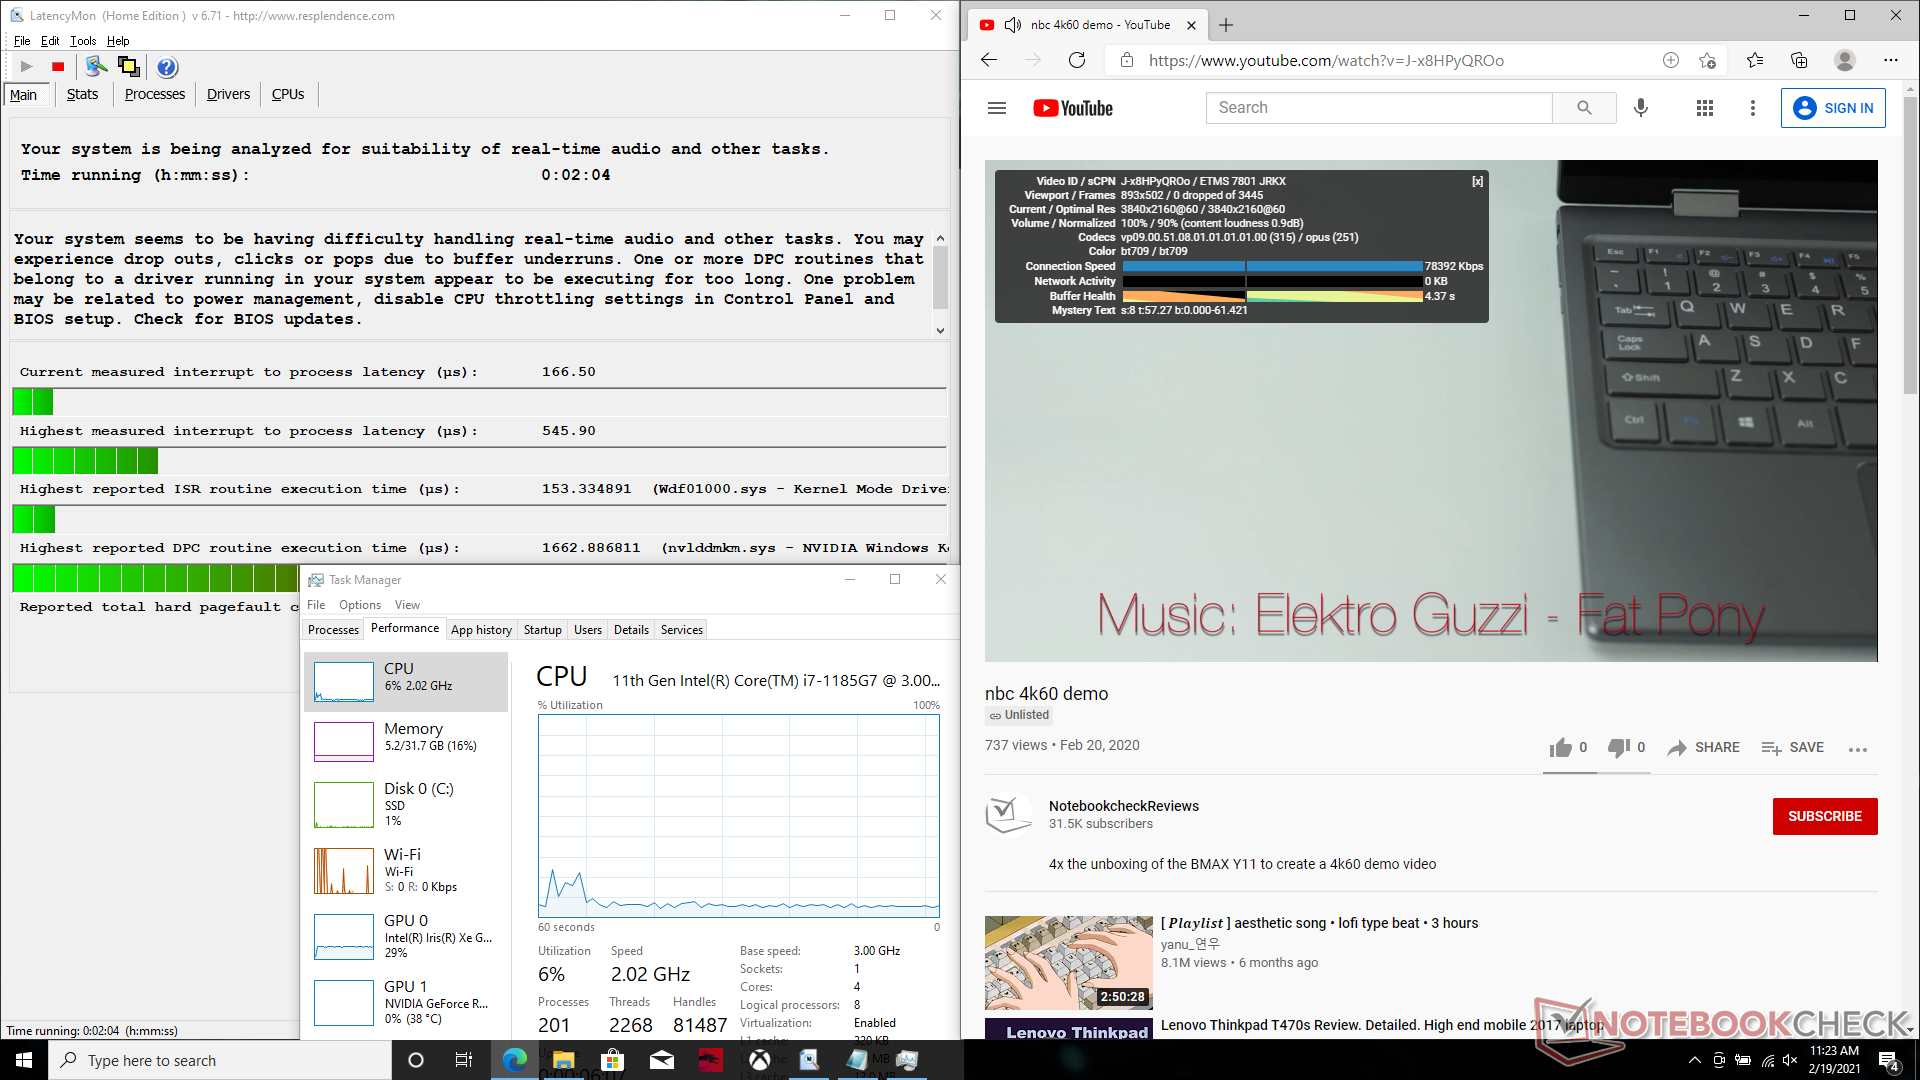
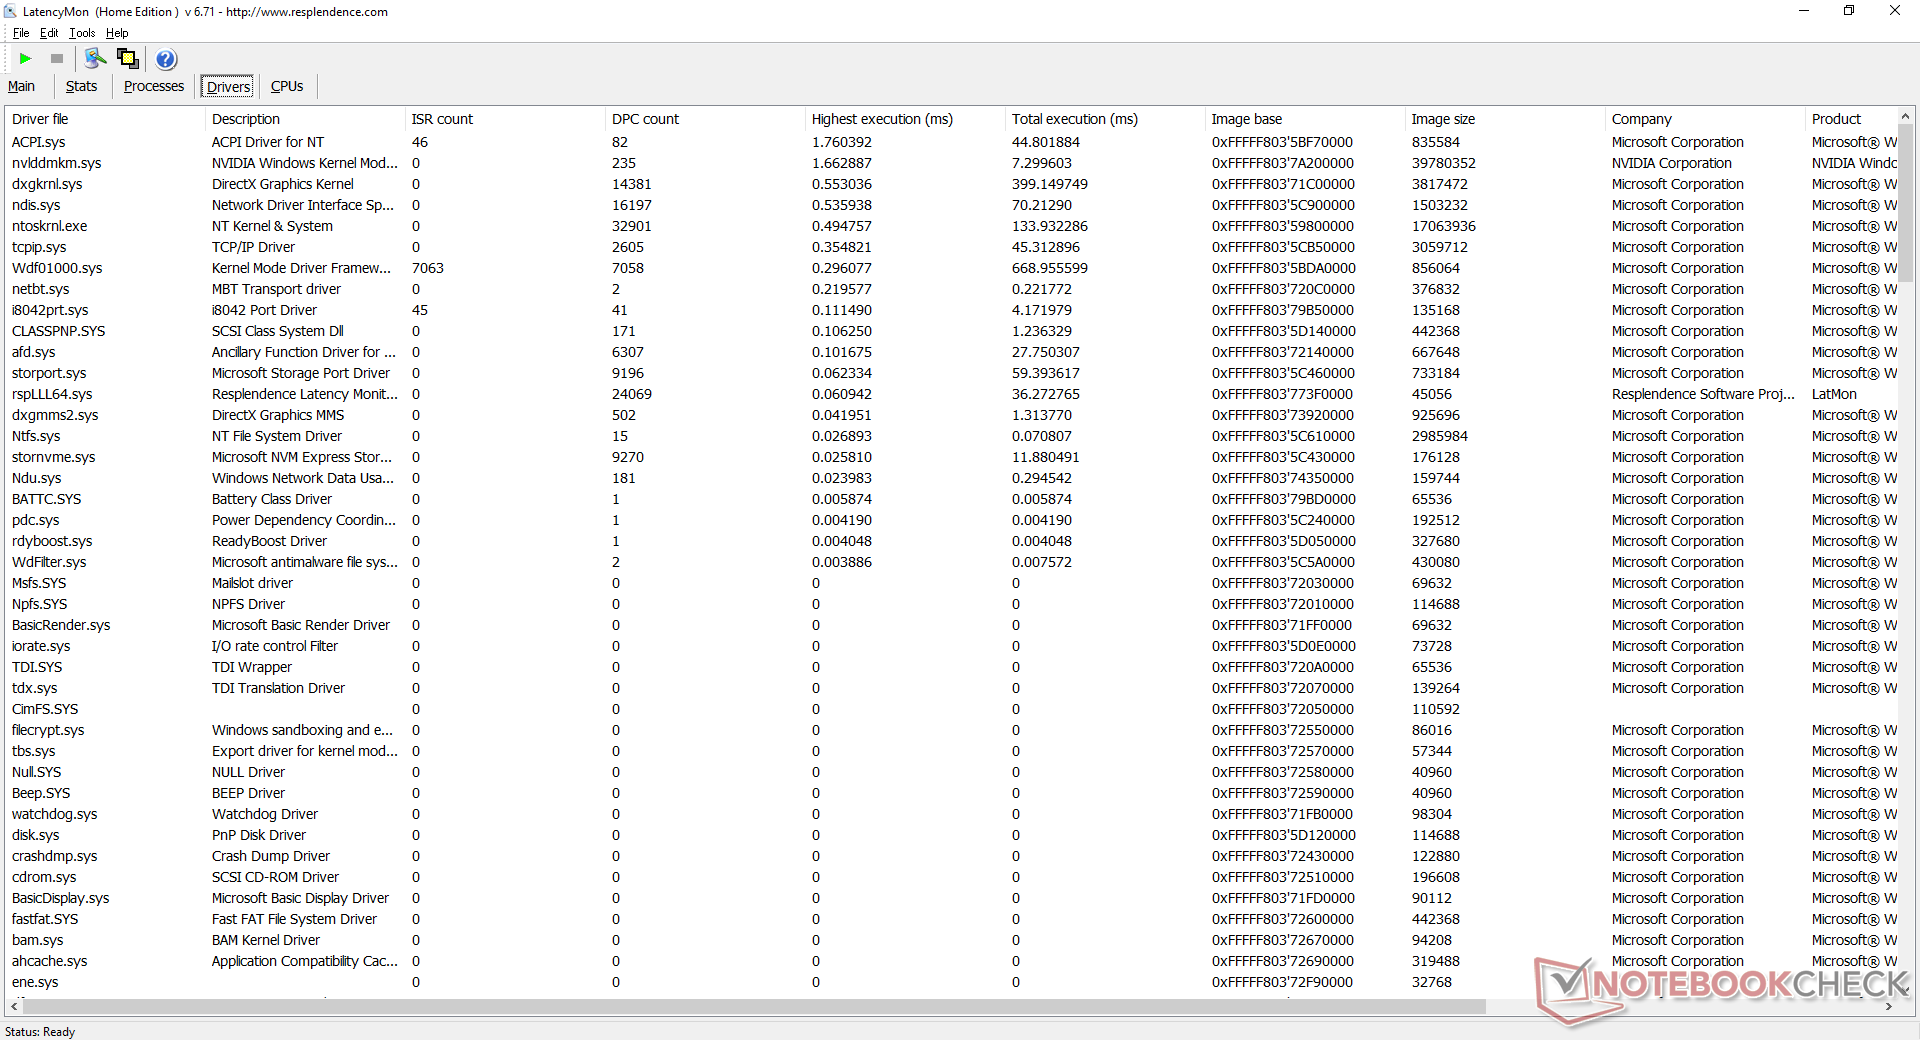
Latenza DPC
LatencyMon rivela problemi di latenza DPC relativi a nvlddmkm.sys quando si aprono più schede del browser sulla nostra homepage. La riproduzione di video 4K a 60 FPS è per il resto fluida e senza perdita di fotogrammi.
| DPC Latencies / LatencyMon - interrupt to process latency (max), Web, Youtube, Prime95 | |
| Dell XPS 15 9500 Core i7 4K UHD | |
| Lenovo ThinkPad T15p-20TN0006GE | |
| Asus ZenBook UX535-M01440 | |
| MSI Stealth 15M A11SEK | |
* ... Meglio usare valori piccoli
Dispositivi di archiviazione
Le opzioni di archiviazione interna sono limitate a un solo slot M.2 PCIe 3.0 x4. La nostra unità di test è dotata di un WD SN530 da 1 TB che è un SSD NVMe di fascia media in contrasto con la serie SN750 di fascia alta. I valori di lettura e scrittura sequenziale sono ancora molto buoni a circa 2400 MB/s e 2000 MB/s, rispettivamente, rispetto a >3000 MB/s su unità più costose.
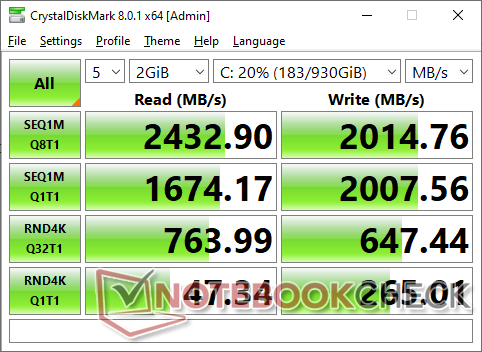
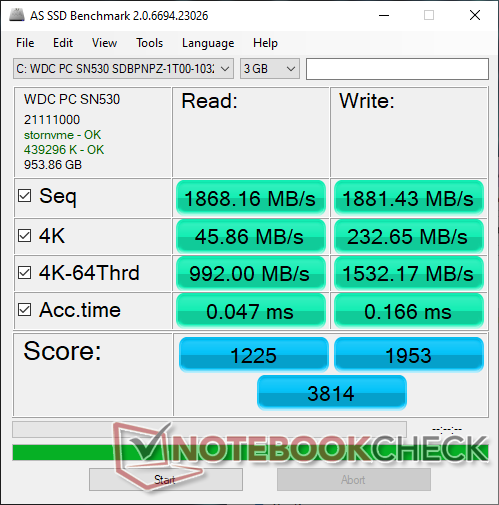
| MSI Stealth 15M A11SEK WDC PC SN530 SDBPNPZ-1T00 | HP Spectre X360 15-5ZV31AV Intel SSD 660p 2TB SSDPEKNW020T8 | Dell XPS 15 9500 Core i7 4K UHD SK Hynix PC611 512GB | Asus ZenBook UX535-M01440 WDC PC SN730 SDBPNTY-1T00 | MSI Prestige 15 A10SC Samsung SSD PM981 MZVLB1T0HALR | |
|---|---|---|---|---|---|
| AS SSD | -26% | -16% | -11% | 4% | |
| Seq Read (MB/s) | 1868 | 1220 -35% | 2072 11% | 1886 1% | 1274 -32% |
| Seq Write (MB/s) | 1881 | 1152 -39% | 1486 -21% | 1221 -35% | 1395 -26% |
| 4K Read (MB/s) | 45.86 | 52.3 14% | 47.41 3% | 41.16 -10% | 50.3 10% |
| 4K Write (MB/s) | 232.6 | 146.6 -37% | 117.6 -49% | 101.2 -56% | 119.8 -48% |
| 4K-64 Read (MB/s) | 992 | 652 -34% | 967 -3% | 1022 3% | 1599 61% |
| 4K-64 Write (MB/s) | 1532 | 847 -45% | 715 -53% | 1618 6% | 1455 -5% |
| Access Time Read * (ms) | 0.047 | 0.077 -64% | 0.057 -21% | 0.058 -23% | 0.044 6% |
| Access Time Write * (ms) | 0.166 | 0.106 36% | 0.096 42% | 0.037 78% | 0.092 45% |
| Score Read (Points) | 1225 | 826 -33% | 1222 0% | 1252 2% | 1777 45% |
| Score Write (Points) | 1953 | 1109 -43% | 981 -50% | 1841 -6% | 1714 -12% |
| Score Total (Points) | 3814 | 2371 -38% | 2809 -26% | 3706 -3% | 4411 16% |
| Copy ISO MB/s (MB/s) | 2320 | 2070 -11% | 1999 -14% | 1611 -31% | 2830 22% |
| Copy Program MB/s (MB/s) | 681 | 571 -16% | 627 -8% | 509 -25% | 609 -11% |
| Copy Game MB/s (MB/s) | 1588 | 1219 -23% | 1001 -37% | 677 -57% | 1424 -10% |
| CrystalDiskMark 5.2 / 6 | -20% | -9% | -10% | -30% | |
| Write 4K (MB/s) | 262.6 | 151.5 -42% | 123.3 -53% | 110 -58% | 150.8 -43% |
| Read 4K (MB/s) | 45.41 | 59.3 31% | 41.85 -8% | 43.44 -4% | 47.3 4% |
| Write Seq (MB/s) | 2001 | 1424 -29% | 2054 3% | 1957 -2% | 981 -51% |
| Read Seq (MB/s) | 1659 | 1609 -3% | 1617 -3% | 1615 -3% | 976 -41% |
| Write 4K Q32T1 (MB/s) | 648 | 393.6 -39% | 413 -36% | 341.6 -47% | 442.7 -32% |
| Read 4K Q32T1 (MB/s) | 767 | 369.4 -52% | 377.5 -51% | 364.3 -53% | 499.7 -35% |
| Write Seq Q32T1 (MB/s) | 2002 | 1946 -3% | 2705 35% | 3081 54% | 1706 -15% |
| Read Seq Q32T1 (MB/s) | 2415 | 1934 -20% | 3442 43% | 3251 35% | 1758 -27% |
| Media totale (Programma / Settaggio) | -23% /
-24% | -13% /
-13% | -11% /
-11% | -13% /
-8% |
* ... Meglio usare valori piccoli

Throttling Disco: DiskSpd Read Loop, Queue Depth 8
Prestazioni della GPU
Le prestazioni grafiche sono alla pari con molti portatili da gioco per surclassare facilmente quasi tutti gli altri portatili multimediali ultrasottili da 15,6 pollici. L'aggiornamento alla configurazione GeForce RTX 3060 porterebbe vantaggi prestazionali ancora maggiori, ma non possiamo stimare l'aumento al momento poiché dobbiamo ancora testare la verrsione RTX 3060.
Consultate la nostra pagina dedicata alla GeForce RTX 2060 Max-Q per ulteriori informazioni tecniche e confronti di benchmarks.
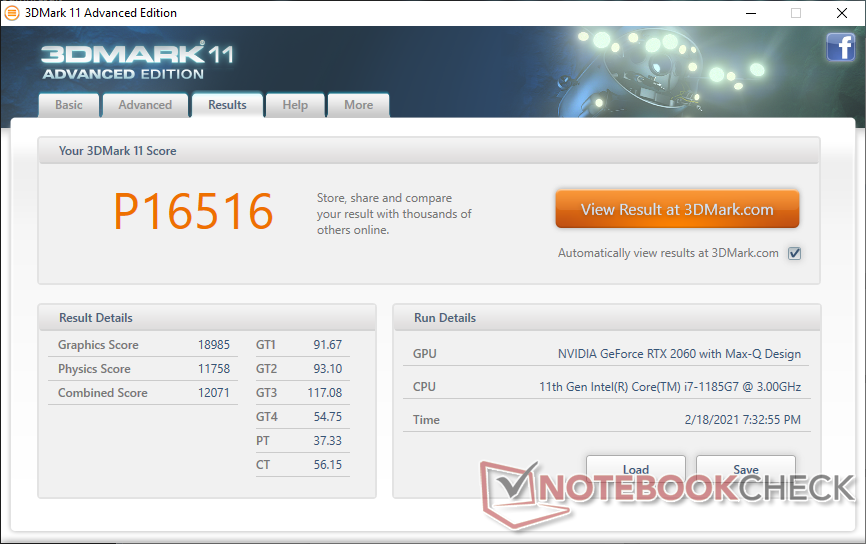
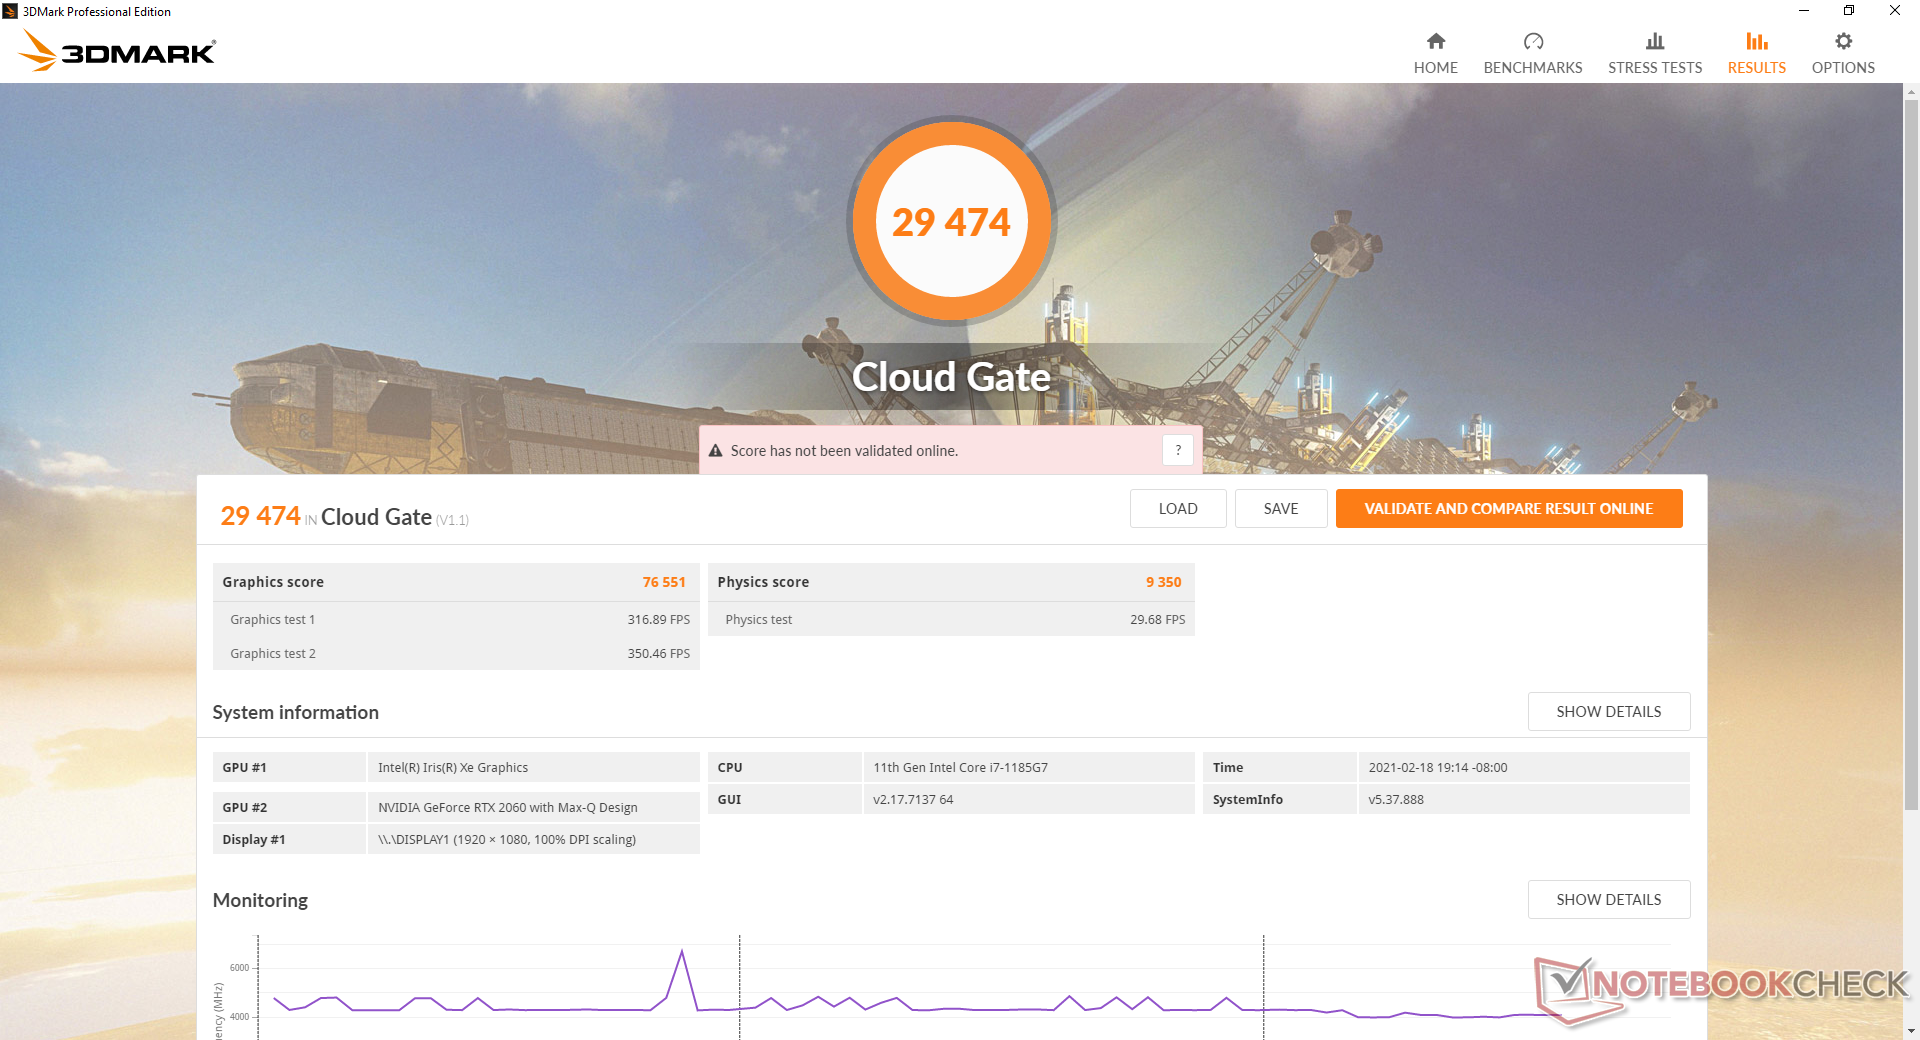
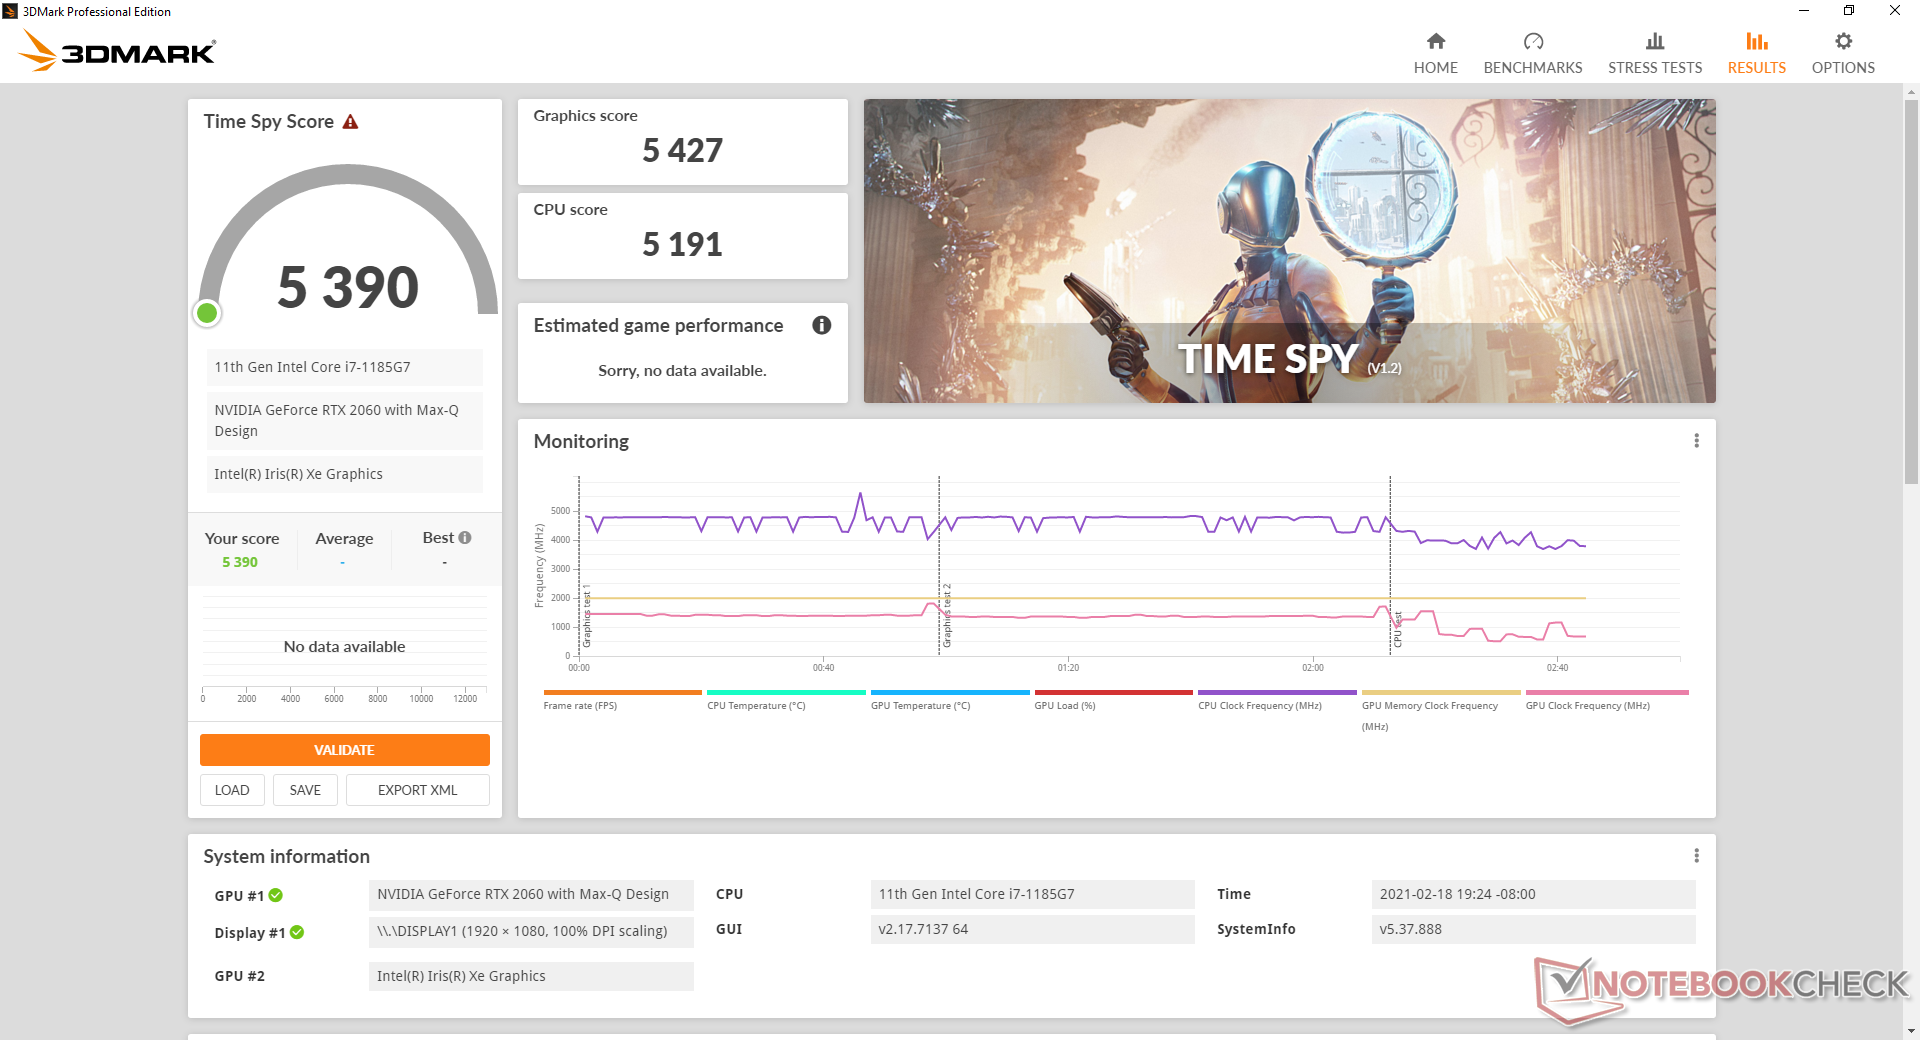
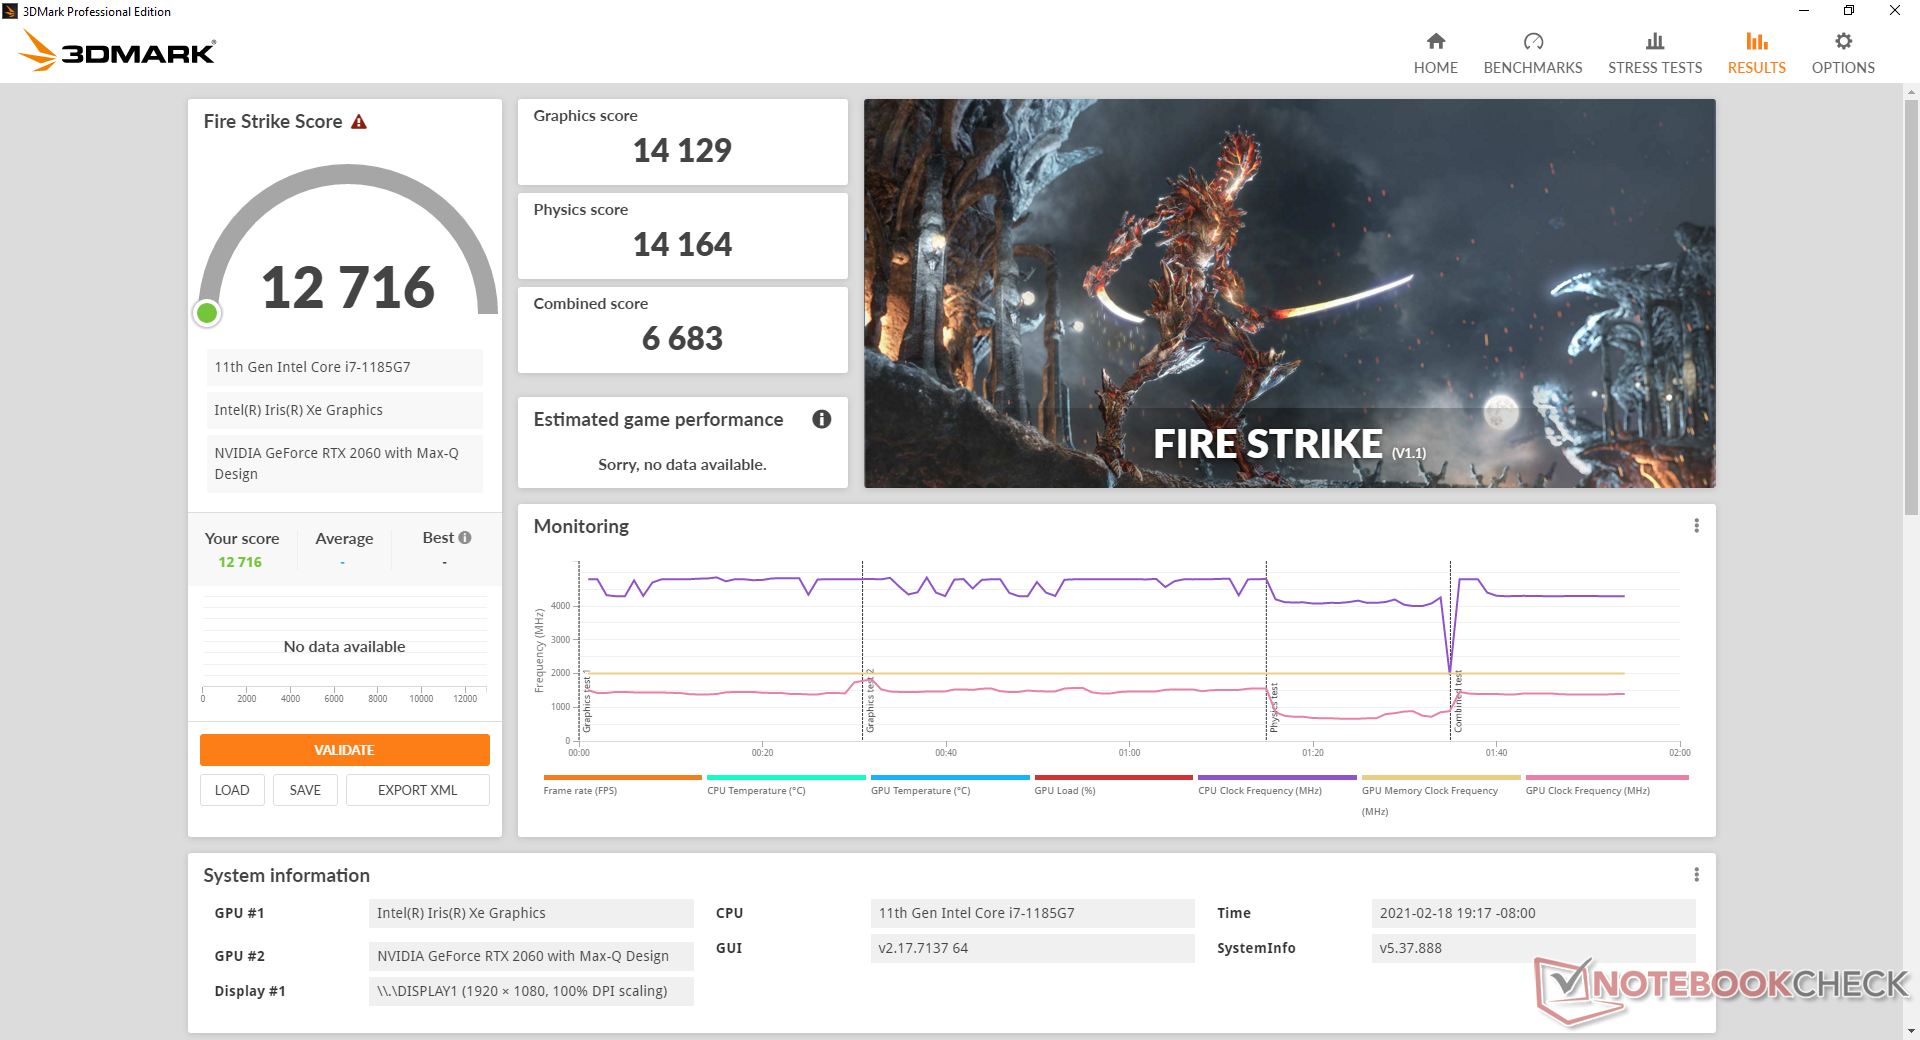
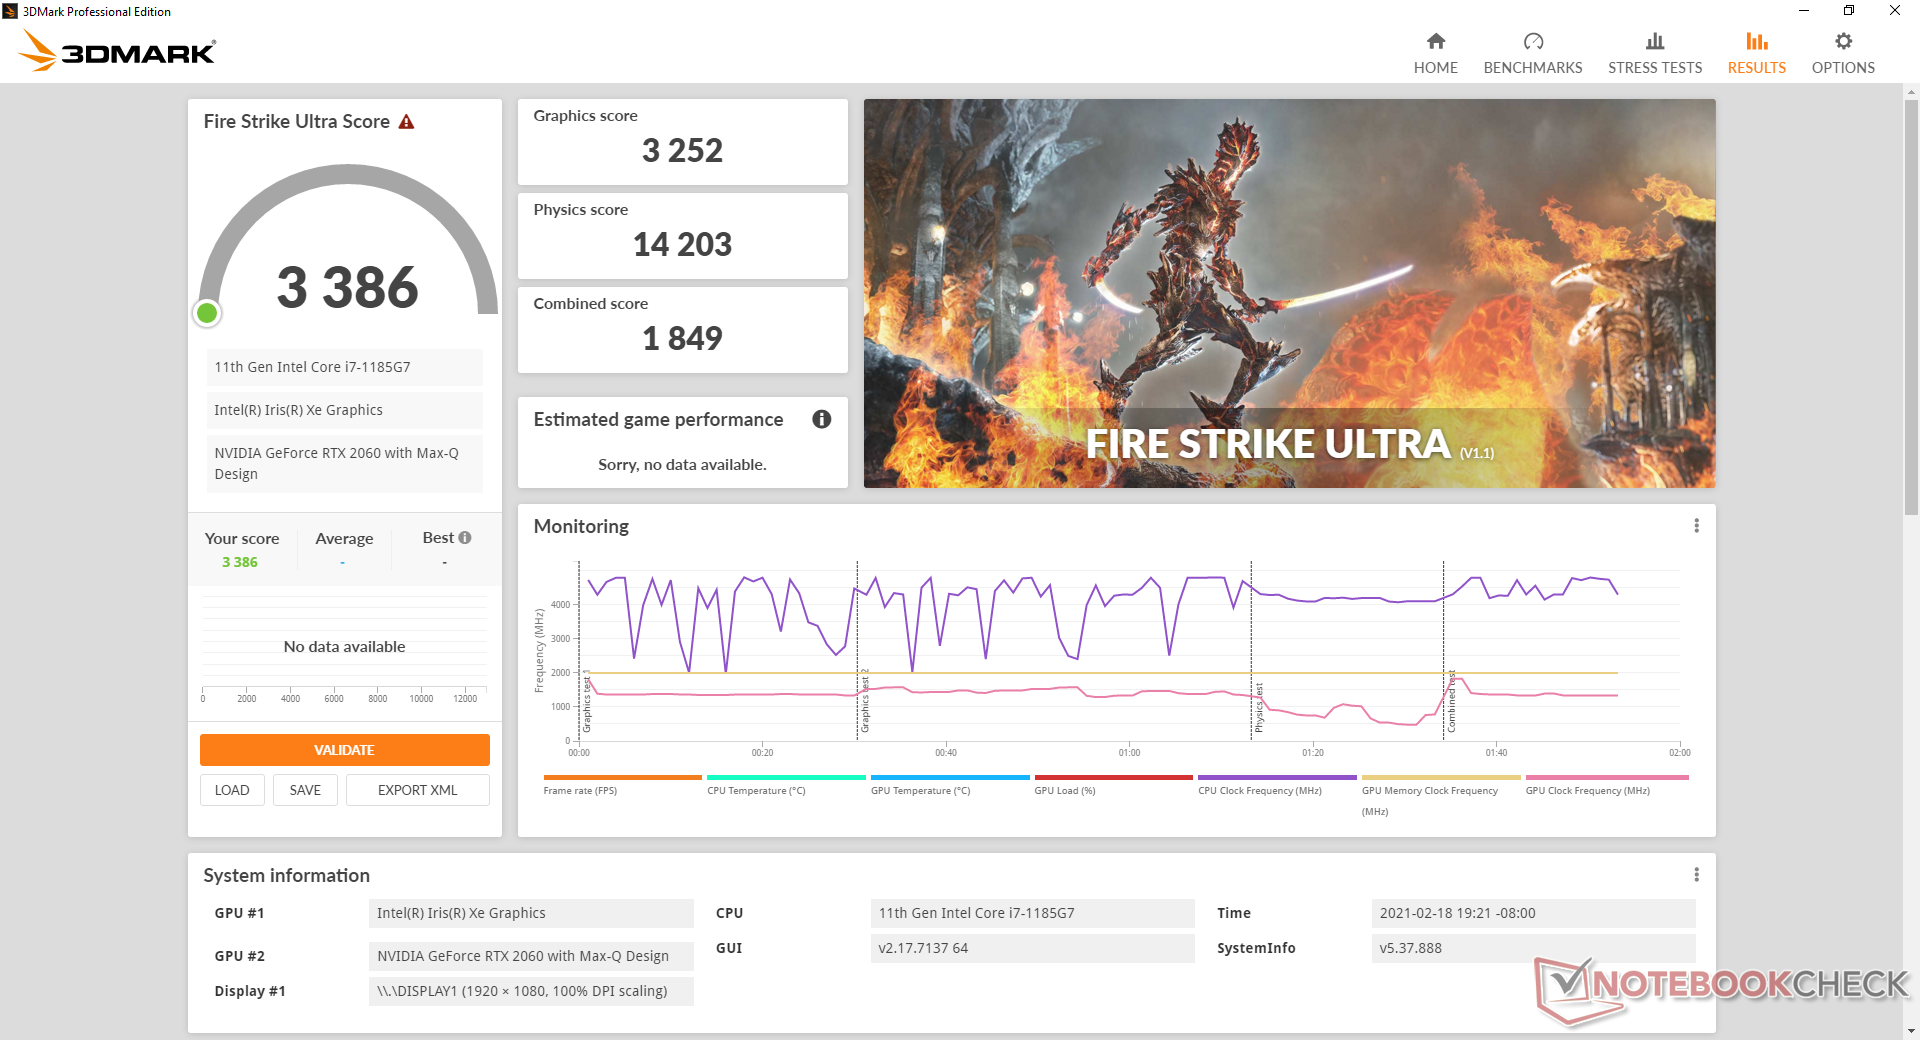
| 3DMark 11 Performance | 16516 punti | |
| 3DMark Cloud Gate Standard Score | 29474 punti | |
| 3DMark Fire Strike Score | 12716 punti | |
| 3DMark Time Spy Score | 5390 punti | |
Aiuto | ||
| GTA V | |
| 1920x1080 Lowest Settings possible | |
| MSI Stealth 15M A11SEK | |
| Media NVIDIA GeForce RTX 2060 Max-Q (n=1) | |
| Lenovo Yoga Slim 7-14ARE | |
| Acer Swift 3 SF314-42-R27B | |
| 1366x768 Normal/Off AF:4x | |
| MSI RTX 2060 Gaming Z 6G | |
| MSI Stealth 15M A11SEK | |
| Media NVIDIA GeForce RTX 2060 Max-Q (n=1) | |
| Acer Swift 3 SF314-42-R27B | |
| 1920x1080 Highest AA:4xMSAA + FX AF:16x | |
| MSI RTX 2060 Gaming Z 6G | |
| MSI Stealth 15M A11SEK | |
| Media NVIDIA GeForce RTX 2060 Max-Q (n=1) | |
| Lenovo Yoga Slim 7-14ARE | |
| Acer Swift 3 SF314-42-R27B | |
| Strange Brigade | |
| 1280x720 lowest AF:1 | |
| MSI Stealth 15M A11SEK | |
| Media NVIDIA GeForce RTX 2060 Max-Q (n=1) | |
| Lenovo Yoga Slim 7-14ARE | |
| 1920x1080 medium AA:medium AF:4 | |
| MSI Stealth 15M A11SEK | |
| Media NVIDIA GeForce RTX 2060 Max-Q (n=1) | |
| Lenovo Yoga Slim 7-14ARE | |
| 1920x1080 high AA:high AF:8 | |
| MSI Stealth 15M A11SEK | |
| Media NVIDIA GeForce RTX 2060 Max-Q (n=1) | |
| Lenovo Yoga Slim 7-14ARE | |
| 1920x1080 ultra AA:ultra AF:16 | |
| MSI Stealth 15M A11SEK | |
| Media NVIDIA GeForce RTX 2060 Max-Q (n=1) | |
| Lenovo Yoga Slim 7-14ARE | |
| basso | medio | alto | ultra | |
|---|---|---|---|---|
| GTA V (2015) | 173 | 164 | 119 | 68.2 |
| The Witcher 3 (2015) | 235.1 | 139.9 | 88.9 | 51.2 |
| Dota 2 Reborn (2015) | 144 | 130 | 119 | 116 |
| Final Fantasy XV Benchmark (2018) | 126 | 74.1 | 55.7 | |
| X-Plane 11.11 (2018) | 102 | 90 | 75.6 | |
| Strange Brigade (2018) | 276 | 130 | 106 | 93.1 |
Emissioni
Rumorosità di sistema
Il rumore delle ventole è sempre presente quando sono collegate a una presa AC a 32 dB(A) contro un sottofondo di 28 dB(A) anche se il sistema è impostato in modalità silenziosa tramite Dragon Center. Quando l'adattatore è scollegato le ventole si fermano realmente per un'esperienza silenziosa. Ci piacerebbe vedere questo cambiamento nelle future versioni, poiché la modalità "Silent" dovrebbe comportarsi allo stesso modo indipendentemente dal fatto che l'adattatore sia collegato o meno.
Quando si gioca, il rumore della ventola può variare da 41 a 46 dB(A) a seconda del carico della CPU. Per esempio, il rumore della ventola è stabile a 41 dB(A) quando si esegue The Witcher 3 ma è più rumoroso quando si esegue 3DMark 06 anche se The Witcher 3 può essere più intenso per la GPU. Questo range è simile a quello che abbiamo registrato sul Dell XPS 15 mentre è più silenzioso dell'Envy 15.
Abilitando la modalità Cooler Boost il rumore della ventola viene portato al suo massimo di 56 dB(A) indipendentemente dal carico sullo schermo. Questa modalità non è generalmente necessaria o raccomandata nella maggior parte dei casi, incluso il gioco, in quanto non offre quasi nessun aumento di prestazioni - solo temperature più fredde.
Non notiamo alcun rumore elettronico provenire dalla nostra unità di test.
| MSI Stealth 15M A11SEK GeForce RTX 2060 Max-Q, i7-1185G7, WDC PC SN530 SDBPNPZ-1T00 | Dell XPS 15 9500 Core i7 4K UHD GeForce GTX 1650 Ti Mobile, i7-10875H, SK Hynix PC611 512GB | Lenovo ThinkPad T15p-20TN0006GE GeForce GTX 1050 Mobile, i7-10750H, WDC PC SN730 SDBQNTY-512GB | Asus ZenBook UX535-M01440 GeForce GTX 1650 Ti Max-Q, i7-10750H, WDC PC SN730 SDBPNTY-1T00 | MSI Prestige 15 A10SC GeForce GTX 1650 Max-Q, i7-10710U, Samsung SSD PM981 MZVLB1T0HALR | HP Envy 15-ep0098nr GeForce RTX 2060 Max-Q, i7-10750H, Intel Optane Memory H10 with Solid State Storage 32GB + 512GB HBRPEKNX0202A(L/H) | |
|---|---|---|---|---|---|---|
| Noise | 7% | 7% | 17% | 11% | -4% | |
| off /ambiente * (dB) | 27.5 | 28.4 -3% | 29.3 -7% | 24.6 11% | 29.3 -7% | 26.4 4% |
| Idle Minimum * (dB) | 32.3 | 28.4 12% | 29.3 9% | 24.6 24% | 30.1 7% | 32.2 -0% |
| Idle Average * (dB) | 32.3 | 28.4 12% | 29.3 9% | 24.6 24% | 30.2 7% | 32.2 -0% |
| Idle Maximum * (dB) | 33.7 | 28.4 16% | 30.6 9% | 24.6 27% | 30.2 10% | 32.2 4% |
| Load Average * (dB) | 46.3 | 46 1% | 42.7 8% | 41.3 11% | 31.5 32% | 48.3 -4% |
| Witcher 3 ultra * (dB) | 41.3 | 42 -2% | 42.7 -3% | 42 -2% | 37 10% | 53.7 -30% |
| Load Maximum * (dB) | 56.2 | 47.1 16% | 42.7 24% | 41.4 26% | 47 16% | 58.8 -5% |
* ... Meglio usare valori piccoli
Rumorosità
| Idle |
| 32.3 / 32.3 / 33.7 dB(A) |
| Sotto carico |
| 46.3 / 56.2 dB(A) |
 | ||
30 dB silenzioso 40 dB(A) udibile 50 dB(A) rumoroso |
||
min: | ||
Temperature
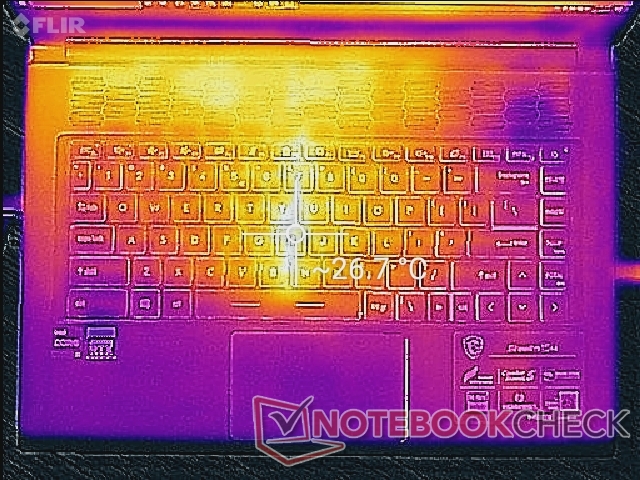
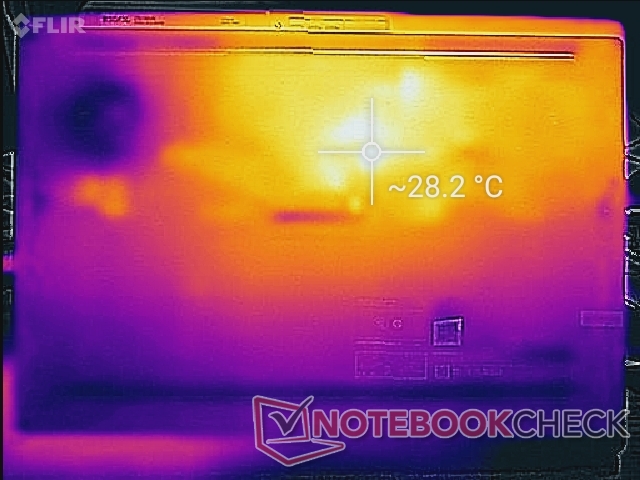
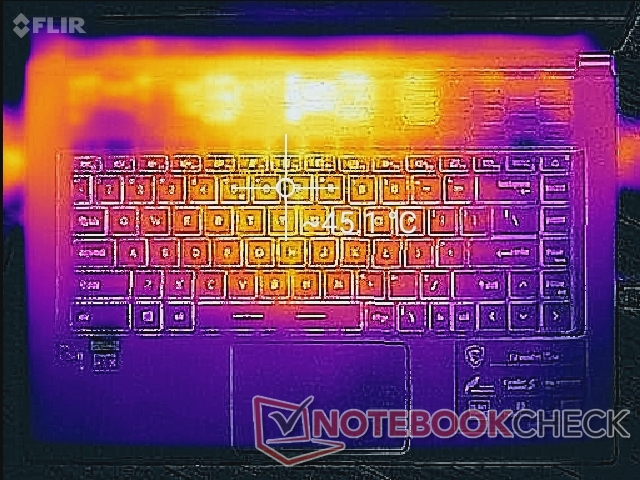
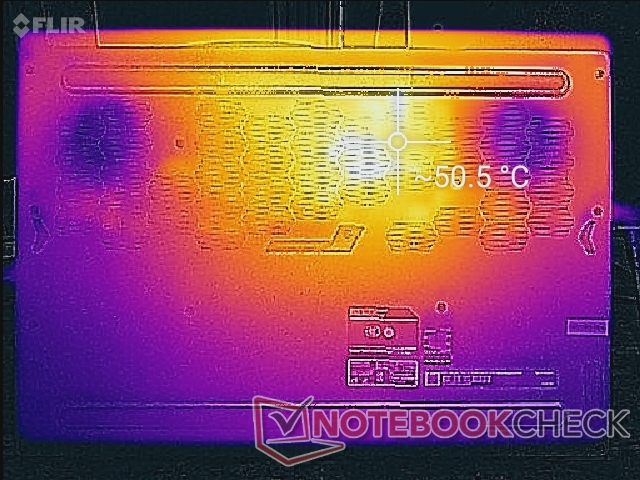
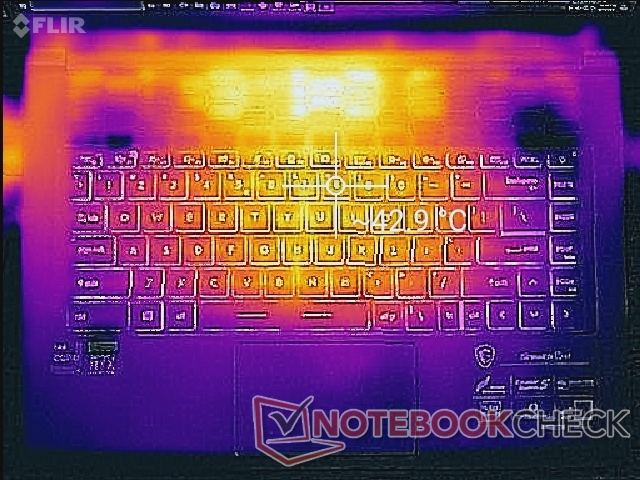
Lo sviluppo delle temperature della superficie è in gran parte simmetrico. Il punto caldo sul centro della tastiera può arivare tra 43° C a 45° C quando si eseguono carichi esigenti come i giochi per essere simile a quello che abbiamo osservato sul GS66 ma ancora più fresco di entrambi i XPS 15 e Lenovo ThinkPad T15p. Così, l'MSI è in grado di offrire prestazioni grafiche più veloci rispetto ai suoi concorrenti senza necessariamente correre più caldo.
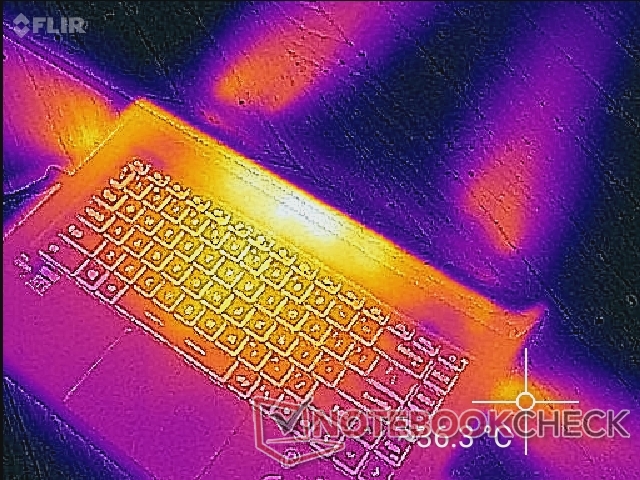
(-) La temperatura massima sul lato superiore è di 47.2 °C / 117 F, rispetto alla media di 36.8 °C / 98 F, che varia da 21 a 71 °C per questa classe Multimedia.
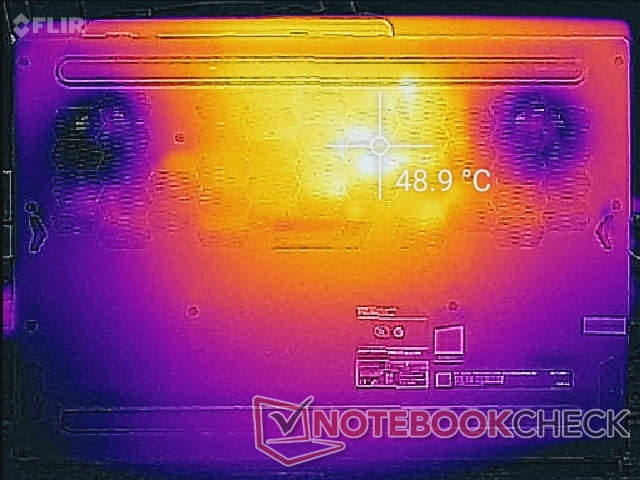
(-) Il lato inferiore si riscalda fino ad un massimo di 47.4 °C / 117 F, rispetto alla media di 39.1 °C / 102 F
(+) In idle, la temperatura media del lato superiore è di 22.6 °C / 73 F, rispetto alla media deld ispositivo di 31.3 °C / 88 F.
(±) Riproducendo The Witcher 3, la temperatura media per il lato superiore e' di 34.4 °C / 94 F, rispetto alla media del dispositivo di 31.3 °C / 88 F.
(+) I poggiapolsi e il touchpad sono piu' freddi della temperatura della pelle con un massimo di 26.8 °C / 80.2 F e sono quindi freddi al tatto.
(±) La temperatura media della zona del palmo della mano di dispositivi simili e'stata di 28.7 °C / 83.7 F (+1.9 °C / 3.5 F).
Stress test
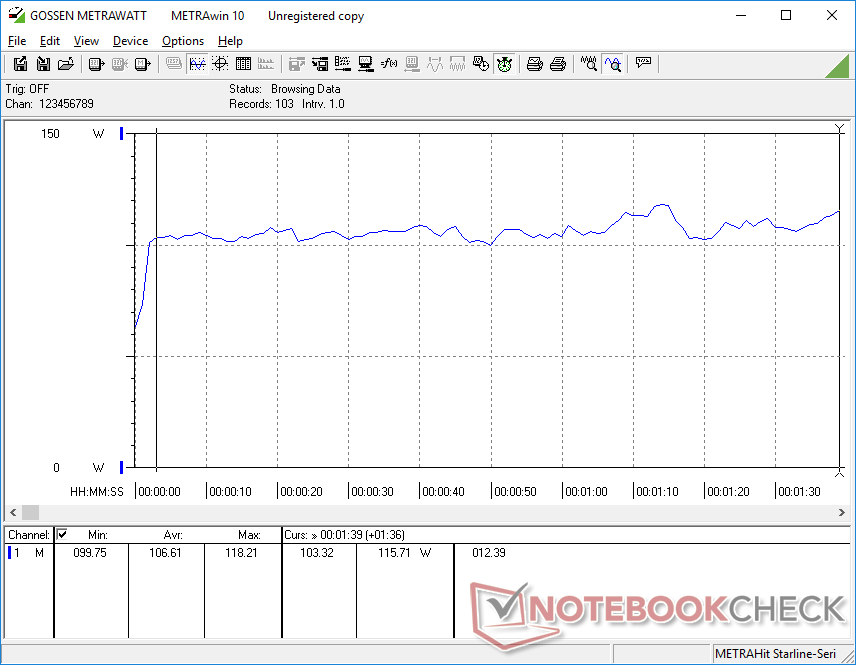
Quando è stressato con Prime95, la frequenza di clock della CPU aumentava a 3,9 GHz per i primi due secondi prima di scendere a 3,5 GHz. Il processore alla fine si stabilizzava a 3.3 - 3.4 GHz e a una temperatura del core di 90° C. Abilitare Cooler Boost farebbe quasi la differenza.
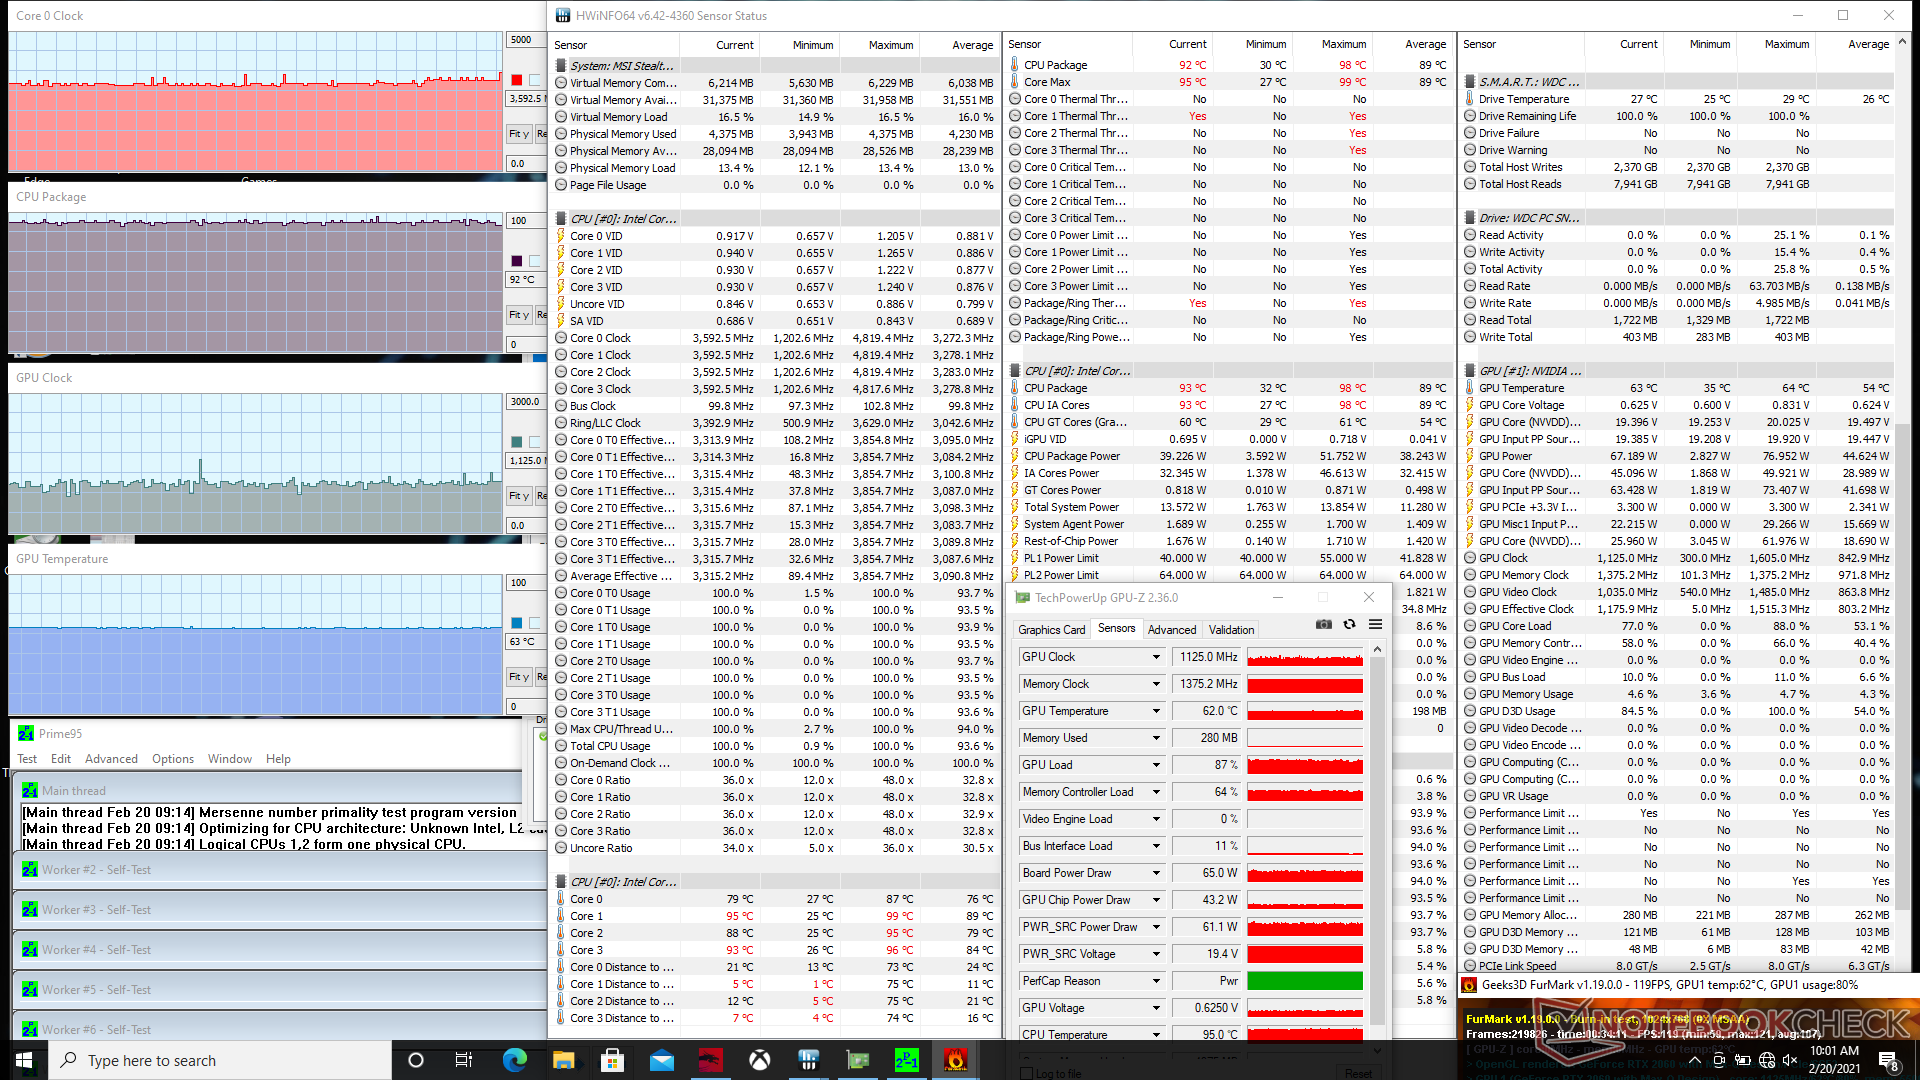
Se stressato contemporaneamente con Prime95 e FurMark, le temperature di CPU e GPU si stabilizzavano rispettivamente a 83° C e 70° C. È interessante notare che l'abilitazione del Cooler Boost aumenta la frequenza di clock della CPU da 2,6 GHz a 3,3 GHz mentre la temperatura del core aumenta a 92° C. Al contrario, la temperatura della GPU scende da 70° C a 63° C.
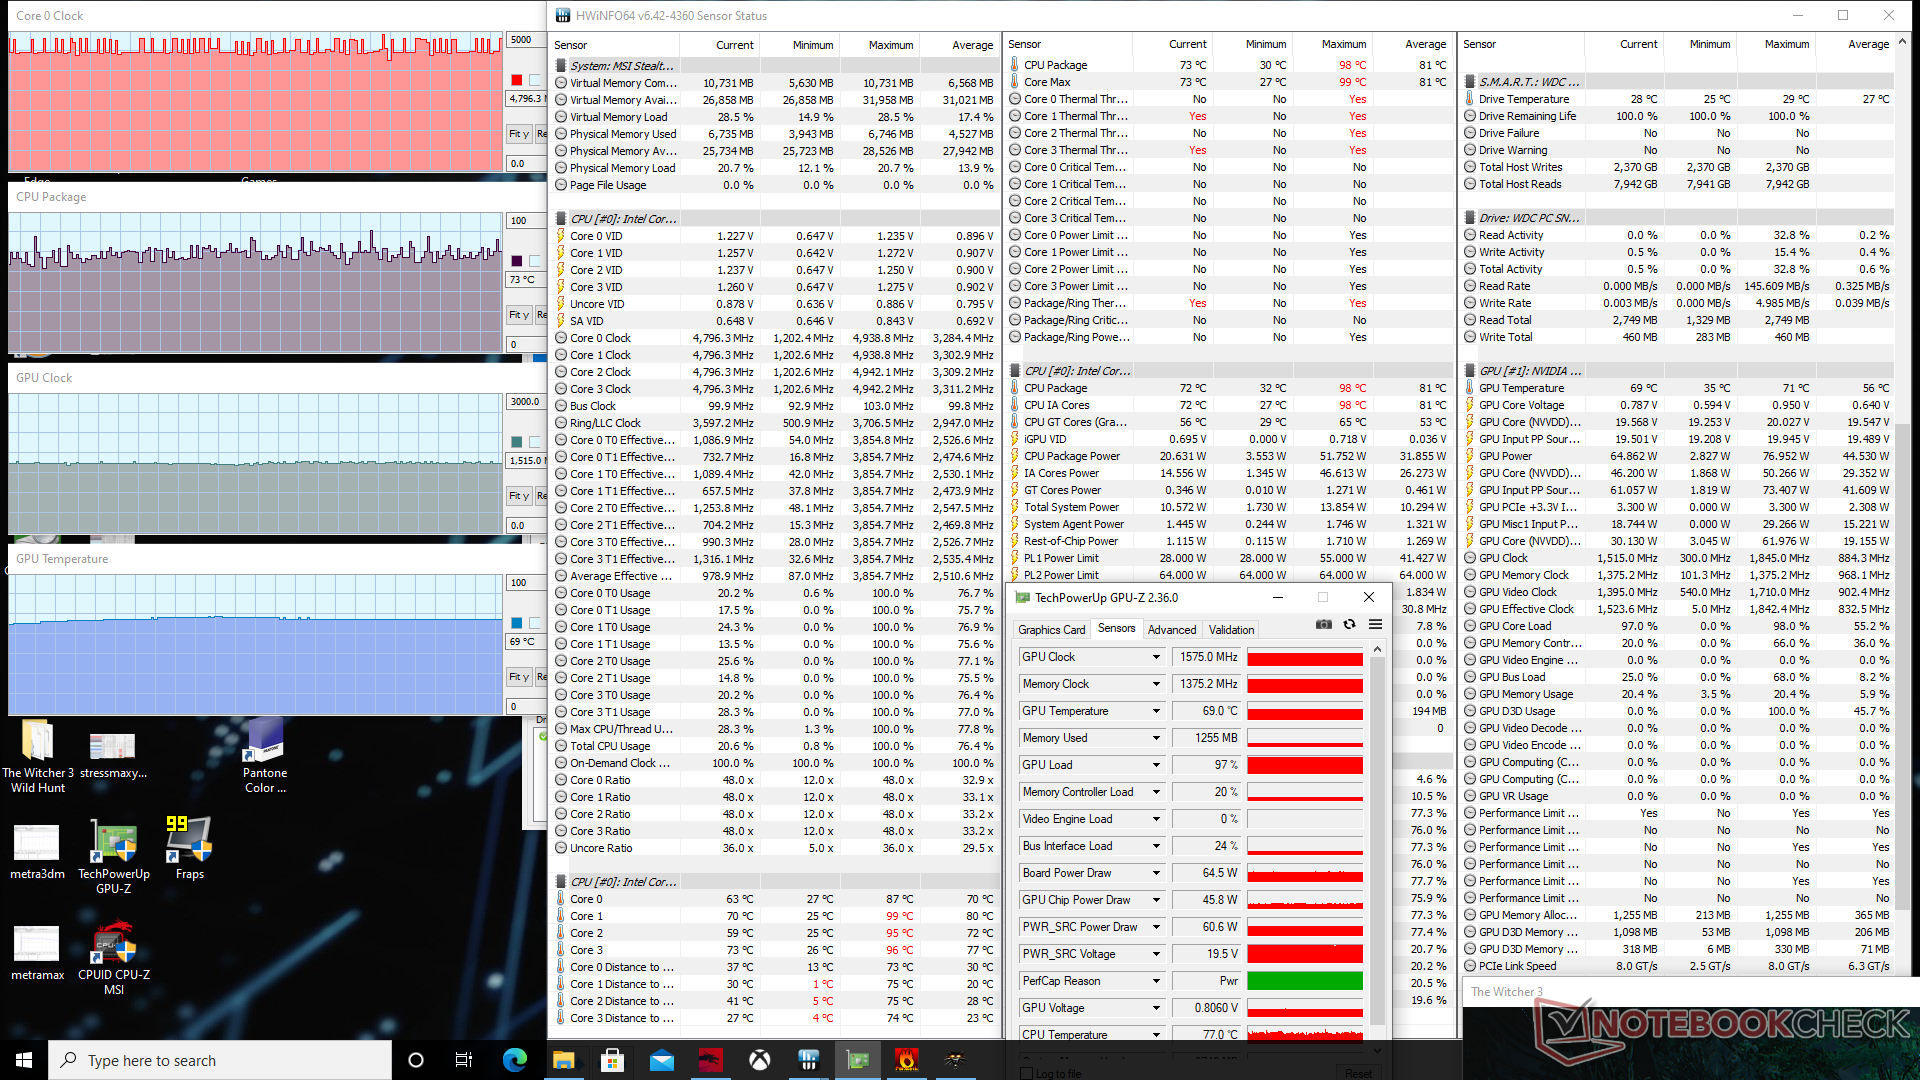
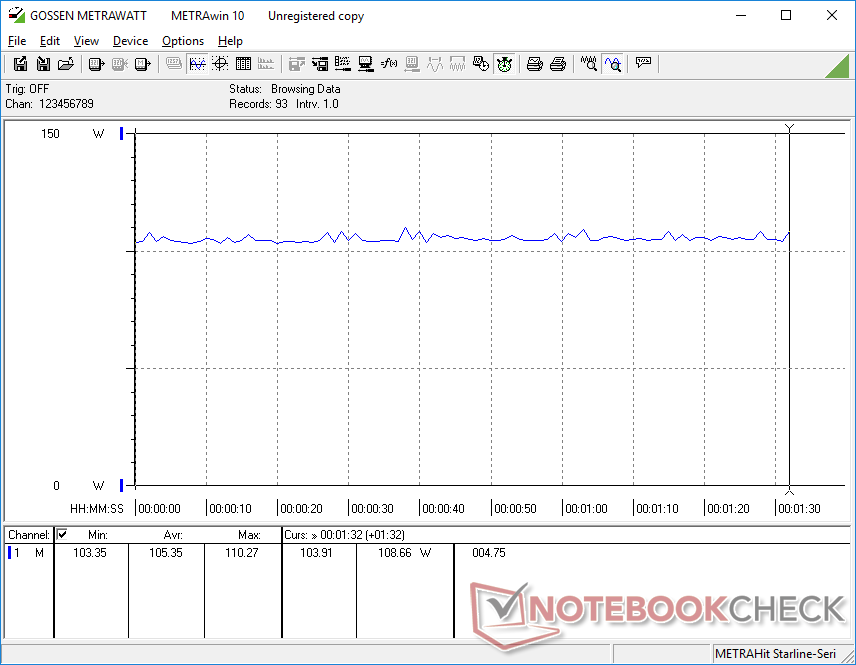
L'esecuzione di The Witcher 3 fa sì che le temperature di CPU e GPU si stabilizzino rispettivamente a 73° C e 69° C. Abilitando Turbo Boost le loro temperature del core si abbassano significativamente a soli 53° C e 58° C. I tassi di clock, tuttavia, rimangono essenzialmente invariati. L'assorbimento della scheda GPU rimane stabile a poco meno di 65 W.
L'utilizzo della batteria limita le prestazioni. Un Fire Strike eseguito usando la sola batteria restituirsce punteggi Physics e Graphics di 12781 e 4423 punti, rispettivamente, rispetto a 14164 e 14129 punti quando si usa la rete elettrica.

| Clock della CPU (GHz)Clock della GPU(MHz)Temperatura media dellaCPU (°C)Temperaturamedia dellaGPU (°C) |
| Sistema inattivo |
| Stress Prime95 (Turbo off) |
| Stress Prime95 (Turbo on) |
| Prime95+ FurMark Stress (Turbo off) |
| Prime95 + FurMark Stress (Turbo on) |
| Witcher 3 Stress (Turbo off) |
| Witcher 3 Stress (Turbo on) |
Casse


MSI Stealth 15M A11SEK analisi audio
(+) | gli altoparlanti sono relativamente potenti (82.3 dB)
Bassi 100 - 315 Hz
(-) | quasi nessun basso - in media 18.9% inferiori alla media
(±) | la linearità dei bassi è media (9.8% delta rispetto alla precedente frequenza)
Medi 400 - 2000 Hz
(+) | medi bilanciati - solo only 4.6% rispetto alla media
(+) | medi lineari (4.4% delta rispetto alla precedente frequenza)
Alti 2 - 16 kHz
(+) | Alti bilanciati - appena 3.2% dalla media
(+) | alti lineari (3.7% delta rispetto alla precedente frequenza)
Nel complesso 100 - 16.000 Hz
(±) | la linearità complessiva del suono è media (17.6% di differenza rispetto alla media
Rispetto alla stessa classe
» 50% di tutti i dispositivi testati in questa classe è stato migliore, 7% simile, 43% peggiore
» Il migliore ha avuto un delta di 5%, medio di 17%, peggiore di 45%
Rispetto a tutti i dispositivi testati
» 35% di tutti i dispositivi testati in questa classe è stato migliore, 8% similare, 57% peggiore
» Il migliore ha avuto un delta di 4%, medio di 23%, peggiore di 134%
Apple MacBook 12 (Early 2016) 1.1 GHz analisi audio
(+) | gli altoparlanti sono relativamente potenti (83.6 dB)
Bassi 100 - 315 Hz
(±) | bassi ridotti - in media 11.3% inferiori alla media
(±) | la linearità dei bassi è media (14.2% delta rispetto alla precedente frequenza)
Medi 400 - 2000 Hz
(+) | medi bilanciati - solo only 2.4% rispetto alla media
(+) | medi lineari (5.5% delta rispetto alla precedente frequenza)
Alti 2 - 16 kHz
(+) | Alti bilanciati - appena 2% dalla media
(+) | alti lineari (4.5% delta rispetto alla precedente frequenza)
Nel complesso 100 - 16.000 Hz
(+) | suono nel complesso lineare (10.2% differenza dalla media)
Rispetto alla stessa classe
» 7% di tutti i dispositivi testati in questa classe è stato migliore, 2% simile, 90% peggiore
» Il migliore ha avuto un delta di 5%, medio di 18%, peggiore di 53%
Rispetto a tutti i dispositivi testati
» 5% di tutti i dispositivi testati in questa classe è stato migliore, 1% similare, 94% peggiore
» Il migliore ha avuto un delta di 4%, medio di 23%, peggiore di 134%
Gestione energetica
Consumo energetico
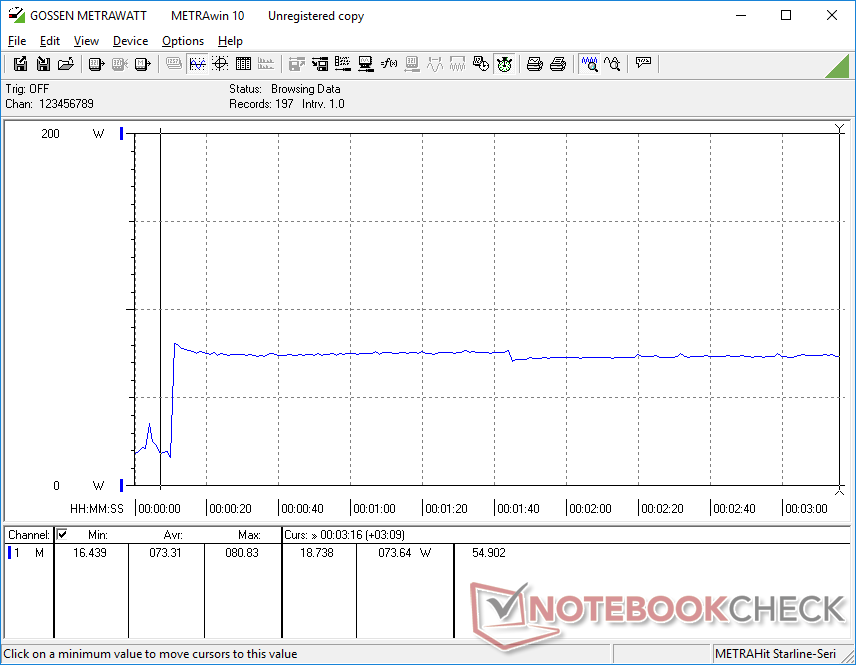
In idle sul desktop consuma solo 7 W quando è impostata la luminosità più bassa e il profilo di risparmio energetico e 18 W quando è impostata la luminosità massima e il profilo ad alte prestazioni. L'esecuzione di The Witcher 3 comporta un consumo di circa 105 W che è molto più alto della maggior parte degli Ultrabooks Core serie U e anche di alcuni portatili da gioco entry-level come il Lenovo Legion 5 a causa della nostra GPU GeForce RTX. I proprietari di MSI stanno ottengono circa il 70% di prestazioni grafiche in più rispetto al Dell XPS 15 9500 per un aumento del 13% del consumo energetico.
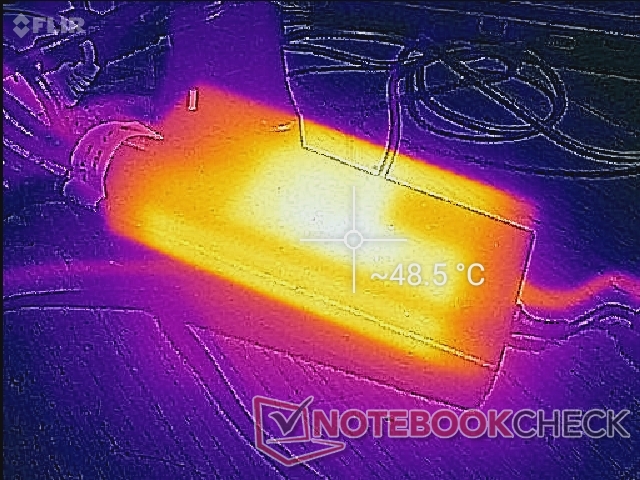
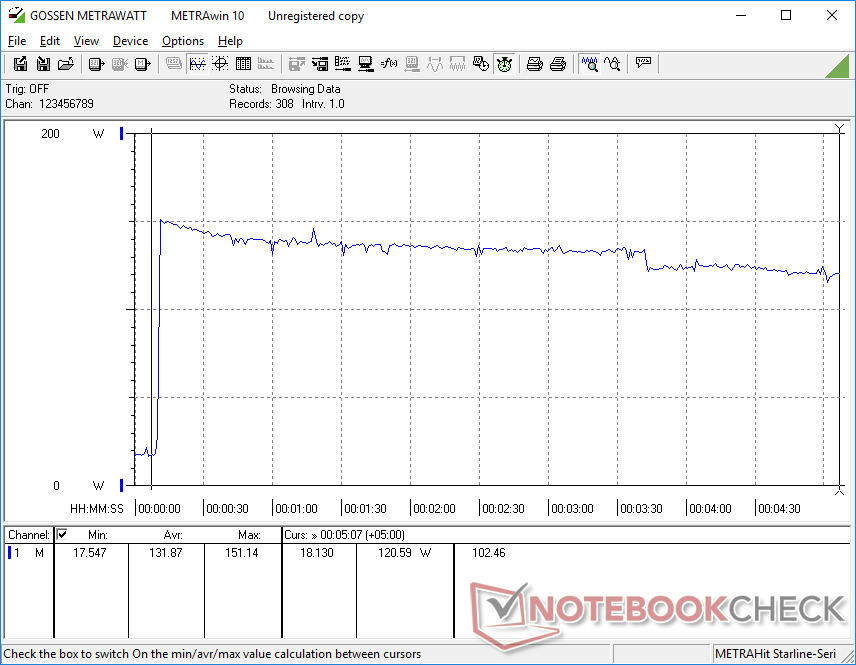
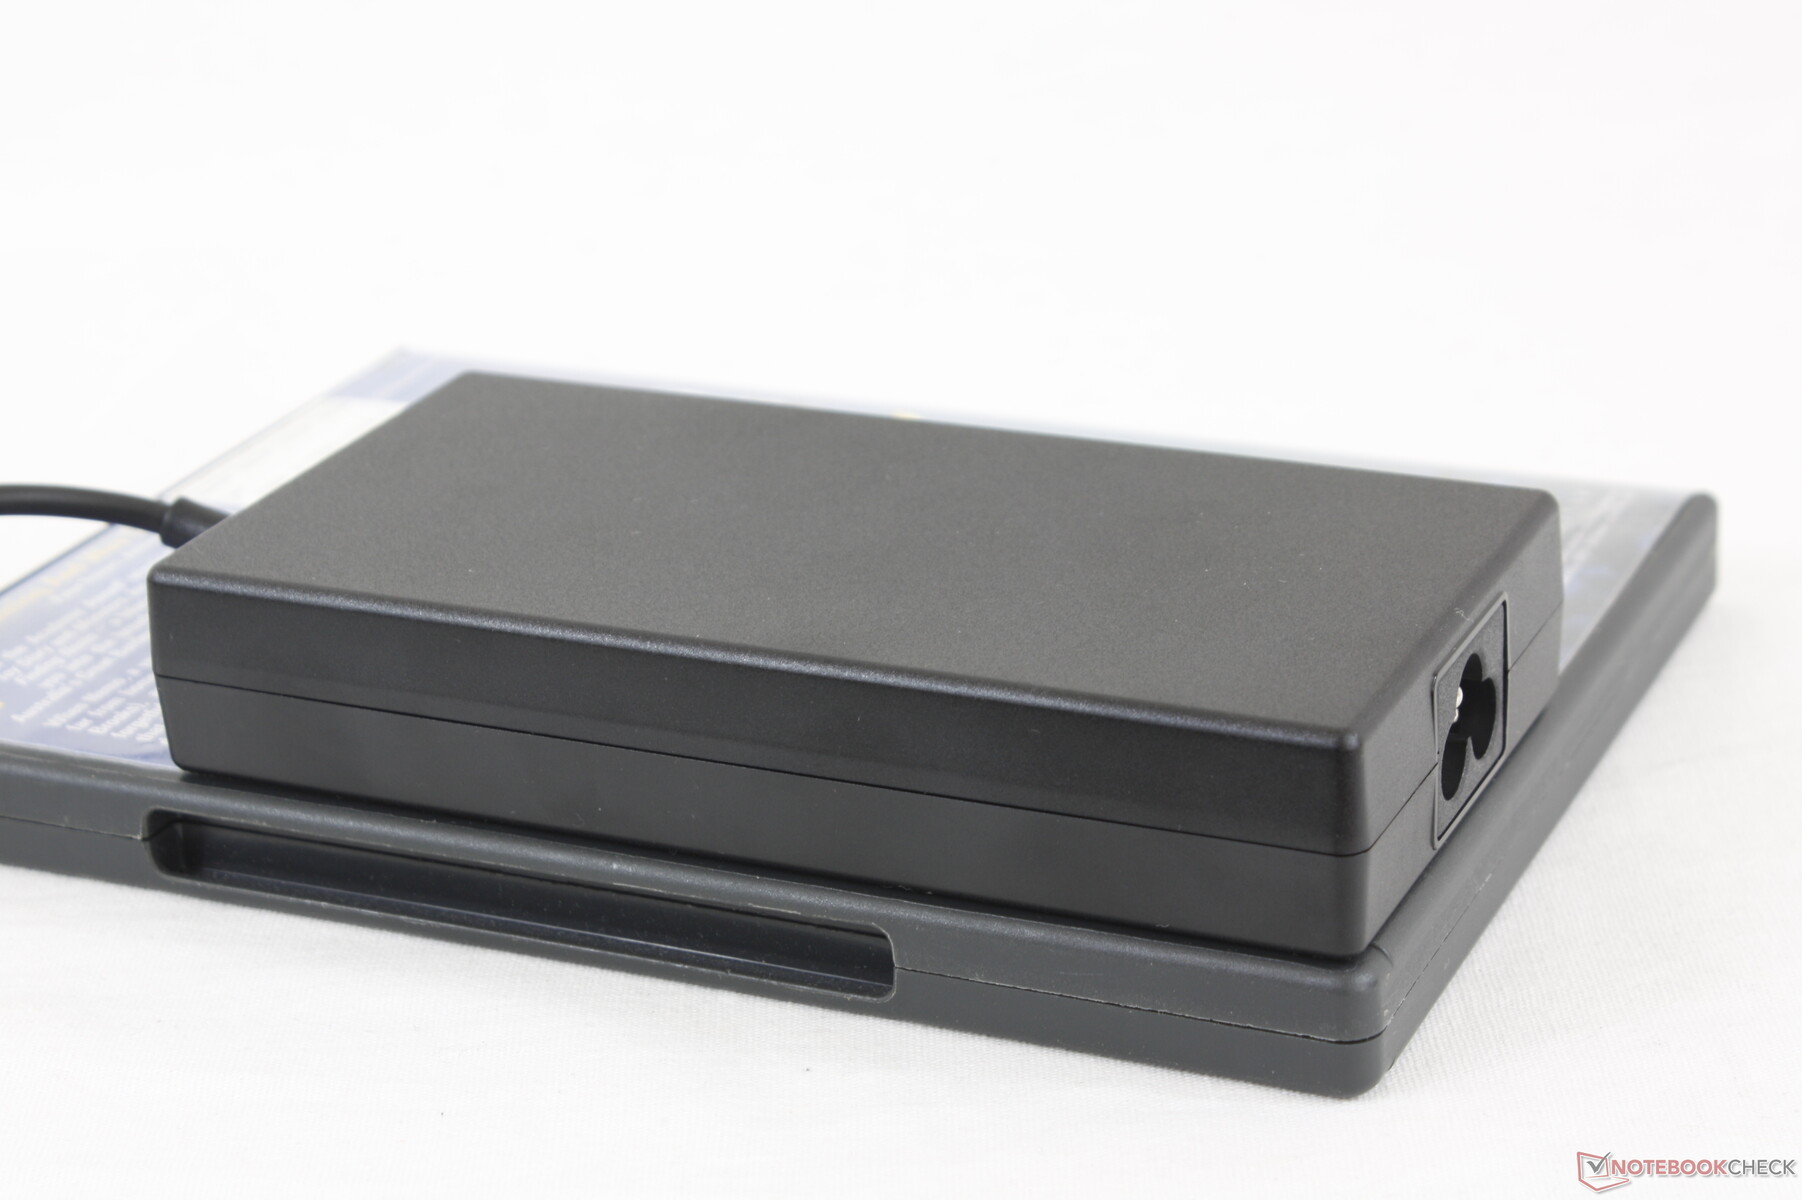
Siamo in grado di misurare un consumo massimo di 151 W dal piccolo-medio (13,6 x 6,8 x 1,9 cm) adattatore AC 150 W quando si esegue Prime95 e FurMark contemporaneamente. Questo valore alla fine scende e si stabilizza a circa 120 W come mostrato dal nostro grafico qui sotto a causa delle limitazioni termiche.
| Off / Standby | |
| Idle | |
| Sotto carico |
|
Leggenda:
min: | |
| MSI Stealth 15M A11SEK i7-1185G7, GeForce RTX 2060 Max-Q, WDC PC SN530 SDBPNPZ-1T00, IPS, 1920x1080, 15.6" | Dell XPS 15 9500 Core i7 4K UHD i7-10875H, GeForce GTX 1650 Ti Mobile, SK Hynix PC611 512GB, IPS, 3840x2400, 15.6" | Lenovo ThinkPad T15p-20TN0006GE i7-10750H, GeForce GTX 1050 Mobile, WDC PC SN730 SDBQNTY-512GB, IPS LED, 3840x2160, 15.6" | Asus ZenBook UX535-M01440 i7-10750H, GeForce GTX 1650 Ti Max-Q, WDC PC SN730 SDBPNTY-1T00, IPS, 3840x2160, 15.6" | HP Envy 15-ep0098nr i7-10750H, GeForce RTX 2060 Max-Q, Intel Optane Memory H10 with Solid State Storage 32GB + 512GB HBRPEKNX0202A(L/H), AMOLED, 3840x2160, 15.6" | |
|---|---|---|---|---|---|
| Power Consumption | -1% | 7% | 23% | -21% | |
| Idle Minimum * (Watt) | 7.3 | 5.7 22% | 6 18% | 4.4 40% | 9.2 -26% |
| Idle Average * (Watt) | 10.1 | 13.5 -34% | 12.8 -27% | 9.8 3% | 14.5 -44% |
| Idle Maximum * (Watt) | 17.6 | 19.6 -11% | 16.1 9% | 14.5 18% | 18 -2% |
| Load Average * (Watt) | 106.6 | 114.1 -7% | 95.6 10% | 83 22% | 110.9 -4% |
| Witcher 3 ultra * (Watt) | 105.4 | 93 12% | 84 20% | 67 36% | 125.5 -19% |
| Load Maximum * (Watt) | 151.2 | 135.2 11% | 131.1 13% | 123 19% | 194.6 -29% |
* ... Meglio usare valori piccoli
Durata della batteria
I tempi di autonomia sono in media di poco più di 6 ore di utilizzo nel mondo reale WLAN dalla piccola batteria interna da 52 Wh. Il concorrente XPS 15 può durare quasi 3 ore in più in condizioni di test simili. La ricarica completa , tuttavia, è relativamente veloce, da 1 a 1,5 ore. Gli adattatori generici USB-C possono anche essere utilizzati per ricaricare il sistema, anche se ad un ritmo più lento.
| MSI Stealth 15M A11SEK i7-1185G7, GeForce RTX 2060 Max-Q, 52 Wh | Dell XPS 15 9500 Core i7 4K UHD i7-10875H, GeForce GTX 1650 Ti Mobile, 86 Wh | Lenovo ThinkPad T15p-20TN0006GE i7-10750H, GeForce GTX 1050 Mobile, 68 Wh | Asus ZenBook UX535-M01440 i7-10750H, GeForce GTX 1650 Ti Max-Q, 96 Wh | MSI Prestige 15 A10SC i7-10710U, GeForce GTX 1650 Max-Q, 82 Wh | HP Envy 15-ep0098nr i7-10750H, GeForce RTX 2060 Max-Q, 83 Wh | |
|---|---|---|---|---|---|---|
| Autonomia della batteria | 88% | 13% | 78% | 71% | 33% | |
| Reader / Idle (h) | 10.5 | 23 119% | 18.3 74% | 19.1 82% | 15 43% | |
| WiFi v1.3 (h) | 6.3 | 9.1 44% | 7.3 16% | 10.1 60% | 7.6 21% | 6 -5% |
| Load (h) | 1 | 2 100% | 1.1 10% | 2 100% | 2.1 110% | 1.6 60% |
Pro
Contro
Giudizio complessivo cel laptop MSI Stealth 15M
Lo Stealth 15M ha alcune cose a suo favore se paragonato ad altri Ultrabooks ultrasottili da 15,6 pollici. Le sue opzioni GeForce RTX spingono immediatamente il sistema a uno dei più veloci della sua categoria quando si tratta di grafica. Riesce anche ad essere più leggero dei suoi concorrenti nonostante le maggiori prestazioni della GPU. Anche le temperature e il rumore della ventola sotto carico non sono molto più elevati.
Super leggero e super veloce. Lo Stealth 15M può superare la maggior parte dei portatili multimediali nella sua classe di dimensioni, ma è anche più fragile e soggetto a danni nel tempo.
I maggiori svantaggi del sistema sono difficili da ignorare. In particolare, lo chassis è molto più incline a deformarsi, piegarsi e scricchiolare rispetto ai telai dei portatili XPS 15, Spectre, ZenBook, o Yoga che costano tutti circa lo stesso del nostro MSI. Questo include anche le cerniere che sono molto deboli sull'MSI. È un portatile dall'aspetto fantastico con prestazioni di livello gaming, ma la qualità costruttiva inconsistente ci preoccupa per la sua longevità.
Prezzo e disponibilità
MSI Stealth 15M A11SEK
- 02/24/2021 v7 (old)
Allen Ngo
Price comparison
