Recensione del comuter portatile MSI Summit B15 A11M: Scegliere Iris Xe invece di GeForce MX
MSI ha presentato la sua serie Summit al CES 2021 che comprende una gamma di computer portatili progettati per luoghi di lavoro, uffici, creazione di contenuti e altri ambienti semi-professionali e professionali. I modelli di fascia alta includono il 13,4" Vertice E13 e il 15,6" Summit E15 ciascuno con un prezzo al dettaglio di circa 2000 dollari USA.
Il modello che testiamo oggi è la versione entry-level della serie chiamata Summit B15. A differenza dei suddetti modelli Summit E, il B15 manca delle finiture in oro e delle opzioni GPU dedicate ed ha un peso più leggero e un prezzo più accessibile. Per il resto è equipaggiato con opzioni di processori simili dell'11a generazione Tiger Lake-U. I concorrenti diretti includono altri portatili prosumer di fascia media e superiore come l'HP Envy 15, l'XPG Xenia Xe, il Lenovo ThinkBook 15, il Microsoft Surface Laptop 4 o la serie LG Gram.
Altre recensioni su MSI:
Confronto con i potenziali concorrenti
Punteggio | Data | Modello | Peso | Altezza | Dimensione | Risoluzione | Prezzo |
|---|---|---|---|---|---|---|---|
| 81.2 % v7 (old) | 05/2021 | MSI Summit B15 A11M i7-1165G7, Iris Xe G7 96EUs | 1.5 kg | 16.9 mm | 15.60" | 1920x1080 | |
| 83.7 % v7 (old) | 02/2021 | MSI Summit E15 A11SCST i7-1185G7, GeForce GTX 1650 Ti Max-Q | 1.8 kg | 16.9 mm | 15.60" | 1920x1080 | |
| 86.8 % v7 (old) | 05/2020 | Dell XPS 15 9500 Core i5 i5-10300H, UHD Graphics 630 | 1.8 kg | 18 mm | 15.60" | 1920x1200 | |
| 85 % v7 (old) | 01/2020 | HP Spectre X360 15-5ZV31AV i7-10510U, GeForce MX250 | 2.1 kg | 19.3 mm | 15.60" | 3840x2160 | |
| 87.5 % v7 (old) | 05/2021 | ADATA XPG Xenia Xe i7-1165G7, Iris Xe G7 96EUs | 1.7 kg | 14.9 mm | 15.60" | 1920x1080 | |
| 85.2 % v7 (old) | 03/2020 | Asus ZenBook 15 UX534FTC-A8190T i7-10510U, GeForce GTX 1650 Max-Q | 1.6 kg | 18.9 mm | 15.60" | 1920x1080 |
Case
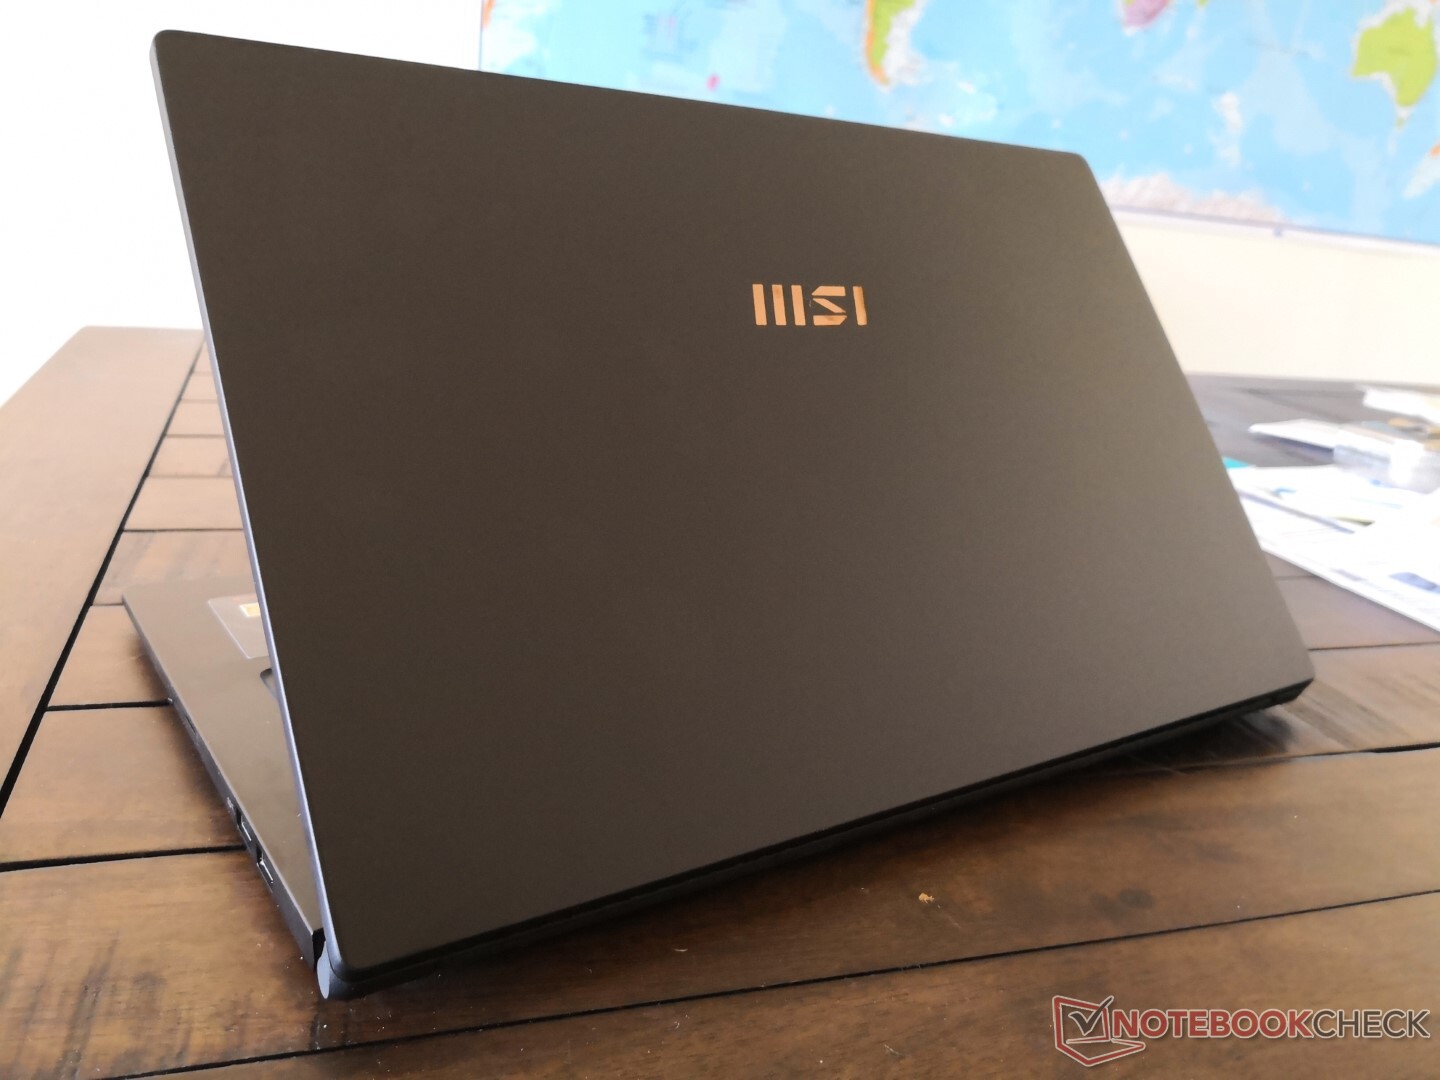
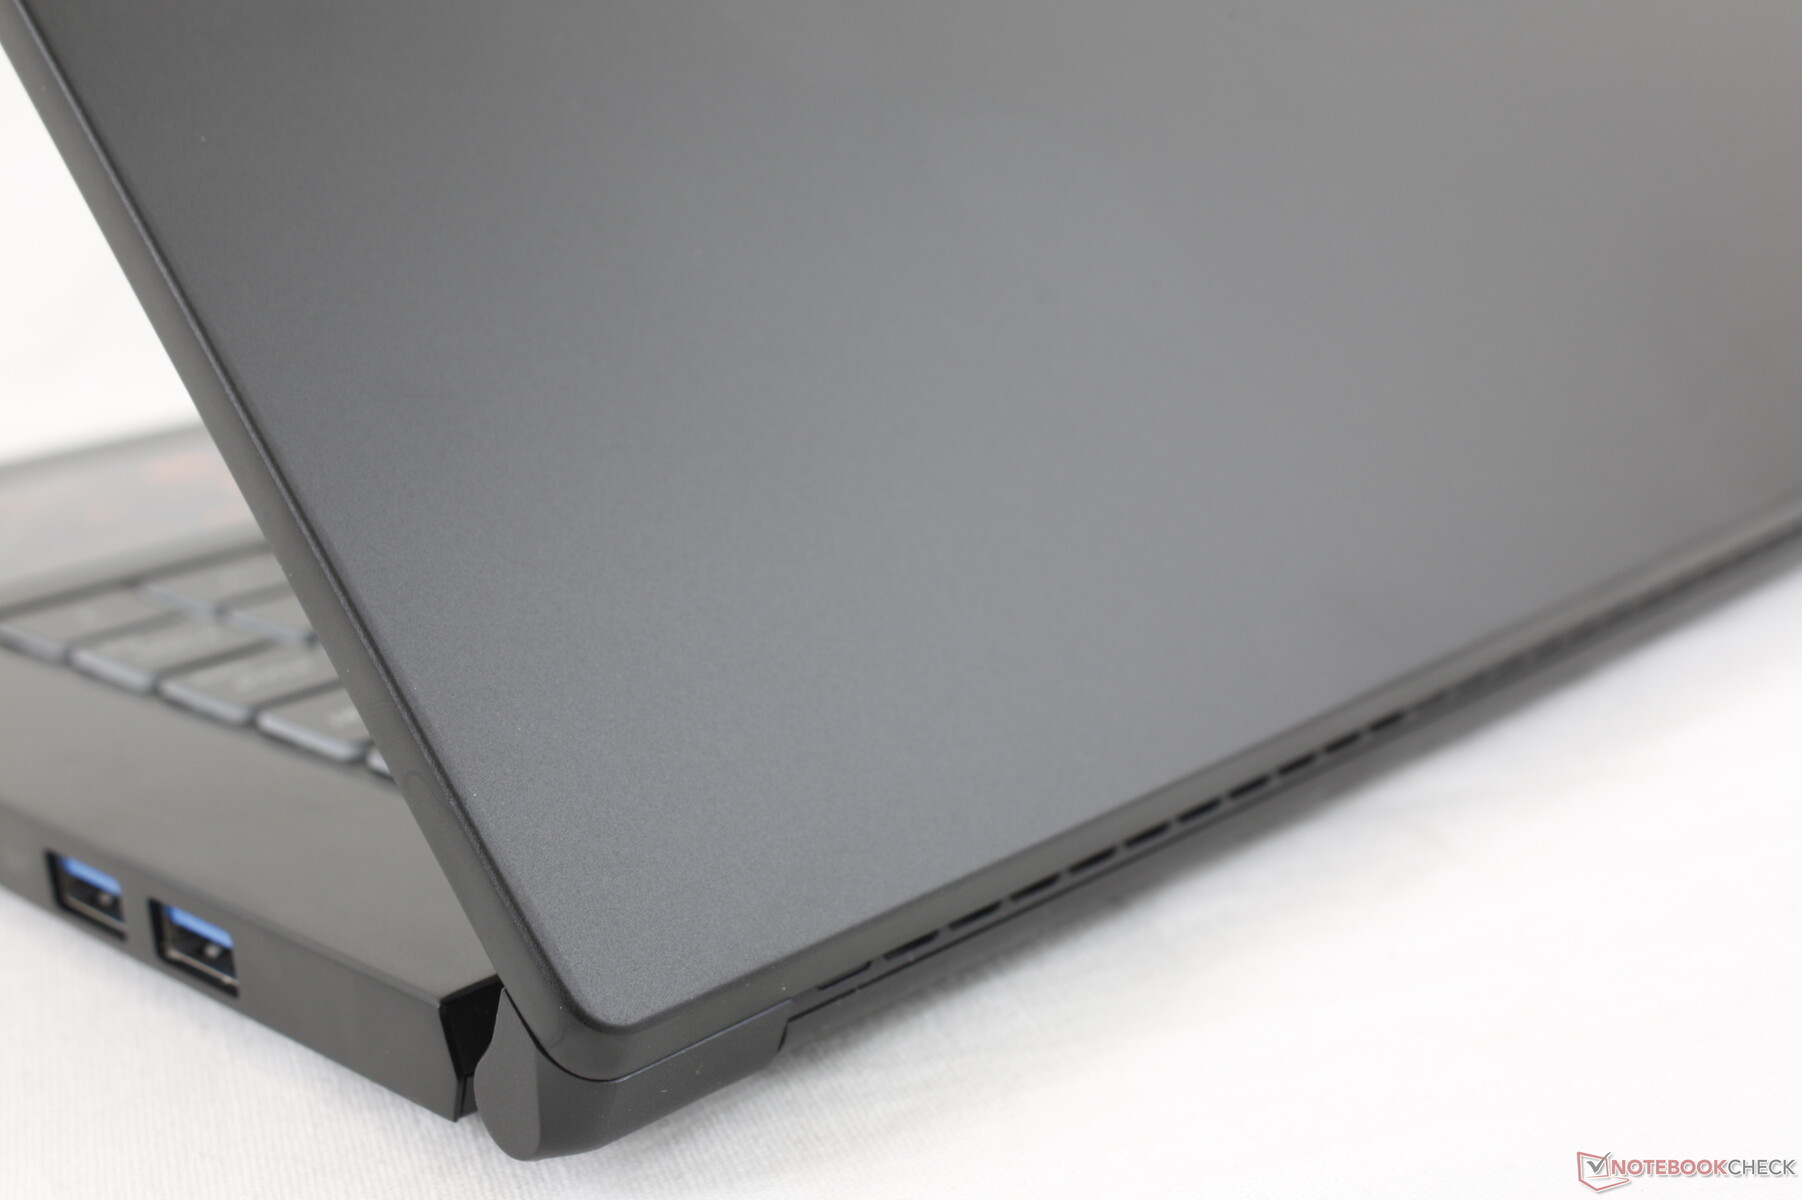
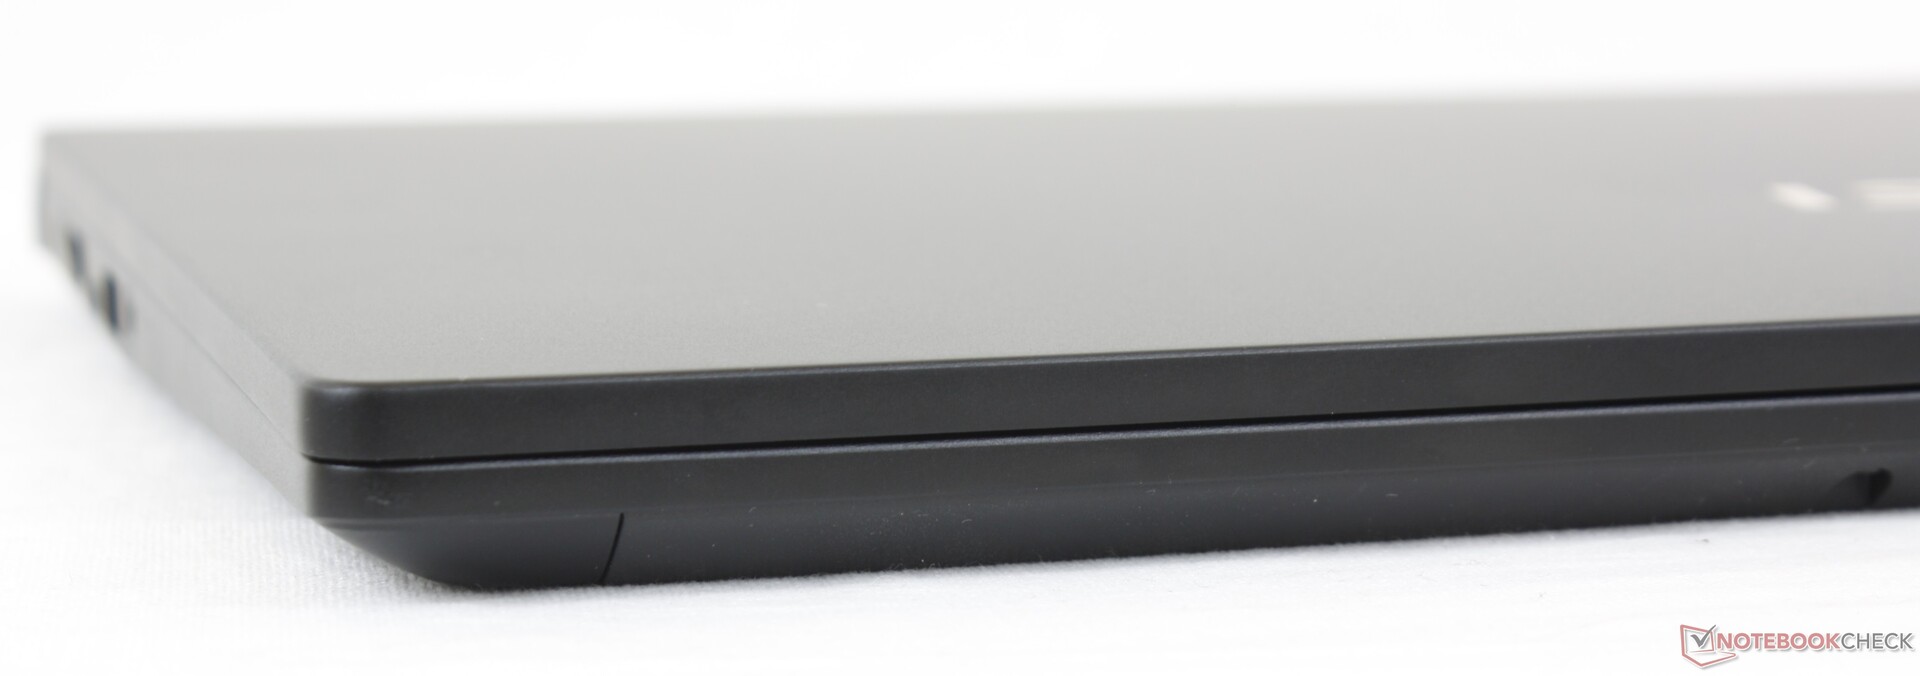
Se il Summit B15 sembra familiare, allora è perché è essenzialmente un Modern 15 2020 rebranded con un nuovo logo dorato 'MSI' sulla cover esterna. Il suo telaio e le sue caratteristiche sono quasi identiche al Modern 15, compresa la scheda madre all'interno. MSI è attualmente nel bel mezzo di un rimpasto del suo portafoglio di laptop e quindi sia la vecchia serie Modern che Prestige alla fine si consolideranno sotto la più recente serie Summit nel prossimo futuro. La mossa dovrebbe rendere più facile per i clienti distinguere tra i diversi laptop MSI, dato che l'azienda ha già troppi nomi di modelli di cui tenere traccia.
Le nostre impressioni originali sul Modern 15 dello scorso anno valgono anche per il Summit B15. La rigidità della base è ancora abbastanza buona, mentre la cover si flette ancora un po' più di quanto vorremmo. I portatili full-on business come il Dell Latitude, HP EliteBook, o Lenovo ThinkPad sono sicuramente più costosi ma sono di qualità superiore.
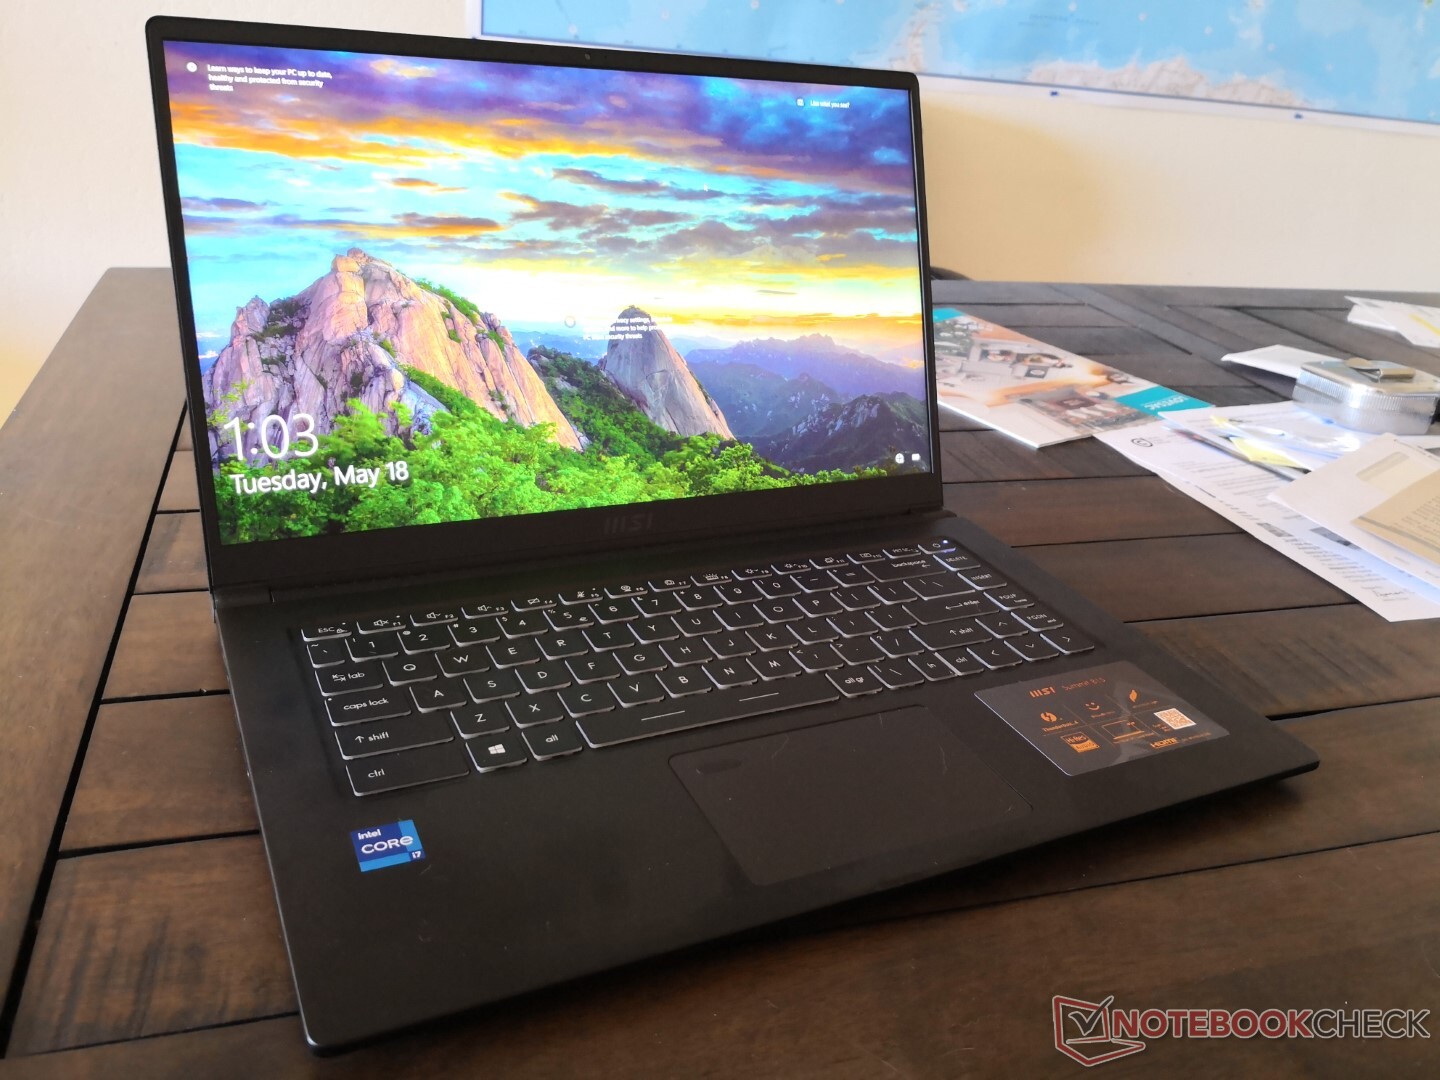
Una ragione fondamentale per scegliere il Summit B15 (o Modern 15) rispetto alle alternative di Dell, HP o altri è il suo peso molto leggero di soli 1,5 kg. Il concorrente Lenovo ThinkBook 15 G2 o l'ADATA XPG Xenia Xe sono ciascuno circa 200 grammi più pesante in confronto pur essendo quasi identici nelle dimensioni.
Connettività
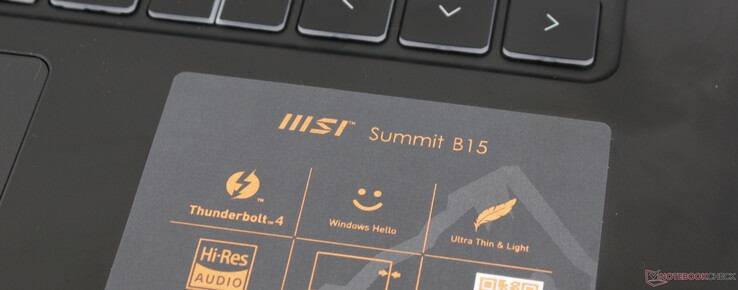
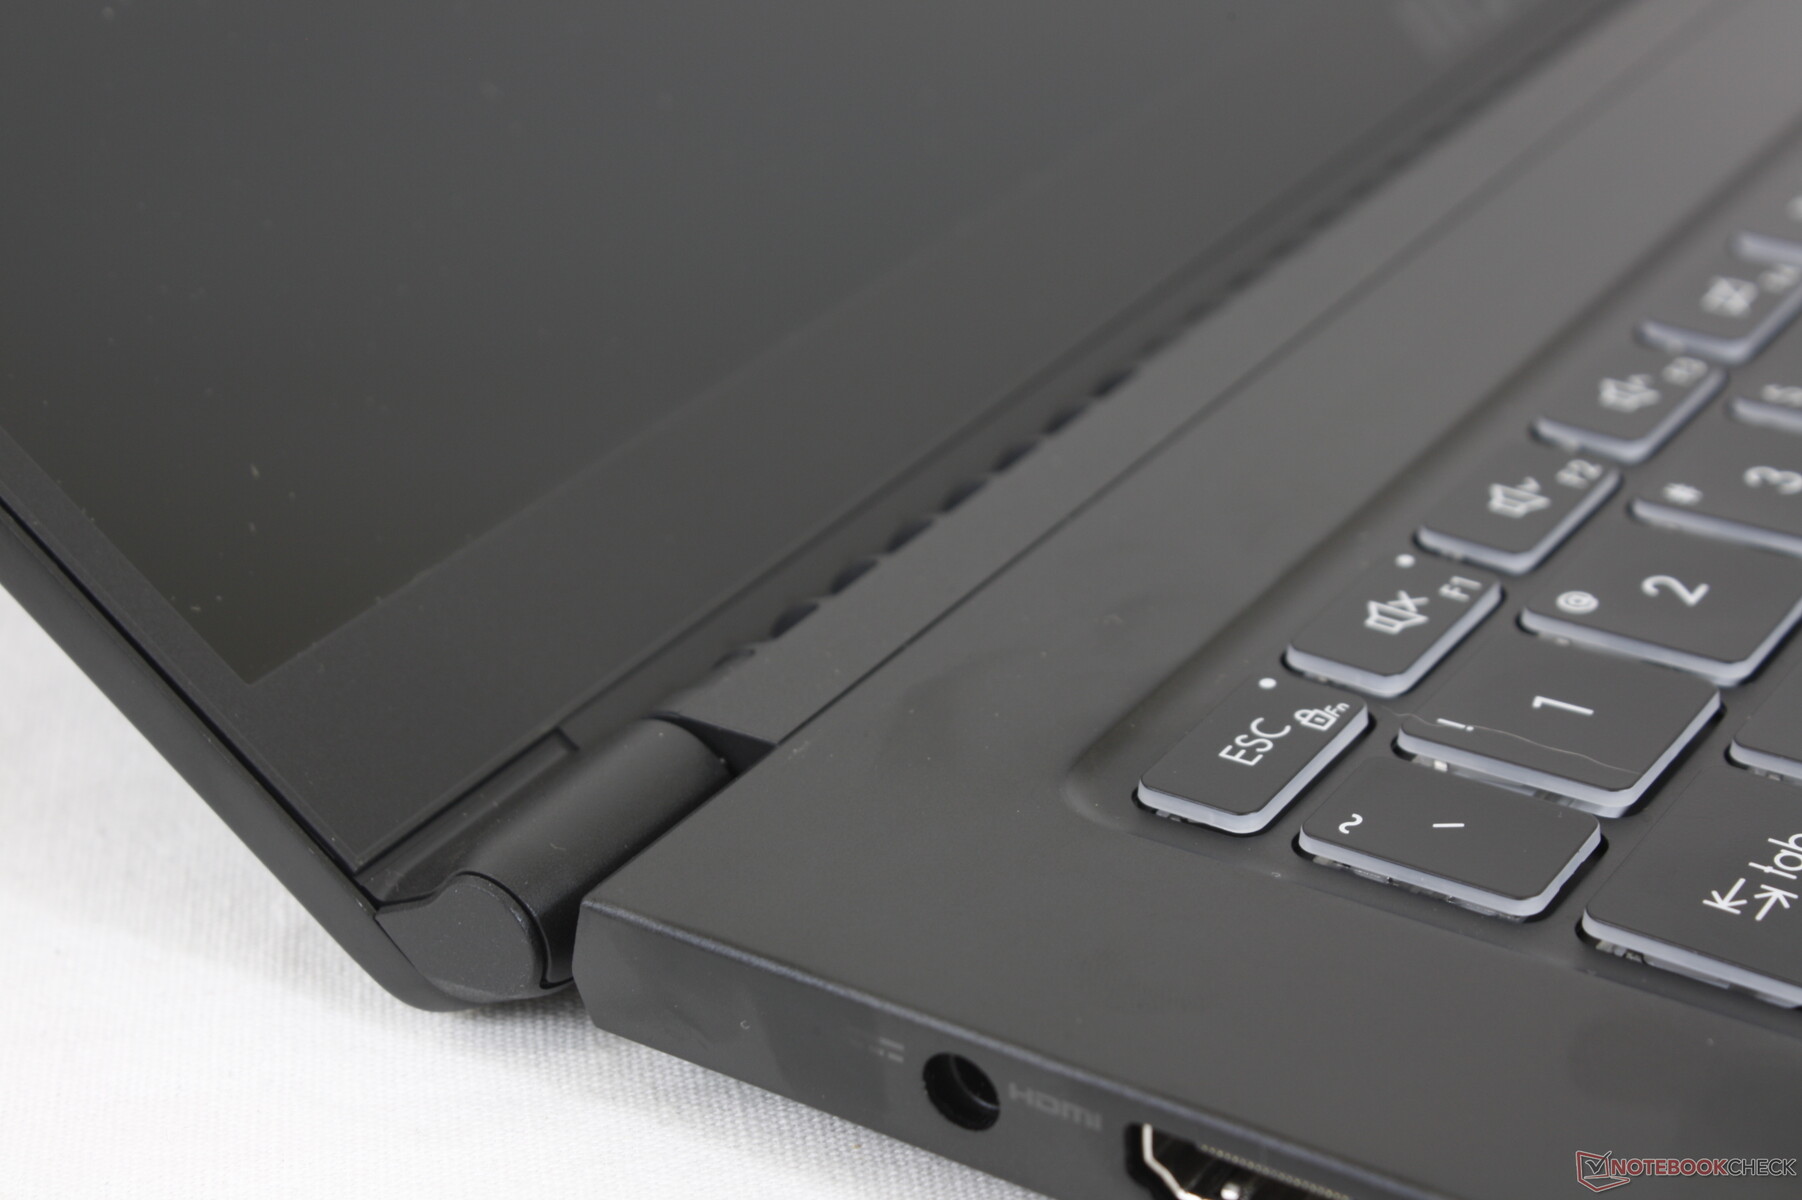
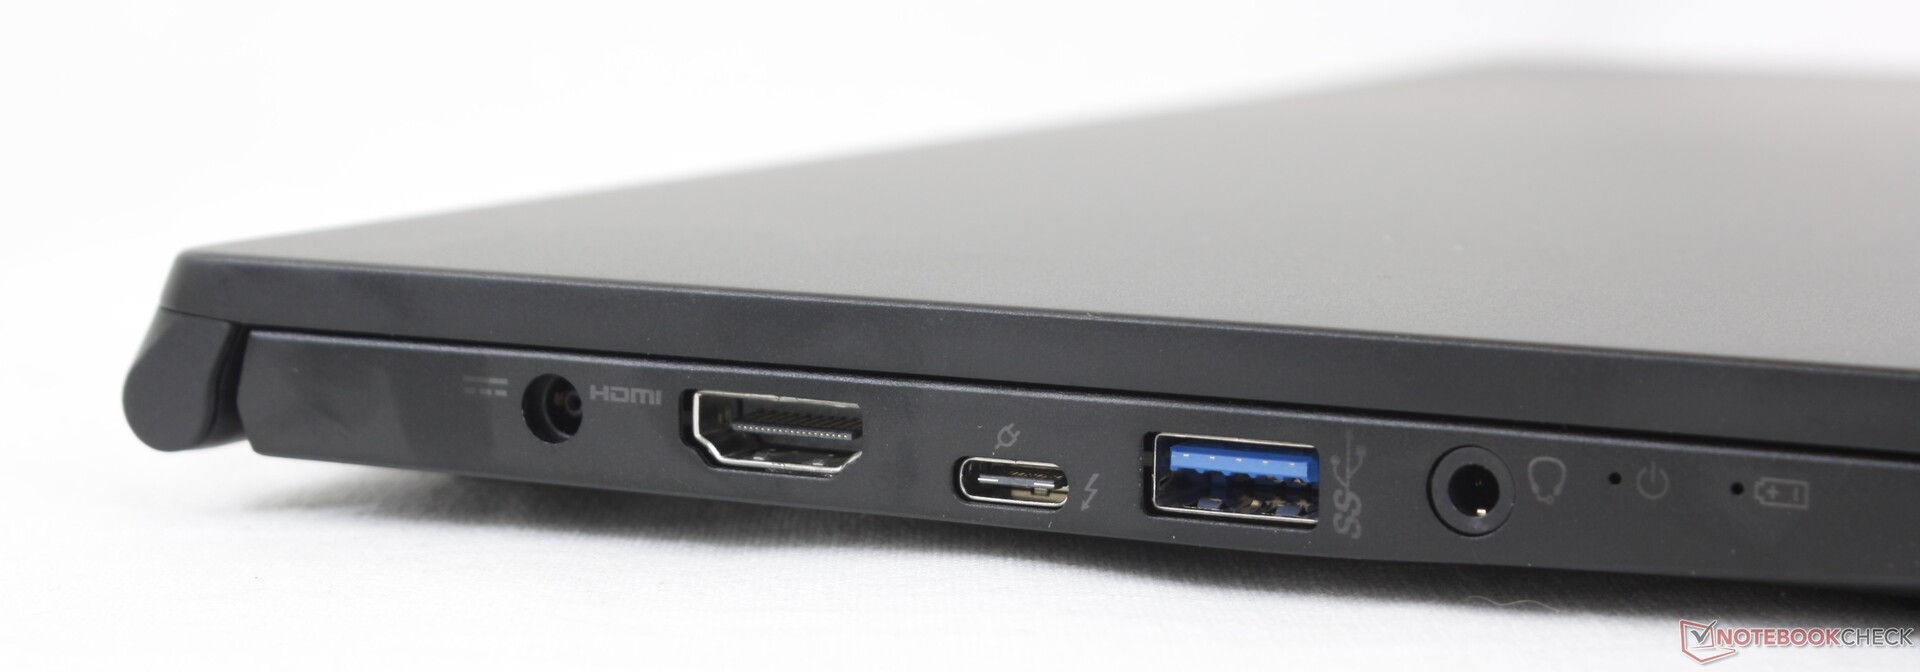
Le opzioni delle porte rimangono invariate rispetto al Modern 15, salvo due importanti aggiornamenti: la porta HDMI ora supporta l'uscita 4K60 mentre la porta USB-C è ora compatibile con Thunderbolt 4. Gli utenti possono collegare dock grafici esterni al Summit B15, mentre questo era impossibile sul Modern 15.
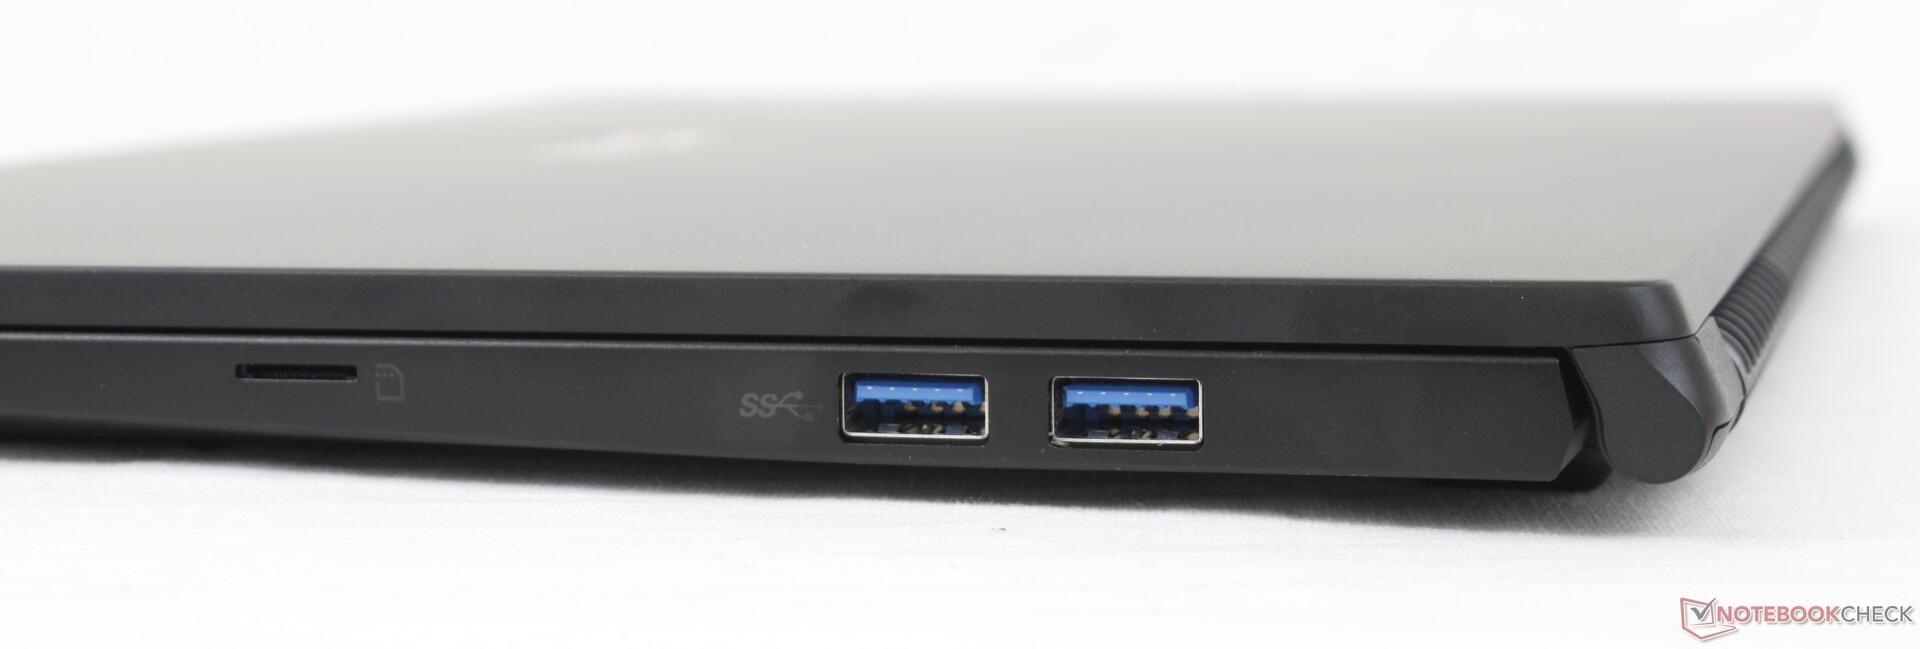
Lettore di schede SD
MSI ha aggiornato lo slot MicroSD rendendolo circa 6 volte più veloce dello stesso slot MicroSD sul vecchio Modern 15. Spostare 1 GB di immagini dalla nostra scheda di test UHS-II al desktop richiede circa 7 secondi rispetto ai 40 secondi del modello dell'anno scorso.
| SD Card Reader | |
| average JPG Copy Test (av. of 3 runs) | |
| Dell XPS 15 9500 Core i5 (Toshiba Exceria Pro SDXC 64 GB UHS-II) | |
| HP Spectre X360 15-5ZV31AV (Toshiba Exceria Pro M501 UHS-II) | |
| MSI Summit B15 A11M (AV PRO microSD 128 GB V60) | |
| MSI Summit E13 Flip Evo A11MT (AV PRO microSD 128 GB V60) | |
| MSI Modern 15 A10RB (Toshiba Exceria Pro M501 UHS-II) | |
| maximum AS SSD Seq Read Test (1GB) | |
| Dell XPS 15 9500 Core i5 (Toshiba Exceria Pro SDXC 64 GB UHS-II) | |
| MSI Summit B15 A11M (AV PRO microSD 128 GB V60) | |
| HP Spectre X360 15-5ZV31AV (Toshiba Exceria Pro M501 UHS-II) | |
| MSI Summit E13 Flip Evo A11MT (AV PRO microSD 128 GB V60) | |
| MSI Modern 15 A10RB (Toshiba Exceria Pro M501 UHS-II) | |
Comunicazioni
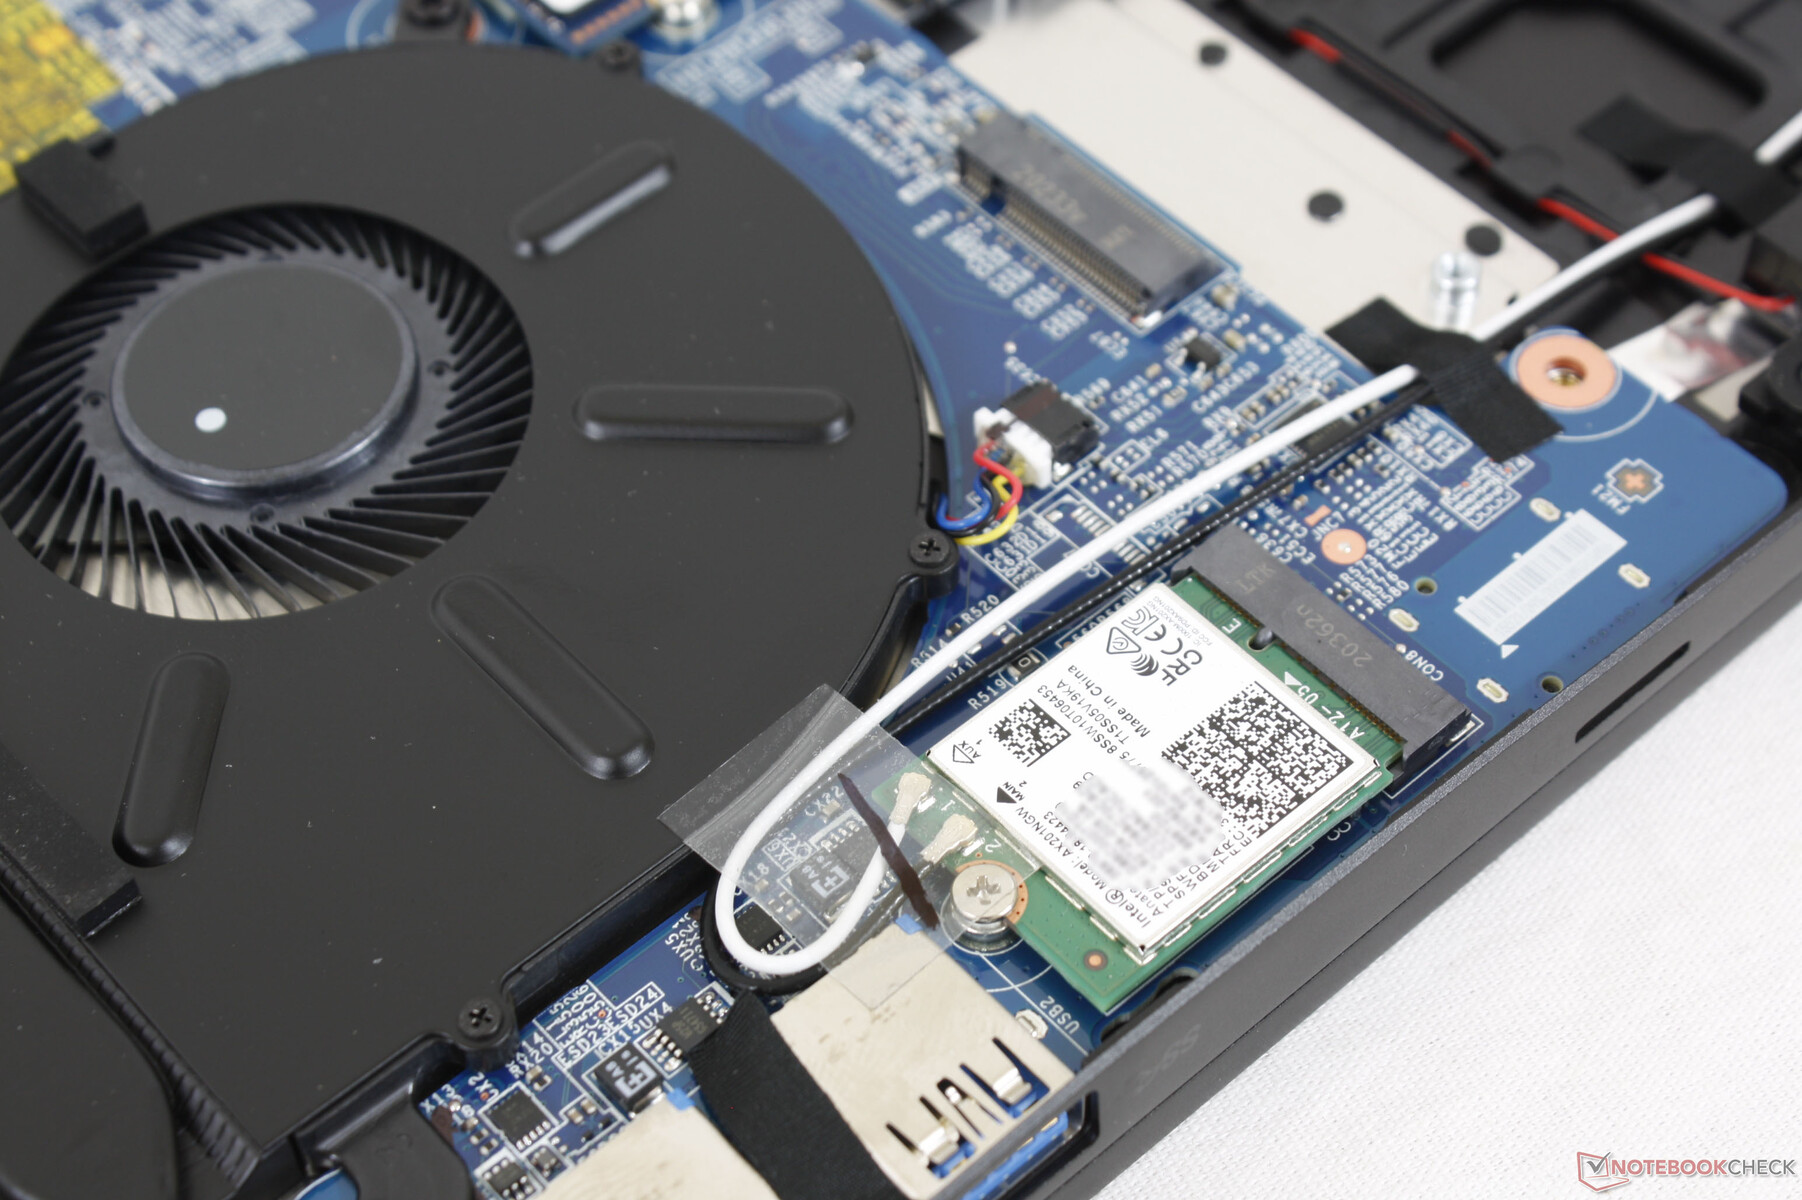
L'Intel AX201 è dotato di serie di connettività Wi-Fi 6 e Bluetooth 5.1. Non abbiamo avuto problemi quando è stato accoppiato al nostro router Netgear RAX200.
Webcam


Manutenzione
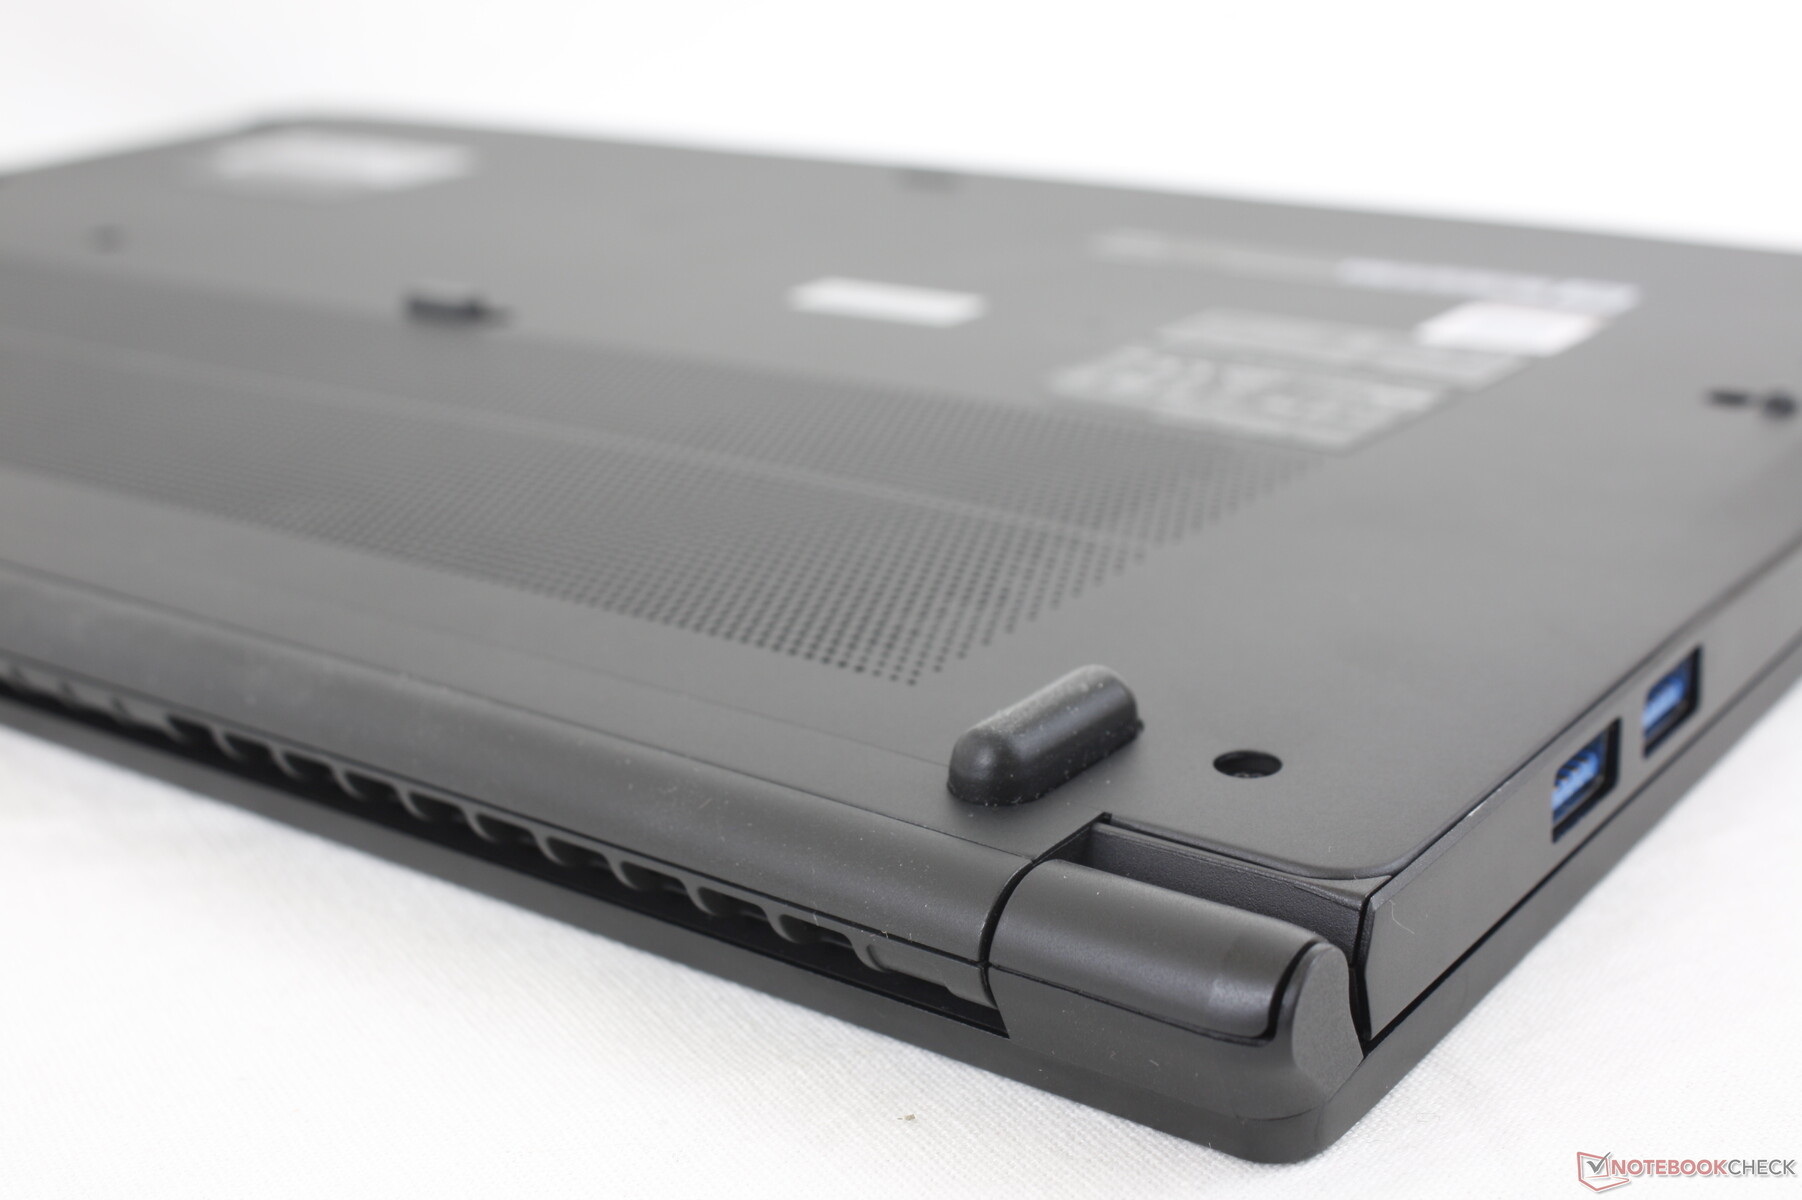
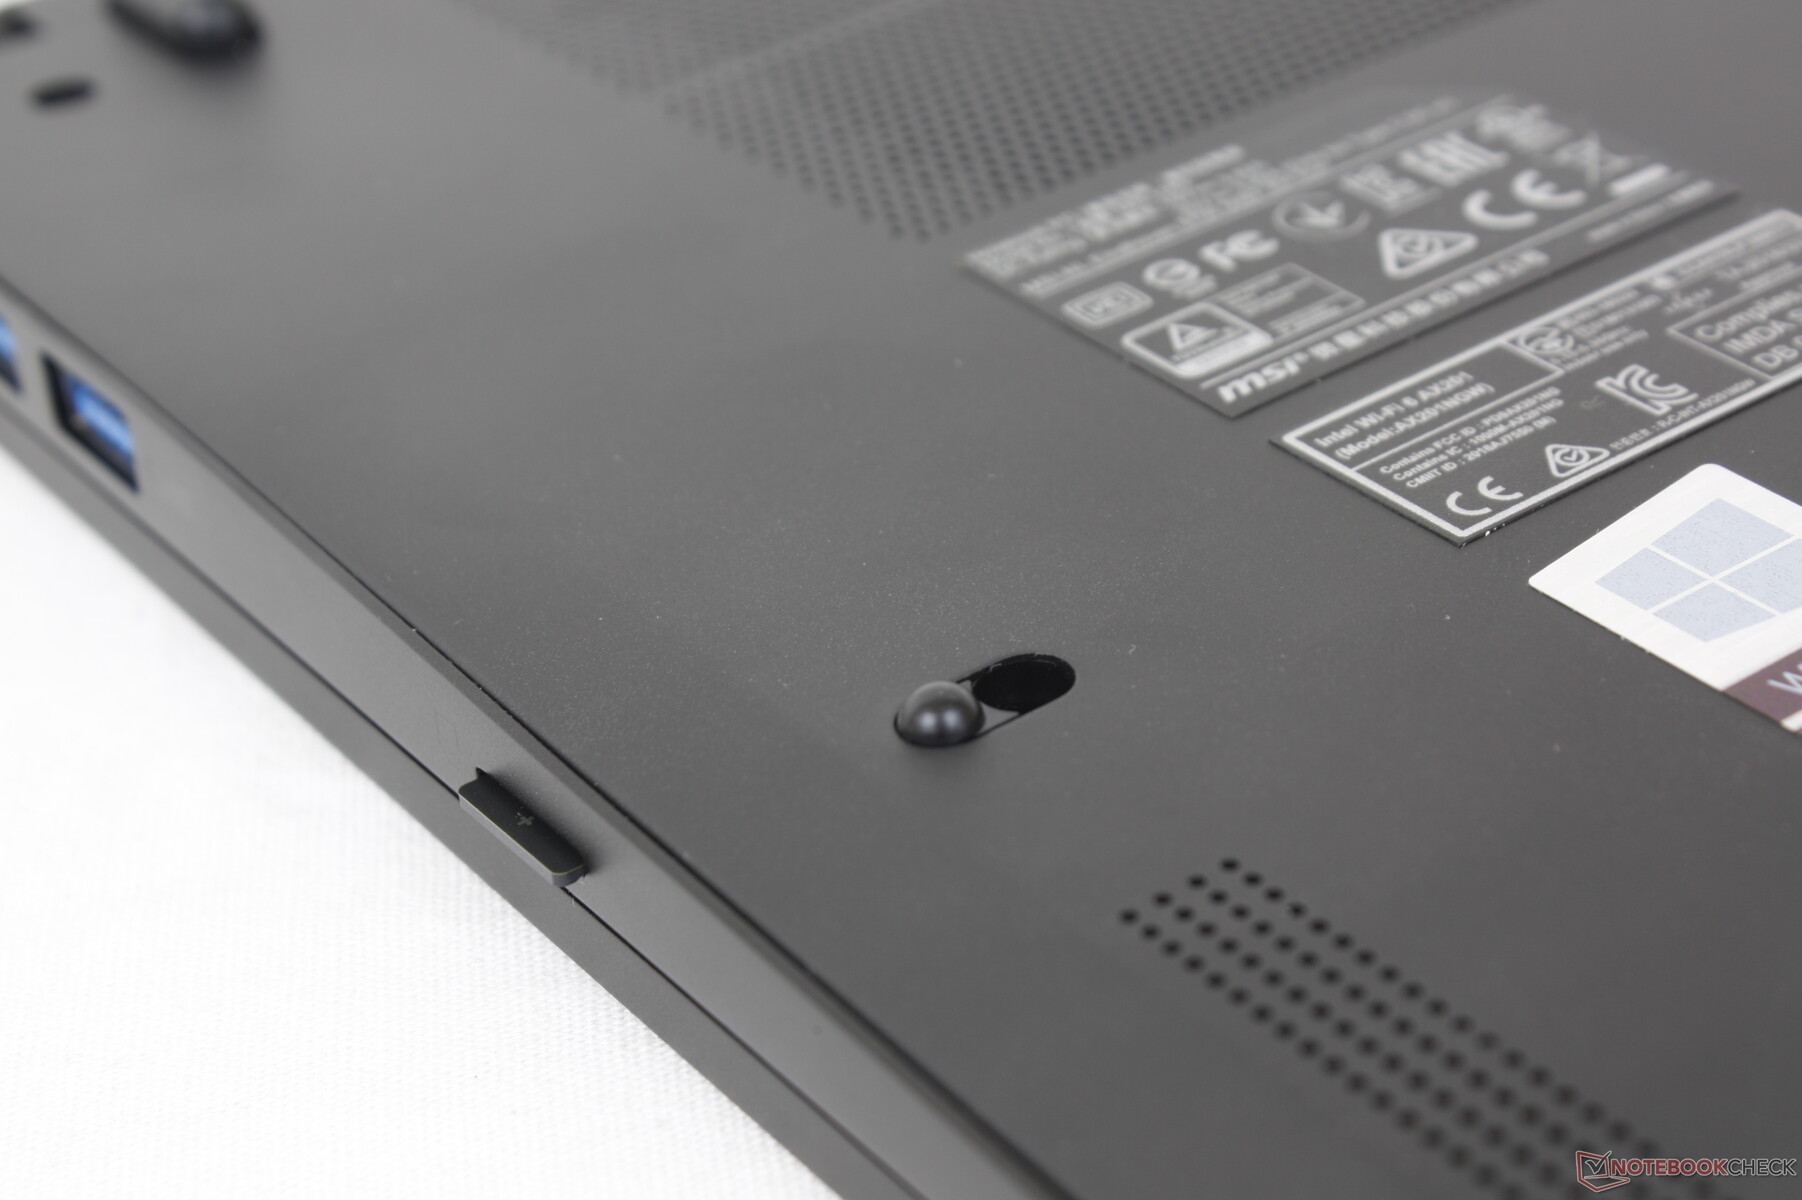
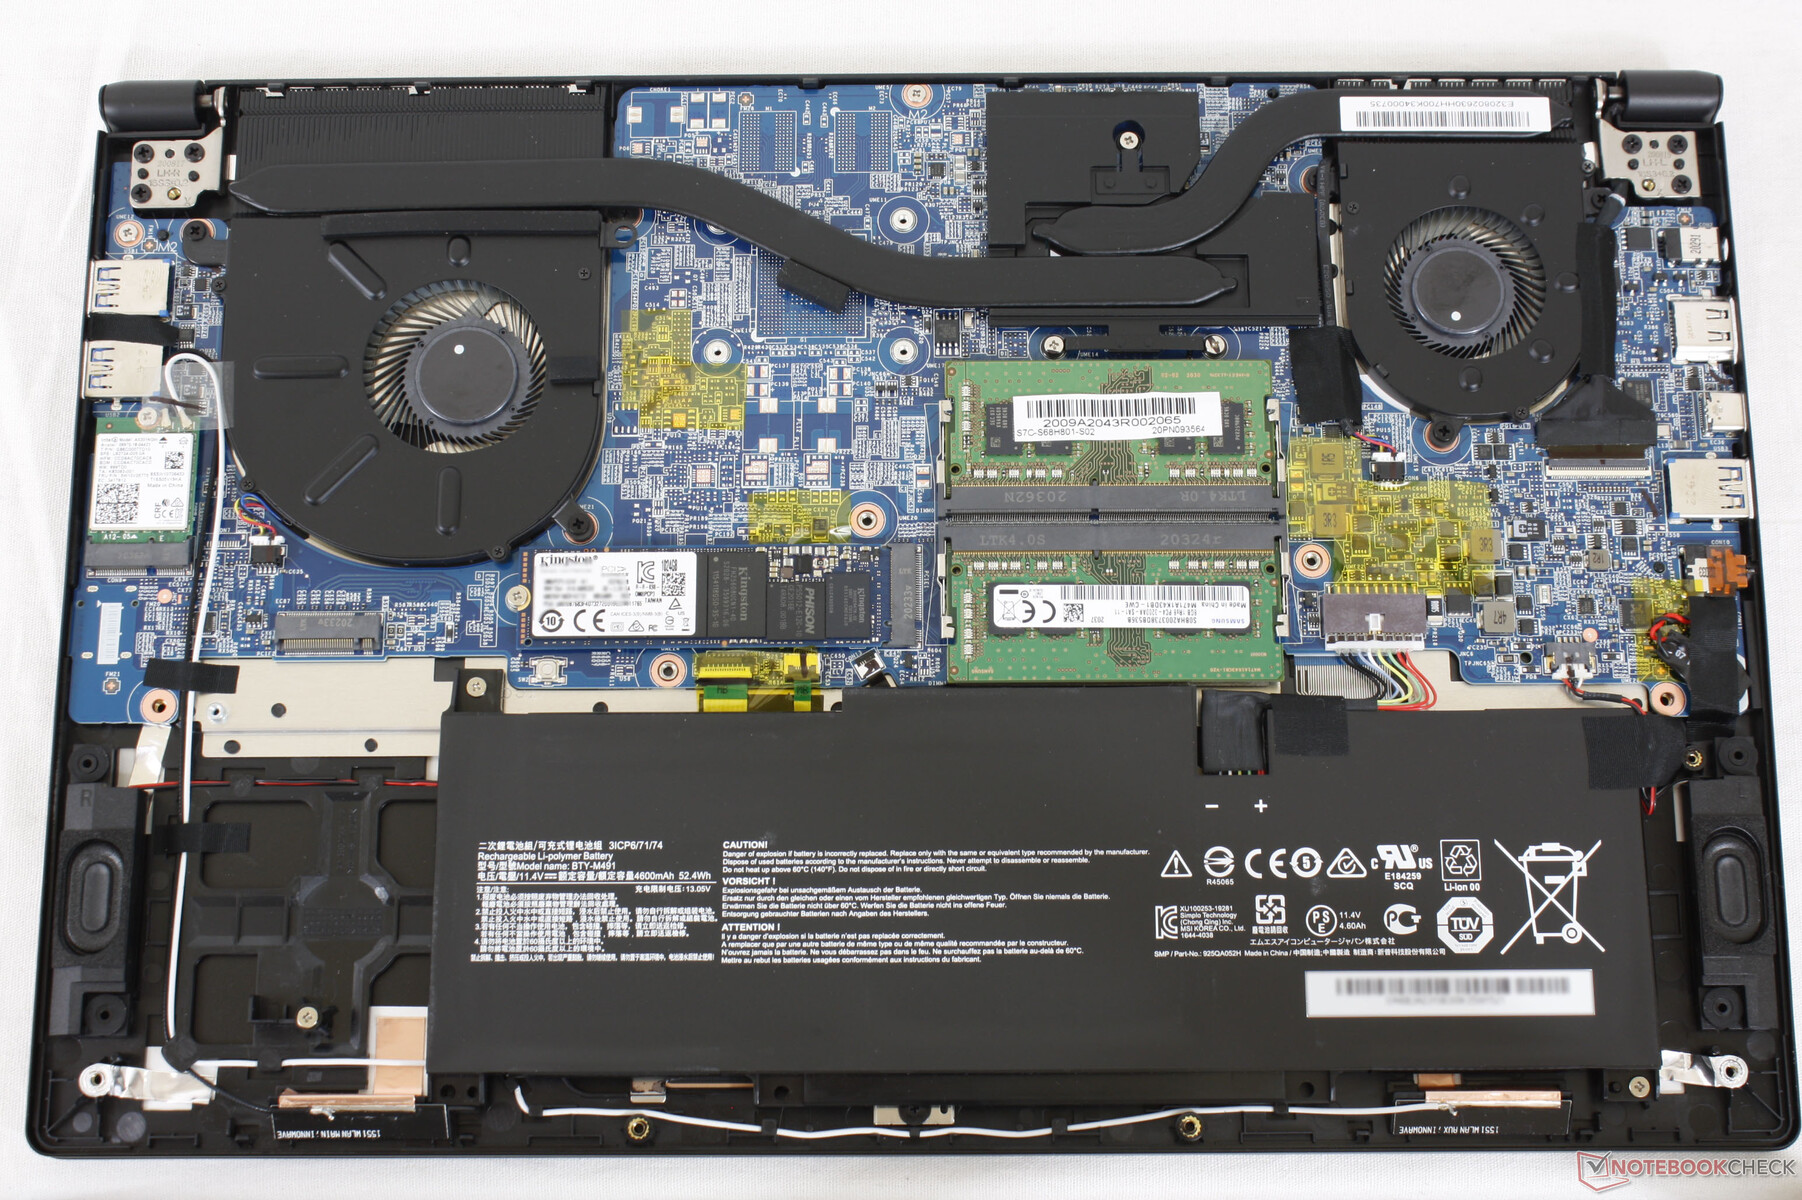
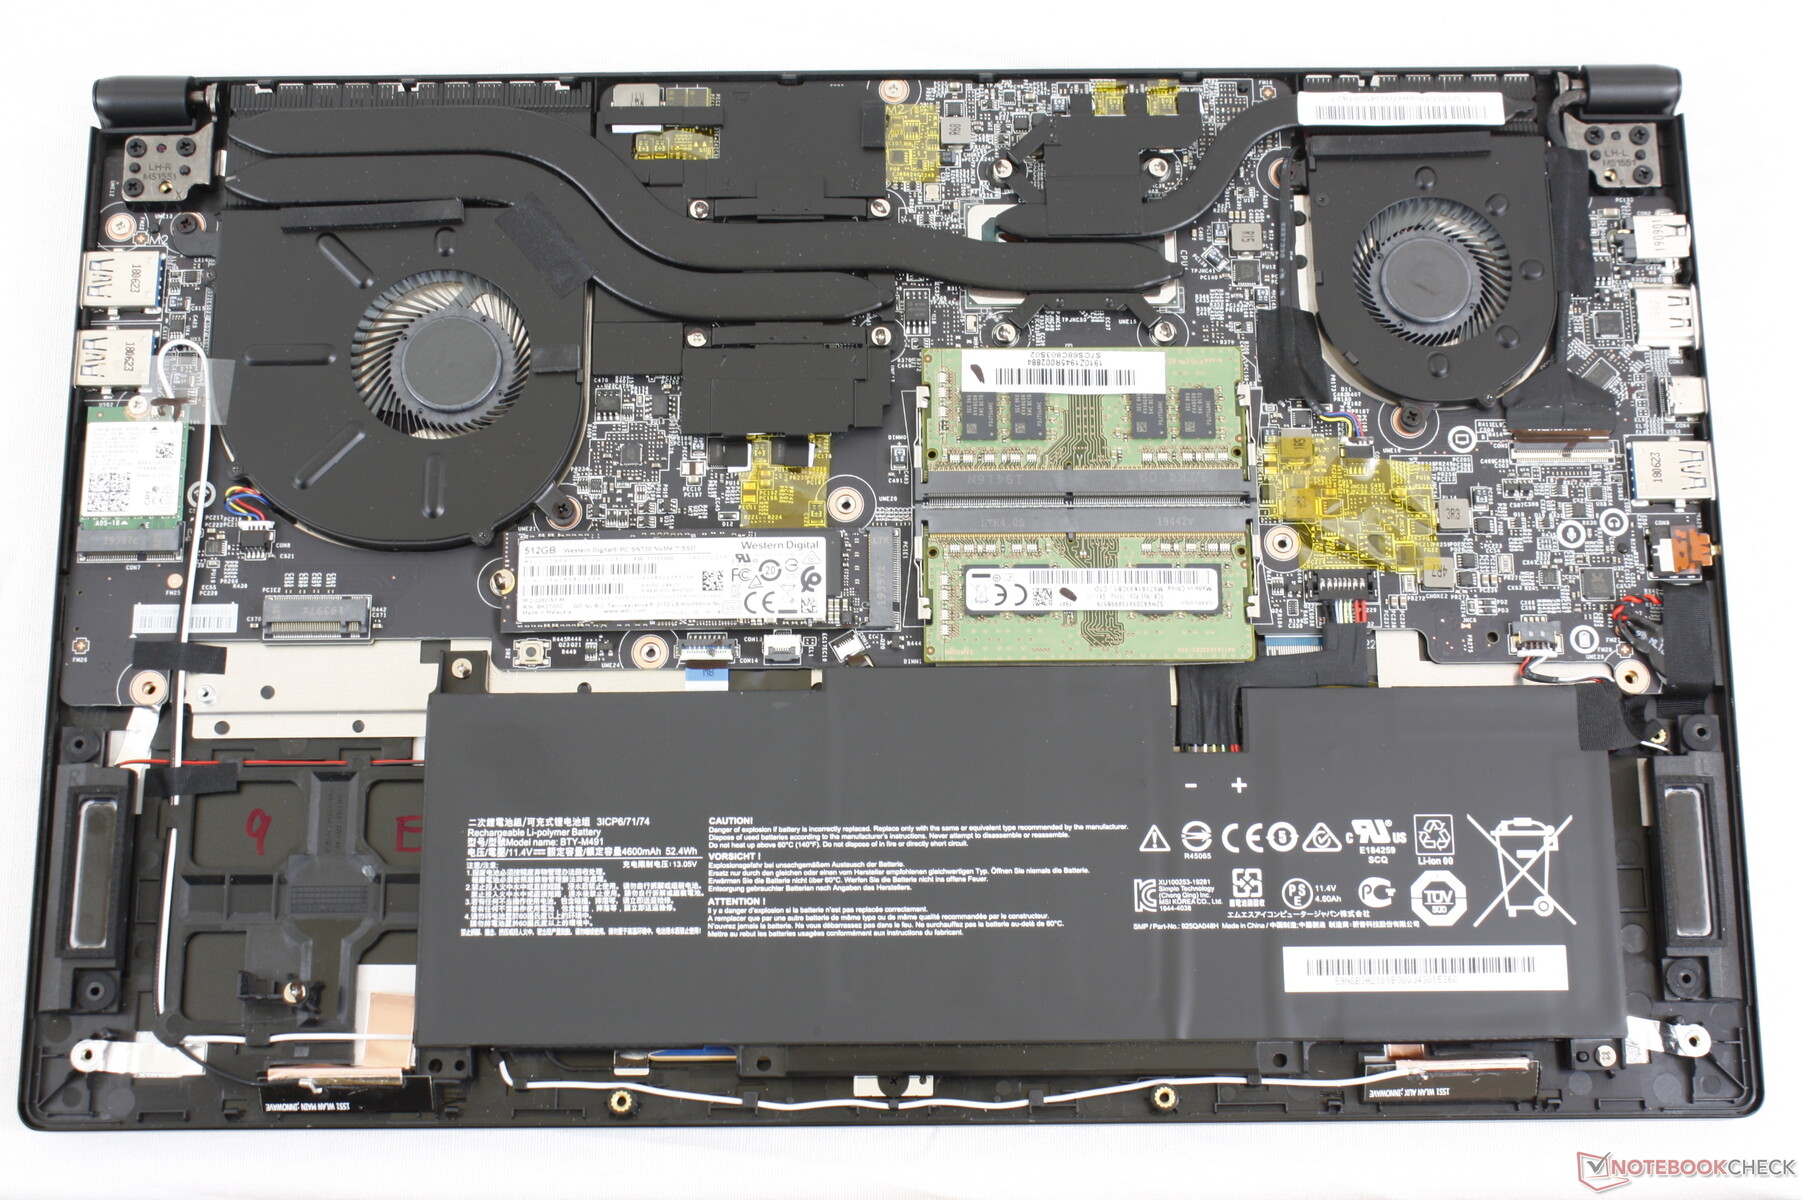
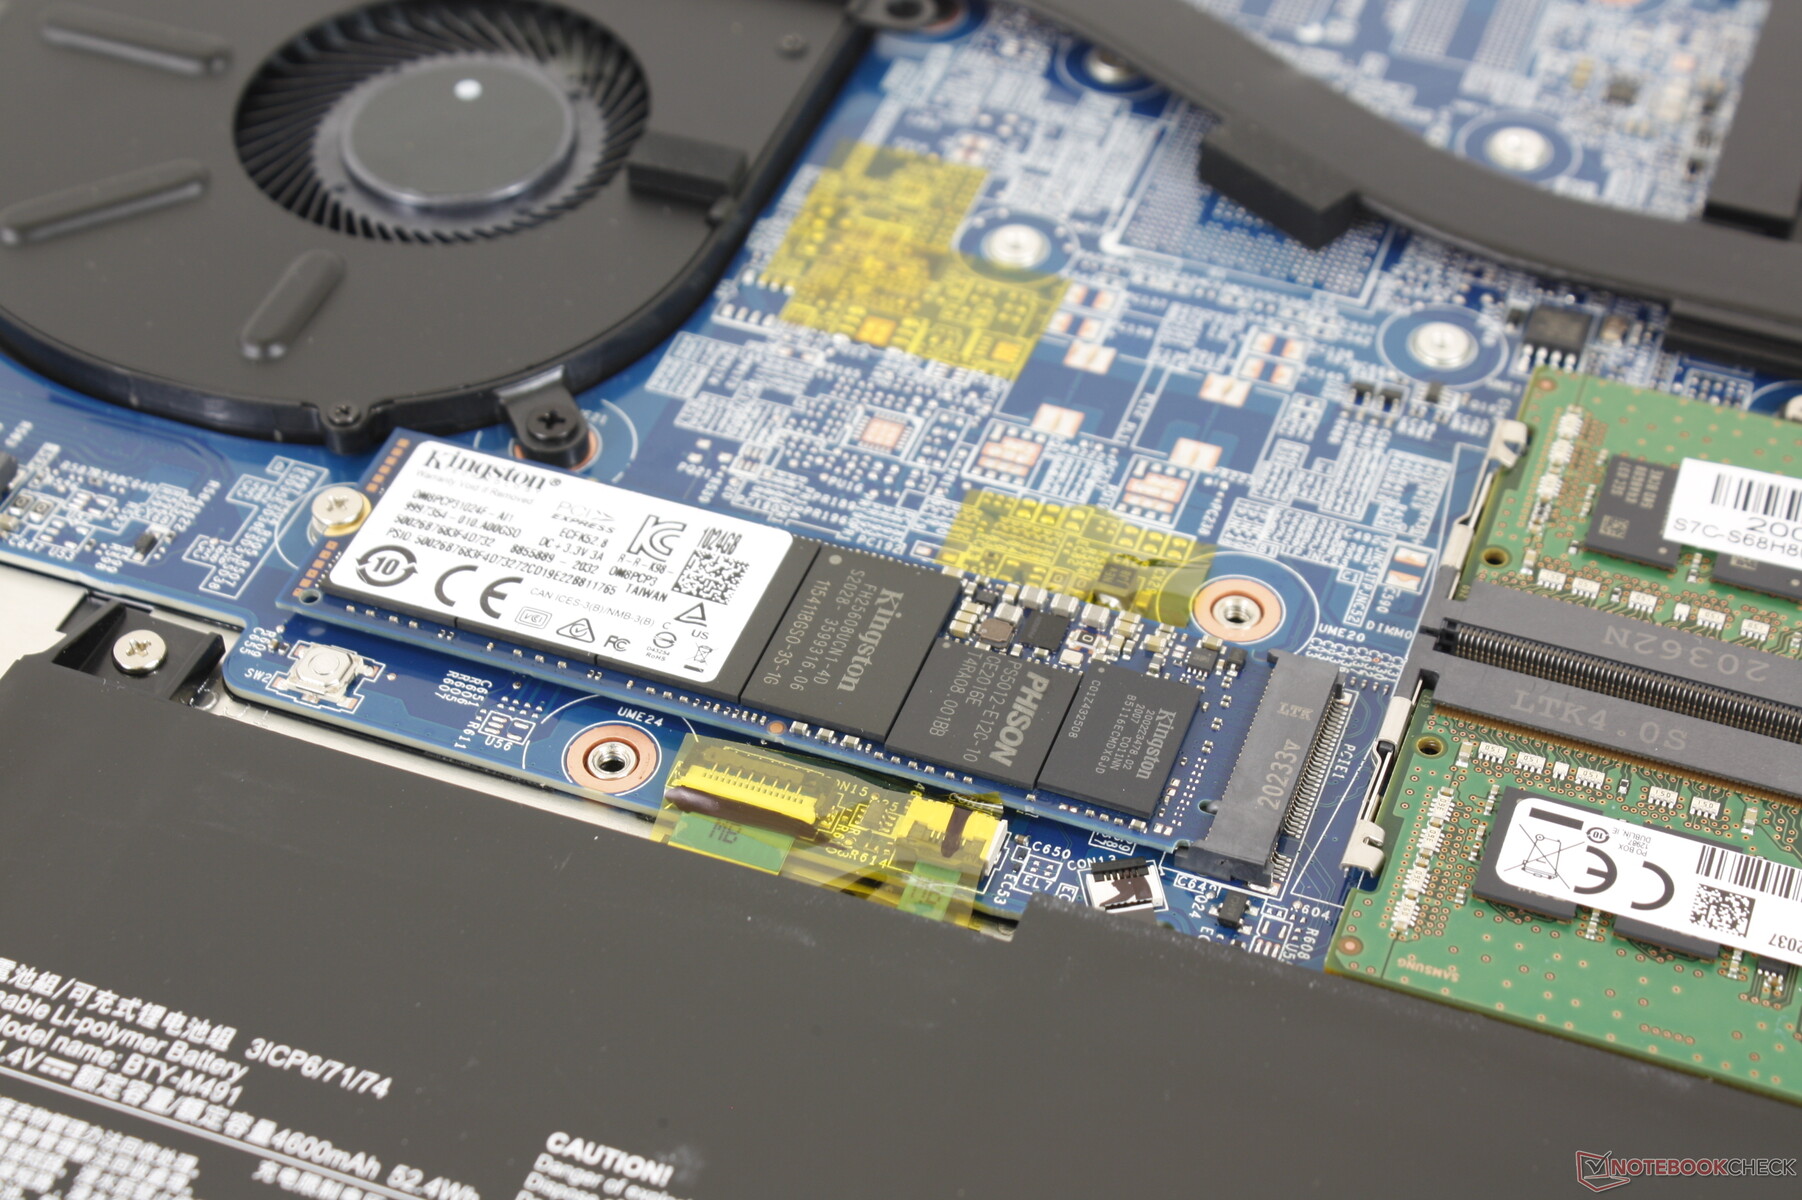
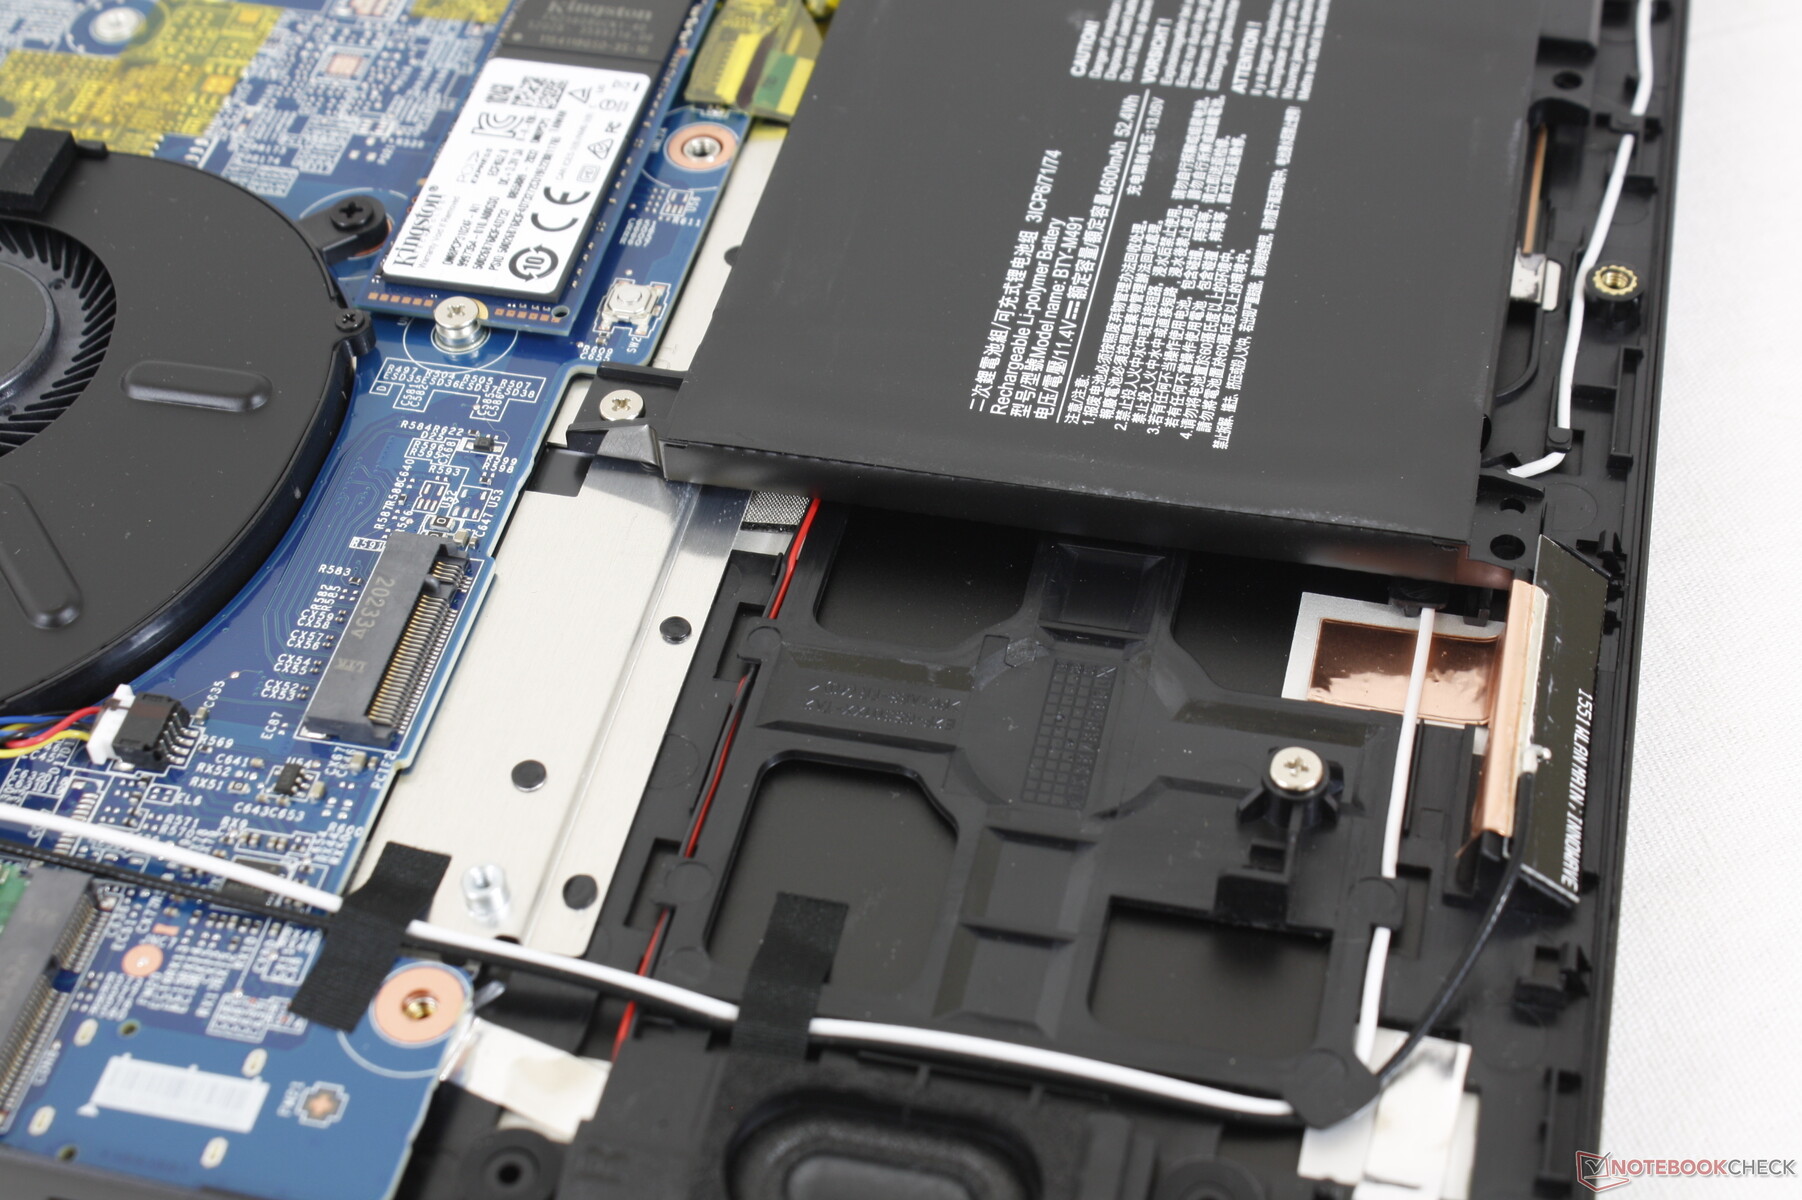
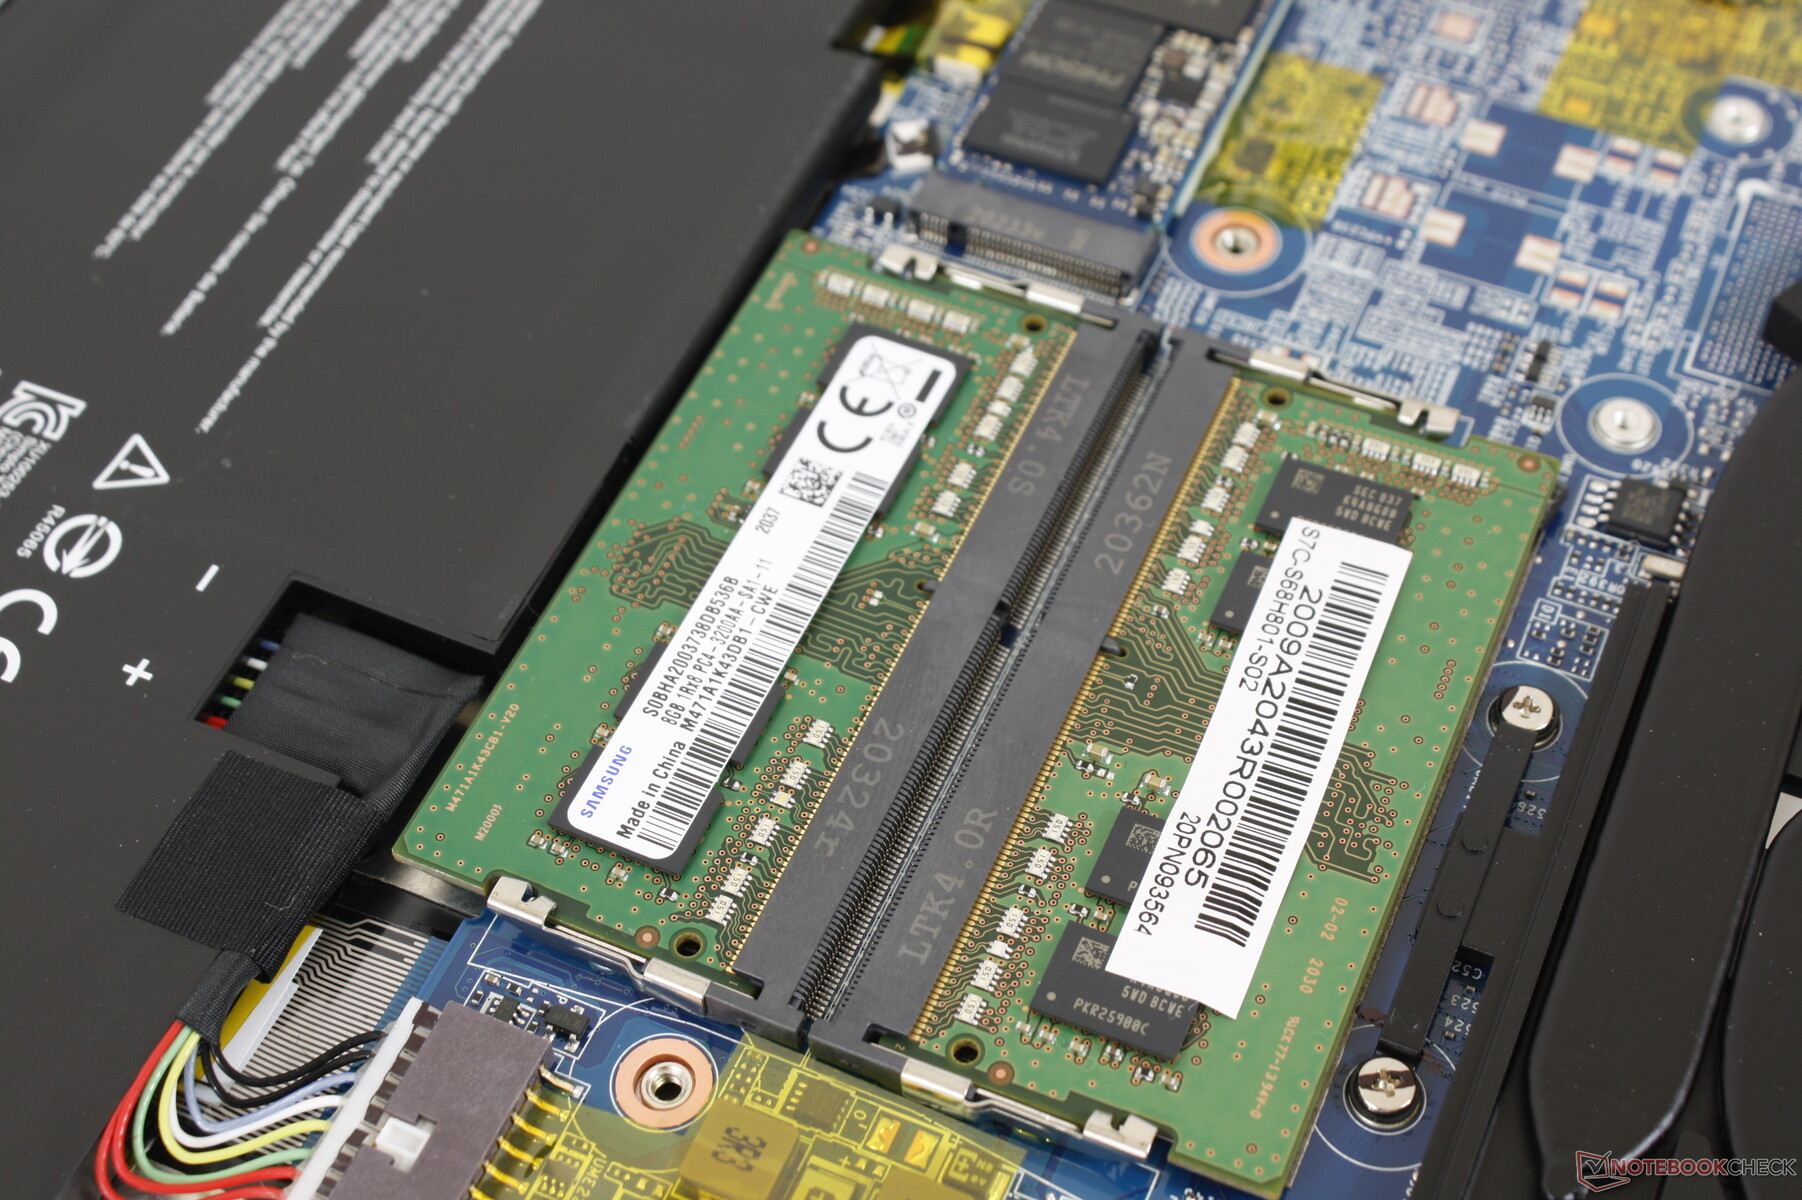
Il pannello inferiore si sgancia abbastanza facilmente con un cacciavite Philips. Tuttavia, tenete a mente che un adesivo di sigillo di fabbrica deve prima essere rotto. Una volta all'interno, le somiglianze tra il Summit B15 e il Modern 15 dell'anno scorso diventano ancora più ovvie come mostrato dalle immagini di confronto qui sotto.
Accessori e garanzia
La confezione include un adattatore da USB-A a RJ-45 insieme alla documentazione e all'adattatore AC. La garanzia limitata standard di un anno si applica con opzioni di estensione se acquistata da Xotic PC.
Dispositivi di input
Tastiera
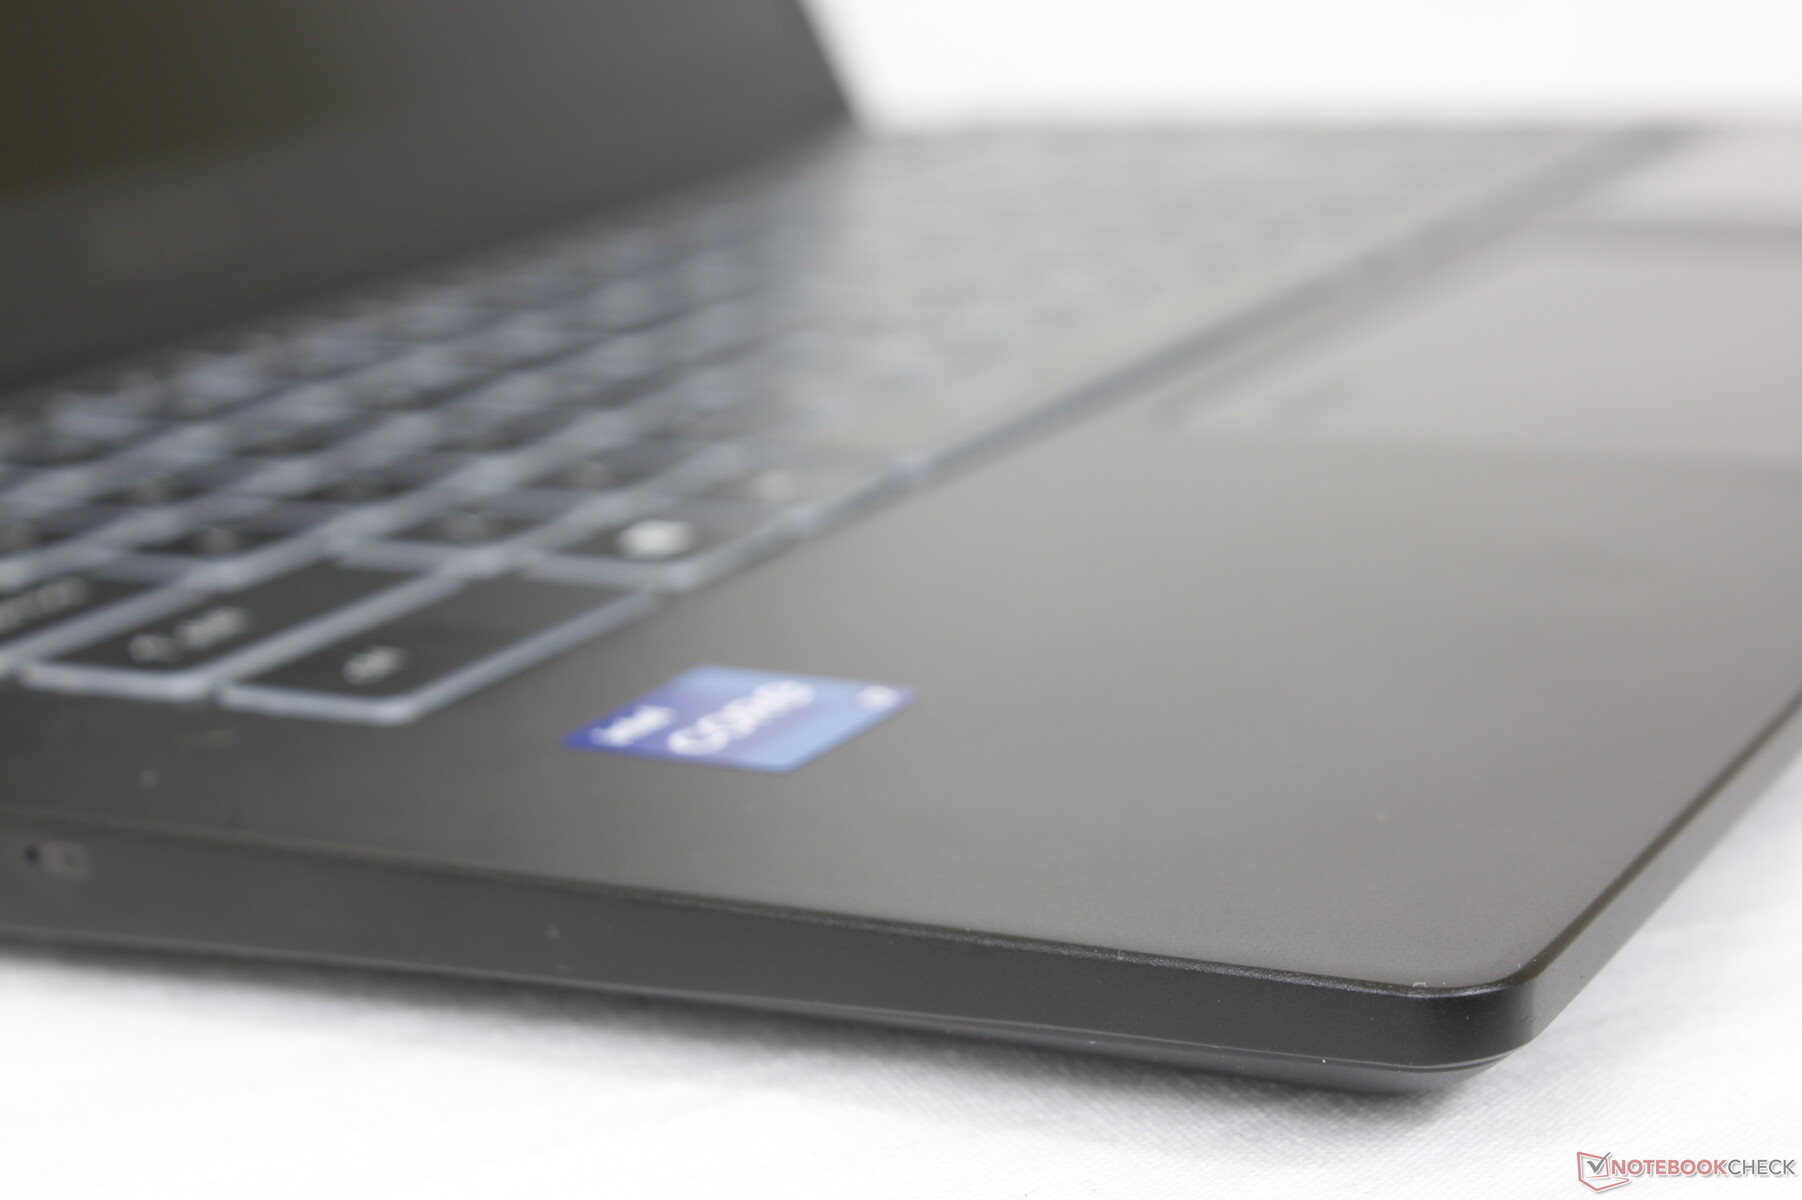
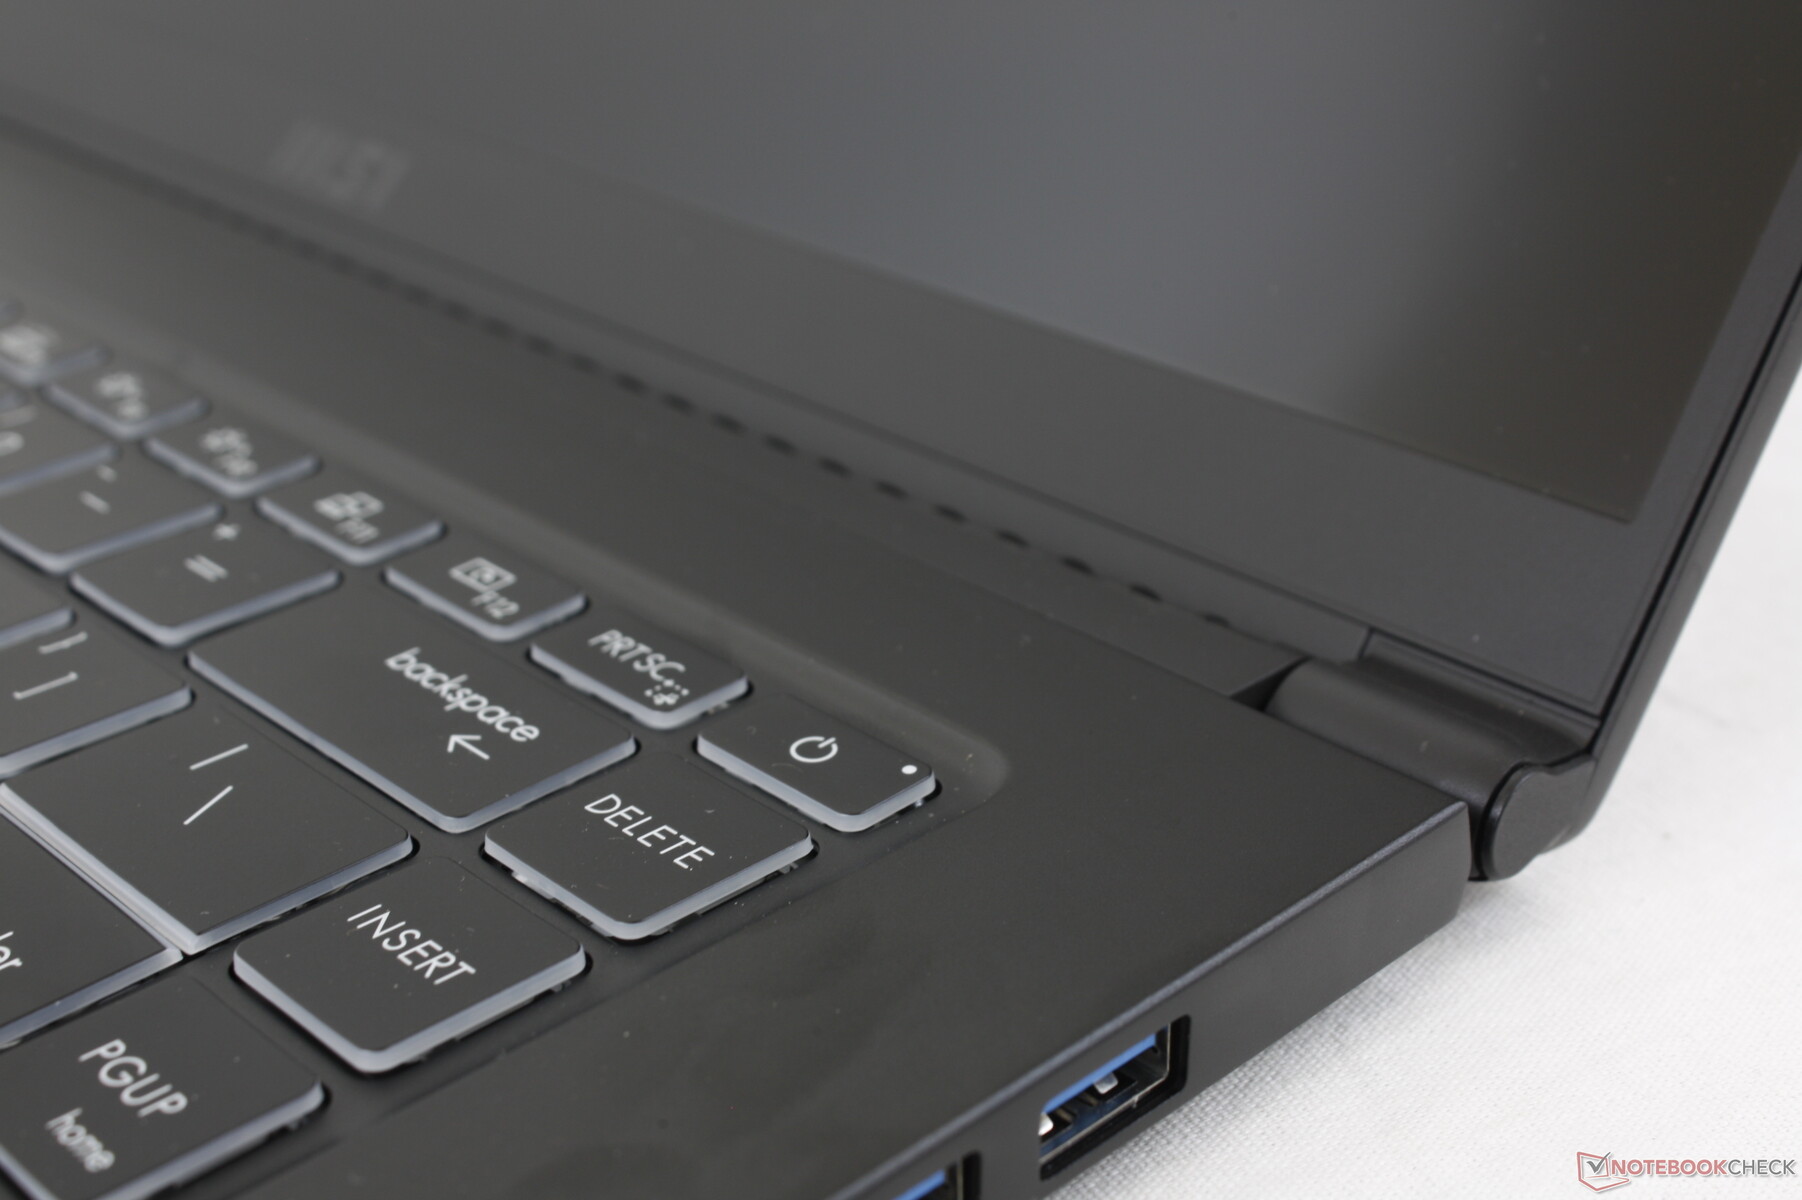
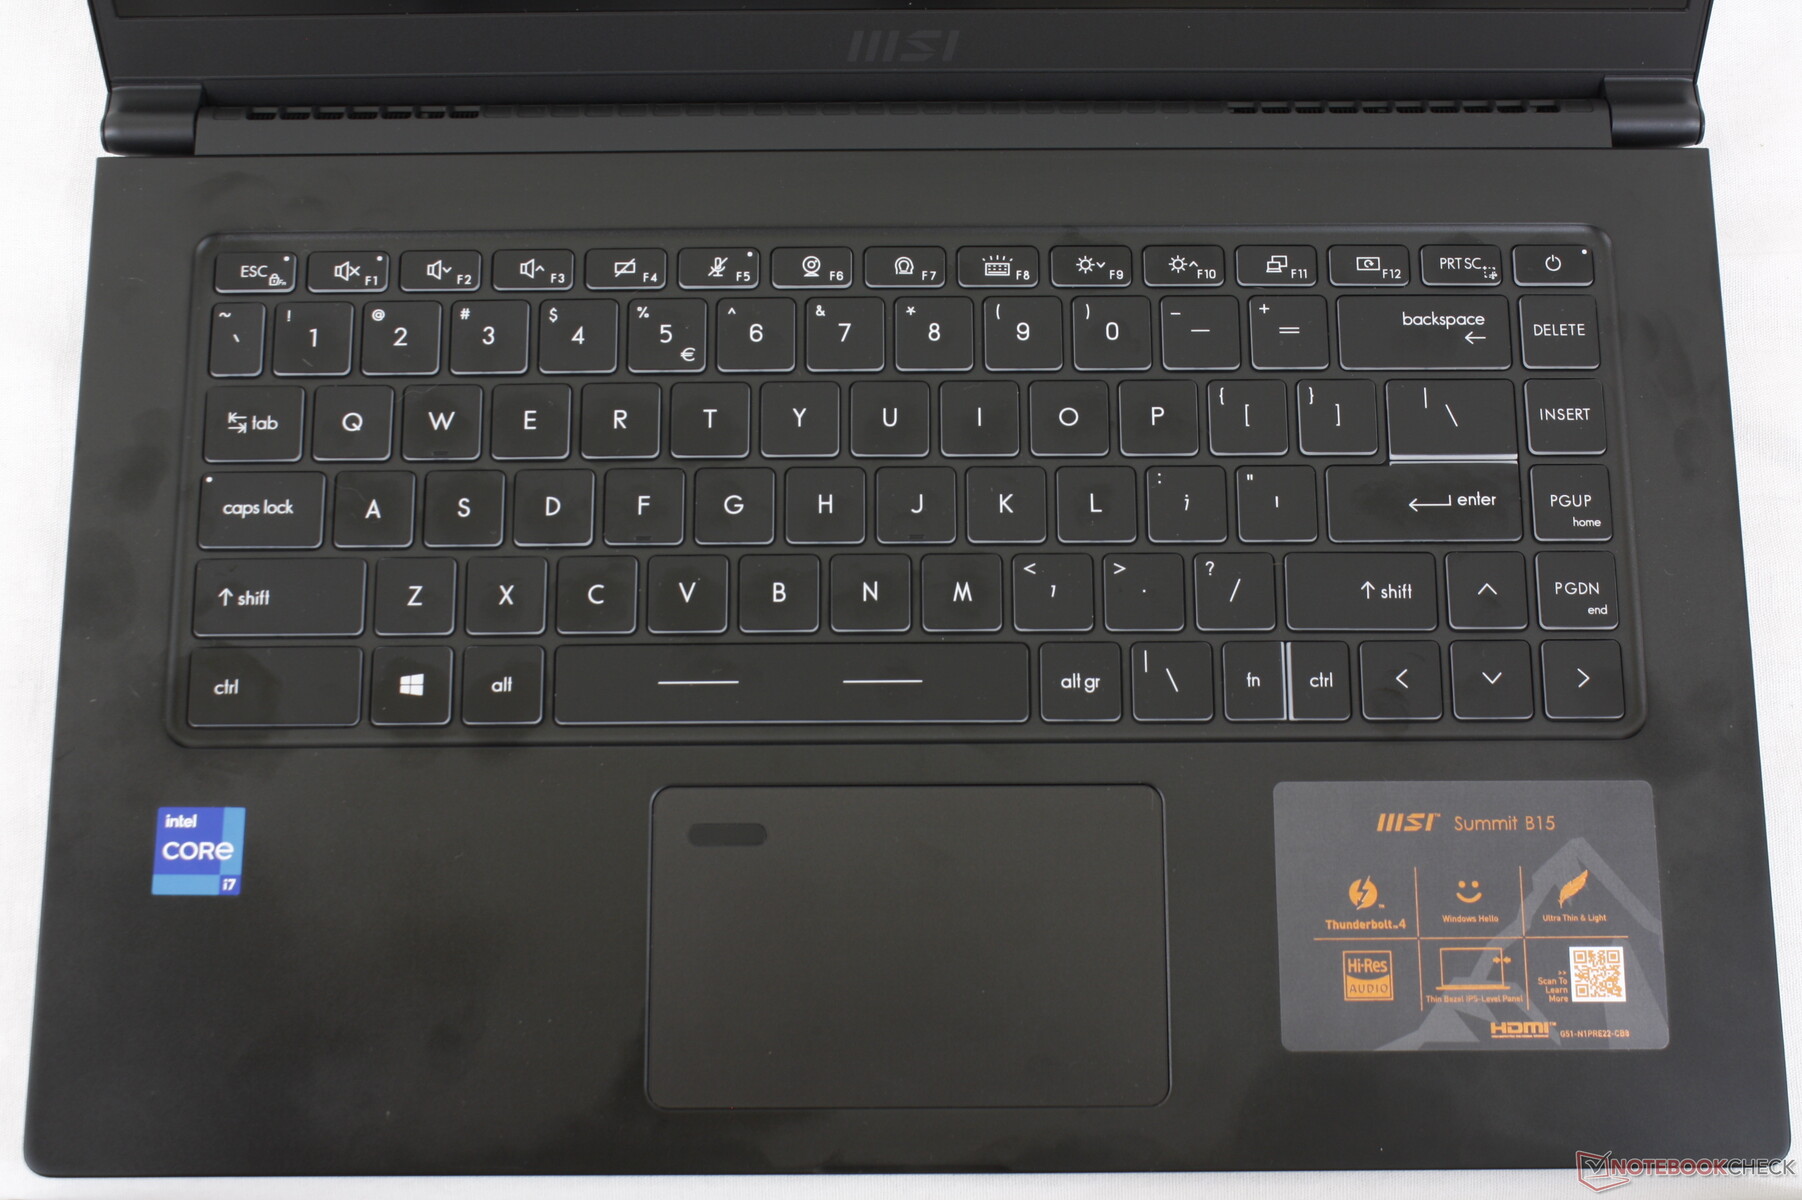
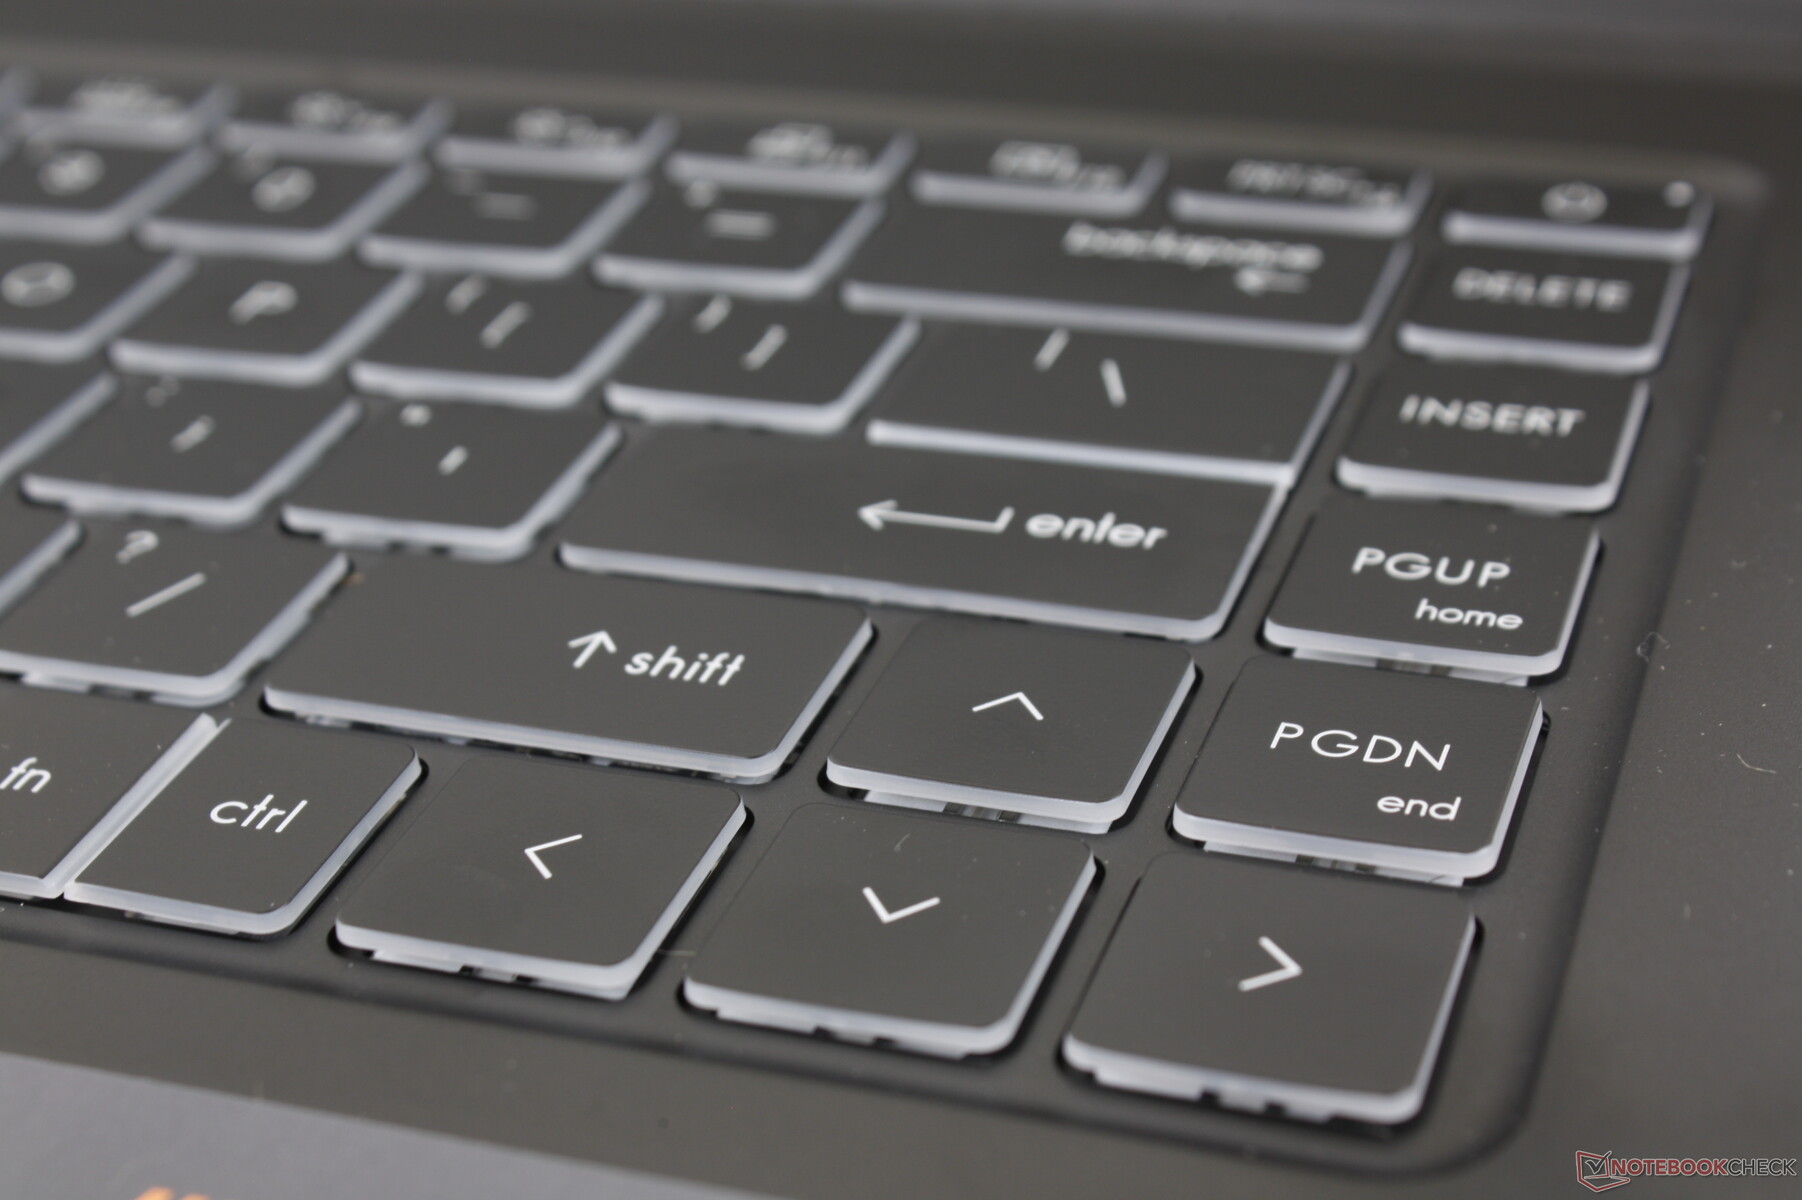
Il carattere dei tasti è cambiato dal Modern 15 risultando essere più nitido e non in grassetto o in corsivo. Per il resto, il feedback dei tasti e il layout rimangono esattamente gli stessi. I tasti appaiono più solidi e profondi rispetto all'XPG Xenia Xe e Dell XPS 15, rispettivamente, ma il rumore è leggermente più forte. Apprezziamo le dimensioni complete dei tasti PgUp, PgDn, Delete e delle frecce, che sono spesso rimpicciolite sulla maggior parte degli altri portatili.
Touchpad
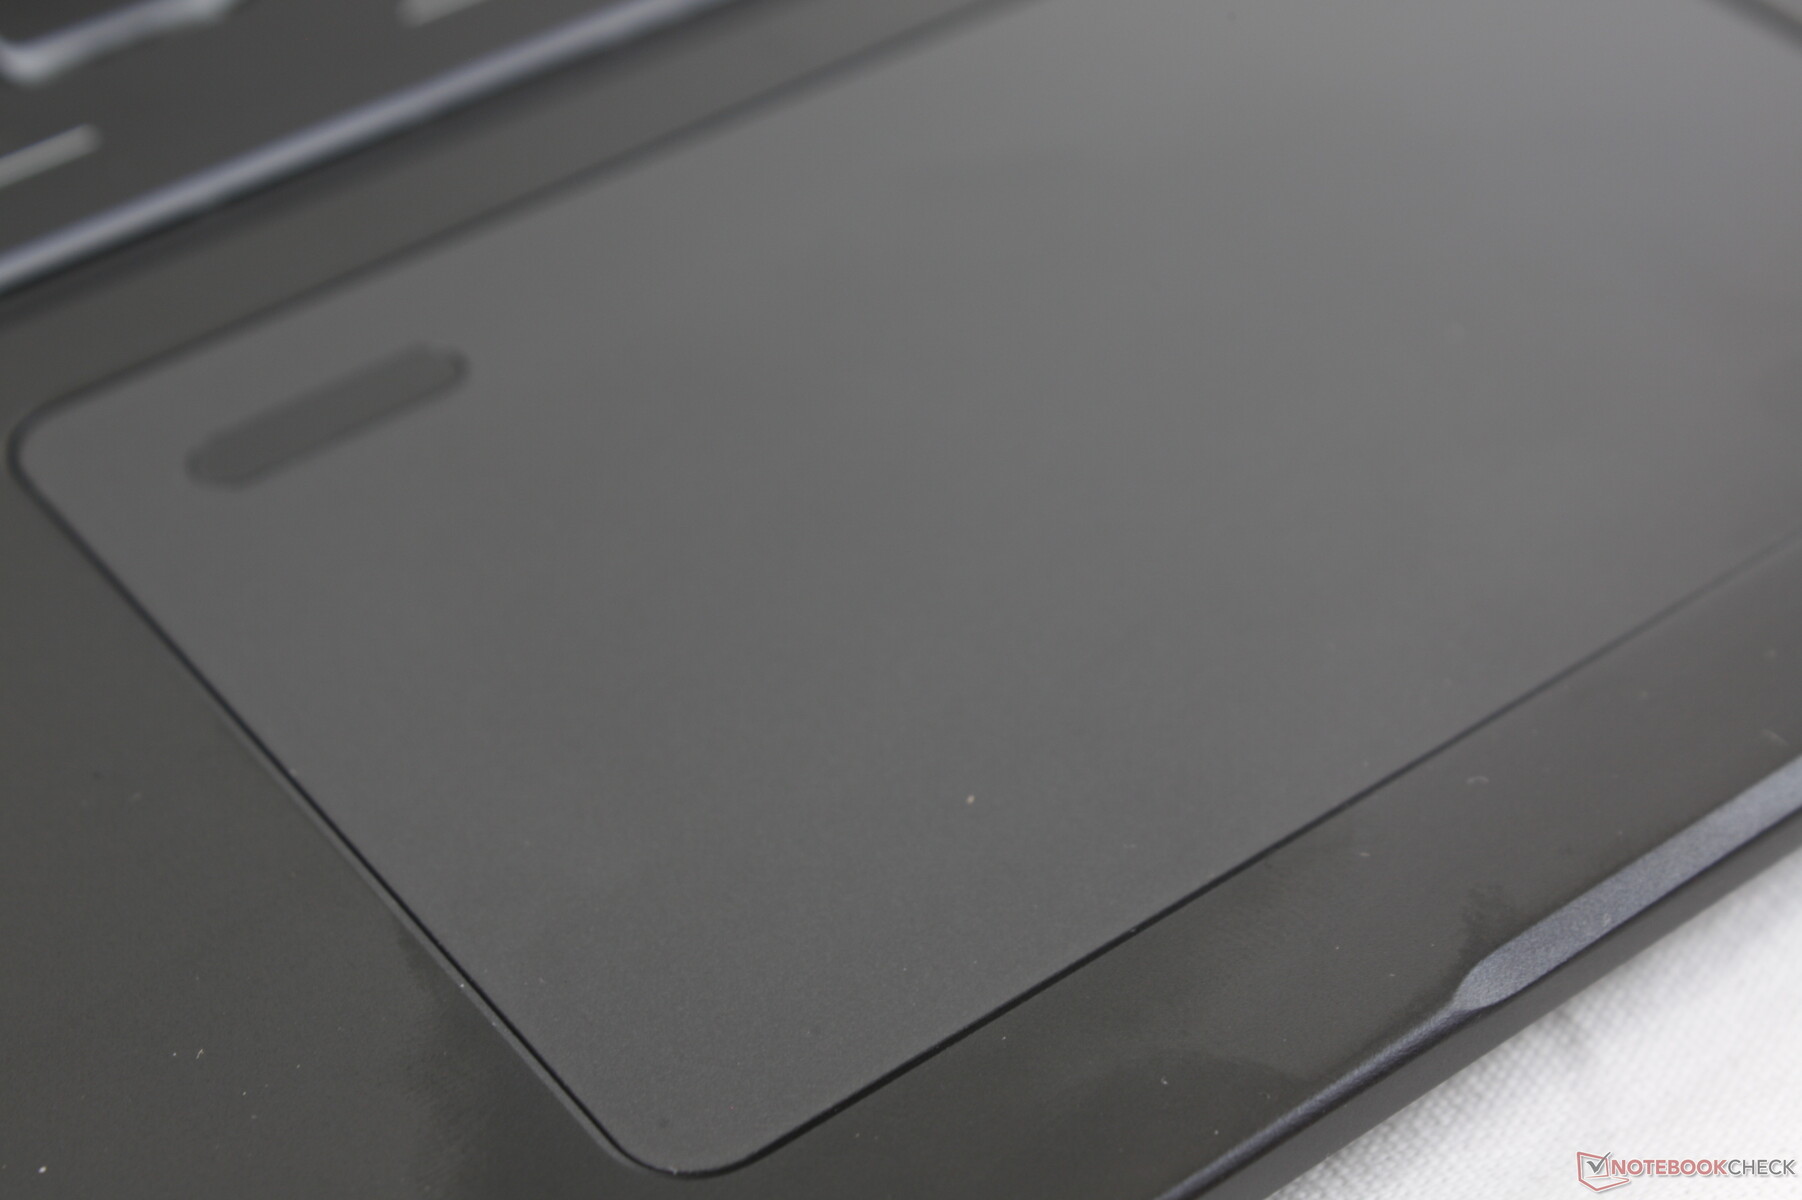
Il clickpad ha le stesse dimensioni di quello del Modern 15 (10,5 x 6,5 cm) con la stessa struttura liscia e un feedback spugnoso. Non è morbido come il clickpad dello Xenia Xe, ma avrebbe potuto essere più solido per un click più soddisfacente.
Sospettiamo che MSI alla fine sposterà il lettore di impronte digitali lontano dal clickpad come quello che stiamo già vedendo da Dell, HP e altri.

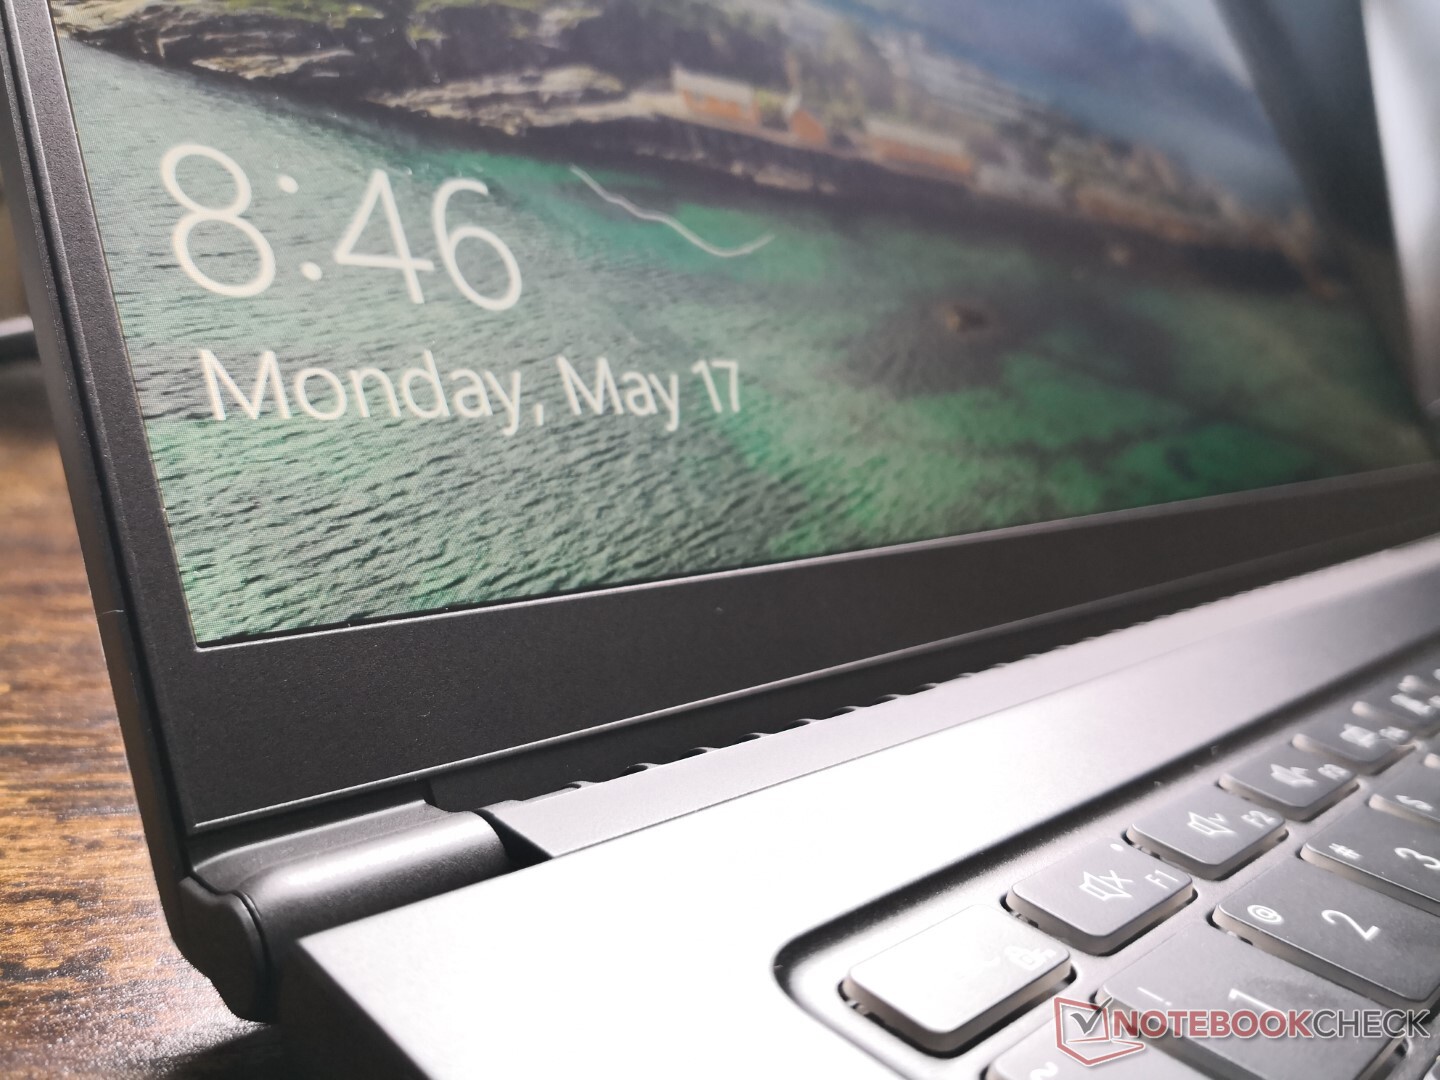
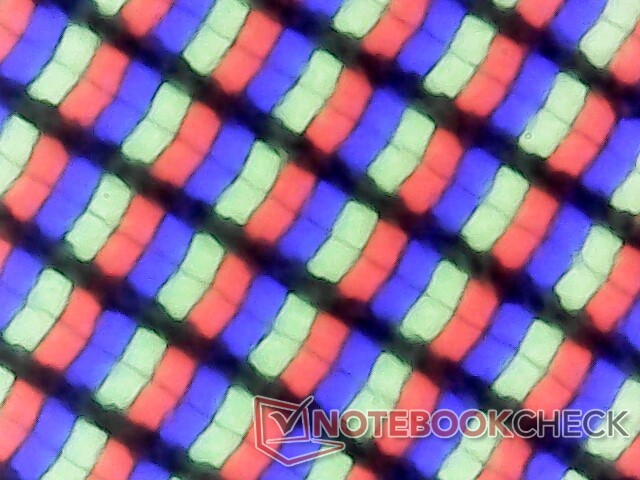
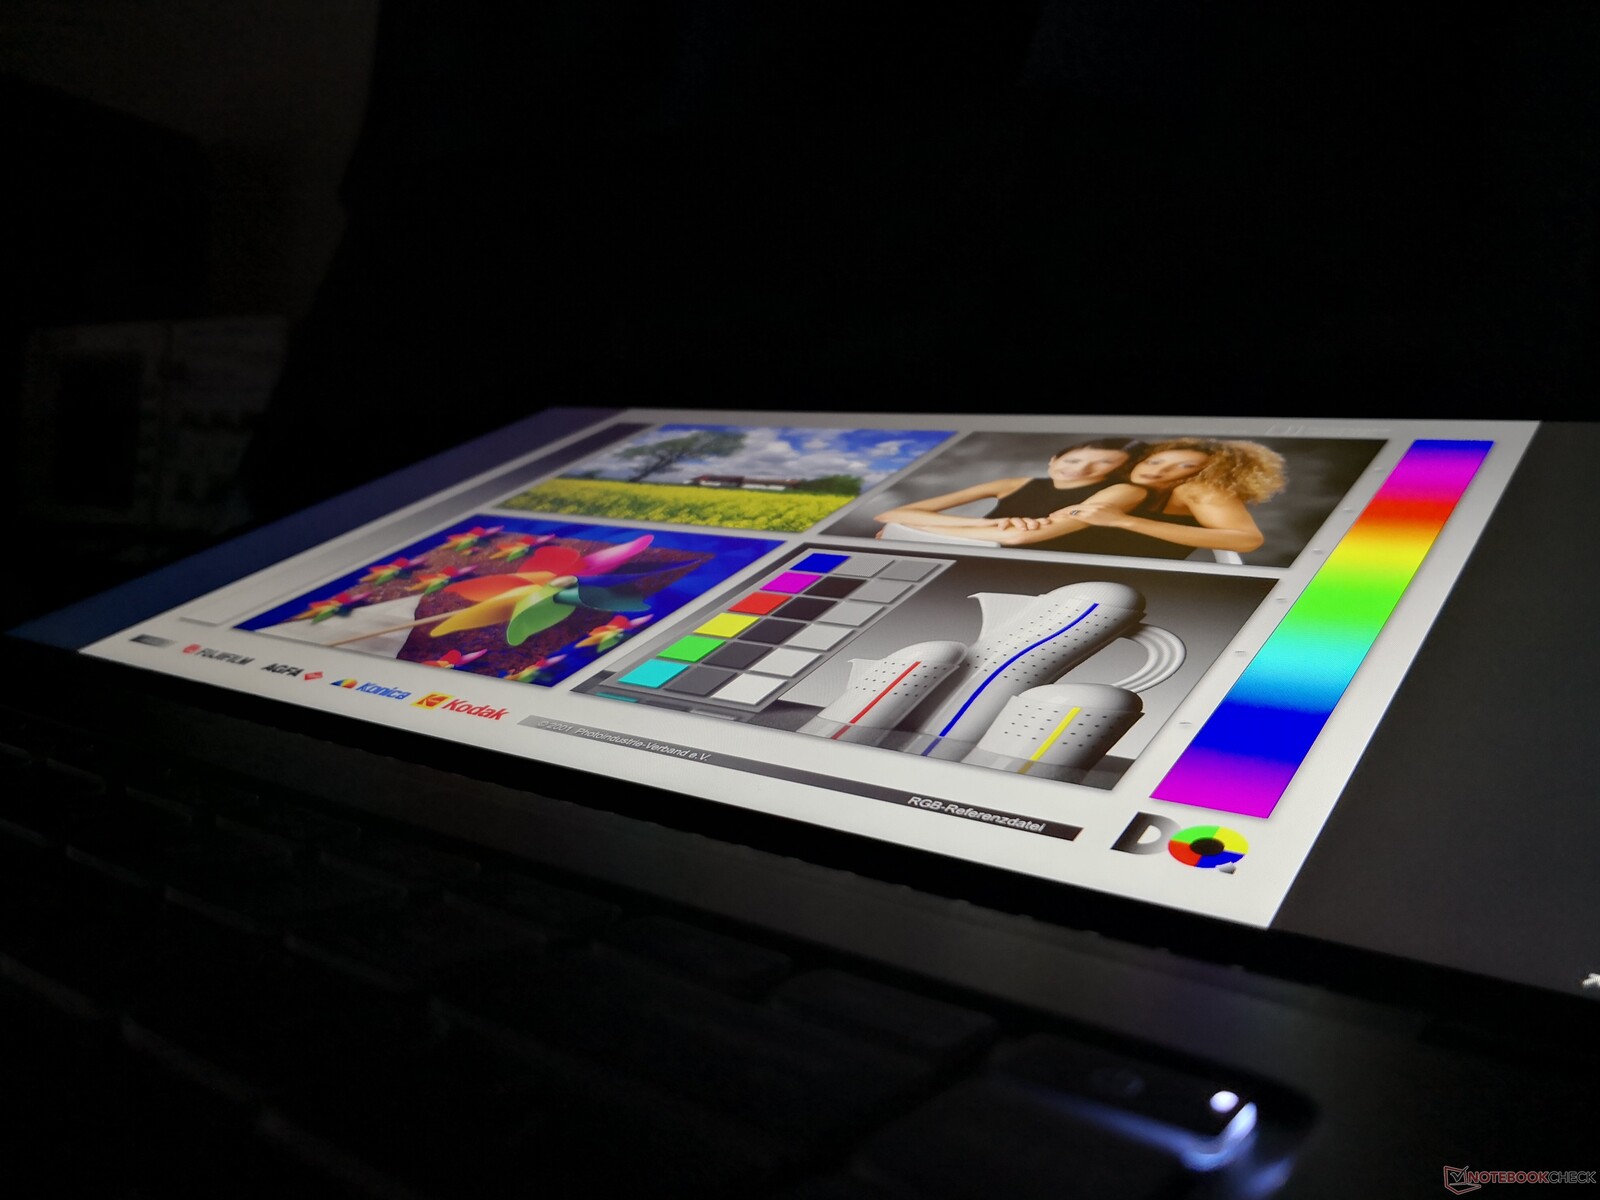
Display
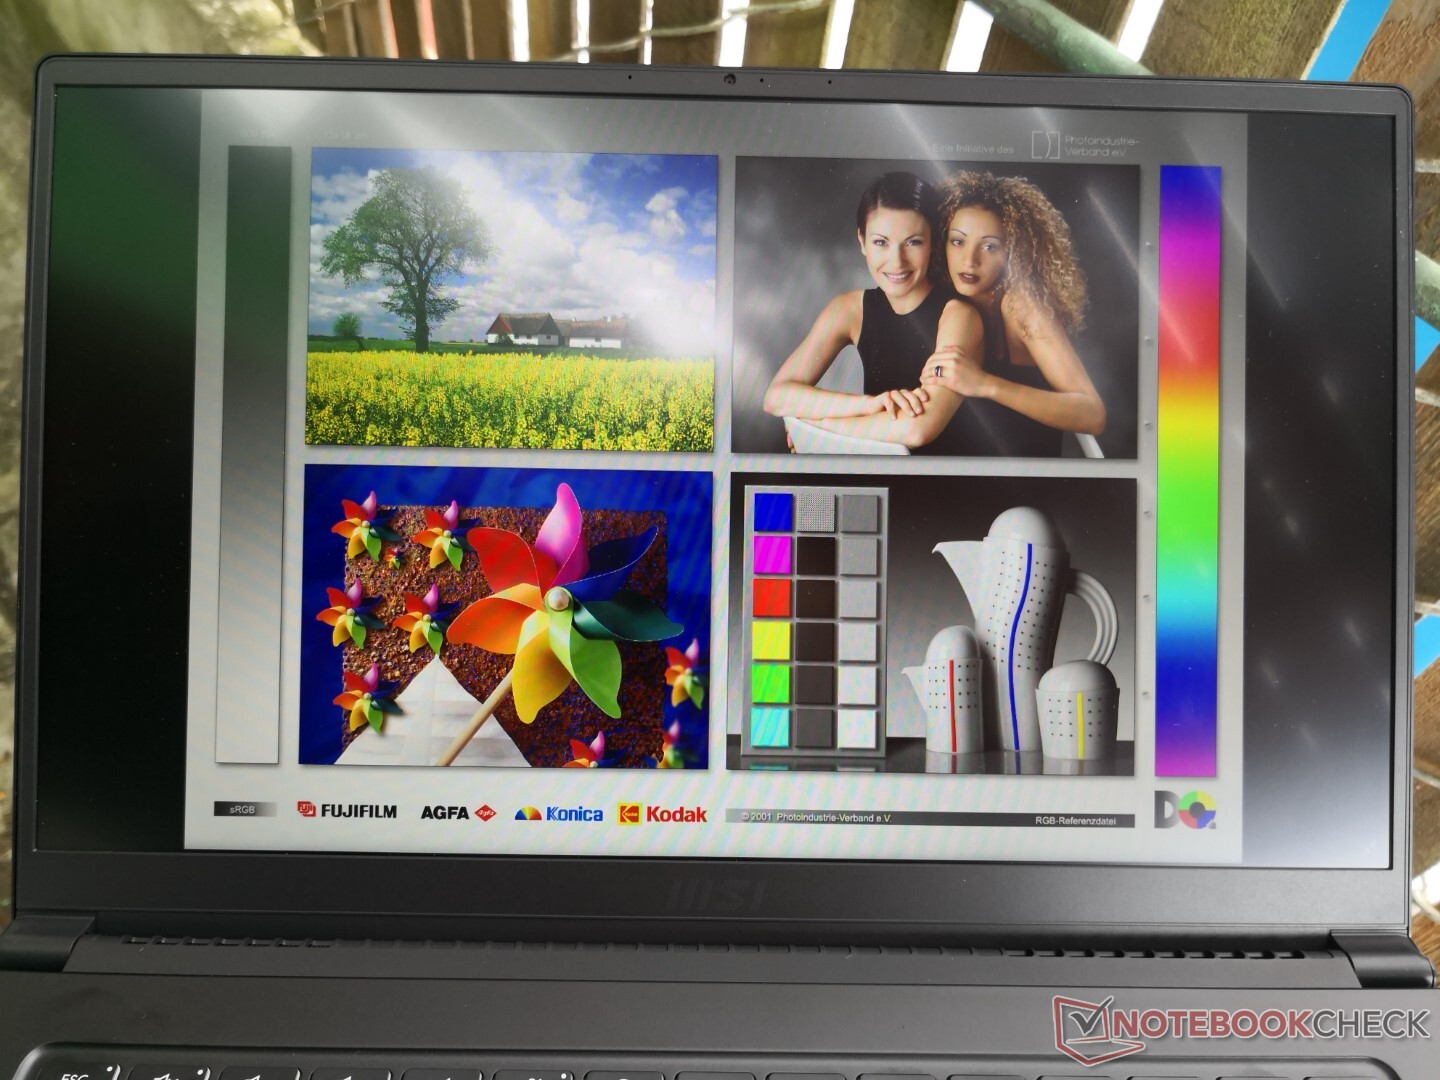
Il Summit B15 utilizza lo stesso pannello IPS opaco Chi Mei N156HCE-EN1 che si trova sull'MSI PS63 Modern 2019. In effetti, questo esatto pannello è abbastanza comune sui portatili da 15,6" di fascia media superiore, tra cui il ThinkPad P52, ThinkPad X1 Extreme, Asus ZenBook Pro UX550e anche il Modern 15 di MSI. La qualità dell'immagine è quindi simile tra tutti questi portatili, compresi i tempi medi di risposta bianco-nero e un rapporto di contrasto decente. Anche la modulazione di larghezza d'impulso a livelli di luminosità più bassi è tornata.
| |||||||||||||||||||||||||
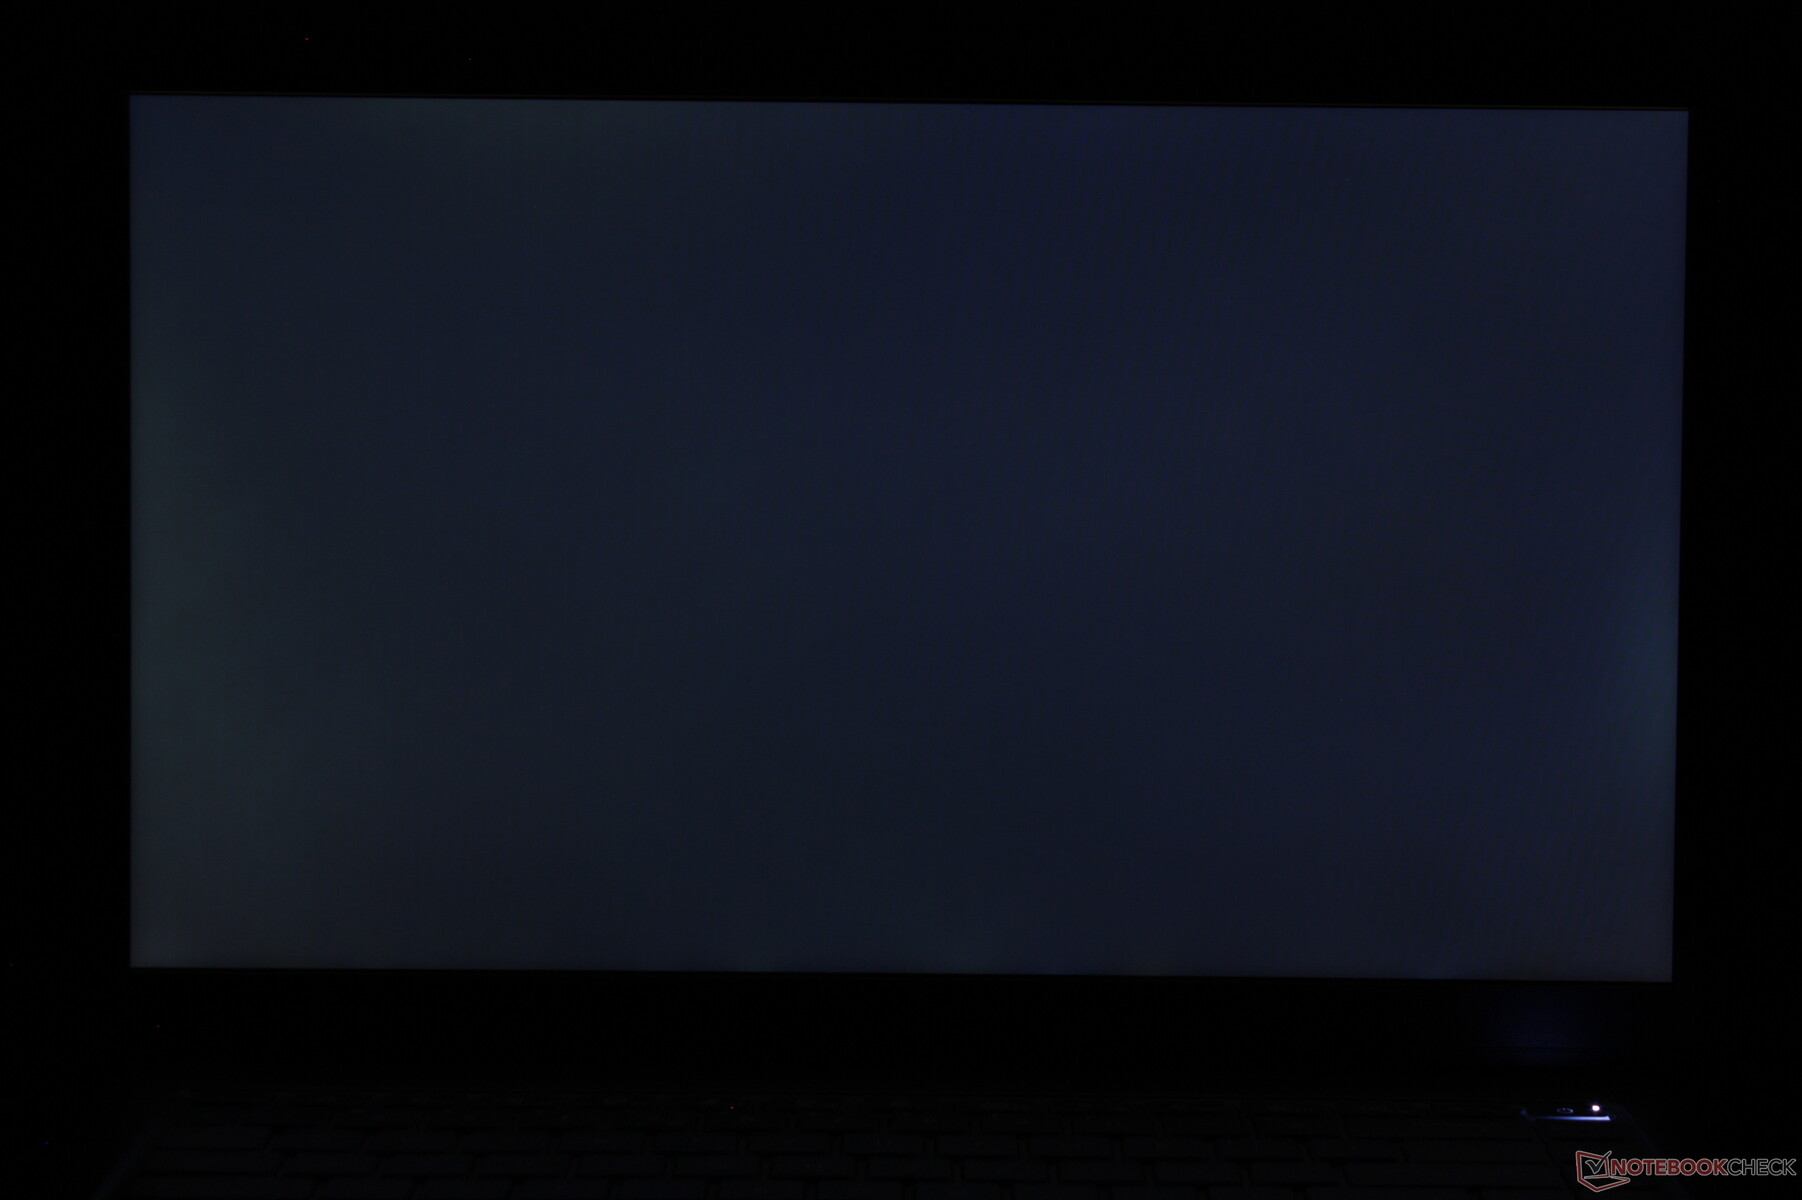
Distribuzione della luminosità: 81 %
Al centro con la batteria: 341.3 cd/m²
Contrasto: 758:1 (Nero: 0.45 cd/m²)
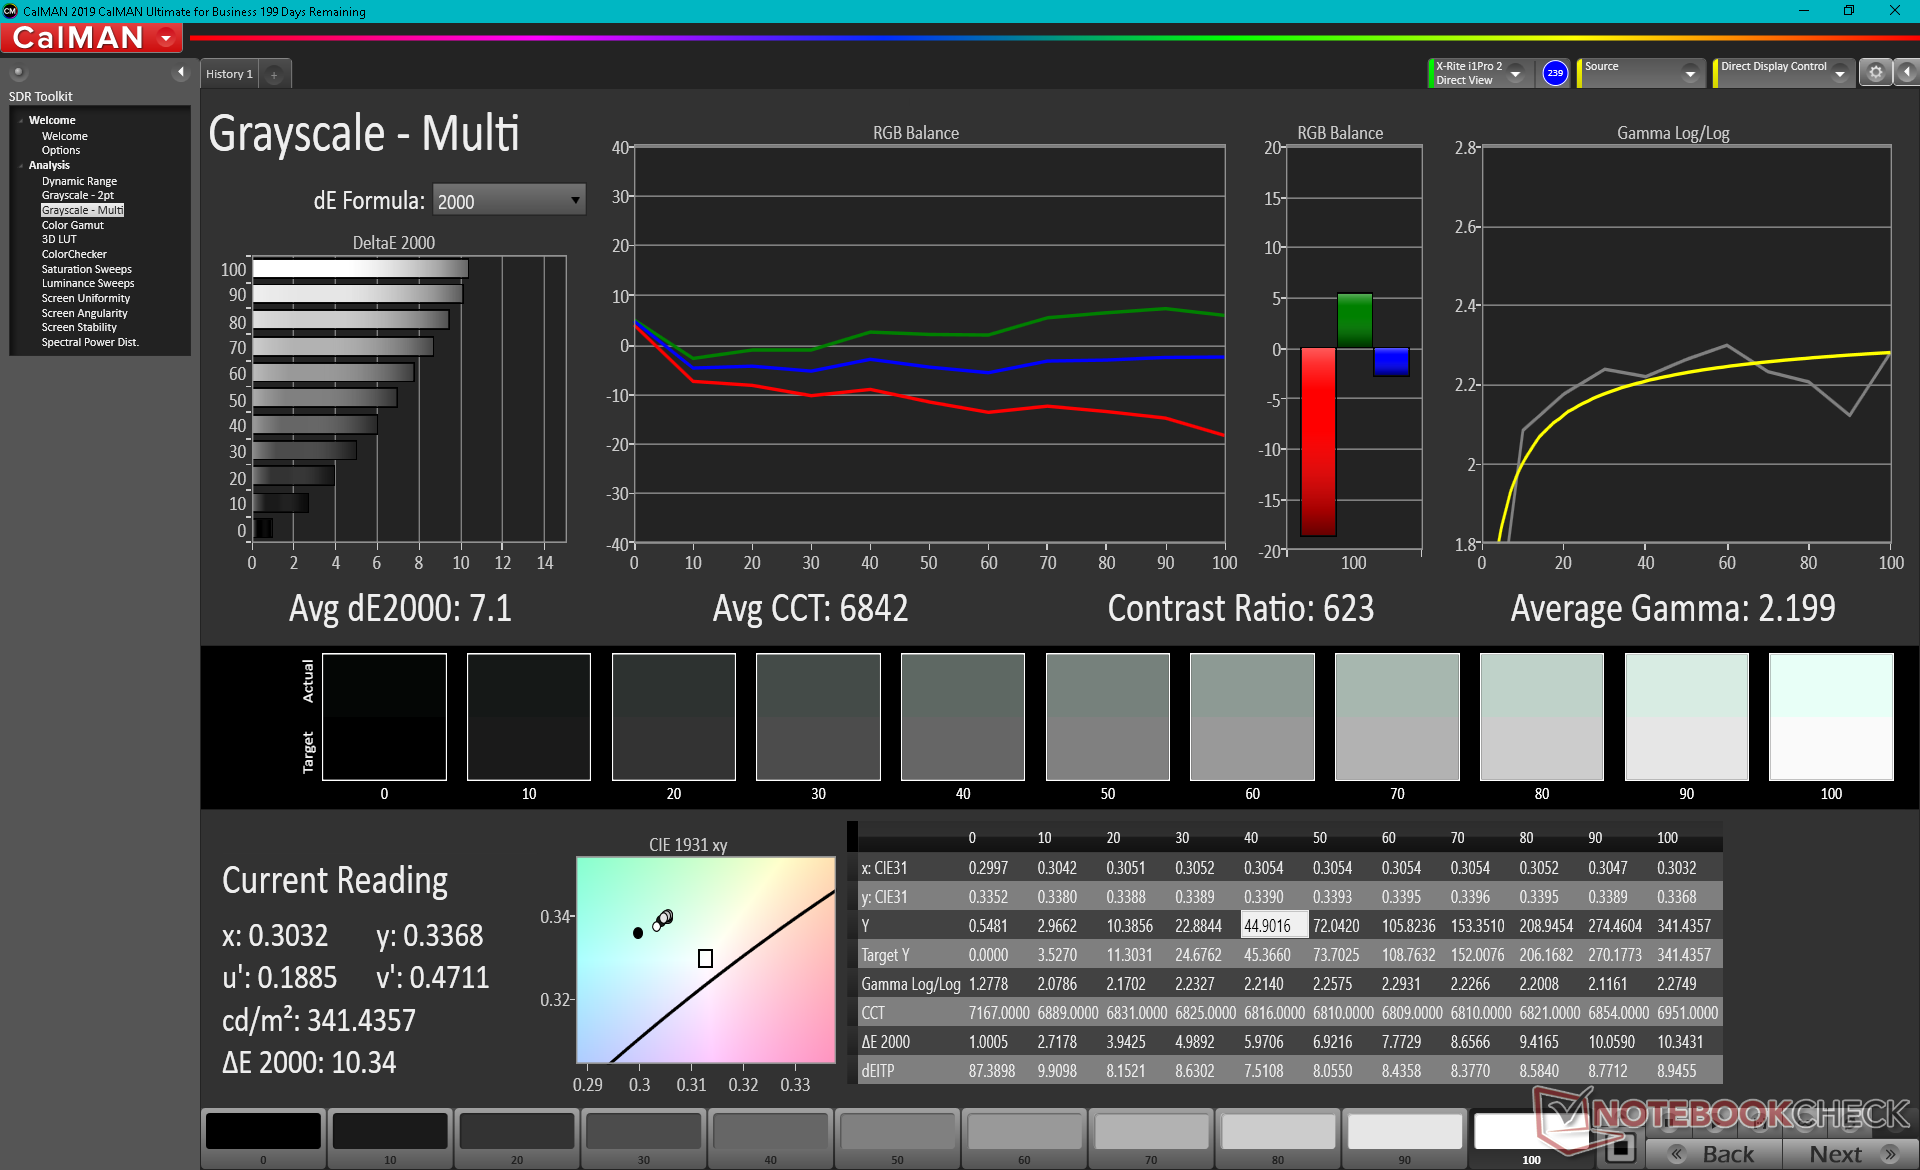
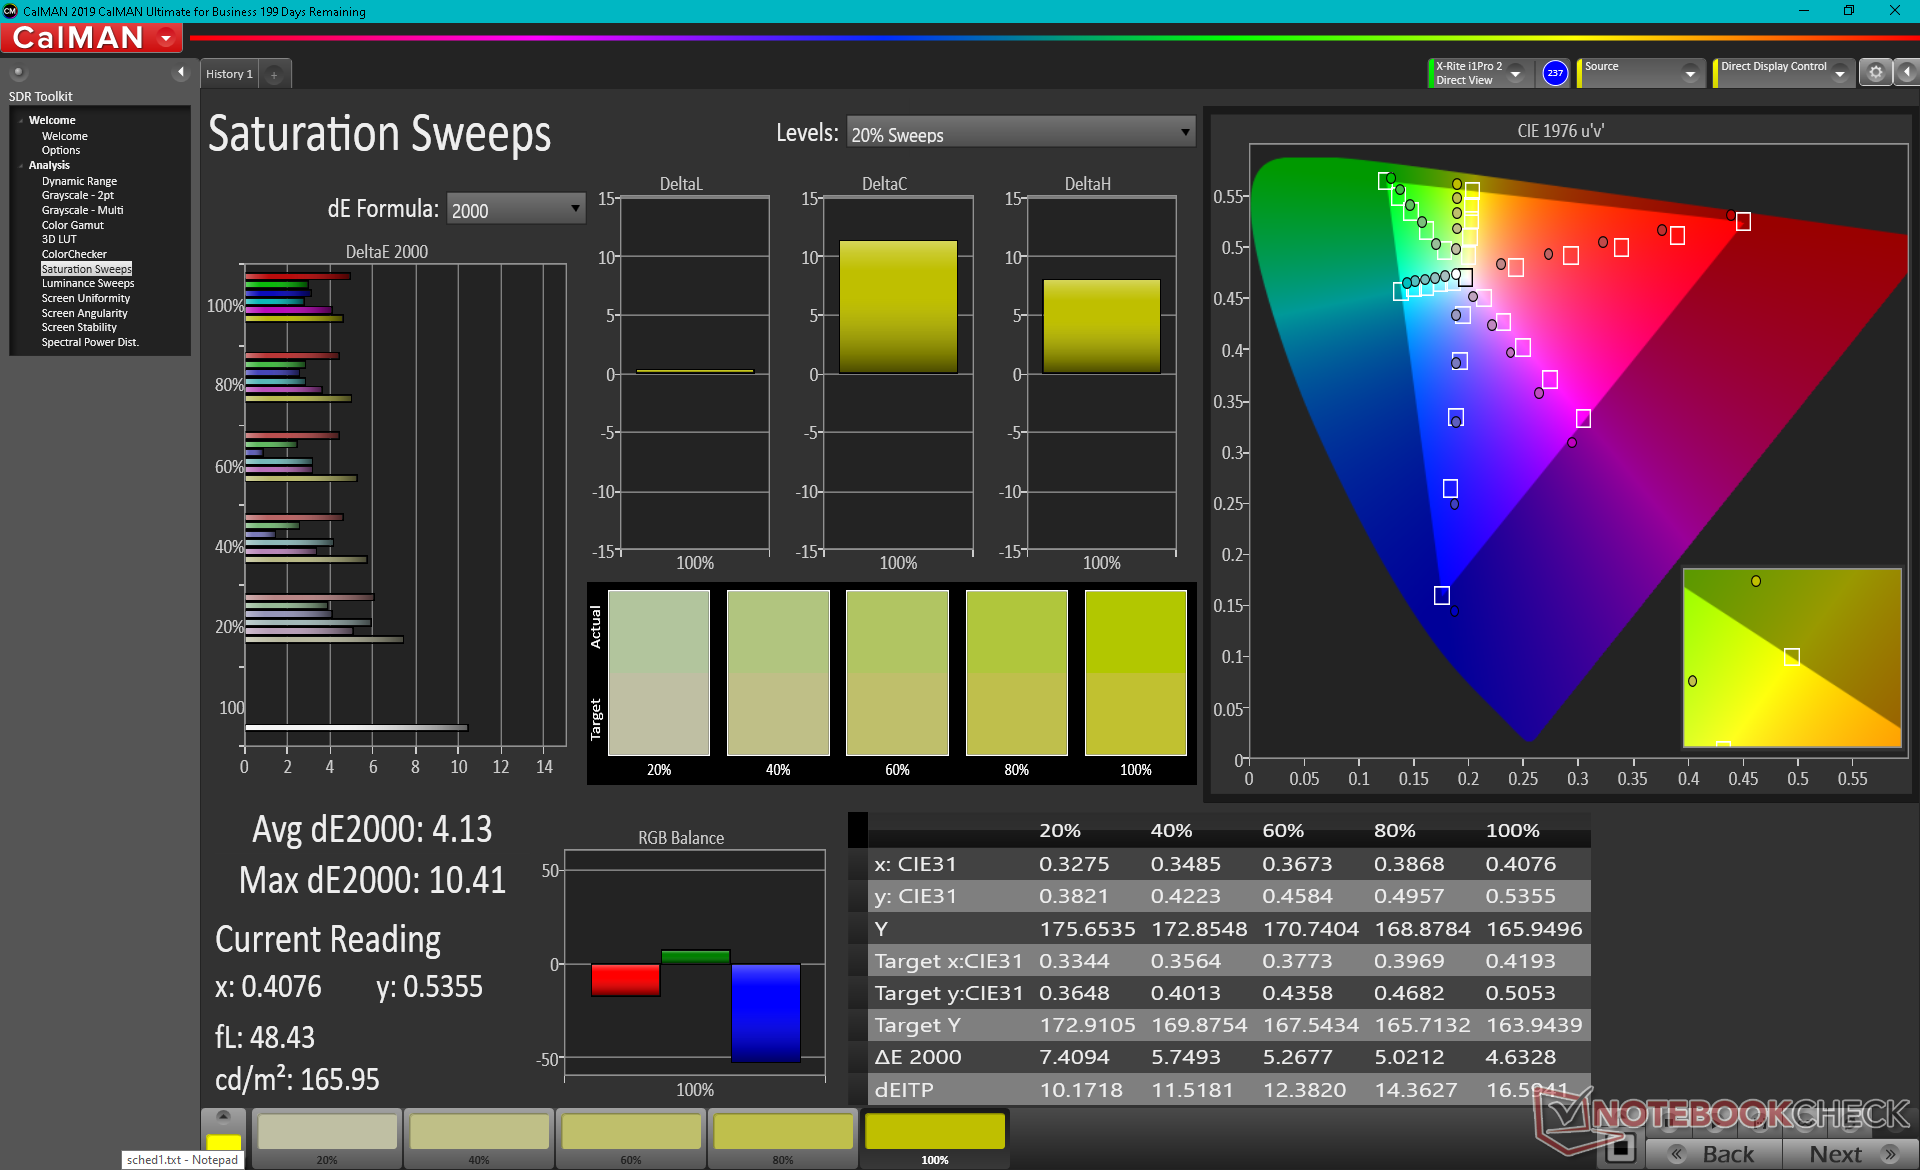
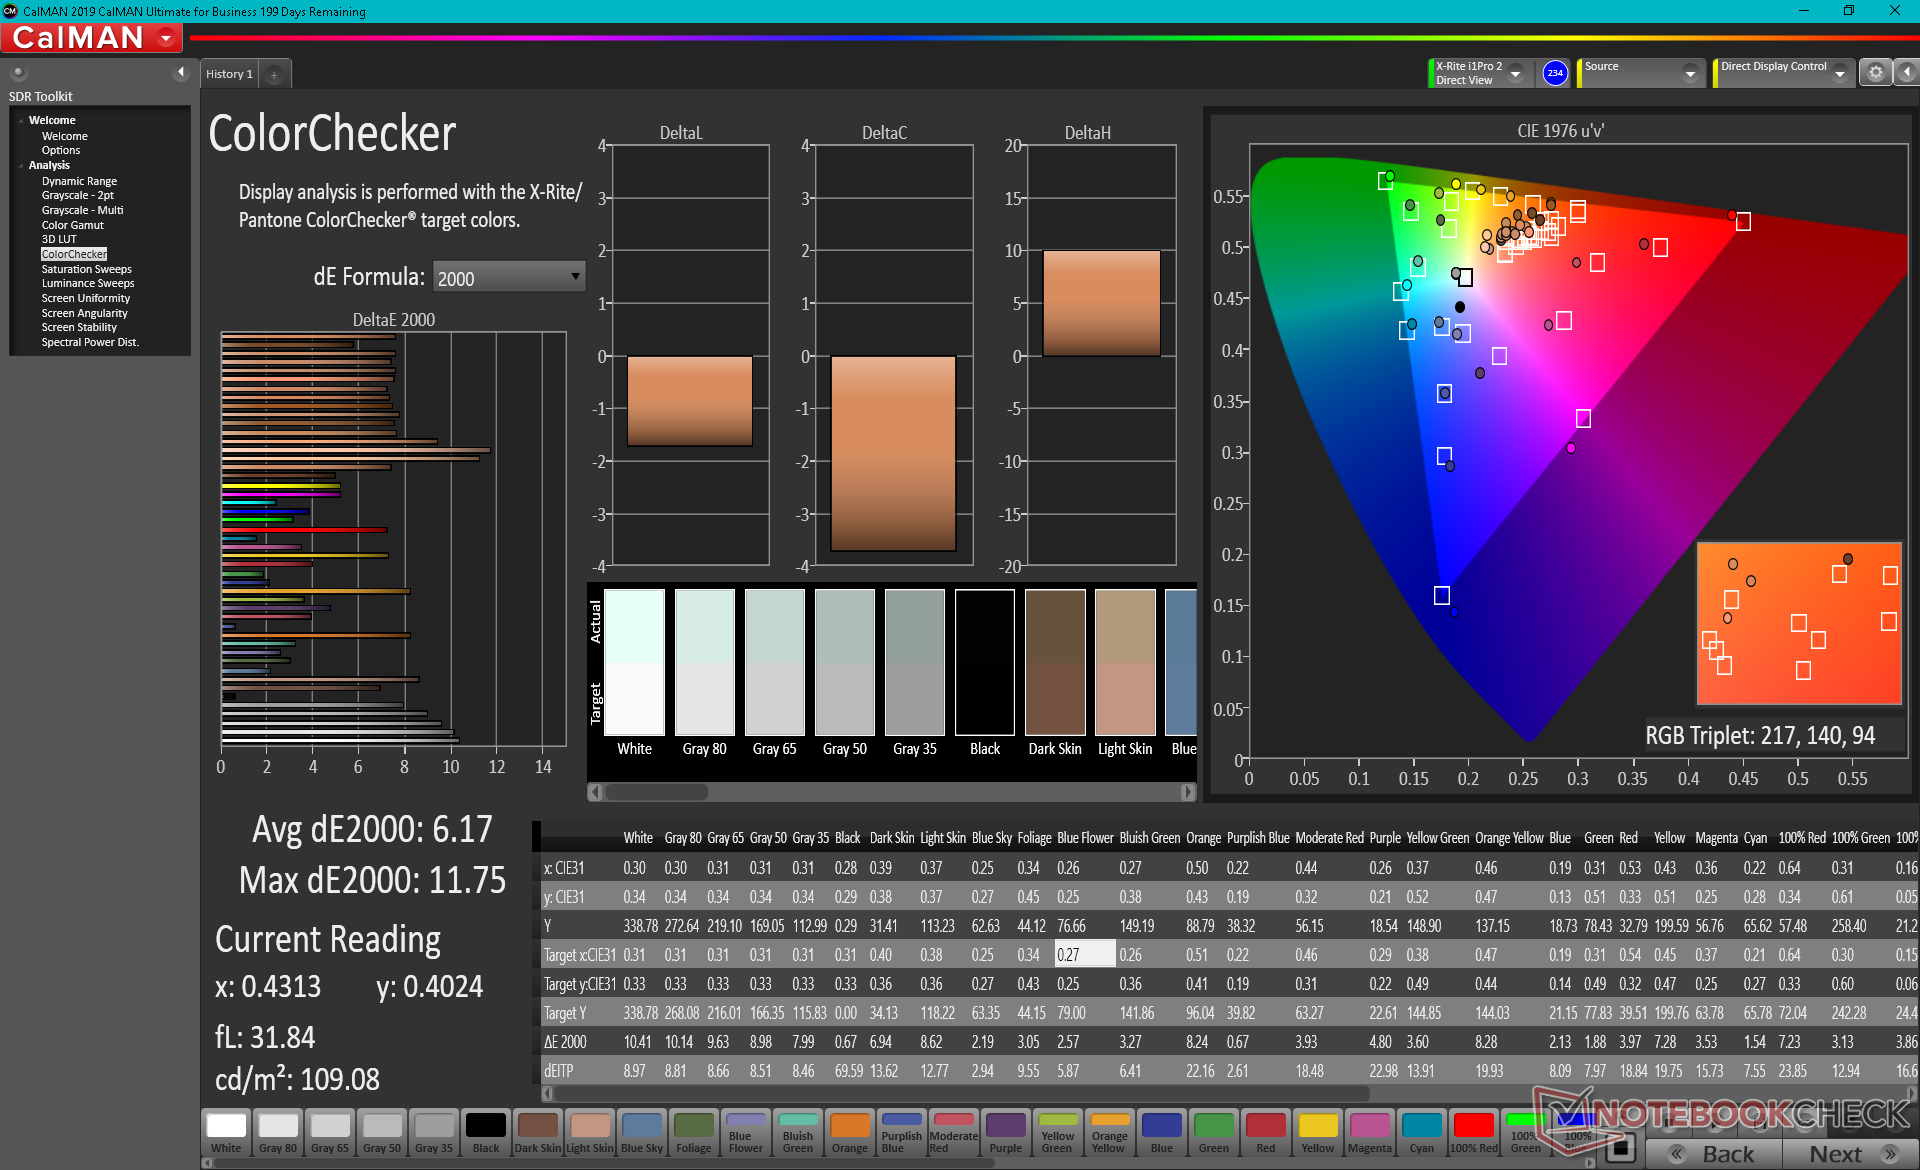
ΔE ColorChecker Calman: 6.17 | ∀{0.5-29.43 Ø4.71}
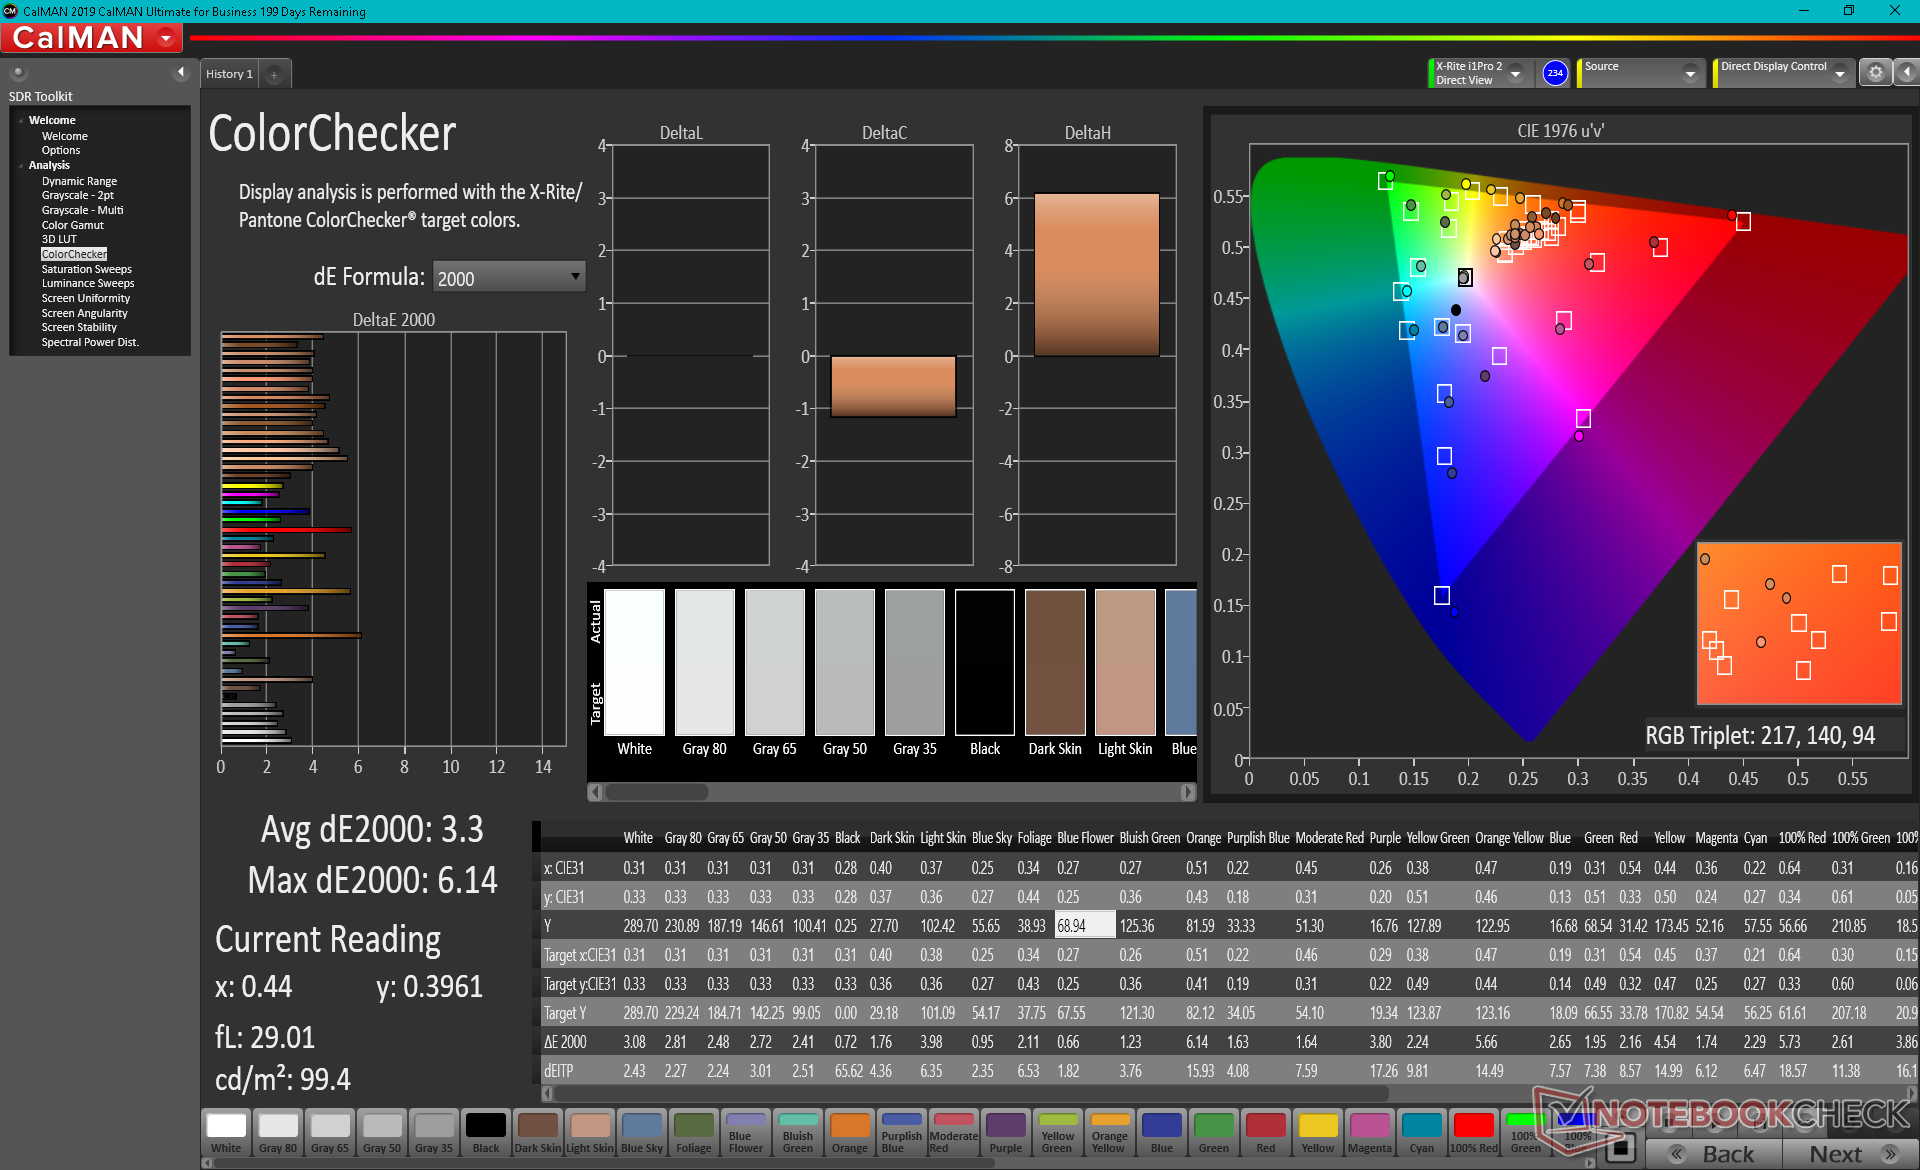
calibrated: 3.3
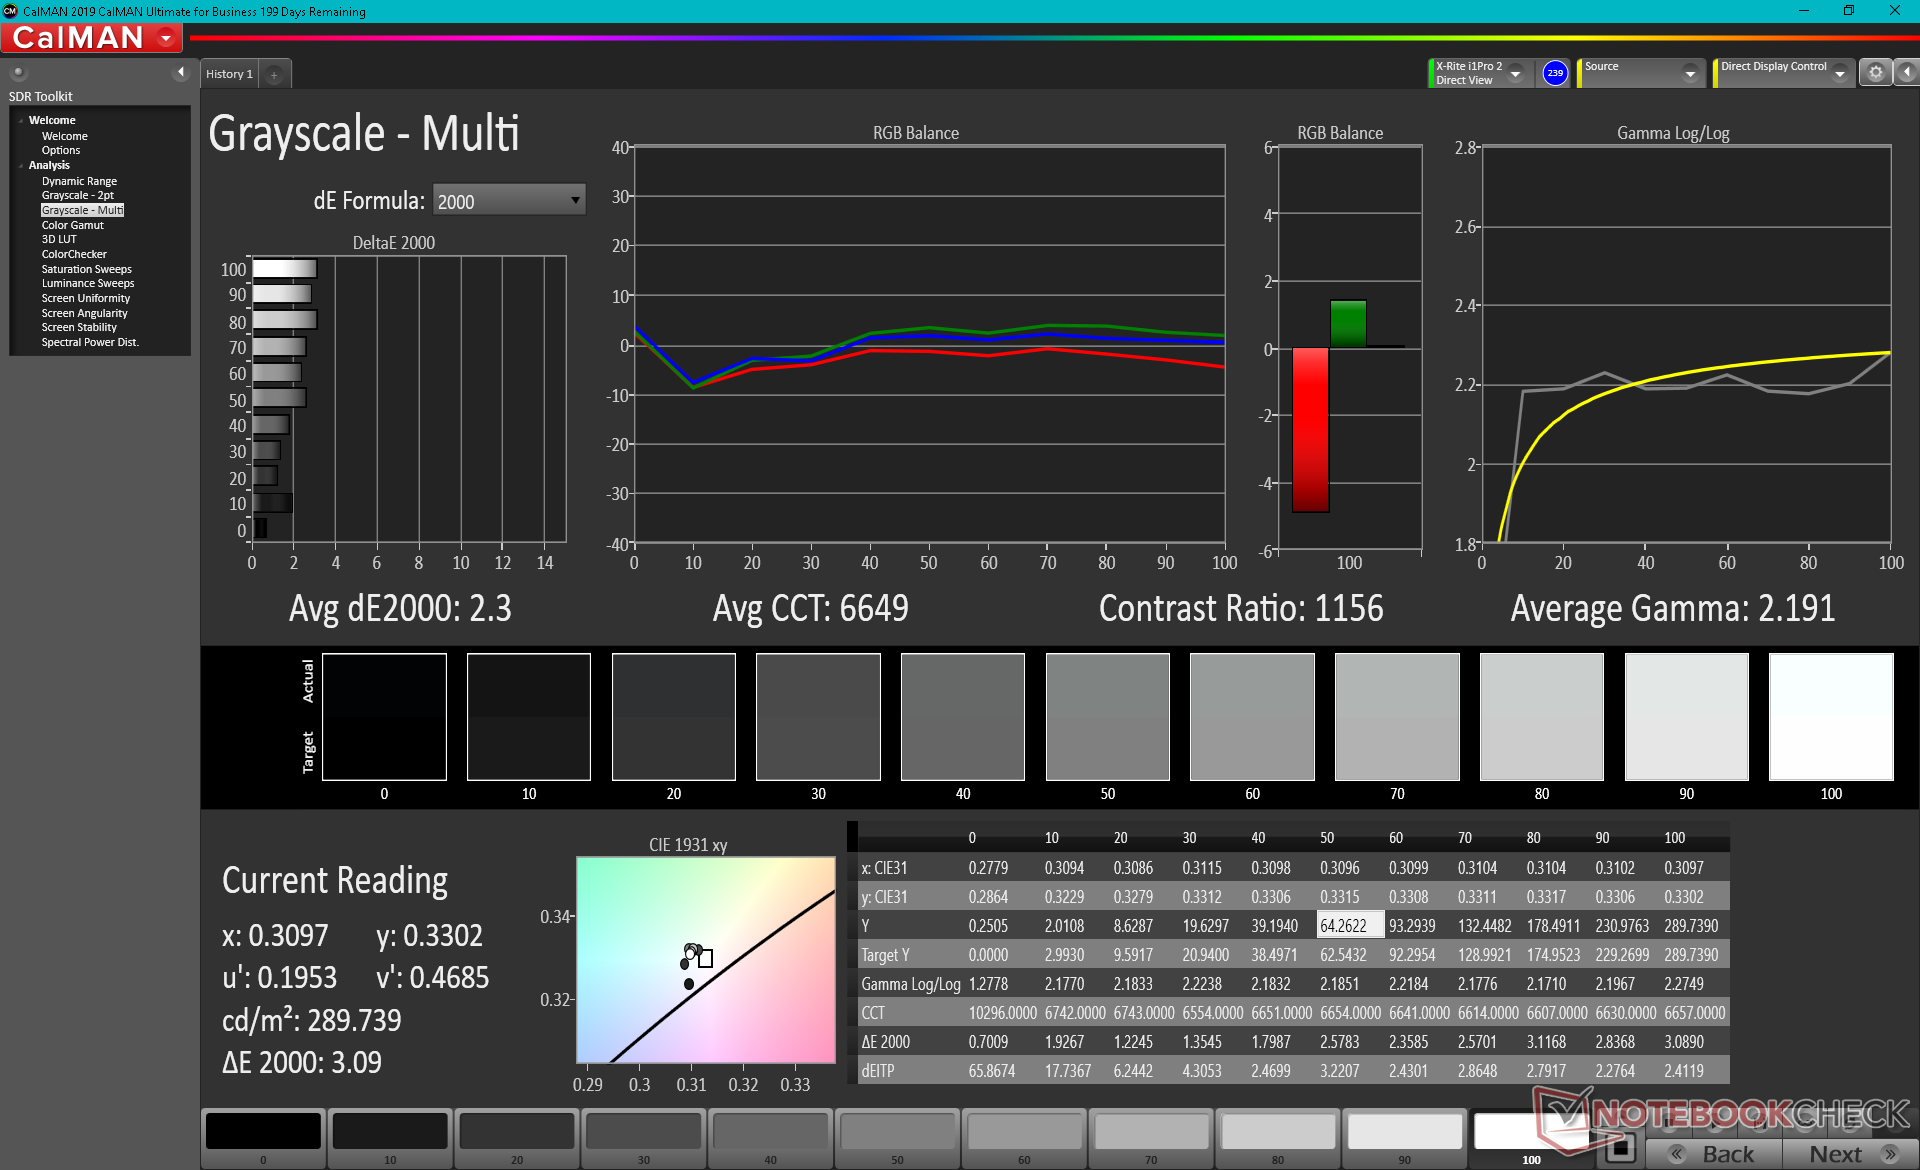
ΔE Greyscale Calman: 7.1 | ∀{0.09-98 Ø4.96}
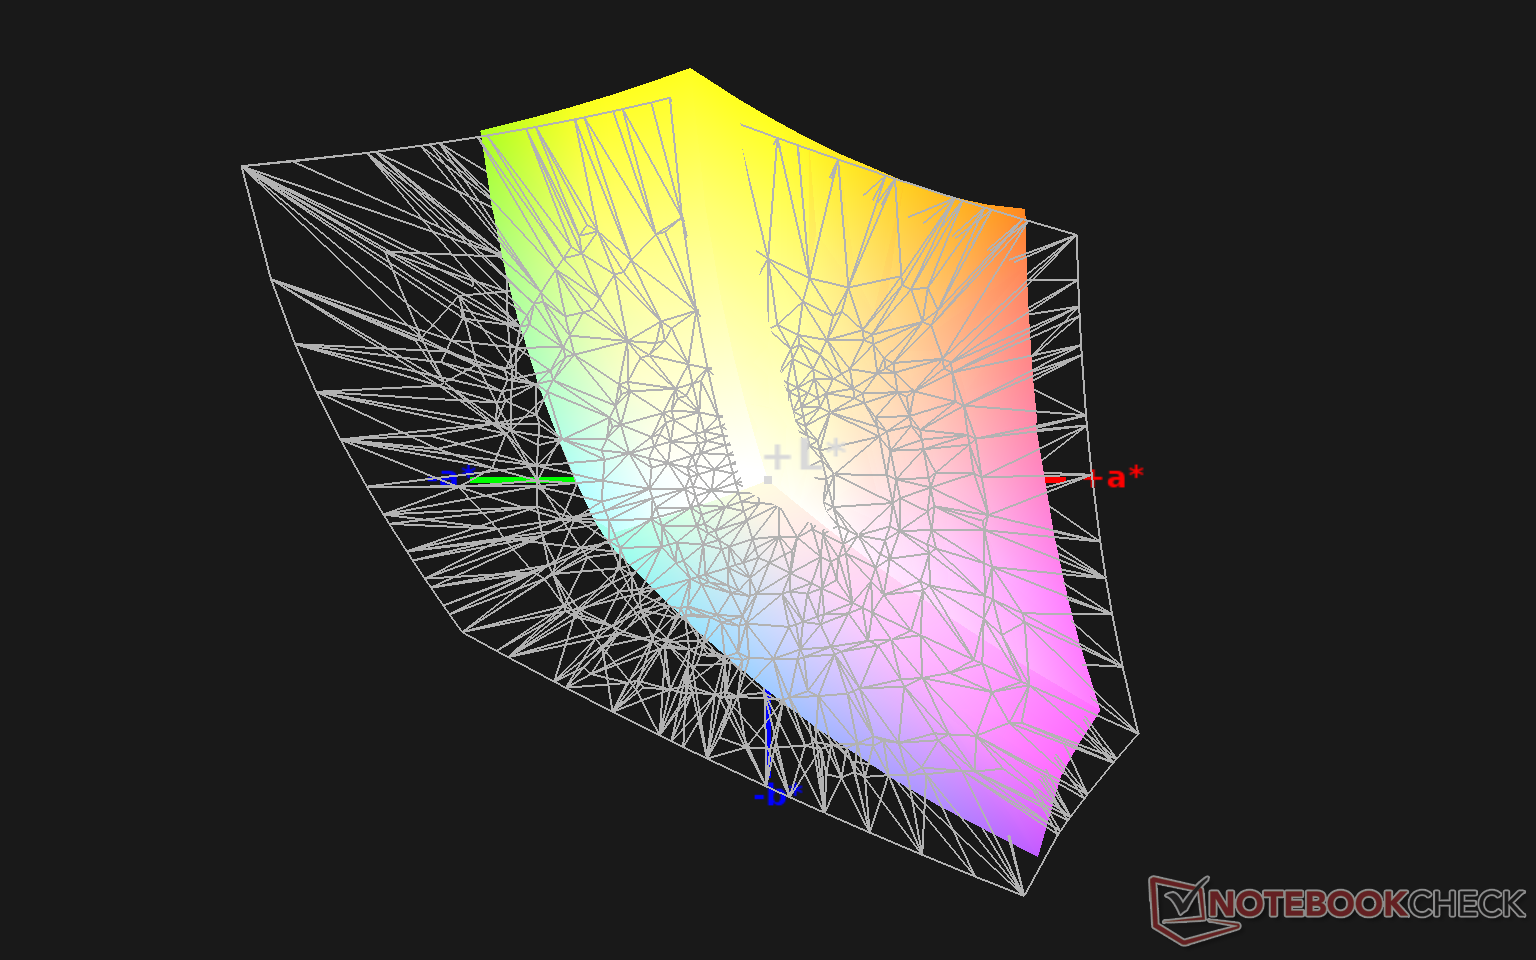
90.1% sRGB (Argyll 1.6.3 3D)
58.7% AdobeRGB 1998 (Argyll 1.6.3 3D)
66% AdobeRGB 1998 (Argyll 3D)
90.6% sRGB (Argyll 3D)
65.7% Display P3 (Argyll 3D)
Gamma: 2.2
CCT: 6842 K
| MSI Summit B15 A11M Chi Mei N156HCE-EN1, IPS, 15.6", 1920x1080 | MSI Summit E15 A11SCST AU Optronics B156HAB03.1, IPS, 15.6", 1920x1080 | Dell XPS 15 9500 Core i5 Sharp LQ156N1, IPS, 15.6", 1920x1200 | HP Spectre X360 15-5ZV31AV AU Optronics AUO30EB, IPS, 15.6", 3840x2160 | ADATA XPG Xenia Xe BOE08F5, IPS, 15.6", 1920x1080 | Asus ZenBook 15 UX534FTC-A8190T BOE CQ NV156FHM-N63, IPS, 15.6", 1920x1080 | |
|---|---|---|---|---|---|---|
| Display | -1% | 18% | 4% | 7% | -4% | |
| Display P3 Coverage (%) | 65.7 | 64.5 -2% | 81.5 24% | 68.3 4% | 70 7% | 65 -1% |
| sRGB Coverage (%) | 90.6 | 89.3 -1% | 100 10% | 94.3 4% | 95.2 5% | 86.2 -5% |
| AdobeRGB 1998 Coverage (%) | 66 | 65.3 -1% | 79.6 21% | 68.4 4% | 71.2 8% | 62.9 -5% |
| Response Times | -1% | 4% | -34% | -31% | -5% | |
| Response Time Grey 50% / Grey 80% * (ms) | 40.4 ? | 43.2 ? -7% | 42 ? -4% | 56.8 ? -41% | 56.8 ? -41% | 45 ? -11% |
| Response Time Black / White * (ms) | 32.4 ? | 30.8 ? 5% | 28.8 ? 11% | 40.8 ? -26% | 38.8 ? -20% | 32 ? 1% |
| PWM Frequency (Hz) | 25510 ? | |||||
| Screen | 20% | 41% | 22% | 39% | 22% | |
| Brightness middle (cd/m²) | 341.3 | 298 -13% | 592 73% | 284.6 -17% | 480.4 41% | 299 -12% |
| Brightness (cd/m²) | 310 | 280 -10% | 565 82% | 285 -8% | 451 45% | 280 -10% |
| Brightness Distribution (%) | 81 | 90 11% | 85 5% | 85 5% | 88 9% | 89 10% |
| Black Level * (cd/m²) | 0.45 | 0.22 51% | 0.46 -2% | 0.25 44% | 0.31 31% | 0.21 53% |
| Contrast (:1) | 758 | 1355 79% | 1287 70% | 1138 50% | 1550 104% | 1424 88% |
| Colorchecker dE 2000 * | 6.17 | 5.41 12% | 3.19 48% | 3.52 43% | 2.53 59% | 4.76 23% |
| Colorchecker dE 2000 max. * | 11.75 | 8.59 27% | 5.45 54% | 5.56 53% | 7.28 38% | 9 23% |
| Colorchecker dE 2000 calibrated * | 3.3 | 2.97 10% | 2.03 38% | 3 9% | 1.69 49% | |
| Greyscale dE 2000 * | 7.1 | 4.1 42% | 3.9 45% | 3.2 55% | 3.8 46% | 3.53 50% |
| Gamma | 2.2 100% | 2.334 94% | 2.25 98% | 2.28 96% | 2.15 102% | 2.3 96% |
| CCT | 6842 95% | 7025 93% | 6522 100% | 7070 92% | 6760 96% | 7228 90% |
| Color Space (Percent of AdobeRGB 1998) (%) | 58.7 | 65 11% | 71.6 22% | 61.1 4% | 63 7% | 56 -5% |
| Color Space (Percent of sRGB) (%) | 90.1 | 90 0% | 100 11% | 93.8 4% | 94.9 5% | 86 -5% |
| Media totale (Programma / Settaggio) | 6% /
13% | 21% /
32% | -3% /
12% | 5% /
25% | 4% /
13% |
* ... Meglio usare valori piccoli
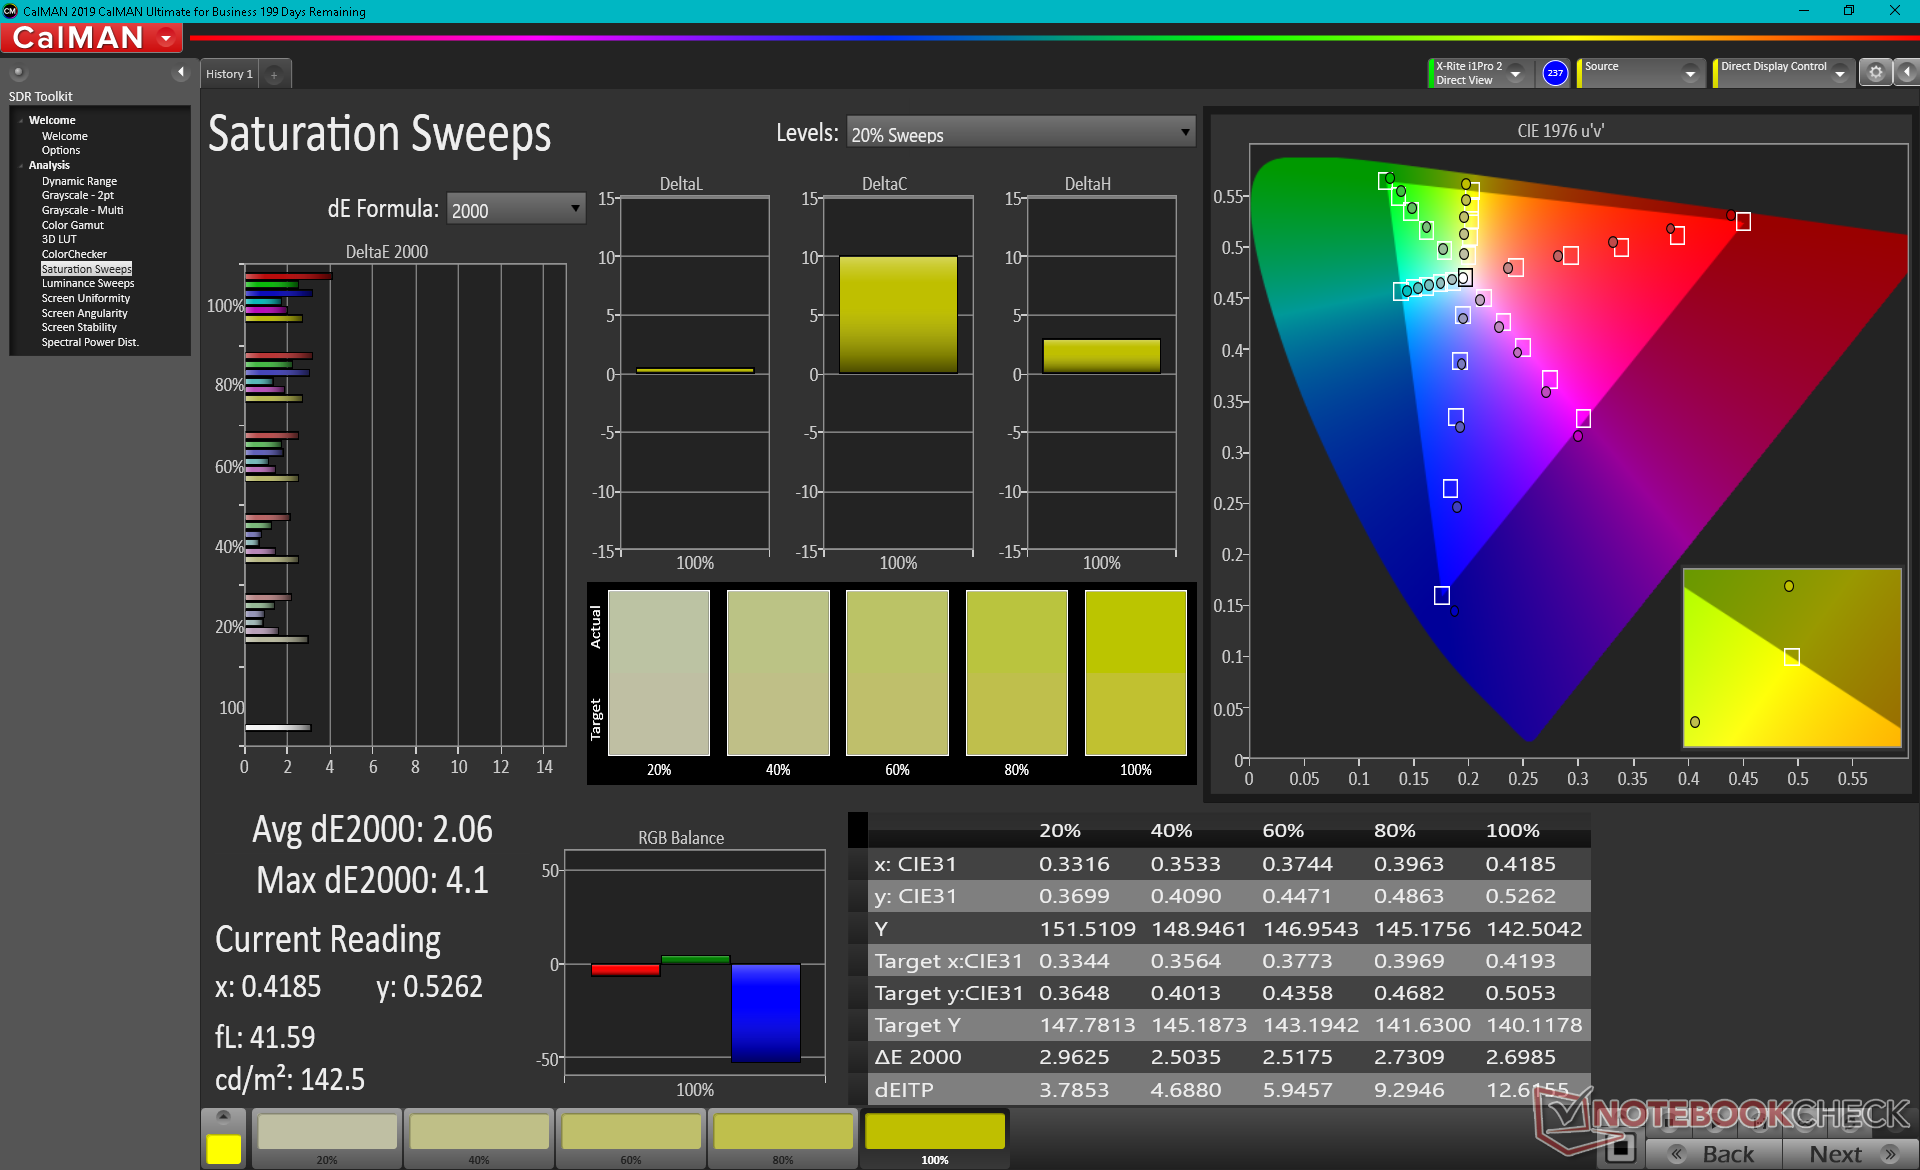
Lo spazio colore copre circa il 90% di sRGB per essere abbastanza buono per l'editor di grafica casuale di destinazione. Dovrete spendere di più su modelli alternativi 4K o OLED di Dell, HP o altri se la copertura AdobeRGB è il vostro obiettivo.
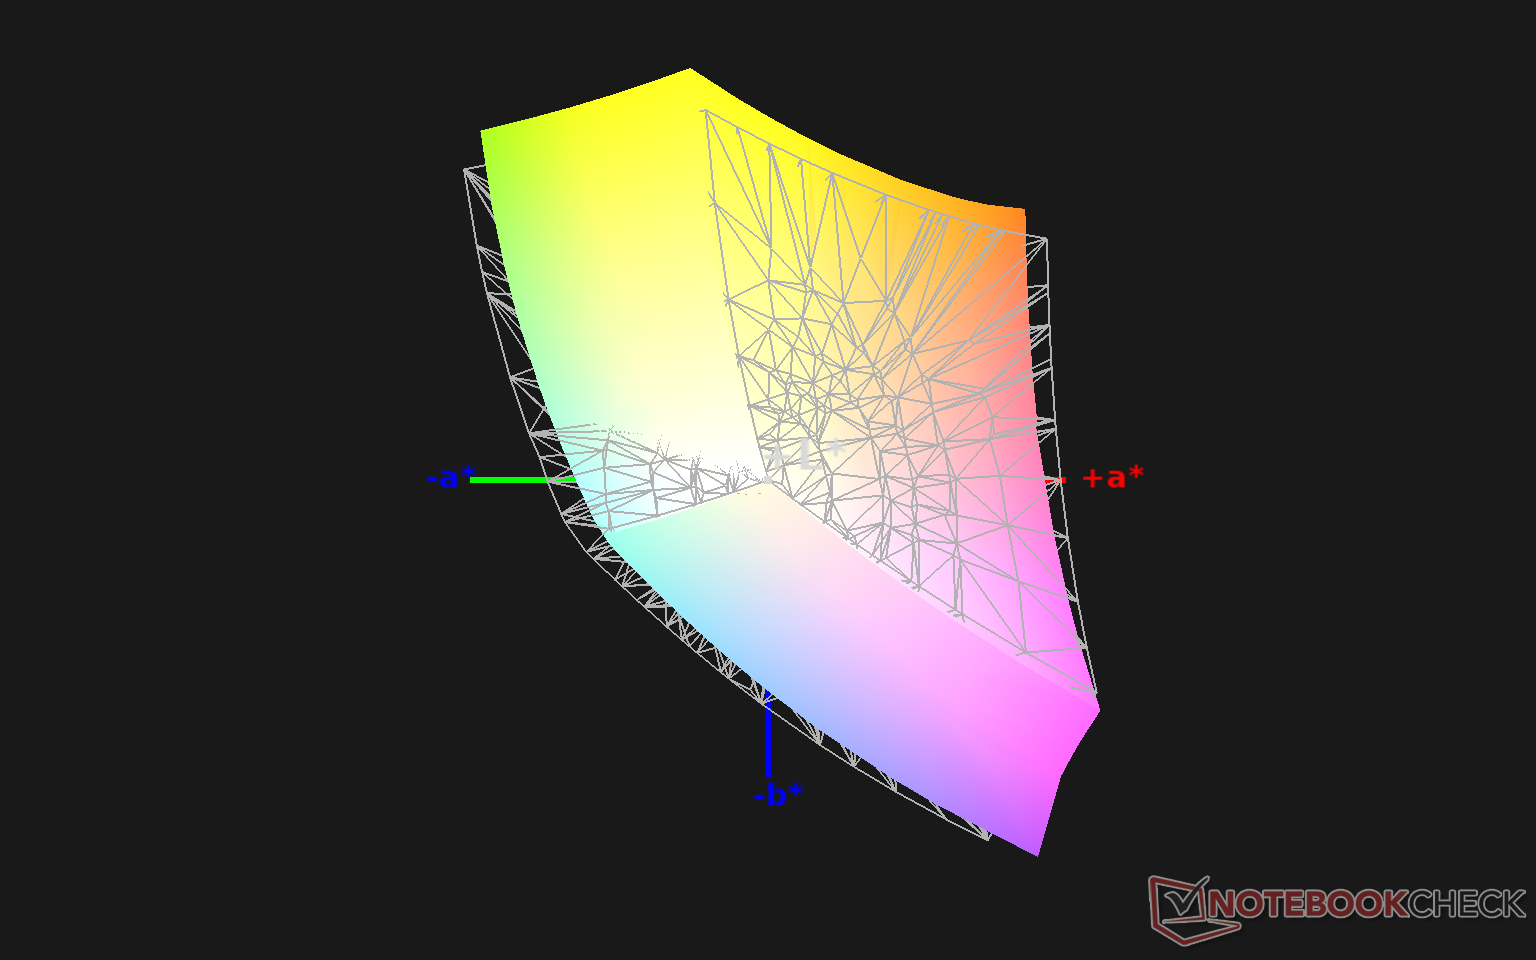
Le misurazioni del colorimetro X-Rite mostrano una temperatura di colore eccessivamente fredda con una scarsa riproduzione della scala di grigi e dei colori nonostante la copertura sRGB relativamente alta del 90%. I dati hanno indicato il perché MSI non pre-calibra la serie Summit B15 in fabbrica. I colori e la scala di grigi migliorano significativamente dopo la calibrazione con valori DeltaE medi molto più bassi. Raccomandiamo di applicare il nostro profilo ICM calibrato per una visualizzazione più accurata dei colori.
Tempi di risposta del Display
| ↔ Tempi di risposta dal Nero al Bianco | ||
|---|---|---|
| 32.4 ms ... aumenta ↗ e diminuisce ↘ combinato | ↗ 18.4 ms Incremento | 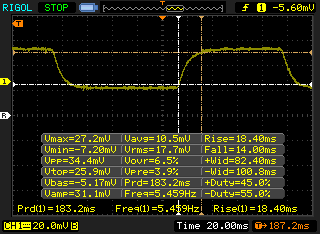 |
| ↘ 14 ms Calo | ||
| Lo schermo mostra tempi di risposta lenti nei nostri tests e sarà insoddisfacente per i gamers. In confronto, tutti i dispositivi di test variano da 0.1 (minimo) a 240 (massimo) ms. » 88 % di tutti i dispositivi è migliore. Questo significa che i tempi di risposta rilevati sono peggiori rispetto alla media di tutti i dispositivi testati (19.8 ms). | ||
| ↔ Tempo di risposta dal 50% Grigio all'80% Grigio | ||
| 40.4 ms ... aumenta ↗ e diminuisce ↘ combinato | ↗ 20.4 ms Incremento | 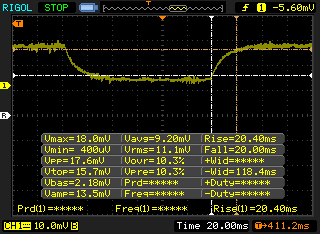 |
| ↘ 20 ms Calo | ||
| Lo schermo mostra tempi di risposta lenti nei nostri tests e sarà insoddisfacente per i gamers. In confronto, tutti i dispositivi di test variano da 0.165 (minimo) a 636 (massimo) ms. » 64 % di tutti i dispositivi è migliore. Questo significa che i tempi di risposta rilevati sono peggiori rispetto alla media di tutti i dispositivi testati (31 ms). | ||
Sfarfallio dello schermo / PWM (Pulse-Width Modulation)
| flickering dello schermo / PWM rilevato | 25510 Hz | ≤ 25 % settaggio luminosita' | 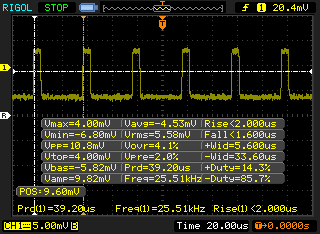 |
Il display sfarfalla a 25510 Hz (Probabilmente a causa dell'uso di PWM) Flickering rilevato ad una luminosita' di 25 % o inferiore. Non dovrebbe verificarsi flickering o PWM sopra questo valore di luminosita'. La frequenza di 25510 Hz è abbastanza alta, quindi la maggioranza degli utenti sensibili al PWM non dovrebbero notare alcun flickering. In confronto: 52 % di tutti i dispositivi testati non utilizza PWM per ridurre la luminosita' del display. Se è rilevato PWM, una media di 7757 (minimo: 5 - massimo: 343500) Hz è stata rilevata. | |||
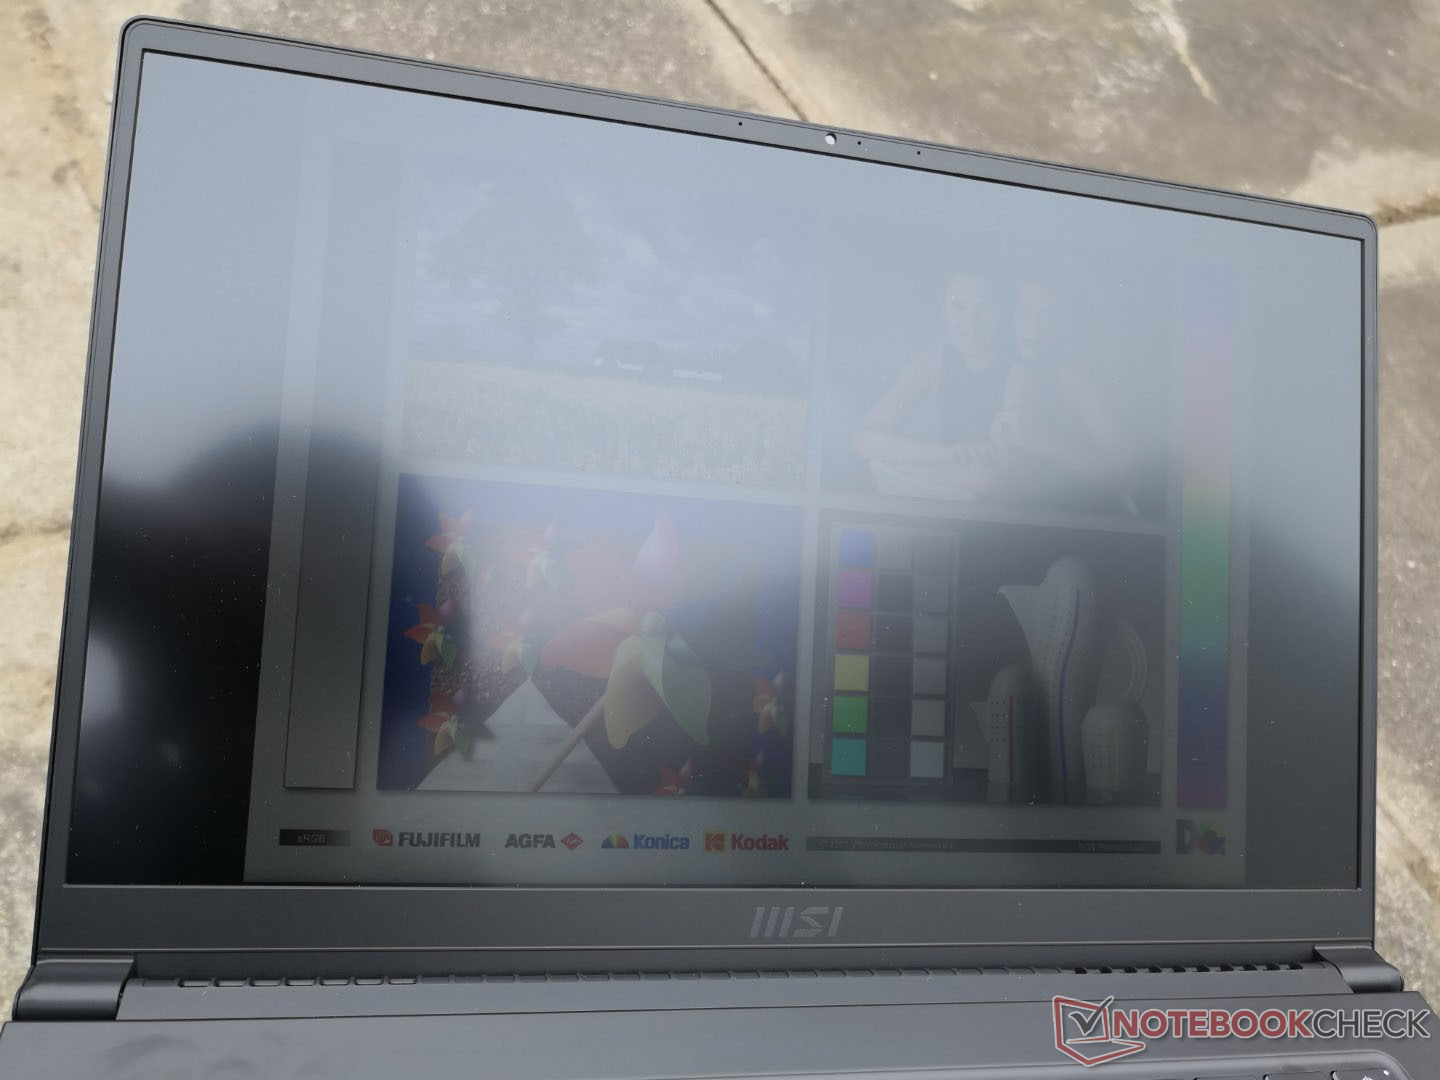
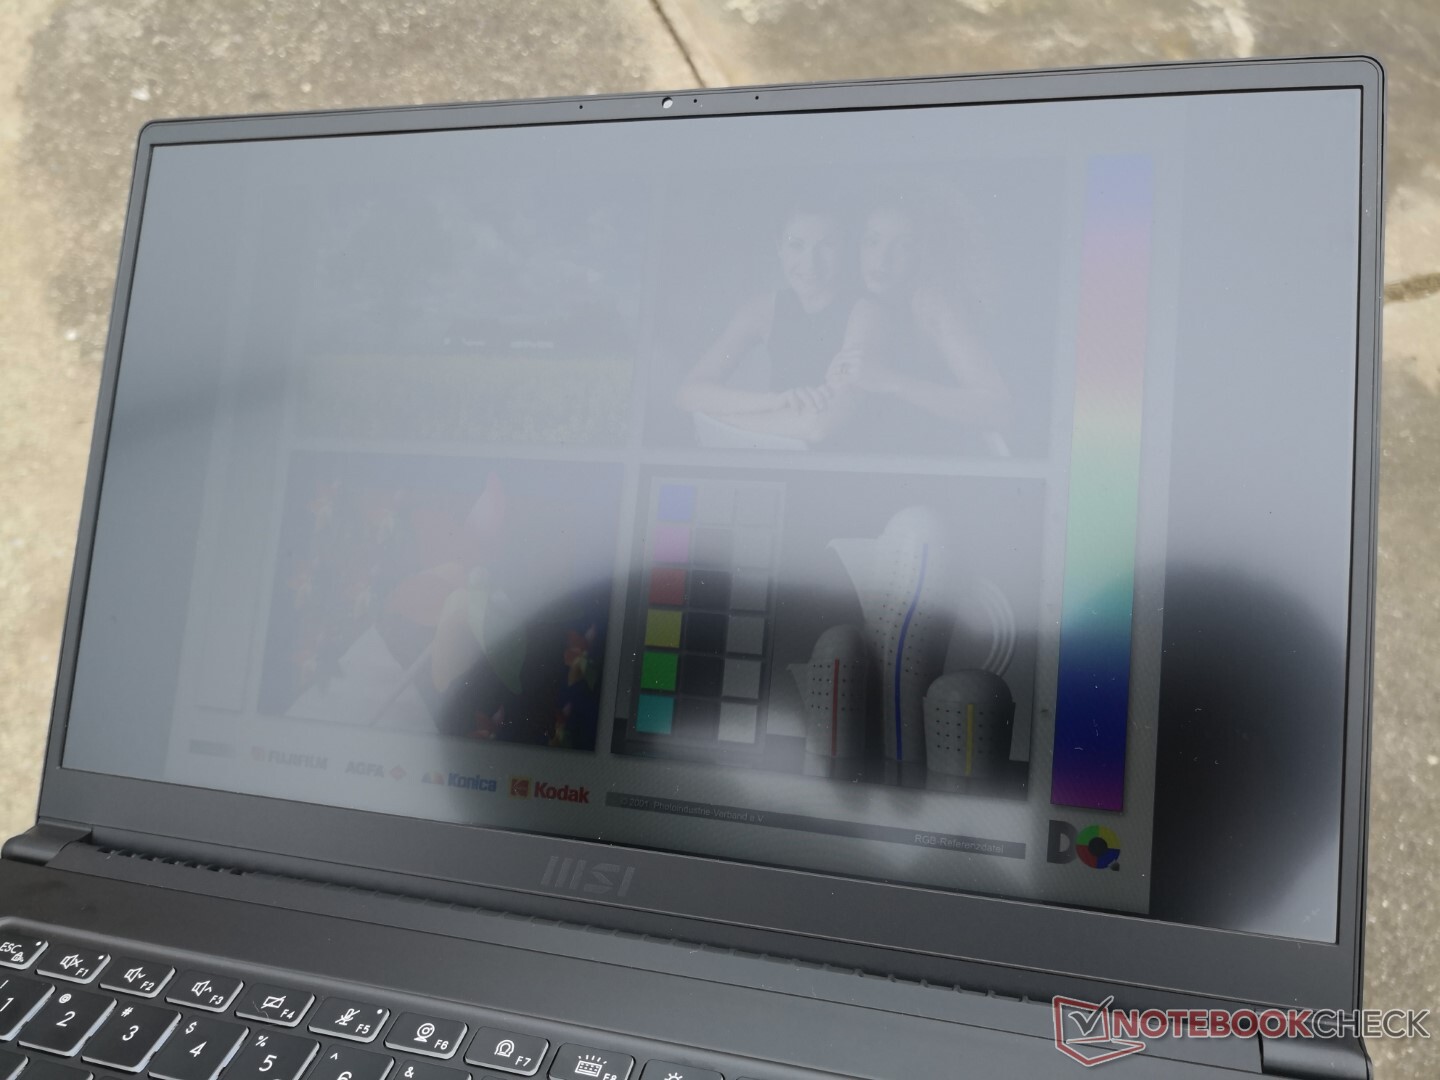
La visibilità all'aperto non è buona come quella del Dell XPS 15 o del MacBook Pro 15 entrambi i quali hanno display notevolmente più luminosi. I riflessi non sono così intensi sull'MSI grazie al suo pannello opaco, ma il display è ancora difficile da vedere comodamente nella maggior parte degli scenari.
Performance
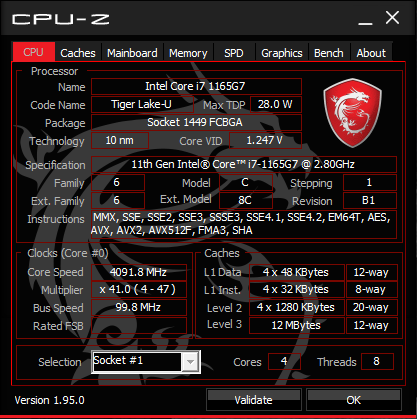
Solo due versioni sono disponibili al momento con il Core i5-1135G7 ULV o il Core i7-1165G7. Per opzioni Core H più veloci, MSI offre invece la serie Creator Z16.
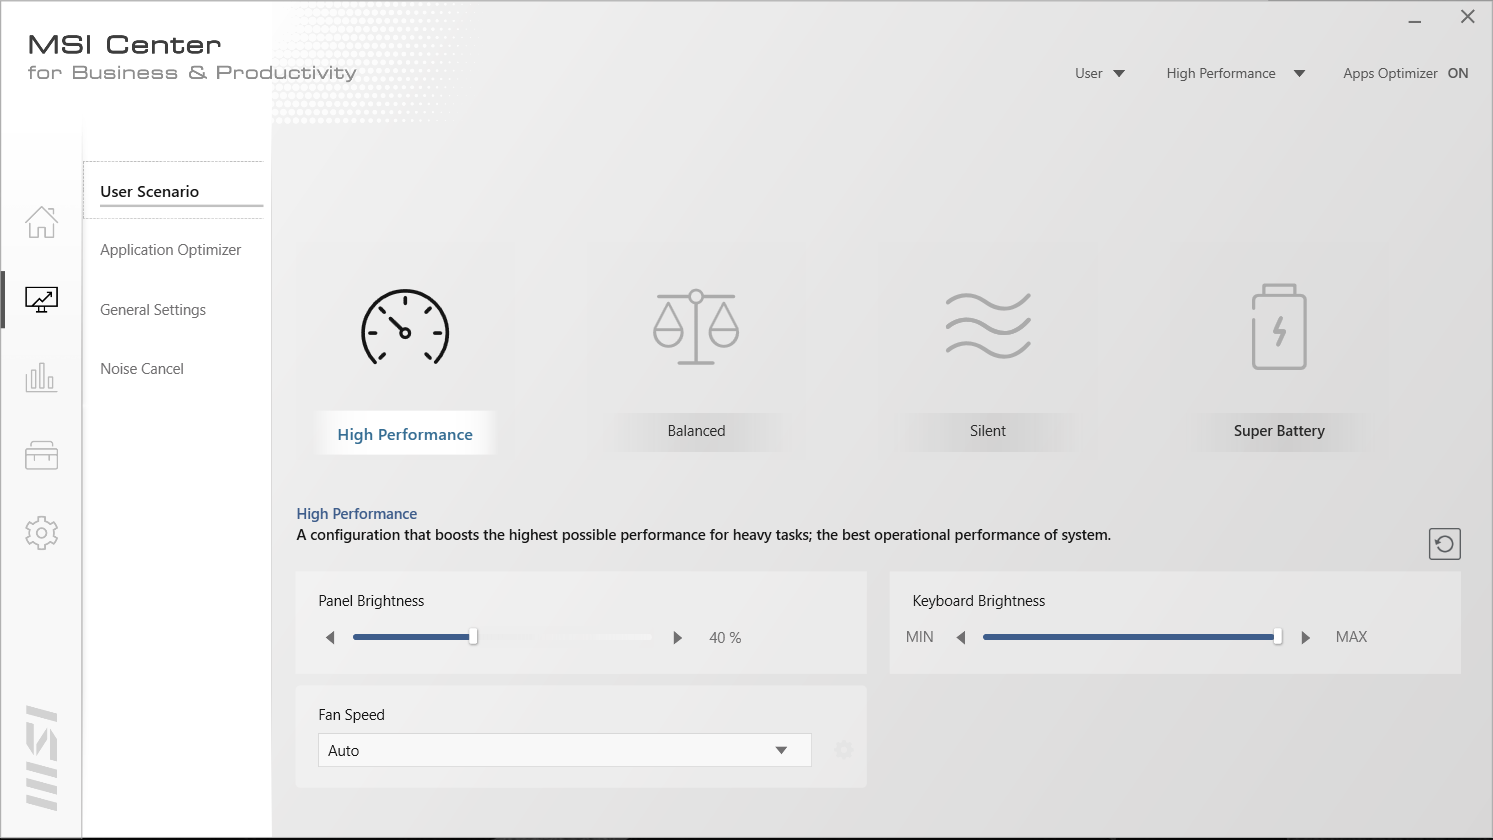
La nostra unità è stata impostata in modalità High Performance tramite MSI Center prima di eseguire qualsiasi benchmark di prestazioni qui sotto per ottenere i migliori punteggi possibili. Raccomandiamo ai proprietari di familiarizzare con questo software in quanto gli aggiornamenti e le caratteristiche specifiche di MSI si trovano qui.
Processore
Le prestazioni della CPU sono eccellenti con punteggi CineBench R15 xT che sono del 12% più veloci rispetto alla media dei laptop nel nostro database equipaggiati con la stessa CPU. I punteggi CineBench R20 e R23 sono ancora migliori con il 23% sopra la media, il che implica una sostenibilità Turbo Boost superiore alla maggior parte degli altri portatili, dato che i benchmarks R20 e R23 sono significativamente più lunghi di R15. Il processore è in grado di superare costantemente sia il 10° gen Core i7-10510U e Core i5-10300H nel modello HP Spectre x360 15 e Dell XPS 15, rispettivamente.
Scegliendo il più economico Core i5-1135G7 invece del nostro Core i7-1165G7 si avrà solo una leggera diminuzione dal 7% al 10% delle prestazioni del processore in base alla nostra esperienza con altri portatili Core i5-1135G7.
Cinebench R23: Multi Core | Single Core
Cinebench R15: CPU Multi 64Bit | CPU Single 64Bit
Blender: v2.79 BMW27 CPU
7-Zip 18.03: 7z b 4 -mmt1 | 7z b 4
Geekbench 5.5: Single-Core | Multi-Core
HWBOT x265 Benchmark v2.2: 4k Preset
LibreOffice : 20 Documents To PDF
R Benchmark 2.5: Overall mean
| Cinebench R23 / Multi Core | |
| Lenovo IdeaPad Flex 5 14ALC05 82HU002YUS | |
| Lenovo Yoga Slim 7-14ARE | |
| MSI Summit B15 A11M | |
| MSI Summit E15 A11SCST | |
| Media Intel Core i7-1165G7 (2525 - 6862, n=64) | |
| Cinebench R23 / Single Core | |
| MSI Summit B15 A11M | |
| MSI Summit E15 A11SCST | |
| Media Intel Core i7-1165G7 (1110 - 1539, n=59) | |
| Lenovo IdeaPad Flex 5 14ALC05 82HU002YUS | |
| Lenovo Yoga Slim 7-14ARE | |
| HWBOT x265 Benchmark v2.2 / 4k Preset | |
| Lenovo Yoga Slim 7-14ARE | |
| Lenovo IdeaPad Flex 5 14ALC05 82HU002YUS | |
| Dell XPS 15 9500 Core i7 4K UHD | |
| Lenovo ThinkPad E15 Gen2-20T9S00K00 | |
| MSI Summit B15 A11M | |
| Dell XPS 15 9500 Core i5 | |
| Lenovo ThinkBook 15 Gen2 ITL | |
| MSI Summit E15 A11SCST | |
| Lenovo IdeaPad 5 15IIL05 | |
| Media Intel Core i7-1165G7 (1.39 - 8.47, n=80) | |
Cinebench R23: Multi Core | Single Core
Cinebench R15: CPU Multi 64Bit | CPU Single 64Bit
Blender: v2.79 BMW27 CPU
7-Zip 18.03: 7z b 4 -mmt1 | 7z b 4
Geekbench 5.5: Single-Core | Multi-Core
HWBOT x265 Benchmark v2.2: 4k Preset
LibreOffice : 20 Documents To PDF
R Benchmark 2.5: Overall mean
* ... Meglio usare valori piccoli
Prestazioni del sistema
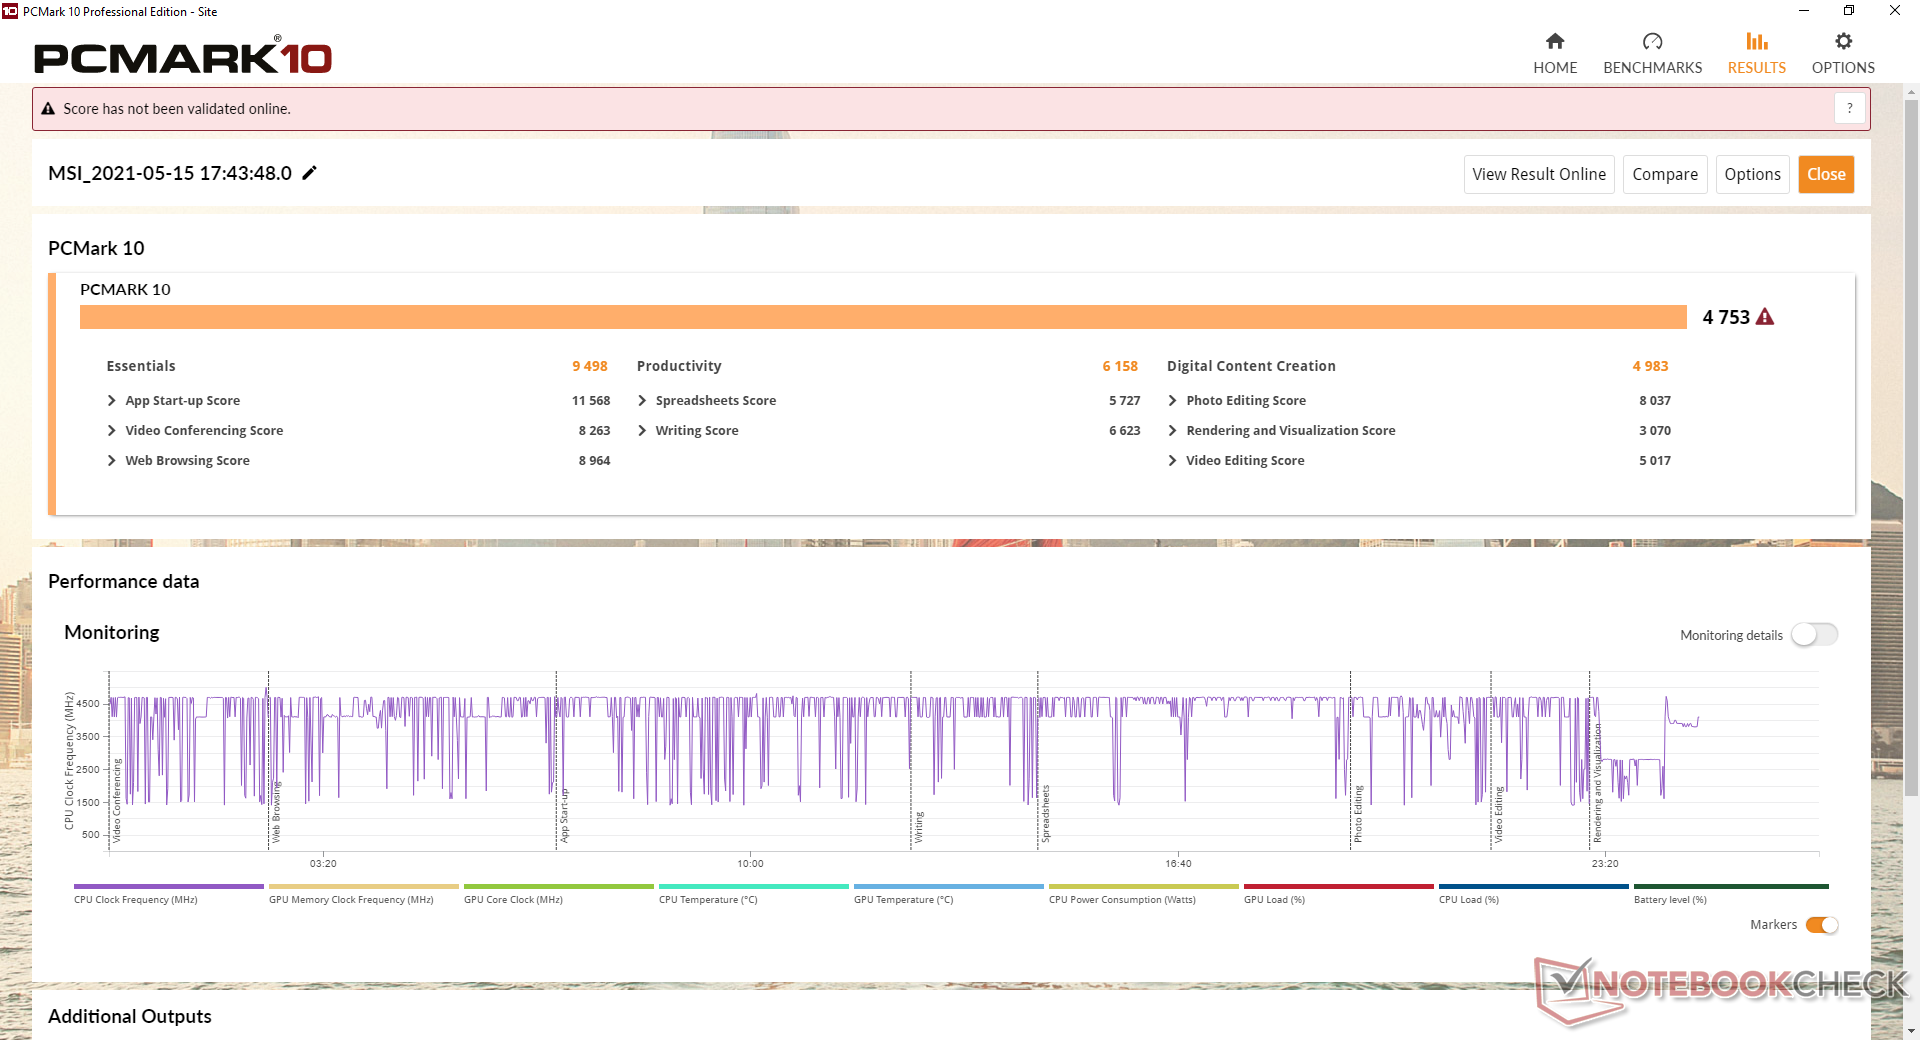
| PCMark 10 Score | 4753 punti | |
Aiuto | ||
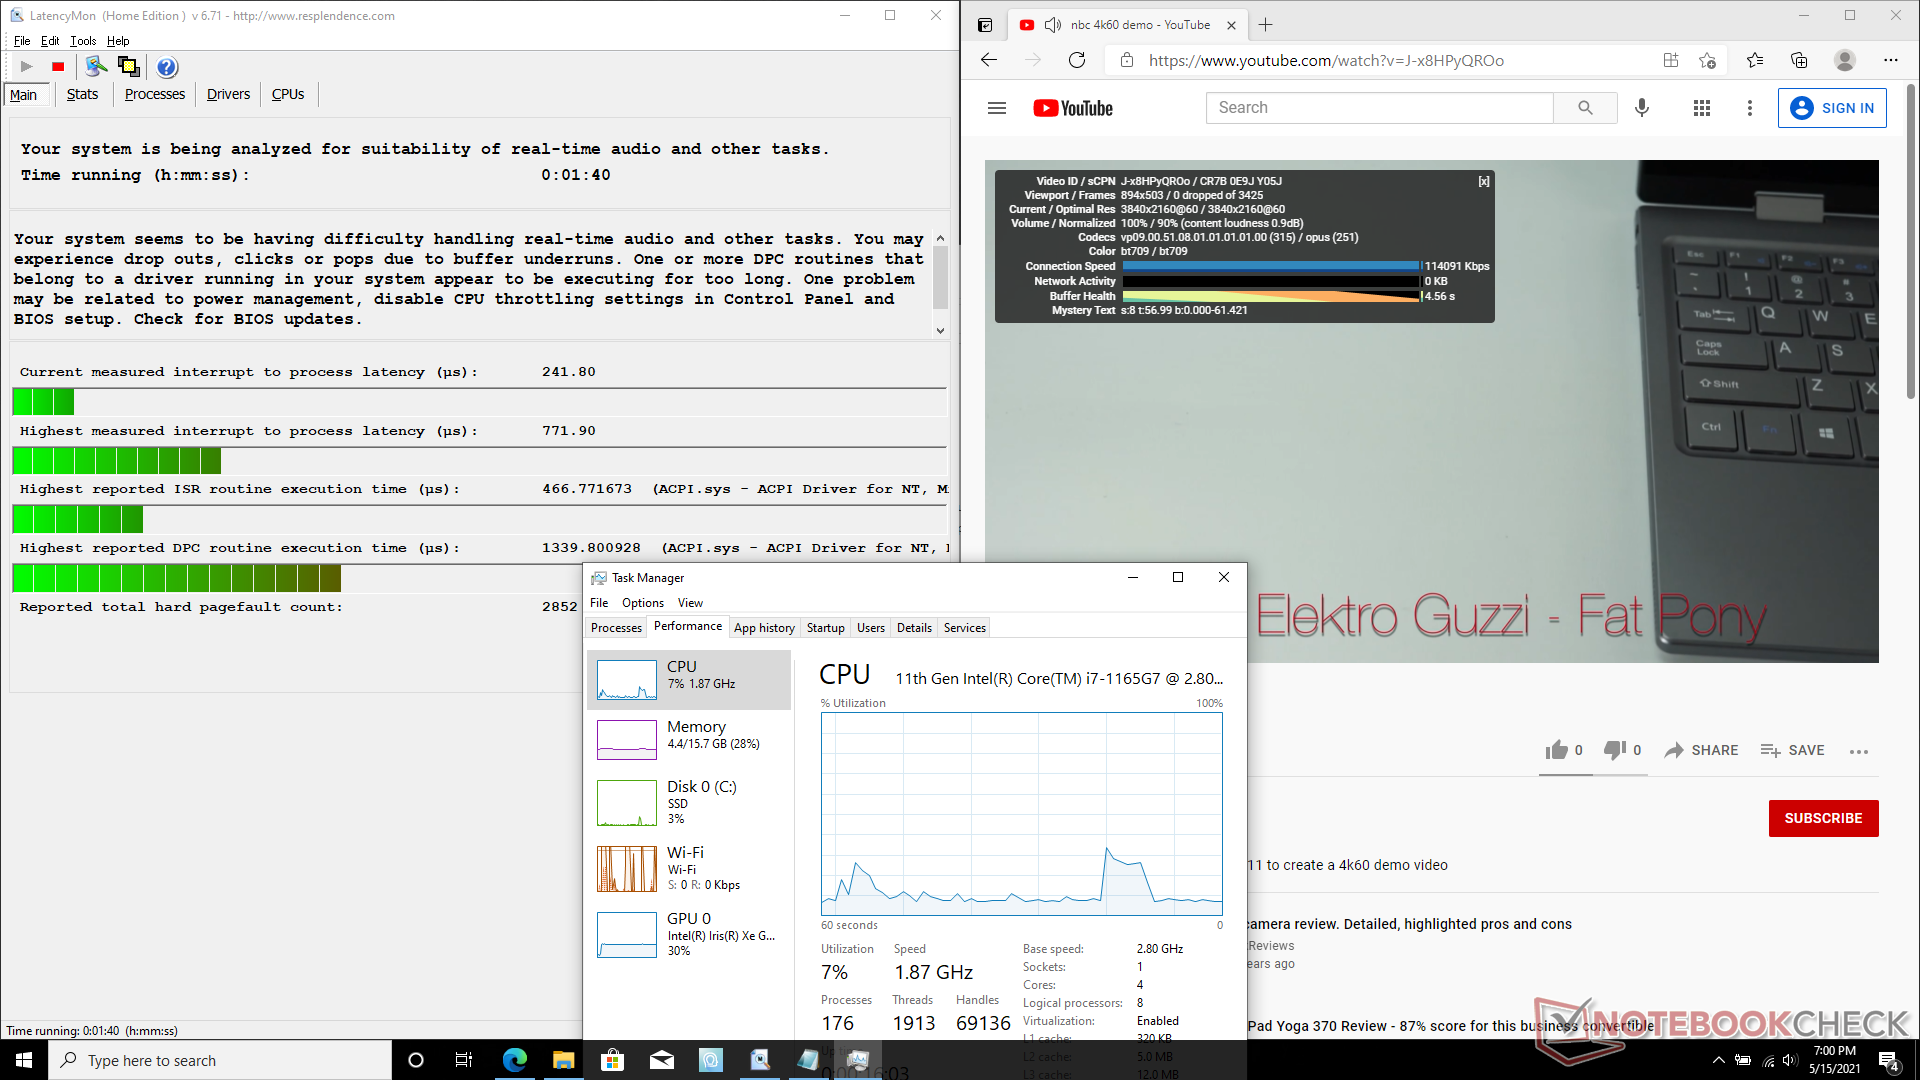
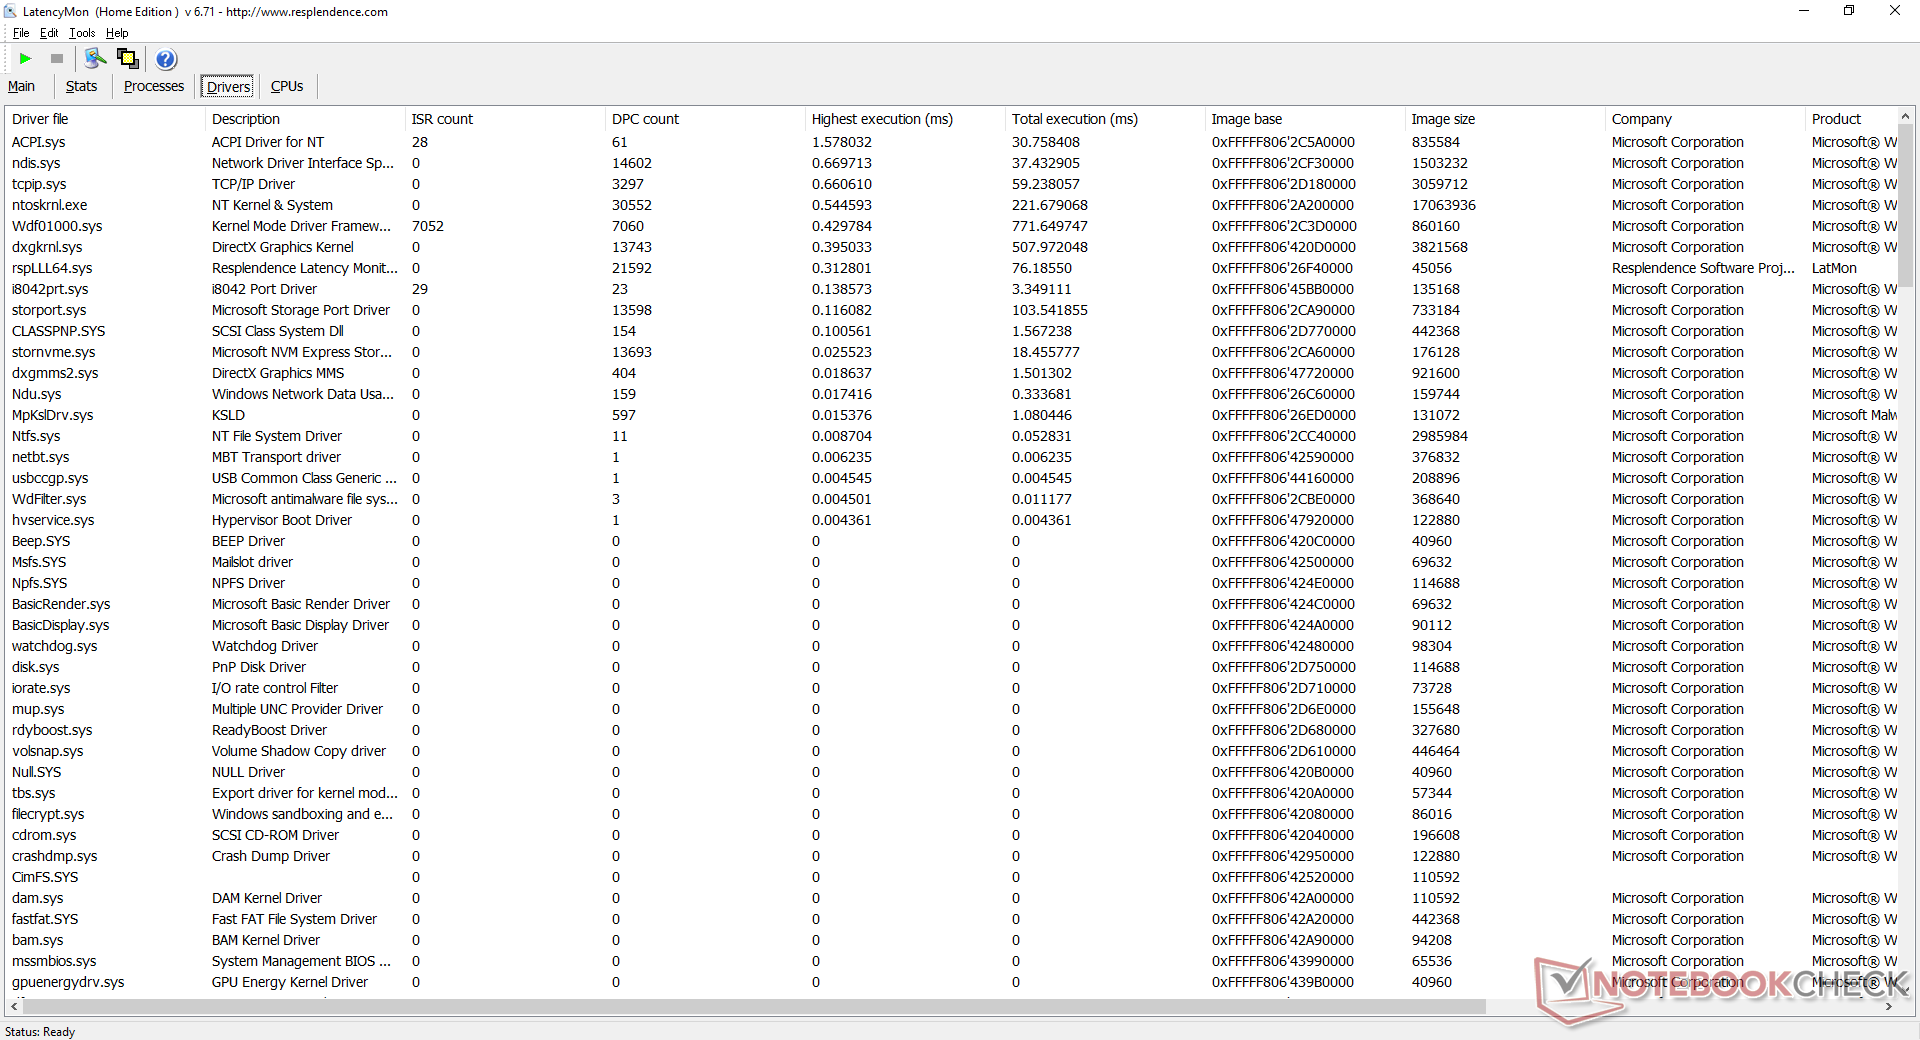
Latenza DPC
LatencyMon mostra piccoli problemi di latenza DPC quando si aprono più schede del browser sulla nostra homepage. La riproduzione di video 4K a 60 FPS è per il resto fluida e senza perdita di fotogrammi.
| DPC Latencies / LatencyMon - interrupt to process latency (max), Web, Youtube, Prime95 | |
| ADATA XPG Xenia Xe | |
| Dell XPS 15 9500 Core i5 | |
| MSI Summit E15 A11SCST | |
| MSI Summit B15 A11M | |
* ... Meglio usare valori piccoli
Dispositivi di archiviazione
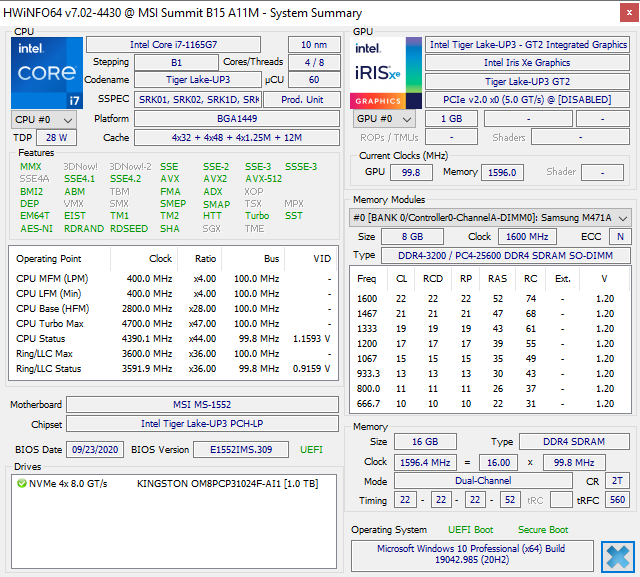
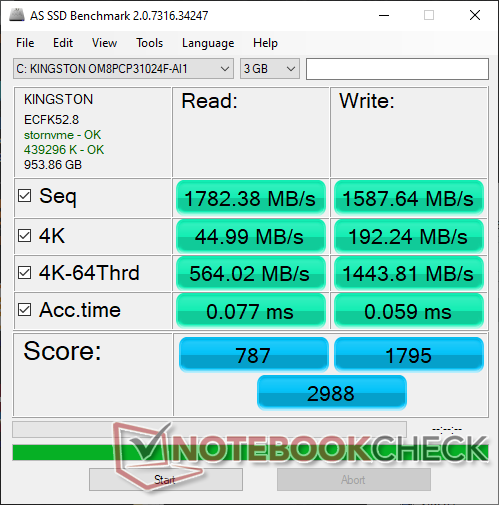
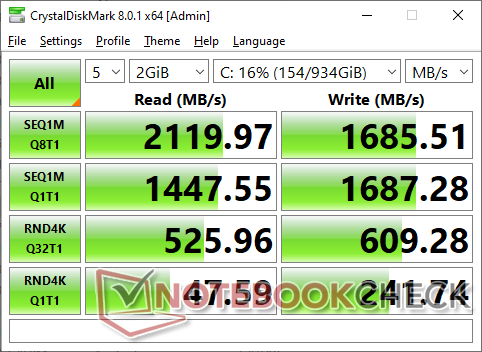
Sono supportati fino a due SSD interni M.2 2280 con uno di questi slot compatibile con le velocità PCIe 4.0. La nostra unità di prova viene dotata del Kingston OM8PCP31024F da 1 TB, che è un SSD NVMe PCIe 3.0 abbastanza economico con velocità di trasferimento medie che raggiungono circa 2100 MB/s. Naturalmente, gli utenti possono configurare SSD più veloci prima dell'acquisto o installarne uno da soli.
| MSI Summit B15 A11M Kingston OM8PCP31024F | MSI Summit E15 A11SCST Phison 1TB SM2801T24GKBB4S-E162 | HP Spectre X360 15-5ZV31AV Intel SSD 660p 2TB SSDPEKNW020T8 | ADATA XPG Xenia Xe ADATA XPG Gammix S50 1TB | |
|---|---|---|---|---|
| AS SSD | 42% | -12% | 25% | |
| Seq Read (MB/s) | 1782 | 3597 102% | 1220 -32% | 3842 116% |
| Seq Write (MB/s) | 1588 | 2101 32% | 1152 -27% | 1601 1% |
| 4K Read (MB/s) | 44.99 | 62.5 39% | 52.3 16% | 51.2 14% |
| 4K Write (MB/s) | 192.2 | 208.9 9% | 146.6 -24% | 260.8 36% |
| 4K-64 Read (MB/s) | 564 | 1145 103% | 652 16% | 1222 117% |
| 4K-64 Write (MB/s) | 1444 | 1482 3% | 847 -41% | 1508 4% |
| Access Time Read * (ms) | 0.077 | 0.05 35% | 0.077 -0% | 0.065 16% |
| Access Time Write * (ms) | 0.059 | 0.019 68% | 0.106 -80% | 0.249 -322% |
| Score Read (Points) | 787 | 1567 99% | 826 5% | 1657 111% |
| Score Write (Points) | 1795 | 1901 6% | 1109 -38% | 1929 7% |
| Score Total (Points) | 2988 | 4207 41% | 2371 -21% | 4329 45% |
| Copy ISO MB/s (MB/s) | 1541 | 2209 43% | 2070 34% | 2166 41% |
| Copy Program MB/s (MB/s) | 641 | 455.2 -29% | 571 -11% | 995 55% |
| Copy Game MB/s (MB/s) | 908 | 1225 35% | 1219 34% | 1844 103% |
| CrystalDiskMark 5.2 / 6 | 42% | -6% | 47% | |
| Write 4K (MB/s) | 235.9 | 242.9 3% | 151.5 -36% | 159.6 -32% |
| Read 4K (MB/s) | 47.06 | 54.6 16% | 59.3 26% | 45.45 -3% |
| Write Seq (MB/s) | 1684 | 2420 44% | 1424 -15% | 2498 48% |
| Read Seq (MB/s) | 1333 | 2300 73% | 1609 21% | 2340 76% |
| Write 4K Q32T1 (MB/s) | 606 | 392.7 -35% | 393.6 -35% | 645 6% |
| Read 4K Q32T1 (MB/s) | 422.8 | 667 58% | 369.4 -13% | 439.4 4% |
| Write Seq Q32T1 (MB/s) | 1688 | 2424 44% | 1946 15% | 4057 140% |
| Read Seq Q32T1 (MB/s) | 2116 | 4944 134% | 1934 -9% | 4960 134% |
| Media totale (Programma / Settaggio) | 42% /
42% | -9% /
-10% | 36% /
33% |
* ... Meglio usare valori piccoli

Throttling Disco: DiskSpd Read Loop, Queue Depth 8
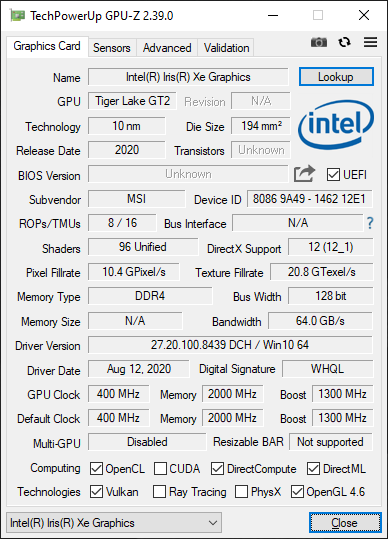
Prestazioni della GPU
Le prestazioni grafiche sono entro pochi punti percentuali della media dei laptop nel nostro database equipaggiati con la stessa GPU Iris Xe 96 EUs. Anche se 3DMark mostra che supera le serie GeForce MX250/350/450, queste GPU Nvidia sono ancora la migliore scommessa in condizioni di gioco reali, in gran parte a causa dei driver più maturi di Nvidia e della maggiore potenza disponibile per la CPU quando una GPU discreta è presente. Per quanto riguarda le GPU integrate, tuttavia, la Iris Xe è quella da battere.
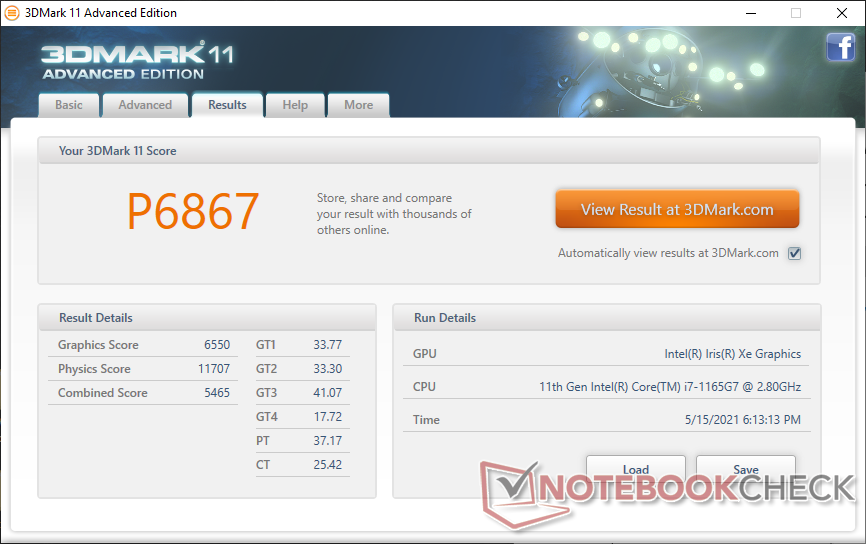
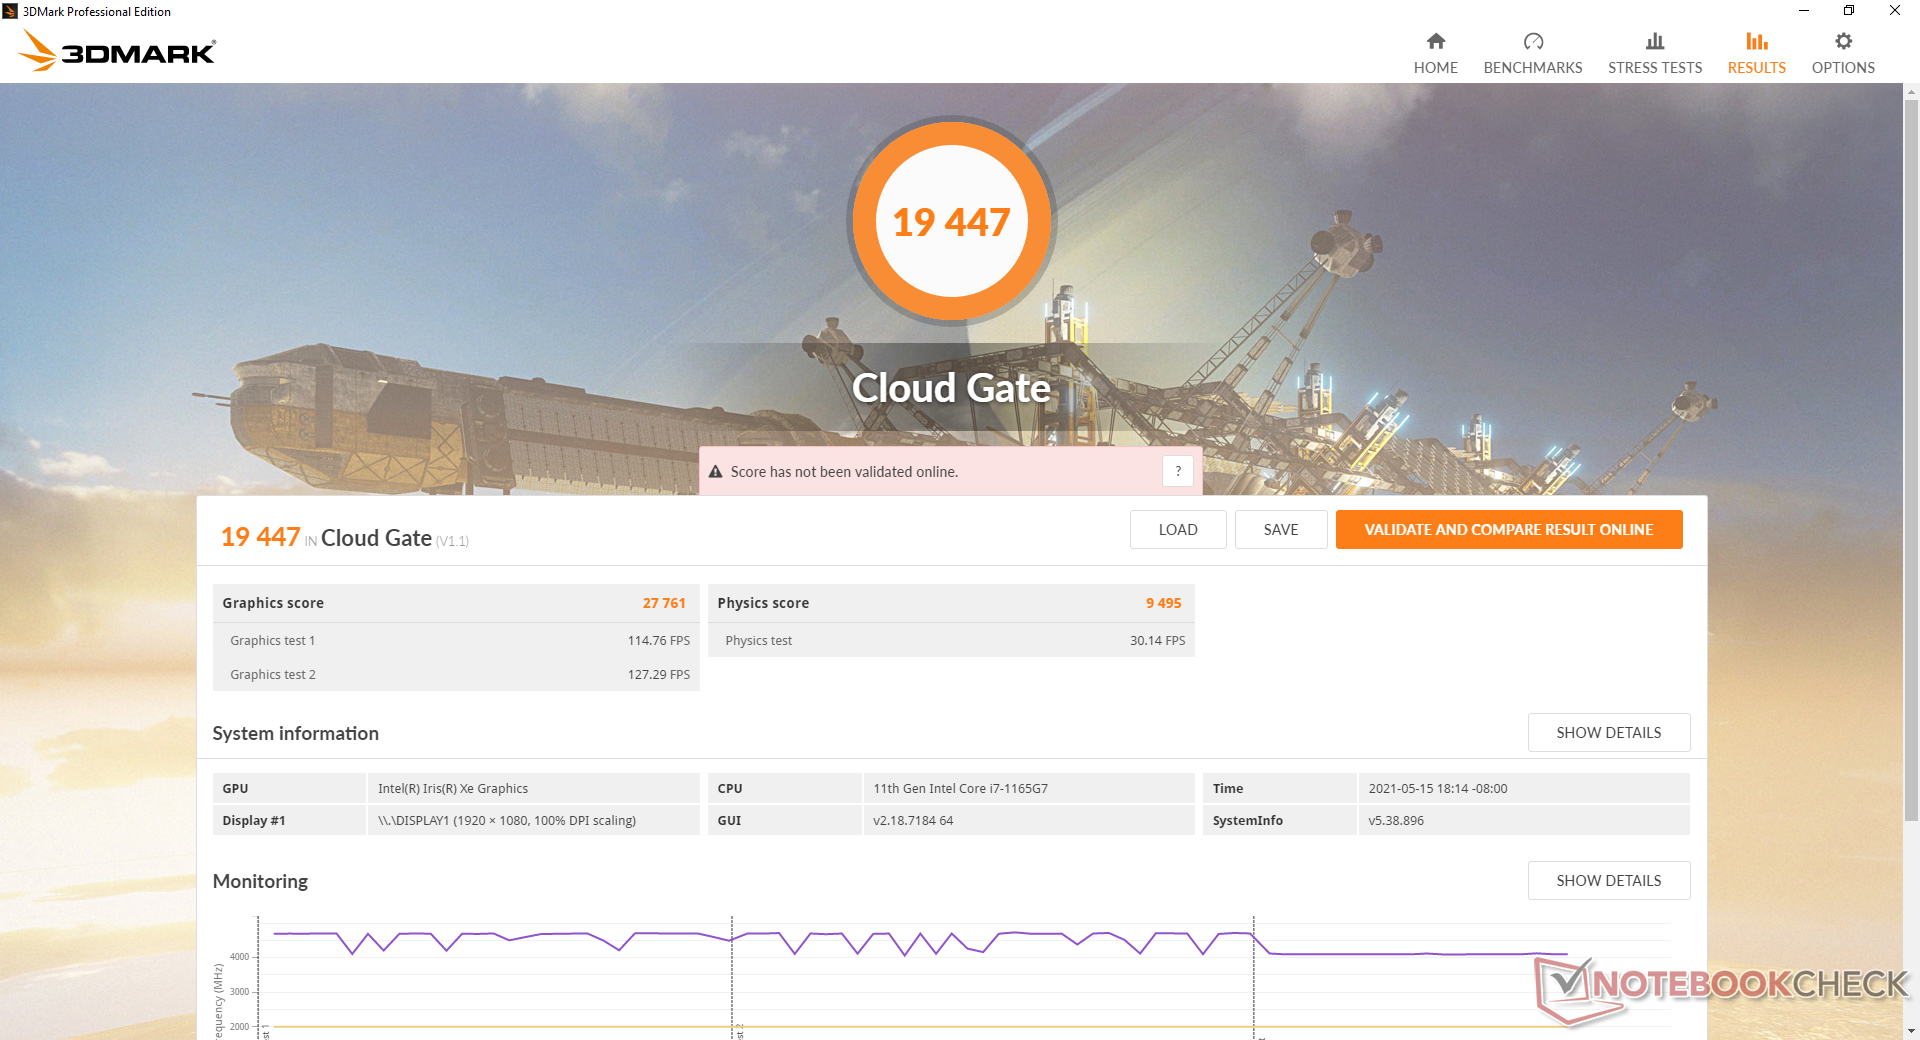
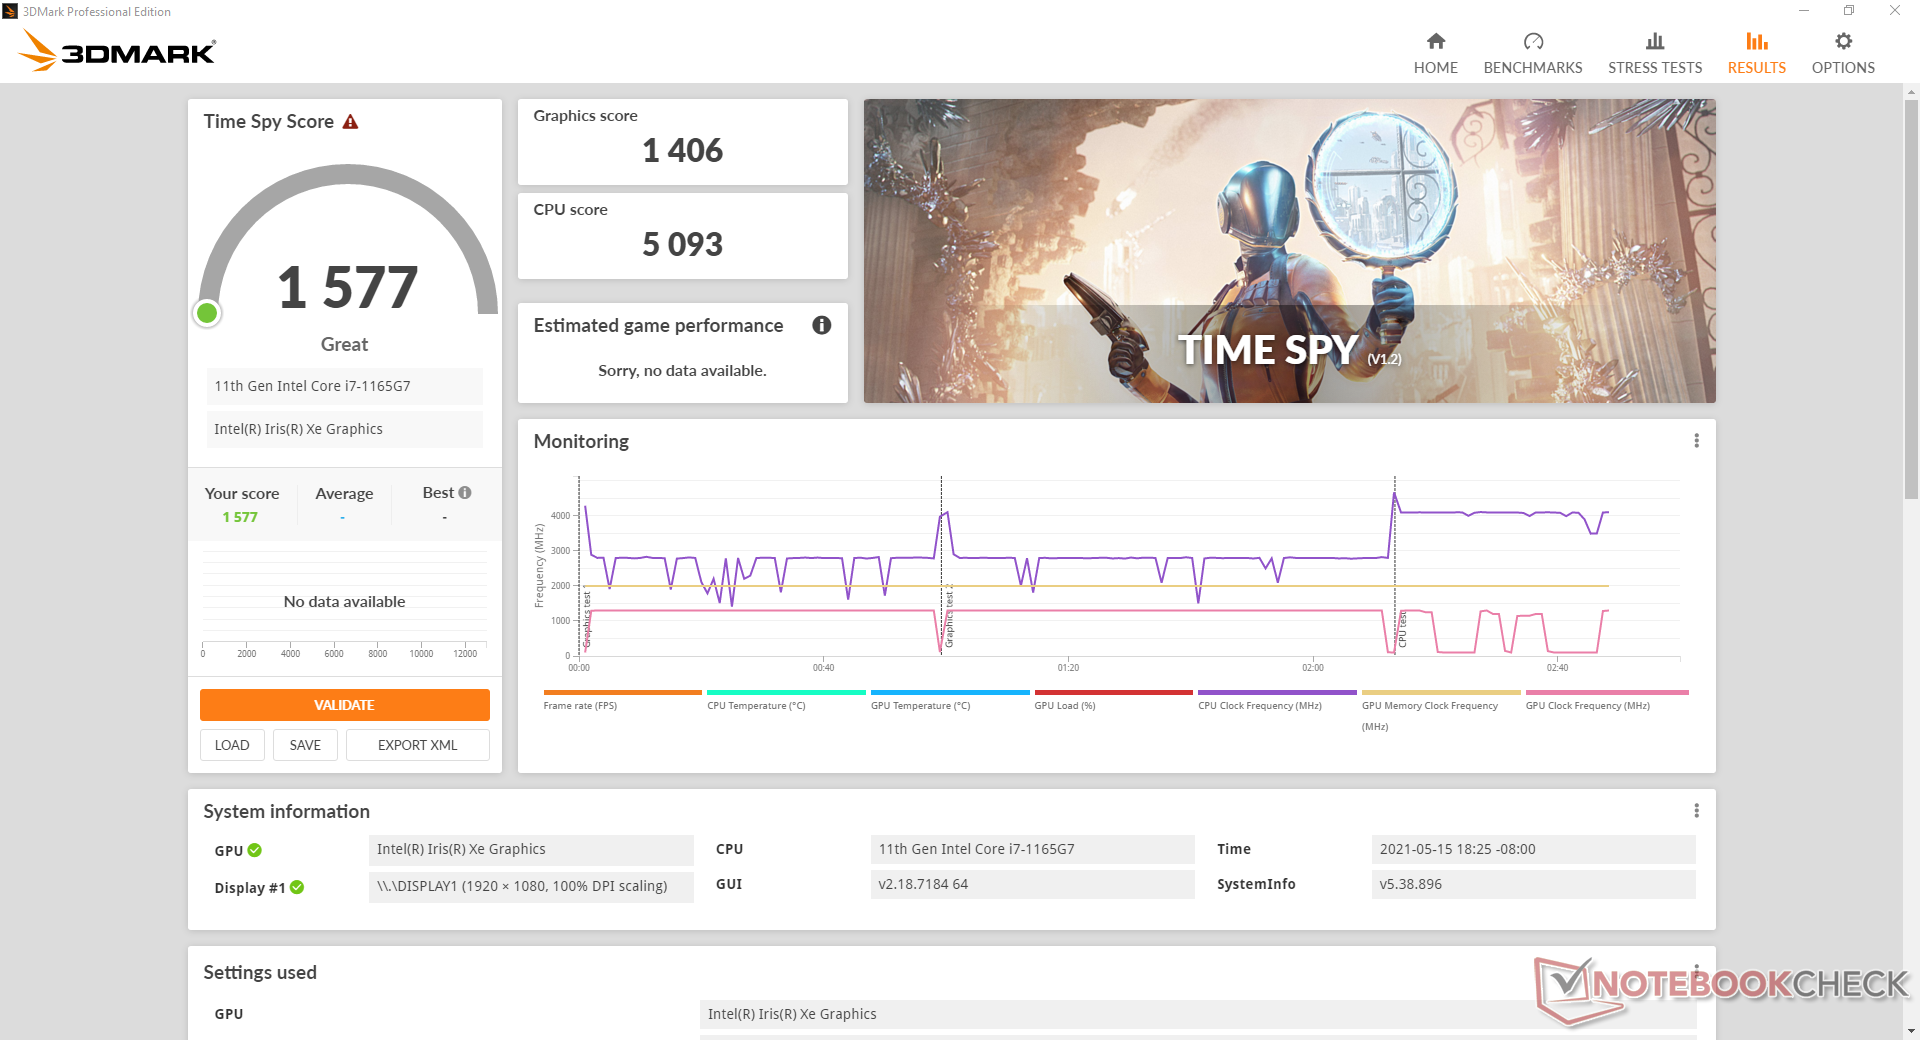
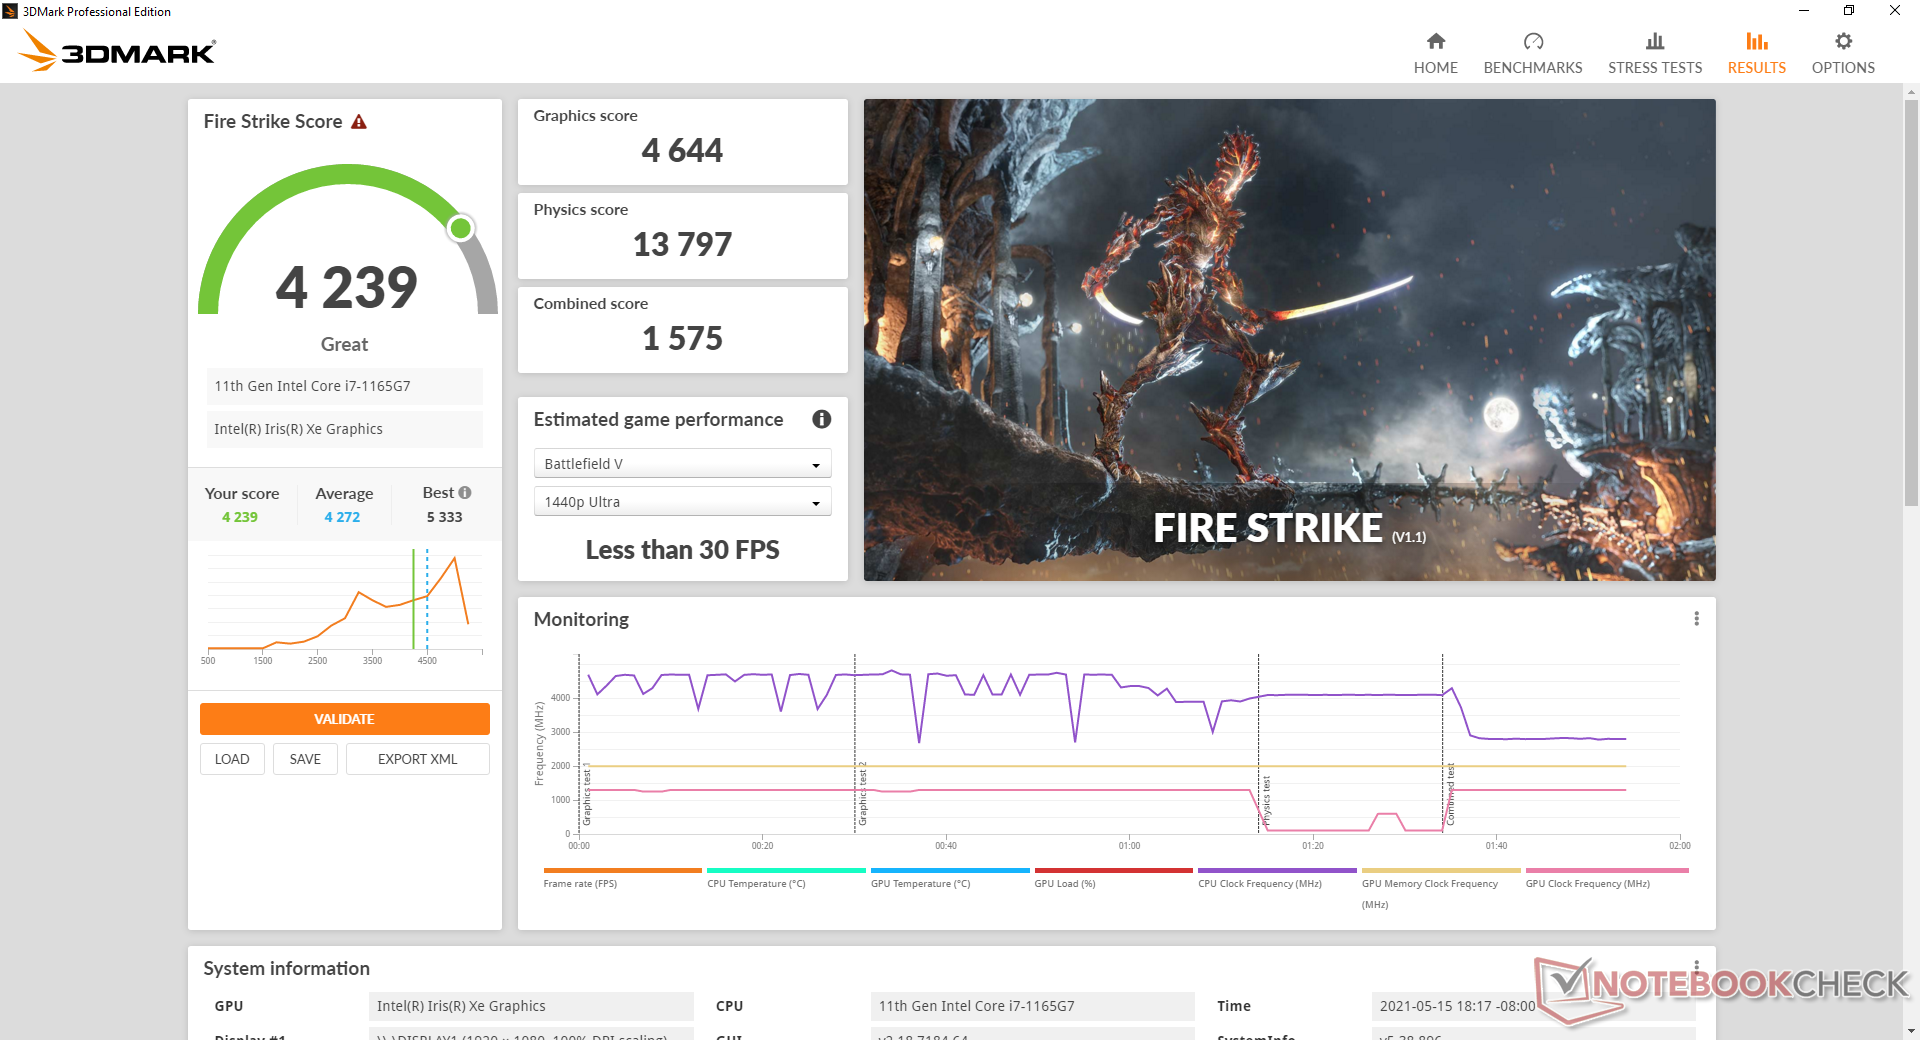
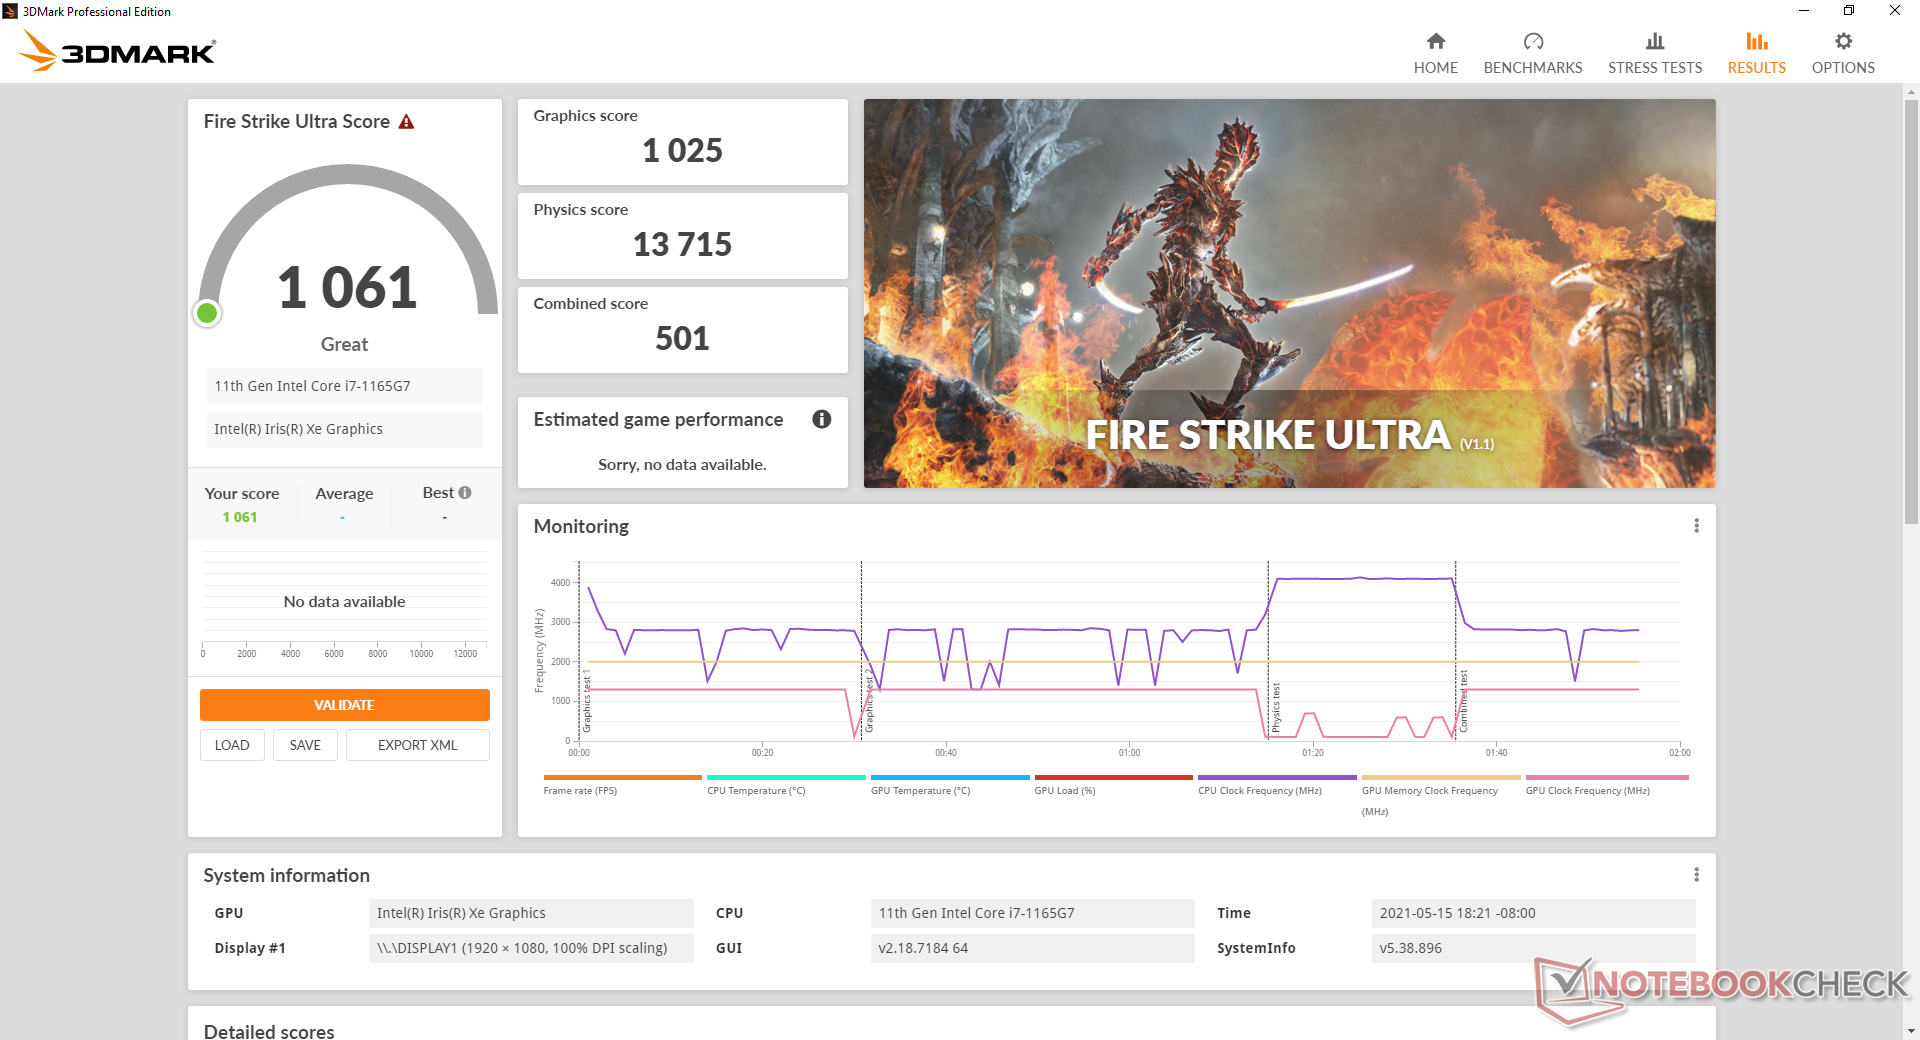
| 3DMark 11 Performance | 6867 punti | |
| 3DMark Cloud Gate Standard Score | 19447 punti | |
| 3DMark Fire Strike Score | 4239 punti | |
| 3DMark Time Spy Score | 1577 punti | |
Aiuto | ||
| basso | medio | alto | ultra | |
|---|---|---|---|---|
| The Witcher 3 (2015) | 95.3 | 56.3 | 30.8 | 14.5 |
| Dota 2 Reborn (2015) | 81.5 | 67.3 | 45.4 | 42.3 |
| Final Fantasy XV Benchmark (2018) | 39.1 | 20.4 | 15.8 | |
| X-Plane 11.11 (2018) | 59.3 | 42.3 | 38.5 |
Emissioni
Rumore di sistema
Il rumore della ventola non è mai veramente silenzioso anche quando è impostato sulla modalità "Silent" su MSI Center. Siamo in grado di registrare un rumore di ventola molto leggero di 26,4 dB(A) contro uno sfondo di 25,2 dB(A) indipendentemende dalla impostazione del portatile.
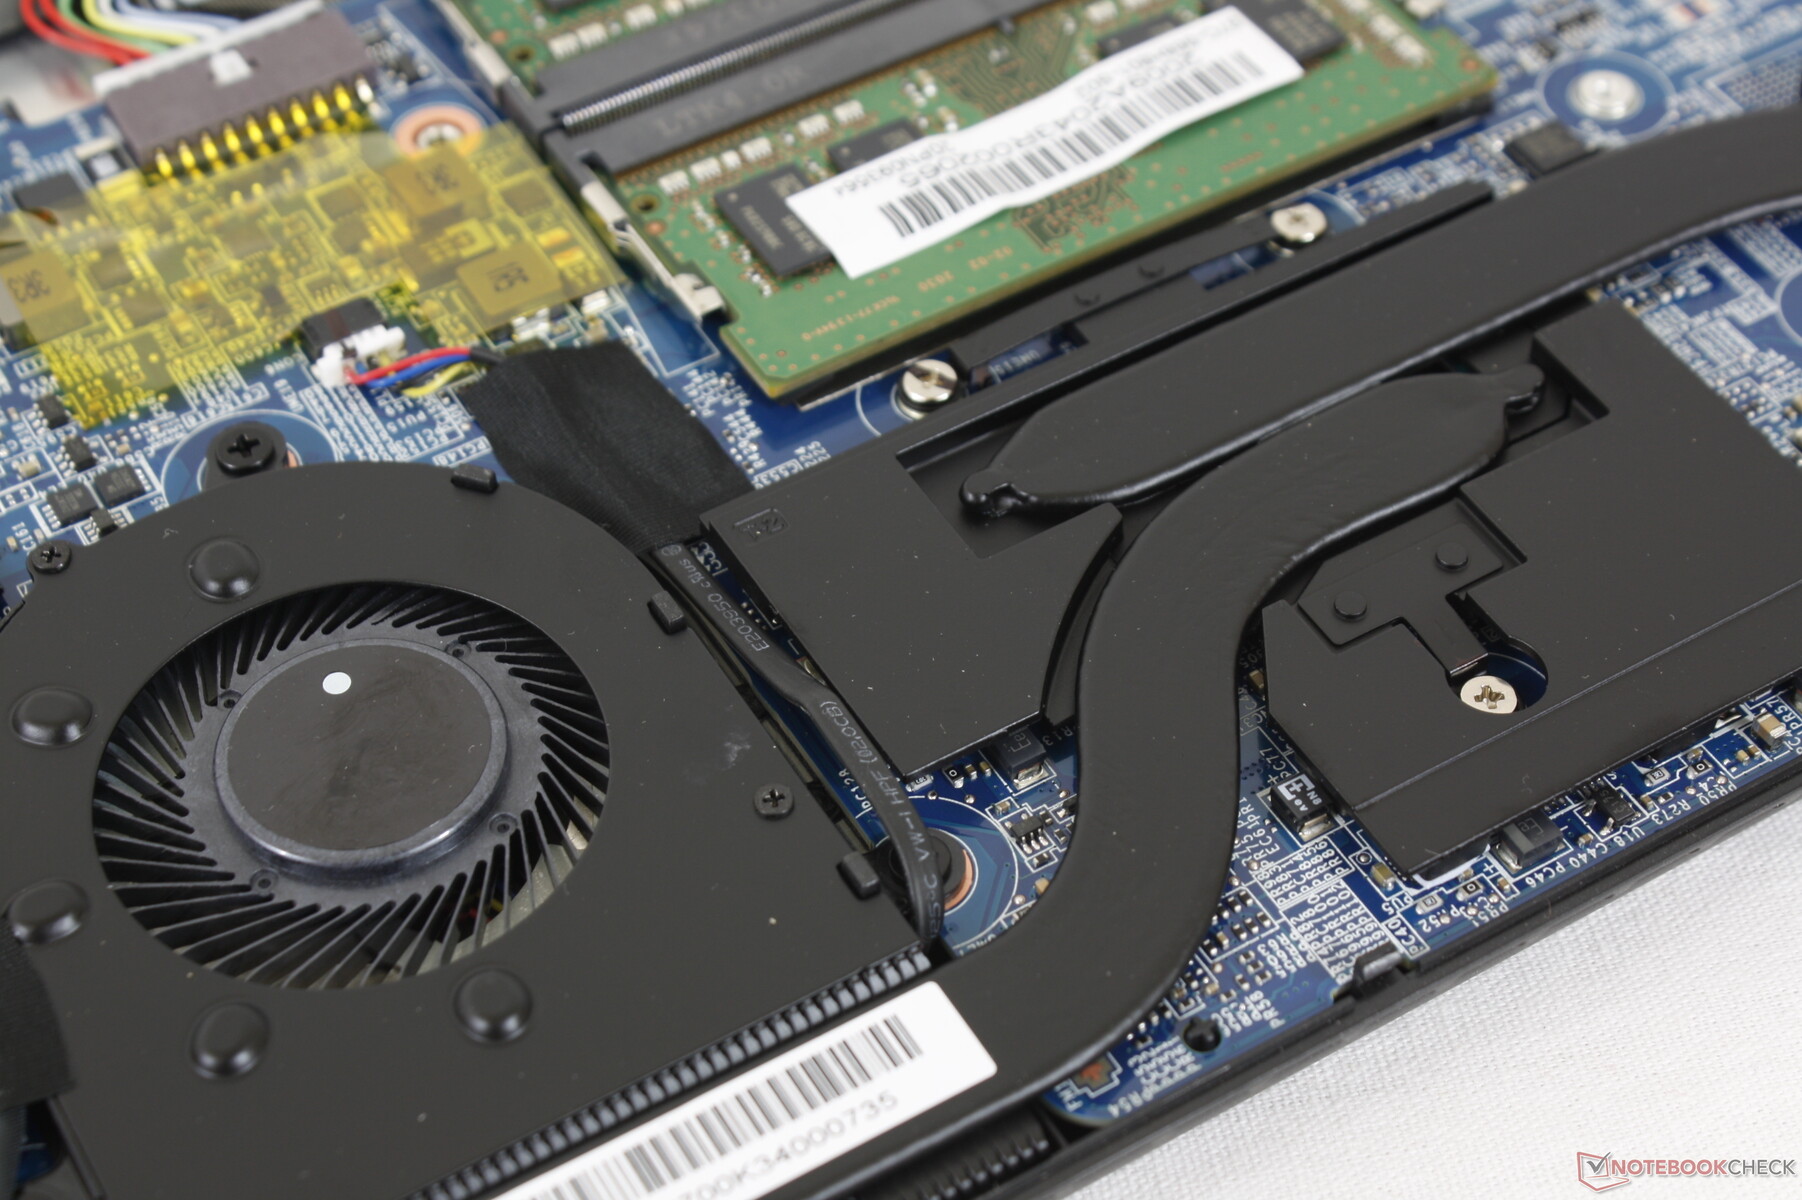
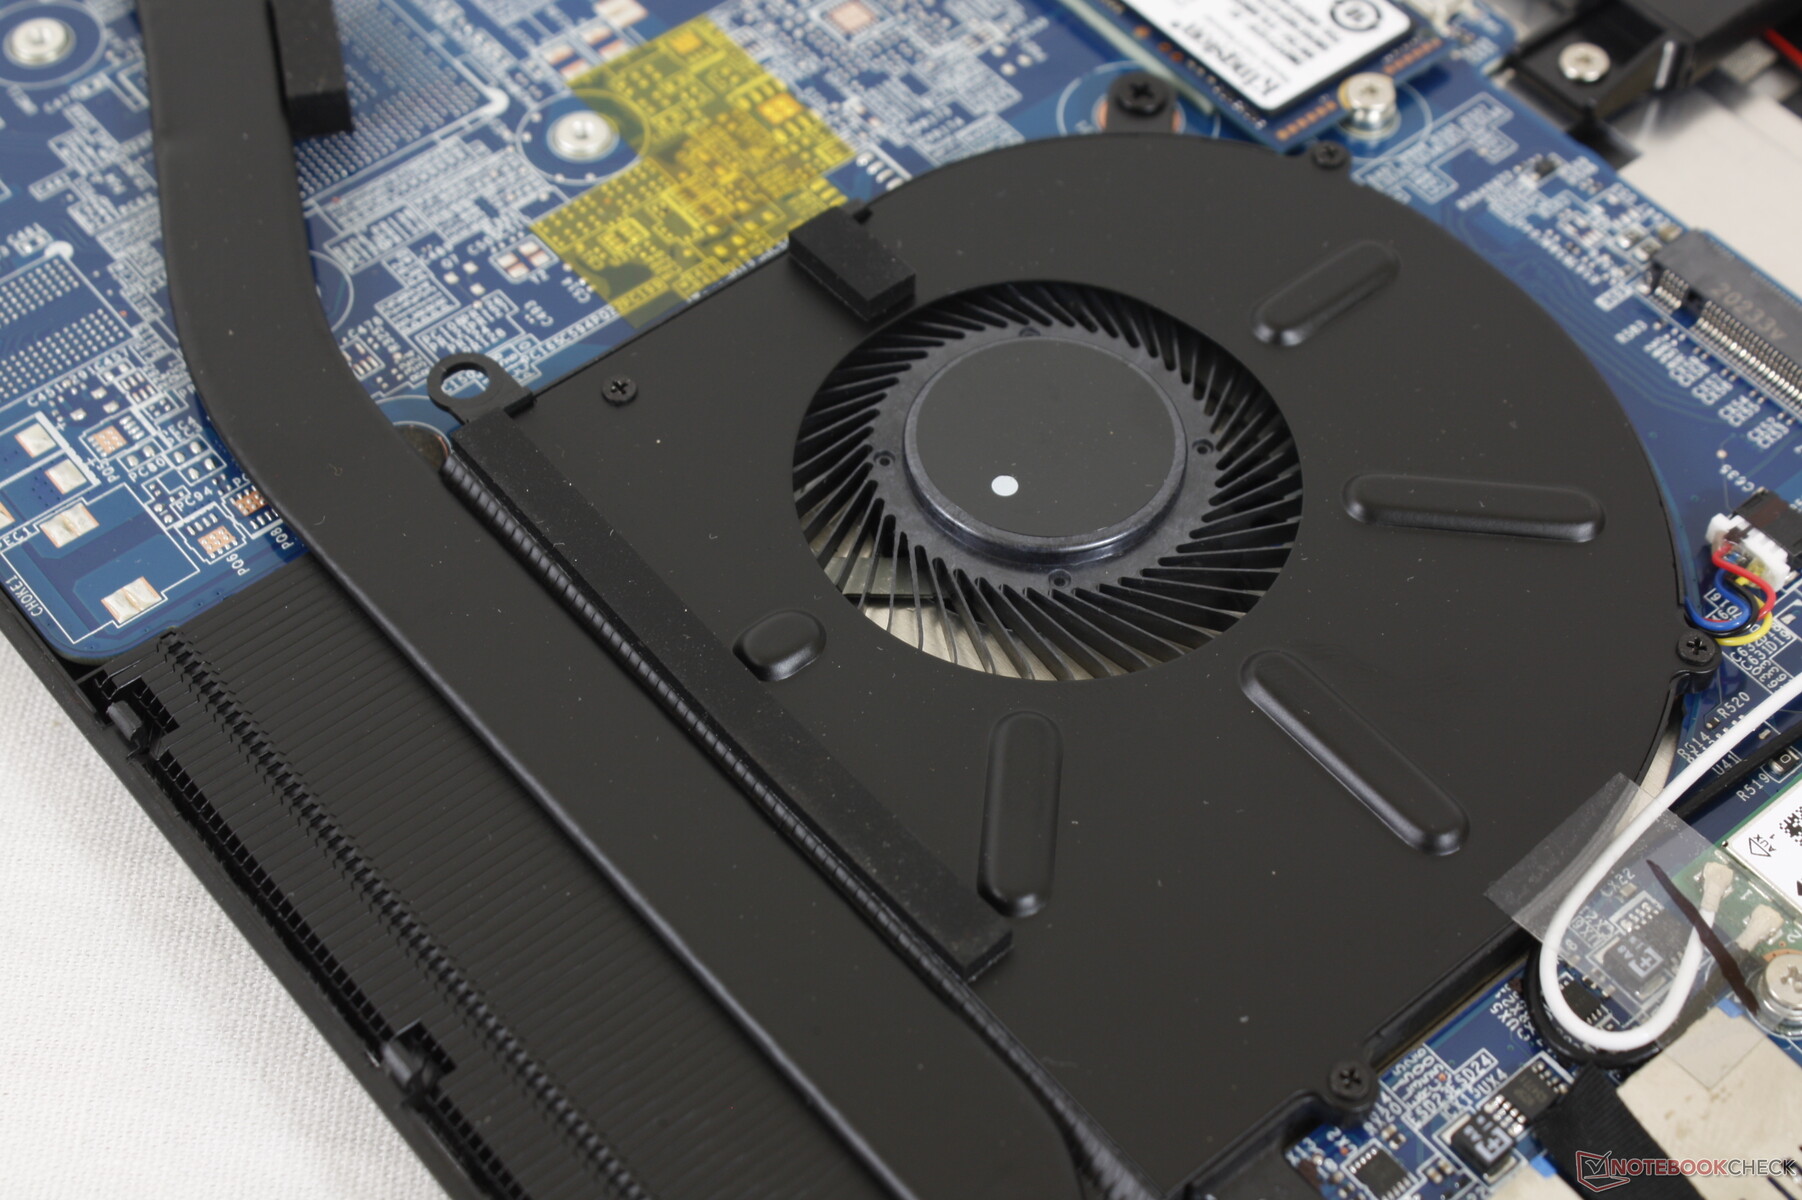
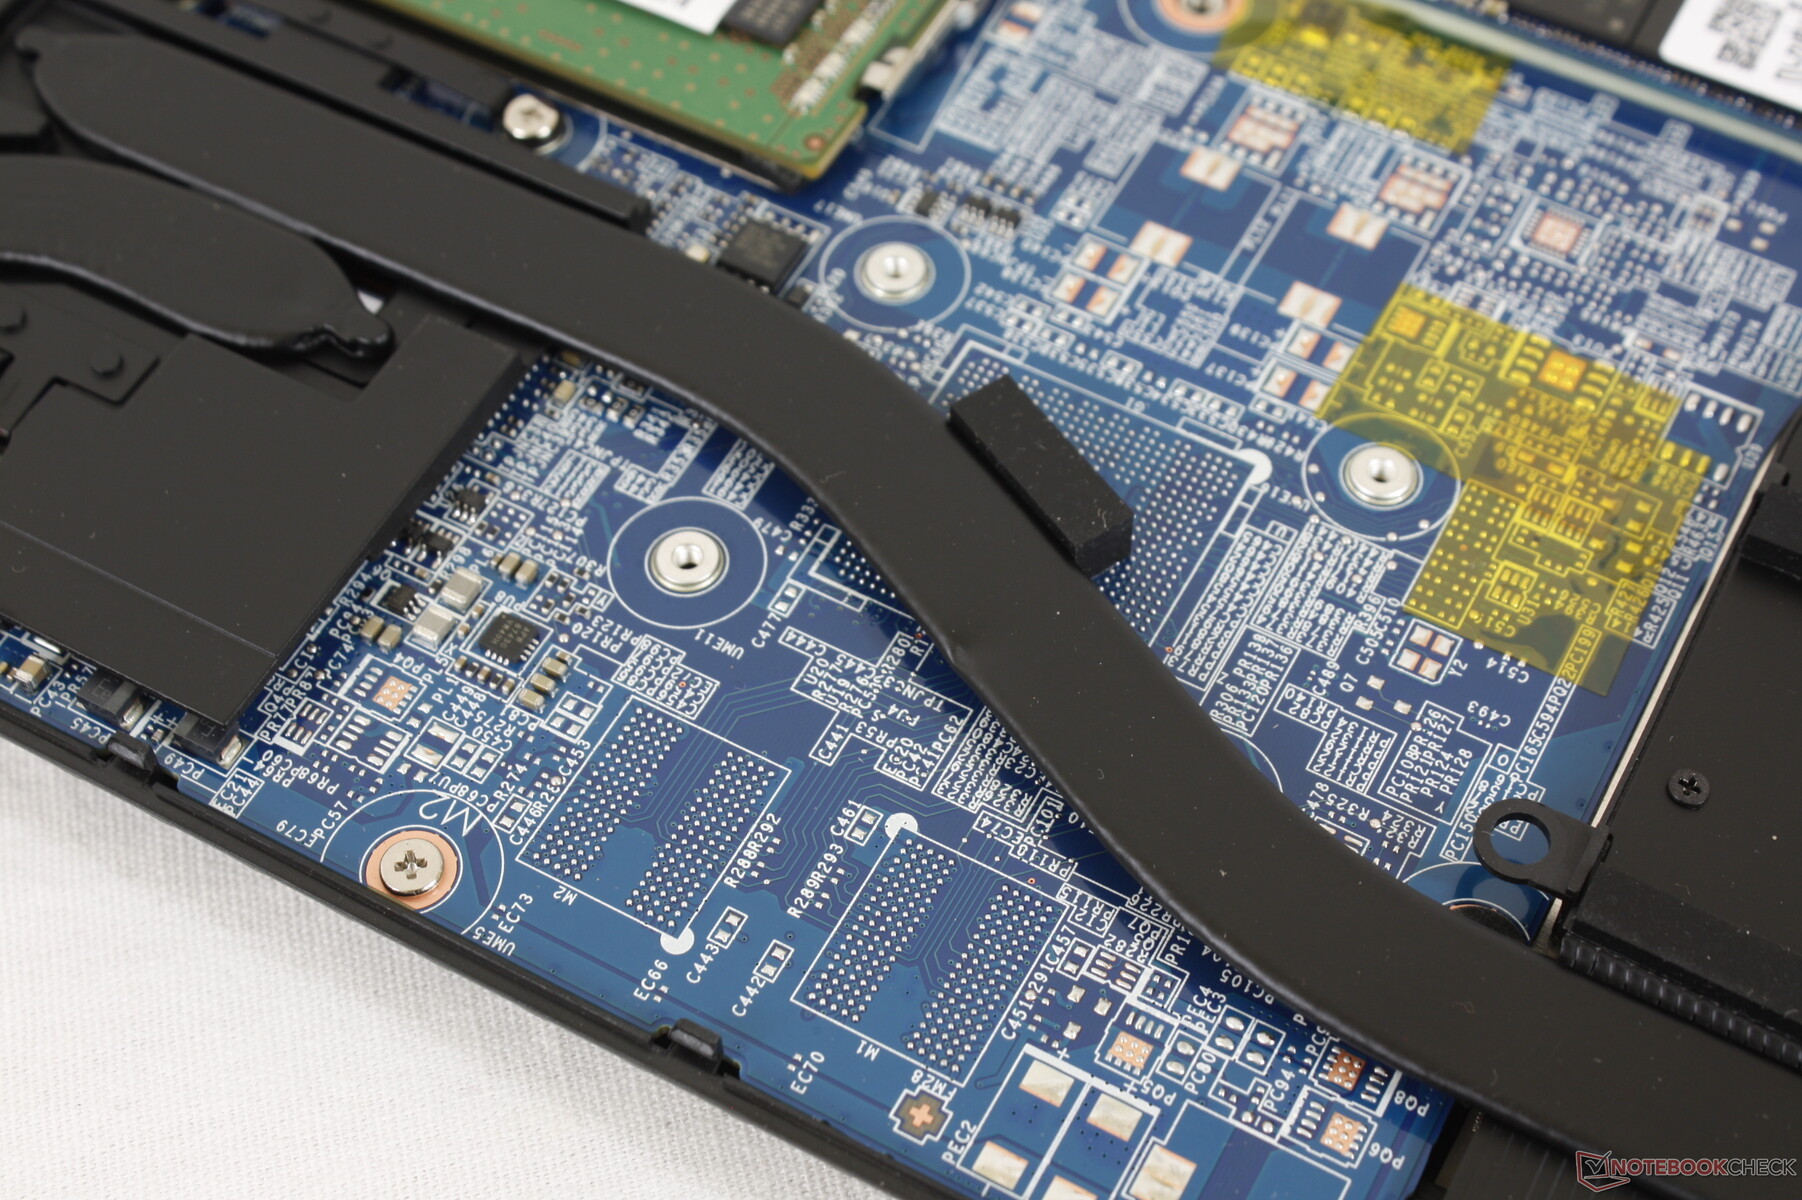
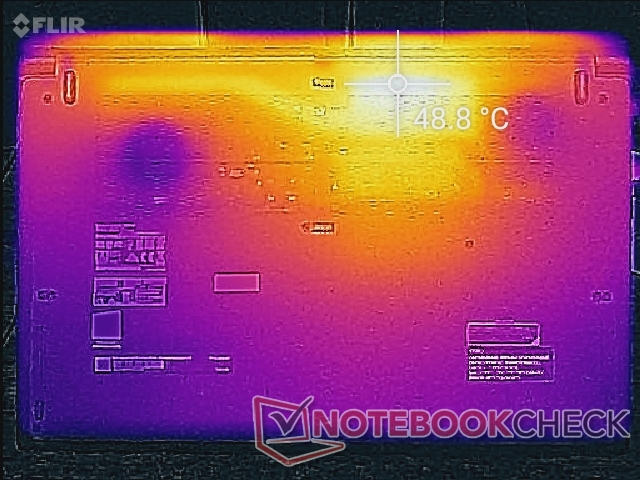
Fortunatamente, le ventole rimangono tranquille a 26,4 dB(A) anche dopo aver eseguito la prima scena di benchmark di 3DMark 06. Questo perché la soluzione di raffreddamento è stata progettata per raffreddare sia una CPU che una GPU dedicata, come mostrato dalle immagini qui sotto, nonostante il fatto che il nostro Summit B15 non abbia una GPU dedicata. Così, le due ventole interne non hanno bisogno di essere sempre attive per mantenere il sistema fresco.
Naturalmente, il sistema può ancora diventare molto rumoroso quando si eseguono giochi ad alto frame rate dove la CPU sarà stressata. In questo caso, il rumore della ventola può arrivare a 40 dB(A) o 52.6 dB(A) quando Cooler Boost è disattivato o attivato, rispettivamente. Si noti che il Cooler Boost è per lo più inutile per questo portatile ULV, come mostrerà la nostra sezione Stress Test qui sotto.
Il rumore della ventola è molto basso quando usiamo The Witcher 3 su impostazioni Ultra poiché il frame rate è a una sola cifra. Quando è impostato su impostazioni grafiche basse, il rumore della ventola salta quasi immediatamente a 40 dB(A) a causa dell'aumento delle prestazioni della CPU.
| MSI Summit B15 A11M Iris Xe G7 96EUs, i7-1165G7, Kingston OM8PCP31024F | MSI Summit E15 A11SCST GeForce GTX 1650 Ti Max-Q, i7-1185G7, Phison 1TB SM2801T24GKBB4S-E162 | Dell XPS 15 9500 Core i5 UHD Graphics 630, i5-10300H, Toshiba KBG40ZNS256G NVMe | HP Spectre X360 15-5ZV31AV GeForce MX250, i7-10510U, Intel SSD 660p 2TB SSDPEKNW020T8 | ADATA XPG Xenia Xe Iris Xe G7 96EUs, i7-1165G7, ADATA XPG Gammix S50 1TB | |
|---|---|---|---|---|---|
| Noise | -17% | -2% | -14% | -7% | |
| off /ambiente * (dB) | 25.2 | 24 5% | 28 -11% | 30.1 -19% | 25.2 -0% |
| Idle Minimum * (dB) | 26.4 | 28 -6% | 28 -6% | 30.1 -14% | 25.2 5% |
| Idle Average * (dB) | 26.4 | 29 -10% | 28 -6% | 30.1 -14% | 25.2 5% |
| Idle Maximum * (dB) | 26.4 | 32 -21% | 28 -6% | 30.1 -14% | 25.2 5% |
| Load Average * (dB) | 26.8 | 43 -60% | 28 -4% | 30.1 -12% | 35.7 -33% |
| Witcher 3 ultra * (dB) | 28 | 41 -46% | 39.7 -42% | 39.7 -42% | |
| Load Maximum * (dB) | 52.6 | 44 16% | 41.9 20% | 42 20% | 45.3 14% |
* ... Meglio usare valori piccoli
Rumorosità
| Idle |
| 26.4 / 26.4 / 26.4 dB(A) |
| Sotto carico |
| 26.8 / 52.6 dB(A) |
 | ||
30 dB silenzioso 40 dB(A) udibile 50 dB(A) rumoroso |
||
min: | ||
Temperature
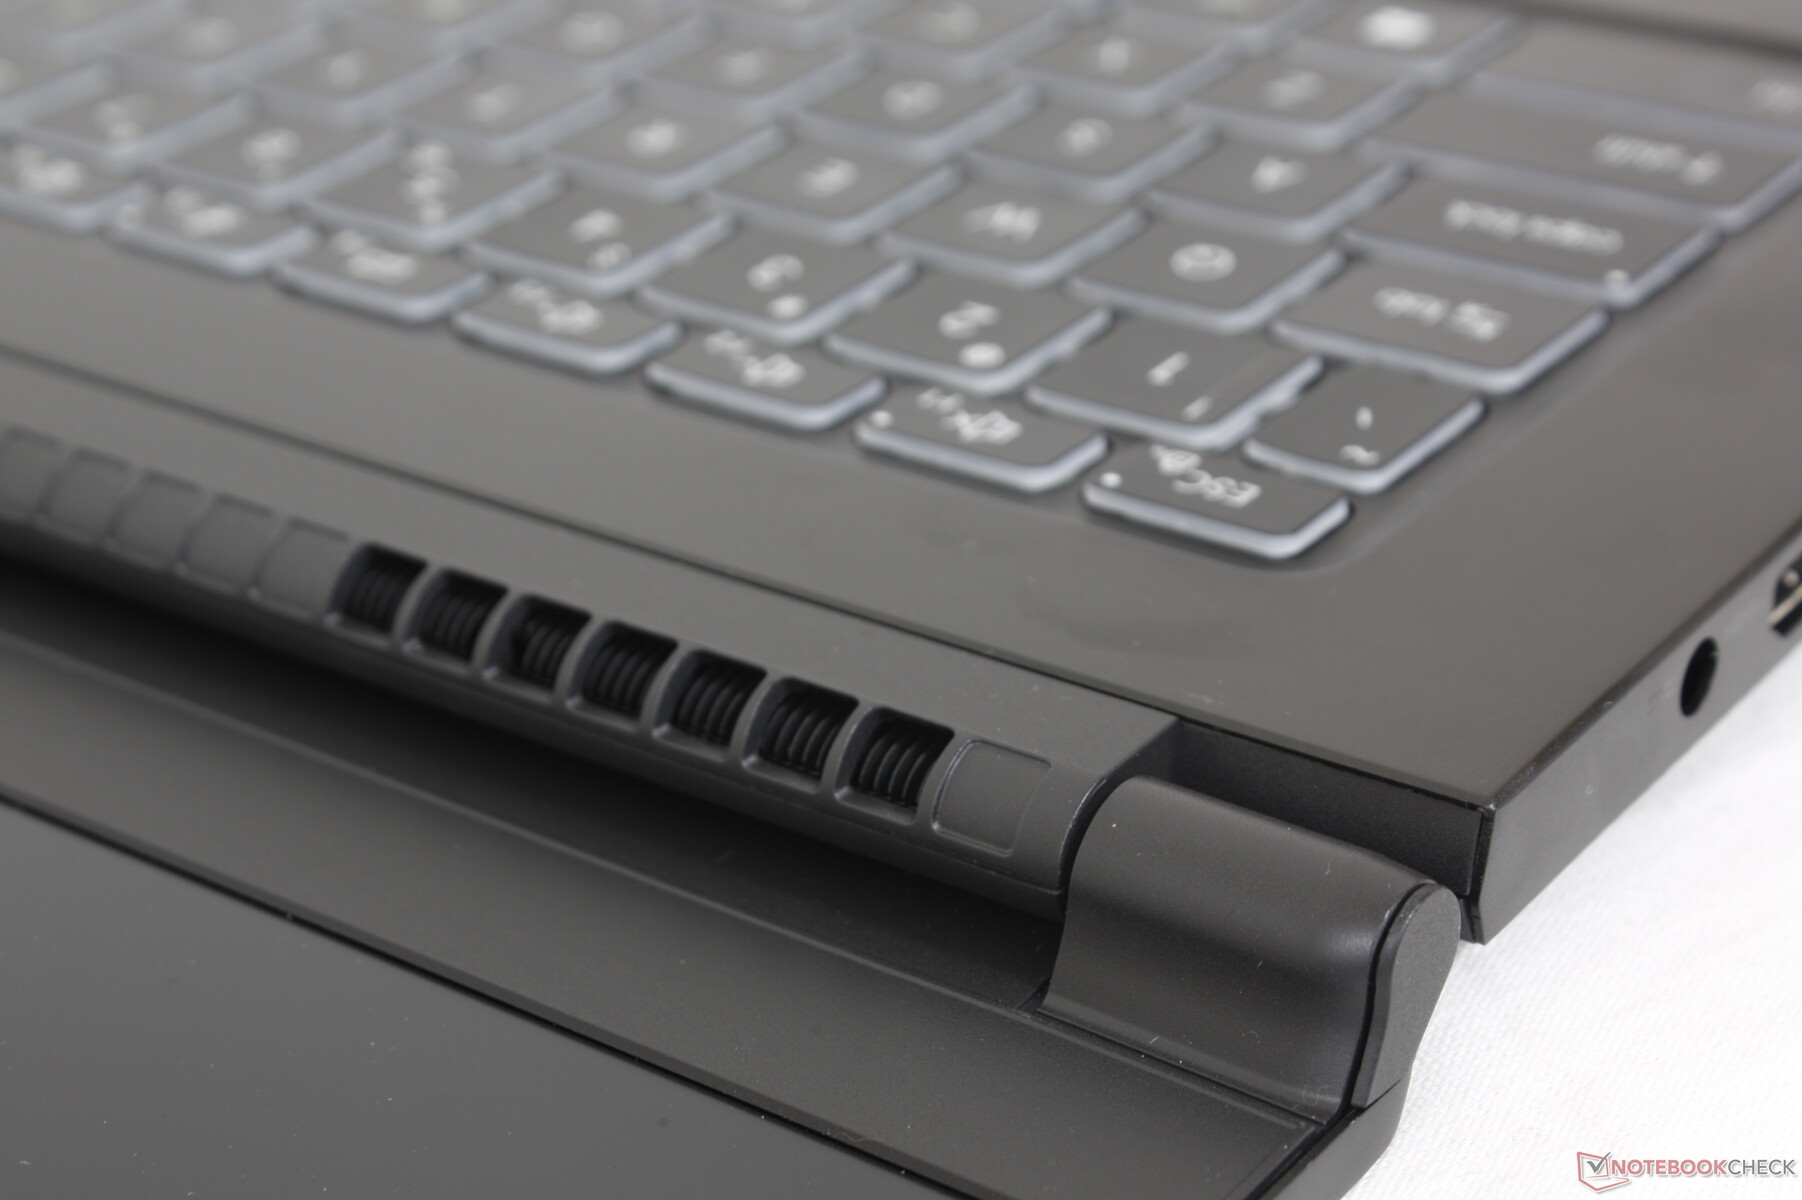
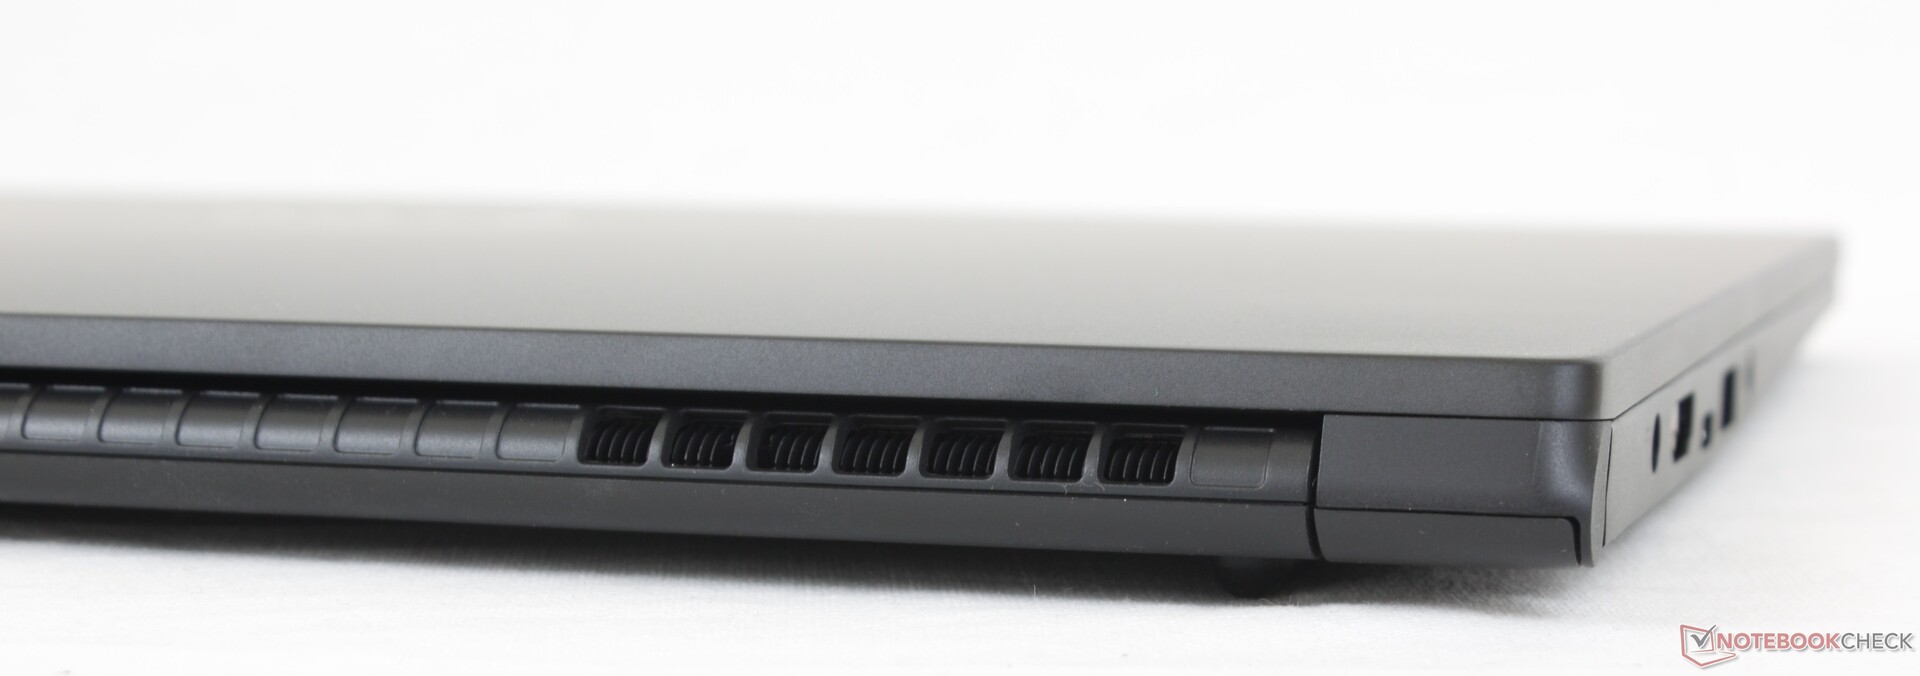
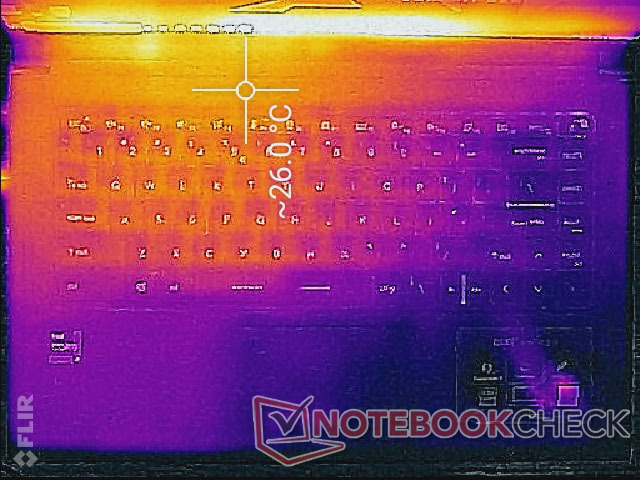
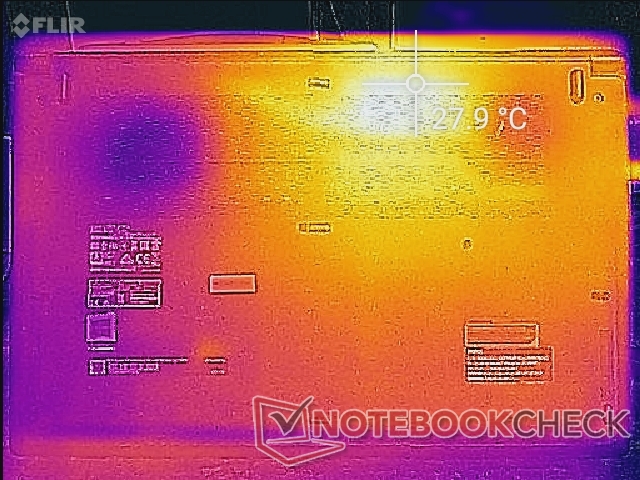
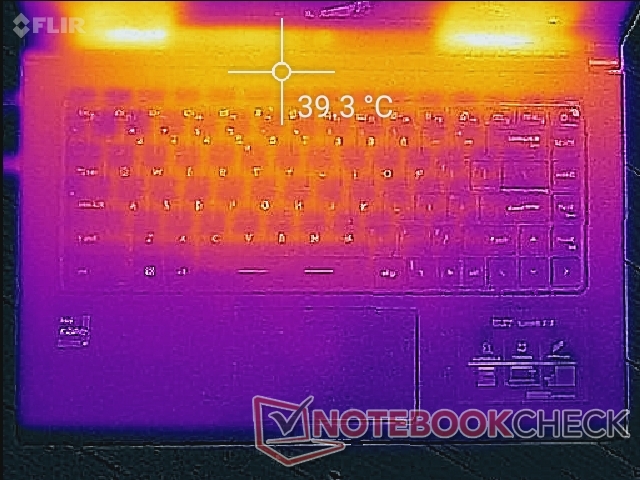
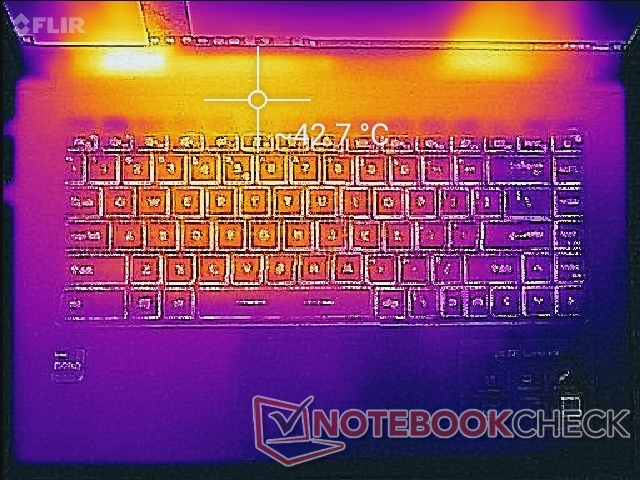
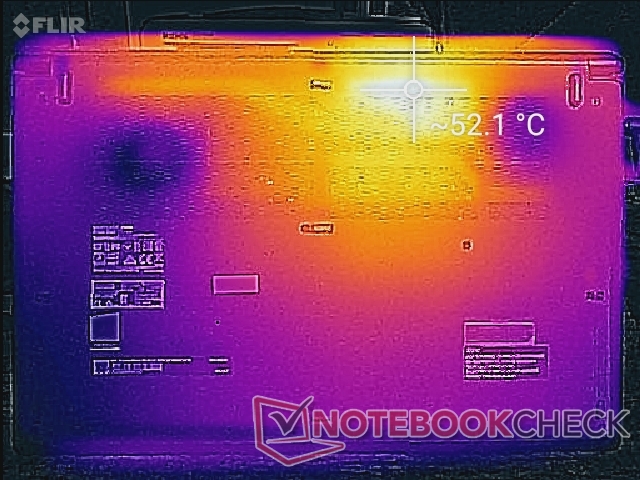
Le temperature di superficie sono notevolmente più fresche di quelle che abbiamo osservato sul Modern 15, probabilmente perché il nostro Summit B15 non è dotato di una GPU dedicata. Per esempio, il centro della tastiera si stabilizza a circa 38° C quando si eseguono carichi di lavoro pesanti rispetto ai 45° C del Modern 15. I punti caldi sul fondo sono anche alcuni gradi più freddi questa volta. Più della superficie inferiore è dedicata alla ventilazione a differenza delle piccole griglie sul Razer Blade Stealth o Lama 15 serie.
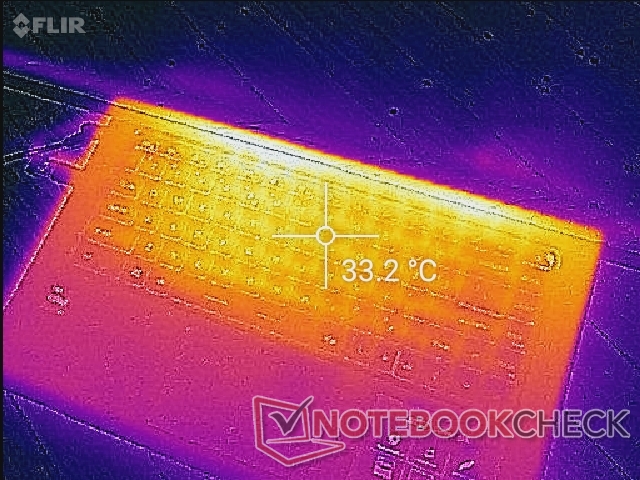
(±) La temperatura massima sul lato superiore è di 42.8 °C / 109 F, rispetto alla media di 34.3 °C / 94 F, che varia da 21.2 a 62.5 °C per questa classe Office.
(-) Il lato inferiore si riscalda fino ad un massimo di 52.2 °C / 126 F, rispetto alla media di 36.8 °C / 98 F
(+) In idle, la temperatura media del lato superiore è di 24.2 °C / 76 F, rispetto alla media deld ispositivo di 29.5 °C / 85 F.
(+) Riproducendo The Witcher 3, la temperatura media per il lato superiore e' di 31.9 °C / 89 F, rispetto alla media del dispositivo di 29.5 °C / 85 F.
(+) I poggiapolsi e il touchpad sono piu' freddi della temperatura della pelle con un massimo di 29.2 °C / 84.6 F e sono quindi freddi al tatto.
(±) La temperatura media della zona del palmo della mano di dispositivi simili e'stata di 27.5 °C / 81.5 F (-1.7 °C / -3.1 F).
Stress Test
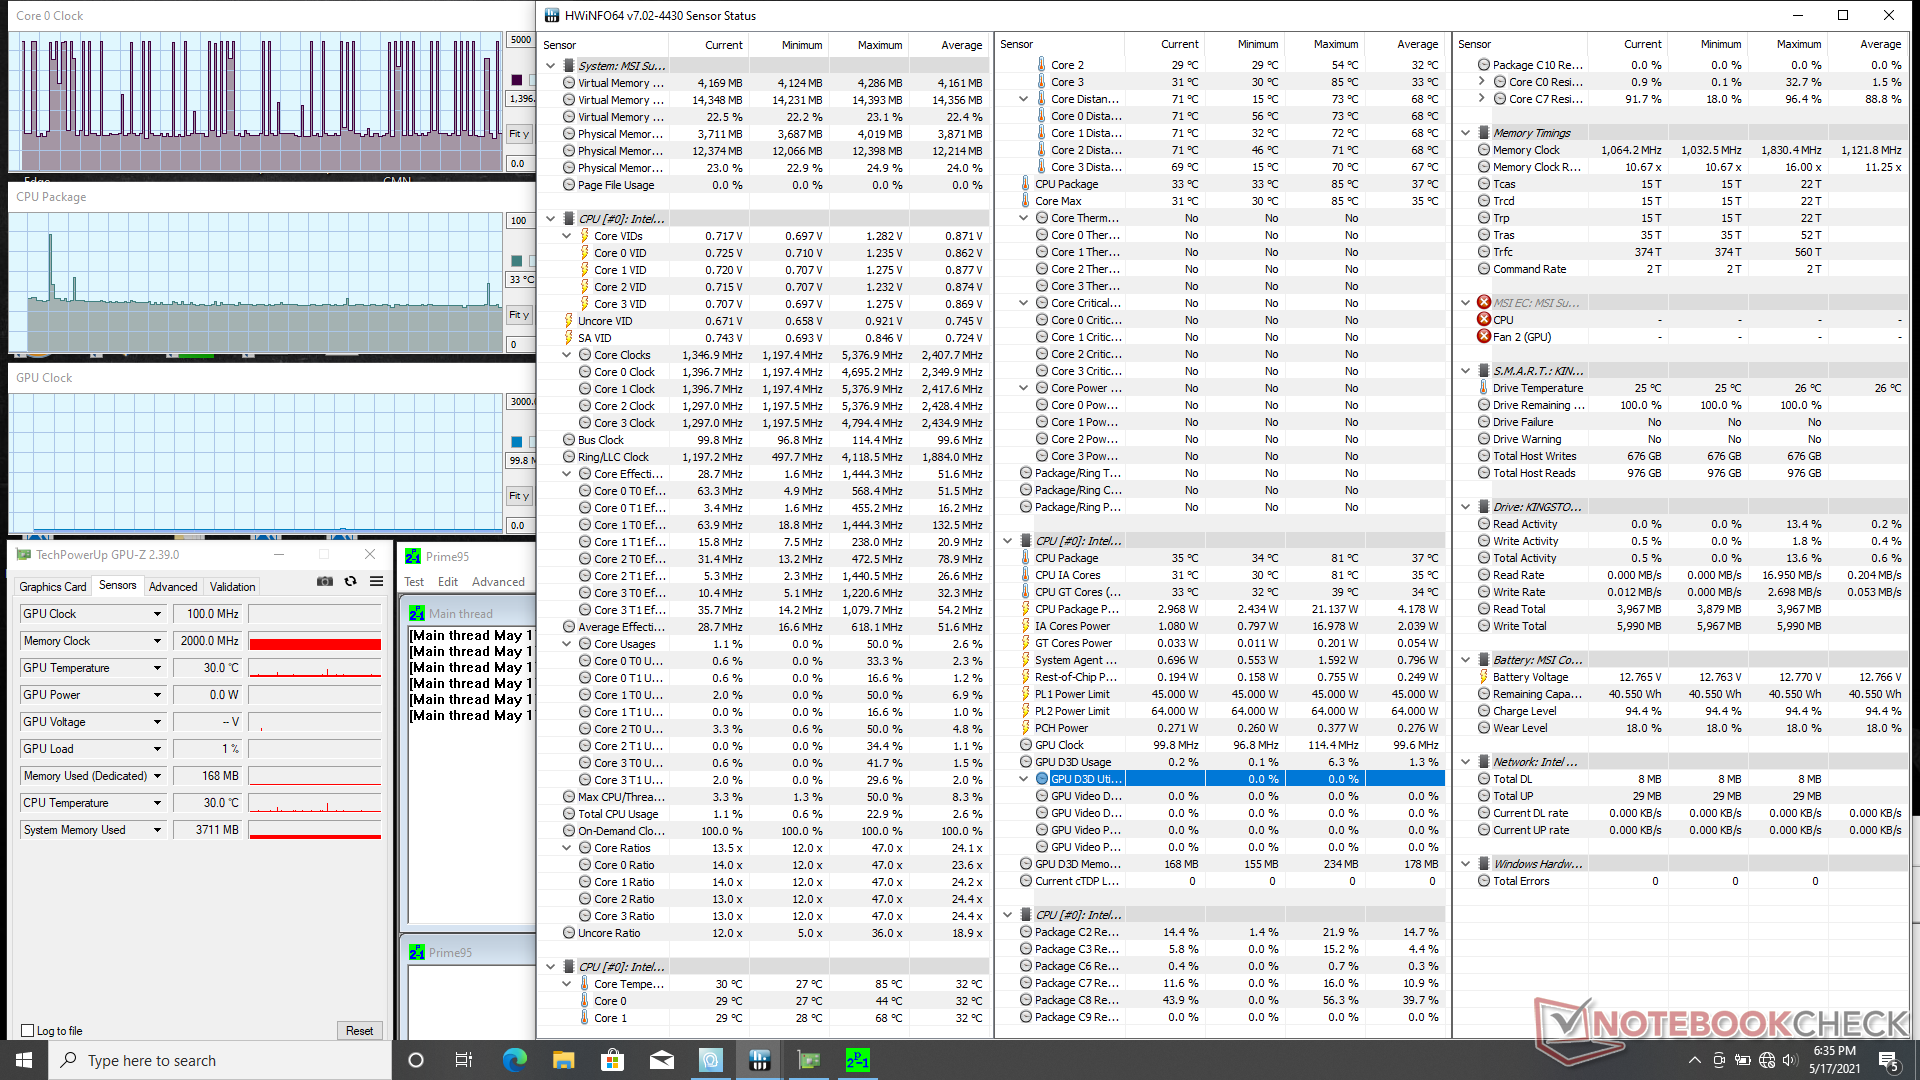
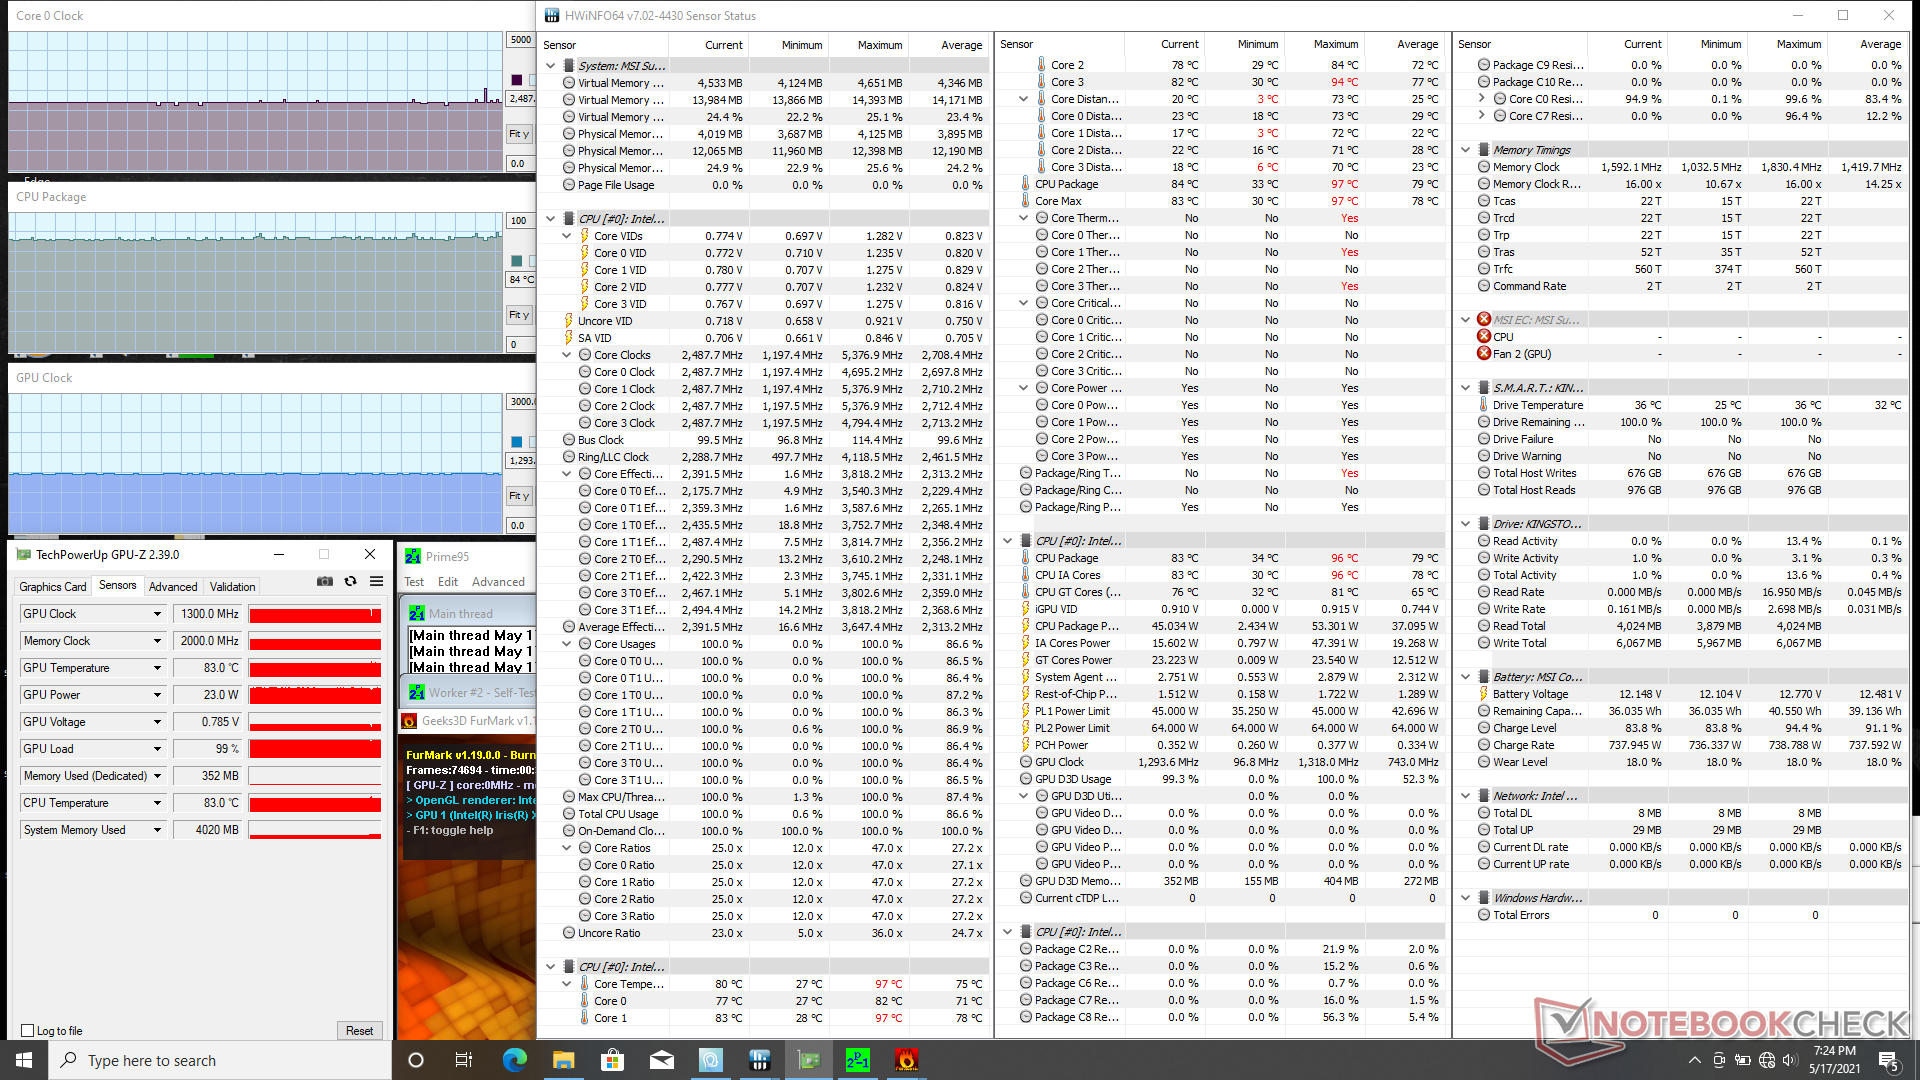
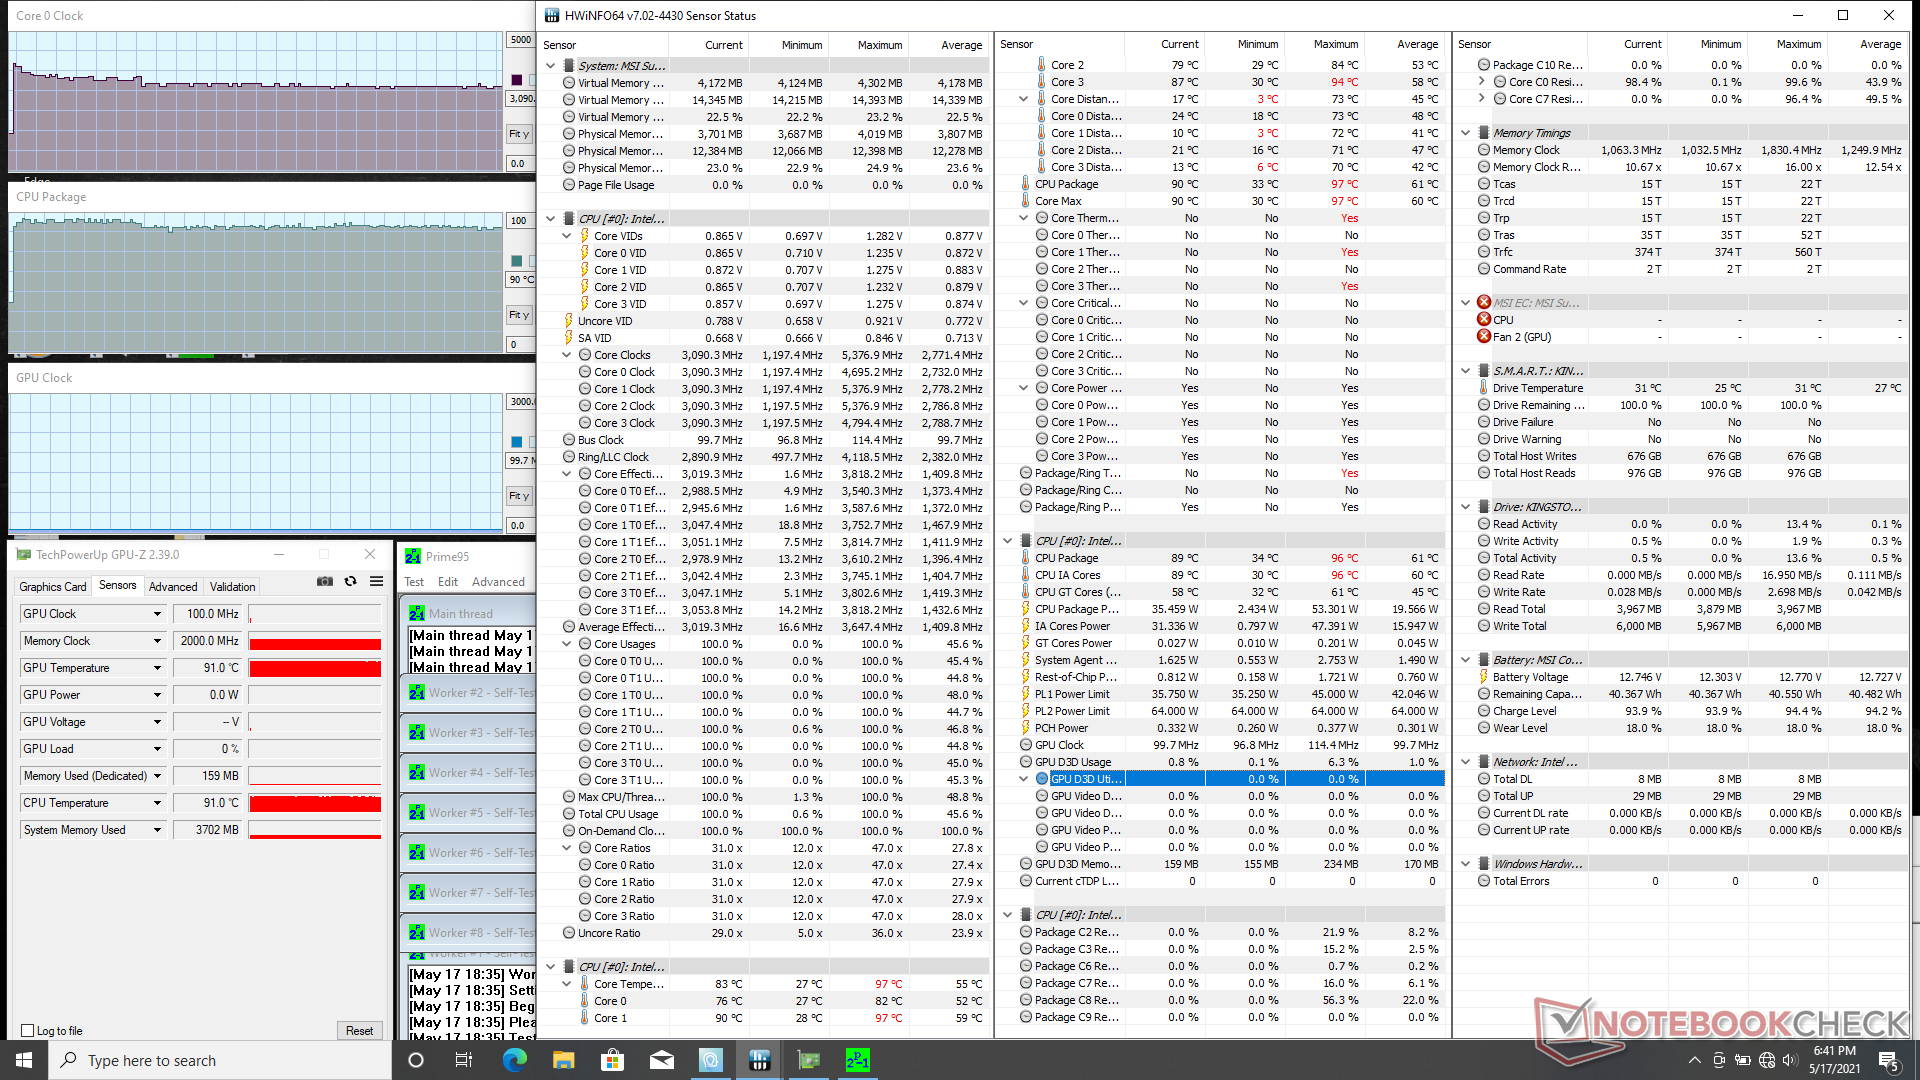
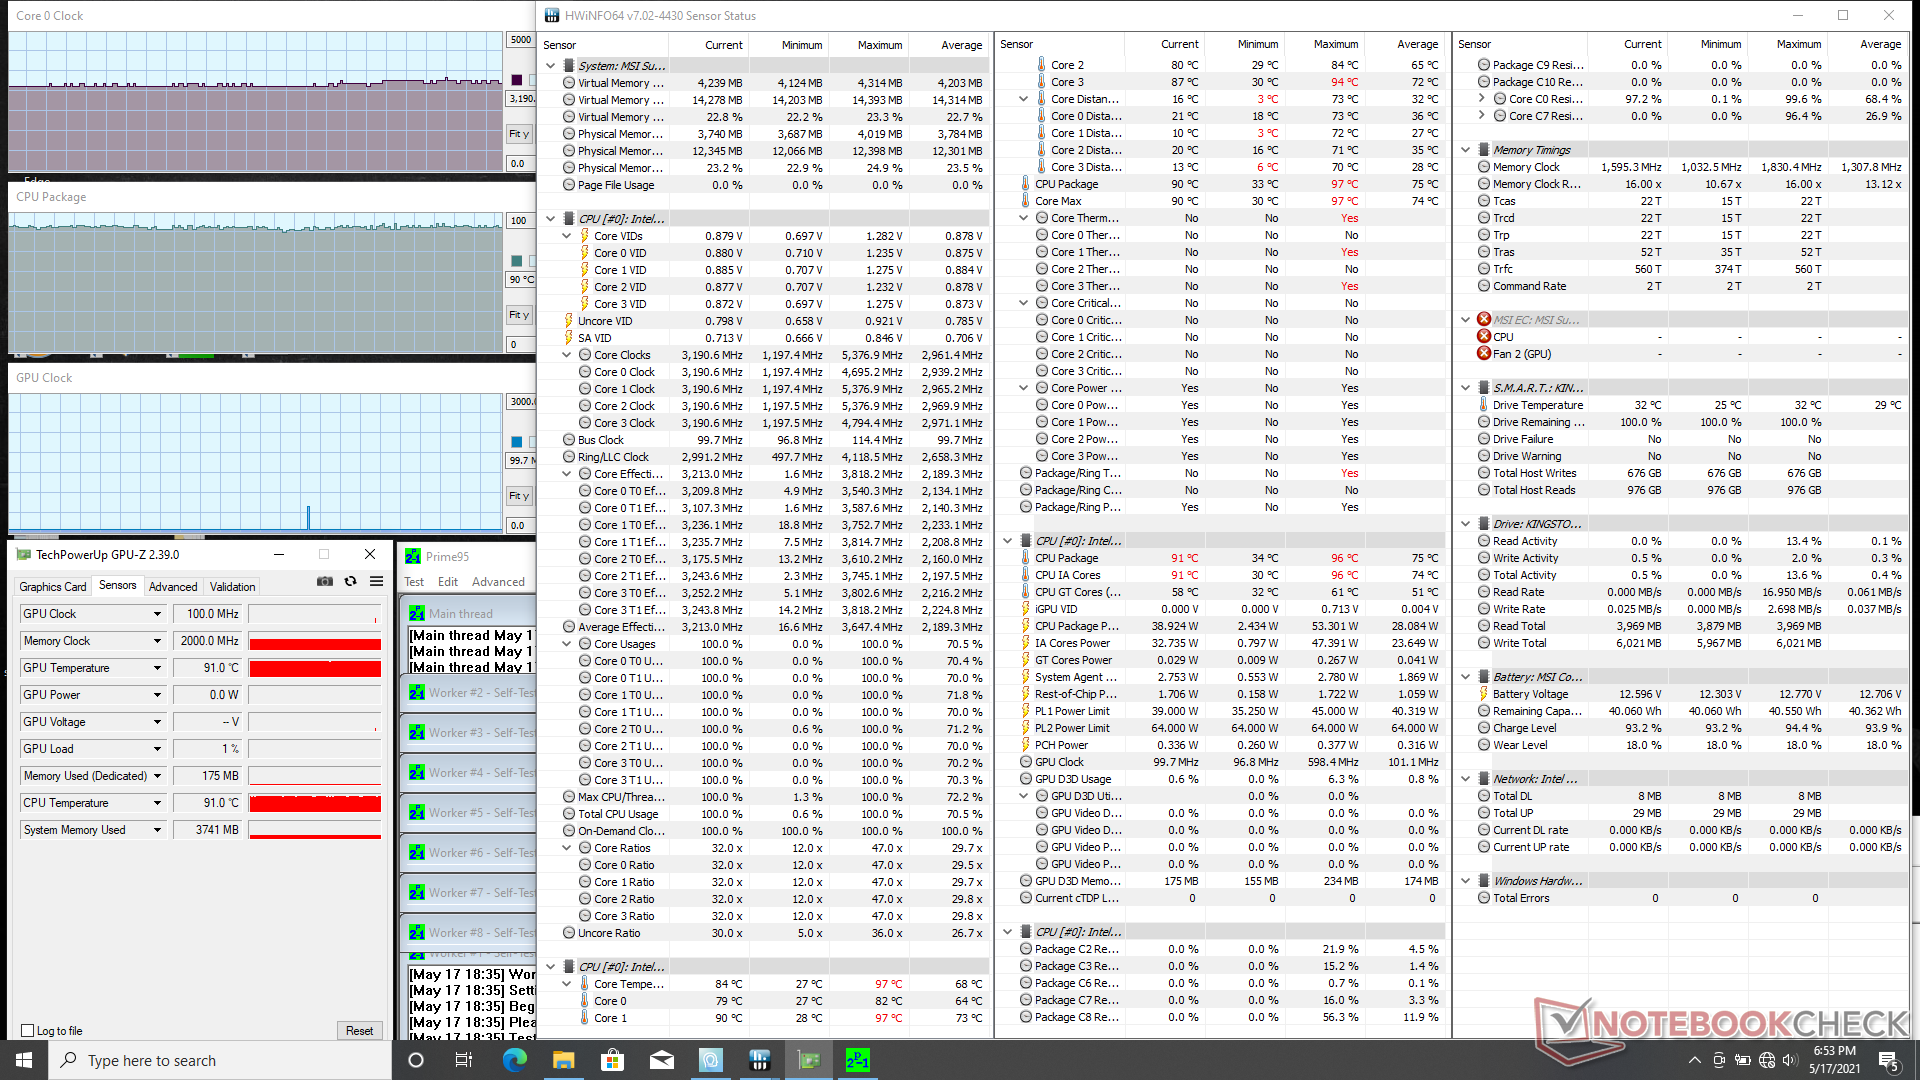
Quando viene stressata con Prime95, la CPU si spinge fino a 3,8 GHz per i primi secondi prima di scendere costantemente e infine stabilizzarsi a 3,0 - 3,1 GHz. Abilitando la modalità Cooler Boost (cioè la modalità massima della ventola), la CPU si muoverà leggermente più velocemente a 3.2 - 3.3 GHz mentre la temperatura del core rimane la stessa a 90° C. La temperatura della CPU sul Modern 15 sarebbe molto più fredda a 73° C con carichi simili.
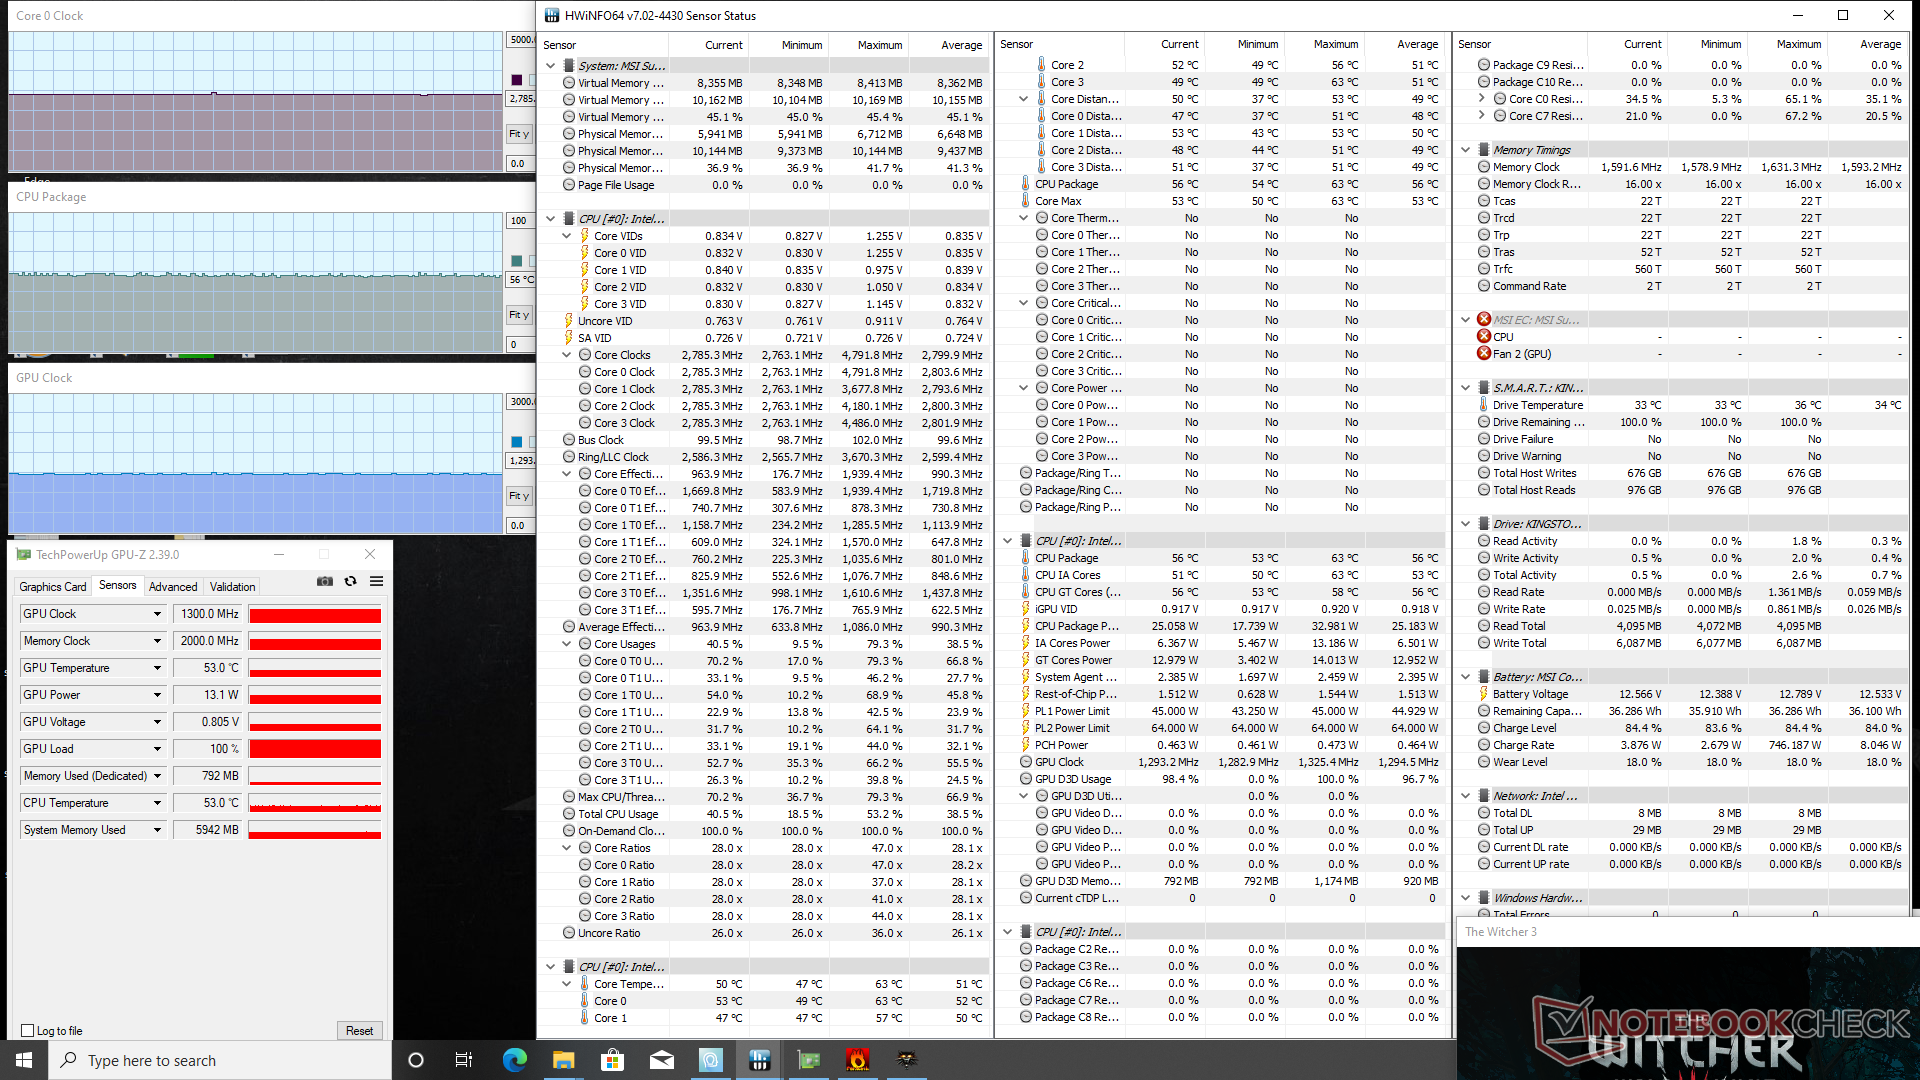
Quando si esegue The Witcher 3 per rappresentare i carichi stressanti del mondo reale, la CPU si stabilizza a soli 67° C o addirittura 56° C se Cooler Boost è abilitato. Le prestazioni rimangono le stesse indipendentemente dall'impostazione di Cooler Boost, tuttavia, il che significa che la caratteristica è principalmente per scopi di temperatura.
L'utilizzo delle batterie può avere un impatto sulle prestazioni grafiche. Un test 3DMark 11 a batteria restituisce lo stesso punteggio di Physics e Graphics dell'alimentazione con adattatore AC, ma con un punteggio grafico leggermente inferiore (6550 contro 6232 punti).

| Clock della CPU (GHz)Clock della GPU(MHz)Temperaturamedia dellaCPU (°C) |
| Sistema inattivo |
| Prime95 + FurMark Stress (Cooler Boost on) |
| Prime95 Stress (CoolerBoost off) |
| Prime95 Stress (CoolerBoost on) |
| Witcher 3 Stress (Cooler Boost off) |
| Witcher 3 Stress (Cooler Boost on) |
Altoparlanti


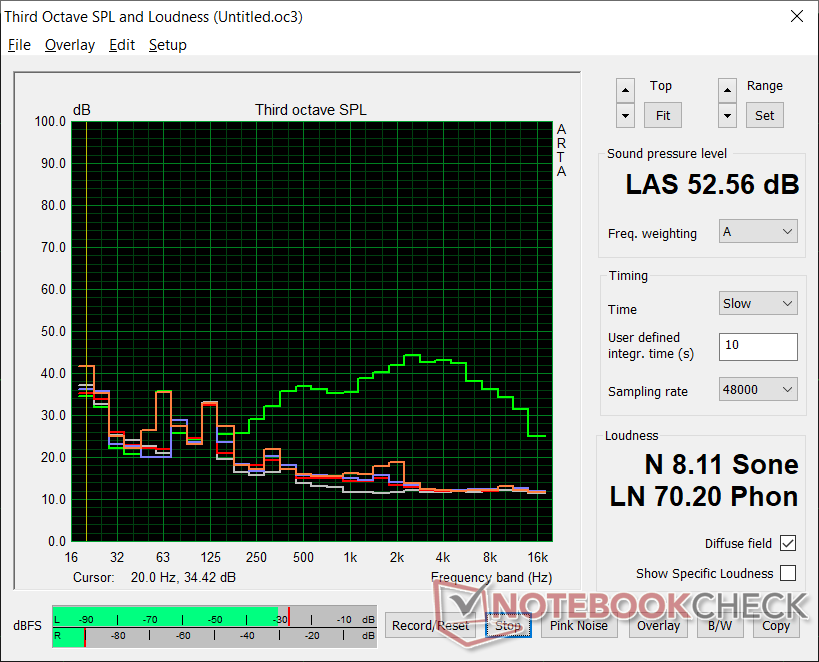
MSI Summit B15 A11M analisi audio
(+) | gli altoparlanti sono relativamente potenti (83.9 dB)
Bassi 100 - 315 Hz
(-) | quasi nessun basso - in media 18.2% inferiori alla media
(±) | la linearità dei bassi è media (12.2% delta rispetto alla precedente frequenza)
Medi 400 - 2000 Hz
(±) | medi elevati - circa 9.5% superiore alla media
(±) | linearità dei medi adeguata (9.3% delta rispetto alla precedente frequenza)
Alti 2 - 16 kHz
(±) | alti elevati - circa 7.5% superiori alla media
(±) | la linearità degli alti è media (7.1% delta rispetto alla precedente frequenza)
Nel complesso 100 - 16.000 Hz
(±) | la linearità complessiva del suono è media (25.6% di differenza rispetto alla media
Rispetto alla stessa classe
» 78% di tutti i dispositivi testati in questa classe è stato migliore, 6% simile, 16% peggiore
» Il migliore ha avuto un delta di 7%, medio di 21%, peggiore di 53%
Rispetto a tutti i dispositivi testati
» 79% di tutti i dispositivi testati in questa classe è stato migliore, 4% similare, 17% peggiore
» Il migliore ha avuto un delta di 4%, medio di 23%, peggiore di 134%
Apple MacBook 12 (Early 2016) 1.1 GHz analisi audio
(+) | gli altoparlanti sono relativamente potenti (83.6 dB)
Bassi 100 - 315 Hz
(±) | bassi ridotti - in media 11.3% inferiori alla media
(±) | la linearità dei bassi è media (14.2% delta rispetto alla precedente frequenza)
Medi 400 - 2000 Hz
(+) | medi bilanciati - solo only 2.4% rispetto alla media
(+) | medi lineari (5.5% delta rispetto alla precedente frequenza)
Alti 2 - 16 kHz
(+) | Alti bilanciati - appena 2% dalla media
(+) | alti lineari (4.5% delta rispetto alla precedente frequenza)
Nel complesso 100 - 16.000 Hz
(+) | suono nel complesso lineare (10.2% differenza dalla media)
Rispetto alla stessa classe
» 7% di tutti i dispositivi testati in questa classe è stato migliore, 2% simile, 90% peggiore
» Il migliore ha avuto un delta di 5%, medio di 18%, peggiore di 53%
Rispetto a tutti i dispositivi testati
» 5% di tutti i dispositivi testati in questa classe è stato migliore, 1% similare, 94% peggiore
» Il migliore ha avuto un delta di 4%, medio di 23%, peggiore di 134%
Gestione Energetica
Consumo di energia
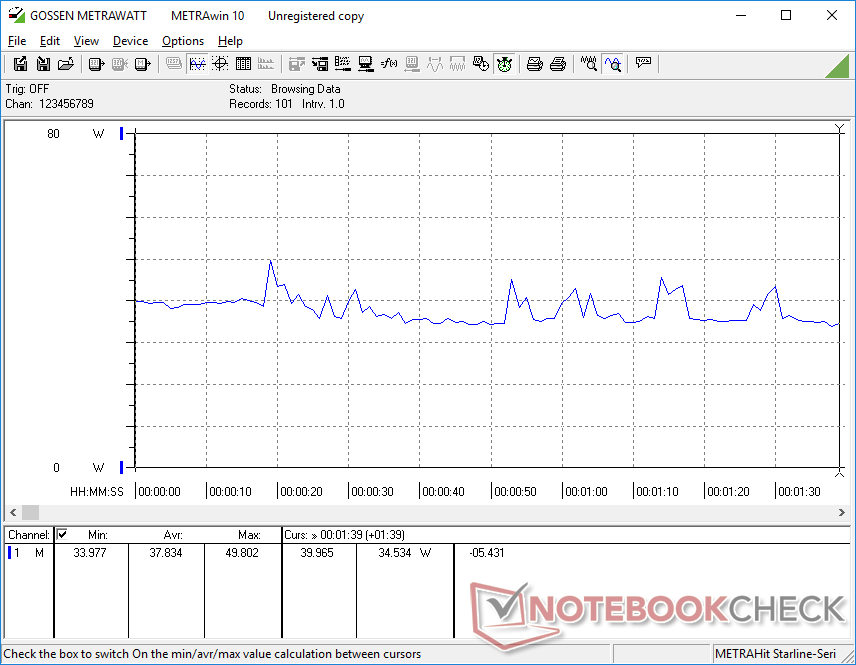
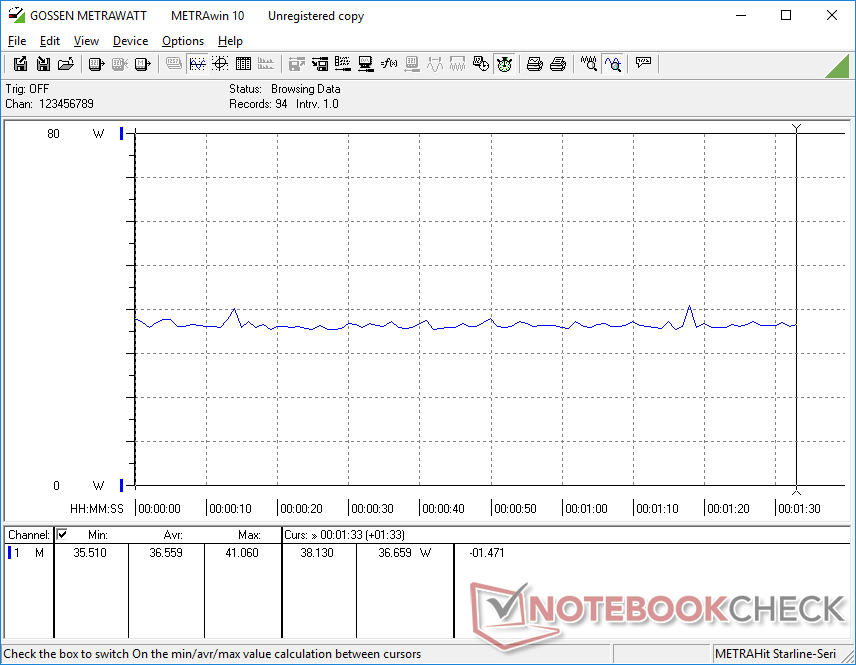
Il consumo di energia è basso soprattutto se paragonato al Modern 15 dell'anno scorso. L'inattività sul desktop consuma tra i 4 W e i 9 W a seconda del livello di luminosità e del profilo energetico, mentre il Modern 15 consumerebbe tra i 6 W e i 15 W. L'esecuzione di giochi spinge il consumo a solo 38 W sul nostro Summit B15 rispetto a 59 W e 83 W rilevati sul Modern 15, anche se il nostro sistema Summit può superare la CPU di decima generazione nel Modern 15 mentre è approssimativamente alla pari con la GeForce MX250.
È interessante notare che l'XPG Xenia Xe con la stessa CPU Core i7-1165G7 e la GPU Iris Xe consuma leggermente più energia del nostro Summit B15 durante il gaming (44 W contro 38 W). Il sistema XPG, tuttavia, avrebbe anche costantemente superato il nostro Summit nei benchmark GPU e nei giochi.
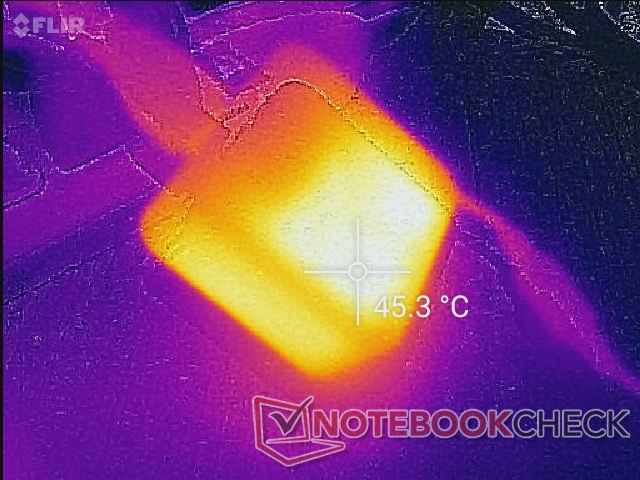
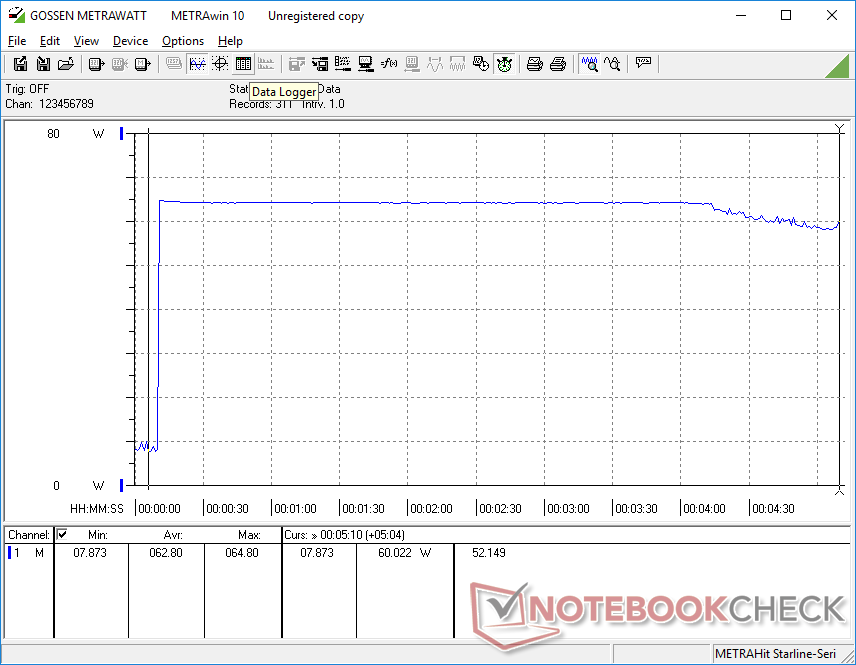
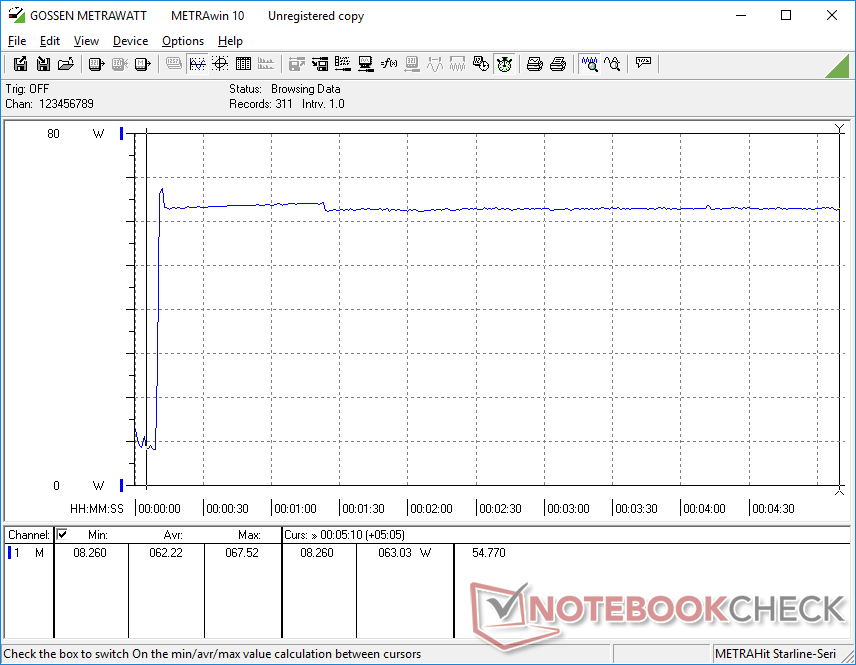
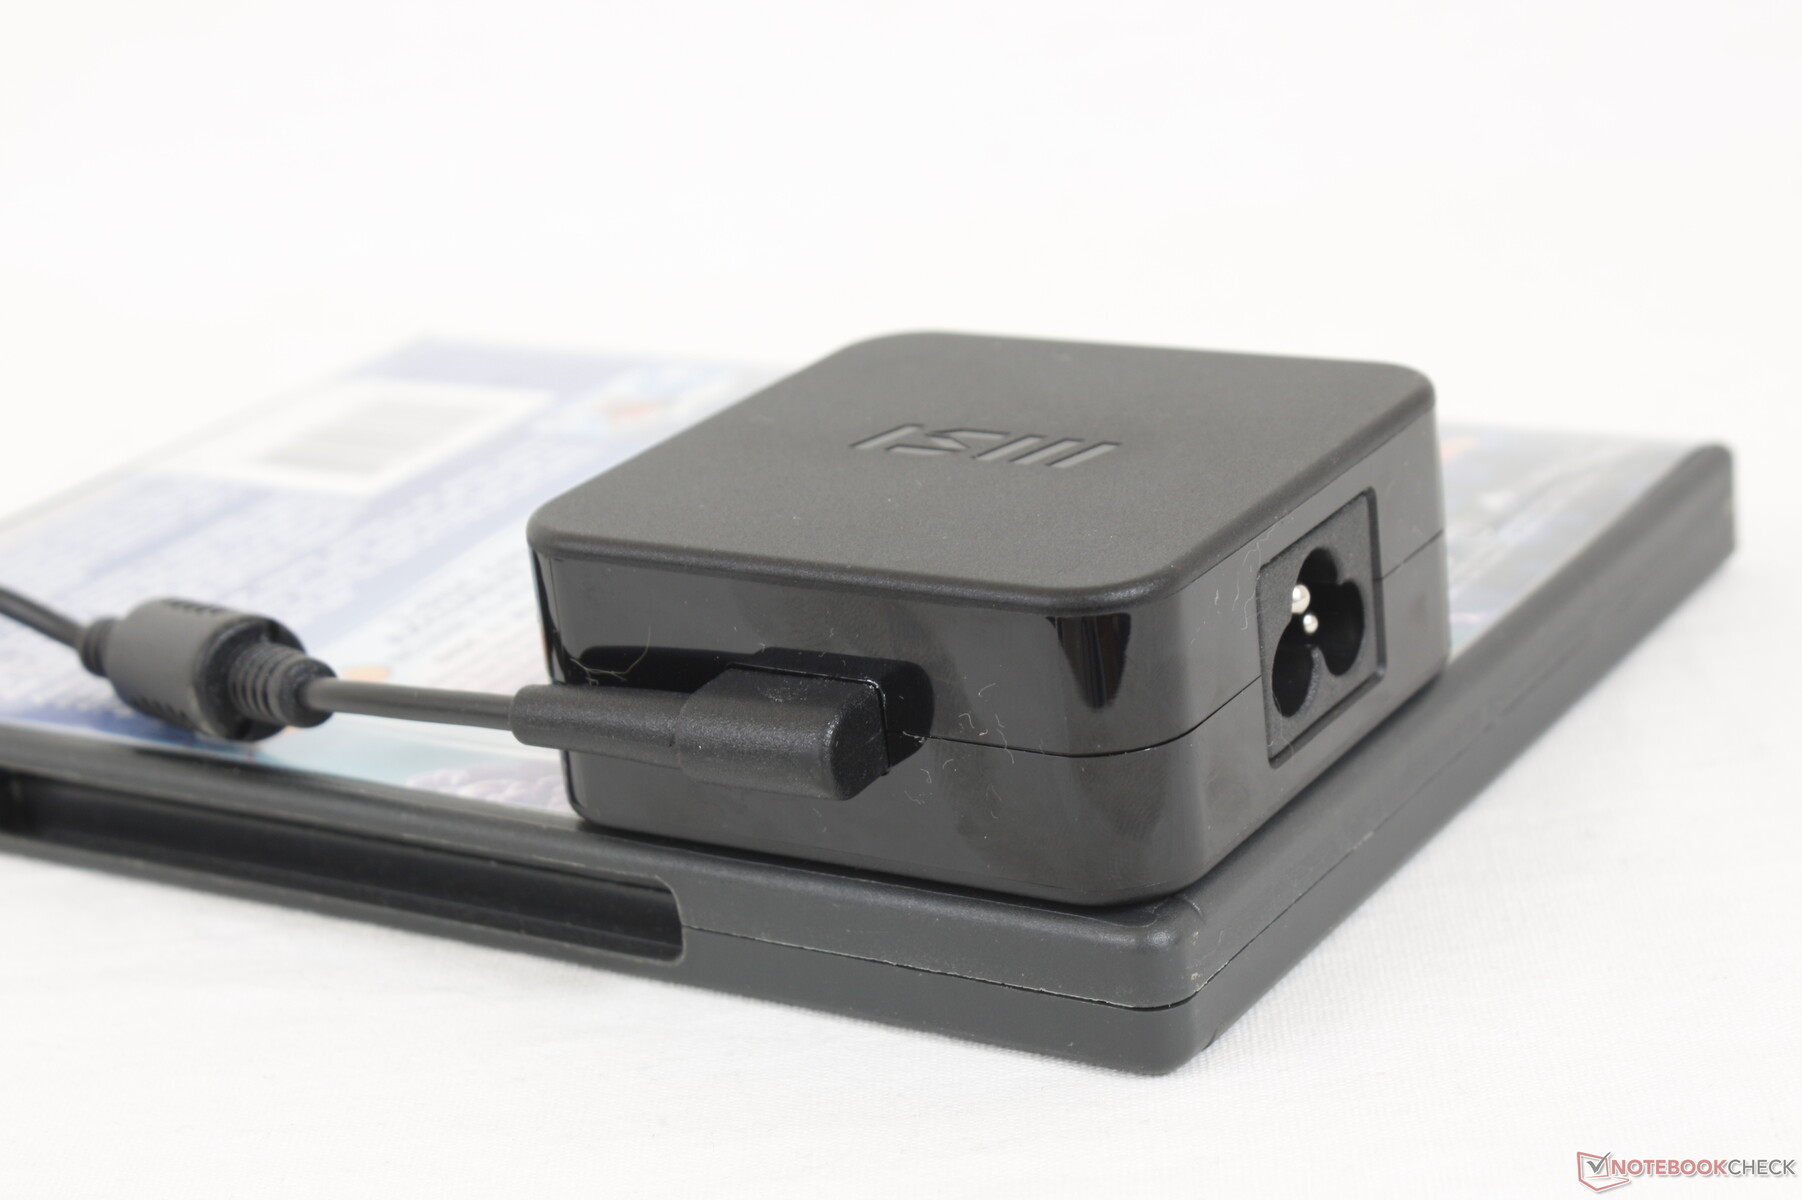
Siamo in grado di registrare un assorbimento massimo temporaneo di 67,5 W dal piccolo (~6,5 x 6,5 x 2,8 cm) adattatore AC da 65 W. Il sistema può anche mantenere un consumo approssimativo di 60-63 W per periodi prolungati quando è sotto stress estremo per mostrare che un adattatore AC più capace avrebbe potuto essere utile.
| Off / Standby | |
| Idle | |
| Sotto carico |
|
Leggenda:
min: | |
| MSI Summit B15 A11M i7-1165G7, Iris Xe G7 96EUs, Kingston OM8PCP31024F, IPS, 1920x1080, 15.6" | MSI Summit E15 A11SCST i7-1185G7, GeForce GTX 1650 Ti Max-Q, Phison 1TB SM2801T24GKBB4S-E162, IPS, 1920x1080, 15.6" | Dell XPS 15 9500 Core i5 i5-10300H, UHD Graphics 630, Toshiba KBG40ZNS256G NVMe, IPS, 1920x1200, 15.6" | HP Spectre X360 15-5ZV31AV i7-10510U, GeForce MX250, Intel SSD 660p 2TB SSDPEKNW020T8, IPS, 3840x2160, 15.6" | ADATA XPG Xenia Xe i7-1165G7, Iris Xe G7 96EUs, ADATA XPG Gammix S50 1TB, IPS, 1920x1080, 15.6" | Asus ZenBook 15 UX534FTC-A8190T i7-10510U, GeForce GTX 1650 Max-Q, Samsung SSD PM981 MZVLB1T0HALR, IPS, 1920x1080, 15.6" | |
|---|---|---|---|---|---|---|
| Power Consumption | -68% | -3% | -34% | 8% | -29% | |
| Idle Minimum * (Watt) | 4.2 | 6 -43% | 2.9 31% | 5.2 -24% | 2.7 36% | 2.8 33% |
| Idle Average * (Watt) | 7.7 | 10 -30% | 7.6 1% | 8.5 -10% | 5.3 31% | 7.7 -0% |
| Idle Maximum * (Watt) | 8.4 | 16 -90% | 8 5% | 8.7 -4% | 7.3 13% | 9.4 -12% |
| Load Average * (Watt) | 37.8 | 84 -122% | 41.7 -10% | 65.6 -74% | 43.6 -15% | 57 -51% |
| Witcher 3 ultra * (Watt) | 36.6 | 69 -89% | 56.5 -54% | 43.5 -19% | 62 -69% | |
| Load Maximum * (Watt) | 67.5 | 90 -33% | 94.8 -40% | 92.4 -37% | 66.8 1% | 116 -72% |
* ... Meglio usare valori piccoli
Durata della batteria
I tempi di autonomia sono decenti a circa 6,5 ore di uso reale WLAN per essere diverse ore più brevi rispetto al più costoso Summit E15. La differenza può essere attribuita alla minore capacità della batteria di soli 52 W rispetto agli 80 W del modello summenzionato.
La ricarica completa con l'adattatore AC richiede circa 2 ore. Il sistema può anche ricaricarsi tramite adattatori AC USB-C di terze parti. Sospettiamo che i modelli futuri abbandoneranno del tutto la porta proprietaria AC e passeranno alla sola ricarica USB-C.
| MSI Summit B15 A11M i7-1165G7, Iris Xe G7 96EUs, 52 Wh | MSI Summit E15 A11SCST i7-1185G7, GeForce GTX 1650 Ti Max-Q, 80.25 Wh | Dell XPS 15 9500 Core i5 i5-10300H, UHD Graphics 630, 56 Wh | HP Spectre X360 15-5ZV31AV i7-10510U, GeForce MX250, 84 Wh | ADATA XPG Xenia Xe i7-1165G7, Iris Xe G7 96EUs, 73.41 Wh | Asus ZenBook 15 UX534FTC-A8190T i7-10510U, GeForce GTX 1650 Max-Q, 71 Wh | |
|---|---|---|---|---|---|---|
| Autonomia della batteria | 41% | 48% | 92% | 77% | 92% | |
| Reader / Idle (h) | 18.4 | 19.5 6% | 26.4 43% | 22.6 23% | 27.2 48% | |
| WiFi v1.3 (h) | 6.6 | 9.1 38% | 9.3 41% | 10.8 64% | 11.7 77% | 12.4 88% |
| Load (h) | 1 | 1.8 80% | 1.6 60% | 2.9 190% | 2.4 140% |
Pro
Contro
Valutazione complessiva del Computer Portatile MSI Summit B15 A11M

Vale la pena acquistare l'MSI Summit B15 rispetto al più vecchio Modern 15 anche se entrambi sono portatili molto simili? Se apprezzi la Thunderbolt 4, un processore più veloce e il rumore della ventola generalmente più silenzioso, allora il più recente Summit B15 potrebbe valere la pena di essere preso in considerazione. Le sue prestazioni pure sono impressionanti per un formato così leggero da 15,6" e gli utenti possono sempre collegare GPU e monitor esterni per una grafica più veloce e colori migliori, rispettivamente.
I viaggiatori ameranno il peso superleggero, le ventole silenziose e le alte prestazioni rispetto ai popolari Ultrabooks da 15.6" come l'XPS 15, lo Spectre x360 15 o il Lenovo IdeaPad 15. Tuttavia, per un portatile >$1000 USD, la rigidità del telaio non è così robusta come vorremmo.
Se i vostri carichi di lavoro consistono principalmente in navigazione web di base, video streaming, giochi leggeri o editing minimo, allora il Modern 15 con grafica GeForce MX sarà più che sufficiente pur costando centinaia di dollari in meno. Tenete a mente che i due portatili forniranno la stessa esperienza quando si tratta di display, tastiera, clickpad e qualità dello chassis. Tuttavia, perderete le redditizie capacità di docking di Thunderbolt.
Prezzo e disponibilità
MSI Summit B15 A11M
- 05/20/2021 v7 (old)
Allen Ngo
Price comparison
