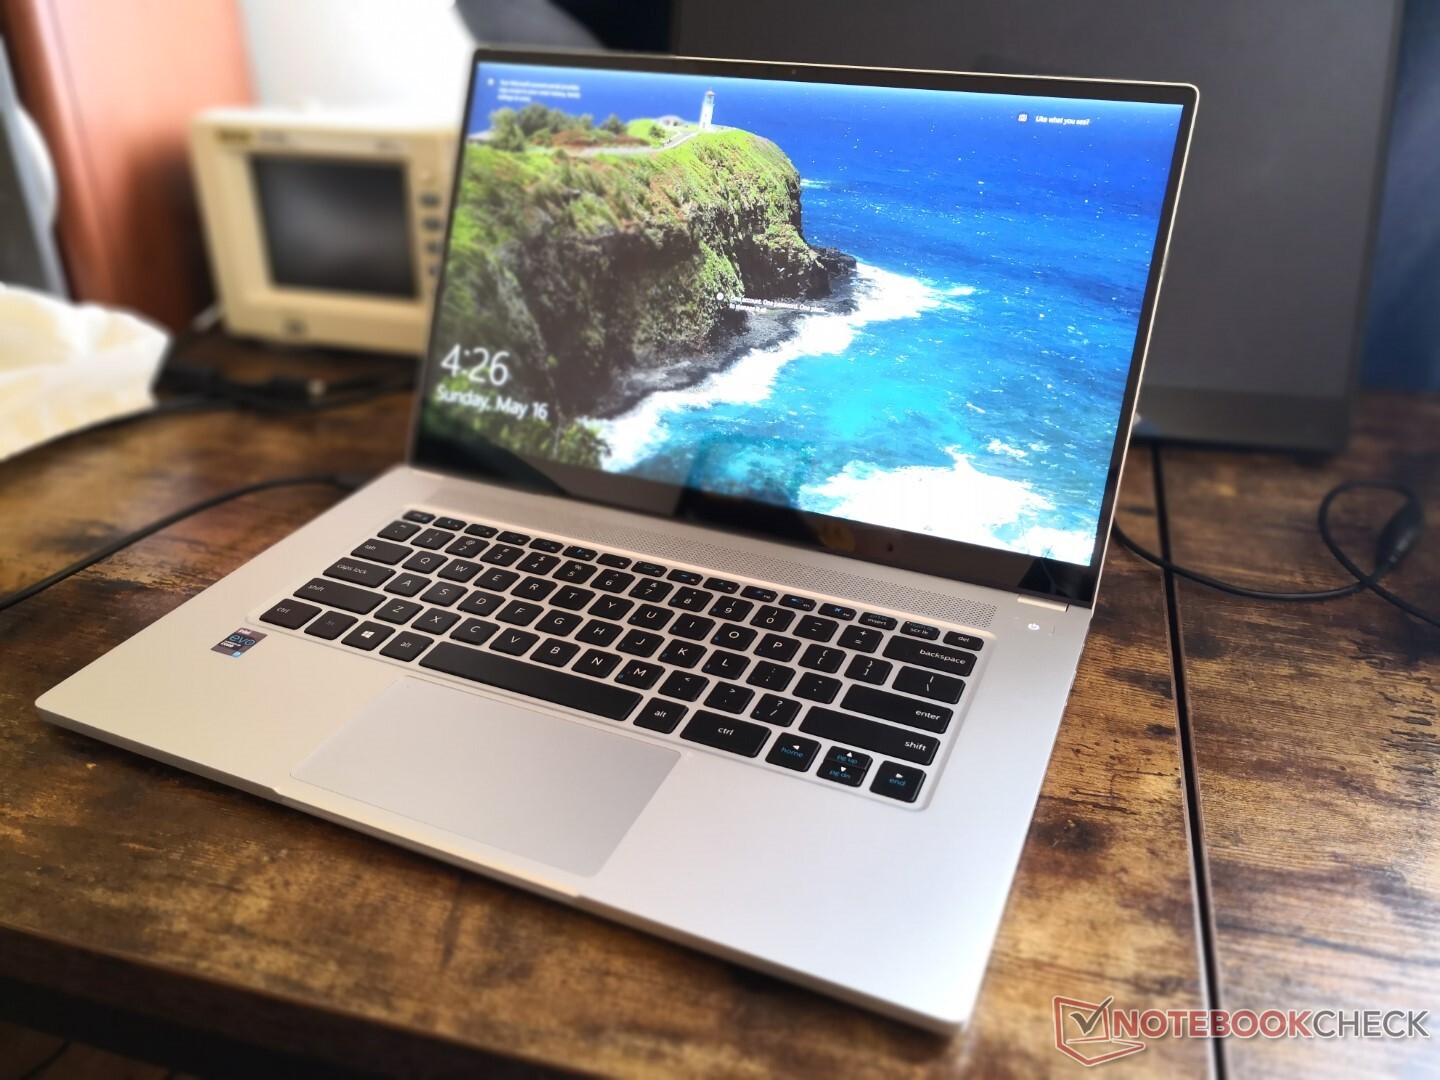
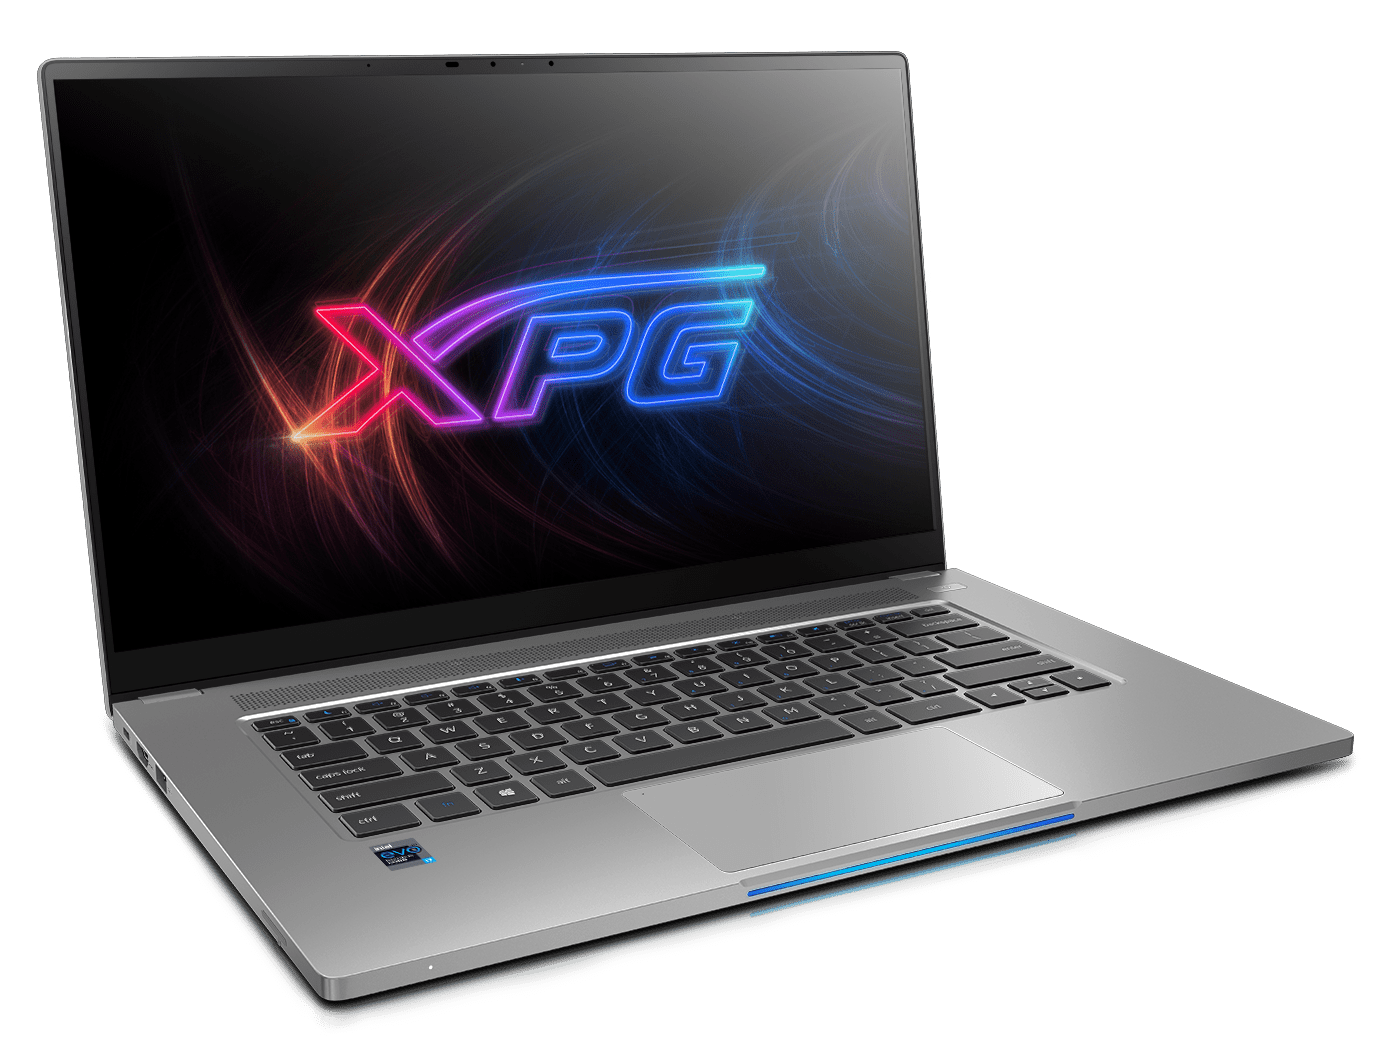
Recensione del computer portatile ADATA XPG Xenia Xe: Laptop Tiger Lake progettato da Intel
Confronto con i potenziali concorrenti
Punteggio | Data | Modello | Peso | Altezza | Dimensione | Risoluzione | Prezzo |
|---|---|---|---|---|---|---|---|
| 87.5 % v7 (old) | 05/2021 | ADATA XPG Xenia Xe i7-1165G7, Iris Xe G7 96EUs | 1.7 kg | 14.9 mm | 15.60" | 1920x1080 | |
| 89.4 % v7 (old) | 01/2020 | Apple MacBook Pro 15 2019 i9 Vega 20 i9-9980HK, Radeon Pro Vega 20 | 1.8 kg | 15.5 mm | 15.40" | 2880x1800 | |
| 86.8 % v7 (old) | 05/2020 | Dell XPS 15 9500 Core i5 i5-10300H, UHD Graphics 630 | 1.8 kg | 18 mm | 15.60" | 1920x1200 | |
| 85 % v7 (old) | 01/2020 | HP Spectre X360 15-5ZV31AV i7-10510U, GeForce MX250 | 2.1 kg | 19.3 mm | 15.60" | 3840x2160 | |
| 85.2 % v7 (old) | 03/2020 | Asus ZenBook 15 UX534FTC-A8190T i7-10510U, GeForce GTX 1650 Max-Q | 1.6 kg | 18.9 mm | 15.60" | 1920x1080 | |
| 87.1 % v7 (old) | 04/2021 | Lenovo Yoga Creator 7 15IMH05 82DS000VGE i7-10750H, GeForce GTX 1650 Mobile | 1.8 kg | 17.5 mm | 15.60" | 1920x1080 |


| |||||||||||||||||||||||||
Distribuzione della luminosità: 88 %
Al centro con la batteria: 480.4 cd/m²
Contrasto: 1550:1 (Nero: 0.31 cd/m²)
ΔE ColorChecker Calman: 2.53 | ∀{0.5-29.43 Ø4.72}
calibrated: 1.69
ΔE Greyscale Calman: 3.8 | ∀{0.09-98 Ø4.97}
94.9% sRGB (Argyll 1.6.3 3D)
63% AdobeRGB 1998 (Argyll 1.6.3 3D)
71.2% AdobeRGB 1998 (Argyll 3D)
95.2% sRGB (Argyll 3D)
70% Display P3 (Argyll 3D)
Gamma: 2.15
CCT: 6760 K
| ADATA XPG Xenia Xe BOE08F5, IPS, 15.6", 1920x1080 | Dell XPS 15 9500 Core i5 Sharp LQ156N1, IPS, 15.6", 1920x1200 | HP Spectre X360 15-5ZV31AV AU Optronics AUO30EB, IPS, 15.6", 3840x2160 | Asus ZenBook 15 UX534FTC-A8190T BOE CQ NV156FHM-N63, IPS, 15.6", 1920x1080 | Lenovo Yoga Creator 7 15IMH05 82DS000VGE BOE CQ NV156FHM-N69, IPS, 15.6", 1920x1080 | Apple MacBook Pro 15 2018 (2.6 GHz, 560X) APPA040, IPS, 15.4", 2880x1800 | |
|---|---|---|---|---|---|---|
| Display | 11% | -2% | -9% | -0% | 23% | |
| Display P3 Coverage (%) | 70 | 81.5 16% | 68.3 -2% | 65 -7% | 68.7 -2% | 98.7 41% |
| sRGB Coverage (%) | 95.2 | 100 5% | 94.3 -1% | 86.2 -9% | 97.1 2% | 99.9 5% |
| AdobeRGB 1998 Coverage (%) | 71.2 | 79.6 12% | 68.4 -4% | 62.9 -12% | 70.3 -1% | 86.6 22% |
| Response Times | 26% | -3% | 20% | 88% | 22% | |
| Response Time Grey 50% / Grey 80% * (ms) | 56.8 ? | 42 ? 26% | 56.8 ? -0% | 45 ? 21% | 5 ? 91% | 43.2 ? 24% |
| Response Time Black / White * (ms) | 38.8 ? | 28.8 ? 26% | 40.8 ? -5% | 32 ? 18% | 6 ? 85% | 31.2 ? 20% |
| PWM Frequency (Hz) | 117000 ? | |||||
| Screen | -2% | -15% | -18% | -47% | 21% | |
| Brightness middle (cd/m²) | 480.4 | 592 23% | 284.6 -41% | 299 -38% | 360 -25% | 520 8% |
| Brightness (cd/m²) | 451 | 565 25% | 285 -37% | 280 -38% | 320 -29% | 492 9% |
| Brightness Distribution (%) | 88 | 85 -3% | 85 -3% | 89 1% | 81 -8% | 88 0% |
| Black Level * (cd/m²) | 0.31 | 0.46 -48% | 0.25 19% | 0.21 32% | 0.18 42% | 0.39 -26% |
| Contrast (:1) | 1550 | 1287 -17% | 1138 -27% | 1424 -8% | 2000 29% | 1333 -14% |
| Colorchecker dE 2000 * | 2.53 | 3.19 -26% | 3.52 -39% | 4.76 -88% | 6.84 -170% | 1.2 53% |
| Colorchecker dE 2000 max. * | 7.28 | 5.45 25% | 5.56 24% | 9 -24% | 12.52 -72% | 2.3 68% |
| Colorchecker dE 2000 calibrated * | 1.69 | 2.03 -20% | 3 -78% | 2.54 -50% | ||
| Greyscale dE 2000 * | 3.8 | 3.9 -3% | 3.2 16% | 3.53 7% | 12.94 -241% | 1.3 66% |
| Gamma | 2.15 102% | 2.25 98% | 2.28 96% | 2.3 96% | 2.55 86% | 2.18 101% |
| CCT | 6760 96% | 6522 100% | 7070 92% | 7228 90% | 6973 93% | 6738 96% |
| Color Space (Percent of AdobeRGB 1998) (%) | 63 | 71.6 14% | 61.1 -3% | 56 -11% | 63 0% | |
| Color Space (Percent of sRGB) (%) | 94.9 | 100 5% | 93.8 -1% | 86 -9% | 97 2% | |
| Media totale (Programma / Settaggio) | 12% /
4% | -7% /
-11% | -2% /
-11% | 14% /
-22% | 22% /
21% |
* ... Meglio usare valori piccoli
Tempi di risposta del Display
| ↔ Tempi di risposta dal Nero al Bianco | ||
|---|---|---|
| 38.8 ms ... aumenta ↗ e diminuisce ↘ combinato | ↗ 20.4 ms Incremento | 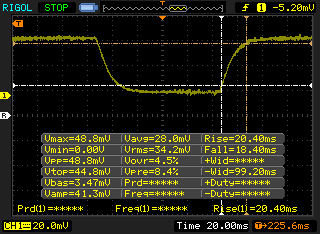 |
| ↘ 18.4 ms Calo | ||
| Lo schermo mostra tempi di risposta lenti nei nostri tests e sarà insoddisfacente per i gamers. In confronto, tutti i dispositivi di test variano da 0.1 (minimo) a 240 (massimo) ms. » 96 % di tutti i dispositivi è migliore. Questo significa che i tempi di risposta rilevati sono peggiori rispetto alla media di tutti i dispositivi testati (19.8 ms). | ||
| ↔ Tempo di risposta dal 50% Grigio all'80% Grigio | ||
| 56.8 ms ... aumenta ↗ e diminuisce ↘ combinato | ↗ 29.2 ms Incremento | 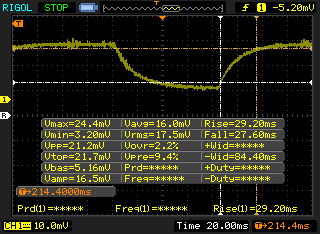 |
| ↘ 27.6 ms Calo | ||
| Lo schermo mostra tempi di risposta lenti nei nostri tests e sarà insoddisfacente per i gamers. In confronto, tutti i dispositivi di test variano da 0.165 (minimo) a 636 (massimo) ms. » 94 % di tutti i dispositivi è migliore. Questo significa che i tempi di risposta rilevati sono peggiori rispetto alla media di tutti i dispositivi testati (31 ms). | ||
Sfarfallio dello schermo / PWM (Pulse-Width Modulation)
| flickering dello schermo / PWM non rilevato | 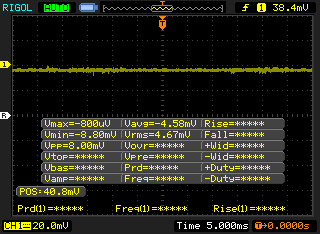 | ||
In confronto: 52 % di tutti i dispositivi testati non utilizza PWM per ridurre la luminosita' del display. Se è rilevato PWM, una media di 7763 (minimo: 5 - massimo: 343500) Hz è stata rilevata. | |||
Cinebench R23: Multi Core | Single Core
Cinebench R15: CPU Multi 64Bit | CPU Single 64Bit
Blender: v2.79 BMW27 CPU
7-Zip 18.03: 7z b 4 -mmt1 | 7z b 4
Geekbench 5.5: Single-Core | Multi-Core
HWBOT x265 Benchmark v2.2: 4k Preset
LibreOffice : 20 Documents To PDF
R Benchmark 2.5: Overall mean
| Cinebench R23 / Multi Core | |
| Lenovo Yoga Creator 7 15IMH05 82DS000VGE | |
| ADATA XPG Xenia Xe | |
| Apple MacBook Pro 15 2018 (2.6 GHz, 560X) | |
| MSI Summit E15 A11SCST | |
| Media Intel Core i7-1165G7 (2525 - 6862, n=64) | |
| Cinebench R23 / Single Core | |
| ADATA XPG Xenia Xe | |
| MSI Summit E15 A11SCST | |
| Media Intel Core i7-1165G7 (1110 - 1539, n=59) | |
| Lenovo Yoga Creator 7 15IMH05 82DS000VGE | |
| Apple MacBook Pro 15 2018 (2.6 GHz, 560X) | |
| HWBOT x265 Benchmark v2.2 / 4k Preset | |
| Lenovo Yoga Creator 7 15IMH05 82DS000VGE | |
| ADATA XPG Xenia Xe | |
| Apple MacBook Pro 15 2018 (2.6 GHz, 560X) | |
| Dell XPS 15 9500 Core i5 | |
| Lenovo ThinkBook 15 Gen2 ITL | |
| MSI Summit E15 A11SCST | |
| Lenovo IdeaPad 5 15IIL05 | |
| Media Intel Core i7-1165G7 (1.39 - 8.47, n=80) | |
| Microsoft Surface Book 3 15 | |
| LibreOffice / 20 Documents To PDF | |
| Apple MacBook Pro 15 2018 (2.6 GHz, 560X) | |
| Microsoft Surface Book 3 15 | |
| Dell XPS 15 9500 Core i5 | |
| MSI Summit E15 A11SCST | |
| Lenovo Yoga Creator 7 15IMH05 82DS000VGE | |
| Lenovo IdeaPad 5 15IIL05 | |
| Media Intel Core i7-1165G7 (21.5 - 88.1, n=78) | |
| Lenovo ThinkBook 15 Gen2 ITL | |
| ADATA XPG Xenia Xe | |
* ... Meglio usare valori piccoli
| PCMark 10 Score | 5069 punti | |
Aiuto | ||
| DPC Latencies / LatencyMon - interrupt to process latency (max), Web, Youtube, Prime95 | |
| ADATA XPG Xenia Xe | |
| Dell XPS 15 9500 Core i5 | |
| Lenovo Yoga Creator 7 15IMH05 82DS000VGE | |
* ... Meglio usare valori piccoli
| ADATA XPG Xenia Xe ADATA XPG Gammix S50 1TB | Dell XPS 15 9500 Core i5 Toshiba KBG40ZNS256G NVMe | HP Spectre X360 15-5ZV31AV Intel SSD 660p 2TB SSDPEKNW020T8 | Asus ZenBook 15 UX534FTC-A8190T Samsung SSD PM981 MZVLB1T0HALR | Lenovo Yoga Creator 7 15IMH05 82DS000VGE Samsung PM981a MZVLB1T0HBLR | |
|---|---|---|---|---|---|
| AS SSD | -60% | -29% | -7% | -2% | |
| Seq Read (MB/s) | 3842 | 1423 -63% | 1220 -68% | 2643 -31% | 2078 -46% |
| Seq Write (MB/s) | 1601 | 766 -52% | 1152 -28% | 1533 -4% | 2441 52% |
| 4K Read (MB/s) | 51.2 | 42.21 -18% | 52.3 2% | 49.12 -4% | 53.2 4% |
| 4K Write (MB/s) | 260.8 | 74.8 -71% | 146.6 -44% | 134.7 -48% | 107 -59% |
| 4K-64 Read (MB/s) | 1222 | 973 -20% | 652 -47% | 1028 -16% | 1533 25% |
| 4K-64 Write (MB/s) | 1508 | 218.8 -85% | 847 -44% | 1353 -10% | 1526 1% |
| Access Time Read * (ms) | 0.065 | 0.125 -92% | 0.077 -18% | 0.033 49% | 0.051 22% |
| Access Time Write * (ms) | 0.249 | 0.552 -122% | 0.106 57% | 0.028 89% | 0.036 86% |
| Score Read (Points) | 1657 | 1157 -30% | 826 -50% | 1342 -19% | 1794 8% |
| Score Write (Points) | 1929 | 370 -81% | 1109 -43% | 1641 -15% | 1877 -3% |
| Score Total (Points) | 4329 | 2094 -52% | 2371 -45% | 3622 -16% | 4613 7% |
| Copy ISO MB/s (MB/s) | 2166 | 1151 -47% | 2070 -4% | 2226 3% | 1633 -25% |
| Copy Program MB/s (MB/s) | 995 | 499.4 -50% | 571 -43% | 506 -49% | 549 -45% |
| Copy Game MB/s (MB/s) | 1844 | 733 -60% | 1219 -34% | 1230 -33% | 940 -49% |
| CrystalDiskMark 5.2 / 6 | -41% | -27% | -18% | -15% | |
| Write 4K (MB/s) | 159.6 | 93.3 -42% | 151.5 -5% | 138.1 -13% | 125.9 -21% |
| Read 4K (MB/s) | 45.45 | 45.9 1% | 59.3 30% | 45.89 1% | 45.78 1% |
| Write Seq (MB/s) | 2498 | 1211 -52% | 1424 -43% | 2147 -14% | 2311 -7% |
| Read Seq (MB/s) | 2340 | 1633 -30% | 1609 -31% | 2188 -6% | 1511 -35% |
| Write 4K Q32T1 (MB/s) | 645 | 273.1 -58% | 393.6 -39% | 427.8 -34% | 446.7 -31% |
| Read 4K Q32T1 (MB/s) | 439.4 | 356 -19% | 369.4 -16% | 404 -8% | 548 25% |
| Write Seq Q32T1 (MB/s) | 4057 | 1198 -70% | 1946 -52% | 2396 -41% | 3020 -26% |
| Read Seq Q32T1 (MB/s) | 4960 | 2269 -54% | 1934 -61% | 3454 -30% | 3518 -29% |
| Media totale (Programma / Settaggio) | -51% /
-53% | -28% /
-28% | -13% /
-11% | -9% /
-7% |
* ... Meglio usare valori piccoli

Throttling Disco: DiskSpd Read Loop, Queue Depth 8
| 3DMark 11 Performance | 7480 punti | |
| 3DMark Cloud Gate Standard Score | 20209 punti | |
| 3DMark Fire Strike Score | 5331 punti | |
| 3DMark Time Spy Score | 1814 punti | |
Aiuto | ||
| basso | medio | alto | ultra | |
|---|---|---|---|---|
| The Witcher 3 (2015) | 103 | 67 | 38.2 | 16.5 |
| Dota 2 Reborn (2015) | 83.2 | 72.2 | 52.8 | 50.3 |
| Final Fantasy XV Benchmark (2018) | 46.3 | 25.4 | 19 | |
| X-Plane 11.11 (2018) | 29 | 38.3 | 34.4 |
| ADATA XPG Xenia Xe Iris Xe G7 96EUs, i7-1165G7, ADATA XPG Gammix S50 1TB | Dell XPS 15 9500 Core i5 UHD Graphics 630, i5-10300H, Toshiba KBG40ZNS256G NVMe | HP Spectre X360 15-5ZV31AV GeForce MX250, i7-10510U, Intel SSD 660p 2TB SSDPEKNW020T8 | Asus ZenBook 15 UX534FTC-A8190T GeForce GTX 1650 Max-Q, i7-10510U, Samsung SSD PM981 MZVLB1T0HALR | Apple MacBook Pro 15 2018 (2.6 GHz, 560X) Radeon Pro 560X, i7-8850H, Apple SSD AP0512 | |
|---|---|---|---|---|---|
| Noise | -2% | -8% | -7% | -14% | |
| off /ambiente * (dB) | 25.2 | 28 -11% | 30.1 -19% | 30.3 -20% | 29.6 -17% |
| Idle Minimum * (dB) | 25.2 | 28 -11% | 30.1 -19% | 30.3 -20% | 30.1 -19% |
| Idle Average * (dB) | 25.2 | 28 -11% | 30.1 -19% | 30.3 -20% | 30.1 -19% |
| Idle Maximum * (dB) | 25.2 | 28 -11% | 30.1 -19% | 30.9 -23% | 30.1 -19% |
| Load Average * (dB) | 35.7 | 28 22% | 30.1 16% | 31.3 12% | 46.8 -31% |
| Witcher 3 ultra * (dB) | 39.7 | 39.7 -0% | 38.1 4% | 36 9% | |
| Load Maximum * (dB) | 45.3 | 41.9 8% | 42 7% | 38.2 16% | 46.8 -3% |
* ... Meglio usare valori piccoli
Rumorosità
| Idle |
| 25.2 / 25.2 / 25.2 dB(A) |
| Sotto carico |
| 35.7 / 45.3 dB(A) |
 | ||
30 dB silenzioso 40 dB(A) udibile 50 dB(A) rumoroso |
||
min: | ||
(-) La temperatura massima sul lato superiore è di 45.2 °C / 113 F, rispetto alla media di 36.8 °C / 98 F, che varia da 21 a 71 °C per questa classe Multimedia.
(-) Il lato inferiore si riscalda fino ad un massimo di 47.8 °C / 118 F, rispetto alla media di 39.1 °C / 102 F
(+) In idle, la temperatura media del lato superiore è di 20.9 °C / 70 F, rispetto alla media deld ispositivo di 31.3 °C / 88 F.
(+) Riproducendo The Witcher 3, la temperatura media per il lato superiore e' di 27.8 °C / 82 F, rispetto alla media del dispositivo di 31.3 °C / 88 F.
(+) I poggiapolsi e il touchpad sono piu' freddi della temperatura della pelle con un massimo di 25.4 °C / 77.7 F e sono quindi freddi al tatto.
(+) La temperatura media della zona del palmo della mano di dispositivi simili e'stata di 28.7 °C / 83.7 F (+3.3 °C / 6 F).
ADATA XPG Xenia Xe analisi audio
(±) | potenza degli altiparlanti media ma buona (79.8 dB)
Bassi 100 - 315 Hz
(±) | bassi ridotti - in media 14.5% inferiori alla media
(±) | la linearità dei bassi è media (10.6% delta rispetto alla precedente frequenza)
Medi 400 - 2000 Hz
(+) | medi bilanciati - solo only 2.6% rispetto alla media
(+) | medi lineari (3.8% delta rispetto alla precedente frequenza)
Alti 2 - 16 kHz
(+) | Alti bilanciati - appena 3.2% dalla media
(+) | alti lineari (4% delta rispetto alla precedente frequenza)
Nel complesso 100 - 16.000 Hz
(+) | suono nel complesso lineare (12.9% differenza dalla media)
Rispetto alla stessa classe
» 26% di tutti i dispositivi testati in questa classe è stato migliore, 4% simile, 70% peggiore
» Il migliore ha avuto un delta di 5%, medio di 17%, peggiore di 45%
Rispetto a tutti i dispositivi testati
» 12% di tutti i dispositivi testati in questa classe è stato migliore, 3% similare, 85% peggiore
» Il migliore ha avuto un delta di 4%, medio di 24%, peggiore di 134%
Apple MacBook 12 (Early 2016) 1.1 GHz analisi audio
(+) | gli altoparlanti sono relativamente potenti (83.6 dB)
Bassi 100 - 315 Hz
(±) | bassi ridotti - in media 11.3% inferiori alla media
(±) | la linearità dei bassi è media (14.2% delta rispetto alla precedente frequenza)
Medi 400 - 2000 Hz
(+) | medi bilanciati - solo only 2.4% rispetto alla media
(+) | medi lineari (5.5% delta rispetto alla precedente frequenza)
Alti 2 - 16 kHz
(+) | Alti bilanciati - appena 2% dalla media
(+) | alti lineari (4.5% delta rispetto alla precedente frequenza)
Nel complesso 100 - 16.000 Hz
(+) | suono nel complesso lineare (10.2% differenza dalla media)
Rispetto alla stessa classe
» 7% di tutti i dispositivi testati in questa classe è stato migliore, 2% simile, 91% peggiore
» Il migliore ha avuto un delta di 5%, medio di 18%, peggiore di 53%
Rispetto a tutti i dispositivi testati
» 5% di tutti i dispositivi testati in questa classe è stato migliore, 1% similare, 94% peggiore
» Il migliore ha avuto un delta di 4%, medio di 24%, peggiore di 134%
| Off / Standby | |
| Idle | |
| Sotto carico |
|
Leggenda:
min: | |
| ADATA XPG Xenia Xe i7-1165G7, Iris Xe G7 96EUs, ADATA XPG Gammix S50 1TB, IPS, 1920x1080, 15.6" | Dell XPS 15 9500 Core i5 i5-10300H, UHD Graphics 630, Toshiba KBG40ZNS256G NVMe, IPS, 1920x1200, 15.6" | HP Spectre X360 15-5ZV31AV i7-10510U, GeForce MX250, Intel SSD 660p 2TB SSDPEKNW020T8, IPS, 3840x2160, 15.6" | Asus ZenBook 15 UX534FTC-A8190T i7-10510U, GeForce GTX 1650 Max-Q, Samsung SSD PM981 MZVLB1T0HALR, IPS, 1920x1080, 15.6" | Lenovo Yoga Creator 7 15IMH05 82DS000VGE i7-10750H, GeForce GTX 1650 Mobile, Samsung PM981a MZVLB1T0HBLR, IPS, 1920x1080, 15.6" | Apple MacBook Pro 15 2018 (2.6 GHz, 560X) i7-8850H, Radeon Pro 560X, Apple SSD AP0512, IPS, 2880x1800, 15.4" | |
|---|---|---|---|---|---|---|
| Power Consumption | -20% | -48% | -38% | -102% | -71% | |
| Idle Minimum * (Watt) | 2.7 | 2.9 -7% | 5.2 -93% | 2.8 -4% | 6.9 -156% | 3.4 -26% |
| Idle Average * (Watt) | 5.3 | 7.6 -43% | 8.5 -60% | 7.7 -45% | 10 -89% | 11 -108% |
| Idle Maximum * (Watt) | 7.3 | 8 -10% | 8.7 -19% | 9.4 -29% | 12.6 -73% | 14.9 -104% |
| Load Average * (Watt) | 43.6 | 41.7 4% | 65.6 -50% | 57 -31% | 96 -120% | 78.9 -81% |
| Witcher 3 ultra * (Watt) | 43.5 | 56.5 -30% | 62 -43% | 75 -72% | ||
| Load Maximum * (Watt) | 66.8 | 94.8 -42% | 92.4 -38% | 116 -74% | 134 -101% | 91.2 -37% |
* ... Meglio usare valori piccoli
| ADATA XPG Xenia Xe i7-1165G7, Iris Xe G7 96EUs, 73.41 Wh | Dell XPS 15 9500 Core i5 i5-10300H, UHD Graphics 630, 56 Wh | HP Spectre X360 15-5ZV31AV i7-10510U, GeForce MX250, 84 Wh | Asus ZenBook 15 UX534FTC-A8190T i7-10510U, GeForce GTX 1650 Max-Q, 71 Wh | Lenovo Yoga Creator 7 15IMH05 82DS000VGE i7-10750H, GeForce GTX 1650 Mobile, 70 Wh | Apple MacBook Pro 15 2018 (2.6 GHz, 560X) i7-8850H, Radeon Pro 560X, 83 Wh | |
|---|---|---|---|---|---|---|
| Autonomia della batteria | -21% | -8% | 6% | -23% | -13% | |
| WiFi v1.3 (h) | 11.7 | 9.3 -21% | 10.8 -8% | 12.4 6% | 9 -23% | 10.2 -13% |
| Reader / Idle (h) | 26.4 | 22.6 | 27.2 | 25.7 | ||
| Load (h) | 1.6 | 2.9 | 2.4 | 1 | ||
| Witcher 3 ultra (h) | 1.5 |
Pro
Contro
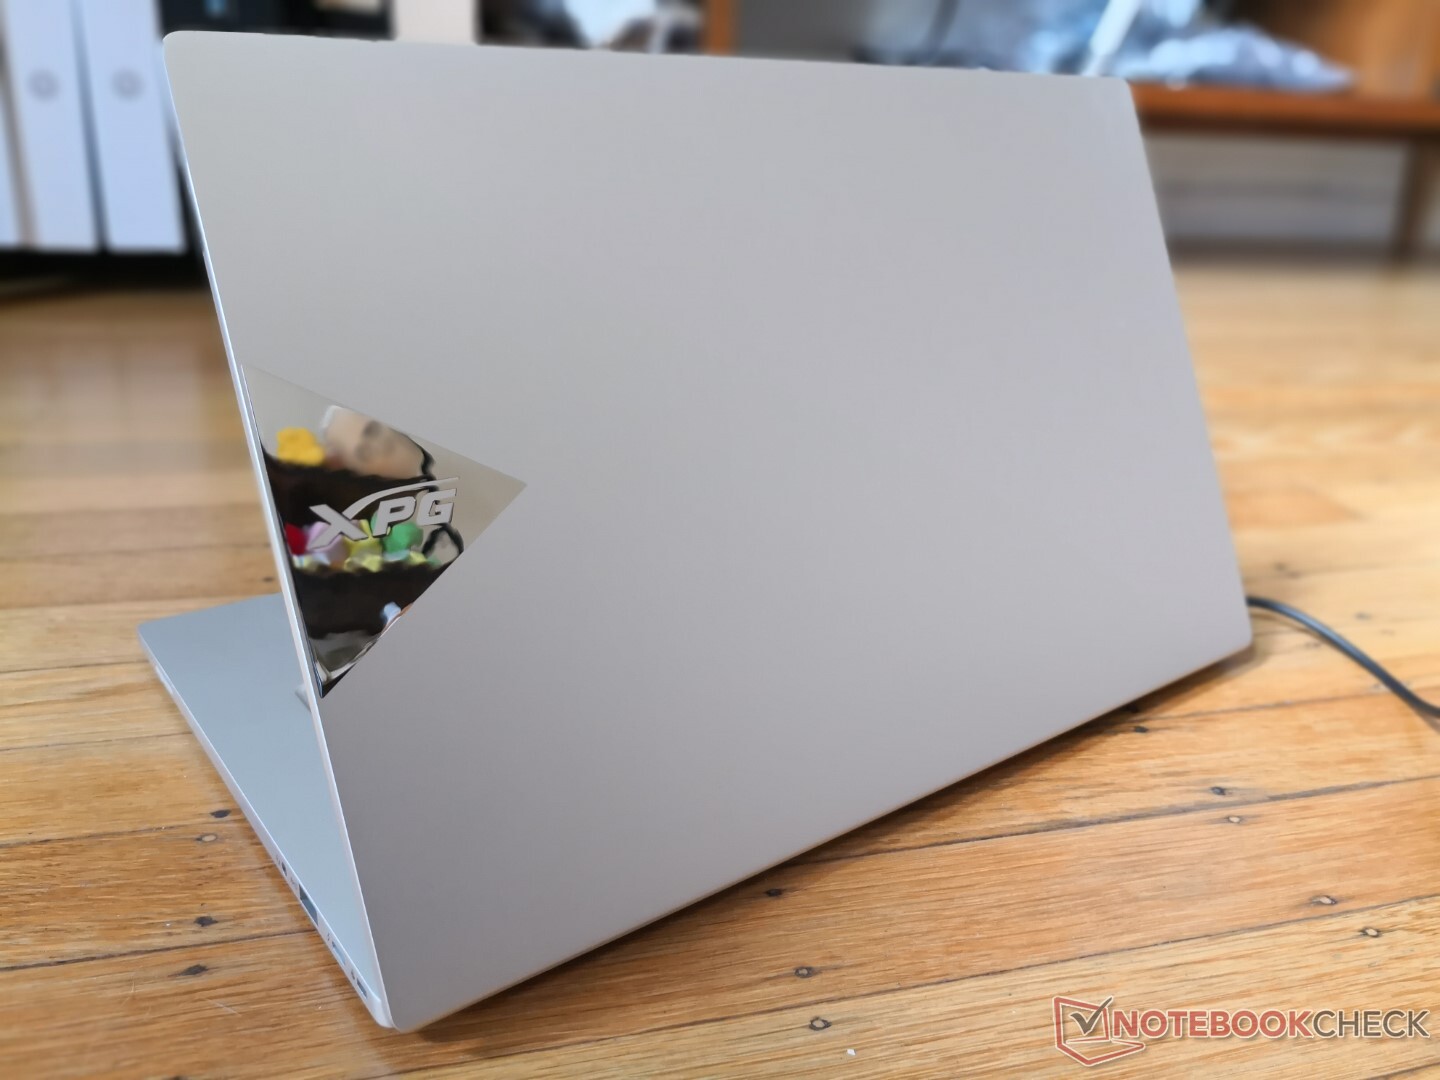
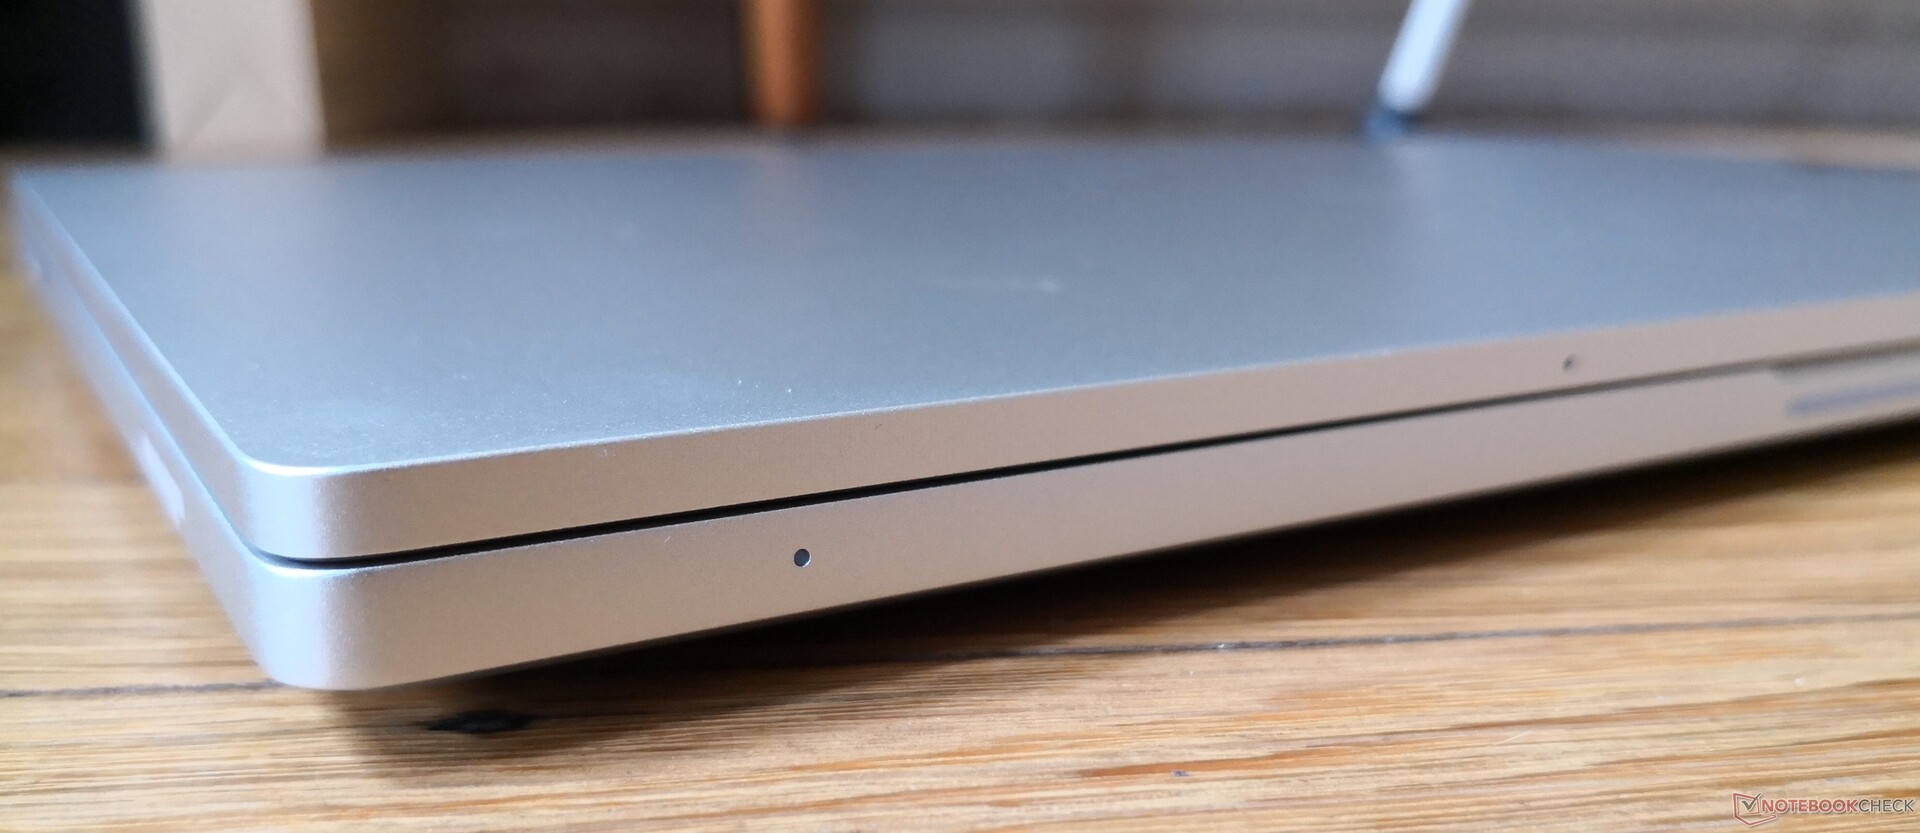
Intel ha dimostrato di poter realizzare mini PC sempre eccellenti e l'XPG Xenia Xe sembra destinato a continuare questa tendenza sui portatili. È esteticamente pulito e raffinato con una struttura che rivaleggia con le più note serie XPS 15 o HP Envy 15.
Le prestazioni grezze sono impressionanti per un sistema alimentato da nient'altro che l'ULV Core i7-1165G7. Il sistema può superare le CPU Core i5 serie H e abbinare la grafica dedicata GeForce MX in molti scenari, il tutto consumando molta meno energia e durando più a lungo. La serie mobile Core U ha sicuramente fatto molta strada dai tempi della Whiskey Lake e della lentissima UHD Graphics 620.
Può essere uno dei primi portatili consumer fatti in casa da Intel, ma già appare raffinato. Sia il design dello chassis che le prestazioni per watt sono spettacolari se paragonati ai portatili multimediali Core i5 serie H o GeForce MX in circolazione.
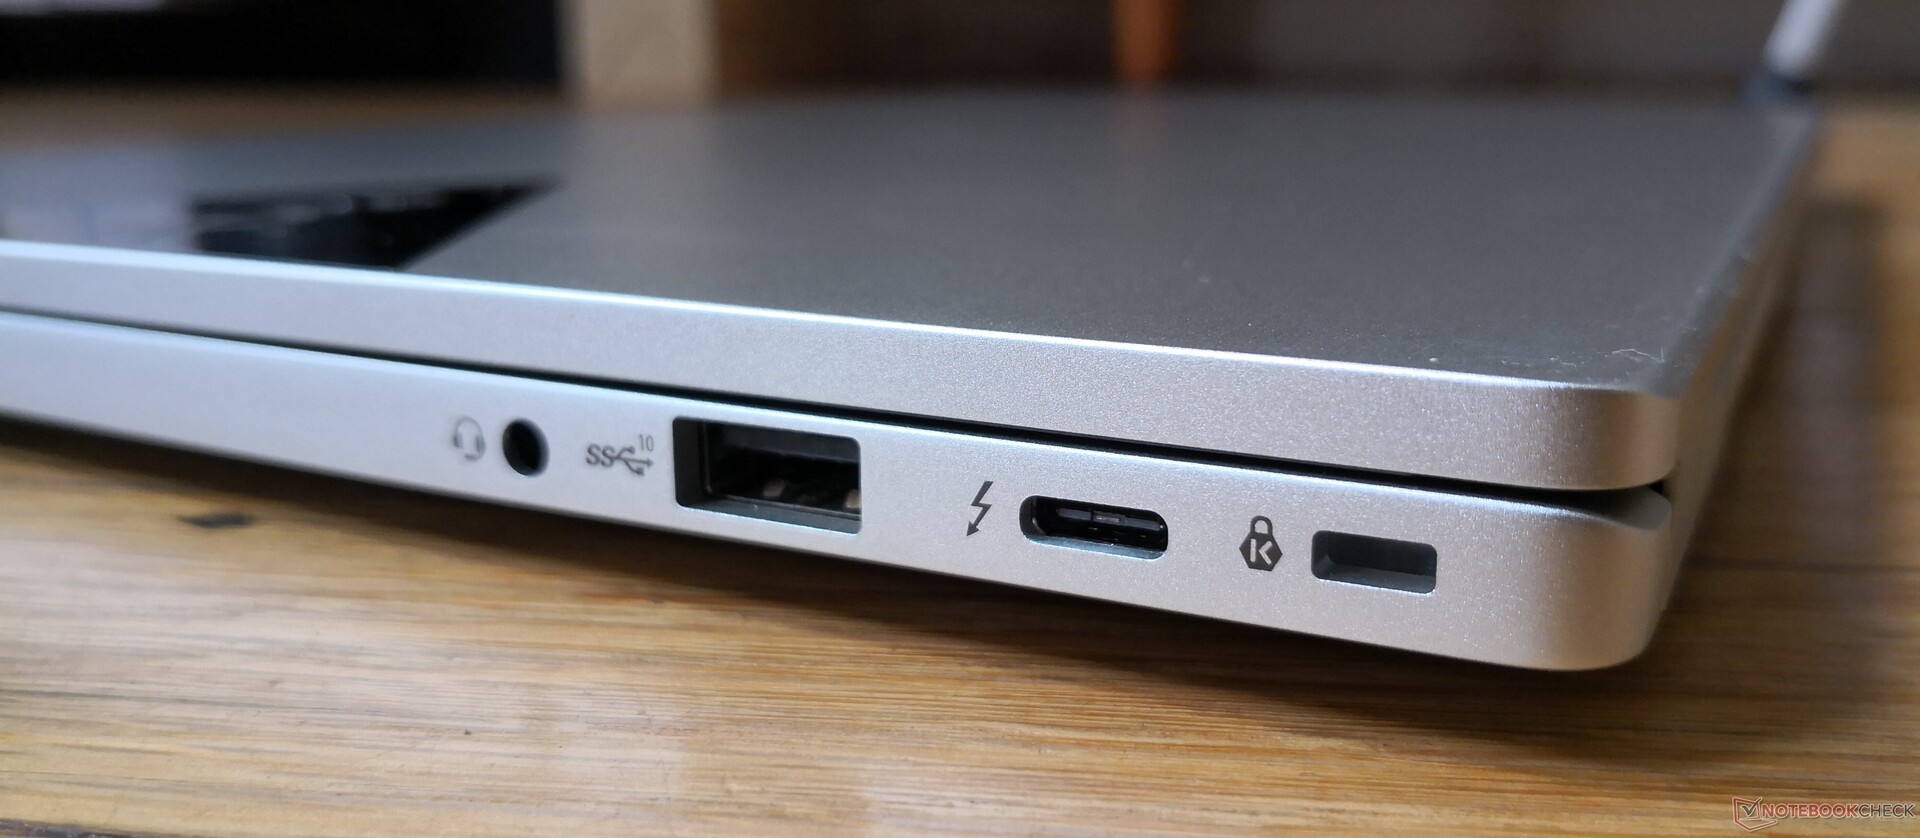
C'è molto che può ancora essere migliorato per i modelli futuri. Elementi fondamentali come l'otturatore della webcam, il lettore di schede SD e il lettore di impronte digitali mancano tutti sullo Xenia Xe. Il clickpad e i tasti della tastiera potrebbero essere più solidi e meno spugnosi, mentre le opzioni di display aggiuntive potrebbero attirare gli utenti che preferiscono l'opaco o l'OLED. L'integrazione della barra luminosa Alexa è un bel tocco per gli utenti Alexa esistenti, ma è una seccatura che non possa essere impostata su Google o altro.
I sistemi con CPU Core i7 serie H e grafica GeForce GTX supereranno ancora di gran lunga lo Xenia Xe anche se le prestazioni per watt sono inferiori. Quindi, se le prestazioni di fascia alta sono una priorità, allora sarebbe preferibile un Dell XPS 15 o un Asus ZenBook Pro 15 completamente configurato.
ADATA XPG Xenia Xe
- 05/18/2021 v7 (old)
Allen Ngo
Price comparison
