Recensione del Computer portatile Lenovo ThinkPad T15 Gen2: dispositivo Business con GPU media e Tiger Lake
Confronto con i potenziali concorrenti
Punteggio | Data | Modello | Peso | Altezza | Dimensione | Risoluzione | Prezzo |
|---|---|---|---|---|---|---|---|
| 87.1 % v7 (old) | 05/2021 | Lenovo ThinkPad T15 Gen2-20W5S00100 i7-1165G7, GeForce MX450 | 1.9 kg | 19.1 mm | 15.60" | 1920x1080 | |
| 83.4 % v7 (old) | 12/2020 | Asus VivoBook S15 S533EQ-BQ002T i7-1165G7, GeForce MX350 | 1.8 kg | 16.1 mm | 15.60" | 1920x1080 | |
| 87.7 % v7 (old) | 12/2020 | Schenker Vision 15 i7-1165G7, Iris Xe G7 96EUs | 1.7 kg | 15 mm | 15.60" | 1920x1080 | |
| 87.2 % v7 (old) | 07/2020 | Lenovo ThinkPad T15 Gen1-20S7S02U00 i7-10510U, GeForce MX330 | 1.8 kg | 19.95 mm | 15.60" | 3840x2160 | |
| 85.8 % v7 (old) | 02/2021 | Lenovo ThinkPad E15 Gen2-20TD002MGE i7-1165G7, GeForce MX450 | 1.8 kg | 18.9 mm | 15.60" | 1920x1080 |
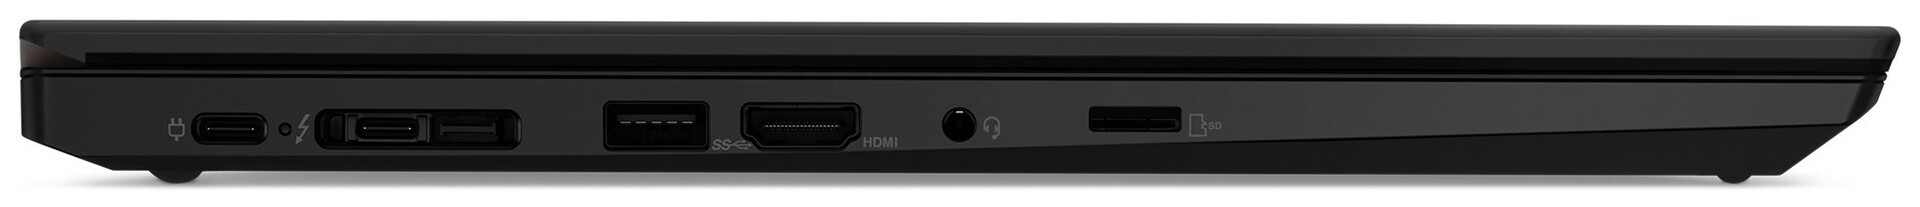
| SD Card Reader | |
| average JPG Copy Test (av. of 3 runs) | |
| Lenovo ThinkPad T15 Gen1-20S7S02U00 (Toshiba Exceria Pro M501 64 GB UHS-II) | |
| Media della classe Office (19.8 - 198.5, n=22, ultimi 2 anni) | |
| Asus VivoBook S15 S533EQ-BQ002T (Toshiba Exceria Pro M501 microSDXC 64GB) | |
| maximum AS SSD Seq Read Test (1GB) | |
| Lenovo ThinkPad T15 Gen1-20S7S02U00 (Toshiba Exceria Pro M501 64 GB UHS-II) | |
| Media della classe Office (27.4 - 249, n=21, ultimi 2 anni) | |
| Asus VivoBook S15 S533EQ-BQ002T (Toshiba Exceria Pro M501 microSDXC 64GB) | |


| |||||||||||||||||||||||||
Distribuzione della luminosità: 95 %
Al centro con la batteria: 354 cd/m²
Contrasto: 1765:1 (Nero: 0.2 cd/m²)
ΔE ColorChecker Calman: 6.1 | ∀{0.5-29.43 Ø4.71}
calibrated: 4.9
ΔE Greyscale Calman: 4.6 | ∀{0.09-98 Ø4.96}
59.8% sRGB (Argyll 1.6.3 3D)
38.2% AdobeRGB 1998 (Argyll 1.6.3 3D)
41.55% AdobeRGB 1998 (Argyll 3D)
60.2% sRGB (Argyll 3D)
40.18% Display P3 (Argyll 3D)
Gamma: 2.26
CCT: 6732 K
| Lenovo ThinkPad T15 Gen2-20W5S00100 B156HAN02.1, IPS, 1920x1080, 15.6" | Asus VivoBook S15 S533EQ-BQ002T Panda LM156LF-5L04, IPS, 1920x1080, 15.6" | Schenker Vision 15 BOE08F5, IPS, 1920x1080, 15.6" | Lenovo ThinkPad T15 Gen1-20S7S02U00 NE156QUM-N66, IPS LED, 3840x2160, 15.6" | Lenovo ThinkPad E15 Gen2-20TD002MGE Lenovo LEN40BA, IPS, 1920x1080, 15.6" | |
|---|---|---|---|---|---|
| Display | -3% | 66% | 98% | -4% | |
| Display P3 Coverage (%) | 40.18 | 39.01 -3% | 69.3 72% | 80.7 101% | 38.71 -4% |
| sRGB Coverage (%) | 60.2 | 58.5 -3% | 94 56% | 98.1 63% | 58.2 -3% |
| AdobeRGB 1998 Coverage (%) | 41.55 | 40.33 -3% | 70.8 70% | 95.5 130% | 39.99 -4% |
| Response Times | 19% | -23% | 23% | 59% | |
| Response Time Grey 50% / Grey 80% * (ms) | 48.8 ? | 38 ? 22% | 60 ? -23% | 42 ? 14% | 28 ? 43% |
| Response Time Black / White * (ms) | 32 ? | 27 ? 16% | 39 ? -22% | 21.6 ? 32% | 8 ? 75% |
| PWM Frequency (Hz) | |||||
| Screen | -15% | 30% | 36% | -6% | |
| Brightness middle (cd/m²) | 353 | 287 -19% | 478 35% | 489 39% | 248 -30% |
| Brightness (cd/m²) | 348 | 261 -25% | 462 33% | 501 44% | 244 -30% |
| Brightness Distribution (%) | 95 | 84 -12% | 94 -1% | 91 -4% | 87 -8% |
| Black Level * (cd/m²) | 0.2 | 0.51 -155% | 0.27 -35% | 0.35 -75% | 0.27 -35% |
| Contrast (:1) | 1765 | 563 -68% | 1770 0% | 1397 -21% | 919 -48% |
| Colorchecker dE 2000 * | 6.1 | 4.72 23% | 3.2 48% | 3 51% | 5.07 17% |
| Colorchecker dE 2000 max. * | 23.5 | 17.94 24% | 8.4 64% | 5.1 78% | 17.47 26% |
| Colorchecker dE 2000 calibrated * | 4.9 | 3.74 24% | 2 59% | 0.8 84% | |
| Greyscale dE 2000 * | 4.6 | 2.2 52% | 4.5 2% | 4 13% | 1.91 58% |
| Gamma | 2.26 97% | 2.51 88% | 2.16 102% | 2.24 98% | 2.39 92% |
| CCT | 6732 97% | 6758 96% | 6788 96% | 7400 88% | 6697 97% |
| Color Space (Percent of AdobeRGB 1998) (%) | 38.2 | 37 -3% | 63.1 65% | 84.7 122% | 37 -3% |
| Color Space (Percent of sRGB) (%) | 59.8 | 58 -3% | 93.6 57% | 98.1 64% | 58 -3% |
| Media totale (Programma / Settaggio) | 0% /
-8% | 24% /
30% | 52% /
46% | 16% /
3% |
* ... Meglio usare valori piccoli
Tempi di risposta del Display
| ↔ Tempi di risposta dal Nero al Bianco | ||
|---|---|---|
| 32 ms ... aumenta ↗ e diminuisce ↘ combinato | ↗ 17.2 ms Incremento | 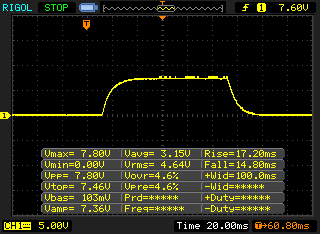 |
| ↘ 14.8 ms Calo | ||
| Lo schermo mostra tempi di risposta lenti nei nostri tests e sarà insoddisfacente per i gamers. In confronto, tutti i dispositivi di test variano da 0.1 (minimo) a 240 (massimo) ms. » 86 % di tutti i dispositivi è migliore. Questo significa che i tempi di risposta rilevati sono peggiori rispetto alla media di tutti i dispositivi testati (19.8 ms). | ||
| ↔ Tempo di risposta dal 50% Grigio all'80% Grigio | ||
| 48.8 ms ... aumenta ↗ e diminuisce ↘ combinato | ↗ 22.8 ms Incremento | 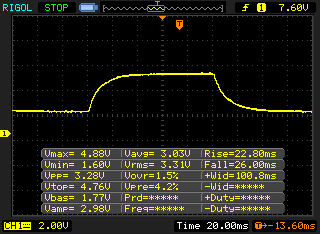 |
| ↘ 26 ms Calo | ||
| Lo schermo mostra tempi di risposta lenti nei nostri tests e sarà insoddisfacente per i gamers. In confronto, tutti i dispositivi di test variano da 0.165 (minimo) a 636 (massimo) ms. » 84 % di tutti i dispositivi è migliore. Questo significa che i tempi di risposta rilevati sono peggiori rispetto alla media di tutti i dispositivi testati (31 ms). | ||
Sfarfallio dello schermo / PWM (Pulse-Width Modulation)
| flickering dello schermo / PWM non rilevato |  | ||
In confronto: 52 % di tutti i dispositivi testati non utilizza PWM per ridurre la luminosita' del display. Se è rilevato PWM, una media di 7757 (minimo: 5 - massimo: 343500) Hz è stata rilevata. | |||
Cinebench R20: CPU (Single Core) | CPU (Multi Core)
Cinebench R15: CPU Single 64Bit | CPU Multi 64Bit
Blender: v2.79 BMW27 CPU
7-Zip 18.03: 7z b 4 -mmt1 | 7z b 4
Geekbench 5.5: Single-Core | Multi-Core
HWBOT x265 Benchmark v2.2: 4k Preset
LibreOffice : 20 Documents To PDF
R Benchmark 2.5: Overall mean
| Cinebench R23 / Single Core | |
| Media della classe Office (708 - 2130, n=75, ultimi 2 anni) | |
| Asus VivoBook S15 S533EQ-BQ002T | |
| Media Intel Core i7-1165G7 (1110 - 1539, n=59) | |
| Schenker Vision 15 | |
| Cinebench R23 / Multi Core | |
| Media della classe Office (1673 - 22808, n=75, ultimi 2 anni) | |
| Asus VivoBook S15 S533EQ-BQ002T | |
| Media Intel Core i7-1165G7 (2525 - 6862, n=64) | |
| Schenker Vision 15 | |
| Cinebench R20 / CPU (Single Core) | |
| Media della classe Office (345 - 816, n=74, ultimi 2 anni) | |
| Asus VivoBook S15 S533EQ-BQ002T | |
| Lenovo ThinkPad T15 Gen2-20W5S00100 | |
| Media Intel Core i7-1165G7 (442 - 589, n=81) | |
| Schenker Vision 15 | |
| Lenovo ThinkPad E15 Gen2-20TD002MGE | |
| Lenovo ThinkPad T15 Gen1-20S7S02U00 | |
| Cinebench R20 / CPU (Multi Core) | |
| Media della classe Office (648 - 8840, n=74, ultimi 2 anni) | |
| Lenovo ThinkPad T15 Gen2-20W5S00100 | |
| Lenovo ThinkPad E15 Gen2-20TD002MGE | |
| Asus VivoBook S15 S533EQ-BQ002T | |
| Schenker Vision 15 | |
| Media Intel Core i7-1165G7 (1060 - 2657, n=81) | |
| Lenovo ThinkPad T15 Gen1-20S7S02U00 | |
| Cinebench R15 / CPU Single 64Bit | |
| Media della classe Office (99.5 - 316, n=76, ultimi 2 anni) | |
| Schenker Vision 15 | |
| Lenovo ThinkPad T15 Gen2-20W5S00100 | |
| Lenovo ThinkPad E15 Gen2-20TD002MGE | |
| Asus VivoBook S15 S533EQ-BQ002T | |
| Media Intel Core i7-1165G7 (115 - 230, n=78) | |
| Lenovo ThinkPad T15 Gen1-20S7S02U00 | |
| Cinebench R15 / CPU Multi 64Bit | |
| Media della classe Office (250 - 3380, n=76, ultimi 2 anni) | |
| Schenker Vision 15 | |
| Lenovo ThinkPad E15 Gen2-20TD002MGE | |
| Lenovo ThinkPad T15 Gen2-20W5S00100 | |
| Asus VivoBook S15 S533EQ-BQ002T | |
| Media Intel Core i7-1165G7 (553 - 1027, n=86) | |
| Lenovo ThinkPad T15 Gen1-20S7S02U00 | |
| Blender / v2.79 BMW27 CPU | |
| Lenovo ThinkPad T15 Gen1-20S7S02U00 | |
| Lenovo ThinkPad T15 Gen2-20W5S00100 | |
| Media Intel Core i7-1165G7 (468 - 1138, n=80) | |
| Asus VivoBook S15 S533EQ-BQ002T | |
| Lenovo ThinkPad E15 Gen2-20TD002MGE | |
| Schenker Vision 15 | |
| Media della classe Office (158 - 1940, n=75, ultimi 2 anni) | |
| 7-Zip 18.03 / 7z b 4 -mmt1 | |
| Media della classe Office (3387 - 6469, n=76, ultimi 2 anni) | |
| Asus VivoBook S15 S533EQ-BQ002T | |
| Lenovo ThinkPad T15 Gen2-20W5S00100 | |
| Lenovo ThinkPad E15 Gen2-20TD002MGE | |
| Media Intel Core i7-1165G7 (4478 - 5507, n=80) | |
| Schenker Vision 15 | |
| Lenovo ThinkPad T15 Gen1-20S7S02U00 | |
| 7-Zip 18.03 / 7z b 4 | |
| Media della classe Office (7098 - 76886, n=76, ultimi 2 anni) | |
| Schenker Vision 15 | |
| Lenovo ThinkPad E15 Gen2-20TD002MGE | |
| Asus VivoBook S15 S533EQ-BQ002T | |
| Media Intel Core i7-1165G7 (15347 - 27405, n=80) | |
| Lenovo ThinkPad T15 Gen2-20W5S00100 | |
| Lenovo ThinkPad T15 Gen1-20S7S02U00 | |
| Geekbench 5.5 / Single-Core | |
| Media della classe Office (811 - 2175, n=72, ultimi 2 anni) | |
| Schenker Vision 15 | |
| Asus VivoBook S15 S533EQ-BQ002T | |
| Lenovo ThinkPad E15 Gen2-20TD002MGE | |
| Media Intel Core i7-1165G7 (1302 - 1595, n=77) | |
| Lenovo ThinkPad T15 Gen2-20W5S00100 | |
| Lenovo ThinkPad T15 Gen1-20S7S02U00 | |
| Geekbench 5.5 / Multi-Core | |
| Media della classe Office (1483 - 16999, n=72, ultimi 2 anni) | |
| Schenker Vision 15 | |
| Media Intel Core i7-1165G7 (3078 - 5926, n=77) | |
| Asus VivoBook S15 S533EQ-BQ002T | |
| Lenovo ThinkPad E15 Gen2-20TD002MGE | |
| Lenovo ThinkPad T15 Gen2-20W5S00100 | |
| Lenovo ThinkPad T15 Gen1-20S7S02U00 | |
| HWBOT x265 Benchmark v2.2 / 4k Preset | |
| Media della classe Office (2.21 - 26, n=75, ultimi 2 anni) | |
| Schenker Vision 15 | |
| Lenovo ThinkPad E15 Gen2-20TD002MGE | |
| Lenovo ThinkPad T15 Gen2-20W5S00100 | |
| Media Intel Core i7-1165G7 (1.39 - 8.47, n=80) | |
| Asus VivoBook S15 S533EQ-BQ002T | |
| Lenovo ThinkPad T15 Gen1-20S7S02U00 | |
| LibreOffice / 20 Documents To PDF | |
| Media della classe Office (39.9 - 102.3, n=75, ultimi 2 anni) | |
| Lenovo ThinkPad T15 Gen1-20S7S02U00 | |
| Lenovo ThinkPad E15 Gen2-20TD002MGE | |
| Media Intel Core i7-1165G7 (21.5 - 88.1, n=78) | |
| Schenker Vision 15 | |
| Asus VivoBook S15 S533EQ-BQ002T | |
| Lenovo ThinkPad T15 Gen2-20W5S00100 | |
| R Benchmark 2.5 / Overall mean | |
| Lenovo ThinkPad T15 Gen1-20S7S02U00 | |
| Media Intel Core i7-1165G7 (0.552 - 1.002, n=80) | |
| Lenovo ThinkPad E15 Gen2-20TD002MGE | |
| Lenovo ThinkPad T15 Gen2-20W5S00100 | |
| Schenker Vision 15 | |
| Asus VivoBook S15 S533EQ-BQ002T | |
| Media della classe Office (0.393 - 0.888, n=75, ultimi 2 anni) | |
* ... Meglio usare valori piccoli
| PCMark 10 Score | 5258 punti | |
Aiuto | ||
| DPC Latencies / LatencyMon - interrupt to process latency (max), Web, Youtube, Prime95 | |
| Schenker Vision 15 | |
| Lenovo ThinkPad E15 Gen2-20TD002MGE | |
| Lenovo ThinkPad T15 Gen1-20S7S02U00 | |
| Lenovo ThinkPad T15 Gen2-20W5S00100 | |
| Asus VivoBook S15 S533EQ-BQ002T | |
* ... Meglio usare valori piccoli
| Lenovo ThinkPad T15 Gen2-20W5S00100 Samsung PM981a MZVLB1T0HBLR | Asus VivoBook S15 S533EQ-BQ002T Intel SSD 660p 1TB SSDPEKNW010T8 | Schenker Vision 15 Samsung SSD 980 Pro 1TB MZ-V8P1T0BW | Lenovo ThinkPad T15 Gen1-20S7S02U00 Toshiba XG6 KXG6AZNV1T02 | Lenovo ThinkPad E15 Gen2-20TD002MGE Samsung PM991 MZALQ512HALU | Media Samsung PM981a MZVLB1T0HBLR | |
|---|---|---|---|---|---|---|
| CrystalDiskMark 5.2 / 6 | -22% | 50% | -24% | -42% | -18% | |
| Write 4K (MB/s) | 227.6 | 214.4 -6% | 238.1 5% | 159.1 -30% | 118.8 -48% | 139.7 ? -39% |
| Read 4K (MB/s) | 75.5 | 58.5 -23% | 79.2 5% | 55.6 -26% | 37.55 -50% | 49.9 ? -34% |
| Write Seq (MB/s) | 2100 | 1678 -20% | 4139 97% | 1435 -32% | 1224 -42% | 2036 ? -3% |
| Read Seq (MB/s) | 2017 | 1648 -18% | 4133 105% | 1435 -29% | 1589 -21% | 2014 ? 0% |
| Write 4K Q32T1 (MB/s) | 646 | 644 0% | 697 8% | 512 -21% | 409.5 -37% | 461 ? -29% |
| Read 4K Q32T1 (MB/s) | 728 | 600 -18% | 758 4% | 541 -26% | 335.5 -54% | 499 ? -31% |
| Write Seq Q32T1 (MB/s) | 2983 | 1760 -41% | 5187 74% | 2682 -10% | 1427 -52% | 2903 ? -3% |
| Read Seq Q32T1 (MB/s) | 3558 | 1853 -48% | 7117 100% | 2902 -18% | 2353 -34% | 3479 ? -2% |
| AS SSD | -51% | 31% | -21% | -60% | -15% | |
| Seq Read (MB/s) | 2694 | 1754 -35% | 5427 101% | 2372 -12% | 1886 -30% | 2553 ? -5% |
| Seq Write (MB/s) | 2370 | 1567 -34% | 3886 64% | 2230 -6% | 1226 -48% | 2084 ? -12% |
| 4K Read (MB/s) | 68.4 | 53 -23% | 72.9 7% | 50.2 -27% | 32.37 -53% | 53.1 ? -22% |
| 4K Write (MB/s) | 208.1 | 167.9 -19% | 219.3 5% | 139.8 -33% | 100.8 -52% | 131.2 ? -37% |
| 4K-64 Read (MB/s) | 1961 | 586 -70% | 2209 13% | 1430 -27% | 842 -57% | 1477 ? -25% |
| 4K-64 Write (MB/s) | 1935 | 858 -56% | 2265 17% | 1368 -29% | 485 -75% | 1805 ? -7% |
| Access Time Read * (ms) | 0.032 | 0.097 -203% | 0.033 -3% | 0.059 -84% | 0.102 -219% | 0.04983 ? -56% |
| Access Time Write * (ms) | 0.081 | 0.038 53% | 0.02 75% | 0.03 63% | 0.037 54% | 0.04222 ? 48% |
| Score Read (Points) | 2299 | 815 -65% | 2825 23% | 1718 -25% | 1063 -54% | 1786 ? -22% |
| Score Write (Points) | 2380 | 1182 -50% | 2873 21% | 1731 -27% | 708 -70% | 2144 ? -10% |
| Score Total (Points) | 5846 | 2421 -59% | 7069 21% | 4325 -26% | 2286 -61% | 4826 ? -17% |
| Media totale (Programma / Settaggio) | -37% /
-39% | 41% /
39% | -23% /
-22% | -51% /
-53% | -17% /
-16% |
* ... Meglio usare valori piccoli

Carico di lettura continuo: DiskSpd Read Loop, Queue Depth 8
| 3DMark 11 Performance | 7035 punti | |
| 3DMark Cloud Gate Standard Score | 19688 punti | |
| 3DMark Fire Strike Score | 4299 punti | |
| 3DMark Time Spy Score | 1222 punti | |
Aiuto | ||
| The Witcher 3 - 1366x768 Medium Graphics & Postprocessing | |
| Schenker Vision 15 | |
| Media della classe Office (44.7 - 90.4, n=3, ultimi 2 anni) | |
| Media NVIDIA GeForce MX450 (34 - 81.4, n=14) | |
| Lenovo ThinkPad T15 Gen2-20W5S00100 | |
| Asus VivoBook S15 S533EQ-BQ002T | |
| Lenovo ThinkPad T15 Gen1-20S7S02U00 | |
| Lenovo ThinkPad E15 Gen2-20TD002MGE | |
| Final Fantasy XV Benchmark - 1920x1080 Standard Quality | |
| Media della classe Office (7.86 - 105.7, n=72, ultimi 2 anni) | |
| Media NVIDIA GeForce MX450 (25 - 34.5, n=13) | |
| Lenovo ThinkPad E15 Gen2-20TD002MGE | |
| Lenovo ThinkPad T15 Gen2-20W5S00100 | |
| Far Cry 5 - 1920x1080 Medium Preset AA:T | |
| Media della classe Office (21 - 59, n=13, ultimi 2 anni) | |
| Lenovo ThinkPad T15 Gen2-20W5S00100 | |
| Media NVIDIA GeForce MX450 (24 - 41, n=7) | |
| Schenker Vision 15 | |
| Lenovo ThinkPad E15 Gen2-20TD002MGE | |
| basso | medio | alto | ultra | |
|---|---|---|---|---|
| The Witcher 3 (2015) | 98.5 | 53.8 | 32.5 | 18 |
| Dota 2 Reborn (2015) | 125 | 115 | 86.6 | 78.6 |
| Final Fantasy XV Benchmark (2018) | 52.8 | 25.1 | 12.7 | |
| X-Plane 11.11 (2018) | 87.2 | 63.9 | 39.6 | |
| Far Cry 5 (2018) | 73 | 34 | 26 | 24 |
| Cyberpunk 2077 1.0 (2020) | 33.9 | 14 | 8.3 | 3.2 |
Rumorosità
| Idle |
| 24.2 / 24.2 / 24.2 dB(A) |
| Sotto carico |
| 34.5 / 37.6 dB(A) |
 | ||
30 dB silenzioso 40 dB(A) udibile 50 dB(A) rumoroso |
||
min: | ||
(±) La temperatura massima sul lato superiore è di 42.2 °C / 108 F, rispetto alla media di 34.3 °C / 94 F, che varia da 21.2 a 62.5 °C per questa classe Office.
(-) Il lato inferiore si riscalda fino ad un massimo di 55.1 °C / 131 F, rispetto alla media di 36.8 °C / 98 F
(+) In idle, la temperatura media del lato superiore è di 22.9 °C / 73 F, rispetto alla media deld ispositivo di 29.5 °C / 85 F.
(±) Riproducendo The Witcher 3, la temperatura media per il lato superiore e' di 35.7 °C / 96 F, rispetto alla media del dispositivo di 29.5 °C / 85 F.
(+) I poggiapolsi e il touchpad sono piu' freddi della temperatura della pelle con un massimo di 30.3 °C / 86.5 F e sono quindi freddi al tatto.
(-) La temperatura media della zona del palmo della mano di dispositivi simili e'stata di 27.5 °C / 81.5 F (-2.8 °C / -5 F).
Lenovo ThinkPad T15 Gen2-20W5S00100 analisi audio
(±) | potenza degli altiparlanti media ma buona (76.3 dB)
Bassi 100 - 315 Hz
(-) | quasi nessun basso - in media 21% inferiori alla media
(±) | la linearità dei bassi è media (12.1% delta rispetto alla precedente frequenza)
Medi 400 - 2000 Hz
(±) | medi elevati - circa 5.6% superiore alla media
(+) | medi lineari (6.4% delta rispetto alla precedente frequenza)
Alti 2 - 16 kHz
(+) | Alti bilanciati - appena 4.2% dalla media
(+) | alti lineari (4.8% delta rispetto alla precedente frequenza)
Nel complesso 100 - 16.000 Hz
(±) | la linearità complessiva del suono è media (21.9% di differenza rispetto alla media
Rispetto alla stessa classe
» 57% di tutti i dispositivi testati in questa classe è stato migliore, 8% simile, 35% peggiore
» Il migliore ha avuto un delta di 7%, medio di 21%, peggiore di 53%
Rispetto a tutti i dispositivi testati
» 63% di tutti i dispositivi testati in questa classe è stato migliore, 7% similare, 30% peggiore
» Il migliore ha avuto un delta di 4%, medio di 23%, peggiore di 134%
Lenovo ThinkPad E15 Gen2-20TD002MGE analisi audio
(±) | potenza degli altiparlanti media ma buona (72.9 dB)
Bassi 100 - 315 Hz
(-) | quasi nessun basso - in media 25.7% inferiori alla media
(±) | la linearità dei bassi è media (14% delta rispetto alla precedente frequenza)
Medi 400 - 2000 Hz
(+) | medi bilanciati - solo only 3.8% rispetto alla media
(+) | medi lineari (4.3% delta rispetto alla precedente frequenza)
Alti 2 - 16 kHz
(±) | alti elevati - circa 5.4% superiori alla media
(±) | la linearità degli alti è media (7.6% delta rispetto alla precedente frequenza)
Nel complesso 100 - 16.000 Hz
(±) | la linearità complessiva del suono è media (21.2% di differenza rispetto alla media
Rispetto alla stessa classe
» 52% di tutti i dispositivi testati in questa classe è stato migliore, 9% simile, 40% peggiore
» Il migliore ha avuto un delta di 7%, medio di 21%, peggiore di 53%
Rispetto a tutti i dispositivi testati
» 59% di tutti i dispositivi testati in questa classe è stato migliore, 7% similare, 34% peggiore
» Il migliore ha avuto un delta di 4%, medio di 23%, peggiore di 134%
| Off / Standby | |
| Idle | |
| Sotto carico |
|
Leggenda:
min: | |
| Lenovo ThinkPad T15 Gen2-20W5S00100 i7-1165G7, GeForce MX450, Samsung PM981a MZVLB1T0HBLR, IPS, 1920x1080, 15.6" | Asus VivoBook S15 S533EQ-BQ002T i7-1165G7, GeForce MX350, Intel SSD 660p 1TB SSDPEKNW010T8, IPS, 1920x1080, 15.6" | Schenker Vision 15 i7-1165G7, Iris Xe G7 96EUs, Samsung SSD 980 Pro 1TB MZ-V8P1T0BW, IPS, 1920x1080, 15.6" | Lenovo ThinkPad T15 Gen1-20S7S02U00 i7-10510U, GeForce MX330, Toshiba XG6 KXG6AZNV1T02, IPS LED, 3840x2160, 15.6" | Lenovo ThinkPad E15 Gen2-20TD002MGE i7-1165G7, GeForce MX450, Samsung PM991 MZALQ512HALU, IPS, 1920x1080, 15.6" | Media NVIDIA GeForce MX450 | Media della classe Office | |
|---|---|---|---|---|---|---|---|
| Power Consumption | 12% | 15% | -23% | 17% | -2% | 16% | |
| Idle Minimum * (Watt) | 4.5 | 3 33% | 3.5 22% | 4.3 4% | 4.4 2% | 4.91 ? -9% | 4.3 ? 4% |
| Idle Average * (Watt) | 8.8 | 6.4 27% | 6.3 28% | 13.8 -57% | 8.2 7% | 8.36 ? 5% | 7.35 ? 16% |
| Idle Maximum * (Watt) | 11.6 | 7.9 32% | 6.8 41% | 16.2 -40% | 10.3 11% | 11.1 ? 4% | 8.6 ? 26% |
| Load Average * (Watt) | 60 | 59 2% | 43.2 28% | 66 -10% | 25 58% | 58.4 ? 3% | 43.9 ? 27% |
| Witcher 3 ultra * (Watt) | 39.2 | 48 -22% | 52 -33% | 53 -35% | |||
| Load Maximum * (Watt) | 68.5 | 68 1% | 67.7 1% | 67.4 2% | 64 7% | 76.2 ? -11% | 64.5 ? 6% |
* ... Meglio usare valori piccoli
| Lenovo ThinkPad T15 Gen2-20W5S00100 i7-1165G7, GeForce MX450, 57 Wh | Asus VivoBook S15 S533EQ-BQ002T i7-1165G7, GeForce MX350, 50 Wh | Schenker Vision 15 i7-1165G7, Iris Xe G7 96EUs, 73 Wh | Lenovo ThinkPad T15 Gen1-20S7S02U00 i7-10510U, GeForce MX330, 57 Wh | Lenovo ThinkPad E15 Gen2-20TD002MGE i7-1165G7, GeForce MX450, 45 Wh | Media della classe Office | |
|---|---|---|---|---|---|---|
| Autonomia della batteria | ||||||
| WiFi v1.3 (h) | 7.9 | 8.4 6% | 15.2 92% | 7.1 -10% | 8 1% | 13 ? 65% |
Pro
Contro
Valutazione complessiva del computer portatile Lenovo ThinkPad T15- la Tiger-Lake apporta più prestazioni alla CPU


Il Lenovo ThinkPad T15 Gen2 offre senza dubbio più prestazioni rispetto al predecessore. La CPU Tiger-Lake migliora le prestazioni quotidiane, e le opzioni di manutenzione, come lo slot RAM libero o lo slot WWAN ready, permettono anche successivi aggiornamenti. Teoricamente, la Nvidia GeForce MX450 può anche aumentare un po' le prestazioni grafiche.
Lenovo aumenta chiaramente le prestazioni del ThinkPad T15 nella seconda generazione, ma l'MX450 apporta solo un piccolo valore aggiunto in questo caso.
In pratica, comunque, l'MX450 raggiunge prestazione prestazioni appena superiori alla grafica interna Intel Iris Xe Graphics G7 della CPU. Anche se questo tiene sotto controllo la produzione di calore, la seconda unità grafica non offre quasi nessun valore aggiunto. Gli utenti che possono fare a meno delle caratteristiche business del ThinkPad T15 Gen2 potrebbero trovarsi meglio co il ThinkPad E15 Gen2, che ha un MX450 con tutte le sue prestazioni.
Lenovo ThinkPad T15 Gen2-20W5S00100
- 05/01/2021 v7 (old)
Mike Wobker
Price comparison
