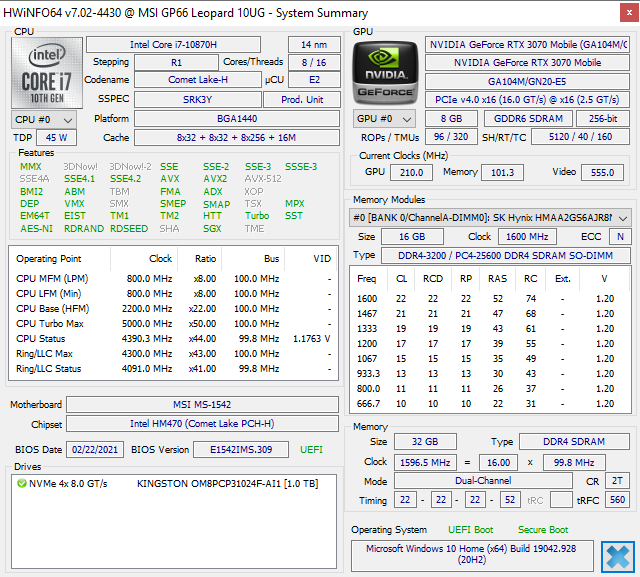
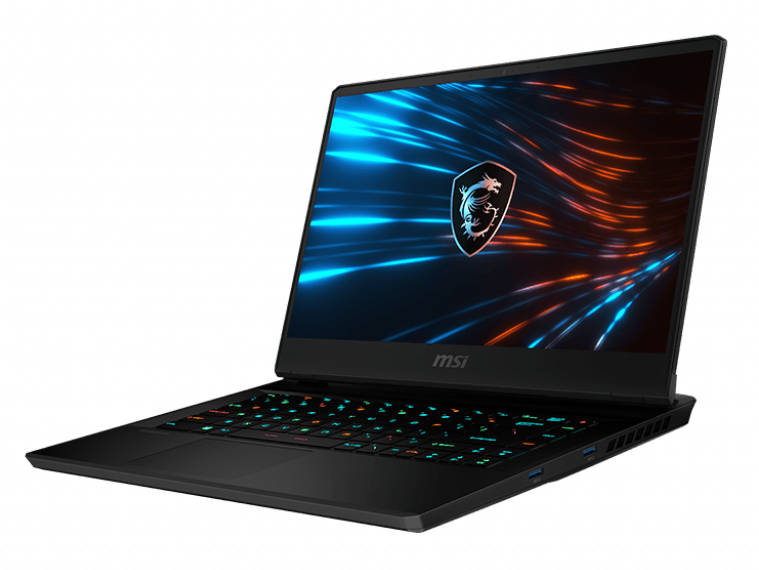
Recensione del portatile MSI GP66 Leopard 10UG: Un aggiornamento completo della serie
Presentato all'inizio di quest'anno insieme alla serie mobile Nvidia Ampere, il GP66 introduce un design completamente nuovo rispetto al vecchio GP65. Quasi tutto è cambiato dalla tastiera alla soluzione di raffreddamento rappresentando l'inizio di una nuova generazione per la famiglia GP. Per chi non lo sapesse, la serie GP è la casa dei portatili gaming di fascia media di MSI sopra le serie GL e GF, più economiche, e sotto le serie GE e GT, più costose.
Le versionii variano da una CPU Intel Core-i7 10870H di decima generazione con grafica GeForce RTX 3060 fino al Core i7-10875H con RTX 3080. La nostra configurazione per la recensione è una configurazione intermedia con i7-10870H e RTX 3070 per circa $2500 USD a seconda della RAM e dello storage.
I modelli concorrenti includono altri portatili gaming da 15,6" di fascia media superiore come il Gigabyte Aorus 15P, Asus ROG Zephyrus G15o Lenovo Legion 7.
Altre recensioni MSI:
Confronto con i potenziali concorrenti
Punteggio | Data | Modello | Peso | Altezza | Dimensione | Risoluzione | Prezzo |
|---|---|---|---|---|---|---|---|
| 84.2 % v7 (old) | 04/2021 | MSI GP66 Leopard 10UG i7-10870H, GeForce RTX 3070 Laptop GPU | 2.3 kg | 23.4 mm | 15.60" | 1920x1080 | |
| 83.2 % v7 (old) | 05/2020 | MSI GP65 10SFK-047US i7-10750H, GeForce RTX 2070 Mobile | 2.3 kg | 27.5 mm | 15.60" | 1920x1080 | |
| 85.4 % v7 (old) | 04/2021 | Alienware m15 R4 i9-10980HK, GeForce RTX 3070 Laptop GPU | 2.3 kg | 20 mm | 15.60" | 1920x1080 | |
| 86.1 % v7 (old) | 02/2021 | Aorus 15P XC i7-10870H, GeForce RTX 3070 Laptop GPU | 2.2 kg | 27 mm | 15.60" | 1920x1080 | |
| 83.8 % v7 (old) | 02/2021 | Asus ROG Zephyrus G15 GA503Q R9 5900HS, GeForce RTX 3080 Laptop GPU | 2 kg | 20 mm | 15.60" | 2560x1440 | |
| 80.4 % v7 (old) | 03/2021 | MSI GF65 Thin 10UE i7-10750H, GeForce RTX 3060 Laptop GPU | 1.9 kg | 21.7 mm | 15.60" | 1920x1080 |
Case
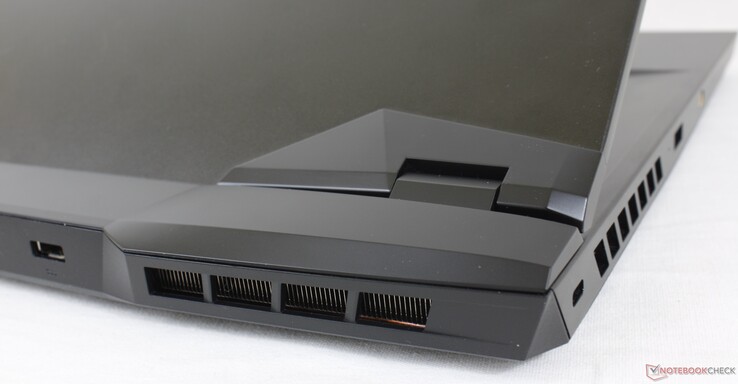
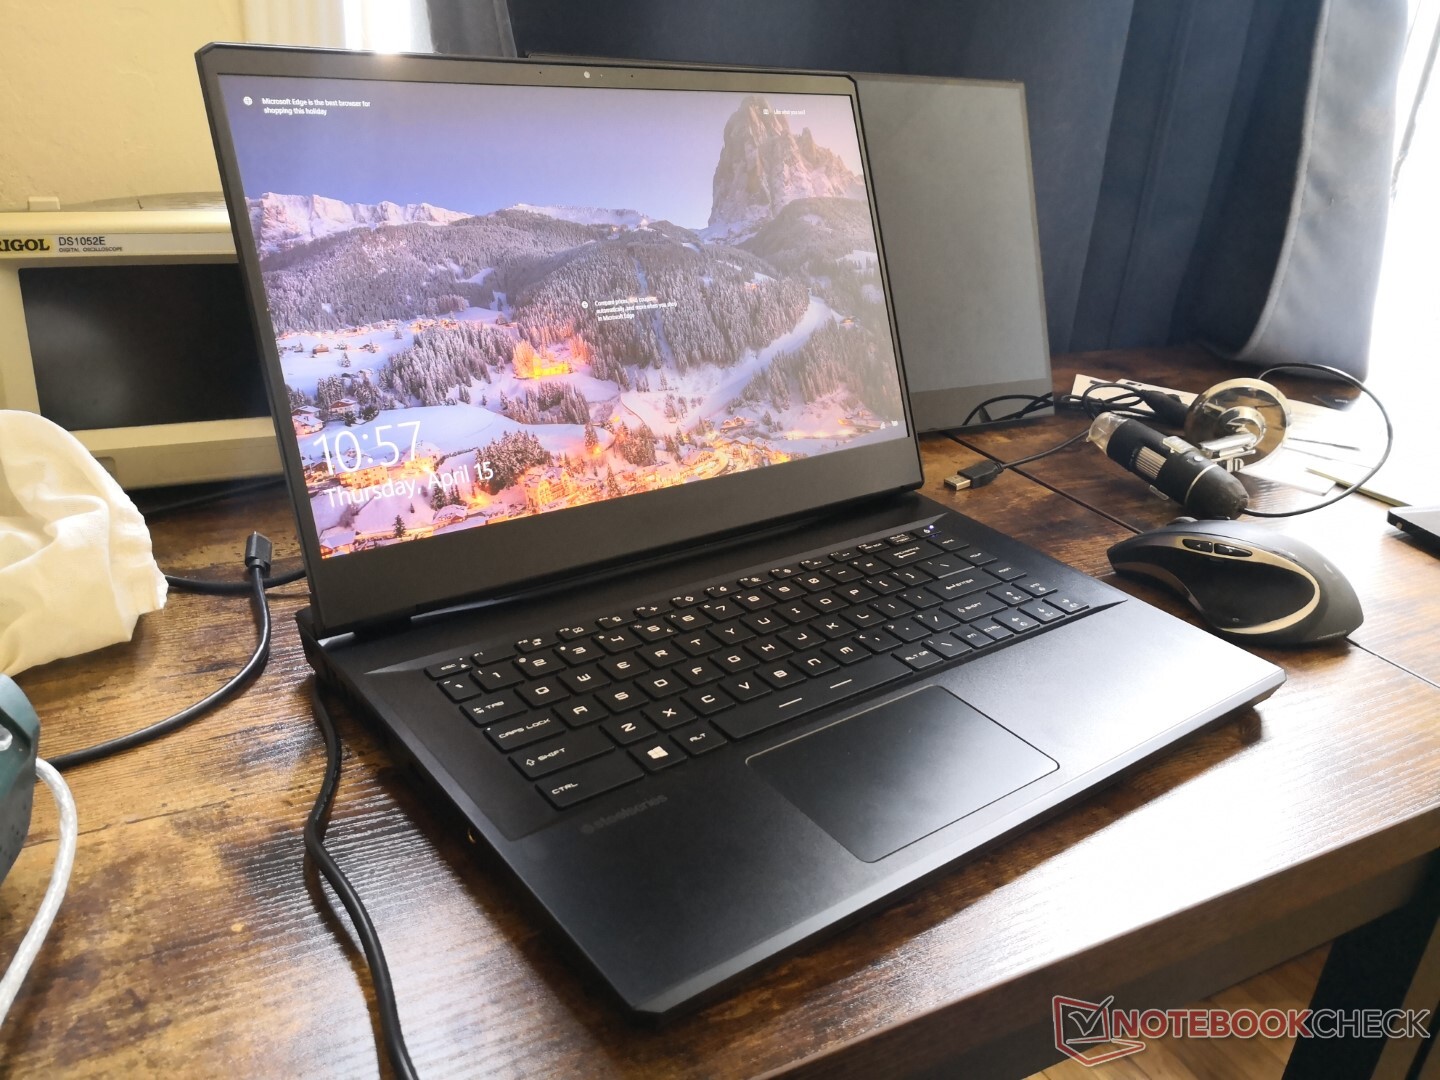
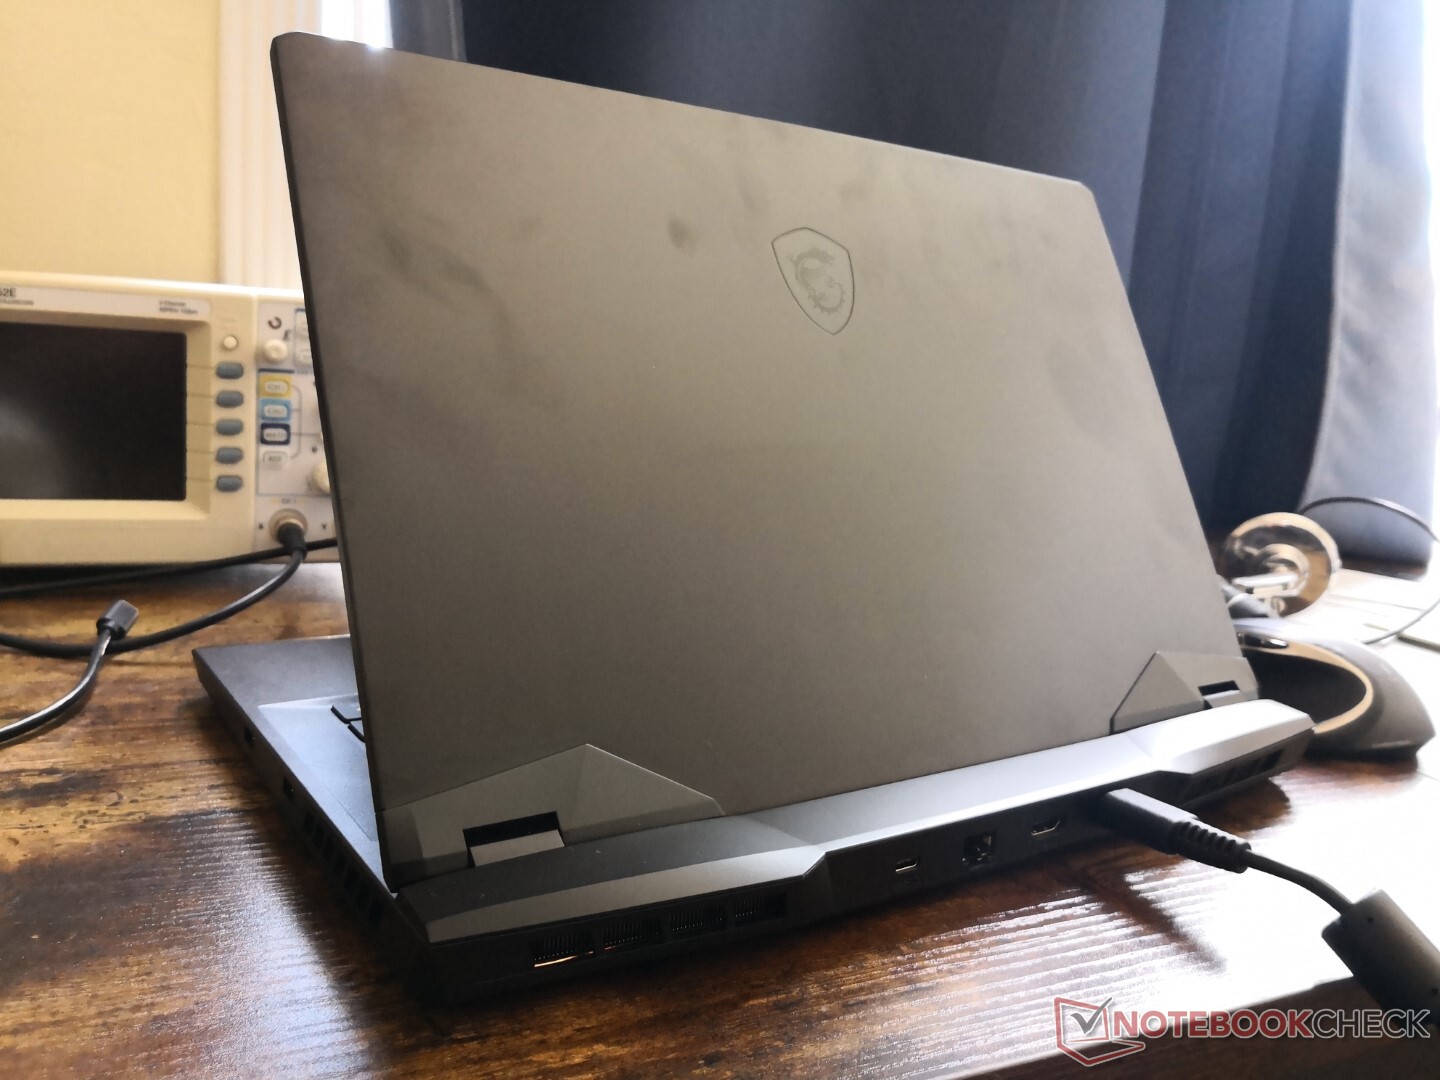
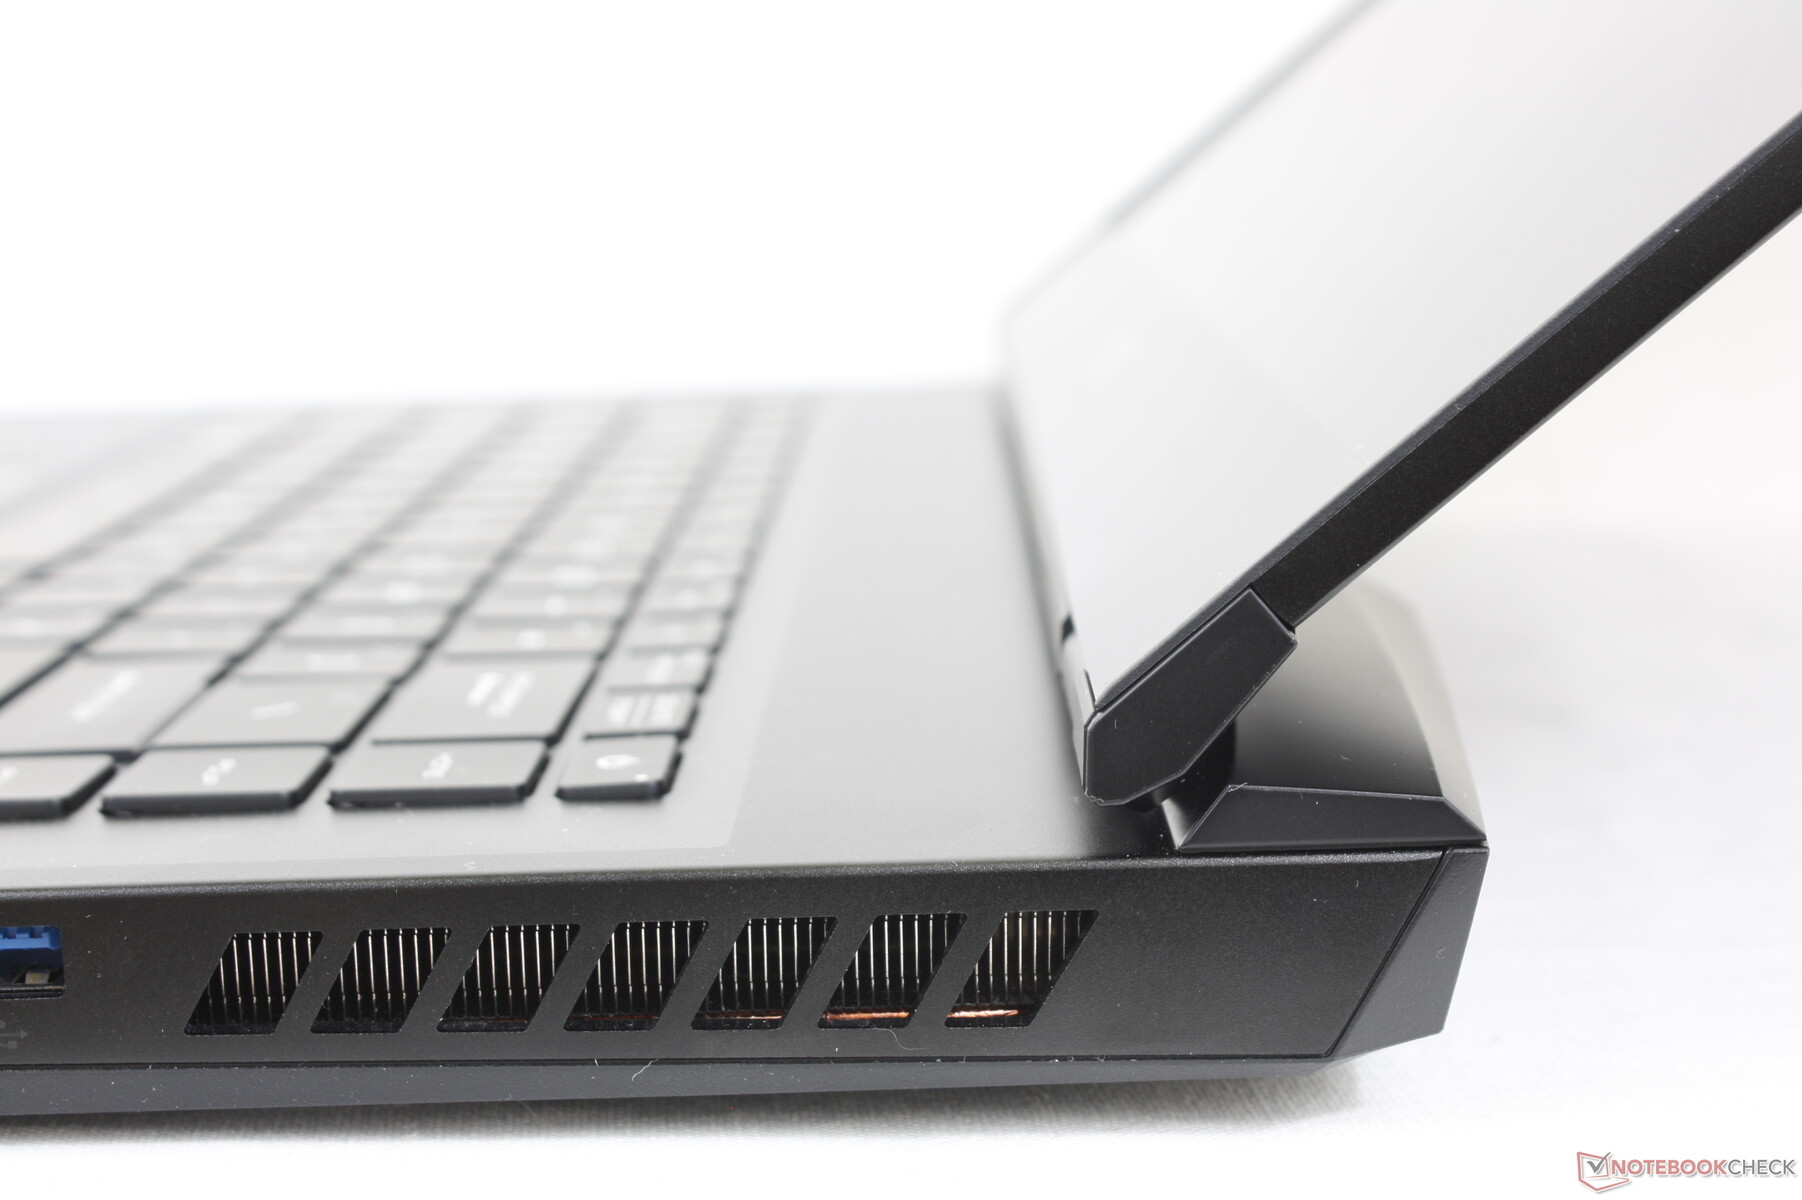
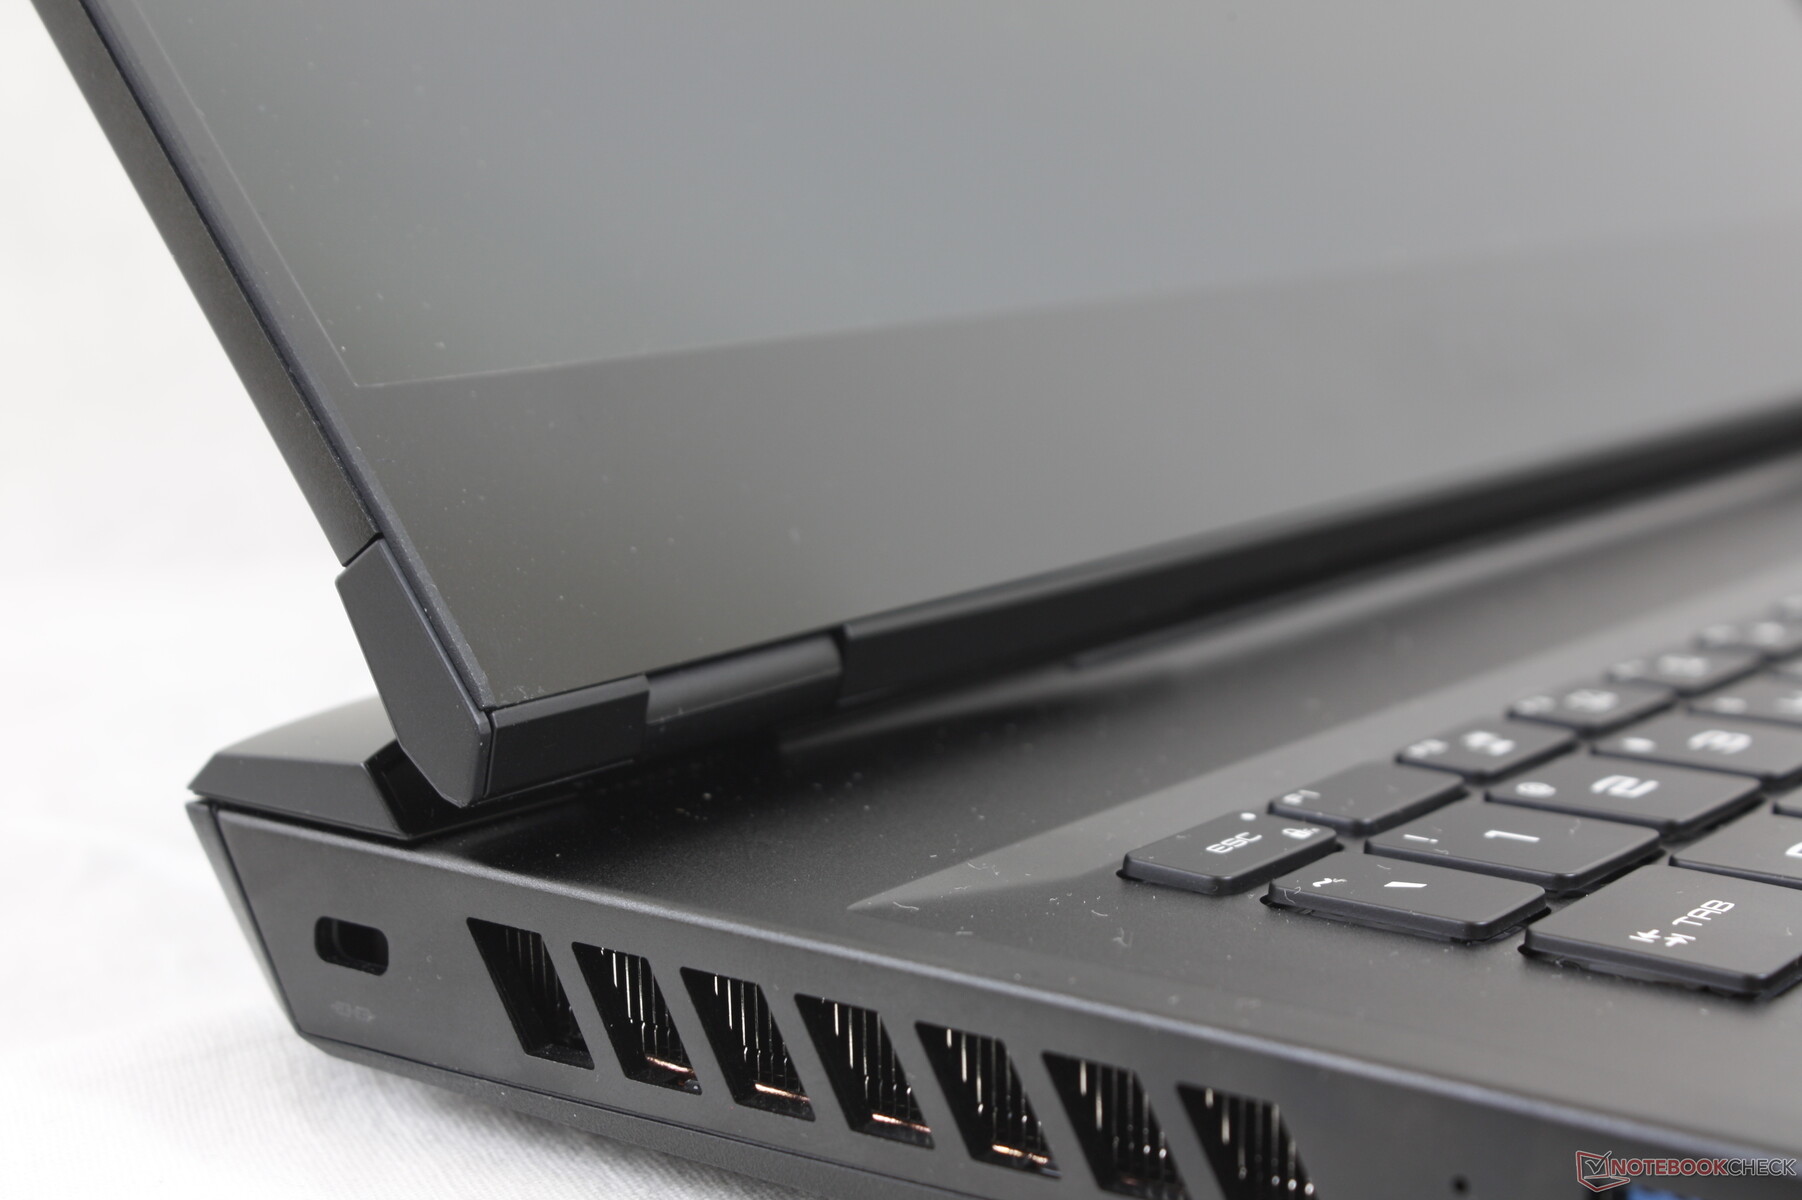
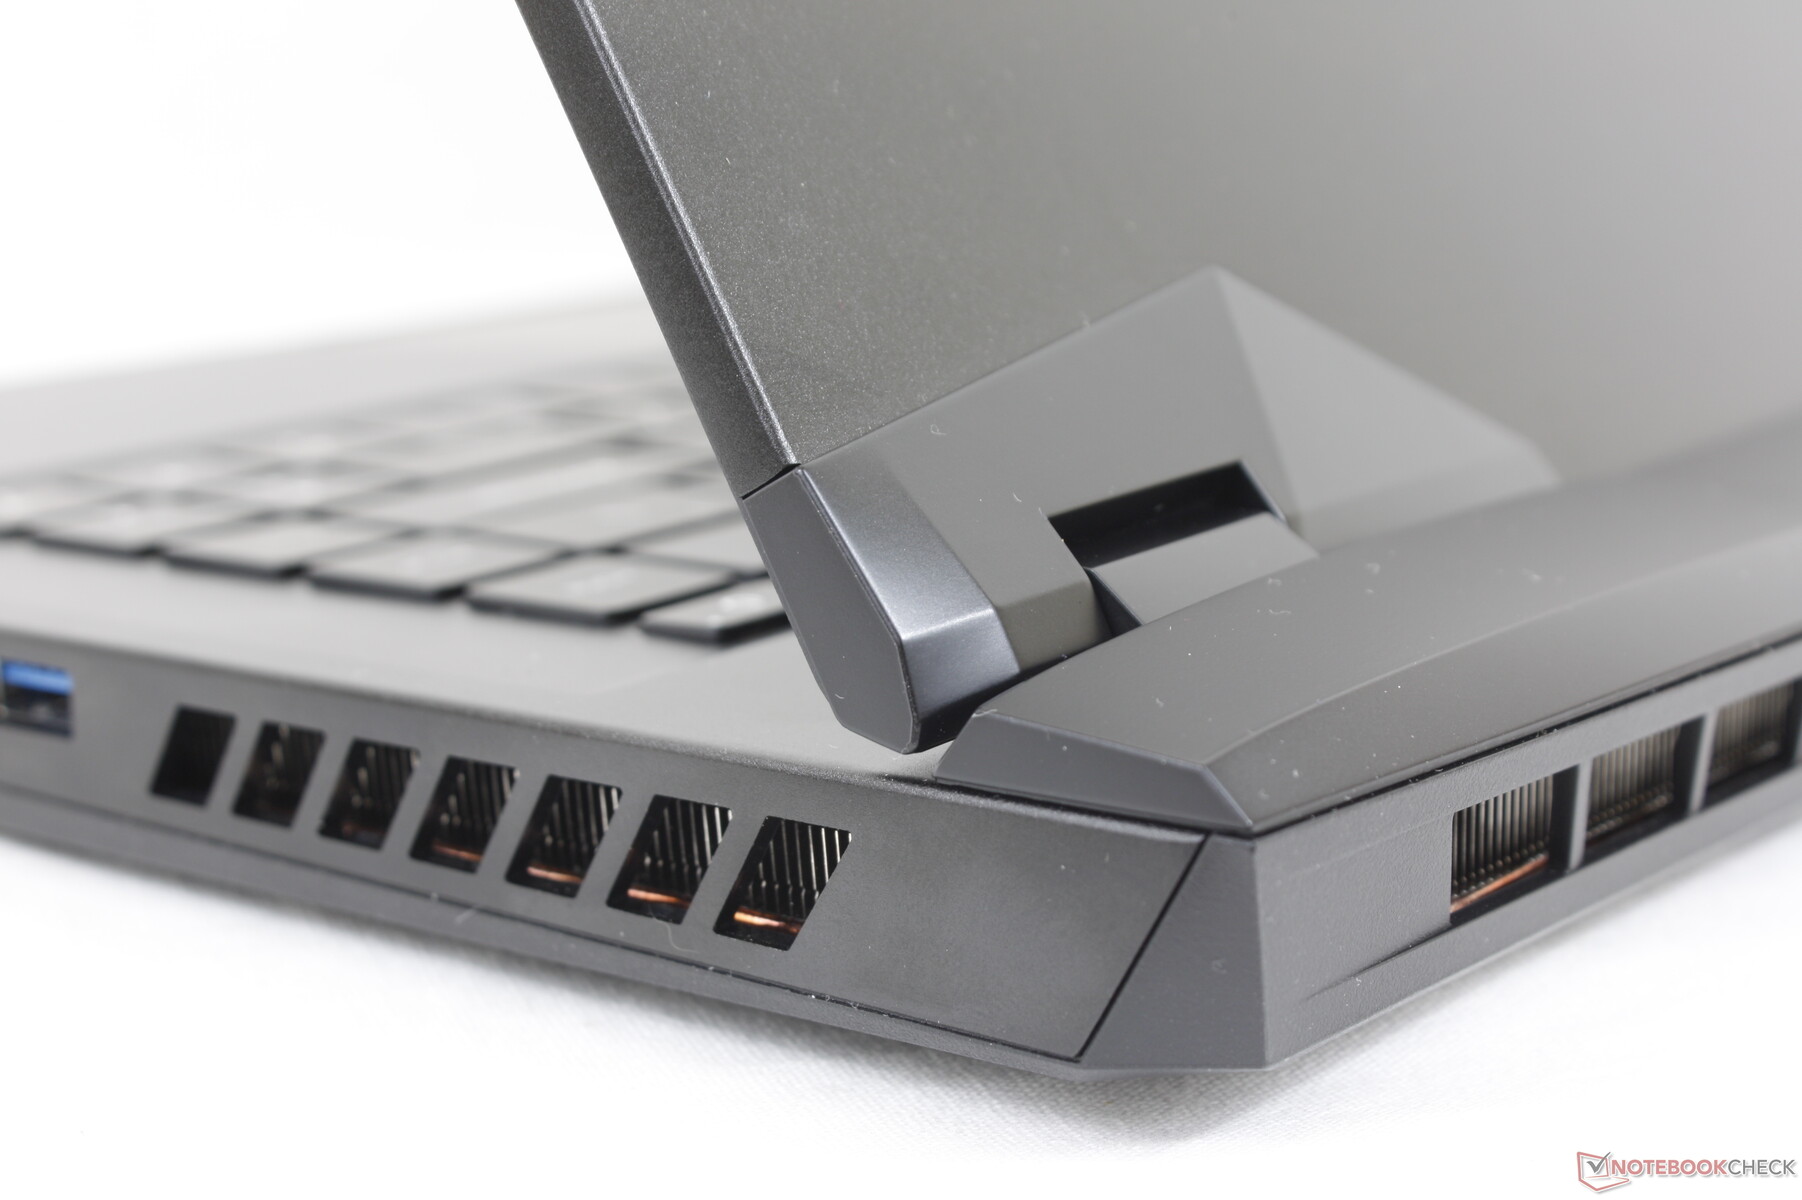
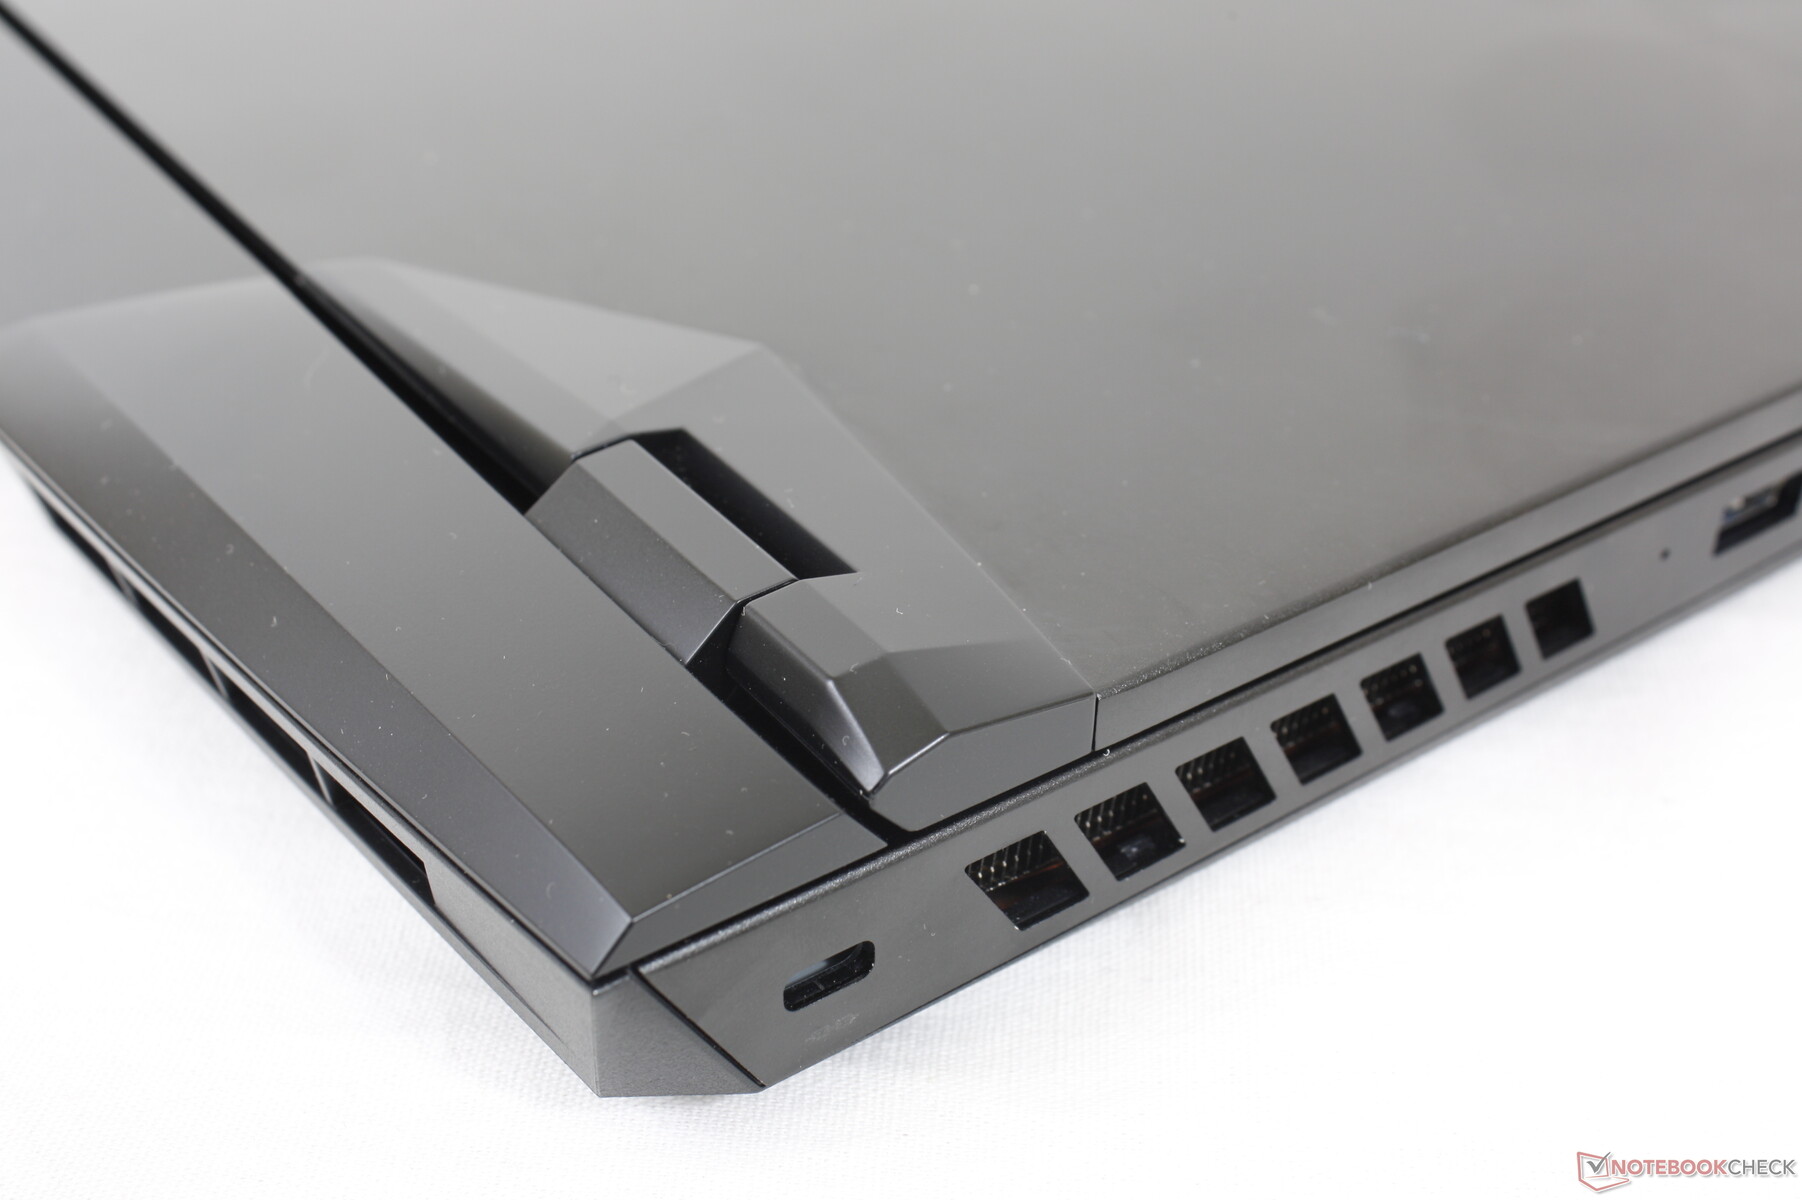
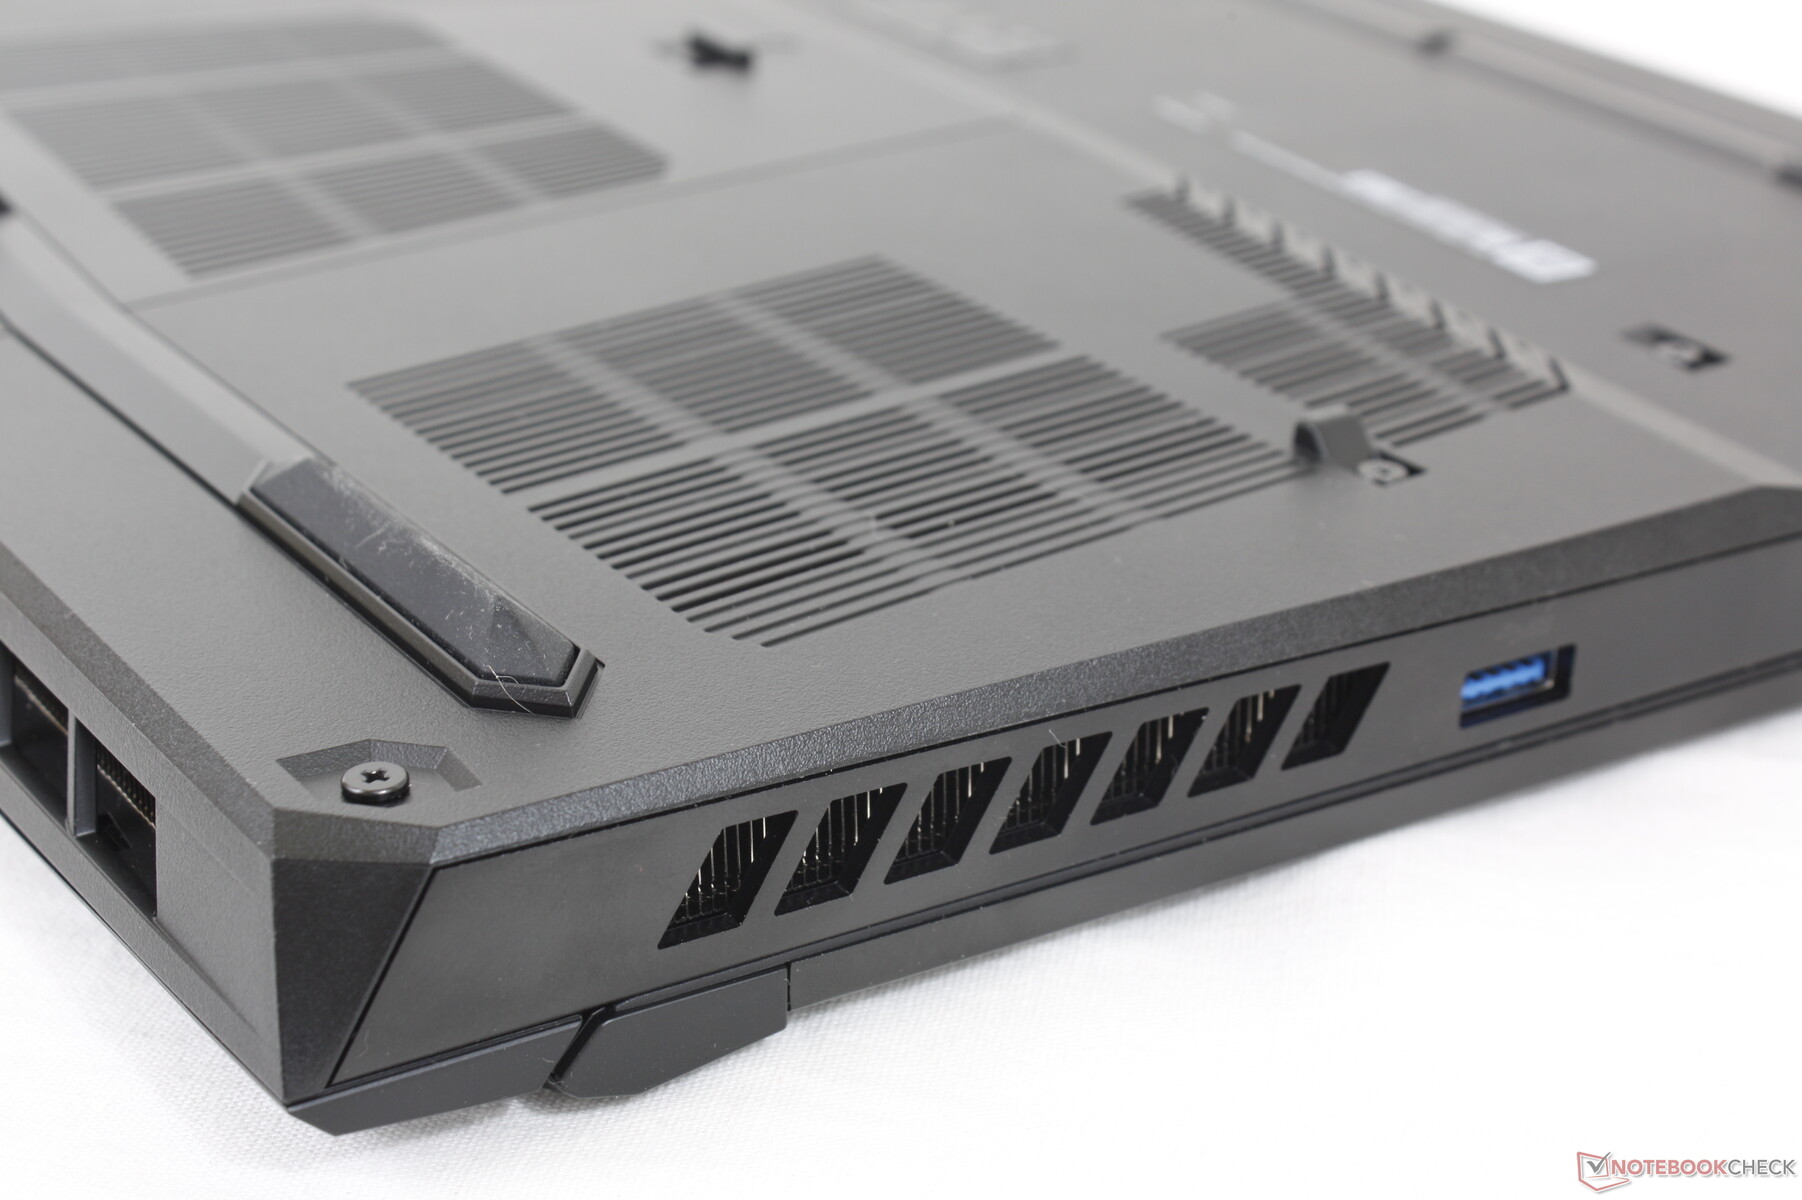
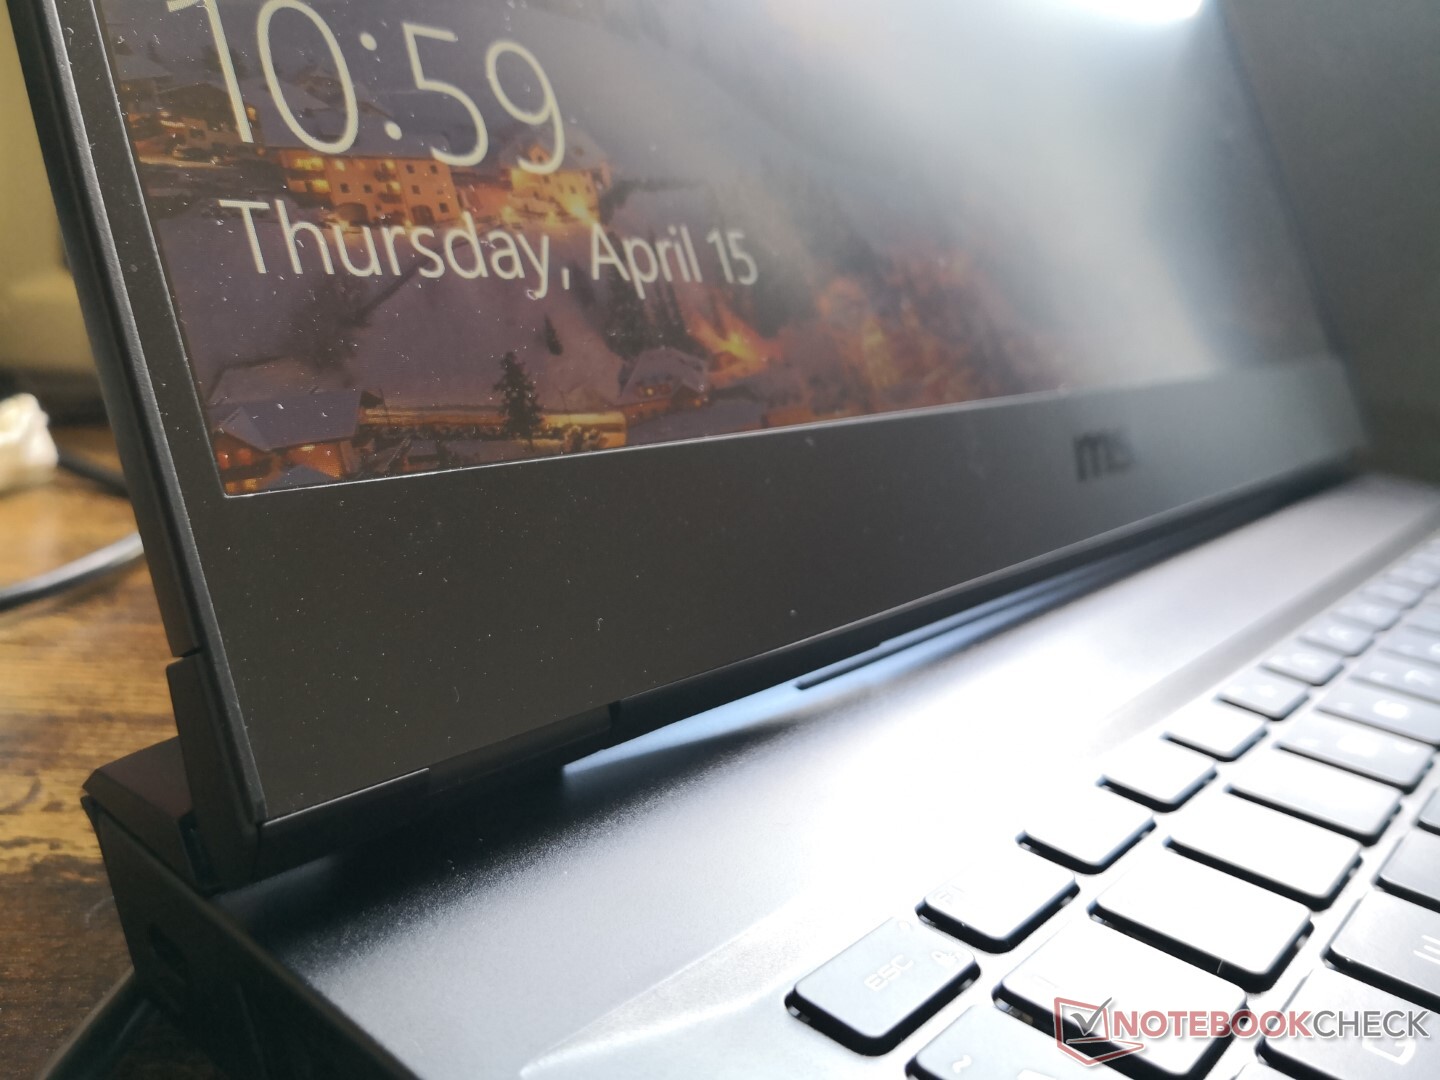
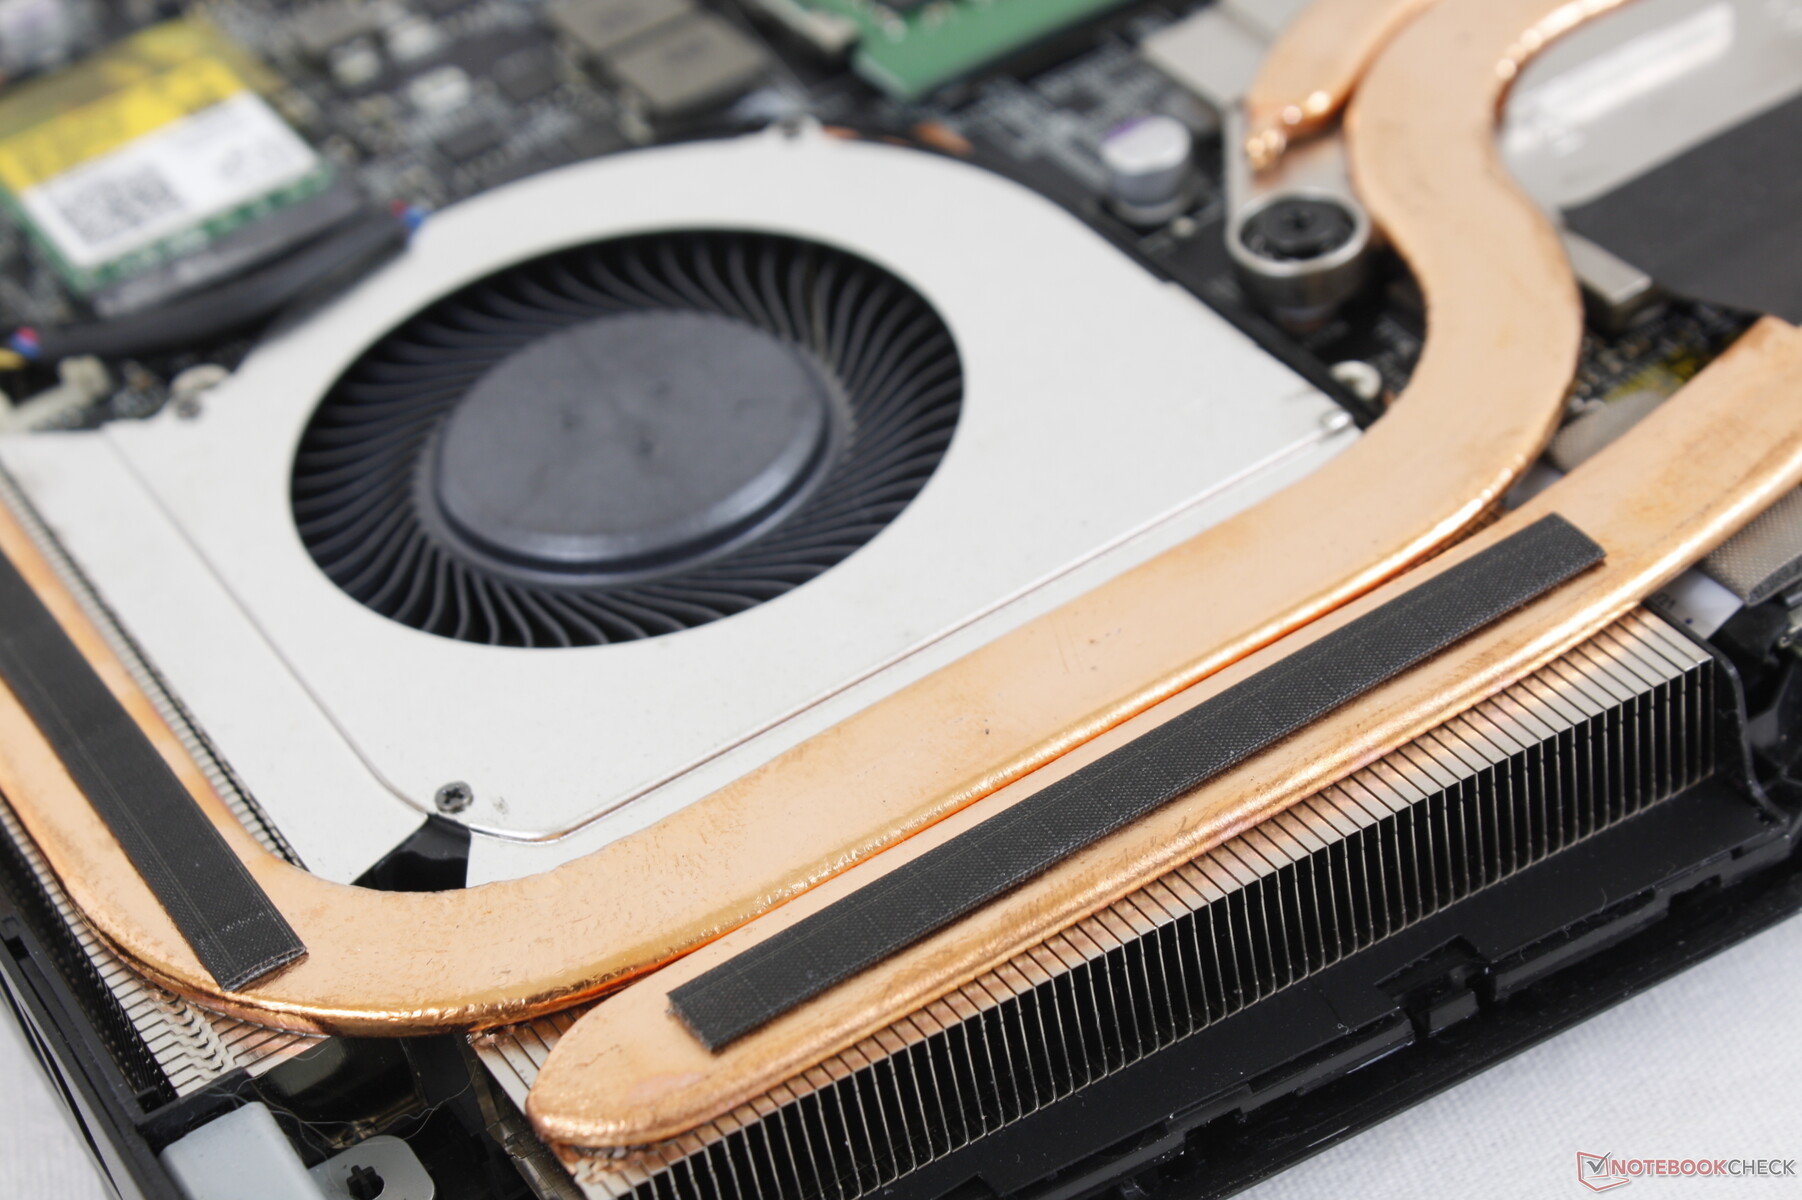
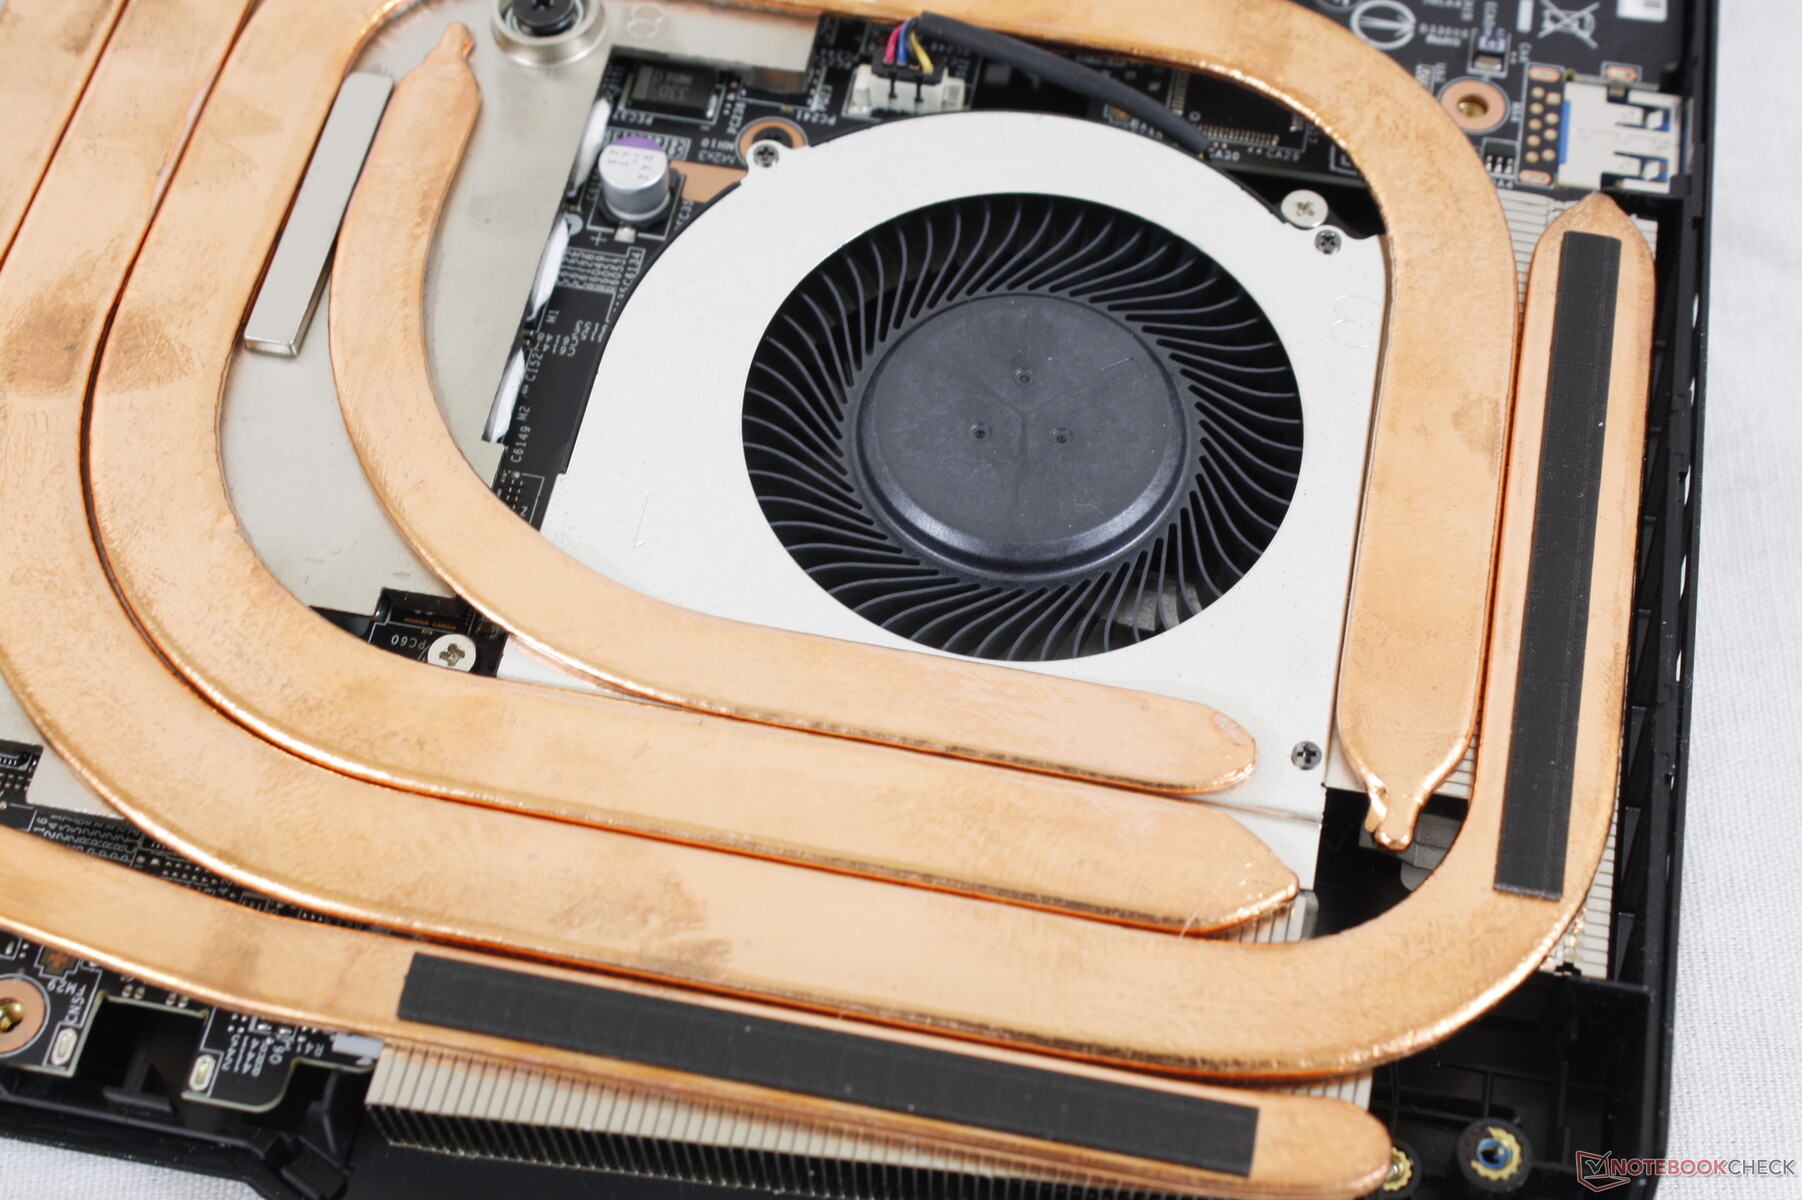
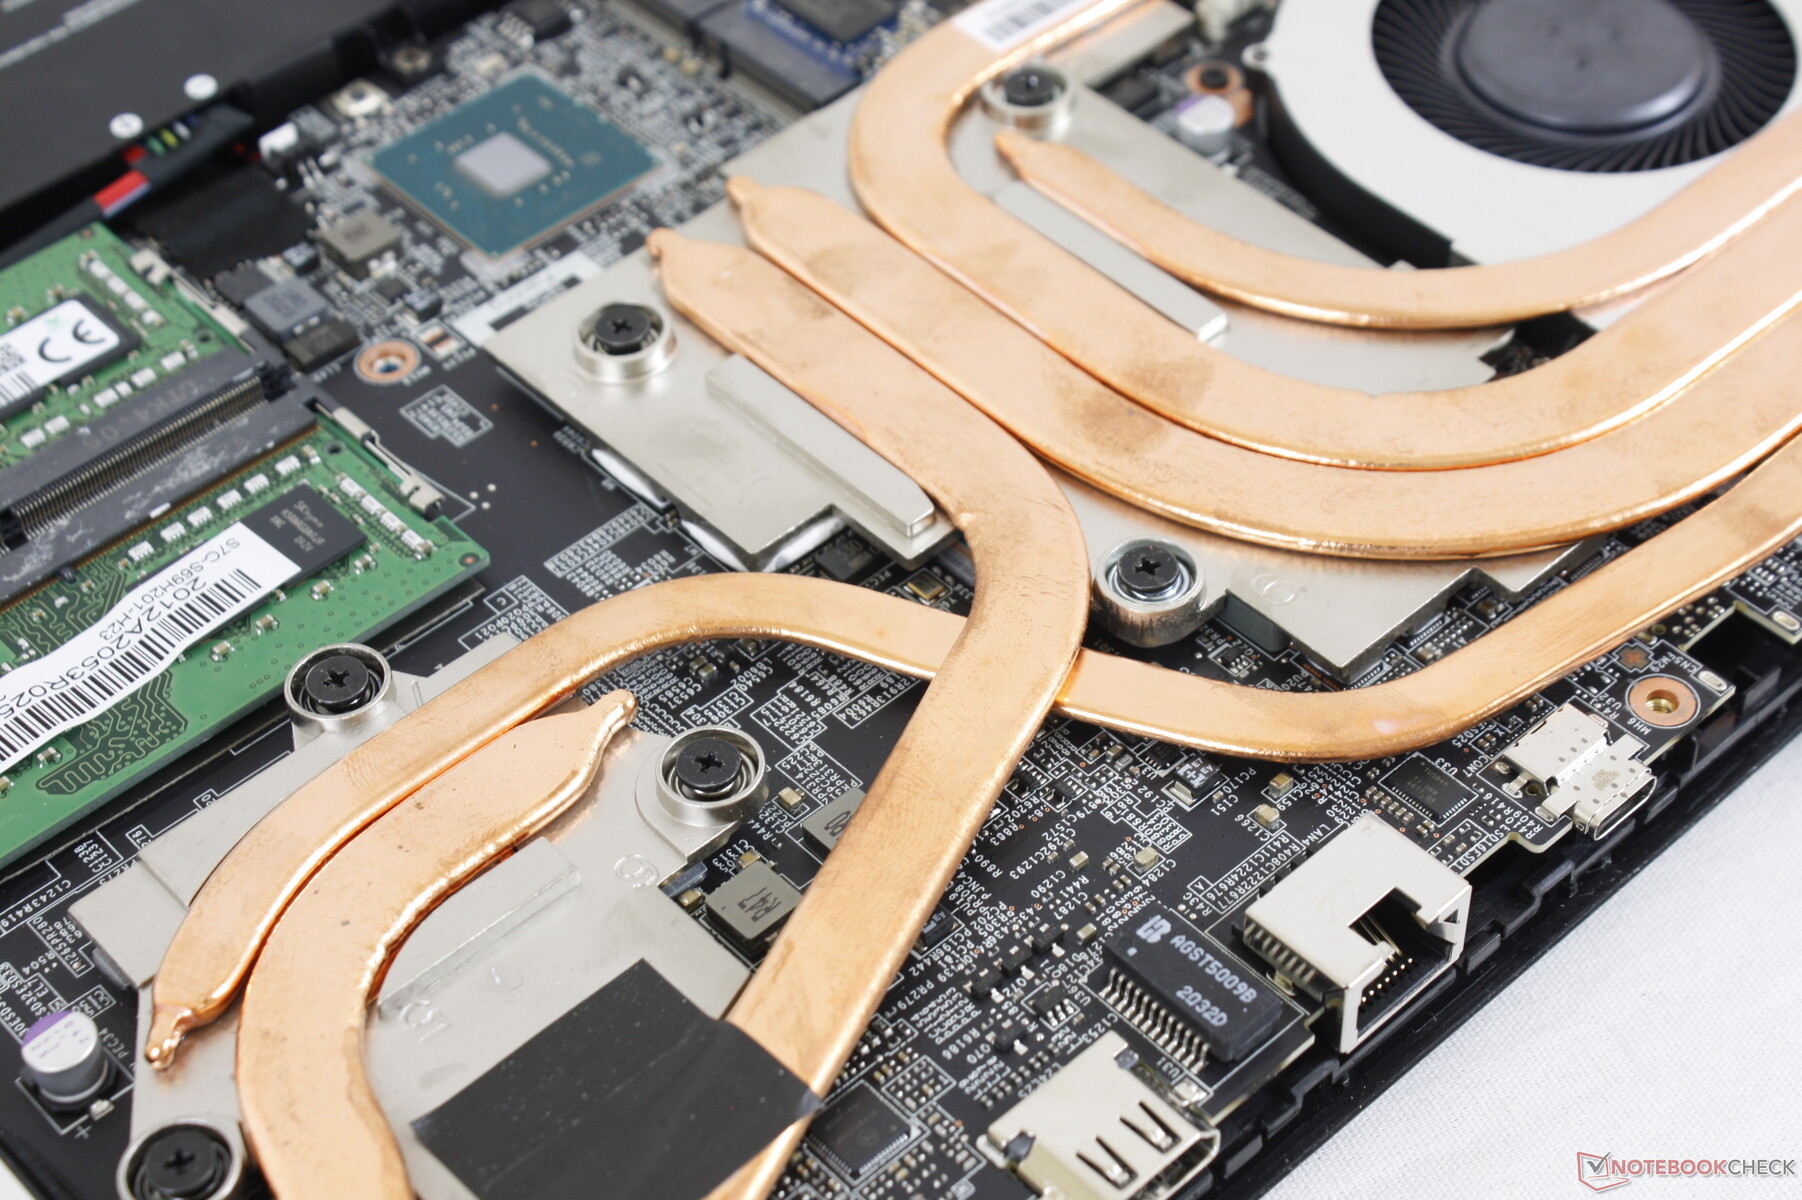
Il più grande cambiamento fisico dal GP65 al GP66 è la parte posteriore più grande realizzata per ospitare una soluzione di raffreddamento più potente. Il design estetico complessivo può per il resto essere descritto come una versione attenuata GE66 con i loro simili pannelli esterni in metallo liscio ma uno schema di colori nero più scuro. La barra luminosa RGB lungo il bordo anteriore del GE66 non è presente sul GP66 mentre l'illuminazione RGB della tastiera rimane.
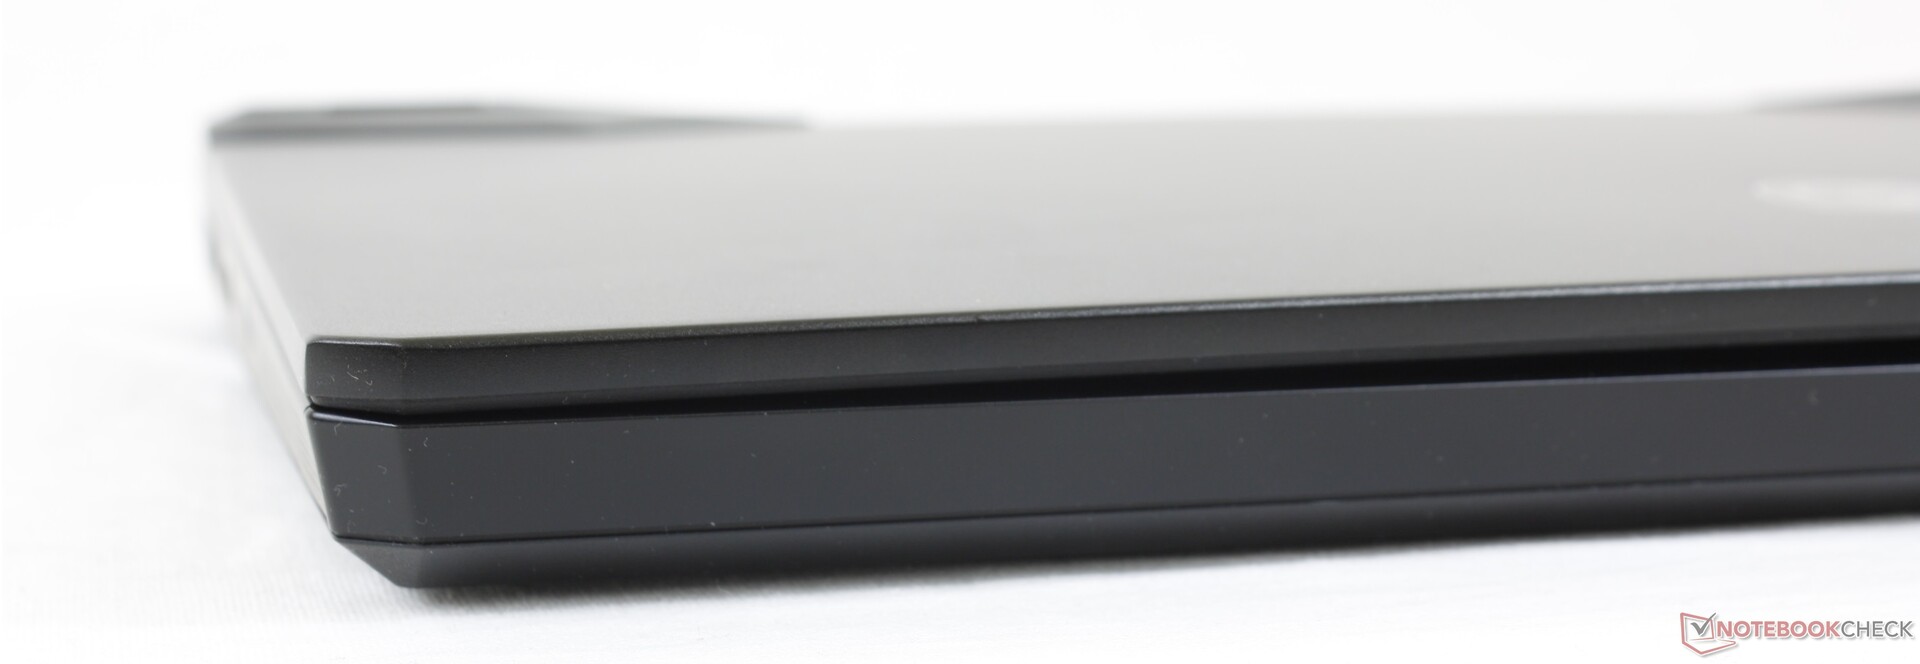
La qualità costruttiva è eccellente, specialmente per la base. Il piano della tastiera mostra solo una minima flessione e scricchiolii quando si piegano o si torcono gli angoli anteriori. La cover, tuttavia, avrebbe potuto essere più rigida poiché le cerniere tendono a traballare quando si regolano gli angoli. La cover esterna si flette più facilmente anche che sul Asus ROG Strix G15 quando si applica una pressione al centro.
Il nuovo design è notevolmente più lungo del vecchio GP65 in lunghezza a causa del nuovo "motore a reazione" posteriore. Per il resto, il peso rimane quasi lo stesso gen-to-gen a 2,3 kg e il sistema è effettivamente più sottile questa volta di circa 4 mm. Il concorrente Alienware m15 R4 è comunque più grande mentre l'Asus Zephyrus G15 GA503Q è sia più leggero che più piccolo.
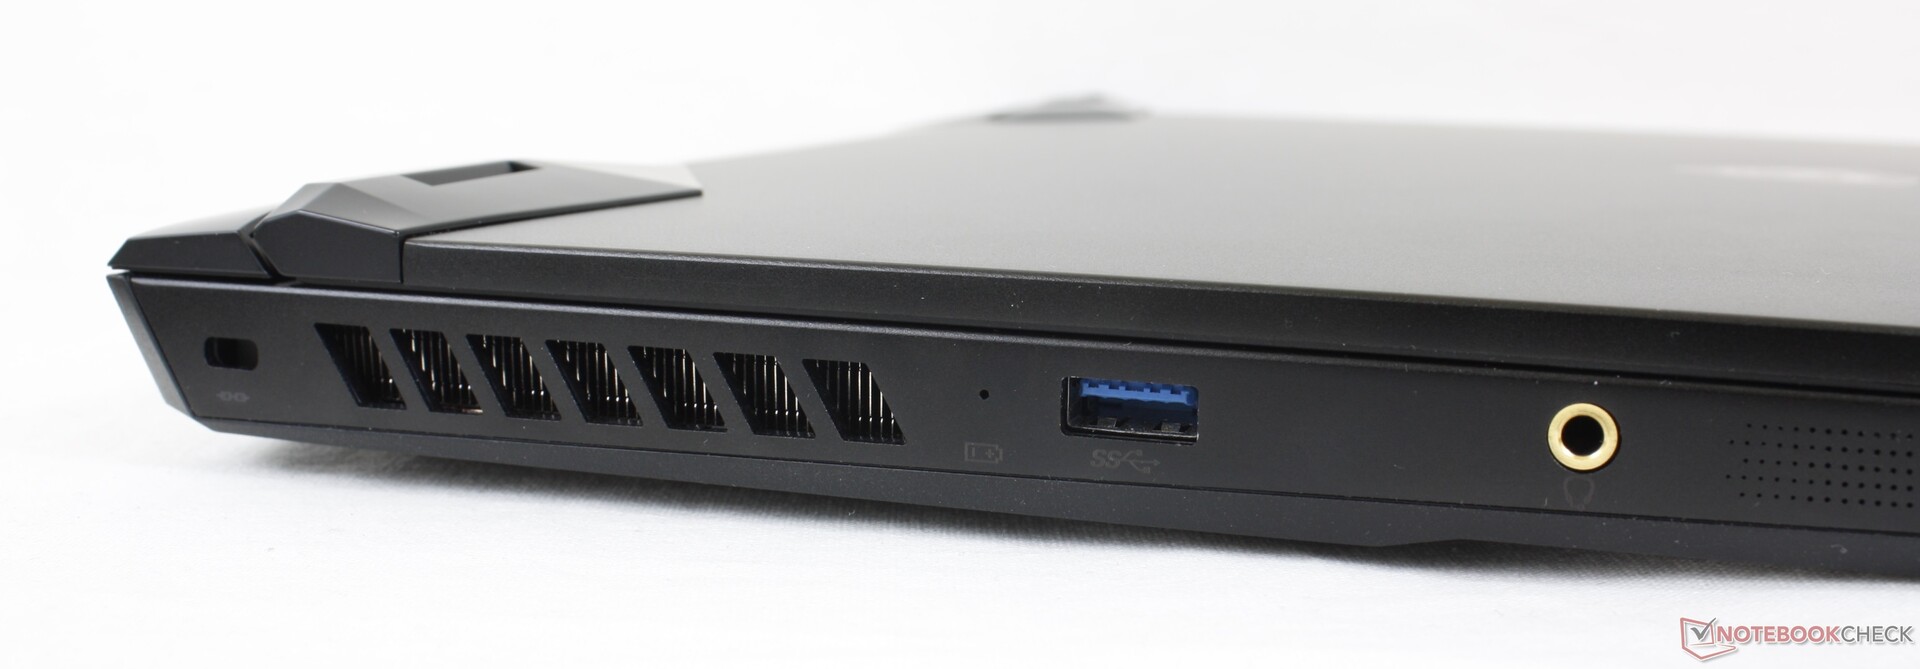
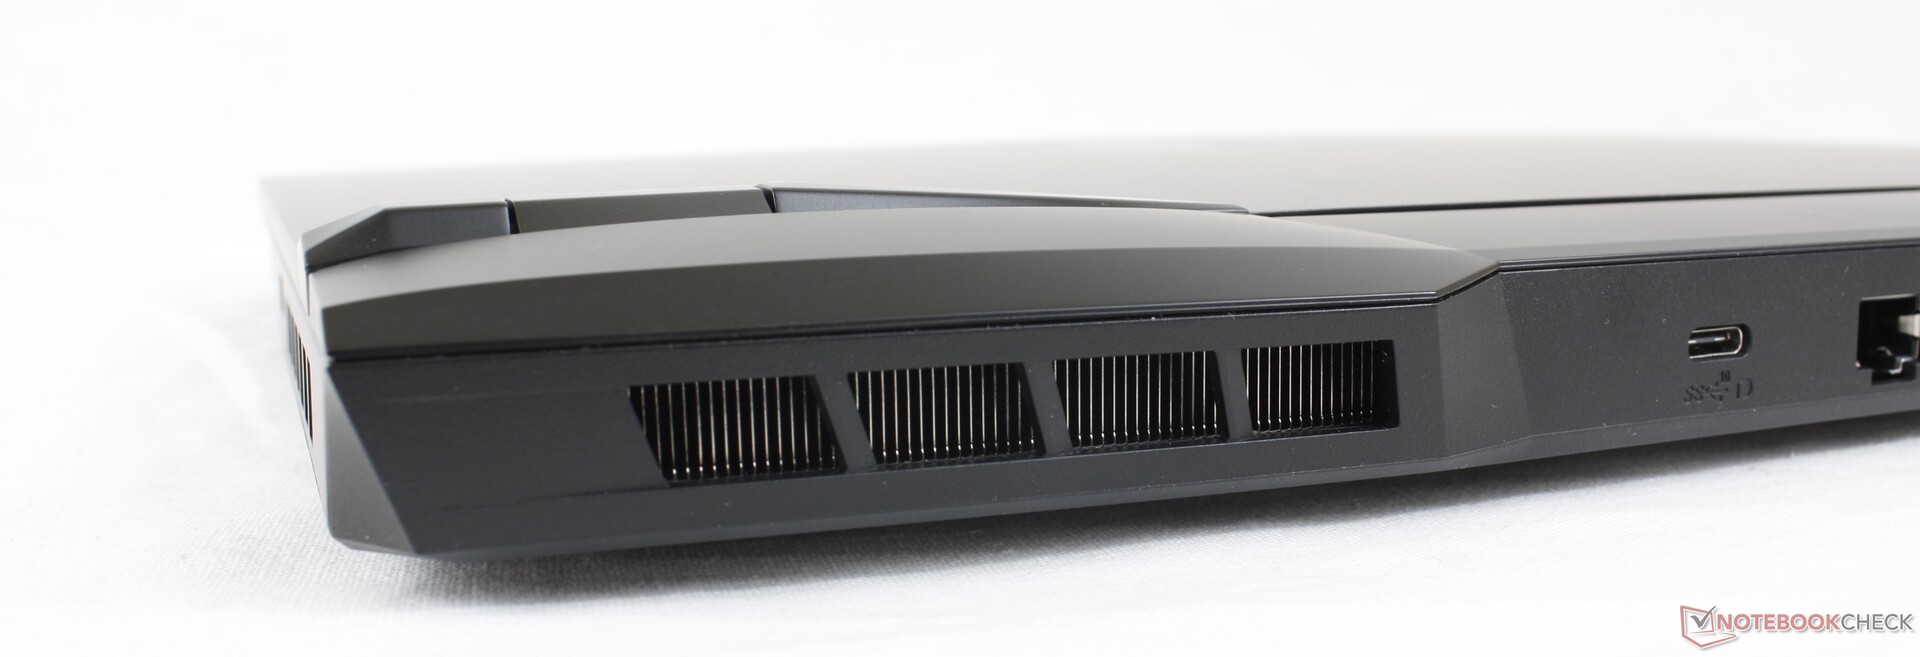
Connettività
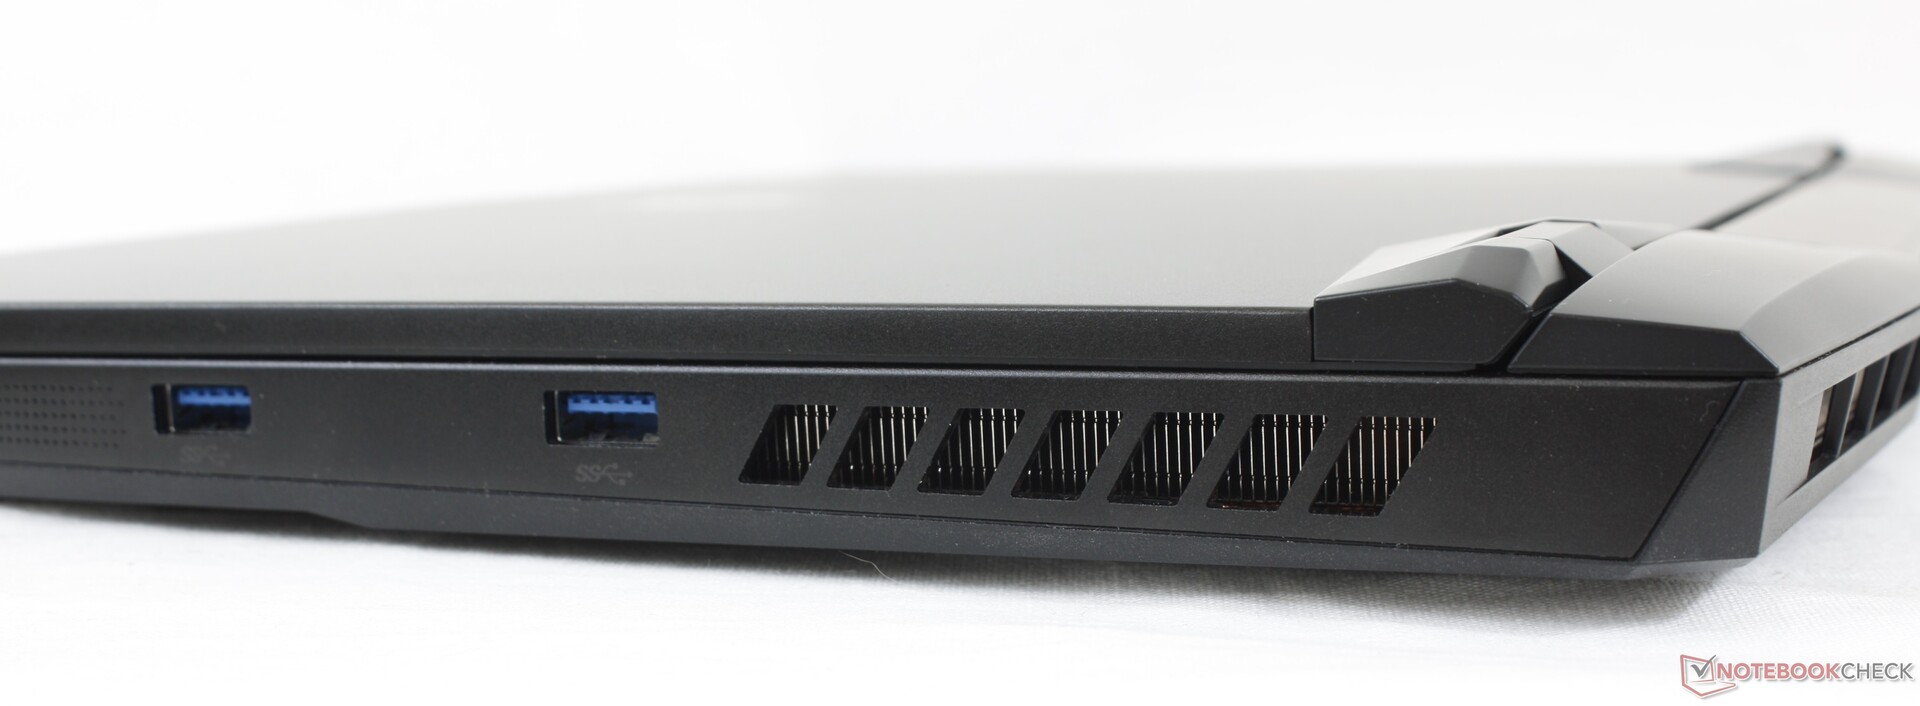
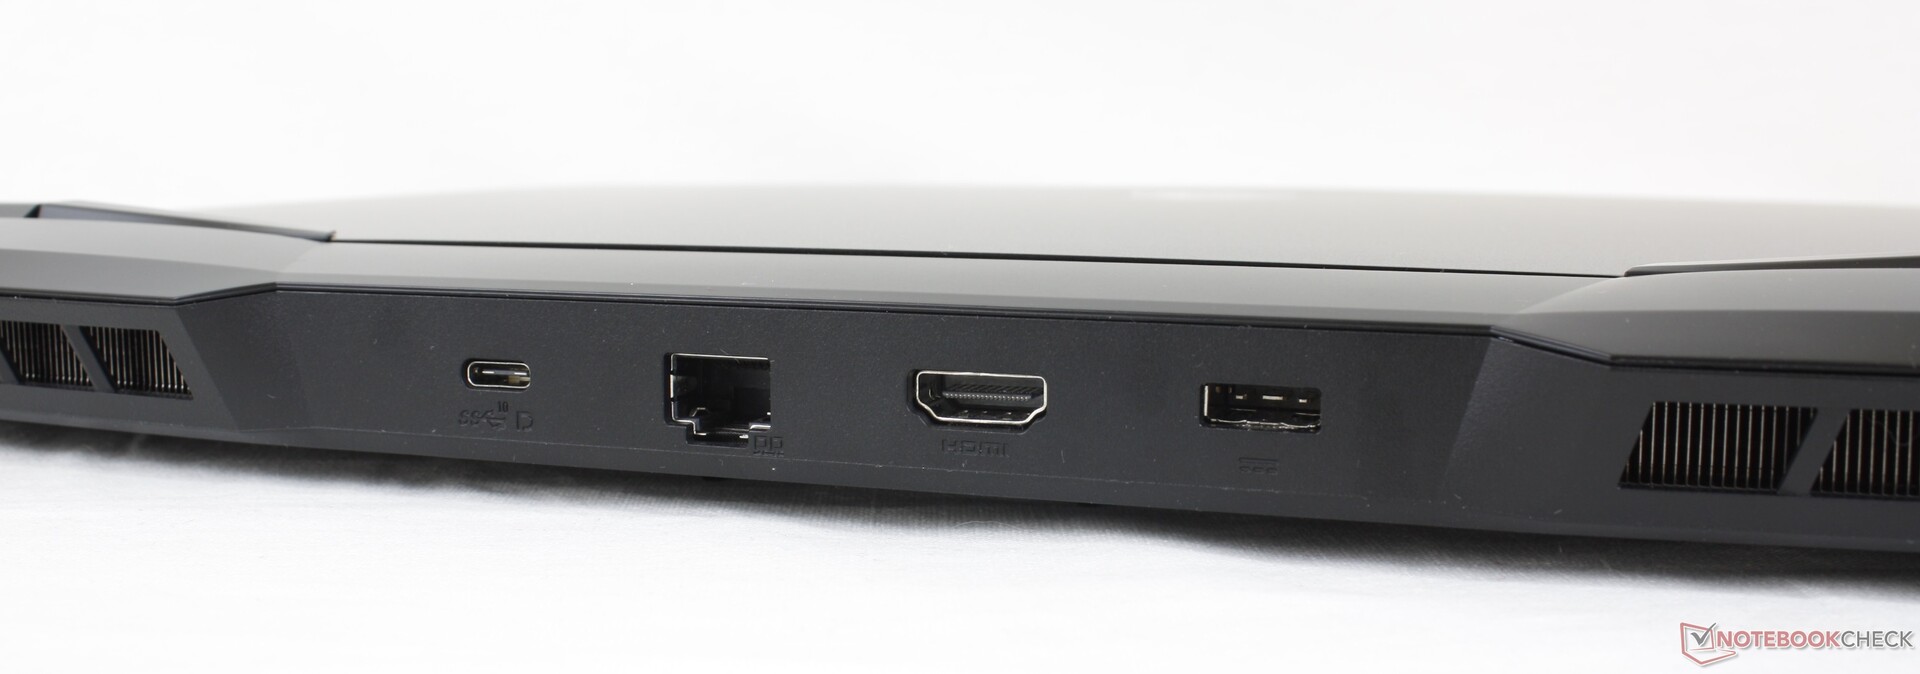
Le opzioni delle porte e il posizionamento sono cambiati molto rispetto al GP65. Per prima cosa, le porte sono ora distribuite più uniformemente lungo i bordi sinistro, destro e posteriore, mentre erano tutte ammassate sul GP65. In secondo luogo, sia il microfono da 3,5 mm che le porte mini-DisplayPort sono state eliminate in favore di DisplayPort-over-USB-C. HDMI è stata aggiornata da 1.4 a 2.0 per il supporto 4K60 e c'è una porta USB-A in più, per un totale di tre.
Tenete a mente che Thunderbolt e USB-C Power Delivery non sono supportati. Così, gli utenti non possono ricaricare il GP66 con adattatori USB-C a differenza del Razer Blade 15 o Alienware m15.
Comunicazioni
Webcam


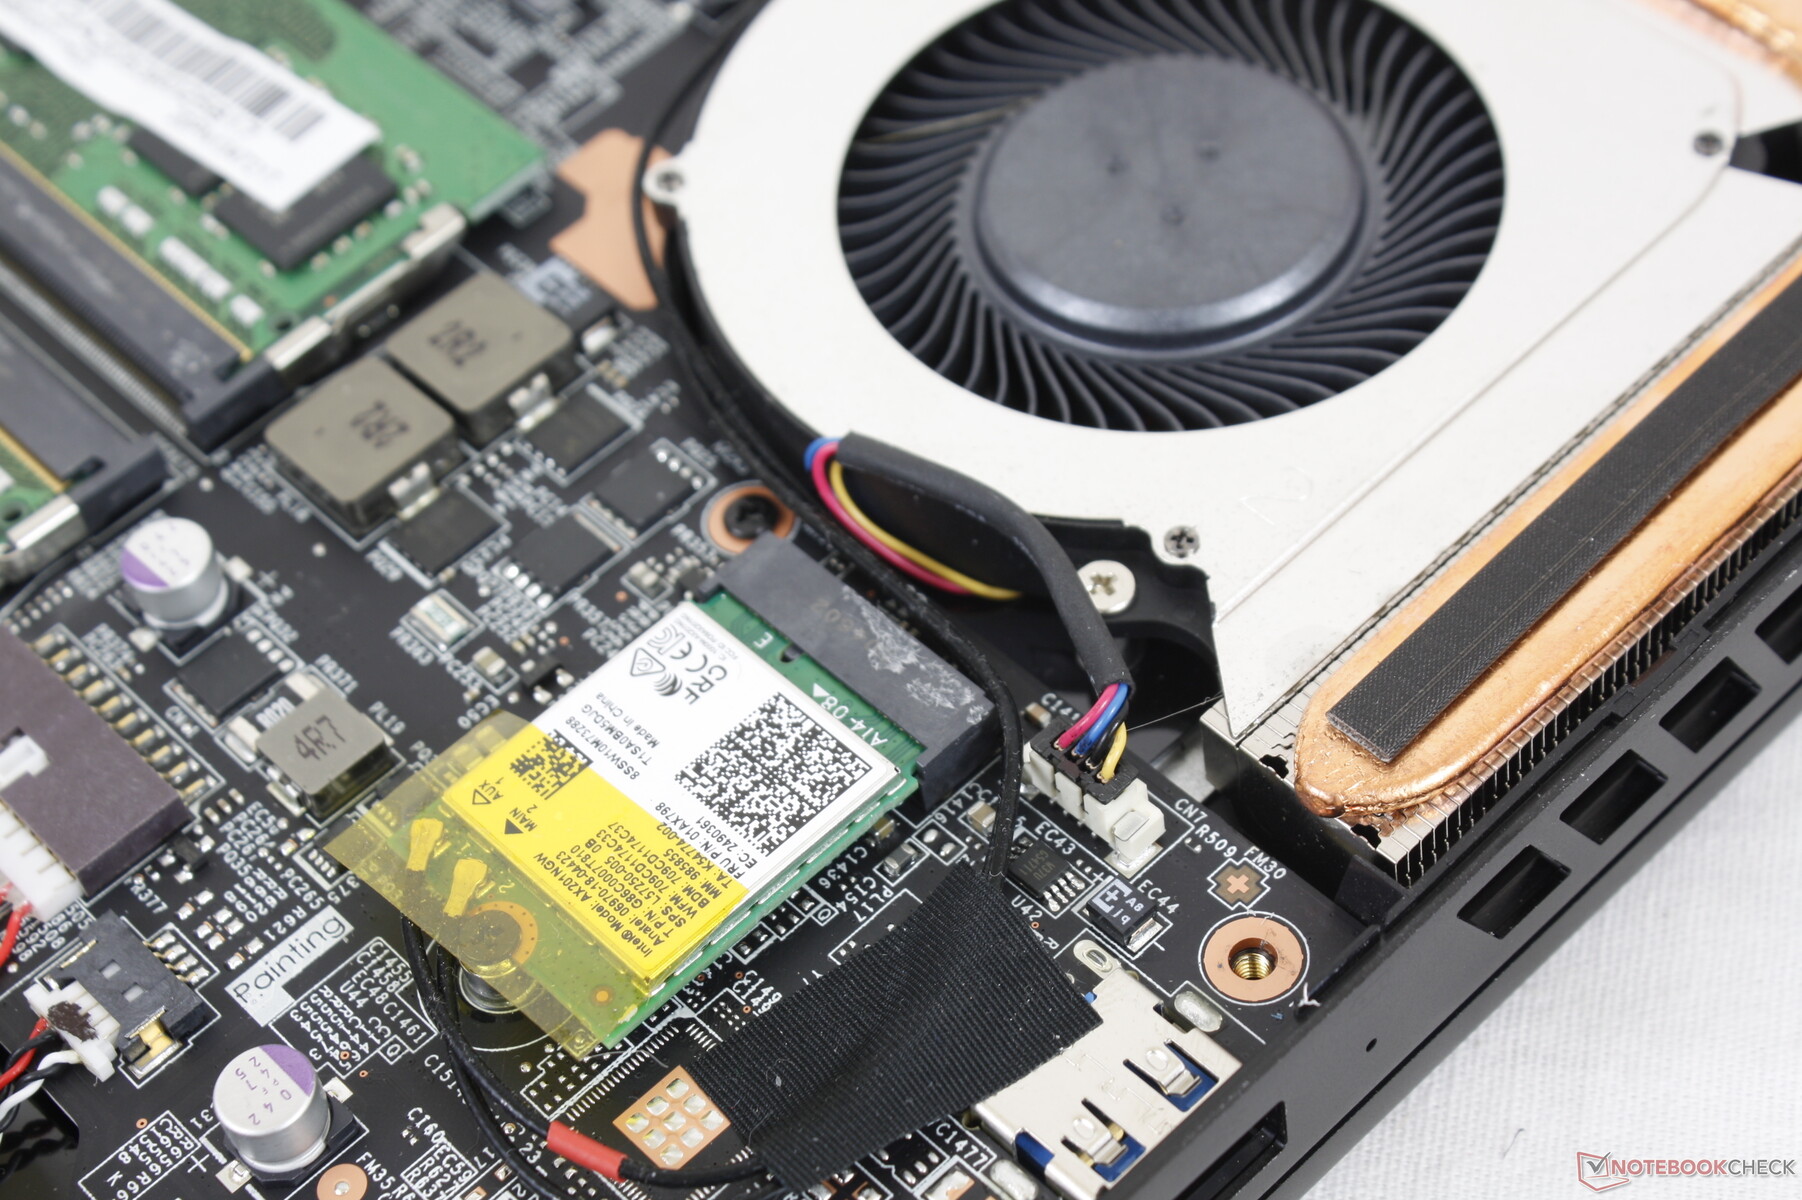
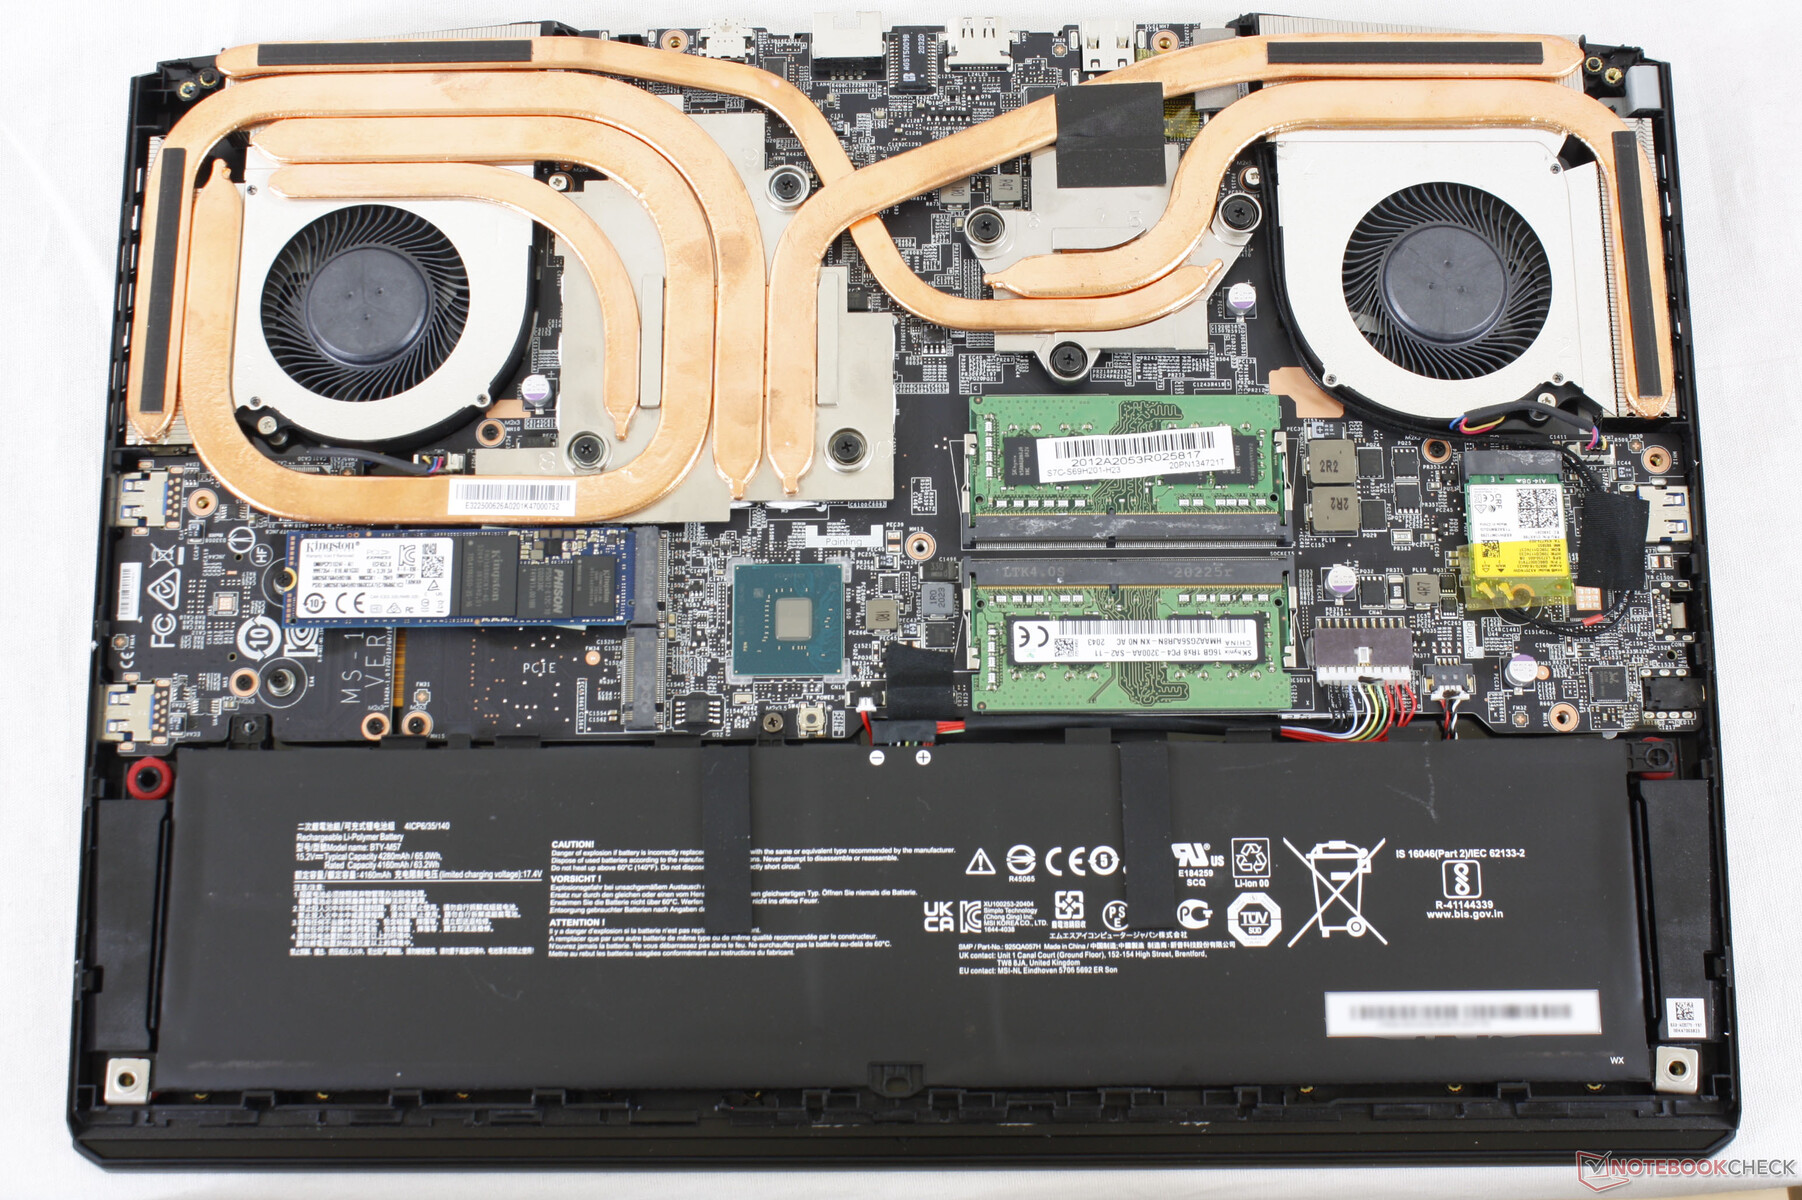
Manutenzione
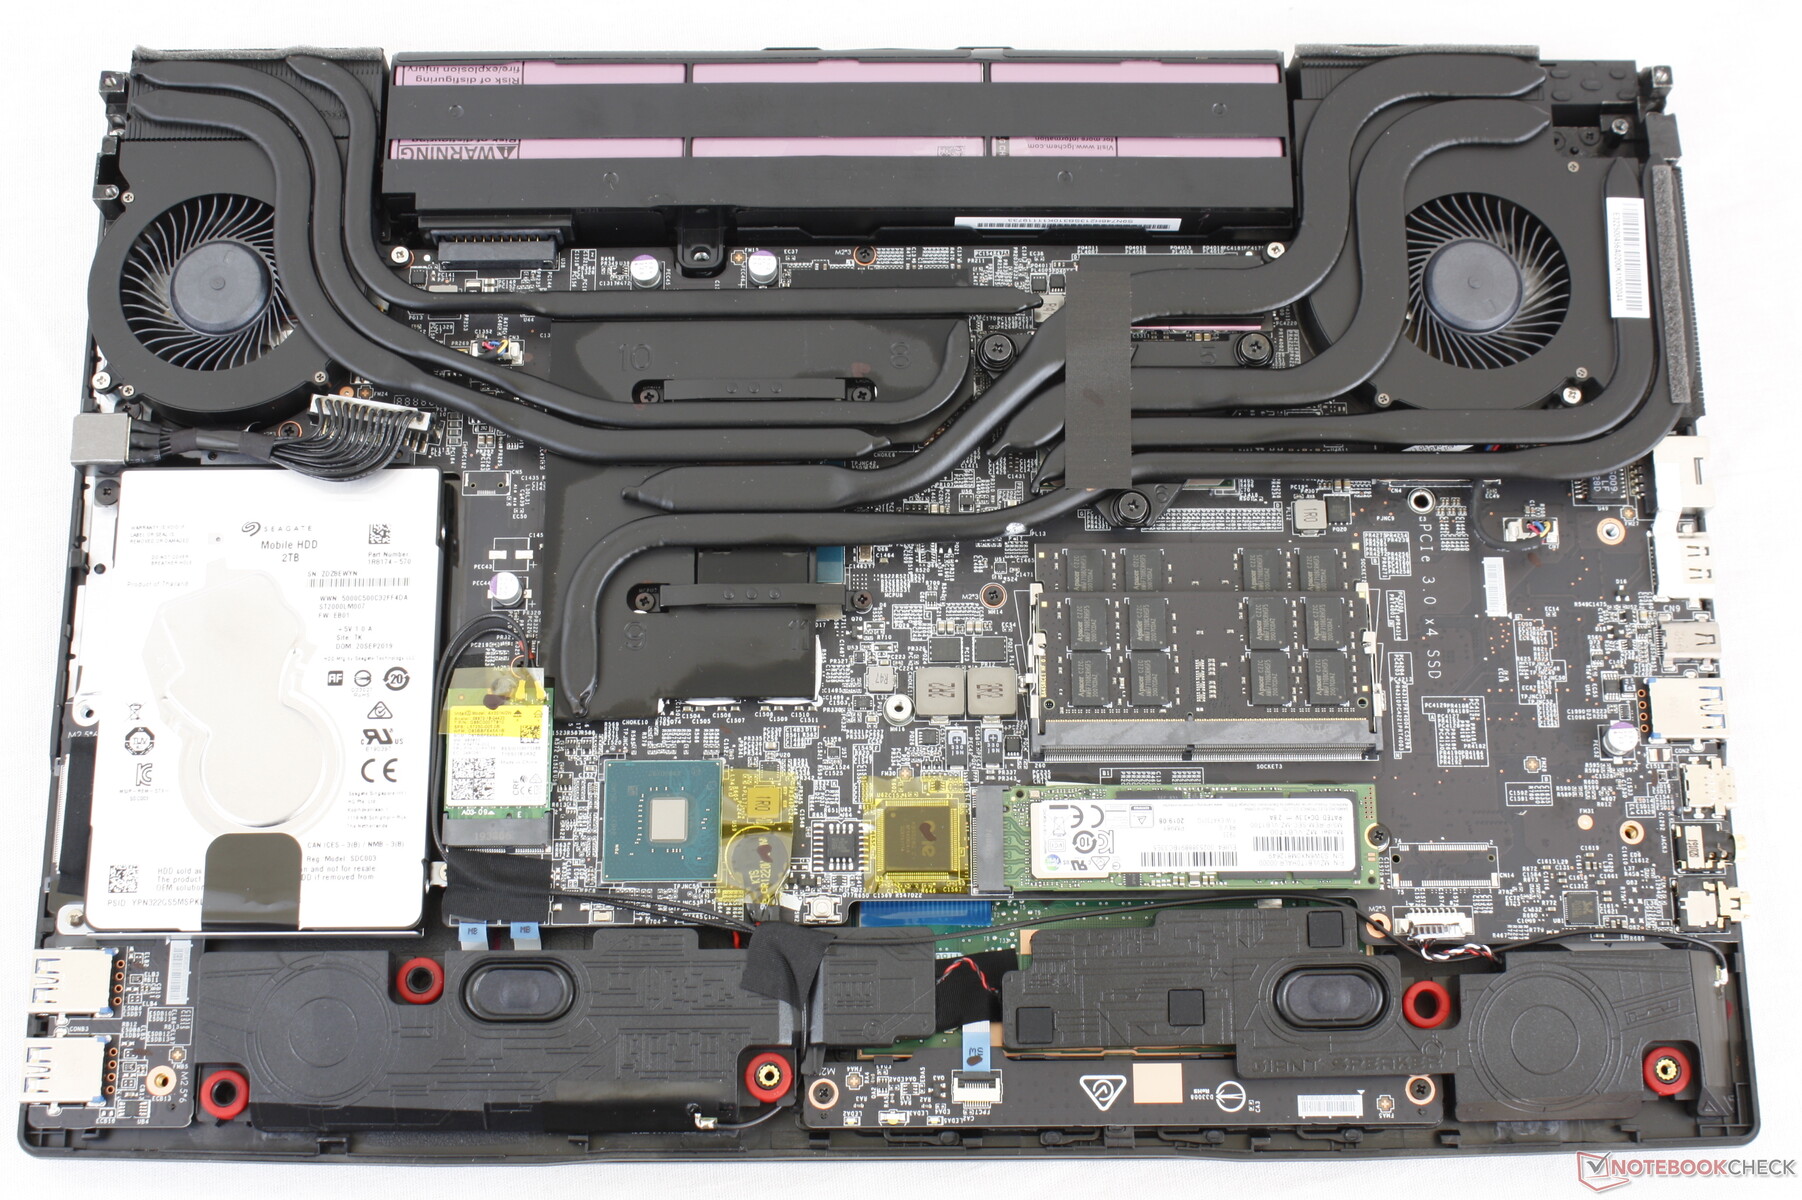
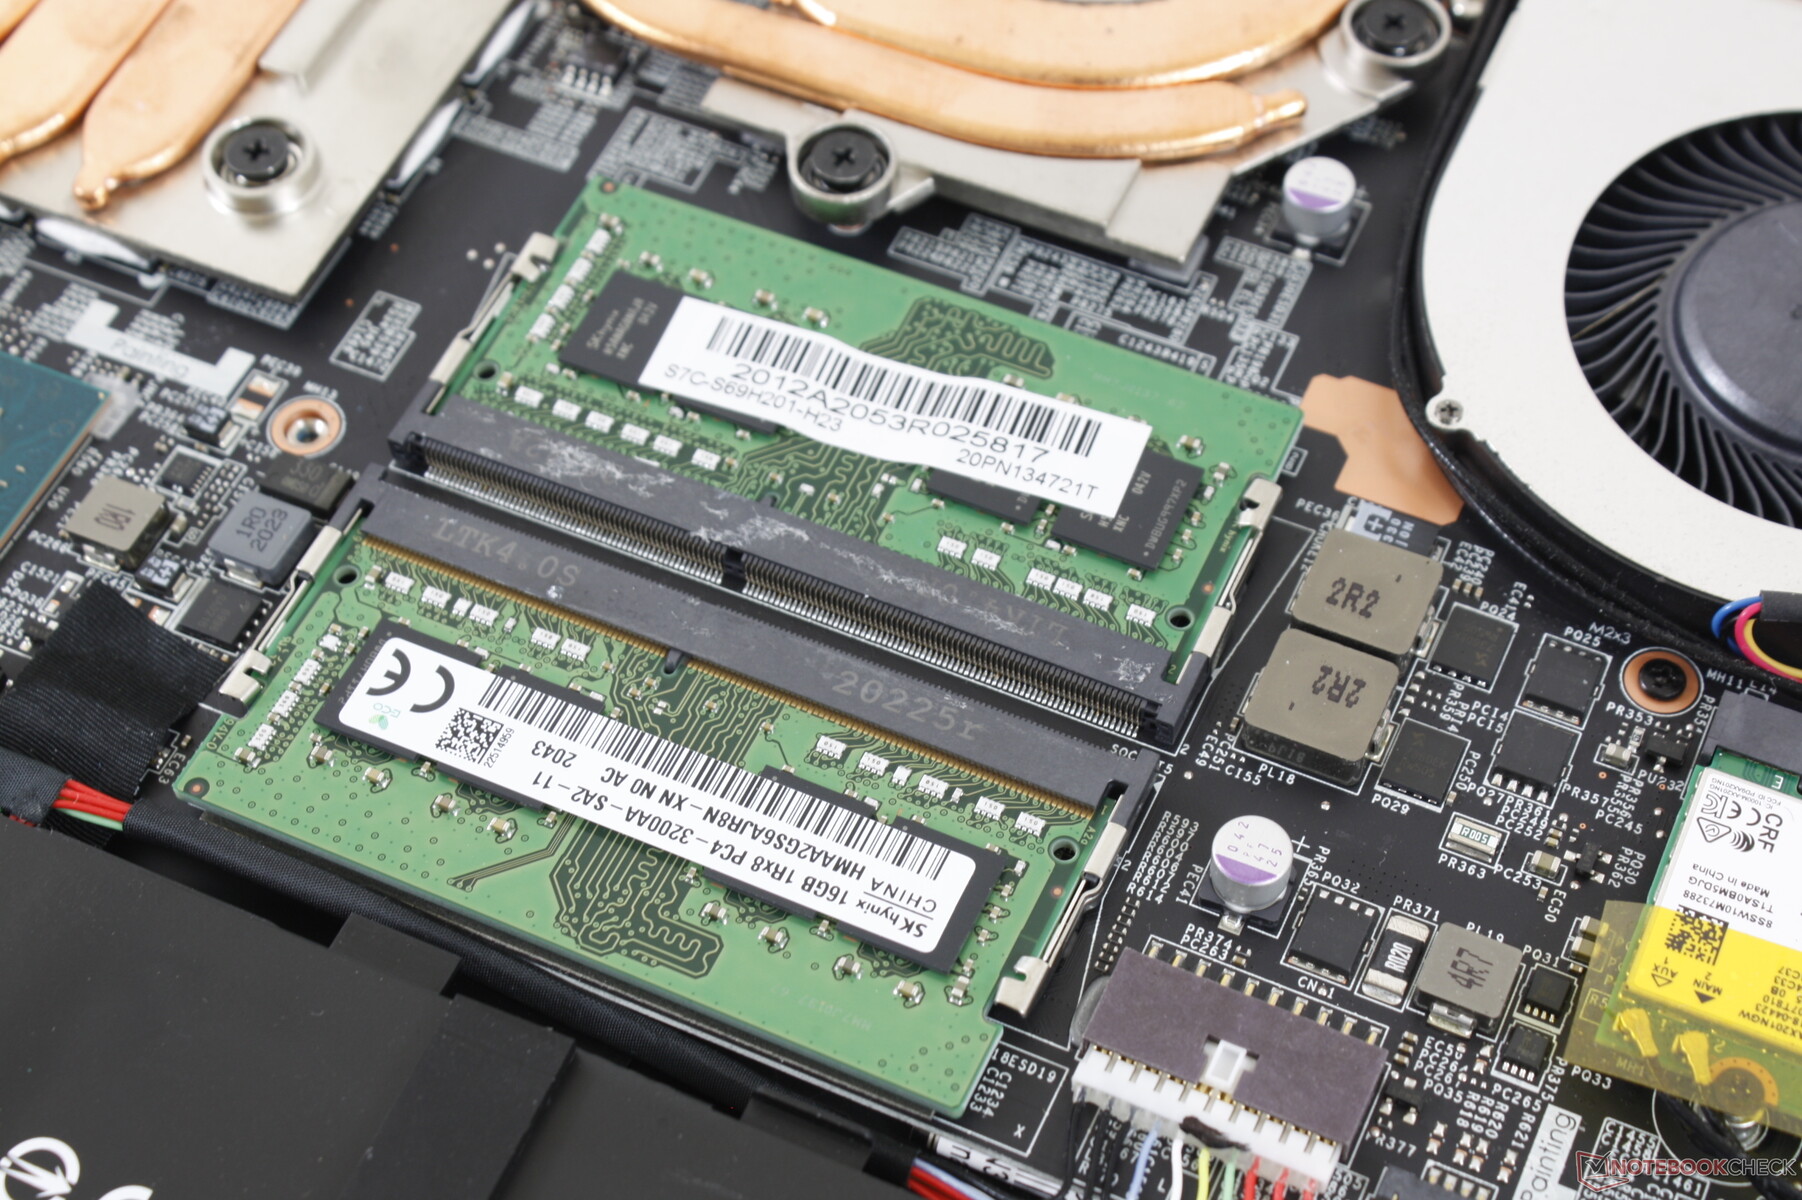
La manutenzione è più difficile che sul GP65 perché il pannello inferiore del GP66 è molto più stretto intorno ai bordi e agli angoli. Un bordo affilato e una mano attenta sono necessari per rimuovere in sicurezza il pannello. Una volta dentro, gli utenti avranno accesso diretto a 2x slot M.2 2280, 2x SODIMM, batteria e modulo WLAN.
Accessori e garanzia
Non ci sono extra nella confezione a parte l'adattatore AC e la documentazione. Il panno di velluto per la pulizia che è incluso con i portatili della serie GS e GT non è incluso qui.
Si applica la garanzia limitata standard di un anno del produttore.
Dispositivi di input
Tastiera
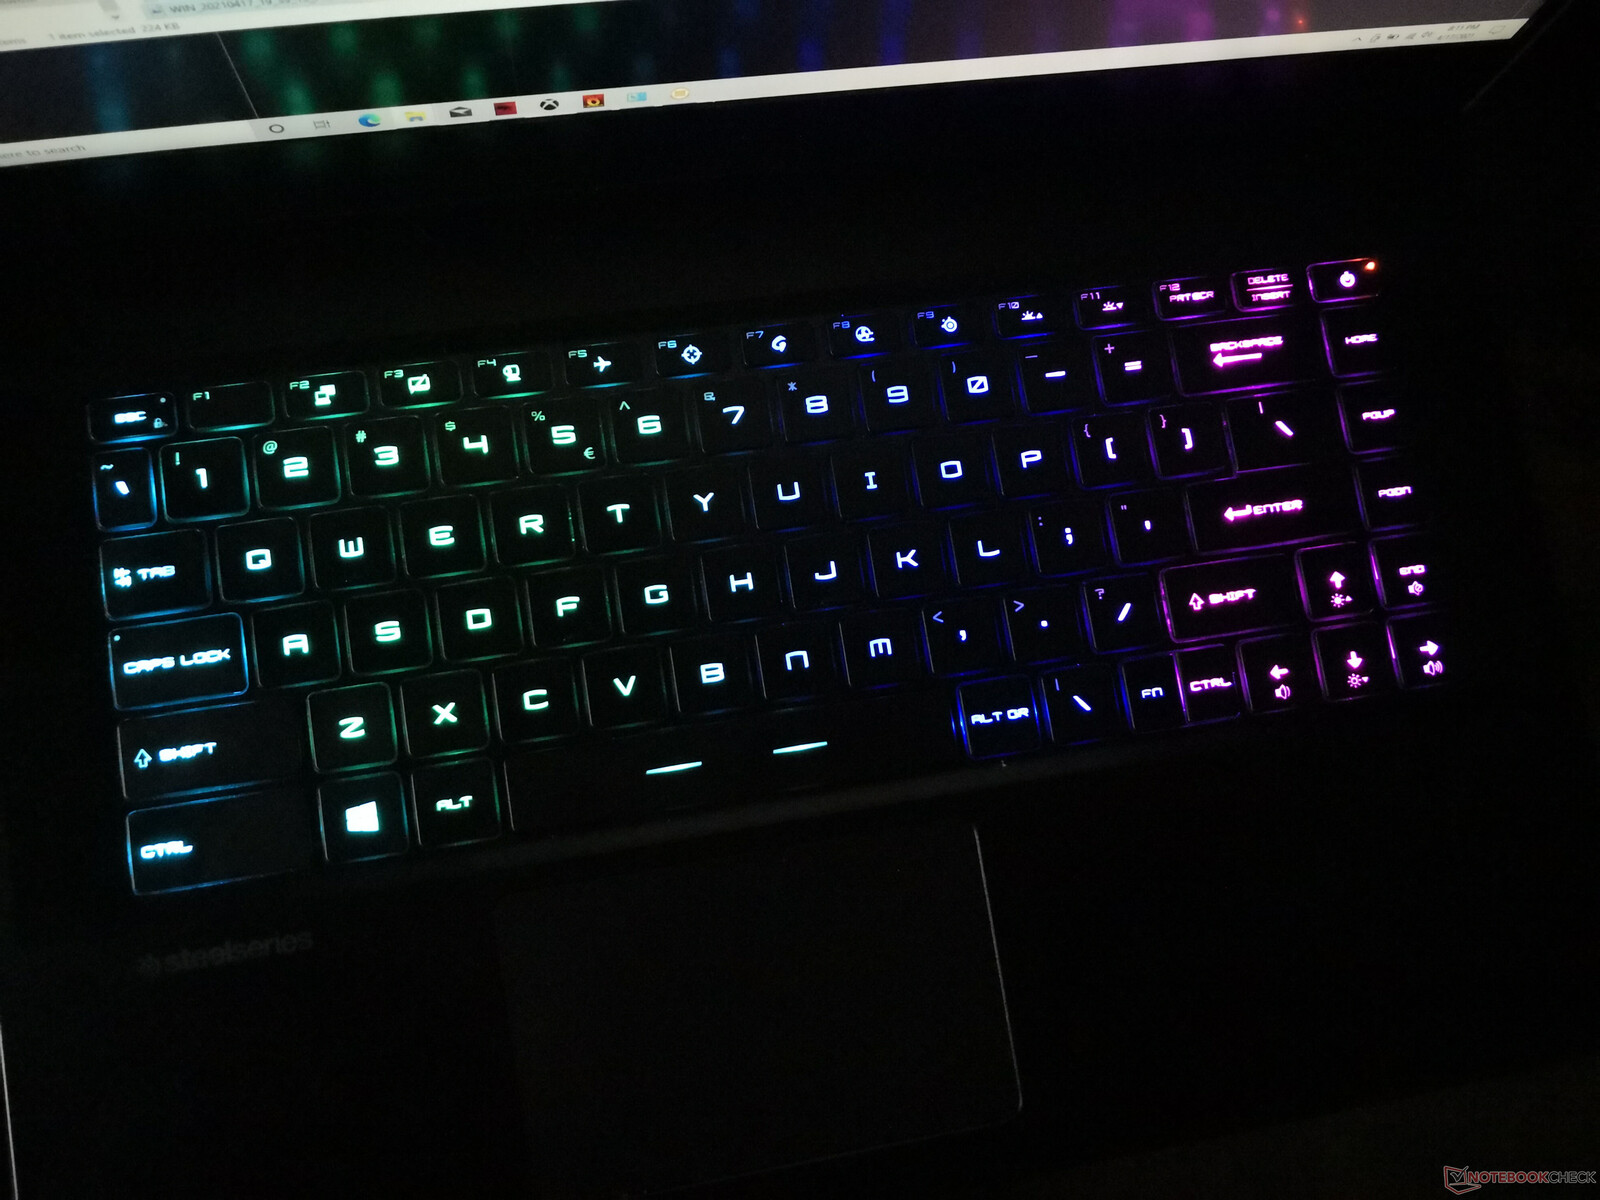
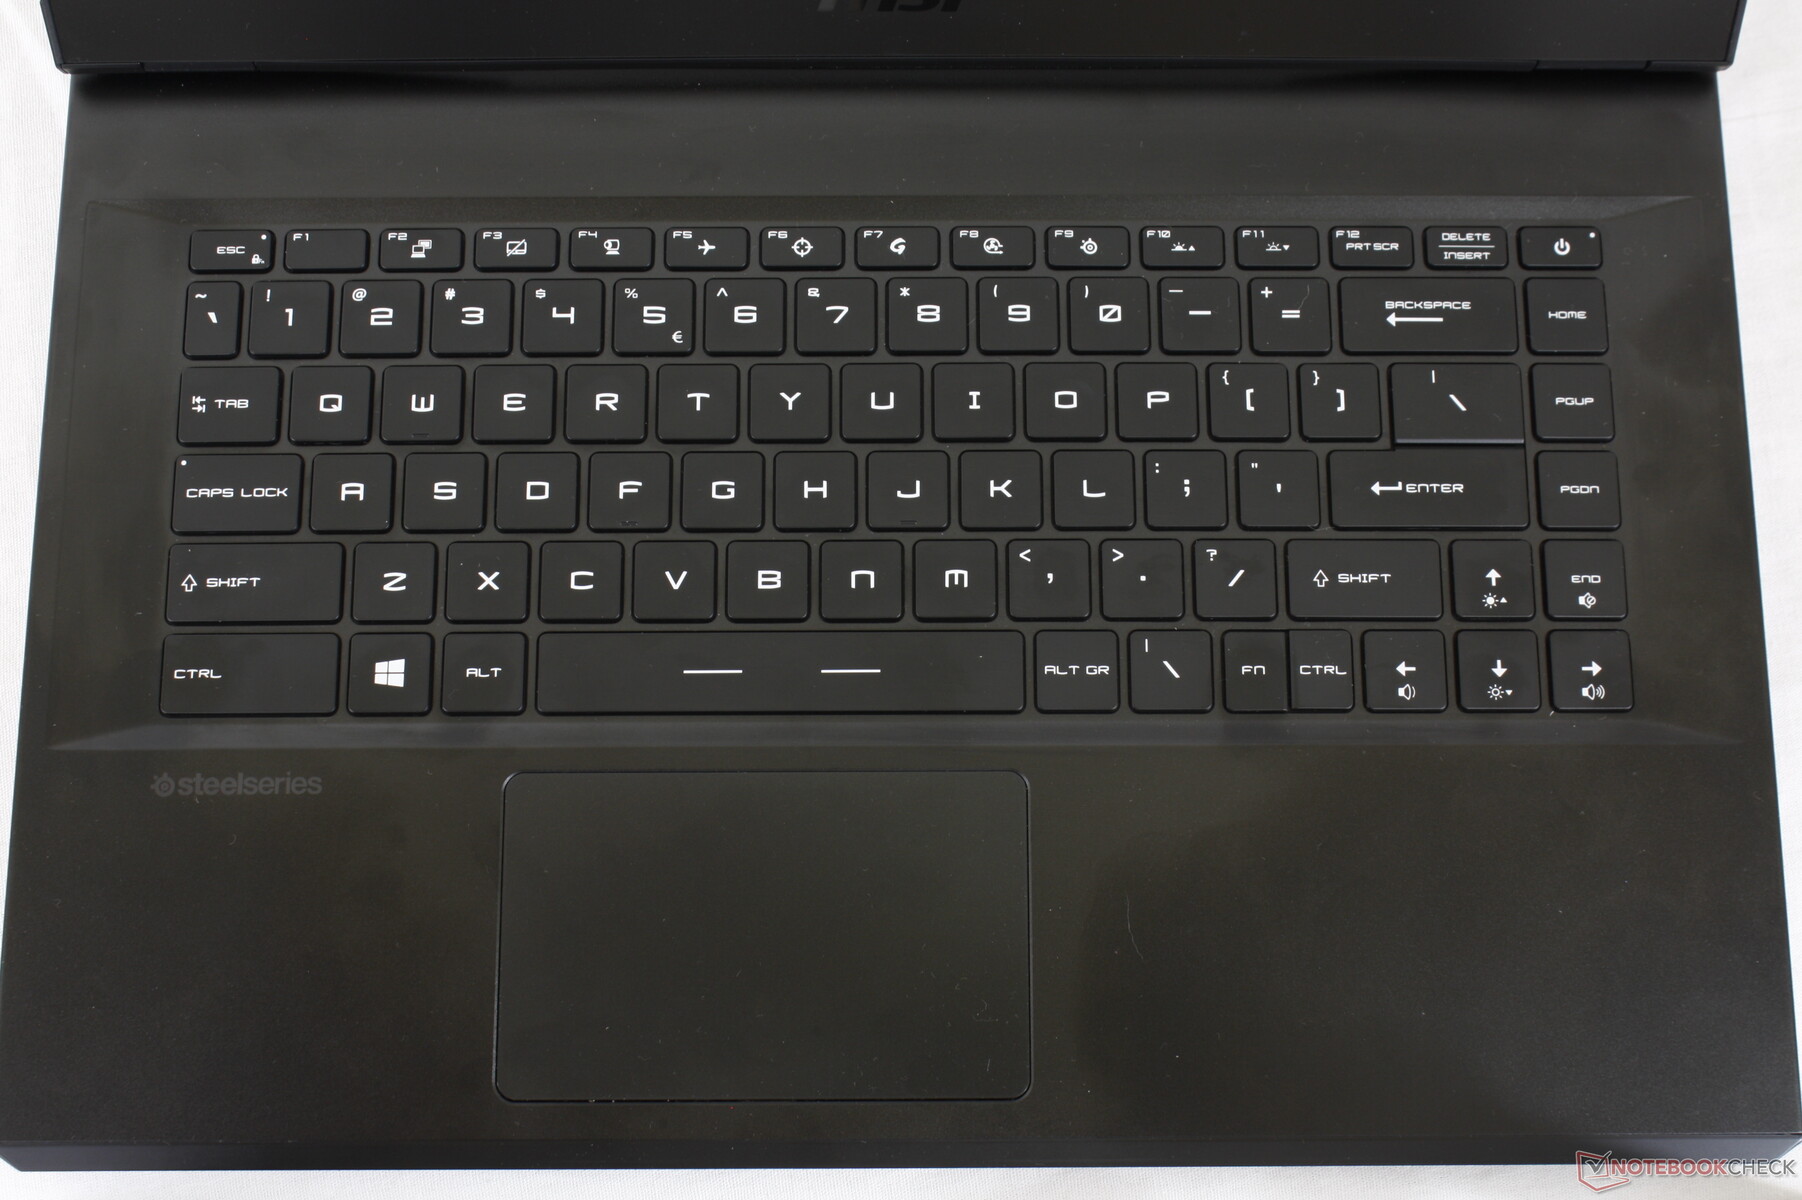
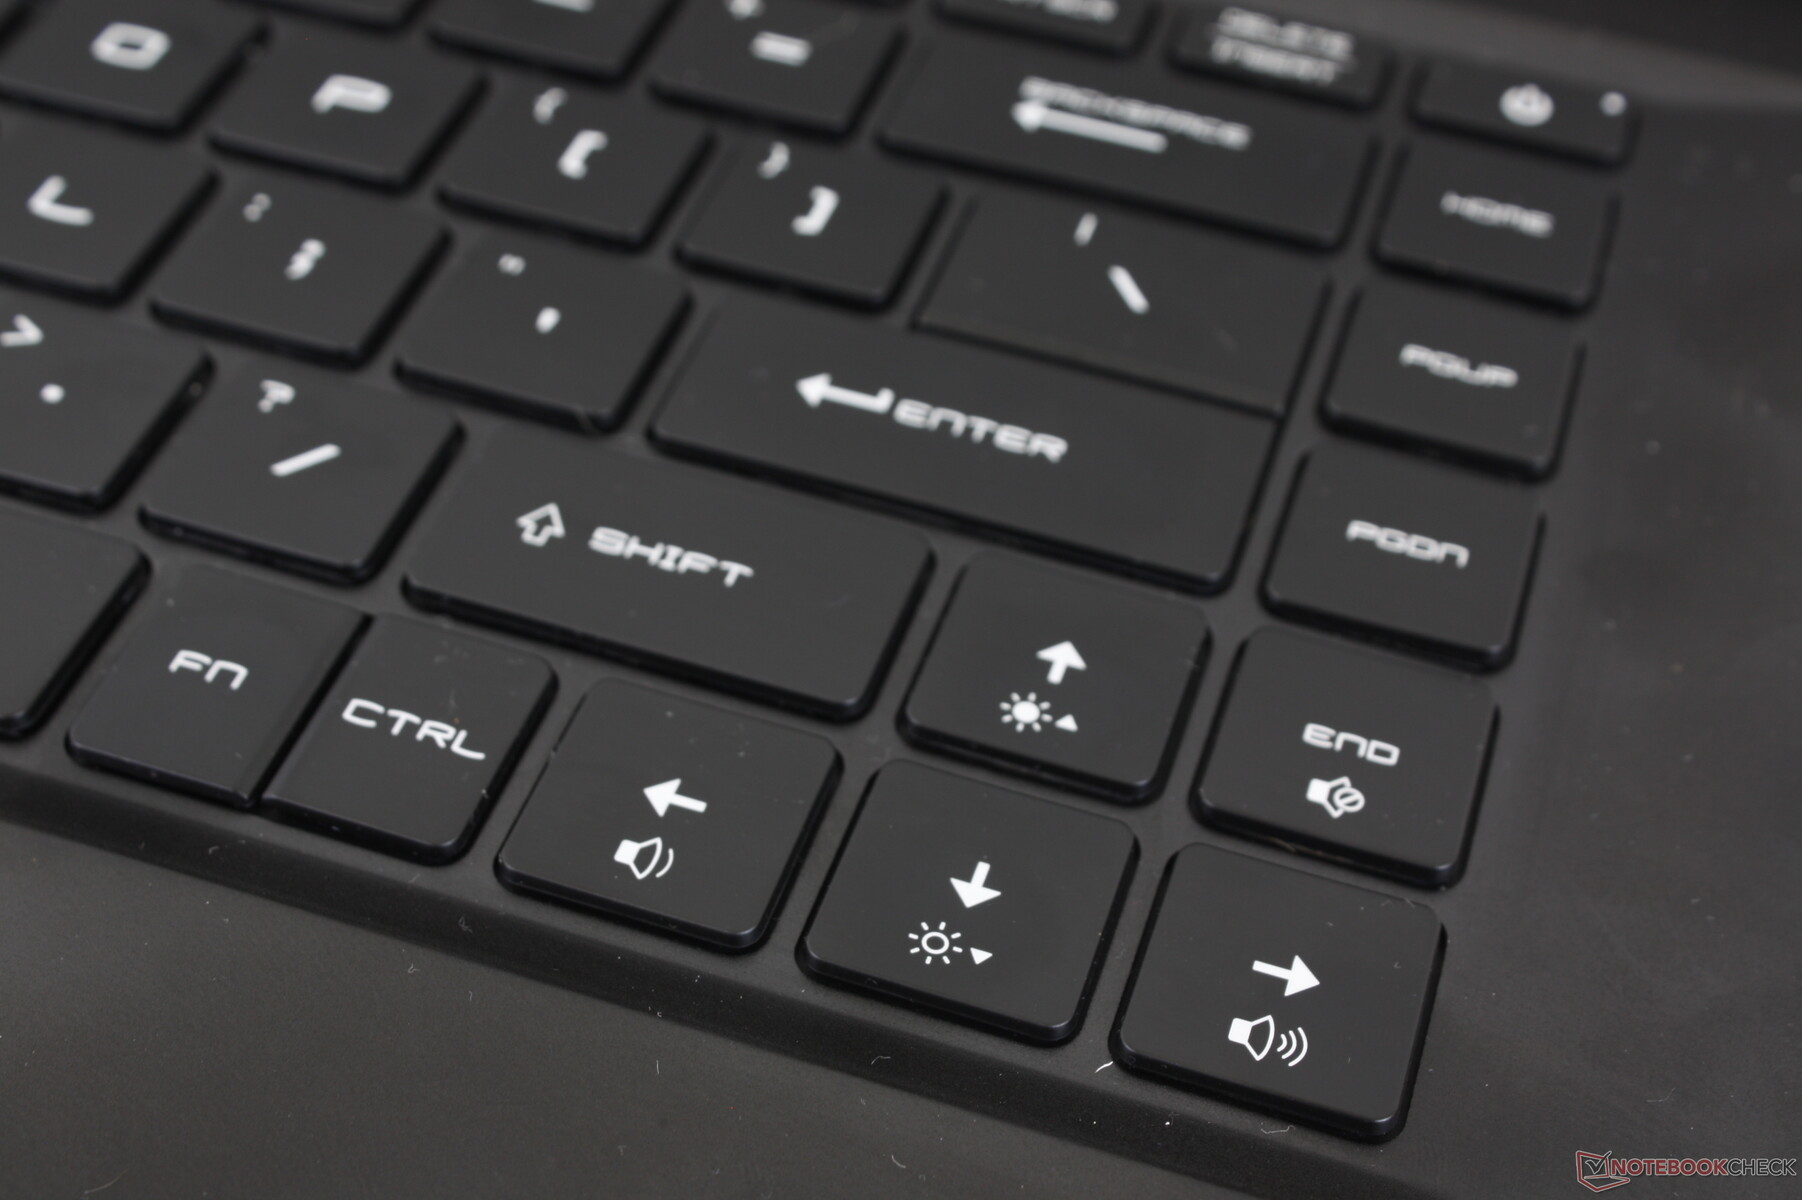
La tastiera è identica a quella del GE66 e molto diverso rispetto al GP65. Il NumPad, per esempio, non c'è più e la corsa sembra più corta con un feedback più nitido in cambio. Il rumore è anche leggermente più forte e più acuto di prima, soprattutto per quanto riguarda i tasti Spazio e Invio.
L'illuminazione RGB per tasto ritorna. L'illuminazione potrebbe essere più uniforme, tuttavia, poiché i simboli dei tasti secondari (cioè, !, @, #, ecc.) non brillano come i simboli principali (1, 2, 3, ecc.).
Touchpad
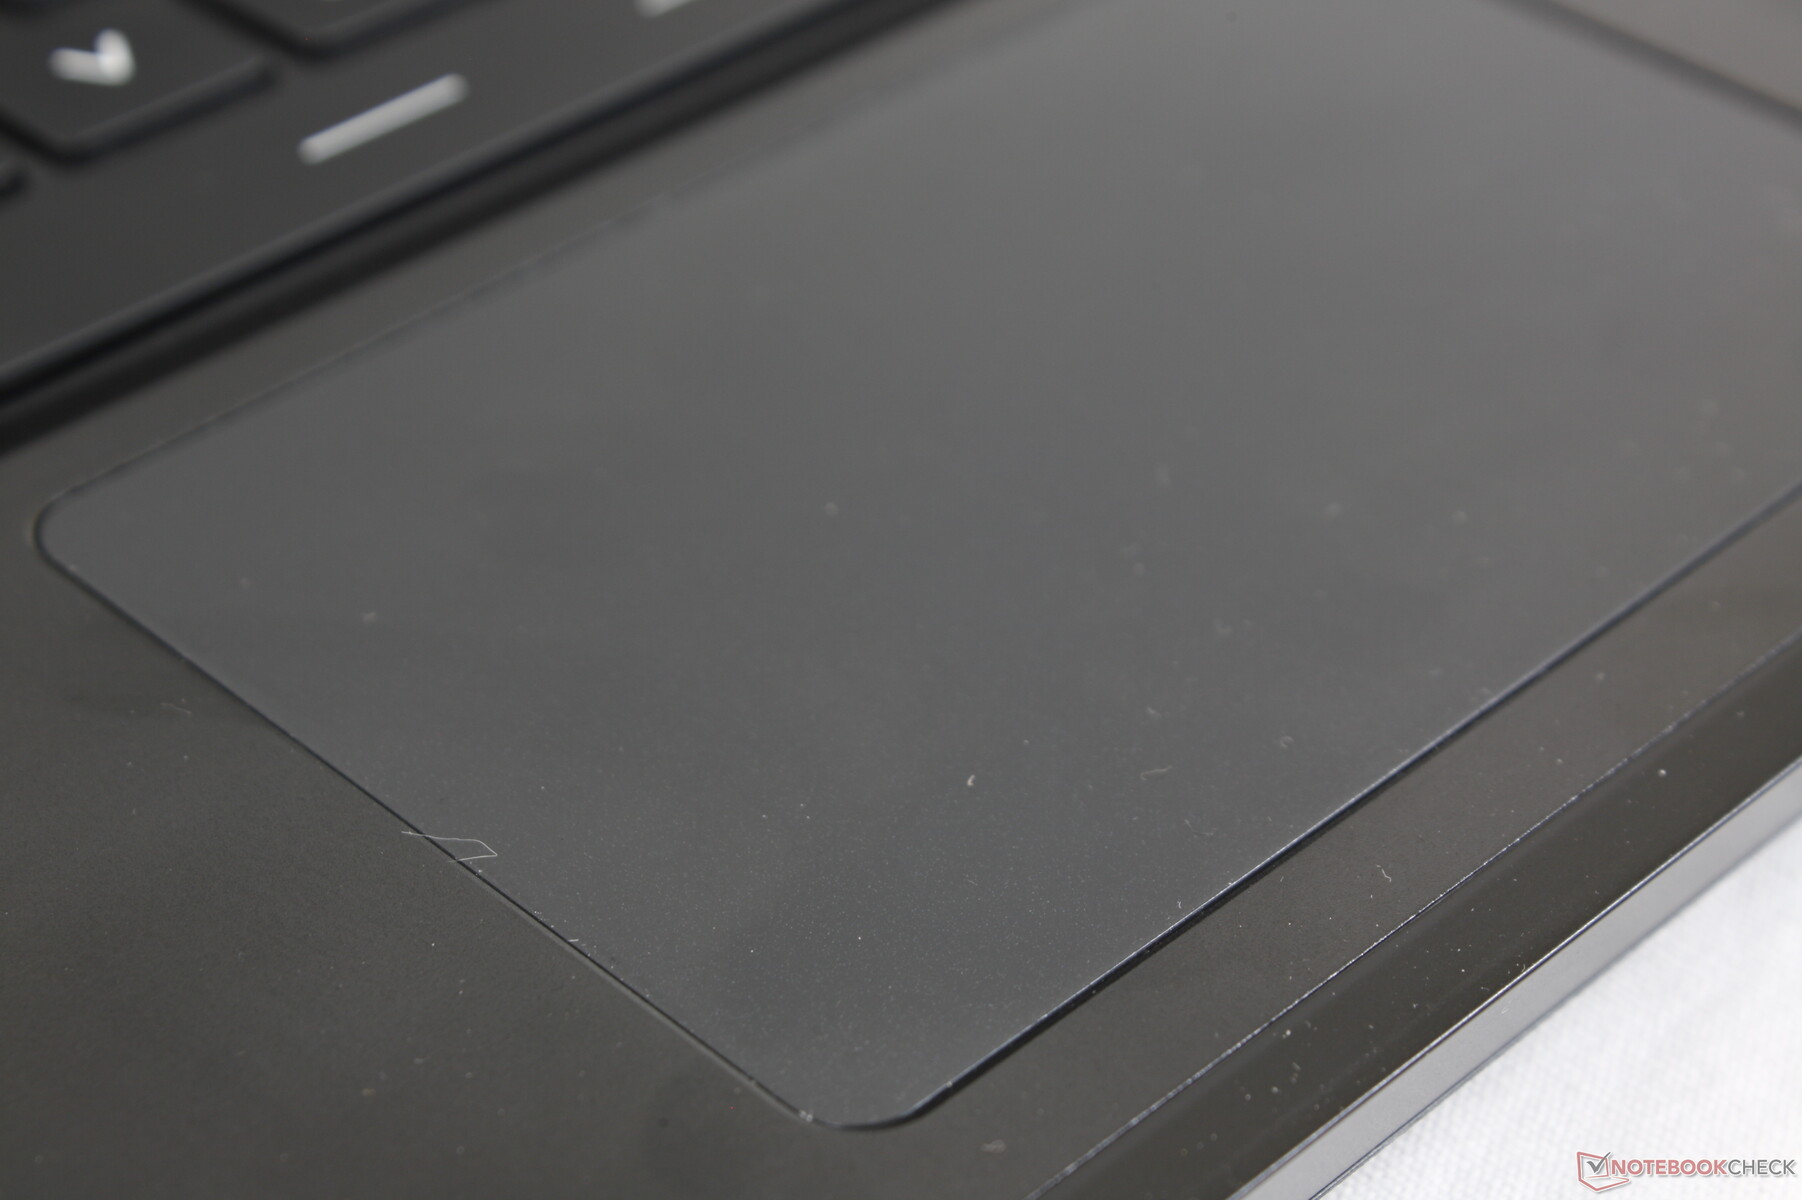
Il clickpad di plastica è relativamente piccolo (10,5 x 6,5 cm) con uno scorrimento fluido a velocità medio-alte e appena un po' appiccicoso a velocità più basseper click più precisi. I suoi tasti integrati sono spugnosi e richiedono più forza del solito per registrarsi, il che può diventare stancante se non avete un mouse esterno. Anche se il nuovo clickpad è utile, ci mancano i pulsanti del mouse dedicati e il clickpad più solido del vecchio GP65.

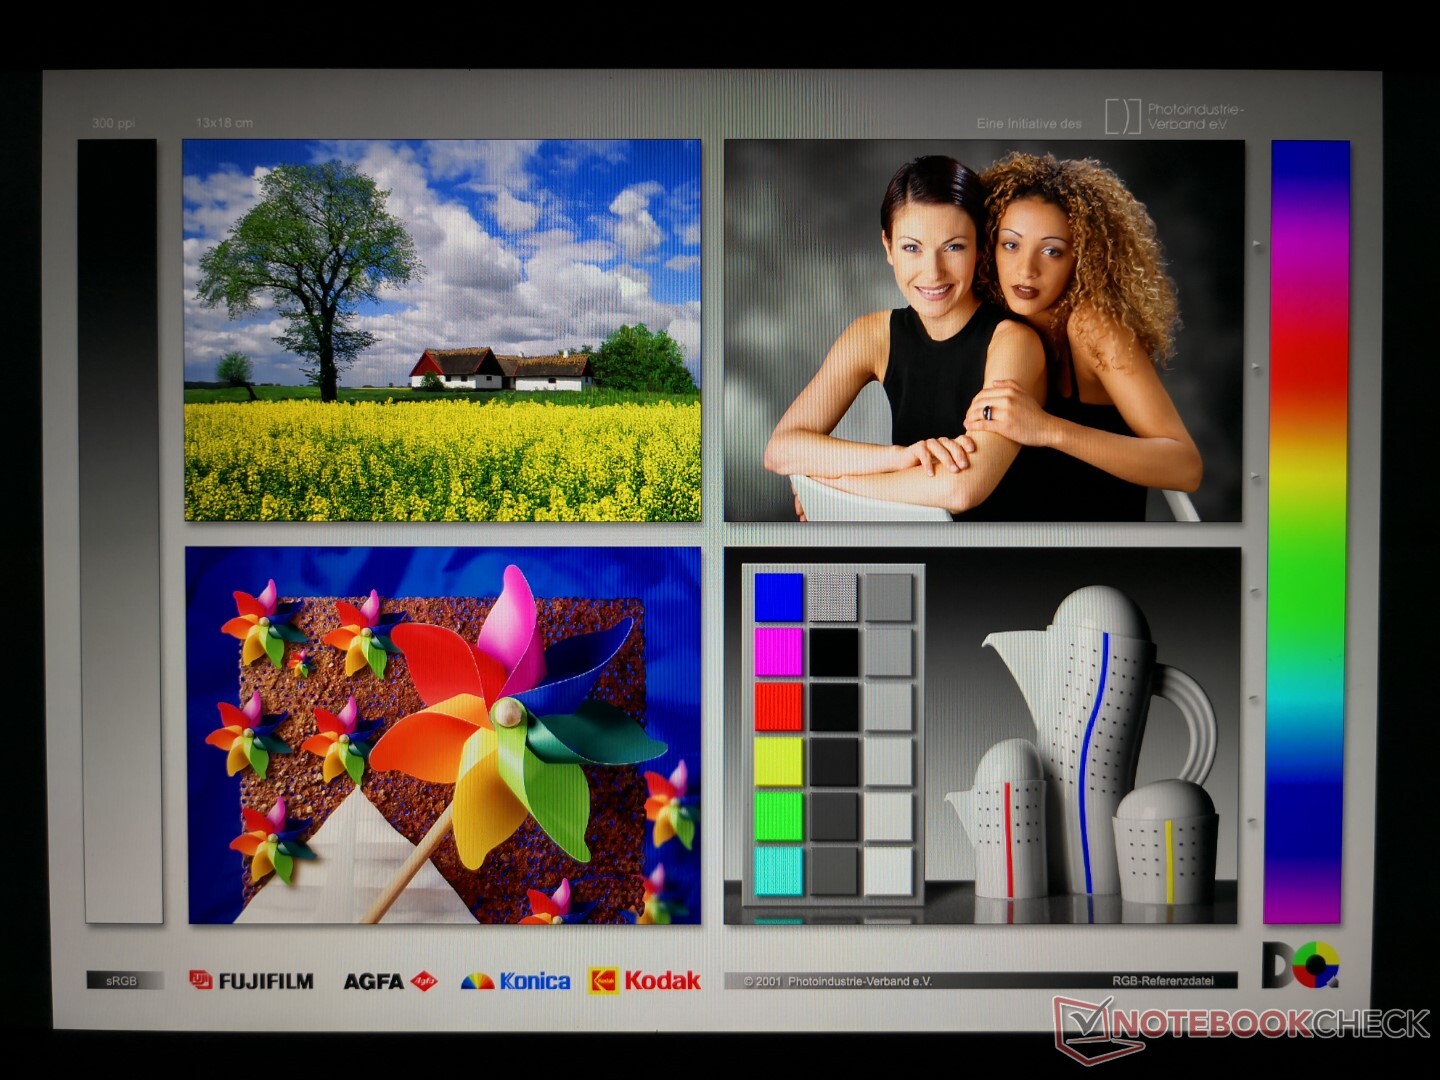
Display
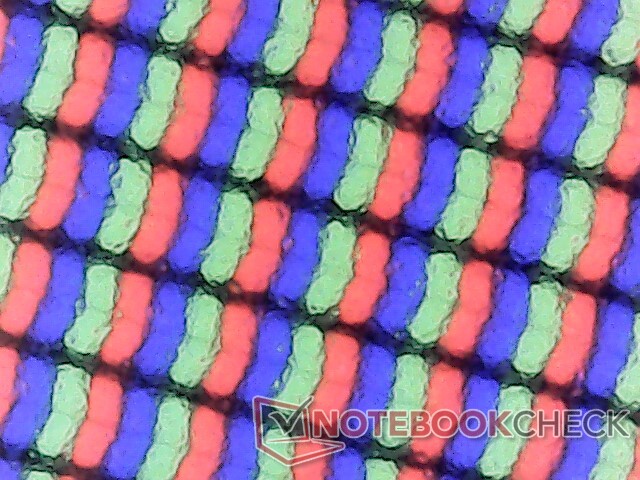
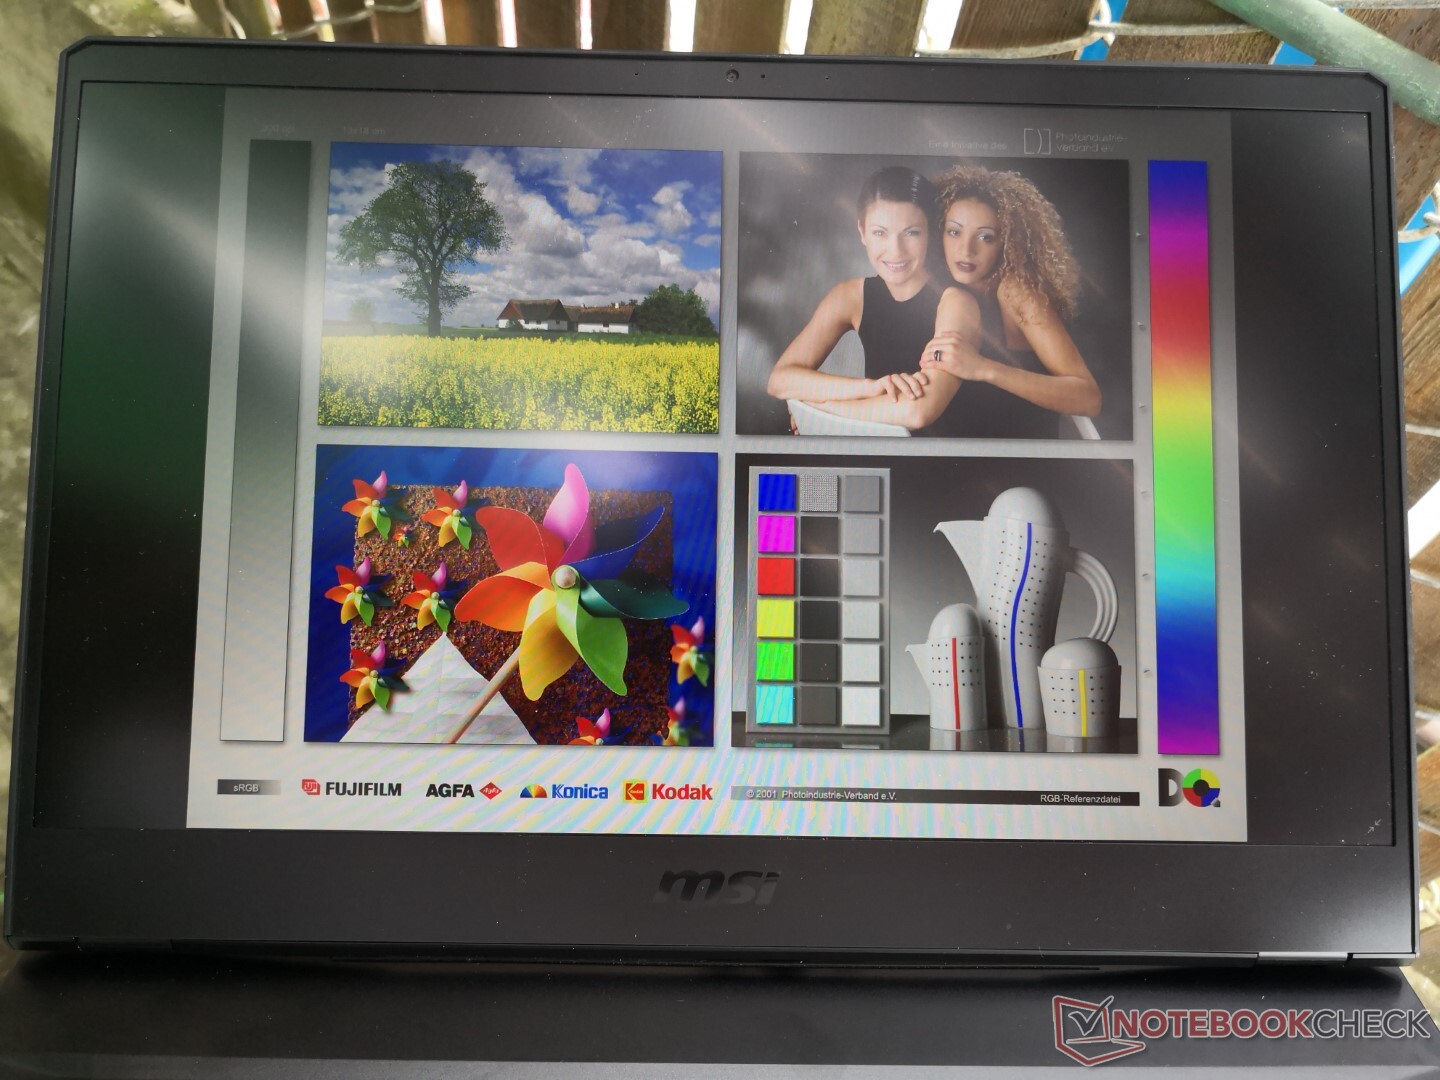
La nostra configurazione GP66 10UG usa lo stesso pannello Sharp LQ156M1JW03 da 240 Hz che si trova sul GE66 10SFS, GS65 Stealth 9SG, Razer Blade 15, e Aorus 15P XC. Colori, contrasto e tempi di risposta sono quindi simili tra tutti questi portatili, il che è una buona cosa dato che molti di questi modelli sono sistemi gaming di fascia alta.
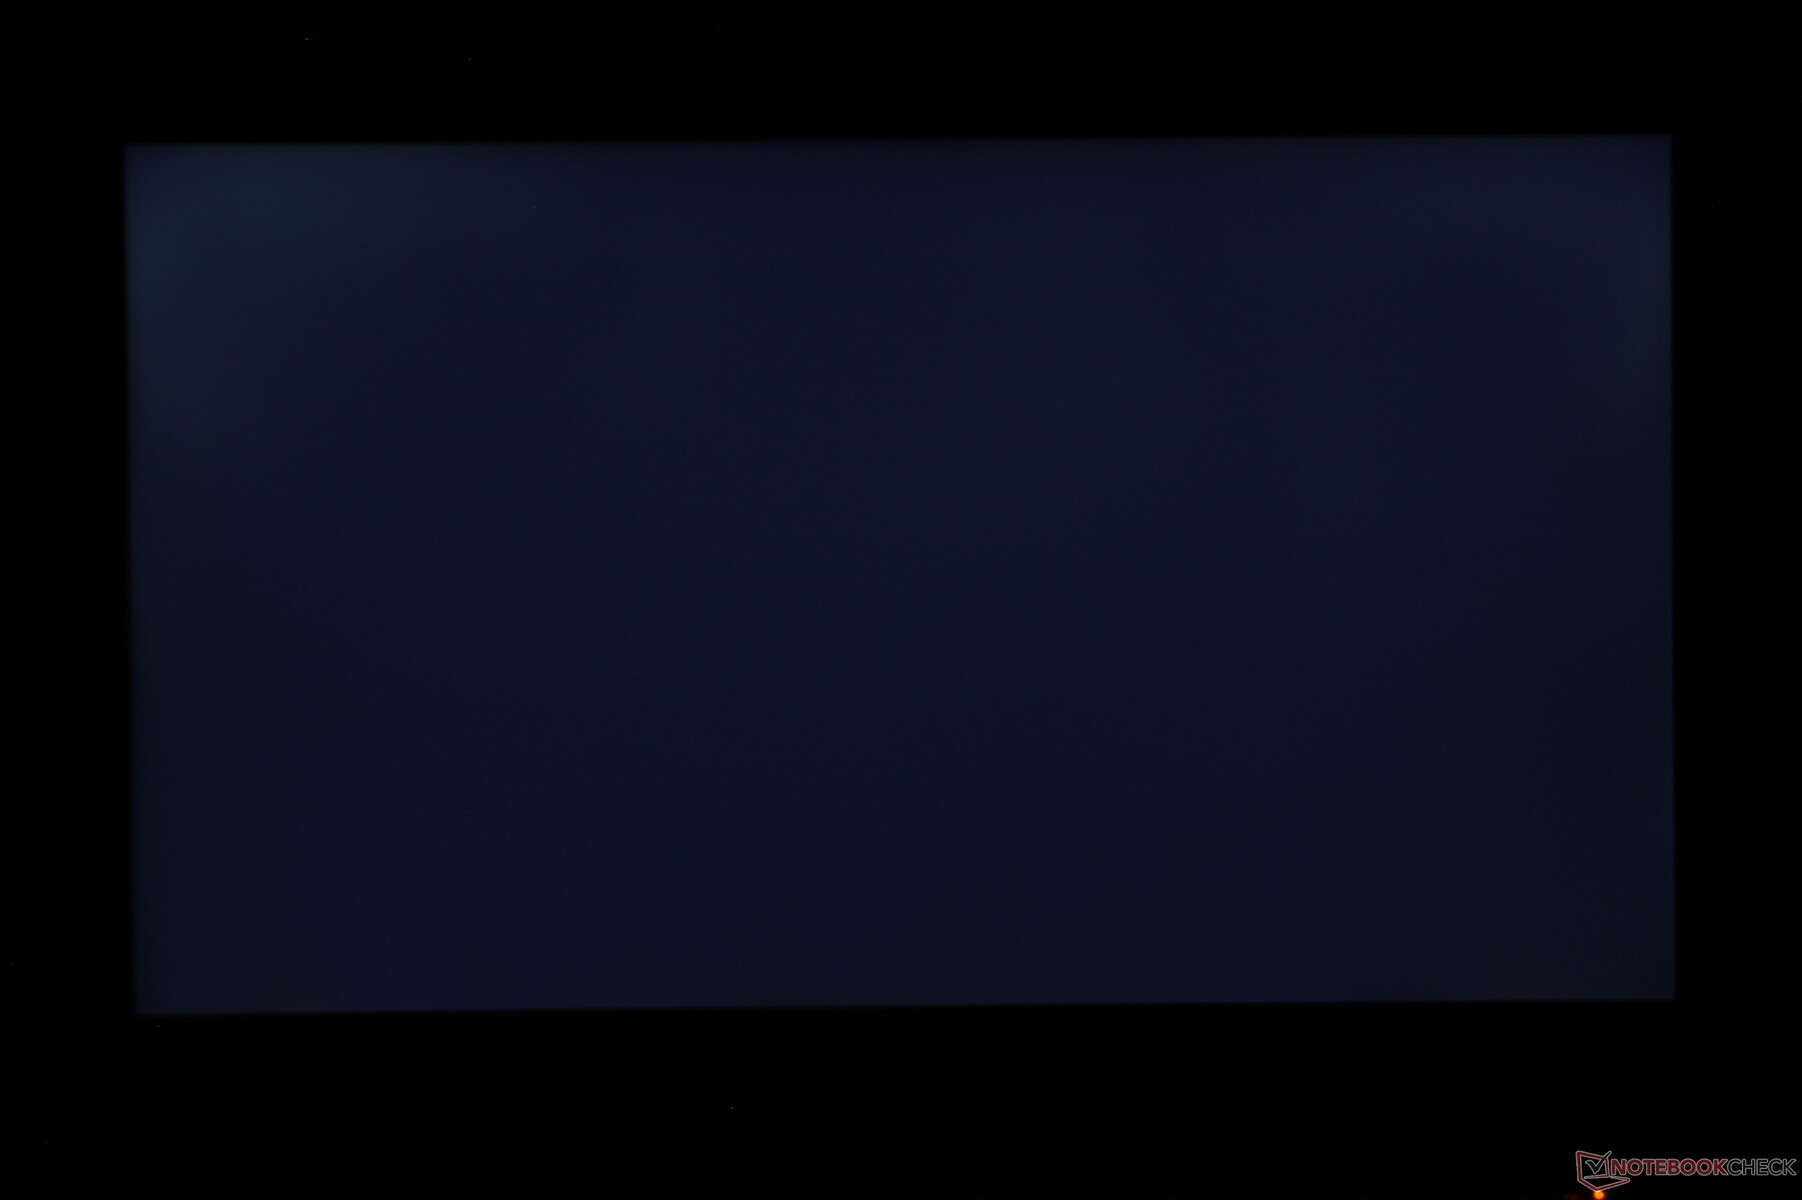
Una differenza chiave sul display del GP66 rispetto ai portatili menzionati sopra è che è notevolmente più debole. La luminosità massima è di circa 210 nits mentre la maggior parte degli altri portatili gaming sono 300 nits o più luminosi.
| |||||||||||||||||||||||||
Distribuzione della luminosità: 83 %
Al centro con la batteria: 225.9 cd/m²
Contrasto: 982:1 (Nero: 0.23 cd/m²)
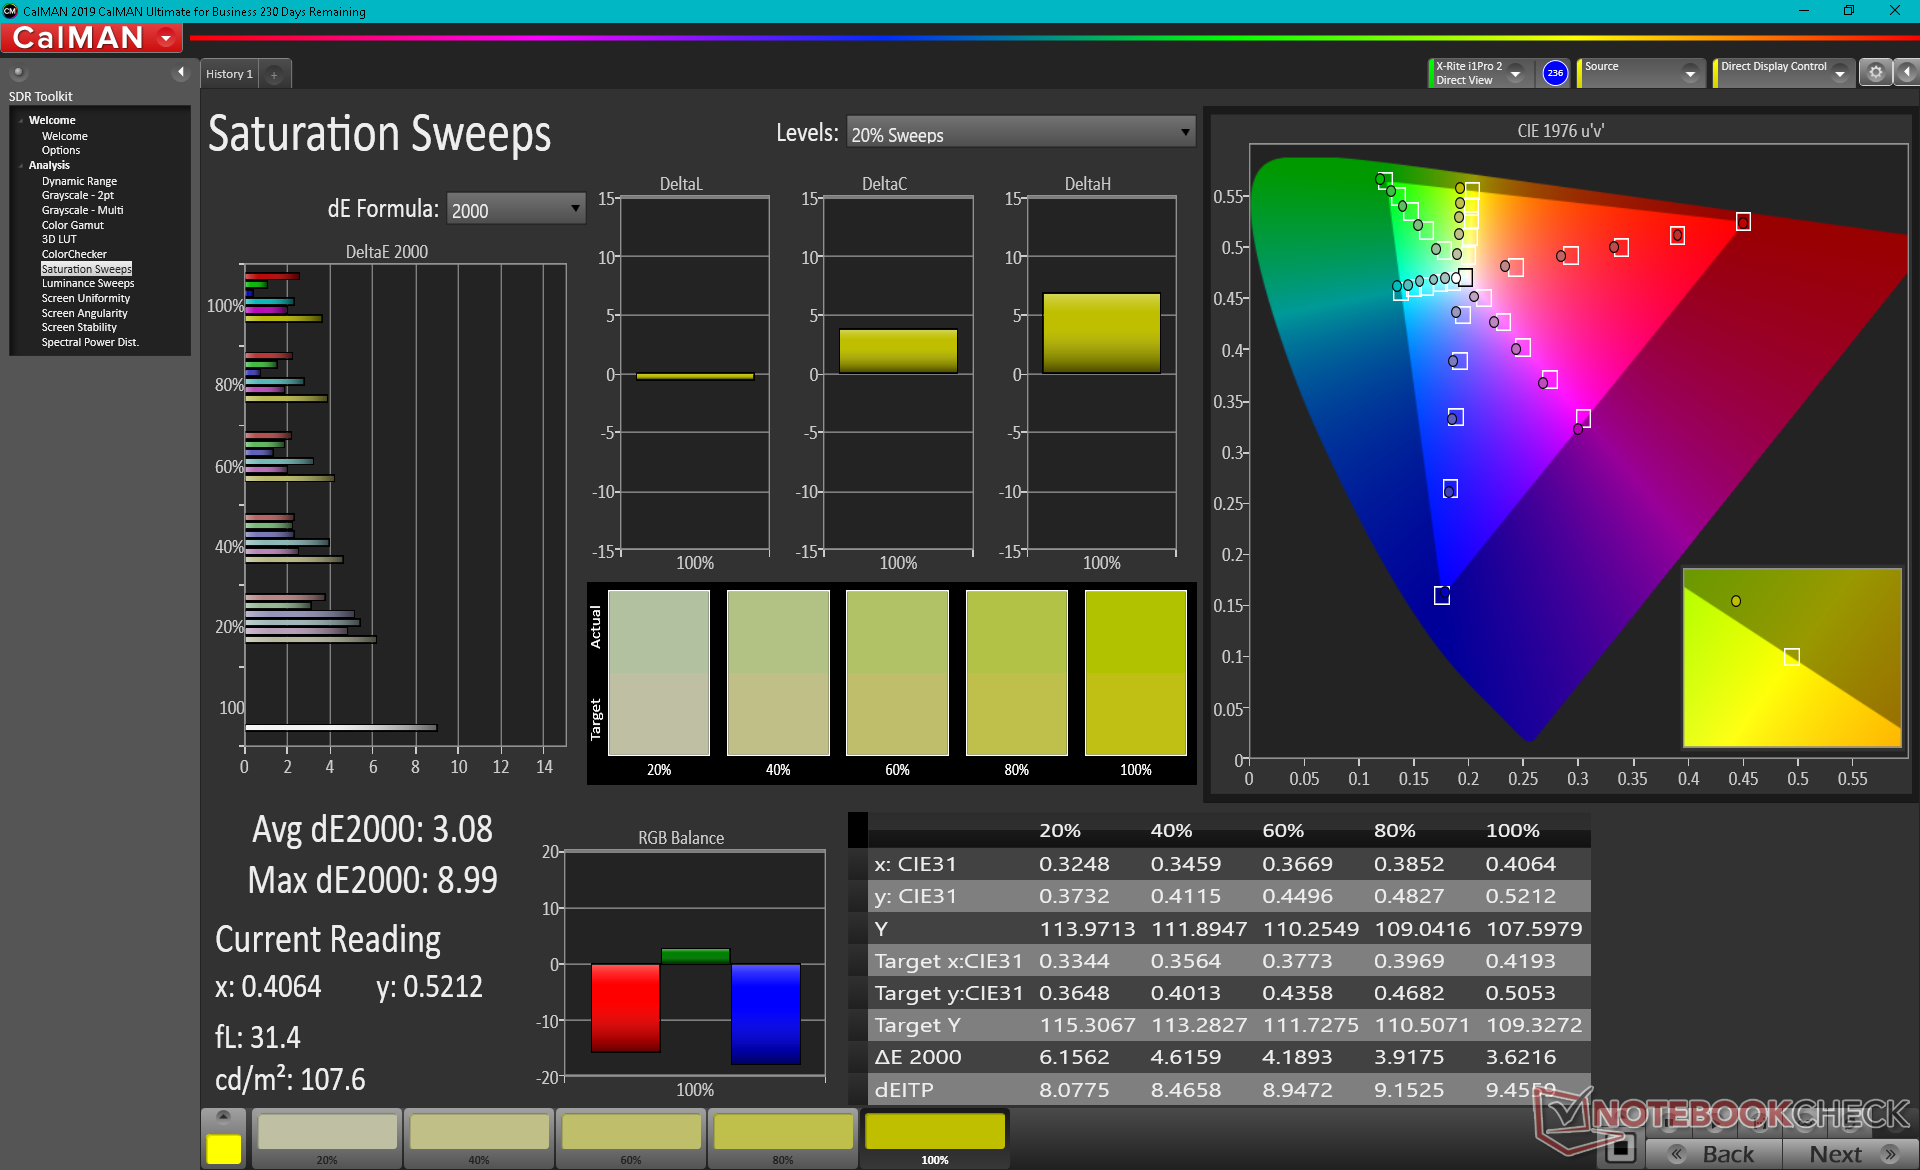
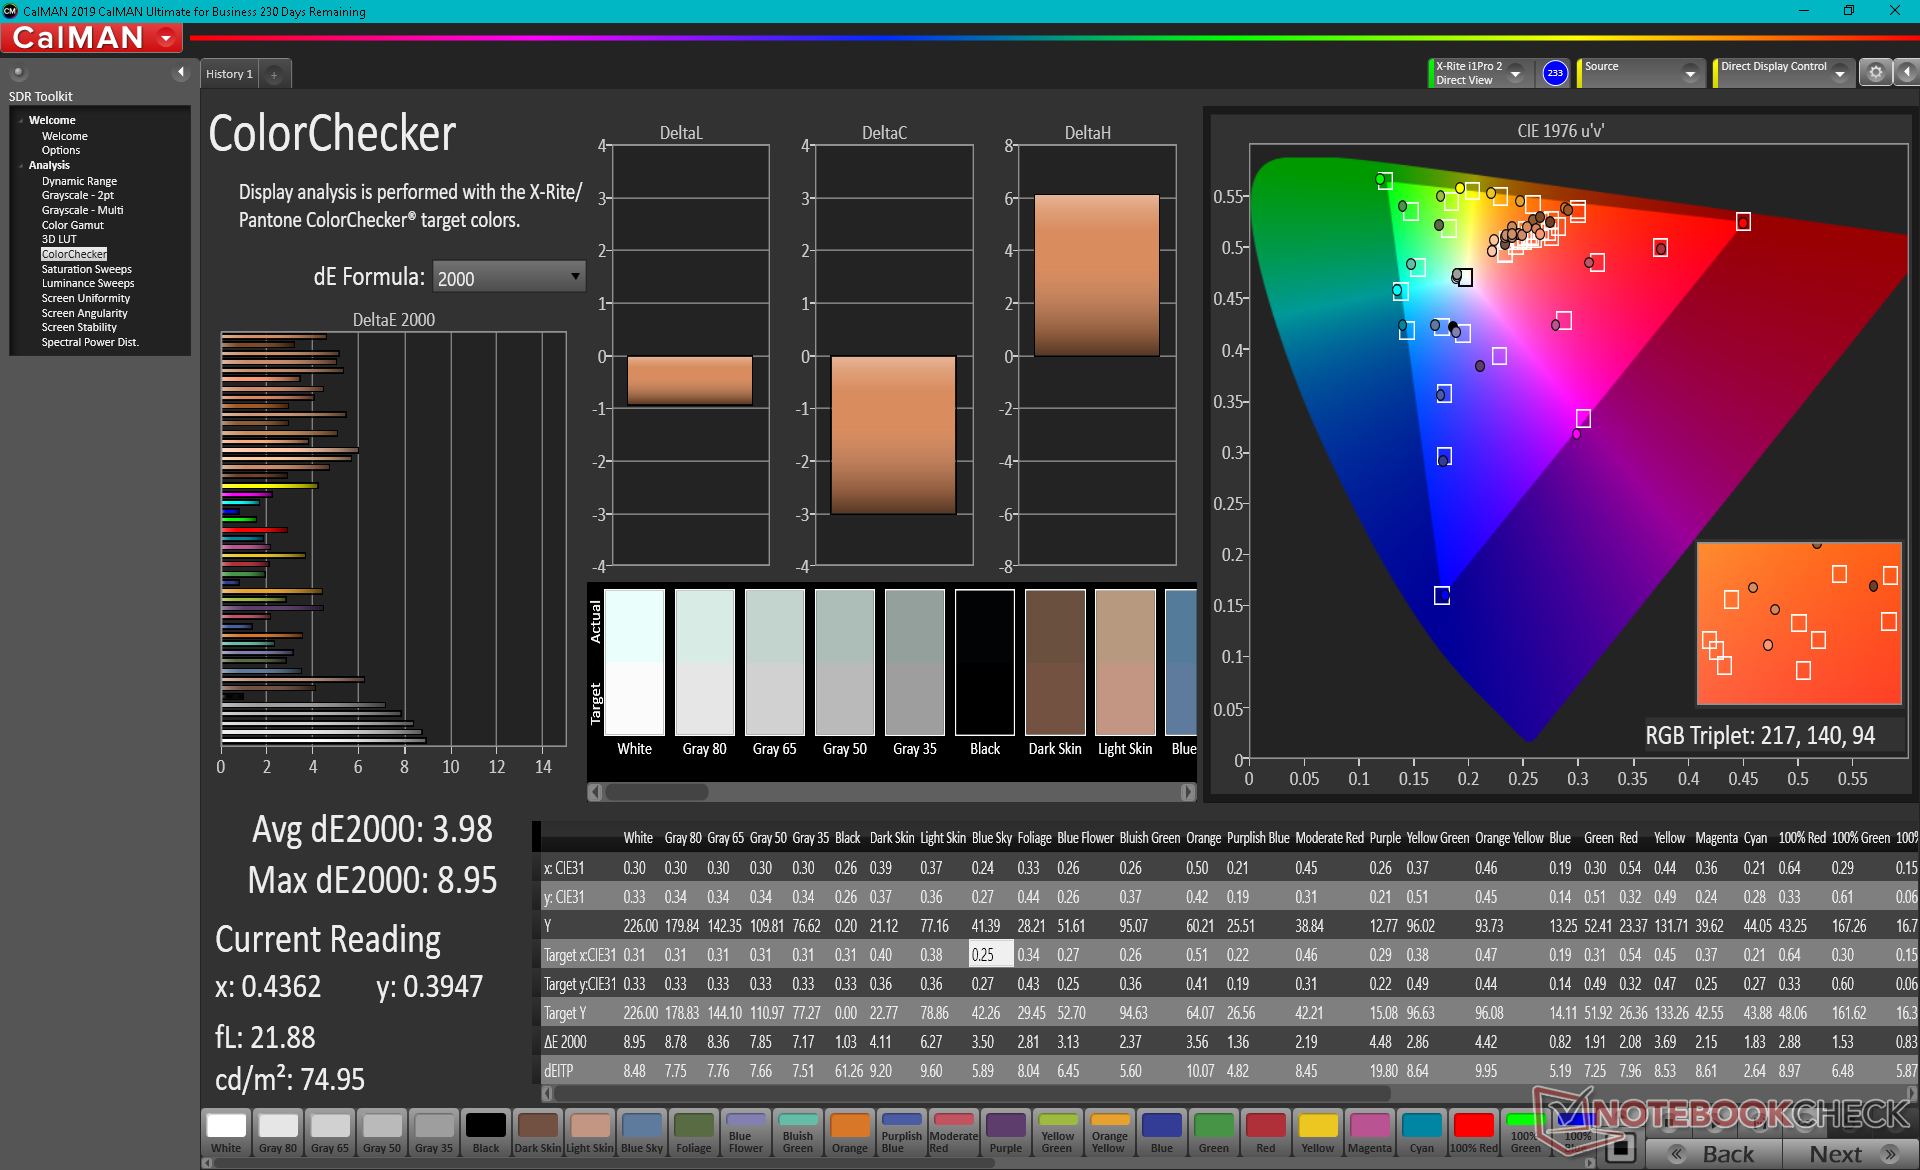
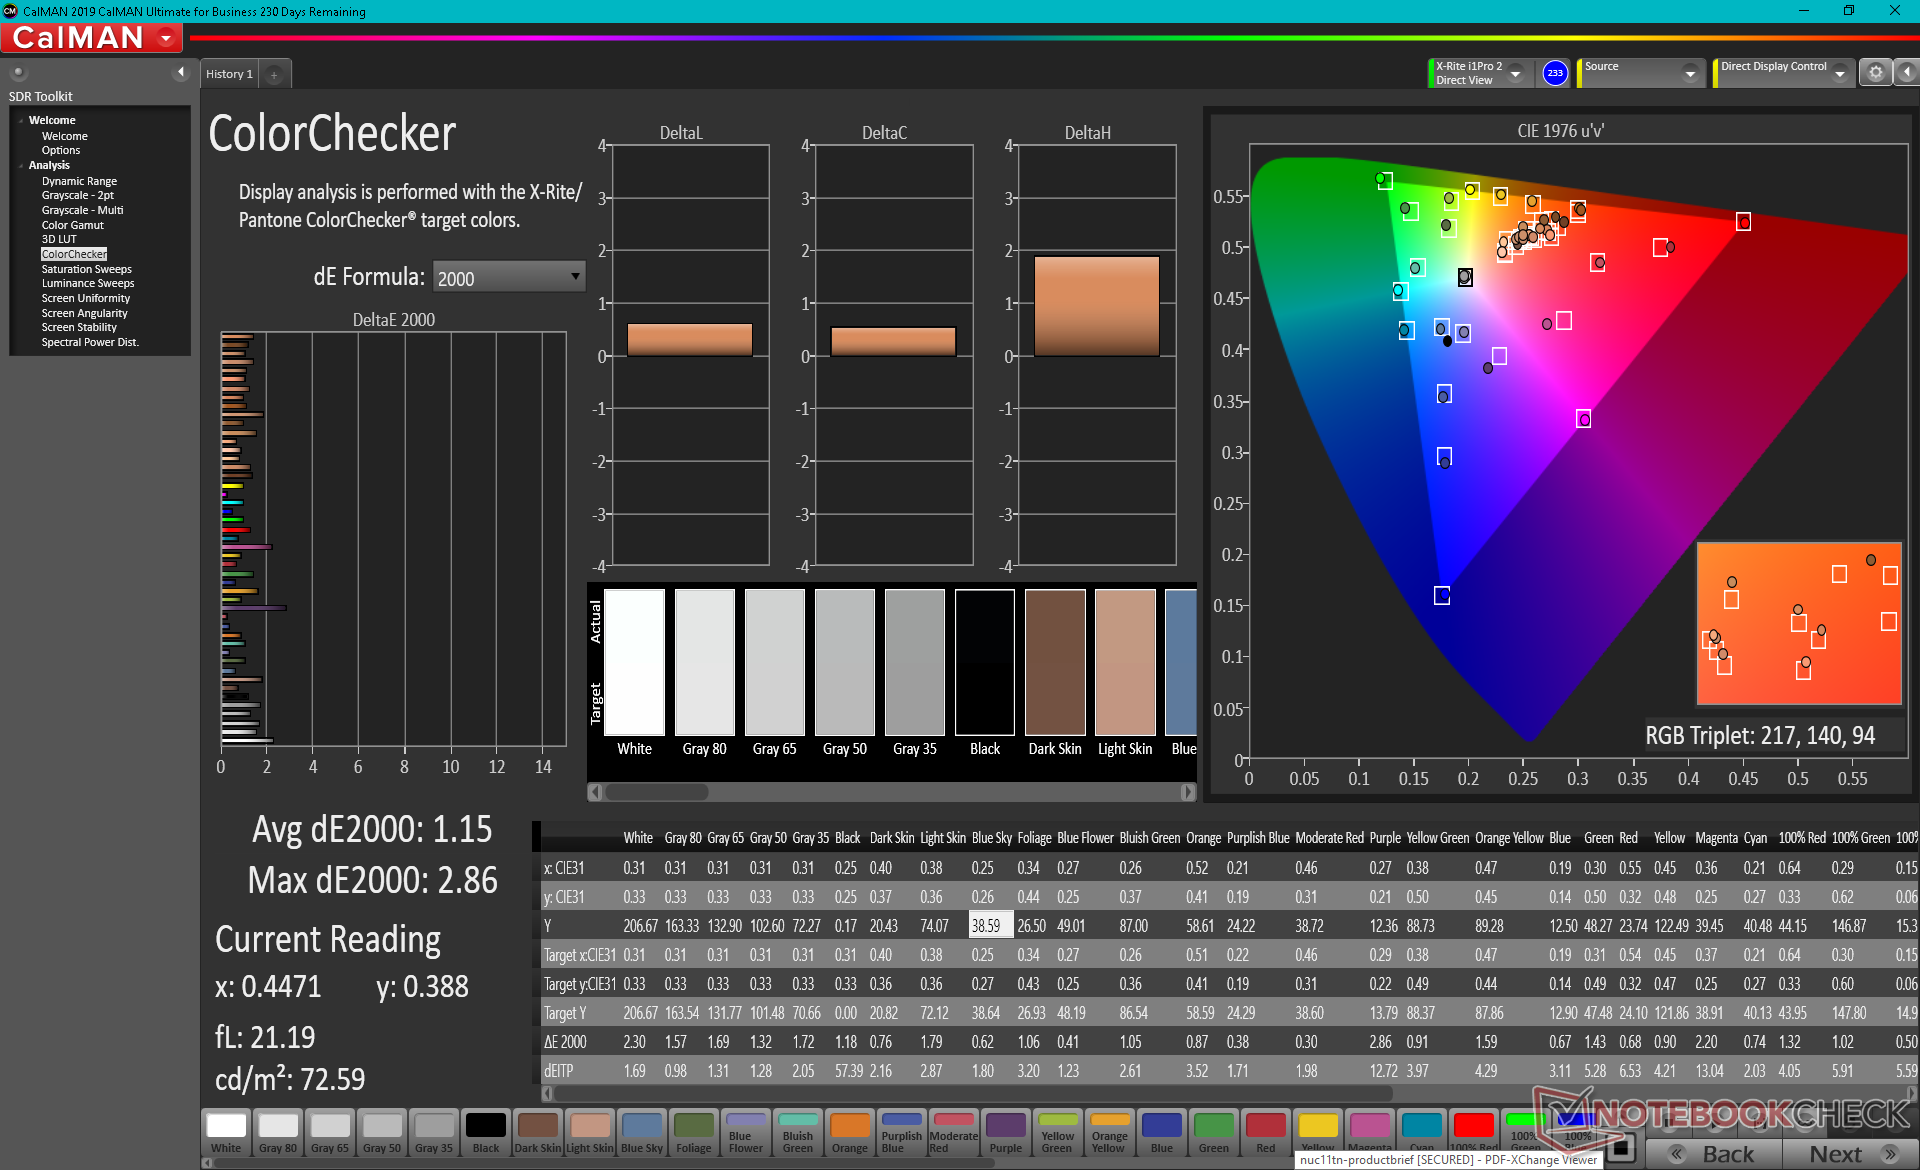
ΔE ColorChecker Calman: 3.98 | ∀{0.5-29.43 Ø4.71}
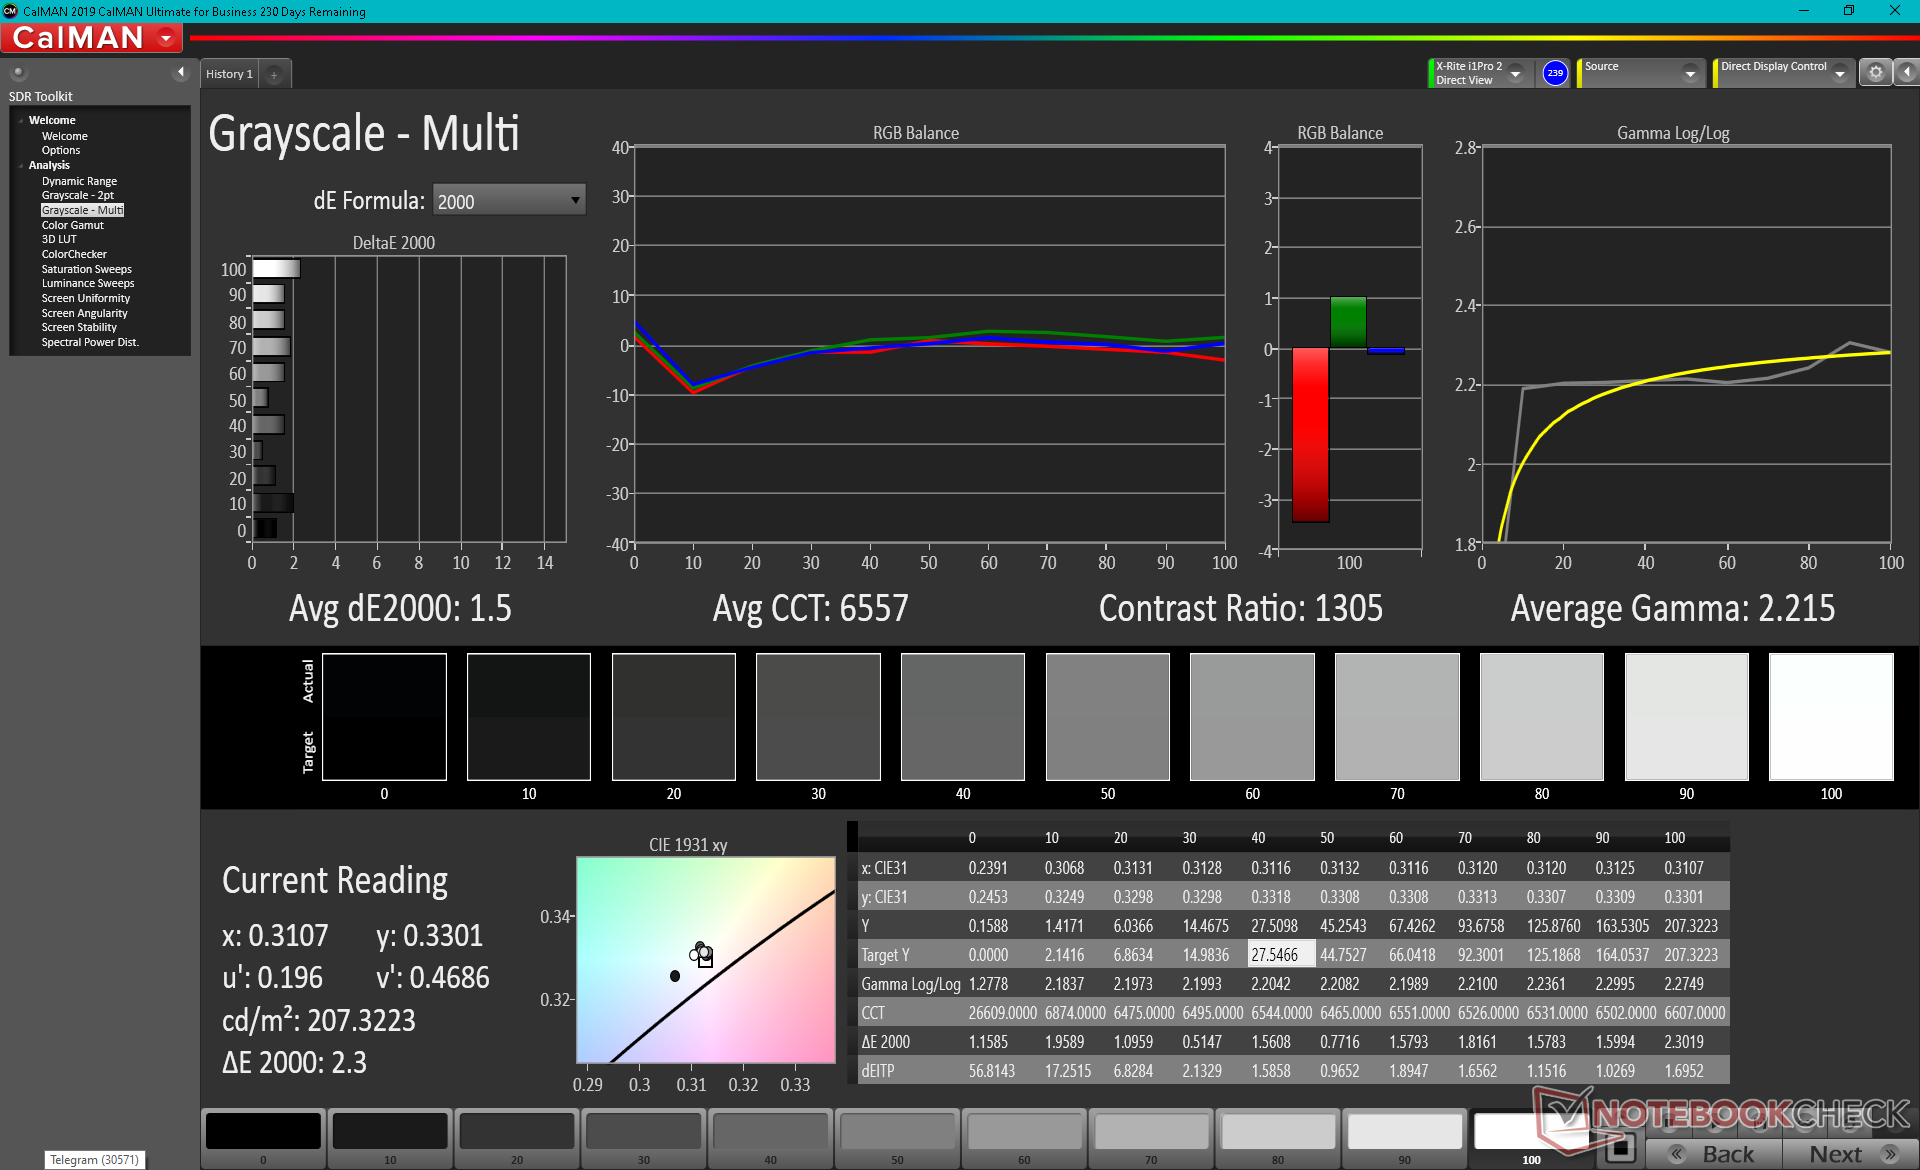
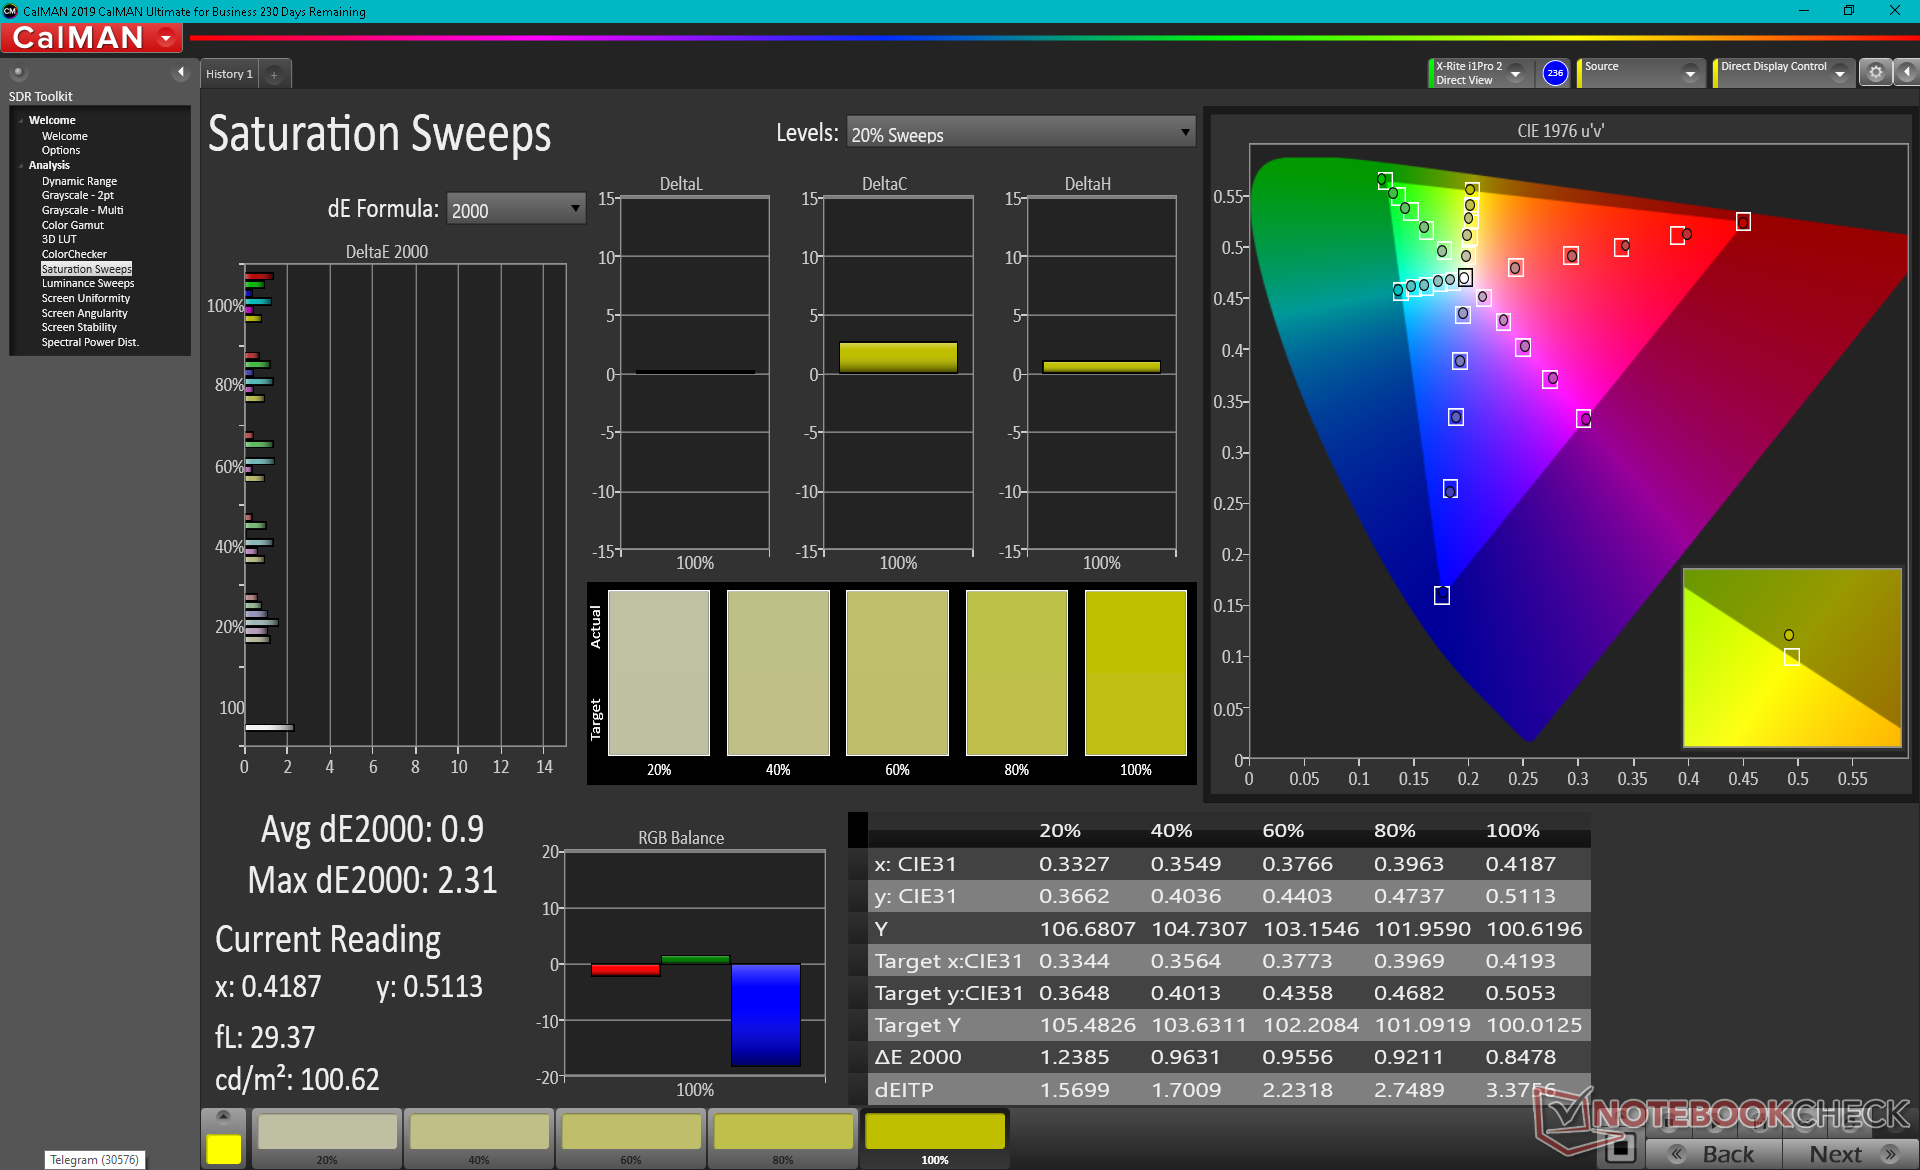
calibrated: 1.15
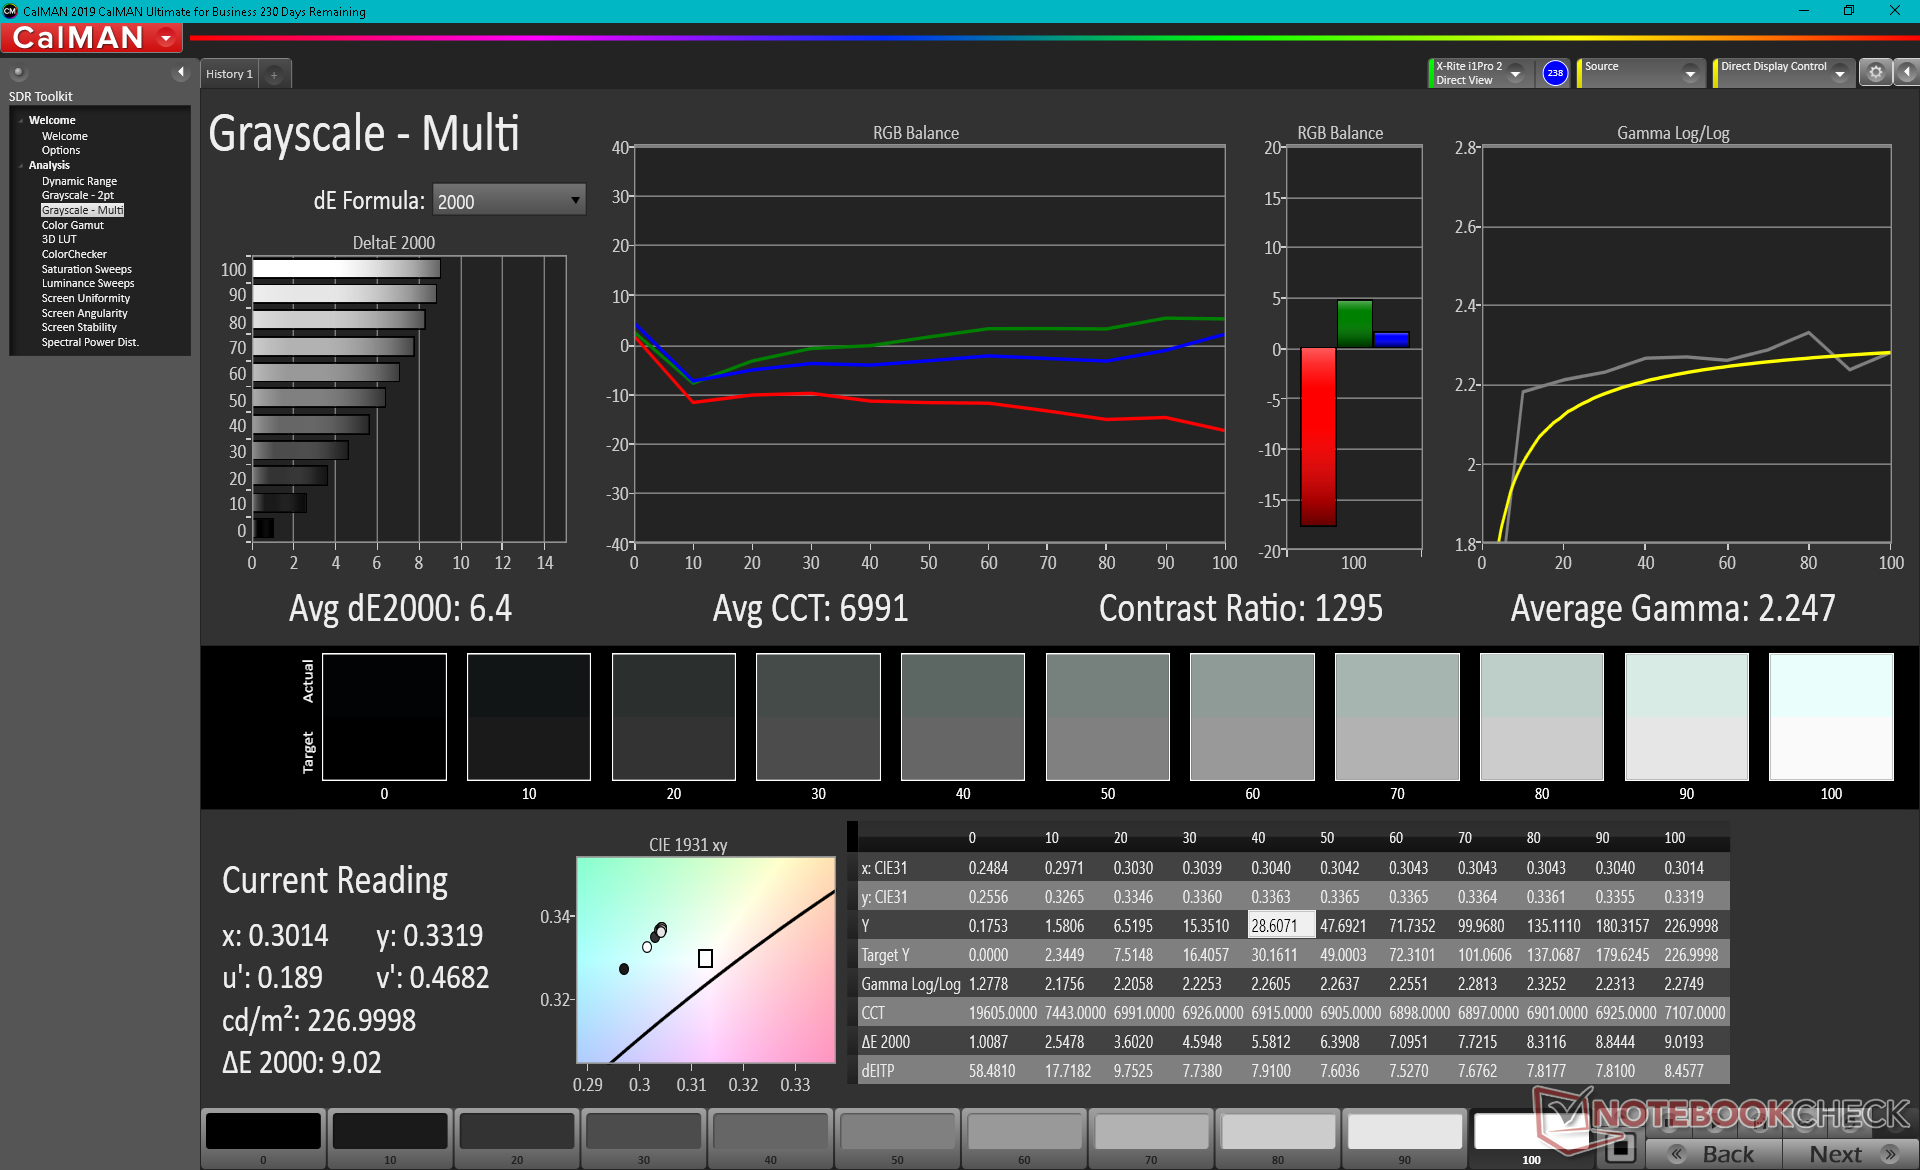
ΔE Greyscale Calman: 6.4 | ∀{0.09-98 Ø4.96}
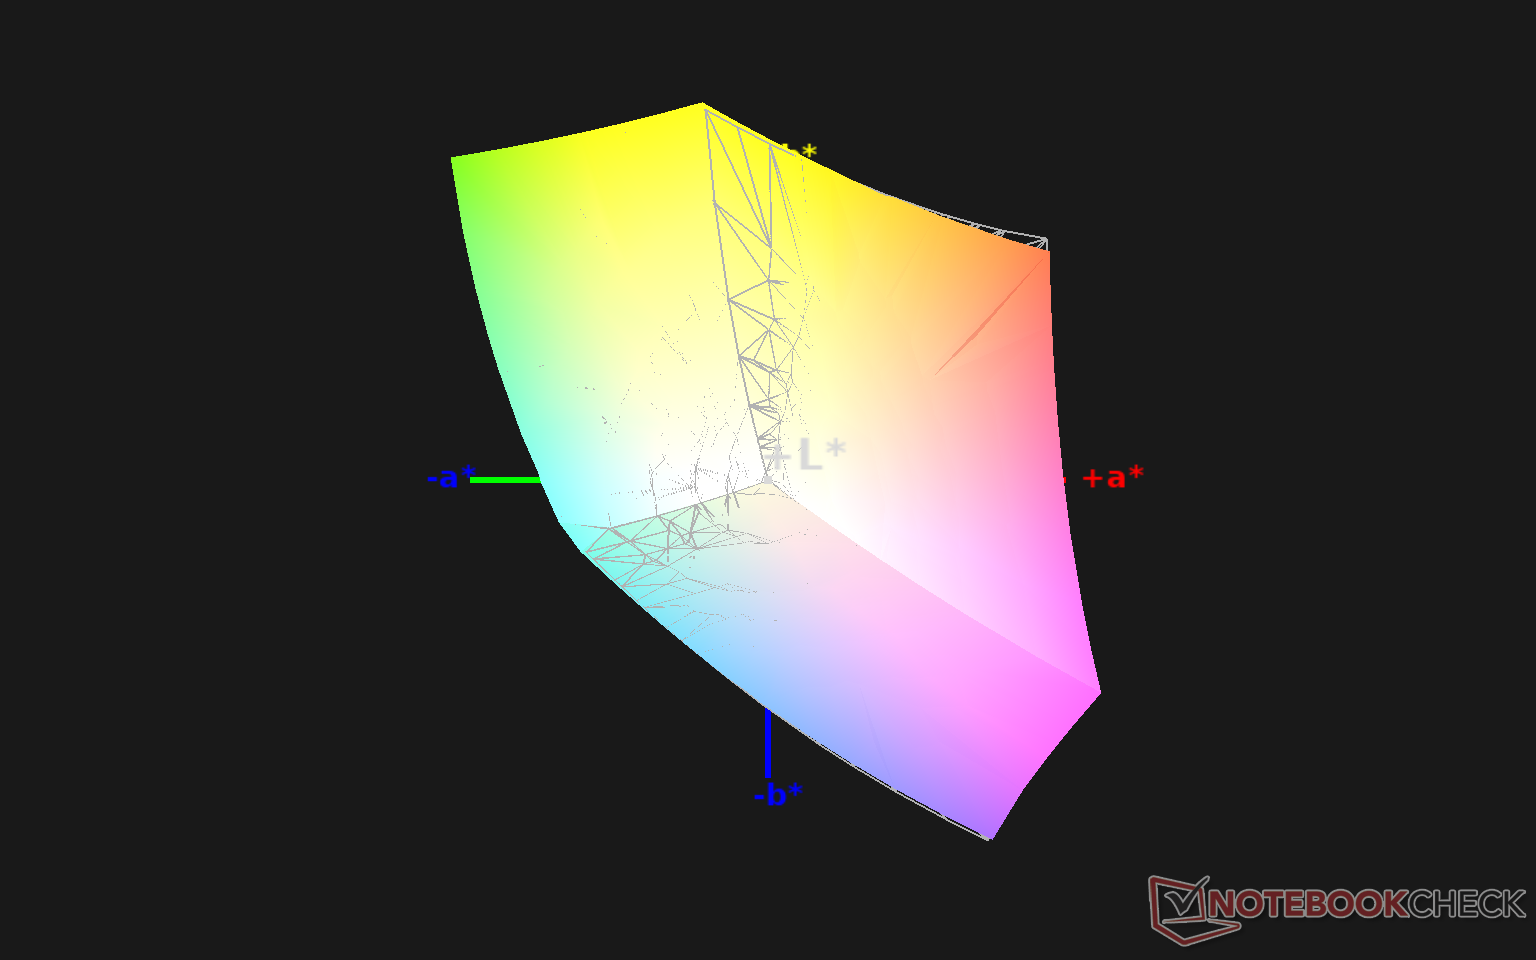
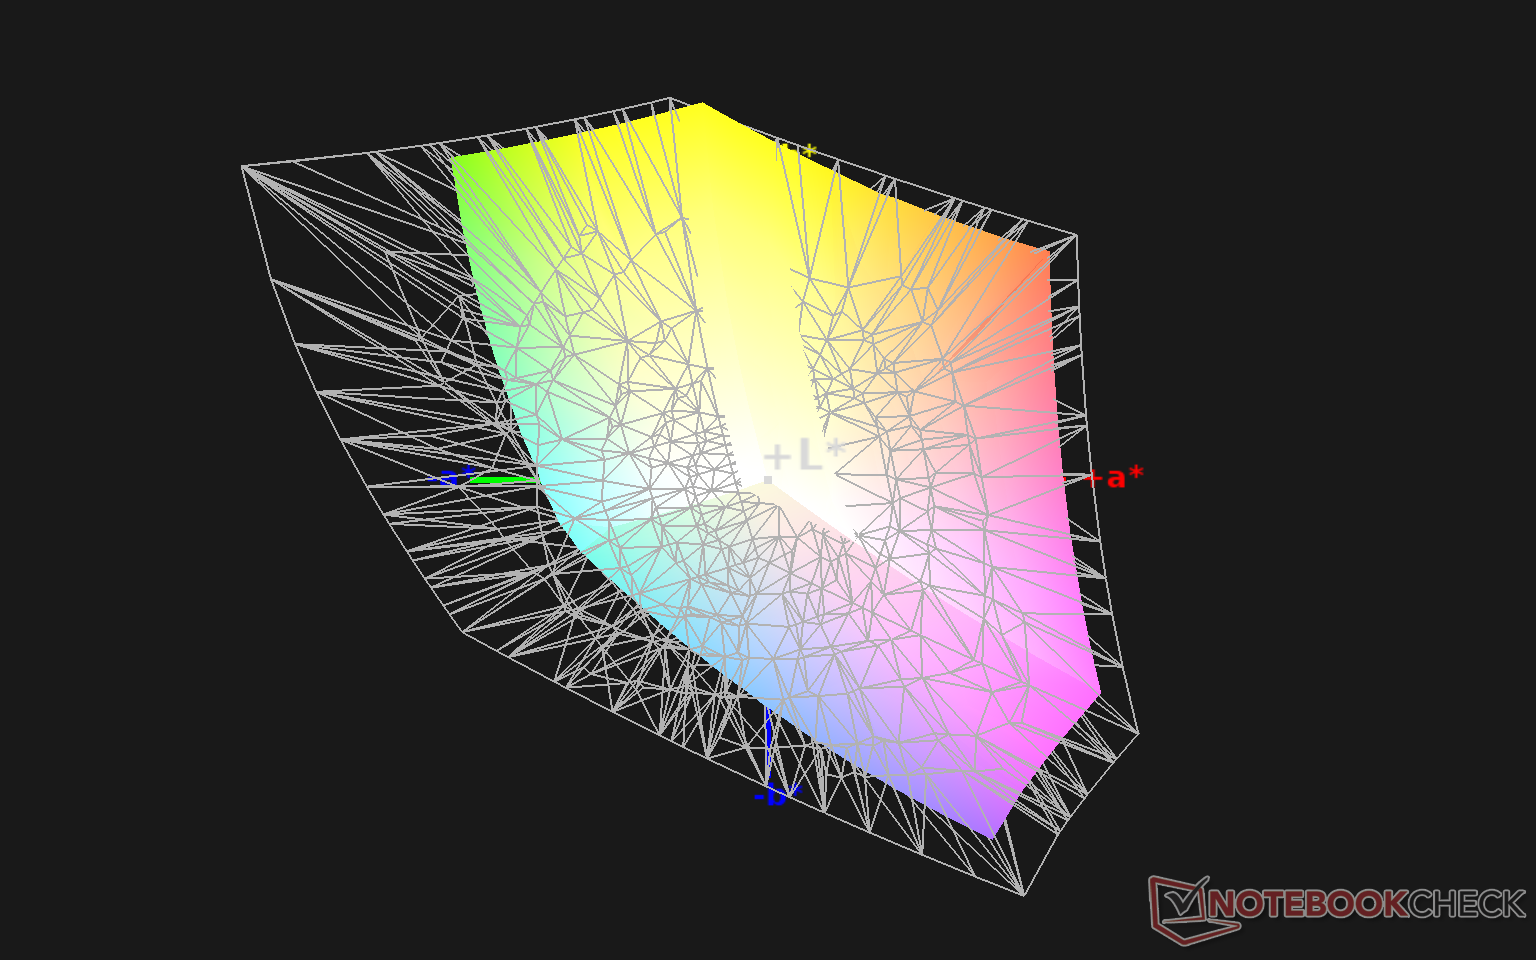
99.3% sRGB (Argyll 1.6.3 3D)
64.5% AdobeRGB 1998 (Argyll 1.6.3 3D)
70.4% AdobeRGB 1998 (Argyll 3D)
99.2% sRGB (Argyll 3D)
68.3% Display P3 (Argyll 3D)
Gamma: 2.25
CCT: 6991 K
| MSI GP66 Leopard 10UG Sharp LQ156M1JW03, IPS, 15.6", 1920x1080 | MSI GP65 10SFK-047US LG Philips LP156WFG-SPB3, IPS, 15.6", 1920x1080 | Alienware m15 R4 LG Philips LGD066E, IPS, 15.6", 1920x1080 | Aorus 15P XC Sharp LQ156M1JW03, IPS, 15.6", 1920x1080 | Asus ROG Zephyrus G15 GA503Q CMN N156KME-GNA (CMN152A), IPS-Level, 15.6", 2560x1440 | MSI GF65 Thin 10UE AU Optronics B156HAN08.4, IPS, 15.6", 1920x1080 | |
|---|---|---|---|---|---|---|
| Display | -7% | 1% | -2% | 22% | -44% | |
| Display P3 Coverage (%) | 68.3 | 63.5 -7% | 69.4 2% | 67.2 -2% | 97.3 42% | 37.65 -45% |
| sRGB Coverage (%) | 99.2 | 94.4 -5% | 99 0% | 98.7 -1% | 99.9 1% | 56.3 -43% |
| AdobeRGB 1998 Coverage (%) | 70.4 | 65.1 -8% | 70.5 0% | 68.6 -3% | 86.2 22% | 38.9 -45% |
| Response Times | -1% | 21% | 9% | 9% | -200% | |
| Response Time Grey 50% / Grey 80% * (ms) | 13.6 ? | 10.4 ? 24% | 7.4 ? 46% | 11.2 ? 18% | 8.8 ? 35% | 36.8 ? -171% |
| Response Time Black / White * (ms) | 9.6 ? | 12 ? -25% | 10 ? -4% | 9.6 ? -0% | 11.2 ? -17% | 31.6 ? -229% |
| PWM Frequency (Hz) | 23580 ? | 24040 ? | ||||
| Screen | -3% | 24% | 27% | 2% | -32% | |
| Brightness middle (cd/m²) | 225.9 | 384.9 70% | 333 47% | 298 32% | 327 45% | 266.5 18% |
| Brightness (cd/m²) | 211 | 358 70% | 303 44% | 278 32% | 309 46% | 262 24% |
| Brightness Distribution (%) | 83 | 87 5% | 86 4% | 88 6% | 89 7% | 91 10% |
| Black Level * (cd/m²) | 0.23 | 0.67 -191% | 0.29 -26% | 0.29 -26% | 0.33 -43% | 0.18 22% |
| Contrast (:1) | 982 | 574 -42% | 1148 17% | 1028 5% | 991 1% | 1481 51% |
| Colorchecker dE 2000 * | 3.98 | 2.43 39% | 1.8 55% | 0.96 76% | 4.49 -13% | 5.33 -34% |
| Colorchecker dE 2000 max. * | 8.95 | 4.58 49% | 4.49 50% | 3.22 64% | 8.42 6% | 18.28 -104% |
| Colorchecker dE 2000 calibrated * | 1.15 | 2.03 -77% | 1.13 2% | 0.83 28% | 2.27 -97% | 4.36 -279% |
| Greyscale dE 2000 * | 6.4 | 2.6 59% | 1.9 70% | 1.3 80% | 4.2 34% | 4.5 30% |
| Gamma | 2.25 98% | 2.2 100% | 2.265 97% | 2.242 98% | 2.173 101% | 2.35 94% |
| CCT | 6991 93% | 6981 93% | 6840 95% | 6519 100% | 7014 93% | 6289 103% |
| Color Space (Percent of AdobeRGB 1998) (%) | 64.5 | 59.7 -7% | 71 10% | 69 7% | 86 33% | 35.6 -45% |
| Color Space (Percent of sRGB) (%) | 99.3 | 93.9 -5% | 93 -6% | 91 -8% | 99 0% | 55.8 -44% |
| Media totale (Programma / Settaggio) | -4% /
-3% | 15% /
19% | 11% /
19% | 11% /
6% | -92% /
-55% |
* ... Meglio usare valori piccoli
Lo spazio colore copre tutto l'sRGB per essere paragonabile alla maggior parte dei portatili gaming di fascia alta. Siamo felici che MSI non stia usando uno di quei pannelli Panda economici che tipicamente hanno colori molto più scadenti.
Le misurazioni del colorimetro X-Rite mostrano un display non calibrato in fabbrica, il che è prevedibile dato che il GP66 non è un portatile gaming di punta con calibrazione Pantone. La temperatura del colore è troppo fredda e la precisione del colore ne risente. I colori migliorano significativamente una volta calibrati correttamente con valori finali di scala di grigi e deltaE colore di appena 1,5 e 1,15, rispettivamente. Raccomandiamo di applicare il nostro profilo ICM presente qui sopra per ottenere il massimo dal display se non avete accesso a un colorimetro.
Tempi di risposta del Display
| ↔ Tempi di risposta dal Nero al Bianco | ||
|---|---|---|
| 9.6 ms ... aumenta ↗ e diminuisce ↘ combinato | ↗ 5.2 ms Incremento | 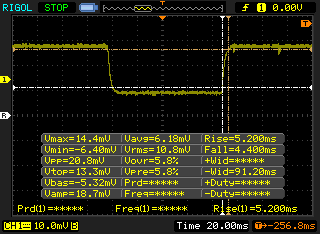 |
| ↘ 4.4 ms Calo | ||
| Lo schermo mostra veloci tempi di risposta durante i nostri tests e dovrebbe esere adatto al gaming In confronto, tutti i dispositivi di test variano da 0.1 (minimo) a 240 (massimo) ms. » 26 % di tutti i dispositivi è migliore. Questo significa che i tempi di risposta rilevati sono migliori rispettto alla media di tutti i dispositivi testati (19.8 ms). | ||
| ↔ Tempo di risposta dal 50% Grigio all'80% Grigio | ||
| 13.6 ms ... aumenta ↗ e diminuisce ↘ combinato | ↗ 7.6 ms Incremento | 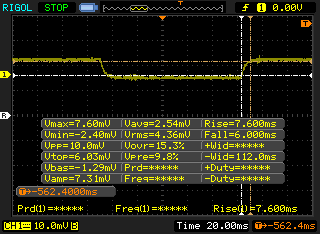 |
| ↘ 6 ms Calo | ||
| Lo schermo mostra buoni tempi di risposta durante i nostri tests, ma potrebbe essere troppo lento per i gamers competitivi. In confronto, tutti i dispositivi di test variano da 0.165 (minimo) a 636 (massimo) ms. » 27 % di tutti i dispositivi è migliore. Questo significa che i tempi di risposta rilevati sono migliori rispettto alla media di tutti i dispositivi testati (31 ms). | ||
Sfarfallio dello schermo / PWM (Pulse-Width Modulation)
| flickering dello schermo / PWM rilevato | 23580 Hz | ≤ 34 % settaggio luminosita' | 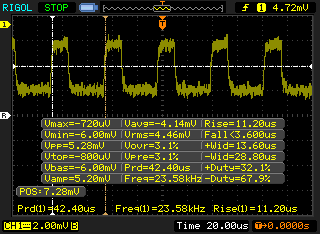 |
Il display sfarfalla a 23580 Hz (Probabilmente a causa dell'uso di PWM) Flickering rilevato ad una luminosita' di 34 % o inferiore. Non dovrebbe verificarsi flickering o PWM sopra questo valore di luminosita'. La frequenza di 23580 Hz è abbastanza alta, quindi la maggioranza degli utenti sensibili al PWM non dovrebbero notare alcun flickering. In confronto: 52 % di tutti i dispositivi testati non utilizza PWM per ridurre la luminosita' del display. Se è rilevato PWM, una media di 7757 (minimo: 5 - massimo: 343500) Hz è stata rilevata. | |||
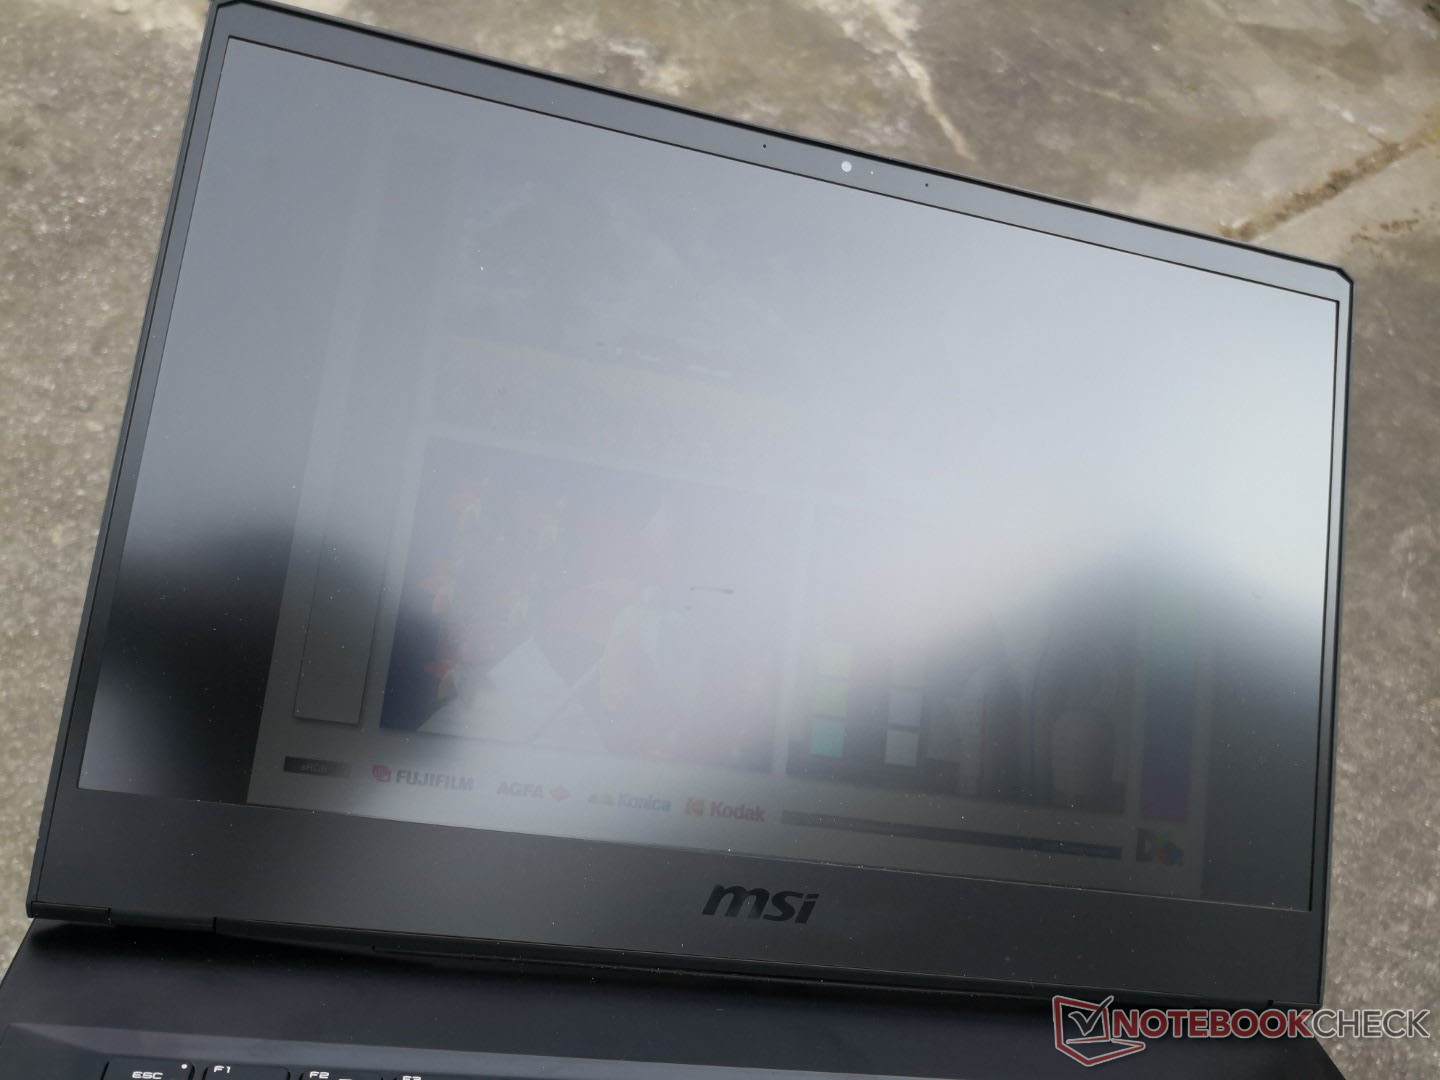
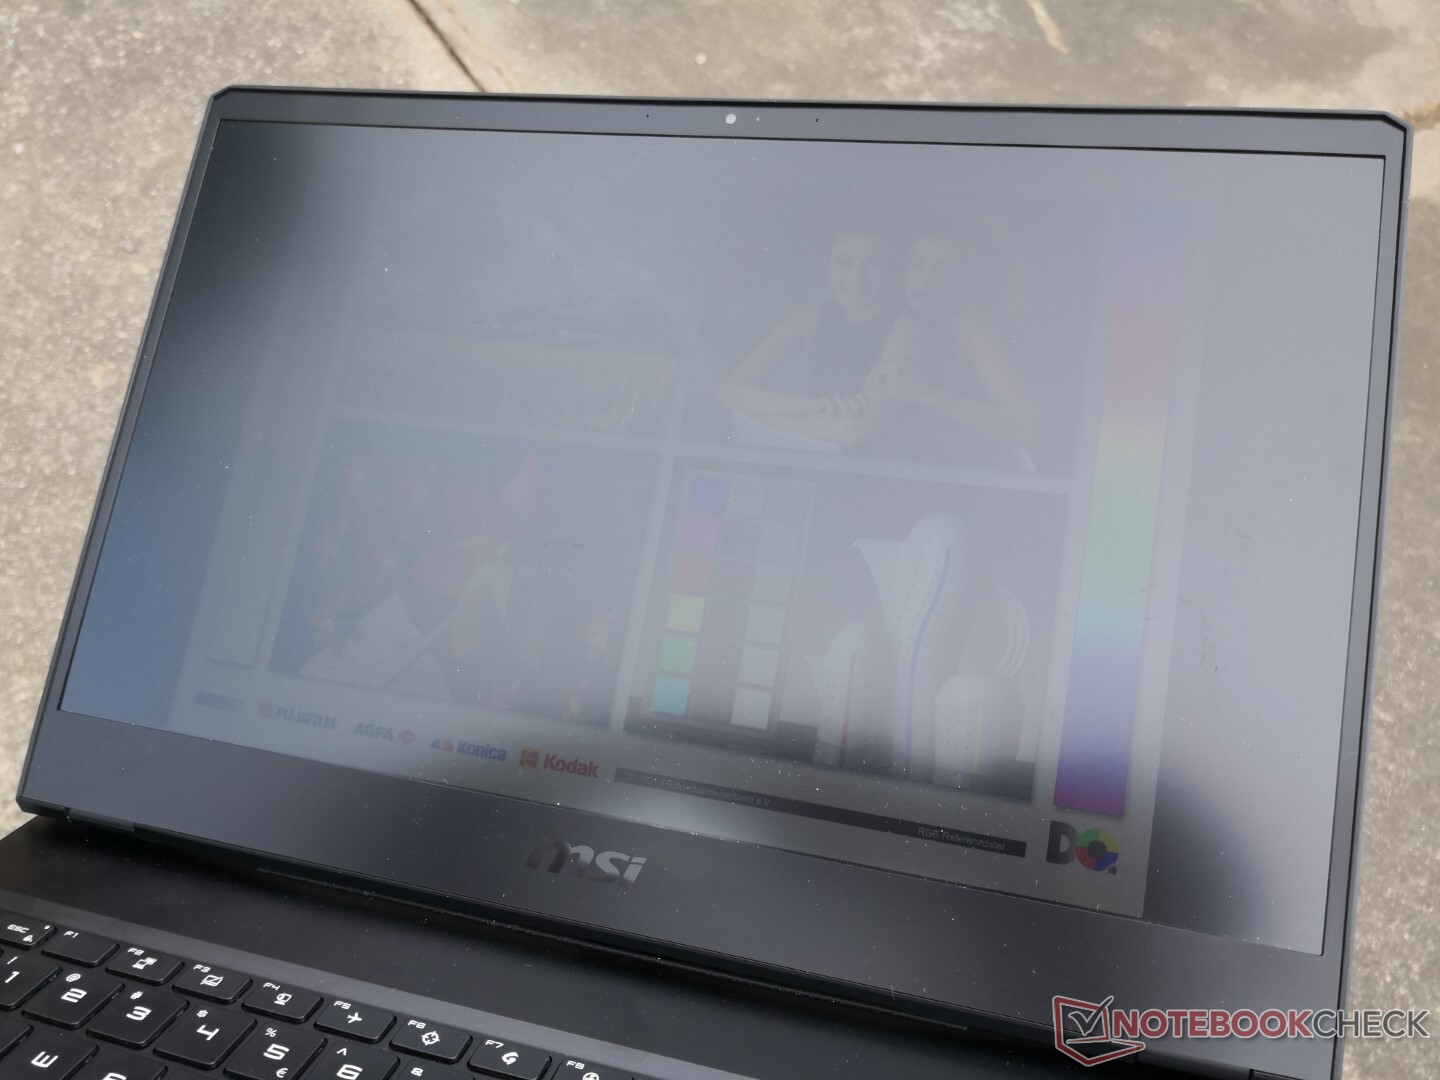
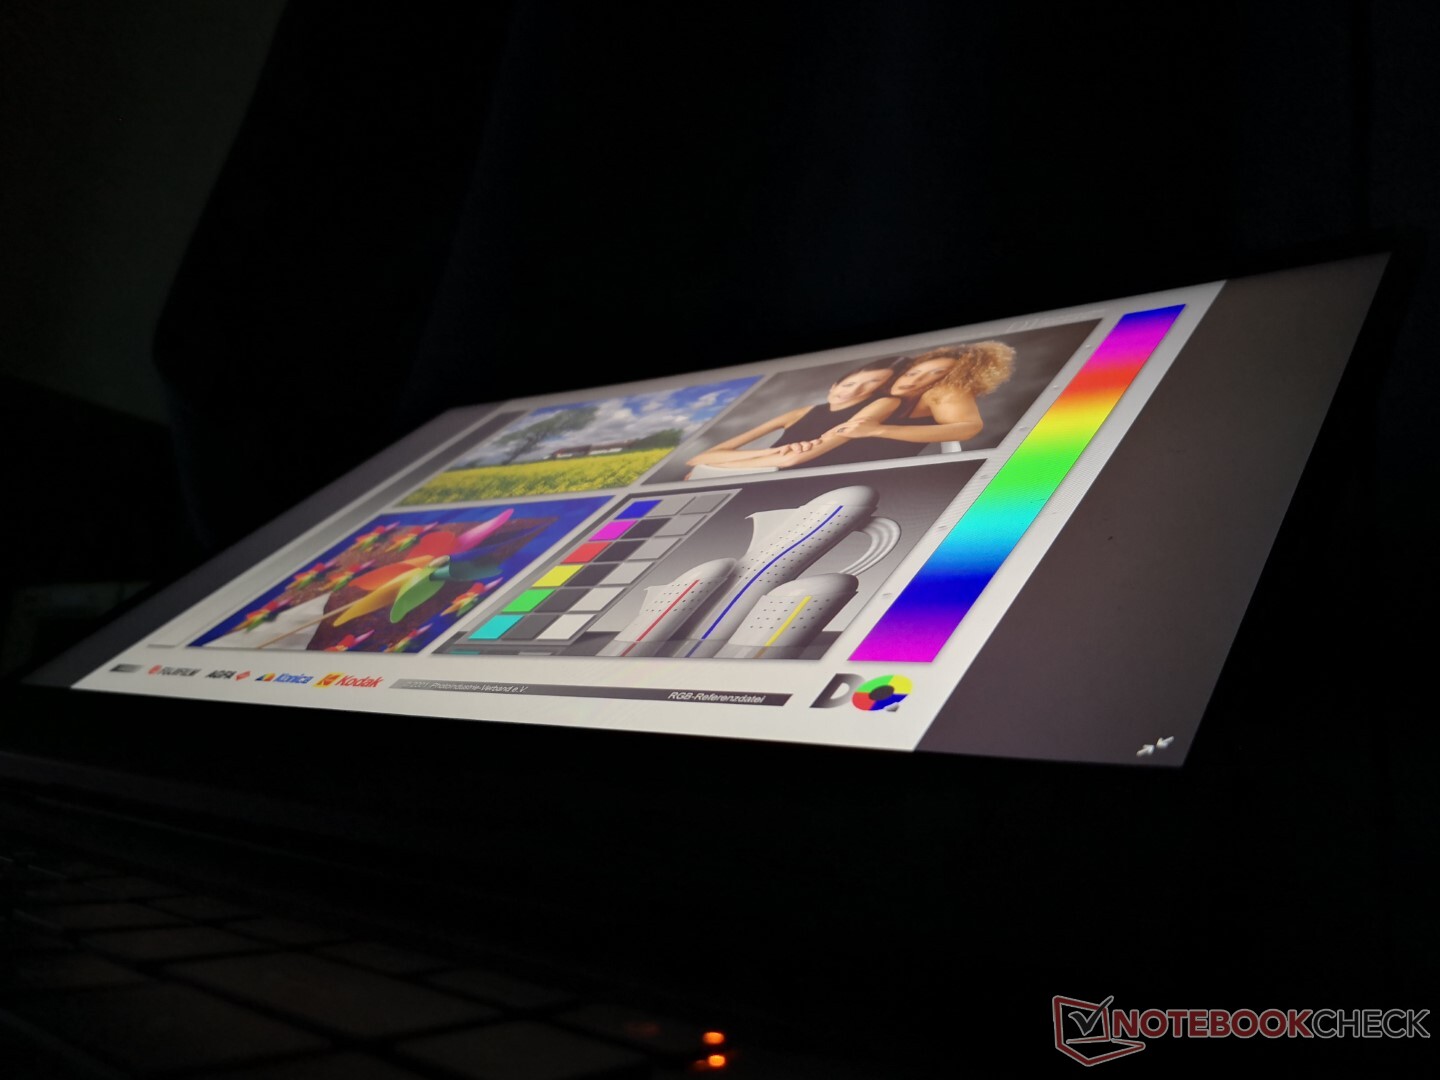
La visibilità all'aperto è scarsa perché il display non è molto luminoso. Il riflesso è evidente nella maggior parte delle condizioni e anche se potrebbe essere ridotto, il contenuto sullo schermo apparirà comunque sbiadito.
Performance
MSI offre solo le opzioni Core i7-10870H e Core i7-10875H della decima generazione Comet Lake-H al momento e nient'altro. Tuttavia, saremmo stati contanti con una sola di queste opzioni, poiché qualsiasi differenza tra l'i7-10870H e l'i7-10875H è incredibilmente limitata. Gli utenti dovranno guardare il più economico Bravo o Alpha per le opzioni AMD.
La grafica va da GeForce RTX 3060 a 3080 a 130 W TGP ciascuno. Sia lo switching grafico automatica che quella manuale sono disponibili tramite il software Dragon Center. Raccomandiamo ai proprietari di familiarizzare con Dragon Center poiché le caratteristiche chiave sono gestite qui.
Abbiamo impostato la nostra unità in modalità Extreme Performance con la GPU Nvidia attiva prima di eseguire qualsiasi benchmark di prestazioni qui sotto.
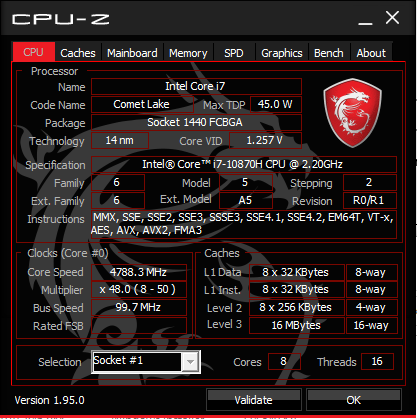
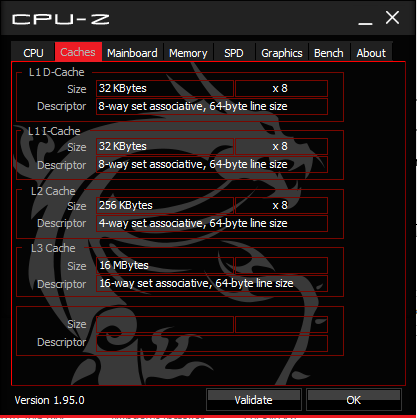
Processore
Le prestazioni della CPU sono eccellenti con una sostenibilità Turbo Boost decente, come mostrato dai nostri risultati del ciclo CineBench R15 xT qui sotto. Le prestazioni sono addirittura veloci come il più costoso Core i9-10980HK nell'Alienware m15 R4. Le differenze tra il Core i7-10875H e Core i7-10870H sono entro un paio di punti percentuali.
Cinebench R15: CPU Multi 64Bit | CPU Single 64Bit
Blender: v2.79 BMW27 CPU
7-Zip 18.03: 7z b 4 -mmt1 | 7z b 4
Geekbench 5.5: Single-Core | Multi-Core
HWBOT x265 Benchmark v2.2: 4k Preset
LibreOffice : 20 Documents To PDF
R Benchmark 2.5: Overall mean
| LibreOffice / 20 Documents To PDF | |
| HP Pavilion Gaming 15-ec1206ng | |
| Schenker XMG Core 15 Ampere | |
| Media Intel Core i7-10870H (46 - 64.4, n=12) | |
| Alienware m15 R4 | |
| MSI GP66 Leopard 10UG | |
| Razer Blade 15 Base Edition 2021, i7-10750H RTX 3060 | |
| Asus Zephyrus S15 GX502L | |
| MSI GT76 Titan DT 10SGS | |
| Asus ROG Zephyrus Duo 15 SE GX551QS | |
* ... Meglio usare valori piccoli
Prestazioni del sistema
I risultati di PCMark sono dove ci aspettiamo che siano rispetto ad altri portatili con la stessa CPU e GPU. I punteggi sono costantemente più alti del GP65 tranne che nel benchmark Essentials, probabilmente a causa del più lento SSD NVMe nella nostra unità di test GP66.
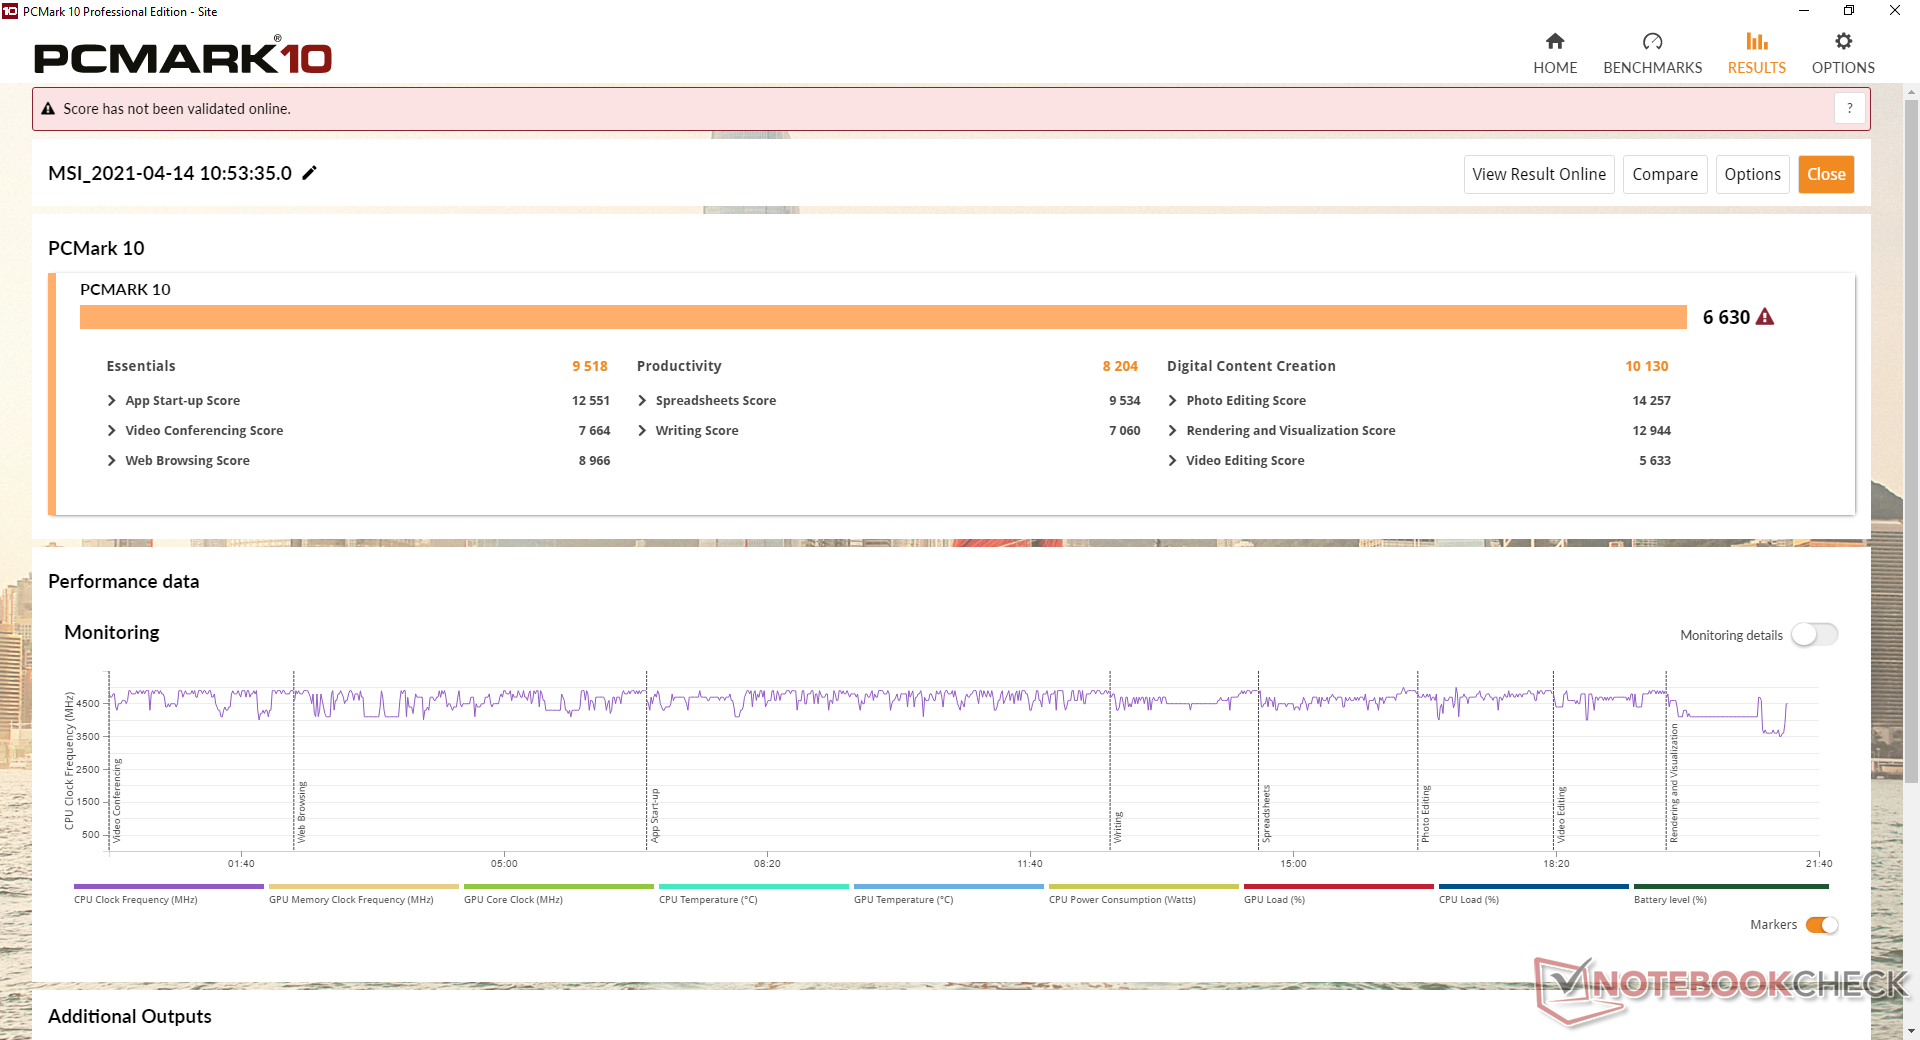
| PCMark 10 Score | 6630 punti | |
Aiuto | ||
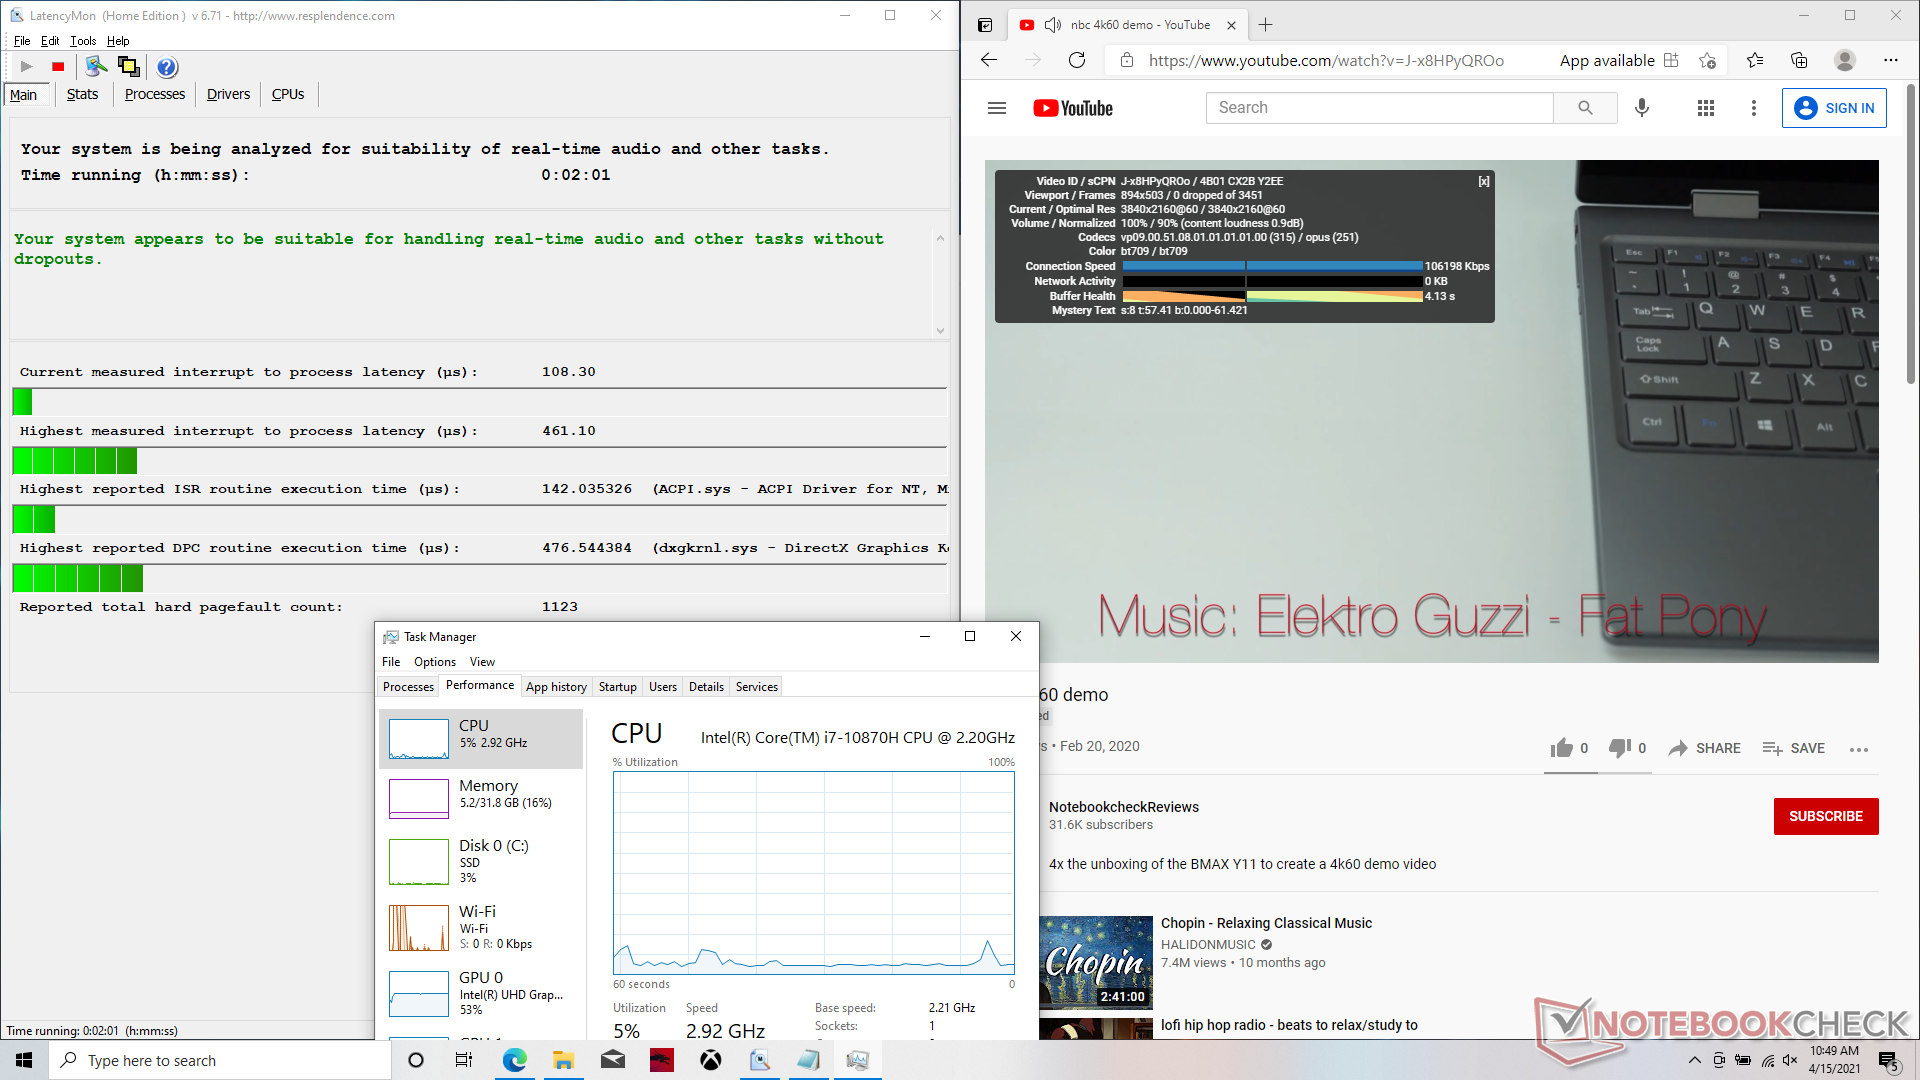
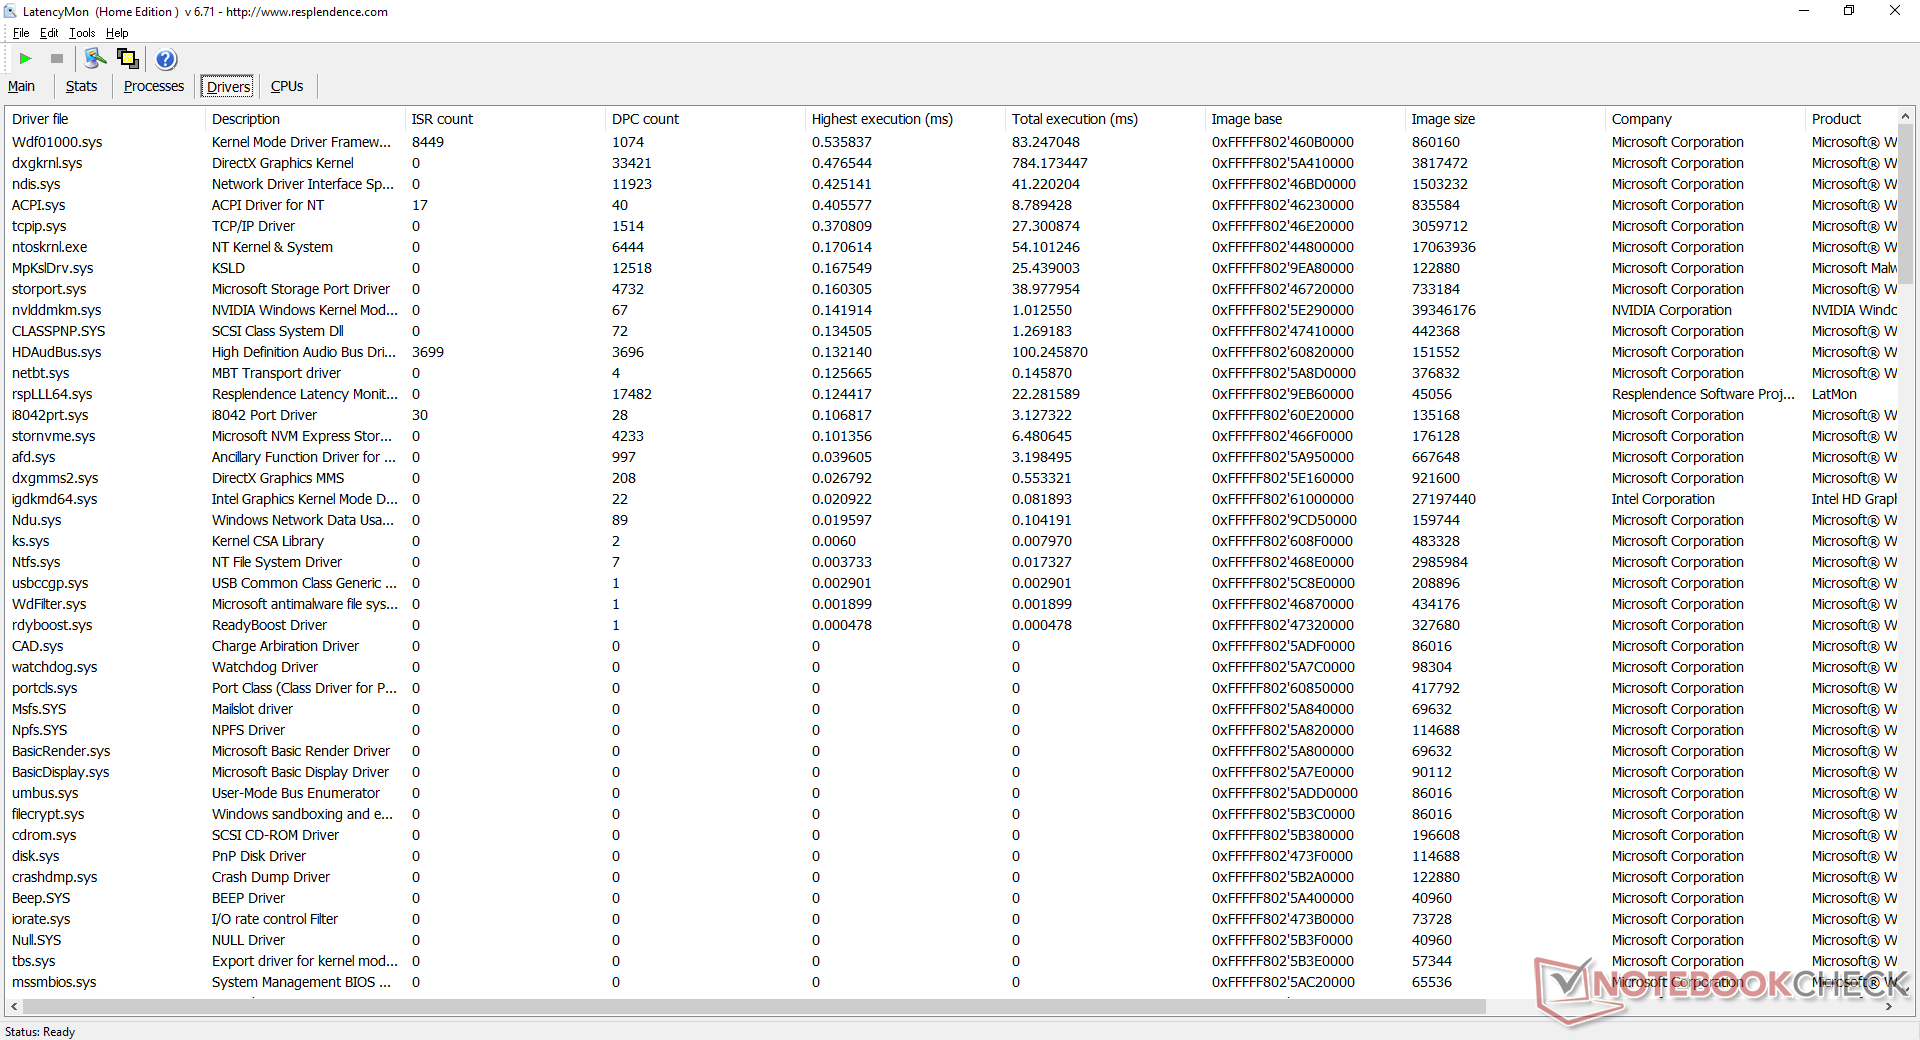
Latenza DPC
LatencyMon non mostra problemi di latenza DPC quando si aprono più schede del browser sulla nostra homepage. La riproduzione di video 4K a 60 FPS è fluida e senza cali di frame, come ci si può aspettare da qualsiasi portatile gaming.
| DPC Latencies / LatencyMon - interrupt to process latency (max), Web, Youtube, Prime95 | |
| Alienware m15 R4 | |
| Aorus 15P XC | |
| MSI GP65 10SFK-047US | |
| MSI GF65 Thin 10UE | |
| MSI GP66 Leopard 10UG | |
| Asus ROG Zephyrus G15 GA503Q | |
* ... Meglio usare valori piccoli
Dispositivi di archiviazione
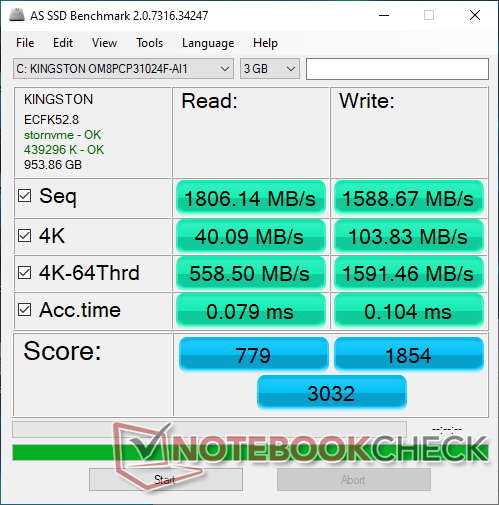
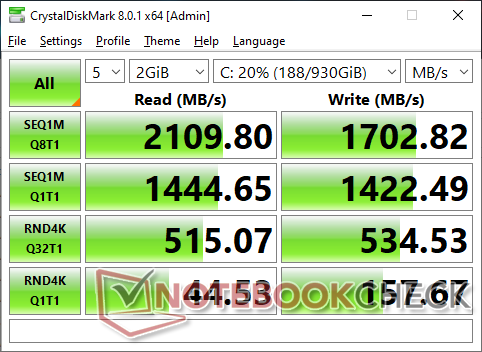
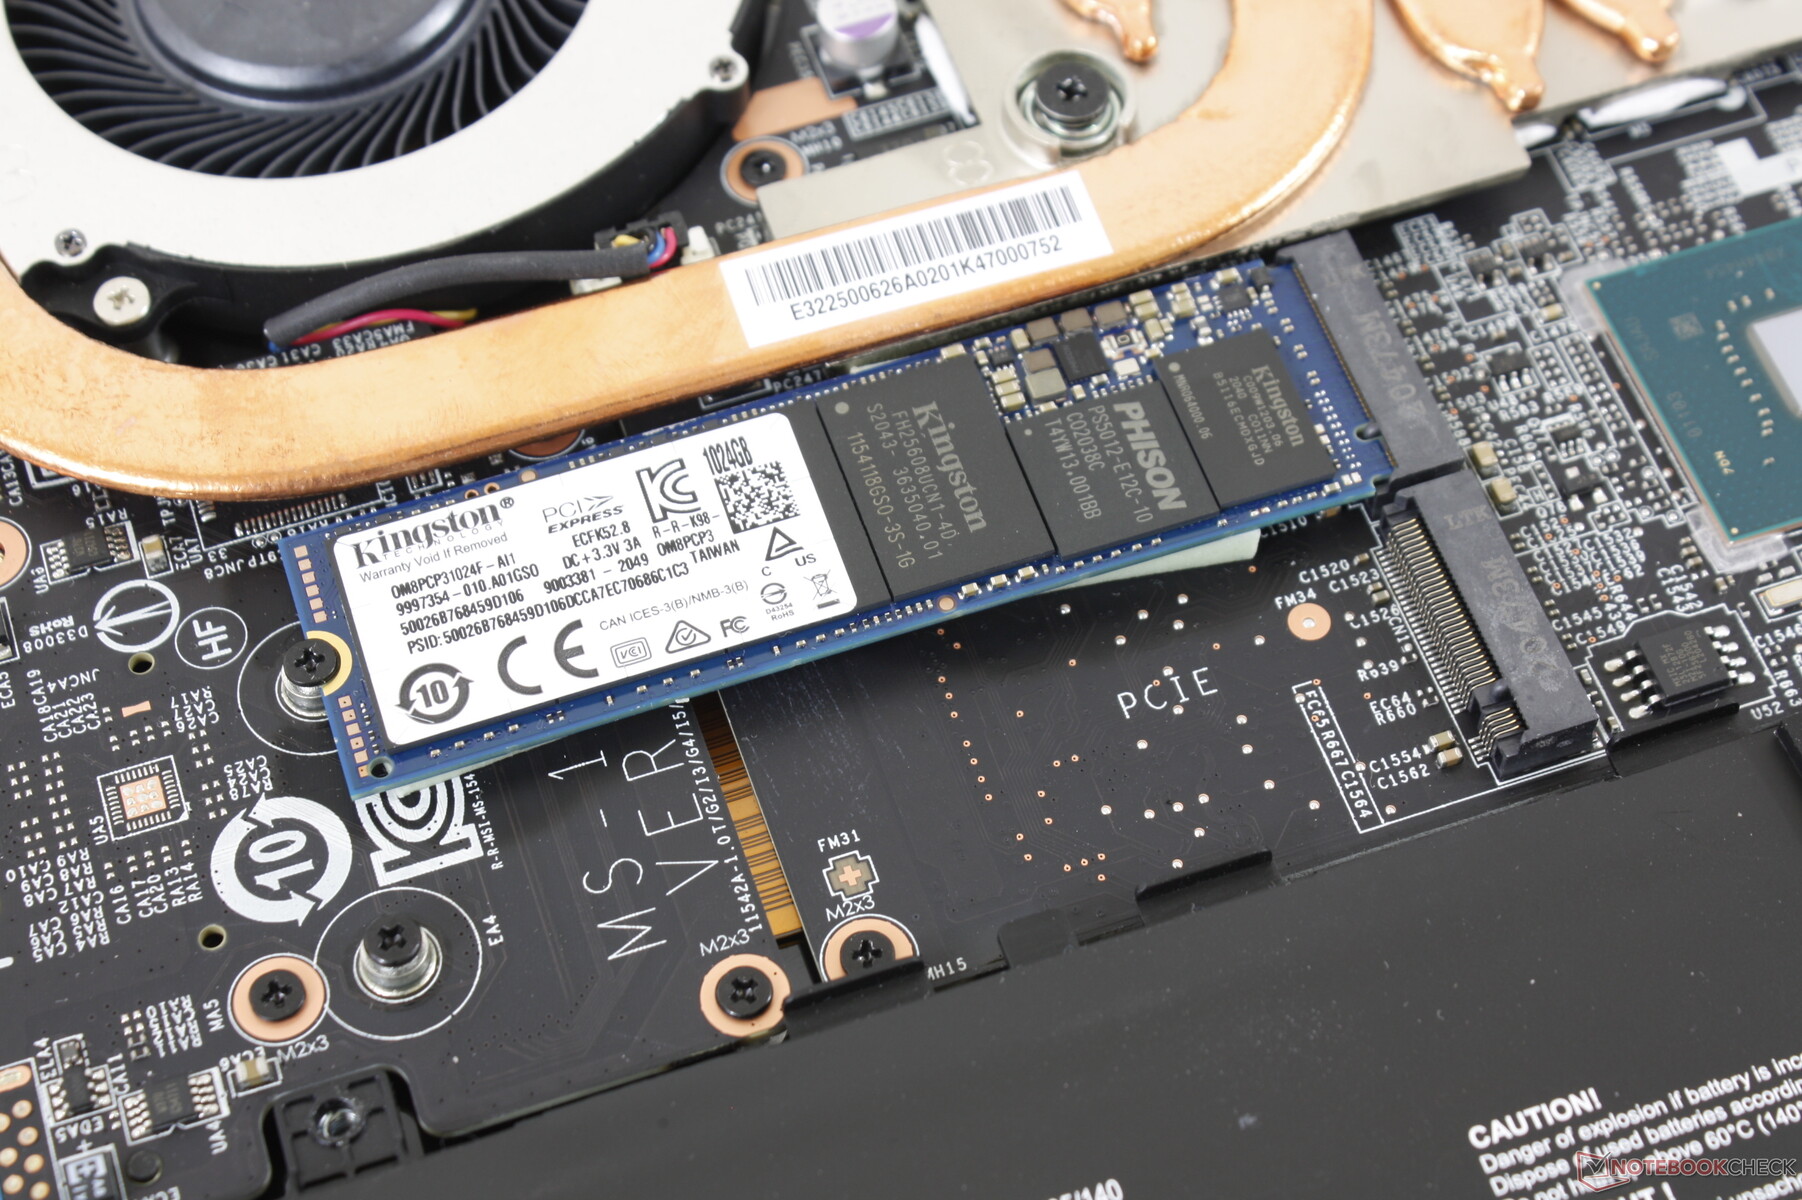
Mentre il GP65 poteva supportare fino a tre unità interne (2x M.2, 1x 2.5 pollici SATA III), il GP66 può supportare fino a 2x unità M.2 solo. Il Kingston OM8PCP31024F da 1 TB nella nostra unità è un drive NVMe di fascia media che è più lento sia del Samsung PM981 che del Micron 2300.
| MSI GP66 Leopard 10UG Kingston OM8PCP31024F | MSI GP65 10SFK-047US Samsung SSD PM981 MZVLB1T0HALR | Alienware m15 R4 Micron 2300 1TB MTFDHBA1T0TDV | Aorus 15P XC ESR512GTLCG-EAC-4 | Asus ROG Zephyrus G15 GA503Q SK Hynix HFM001TD3JX013N | MSI GF65 Thin 10UE Samsung SSD PM981 MZVLB1T0HALR | |
|---|---|---|---|---|---|---|
| AS SSD | 50% | 38% | 45% | 58% | 50% | |
| Seq Read (MB/s) | 1806 | 2066 14% | 2658 47% | 2694 49% | 2950 63% | 3002 66% |
| Seq Write (MB/s) | 1589 | 2418 52% | 2769 74% | 2327 46% | 1600 1% | 2420 52% |
| 4K Read (MB/s) | 40.09 | 54.2 35% | 46.07 15% | 47.77 19% | 53.6 34% | 48.46 21% |
| 4K Write (MB/s) | 103.8 | 129 24% | 87.2 -16% | 98.8 -5% | 126.8 22% | 114.3 10% |
| 4K-64 Read (MB/s) | 559 | 1865 234% | 1372 145% | 1746 212% | 1429 156% | 1873 235% |
| 4K-64 Write (MB/s) | 1591 | 1878 18% | 1247 -22% | 2267 42% | 2177 37% | 1882 18% |
| Access Time Read * (ms) | 0.079 | 0.042 47% | 0.052 34% | 0.079 -0% | 0.064 19% | 0.045 43% |
| Access Time Write * (ms) | 0.104 | 0.091 12% | 0.098 6% | 0.039 62% | 0.029 72% | 0.101 3% |
| Score Read (Points) | 779 | 2126 173% | 1684 116% | 2063 165% | 1778 128% | 2221 185% |
| Score Write (Points) | 1854 | 2249 21% | 1611 -13% | 2598 40% | 2464 33% | 2238 21% |
| Score Total (Points) | 3032 | 5482 81% | 4166 37% | 5698 88% | 5090 68% | 5565 84% |
| Copy ISO MB/s (MB/s) | 2674 | 2927 9% | 1877 -30% | 2421 -9% | ||
| Copy Program MB/s (MB/s) | 895 | 728 -19% | 555 -38% | 705 -21% | ||
| Copy Game MB/s (MB/s) | 1596 | 1614 1% | 1201 -25% | 1490 -7% | ||
| CrystalDiskMark 5.2 / 6 | 31% | 41% | 28% | 42% | 30% | |
| Write 4K (MB/s) | 153.2 | 145 -5% | 93.7 -39% | 130.2 -15% | 156.4 2% | 157.3 3% |
| Read 4K (MB/s) | 43.98 | 46.84 7% | 48.1 9% | 45.47 3% | 66.7 52% | 46.69 6% |
| Write Seq (MB/s) | 1527 | 2377 56% | 2785 82% | 2269 49% | 2318 52% | 2389 56% |
| Read Seq (MB/s) | 1112 | 2185 96% | 2598 134% | 1643 48% | 2151 93% | 2196 97% |
| Write 4K Q32T1 (MB/s) | 520 | 463.5 -11% | 481.9 -7% | 547 5% | 525 1% | 407.6 -22% |
| Read 4K Q32T1 (MB/s) | 516 | 527 2% | 521 1% | 654 27% | 452.1 -12% | 519 1% |
| Write Seq Q32T1 (MB/s) | 1697 | 2395 41% | 3362 98% | 2512 48% | 3055 80% | 2401 41% |
| Read Seq Q32T1 (MB/s) | 2110 | 3470 64% | 3200 52% | 3382 60% | 3607 71% | 3344 58% |
| Media totale (Programma / Settaggio) | 41% /
43% | 40% /
40% | 37% /
39% | 50% /
51% | 40% /
43% |
* ... Meglio usare valori piccoli

Throttling Disco: DiskSpd Read Loop, Queue Depth 8
Prestazioni della GPU
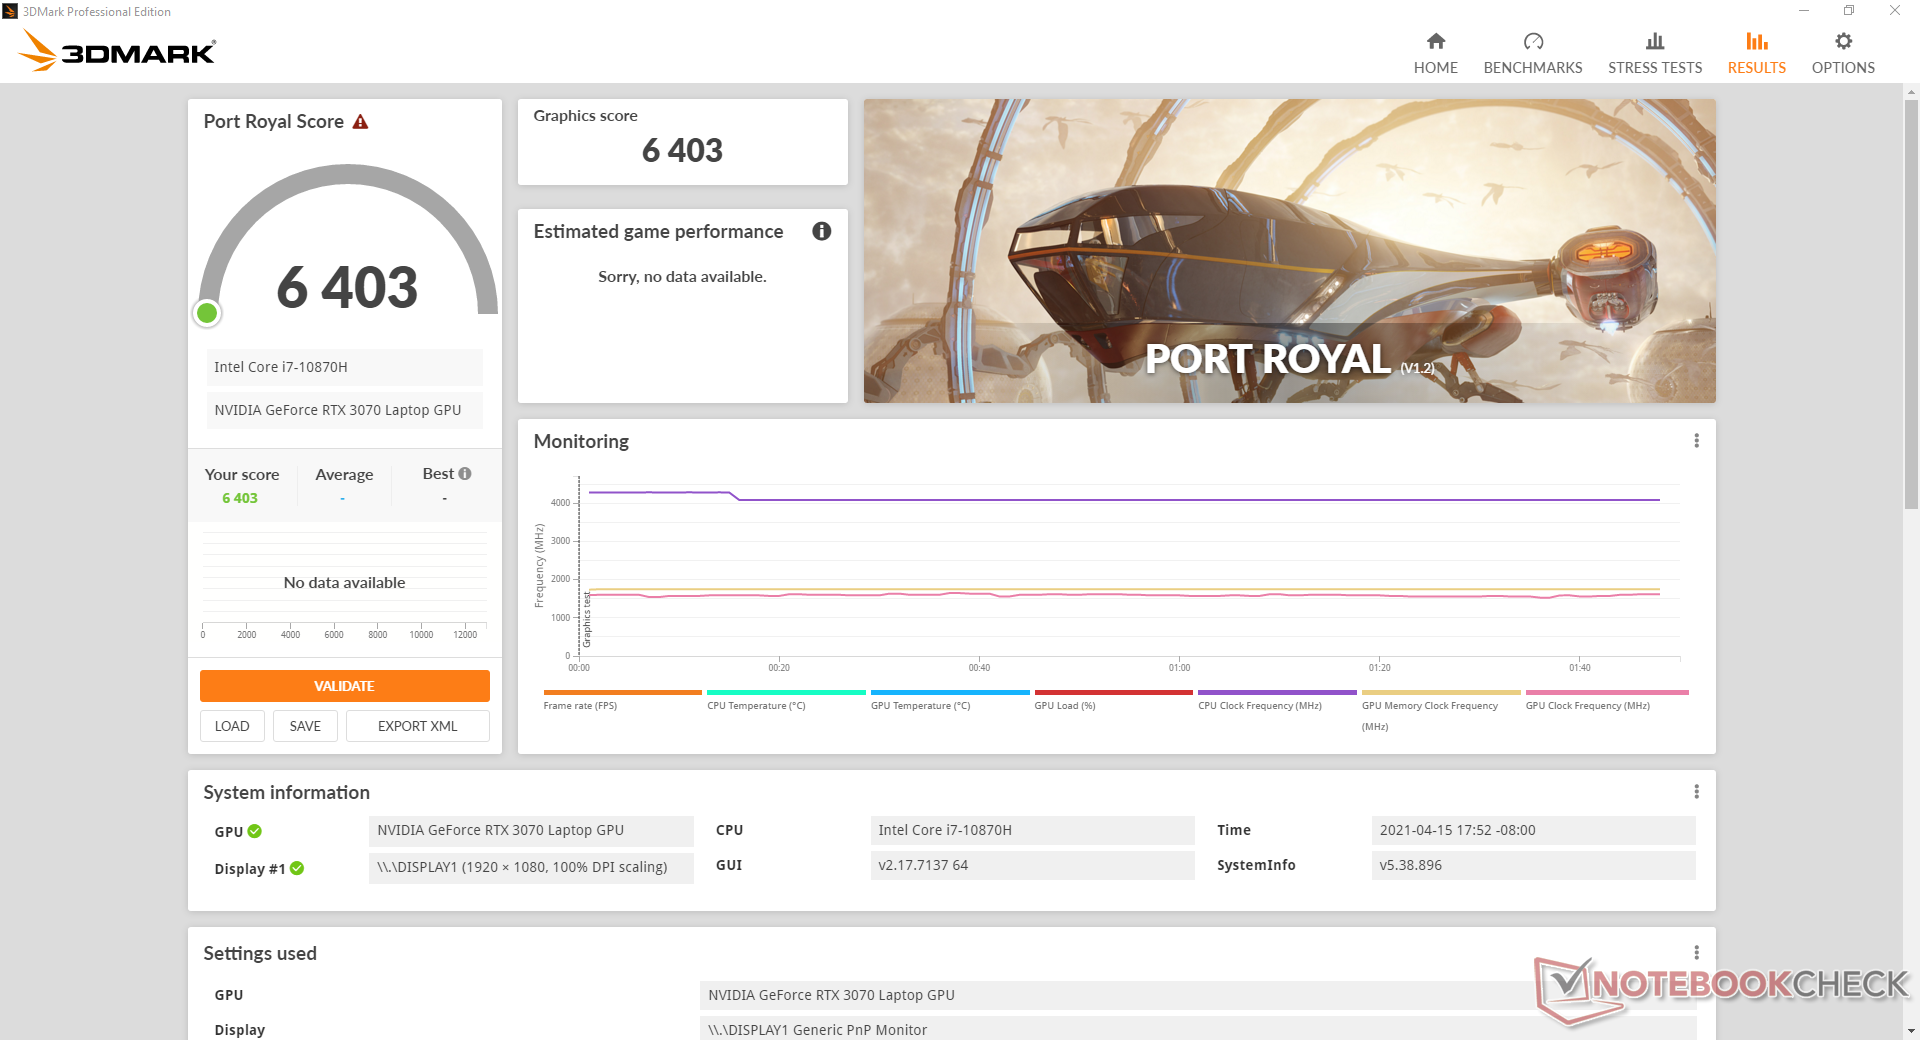
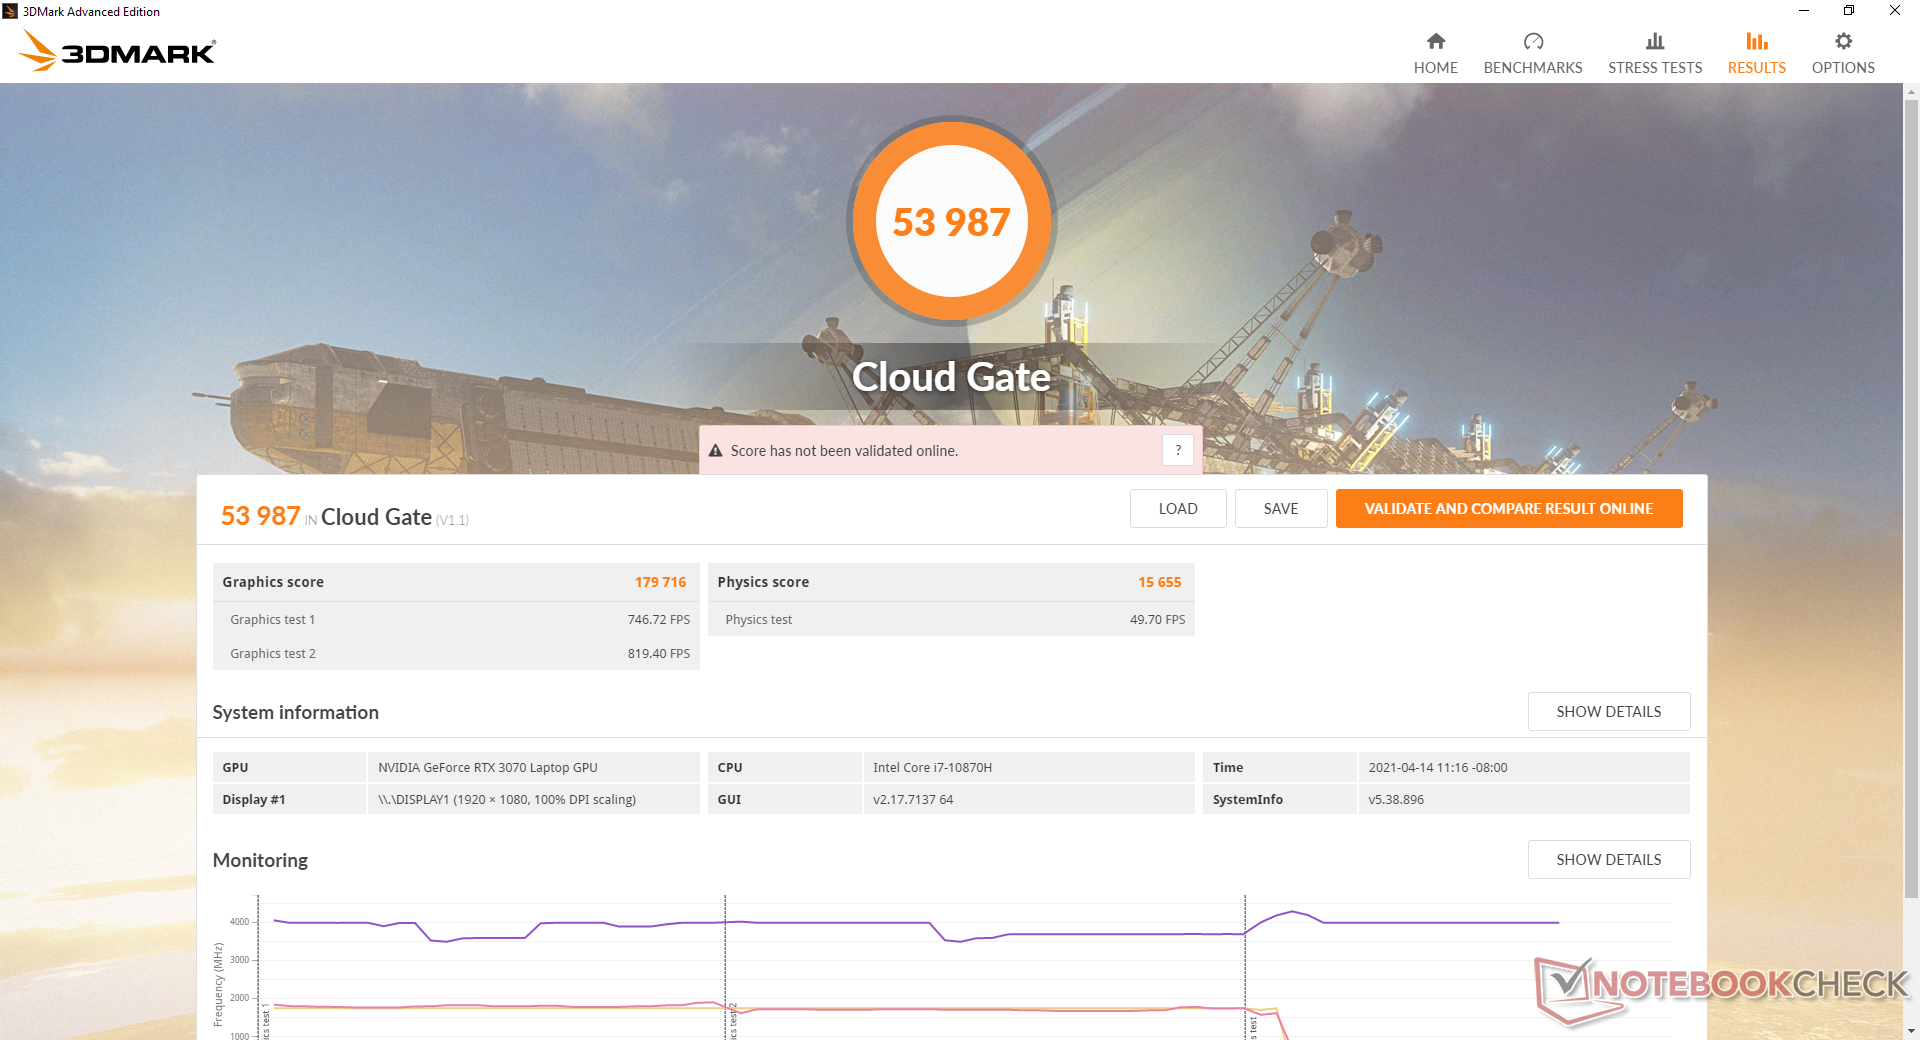
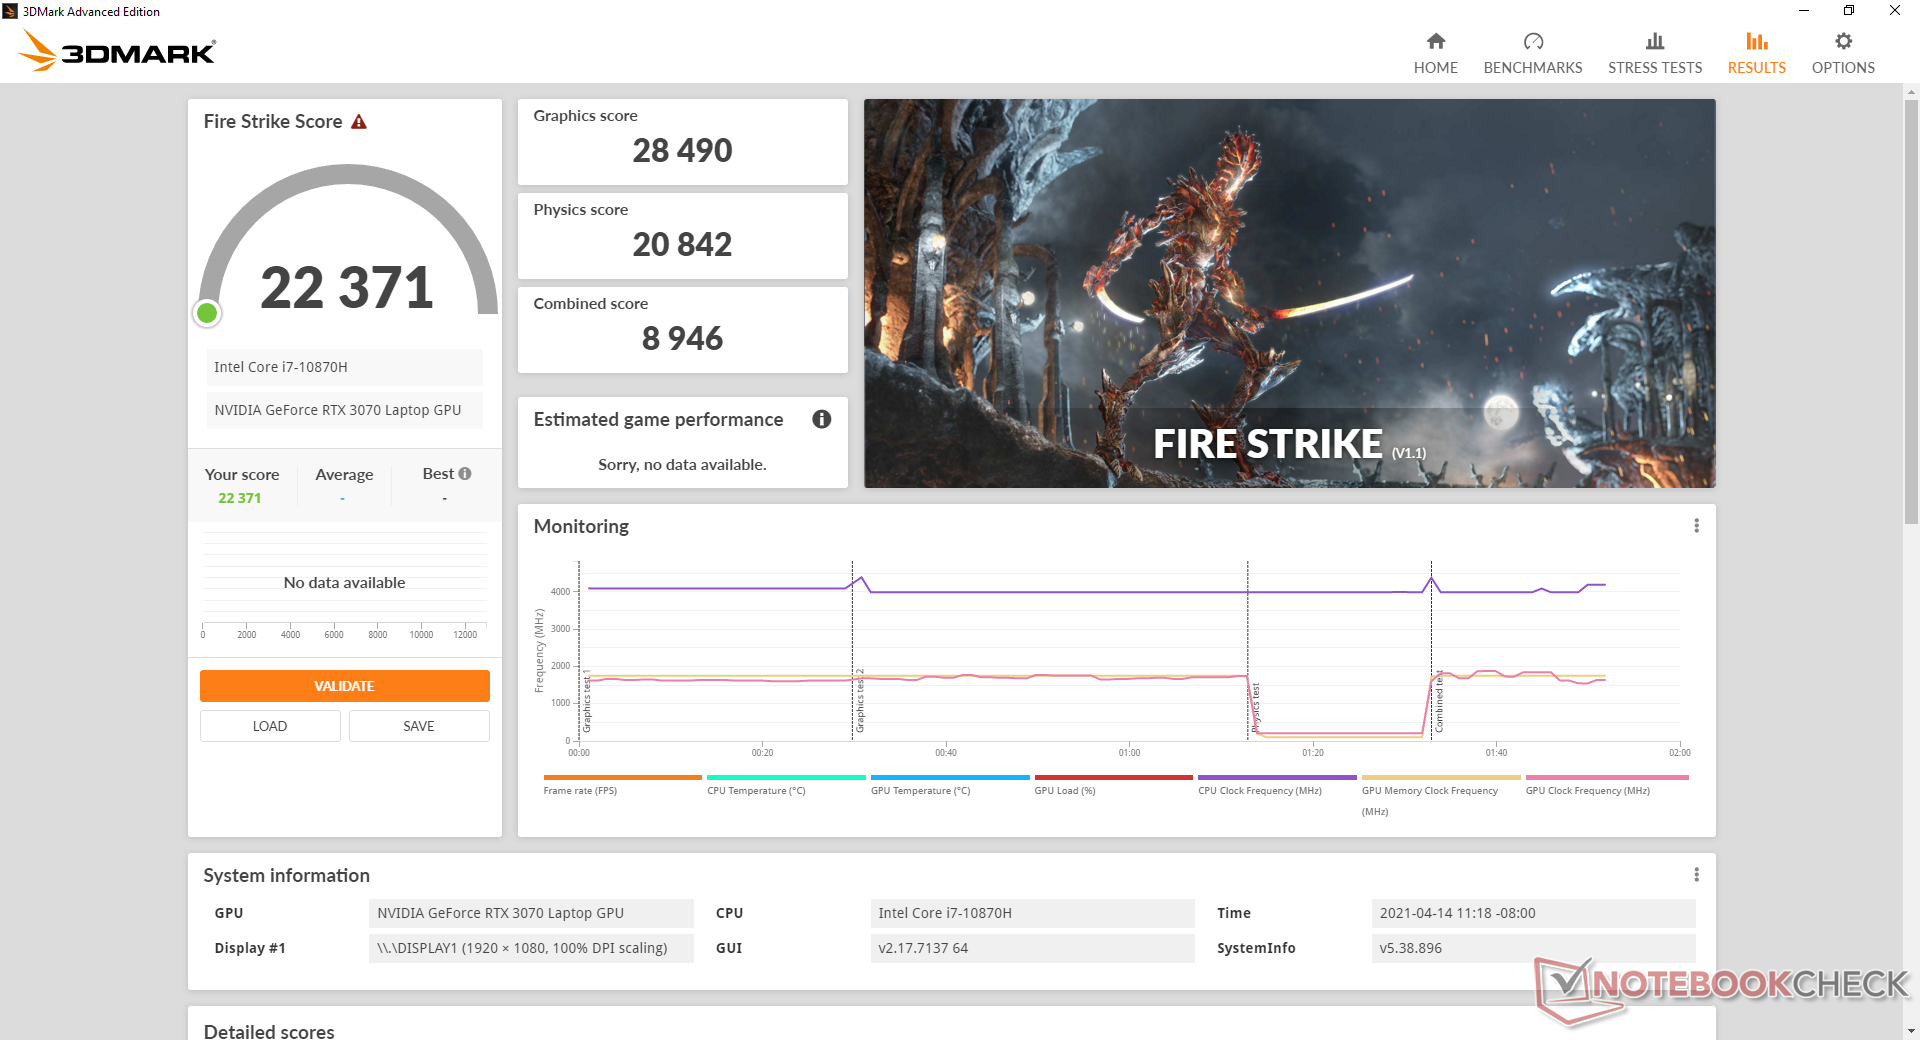
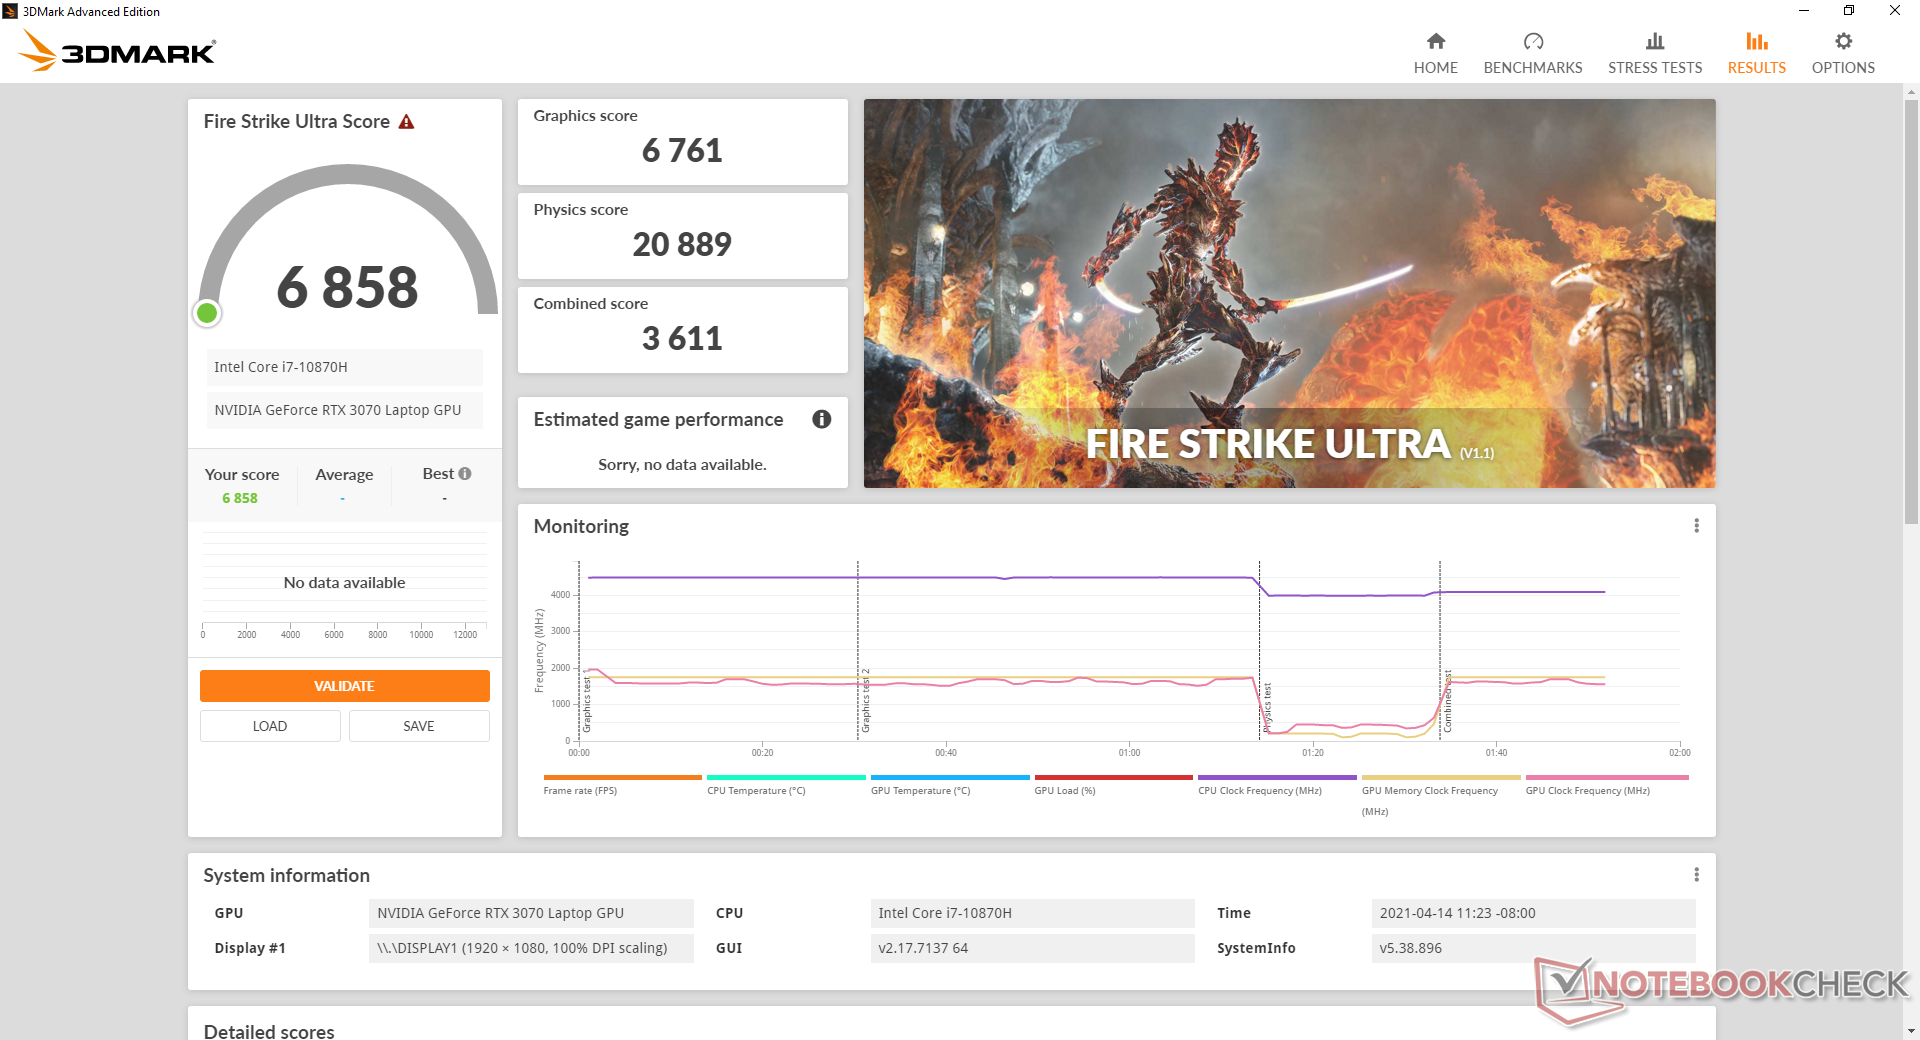
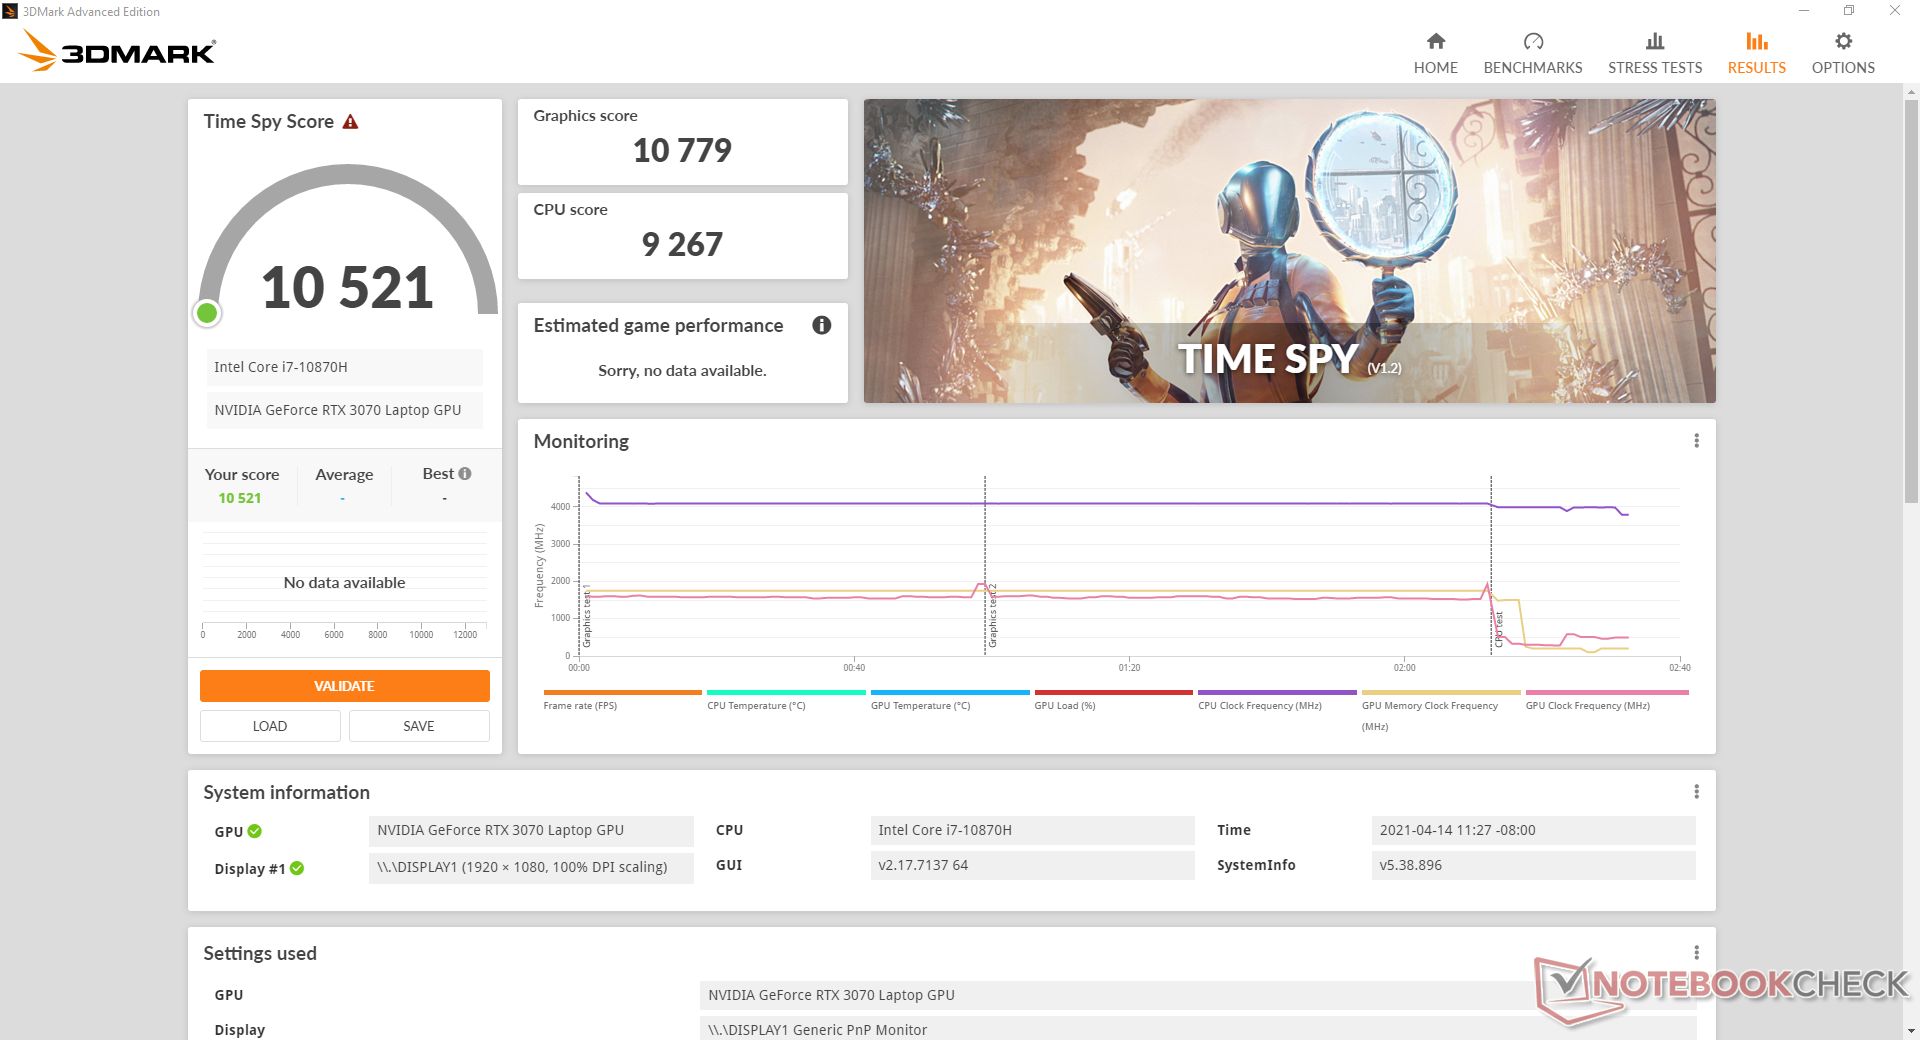
Le prestazioni grafiche pure sono solo dal 6 al 9% più lente del 130 W GeForce RTX 3080 nell'Asus Zephyrus Duo 15 SE secondo i benchmarks di 3DMark. Gli utenti che passano da una vecchia RTX 2070 vedranno notevoli guadagni fino al 35-40%. Tuttavia, un PC desktop con una "corretta" GeForce RTX 3070 è ancora circa il 20% più veloce della nostra RTX 3070 versione mobile.
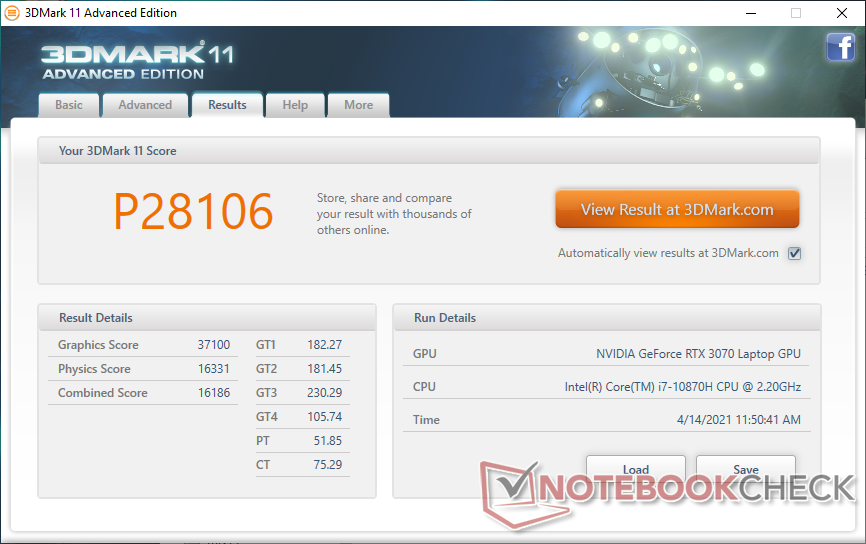
| 3DMark 11 Performance | 28106 punti | |
| 3DMark Cloud Gate Standard Score | 53987 punti | |
| 3DMark Fire Strike Score | 22371 punti | |
| 3DMark Time Spy Score | 10521 punti | |
Aiuto | ||
| basso | medio | alto | ultra | |
|---|---|---|---|---|
| GTA V (2015) | 181 | 166 | 96.6 | |
| The Witcher 3 (2015) | 362.7 | 298.1 | 206.9 | 107.9 |
| Dota 2 Reborn (2015) | 156 | 141 | 141 | 135 |
| Final Fantasy XV Benchmark (2018) | 175 | 142 | 103 | |
| X-Plane 11.11 (2018) | 116 | 104 | 85.7 | |
| Strange Brigade (2018) | 399 | 279 | 225 | 194 |
Emissioni
Rumorosità
Le ventole saranno spente quando il portatile è inattivo sul desktop senza altri programmi attivi. Tuttavia, anche un leggero aumento dell'utilizzo della CPU farà partire la ventola della CPU e quindi il portatile non sarà veramente silenzioso nella maggior parte degli scenari del mondo reale. Siamo in grado di registrare un rumore di 32,8 dB(A) durante la navigazione web o lo streaming video contro uno sfondo silenzioso di 24,7 dB(A). È abbastanza per essere evidente ma non particolarmente fastidioso.
Il rumore della ventola quando si gioca si aggira intorno ai 48.8 dB(A) senza pulsazioni o comportamenti anomali. Questo è più silenzioso di quello che abbiamo registrato sul vecchio GP65 mentre è alla pari con gli ultimi Alienware m15 R4, Aorus 15P, e Asus ROG Zephyrus G15, ognuno con grafica RTX 30.
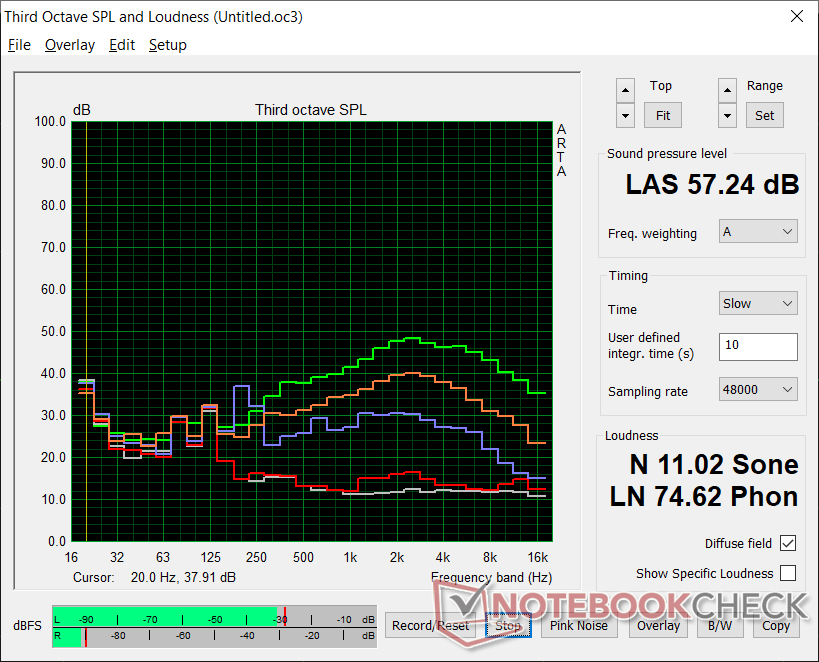
Se Cooler Boost (cioè la modalità massima della ventola) è abilitata, il rumore della ventola salta immediatamente a 57,2 dB(A) indipendentemente dal carico sullo schermo. Si tratta di un massiccio aumento del rumore della ventola per non un gran guadagno in termini di prestazioni, come la nostra sezione di Stress Test di seguito dettaglierà.
La nostra unità di test mostra un leggero fruscio di 26,8 dB(A) contro uno sfondo di 24,7 dB(A).
| MSI GP66 Leopard 10UG GeForce RTX 3070 Laptop GPU, i7-10870H, Kingston OM8PCP31024F | MSI GP65 10SFK-047US GeForce RTX 2070 Mobile, i7-10750H, Samsung SSD PM981 MZVLB1T0HALR | Alienware m15 R4 GeForce RTX 3070 Laptop GPU, i9-10980HK, Micron 2300 1TB MTFDHBA1T0TDV | Aorus 15P XC GeForce RTX 3070 Laptop GPU, i7-10870H, ESR512GTLCG-EAC-4 | Asus ROG Zephyrus G15 GA503Q GeForce RTX 3080 Laptop GPU, R9 5900HS, SK Hynix HFM001TD3JX013N | MSI GF65 Thin 10UE GeForce RTX 3060 Laptop GPU, i7-10750H, Samsung SSD PM981 MZVLB1T0HALR | |
|---|---|---|---|---|---|---|
| Noise | -15% | -4% | -4% | -4% | -9% | |
| off /ambiente * (dB) | 24.7 | 29.3 -19% | 24 3% | 24 3% | 25 -1% | 24.7 -0% |
| Idle Minimum * (dB) | 26.8 | 31.9 -19% | 25 7% | 25 7% | 26 3% | 33.1 -24% |
| Idle Average * (dB) | 26.8 | 31.9 -19% | 26 3% | 29 -8% | 27 -1% | 33.1 -24% |
| Idle Maximum * (dB) | 26.8 | 33.5 -25% | 37 -38% | 34 -27% | 31 -16% | 33.1 -24% |
| Load Average * (dB) | 40.4 | 47 -16% | 48 -19% | 44 -9% | 49 -21% | 42.7 -6% |
| Witcher 3 ultra * (dB) | 48.8 | 53.8 -10% | 47 4% | 49 -0% | 49 -0% | 40.6 17% |
| Load Maximum * (dB) | 57.2 | 56.7 1% | 49 14% | 53 7% | 51 11% | 59.4 -4% |
* ... Meglio usare valori piccoli
Rumorosità
| Idle |
| 26.8 / 26.8 / 26.8 dB(A) |
| Sotto carico |
| 40.4 / 57.2 dB(A) |
 | ||
30 dB silenzioso 40 dB(A) udibile 50 dB(A) rumoroso |
||
min: | ||
Temperature
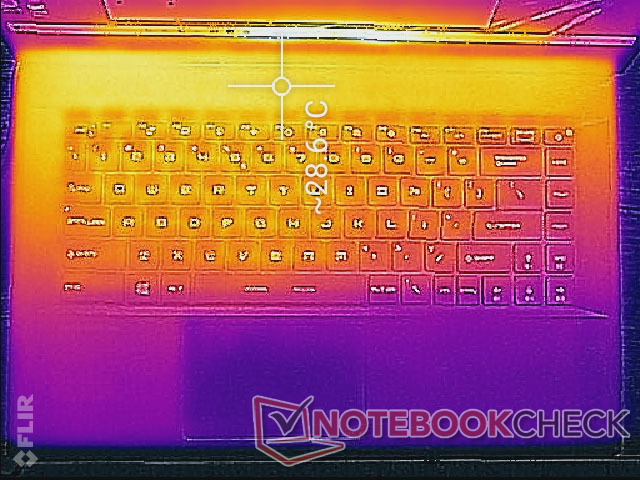
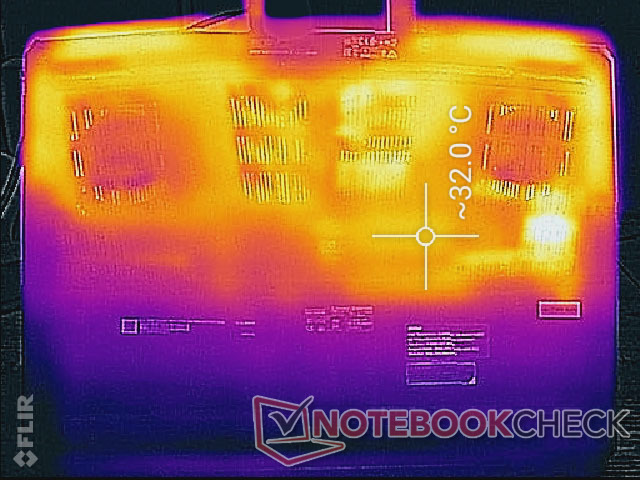
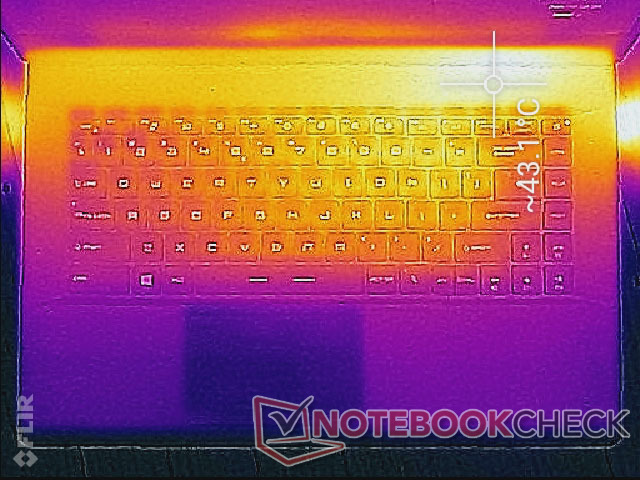
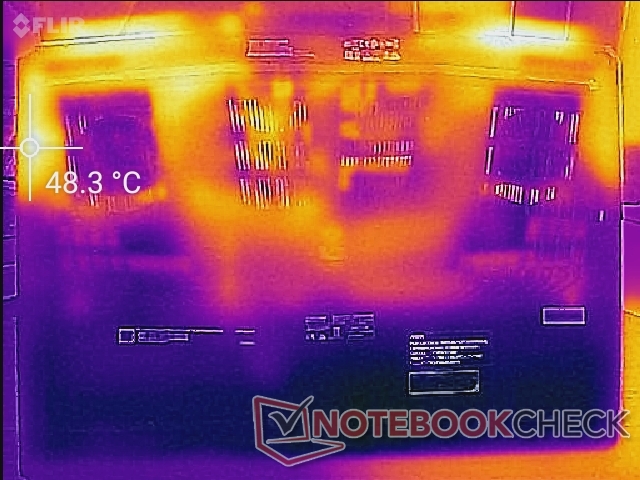
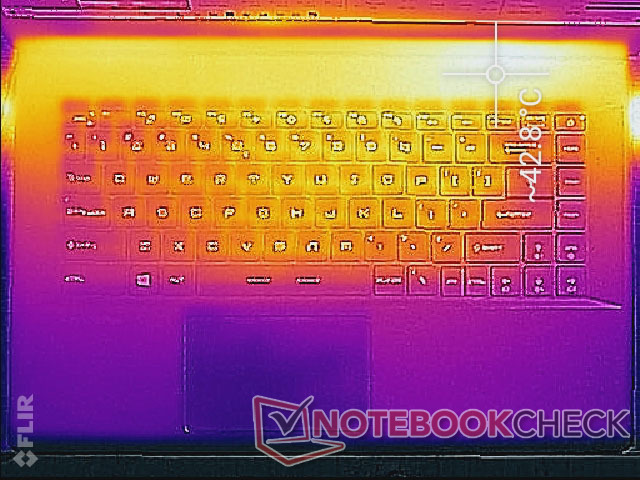
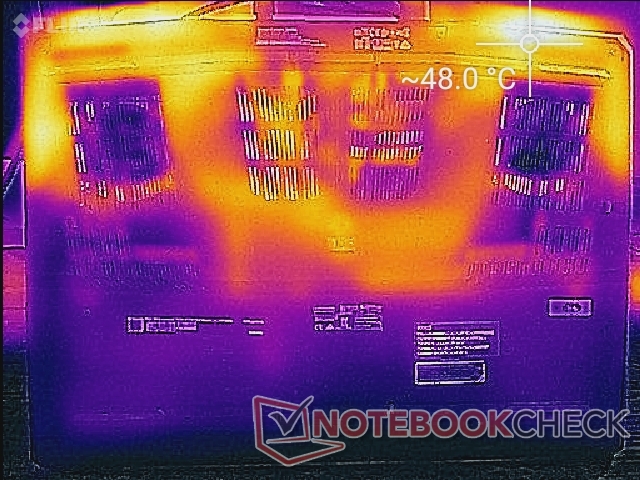
Le temperature di superficie sono leggermente più fredde che sul GP65. Quando si gioca, i punti caldi sul GP66 raggiungono 43° C e 48° C sulla parte superiore e inferiore della base, rispettivamente, rispetto ai 46° C-50° C del GP65. Inoltre, i punti caldi sono ora situati sopra la prima fila di tasti della tastiera per un'esperienza di digitazione più fresca, mentre i punti caldi del GP65 e anche del GS66 sono più vicini al centro della tastiera.
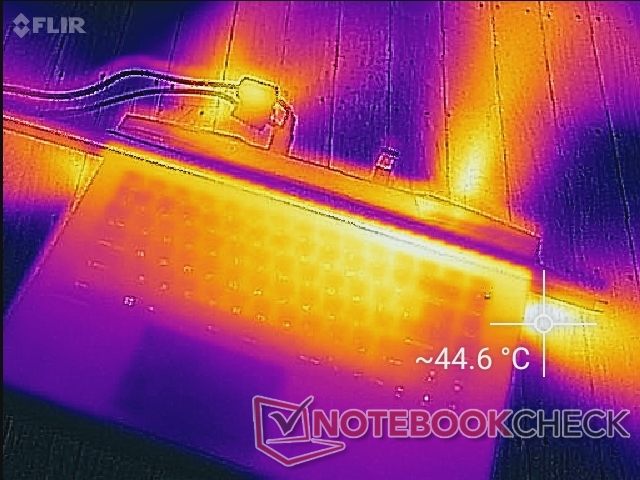
(±) La temperatura massima sul lato superiore è di 42.8 °C / 109 F, rispetto alla media di 40.4 °C / 105 F, che varia da 21.2 a 68.8 °C per questa classe Gaming.
(-) Il lato inferiore si riscalda fino ad un massimo di 50 °C / 122 F, rispetto alla media di 43.2 °C / 110 F
(+) In idle, la temperatura media del lato superiore è di 29.4 °C / 85 F, rispetto alla media deld ispositivo di 33.9 °C / 93 F.
(±) Riproducendo The Witcher 3, la temperatura media per il lato superiore e' di 33.4 °C / 92 F, rispetto alla media del dispositivo di 33.9 °C / 93 F.
(+) I poggiapolsi e il touchpad sono piu' freddi della temperatura della pelle con un massimo di 25.8 °C / 78.4 F e sono quindi freddi al tatto.
(+) La temperatura media della zona del palmo della mano di dispositivi simili e'stata di 28.8 °C / 83.8 F (+3 °C / 5.4 F).
Test di stress
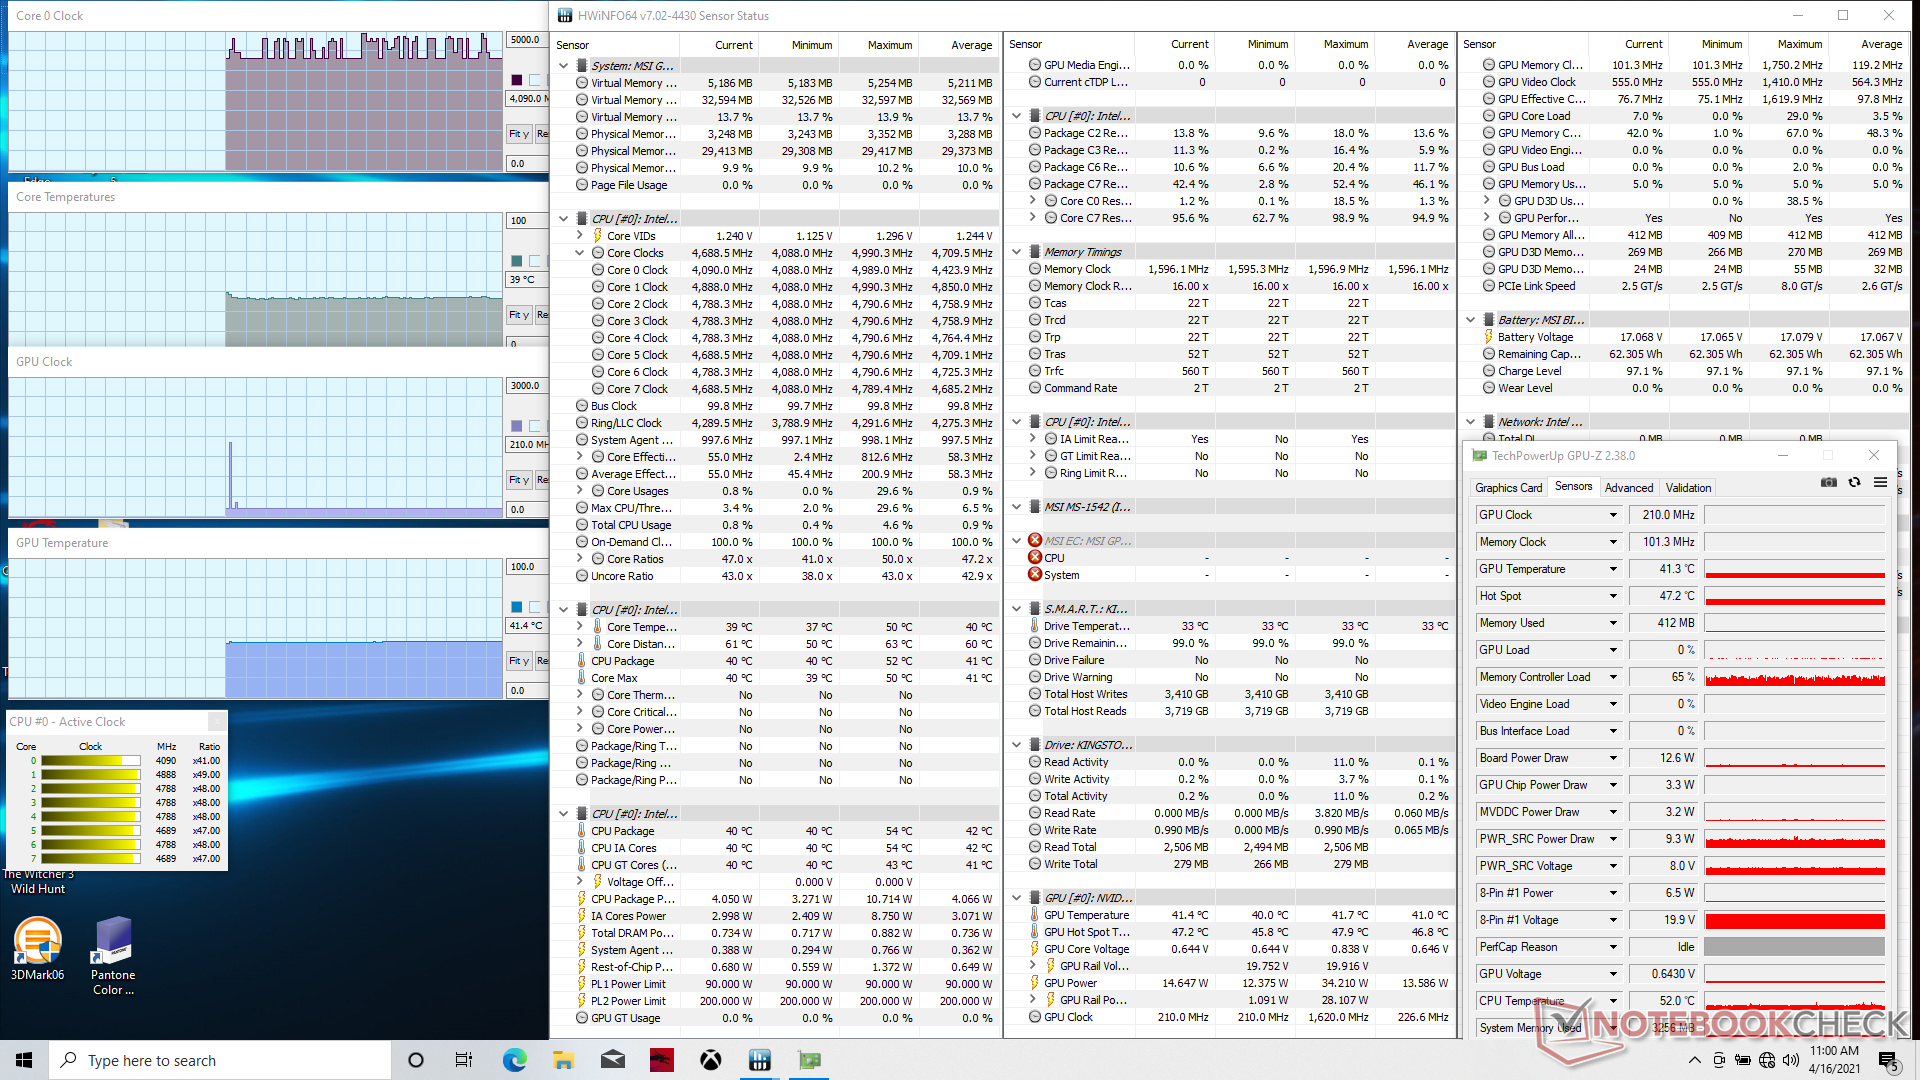
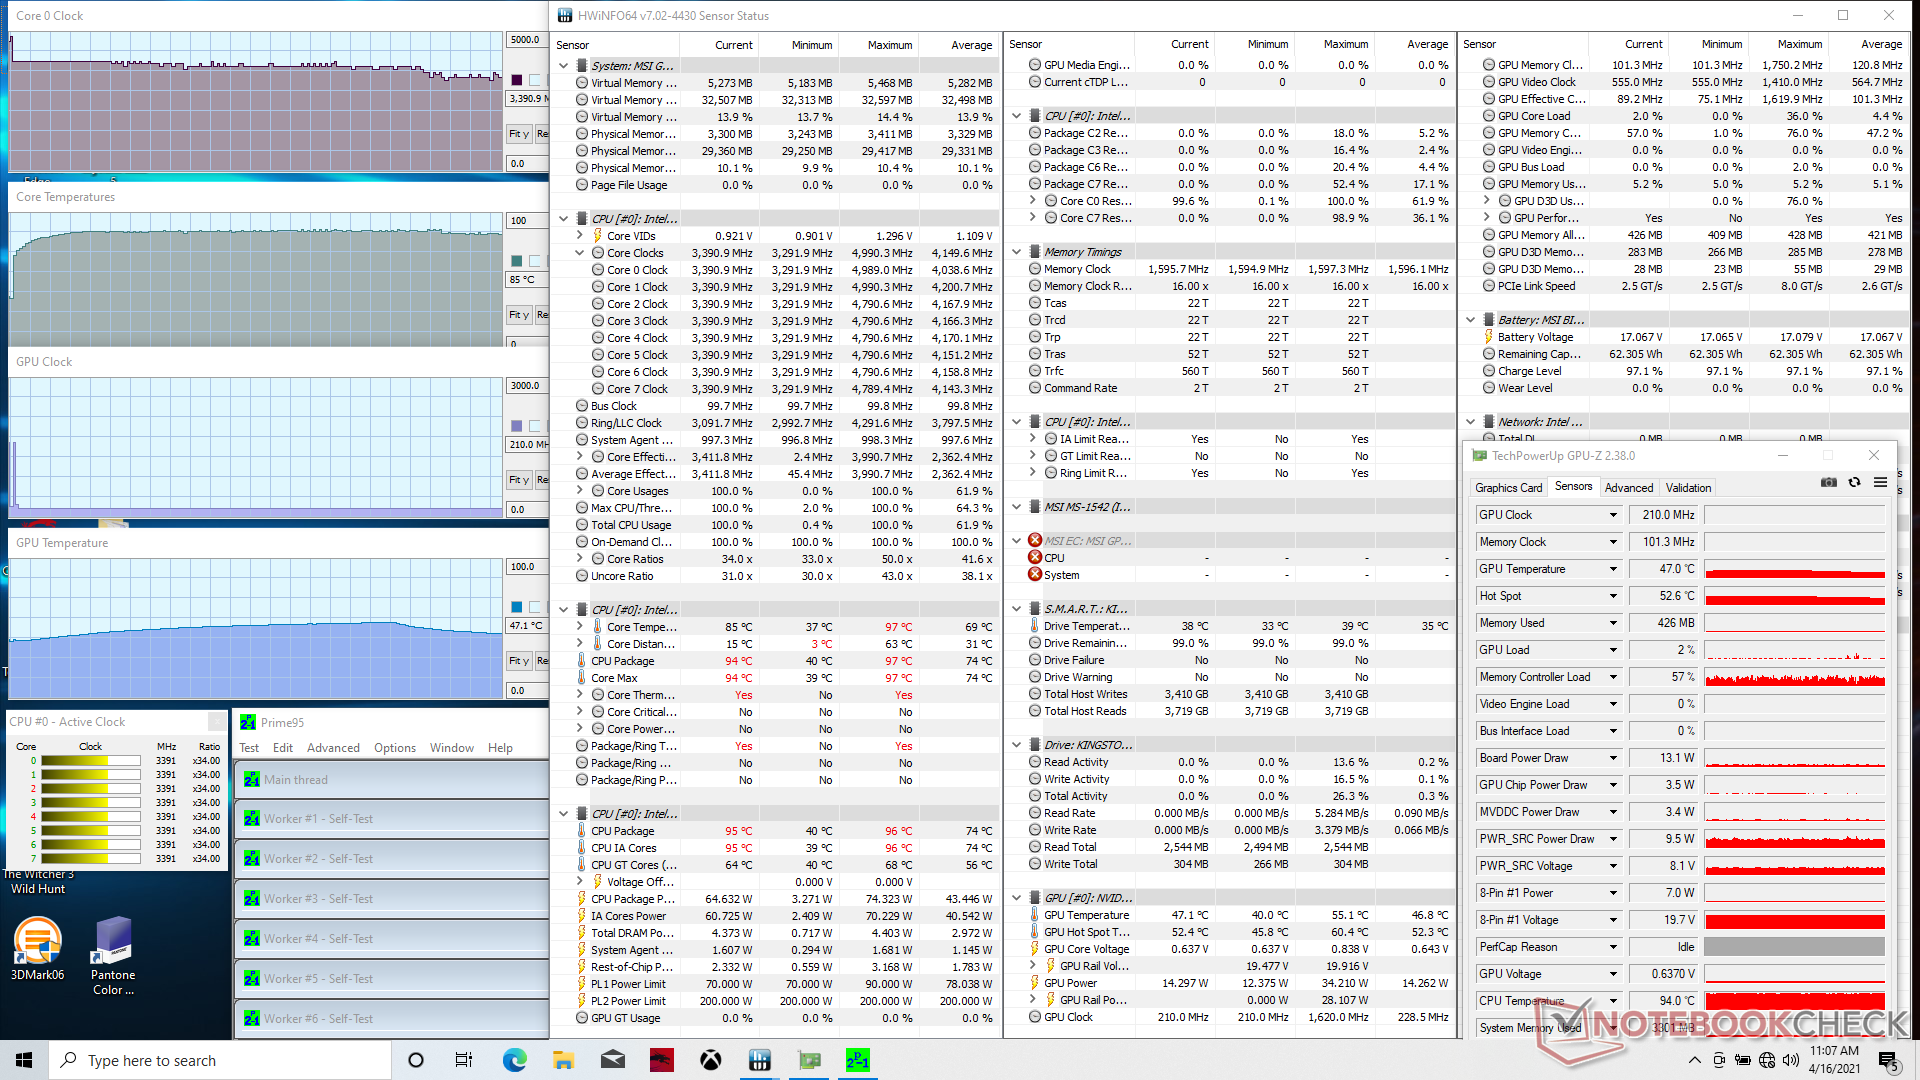
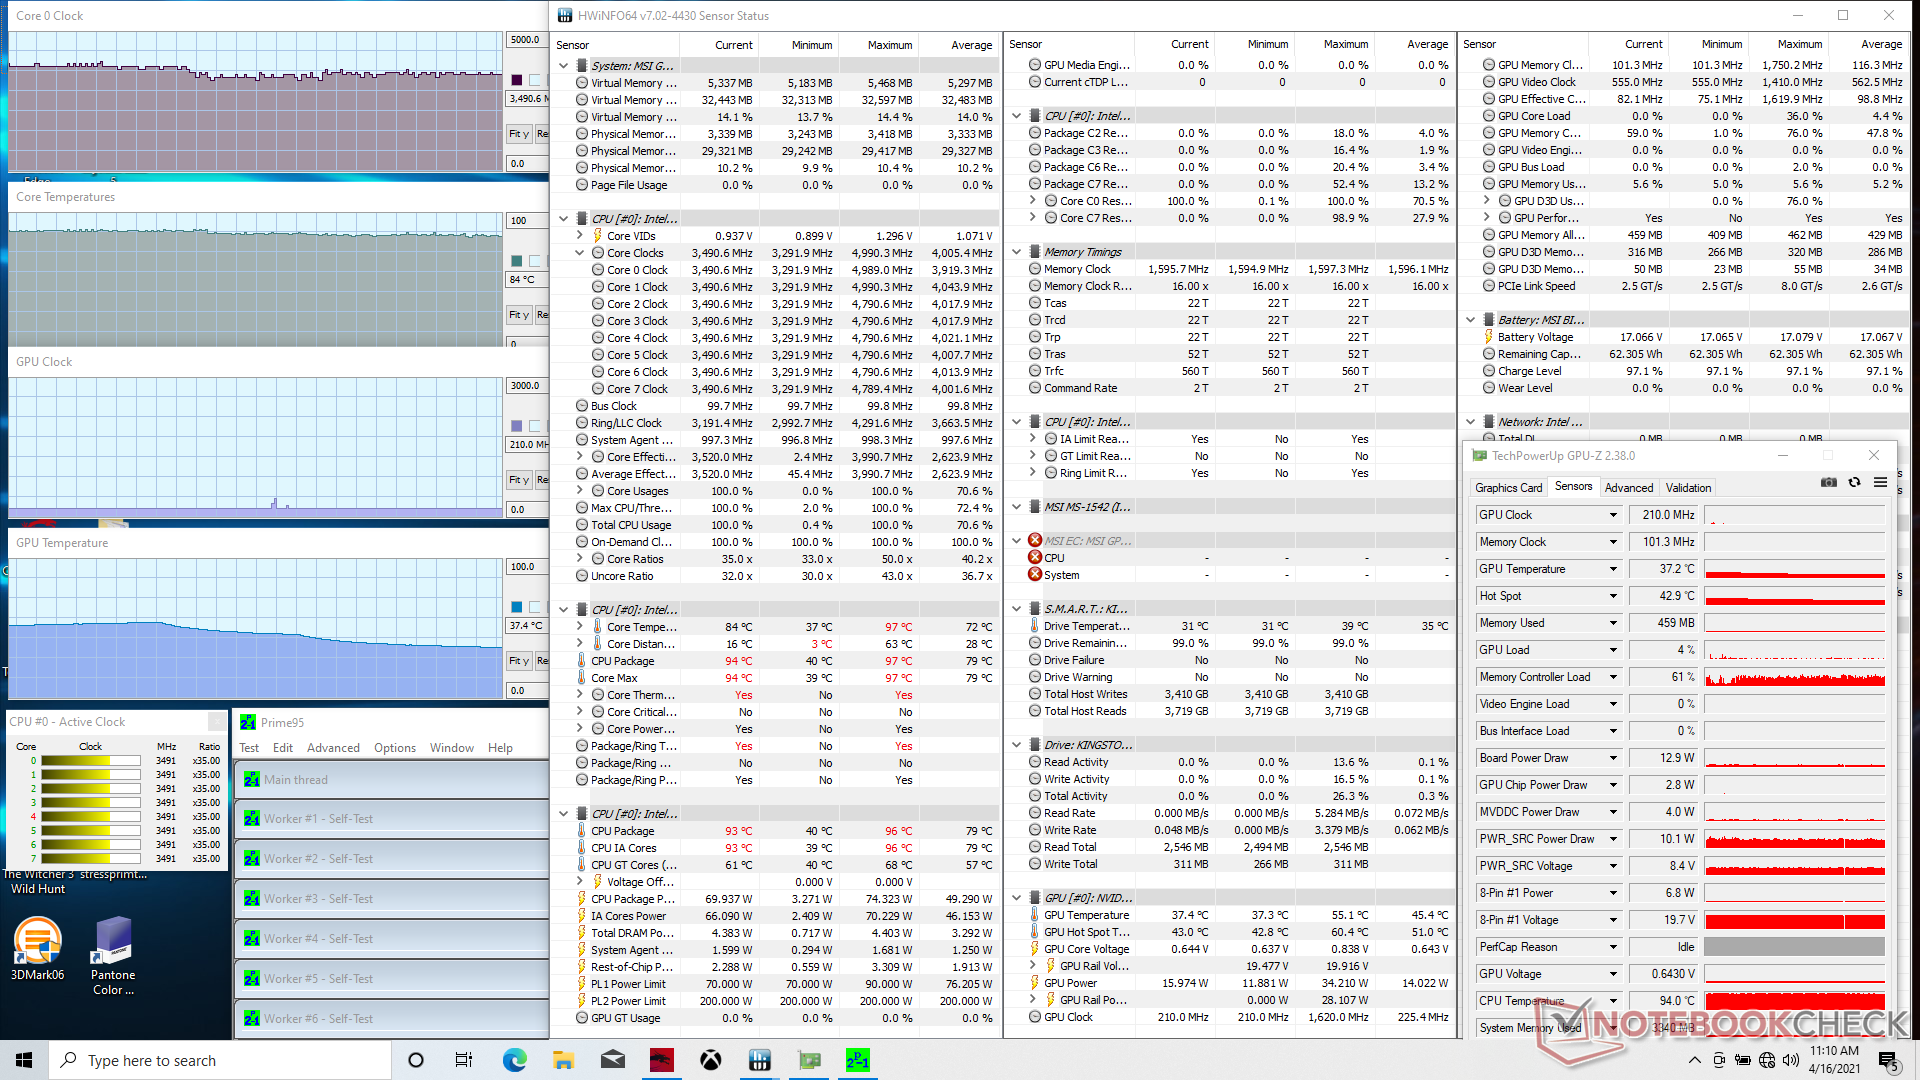
Quando si esegue Prime95 per stressare il processore, le frequenze di clock della CPU aumentano a 4 GHz fino a raggiungere una temperatura del core di 88° C circa 20 secondi dopo. Dopodiché, le frequenze di clock scendevano costantemente e si stabilizzavano tra i 3,2 e i 3,4 GHz per mantenere una temperatura del core leggermente più fredda di 85° C. Abilitando la modalità Cooler Boost si ottenevano solo cambiamenti molto piccoli alle frequenze di clock della CPU e alla temperatura.
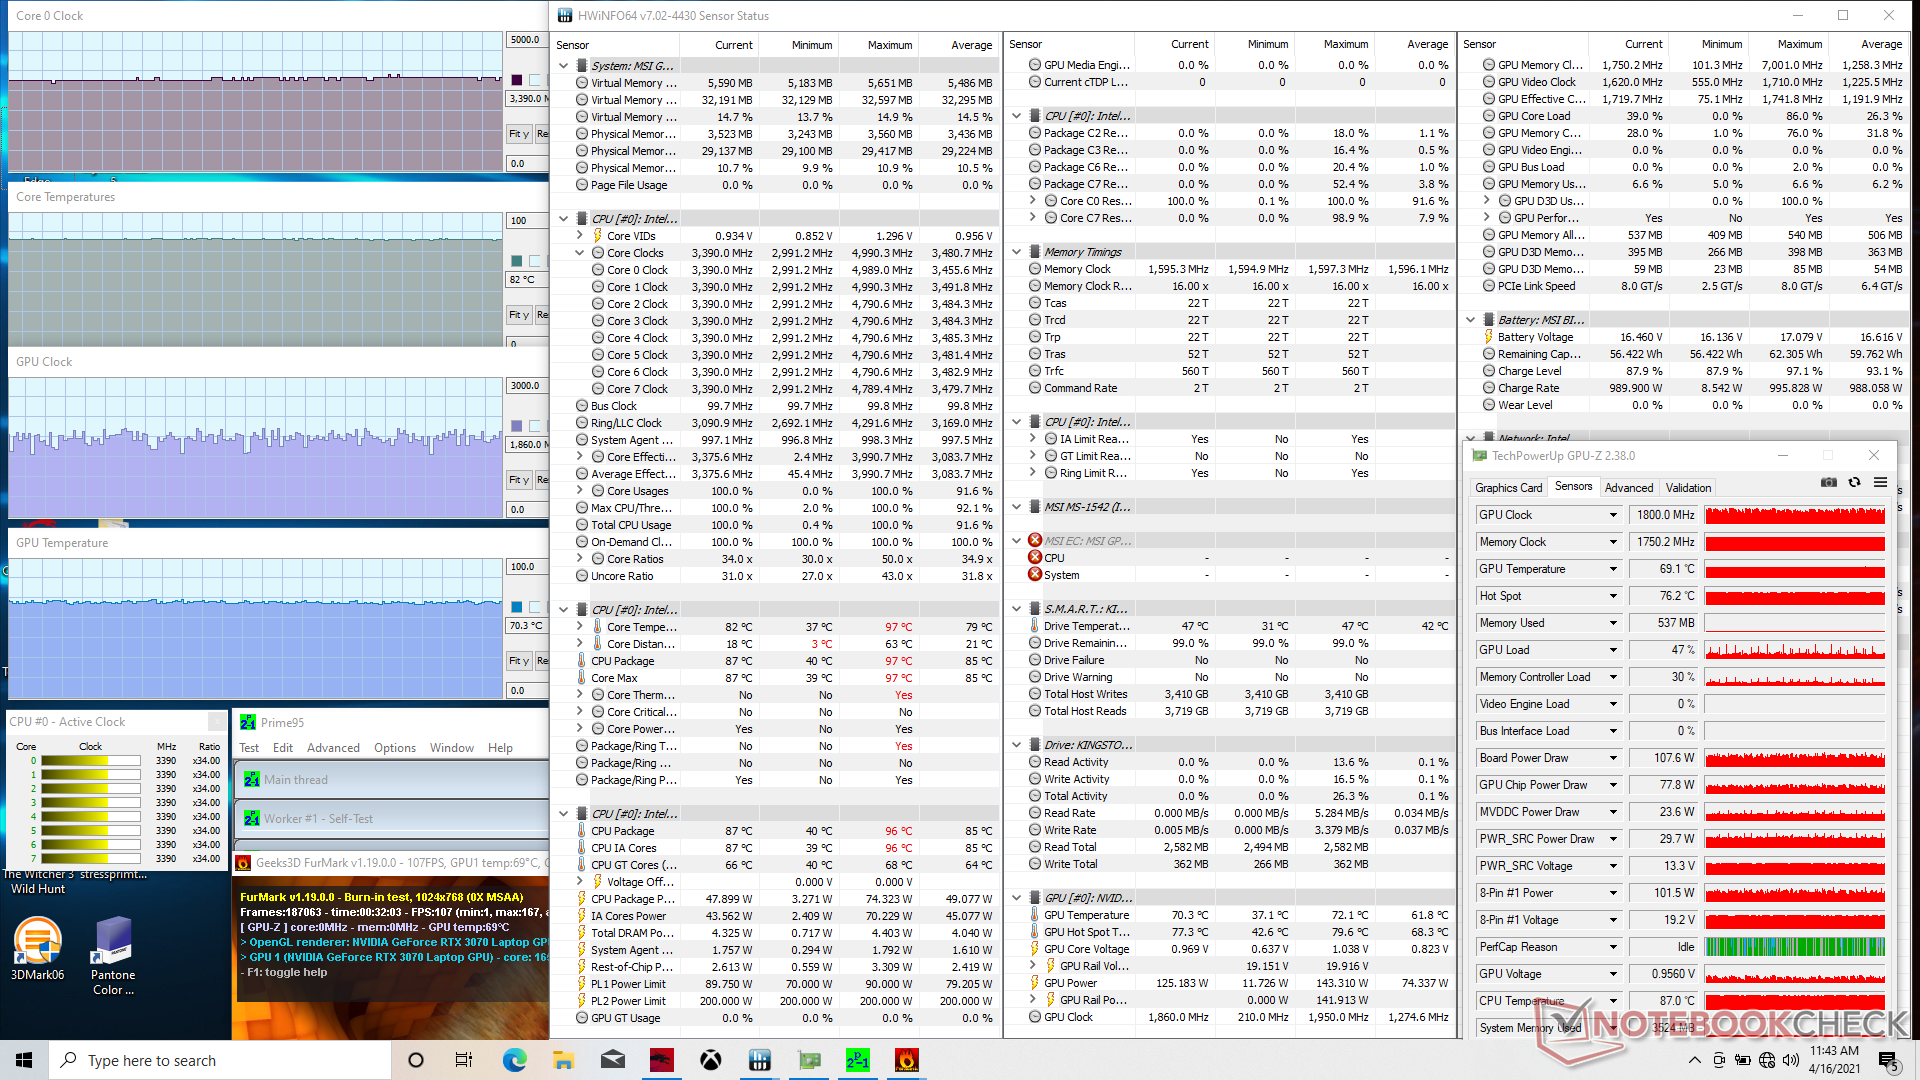
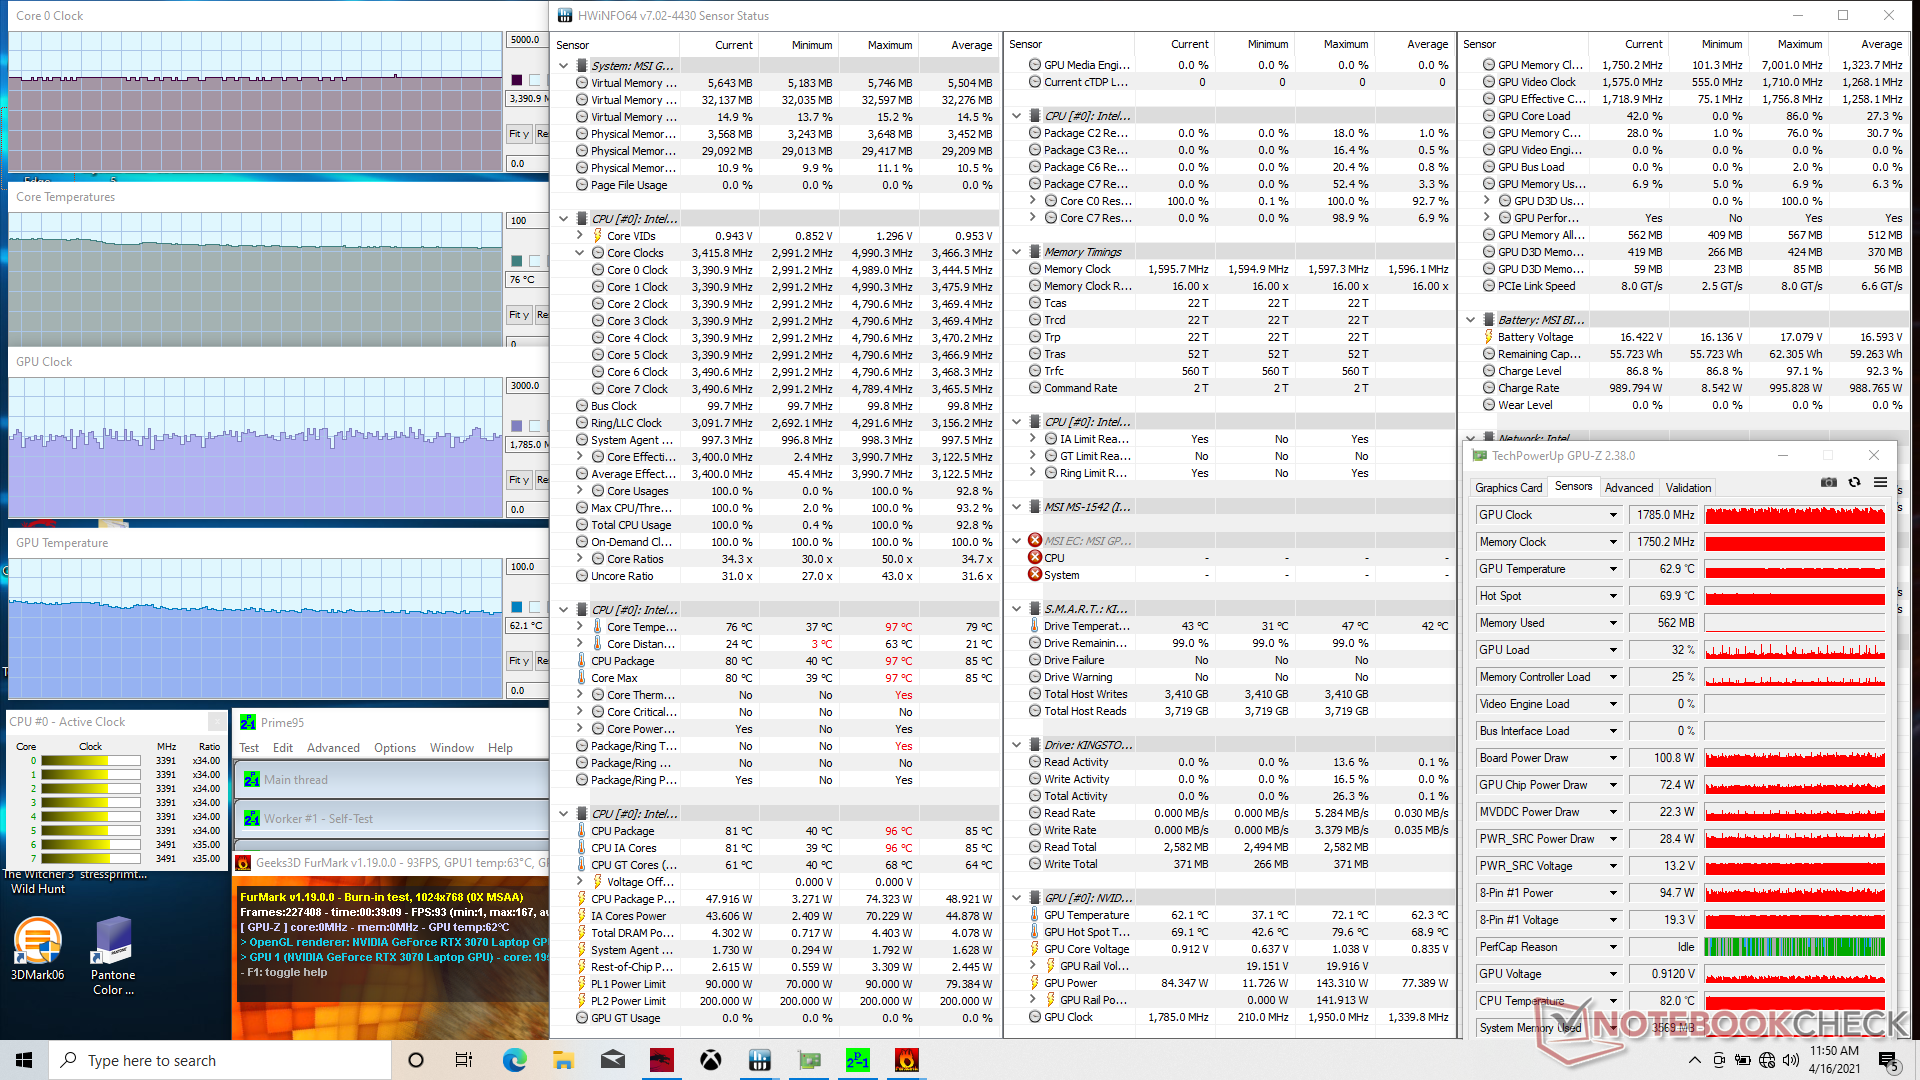
L'esecuzione simultanea di Prime95 e FurMark porta a temperature stabili di CPU e GPU di 82° C e 70° C, rispettivamente. Se Cooler Boost è attivo, le temperature dei core diminuiscono di circa 8° C ciascuna.
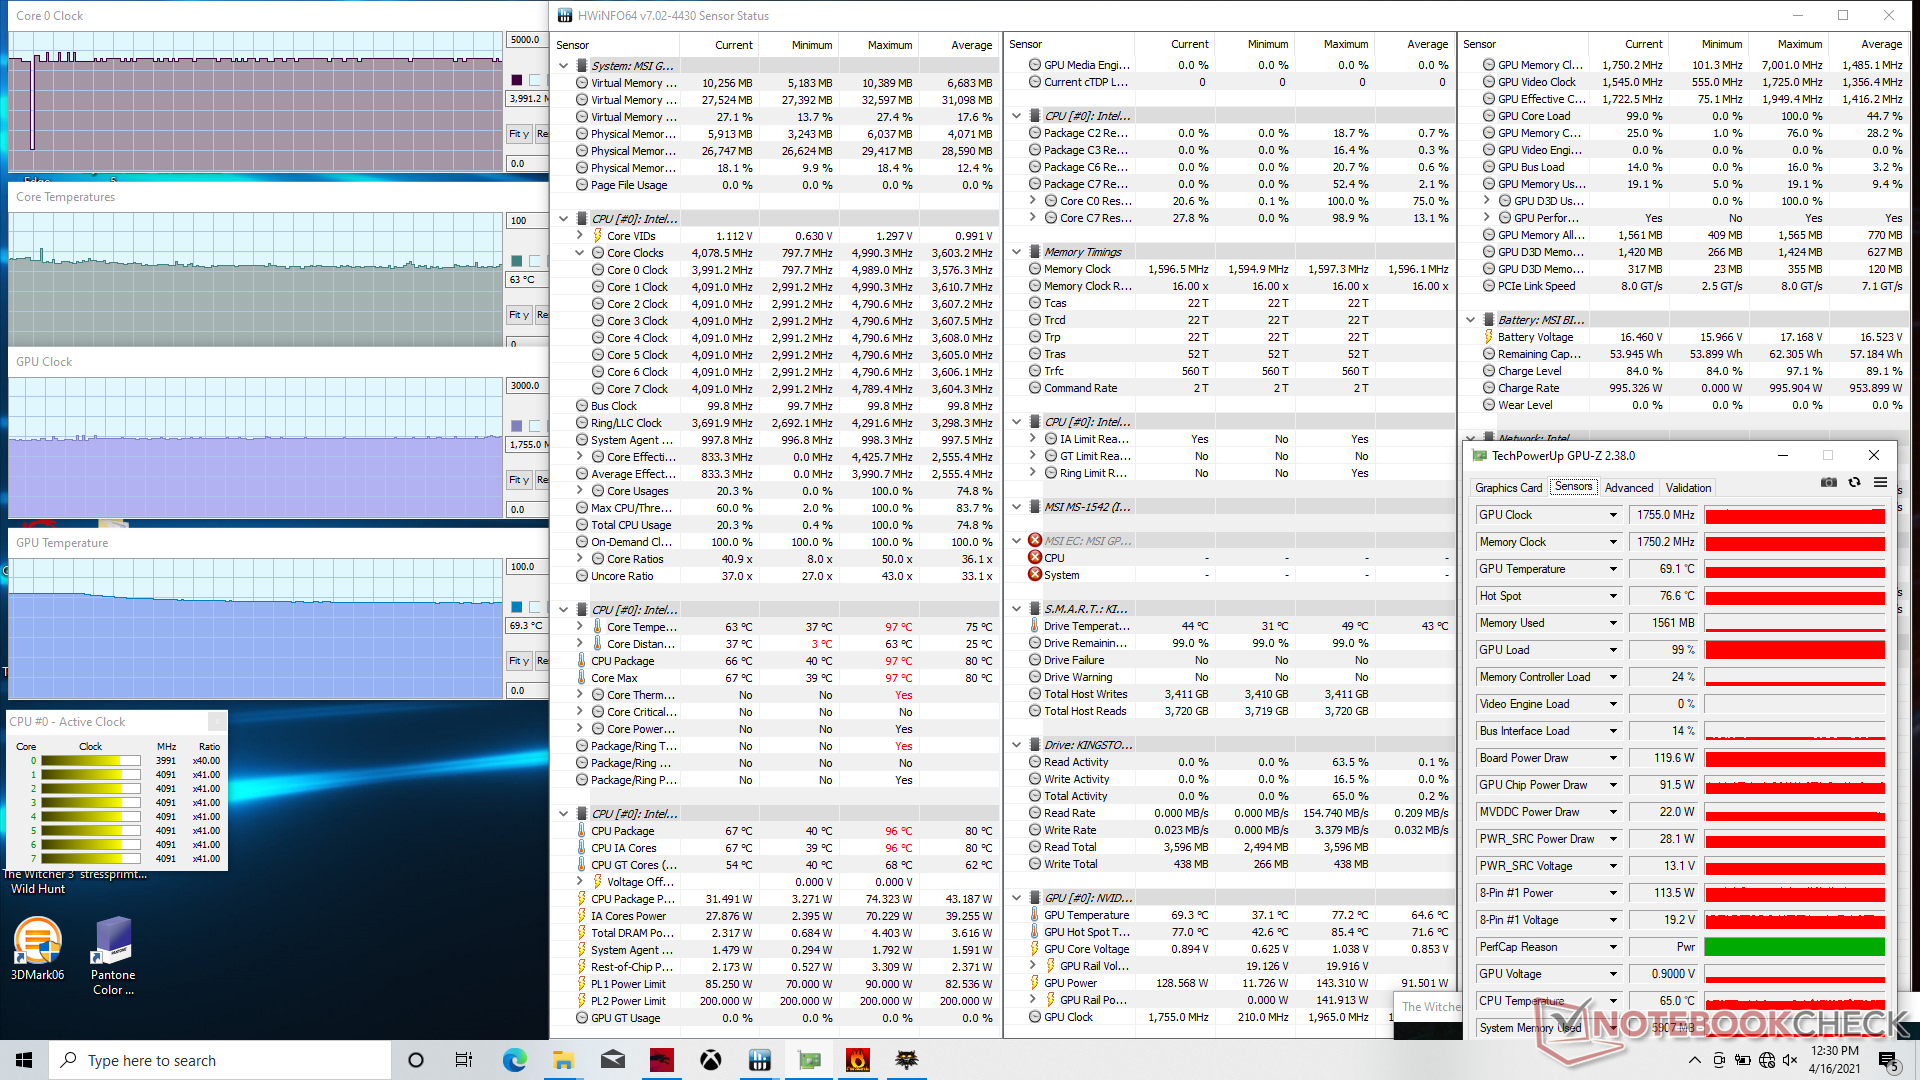
Quando si esegue The Witcher 3 per rappresentare lo stress da gioco del mondo reale, le temperature del core si stabilizzano nell'intervallo da 67° C a 76° C se il Cooler Boost è spento e da 63° a 69° C se il Cooler Boost è attivo. Le frequenze di clock della GPU aumentano leggermente da 1680 MHz a 1755 MHz con un assorbimento della scheda da 120 W a 130 W come pubblicizzato dal produttore. Eseguendo questo stesso test sul GP65 si ottengono temperature più calde di CPU e GPU di 96° C e 79° C.
L'utilizzo di batterie limita le prestazioni. Un test su Fire Strike con l'alimentazione a batteria ha restituito punteggi di fisica e grafica di 12004 e 6385 punti, rispettivamente, rispetto a 20842 e 28490 punti con l'alimentazione di rete.

| Clock della CPU (GHz)Clock della GPU(MHz)Temperatura media dellaCPU (°C)Temperaturamedia dellaGPU (°C) |
| Sistema inattivo |
| Prime95 Stress (Cooler Boost off) |
| Prime95 Stress (CoolerBoost on) |
| Prime95+ FurMark Stress (Cooler Boost off) |
| Prime95 + FurMark Stress (Cooler Boost on) |
| Witcher 3 Stress (Cooler Boost off) |
| Witcher 3 Stress (Cooler Boost on) |
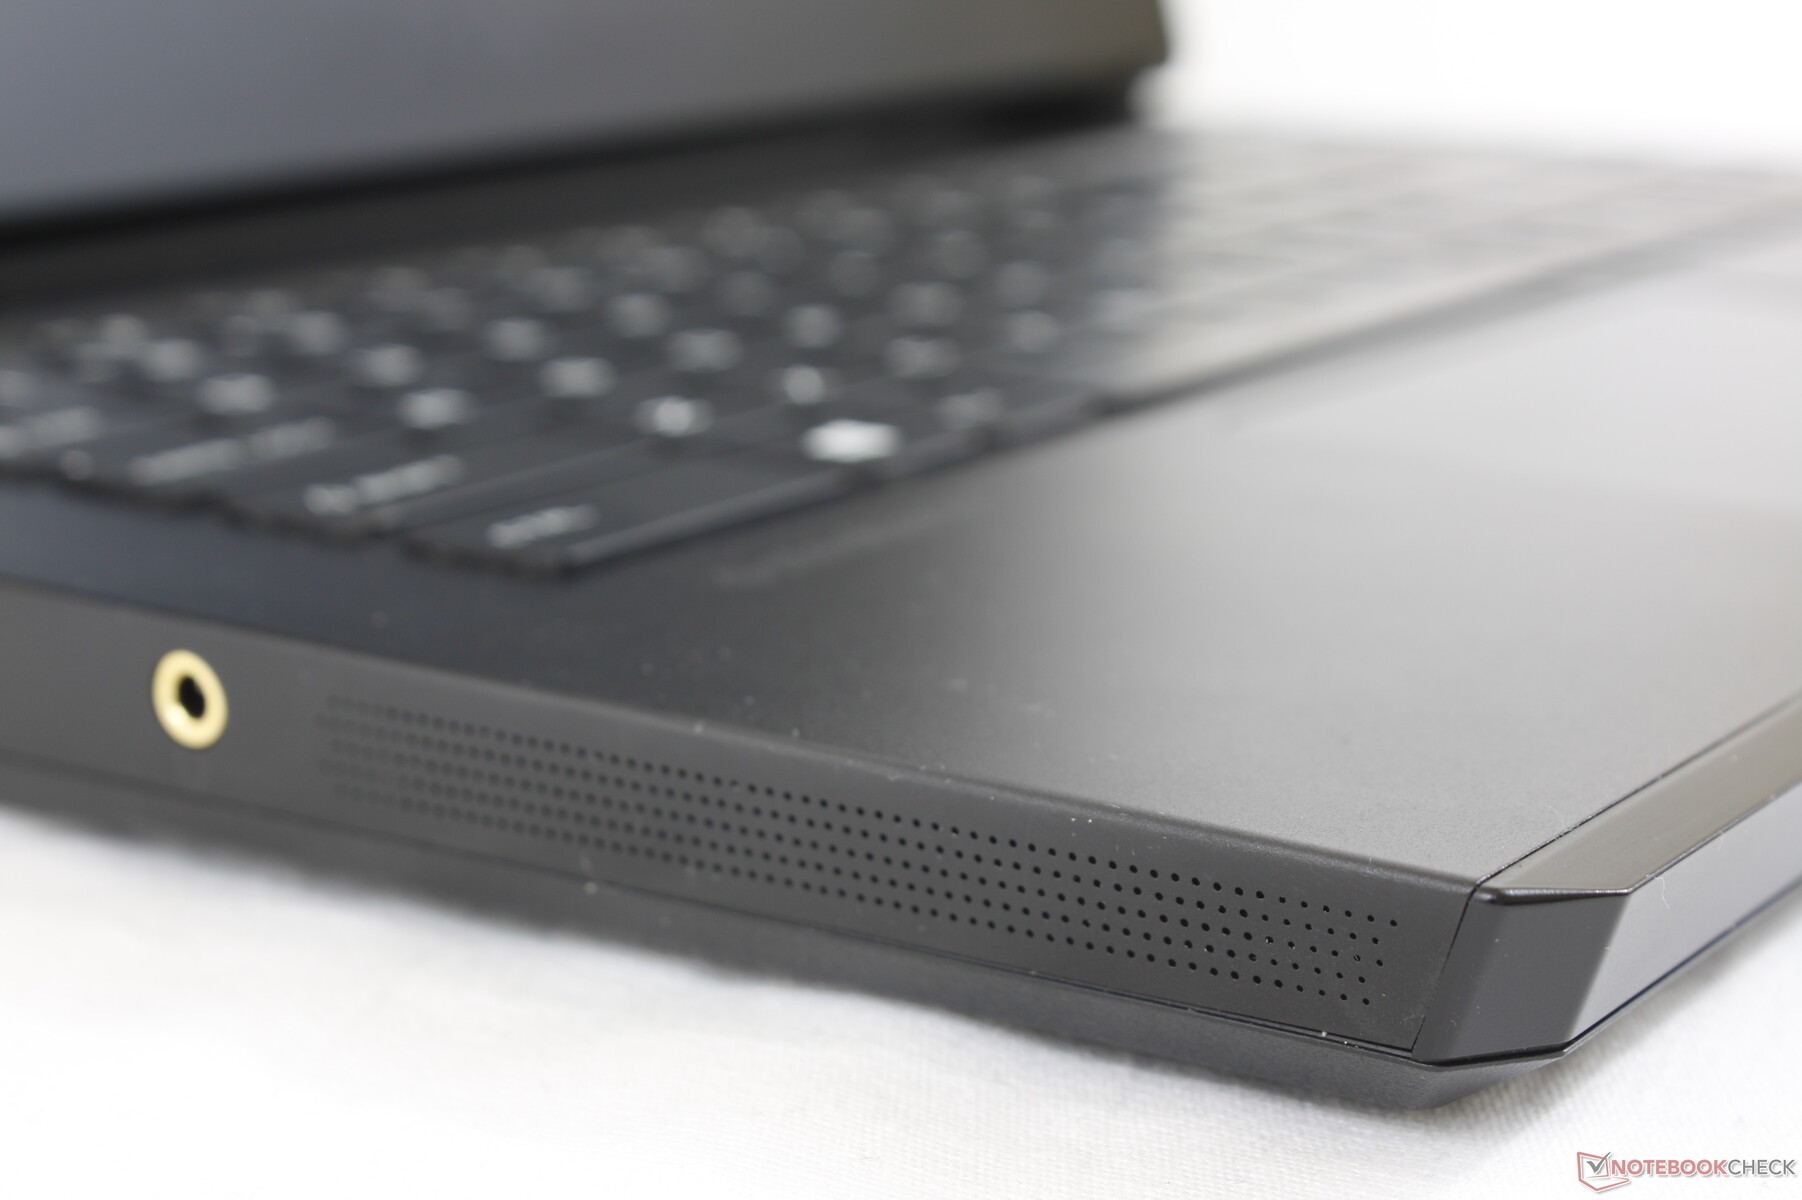
Altoparlanti


MSI GP66 Leopard 10UG analisi audio
(±) | potenza degli altiparlanti media ma buona (81.3 dB)
Bassi 100 - 315 Hz
(-) | quasi nessun basso - in media 18.4% inferiori alla media
(±) | la linearità dei bassi è media (11% delta rispetto alla precedente frequenza)
Medi 400 - 2000 Hz
(±) | medi elevati - circa 5.1% superiore alla media
(+) | medi lineari (4.6% delta rispetto alla precedente frequenza)
Alti 2 - 16 kHz
(±) | alti elevati - circa 5.9% superiori alla media
(±) | la linearità degli alti è media (9.2% delta rispetto alla precedente frequenza)
Nel complesso 100 - 16.000 Hz
(±) | la linearità complessiva del suono è media (19.3% di differenza rispetto alla media
Rispetto alla stessa classe
» 65% di tutti i dispositivi testati in questa classe è stato migliore, 8% simile, 27% peggiore
» Il migliore ha avuto un delta di 6%, medio di 18%, peggiore di 132%
Rispetto a tutti i dispositivi testati
» 47% di tutti i dispositivi testati in questa classe è stato migliore, 8% similare, 46% peggiore
» Il migliore ha avuto un delta di 4%, medio di 23%, peggiore di 134%
Apple MacBook 12 (Early 2016) 1.1 GHz analisi audio
(+) | gli altoparlanti sono relativamente potenti (83.6 dB)
Bassi 100 - 315 Hz
(±) | bassi ridotti - in media 11.3% inferiori alla media
(±) | la linearità dei bassi è media (14.2% delta rispetto alla precedente frequenza)
Medi 400 - 2000 Hz
(+) | medi bilanciati - solo only 2.4% rispetto alla media
(+) | medi lineari (5.5% delta rispetto alla precedente frequenza)
Alti 2 - 16 kHz
(+) | Alti bilanciati - appena 2% dalla media
(+) | alti lineari (4.5% delta rispetto alla precedente frequenza)
Nel complesso 100 - 16.000 Hz
(+) | suono nel complesso lineare (10.2% differenza dalla media)
Rispetto alla stessa classe
» 7% di tutti i dispositivi testati in questa classe è stato migliore, 2% simile, 90% peggiore
» Il migliore ha avuto un delta di 5%, medio di 18%, peggiore di 53%
Rispetto a tutti i dispositivi testati
» 5% di tutti i dispositivi testati in questa classe è stato migliore, 1% similare, 94% peggiore
» Il migliore ha avuto un delta di 4%, medio di 23%, peggiore di 134%
Gestione energetica
Consumo di energia
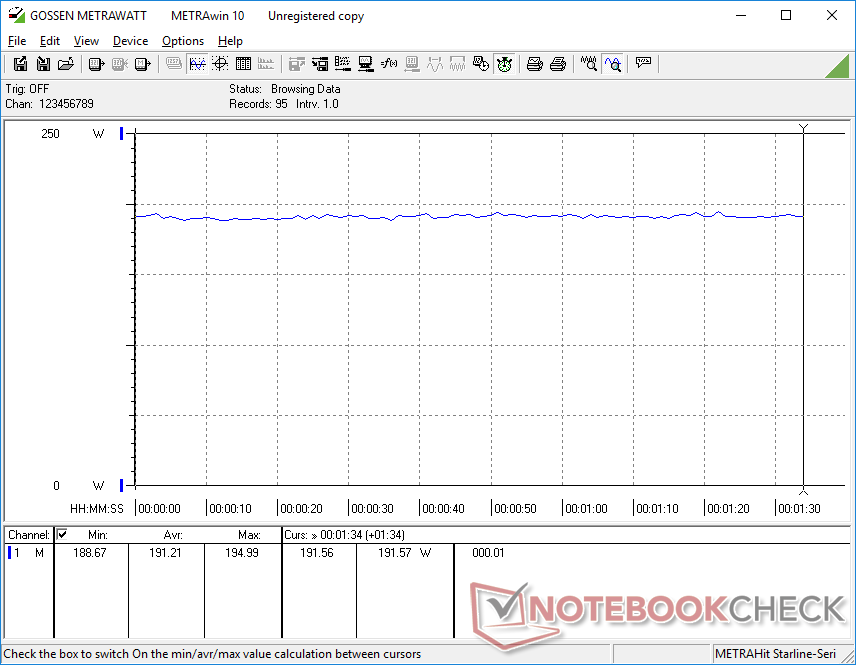
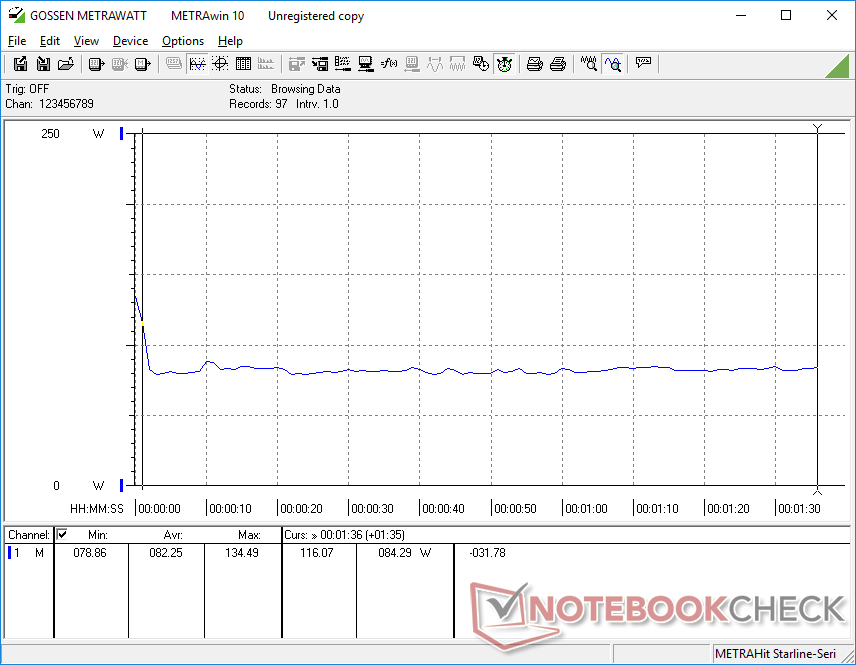
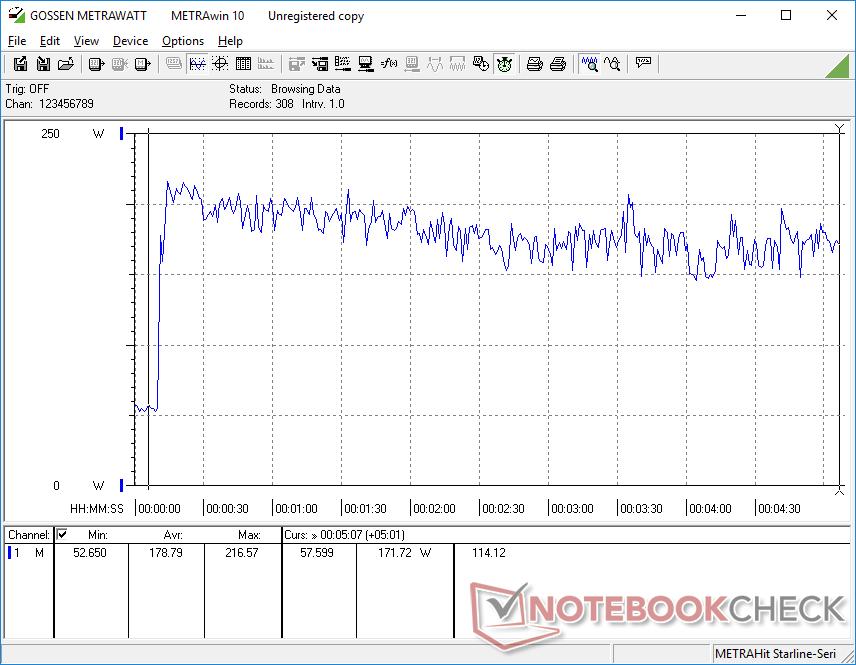
Il consumo complessivo di energia è molto più vicino al GP65 di quanto ci aspettassimo. Per esempio, il funzionamento al minimo sul desktop consuma tra i 13 W e i 23 W, quasi come il GP65. Eseguendo The Witcher 3 si ha una media di 191 W per essere solo il 3% in più rispetto al GP65, pur offrendo un aumento del 40-45% delle prestazioni grafiche. L'aumento gen-to-gen delle prestazioni per watt è impressionante a questo proposito.
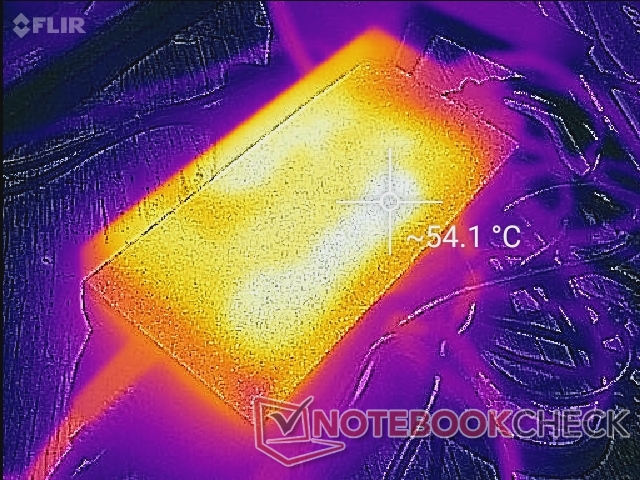
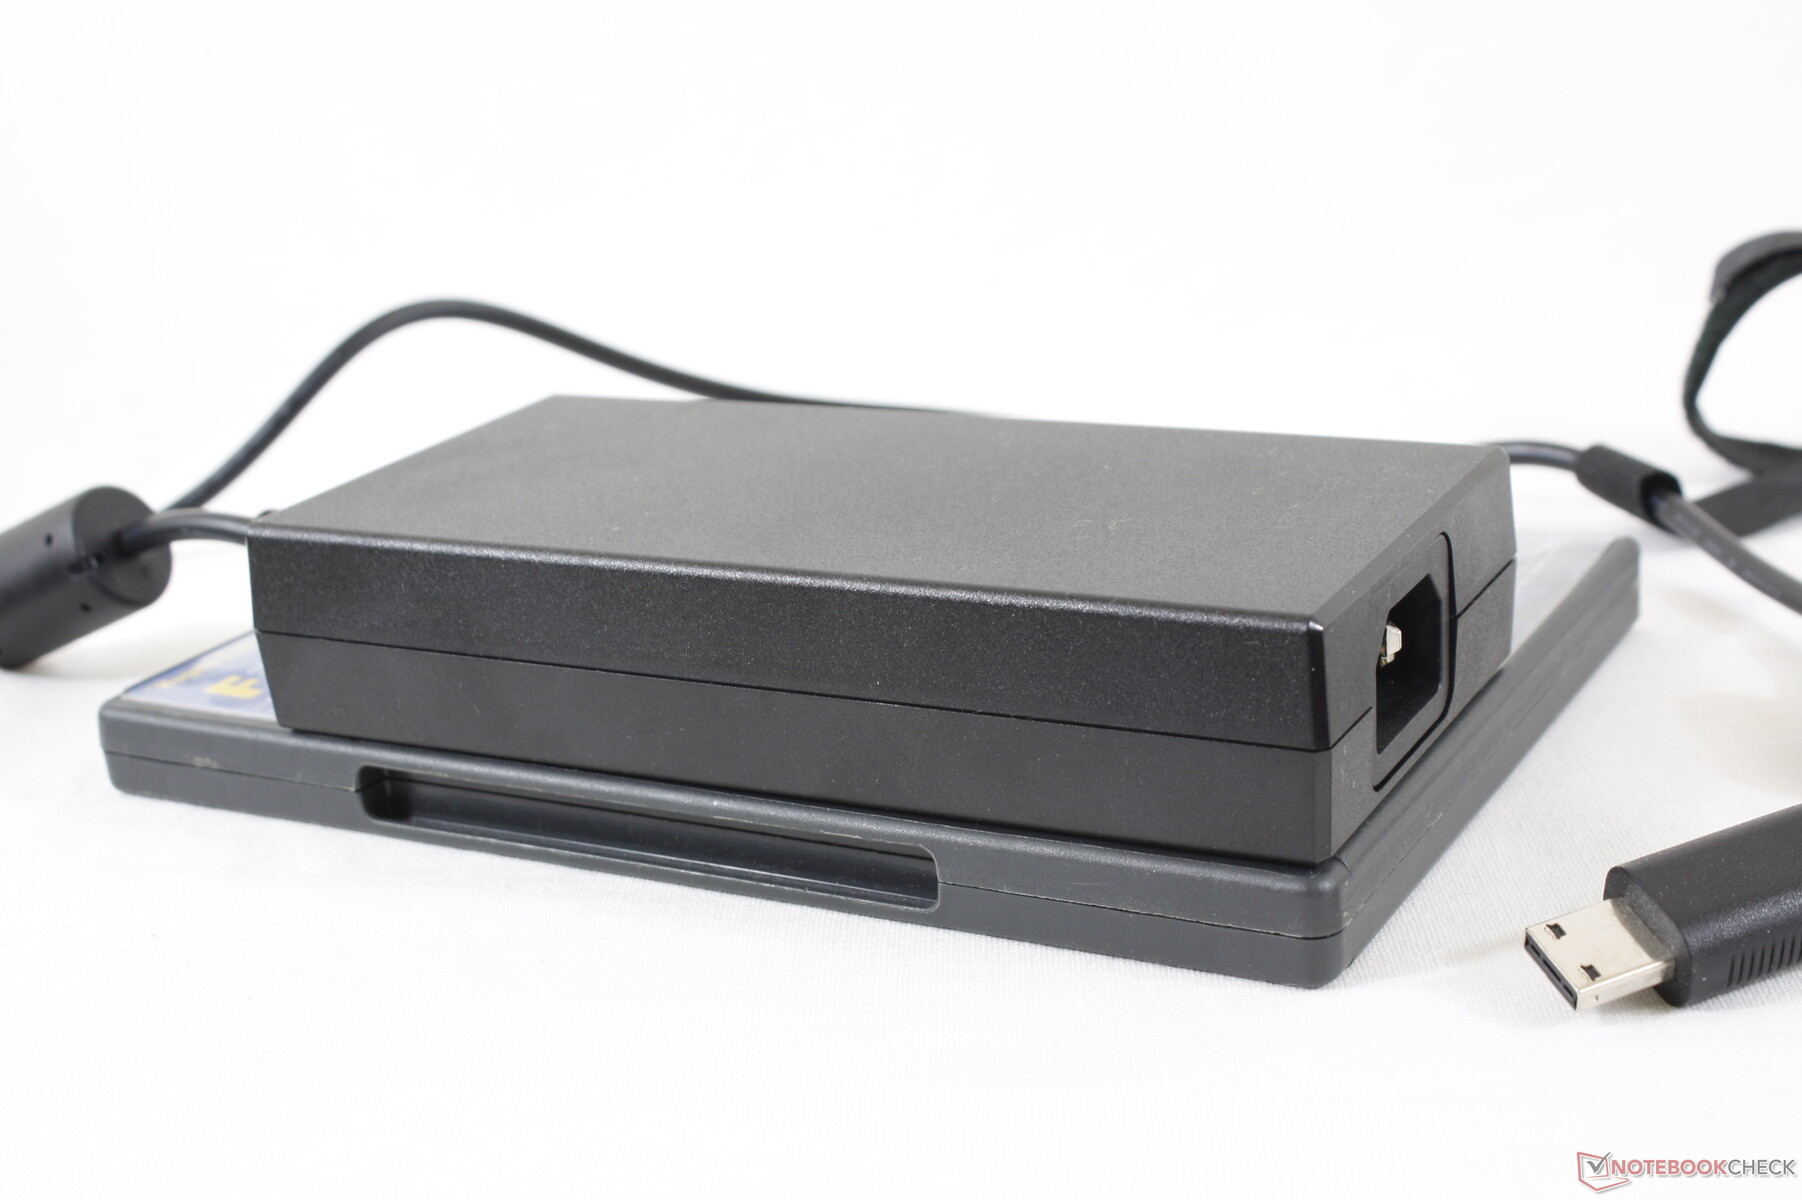
Siamo in grado di registrare un assorbimento massimo di 216 W dall'adattatore AC 230 W di medie dimensioni (~15,3 x 7,3 x 3,0 cm).

| Off / Standby | |
| Idle | |
| Sotto carico |
|
Leggenda:
min: | |
| MSI GP66 Leopard 10UG i7-10870H, GeForce RTX 3070 Laptop GPU, Kingston OM8PCP31024F, IPS, 1920x1080, 15.6" | MSI GP65 10SFK-047US i7-10750H, GeForce RTX 2070 Mobile, Samsung SSD PM981 MZVLB1T0HALR, IPS, 1920x1080, 15.6" | Alienware m15 R4 i9-10980HK, GeForce RTX 3070 Laptop GPU, Micron 2300 1TB MTFDHBA1T0TDV, IPS, 1920x1080, 15.6" | Aorus 15P XC i7-10870H, GeForce RTX 3070 Laptop GPU, ESR512GTLCG-EAC-4, IPS, 1920x1080, 15.6" | Asus ROG Zephyrus G15 GA503Q R9 5900HS, GeForce RTX 3080 Laptop GPU, SK Hynix HFM001TD3JX013N, IPS-Level, 2560x1440, 15.6" | MSI GF65 Thin 10UE i7-10750H, GeForce RTX 3060 Laptop GPU, Samsung SSD PM981 MZVLB1T0HALR, IPS, 1920x1080, 15.6" | |
|---|---|---|---|---|---|---|
| Power Consumption | -2% | -68% | -8% | 21% | 29% | |
| Idle Minimum * (Watt) | 15.3 | 14.2 7% | 35 -129% | 14 8% | 10 35% | 5.4 65% |
| Idle Average * (Watt) | 21.2 | 18.8 11% | 39 -84% | 17 20% | 12 43% | 12.8 40% |
| Idle Maximum * (Watt) | 22.3 | 23.9 -7% | 48 -115% | 33 -48% | 17 24% | 19.5 13% |
| Load Average * (Watt) | 82.3 | 96.9 -18% | 135 -64% | 96 -17% | 108 -31% | 86.6 -5% |
| Witcher 3 ultra * (Watt) | 191.2 | 185 3% | 194 -1% | 179 6% | 123 36% | 115.7 39% |
| Load Maximum * (Watt) | 216.6 | 233.4 -8% | 252 -16% | 256 -18% | 182 16% | 175.2 19% |
* ... Meglio usare valori piccoli
Durata della batteria
La capacità della batteria è aumentata da 51 Wh sul GP65 a 65 Wh sul GP66. Anche i tempi di autonomia della WLAN sono ora molto più lunghi con poco più di 5 ore, quasi 1,5 ore in più rispetto a quanto registrato sul GP65.
La durata massima della batteria, tuttavia, avrebbe potuto essere migliore. Impostando il sistema in modalità Super Battery con la luminosità al minimo e l'iGPU attiva si otterrebbe un'autonomia totale di appena 6,5 ore, che non è molto più lunga delle nostre impostazioni WLAN.
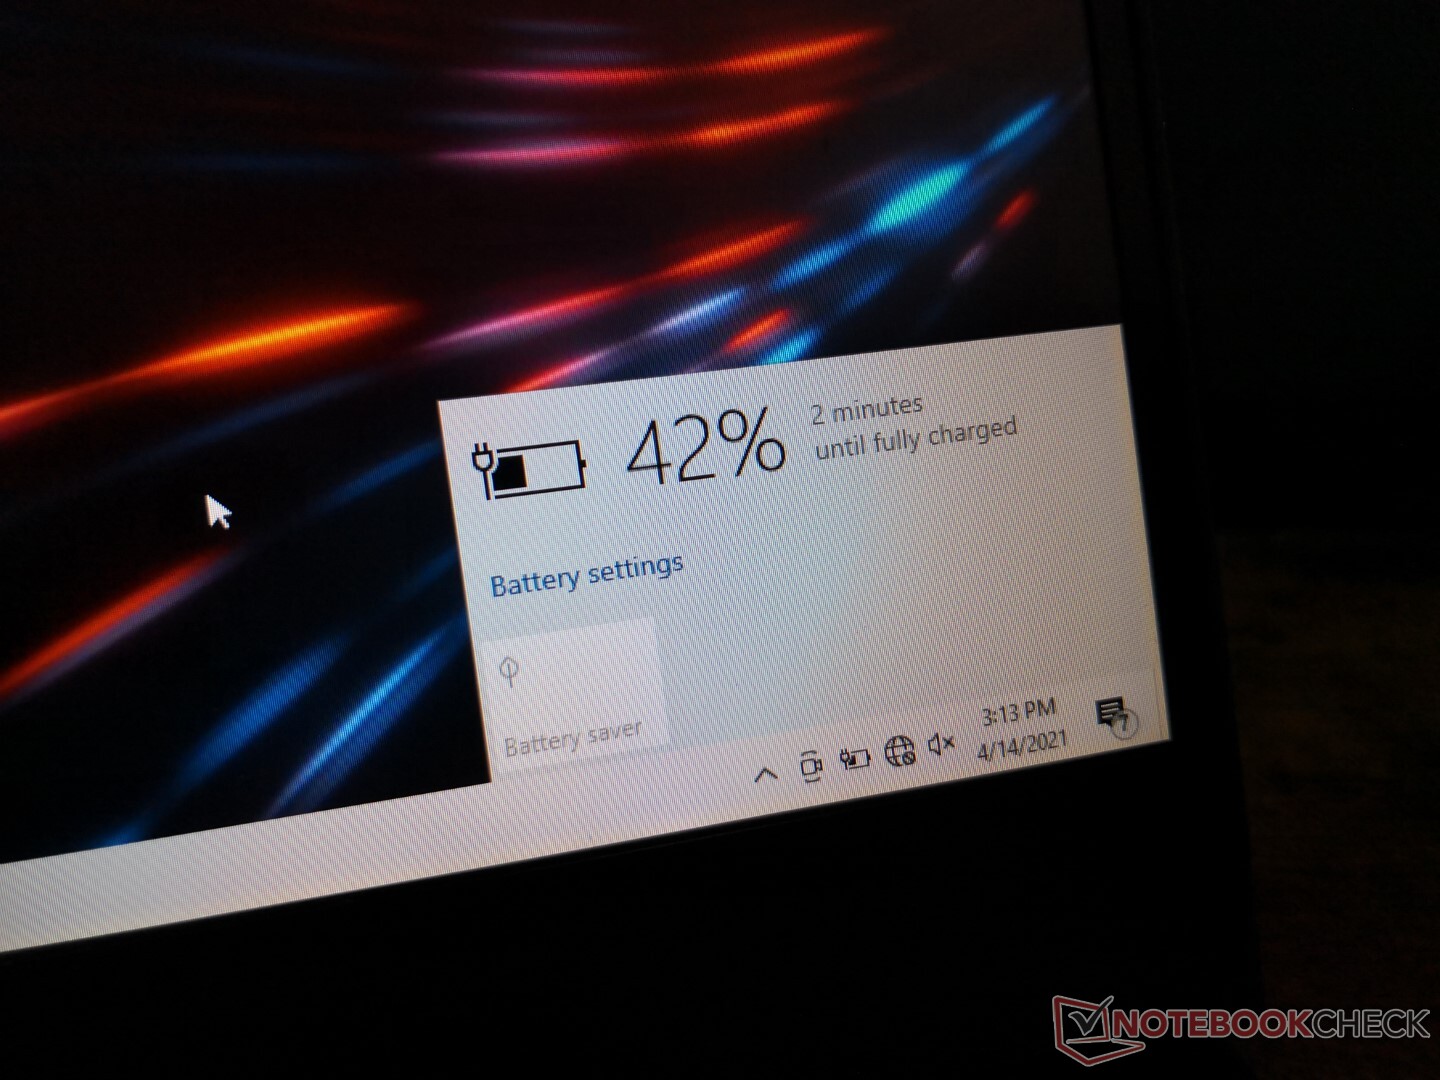
Il valore di ricarica da vuoto a pieno è molto lento, oltre 4 ore con l'adattatore AC incluso. Sospettiamo che ci sia un bug di ricarica perché il tempo di ricarica stimato può anche essere talvolta impreciso. La maggior parte degli altri portatili si ricarica completamente in appena 1,5 o 2 ore in confronto.
La batteria si ricarica ancora più lentamente o non si ricarica affatto quando si eseguono giochi. Per esempio, giocando The Witcher 3 con l'adattatore AC al 20% di carica della batteria per un'ora, la batteria si ricaricherà solo al 23% (o +3% nel corso di un'ora).
| MSI GP66 Leopard 10UG i7-10870H, GeForce RTX 3070 Laptop GPU, 65 Wh | MSI GP65 10SFK-047US i7-10750H, GeForce RTX 2070 Mobile, 51 Wh | Alienware m15 R4 i9-10980HK, GeForce RTX 3070 Laptop GPU, 86 Wh | Aorus 15P XC i7-10870H, GeForce RTX 3070 Laptop GPU, 99 Wh | Asus ROG Zephyrus G15 GA503Q R9 5900HS, GeForce RTX 3080 Laptop GPU, 90 Wh | MSI GF65 Thin 10UE i7-10750H, GeForce RTX 3060 Laptop GPU, 51 Wh | |
|---|---|---|---|---|---|---|
| Autonomia della batteria | -27% | -34% | 42% | 72% | 23% | |
| Reader / Idle (h) | 6.6 | 3.7 -44% | 9.5 44% | 12.1 83% | 11.1 68% | |
| WiFi v1.3 (h) | 5.1 | 3.7 -27% | 2.7 -47% | 6.7 31% | 9.4 84% | 4.6 -10% |
| Load (h) | 1 | 0.9 -10% | 1.5 50% | 1.5 50% | 1.1 10% |
Pro
Contro
Valutazione complessiva dell'MSI GP66 Leopard 10UG
Dopo due anni con il design del GP65, il GP66 è un aggiornamento completo e un enorme miglioramento in generale. Potrebbe essere diventato un po' più grande gen-to-gen, ma l'aumento delle dimensioni sembra giustificato considerando il salto nelle prestazioni grafiche, i miglioramenti al rumore della ventola, le temperature del core più basse, il design più elegante e la maggiore durata della batteria. Le impressioni generali sono molto vicine al GE66, che dovrebbe essere il modello di fascia alta.
Il GP66 si pone al di sopra del suo peso medio risultando essere buono come molti modelli di fascia alta.
C'è un asterisco enorme sopra "mid-range", tuttavia, poiché il GP66 non è economico al momento nonostante la sua classificazione. I prezzi variano molto da $2500 a $3000 USD collocandosi quasi nella categoria high-end o enthusiast. Speriamo che questo sia solo un problema di fornitura che può essere risolto in breve tempo perché possiamo sicuramente vedere il GP66 diventare un modello popolare a causa dei suoi attributi superiori alla media in tutto.
A prescindere dal suo prezzo di fascia alta, questo è comunque un portatile gaming di fascia media e quindi gli utenti dovrebbero essere consapevoli delle sue carenze. Mancano Thunderbolt, fotocamera IR, o lettore di schede SD, per esempio, e il display è poco luminoso rispetto alla maggior parte degli altri portatili gaming. Il lento ed incostante valore di ricarica della batteria merita certamente uno sguardo più attento. Fino ad allora, non aspettatevi che la batteria si carichi ad una velocità decente durante il gaming.
Prezzo e disponibilità
MSI GP66 Leopard 10UG
- 04/18/2021 v7 (old)
Allen Ngo
Price comparison
