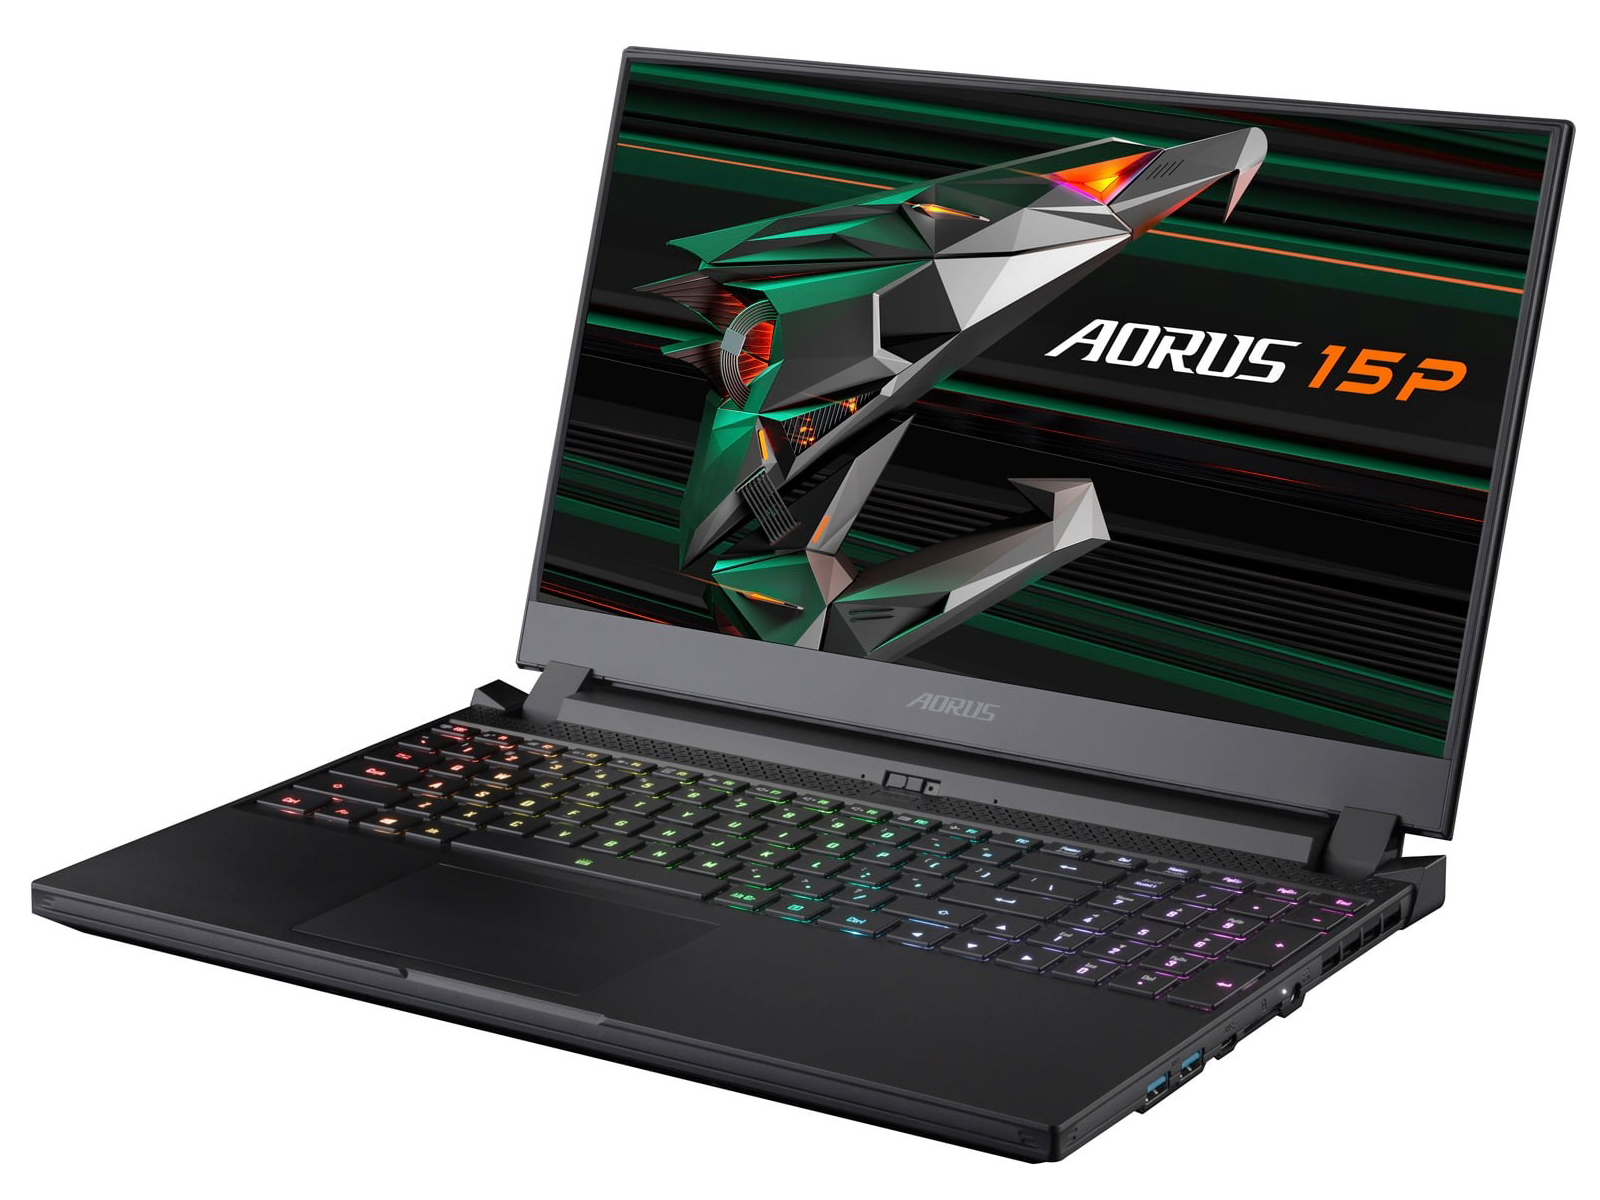
Recensione del portatile Aorus 15P XC: Tanta potenza di calcolo in un case compatto

Gigabyte ha creato un gaming notebook compatto da 15,6 pollici che funziona con un octa-core Core i7 10870H e una GeForce RTX 3070. Il modello è quasi identico ai suoi modelli fratelli Aorus 15G XC e Aorus 15P. La sua concorrenza comprende dispositivi come lo MSI GS66 Stealth 10UG, Schenker XMG Neo 15, Asus TUF Dash F15 FX516PR, e l'Asus ROG Strix G15 G513QR.
Dato che abbiamo già recensito due modelli con una struttura molto simile, non entreremo nel dettaglio del case, della connettività, dei dispositivi di input, degli altoparlanti o del display in questa recensione a meno che non notiamo delle differenze. Per favore fate riferimento alle nostre recensioni dell' Aorus 15P WB e Aorus 15G XC per i dettagli su questi aspetti.
Confronto con i potenziali concorrenti
Punteggio | Data | Modello | Peso | Altezza | Dimensione | Risoluzione | Prezzo |
|---|---|---|---|---|---|---|---|
| 86.1 % v7 (old) | 02/2021 | Aorus 15P XC i7-10870H, GeForce RTX 3070 Laptop GPU | 2.2 kg | 27 mm | 15.60" | 1920x1080 | |
| 84 % v7 (old) | 02/2021 | MSI GS66 Stealth 10UG i7-10870H, GeForce RTX 3070 Laptop GPU | 2.1 kg | 19.8 mm | 15.60" | 1920x1080 | |
| 82.4 % v7 (old) | 02/2021 | Asus TUF Dash F15 FX516PR i7-11370H, GeForce RTX 3070 Laptop GPU | 2 kg | 20 mm | 15.60" | 1920x1080 | |
| 85.9 % v7 (old) | 11/2020 | Schenker XMG Neo 15 Comet Lake i7-10875H, GeForce RTX 2070 Super Mobile | 2.2 kg | 23 mm | 15.60" | 1920x1080 | |
| 85 % v7 (old) | 02/2021 | Asus ROG Strix G15 G513QR R9 5900HX, GeForce RTX 3070 Laptop GPU | 2.3 kg | 27.2 mm | 15.60" | 1920x1080 |
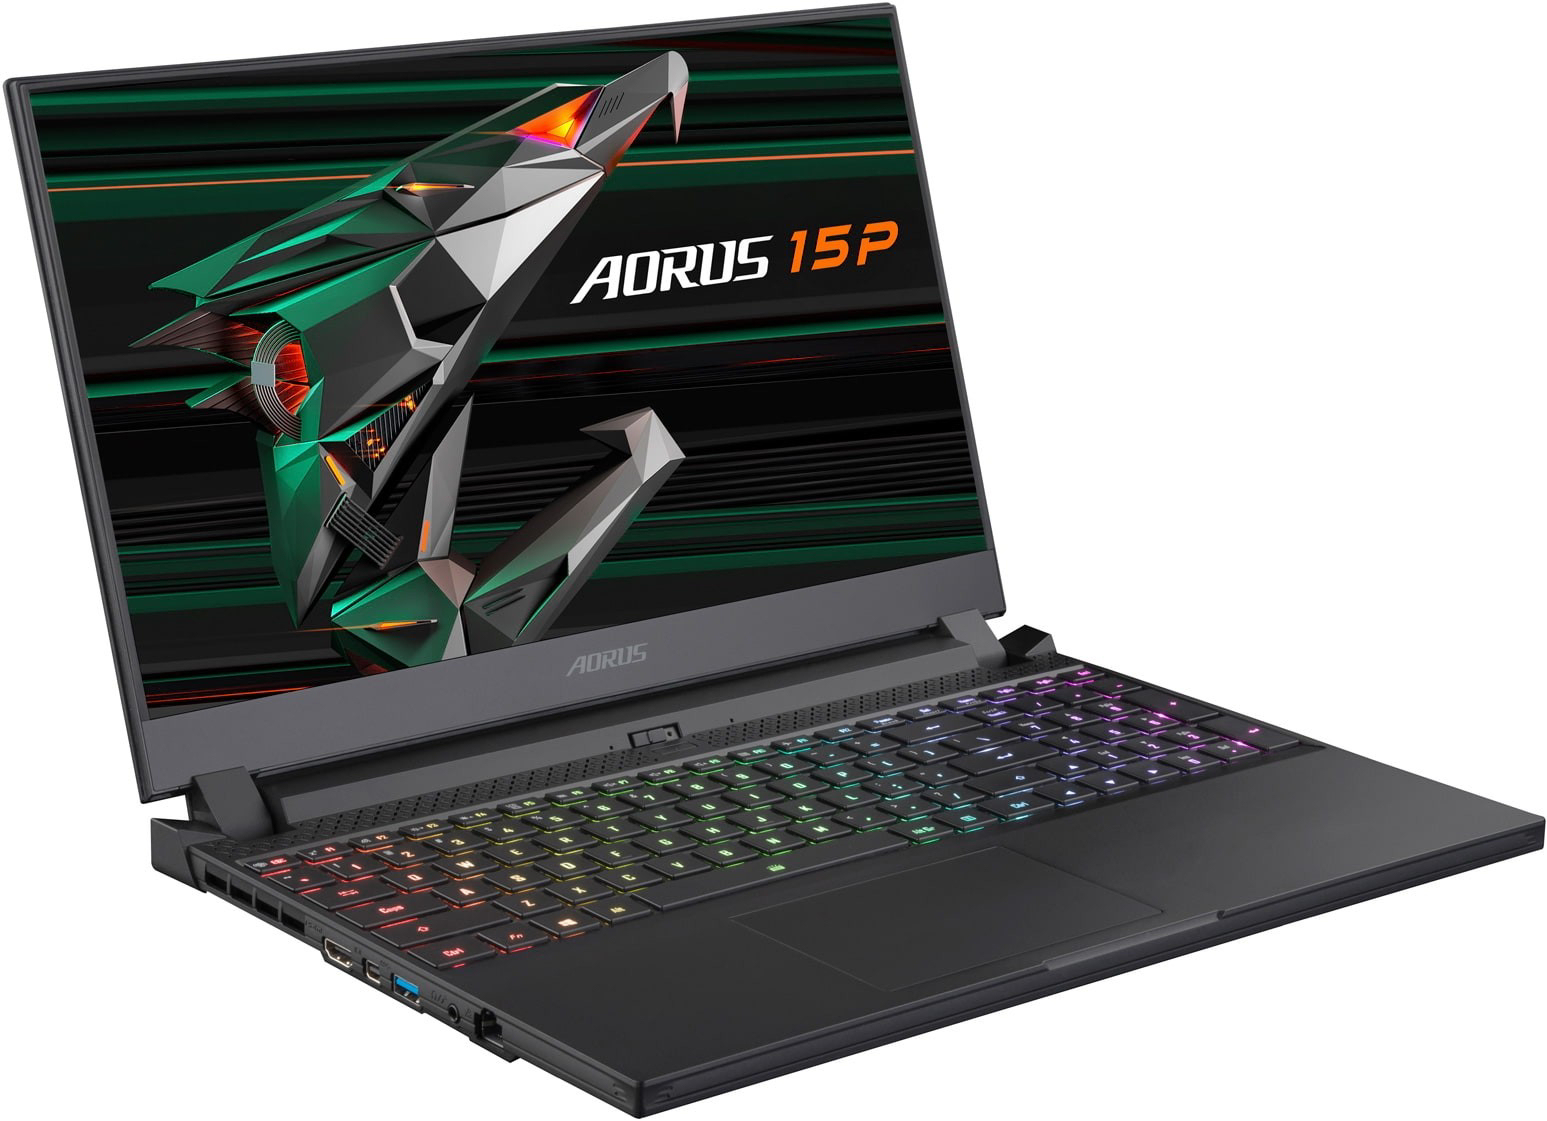
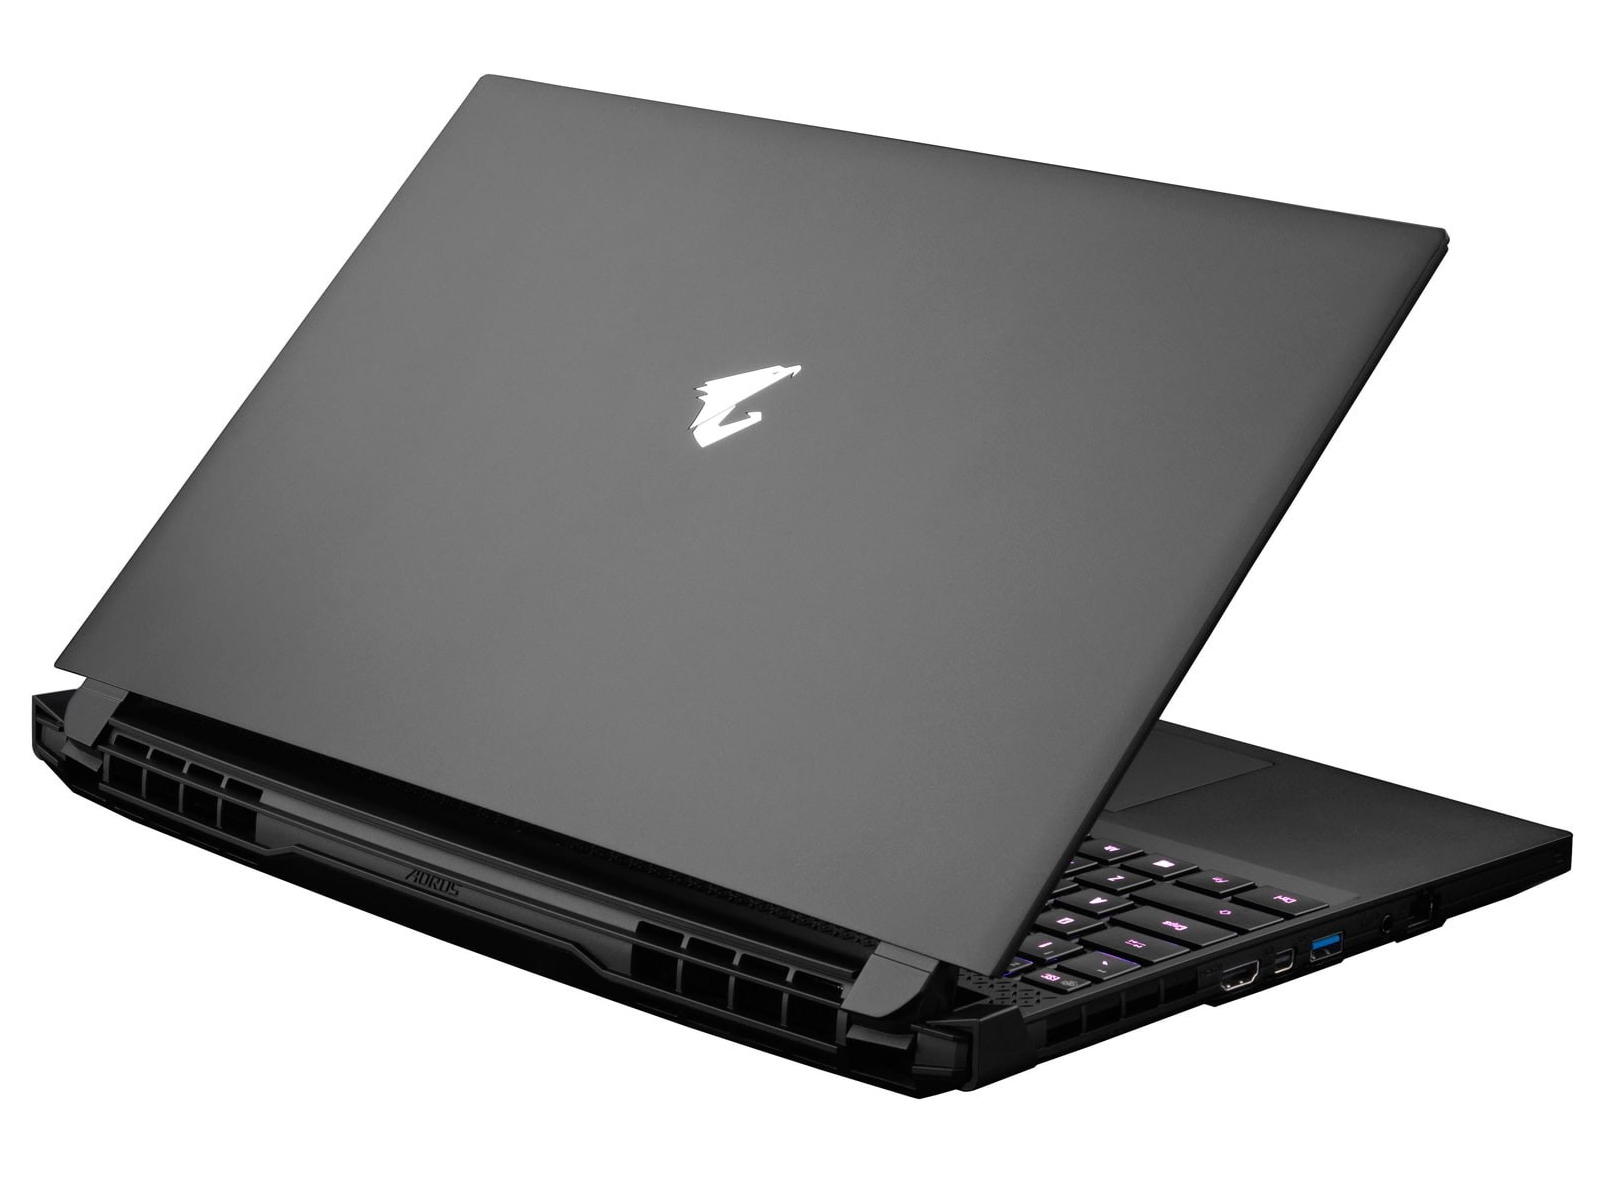
Case - 15P XC leggermente più pesante dei suoi modelli fratelli
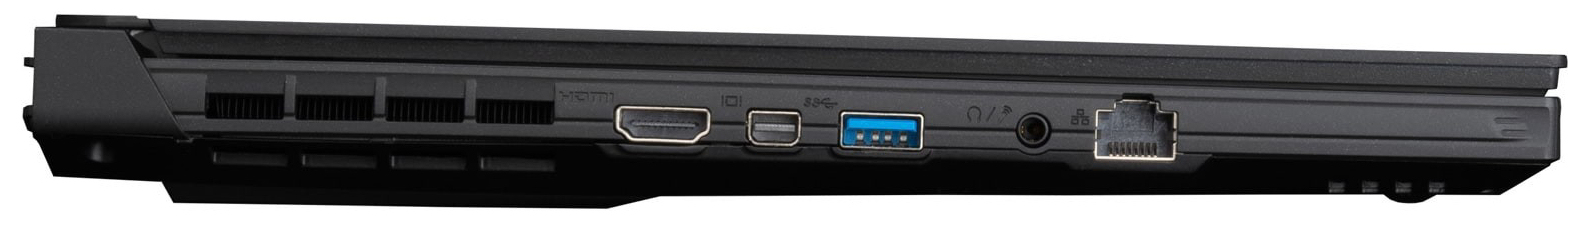
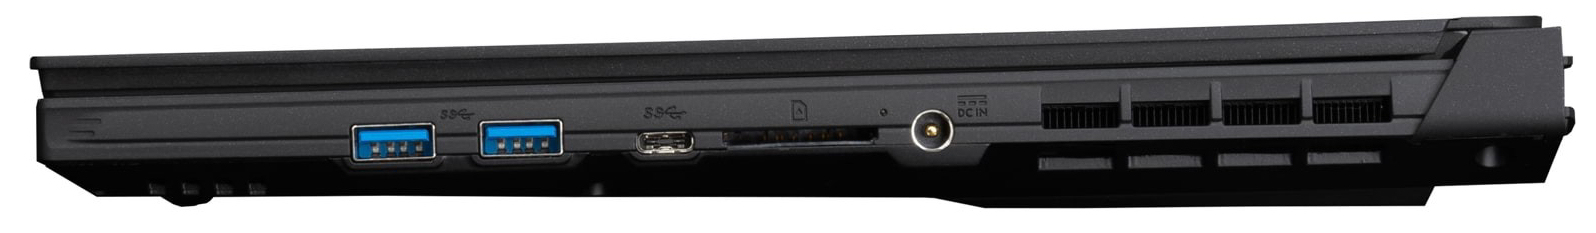
Il 15P XC, il 15P WB e il 15G XC sembrano tutti uguali a prima e anche a seconda vista. Il case ha lo stesso design e posizionamento delle porte. Tuttavia, ci sono alcune piccole differenze: Il 15P XC è 4 mm più alto e circa 200 grammi più pesante dei suoi due modelli fratelli. Il case più spesso del 15P XC può essere riconosciuto dalle fessure di ventilazione aggiuntive lungo il retro.

| SD Card Reader | |
| average JPG Copy Test (av. of 3 runs) | |
| Aorus 15P WB (Toshiba Exceria Pro SDXC 64 GB UHS-II) | |
| Aorus 15P XC (Toshiba Exceria Pro SDXC 64 GB UHS-II) | |
| Aorus 15G XC (Toshiba Exceria Pro SDXC 64 GB UHS-II) | |
| Media della classe Gaming (20.9 - 210, n=54, ultimi 2 anni) | |
| Schenker XMG Neo 15 Comet Lake (Toshiba Exceria Pro SDXC 64 GB UHS-II) | |
| maximum AS SSD Seq Read Test (1GB) | |
| Aorus 15P WB (Toshiba Exceria Pro SDXC 64 GB UHS-II) | |
| Aorus 15G XC (Toshiba Exceria Pro SDXC 64 GB UHS-II) | |
| Aorus 15P XC (Toshiba Exceria Pro SDXC 64 GB UHS-II) | |
| Media della classe Gaming (25.5 - 261, n=51, ultimi 2 anni) | |
| Schenker XMG Neo 15 Comet Lake (Toshiba Exceria Pro SDXC 64 GB UHS-II) | |


")
")


Display - 240-Hz IPS
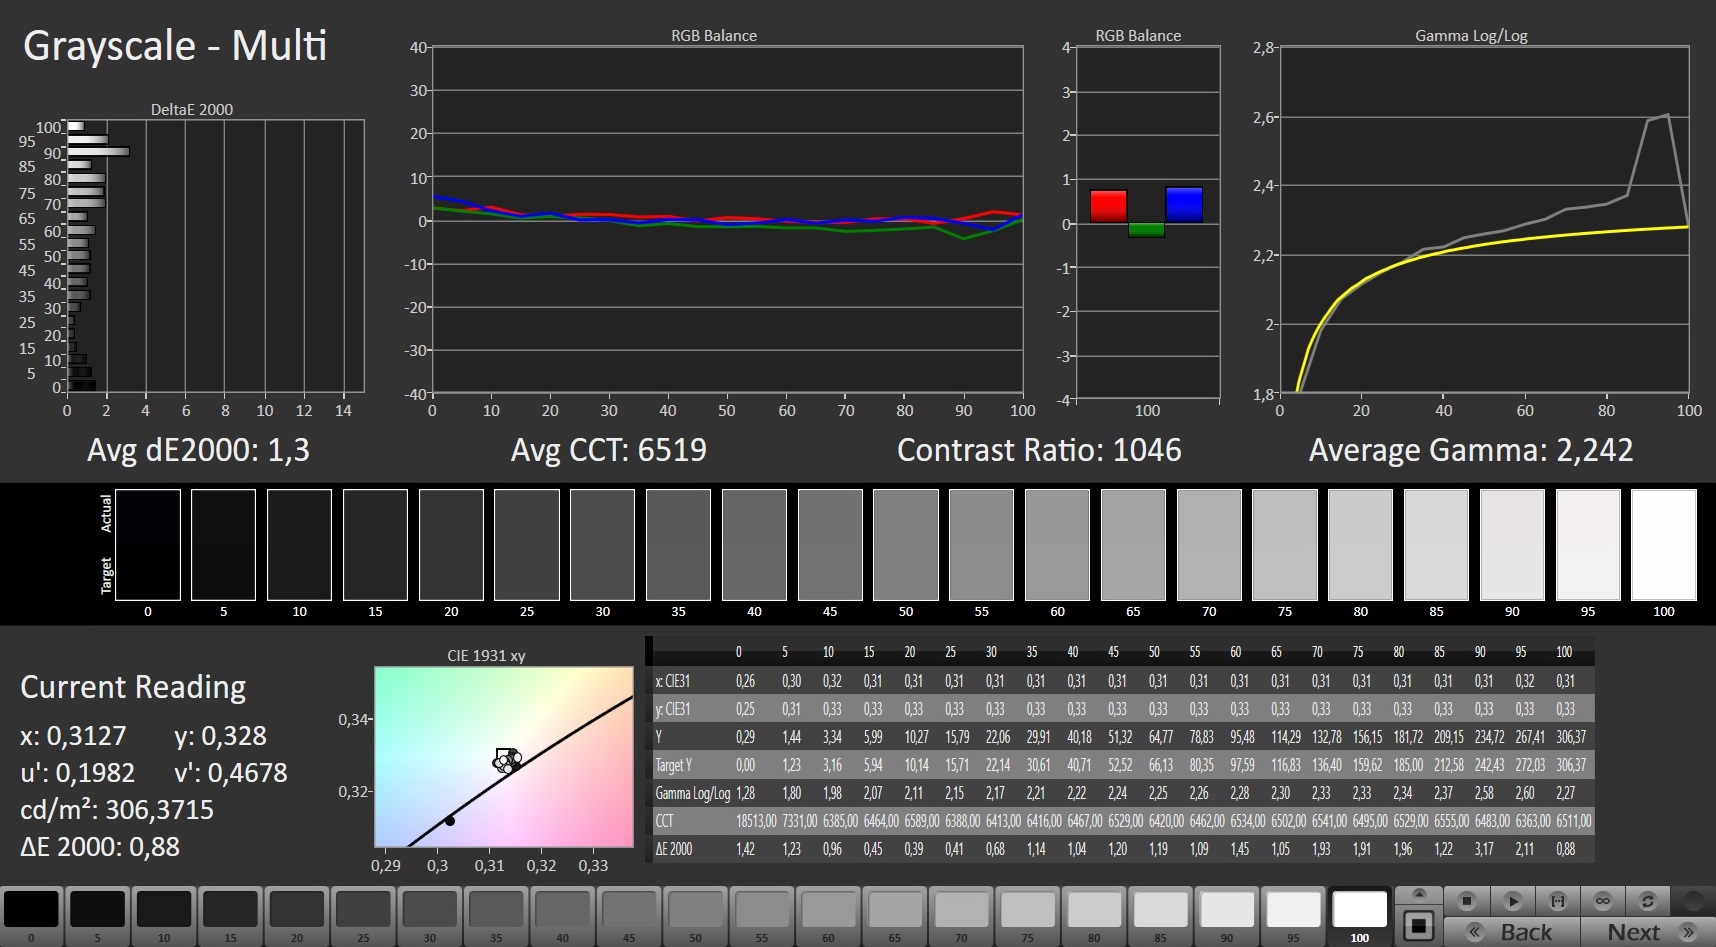
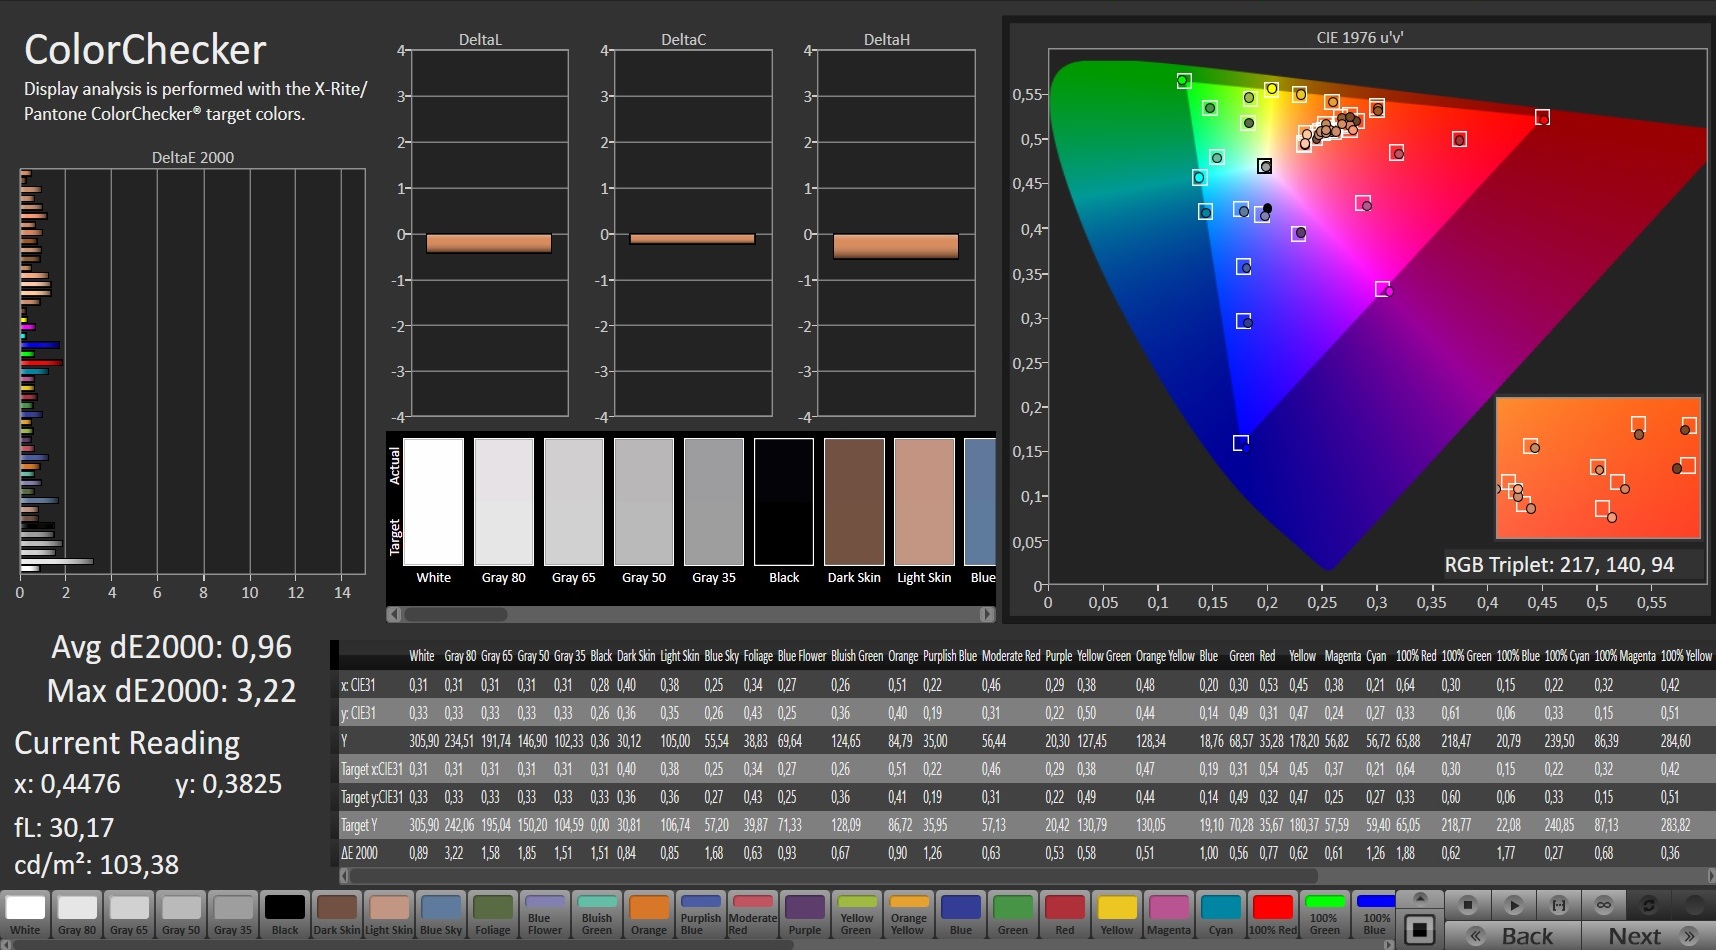
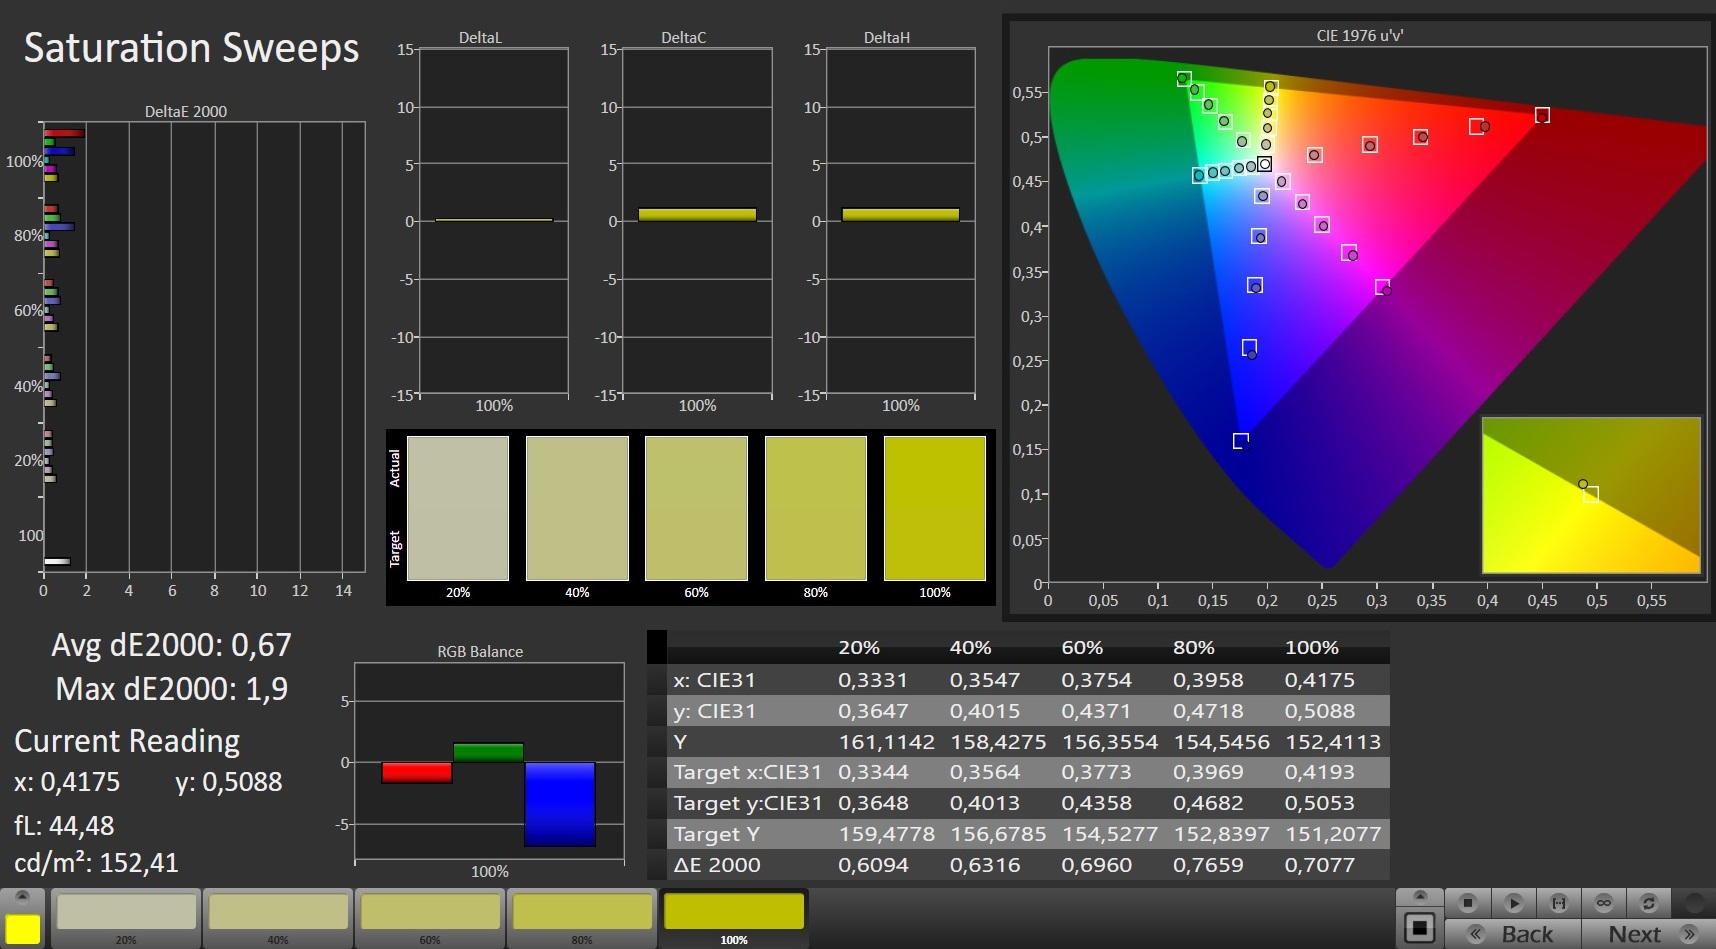
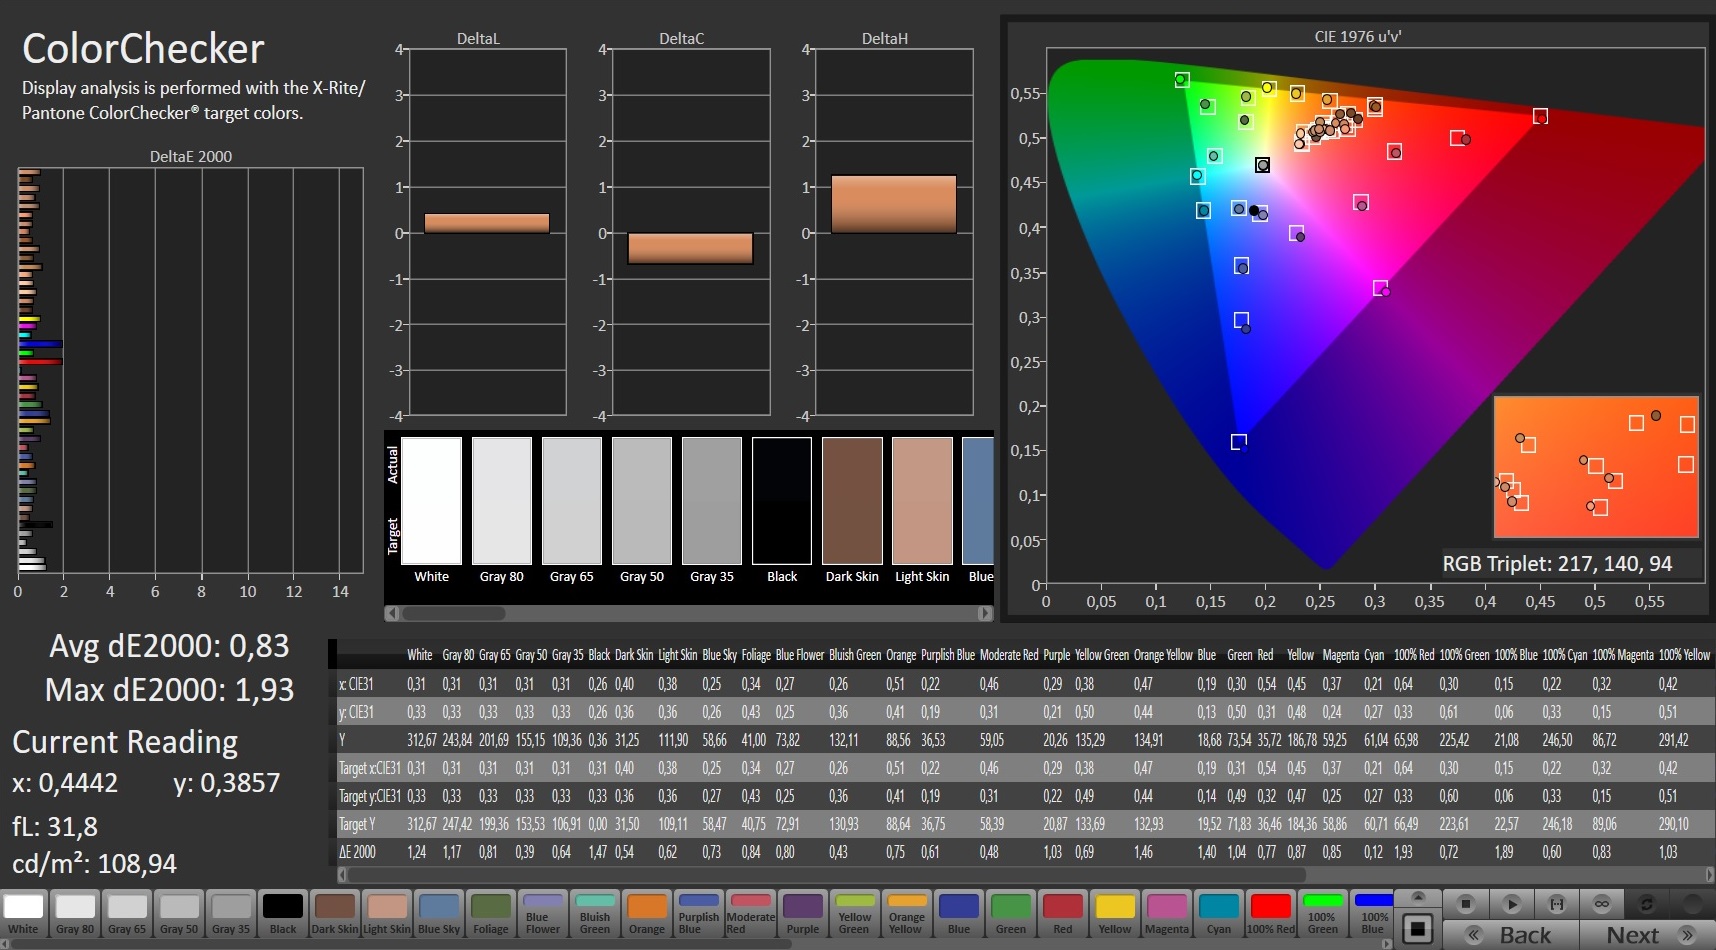
Mentre il rapporto di contrasto (1028:1) del display da 15.6 pollici con angoli di visualizzazione stabili e elevati valori di risposta (FHD, IPS, 240 Hz) è quasi nella gamma ideale ( 1000:1), la luminosità media è troppo bassa a 278 nits. Consideriamo buoni i valori sopra i 300 nits. Grazie alla sua certificazione Pantone, il display offre già ottimi colori ex-works. Sfortunatamente, il display utilizza PWM per regolare la luminosità al di sotto del 25% con una frequenza di 24040 Hz.
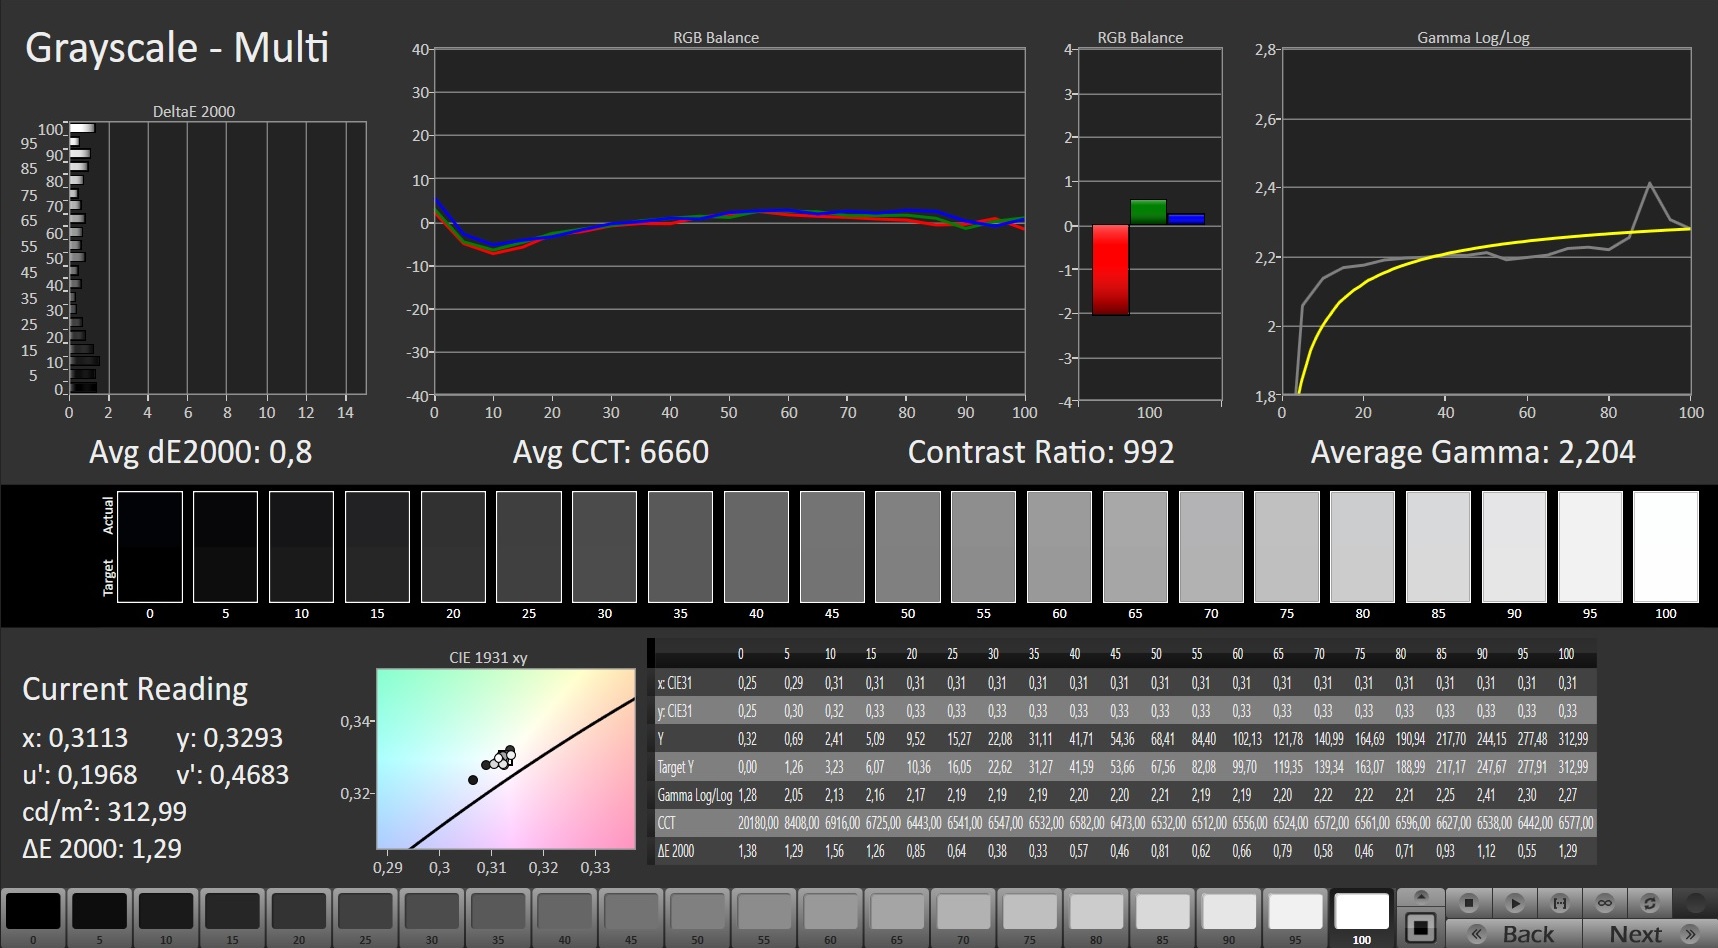
Questo è lo stesso pannello dell'Aorus 15G XC. È abbastanza normale che i risultati differiscano leggermente. Due display della stessa costruzione non corrispondono mai al 100%.
| |||||||||||||||||||||||||
Distribuzione della luminosità: 88 %
Al centro con la batteria: 298 cd/m²
Contrasto: 1028:1 (Nero: 0.29 cd/m²)
ΔE ColorChecker Calman: 0.96 | ∀{0.5-29.43 Ø4.71}
calibrated: 0.83
ΔE Greyscale Calman: 1.3 | ∀{0.09-98 Ø4.96}
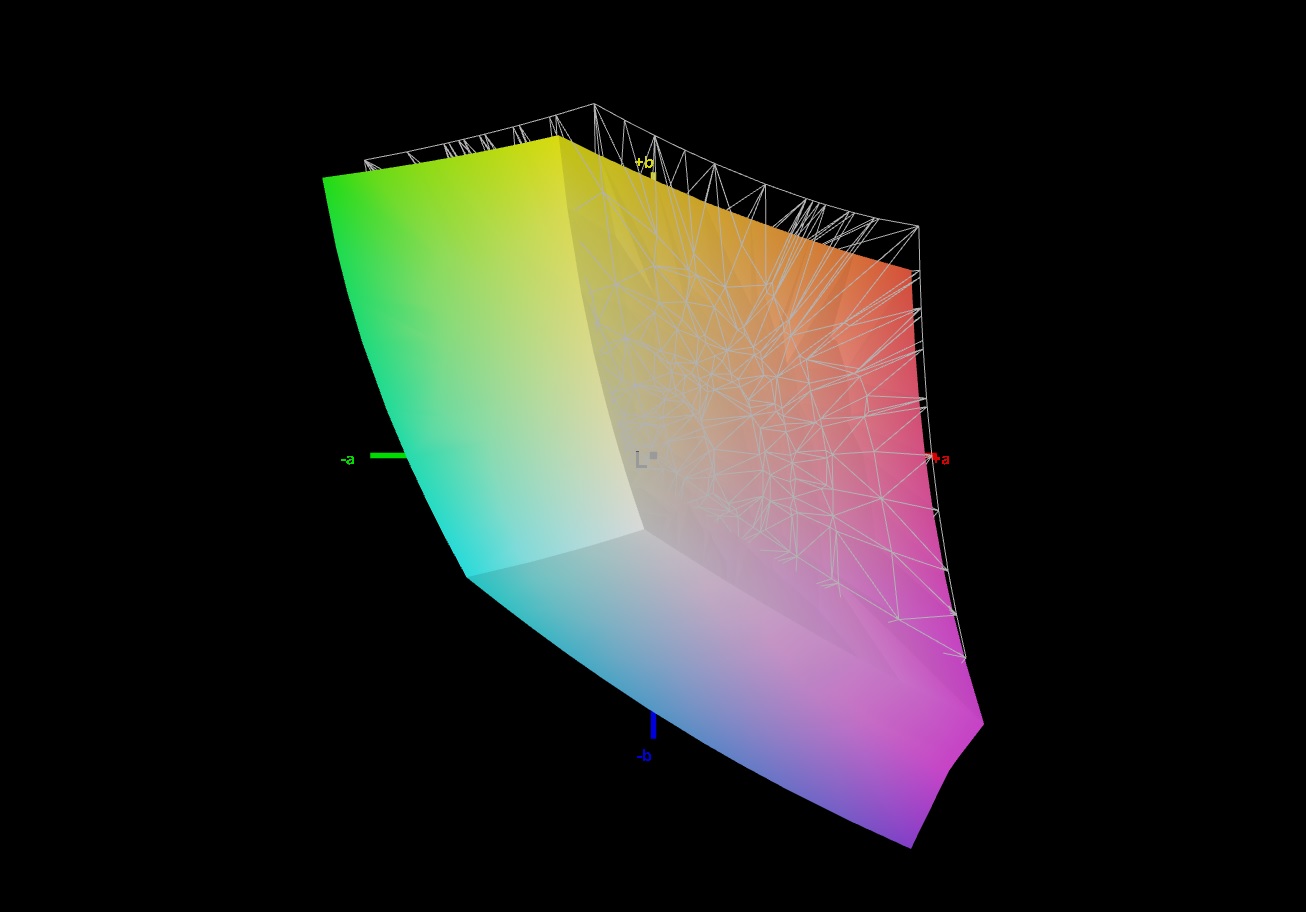
91% sRGB (Argyll 1.6.3 3D)
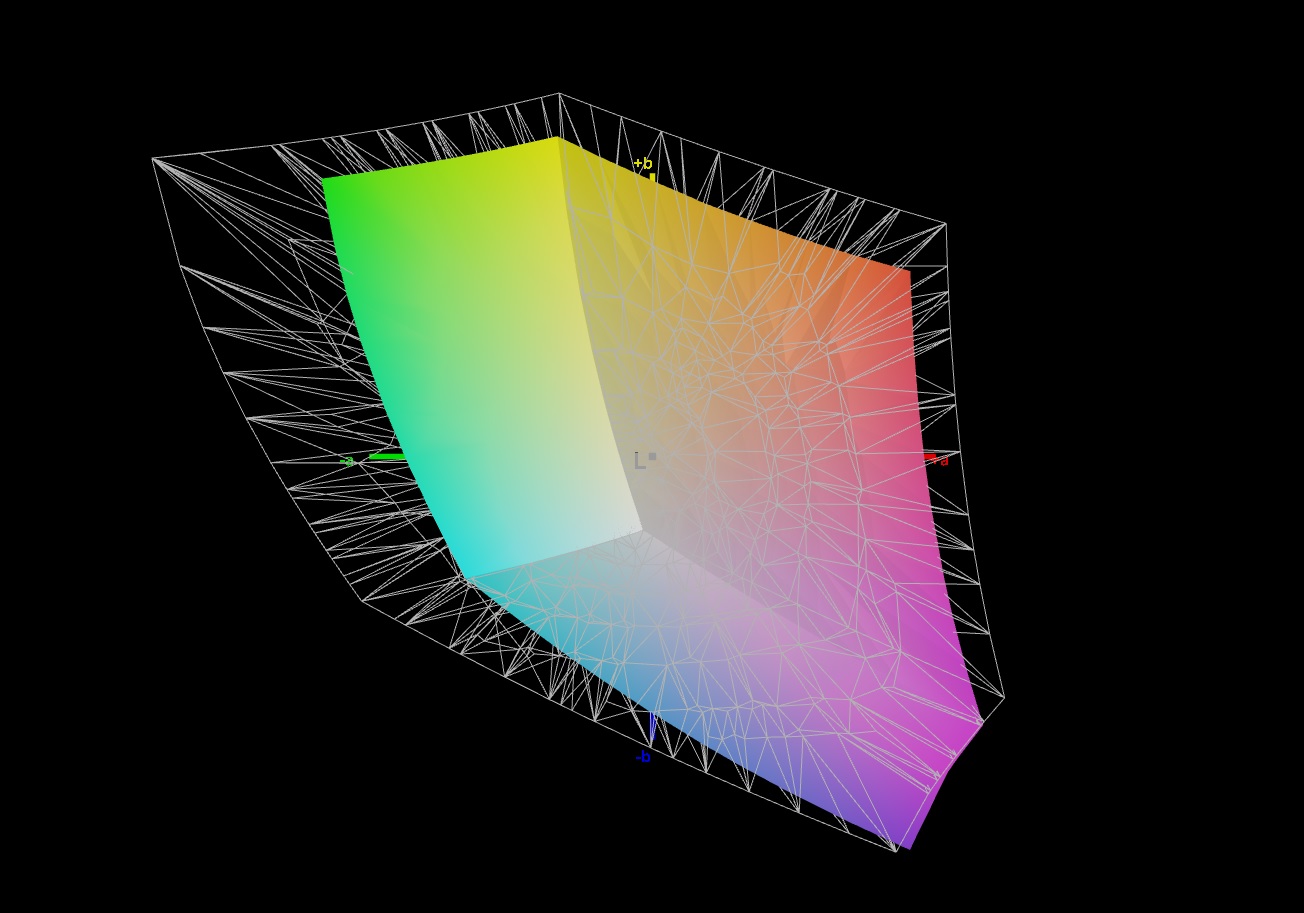
69% AdobeRGB 1998 (Argyll 1.6.3 3D)
68.6% AdobeRGB 1998 (Argyll 3D)
98.7% sRGB (Argyll 3D)
67.2% Display P3 (Argyll 3D)
Gamma: 2.242
CCT: 6519 K
| Aorus 15P XC Sharp LQ156M1JW03, IPS, 1920x1080, 15.6" | Aorus 15G XC Sharp LQ156M1JW03, IPS, 1920x1080, 15.6" | MSI GS66 Stealth 10UG AU Optronics B156HAN12.0, IPS, 1920x1080, 15.6" | Asus TUF Dash F15 FX516PR LQ156M1JW26 (SHP1532), IPS, 1920x1080, 15.6" | Schenker XMG Neo 15 Comet Lake IPS, 1920x1080, 15.6" | Aorus 15P WB BOE HF NV156FHM-N4G, IPS, 1920x1080, 15.6" | Asus ROG Strix G15 G513QR LQ156M1JW25, IPS, 1920x1080, 15.6" | |
|---|---|---|---|---|---|---|---|
| Display | -2% | 1% | -1% | 1% | -6% | -1% | |
| Display P3 Coverage (%) | 67.2 | 65.6 -2% | 67.7 1% | 66.9 0% | 69.5 3% 67.9 1% | 63 -6% | 67.7 1% |
| sRGB Coverage (%) | 98.7 | 97.5 -1% | 98.4 0% | 98.1 -1% | 99.2 1% 98.7 0% | 91.3 -7% | 94.3 -4% |
| AdobeRGB 1998 Coverage (%) | 68.6 | 67.1 -2% | 69.1 1% | 67.9 -1% | 70.7 3% 68.8 0% | 64.6 -6% | 68.2 -1% |
| Response Times | 7% | -25% | -6% | -22% | 13% | 16% | |
| Response Time Grey 50% / Grey 80% * (ms) | 11.2 ? | 9.6 ? 14% | 14.4 ? -29% | 12 ? -7% | 15.2 ? -36% | 8.8 ? 21% | 8.2 ? 27% |
| Response Time Black / White * (ms) | 9.6 ? | 9.6 ? -0% | 11.6 ? -21% | 10 ? -4% | 10.4 ? -8% | 9.2 ? 4% | 9.2 ? 4% |
| PWM Frequency (Hz) | 24040 ? | 24040 ? | 23580 ? | 23580 ? | |||
| Screen | -3% | -36% | -36% | -46% | -45% | -58% | |
| Brightness middle (cd/m²) | 298 | 288 -3% | 259.5 -13% | 286 -4% | 308 3% | 275 -8% | 308 3% |
| Brightness (cd/m²) | 278 | 270 -3% | 264 -5% | 275 -1% | 284 2% | 268 -4% | 288 4% |
| Brightness Distribution (%) | 88 | 89 1% | 90 2% | 91 3% | 87 -1% | 91 3% | 86 -2% |
| Black Level * (cd/m²) | 0.29 | 0.25 14% | 0.25 14% | 0.25 14% | 0.32 -10% | 0.33 -14% | 0.23 21% |
| Contrast (:1) | 1028 | 1152 12% | 1038 1% | 1144 11% | 963 -6% | 833 -19% | 1339 30% |
| Colorchecker dE 2000 * | 0.96 | 1.19 -24% | 2.52 -163% | 2.43 -153% | 2.45 -155% | 2.72 -183% | 3.28 -242% |
| Colorchecker dE 2000 max. * | 3.22 | 3.79 -18% | 5.55 -72% | 6.33 -97% | 7.74 -140% | 4.45 -38% | 8.51 -164% |
| Colorchecker dE 2000 calibrated * | 0.83 | 0.71 14% | 1.93 -133% | 0.83 -0% | 0.83 -0% | 2.09 -152% | 0.83 -0% |
| Greyscale dE 2000 * | 1.3 | 1.6 -23% | 1.7 -31% | 3.5 -169% | 3.9 -200% | 2.3 -77% | 5 -285% |
| Gamma | 2.242 98% | 2.229 99% | 2.04 108% | 2.32 95% | 2.211 100% | 2.266 97% | 2.057 107% |
| CCT | 6519 100% | 6539 99% | 6414 101% | 7145 91% | 7434 87% | 6933 94% | 7393 88% |
| Color Space (Percent of AdobeRGB 1998) (%) | 69 | 67 -3% | 63.3 -8% | 68 -1% | 69 0% | 65 -6% | 68 -1% |
| Color Space (Percent of sRGB) (%) | 91 | 90 -1% | 98.8 9% | 91 0% | 91 0% | 90 -1% | 90 -1% |
| Media totale (Programma / Settaggio) | 1% /
-2% | -20% /
-28% | -14% /
-26% | -22% /
-29% | -13% /
-31% | -14% /
-38% |
* ... Meglio usare valori piccoli

Tempi di risposta del Display
| ↔ Tempi di risposta dal Nero al Bianco | ||
|---|---|---|
| 9.6 ms ... aumenta ↗ e diminuisce ↘ combinato | ↗ 5.2 ms Incremento | 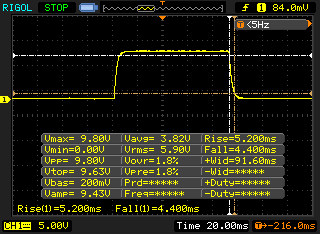 |
| ↘ 4.4 ms Calo | ||
| Lo schermo mostra veloci tempi di risposta durante i nostri tests e dovrebbe esere adatto al gaming In confronto, tutti i dispositivi di test variano da 0.1 (minimo) a 240 (massimo) ms. » 26 % di tutti i dispositivi è migliore. Questo significa che i tempi di risposta rilevati sono migliori rispettto alla media di tutti i dispositivi testati (19.8 ms). | ||
| ↔ Tempo di risposta dal 50% Grigio all'80% Grigio | ||
| 11.2 ms ... aumenta ↗ e diminuisce ↘ combinato | ↗ 6 ms Incremento | 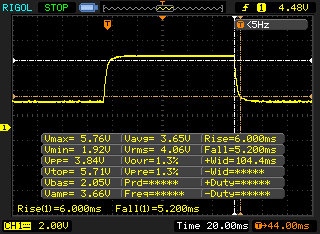 |
| ↘ 5.2 ms Calo | ||
| Lo schermo mostra buoni tempi di risposta durante i nostri tests, ma potrebbe essere troppo lento per i gamers competitivi. In confronto, tutti i dispositivi di test variano da 0.165 (minimo) a 636 (massimo) ms. » 25 % di tutti i dispositivi è migliore. Questo significa che i tempi di risposta rilevati sono migliori rispettto alla media di tutti i dispositivi testati (30.9 ms). | ||
Sfarfallio dello schermo / PWM (Pulse-Width Modulation)
| flickering dello schermo / PWM rilevato | 24040 Hz | ≤ 25 % settaggio luminosita' | 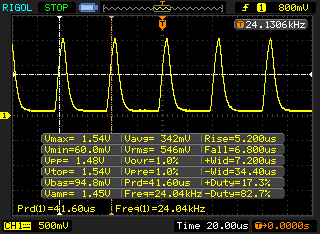 |
Il display sfarfalla a 24040 Hz (Probabilmente a causa dell'uso di PWM) Flickering rilevato ad una luminosita' di 25 % o inferiore. Non dovrebbe verificarsi flickering o PWM sopra questo valore di luminosita'. La frequenza di 24040 Hz è abbastanza alta, quindi la maggioranza degli utenti sensibili al PWM non dovrebbero notare alcun flickering. In confronto: 52 % di tutti i dispositivi testati non utilizza PWM per ridurre la luminosita' del display. Se è rilevato PWM, una media di 7744 (minimo: 5 - massimo: 343500) Hz è stata rilevata. | |||
Prestazioni - nessun problema per i prossimi anni
Il Gigabyte Aorus 15P XC è un notebook per il gaming da 15,6 pollici che può gestire tutti i giochi attuali senza problemi e fa anche un buon lavoro in tutte le altre aree di utilizzo.
Condizioni di test
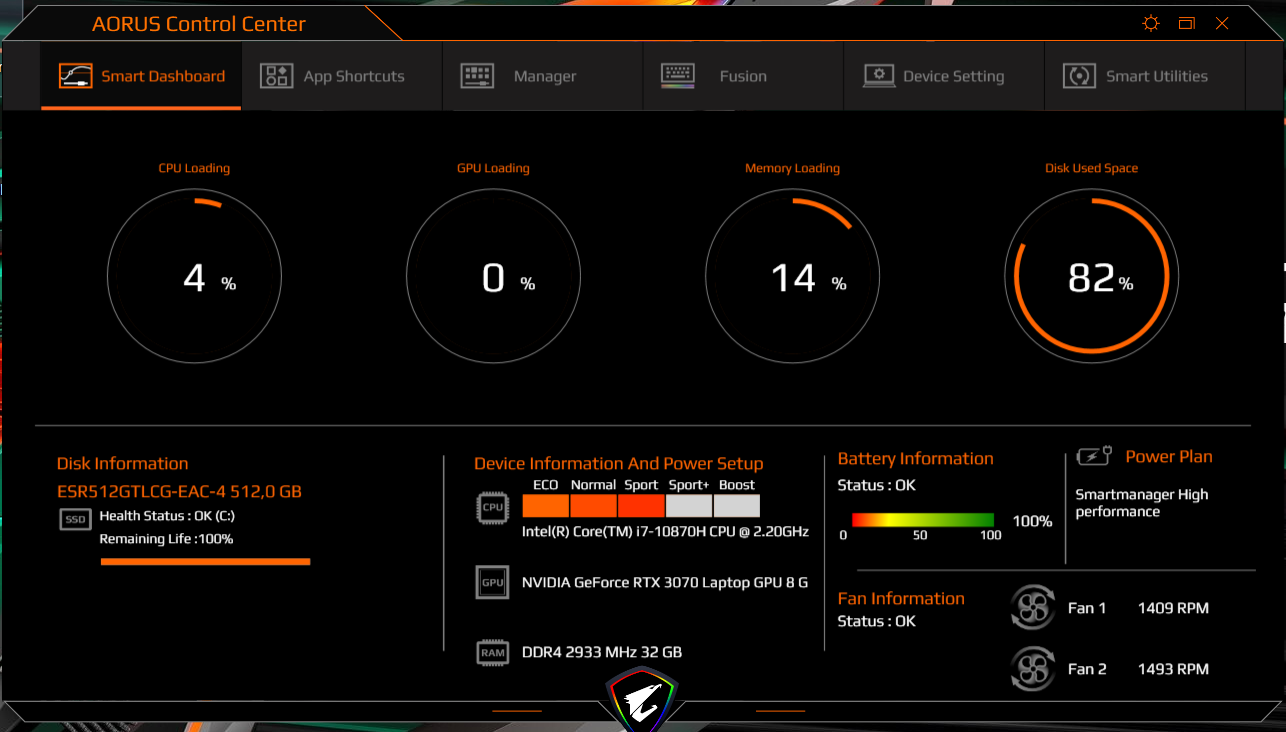
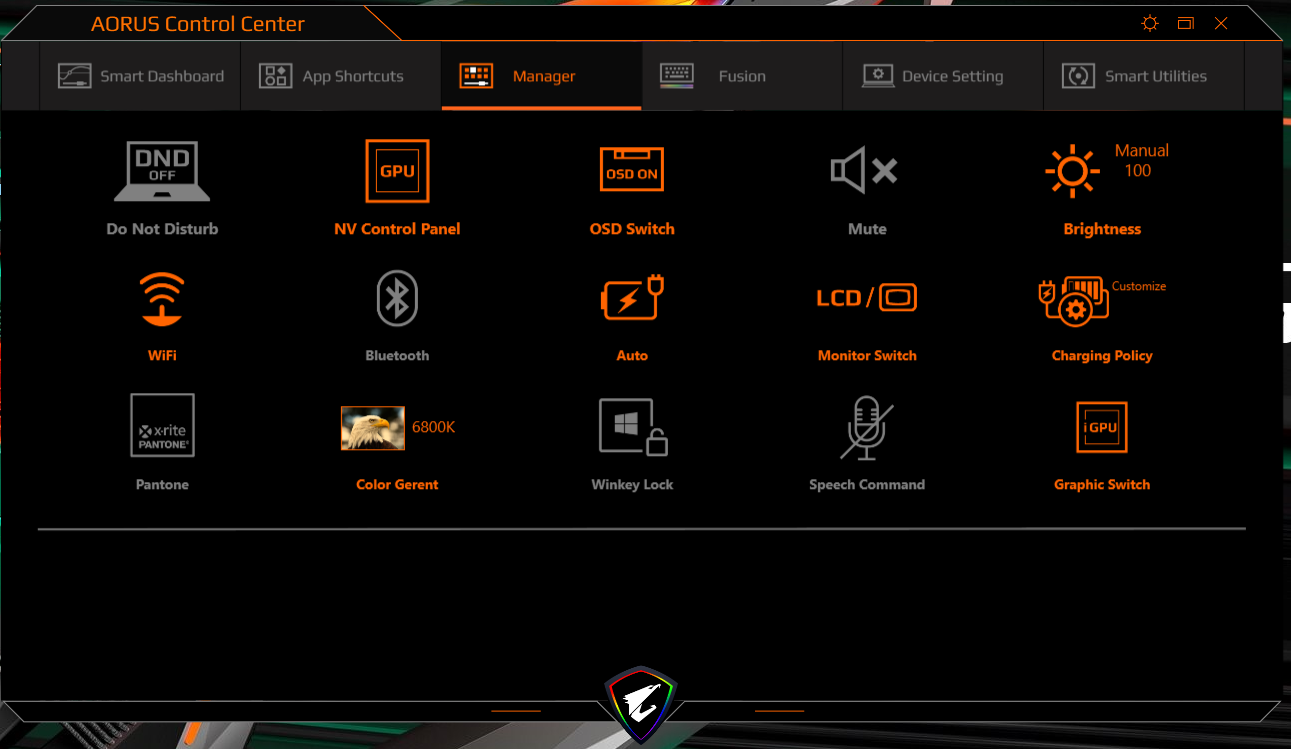
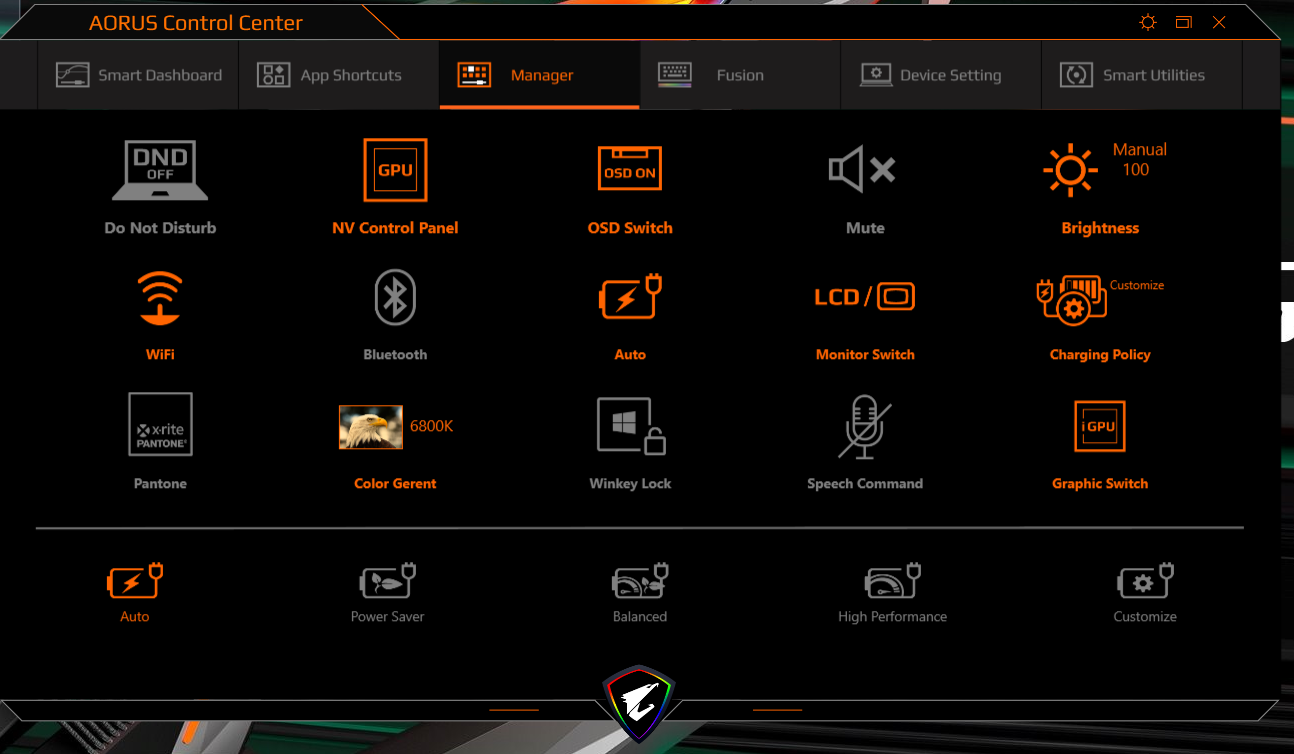
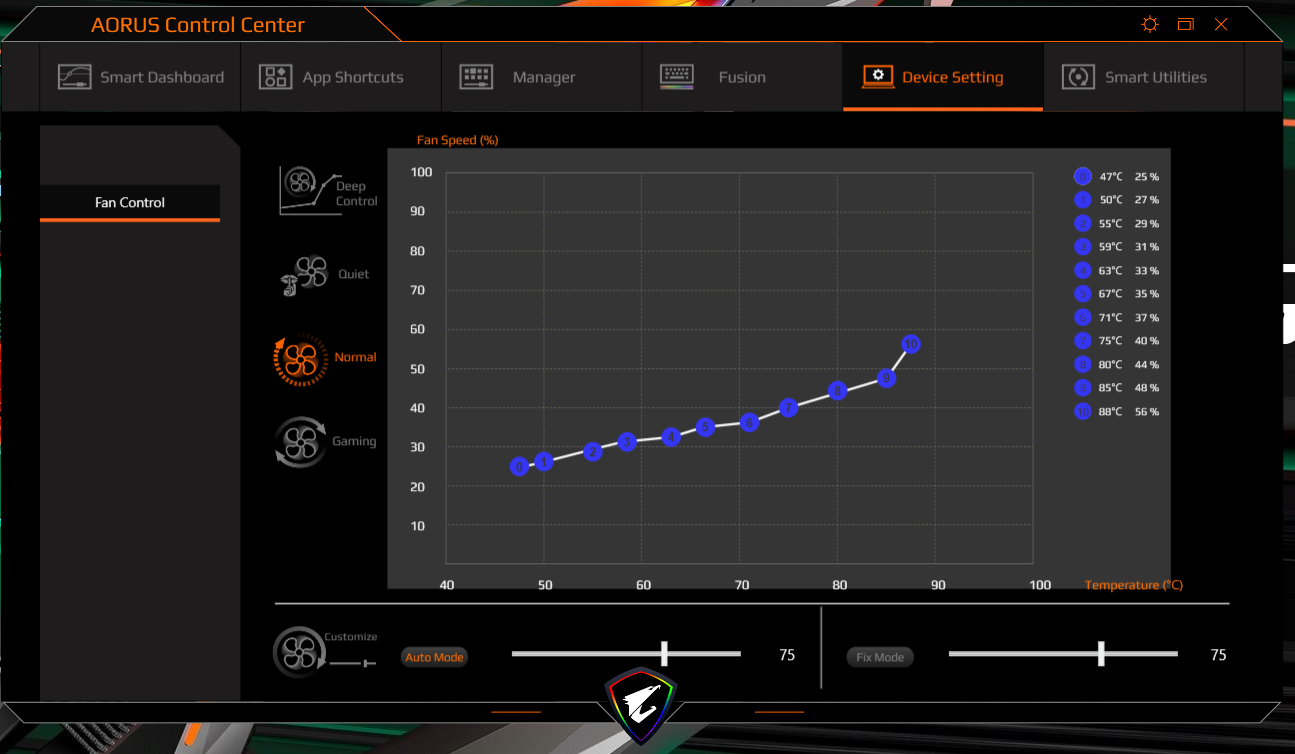
L'Aorus Control Center preinstallato permette agli utenti, tra le altre cose, di impostare profili energetici. Abbiamo usato l'opzione "auto" (con AI attivata) per i nostri test. Questo permette al Control Center di selezionare da solo le impostazioni adatte. Il controllo della ventola è stato impostato su "normale".
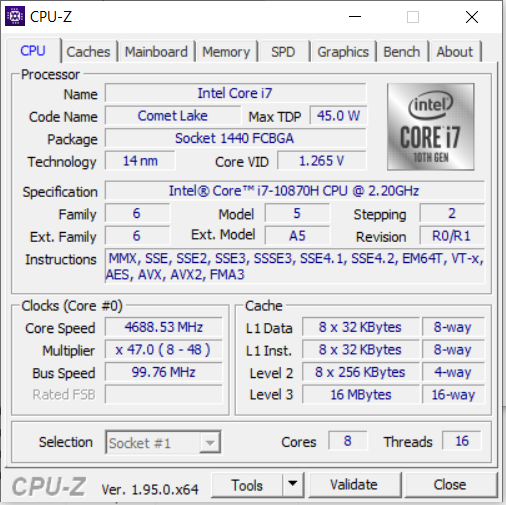
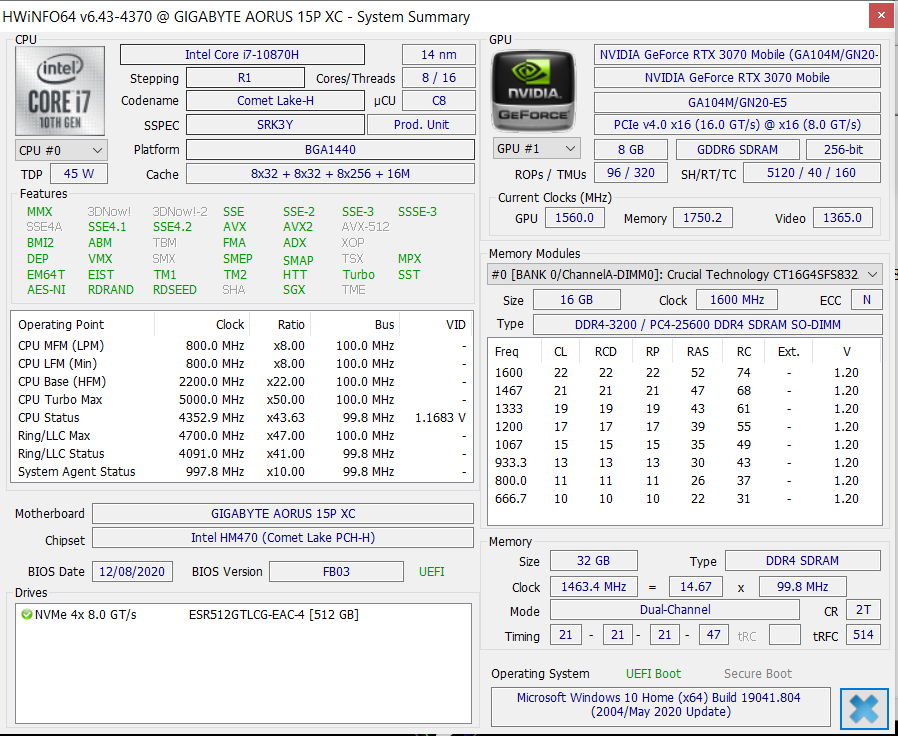
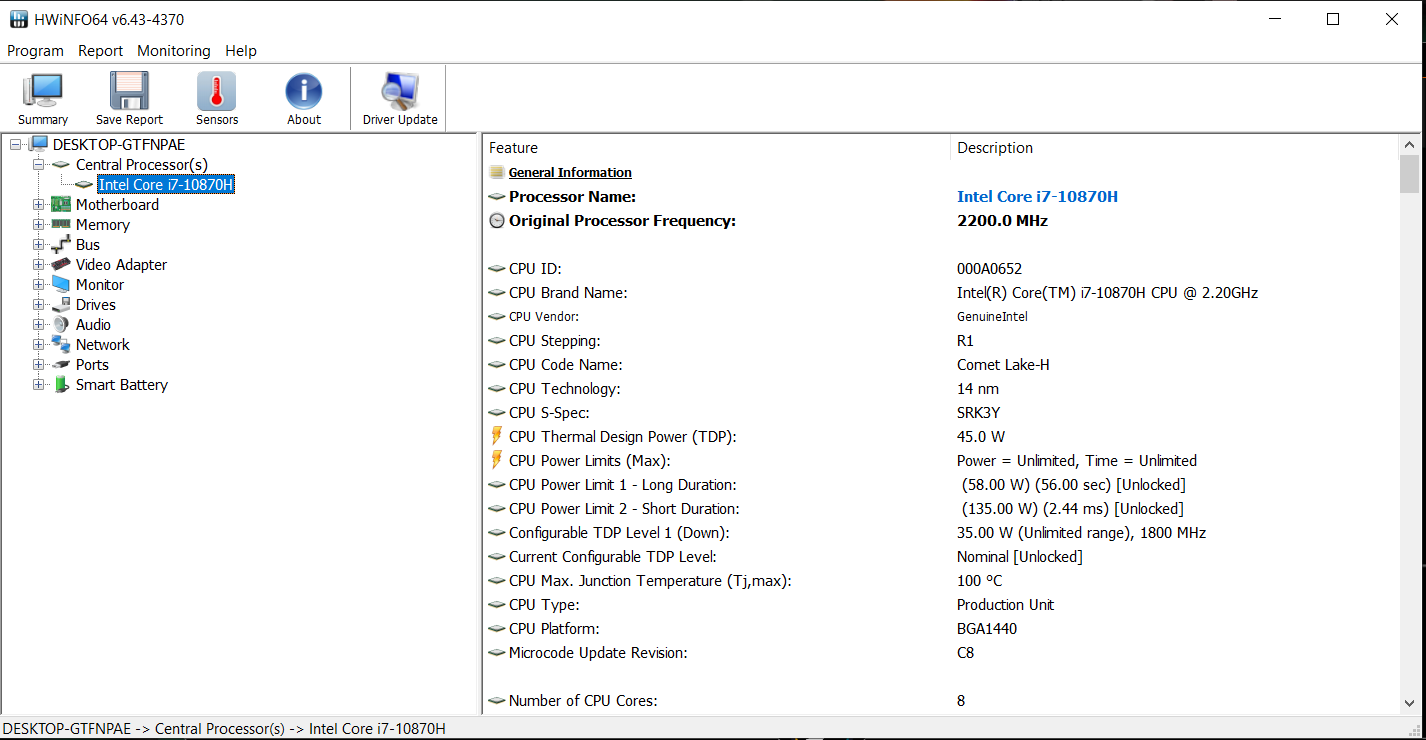
Processore
L'octa-core Core i7 10870H (Comet Lake) ha un clock rate di base di 2,2 GHz che può essere aumentato a 4,2 GHz (otto cores) o 5 GHz (un core) tramite Turbo Boost. Supporta l'hyperthreading con due threads per core.
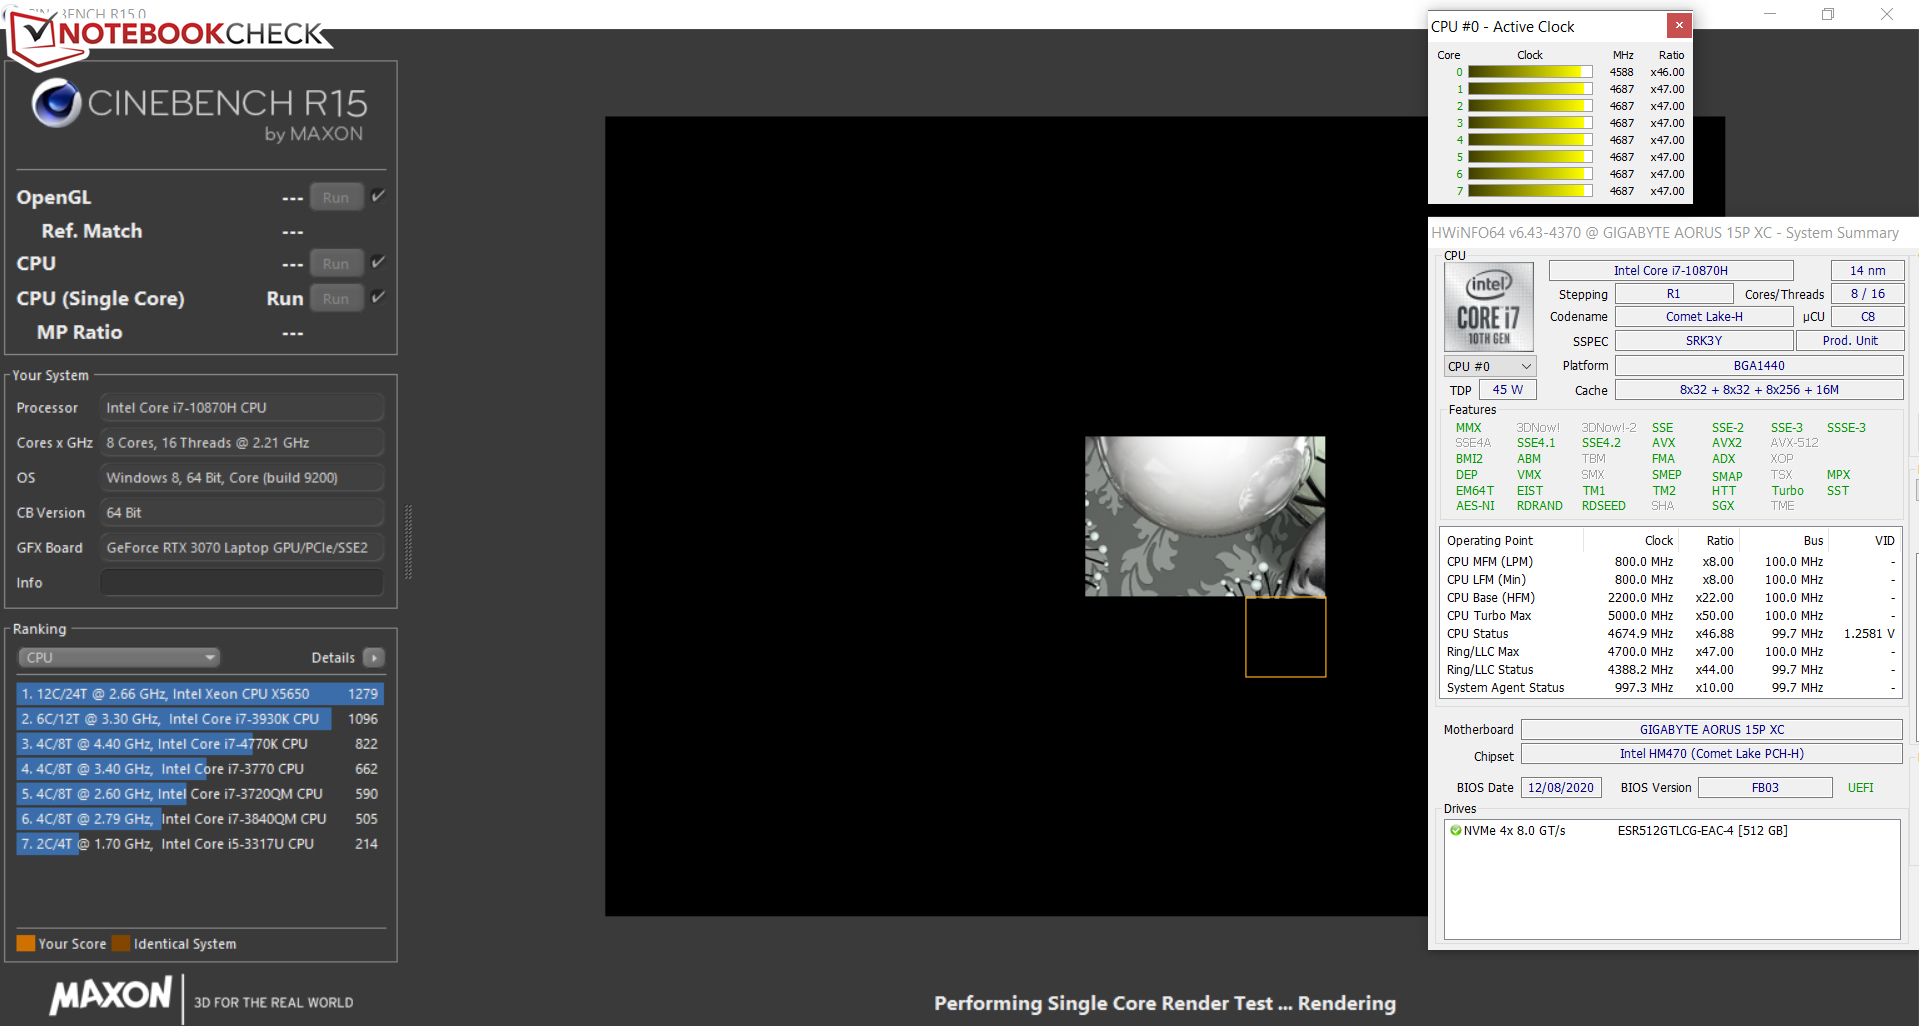
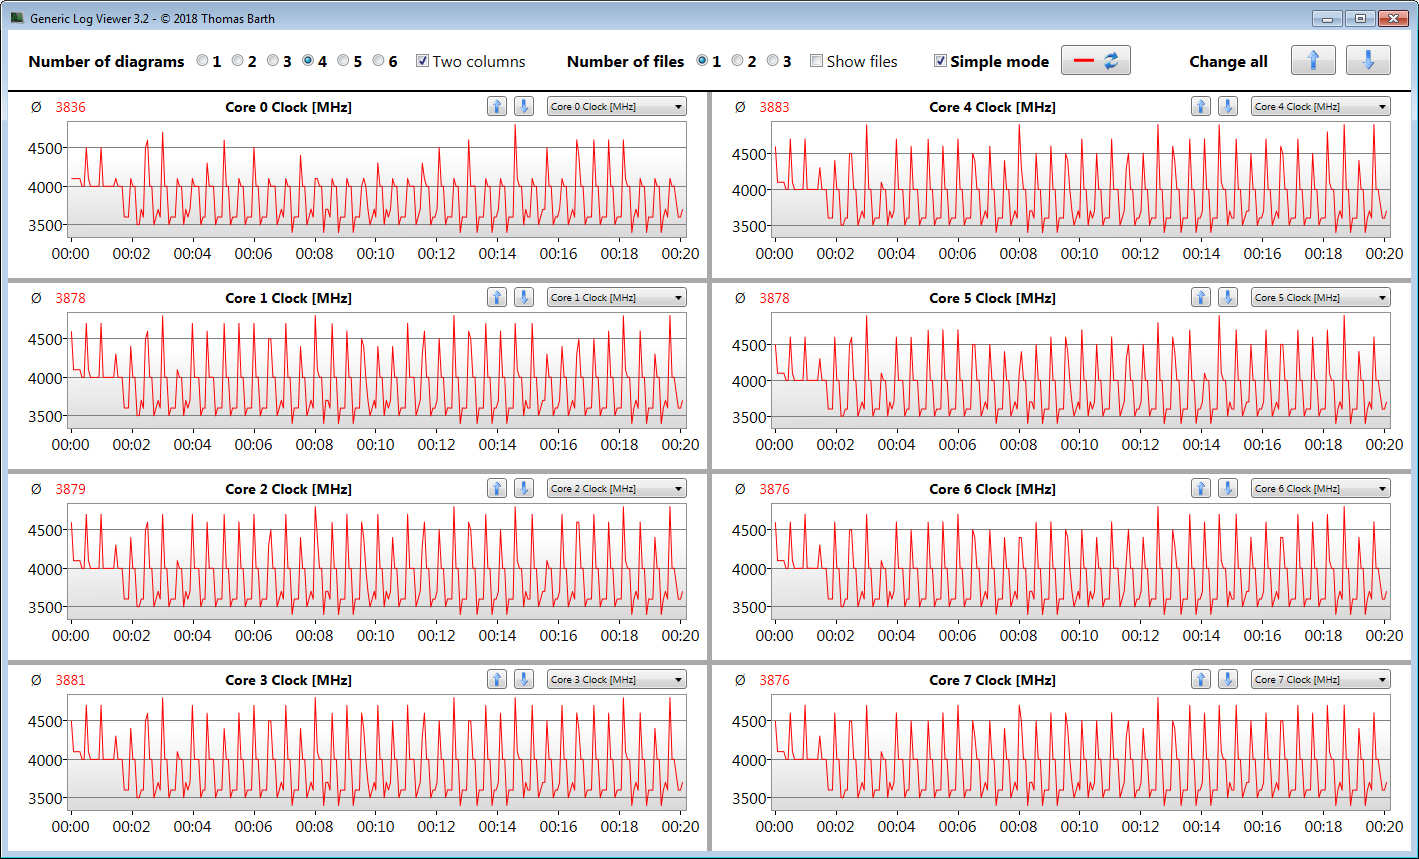
I test della CPU dei benchmarks CineBench R15 sono effettuati a 4 GHz (multi-thread) e da 4 a 4,7 GHz (single-thread). La CPU riduce il suo clock rate a 1,7 GHz (multi e single-thread) quando si usa la batteria.
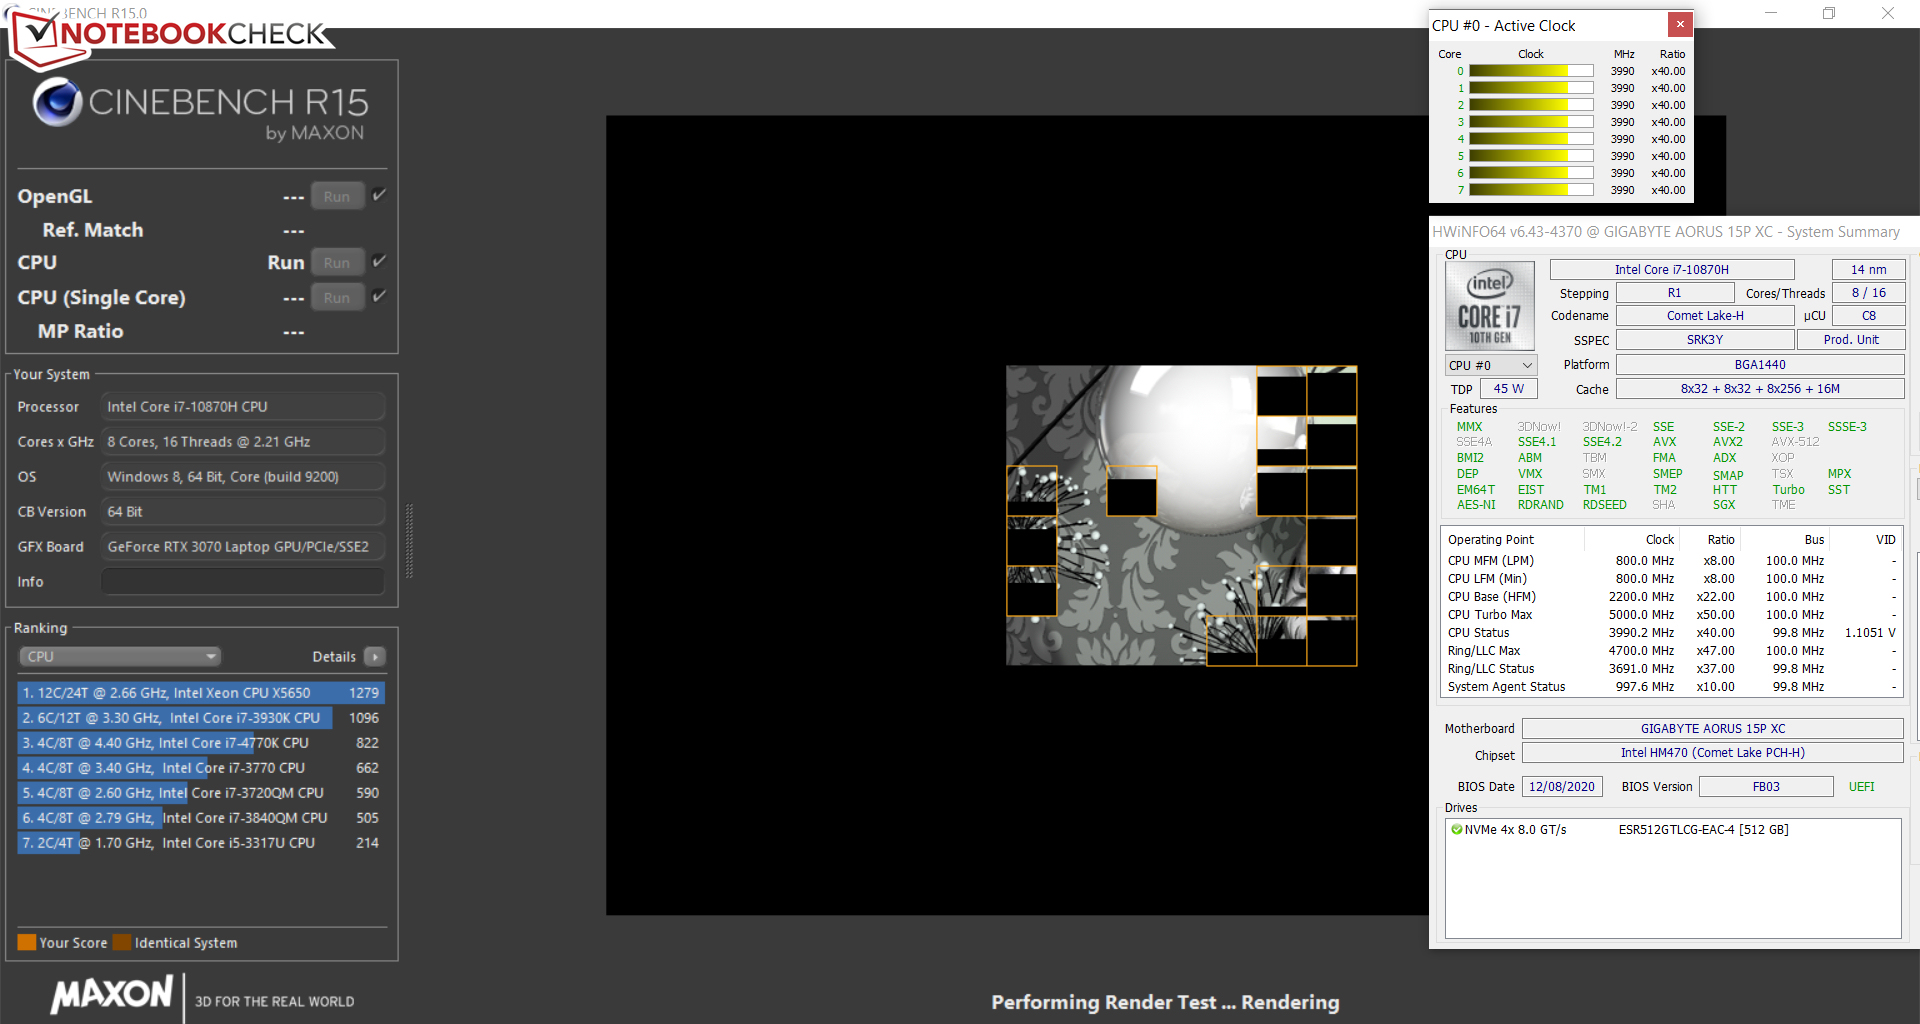
Abbiamo eseguito la versione multi-thread del benchmark Cinebench R15 in un ciclo per almeno 30 minuti a rete per scoprire come il turbo della CPU si comporta sotto carico continuo. L'unità di test di oggi continua ad usare il turbo ad alto livello.
* ... Meglio usare valori piccoli
Prestazioni del sistema
Il sistema veloce e fluido dovrebbe offrire prestazioni sufficienti per i prossimi anni in tutte le aree di utilizzo - gioco, elaborazione delle immagini, editing video, uso dell'ufficio e di internet. Anche i risultati dei benchmarks PCMark sono buoni.
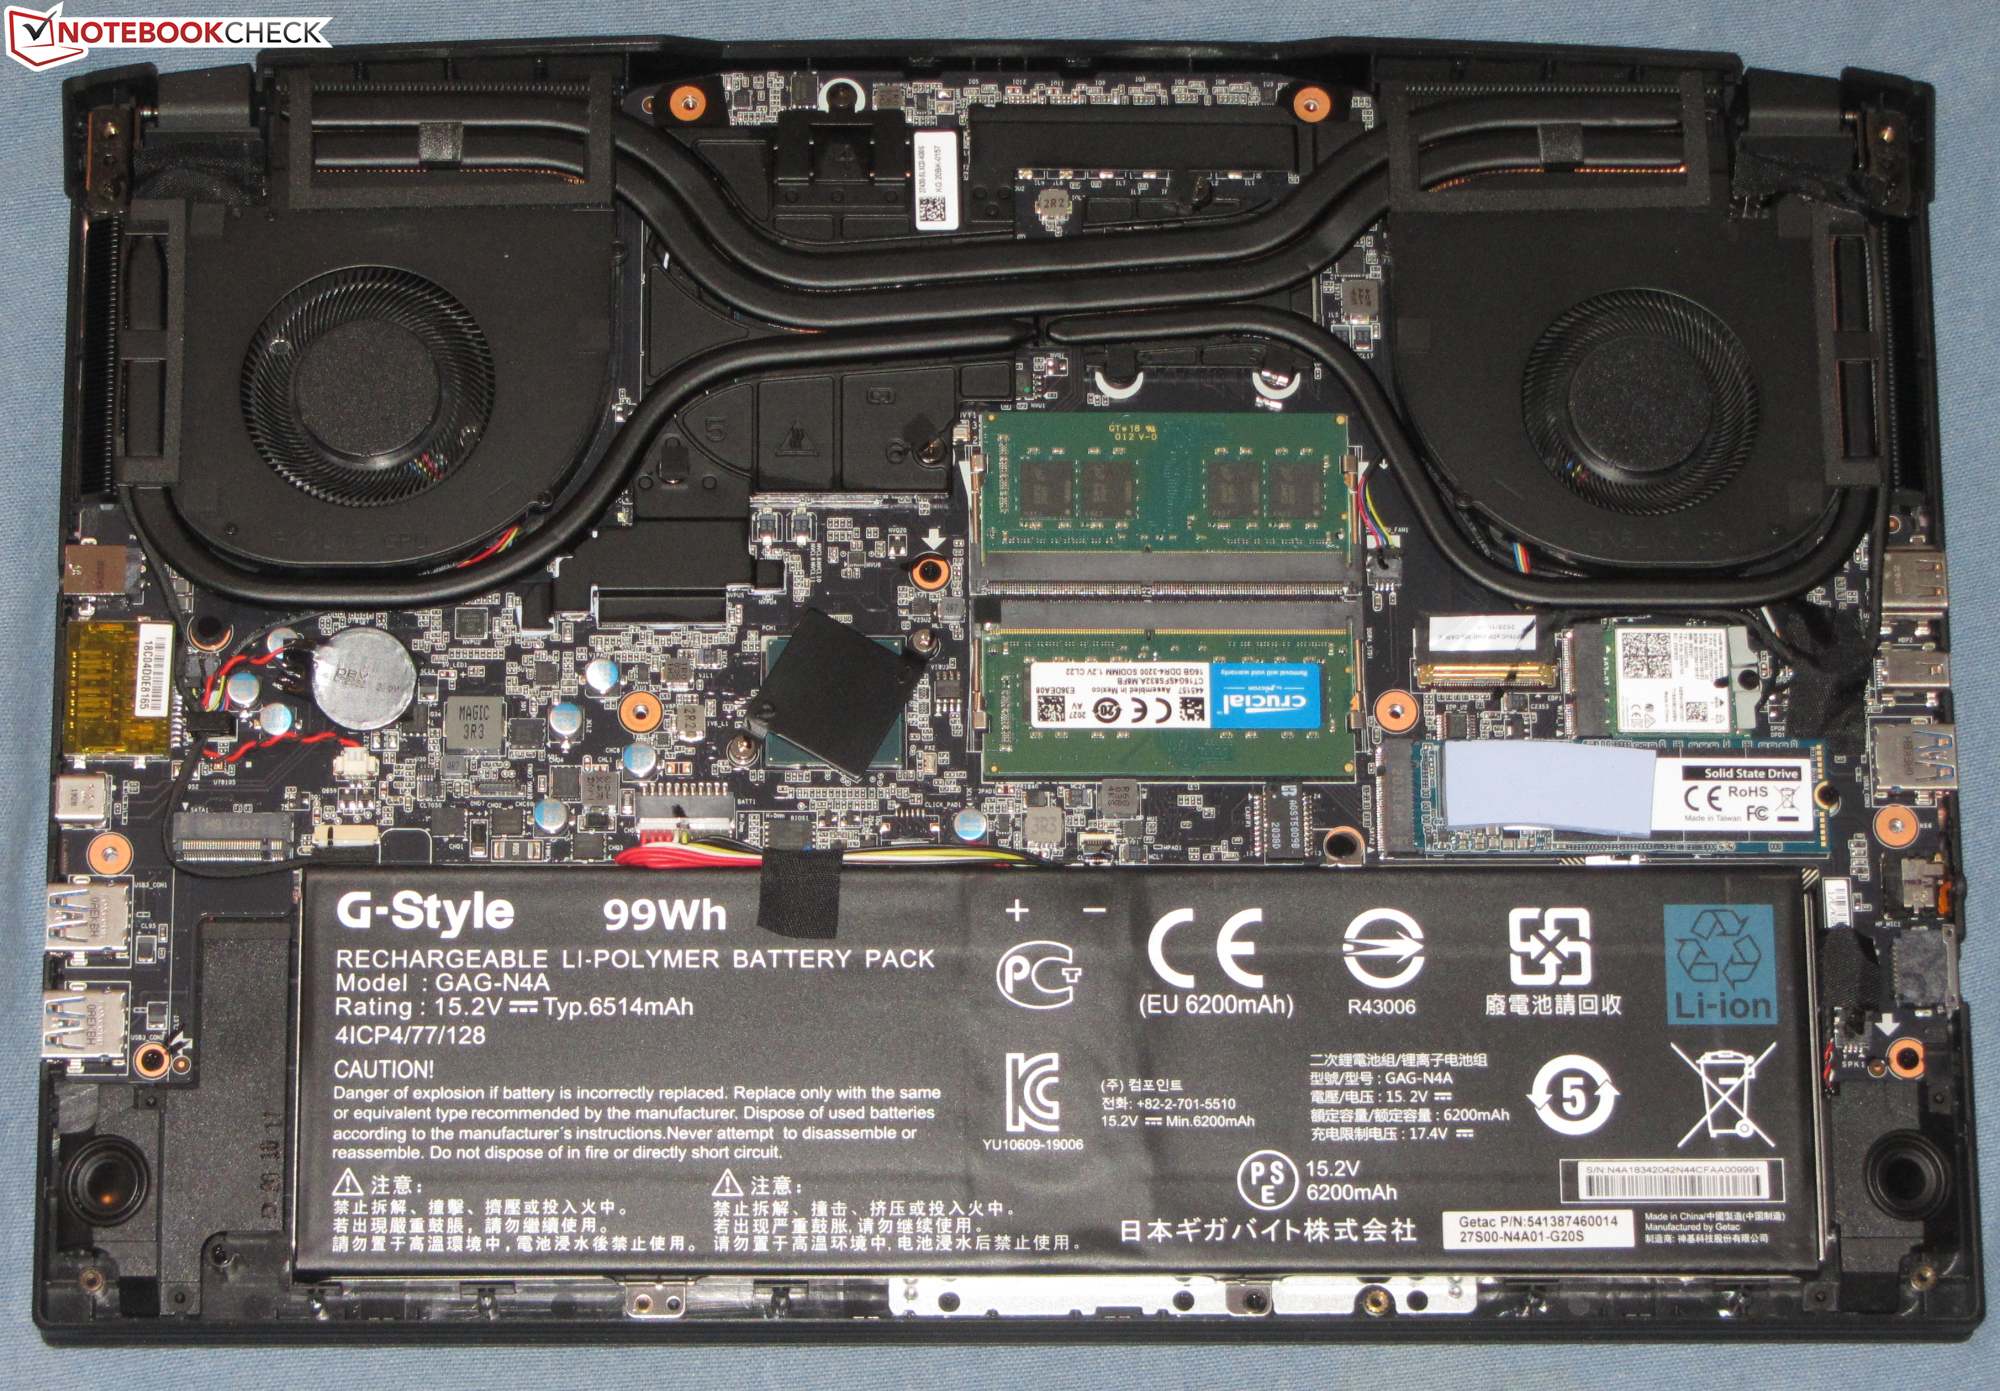
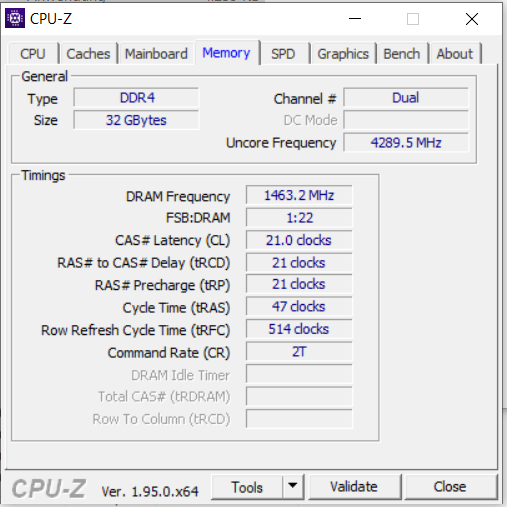
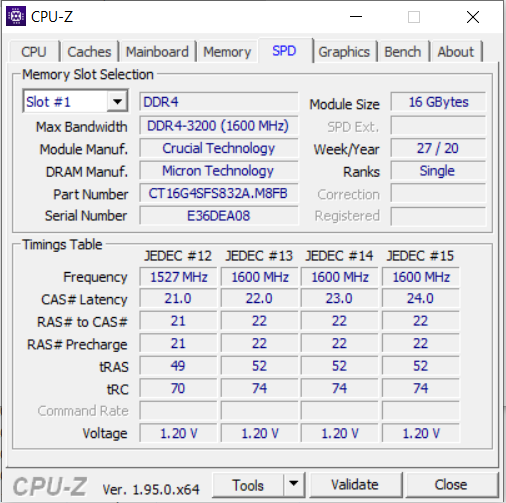
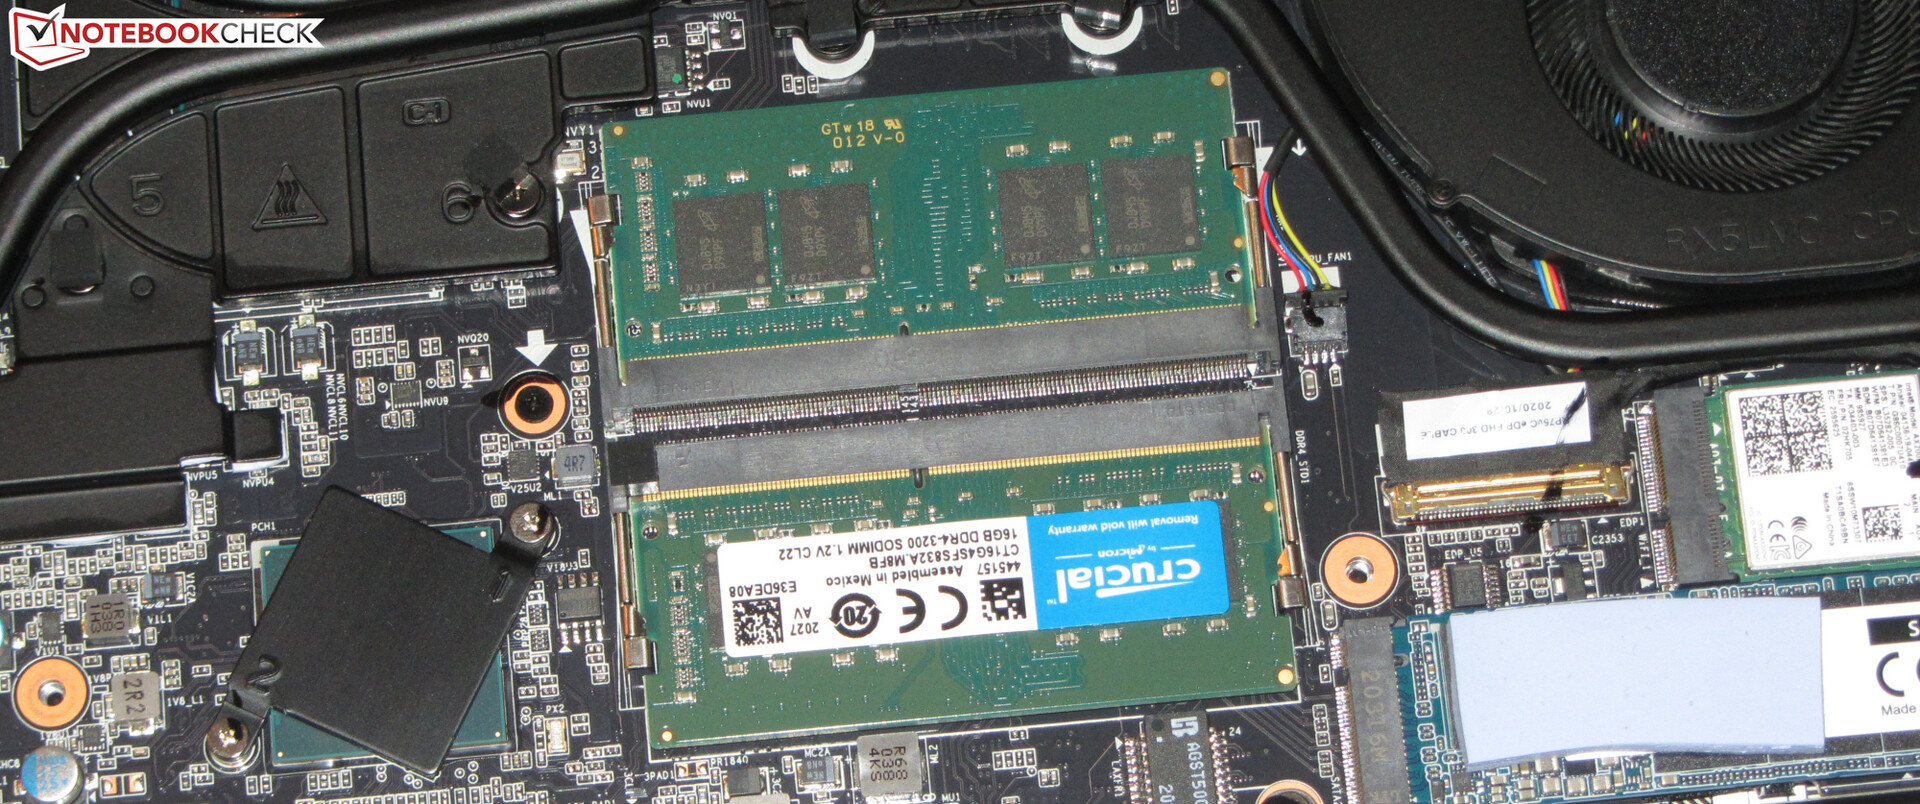
La RAM (DDR4-3200) del notebook da 15,6 pollici funziona in modalità dual channel. I due banchi di memoria sono occupati ciascuno da un modulo da 16 GB.
| PCMark 8 Home Score Accelerated v2 | 4486 punti | |
| PCMark 8 Creative Score Accelerated v2 | 6694 punti | |
| PCMark 8 Work Score Accelerated v2 | 5970 punti | |
| PCMark 10 Score | 6463 punti | |
Aiuto | ||
Latenze DPC
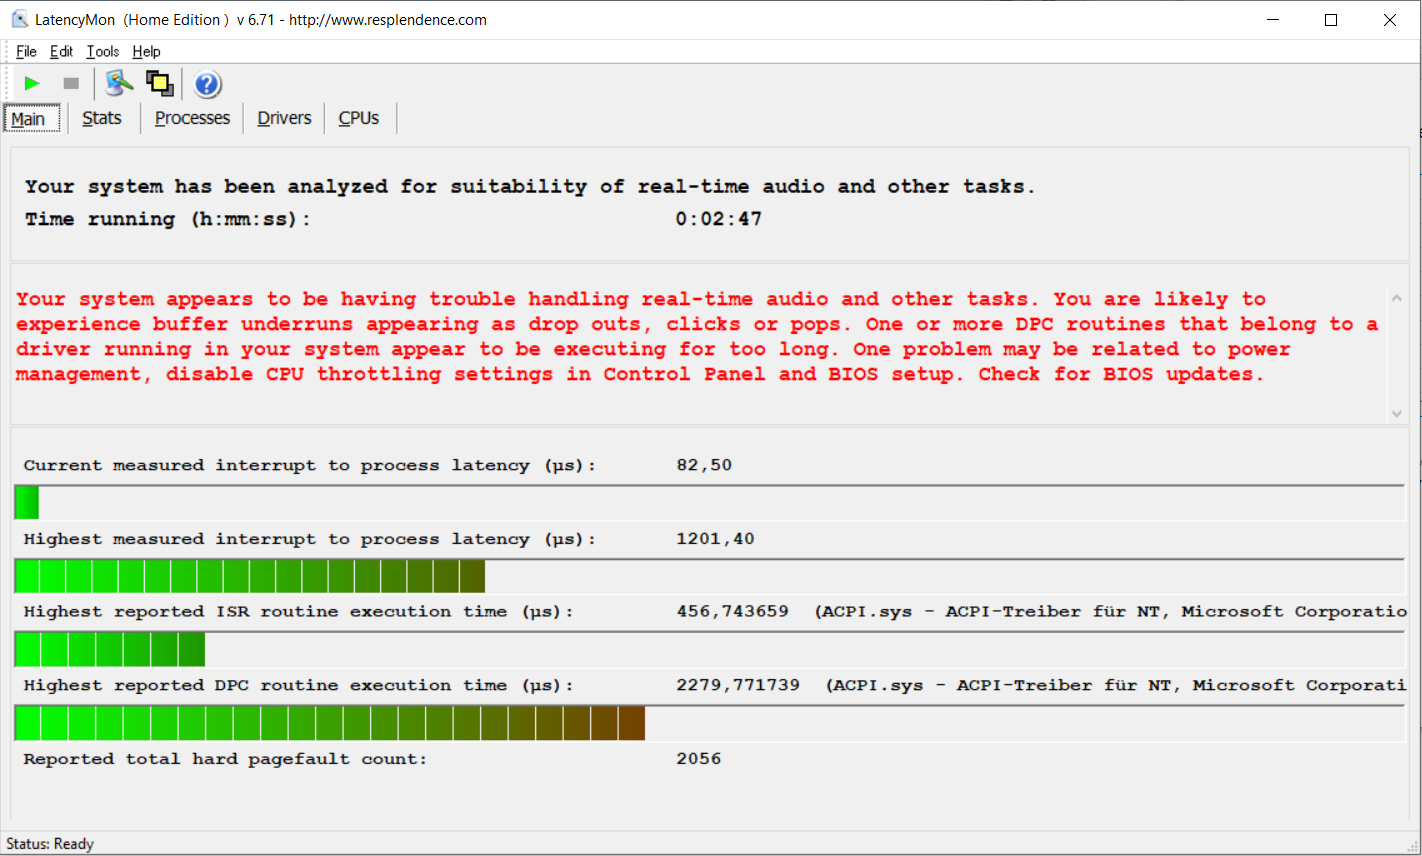
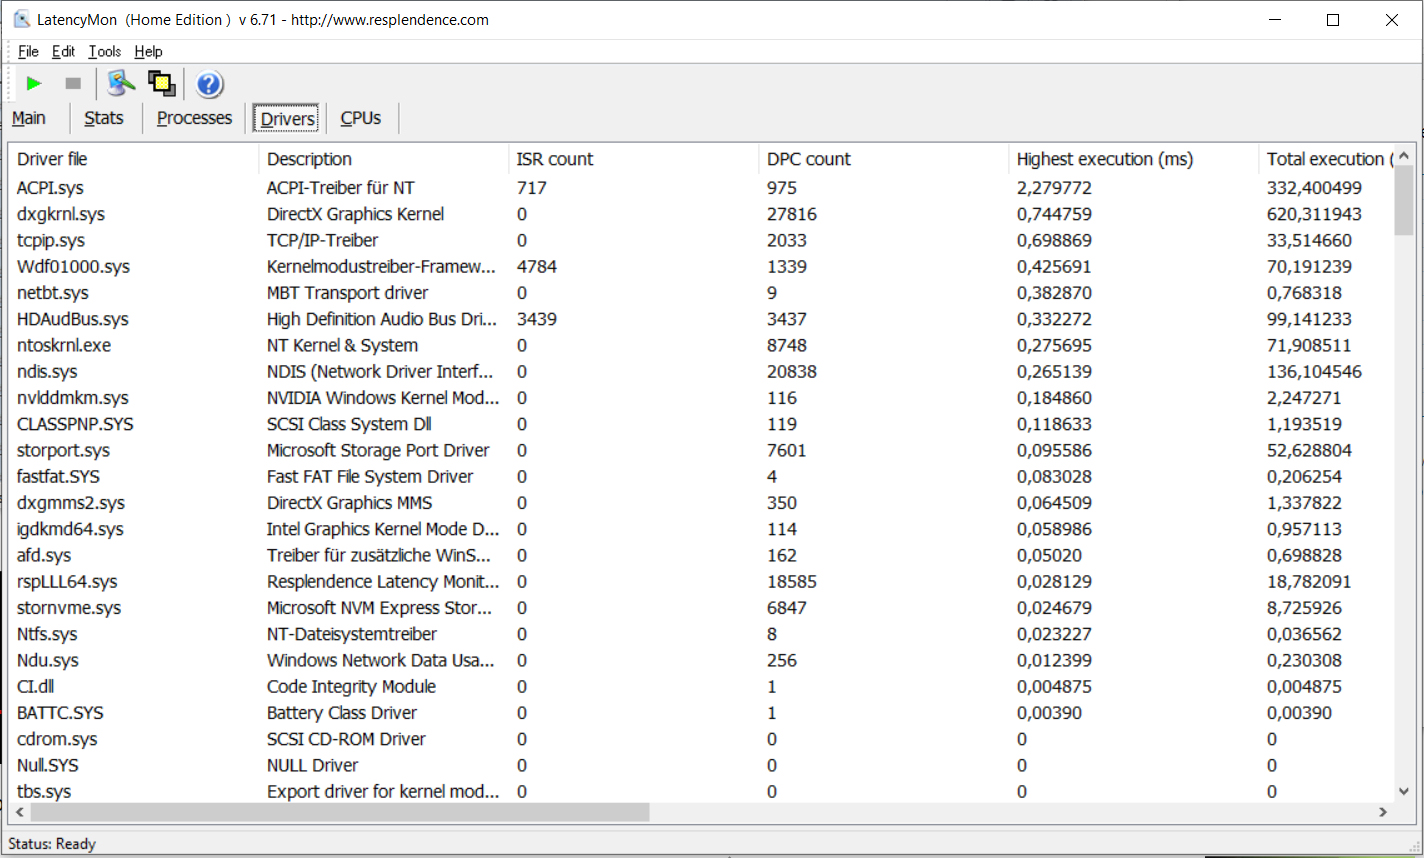
Il nostro test standardizzato Latency Monitor (navigazione sul web, streaming video 4K, Prime95 High Load) ha mostrato diversi problemi con le latenze DPC. Il sistema non sembra essere adatto all'editing di video e audio in tempo reale.
| DPC Latencies / LatencyMon - interrupt to process latency (max), Web, Youtube, Prime95 | |
| Aorus 15G XC | |
| Aorus 15P XC | |
| Asus TUF Dash F15 FX516PR | |
| Aorus 15P WB | |
| MSI GS66 Stealth 10UG | |
| Schenker XMG Neo 15 Comet Lake | |
| Asus ROG Strix G15 G513QR | |
* ... Meglio usare valori piccoli
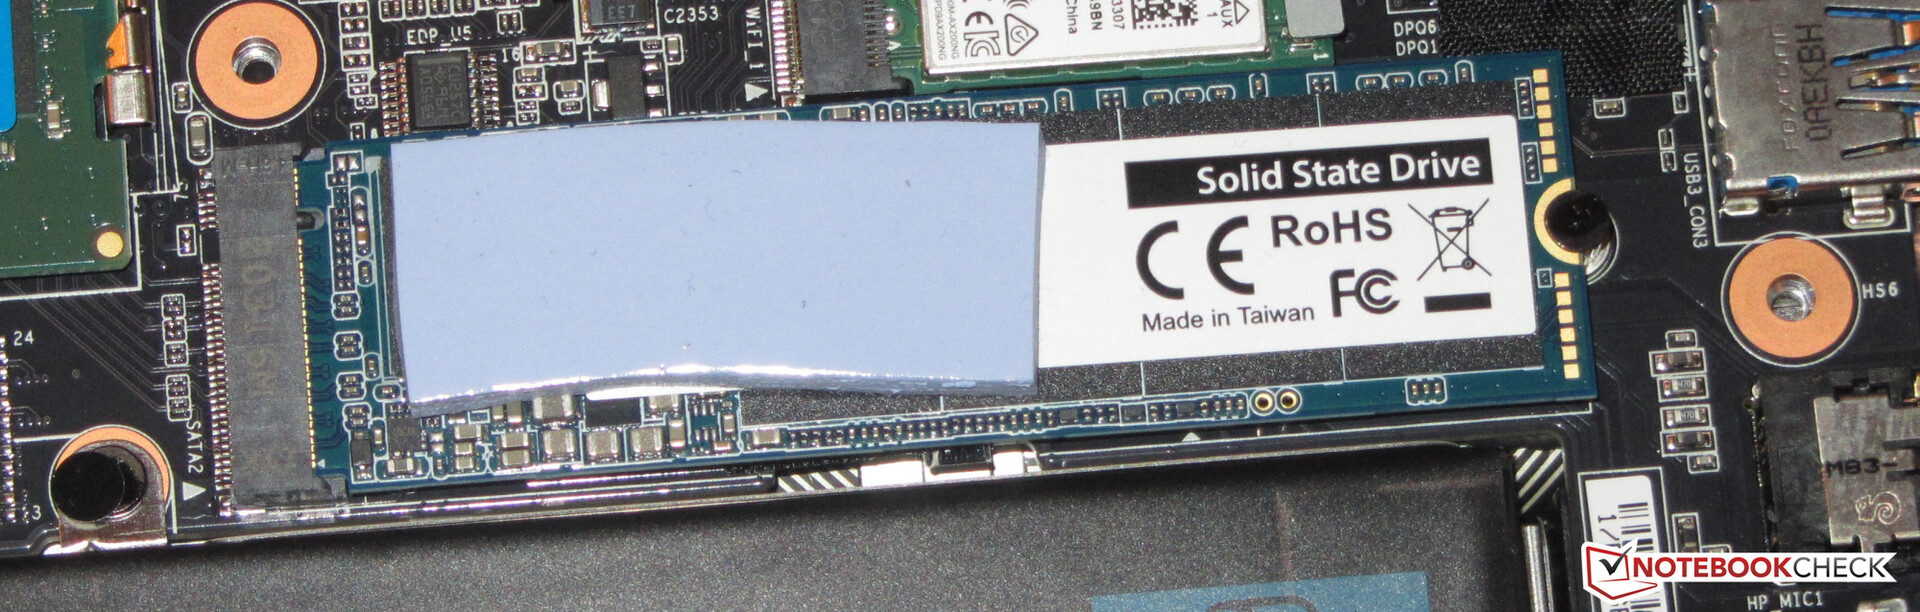
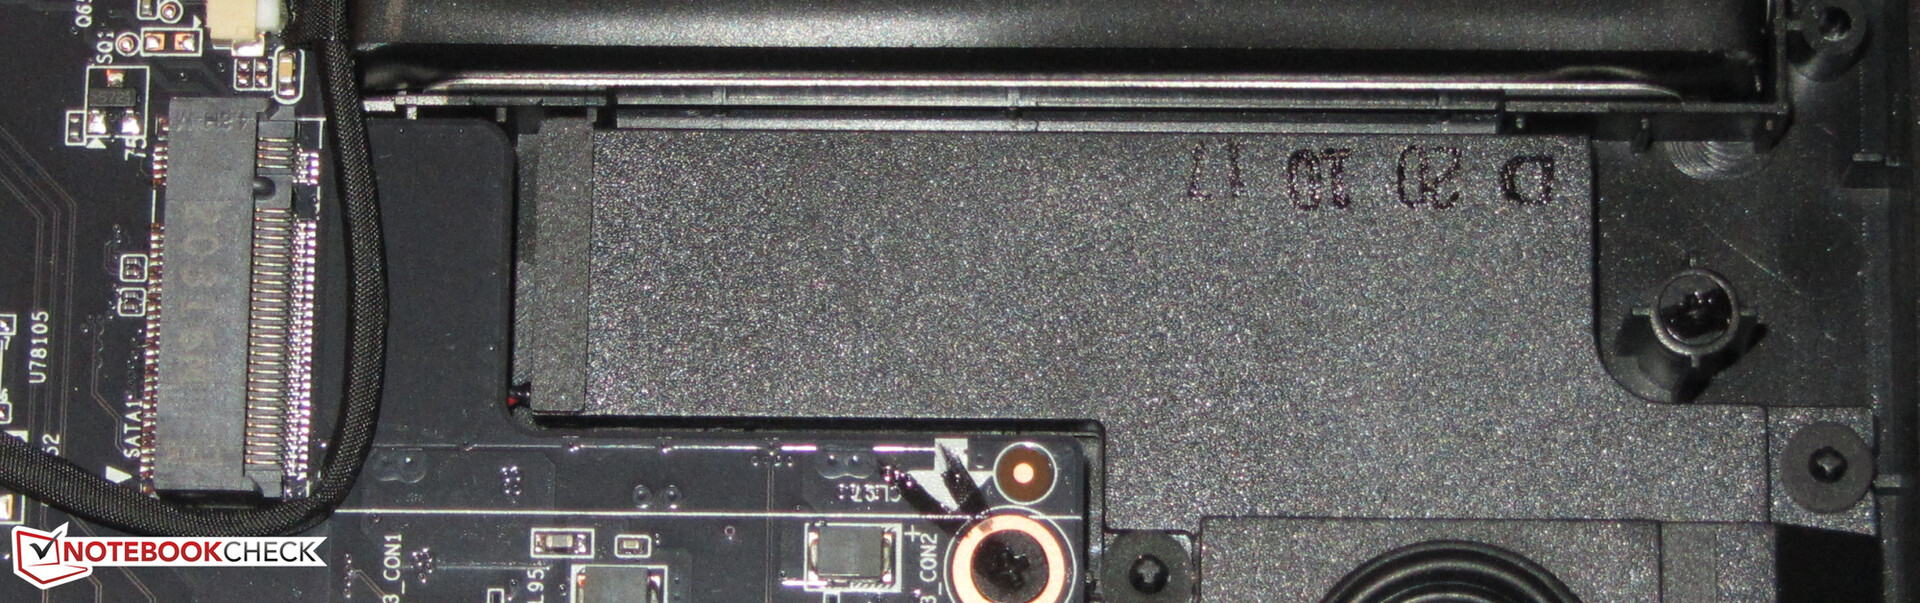
Dispositivi di archiviazione
Il dispositivo di archiviazione nella nostra unità di test è un SSD NVMe da 512 GB (M.2-2280) di Phison. Offre buone velocità di trasferimento. Il notebook ha un altro slot disponibile per un SSD M.2 2280 (1x NVMe, 1x NVMe/SATA). Non supporta il RAID-0/1.

| Aorus 15P XC ESR512GTLCG-EAC-4 | MSI GS66 Stealth 10UG WDC PC SN730 SDBPNTY-1T00 | Asus TUF Dash F15 FX516PR SK Hynix HFM001TD3JX013N | Schenker XMG Neo 15 Comet Lake Samsung SSD 970 EVO Plus 1TB | Aorus 15P WB ADATA XPG SX8200 Pro (ASX8200PNP-512GT) | Aorus 15G XC ESR512GTLCG-EAC-4 | Asus ROG Strix G15 G513QR SK Hynix HFM001TD3JX013N | |
|---|---|---|---|---|---|---|---|
| CrystalDiskMark 5.2 / 6 | 6% | -11% | 22% | 5% | -2% | ||
| Write 4K (MB/s) | 130.2 | 163.1 25% | 129.6 0% | 182.6 40% | 131.7 1% | 137.6 6% | |
| Read 4K (MB/s) | 45.47 | 48.97 8% | 44.71 -2% | 53.5 18% | 55.7 22% | 45.87 1% | |
| Write Seq (MB/s) | 2269 | 2607 15% | 1929 -15% | 3035 34% | 2273 0% | 2304 2% | |
| Read Seq (MB/s) | 1643 | 2316 41% | 2035 24% | 2520 53% | 2533 54% | 1052 -36% | |
| Write 4K Q32T1 (MB/s) | 547 | 338 -38% | 425.9 -22% | 524 -4% | 475.1 -13% | 601 10% | |
| Read 4K Q32T1 (MB/s) | 654 | 475.6 -27% | 433.4 -34% | 617 -6% | 590 -10% | 677 4% | |
| Write Seq Q32T1 (MB/s) | 2512 | 3090 23% | 1390 -45% | 3316 32% | 2373 -6% | 2536 1% | |
| Read Seq Q32T1 (MB/s) | 3382 | 3421 1% | 3505 4% | 3548 5% | 3068 -9% | 3372 0% | |
| AS SSD | -12% | -26% | 19% | -21% | -16% | -0% | |
| Seq Read (MB/s) | 2694 | 2198 -18% | 2671 -1% | 2970 10% | 2241 -17% | 2048 -24% | 2881 7% |
| Seq Write (MB/s) | 2327 | 2596 12% | 1501 -35% | 2559 10% | 2121 -9% | 2403 3% | 1570 -33% |
| 4K Read (MB/s) | 47.77 | 43.81 -8% | 39.65 -17% | 56.6 18% | 52.3 9% | 48.27 1% | 52.4 10% |
| 4K Write (MB/s) | 98.8 | 115.5 17% | 69 -30% | 145 47% | 116.2 18% | 101.6 3% | 124 26% |
| 4K-64 Read (MB/s) | 1746 | 1692 -3% | 1209 -31% | 1938 11% | 713 -59% | 1606 -8% | 1334 -24% |
| 4K-64 Write (MB/s) | 2267 | 2162 -5% | 1650 -27% | 2307 2% | 827 -64% | 1473 -35% | 2189 -3% |
| Access Time Read * (ms) | 0.079 | 0.056 29% | 0.093 -18% | 0.035 56% | 0.054 32% | 0.131 -66% | 0.055 30% |
| Access Time Write * (ms) | 0.039 | 0.098 -151% | 0.055 -41% | 0.025 36% | 0.031 21% | 0.038 3% | 0.03 23% |
| Score Read (Points) | 2063 | 1956 -5% | 1516 -27% | 2291 11% | 989 -52% | 1859 -10% | 1675 -19% |
| Score Write (Points) | 2598 | 2537 -2% | 1869 -28% | 2708 4% | 1155 -56% | 1815 -30% | 2470 -5% |
| Score Total (Points) | 5698 | 5513 -3% | 4105 -28% | 6152 8% | 2659 -53% | 4645 -18% | 4943 -13% |
| Media totale (Programma / Settaggio) | -3% /
-5% | -19% /
-20% | 21% /
20% | -8% /
-10% | -9% /
-10% | 0% /
-0% |
* ... Meglio usare valori piccoli
Throttling Disco: DiskSpd Read Loop, Queue Depth 8
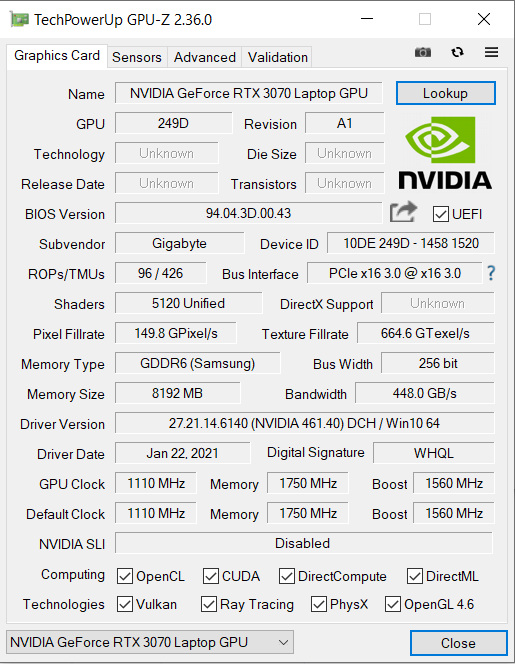
Prestazioni grafiche
NVIDIA GeForce RTX 3070 Mobile GPU - Benchmarks and SpecsMentre la GeForce RTX 3070 Laptop è posizionata all'estremità superiore della scala, il suo nome da solo non dà alcuna indicazione delle sue prestazioni effettive. I produttori possono impostare individualmente il TGP all'interno di una gamma definita da Nvidia. Questo è ciò che realmente decide quale livello di prestazioni la GPU avrà da offrire.
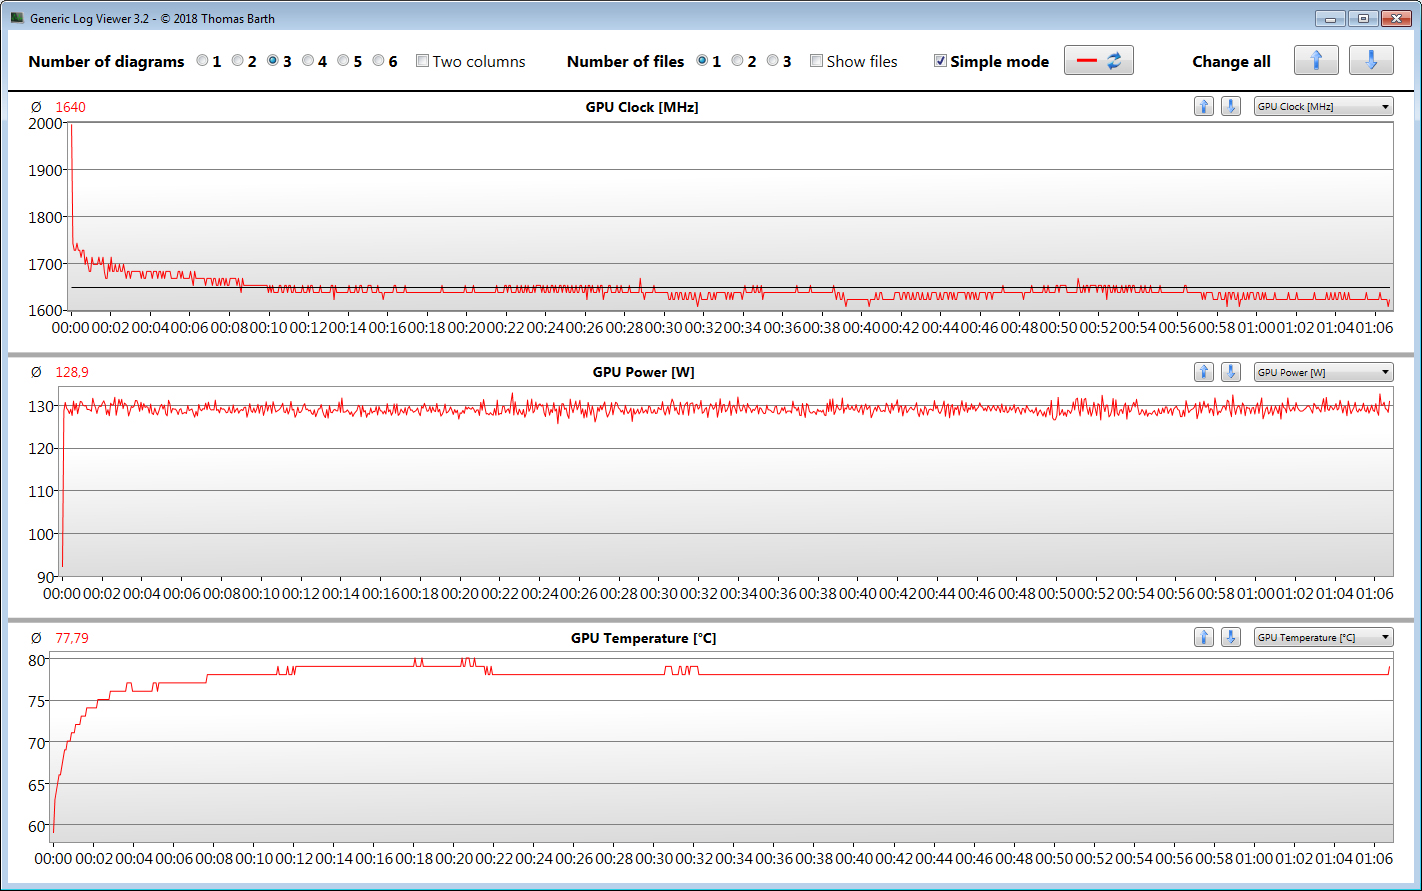
Gigabyte quasi massimizza la sua GPU con un TGB di 130 Watt (il massimo stabilito da Nvidia è 140 Watt). Il produttore ha dichiarato questo valore sul suo sito web globale. I nostri test hanno confermato il TGB di 130 Watt.
Come risultato del TGB più alto, il 15P raggiunge risultati di benchmark significativamente migliori rispetto ai suoi concorrenti dotati della stessa GPU come lo MSI GS66 Stealth 10UG (TGP: 95 Watt) e l'Asus TUF Dash F15 FX516PR (TGP: 85 Watt). Il 15P può anche superare il suo modello gemello con quasi la stessa struttura, l'Aorus 15G XC, che ha un TGP di 105 Watt. Abbiamo creato una panoramica di tutti i portatili RTX 3070 inclusi i loro TGP.
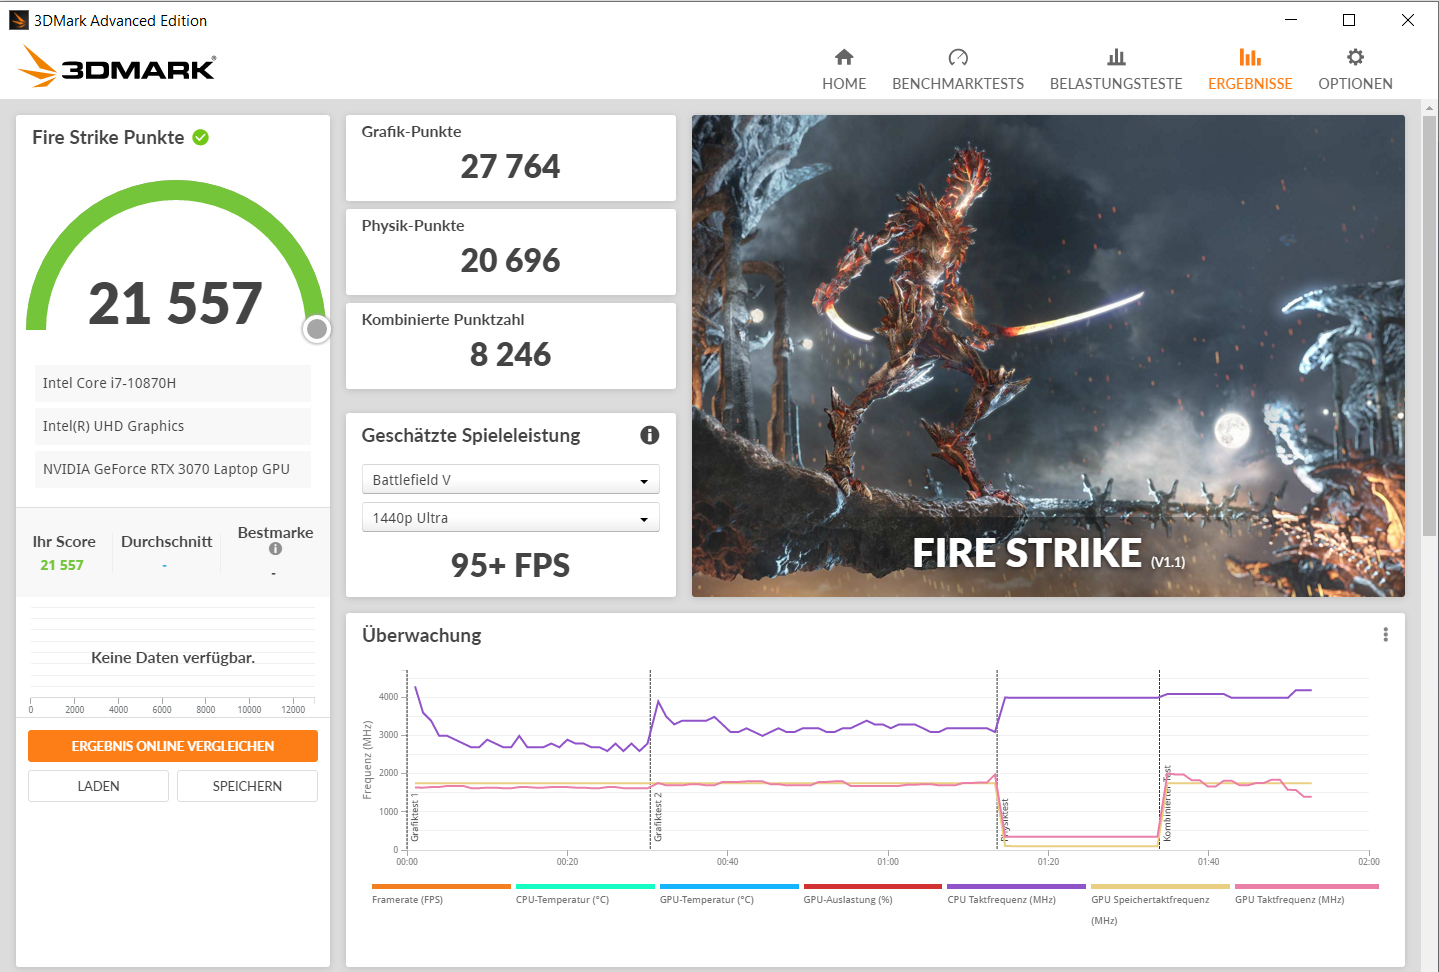

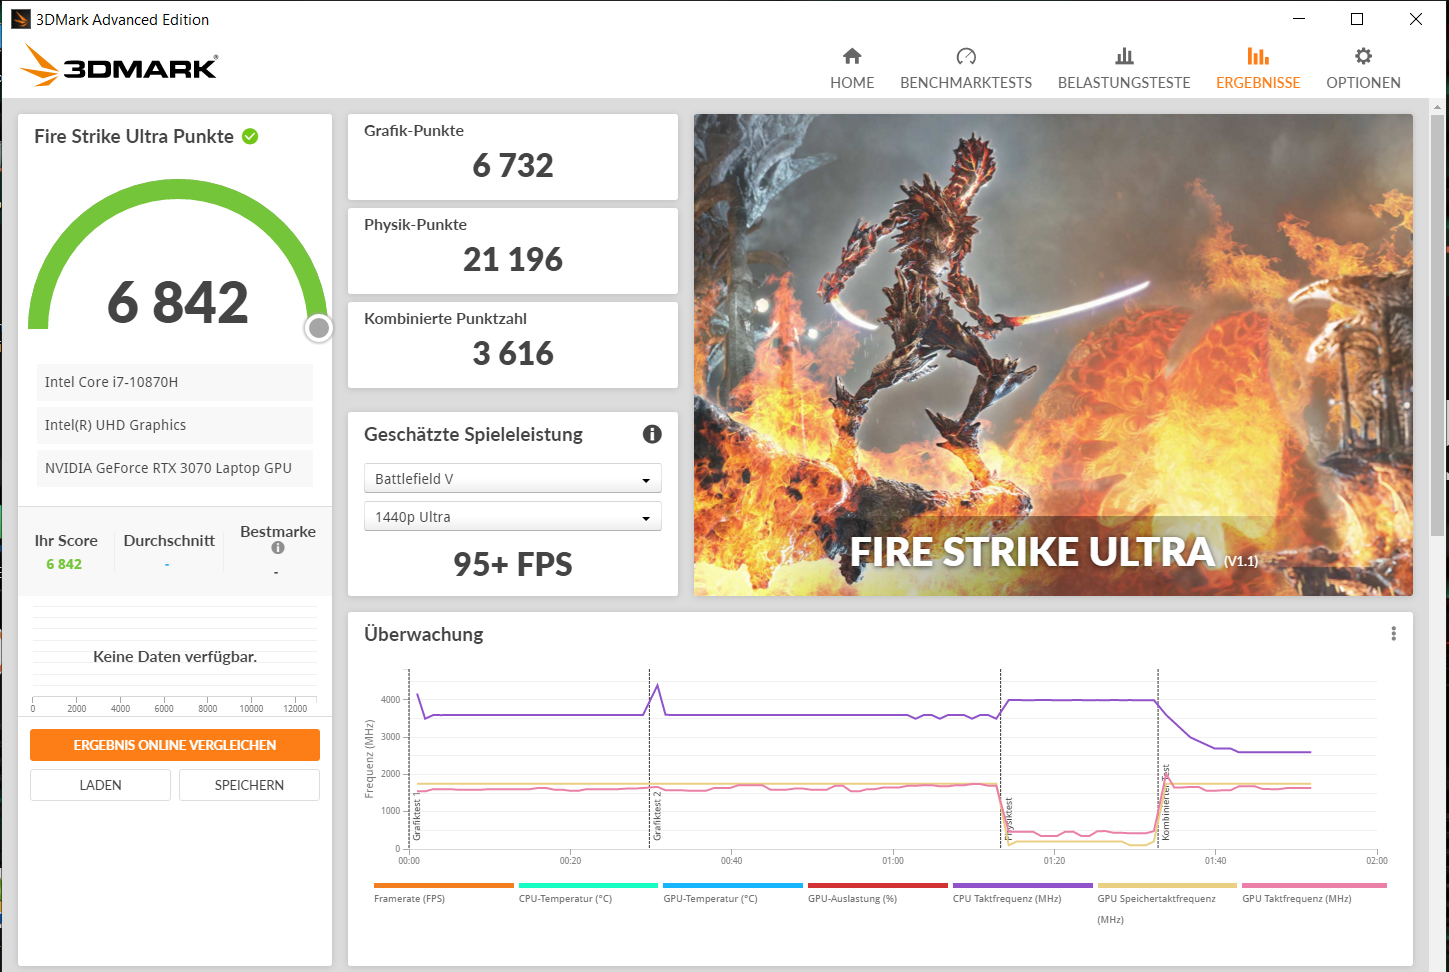
| 3DMark 11 Performance | 27446 punti | |
| 3DMark Cloud Gate Standard Score | 51836 punti | |
| 3DMark Fire Strike Score | 21557 punti | |
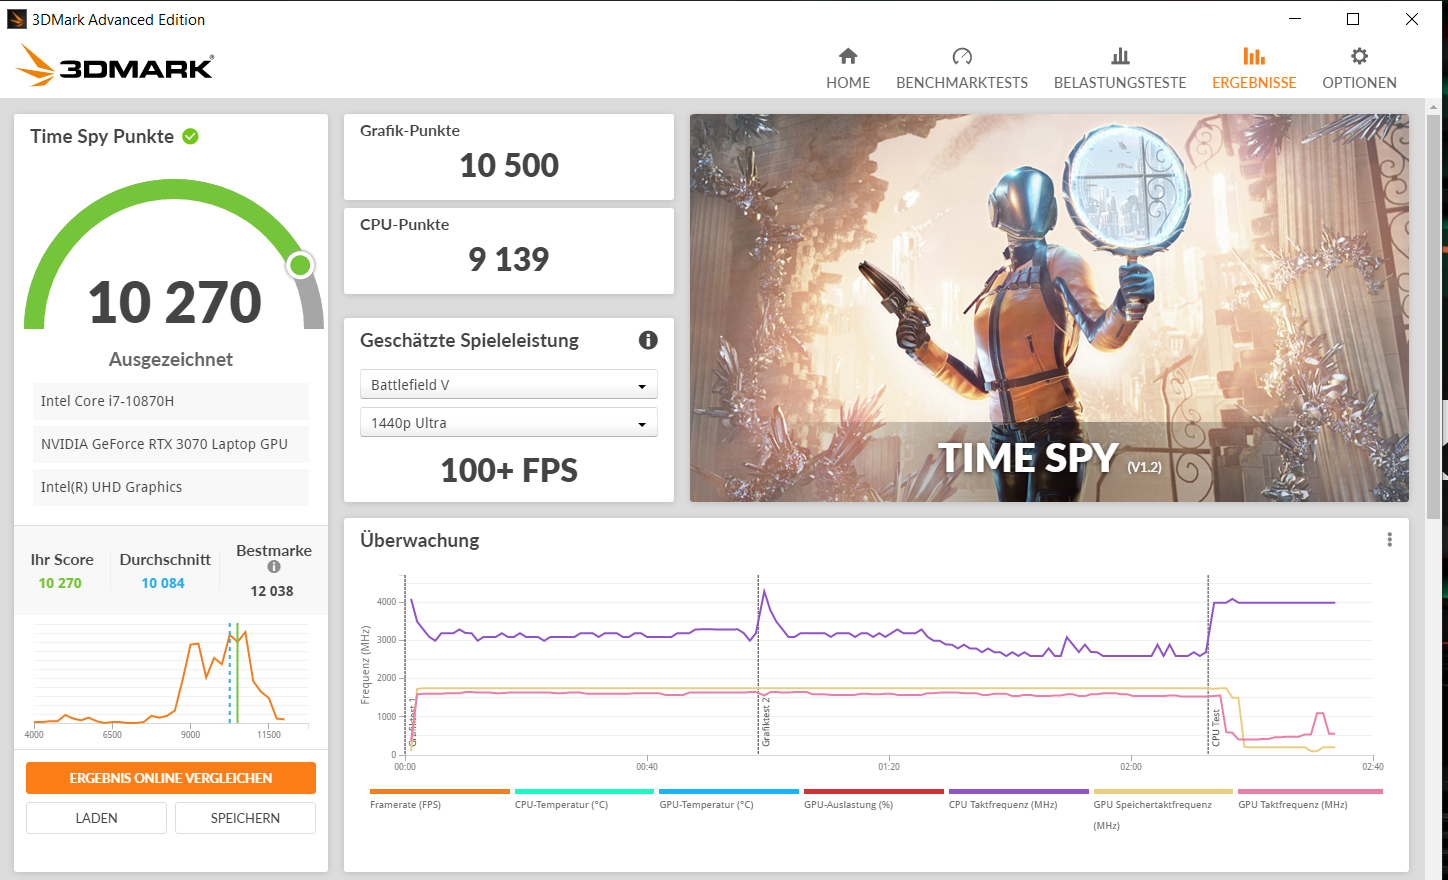
| 3DMark Time Spy Score | 10270 punti | |
Aiuto | ||
Prestazioni gaming
L'hardware nella nostra unità di test è in grado di gestire tutti i giochi attuali senza problemi con una risoluzione Full-HD e impostazioni di qualità massima. Risoluzioni più alte (che richiederebbero agli utenti di collegare un monitor esterno adatto) possono richiedere una riduzione delle impostazioni di qualità.
| The Witcher 3 - 1920x1080 Ultra Graphics & Postprocessing (HBAO+) | |
| Media della classe Gaming (104.7 - 240, n=7, ultimi 2 anni) | |
| Aorus 15P XC | |
| Asus ROG Strix G15 G513QR | |
| Aorus 15G XC | |
| Media NVIDIA GeForce RTX 3070 Laptop GPU (34.9 - 109, n=52) | |
| MSI GS66 Stealth 10UG | |
| Schenker XMG Neo 15 Comet Lake | |
| Asus TUF Dash F15 FX516PR | |
| Aorus 15P WB | |
| Watch Dogs Legion - 1920x1080 Ultra Preset (DX12) | |
| Aorus 15P XC | |
| Media NVIDIA GeForce RTX 3070 Laptop GPU (55 - 73, n=7) | |
| Asus TUF Dash F15 FX516PR | |
| Aorus 15P WB | |
| Immortals Fenyx Rising - 1920x1080 Very High Preset | |
| Aorus 15P XC | |
| Media NVIDIA GeForce RTX 3070 Laptop GPU (69 - 94, n=4) | |
| Asus TUF Dash F15 FX516PR | |
| Aorus 15P WB | |
| Serious Sam 4 - 1920x1080 Ultra (DX12) AA:2xMS | |
| Aorus 15P XC | |
| Media NVIDIA GeForce RTX 3070 Laptop GPU (66.4 - 82.1, n=5) | |
| Asus TUF Dash F15 FX516PR | |
| Shadow of the Tomb Raider - 1920x1080 Highest Preset AA:T | |
| Media NVIDIA GeForce RTX 3070 Laptop GPU (86 - 133.7, n=6) | |
| Aorus 15G XC | |
| Aorus 15P XC | |
| Media della classe Gaming (96 - 116, n=2, ultimi 2 anni) | |
| Asus TUF Dash F15 FX516PR | |
| F1 2020 - 1920x1080 Ultra High Preset AA:T AF:16x | |
| Media NVIDIA GeForce RTX 3070 Laptop GPU (97 - 173, n=7) | |
| Aorus 15P XC | |
| Asus TUF Dash F15 FX516PR | |
| Cyberpunk 2077 1.0 - 1920x1080 Ultra Preset | |
| Aorus 15P XC | |
| Media NVIDIA GeForce RTX 3070 Laptop GPU (50 - 70.5, n=11) | |
| Asus TUF Dash F15 FX516PR | |
| Aorus 15P WB | |
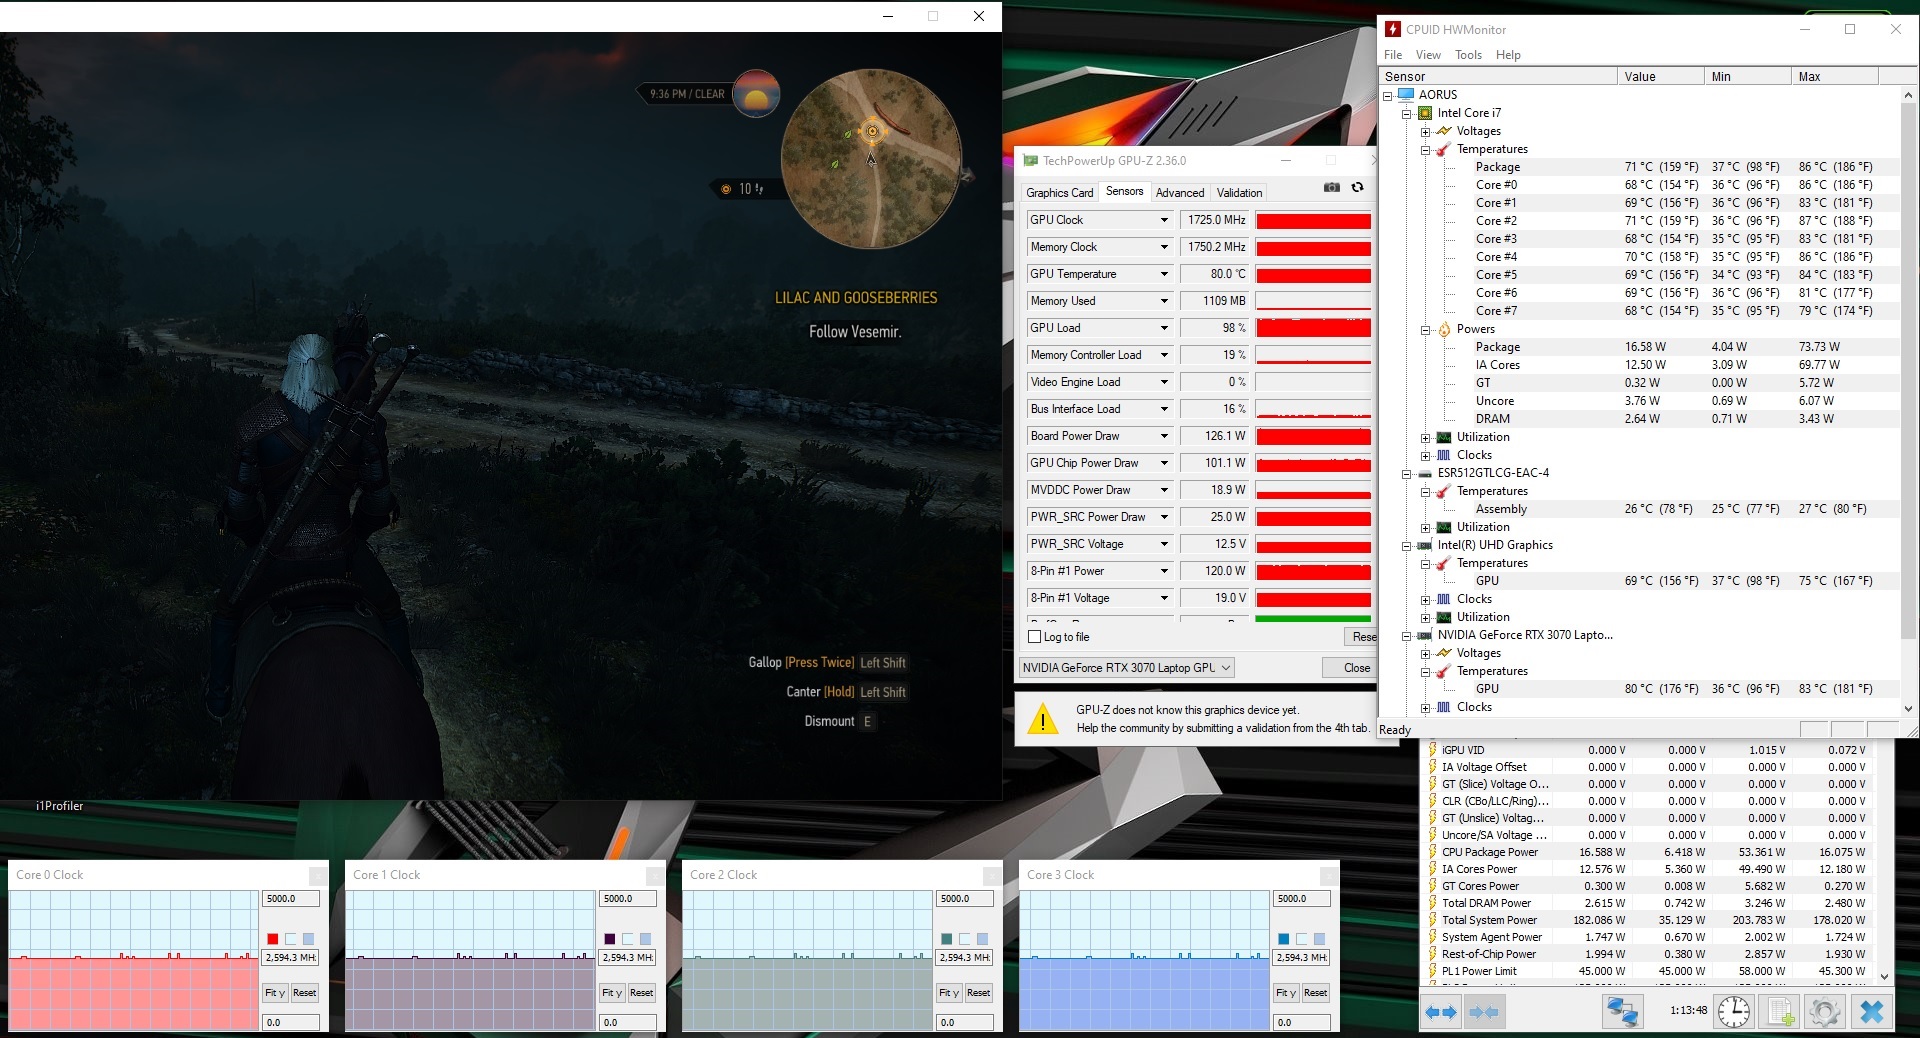
Abbiamo eseguito il gioco "The Witcher 3" per circa 60 minuti con risoluzione Full-HD e impostazioni di qualità massima, al fine di scoprire se il frame rate rimane costante per un lungo periodo di tempo. Il personaggio del gioco non si è mosso durante questo test. Non abbiamo registrato un calo del frame rate.
| basso | medio | alto | ultra | |
|---|---|---|---|---|
| The Witcher 3 (2015) | 672 | 265 | 176 | 101 |
| Dota 2 Reborn (2015) | 128 | 120 | ||
| X-Plane 11.11 (2018) | 111 | 96.3 | 79.5 | |
| Far Cry 5 (2018) | 146 | 119 | 115 | 108 |
| Shadow of the Tomb Raider (2018) | 132 | 111 | 108 | 107 |
| Total War: Three Kingdoms (2019) | 202.3 | 135.6 | 100.7 | 78.9 |
| Red Dead Redemption 2 (2019) | 128 | 108 | 88.4 | 60.7 |
| F1 2020 (2020) | 186 | 157 | 177 | 130 |
| Death Stranding (2020) | 150 | 143 | 137 | 134 |
| Horizon Zero Dawn (2020) | 127 | 99 | 92 | 86 |
| Flight Simulator 2020 (2020) | 59.1 | 41.6 | 42.2 | 38 |
| Serious Sam 4 (2020) | 131 | 98.1 | 91.8 | 82.1 |
| Watch Dogs Legion (2020) | 108 | 104 | 94.7 | 72.3 |
| Assassin´s Creed Valhalla (2020) | 126 | 95 | 84 | 75 |
| Yakuza Like a Dragon (2020) | 134 | 114 | 115 | 106 |
| Immortals Fenyx Rising (2020) | 127 | 112 | 101 | 94 |
| Cyberpunk 2077 1.0 (2020) | 106 | 89.5 | 76.9 | 67.8 |
| Hitman 3 (2021) | 174.4 | 128 | 120.7 | 134.8 |
Emissioni - questo laptop Aorus si riscalda molto sotto carico
Rumorosità di sistema
Le due ventole girano quasi costantemente anche quando sono al minimo, anche se a bassa velocità. Non sono quasi mai veramente udibili in questo scenario. Lo scenario cambia sotto carico. L'Aorus 15P può produrre un livello massimo di rumore di 53 dB(A) (stress test) o 49 dB(A) (Witcher 3 test). Raccomandiamo di usare una cuffia a questi livelli di rumore.
Rumorosità
| Idle |
| 25 / 29 / 34 dB(A) |
| Sotto carico |
| 44 / 53 dB(A) |
 | ||
30 dB silenzioso 40 dB(A) udibile 50 dB(A) rumoroso |
||
min: | ||
| Aorus 15P XC i7-10870H, GeForce RTX 3070 Laptop GPU | MSI GS66 Stealth 10UG i7-10870H, GeForce RTX 3070 Laptop GPU | Asus TUF Dash F15 FX516PR i7-11370H, GeForce RTX 3070 Laptop GPU | Schenker XMG Neo 15 Comet Lake i7-10875H, GeForce RTX 2070 Super Mobile | Aorus 15G XC i7-10870H, GeForce RTX 3070 Laptop GPU | Aorus 15P WB i7-10750H, GeForce RTX 2070 Max-Q | Asus ROG Strix G15 G513QR R9 5900HX, GeForce RTX 3070 Laptop GPU | Media della classe Gaming | |
|---|---|---|---|---|---|---|---|---|
| Noise | -10% | -4% | -5% | 0% | 3% | 0% | 2% | |
| off /ambiente * (dB) | 24 | 26.2 -9% | 24 -0% | 25 -4% | 25 -4% | 25 -4% | 24 -0% | 24.1 ? -0% |
| Idle Minimum * (dB) | 25 | 34 -36% | 25 -0% | 26 -4% | 29 -16% | 29 -16% | 25 -0% | 25.9 ? -4% |
| Idle Average * (dB) | 29 | 34 -17% | 30 -3% | 28 3% | 30 -3% | 30 -3% | 31 -7% | 27.4 ? 6% |
| Idle Maximum * (dB) | 34 | 34 -0% | 35 -3% | 33 3% | 31 9% | 31 9% | 33 3% | 30.1 ? 11% |
| Load Average * (dB) | 44 | 47.2 -7% | 53 -20% | 52 -18% | 41 7% | 41 7% | 45 -2% | 43.7 ? 1% |
| Witcher 3 ultra * (dB) | 49 | 46.3 6% | 48 2% | 55 -12% | 47 4% | 43 12% | 48 2% | |
| Load Maximum * (dB) | 53 | 58.2 -10% | 54 -2% | 56 -6% | 51 4% | 45 15% | 50 6% | 54.3 ? -2% |
* ... Meglio usare valori piccoli
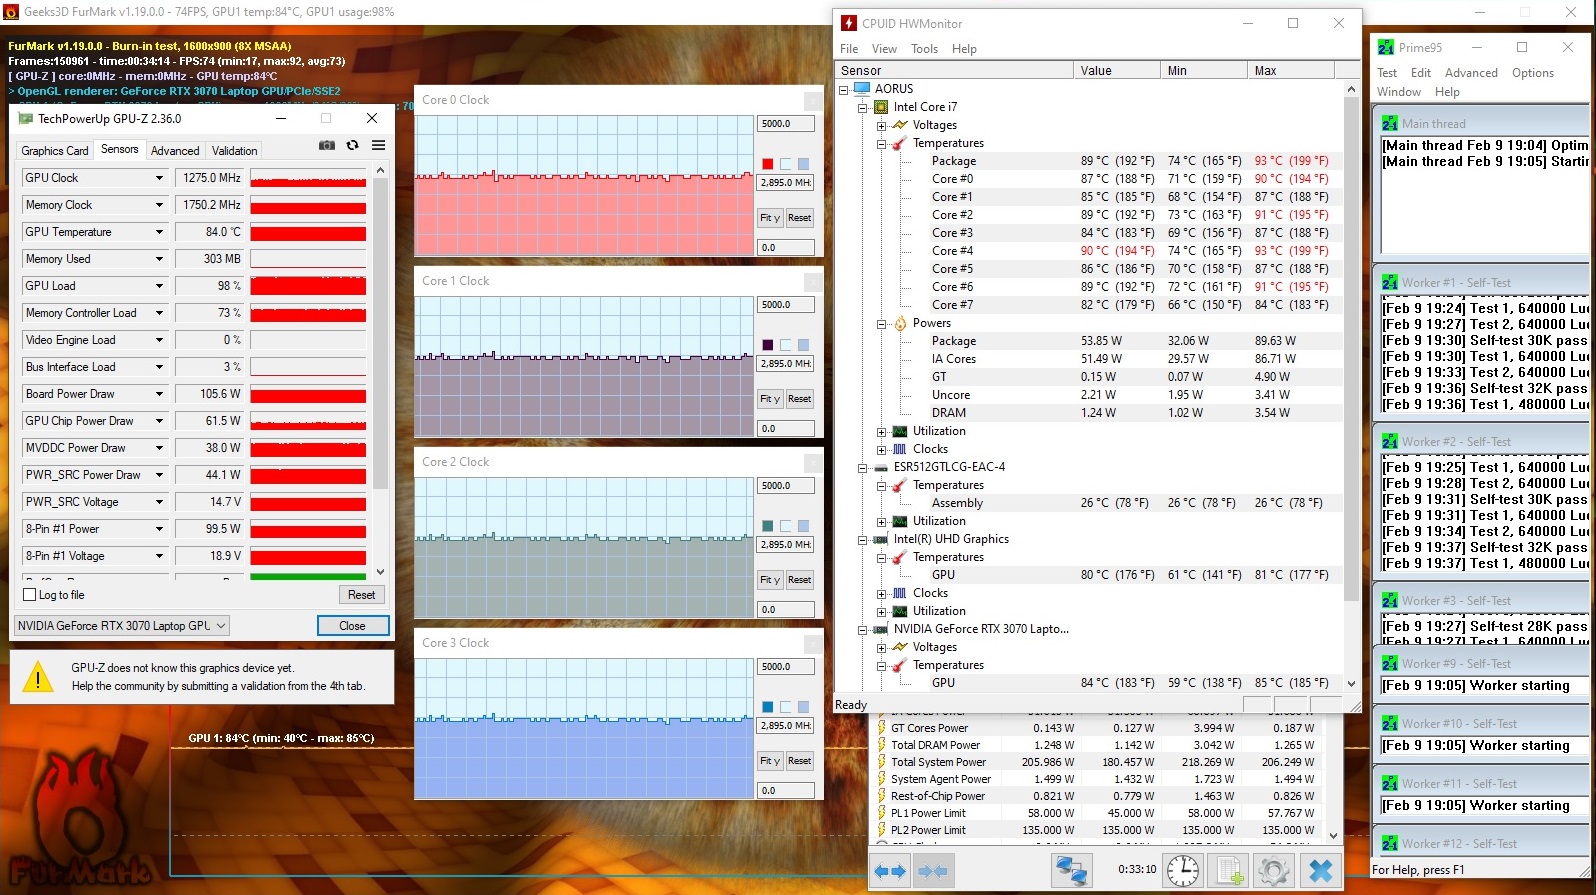
Temperature
La CPU e la GPU lavorano rispettivamente a 2,9 GHz e 1275 MHz durante il nostro stress test (Prime 95 e FurMark in esecuzione per almeno un'ora). Lo stress test rappresenta uno scenario estremo che non si verificherà durante l'uso quotidiano. Usiamo questo test per scoprire se il sistema rimane stabile sotto il carico massimo.
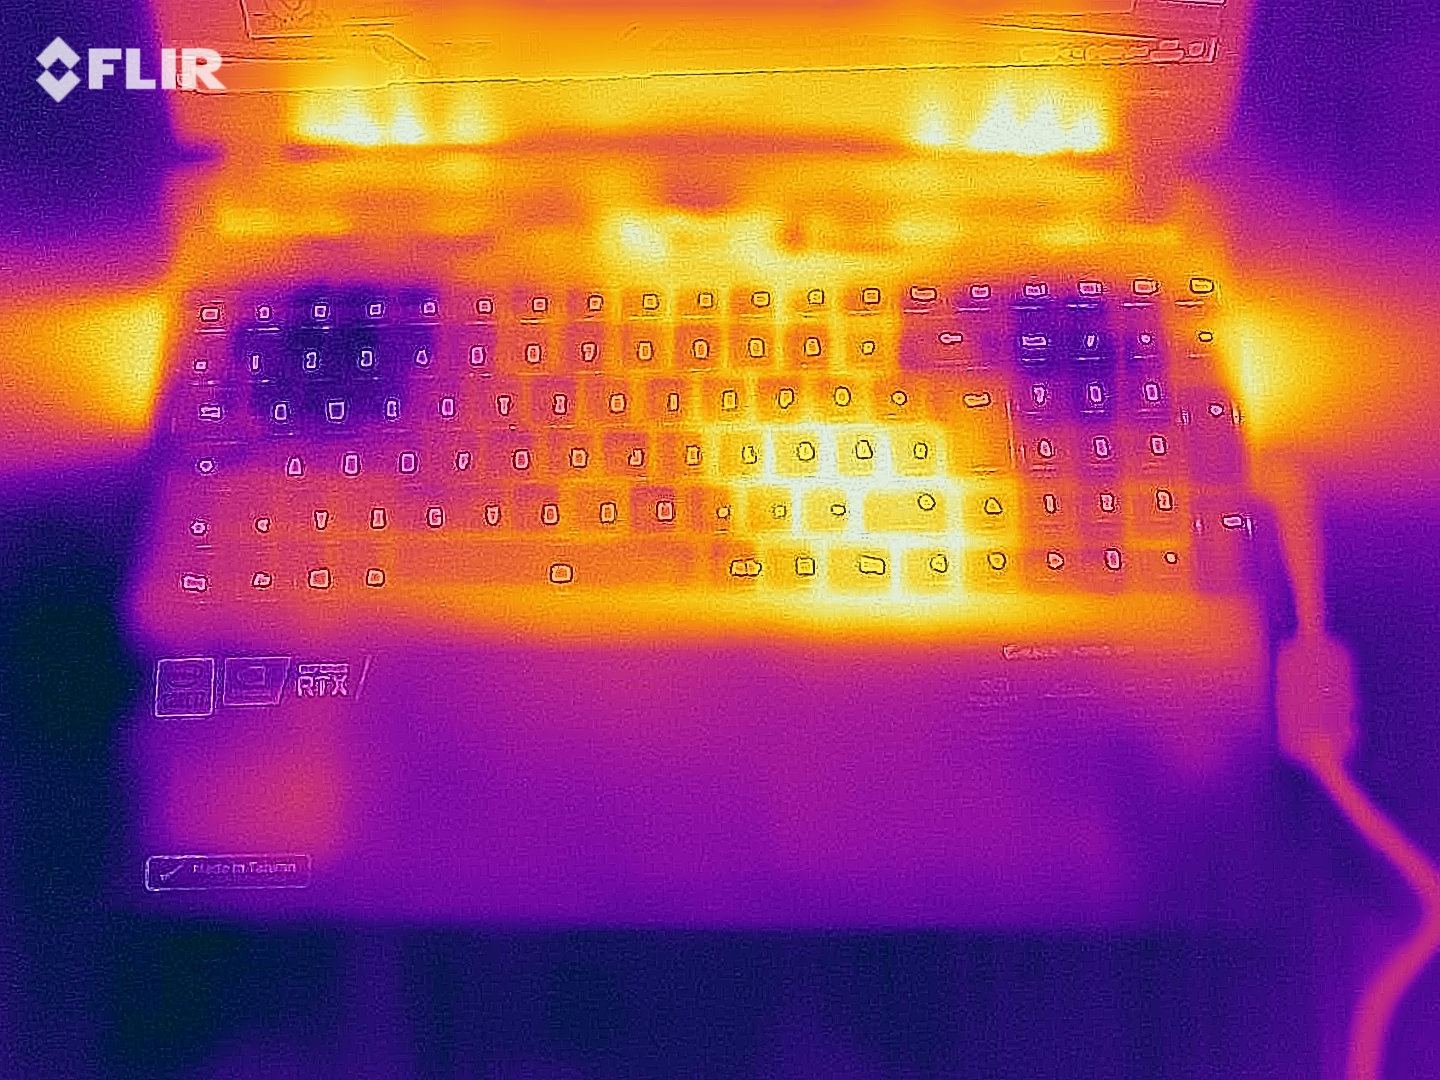
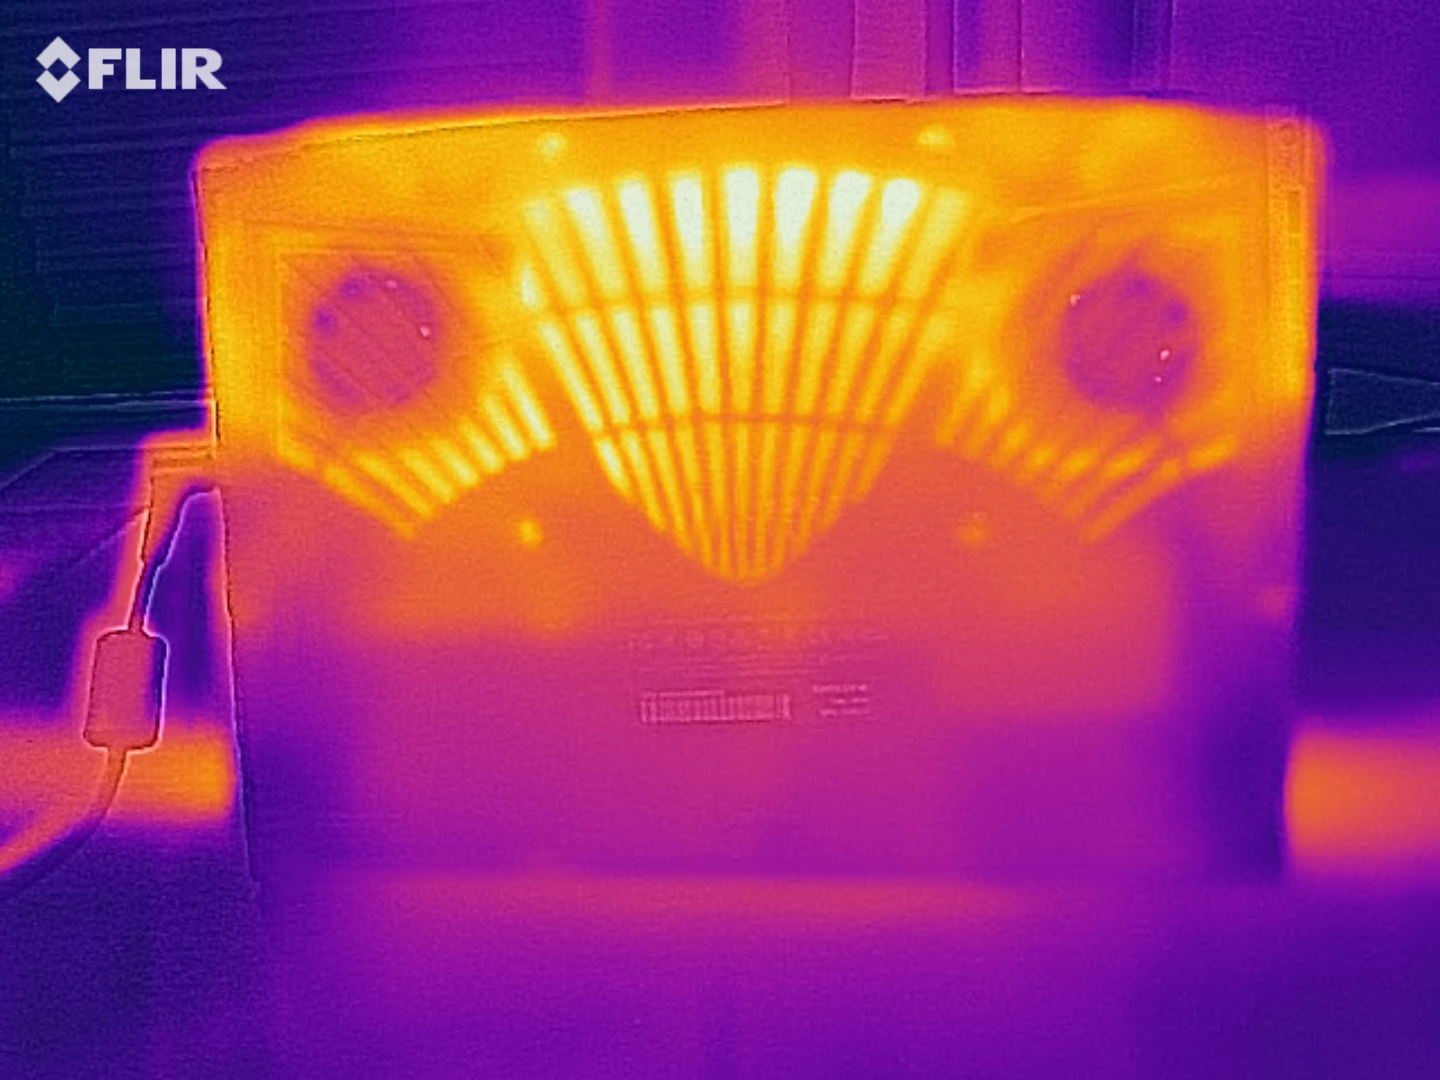
Abbiamo registrato temperature superiori ai 50 °C in diverse aree del case. Il dispositivo si riscalda leggermente meno durante il test The Witcher 3. Raccomandiamo comunque di non usare il dispositivo sulle ginocchia. Le temperature sono accettabili durante l'uso quotidiano.
(-) La temperatura massima sul lato superiore è di 47 °C / 117 F, rispetto alla media di 40.4 °C / 105 F, che varia da 21.2 a 68.8 °C per questa classe Gaming.
(-) Il lato inferiore si riscalda fino ad un massimo di 57 °C / 135 F, rispetto alla media di 43.2 °C / 110 F
(+) In idle, la temperatura media del lato superiore è di 24.4 °C / 76 F, rispetto alla media deld ispositivo di 33.9 °C / 93 F.
(-) Riproducendo The Witcher 3, la temperatura media per il lato superiore e' di 39.9 °C / 104 F, rispetto alla media del dispositivo di 33.9 °C / 93 F.
(+) I poggiapolsi e il touchpad raggiungono la temperatura massima della pelle (34 °C / 93.2 F) e quindi non sono caldi.
(-) La temperatura media della zona del palmo della mano di dispositivi simili e'stata di 28.8 °C / 83.8 F (-5.2 °C / -9.4 F).
| Aorus 15P XC i7-10870H, GeForce RTX 3070 Laptop GPU | MSI GS66 Stealth 10UG i7-10870H, GeForce RTX 3070 Laptop GPU | Asus TUF Dash F15 FX516PR i7-11370H, GeForce RTX 3070 Laptop GPU | Schenker XMG Neo 15 Comet Lake i7-10875H, GeForce RTX 2070 Super Mobile | Aorus 15G XC i7-10870H, GeForce RTX 3070 Laptop GPU | Aorus 15P WB i7-10750H, GeForce RTX 2070 Max-Q | Asus ROG Strix G15 G513QR R9 5900HX, GeForce RTX 3070 Laptop GPU | Media della classe Gaming | |
|---|---|---|---|---|---|---|---|---|
| Heat | -4% | -12% | -15% | -3% | -2% | -7% | -7% | |
| Maximum Upper Side * (°C) | 47 | 40.2 14% | 55 -17% | 46 2% | 45 4% | 47 -0% | 49 -4% | 45.1 ? 4% |
| Maximum Bottom * (°C) | 57 | 45.6 20% | 56 2% | 65 -14% | 61 -7% | 62 -9% | 48 16% | 48.1 ? 16% |
| Idle Upper Side * (°C) | 26 | 28.8 -11% | 29 -12% | 32 -23% | 27 -4% | 26 -0% | 31 -19% | 31 ? -19% |
| Idle Bottom * (°C) | 27 | 37.4 -39% | 32 -19% | 34 -26% | 28 -4% | 27 -0% | 33 -22% | 34.2 ? -27% |
* ... Meglio usare valori piccoli
Casse
Aorus 15P XC analisi audio
(+) | gli altoparlanti sono relativamente potenti (84 dB)
Bassi 100 - 315 Hz
(-) | quasi nessun basso - in media 20.8% inferiori alla media
(±) | la linearità dei bassi è media (10.8% delta rispetto alla precedente frequenza)
Medi 400 - 2000 Hz
(±) | medi elevati - circa 7.1% superiore alla media
(+) | medi lineari (4.9% delta rispetto alla precedente frequenza)
Alti 2 - 16 kHz
(+) | Alti bilanciati - appena 1.9% dalla media
(+) | alti lineari (4.6% delta rispetto alla precedente frequenza)
Nel complesso 100 - 16.000 Hz
(±) | la linearità complessiva del suono è media (17% di differenza rispetto alla media
Rispetto alla stessa classe
» 45% di tutti i dispositivi testati in questa classe è stato migliore, 12% simile, 43% peggiore
» Il migliore ha avuto un delta di 6%, medio di 18%, peggiore di 132%
Rispetto a tutti i dispositivi testati
» 31% di tutti i dispositivi testati in questa classe è stato migliore, 8% similare, 61% peggiore
» Il migliore ha avuto un delta di 4%, medio di 23%, peggiore di 134%
Gestione dell'energia - buona durata della batteria per un gaming notebook
Consumo energetico
Abbiamo misurato un consumo massimo di 33 Watt quando è al minimo. Questo è un po' troppo alto per i nostri gusti. Lo stress test e il test The Witcher 3 danno come risultato un consumo fino a 256 Watt e una media di 179 Watt, rispettivamente. L'MSIGS66 Stealth 10UG, dotato della stessa combinazione di CPU e GPU, è meno esigente grazie al suo TGP inferiore. La potenza nominale dell'alimentatore è di 230 Watt.
| Off / Standby | |
| Idle | |
| Sotto carico |
|
Leggenda:
min: | |
| Aorus 15P XC i7-10870H, GeForce RTX 3070 Laptop GPU | MSI GS66 Stealth 10UG i7-10870H, GeForce RTX 3070 Laptop GPU | Asus TUF Dash F15 FX516PR i7-11370H, GeForce RTX 3070 Laptop GPU | Schenker XMG Neo 15 Comet Lake i7-10875H, GeForce RTX 2070 Super Mobile | Aorus 15G XC i7-10870H, GeForce RTX 3070 Laptop GPU | Aorus 15P WB i7-10750H, GeForce RTX 2070 Max-Q | Asus ROG Strix G15 G513QR R9 5900HX, GeForce RTX 3070 Laptop GPU | Media della classe Gaming | |
|---|---|---|---|---|---|---|---|---|
| Power Consumption | 8% | 30% | -8% | 9% | 13% | 15% | 0% | |
| Idle Minimum * (Watt) | 14 | 12.9 8% | 9 36% | 17 -21% | 13 7% | 13 7% | 4 71% | 13.1 ? 6% |
| Idle Average * (Watt) | 17 | 15.4 9% | 11 35% | 19 -12% | 16 6% | 15 12% | 9 47% | 19 ? -12% |
| Idle Maximum * (Watt) | 33 | 27.1 18% | 16 52% | 29 12% | 30 9% | 19 42% | 36 -9% | 24.6 ? 25% |
| Load Average * (Watt) | 96 | 98.2 -2% | 107 -11% | 120 -25% | 92 4% | 100 -4% | 130 -35% | 111.3 ? -16% |
| Witcher 3 ultra * (Watt) | 179 | 164.9 8% | 121 32% | 186 -4% | 154 14% | 150 16% | 174 3% | |
| Load Maximum * (Watt) | 256 | 232.9 9% | 162 37% | 250 2% | 223 13% | 249 3% | 227 11% | 260 ? -2% |
* ... Meglio usare valori piccoli
Durata della batteria
L'Aorus 15P raggiunge una durata della batteria di 6:39 o 6:58 ore nel nostro test Wi-Fi (apertura di siti web con uno script) e nel nostro test video (esecuzione in loop del cortometraggio Big Buck Bunny (codec H.264, FHD), rispettivamente. La modalità di risparmio energetico è disattivata e la luminosità del display è impostata a circa 150 nits in entrambi i test. Abbiamo inoltre disattivato i moduli di rete per il test video.
| Aorus 15P XC i7-10870H, GeForce RTX 3070 Laptop GPU, 99 Wh | MSI GS66 Stealth 10UG i7-10870H, GeForce RTX 3070 Laptop GPU, 99.9 Wh | Asus TUF Dash F15 FX516PR i7-11370H, GeForce RTX 3070 Laptop GPU, 76 Wh | Schenker XMG Neo 15 Comet Lake i7-10875H, GeForce RTX 2070 Super Mobile, 93 Wh | Aorus 15P WB i7-10750H, GeForce RTX 2070 Max-Q, 94.24 Wh | Aorus 15G XC i7-10870H, GeForce RTX 3070 Laptop GPU, 99 Wh | Asus ROG Strix G15 G513QR R9 5900HX, GeForce RTX 3070 Laptop GPU, 90 Wh | Media della classe Gaming | |
|---|---|---|---|---|---|---|---|---|
| Autonomia della batteria | 22% | 52% | 12% | 24% | 10% | 39% | 2% | |
| Reader / Idle (h) | 9.5 | 10.8 14% | 16 68% | 11.3 19% | 9.6 1% | 7.84 ? -17% | ||
| H.264 (h) | 7 | 8.1 16% | 6.5 -7% | 13.5 93% | 8.27 ? 18% | |||
| WiFi v1.3 (h) | 6.7 | 7.1 6% | 9.1 36% | 7.5 12% | 7.1 6% | 6.3 -6% | 7.4 10% | 7.08 ? 6% |
| Load (h) | 1.5 | 2.2 47% | 2.3 53% | 2.3 53% | 1.7 13% | 1.496 ? 0% |
Pro
Contro
Giudizio finale
Il 15P XC riesce a visualizzare tutti i giochi attuali senza problemi grazie alla sua CPU octa-core Core i7-10870H e alla sua GPU GeForce RTX 3070 Laptop. Non ci sono compromessi - Gigabyte ha impostato il TGP della GPU a 130 Watt, il che significa che funziona quasi alla sua capacità massima (140 Watt).
Gigabyte ha creato un notebook gaming a tutto tondo con molta potenza di calcolo - l'Aorus 15P XC.
CPU potente, GPU performante, 32 GB di RAM (2x 16 GB, modalità dual-channel, massimo 64 GB) - ma solo un SSD da 512 GB. La capacità di archiviazione non è particolarmente generosa per un notebook gaming. Molti acquirenti dovranno espandere lo storage prima o poi. Questo non dovrebbe rappresentare un grosso problema, dato che il notebook ha un secondo slot disponibile per un ulteriore SSD NVMe.
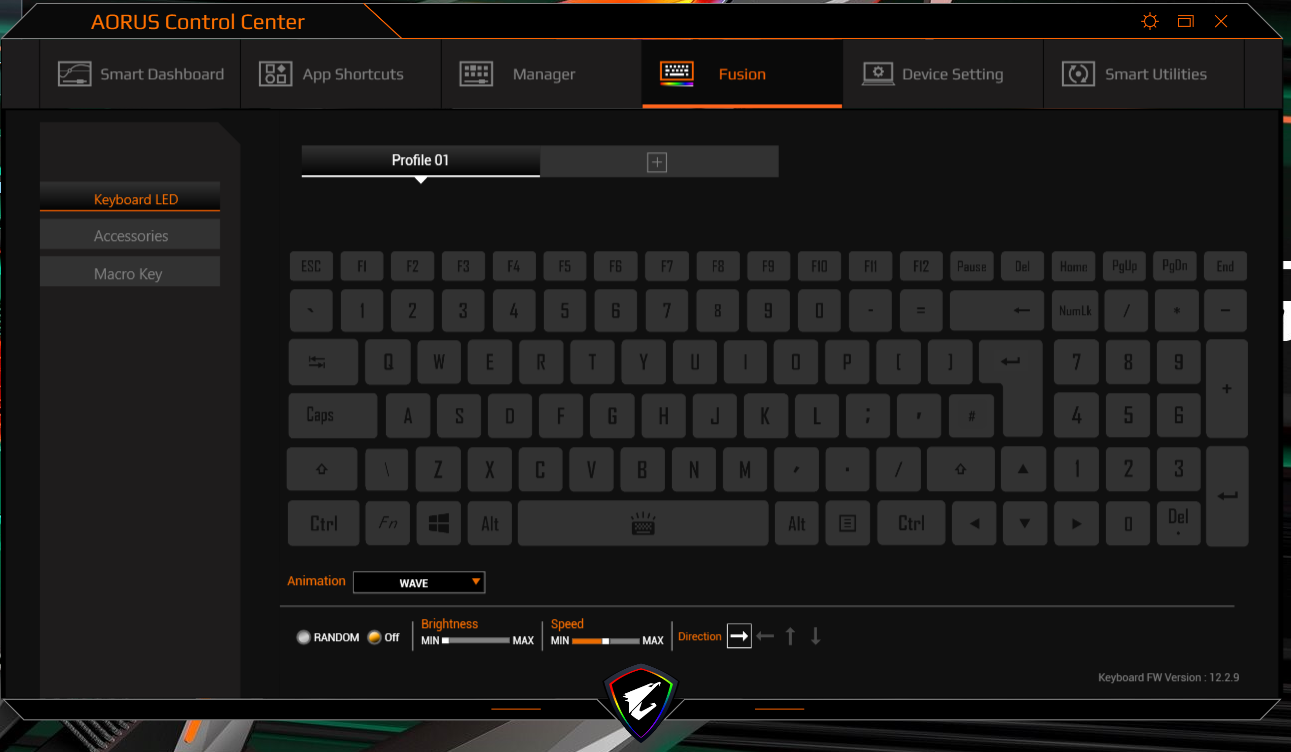
Il display (FHD, IPS, 240 Hz) ha angoli di visualizzazione stabili, una superficie opaca, tempi di risposta brevi, una copertura dello spazio colore decente e - grazie alla sua certificazione Pantone - una grande precisione dei colori. La luminosità massima è troppo bassa, tuttavia, per un notebook in questa fascia di prezzo in particolare. La tastiera (retroilluminazione RGB) è adatta all'uso quotidiano e la durata della batteria è buona con una carica che dura circa 6-7 ore di uso normale.
Prezzo e disponibilità
L'Aorus 15P XC non è ancora presente nei negozi online dei principali rivenditori al momento della pubblicazione. Attualmente ha un prezzo di 1.900 Euro (~$2.400) in Germania.
Aorus 15P XC
- 02/24/2021 v7 (old)
Sascha Mölck
Price comparison
