Recensione del Laptop Dell Alienware m15 R3: la camera di vapore è una salvezza
L'Alienware m15 R3 Dell 2020 è un aggiornamento dell'Alienware m15 R2 del 2019. Tuttavia, questa affermazione da sola sottovaluta tutte le modifiche apportate all'm15 R3, in quanto quest'ultimo modello offre più di un semplice aggiornamento del processore e delle opzioni di display che di solito vediamo dalla maggior parte degli altri OEM. Dell ha rinnovato la soluzione di raffreddamento senza influire sulle dimensioni del sistema per ciò che dovrebbe portare a temperature più basse durante il gaming.
I concorrenti dell'Alienware m15 R3 includono altri portatili gaming ultra-sottili di fascia alta come l'MSI GS66, Razer Blade Pro 17, Asus Zephyrus S GX701, Acer Predator Triton, o Lenovo Legion Y740. Per maggiori informazioni sul telaio e le sue caratteristiche, si veda la nostra recensione sull'Alienware m15 R2, dato che l'm15 R3 è esteticamente quasi identico.
Altre recensioni Dell:
Punteggio | Data | Modello | Peso | Altezza | Dimensione | Risoluzione | Prezzo |
|---|---|---|---|---|---|---|---|
| 84.8 % v7 (old) | 08/2020 | Alienware m15 R3 P87F i7-10750H, GeForce RTX 2070 Mobile | 2.3 kg | 19.9 mm | 15.60" | 1920x1080 | |
| 82.6 % v7 (old) | 05/2020 | Eluktronics RP-15 R7 4800H, GeForce RTX 2060 Mobile | 1.9 kg | 20 mm | 15.60" | 1920x1080 | |
| 86 % v7 (old) | 05/2020 | Razer Blade 15 RZ09-0328 i7-10750H, GeForce RTX 2070 Max-Q | 2.1 kg | 19.9 mm | 15.60" | 3840x2160 | |
| 81.3 % v7 (old) | 05/2019 | Asus Zephyrus S GX502GW i7-9750H, GeForce RTX 2070 Mobile | 2.1 kg | 19 mm | 15.60" | 1920x1080 | |
| 82.8 % v7 (old) | 05/2020 | MSI GS66 Stealth 10SFS i9-10980HK, GeForce RTX 2070 Super Max-Q | 2.2 kg | 20 mm | 15.60" | 1920x1080 |
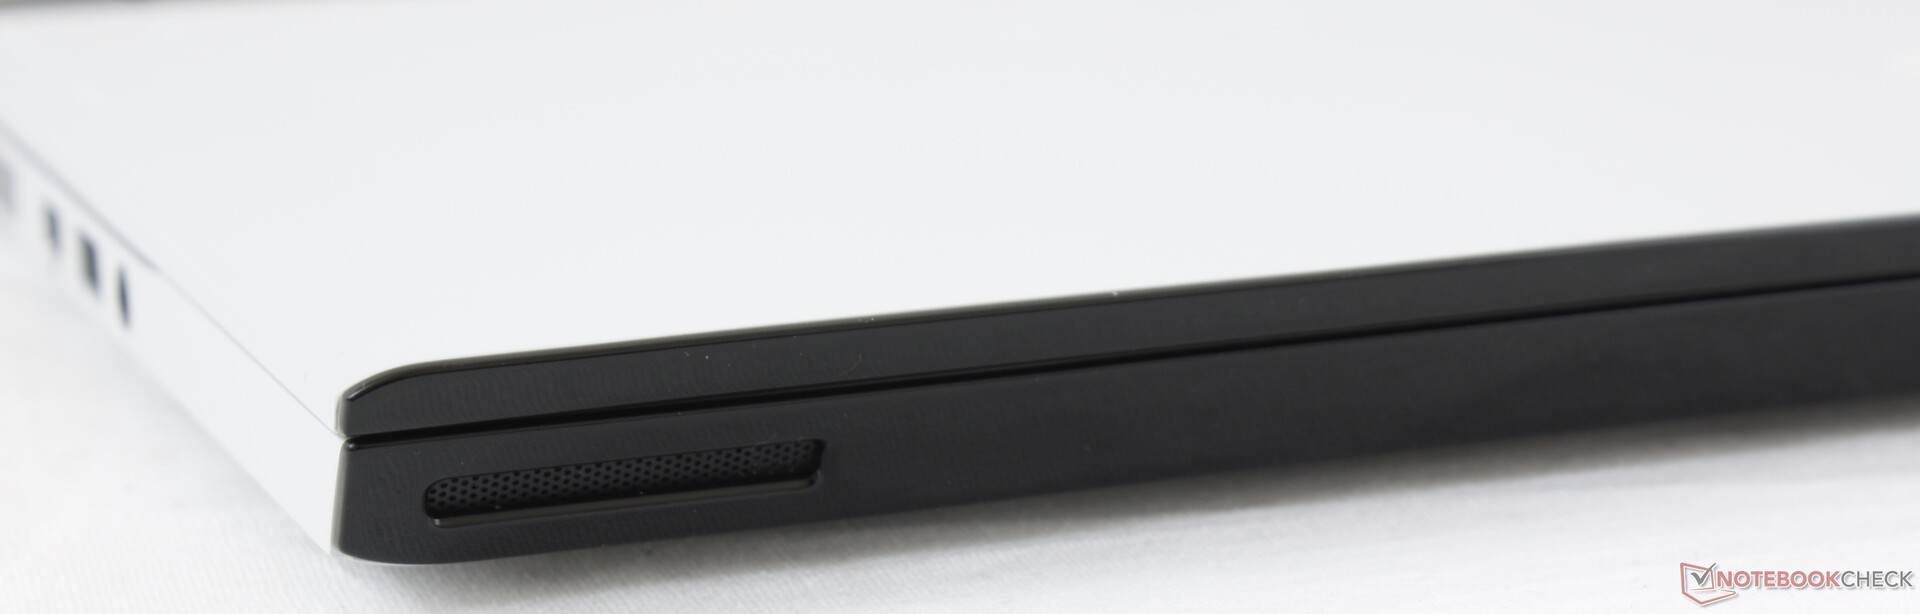
Case
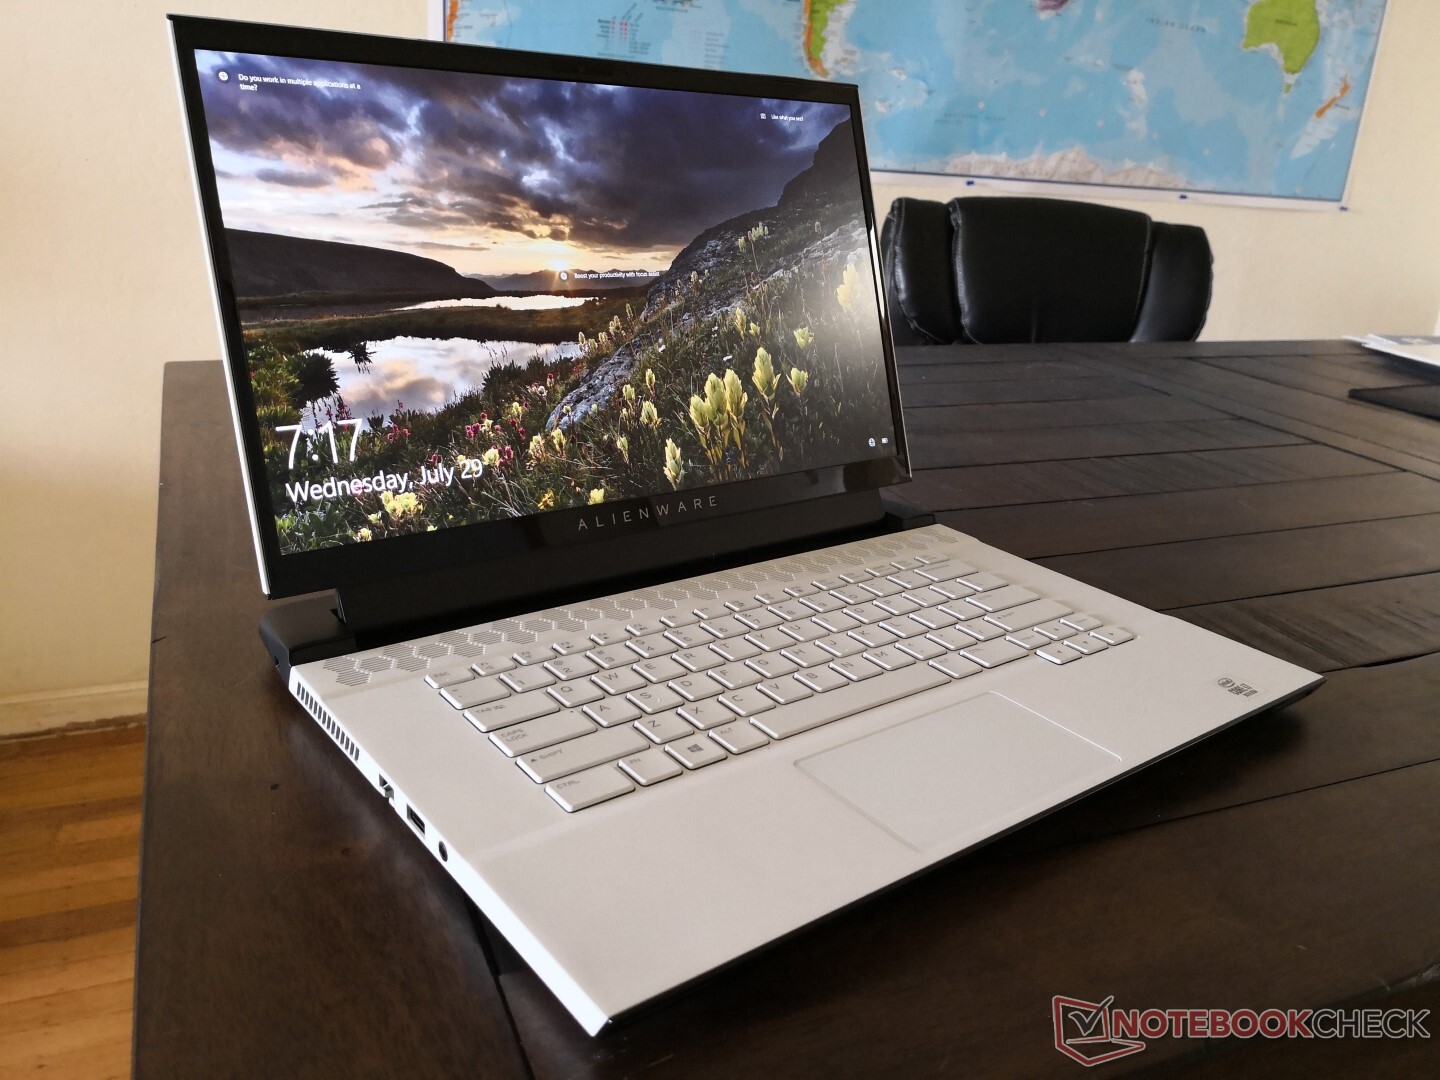
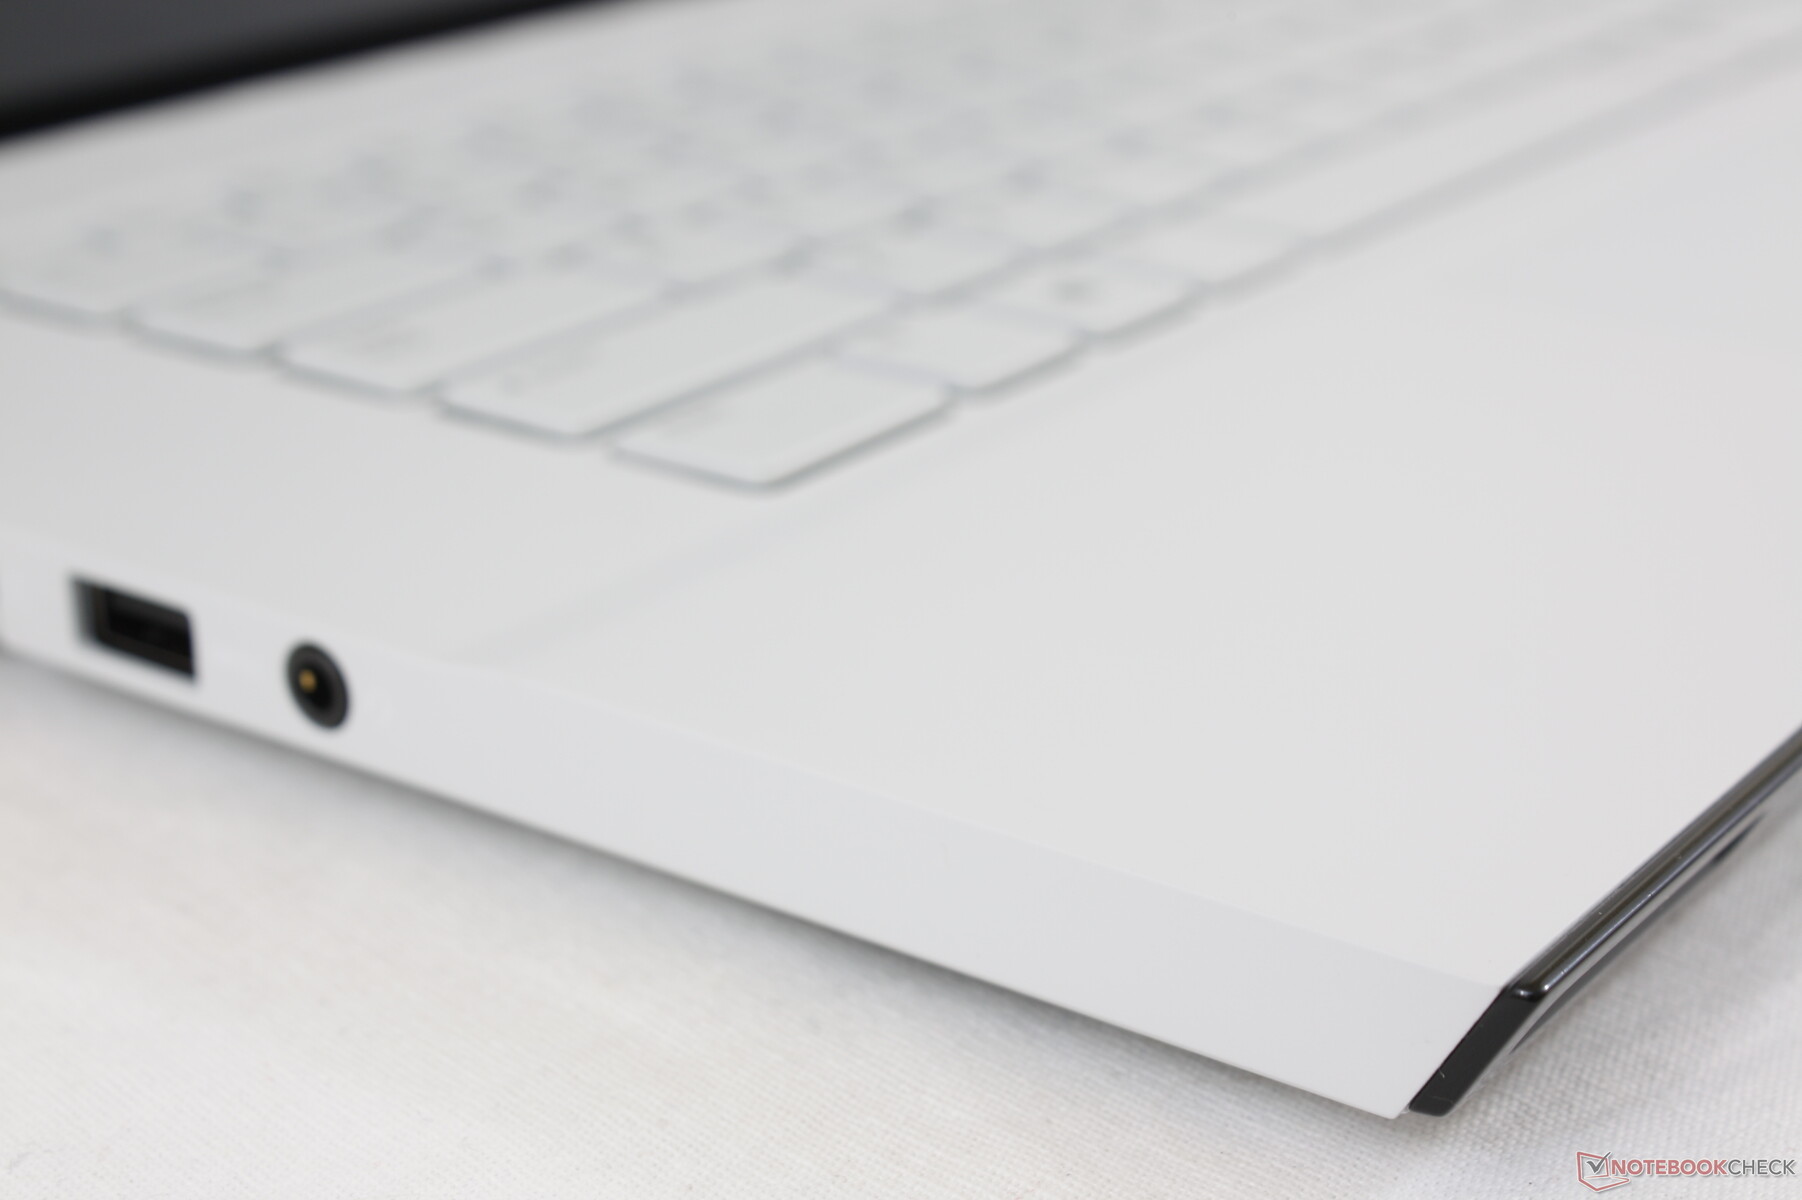
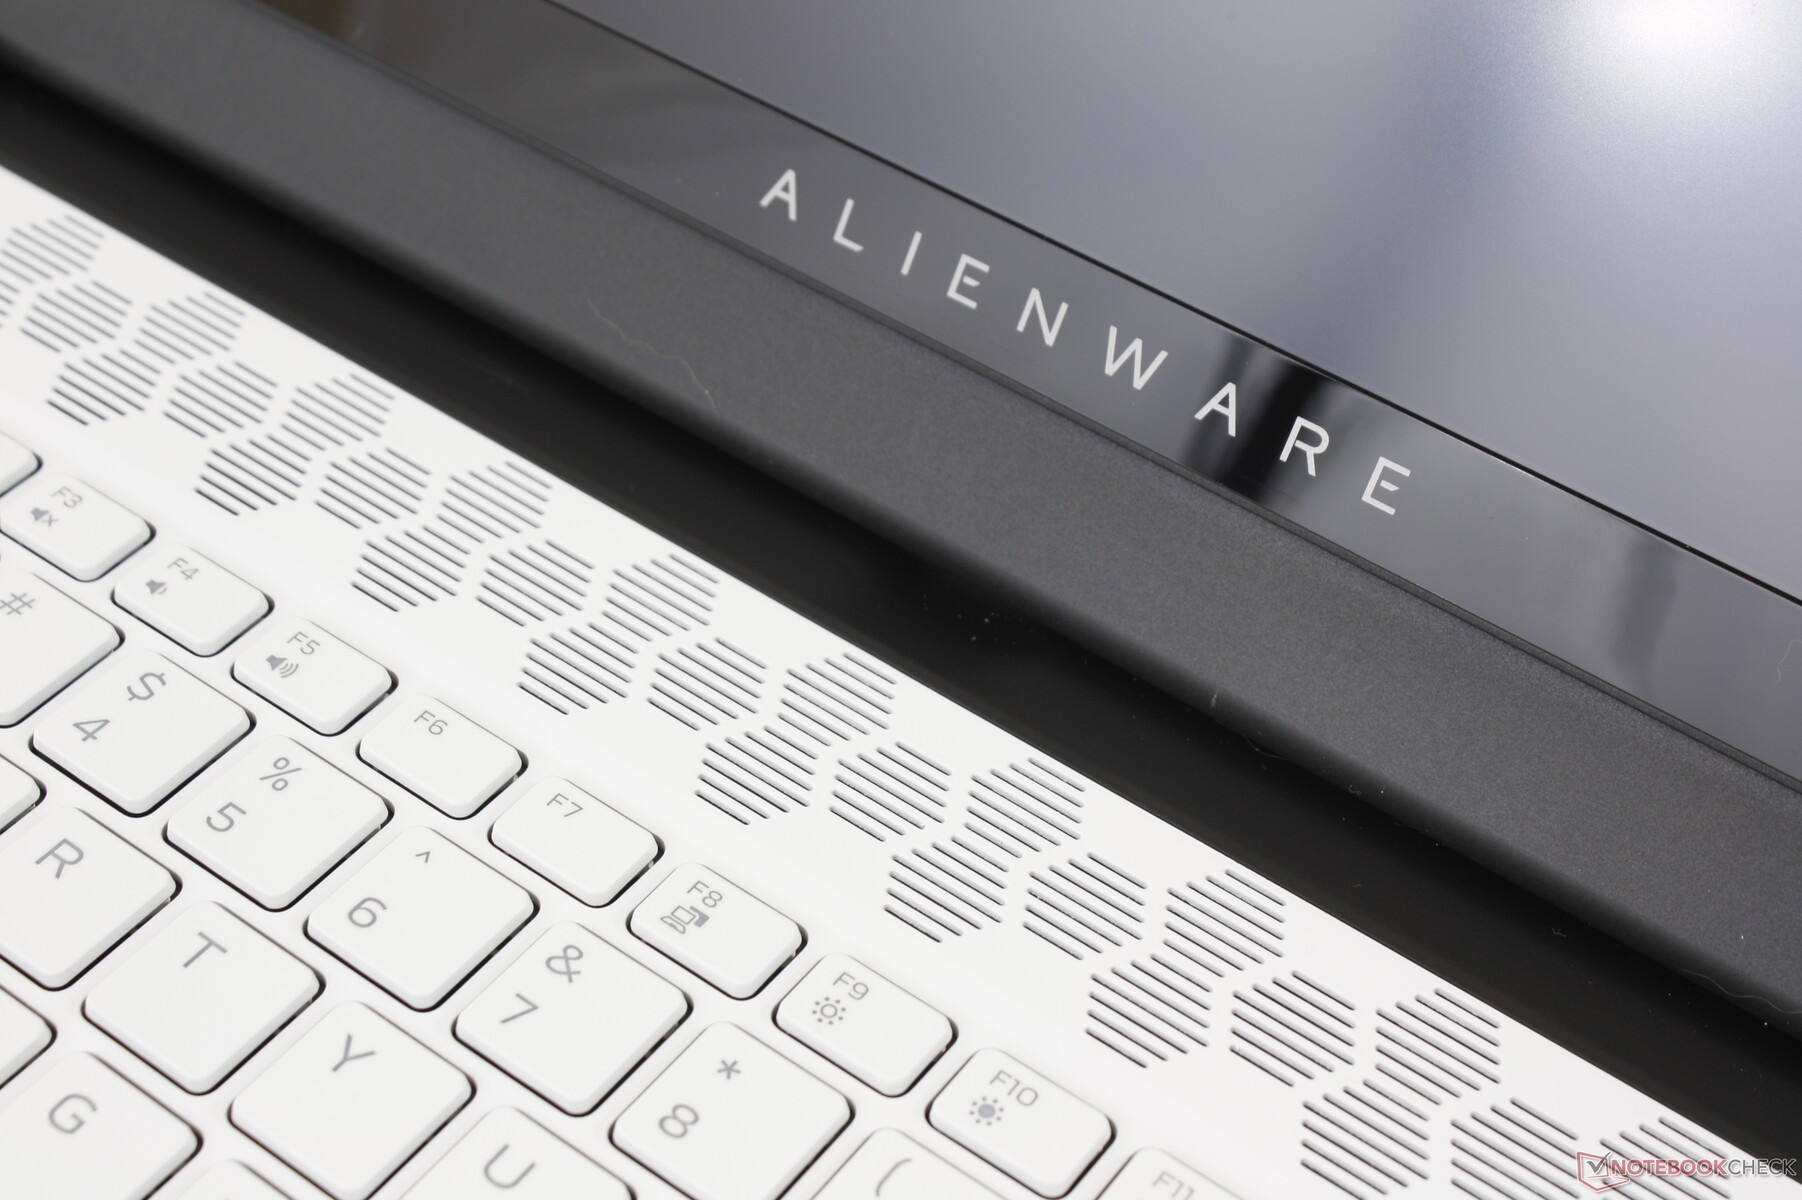
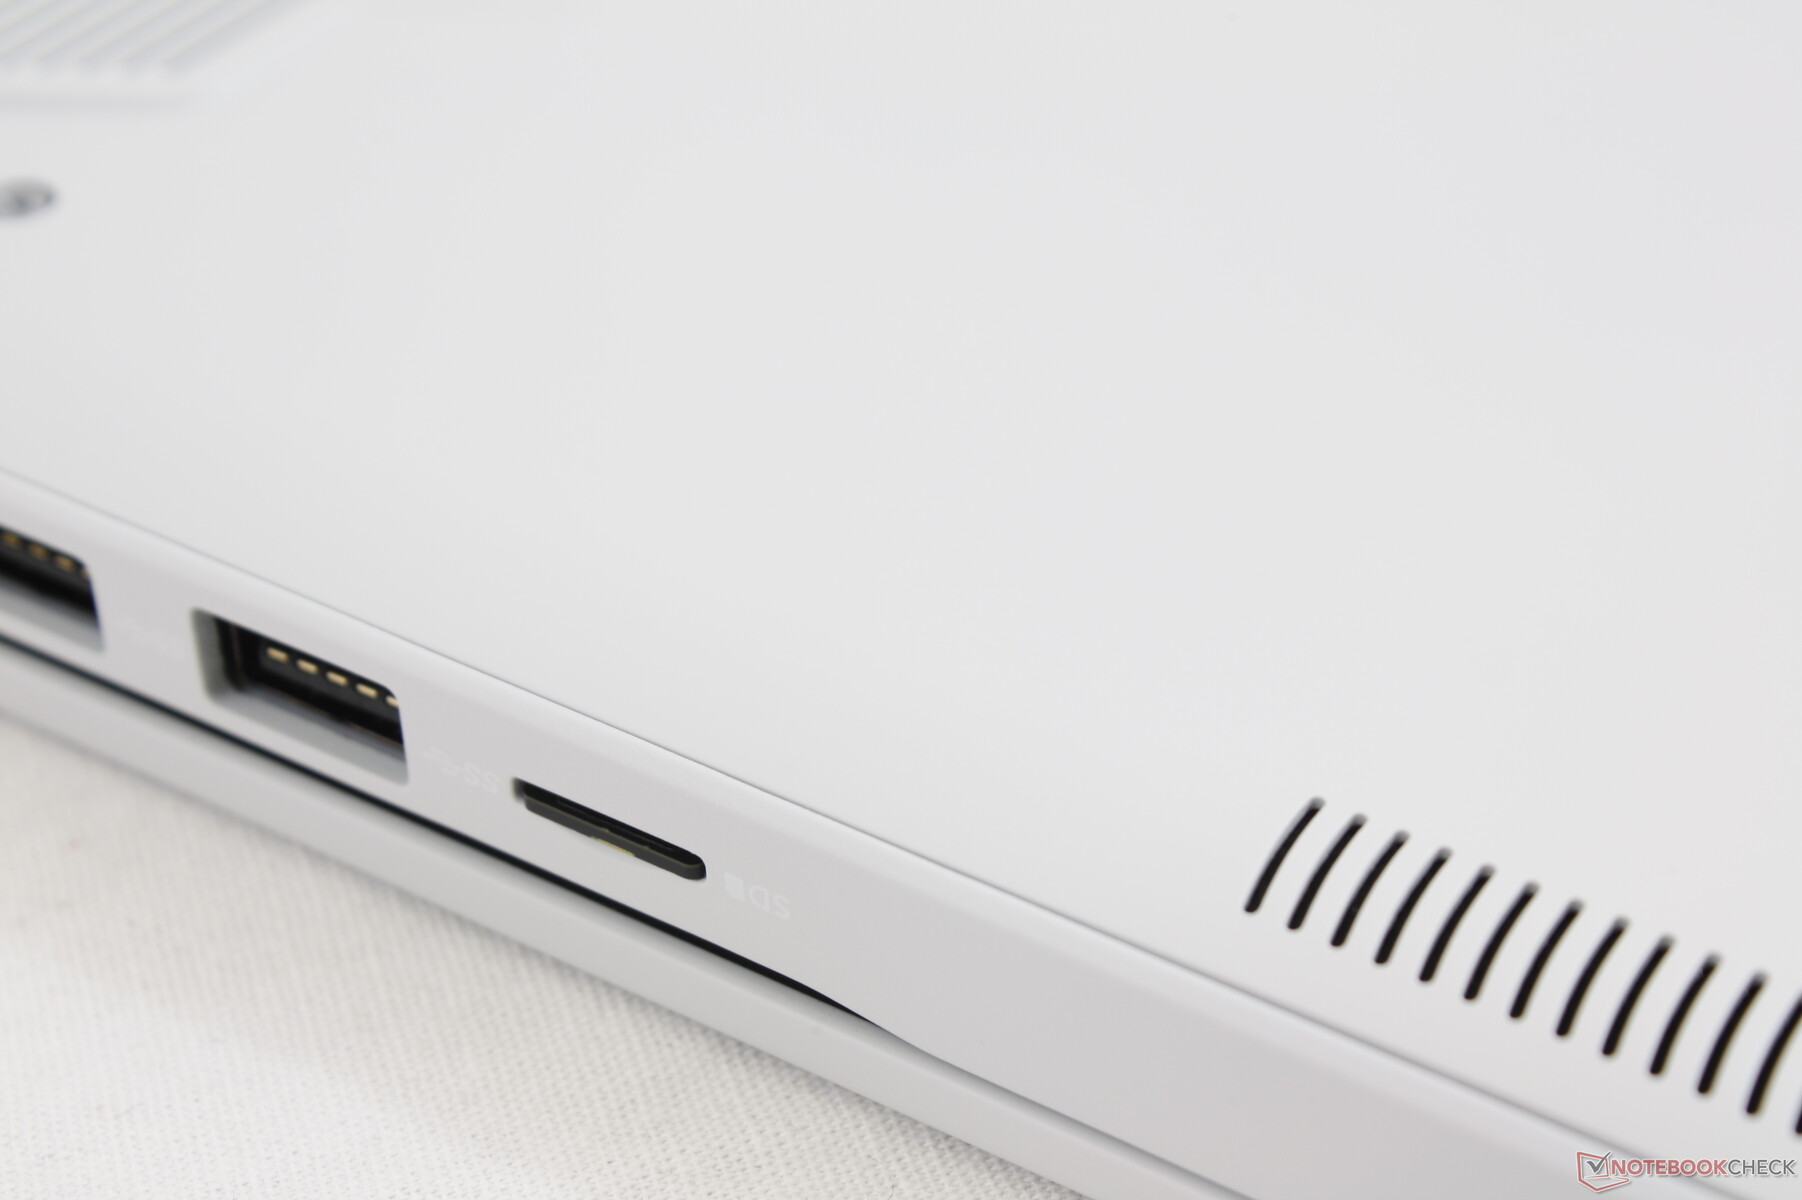
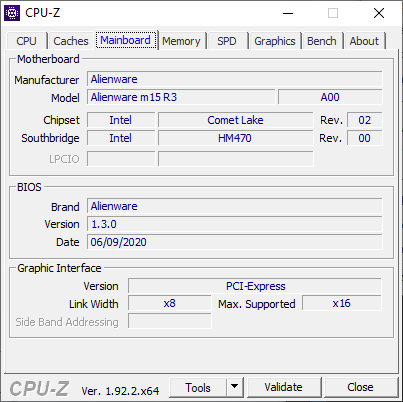
Il modo più semplice per distinguere un Alienware m15 R3 dall'm15 R2 è cercare il lettore di schede MicroSD lungo il bordo sinistro. Per il resto, i sistemi condividono lo stesso design del telaio. L'aspetto attuale ha appena un anno di vita, quindi non è ancora il momento per Dell di rinnovare completamente il telaio.
Un altro aggiornamento esterno più piccolo è l'uso di una nuova finitura "High Endurance Clear Coat" per ridurre l'accumulo di ditate. Sospettiamo che questo farà una differenza maggiore sull'opzione del telaio nero, dato che le ditate sono già difficili da vedere sulla nostra unità di prova bianca.
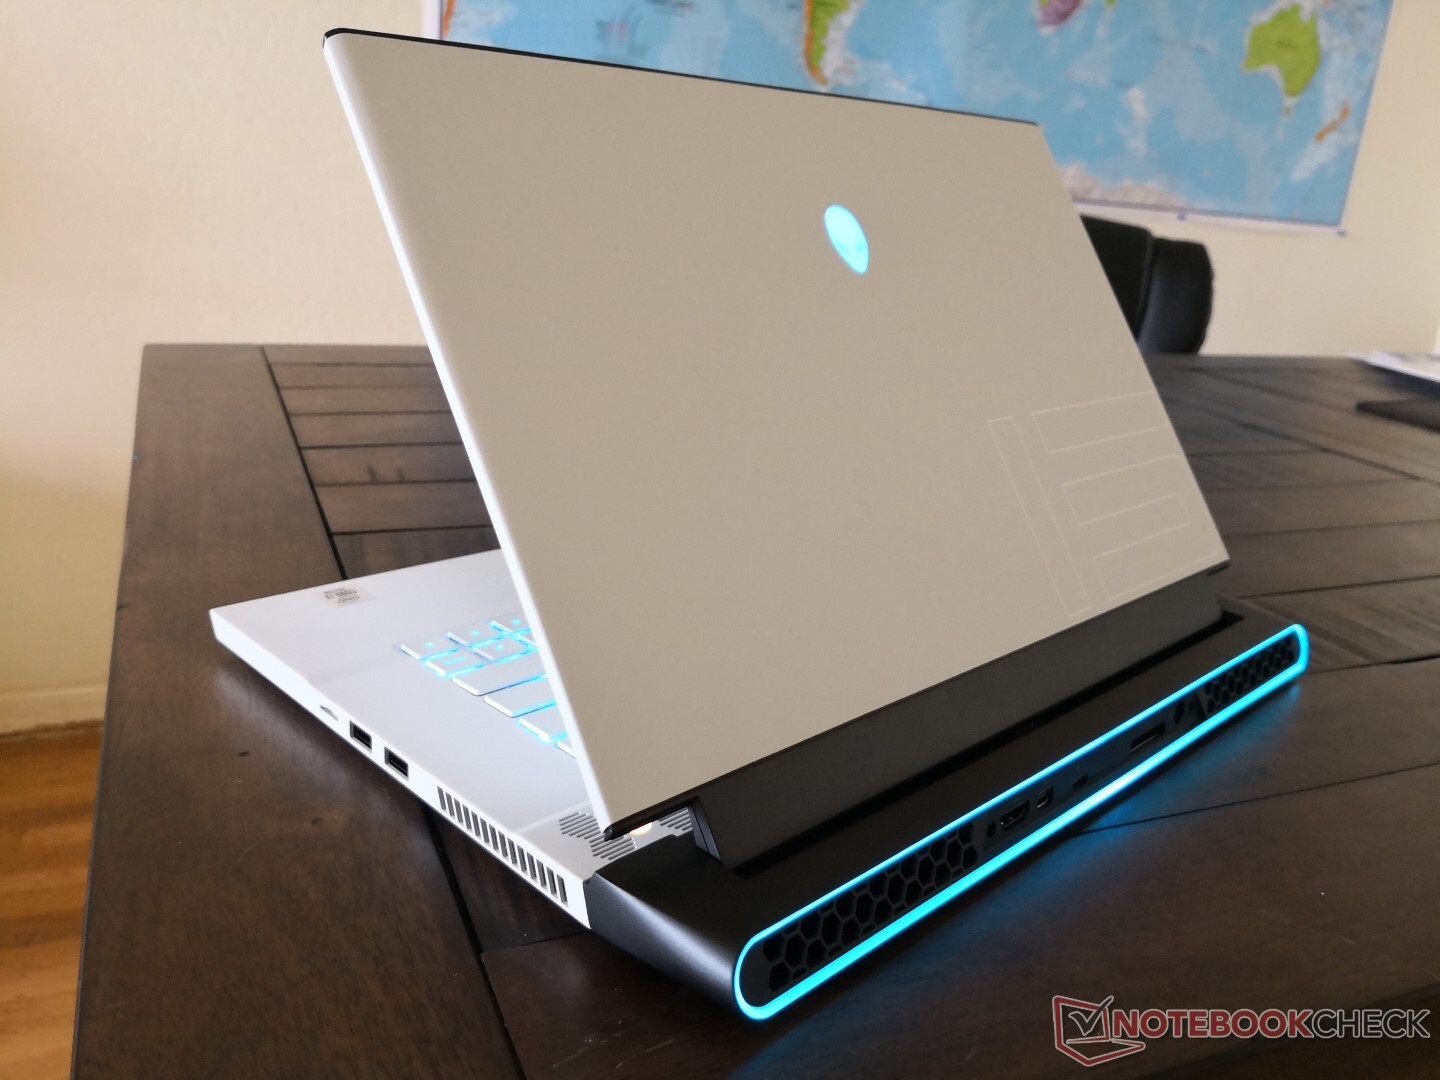
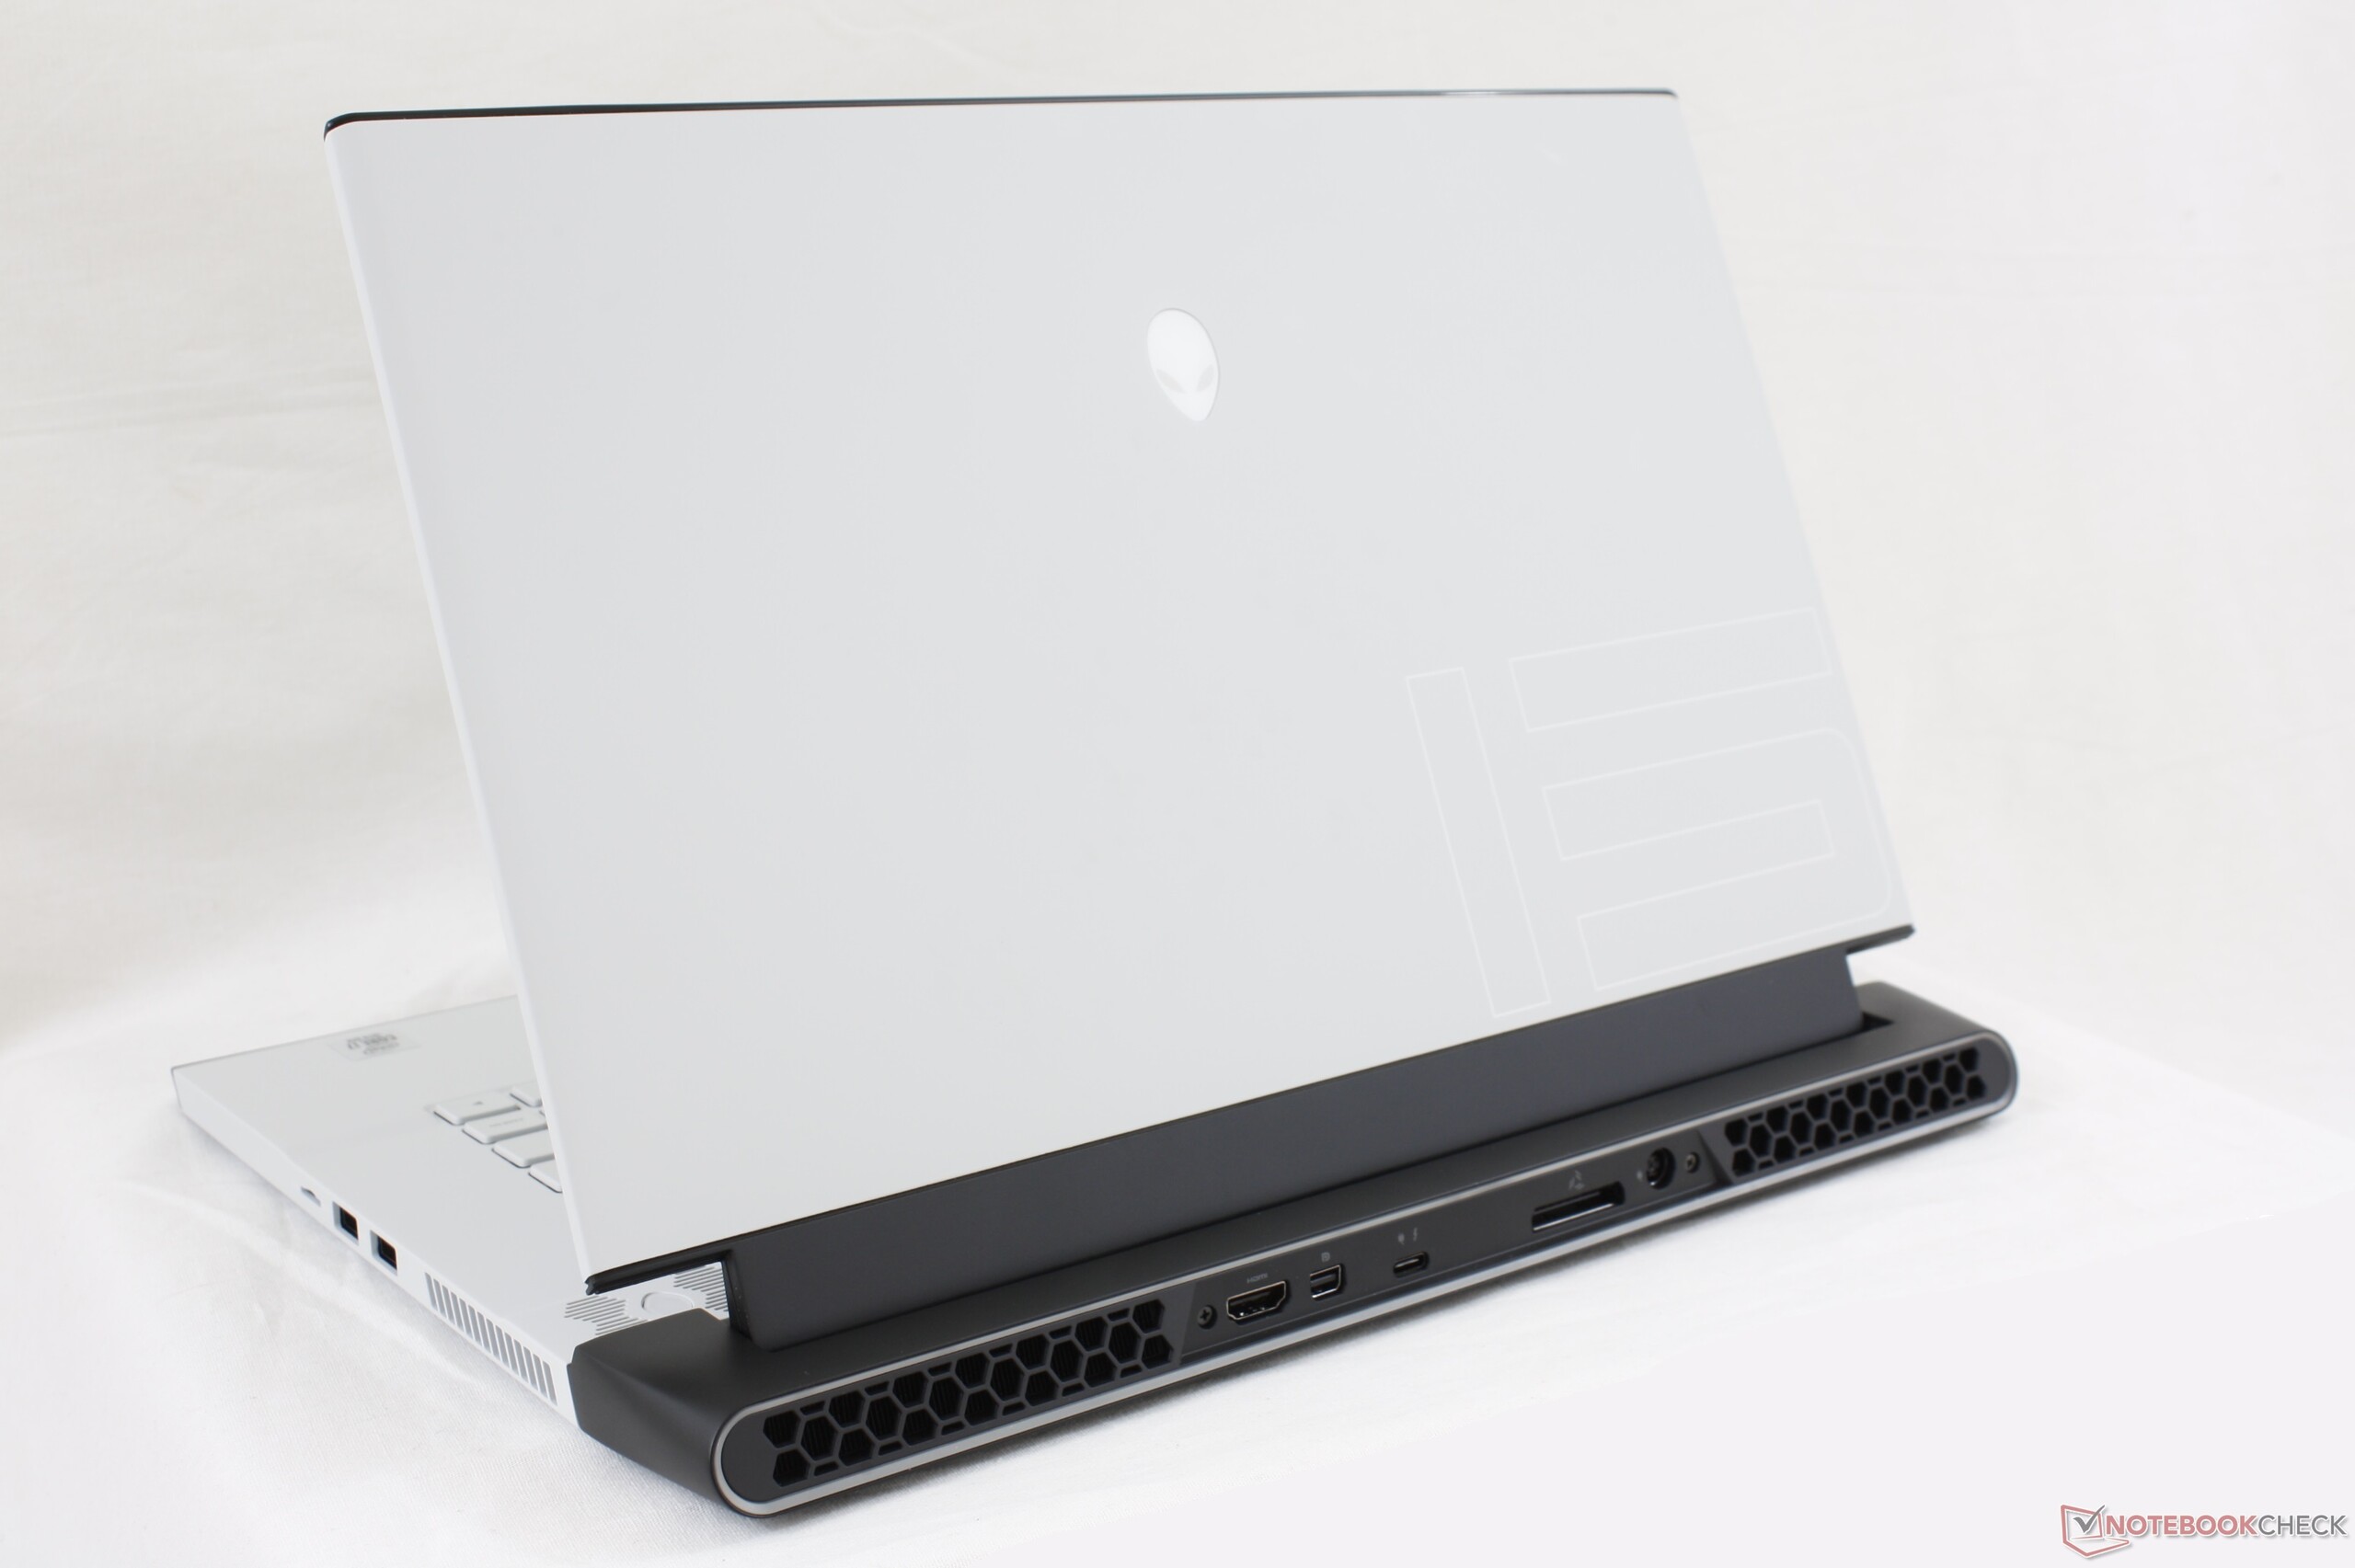
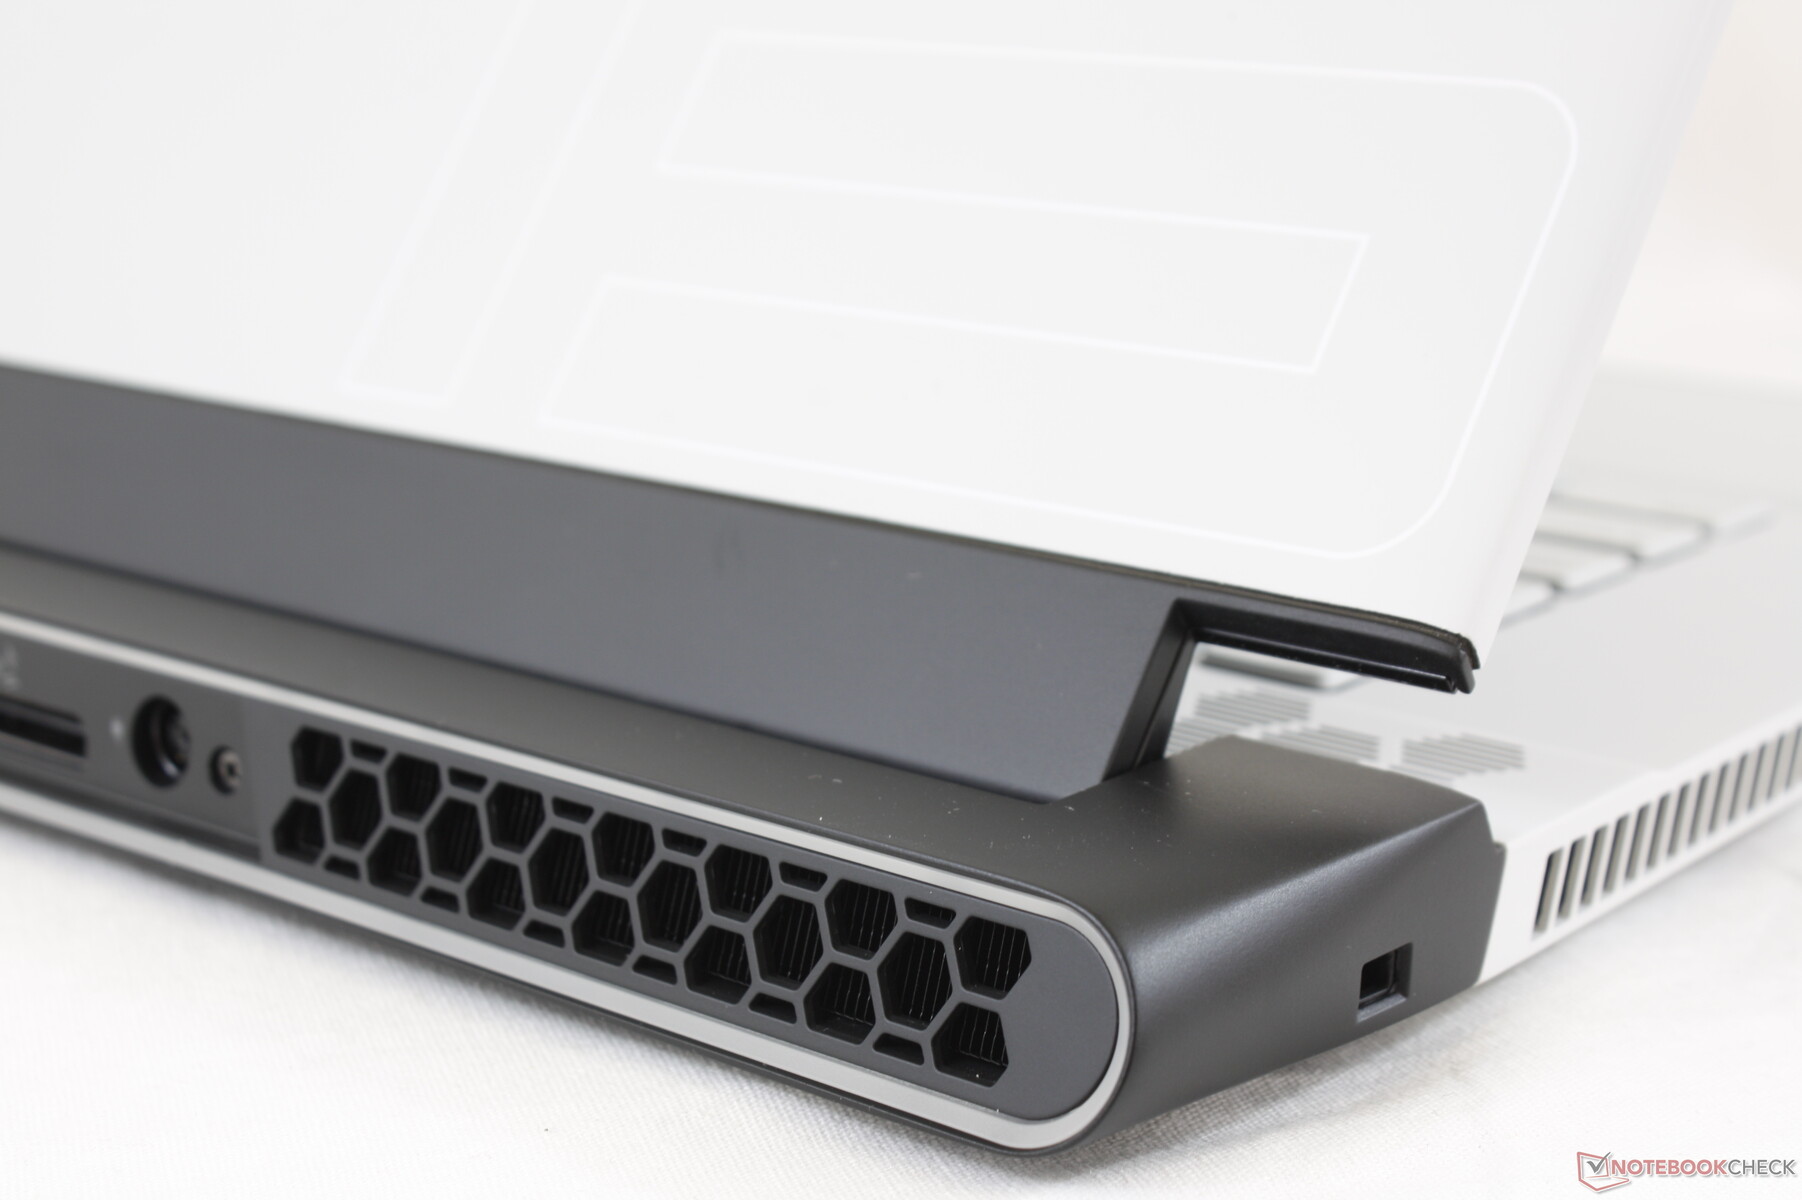
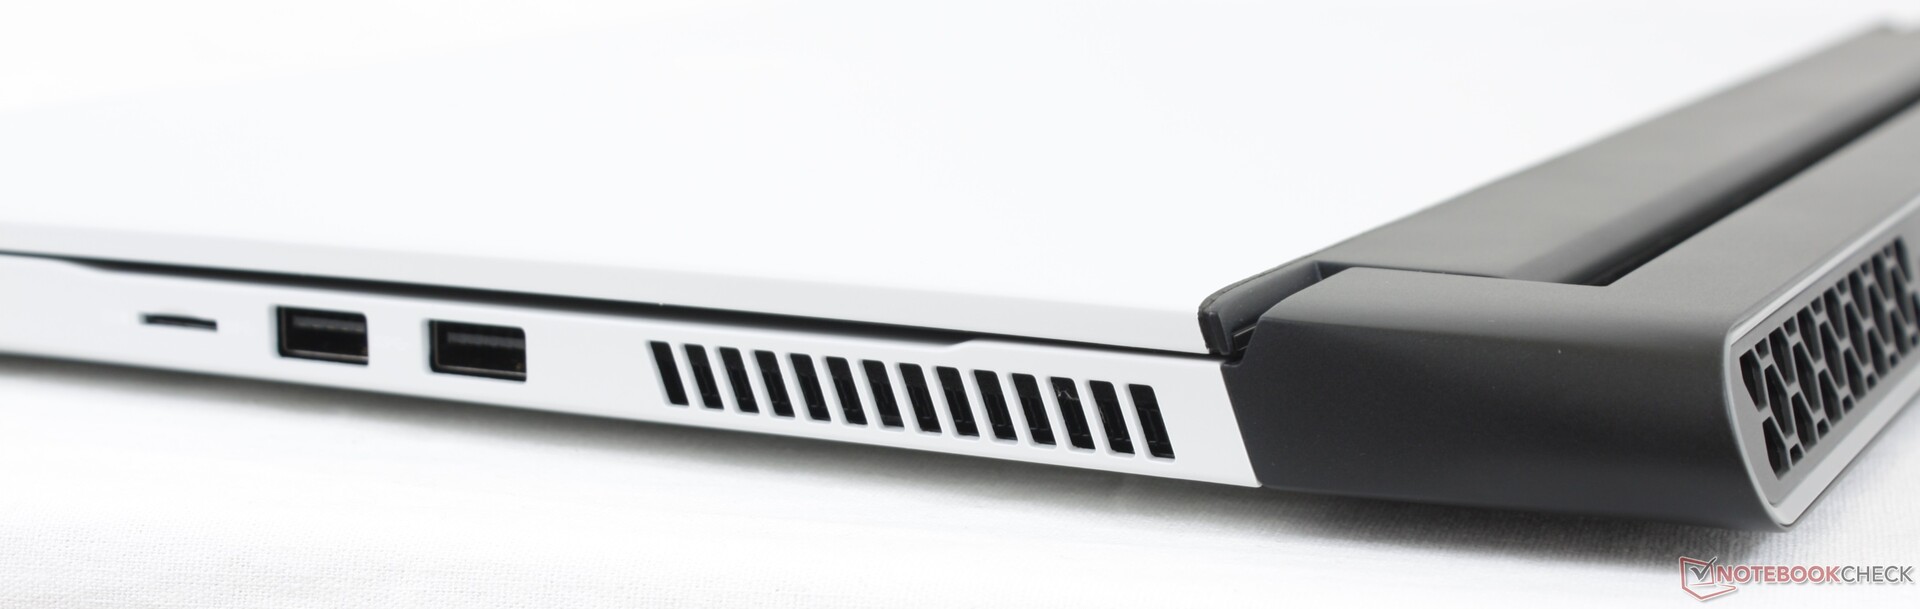
Connettività
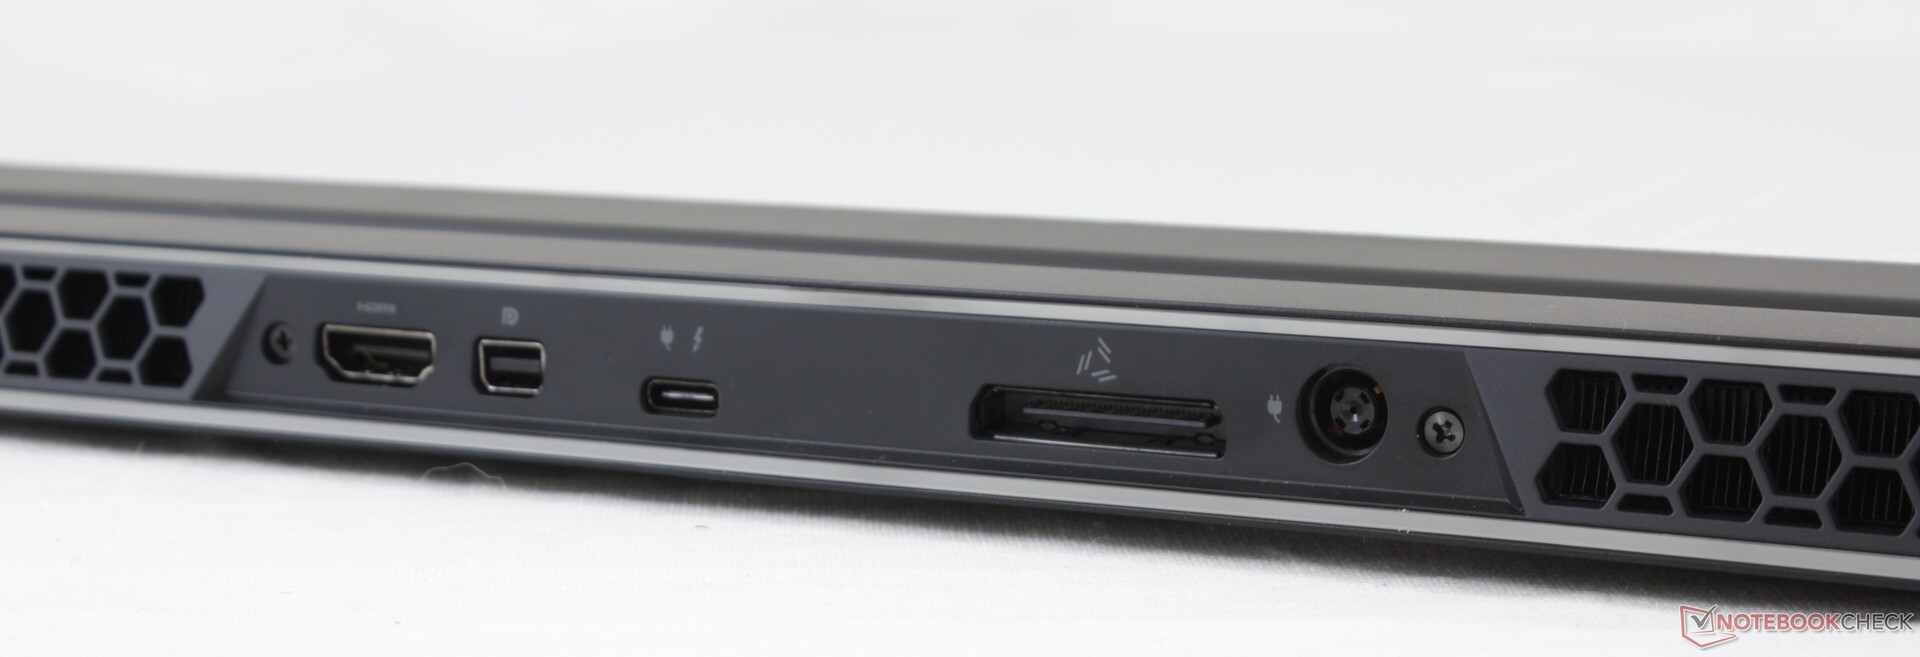
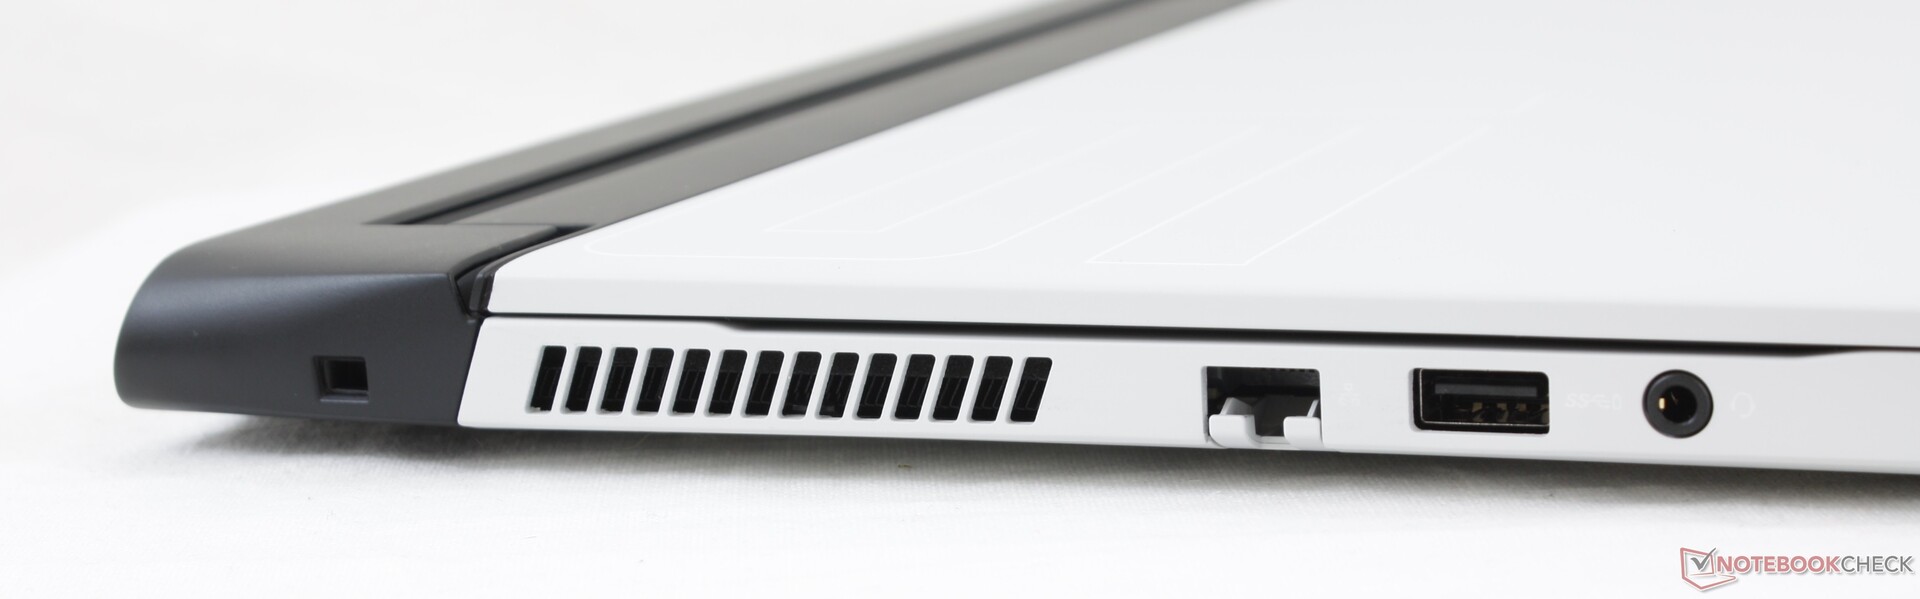
Le porte rimangono identiche a quelle dell'm15 R2, compreso il ritorno della porta dell'amplificatore grafico proprietario. La porta USB-C, tuttavia, può ora ricaricare il laptop. Ci sarebbe piaciuto vedere gli indicatori a LED per le porte posteriori molto simili a quelli del vecchio Lenovo Legion Y730 per un accesso più facile. Ora sono difficili da vedere senza doversi prima alzare.
Lettore schede SD
Le velocità di trasferimento sono estremamente veloci con la nostra scheda di prova UHS-II. Lo spostamento di 1 GB di immagini dalla scheda al desktop richiede solo circa 6 secondi come nella serie XPS.
| SD Card Reader | |
| average JPG Copy Test (av. of 3 runs) | |
| MSI GS75 10SF-609US (Toshiba Exceria Pro M501 UHS-II) | |
| Dell XPS 15 9500 Core i7 4K UHD (Toshiba Exceria Pro SDXC 64 GB UHS-II) | |
| Gigabyte Aero 15 OLED XA (Toshiba Exceria Pro SDXC 64 GB UHS-II) | |
| Alienware m15 R3 P87F (Toshiba Exceria Pro M501 UHS-II) | |
| Eluktronics RP-15 (Toshiba Exceria Pro SDXC 64 GB UHS-II) | |
| maximum AS SSD Seq Read Test (1GB) | |
| Gigabyte Aero 15 OLED XA (Toshiba Exceria Pro SDXC 64 GB UHS-II) | |
| Alienware m15 R3 P87F (Toshiba Exceria Pro M501 UHS-II) | |
| MSI GS75 10SF-609US (Toshiba Exceria Pro M501 UHS-II) | |
| Dell XPS 15 9500 Core i7 4K UHD (Toshiba Exceria Pro SDXC 64 GB UHS-II) | |
| Eluktronics RP-15 (Toshiba Exceria Pro SDXC 64 GB UHS-II) | |
Comunicazioni
La Killer AX1650w viene fornita di serie per la connettività Wi-Fi 6 e Bluetooth 5.1. È essenzialmente identica all'Intel AX201, ma con miglioramenti specifici per il gaming.
Webcam

")
")
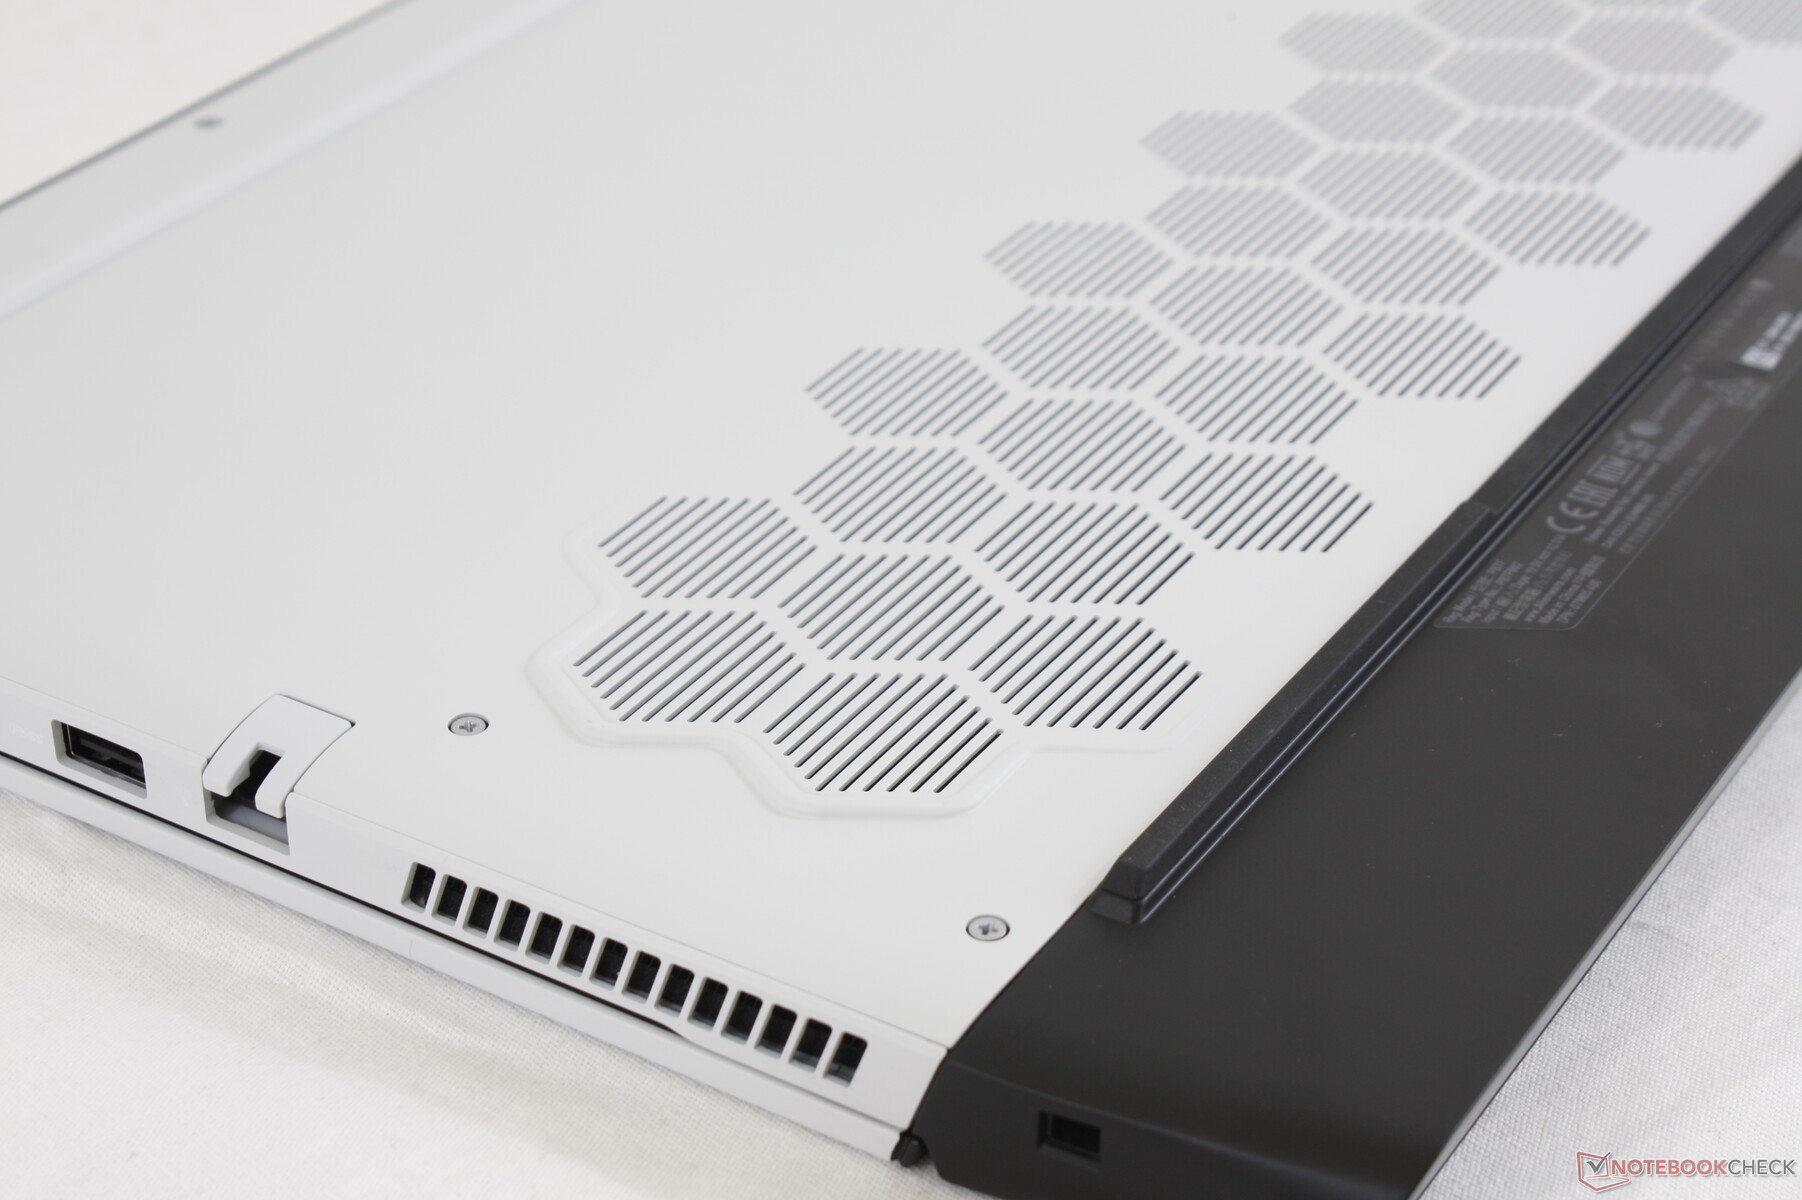
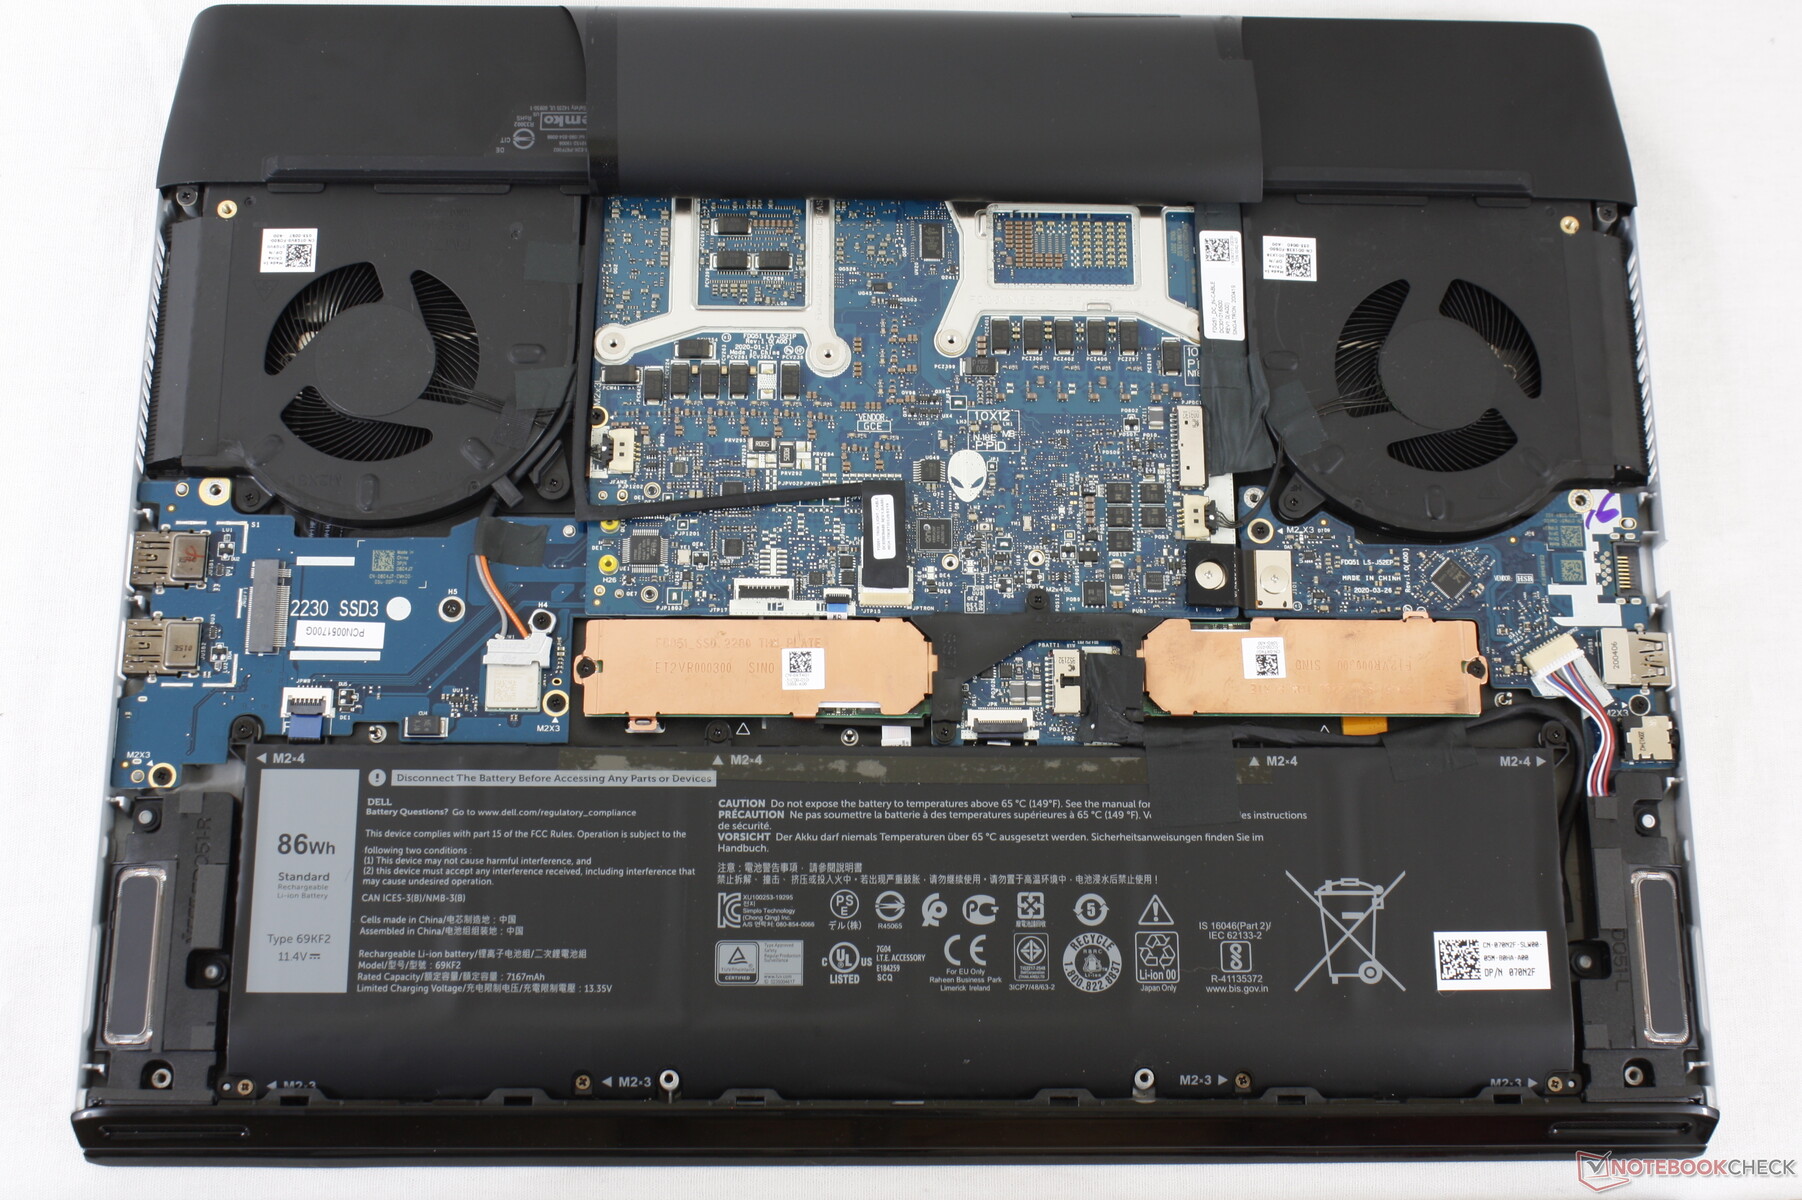
Manutenzione
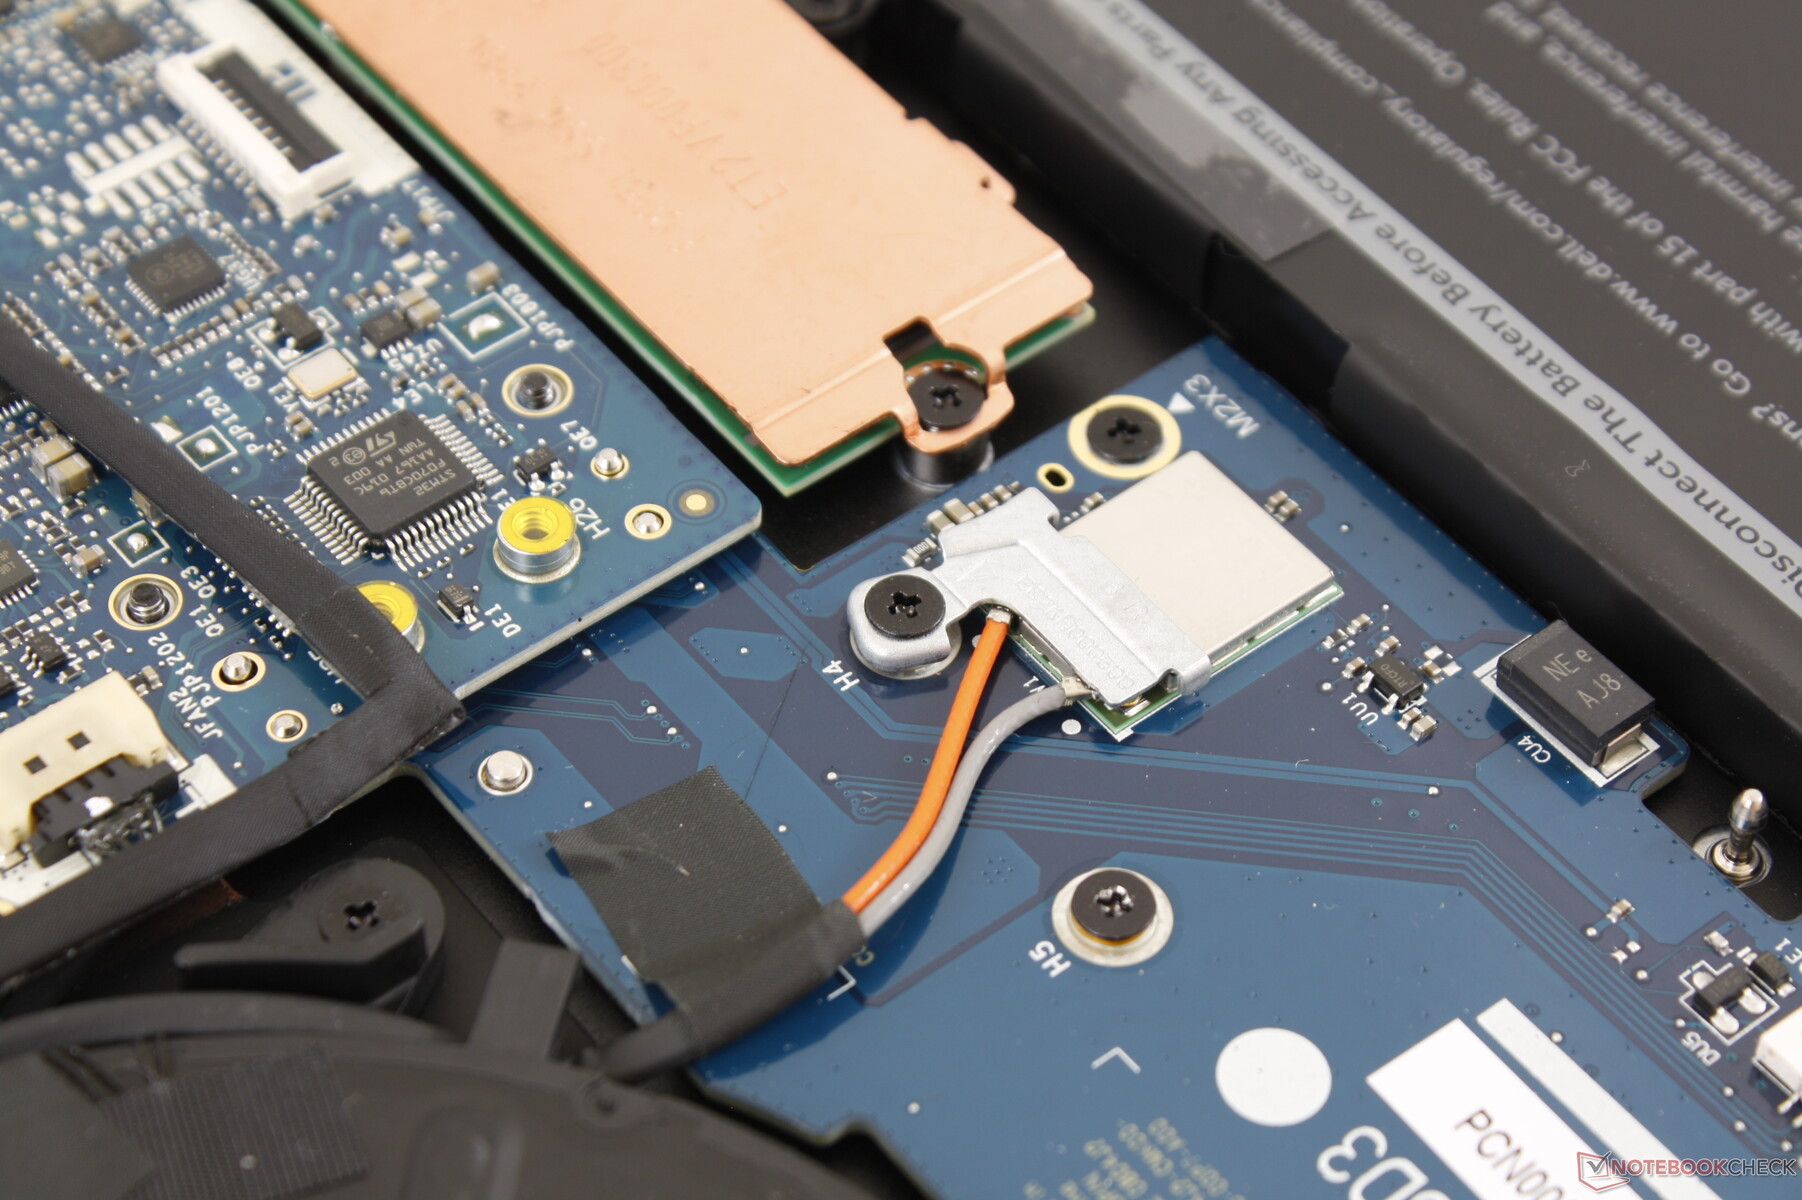
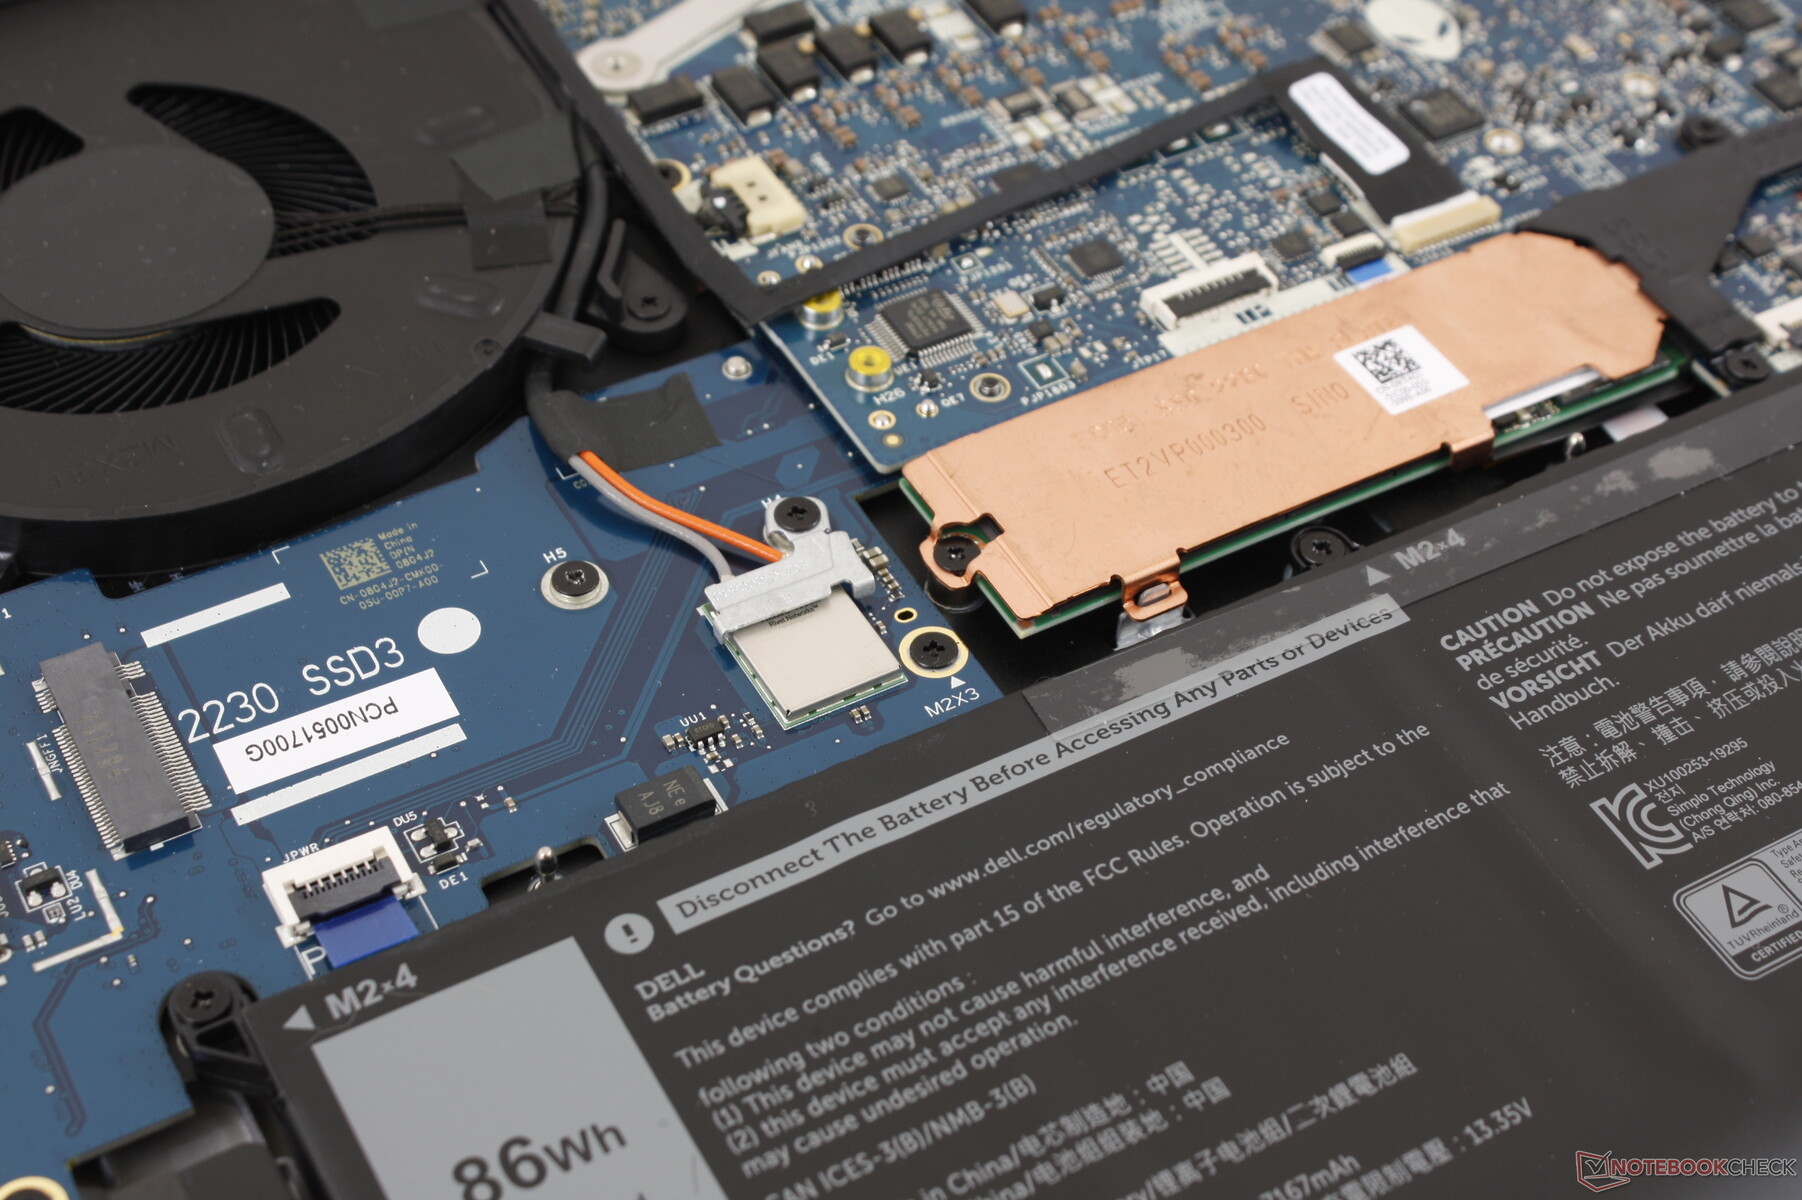
Il pannello inferiore è fissato con 8 viti a croce ed è relativamente facile da rimuovere. Gli utenti hanno ora accesso a tre alloggiamenti, ma la WLAN e la RAM rimangono saldate. Dell ha aumentato la RAM massima configurabile a 32 GB rispetto alla m15 R2.
Accessori e Garanzia
Non ci sono extra nella confezione oltre al solito alimentatore e alla documentazione. La garanzia limitata standard di un anno si applica con possibilità di estensione fino a 4 anni.
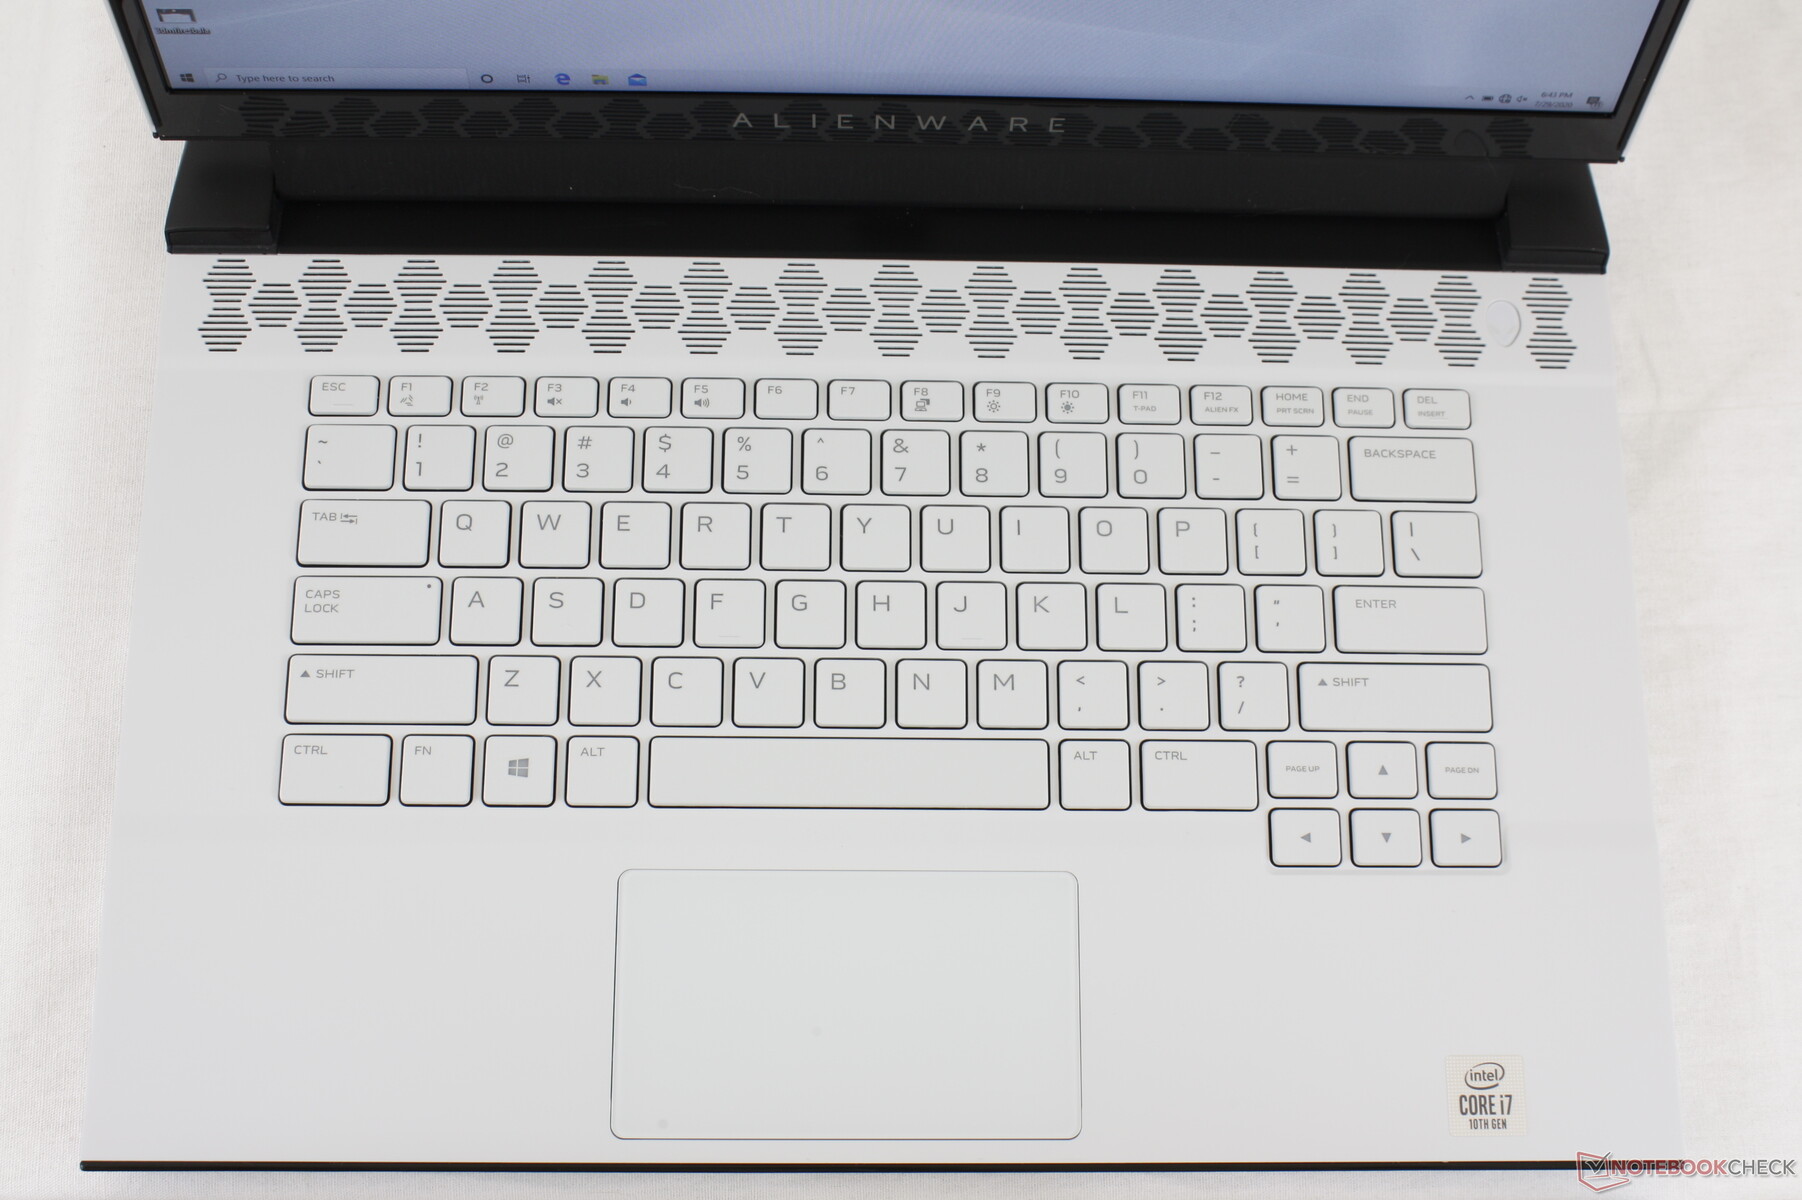
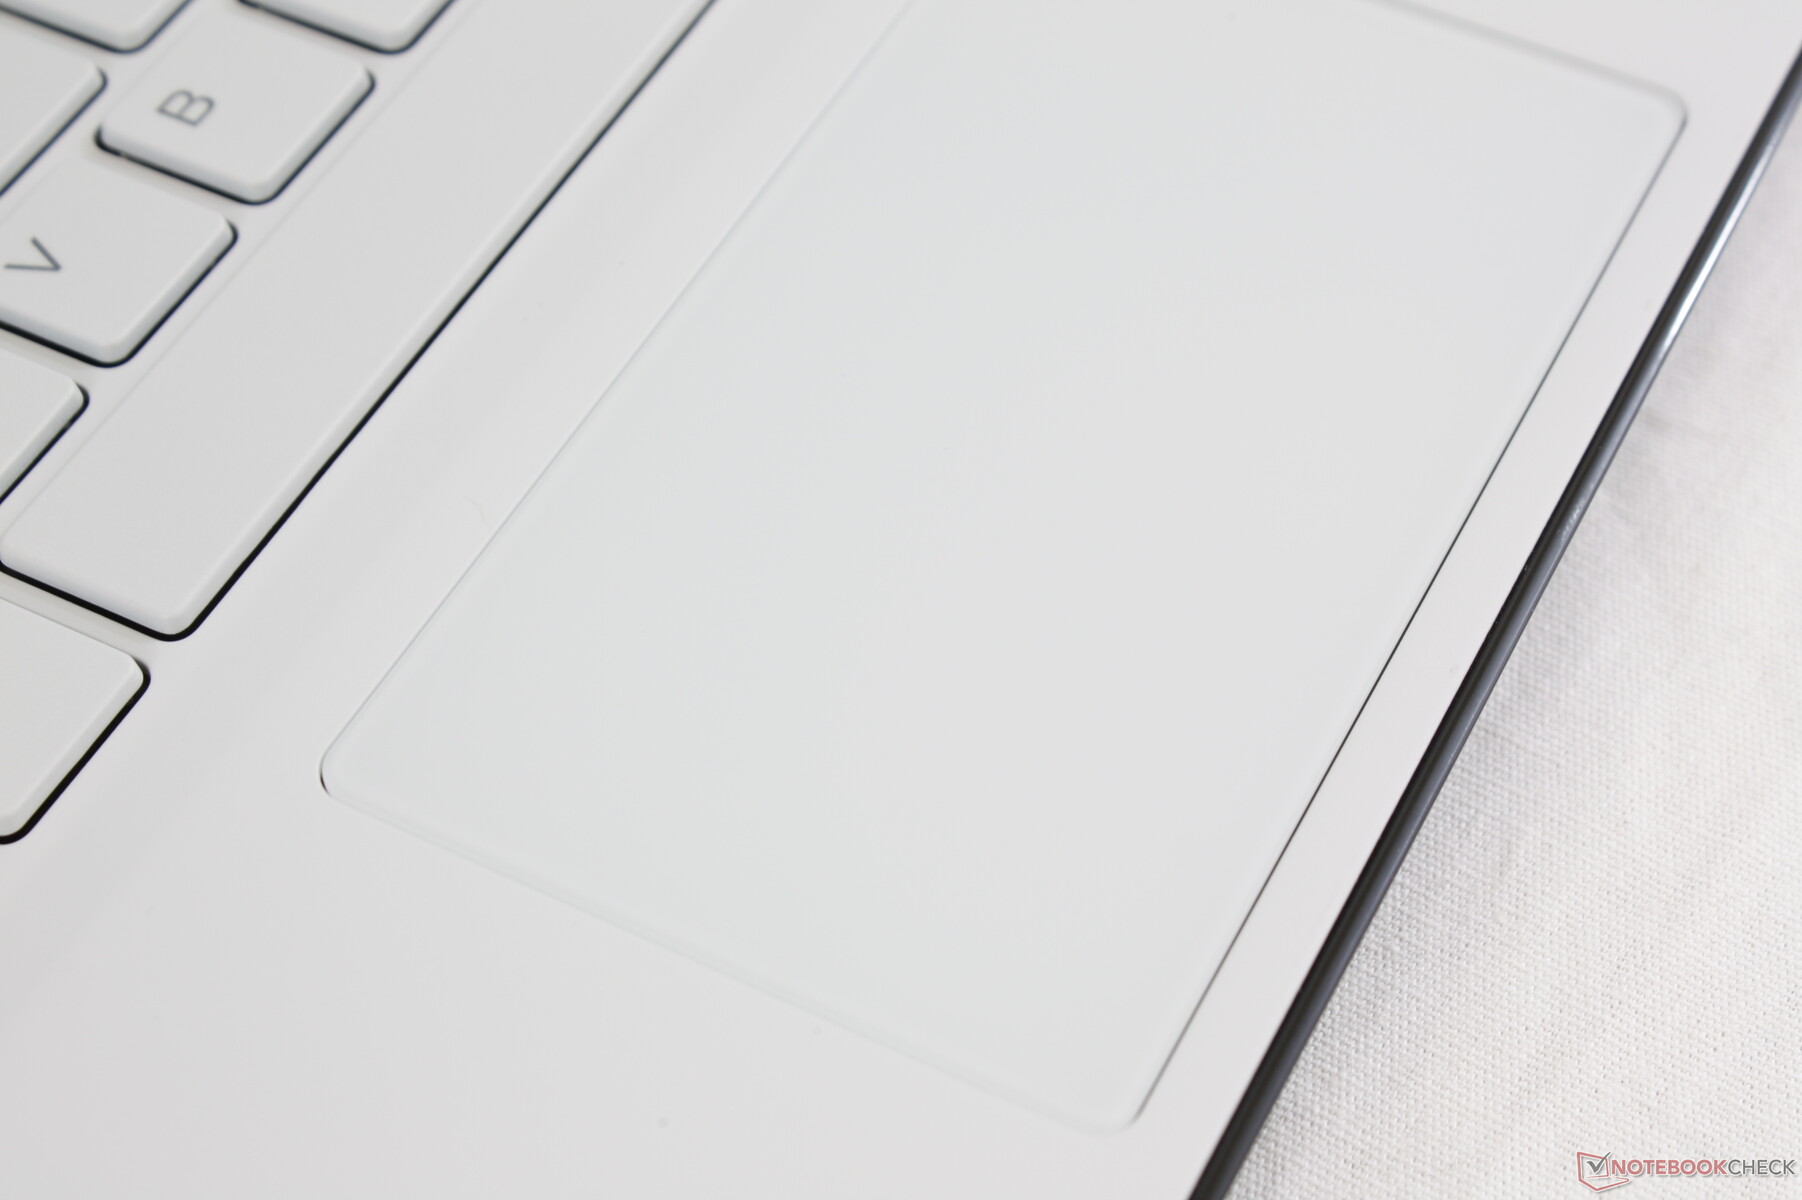
Dispostitivi di Input
Tastiera e Touchpad


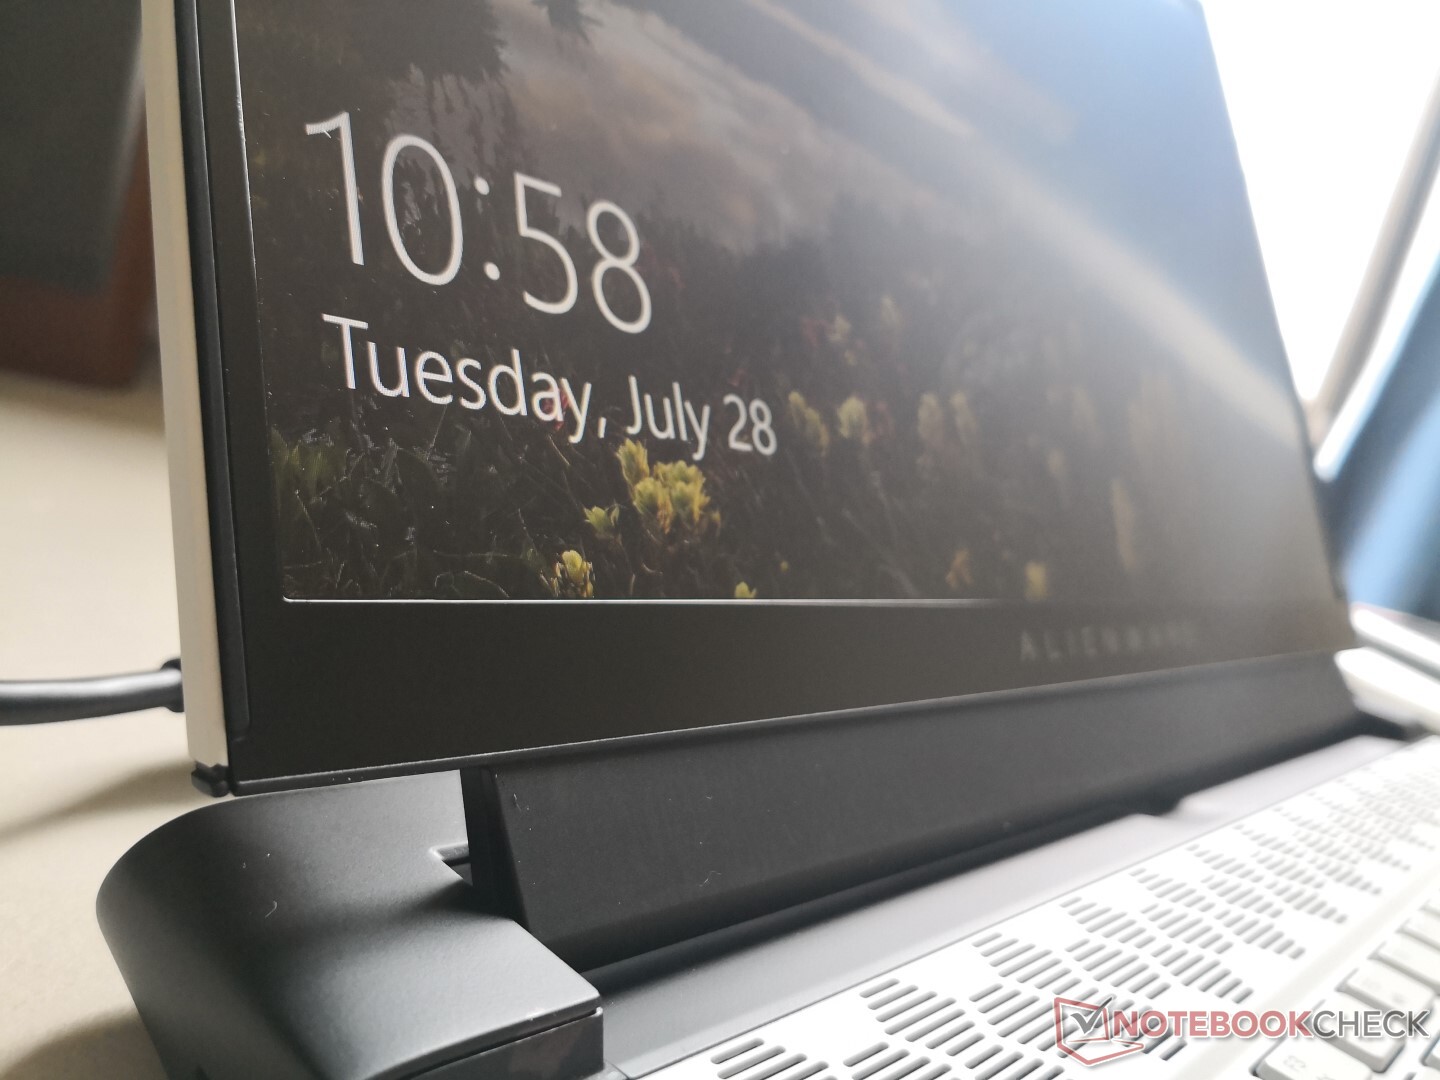
Display
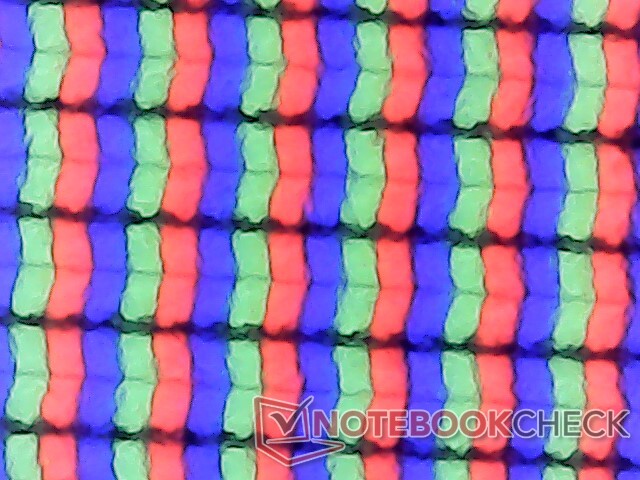
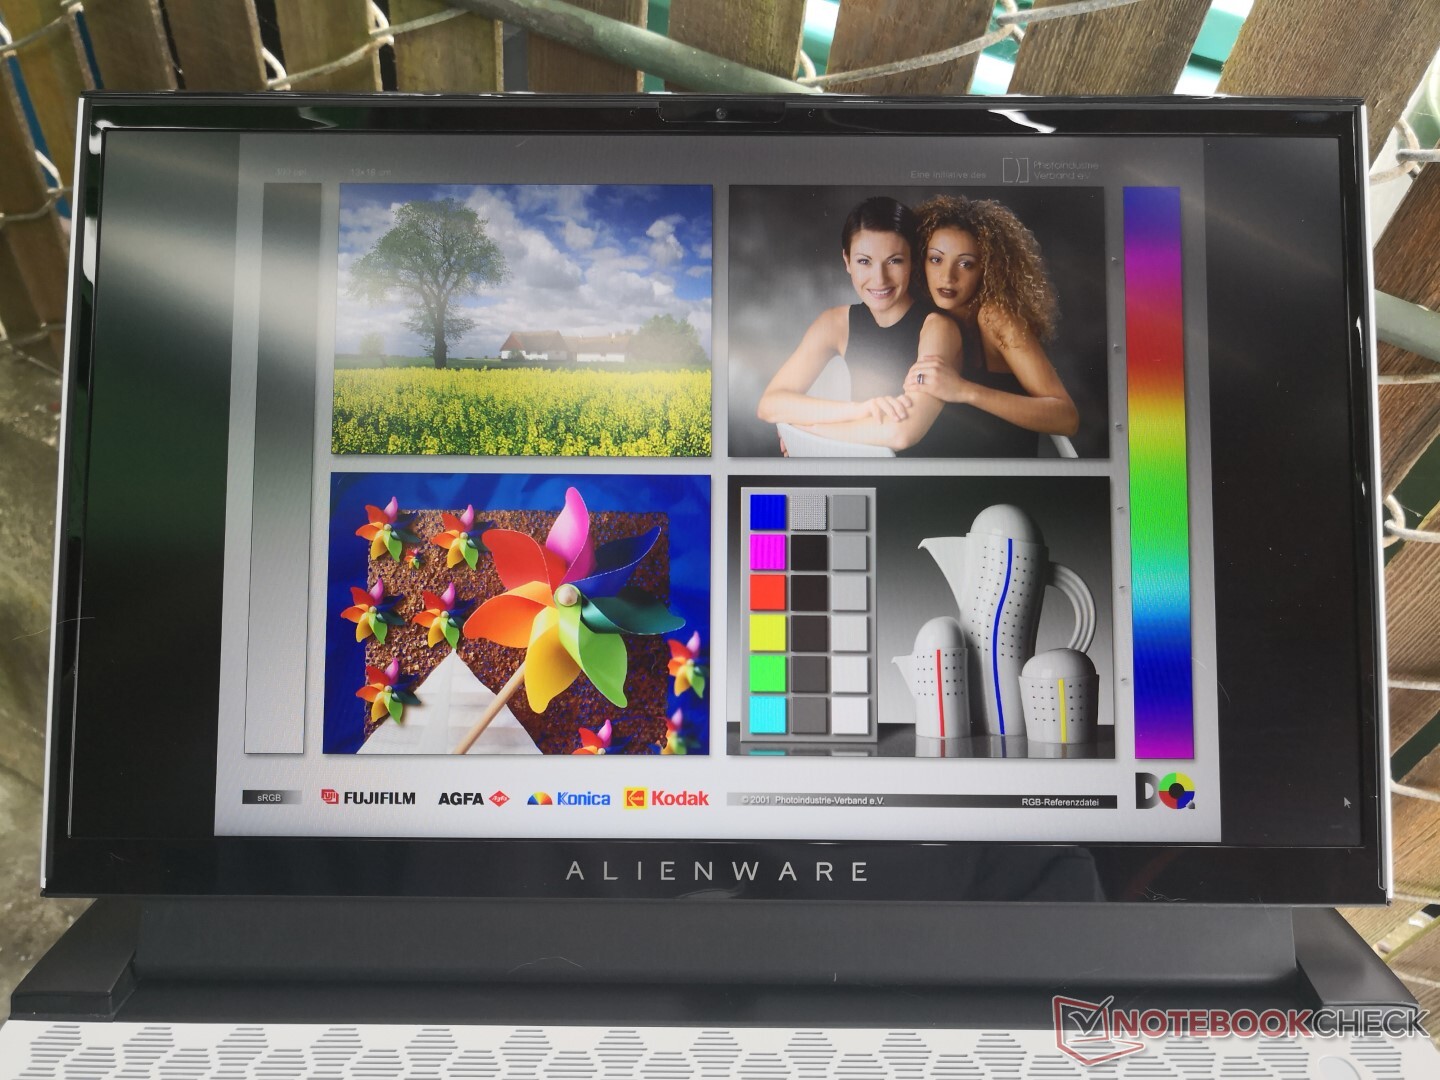
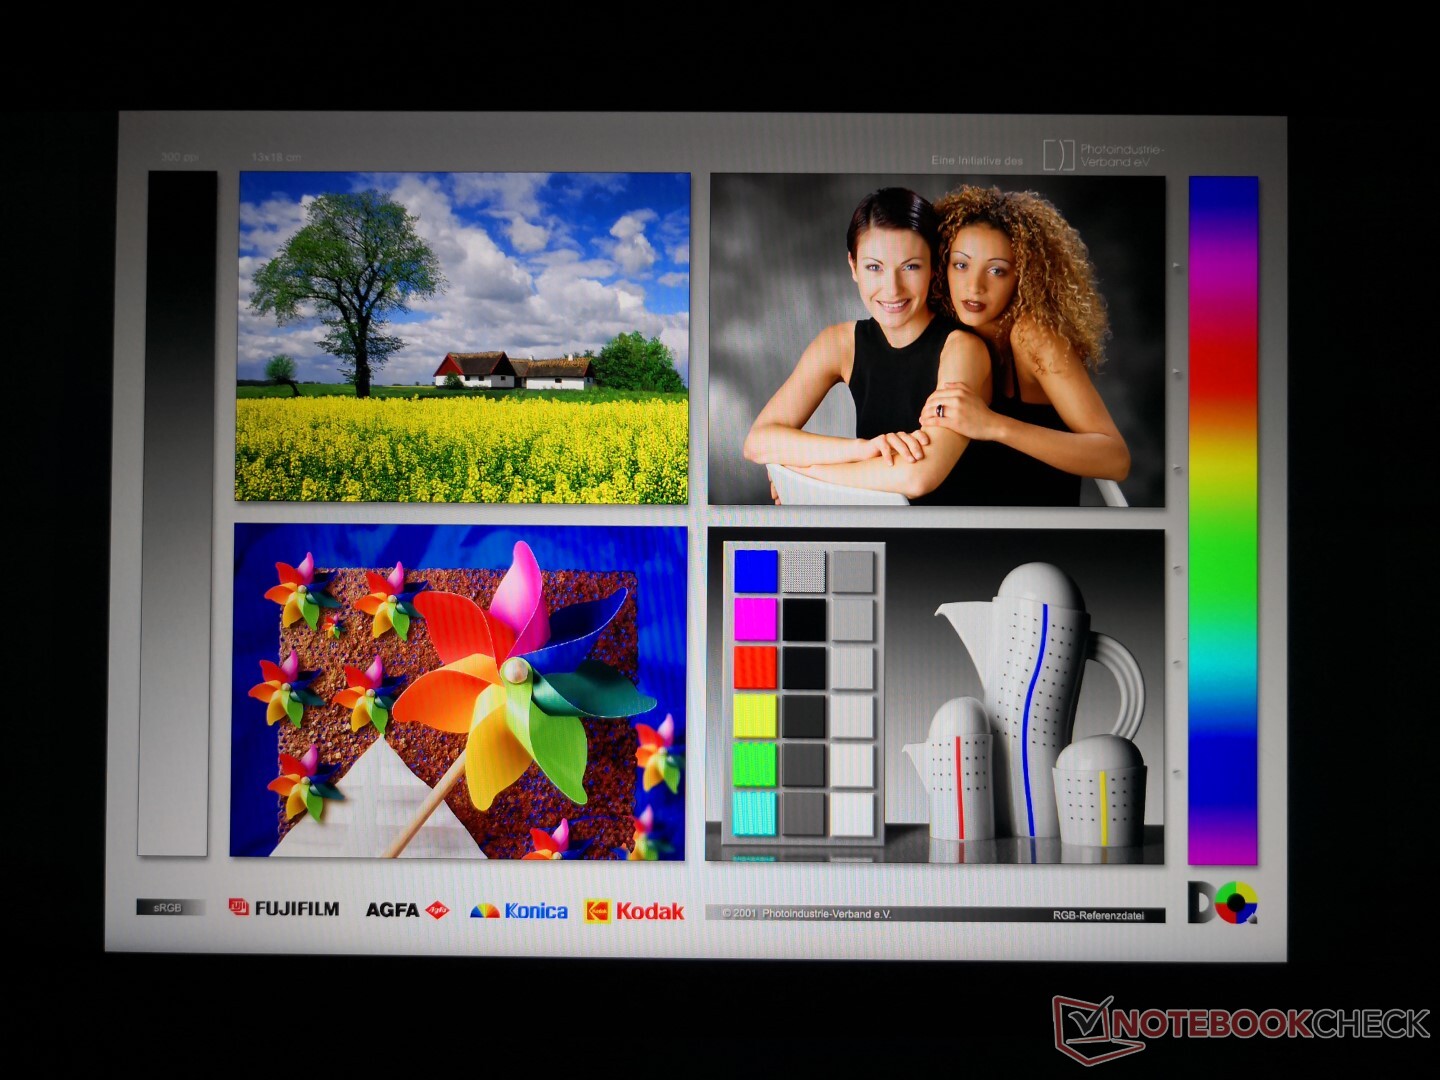
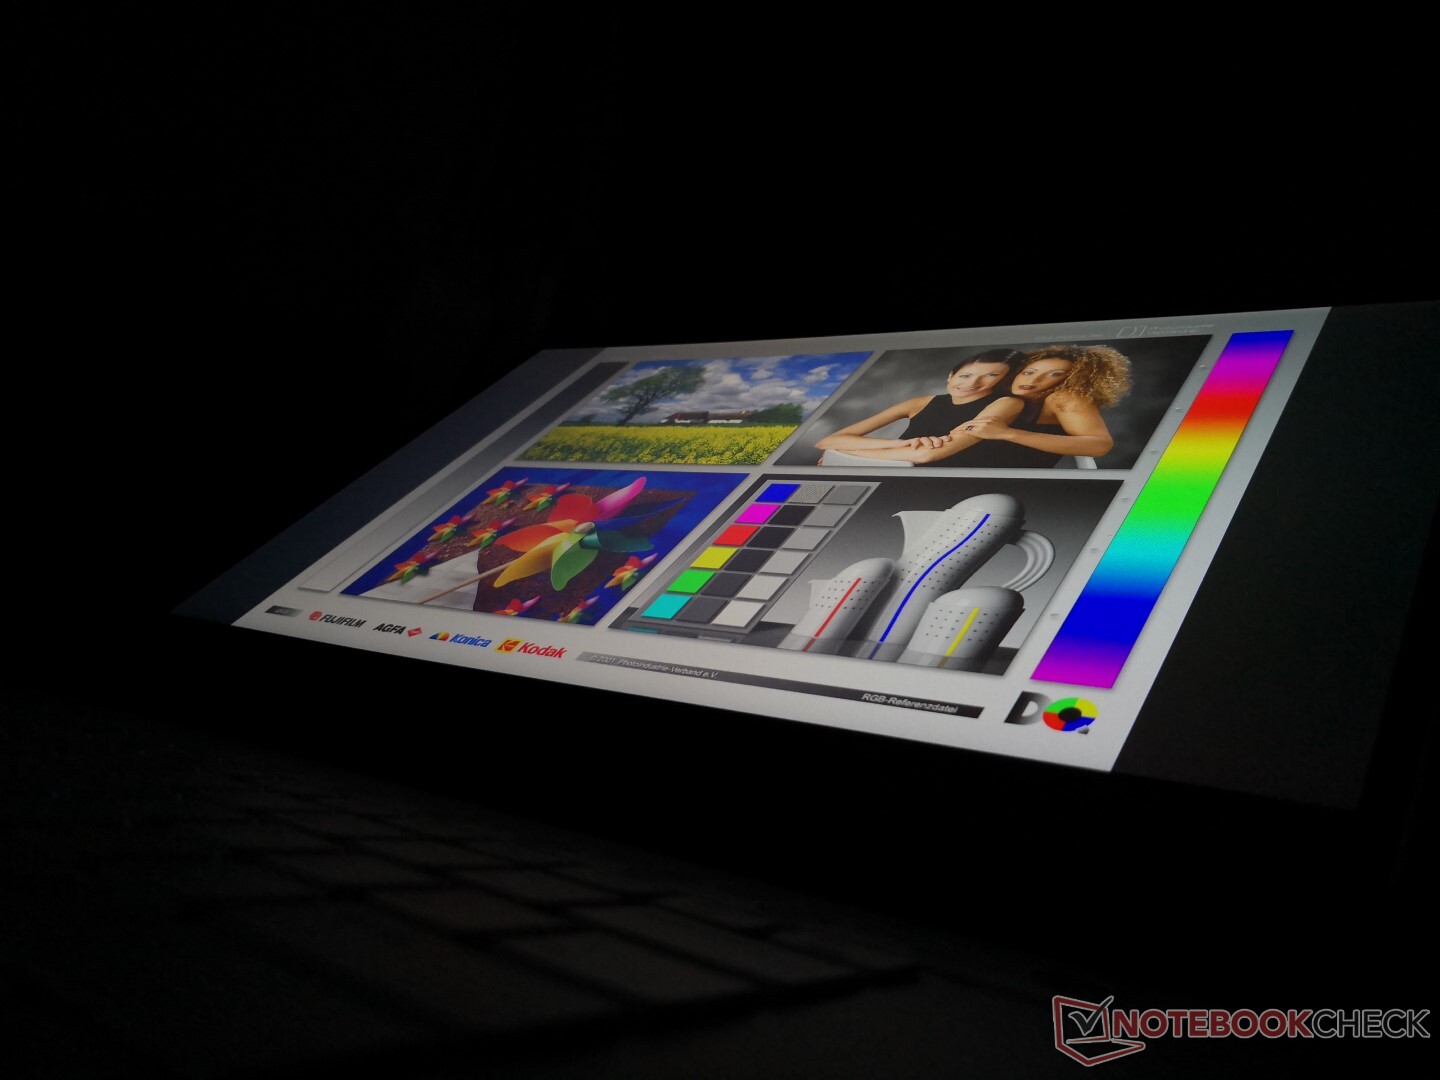
L'Alienware m15 R3 abbandona le opzioni IPS 60 Hz e 240 Hz sul modello dell'anno scorso a favore di 144 Hz come nuova opzione base e 300 Hz come nuova opzione high-end. L'AUO B156HAN a 300 Hz sulla nostra unità di prova è simile a quella che si trova sull'MSI GS66. Gli utenti possono anche configurare un dispositivo con l'OLED 4K a 60 Hz, ma la frequenza di aggiornamento ultra-fluida di 300 Hz rende difficile tornare a 60 Hz a meno che non si valorizzino davvero i colori più profondi e la risoluzione nativa più alta dell'OLED.

| |||||||||||||||||||||||||
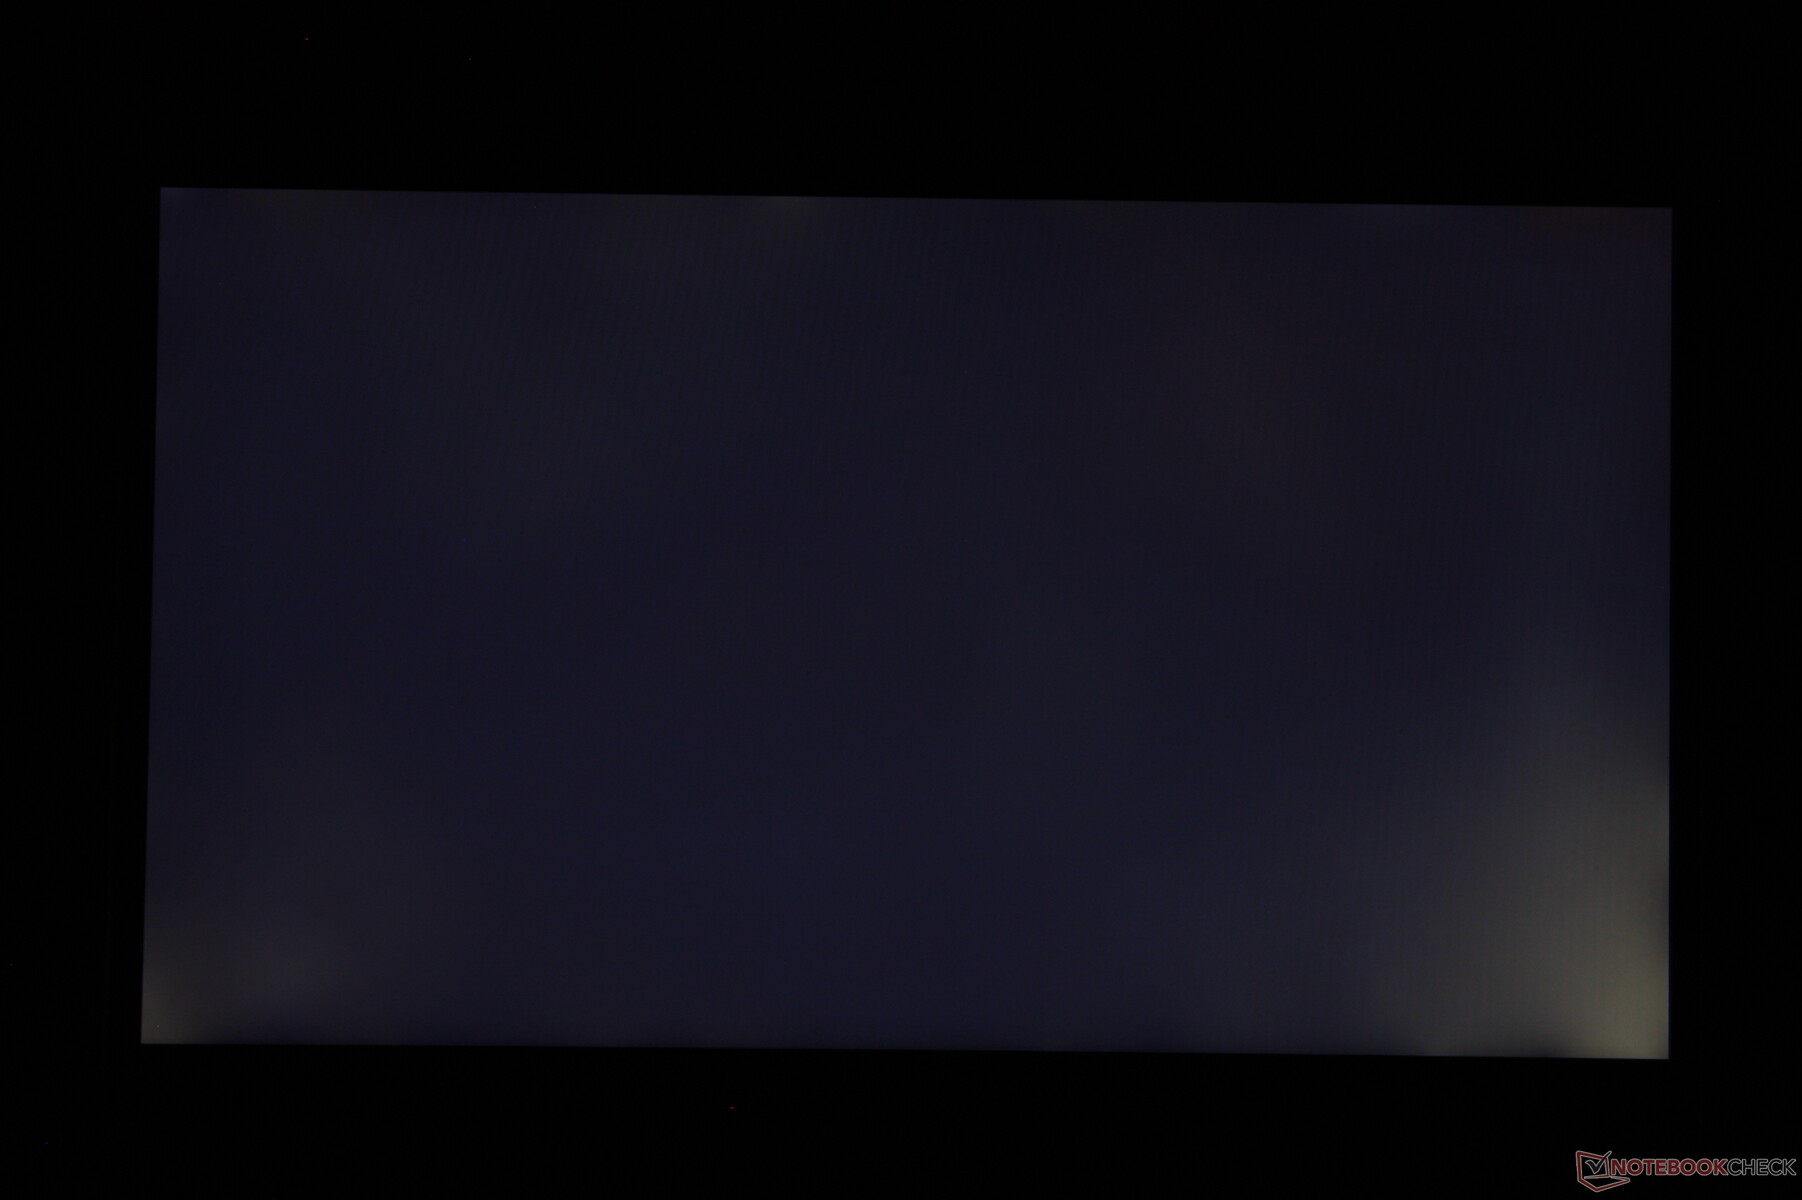
Distribuzione della luminosità: 87 %
Al centro con la batteria: 326.7 cd/m²
Contrasto: 990:1 (Nero: 0.33 cd/m²)
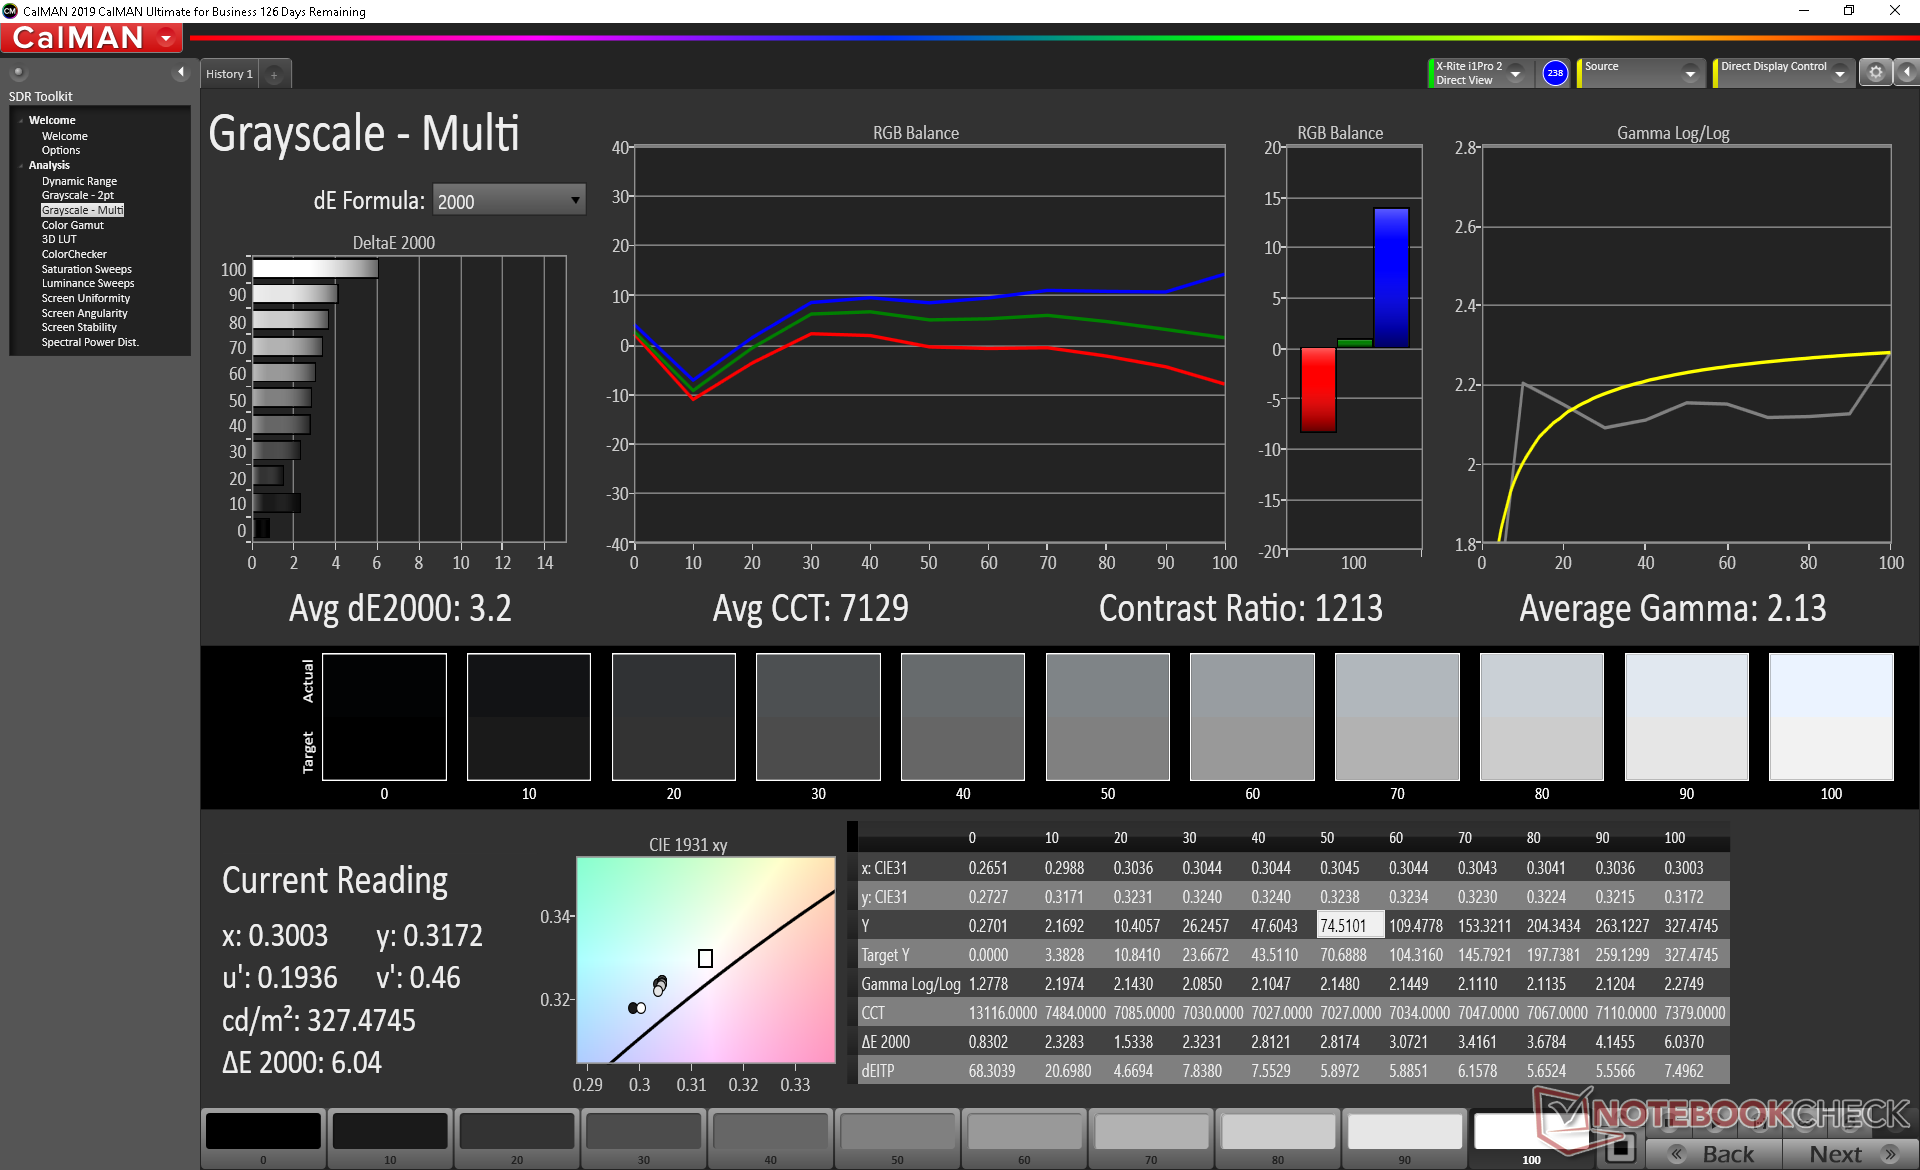
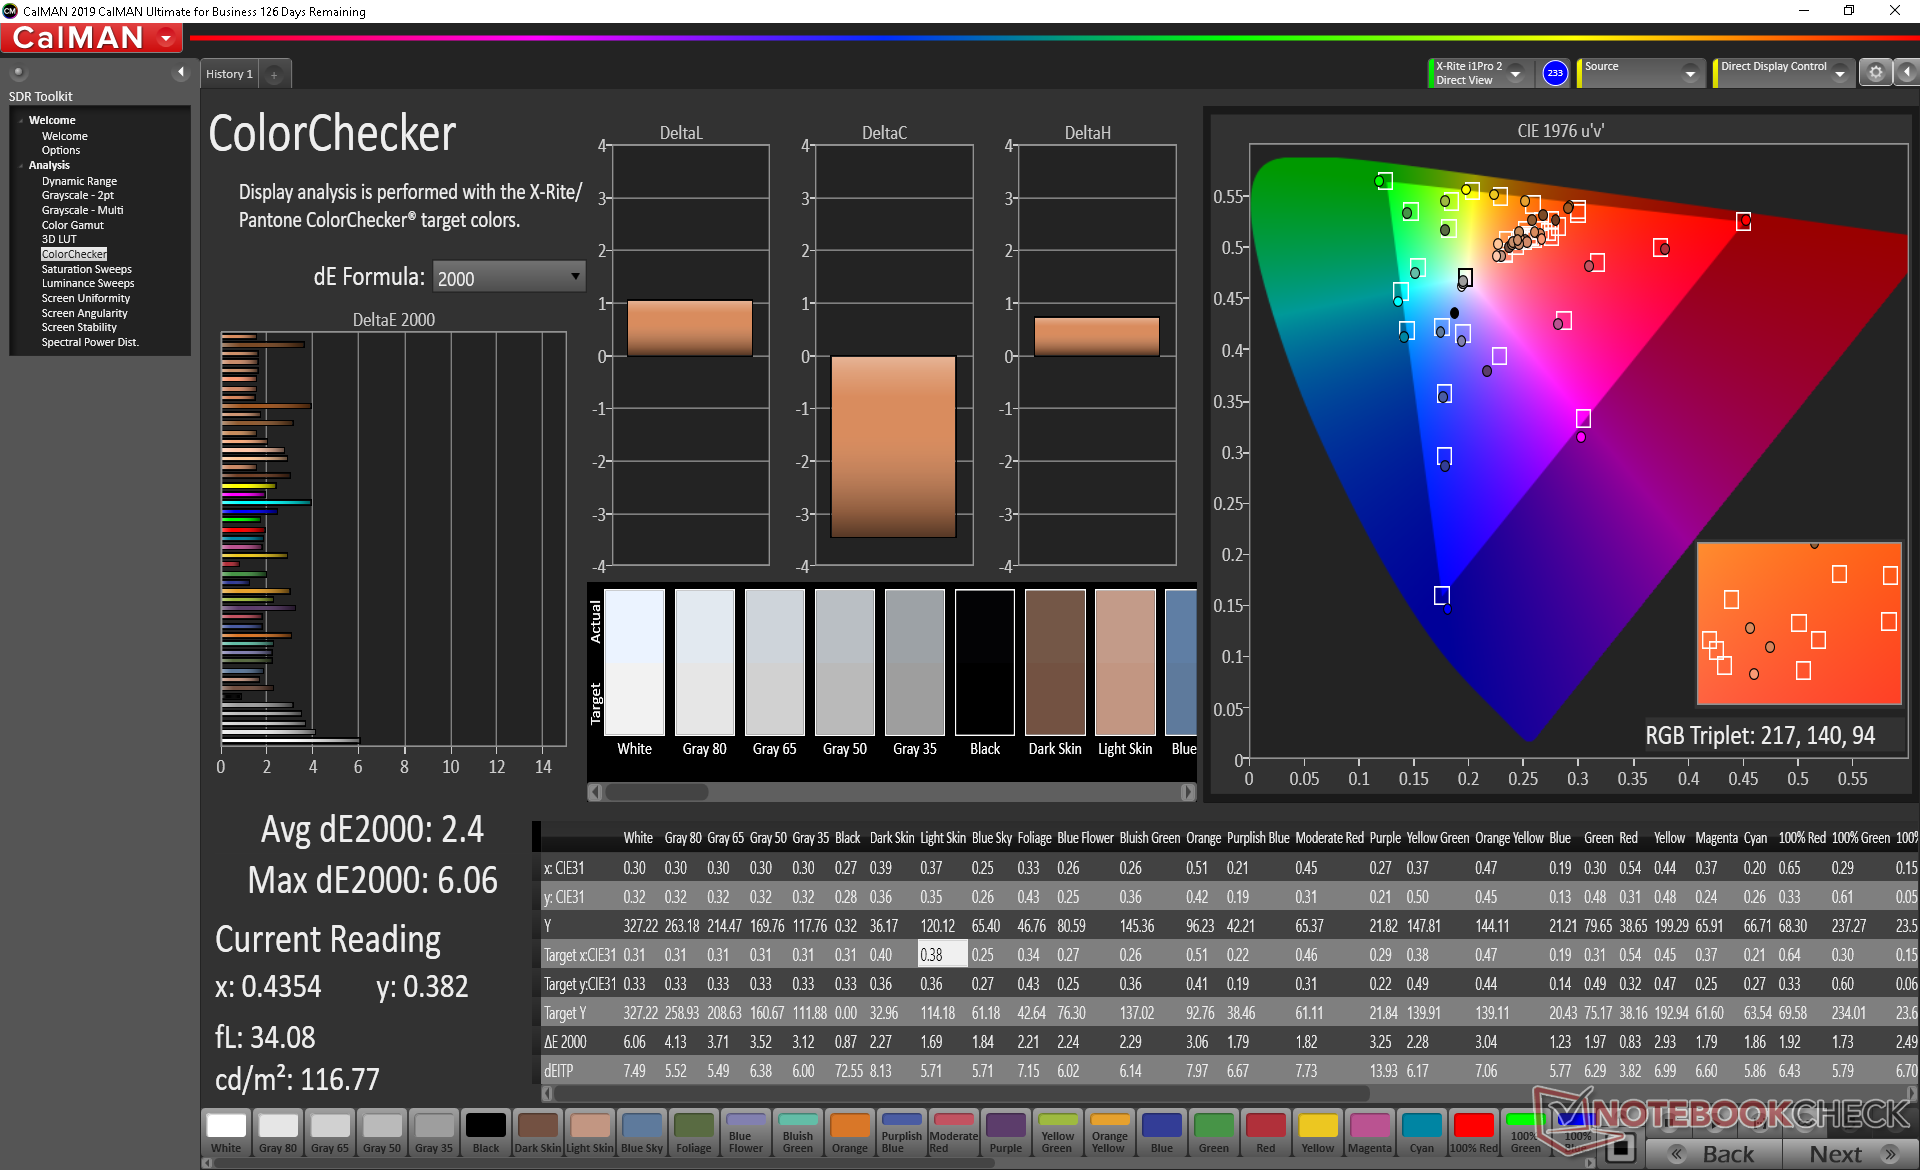
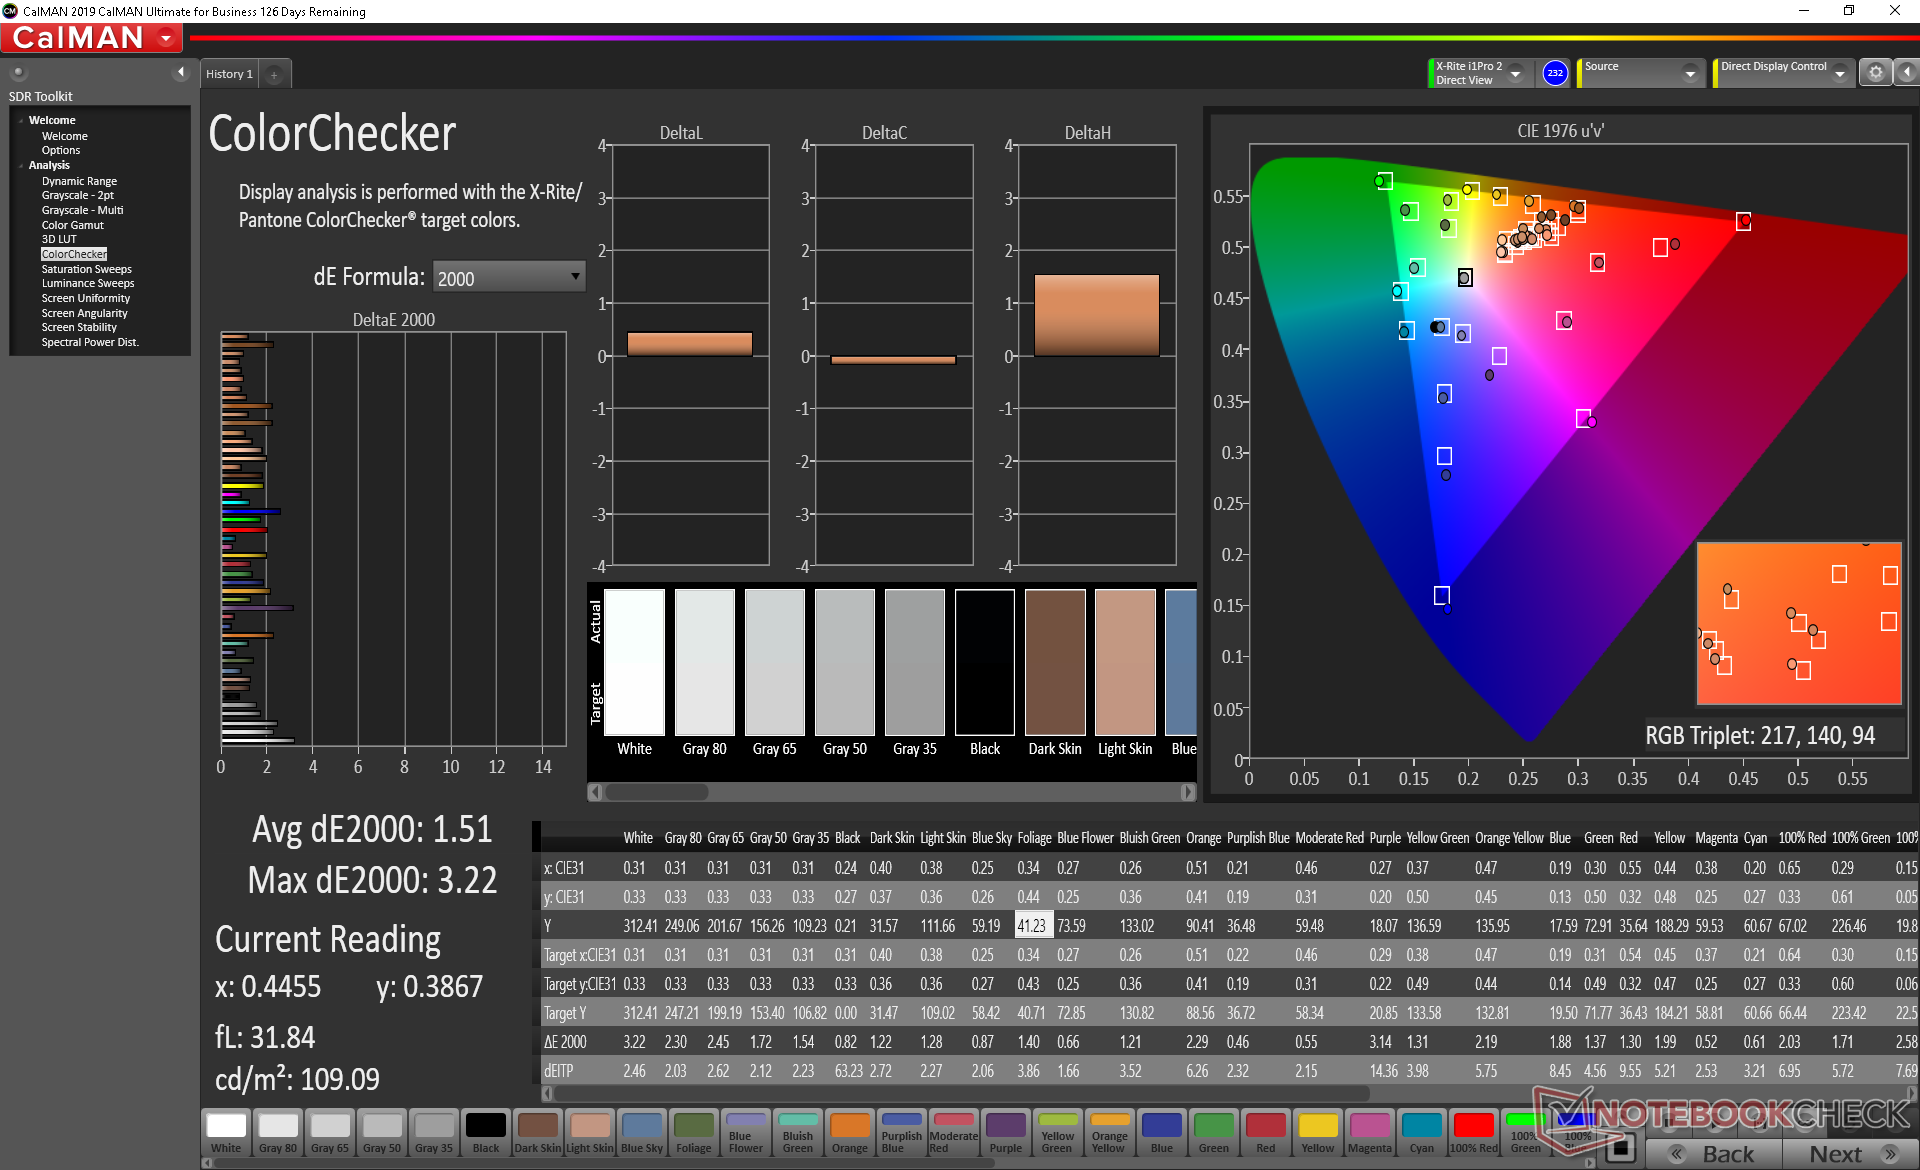
ΔE ColorChecker Calman: 2.4 | ∀{0.5-29.43 Ø4.73}
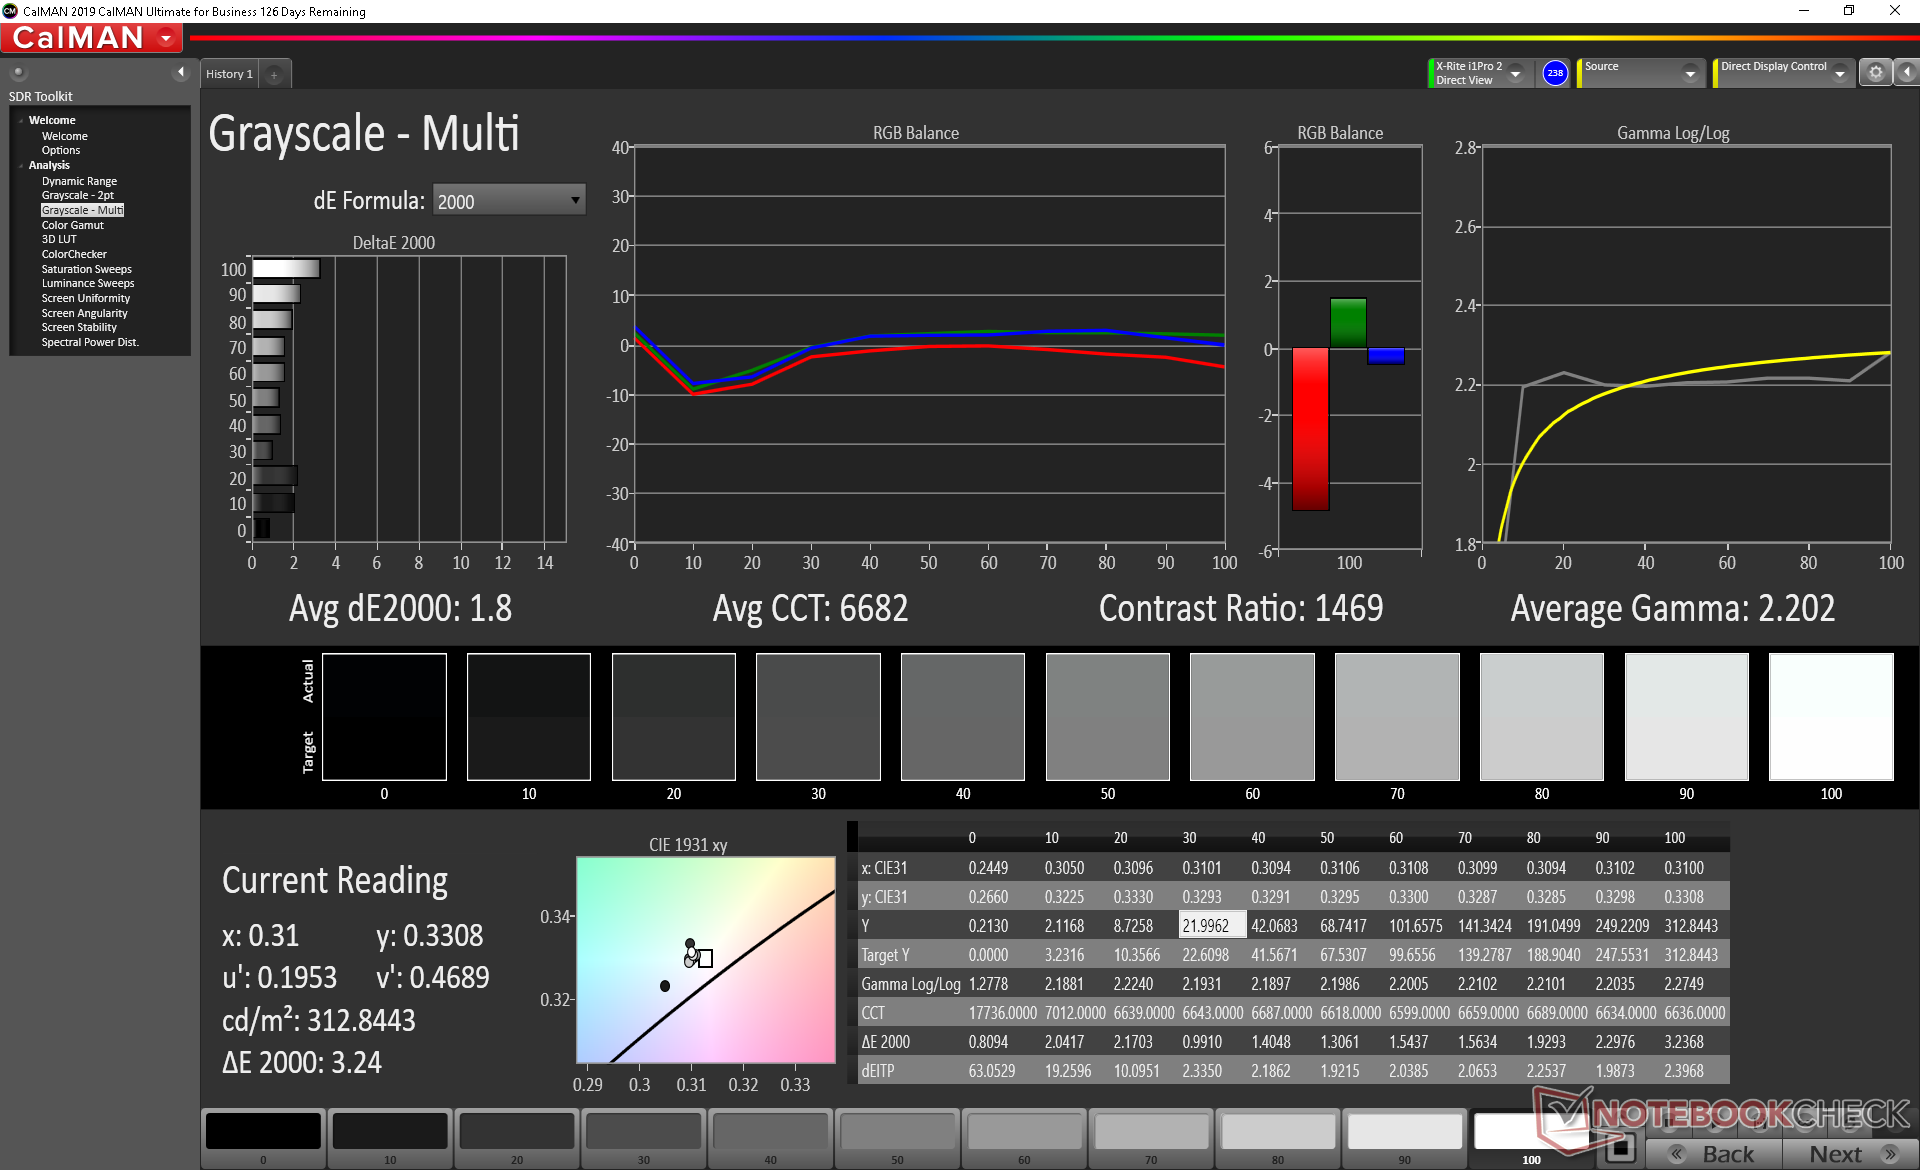
calibrated: 1.51
ΔE Greyscale Calman: 3.2 | ∀{0.09-98 Ø4.97}
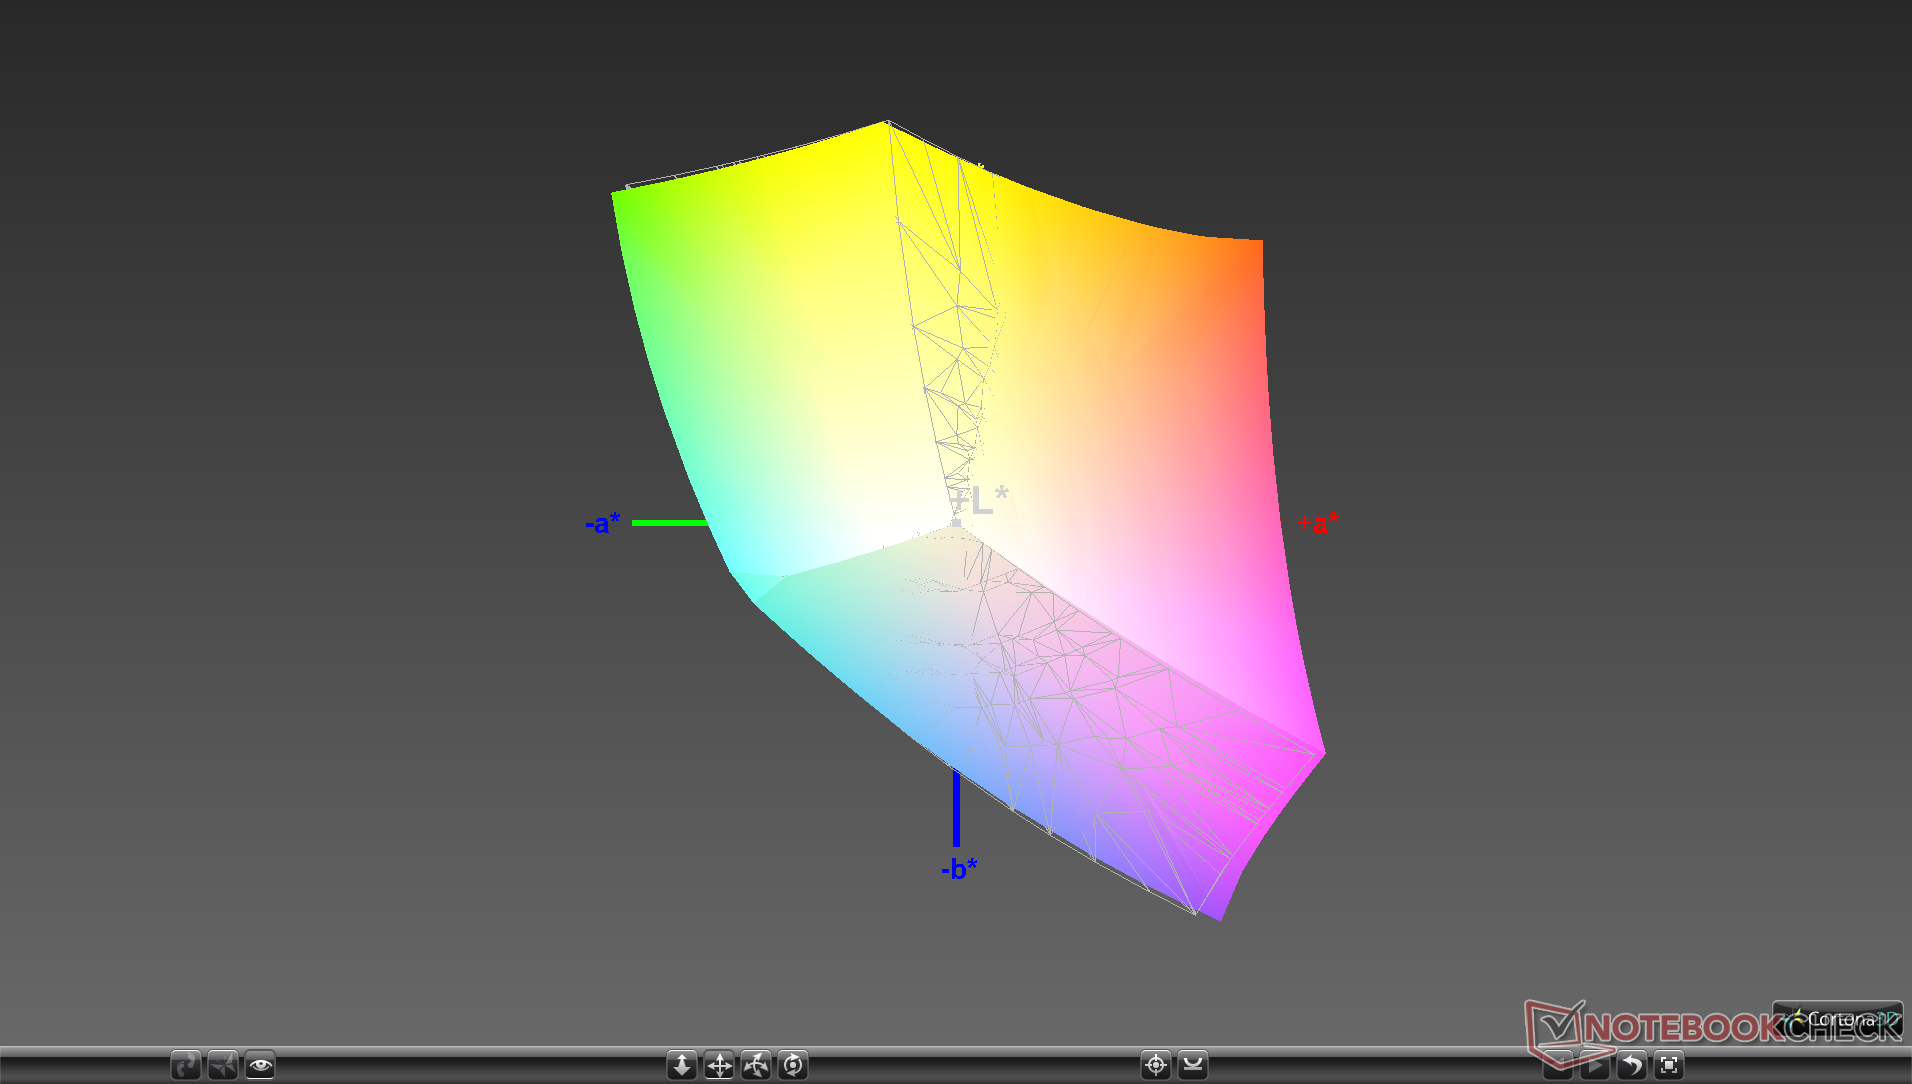
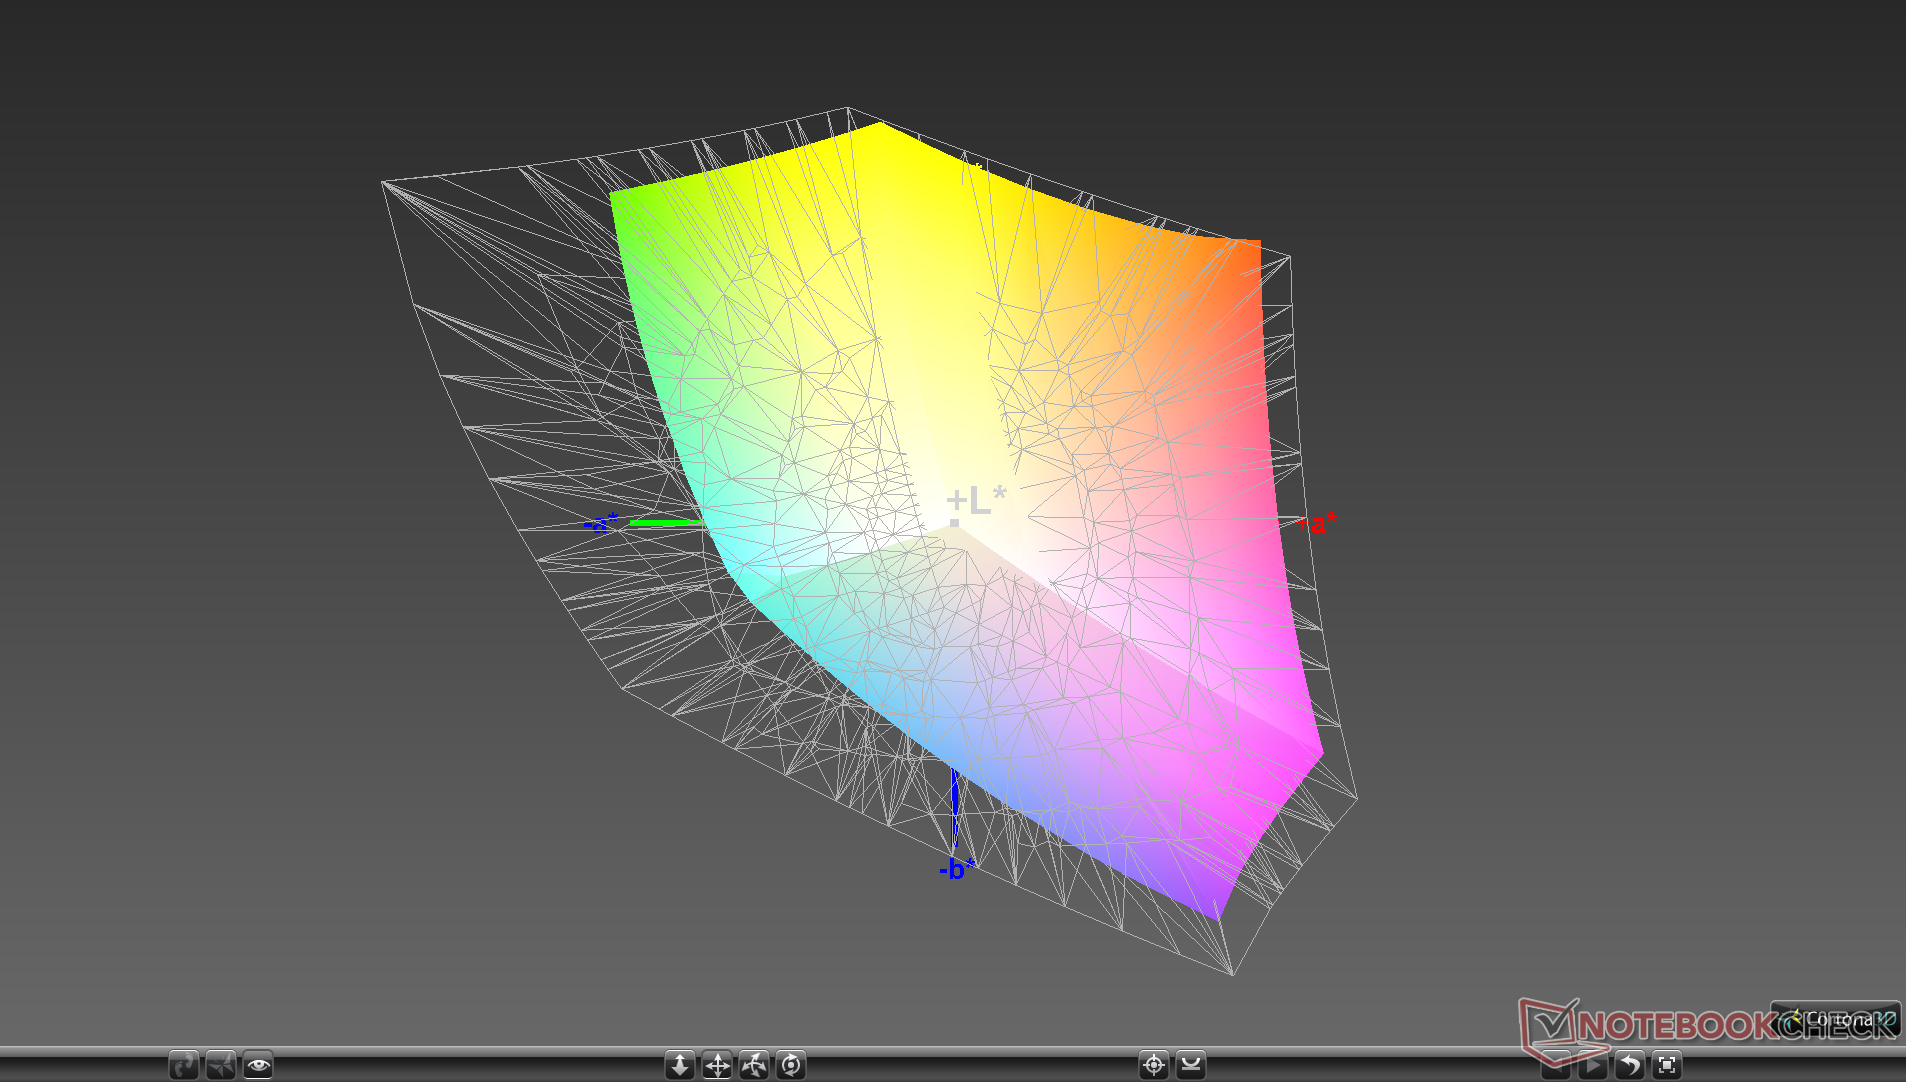
99.2% sRGB (Argyll 1.6.3 3D)
63.7% AdobeRGB 1998 (Argyll 1.6.3 3D)
69.8% AdobeRGB 1998 (Argyll 3D)
98.9% sRGB (Argyll 3D)
68.6% Display P3 (Argyll 3D)
Gamma: 2.13
CCT: 7129 K
| Alienware m15 R3 P87F AU Optronics B156HAN, IPS, 15.6", 1920x1080 | Alienware m15 P79F Samsung SDCA029, 156WR04, OLED, 15.6", 3840x2160 | Eluktronics RP-15 BOE NV156FHM-N4G, IPS, 15.6", 1920x1080 | Razer Blade 15 RZ09-0328 Samsung SDCA029, AMOLED, 15.6", 3840x2160 | Asus Zephyrus S GX502GW AU Optronics B156HAN08.2 (AUO82ED), IPS, 15.6", 1920x1080 | MSI GS66 Stealth 10SFS AUO B156HAN12.0 (AUO328E), IPS, 15.6", 1920x1080 | |
|---|---|---|---|---|---|---|
| Display | 30% | -7% | 29% | -6% | 1% | |
| Display P3 Coverage (%) | 68.6 | 99.9 46% | 63.7 -7% | 99.9 46% | 64.9 -5% | 69.5 1% |
| sRGB Coverage (%) | 98.9 | 100 1% | 92 -7% | 100 1% | 91 -8% | 99.6 1% |
| AdobeRGB 1998 Coverage (%) | 69.8 | 100 43% | 65.2 -7% | 97.4 40% | 65.9 -6% | 70.8 1% |
| Response Times | 57% | -163% | 54% | -31% | -120% | |
| Response Time Grey 50% / Grey 80% * (ms) | 4 ? | 2.6 ? 35% | 17.2 ? -330% | 2.7 ? 32% | 7.2 ? -80% | 14 ? -250% |
| Response Time Black / White * (ms) | 10.8 ? | 2.3 ? 79% | 10.4 ? 4% | 2.6 ? 76% | 8.8 ? 19% | 9.6 ? 11% |
| PWM Frequency (Hz) | 60.2 ? | 59.5 ? | ||||
| Screen | -17% | -28% | -5% | -5% | 5% | |
| Brightness middle (cd/m²) | 326.7 | 452.1 38% | 298.6 -9% | 366.7 12% | 286 -12% | 316 -3% |
| Brightness (cd/m²) | 316 | 452 43% | 289 -9% | 371 17% | 275 -13% | 311 -2% |
| Brightness Distribution (%) | 87 | 90 3% | 90 3% | 91 5% | 90 3% | 92 6% |
| Black Level * (cd/m²) | 0.33 | 0.35 -6% | 0.37 -12% | 0.21 36% | ||
| Contrast (:1) | 990 | 853 -14% | 773 -22% | 1505 52% | ||
| Colorchecker dE 2000 * | 2.4 | 6.34 -164% | 5.01 -109% | 5.21 -117% | 2.19 9% | 3.03 -26% |
| Colorchecker dE 2000 max. * | 6.06 | 12.97 -114% | 7.06 -17% | 7.92 -31% | 4.4 27% | 7.32 -21% |
| Colorchecker dE 2000 calibrated * | 1.51 | 2.52 -67% | 2.27 -50% | 1.1 27% | ||
| Greyscale dE 2000 * | 3.2 | 2.8 13% | 5.4 -69% | 2 37% | 2.2 31% | 3.9 -22% |
| Gamma | 2.13 103% | 2.21 100% | 2.54 87% | 2.17 101% | 2.41 91% | 2.42 91% |
| CCT | 7129 91% | 6114 106% | 7461 87% | 6514 100% | 6405 101% | 7439 87% |
| Color Space (Percent of AdobeRGB 1998) (%) | 63.7 | 91 43% | 59.1 -7% | 86.6 36% | 59 -7% | 65 2% |
| Color Space (Percent of sRGB) (%) | 99.2 | 100 1% | 91.6 -8% | 100 1% | 91 -8% | 100 1% |
| Media totale (Programma / Settaggio) | 23% /
5% | -66% /
-41% | 26% /
12% | -14% /
-8% | -38% /
-12% |
* ... Meglio usare valori piccoli
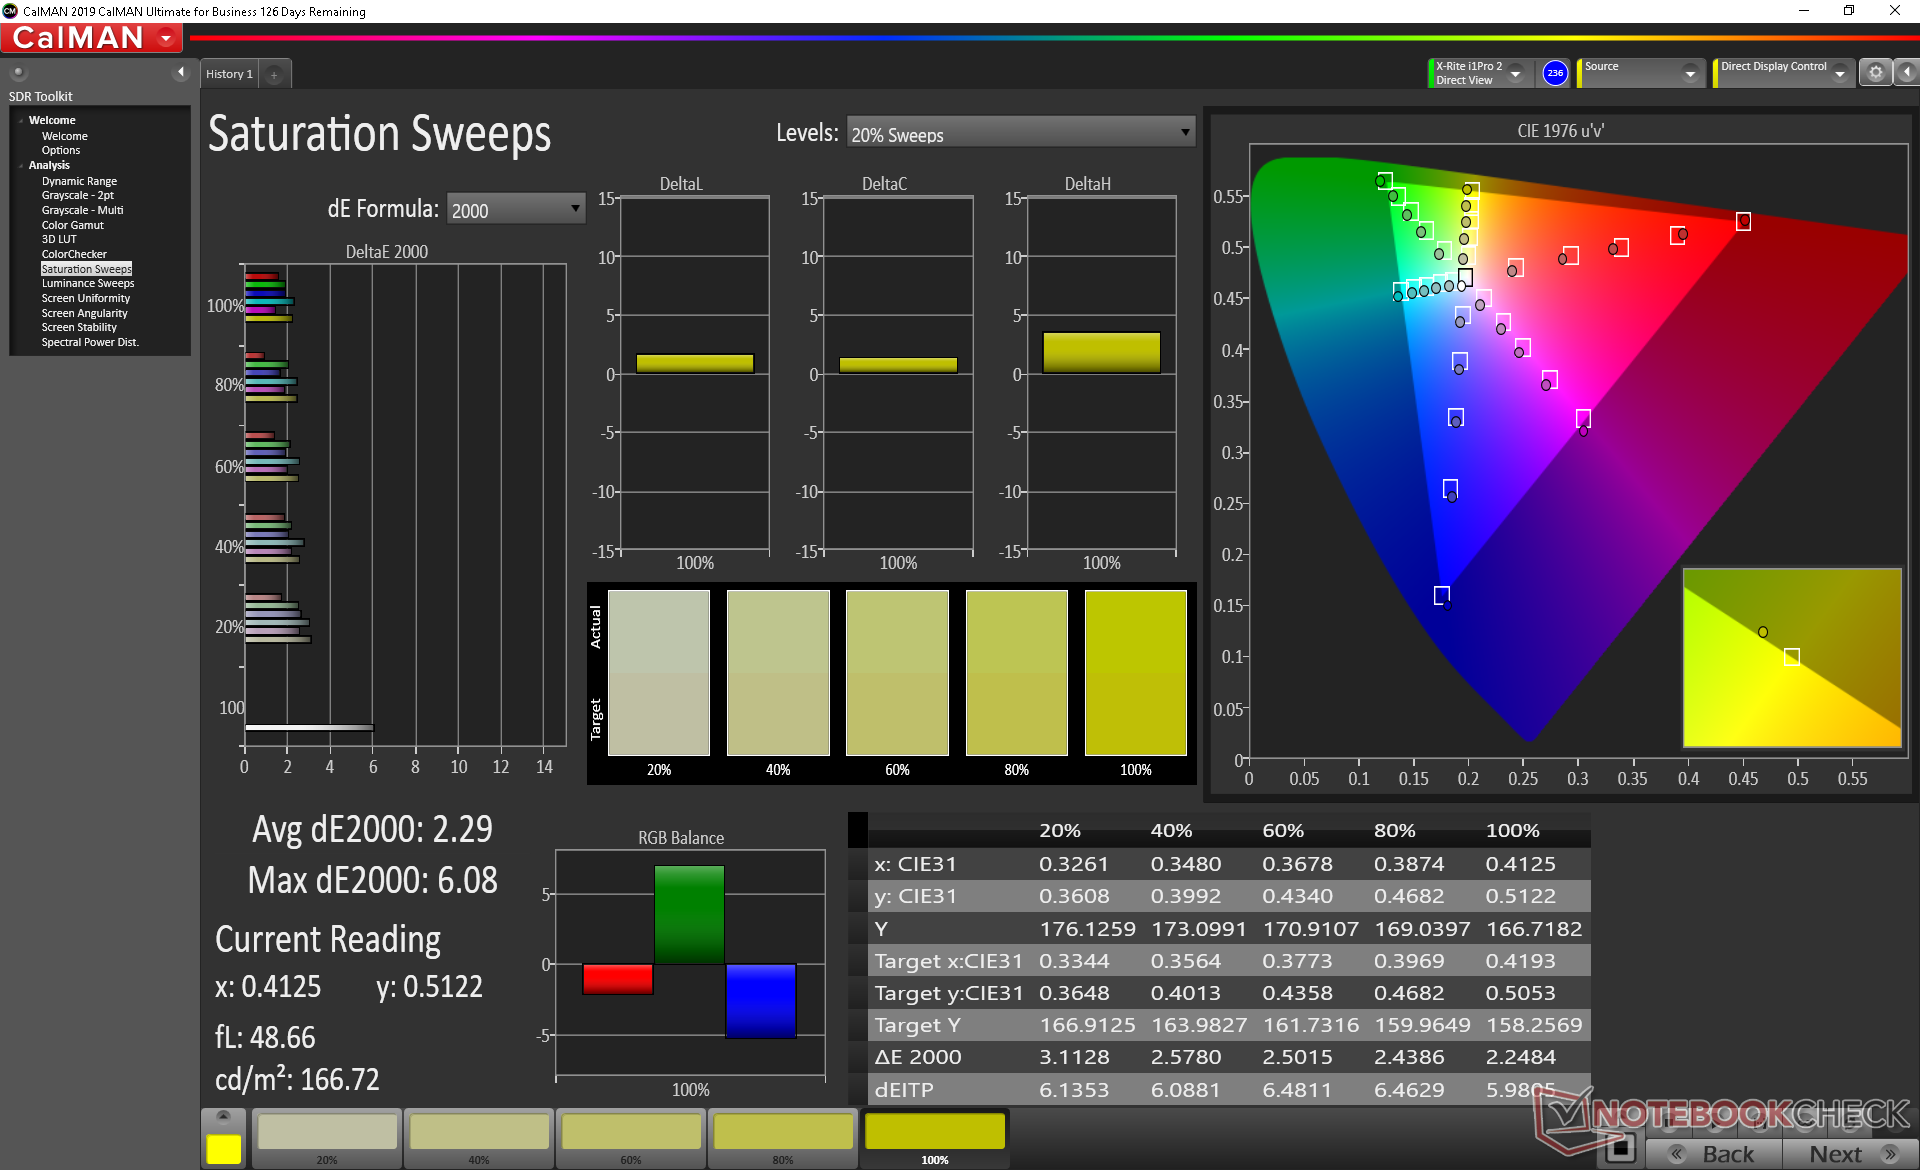
Lo spazio colore copre tutta la gamma sRGB e circa il 64% di quella AdobeRGB, come la maggior parte degli altri pannelli ad elevato refresh rate. L'opzione OLED di Dell promette una copertura DCI-P3 con compatibilità di riproduzione HDR al costo di un refresh rate più lento di 60 Hz.
Le misurazioni con un colorimetro X-Rite rivelano che la temperatura del colore tende leggermente alle tonalità fredde. Una calibrazione dell'utente finale risolve questo aspetto per migliorare il valore medio della scala dei grigi DeltaE da un già basso 3,2 ad un ancora più basso 1,8. In caso contrario, i colori sono accurati senza bisogno di ulteriori calibrazioni.

Tempi di risposta del Display
| ↔ Tempi di risposta dal Nero al Bianco | ||
|---|---|---|
| 10.8 ms ... aumenta ↗ e diminuisce ↘ combinato | ↗ 5.2 ms Incremento | 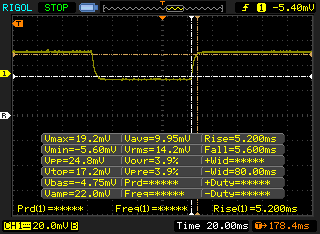 |
| ↘ 5.6 ms Calo | ||
| Lo schermo mostra buoni tempi di risposta durante i nostri tests, ma potrebbe essere troppo lento per i gamers competitivi. In confronto, tutti i dispositivi di test variano da 0.1 (minimo) a 240 (massimo) ms. » 29 % di tutti i dispositivi è migliore. Questo significa che i tempi di risposta rilevati sono migliori rispettto alla media di tutti i dispositivi testati (19.9 ms). | ||
| ↔ Tempo di risposta dal 50% Grigio all'80% Grigio | ||
| 4 ms ... aumenta ↗ e diminuisce ↘ combinato | ↗ 1.6 ms Incremento | 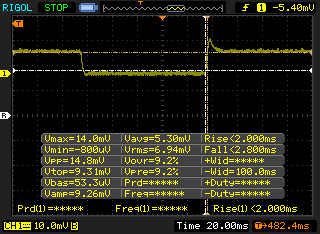 |
| ↘ 2.4 ms Calo | ||
| Lo schermo ha mostrato valori di risposta molto veloci nei nostri tests ed è molto adatto per i gaming veloce. In confronto, tutti i dispositivi di test variano da 0.165 (minimo) a 636 (massimo) ms. » 15 % di tutti i dispositivi è migliore. Questo significa che i tempi di risposta rilevati sono migliori rispettto alla media di tutti i dispositivi testati (31.1 ms). | ||
Sfarfallio dello schermo / PWM (Pulse-Width Modulation)
| flickering dello schermo / PWM non rilevato | 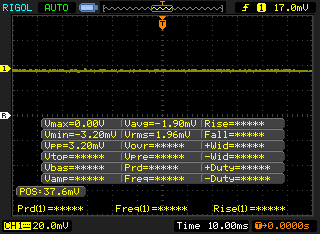 | ||
In confronto: 52 % di tutti i dispositivi testati non utilizza PWM per ridurre la luminosita' del display. Se è rilevato PWM, una media di 7784 (minimo: 5 - massimo: 343500) Hz è stata rilevata. | |||
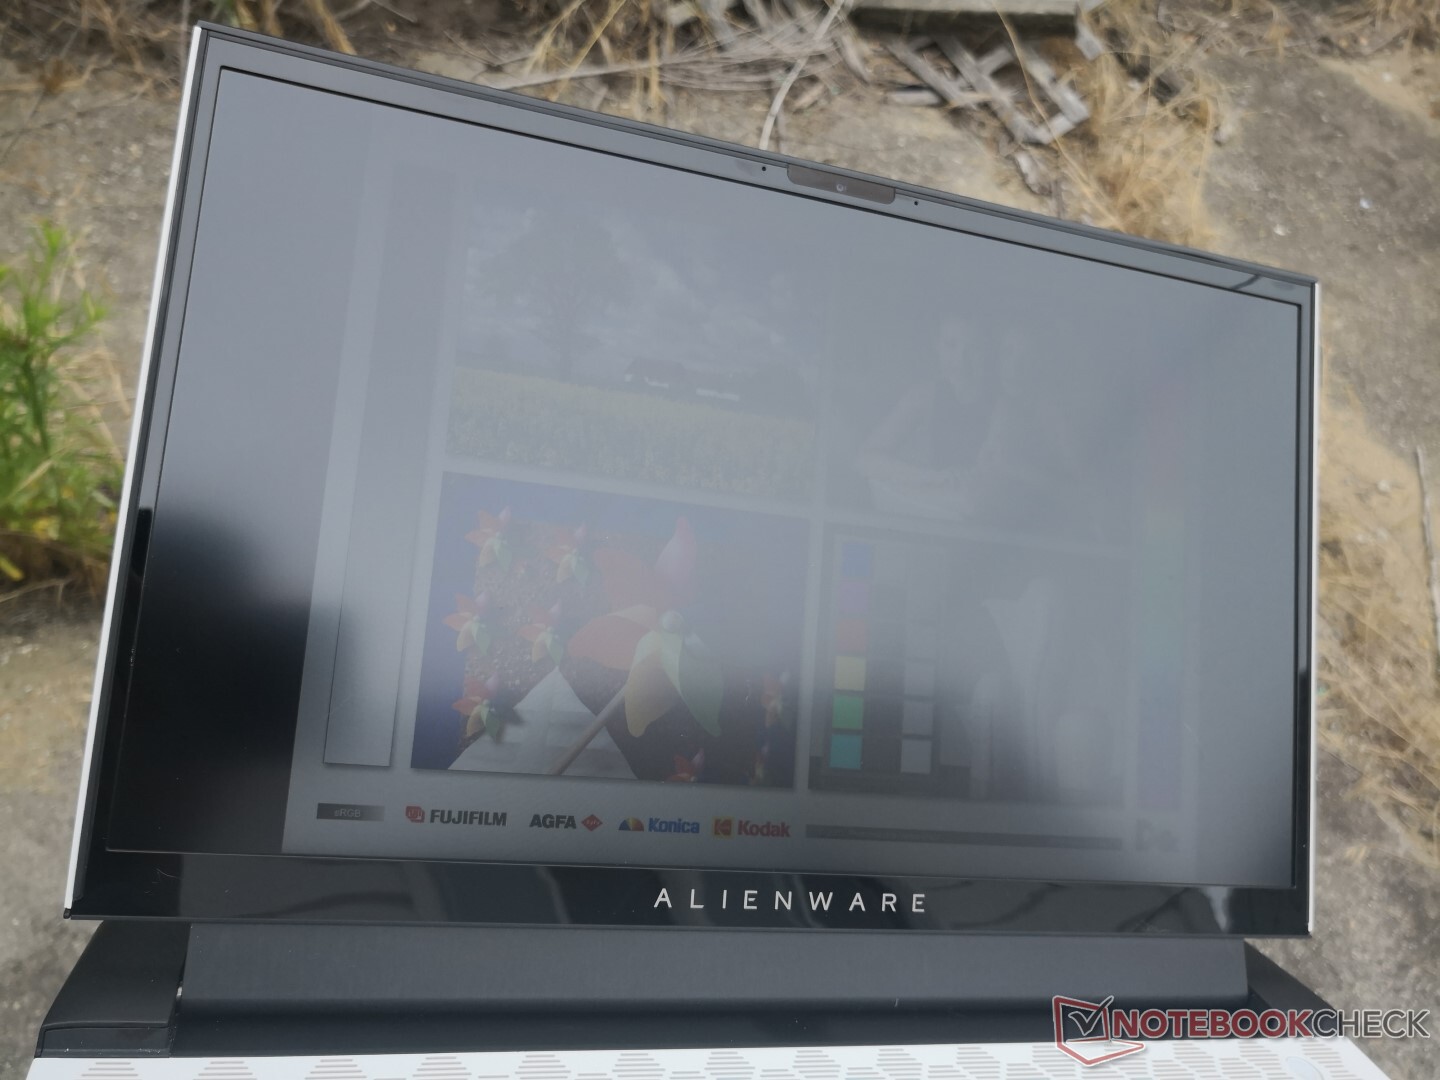
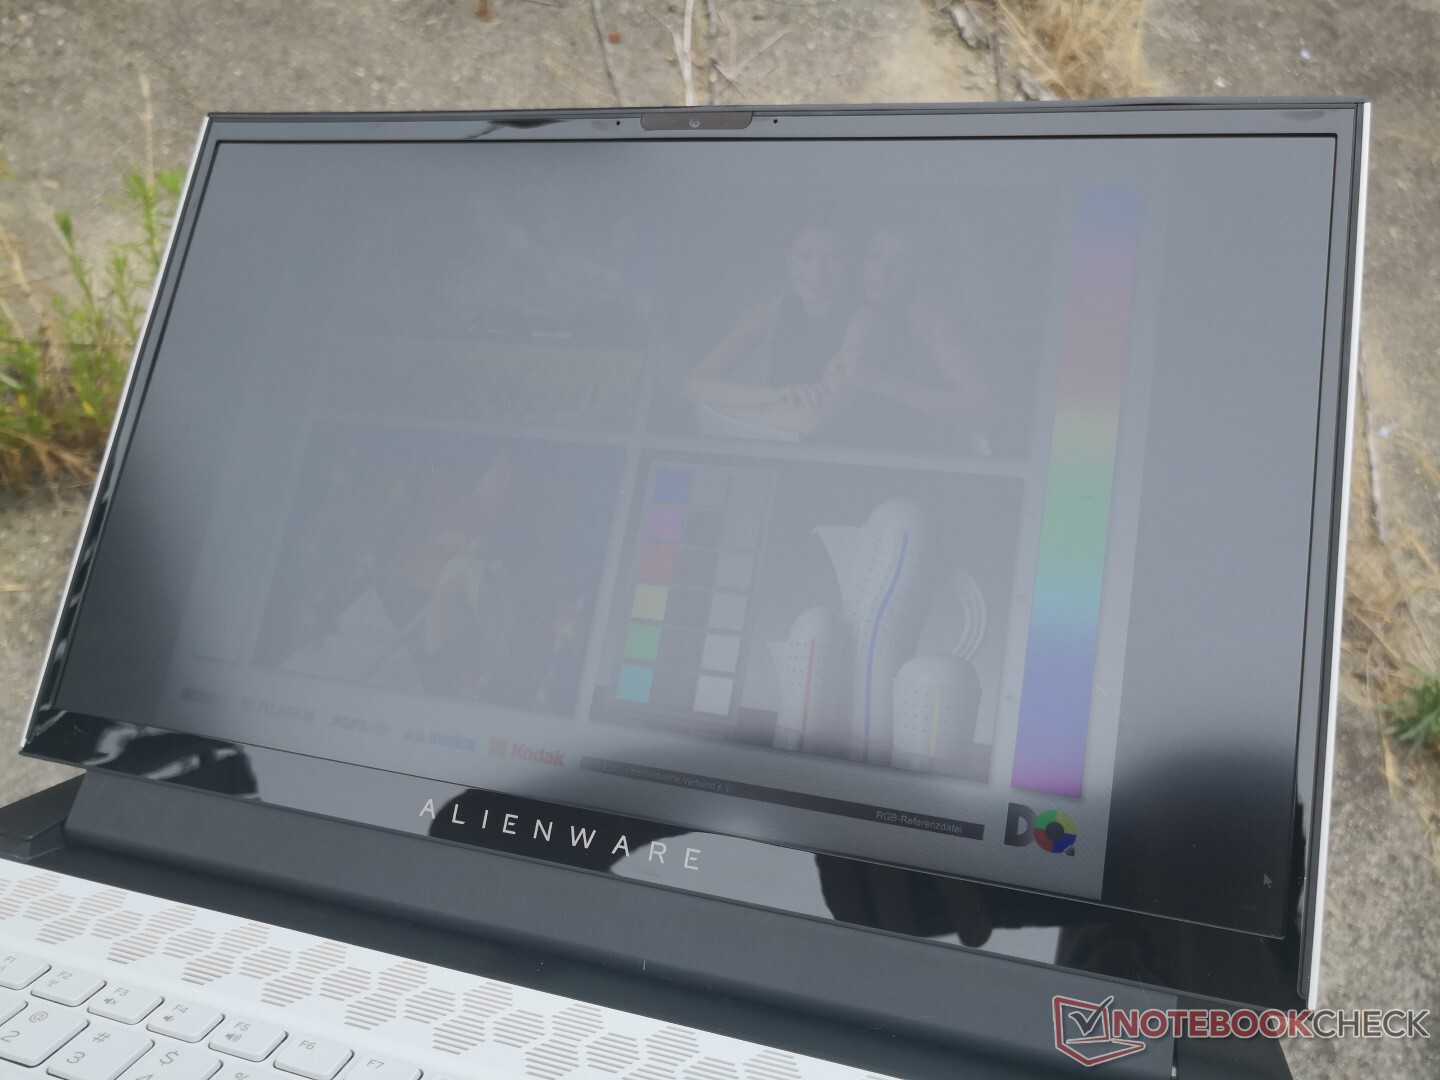
Con 300 nits, il display è circa la media della sua categoria. L'opzione OLED offrirà una migliore visibilità all'esterno in quanto è più luminoso e con un maggiore contrasto.
Prestazioni
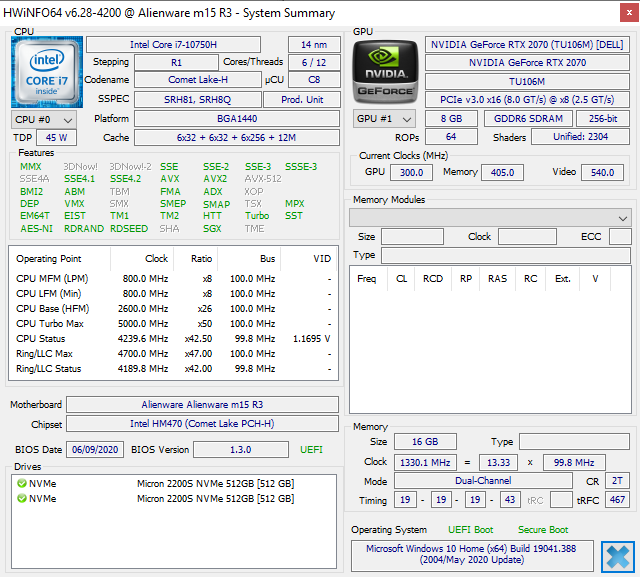
Gli utenti possono scegliere tra il Core di 10a generazione a 6-cores i7-10750H o sbloccato ilCore ad 8-cores i9-10980HK senza una terza opzione. Un Core i7-10875H o anche Ryzen 7 4800H sarebbe stato bello da vedere.
Le opzioni grafiche vanno dalla Radeon RX 5500M a scendere fino alle GTX 1660 Ti, RTX 2060, RTX 2060, RTX 2070, RTX 2070 Super, o RTX 2080 Super Max-Q. Ultimamente le GPU mobili Nvidia sono anda te fuori control ultimamente e quindi consigliamo di scegliere con attenzione.
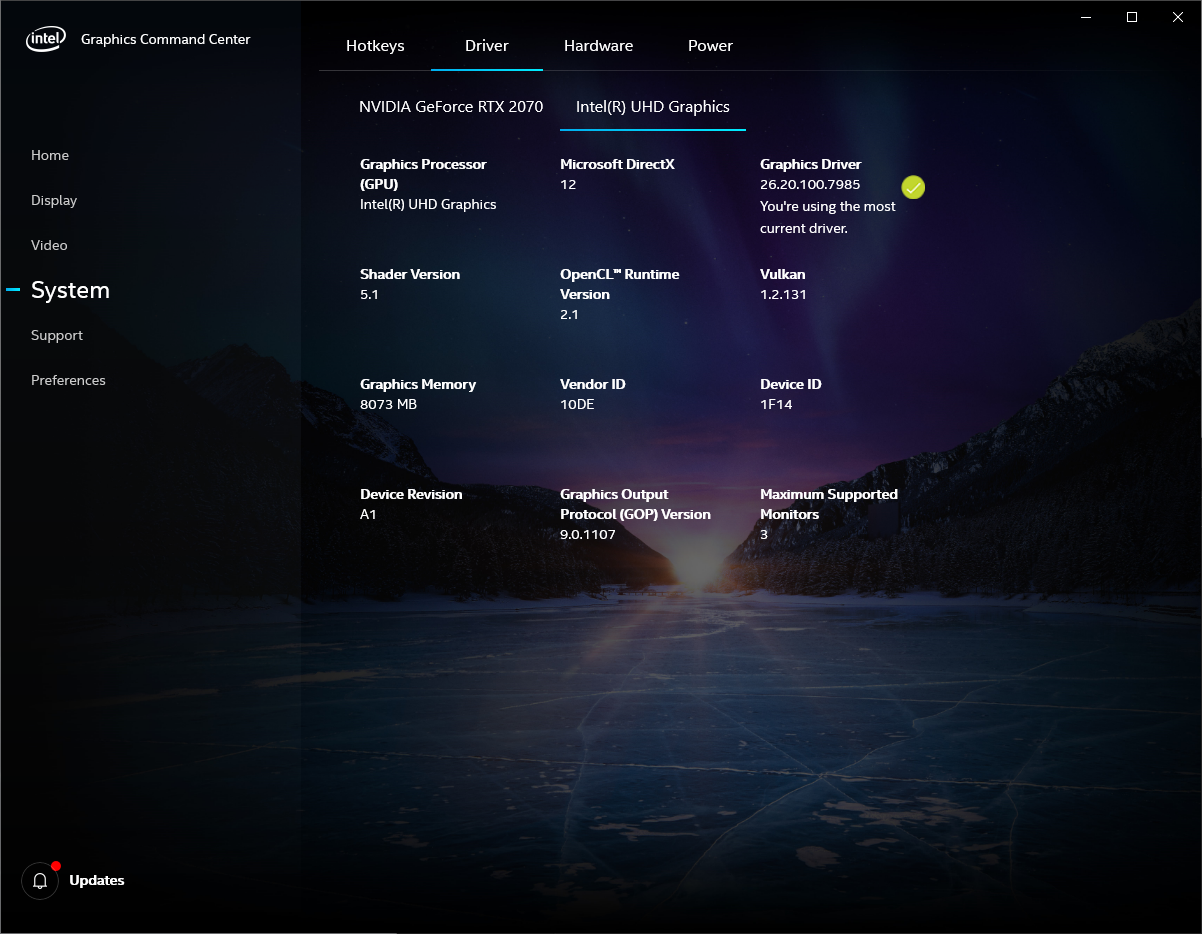
Dell dice che Nvidia Optimus non è incluso nelle SKU con il pannello a 300 Hz come quello che abbiamo qui perché l'UHD Graphics 630 integrato avrebbe problemi a far funzionare il display a 300 Hz. Tuttavia, Optimus *è* disponibile sulle SKU OLED e 144 Hz che dovrebbero portare ad una maggiore durata della batteria in queste configurazioni.
G-Sync non è supportato sul display interno a 300 Hz nonostante la mancanza di Optimus sulla nostra unità di prova. Fortunatamente, la funzione è ancora disponibile quando è collegata a monitor esterni.
Tutti i benchmarks sotto riportati sono stati eseguiti in modalità Turbo per ottenere i migliori punteggi possibili.
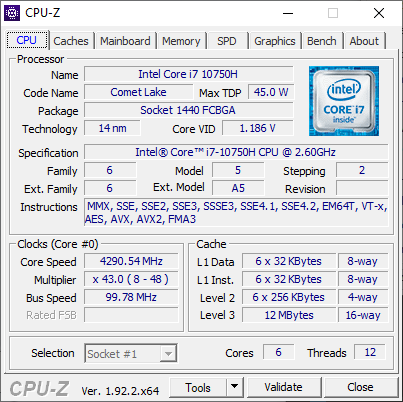
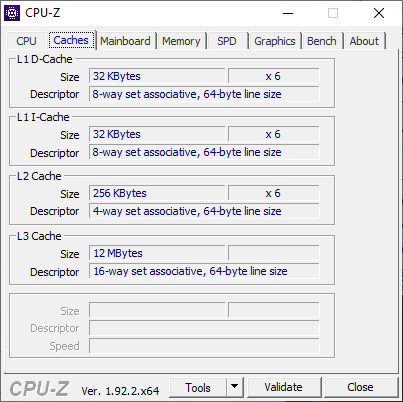
Processore
Le prestazioni della CPU sono eccellenti soprattutto per quanto riguarda la sostenibilità. Quando si esegue CineBench R15 xT in loop, i risultati sono costanti nel tempo senza i soliti cali nel tempo che normalmente vediamo sulla maggior parte degli altri portatili, come mostrato dal grafico sottostante.
L'aggiornamento al Core i9-10980HK dovrebbe portare circa il 30% di prestazioni multi-threaded più veloci. Peccato che Dell non offra il Core i7-10875HH come avrebbe funzionato in modo simile al Core i9-10980HK ma ad un prezzo più economico.
Consultate la nostra pagina dedicata al Core i7-10750H per maggiori informazioni tecniche e confronti di benchmarks.
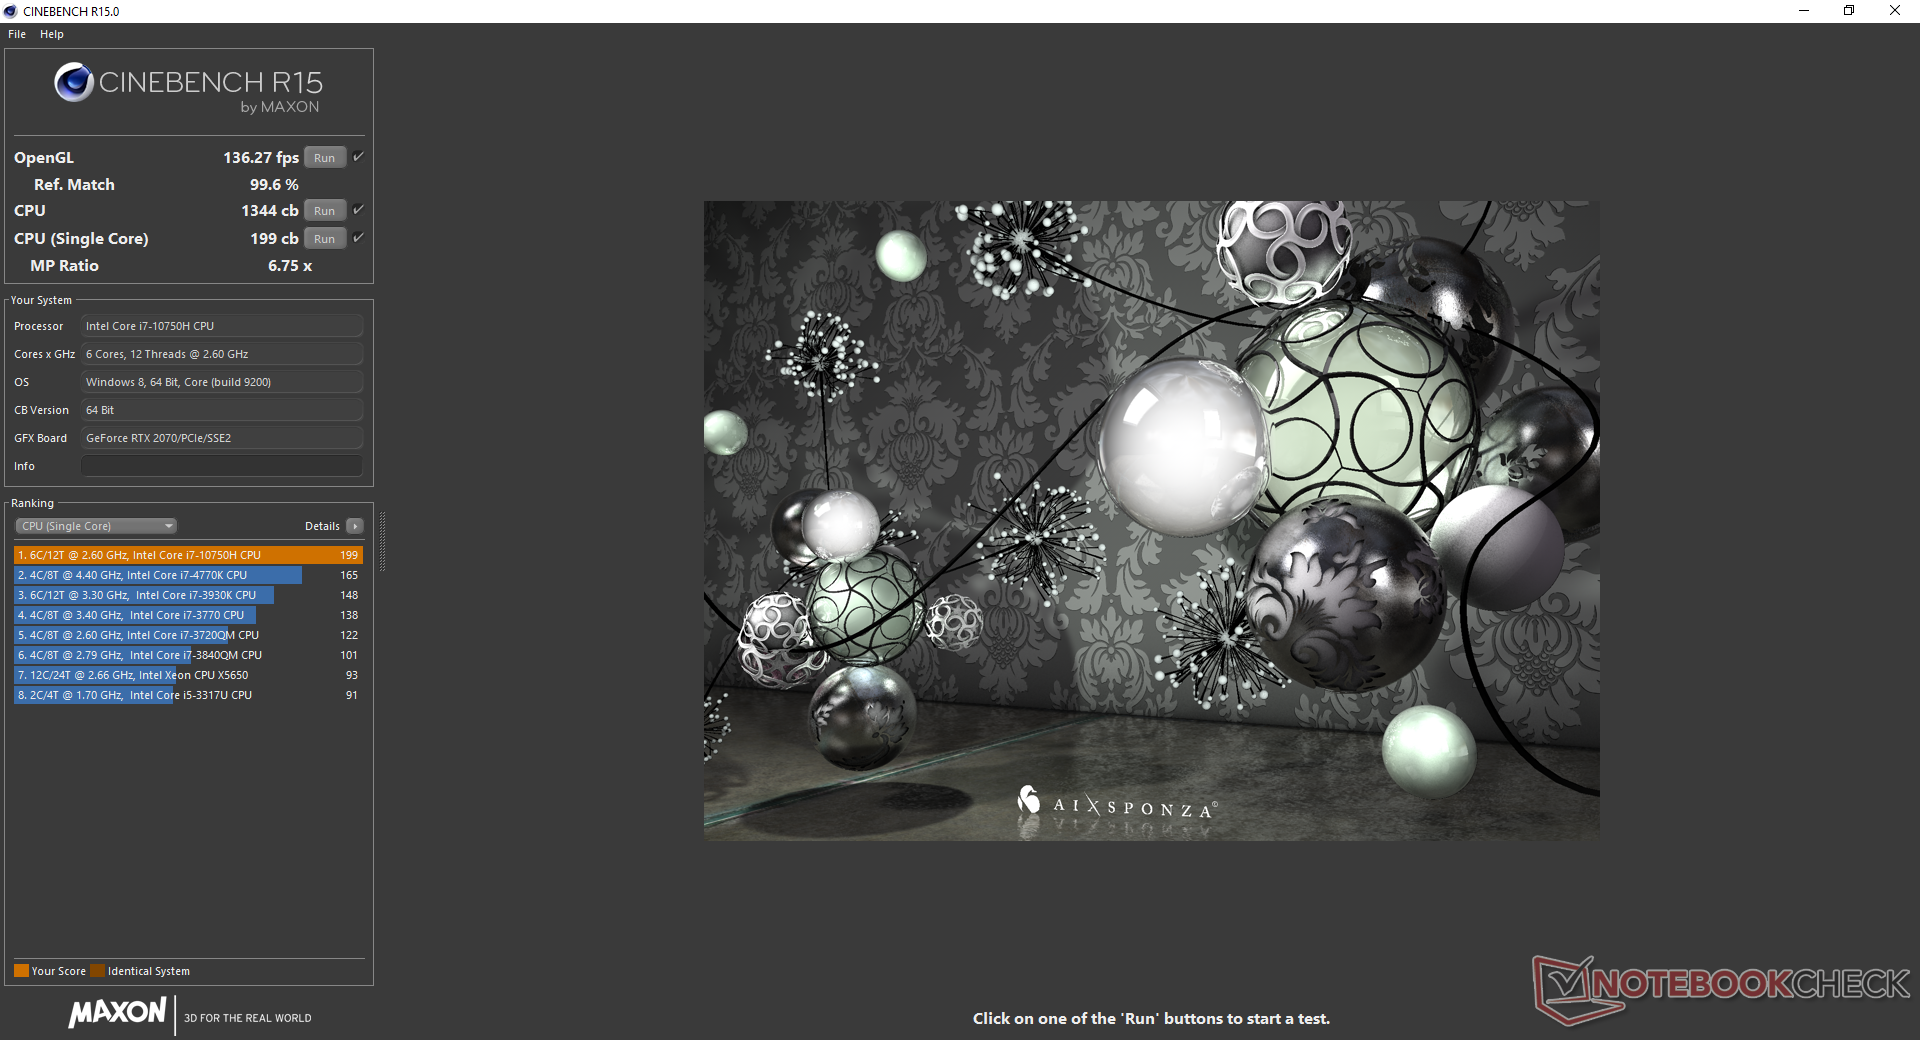
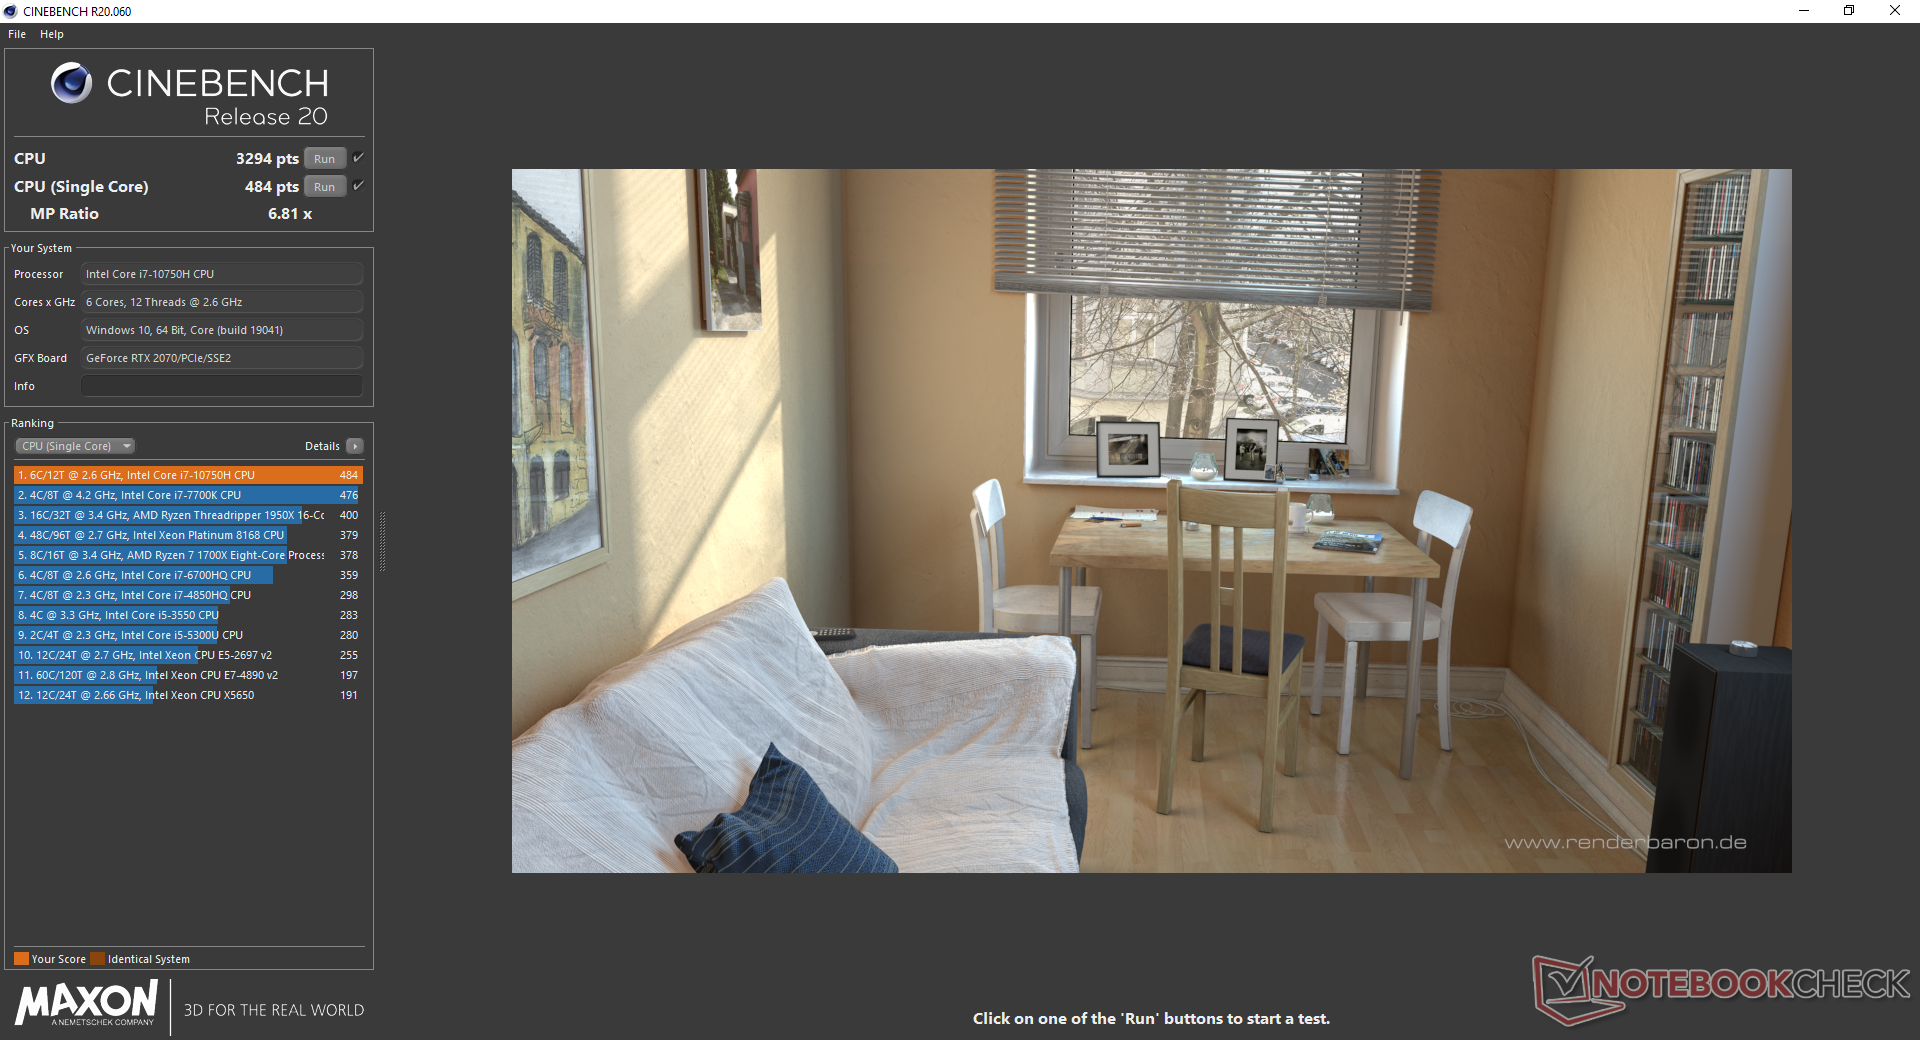
Cinebench R15: CPU Multi 64Bit | CPU Single 64Bit
Blender: v2.79 BMW27 CPU
7-Zip 18.03: 7z b 4 -mmt1 | 7z b 4
Geekbench 5.5: Single-Core | Multi-Core
HWBOT x265 Benchmark v2.2: 4k Preset
LibreOffice : 20 Documents To PDF
R Benchmark 2.5: Overall mean
| Cinebench R20 / CPU (Single Core) | |
| Intel Core i9-10900K | |
| Gigabyte Aero 15 OLED XB-8DE51B0SP | |
| Asus ROG Strix Scar 15 G532LWS | |
| Dell G5 15 SE 5505 P89F | |
| Alienware m15 R3 P87F | |
| MSI GE65 Raider 9SF-049US | |
| Media Intel Core i7-10750H (431 - 504, n=43) | |
| Maingear Vector 15 | |
| Acer Nitro 5 AN515-44-R5FT | |
| MSI GE63 Raider 8SG | |
| Asus Zephyrus GX501 | |
| Blender / v2.79 BMW27 CPU | |
| Media Intel Core i7-10750H (322 - 587, n=43) | |
| Acer Nitro 5 AN515-44-R5FT | |
| Alienware m15 R3 P87F | |
| Gigabyte Aero 15 OLED XB-8DE51B0SP | |
| Asus ROG Strix Scar 15 G532LWS | |
| Dell G5 15 SE 5505 P89F | |
| Intel Core i9-10900K | |
| 7-Zip 18.03 / 7z b 4 -mmt1 | |
| Intel Core i9-10900K | |
| Asus ROG Strix Scar 15 G532LWS | |
| Gigabyte Aero 15 OLED XB-8DE51B0SP | |
| Media Intel Core i7-10750H (4504 - 5470, n=43) | |
| Dell G5 15 SE 5505 P89F | |
| Alienware m15 R3 P87F | |
| Acer Nitro 5 AN515-44-R5FT | |
| 7-Zip 18.03 / 7z b 4 | |
| Intel Core i9-10900K | |
| Dell G5 15 SE 5505 P89F | |
| Asus ROG Strix Scar 15 G532LWS | |
| Gigabyte Aero 15 OLED XB-8DE51B0SP | |
| Acer Nitro 5 AN515-44-R5FT | |
| Alienware m15 R3 P87F | |
| Media Intel Core i7-10750H (26040 - 37345, n=43) | |
| Geekbench 5.5 / Single-Core | |
| Intel Core i9-10900K | |
| Asus ROG Strix Scar 15 G532LWS | |
| Gigabyte Aero 15 OLED XB-8DE51B0SP | |
| Alienware m15 R3 P87F | |
| Media Intel Core i7-10750H (1114 - 1333, n=43) | |
| Dell G5 15 SE 5505 P89F | |
| Acer Nitro 5 AN515-44-R5FT | |
| Geekbench 5.5 / Multi-Core | |
| Intel Core i9-10900K | |
| Asus ROG Strix Scar 15 G532LWS | |
| Gigabyte Aero 15 OLED XB-8DE51B0SP | |
| Dell G5 15 SE 5505 P89F | |
| Alienware m15 R3 P87F | |
| Media Intel Core i7-10750H (4443 - 6674, n=43) | |
| Acer Nitro 5 AN515-44-R5FT | |
| HWBOT x265 Benchmark v2.2 / 4k Preset | |
| Intel Core i9-10900K | |
| Gigabyte Aero 15 OLED XB-8DE51B0SP | |
| Asus ROG Strix Scar 15 G532LWS | |
| Dell G5 15 SE 5505 P89F | |
| Alienware m15 R3 P87F | |
| Media Intel Core i7-10750H (5.54 - 11.6, n=43) | |
| Acer Nitro 5 AN515-44-R5FT | |
| LibreOffice / 20 Documents To PDF | |
| Intel Core i9-10900K | |
| Dell G5 15 SE 5505 P89F | |
| Acer Nitro 5 AN515-44-R5FT | |
| Alienware m15 R3 P87F | |
| Media Intel Core i7-10750H (43.1 - 99.2, n=43) | |
| Gigabyte Aero 15 OLED XB-8DE51B0SP | |
| Asus ROG Strix Scar 15 G532LWS | |
| R Benchmark 2.5 / Overall mean | |
| Alienware m15 R3 P87F | |
| Acer Nitro 5 AN515-44-R5FT | |
| Media Intel Core i7-10750H (0.578 - 0.708, n=42) | |
| Dell G5 15 SE 5505 P89F | |
| Asus ROG Strix Scar 15 G532LWS | |
| Gigabyte Aero 15 OLED XB-8DE51B0SP | |
| Intel Core i9-10900K | |
* ... Meglio usare valori piccoli
Prestazioni di sistema
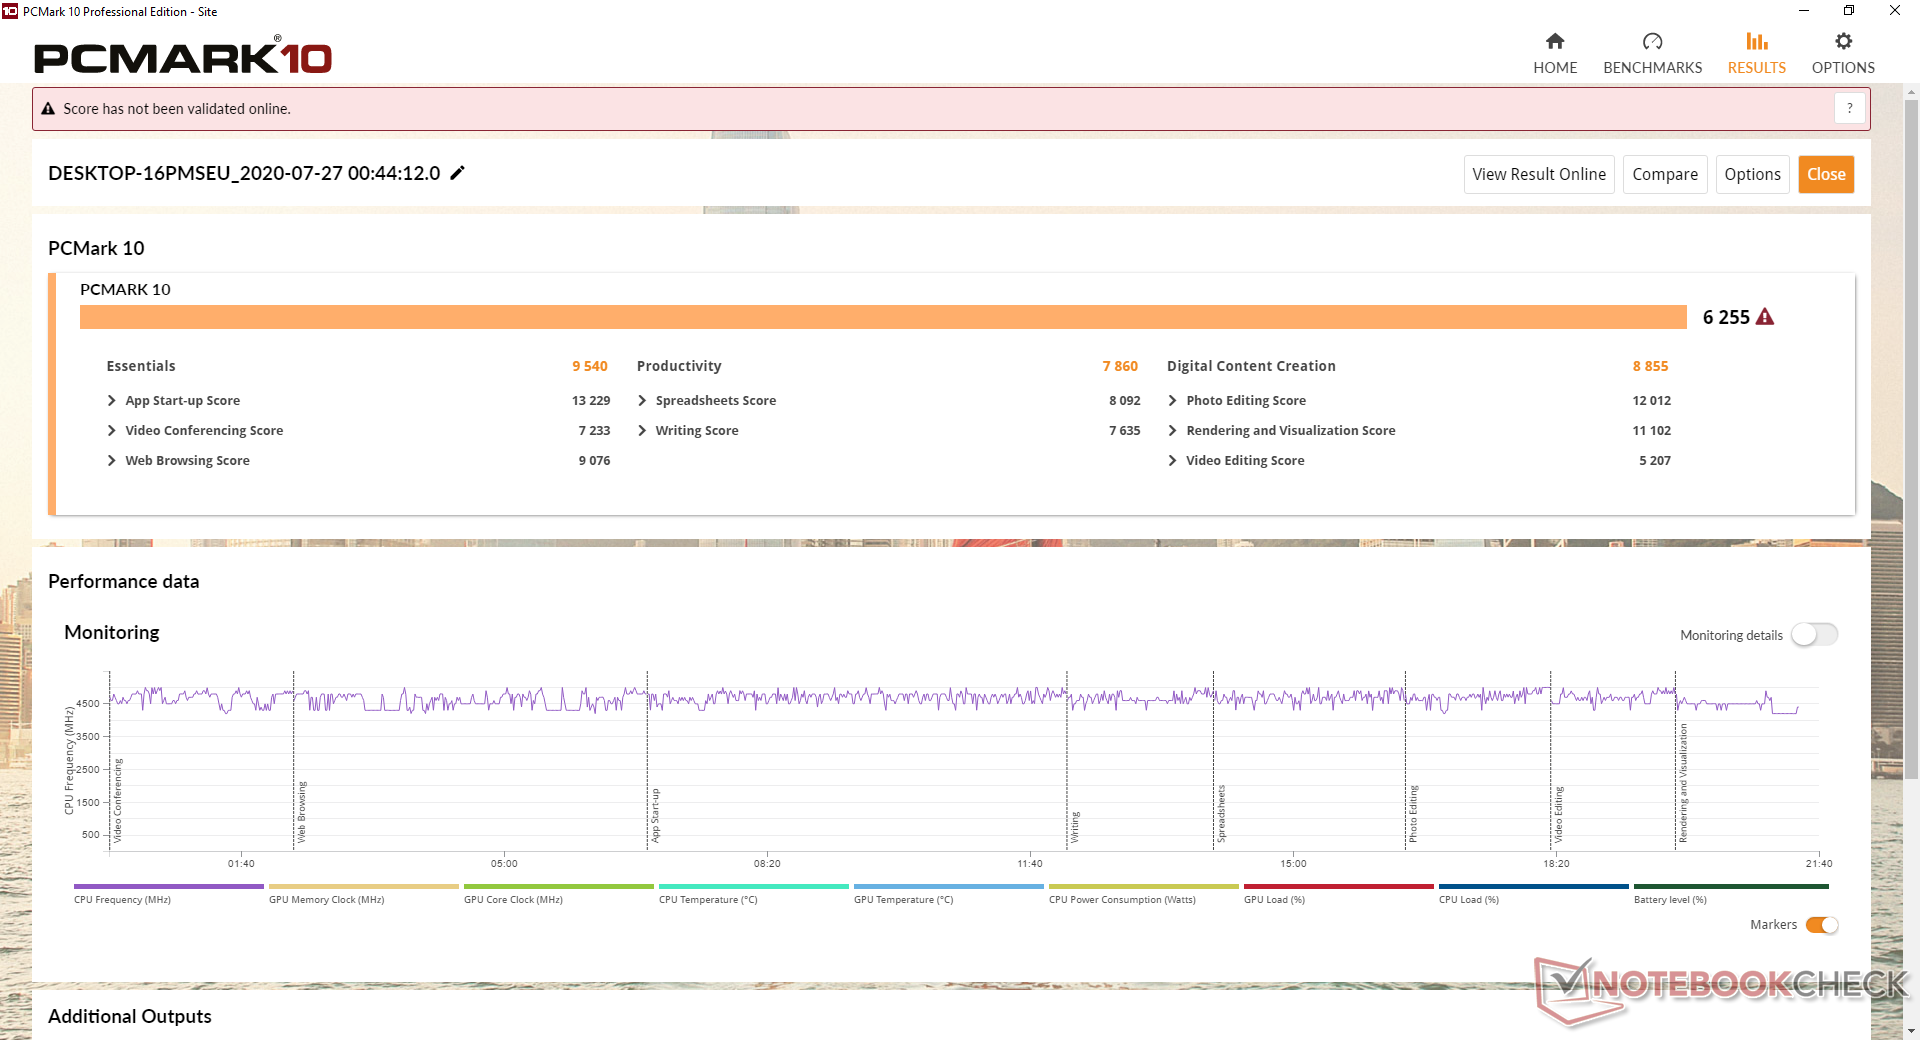
I risultati di PCMark rispecchiano le attese per la categoria dei dispositivi gaming di fascia alta. Raccomandiamo vivamente agli utenti di familiarizzare con il software preinstallato Alienware Command Center, in quanto controlla direttamente le prestazioni e il comportamento delle ventole del portatile più dei profili di alimentazione di default di Windows.
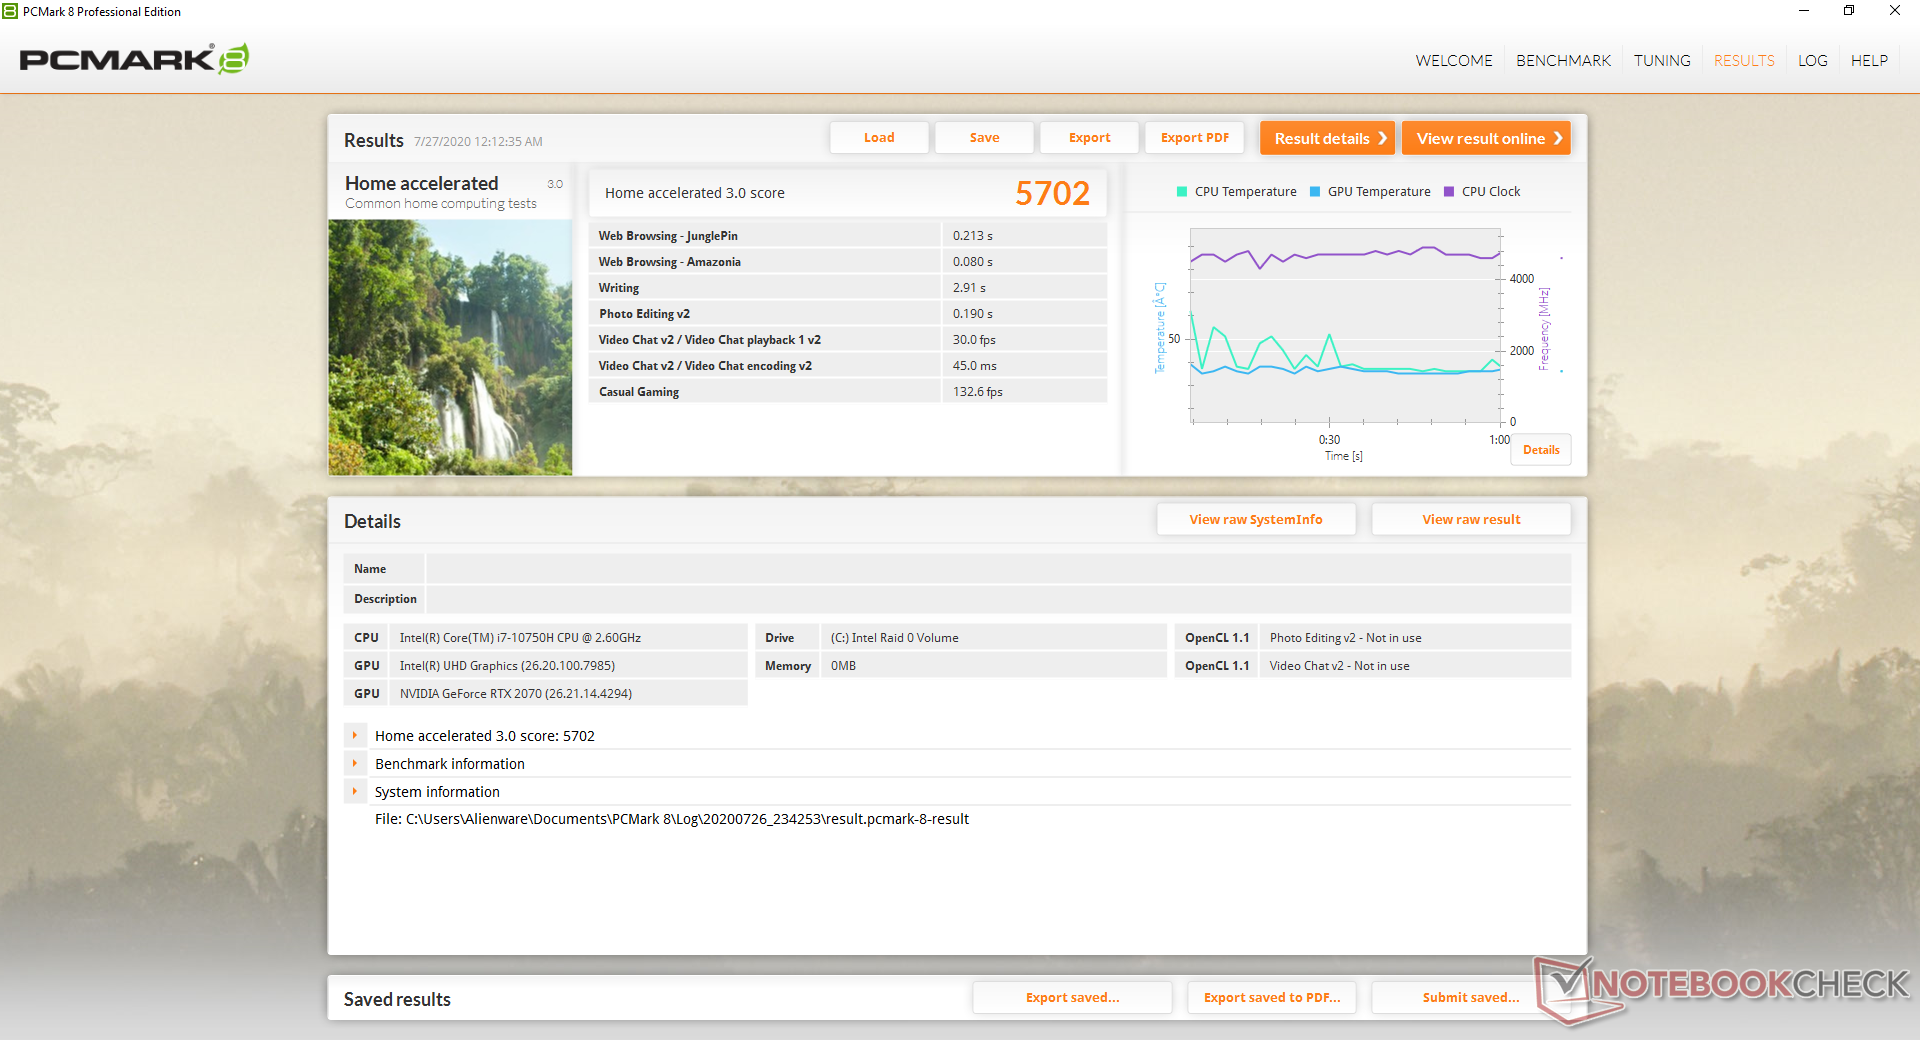
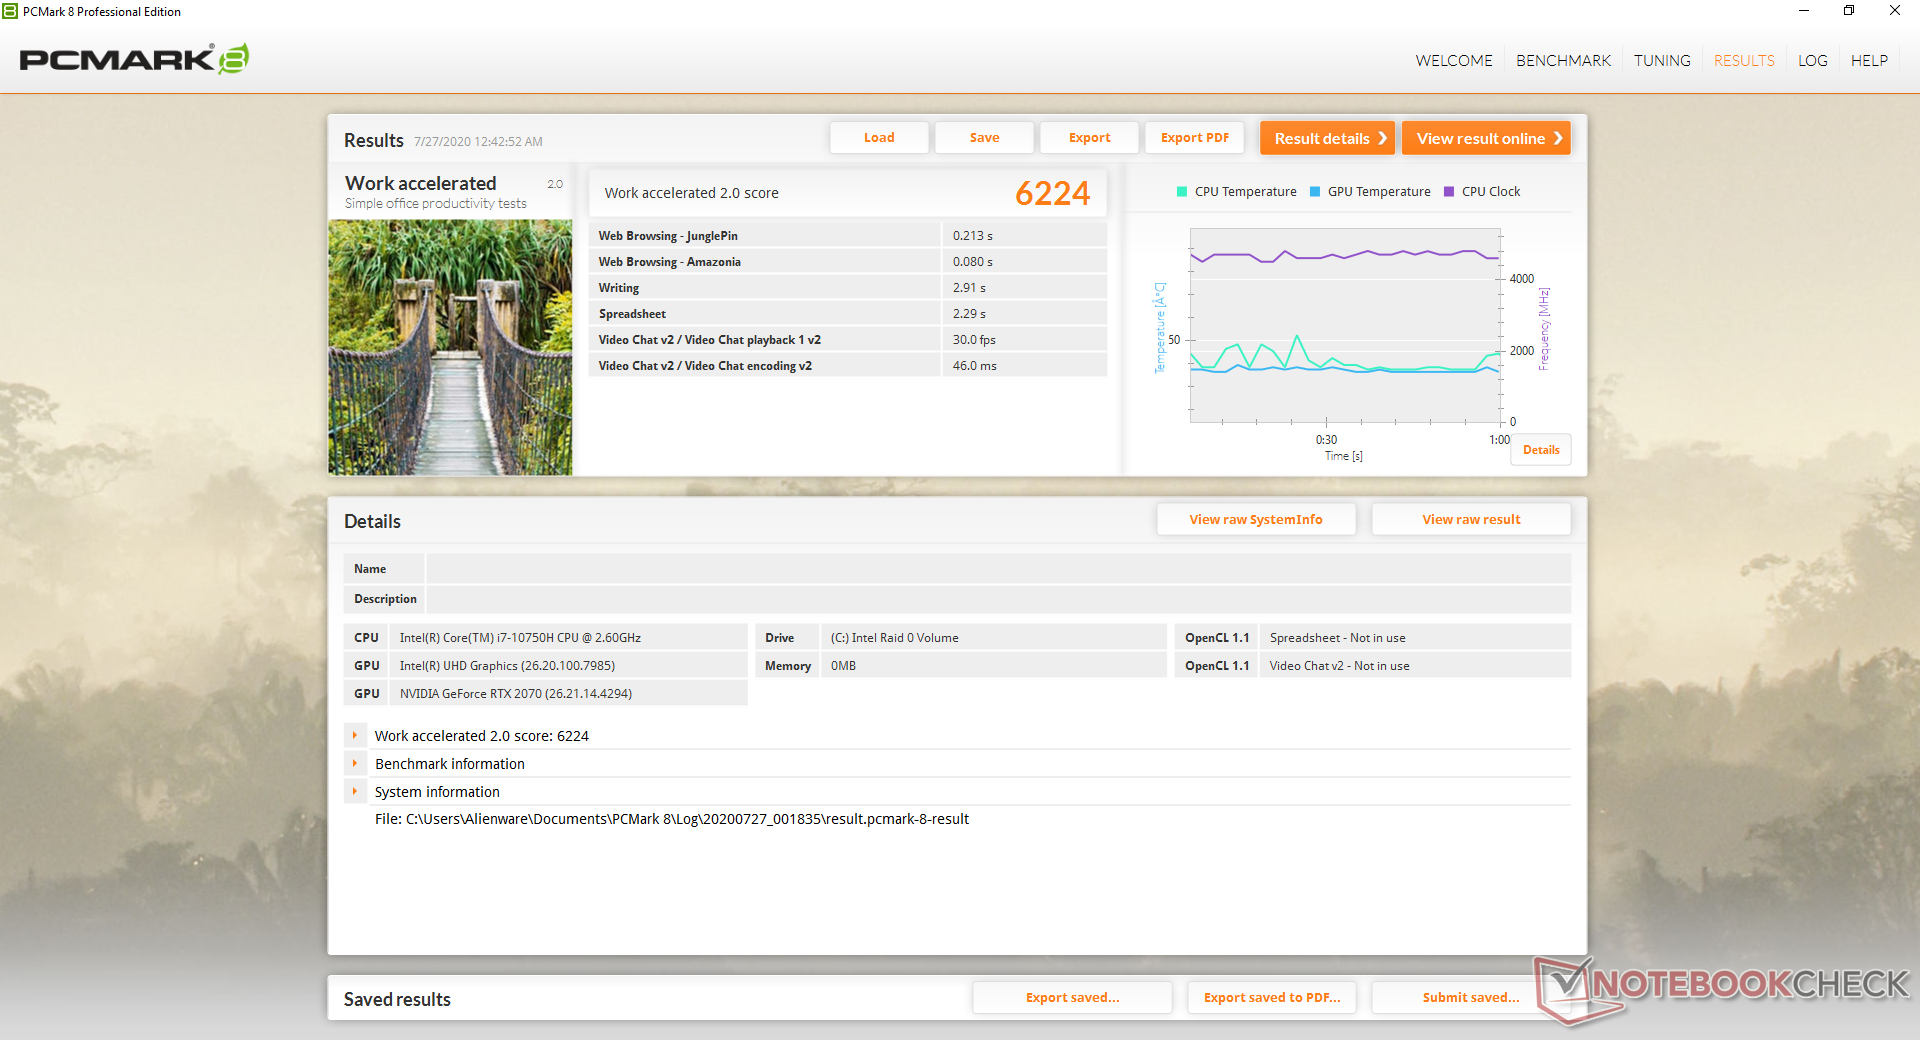
| PCMark 8 Home Score Accelerated v2 | 5702 punti | |
| PCMark 8 Work Score Accelerated v2 | 6224 punti | |
| PCMark 10 Score | 6255 punti | |
Aiuto | ||
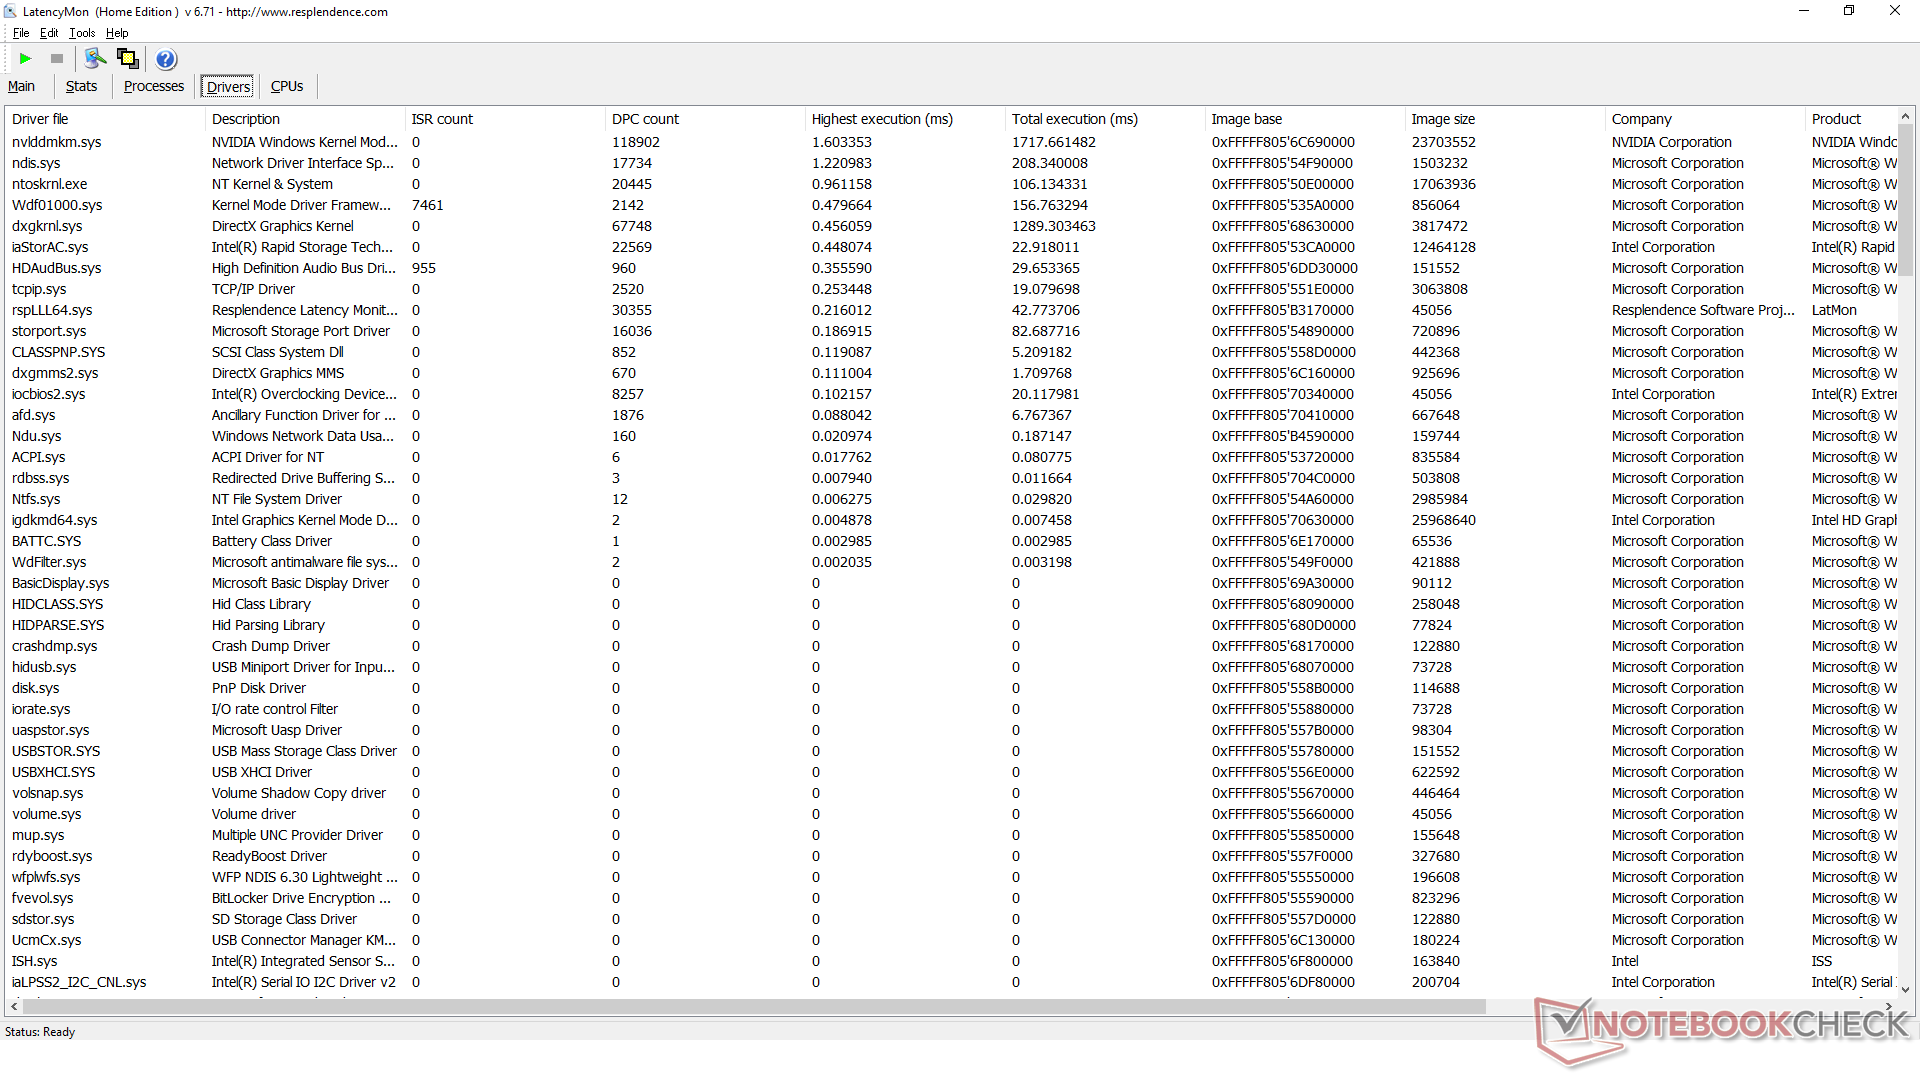
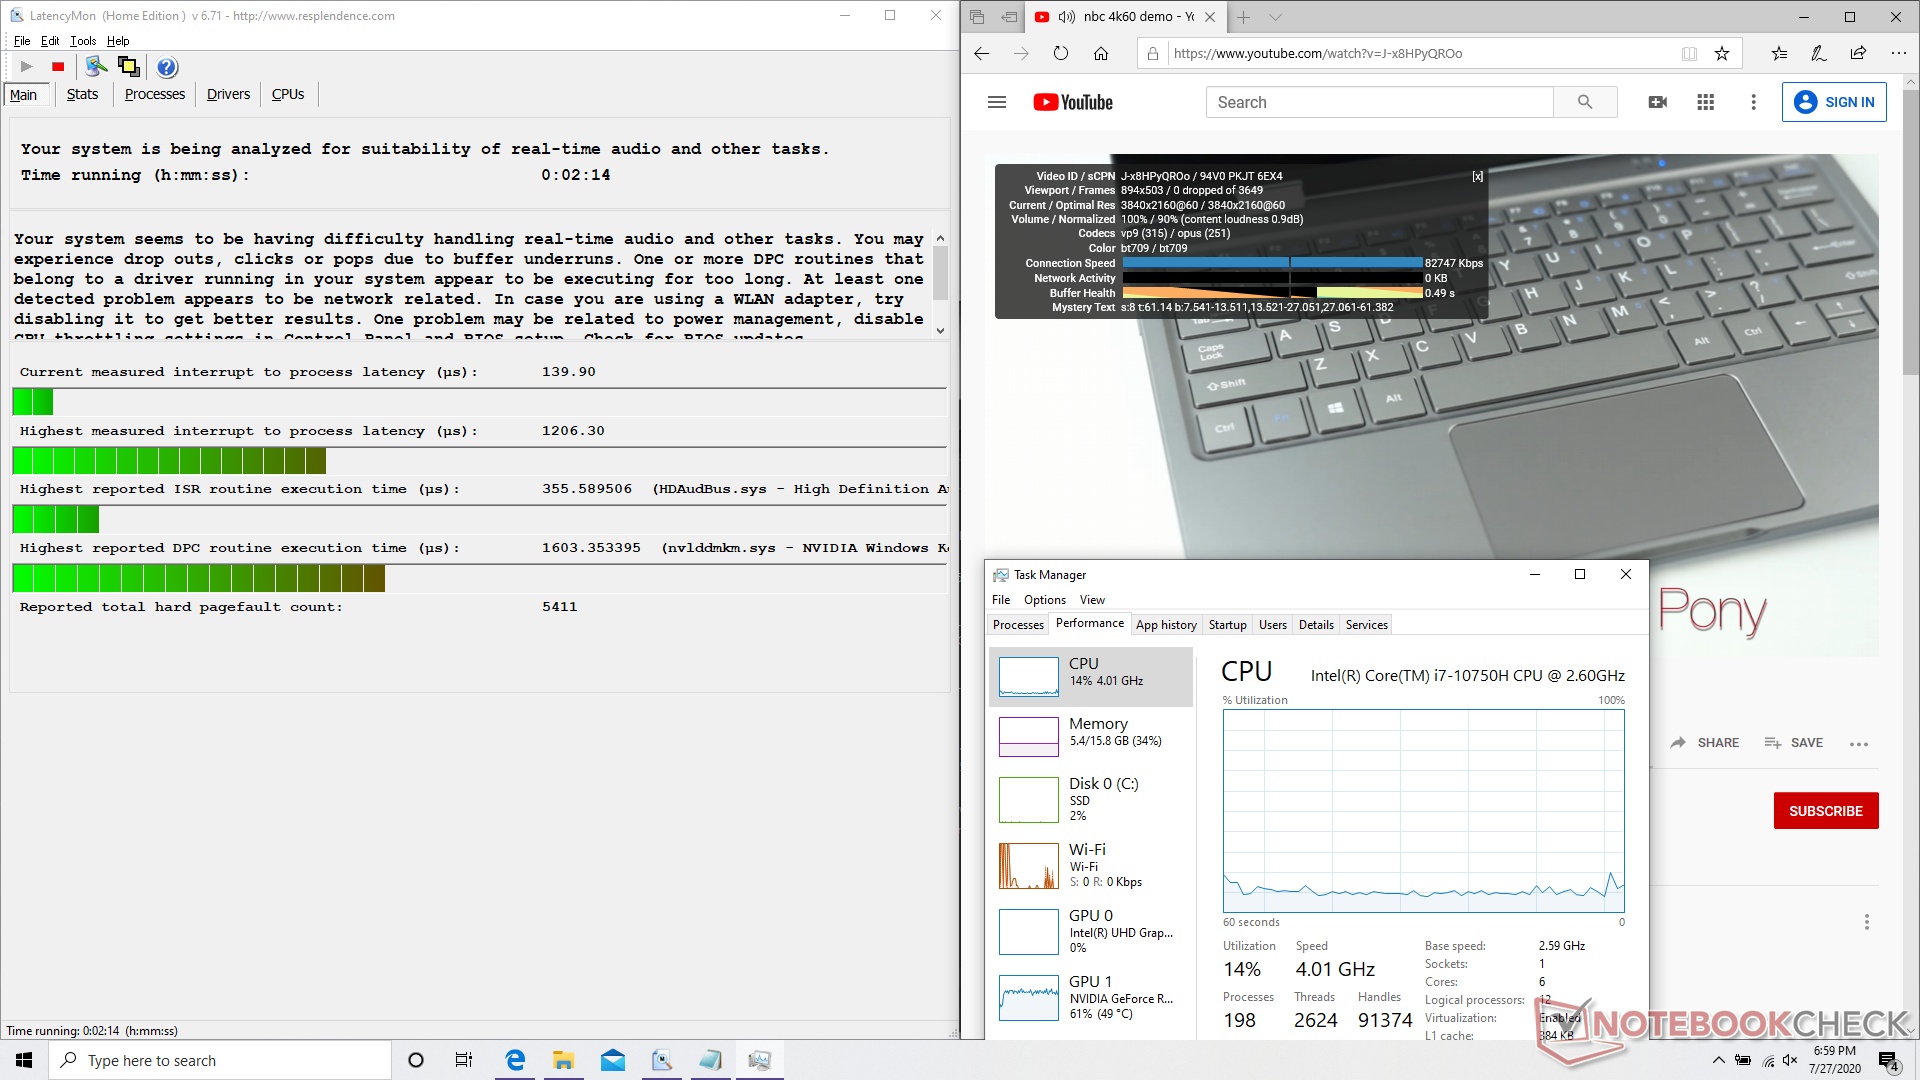
Latenza DPC
LatencyMon mostra i problemi di latenza del DPC quando si aprono più schede sulla nostra homepage. La riproduzione di video 4K UHD su YouTube è per il resto fluida e senza fotogrammi caduti, a differenza di quanto abbiamo notato sul recente Asus ROG G532.
| DPC Latencies / LatencyMon - interrupt to process latency (max), Web, Youtube, Prime95 | |
| Dell G5 15 SE 5505 P89F | |
| MSI GS66 Stealth 10SFS | |
| Gigabyte Aero 15 OLED XB-8DE51B0SP | |
| Asus ROG Strix Scar 15 G532LWS | |
| Alienware m15 R3 P87F | |
| MSI GS66 Stealth 10SE-045 | |
| Acer Nitro 5 AN515-44-R5FT | |
| Razer Blade 15 RZ09-0328 | |
| Eluktronics RP-15 | |
| MSI GS75 10SF-609US | |
* ... Meglio usare valori piccoli
Dispositivi di archiviazione
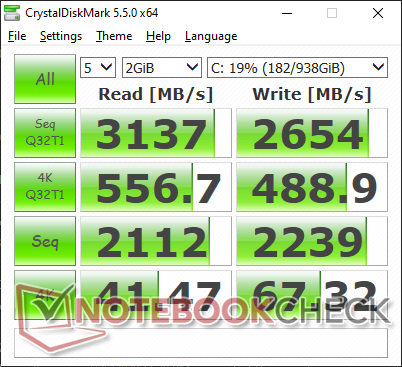
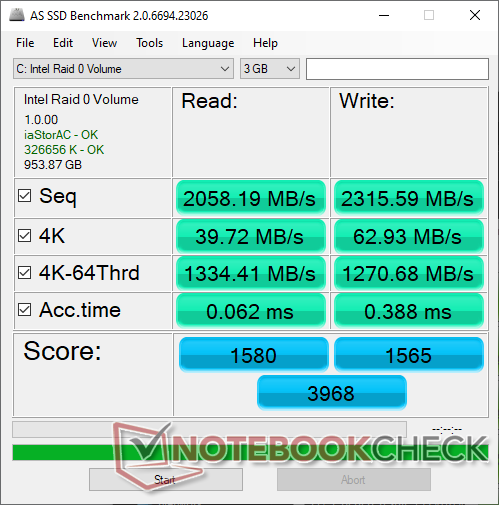
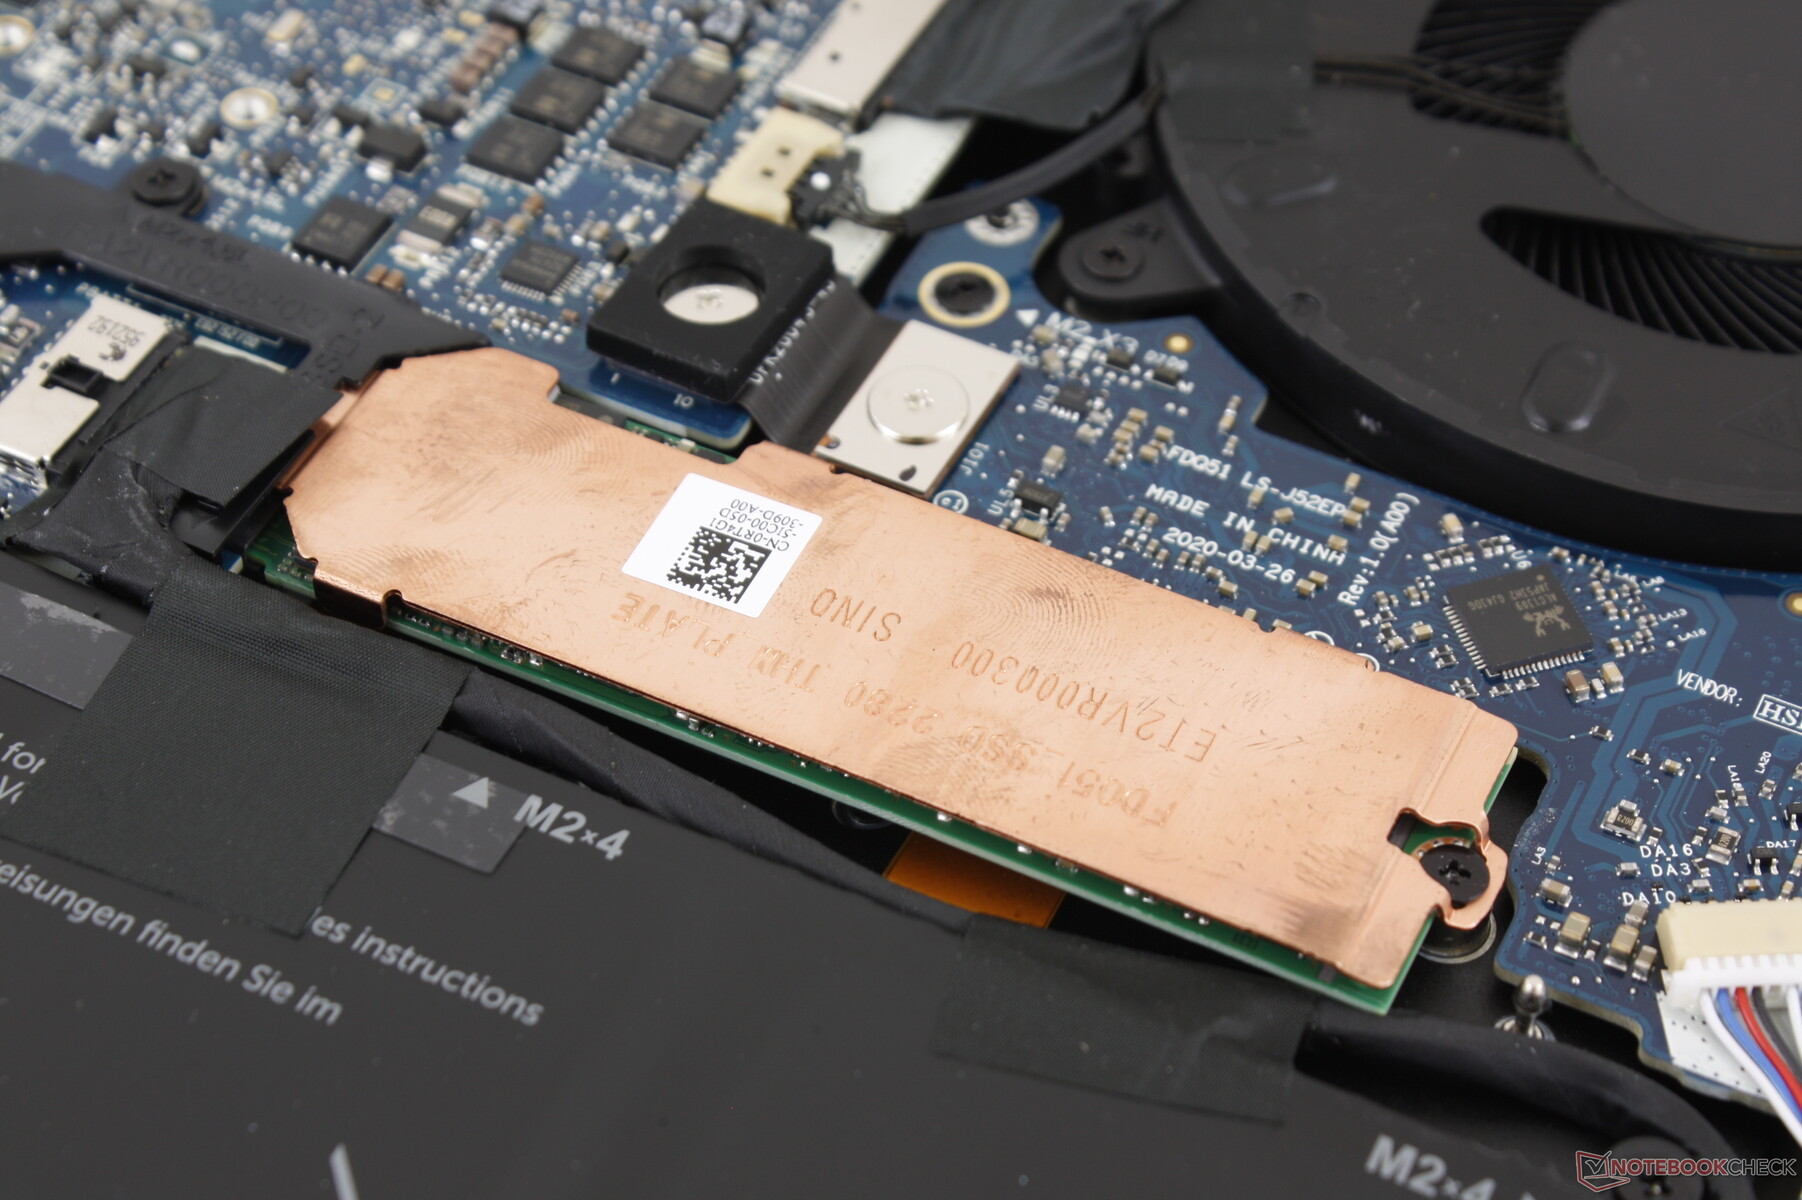
Ci sono tre slots di memoria M.2 rispetto ai due del modello dell'anno scorso, ma il terzo accetta solo unità più corte da 2230 o 2242. La nostra unità viene fornita configurata con due SSD Micron 2200S NVMe da 512 GB in configurazione RAID 0. Le prestazioni sono vicine ad un singolo SSD Lite-On CA5-8D512 da 512 GB come si trova sul Razer Blade 15. E' possibile che altre SKU e capacità provengano da diversi produttori di unità e non solo da Micron.
| Alienware m15 R3 P87F 2x Micron 2200S 512 GB (RAID 0) | Alienware m15 P79F Toshiba XG5 KXG50ZNV512G | Razer Blade 15 RZ09-0328 Lite-On CA5-8D512 | Asus Zephyrus S GX502GW 2x Intel SSD 660p SSDPEKNW512G8 (RAID 0) | MSI GS66 Stealth 10SFS Samsung SSD PM981 MZVLB1T0HALR | |
|---|---|---|---|---|---|
| AS SSD | -9% | 4% | 2% | 25% | |
| Seq Read (MB/s) | 2058 | 1937 -6% | 2021 -2% | 2506 22% | 1065 -48% |
| Seq Write (MB/s) | 2316 | 1066 -54% | 2090 -10% | 1712 -26% | 2360 2% |
| 4K Read (MB/s) | 39.72 | 31.76 -20% | 47.71 20% | 48.32 22% | 48.09 21% |
| 4K Write (MB/s) | 62.9 | 102.6 63% | 101.1 61% | 103.6 65% | 110.7 76% |
| 4K-64 Read (MB/s) | 1334 | 1140 -15% | 856 -36% | 624 -53% | 1635 23% |
| 4K-64 Write (MB/s) | 1271 | 938 -26% | 1041 -18% | 1253 -1% | 1829 44% |
| Access Time Read * (ms) | 0.062 | 0.058 6% | 0.052 16% | 0.08 -29% | 0.071 -15% |
| Access Time Write * (ms) | 0.388 | 0.04 90% | 0.111 71% | 0.04 90% | 0.034 91% |
| Score Read (Points) | 1580 | 1366 -14% | 1105 -30% | 923 -42% | 1790 13% |
| Score Write (Points) | 1565 | 1147 -27% | 1351 -14% | 1528 -2% | 2176 39% |
| Score Total (Points) | 3968 | 3168 -20% | 3037 -23% | 2896 -27% | 4950 25% |
| Copy ISO MB/s (MB/s) | 1685 | 946 -44% | 2474 47% | ||
| Copy Program MB/s (MB/s) | 669 | 452.8 -32% | 679 1% | ||
| Copy Game MB/s (MB/s) | 1493 | 1013 -32% | 1037 -31% | ||
| CrystalDiskMark 5.2 / 6 | 5% | 13% | -6% | 9% | |
| Write 4K (MB/s) | 67.3 | 148.4 121% | 118.7 76% | 97 44% | 131.3 95% |
| Read 4K (MB/s) | 41.47 | 49.65 20% | 52.4 26% | 49.58 20% | 45.84 11% |
| Write Seq (MB/s) | 2239 | 1139 -49% | 2247 0% | 1838 -18% | 2370 6% |
| Read Seq (MB/s) | 2112 | 2353 11% | 2234 6% | 2421 15% | 1509 -29% |
| Write 4K Q32T1 (MB/s) | 488.9 | 484.7 -1% | 515 5% | 326.9 -33% | 481.5 -2% |
| Read 4K Q32T1 (MB/s) | 557 | 542 -3% | 584 5% | 372.9 -33% | 560 1% |
| Write Seq Q32T1 (MB/s) | 2654 | 1139 -57% | 2235 -16% | 1894 -29% | 2392 -10% |
| Read Seq Q32T1 (MB/s) | 3137 | 3108 -1% | 3171 1% | 2828 -10% | 3232 3% |
| Media totale (Programma / Settaggio) | -2% /
-4% | 9% /
7% | -2% /
-1% | 17% /
18% |
* ... Meglio usare valori piccoli

Throttling disco: DiskSpd Read Loop, Queue Depth 8
Prestazioni GPU
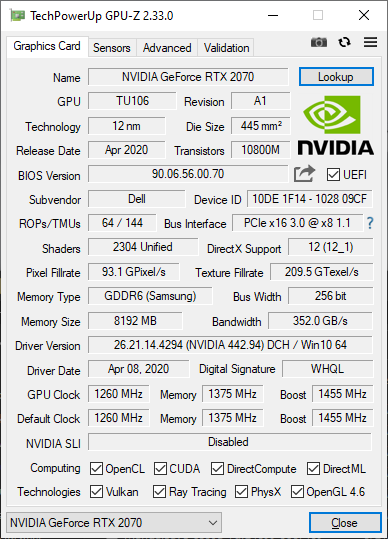
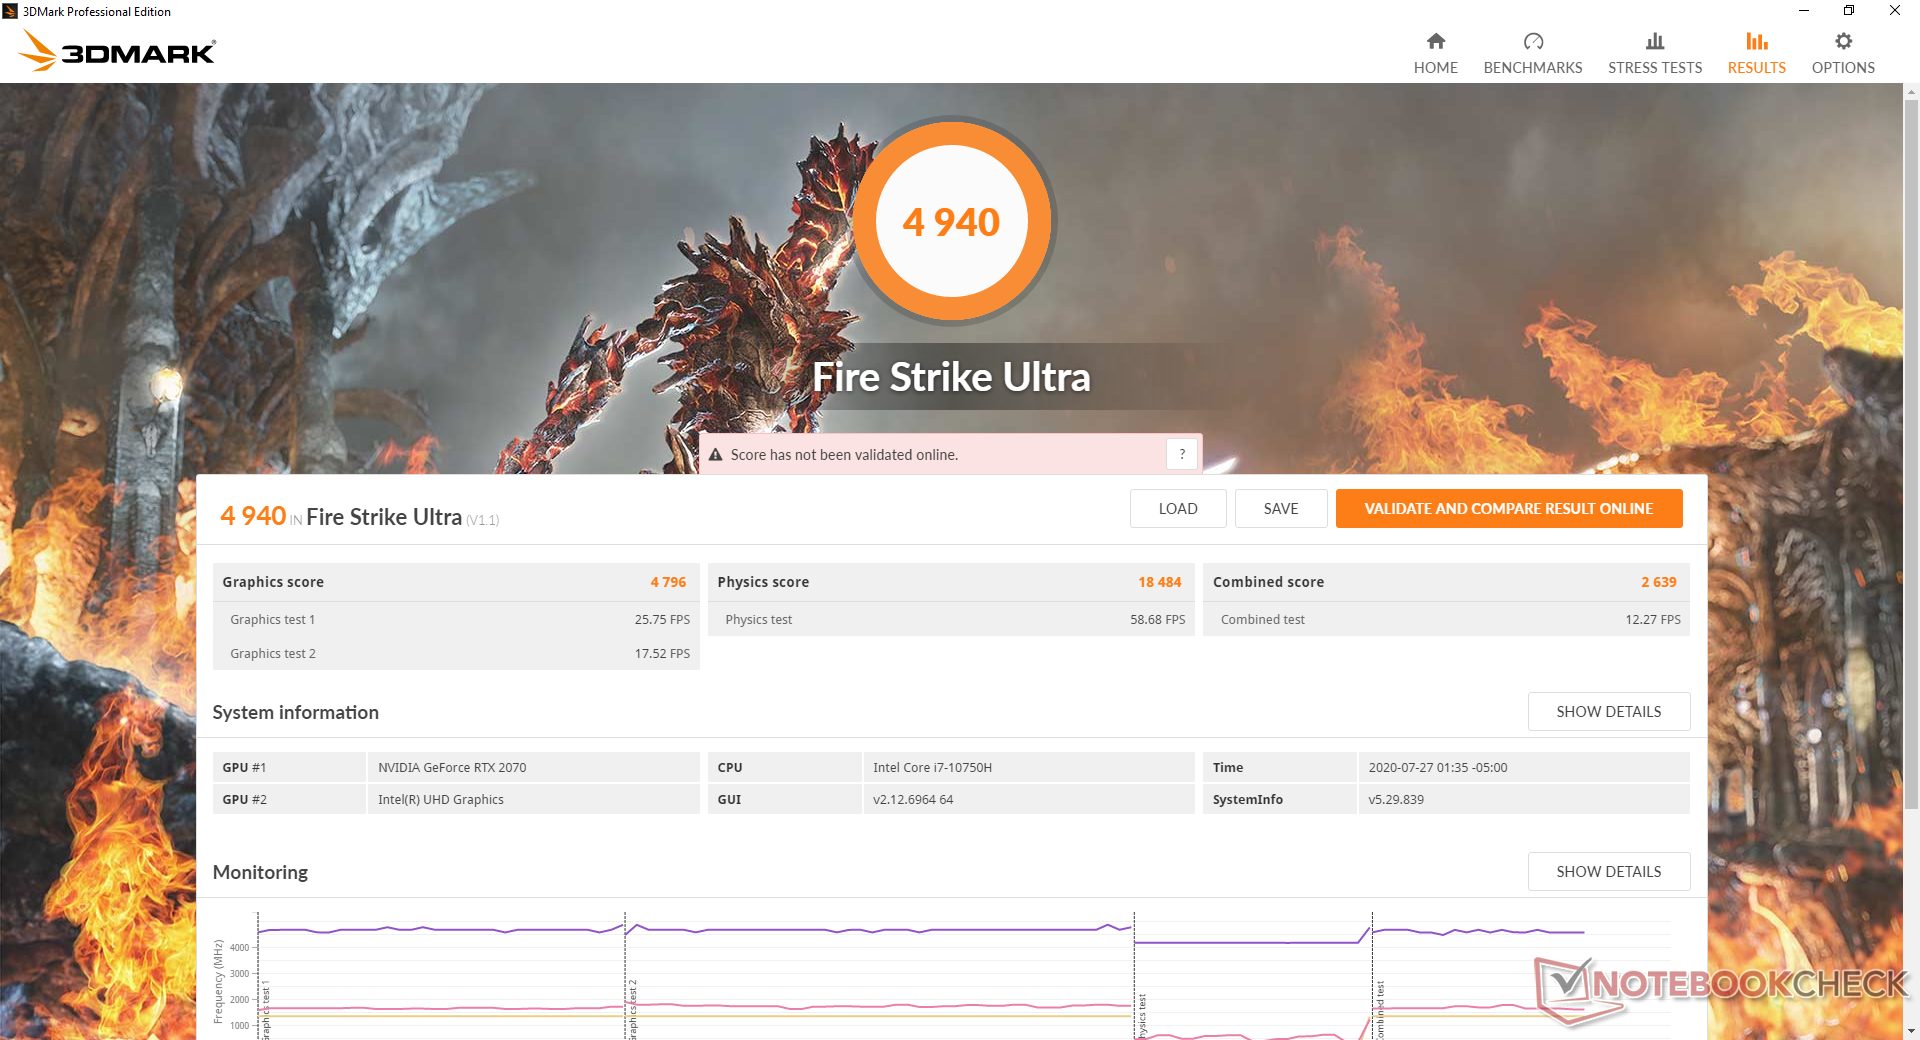
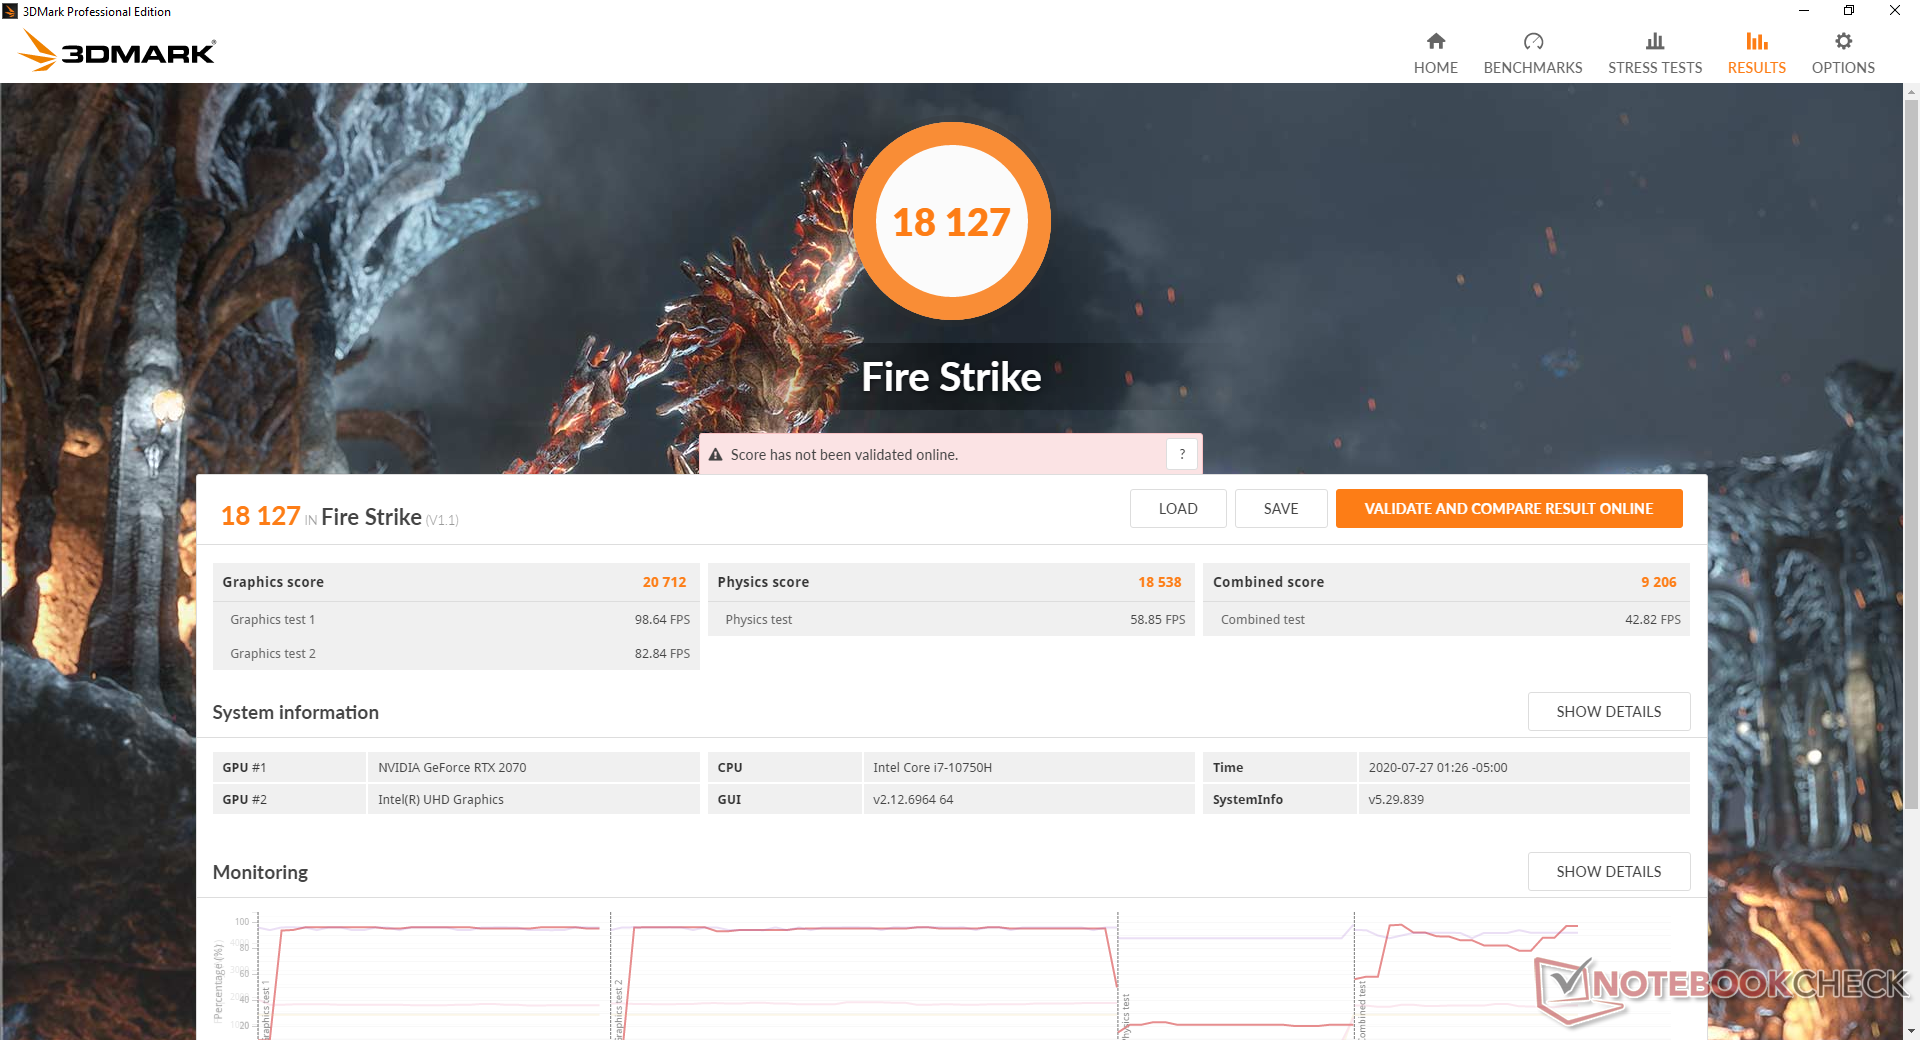
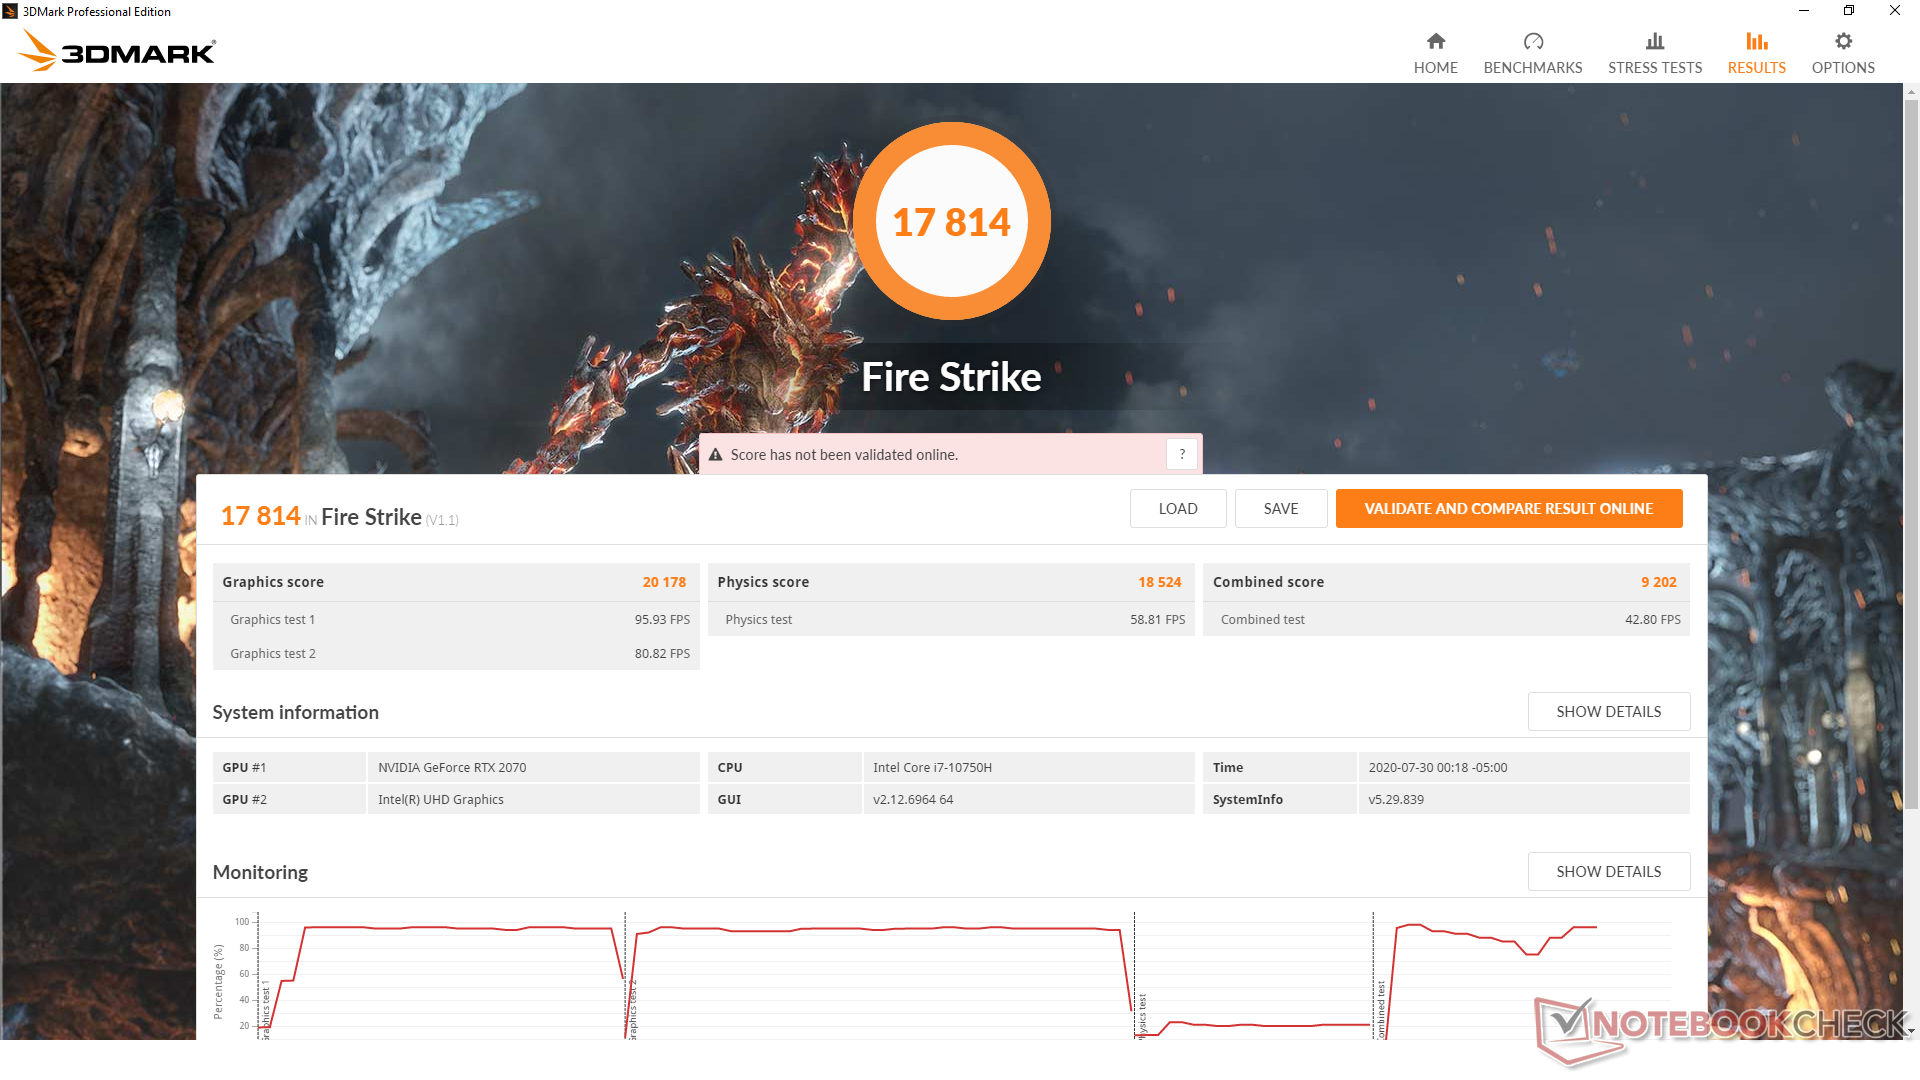
La GeForce RTX 2070 funziona secondo le attese rispetto ad altri portatili del nostro database dotati della stessa GPU. Le prestazioni grezze sono quasi il 20% superiori rispetto alla versione RTX 2070 Max-Q che si trova sulla Razer Blade 15 risultando essere allo stesso livello della RTX 2070 Super Max-Q. L'aggiornamento alla RTX 2070 Super o alla RTX 2080 Super Max-Q consentirà agli utenti di ottenere miglioramenti molto marginali di una cifra, sulla base della nostra esperienza con una gamma di laptop gaming.
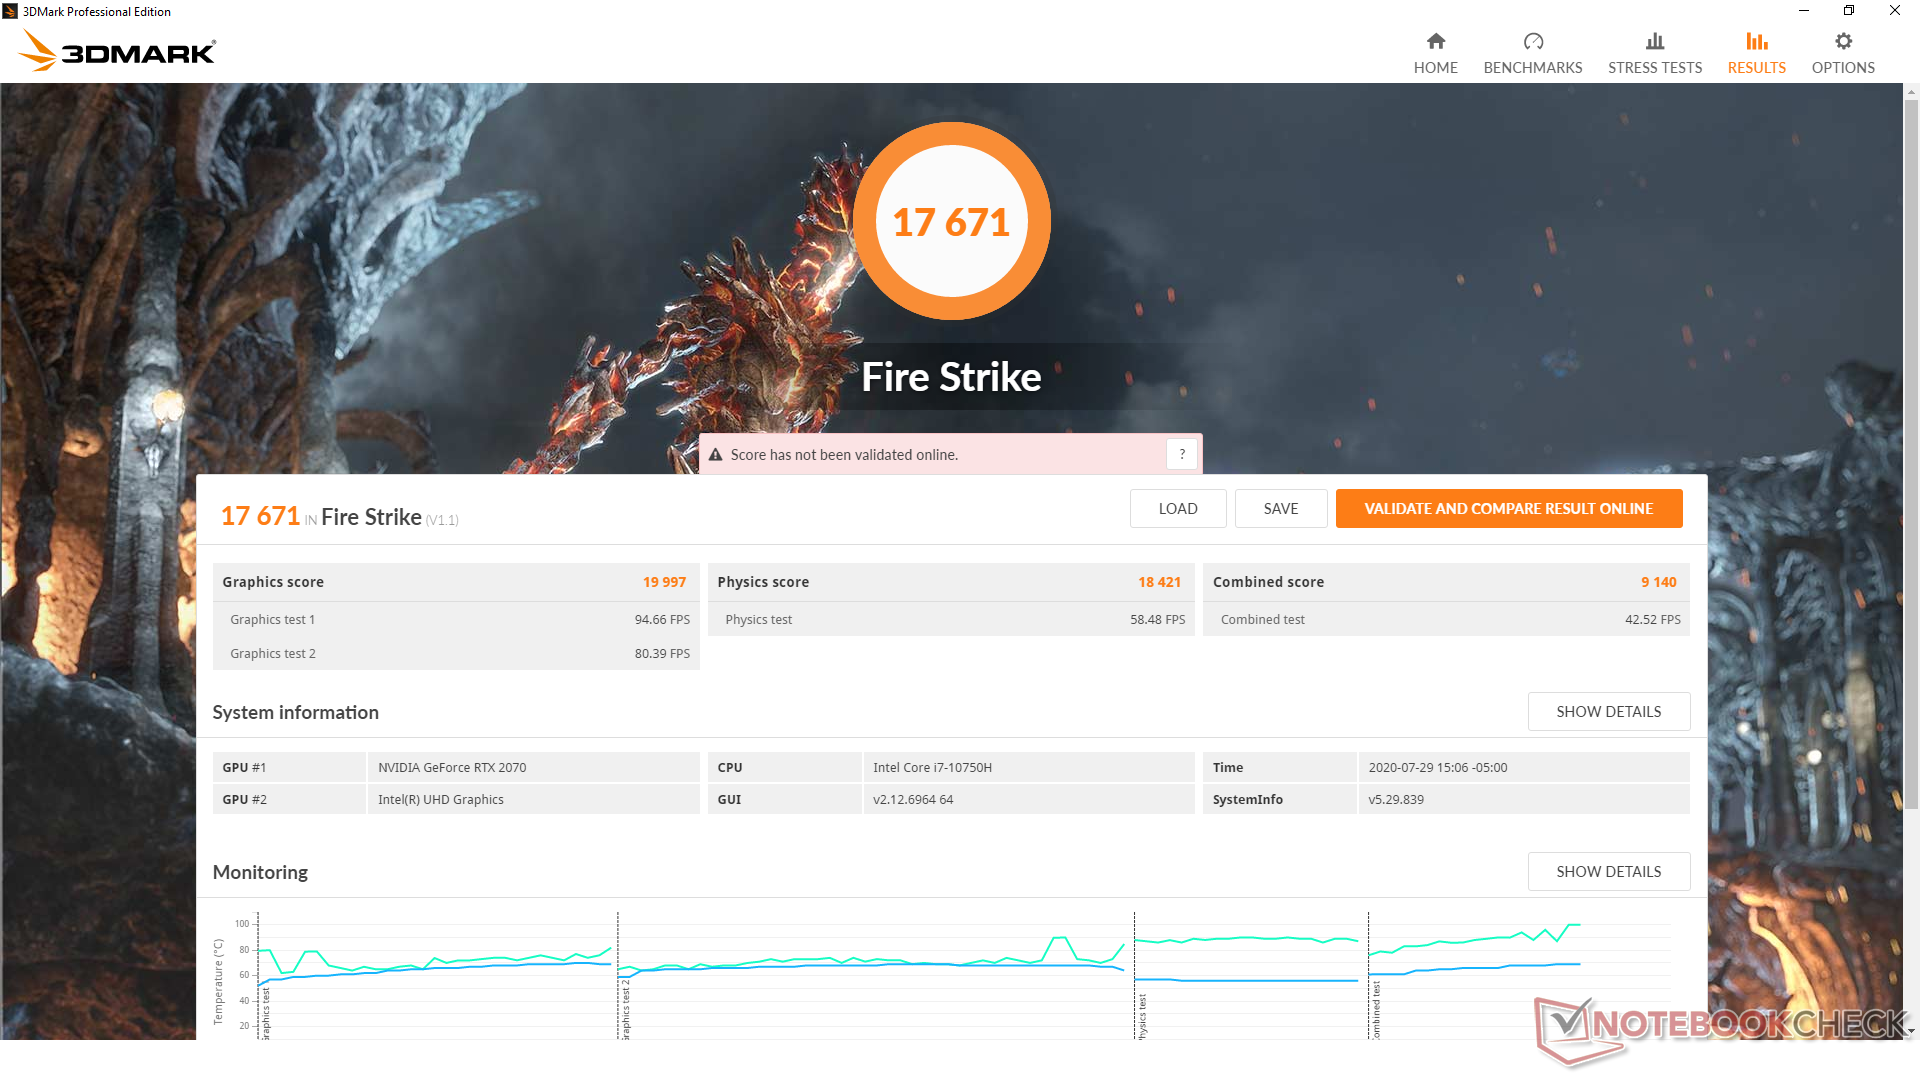
È interessante notare che i punteggi di Fire Strike tra la modalità Bilanciata, la modalità Performance e la modalità Turbo fan sono molto vicini tra loro, nonostante le differenze nel rumore delle ventole. Se non si prevede l'overclocking e non ci si preoccupa di temperature più elevate, allora si può giocare in modalità Balanced o Performance per un rumore più silenzioso delle ventole senza sacrificare le prestazioni.
Consultate la nostra pagina dedicata alla GeForce RTX 2070 mobile per maggiori informazioni tecniche e confronti di benchmark.
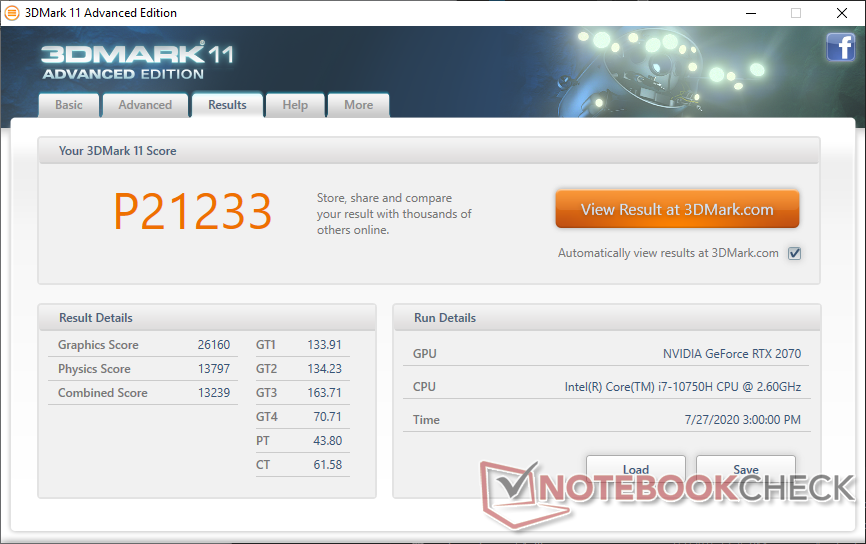
| 3DMark 11 Performance | 21233 punti | |
| 3DMark Cloud Gate Standard Score | 41006 punti | |
| 3DMark Fire Strike Score | 18127 punti | |
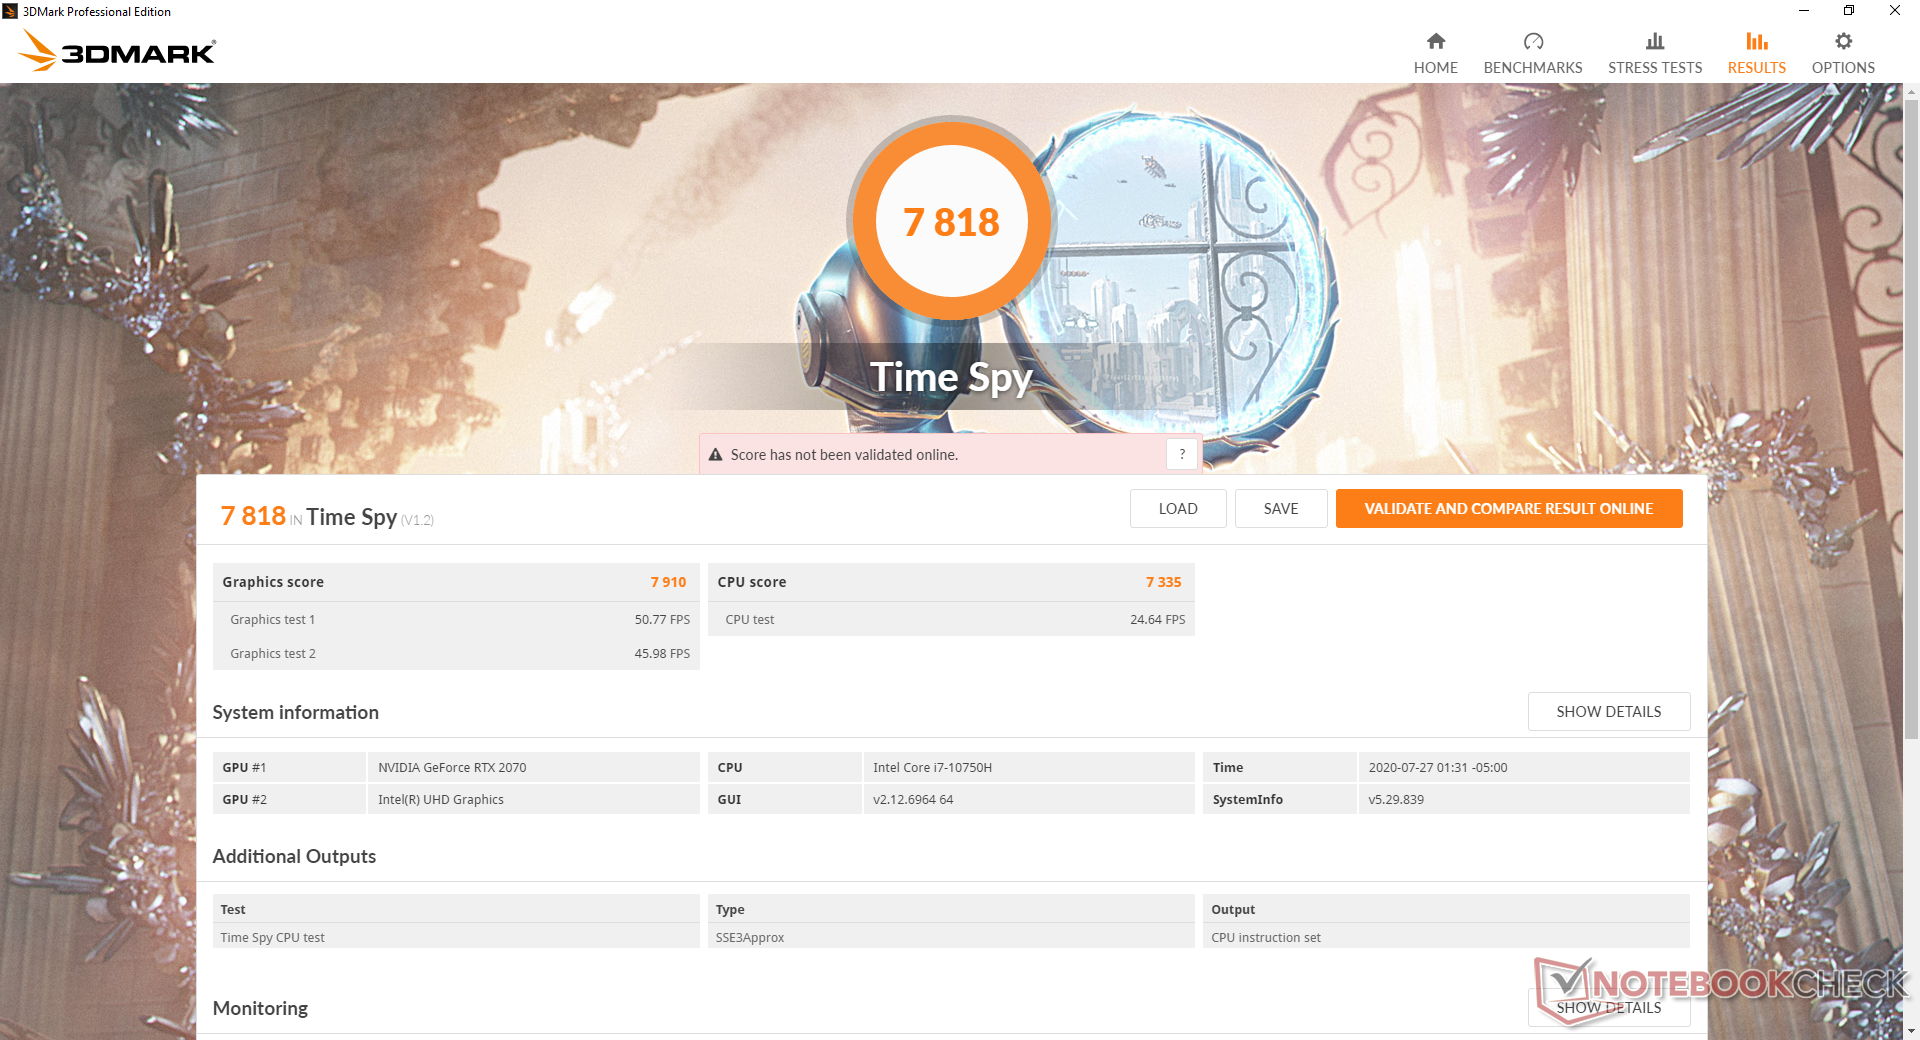
| 3DMark Time Spy Score | 7818 punti | |
Aiuto | ||
| basso | medio | alto | ultra | |
|---|---|---|---|---|
| The Witcher 3 (2015) | 356.7 | 249.9 | 149.8 | 81 |
| Dota 2 Reborn (2015) | 142 | 133 | 125 | 120 |
| X-Plane 11.11 (2018) | 96.1 | 87.3 | 71.9 | |
| Shadow of the Tomb Raider (2018) | 138 | 111 | 103 | 93 |
Emissioni
Rumorosità di sistema
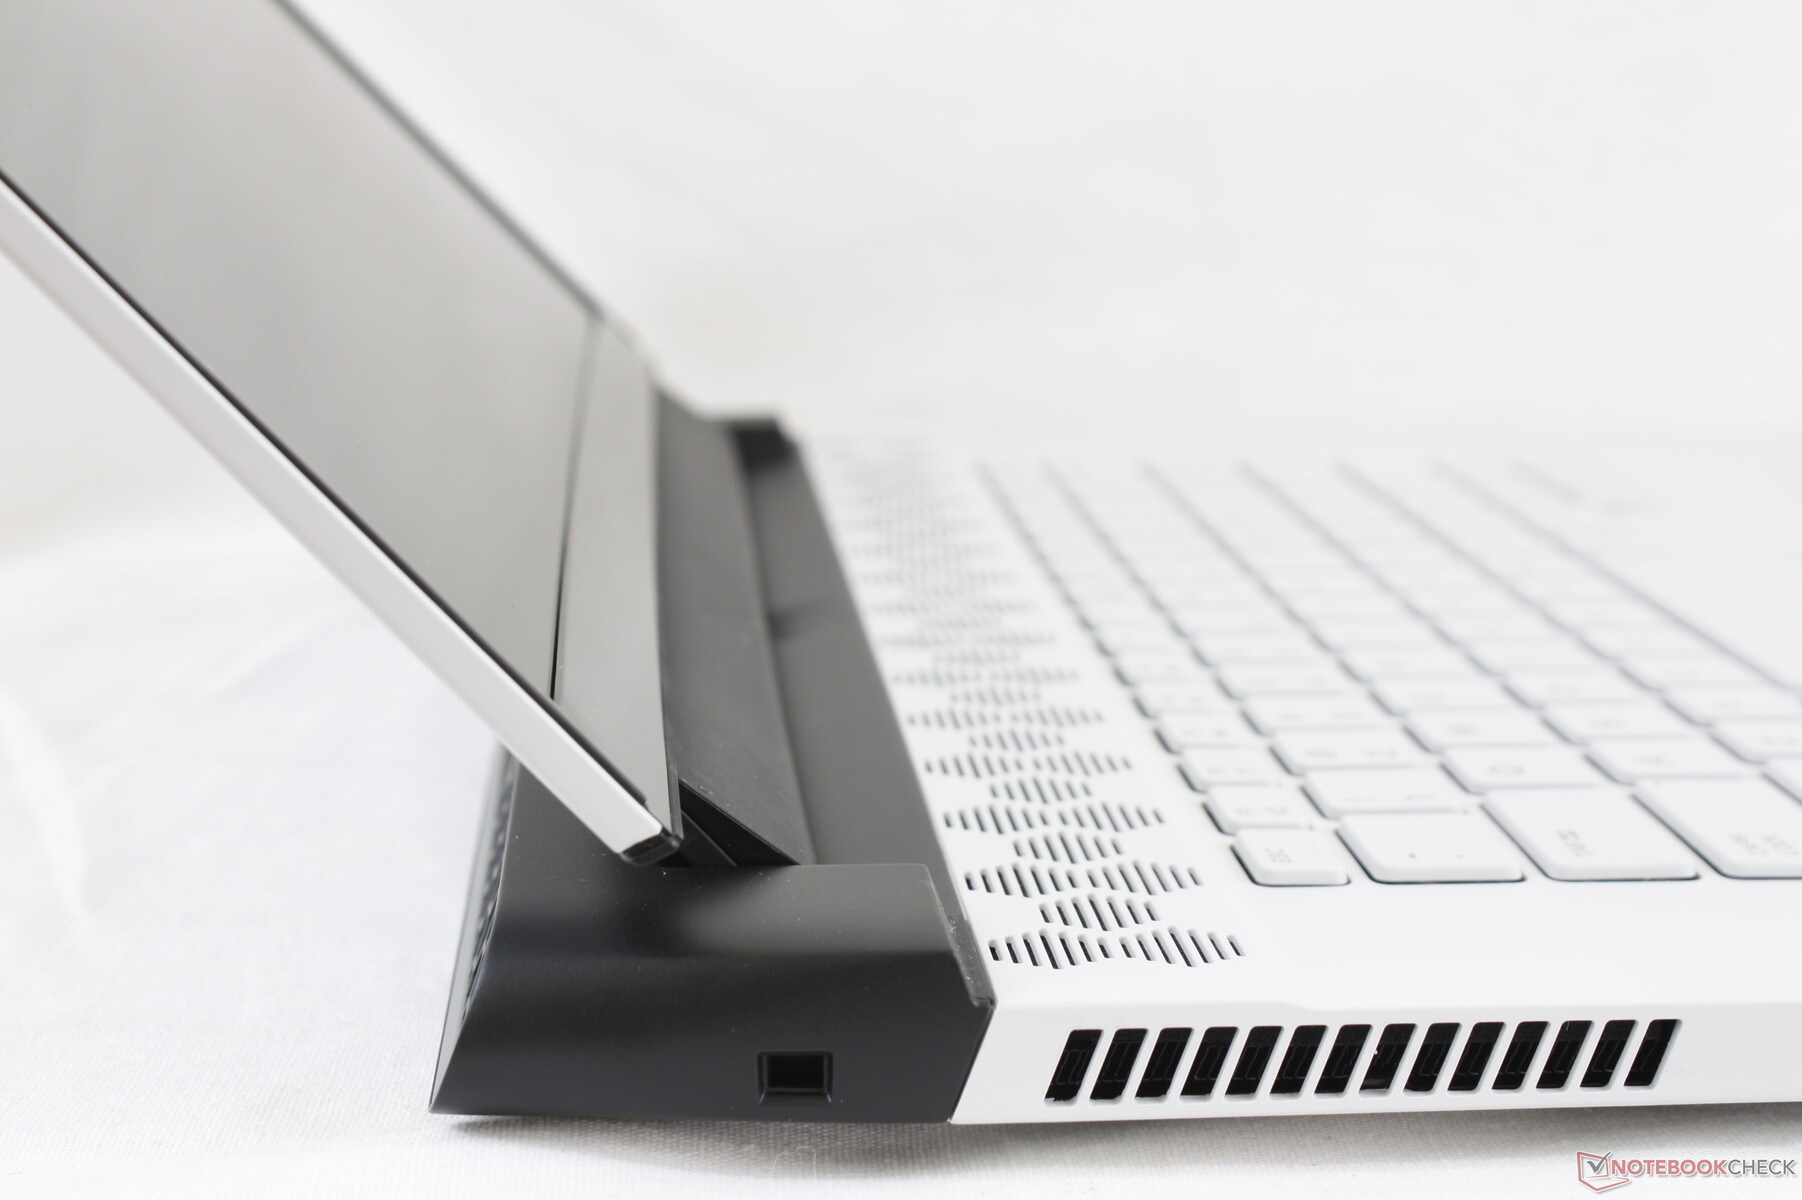
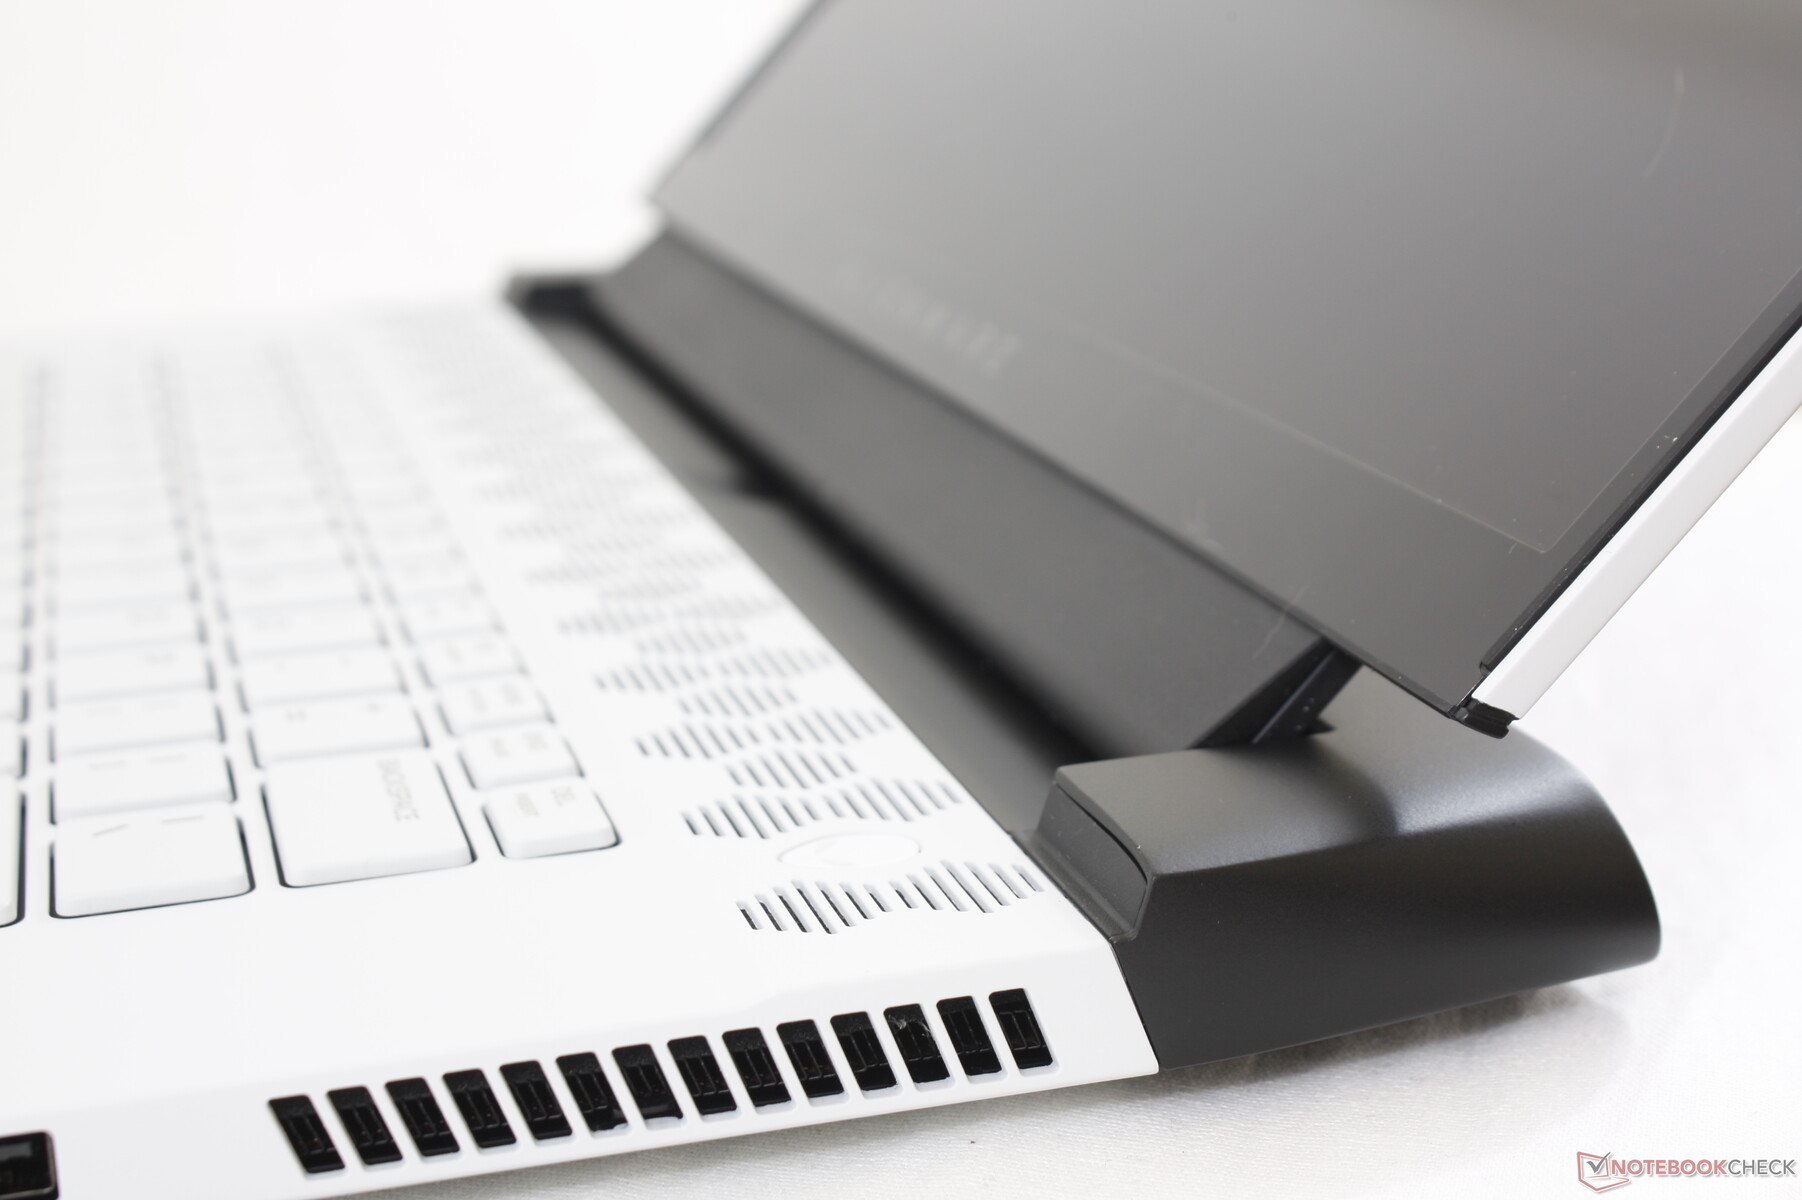
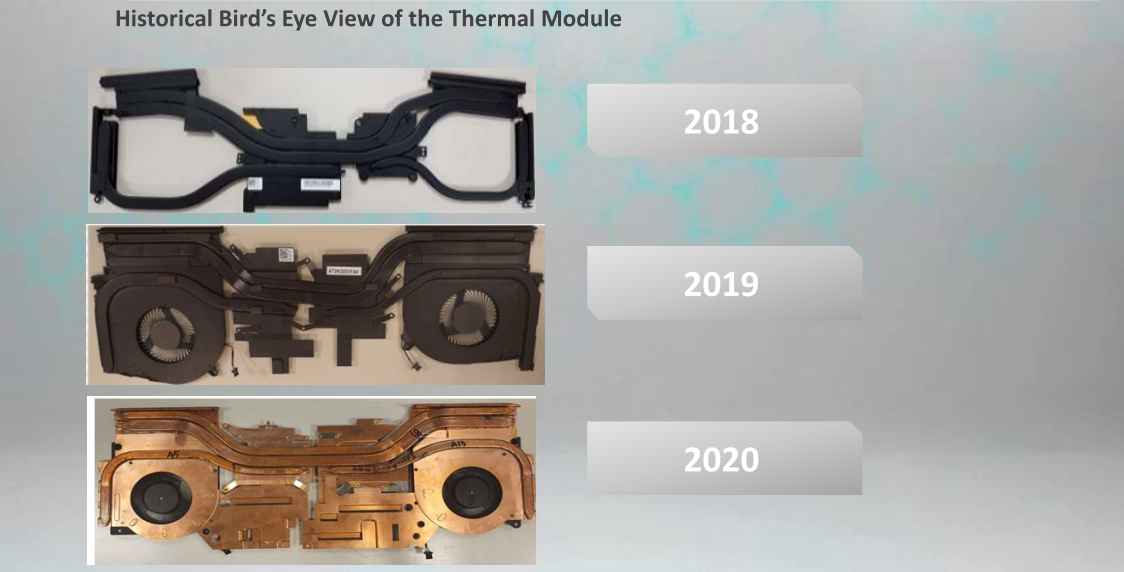
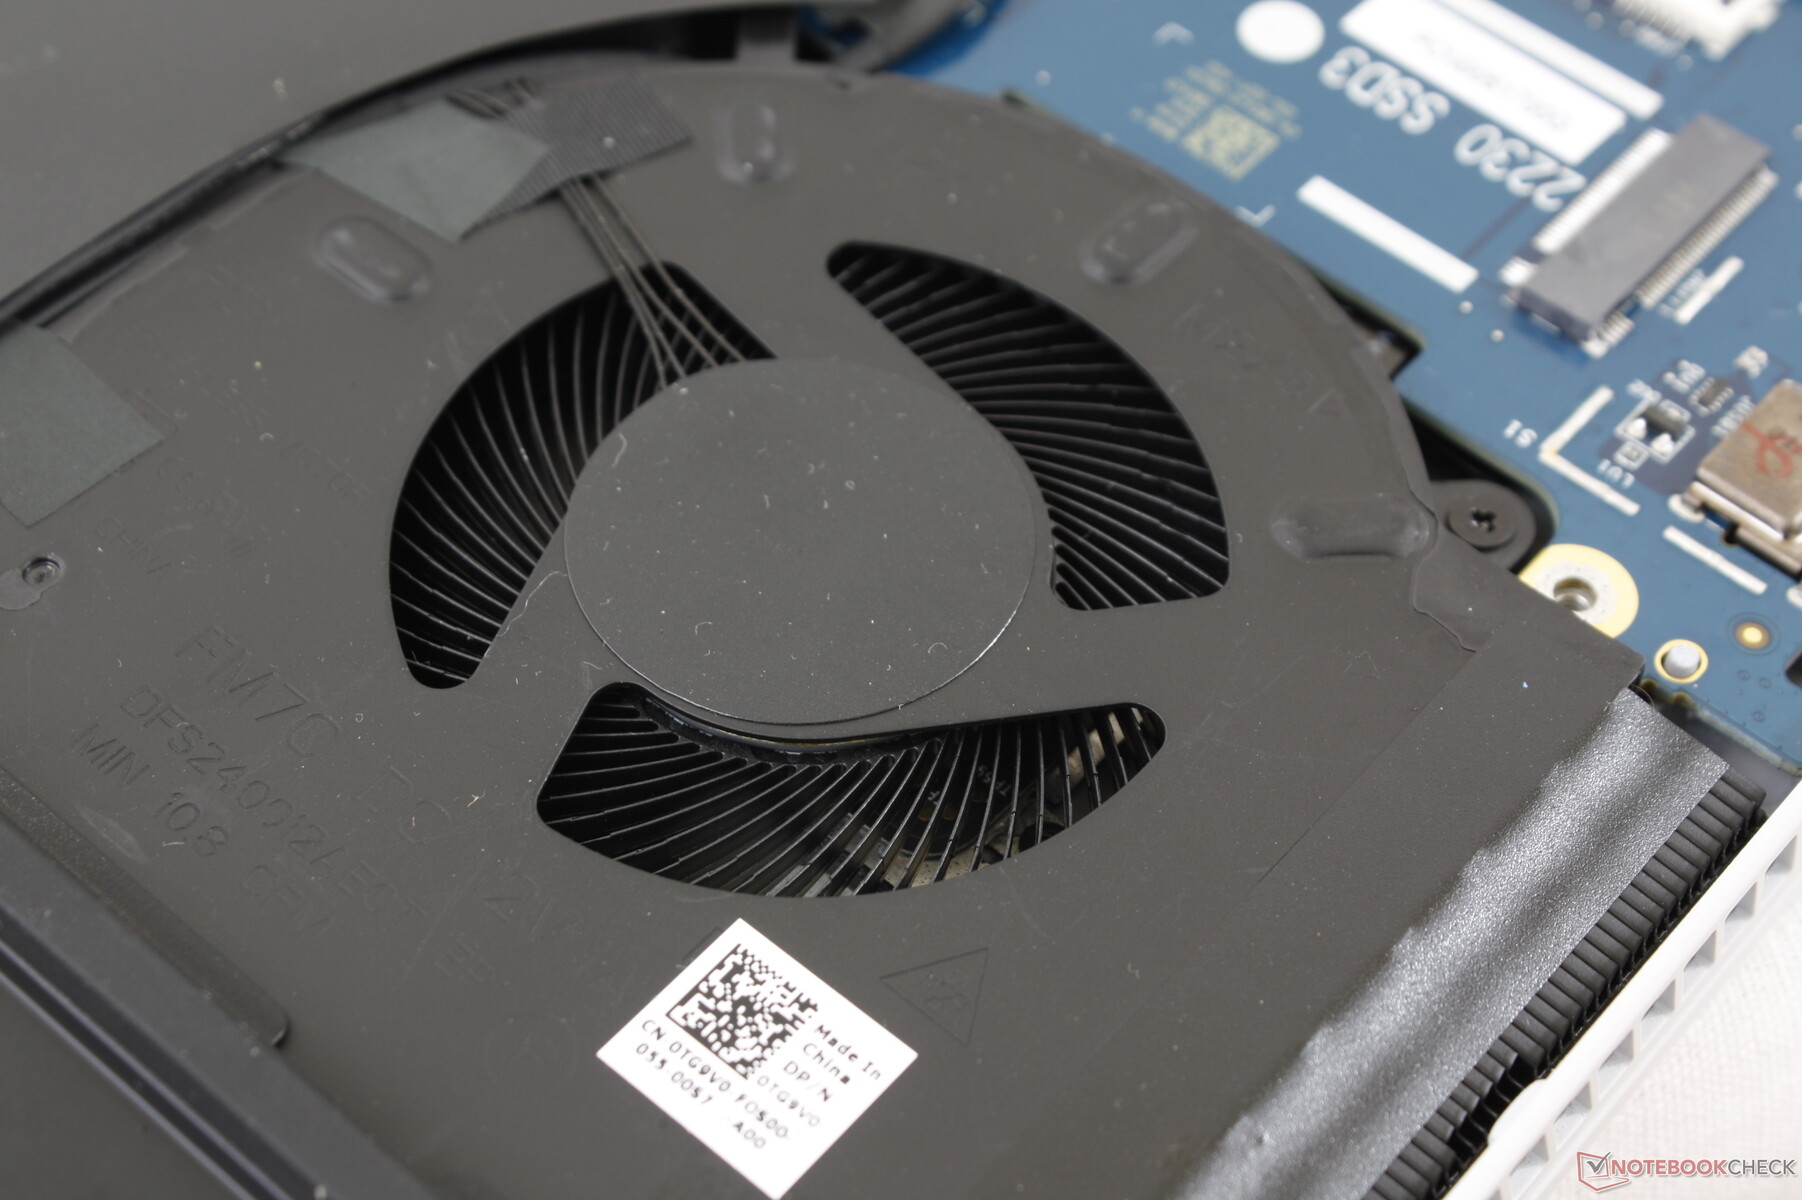
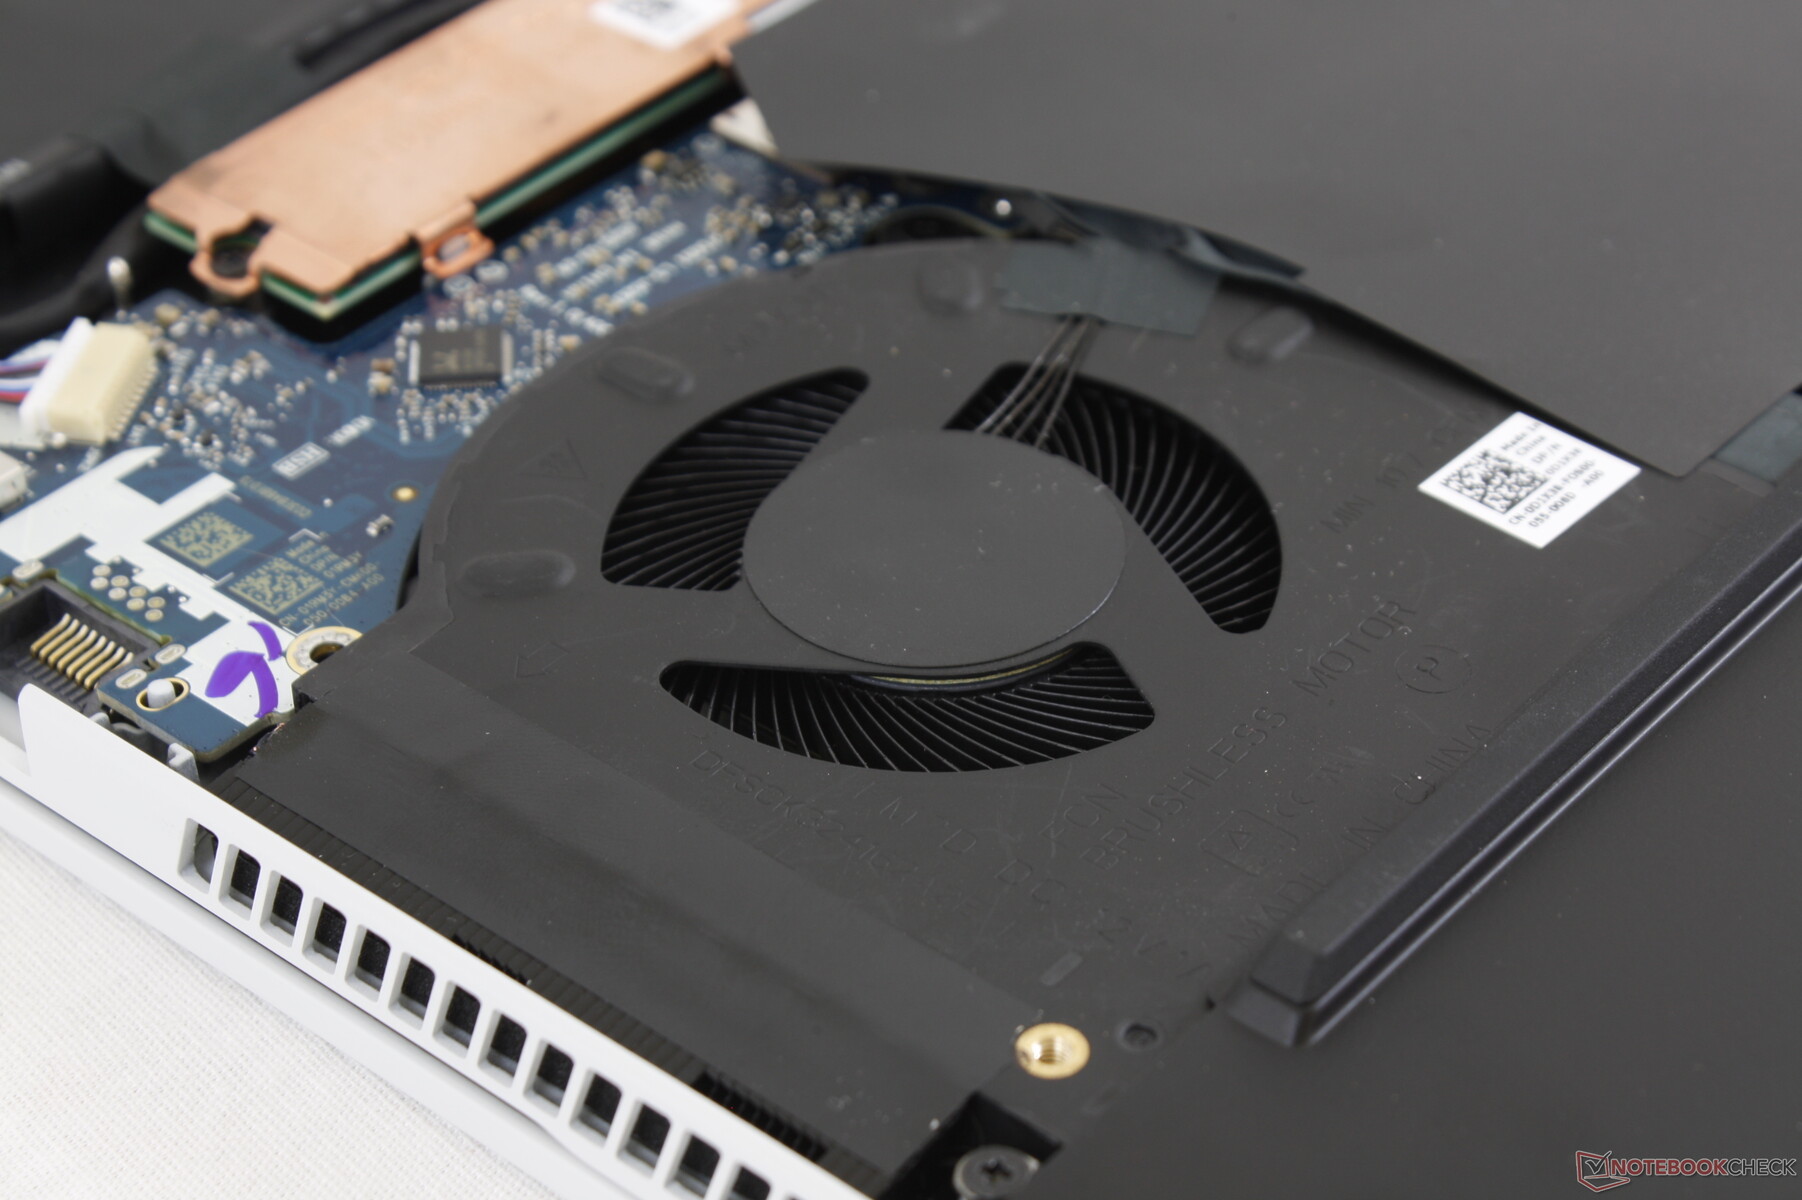
Forse il cambiamento più importante tra l'm15 R2 e l'm15 R3 riguarda la nuova soluzione di raffreddamento Cryo-Tech. L'm15 R3 utilizza il 39% in più di rame e il 25% in più di pale della ventola rispetto all'm15 R2 per circa il 10% in più di presa d'aria CFM. Per finire, il sistema integra ora il raffreddamento a camera di vapore per tutte le SKU GPU Nvidia che Dell ha recentemente adottato anche per la serie XPS 17. La camera di vapore si applica però solo alla CPU e non alla GPU.
Mentre la camera di vapore ha un impatto significativo sulla temperatura della CPU che la nostra prossima sezione dimostrerà, il rumore e il comportamento delle ventole non è cambiato da tutto questo gen-to-gen. Il gaming, per esempio, induce ancora un rumore della ventola di ~50 dB(A) come la maggior parte degli altri portatili gaming ad alte prestazioni in questa classe di dimensioni. L'Alienware non è quindi sensibilmente piùsilenzioso o più rumoroso nonostante i cambiamenti di raffreddamento.
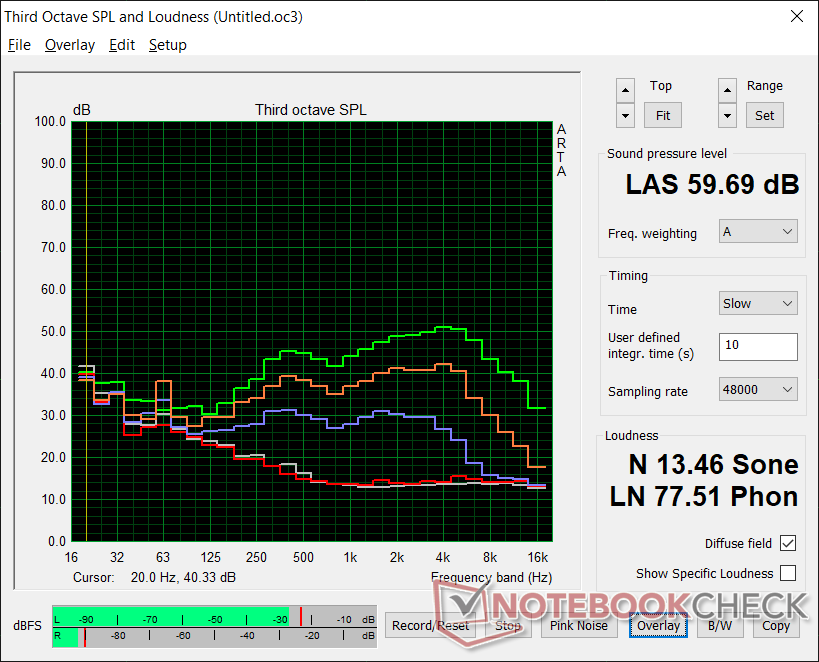
Il rumore delle ventole salirà fino a un massimo di 30,7 dB(A) su uno sfondo di 26,3 dB(A) quando è impostato in modalità Quiet, mentre la modalità Turbo farà arrivare istantaneamente le ventole al loro massimo di 59,7 dB(A), indipendentemente dal carico sullo schermo. Le ventole pulseranno più frequentemente anche se impostate in modalità Bilanciata e quindi si raccomanda di far funzionare il portatile in modalità Quiet se semplicemente si naviga o si effettua lo streaming video.
| Alienware m15 R3 P87F GeForce RTX 2070 Mobile, i7-10750H, 2x Micron 2200S 512 GB (RAID 0) | Alienware m15 R2 P87F GeForce RTX 2080 Max-Q, i7-9750H, 2x Toshiba XG6 KXG60ZNV512G (RAID 0) | Razer Blade 15 RZ09-0328 GeForce RTX 2070 Max-Q, i7-10750H, Lite-On CA5-8D512 | Asus Zephyrus S GX502GW GeForce RTX 2070 Mobile, i7-9750H, 2x Intel SSD 660p SSDPEKNW512G8 (RAID 0) | MSI GS66 Stealth 10SFS GeForce RTX 2070 Super Max-Q, i9-10980HK, Samsung SSD PM981 MZVLB1T0HALR | Asus ROG Strix Scar 15 G532LWS GeForce RTX 2070 Super Mobile, i9-10980HK, 2x Intel SSD 660p 1TB SSDPEKNW010T8 (RAID 0) | |
|---|---|---|---|---|---|---|
| Noise | -13% | -3% | -14% | -15% | -10% | |
| off /ambiente * (dB) | 26.3 | 28.3 -8% | 28.4 -8% | 30 -14% | 30 -14% | 26.5 -1% |
| Idle Minimum * (dB) | 26.7 | 28.5 -7% | 28.4 -6% | 31 -16% | 32 -20% | 27.1 -1% |
| Idle Average * (dB) | 26.7 | 28.5 -7% | 28.4 -6% | 33 -24% | 34 -27% | 32.2 -21% |
| Idle Maximum * (dB) | 30.7 | 49 -60% | 31.7 -3% | 38 -24% | 39 -27% | 34 -11% |
| Load Average * (dB) | 40.2 | 49 -22% | 47.7 -19% | 50 -24% | 53 -32% | 52.4 -30% |
| Witcher 3 ultra * (dB) | 51 | 49 4% | 47.5 7% | 53 -4% | 48 6% | 57.5 -13% |
| Load Maximum * (dB) | 59.7 | 55 8% | 49.5 17% | 56 6% | 53 11% | 57.5 4% |
* ... Meglio usare valori piccoli
Rumorosità
| Idle |
| 26.7 / 26.7 / 30.7 dB(A) |
| Sotto carico |
| 40.2 / 59.7 dB(A) |
 | ||
30 dB silenzioso 40 dB(A) udibile 50 dB(A) rumoroso |
||
min: | ||
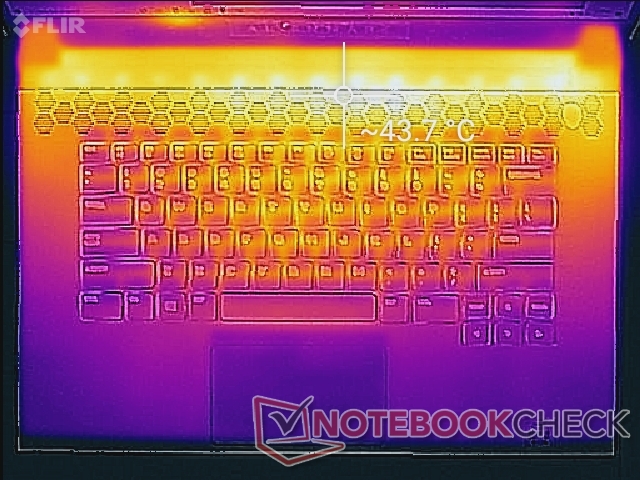
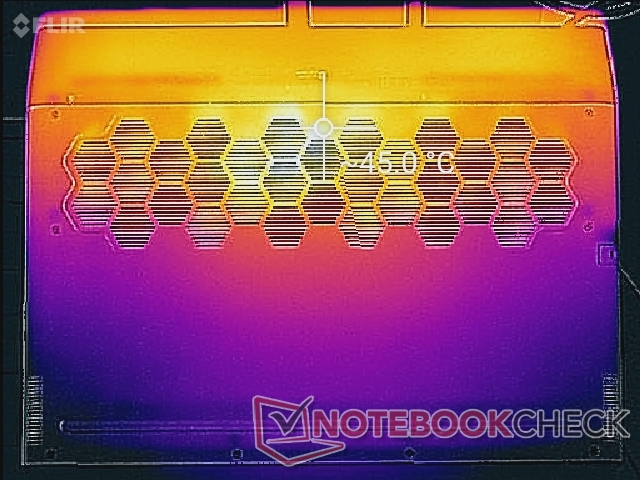
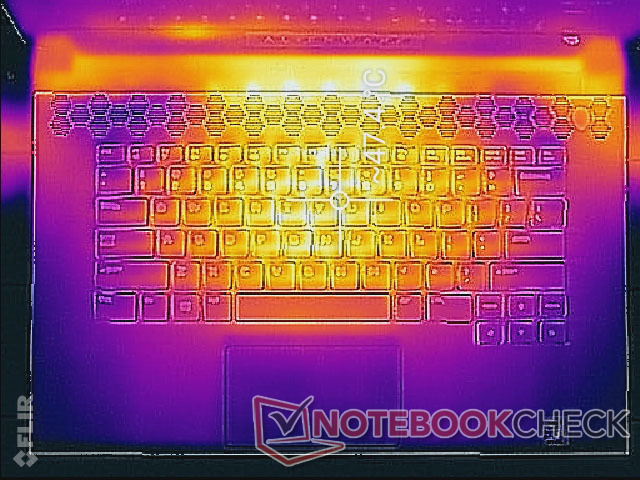
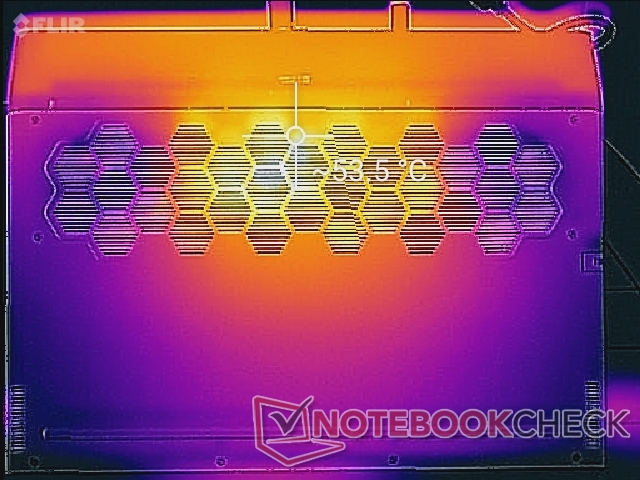
Temperature
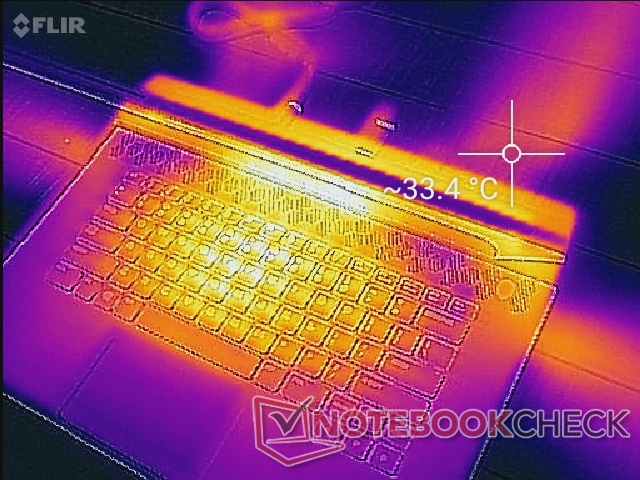
Le temperature di superficie al minimo sono molto calde, con punti che raggiungono tra 43° C e 45° C, probabilmente perché le ventole sono completamente inattive in questo stato. Quindi, il prezzo da pagare per una navigazione silenziosa o per un'esperienza di video streaming è un laptop più caldo.
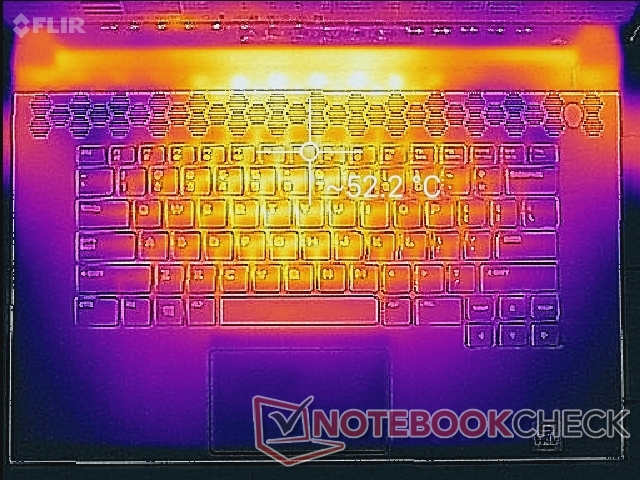
Quando si gioca o si eseguono carichi estremi, le temperature di superficie possono raggiungere oltre 50° C vicino al centro della tastiera, in modo simile a quanto registrato sull'MSI GS66. Anche i tasti WASD diventano caldi, ma non abbastanza da risultare scomodi al tatto.
(-) La temperatura massima sul lato superiore è di 55.8 °C / 132 F, rispetto alla media di 40.4 °C / 105 F, che varia da 21.2 a 68.8 °C per questa classe Gaming.
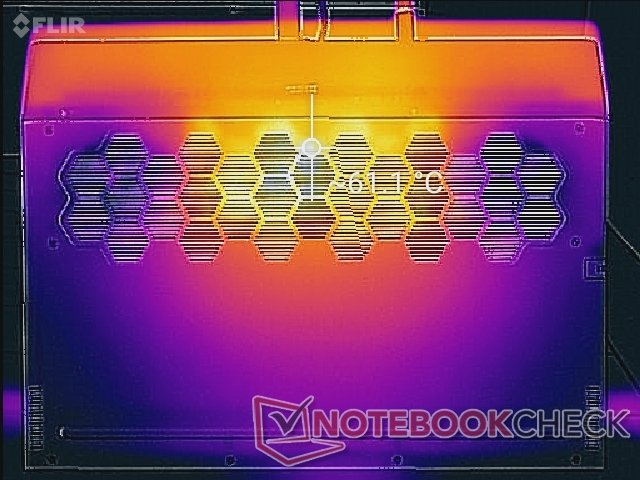
(-) Il lato inferiore si riscalda fino ad un massimo di 62 °C / 144 F, rispetto alla media di 43.2 °C / 110 F
(±) In idle, la temperatura media del lato superiore è di 35.4 °C / 96 F, rispetto alla media deld ispositivo di 33.9 °C / 93 F.
(±) Riproducendo The Witcher 3, la temperatura media per il lato superiore e' di 35.8 °C / 96 F, rispetto alla media del dispositivo di 33.9 °C / 93 F.
(+) I poggiapolsi e il touchpad sono piu' freddi della temperatura della pelle con un massimo di 29.4 °C / 84.9 F e sono quindi freddi al tatto.
(±) La temperatura media della zona del palmo della mano di dispositivi simili e'stata di 28.8 °C / 83.8 F (-0.6 °C / -1.1 F).
Stress Test
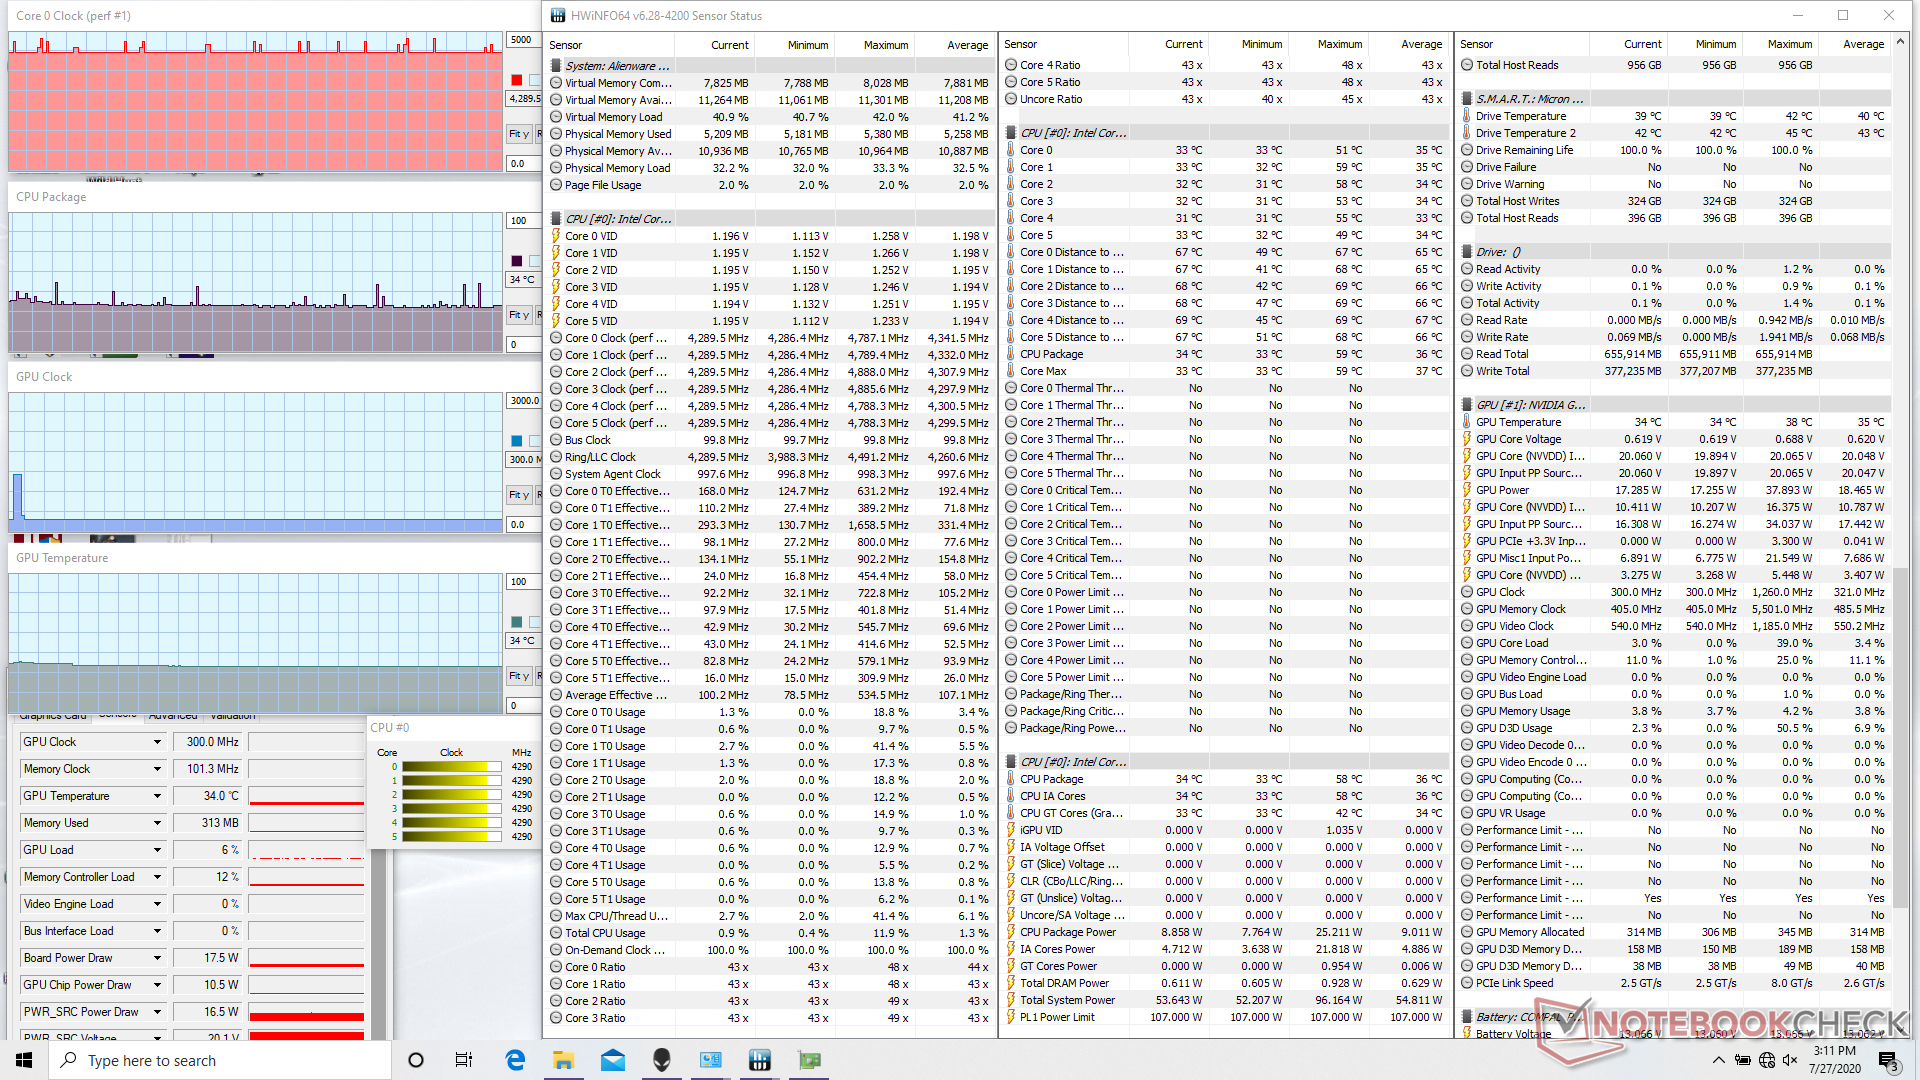
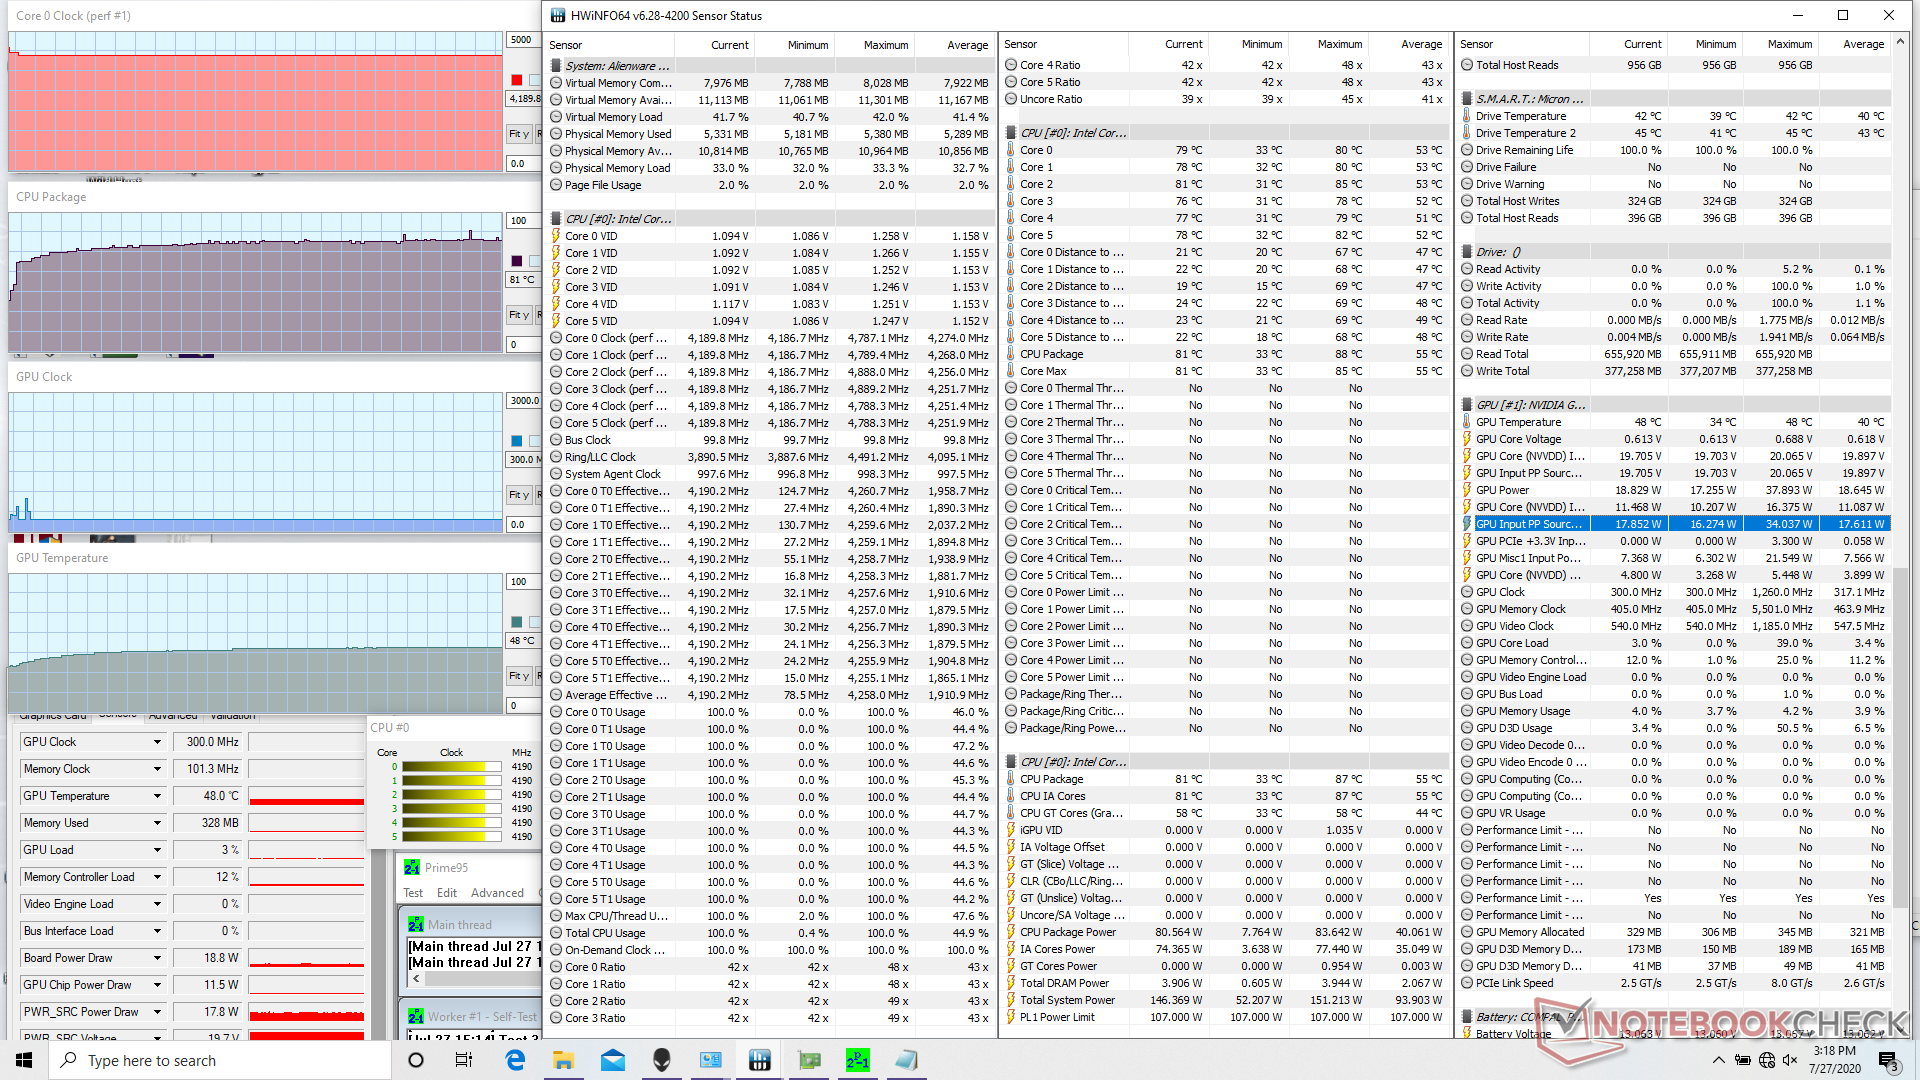
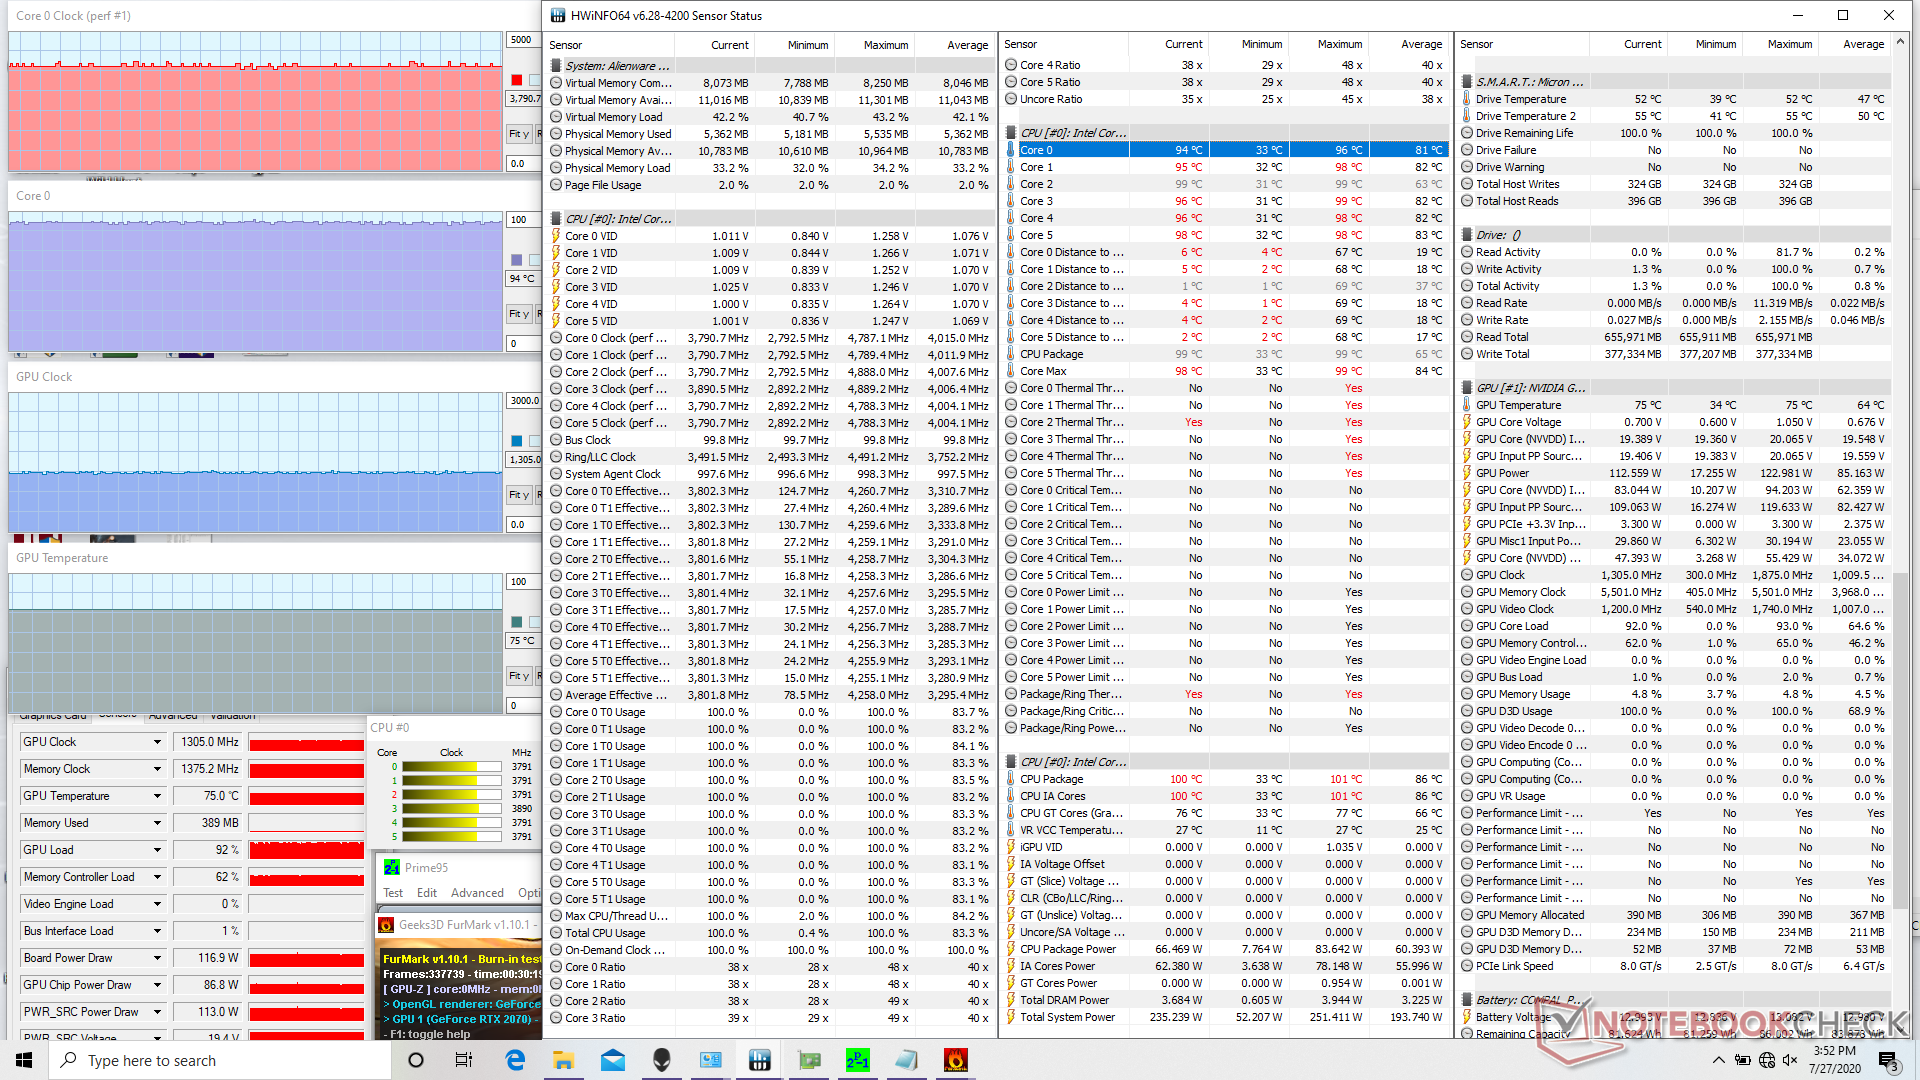
Quando si esegue Prime95, le frequenze di clock raggiungono i 4,4 GHz per un paio di secondi prima di stabilizzarsi a 4,2 GHz e ad una temperatura del core di 81 °C. L'esecuzione sia di Prime95 che di FurMark farà sì che la CPU funzioni a 99 °C, come nella maggior parte degli altri sistemi Alienware e XPS 15/17. L'elevata temperatura del core è il prezzo da pagare per l'eccellente sostenibilità delle prestazioni della CPU di cui abbiamo parlato sopra.
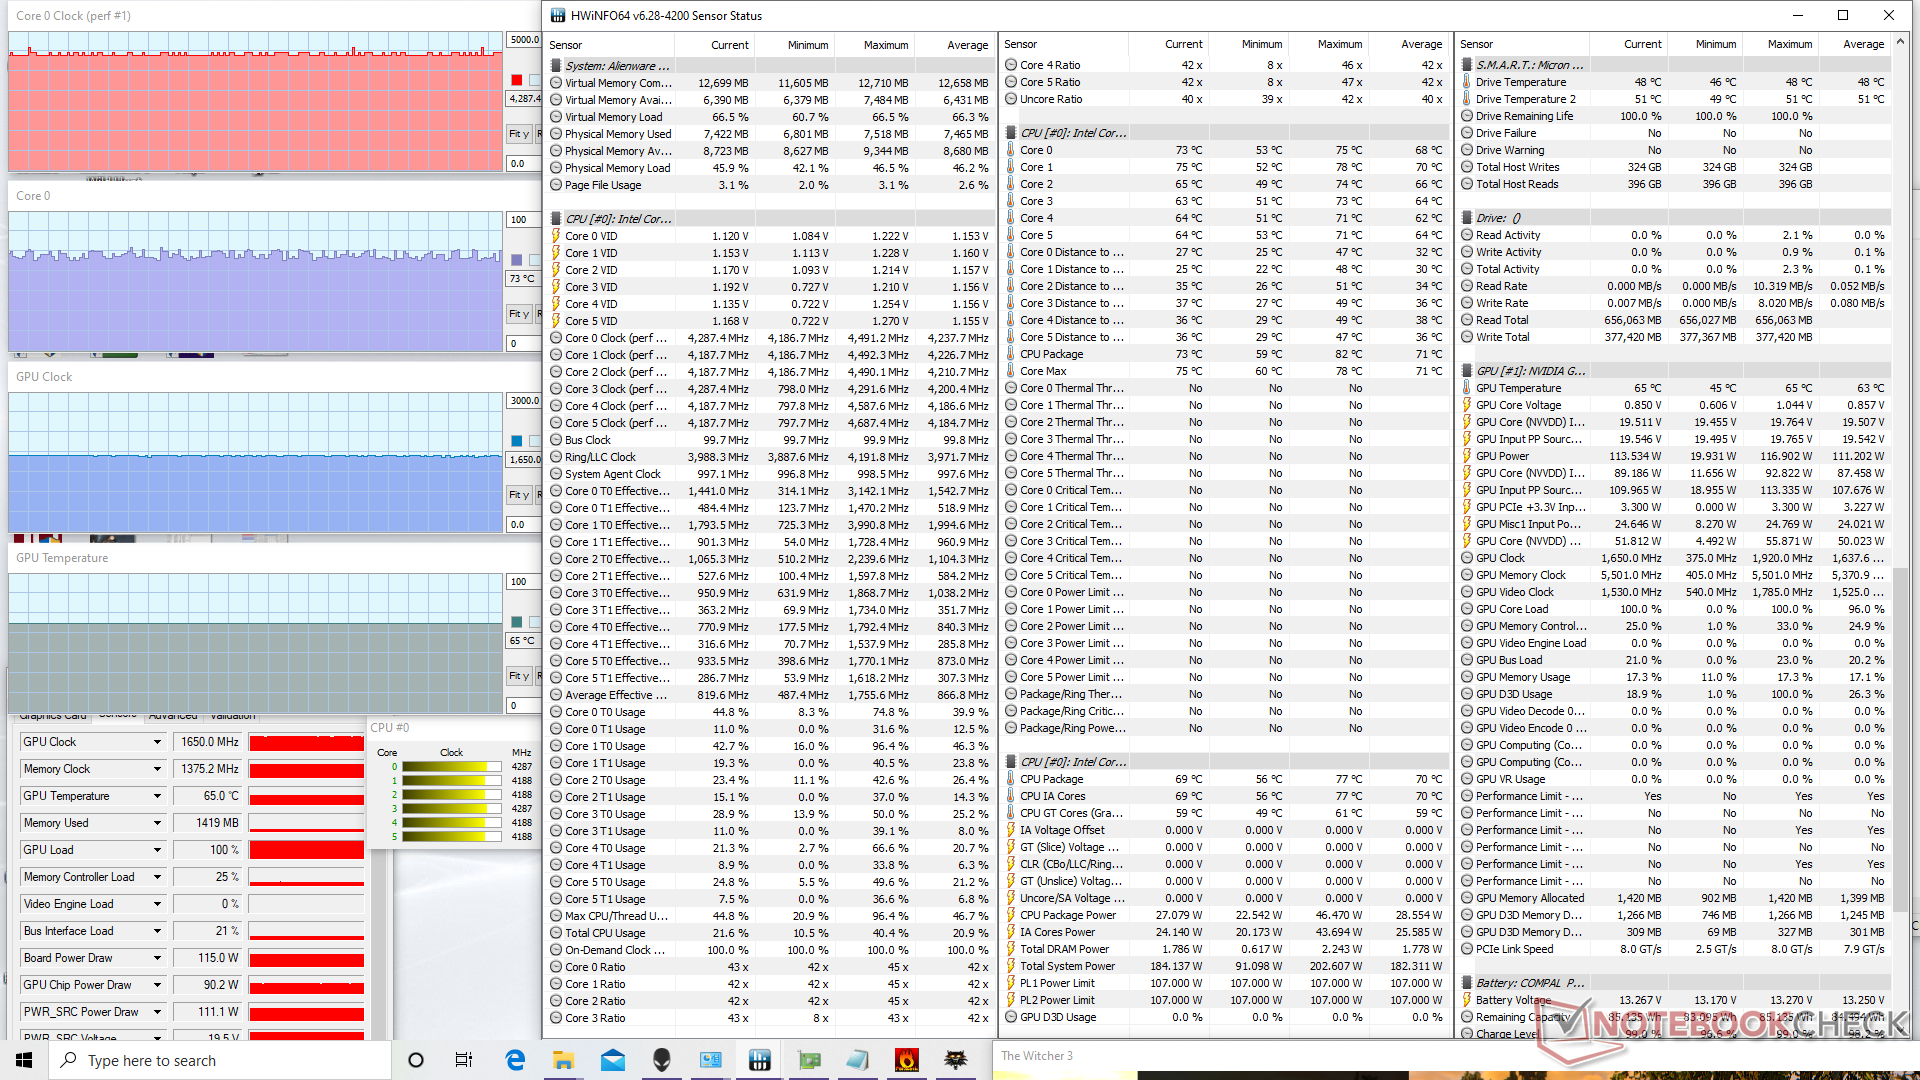
L'esecuzione di The Witcher 3 in modalità Turbo fan è più rappresentativa dei carichi di gioco del mondo reale. La CPU e la GPU si attestano rispettivamente a 73 °C e 65 °C, rispetto ai 96 °C e 79 °C del più economico MSI GL65 equipaggiato con la stessa CPU e GPU. Se l'Alienware funziona in modalità bilanciata, le temperature di CPU e GPU si stabilizzano rispettivamente a 80 °C e 74 °C, mentre i valor di clock rimangono quasi invariati. Quindi, la modalità Turbo fan può fornire ulteriore spazio di testa per l'overclocking della GPU dell'utente finale.
I risultati sono ancora significativamente migliori di quelli registrati l'anno scorso sulla m15 R2, dove la CPU e la GPU si stabilizzano rispettivamente a 99 °C e 70 °C, anche quando la modalità Turbo fan è attiva. La nuova soluzione di raffreddamento di Dell per l'm15 R3 è probabilmente responsabile dei miglioramenti tangibili.
Il funzionamento a batteria limiterà le prestazioni grafiche. Un Fire Strike eseguito usando la batteria restituisce un punteggio di Physics e Graphics di 18534 e 9994 punti, rispettivamente, rispetto a 18538 e 20712 punti ottenuto con l'alimentazione di rete.
| CPU Clock (GHz) | GPU Clock (MHz) | Average CPU Temperature (°C) | Average GPU Temperature (°C) | |
| System Idle (Turbo fan off) | -- | -- | 48 | 50 |
| System Idle (Turbo fan on) | -- | -- | 34 | 34 |
| Prime95 Stress (Turbo fan on) | 4.2 | -- | 81 | 48 |
| Prime95 + FurMark Stress (Turbo fan on) | 3.8 | 1305 | 94 | 75 |
| Witcher 3 Stress (Turbo fan on) | 4.2 - 4.3 | 1650 | ~73 | 65 |
Altoparlante


Alienware m15 R3 P87F analisi audio
(+) | gli altoparlanti sono relativamente potenti (89.5 dB)
Bassi 100 - 315 Hz
(-) | quasi nessun basso - in media 20.6% inferiori alla media
(±) | la linearità dei bassi è media (8.1% delta rispetto alla precedente frequenza)
Medi 400 - 2000 Hz
(±) | medi ridotti - circa 6.6% inferiori alla media
(+) | medi lineari (6.7% delta rispetto alla precedente frequenza)
Alti 2 - 16 kHz
(±) | alti elevati - circa 5% superiori alla media
(±) | la linearità degli alti è media (7.5% delta rispetto alla precedente frequenza)
Nel complesso 100 - 16.000 Hz
(±) | la linearità complessiva del suono è media (16.5% di differenza rispetto alla media
Rispetto alla stessa classe
» 42% di tutti i dispositivi testati in questa classe è stato migliore, 7% simile, 51% peggiore
» Il migliore ha avuto un delta di 6%, medio di 18%, peggiore di 132%
Rispetto a tutti i dispositivi testati
» 28% di tutti i dispositivi testati in questa classe è stato migliore, 6% similare, 66% peggiore
» Il migliore ha avuto un delta di 4%, medio di 24%, peggiore di 134%
Apple MacBook 12 (Early 2016) 1.1 GHz analisi audio
(+) | gli altoparlanti sono relativamente potenti (83.6 dB)
Bassi 100 - 315 Hz
(±) | bassi ridotti - in media 11.3% inferiori alla media
(±) | la linearità dei bassi è media (14.2% delta rispetto alla precedente frequenza)
Medi 400 - 2000 Hz
(+) | medi bilanciati - solo only 2.4% rispetto alla media
(+) | medi lineari (5.5% delta rispetto alla precedente frequenza)
Alti 2 - 16 kHz
(+) | Alti bilanciati - appena 2% dalla media
(+) | alti lineari (4.5% delta rispetto alla precedente frequenza)
Nel complesso 100 - 16.000 Hz
(+) | suono nel complesso lineare (10.2% differenza dalla media)
Rispetto alla stessa classe
» 7% di tutti i dispositivi testati in questa classe è stato migliore, 2% simile, 91% peggiore
» Il migliore ha avuto un delta di 5%, medio di 18%, peggiore di 53%
Rispetto a tutti i dispositivi testati
» 5% di tutti i dispositivi testati in questa classe è stato migliore, 1% similare, 94% peggiore
» Il migliore ha avuto un delta di 4%, medio di 24%, peggiore di 134%
Gestione Energetica
Consumo Energetico
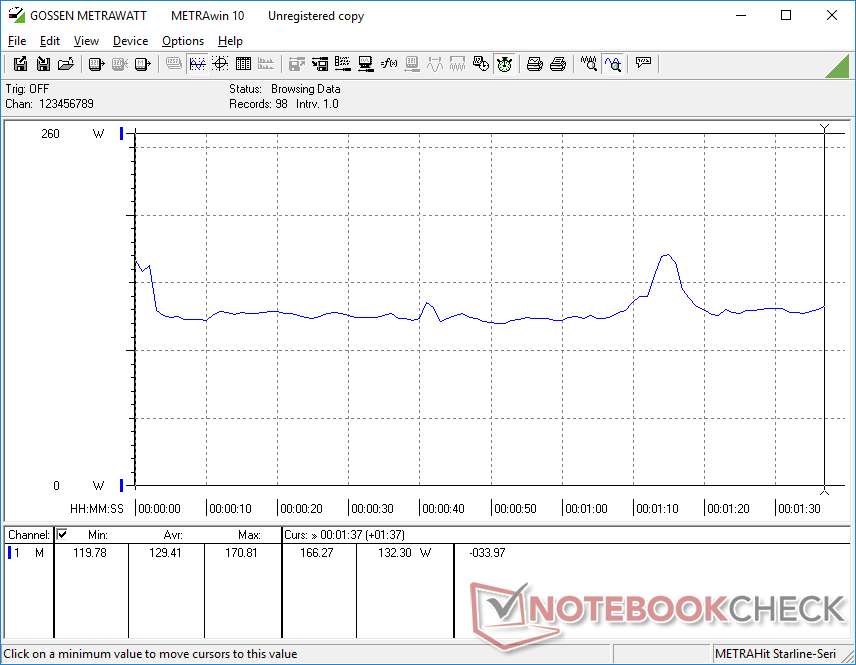
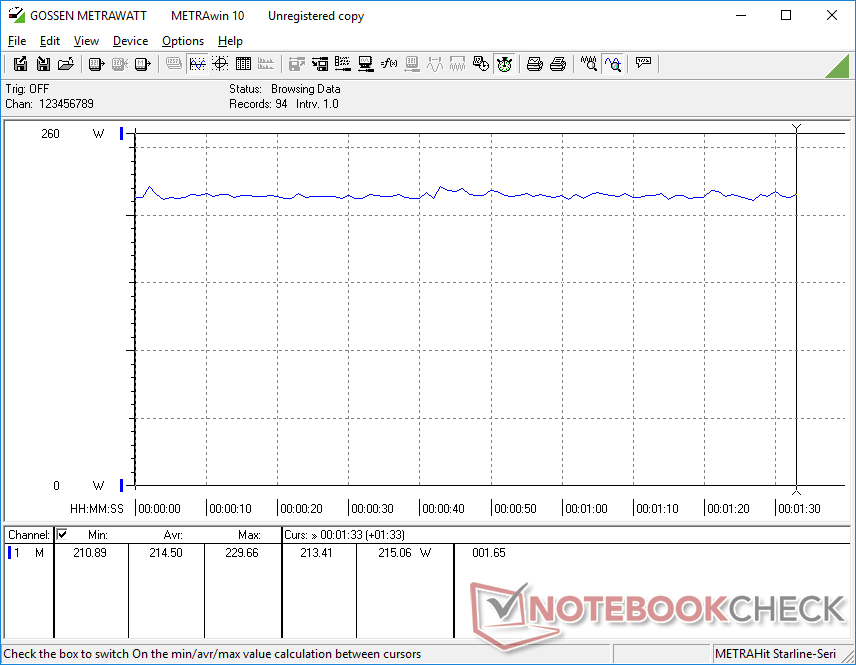
L'Alienware è un dispostivo molto affamato di energia - forse più di quanto sia necessario. Quando si gioca, il sistema consuma 215 W rispetto ai soli 155 W dell'MSI GS66 equipaggiato con la GeForce RTX 2070 Super Max-Q o ai 185 W dell'MSI GP65 con lo stesso identico Core i7 e GPU RTX 2070. Tenete presente che la RTX 2070 Super Max-Q è essenzialmente alla pari con la nostra RTX 2070 mobile standard in termini di potenza grafica.
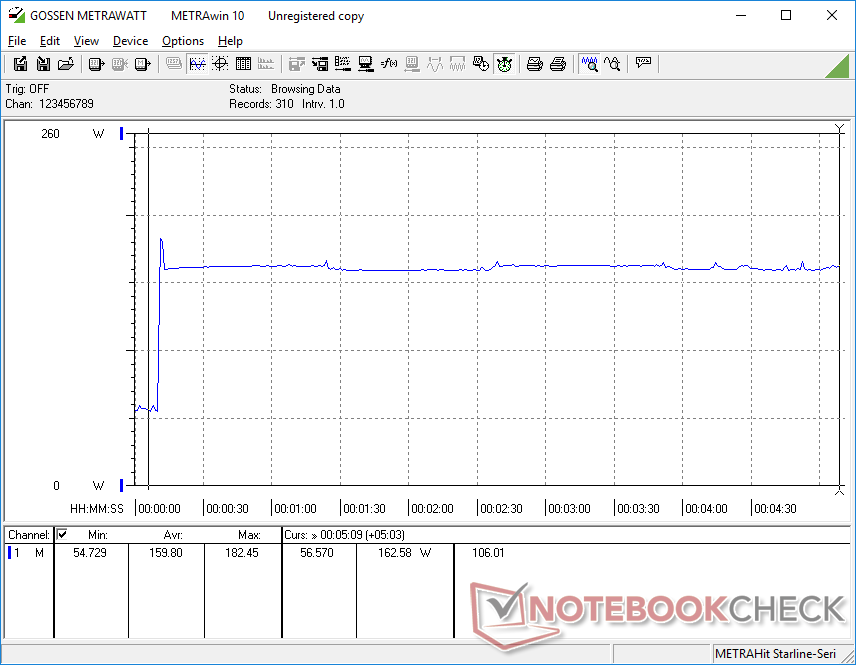
Anche il consumo di potenza al minimo sulla scrivania è molto alto, da 34 W a 59 W, il che spiega in parte le temperature molto elevate della superficie al minimo che abbiamo registrato sopra.
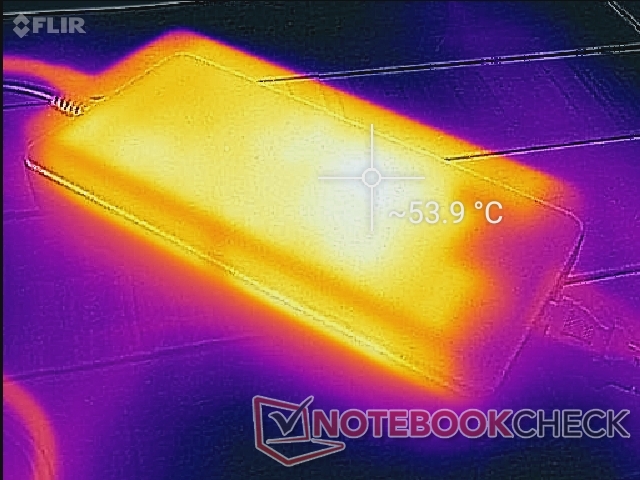
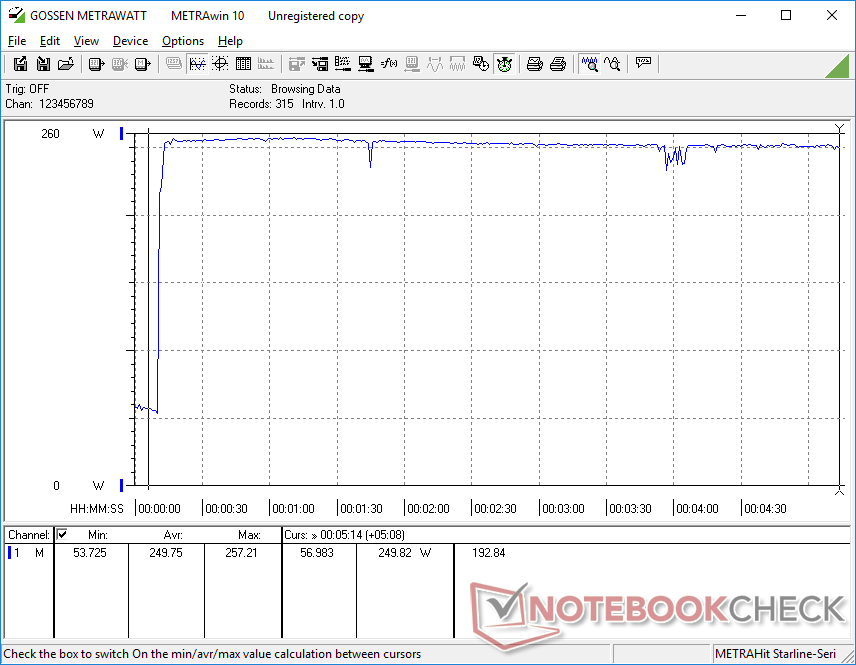
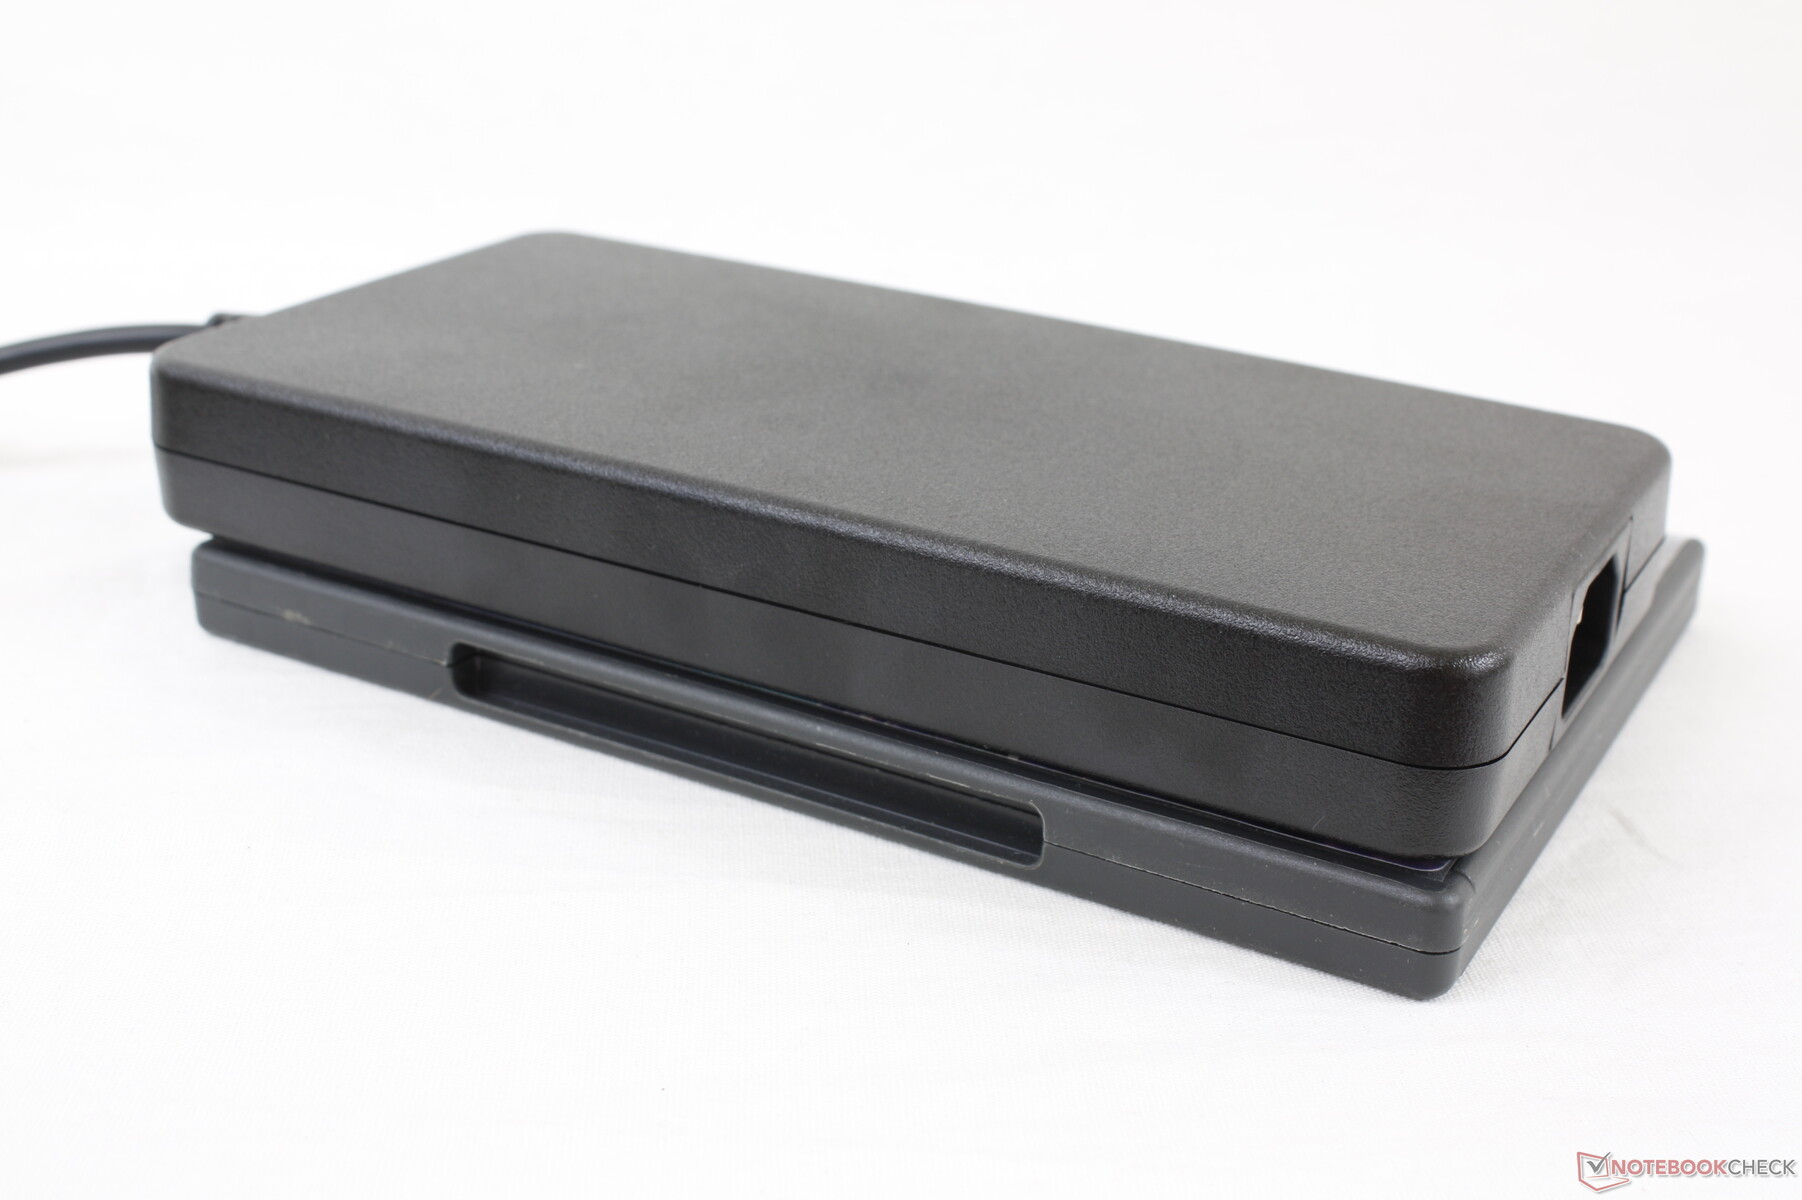
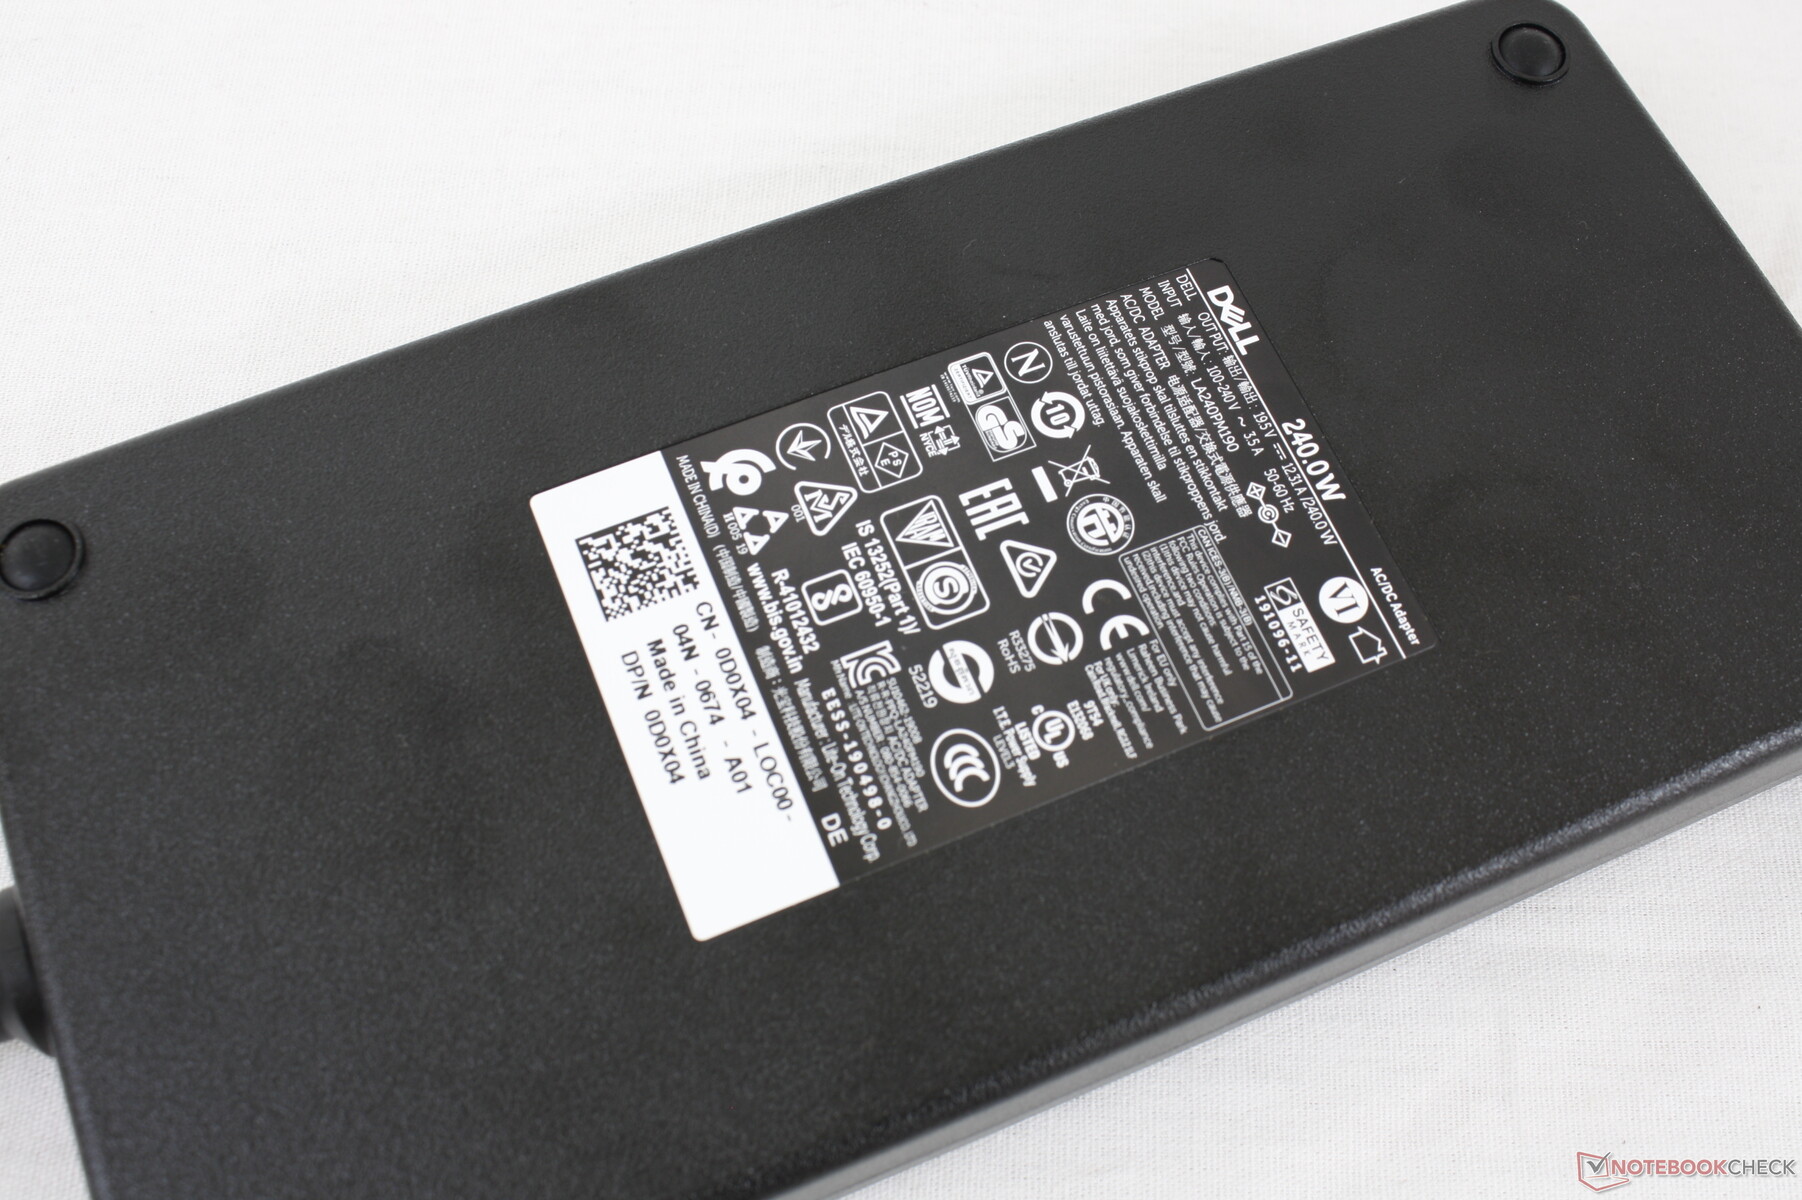
Siamo in grado di registrare un massimo di 257,3 W dal grande (~20 x 10 x 2,6 cm) alimentatore da 240 W quando si utilizzano contemporaneamente Prime95 e FurMark. Si noti che la batteria si scarica molto lentamente quando si eseguono carichi così estremi sul sistema.
| Off / Standby | |
| Idle | |
| Sotto carico |
|
Leggenda:
min: | |
| Alienware m15 R3 P87F i7-10750H, GeForce RTX 2070 Mobile, IPS, 1920x1080, 15.6" | Alienware m15 P79F i7-8750H, GeForce RTX 2070 Max-Q, OLED, 3840x2160, 15.6" | Eluktronics RP-15 R7 4800H, GeForce RTX 2060 Mobile, IPS, 1920x1080, 15.6" | Razer Blade 15 RZ09-0328 i7-10750H, GeForce RTX 2070 Max-Q, AMOLED, 3840x2160, 15.6" | Asus Zephyrus S GX502GW i7-9750H, GeForce RTX 2070 Mobile, IPS, 1920x1080, 15.6" | MSI GS66 Stealth 10SFS i9-10980HK, GeForce RTX 2070 Super Max-Q, IPS, 1920x1080, 15.6" | MSI GP65 10SFK-047US i7-10750H, GeForce RTX 2070 Mobile, IPS, 1920x1080, 15.6" | |
|---|---|---|---|---|---|---|---|
| Power Consumption | 45% | 31% | 41% | 25% | 39% | 38% | |
| Idle Minimum * (Watt) | 34 | 10.9 68% | 21.7 36% | 11.1 67% | 24 29% | 13 62% | 14.2 58% |
| Idle Average * (Watt) | 48.6 | 12.3 75% | 30.1 38% | 13.7 72% | 27 44% | 16 67% | 18.8 61% |
| Idle Maximum * (Watt) | 58.2 | 19 67% | 35 40% | 33.4 43% | 33 43% | 27 54% | 23.9 59% |
| Load Average * (Watt) | 129.4 | 96 26% | 112.6 13% | 104.4 19% | 129 -0% | 109 16% | 96.9 25% |
| Witcher 3 ultra * (Watt) | 214.5 | 161.7 25% | 134.4 37% | 159.9 25% | 176 18% | 155 28% | 185 14% |
| Load Maximum * (Watt) | 257.3 | 229.1 11% | 201.5 22% | 203.8 21% | 216 16% | 236 8% | 233.4 9% |
* ... Meglio usare valori piccoli
Autonomia della batteria
L'autoonomia è breve anche per un portatile gaming, probabilmente come conseguenza del consumo energetico molto elevato di cui sopra e della mancanza di Optimus. Navigando sul web sul profilo Balanced power dura poco meno di 3 ore risultando essere inferiore a quanto abbiamo registrato sull'Alienware m15 R1 o m15 R2. Semplicemente restando al minimo sulla scrivania con l'impostazione di luminosità più bassa e il profilo di potenza disponibile dura solo 5 ore prima dello spegnimento automatico.
La ricarica completa richiede circa 2-2,5 ore. Il sistema può essere ricaricato tramite USB-C, proprio come sull'MSI GS75 o sull'Asus Zephyrus M. Alcune SKU possono essere fornite con una batteria più piccola da 56 Wh invece che da 86 Wh.
| Alienware m15 R3 P87F i7-10750H, GeForce RTX 2070 Mobile, 86 Wh | Alienware m15 P79F i7-8750H, GeForce RTX 2070 Max-Q, 90 Wh | Eluktronics RP-15 R7 4800H, GeForce RTX 2060 Mobile, 46.7 Wh | Razer Blade 15 RZ09-0328 i7-10750H, GeForce RTX 2070 Max-Q, 65 Wh | Asus Zephyrus S GX502GW i7-9750H, GeForce RTX 2070 Mobile, 76 Wh | MSI GS66 Stealth 10SFS i9-10980HK, GeForce RTX 2070 Super Max-Q, 99.99 Wh | |
|---|---|---|---|---|---|---|
| Autonomia della batteria | 86% | 29% | 43% | 31% | 110% | |
| Reader / Idle (h) | 5 | 5.9 18% | 8.4 68% | |||
| WiFi v1.3 (h) | 2.8 | 5.2 86% | 3.6 29% | 4 43% | 3.7 32% | 6.1 118% |
| Load (h) | 0.7 | 1 43% | 1.7 143% |
Pro
Contro
Giudizio Complessivo
Esternamente, l'Alienware m15 R3 non sembra nient'altro che un piccolo aggiornamento rispetto all'm15 R2 dell'anno scorso. Invece, tutti i cambiamenti principali sono interni, il che è un peccato perché probabilmente passeranno inosservati alla maggior parte degli utenti. Dell ha affrontato direttamente uno dei problemi più importanti dell'm15 R2 con l'm15 R3, passando a una soluzione di raffreddamento molto più potente e abbassando le temperature del core di circa 20° C quando si gioca. Abbinate questo con le nuove opzioni di CPU e GPU e avrete un sistema che può funzionare sia più velocemente che in modo più freddo rispetto al suo immediato predecessore, nonostante l'aspetto quasi identico dall'esterno. In breve, l'Alienware m15 R3 è quello che avrebbe dovuto essere l'm15 R2.
Con uno dei maggiori problemi del modello dell'anno scorso, ora è il momento di migliorare gli altri aspetti del sistema. Il rumore della ventola, in particolare, non è cambiato, il che significa che si desidera ancora un buon paio di cuffie quando si gioca. Il telaio sottile e leggero non è così sottile o leggero come gli altri della stessa categoria e l'inclusione di una camera di vapore ha reso il sistema leggermente più pesante di prima. Il consumo di energia molto elevato e la breve durata della batteria rendono il sistema una soluzione più povera anche per i viaggiatori rispetto al MSI GS66 o al Razer Blade 15 che offrono quasi le stesse opzioni di CPU e GPU del nostro Dell.
Nel complesso, l'Alienware m15 R3 è un notevole miglioramento rispetto all'm15 R2, soprattutto in termini di temperatura del core. Anche le nuove opzioni del processore sono benvenute, ma quasi tutto il resto rimane uguale al modello m15 R2 dell'anno scorso per molti degli stessi svantaggi.
Alienware m15 R3 P87F
- 07/31/2020 v7 (old)
Allen Ngo
Price comparison
