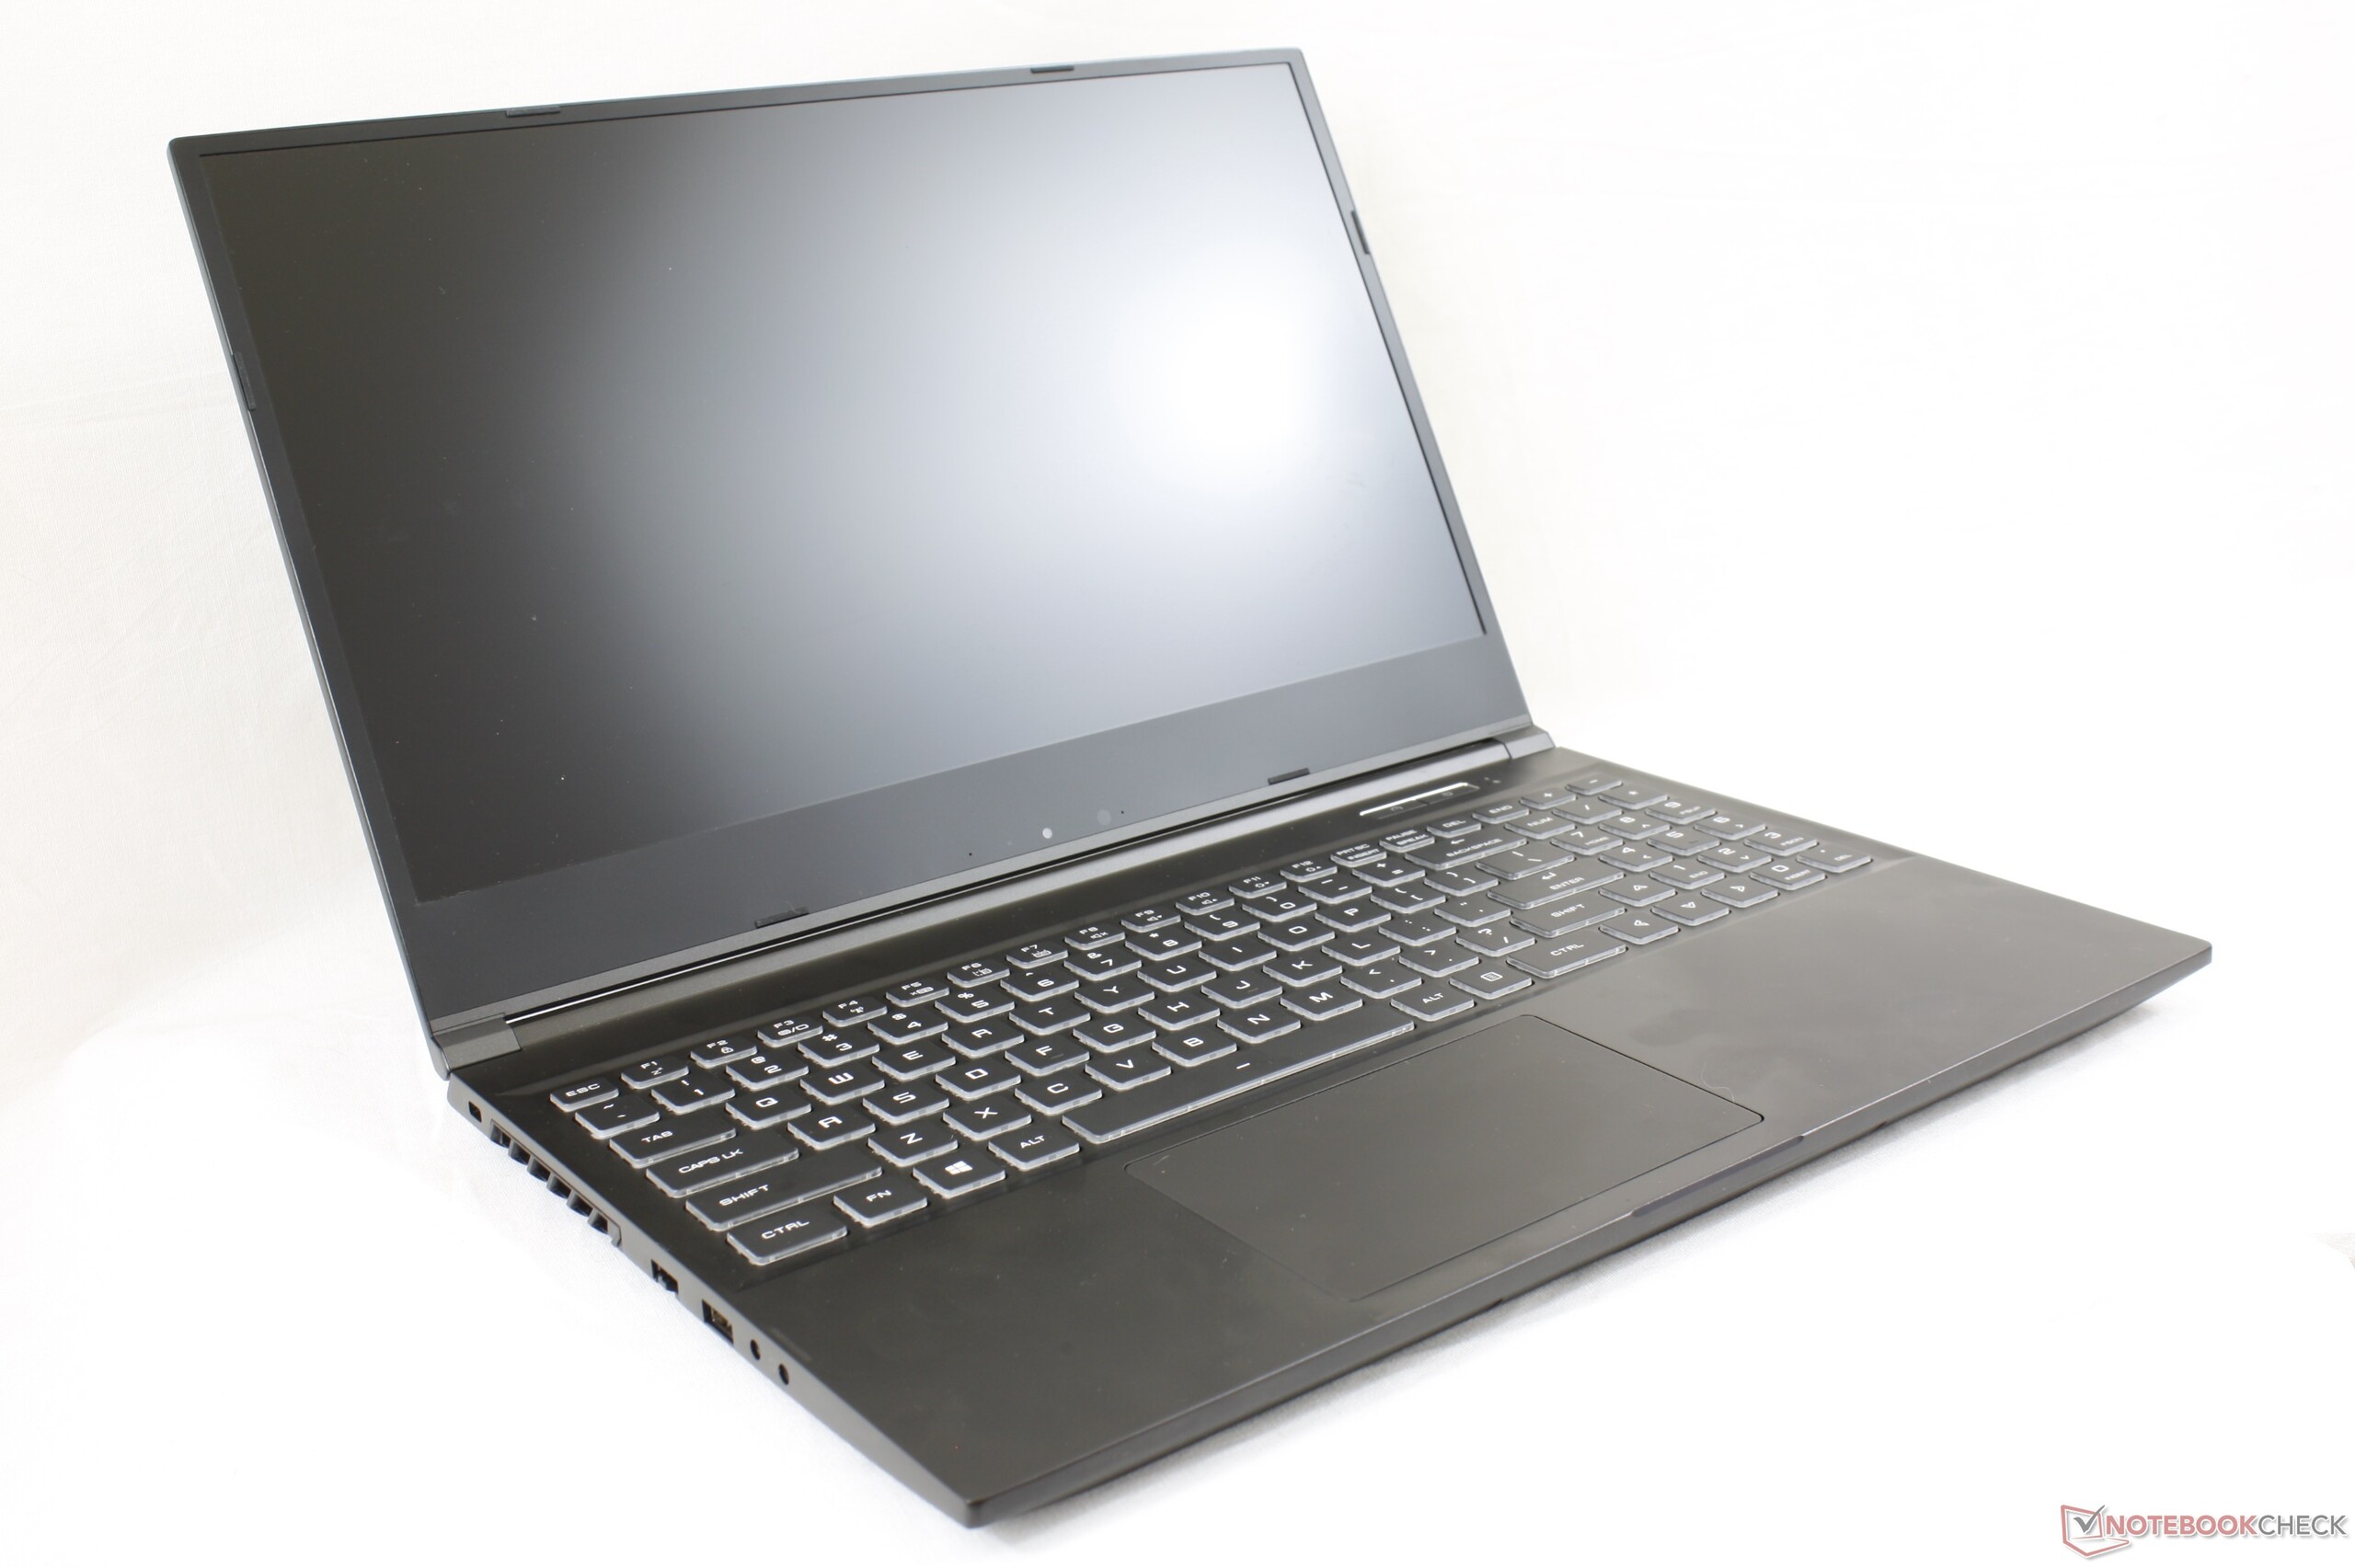
Recensione del Laptop Eluktronics RP-15: La Ryzen 7 4800H colpisce ancora una volta
Punteggio | Data | Modello | Peso | Altezza | Dimensione | Risoluzione | Prezzo |
|---|---|---|---|---|---|---|---|
| 82.6 % v7 (old) | 05/2020 | Eluktronics RP-15 R7 4800H, GeForce RTX 2060 Mobile | 1.9 kg | 20 mm | 15.60" | 1920x1080 | |
| 84 % v7 (old) | 05/2020 | MSI GS66 10SGS i7-10750H, GeForce RTX 2080 Super Max-Q | 2.2 kg | 20 mm | 15.60" | 1920x1080 | |
| 86 % v7 (old) | 05/2020 | Razer Blade 15 RZ09-0328 i7-10750H, GeForce RTX 2070 Max-Q | 2.1 kg | 19.9 mm | 15.60" | 3840x2160 | |
| 84.4 % v7 (old) | 08/2019 | Asus Strix GL531GV-PB74 i7-9750H, GeForce RTX 2060 Mobile | 2.4 kg | 25.9 mm | 15.60" | 1920x1080 | |
| 85.1 % v7 (old) | 03/2019 | Lenovo Legion Y740-15ICHg i7-8750H, GeForce RTX 2070 Max-Q | 2.3 kg | 25 mm | 15.60" | 1920x1080 | |
| 83 % v7 (old) | 09/2019 | Alienware m15 R2 P87F i7-9750H, GeForce RTX 2080 Max-Q | 2.2 kg | 18.3 mm | 15.60" | 1920x1080 |
| SD Card Reader | |
| average JPG Copy Test (av. of 3 runs) | |
| Razer Blade Pro 17 4K UHD 120 Hz (Toshiba Exceria Pro SDXC 64 GB UHS-II) | |
| Dell XPS 15 7590 9980HK GTX 1650 (Toshiba Exceria Pro SDXC 64 GB UHS-II) | |
| MSI GT75 8RG-090 Titan (Toshiba Exceria Pro SDXC 64 GB UHS-II) | |
| Asus ZenBook 15 UX534FTC-A8190T (Toshiba Exceria Pro SDXC 64 GB UHS-II) | |
| Eluktronics RP-15 (Toshiba Exceria Pro SDXC 64 GB UHS-II) | |
| maximum AS SSD Seq Read Test (1GB) | |
| Razer Blade Pro 17 4K UHD 120 Hz (Toshiba Exceria Pro SDXC 64 GB UHS-II) | |
| Dell XPS 15 7590 9980HK GTX 1650 (Toshiba Exceria Pro SDXC 64 GB UHS-II) | |
| MSI GT75 8RG-090 Titan (Toshiba Exceria Pro SDXC 64 GB UHS-II) | |
| Eluktronics RP-15 (Toshiba Exceria Pro SDXC 64 GB UHS-II) | |
| Networking | |
| iperf3 transmit AX12 | |
| Asus Zephyrus G14 GA401IV | |
| Razer Blade 15 RZ09-0328 | |
| Eluktronics RP-15 | |
| MSI GS66 10SGS | |
| iperf3 receive AX12 | |
| Razer Blade 15 RZ09-0328 | |
| Eluktronics RP-15 | |
| MSI GS66 10SGS | |
| Asus Zephyrus G14 GA401IV | |


| |||||||||||||||||||||||||
Distribuzione della luminosità: 90 %
Al centro con la batteria: 298.6 cd/m²
Contrasto: 853:1 (Nero: 0.35 cd/m²)
ΔE ColorChecker Calman: 5.01 | ∀{0.5-29.43 Ø4.73}
calibrated: 2.52
ΔE Greyscale Calman: 5.4 | ∀{0.09-98 Ø4.97}
91.6% sRGB (Argyll 1.6.3 3D)
59.1% AdobeRGB 1998 (Argyll 1.6.3 3D)
65.2% AdobeRGB 1998 (Argyll 3D)
92% sRGB (Argyll 3D)
63.7% Display P3 (Argyll 3D)
Gamma: 2.54
CCT: 7461 K
| Eluktronics RP-15 BOE NV156FHM-N4G, IPS, 15.6", 1920x1080 | MSI GS66 10SGS AU Optronics B156HAN12.0, IPS, 15.6", 1920x1080 | Razer Blade 15 RZ09-0328 Samsung SDCA029, AMOLED, 15.6", 3840x2160 | Asus Strix GL531GV-PB74 Panda LM156LF-GL02, IPS, 15.6", 1920x1080 | Lenovo Legion Y740-15ICHg LP156WFG-SPB2, IPS, 15.6", 1920x1080 | Alienware m15 R2 P87F Sharp LQ156M1, IPS, 15.6", 1920x1080 | |
|---|---|---|---|---|---|---|
| Display | 9% | 38% | -36% | -0% | 2% | |
| Display P3 Coverage (%) | 63.7 | 69.9 10% | 99.9 57% | 40.13 -37% | 63.5 0% | 65.3 3% |
| sRGB Coverage (%) | 92 | 99.1 8% | 100 9% | 60.3 -34% | 92.4 0% | 95.1 3% |
| AdobeRGB 1998 Coverage (%) | 65.2 | 71.1 9% | 97.4 49% | 41.48 -36% | 64.7 -1% | 65.9 1% |
| Response Times | 20% | 80% | -99% | -18% | 10% | |
| Response Time Grey 50% / Grey 80% * (ms) | 17.2 ? | 11.2 ? 35% | 2.7 ? 84% | 26 ? -51% | 18.8 ? -9% | 16.4 ? 5% |
| Response Time Black / White * (ms) | 10.4 ? | 10 ? 4% | 2.6 ? 75% | 25.6 ? -146% | 13.2 ? -27% | 8.8 ? 15% |
| PWM Frequency (Hz) | 59.5 ? | 23810 ? | ||||
| Screen | 33% | 19% | -35% | 6% | -7% | |
| Brightness middle (cd/m²) | 298.6 | 339.4 14% | 366.7 23% | 290.1 -3% | 320.4 7% | 324.2 9% |
| Brightness (cd/m²) | 289 | 331 15% | 371 28% | 274 -5% | 298 3% | 304 5% |
| Brightness Distribution (%) | 90 | 92 2% | 91 1% | 86 -4% | 85 -6% | 90 0% |
| Black Level * (cd/m²) | 0.35 | 0.24 31% | 0.54 -54% | 0.42 -20% | 0.38 -9% | |
| Contrast (:1) | 853 | 1414 66% | 537 -37% | 763 -11% | 853 0% | |
| Colorchecker dE 2000 * | 5.01 | 1.58 68% | 5.21 -4% | 5.16 -3% | 3.21 36% | 5.01 -0% |
| Colorchecker dE 2000 max. * | 7.06 | 3.8 46% | 7.92 -12% | 18.09 -156% | 5.54 22% | 12.7 -80% |
| Colorchecker dE 2000 calibrated * | 2.52 | 1.47 42% | 4.35 -73% | 2.36 6% | 1.64 35% | |
| Greyscale dE 2000 * | 5.4 | 2.3 57% | 2 63% | 4.4 19% | 3.6 33% | 7.9 -46% |
| Gamma | 2.54 87% | 2.24 98% | 2.17 101% | 2.1 105% | 2.27 97% | 2.35 94% |
| CCT | 7461 87% | 6952 93% | 6514 100% | 7362 88% | 6503 100% | 8455 77% |
| Color Space (Percent of AdobeRGB 1998) (%) | 59.1 | 64.8 10% | 86.6 47% | 38.1 -36% | 59 0% | 60.8 3% |
| Color Space (Percent of sRGB) (%) | 91.6 | 99.4 9% | 100 9% | 60 -34% | 92 0% | 95.5 4% |
| Media totale (Programma / Settaggio) | 21% /
27% | 46% /
33% | -57% /
-43% | -4% /
2% | 2% /
-3% |
* ... Meglio usare valori piccoli
Tempi di risposta del Display
| ↔ Tempi di risposta dal Nero al Bianco | ||
|---|---|---|
| 10.4 ms ... aumenta ↗ e diminuisce ↘ combinato | ↗ 6 ms Incremento | 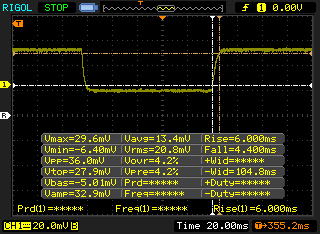 |
| ↘ 4.4 ms Calo | ||
| Lo schermo mostra buoni tempi di risposta durante i nostri tests, ma potrebbe essere troppo lento per i gamers competitivi. In confronto, tutti i dispositivi di test variano da 0.1 (minimo) a 240 (massimo) ms. » 28 % di tutti i dispositivi è migliore. Questo significa che i tempi di risposta rilevati sono migliori rispettto alla media di tutti i dispositivi testati (19.9 ms). | ||
| ↔ Tempo di risposta dal 50% Grigio all'80% Grigio | ||
| 17.2 ms ... aumenta ↗ e diminuisce ↘ combinato | ↗ 6 ms Incremento | 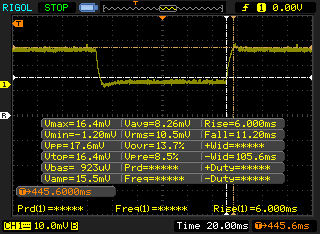 |
| ↘ 11.2 ms Calo | ||
| Lo schermo mostra buoni tempi di risposta durante i nostri tests, ma potrebbe essere troppo lento per i gamers competitivi. In confronto, tutti i dispositivi di test variano da 0.165 (minimo) a 636 (massimo) ms. » 31 % di tutti i dispositivi è migliore. Questo significa che i tempi di risposta rilevati sono migliori rispettto alla media di tutti i dispositivi testati (31.1 ms). | ||
Sfarfallio dello schermo / PWM (Pulse-Width Modulation)
| flickering dello schermo / PWM non rilevato | 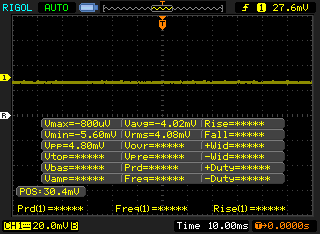 | ||
In confronto: 52 % di tutti i dispositivi testati non utilizza PWM per ridurre la luminosita' del display. Se è rilevato PWM, una media di 7784 (minimo: 5 - massimo: 343500) Hz è stata rilevata. | |||
Cinebench R15: CPU Multi 64Bit | CPU Single 64Bit
Blender: v2.79 BMW27 CPU
7-Zip 18.03: 7z b 4 -mmt1 | 7z b 4
Geekbench 5.5: Single-Core | Multi-Core
HWBOT x265 Benchmark v2.2: 4k Preset
LibreOffice : 20 Documents To PDF
R Benchmark 2.5: Overall mean
| Blender / v2.79 BMW27 CPU | |
| Asus ROG Zephyrus G15 GA502DU | |
| Eurocom Nightsky RX15 | |
| Schenker XMG Pro 15 | |
| MSI GS66 10SGS | |
| Asus Zephyrus G14 GA401IV | |
| Gigabyte Aero 15 OLED XB-8DE51B0SP | |
| Media AMD Ryzen 7 4800H (248 - 299, n=15) | |
| Eluktronics RP-15 | |
| Eurocom Sky X4C i9-9900KS | |
| 7-Zip 18.03 / 7z b 4 -mmt1 | |
| Eurocom Sky X4C i9-9900KS | |
| Gigabyte Aero 15 OLED XB-8DE51B0SP | |
| Eurocom Nightsky RX15 | |
| MSI GS66 10SGS | |
| Eluktronics RP-15 | |
| Media AMD Ryzen 7 4800H (4575 - 4743, n=15) | |
| Asus Zephyrus G14 GA401IV | |
| Schenker XMG Pro 15 | |
| Asus ROG Zephyrus G15 GA502DU | |
| Geekbench 5.5 / Single-Core | |
| Eurocom Sky X4C i9-9900KS | |
| Gigabyte Aero 15 OLED XB-8DE51B0SP | |
| Asus Zephyrus G14 GA401IV | |
| MSI GS66 10SGS | |
| Eluktronics RP-15 | |
| Media AMD Ryzen 7 4800H (1154 - 1207, n=17) | |
| Schenker XMG Pro 15 | |
| Geekbench 5.5 / Multi-Core | |
| Eurocom Sky X4C i9-9900KS | |
| Eluktronics RP-15 | |
| Gigabyte Aero 15 OLED XB-8DE51B0SP | |
| Media AMD Ryzen 7 4800H (5920 - 8672, n=17) | |
| Asus Zephyrus G14 GA401IV | |
| MSI GS66 10SGS | |
| Schenker XMG Pro 15 | |
| HWBOT x265 Benchmark v2.2 / 4k Preset | |
| Eurocom Sky X4C i9-9900KS | |
| Eluktronics RP-15 | |
| Gigabyte Aero 15 OLED XB-8DE51B0SP | |
| Media AMD Ryzen 7 4800H (10.8 - 14.1, n=16) | |
| Eurocom Nightsky RX15 | |
| Asus Zephyrus G14 GA401IV | |
| MSI GS66 10SGS | |
| Schenker XMG Pro 15 | |
| Asus ROG Zephyrus G15 GA502DU | |
| LibreOffice / 20 Documents To PDF | |
| Media AMD Ryzen 7 4800H (28.6 - 95.8, n=14) | |
| Eluktronics RP-15 | |
| MSI GS66 10SGS | |
| Gigabyte Aero 15 OLED XB-8DE51B0SP | |
| R Benchmark 2.5 / Overall mean | |
| Schenker XMG Pro 15 | |
| MSI GS66 10SGS | |
| Media AMD Ryzen 7 4800H (0.562 - 0.603, n=15) | |
| Eluktronics RP-15 | |
| Gigabyte Aero 15 OLED XB-8DE51B0SP | |
* ... Meglio usare valori piccoli
| PCMark 8 Home Score Accelerated v2 | 4937 punti | |
| PCMark 8 Work Score Accelerated v2 | 5969 punti | |
| PCMark 10 Score | 5706 punti | |
Aiuto | ||
| DPC Latencies / LatencyMon - interrupt to process latency (max), Web, Youtube, Prime95 | |
| Asus Zephyrus G14 GA401IV | |
| MSI GS66 10SGS | |
| Razer Blade 15 RZ09-0328 | |
| Eluktronics RP-15 | |
* ... Meglio usare valori piccoli
| Eluktronics RP-15 Phison PM81000GPMQCN28BTF-E12S4 M.2 NVM SSD | MSI GS66 10SGS Samsung SSD PM981 MZVLB512HAJQ | Razer Blade 15 RZ09-0328 Lite-On CA5-8D512 | Asus Strix GL531GV-PB74 Intel SSD 660p SSDPEKNW512G8 | Alienware m15 R2 P87F 2x Toshiba XG6 KXG60ZNV512G (RAID 0) | |
|---|---|---|---|---|---|
| AS SSD | 24% | 13% | -16% | 18% | |
| Seq Read (MB/s) | 509 | 1086 113% | 2021 297% | 1280 151% | 1925 278% |
| Seq Write (MB/s) | 1743 | 1901 9% | 2090 20% | 905 -48% | 2371 36% |
| 4K Read (MB/s) | 55.8 | 51 -9% | 47.71 -14% | 48.73 -13% | 37.2 -33% |
| 4K Write (MB/s) | 185 | 117.3 -37% | 101.1 -45% | 107 -42% | 108.9 -41% |
| 4K-64 Read (MB/s) | 596 | 1503 152% | 856 44% | 321.1 -46% | 1177 97% |
| 4K-64 Write (MB/s) | 1746 | 1721 -1% | 1041 -40% | 761 -56% | 1135 -35% |
| Access Time Read * (ms) | 0.047 | 0.059 -26% | 0.052 -11% | 0.058 -23% | 0.065 -38% |
| Access Time Write * (ms) | 0.059 | 0.1 -69% | 0.111 -88% | 0.046 22% | 0.108 -83% |
| Score Read (Points) | 703 | 1662 136% | 1105 57% | 498 -29% | 1407 100% |
| Score Write (Points) | 2105 | 2029 -4% | 1351 -36% | 958 -54% | 1481 -30% |
| Score Total (Points) | 3249 | 4588 41% | 3037 -7% | 1711 -47% | 3633 12% |
| Copy ISO MB/s (MB/s) | 2413 | 2155 -11% | 2474 3% | 1519 -37% | 2073 -14% |
| Copy Program MB/s (MB/s) | 580 | 715 23% | 679 17% | 749 29% | 576 -1% |
| Copy Game MB/s (MB/s) | 1311 | 1506 15% | 1037 -21% | 943 -28% | 1426 9% |
| CrystalDiskMark 5.2 / 6 | -14% | -3% | -37% | 2% | |
| Write 4K (MB/s) | 245.5 | 132.5 -46% | 118.7 -52% | 121.9 -50% | 108.8 -56% |
| Read 4K (MB/s) | 62.8 | 45.03 -28% | 52.4 -17% | 53.6 -15% | 45.41 -28% |
| Write Seq (MB/s) | 1853 | 1987 7% | 2247 21% | 967 -48% | 2467 33% |
| Read Seq (MB/s) | 1770 | 1434 -19% | 2234 26% | 1461 -17% | 2456 39% |
| Write 4K Q32T1 (MB/s) | 565 | 467.5 -17% | 515 -9% | 431.4 -24% | 532 -6% |
| Read 4K Q32T1 (MB/s) | 628 | 536 -15% | 584 -7% | 337.3 -46% | 590 -6% |
| Write Seq Q32T1 (MB/s) | 1839 | 2003 9% | 2235 22% | 972 -47% | 2801 52% |
| Read Seq Q32T1 (MB/s) | 3473 | 3306 -5% | 3171 -9% | 1727 -50% | 3172 -9% |
| Media totale (Programma / Settaggio) | 5% /
10% | 5% /
7% | -27% /
-24% | 10% /
13% |
* ... Meglio usare valori piccoli

Disk Throttling: DiskSpd Read Loop, Queue Depth 8
| 3DMark 11 Performance | 19967 punti | |
| 3DMark Cloud Gate Standard Score | 37740 punti | |
| 3DMark Fire Strike Score | 15476 punti | |
| 3DMark Time Spy Score | 6600 punti | |
Aiuto | ||
| The Witcher 3 | |
| 1024x768 Low Graphics & Postprocessing | |
| MSI GS66 10SGS | |
| Razer Blade 15 RZ09-0328 | |
| MSI GF65 9SD | |
| MSI RTX 2060 Gaming Z 6G | |
| Eluktronics RP-15 | |
| Media NVIDIA GeForce RTX 2060 Mobile (188.7 - 295, n=27) | |
| HP Omen 15-dc0015ng | |
| Lenovo Yoga C940-15IRH | |
| 1920x1080 Ultra Graphics & Postprocessing (HBAO+) | |
| Schenker XMG Apex 15 NH57AF1 | |
| MSI GS66 10SGS | |
| MSI RTX 2060 Gaming Z 6G | |
| Eluktronics RP-15 | |
| Razer Blade 15 RZ09-0328 | |
| Media NVIDIA GeForce RTX 2060 Mobile (50.6 - 74, n=40) | |
| MSI GF65 9SD | |
| HP Omen 15-dc0015ng | |
| Medion Erazer X6805-MD61085 | |
| Lenovo Yoga C940-15IRH | |
| basso | medio | alto | ultra | |
|---|---|---|---|---|
| The Witcher 3 (2015) | 275.4 | 113.6 | 62.4 | |
| Dota 2 Reborn (2015) | 122 | 116 | 107 | 104 |
| X-Plane 11.11 (2018) | 95.7 | 84.9 | 71.1 | |
| Shadow of the Tomb Raider (2018) | 118 | 91 | 84 | 75 |
| Metro Exodus (2019) | 132.8 | 71.8 | 54.3 | 43 |
| Borderlands 3 (2019) | 118.1 | 88.1 | 61 | 47.5 |
| Eluktronics RP-15 GeForce RTX 2060 Mobile, R7 4800H, Phison PM81000GPMQCN28BTF-E12S4 M.2 NVM SSD | MSI GS66 10SGS GeForce RTX 2080 Super Max-Q, i7-10750H, Samsung SSD PM981 MZVLB512HAJQ | Razer Blade 15 RZ09-0328 GeForce RTX 2070 Max-Q, i7-10750H, Lite-On CA5-8D512 | Asus Strix GL531GV-PB74 GeForce RTX 2060 Mobile, i7-9750H, Intel SSD 660p SSDPEKNW512G8 | Lenovo Legion Y740-15ICHg GeForce RTX 2070 Max-Q, i7-8750H, Samsung SSD PM981 MZVLB256HAHQ | Alienware m15 R2 P87F GeForce RTX 2080 Max-Q, i7-9750H, 2x Toshiba XG6 KXG60ZNV512G (RAID 0) | |
|---|---|---|---|---|---|---|
| Noise | -2% | 0% | -4% | 3% | -11% | |
| off /ambiente * (dB) | 28 | 28.5 -2% | 28.4 -1% | 28.2 -1% | 28 -0% | 28.3 -1% |
| Idle Minimum * (dB) | 28 | 30 -7% | 28.4 -1% | 28.8 -3% | 32.6 -16% | 28.5 -2% |
| Idle Average * (dB) | 28 | 30 -7% | 28.4 -1% | 31.4 -12% | 32.7 -17% | 28.5 -2% |
| Idle Maximum * (dB) | 31.5 | 30.9 2% | 31.7 -1% | 33.3 -6% | 32.7 -4% | 49 -56% |
| Load Average * (dB) | 44 | 39.5 10% | 47.7 -8% | 46.2 -5% | 33.3 24% | 49 -11% |
| Witcher 3 ultra * (dB) | 48.8 | 48 2% | 47.5 3% | 50.5 -3% | 41.6 15% | 49 -0% |
| Load Maximum * (dB) | 54.1 | 59.4 -10% | 49.5 9% | 51.3 5% | 45.2 16% | 55 -2% |
* ... Meglio usare valori piccoli
Rumorosità
| Idle |
| 28 / 28 / 31.5 dB(A) |
| Sotto carico |
| 44 / 54.1 dB(A) |
 | ||
30 dB silenzioso 40 dB(A) udibile 50 dB(A) rumoroso |
||
min: | ||
(-) La temperatura massima sul lato superiore è di 50 °C / 122 F, rispetto alla media di 40.4 °C / 105 F, che varia da 21.2 a 68.8 °C per questa classe Gaming.
(-) Il lato inferiore si riscalda fino ad un massimo di 58 °C / 136 F, rispetto alla media di 43.2 °C / 110 F
(±) In idle, la temperatura media del lato superiore è di 34.4 °C / 94 F, rispetto alla media deld ispositivo di 33.9 °C / 93 F.
(+) Riproducendo The Witcher 3, la temperatura media per il lato superiore e' di 31 °C / 88 F, rispetto alla media del dispositivo di 33.9 °C / 93 F.
(+) I poggiapolsi e il touchpad sono piu' freddi della temperatura della pelle con un massimo di 31.4 °C / 88.5 F e sono quindi freddi al tatto.
(-) La temperatura media della zona del palmo della mano di dispositivi simili e'stata di 28.8 °C / 83.8 F (-2.6 °C / -4.7 F).
Eluktronics RP-15 analisi audio
(±) | potenza degli altiparlanti media ma buona (78.8 dB)
Bassi 100 - 315 Hz
(-) | quasi nessun basso - in media 18.2% inferiori alla media
(±) | la linearità dei bassi è media (10.8% delta rispetto alla precedente frequenza)
Medi 400 - 2000 Hz
(+) | medi bilanciati - solo only 3.8% rispetto alla media
(±) | linearità dei medi adeguata (8.1% delta rispetto alla precedente frequenza)
Alti 2 - 16 kHz
(+) | Alti bilanciati - appena 3% dalla media
(+) | alti lineari (4.6% delta rispetto alla precedente frequenza)
Nel complesso 100 - 16.000 Hz
(±) | la linearità complessiva del suono è media (20% di differenza rispetto alla media
Rispetto alla stessa classe
» 70% di tutti i dispositivi testati in questa classe è stato migliore, 7% simile, 23% peggiore
» Il migliore ha avuto un delta di 6%, medio di 18%, peggiore di 132%
Rispetto a tutti i dispositivi testati
» 51% di tutti i dispositivi testati in questa classe è stato migliore, 8% similare, 41% peggiore
» Il migliore ha avuto un delta di 4%, medio di 24%, peggiore di 134%
Apple MacBook 12 (Early 2016) 1.1 GHz analisi audio
(+) | gli altoparlanti sono relativamente potenti (83.6 dB)
Bassi 100 - 315 Hz
(±) | bassi ridotti - in media 11.3% inferiori alla media
(±) | la linearità dei bassi è media (14.2% delta rispetto alla precedente frequenza)
Medi 400 - 2000 Hz
(+) | medi bilanciati - solo only 2.4% rispetto alla media
(+) | medi lineari (5.5% delta rispetto alla precedente frequenza)
Alti 2 - 16 kHz
(+) | Alti bilanciati - appena 2% dalla media
(+) | alti lineari (4.5% delta rispetto alla precedente frequenza)
Nel complesso 100 - 16.000 Hz
(+) | suono nel complesso lineare (10.2% differenza dalla media)
Rispetto alla stessa classe
» 7% di tutti i dispositivi testati in questa classe è stato migliore, 2% simile, 91% peggiore
» Il migliore ha avuto un delta di 5%, medio di 18%, peggiore di 53%
Rispetto a tutti i dispositivi testati
» 5% di tutti i dispositivi testati in questa classe è stato migliore, 1% similare, 94% peggiore
» Il migliore ha avuto un delta di 4%, medio di 24%, peggiore di 134%
| Off / Standby | |
| Idle | |
| Sotto carico |
|
Leggenda:
min: | |
| Eluktronics RP-15 R7 4800H, GeForce RTX 2060 Mobile, Phison PM81000GPMQCN28BTF-E12S4 M.2 NVM SSD, IPS, 1920x1080, 15.6" | MSI GS66 10SGS i7-10750H, GeForce RTX 2080 Super Max-Q, Samsung SSD PM981 MZVLB512HAJQ, IPS, 1920x1080, 15.6" | Razer Blade 15 RZ09-0328 i7-10750H, GeForce RTX 2070 Max-Q, Lite-On CA5-8D512, AMOLED, 3840x2160, 15.6" | Asus Strix GL531GV-PB74 i7-9750H, GeForce RTX 2060 Mobile, Intel SSD 660p SSDPEKNW512G8, IPS, 1920x1080, 15.6" | Lenovo Legion Y740-15ICHg i7-8750H, GeForce RTX 2070 Max-Q, Samsung SSD PM981 MZVLB256HAHQ, IPS, 1920x1080, 15.6" | Maingear Vector 15 i7-9750H, GeForce GTX 1660 Ti Mobile, , IPS, 1920x1080, 15.6" | |
|---|---|---|---|---|---|---|
| Power Consumption | 15% | 16% | 15% | 11% | 16% | |
| Idle Minimum * (Watt) | 21.7 | 14.9 31% | 11.1 49% | 10.9 50% | 22.9 -6% | 16.2 25% |
| Idle Average * (Watt) | 30.1 | 17.5 42% | 13.7 54% | 14.7 51% | 27.2 10% | 21.1 30% |
| Idle Maximum * (Watt) | 35 | 29.5 16% | 33.4 5% | 32.4 7% | 27.5 21% | 26.4 25% |
| Load Average * (Watt) | 112.6 | 94.8 16% | 104.4 7% | 121.9 -8% | 83.4 26% | 85.1 24% |
| Witcher 3 ultra * (Watt) | 134.4 | 146.1 -9% | 159.9 -19% | 143.5 -7% | 143.6 -7% | 158.2 -18% |
| Load Maximum * (Watt) | 201.5 | 210.9 -5% | 203.8 -1% | 209.6 -4% | 160.5 20% | 188 7% |
* ... Meglio usare valori piccoli
| Eluktronics RP-15 R7 4800H, GeForce RTX 2060 Mobile, 46.7 Wh | MSI GS66 10SGS i7-10750H, GeForce RTX 2080 Super Max-Q, 99.99 Wh | Razer Blade 15 RZ09-0328 i7-10750H, GeForce RTX 2070 Max-Q, 65 Wh | Asus Strix GL531GV-PB74 i7-9750H, GeForce RTX 2060 Mobile, 66 Wh | Lenovo Legion Y740-15ICHg i7-8750H, GeForce RTX 2070 Max-Q, 57 Wh | Alienware m15 R2 P87F i7-9750H, GeForce RTX 2080 Max-Q, 76 Wh | |
|---|---|---|---|---|---|---|
| Autonomia della batteria | 92% | 11% | -47% | -22% | 53% | |
| WiFi v1.3 (h) | 3.6 | 6.9 92% | 4 11% | 1.9 -47% | 2.8 -22% | 5.5 53% |
| Reader / Idle (h) | 10.2 | 3.9 | 9.2 | |||
| Load (h) | 1.6 | 0.8 | 0.7 |
Pro
Contro
L'Eluktronics RP-15 da 15,6" condivide molti pro e contro con l'Asus Zephyrus G14 da 14". Entrambi sono molto compatti per le rispettive dimensioni di classe con prestazioni estreme per volume grazie soprattutto alle loro CPU Ryzen da 7 nm. Per ora, non troverete un altro laptop da 15,6" gaming con prestazioni del processore più veloci rispetto alla Eluktronics al di sotto dei 2 kg.
Gli svantaggi principali sono quelli che ci si aspetterebbe: ventole rumorose e temperature elevate quando si eseguono carichi impegnativi. Se volete spremere tutto ciò che il sistema ha da offrire, allora dovrete sopportare la modalità Fan Boost e il suo inevitabile rumore delle ventole di 54 dB(A).
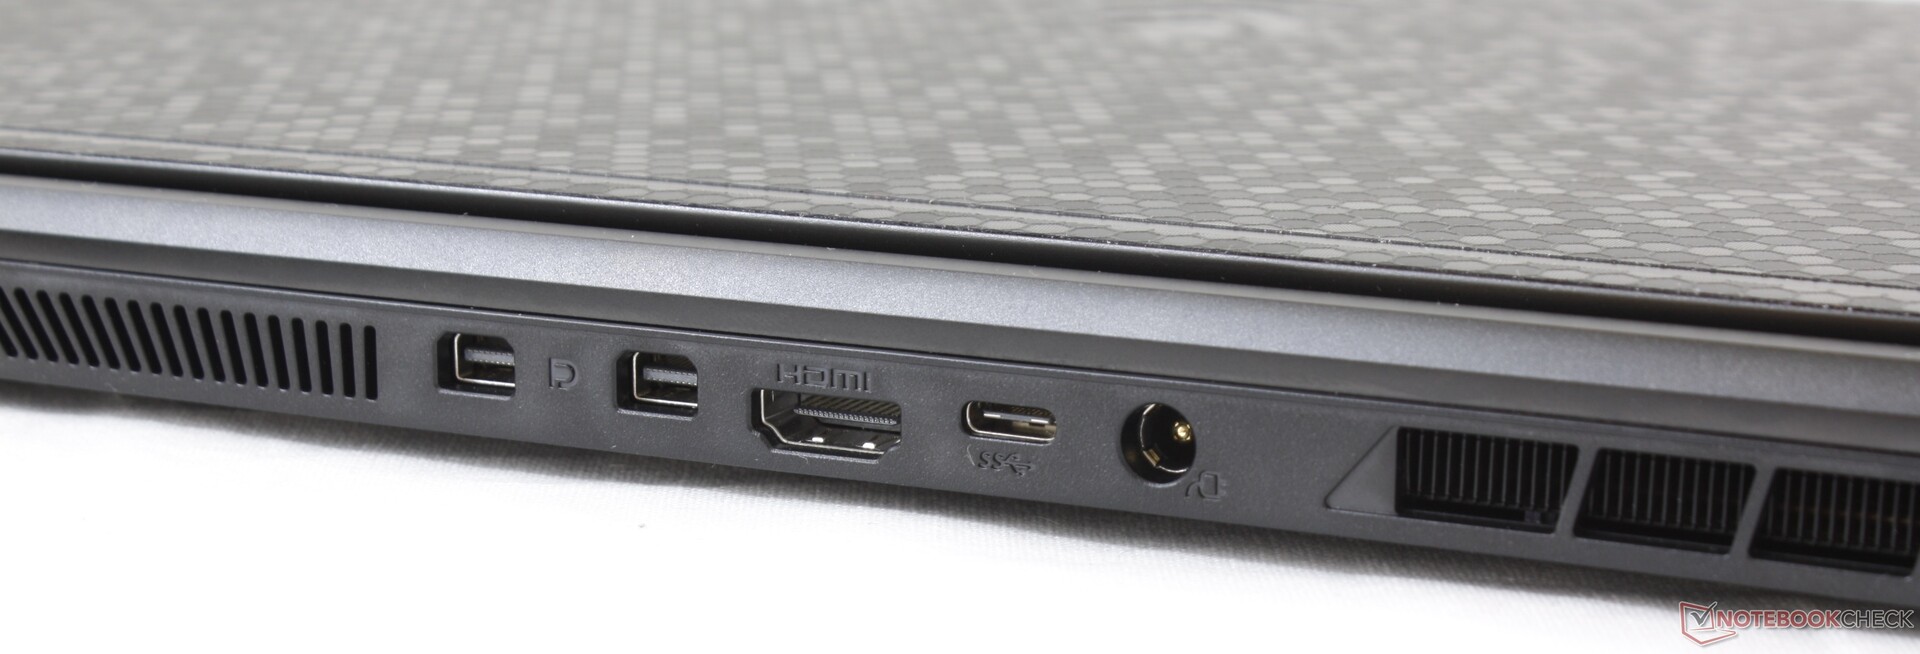
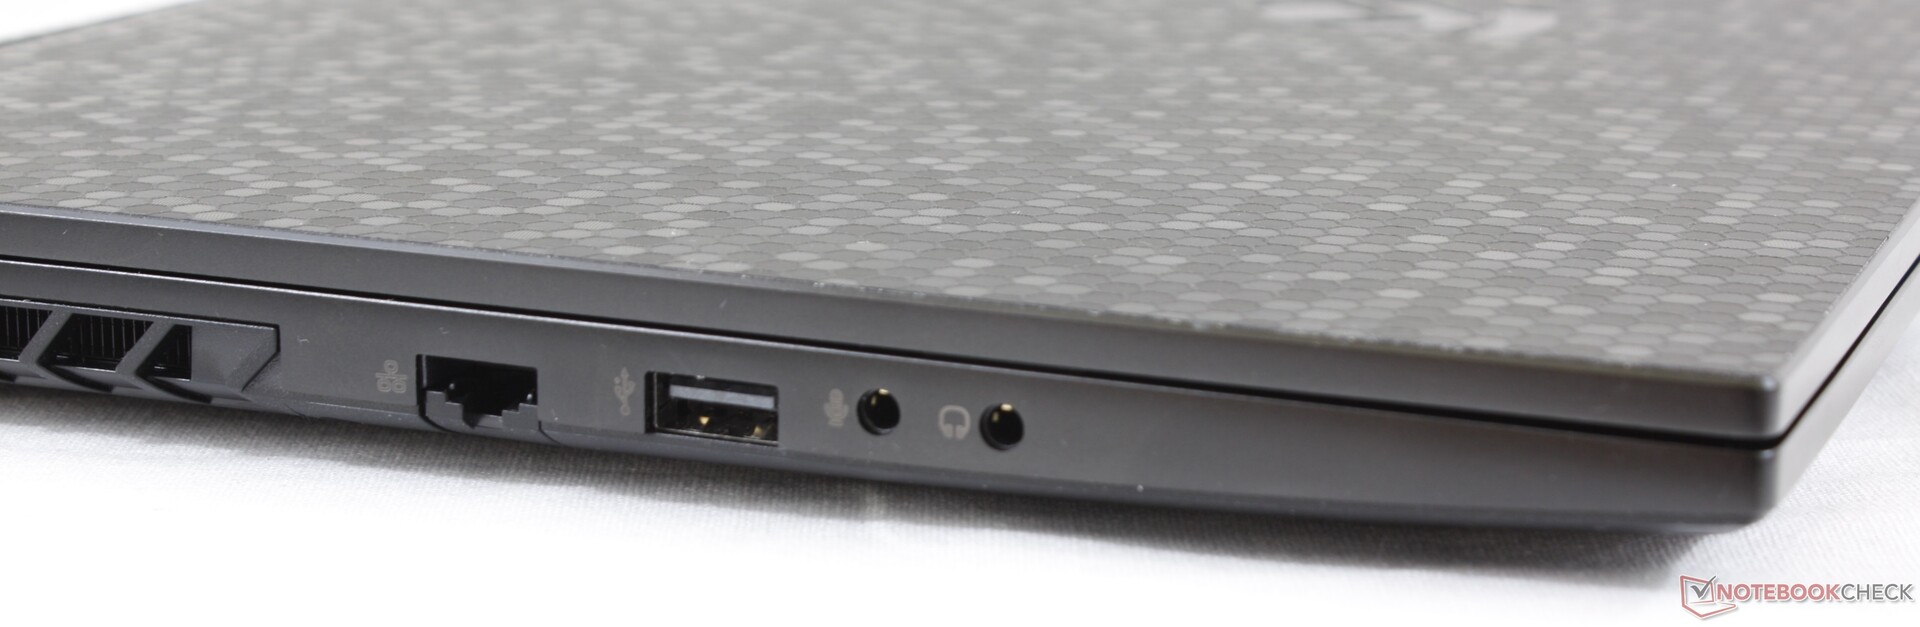
Prestazioni di fascia alta ad un prezzo medio. Vi perderete alcune caratteristiche di lusso come la Thunderbolt 3, l'illuminazione RGB per tasto e la sincronizzazione adattiva, mentre il posizionamento non ottimale della webcam e il lento lettore di schede SD sono una seccatura. Tuttavia, le altissime prestazioni per peso, la facilità di manutenzione e i comodi tasti della tastiera compensano la maggior parte degli inconvenienti.
Eluktronics RP-15
- 05/28/2020 v7 (old)
Allen Ngo
Price comparison
