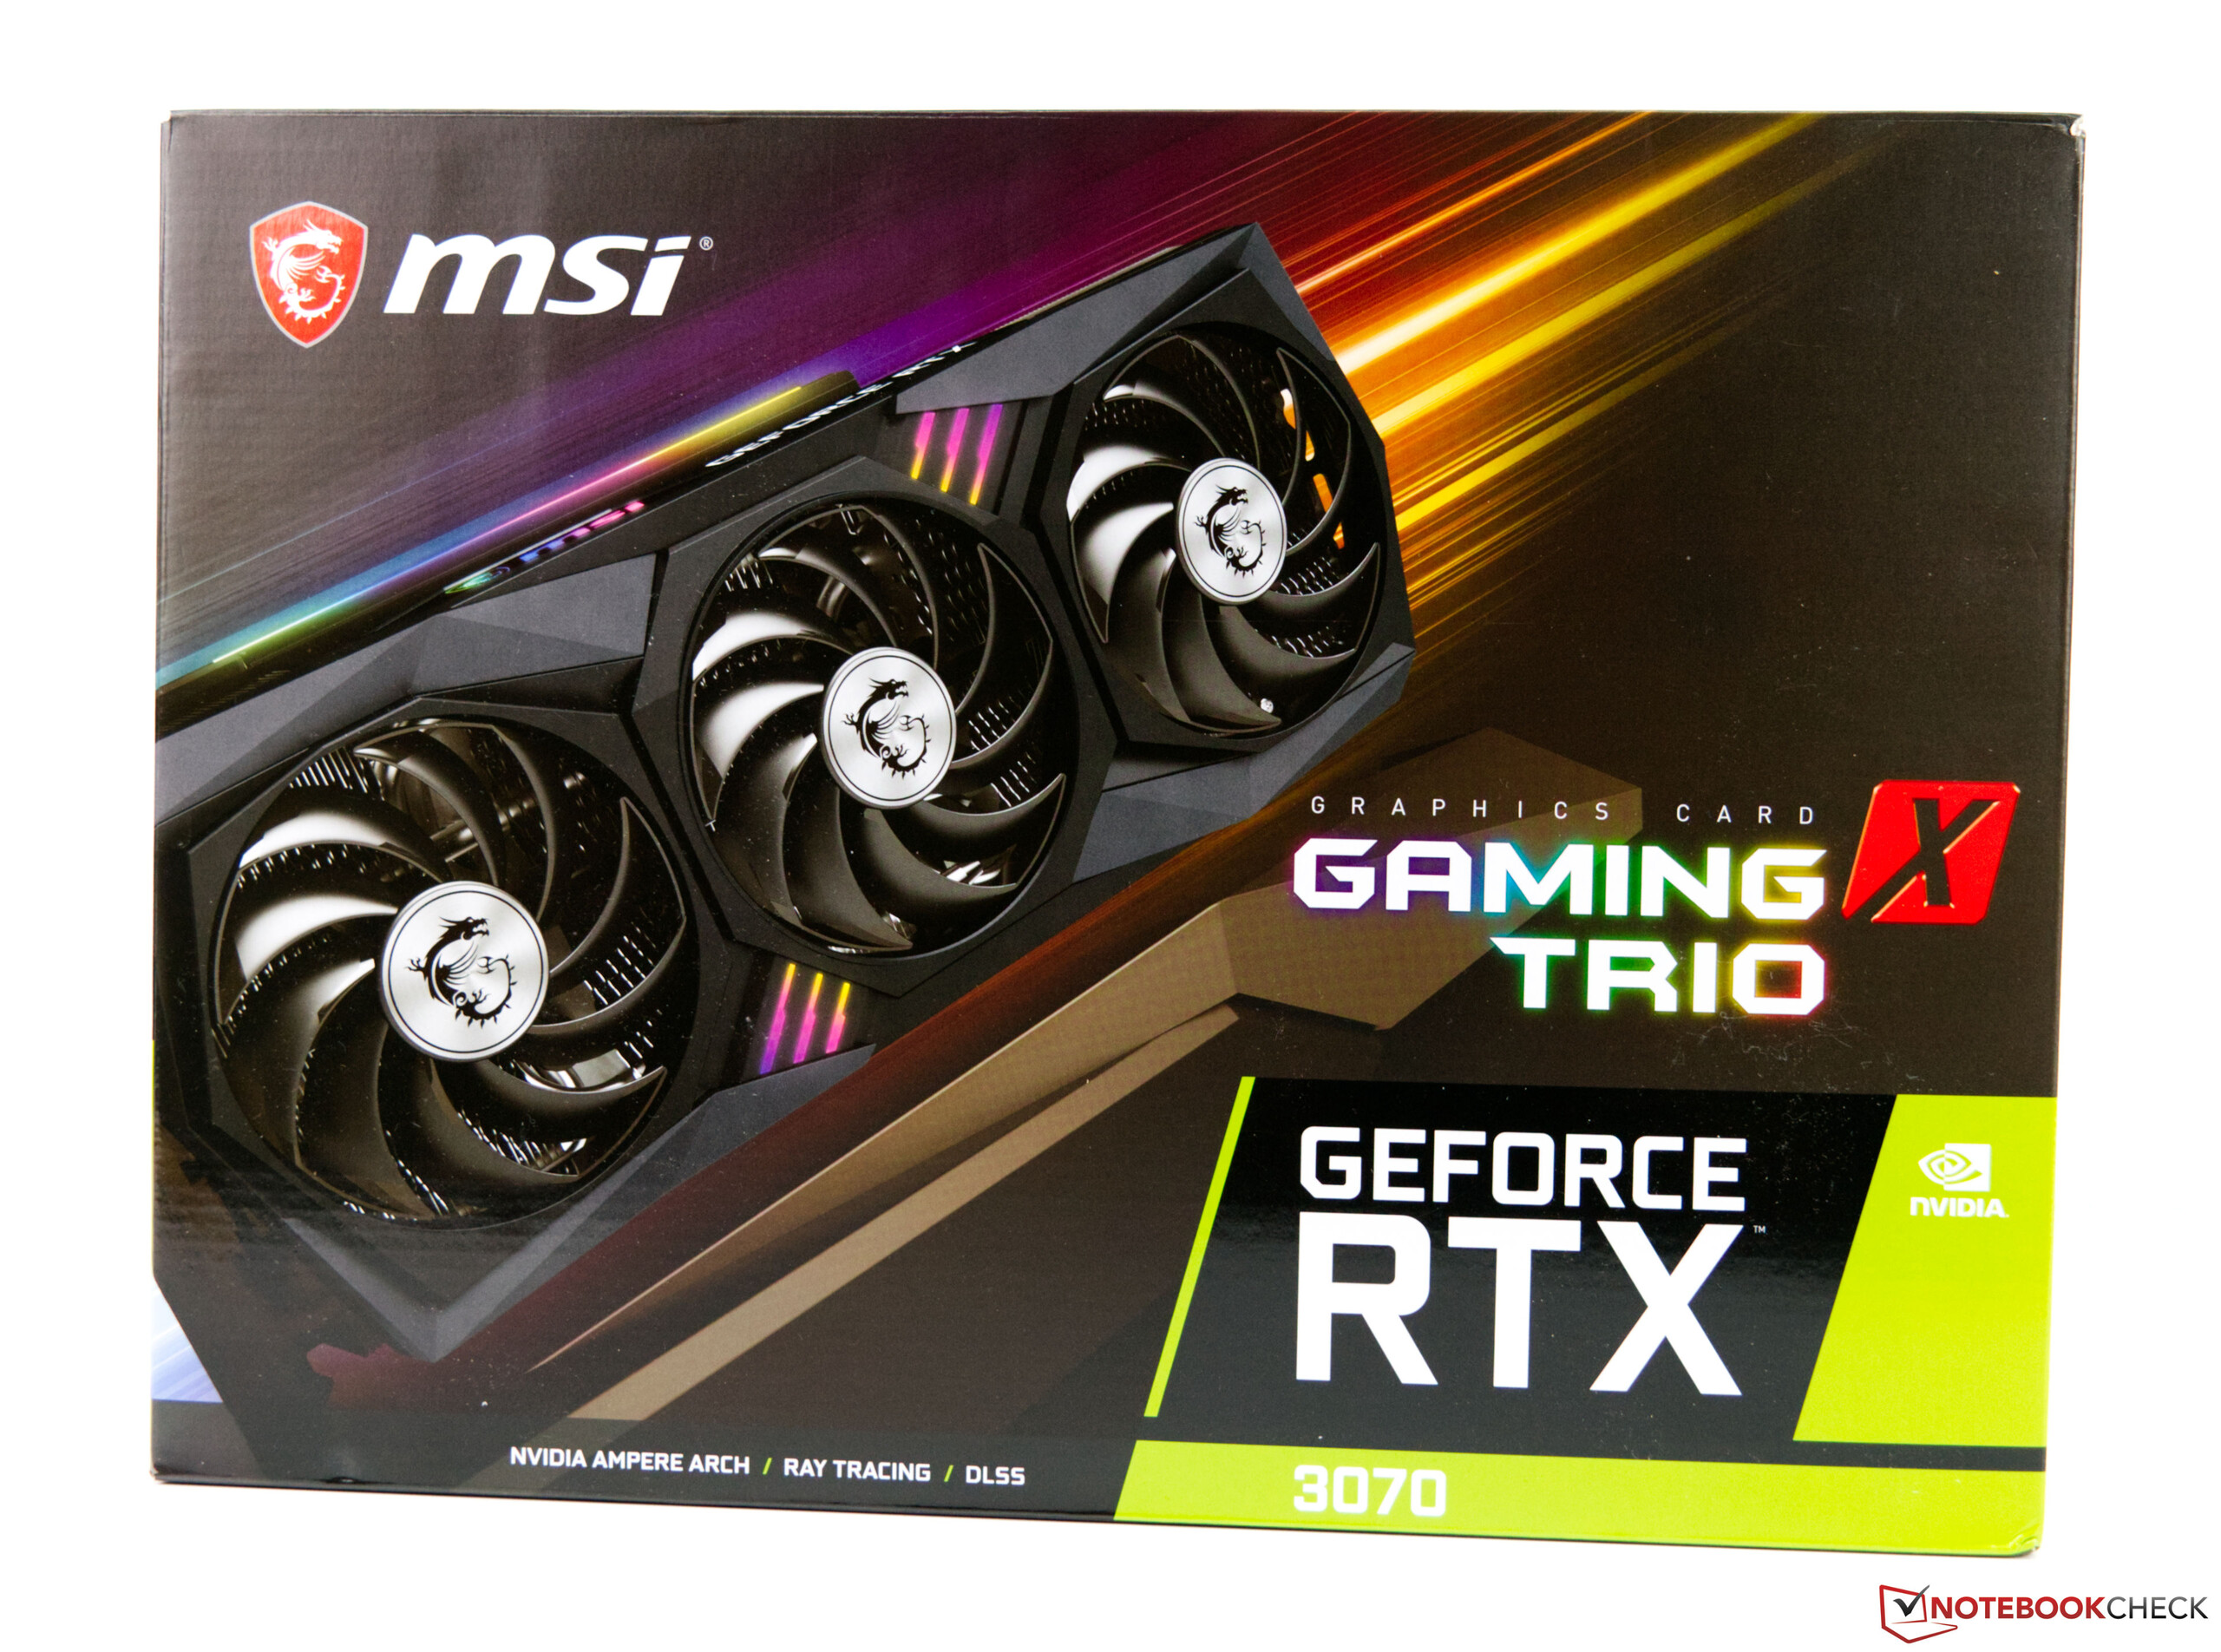
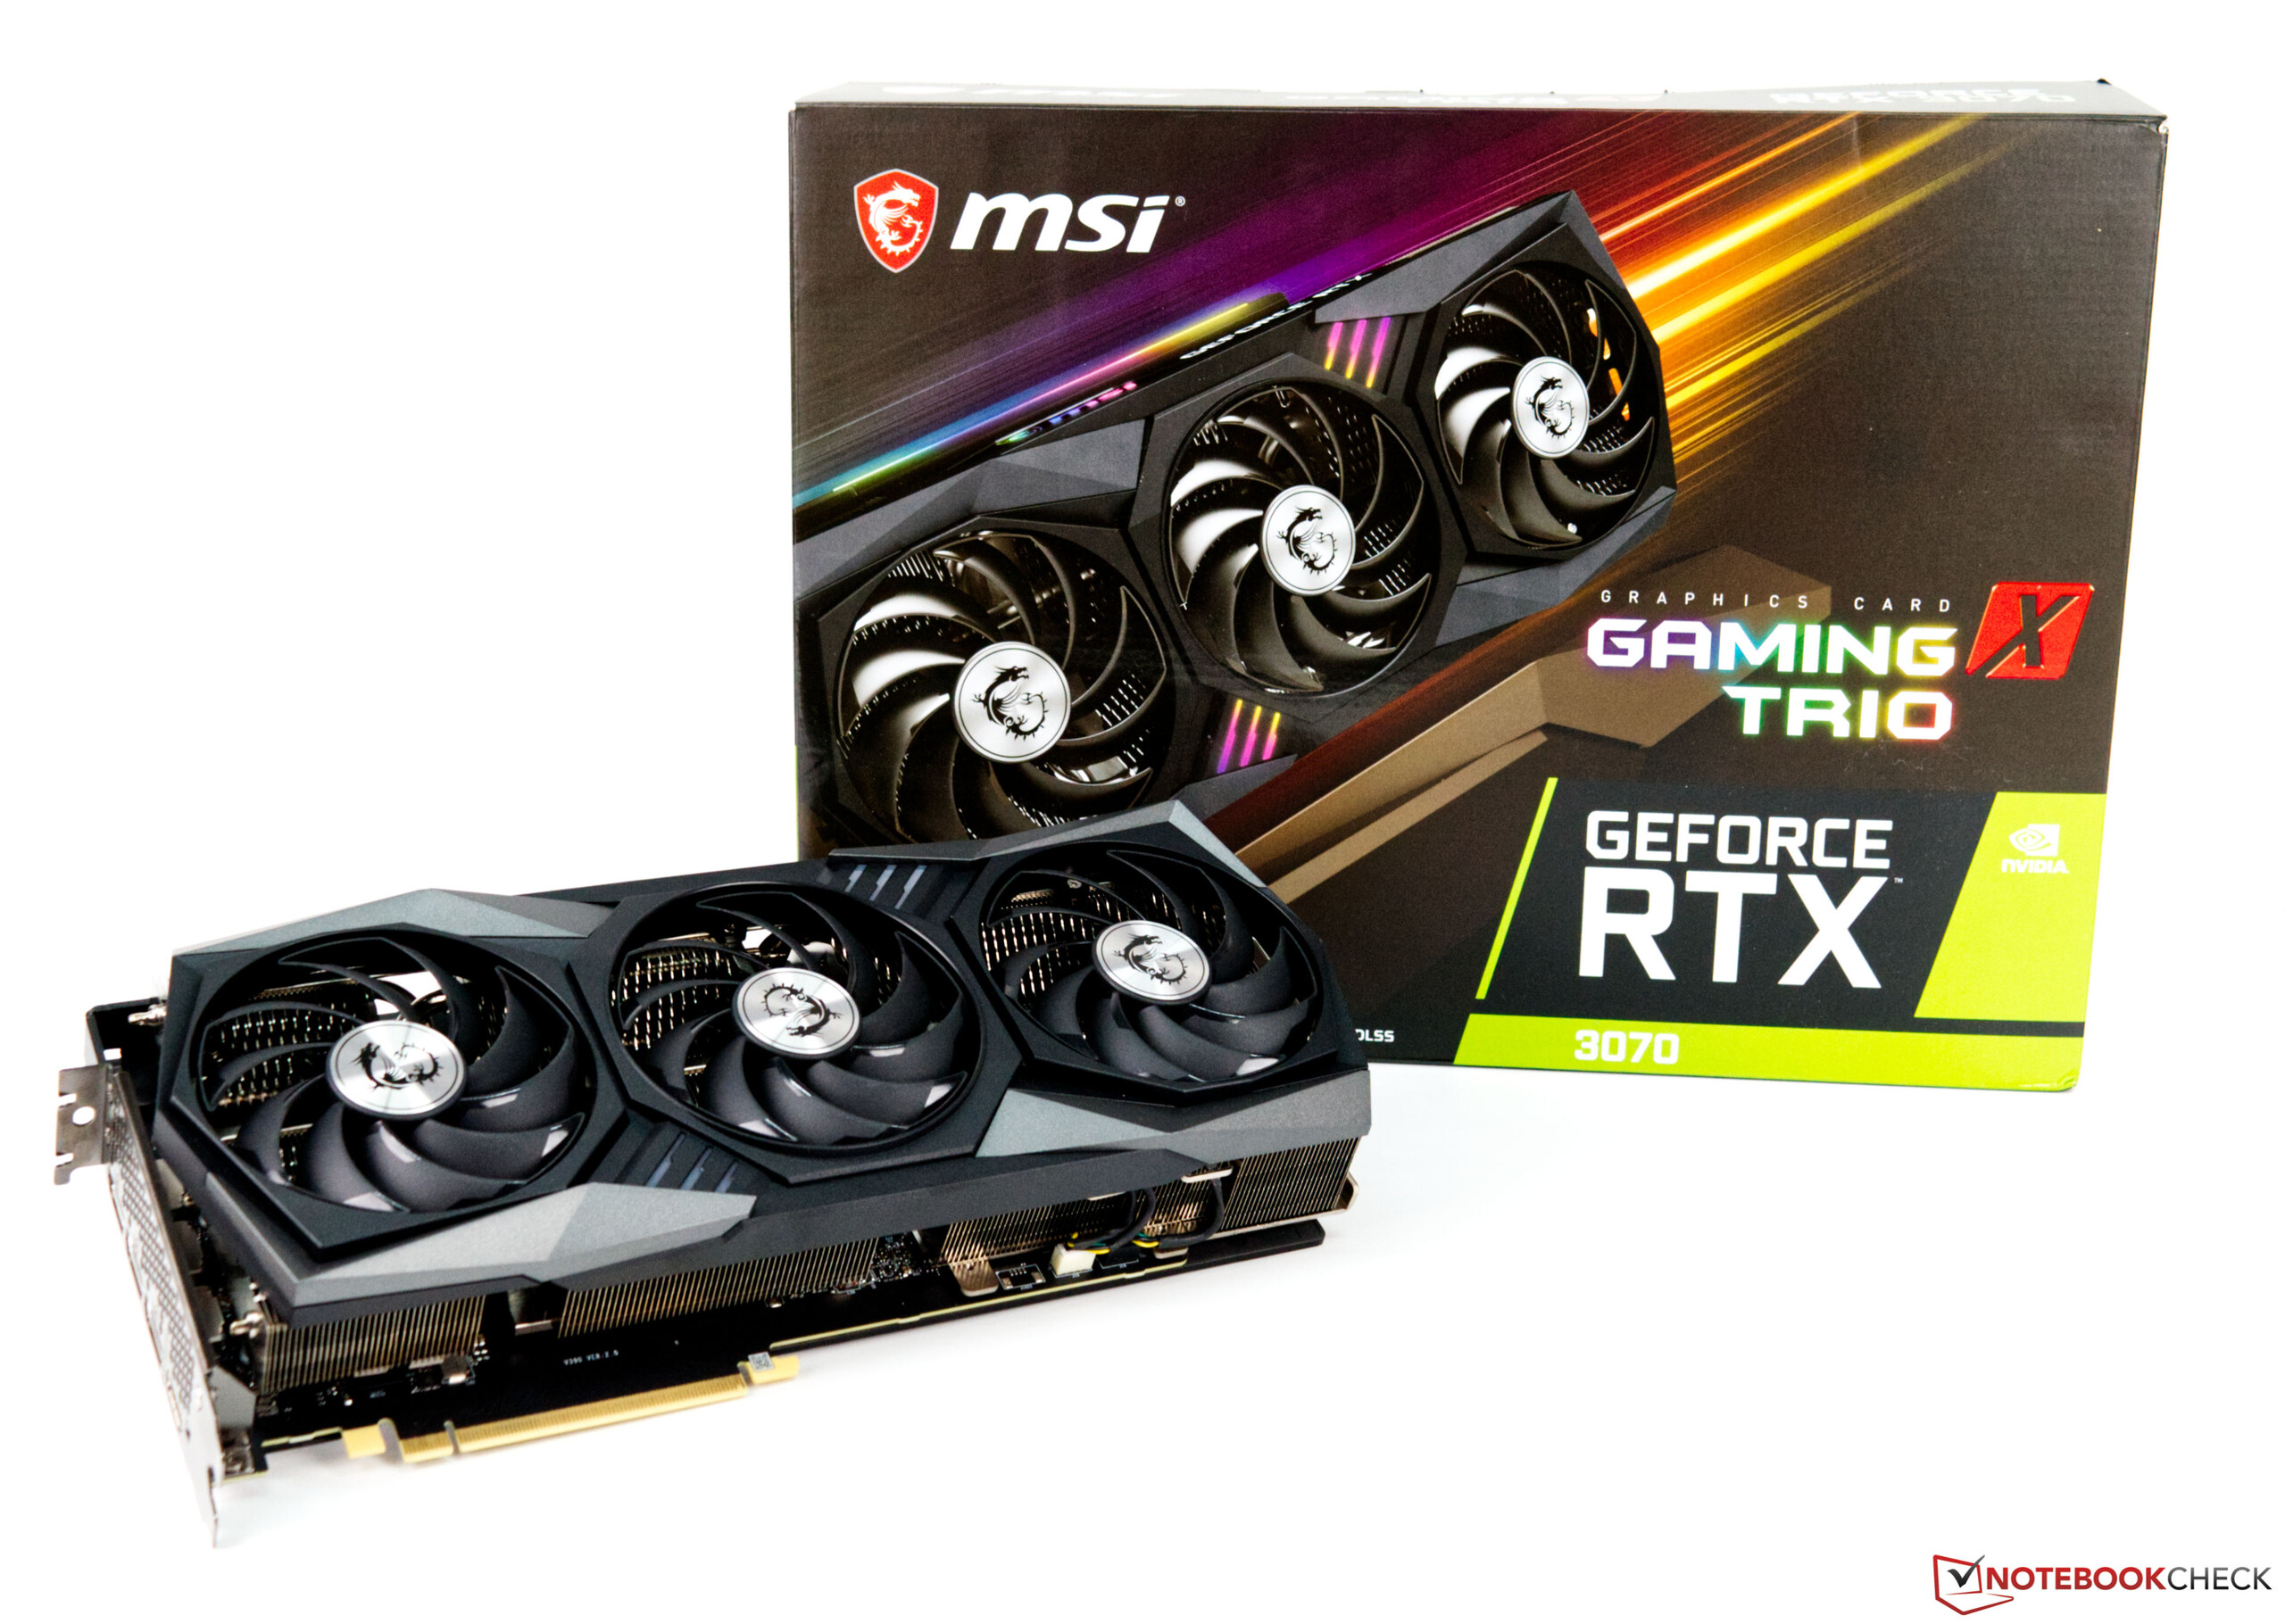
Recensione della scheda grafica desktop MSI GeForce RTX 3070 Gaming X Trio
L'architettura Ampere ha fatto il suo debutto all'inizio di quest'anno, anche se inizialmente solo per il mercato dei server. Successivamente sono arrivati i dispositivi gaming basati sui nuovi chip prodotti in 8 nm. Dopo i test iniziali, alcuni di essi hanno superato in modo significativo le schede grafiche di Turing. A seconda dello scenario applicativo, Ampere offre fino al 30% di prestazioni in più rispetto a Turing.
In questo modo, la GeForce RTX 3070, come successore della GeForce 2070 Super, prende un'eredità relativamente leggera, perché le prestazioni sono significativamente superate ed è paragonabile ad una GeForce RTX 2080 Ti. Al contrario, questo significa maggiori prestazioni ad un prezzo più basso per i clienti, perché la GeForce RTX 2080 Ti costa 999 Euro (~$1.189) al rilascio, mentre Nvidia fa pagare 499 Euro (~$594) per l'RTX 3070 Founders Edition. A seconda del modello personalizzato, i prezzi sono aumentati grazie alle migliori soluzioni di raffreddamento. Questo vale anche per la generazione attuale, perché la nostra GeForce RTX 3070 Gaming X Trio di MSI costa attualmente poco meno di 720 Euro (~$857), quando è addirittura disponibile. Questo ci porta direttamente all'argomento successivo, perché le scarse scorte hanno causato un ulteriore aumento dei prezzi dal momento del rilascio. Ma non è solo Nvidia a sentire il malcontento dei clienti, visto che anche AMD è alle prese con questo problema. Purtroppo, al momento è impossibile dire quando questa situazione migliorerà.
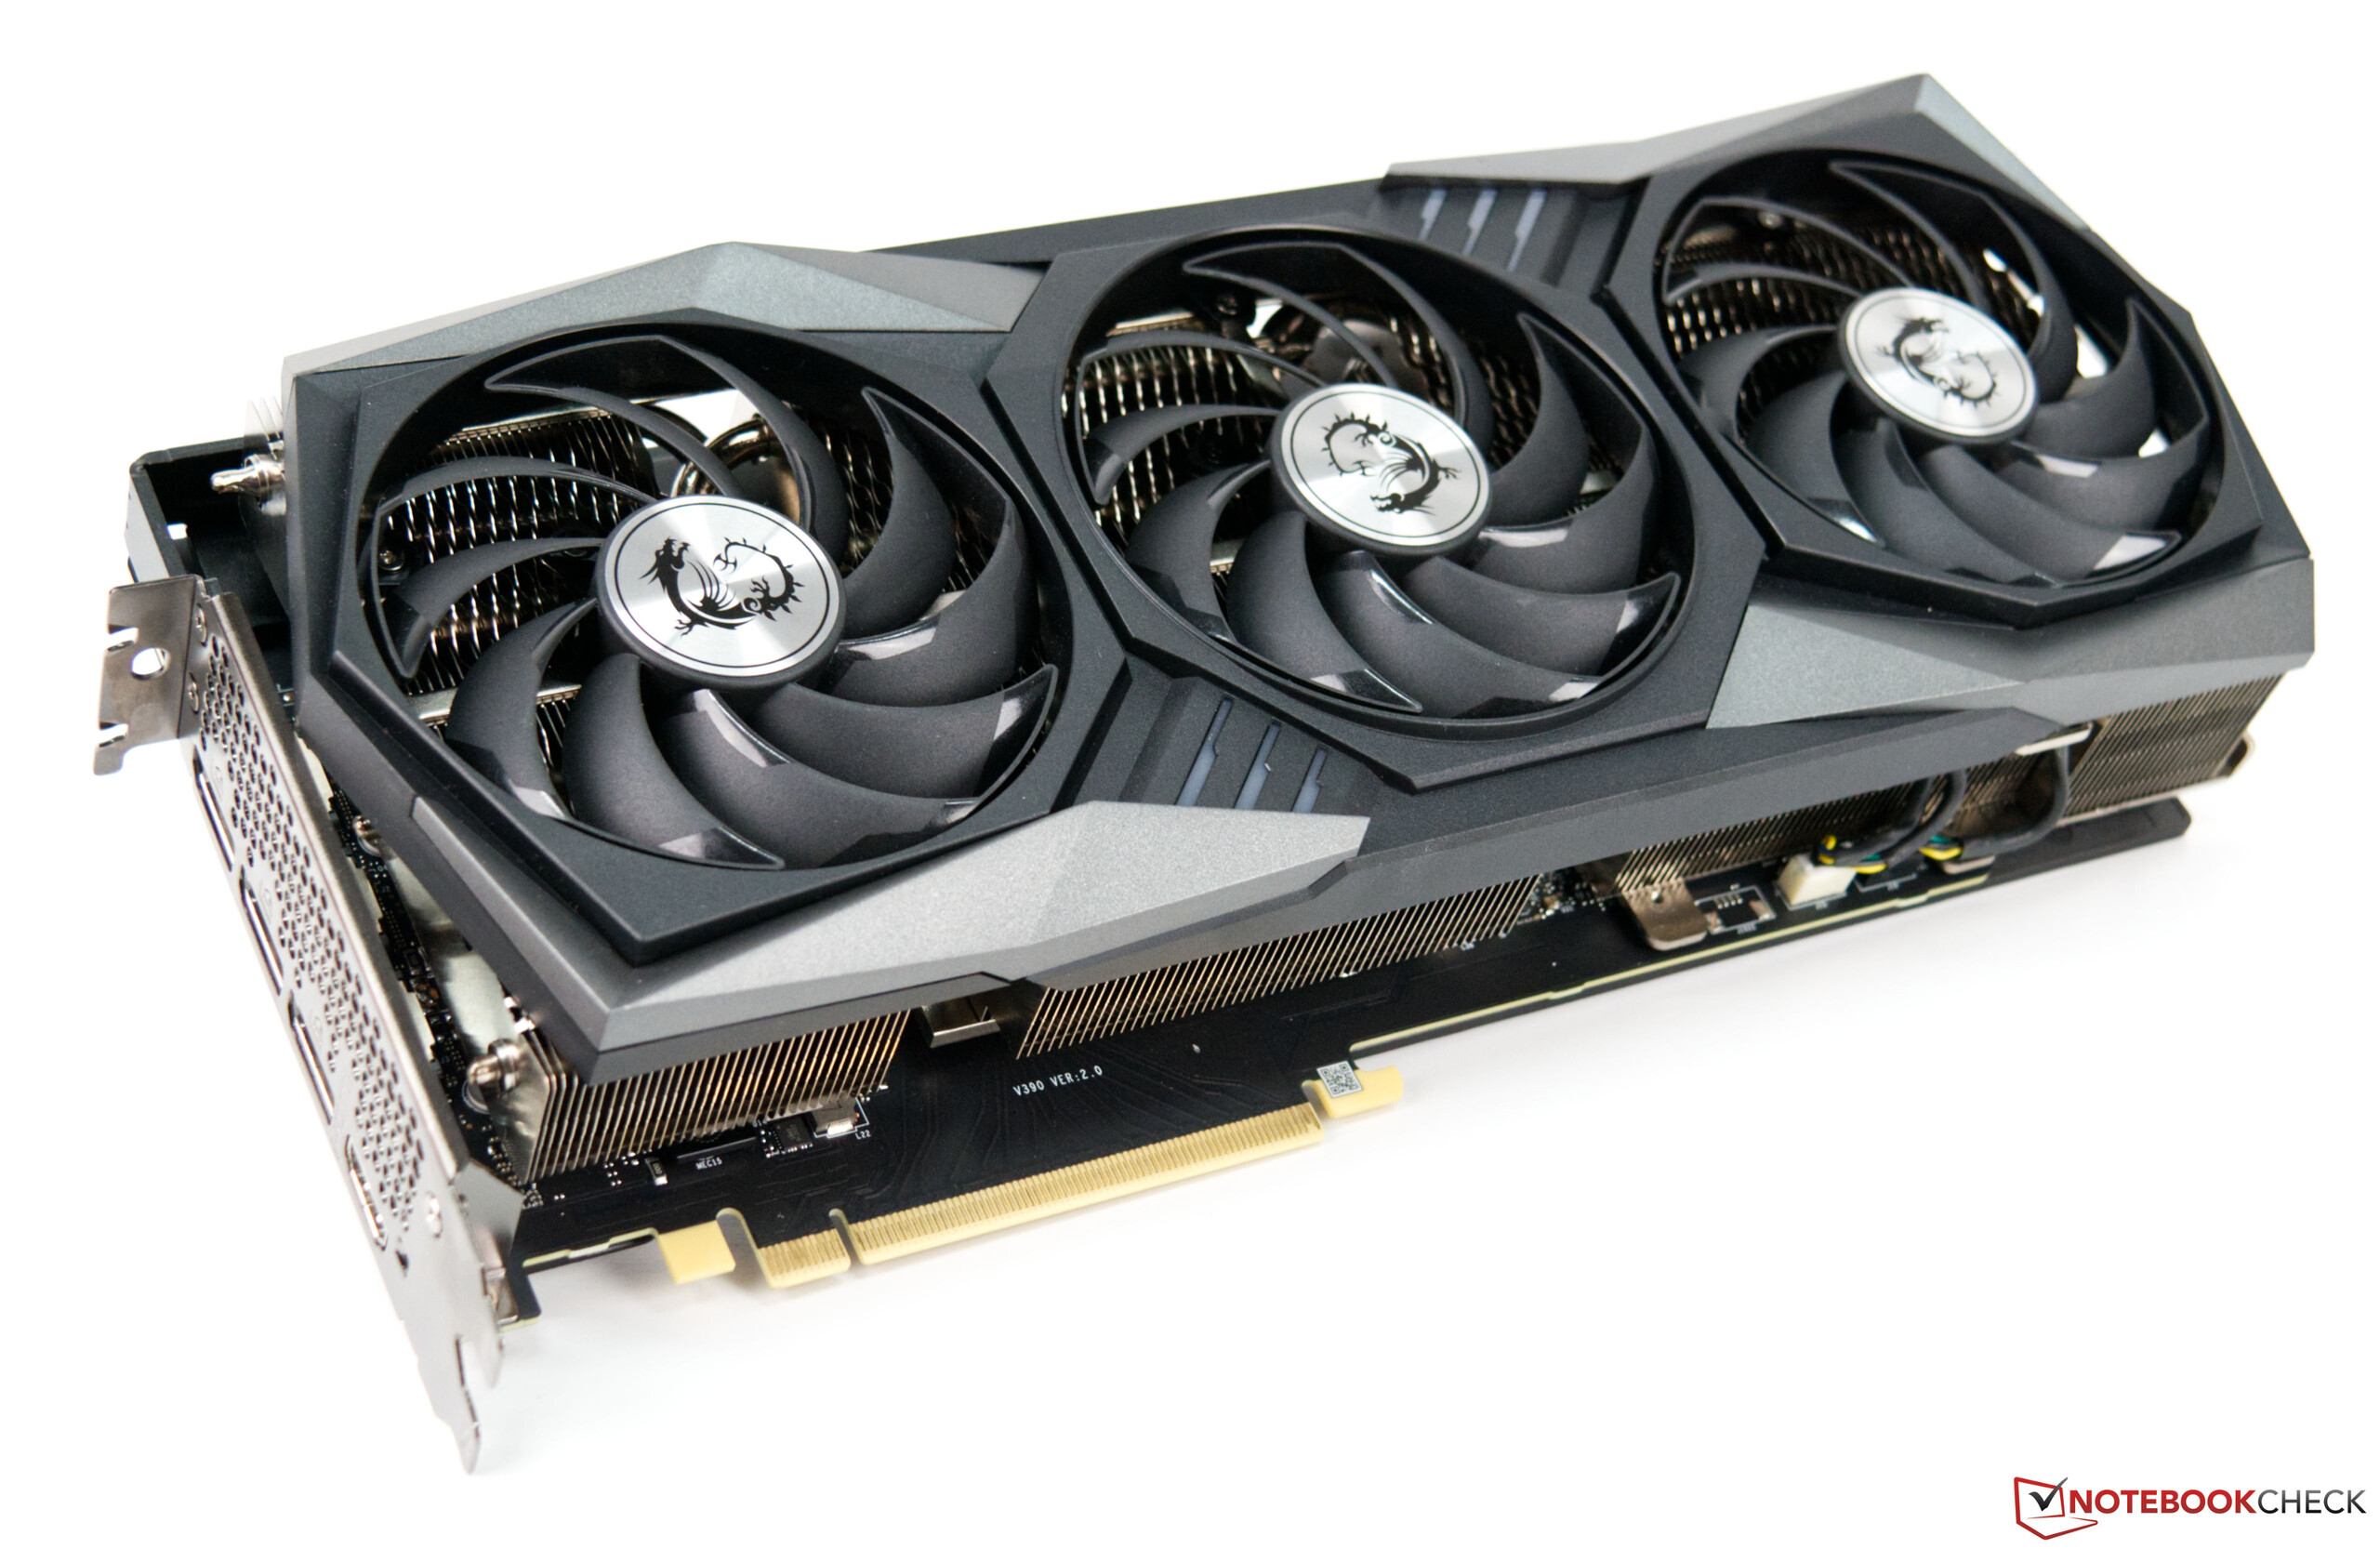
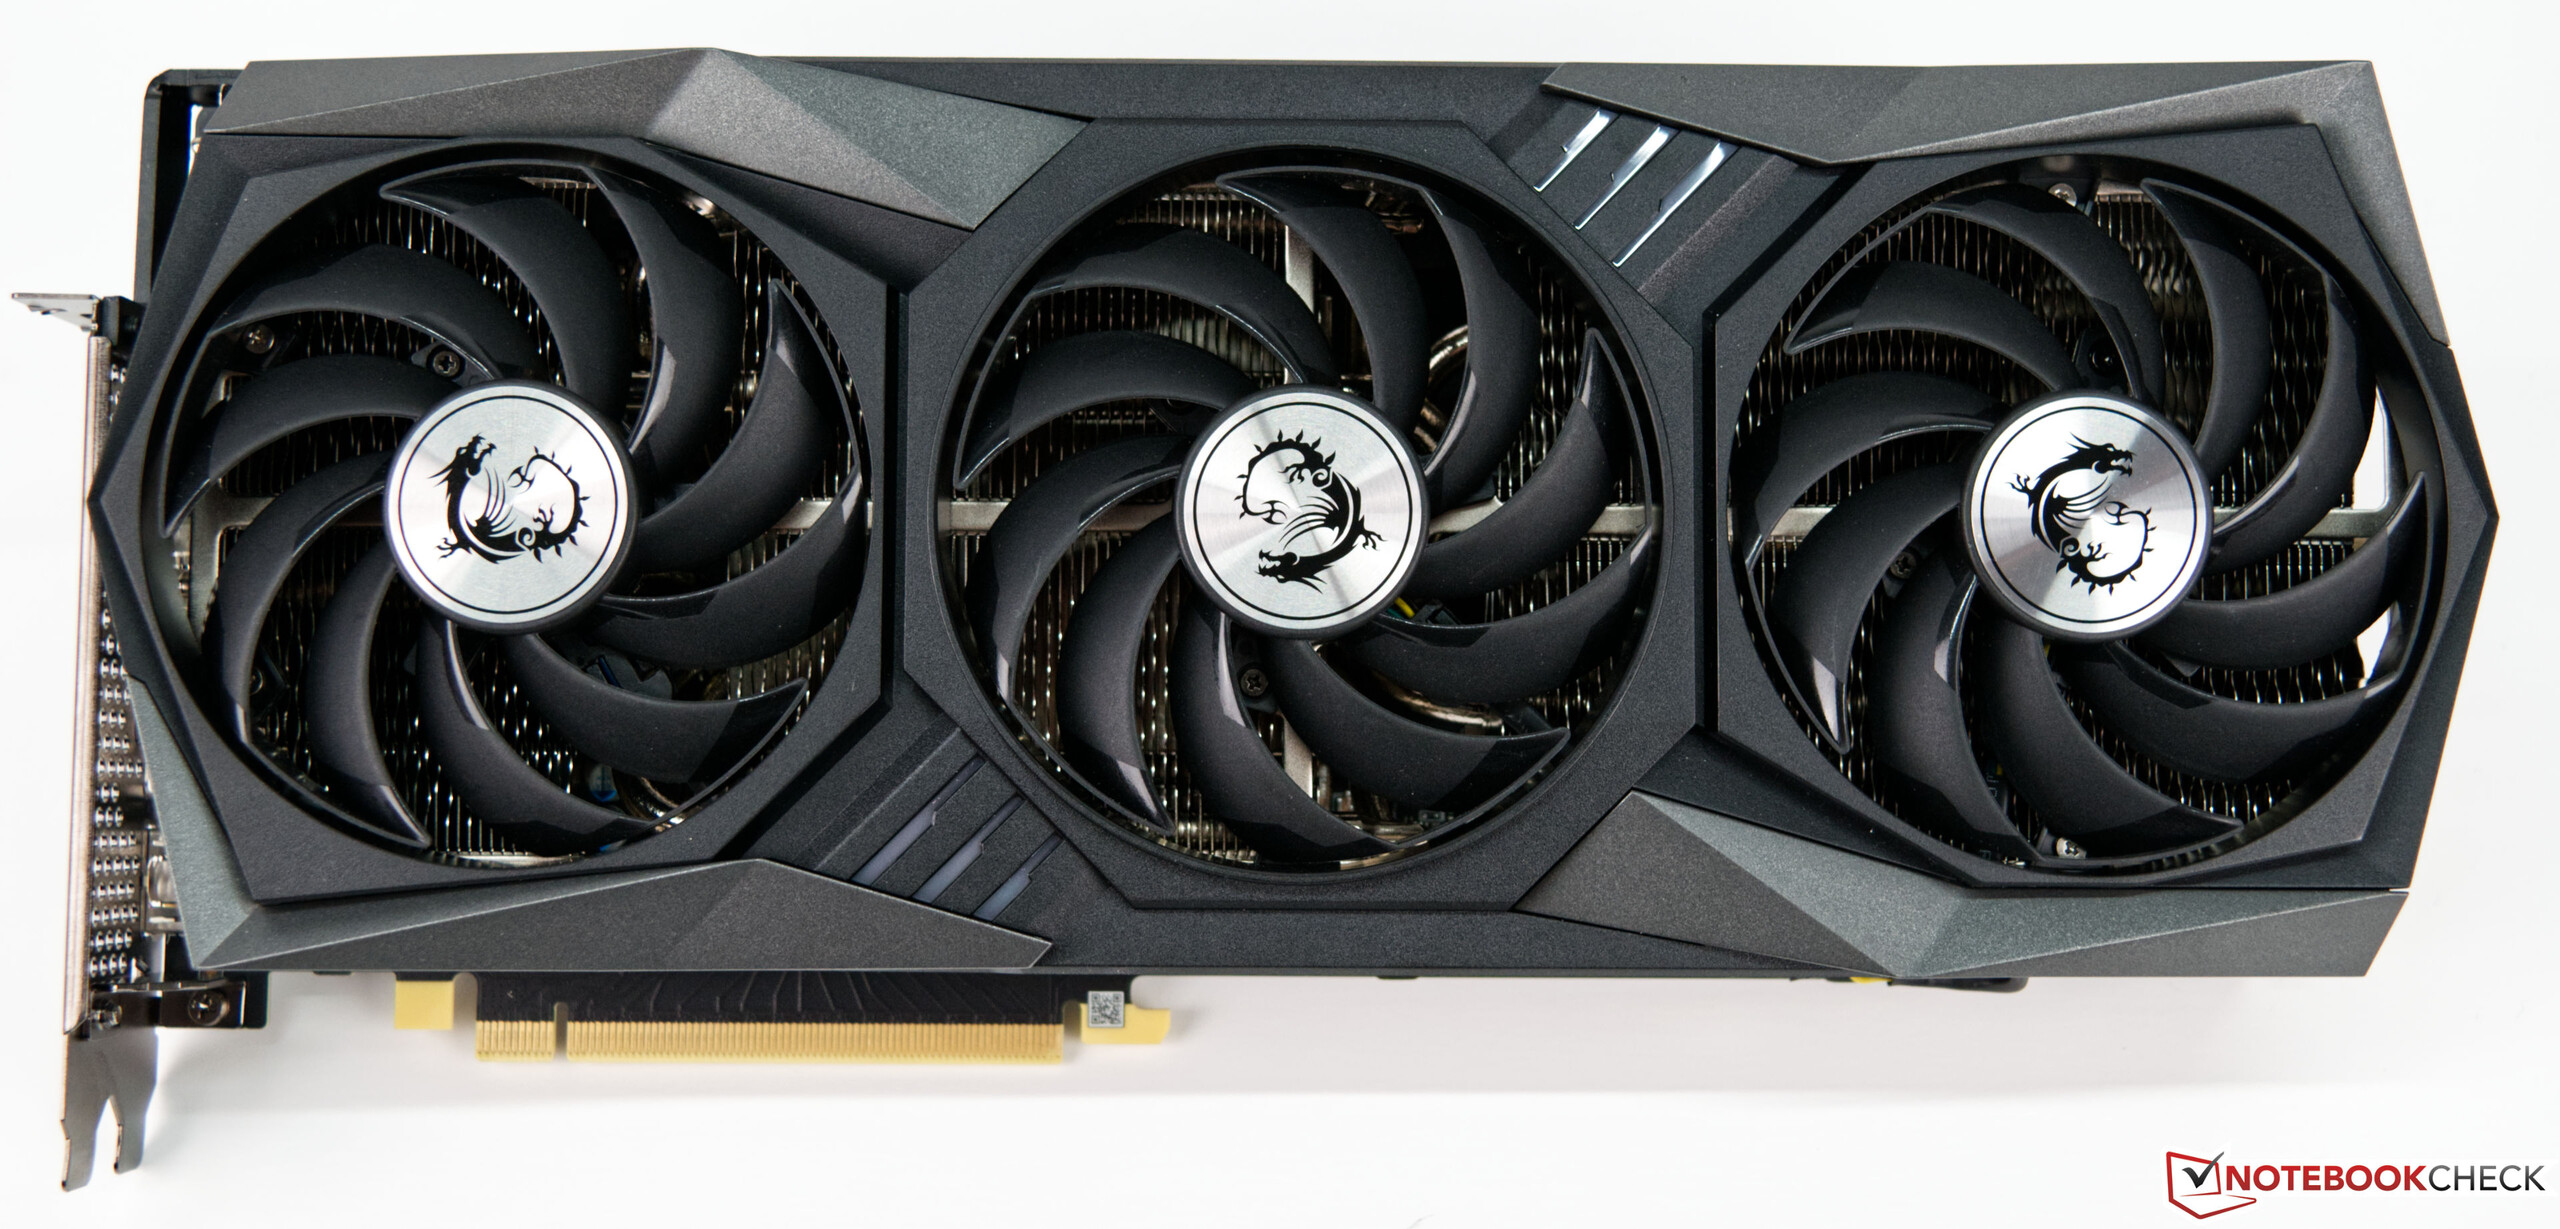
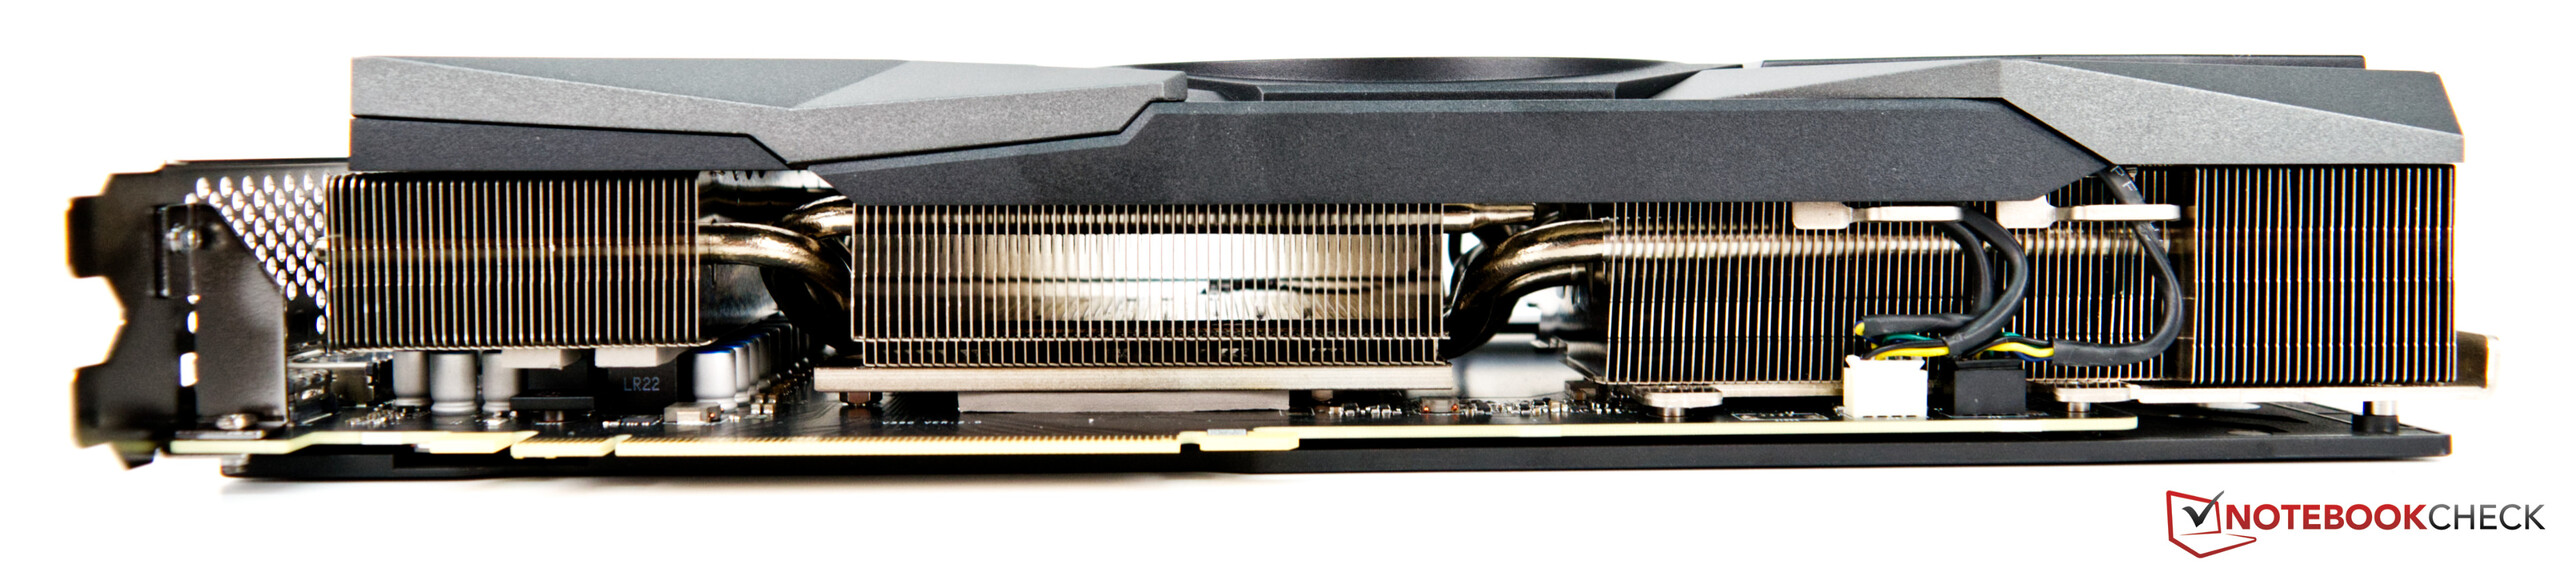
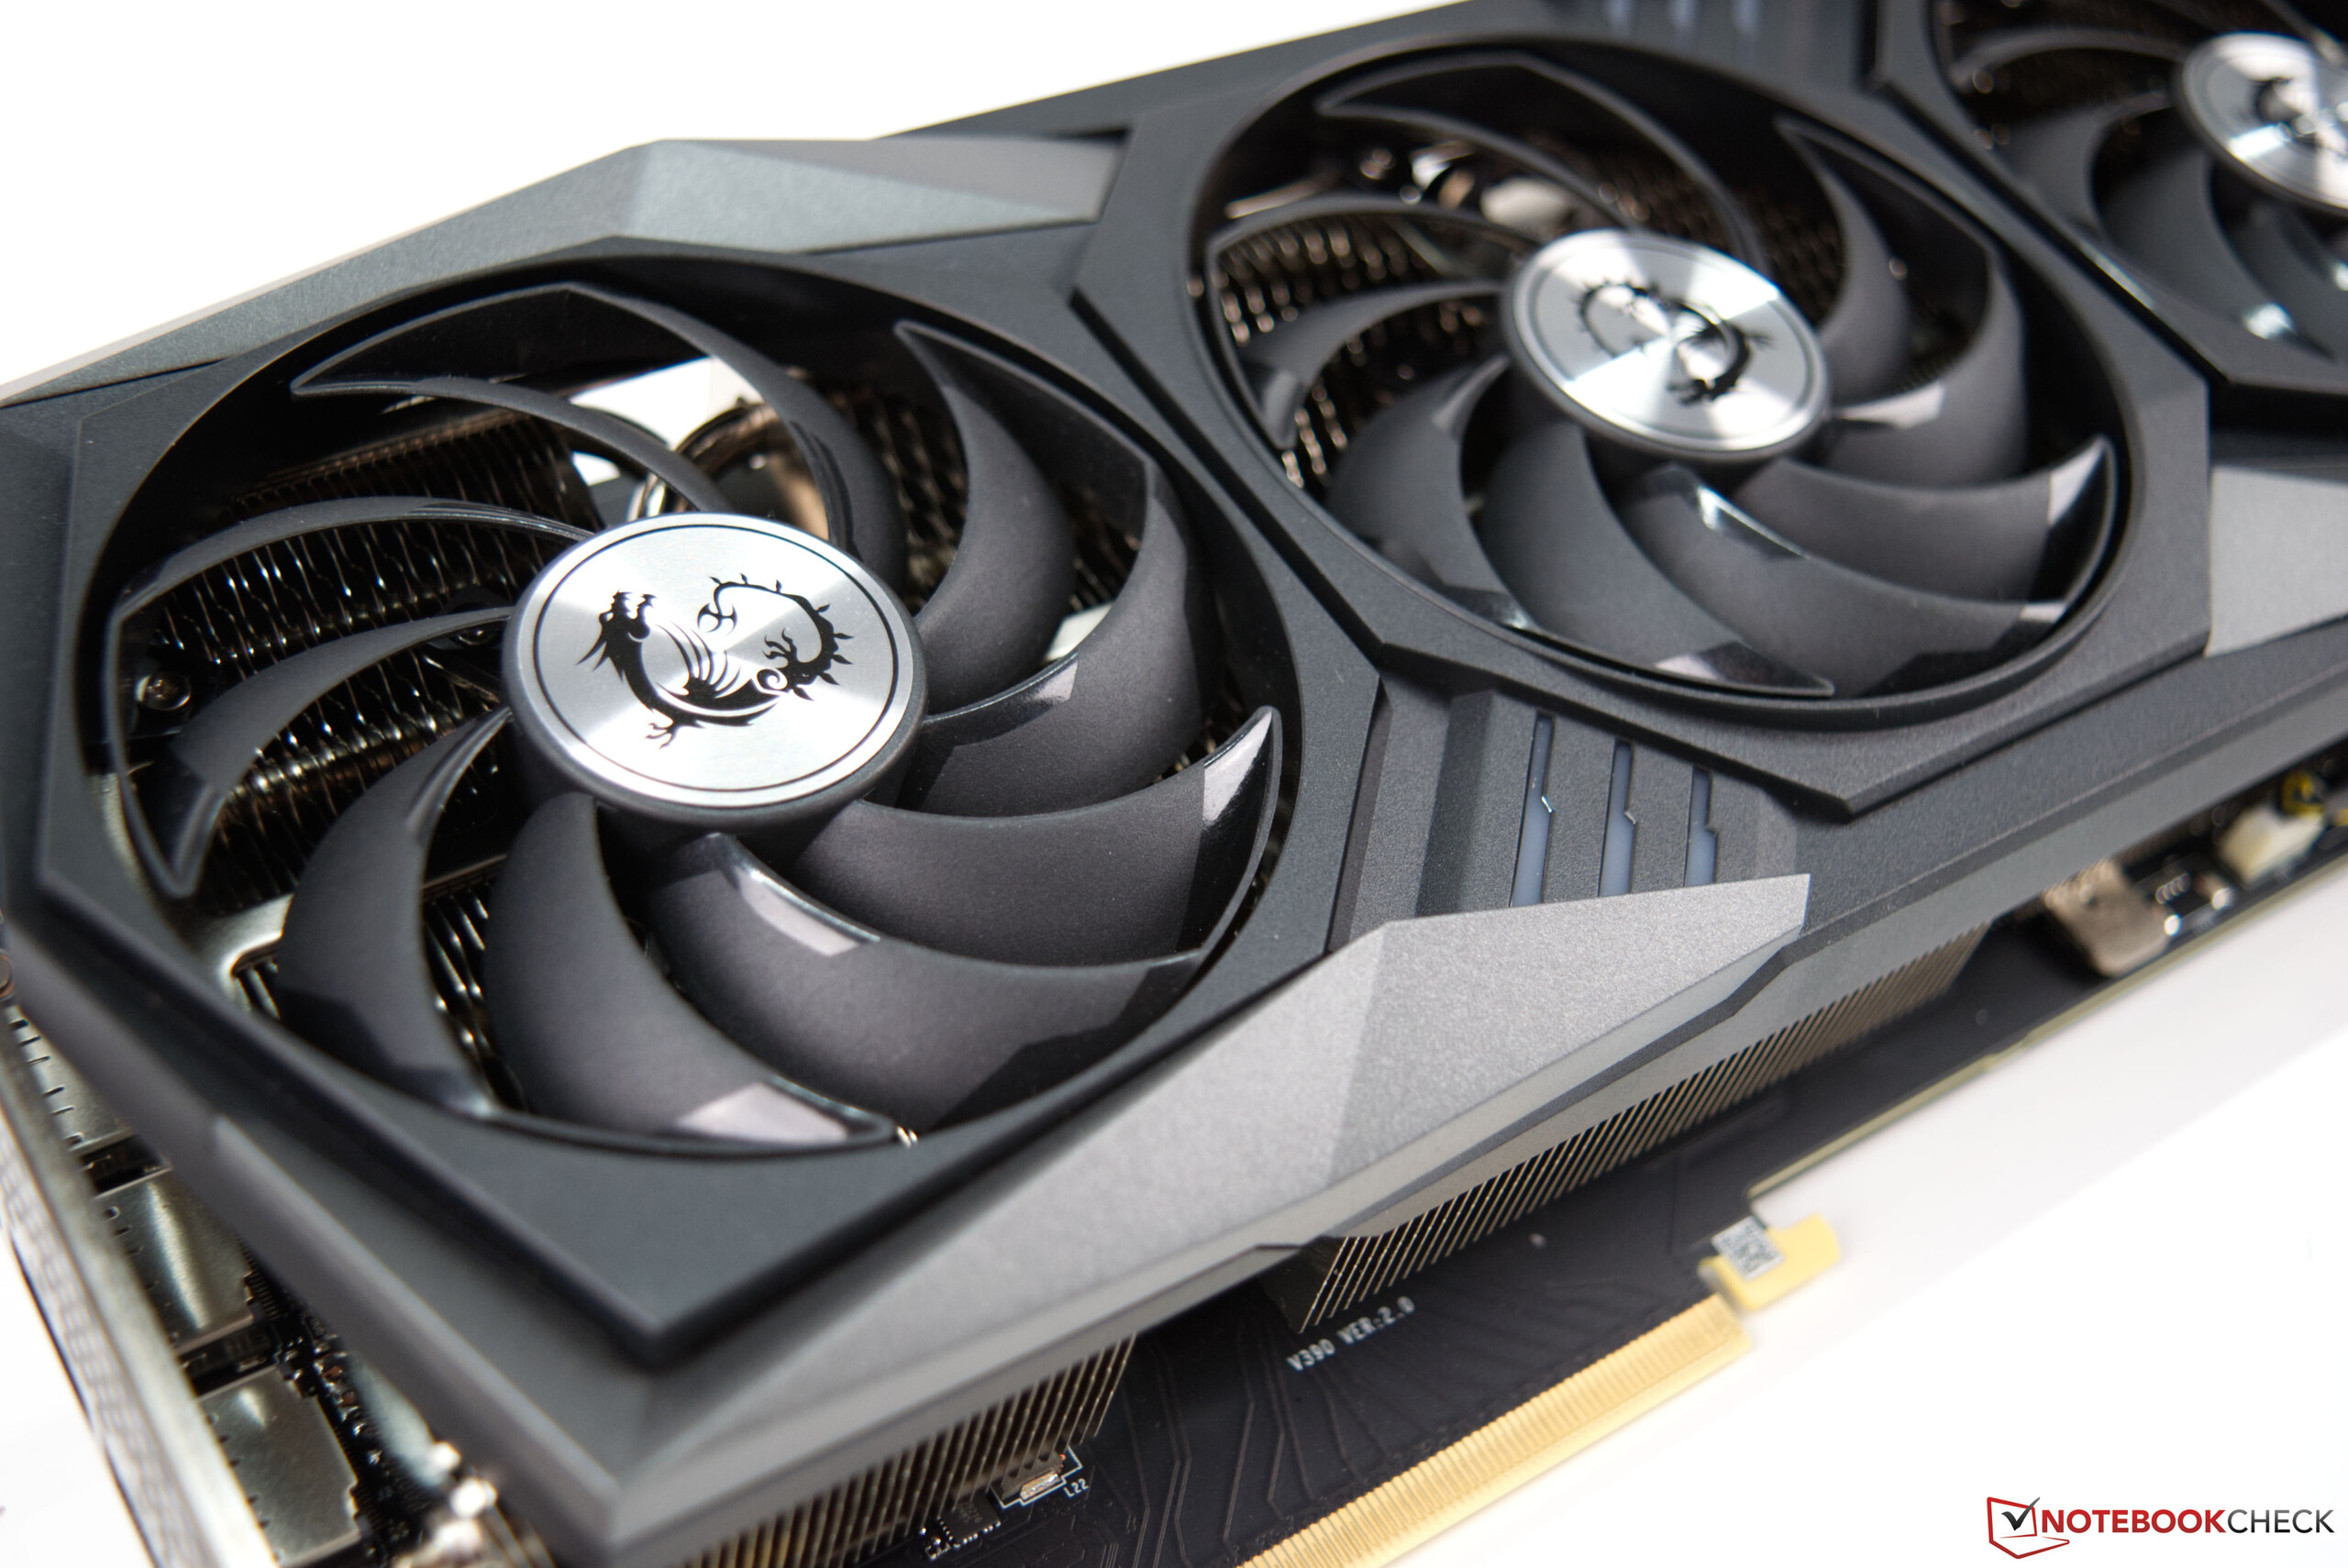
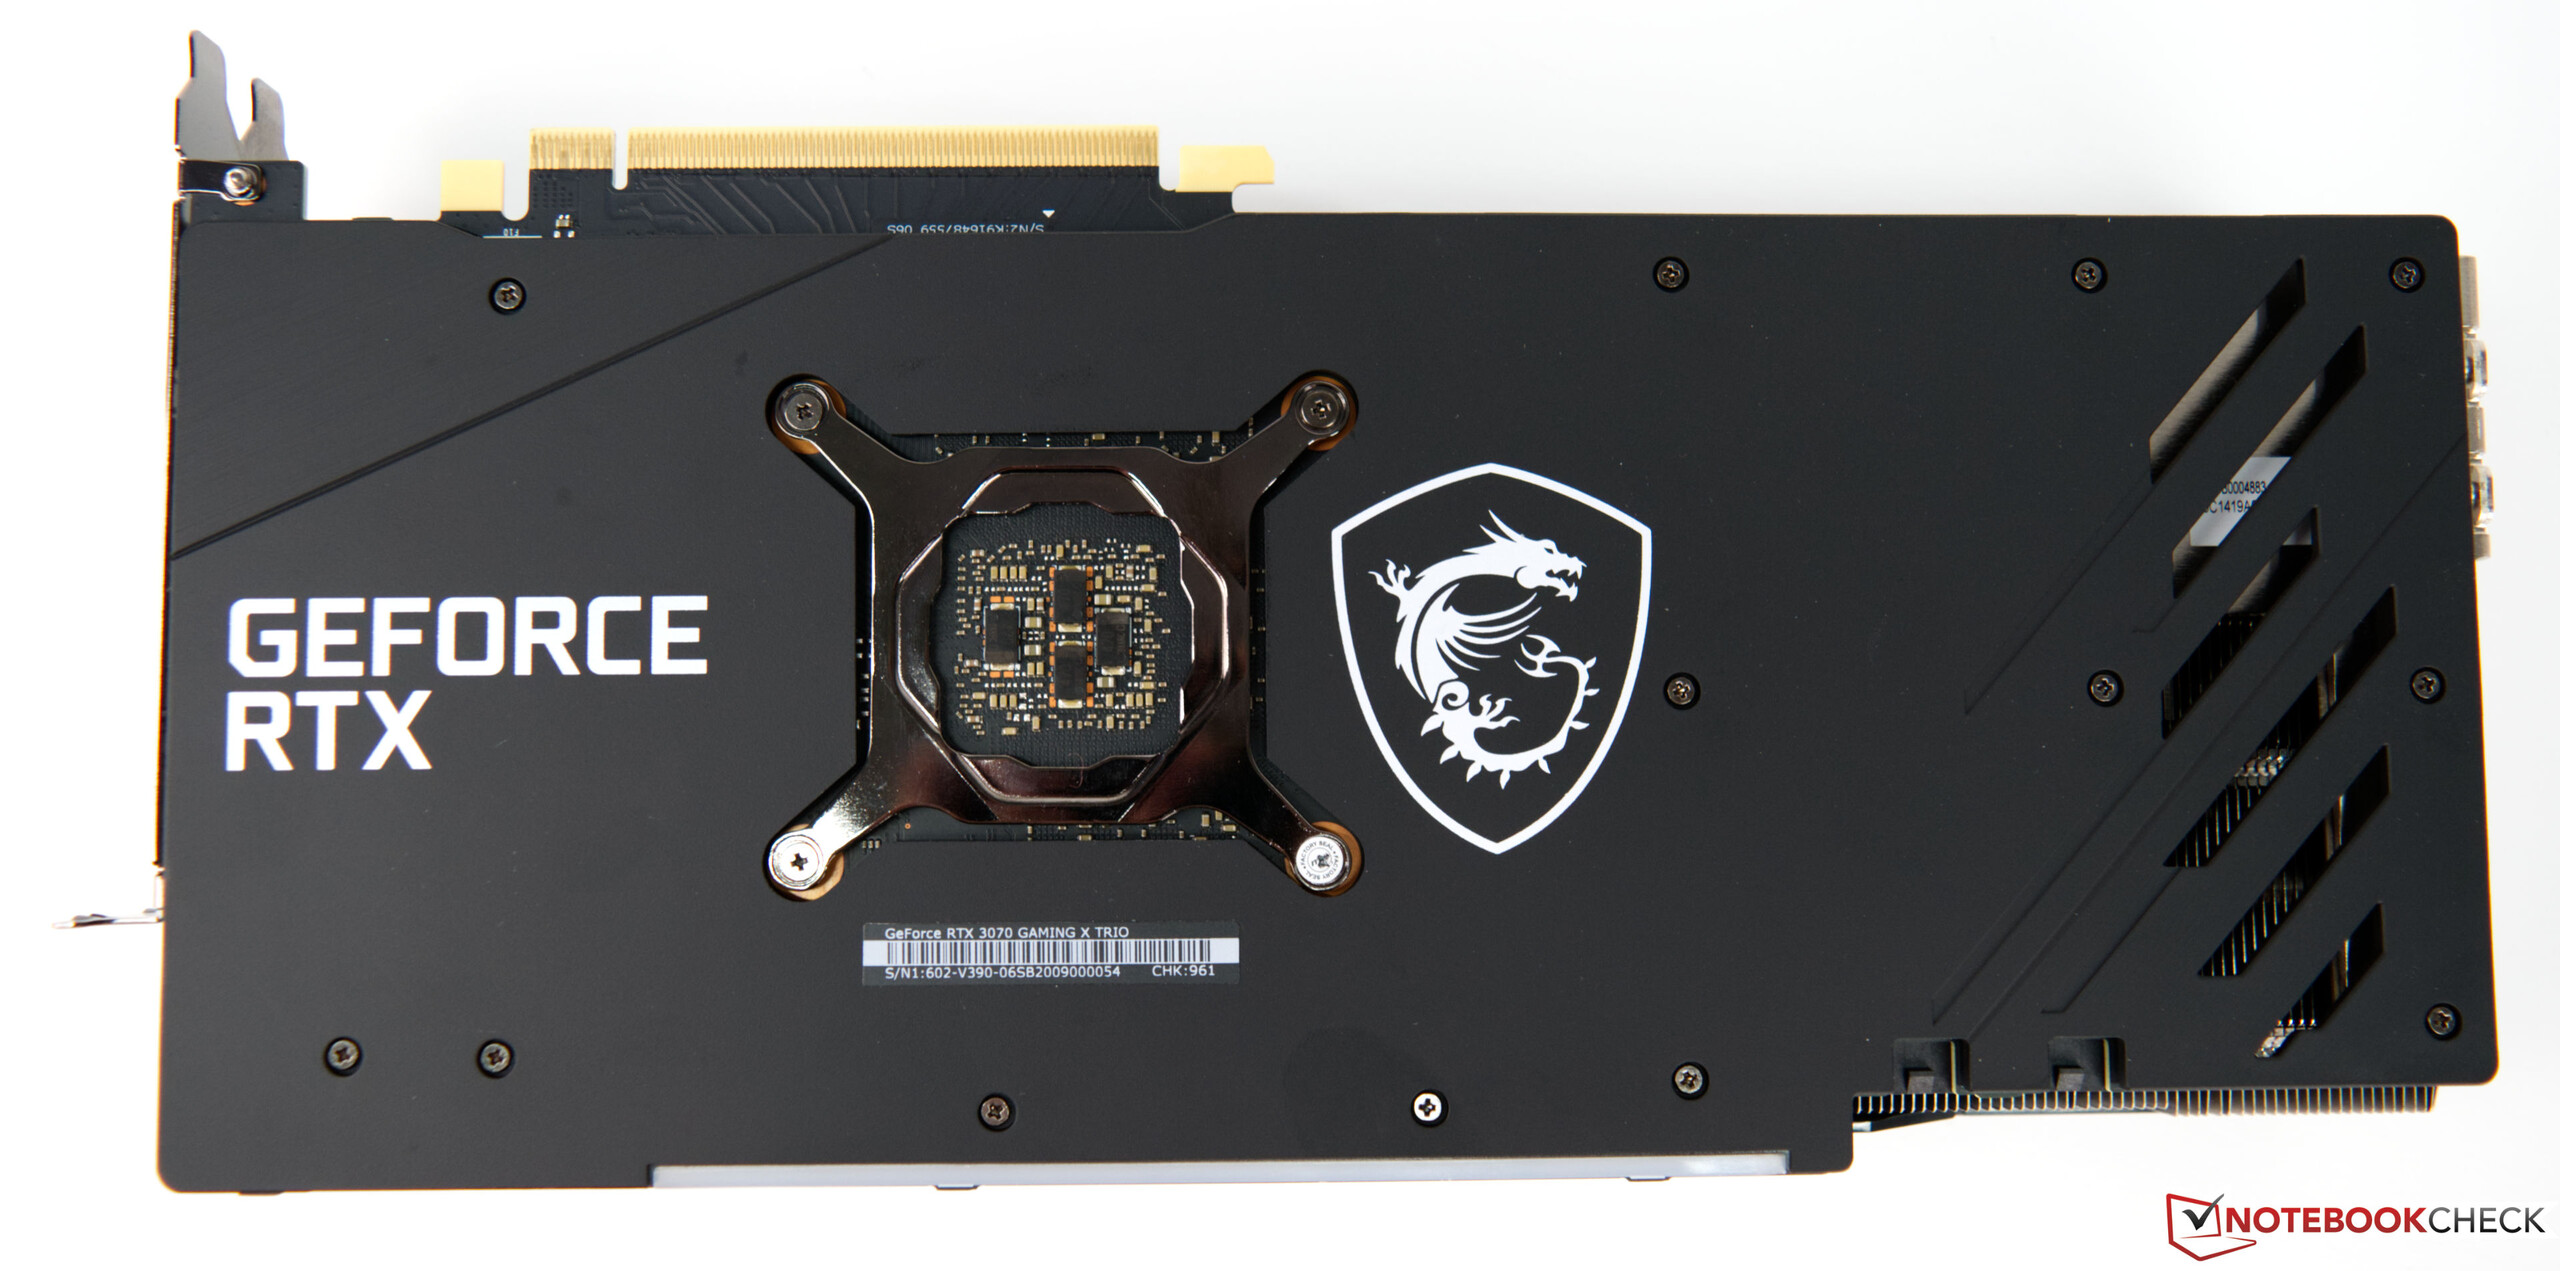
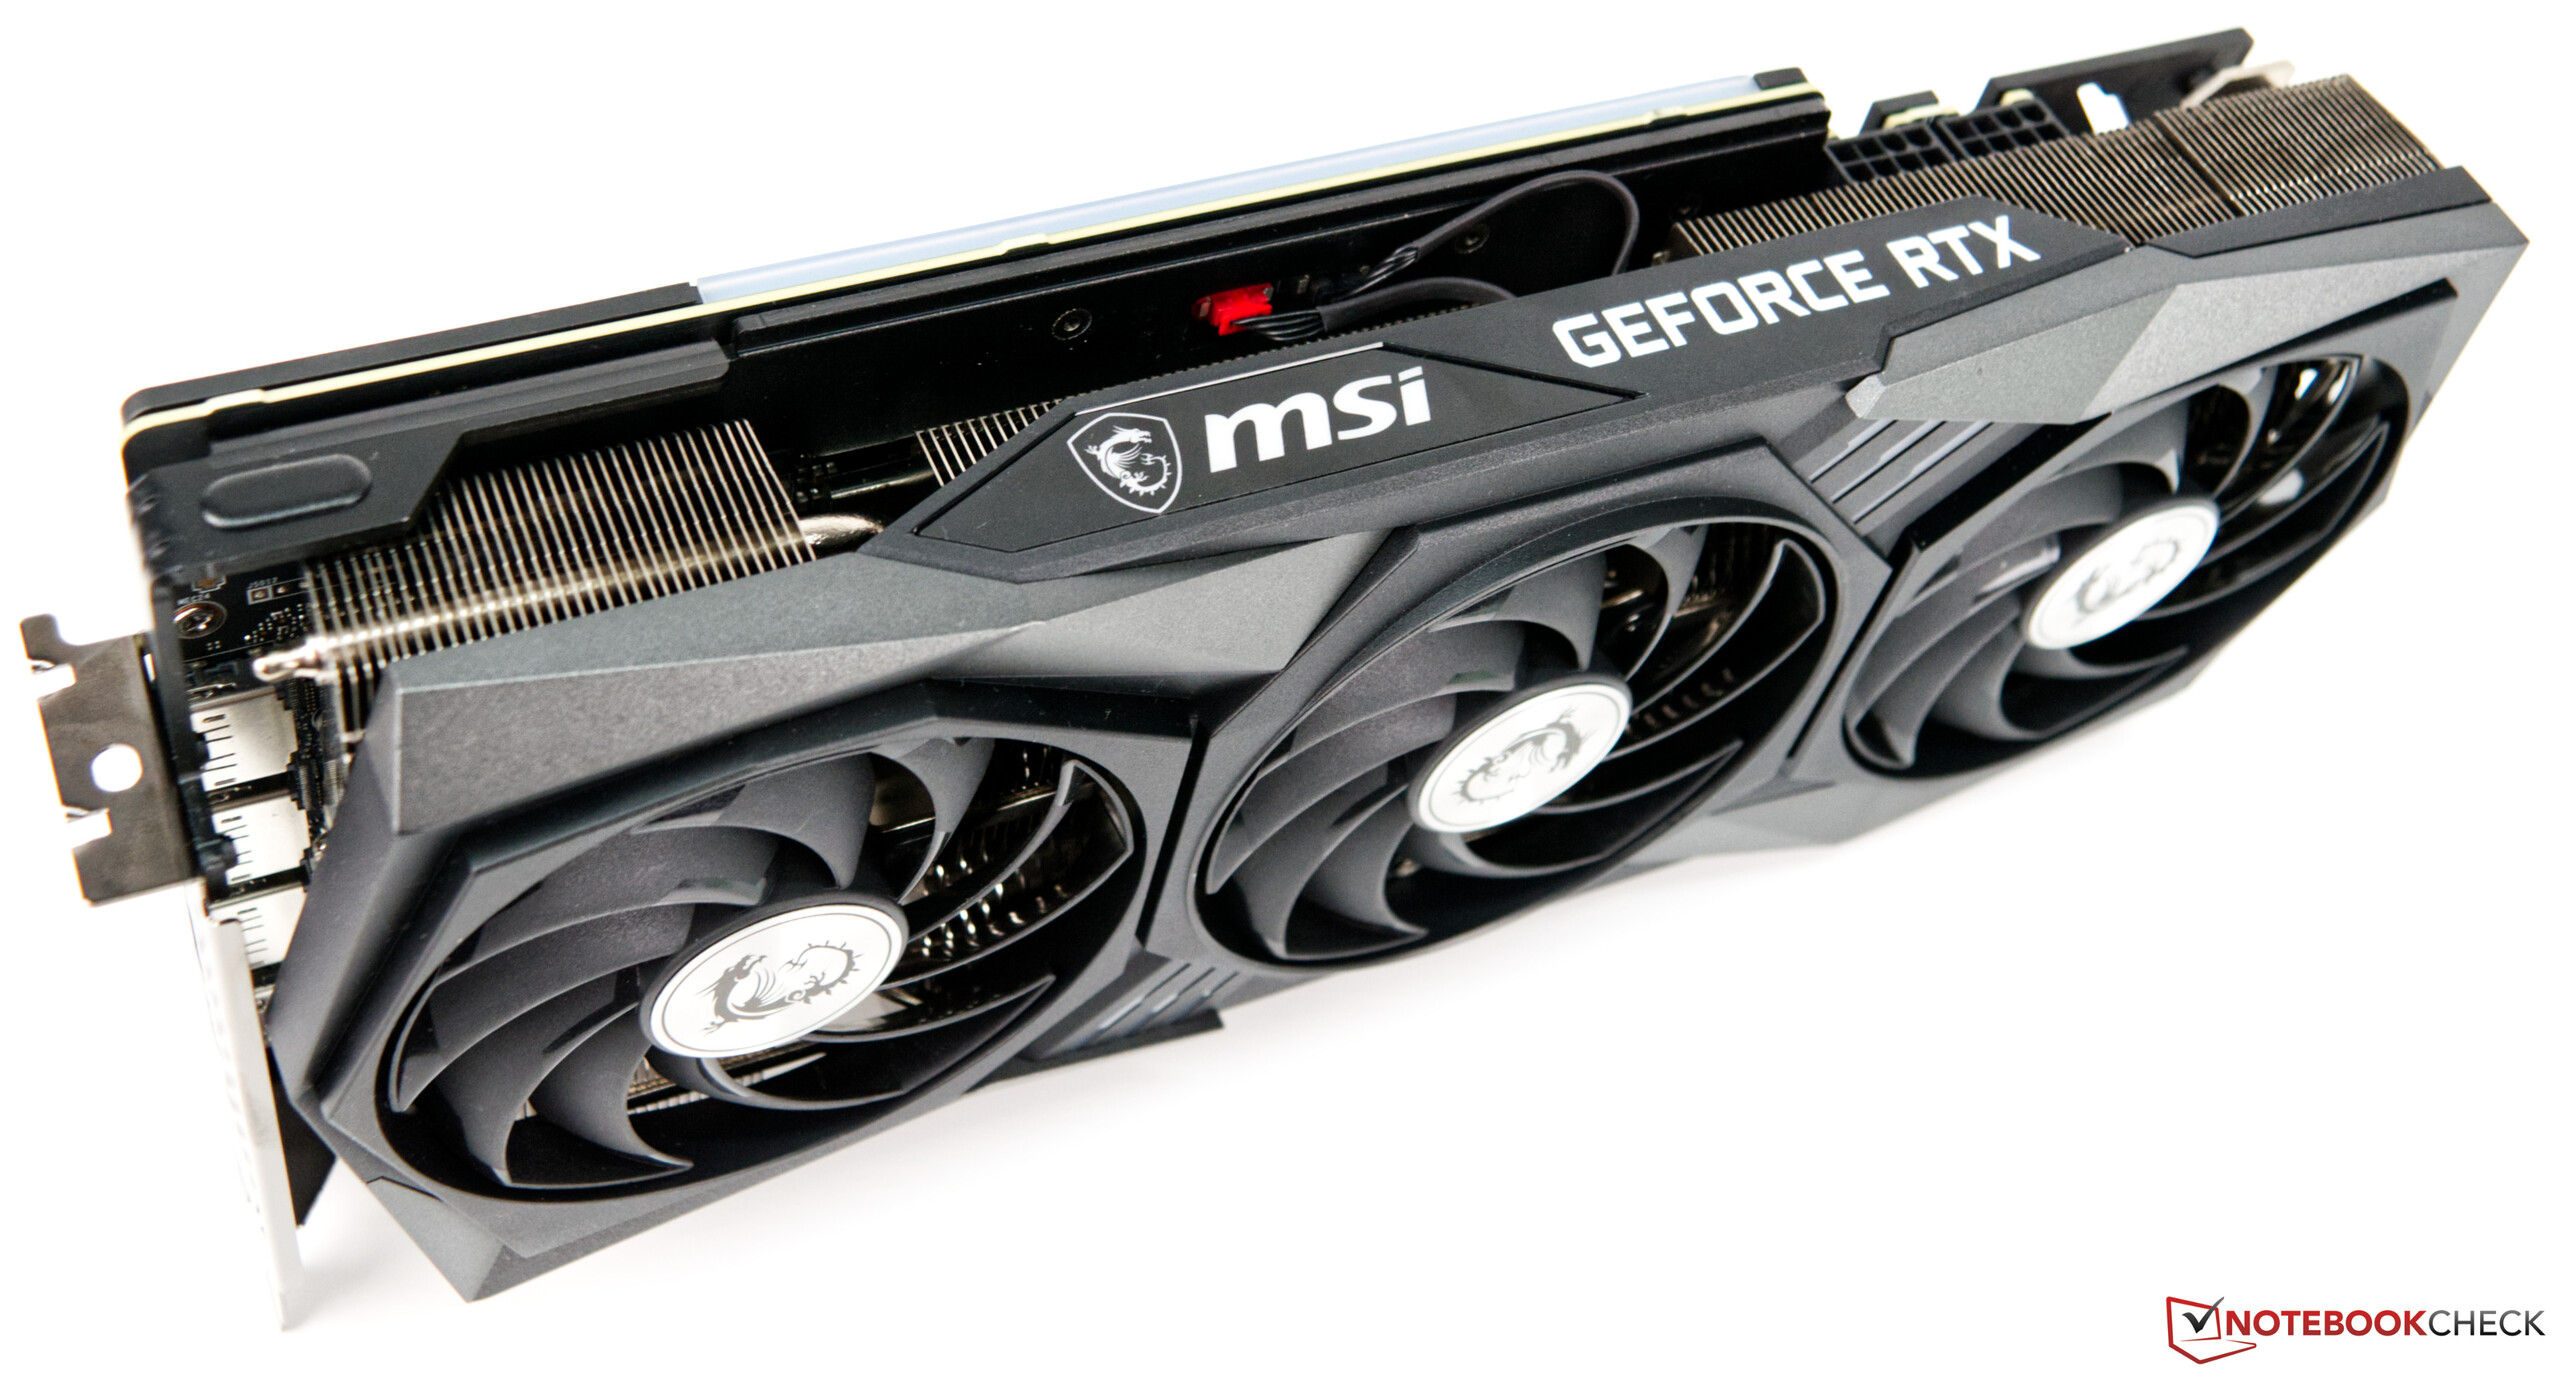
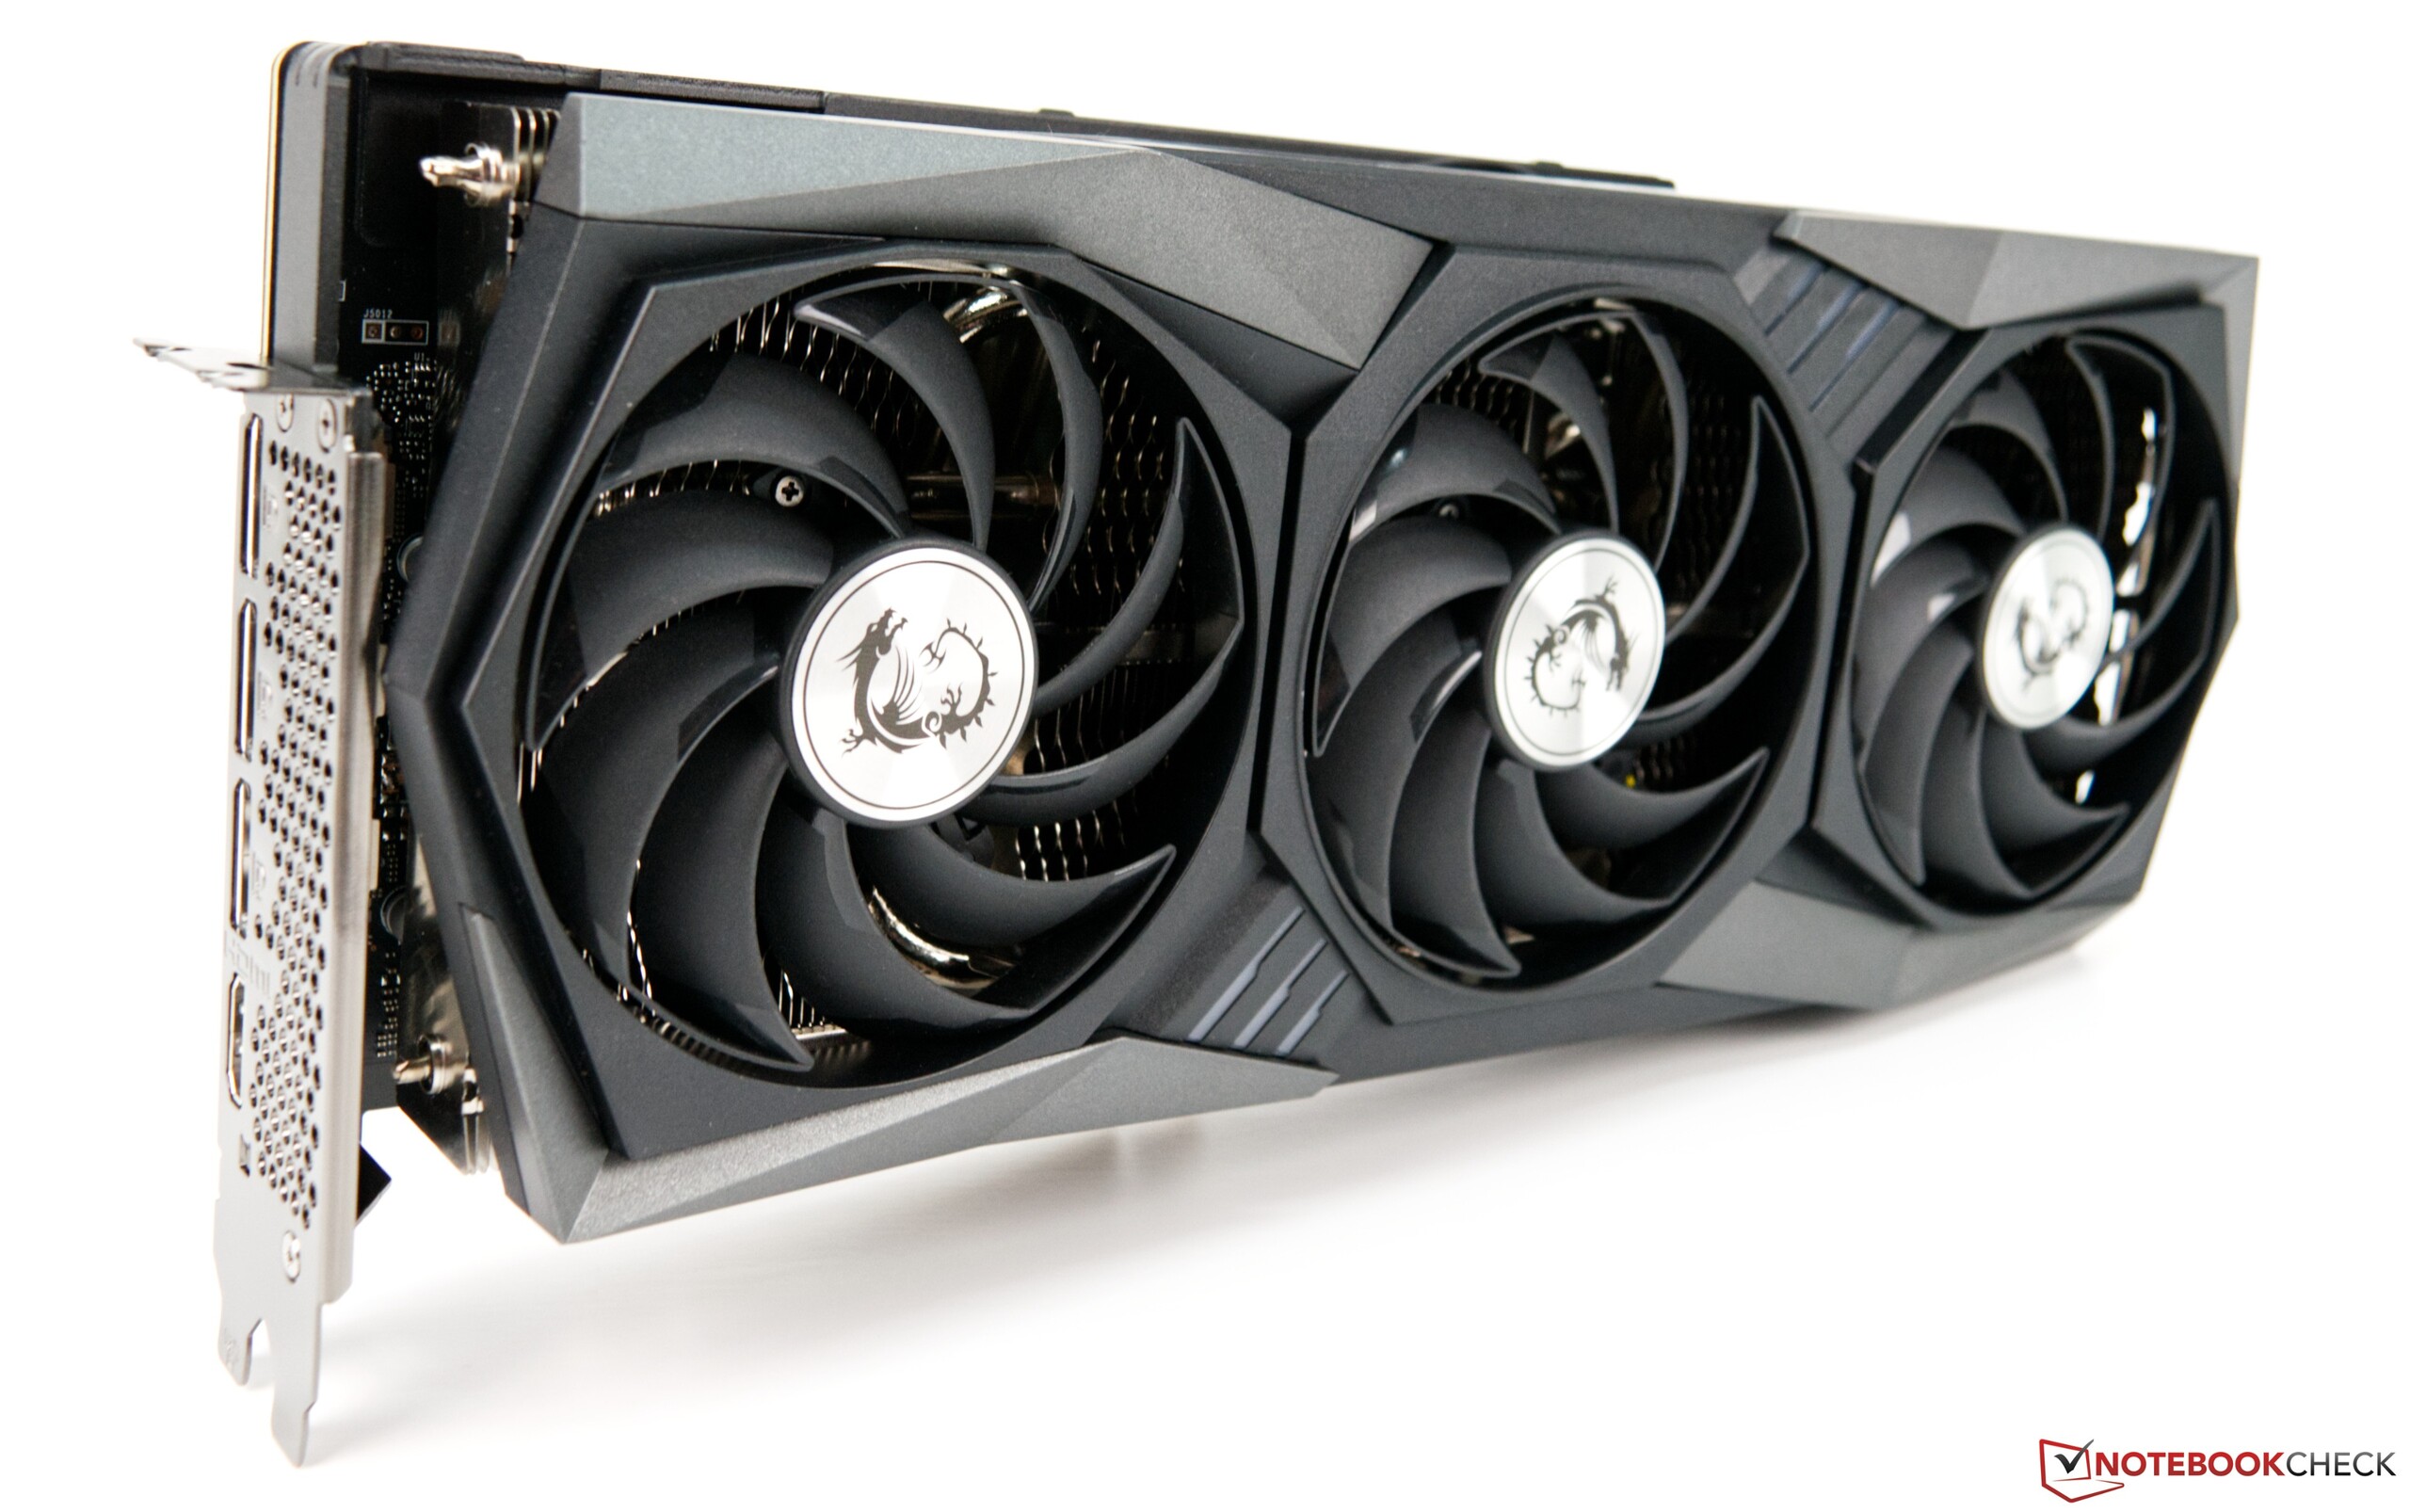
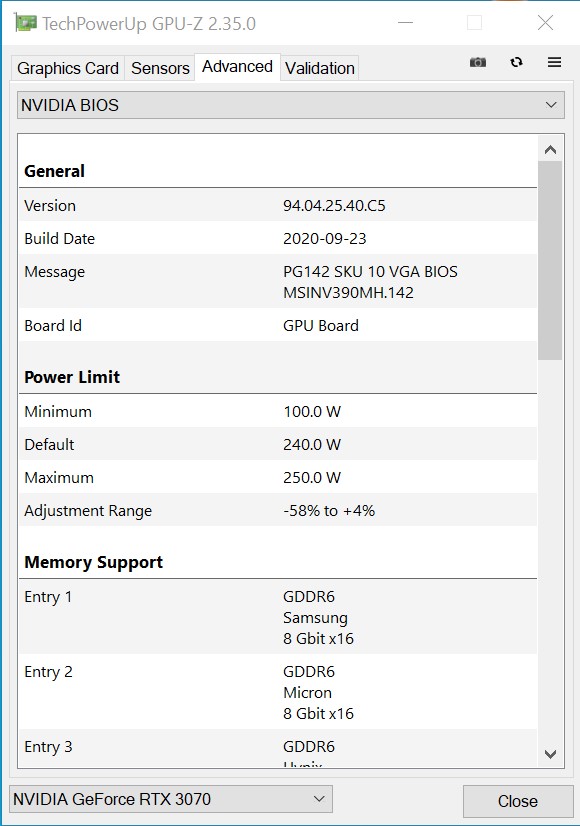
La MSI GeForce RTX 3070 Gaming X Trio è senza dubbio una scheda grafica molto veloce e di ottima fattura. Inoltre, viene fornita con un BIOS da 240 watt. La Founders Edition, invece, si accontenta di 220 watt. L'ottimo e massiccio dissipatore di calore, dotato di tre ventole assiali, si occupa del calore sviluppato. Il dissipatore di calore si fa mai notare, anche sotto carico, come possiamo già rivelare a questo punto.
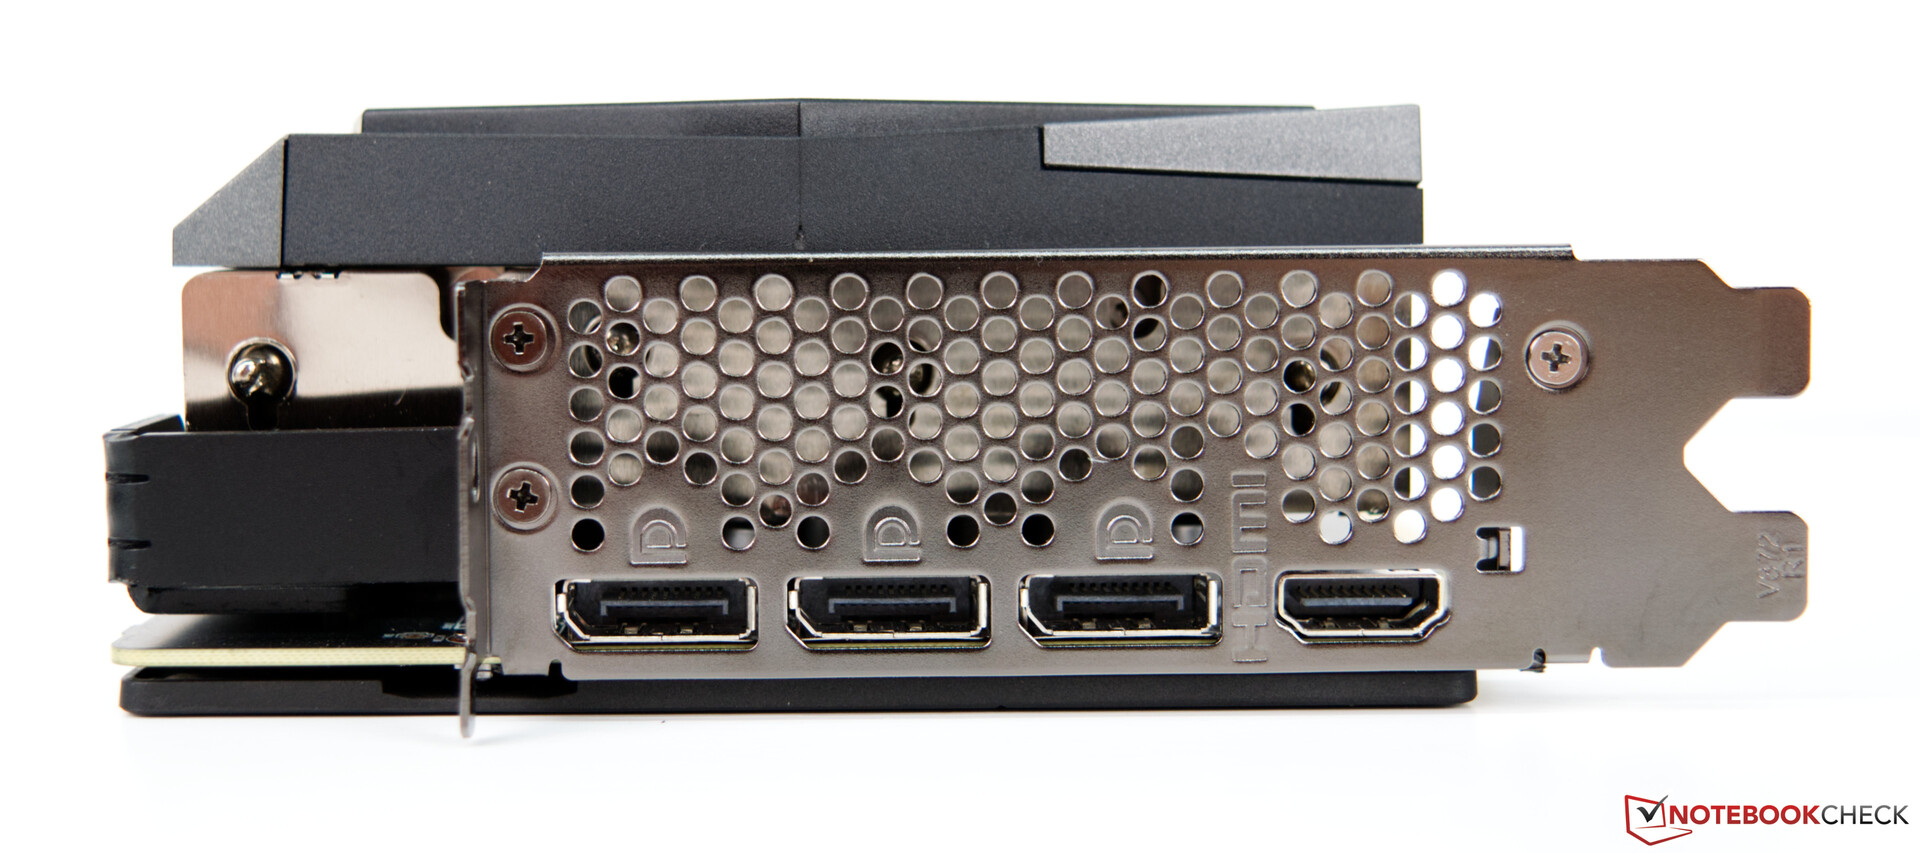
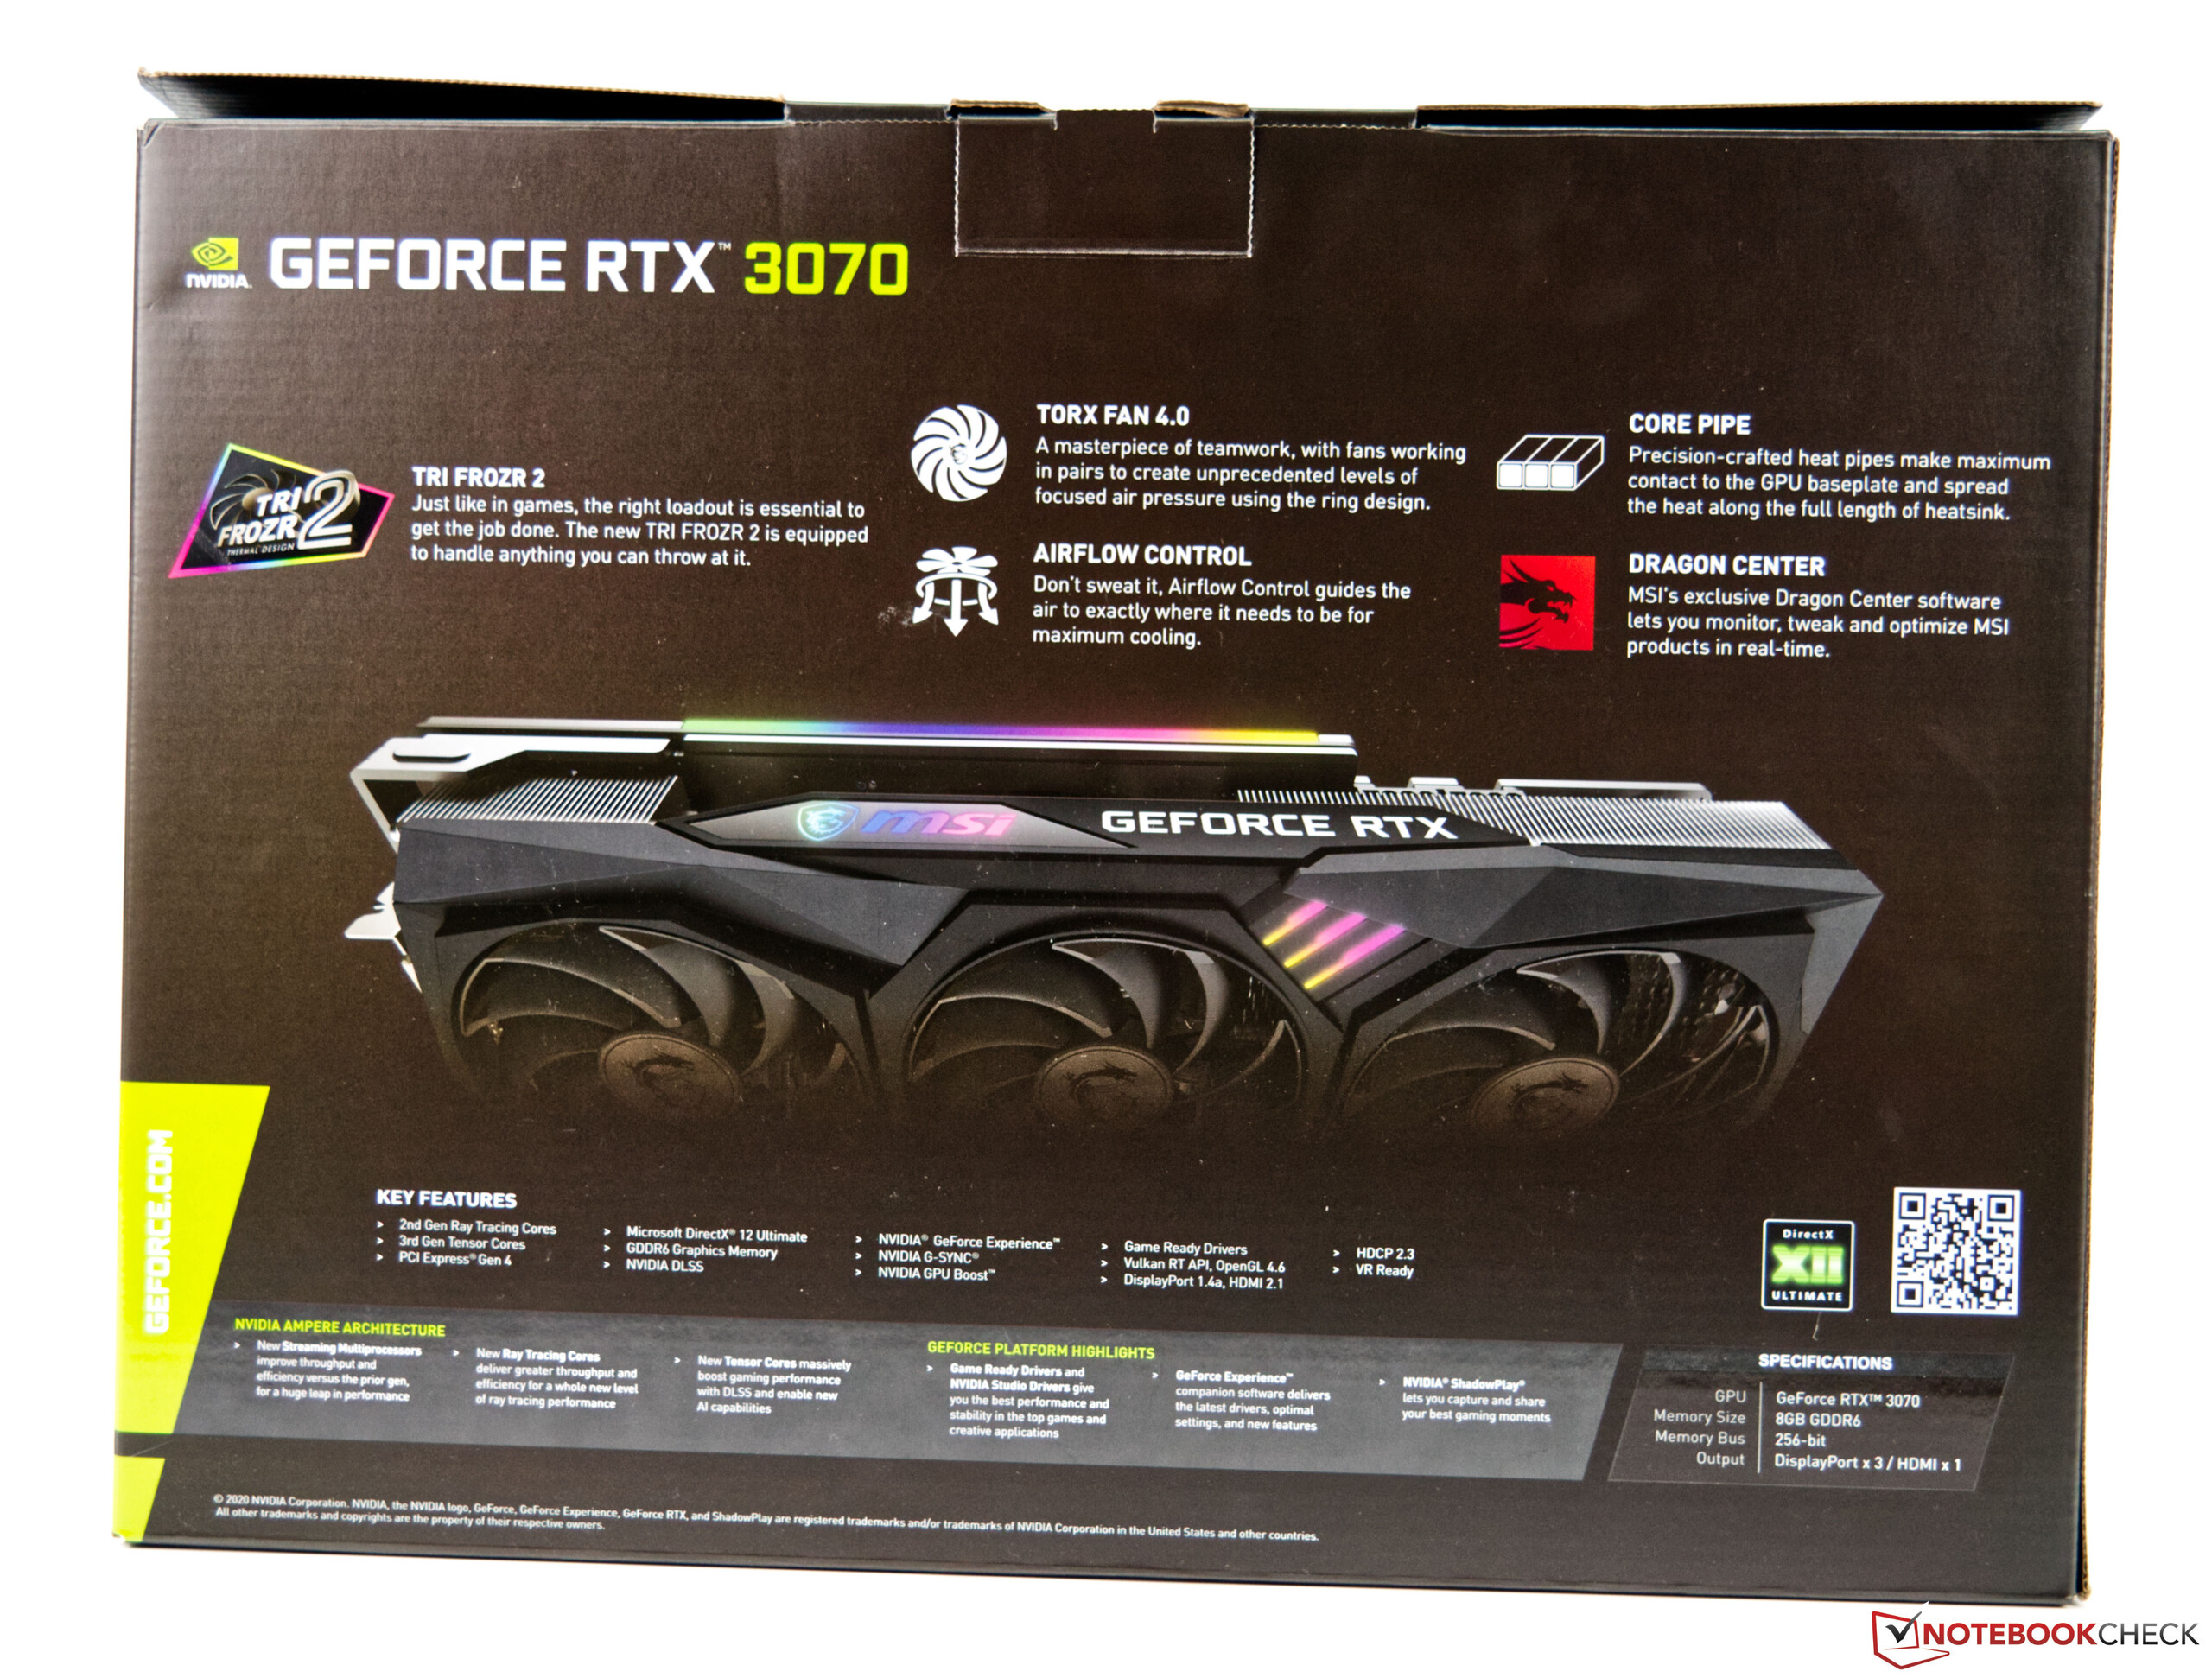
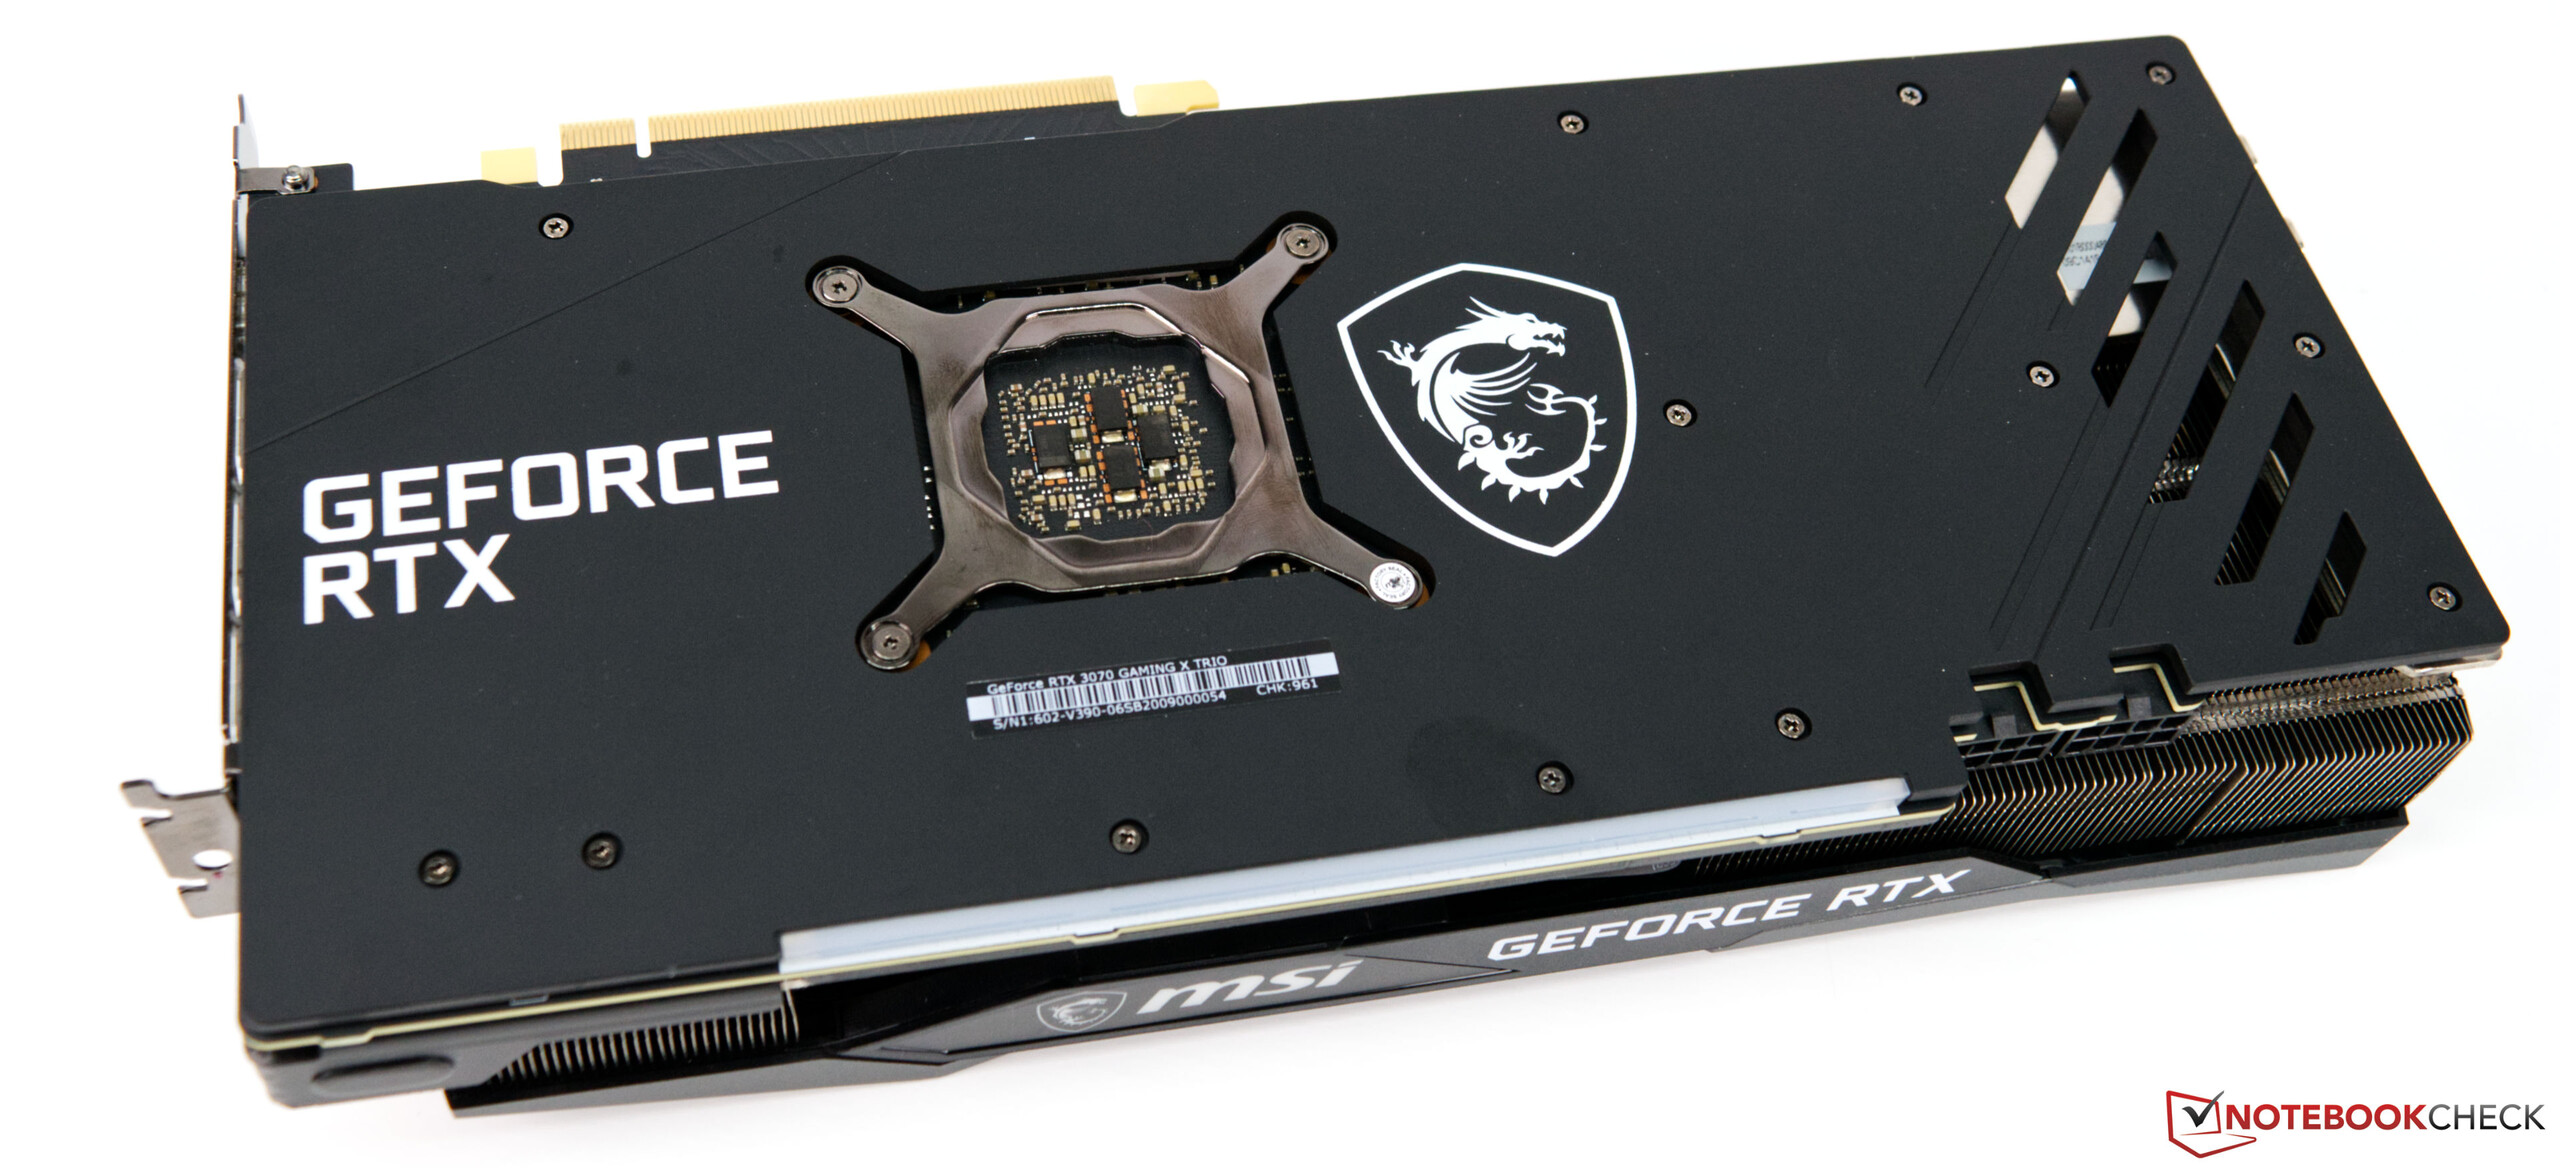
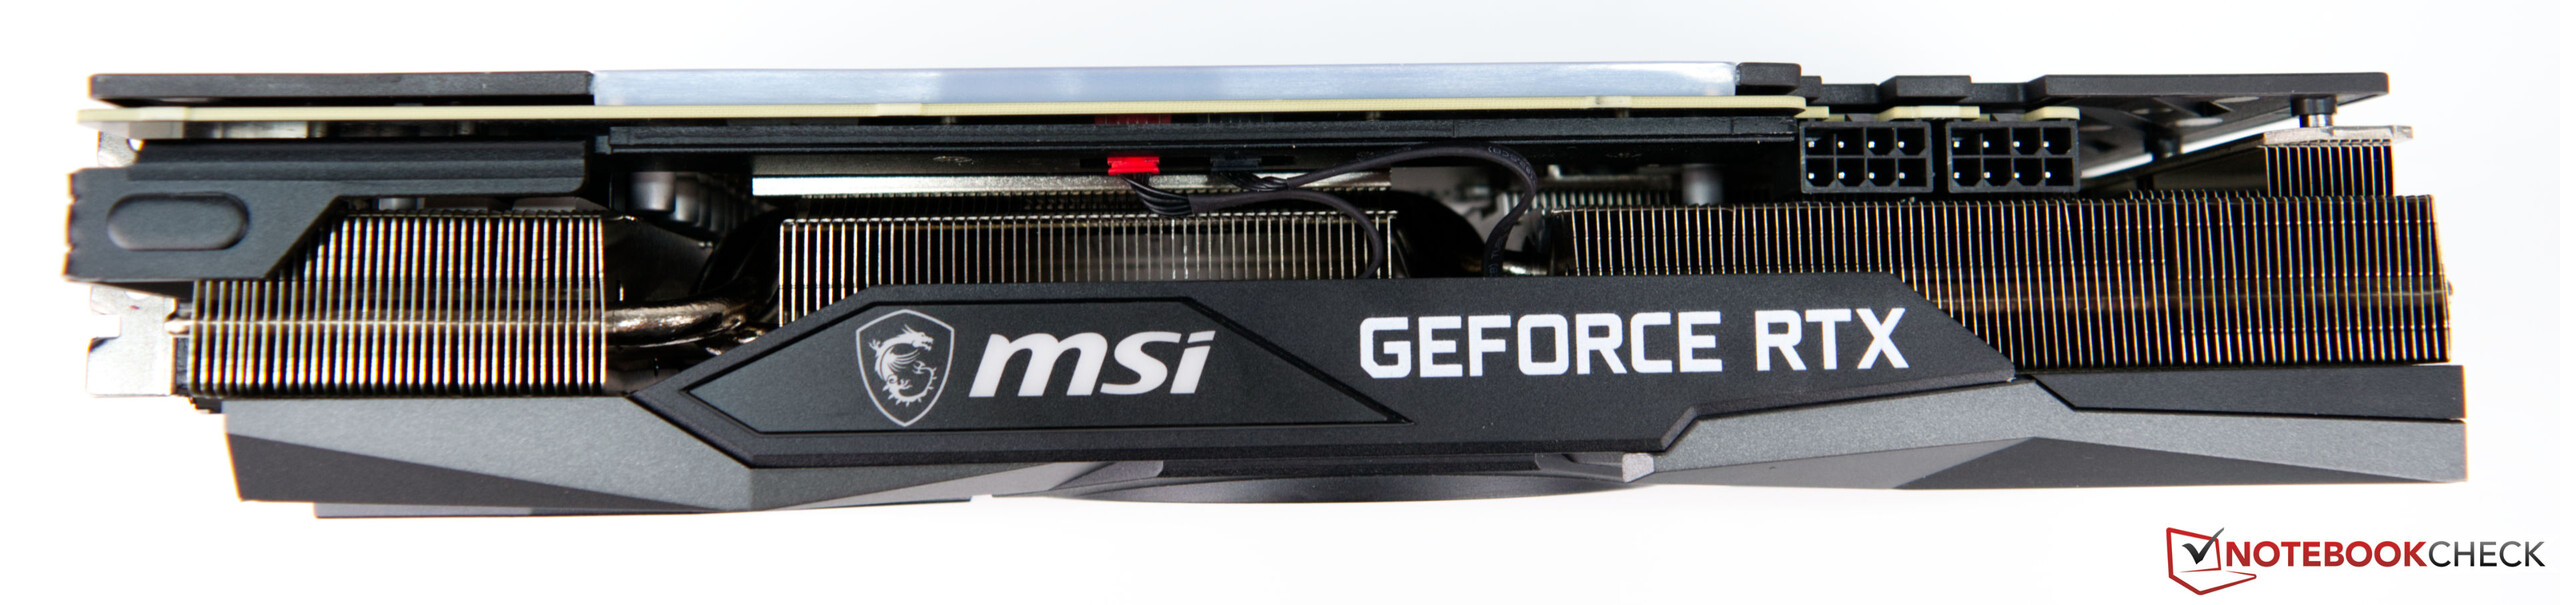
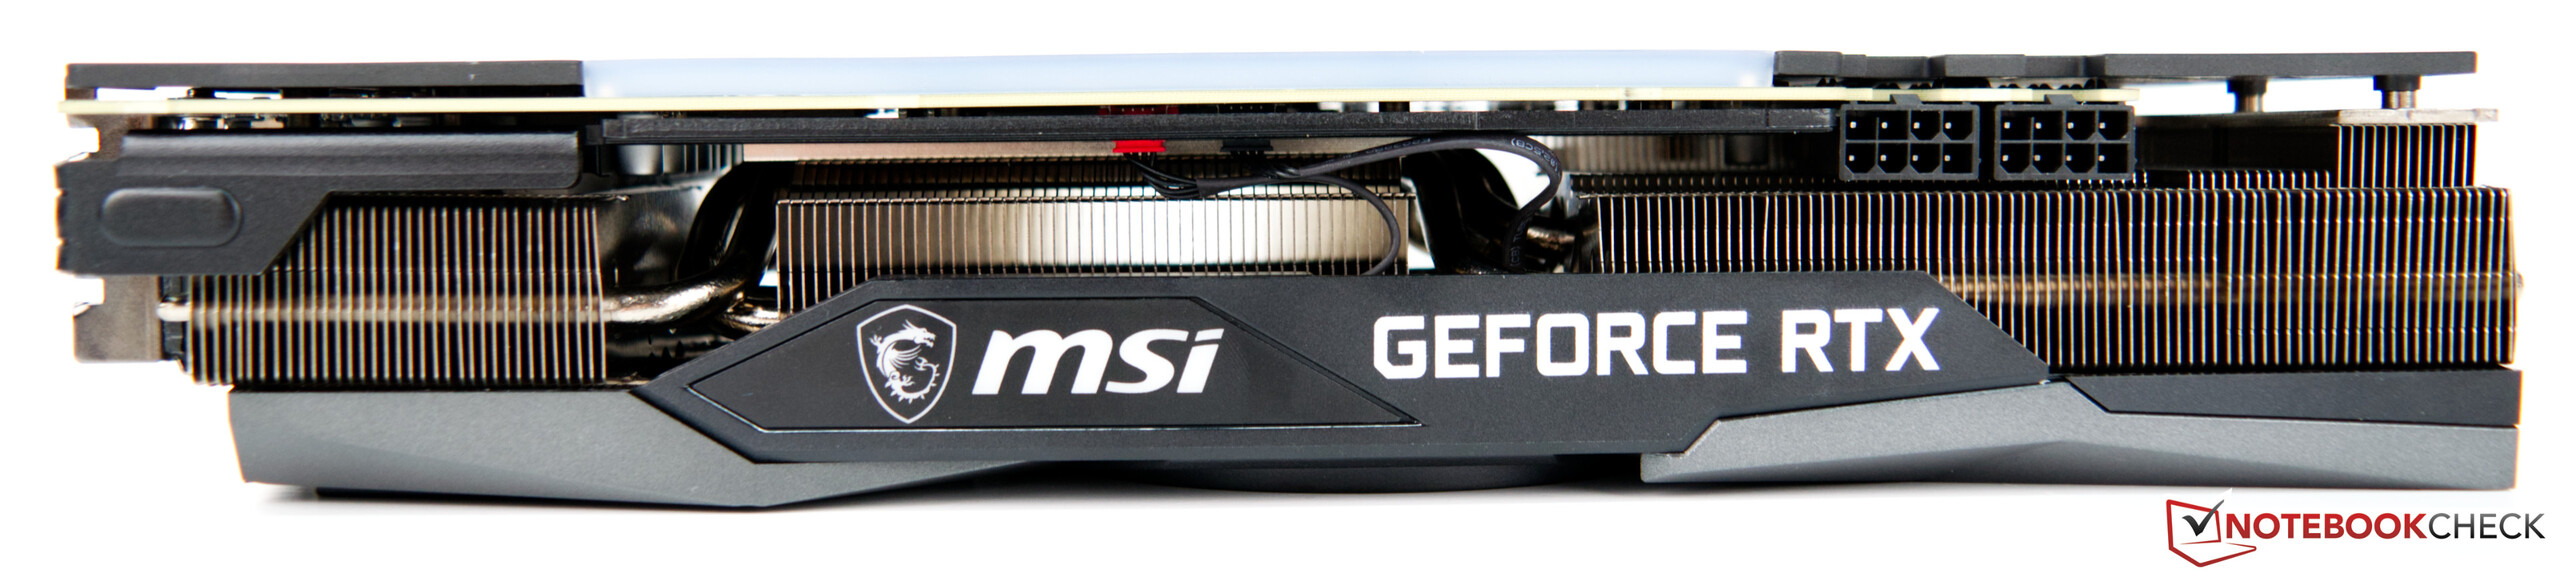
Per l'alimentazione, MSI fa a meno del connettore a 12 pin che Nvidia utilizza con le sue schede Founders Edition e rimane con quello classico. La GeForce RTX 3070 Gaming X Trio richiede due connettori di alimentazione a 8 pin. Esternamente, è possibile far funzionare fino a quattro monitor contemporaneamente. Per questo, c'è un'uscita HDMI con l'ultimo standard (2.1) e tre connessioni DisplayPort (1.4a).
Confronto di RTX 3070 con altre GPU NVIDIA
| Specifica | RTX 3090 | RTX 3080 FE | MSIRTX 3070 | RTX 3070 FE | Titan RTX | TITAN X Pascal | RTX 2080 Ti | RTX 2080 | RTX 2080 | RTX 2070 S |
| Chip | GA102 | GA102 | GA104 | GA104 | TU102 | GP102 | TU102 | TU104 | TU104 | |
| Processo FinFET | 8 nm | 8 nm | 8 nm | 8nm | 8 nm | 12 nm | 16 nm | 12 nm | 12 nm | 12 nm |
| CUDA cores | 10,496 | 8,704 | 5,888 | 5,888 | 4,608 | 3,584 | 4,352 | 2,944 | 2,560 | |
| Textureunits | 328 | 272 | 184 | 184 | 288 | 224 | 272 | 184 | 160 | |
| Tensor cores | 328 3a Gen. | 272 3a Gen. | 184 3a Gen. | 184 3a Gen. | 184 3a Gen. | 576 2a Gen. | - | 544 2a Gen. | 368 2a Gen. | 320 2a Gen. |
| RTcores | 82 | 68 | 46 | 46 | 72 | - | 68 | 46 | 40 | |
| Clock base GPU | 1.395 MHz | 1.440 MHz | 1.440 MHz | 1.500 MHz | 1.500 MHz | 1.350 MHz | 1.417 MHz | 1.350 MHz | 1.515 MHz | 1.605 MHz |
| Clock GPU boost clock | 1,695 MHz | 1,710 MHz | 1,830 MHz | 1,750 MHz | 1,770 MHz | 1,531 MHz | 1,545 MHz | 1,710 MHz | 1,770 MHz | |
| Memoriabus | 384-bit | 320-bit | 256-bit | 256-bit | 384-bit | 384-bit | 352-bit | 256-bit | 256-bit | |
| Larghezza di banda di memoria | 936 GB/s | 760 GB/s | 448GB/s | 448 GB/s | 672 GB/s | 480,4 GB/s | 616 GB/s | 448 GB/s | 448 GB/s | |
| Memoria video | 24 GB GDDR6X | 10 GB GDDR6X | 8 GBGDDR6X | 8 GB GDDR6 | 8 GB GDDR6 | 24 GB GDDR6 | 12 GB GDDR5X | 11 GB GDDR6 | 8 GB GDDR6 | 8 GB GDDRDR6 |
| Potenza assorbita | 350 W | 320 W | 240W | 220 W | 220 W | 280 W | 250 W | 250 W | 215 W | 215 W |
Il nostro sistema di test con AMD Ryzen 9 3900X come base
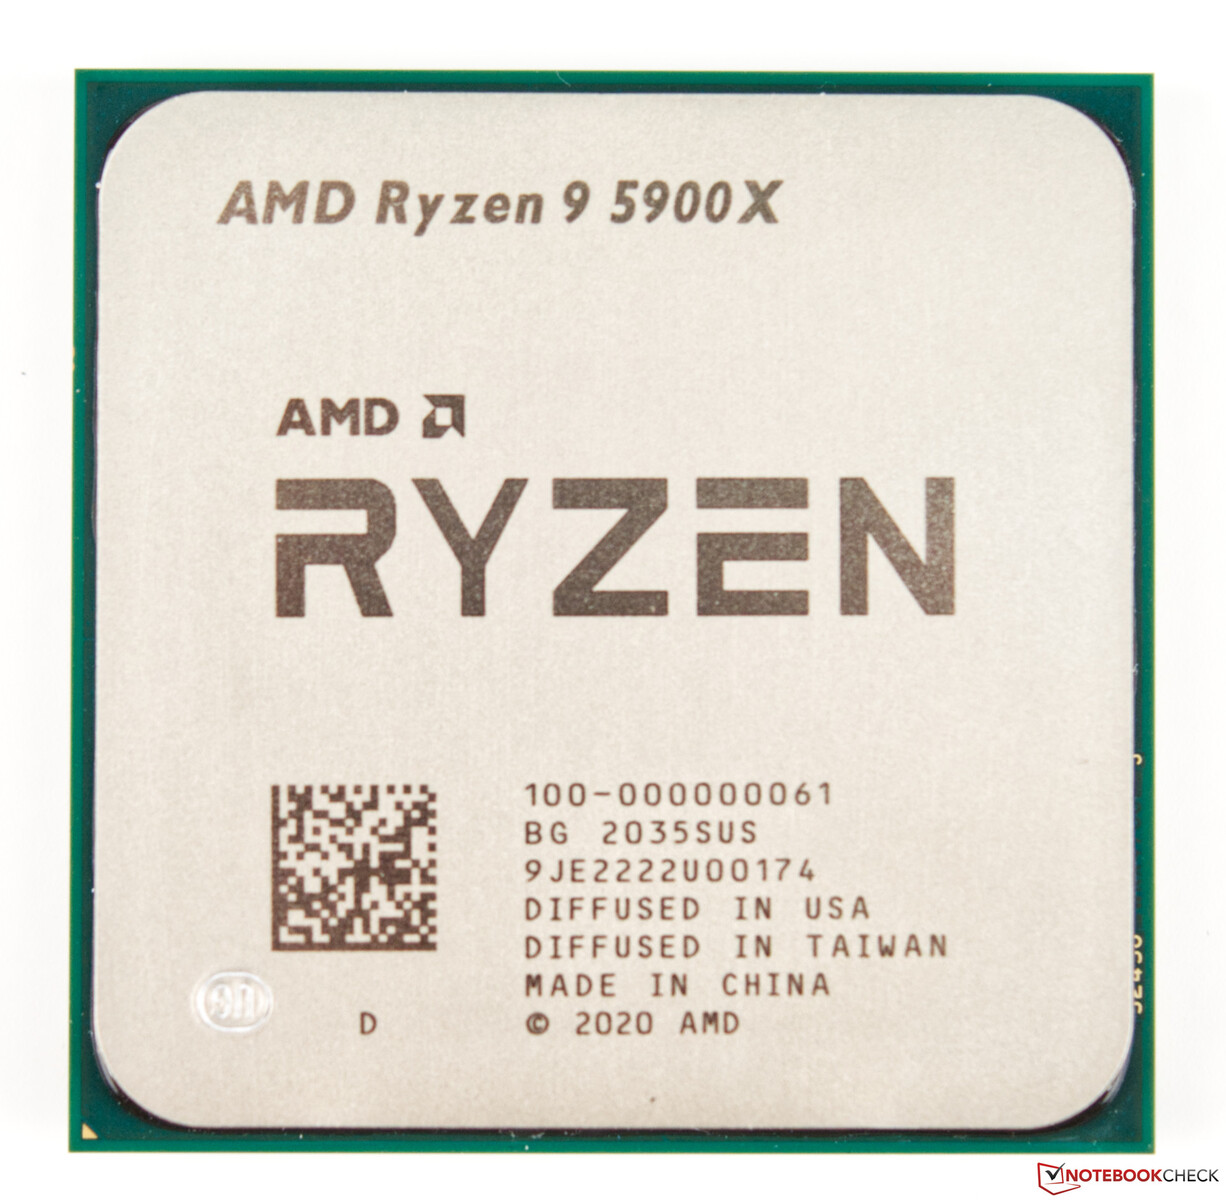
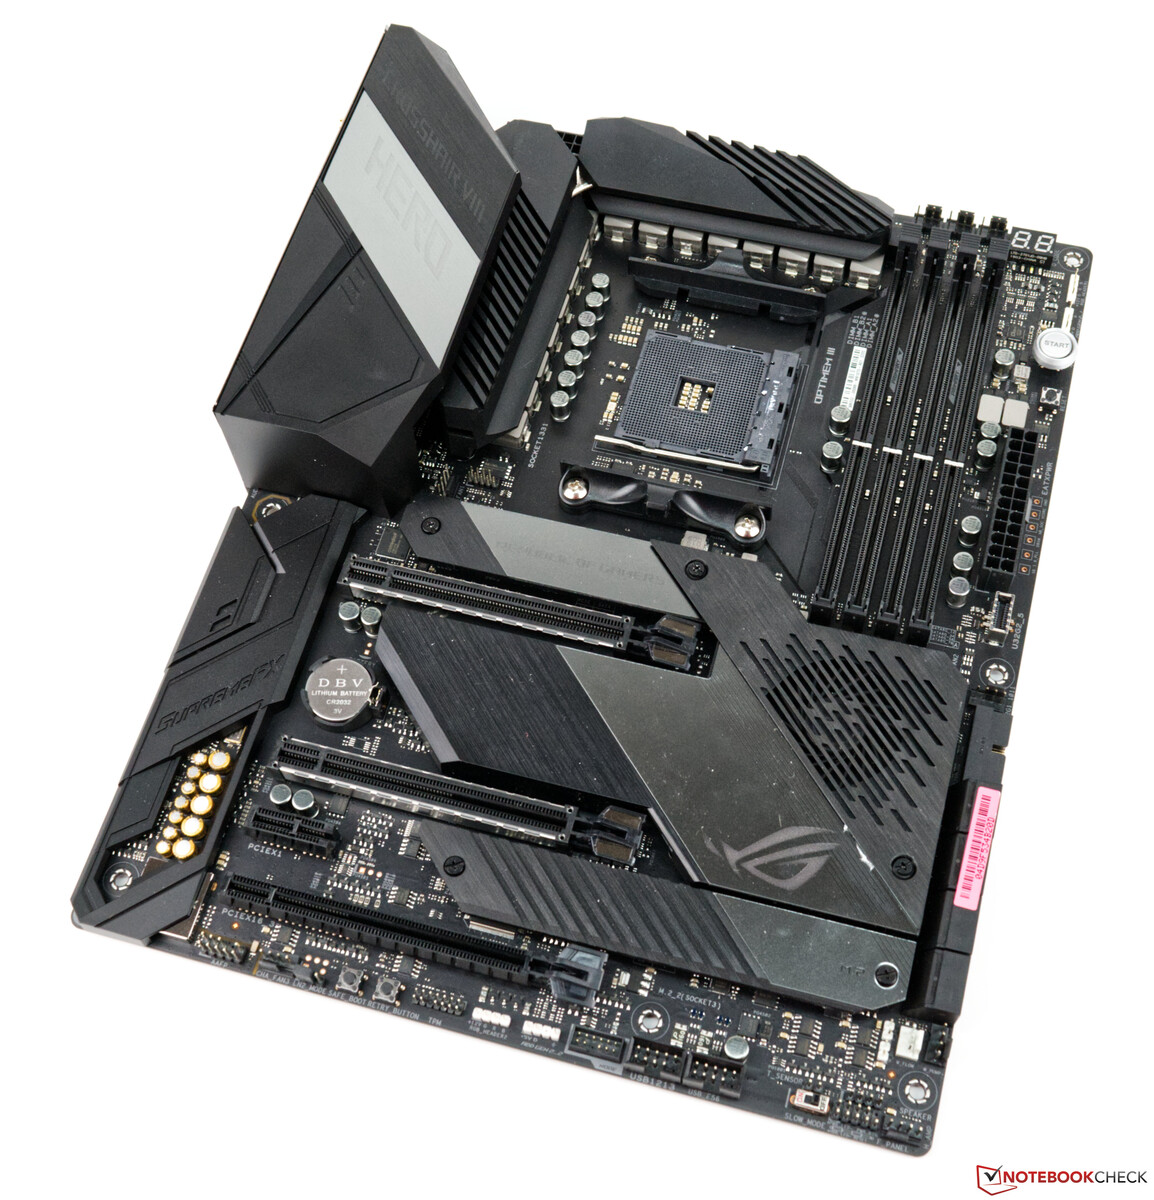
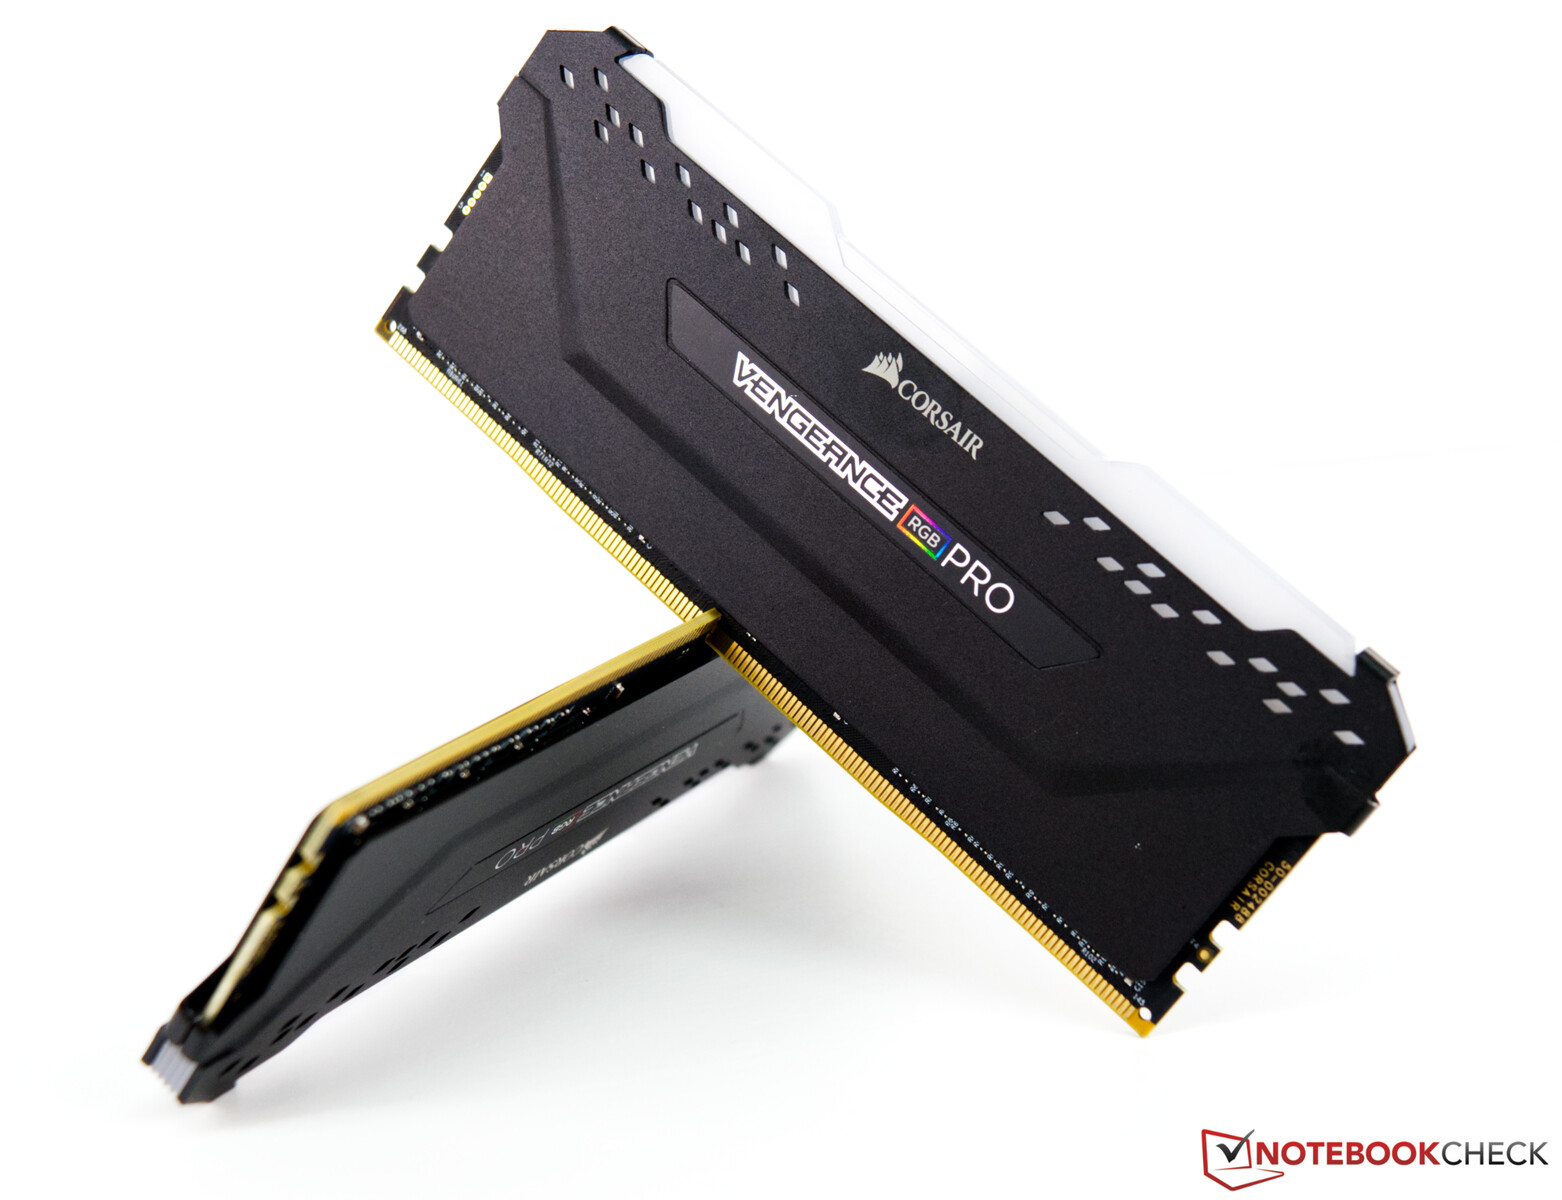
L'attuale piattaforma AMD basata sul Crosshair VIII dell'Asus X570 ROG funge da sistema di test. La CPU (AMD Ryzen 9 5900X) offre buone prestazioni della CPU, e abbiamo utilizzato un AIO (Alphacool Eisbaer 280 mm) come sistema di raffreddamento. La RAM da 32 GB è di Corsair e i clocks da 4.000 MHz. Utilizziamo l'Acer Predator XB321HK come monitor. Questo non ci limita grazie alla sua idoneità UHD. A questo punto, vorremmo ringraziare AMD per aver fornito la piattaforma di test e Corsair per il kit di RAM
Per i successivi benchmarks e test, utilizziamo il seguente sistema:
- Corsair Carbide Air 540 ATX Cube
- AMD Ryzen 9 5900X
- MSI GeForce RTX 3070 Gaming X Trio (driver Nvidia 457.30)
- Asus X570 ROG Crosshair VIII Hero Wi-Fi (BIOS 2402, impostazioni predefinite, XMP 1 - DDR4 4000)
- Alimentatore Corsair RM1000X 1000 watt
- Corsair Vengeance RGB Pro DDR4 4000 Kit di memoria 2x 16 GB
- Corsair MP600 2 TB M.2 PCIe 4.0 SSD
- Crucial MX500 2 TB (per i giochi)
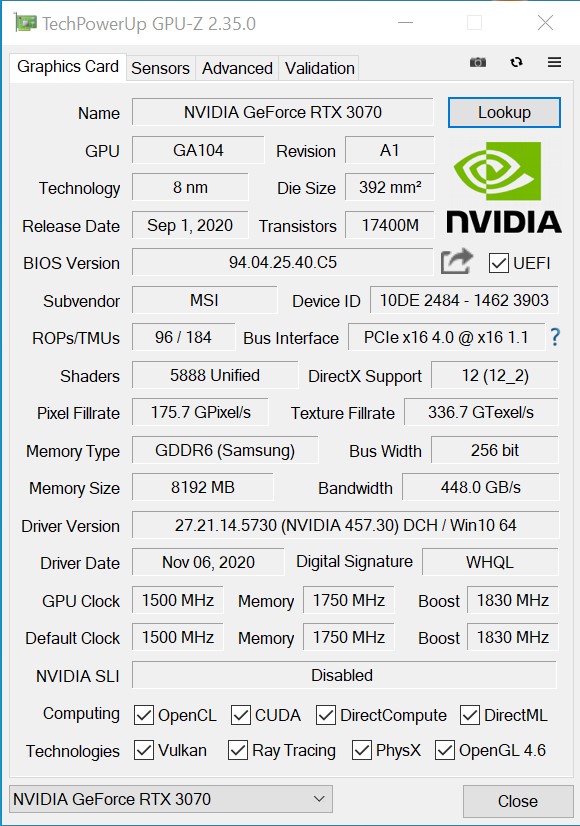
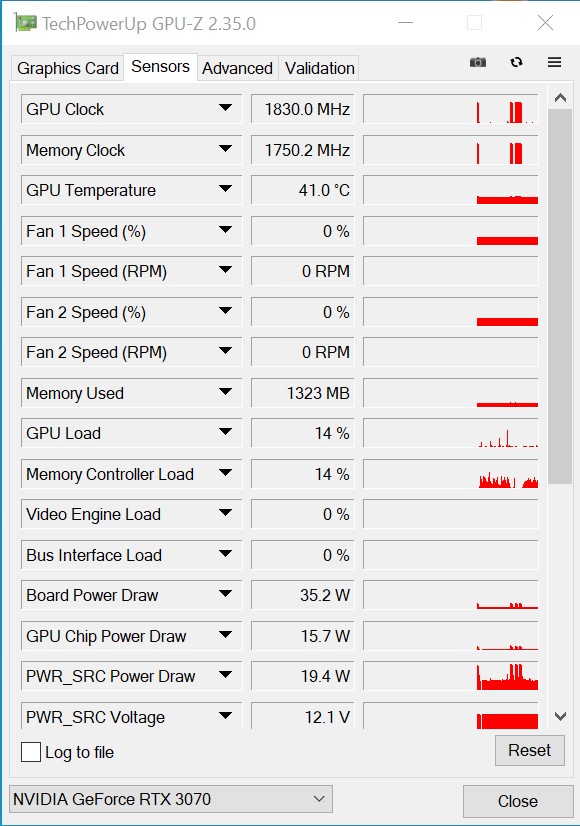
Le velocità di clock della MSI GeForce RTX 3070 Gaming X Trio
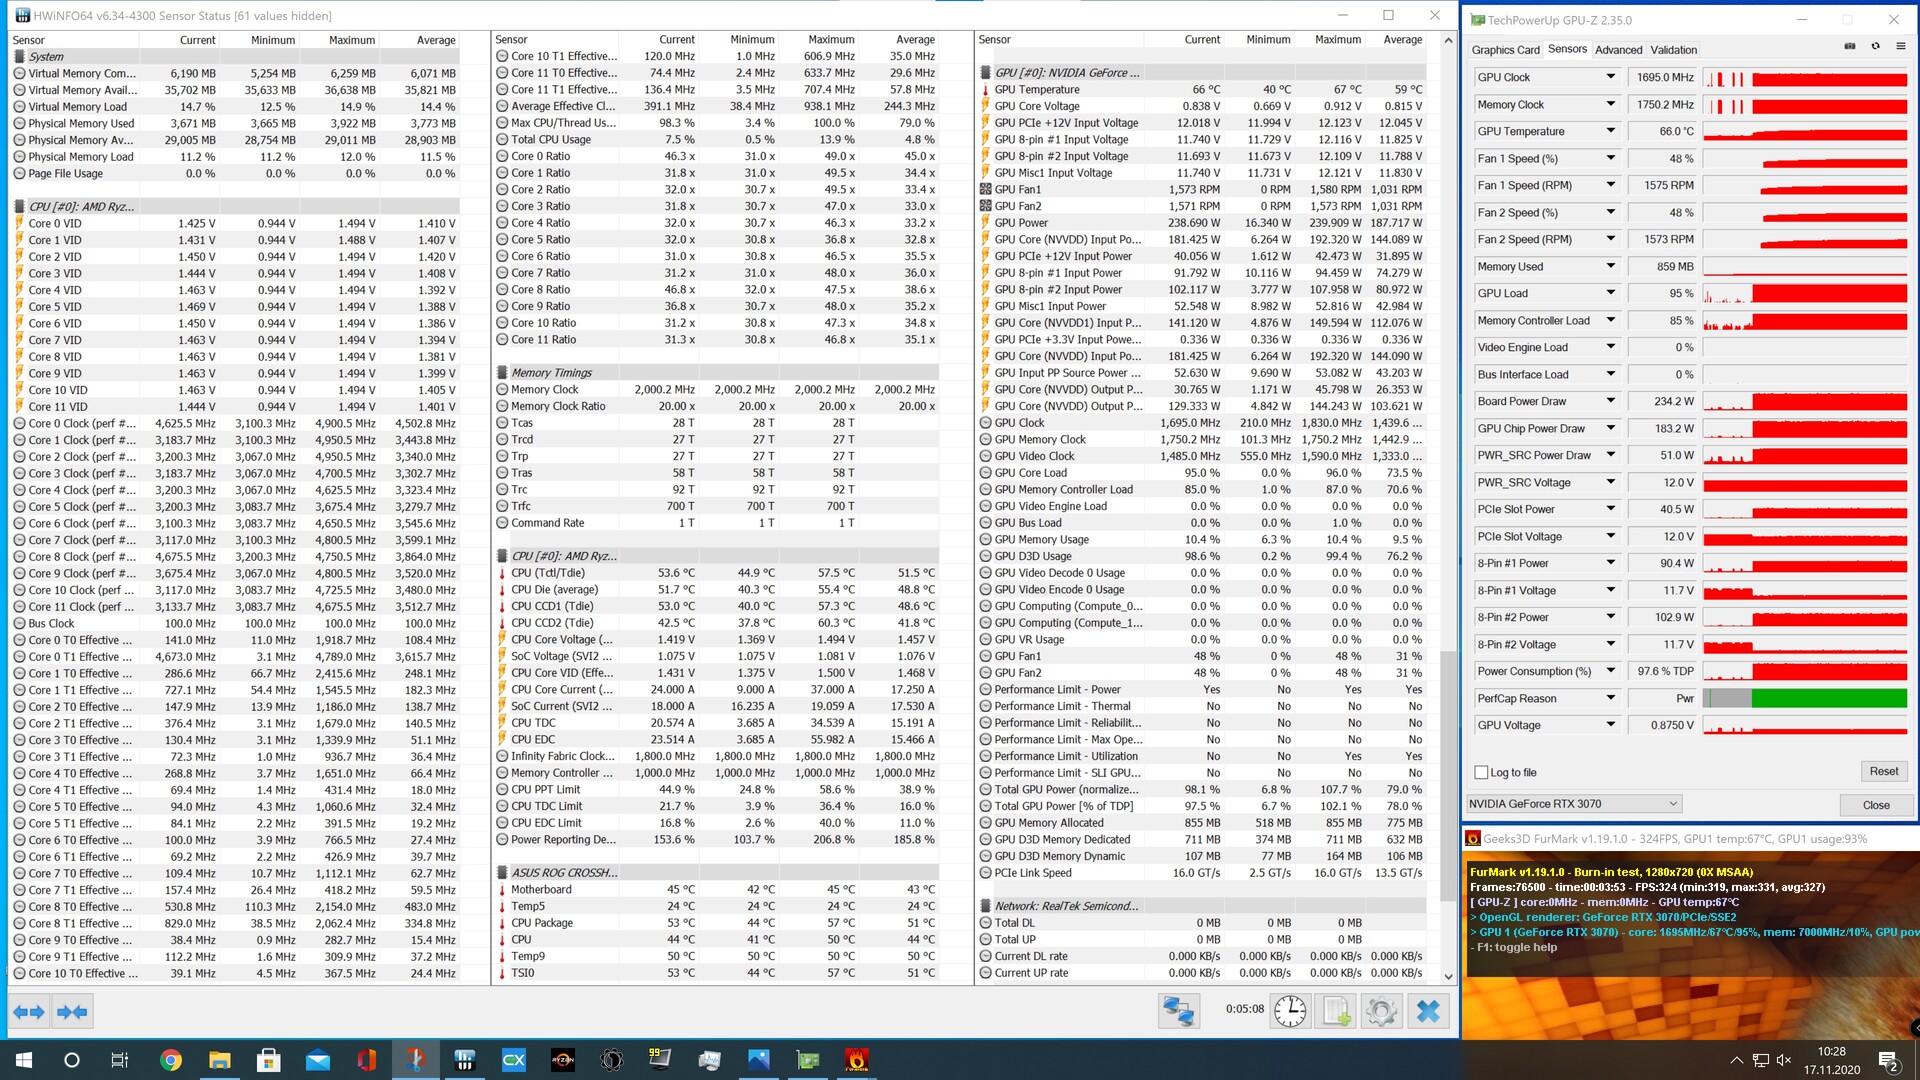
Rispetto al modello di riferimento, MSI non ha toccato la velocità di base del clock, il che vale anche per la velocità di funzionamento della VRAM. Solo la velocità massima di clock del turbo è un po' più alta a 1.830 MHz (+6%). In cambio, la GeForce RTX 3070 Gaming X Trio può anche utilizzare 20 watt in più di energia. Ma questo probabilmente non sarà di completo beneficio per il chip grafico, perché anche la ventola aggiuntiva e lo spettacolo RGB richiedono potenza.
In generale, tuttavia, la velocità di spinta è quasi sempre superata durante il gaming, il che è dovuto all'ottima soluzione di raffreddamento. Anche sotto carico, garantisce temperature ben al di sotto del limite di allarme.
Benchmarks sintetici
Per un primo confronto delle prestazioni, diamo un'occhiata ai risultati dei benchmarks sintetici. Qui, la MSI GeForce RTX 3070 Gaming X Trio è veloce come una GeForce RTX 2080 Ti. Le prestazioni della Nvidia Titan RTX non possono essere raggiunte, ma sono quasi a portata di mano. Rispetto alla GeForce RTX 2070 Super il nostro modello di prova può chiaramente distinguersi dal modello di Turing di circa il 40%. La GeForce RTX 3070 ha bisogno di circa il 10% di energia in più per raggiungere questo obiettivo
| Unigine Superposition | |
| 1280x720 720p Low | |
| Titan RTX | |
| MSI GeForce RTX 3070 Gaming X Trio | |
| GeForce RTX 3080 | |
| 1920x1080 1080p High | |
| GeForce RTX 3090 | |
| GeForce RTX 3080 | |
| Titan RTX | |
| MSI GeForce RTX 3070 Gaming X Trio | |
| 1920x1080 1080p Extreme | |
| GeForce RTX 3090 | |
| GeForce RTX 3080 | |
| Titan RTX | |
| MSI GeForce RTX 3070 Gaming X Trio | |
| 3840x2160 4k Optimized | |
| GeForce RTX 3090 | |
| GeForce RTX 3080 | |
| Titan RTX | |
| MSI GeForce RTX 3070 Gaming X Trio | |
| 7680x4320 8k Optimized | |
| GeForce RTX 3090 | |
| GeForce RTX 3080 | |
| Titan RTX | |
| MSI GeForce RTX 3070 Gaming X Trio | |
| 3DMark 05 Standard | 51451 punti | |
| 3DMark 06 Standard Score | 42108 punti | |
| 3DMark Vantage P Result | 85505 punti | |
| 3DMark 11 Performance | 28358 punti | |
| 3DMark Ice Storm Standard Score | 201360 punti | |
| 3DMark Cloud Gate Standard Score | 59414 punti | |
| 3DMark Fire Strike Score | 26306 punti | |
| 3DMark Fire Strike Extreme Score | 15681 punti | |
| 3DMark Time Spy Score | 12889 punti | |
Aiuto | ||
Gaming Benchmarks
Abbiamo testato la MSI GeForce RTX 3070 Gaming X Trio con una varietà di giochi e possiamo confermare che la scheda grafica ha un'ottima performance di gioco in Full HD e WQHD. Tuttavia, la GeForce RTX 3070 domina anche molti giochi in 4K, anche se alcuni giochi raggiungono solo 40 FPS. Anche in questa risoluzione, però, i giochi che non sono così affamati di hardware non sono un problema per la MSI GeForce RTX 3070 Gaming X Trio
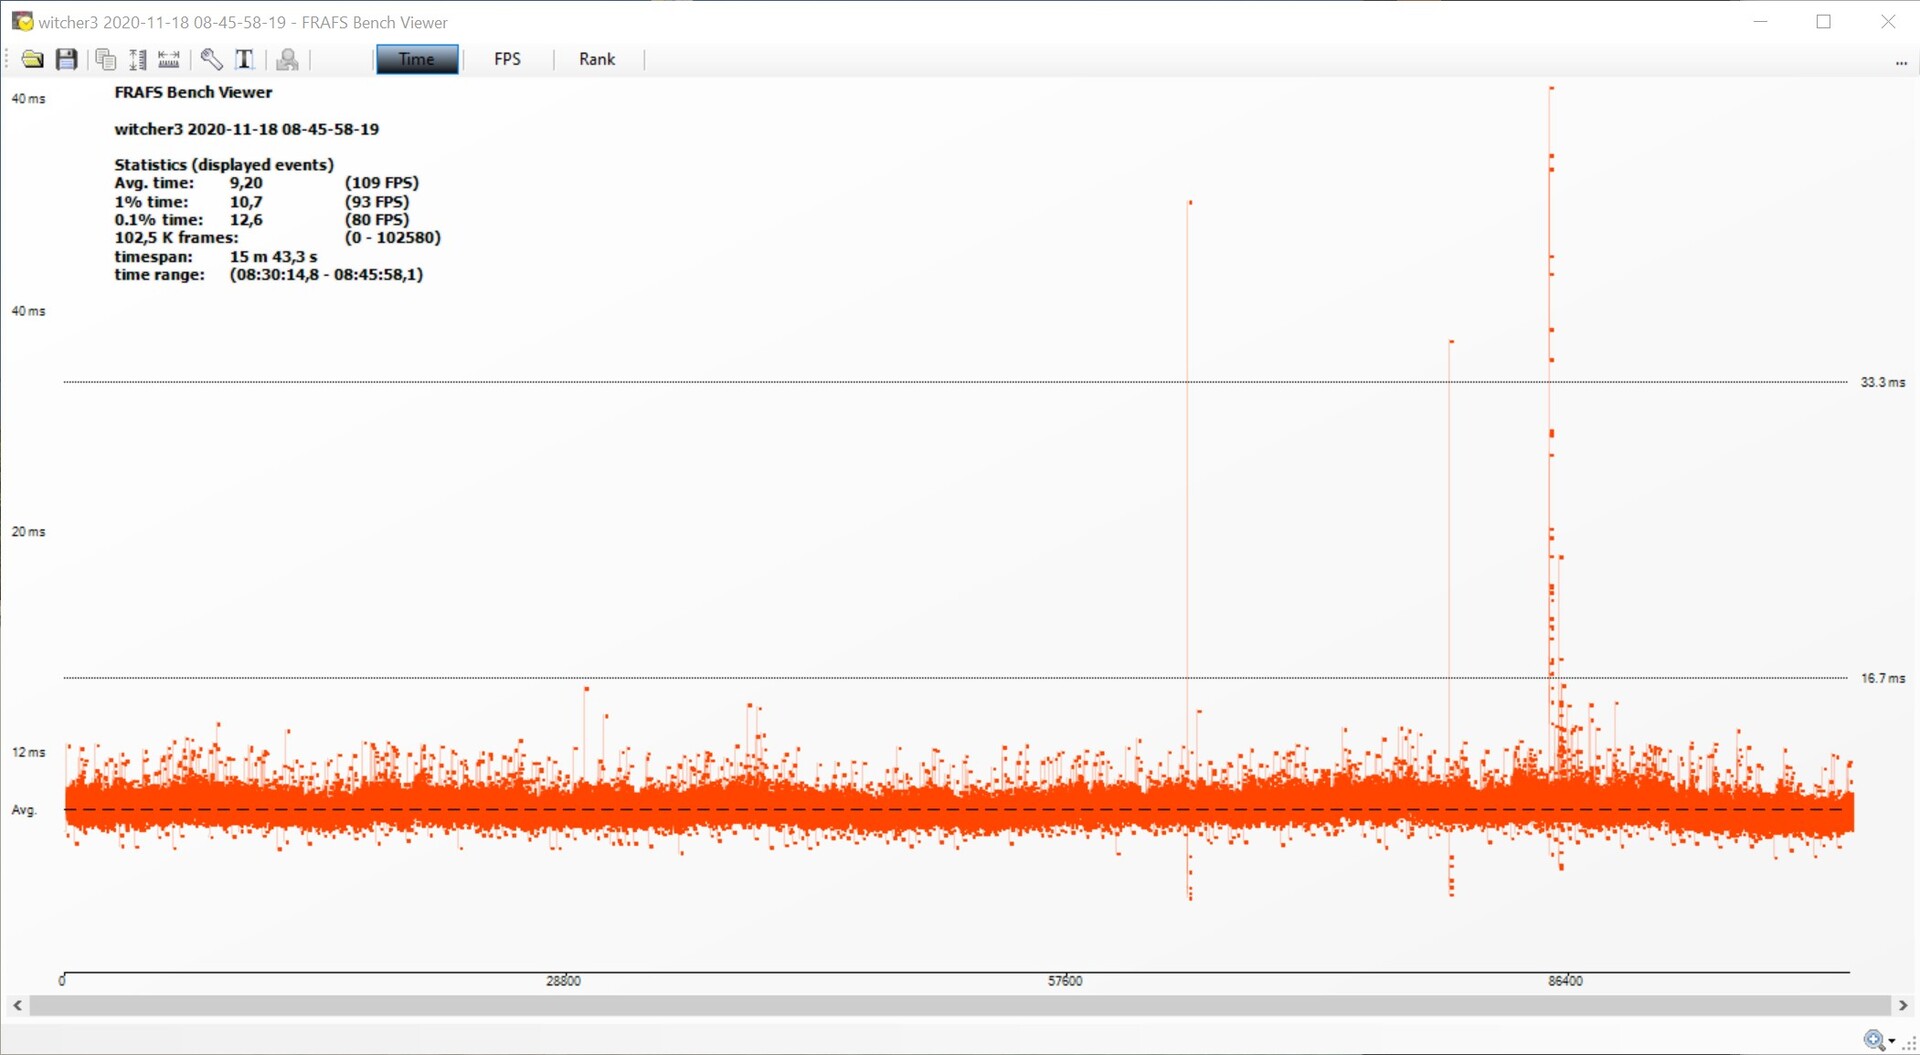
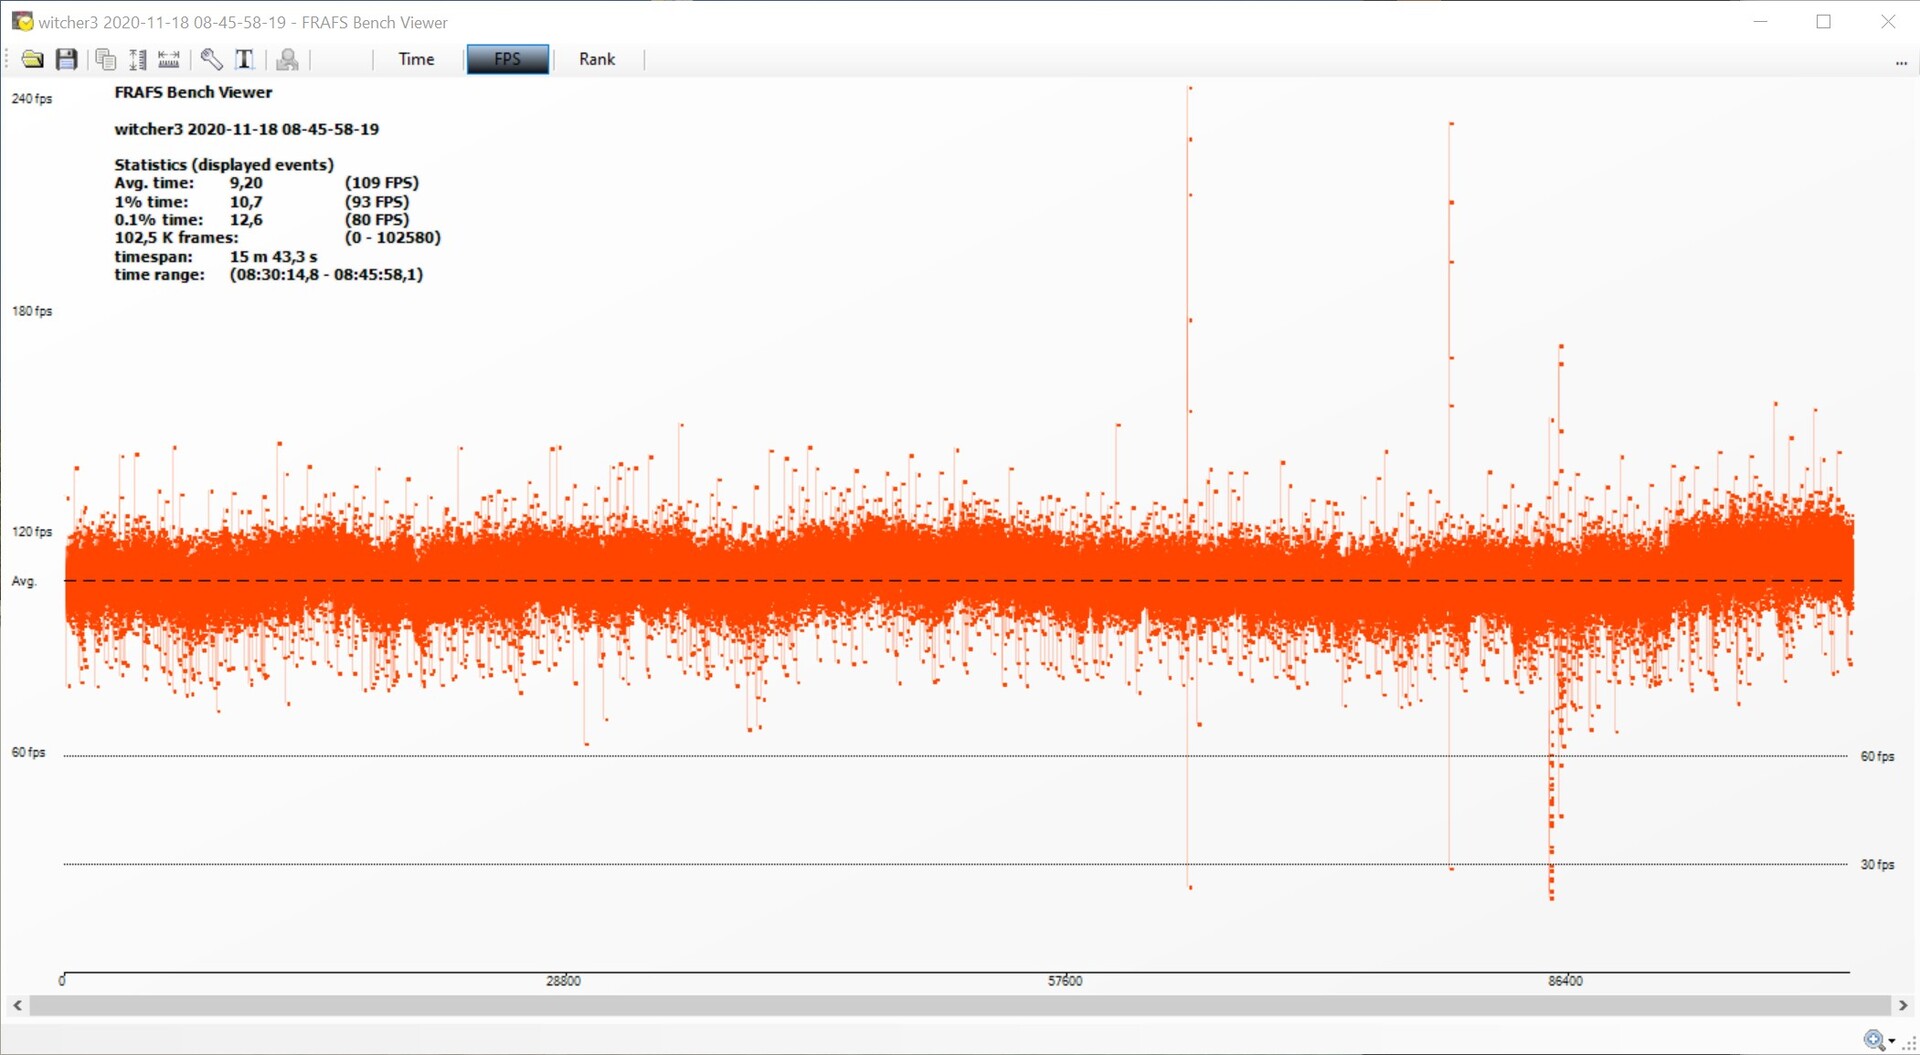
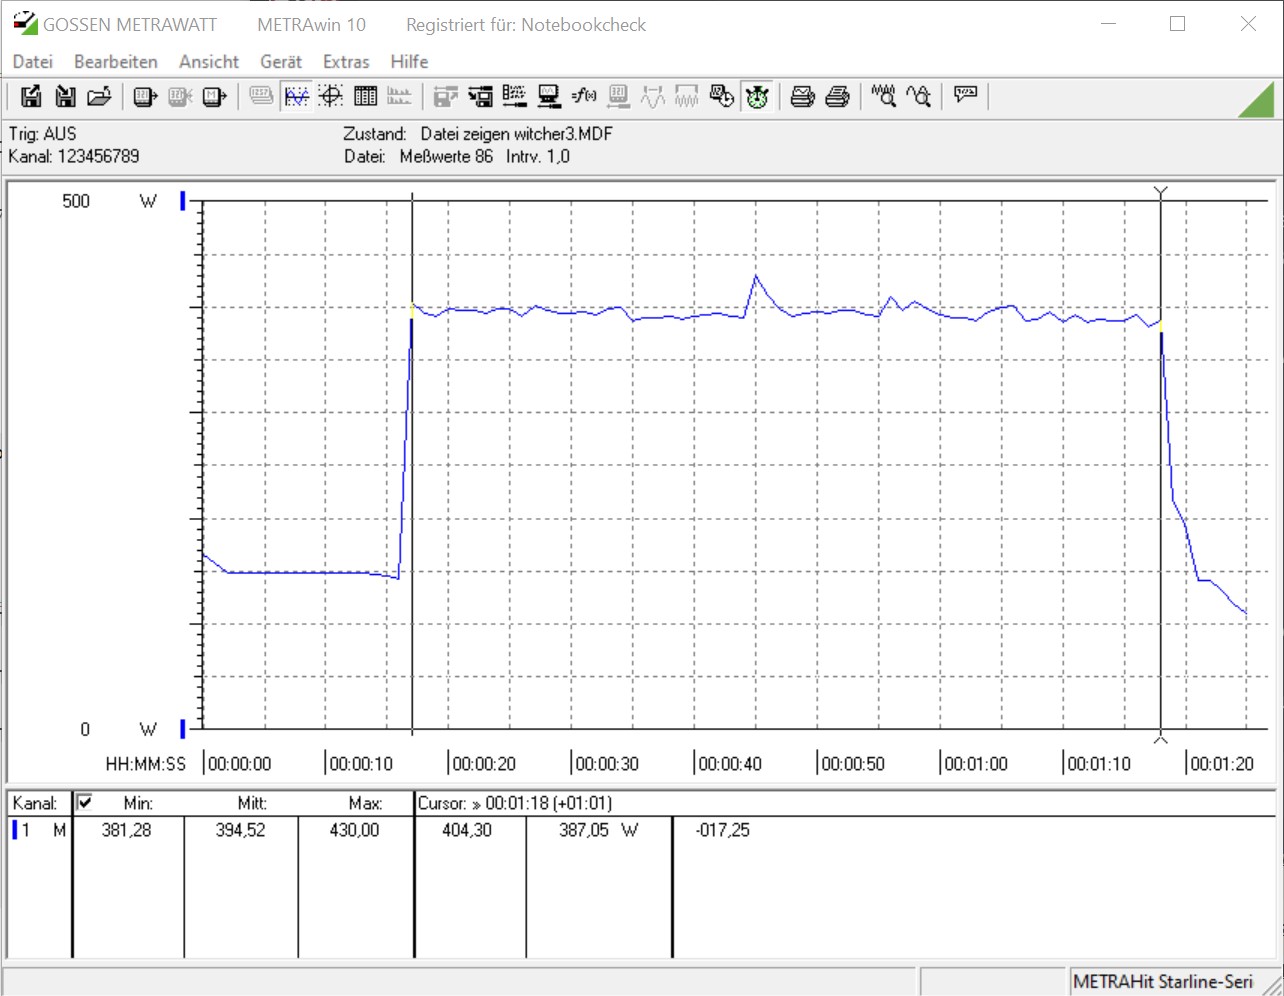
Se giocate per lo più in 1080p o 1440p, sarete completamente soddisfatti delle prestazioni dell'MSI GeForce RTX 3070 Gaming X Trio. Gli 8 GB di VRAM potrebbero sembrare un po' limitati a prima vista. Tuttavia, questo è sufficiente per i giochi moderni. Con i tempi di frame e la progressione dei frame che abbiamo registrato con il gioco The Witcher 3 (Ultra preset), alcune latenze più elevate compaiono solo di tanto in tanto, ma non influenzano l'esperienza di gioco in modo evidente. La progressione del frame è costante anche a lungo termine, il che indica ancora una volta la buona unità di raffreddamento.
La nostra GeForce RTX 3070 di MSI perde di poco contro la GeForce RTX 2080 Ti in questo confronto. La differenza di prestazioni rispetto alla più veloce GeForce RTX 3080 è di circa il 25-30% in alta risoluzione (2160p).
Progressione frame The Witcher 3 Ultra preset
| F1 2020 - 3840x2160 Ultra High Preset AA:T AF:16x | |
| GeForce RTX 3090 | |
| GeForce RTX 3080 | |
| Titan RTX | |
| MSI GeForce RTX 3070 Gaming X Trio | |
| Borderlands 3 - 3840x2160 Badass Overall Quality (DX11) | |
| GeForce RTX 3090 | |
| GeForce RTX 3080 | |
| Titan RTX | |
| Titan RTX | |
| MSI GeForce RTX 3070 Gaming X Trio | |
| GeForce RTX 2080 Ti (Desktop) | |
| Red Dead Redemption 2 - 3840x2160 Maximum Settings | |
| GeForce RTX 3090 | |
| GeForce RTX 3080 | |
| MSI GeForce RTX 3070 Gaming X Trio | |
| Titan RTX | |
| Rise of the Tomb Raider - 3840x2160 High Preset AA:FX AF:4x | |
| GeForce RTX 3080 | |
| GeForce RTX 2080 Ti (Desktop) | |
| MSI GeForce RTX 3070 Gaming X Trio | |
| GeForce RTX 2080 Super (Desktop) | |
| GeForce RTX 2080 (Desktop) | |
| GeForce RTX 2070 Super (Desktop) | |
| GeForce RTX 2070 (Desktop) | |
| Radeon VII | |
| GeForce RTX 2060 Super (Desktop) | |
| RX Vega 64 | |
| GeForce RTX 2060 (Desktop) | |
| The Witcher 3 - 3840x2160 High Graphics & Postprocessing (Nvidia HairWorks Off) | |
| GeForce RTX 3080 | |
| Titan RTX | |
| Titan RTX | |
| GeForce RTX 2080 Ti (Desktop) | |
| MSI GeForce RTX 3070 Gaming X Trio | |
| GeForce RTX 2080 Super (Desktop) | |
| GeForce RTX 2080 (Desktop) | |
| GeForce RTX 2070 Super (Desktop) | |
| GeForce RTX 2070 (Desktop) | |
| GeForce RTX 2060 Super (Desktop) | |
| Radeon VII | |
| Radeon RX 5700 XT (Desktop) | |
| GeForce RTX 2060 (Desktop) | |
| RX Vega 64 | |
| Radeon RX 5700 (Desktop) | |
| basso | medio | alto | ultra | QHD | 4K | |
|---|---|---|---|---|---|---|
| GTA V (2015) | 182 | 172 | 157 | 91.1 | 86.5 | 112 |
| The Witcher 3 (2015) | 451 | 350 | 224 | 122 | 88.2 | |
| Dota 2 Reborn (2015) | 162.9 | 140.5 | 137.6 | 128.6 | 123.4 | |
| Rise of the Tomb Raider (2016) | 336 | 252 | 197 | 169 | 83.8 | |
| Final Fantasy XV Benchmark (2018) | 190 | 148 | 115 | 93.9 | 56.9 | |
| X-Plane 11.11 (2018) | 143 | 117 | 95.4 | 81.1 | ||
| Far Cry 5 (2018) | 159 | 139 | 133 | 127 | 113 | 69 |
| Strange Brigade (2018) | 439 | 311 | 256 | 223 | 166 | 97.6 |
| Shadow of the Tomb Raider (2018) | 155 | 143 | 143 | 138 | 108 | 61 |
| Battlefield V (2018) | 177.5 | 144.3 | 125.8 | 113.6 | 98.8 | 69 |
| Apex Legends (2019) | 144 | 144 | 144 | 144 | 144 | 107 |
| Far Cry New Dawn (2019) | 131 | 112 | 112 | 97 | 94 | 70 |
| Metro Exodus (2019) | 156 | 136 | 113 | 91.3 | 74.4 | 49.1 |
| The Division 2 (2019) | 220 | 173 | 142 | 112 | 82 | 49 |
| Anno 1800 (2019) | 115 | 112 | 82.7 | 46.5 | 46.2 | 34.3 |
| Rage 2 (2019) | 264 | 192 | 168 | 163 | 110 | 56.7 |
| Control (2019) | 238 | 147 | 122 | 82.5 | 42.3 | |
| Borderlands 3 (2019) | 142 | 129 | 111 | 95.8 | 75.9 | 44.2 |
| Star Wars Jedi Fallen Order (2019) | 106 | 106 | 104 | 102 | 67.6 | |
| Red Dead Redemption 2 (2019) | 168 | 156 | 119 | 78 | 65 | 44 |
| Hunt Showdown (2020) | 216 | 192 | 180 | 138 | 70.2 | |
| Doom Eternal (2020) | 246 | 246 | 244 | 237 | 208 | 116 |
| F1 2020 (2020) | 321 | 288 | 249 | 179 | 146 | 89.2 |
| Horizon Zero Dawn (2020) | 172 | 152 | 132 | 125 | 109 | 77 |
| Flight Simulator 2020 (2020) | 115 | 97.4 | 79.9 | 62.8 | 55.6 | 37.3 |
| Serious Sam 4 (2020) | 161.2 | 130.6 | 121.3 | 104.2 | 91.3 | 67.6 |
| Mafia Definitive Edition (2020) | 152 | 128 | 124 | 98.7 | 56.6 | |
| Star Wars Squadrons (2020) | 382 | 316 | 292 | 268 | 207 | 128 |
| FIFA 21 (2020) | 150 | 152 | 156 | 152 | 156 | 160 |
| Watch Dogs Legion (2020) | 100 | 100 | 88.9 | 79 | 65.7 | 37 |
| Dirt 5 (2020) | 169 | 119 | 102 | 86 | 74 | 52.9 |
| Assassin´s Creed Valhalla (2020) | 125 | 100 | 87 | 78 | 67 | 47 |
| Call of Duty Black Ops Cold War (2020) | 205 | 186 | 132 | 122 | 107 | 74 |
Calcolo delle prestazioni
In LuxMark e ComputeMark, l'MSI GeForce RTX 3070 Gaming X Trio compete nuovamente con la GeForce RTX 2080 Ti e può, quindi, anche chiaramente superare la GeForce RTX 2070 Super. Tuttavia, la differenza rispetto alla GeForce RTX 3080 più veloce è più piccola qui che nei benchmarks di gioco puri. Rispetto alle schede grafiche per workstation, le schede GeForce mancano delle ottimizzazioni dei driver.
Emissioni dell'MSI GeForce RTX 3070 Gaming X Trio
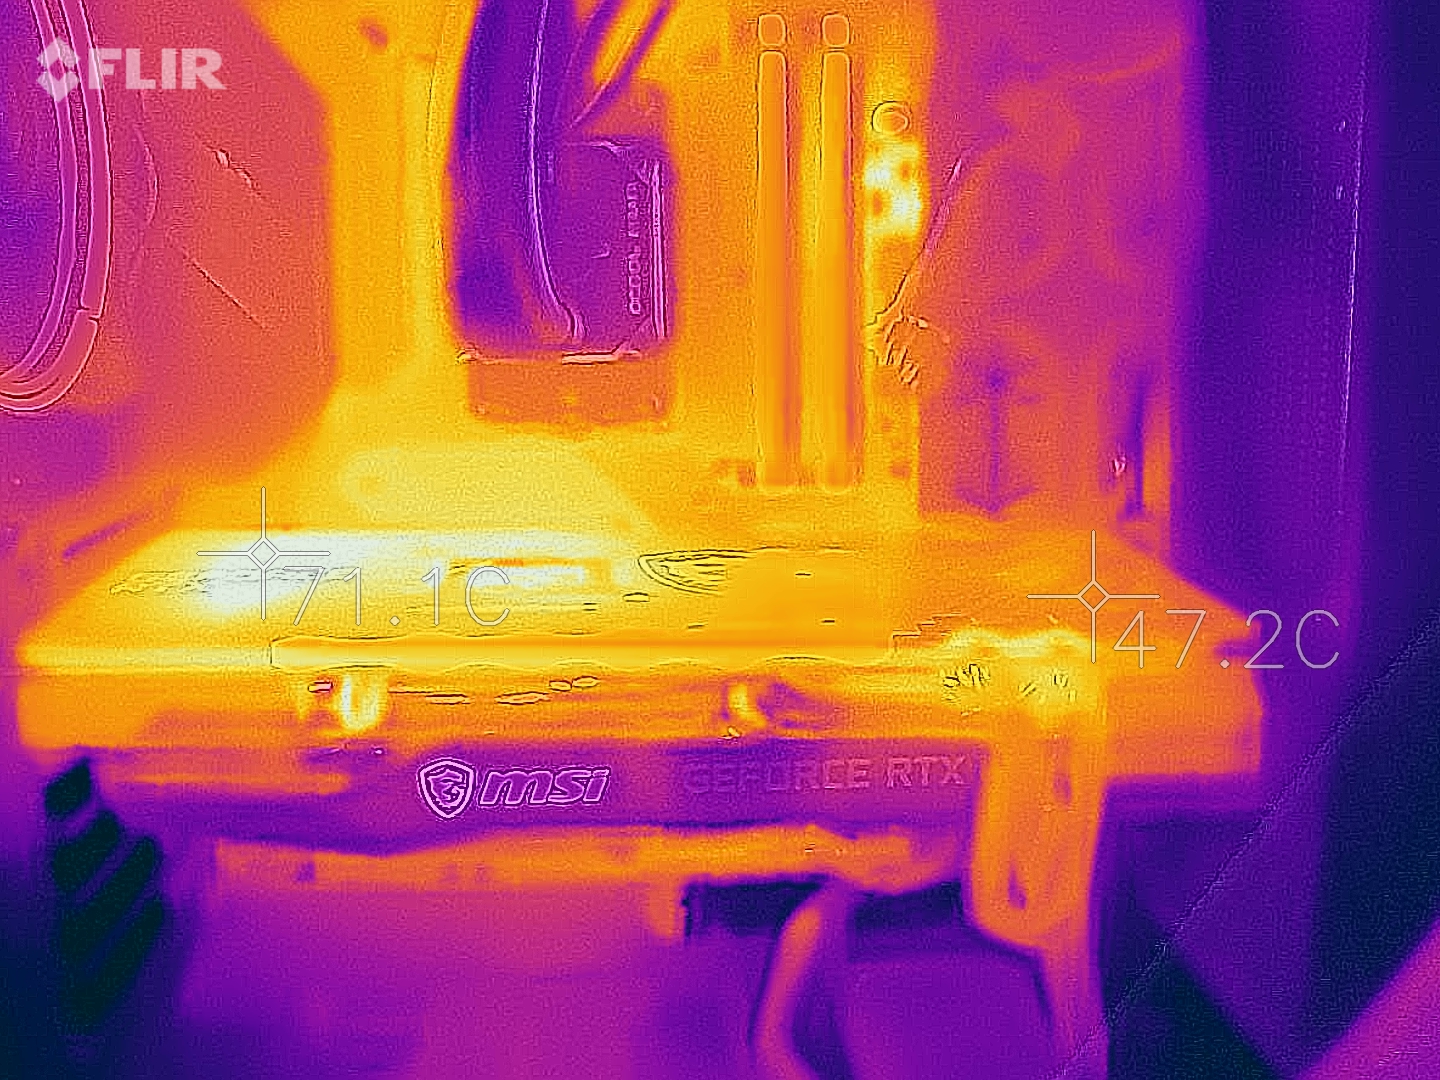
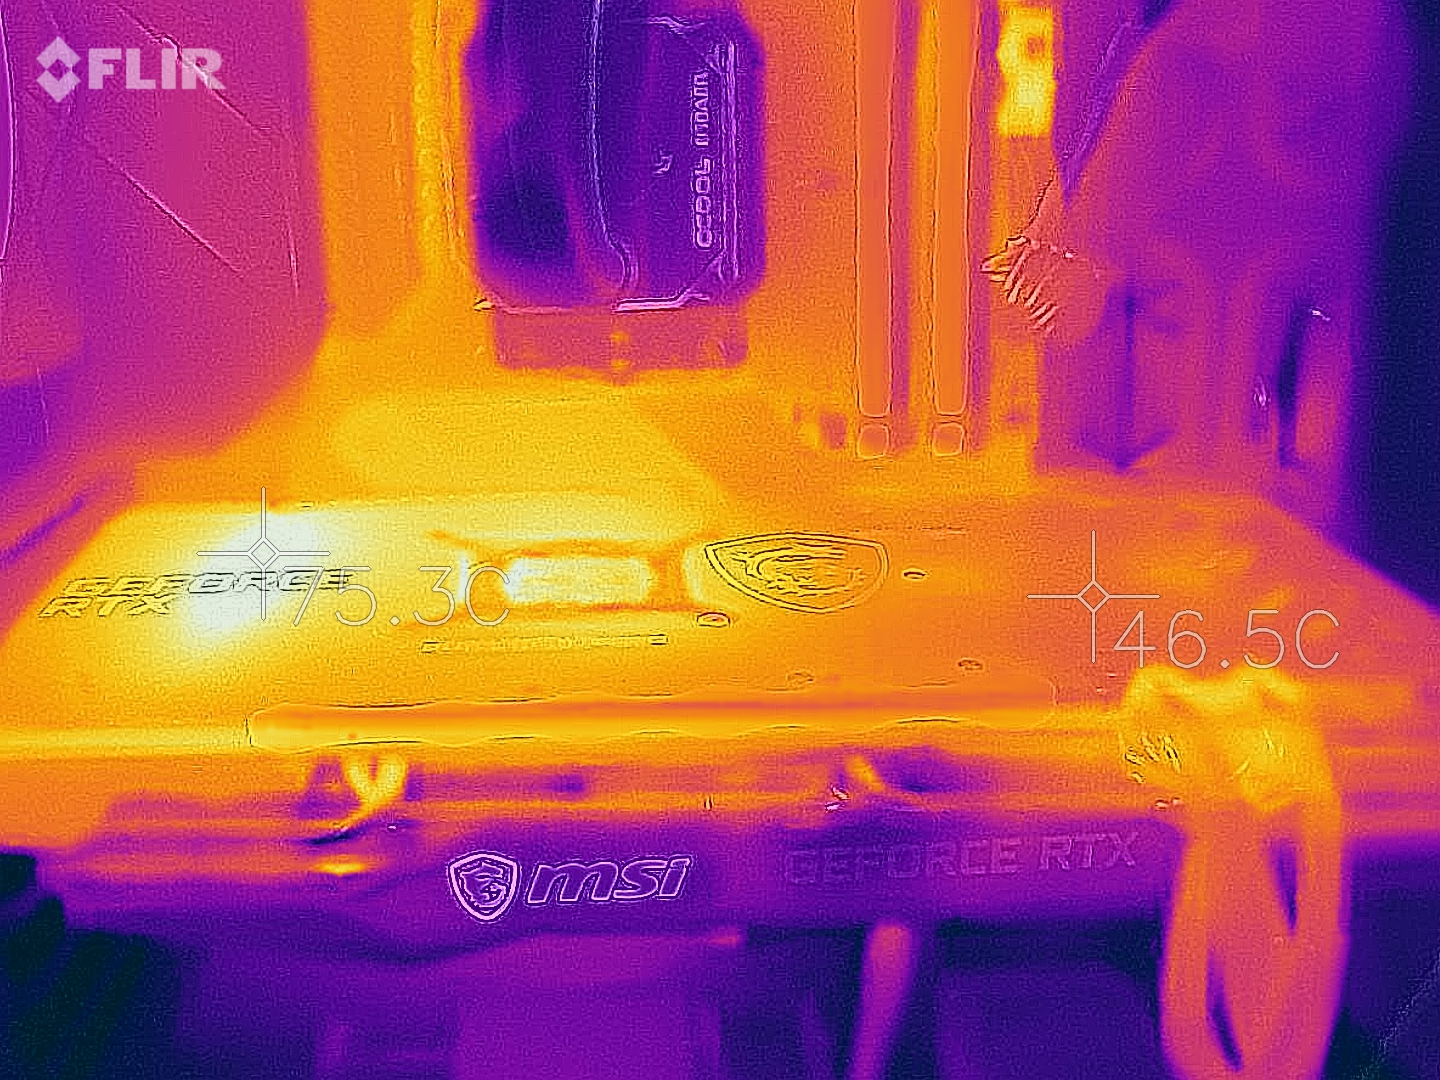
La MSI GeForce RTX 3070 Gaming X Trio ha un BIOS da 240 watt, in cui la scheda grafica si abbandona anche sotto carico. Questo è un po' meno che sull'altrettanto veloce GeForce RTX 2080 Ti ma anche un po' più che sul modello di riferimento di Nvidia.
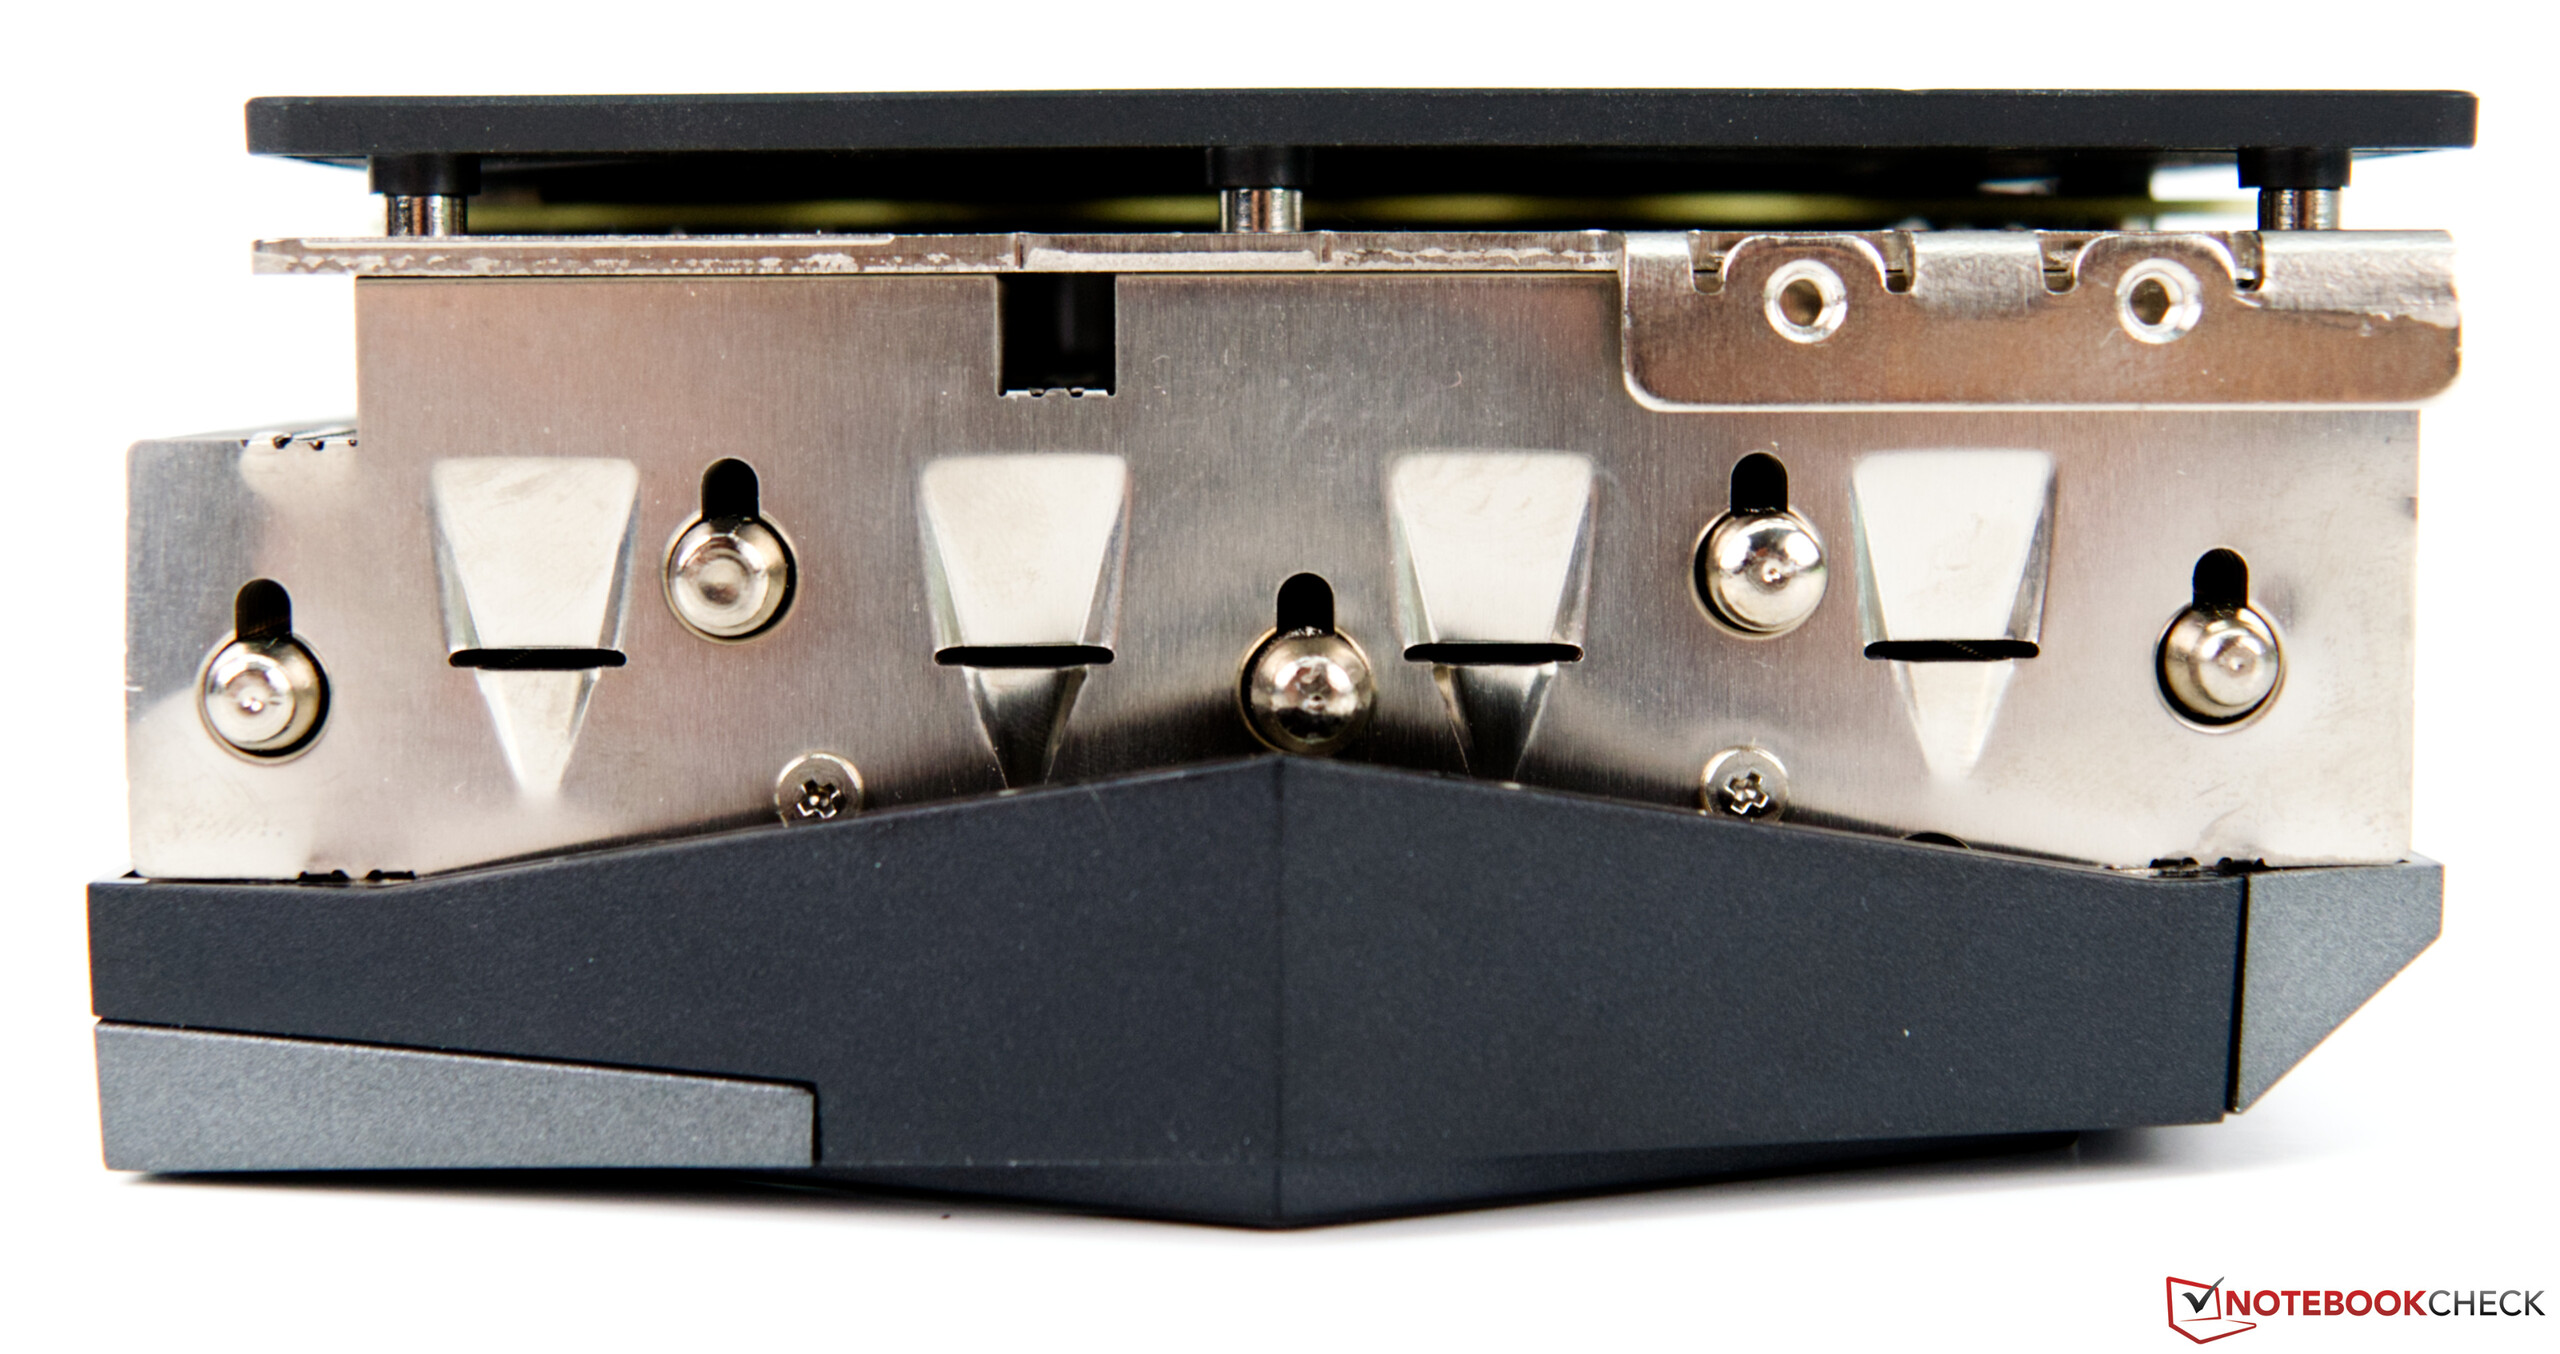
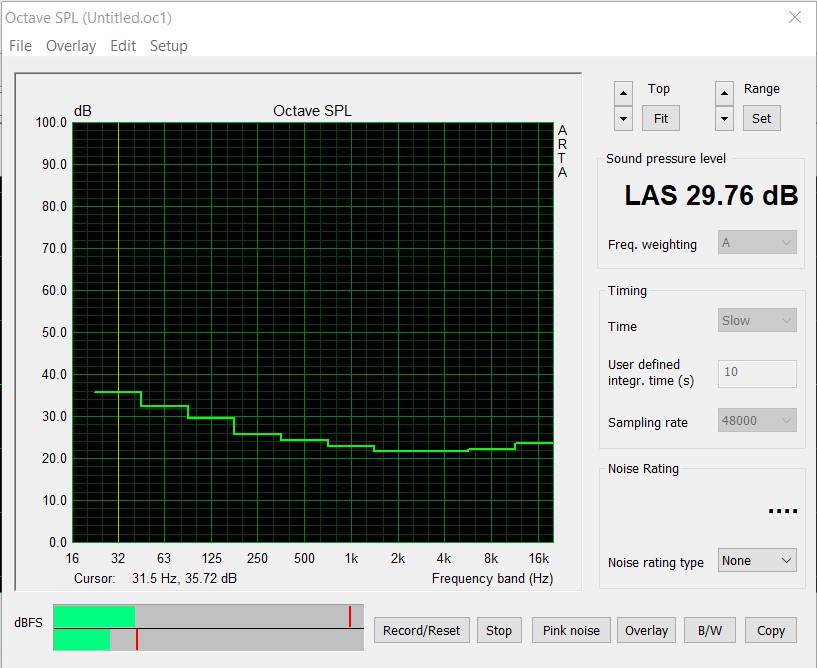
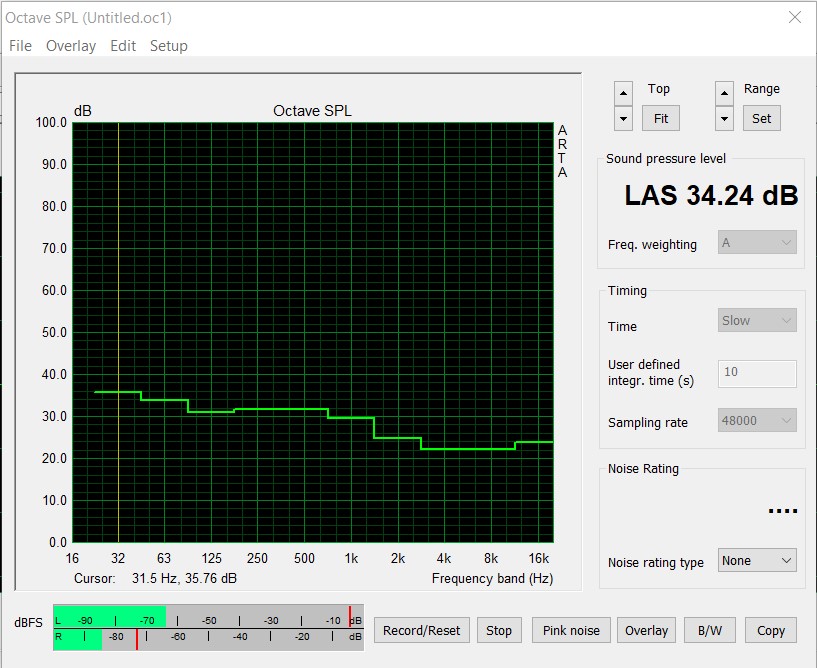
L'unità di raffreddamento della scheda grafica Gaming X Trio è molto grande e di questo bisogna tener conto nella scelta del case. In cambio, il raffreddatore incorporato fa un ottimo lavoro e raffredda la scheda grafica in modo affidabile e silenzioso. Senza carico, le ventole rimangono ferme, in modo che non venga generato alcun rumore. Solo sotto carico le tre ventole assiali accelerano un po'. Durante lo test test, però, abbiamo potuto misurare solo un massimo di 34,24 dB(A). Di conseguenza, questa scheda grafica è molto silenziosa anche sotto carico. Ciononostante, la temperatura della GPU rimane lontana dai livelli critici ad un massimo di 67 °C (~153 °F).
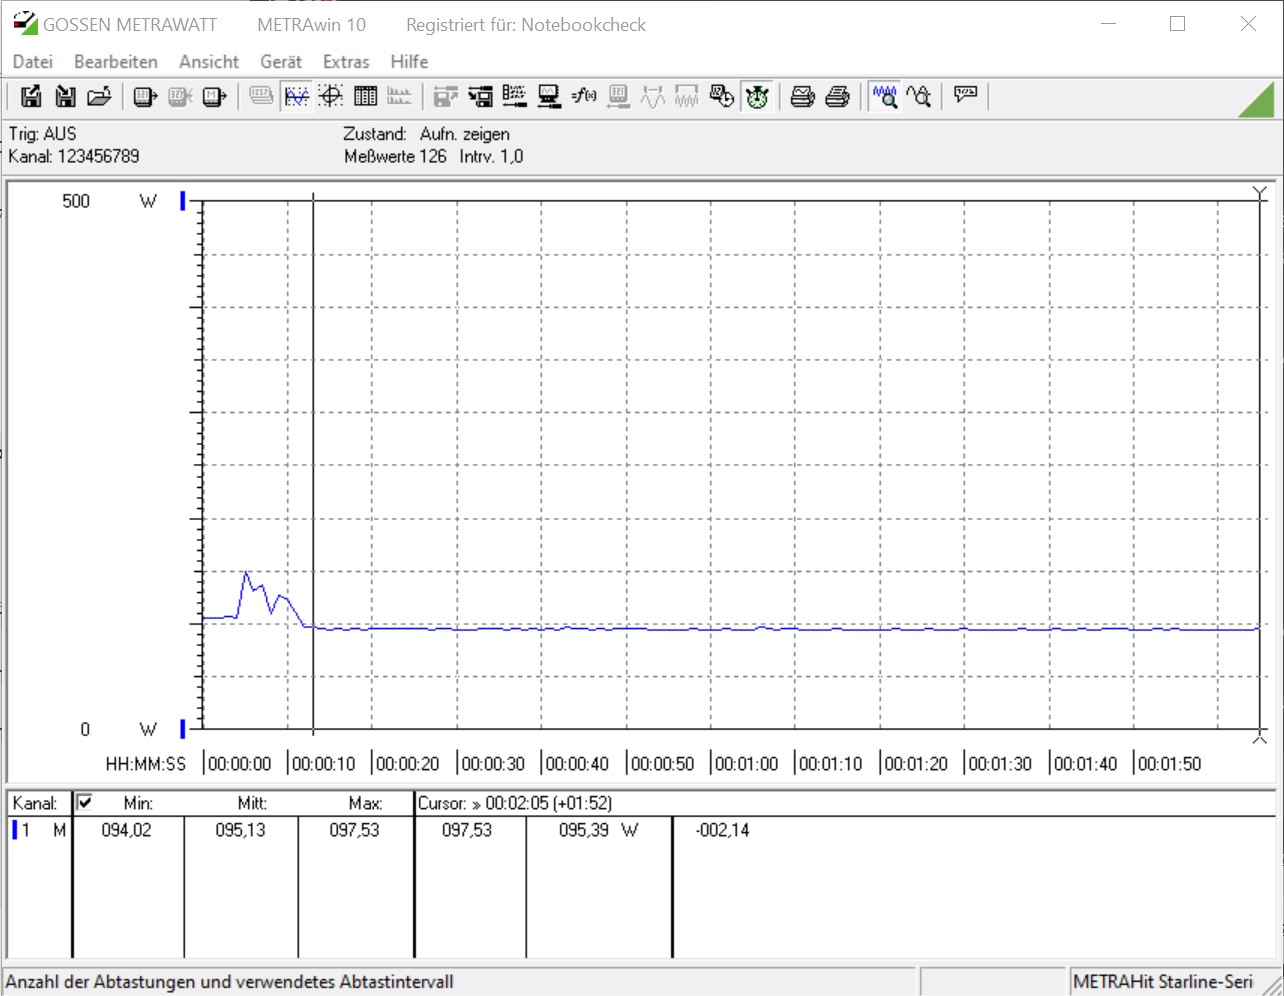
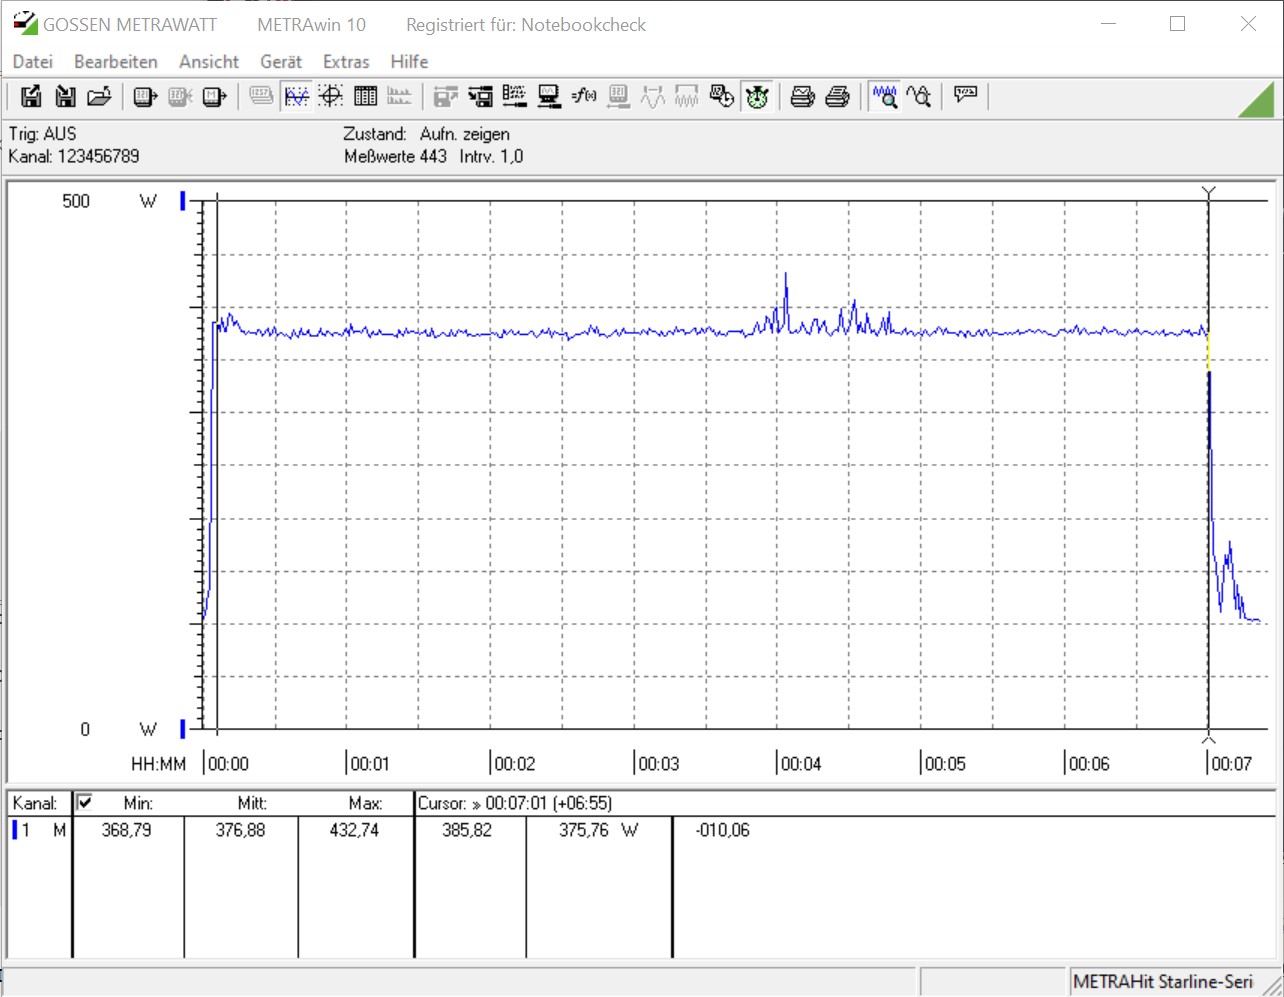
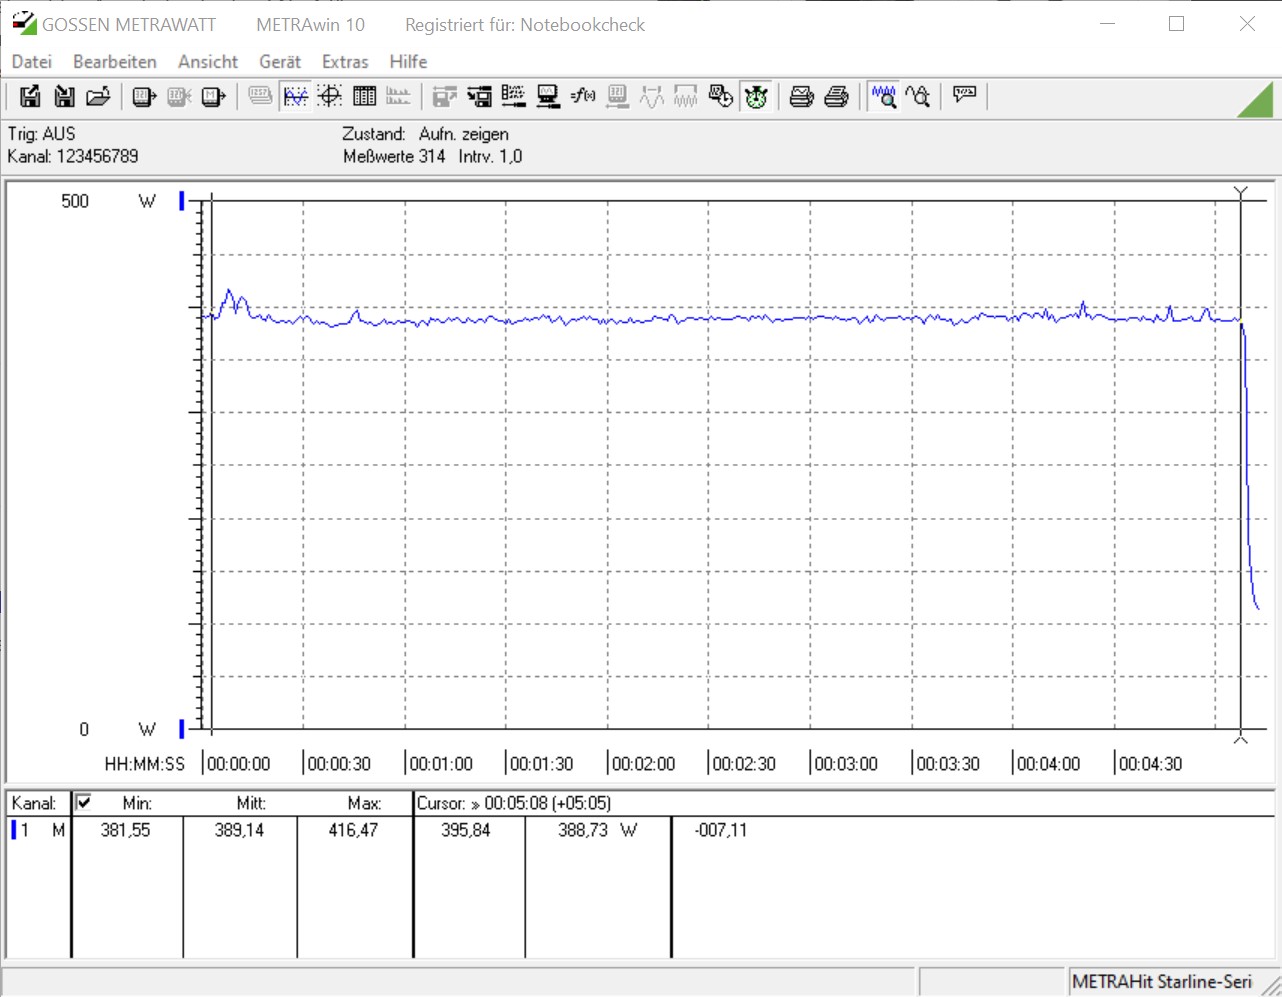
Per quanto riguarda il consumo energetico, l'MSI GeForce RTX 3070 Gaming X Trio si comporta abbastanza bene. Il sistema di test richiede circa 95 watt in condizioni di utilizzo inattivo. Allo stesso tempo, però, durante il gaming, dalla presa di corrente vengono assorbiti 394 watt. Ma il risultato è ancora buono alla fine, perché la GeForce RTX 2080 Ti ha sempre avuto bisogno di un po' più di energia nel nostro test. La differenza rispetto alla GeForce RTX 2070 Super è relativamente piccola.
* ... Meglio usare valori piccoli
Pro
Contro
Giudizio Complessivo - Quasi inudibile nonostante il TDP più alto


La GeForce RTX 3070 è ancora la più piccola GPU Ampere per il mercato consumer. Con la GeForce RTX 3070 Gaming X Trio, MSI continua a sviluppare molto bene la serie Gaming X Trio. Il modello di prova offre maggiori prestazioni grazie al TDP più elevato, che si traduce in una velocità di spinta leggermente superiore. Ma l'ottimo sistema di raffreddamento contribuisce anche a non dover sacrificare le prestazioni sotto carico. Inoltre, la GPU non ha mai raggiunto temperature critiche. Ciononostante, la scheda grafica è difficilmente udibile in un caso chiuso.
Quando la scheda grafica sarà disponibile, al momento vi costerà quasi 720 euro (~$857). Questo è significativamente al di sopra del prezzo che MSI ha impostato per la GeForce Gaming X Trio. Secondo il produttore, questo valore è di 559 Euro (~$665). È comprensibile che queste schede partner costino un po' di più dei modelli di riferimento a causa dell'ottimo sistema di raffreddamento e dell'illuminazione RGB. Ma al momento, le scorte molto scarse stanno spingendo il prezzo ancora più in alto.
I proprietari di una GeForce RTX 2080 Ti possono rimanere fermi e rilassarsi, perché un upgrade non vale la pena in questo caso. Gli utenti che giocano ancora con una GPU Pascal come la GTX 1070 o la GTX 1080 tuttavia, può prendere in considerazione l'aggiornamento, dato che l'aumento delle prestazioni è qui significativamente evidente.
Con la GeForce RTX 3070 Gaming X Trio, MSI non solo ha sul mercato una scheda grafica molto silenziosa con una GPU Ampere, ma aumenta anche il limite TDP per ottenere prestazioni leggermente superiori.
Oltre al prezzo, che è l'unico punto critico che si può attualmente menzionare, a questo punto si potrebbe includere anche la dimensione della scheda grafica. Allo stesso tempo, però, le dimensioni della scheda sono anche responsabili del basso livello di rumore sotto carico, perché un grande PCB permette di distribuire meglio il calore. Quindi, se volete acquistare la GeForce RTX 3070 Gaming X Trio, dovreste tenerne conto nella scelta del case. Quando si tratta di scegliere l'alimentatore, si è ben serviti con un alimentatore da 650 watt.
Tutti i benchmarks e i valori di prova per la RTX 3070 si trovano sul sito della scheda grafica della GeForce RTX 3070 (regolarmente aggiornata).
