Recensione della Zotac Gaming GeForce RTX 3070 Twin Edge: RTX 2080 Ti prestazioni per tutti
")
Durante il lancio dell'Ampere di NVIDIA alla fine dell'anno scorso, si è parlato molto di come la GeForce RTX 3080 permetta il gaming 4K mainstream mentre la RTX 3090 cerca di soppiantare la Titan RTX. In mezzo a tutto questo entusiasmo, una scheda che spiccava era la GeForce RTX 3070.
La RTX 3070 arriva con la promessa di offrire i livelli di prestazioni della RTX 2080 Ti per meno della metà del prezzo. La RTX 3070 non dispone di memoria GDDR6X e ha meno VRAM e larghezza di banda di memoria rispetto alla RTX 2080 TI. Tuttavia, la combinazione di maggiori CUDA cores, Tensor cores di terza generazione, RT cores di seconda generazione e clocks più elevati aiuta a portare la RTX 3070 alla velocità della GPU di gioco di punta di Turing.
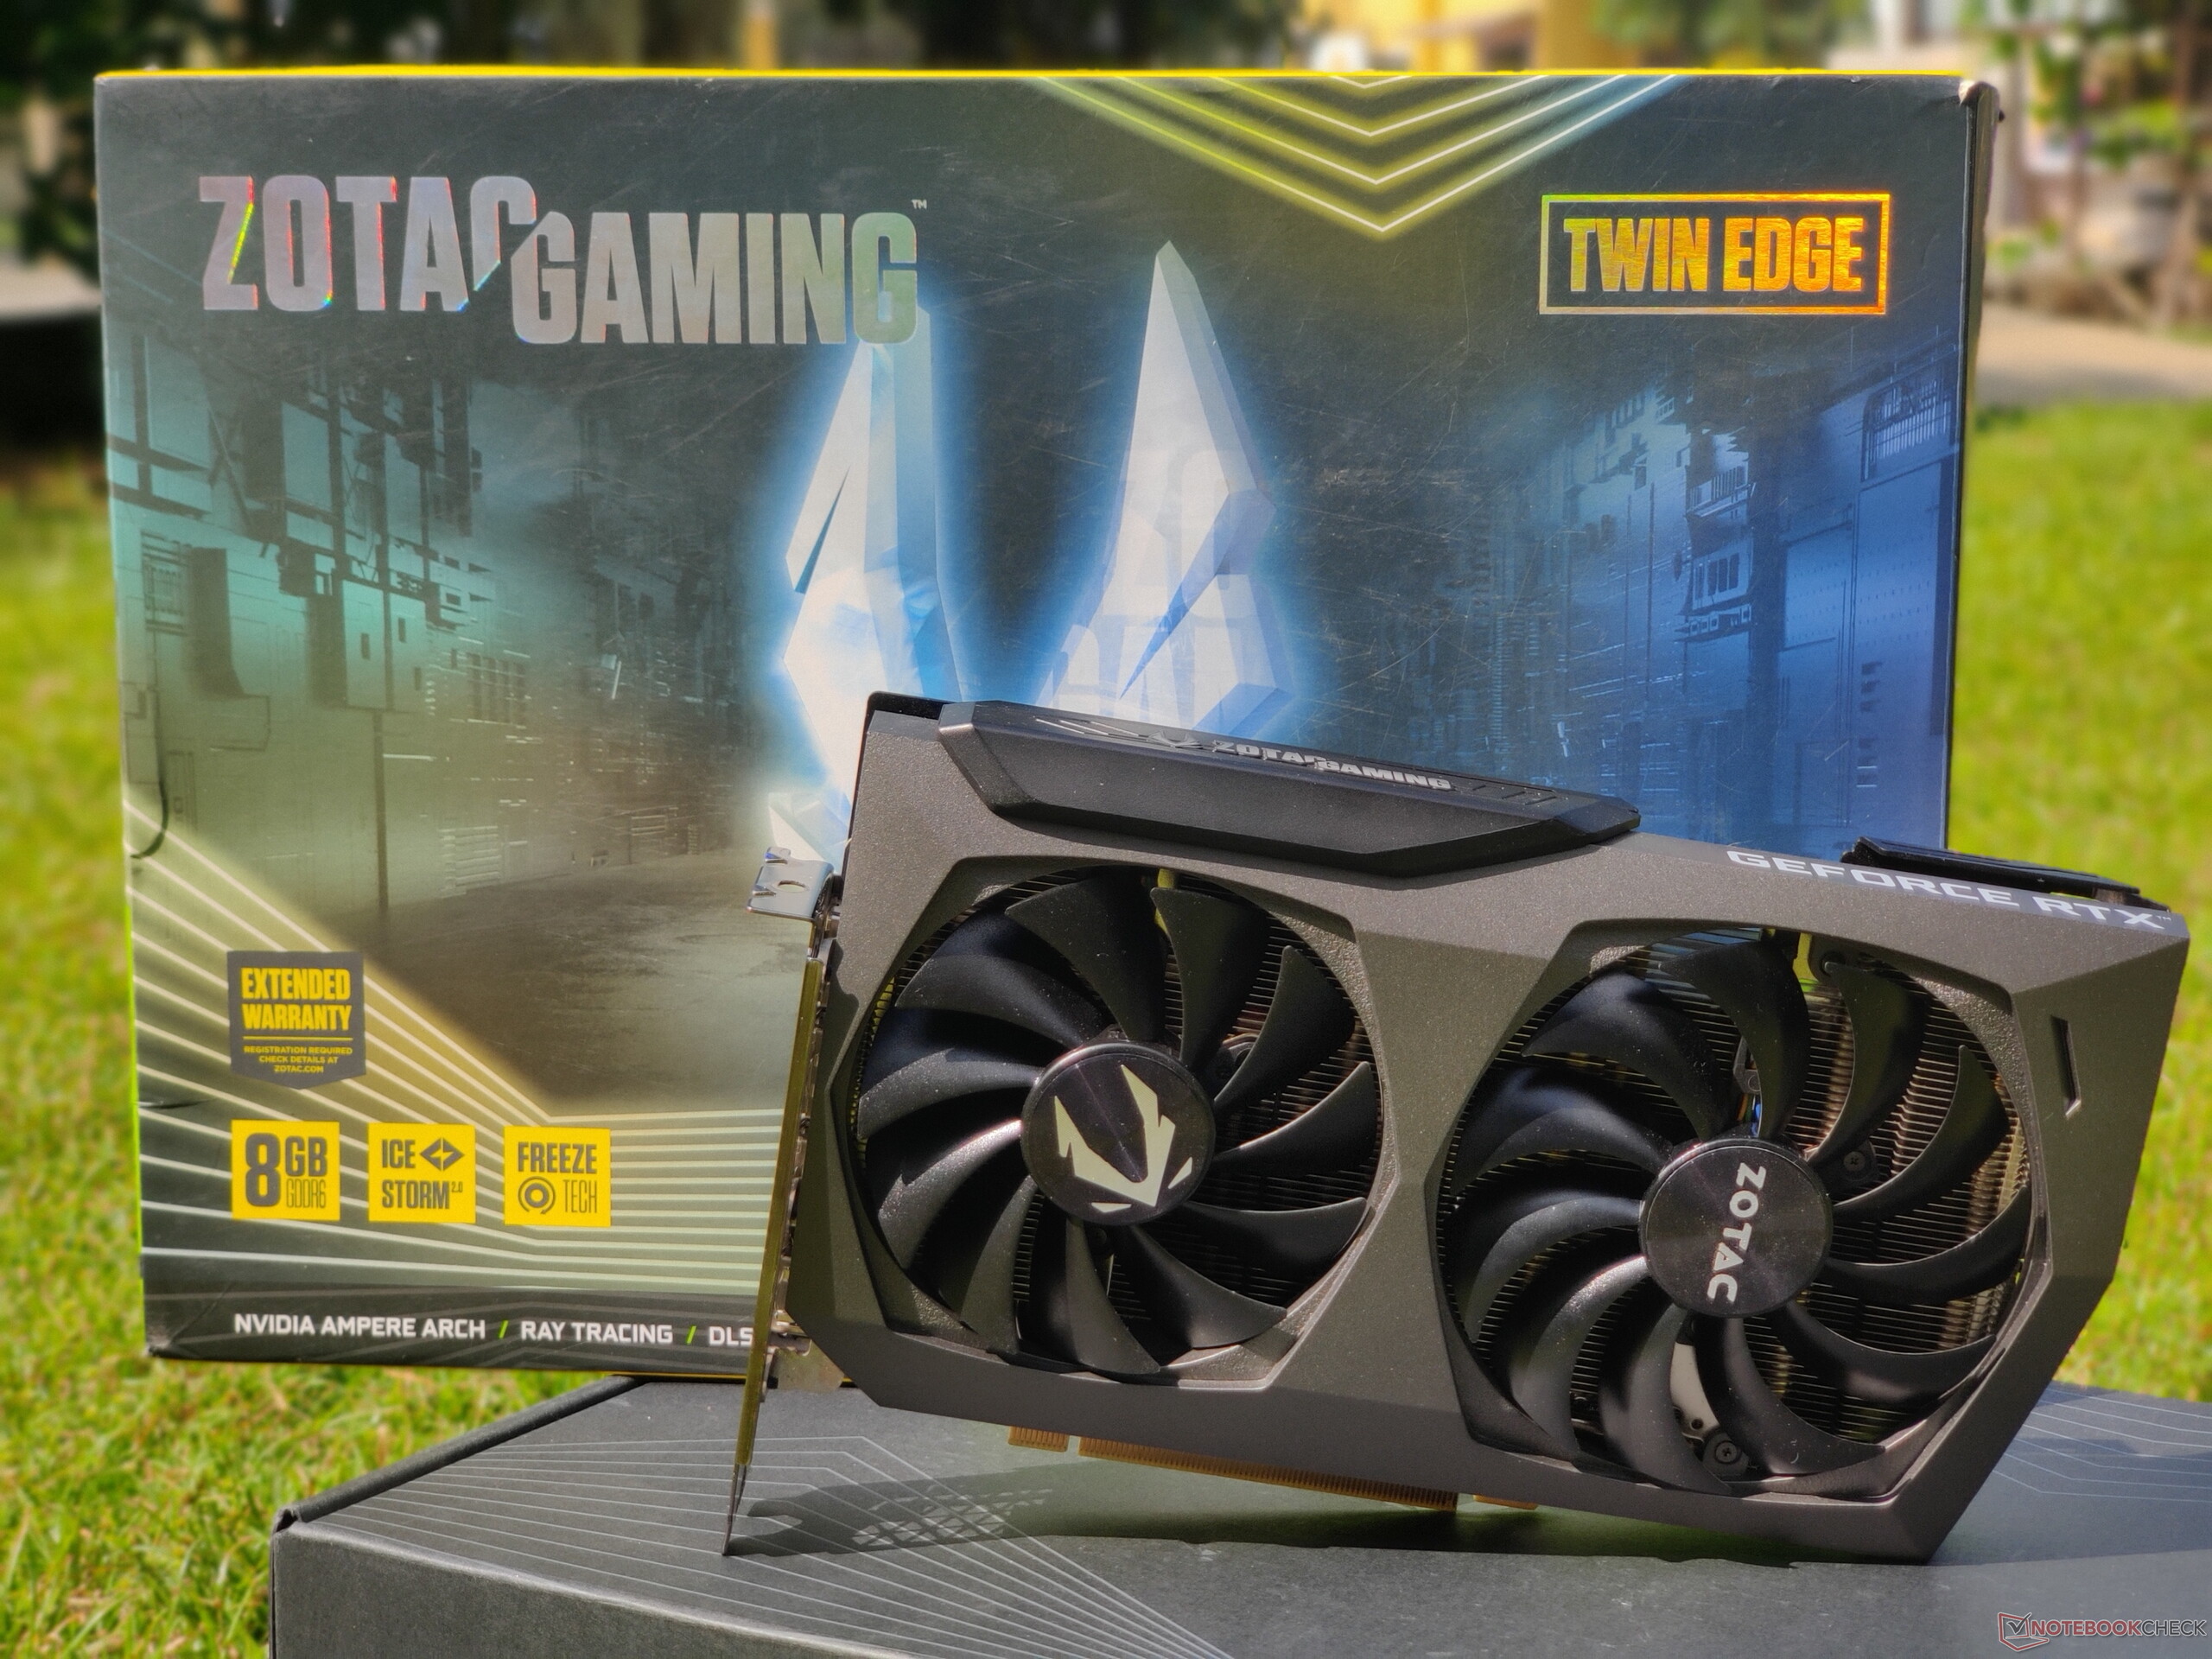
La Zotac Gaming GeForce RTX 3070 Twin Edge, come indica il nome, è una scheda a doppia ventola che è disponibile sia in versione OC che non-OC. Abbiamo la Twin Edge non OC con noi per la recensione. Questa scheda ha un clock leggermente inferiore a quello della Founders Edition pur offrendo la stessa potenza di 220 W.
La versione OC, d'altra parte, ha un clock superiore di soli 5 MHz. Coloro che preferiscono boost più elevati possono optare per le schede Zotac RTX 3070 AMP Holo (240 W) e Super Mini (215 W) o dare un'occhiata alla MSI GeForce RTX 3070 Gaming X Trio.
Confronto della RTX 3070 con altre GPU NVIDIA
| Specifiche | RTX3090 | RTX3080 FE | ZotacRTX 3070 Twin Edge | RTX3070 FE | TitanRTX | RTX2080 Ti | RTX2080 | RTX2070 S | TITANX Pascal |
| Chip | GA102 | GA102 | GA104 | GA104 | TU102 | TU102 | TU104 | TU104 | GP102 |
| Processo FinFET | 8 nm | 8 nm | 8nm | 8 nm | 12 nm | 12 nm | 12 nm | 16 nm | |
| CUDA cores | 10,496 | 8,704 | 5,888 | 5,888 | 4,608 | 4,352 | 2,944 | 2,560 | 3,584 |
| Textureunits | 328 | 272 | 184 | 184 | 288 | 272 | 184 | 160 | 224 |
| Tensor cores | 328 3rd Gen. | 272 3rd Gen. | 1843rd Gen. | 184 3rd Gen. | 576 2nd Gen. | 544 2nd Gen. | 368 2nd Gen. | 320 2nd Gen. | - |
| RTcores | 82 | 68 | 46 | 46 | 72 | 68 | 46 | 40 | - |
| GPU base clock | 1,395 MHz | 1,440 MHz | 1,500 MHz | 1,500 MHz | 1,350 MHz | 1,350 MHz | 1,515 MHz | 1,605 MHz | 1,417 MHz |
| GPU boost clock | 1,695 MHz | 1,710 MHz | 1,725 MHz | 1,750 MHz | 1,770 MHz | 1,545 MHz | 1,710 MHz | 1,770 MHz | 1,531 MHz |
| Memoriabus | 384-bit | 320-bit | 256-bit | 256-bit | 384-bit | 352-bit | 256-bit | 256-bit | 384-bit |
| Larghezza di banda di memoria | 936 GB/s | 760 GB/s | 448GB/s | 448 GB/s | 672 GB/s | 616 GB/s | 448 GB/s | 448 GB/s | 480.4 GB/s |
| Memoria video | 24 GB GDDR6X | 10 GB GDDR6X | 8GB GDDR6 | 8 GB GDDR6 | 24 GB GDDR6 | 11 GB GDDR6 | 8 GB GDDR6 | 8 GB GDDR6 | 12 GB GDDR5X |
| Consumo energetico | 350 W | 320 W | 220W | 220 W | 280 W | 250 W | 215 W | 215 W | 250 W |
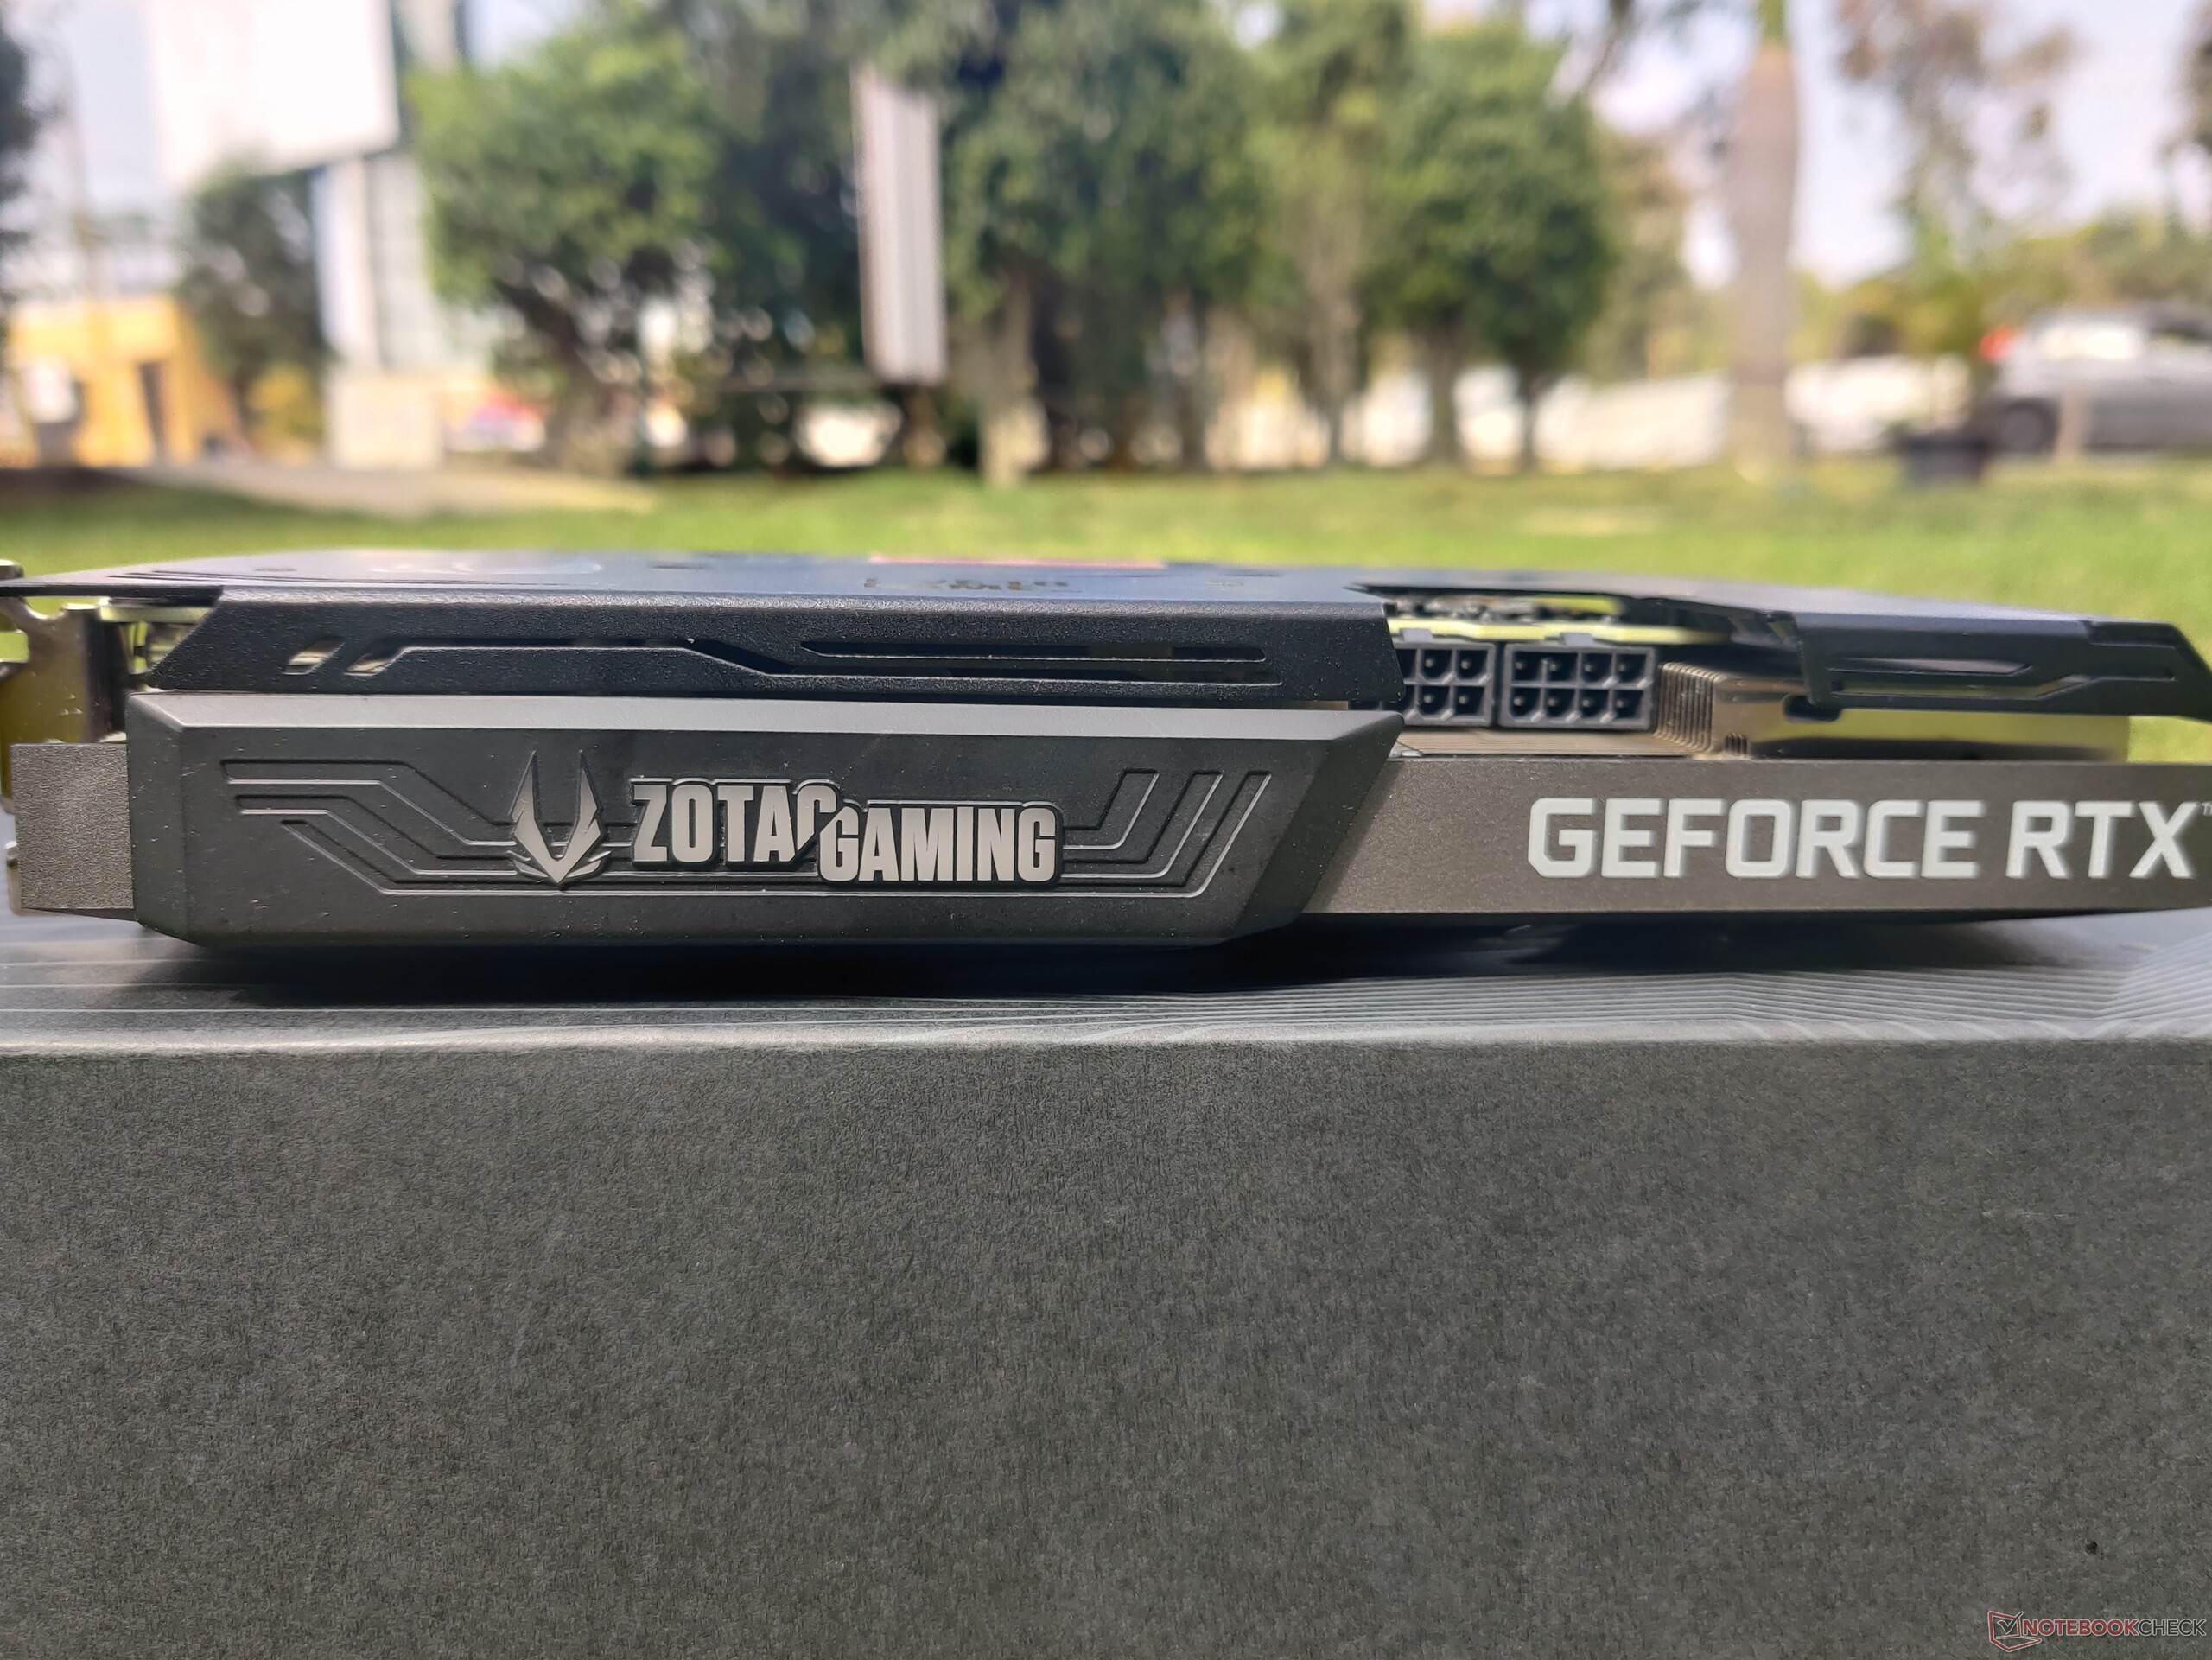
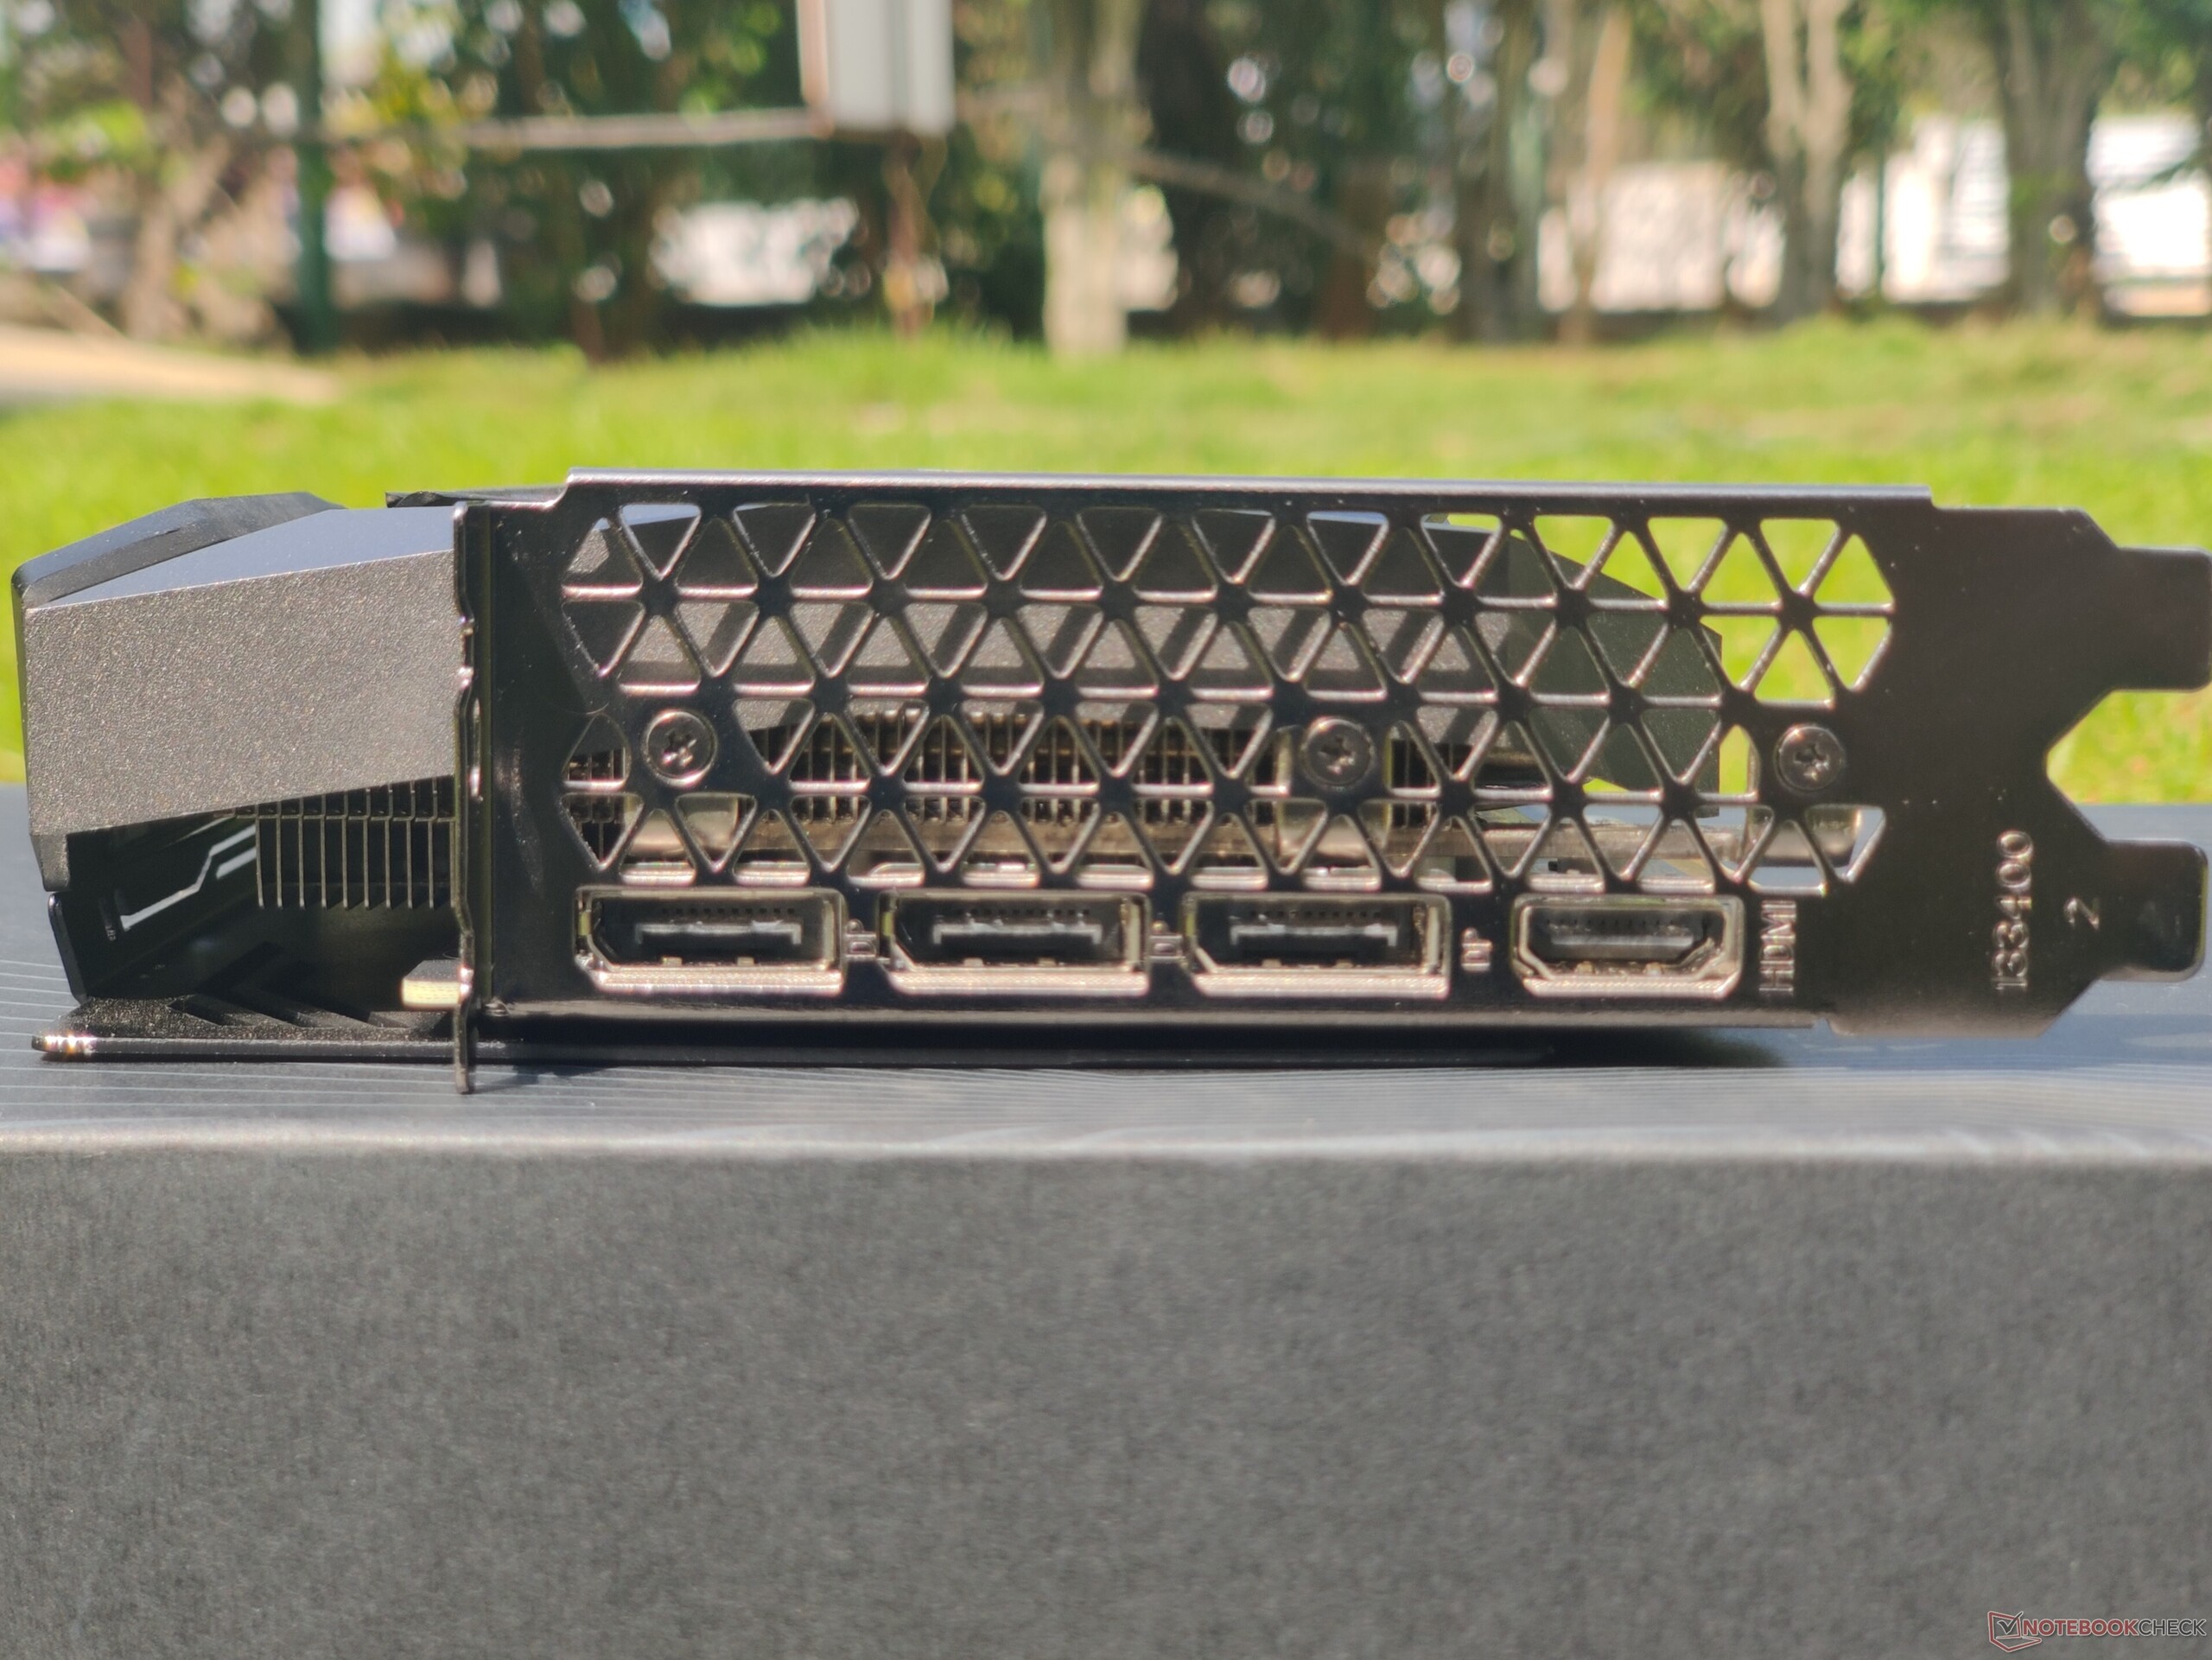
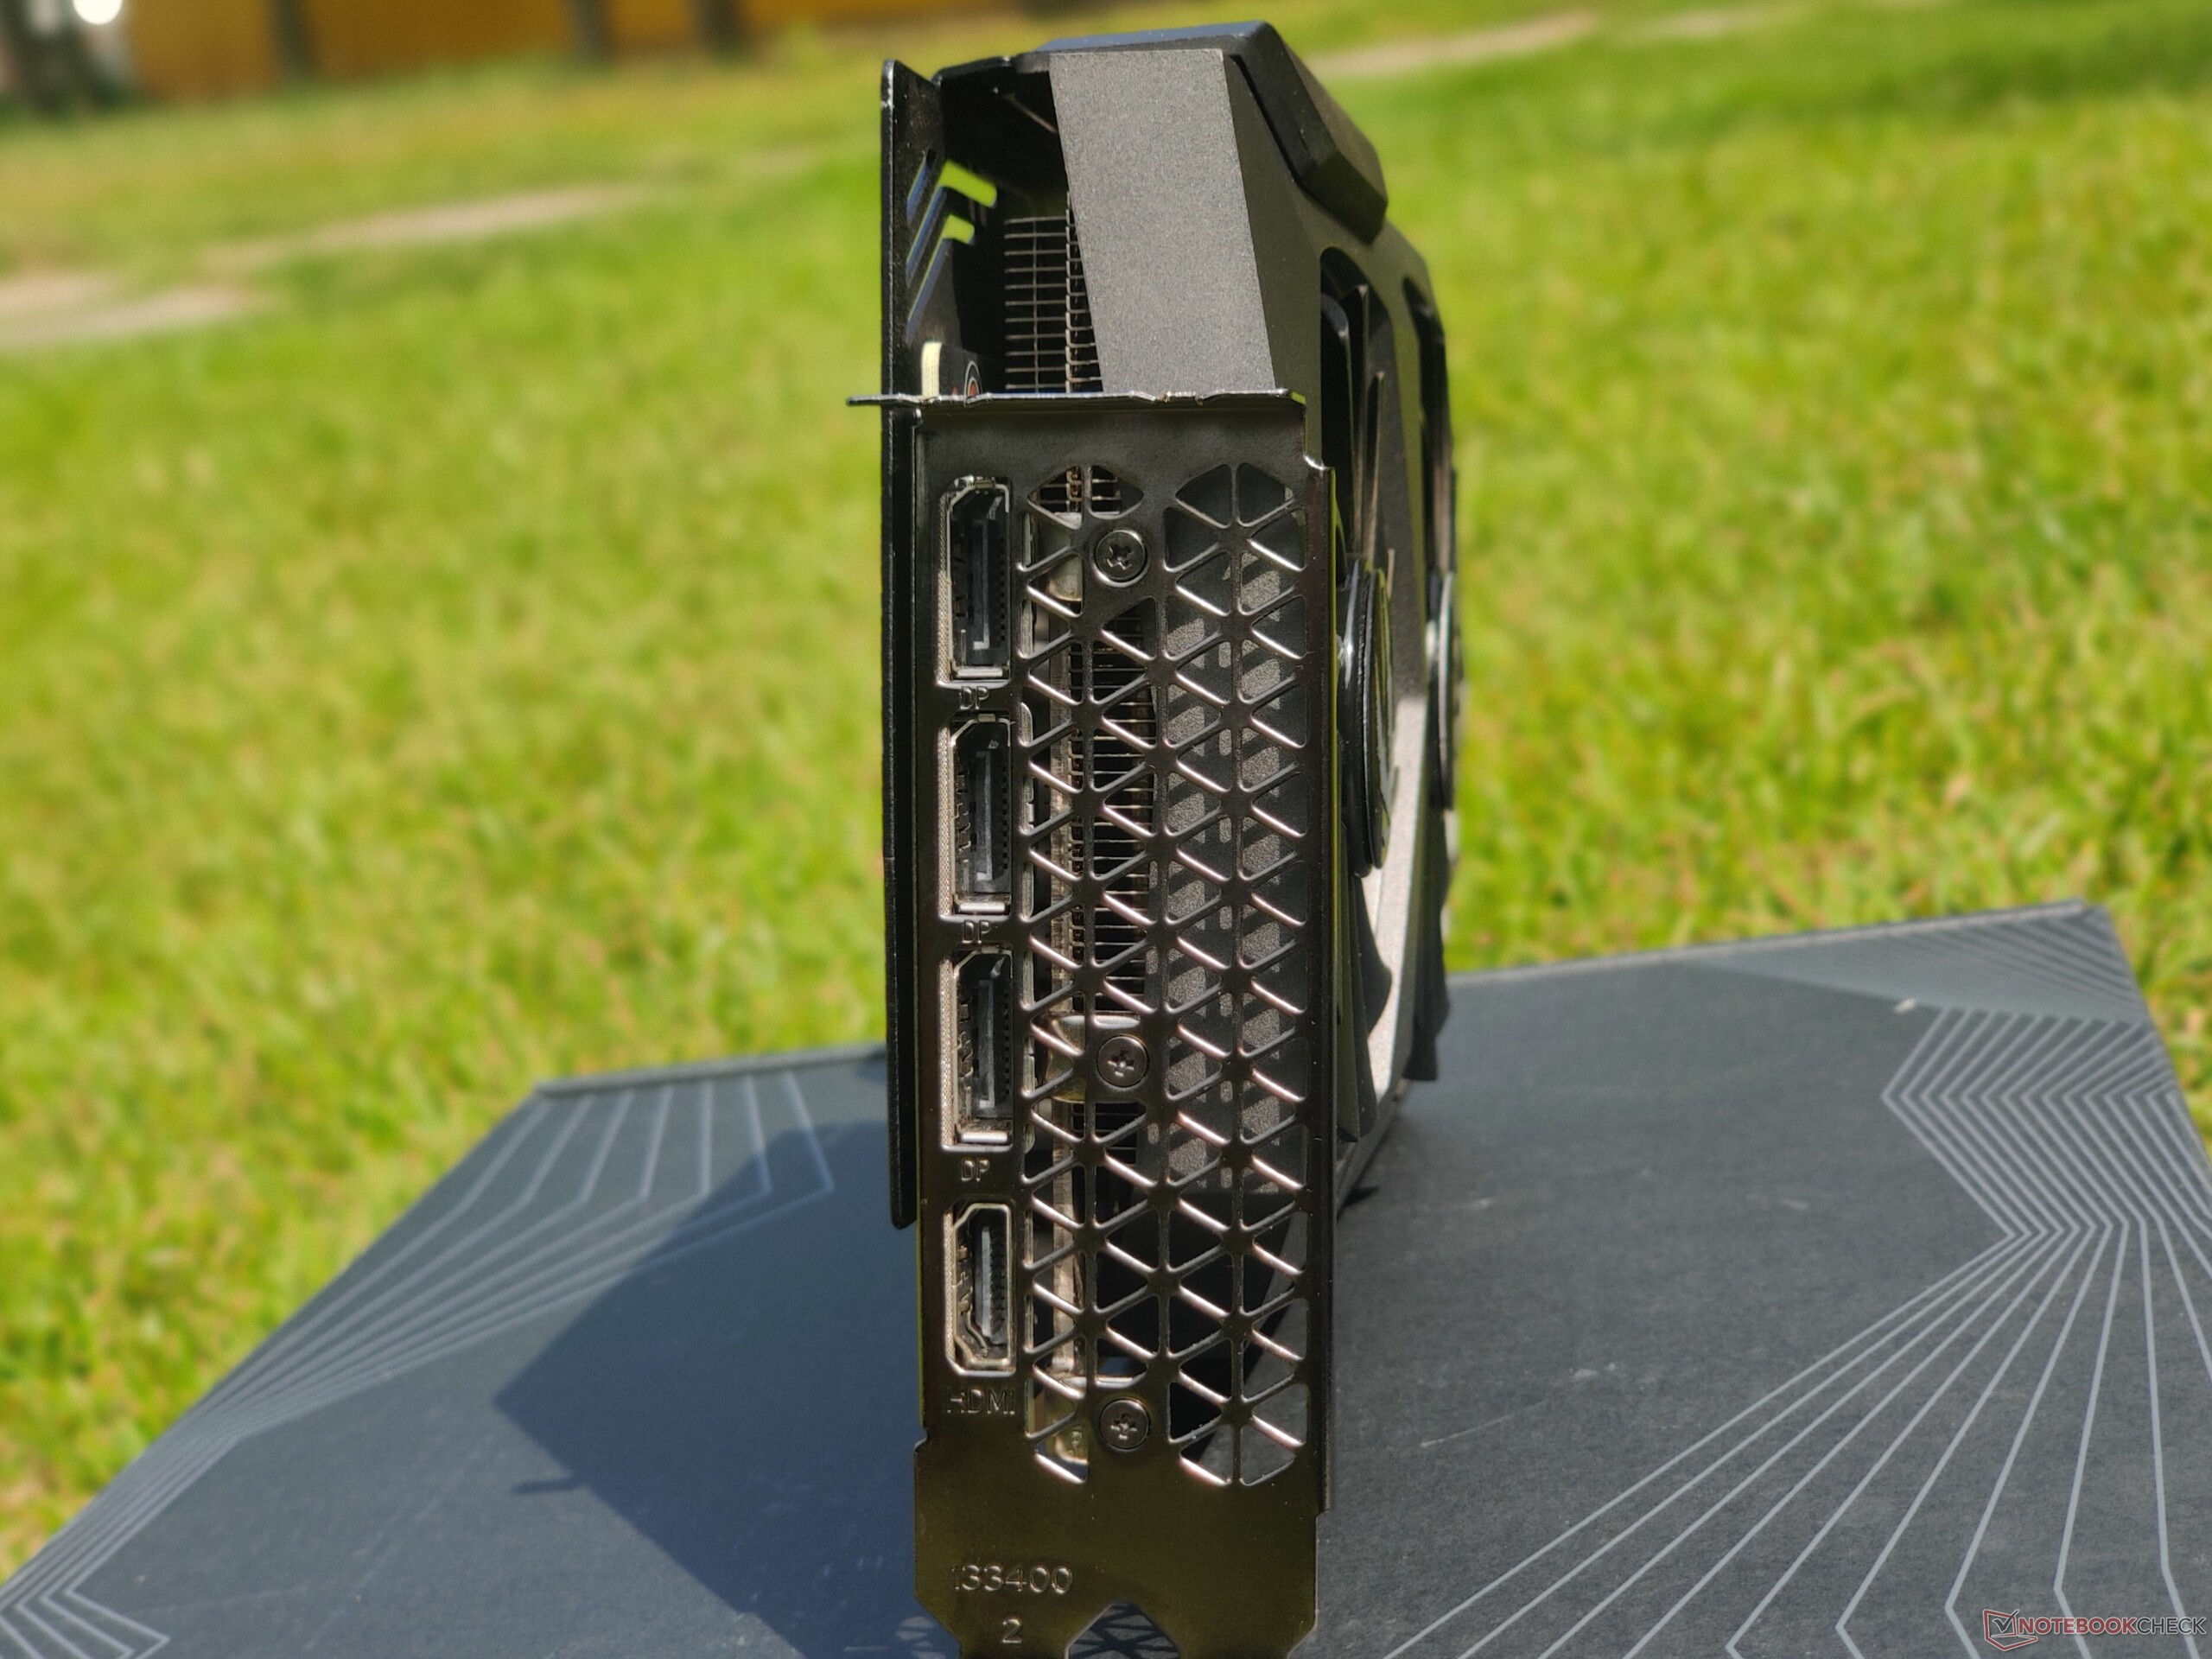
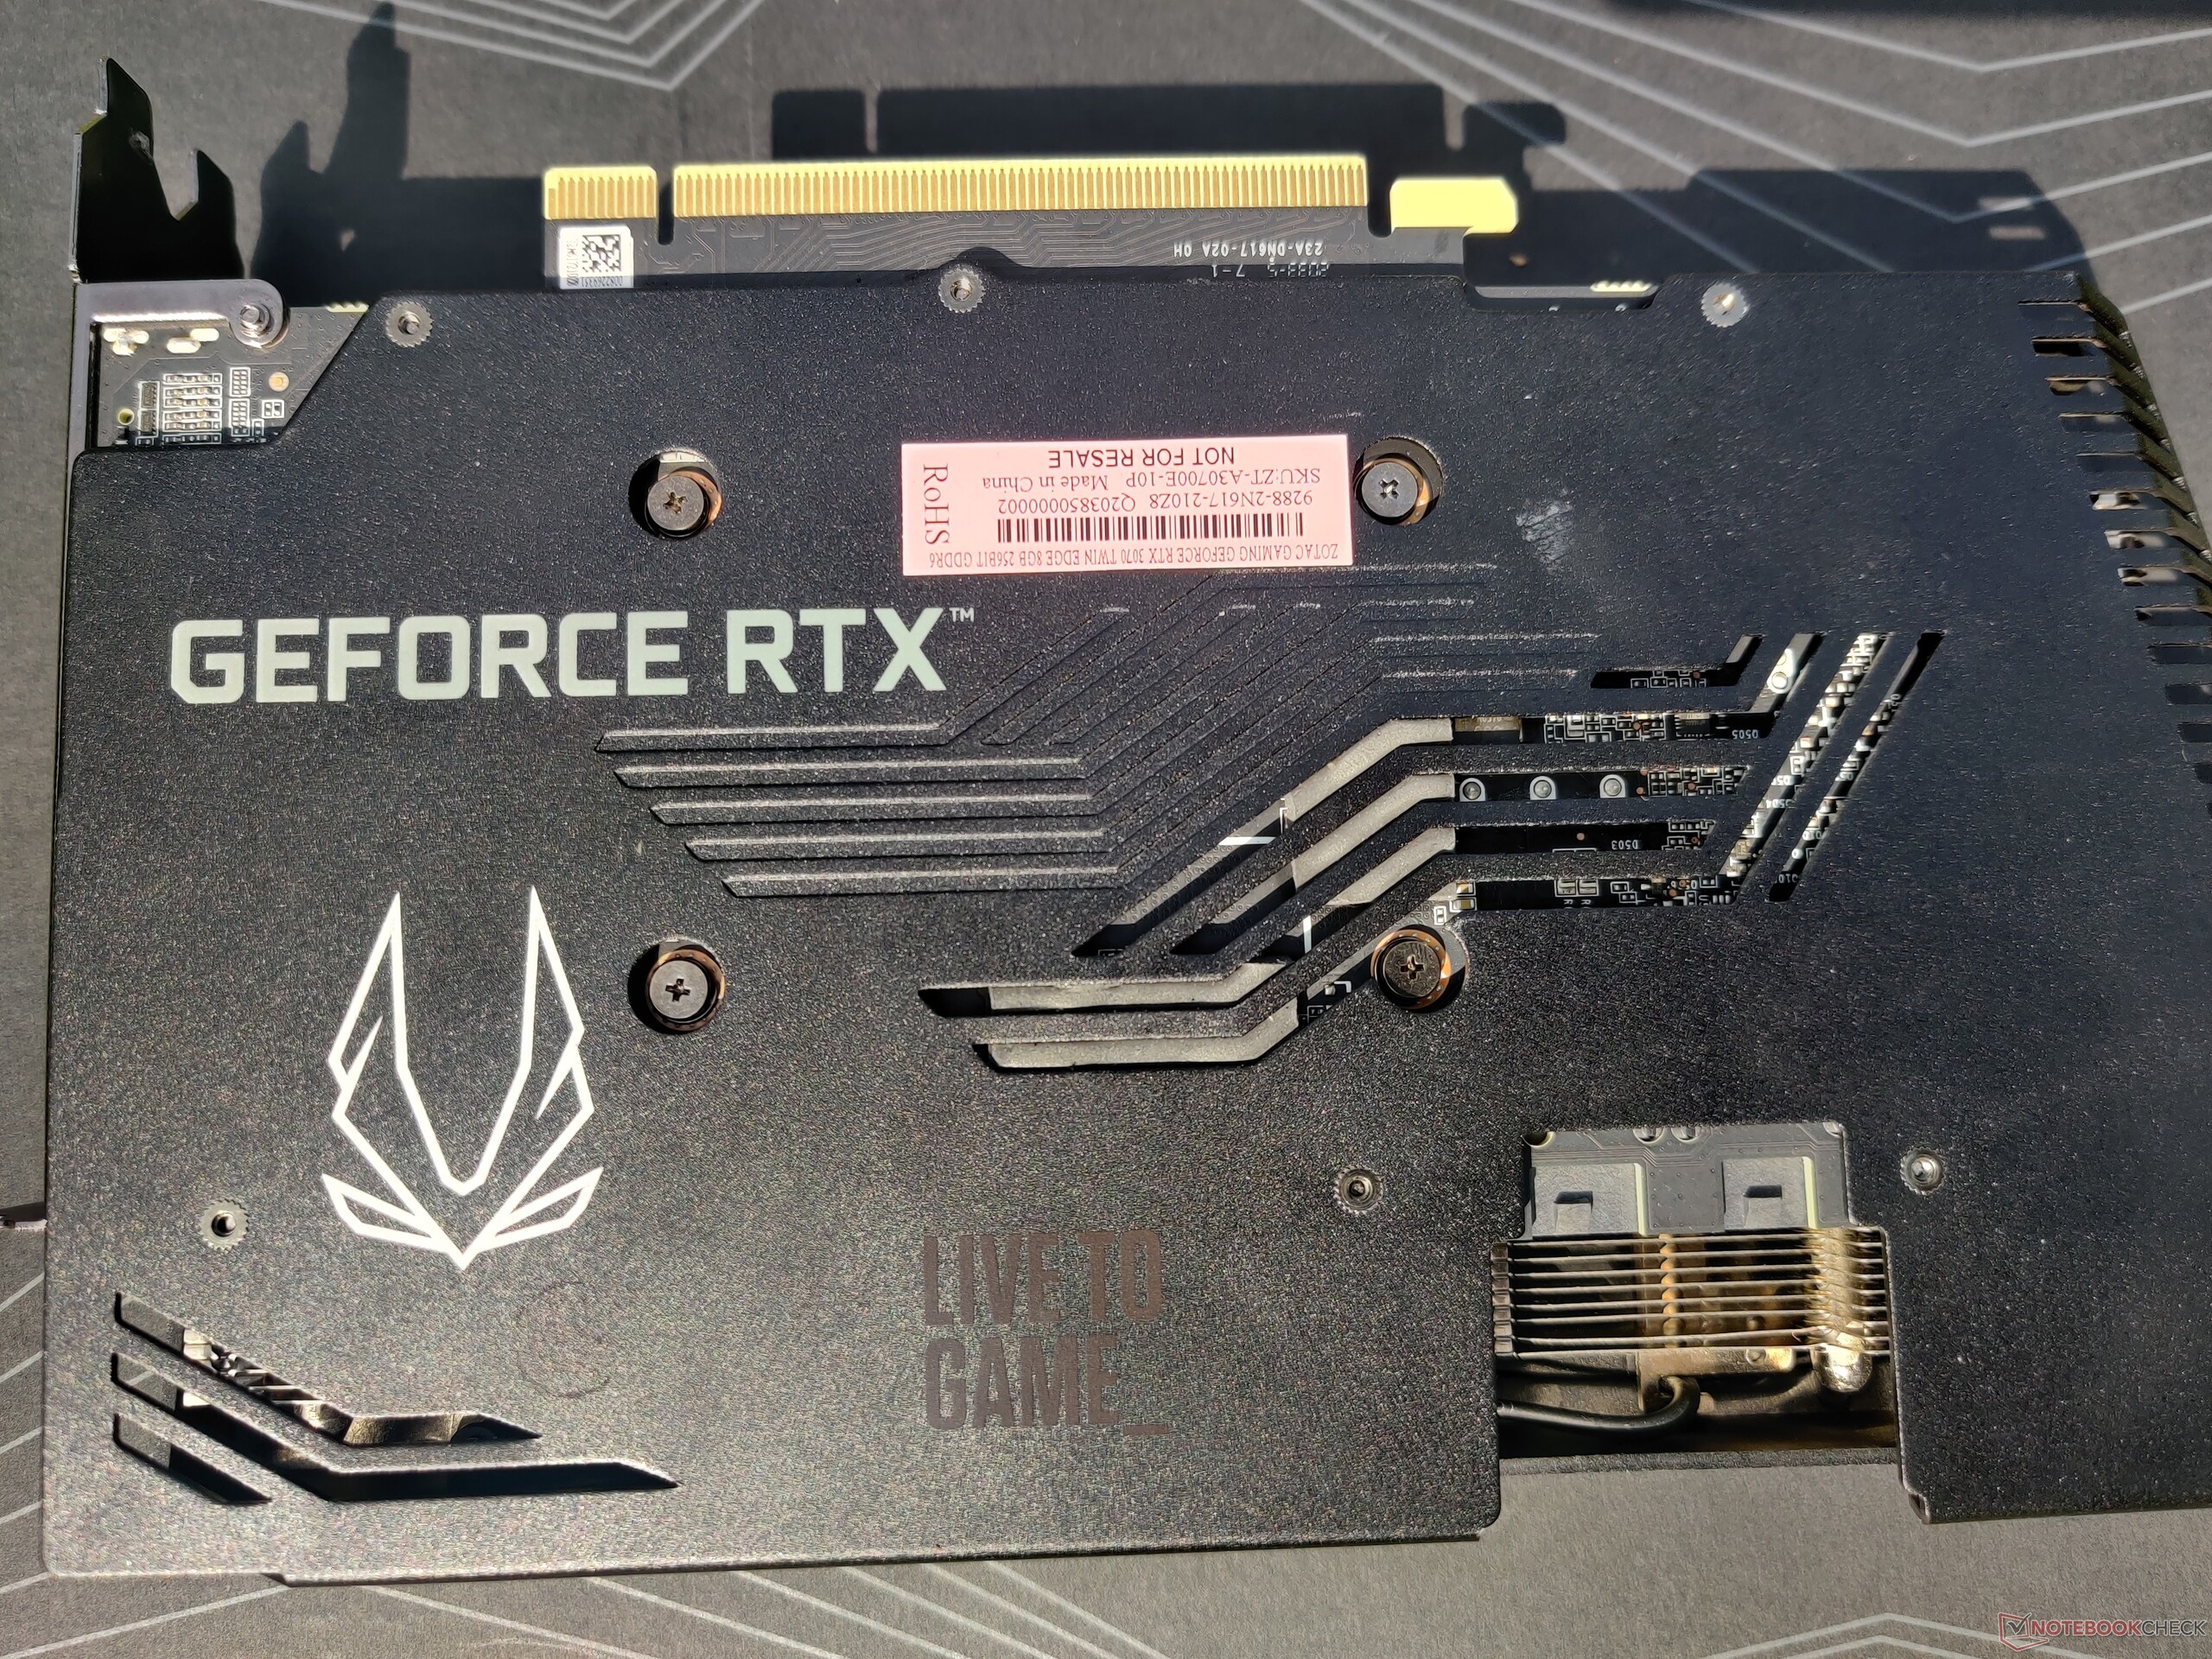
Un tour della Zotac Gaming GeForce RTX 3070 Twin Edge
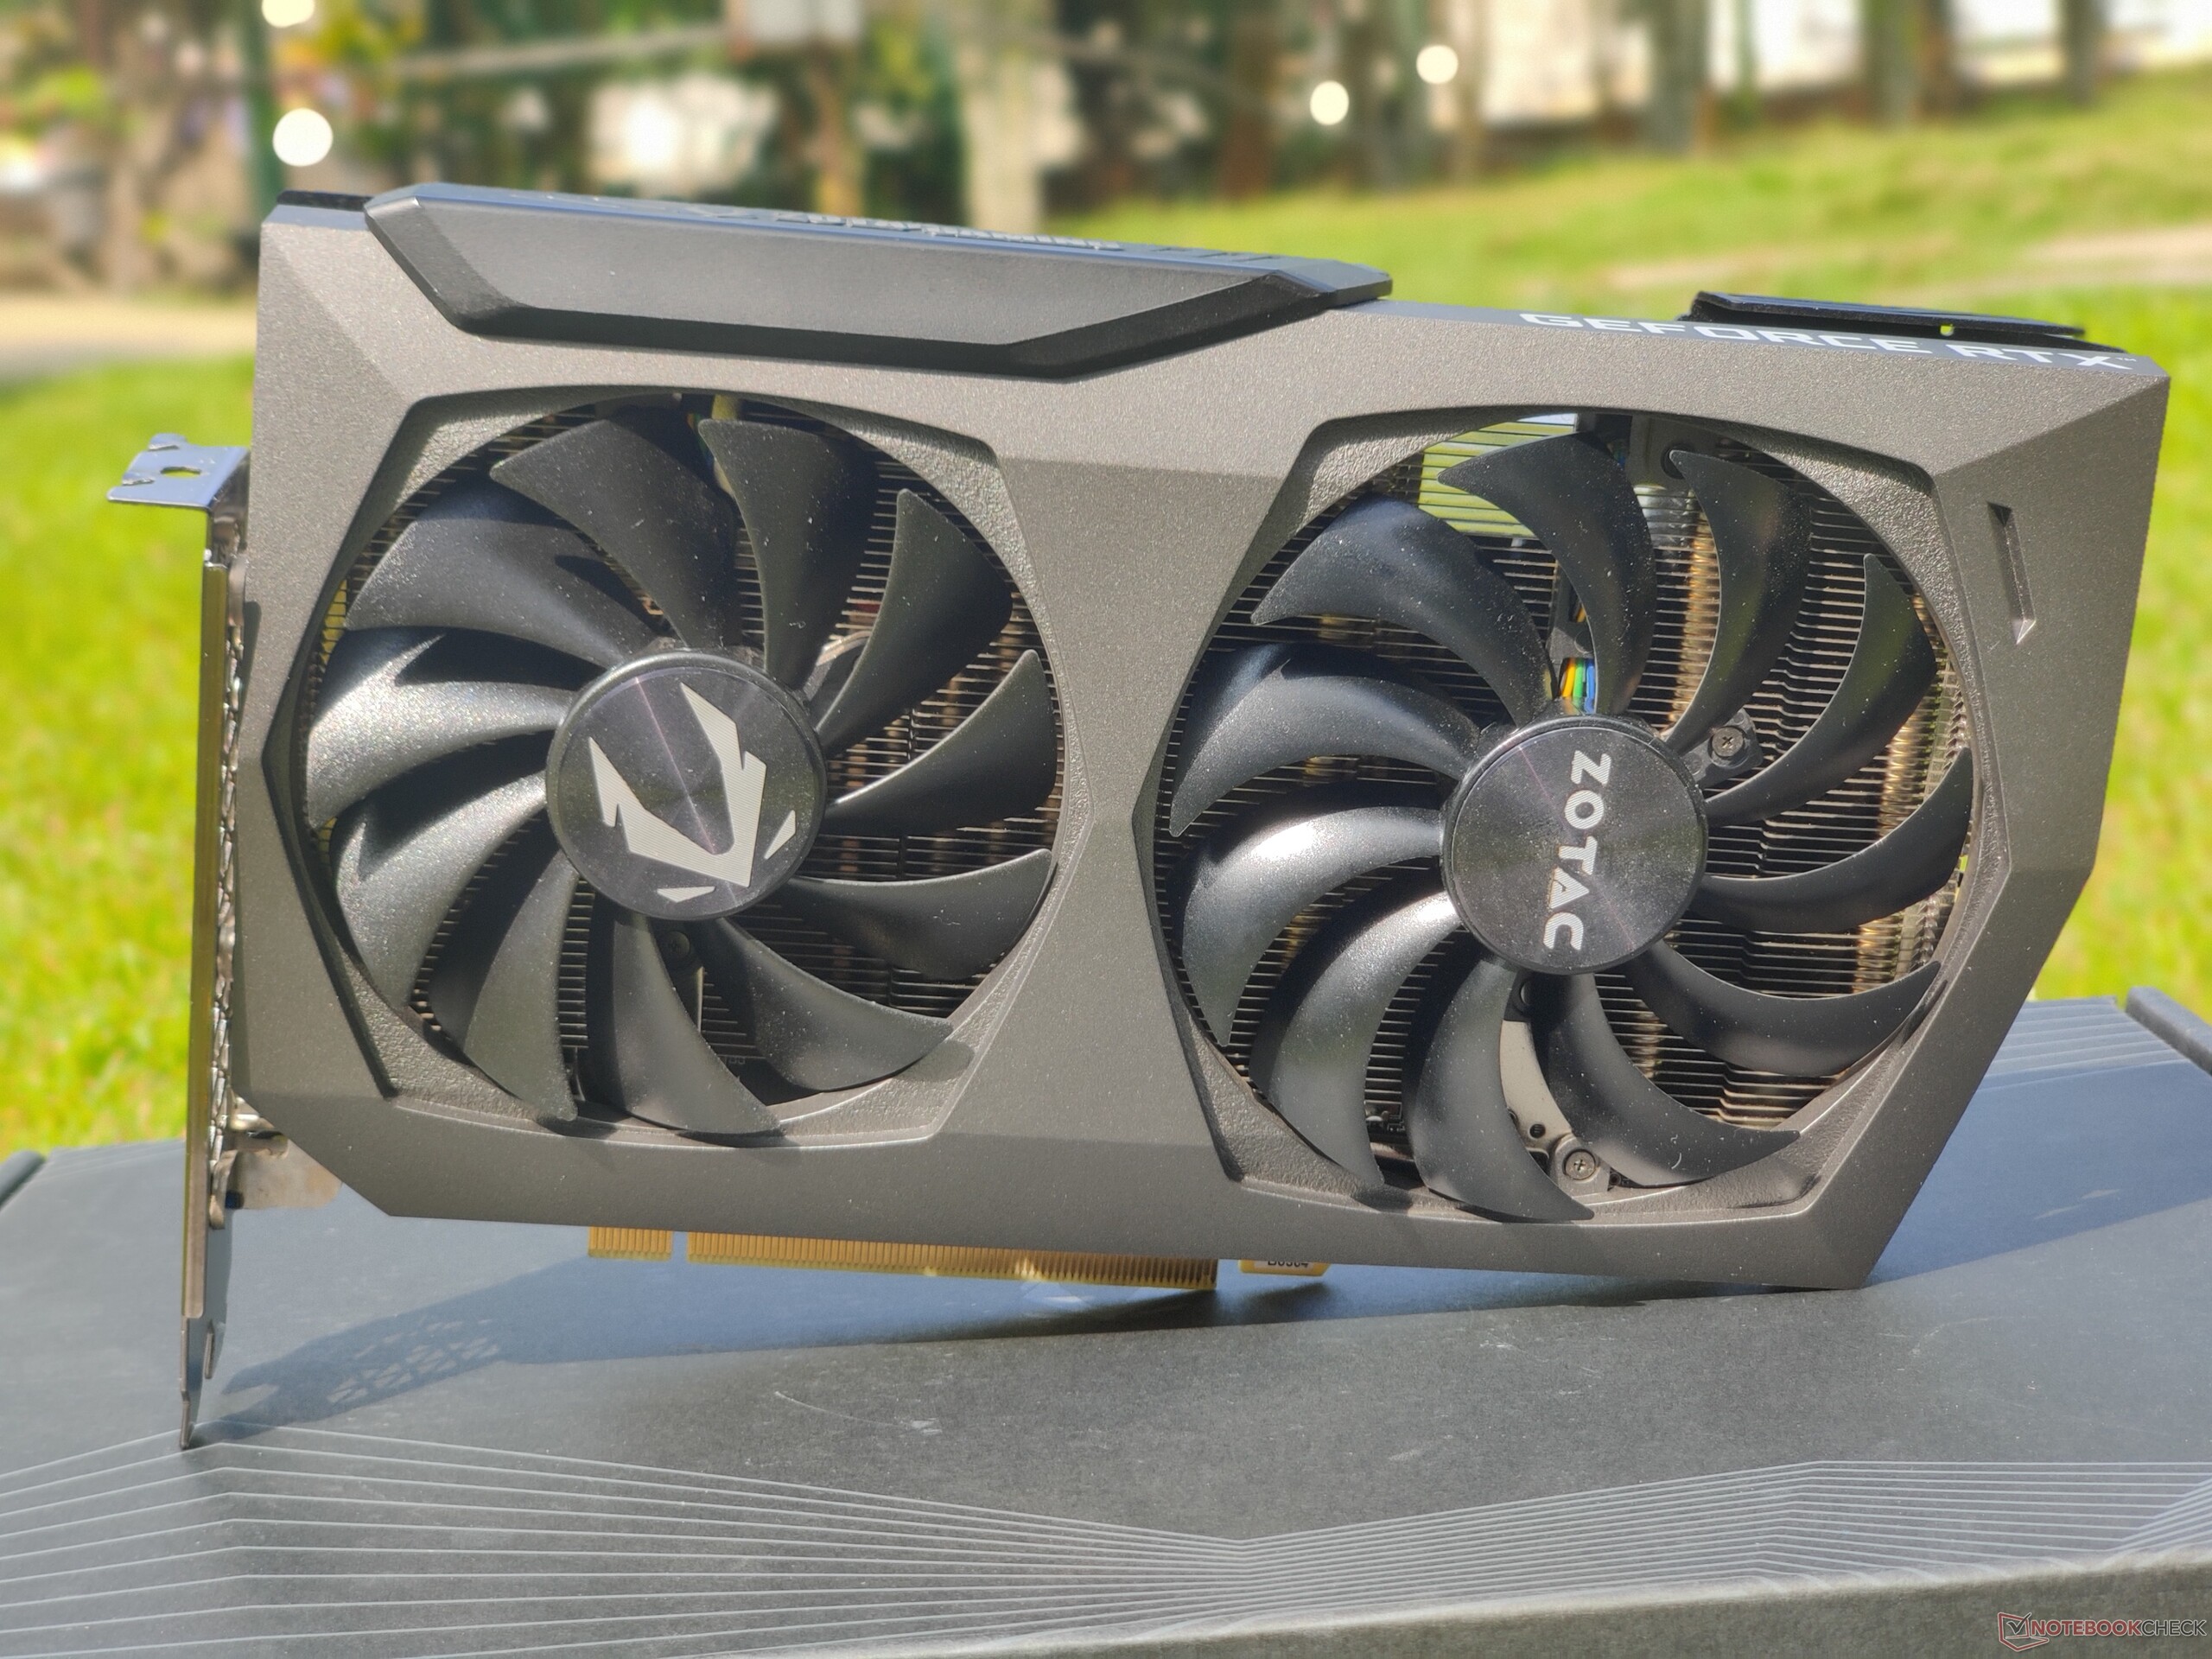
La Zotac Gaming RTX 3070 Twin Edge non farà esattamente girare la testa in termini di look, ma offre comunque un design pulito e minimalista. Non c'è nessun effetto luminoso RGB, e il logo Zotac Gaming si illumina solo in bianco. La scheda offre due connettori di alimentazione a 8 pin insieme a quattro porte di uscita video composte da tre DisplayPort 1.4a-out e una HDMI 2.1-out
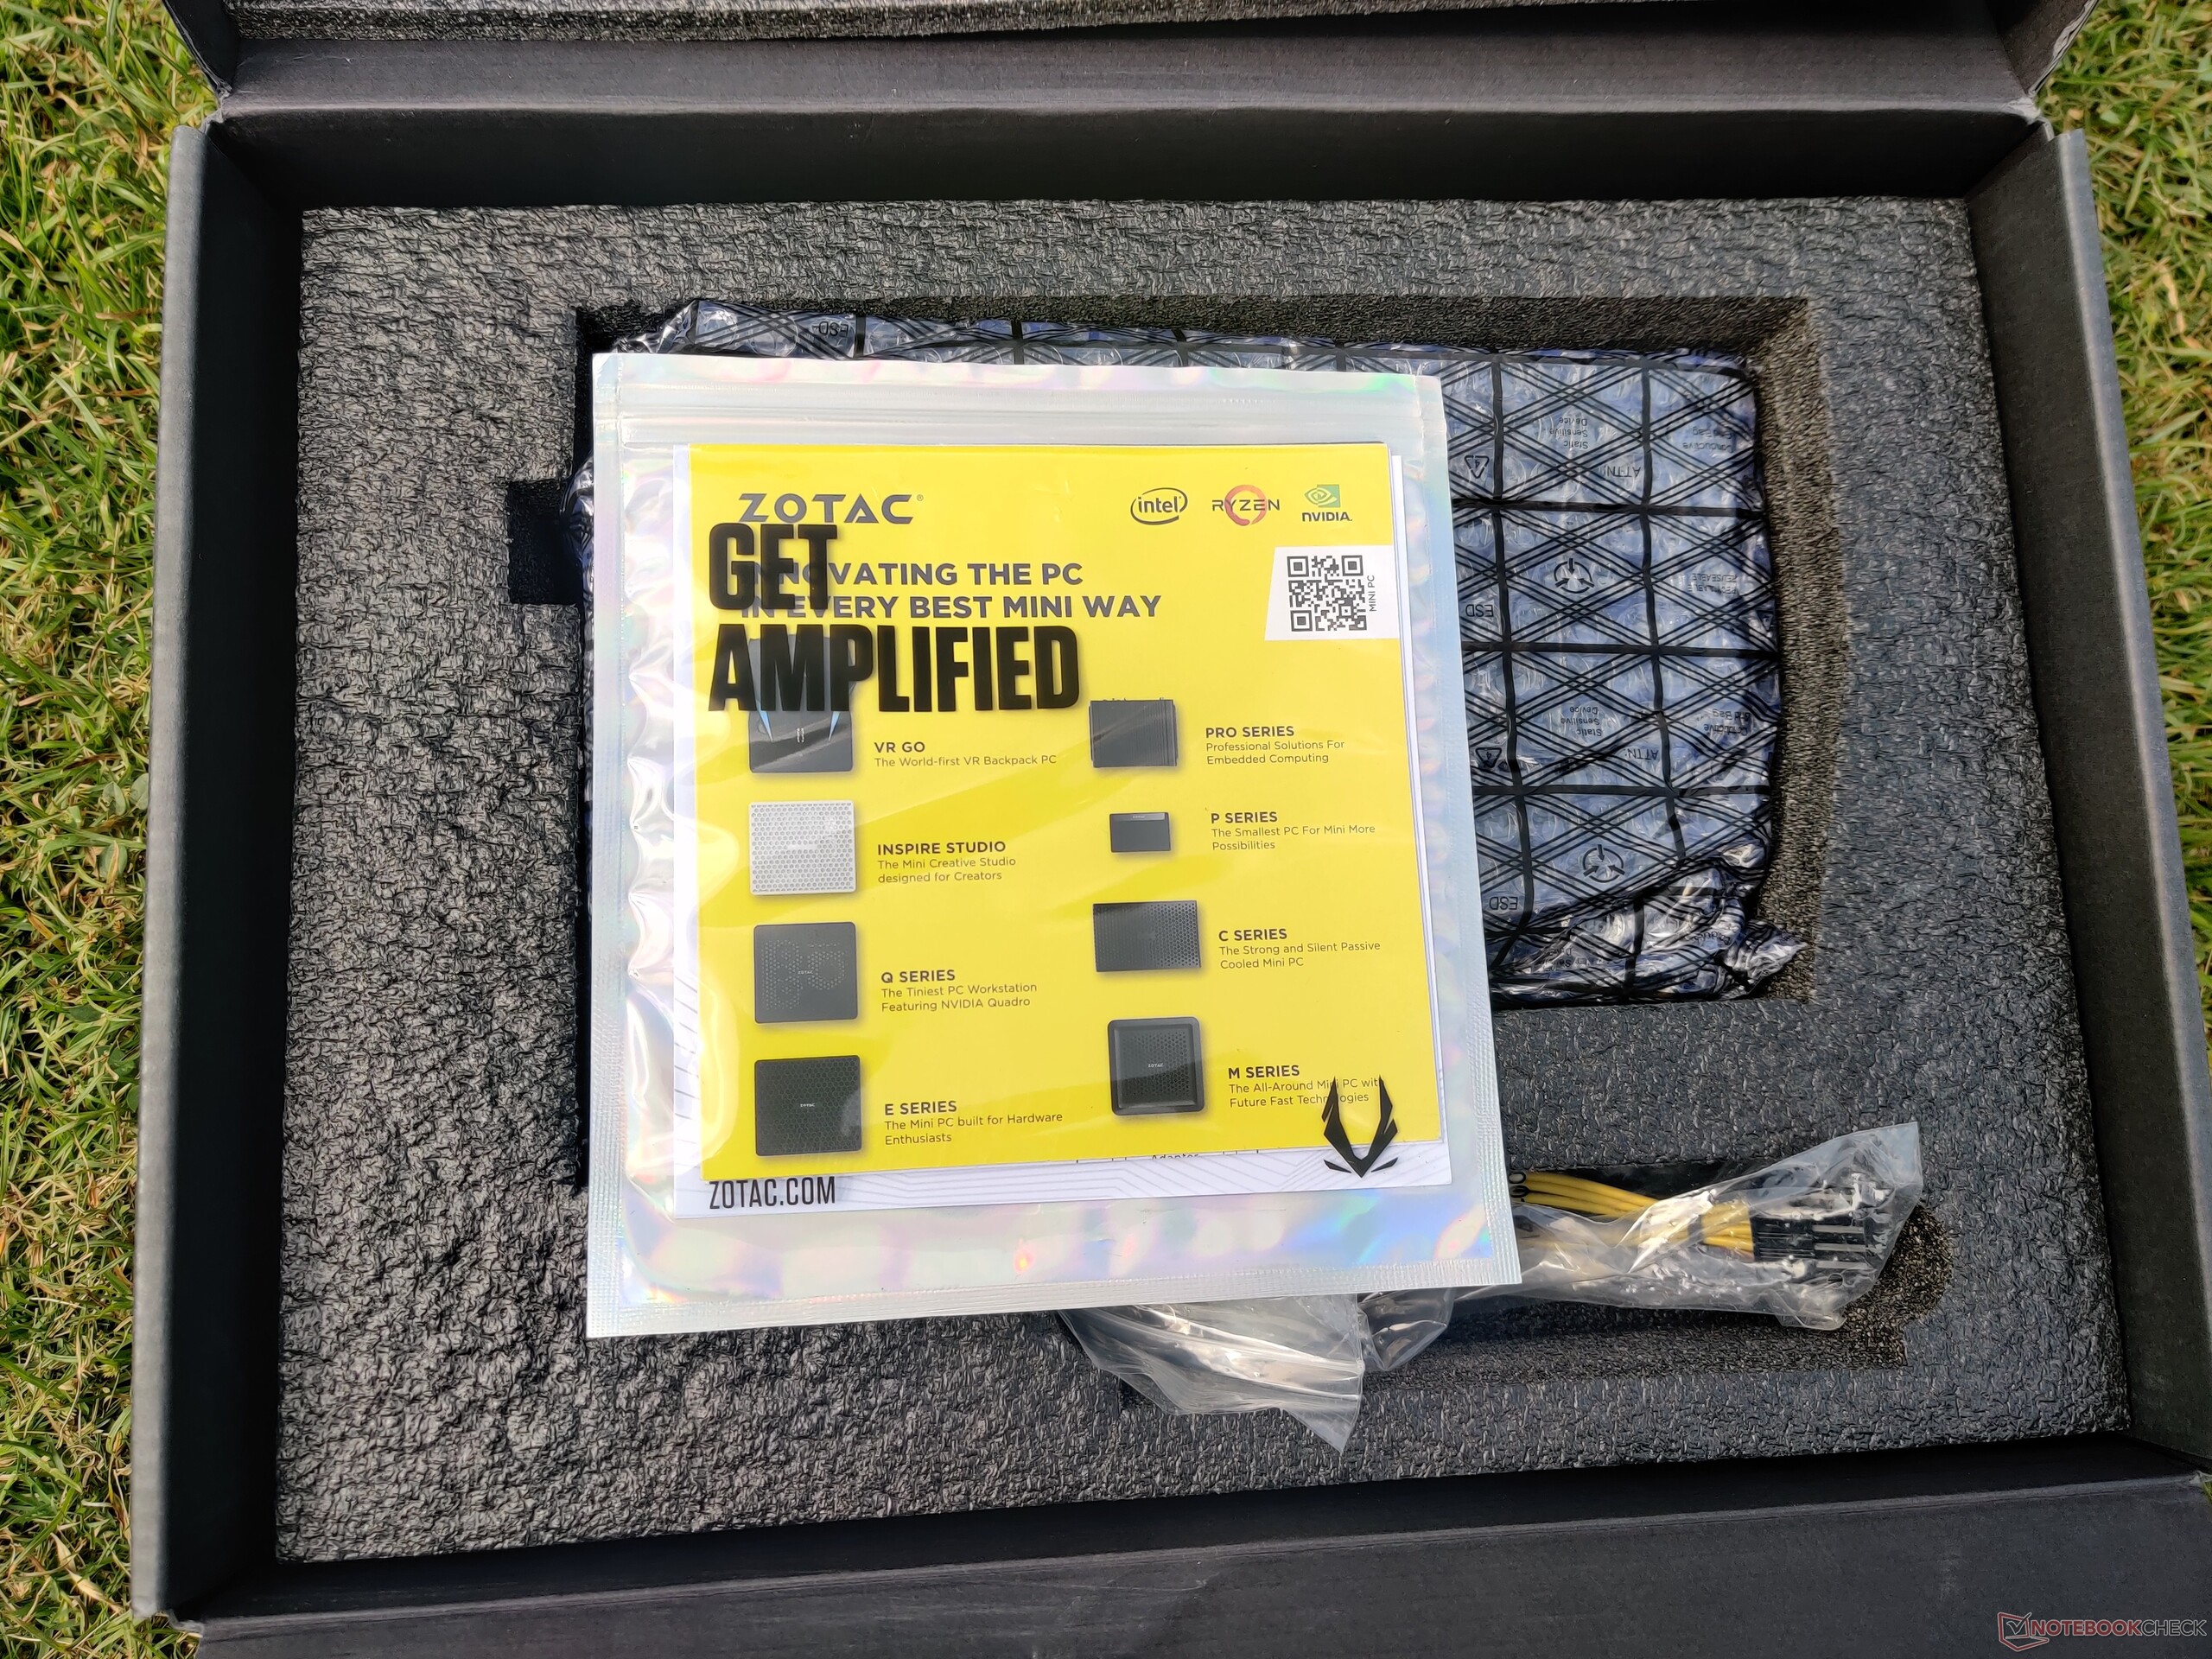
I connettori di alimentazione dual-8-pin sono posizionati un po' più all'interno dal bordo destro, come è il caso con la maggior parte delle schede Zotac, quindi alcuni utenti potrebbero trovare che i loro cavi di alimentazione sono un po' corti. La cosa buona è che Zotac fornisce due connettori da 6-pin a 8-pin come accessori, che possono essere utilizzati come soluzione alternativa. Non abbiamo trovato problemi di stabilità nel far funzionare la scheda usando questi cavi.
Zotac offre una garanzia standard di 3 anni per tutte le schede RTX 30, che può essere estesa di altri due anni se l'acquisto è registrato sul sito web di Zotac. Tuttavia, questa politica di garanzia è applicabile solo per le regioni EMEAI.
Gli acquirenti del Nord America (USA e Canada) ottengono una garanzia standard di 2 anni che è estendibile di un altro anno se il prodotto viene registrato su Zotac.com entro 30 giorni dall'acquisto.
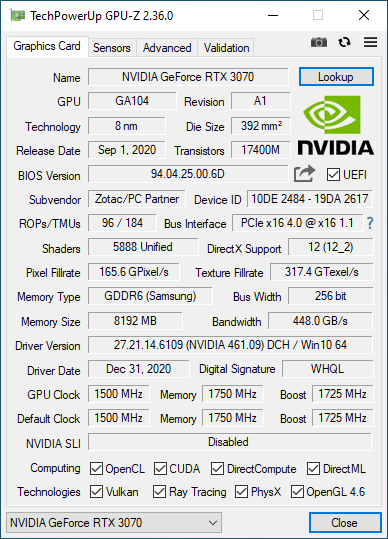
GPU-Z non presenta alcuna sorpresa, dato che Zotac non ha modificato molto le specifiche della Founders Edition. La RTX 3070 Twin Edge offre un clock di base di 1.500 MHz e un boost fino a 1.725 MHz. Anche se il TGP della RTX 3070 è valutato a 220 W, è possibile aumentarlo del 9% fino a 240 W. Una buona parte di questa potenza aggiuntiva è alimentata alla GPU stessa in quanto la scheda manca di RGB e ha solo due ventole.
Modalità di test
Il nostro banco di prova è basato sulla piattaforma AMD Ryzen 5000 Zen 3 X570. Il processore AMD Ryzen 9 5950X 16-cores offre eccellenti prestazioni di gioco che batte l'Intel Core i9-10900K ed è il nostro processore scelto per questo test. Un dispositivo di raffreddamento Corsair iCUE H115i Elite Capellix AIO ha aiutato a mantenere fresca questa CPU mastodontica.
Abbiamo usato la scheda madre MSI Prestige X570 Creation come base. Il Ryzen 9 5950X è stato abbinato a 32 GB (16 GB x2) di G.SKILL Trident Z Neo DDR4-3600 RAM con tempi 16-19-19-39. Windows 10 20H2 con gli ultimi aggiornamenti cumulativi (Build 19041.662) è stato installato su un SSD Gigabyte Aorus NVMe Gen4 da 1 TB e due SSD Crucial MX500 SATA da 1 TB ciascuno sono stati utilizzati per eseguire benchmarks e giochi.
L'intera build è stata alloggiata in un case Corsair iCUE 4000X RGB con un alimentatore Thermaltake Toughpower Grand 850 W 80 Plus Gold come scelta. Tutti i test sono stati effettuati con il case chiuso per essere maggiormente rappresentativi di uno scenario di utilizzo normale.
Vorremmo ringraziare AMD per aver fornito il Ryzen 9 5950X e Corsair per il sistema di raffreddamento iCUE Elite Capellix e il case iCUE 4000X.
Abbiamo accoppiato la RTX 3070 Twin Edge a una smart TV OnePlus U Series 55U1 che funziona a 4K 60 Hz. L'output del colore è stato impostato su RGB a 32 bit nel pannello di controllo NVIDIA e lo scaling del desktop di Windows è stato impostato al 100%.
Benchmarks sintetici
La Zotac RTX 3070 Twin Edge si comporta decentemente nei nostri test di benchmarks sintetici. Questa scheda pareggia con la MSI GeForce RTX 3070 Ventus 3X OC nella maggior parte dei test 3DMark, dato che entrambe hanno praticamente le stesse specifiche (la Ventus è solo 25 MHz più veloce).
Vediamo anche che le prestazioni complessive sono in linea con una RTX 2080 Ti ed è tra il 13% e il 20% più veloce di una RTX 2080 Super.
Il delta di prestazioni tra la RTX 3070 e la Titan RTX è significativamente ridotto nei benchmarks Unigine Heaven 4.0 e Valley 1.0. Tuttavia, si vede che la Titan RTX ha un vantaggio in tutti i sottoinsiemi del test Superposition.
| 3DMark 11 Performance | 36313 punti | |
| 3DMark Fire Strike Score | 29648 punti | |
| 3DMark Fire Strike Extreme Score | 15360 punti | |
| 3DMark Time Spy Score | 12696 punti | |
Aiuto | ||
Gaming Benchmarks
La Zotac RTX 3070 Twin Edge si comporta come previsto quando si tratta di gaming. La RTX 3070 è adatta per giocare ai moderni titoli AAA a 1440p Ultra 60+ fps o 1080p Ultra 100+ fps. Il gioco a 4K è molto più che possibile, dato che vediamo la maggior parte dei titoli raggiungere i 40 e i 50 fps. Modificando alcune delle impostazioni di gioco si dovrebbe essere in grado di giocare a 4K 60 fps senza compromettere molto la fedeltà grafica.
La scheda offre 8 GB di RAM GDDR6 onboard, che dovrebbe essere adeguata per la maggior parte dei giochi attuali. Mentre i 16 GB di RAM della AMD Radeon RX 6800 possono sembrare allettanti, non ci siamo imbattuti in nessun problema di limitazione della VRAM con la RTX 3070 durante l'esecuzione della nostra suite di giochi.
La RTX 3070 Twin Edge gestisce circa 123 fps medi in Il Witcher 3 preset 1080p Ultra. Questo valore scende un po' di tanto in tanto, ma la scheda riesce a offrire una prestazione abbastanza costante nel tempo e non scende mai sotto i 120 fps. Questo indica che la configurazione di raffreddamento della scheda sta facendo bene il suo lavoro per evitare qualsiasi tipo di throttling.
| basso | medio | alto | ultra | QHD | 4K | |
|---|---|---|---|---|---|---|
| The Witcher 3 (2015) | 548 | 449 | 244 | 123 | 89.6 | |
| Shadow of the Tomb Raider (2018) | 165 | 161 | 157 | 150 | 114 | 62 |
| Assassin´s Creed Odyssey (2018) | 149 | 125 | 107 | 81 | 68 | 48 |
| Metro Exodus (2019) | 197 | 154 | 118 | 93.6 | 75.4 | 48.3 |
| Total War: Three Kingdoms (2019) | 371.5 | 206.4 | 136 | 103.5 | 67.5 | 33.1 |
| Borderlands 3 (2019) | 169 | 150 | 126 | 104 | 79 | 44.5 |
| Red Dead Redemption 2 (2019) | 175 | 160 | 118 | 77.9 | 63.2 | 42.6 |
| Doom Eternal (2020) | 547 | 358 | 322 | 311 | 244 | 136 |
| Gears Tactics (2020) | 342.6 | 204.9 | 150.8 | 136.2 | 98.2 | 53.5 |
| Watch Dogs Legion (2020) | 129 | 127 | 113 | 84.9 | 65.3 | 38.9 |
| Assassin´s Creed Valhalla (2020) | 130 | 100 | 85 | 77 | 65 | 43 |
| Call of Duty Black Ops Cold War (2020) | 239 | 146 | 124 | 120 | 89.5 | 43.8 |
| Immortals Fenyx Rising (2020) | 148 | 109 | 96 | 88 | 76 | 54 |
| Cyberpunk 2077 1.0 (2020) | 125 | 108 | 93.1 | 80.6 | 53.7 | 26.6 |
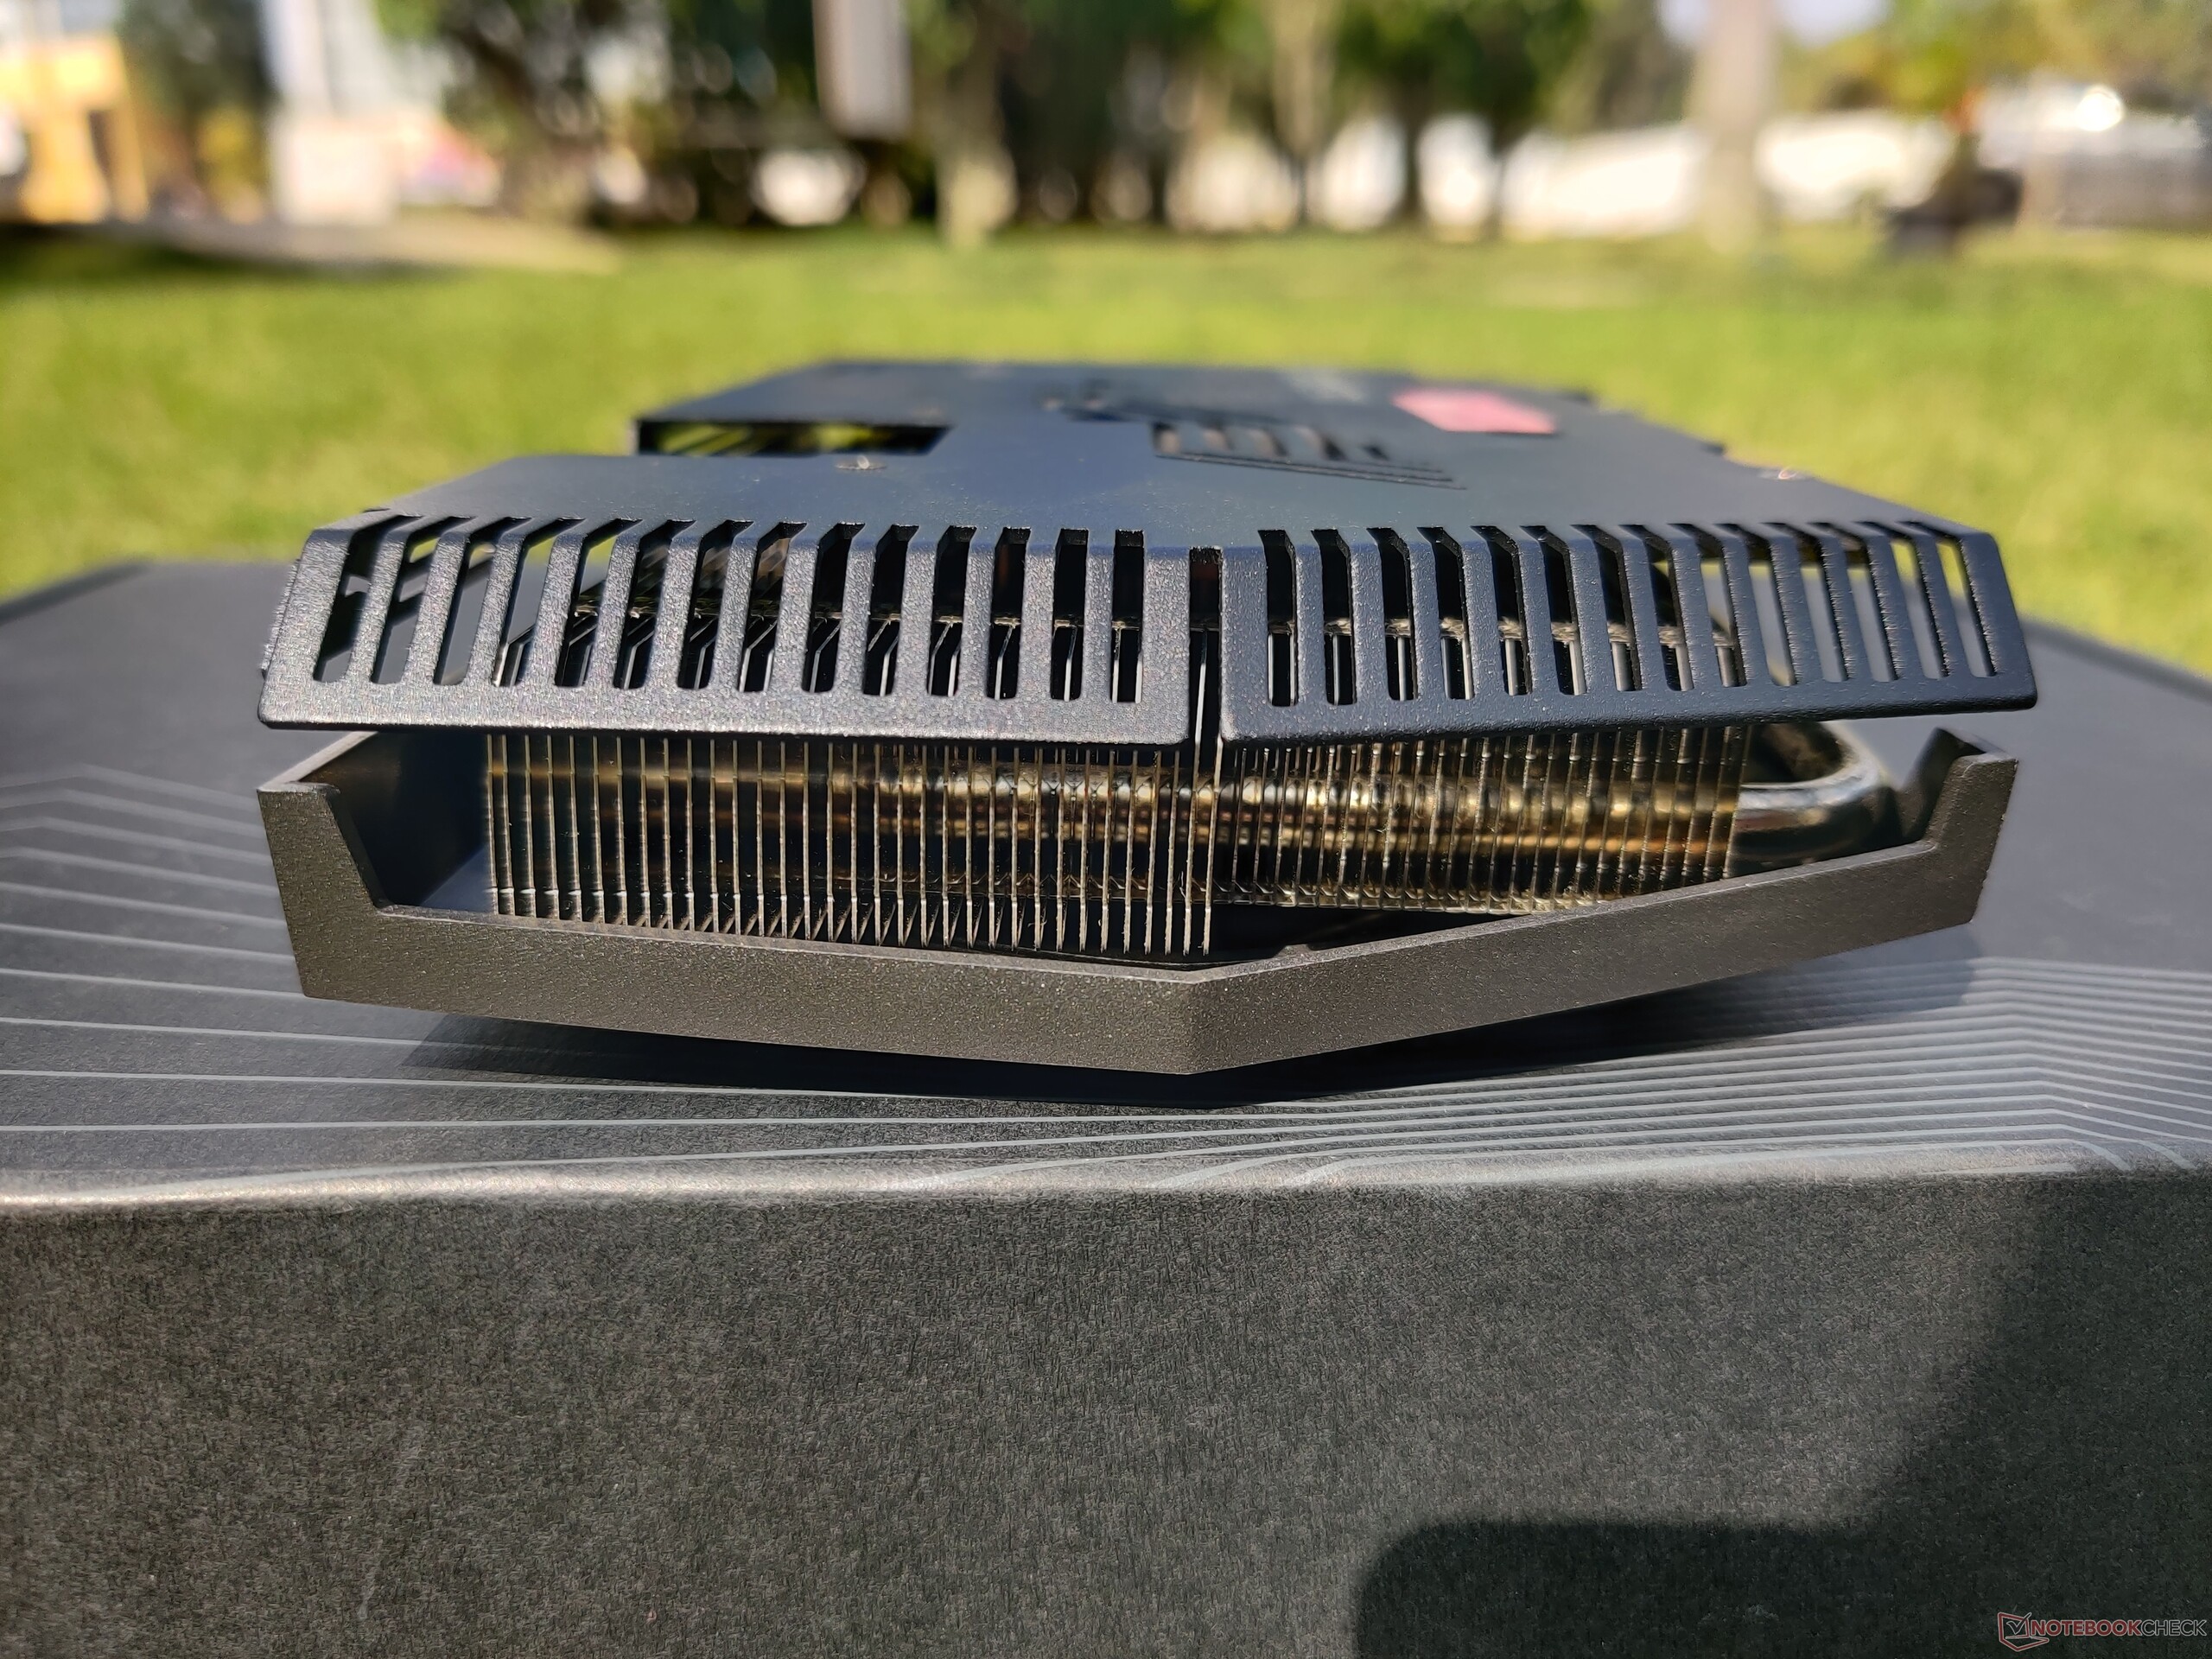
Emissioni
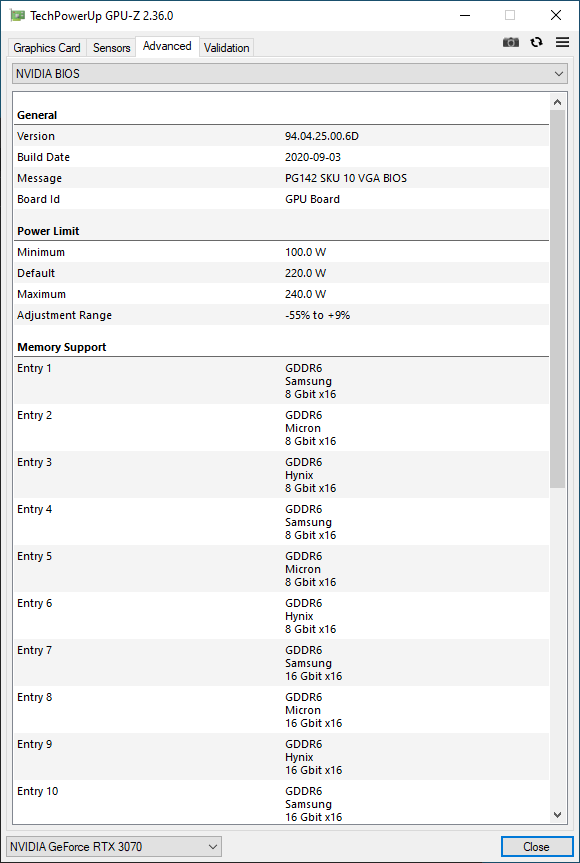
La RTX 3070 non è esattamente una GPU parsimoniosa quando si tratta di produzione di calore o consumo energetico. Zotac, tuttavia, impiega alcuni trucchi come il clocking della GPU leggermente inferiore, l'implementazione di un sistema di raffreddamento IceStorm 2.0 migliorato e l'utilizzo di una piastra posteriore in metallo per una migliore dissipazione del calore.
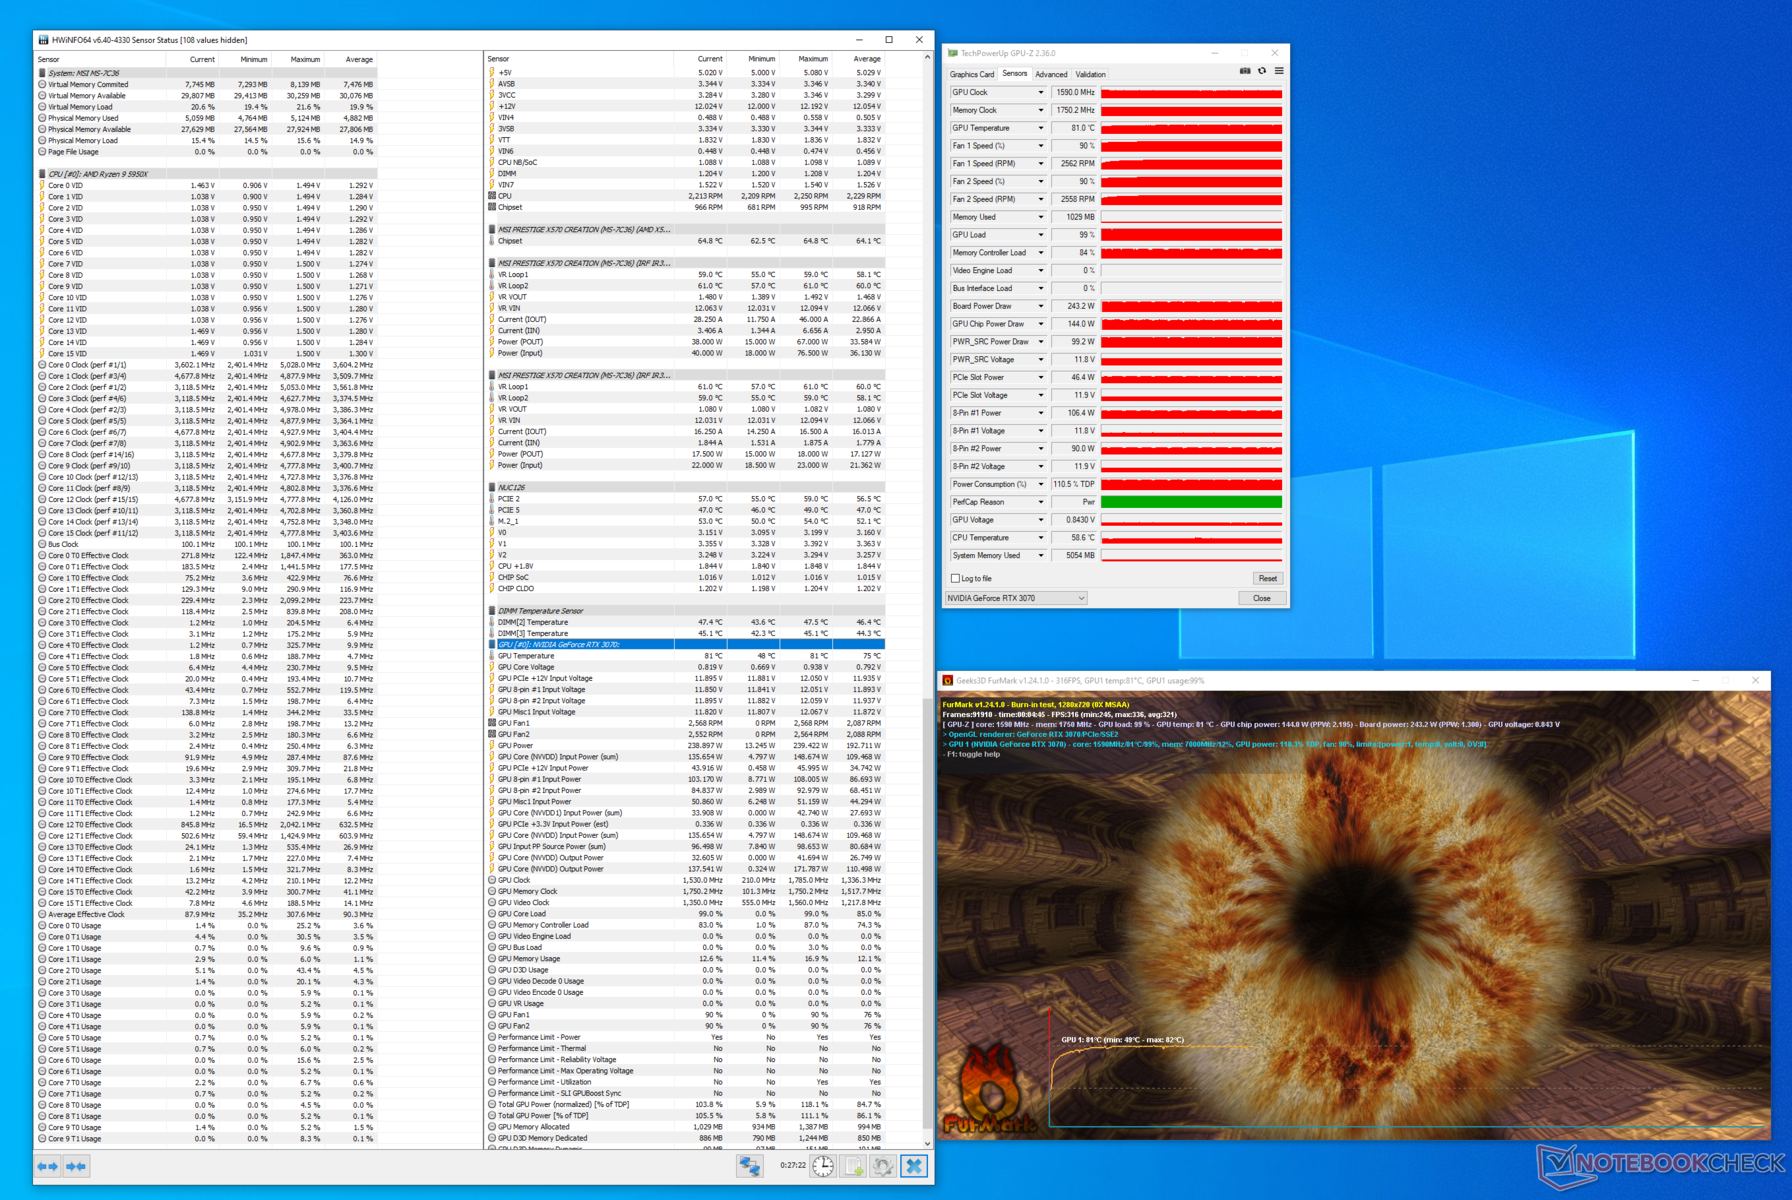
Il TGP stock da 220 W può essere aumentato del 9% a 240 W per consentire boost fino a 1.785 MHz portandolo a circa 45 MHz più lento rispetto all'OC della MSI RTX 3070 Gaming X Trio.
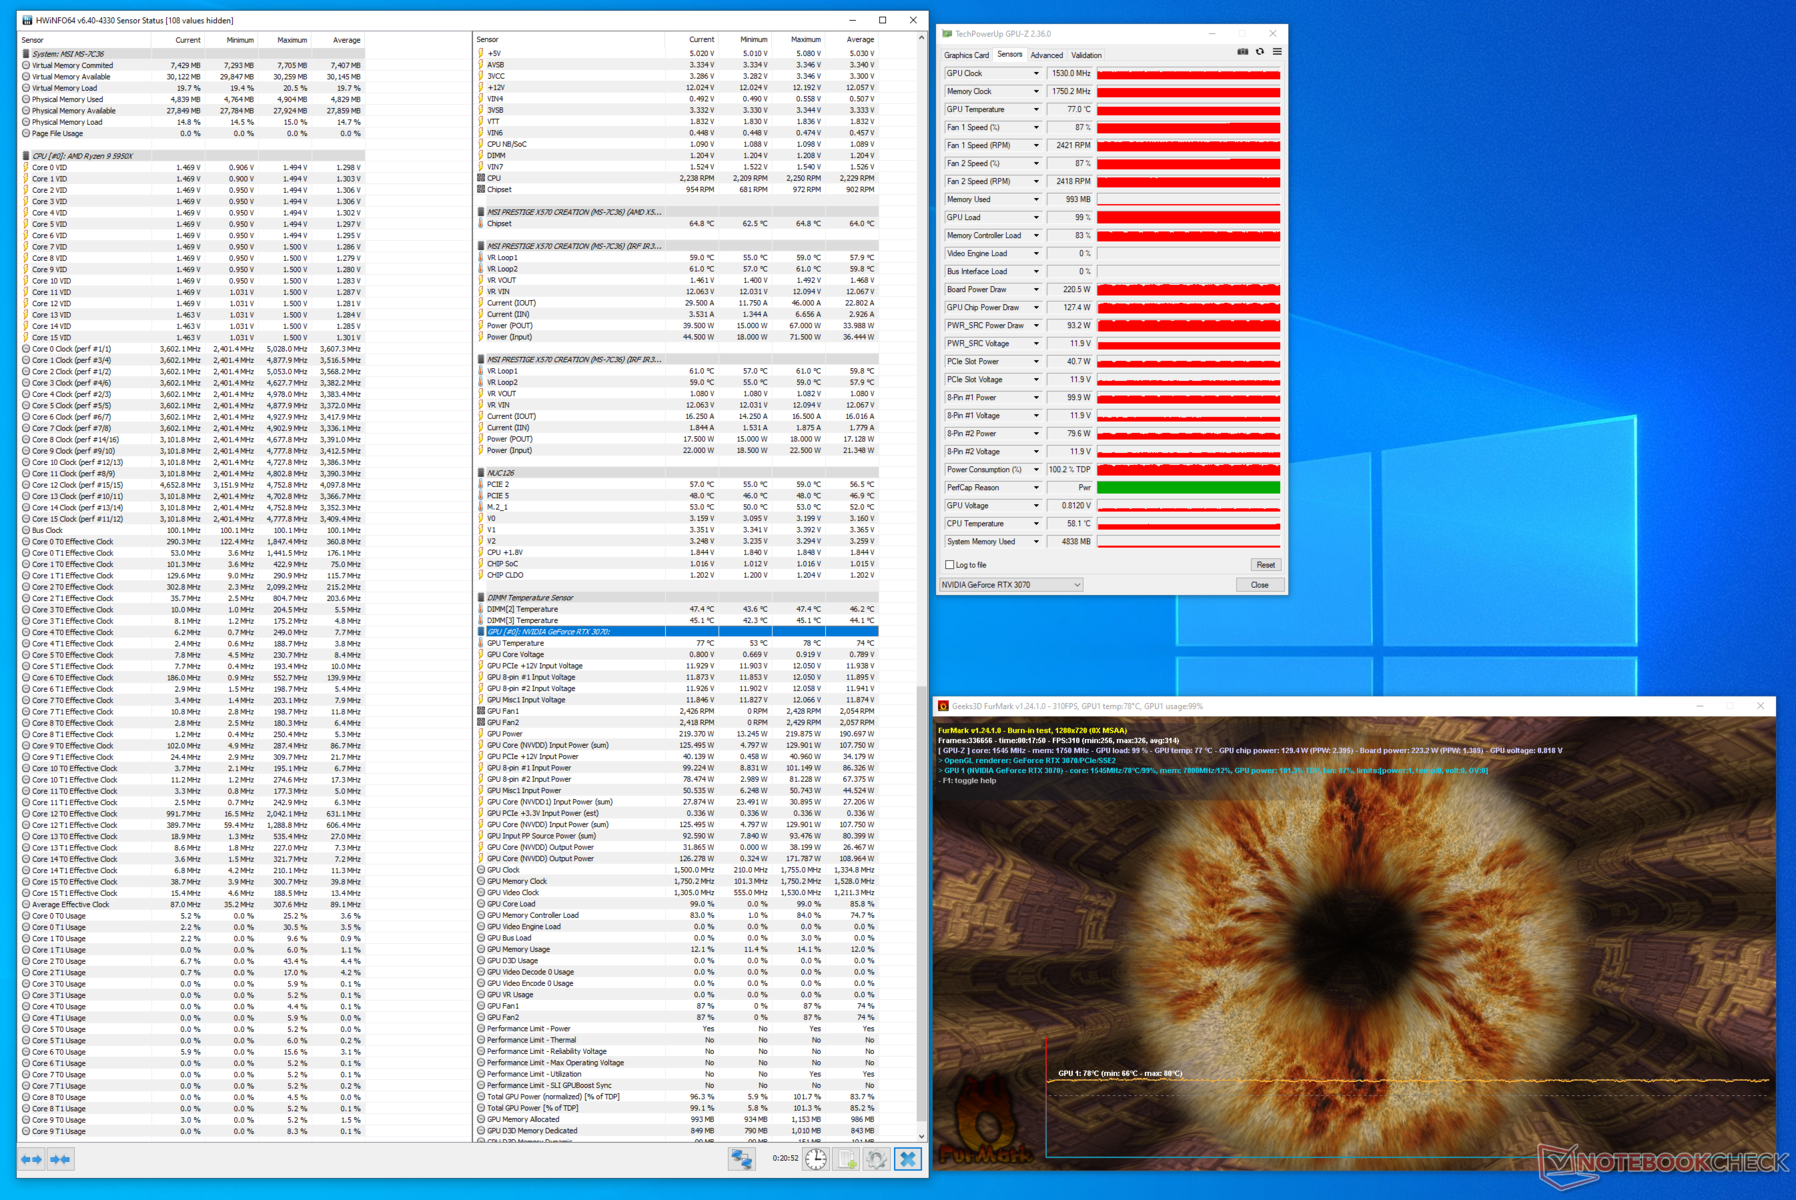
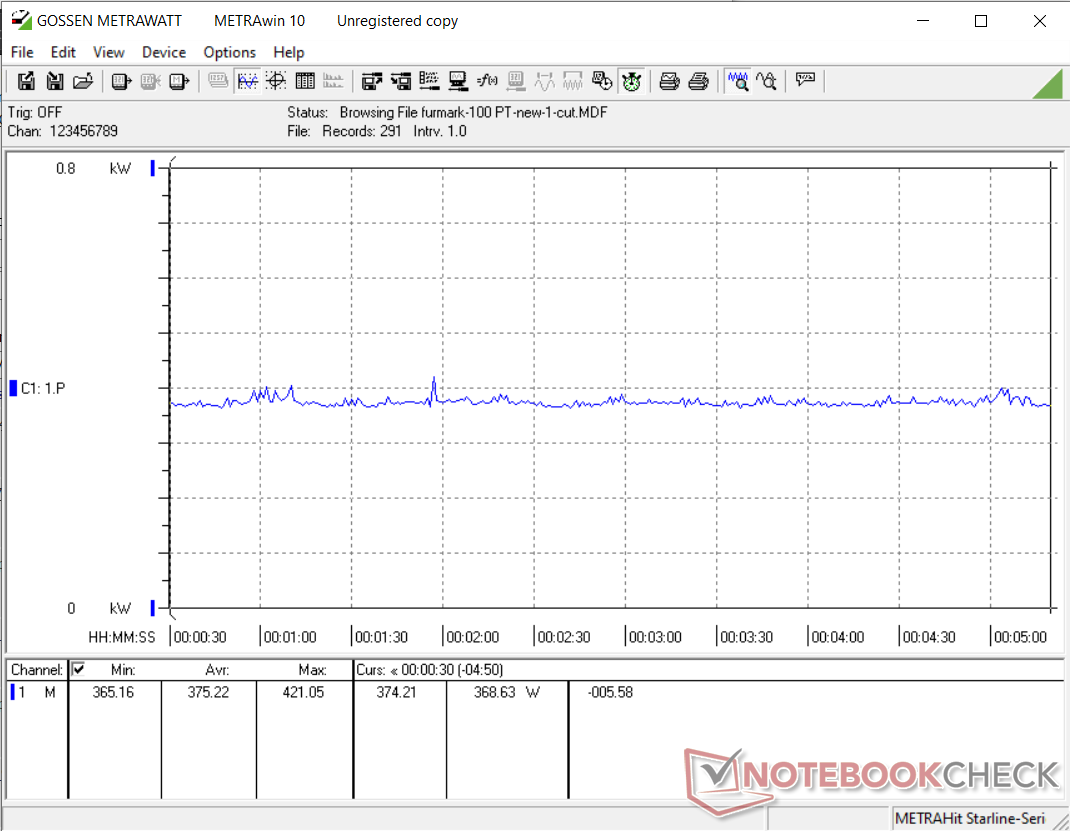
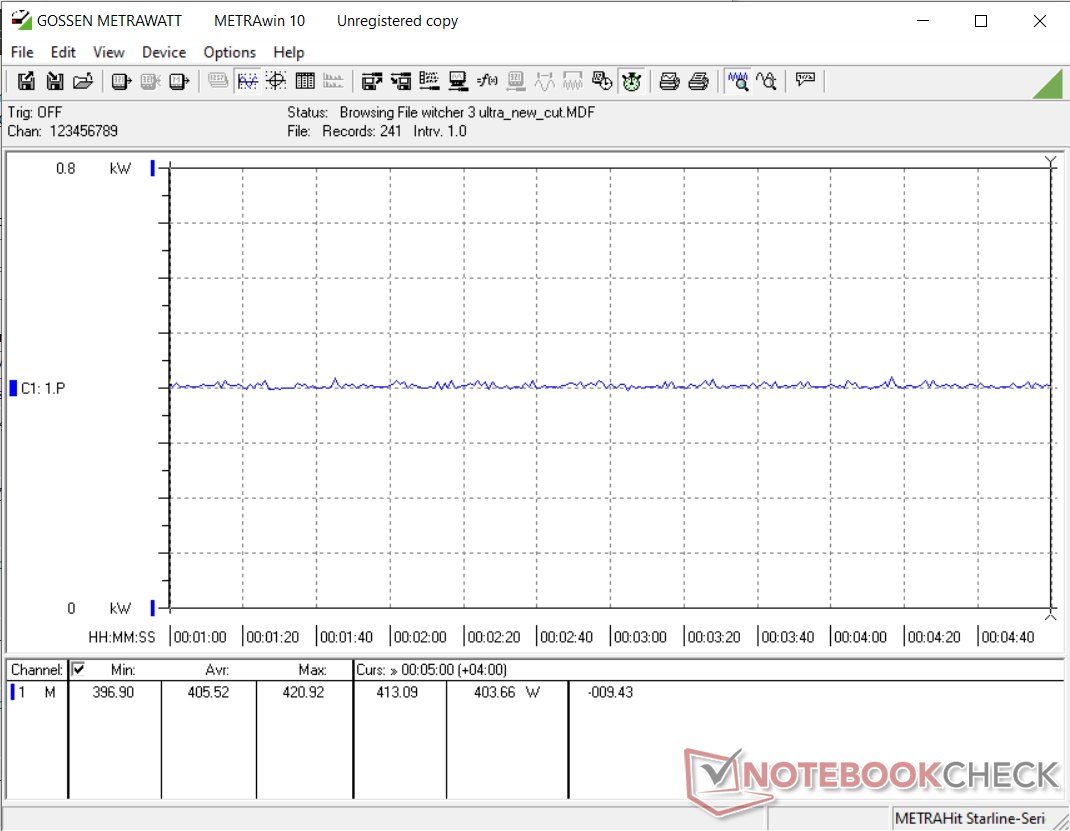
Abbiamo usato lo stress test FurMark sia al 100% che al 109% degli obiettivi di potenza per determinare i livelli di temperatura e rumore. Il consumo totale di energia del sistema è stato controllato durante lo stress con FurMark e The Witcher 3 a 1080p Ultra preimpostato a entrambi i target di potenza.
Temperature
La RTX 3070 Twin Edge sembra essere relativamente fresca grazie alle doppie ventole a 11 pale, che secondo Zotac aumenta il flusso d'aria del 10% in più rispetto alla generazione precedente. Tuttavia, questo significa anche che le ventole possono diventare notevolmente rumorose, come si vede nei nostri test sul rumore qui sotto.
Il core della GPU si scalda fino a 77 °C a pieno carico con il TGP predefinito di 220 W. Aumentando il TGP a 240 W il core si scalda di più, a 81 °C.
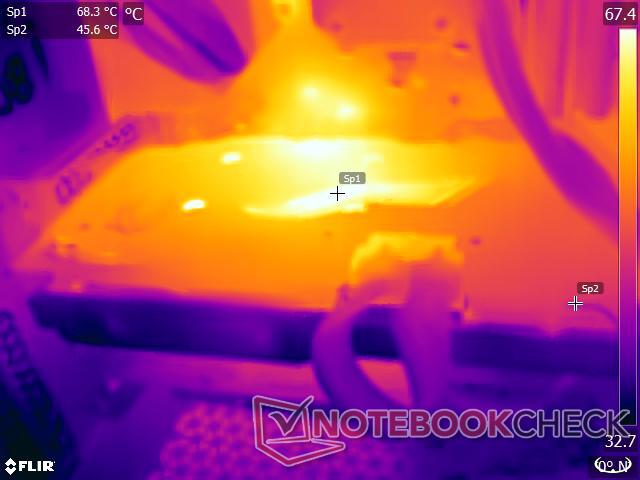
Abbiamo scoperto che la temperatura di superficie raggiunge un massimo di 68,3 °C vicino all'area della GPU quando è sotto stress, mentre le regioni lontane dal centro rimangono relativamente fresche a circa 45 °C come si vede nella nostra mappa di calore.
Le temperature al minimo oscillano tra i 48 °C e i 53 °C durante i quali le ventole sono completamente spente.
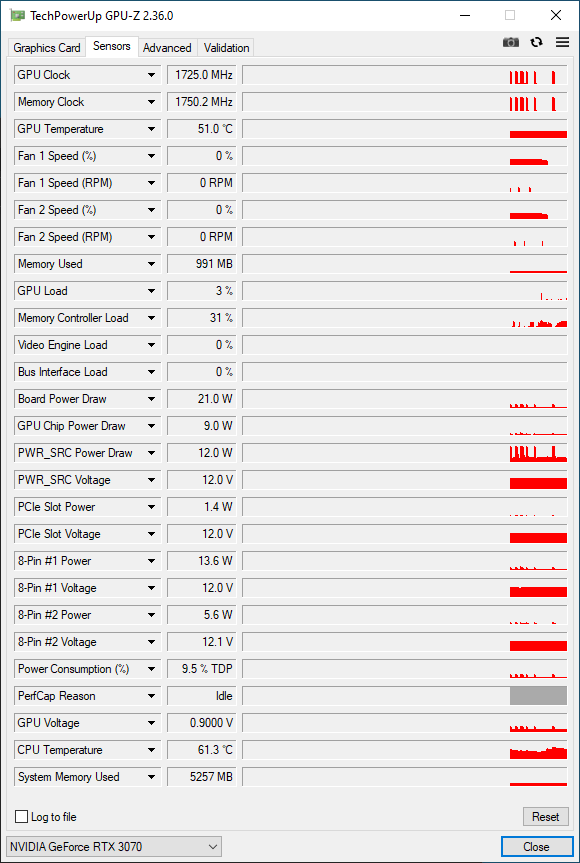
Consumo energetico
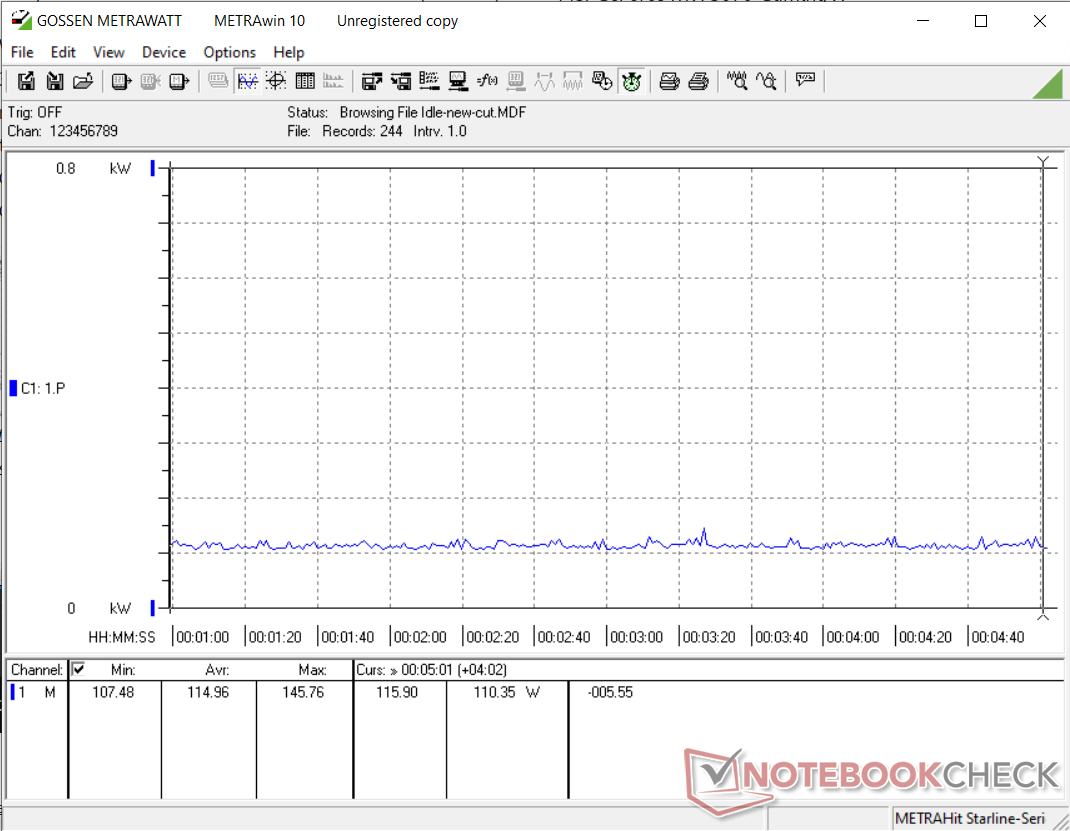
Il nostro dispositivo di prova gira al minimo a circa 115 W con tutta l'illuminazione RGB spenta e un totale di cinque ventole (tre ventole Corsair SP 120 mm per il case e due ventole Corsair ML 120 per il radiatore) e la pompa Elite Capellix in un profilo bilanciato.
Abbiamo rilevato un consumo energetico totale medio del sistema di 375 W durante l'esecuzione di FurMark al target di alimentazione predefinito del 100% (PT). Questo è circa il 6% più basso di una RTX 2080 Ti e alla pari con una RTX 2080 Super. Aumentando il PT al 109% si ottiene un consumo di energia superiore del 5% a 393 W.
La RTX 3070 Twin Edge consuma un po' di più rispetto alla MSI RTX 3070 Gaming X Trio nel preset The Witcher 3 a 1080p Ultra, ma è ancora piuttosto parsimoniosa rispetto alla RTX 2080 Ti e alla Titan RTX.

* ... Meglio usare valori piccoli
Rumorosità
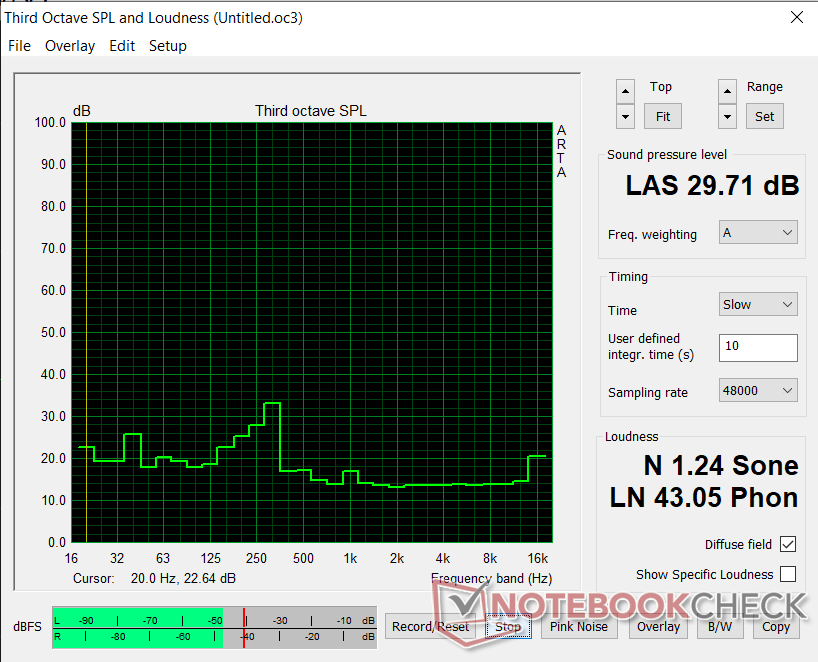
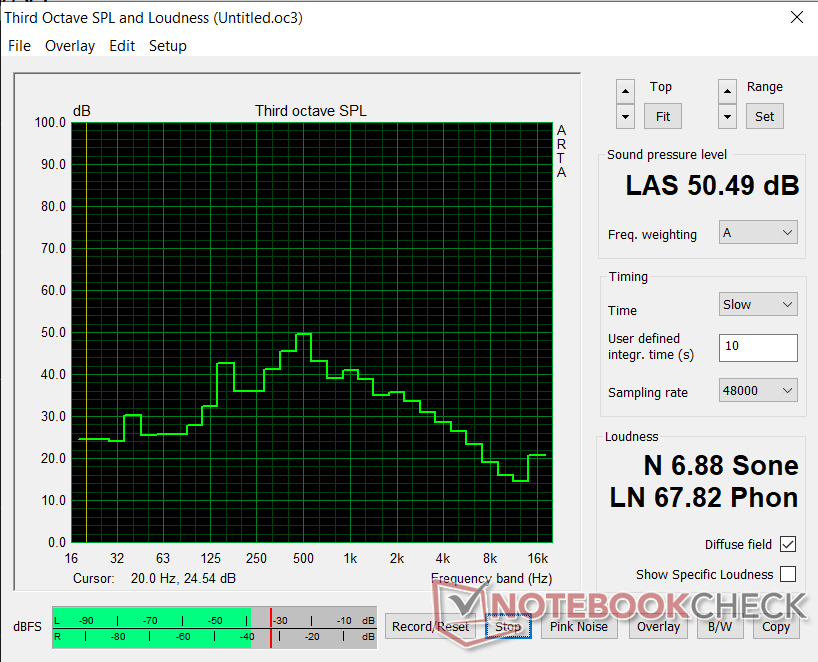
Al minimo, la Zotac RTX 3070 Twin Edge è una scheda silenziosa e il livello di rumorosità (SPL) è più o meno uguale al valore ambientale di 29,71 dB(A) a una distanza di 20 cm dal case. Tuttavia, le cose iniziano a cambiare sotto stress. Dopo aver stressato la scheda usando FurMark per circa 30 minuti, abbiamo osservato che i livelli SPL della ventola hanno superato i 50 db(A). Questo è probabilmente dovuto alla presenza di due sole ventole che lavorano molto per mantenere le temperature sotto controllo e al formato compatto della scheda.
Gli utenti possono ancora essere in grado di sintonizzare i livelli di rumore regolando manualmente le curve delle ventole, ma raccomandiamo un buon set di cuffie per evitare il rumore mentre si gioca con le impostazioni al massimo.
Pro
Contro
Valutazione complessiva della Zotac Gaming GeForce RTX 3070 Twin Edge

La Zotac Gaming GeForce RTX 3070 Twin Edge è ben fatta, senza bordi taglienti, anche se il rivestimento in plastica potrebbe essere un po' più robusto. La scheda occupa uno spazio minimo e si adatta alla maggior parte dei casi con facilità. La piastra posteriore in metallo è un'aggiunta gradita per aiutare la corretta dissipazione del calore.
Gli intenditori di RGB saranno delusi dal fatto che Twin Edge offre solo un'illuminazione bianca statica per il logo Zotac. In combinazione con un array di cinque tubi di calore in rame, le due ventole a 11 pale aiutano a mantenere le temperature sotto controllo. Tuttavia, queste ventole possono diventare sensibilmente rumorose sotto carico, il che può essere sgradevole in un ambiente silenzioso.
La Zotac Gaming GeForce RTX 3070 Twin Edge ha tutte le carte in regola per chi cerca una valida offerta di RTX 3070 su scheda aggiuntiva (AiB). Le prestazioni sono invidiabilmente vicine o a volte anche marginalmente migliori di una RTX 2080 Ti, ma c'è sicuramente spazio per ottimizzare ulteriormente il consumo energetico e i livelli di rumore della ventola.
La Zotac RTX 3070 Twin Edge si comporta alla pari con la RTX 2080 Ti in entrambi i benchmarks sintetici e di gioco, consumando meno energia. Zotac permette di aggiungere altri 20 W al TGP, che aumenta ulteriormente i clocks di 60 MHz mentre aumenta il consumo energetico di circa il 5%.
Il nostro problema principale con la Zotac RTX 3070 Twin Edge è l'attuale prezzo di vendita. Il prezzo di NVIDIA per la RTX 3070 è di 499 dollari, mentre la RTX 3070 Twin Edge originariamente costa 620 dollari. Tuttavia, la domanda attuale e i vincoli di fornitura comportano che la RTX 3070 Twin Edge ha un prezzo esorbitante di 950 dollari su Amazon. A meno che non abbiate un bisogno assolutamente urgente, vi suggeriamo di tenere d'occhio i prezzi finché non scendono a livelli più ragionevoli.
Prezzo e disponibilità
La Zotac Gaming GeForce RTX 3070 Twin Edge può essere acquistata su diversi negozi online tra cui lo Zotac Store, Amazon e Newegg. Newegg attualmente offre la RTX 3070 Twin Edge per 649,99 dollari e la Twin Edge OC per 694,99 dollari. Non sorprende che la scheda sia come esaurita al momento della pubblicazione.
La RTX 3070 Twin Edge è attualmente in stock su Amazon per 949,99 dollari. Si tratta di un aumento significativamente ripido che diminuisce la proposta di valore di questa scheda rispetto alla RTX 2080 Ti.
Price comparison
