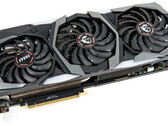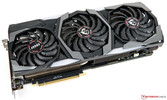
Recensione dell'MSI GeForce RTX 2080 Ti Gaming X Trio Desktop GPU: La scheda grafica GeForce più veloce in circolazione
AMD Ryzen 9 3900X | NVIDIA GeForce RTX 2080 Ti (Desktop) | 32.00"

La NVIDIA GeForce RTX 2080 Ti Ë la scheda grafica desktop pi˘ veloce del 2018 e la pi˘ veloce scheda Turing RTX al lancio. Offre 4.352 shaders, 11 GB di GDDR6 con un'interfaccia a 352 bit (14 GHz, 616 GB/s per la Founders Edition). Inoltre, il 2080Ti include 544 Tensor cores e 68 raytracing cores.
Caratteristiche
NVIDIA produce il chip TU102 in un processo FinFET da 12 nm e include funzionalit‡ come il Deep Learning Super Sampling (DLSS) e il Real-Time Ray Tracing (RTRT), che dovrebbero combinarsi per creare effetti di illuminazione pi˘ realistici rispetto alle vecchie GPU basate sull'architettura Pascal dell'azienda (se i giochi lo supportano). La RTX 2080 Ti Ë anche predisposta per la DisplayPort 1.4, mentre c'Ë anche il supporto per HDMI 2.0b, HDR, Simultaneous Multi-Projection (SMP) e H.265 video en/decoding (PlayReady 3.0).
Prestazioni
Le prestazioni di gioco della 2080 Ti sono di circa il 27% superiori ad una RTX 2080 in 4K e circa il 35% superiori rispetto ad una GTX 1080 Ti. Pertanto, la 2080 Ti 2080 Ë in grado di raggiungere il massimo delle impostazioni in 4K per tutti i giochi AAA attuali. L'aggiunta del raytracing puÚ tuttavia ridurre le prestazioni al di sotto dei 60 fps.
Requisiti energetici
NVIDIA stima che la RTX 2080 Ti dovrebbe consumare un massimo di 250 W o 260 W per la Founders Edition, un valore che Ë al livello della GTX 1080 Ti (250 Watt).
GeForce RTX 2000 Serie
| ||||||||||||||||||||||||||||||||||||||||||||||||||||||||||
| Nome in codice | Turing TU102 | |||||||||||||||||||||||||||||||||||||||||||||||||||||||||
| Architettura | Turing | |||||||||||||||||||||||||||||||||||||||||||||||||||||||||
| Pipelines | 4352 - unified | |||||||||||||||||||||||||||||||||||||||||||||||||||||||||
| Velocità del core | 1350 - 1545 (Boost) MHz | |||||||||||||||||||||||||||||||||||||||||||||||||||||||||
| Velocità della memoria | 14000 MHz | |||||||||||||||||||||||||||||||||||||||||||||||||||||||||
| Larghezza del bus di memoria | 352 Bit | |||||||||||||||||||||||||||||||||||||||||||||||||||||||||
| Tipo di memoria | GDDR6 | |||||||||||||||||||||||||||||||||||||||||||||||||||||||||
| Max. quantità di memoria | 11 GB | |||||||||||||||||||||||||||||||||||||||||||||||||||||||||
| Memoria condivisa | no | |||||||||||||||||||||||||||||||||||||||||||||||||||||||||
| API | DirectX 12_1, Shader 6.4, OpenGL 4.6 | |||||||||||||||||||||||||||||||||||||||||||||||||||||||||
| Consumo di corrente | 270 Watt | |||||||||||||||||||||||||||||||||||||||||||||||||||||||||
| Transistor Count | 18.6 Billion | |||||||||||||||||||||||||||||||||||||||||||||||||||||||||
| tecnologia | 12 nm | |||||||||||||||||||||||||||||||||||||||||||||||||||||||||
| Caratteristiche | NVLink, DLSS, Raytraycing, VR Ready, G-SYNC, Vulkan, Multi Monitor, 650 Watt system power recommended | |||||||||||||||||||||||||||||||||||||||||||||||||||||||||
| Data dell'annuncio | 27.08.2018 | |||||||||||||||||||||||||||||||||||||||||||||||||||||||||
I seguenti benchmarks deirivano dai benchmarks dei portatili recensiti. Le prestazioni dipendono dalla scheda grafica utilizzata, dal clock rate, dal processore, dai settaggi di sistema, dai drivers, e dai sistemi operativi. Quindi i risultati non sono rappresentativi per i portatili con questa GPU. Per informazioni dettagliate sui risultati del benchmark, cliccate sul numero di fps.


| basso | medio | alto | ultra | QHD | 4K | |
|---|---|---|---|---|---|---|
| F1 2021 | 254 | 237 | 147 | 119 | 68 | |
| Days Gone | 163 | 158 | 135 | 105 | 63.9 | |
| Mass Effect Legendary Edition | 132 | 126 | 125 | 115 | ||
| Resident Evil Village | 183 | 181 | 181 | 147 | 74.3 | |
| Outriders | 135 | 135 | 132 | 114 | 61.8 | |
| Hitman 3 | 171 | 164 | 162 | 147 | 85.2 | |
| Cyberpunk 2077 1.0 | 114 | 107 | 95.4 | 64 | 32.2 | |
| Immortals Fenyx Rising | 113 | 102 | 93 | 81 | 59 | |
| Yakuza Like a Dragon | 161 | 156 | 139 | 100 | 53.8 | |
| Call of Duty Black Ops Cold War | 155 | 133 | 118 | 89.2 | 54.4 | |
| Assassin´s Creed Valhalla | 107 | 91 | 80 | 67 | 46 | |
| Dirt 5 | 134 | 112 | 73.4 | 64.8 | 50 | |
| Watch Dogs Legion | 111 | 98.7 | 89.6 | 72.9 | 44 | |
| FIFA 21 | 269 | 266 | 255 | 254 | 251 | 247 |
| Star Wars Squadrons | 360 | 354 | 331 | 326 | 246 | 144 |
| Mafia Definitive Edition | 131 | 120 | 117 | 105 | 62.4 | |
| Serious Sam 4 | 185 | 123 | 117 | 108 | 107 | 86.3 |
| Crysis Remastered | 179 | 106 | 71.3 | 57.9 | 37.6 | |
| Flight Simulator 2020 | 84.4 | 70.8 | 58.6 | 47.3 | 46.5 | 32.7 |
| Horizon Zero Dawn | 159 | 146 | 133 | 115 | 94 | 54 |
| Death Stranding | 174 | 173 | 170 | 169 | 133 | 78.8 |
| F1 2020 | 289 | 247 | 240 | 202 | 162 | 100 |
| Valorant | 290 | 285 | 267 | 266 | 259 | |
| Gears Tactics | 321 | 243 | 166 | 126 | 101 | 64.7 |
| Doom Eternal | 315 | 290 | 266 | 259 | 204 | 113 |
| Hunt Showdown | 235 | 200 | 170 | 125 | 60.4 | |
| Escape from Tarkov | 121 | 121 | 121 | 121 | 120 | 73.4 |
| Red Dead Redemption 2 | 127 | 119 | 103 | 76 | 63 | 42.3 |
| Star Wars Jedi Fallen Order | 106 | 106 | 104 | 105 | 73 | |
| Need for Speed Heat | 93 | 91 | 67 | |||
| Call of Duty Modern Warfare 2019 | 162 | 127 | 77 | |||
| GRID 2019 | 141 | 118 | 77 | |||
| Ghost Recon Breakpoint | 103 | 82 | 52 | |||
| FIFA 20 | 269 | 269 | 255 | 253 | 247 | 249 |
| Borderlands 3 | 155 | 137 | 122 | 105 | 81 | 45 |
| Control | 240 | 166 | 129 | 87 | 44 | |
| F1 2019 | 269 | 243 | 192 | 171 | 145 | 96 |
| Total War: Three Kingdoms | 96.3 | 81.1 | 43.8 | |||
| Rage 2 | 287 | 195 | 171 | 166 | 114 | 58 |
| Anno 1800 | 108 | 106 | 81 | 45 | 43 | 40 |
| The Division 2 | 211 | 180 | 144 | 127 | 96 | 55 |
| Dirt Rally 2.0 | 304 | 228 | 220 | 166 | 133 | 83 |
| Anthem | 117 | 120 | 118 | 112 | 106 | 69 |
| Far Cry New Dawn | 133 | 114 | 110 | 100 | 98 | 76 |
| Metro Exodus | 154 | 131 | 109 | 94 | 75 | 50 |
| Apex Legends | 144 | 144 | 144 | 144 | 144 | 111 |
| Just Cause 4 | 232 | 197 | 156 | 149 | 112 | 66 |
| Darksiders III | 208 | 135 | 127 | 121 | 112 | 71 |
| Battlefield V | 189 | 170 | 164 | 159 | 134 | 86 |
| Farming Simulator 19 | 245 | 184 | 159 | 146 | 146 | 107 |
| Hitman 2 | 88 | 85 | 77 | 74 | 74 | 62 |
| Call of Duty Black Ops 4 | 285 | 244 | 235 | 213 | 166 | 87 |
| Assassin´s Creed Odyssey | 137 | 125 | 108 | 82 | 72 | 50 |
| Forza Horizon 4 | 212 | 184 | 182 | 163 | 143 | 105 |
| FIFA 19 | 361 | 346 | 321 | 317 | 313 | 300 |
| Shadow of the Tomb Raider | 158 | 144 | 143 | 136 | 110 | 61 |
| F1 2018 | 248 | 216 | 167 | 141 | 133 | 97 |
| Monster Hunter World | 188 | 182 | 179 | 145 | 102 | 49 |
| The Crew 2 | 60 | 60 | 60 | 60 | 60 | 60 |
| Far Cry 5 | 153 | 136 | 130 | 121 | 116 | 77 |
| World of Tanks enCore | 105 | |||||
| X-Plane 11.11 | 130 | 117 | 92 | 78 | ||
| Kingdom Come: Deliverance | 187 | 163 | 132 | 91 | 84 | 50 |
| Final Fantasy XV Benchmark | 198 | 162 | 121 | 57 | ||
| Fortnite | 381 | 302 | 232 | 216 | 151 | 79 |
| Star Wars Battlefront 2 | 198 | 190 | 179 | 138 | 76.9 | |
| Need for Speed Payback | 163 | 157 | 154 | 151 | 95.6 | |
| Call of Duty WWII | 313 | 308 | 224 | 203 | 172 | 113 |
| Assassin´s Creed Origins | 146 | 131 | 126 | 107 | 93 | 64 |
| Destiny 2 | 193 | 191 | 190 | 190 | 162 | 91 |
| ELEX | 121 | 121 | 121 | 116 | 62.3 | |
| Middle-earth: Shadow of War | 204 | 180 | 153 | 78 | ||
| Playerunknown's Battlegrounds (PUBG) | 221 | 201 | 193 | 191 | 88 | |
| Dirt 4 | 364 | 268 | 231 | 183 | 125 | |
| Rocket League | 250 | 250 | 249 | 209 | ||
| Prey | 144 | 144 | 144 | 123 | ||
| Ghost Recon Wildlands | 169 | 139 | 135 | 86 | 66 | |
| For Honor | 369 | 270 | 258 | 206 | 99 | |
| Resident Evil 7 | 599 | 382 | 316 | 117 | ||
| Watch Dogs 2 | 166 | 156 | 135 | 107 | 68 | |
| Dishonored 2 | 106 | 105 | 104 | 101 | 96 | |
| Battlefield 1 | 200 | 198 | 192 | 185 | 115 | |
| Deus Ex Mankind Divided | 177 | 165 | 143 | 103 | 69 | |
| Overwatch | 300 | 300 | 300 | 297 | 193 | |
| Doom | 191 | 176 | 164 | 162 | 138 | |
| Ashes of the Singularity | 89.4 | 83.4 | ||||
| The Division | 341 | 282 | 196 | 158 | 90 | |
| Far Cry Primal | 139 | 126 | 116 | 107 | 90 | |
| Rise of the Tomb Raider | 335 | 231 | 217 | 200 | 95 | |
| Rainbow Six Siege | 448 | 370 | 338 | 320 | 180 | |
| World of Warships | 168 | |||||
| Dota 2 Reborn | 154 | 145 | 146 | 140 | 137 | |
| The Witcher 3 | 399 | 342 | 247 | 134 | 98 | |
| GTA V | 180 | 174 | 165 | 103 | 142 | |
| Battlefield 4 | 200 | 200 | 200 | 200 | 152 | |
| BioShock Infinite | 419 | 384 | 355 | 246 | ||
| Counter-Strike: GO | 270 | |||||
| basso | medio | alto | ultra | QHD | 4K | < 30 fps < 60 fps < 120 fps ≥ 120 fps | 6 62 | 13 74 | 1 21 66 | 2 29 55 | 3 38 27 | 23 57 16 |
Per conoscere altri giochi che potrebbero essere utilizzabili e per una lista completa di tutti i giochi e delle schede grafiche visitate la nostra Gaming List


Posizione approssimativa dell'adattatore grafico
I nostri Top 10
» Top 10 Portatili Multimedia
» Top 10 Portatili Gaming
» Top 10 Portatili Gaming Leggeri
» Top 10 Portatili da Ufficio e Business economici
» Top 10 Portatili Premium da Ufficio/Business
» Top 10 Portatili sotto i 300 Euro
» Top 10 Portatili sotto i 500 Euro
» Top 10 dei Portatili Workstation
» Top 10 Subnotebooks
» Top 10 Ultrabooks
» Top 10 Convertibili
» Top 10 Tablets
» Top 10 Tablets Windows
» Top 10 Smartphones