NVIDIA GeForce RTX 3050 6GB Laptop GPU
La GPU per laptop Nvidia GeForce RTX 3050 da 6 GB (mobile, GN20-P0-R, aggiornamento 2023) è l'aggiornamento della GPU per laptop RTX 3050 da 4 GB (scheda mobile RTX 3000 più lenta) e anch'essa basata sul chip GA107 Ampere. La variante da 6GB offre più CUDA cores (2.560, +25%) ma un bus di memoria ridotto a 96 Bit. La velocità clock dipende dalla variante TGP e può variare da 713 - 1530 (base) e 1058 - 1740 (boost) per le varianti TGP da 35 a 80 Watt (vedi tabella sotto).
Le prestazioni sono comprese tra la vecchia RTX 3050 da 4 GB e la RTX 3050 Ti e quindi più adatte per i giochi full HD (1920 x 1080) con impostazioni grafiche medio-alte. Le prestazioni non sono sufficienti per abilitare il Raytracing nella maggior parte dei giochi, ma i core Tensor possono essere utilizzati per DLSS in alcuni giochi (e ottenere un aumento delle prestazioni con una leggera riduzione della qualità). Attenzione, le varianti a basso TGP offriranno prestazioni notevolmente inferiori.
Il chip GA107 offre 3.072 ALU FP32 di cui la metà può anche eseguire istruzioni INT32 (ovvero 1.536 ALU INT32). L'RTX 3050 tuttavia forse non utilizzerà tutte le ALU sul chip. Con Turing tutti gli shader potevano ancora eseguire istruzioni FP32 o INT32. Secondo Nvidia anche il raytracing ed i tensor cores del chip sono stati migliorati. I chip Ampere includono anche un codificatore video di quinta generazione migliorato (NVENC per H.264 e H.265) e un decoder di settima generazione (per vari formati ora incluso AV1).
Il chip GA107 è prodotto da Samsung in 8nm (8N), che non è in grado di tenere il passo con il nodo da 7nm di TSMC (ad esempio utilizzato da AMD ed anche per il chip professionale GA100 Ampere).
GeForce RTX 3000 Serie
| |||||||||||||||||||||||||||||||||||||||||||||||||||||||||||||||||||
| Nome in codice | GN20-P0-R 6GB | ||||||||||||||||||||||||||||||||||||||||||||||||||||||||||||||||||
| Architettura | Ampere | ||||||||||||||||||||||||||||||||||||||||||||||||||||||||||||||||||
| Pipelines | 2560 - unified | ||||||||||||||||||||||||||||||||||||||||||||||||||||||||||||||||||
| TMUs | 80 | ||||||||||||||||||||||||||||||||||||||||||||||||||||||||||||||||||
| ROPs | 32 | ||||||||||||||||||||||||||||||||||||||||||||||||||||||||||||||||||
| Raytracing Cores | 16 | ||||||||||||||||||||||||||||||||||||||||||||||||||||||||||||||||||
| Tensor / AI Cores | 64 | ||||||||||||||||||||||||||||||||||||||||||||||||||||||||||||||||||
| Velocità del core | 1237 - 1492 (Boost) MHz | ||||||||||||||||||||||||||||||||||||||||||||||||||||||||||||||||||
| Velocità della memoria | 12000 effective = 1500 MHz | ||||||||||||||||||||||||||||||||||||||||||||||||||||||||||||||||||
| Larghezza del bus di memoria | 96 Bit | ||||||||||||||||||||||||||||||||||||||||||||||||||||||||||||||||||
| Tipo di memoria | GDDR6 | ||||||||||||||||||||||||||||||||||||||||||||||||||||||||||||||||||
| Max. quantità di memoria | 6 GB | ||||||||||||||||||||||||||||||||||||||||||||||||||||||||||||||||||
| Memoria condivisa | no | ||||||||||||||||||||||||||||||||||||||||||||||||||||||||||||||||||
| Memory Bandwidth | 144 GB/s | ||||||||||||||||||||||||||||||||||||||||||||||||||||||||||||||||||
| API | DirectX 12_2, Shader 6.7, OpenGL 4.6 | ||||||||||||||||||||||||||||||||||||||||||||||||||||||||||||||||||
| Consumo di corrente | 60 Watt (35 - 80 Watt TGP) | ||||||||||||||||||||||||||||||||||||||||||||||||||||||||||||||||||
| tecnologia | 8 nm | ||||||||||||||||||||||||||||||||||||||||||||||||||||||||||||||||||
| PCIe | 4.0 | ||||||||||||||||||||||||||||||||||||||||||||||||||||||||||||||||||
| Displays | HDMI 2.1, DisplayPort 1.4a | ||||||||||||||||||||||||||||||||||||||||||||||||||||||||||||||||||
| Caratteristiche | NVIDIA DLSS, NVIDIA Reflex, Resizable BAR, NVIDIA Broadcast, NVIDIA Ansel, NVIDIA ShadowPlay, NVIDIA G-SYNC, Advanced Optimus, Nvidia Max-Q, Dynamic Boost | ||||||||||||||||||||||||||||||||||||||||||||||||||||||||||||||||||
| Dimensione del portatile | grande | ||||||||||||||||||||||||||||||||||||||||||||||||||||||||||||||||||
| Data dell'annuncio | 06.01.2023 | ||||||||||||||||||||||||||||||||||||||||||||||||||||||||||||||||||
| Predecessor | GeForce RTX 3050 4GB Laptop GPU | ||||||||||||||||||||||||||||||||||||||||||||||||||||||||||||||||||
Benchmark
Cinebench R15 OpenGL 64 Bit +
* Numeri più piccoli rappresentano prestazioni supeiori
Benchmarks per i giochi
I seguenti benchmarks deirivano dai benchmarks dei portatili recensiti. Le prestazioni dipendono dalla scheda grafica utilizzata, dal clock rate, dal processore, dai settaggi di sistema, dai drivers, e dai sistemi operativi. Quindi i risultati non sono rappresentativi per i portatili con questa GPU. Per informazioni dettagliate sui risultati del benchmark, cliccate sul numero di fps.

Cyberpunk 2077
2023
Baldur's Gate 3
2023
F1 23
2023
Returnal
2023
F1 22
2022
Cyberpunk 2077 1.6
2022
F1 2021
2021
Far Cry 5
2018
X-Plane 11.11
2018
Dota 2 Reborn
2015
The Witcher 3
2015
GTA V
2015| basso | medio | alto | ultra | QHD | 4K | |
|---|---|---|---|---|---|---|
| Avatar Frontiers of Pandora | 39.5 | 36.3 | 31.5 | 23.4 | 15.1 | |
| Assassin's Creed Mirage | 70 | 63 | 55 | 41 | 31 | |
| Cyberpunk 2077 | 63 | 49 | 41 | 35 | 21.3 | |
| Baldur's Gate 3 | 59.7 | 50.3 | 45.4 | 44.3 | ||
| F1 23 | 132 | 125 | 92 | 23 | 12 | |
| Returnal | 40 | 38 | 34 | 29 | ||
| F1 22 | 144 | 135 | 102 | 32 | 19 | |
| Tiny Tina's Wonderlands | 109 | 87 | 58 | 45 | ||
| Cyberpunk 2077 1.6 | 80.8 | 64.2 | 46.4 | 38.5 | ||
| F1 2021 | 218 | 127.4 | 104.8 | 61.9 | 40 | |
| Strange Brigade | 237 | 105 | 87 | 76 | 57.1 | |
| Far Cry 5 | 141 | 83 | 77 | 72 | 52 | |
| X-Plane 11.11 | 117 | 100 | 84 | |||
| Final Fantasy XV Benchmark | 124 | 67 | 49 | 35 | ||
| Dota 2 Reborn | 152 | 136 | 122 | 112 | ||
| The Witcher 3 | 222 | 139 | 86 | 49 | 37 | |
| GTA V | 176 | 174 | 116 | 61 | 40 | |
| basso | medio | alto | ultra | QHD | 4K | < 30 fps < 60 fps < 120 fps ≥ 120 fps | 3 5 9 | 4 7 6 | 8 8 1 | 3 7 5 | 4 7 | |
Per conoscere altri giochi che potrebbero essere utilizzabili e per una lista completa di tutti i giochi e delle schede grafiche visitate la nostra Gaming List
Recensioni Notebook con NVIDIA GeForce RTX 3050 6GB Laptop GPU la scheda grafica

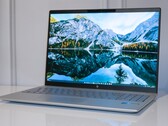
Recensione dell'HP Pavilion Plus 16: Laptop multimediale premium che avrebbe potuto beneficiare di una RTX 4050
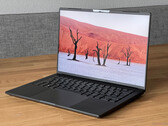
Recensione dello Schenker Vision 14 M23 - L'ultrabook in magnesio ora con una GeForce RTX 3050 da 6 GB

Recensione del portatile Lenovo Slim 7 Pro Ryzen 7 7735HS: Nuovo nome della CPU, vecchie prestazioni della CPU
Acer Aspire 7 A715-59G: Intel Core i5-12450H, 15.60", 2.7 kg
Recensioni esterne » Acer Aspire 7 A715-59G
Lenovo LOQ Essential 15IAX9E: Intel Core i5-12450HX, 15.60", 1.7 kg
Recensioni esterne » Lenovo LOQ Essential 15IAX9E
Acer Nitro Lite 16 NL16-71G: Intel Core i7-13620H, 16.00", 1.9 kg
Recensioni esterne » Acer Nitro Lite 16 NL16-71G
Asus V16 V3607V: Intel Core 7 240H, 16.00", 2 kg
Recensioni esterne » Asus V16 V3607V
Lenovo LOQ 15 ARP9: unknown, 15.60", 2.4 kg
Recensioni esterne » Lenovo LOQ 15 ARP9
HP Victus 16-r1000TX: Intel Core i5-14450HX, 16.10", 2.3 kg
Recensioni esterne » HP Victus 16-r1000TX
Lenovo Yoga Pro 7 14AHP9: AMD Ryzen 7 8845HS, 14.50", 1.5 kg
Recensioni esterne » Lenovo Yoga Pro 7 14AHP9
Lenovo LOQ 15IAX9I, RTX 3050: Intel Core i5-12450HX, 15.60", 2.4 kg
Recensioni esterne » Lenovo LOQ 15IAX9I, RTX 3050
MSI Katana 15 B13UDXK: Intel Core i7-13620H, 15.60", 2.3 kg
Recensioni esterne » MSI Katana 15 B13UDXK
Acer Aspire Lite 15 AL15-52: Intel Core i5-12450H, 15.60", 2 kg
Recensioni esterne » Acer Aspire Lite 15 AL15-52
Acer Aspire Lite 15 AL15G-52: Intel Core i5-12450H, 15.60", 2 kg
Recensioni esterne » Acer ALG AL15G-52
MSI Katana 17 B12UDXK: Intel Core i5-12450H, 17.30", 2.6 kg
Recensioni esterne » MSI Katana 17 B12UDXK
Acer Nitro V 15 ANV15-41: AMD Ryzen 5 7535HS, 15.60", 2.1 kg
Recensioni esterne » Acer Nitro V 15 ANV15-41
MSI Prestige 14 AI Studio C1UDXG: , 14.00", 1.7 kg
Recensioni esterne » MSI Prestige 14 AI Studio C1UDXG
Infinix GT Book 16, RTX 3050: Intel Core i5-12450H, 16.00", 2 kg
Recensioni esterne » Infinix GT Book 16, RTX 3050
Acer Nitro V16 ANV16-41, RTX 3050: AMD Ryzen 7 8845HS, 16.00", 2.5 kg
Recensioni esterne » Acer Nitro V16 ANV16-41, RTX 3050
HP Pavilion Plus 16-ab0456tx: Intel Core i7-13700H, 16.00", 1.9 kg
Recensioni esterne » HP Pavilion Plus 16-ab0456tx
Asus Vivobook Pro 15 OLED Q533: Intel Core Ultra 7 155H, 15.60", 1.9 kg
Recensioni esterne » Asus Vivobook Pro 15 OLED Q533
Lenovo IdeaPad Pro 5 14IRH8, i5-13500H: Intel Core i5-13500H, 14.00", 1.5 kg
Recensioni esterne » Lenovo IdeaPad Pro 5 14IRH8, i5-13500H
MSI Thin 15 B12UC: Intel Core i7-12650H, 15.60", 1.9 kg
Recensioni esterne » MSI Thin 15 B12UC
Lenovo LOQ 15IRH8, i5-13450HX RTX 3050: Intel Core i5-13450HX, 15.60", 2.4 kg
Recensioni esterne » Lenovo LOQ 15IRH8, i5-13450HX RTX 3050
Lenovo IdeaPad Pro 5 14IRH8: Intel Core i7-13700H, 14.00", 1.5 kg
Recensioni esterne » Lenovo IdeaPad Pro 5 14IRH8
Acer Nitro V 15 ANV15-51, RTX 3050: Intel Core i5-13420H, 15.60", 2.1 kg
Recensioni esterne » Acer Nitro V 15 ANV15-51, RTX 3050
HP Pavilion Plus 16-ab0000: Intel Core i7-13700H, 16.00", 1.9 kg
Recensioni esterne » HP Pavilion Plus 16-ab0000
HP Victus 16-r0000TX: Intel Core i5-13500H, 16.10", 2.3 kg
Recensioni esterne » HP Victus 16-r0000TX
Acer Nitro 16 AN16-51, i7-13700H RTX 3050: Intel Core i7-13700H, 16.00", 2.7 kg
Recensioni esterne » Acer Nitro 16 AN16-51, i7-13700H RTX 3050
MSI Bravo 15 C7UDX: AMD Ryzen 7 7735HS, 15.60", 2.3 kg
Recensioni esterne » MSI Bravo 15 C7UDX
Lenovo LOQ 15IRH8, i5-13500H RTX 3050: Intel Core i5-13500H, 15.60", 2.4 kg
Recensioni esterne » Lenovo LOQ 15IRH8, i5-13500H RTX 3050
Lenovo Yoga Pro 7 14ARP G8, R5 7535HS RTX 3050: AMD Ryzen 5 7535HS, 14.50", 1.6 kg
Recensioni esterne » Lenovo Yoga Pro 7 14ARP G8, R5 7535HS RTX 3050
Lenovo Slim Pro 7 14ARP8: AMD Ryzen 7 7735HS, 14.50", 1.6 kg
Recensioni esterne » Lenovo Slim Pro 7 14ARP8
Gigabyte G5 KE: Intel Core i5-12500H, 15.60", 2 kg
Recensioni esterne » Gigabyte G5 KE
Asus V16 V3607V: Intel Core 7 240H, 16.00", 2 kg
» Il nuovo Asus V16 offre un buon valore per meno di 1000 dollari, ma la sua custodia interamente in plastica è un punto a sfavore
Lenovo Slim Pro 7 14ARP8: AMD Ryzen 7 7735HS, 14.50", 1.6 kg
» GeForce RTX 3050 vs. GTX 1660 Ti: due GPU per due scopi diversi


