Recensione dell'HP Pavilion Plus 16: Laptop multimediale premium che avrebbe potuto beneficiare di una RTX 4050
 in recensione")
HP ha introdotto recentemente due nuovi modelli Pavilion Plus come alternativa più economica alla serie Envy. In precedenza abbiamo recensito il modello Pavilion Plus 14 in entrambe le versioni Intel Raptor Lake e AMD Zen 4 AMD Zen 4 nelle varianti Intel Raptor Lake e AMD Zen 4. Ora, diamo un'occhiata al modello più grande Pavilion Plus 16.
Il Pavilion Plus 16 rinuncia al pannello OLED "IMAX Enhanced" del Pavilion Plus 14, ma offre invece un processore della serie H e una grafica Nvidia opzionale.
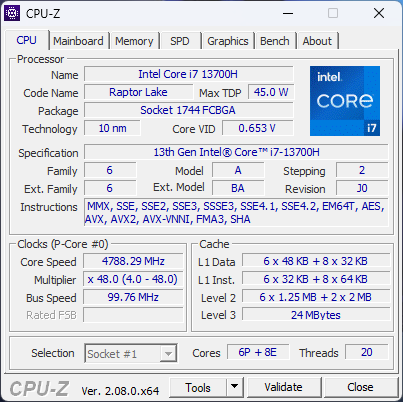
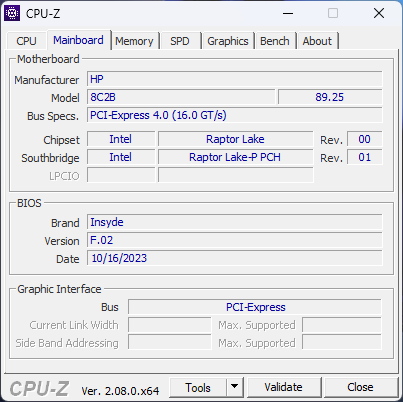
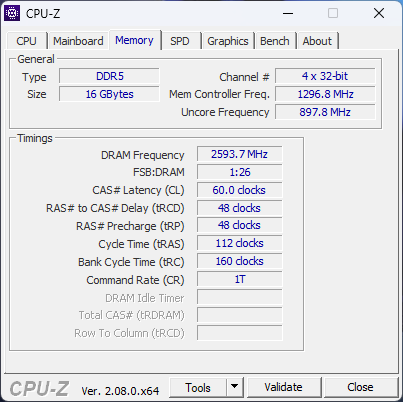
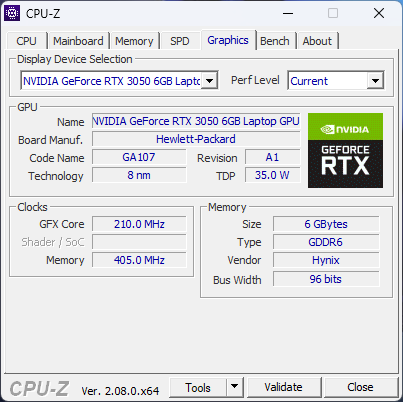
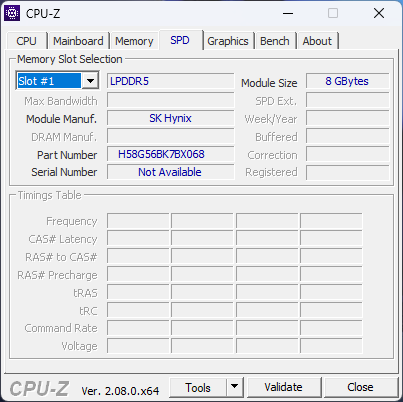
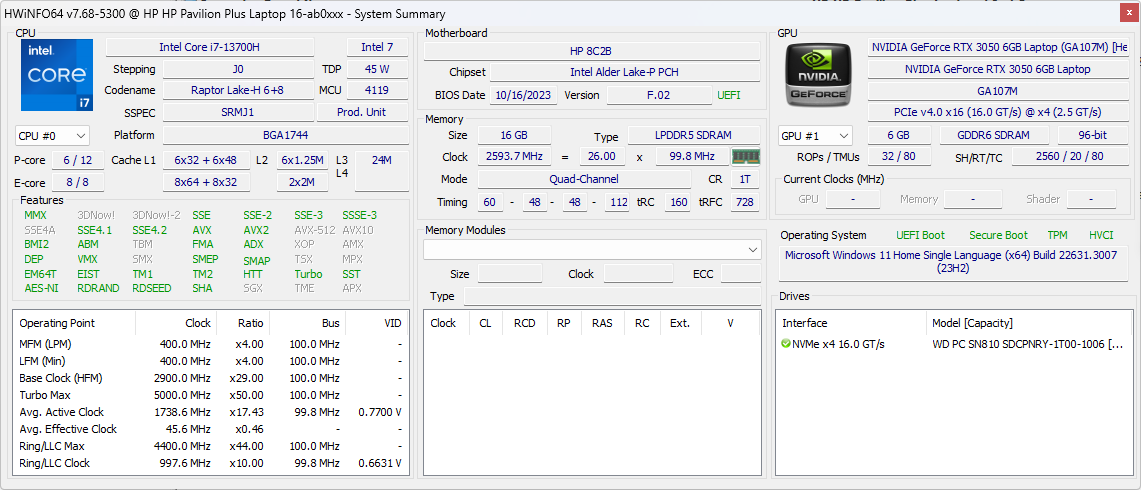
La nostra unità Pavilion Plus 16 è dotata di un Intel Core i7-13700H insieme a 16 GB di RAM, 1 TB di SSD e un display IPS da 16 pollici 2560 x 1600 120 Hz. Pavilion Plus 16 è tra i pochi computer portatili che presentano la tecnologia Nvidia GeForce RTX 3050 6 GB GPU per computer portatili. Questa configurazione costerà ₹1.24.999 (US$1.350) sul negozio ufficiale HP India.
Potenziali concorrenti a confrontos
Punteggio | Data | Modello | Peso | Altezza | Dimensione | Risoluzione | Prezzo |
|---|---|---|---|---|---|---|---|
| 88.7 % v7 (old) | 02/2024 | HP Pavilion Plus 16-ab0456tx i7-13700H, GeForce RTX 3050 6GB Laptop GPU | 1.9 kg | 19.9 mm | 16.00" | 2560x1600 | |
| 88.2 % v7 (old) | 01/2024 | Schenker Vision 14 M23 RTX 3050 i7-13700H, GeForce RTX 3050 6GB Laptop GPU | 1.3 kg | 16.6 mm | 14.00" | 2880x1800 | |
| 87.1 % v7 (old) | 08/2023 | Dell Inspiron 16 Plus 7630 i7-13700H, GeForce RTX 4060 Laptop GPU | 2.2 kg | 19.95 mm | 16.00" | 2560x1600 | |
| 85.6 % v7 (old) | 08/2023 | Asus VivoBook 14X K3405 i5-13500H, GeForce RTX 3050 4GB Laptop GPU | 1.4 kg | 18.9 mm | 14.00" | 2880x1800 | |
| 89.2 % v7 (old) | 04/2023 | Lenovo Slim Pro 7 14ARP8 R7 7735HS, GeForce RTX 3050 6GB Laptop GPU | 1.6 kg | 15.6 mm | 14.50" | 2560x1600 | |
| 87.6 % v7 (old) | 11/2023 | Asus VivoBook Pro 16 K6602VU i9-13900H, GeForce RTX 4050 Laptop GPU | 1.9 kg | 19 mm | 16.00" | 3200x2000 | |
| 89.4 % v7 (old) | 04/2023 | Samsung Galaxy Book3 Ultra 16 i7-13700H, GeForce RTX 4050 Laptop GPU | 1.8 kg | 16.5 mm | 16.00" | 2880x1800 |
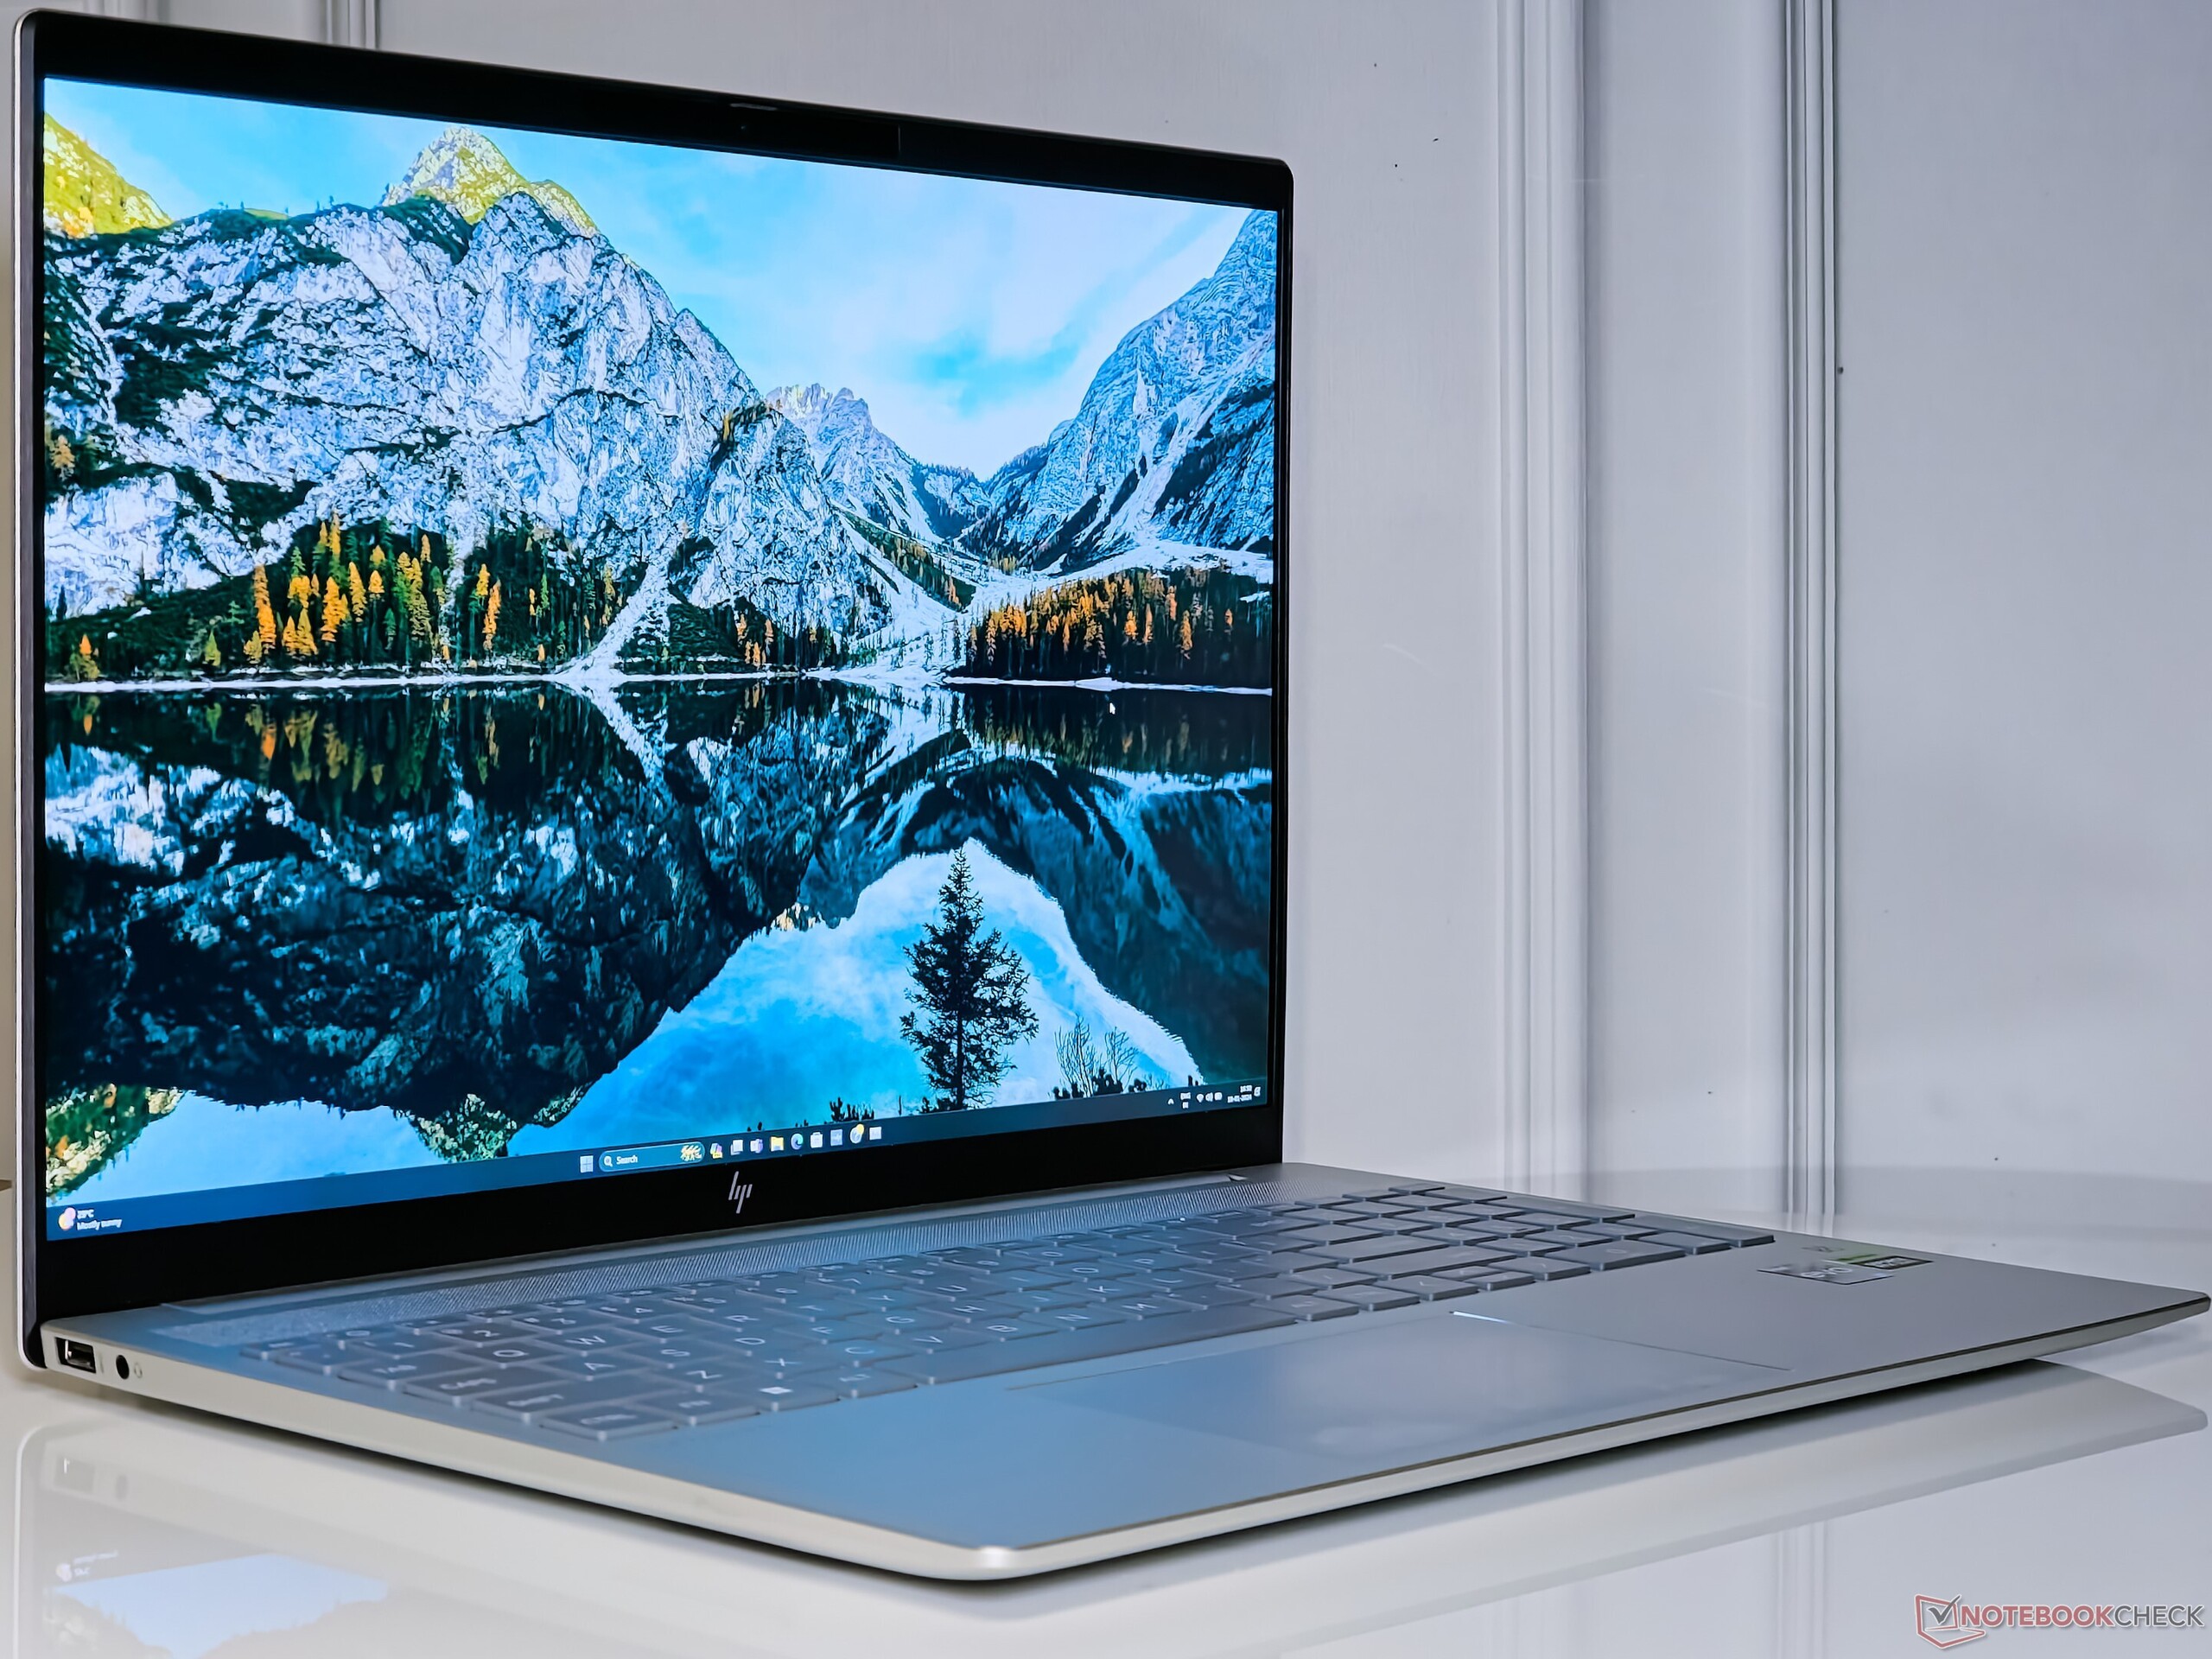
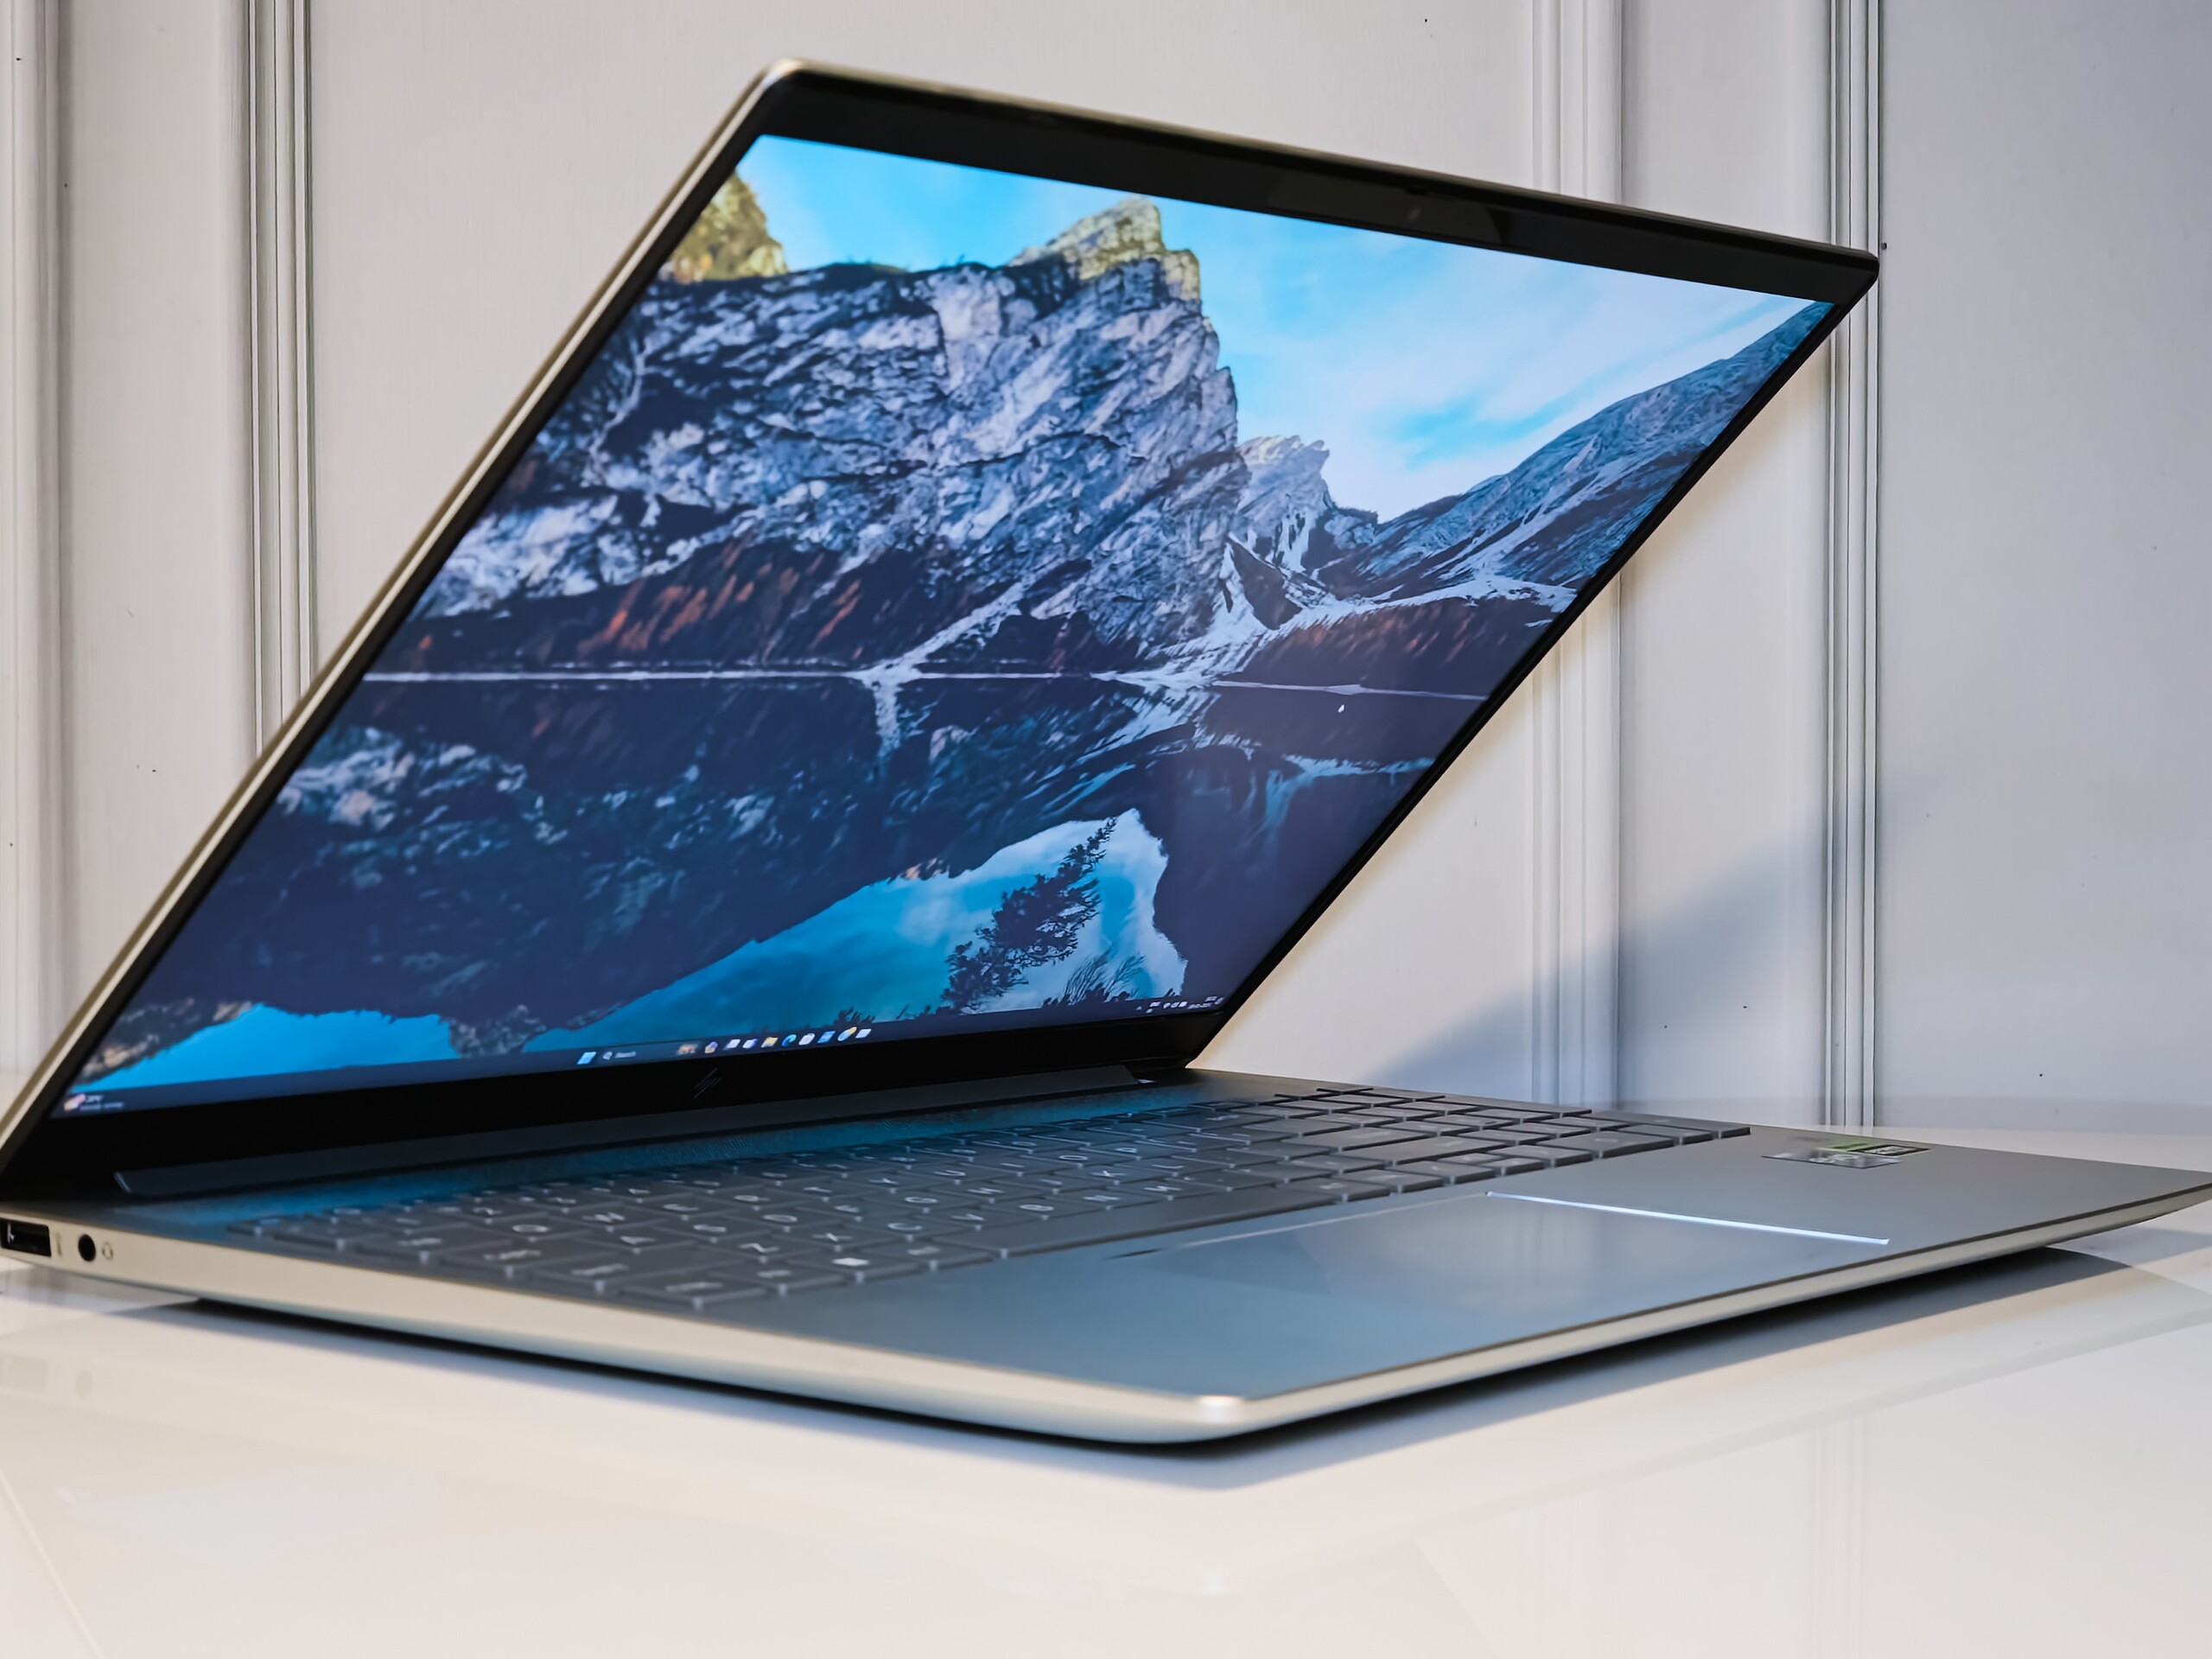
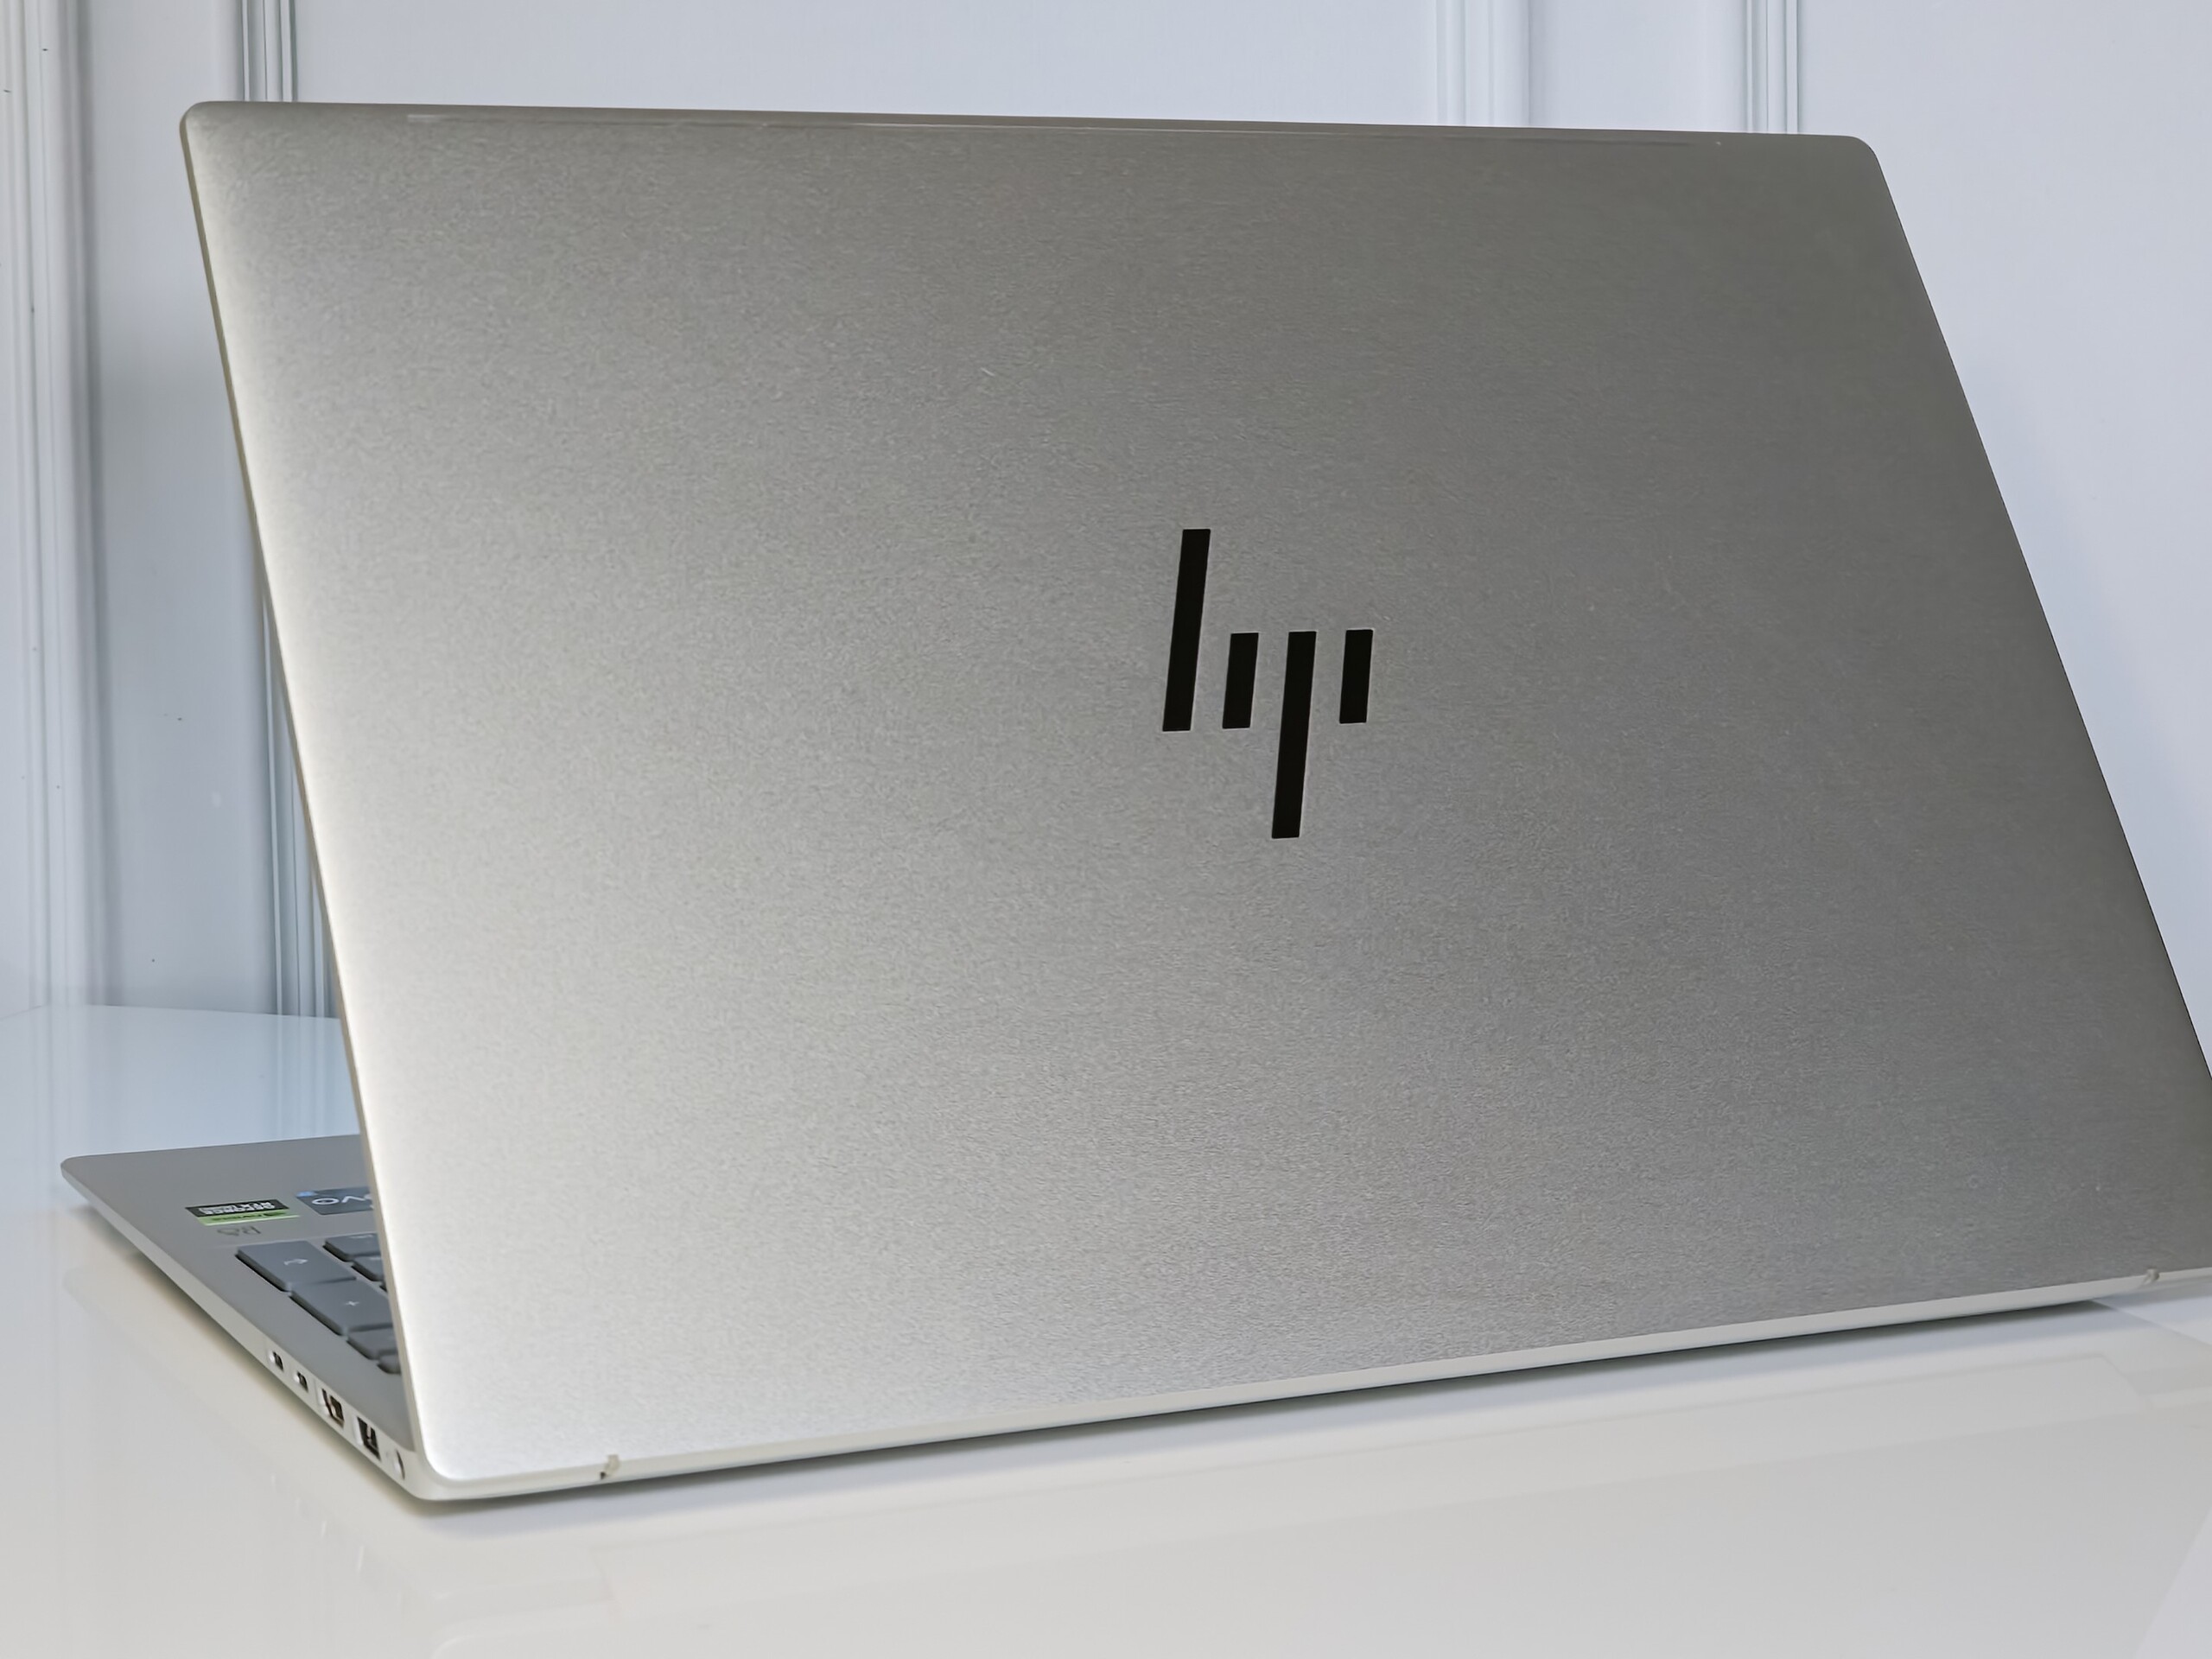
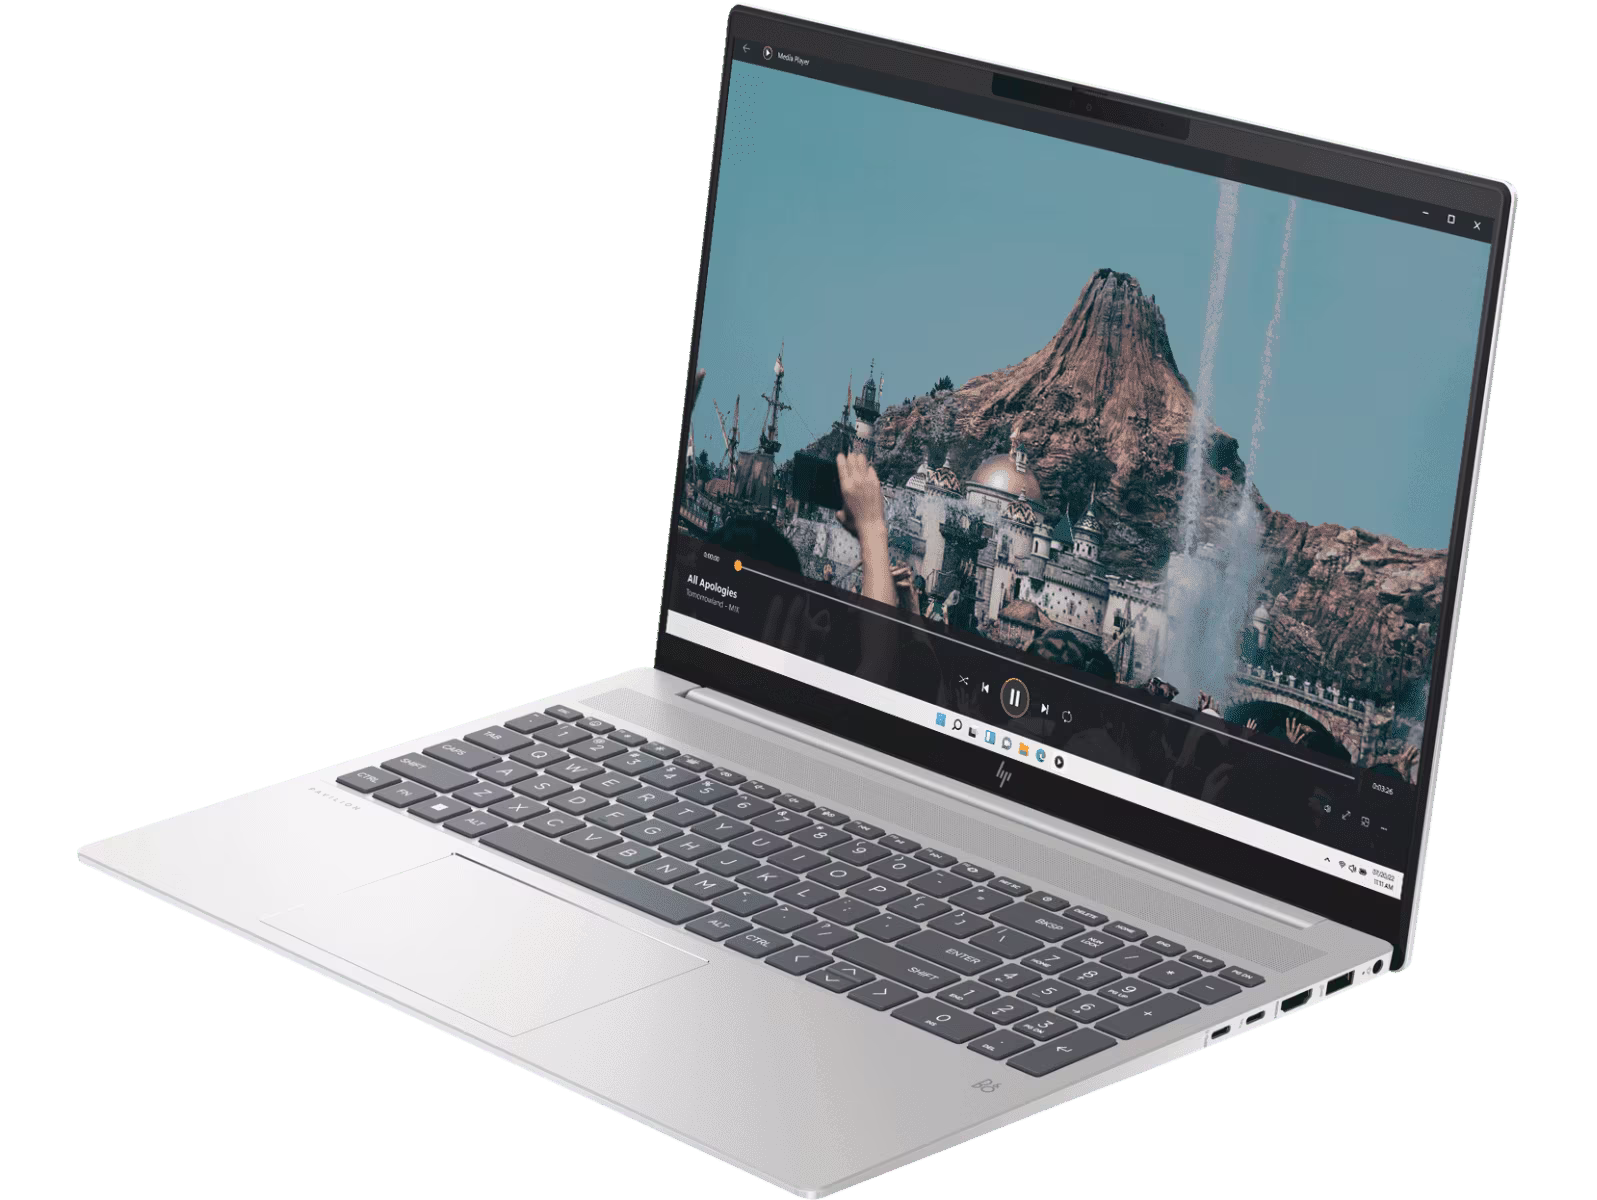
Telaio: Robusta costruzione interamente in metallo
Simile a Pavilion Plus 14, Pavilion Plus 16 presenta una struttura metallica Natural Silver per le coperture A, C e D, mentre il coperchio è in alluminio.
La qualità costruttiva complessiva lascia poco spazio alle lamentele. Non abbiamo notato alcuna flessione particolare nel coperchio o nel piano della tastiera.
HP pubblica un rapporto schermo-corpo dell'89,74%, ma il valore misurato è dell'83%. Con un peso di 1,9 kg, il portatile ha un peso simile a quello di altri portatili multimediali da 16 pollici in voga.
Connettività: Velocità di trasmissione WLAN costante
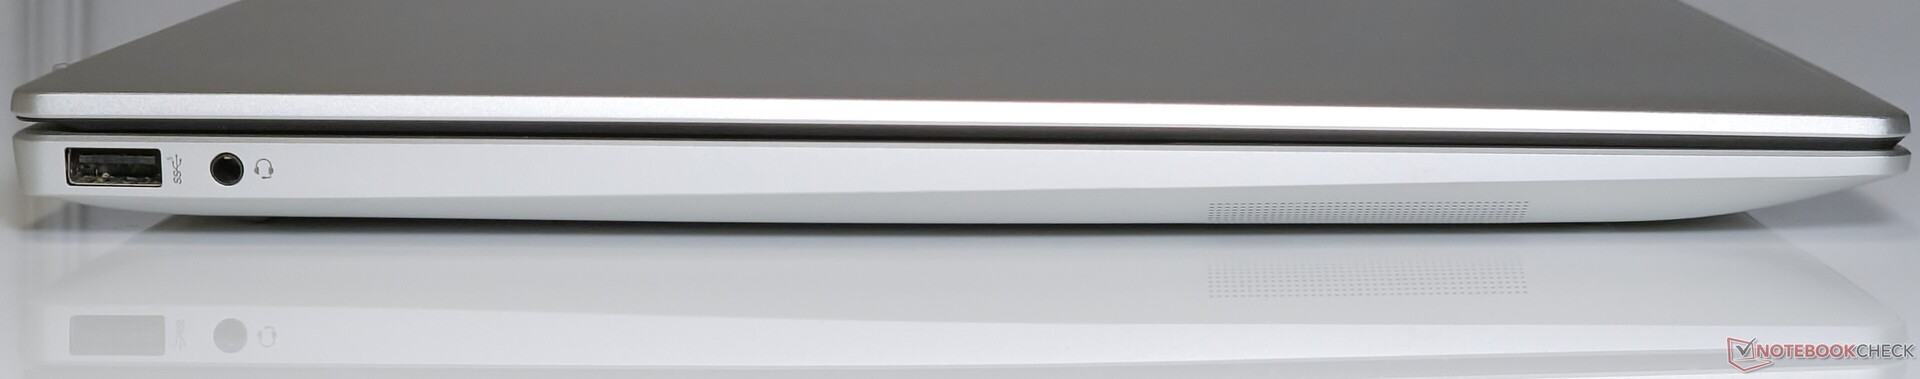
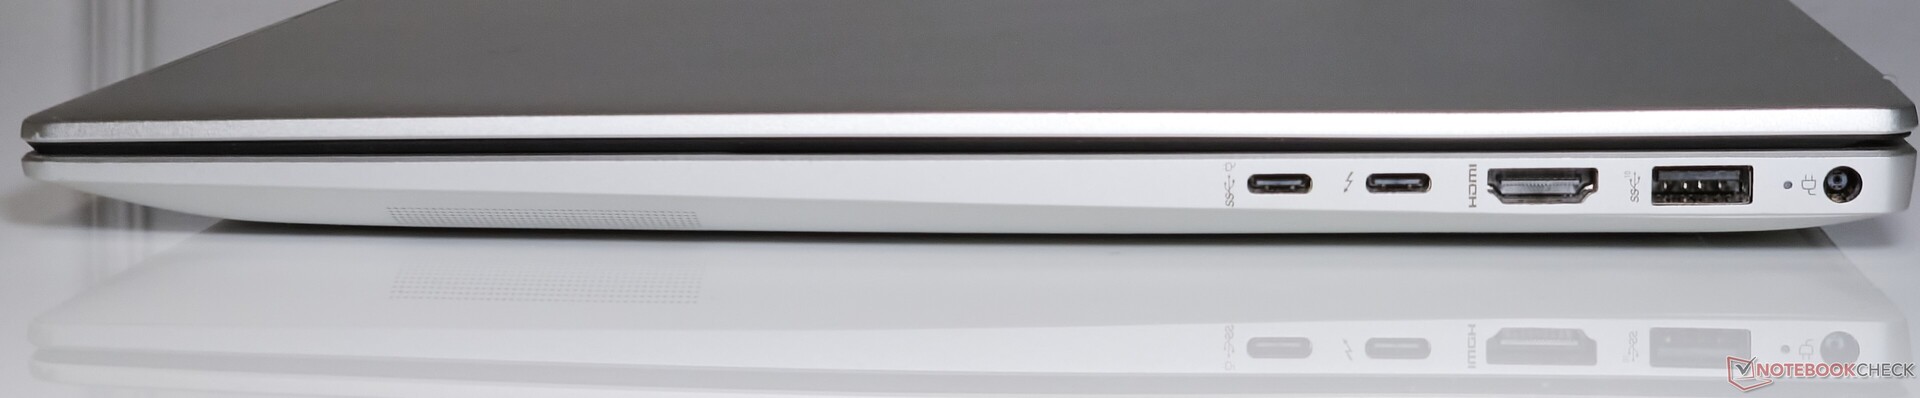
Pavilion Plus 16 offre una discreta selezione di porte, tra cui una porta USB Tipo-A e una porta USB Tipo-C, inclusa la Thunderbolt 4.
Il posizionamento delle porte va bene e non ostacola la connettività delle periferiche adiacenti, ma una delle porte Type-C avrebbe potuto trovarsi sul lato sinistro per una distribuzione più uniforme.
Comunicazione
Le prestazioni iPerf3 di Pavilion Plus 16 nella banda a 5 GHz sono un po' più lente rispetto a quelle osservate con il modello VivoBook Pro 16 Asus VivoBook Pro 16 con la stessa scheda WLAN Intel Wi-Fi 6E AX211.
Il Pavilion recupera questa carenza rispetto al VivoBook Pro 16 nelle prestazioni di ricezione a 6 GHz, ma non di molto.
le prestazioni iPerf3 in entrambe le bande 5 GHz e 6 GHz sono abbastanza coerenti, senza alcun intoppo, a differenza di quanto vediamo con il modello Lenovo Slim Pro 7 con un chip MediaTek Wi-Fi 6E MT7922.
| Networking / iperf3 transmit AXE11000 | |
| Asus VivoBook 14X K3405 | |
| HP Pavilion Plus 16-ab0456tx | |
| Asus VivoBook Pro 16 K6602VU | |
| Samsung Galaxy Book3 Ultra 16 | |
| Media della classe Multimedia (606 - 1978, n=56, ultimi 2 anni) | |
| Lenovo Slim Pro 7 14ARP8 | |
| Dell Inspiron 16 Plus 7630 | |
| Media Intel Wi-Fi 6E AX211 (64 - 1921, n=276) | |
| Networking / iperf3 receive AXE11000 | |
| Asus VivoBook 14X K3405 | |
| Asus VivoBook Pro 16 K6602VU | |
| HP Pavilion Plus 16-ab0456tx | |
| Samsung Galaxy Book3 Ultra 16 | |
| Lenovo Slim Pro 7 14ARP8 | |
| Media Intel Wi-Fi 6E AX211 (582 - 1890, n=276) | |
| Media della classe Multimedia (682 - 1818, n=56, ultimi 2 anni) | |
| Dell Inspiron 16 Plus 7630 | |
| Networking / iperf3 transmit AXE11000 6GHz | |
| HP Pavilion Plus 16-ab0456tx | |
| Dell Inspiron 16 Plus 7630 | |
| Media della classe Multimedia (869 - 2373, n=23, ultimi 2 anni) | |
| Asus VivoBook 14X K3405 | |
| Asus VivoBook Pro 16 K6602VU | |
| Media Intel Wi-Fi 6E AX211 (385 - 1851, n=226) | |
| Networking / iperf3 receive AXE11000 6GHz | |
| HP Pavilion Plus 16-ab0456tx | |
| Media della classe Multimedia (1212 - 2361, n=23, ultimi 2 anni) | |
| Asus VivoBook Pro 16 K6602VU | |
| Asus VivoBook 14X K3405 | |
| Media Intel Wi-Fi 6E AX211 (700 - 1857, n=226) | |
| Dell Inspiron 16 Plus 7630 | |
Webcam
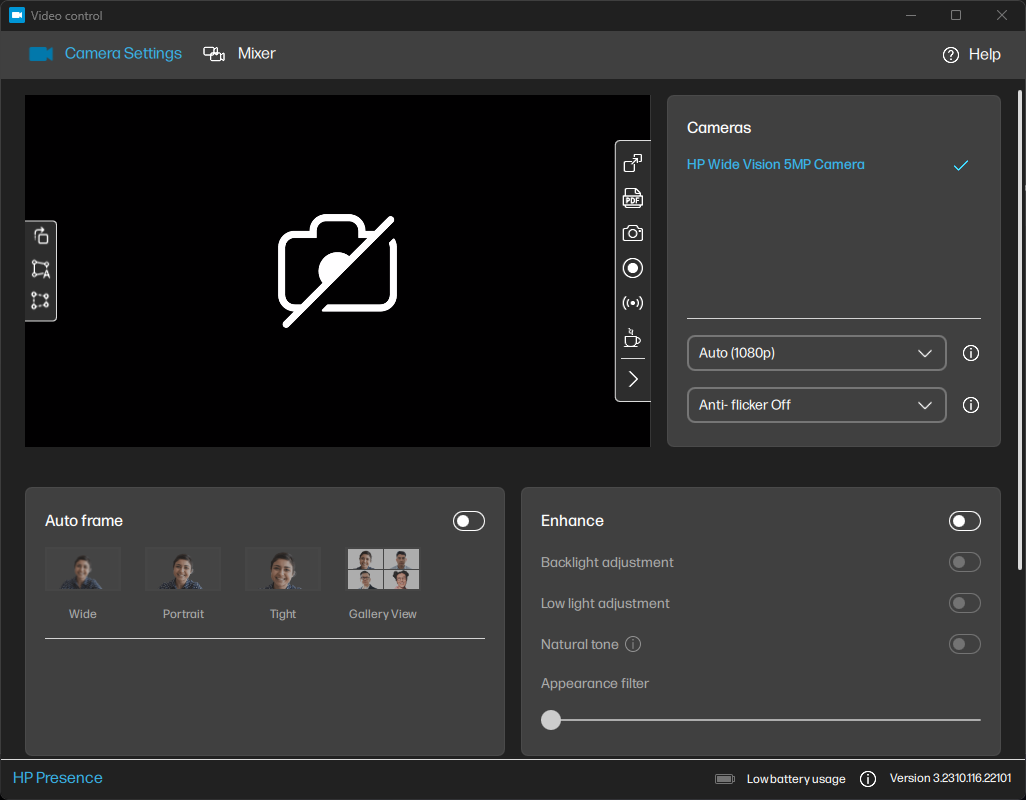
La webcam da 5 MP produce immagini decenti, abbastanza utili per le videoconferenze. I dettagli sono abbastanza ben conservati per una webcam portatile, ma la fotocamera può avere difficoltà in condizioni di scarsa illuminazione.
HP mette a disposizione alcune utility interessanti, come HP Enhanced Lighting che illumina lo schermo intorno al soggetto e l'applicazione Video Control che offre ulteriori opzioni di inquadratura e regolazione dell'immagine.


Sicurezza
HP fornisce una fotocamera IR compatibile con Windows Hello per Pavilion Plus 16 e un adattatore per la privacy per la webcam. La fotocamera IR ha funzionato in modo ragionevolmente veloce durante la nostra permanenza sul dispositivo.
Inoltre, è presente un modulo TPM 2.0 per soddisfare i requisiti di sicurezza di Windows 11.
Accessori e garanzia
Nella confezione non ci sono altri accessori, a parte l'adattatore di alimentazione da 135 W e la solita documentazione.
HP offre una garanzia di un anno per Pavilion Plus 16 in India. Gli acquirenti possono estendere la garanzia fino a tre anni acquistando i Care Pack HP idonei.
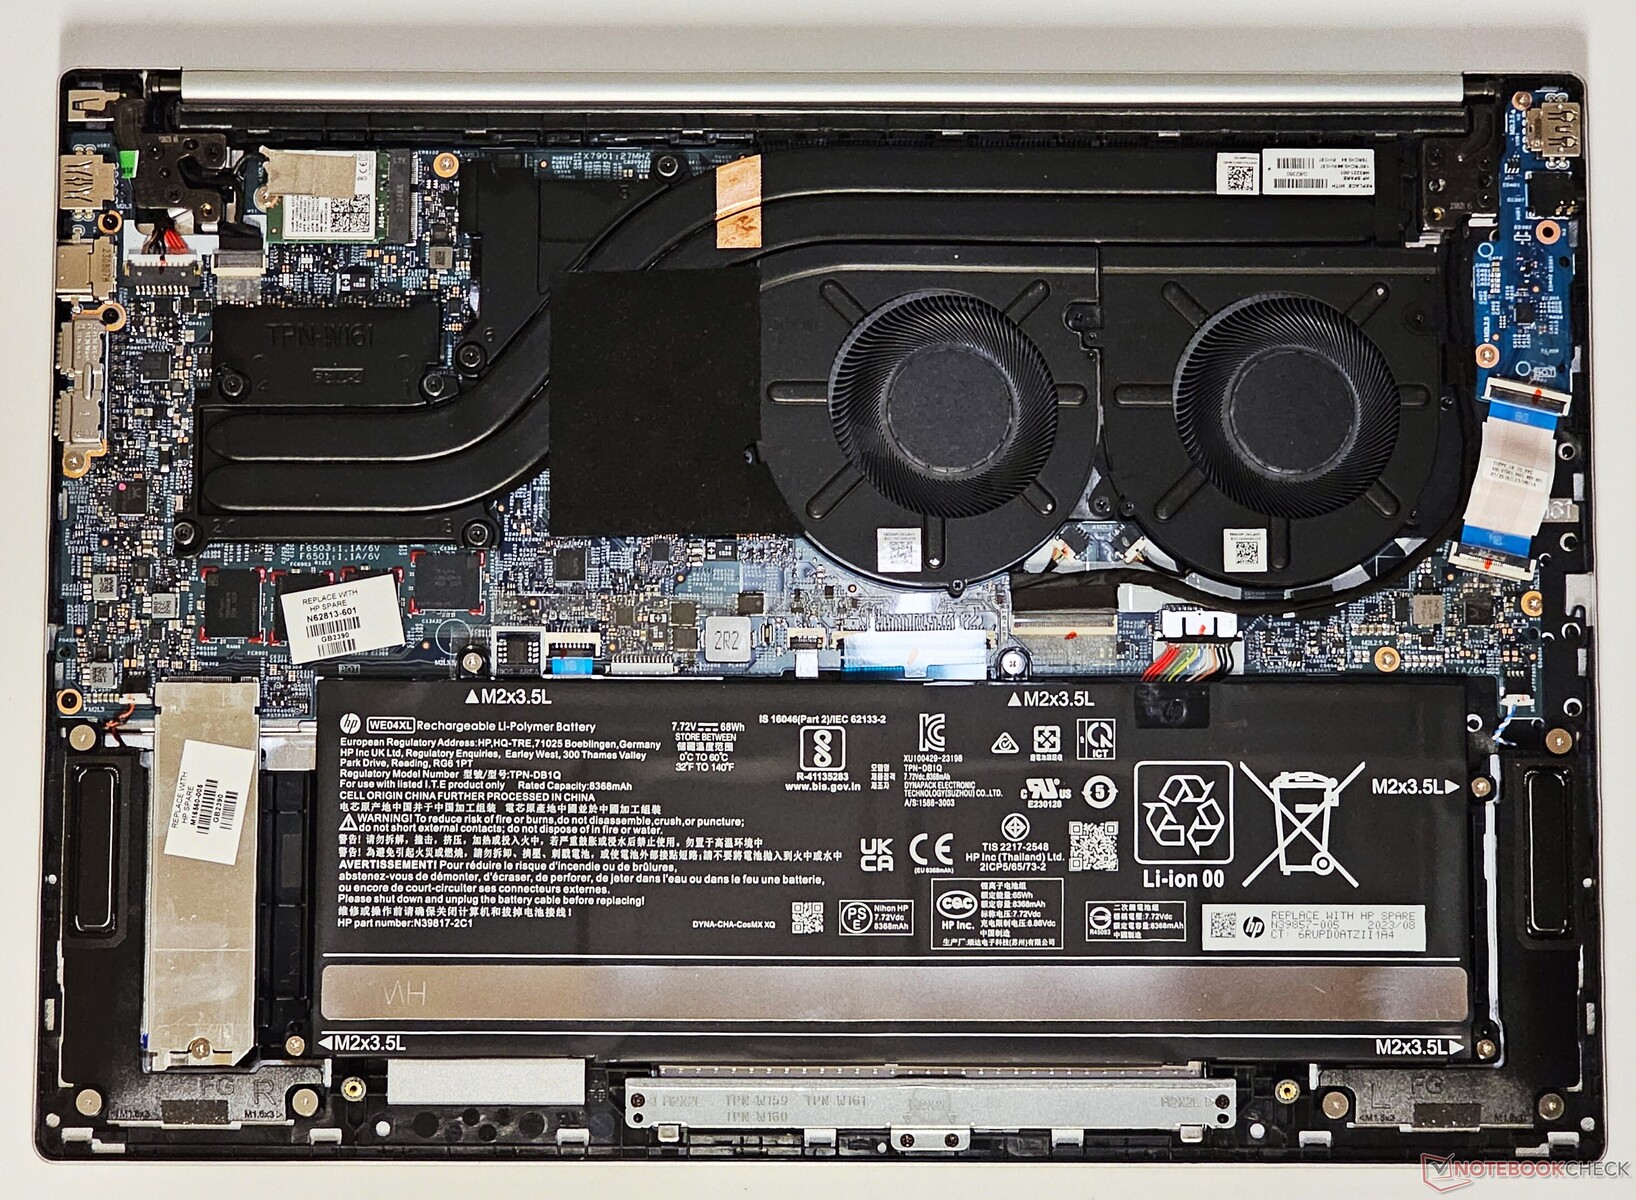
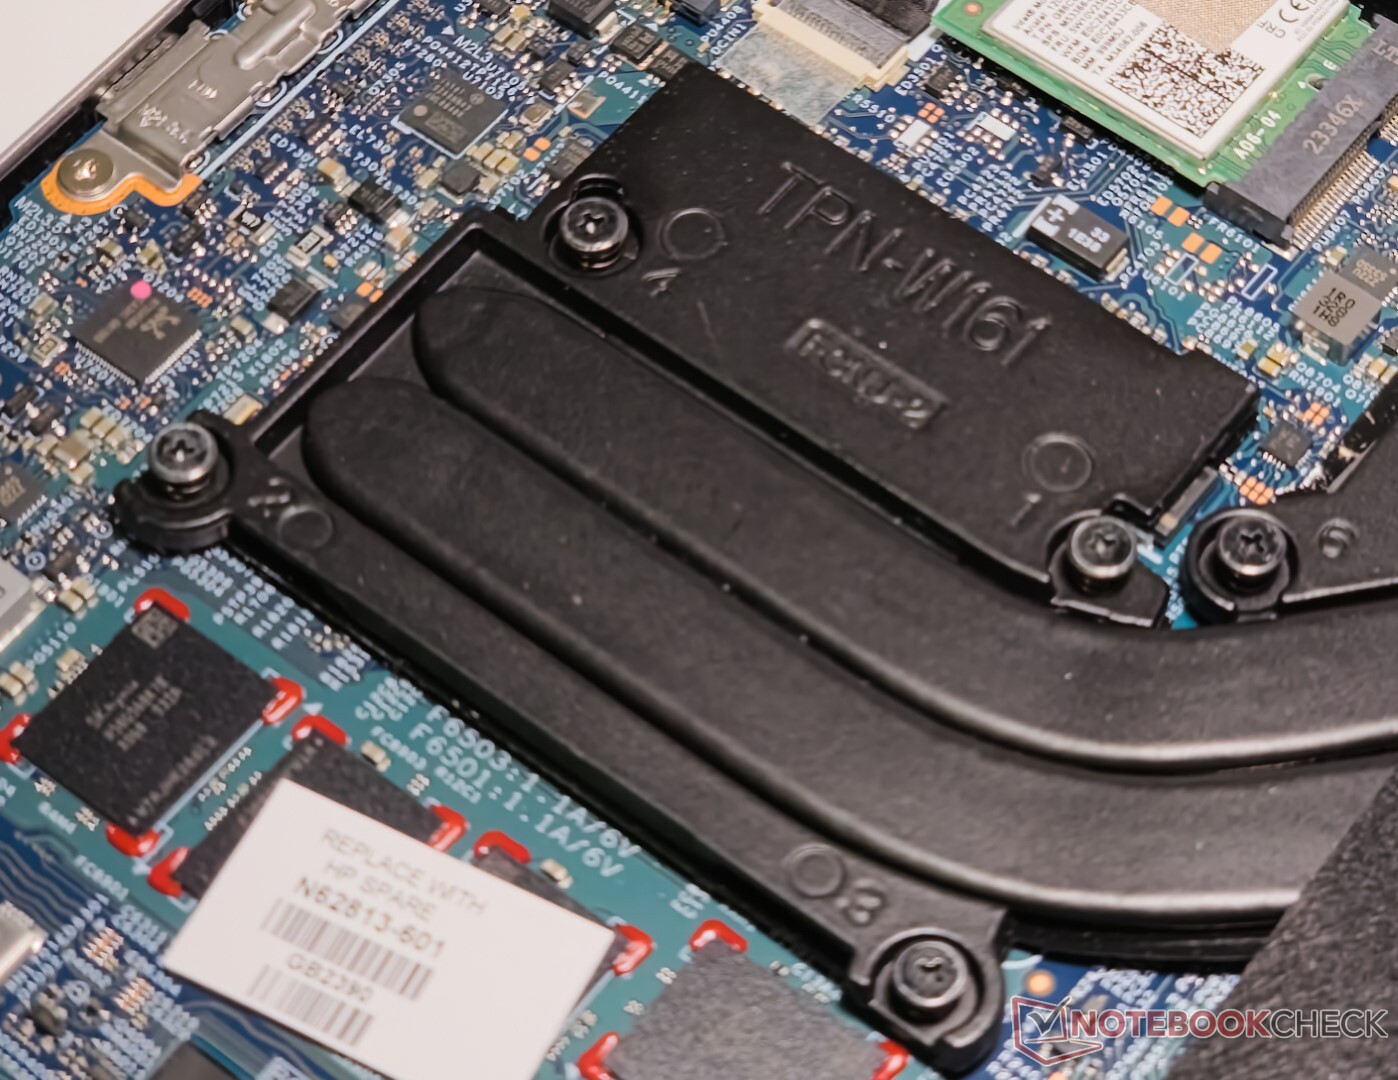
Manutenzione
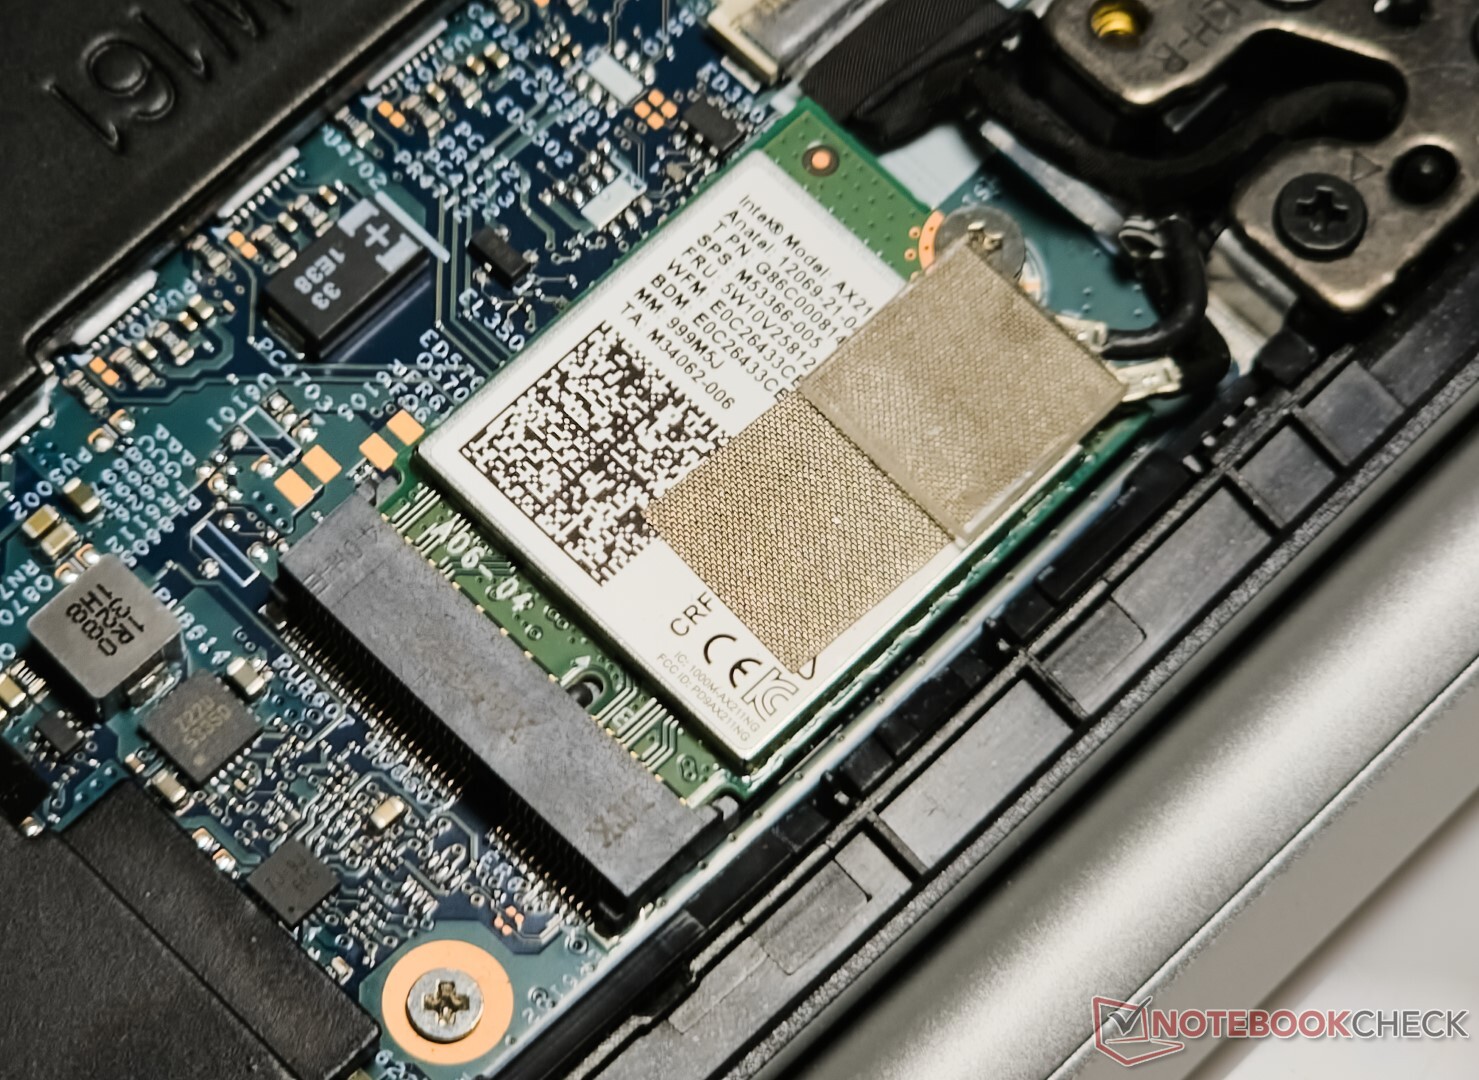
Il pannello inferiore può essere aperto dopo aver rimosso le quattro viti PH0. La memoria è saldata, ma la scheda WLAN, l'SSD NVMe e il pacco batteria possono essere sostituiti se necessario.
Dispositivi di input: Tastierino numerico full-size con tattilità decente
Tastiera
La tastiera di Pavilion Plus 16 offre una discreta esperienza di digitazione. I tasti grigi offrono un buon contrasto con il colore dello chassis Natural Silver. Il tastierino numerico è spazioso e risulta utile per la scrittura di numeri in Excel. Manca però un indicatore di blocco numerico.
Il pulsante di accensione si trova proprio accanto al tasto Canc, il che potrebbe confondere gli utenti che si avvicinano per la prima volta. Anche i tasti freccia superiore e inferiore sembrano stretti. La retroilluminazione bianca a tre livelli aiuta la leggibilità in condizioni di scarsa illuminazione.
Touchpad
Il touchpad da 12,5 cm x 8 cm è spazioso e offre un'esperienza di scorrimento fluida con un buon feedback. Tuttavia, la corsa non è così profonda.
L'intero touchpad funziona da pulsante sinistro del mouse. I clic verso il centro e la base del touchpad sono più reattivi di quelli in alto.
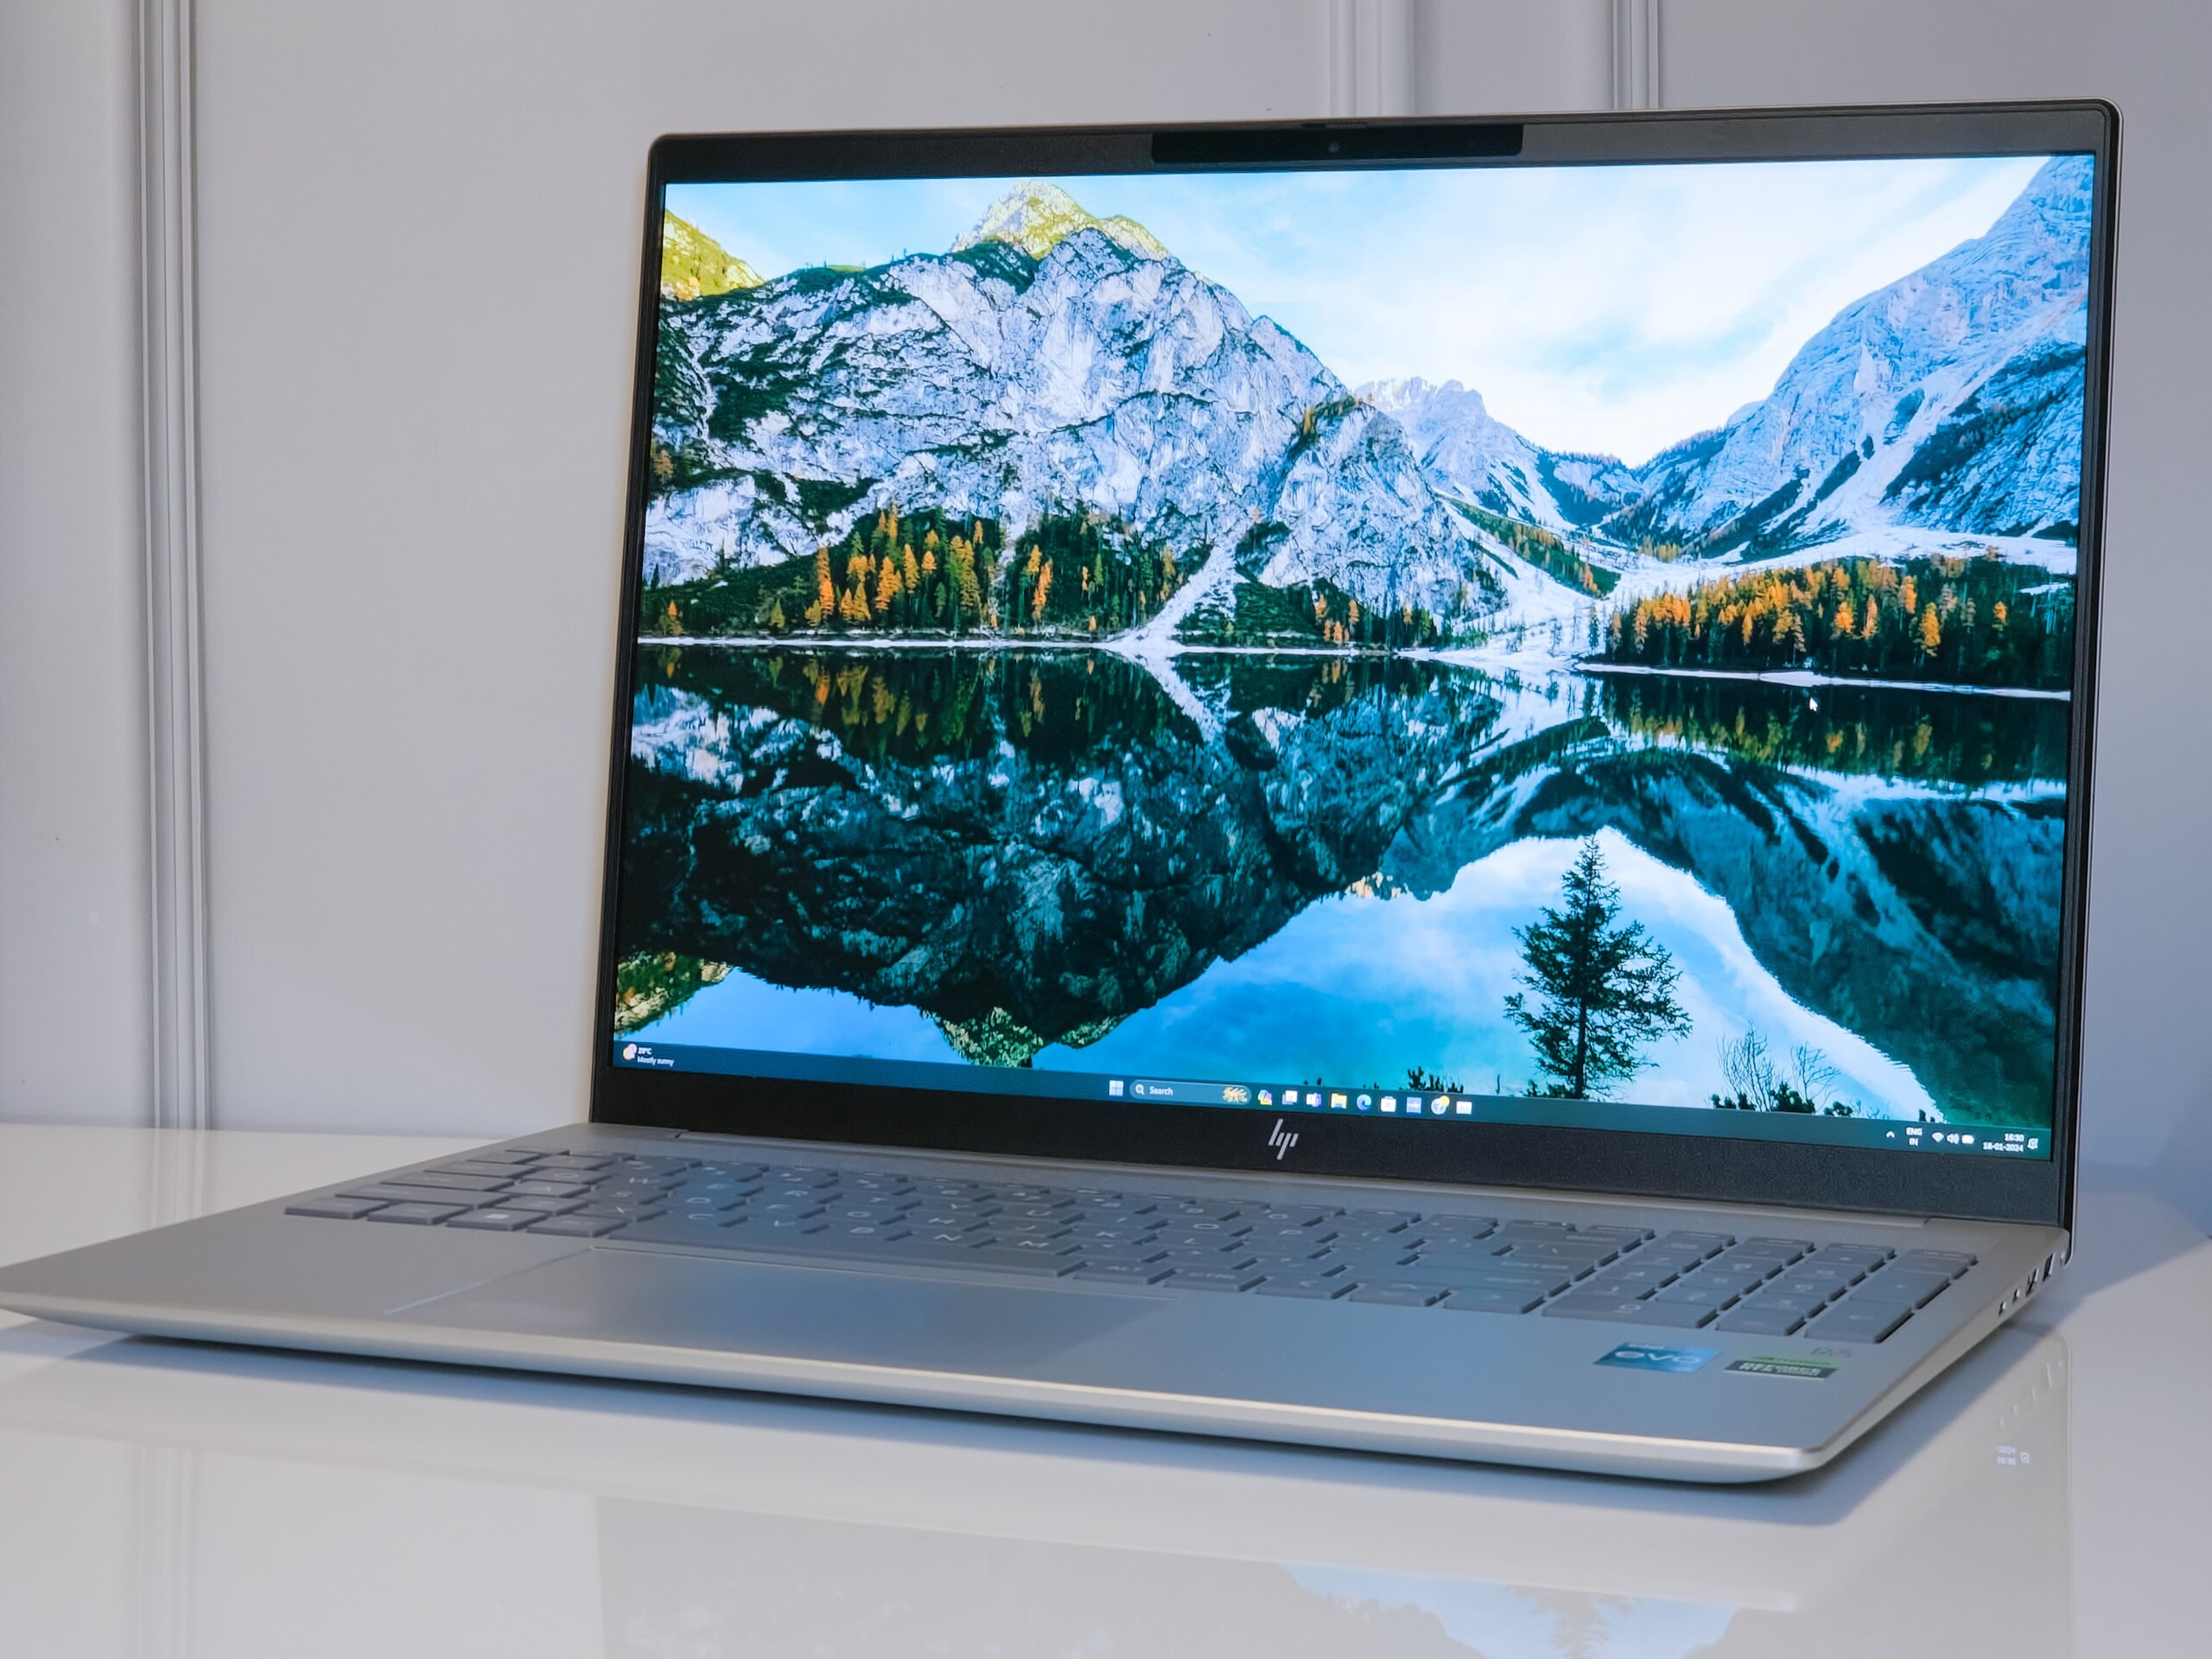
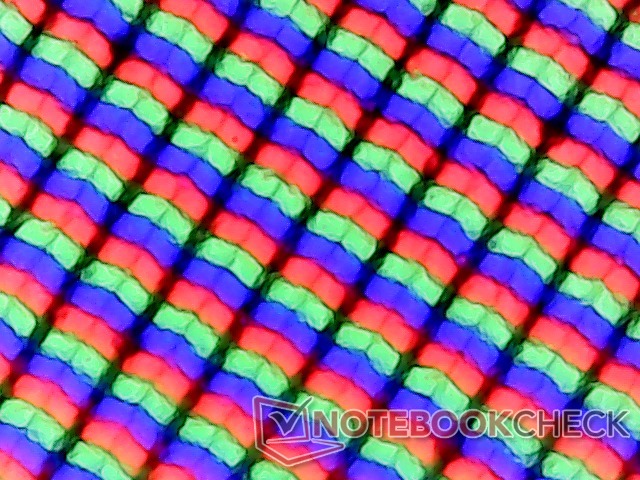
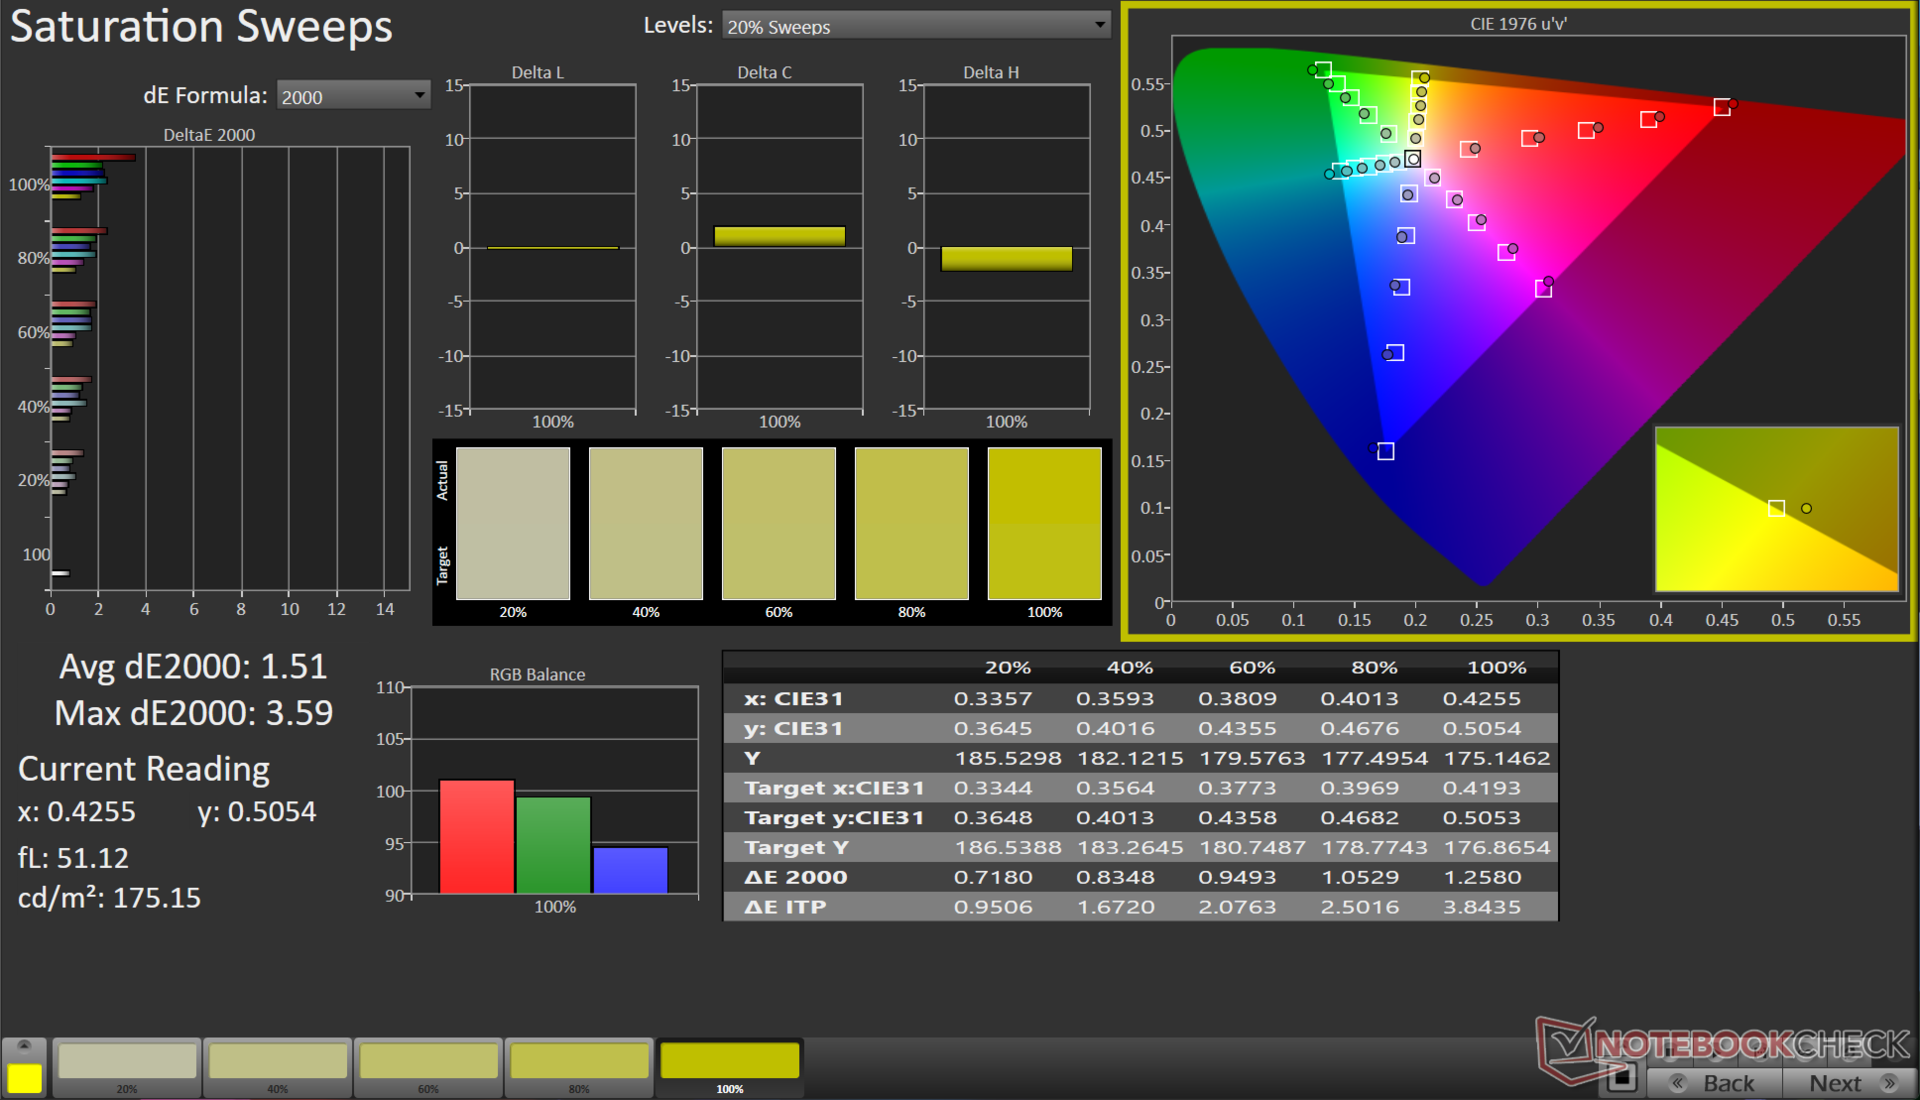
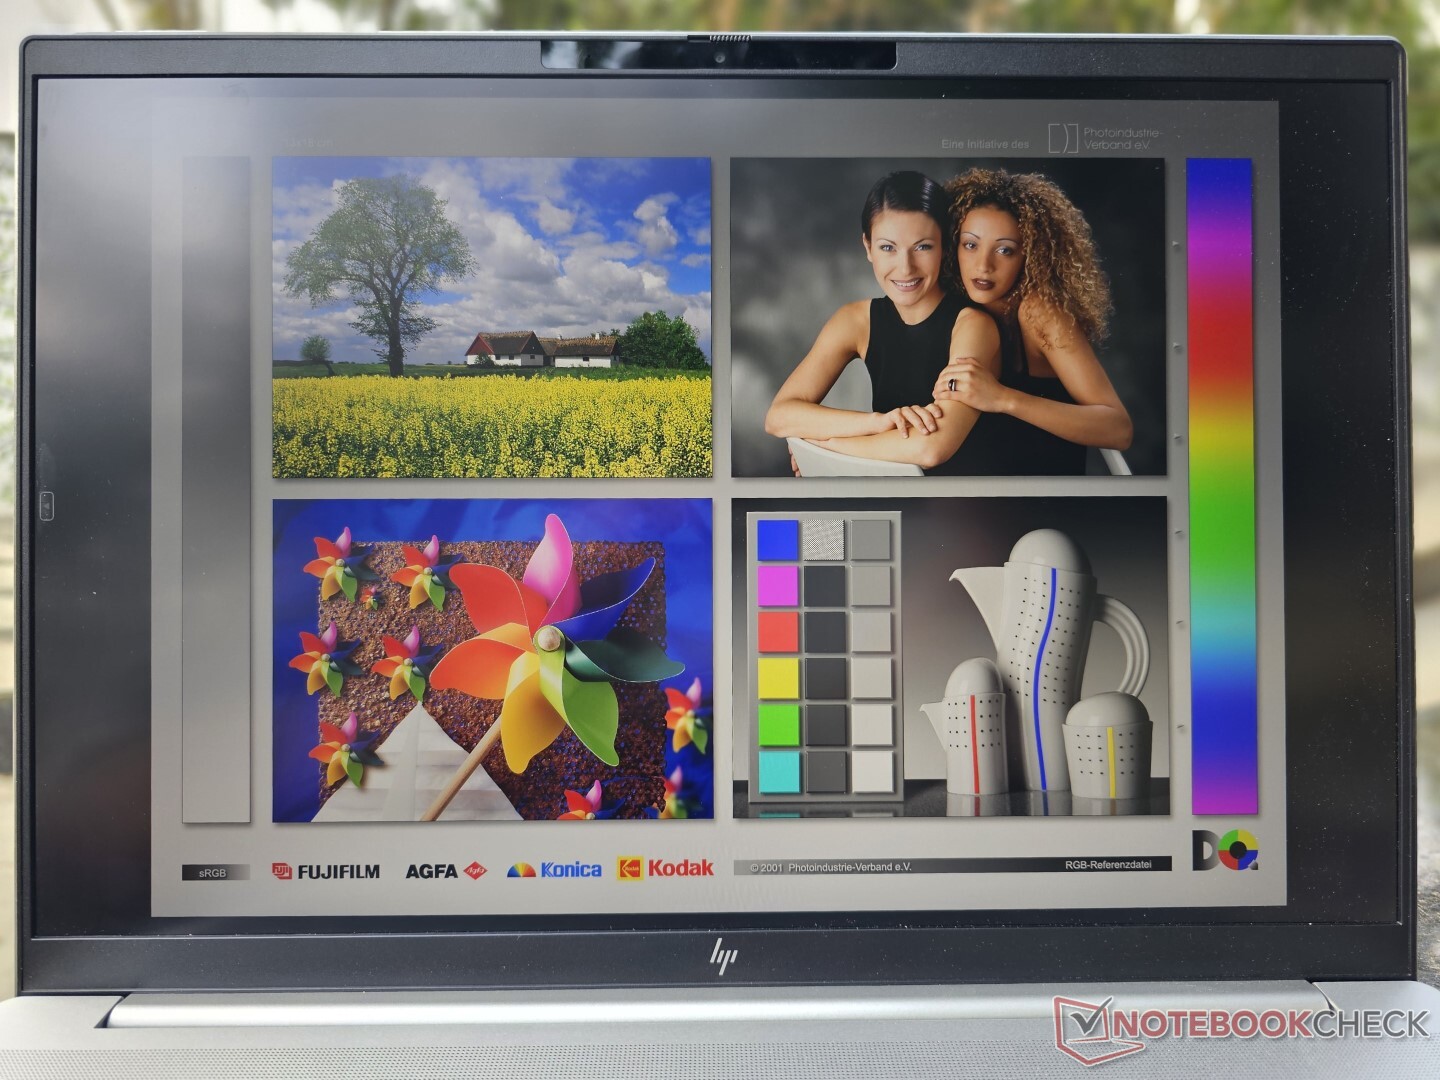
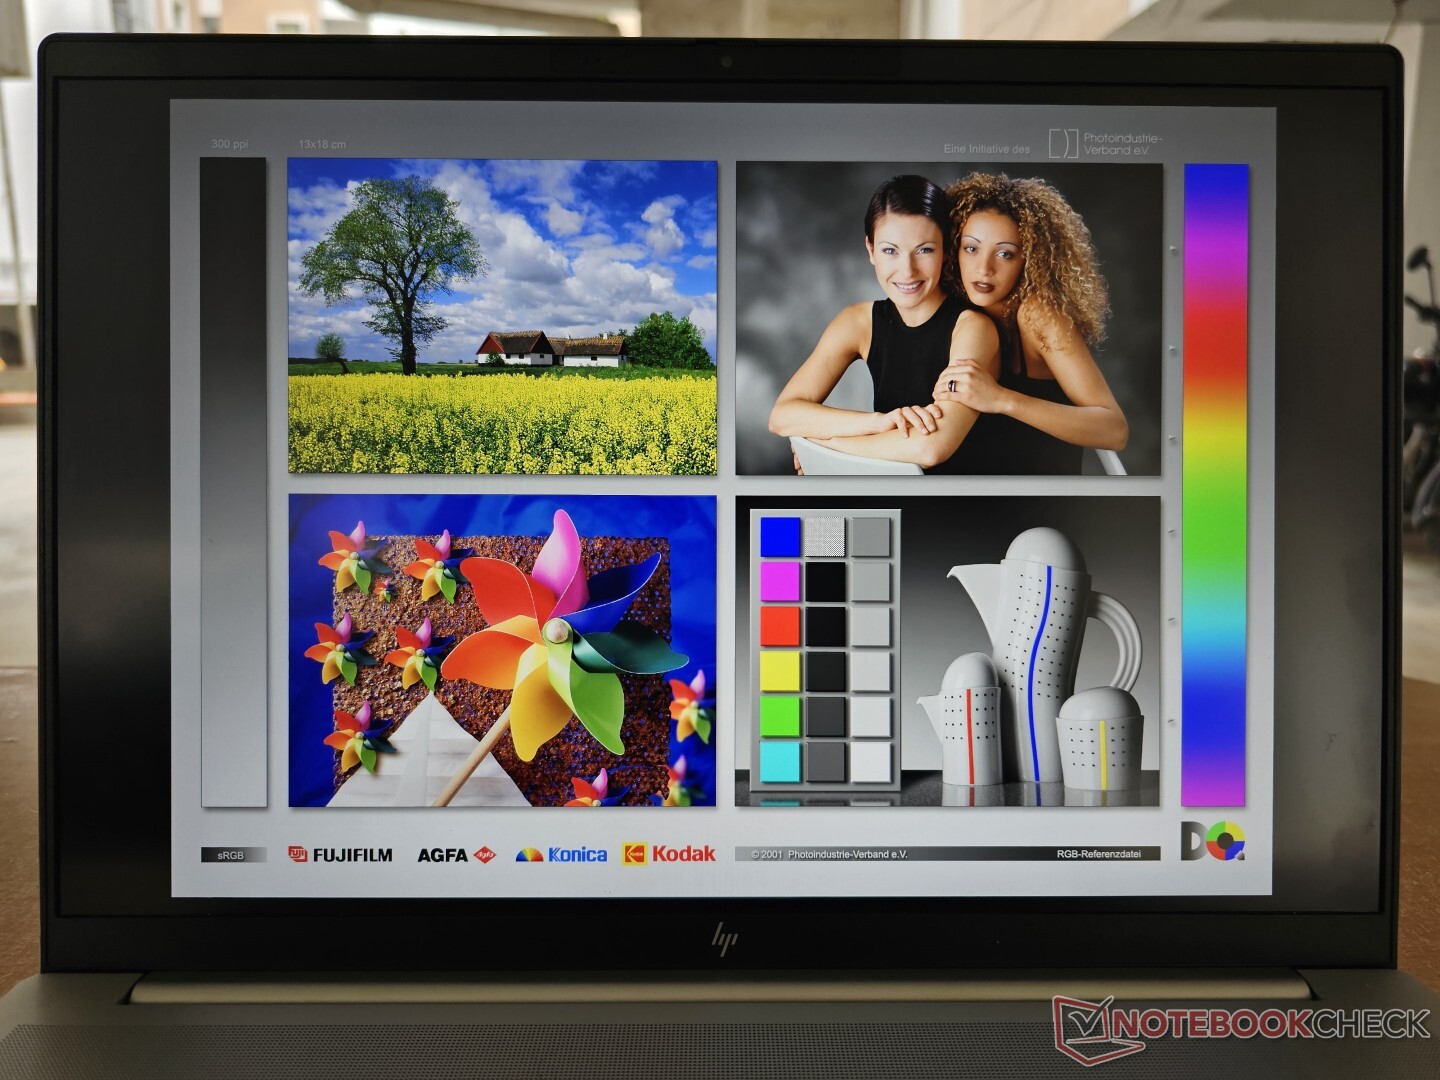
Display: pannello WQXGA a 120 Hz con un profilo di colore decente e senza PWM
Pavilion Plus 16 è dotato di un pannello IPS WQXGA da 16 pollici 16:10 2560 x 1600 con una frequenza di aggiornamento di 120 Hz e una luminosità nominale di 400 nit.
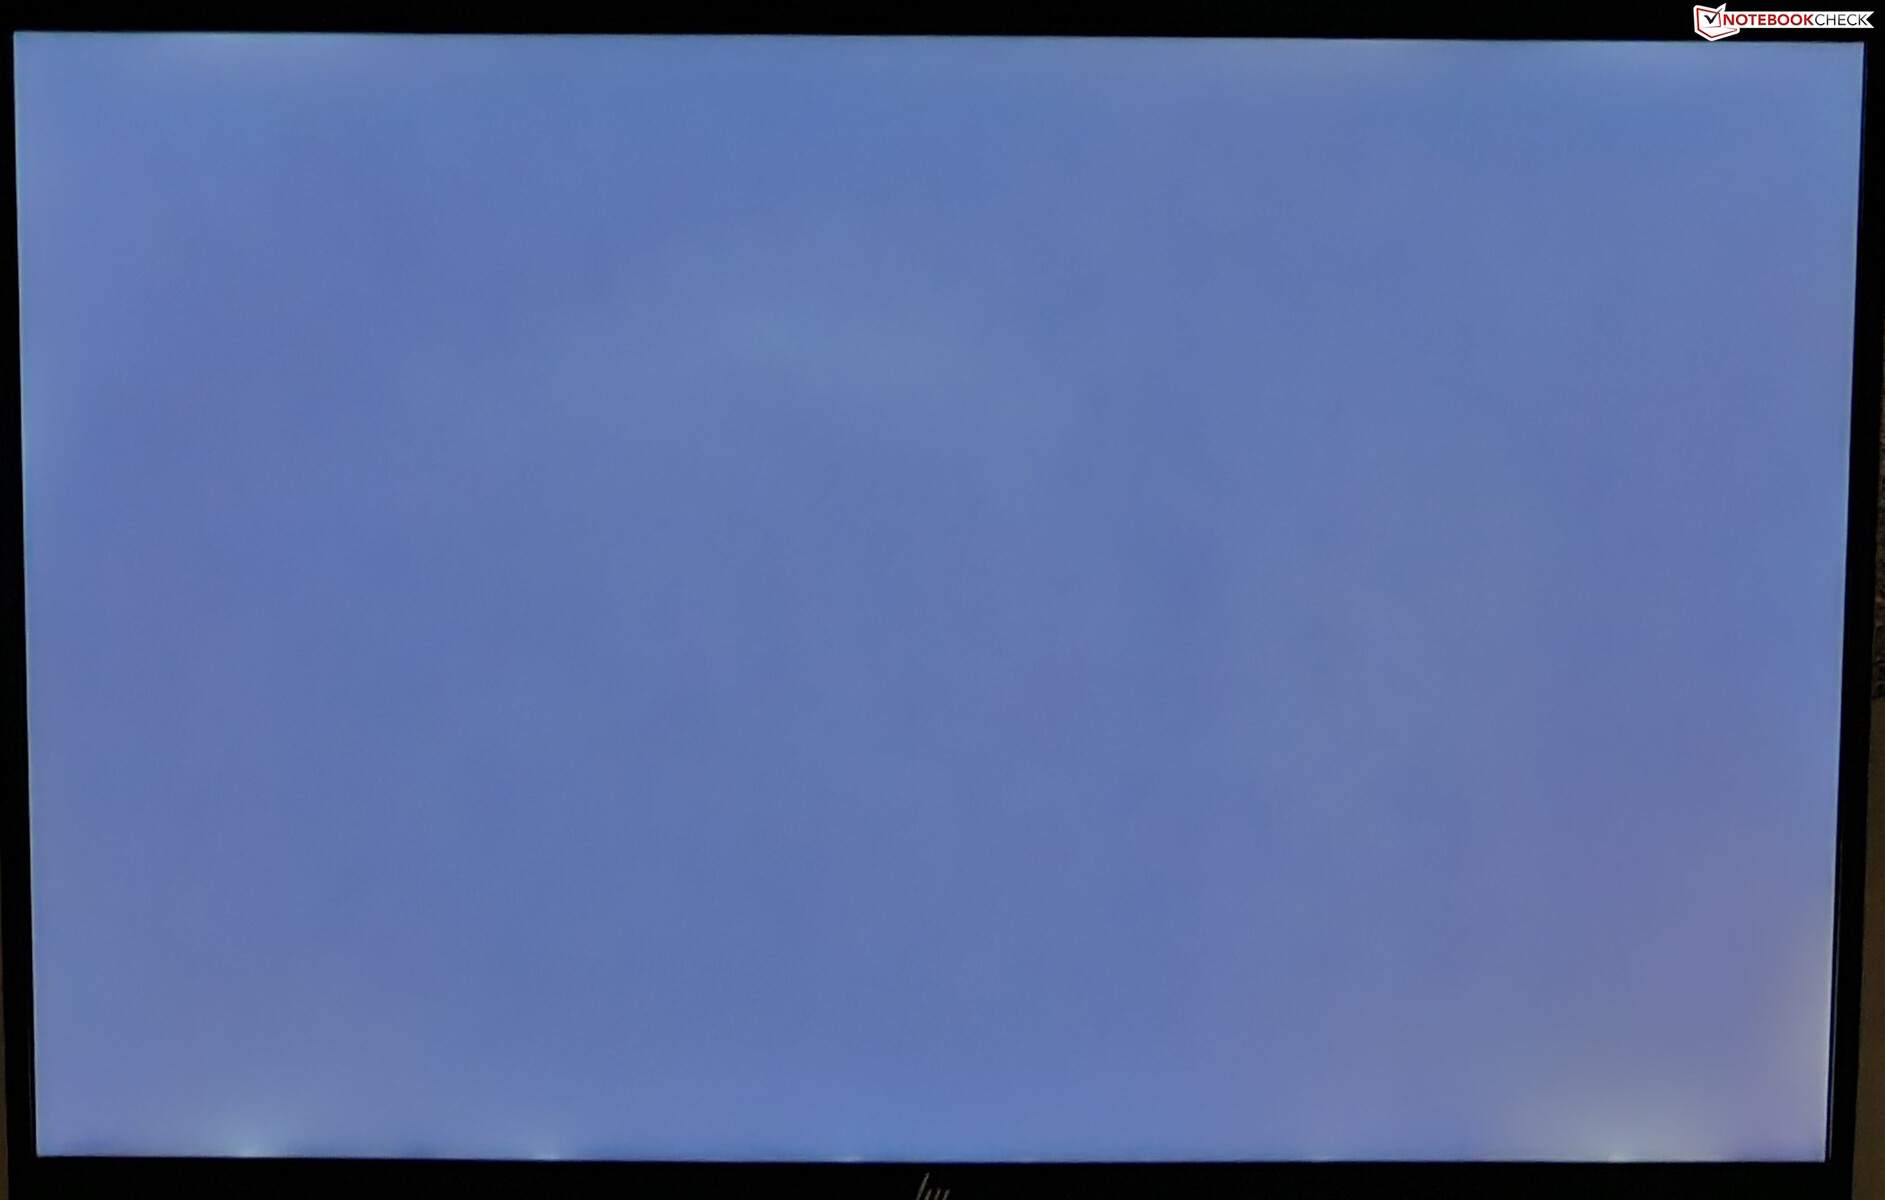
Abbiamo misurato fino a 415 nit di luminosità massima, con una media di 394 nit e una buona distribuzione del 90%. Essendo un pannello IPS, il display non è immune dal backlight bleed, che si può notare negli angoli inferiori in caso di esposizione prolungata.
Soggettivamente, Pavilion Plus 16 offre una buona esperienza visiva che dovrebbe essere adatta sia al lavoro che all'intrattenimento.
| |||||||||||||||||||||||||
Distribuzione della luminosità: 90 %
Al centro con la batteria: 401 cd/m²
Contrasto: 1185:1 (Nero: 0.34 cd/m²)
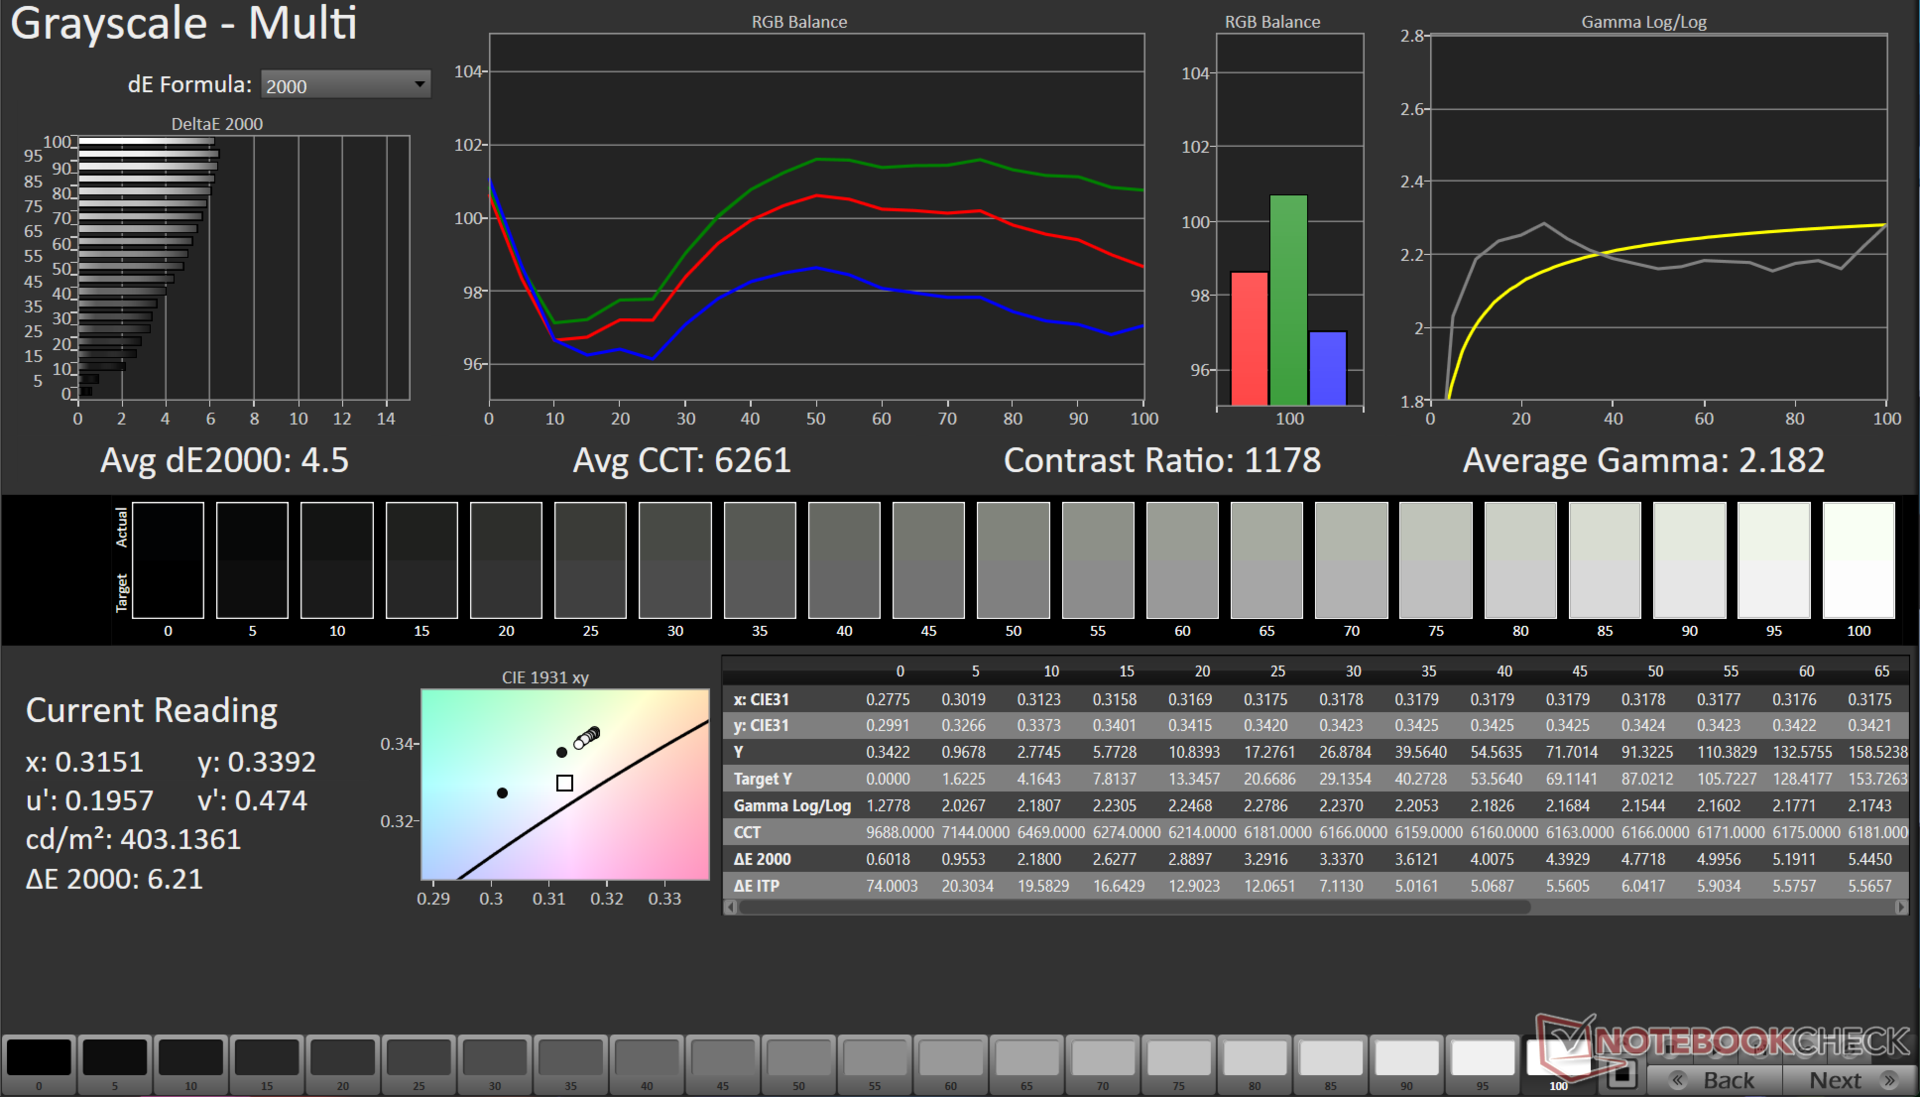
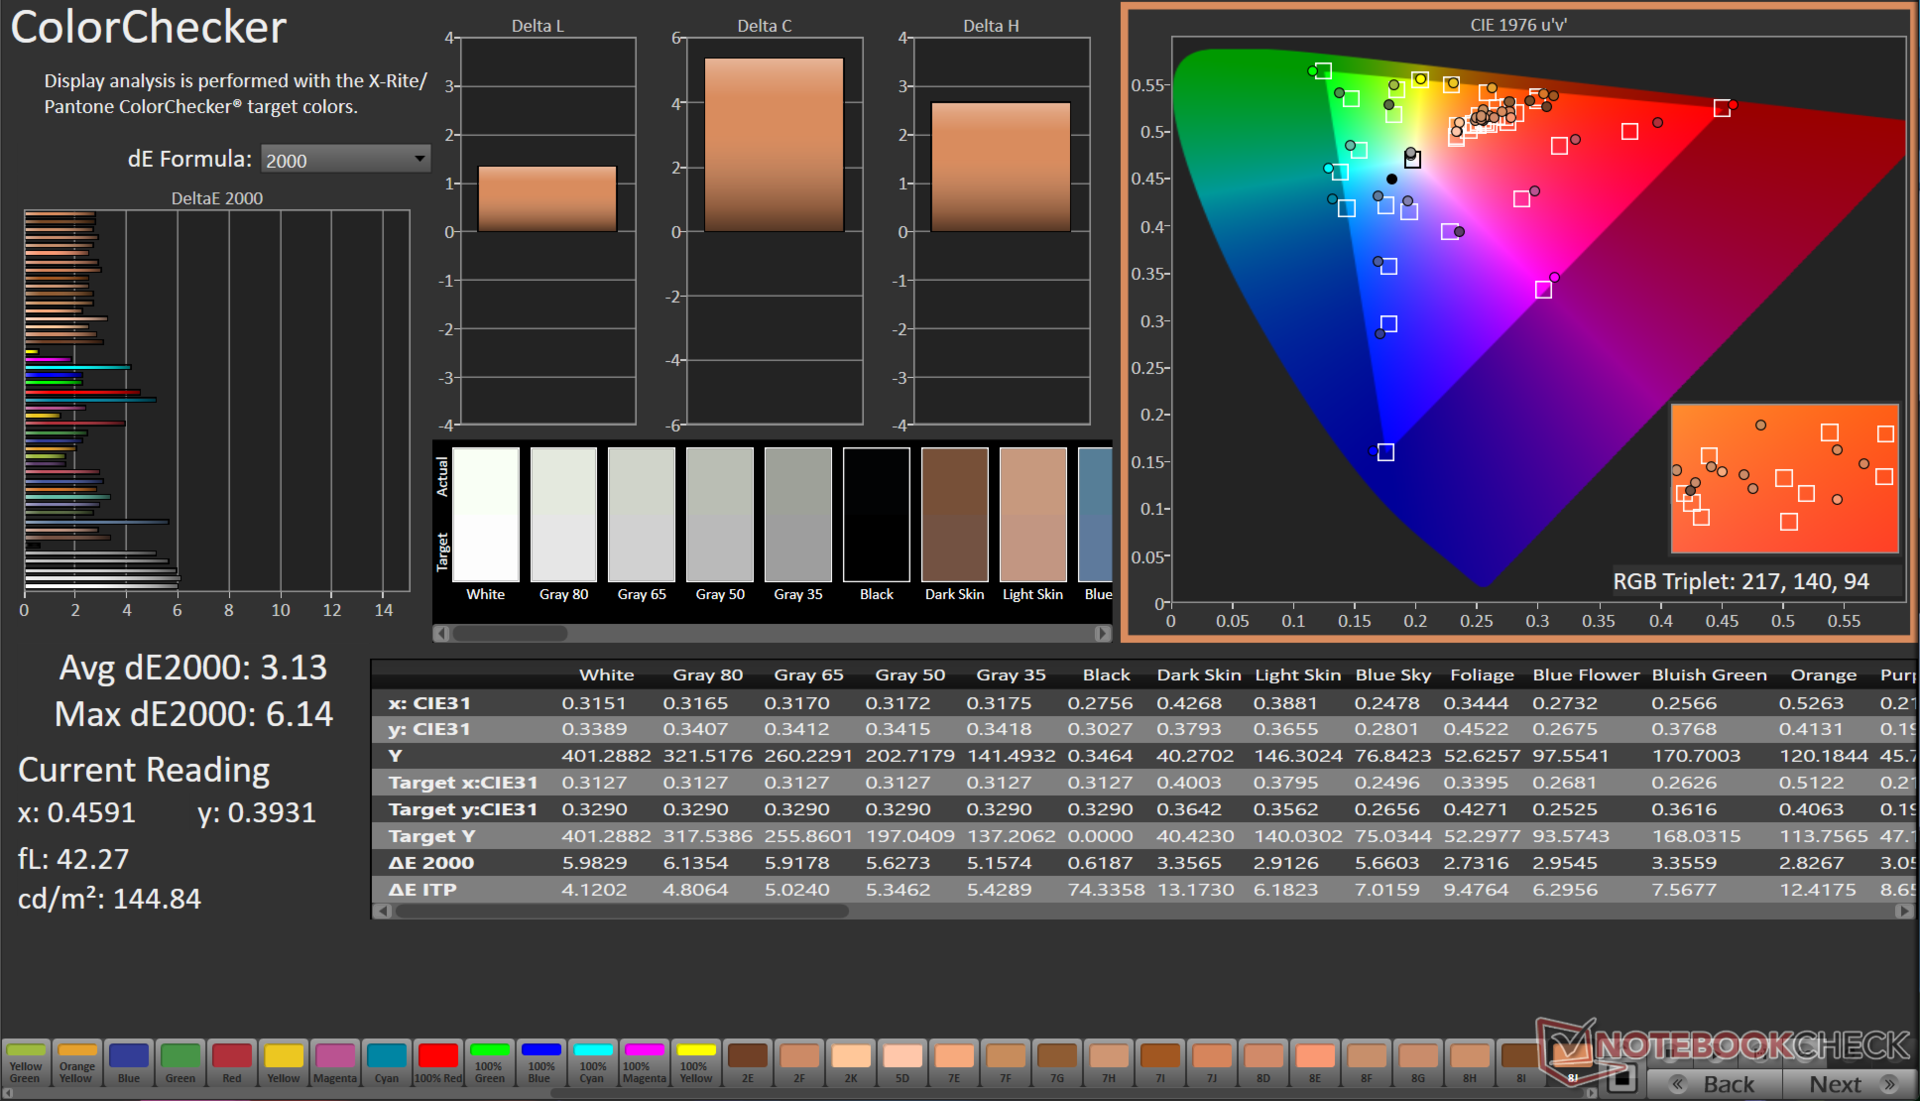
ΔE ColorChecker Calman: 3.13 | ∀{0.5-29.43 Ø4.71}
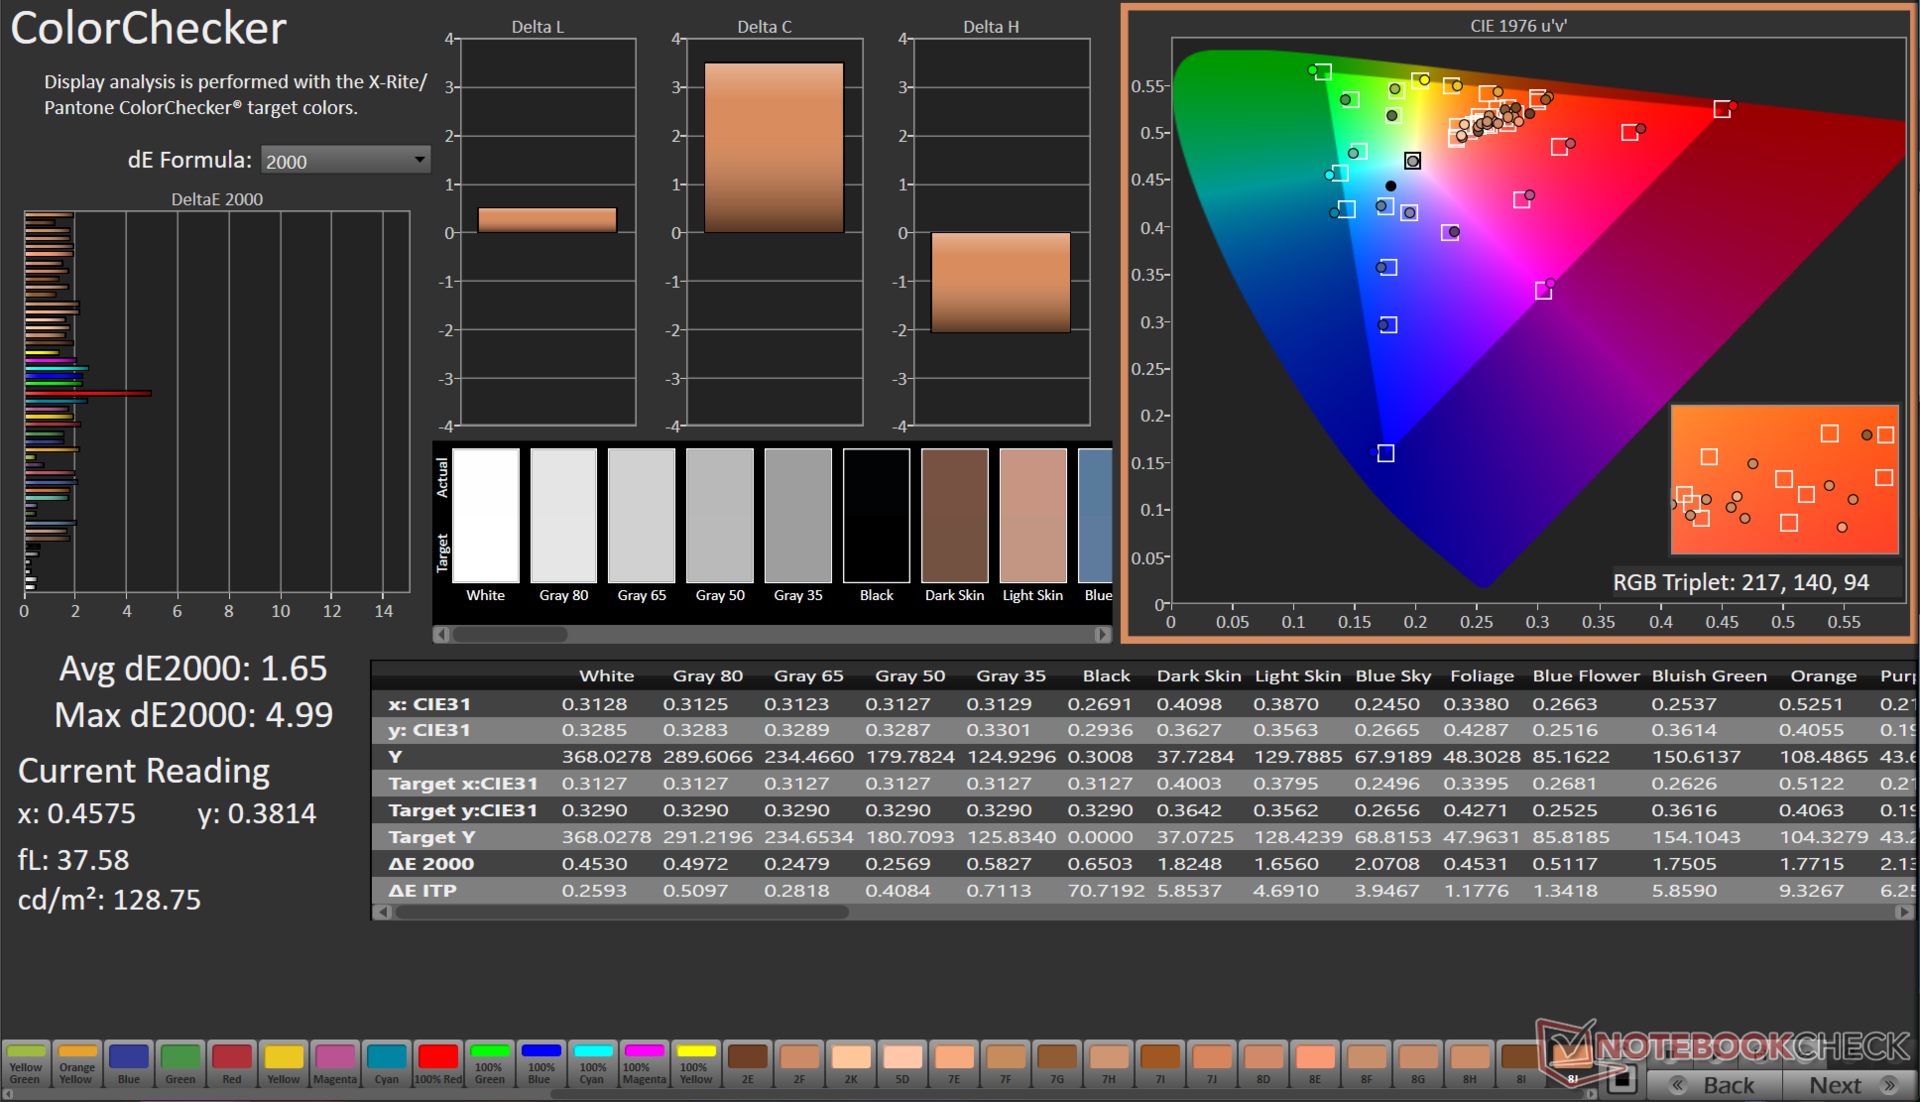
calibrated: 1.65
ΔE Greyscale Calman: 4.5 | ∀{0.09-98 Ø4.96}
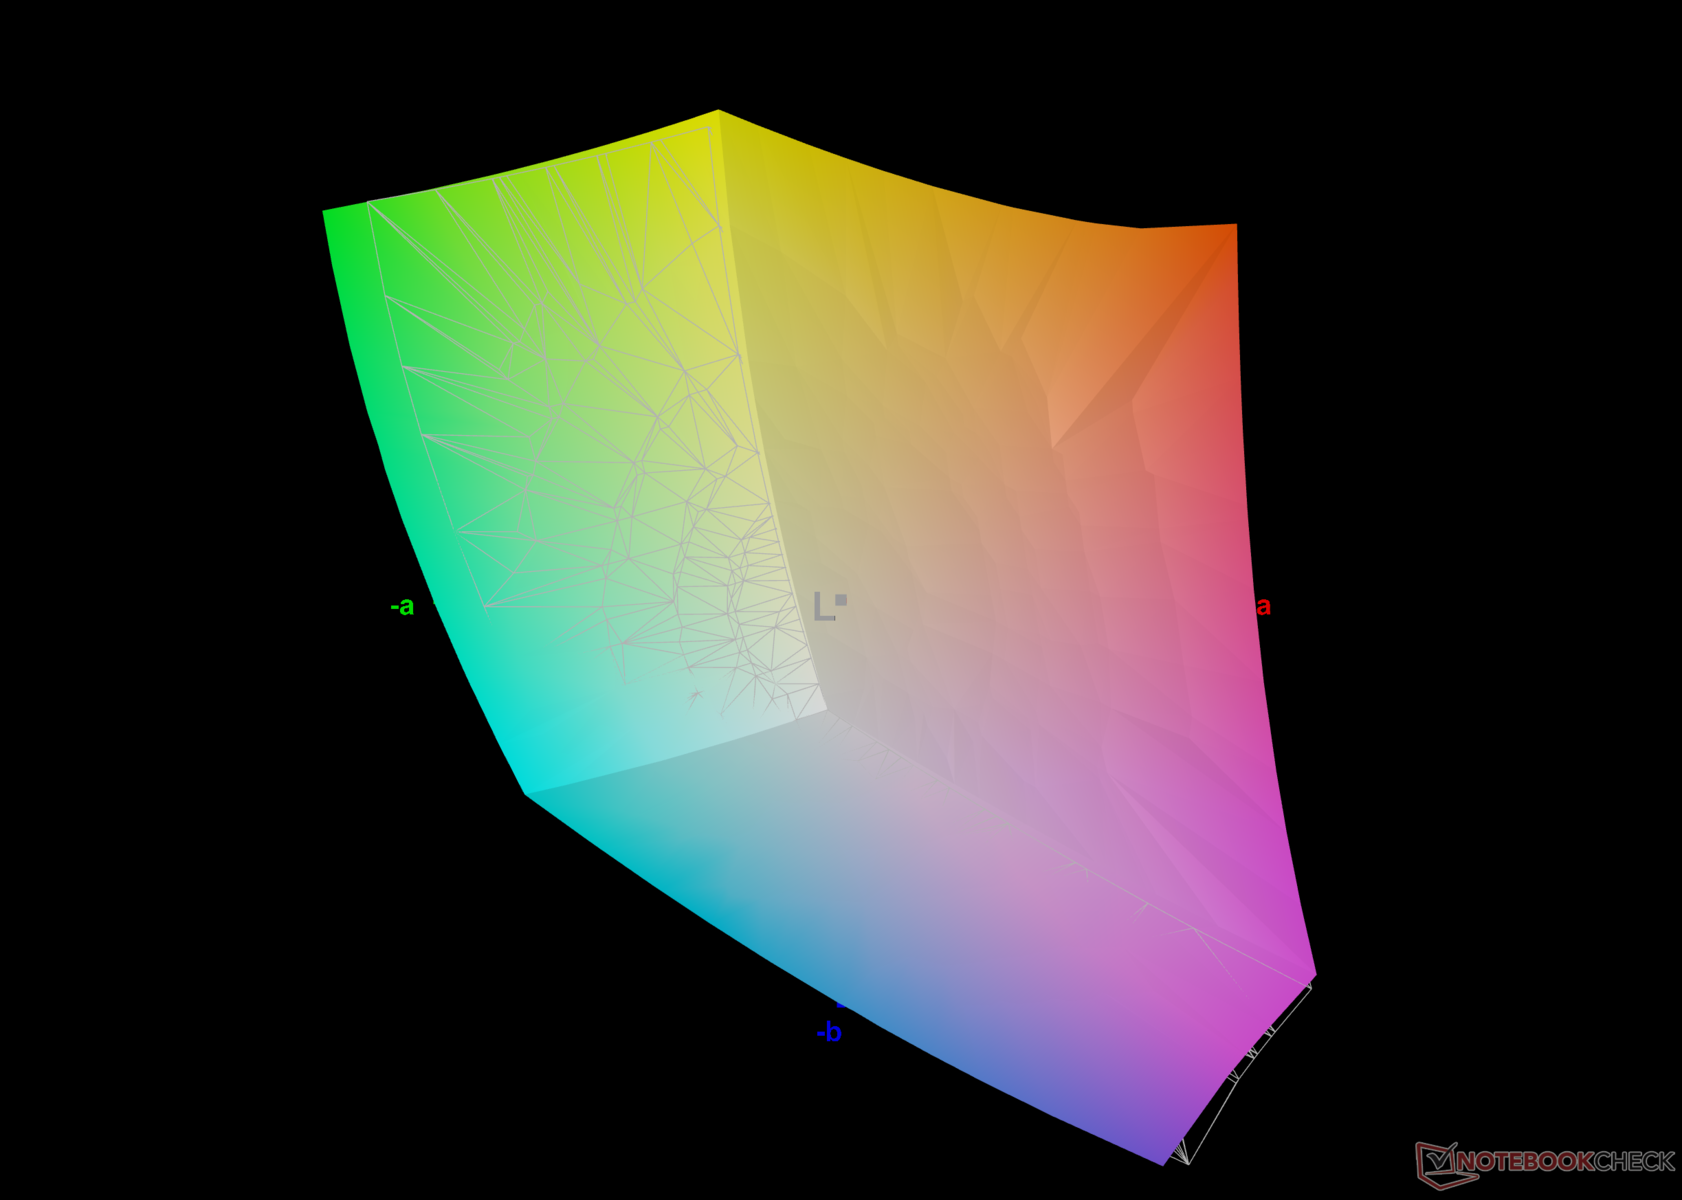
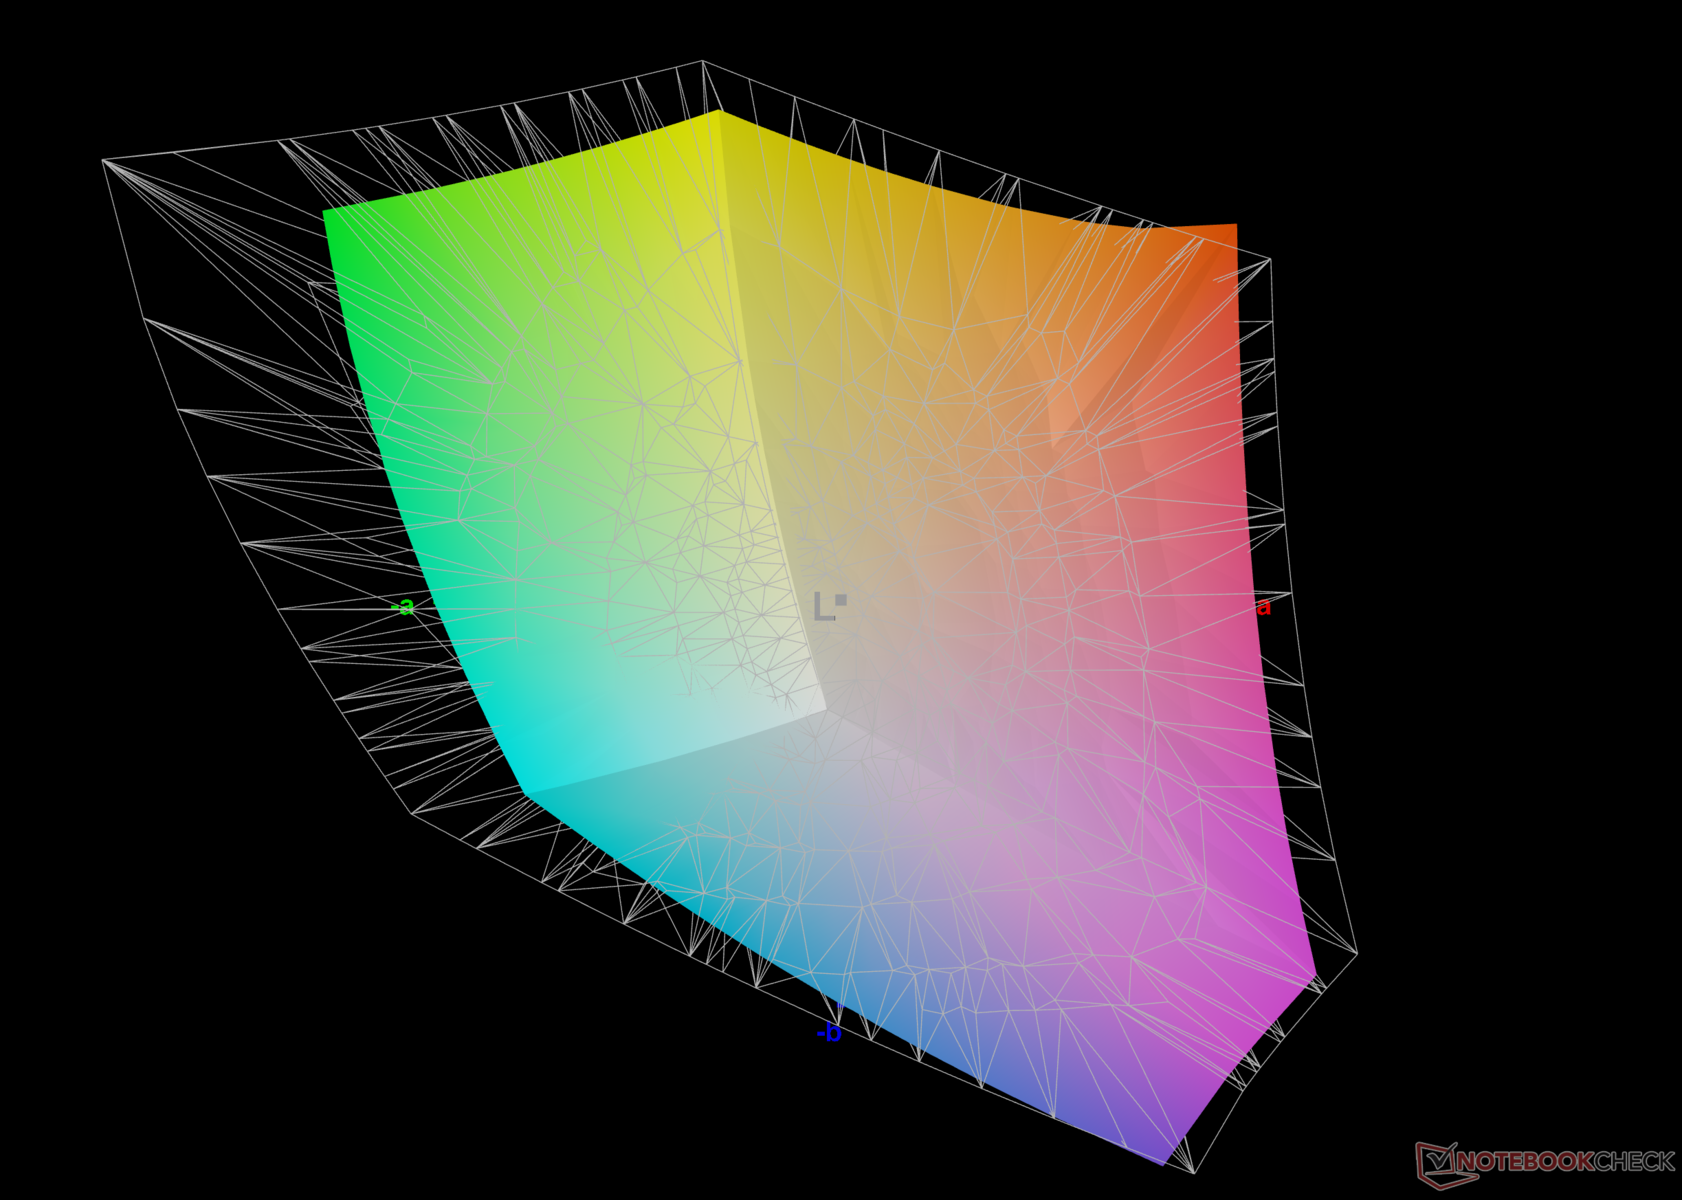
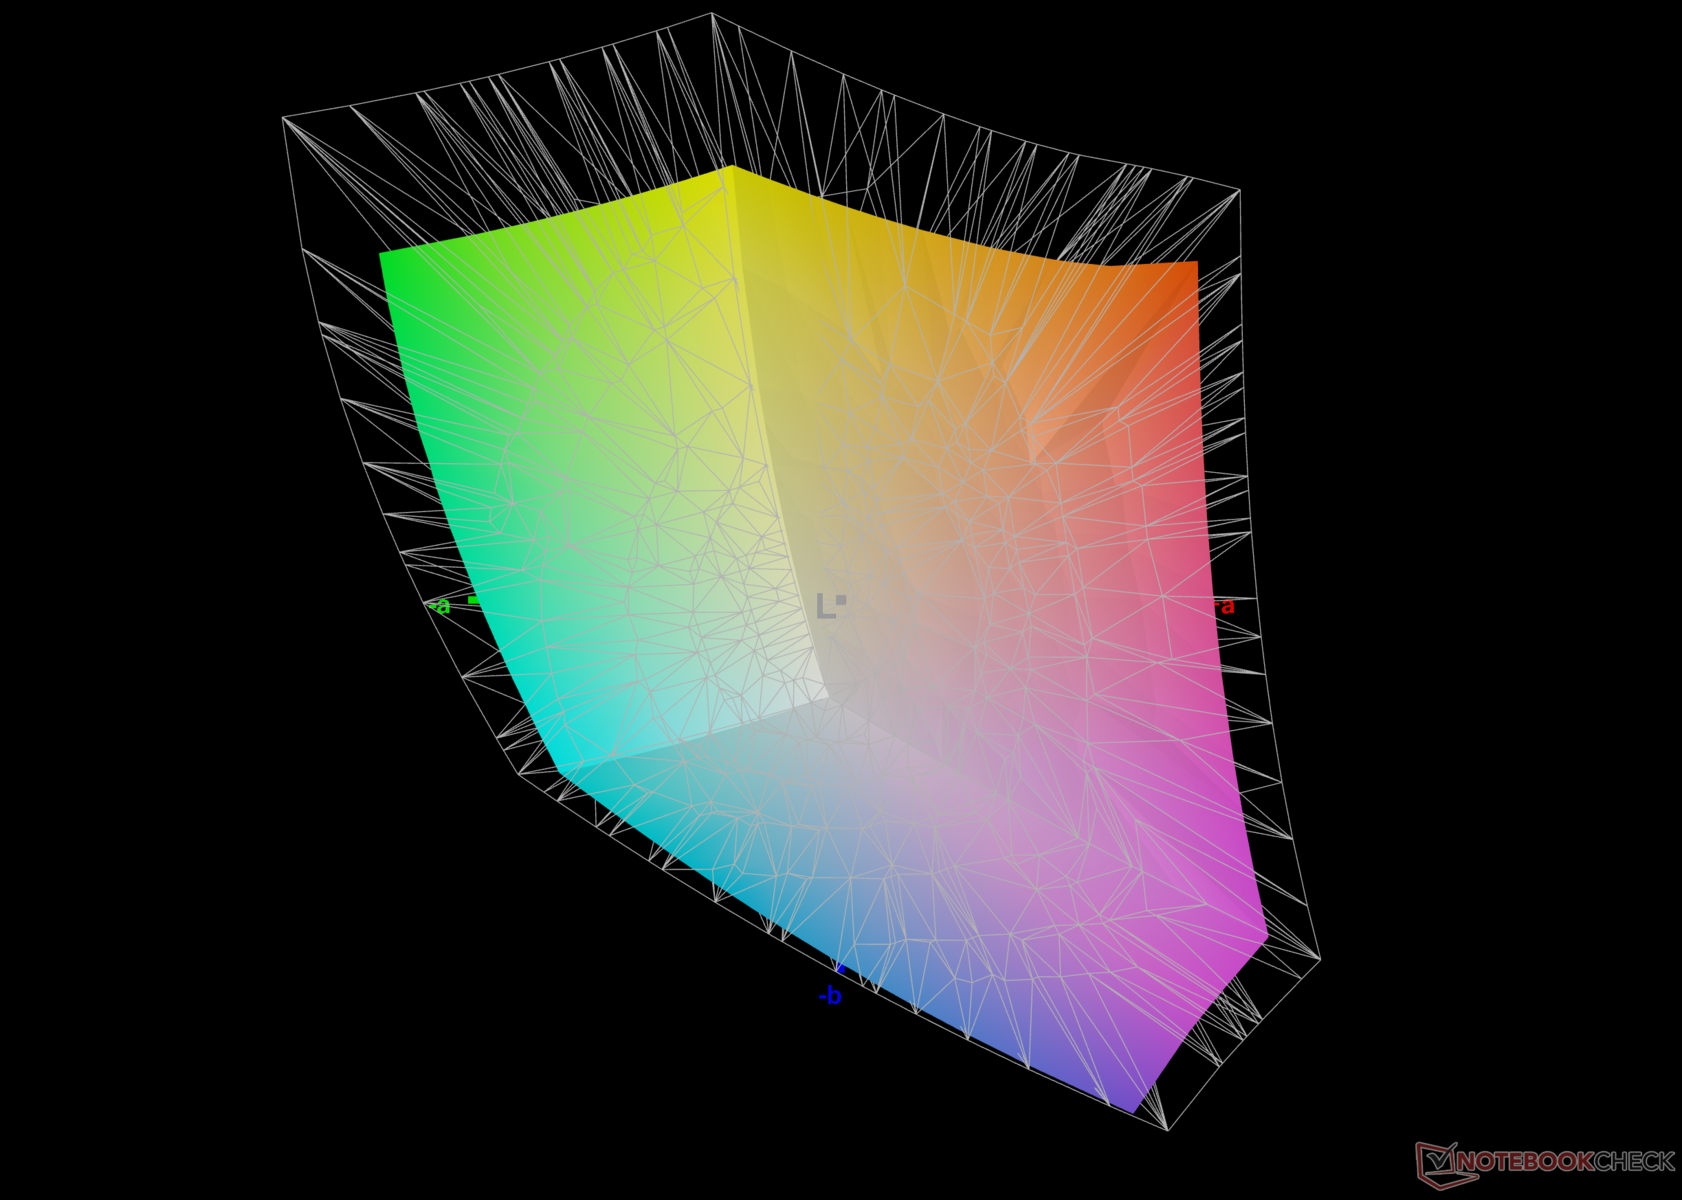
76.5% AdobeRGB 1998 (Argyll 3D)
99% sRGB (Argyll 3D)
74.6% Display P3 (Argyll 3D)
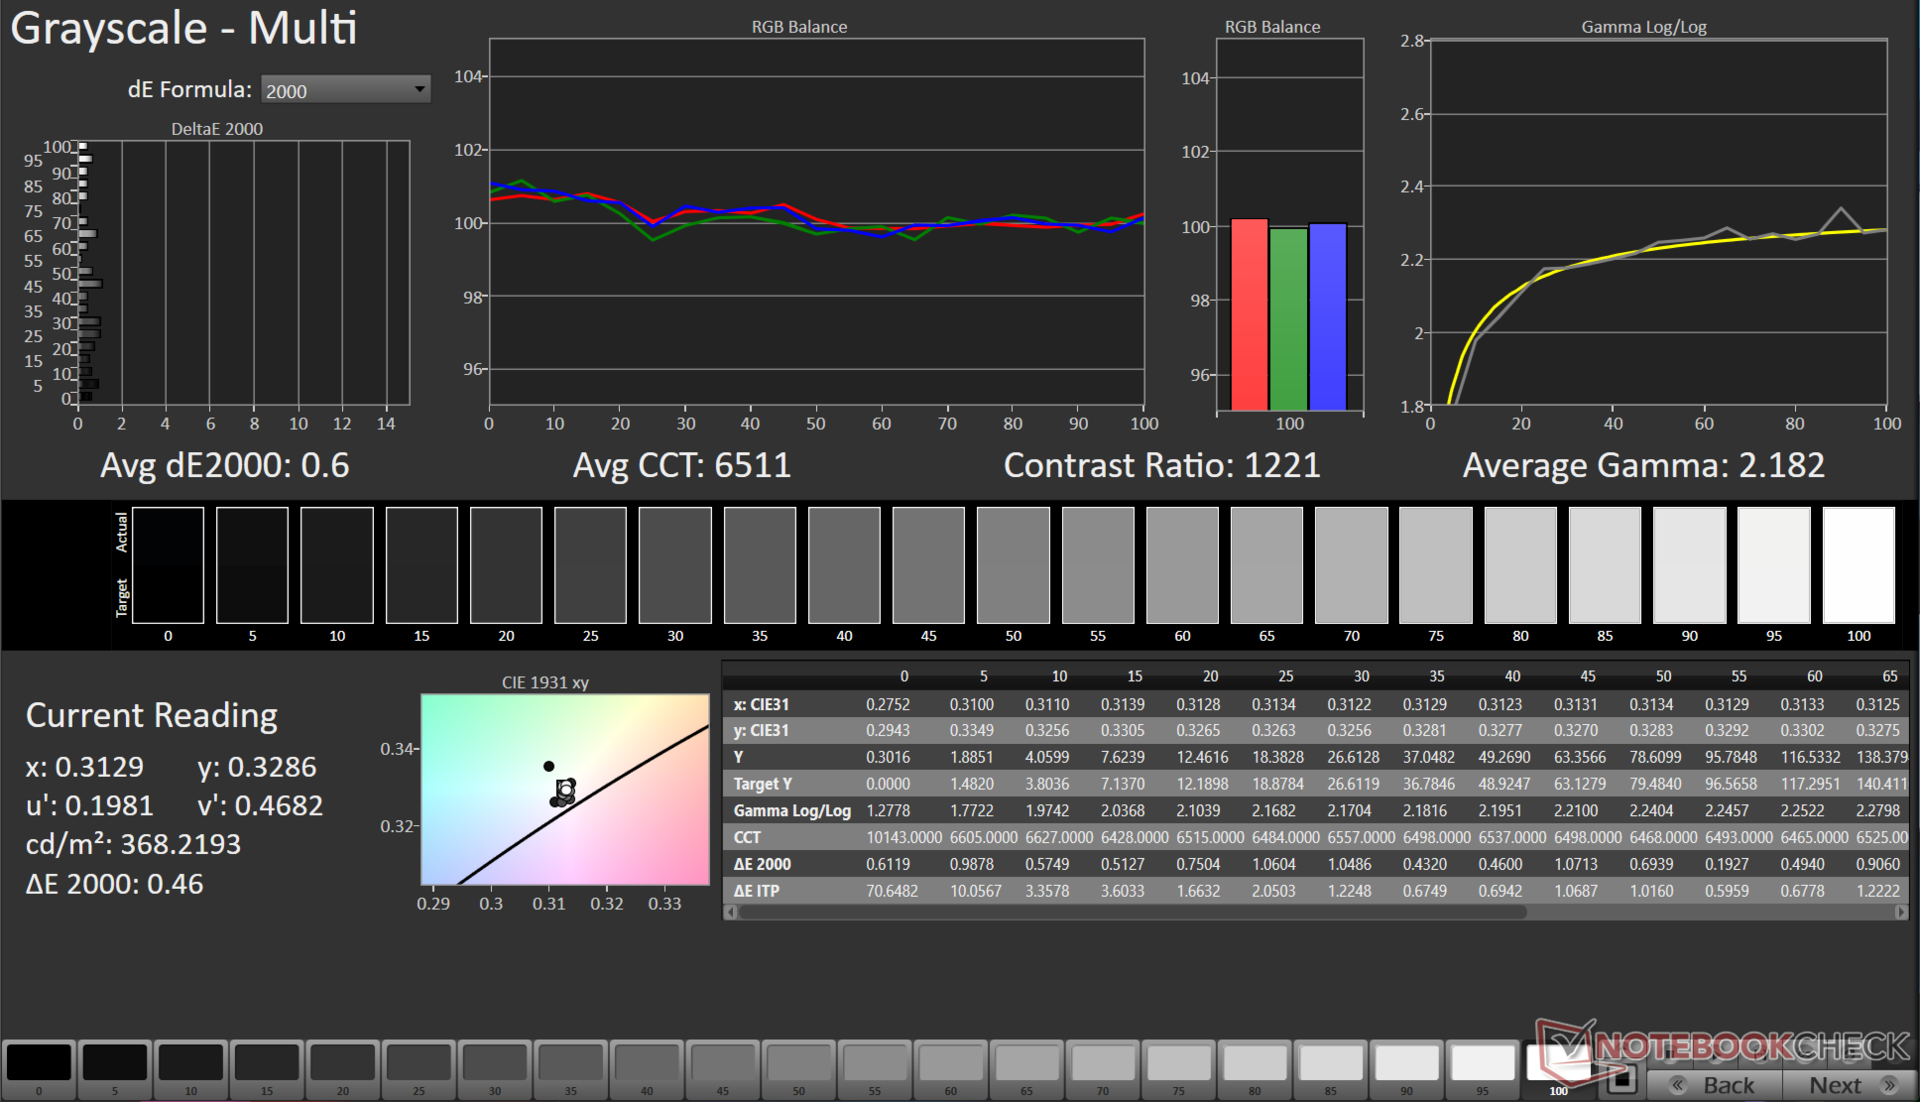
Gamma: 2.18
CCT: 6261 K
| HP Pavilion Plus 16-ab0456tx AU Optronics AUOFDA4, IPS, 2560x1600, 16" | Schenker Vision 14 2023 CSOT T3 MNE007ZA1-3, IPS, 2880x1800, 14" | Dell Inspiron 16 Plus 7630 LG Philips 160WQ2, IPS, 2560x1600, 16" | Asus VivoBook 14X K3405 Samsung ATNA40YK07-1, , 2880x1800, 14" | Lenovo Slim Pro 7 14ARP8 LEN89C1, IPS, 2560x1600, 14.5" | Asus VivoBook Pro 16 K6602VU Samsung ATNA60BX01-1, OLED, 3200x2000, 16" | Samsung Galaxy Book3 Ultra 16 Samsung ATNA60CL03-0, AMOLED, 2880x1800, 16" | |
|---|---|---|---|---|---|---|---|
| Display | 0% | -3% | 20% | -2% | 20% | 20% | |
| Display P3 Coverage (%) | 74.6 | 74.7 0% | 70.1 -6% | 99.9 34% | 72.9 -2% | 98.7 32% | 99.9 34% |
| sRGB Coverage (%) | 99 | 99.6 1% | 99.6 1% | 100 1% | 98.2 -1% | 99.7 1% | 100 1% |
| AdobeRGB 1998 Coverage (%) | 76.5 | 75.8 -1% | 72.3 -5% | 96.5 26% | 74.6 -2% | 96.5 26% | 96.3 26% |
| Response Times | -193% | -274% | -14% | -220% | -3% | 93% | |
| Response Time Grey 50% / Grey 80% * (ms) | 9.06 ? | 32.2 ? -255% | 35 ? -286% | 1.15 ? 87% | 31.8 ? -251% | 0.68 ? 92% | 0.49 ? 95% |
| Response Time Black / White * (ms) | 6.7 ? | 15.4 ? -130% | 24.2 ? -261% | 14.4 ? -115% | 19.3 ? -188% | 13.2 ? -97% | 0.65 ? 90% |
| PWM Frequency (Hz) | 90.02 ? | 240 ? | 240 ? | ||||
| Screen | 21% | 1% | 5% | 3% | -10% | 135% | |
| Brightness middle (cd/m²) | 403 | 402 0% | 299.4 -26% | 369 -8% | 344.7 -14% | 353 -12% | 400 -1% |
| Brightness (cd/m²) | 394 | 371 -6% | 290 -26% | 364 -8% | 334 -15% | 354 -10% | 399 1% |
| Brightness Distribution (%) | 90 | 86 -4% | 92 2% | 85 -6% | 92 2% | 98 9% | 93 3% |
| Black Level * (cd/m²) | 0.34 | 0.27 21% | 0.21 38% | 0.31 9% | 0.03 91% | ||
| Contrast (:1) | 1185 | 1489 26% | 1426 20% | 1112 -6% | 13333 1025% | ||
| Colorchecker dE 2000 * | 3.13 | 1.8 42% | 4.25 -36% | 2.85 9% | 3.01 4% | 4.23 -35% | 2.3 27% |
| Colorchecker dE 2000 max. * | 6.14 | 3.6 41% | 6.71 -9% | 4.22 31% | 6.3 -3% | 7.13 -16% | 4.15 32% |
| Colorchecker dE 2000 calibrated * | 1.65 | 1.5 9% | 0.52 68% | 2.18 -32% | 0.83 50% | 2.42 -47% | 1.66 -1% |
| Greyscale dE 2000 * | 4.5 | 1.8 60% | 5.5 -22% | 2.2 51% | 4.6 -2% | 2.5 44% | 2.7 40% |
| Gamma | 2.18 101% | 2.27 97% | 2.35 94% | 2.15 102% | 2.28 96% | 2.4 92% | 2.266 97% |
| CCT | 6261 104% | 6695 97% | 6368 102% | 6518 100% | 6420 101% | 6642 98% | 7047 92% |
| Media totale (Programma / Settaggio) | -57% /
-14% | -92% /
-39% | 4% /
6% | -73% /
-30% | 2% /
-1% | 83% /
105% |
* ... Meglio usare valori piccoli
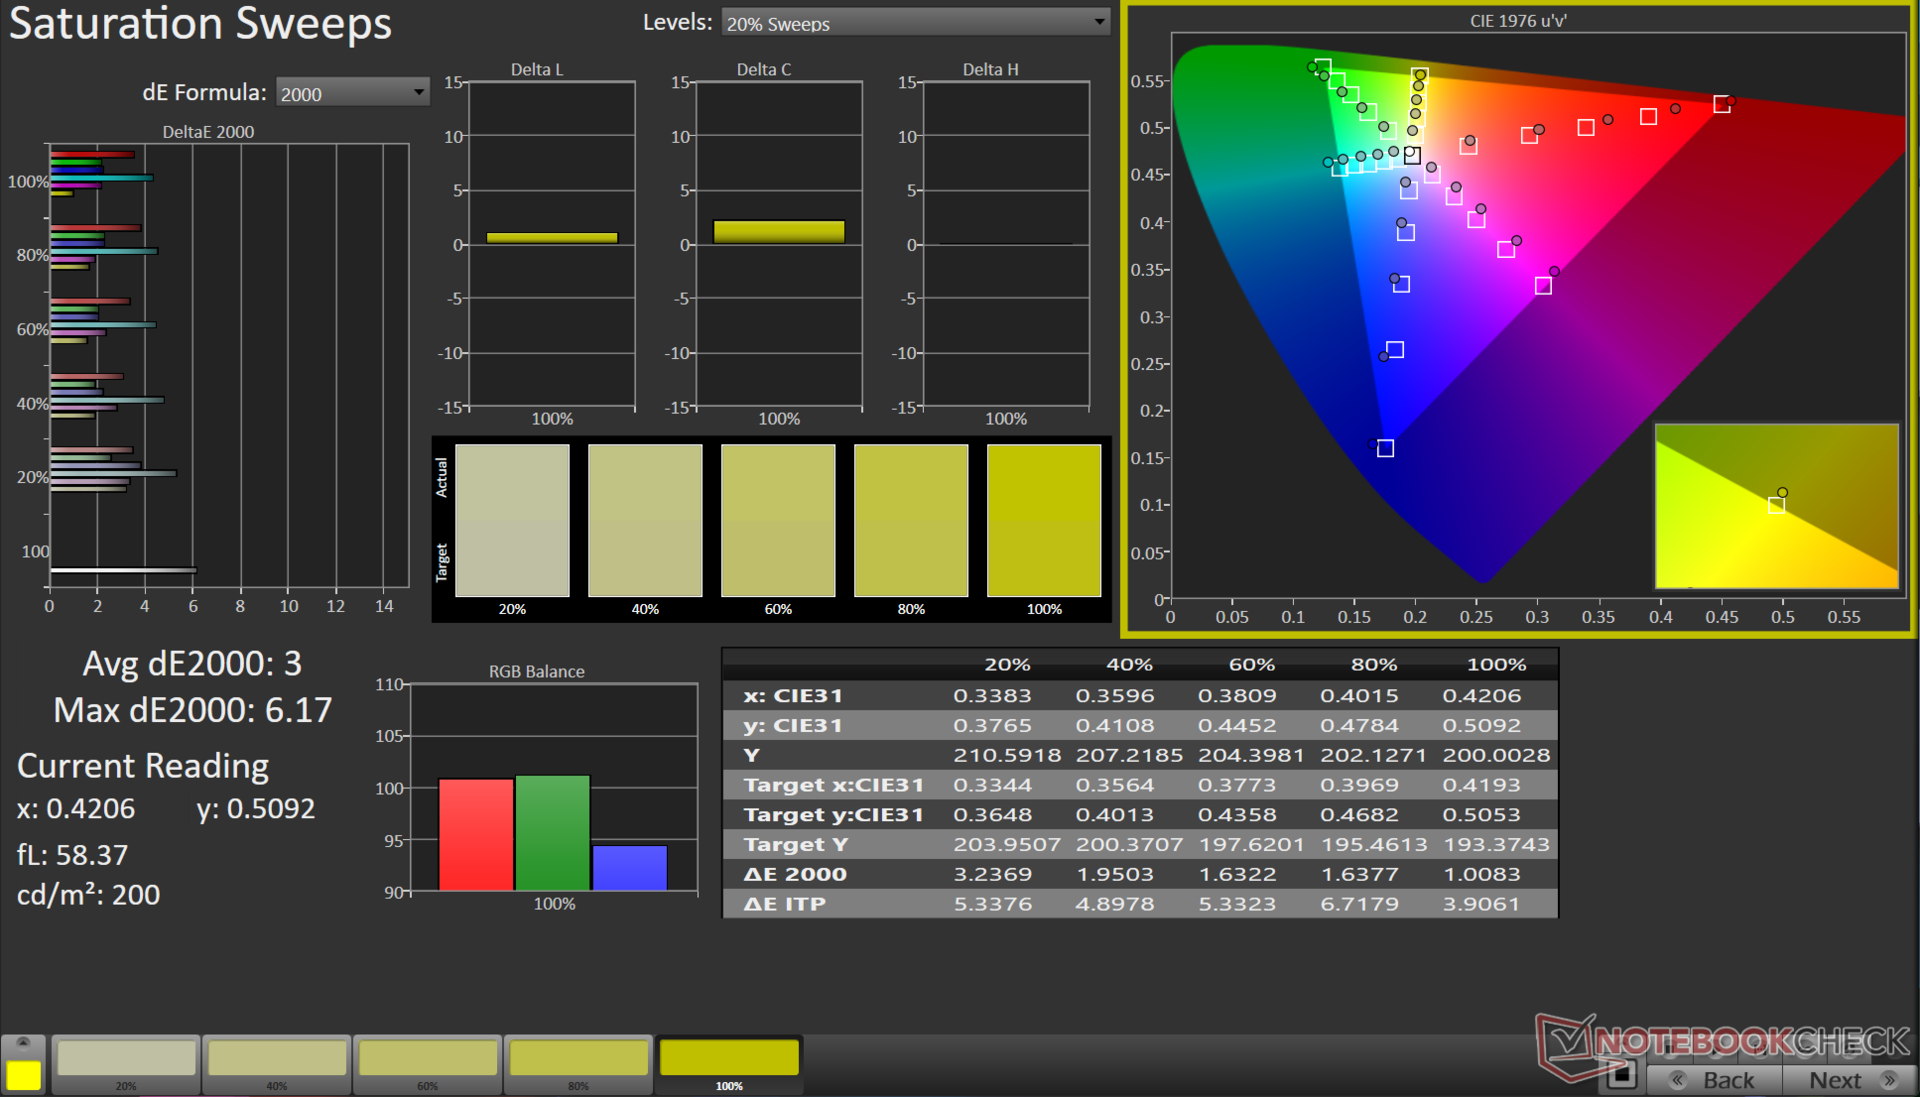
Il pannello copre il 99% dello spazio cromatico sRGB e offre una riproduzione decente di Adobe RGB e Display P3. Questo rende Pavilion Plus 16 adatto al consumo multimediale generale e anche ai flussi di lavoro di editing di base, soprattutto per i contenuti web.
Utilizzando lo spettrofotometro X-Rite i1Basic Pro 3 e il software Calman Ultimate di Portrait Displays, siamo riusciti a migliorare i valori medi della Scala di grigi e di ColorChecker Delta E 2000 da 4,5 a 0,6 e da 3,13 a 1,65, rispettivamente.
Il nostro file calibrato può essere scaricato dal link qui sopra.
Tempi di risposta del Display
| ↔ Tempi di risposta dal Nero al Bianco | ||
|---|---|---|
| 6.7 ms ... aumenta ↗ e diminuisce ↘ combinato | ↗ 3.6 ms Incremento | 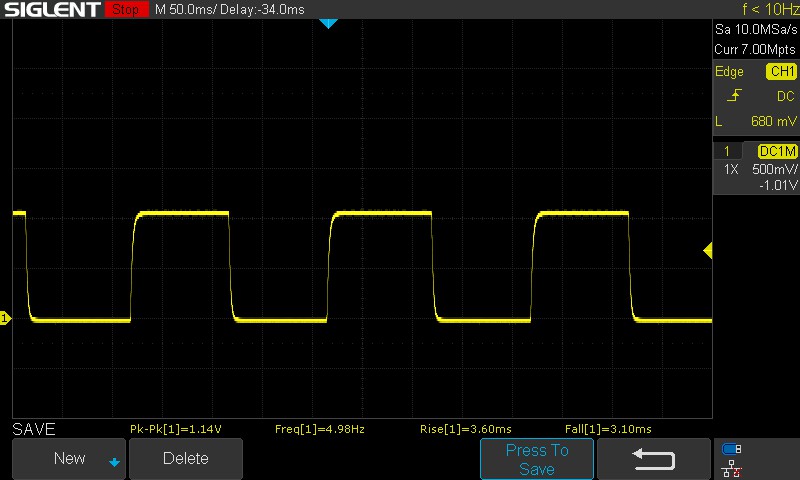 |
| ↘ 3.1 ms Calo | ||
| Lo schermo ha mostrato valori di risposta molto veloci nei nostri tests ed è molto adatto per i gaming veloce. In confronto, tutti i dispositivi di test variano da 0.1 (minimo) a 240 (massimo) ms. » 21 % di tutti i dispositivi è migliore. Questo significa che i tempi di risposta rilevati sono migliori rispettto alla media di tutti i dispositivi testati (19.8 ms). | ||
| ↔ Tempo di risposta dal 50% Grigio all'80% Grigio | ||
| 9.06 ms ... aumenta ↗ e diminuisce ↘ combinato | ↗ 4.27 ms Incremento | 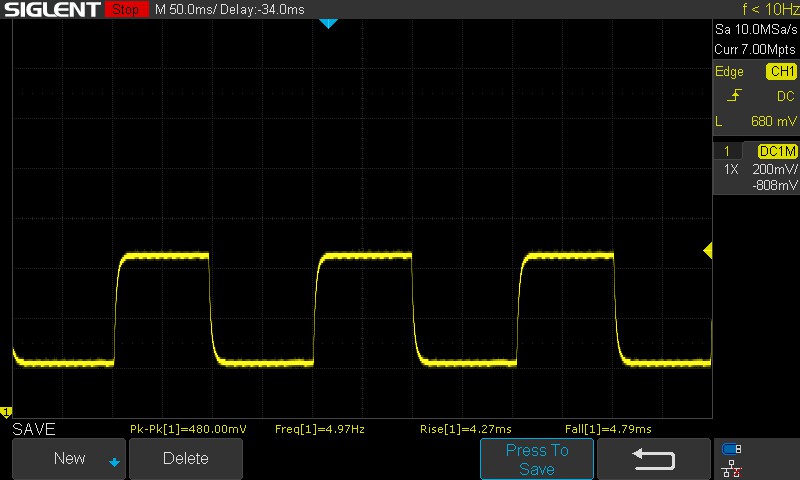 |
| ↘ 4.79 ms Calo | ||
| Lo schermo mostra veloci tempi di risposta durante i nostri tests e dovrebbe esere adatto al gaming In confronto, tutti i dispositivi di test variano da 0.165 (minimo) a 636 (massimo) ms. » 23 % di tutti i dispositivi è migliore. Questo significa che i tempi di risposta rilevati sono migliori rispettto alla media di tutti i dispositivi testati (31 ms). | ||
Sfarfallio dello schermo / PWM (Pulse-Width Modulation)
| flickering dello schermo / PWM non rilevato | ≤ 100 % settaggio luminosita' | 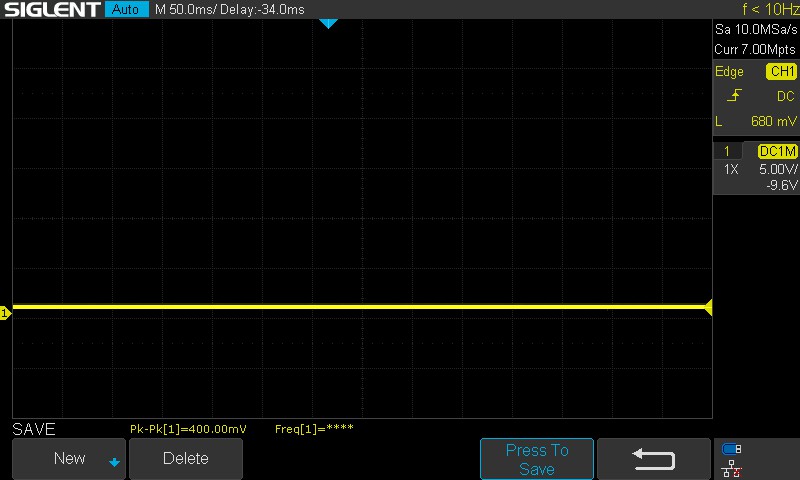 | |
In confronto: 52 % di tutti i dispositivi testati non utilizza PWM per ridurre la luminosita' del display. Se è rilevato PWM, una media di 7747 (minimo: 5 - massimo: 343500) Hz è stata rilevata. | |||
I tempi di risposta sono decenti, dato che Pavilion Plus 16 non è destinato al pubblico dei videogiochi. Non abbiamo osservato alcun PWM a tutti i livelli di luminosità testati, il che è positivo.
Per maggiori informazioni, consulti il nostro articolo "Perché il PWM è un tale mal di testa". La nostra tabella PWM Ranking fornisce una panoramica del PWM misurato sui dispositivi recensiti.
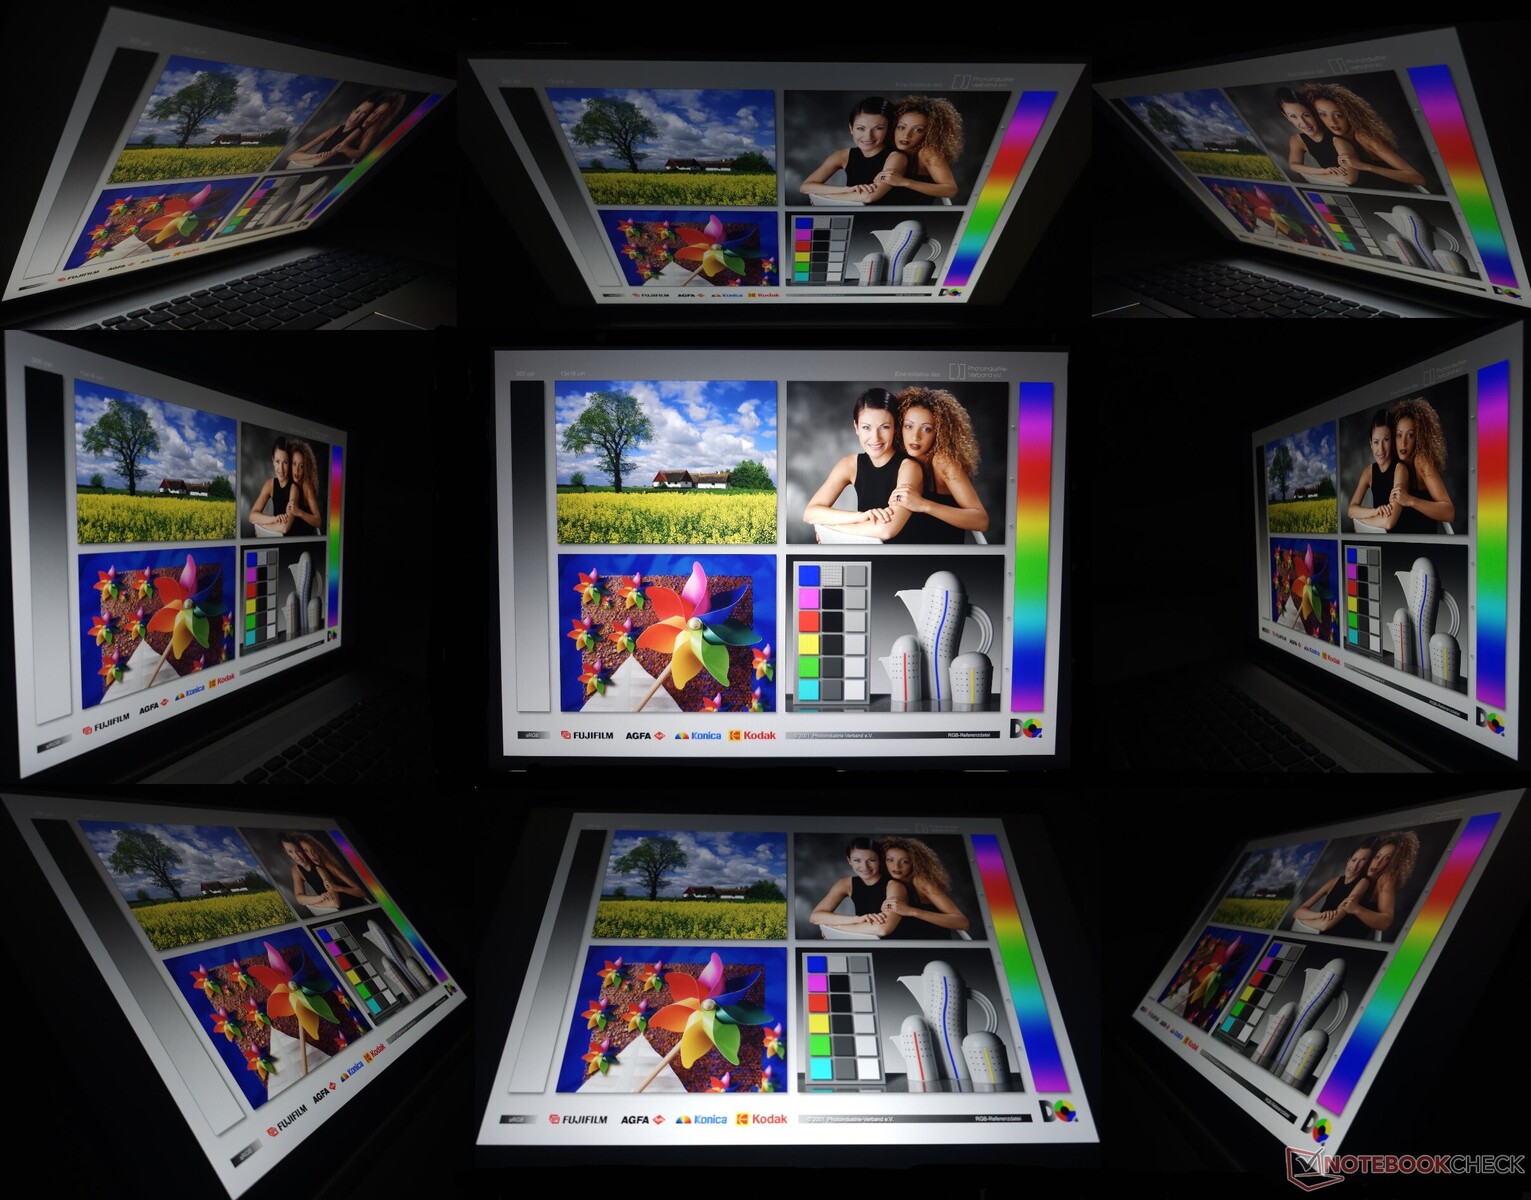
La visione all'aperto va generalmente bene con la massima luminosità, a patto che non ci sia la luce diretta del sole sul display. Gli angoli di visione sono stabili, ma abbiamo osservato una perdita di luminosità e di informazioni cromatiche agli estremi.
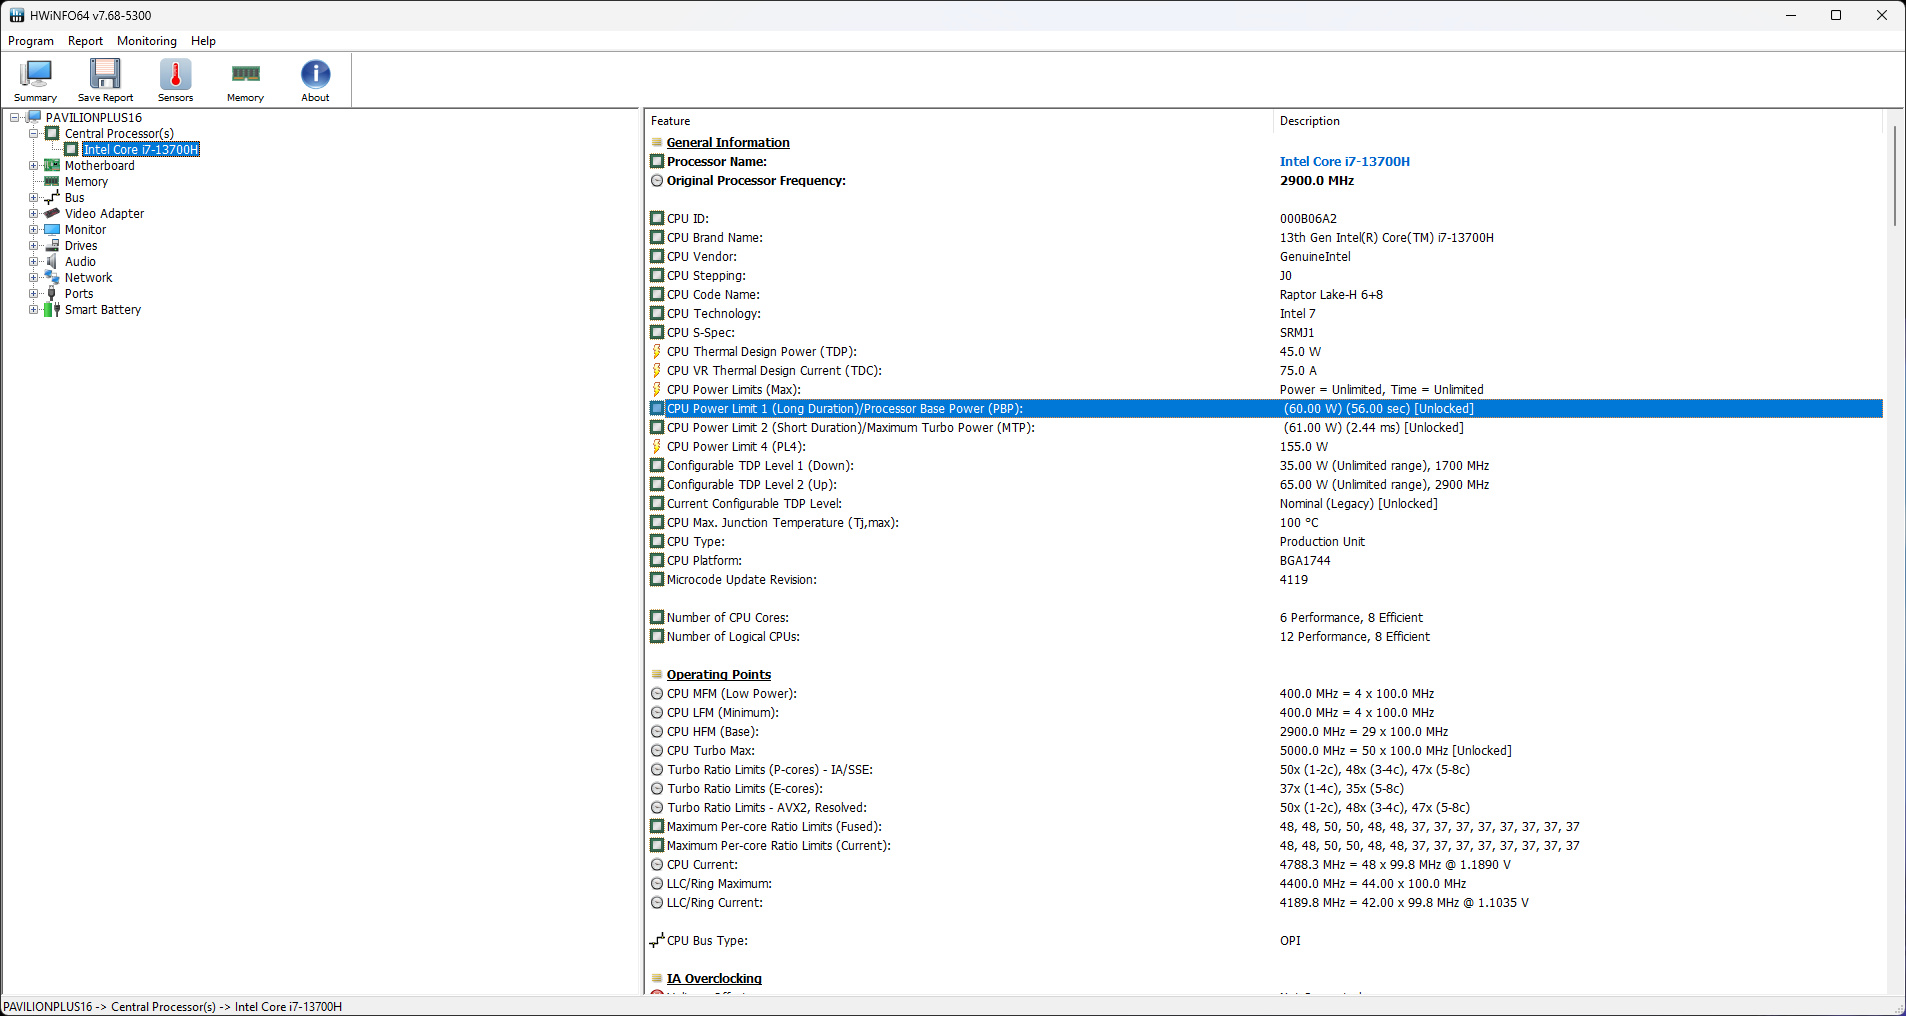
Prestazioni: Core i7-13700H limitato da un basso PL2
A seconda della regione, HP offre il modello Pavilion Plus 16 in Core i5-13500H e Core i7-13700H con grafica RTX 3050 6 GB opzionale.
Condizioni del test
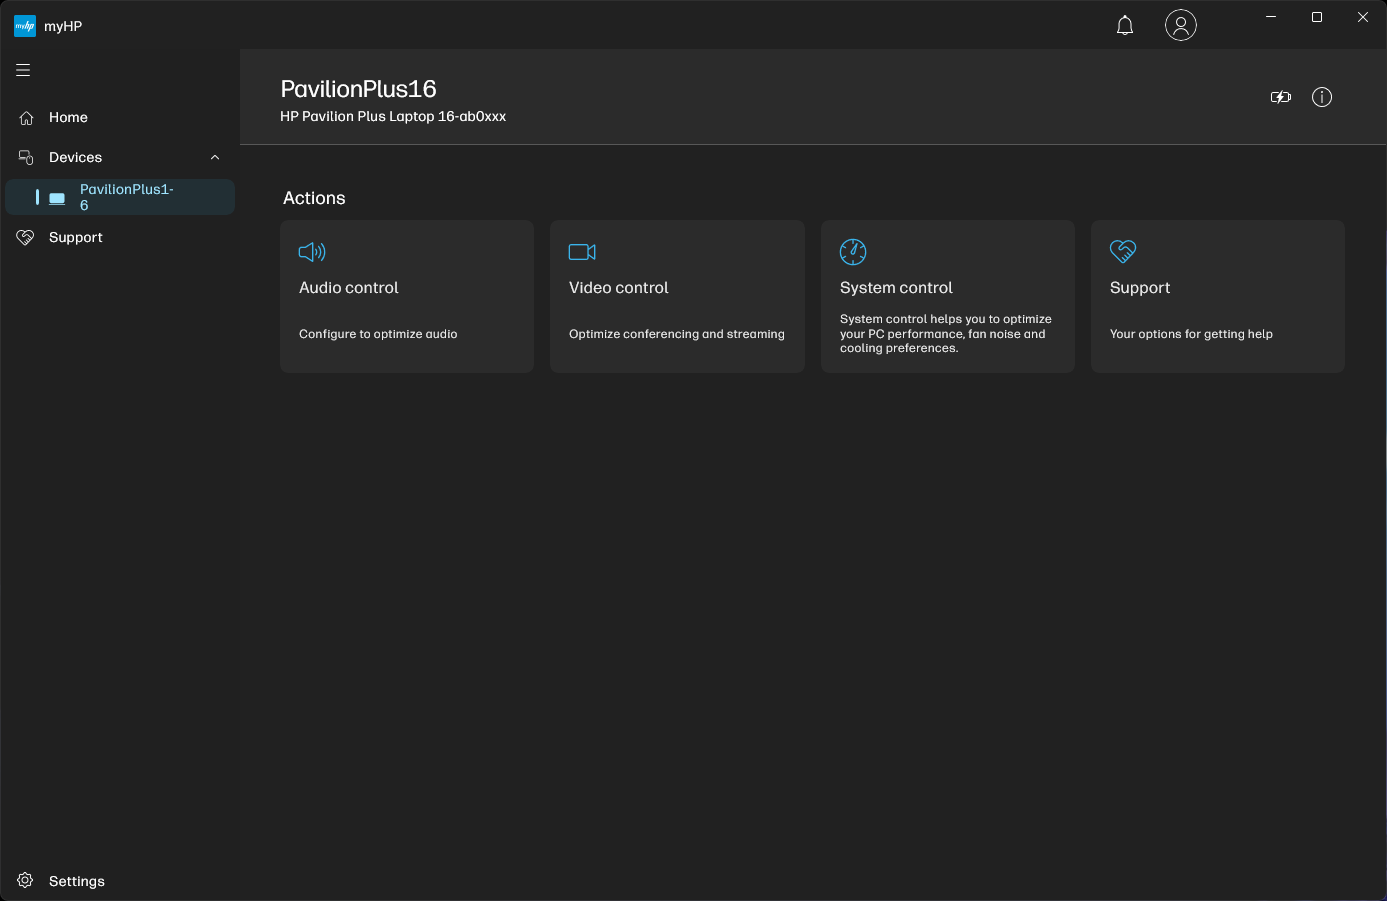
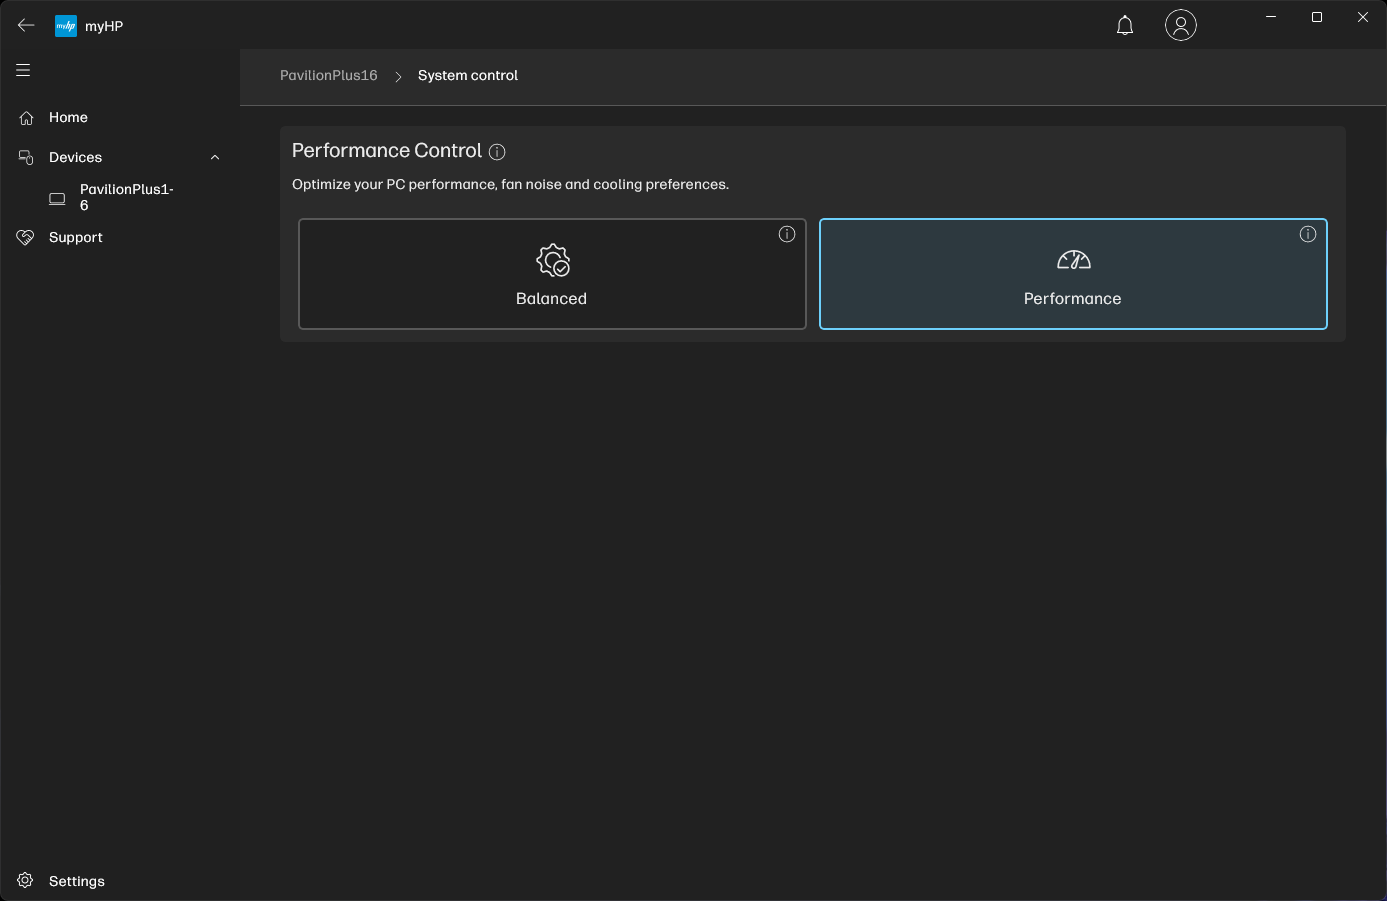
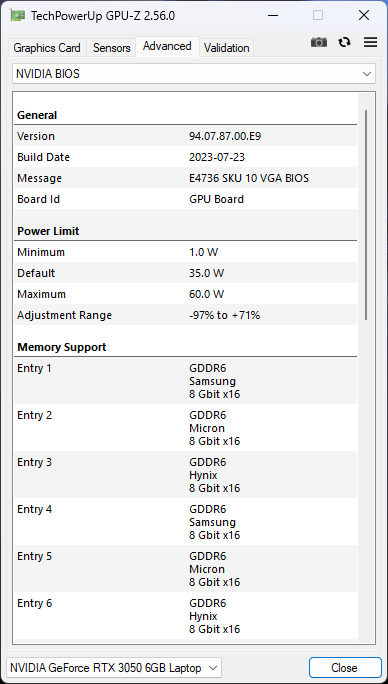
L'applicazione myHP consente agli utenti di scegliere tra due modalità operative: Bilanciata e Performance. La modalità Bilanciata utilizza un PL1 da 50 W, che sale a 60 W nella modalità Performance. Il PL2 in entrambe le modalità ha un limite massimo di 61 W.
La GPU RTX 3050 6 GB funziona in modalità MSHybrid / Optimus per impostazione predefinita, senza possibilità di commutazione MUX.
Abbiamo utilizzato la modalità Performance per tutti i benchmark. Il PL1/PL2 scende a 35 W / 35 W con l'alimentazione a batteria.
Processore
Il Core i7-13700H di Pavilion Plus 16 è ostacolato da un basso valore PL2. Ciò diventa particolarmente evidente nei benchmark multi-core, dove si trova significativamente indietro rispetto a modelli del calibro di Dell Inspiron 16 Plus 7630 che sfoggia un Core i7-13700H da 89 W PL2.
Detto questo, il raffreddamento di Pavilion Plus 16 sembra essere molto efficace nel garantire prestazioni ben sostenute durante il nostro test Cinebench R15 multi-core loop.
Pavilion Plus 16 è in cima alla maggior parte delle classifiche delle CPU single-core, ma il modello Schenker Vision 14 M23 è alle sue calcagna in questi test.
Cinebench R15 Multi Loop
Cinebench R23: Multi Core | Single Core
Cinebench R20: CPU (Multi Core) | CPU (Single Core)
Cinebench R15: CPU Multi 64Bit | CPU Single 64Bit
Blender: v2.79 BMW27 CPU
7-Zip 18.03: 7z b 4 | 7z b 4 -mmt1
Geekbench 6.7: Multi-Core | Single-Core
Geekbench 5.5: Multi-Core | Single-Core
HWBOT x265 Benchmark v2.2: 4k Preset
LibreOffice : 20 Documents To PDF
R Benchmark 2.5: Overall mean
| CPU Performance rating | |
| Media della classe Multimedia | |
| Dell Inspiron 16 Plus 7630 | |
| Media Intel Core i7-13700H | |
| HP Pavilion Plus 16-ab0456tx | |
| Asus VivoBook Pro 16 K6602VU | |
| Samsung Galaxy Book3 Ultra 16 -2! | |
| Schenker Vision 14 M23 RTX 3050 | |
| Asus VivoBook 14X K3405 -2! | |
| Lenovo Slim Pro 7 14ARP8 -2! | |
| Cinebench R23 / Multi Core | |
| Media della classe Multimedia (4861 - 33362, n=76, ultimi 2 anni) | |
| Dell Inspiron 16 Plus 7630 | |
| Samsung Galaxy Book3 Ultra 16 | |
| Media Intel Core i7-13700H (5890 - 20034, n=29) | |
| Asus VivoBook Pro 16 K6602VU | |
| Asus VivoBook 14X K3405 | |
| Schenker Vision 14 M23 RTX 3050 | |
| Lenovo Slim Pro 7 14ARP8 | |
| HP Pavilion Plus 16-ab0456tx | |
| Cinebench R23 / Single Core | |
| Media della classe Multimedia (1128 - 2459, n=68, ultimi 2 anni) | |
| HP Pavilion Plus 16-ab0456tx | |
| Schenker Vision 14 M23 RTX 3050 | |
| Dell Inspiron 16 Plus 7630 | |
| Media Intel Core i7-13700H (1323 - 1914, n=29) | |
| Asus VivoBook Pro 16 K6602VU | |
| Asus VivoBook 14X K3405 | |
| Samsung Galaxy Book3 Ultra 16 | |
| Lenovo Slim Pro 7 14ARP8 | |
| Cinebench R20 / CPU (Multi Core) | |
| Media della classe Multimedia (1887 - 12912, n=59, ultimi 2 anni) | |
| Dell Inspiron 16 Plus 7630 | |
| Samsung Galaxy Book3 Ultra 16 | |
| Media Intel Core i7-13700H (2322 - 7674, n=29) | |
| HP Pavilion Plus 16-ab0456tx | |
| Asus VivoBook Pro 16 K6602VU | |
| Asus VivoBook 14X K3405 | |
| Schenker Vision 14 M23 RTX 3050 | |
| Lenovo Slim Pro 7 14ARP8 | |
| Cinebench R20 / CPU (Single Core) | |
| HP Pavilion Plus 16-ab0456tx | |
| Schenker Vision 14 M23 RTX 3050 | |
| Media della classe Multimedia (425 - 853, n=59, ultimi 2 anni) | |
| Dell Inspiron 16 Plus 7630 | |
| Media Intel Core i7-13700H (508 - 741, n=29) | |
| Asus VivoBook Pro 16 K6602VU | |
| Asus VivoBook 14X K3405 | |
| Samsung Galaxy Book3 Ultra 16 | |
| Lenovo Slim Pro 7 14ARP8 | |
| Cinebench R15 / CPU Multi 64Bit | |
| Media della classe Multimedia (856 - 5224, n=63, ultimi 2 anni) | |
| Samsung Galaxy Book3 Ultra 16 | |
| Asus VivoBook Pro 16 K6602VU | |
| Dell Inspiron 16 Plus 7630 | |
| Media Intel Core i7-13700H (905 - 2982, n=29) | |
| Asus VivoBook 14X K3405 | |
| HP Pavilion Plus 16-ab0456tx | |
| Lenovo Slim Pro 7 14ARP8 | |
| Schenker Vision 14 M23 RTX 3050 | |
| Cinebench R15 / CPU Single 64Bit | |
| Media della classe Multimedia (184.8 - 326, n=61, ultimi 2 anni) | |
| HP Pavilion Plus 16-ab0456tx | |
| Schenker Vision 14 M23 RTX 3050 | |
| Dell Inspiron 16 Plus 7630 | |
| Media Intel Core i7-13700H (213 - 278, n=29) | |
| Asus VivoBook Pro 16 K6602VU | |
| Asus VivoBook 14X K3405 | |
| Samsung Galaxy Book3 Ultra 16 | |
| Lenovo Slim Pro 7 14ARP8 | |
| Blender / v2.79 BMW27 CPU | |
| Schenker Vision 14 M23 RTX 3050 | |
| Media della classe Multimedia (100 - 557, n=60, ultimi 2 anni) | |
| Lenovo Slim Pro 7 14ARP8 | |
| Asus VivoBook 14X K3405 | |
| Media Intel Core i7-13700H (169 - 555, n=29) | |
| Samsung Galaxy Book3 Ultra 16 | |
| Dell Inspiron 16 Plus 7630 | |
| HP Pavilion Plus 16-ab0456tx | |
| Asus VivoBook Pro 16 K6602VU | |
| 7-Zip 18.03 / 7z b 4 | |
| Asus VivoBook Pro 16 K6602VU | |
| HP Pavilion Plus 16-ab0456tx | |
| Samsung Galaxy Book3 Ultra 16 | |
| Media Intel Core i7-13700H (27322 - 76344, n=29) | |
| Dell Inspiron 16 Plus 7630 | |
| Media della classe Multimedia (26062 - 130368, n=57, ultimi 2 anni) | |
| Lenovo Slim Pro 7 14ARP8 | |
| Schenker Vision 14 M23 RTX 3050 | |
| Asus VivoBook 14X K3405 | |
| 7-Zip 18.03 / 7z b 4 -mmt1 | |
| Schenker Vision 14 M23 RTX 3050 | |
| HP Pavilion Plus 16-ab0456tx | |
| Media della classe Multimedia (3666 - 7545, n=58, ultimi 2 anni) | |
| Media Intel Core i7-13700H (4825 - 6238, n=29) | |
| Asus VivoBook Pro 16 K6602VU | |
| Dell Inspiron 16 Plus 7630 | |
| Asus VivoBook 14X K3405 | |
| Samsung Galaxy Book3 Ultra 16 | |
| Lenovo Slim Pro 7 14ARP8 | |
| Geekbench 6.7 / Multi-Core | |
| Media della classe Multimedia (4983 - 29415, n=71, ultimi 2 anni) | |
| Dell Inspiron 16 Plus 7630 | |
| HP Pavilion Plus 16-ab0456tx | |
| Schenker Vision 14 M23 RTX 3050 | |
| Media Intel Core i7-13700H (8415 - 13832, n=13) | |
| Asus VivoBook Pro 16 K6602VU | |
| Geekbench 6.7 / Single-Core | |
| Media della classe Multimedia (1534 - 4335, n=70, ultimi 2 anni) | |
| Schenker Vision 14 M23 RTX 3050 | |
| Dell Inspiron 16 Plus 7630 | |
| HP Pavilion Plus 16-ab0456tx | |
| Media Intel Core i7-13700H (2316 - 2639, n=13) | |
| Asus VivoBook Pro 16 K6602VU | |
| Geekbench 5.5 / Multi-Core | |
| Media della classe Multimedia (4652 - 20422, n=58, ultimi 2 anni) | |
| Dell Inspiron 16 Plus 7630 | |
| Media Intel Core i7-13700H (6165 - 14215, n=29) | |
| Samsung Galaxy Book3 Ultra 16 | |
| HP Pavilion Plus 16-ab0456tx | |
| Schenker Vision 14 M23 RTX 3050 | |
| Asus VivoBook Pro 16 K6602VU | |
| Asus VivoBook 14X K3405 | |
| Lenovo Slim Pro 7 14ARP8 | |
| Geekbench 5.5 / Single-Core | |
| Media della classe Multimedia (805 - 2974, n=58, ultimi 2 anni) | |
| Dell Inspiron 16 Plus 7630 | |
| Schenker Vision 14 M23 RTX 3050 | |
| HP Pavilion Plus 16-ab0456tx | |
| Media Intel Core i7-13700H (1362 - 1919, n=29) | |
| Asus VivoBook Pro 16 K6602VU | |
| Samsung Galaxy Book3 Ultra 16 | |
| Asus VivoBook 14X K3405 | |
| Lenovo Slim Pro 7 14ARP8 | |
| HWBOT x265 Benchmark v2.2 / 4k Preset | |
| Media della classe Multimedia (5.26 - 36.1, n=58, ultimi 2 anni) | |
| Samsung Galaxy Book3 Ultra 16 | |
| Asus VivoBook Pro 16 K6602VU | |
| Media Intel Core i7-13700H (6.72 - 21.2, n=29) | |
| HP Pavilion Plus 16-ab0456tx | |
| Lenovo Slim Pro 7 14ARP8 | |
| Dell Inspiron 16 Plus 7630 | |
| Asus VivoBook 14X K3405 | |
| Schenker Vision 14 M23 RTX 3050 | |
| LibreOffice / 20 Documents To PDF | |
| HP Pavilion Plus 16-ab0456tx | |
| Lenovo Slim Pro 7 14ARP8 | |
| Schenker Vision 14 M23 RTX 3050 | |
| Asus VivoBook Pro 16 K6602VU | |
| Media della classe Multimedia (23.9 - 146.7, n=59, ultimi 2 anni) | |
| Samsung Galaxy Book3 Ultra 16 | |
| Media Intel Core i7-13700H (31.3 - 62.4, n=29) | |
| Asus VivoBook 14X K3405 | |
| Dell Inspiron 16 Plus 7630 | |
| R Benchmark 2.5 / Overall mean | |
| Lenovo Slim Pro 7 14ARP8 | |
| Asus VivoBook 14X K3405 | |
| Samsung Galaxy Book3 Ultra 16 | |
| Asus VivoBook Pro 16 K6602VU | |
| Media Intel Core i7-13700H (0.4308 - 0.607, n=29) | |
| Media della classe Multimedia (0.3604 - 0.947, n=58, ultimi 2 anni) | |
| Schenker Vision 14 M23 RTX 3050 | |
| HP Pavilion Plus 16-ab0456tx | |
| Dell Inspiron 16 Plus 7630 | |
* ... Meglio usare valori piccoli
AIDA64: FP32 Ray-Trace | FPU Julia | CPU SHA3 | CPU Queen | FPU SinJulia | FPU Mandel | CPU AES | CPU ZLib | FP64 Ray-Trace | CPU PhotoWorxx
| Performance rating | |
| Media della classe Multimedia | |
| Asus VivoBook Pro 16 K6602VU | |
| Lenovo Slim Pro 7 14ARP8 | |
| HP Pavilion Plus 16-ab0456tx | |
| Samsung Galaxy Book3 Ultra 16 | |
| Media Intel Core i7-13700H | |
| Dell Inspiron 16 Plus 7630 | |
| Asus VivoBook 14X K3405 | |
| Schenker Vision 14 M23 RTX 3050 | |
| AIDA64 / FP32 Ray-Trace | |
| Media della classe Multimedia (2214 - 50388, n=55, ultimi 2 anni) | |
| Lenovo Slim Pro 7 14ARP8 | |
| HP Pavilion Plus 16-ab0456tx | |
| Samsung Galaxy Book3 Ultra 16 | |
| Media Intel Core i7-13700H (4986 - 18908, n=29) | |
| Dell Inspiron 16 Plus 7630 | |
| Asus VivoBook Pro 16 K6602VU | |
| Asus VivoBook 14X K3405 | |
| Schenker Vision 14 M23 RTX 3050 | |
| AIDA64 / FPU Julia | |
| Lenovo Slim Pro 7 14ARP8 | |
| Media della classe Multimedia (12867 - 201874, n=56, ultimi 2 anni) | |
| HP Pavilion Plus 16-ab0456tx | |
| Asus VivoBook Pro 16 K6602VU | |
| Media Intel Core i7-13700H (25360 - 92359, n=29) | |
| Samsung Galaxy Book3 Ultra 16 | |
| Dell Inspiron 16 Plus 7630 | |
| Asus VivoBook 14X K3405 | |
| Schenker Vision 14 M23 RTX 3050 | |
| AIDA64 / CPU SHA3 | |
| Media della classe Multimedia (626 - 8623, n=56, ultimi 2 anni) | |
| Asus VivoBook 14X K3405 | |
| HP Pavilion Plus 16-ab0456tx | |
| Asus VivoBook Pro 16 K6602VU | |
| Samsung Galaxy Book3 Ultra 16 | |
| Media Intel Core i7-13700H (1339 - 4224, n=29) | |
| Lenovo Slim Pro 7 14ARP8 | |
| Dell Inspiron 16 Plus 7630 | |
| Schenker Vision 14 M23 RTX 3050 | |
| AIDA64 / CPU Queen | |
| Dell Inspiron 16 Plus 7630 | |
| Samsung Galaxy Book3 Ultra 16 | |
| HP Pavilion Plus 16-ab0456tx | |
| Media Intel Core i7-13700H (59324 - 107159, n=29) | |
| Asus VivoBook Pro 16 K6602VU | |
| Lenovo Slim Pro 7 14ARP8 | |
| Schenker Vision 14 M23 RTX 3050 | |
| Asus VivoBook 14X K3405 | |
| Media della classe Multimedia (13483 - 181505, n=43, ultimi 2 anni) | |
| AIDA64 / FPU SinJulia | |
| Lenovo Slim Pro 7 14ARP8 | |
| HP Pavilion Plus 16-ab0456tx | |
| Samsung Galaxy Book3 Ultra 16 | |
| Media della classe Multimedia (886 - 28794, n=56, ultimi 2 anni) | |
| Dell Inspiron 16 Plus 7630 | |
| Asus VivoBook Pro 16 K6602VU | |
| Media Intel Core i7-13700H (4800 - 11050, n=29) | |
| Schenker Vision 14 M23 RTX 3050 | |
| Asus VivoBook 14X K3405 | |
| AIDA64 / FPU Mandel | |
| Lenovo Slim Pro 7 14ARP8 | |
| Media della classe Multimedia (6395 - 105740, n=55, ultimi 2 anni) | |
| HP Pavilion Plus 16-ab0456tx | |
| Samsung Galaxy Book3 Ultra 16 | |
| Media Intel Core i7-13700H (12321 - 45118, n=29) | |
| Asus VivoBook Pro 16 K6602VU | |
| Dell Inspiron 16 Plus 7630 | |
| Asus VivoBook 14X K3405 | |
| Schenker Vision 14 M23 RTX 3050 | |
| AIDA64 / CPU AES | |
| Asus VivoBook Pro 16 K6602VU | |
| Asus VivoBook 14X K3405 | |
| Media Intel Core i7-13700H (28769 - 151254, n=29) | |
| HP Pavilion Plus 16-ab0456tx | |
| Samsung Galaxy Book3 Ultra 16 | |
| Media della classe Multimedia (8171 - 126790, n=56, ultimi 2 anni) | |
| Dell Inspiron 16 Plus 7630 | |
| Schenker Vision 14 M23 RTX 3050 | |
| Lenovo Slim Pro 7 14ARP8 | |
| AIDA64 / CPU ZLib | |
| Samsung Galaxy Book3 Ultra 16 | |
| Media della classe Multimedia (143.8 - 2022, n=56, ultimi 2 anni) | |
| HP Pavilion Plus 16-ab0456tx | |
| Asus VivoBook Pro 16 K6602VU | |
| Media Intel Core i7-13700H (389 - 1215, n=29) | |
| Asus VivoBook 14X K3405 | |
| Dell Inspiron 16 Plus 7630 | |
| Schenker Vision 14 M23 RTX 3050 | |
| Lenovo Slim Pro 7 14ARP8 | |
| AIDA64 / FP64 Ray-Trace | |
| Media della classe Multimedia (1014 - 26875, n=56, ultimi 2 anni) | |
| HP Pavilion Plus 16-ab0456tx | |
| Lenovo Slim Pro 7 14ARP8 | |
| Samsung Galaxy Book3 Ultra 16 | |
| Asus VivoBook Pro 16 K6602VU | |
| Media Intel Core i7-13700H (2540 - 10135, n=29) | |
| Dell Inspiron 16 Plus 7630 | |
| Asus VivoBook 14X K3405 | |
| Schenker Vision 14 M23 RTX 3050 | |
| AIDA64 / CPU PhotoWorxx | |
| Media della classe Multimedia (8187 - 88154, n=56, ultimi 2 anni) | |
| Samsung Galaxy Book3 Ultra 16 | |
| Schenker Vision 14 M23 RTX 3050 | |
| HP Pavilion Plus 16-ab0456tx | |
| Media Intel Core i7-13700H (12872 - 52727, n=29) | |
| Asus VivoBook Pro 16 K6602VU | |
| Dell Inspiron 16 Plus 7630 | |
| Lenovo Slim Pro 7 14ARP8 | |
| Asus VivoBook 14X K3405 | |
Scopra il nostro sito dedicato Intel Core i7-13700H per ulteriori confronti sulle prestazioni.
Prestazioni del sistema
Il Pavilion Plus 16 riesce in qualche modo a superare il VivoBook Pro 16 con un Core i9-13900H e RTX 4050 nei test CrossMark complessivi, ma perde contro quest'ultimo in PCMark 10 del 6%.
Per il resto, il sistema è abbastanza reattivo per la produttività quotidiana e la navigazione web.
CrossMark: Overall | Productivity | Creativity | Responsiveness
AIDA64: Memory Copy | Memory Read | Memory Write | Memory Latency
WebXPRT 3: Overall
WebXPRT 4: Overall
Mozilla Kraken 1.1: Total
| PCMark 10 / Score | |
| Media della classe Multimedia (4325 - 10386, n=54, ultimi 2 anni) | |
| Dell Inspiron 16 Plus 7630 | |
| Asus VivoBook Pro 16 K6602VU | |
| Samsung Galaxy Book3 Ultra 16 | |
| Asus VivoBook 14X K3405 | |
| HP Pavilion Plus 16-ab0456tx | |
| Media Intel Core i7-13700H, NVIDIA GeForce RTX 3050 6GB Laptop GPU (6290 - 6597, n=2) | |
| Lenovo Slim Pro 7 14ARP8 | |
| Schenker Vision 14 M23 RTX 3050 | |
| PCMark 10 / Essentials | |
| Dell Inspiron 16 Plus 7630 | |
| Samsung Galaxy Book3 Ultra 16 | |
| Media della classe Multimedia (8025 - 11664, n=53, ultimi 2 anni) | |
| Asus VivoBook Pro 16 K6602VU | |
| Asus VivoBook 14X K3405 | |
| HP Pavilion Plus 16-ab0456tx | |
| Media Intel Core i7-13700H, NVIDIA GeForce RTX 3050 6GB Laptop GPU (9943 - 10112, n=2) | |
| Lenovo Slim Pro 7 14ARP8 | |
| Schenker Vision 14 M23 RTX 3050 | |
| PCMark 10 / Productivity | |
| Media della classe Multimedia (7323 - 18233, n=53, ultimi 2 anni) | |
| Dell Inspiron 16 Plus 7630 | |
| Asus VivoBook 14X K3405 | |
| Schenker Vision 14 M23 RTX 3050 | |
| Media Intel Core i7-13700H, NVIDIA GeForce RTX 3050 6GB Laptop GPU (8803 - 8950, n=2) | |
| HP Pavilion Plus 16-ab0456tx | |
| Asus VivoBook Pro 16 K6602VU | |
| Samsung Galaxy Book3 Ultra 16 | |
| Lenovo Slim Pro 7 14ARP8 | |
| PCMark 10 / Digital Content Creation | |
| Dell Inspiron 16 Plus 7630 | |
| Asus VivoBook Pro 16 K6602VU | |
| Media della classe Multimedia (3651 - 16240, n=53, ultimi 2 anni) | |
| Samsung Galaxy Book3 Ultra 16 | |
| Lenovo Slim Pro 7 14ARP8 | |
| HP Pavilion Plus 16-ab0456tx | |
| Asus VivoBook 14X K3405 | |
| Media Intel Core i7-13700H, NVIDIA GeForce RTX 3050 6GB Laptop GPU (7590 - 8752, n=2) | |
| Schenker Vision 14 M23 RTX 3050 | |
| CrossMark / Overall | |
| Media della classe Multimedia (866 - 2728, n=62, ultimi 2 anni) | |
| Dell Inspiron 16 Plus 7630 | |
| HP Pavilion Plus 16-ab0456tx | |
| Asus VivoBook Pro 16 K6602VU | |
| Asus VivoBook 14X K3405 | |
| Media Intel Core i7-13700H, NVIDIA GeForce RTX 3050 6GB Laptop GPU (1504 - 1752, n=2) | |
| Samsung Galaxy Book3 Ultra 16 | |
| Schenker Vision 14 M23 RTX 3050 | |
| Lenovo Slim Pro 7 14ARP8 | |
| CrossMark / Productivity | |
| Media della classe Multimedia (931 - 2489, n=62, ultimi 2 anni) | |
| Dell Inspiron 16 Plus 7630 | |
| Asus VivoBook Pro 16 K6602VU | |
| HP Pavilion Plus 16-ab0456tx | |
| Asus VivoBook 14X K3405 | |
| Media Intel Core i7-13700H, NVIDIA GeForce RTX 3050 6GB Laptop GPU (1417 - 1657, n=2) | |
| Samsung Galaxy Book3 Ultra 16 | |
| Schenker Vision 14 M23 RTX 3050 | |
| Lenovo Slim Pro 7 14ARP8 | |
| CrossMark / Creativity | |
| Media della classe Multimedia (907 - 3465, n=62, ultimi 2 anni) | |
| Dell Inspiron 16 Plus 7630 | |
| HP Pavilion Plus 16-ab0456tx | |
| Asus VivoBook Pro 16 K6602VU | |
| Media Intel Core i7-13700H, NVIDIA GeForce RTX 3050 6GB Laptop GPU (1711 - 1970, n=2) | |
| Schenker Vision 14 M23 RTX 3050 | |
| Asus VivoBook 14X K3405 | |
| Samsung Galaxy Book3 Ultra 16 | |
| Lenovo Slim Pro 7 14ARP8 | |
| CrossMark / Responsiveness | |
| Dell Inspiron 16 Plus 7630 | |
| Media della classe Multimedia (605 - 2024, n=62, ultimi 2 anni) | |
| Asus VivoBook Pro 16 K6602VU | |
| Samsung Galaxy Book3 Ultra 16 | |
| Asus VivoBook 14X K3405 | |
| HP Pavilion Plus 16-ab0456tx | |
| Media Intel Core i7-13700H, NVIDIA GeForce RTX 3050 6GB Laptop GPU (1220 - 1458, n=2) | |
| Schenker Vision 14 M23 RTX 3050 | |
| Lenovo Slim Pro 7 14ARP8 | |
| AIDA64 / Memory Copy | |
| Media della classe Multimedia (11299 - 132135, n=56, ultimi 2 anni) | |
| Samsung Galaxy Book3 Ultra 16 | |
| Schenker Vision 14 M23 RTX 3050 | |
| Media Intel Core i7-13700H, NVIDIA GeForce RTX 3050 6GB Laptop GPU (64356 - 65837, n=2) | |
| HP Pavilion Plus 16-ab0456tx | |
| Dell Inspiron 16 Plus 7630 | |
| Asus VivoBook Pro 16 K6602VU | |
| Lenovo Slim Pro 7 14ARP8 | |
| Asus VivoBook 14X K3405 | |
| AIDA64 / Memory Read | |
| Media della classe Multimedia (11624 - 174586, n=56, ultimi 2 anni) | |
| Schenker Vision 14 M23 RTX 3050 | |
| Samsung Galaxy Book3 Ultra 16 | |
| Media Intel Core i7-13700H, NVIDIA GeForce RTX 3050 6GB Laptop GPU (65825 - 70861, n=2) | |
| Dell Inspiron 16 Plus 7630 | |
| Asus VivoBook Pro 16 K6602VU | |
| HP Pavilion Plus 16-ab0456tx | |
| Lenovo Slim Pro 7 14ARP8 | |
| Asus VivoBook 14X K3405 | |
| AIDA64 / Memory Write | |
| Samsung Galaxy Book3 Ultra 16 | |
| Media della classe Multimedia (11755 - 134998, n=56, ultimi 2 anni) | |
| HP Pavilion Plus 16-ab0456tx | |
| Media Intel Core i7-13700H, NVIDIA GeForce RTX 3050 6GB Laptop GPU (68174 - 76930, n=2) | |
| Schenker Vision 14 M23 RTX 3050 | |
| Asus VivoBook Pro 16 K6602VU | |
| Dell Inspiron 16 Plus 7630 | |
| Lenovo Slim Pro 7 14ARP8 | |
| Asus VivoBook 14X K3405 | |
| AIDA64 / Memory Latency | |
| Media della classe Multimedia (7 - 535, n=55, ultimi 2 anni) | |
| Lenovo Slim Pro 7 14ARP8 | |
| Samsung Galaxy Book3 Ultra 16 | |
| Dell Inspiron 16 Plus 7630 | |
| Asus VivoBook Pro 16 K6602VU | |
| HP Pavilion Plus 16-ab0456tx | |
| Asus VivoBook 14X K3405 | |
| Media Intel Core i7-13700H, NVIDIA GeForce RTX 3050 6GB Laptop GPU (85.7 - 89.7, n=2) | |
| Schenker Vision 14 M23 RTX 3050 | |
| WebXPRT 3 / Overall | |
| Media della classe Multimedia (136.4 - 596, n=65, ultimi 2 anni) | |
| Dell Inspiron 16 Plus 7630 | |
| Schenker Vision 14 M23 RTX 3050 | |
| Media Intel Core i7-13700H, NVIDIA GeForce RTX 3050 6GB Laptop GPU (286 - 300, n=2) | |
| HP Pavilion Plus 16-ab0456tx | |
| Asus VivoBook 14X K3405 | |
| Lenovo Slim Pro 7 14ARP8 | |
| Samsung Galaxy Book3 Ultra 16 | |
| WebXPRT 4 / Overall | |
| Schenker Vision 14 M23 RTX 3050 | |
| Media Intel Core i7-13700H, NVIDIA GeForce RTX 3050 6GB Laptop GPU (273 - 325, n=2) | |
| Media della classe Multimedia (167.3 - 402, n=67, ultimi 2 anni) | |
| Dell Inspiron 16 Plus 7630 | |
| HP Pavilion Plus 16-ab0456tx | |
| Asus VivoBook 14X K3405 | |
| Asus VivoBook Pro 16 K6602VU | |
| Samsung Galaxy Book3 Ultra 16 | |
| Lenovo Slim Pro 7 14ARP8 | |
| Mozilla Kraken 1.1 / Total | |
| Lenovo Slim Pro 7 14ARP8 | |
| Samsung Galaxy Book3 Ultra 16 | |
| Asus VivoBook 14X K3405 | |
| Asus VivoBook Pro 16 K6602VU | |
| Dell Inspiron 16 Plus 7630 | |
| Schenker Vision 14 M23 RTX 3050 | |
| Media Intel Core i7-13700H, NVIDIA GeForce RTX 3050 6GB Laptop GPU (490 - 496, n=2) | |
| HP Pavilion Plus 16-ab0456tx | |
| Media della classe Multimedia (228 - 835, n=68, ultimi 2 anni) | |
* ... Meglio usare valori piccoli
| PCMark 8 Home Score Accelerated v2 | 5525 punti | |
| PCMark 8 Work Score Accelerated v2 | 5653 punti | |
| PCMark 10 Score | 6597 punti | |
Aiuto | ||
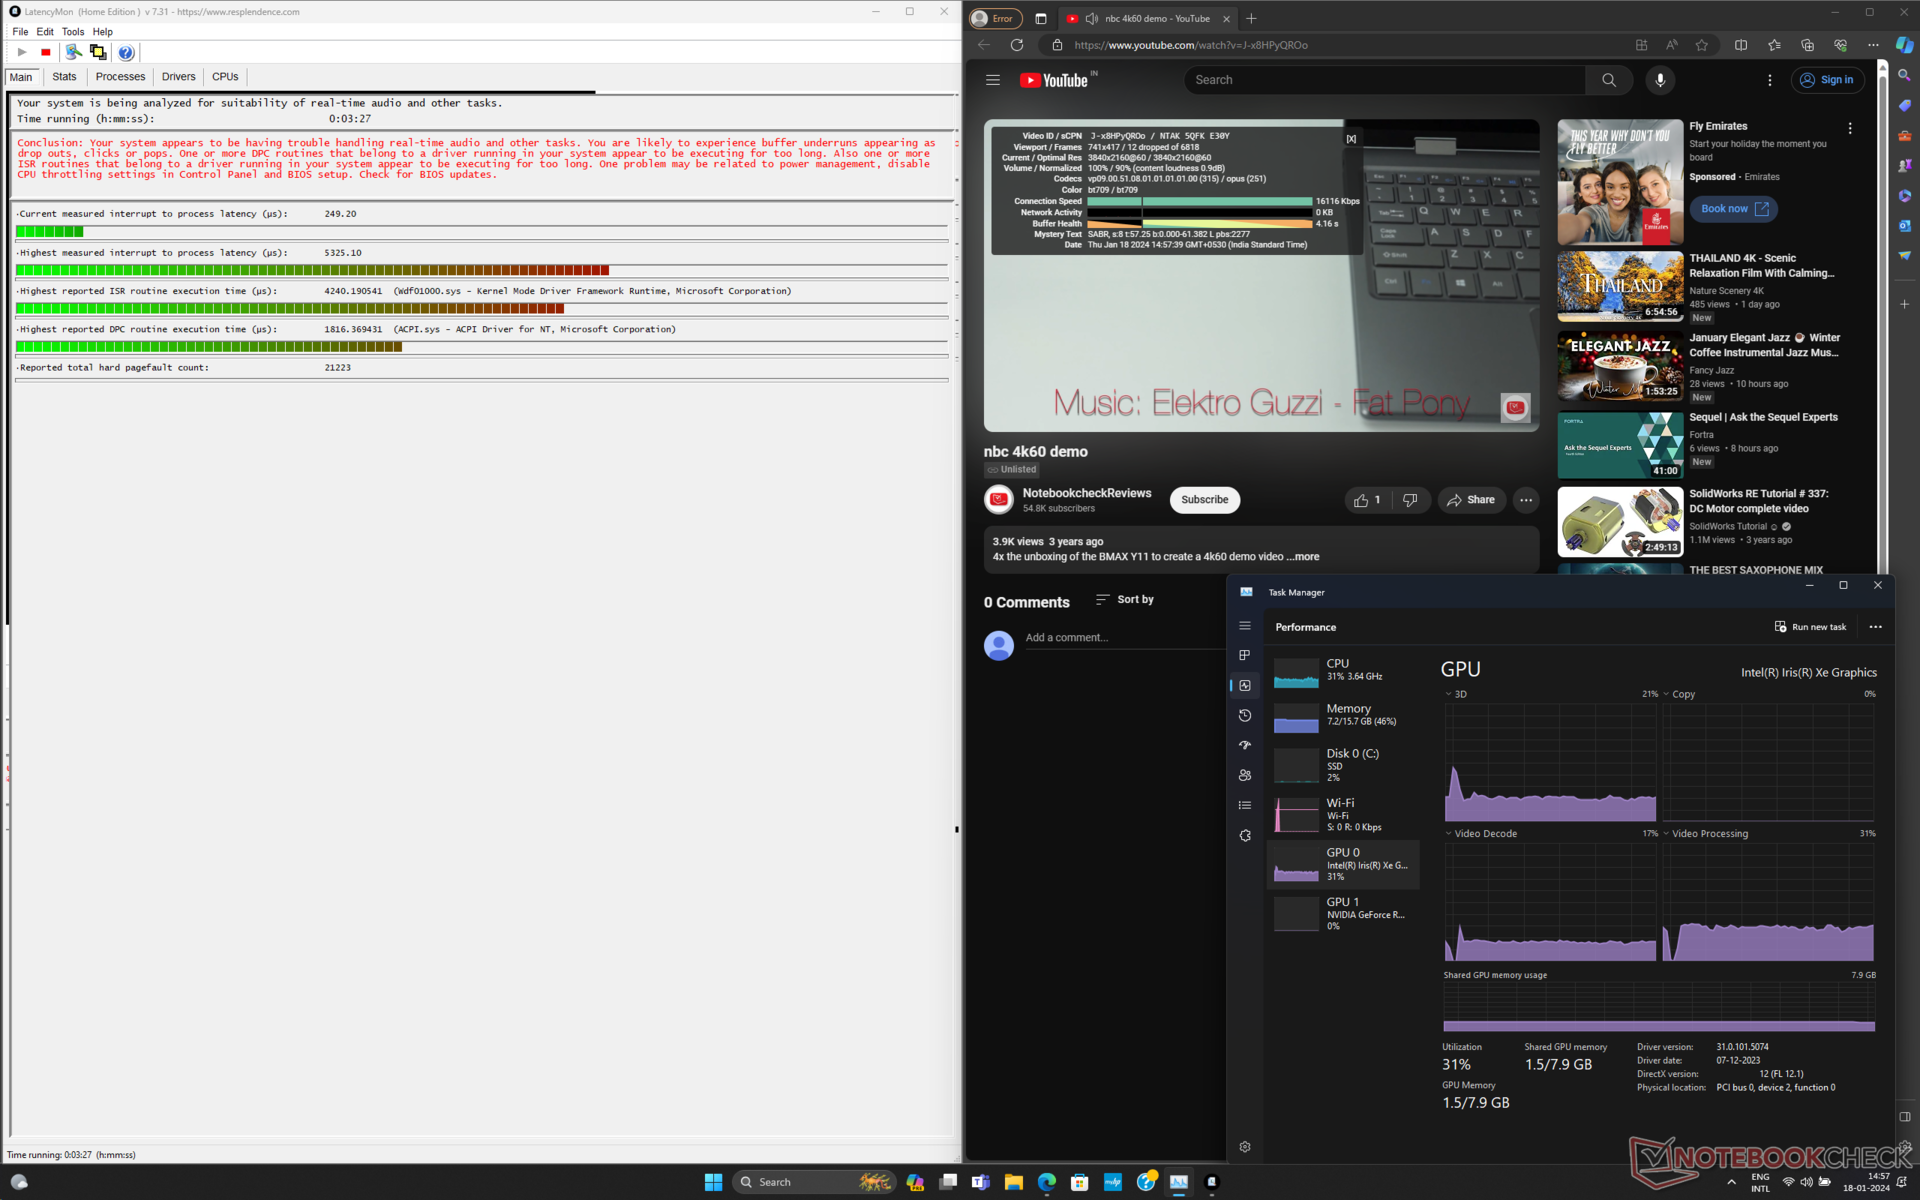
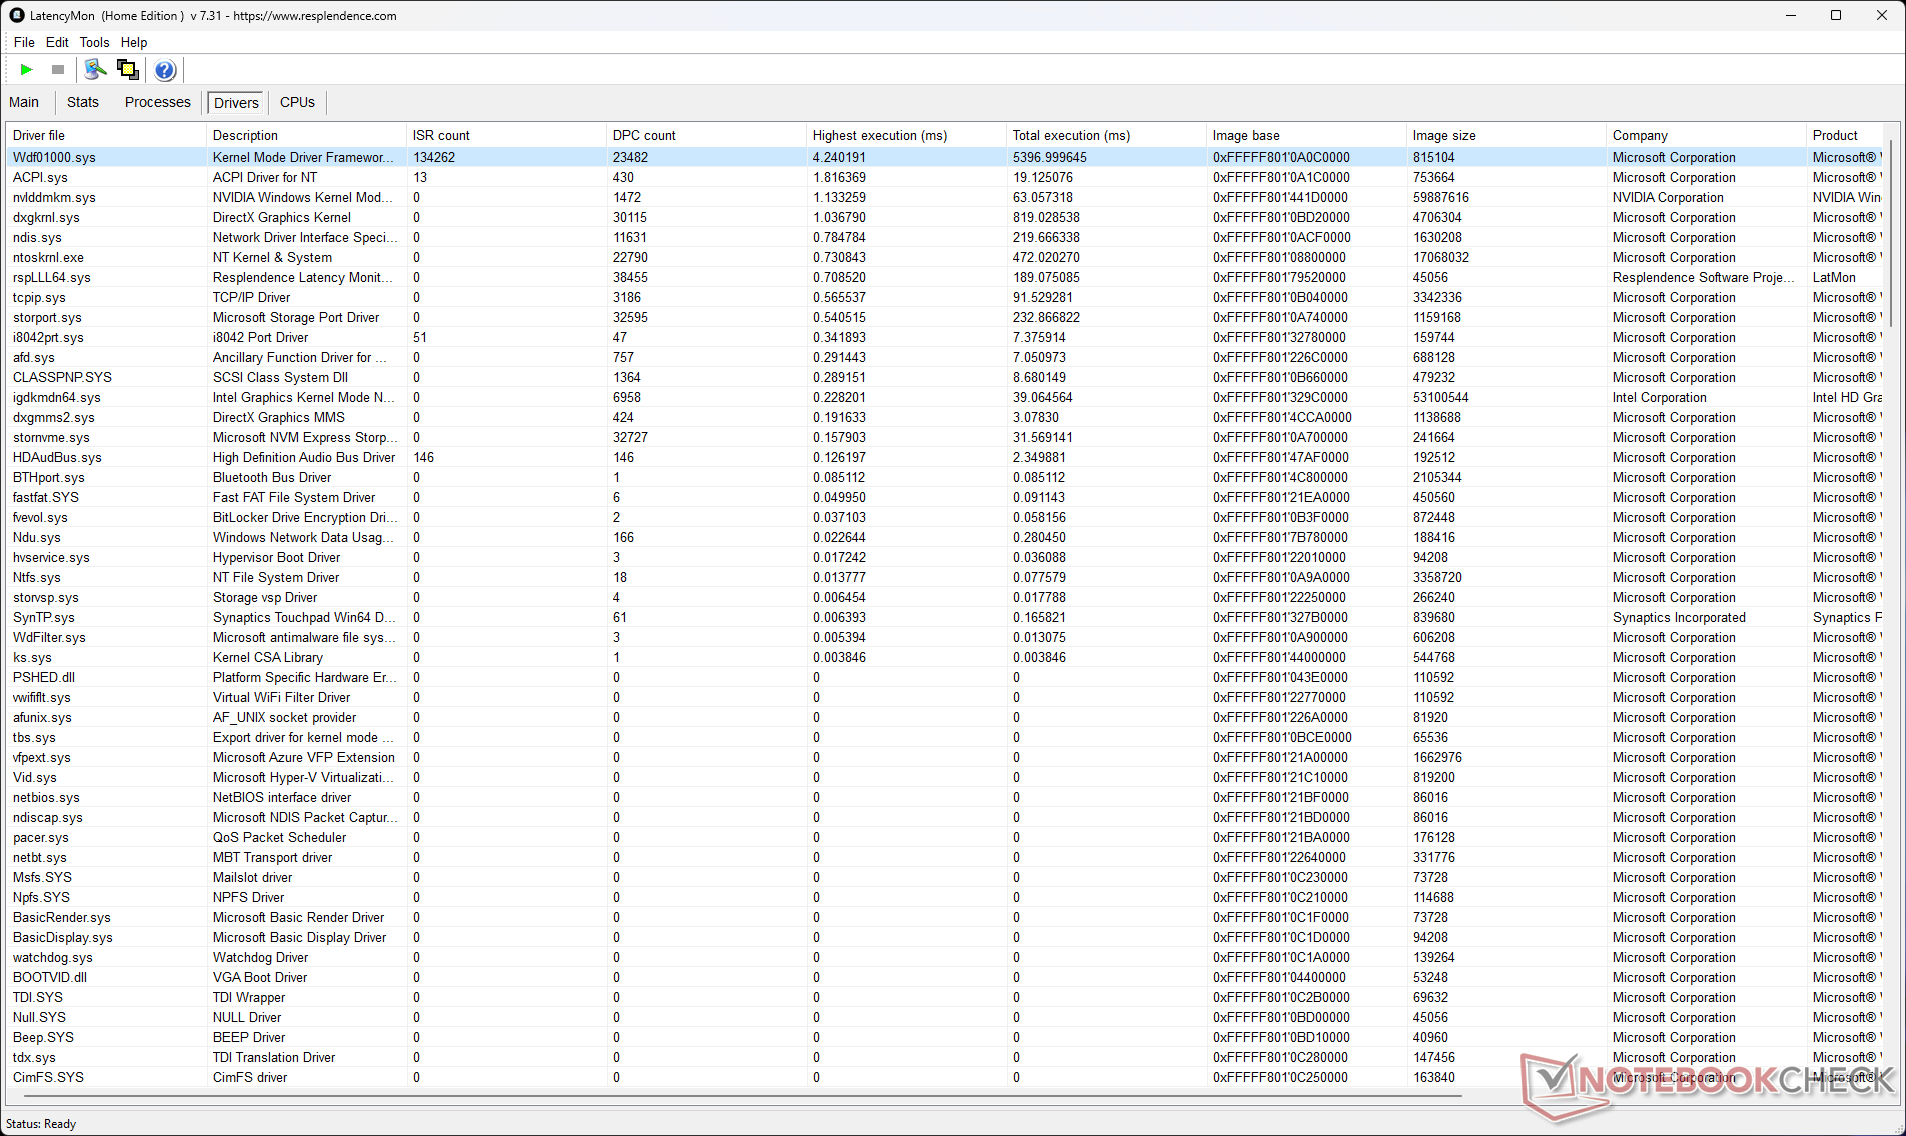
Latenza DPC
La latenza interrupt-to-process misurata da Pavilion Plus 16, pari a 5325,1 μs, è più alta, il che può essere un problema per chi lavora con flussi audio e video in tempo reale.
| DPC Latencies / LatencyMon - interrupt to process latency (max), Web, Youtube, Prime95 | |
| HP Pavilion Plus 16-ab0456tx | |
| Samsung Galaxy Book3 Ultra 16 | |
| Asus VivoBook Pro 16 K6602VU | |
| Schenker Vision 14 M23 RTX 3050 | |
| Lenovo Slim Pro 7 14ARP8 | |
| Asus VivoBook 14X K3405 | |
| Dell Inspiron 16 Plus 7630 | |
* ... Meglio usare valori piccoli
Il nostro Classifica della latenza DPC offre ulteriori confronti di latenza tra i dispositivi recensiti.
Dispositivi di archiviazione
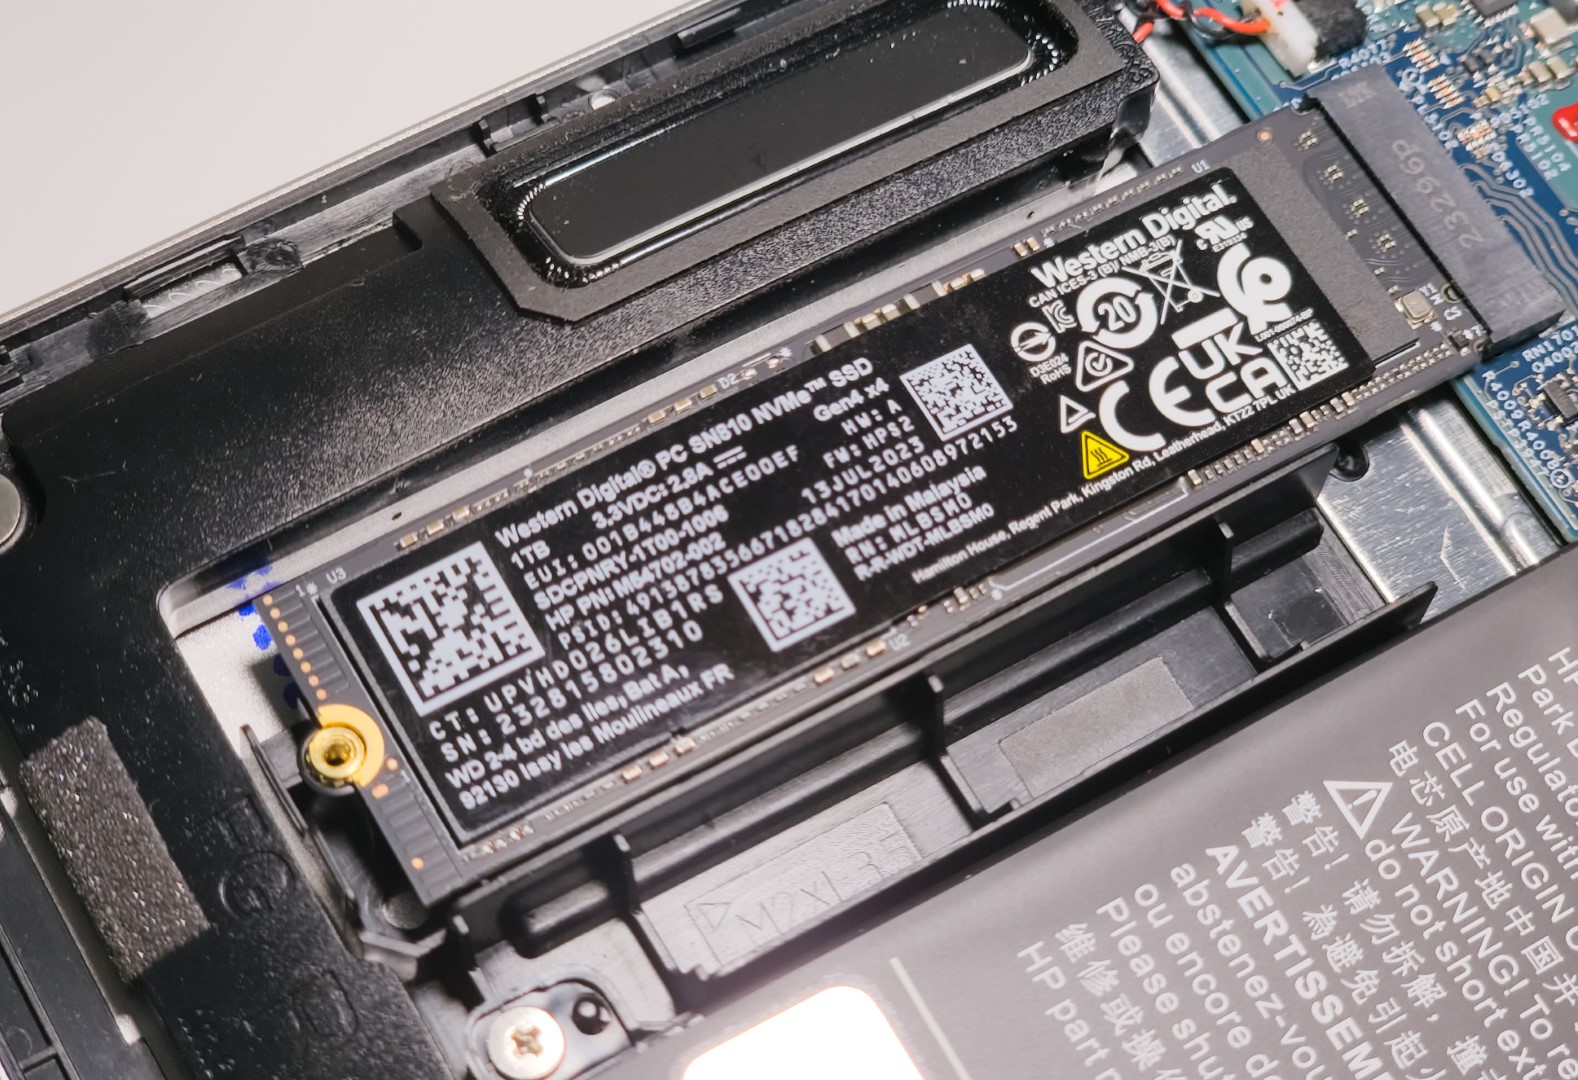
Un'unità Western Digital PC SN810 1 TB NVMe viene installata nella nostra unità Pavilion Plus 16. Le prestazioni cumulative dell'unità sono circa il 10% più lente rispetto a Samsung 990 Pro nell'unità Schenker Vision 14 M23 e circa il 16% più lente rispetto a Samsung PM9A1 nell'unità Samsung Galaxy Book3 Ultra 16.
Le minori prestazioni di lettura/scrittura 4K contribuiscono principalmente a questo deficit di prestazioni.
Purtroppo, nello chassis è possibile installare solo un SSD. Non c'è nemmeno la possibilità di aggiungere unità da 2,5 pollici.

* ... Meglio usare valori piccoli
Strozzatura del disco: DiskSpd Lettura in loop, Profondità coda 8
Sebbene HP fornisca una copertura termica per l'SSD, a quanto pare non è sufficiente per evitare che l'unità vada in throttling dopo il 25° ciclo durante il nostro test di lettura DiskSpd con una profondità di coda di 8.
Altri benchmark di archiviazione sono disponibili nella nostra Pagina di confronto SSD.
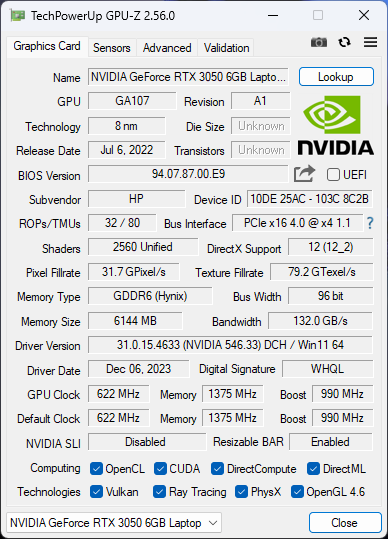
Prestazioni della GPU
Il notebook Pavilion Plus 16 è l'unico altro portatile che abbiamo testato ad avere la nuova GPU RTX 3050 6 GB Laptop, oltre a Lenovo Slim Pro 7 e a Schenker Vision 14 M23.
La RTX 3050 6 GB nel notebook HP è valutata con un TGP di 60 W, mentre Schenker e Lenovo presentano implementazioni da 50 W e 63 W, rispettivamente.
Di conseguenza, lo Slim 7 Pro ha un leggero vantaggio nelle prestazioni cumulative 3DMark rispetto a Pavilion Plus 16, mentre il Vision 14 M23 è inferiore all'HP del 5%.
| 3DMark 11 Performance | 17282 punti | |
| 3DMark Ice Storm Standard Score | 82182 punti | |
| 3DMark Cloud Gate Standard Score | 43015 punti | |
| 3DMark Fire Strike Score | 10890 punti | |
| 3DMark Fire Strike Extreme Score | 5641 punti | |
Aiuto | ||
| Blender / v3.3 Classroom OPTIX/RTX | |
| Asus VivoBook 14X K3405 | |
| Schenker Vision 14 M23 RTX 3050 | |
| Media NVIDIA GeForce RTX 3050 4GB Laptop GPU (53 - 99, n=12) | |
| Lenovo Slim Pro 7 14ARP8 | |
| HP Pavilion Plus 16-ab0456tx | |
| Media della classe Multimedia (12 - 105, n=23, ultimi 2 anni) | |
| Samsung Galaxy Book3 Ultra 16 | |
| Asus VivoBook Pro 16 K6602VU | |
| Dell Inspiron 16 Plus 7630 | |
| Blender / v3.3 Classroom CUDA | |
| Asus VivoBook 14X K3405 | |
| Asus VivoBook 14X K3405 | |
| Media NVIDIA GeForce RTX 3050 4GB Laptop GPU (97 - 152, n=13) | |
| Schenker Vision 14 M23 RTX 3050 | |
| Lenovo Slim Pro 7 14ARP8 | |
| HP Pavilion Plus 16-ab0456tx | |
| Samsung Galaxy Book3 Ultra 16 | |
| Media della classe Multimedia (20 - 186, n=23, ultimi 2 anni) | |
| Asus VivoBook Pro 16 K6602VU | |
| Dell Inspiron 16 Plus 7630 | |
| Blender / v3.3 Classroom CPU | |
| Media NVIDIA GeForce RTX 3050 4GB Laptop GPU (388 - 937, n=11) | |
| Schenker Vision 14 M23 RTX 3050 | |
| Asus VivoBook 14X K3405 | |
| Lenovo Slim Pro 7 14ARP8 | |
| Dell Inspiron 16 Plus 7630 | |
| Media della classe Multimedia (134.5 - 1042, n=63, ultimi 2 anni) | |
| Samsung Galaxy Book3 Ultra 16 | |
| HP Pavilion Plus 16-ab0456tx | |
| Asus VivoBook Pro 16 K6602VU | |
* ... Meglio usare valori piccoli
Prestazioni di gioco
Vediamo un vantaggio cumulativo del 10% circa nel gioco a 1080p con la RTX 3050 6 GB rispetto alla RTX 3050 4 GB media.
La RTX 3050 di Pavilion Plus 16 mostra un buon guadagno nelle prestazioni di gioco a 1080p cumulative rispetto a Slim Pro 7 e al Vision 14 M23, mentre rimane indietro del 25% rispetto alla GPU RTX 4050 Laptop da 65 W del VivoBook Pro 16.
È interessante notare che Pavilion Plus 16 è anche in grado di superare Galaxy Book3 Ultra 16 con RTX 4050 nel gioco complessivo, ma ciò è dovuto alle scarse prestazioni di quest'ultimo in Dota 2 Reborn e X-Plane 11.
La RTX 3050 6 GB è in grado di riprodurre i titoli più vecchi senza problemi a 1080p Ultra, ma i giochi AAA moderni faticano a superare le impostazioni 1080p High.
Il grafico FPS di Witcher 3
Non abbiamo osservato alcun throttling percepibile durante un test di stress con The Witcher 3 a 1080p Ultra, il che indica un raffreddamento efficiente.
| basso | medio | alto | ultra | QHD | |
|---|---|---|---|---|---|
| GTA V (2015) | 177.9 | 172 | 123.3 | 62.7 | 42.7 |
| The Witcher 3 (2015) | 244 | 159.1 | 91.4 | 50.1 | 37 |
| Dota 2 Reborn (2015) | 155.2 | 131 | 124.2 | 116.9 | |
| Final Fantasy XV Benchmark (2018) | 128.2 | 70.9 | 52 | 37.4 | |
| X-Plane 11.11 (2018) | 140.6 | 117 | 97.3 | ||
| Far Cry 5 (2018) | 89 | 82 | 76 | 52 | |
| Strange Brigade (2018) | 256 | 112.8 | 91.9 | 80.5 | 57.1 |
| F1 22 (2022) | 150.2 | 145.3 | 109.5 | 34 | 20.1 |
| F1 23 (2023) | 150.1 | 141.2 | 97.5 | 26 | 14.3 |
| Cyberpunk 2077 (2023) | 67.6 | 52.1 | 43.2 | 36.9 | 21.3 |
| Assassin's Creed Mirage (2023) | 70 | 63 | 55 | 41 | 31 |
| Avatar Frontiers of Pandora (2023) | 39.5 | 36.3 | 31.5 | 23.4 | 15.1 |
Faccia riferimento al nostro sito dedicato GPU Nvidia GeForce RTX 3050 6 GB per computer portatili per maggiori informazioni.
Emissioni: Rumore della ventola tollerabile, ma temperature superficiali elevate sotto carico
Rumore del sistema
Abbiamo misurato un livello di pressione sonora (SPL) di 42,1 dB(A) nella modalità Performance sotto carico massimo. Sembra che HP abbia fissato dei limiti per il rumore della ventola, in modo da rimanere sotto i 35 db(A) in modalità Bilanciata e i 45 dB(A) in modalità Prestazioni.
Rumorosità
| Idle |
| 22.22 / 22.22 / 22.22 dB(A) |
| Sotto carico |
| 42.03 / 42.1 dB(A) |
 | ||
30 dB silenzioso 40 dB(A) udibile 50 dB(A) rumoroso |
||
min: | ||
| Modalità di prestazioni | Inattivo dB(A) | Carico medio dB(A) | Carico massimo dB(A) | Il Witcher 3 1080p Ultra dB(A) |
|---|---|---|---|---|
| Bilanciato | 22,22 | 33,81 | 34,08 | 34,41 / 48 fps |
| Prestazioni | 22,22 | 42,03 | 42,1 | 42,1 / 50 fps |
| HP Pavilion Plus 16-ab0456tx i7-13700H, GeForce RTX 3050 6GB Laptop GPU | Schenker Vision 14 M23 RTX 3050 i7-13700H, GeForce RTX 3050 6GB Laptop GPU | Dell Inspiron 16 Plus 7630 i7-13700H, GeForce RTX 4060 Laptop GPU | Asus VivoBook 14X K3405 i5-13500H, GeForce RTX 3050 4GB Laptop GPU | Lenovo Slim Pro 7 14ARP8 R7 7735HS, GeForce RTX 3050 6GB Laptop GPU | Asus VivoBook Pro 16 K6602VU i9-13900H, GeForce RTX 4050 Laptop GPU | Samsung Galaxy Book3 Ultra 16 i7-13700H, GeForce RTX 4050 Laptop GPU | |
|---|---|---|---|---|---|---|---|
| Noise | -10% | -7% | -10% | -4% | -14% | -9% | |
| off /ambiente * (dB) | 22.22 | 23.5 -6% | 23.2 -4% | 21.46 3% | 22.7 -2% | 20.96 6% | 25 -13% |
| Idle Minimum * (dB) | 22.22 | 23.5 -6% | 23.2 -4% | 22.08 1% | 22.8 -3% | 25.28 -14% | 26 -17% |
| Idle Average * (dB) | 22.22 | 23.5 -6% | 23.2 -4% | 22.08 1% | 22.8 -3% | 25.28 -14% | 27 -22% |
| Idle Maximum * (dB) | 22.22 | 26 -17% | 23.2 -4% | 22.08 1% | 22.8 -3% | 25.28 -14% | 28 -26% |
| Load Average * (dB) | 42.03 | 43.6 -4% | 35.1 16% | 52.98 -26% | 43.8 -4% | 51.88 -23% | 40 5% |
| Witcher 3 ultra * (dB) | 42.1 | 48.7 -16% | 52.5 -25% | 52.7 -25% | 43.8 -4% | 49 -16% | 39 7% |
| Load Maximum * (dB) | 42.1 | 49.1 -17% | 52.5 -25% | 52.67 -25% | 47.1 -12% | 51.8 -23% | 41 3% |
* ... Meglio usare valori piccoli
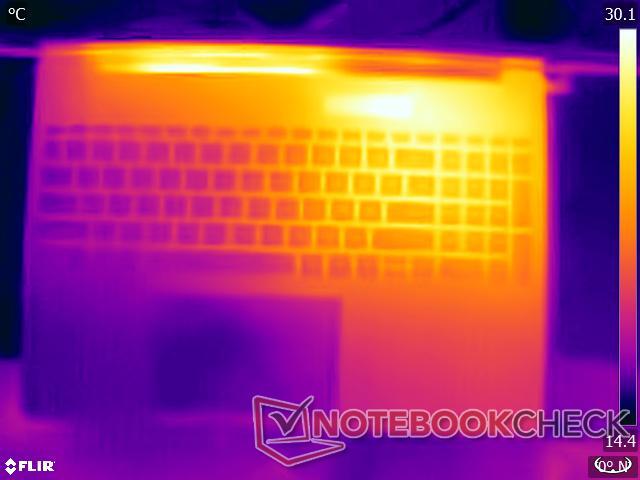
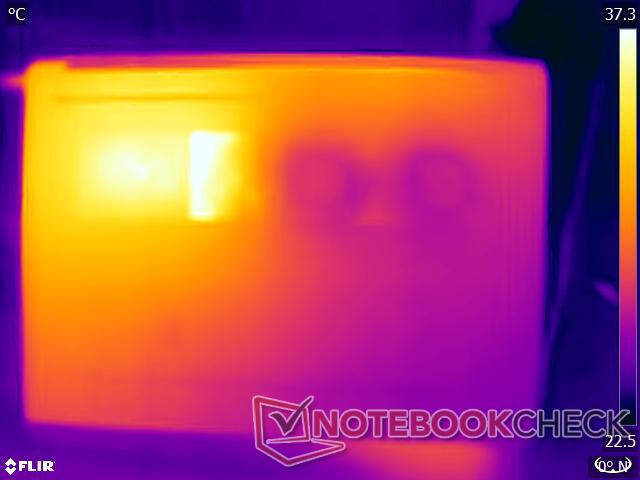
Temperatura
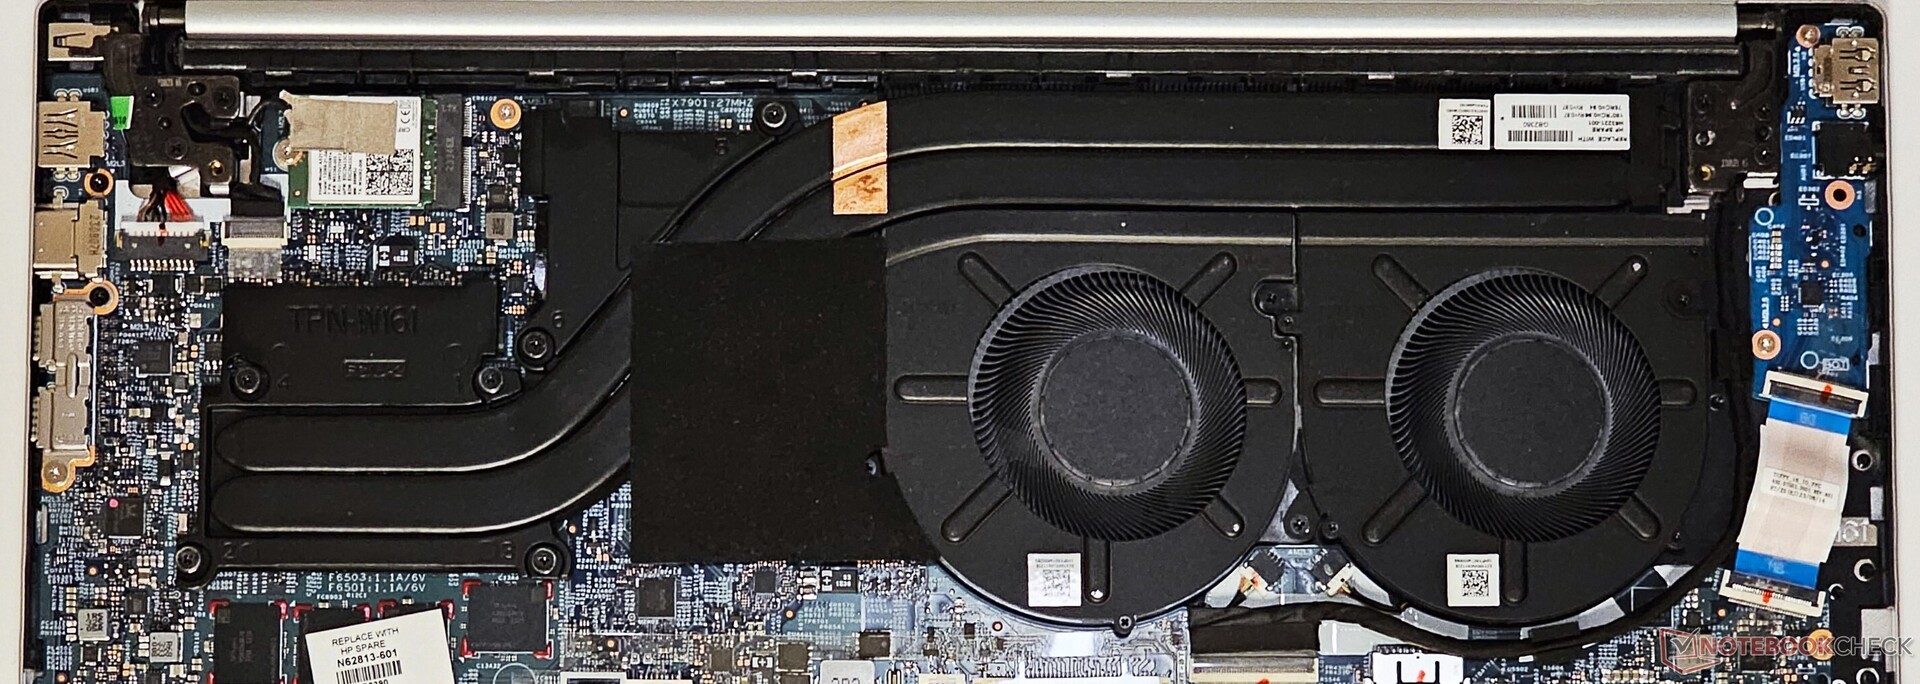
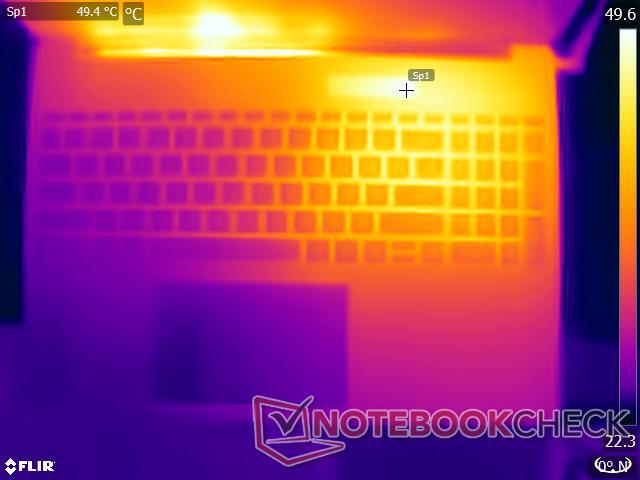
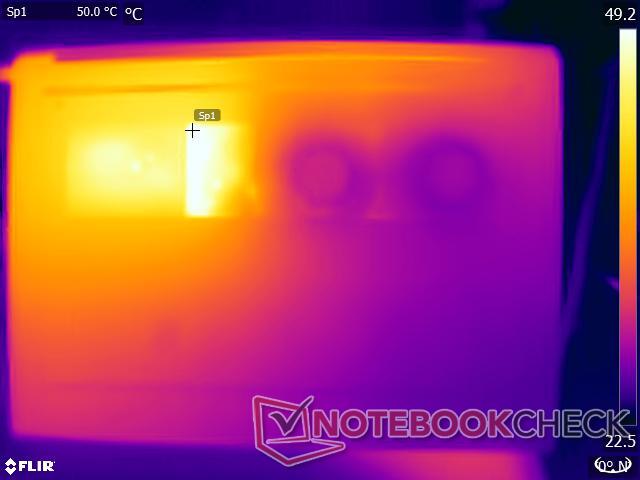
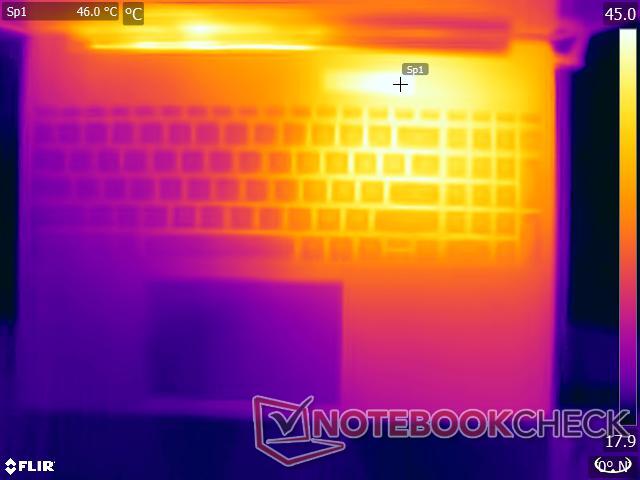
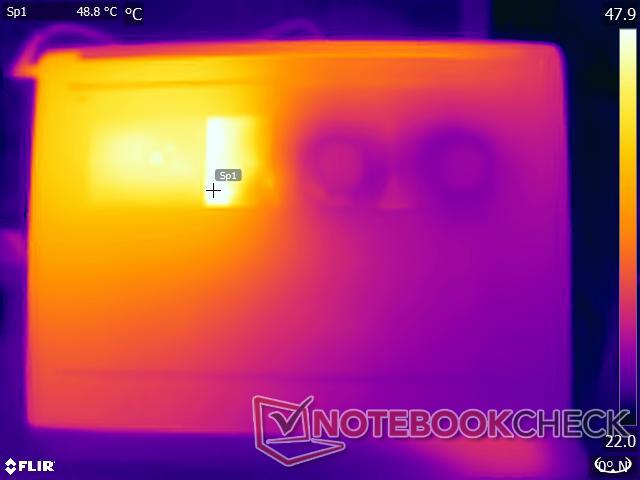
Pavilion Plus 16 impiega un sistema dual-fan dual-heatpipe per raffreddare la CPU e la GPU. Durante i nostri stress test, questa configurazione è stata portata al limite, con temperature di superficie che hanno raggiunto i 49,6°C nella parte superiore e i 45,8°C nella parte inferiore.
Sebbene il dispositivo possa essere utilizzato comodamente sulla ginocchia per attività leggere, può risultare scomodo in caso di carichi di lavoro elevati.
(-) La temperatura massima sul lato superiore è di 49.6 °C / 121 F, rispetto alla media di 36.8 °C / 98 F, che varia da 21 a 71 °C per questa classe Multimedia.
(-) Il lato inferiore si riscalda fino ad un massimo di 45.8 °C / 114 F, rispetto alla media di 39.1 °C / 102 F
(±) In idle, la temperatura media del lato superiore è di 32.3 °C / 90 F, rispetto alla media deld ispositivo di 31.3 °C / 88 F.
(-) Riproducendo The Witcher 3, la temperatura media per il lato superiore e' di 39.7 °C / 103 F, rispetto alla media del dispositivo di 31.3 °C / 88 F.
(+) I poggiapolsi e il touchpad raggiungono la temperatura massima della pelle (35 °C / 95 F) e quindi non sono caldi.
(-) La temperatura media della zona del palmo della mano di dispositivi simili e'stata di 28.7 °C / 83.7 F (-6.3 °C / -11.3 F).
| HP Pavilion Plus 16-ab0456tx Intel Core i7-13700H, NVIDIA GeForce RTX 3050 6GB Laptop GPU | Schenker Vision 14 M23 RTX 3050 Intel Core i7-13700H, NVIDIA GeForce RTX 3050 6GB Laptop GPU | Dell Inspiron 16 Plus 7630 Intel Core i7-13700H, NVIDIA GeForce RTX 4060 Laptop GPU | Asus VivoBook 14X K3405 Intel Core i5-13500H, NVIDIA GeForce RTX 3050 4GB Laptop GPU | Lenovo Slim Pro 7 14ARP8 AMD Ryzen 7 7735HS, NVIDIA GeForce RTX 3050 6GB Laptop GPU | Asus VivoBook Pro 16 K6602VU Intel Core i9-13900H, NVIDIA GeForce RTX 4050 Laptop GPU | Samsung Galaxy Book3 Ultra 16 Intel Core i7-13700H, NVIDIA GeForce RTX 4050 Laptop GPU | |
|---|---|---|---|---|---|---|---|
| Heat | 10% | 6% | -2% | 19% | -1% | 22% | |
| Maximum Upper Side * (°C) | 49.6 | 48.5 2% | 47.8 4% | 49.2 1% | 42.2 15% | 42.6 14% | 41 17% |
| Maximum Bottom * (°C) | 45.8 | 52.8 -15% | 42.2 8% | 54 -18% | 49 -7% | 48.4 -6% | 44 4% |
| Idle Upper Side * (°C) | 39.2 | 27.6 30% | 35.2 10% | 33.6 14% | 24.4 38% | 39.4 -1% | 23 41% |
| Idle Bottom * (°C) | 35.4 | 27 24% | 35 1% | 37.6 -6% | 25.2 29% | 39.8 -12% | 26 27% |
* ... Meglio usare valori piccoli
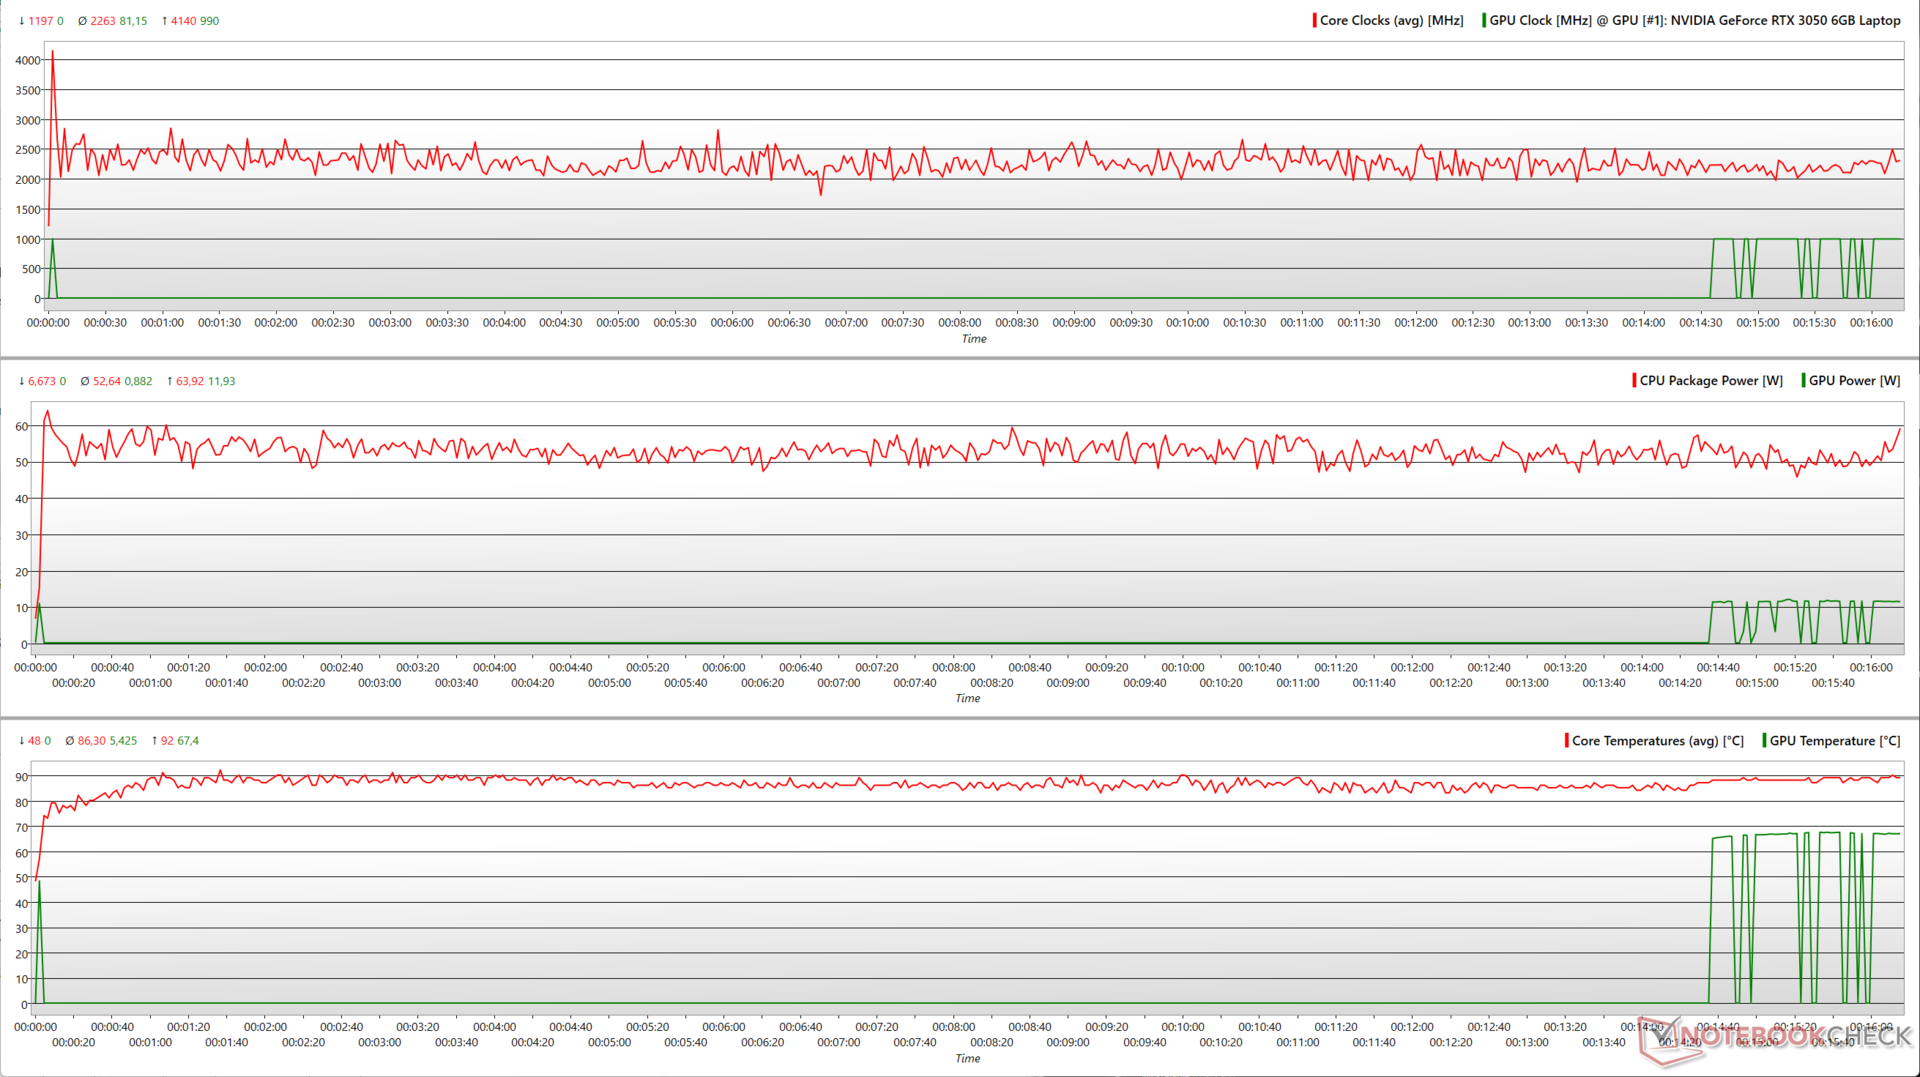
Test da sforzo
Durante uno stress Prime95 in-place large FFTs, il Core i7-13700H di Pavilion Plus 16 ha un clock medio di 2,2 GHz e un consumo medio di 53 W di potenza del pacchetto.
Aggiungendo FurMark, il Core i7-13700H e la RTX 3050 competono per l'alimentazione, con conseguente aumento e diminuzione intermittente del clock sia per la CPU che per la GPU.
In media, il Core i7-13700H può raggiungere un clock di 1,96 GHz, mentre la RTX 3050 raggiunge i 910 MHz, con un consumo medio di 41 W e 39 W, rispettivamente.
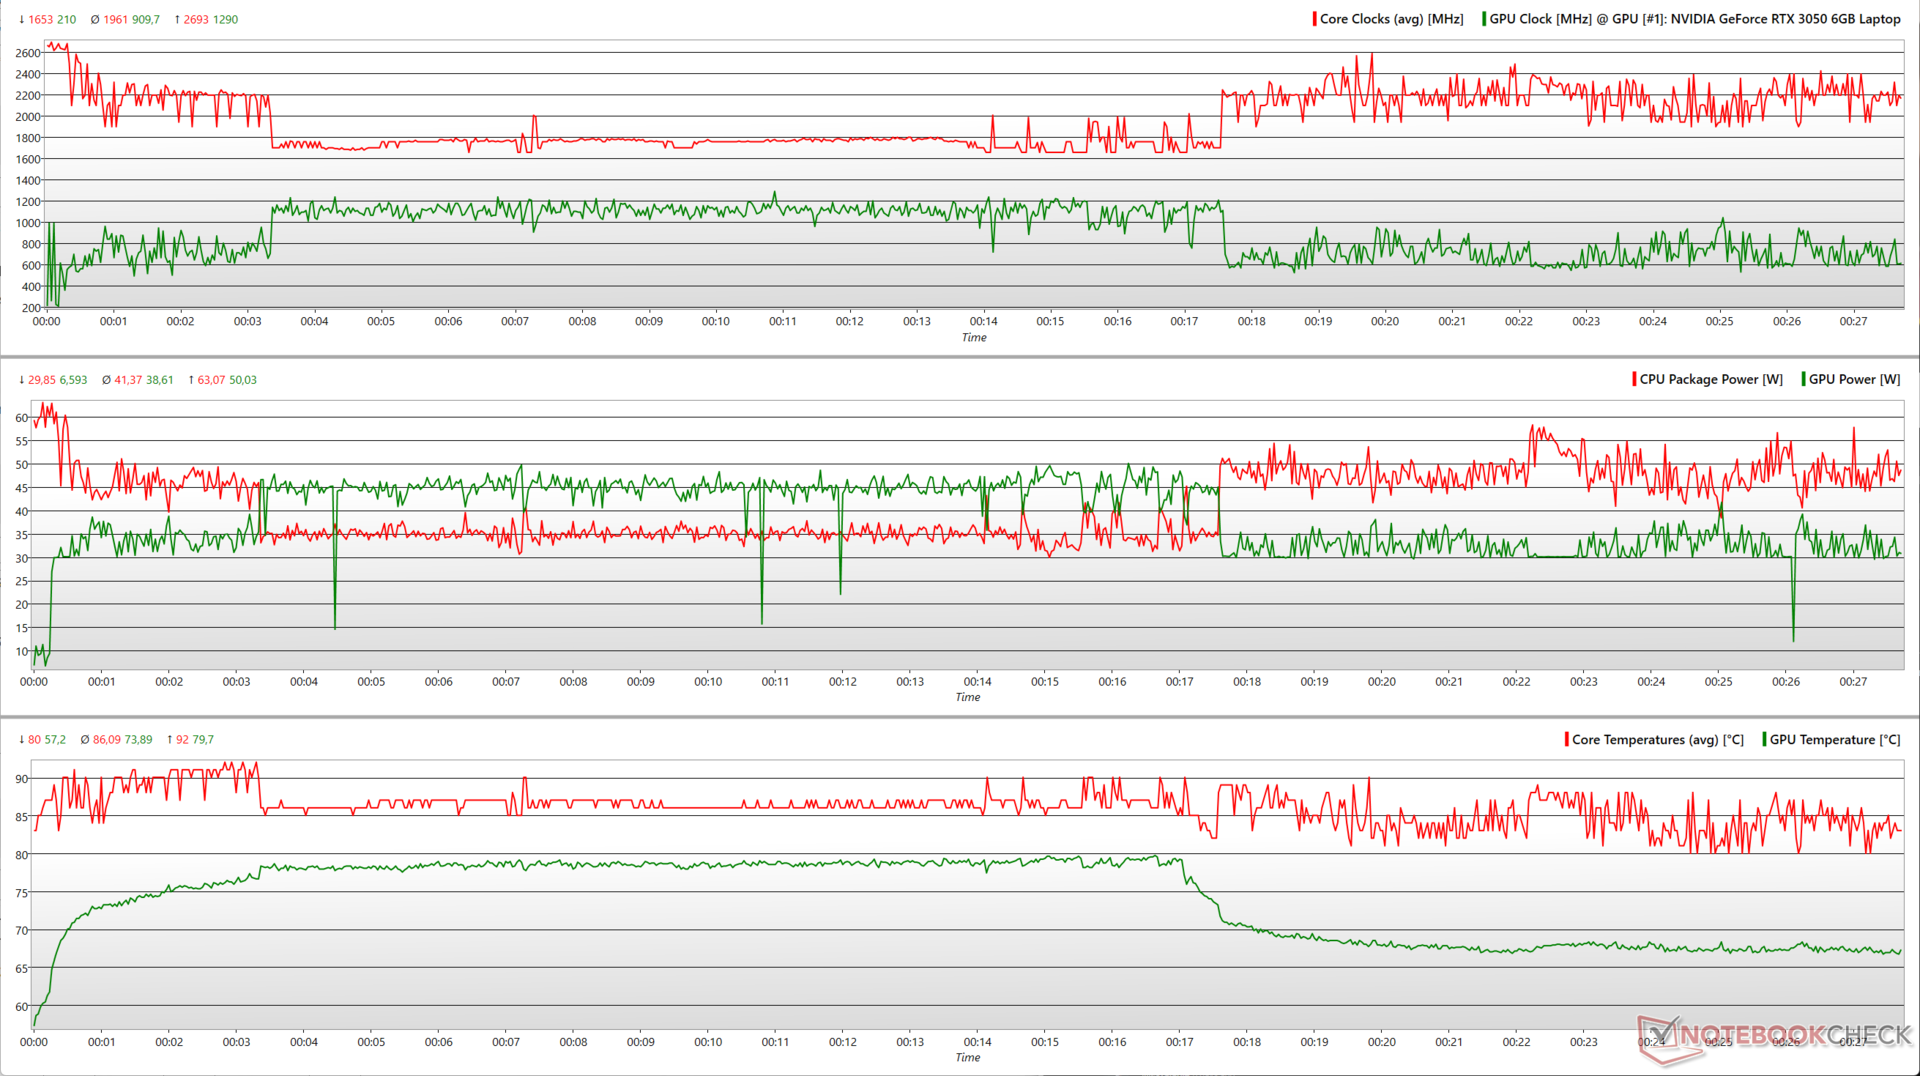
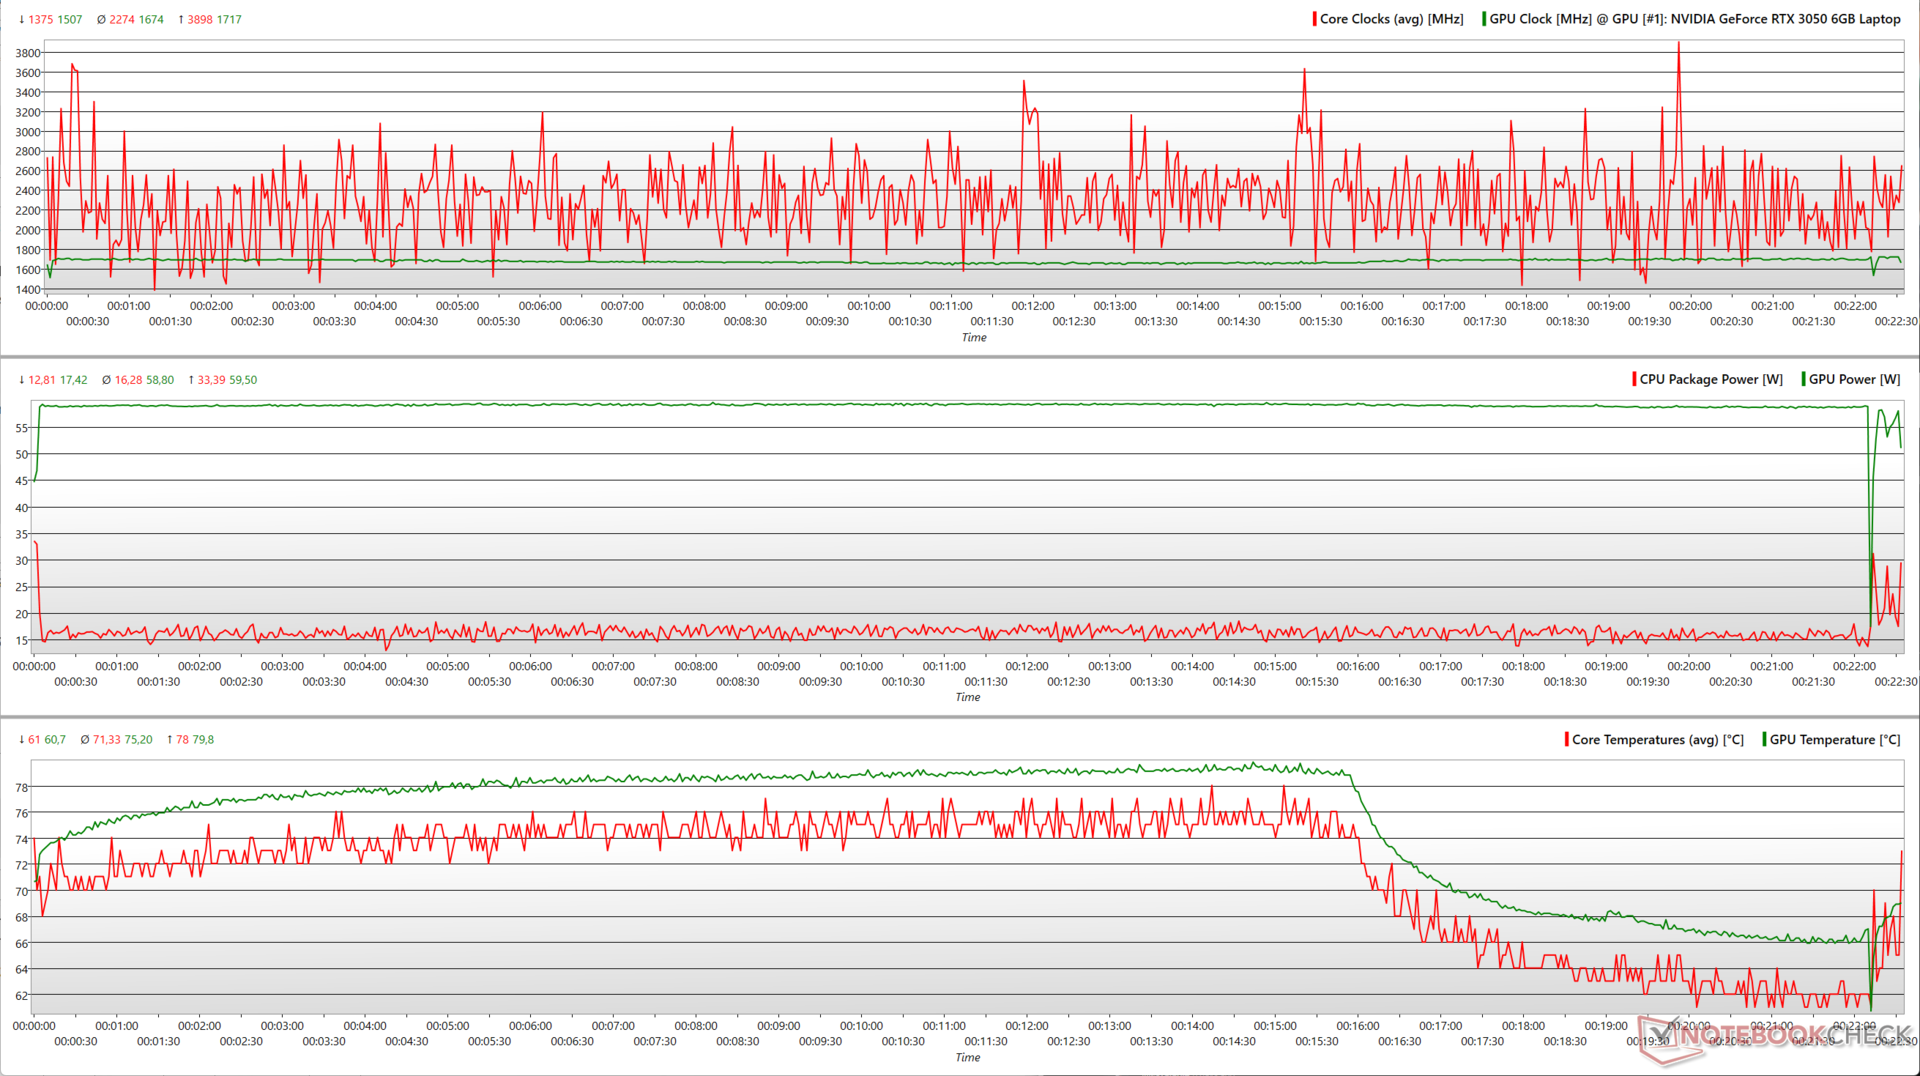
Le cose diventano molto più prevedibili con The Witcher 3 a 1080p Ultra. La RTX 3050 è ora in grado di utilizzare quasi costantemente il suo TGP massimo vicino ai 60 W.
È interessante notare che le temperature del core iniziano a scendere dopo un po', anche quando i clock di CPU/GPU e la potenza rimangono relativamente invariati.
| Stress Test | Clock CPU (GHz) | Clock GPU (MHz) | Temperatura media CPU (°C) | Temperatura media GPU (°C) |
| Sistema inattivo | 3,74 | - | 52 | 31,1 |
| Prime95 | 2,1 | - | 86 | 67,4 |
| Prime95 + FurMark | 1,93 | 735 | 86 | 73,5 |
| Il Witcher 3 1080p Ultra | 2,2 | 1.717 | 71 | 74,2 |
Altoparlanti
Il Pavilion Plus 16 è dotato di una coppia di diffusori stereo con un'uscita ragionevolmente forte di 74,2 dB(A), che dovrebbe essere sufficiente nella maggior parte delle stanze di medie dimensioni. I bassi sono percepibili ma non molto prominenti. Tuttavia, i medi e gli alti sono relativamente ben definiti.
Tuttavia, gli utenti possono ottenere un audio migliore tramite altoparlanti esterni o Bluetooth 5.3.
HP Pavilion Plus 16-ab0456tx analisi audio
(±) | potenza degli altiparlanti media ma buona (74.2 dB)
Bassi 100 - 315 Hz
(±) | bassi ridotti - in media 14.7% inferiori alla media
(±) | la linearità dei bassi è media (7.8% delta rispetto alla precedente frequenza)
Medi 400 - 2000 Hz
(+) | medi bilanciati - solo only 3.4% rispetto alla media
(+) | medi lineari (4.2% delta rispetto alla precedente frequenza)
Alti 2 - 16 kHz
(+) | Alti bilanciati - appena 4.6% dalla media
(+) | alti lineari (4.8% delta rispetto alla precedente frequenza)
Nel complesso 100 - 16.000 Hz
(±) | la linearità complessiva del suono è media (16.7% di differenza rispetto alla media
Rispetto alla stessa classe
» 44% di tutti i dispositivi testati in questa classe è stato migliore, 8% simile, 48% peggiore
» Il migliore ha avuto un delta di 5%, medio di 17%, peggiore di 45%
Rispetto a tutti i dispositivi testati
» 29% di tutti i dispositivi testati in questa classe è stato migliore, 7% similare, 64% peggiore
» Il migliore ha avuto un delta di 4%, medio di 23%, peggiore di 134%
Apple MacBook Pro 16 2021 M1 Pro analisi audio
(+) | gli altoparlanti sono relativamente potenti (84.7 dB)
Bassi 100 - 315 Hz
(+) | bassi buoni - solo 3.8% dalla media
(+) | bassi in lineaa (5.2% delta rispetto alla precedente frequenza)
Medi 400 - 2000 Hz
(+) | medi bilanciati - solo only 1.3% rispetto alla media
(+) | medi lineari (2.1% delta rispetto alla precedente frequenza)
Alti 2 - 16 kHz
(+) | Alti bilanciati - appena 1.9% dalla media
(+) | alti lineari (2.7% delta rispetto alla precedente frequenza)
Nel complesso 100 - 16.000 Hz
(+) | suono nel complesso lineare (4.6% differenza dalla media)
Rispetto alla stessa classe
» 0% di tutti i dispositivi testati in questa classe è stato migliore, 0% simile, 100% peggiore
» Il migliore ha avuto un delta di 5%, medio di 17%, peggiore di 45%
Rispetto a tutti i dispositivi testati
» 0% di tutti i dispositivi testati in questa classe è stato migliore, 0% similare, 100% peggiore
» Il migliore ha avuto un delta di 4%, medio di 23%, peggiore di 134%
Gestione dell'energia: Consumi economici e buona durata della batteria
Consumo di energia
Nel complesso, Pavilion Plus 16 consuma relativamente meno energia per l'hardware dato. Mentre Schenker Vision 14 M23 e Lenovo Slim Pro 7 sono più parsimoniosi con un carico medio e Witcher 3, Pavilion Plus 16 è più economico con un carico massimo.
L'alimentatore da 135 W in dotazione è più che sufficiente per alimentare il portatile sotto stress.
| Off / Standby | |
| Idle | |
| Sotto carico |
|
Leggenda:
min: | |
| HP Pavilion Plus 16-ab0456tx i7-13700H, GeForce RTX 3050 6GB Laptop GPU, IPS, 2560x1600, 16" | Schenker Vision 14 M23 RTX 3050 i7-13700H, GeForce RTX 3050 6GB Laptop GPU, IPS, 2880x1800, 14" | Dell Inspiron 16 Plus 7630 i7-13700H, GeForce RTX 4060 Laptop GPU, IPS, 2560x1600, 16" | Asus VivoBook 14X K3405 i5-13500H, GeForce RTX 3050 4GB Laptop GPU, , 2880x1800, 14" | Lenovo Slim Pro 7 14ARP8 R7 7735HS, GeForce RTX 3050 6GB Laptop GPU, IPS, 2560x1600, 14.5" | Asus VivoBook Pro 16 K6602VU i9-13900H, GeForce RTX 4050 Laptop GPU, OLED, 3200x2000, 16" | Samsung Galaxy Book3 Ultra 16 i7-13700H, GeForce RTX 4050 Laptop GPU, AMOLED, 2880x1800, 16" | Media NVIDIA GeForce RTX 3050 6GB Laptop GPU | Media della classe Multimedia | |
|---|---|---|---|---|---|---|---|---|---|
| Power Consumption | -2% | -100% | 6% | -30% | -141% | 20% | -8% | -14% | |
| Idle Minimum * (Watt) | 3.3 | 5.2 -58% | 15.6 -373% | 4.96 -50% | 7.6 -130% | 21.06 -538% | 3 9% | 4.55 ? -38% | 5.72 ? -73% |
| Idle Average * (Watt) | 7.3 | 7.8 -7% | 17.7 -142% | 7.54 -3% | 12.2 -67% | 24.27 -232% | 5 32% | 8.63 ? -18% | 10.2 ? -40% |
| Idle Maximum * (Watt) | 14.24 | 9 37% | 20.6 -45% | 9.31 35% | 12.8 10% | 25.12 -76% | 11 23% | 11.7 ? 18% | 12.4 ? 13% |
| Load Average * (Watt) | 91.7 | 78.6 14% | 87.4 5% | 83.4 9% | 76.5 17% | 52.4 43% | 72 21% | 86.6 ? 6% | 65.5 ? 29% |
| Witcher 3 ultra * (Watt) | 96.2 | 86.8 10% | 121.7 -27% | 73.3 24% | 89.5 7% | 110.2 -15% | 69.7 28% | ||
| Load Maximum * (Watt) | 115.8 | 121.2 -5% | 138 -19% | 91.74 21% | 135.7 -17% | 146 -26% | 108 7% | 127.6 ? -10% | 114 ? 2% |
* ... Meglio usare valori piccoli
Power Consumption: The Witcher 3 / Stress test
Power Consumption: External monitor
Durata della batteria
L'interno potente ma poco potente contribuisce alla buona durata della batteria. Con una luminosità di 150 nit, la batteria da 68 WHr di Pavilion Plus 16 è in grado di raggiungere quasi 10,5 ore di navigazione web e 12 ore di riproduzione video a 1080p, tempi di esecuzione impressionanti.
| HP Pavilion Plus 16-ab0456tx i7-13700H, GeForce RTX 3050 6GB Laptop GPU, 68 Wh | Schenker Vision 14 M23 RTX 3050 i7-13700H, GeForce RTX 3050 6GB Laptop GPU, 99 Wh | Dell Inspiron 16 Plus 7630 i7-13700H, GeForce RTX 4060 Laptop GPU, 86 Wh | Asus VivoBook 14X K3405 i5-13500H, GeForce RTX 3050 4GB Laptop GPU, 63 Wh | Lenovo Slim Pro 7 14ARP8 R7 7735HS, GeForce RTX 3050 6GB Laptop GPU, 73 Wh | Asus VivoBook Pro 16 K6602VU i9-13900H, GeForce RTX 4050 Laptop GPU, 96 Wh | Samsung Galaxy Book3 Ultra 16 i7-13700H, GeForce RTX 4050 Laptop GPU, 76 Wh | Media della classe Multimedia | |
|---|---|---|---|---|---|---|---|---|
| Autonomia della batteria | 16% | -10% | -18% | 1% | -11% | 2% | 27% | |
| H.264 (h) | 12 | 10.4 -13% | 9.8 -18% | 13.4 12% | 16.4 ? 37% | |||
| WiFi v1.3 (h) | 10.4 | 12.1 16% | 9.4 -10% | 8.1 -22% | 10.5 1% | 10.1 -3% | 9.6 -8% | 12.2 ? 17% |
| Reader / Idle (h) | 17.6 | 18.2 | 24.9 ? | |||||
| Load (h) | 1.4 | 1.1 | 1.8 | 1.668 ? | ||||
| Witcher 3 ultra (h) | 1.3 |
Pro
Contro
Verdetto: un grande potenziale frenato dai compromessi
HP Pavilion Plus 16 soddisfa la maggior parte delle esigenze di un moderno computer portatile multimediale per il lavoro e l'intrattenimento. Pavilion Plus 16 è caratterizzato da una struttura interamente in metallo che emana una sensazione di qualità superiore, senza inutili flessioni, e da una selezione di porte che copre l'essenziale.
Il pannello da 2560 x 1600 120 Hz non vanta l'HDR né un'ampia copertura Adobe RGB e Display P3 come nel caso del modello Pavilion Plus 14del Plus 14. Il pannello OLED da 2,8K. Tuttavia, ottiene le basi giuste con tempi di risposta decenti e nessun sfarfallio PWM.
HP Pavilion Plus 16 è un portatile multimediale e di produttività a tutto tondo, ma il prezzo richiesto avrebbe potuto includere almeno una RTX 4050"
I limiti delle prestazioni diventano evidenti quando si inizia a confrontarlo con la concorrenza. Il PL2 da 60 W si rivela particolarmente svantaggioso per Pavilion Plus 16 in multi-core, se confrontato con il modello Dell Inspiron 16 Plus 7630 e persino al Samsung Galaxy Book3 Ultra 16che dispongono di un Core i7-13700H a più alto wattaggio.
HP avrebbe potuto facilmente consentire 80 W PL2 o più in un profilo di alimentazione aggiuntivo per massimizzare il potenziale del chip. Tuttavia, il sottosistema di raffreddamento appare già sotto pressione con l'attuale configurazione sotto carico.
La Nvidia GeForce RTX 3050 6 GB è inferiore alla generazione Ada in termini di prestazioni ed efficienza energetica. Sebbene i giochi a 1080p vedano un notevole aumento rispetto alla RTX 3050 4 GB, i test sintetici non mostrano un grande incentivo.
Con un prezzo richiesto di 1.350 dollari sul sito di HP, Pavilion Plus 16 è più caro di 100 dollari rispetto all'Inspiron 16 Plus 7630, che offre una RTX 4060 da 60 W e un Core i7-13700H più performante. Detto questo, Pavilion Plus 16 ha un prezzo inferiore a Inspiron 16 Plus 7630 nel mercato indiano.
Il Asus VivoBook Pro 16 con display OLED 3.2K, Core i9-13900H e fino a RTX 4060 è un'ottima alternativa per i creatori in erba, a patto che la plastica e il sovrapprezzo di 300 dollari non la frenino.
Prezzo e disponibilità
L'HP Pavilion Plus 16-ab0456tx testato può essere acquistato dal sito ufficiale HP India al prezzo di ₹1.24.999. Il portatile può anche essere configurato sul sito HP US per 1.350 dollari.
Amazon India offre Pavilion Plus 16 senza la dGPU RTX 3050 per ₹1.900.
HP Pavilion Plus 16-ab0456tx
- 02/07/2024 v7 (old)
Vaidyanathan Subramaniam
Transparency
La selezione dei dispositivi da recensire viene effettuata dalla nostra redazione. Il campione di prova è stato fornito all'autore come prestito dal produttore o dal rivenditore ai fini di questa recensione. L'istituto di credito non ha avuto alcuna influenza su questa recensione, né il produttore ne ha ricevuto una copia prima della pubblicazione. Non vi era alcun obbligo di pubblicare questa recensione. In quanto società mediatica indipendente, Notebookcheck non è soggetta all'autorità di produttori, rivenditori o editori.
Ecco come Notebookcheck esegue i test
Ogni anno, Notebookcheck esamina in modo indipendente centinaia di laptop e smartphone utilizzando procedure standardizzate per garantire che tutti i risultati siano comparabili. Da circa 20 anni sviluppiamo continuamente i nostri metodi di prova e nel frattempo stabiliamo gli standard di settore. Nei nostri laboratori di prova, tecnici ed editori esperti utilizzano apparecchiature di misurazione di alta qualità. Questi test comportano un processo di validazione in più fasi. Il nostro complesso sistema di valutazione si basa su centinaia di misurazioni e parametri di riferimento ben fondati, che mantengono l'obiettività.Price comparison

