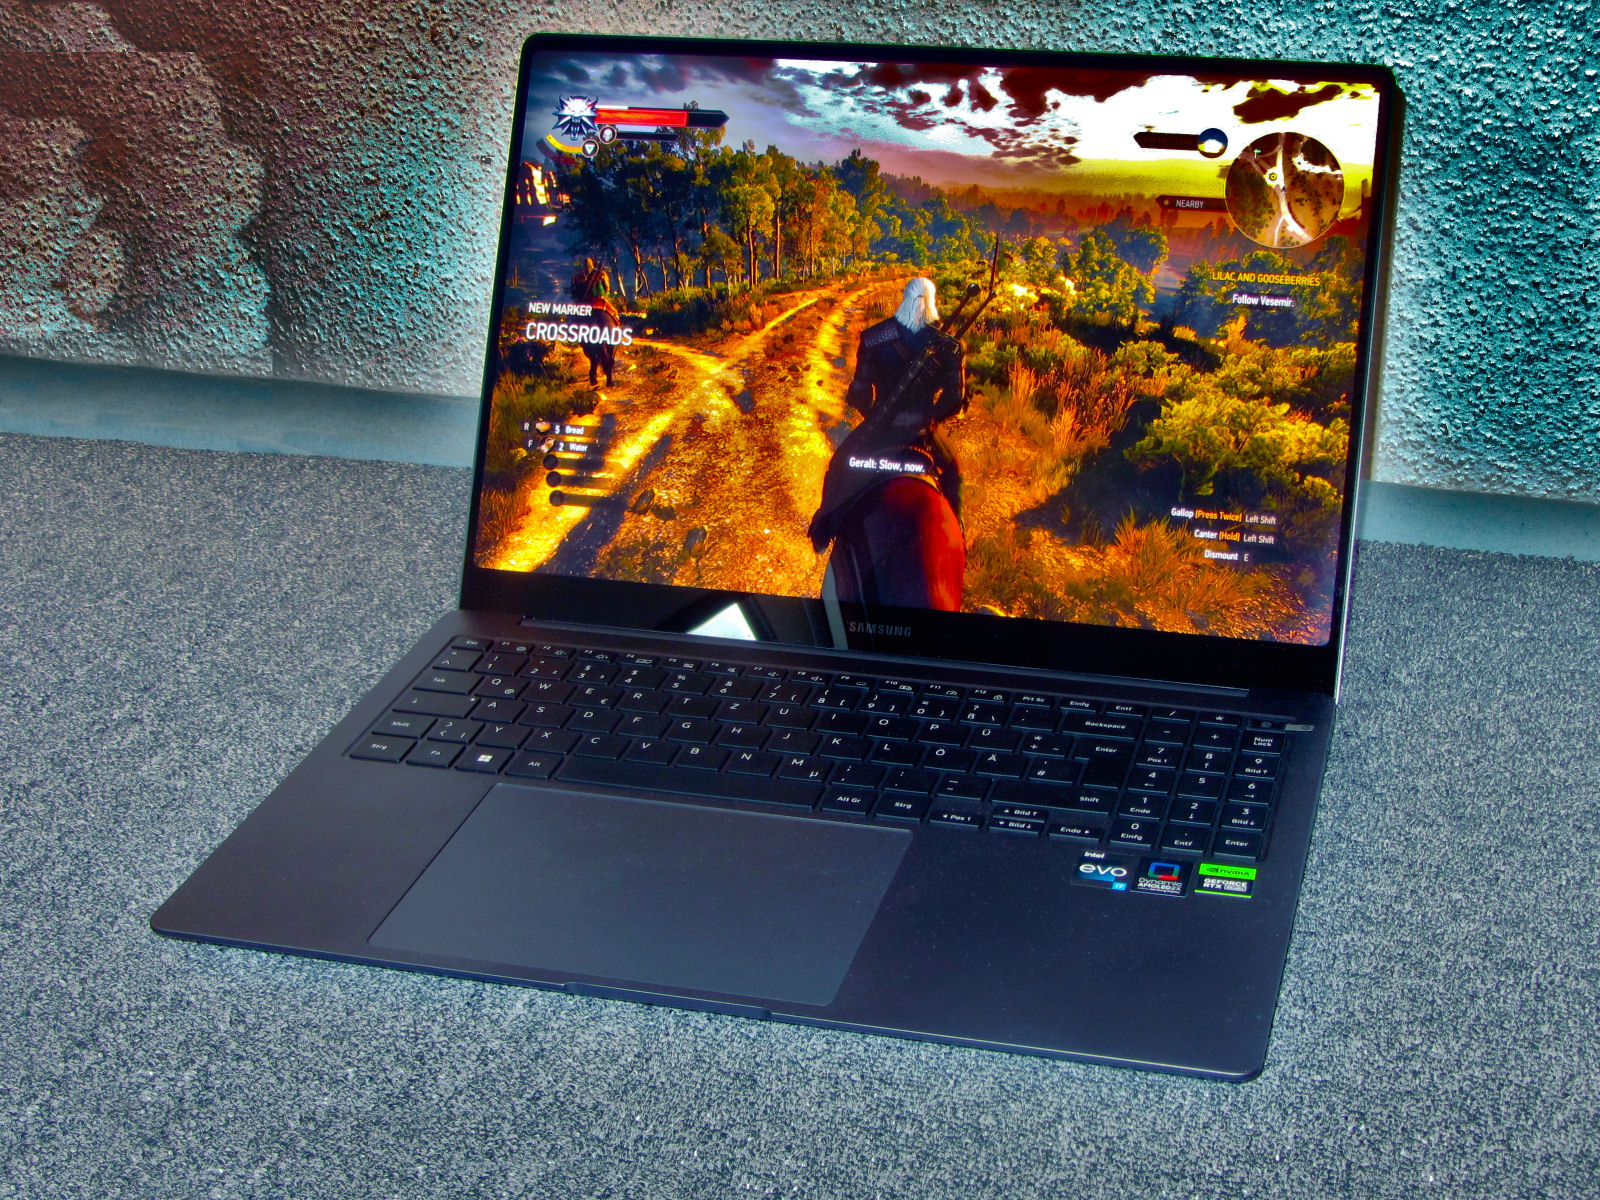
Recensione del Samsung Galaxy Book3 Ultra 16: Ultrabook da 16 pollici resistente con RTX 4050

Con Galaxy Book 3 Ultra 16, Samsung presenta una combinazione di notebook per il gioco, workstation e laptop per i lavoratori creativi, con particolare attenzione alla mobilità, all'ergonomia e al basso consumo energetico. Non sono necessarie prestazioni elevate: ilCore i7-13700H e la GeForce RTX 4050 sono rallentati da limiti di potenza conservativi, ovvero un TGP basso (60 watt). Un alimentatore da 100 watt copre tutte le esigenze hardware.
I concorrenti includono dispositivi come loSchenker Vision 16 Pro, il LG Gram 17, il Dell XPS 15 9520, l' Asus VivoBook Pro 16X OLED, l' Acer Swift X SFX16-52G e il Lenovo ThinkBook 16p G3 ARH.
Potenziali concorrenti a confronto
Punteggio | Data | Modello | Peso | Altezza | Dimensione | Risoluzione | Prezzo |
|---|---|---|---|---|---|---|---|
| 89.4 % v7 (old) | 04/2023 | Samsung Galaxy Book3 Ultra 16 i7-13700H, GeForce RTX 4050 Laptop GPU | 1.8 kg | 16.5 mm | 16.00" | 2880x1800 | |
| 87.8 % v7 (old) | 11/2022 | Schenker Vision 16 Pro RTX 3070 Ti i7-12700H, GeForce RTX 3070 Ti Laptop GPU | 1.7 kg | 17.1 mm | 16.00" | 2560x1600 | |
| 86.4 % v7 (old) | 03/2023 | LG Gram 17Z90Q-E.AD78G i7-1260P, GeForce RTX 2050 Mobile | 1.4 kg | 17.8 mm | 17.00" | 2560x1600 | |
| 87.9 % v7 (old) | 10/2022 | Lenovo ThinkBook 16p G3 ARH R9 6900HX, GeForce RTX 3060 Laptop GPU | 2.1 kg | 19.5 mm | 16.00" | 2560x1600 | |
| 89.5 % v7 (old) | 05/2022 | Dell XPS 15 9520 RTX 3050 Ti i7-12700H, GeForce RTX 3050 Ti Laptop GPU | 1.9 kg | 18 mm | 15.60" | 3456x2160 | |
| 83.7 % v7 (old) | 11/2022 | Asus VivoBook Pro 16X OLED N7600PC-L2026X i7-11370H, GeForce RTX 3050 4GB Laptop GPU | 2 kg | 18.9 mm | 16.00" | 3840x2400 | |
| 86.4 % v7 (old) | 11/2022 | Acer Swift X SFX16-52G-77RX i7-1260P, A370M | 1.8 kg | 21.2 mm | 16.00" | 2560x1600 |
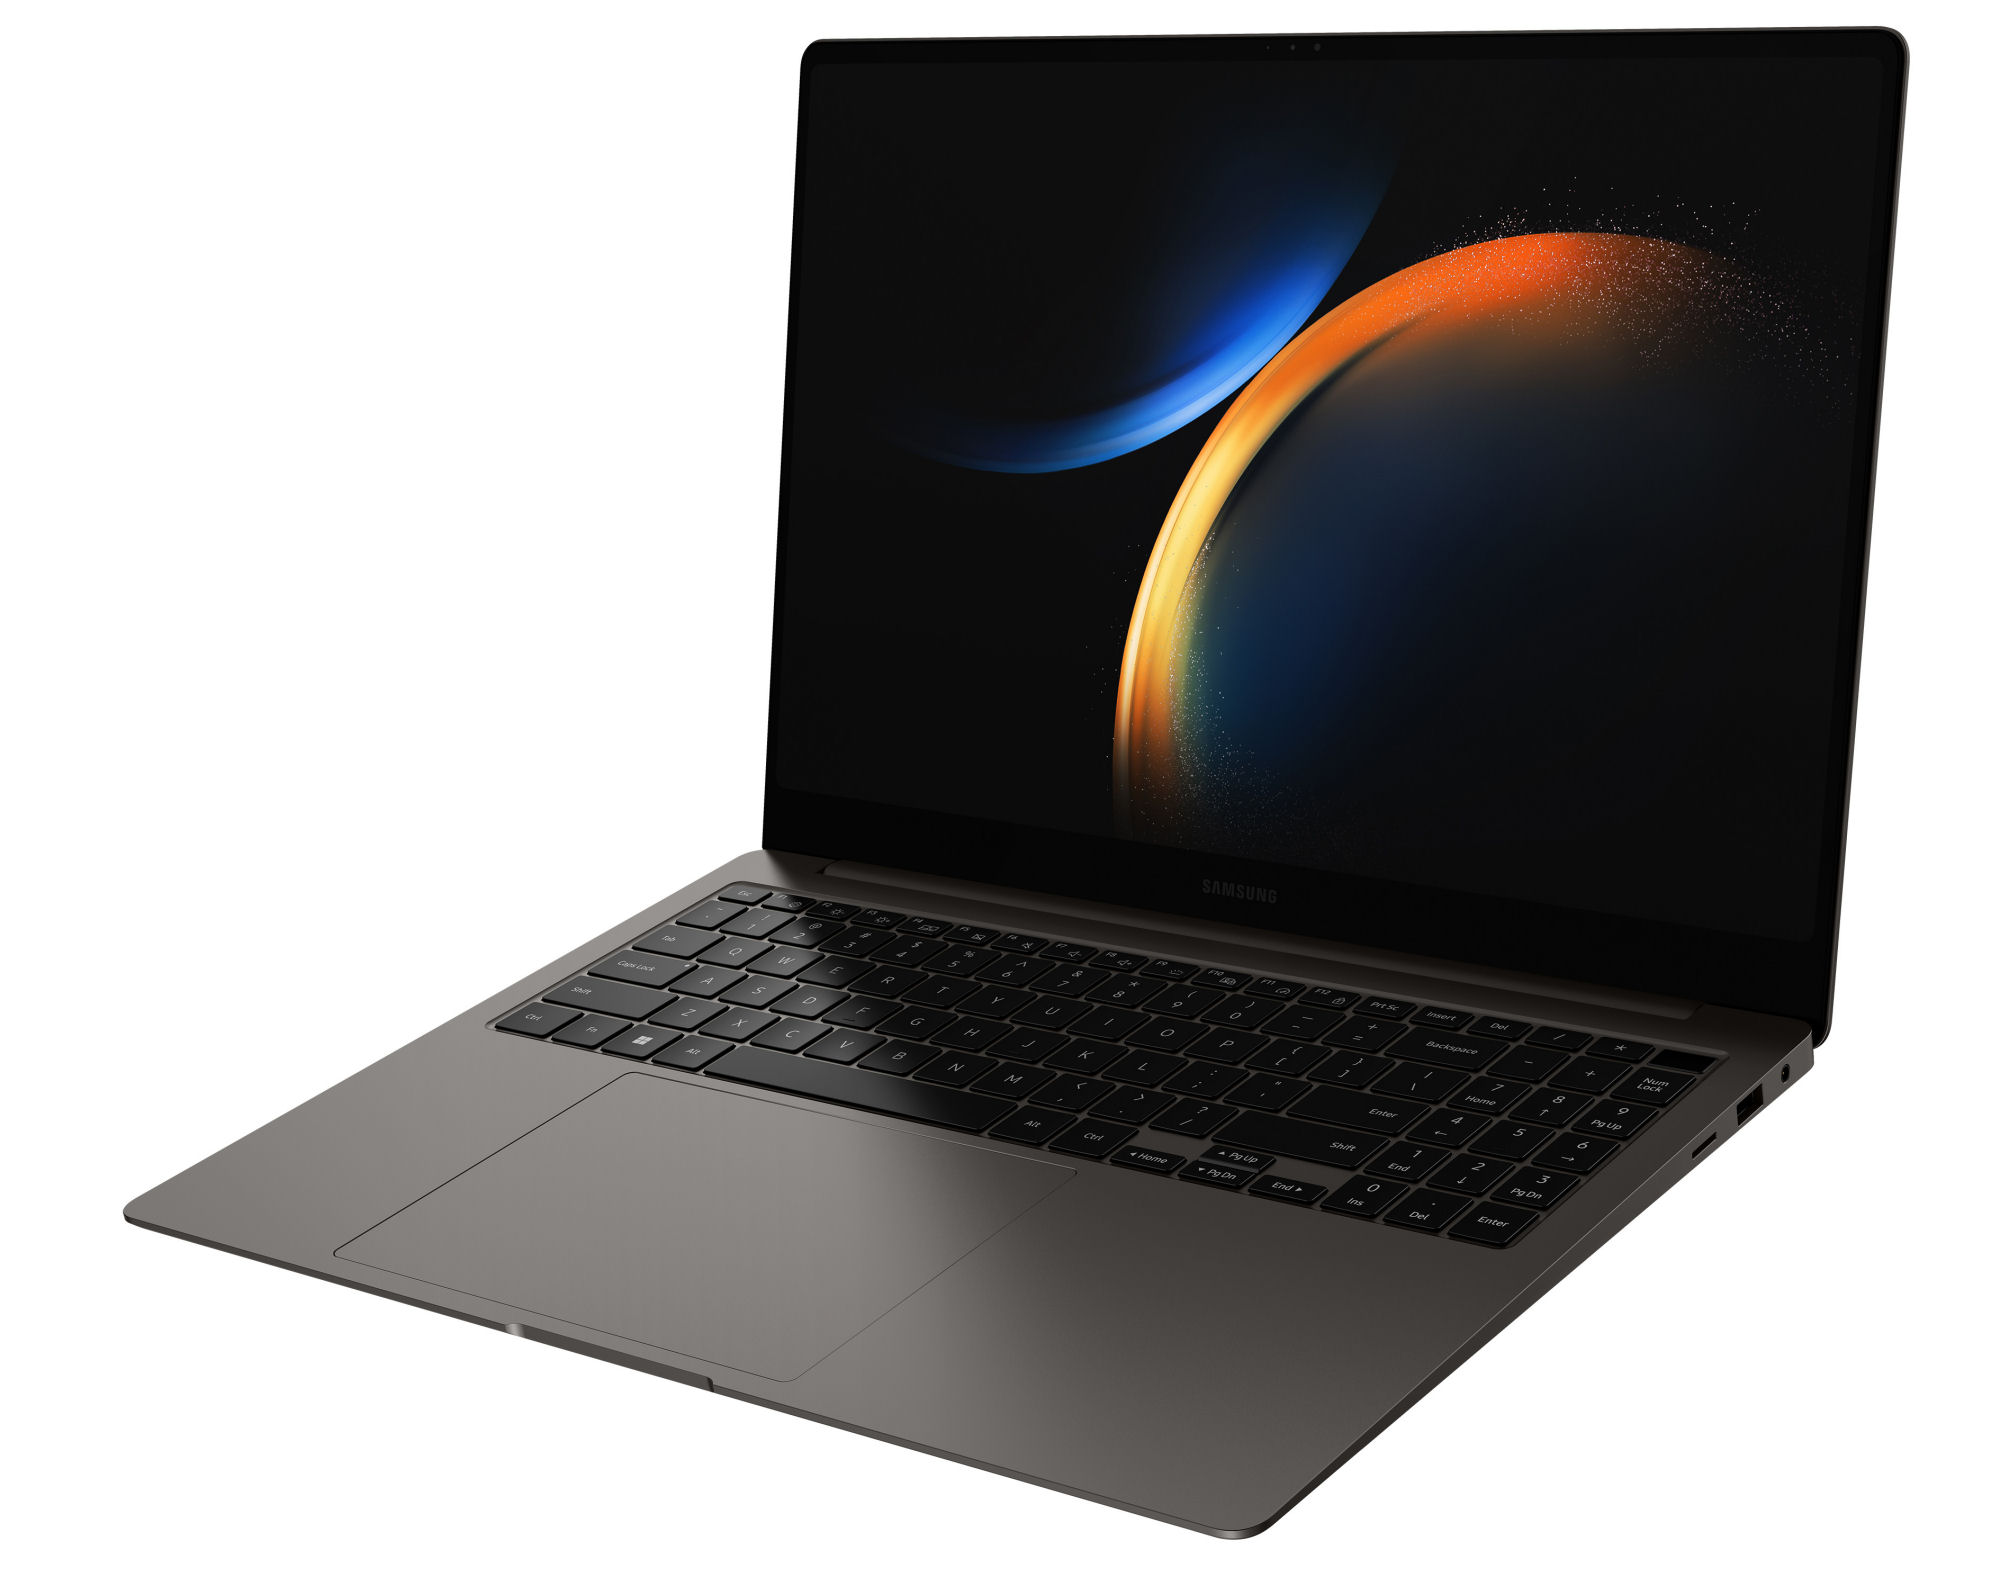
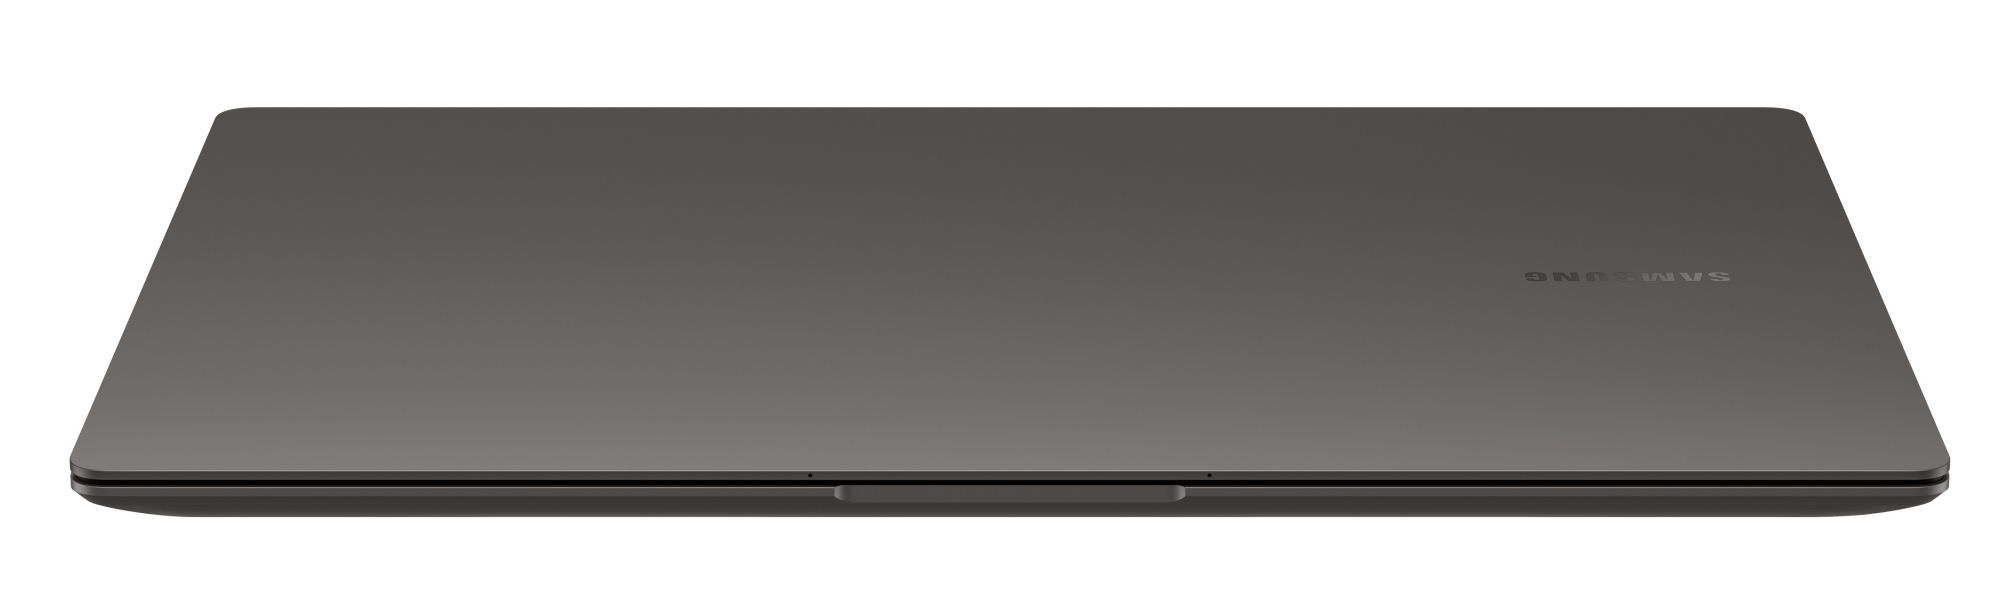
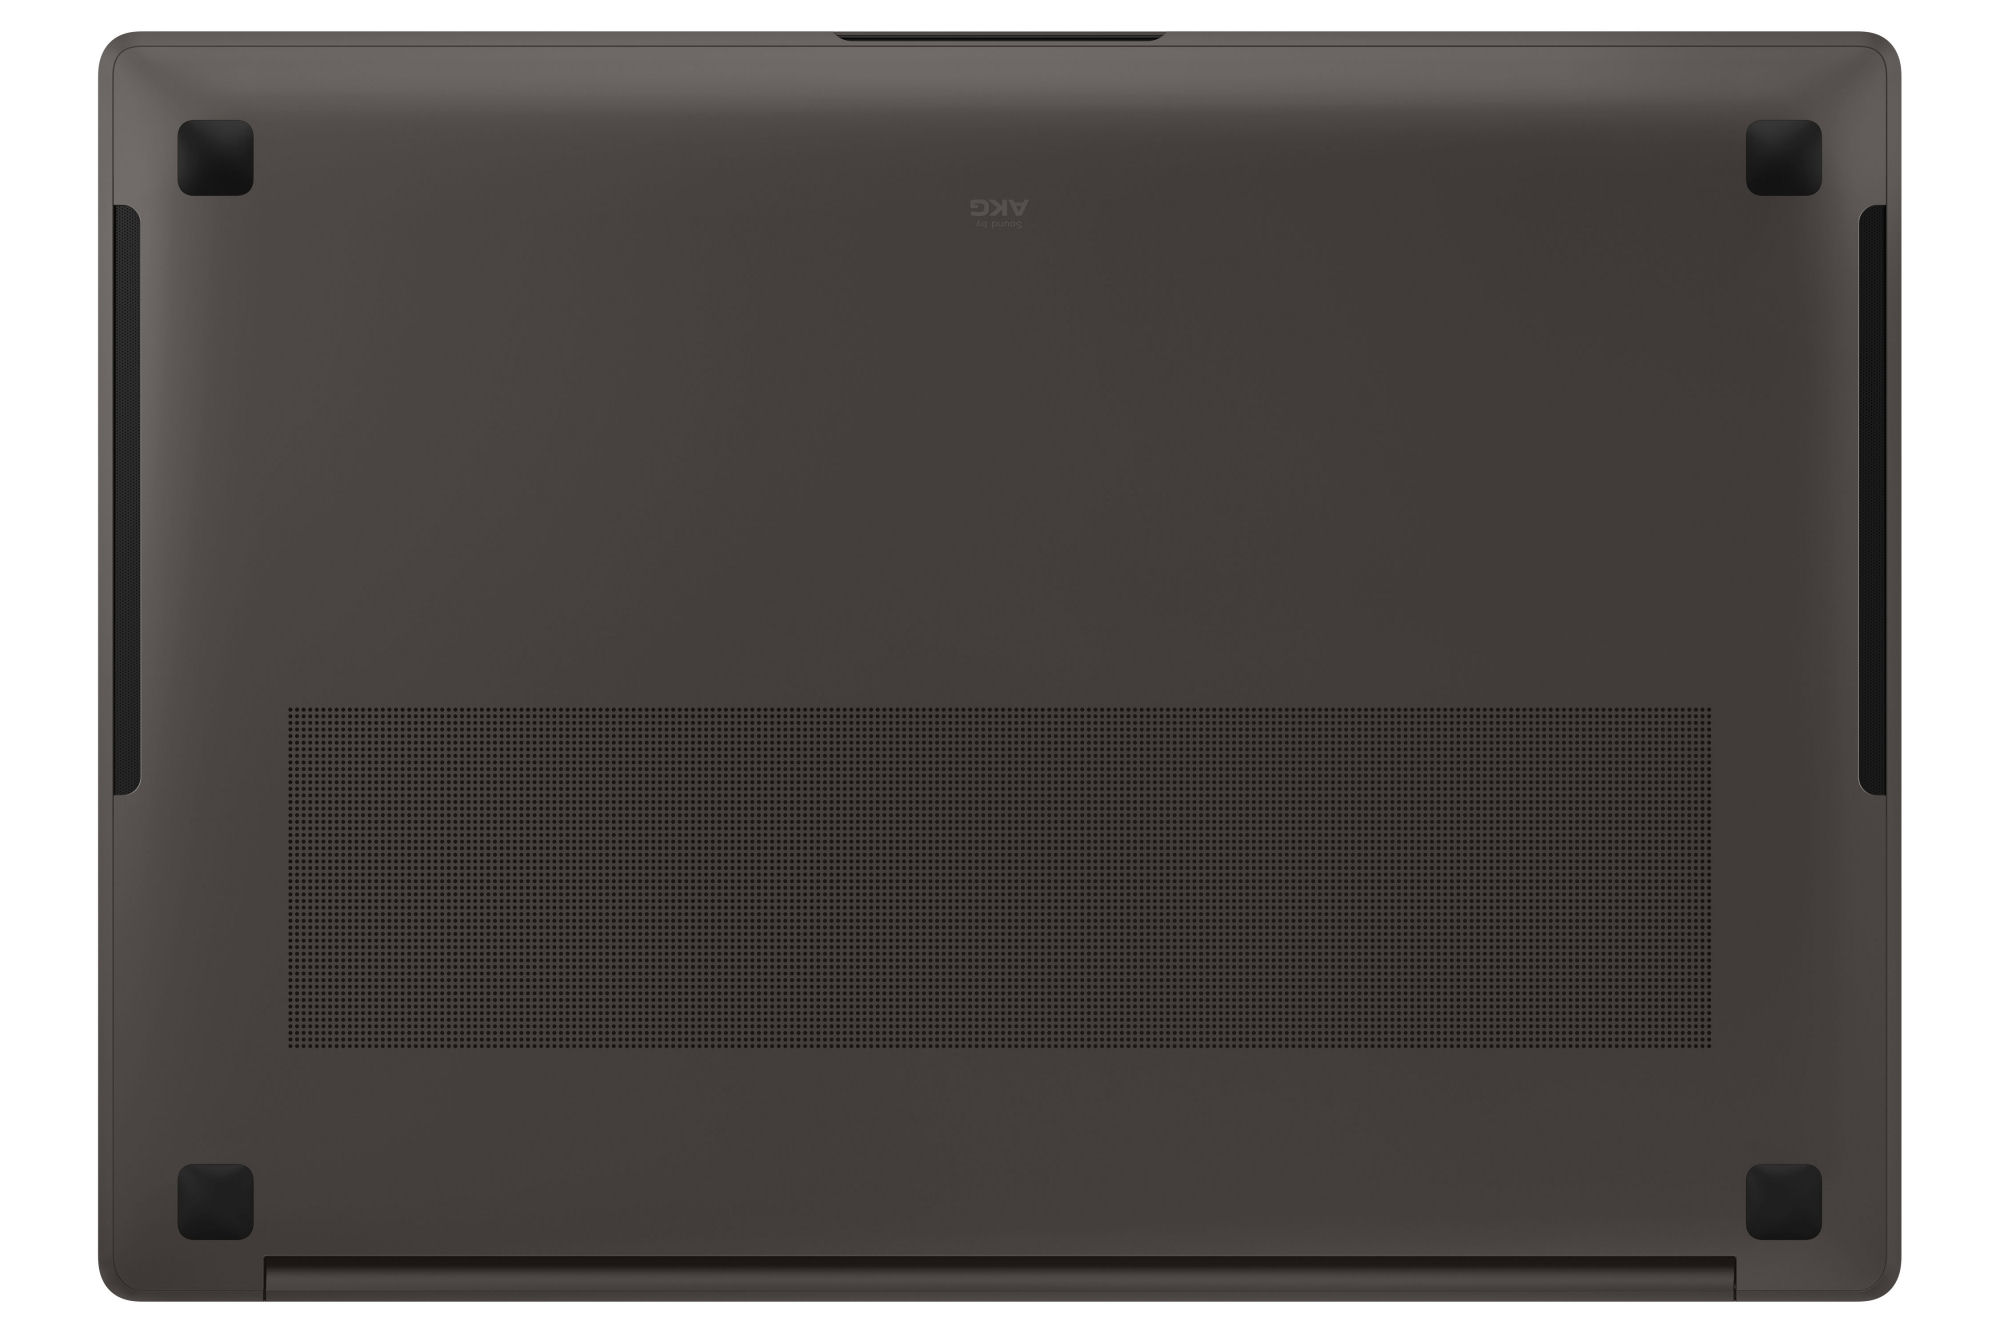
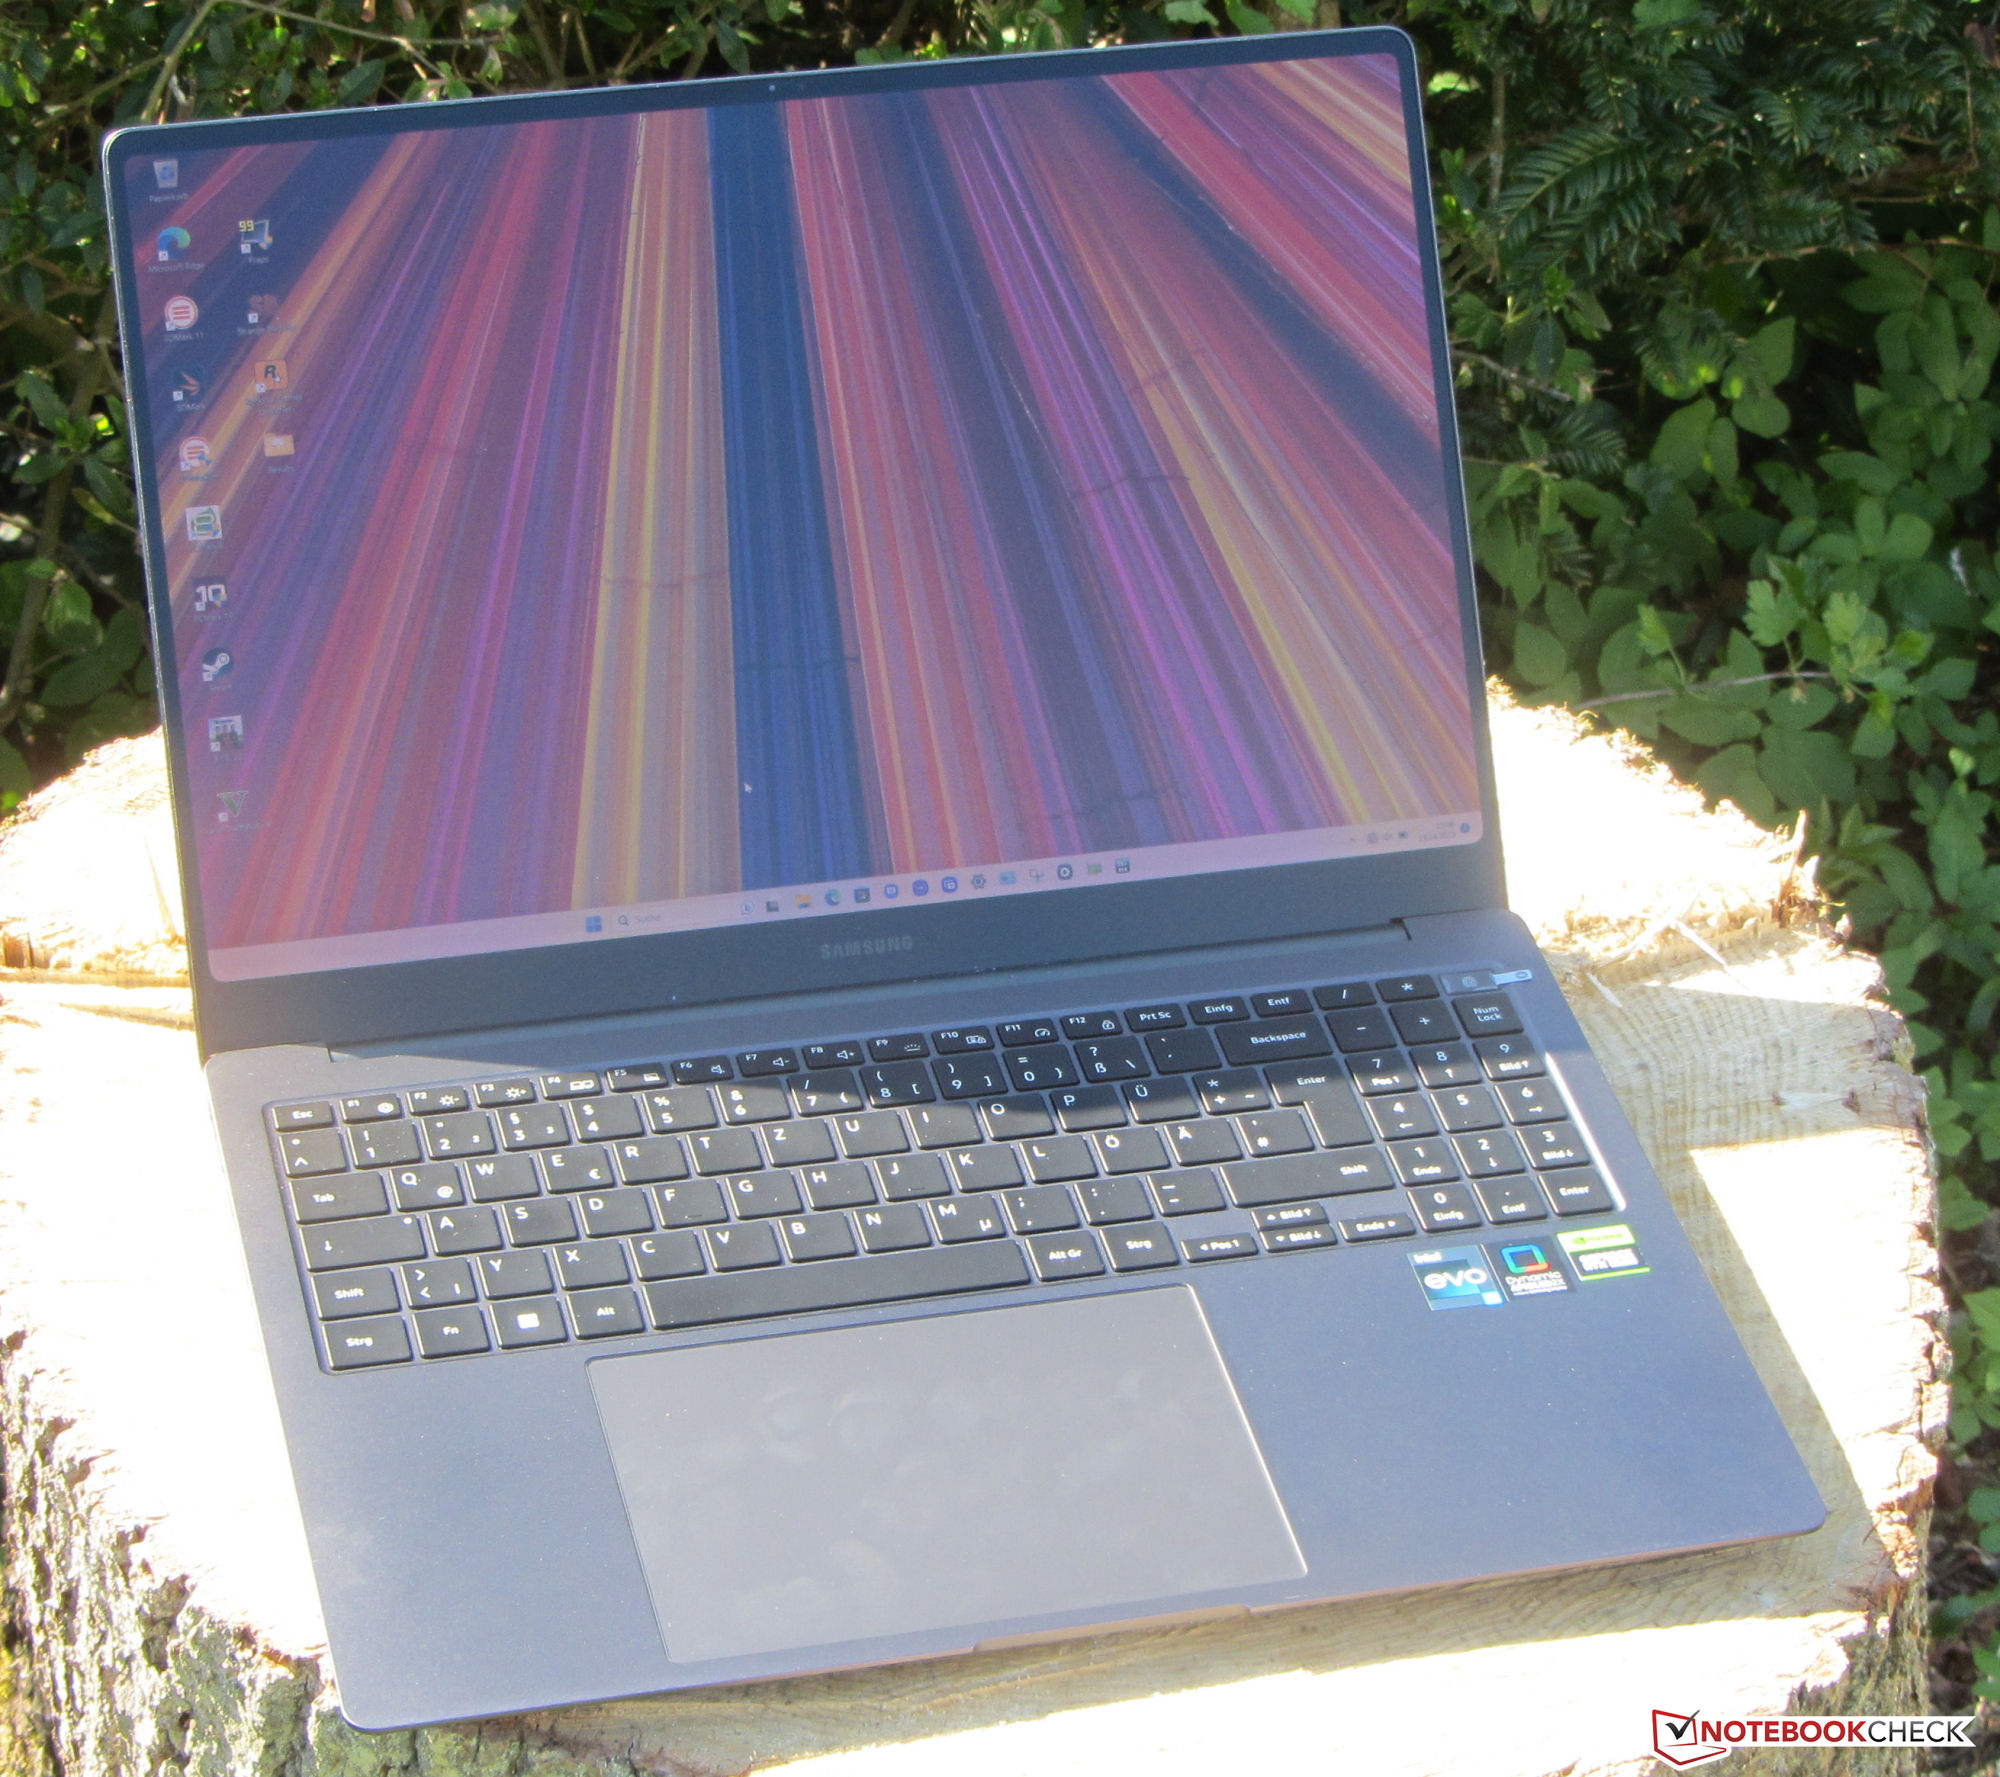
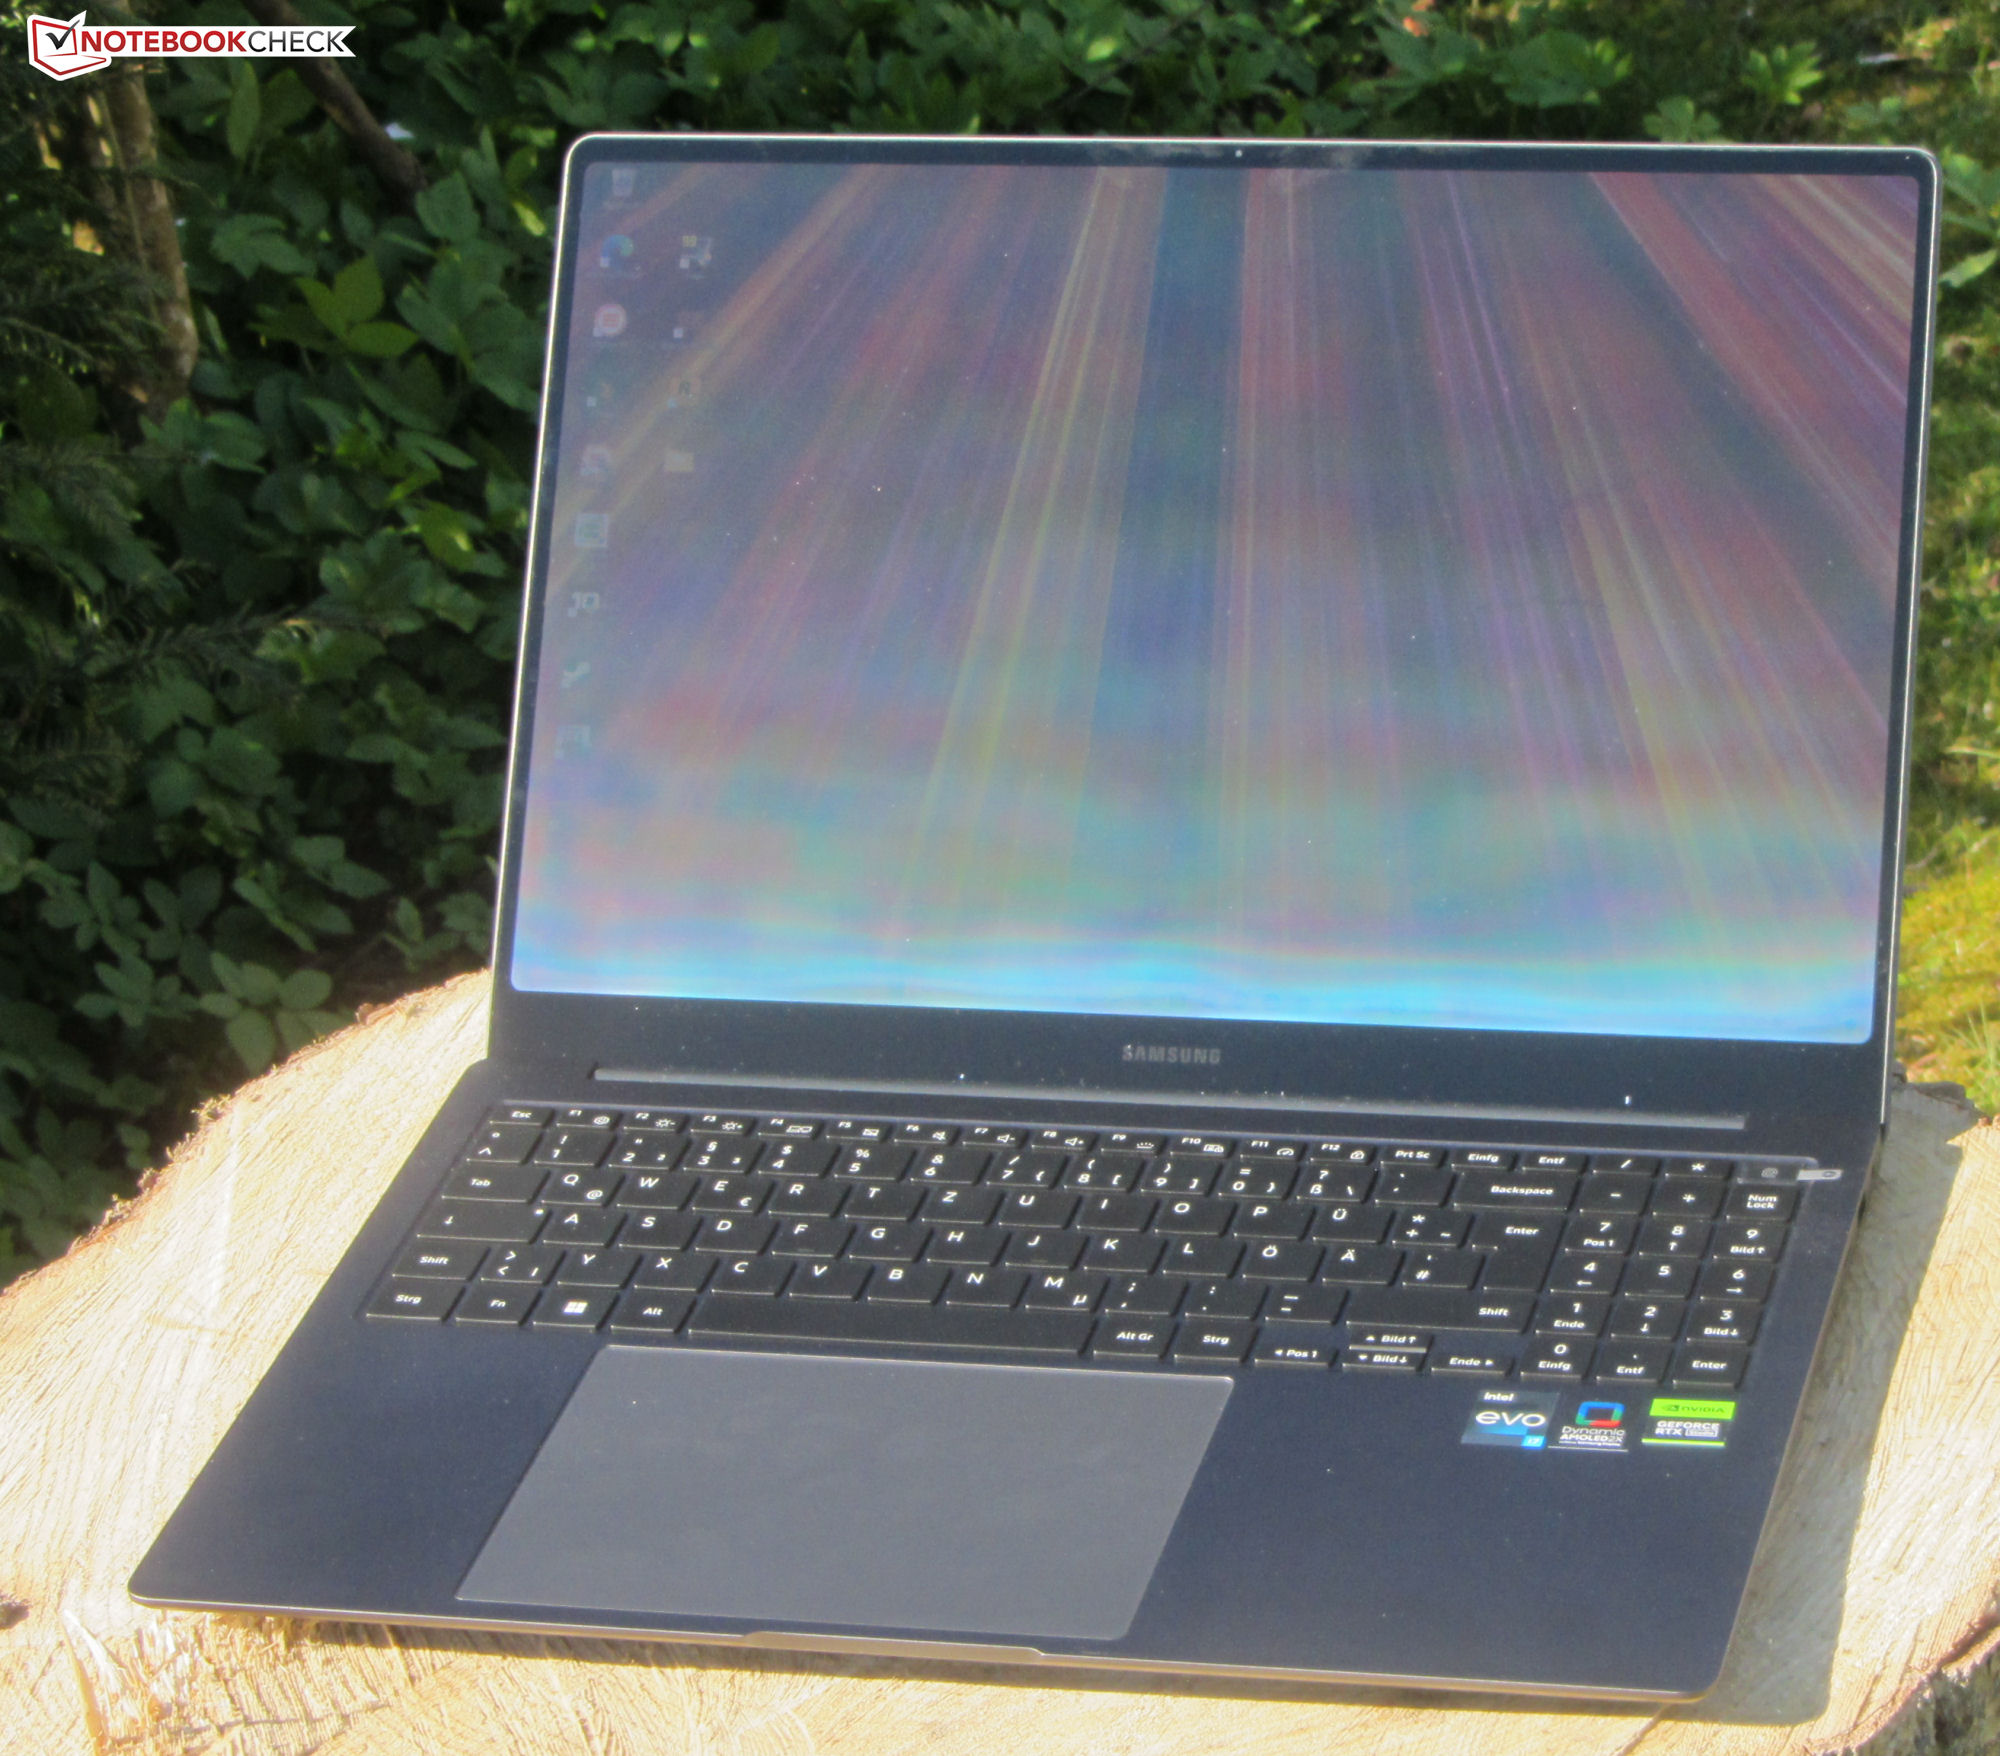
Custodia - Un elegante chassis in alluminio per il Galaxy
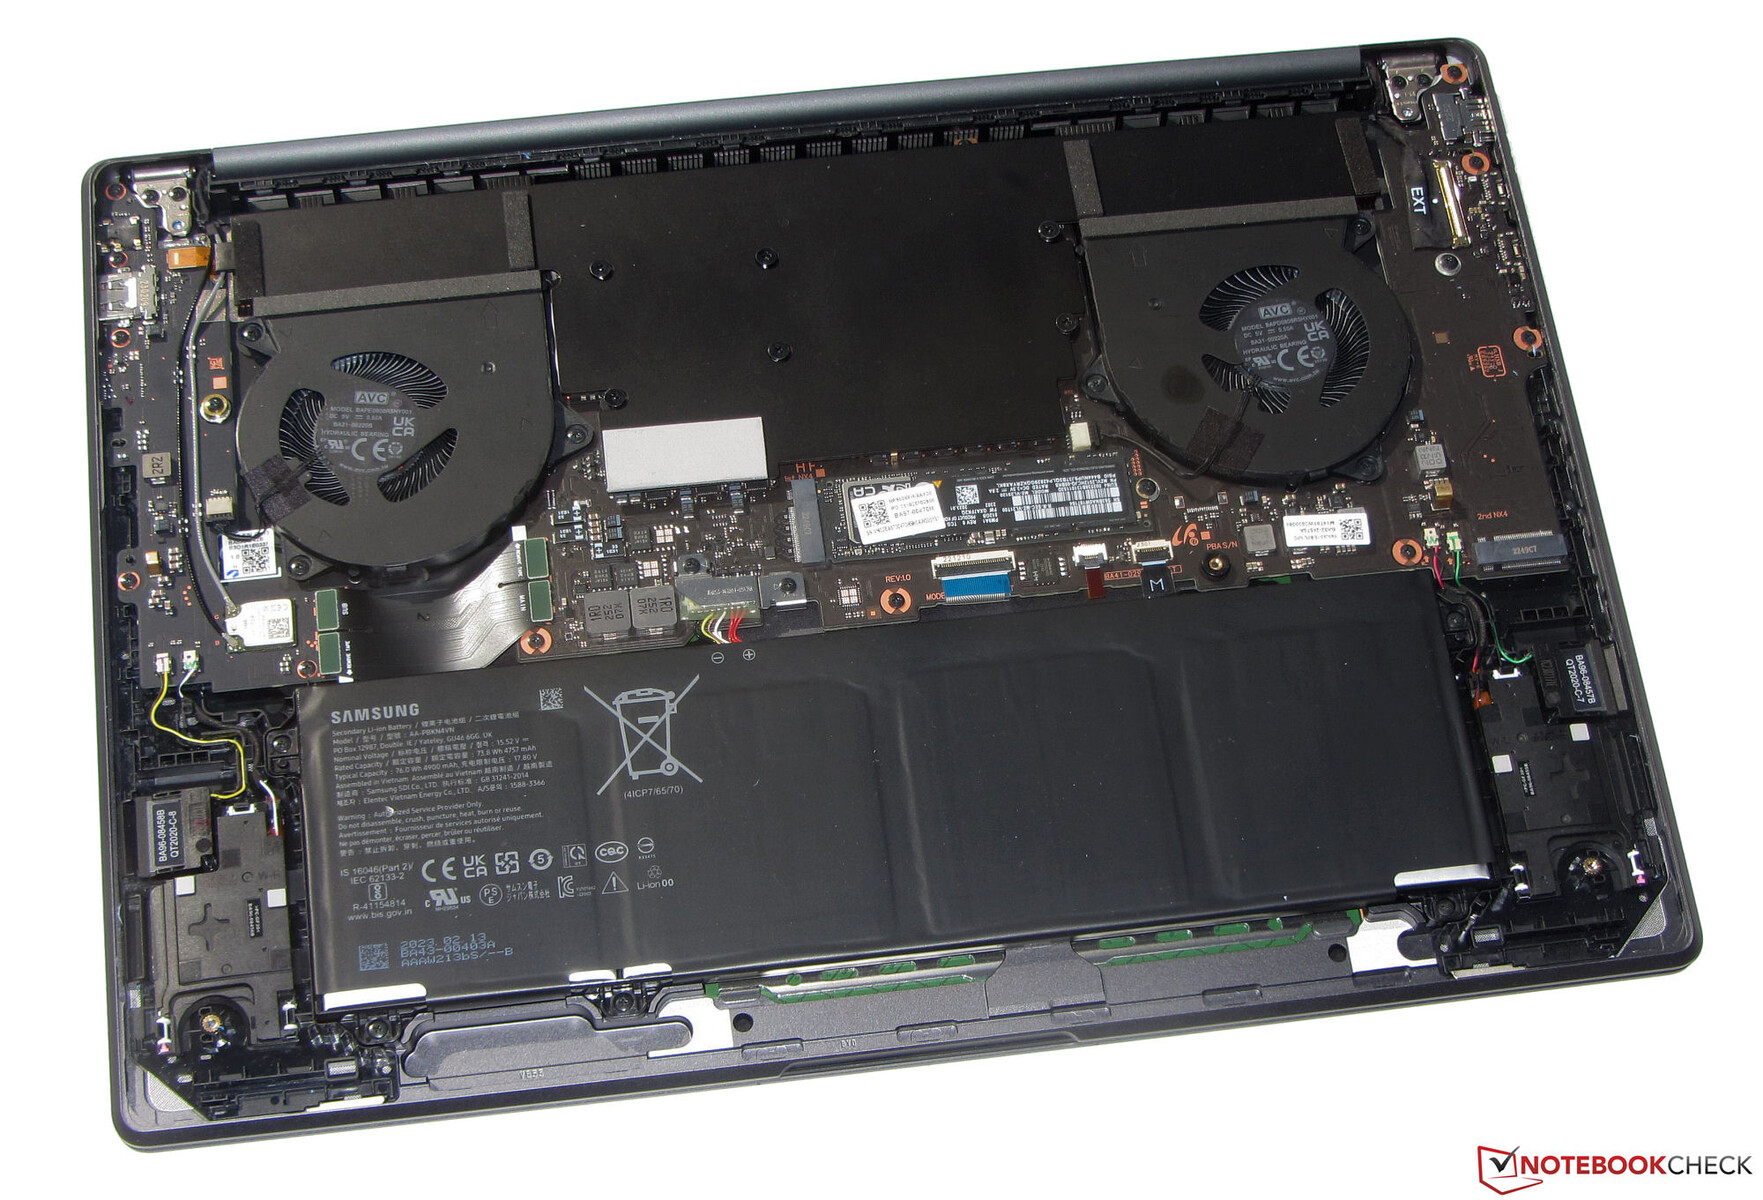
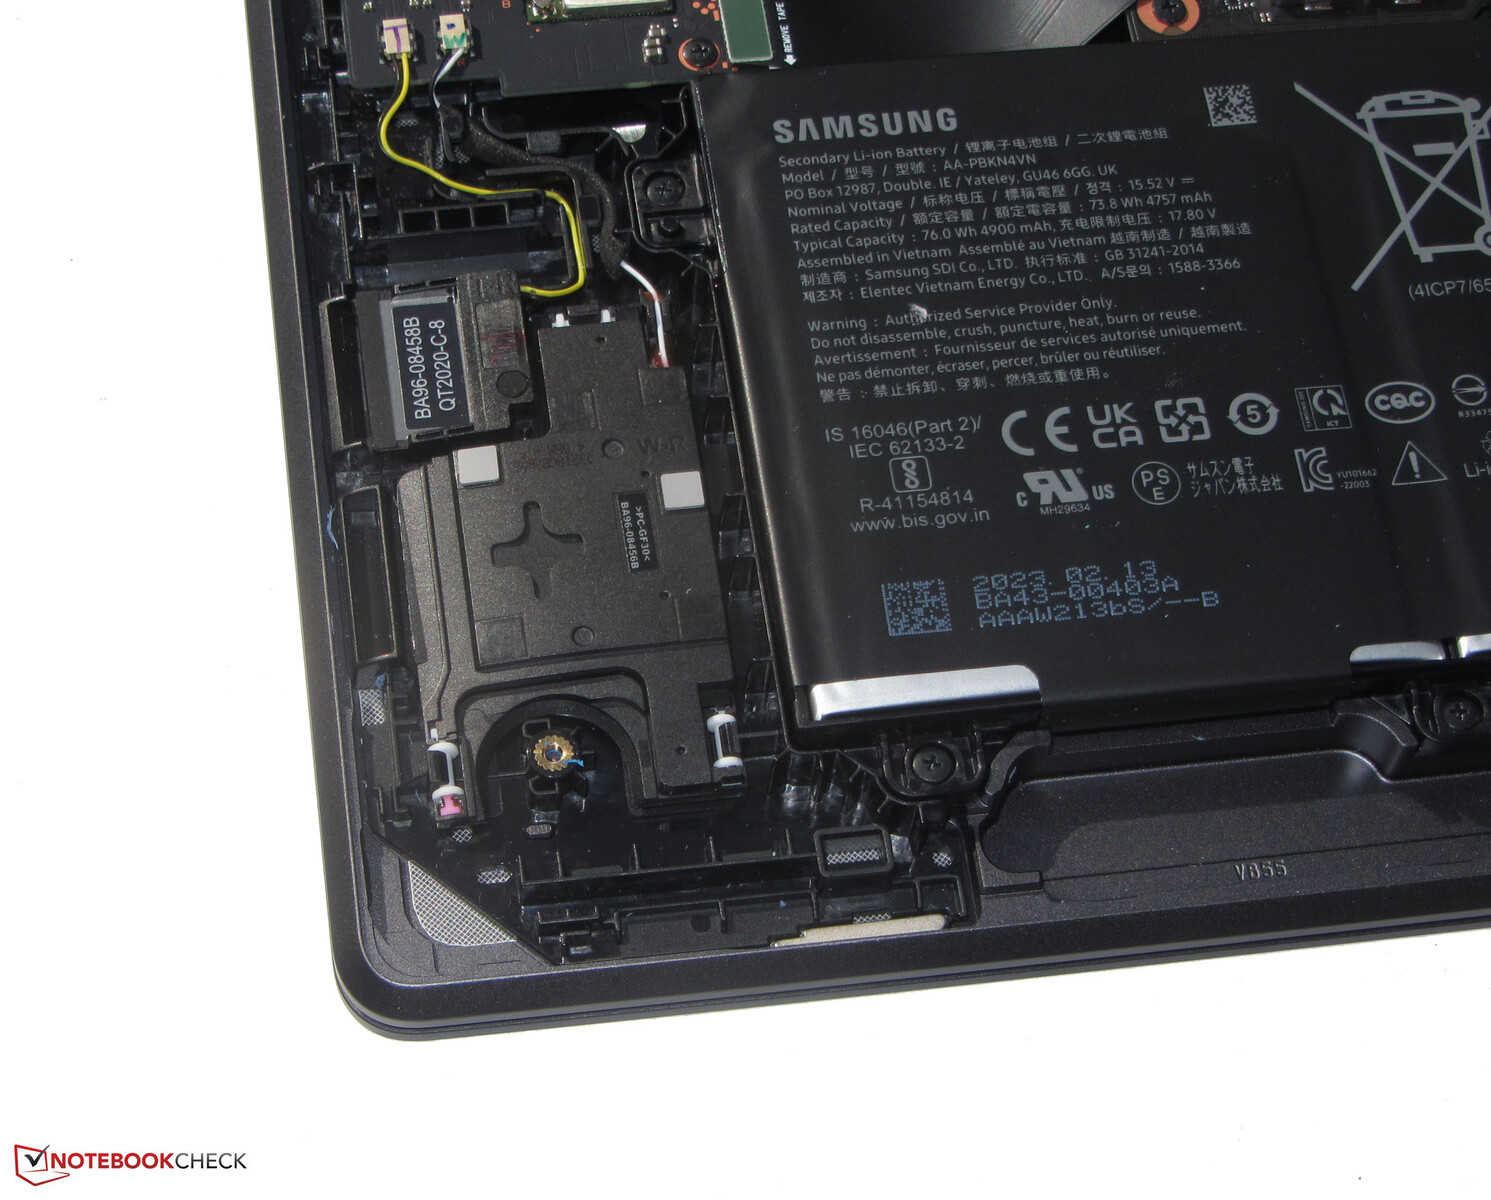
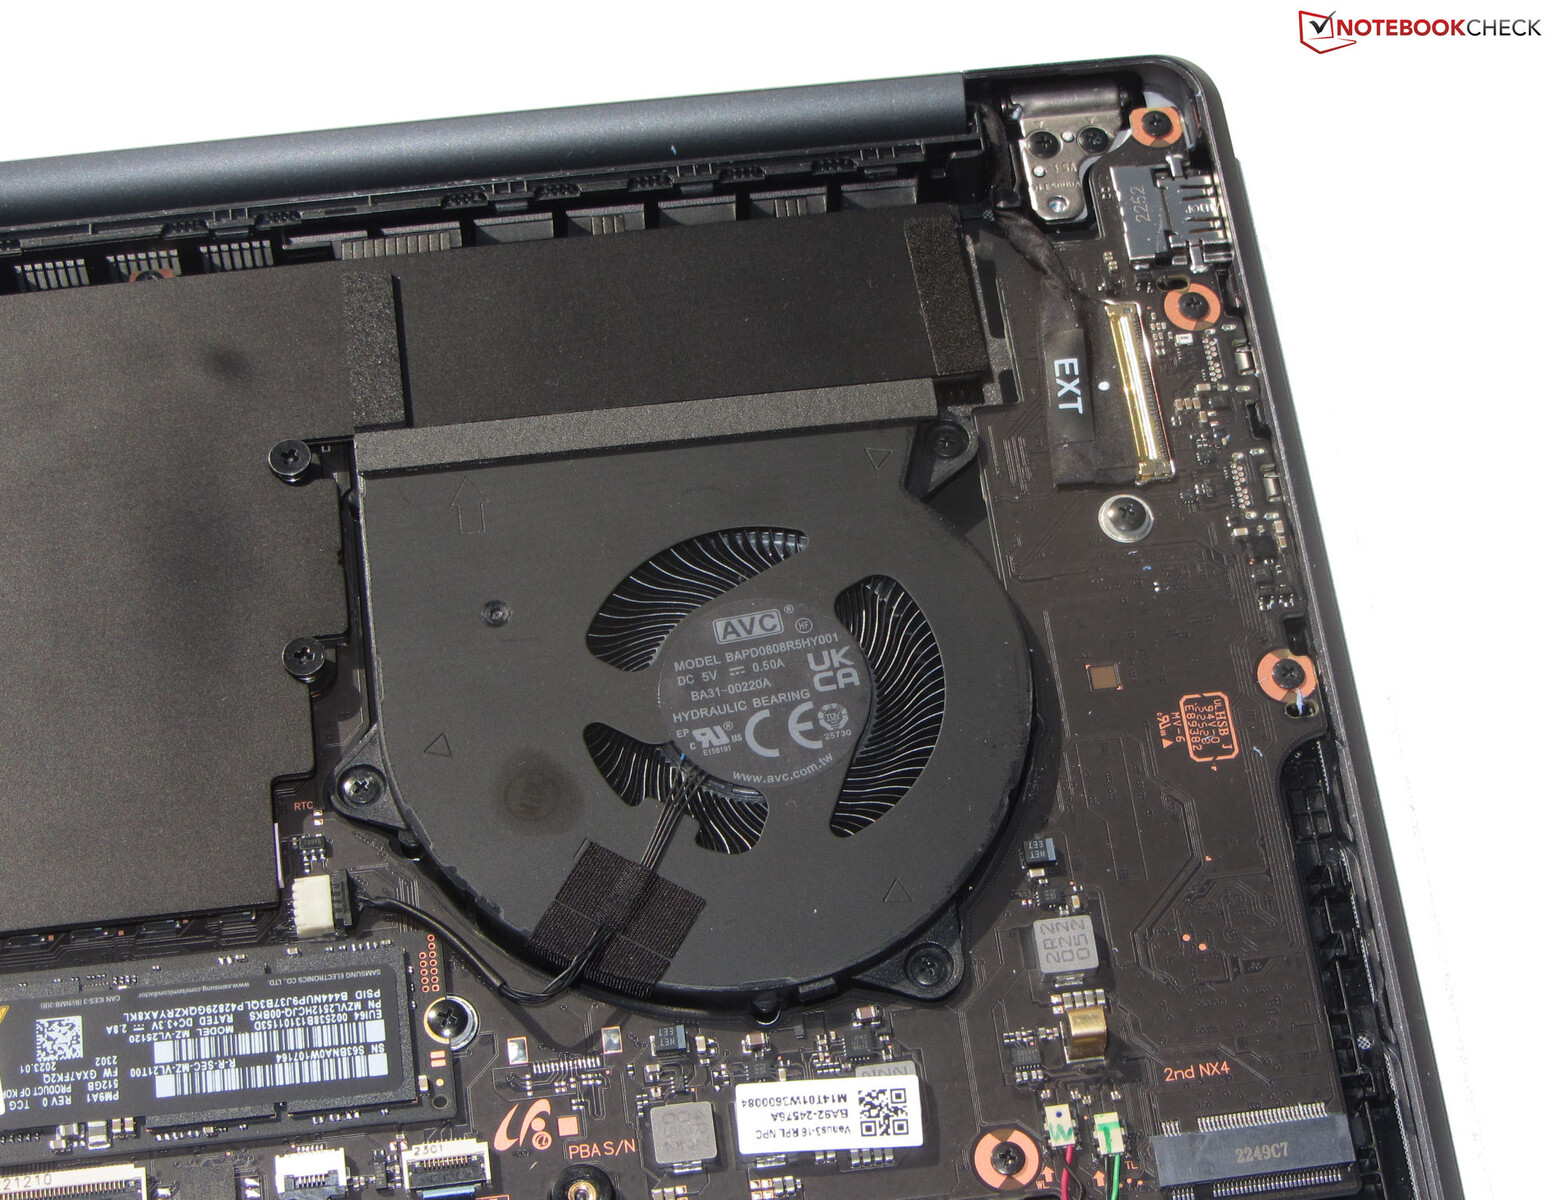
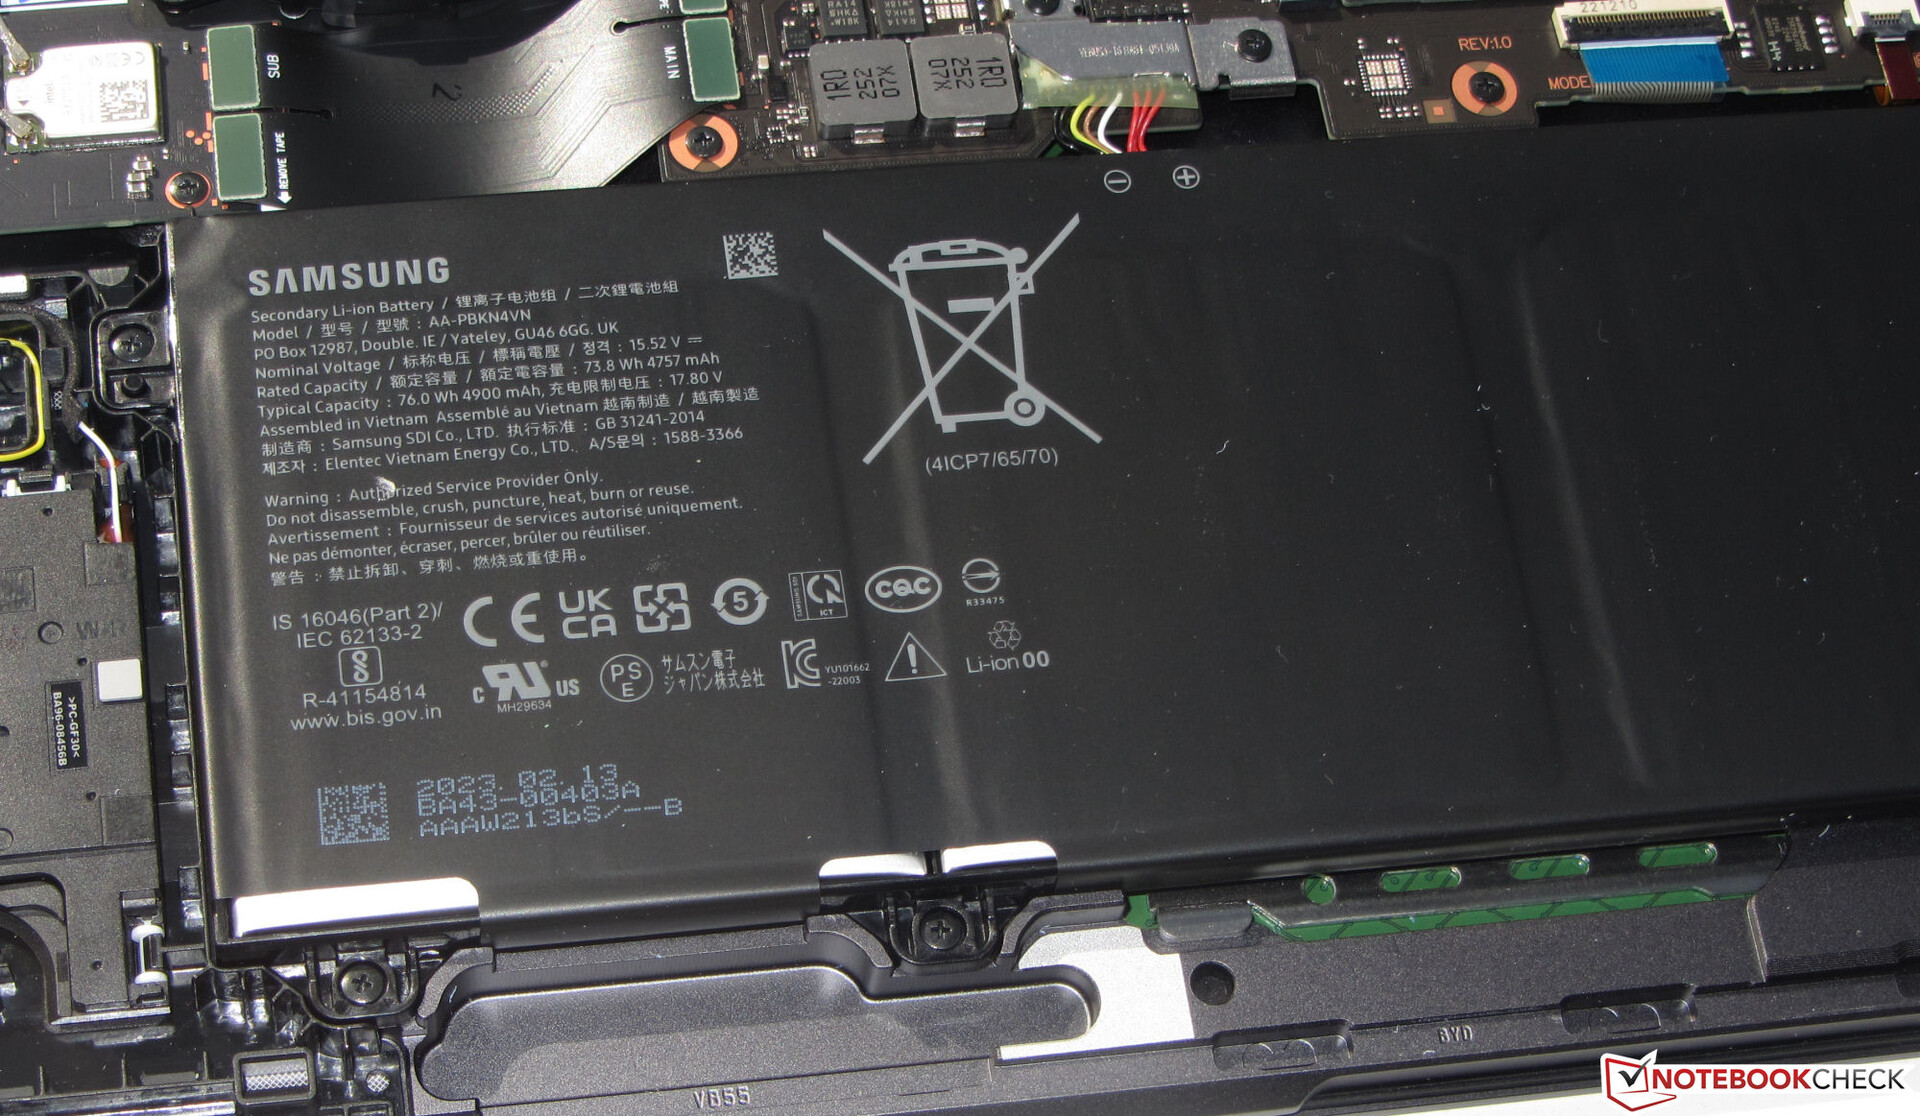
Samsung utilizza un case in alluminio grigio-nero (grafite) con superfici lisce e opache. Questo computer chic-elegante non ha caratteristiche di design accattivanti e non ne ha nemmeno bisogno. La batteria (avvitata, non incollata) e gli altri componenti interni sono accessibili dopo aver rimosso il guscio inferiore.
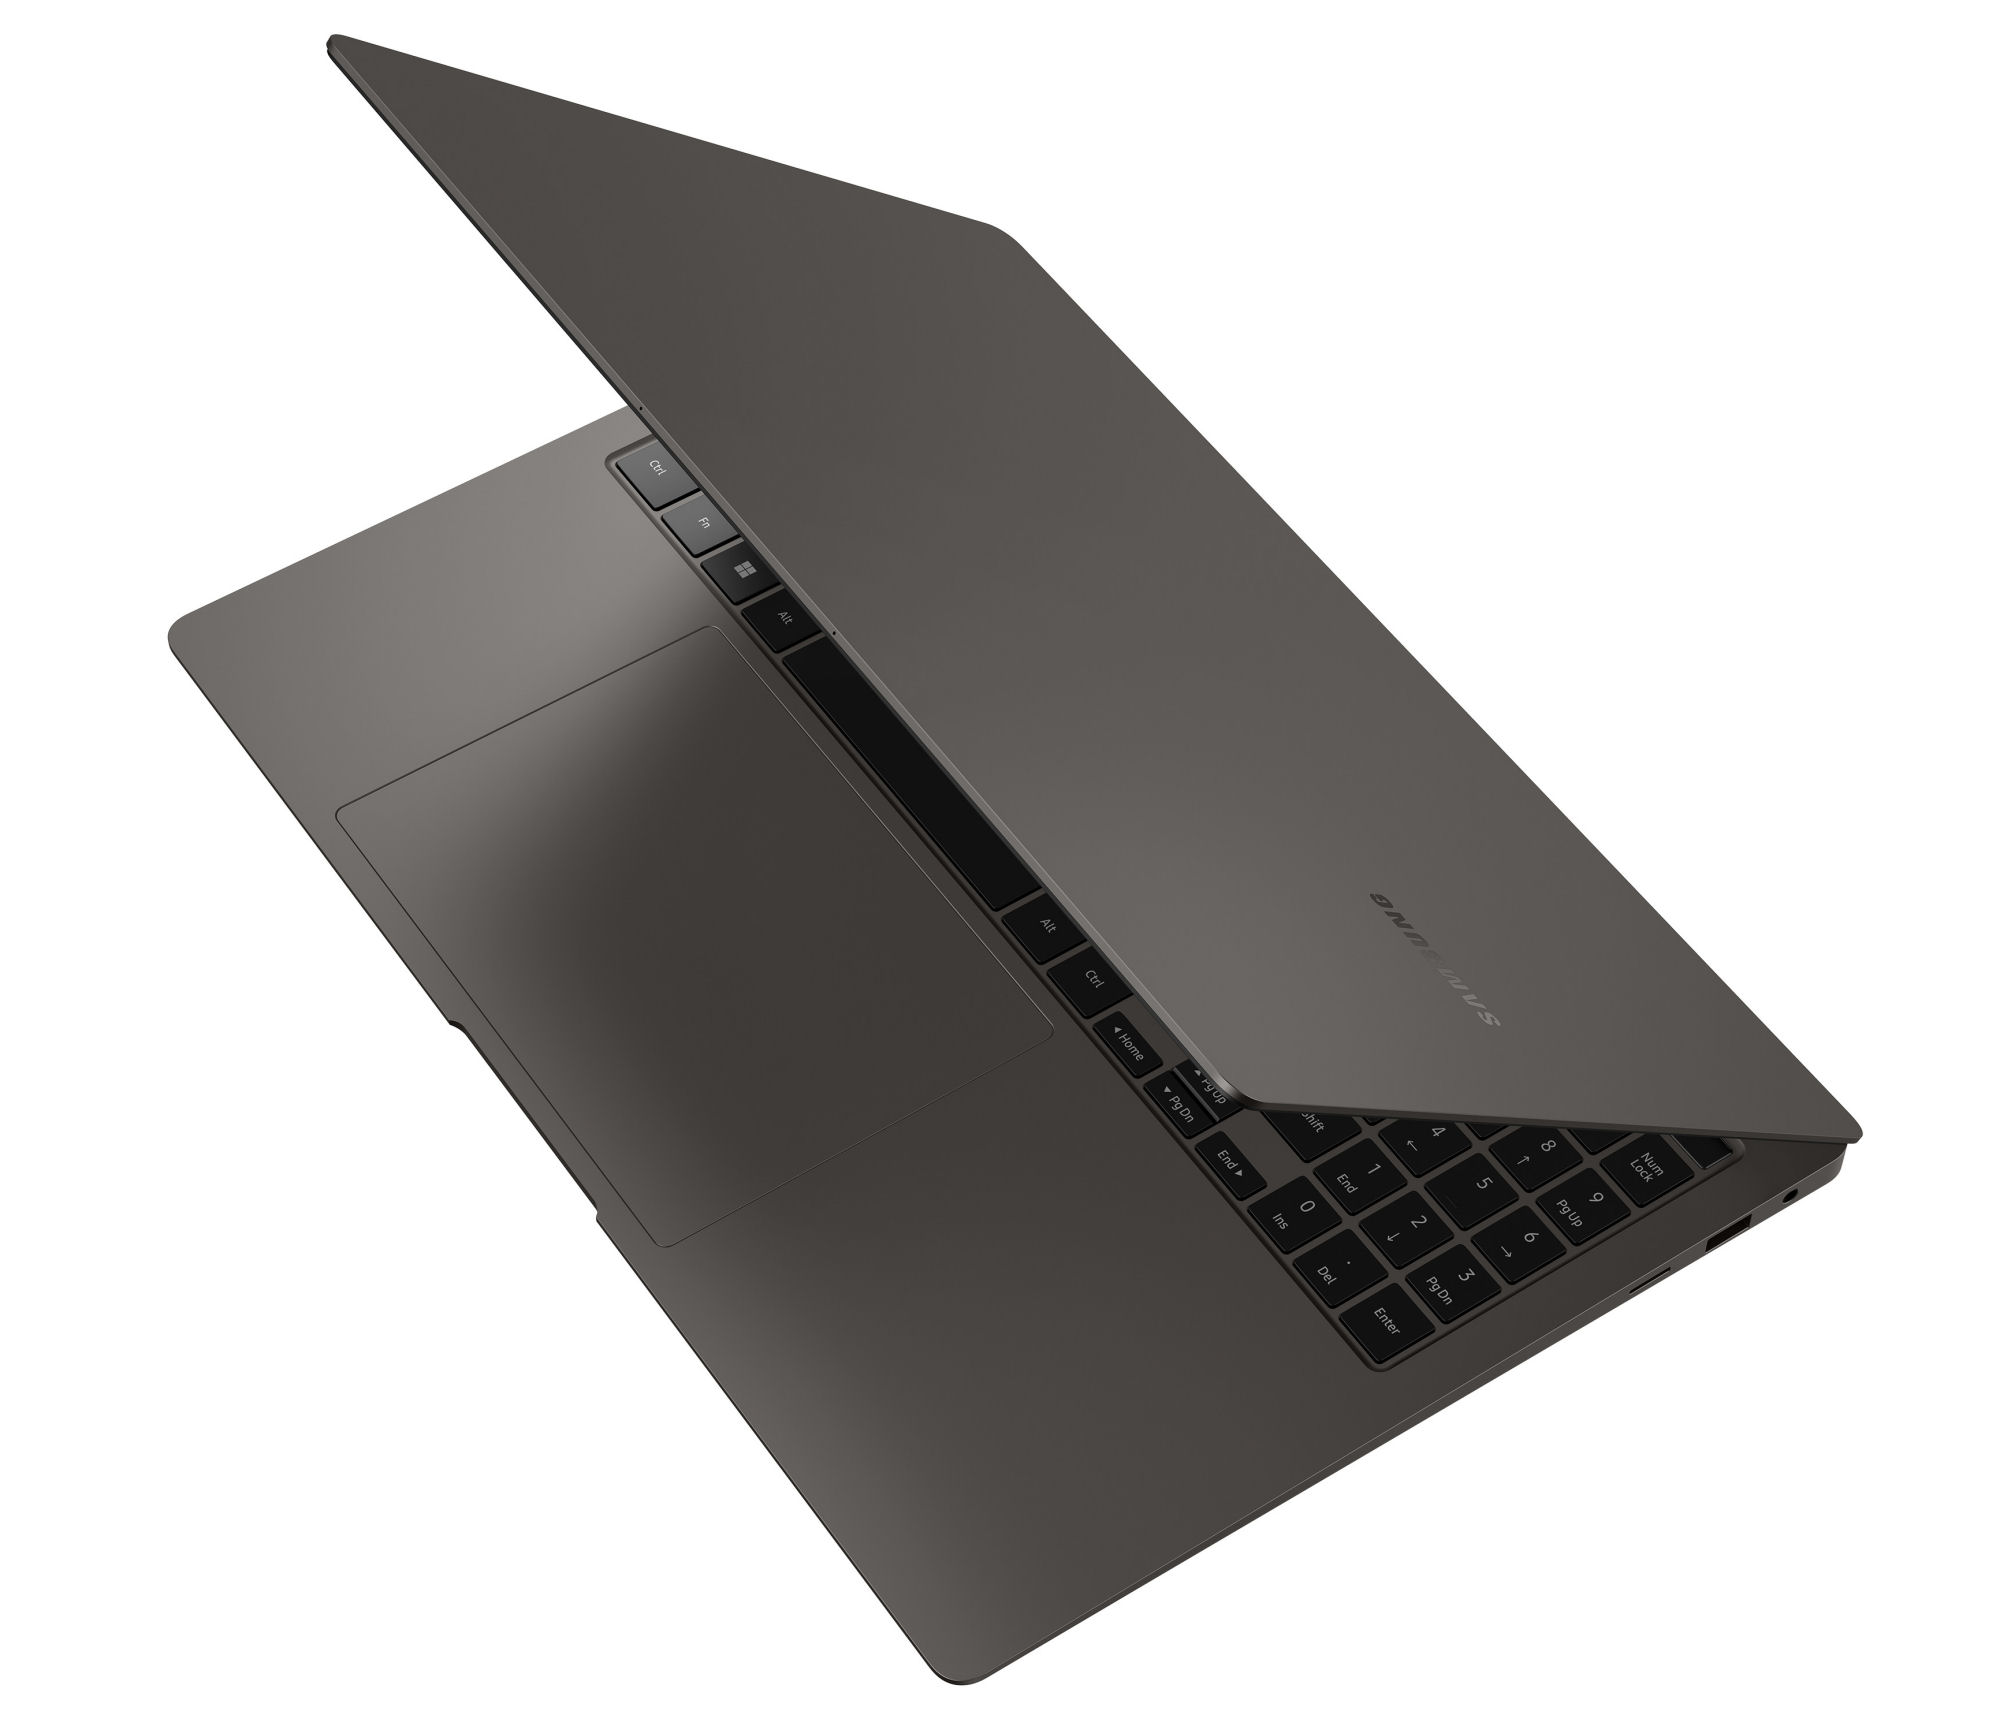
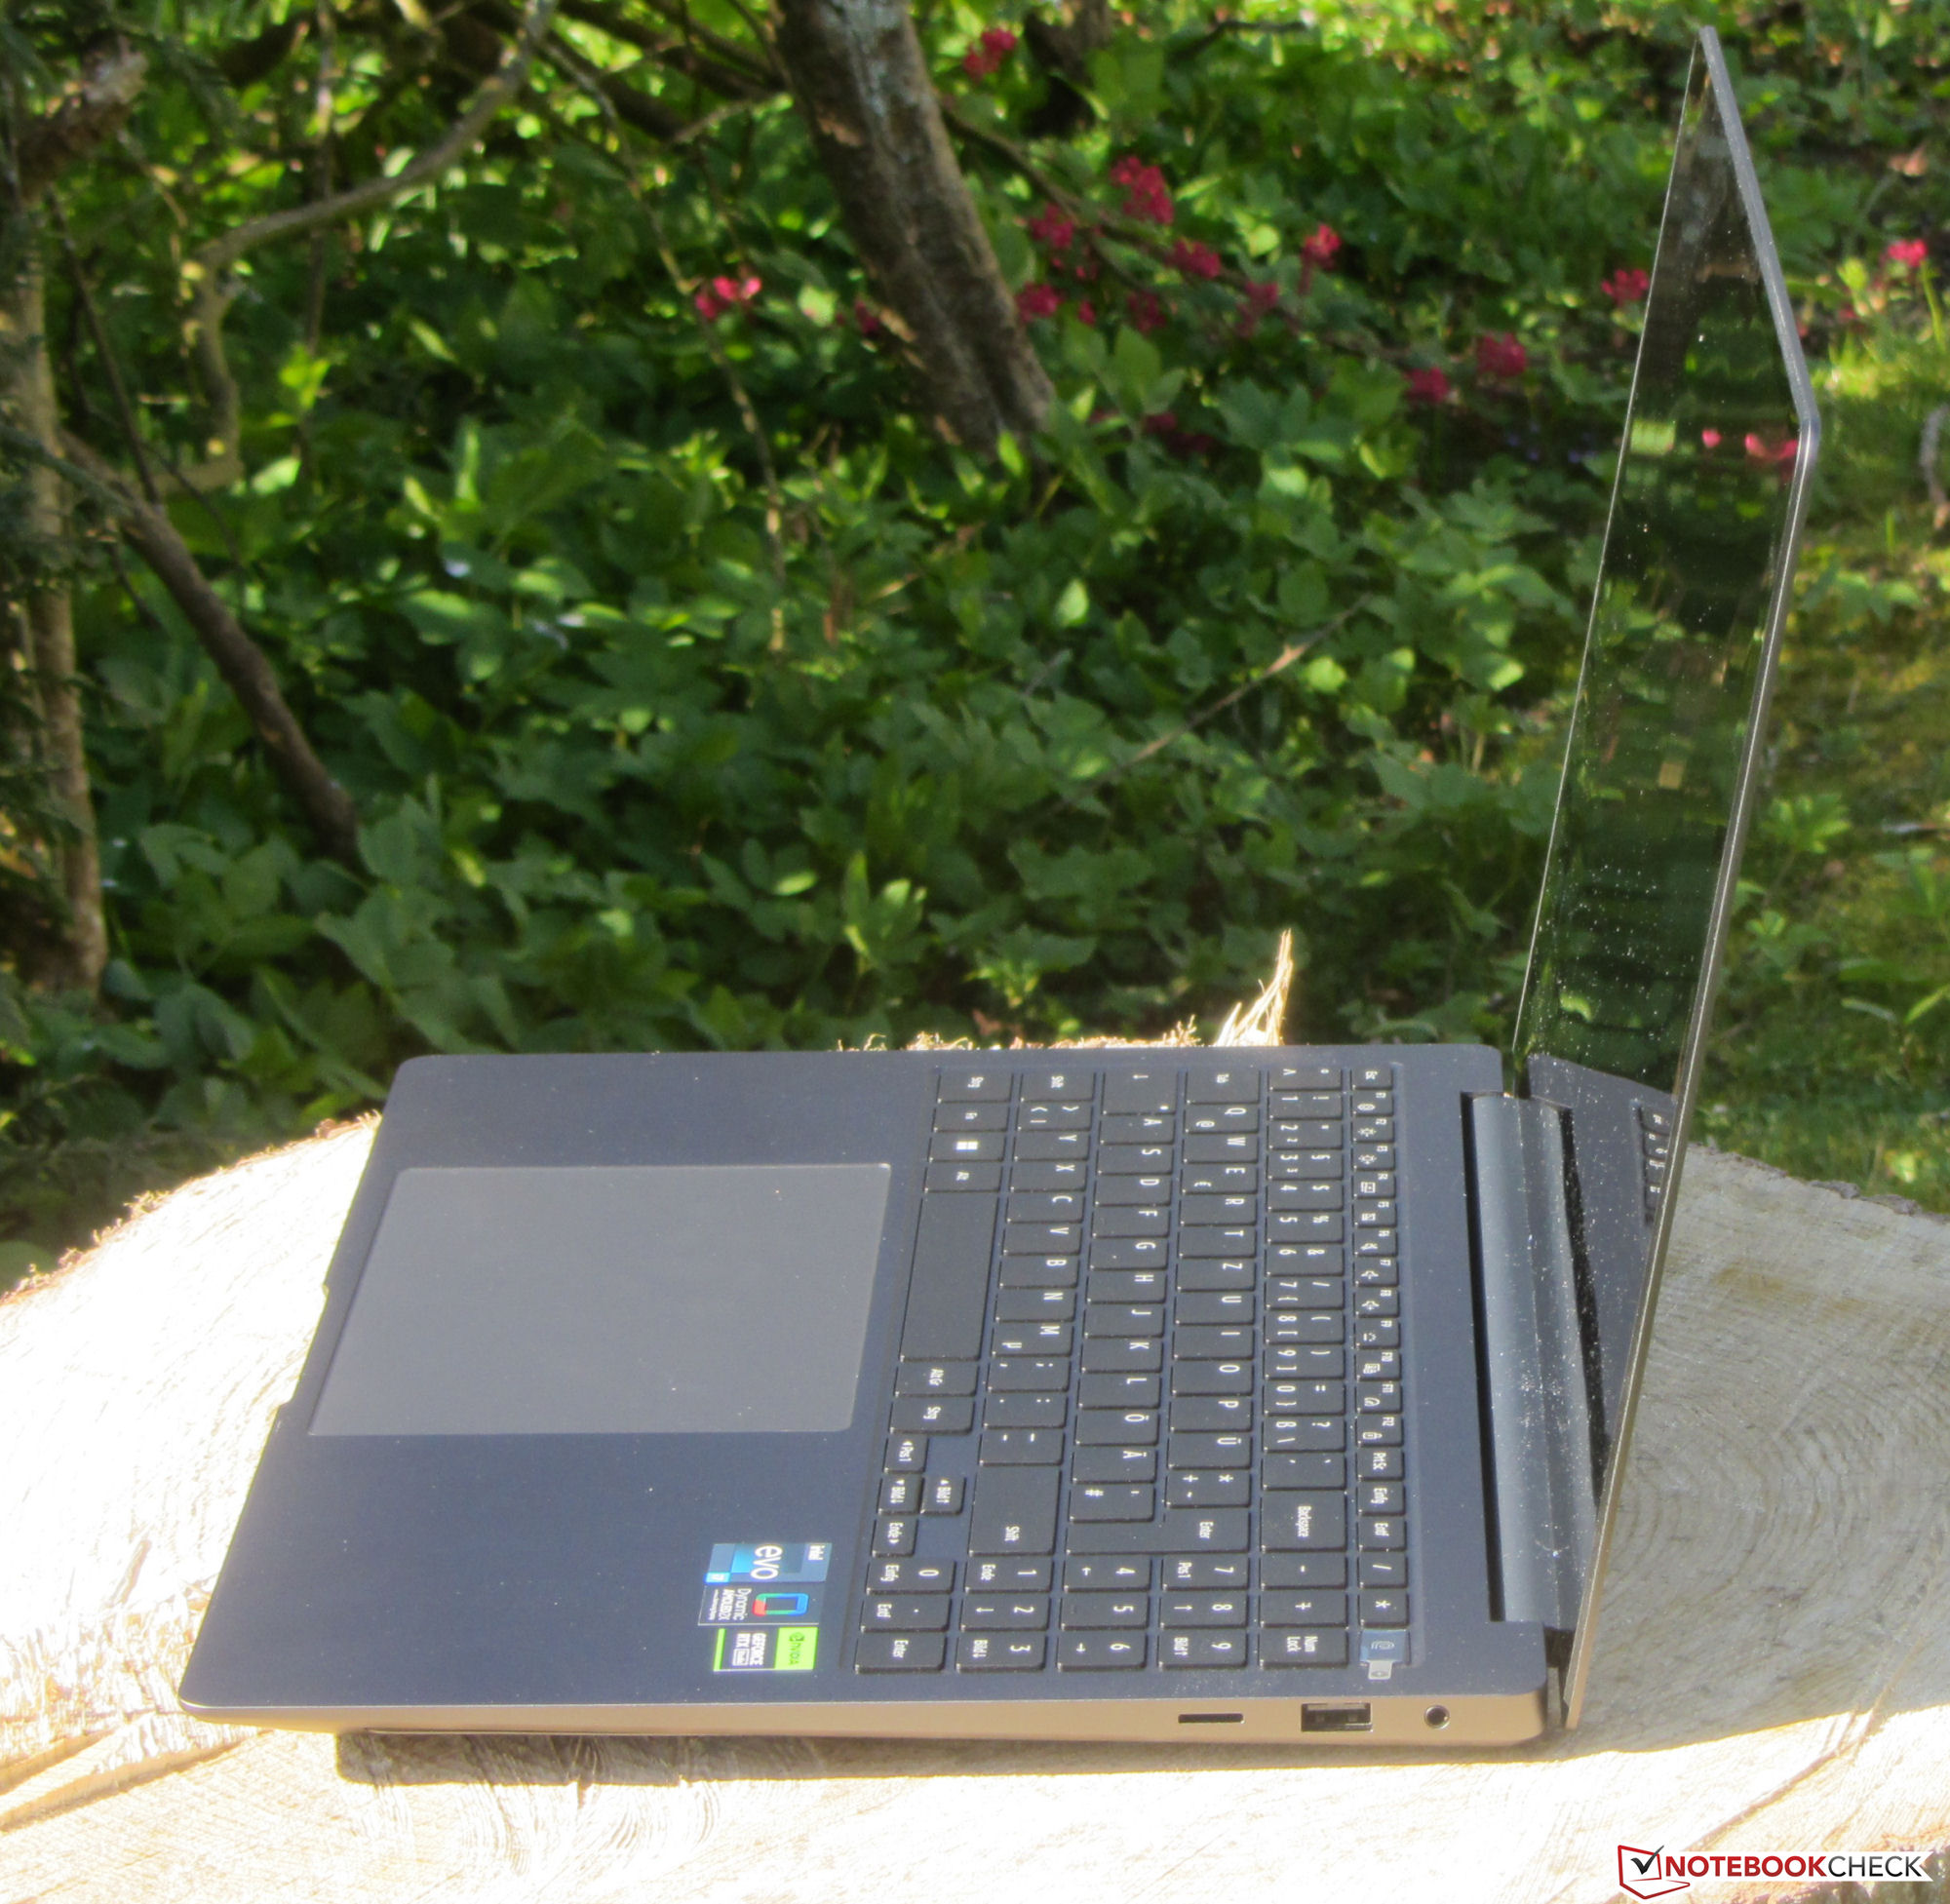
Il notebook è di buona fattura. Le dimensioni degli spazi sono regolari e non ci sono sporgenze di materiale. L'unità base e il coperchio possono essere ruotati solo in minima parte. Le cerniere mantengono il coperchio saldamente in posizione e l'angolo di apertura massimo è di circa 125 gradi. È possibile l'apertura con una sola mano.
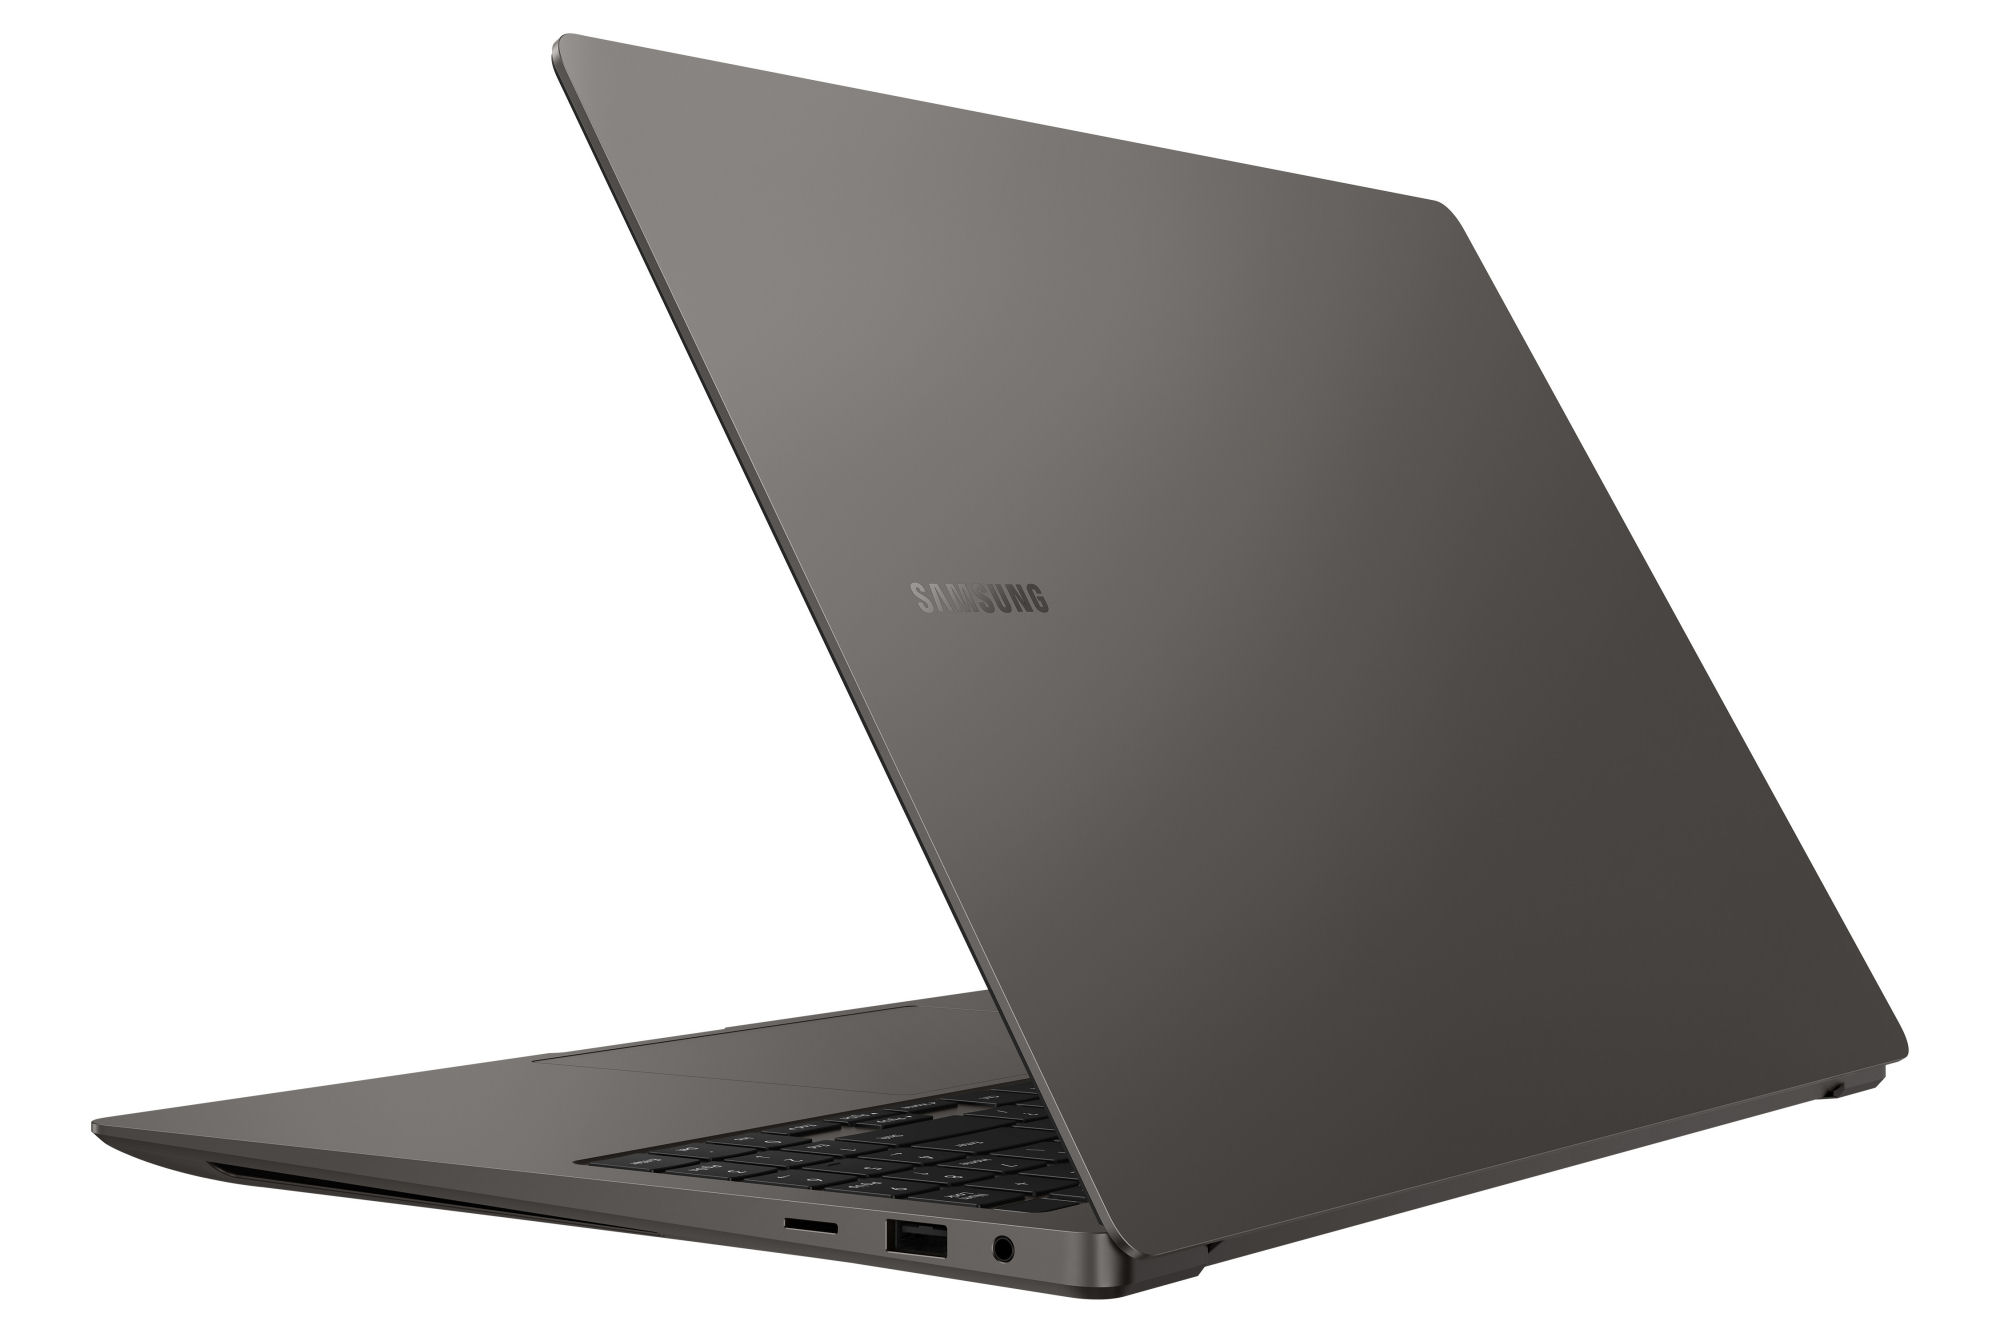

Il Galaxy Book3 appartiene fondamentalmente alla categoria dei notebook compatti e leggeri. Tuttavia, si colloca a metà del campo di confronto. Il suo diretto concorrente, lo Schenker Vision 16 Pro, è un po' più compatto e leggero. Nessun portatile può eguagliare il peso ridotto (1,4 kg) dell' LG Gram 17.
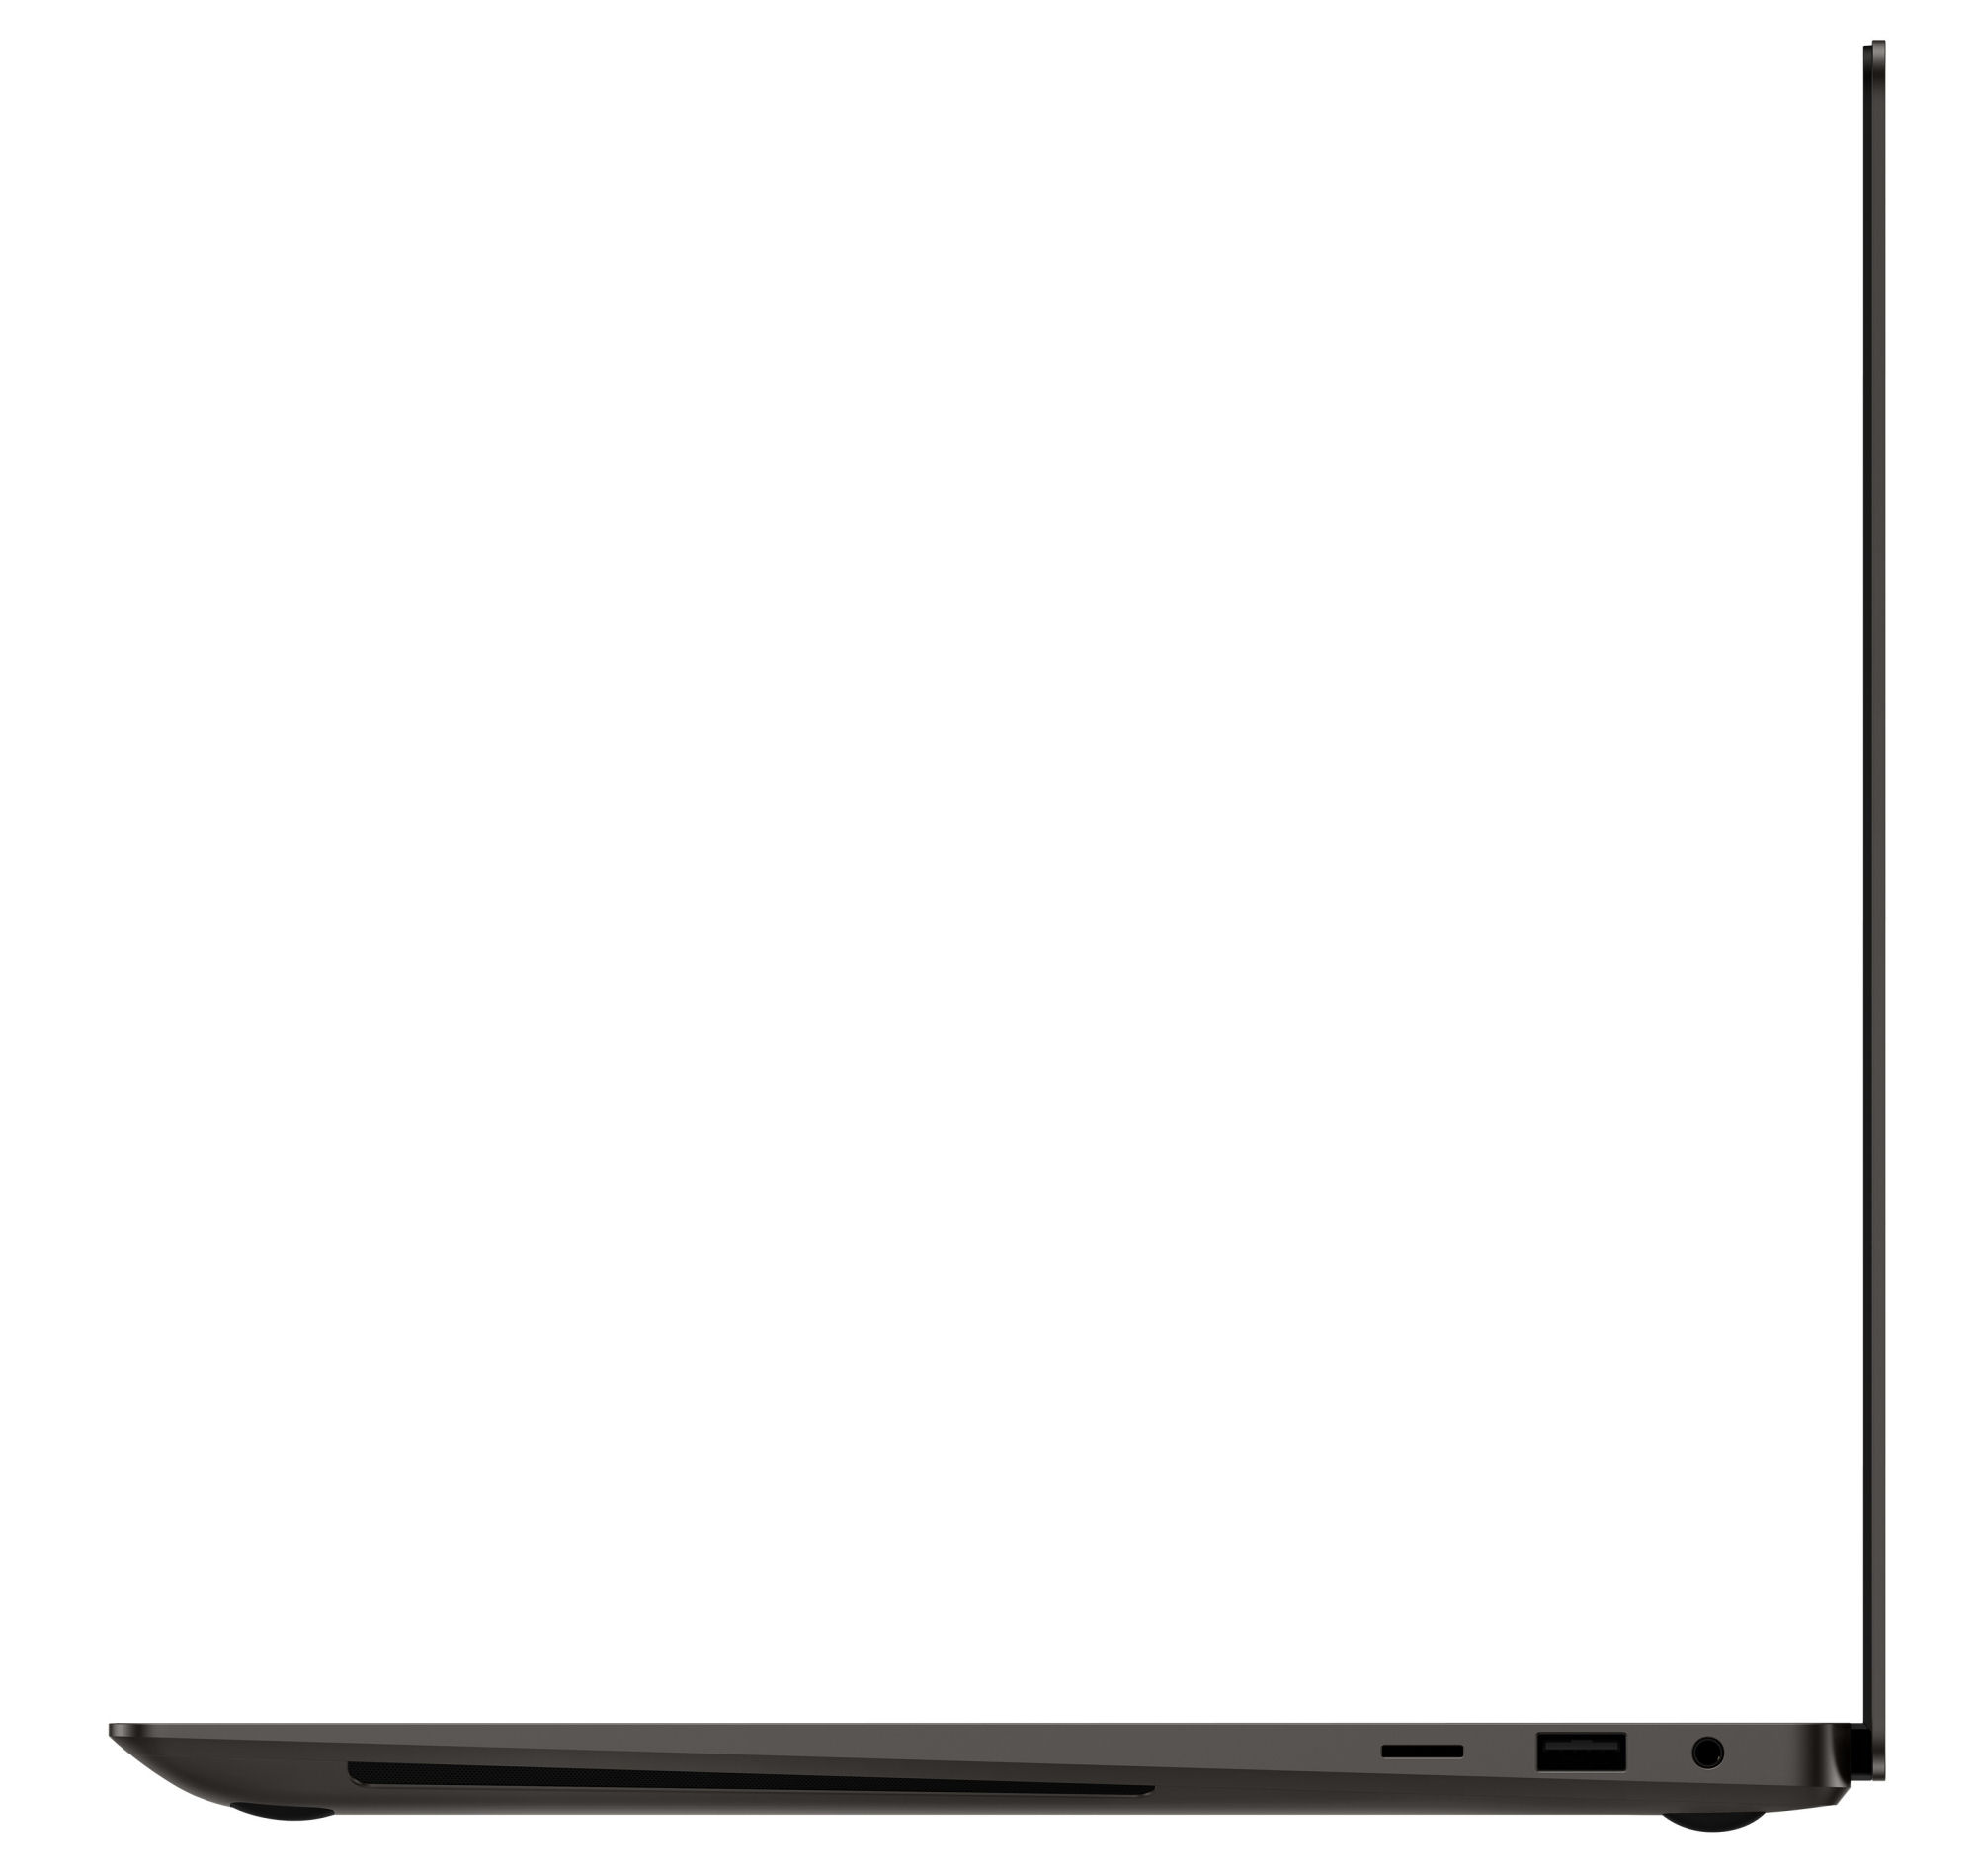
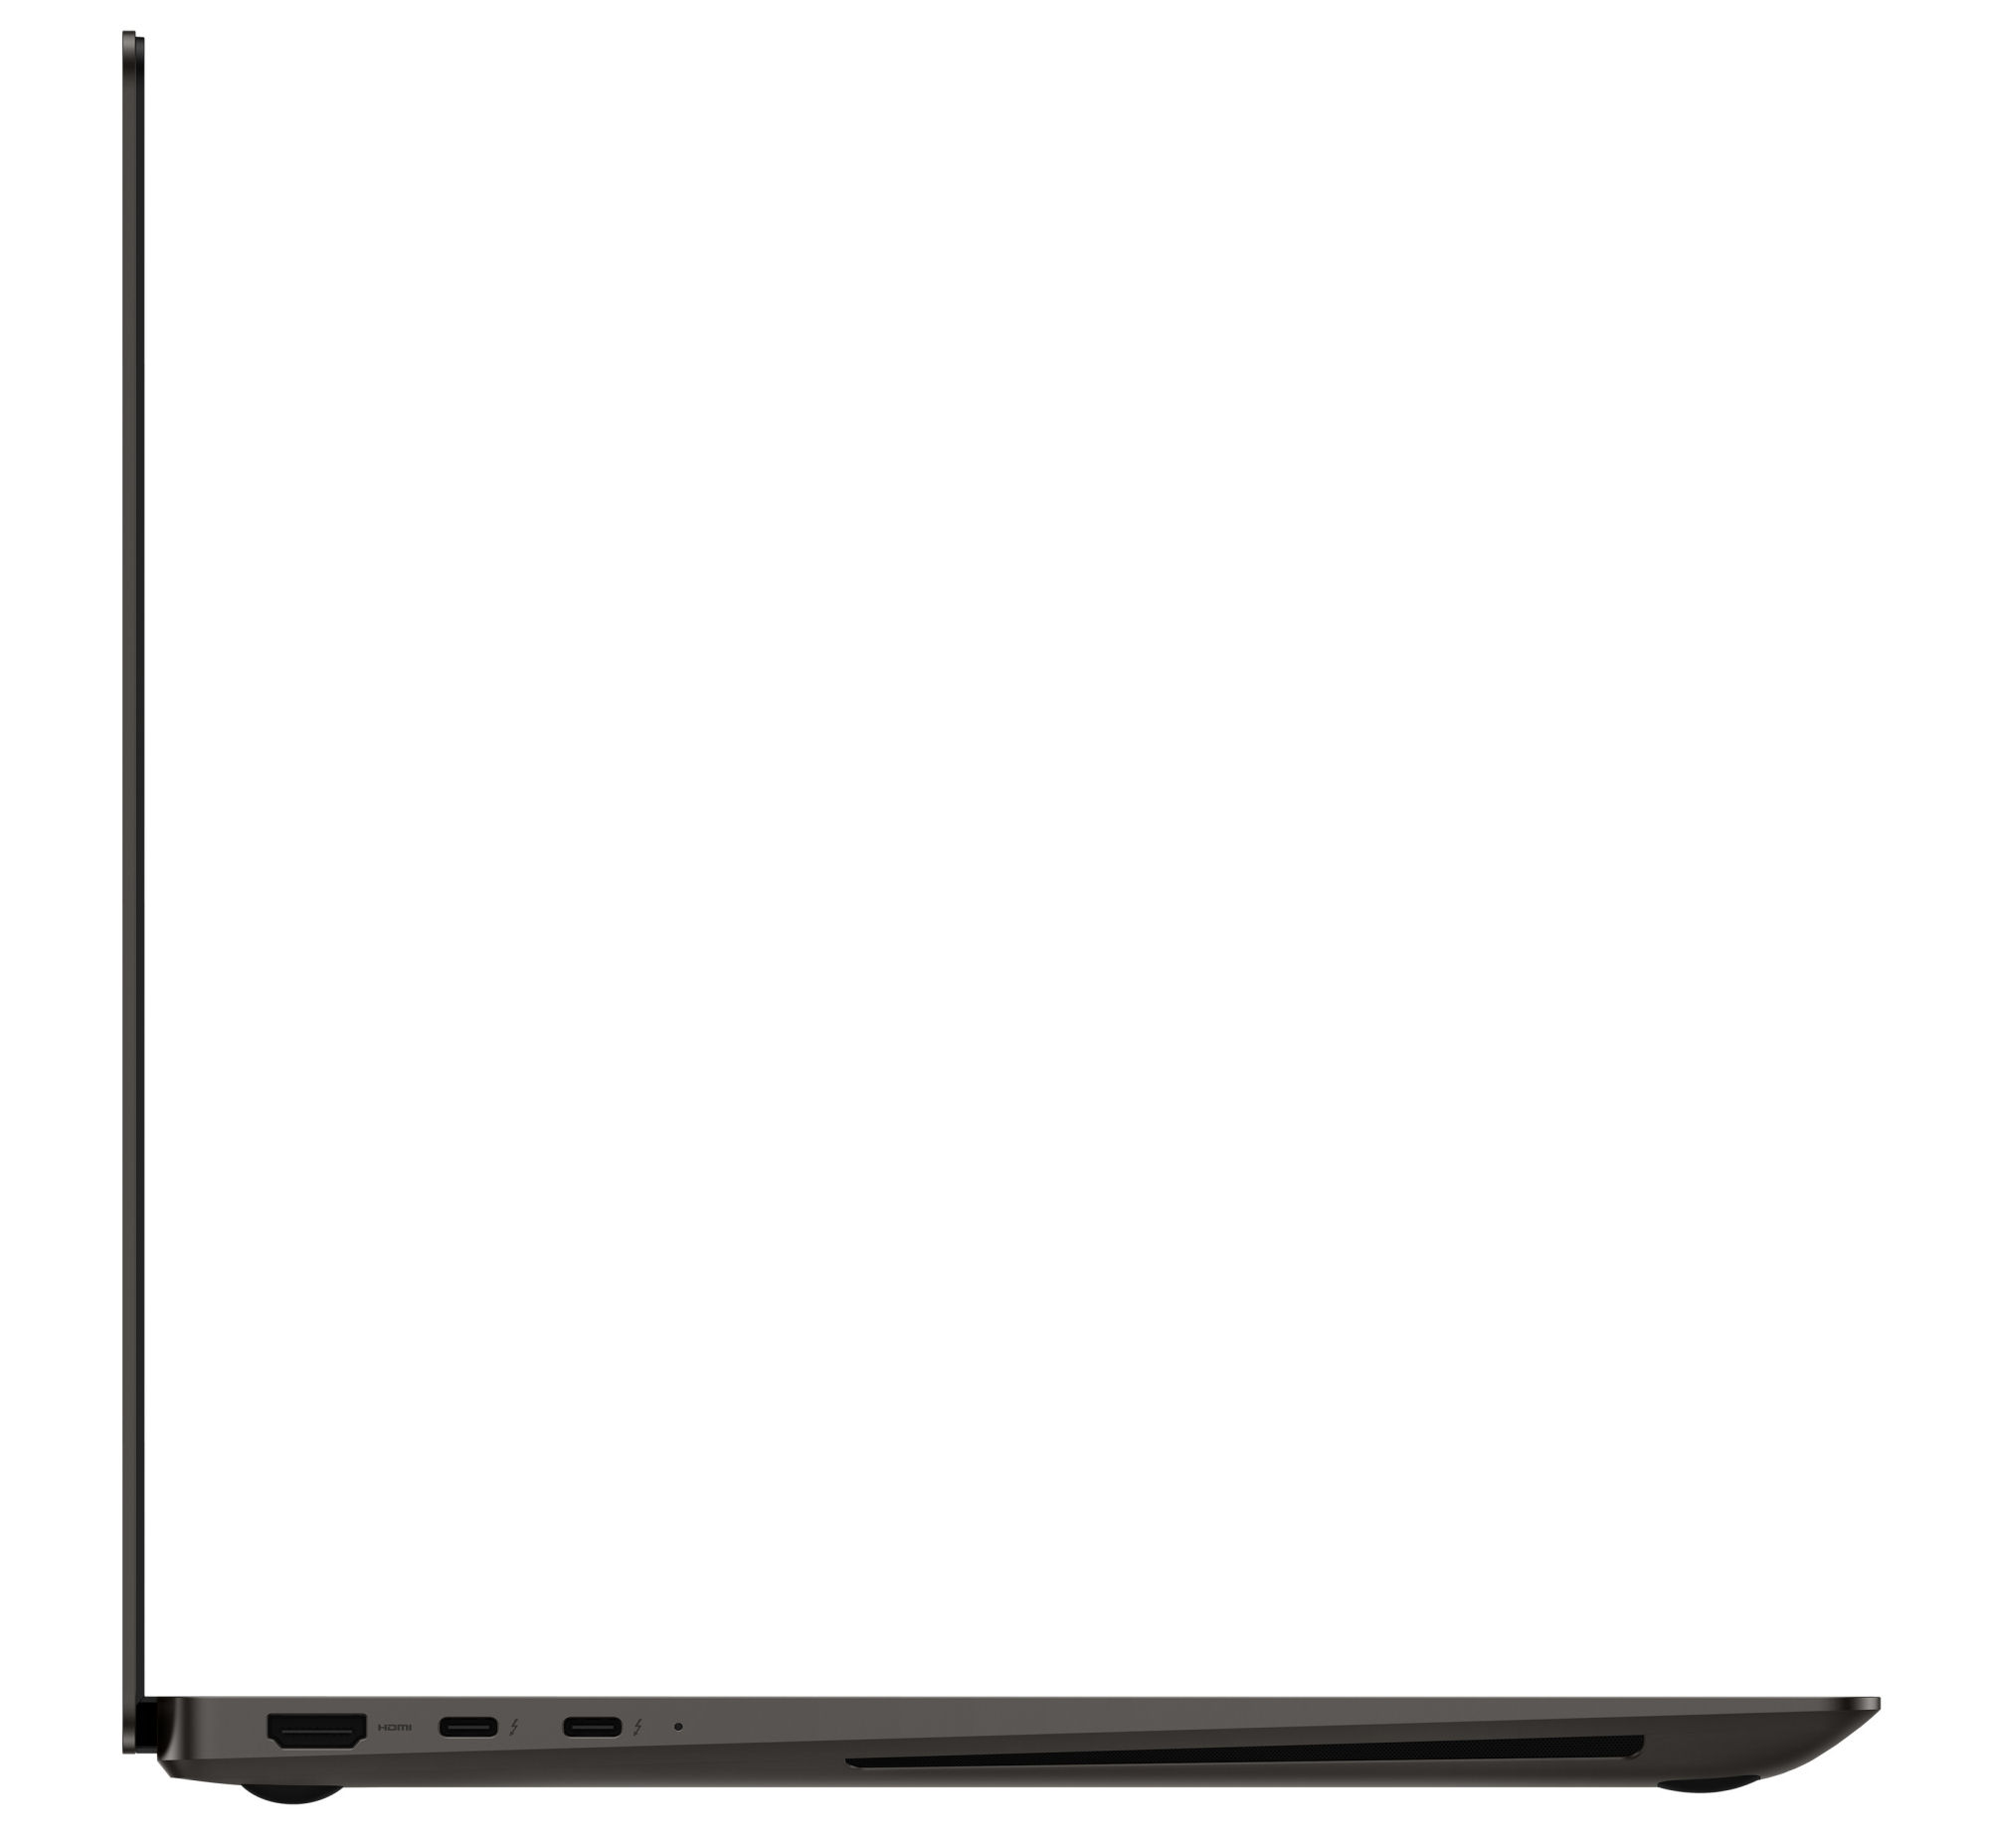
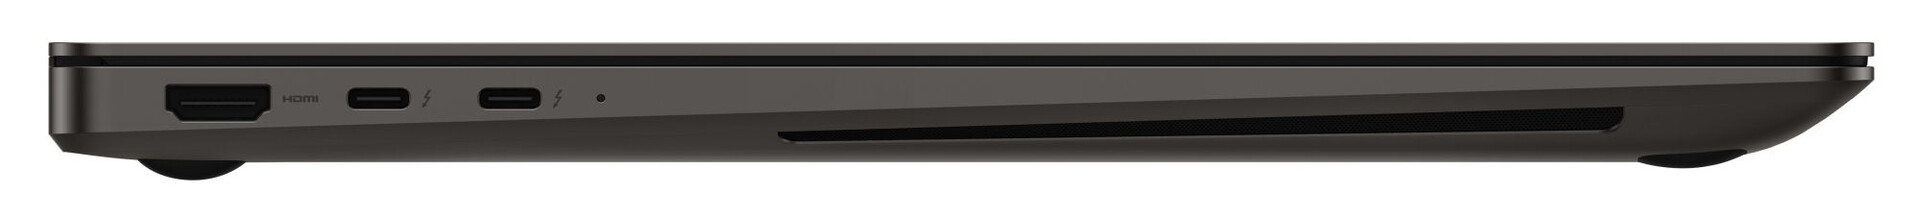
Apparecchiature - Samsung installa Thunderbolt 4 nell'Ultra 16
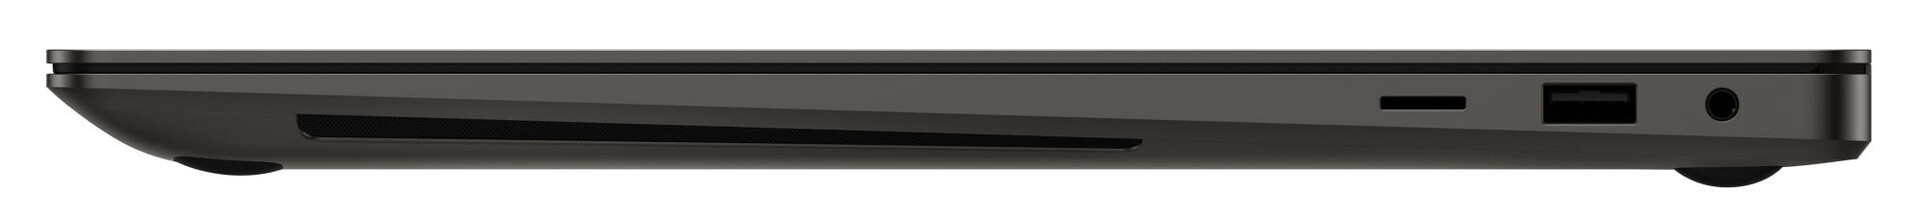
Il portatile dispone di una porta USB-A (USB 3.2 Gen 1) e due porte USB-C (Thunderbolt 4). Quest'ultima è in grado di alimentare il portatile (Power Delivery) e di emettere DisplayPort. In totale sono presenti tre uscite video (2x DP, 1x HDMI). Le porte mancanti possono essere aggiunte con una docking station.
Le porte sono situate nelle aree posteriori dei lati destro e sinistro, in modo che lo spazio accanto al palm rest rimanga libero da cavi. Un aspetto negativo: tutte le uscite video e le connessioni di alimentazione si trovano a sinistra. Sarebbe stato opportuno installare la Thunderbolt 4 su entrambi i lati.
Lettore di schede SD
Il lettore di schede di memoria microSD (scheda di riferimento: AV PRO microSD 128 GB V60) si colloca tra i modelli medio-veloci con velocità di trasferimento massime di 74 MB/s (trasferimento di 250 file immagine jpg da circa 5 MB ciascuno) e 83 MB/s (copia di grandi blocchi di dati).
| SD Card Reader | |
| average JPG Copy Test (av. of 3 runs) | |
| Dell XPS 15 9520 RTX 3050 Ti (Toshiba Exceria Pro SDXC 64 GB UHS-II) | |
| Media della classe Multimedia (23 - 531, n=40, ultimi 2 anni) | |
| Schenker Vision 16 Pro RTX 3070 Ti (AV Pro V60) | |
| Lenovo ThinkBook 16p G3 ARH (AV PRO microSD 128 GB V60) | |
| LG Gram 17Z90Q-E.AD78G (AV Pro SD microSD 128 GB V60) | |
| Samsung Galaxy Book3 Ultra 16 (AV PRO microSD 128 GB V60) | |
| Asus VivoBook Pro 16X OLED N7600PC-L2026X | |
| maximum AS SSD Seq Read Test (1GB) | |
| Media della classe Multimedia (37.3 - 1455, n=39, ultimi 2 anni) | |
| Dell XPS 15 9520 RTX 3050 Ti (Toshiba Exceria Pro SDXC 64 GB UHS-II) | |
| LG Gram 17Z90Q-E.AD78G (AV Pro SD microSD 128 GB V60) | |
| Lenovo ThinkBook 16p G3 ARH (AV PRO microSD 128 GB V60) | |
| Samsung Galaxy Book3 Ultra 16 (AV PRO microSD 128 GB V60) | |
| Schenker Vision 16 Pro RTX 3070 Ti (AV Pro V60) | |
| Asus VivoBook Pro 16X OLED N7600PC-L2026X | |
Comunicazione
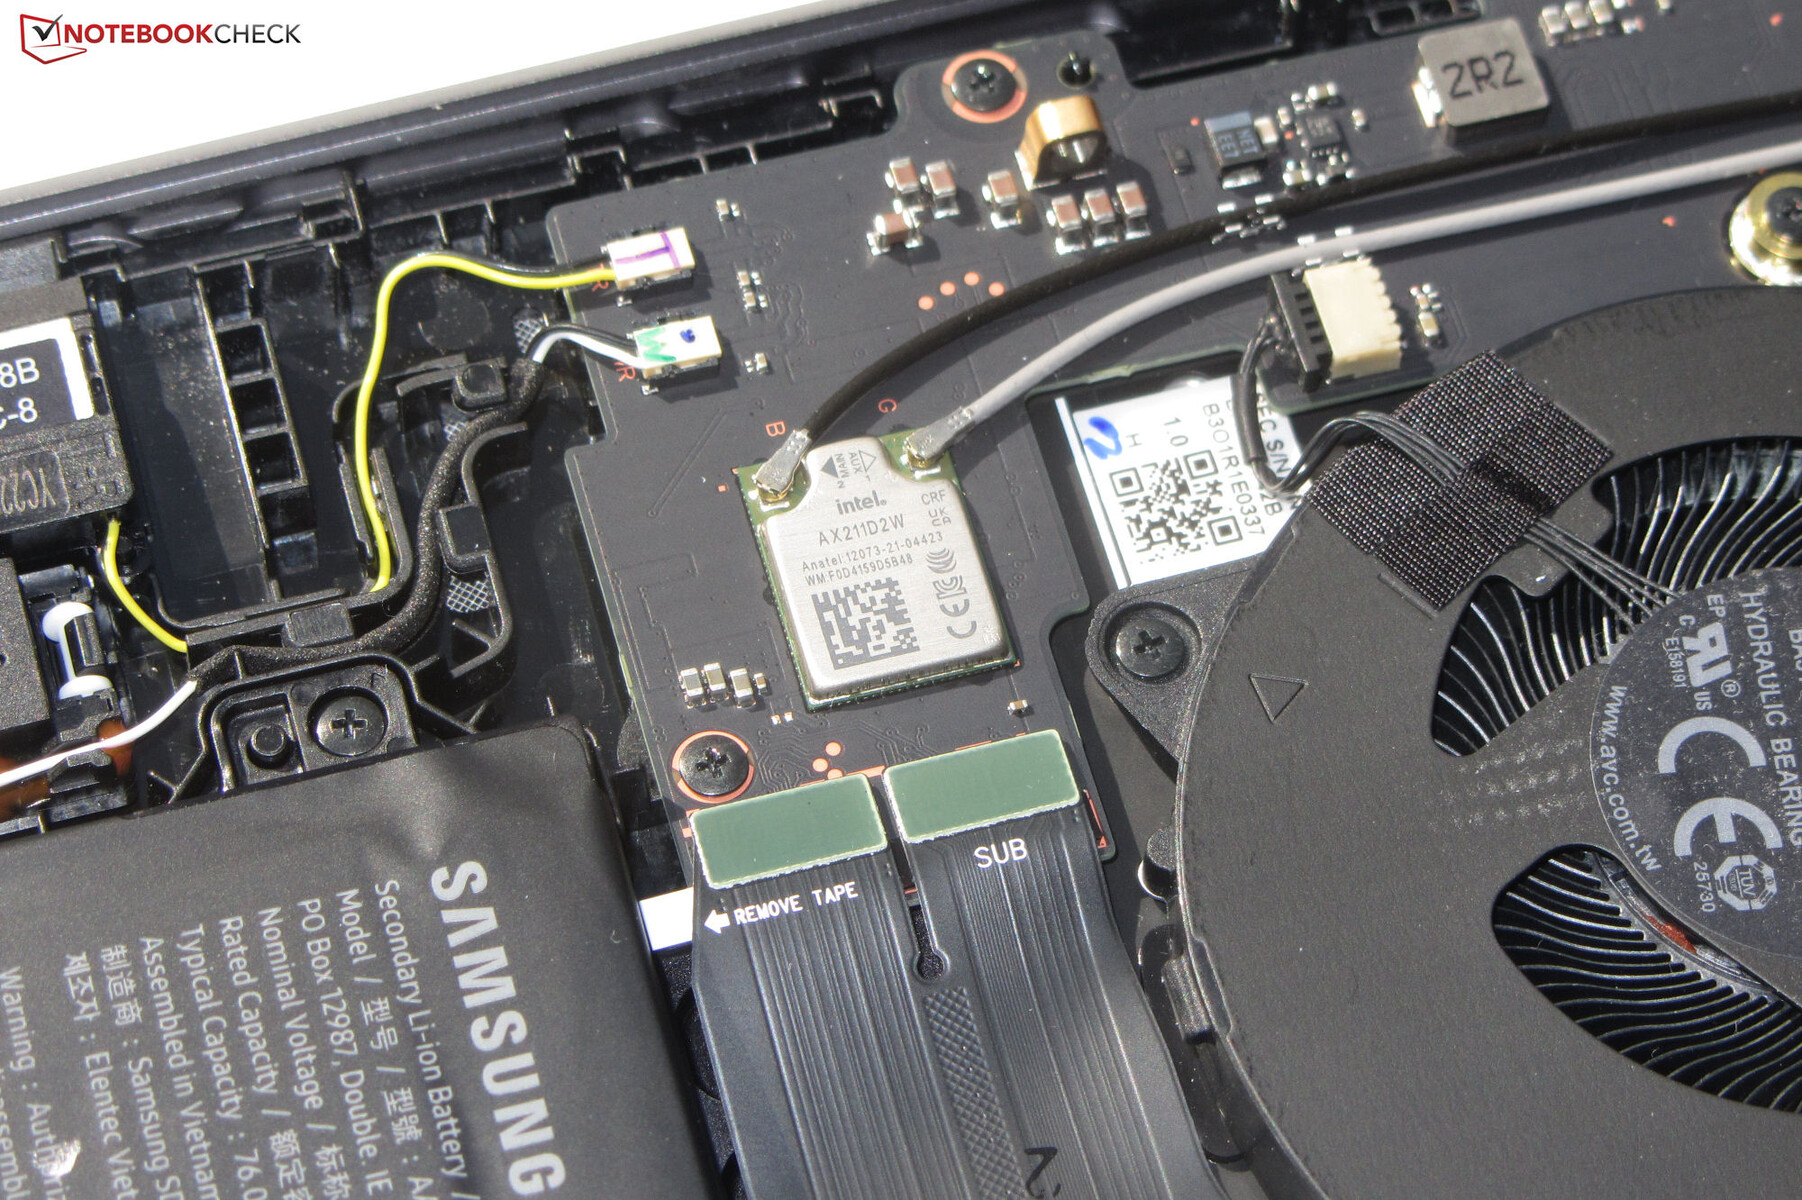
In condizioni ottimali (assenza di dispositivi WLAN nelle vicinanze, distanza ridotta tra il portatile e il PC server) si ottengono velocità di trasmissione dati WiFi eccellenti. Il notebook Samsung ha a bordo un chip WiFi 6E (Intel AX211). Non è disponibile uno slot Ethernet.
Webcam
La webcam (2,1 MP, max. 1.920 x 1.080) non ha un otturatore meccanico. Dal punto di vista qualitativo, offre prestazioni standard. L'accuratezza del colore è un problema, in quanto l'obiettivo (DeltaE inferiore a 3) viene mancato con una deviazione del colore di quasi 8.


Accessori
Oltre ai soliti documenti (informazioni sulla garanzia, guida rapida), il notebook non viene fornito con altri accessori.
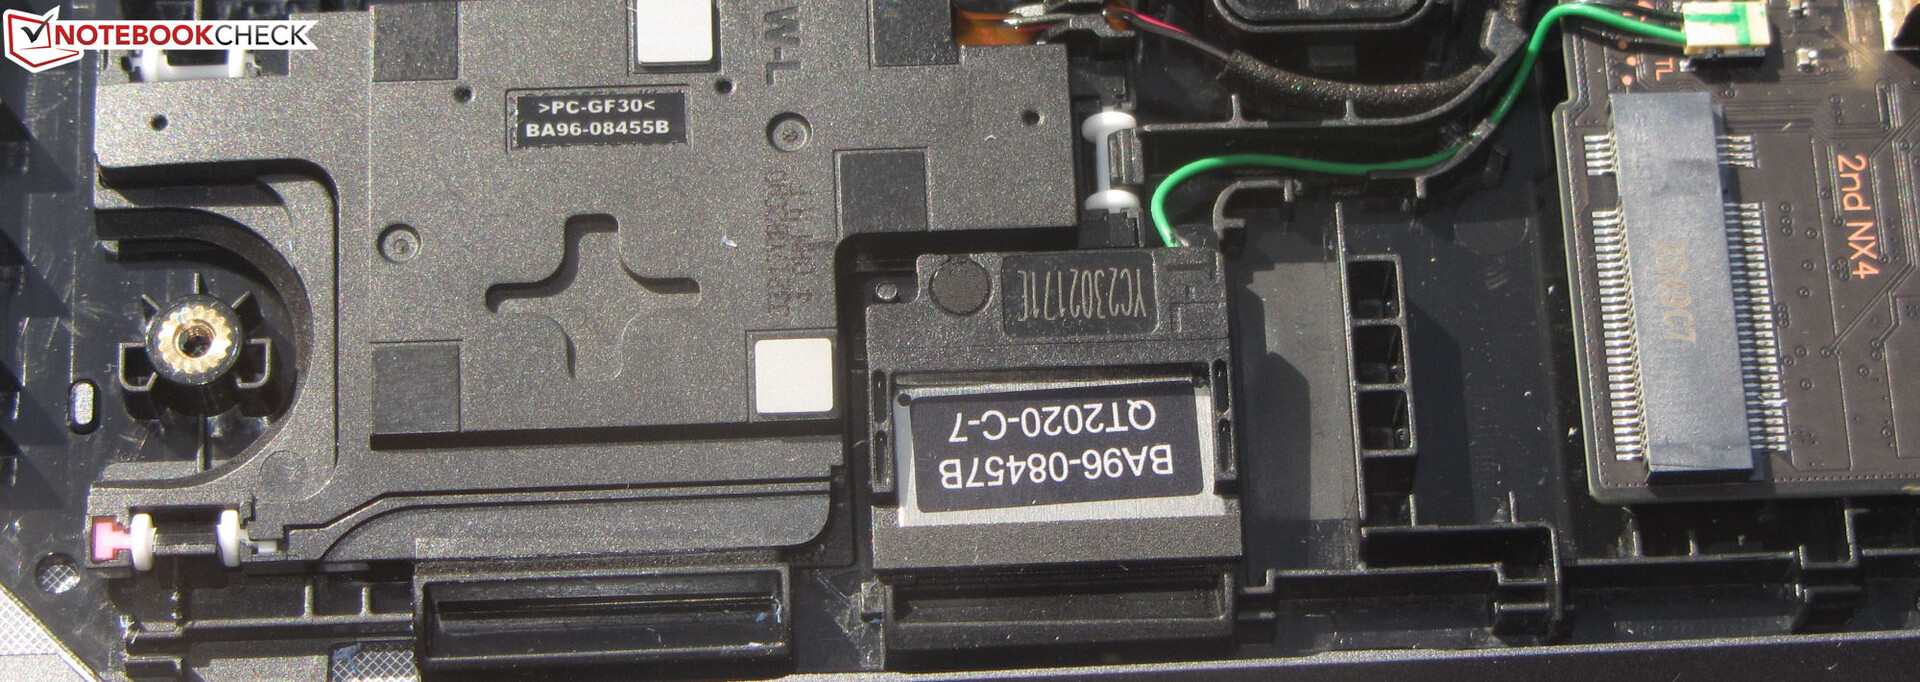
Manutenzione
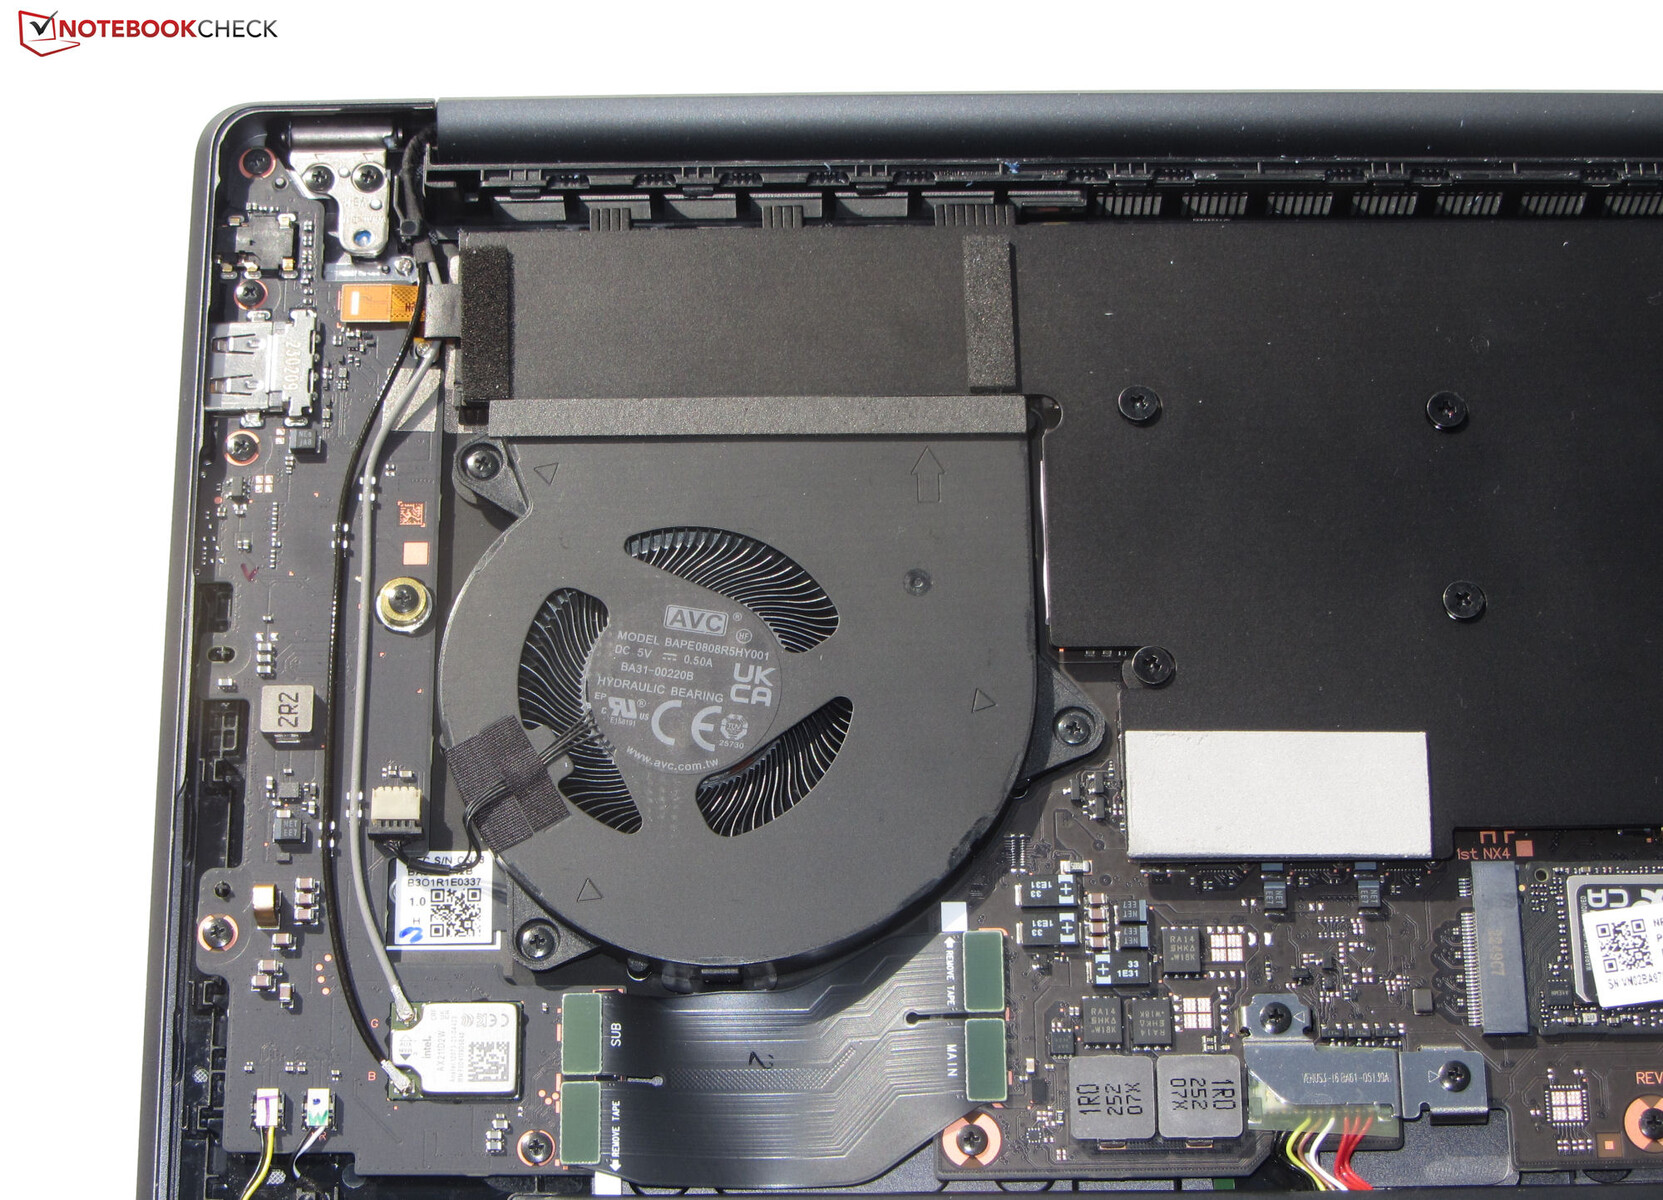
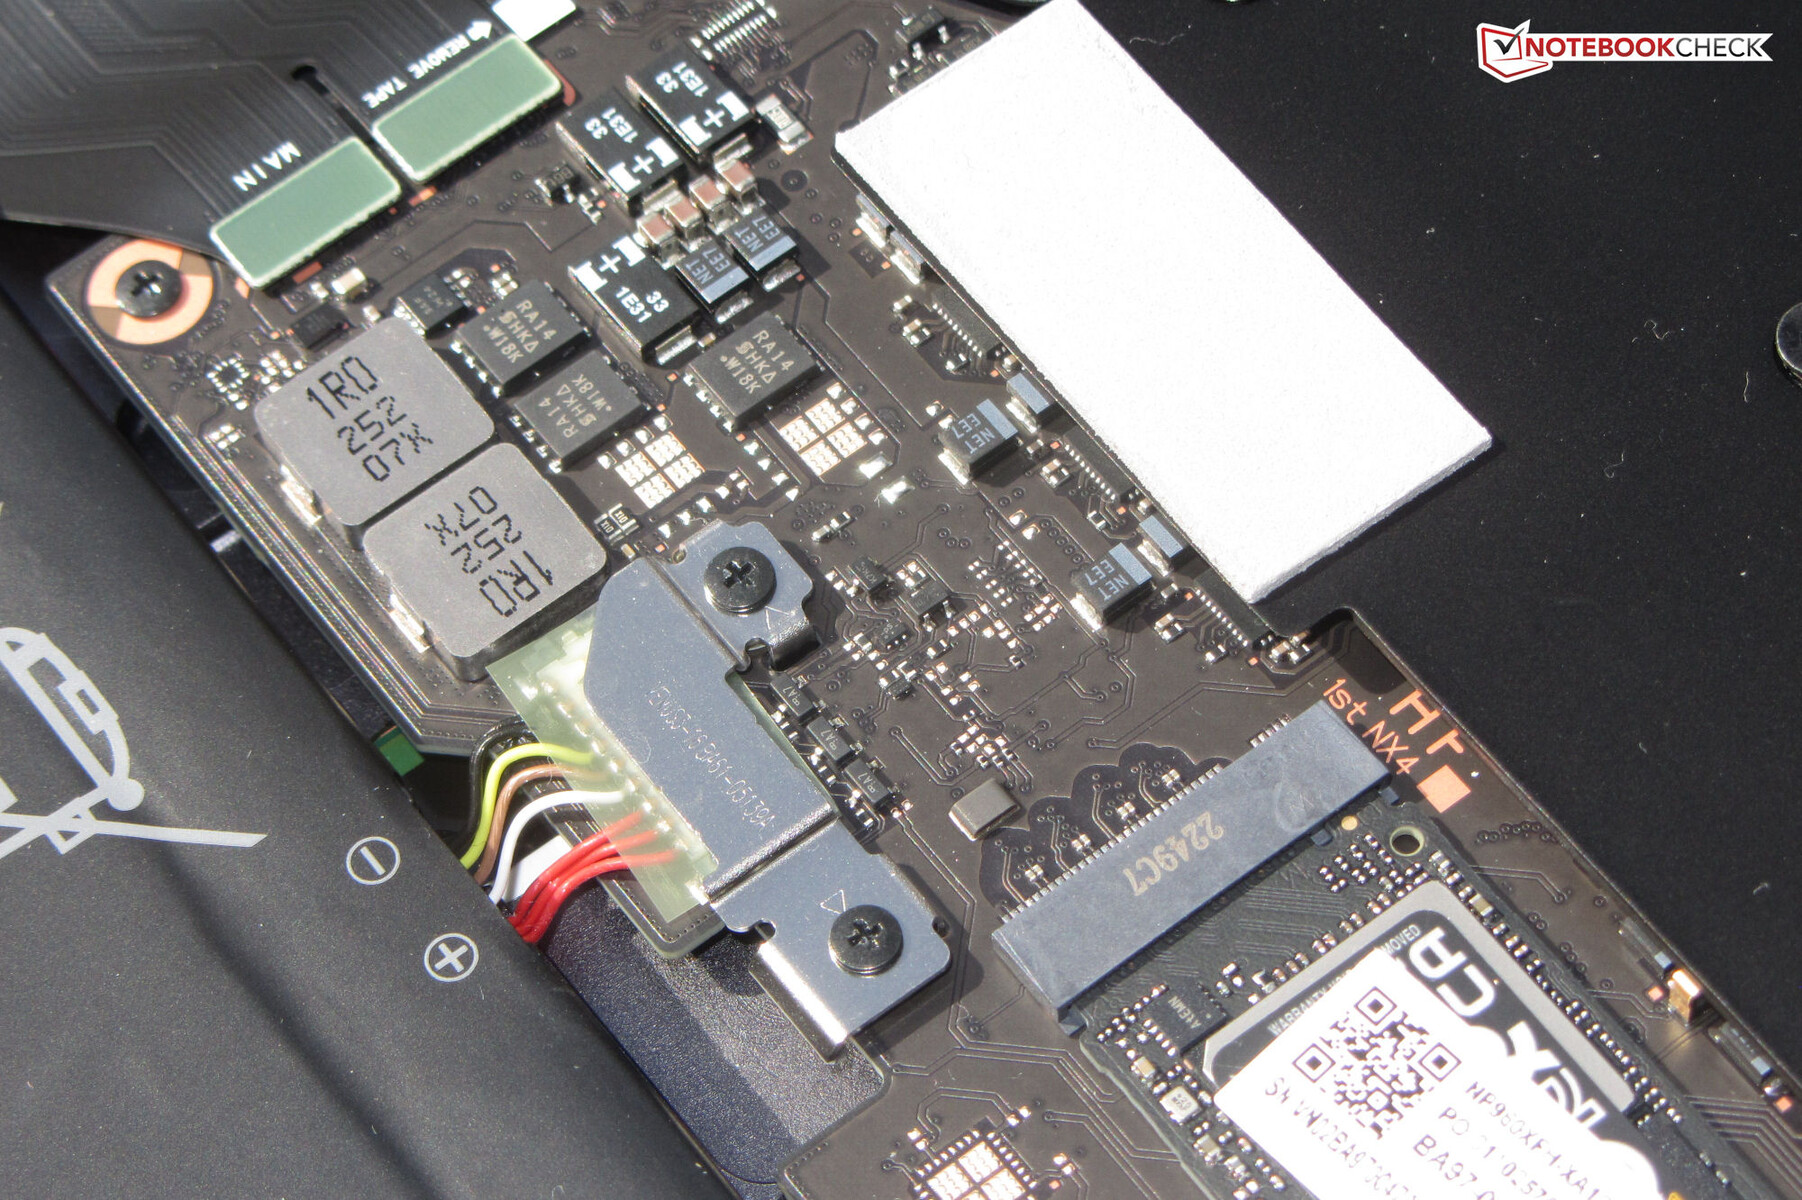
Lo smontaggio del coperchio inferiore richiede la rimozione di tutte le viti nascoste sotto i quattro piedini di gomma (inseriti, non incollati). Successivamente, è necessario prestare attenzione (!) alla rimozione del coperchio inferiore, che è molto stretto e può essere danneggiato. Si consiglia di utilizzare una spatola piatta. Successivamente, è possibile accedere all'unità SSD (PCIe 4, M.2-2280), al secondo slot SSD, alle ventole, agli altoparlanti e alla batteria.
Garanzia
Samsung concede al 16 pollici una garanzia di due anni in Germania. L'estensione di uno o due anni costa rispettivamente 79 e 149 euro. Questi termini potrebbero essere diversi in altri Paesi, quindi gli acquirenti dovrebbero verificare prima dell'acquisto.
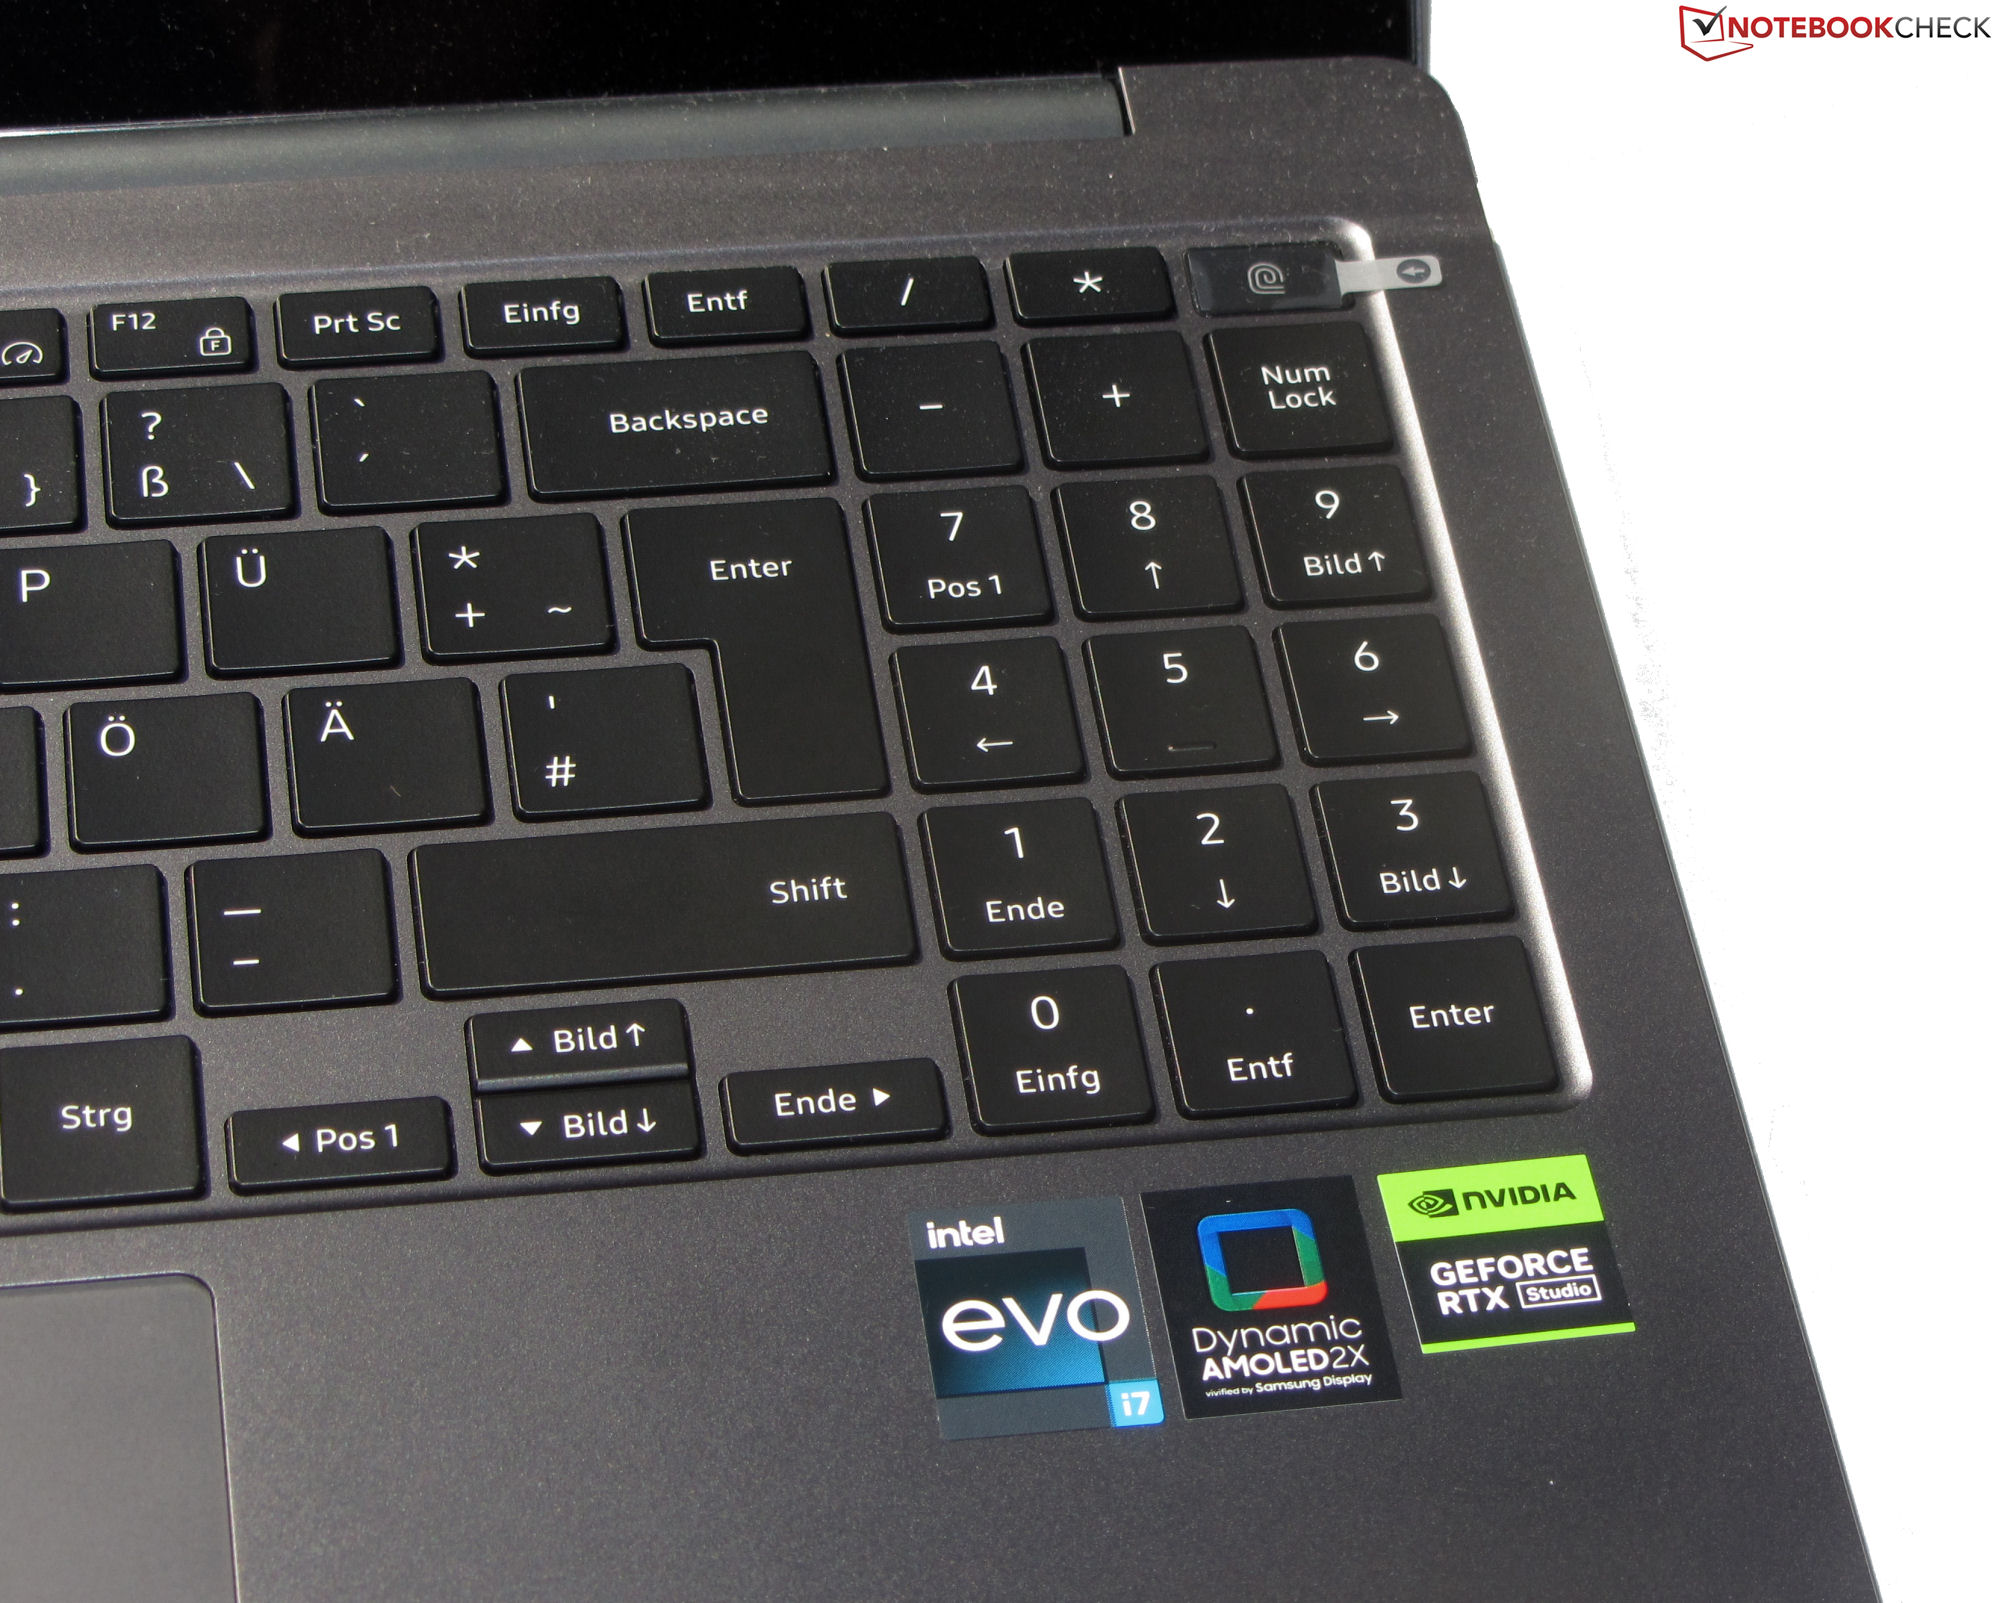
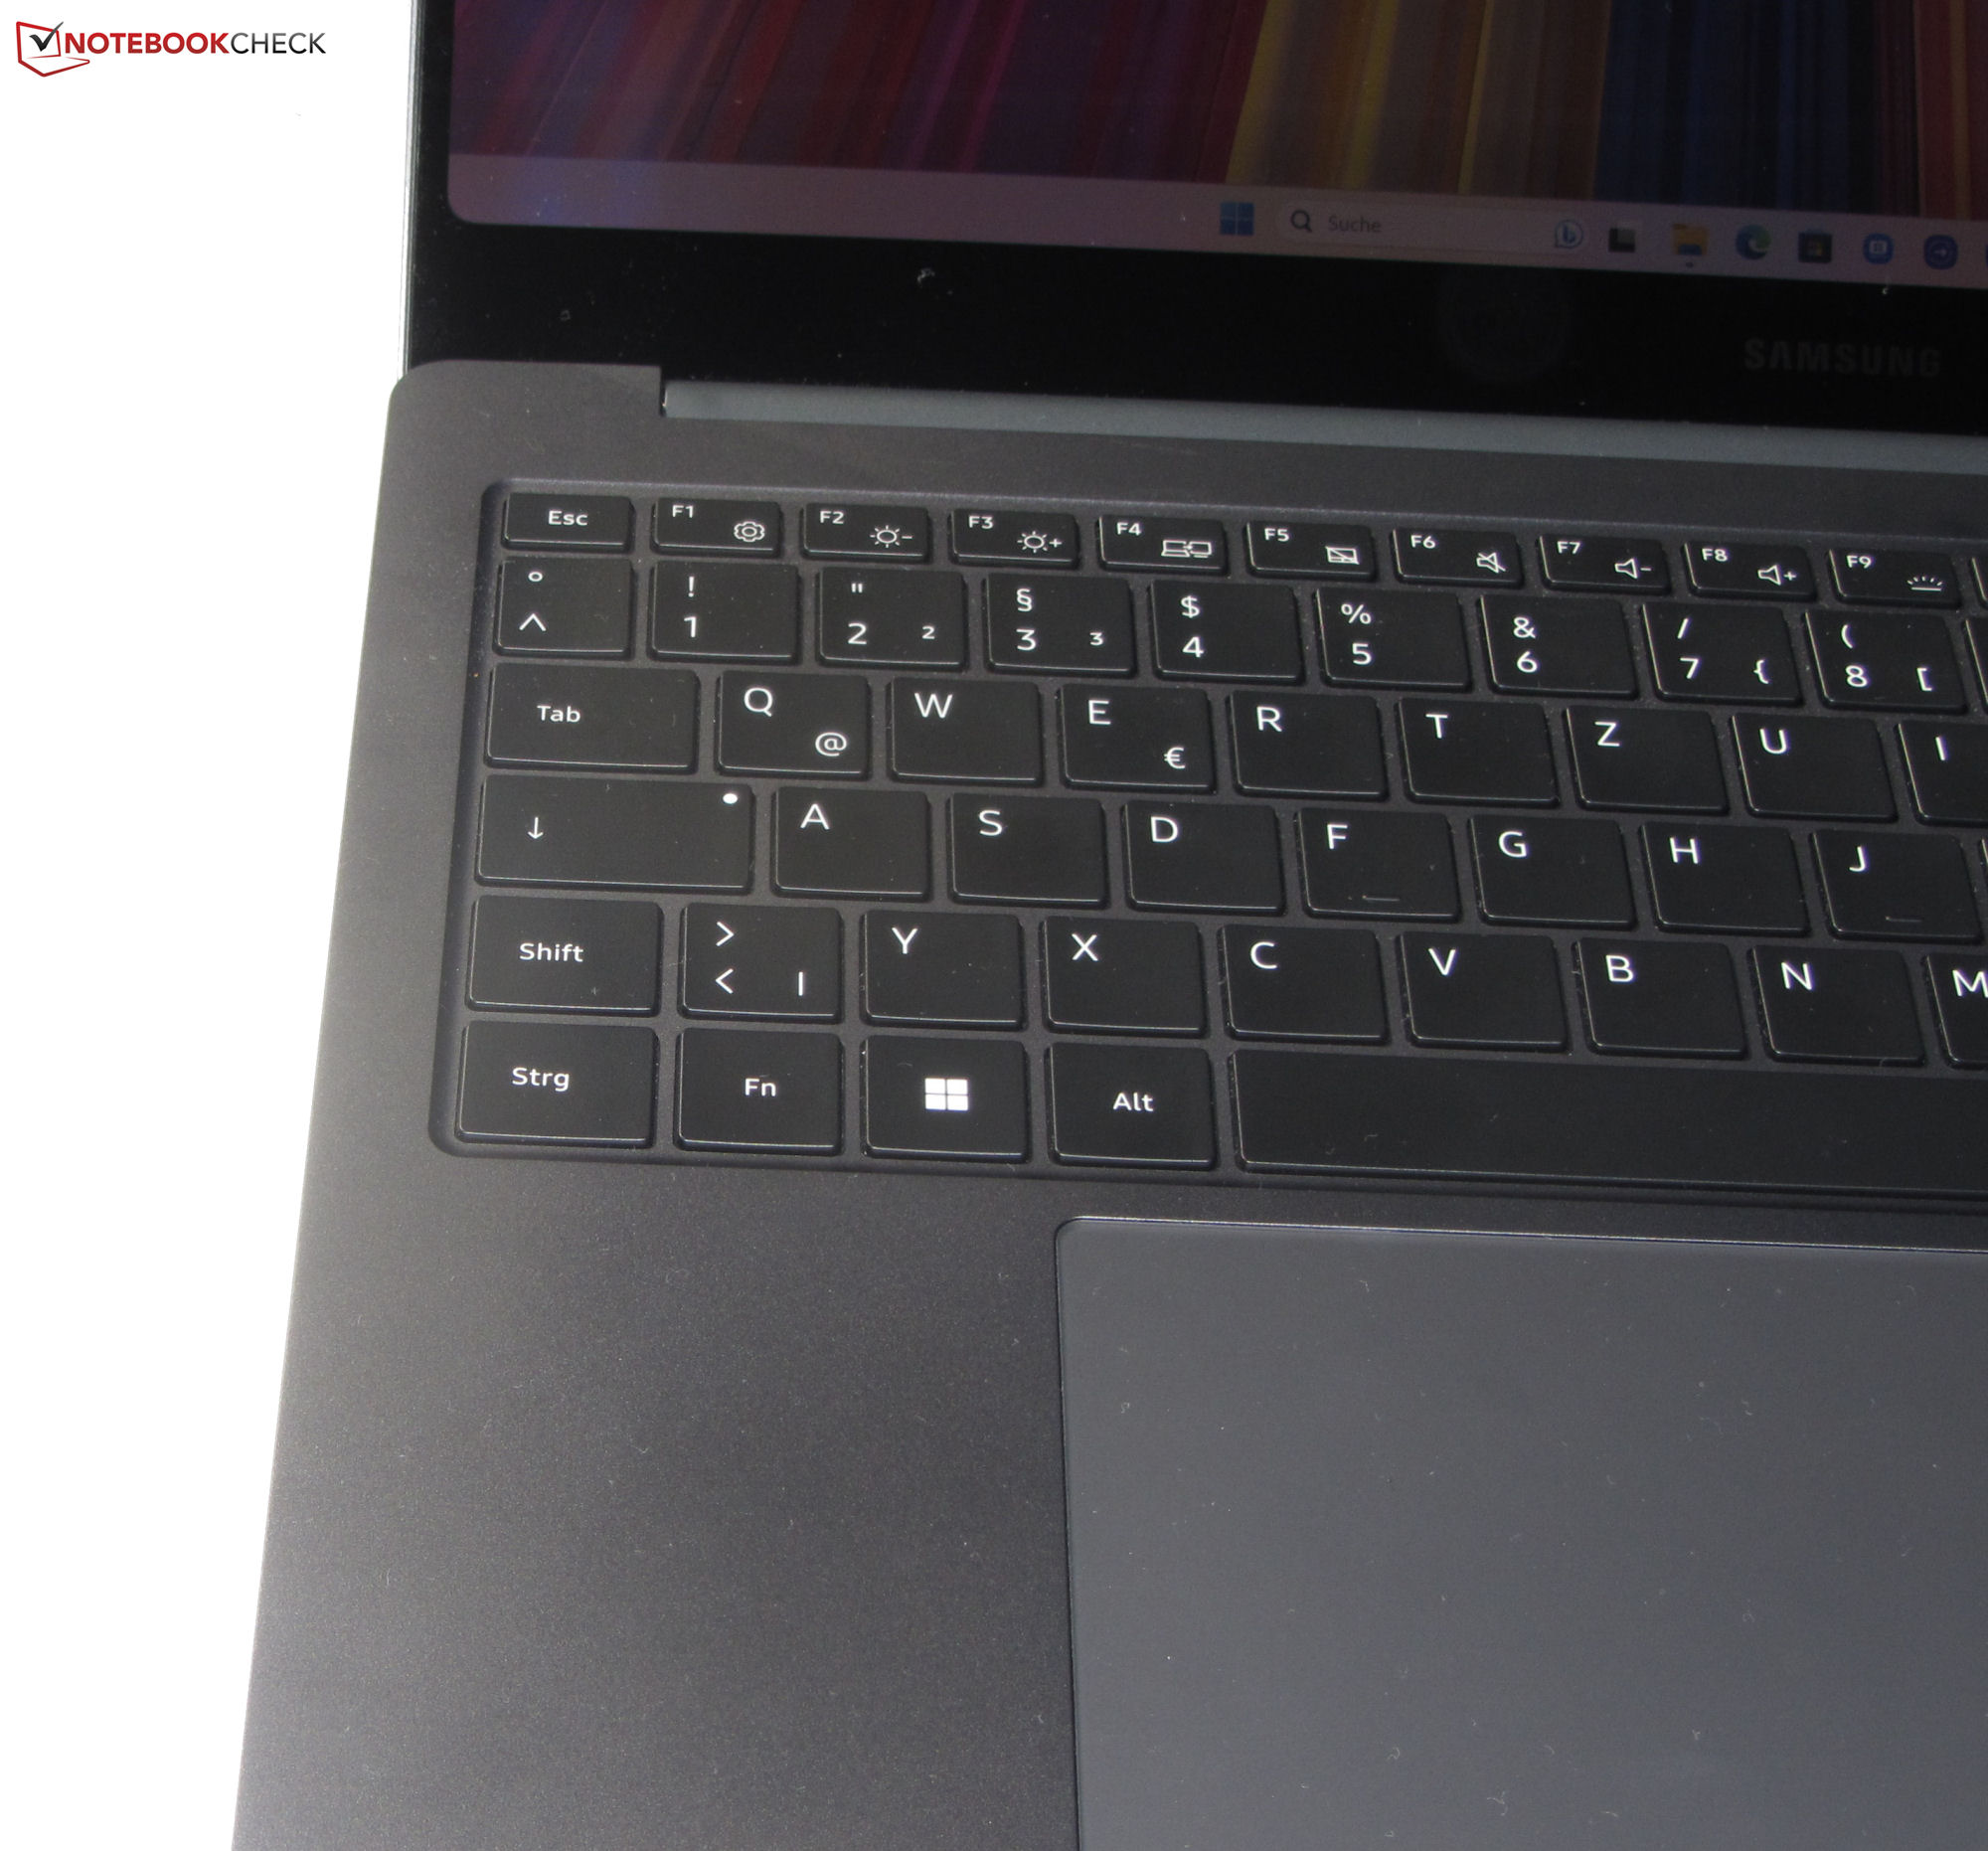
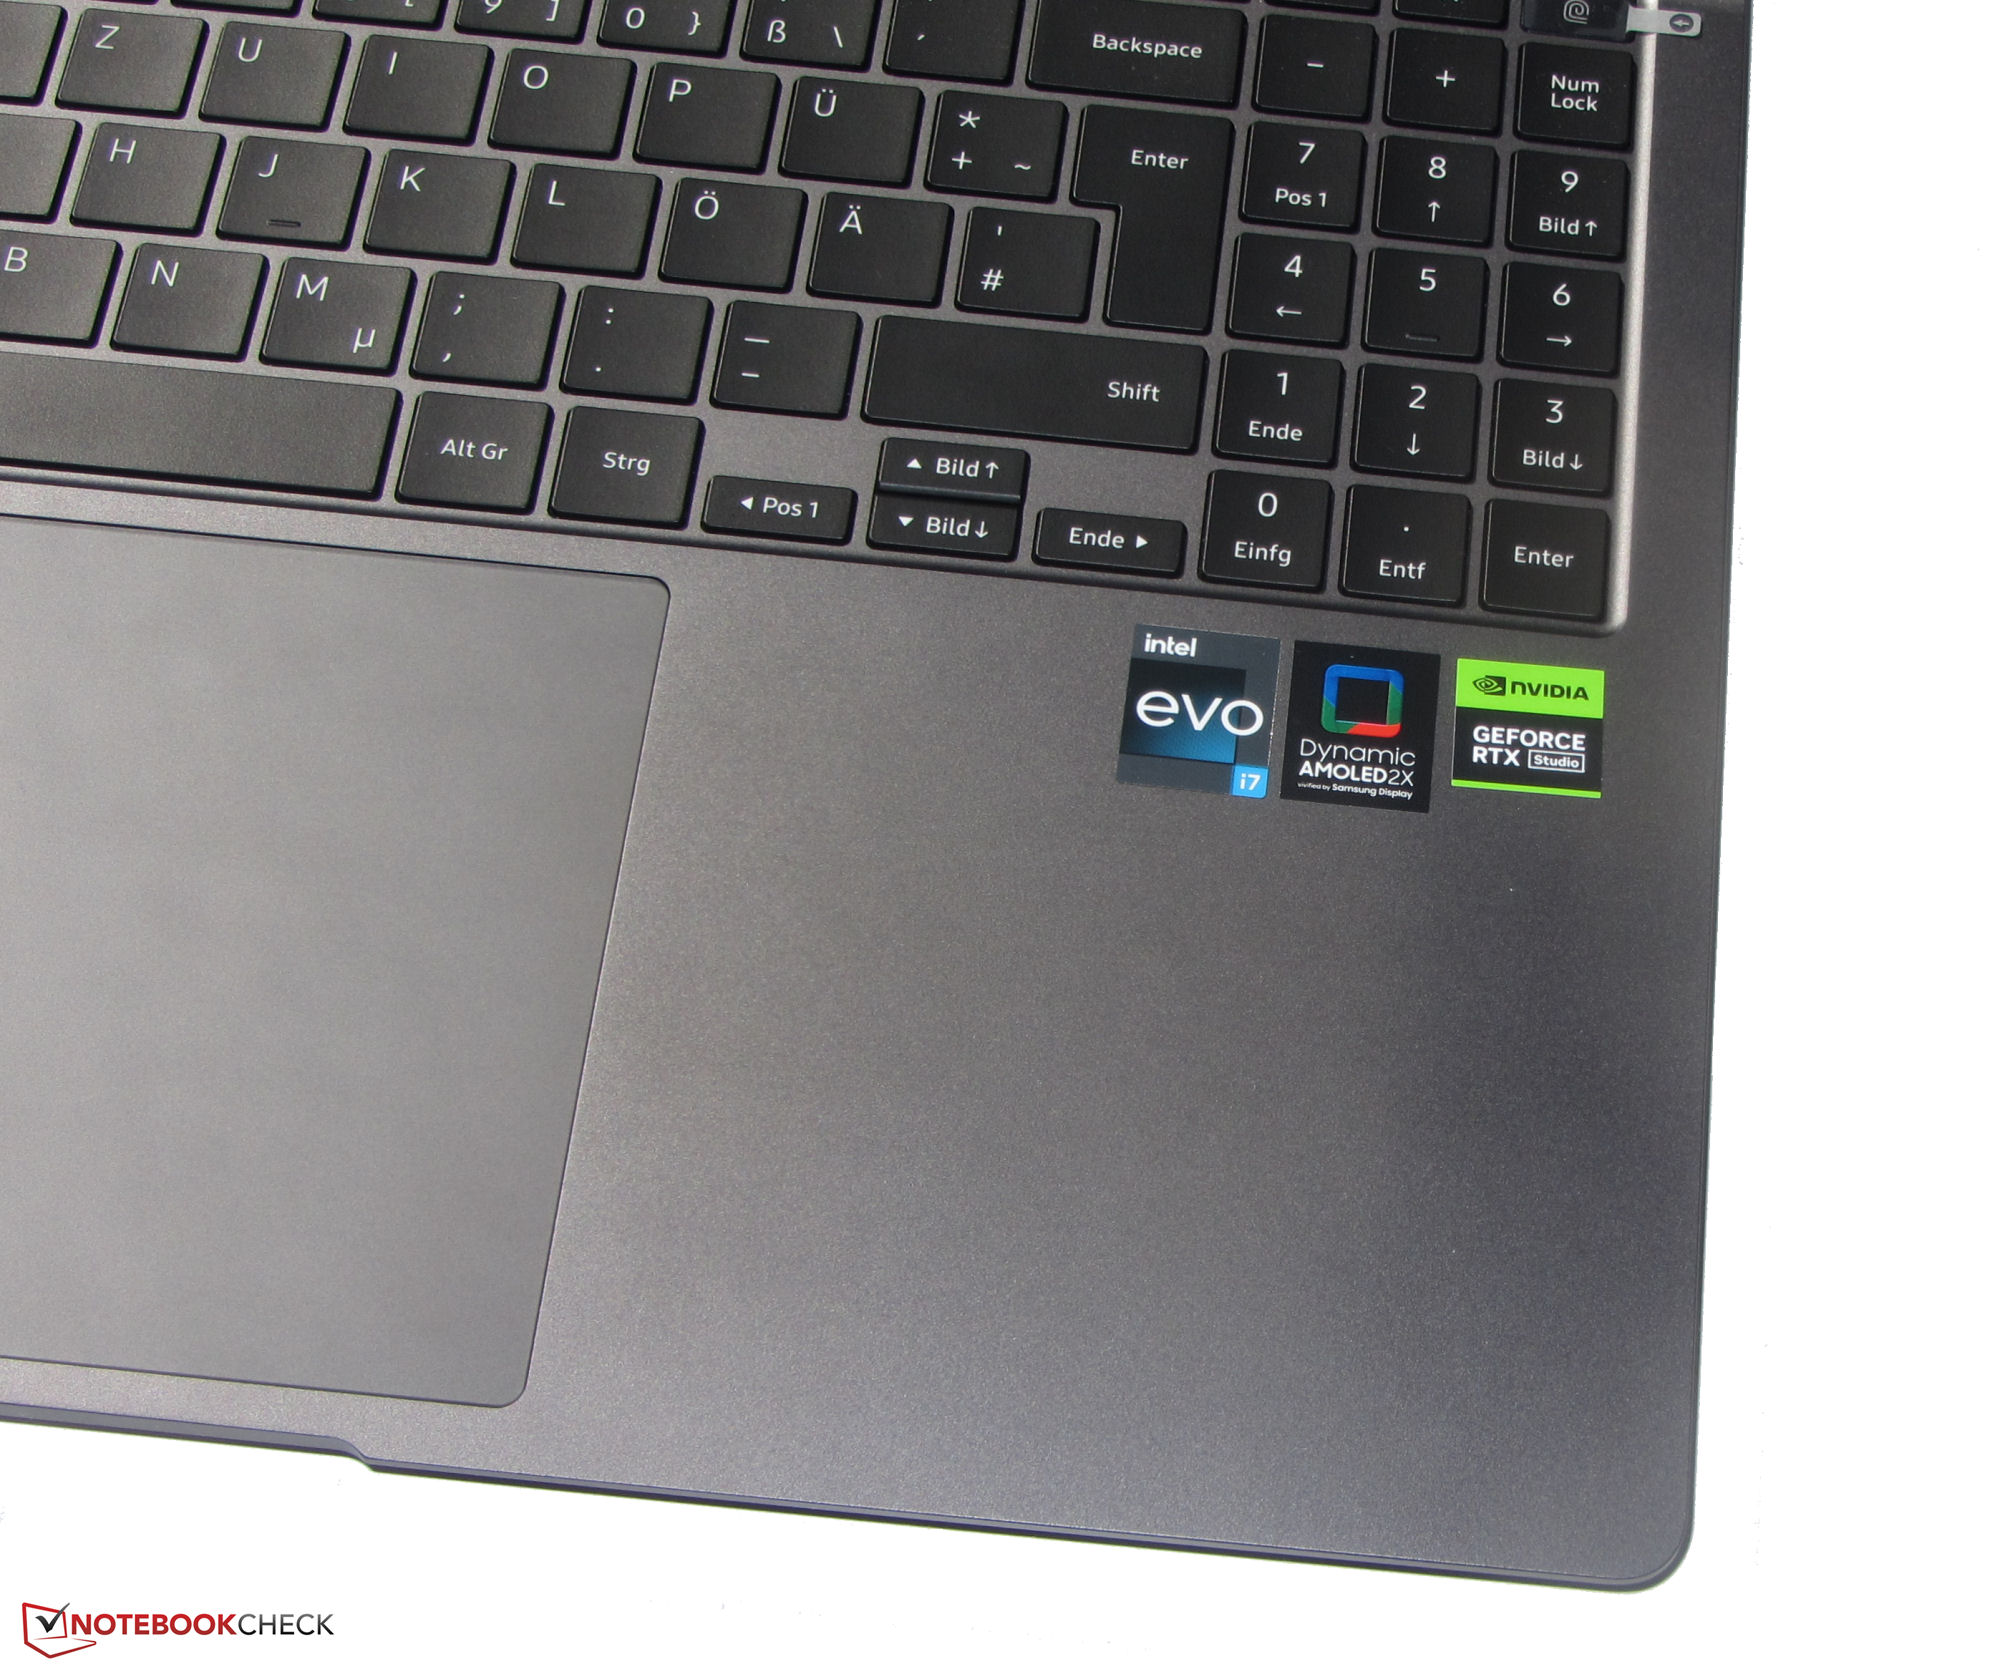
Dispositivi di input - Galaxy Book3 dispone di una tastiera retroilluminata
Tastiera
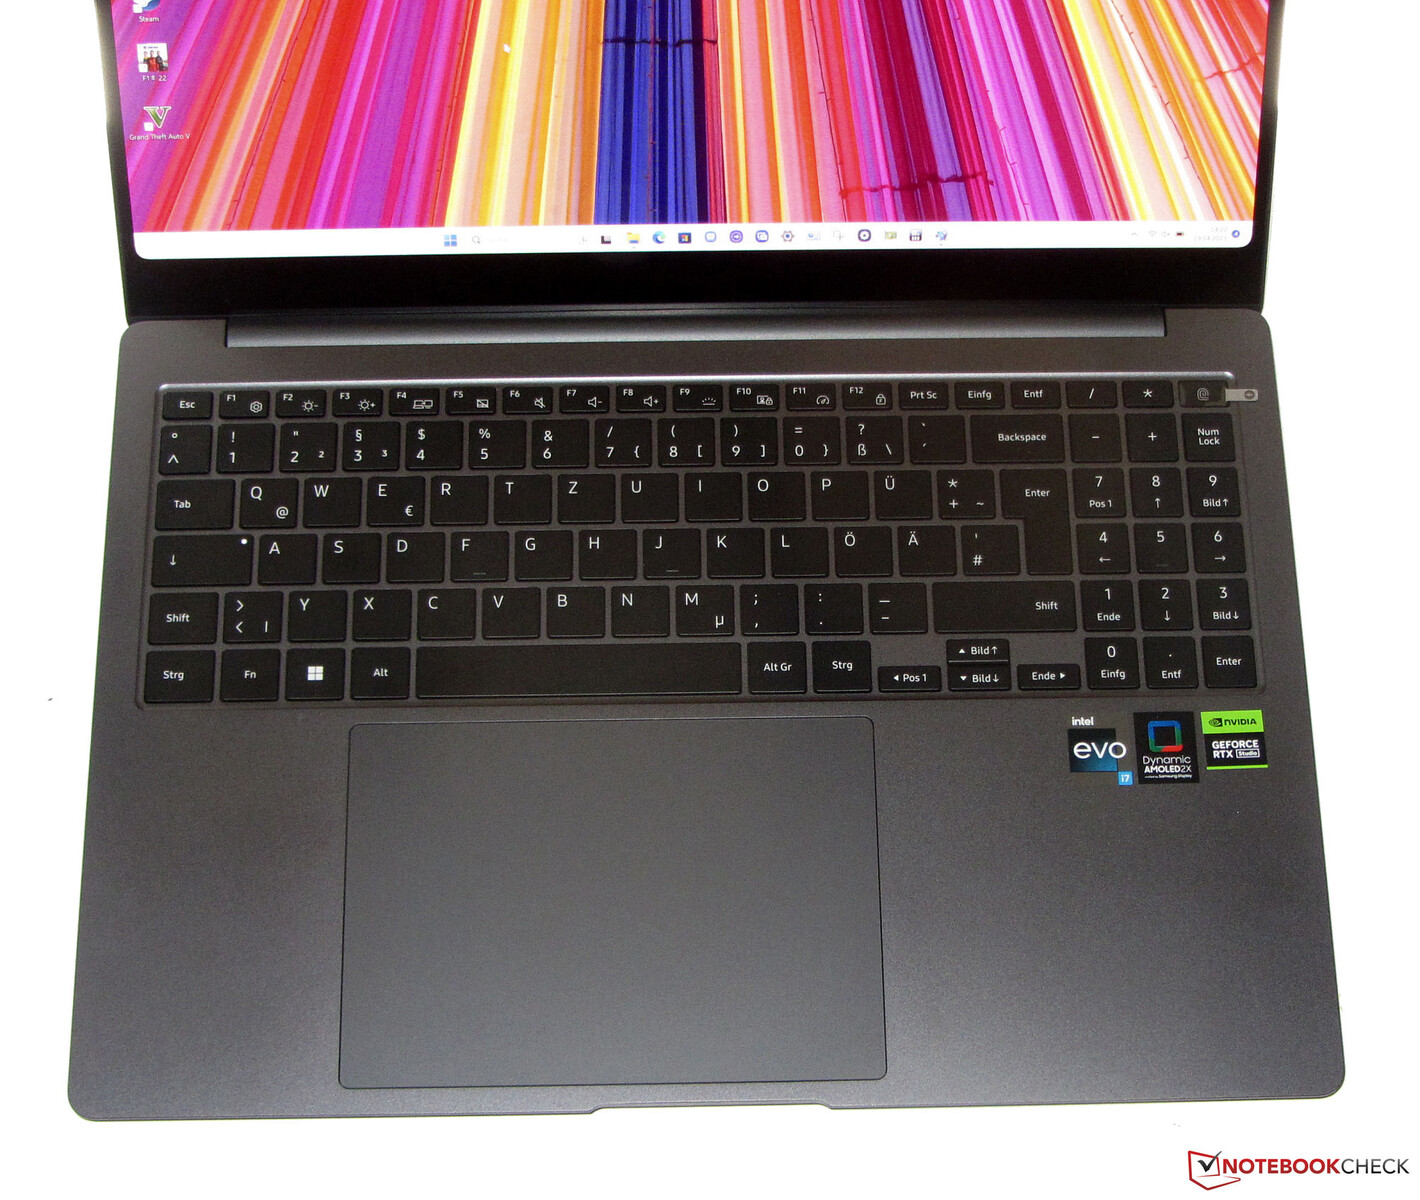
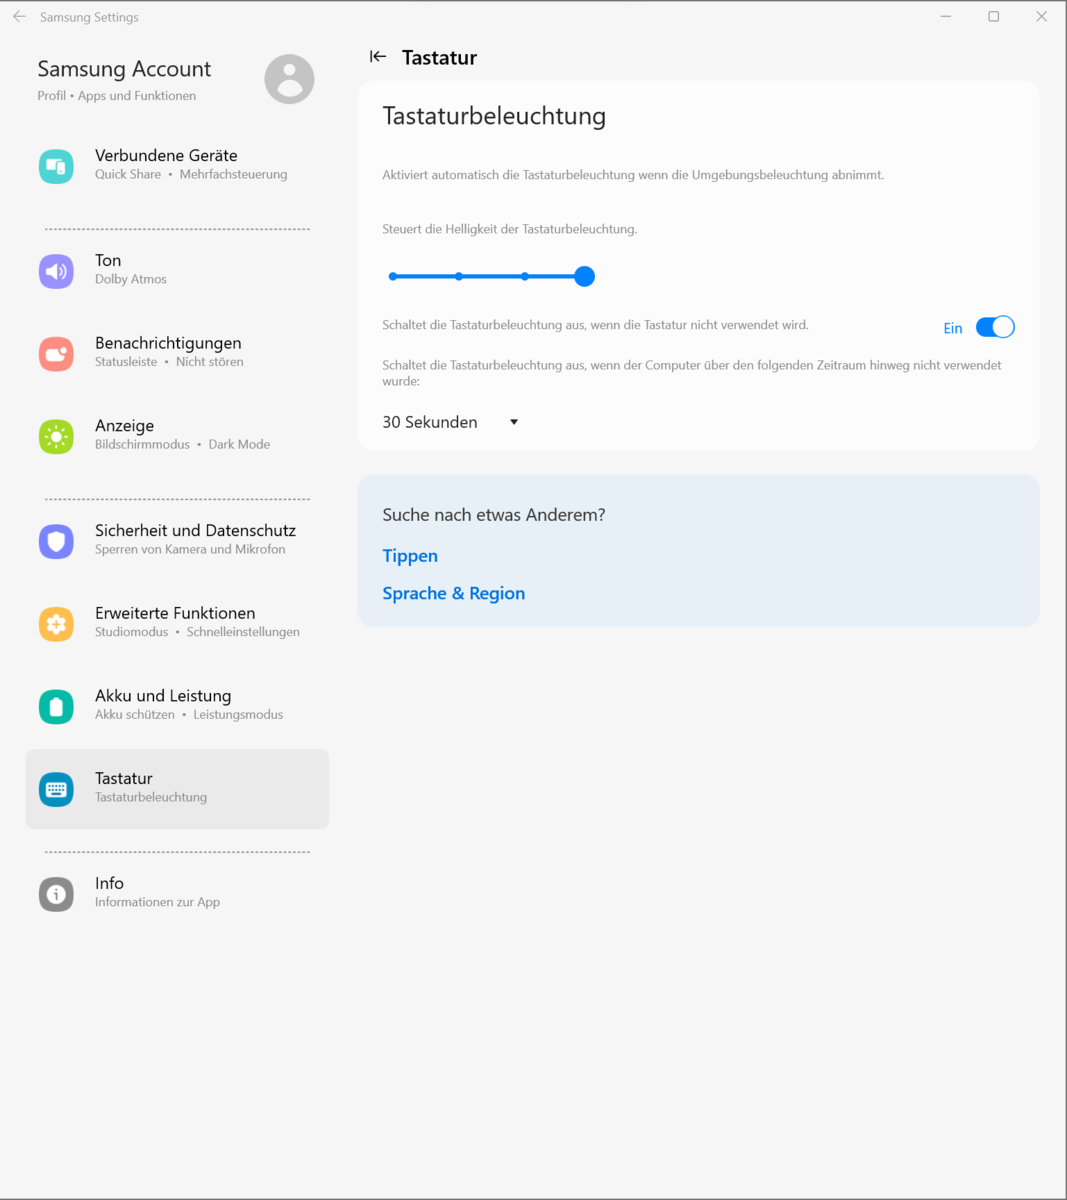
Il modello NP960XFH è dotato di una tastiera chiclet retroilluminata e di un tastierino numerico. I tasti lisci e leggermente concavi offrono una corsa breve e un punto di pressione chiaro. La resistenza dei tasti è accettabile. La tastiera cede leggermente sotto pressione, ma non è un motivo di preoccupazione. La retroilluminazione a tre livelli è controllata da un tasto funzione. Nel complesso, Samsung offre una tastiera adatta all'uso quotidiano.
Touchpad
Il ClickPad misura circa 15,1 x 10,8 cm. Sarebbe stata sufficiente anche una misura più piccola: Se si utilizzano i tasti WASD con la mano sinistra, l'intero pollice poggia sul pad. In tal caso, quindi, quest'ultimo dovrebbe essere disattivato. Per il resto, la superficie liscia è molto favorevole allo scorrimento e al passaggio delle dita. Reagisce agli input negli angoli, offre una corsa breve e un punto di pressione chiaro.
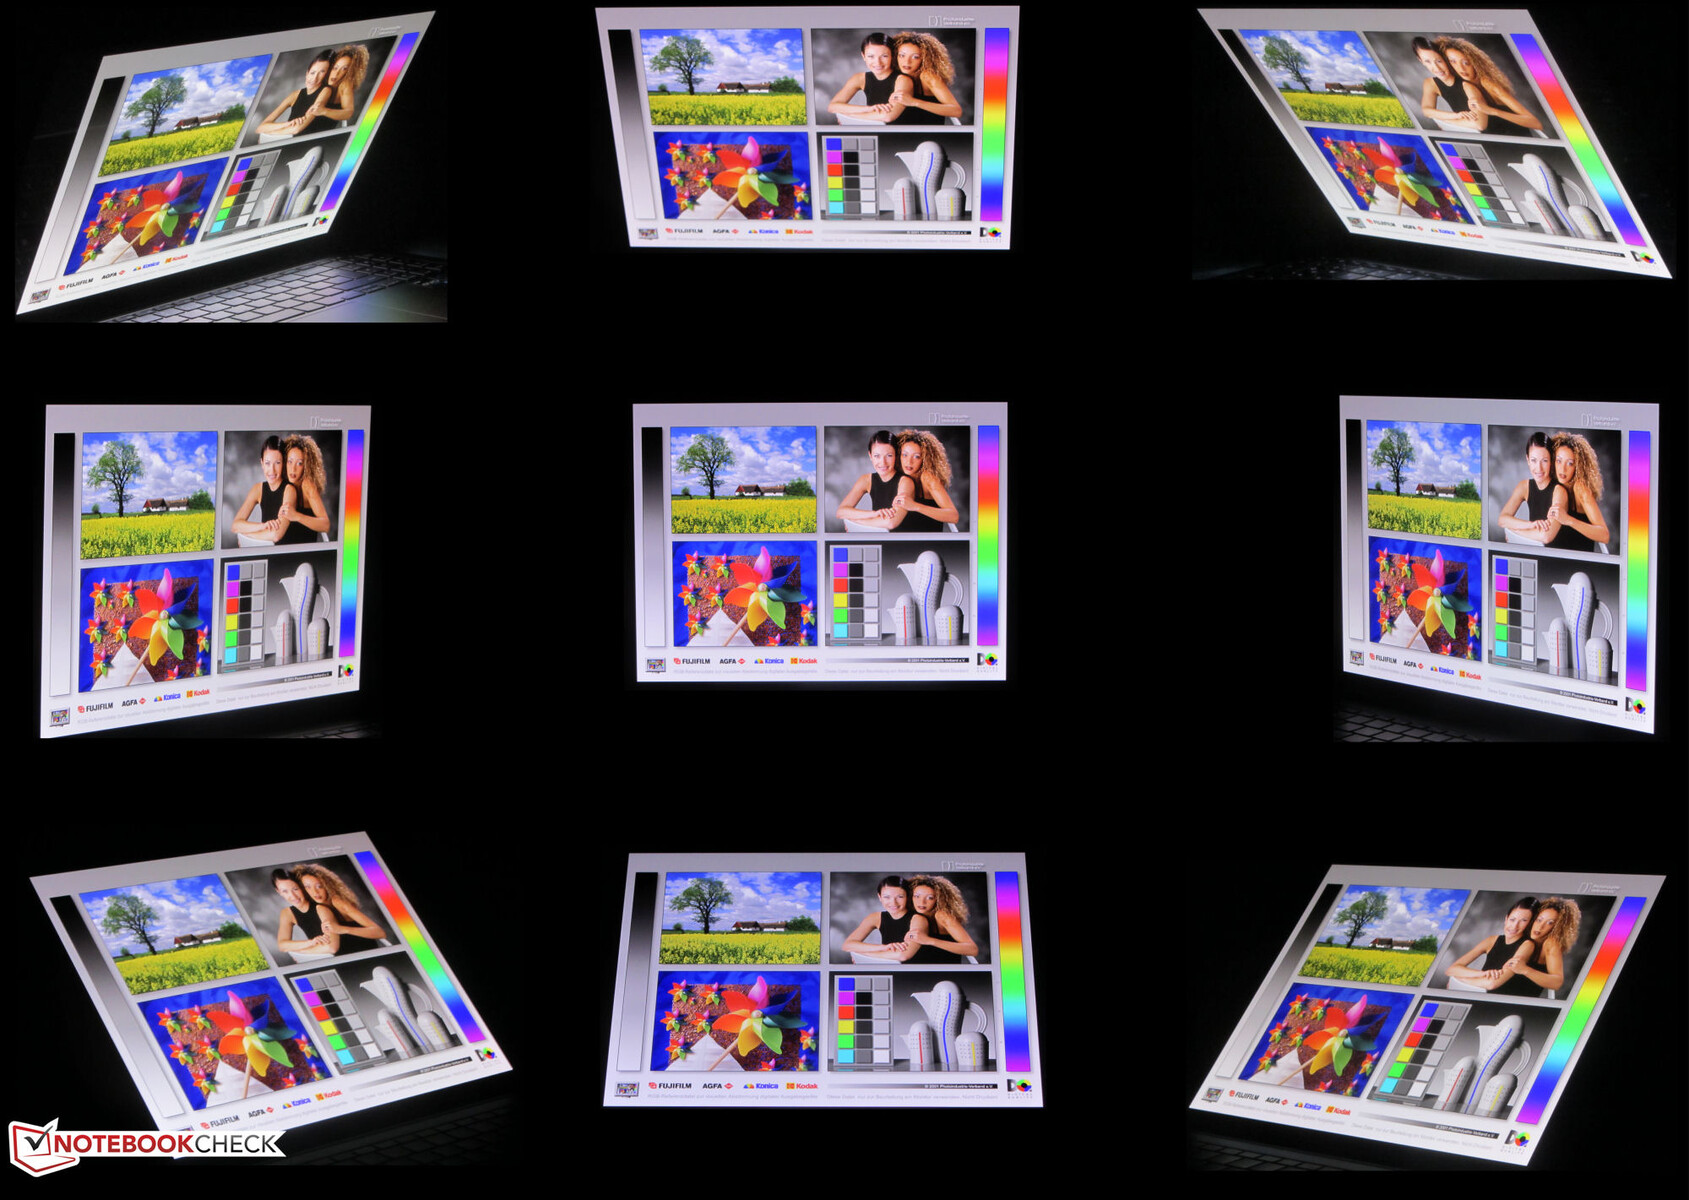
Display - AMOLED in formato 16:10
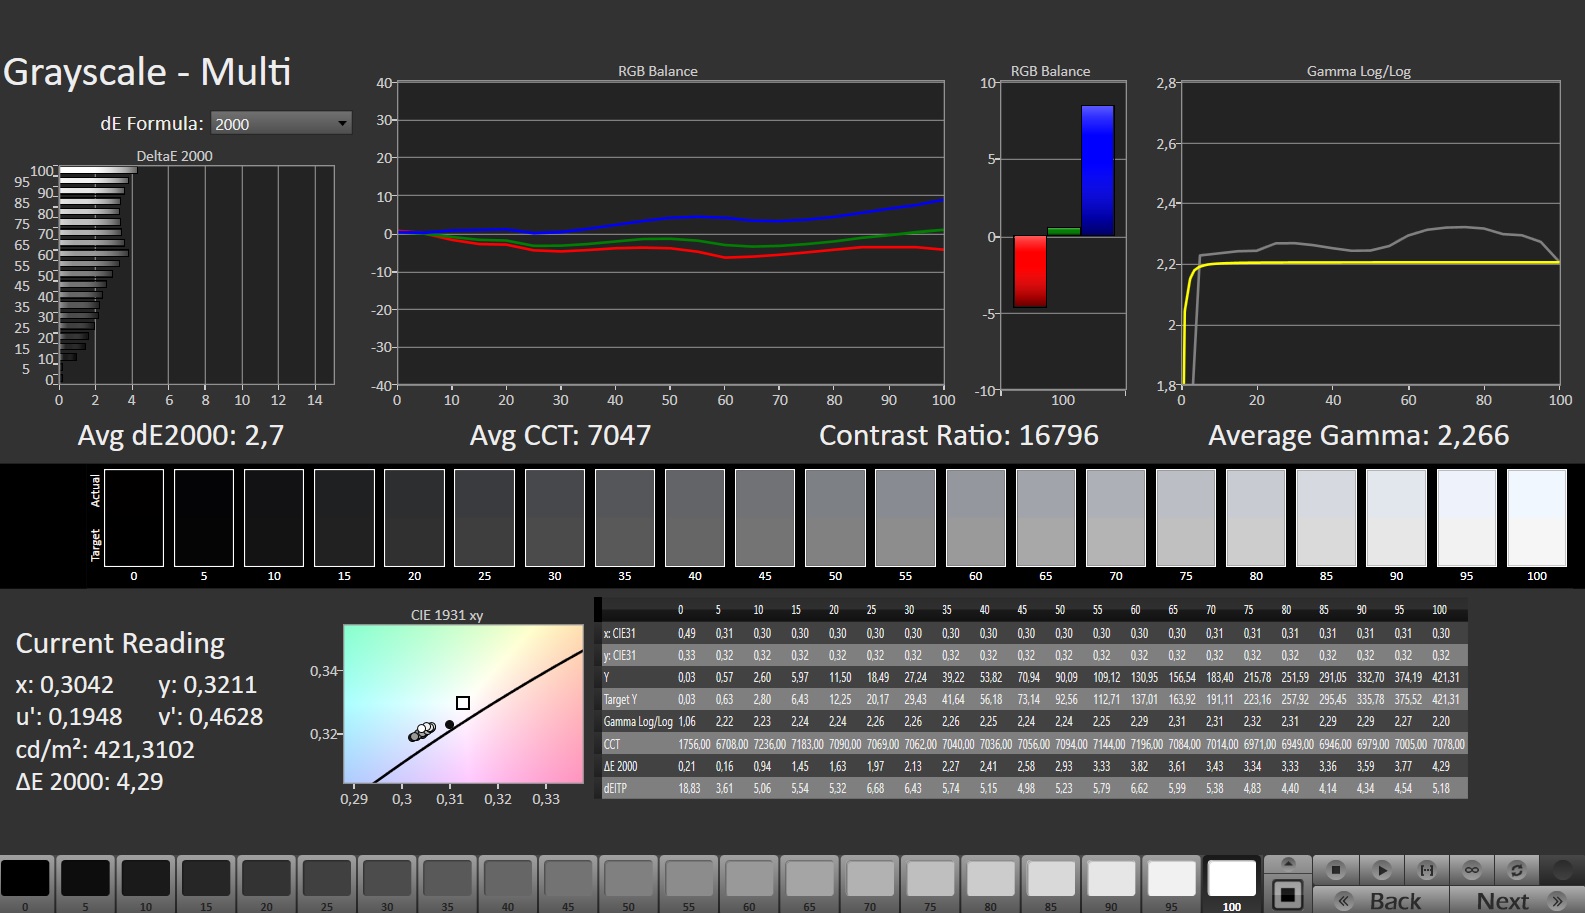
L'ampio schermo da 16 pollici (2880x1800) in formato 16:10, adatto al lavoro, offre un eccellente valore del nero e tempi di risposta brevi, tipici degli OLED. La luminosità del display è superiore all'obiettivo, anche se ilThinkBook 16p G3 ARH ha un display molto più luminoso.
I punti deboli del pannello OLED: ha una superficie riflettente e sfarfalla a un livello di luminosità ≤ 100 percento a una frequenza di 240 Hz. Lo sfarfallio è legato al controllo della luminosità del pannello.
| |||||||||||||||||||||||||
Distribuzione della luminosità: 93 %
Al centro con la batteria: 400 cd/m²
Contrasto: 13333:1 (Nero: 0.03 cd/m²)
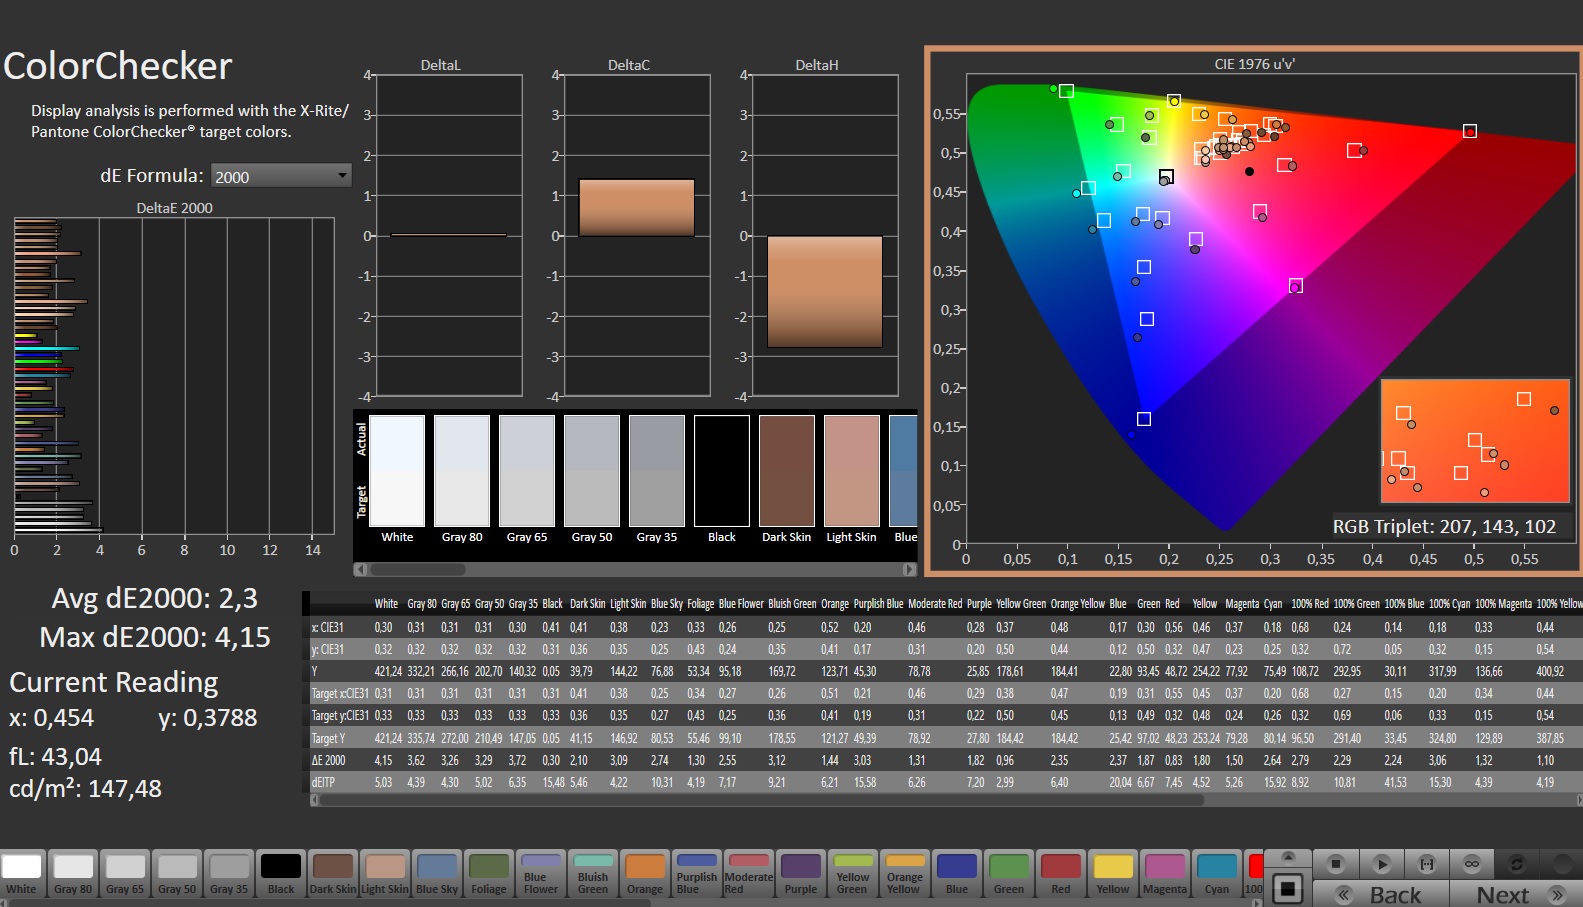
ΔE ColorChecker Calman: 2.3 | ∀{0.5-29.43 Ø4.71}
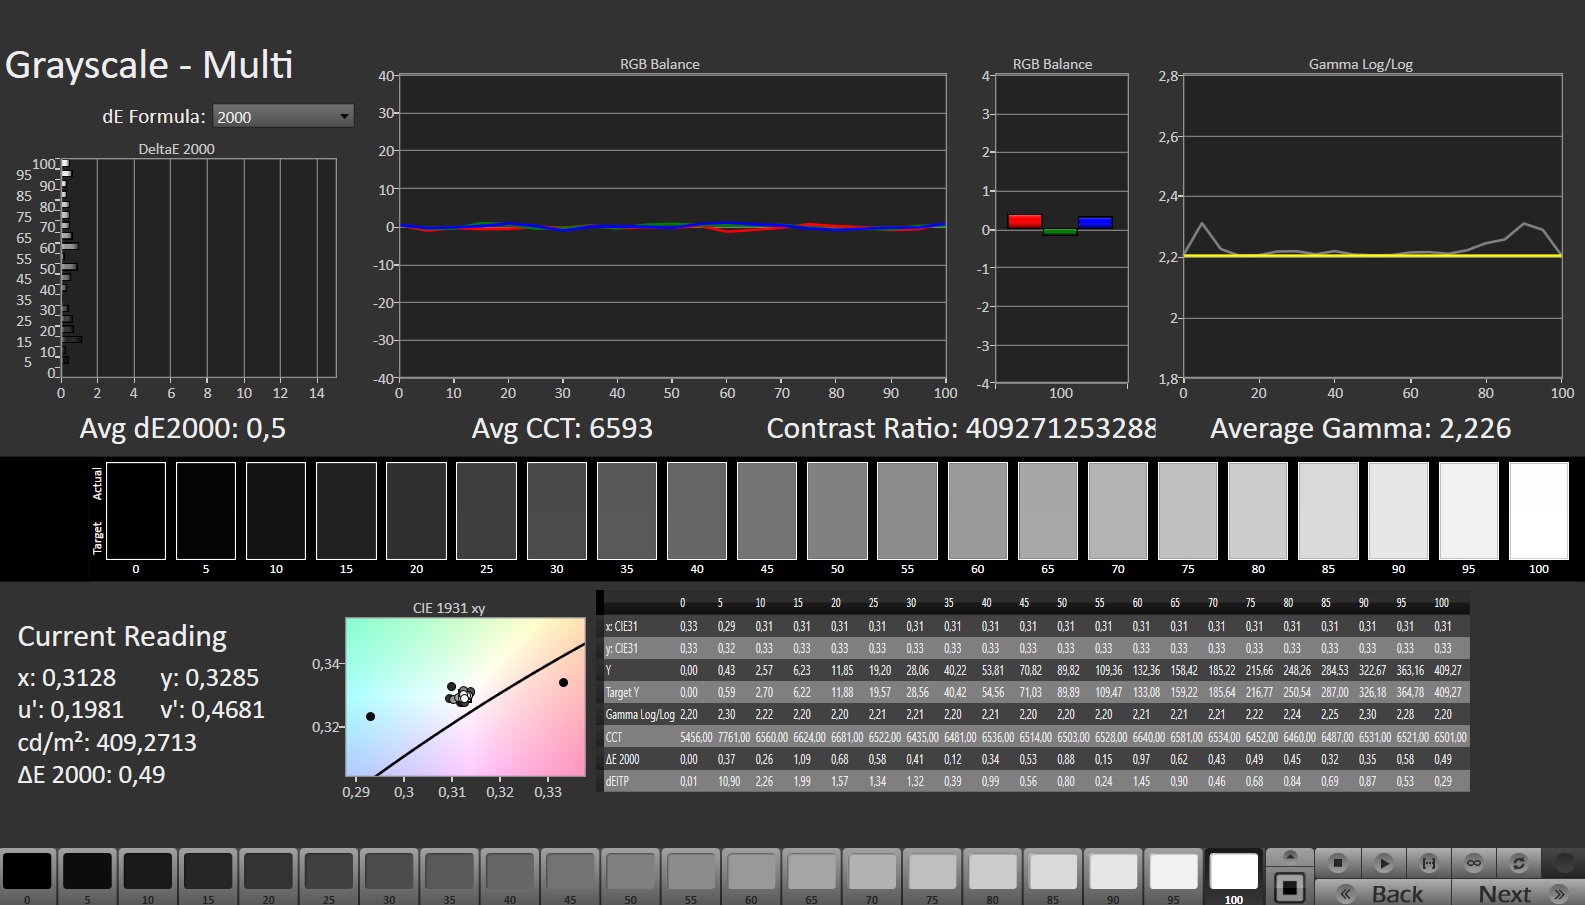
calibrated: 1.66
ΔE Greyscale Calman: 2.7 | ∀{0.09-98 Ø4.96}
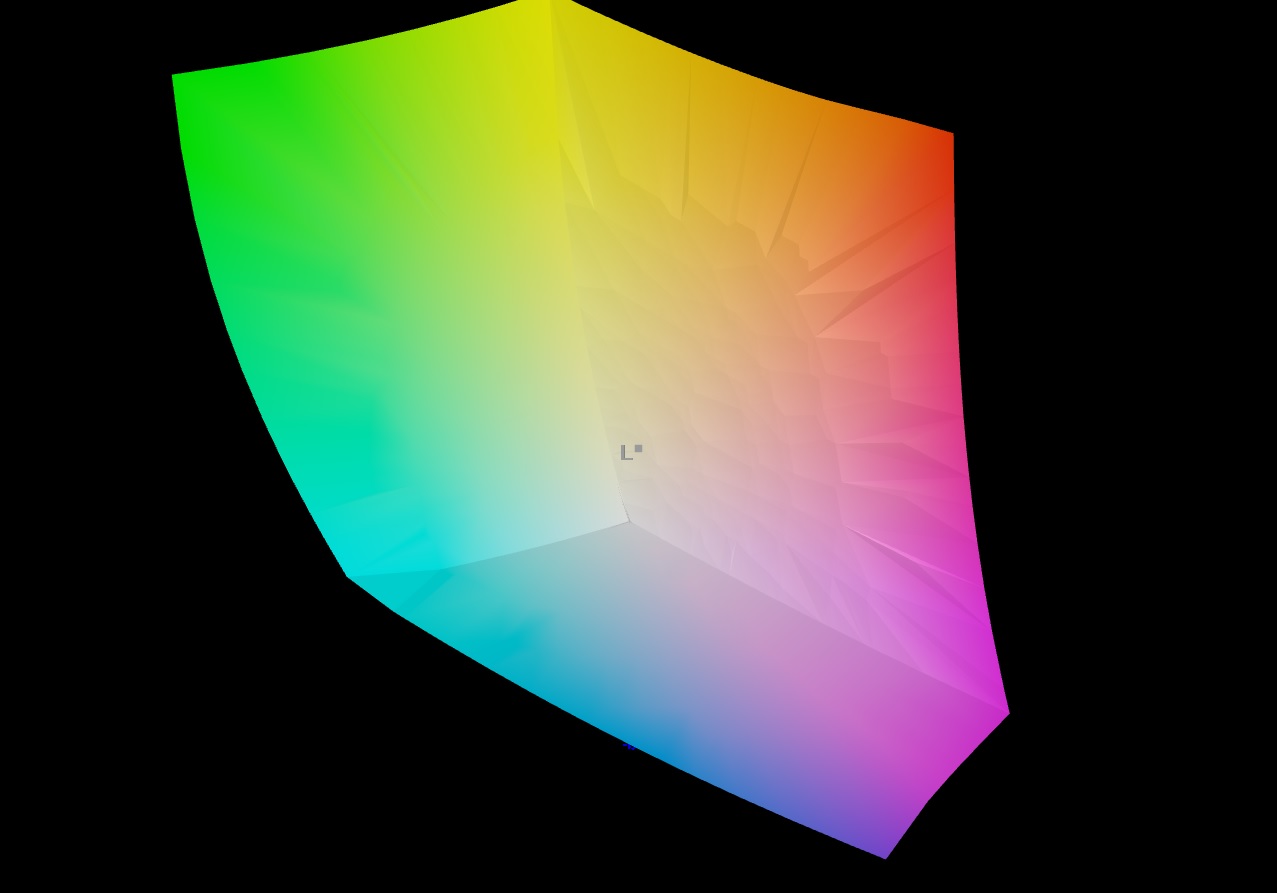
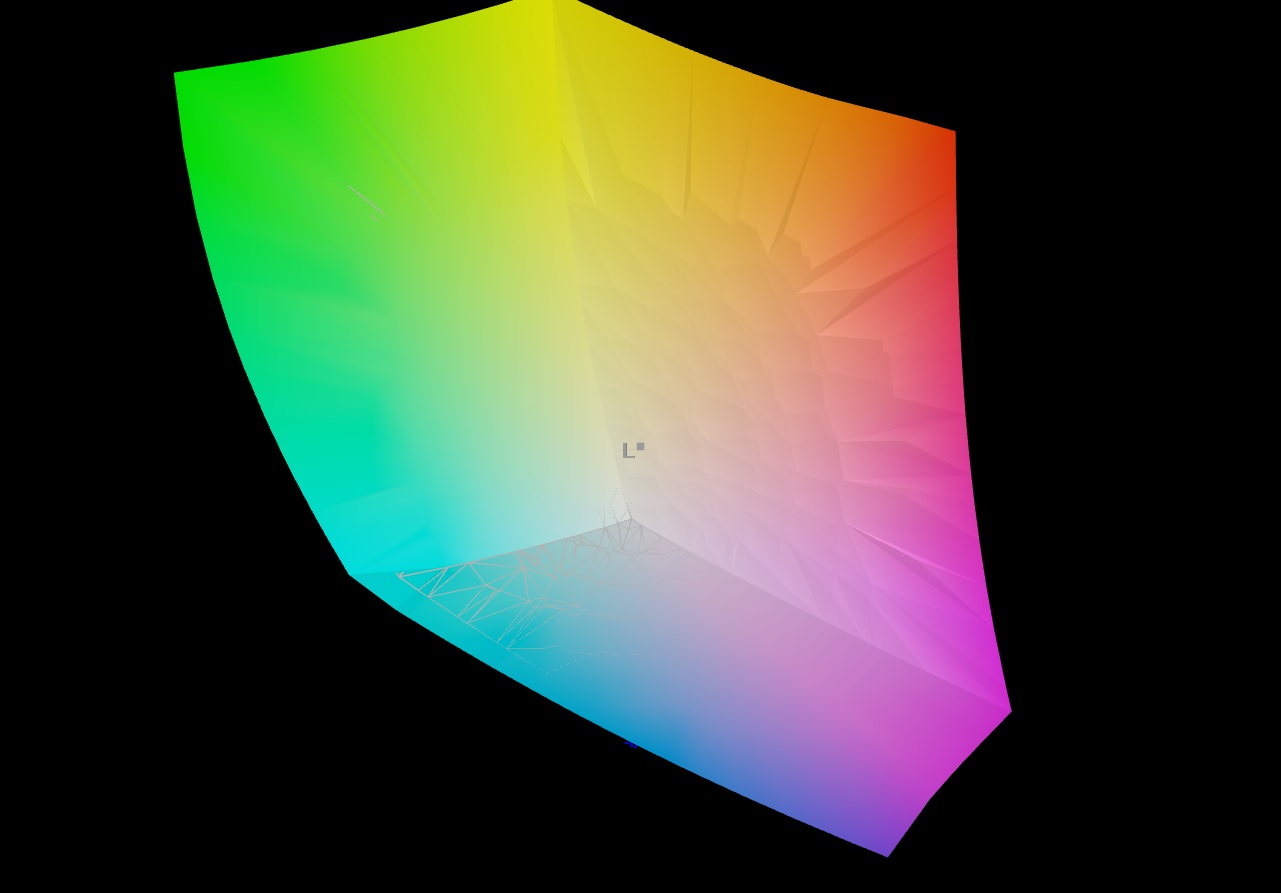
96.3% AdobeRGB 1998 (Argyll 3D)
100% sRGB (Argyll 3D)
99.9% Display P3 (Argyll 3D)
Gamma: 2.266
CCT: 7047 K
| Samsung Galaxy Book3 Ultra 16 Samsung ATNA60CL03-0, AMOLED, 2880x1800, 16" | Schenker Vision 16 Pro RTX 3070 Ti N160QDM-NZ1, IPS, 2560x1600, 16" | LG Gram 17Z90Q-E.AD78G LG Display LP170WQ1-SPF2, IPS, 2560x1600, 17" | Lenovo ThinkBook 16p G3 ARH BOE CQ NE160QDM-NY1, IPS, 2560x1600, 16" | Dell XPS 15 9520 RTX 3050 Ti Samsung 156XG01, OLED, 3456x2160, 15.6" | Asus VivoBook Pro 16X OLED N7600PC-L2026X Samsung ATNA60YV02-0, OLED, 3840x2400, 16" | Acer Swift X SFX16-52G-77RX B160QAN02.M, IPS-LED, 2560x1600, 16" | |
|---|---|---|---|---|---|---|---|
| Display | -20% | -8% | -19% | -4% | 1% | -15% | |
| Display P3 Coverage (%) | 99.9 | 68.7 -31% | 92.2 -8% | 69.8 -30% | 97.8 -2% | 99.9 0% | 76.4 -24% |
| sRGB Coverage (%) | 100 | 96.7 -3% | 98.66 -1% | 98.2 -2% | 99.9 0% | 100 0% | 100 0% |
| AdobeRGB 1998 Coverage (%) | 96.3 | 70 -27% | 82.98 -14% | 71.4 -26% | 86 -11% | 98.05 2% | 76.6 -20% |
| Response Times | -2021% | -3068% | -2354% | -240% | -156% | -4422% | |
| Response Time Grey 50% / Grey 80% * (ms) | 0.49 ? | 14.3 ? -2818% | 22 ? -4390% | 15.6 ? -3084% | 1.9 ? -288% | 1 -104% | 33 ? -6635% |
| Response Time Black / White * (ms) | 0.65 ? | 8.6 ? -1223% | 12 ? -1746% | 11.2 ? -1623% | 1.9 ? -192% | 2 ? -208% | 15 ? -2208% |
| PWM Frequency (Hz) | 240 ? | 59.52 ? | 247 ? | ||||
| Screen | -140% | -125% | -186% | -32% | 8% | -108% | |
| Brightness middle (cd/m²) | 400 | 364 -9% | 391 -2% | 532.8 33% | 381.4 -5% | 383 -4% | 411 3% |
| Brightness (cd/m²) | 399 | 347 -13% | 358 -10% | 519 30% | 384 -4% | 390 -2% | 378 -5% |
| Brightness Distribution (%) | 93 | 89 -4% | 84 -10% | 94 1% | 95 2% | 96 3% | 83 -11% |
| Black Level * (cd/m²) | 0.03 | 0.3 -900% | 0.29 -867% | 0.55 -1733% | 0.027 10% | 0.29 -867% | |
| Contrast (:1) | 13333 | 1213 -91% | 1348 -90% | 969 -93% | 14185 6% | 1417 -89% | |
| Colorchecker dE 2000 * | 2.3 | 3.3 -43% | 3.52 -53% | 1.32 43% | 4.34 -89% | 2.29 -0% | 2.18 5% |
| Colorchecker dE 2000 max. * | 4.15 | 6.6 -59% | 6.06 -46% | 3.97 4% | 9.24 -123% | 3.47 16% | 4.84 -17% |
| Colorchecker dE 2000 calibrated * | 1.66 | 2.5 -51% | 1.43 14% | 1.59 4% | 1.48 11% | ||
| Greyscale dE 2000 * | 2.7 | 5.2 -93% | 4.27 -58% | 1.8 33% | 2 26% | 1.84 32% | 2.68 1% |
| Gamma | 2.266 97% | 2.14 103% | 2.3 96% | 2.64 83% | 2.13 103% | 2.32 95% | 2.43 91% |
| CCT | 7047 92% | 6331 103% | 7203 90% | 6761 96% | 6210 105% | 6308 103% | 6717 97% |
| Media totale (Programma / Settaggio) | -727% /
-383% | -1067% /
-520% | -853% /
-460% | -92% /
-62% | -49% /
-19% | -1515% /
-704% |
* ... Meglio usare valori piccoli
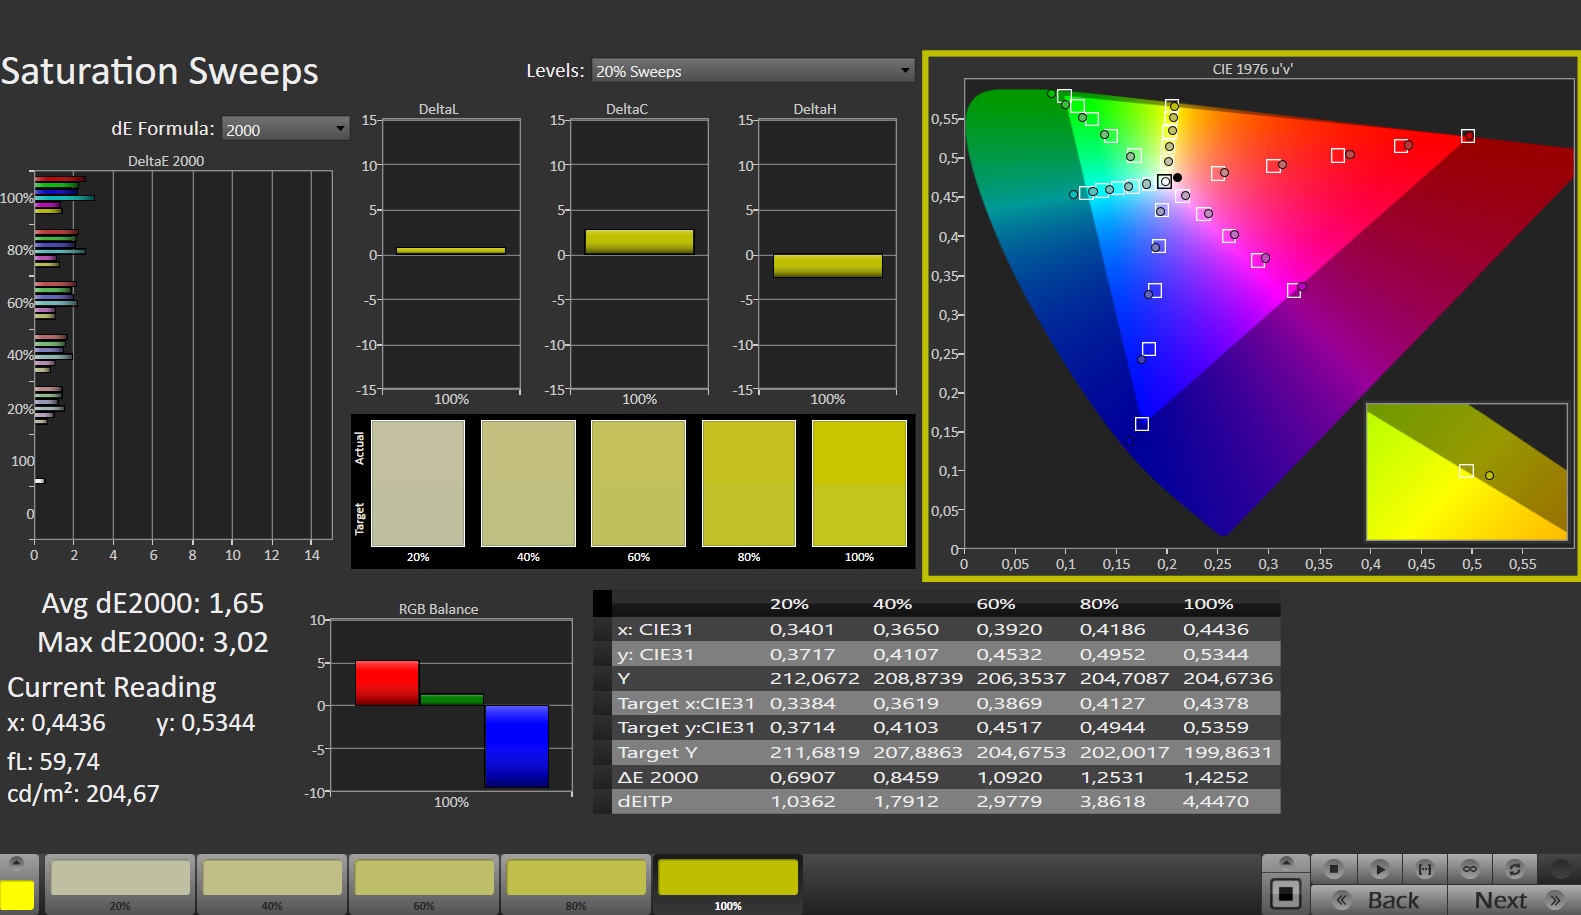
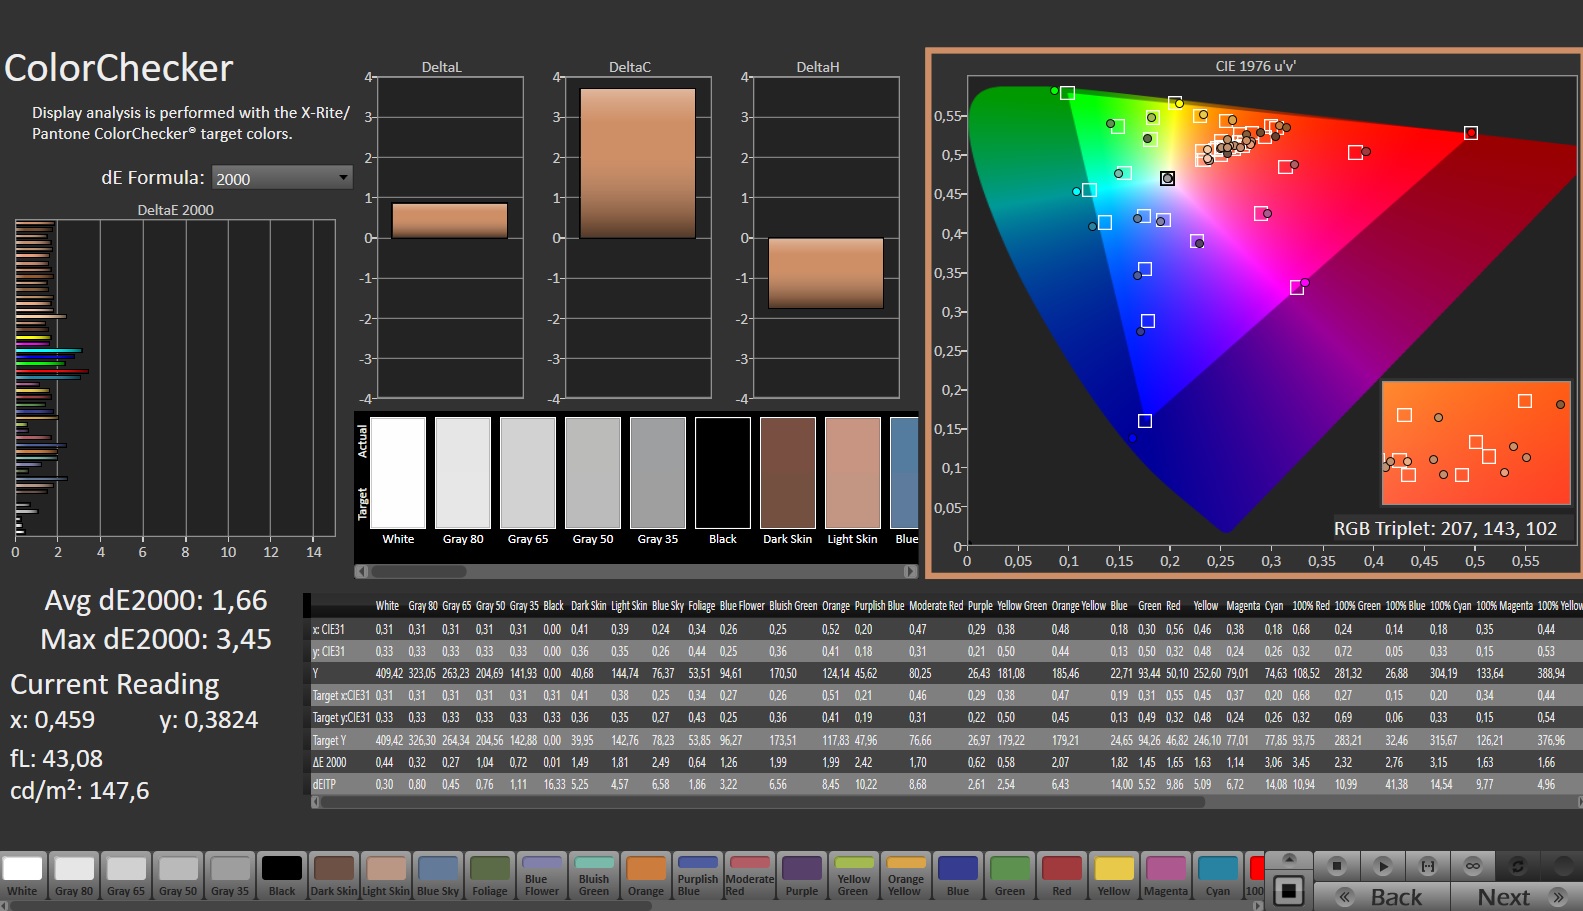
Lo schermo ha già una buona riproduzione dei colori nel suo stato di fornitura: Con una deviazione di 2,3, l'obiettivo (DeltaE < 3) è raggiunto. La calibrazione riduce il valore a 1,66 e garantisce livelli di scala di grigi più equilibrati
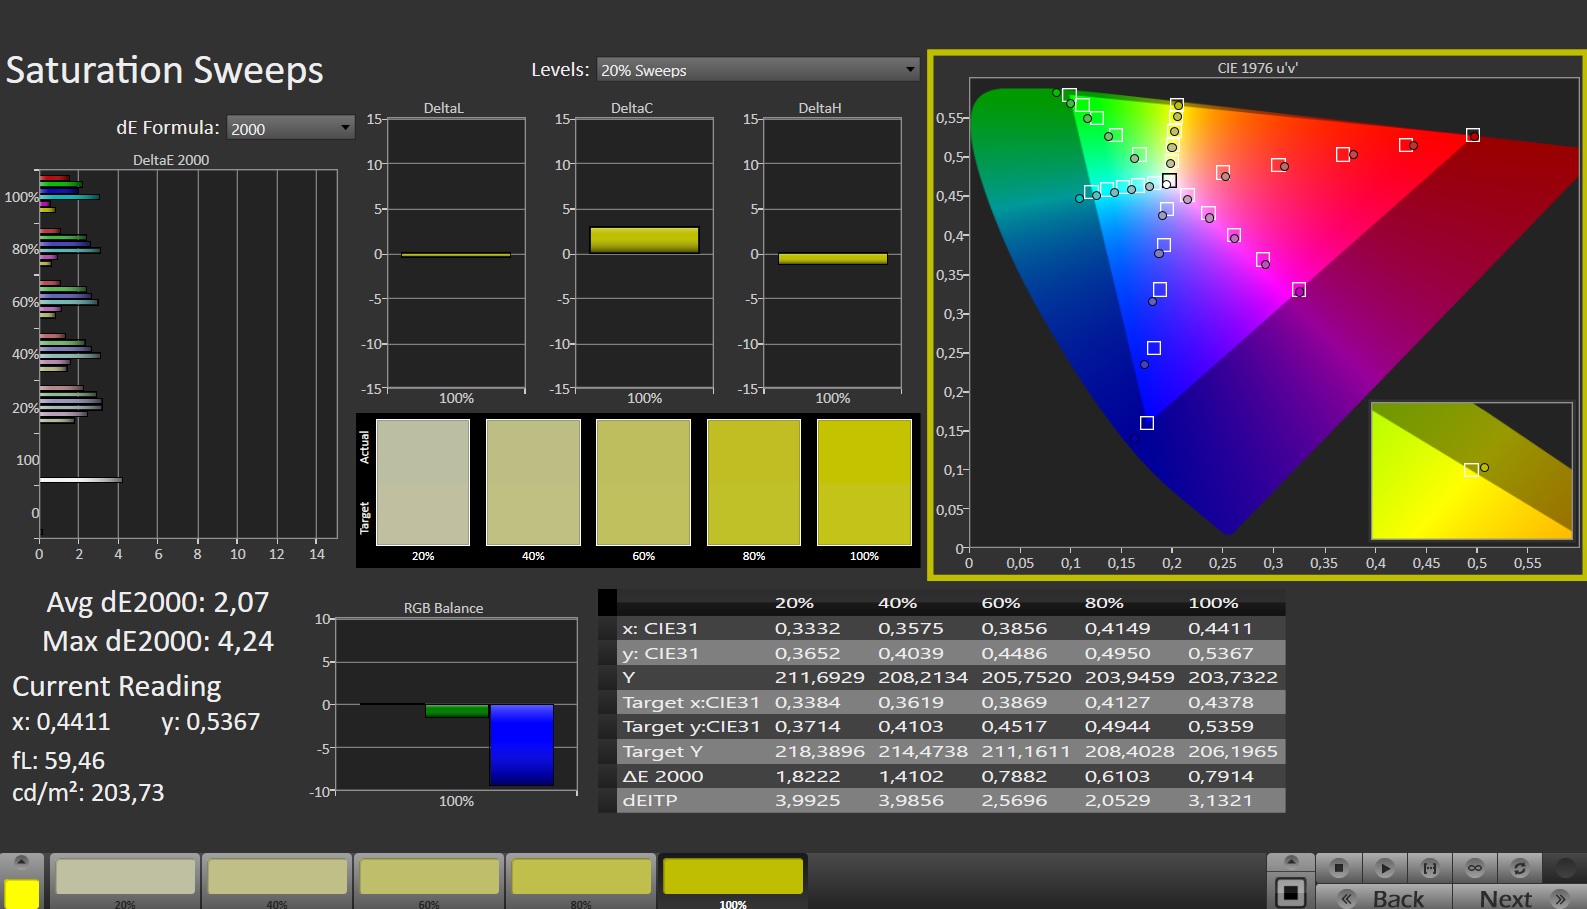
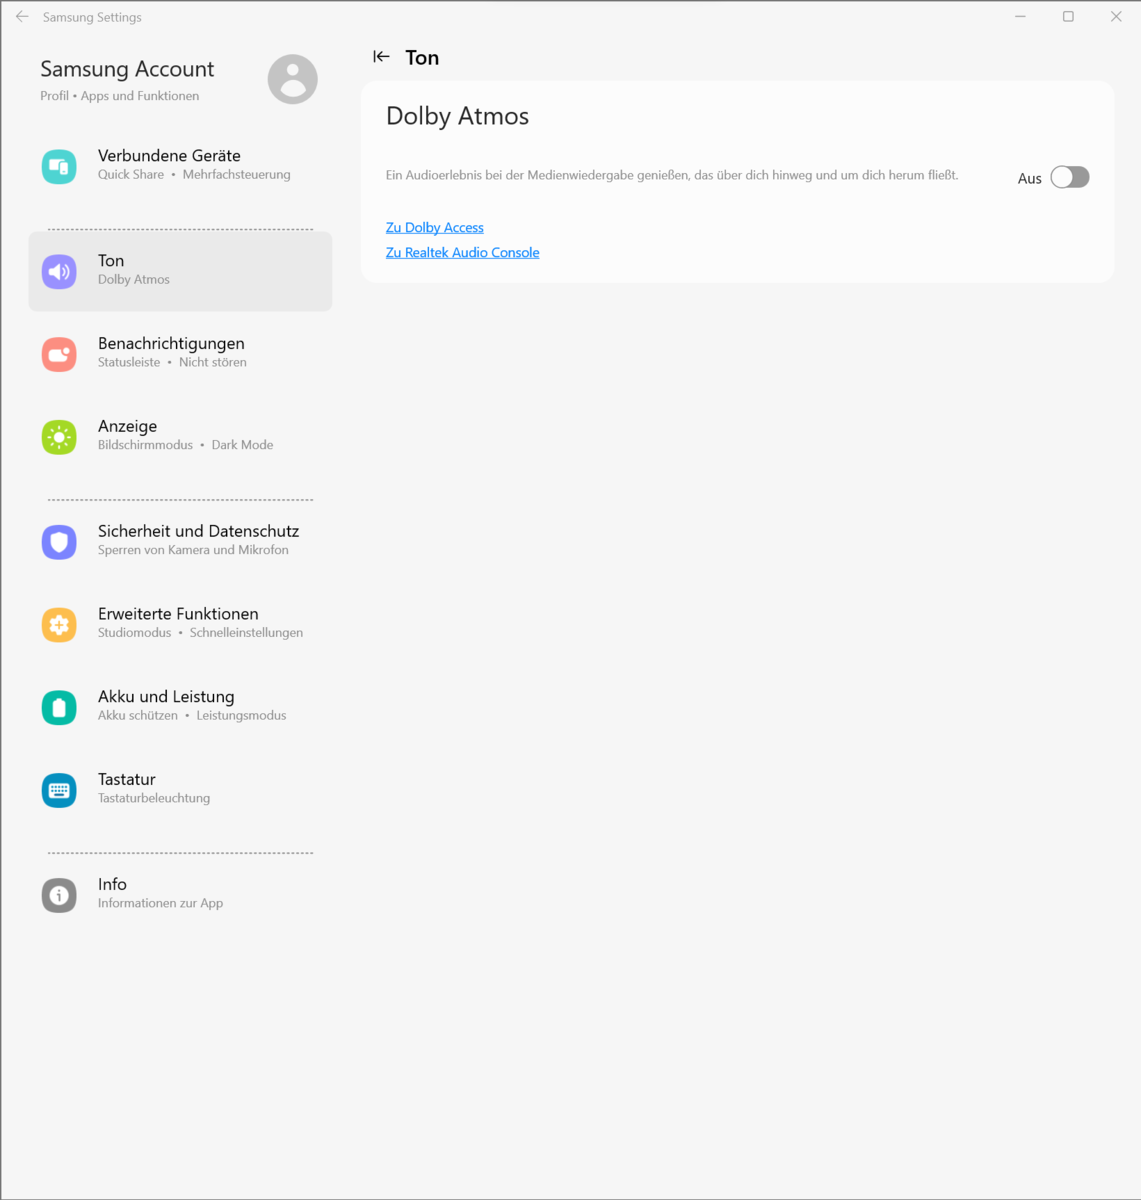
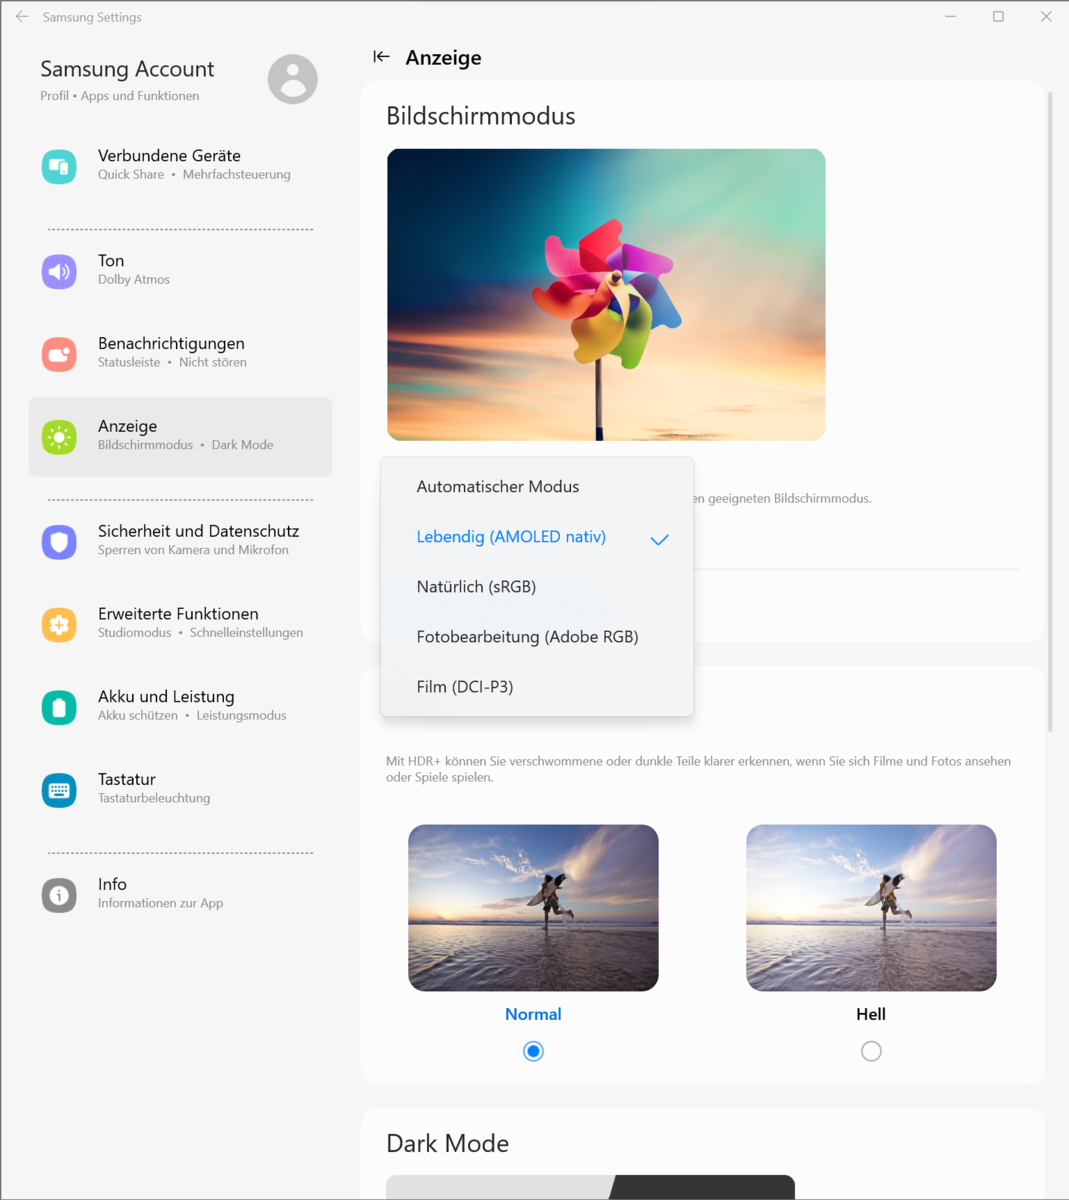
La fedeltà cromatica è un dato di fatto: lo spazio colore sRGB e DCI-P3 sono riprodotti integralmente e lo spazio Adobe RGB quasi completamente. Il display può essere regolato su uno dei tre spazi tramite le impostazioni del software Samsung preinstallato. In questo caso abbiamo utilizzato l'impostazione predefinita "Vivid (AMOLED nativo)".

Tempi di risposta del Display
| ↔ Tempi di risposta dal Nero al Bianco | ||
|---|---|---|
| 0.65 ms ... aumenta ↗ e diminuisce ↘ combinato | ↗ 0.37 ms Incremento | 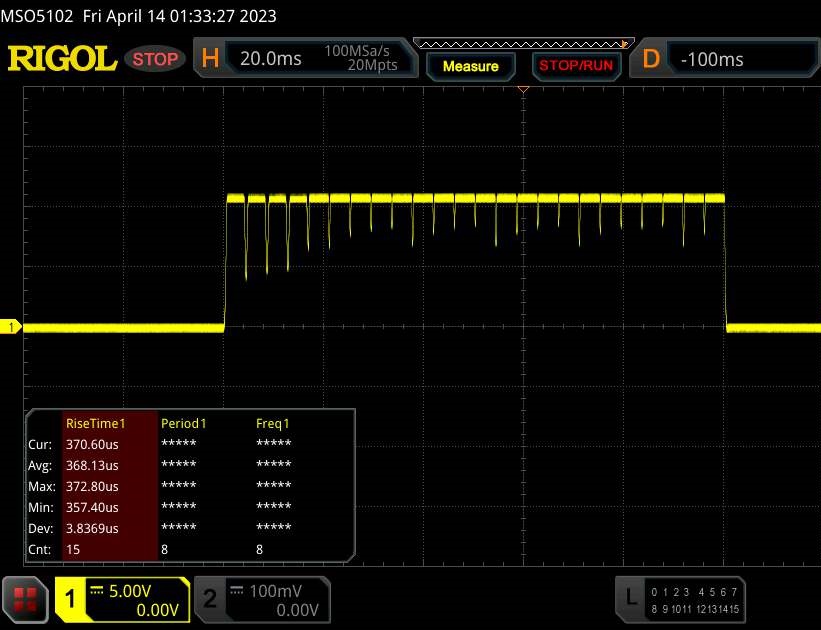 |
| ↘ 0.28 ms Calo | ||
| Lo schermo ha mostrato valori di risposta molto veloci nei nostri tests ed è molto adatto per i gaming veloce. In confronto, tutti i dispositivi di test variano da 0.1 (minimo) a 240 (massimo) ms. » 2 % di tutti i dispositivi è migliore. Questo significa che i tempi di risposta rilevati sono migliori rispettto alla media di tutti i dispositivi testati (19.8 ms). | ||
| ↔ Tempo di risposta dal 50% Grigio all'80% Grigio | ||
| 0.49 ms ... aumenta ↗ e diminuisce ↘ combinato | ↗ 0.26 ms Incremento | 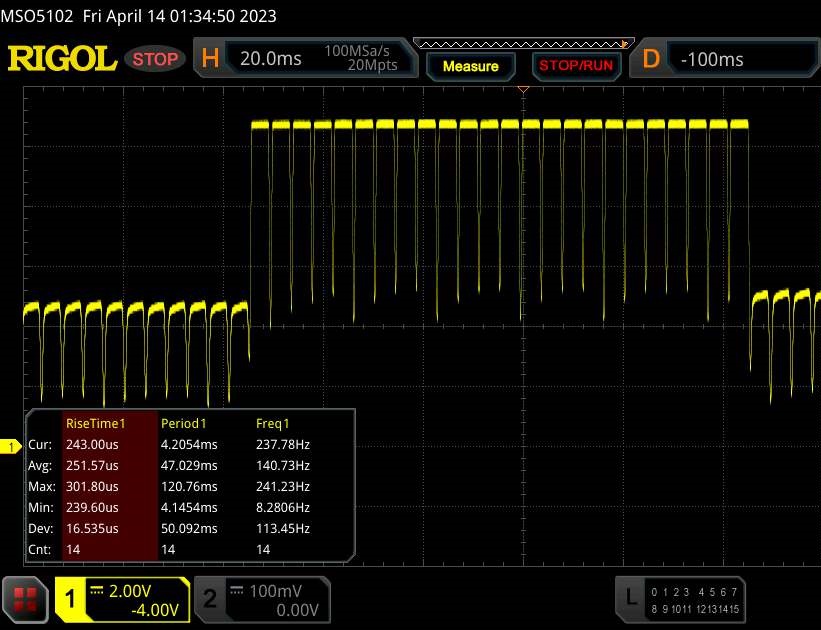 |
| ↘ 0.23 ms Calo | ||
| Lo schermo ha mostrato valori di risposta molto veloci nei nostri tests ed è molto adatto per i gaming veloce. In confronto, tutti i dispositivi di test variano da 0.165 (minimo) a 636 (massimo) ms. » 1 % di tutti i dispositivi è migliore. Questo significa che i tempi di risposta rilevati sono migliori rispettto alla media di tutti i dispositivi testati (31 ms). | ||
Sfarfallio dello schermo / PWM (Pulse-Width Modulation)
| flickering dello schermo / PWM rilevato | 240 Hz | ≤ 100 % settaggio luminosita' | 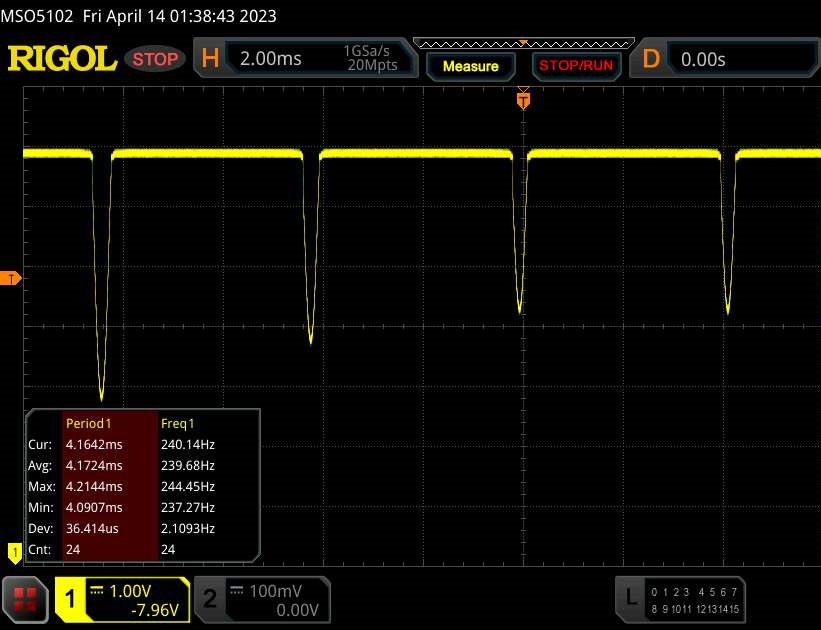 |
Il display sfarfalla a 240 Hz (Probabilmente a causa dell'uso di PWM) Flickering rilevato ad una luminosita' di 100 % o inferiore. Non dovrebbe verificarsi flickering o PWM sopra questo valore di luminosita'. La frequenza di 240 Hz è relativamente bassa, quindi gli utenti sensibili potrebbero notare il flickering ed accusare stanchezza agli occhi a questo livello di luminosità e a livelli inferiori. In confronto: 52 % di tutti i dispositivi testati non utilizza PWM per ridurre la luminosita' del display. Se è rilevato PWM, una media di 7747 (minimo: 5 - massimo: 343500) Hz è stata rilevata. | |||
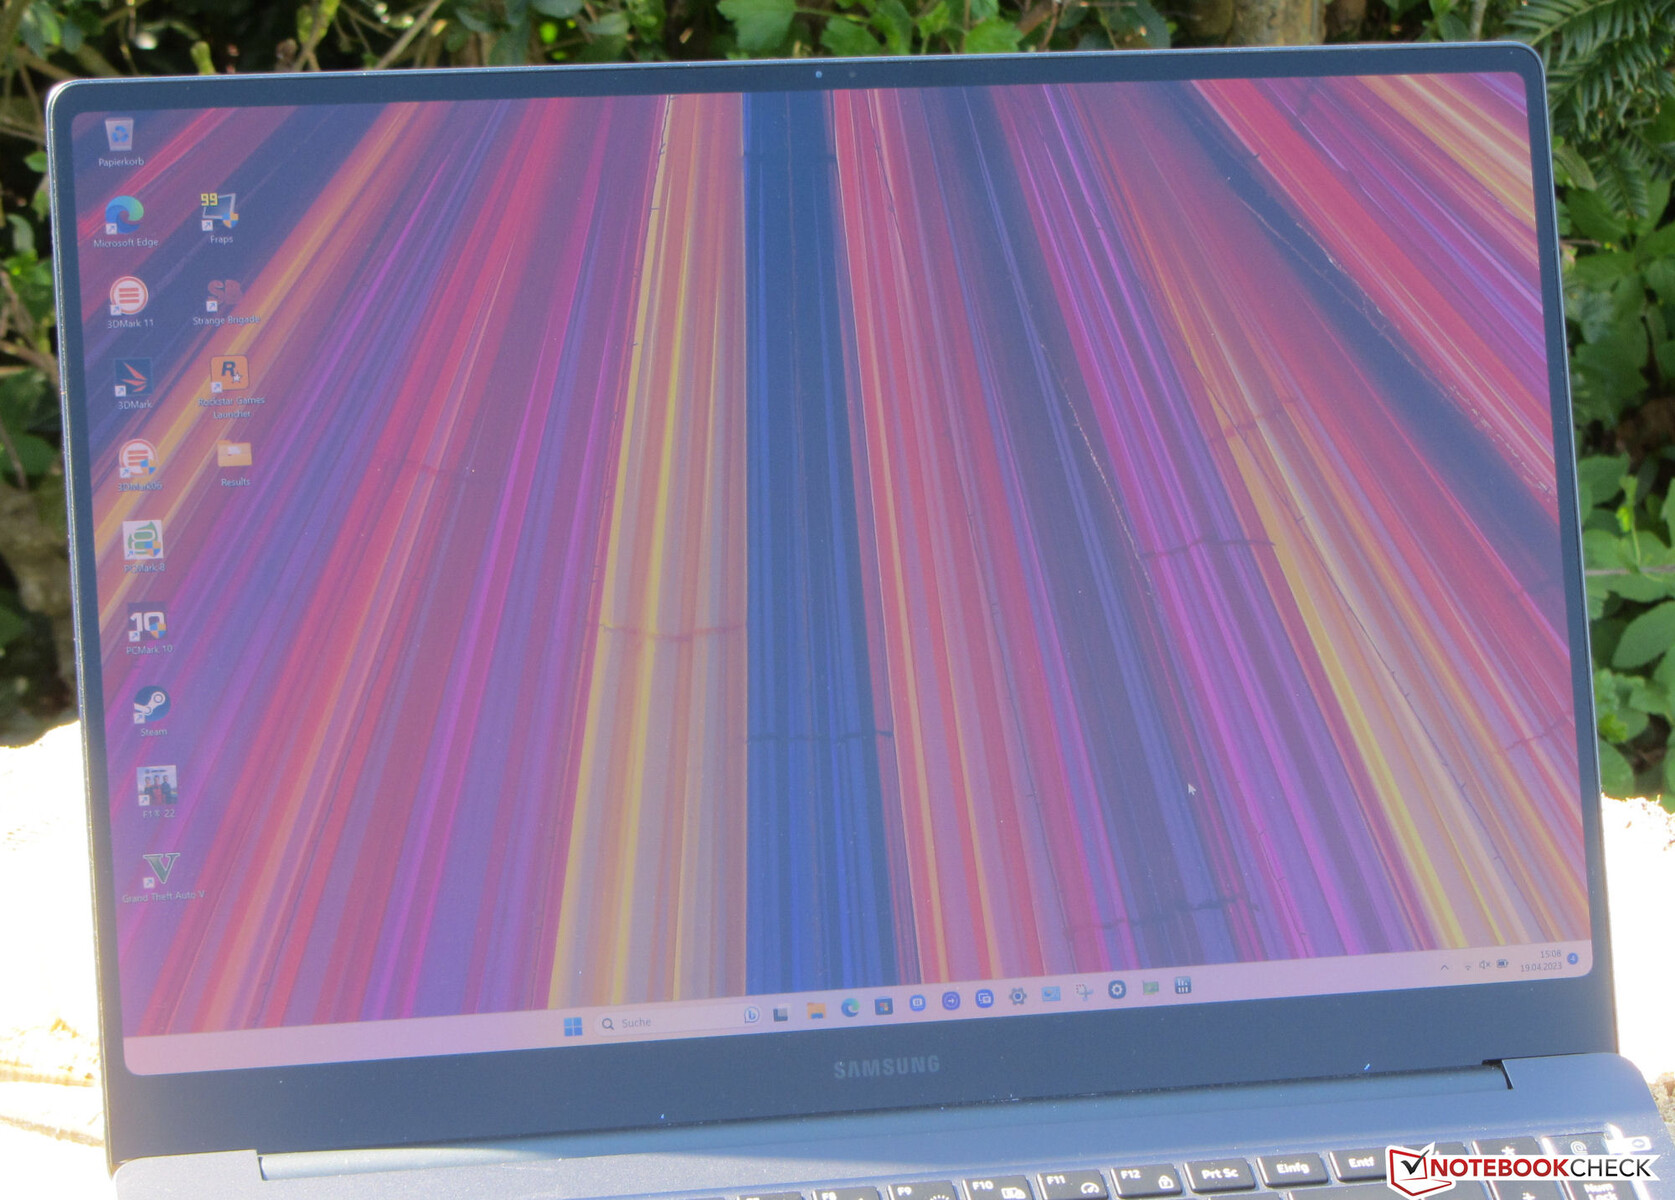
Il pannello con angolo di visione stabile può essere letto da qualsiasi posizione. La lettura all'aperto è difficile a causa della superficie riflettente del display.
Performance - Alder Lake e Ada Lovelace a bordo
Con i modelli Galaxy Book3 Ultra 16, Samsung offre una serie di notebook mobili per giocatori e lavoratori creativi. La certificazione RTX Studio di GeForce dovrebbe garantire un'elevata potenza di calcolo, driver adeguati, un buon supporto software e un'adeguata copertura dello spazio colore del display
Vengono utilizzate versioni a basso consumo delle GPU RTX 4050 o RTX 4070, mentre i processori provengono da Intel (Raptor Lake). Questa variante è basata sulla RTX 4050 ed è il modello di base con un prezzo di circa 2.400 dollari.
Condizioni di test
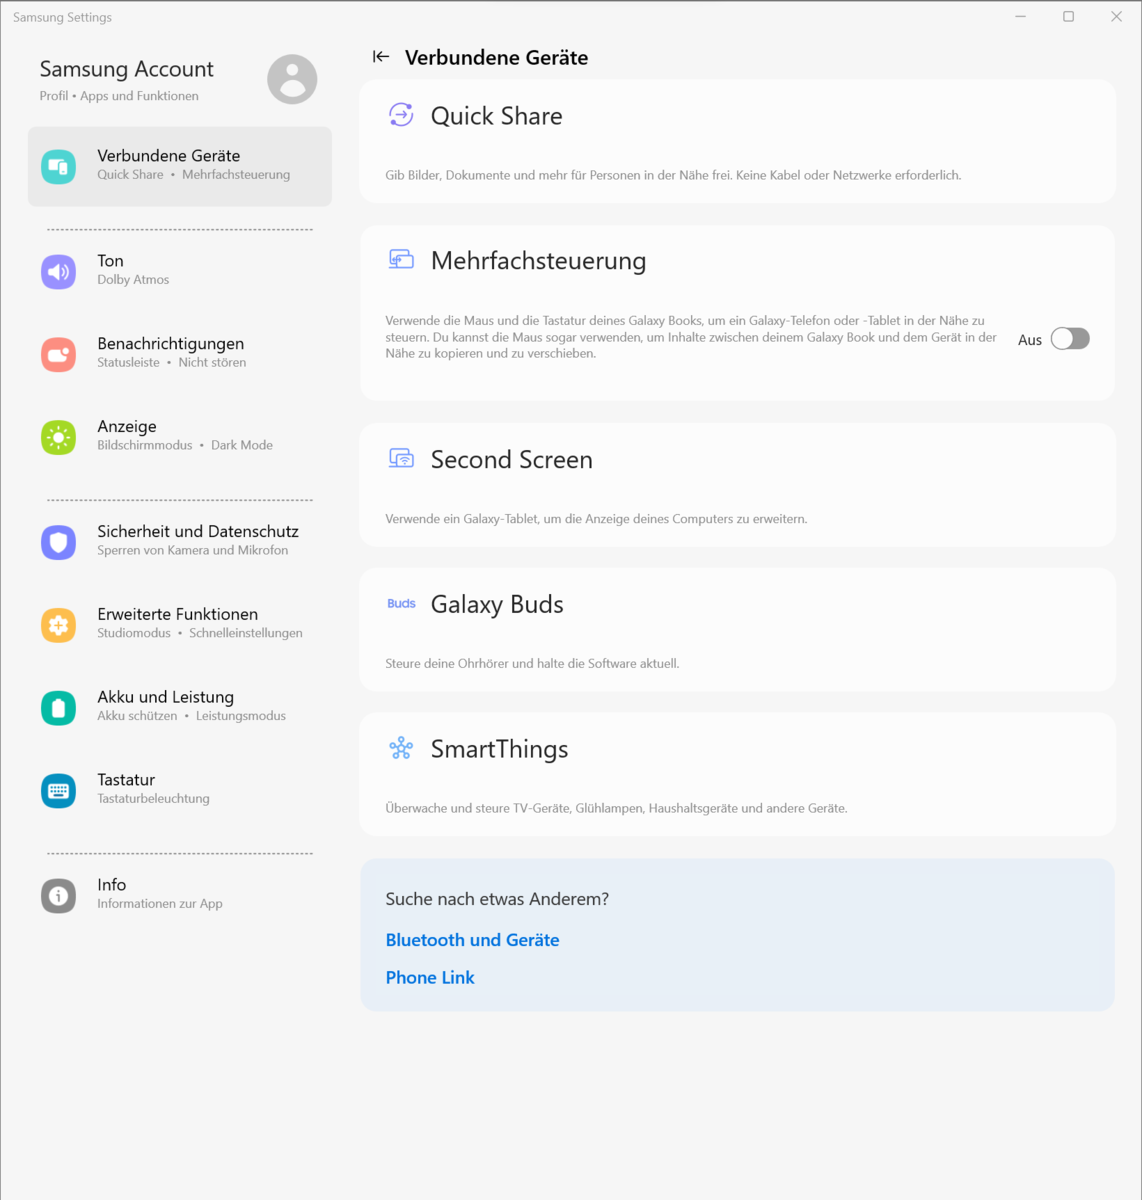
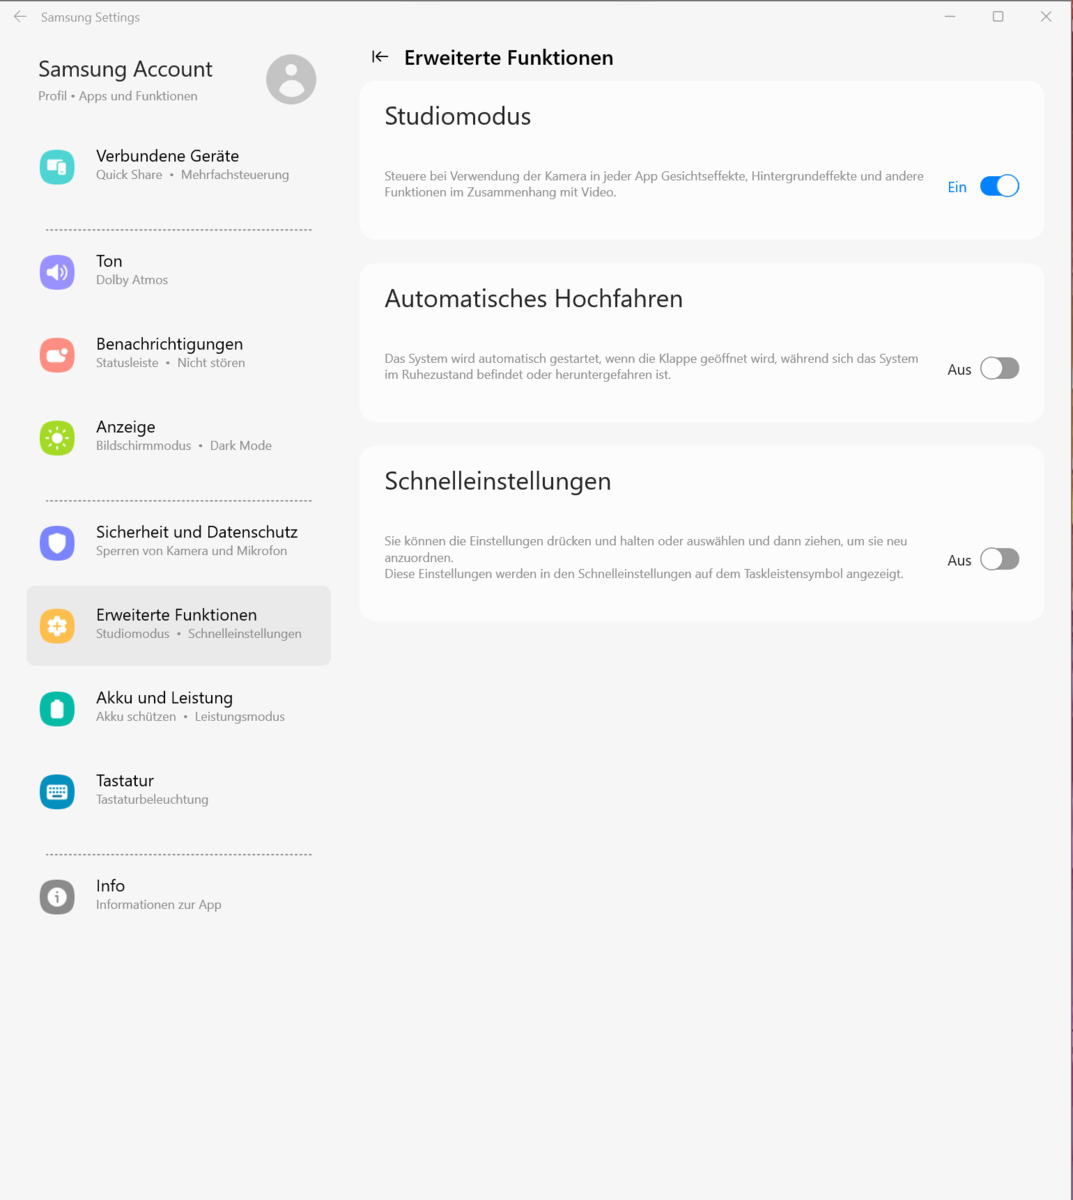
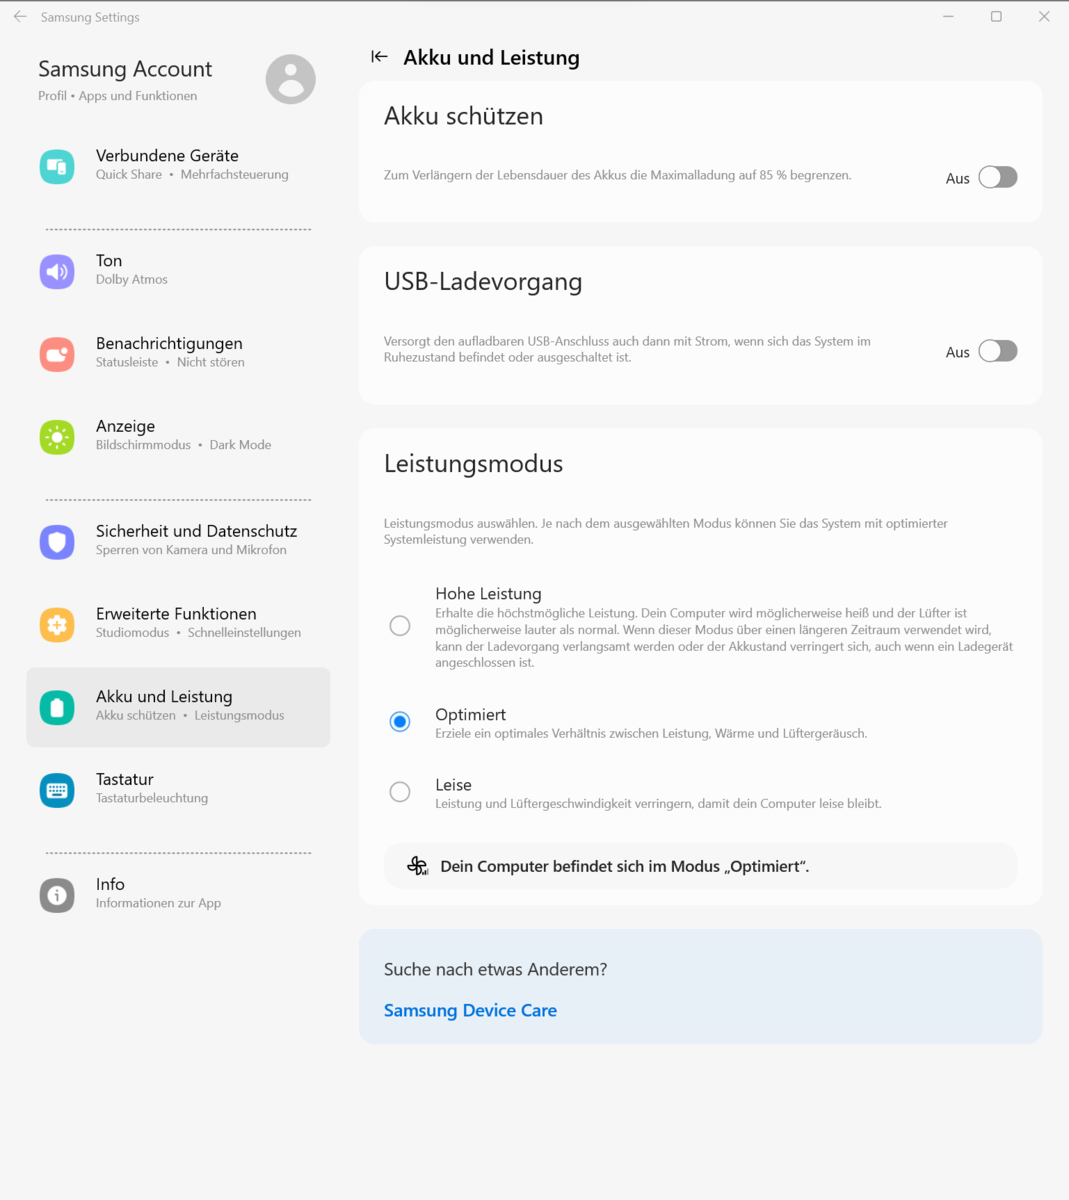
Il notebook dispone di tre modalità di prestazioni specifiche del produttore (vedi tabella), che possono essere alternate tramite la combinazione di tasti "Fn" + "F11" (o tramite le impostazioni software di Samsung sul centro di controllo del portatile). Sono state utilizzate le modalità "Ottimizzato" (benchmark) e "Silenzioso" (test della batteria).
| Elevate prestazioni | Ottimizzato | Silenzioso | |
|---|---|---|---|
| Limite di potenza 1 (HWInfo) | 70 watt | 45 watt | 30 watt |
| Limite di potenza 2 (HWInfo) | 75 watt | 75 watt | 75 watt |
| TGP RTX 4050 | 60 watt | ~ 40 - 45 watt | 20 watt |
| Rumore (Witcher 3 ) | 48 dB(A) | 39 dB(A) | 34 dB(A) |
| Prestazioni (Witcher 3 ) | ~ 73 fps | ~ 60 fps | ~ 20 fps |
Processore
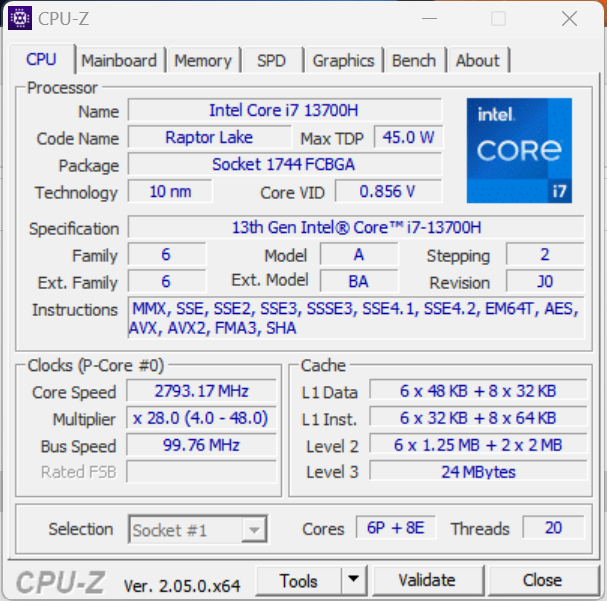
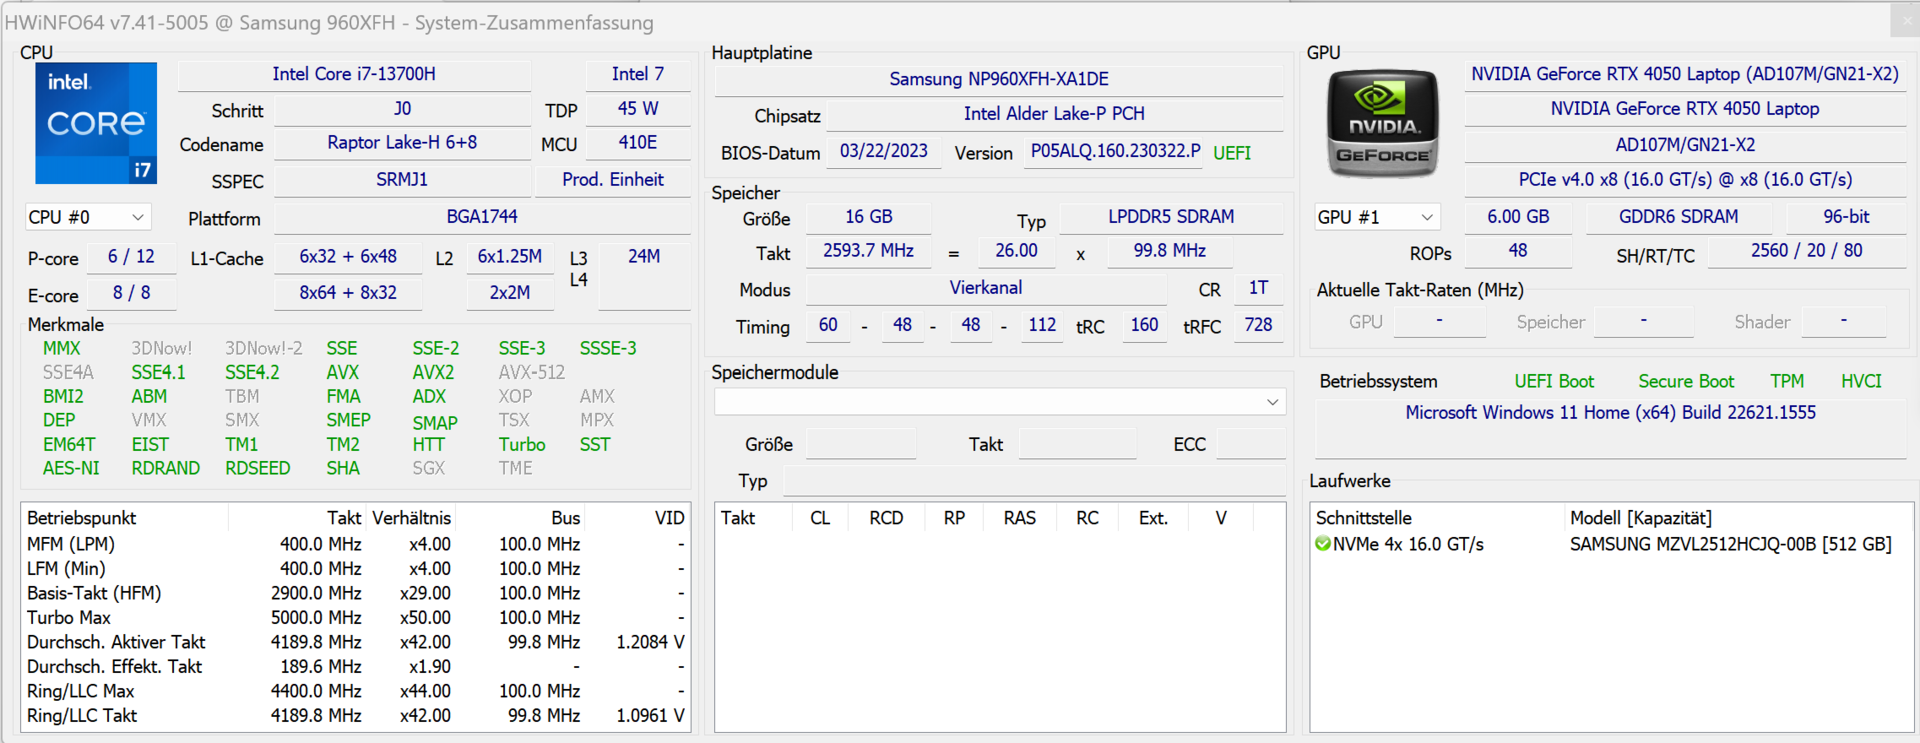
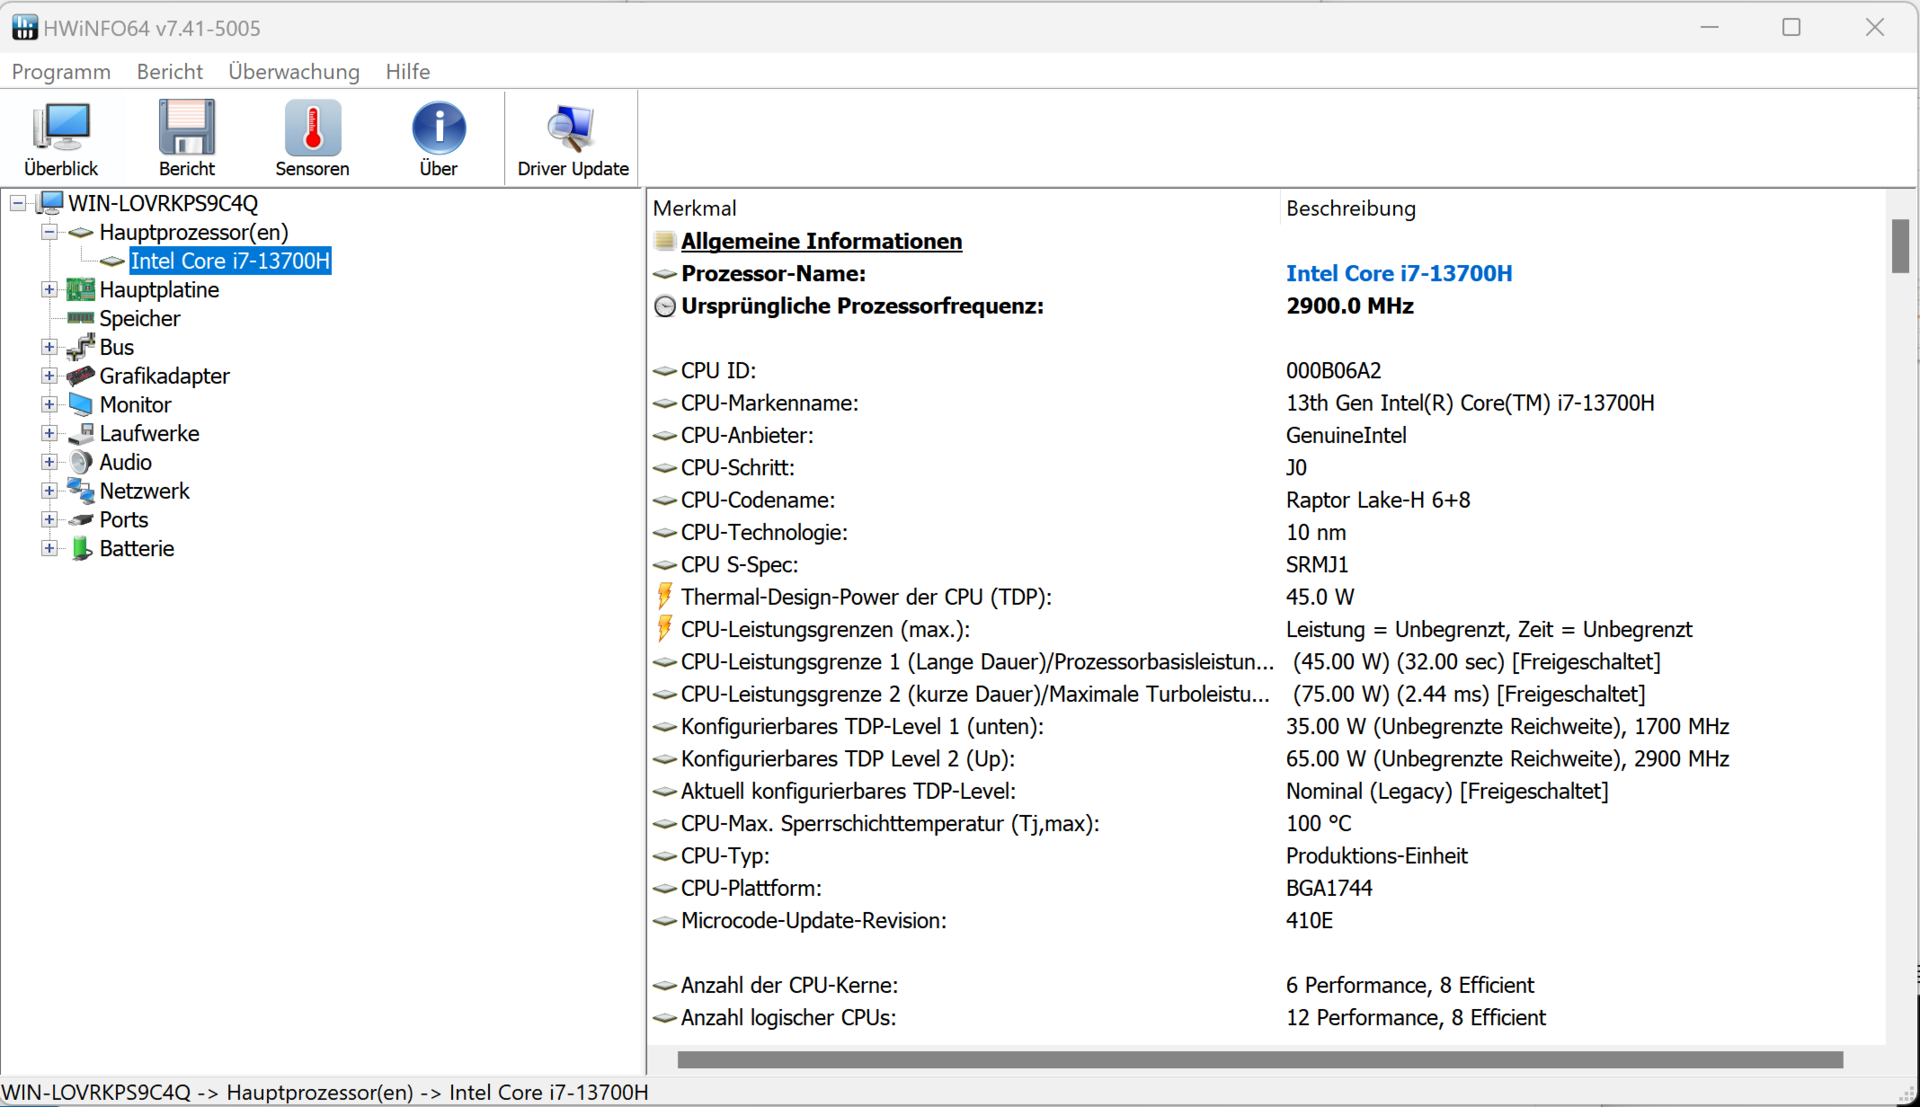
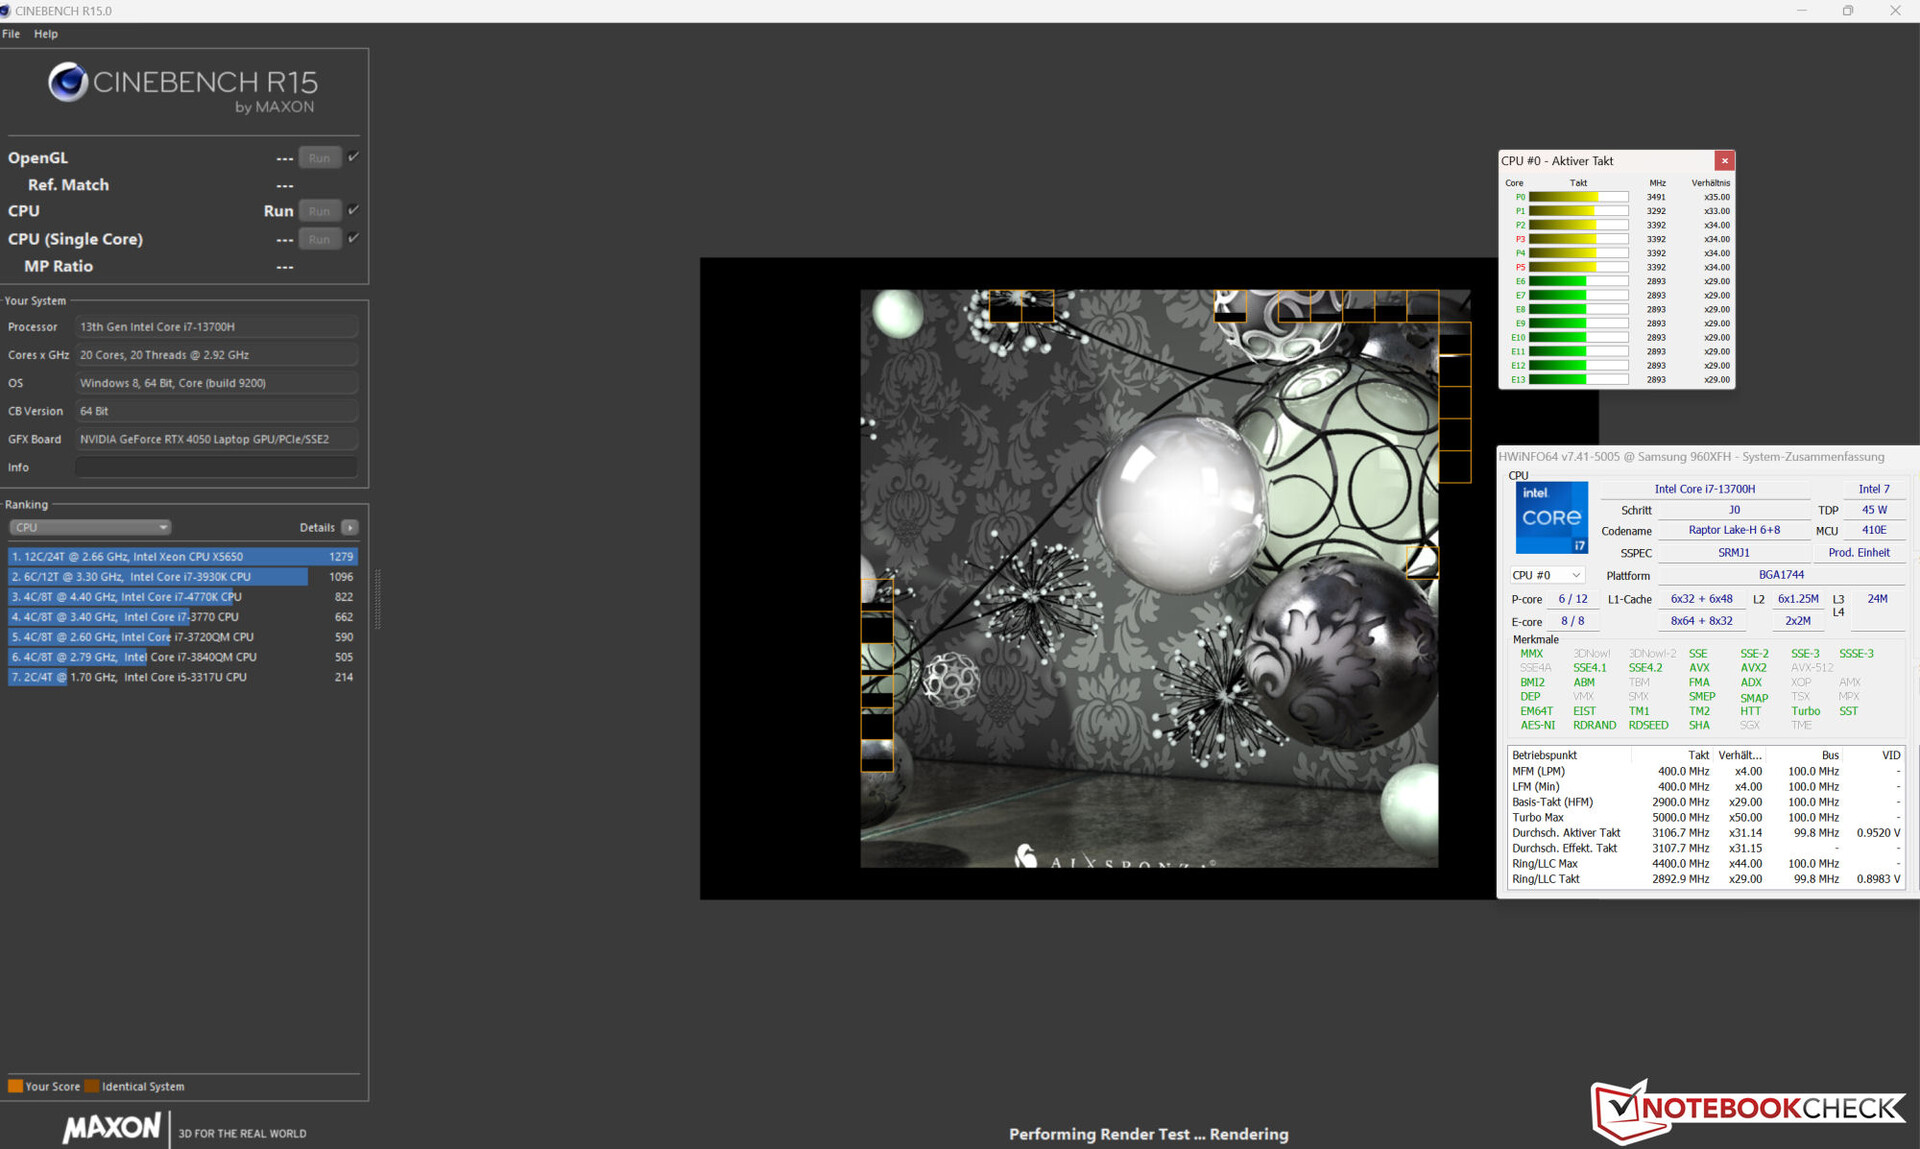
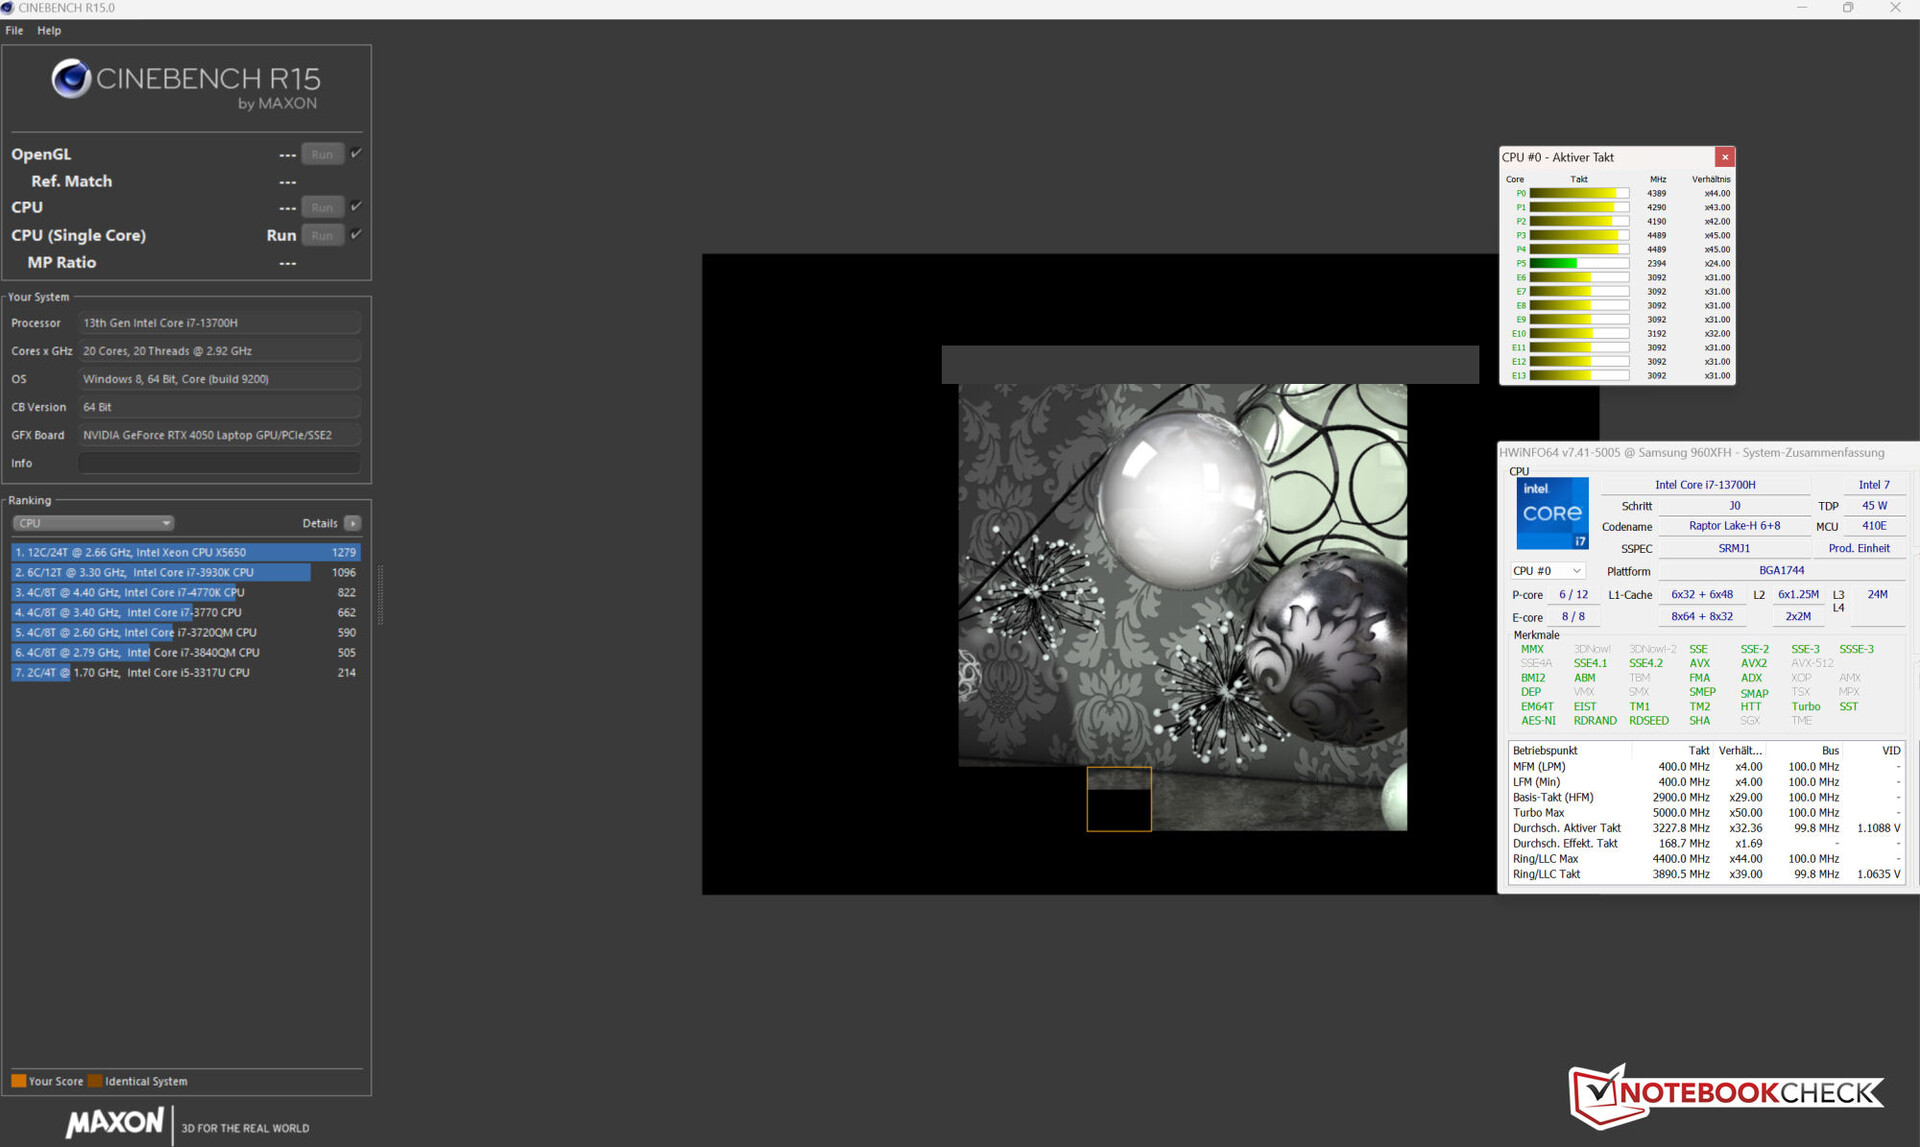
Il Core i7-13700H (Raptor Lake) è composto da otto core efficienti (senza hyperthreading, da 1,8 a 3,7 GHz) e sei core ad alte prestazioni (hyperthreading, da 2,4 a 5 GHz). In totale si tratta di 20 core logici della CPU.
Le modalità di prestazione "High Performance" e "Optimized" forniscono risultati di benchmark che sono approssimativamente al livello della media della CPU determinata finora. Il profilo "Silenzioso" abbassa notevolmente questi valori, ma fornisce comunque prestazioni più che sufficienti per l'uso quotidiano
Il test in loop CB15 rivela che il carico continuo di multi-thread fa sì che il clock del turbo diminuisca a ogni ulteriore esecuzione e fluttui a partire dall'ottava esecuzione. Non è possibile mantenere un livello costante. Il profilo "High Performance" garantisce un clock medio più elevato e fluttuazioni inferiori.
Cinebench R15 Multi Sustained Load
| CPU Performance rating - Percent | |
| Media della classe Multimedia | |
| Samsung Galaxy Book3 Ultra 16 | |
| Media Intel Core i7-13700H | |
| Dell XPS 15 9520 RTX 3050 Ti | |
| Samsung Galaxy Book3 Ultra 16 | |
| Schenker Vision 16 Pro RTX 3070 Ti | |
| Lenovo ThinkBook 16p G3 ARH | |
| Acer Swift X SFX16-52G-77RX | |
| Samsung Galaxy Book3 Ultra 16 | |
| LG Gram 17Z90Q-E.AD78G | |
| Asus VivoBook Pro 16X OLED N7600PC-L2026X | |
| Cinebench R23 | |
| Multi Core | |
| Media della classe Multimedia (4861 - 33362, n=76, ultimi 2 anni) | |
| Samsung Galaxy Book3 Ultra 16 | |
| Media Intel Core i7-13700H (5890 - 20034, n=29) | |
| Samsung Galaxy Book3 Ultra 16 (Hohe Leistung) | |
| Dell XPS 15 9520 RTX 3050 Ti | |
| Lenovo ThinkBook 16p G3 ARH | |
| Schenker Vision 16 Pro RTX 3070 Ti | |
| Samsung Galaxy Book3 Ultra 16 (Leise) | |
| Acer Swift X SFX16-52G-77RX | |
| LG Gram 17Z90Q-E.AD78G | |
| LG Gram 17Z90Q-E.AD78G | |
| Asus VivoBook Pro 16X OLED N7600PC-L2026X | |
| Single Core | |
| Media della classe Multimedia (1128 - 2459, n=68, ultimi 2 anni) | |
| Samsung Galaxy Book3 Ultra 16 (Hohe Leistung) | |
| Schenker Vision 16 Pro RTX 3070 Ti | |
| Media Intel Core i7-13700H (1323 - 1914, n=29) | |
| Dell XPS 15 9520 RTX 3050 Ti | |
| Acer Swift X SFX16-52G-77RX | |
| Samsung Galaxy Book3 Ultra 16 | |
| LG Gram 17Z90Q-E.AD78G | |
| Lenovo ThinkBook 16p G3 ARH | |
| Asus VivoBook Pro 16X OLED N7600PC-L2026X | |
| Samsung Galaxy Book3 Ultra 16 (Leise) | |
| Cinebench R20 | |
| CPU (Multi Core) | |
| Media della classe Multimedia (1887 - 12912, n=59, ultimi 2 anni) | |
| Samsung Galaxy Book3 Ultra 16 | |
| Media Intel Core i7-13700H (2322 - 7674, n=29) | |
| Samsung Galaxy Book3 Ultra 16 (Hohe Leistung) | |
| Dell XPS 15 9520 RTX 3050 Ti | |
| Lenovo ThinkBook 16p G3 ARH | |
| Schenker Vision 16 Pro RTX 3070 Ti | |
| Samsung Galaxy Book3 Ultra 16 (Leise) | |
| Acer Swift X SFX16-52G-77RX | |
| LG Gram 17Z90Q-E.AD78G | |
| Asus VivoBook Pro 16X OLED N7600PC-L2026X | |
| CPU (Single Core) | |
| Media della classe Multimedia (425 - 853, n=59, ultimi 2 anni) | |
| Samsung Galaxy Book3 Ultra 16 (Hohe Leistung) | |
| Schenker Vision 16 Pro RTX 3070 Ti | |
| Media Intel Core i7-13700H (508 - 741, n=29) | |
| Dell XPS 15 9520 RTX 3050 Ti | |
| Acer Swift X SFX16-52G-77RX | |
| Samsung Galaxy Book3 Ultra 16 | |
| LG Gram 17Z90Q-E.AD78G | |
| Lenovo ThinkBook 16p G3 ARH | |
| Asus VivoBook Pro 16X OLED N7600PC-L2026X | |
| Samsung Galaxy Book3 Ultra 16 (Leise) | |
| Cinebench R15 | |
| CPU Multi 64Bit | |
| Schenker Vision 16 Pro RTX 3070 Ti (Turbo) | |
| Schenker Vision 16 Pro RTX 3070 Ti | |
| Media della classe Multimedia (856 - 5224, n=63, ultimi 2 anni) | |
| Samsung Galaxy Book3 Ultra 16 | |
| Samsung Galaxy Book3 Ultra 16 (Hohe Leistung) | |
| Media Intel Core i7-13700H (905 - 2982, n=29) | |
| Samsung Galaxy Book3 Ultra 16 (Leise) | |
| Dell XPS 15 9520 RTX 3050 Ti | |
| Lenovo ThinkBook 16p G3 ARH | |
| Acer Swift X SFX16-52G-77RX | |
| LG Gram 17Z90Q-E.AD78G | |
| Asus VivoBook Pro 16X OLED N7600PC-L2026X | |
| CPU Single 64Bit | |
| Media della classe Multimedia (184.8 - 326, n=61, ultimi 2 anni) | |
| Samsung Galaxy Book3 Ultra 16 (Hohe Leistung) | |
| Schenker Vision 16 Pro RTX 3070 Ti | |
| Media Intel Core i7-13700H (213 - 278, n=29) | |
| Dell XPS 15 9520 RTX 3050 Ti | |
| Acer Swift X SFX16-52G-77RX | |
| Samsung Galaxy Book3 Ultra 16 | |
| Lenovo ThinkBook 16p G3 ARH | |
| Asus VivoBook Pro 16X OLED N7600PC-L2026X | |
| Asus VivoBook Pro 16X OLED N7600PC-L2026X | |
| LG Gram 17Z90Q-E.AD78G | |
| Samsung Galaxy Book3 Ultra 16 (Leise) | |
| Blender - v2.79 BMW27 CPU | |
| Asus VivoBook Pro 16X OLED N7600PC-L2026X | |
| LG Gram 17Z90Q-E.AD78G | |
| Acer Swift X SFX16-52G-77RX | |
| Samsung Galaxy Book3 Ultra 16 (Leise) | |
| Schenker Vision 16 Pro RTX 3070 Ti | |
| Lenovo ThinkBook 16p G3 ARH | |
| Media della classe Multimedia (100 - 557, n=60, ultimi 2 anni) | |
| Media Intel Core i7-13700H (169 - 555, n=29) | |
| Dell XPS 15 9520 RTX 3050 Ti | |
| Samsung Galaxy Book3 Ultra 16 | |
| Samsung Galaxy Book3 Ultra 16 (Hohe Leistung) | |
| 7-Zip 18.03 | |
| 7z b 4 | |
| Dell XPS 15 9520 RTX 3050 Ti | |
| Samsung Galaxy Book3 Ultra 16 | |
| Media Intel Core i7-13700H (27322 - 76344, n=29) | |
| Media della classe Multimedia (26062 - 130368, n=57, ultimi 2 anni) | |
| Samsung Galaxy Book3 Ultra 16 (Hohe Leistung) | |
| Lenovo ThinkBook 16p G3 ARH | |
| Schenker Vision 16 Pro RTX 3070 Ti | |
| Samsung Galaxy Book3 Ultra 16 (Leise) | |
| Acer Swift X SFX16-52G-77RX | |
| LG Gram 17Z90Q-E.AD78G | |
| Asus VivoBook Pro 16X OLED N7600PC-L2026X | |
| 7z b 4 -mmt1 | |
| Samsung Galaxy Book3 Ultra 16 (Hohe Leistung) | |
| Media della classe Multimedia (3666 - 7545, n=58, ultimi 2 anni) | |
| Media Intel Core i7-13700H (4825 - 6238, n=29) | |
| Schenker Vision 16 Pro RTX 3070 Ti | |
| Dell XPS 15 9520 RTX 3050 Ti | |
| Samsung Galaxy Book3 Ultra 16 | |
| Asus VivoBook Pro 16X OLED N7600PC-L2026X | |
| Acer Swift X SFX16-52G-77RX | |
| Lenovo ThinkBook 16p G3 ARH | |
| LG Gram 17Z90Q-E.AD78G | |
| Samsung Galaxy Book3 Ultra 16 (Leise) | |
| Geekbench 5.5 | |
| Multi-Core | |
| Media della classe Multimedia (4652 - 20422, n=58, ultimi 2 anni) | |
| Samsung Galaxy Book3 Ultra 16 (Hohe Leistung) | |
| Dell XPS 15 9520 RTX 3050 Ti | |
| Media Intel Core i7-13700H (6165 - 14215, n=29) | |
| Samsung Galaxy Book3 Ultra 16 | |
| Schenker Vision 16 Pro RTX 3070 Ti | |
| Acer Swift X SFX16-52G-77RX | |
| Samsung Galaxy Book3 Ultra 16 (Leise) | |
| Lenovo ThinkBook 16p G3 ARH | |
| LG Gram 17Z90Q-E.AD78G | |
| Asus VivoBook Pro 16X OLED N7600PC-L2026X | |
| Single-Core | |
| Media della classe Multimedia (805 - 2974, n=58, ultimi 2 anni) | |
| Samsung Galaxy Book3 Ultra 16 (Hohe Leistung) | |
| Schenker Vision 16 Pro RTX 3070 Ti | |
| Media Intel Core i7-13700H (1362 - 1919, n=29) | |
| Acer Swift X SFX16-52G-77RX | |
| Dell XPS 15 9520 RTX 3050 Ti | |
| Samsung Galaxy Book3 Ultra 16 | |
| LG Gram 17Z90Q-E.AD78G | |
| Lenovo ThinkBook 16p G3 ARH | |
| Asus VivoBook Pro 16X OLED N7600PC-L2026X | |
| Samsung Galaxy Book3 Ultra 16 (Leise) | |
| HWBOT x265 Benchmark v2.2 - 4k Preset | |
| Media della classe Multimedia (5.26 - 36.1, n=58, ultimi 2 anni) | |
| Samsung Galaxy Book3 Ultra 16 (Hohe Leistung) | |
| Lenovo ThinkBook 16p G3 ARH | |
| Samsung Galaxy Book3 Ultra 16 | |
| Media Intel Core i7-13700H (6.72 - 21.2, n=29) | |
| Dell XPS 15 9520 RTX 3050 Ti | |
| Schenker Vision 16 Pro RTX 3070 Ti | |
| Acer Swift X SFX16-52G-77RX | |
| Samsung Galaxy Book3 Ultra 16 (Leise) | |
| LG Gram 17Z90Q-E.AD78G | |
| Asus VivoBook Pro 16X OLED N7600PC-L2026X | |
| LibreOffice - 20 Documents To PDF | |
| LG Gram 17Z90Q-E.AD78G | |
| Lenovo ThinkBook 16p G3 ARH | |
| Acer Swift X SFX16-52G-77RX | |
| Asus VivoBook Pro 16X OLED N7600PC-L2026X | |
| Samsung Galaxy Book3 Ultra 16 (Leise) | |
| Media della classe Multimedia (23.9 - 146.7, n=59, ultimi 2 anni) | |
| Samsung Galaxy Book3 Ultra 16 | |
| Media Intel Core i7-13700H (31.3 - 62.4, n=29) | |
| Schenker Vision 16 Pro RTX 3070 Ti | |
| Dell XPS 15 9520 RTX 3050 Ti | |
| Samsung Galaxy Book3 Ultra 16 (Hohe Leistung) | |
| R Benchmark 2.5 - Overall mean | |
| Samsung Galaxy Book3 Ultra 16 (Leise) | |
| Asus VivoBook Pro 16X OLED N7600PC-L2026X | |
| LG Gram 17Z90Q-E.AD78G | |
| Lenovo ThinkBook 16p G3 ARH | |
| Samsung Galaxy Book3 Ultra 16 | |
| Samsung Galaxy Book3 Ultra 16 (Hohe Leistung) | |
| Acer Swift X SFX16-52G-77RX | |
| Media Intel Core i7-13700H (0.4308 - 0.607, n=29) | |
| Media della classe Multimedia (0.3604 - 0.947, n=58, ultimi 2 anni) | |
| Schenker Vision 16 Pro RTX 3070 Ti | |
| Dell XPS 15 9520 RTX 3050 Ti | |
* ... Meglio usare valori piccoli
AIDA64: FP32 Ray-Trace | FPU Julia | CPU SHA3 | CPU Queen | FPU SinJulia | FPU Mandel | CPU AES | CPU ZLib | FP64 Ray-Trace | CPU PhotoWorxx
| Performance rating | |
| Media della classe Multimedia | |
| Lenovo ThinkBook 16p G3 ARH | |
| Samsung Galaxy Book3 Ultra 16 | |
| Media Intel Core i7-13700H | |
| Schenker Vision 16 Pro RTX 3070 Ti | |
| Dell XPS 15 9520 RTX 3050 Ti | |
| Acer Swift X SFX16-52G-77RX | |
| LG Gram 17Z90Q-E.AD78G | |
| Asus VivoBook Pro 16X OLED N7600PC-L2026X | |
| AIDA64 / FP32 Ray-Trace | |
| Media della classe Multimedia (2214 - 50388, n=55, ultimi 2 anni) | |
| Lenovo ThinkBook 16p G3 ARH (v6.75.6100) | |
| Samsung Galaxy Book3 Ultra 16 (v6.75.6100) | |
| Media Intel Core i7-13700H (4986 - 18908, n=29) | |
| Schenker Vision 16 Pro RTX 3070 Ti (v6.75.6100) | |
| Acer Swift X SFX16-52G-77RX (v6.70.6000) | |
| Dell XPS 15 9520 RTX 3050 Ti (v6.50.5800) | |
| Asus VivoBook Pro 16X OLED N7600PC-L2026X (v6.75.6100) | |
| LG Gram 17Z90Q-E.AD78G (v6.50.5800) | |
| AIDA64 / FPU Julia | |
| Lenovo ThinkBook 16p G3 ARH (v6.75.6100) | |
| Media della classe Multimedia (12867 - 201874, n=56, ultimi 2 anni) | |
| Media Intel Core i7-13700H (25360 - 92359, n=29) | |
| Samsung Galaxy Book3 Ultra 16 (v6.75.6100) | |
| Schenker Vision 16 Pro RTX 3070 Ti (v6.75.6100) | |
| Acer Swift X SFX16-52G-77RX (v6.70.6000) | |
| Dell XPS 15 9520 RTX 3050 Ti (v6.50.5800) | |
| Asus VivoBook Pro 16X OLED N7600PC-L2026X (v6.75.6100) | |
| LG Gram 17Z90Q-E.AD78G (v6.50.5800) | |
| AIDA64 / CPU SHA3 | |
| Media della classe Multimedia (626 - 8623, n=56, ultimi 2 anni) | |
| Lenovo ThinkBook 16p G3 ARH (v6.75.6100) | |
| Samsung Galaxy Book3 Ultra 16 (v6.75.6100) | |
| Media Intel Core i7-13700H (1339 - 4224, n=29) | |
| Schenker Vision 16 Pro RTX 3070 Ti (v6.75.6100) | |
| Dell XPS 15 9520 RTX 3050 Ti (v6.50.5800) | |
| Acer Swift X SFX16-52G-77RX (v6.70.6000) | |
| Asus VivoBook Pro 16X OLED N7600PC-L2026X (v6.75.6100) | |
| LG Gram 17Z90Q-E.AD78G (v6.50.5800) | |
| AIDA64 / CPU Queen | |
| Lenovo ThinkBook 16p G3 ARH (v6.75.6100) | |
| Samsung Galaxy Book3 Ultra 16 (v6.75.6100) | |
| Dell XPS 15 9520 RTX 3050 Ti (v6.50.5800) | |
| Media Intel Core i7-13700H (59324 - 107159, n=29) | |
| Schenker Vision 16 Pro RTX 3070 Ti (v6.75.6100) | |
| Acer Swift X SFX16-52G-77RX (v6.70.6000) | |
| Media della classe Multimedia (13483 - 181505, n=43, ultimi 2 anni) | |
| LG Gram 17Z90Q-E.AD78G (v6.50.5800) | |
| Asus VivoBook Pro 16X OLED N7600PC-L2026X (v6.75.6100) | |
| AIDA64 / FPU SinJulia | |
| Lenovo ThinkBook 16p G3 ARH (v6.75.6100) | |
| Samsung Galaxy Book3 Ultra 16 (v6.75.6100) | |
| Media della classe Multimedia (886 - 28794, n=56, ultimi 2 anni) | |
| Media Intel Core i7-13700H (4800 - 11050, n=29) | |
| Dell XPS 15 9520 RTX 3050 Ti (v6.50.5800) | |
| Schenker Vision 16 Pro RTX 3070 Ti (v6.75.6100) | |
| Acer Swift X SFX16-52G-77RX (v6.70.6000) | |
| LG Gram 17Z90Q-E.AD78G (v6.50.5800) | |
| Asus VivoBook Pro 16X OLED N7600PC-L2026X (v6.75.6100) | |
| AIDA64 / FPU Mandel | |
| Lenovo ThinkBook 16p G3 ARH (v6.75.6100) | |
| Media della classe Multimedia (6395 - 105740, n=55, ultimi 2 anni) | |
| Samsung Galaxy Book3 Ultra 16 (v6.75.6100) | |
| Media Intel Core i7-13700H (12321 - 45118, n=29) | |
| Schenker Vision 16 Pro RTX 3070 Ti (v6.75.6100) | |
| Acer Swift X SFX16-52G-77RX (v6.70.6000) | |
| Dell XPS 15 9520 RTX 3050 Ti (v6.50.5800) | |
| Asus VivoBook Pro 16X OLED N7600PC-L2026X (v6.75.6100) | |
| LG Gram 17Z90Q-E.AD78G (v6.50.5800) | |
| AIDA64 / CPU AES | |
| Dell XPS 15 9520 RTX 3050 Ti (v6.50.5800) | |
| Media Intel Core i7-13700H (28769 - 151254, n=29) | |
| Samsung Galaxy Book3 Ultra 16 (v6.75.6100) | |
| Media della classe Multimedia (8171 - 126790, n=56, ultimi 2 anni) | |
| Schenker Vision 16 Pro RTX 3070 Ti (v6.75.6100) | |
| Asus VivoBook Pro 16X OLED N7600PC-L2026X (v6.75.6100) | |
| Lenovo ThinkBook 16p G3 ARH (v6.75.6100) | |
| Acer Swift X SFX16-52G-77RX (v6.70.6000) | |
| LG Gram 17Z90Q-E.AD78G (v6.50.5800) | |
| AIDA64 / CPU ZLib | |
| Samsung Galaxy Book3 Ultra 16 (v6.75.6100) | |
| Media della classe Multimedia (143.8 - 2022, n=56, ultimi 2 anni) | |
| Media Intel Core i7-13700H (389 - 1215, n=29) | |
| Lenovo ThinkBook 16p G3 ARH (v6.75.6100) | |
| Schenker Vision 16 Pro RTX 3070 Ti (v6.75.6100) | |
| Dell XPS 15 9520 RTX 3050 Ti (v6.50.5800) | |
| Acer Swift X SFX16-52G-77RX (v6.70.6000) | |
| LG Gram 17Z90Q-E.AD78G (v6.50.5800) | |
| Asus VivoBook Pro 16X OLED N7600PC-L2026X (v6.75.6100) | |
| AIDA64 / FP64 Ray-Trace | |
| Media della classe Multimedia (1014 - 26875, n=56, ultimi 2 anni) | |
| Lenovo ThinkBook 16p G3 ARH (v6.75.6100) | |
| Samsung Galaxy Book3 Ultra 16 (v6.75.6100) | |
| Media Intel Core i7-13700H (2540 - 10135, n=29) | |
| Schenker Vision 16 Pro RTX 3070 Ti (v6.75.6100) | |
| Acer Swift X SFX16-52G-77RX (v6.70.6000) | |
| Dell XPS 15 9520 RTX 3050 Ti (v6.50.5800) | |
| Asus VivoBook Pro 16X OLED N7600PC-L2026X (v6.75.6100) | |
| LG Gram 17Z90Q-E.AD78G (v6.50.5800) | |
| AIDA64 / CPU PhotoWorxx | |
| Media della classe Multimedia (8187 - 88154, n=56, ultimi 2 anni) | |
| Samsung Galaxy Book3 Ultra 16 (v6.75.6100) | |
| Acer Swift X SFX16-52G-77RX (v6.70.6000) | |
| Schenker Vision 16 Pro RTX 3070 Ti (v6.75.6100) | |
| Media Intel Core i7-13700H (12872 - 52727, n=29) | |
| LG Gram 17Z90Q-E.AD78G (v6.50.5800) | |
| Dell XPS 15 9520 RTX 3050 Ti (v6.50.5800) | |
| Lenovo ThinkBook 16p G3 ARH (v6.75.6100) | |
| Asus VivoBook Pro 16X OLED N7600PC-L2026X (v6.75.6100) | |
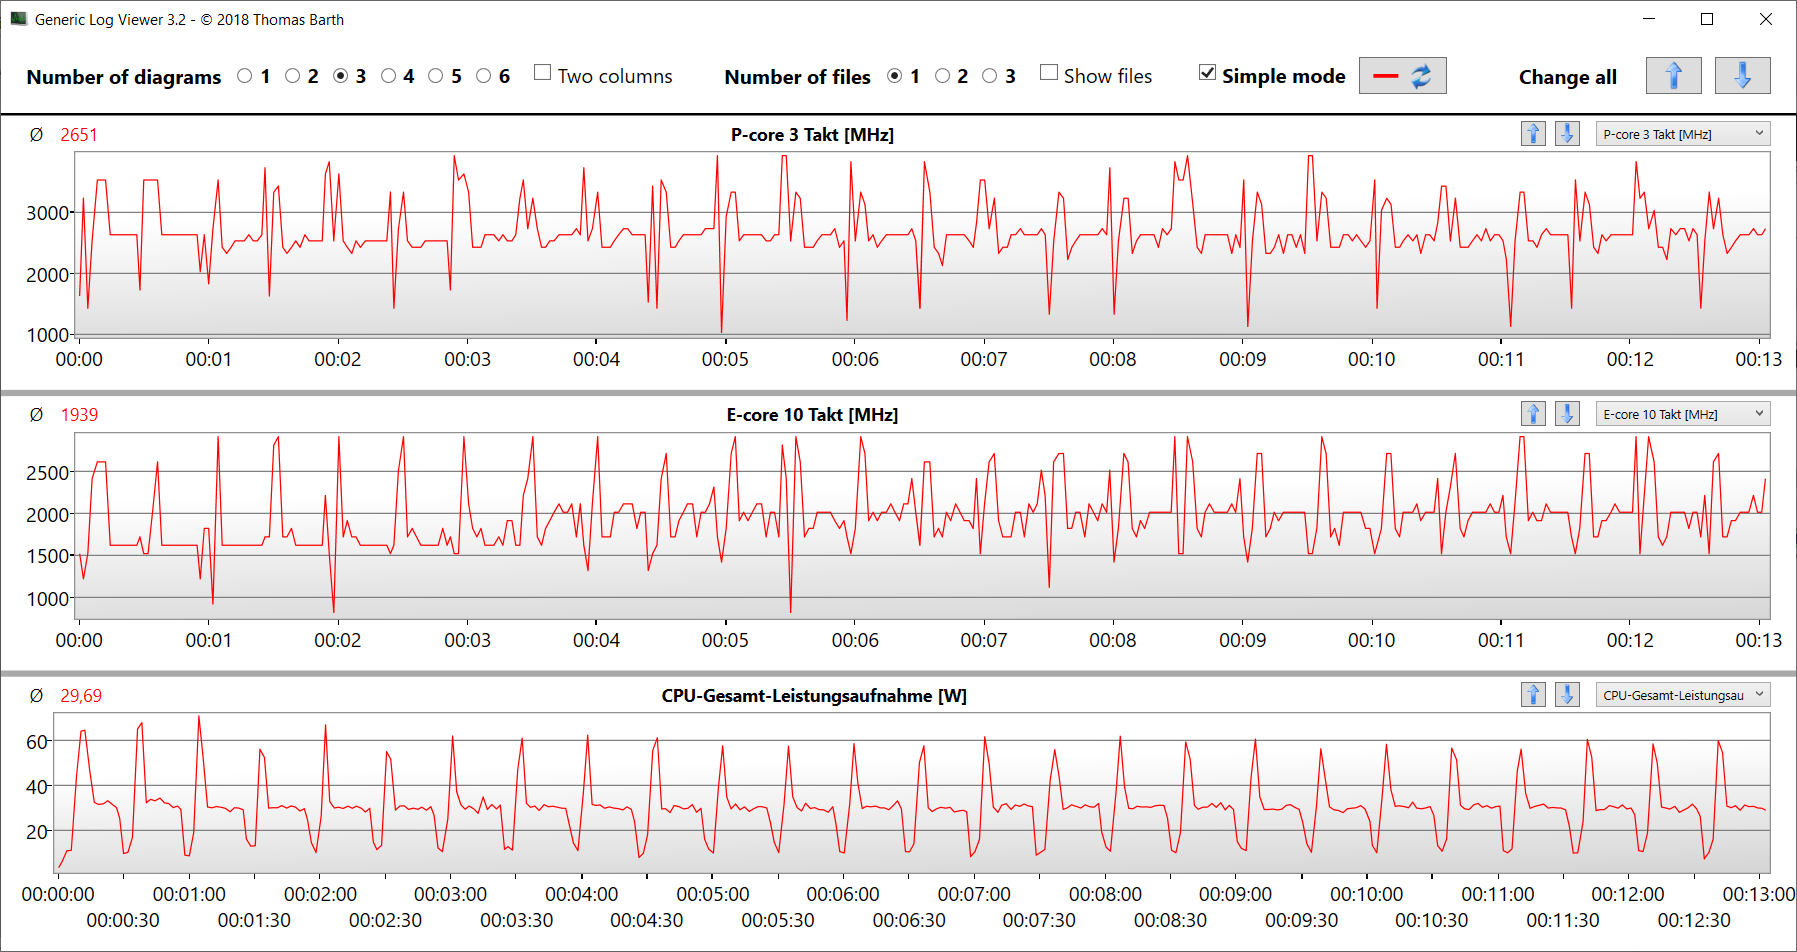
Prestazioni del sistema
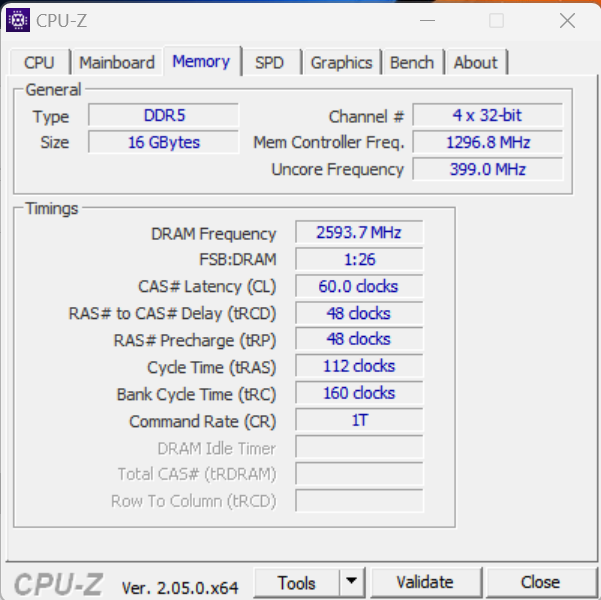
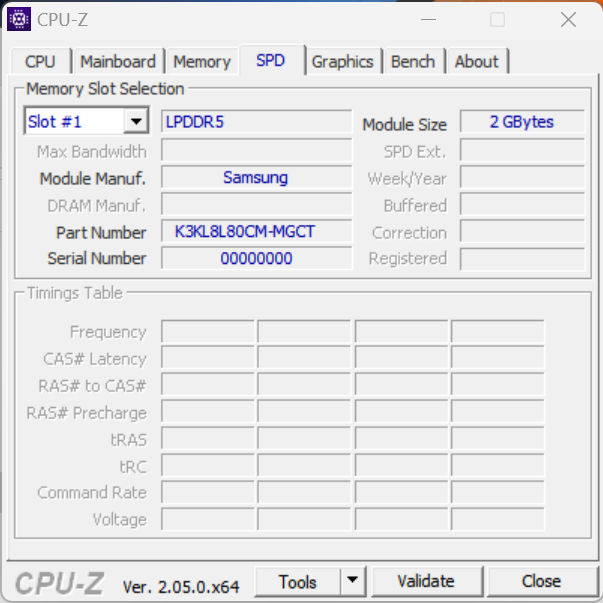
Il sistema scorrevole non è stato progettato per ottenere le massime prestazioni. L'obiettivo è un compromesso tra compattezza, mobilità, consumo energetico e prestazioni. Tuttavia, il portatile è in grado di gestire applicazioni impegnative come il rendering e il gioco, come confermano i buoni risultati di PCMark. Le velocità di trasferimento della RAM sono nella norma per una RAM LPDDR5-5200.
CrossMark: Overall | Productivity | Creativity | Responsiveness
| PCMark 10 / Score | |
| Media della classe Multimedia (4325 - 10386, n=54, ultimi 2 anni) | |
| Media Intel Core i7-13700H, NVIDIA GeForce RTX 4050 Laptop GPU (6822 - 7556, n=7) | |
| Dell XPS 15 9520 RTX 3050 Ti | |
| Lenovo ThinkBook 16p G3 ARH | |
| Samsung Galaxy Book3 Ultra 16 | |
| LG Gram 17Z90Q-E.AD78G | |
| Acer Swift X SFX16-52G-77RX | |
| Asus VivoBook Pro 16X OLED N7600PC-L2026X | |
| PCMark 10 / Essentials | |
| Dell XPS 15 9520 RTX 3050 Ti | |
| Media Intel Core i7-13700H, NVIDIA GeForce RTX 4050 Laptop GPU (10283 - 11549, n=7) | |
| Acer Swift X SFX16-52G-77RX | |
| Samsung Galaxy Book3 Ultra 16 | |
| Media della classe Multimedia (8025 - 11664, n=53, ultimi 2 anni) | |
| Lenovo ThinkBook 16p G3 ARH | |
| LG Gram 17Z90Q-E.AD78G | |
| Asus VivoBook Pro 16X OLED N7600PC-L2026X | |
| PCMark 10 / Productivity | |
| Media della classe Multimedia (7323 - 18233, n=53, ultimi 2 anni) | |
| Dell XPS 15 9520 RTX 3050 Ti | |
| LG Gram 17Z90Q-E.AD78G | |
| Media Intel Core i7-13700H, NVIDIA GeForce RTX 4050 Laptop GPU (8368 - 9836, n=7) | |
| Lenovo ThinkBook 16p G3 ARH | |
| Samsung Galaxy Book3 Ultra 16 | |
| Asus VivoBook Pro 16X OLED N7600PC-L2026X | |
| Acer Swift X SFX16-52G-77RX | |
| PCMark 10 / Digital Content Creation | |
| Media della classe Multimedia (3651 - 16240, n=53, ultimi 2 anni) | |
| Media Intel Core i7-13700H, NVIDIA GeForce RTX 4050 Laptop GPU (9527 - 10643, n=7) | |
| Samsung Galaxy Book3 Ultra 16 | |
| Lenovo ThinkBook 16p G3 ARH | |
| Dell XPS 15 9520 RTX 3050 Ti | |
| LG Gram 17Z90Q-E.AD78G | |
| Acer Swift X SFX16-52G-77RX | |
| Asus VivoBook Pro 16X OLED N7600PC-L2026X | |
| CrossMark / Overall | |
| Media della classe Multimedia (866 - 2728, n=62, ultimi 2 anni) | |
| Dell XPS 15 9520 RTX 3050 Ti | |
| Media Intel Core i7-13700H, NVIDIA GeForce RTX 4050 Laptop GPU (1205 - 1937, n=9) | |
| Acer Swift X SFX16-52G-77RX | |
| Schenker Vision 16 Pro RTX 3070 Ti | |
| Samsung Galaxy Book3 Ultra 16 | |
| Lenovo ThinkBook 16p G3 ARH | |
| LG Gram 17Z90Q-E.AD78G | |
| Asus VivoBook Pro 16X OLED N7600PC-L2026X | |
| CrossMark / Productivity | |
| Dell XPS 15 9520 RTX 3050 Ti | |
| Media della classe Multimedia (931 - 2489, n=62, ultimi 2 anni) | |
| Acer Swift X SFX16-52G-77RX | |
| Media Intel Core i7-13700H, NVIDIA GeForce RTX 4050 Laptop GPU (1158 - 1877, n=9) | |
| Schenker Vision 16 Pro RTX 3070 Ti | |
| Lenovo ThinkBook 16p G3 ARH | |
| Samsung Galaxy Book3 Ultra 16 | |
| LG Gram 17Z90Q-E.AD78G | |
| Asus VivoBook Pro 16X OLED N7600PC-L2026X | |
| CrossMark / Creativity | |
| Media della classe Multimedia (907 - 3465, n=62, ultimi 2 anni) | |
| Dell XPS 15 9520 RTX 3050 Ti | |
| Media Intel Core i7-13700H, NVIDIA GeForce RTX 4050 Laptop GPU (1293 - 2044, n=9) | |
| Schenker Vision 16 Pro RTX 3070 Ti | |
| Acer Swift X SFX16-52G-77RX | |
| Samsung Galaxy Book3 Ultra 16 | |
| LG Gram 17Z90Q-E.AD78G | |
| Lenovo ThinkBook 16p G3 ARH | |
| Asus VivoBook Pro 16X OLED N7600PC-L2026X | |
| CrossMark / Responsiveness | |
| Dell XPS 15 9520 RTX 3050 Ti | |
| Acer Swift X SFX16-52G-77RX | |
| Media Intel Core i7-13700H, NVIDIA GeForce RTX 4050 Laptop GPU (1097 - 1929, n=9) | |
| Media della classe Multimedia (605 - 2024, n=62, ultimi 2 anni) | |
| Samsung Galaxy Book3 Ultra 16 | |
| Schenker Vision 16 Pro RTX 3070 Ti | |
| Lenovo ThinkBook 16p G3 ARH | |
| LG Gram 17Z90Q-E.AD78G | |
| Asus VivoBook Pro 16X OLED N7600PC-L2026X | |
| PCMark 8 Home Score Accelerated v2 | 4564 punti | |
| PCMark 8 Work Score Accelerated v2 | 5090 punti | |
| PCMark 10 Score | 6822 punti | |
Aiuto | ||
| AIDA64 / Memory Copy | |
| Media della classe Multimedia (11299 - 132135, n=56, ultimi 2 anni) | |
| Samsung Galaxy Book3 Ultra 16 | |
| LG Gram 17Z90Q-E.AD78G | |
| Acer Swift X SFX16-52G-77RX | |
| Schenker Vision 16 Pro RTX 3070 Ti | |
| Media Intel Core i7-13700H (24334 - 78081, n=29) | |
| Dell XPS 15 9520 RTX 3050 Ti | |
| Lenovo ThinkBook 16p G3 ARH | |
| Asus VivoBook Pro 16X OLED N7600PC-L2026X | |
| AIDA64 / Memory Read | |
| Media della classe Multimedia (11624 - 174586, n=56, ultimi 2 anni) | |
| LG Gram 17Z90Q-E.AD78G | |
| Samsung Galaxy Book3 Ultra 16 | |
| Acer Swift X SFX16-52G-77RX | |
| Schenker Vision 16 Pro RTX 3070 Ti | |
| Media Intel Core i7-13700H (23681 - 79656, n=29) | |
| Dell XPS 15 9520 RTX 3050 Ti | |
| Lenovo ThinkBook 16p G3 ARH | |
| Asus VivoBook Pro 16X OLED N7600PC-L2026X | |
| AIDA64 / Memory Write | |
| Samsung Galaxy Book3 Ultra 16 | |
| Media della classe Multimedia (11755 - 134998, n=56, ultimi 2 anni) | |
| Media Intel Core i7-13700H (22986 - 99898, n=29) | |
| Schenker Vision 16 Pro RTX 3070 Ti | |
| LG Gram 17Z90Q-E.AD78G | |
| Acer Swift X SFX16-52G-77RX | |
| Dell XPS 15 9520 RTX 3050 Ti | |
| Lenovo ThinkBook 16p G3 ARH | |
| Asus VivoBook Pro 16X OLED N7600PC-L2026X | |
| AIDA64 / Memory Latency | |
| Media della classe Multimedia (7 - 535, n=55, ultimi 2 anni) | |
| Lenovo ThinkBook 16p G3 ARH | |
| Acer Swift X SFX16-52G-77RX | |
| LG Gram 17Z90Q-E.AD78G | |
| Dell XPS 15 9520 RTX 3050 Ti | |
| Samsung Galaxy Book3 Ultra 16 | |
| Media Intel Core i7-13700H (82.4 - 136.8, n=29) | |
| Schenker Vision 16 Pro RTX 3070 Ti | |
| Asus VivoBook Pro 16X OLED N7600PC-L2026X | |
* ... Meglio usare valori piccoli
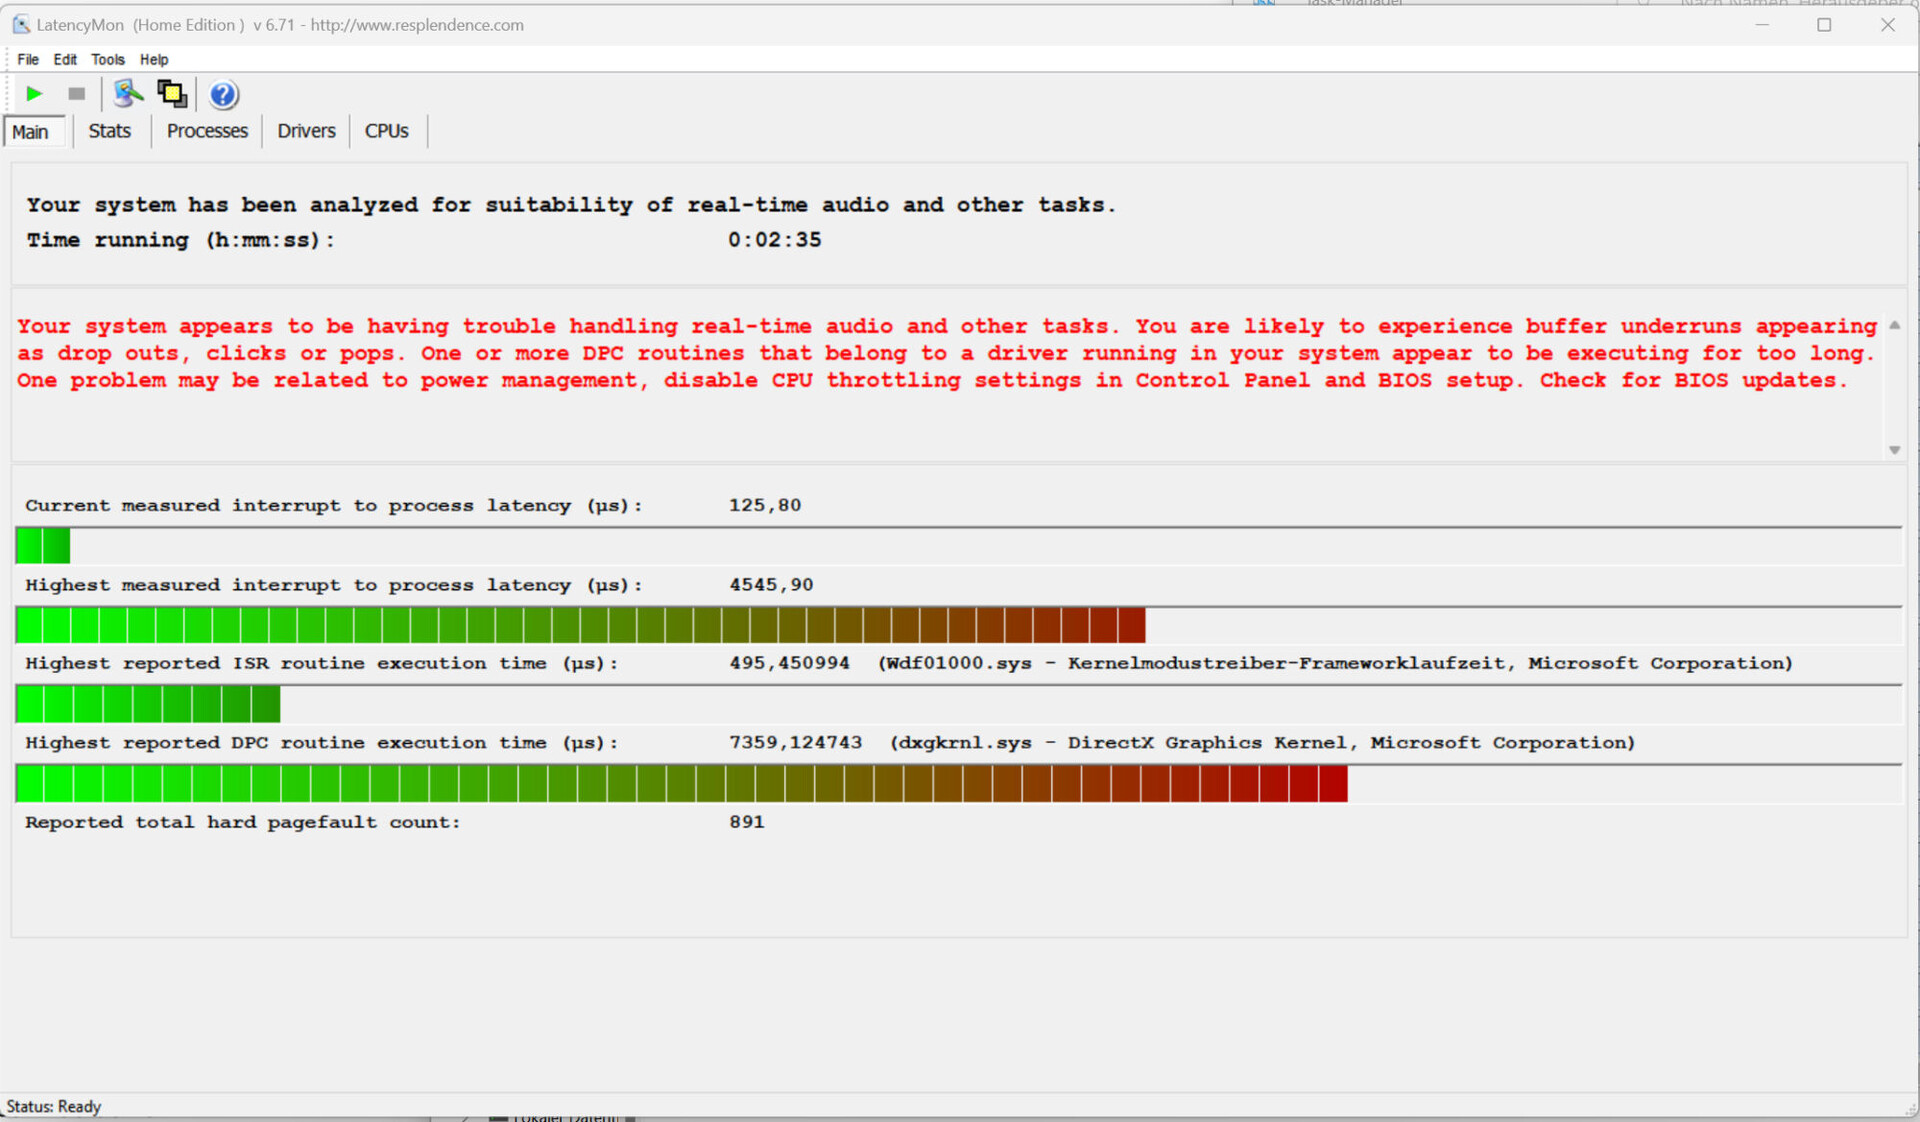
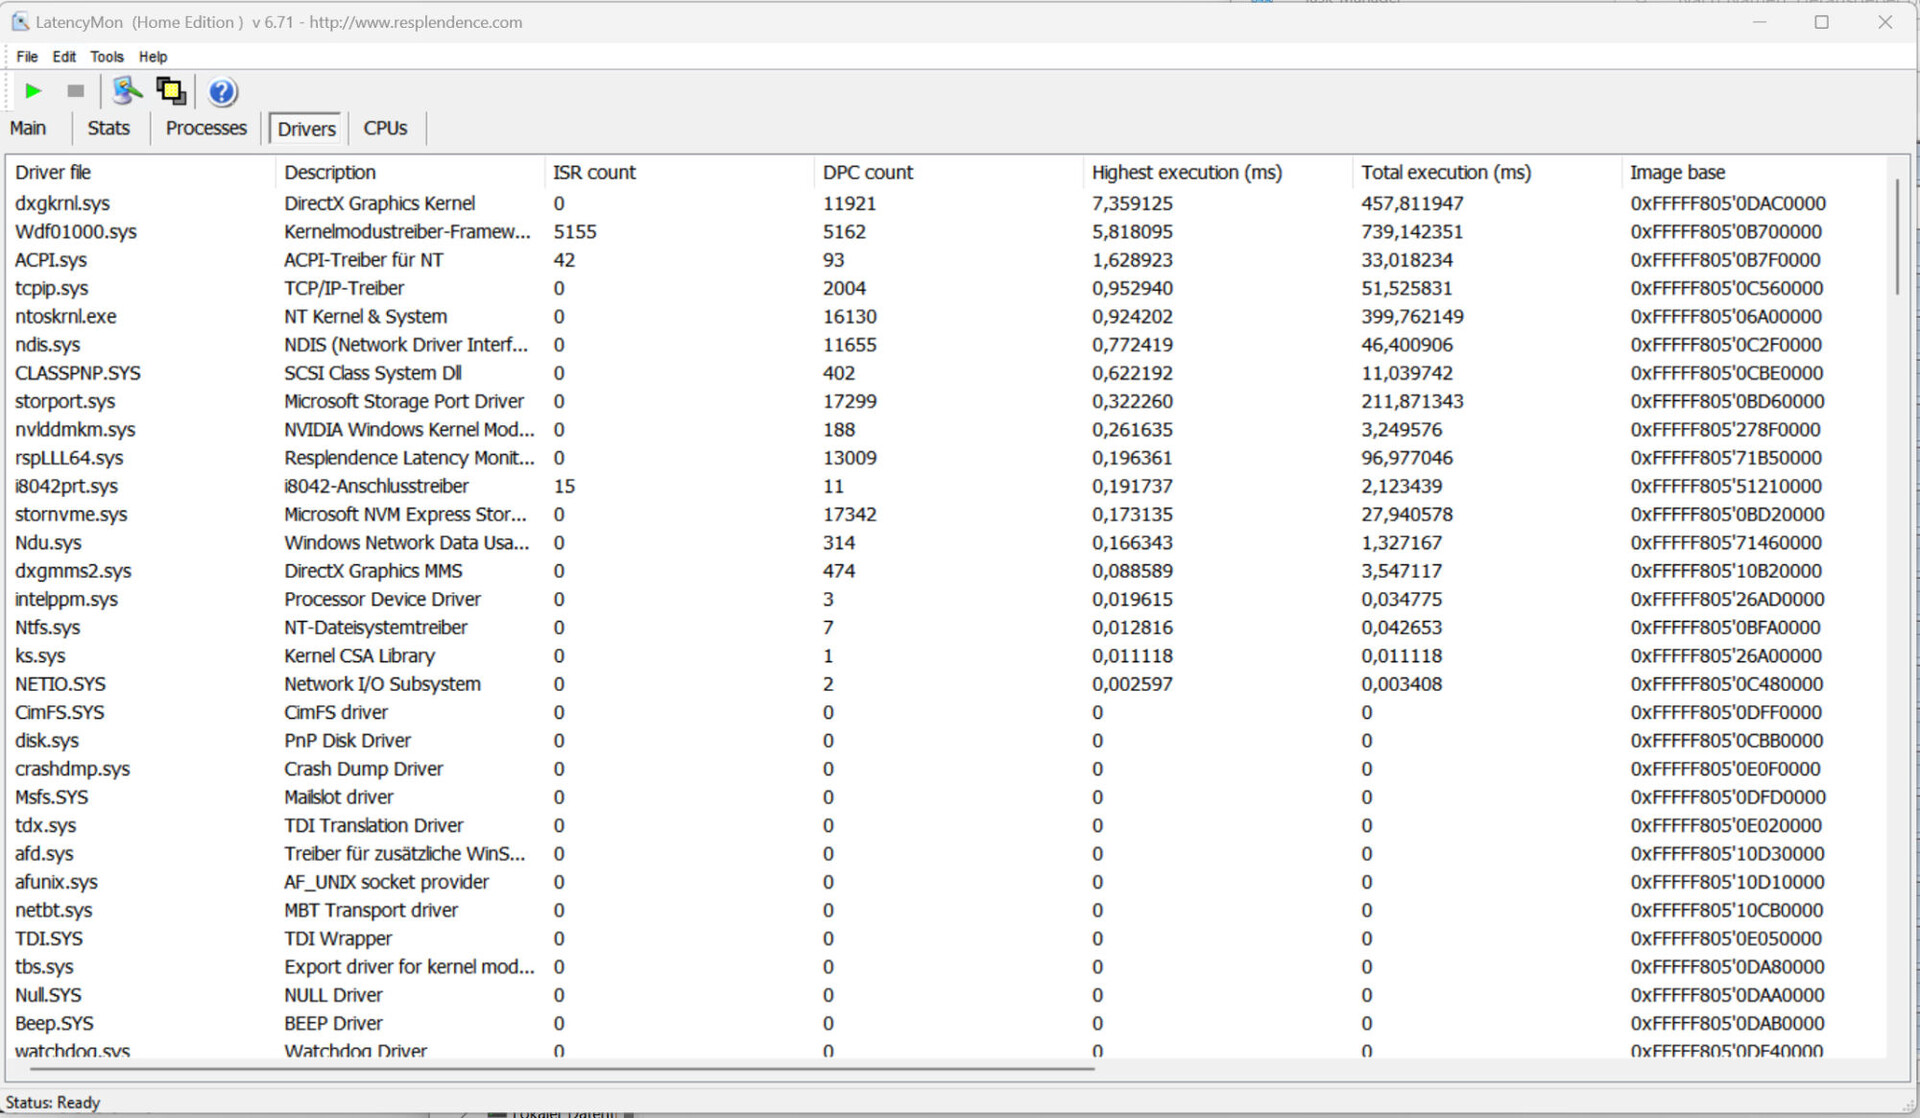
Latenza DPC
Il test standardizzato di monitoraggio della latenza (navigazione web, riproduzione di video 4k, Prime95 ad alto carico) ha rivelato anomalie, quindi il sistema non sembra essere adatto all'editing video e audio in tempo reale. I futuri aggiornamenti del software potrebbero portare a un miglioramento o addirittura a un peggioramento.
| DPC Latencies / LatencyMon - interrupt to process latency (max), Web, Youtube, Prime95 | |
| LG Gram 17Z90Q-E.AD78G | |
| Samsung Galaxy Book3 Ultra 16 | |
| Lenovo ThinkBook 16p G3 ARH | |
| Dell XPS 15 9520 RTX 3050 Ti | |
| Acer Swift X SFX16-52G-77RX | |
| Schenker Vision 16 Pro RTX 3070 Ti | |
| Asus VivoBook Pro 16X OLED N7600PC-L2026X | |
* ... Meglio usare valori piccoli
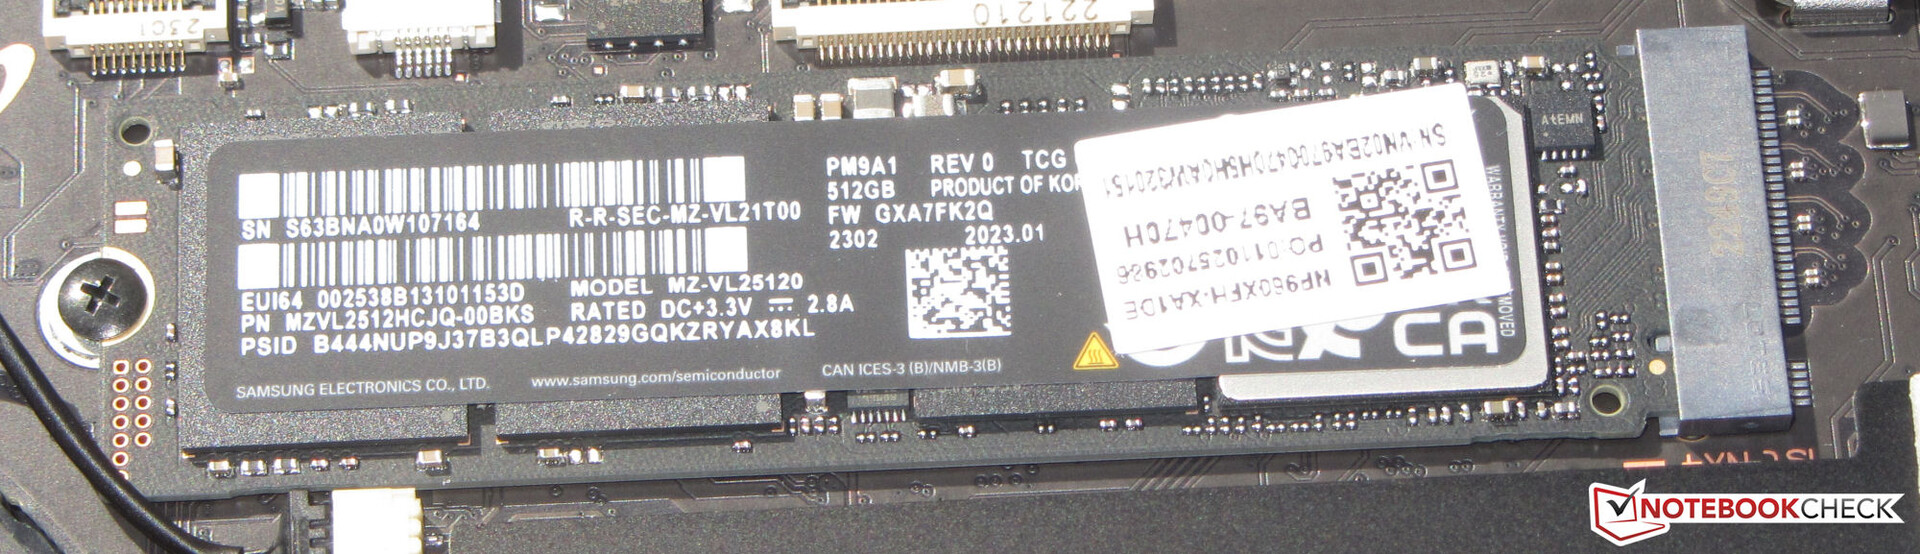
Dispositivi di archiviazione
Samsung è avara quando si tratta di spazio di archiviazione, perché l'unità SSD PCIe 4 (M.2 2280) integrata nel nostro dispositivo di prova ha solo 512 GB, troppo pochi per un portatile da 2400 dollari. Almeno offre un'eccellente velocità di trasferimento dati. È possibile installare una seconda unità SSD.

* ... Meglio usare valori piccoli
Sustained Read Performance: DiskSpd Read Loop, Queue Depth 8
Scheda grafica
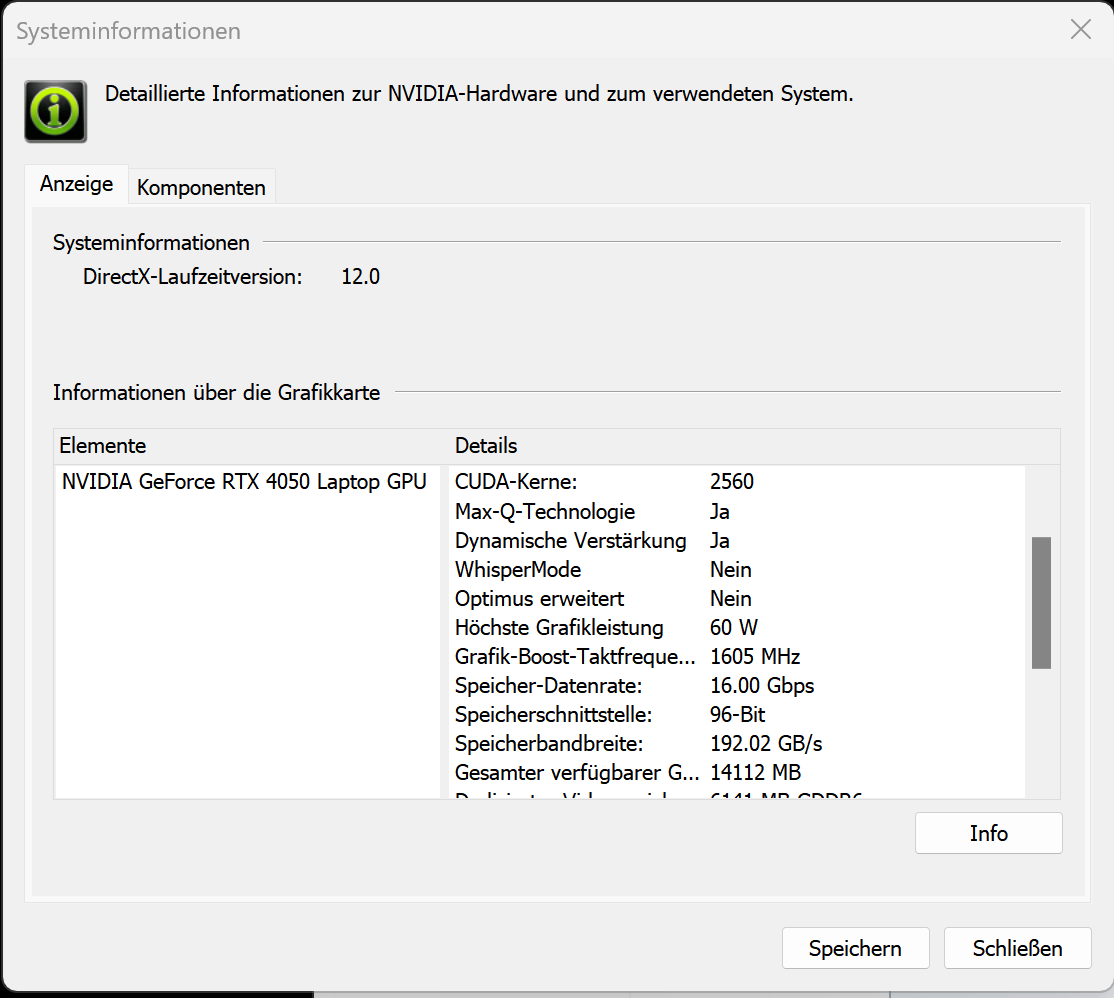
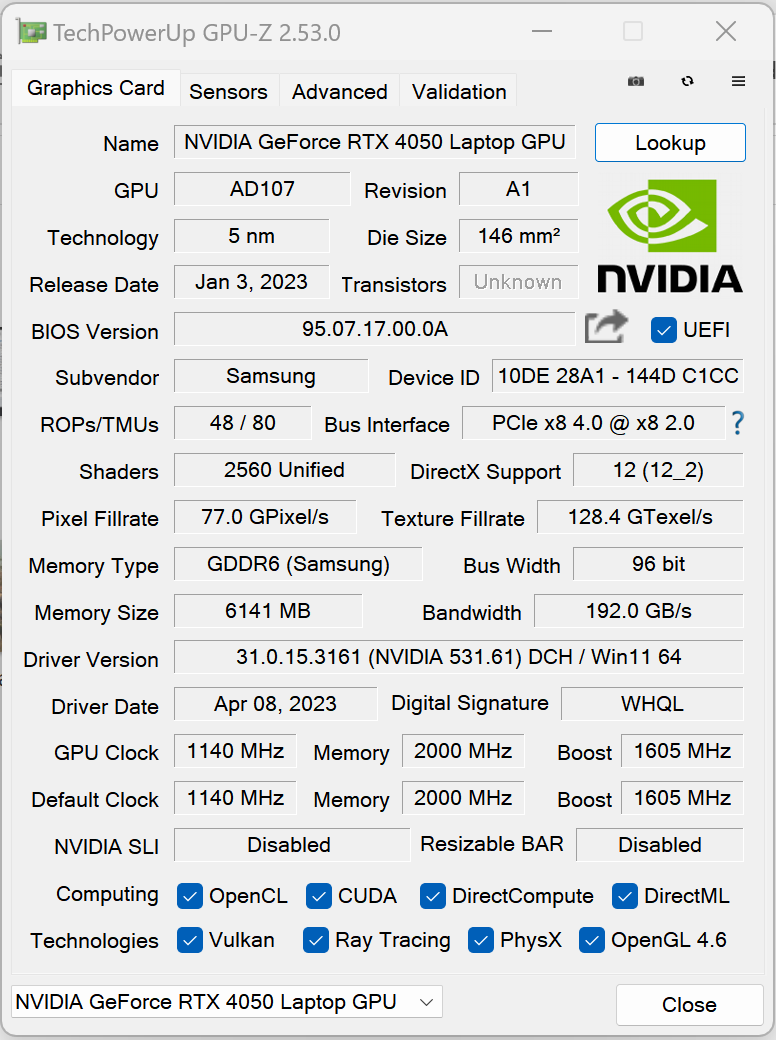
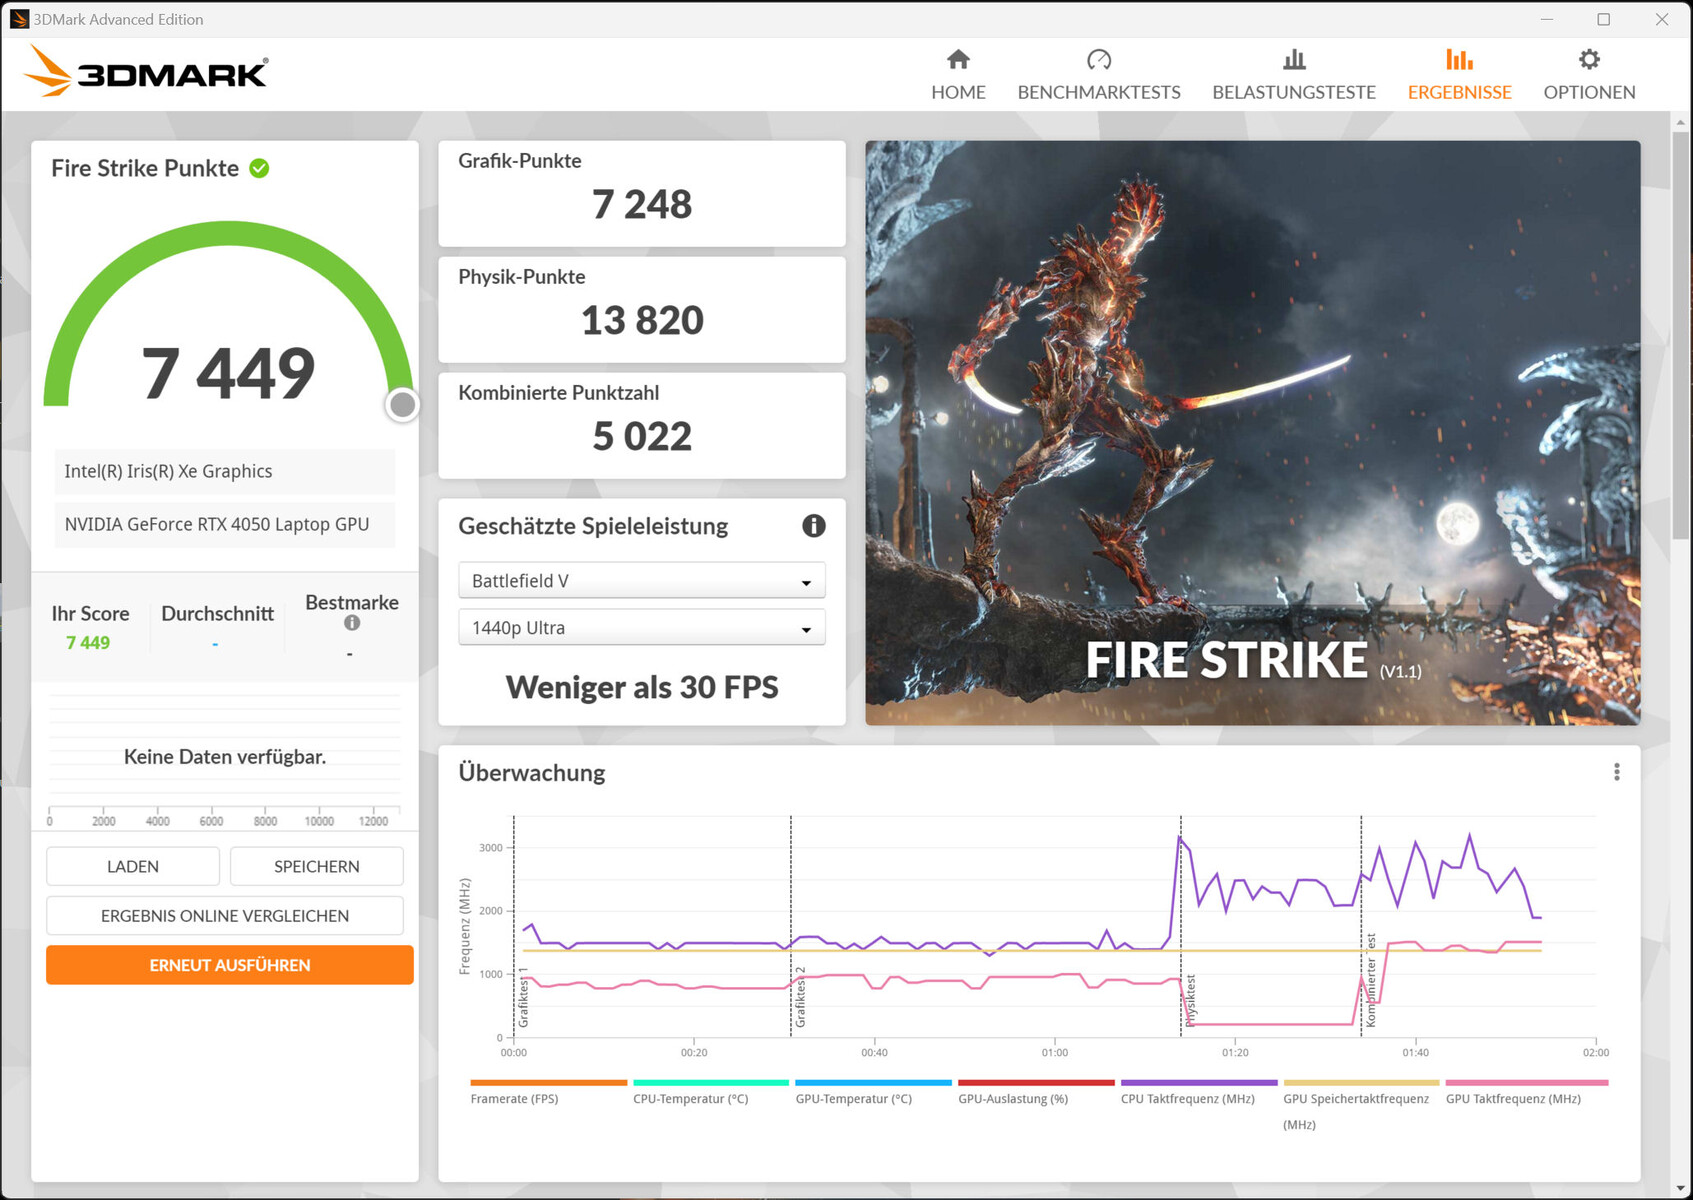
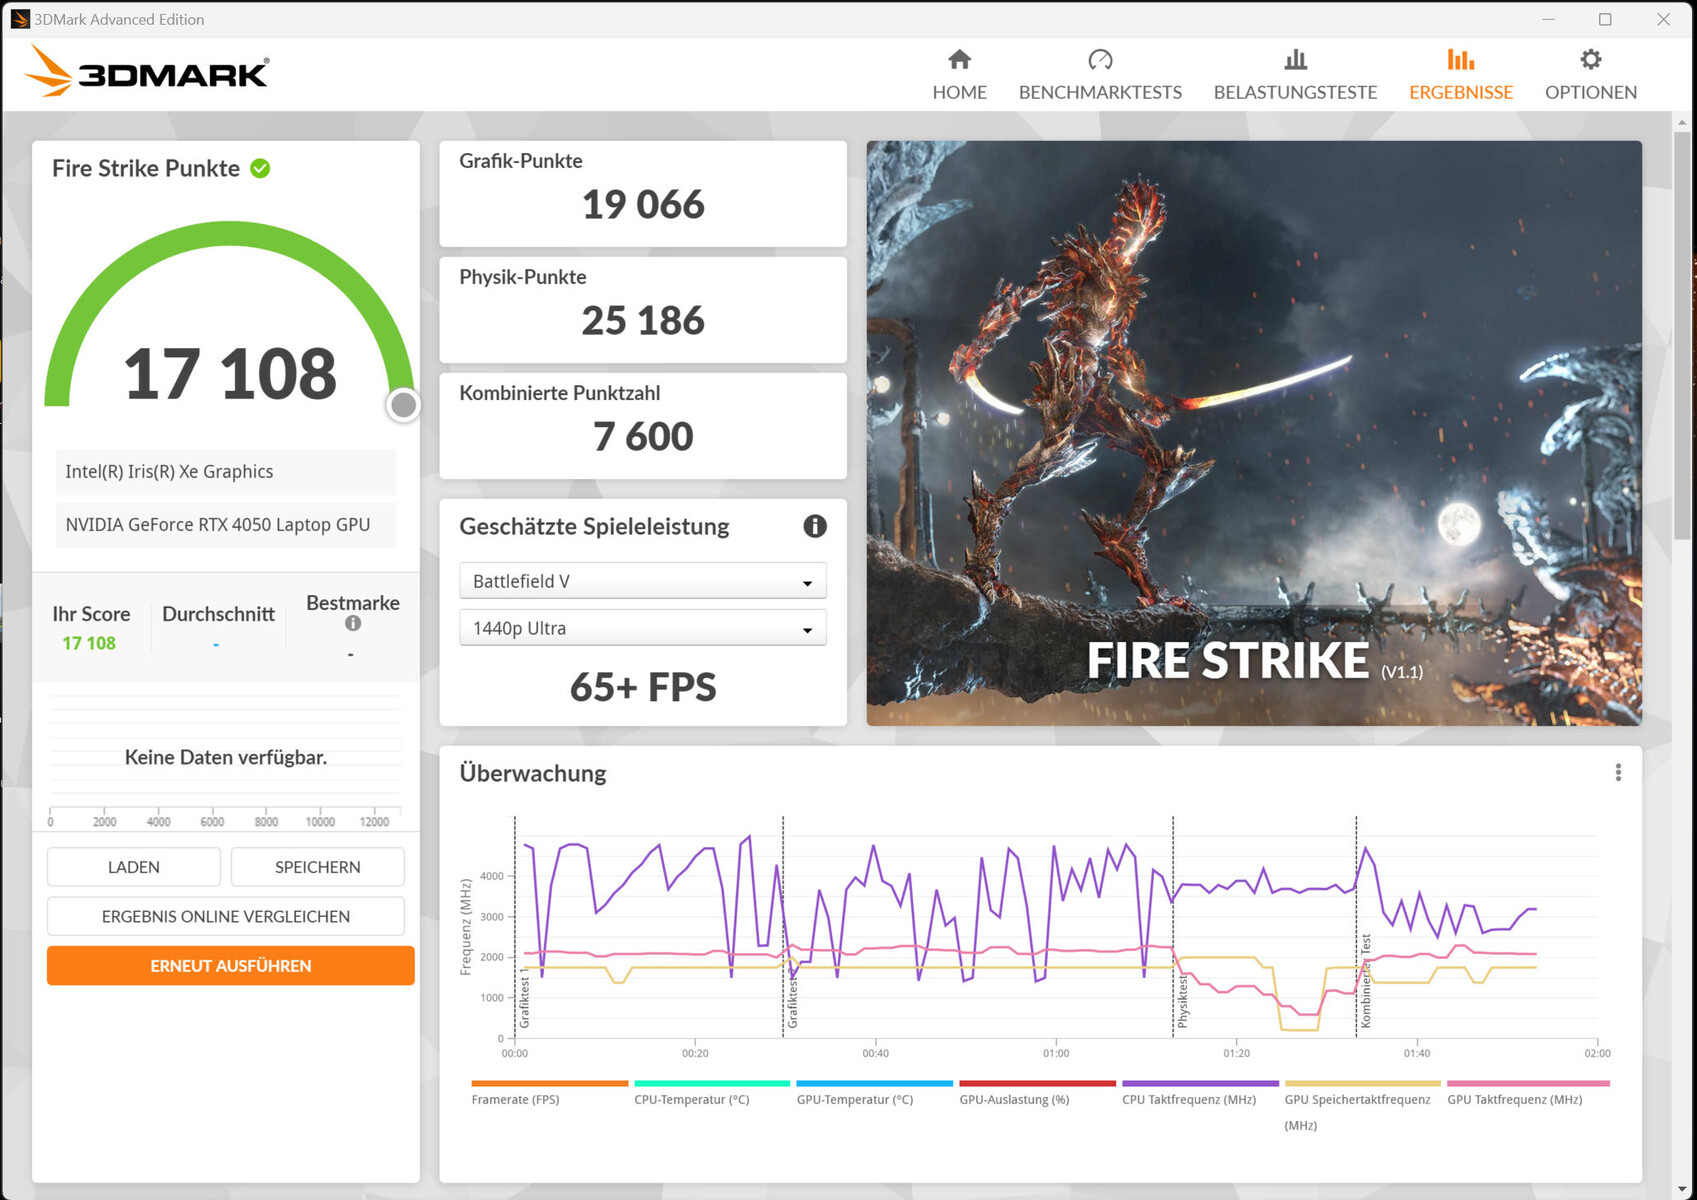
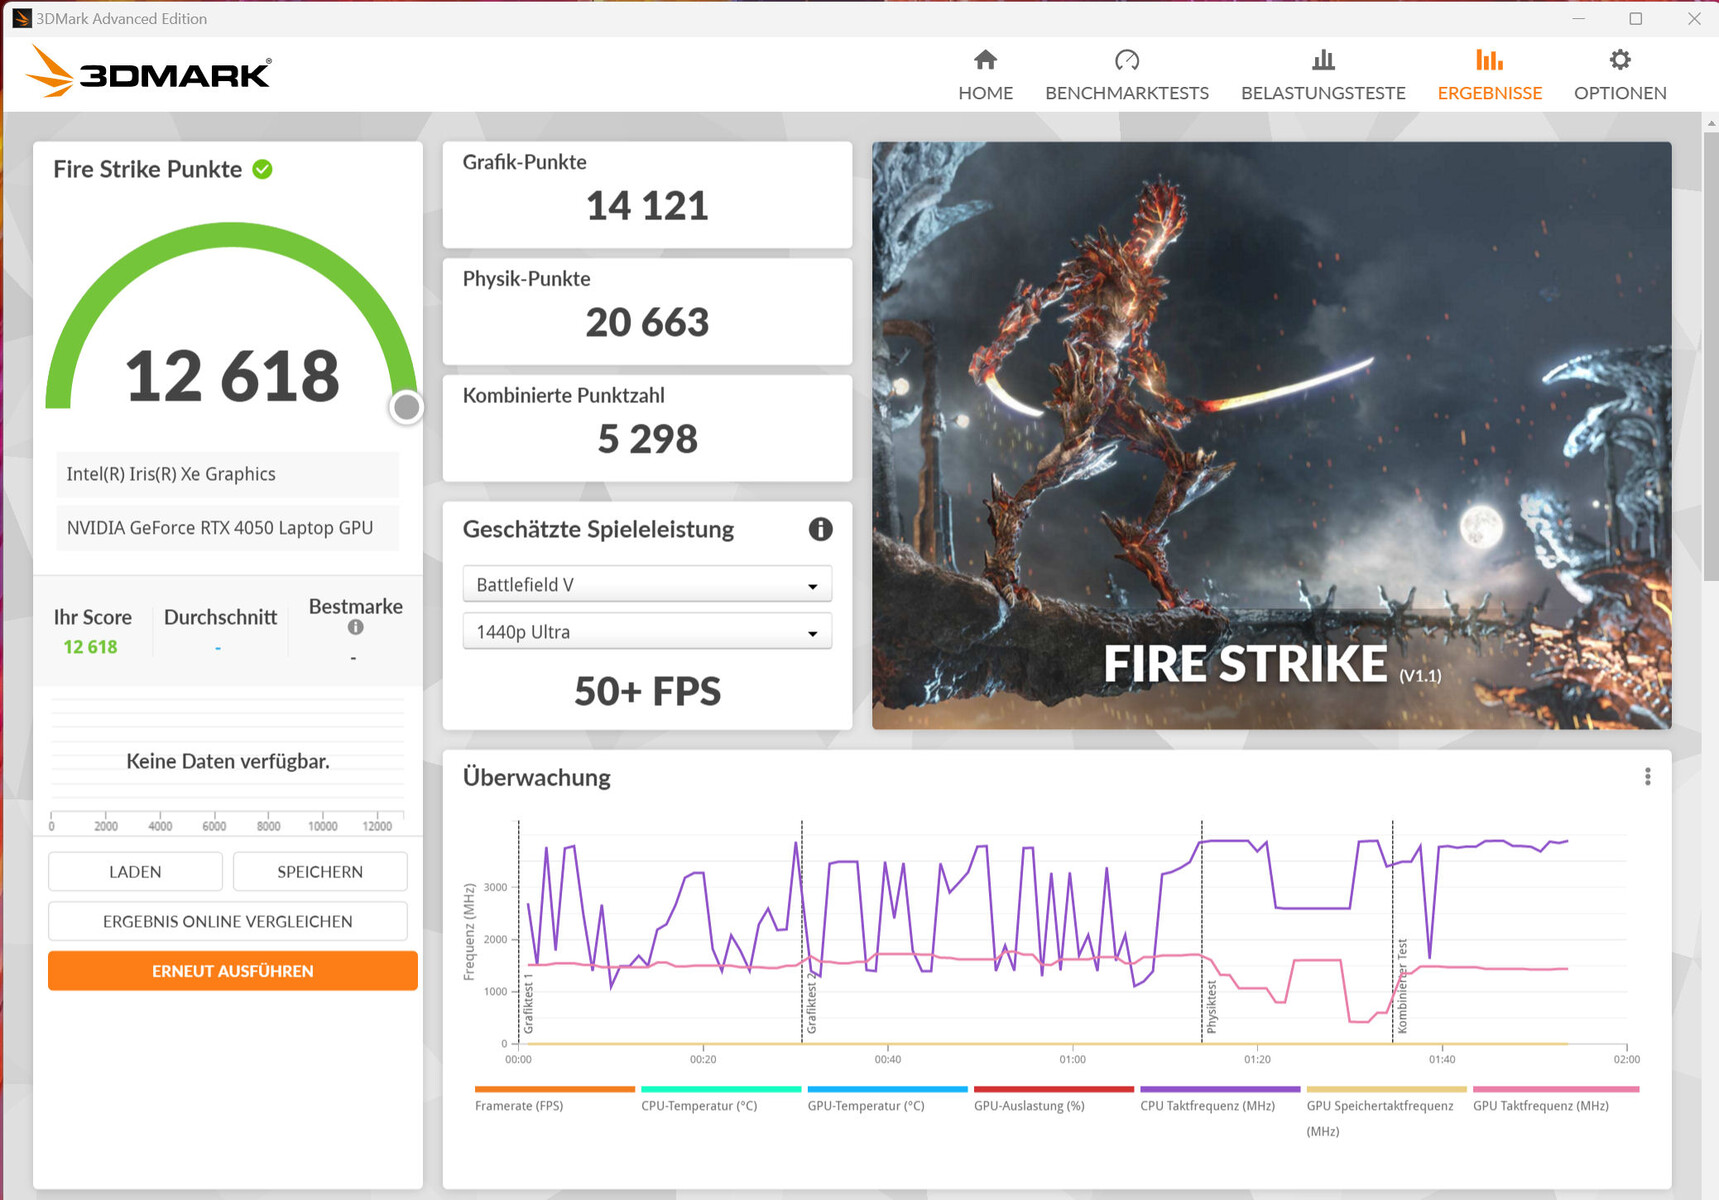
Il GeForce RTX 4050 offre 2.560 shader, un bus largo 96 bit e una memoria GDDR6 veloce (6.144 MB). Samsung gli attribuisce un TGP di 60 watt (35 watt + 25 watt dinamici) - un valore che si colloca all'estremità inferiore del possibile. Secondo il test di Witcher 3, il TGP è pienamente utilizzato, ma solo quando è attivo il profilo "High Performance". Il notebook non offre una modalità dGPU.
I risultati del benchmark dipendono dal profilo di prestazioni scelto, ma sono sempre inferiori alla media della RTX 4050. Fondamentalmente, la RTX 4050 lavora in modo abbastanza efficiente con un TGP basso, ottenendo più punti o frame rate più elevati per watt rispetto alla RTX 4050 di MSI Katana 15 (TGP: 105 watt).
| 3DMark Performance rating - Percent | |
| Schenker Vision 16 Pro RTX 3070 Ti -1! | |
| MSI Katana 15 B12VEK | |
| Media NVIDIA GeForce RTX 4050 Laptop GPU | |
| Lenovo ThinkBook 16p G3 ARH | |
| Samsung Galaxy Book3 Ultra 16 | |
| Samsung Galaxy Book3 Ultra 16 | |
| Media della classe Multimedia | |
| Samsung Galaxy Book3 Ultra 16 | |
| Dell XPS 15 9520 RTX 3050 Ti | |
| Asus VivoBook Pro 16X OLED N7600PC-L2026X | |
| Acer Swift X SFX16-52G-77RX | |
| LG Gram 17Z90Q-E.AD78G | |
| 3DMark 11 - 1280x720 Performance GPU | |
| Schenker Vision 16 Pro RTX 3070 Ti | |
| MSI Katana 15 B12VEK | |
| Media NVIDIA GeForce RTX 4050 Laptop GPU (13339 - 32642, n=41) | |
| Samsung Galaxy Book3 Ultra 16 (Hohe Leistung) | |
| Lenovo ThinkBook 16p G3 ARH | |
| Samsung Galaxy Book3 Ultra 16 | |
| Media della classe Multimedia (3749 - 60002, n=58, ultimi 2 anni) | |
| Samsung Galaxy Book3 Ultra 16 (Leise) | |
| Asus VivoBook Pro 16X OLED N7600PC-L2026X | |
| Dell XPS 15 9520 RTX 3050 Ti | |
| Acer Swift X SFX16-52G-77RX | |
| LG Gram 17Z90Q-E.AD78G | |
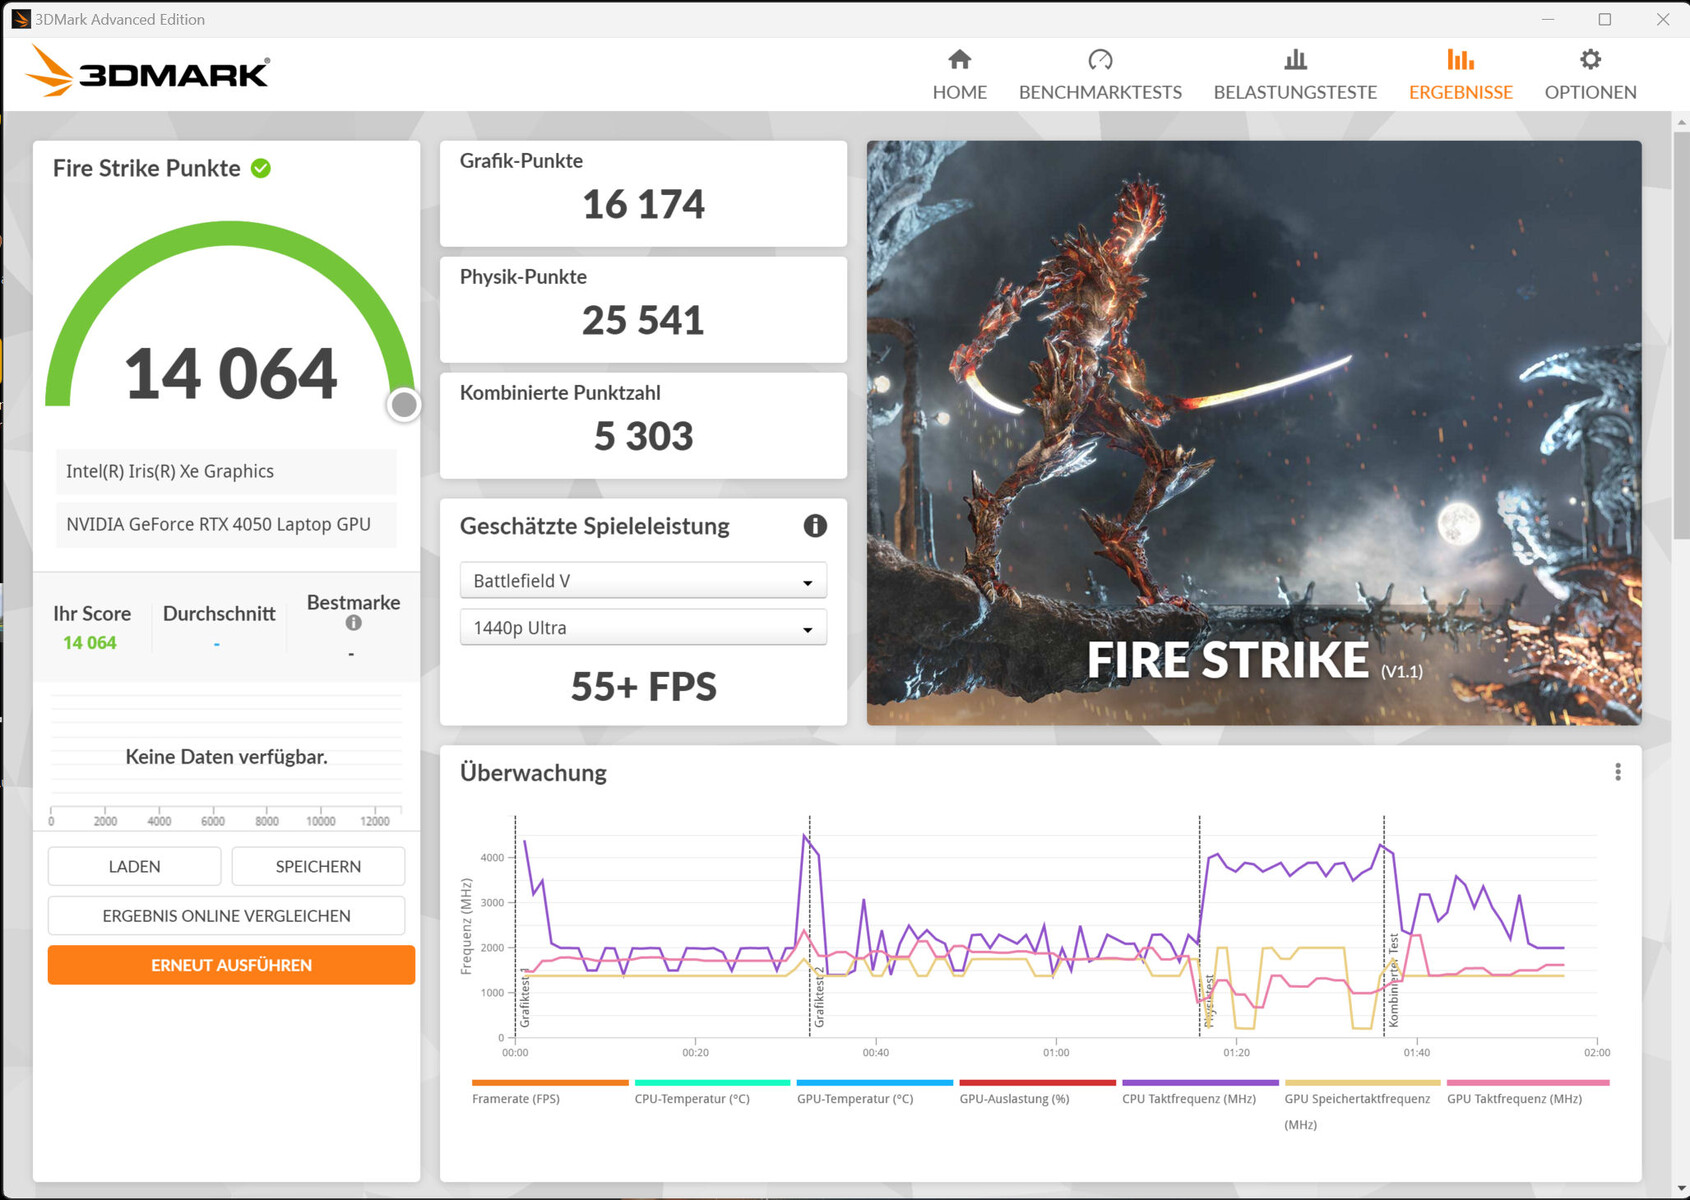
| 3DMark 06 Standard Score | 45618 punti | |
| 3DMark 11 Performance | 18217 punti | |
| 3DMark Cloud Gate Standard Score | 41061 punti | |
| 3DMark Fire Strike Score | 14064 punti | |
| 3DMark Time Spy Score | 5784 punti | |
Aiuto | ||
| Blender | |
| v3.3 Classroom OPTIX/RTX | |
| LG Gram 17Z90Q-E.AD78G (3.3.2) | |
| Asus VivoBook Pro 16X OLED N7600PC-L2026X (3.3.0) | |
| Samsung Galaxy Book3 Ultra 16 (3.3.3, Leise) | |
| Media della classe Multimedia (12 - 105, n=23, ultimi 2 anni) | |
| Lenovo ThinkBook 16p G3 ARH (3.3.0) | |
| Samsung Galaxy Book3 Ultra 16 (3.3.3) | |
| Media NVIDIA GeForce RTX 4050 Laptop GPU (25 - 37, n=40) | |
| Samsung Galaxy Book3 Ultra 16 (3.3.3, Hohe Leistung) | |
| Schenker Vision 16 Pro RTX 3070 Ti (3.3.0) | |
| v3.3 Classroom CUDA | |
| LG Gram 17Z90Q-E.AD78G (3.3.2) | |
| Asus VivoBook Pro 16X OLED N7600PC-L2026X (3.3.0) | |
| Samsung Galaxy Book3 Ultra 16 (3.3.3, Leise) | |
| Samsung Galaxy Book3 Ultra 16 (3.3.3) | |
| Media della classe Multimedia (20 - 186, n=23, ultimi 2 anni) | |
| Lenovo ThinkBook 16p G3 ARH (3.3.0) | |
| Samsung Galaxy Book3 Ultra 16 (3.3.3, Hohe Leistung) | |
| Media NVIDIA GeForce RTX 4050 Laptop GPU (47 - 68, n=39) | |
| Schenker Vision 16 Pro RTX 3070 Ti (3.3.0) | |
| v3.3 Classroom oneAPI/Intel | |
| Media della classe Multimedia (105 - 492, n=17, ultimi 2 anni) | |
| Acer Swift X SFX16-52G-77RX | |
| V-Ray Benchmark Next 4.10 | |
| GPU | |
| Media NVIDIA GeForce RTX 4050 Laptop GPU (333 - 565, n=35) | |
| Schenker Vision 16 Pro RTX 3070 Ti (v4.10.07 ) | |
| Samsung Galaxy Book3 Ultra 16 (v4.10.07, Hohe Leistung) | |
| Samsung Galaxy Book3 Ultra 16 (v4.10.07 ) | |
| Samsung Galaxy Book3 Ultra 16 (v4.10.07, Leise) | |
| Media della classe Multimedia (32 - 1191, n=55, ultimi 2 anni) | |
| Asus VivoBook Pro 16X OLED N7600PC-L2026X (v4.10.07 ) | |
| LG Gram 17Z90Q-E.AD78G (v4.10.07 ) | |
| Acer Swift X SFX16-52G-77RX (v4.10.07 ) | |
| CPU | |
| Media della classe Multimedia (4772 - 35165, n=55, ultimi 2 anni) | |
| Samsung Galaxy Book3 Ultra 16 (v4.10.07, Hohe Leistung ) | |
| Media NVIDIA GeForce RTX 4050 Laptop GPU (5413 - 24181, n=35) | |
| Samsung Galaxy Book3 Ultra 16 (v4.10.07 ) | |
| Schenker Vision 16 Pro RTX 3070 Ti (v4.10.07 ) | |
| Samsung Galaxy Book3 Ultra 16 (v4.10.07, Leise) | |
| Acer Swift X SFX16-52G-77RX (v4.10.07 ) | |
| LG Gram 17Z90Q-E.AD78G (v4.10.07 ) | |
| Asus VivoBook Pro 16X OLED N7600PC-L2026X (v4.10.07 ) | |
* ... Meglio usare valori piccoli
Prestazioni di gioco
Il portatile è in grado di gestire giochi in FHD con impostazioni medio-alte, a volte massime. Il pieno splendore (2880x1800) dello schermo OLED può essere esaltato con impostazioni ridotte. Il frame rate dipende dalla modalità di prestazioni utilizzata, ma è sempre inferiore alla media della RTX 4050. la modalità "Prestazioni elevate" offre un frame rate superiore del 20-30% rispetto a "Ottimizzato". Il profilo "Silenzioso" è adatto soprattutto per i giochi a livello HD.
| Performance rating - Percent | |
| Schenker Vision 16 Pro RTX 3070 Ti | |
| MSI Katana 15 B12VEK | |
| Media NVIDIA GeForce RTX 4050 Laptop GPU | |
| Samsung Galaxy Book3 Ultra 16 | |
| Lenovo ThinkBook 16p G3 ARH | |
| Samsung Galaxy Book3 Ultra 16 | |
| Dell XPS 15 9520 RTX 3050 Ti | |
| Media della classe Multimedia | |
| Asus VivoBook Pro 16X OLED N7600PC-L2026X | |
| LG Gram 17Z90Q-E.AD78G | |
| Samsung Galaxy Book3 Ultra 16 | |
| Acer Swift X SFX16-52G-77RX | |
| The Witcher 3 - 1920x1080 Ultra Graphics & Postprocessing (HBAO+) | |
| Schenker Vision 16 Pro RTX 3070 Ti | |
| MSI Katana 15 B12VEK | |
| Media NVIDIA GeForce RTX 4050 Laptop GPU (18.5 - 94.7, n=40) | |
| Lenovo ThinkBook 16p G3 ARH | |
| Samsung Galaxy Book3 Ultra 16 (Hohe Leistung) | |
| Samsung Galaxy Book3 Ultra 16 | |
| Media della classe Multimedia (11 - 121, n=10, ultimi 2 anni) | |
| Asus VivoBook Pro 16X OLED N7600PC-L2026X | |
| Dell XPS 15 9520 RTX 3050 Ti | |
| LG Gram 17Z90Q-E.AD78G | |
| Acer Swift X SFX16-52G-77RX | |
| Samsung Galaxy Book3 Ultra 16 | |
| GTA V - 1920x1080 Highest AA:4xMSAA + FX AF:16x | |
| Schenker Vision 16 Pro RTX 3070 Ti | |
| MSI Katana 15 B12VEK | |
| Samsung Galaxy Book3 Ultra 16 (Hohe Leistung) | |
| Media NVIDIA GeForce RTX 4050 Laptop GPU (14.9 - 101.7, n=35) | |
| Lenovo ThinkBook 16p G3 ARH | |
| Samsung Galaxy Book3 Ultra 16 | |
| Media della classe Multimedia (7.92 - 141.6, n=58, ultimi 2 anni) | |
| Asus VivoBook Pro 16X OLED N7600PC-L2026X | |
| Dell XPS 15 9520 RTX 3050 Ti | |
| LG Gram 17Z90Q-E.AD78G | |
| Acer Swift X SFX16-52G-77RX | |
| Samsung Galaxy Book3 Ultra 16 (Leise) | |
| Final Fantasy XV Benchmark - 1920x1080 High Quality | |
| Schenker Vision 16 Pro RTX 3070 Ti (1.3) | |
| MSI Katana 15 B12VEK (1.3) | |
| Lenovo ThinkBook 16p G3 ARH (1.3) | |
| Media NVIDIA GeForce RTX 4050 Laptop GPU (15.5 - 122.3, n=39) | |
| Samsung Galaxy Book3 Ultra 16 (1.3, Hohe Leistung) | |
| Samsung Galaxy Book3 Ultra 16 (1.3) | |
| Media della classe Multimedia (7.61 - 144.4, n=60, ultimi 2 anni) | |
| Dell XPS 15 9520 RTX 3050 Ti (1.3) | |
| Asus VivoBook Pro 16X OLED N7600PC-L2026X (1.3) | |
| LG Gram 17Z90Q-E.AD78G (1.3) | |
| Acer Swift X SFX16-52G-77RX (1.3) | |
| Samsung Galaxy Book3 Ultra 16 (1.3, Leise) | |
| Strange Brigade - 1920x1080 ultra AA:ultra AF:16 | |
| Schenker Vision 16 Pro RTX 3070 Ti (1.47.22.14 D3D12) | |
| MSI Katana 15 B12VEK (1.47.22.14 D3D12) | |
| Media NVIDIA GeForce RTX 4050 Laptop GPU (21.2 - 156.6, n=38) | |
| Lenovo ThinkBook 16p G3 ARH (1.47.22.14 D3D12) | |
| Samsung Galaxy Book3 Ultra 16 (1.47.22.14 D3D12, Hohe Leistung) | |
| Samsung Galaxy Book3 Ultra 16 (1.47.22.14 D3D12) | |
| Media della classe Multimedia (13.3 - 303, n=60, ultimi 2 anni) | |
| Dell XPS 15 9520 RTX 3050 Ti (1.47.22.14 D3D12) | |
| Asus VivoBook Pro 16X OLED N7600PC-L2026X (1.47.22.14 D3D12) | |
| Acer Swift X SFX16-52G-77RX (1.47.22.14 D3D12) | |
| LG Gram 17Z90Q-E.AD78G (1.47.22.14 D3D12) | |
| Samsung Galaxy Book3 Ultra 16 (1.47.22.14 D3D12, Leise) | |
| Dota 2 Reborn - 1920x1080 ultra (3/3) best looking | |
| Schenker Vision 16 Pro RTX 3070 Ti | |
| MSI Katana 15 B12VEK | |
| Samsung Galaxy Book3 Ultra 16 (Hohe Leistung) | |
| Media NVIDIA GeForce RTX 4050 Laptop GPU (73.5 - 175.6, n=39) | |
| Samsung Galaxy Book3 Ultra 16 (Leise) | |
| Dell XPS 15 9520 RTX 3050 Ti | |
| Asus VivoBook Pro 16X OLED N7600PC-L2026X | |
| Lenovo ThinkBook 16p G3 ARH | |
| Media della classe Multimedia (29 - 179.9, n=62, ultimi 2 anni) | |
| Samsung Galaxy Book3 Ultra 16 | |
| Acer Swift X SFX16-52G-77RX | |
| LG Gram 17Z90Q-E.AD78G | |
| X-Plane 11.11 - 1920x1080 high (fps_test=3) | |
| Schenker Vision 16 Pro RTX 3070 Ti | |
| Dell XPS 15 9520 RTX 3050 Ti | |
| Samsung Galaxy Book3 Ultra 16 (Hohe Leistung) | |
| MSI Katana 15 B12VEK | |
| Media NVIDIA GeForce RTX 4050 Laptop GPU (55.5 - 117, n=40) | |
| Samsung Galaxy Book3 Ultra 16 (Leise) | |
| Samsung Galaxy Book3 Ultra 16 | |
| Asus VivoBook Pro 16X OLED N7600PC-L2026X | |
| Lenovo ThinkBook 16p G3 ARH | |
| LG Gram 17Z90Q-E.AD78G | |
| LG Gram 17Z90Q-E.AD78G | |
| Media della classe Multimedia (16.9 - 141.1, n=57, ultimi 2 anni) | |
| Acer Swift X SFX16-52G-77RX | |
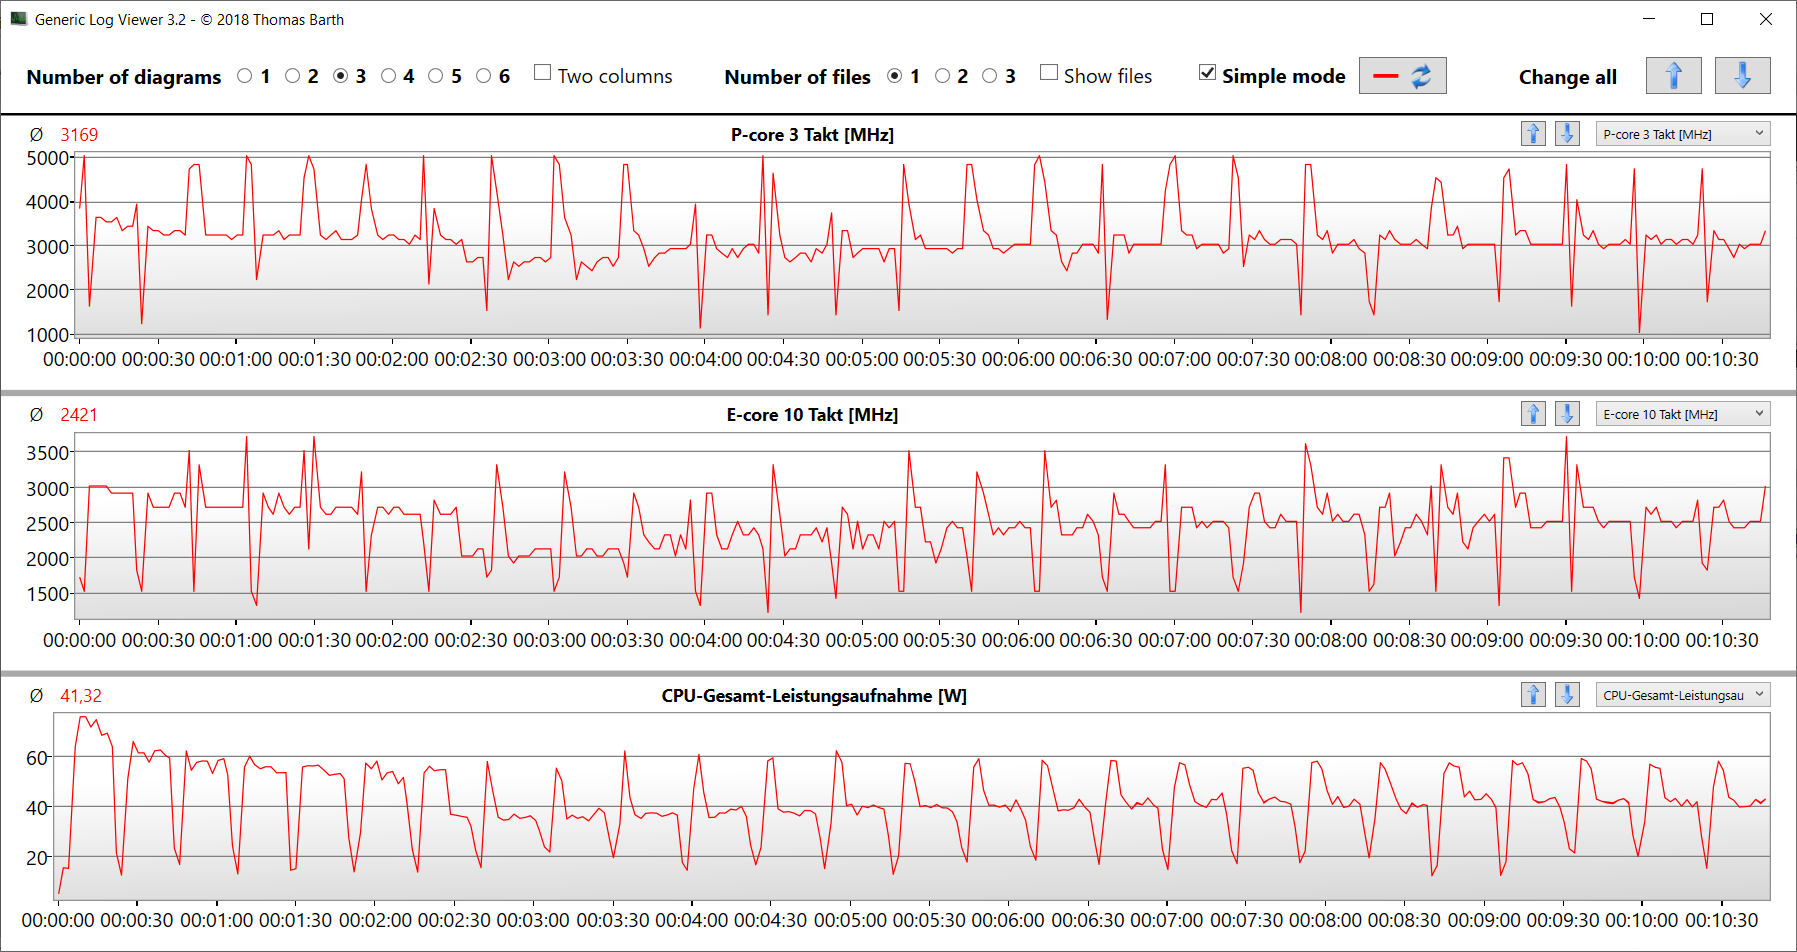
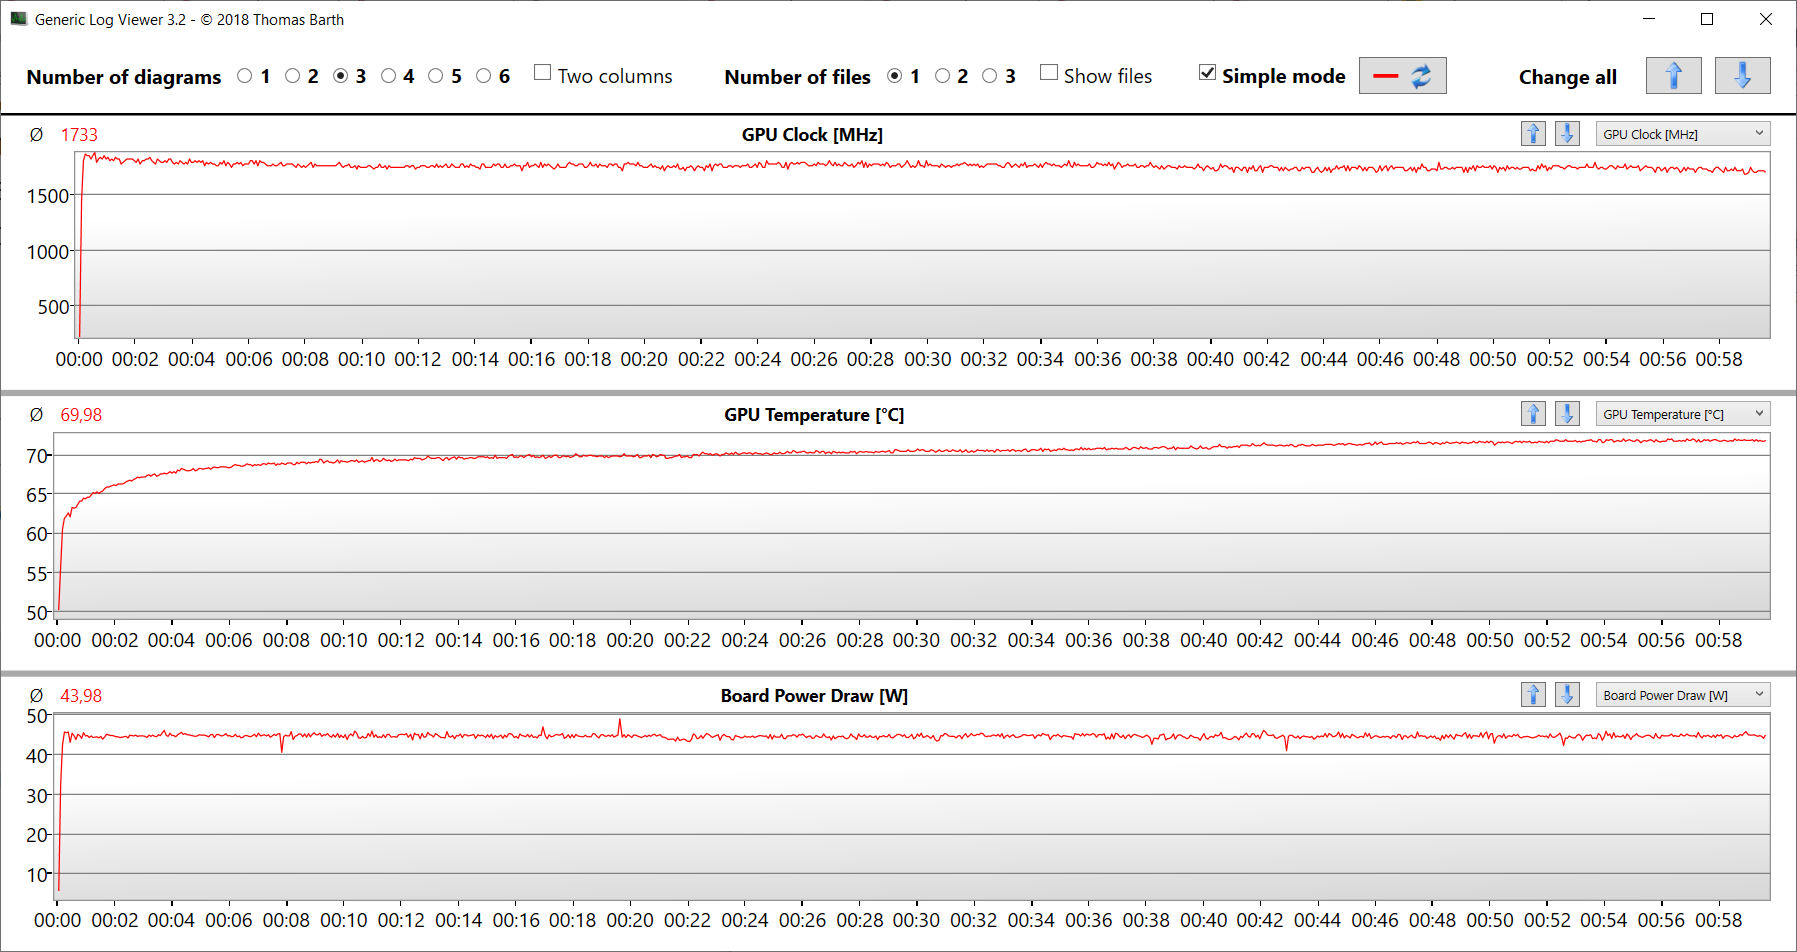
Per verificare se la frequenza dei fotogrammi rimane costante per un periodo più lungo, abbiamo eseguito "The Witcher 3" per circa 60 minuti con una risoluzione Full HD e con le impostazioni di qualità massime. Il personaggio del gioco non è stato spostato. Non è stato rilevato alcun calo della frequenza dei fotogrammi.
Witcher 3 FPS chart
| basso | medio | alto | ultra | QHD | |
|---|---|---|---|---|---|
| GTA V (2015) | 182.1 | 166.5 | 133.2 | 65.3 | 50.5 |
| The Witcher 3 (2015) | 268.5 | 184.1 | 107.1 | 60.1 | |
| Dota 2 Reborn (2015) | 161.8 | 138.7 | 79.2 | 73.5 | |
| Final Fantasy XV Benchmark (2018) | 105 | 77.2 | 56.9 | 41.5 | |
| X-Plane 11.11 (2018) | 143.6 | 88.2 | 79 | ||
| Far Cry 5 (2018) | 148 | 87 | 74 | 71 | 56 |
| Strange Brigade (2018) | 321 | 153.5 | 120.1 | 103.9 | 72.7 |
| The Division 2 (2019) | 130 | 83 | 69 | 53 | 35 |
| Doom Eternal (2020) | 228 | 135.6 | 124.7 | 114.3 | 82.5 |
| Gears Tactics (2020) | 268.5 | 141.8 | 95.2 | 64.8 | 44.8 |
| Flight Simulator 2020 (2020) | 107.2 | 57.6 | 40.5 | 30.6 | 22.9 |
| Crysis Remastered (2020) | 242 | 121.1 | 49.5 | 41.6 | 28.6 |
| Hitman 3 (2021) | 193.9 | 111.4 | 101 | 94.2 | 60.1 |
| Alan Wake Remastered (2021) | 161.5 | 98.3 | 86.7 | 63.2 | |
| Riders Republic (2021) | 138 | 72 | 67 | 63 | 44 |
| Forza Horizon 5 (2021) | 119 | 68 | 69 | 42 | 36 |
| Rainbow Six Extraction (2022) | 139 | 115 | 111 | 89 | 56 |
| Cyberpunk 2077 1.6 (2022) | 71 | 54.7 | 48 | 44.4 | 27.2 |
| Tiny Tina's Wonderlands (2022) | 104.5 | 93.4 | 63.3 | 49.8 | 33.6 |
| F1 22 (2022) | 135.3 | 127.4 | 97.5 | 36.2 | 23.1 |
| The Quarry (2022) | 91 | 68.8 | 57 | 44.6 | 28.5 |
| FIFA 23 (2022) | 94.3 | ||||
| A Plague Tale Requiem (2022) | 58.6 | 49 | 42.8 | 36.3 | 27.5 |
| Call of Duty Modern Warfare 2 2022 (2022) | 79 | 73 | 56 | 54 | 36 |
| Spider-Man Miles Morales (2022) | 72.9 | 67.1 | 56.9 | 51.5 | 42.5 |
| The Callisto Protocol (2022) | 74 | 62.5 | 59.3 | 41.4 | 29.5 |
| Need for Speed Unbound (2022) | 51.2 | 42.8 | 37 | 28.9 | 26.7 |
| High On Life (2023) | 104.9 | 78.1 | 65.3 | 57.3 | 35.7 |
| The Witcher 3 v4 (2023) | 113.4 | 82.5 | 43 | 38.1 | 23.8 |
| Dead Space Remake (2023) | 47.9 | 47.7 | 40.2 | 39.8 | 25.1 |
| Hogwarts Legacy (2023) | 92 | 74.2 | 59.6 | 51.9 | 23.9 |
| Returnal (2023) | 59 | 57 | 52 | 44 | |
| Atomic Heart (2023) | 95 | 76.1 | 47.8 | 37.8 | 28.2 |
| Company of Heroes 3 (2023) | 116.4 | 106.2 | 79 | 79.7 | 55.7 |
| Resident Evil 4 Remake (2023) | 81 | 57.7 | 53.4 | 36.8 | 23.8 |
Emissioni - Ultrabook Samsung con sviluppo di rumore moderato
Rumore
Nel complesso, Samsung riesce a tenere sotto controllo lo sviluppo del rumore. I profili del notebook offrono un equilibrio accettabile tra rumore e prestazioni. Il valore massimo di 48 dB(A) è stato raggiunto durante il test Witcher 3 con "Prestazioni elevate". il profilo "Ottimizzato" garantisce livelli moderati di rumore con frame rate ancora riproducibili. Il profilo "Silenzioso" è all'altezza del suo nome. Le due ventole si sentono poco o nulla durante l'uso inattivo e quotidiano, poiché spesso rimangono ferme.
Rumorosità
| Idle |
| 26 / 27 / 28 dB(A) |
| Sotto carico |
| 40 / 41 dB(A) |
 | ||
30 dB silenzioso 40 dB(A) udibile 50 dB(A) rumoroso |
||
min: | ||
| Samsung Galaxy Book3 Ultra 16 i7-13700H, GeForce RTX 4050 Laptop GPU | Schenker Vision 16 Pro RTX 3070 Ti i7-12700H, GeForce RTX 3070 Ti Laptop GPU | LG Gram 17Z90Q-E.AD78G i7-1260P, GeForce RTX 2050 Mobile | Lenovo ThinkBook 16p G3 ARH R9 6900HX, GeForce RTX 3060 Laptop GPU | Dell XPS 15 9520 RTX 3050 Ti i7-12700H, GeForce RTX 3050 Ti Laptop GPU | Asus VivoBook Pro 16X OLED N7600PC-L2026X i7-11370H, GeForce RTX 3050 4GB Laptop GPU | Acer Swift X SFX16-52G-77RX i7-1260P, A370M | |
|---|---|---|---|---|---|---|---|
| Noise | -2% | -10% | 5% | 10% | -22% | -0% | |
| off /ambiente * (dB) | 25 | 22.9 8% | 26 -4% | 22.7 9% | 22.8 9% | 25.15 -1% | 25 -0% |
| Idle Minimum * (dB) | 26 | 24.3 7% | 28 -8% | 23.1 11% | 22.9 12% | 30 -15% | 25 4% |
| Idle Average * (dB) | 27 | 24.3 10% | 28 -4% | 23.2 14% | 22.9 15% | 30 -11% | 25 7% |
| Idle Maximum * (dB) | 28 | 24.3 13% | 28.8 -3% | 23.6 16% | 22.9 18% | 30 -7% | 25 11% |
| Load Average * (dB) | 40 | 38.5 4% | 49.3 -23% | 30.6 23% | 30.9 23% | 57.6 -44% | 44.7 -12% |
| Witcher 3 ultra * (dB) | 39 | 51 -31% | 47.6 -22% | 37.8 3% | |||
| Load Maximum * (dB) | 41 | 51 -24% | 49.1 -20% | 47.5 -16% | 44.7 -9% | 62.9 -53% | 45.6 -11% |
* ... Meglio usare valori piccoli
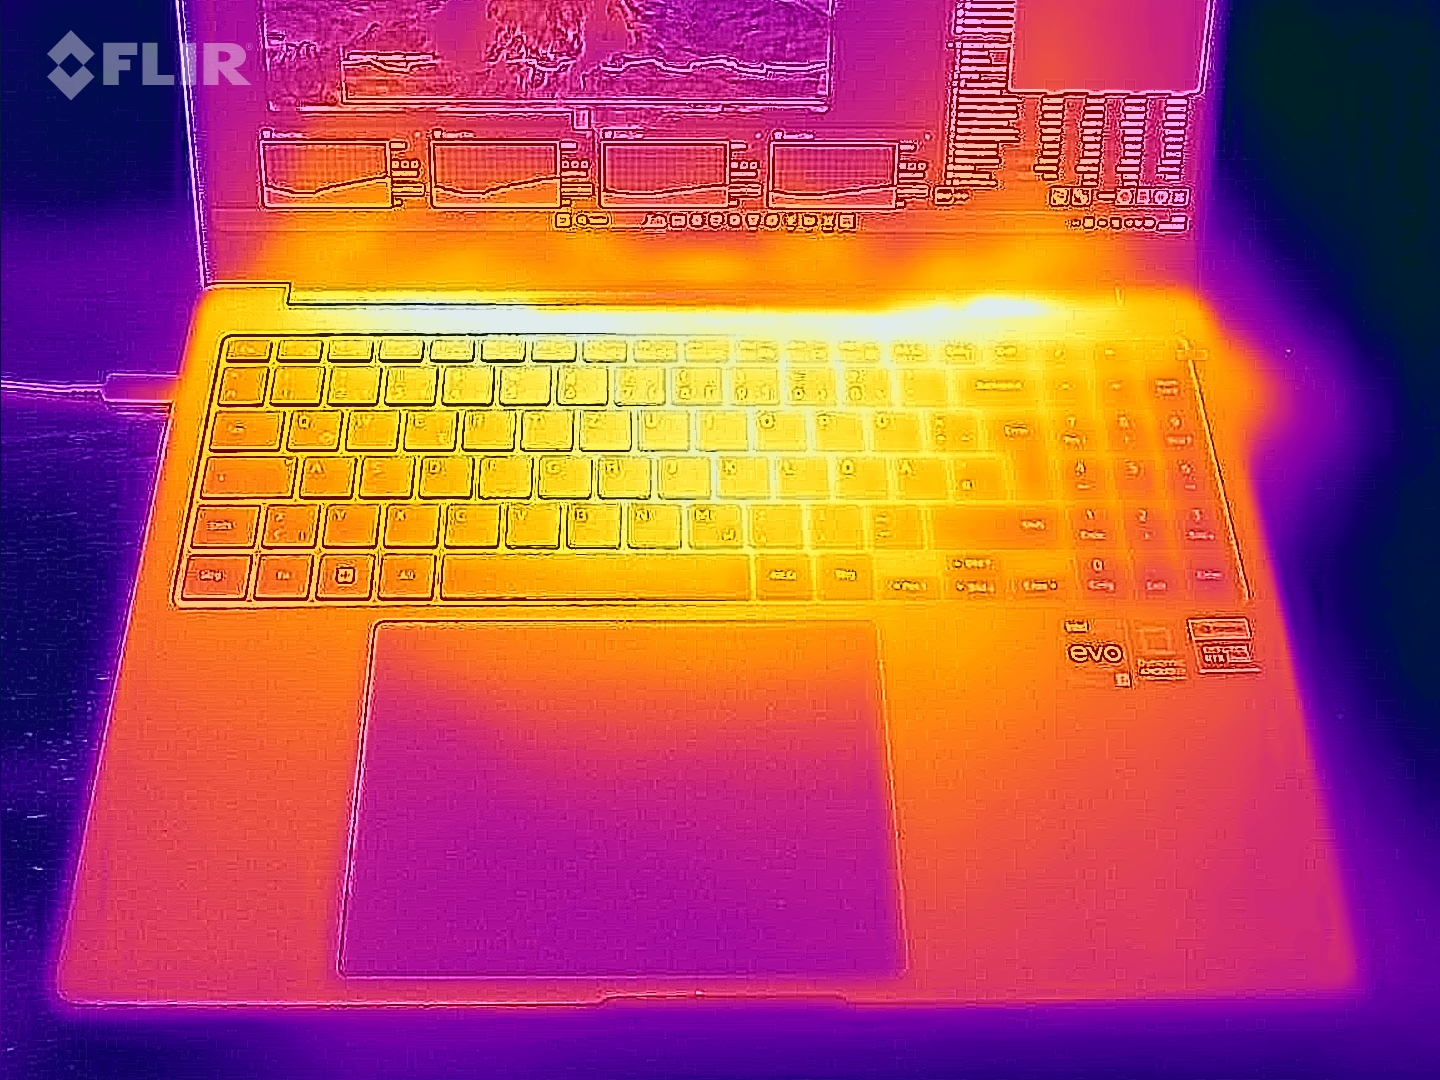
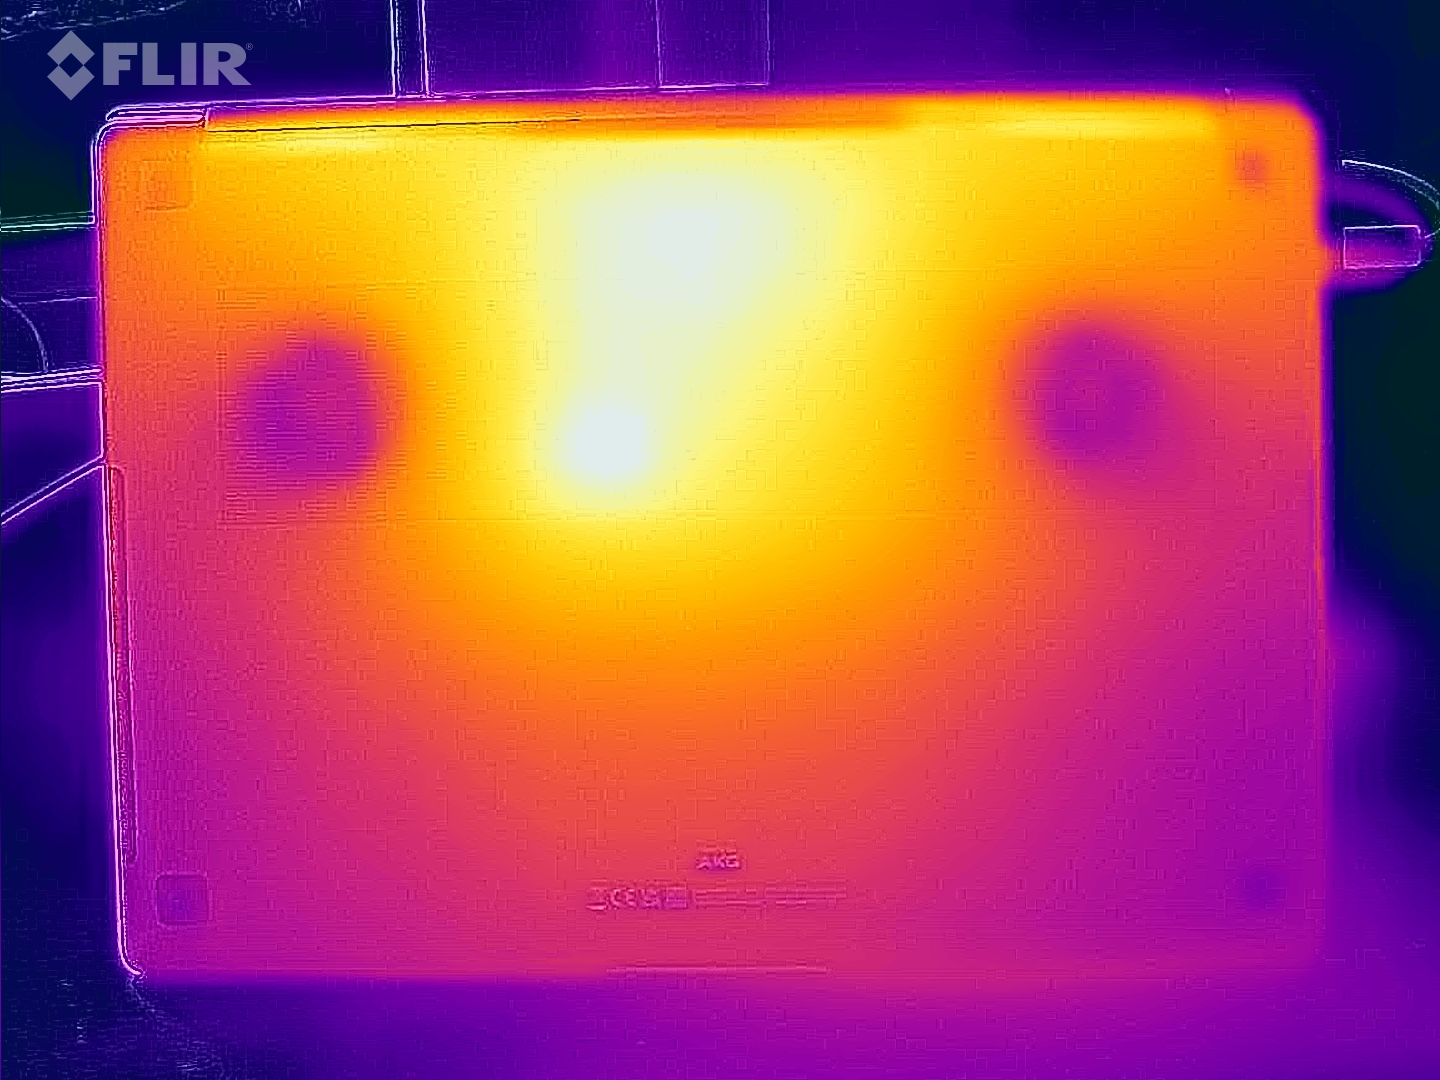
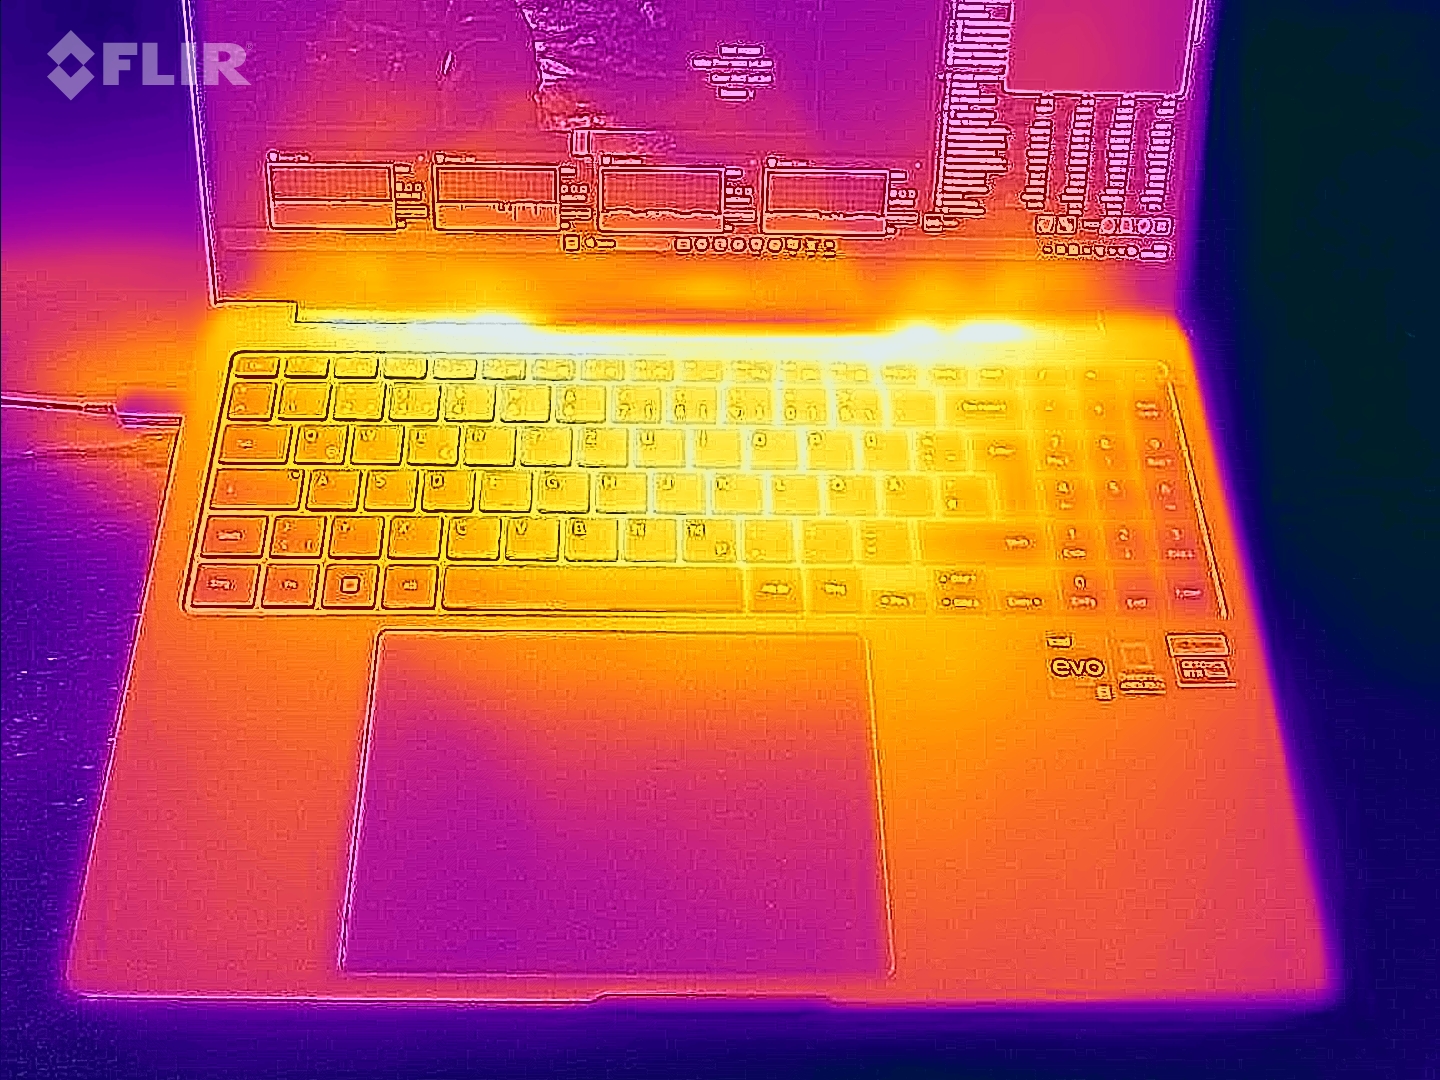
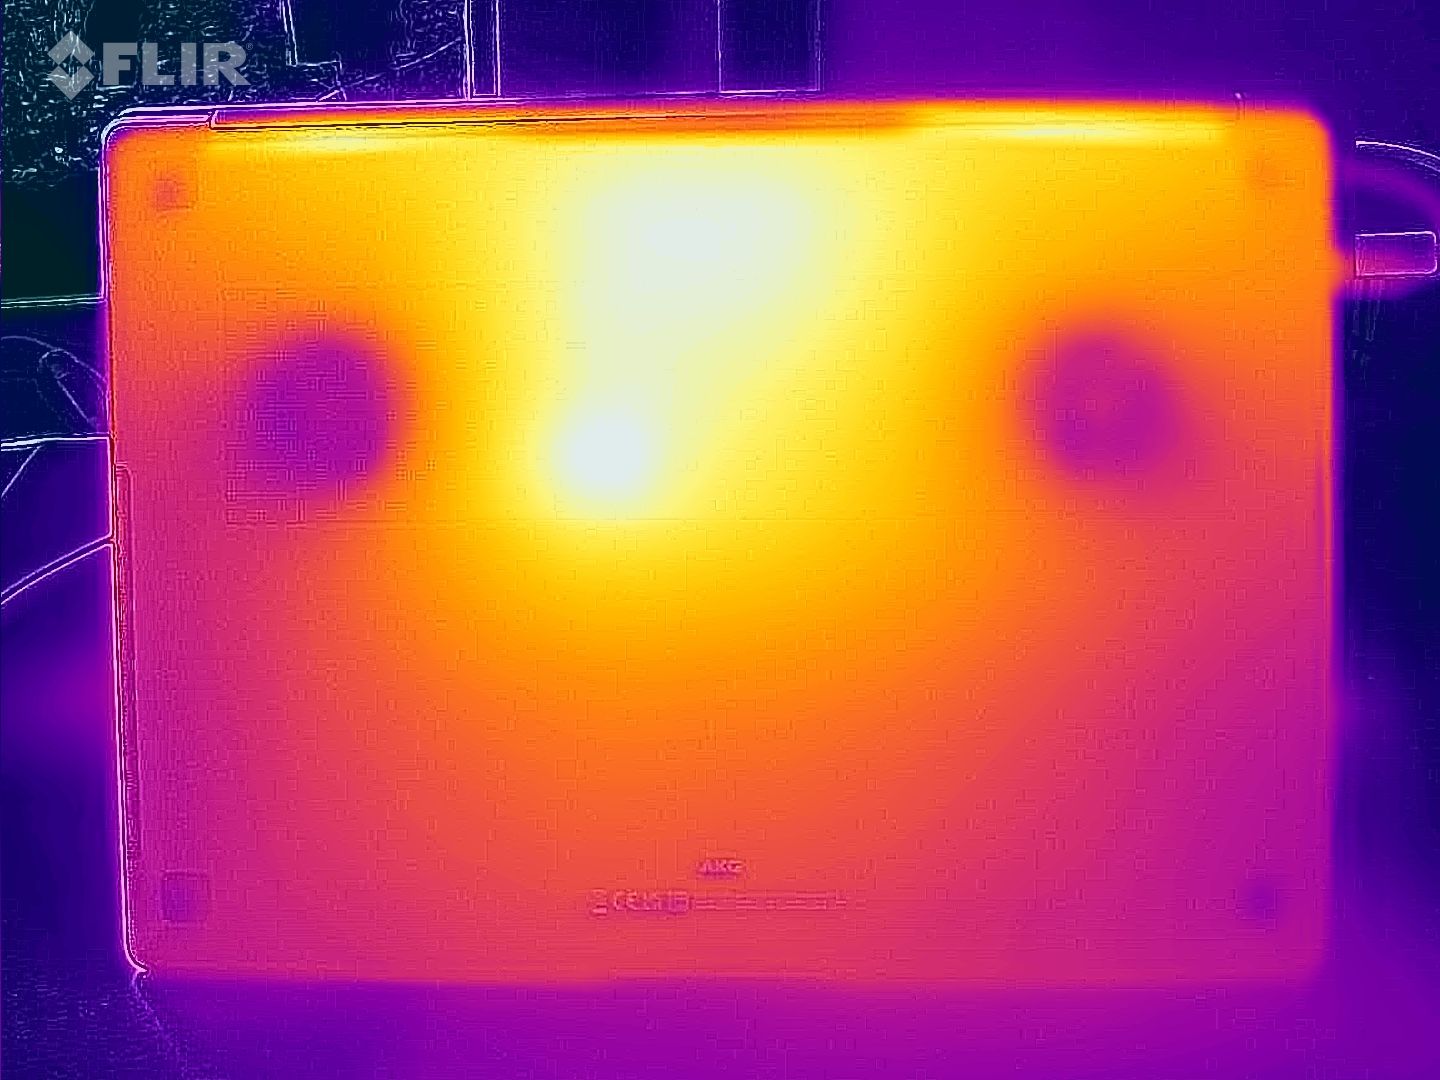
Temperatura
Le temperature del case rimangono nella zona verde nell'uso quotidiano (ufficio, internet). Sotto carico (stress test, test Witcher 3 ), il notebook si riscalda sensibilmente, ma non eccessivamente. Le temperature della CPU non destano preoccupazione.
(±) La temperatura massima sul lato superiore è di 41 °C / 106 F, rispetto alla media di 36.8 °C / 98 F, che varia da 21 a 71 °C per questa classe Multimedia.
(±) Il lato inferiore si riscalda fino ad un massimo di 44 °C / 111 F, rispetto alla media di 39.1 °C / 102 F
(+) In idle, la temperatura media del lato superiore è di 22.9 °C / 73 F, rispetto alla media deld ispositivo di 31.3 °C / 88 F.
(-) Riproducendo The Witcher 3, la temperatura media per il lato superiore e' di 38.6 °C / 101 F, rispetto alla media del dispositivo di 31.3 °C / 88 F.
(+) I poggiapolsi e il touchpad raggiungono la temperatura massima della pelle (35 °C / 95 F) e quindi non sono caldi.
(-) La temperatura media della zona del palmo della mano di dispositivi simili e'stata di 28.7 °C / 83.7 F (-6.3 °C / -11.3 F).
| Samsung Galaxy Book3 Ultra 16 Intel Core i7-13700H, NVIDIA GeForce RTX 4050 Laptop GPU | Schenker Vision 16 Pro RTX 3070 Ti Intel Core i7-12700H, NVIDIA GeForce RTX 3070 Ti Laptop GPU | LG Gram 17Z90Q-E.AD78G Intel Core i7-1260P, NVIDIA GeForce RTX 2050 Mobile | Lenovo ThinkBook 16p G3 ARH AMD Ryzen 9 6900HX, NVIDIA GeForce RTX 3060 Laptop GPU | Dell XPS 15 9520 RTX 3050 Ti Intel Core i7-12700H, NVIDIA GeForce RTX 3050 Ti Laptop GPU | Asus VivoBook Pro 16X OLED N7600PC-L2026X Intel Core i7-11370H, NVIDIA GeForce RTX 3050 4GB Laptop GPU | Acer Swift X SFX16-52G-77RX Intel Core i7-1260P, Intel Arc A370M | |
|---|---|---|---|---|---|---|---|
| Heat | -12% | -15% | -25% | -25% | -14% | -24% | |
| Maximum Upper Side * (°C) | 41 | 50.8 -24% | 50.3 -23% | 48.2 -18% | 51.4 -25% | 40.6 1% | 49.4 -20% |
| Maximum Bottom * (°C) | 44 | 46.3 -5% | 52.5 -19% | 49.6 -13% | 51 -16% | 53 -20% | 55.5 -26% |
| Idle Upper Side * (°C) | 23 | 27.2 -18% | 26.9 -17% | 31.8 -38% | 30 -30% | 29 -26% | 28.4 -23% |
| Idle Bottom * (°C) | 26 | 26.6 -2% | 26.5 -2% | 33.6 -29% | 33 -27% | 28.3 -9% | 32.6 -25% |
* ... Meglio usare valori piccoli
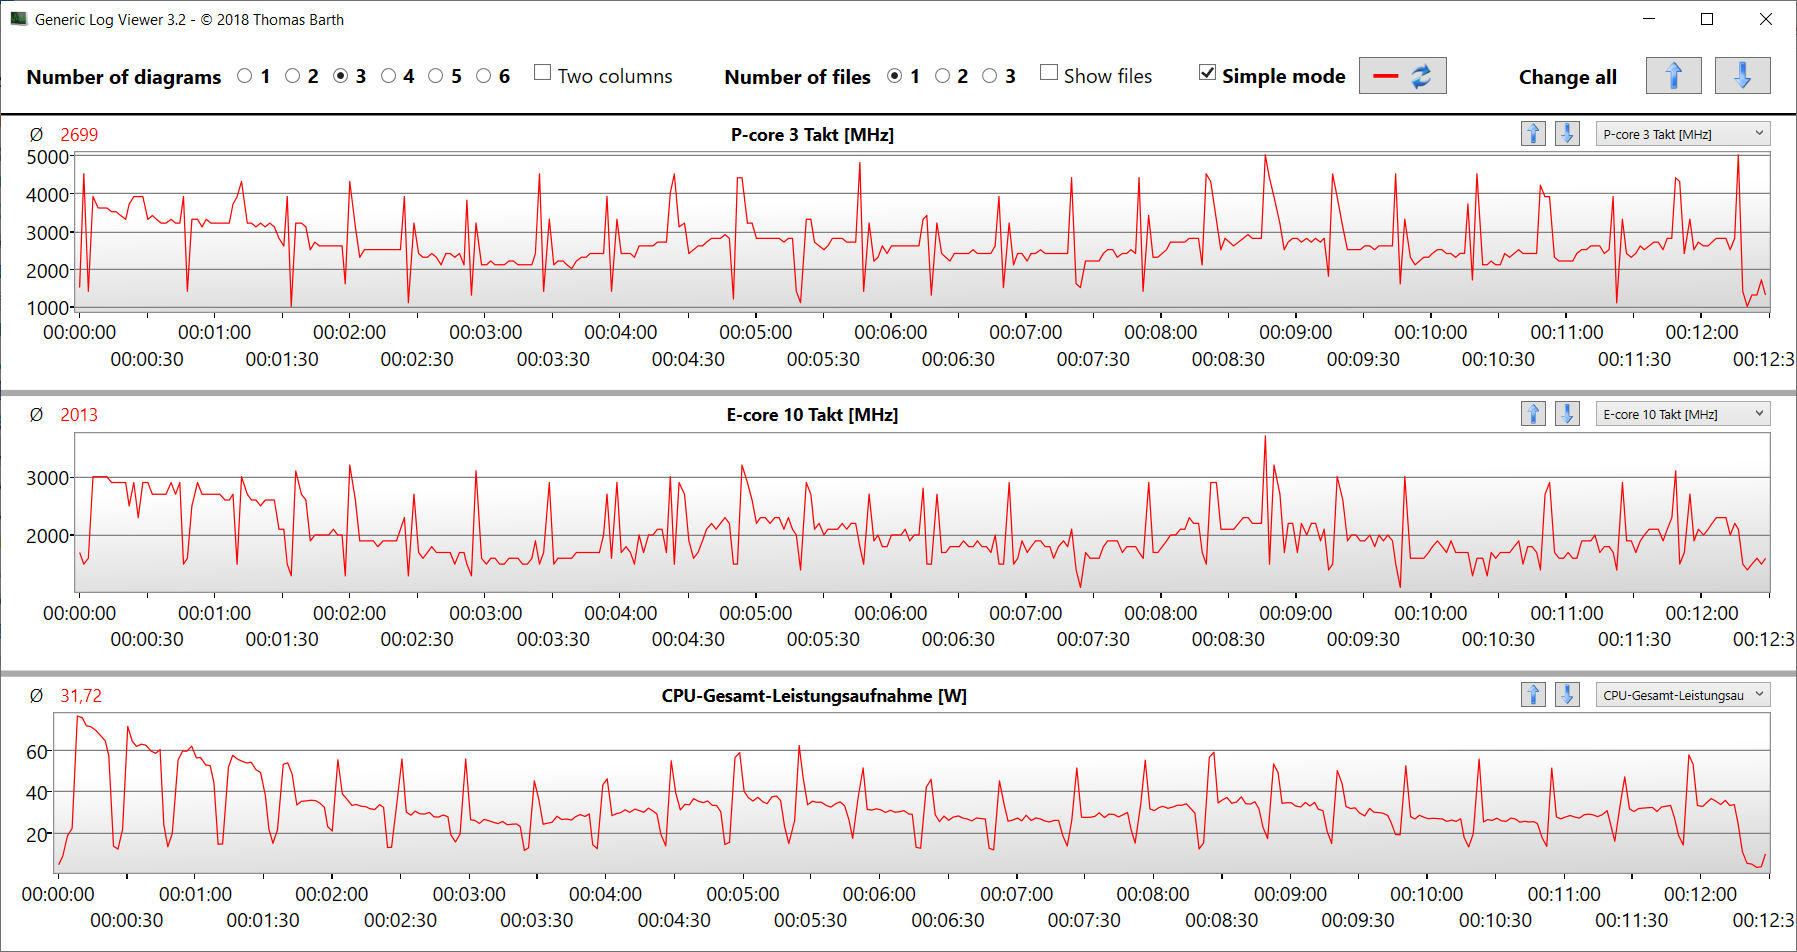
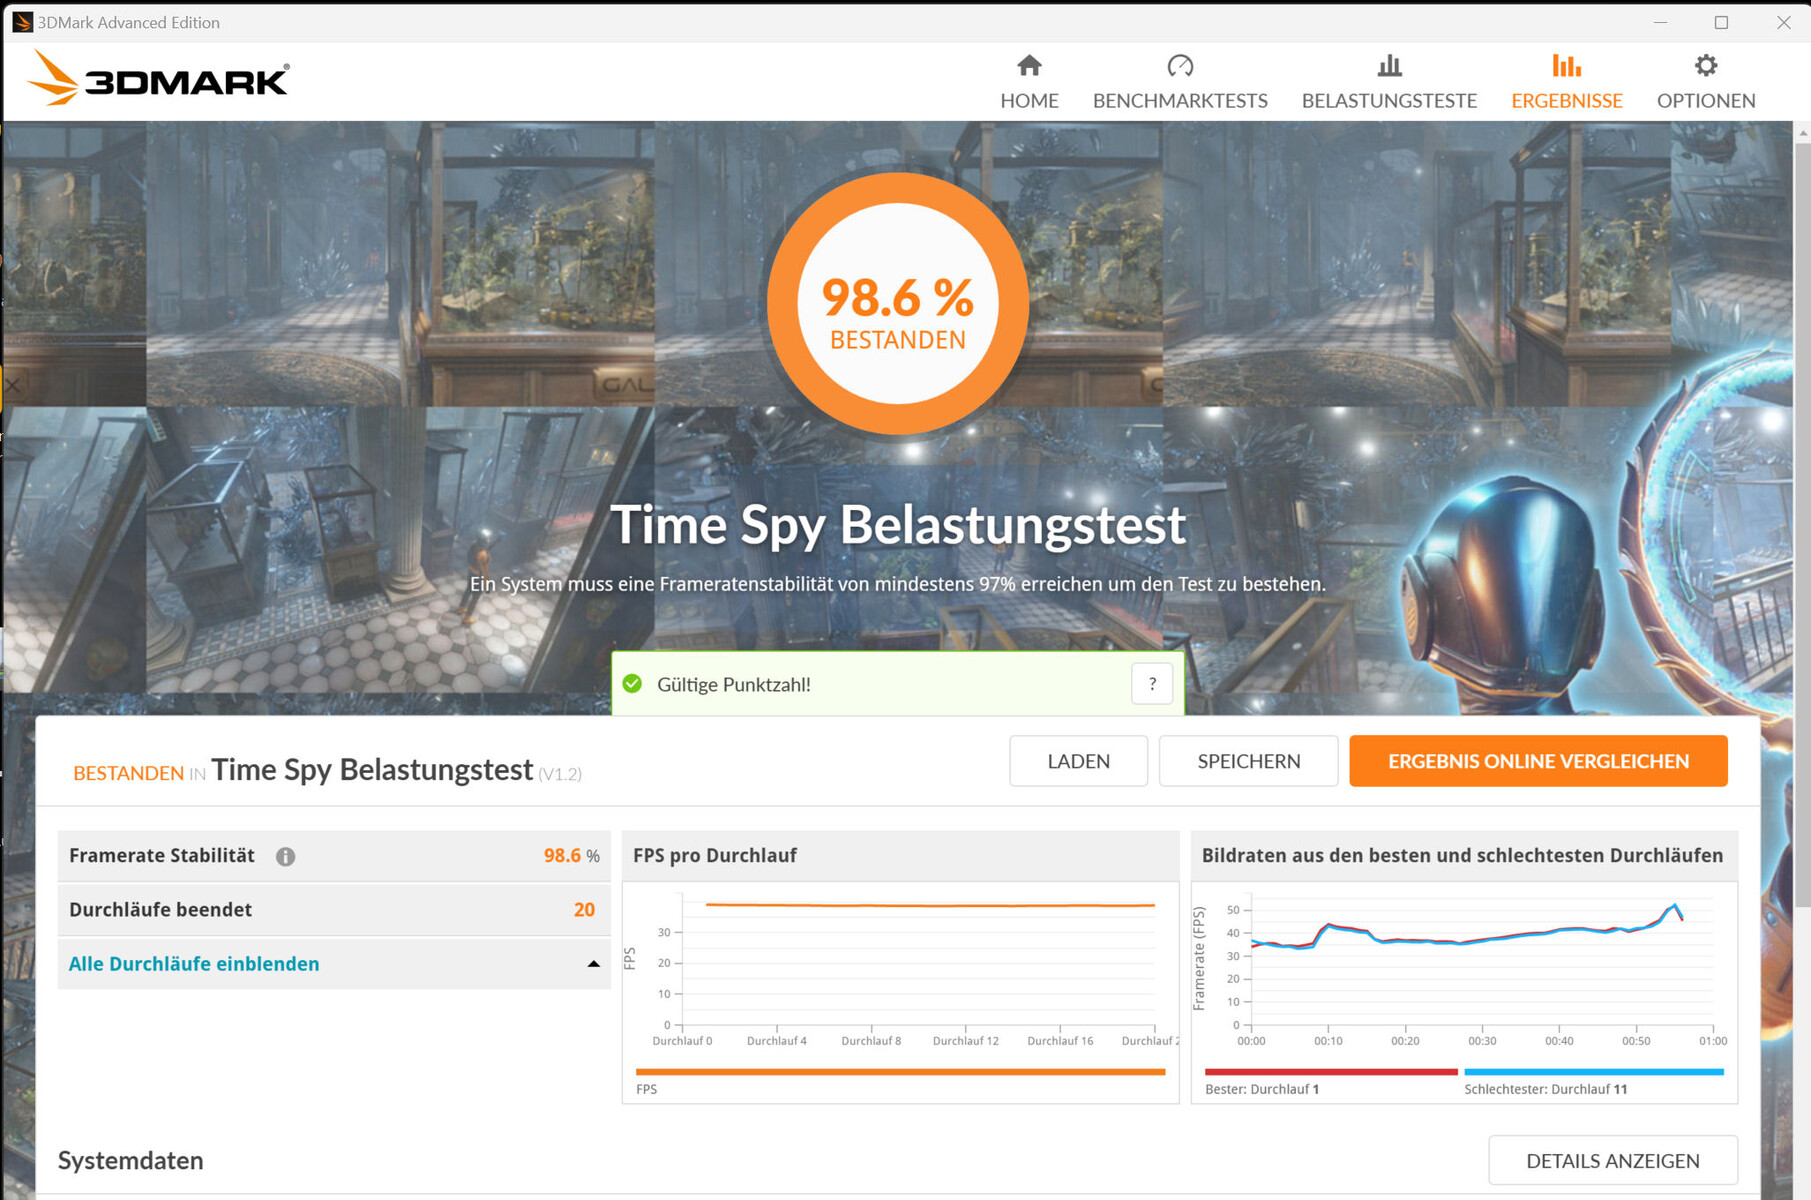
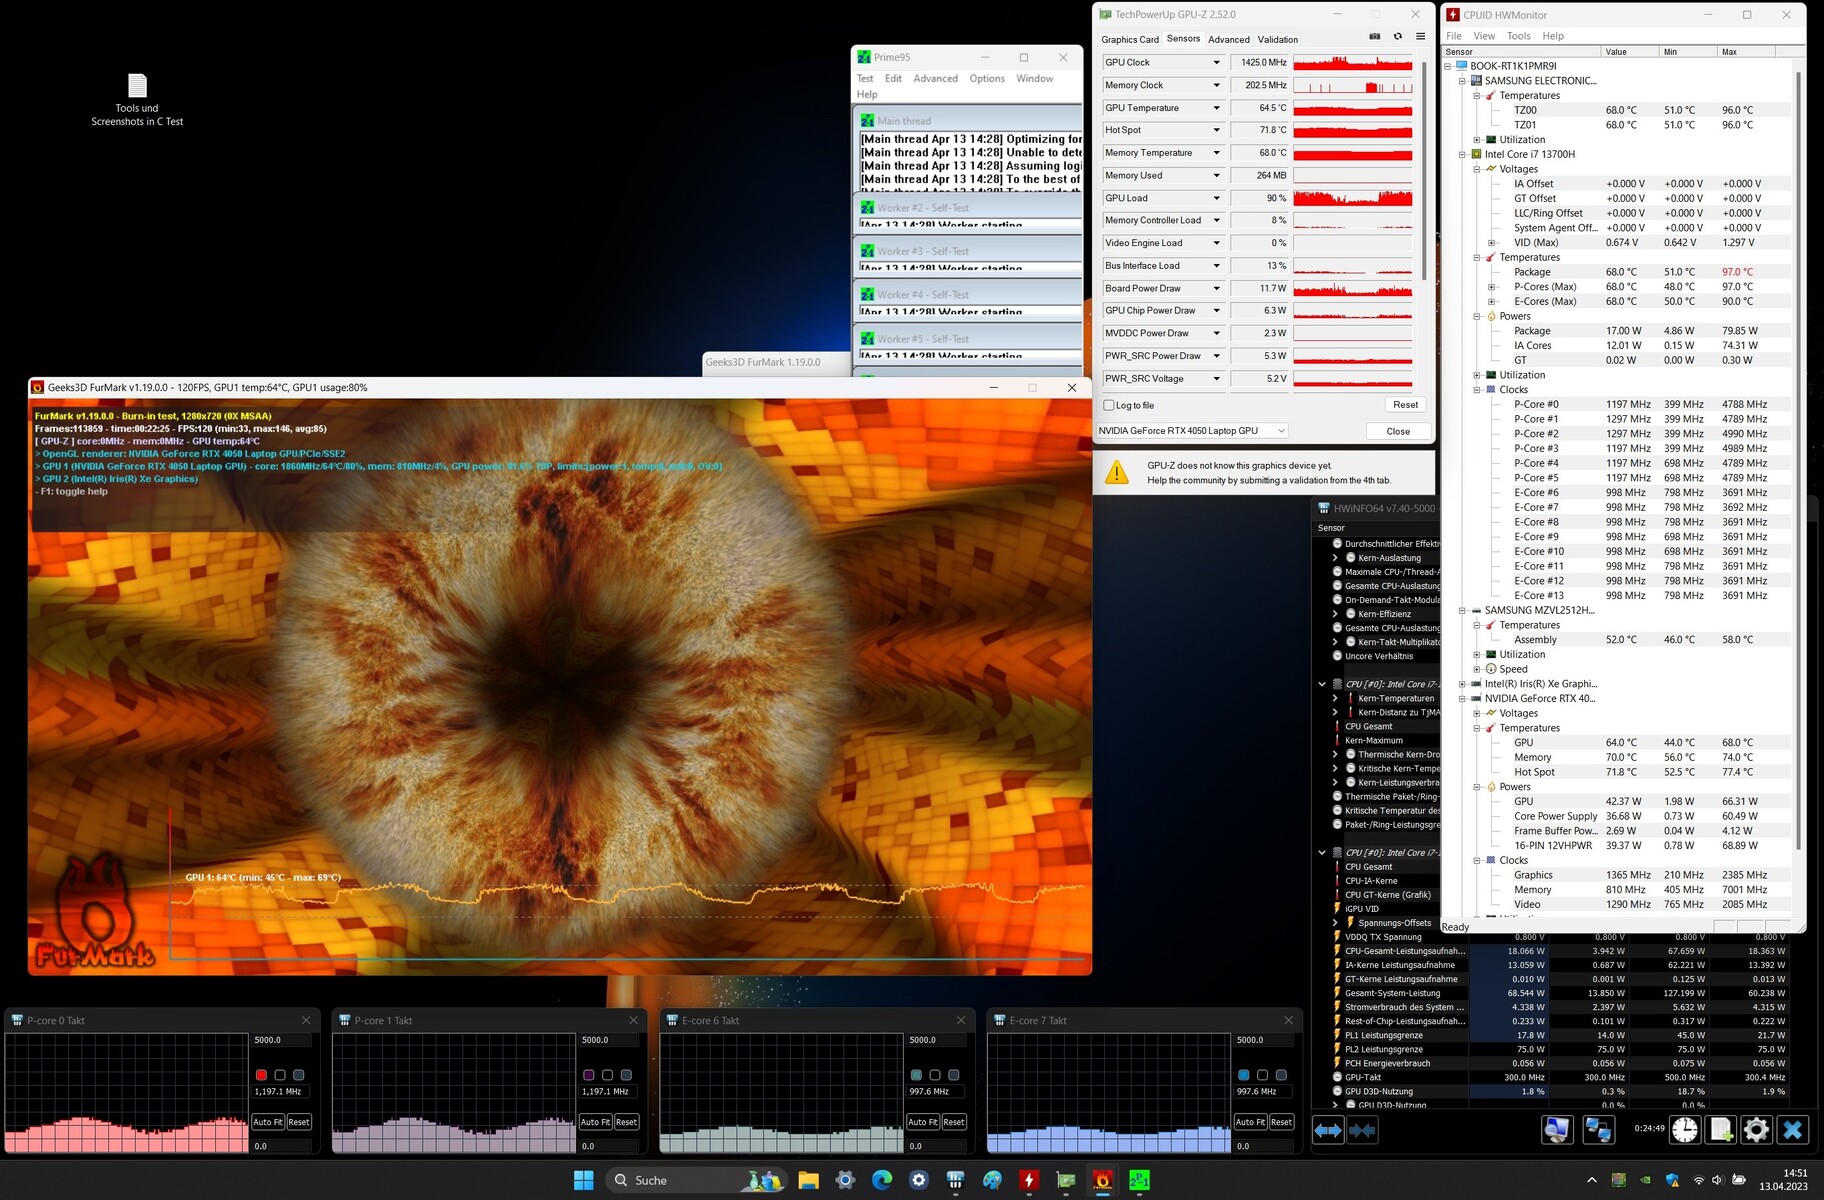
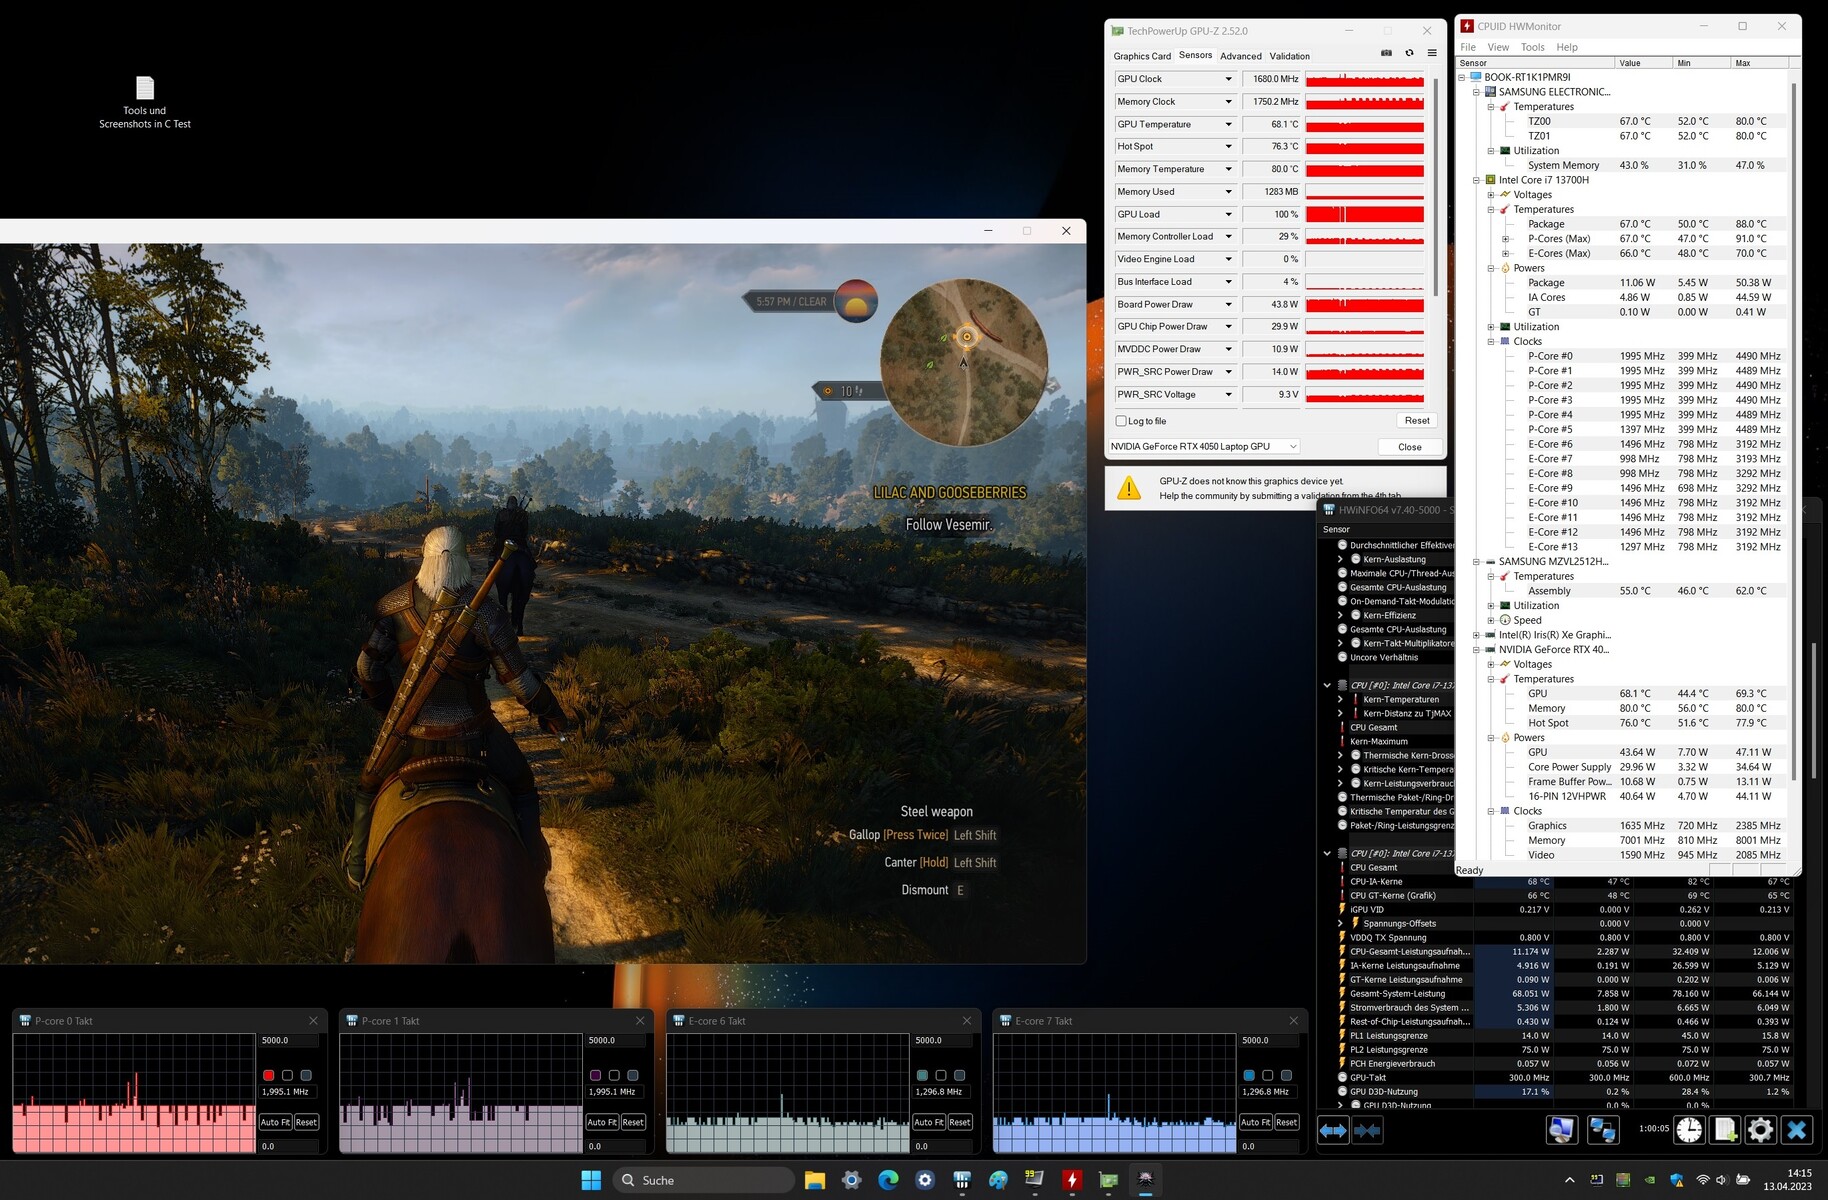
Stress test
Lo stress test (Prime95 e Furmark in funzionamento prolungato) rappresenta uno scenario estremo per verificare la stabilità del sistema a pieno carico. La CPU (P: da 2,8 a 2,9 GHz, E: da 2,3 a 2,4 GHz) e la GPU (circa 1.100 MHz) iniziano il test con velocità che si aggirano intorno al livello di clock di base, per poi diminuire significativamente nel corso del test.
Altoparlanti
Gli altoparlanti stereo producono un suono molto decente, ma avrebbero bisogno di più bassi. Per una migliore qualità del suono si consiglia di utilizzare cuffie o altoparlanti esterni.
Samsung Galaxy Book3 Ultra 16 analisi audio
(+) | gli altoparlanti sono relativamente potenti (83 dB)
Bassi 100 - 315 Hz
(±) | bassi ridotti - in media 11.4% inferiori alla media
(±) | la linearità dei bassi è media (10.3% delta rispetto alla precedente frequenza)
Medi 400 - 2000 Hz
(±) | medi elevati - circa 5.4% superiore alla media
(+) | medi lineari (3% delta rispetto alla precedente frequenza)
Alti 2 - 16 kHz
(+) | Alti bilanciati - appena 1.6% dalla media
(+) | alti lineari (3.8% delta rispetto alla precedente frequenza)
Nel complesso 100 - 16.000 Hz
(+) | suono nel complesso lineare (11.8% differenza dalla media)
Rispetto alla stessa classe
» 19% di tutti i dispositivi testati in questa classe è stato migliore, 4% simile, 76% peggiore
» Il migliore ha avuto un delta di 5%, medio di 17%, peggiore di 45%
Rispetto a tutti i dispositivi testati
» 9% di tutti i dispositivi testati in questa classe è stato migliore, 3% similare, 89% peggiore
» Il migliore ha avuto un delta di 4%, medio di 23%, peggiore di 134%
Schenker Vision 16 Pro RTX 3070 Ti analisi audio
(±) | potenza degli altiparlanti media ma buona (77.6 dB)
Bassi 100 - 315 Hz
(-) | quasi nessun basso - in media 17.9% inferiori alla media
(±) | la linearità dei bassi è media (12.2% delta rispetto alla precedente frequenza)
Medi 400 - 2000 Hz
(+) | medi bilanciati - solo only 3.3% rispetto alla media
(+) | medi lineari (4.9% delta rispetto alla precedente frequenza)
Alti 2 - 16 kHz
(+) | Alti bilanciati - appena 2.8% dalla media
(+) | alti lineari (5.1% delta rispetto alla precedente frequenza)
Nel complesso 100 - 16.000 Hz
(±) | la linearità complessiva del suono è media (15.1% di differenza rispetto alla media
Rispetto alla stessa classe
» 36% di tutti i dispositivi testati in questa classe è stato migliore, 4% simile, 60% peggiore
» Il migliore ha avuto un delta di 5%, medio di 17%, peggiore di 45%
Rispetto a tutti i dispositivi testati
» 21% di tutti i dispositivi testati in questa classe è stato migliore, 4% similare, 75% peggiore
» Il migliore ha avuto un delta di 4%, medio di 23%, peggiore di 134%
Gestione dell'alimentazione - Il dispositivo NP960XFH non manca di resistenza
Consumo di energia
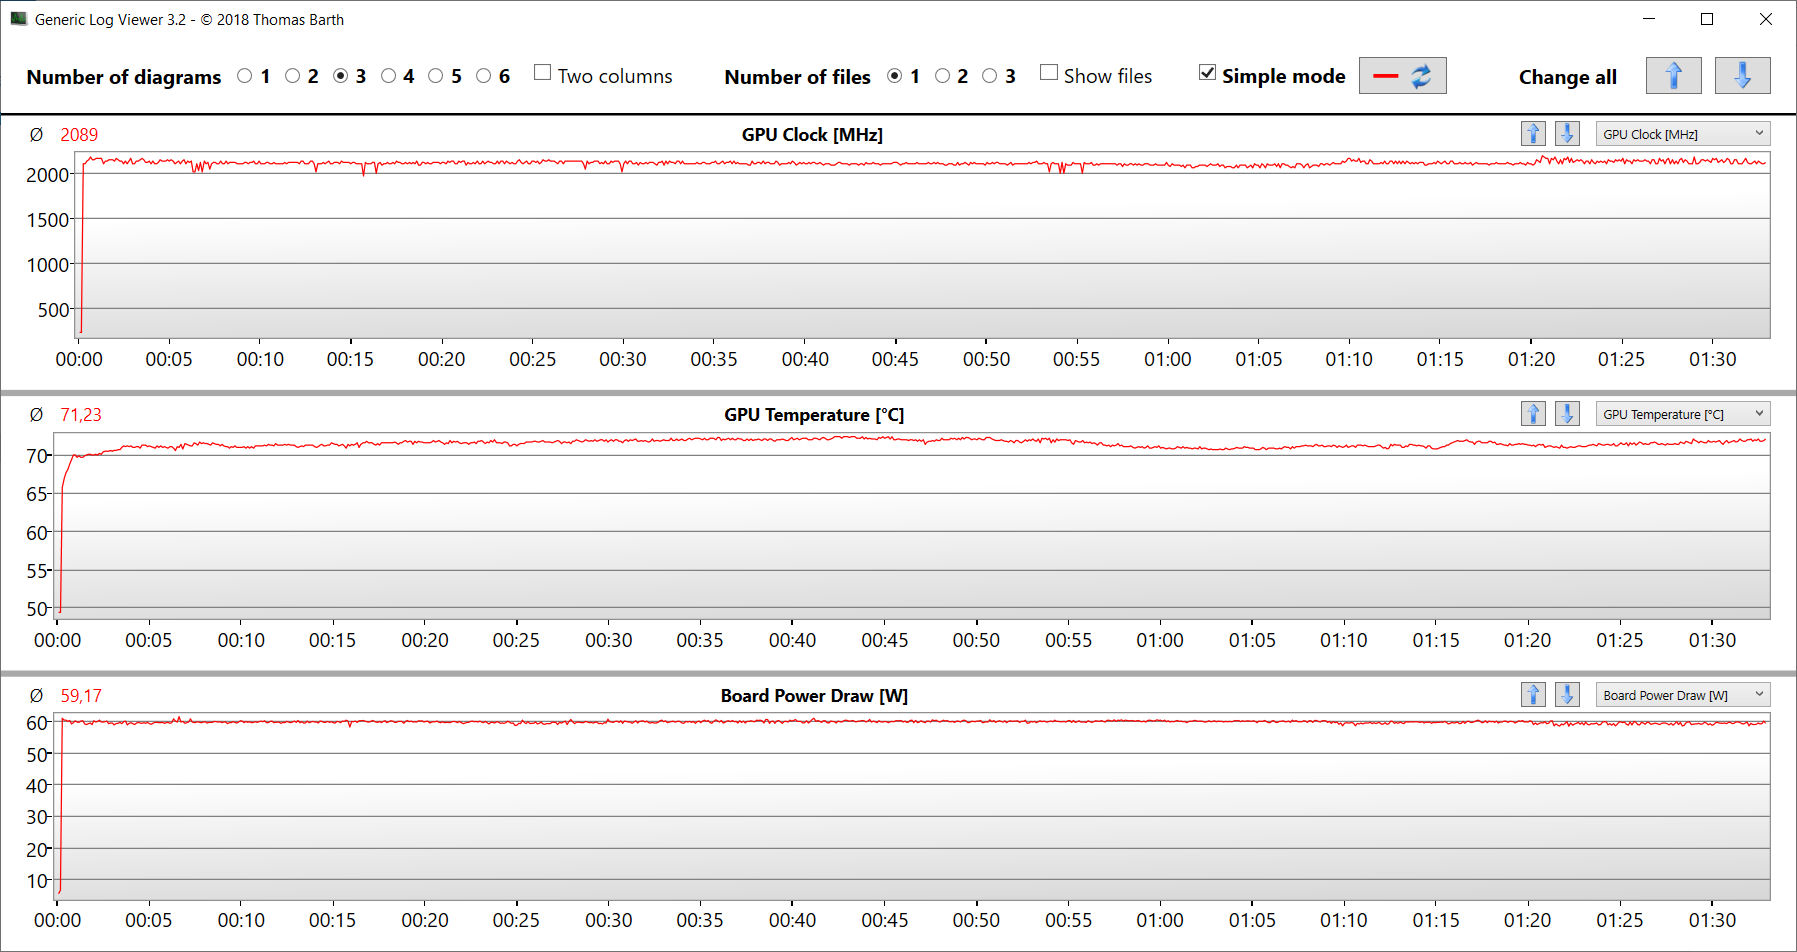
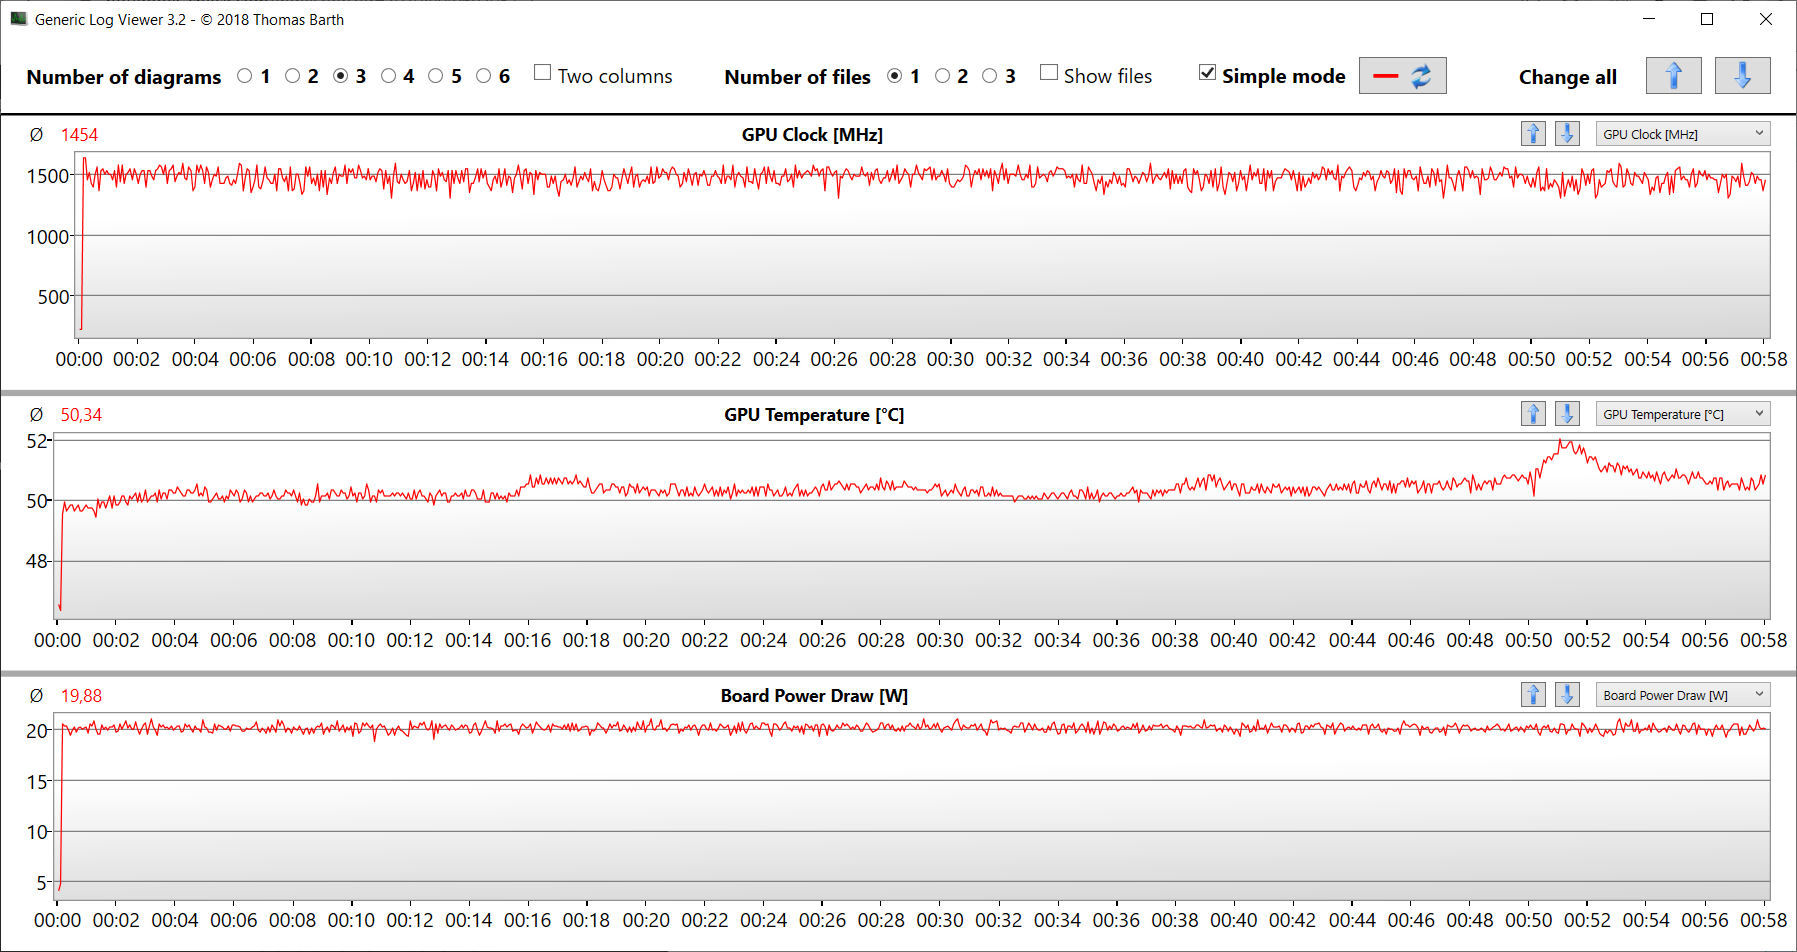
Nel complesso, il portatile Samsung si accontenta di un consumo energetico relativamente basso. Sia in idle che sotto carico, la richiesta di energia è inferiore a quella della concorrenza, con l'eccezione dell'LG Gram https://www.notebookcheck.net/LG-Gram-17-review-A-super-light-17-inch-laptop-with-a-modest-dGPU.698340.0.html. Il test Witcher 3 e lo stress test si svolgono con un consumo energetico relativamente costante. Verso la fine dello stress test, la richiesta diminuisce leggermente. L'alimentatore USB-C (100 watt) è sufficientemente dimensionato.
| Off / Standby | |
| Idle | |
| Sotto carico |
|
Leggenda:
min: | |
| Samsung Galaxy Book3 Ultra 16 i7-13700H, GeForce RTX 4050 Laptop GPU | Schenker Vision 16 Pro RTX 3070 Ti i7-12700H, GeForce RTX 3070 Ti Laptop GPU | LG Gram 17Z90Q-E.AD78G i7-1260P, GeForce RTX 2050 Mobile | Lenovo ThinkBook 16p G3 ARH R9 6900HX, GeForce RTX 3060 Laptop GPU | Dell XPS 15 9520 RTX 3050 Ti i7-12700H, GeForce RTX 3050 Ti Laptop GPU | Asus VivoBook Pro 16X OLED N7600PC-L2026X i7-11370H, GeForce RTX 3050 4GB Laptop GPU | Acer Swift X SFX16-52G-77RX i7-1260P, A370M | Media NVIDIA GeForce RTX 4050 Laptop GPU | Media della classe Multimedia | |
|---|---|---|---|---|---|---|---|---|---|
| Power Consumption | -105% | -7% | -126% | -39% | -63% | -12% | -123% | -41% | |
| Idle Minimum * (Watt) | 3 | 9 -200% | 4.1 -37% | 10.3 -243% | 5.5 -83% | 8.9 -197% | 3.7 -23% | 9.95 ? -232% | 5.72 ? -91% |
| Idle Average * (Watt) | 5 | 13.3 -166% | 9.8 -96% | 16 -220% | 7.2 -44% | 10.2 -104% | 7.6 -52% | 15.8 ? -216% | 10.2 ? -104% |
| Idle Maximum * (Watt) | 11 | 14.3 -30% | 12 -9% | 24 -118% | 16 -45% | 12 -9% | 11.1 -1% | 20.1 ? -83% | 12.4 ? -13% |
| Load Average * (Watt) | 72 | 107 -49% | 49.3 32% | 85.4 -19% | 91.8 -27% | 94 -31% | 70 3% | 88 ? -22% | 65.5 ? 9% |
| Witcher 3 ultra * (Watt) | 69.7 | 155.2 -123% | 49.3 29% | 132.2 -90% | 74.6 -7% | 93.1 -34% | 68.8 1% | ||
| Load Maximum * (Watt) | 108 | 172 -59% | 66 39% | 181.9 -68% | 134.7 -25% | 112 -4% | 108 -0% | 176.3 ? -63% | 114 ? -6% |
* ... Meglio usare valori piccoli
Power consumption Witcher 3 / Stress test
Power consumption with an external monitor
Durata della batteria
Il 16 pollici ha raggiunto tempi di esecuzione di 9:36 ore e 13:23 ore rispettivamente nel test WLAN (richiamo di siti web tramite uno script) e nel test video (cortometraggio Big Buck Bunny, codifica H.264, FHD, in loop). Durante entrambi i test, le funzioni di risparmio energetico del notebook sono state disattivate e la luminosità del display è stata impostata a circa 150 cd/m². Anche i moduli wireless sono stati disattivati durante il test video.
| Samsung Galaxy Book3 Ultra 16 i7-13700H, GeForce RTX 4050 Laptop GPU, 76 Wh | Schenker Vision 16 Pro RTX 3070 Ti i7-12700H, GeForce RTX 3070 Ti Laptop GPU, 80 Wh | LG Gram 17Z90Q-E.AD78G i7-1260P, GeForce RTX 2050 Mobile, 90 Wh | Lenovo ThinkBook 16p G3 ARH R9 6900HX, GeForce RTX 3060 Laptop GPU, 71 Wh | Dell XPS 15 9520 RTX 3050 Ti i7-12700H, GeForce RTX 3050 Ti Laptop GPU, 86 Wh | Asus VivoBook Pro 16X OLED N7600PC-L2026X i7-11370H, GeForce RTX 3050 4GB Laptop GPU, 96 Wh | Acer Swift X SFX16-52G-77RX i7-1260P, A370M, 56 Wh | Media della classe Multimedia | |
|---|---|---|---|---|---|---|---|---|
| Autonomia della batteria | -40% | 37% | -32% | 17% | -3% | -22% | 20% | |
| Reader / Idle (h) | 18.2 | 14.8 -19% | 11.1 -39% | 24.9 ? 37% | ||||
| H.264 (h) | 13.4 | 6.1 -54% | 10.4 -22% | 16.4 ? 22% | ||||
| WiFi v1.3 (h) | 9.6 | 6 -37% | 14.5 51% | 6.5 -32% | 8.8 -8% | 8.7 -9% | 9.1 -5% | 12.2 ? 27% |
| Load (h) | 1.8 | 1.3 -28% | 2.2 22% | 3.2 78% | 2.5 39% | 1.1 -39% | 1.668 ? -7% |
Pro
Contro
Conclusione - Un compromesso riuscito
Il Galaxy Book3 Ultra 16 è un buon compromesso tra prestazioni, mobilità ed ergonomia. Il Core i7-13700H e GeForce RTX 4050 funzionano a prestazioni ridotte, ma offrono comunque una potenza sufficiente per i giochi e il rendering in FHD.
Con Galaxy Book3 Ultra 16, Samsung offre un notebook mobile per giocatori e creativi. Tuttavia, il prezzo eccessivamente elevato getta un'ombra sul carattere altrimenti forte del portatile.
Il dispositivo compatto non pesa troppo (1,8 kg). In combinazione con una pratica durata della batteria da 9 a 13 ore, si ha tra le mani un dispositivo abbastanza mobile. La rumorosità e lo sviluppo di calore sono moderati. Due slot USB-C (Thunderbolt 4) sono utilizzati per l'alimentazione e consentono una facile integrazione nelle configurazioni di lavoro esistenti.
L'ampio schermo da 16 pollici (2.880 x 1.800, OLED) in formato 16:10, adatto al lavoro, si distingue per l'elevata luminosità, l'eccellente contrasto, gli angoli di visione stabili, i tempi di risposta brevi, l'ottima riproduzione dei colori e l'ottima copertura dello spazio colore. L'aspetto negativo è che il pannello ha una superficie riflettente e utilizza il PWM per tutti i livelli di luminosità: un dispositivo da 2399,99 dollari dovrebbe offrire di più.
Anche la RAM, con 16 GB, è un po' scarsa. Un dispositivo con le caratteristiche del Galaxy Book dovrebbe offrire 32 GB, soprattutto perché la memoria (integrata) non può essere espansa. Almeno sono disponibili modelli da 32 GB di prezzo superiore.
Il Schenker Vision 16 Pro potrebbe essere considerato un'alternativa. Offre maggiori prestazioni grafiche e RAM espandibile, ma è svantaggiato in termini di tempi di esecuzione ed emissioni. Il Asus VivoBook Pro 16X OLED (circa 1.400 dollari) e l' Acer Swift X 16 (circa 1.100 dollari) sono alternative più economiche e più deboli del computer Samsung. Offrono prestazioni inferiori, tempi di esecuzione occasionalmente più brevi e memoria di lavoro saldata in modo permanente.
Prezzo e disponibilità
La configurazione del nostro dispositivo di prova è disponibile tramite Amazon UK e Amazon Canada rispettivamente a 2.449,00 sterline e 2.799,99 dollari CAD. Negli Stati Uniti, 1 TB sembra essere la configurazione minima sul sito Samsunga partire da 2399,99 dollari.
Samsung Galaxy Book3 Ultra 16
- 04/26/2023 v7 (old)
Sascha Mölck
Transparency
La selezione dei dispositivi da recensire viene effettuata dalla nostra redazione. Il campione di prova è stato fornito all'autore come prestito dal produttore o dal rivenditore ai fini di questa recensione. L'istituto di credito non ha avuto alcuna influenza su questa recensione, né il produttore ne ha ricevuto una copia prima della pubblicazione. Non vi era alcun obbligo di pubblicare questa recensione. In quanto società mediatica indipendente, Notebookcheck non è soggetta all'autorità di produttori, rivenditori o editori.
Ecco come Notebookcheck esegue i test
Ogni anno, Notebookcheck esamina in modo indipendente centinaia di laptop e smartphone utilizzando procedure standardizzate per garantire che tutti i risultati siano comparabili. Da circa 20 anni sviluppiamo continuamente i nostri metodi di prova e nel frattempo stabiliamo gli standard di settore. Nei nostri laboratori di prova, tecnici ed editori esperti utilizzano apparecchiature di misurazione di alta qualità. Questi test comportano un processo di validazione in più fasi. Il nostro complesso sistema di valutazione si basa su centinaia di misurazioni e parametri di riferimento ben fondati, che mantengono l'obiettività.Price comparison

