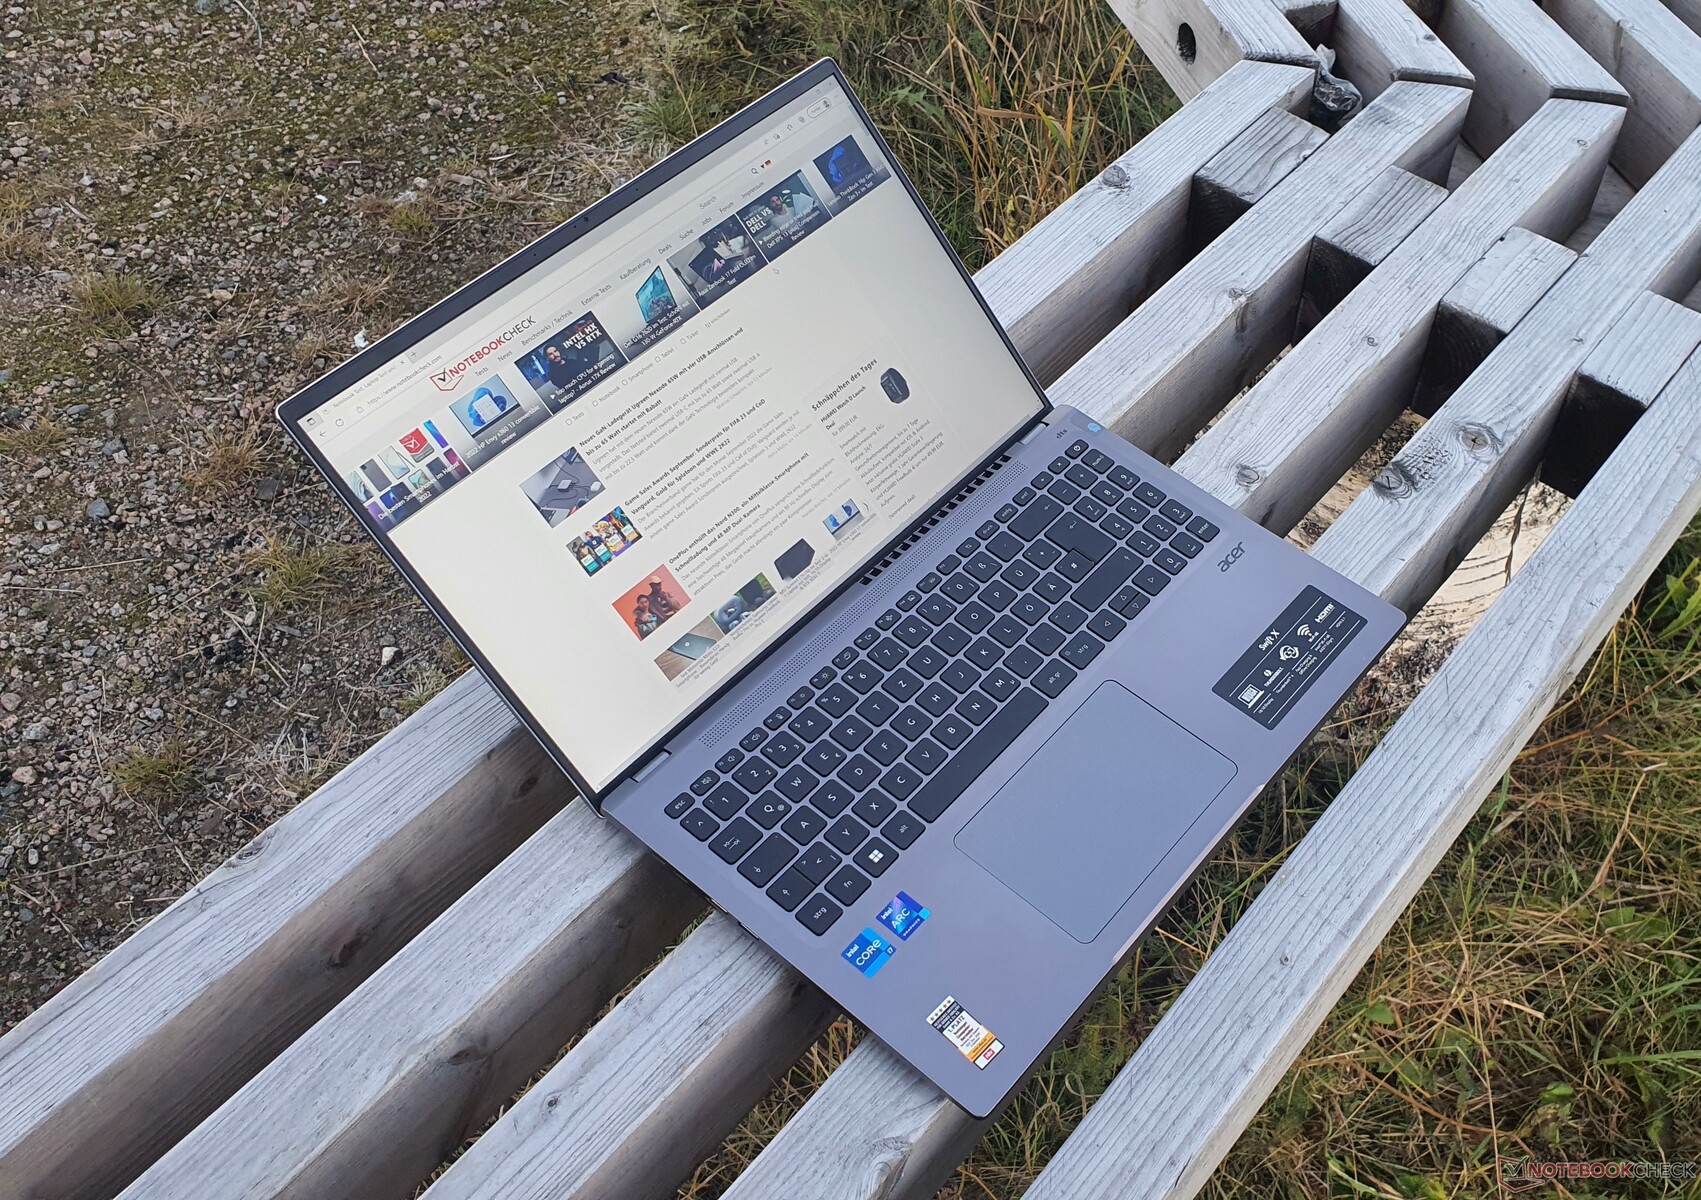
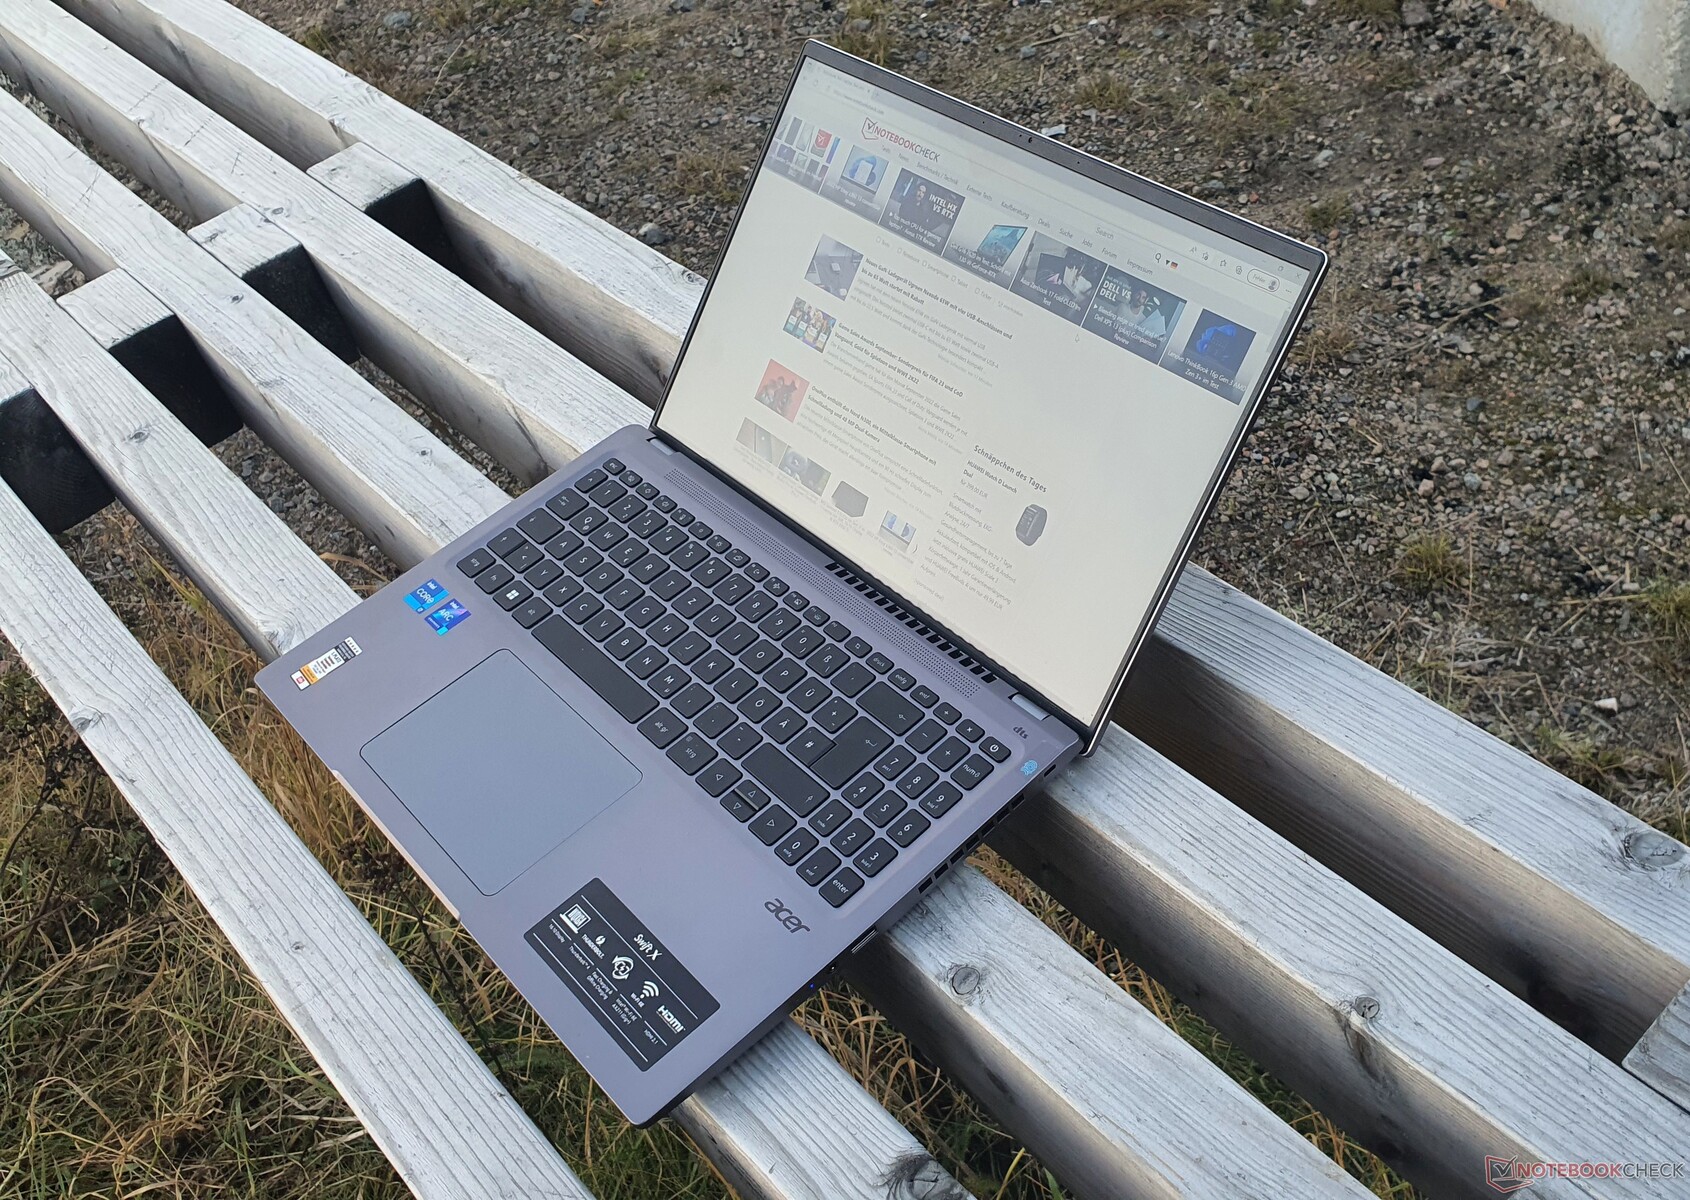
Recensione dell'Acer Swift X 16 (2022): un portatile da 16 pollici con potenti aggiornamenti
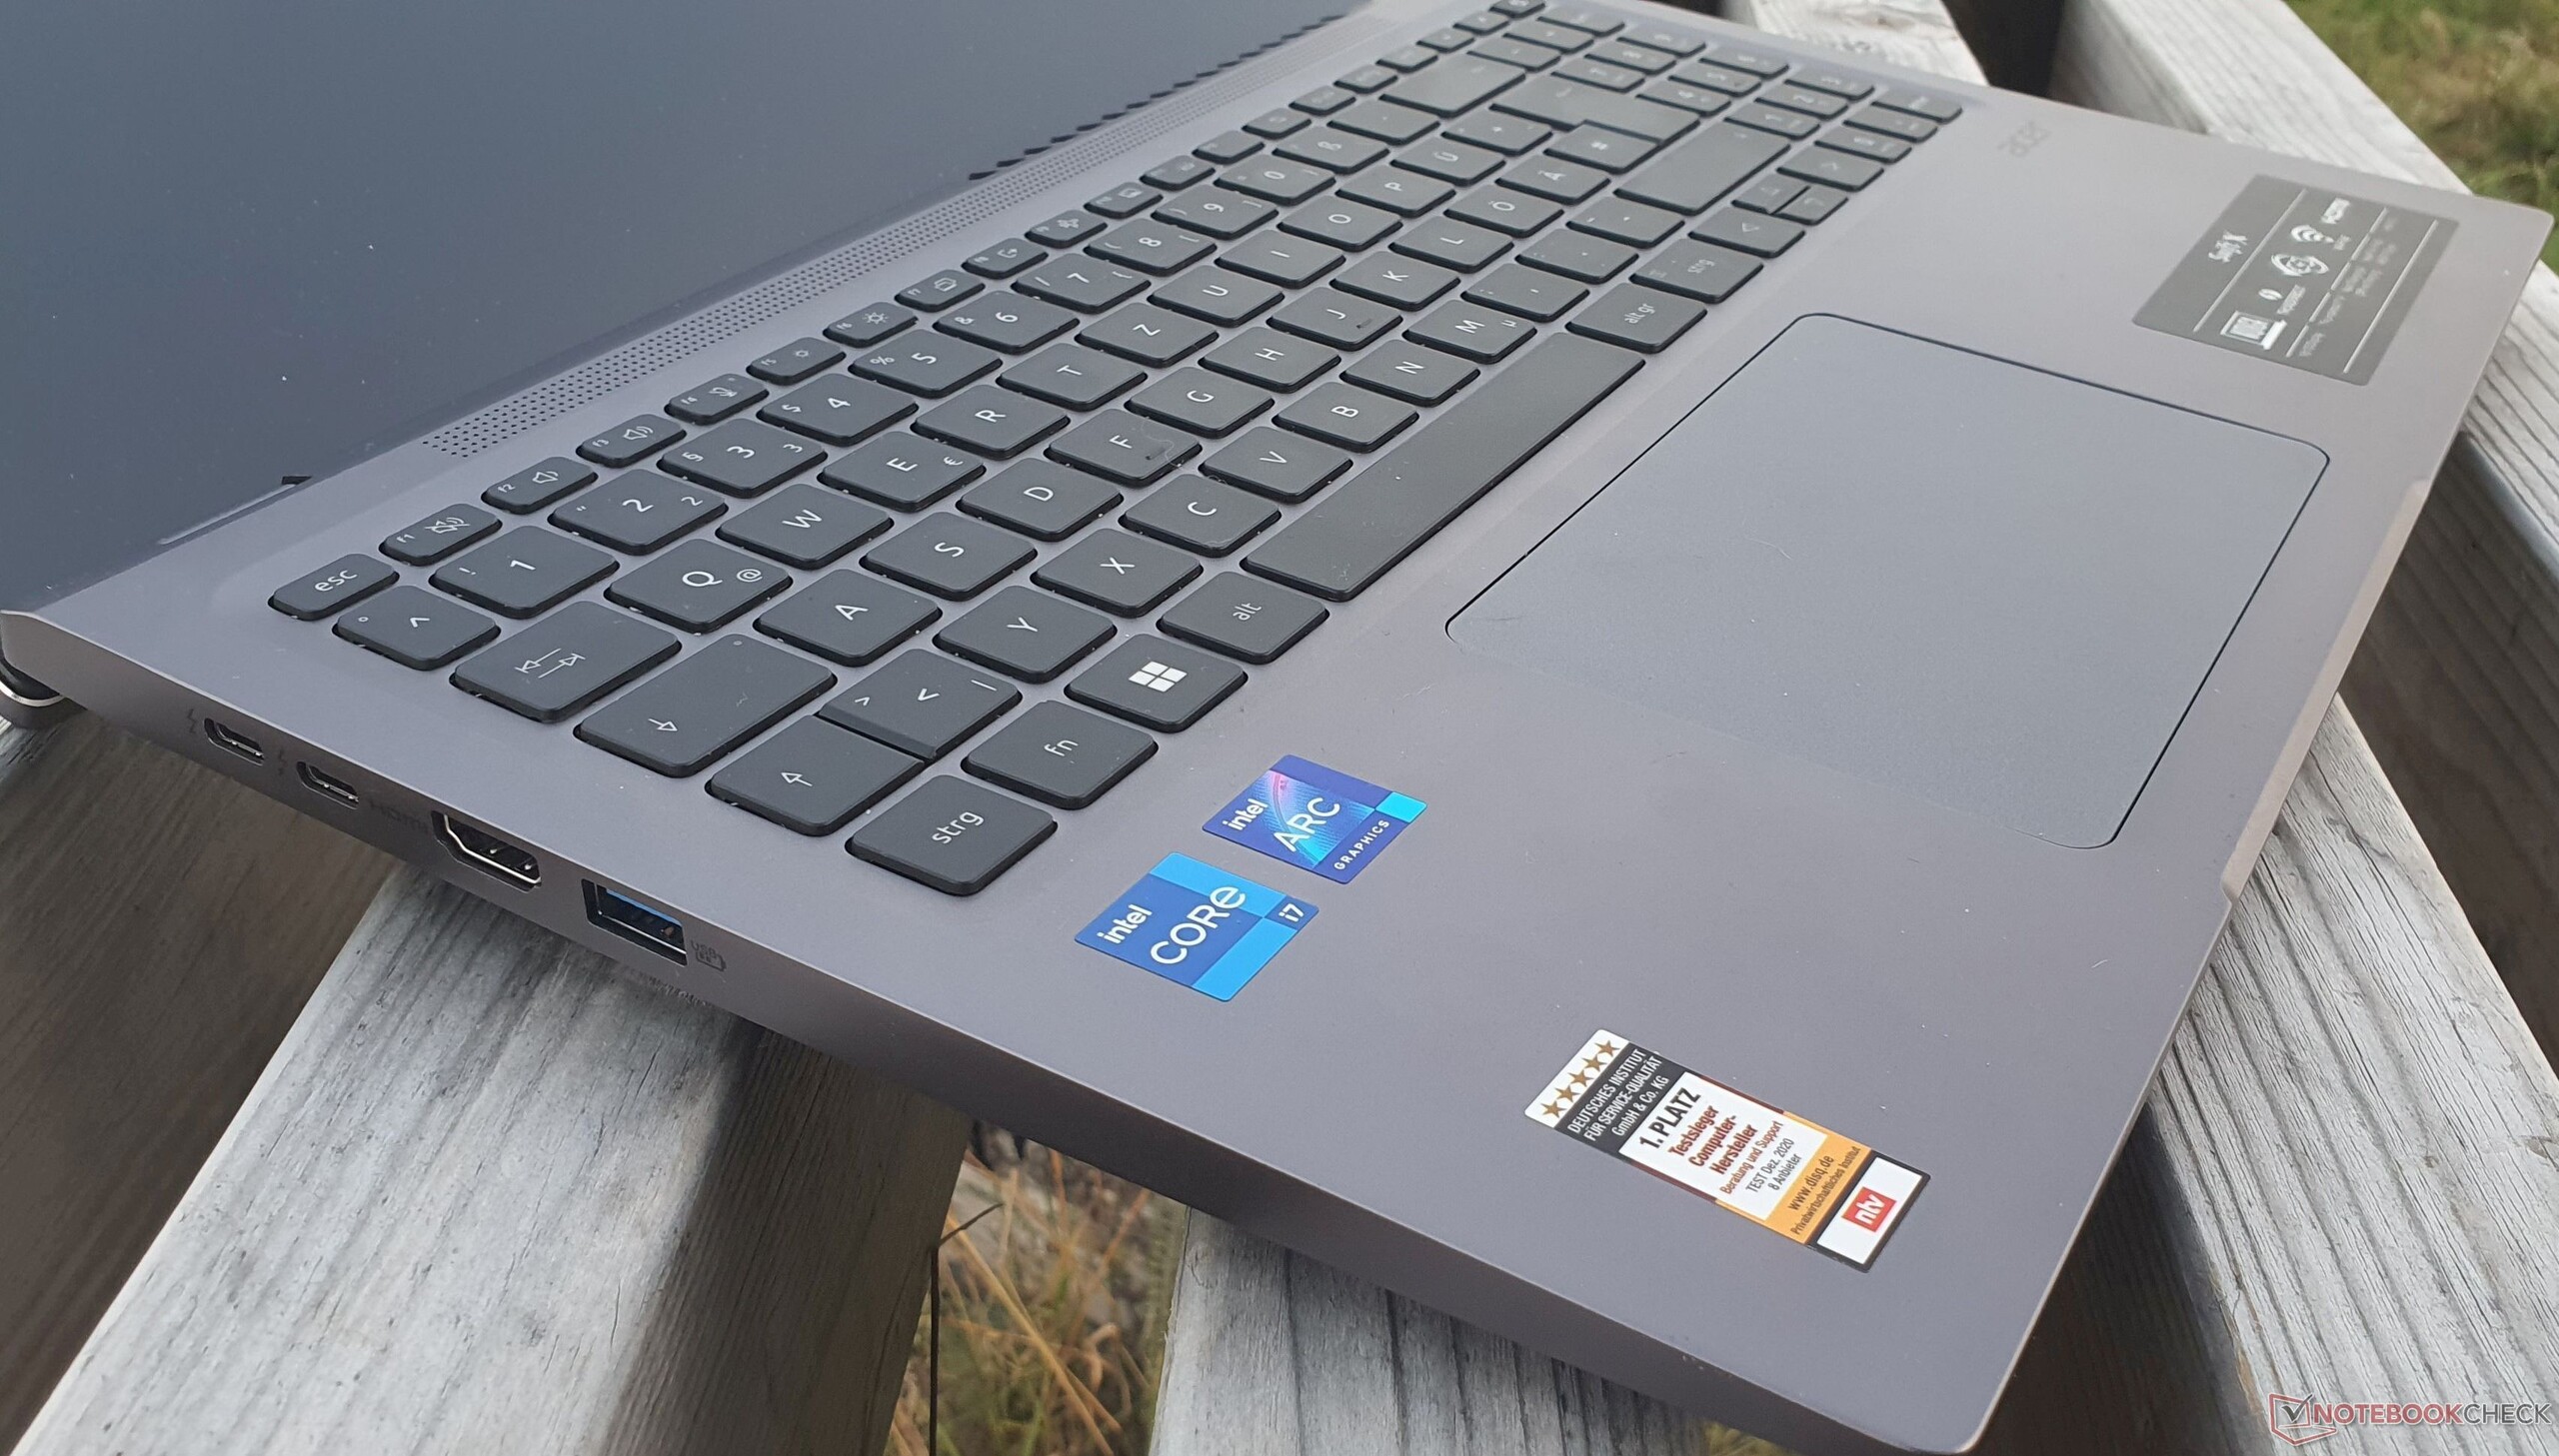
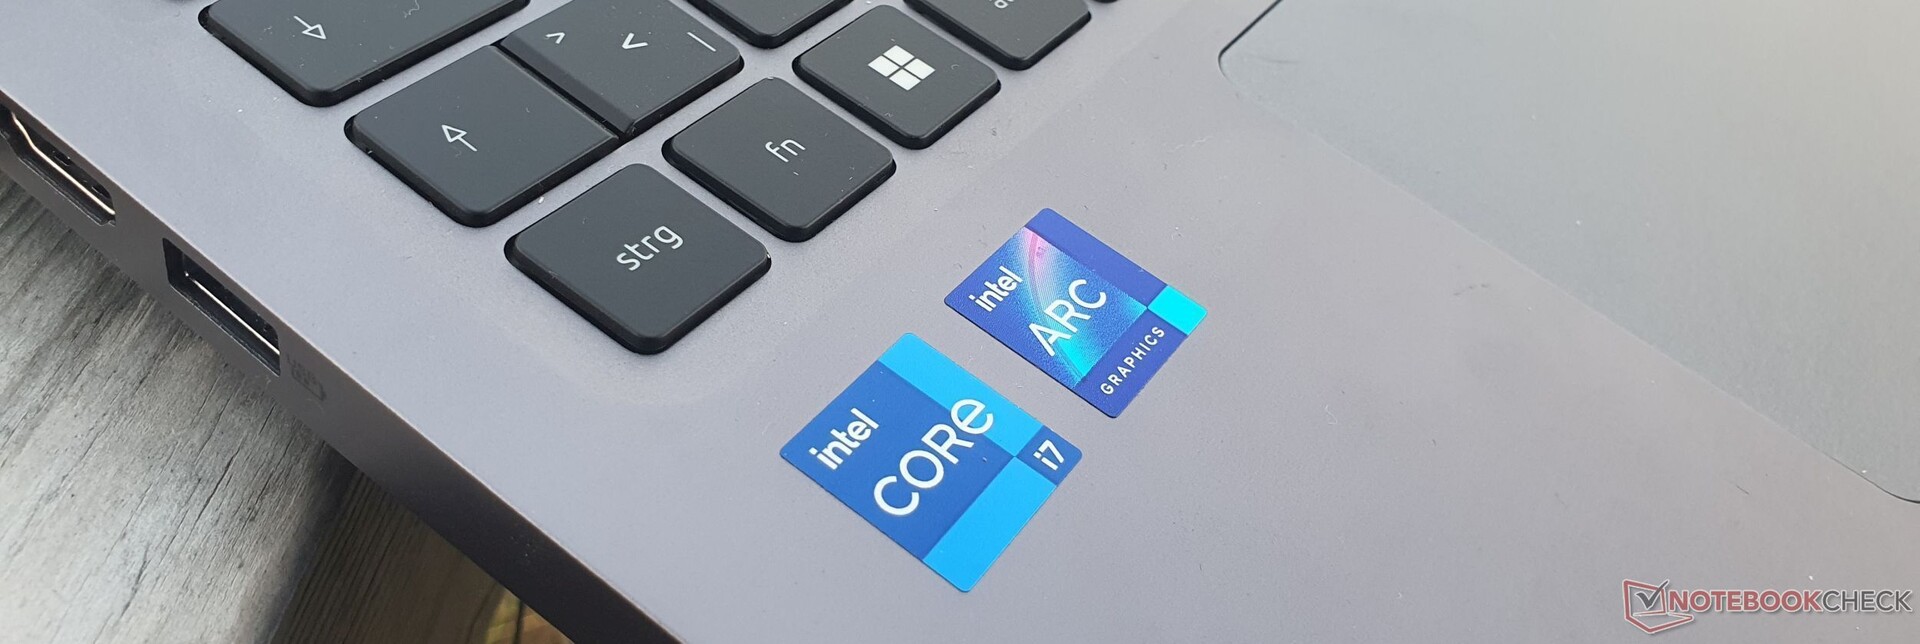
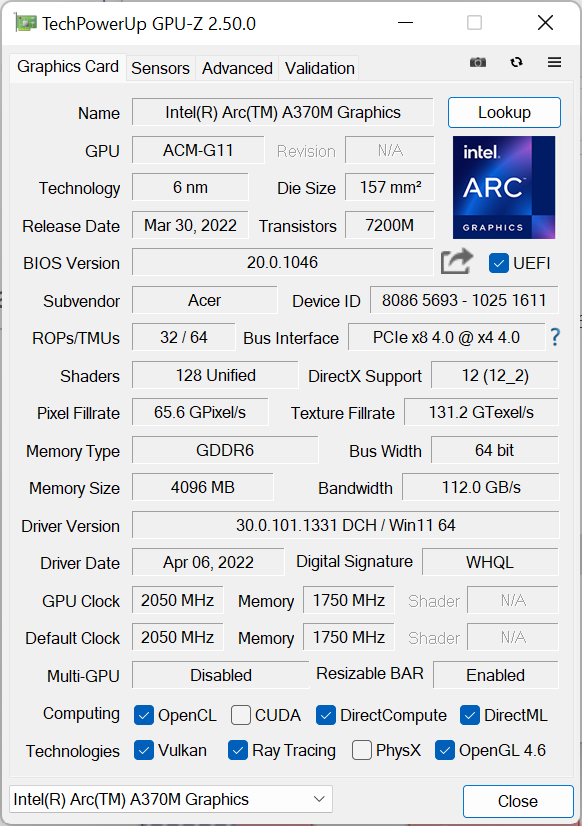
L'Acer Swift X 16 (2022) ha ricevuto molti miglioramenti: Un luminoso display da 16 pollici con risoluzione di 2,5K in formato 16:10 gestito da Intel Arc A370M, unCore i7-1260Pe un veloce SSD PCIe 4.0 da 1 TB. In tutti i casi, sono presenti 16 GB di RAM DDR5 4800 saldata. Anche alcuni miglioramenti minori, come l'HDMI 2.1 e la webcam a 1080p, vanno a vantaggio del portatile multimediale.
Con l'attuale generazione di Swift X 16, Acer è riuscita a colmare molte lacune del predecessore. Ma come si comporta Arc A370M di Inteldi Intel rispetto a una Nvidia GeForce RTX 3050 Tiin dispositivi di confronto come il Dell Inspiron 16 Pluse Asus Vivobook Pro 16Xo laRTX 2050 nel Lenovo ThinkBook 16 G4+?
Dal momento che, a parte la CPU e l'SSD, il modello fratello che abbiamo recentemente testato è identico, per i dettagli sul case, l'equipaggiamento, i dispositivi di input e la comunicazione, vi rimandiamo alla corrispondente recensione dell' Acer Swift X SFX16-52G-52VE. Anche il display utilizzato è identico.
Altre recensioni Acer:
Potenziali concorrenti a confronto
Punteggio | Data | Modello | Peso | Altezza | Dimensione | Risoluzione | Prezzo |
|---|---|---|---|---|---|---|---|
| 86.4 % v7 (old) | 11/2022 | Acer Swift X SFX16-52G-77RX i7-1260P, A370M | 1.8 kg | 21.2 mm | 16.00" | 2560x1600 | |
| 88.4 % v7 (old) | 09/2022 | Lenovo ThinkBook 16 G4+ IAP i7-12700H, GeForce RTX 2050 Mobile | 1.8 kg | 16.5 mm | 16.00" | 2560x1600 | |
| 87.4 % v7 (old) | 08/2022 | Dell Inspiron 16 Plus 7620 i7-12700H, GeForce RTX 3050 Ti Laptop GPU | 2.1 kg | 18.99 mm | 16.00" | 3072x1920 | |
| 86.9 % v7 (old) | 09/2022 | HP Envy 16 h0112nr i7-12700H, GeForce RTX 3060 Laptop GPU | 2.3 kg | 19.8 mm | 16.00" | 3840x2400 | |
| 86.2 % v7 (old) | 11/2022 | Acer Swift X SFX16-52G-52VE i5-1240P, A370M | 1.8 kg | 21.3 mm | 16.00" | 2560x1600 | |
| 86.2 % v7 (old) | 07/2022 | Acer Swift X SFX16-51G-5388 i5-11320H, GeForce RTX 3050 4GB Laptop GPU | 1.8 kg | 18.9 mm | 16.10" | 1920x1080 | |
| 85.7 % v7 (old) | 09/2022 | Lenovo IdeaPad 5 Pro 16ARH7 R5 6600HS, Radeon 660M | 1.9 kg | 18.4 mm | 16.00" | 2560x1600 | |
v (old) | 12/2021 | Asus Vivobook Pro 16X-M7600QE R9 5900HX, GeForce RTX 3050 Ti Laptop GPU | 1.9 kg | 19 mm | 16.10" | 3840x2400 |
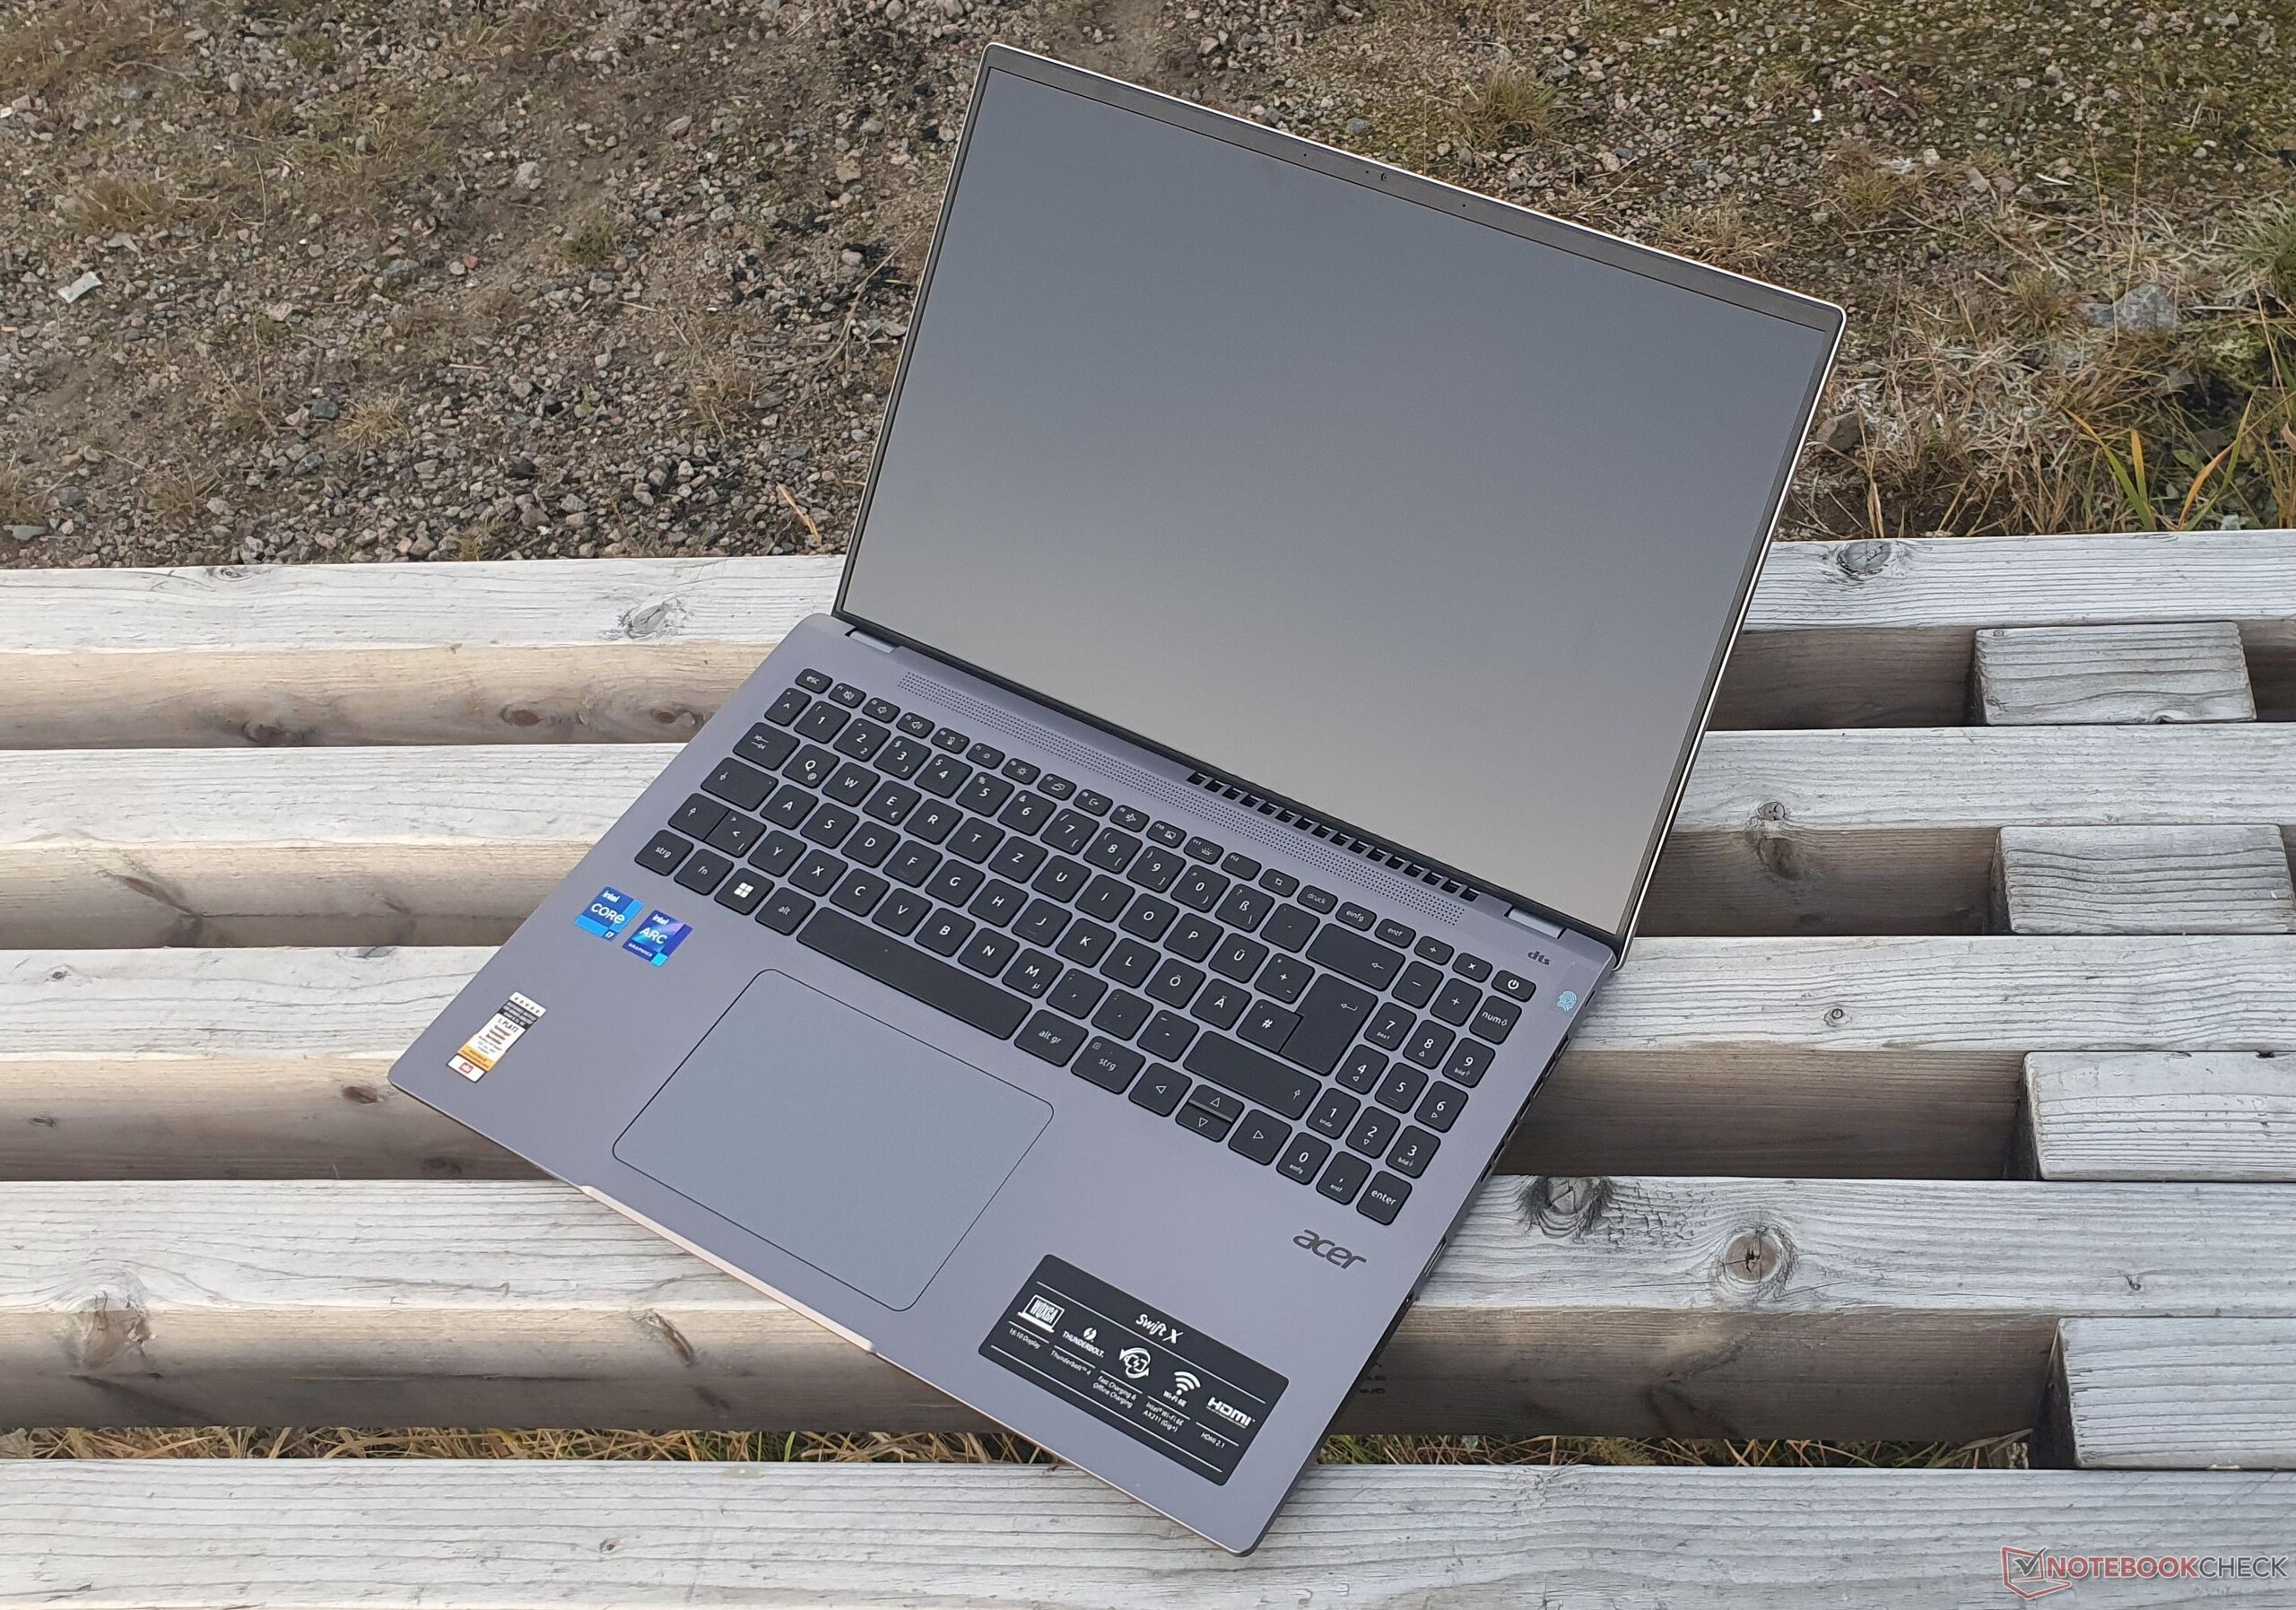
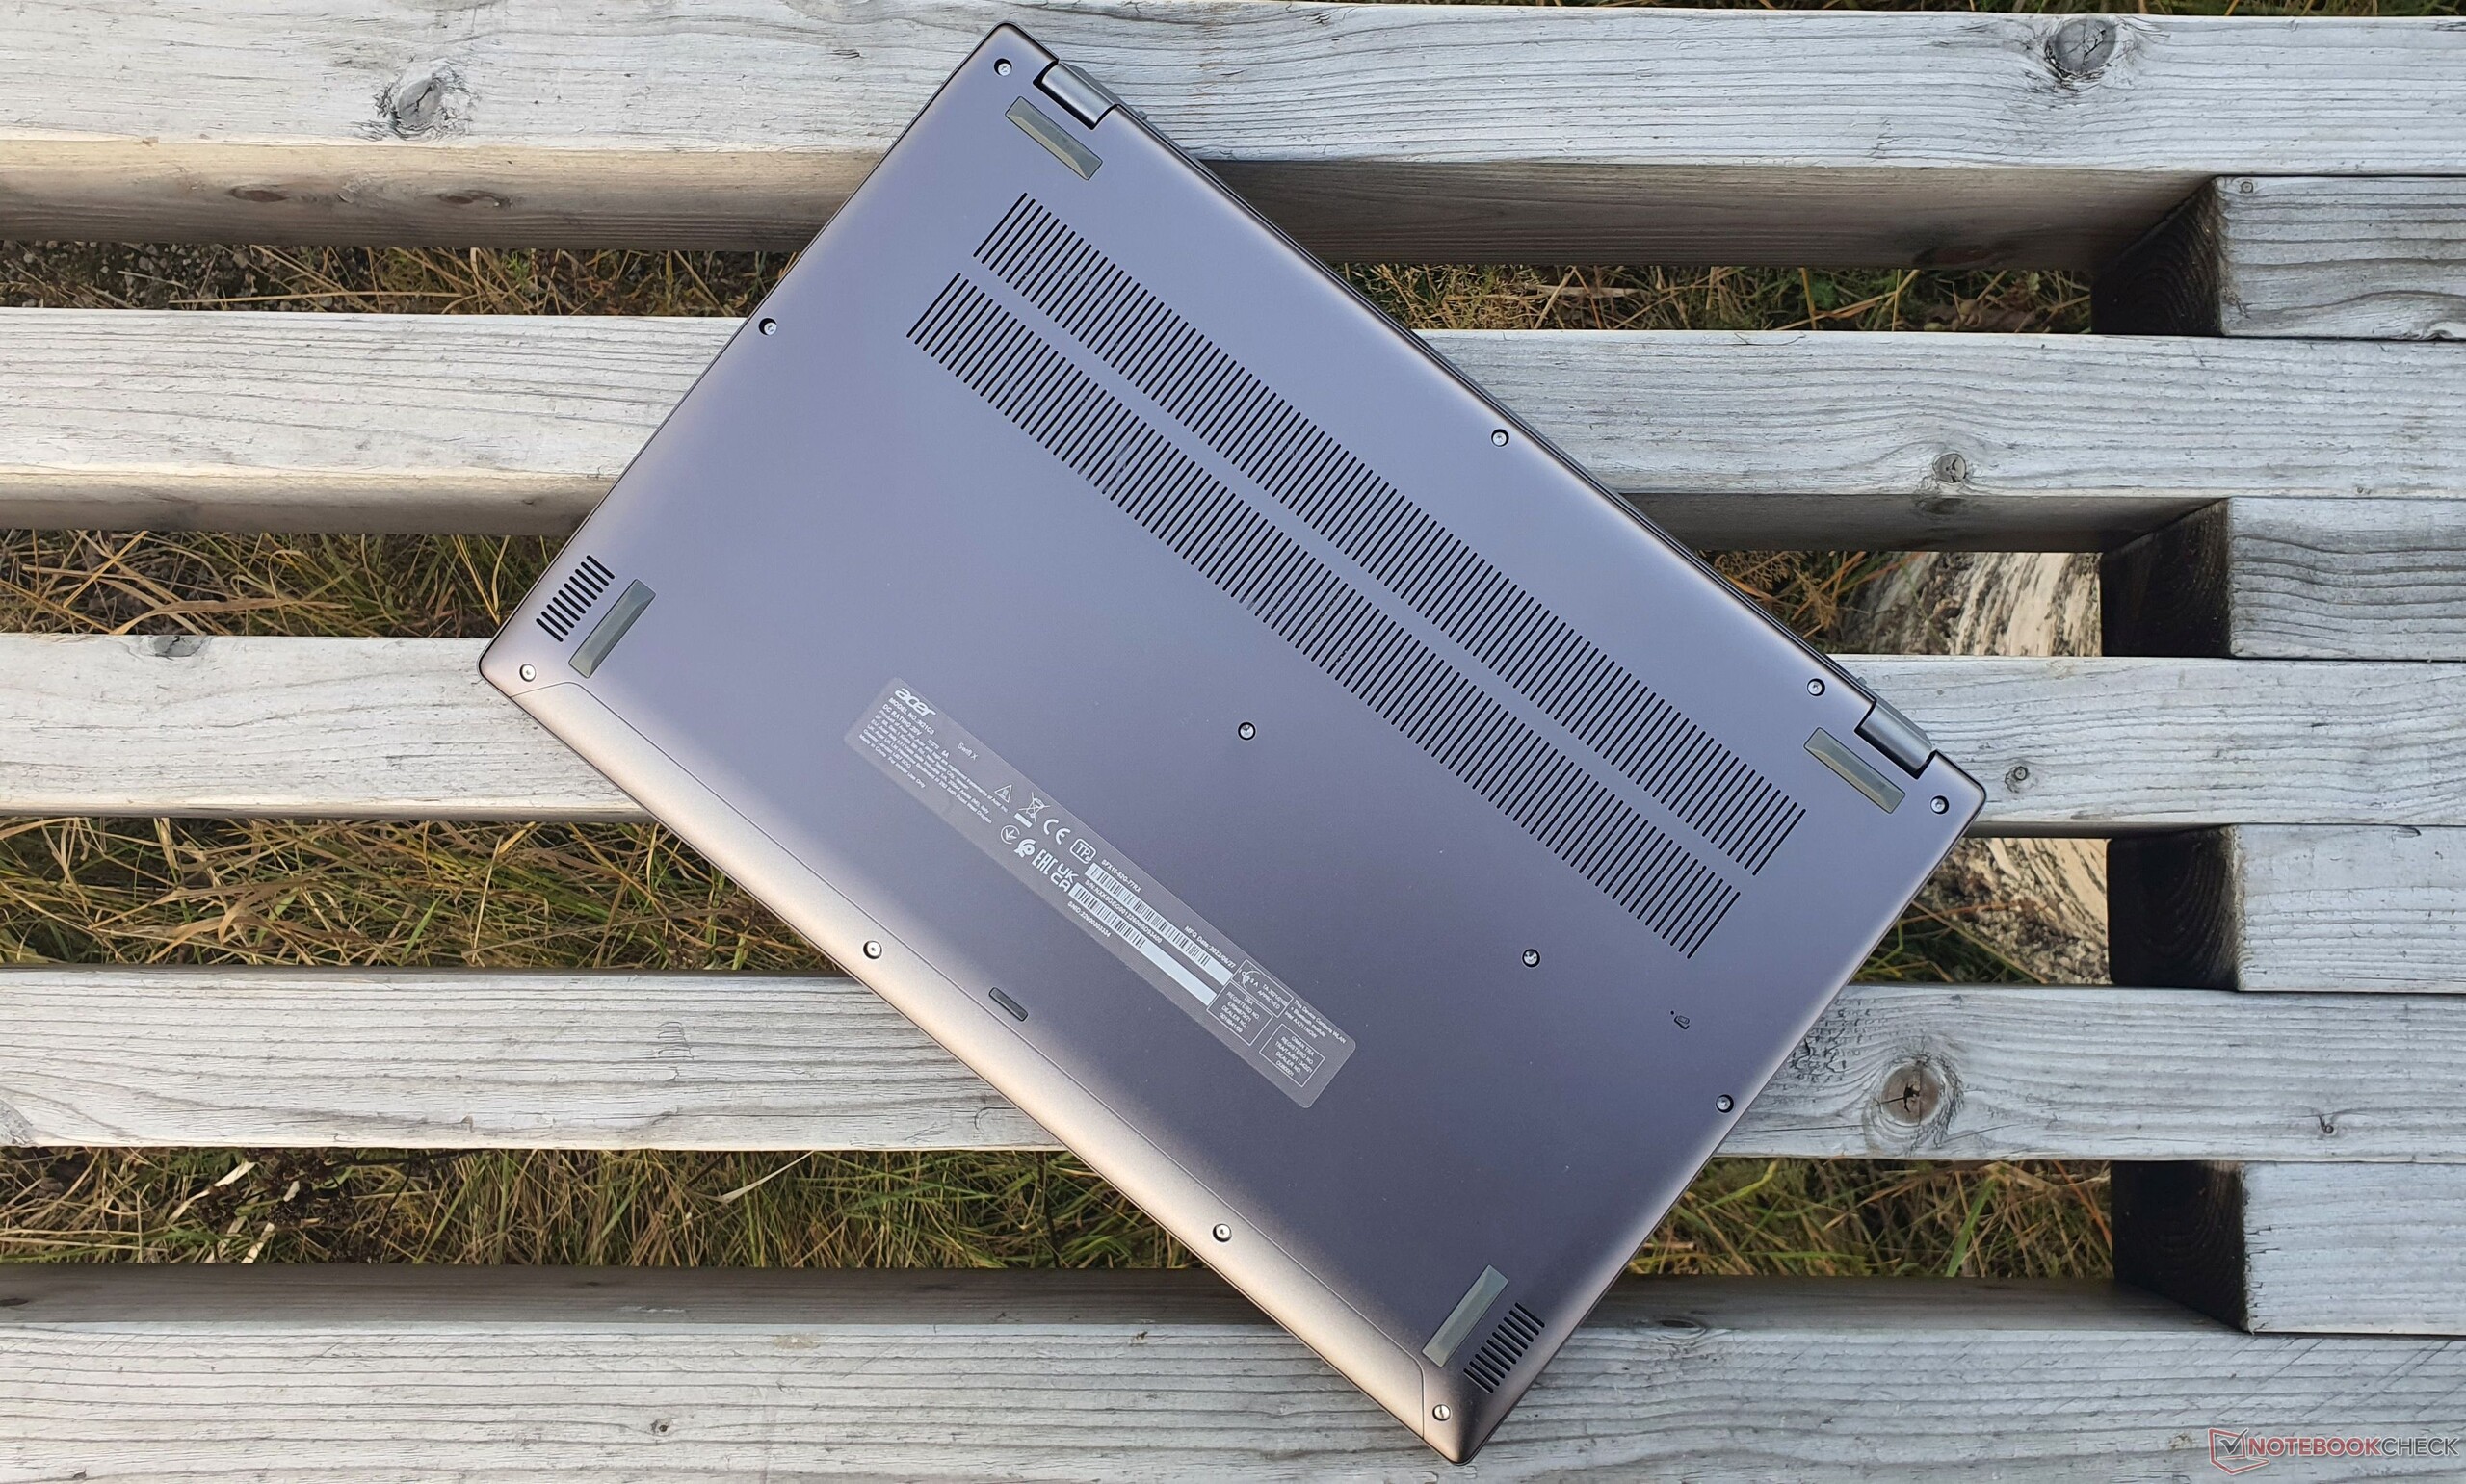
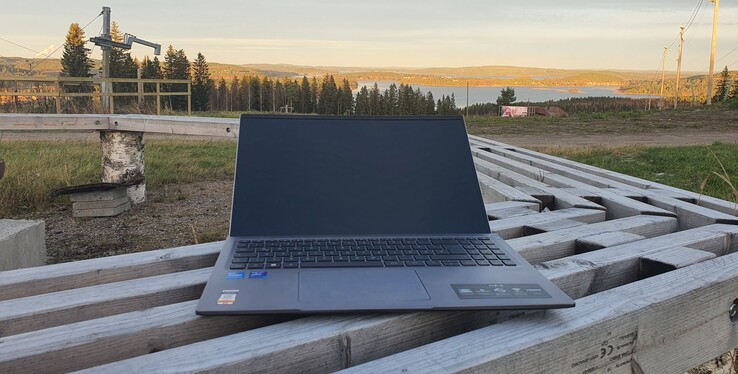
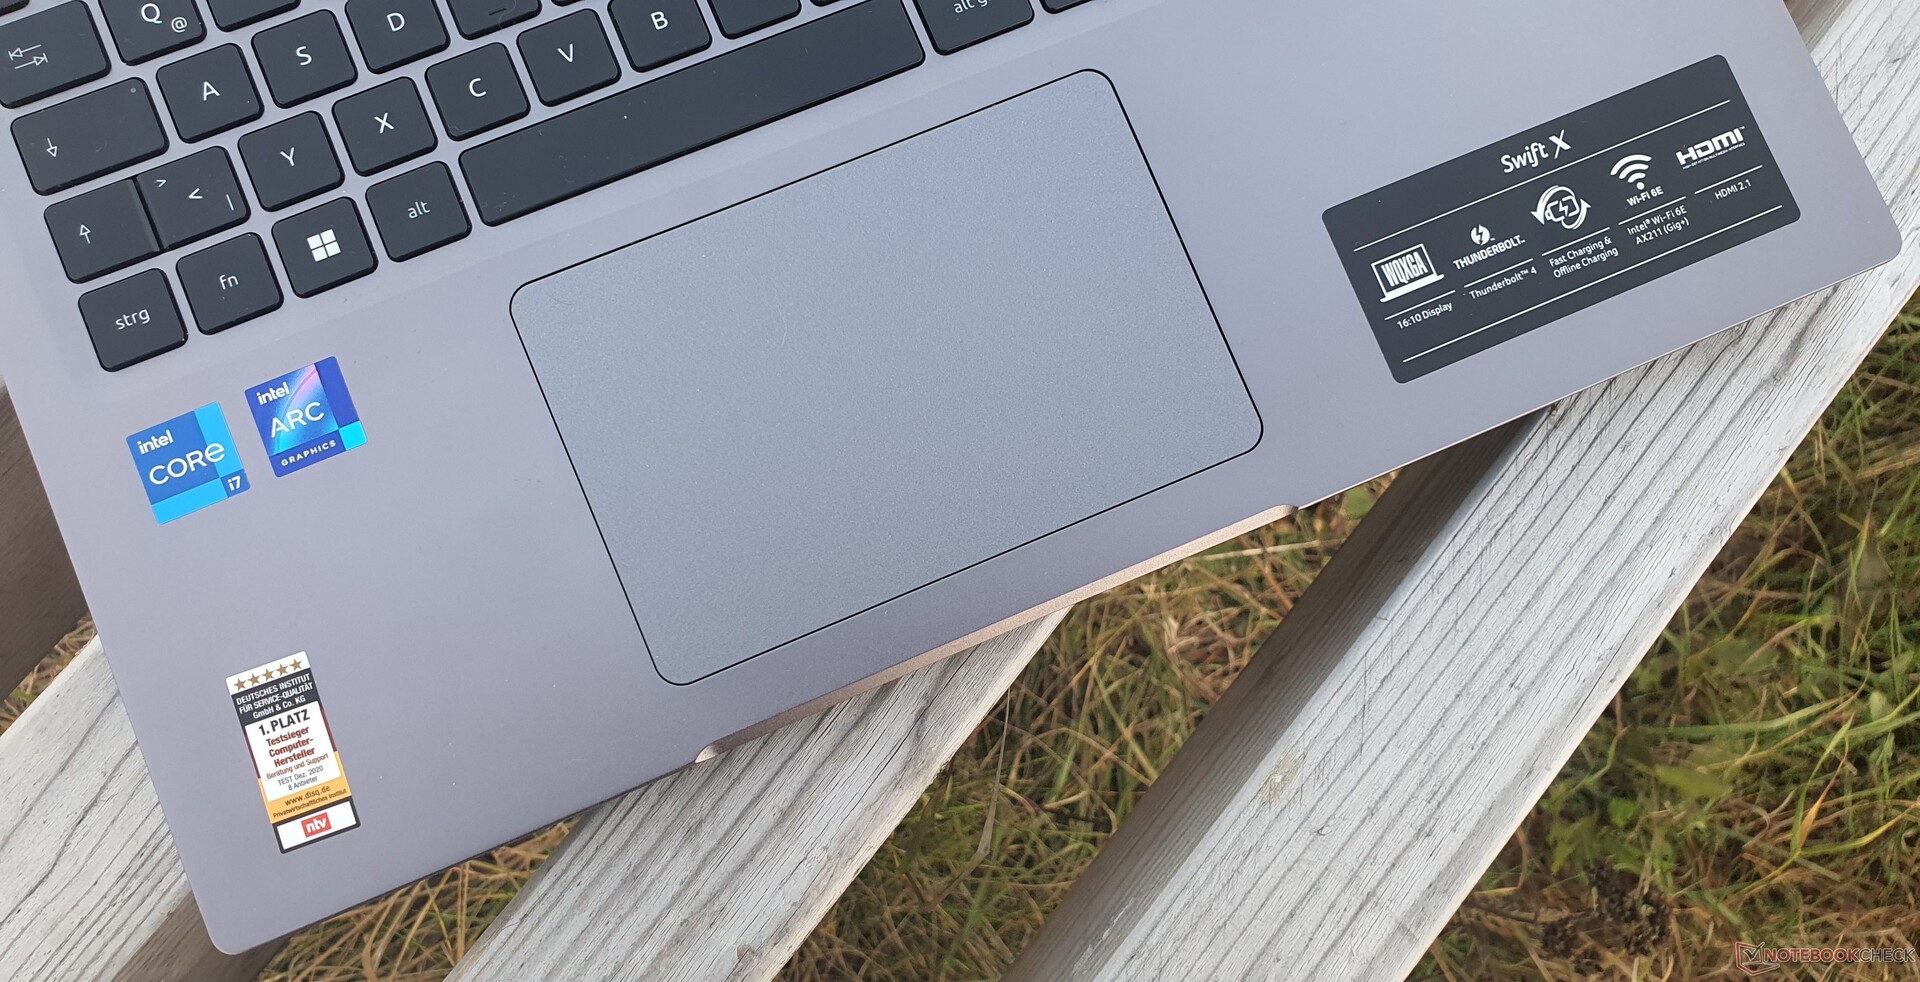
Poiché l'intero fondo della cassa è rigonfio, lo spessore massimo della cassa è di circa 21 mm. La specifica del produttore di 17,9 mm (~0,7 in) si riferisce a una misurazione che non tiene conto di questo rigonfiamento.
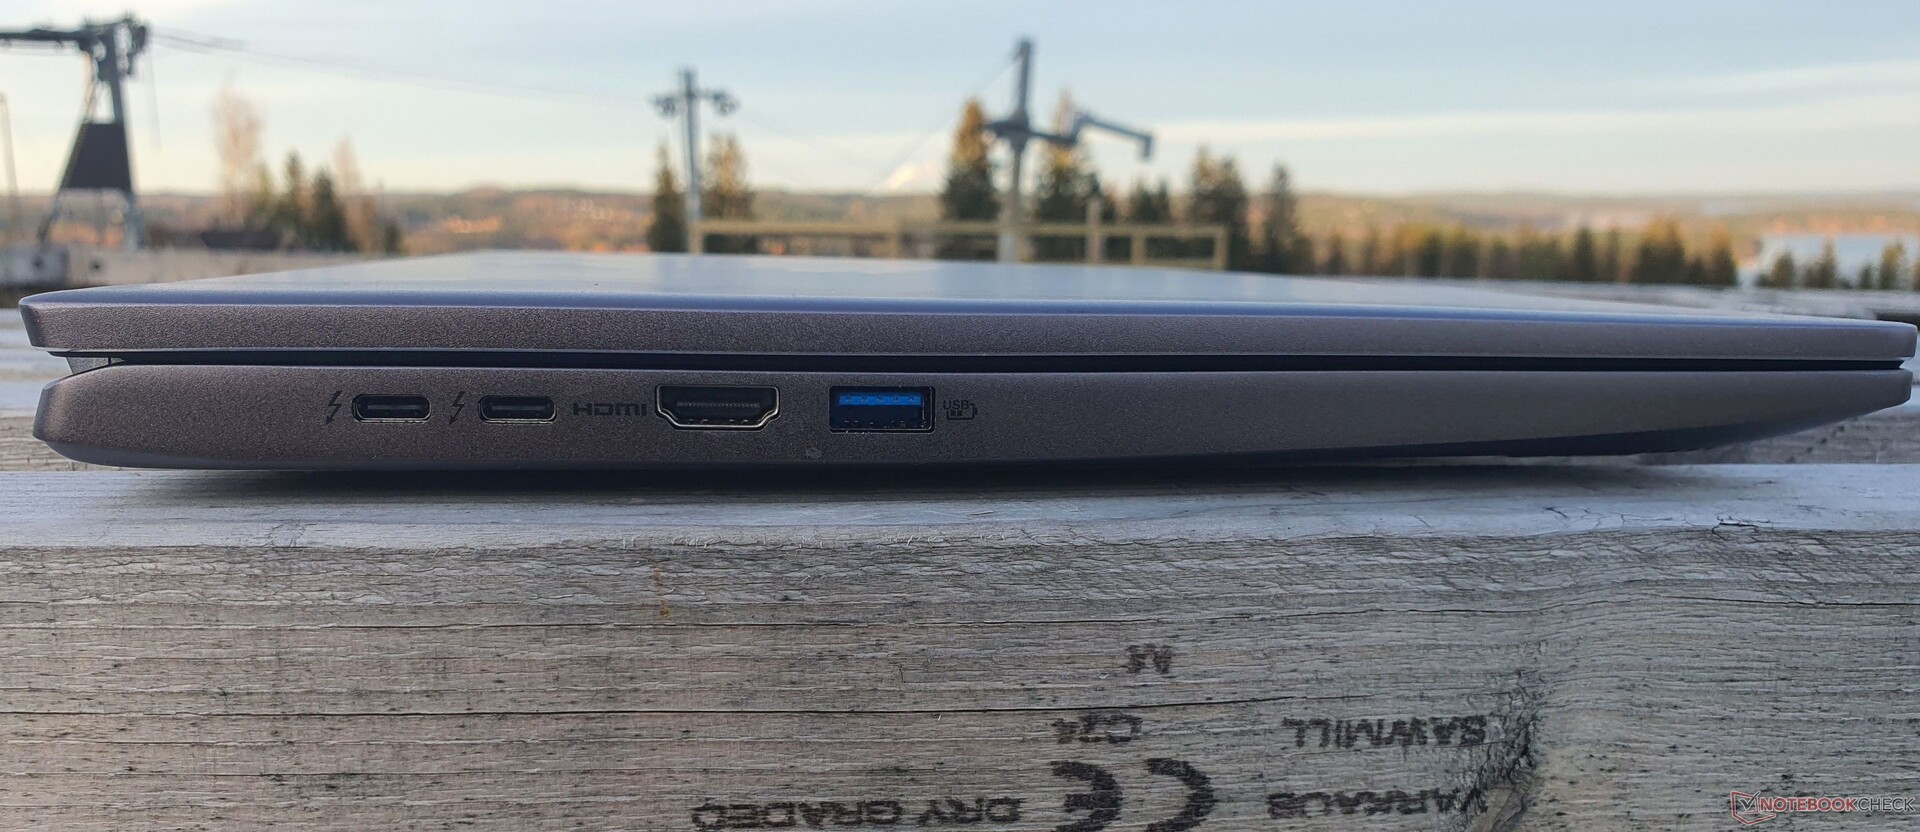
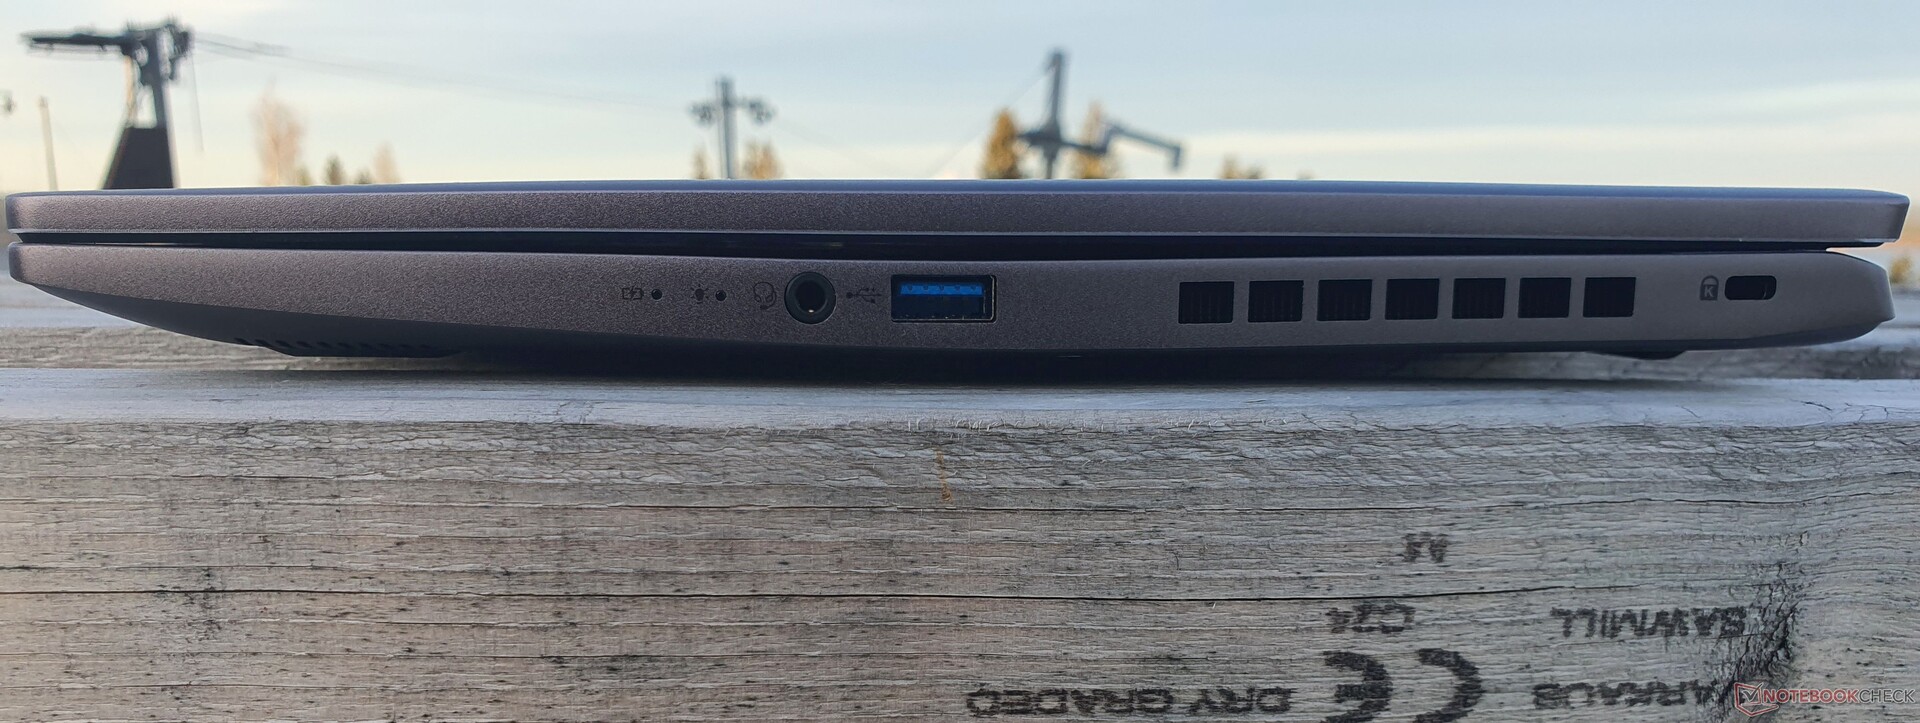
Apparecchiatura: Aggiornamento a HDMI 2.1 e TB4 per Acer Swift X
| Networking | |
| Acer Swift X SFX16-52G-77RX | |
| iperf3 receive AXE11000 | |
| iperf3 transmit AXE11000 | |
| Acer Swift X SFX16-52G-52VE | |
| iperf3 receive AXE11000 | |
| iperf3 transmit AXE11000 | |
| Acer Swift X SFX16-51G-5388 | |
| iperf3 transmit AX12 | |
| iperf3 receive AX12 | |
| Lenovo ThinkBook 16 G4+ IAP | |
| iperf3 receive AXE11000 | |
| iperf3 transmit AXE11000 | |
| HP Envy 16 h0112nr | |
| iperf3 receive AXE11000 6GHz | |
| iperf3 transmit AXE11000 6GHz | |
| Dell Inspiron 16 Plus 7620 | |
| iperf3 receive AXE11000 6GHz | |
| iperf3 transmit AXE11000 6GHz | |
| Lenovo IdeaPad 5 Pro 16ARH7 | |
| iperf3 receive AXE11000 | |
| iperf3 transmit AXE11000 | |
| Asus Vivobook Pro 16X-M7600QE | |
| iperf3 transmit AX12 | |
| iperf3 receive AX12 | |
WiFi Chart
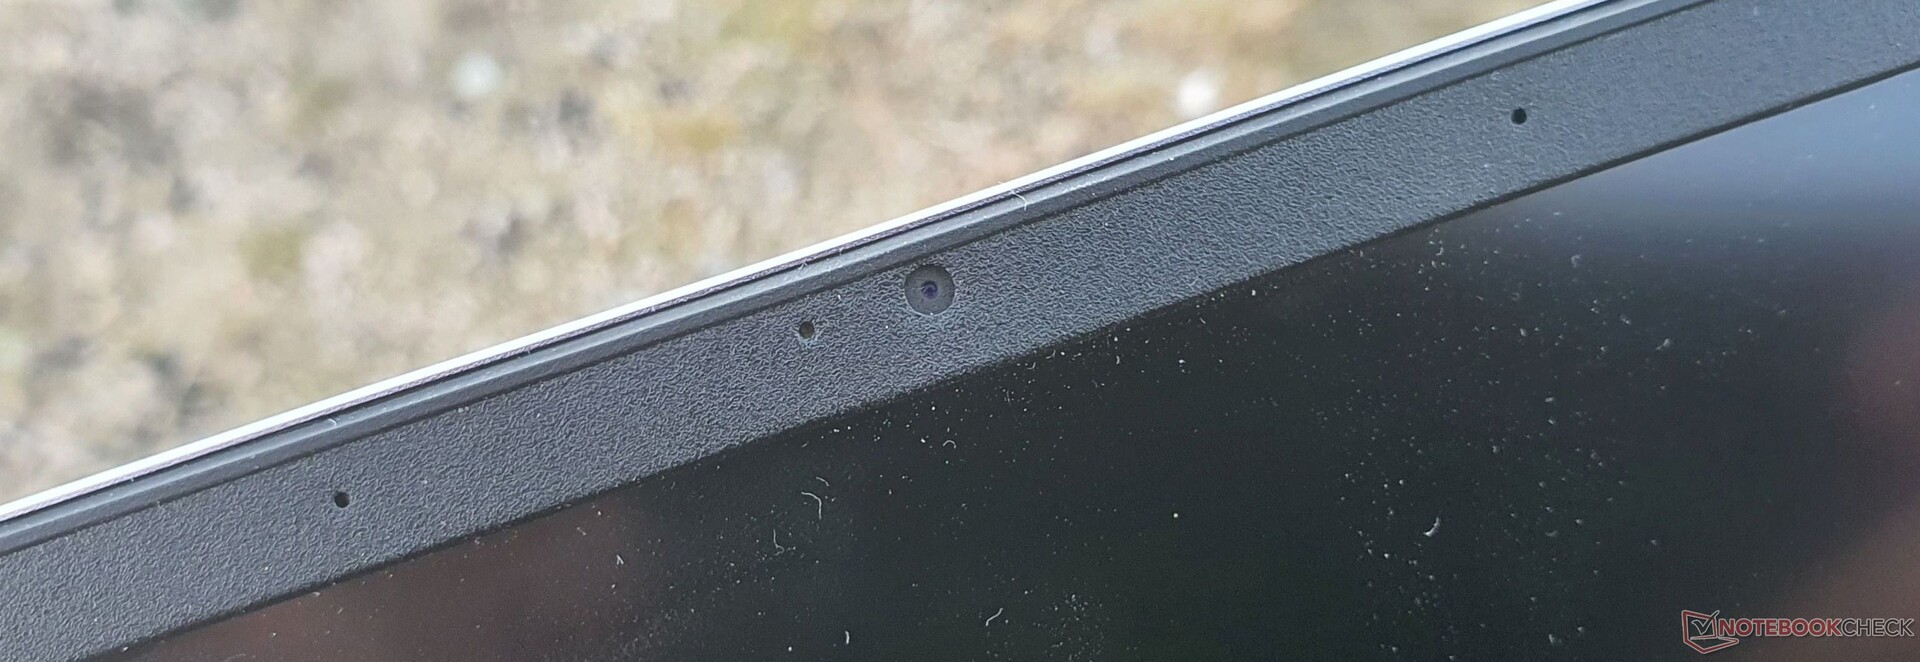
Webcam


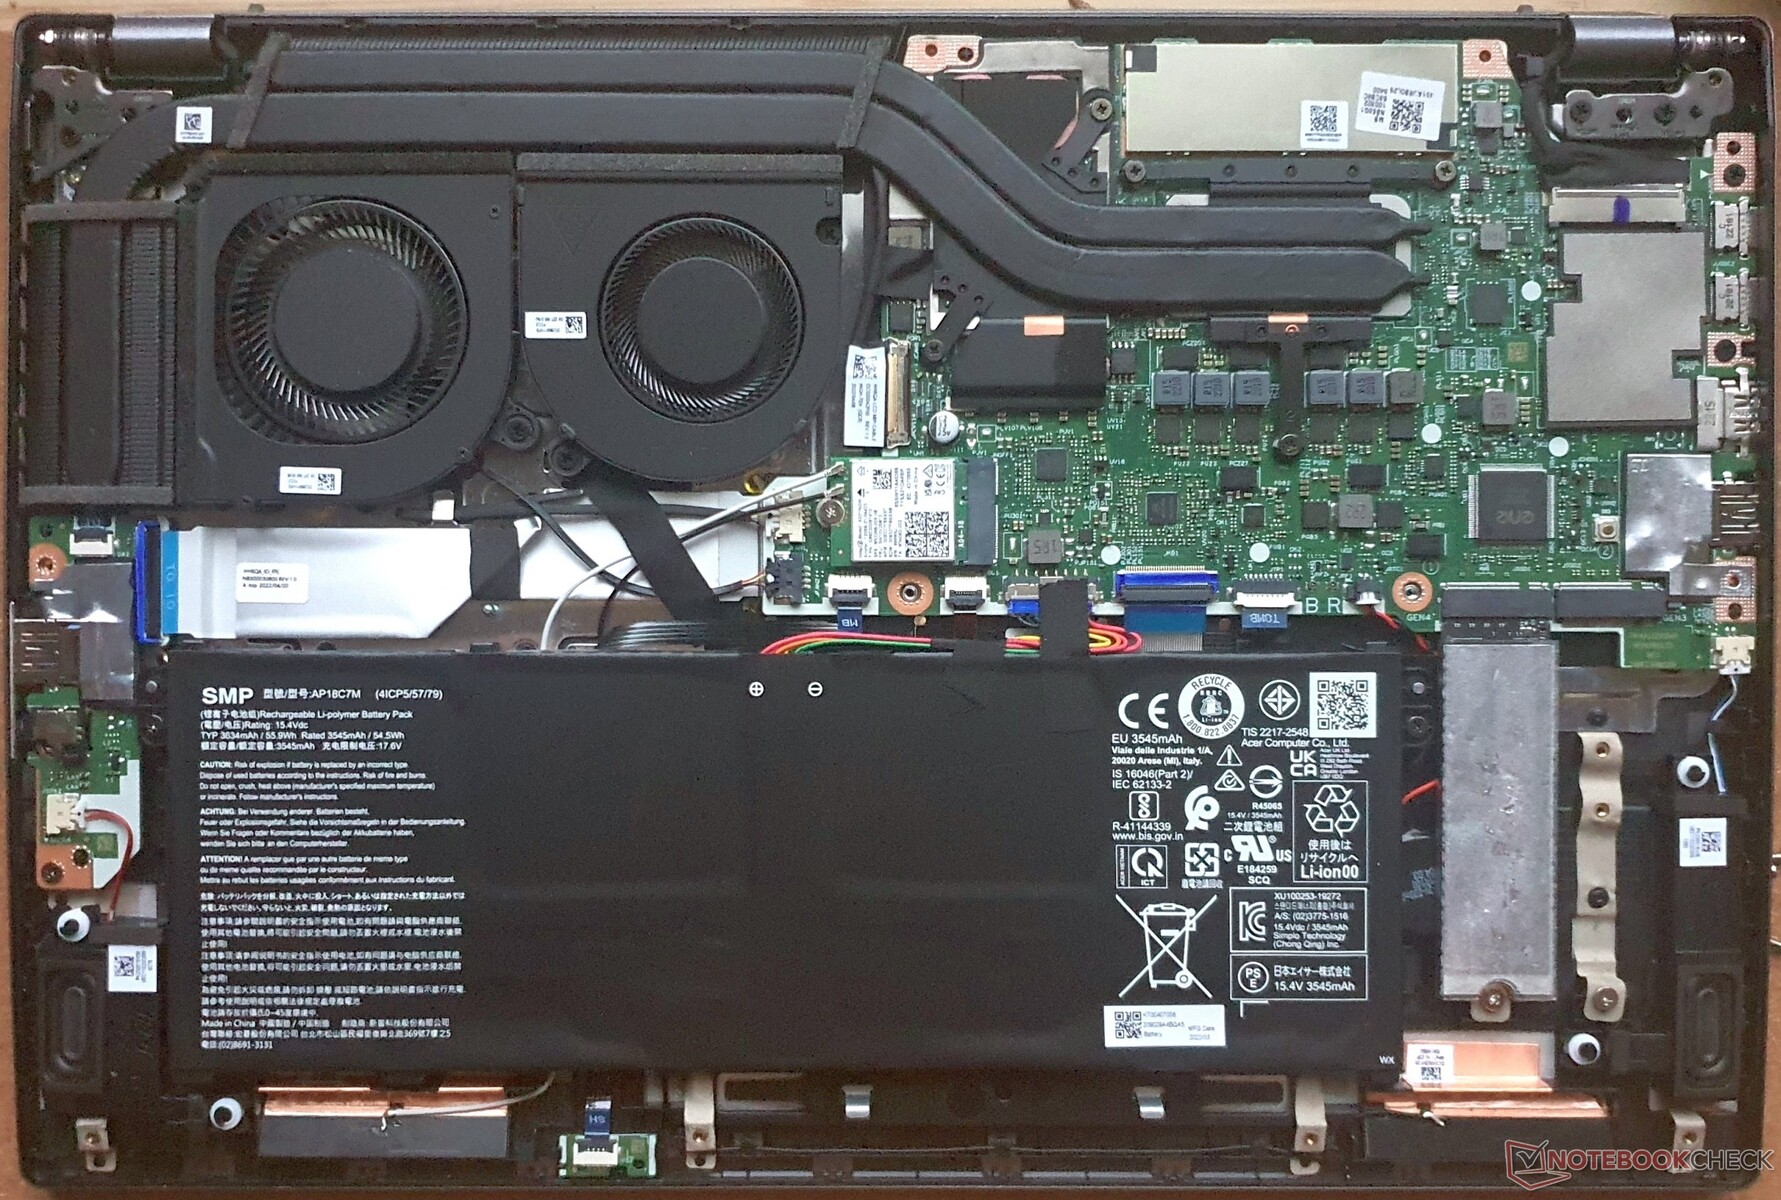
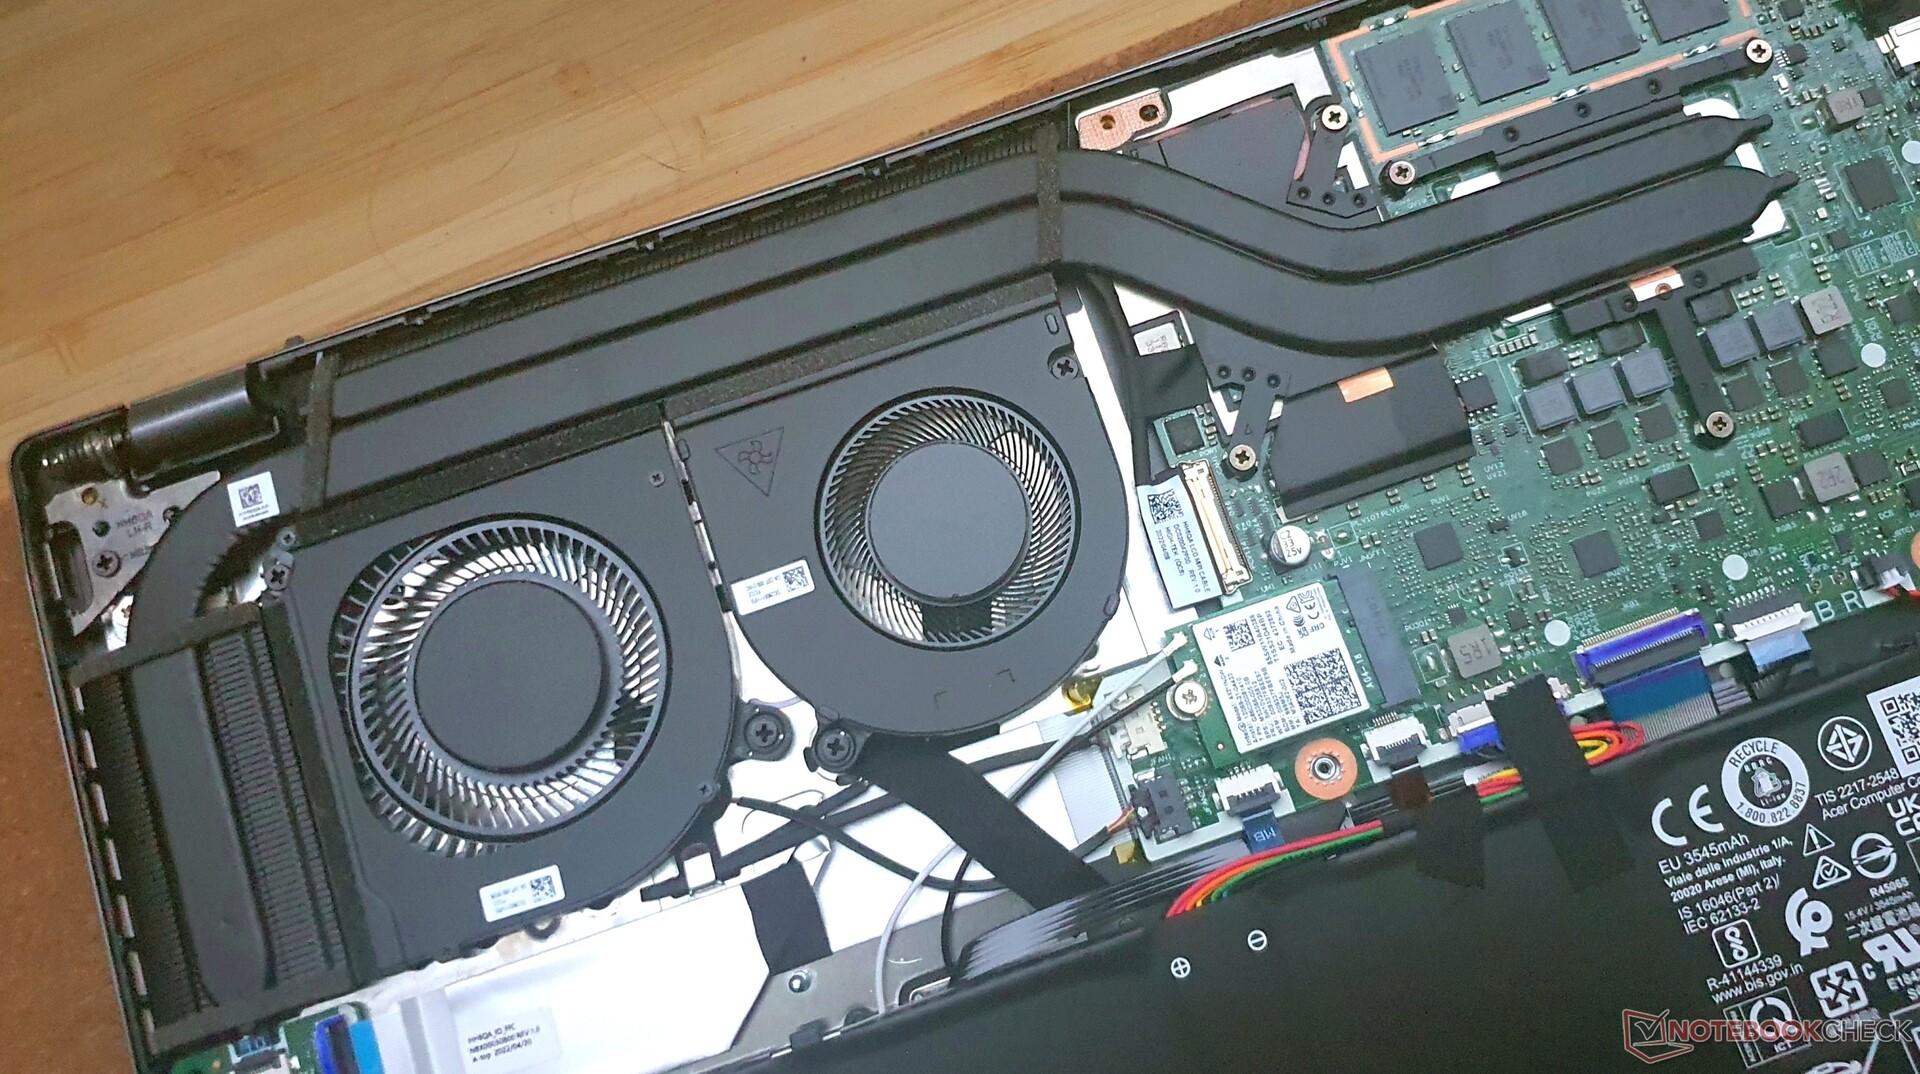
Manutenzione
Garanzia
Acer offre i consueti 2 anni di garanzia per la serie Swift in Germania.
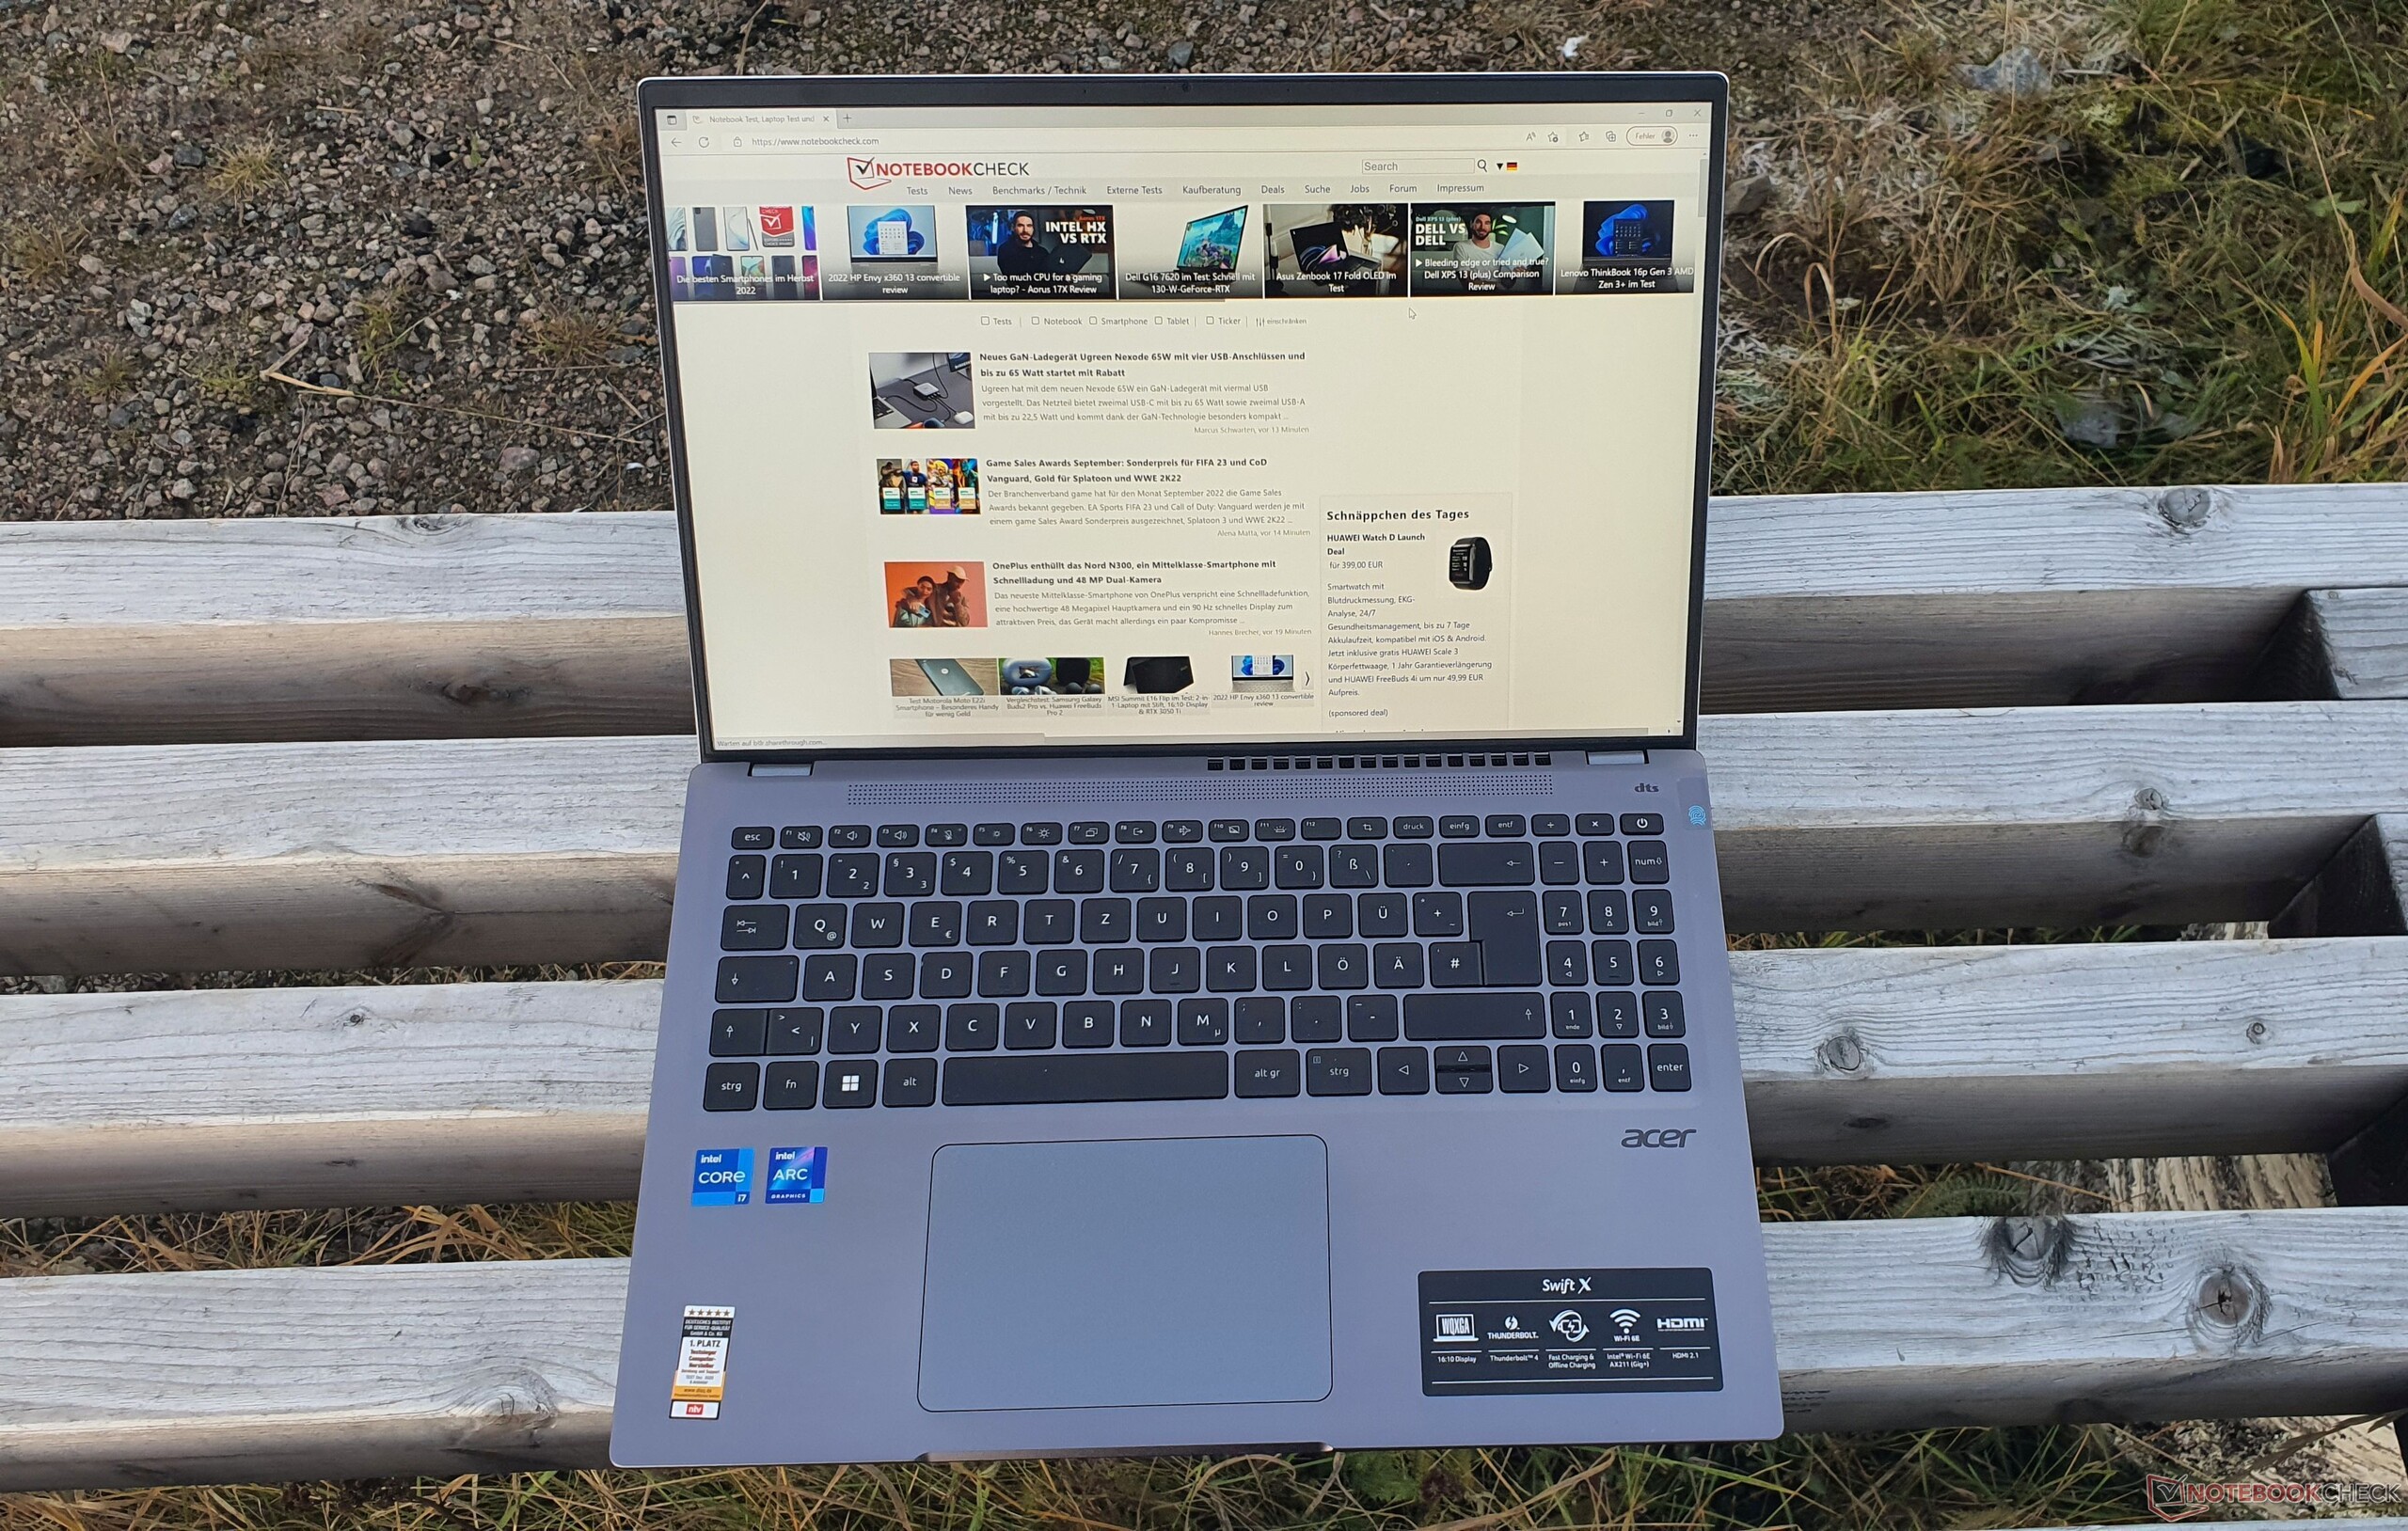
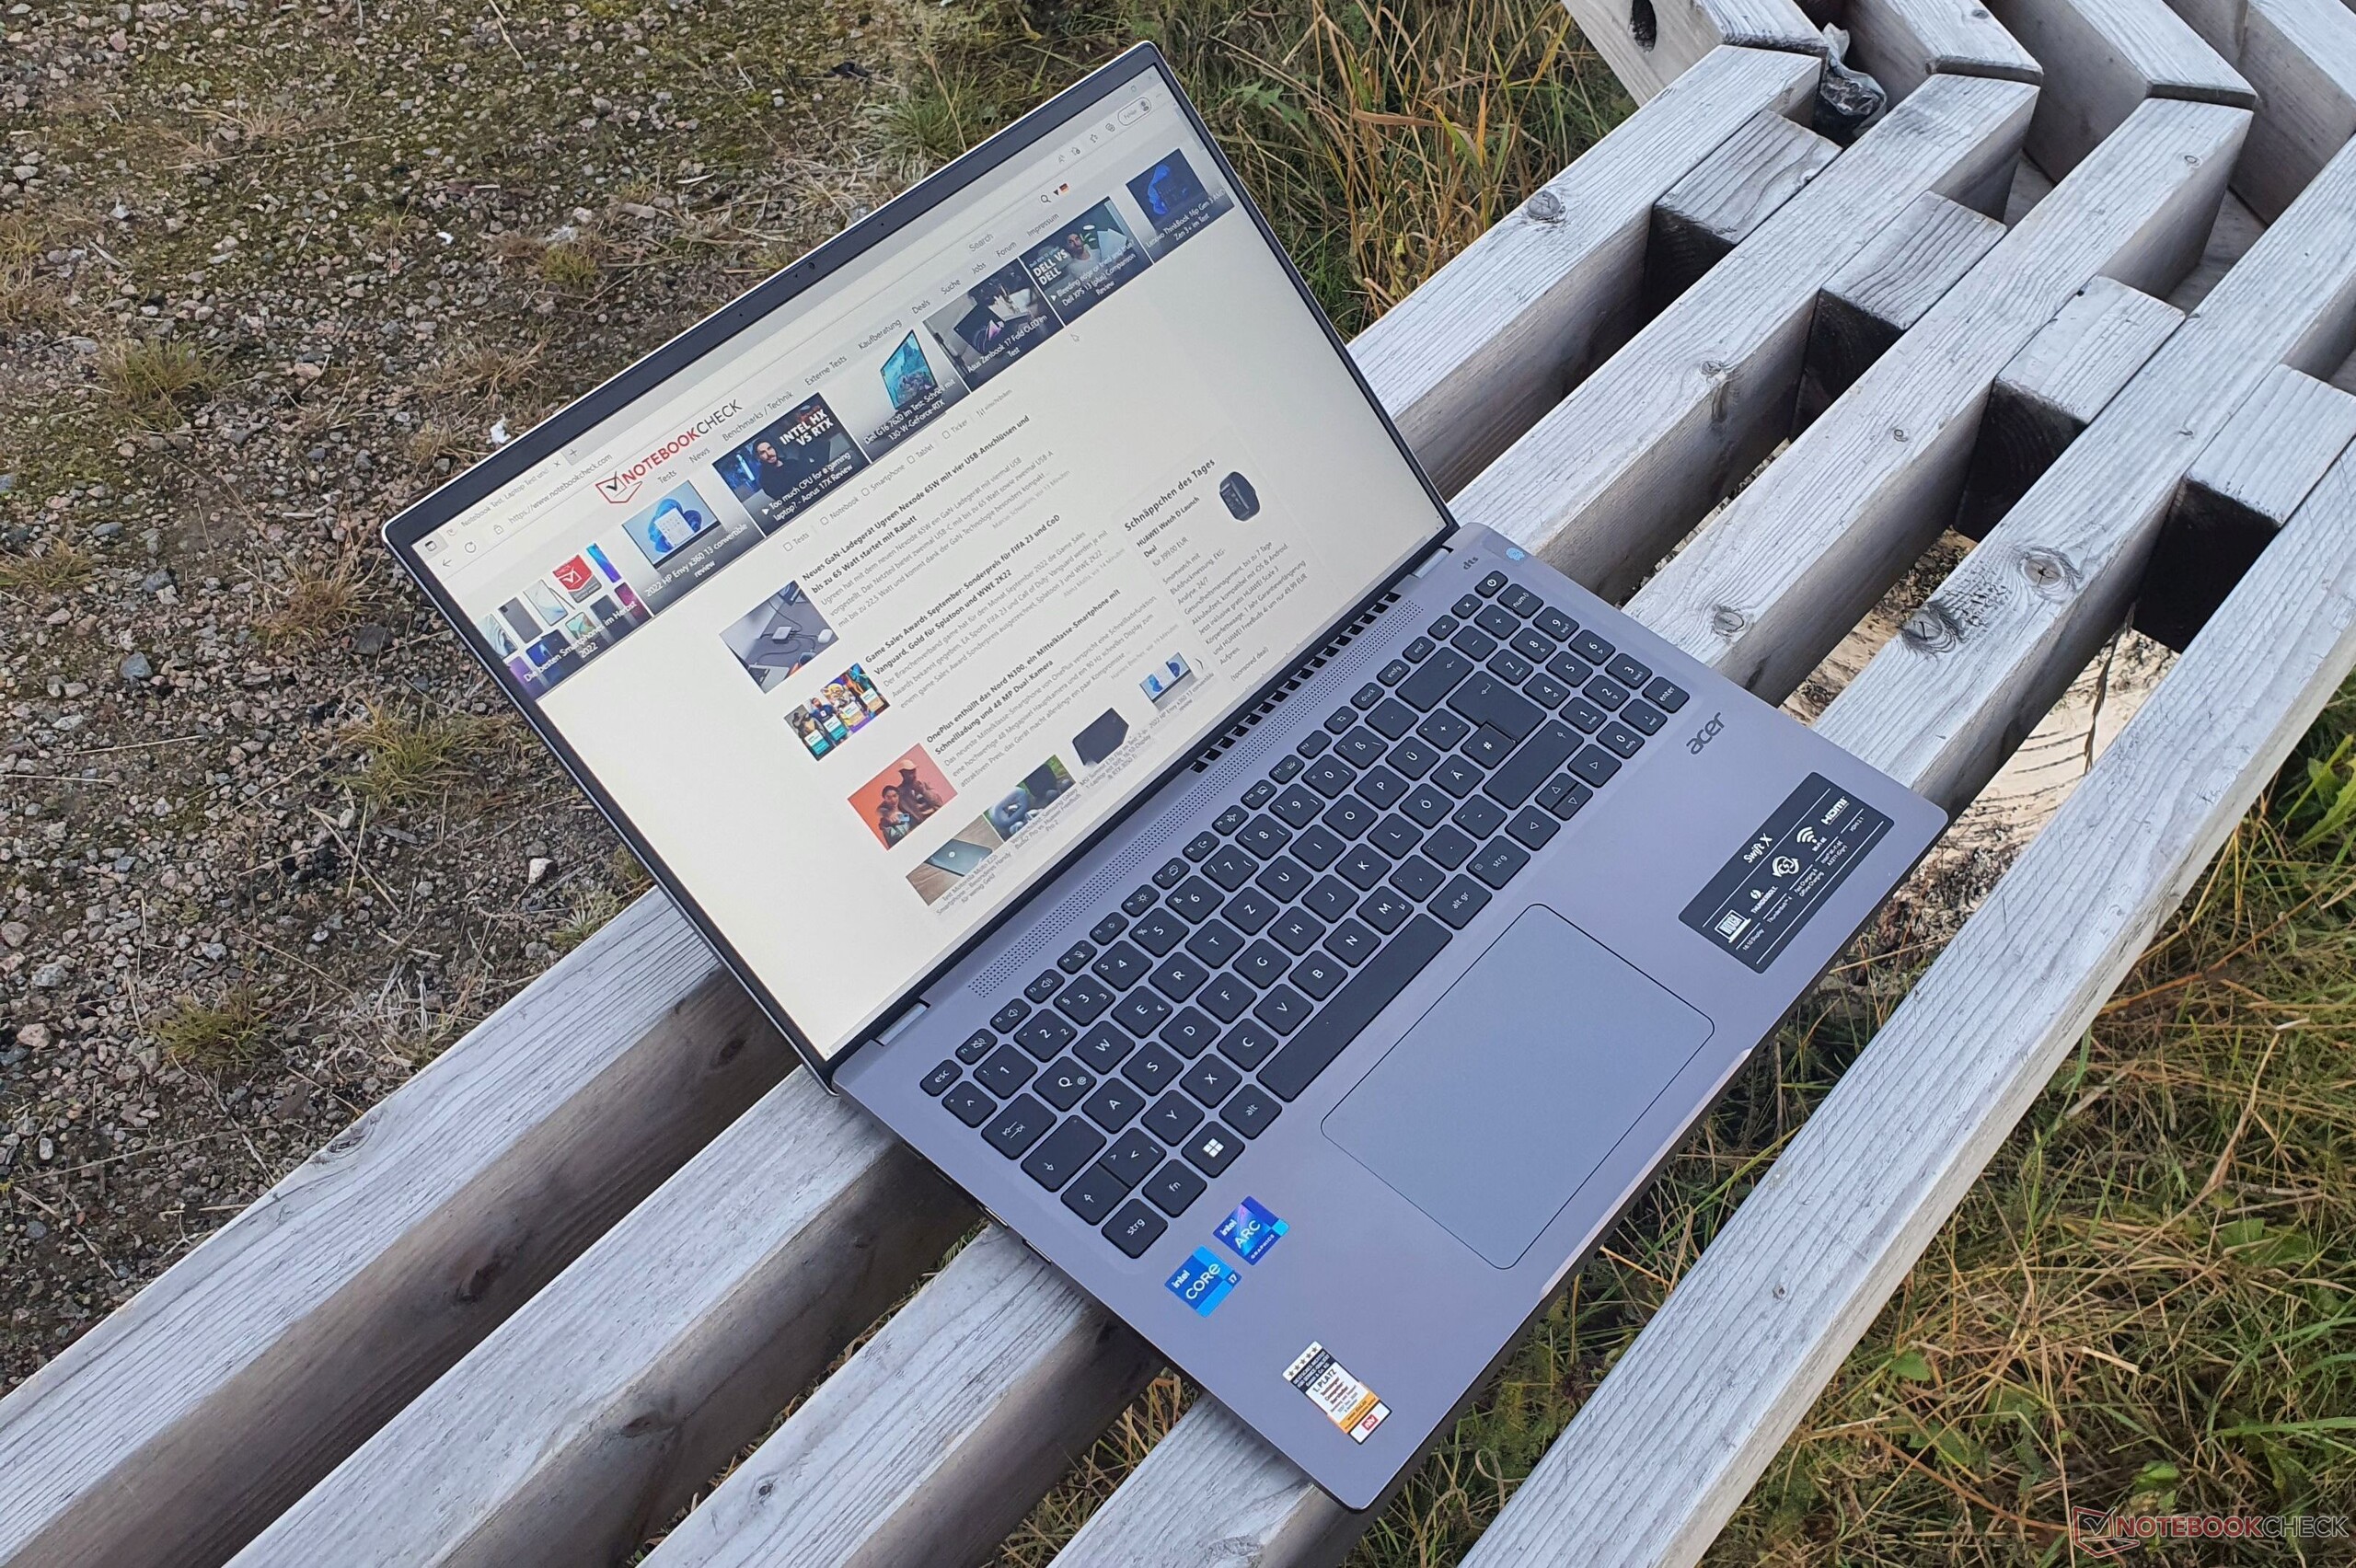
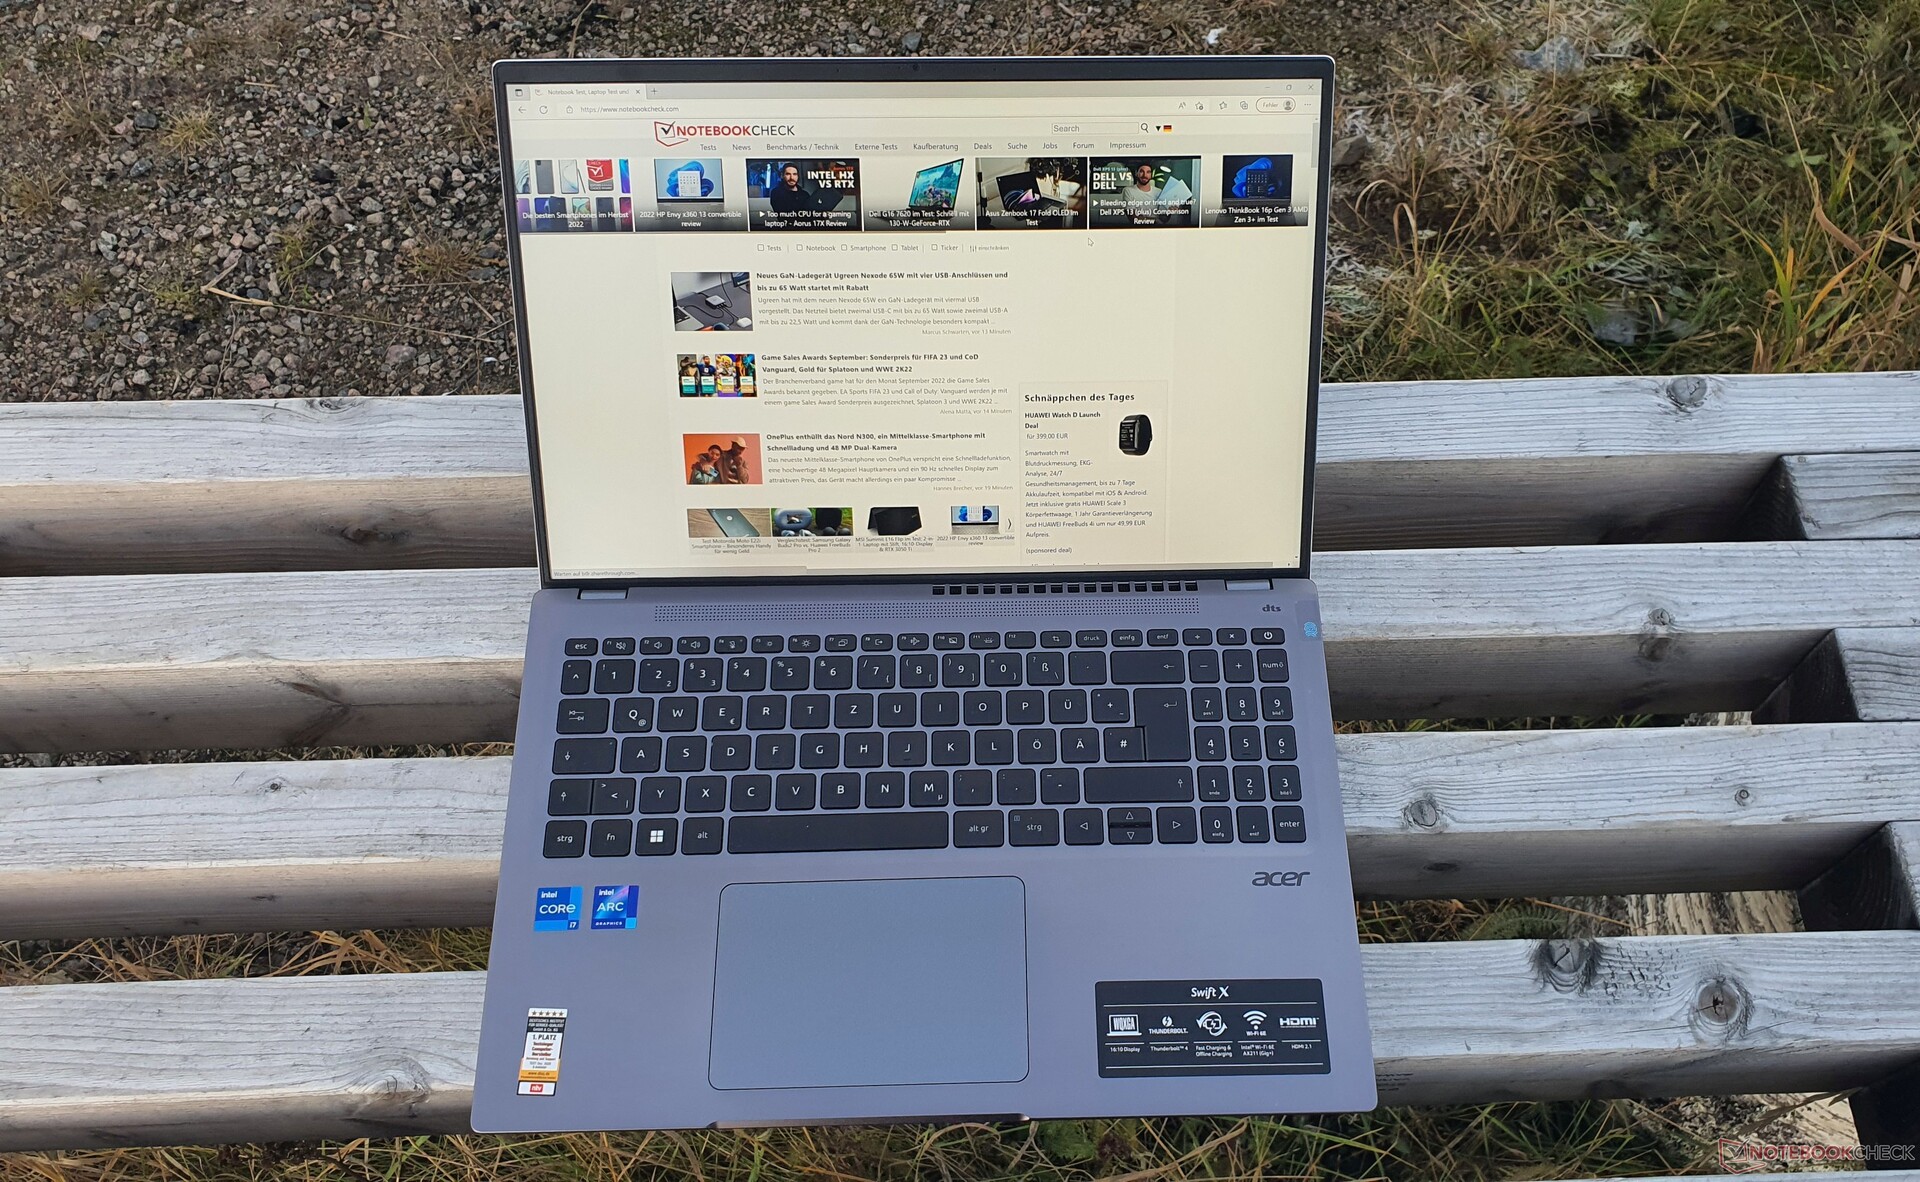
Dispositivi di input: Ottima tastiera ma touchpad debole nell'Acer Swift X
Tastiera
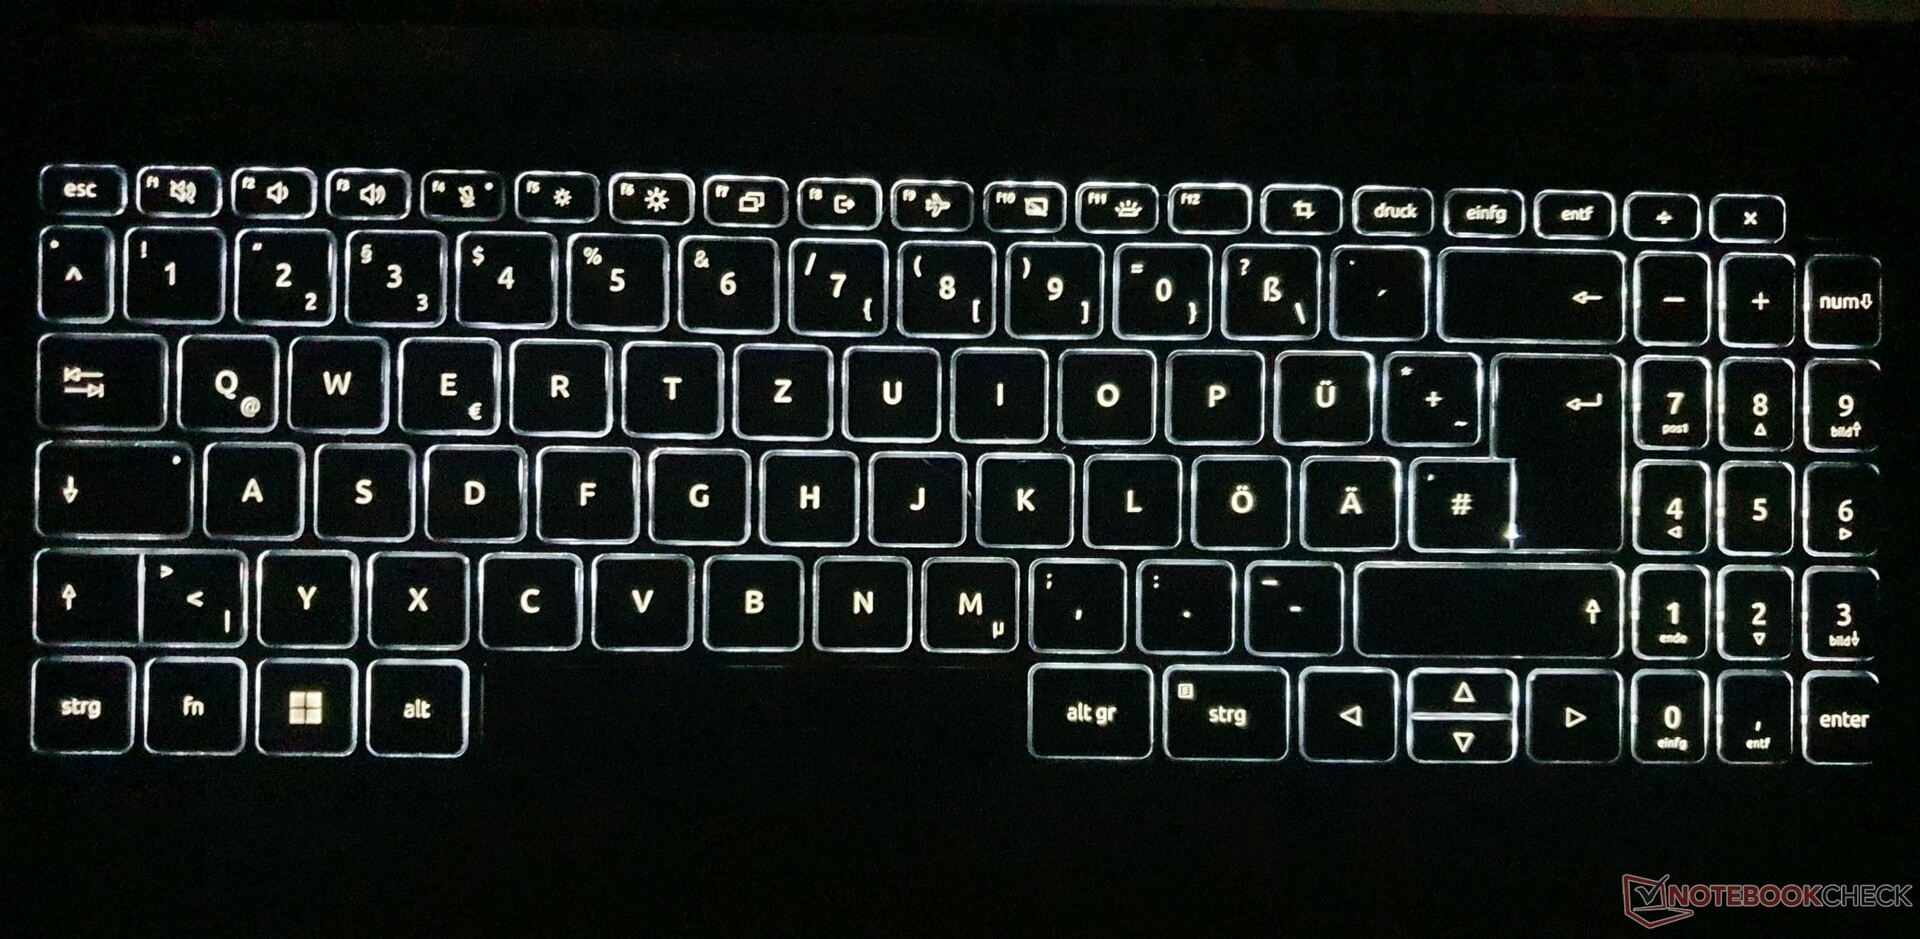
Le dimensioni dei tasti della tastiera chiclet a 6 file sono leggermente ridotte, 15 x 15 mm (~0,59 x 0,59 pollici). La battuta dei tasti è breve, ma insieme alla resistenza ben regolata, il punto di pressione crea un feedback potente. È possibile utilizzarla anche per digitare testi più lunghi senza problemi.
La tastiera ha un certo cedimento sotto la pressione mirata. Durante la digitazione, questo si manifesta sotto forma di un leggero rumore dei tasti Invio e Hash. Il layout della tastiera Acer presenta le tipiche doppie occupazioni, un blocco numerico angusto e tasti freccia su/giù più piccoli.
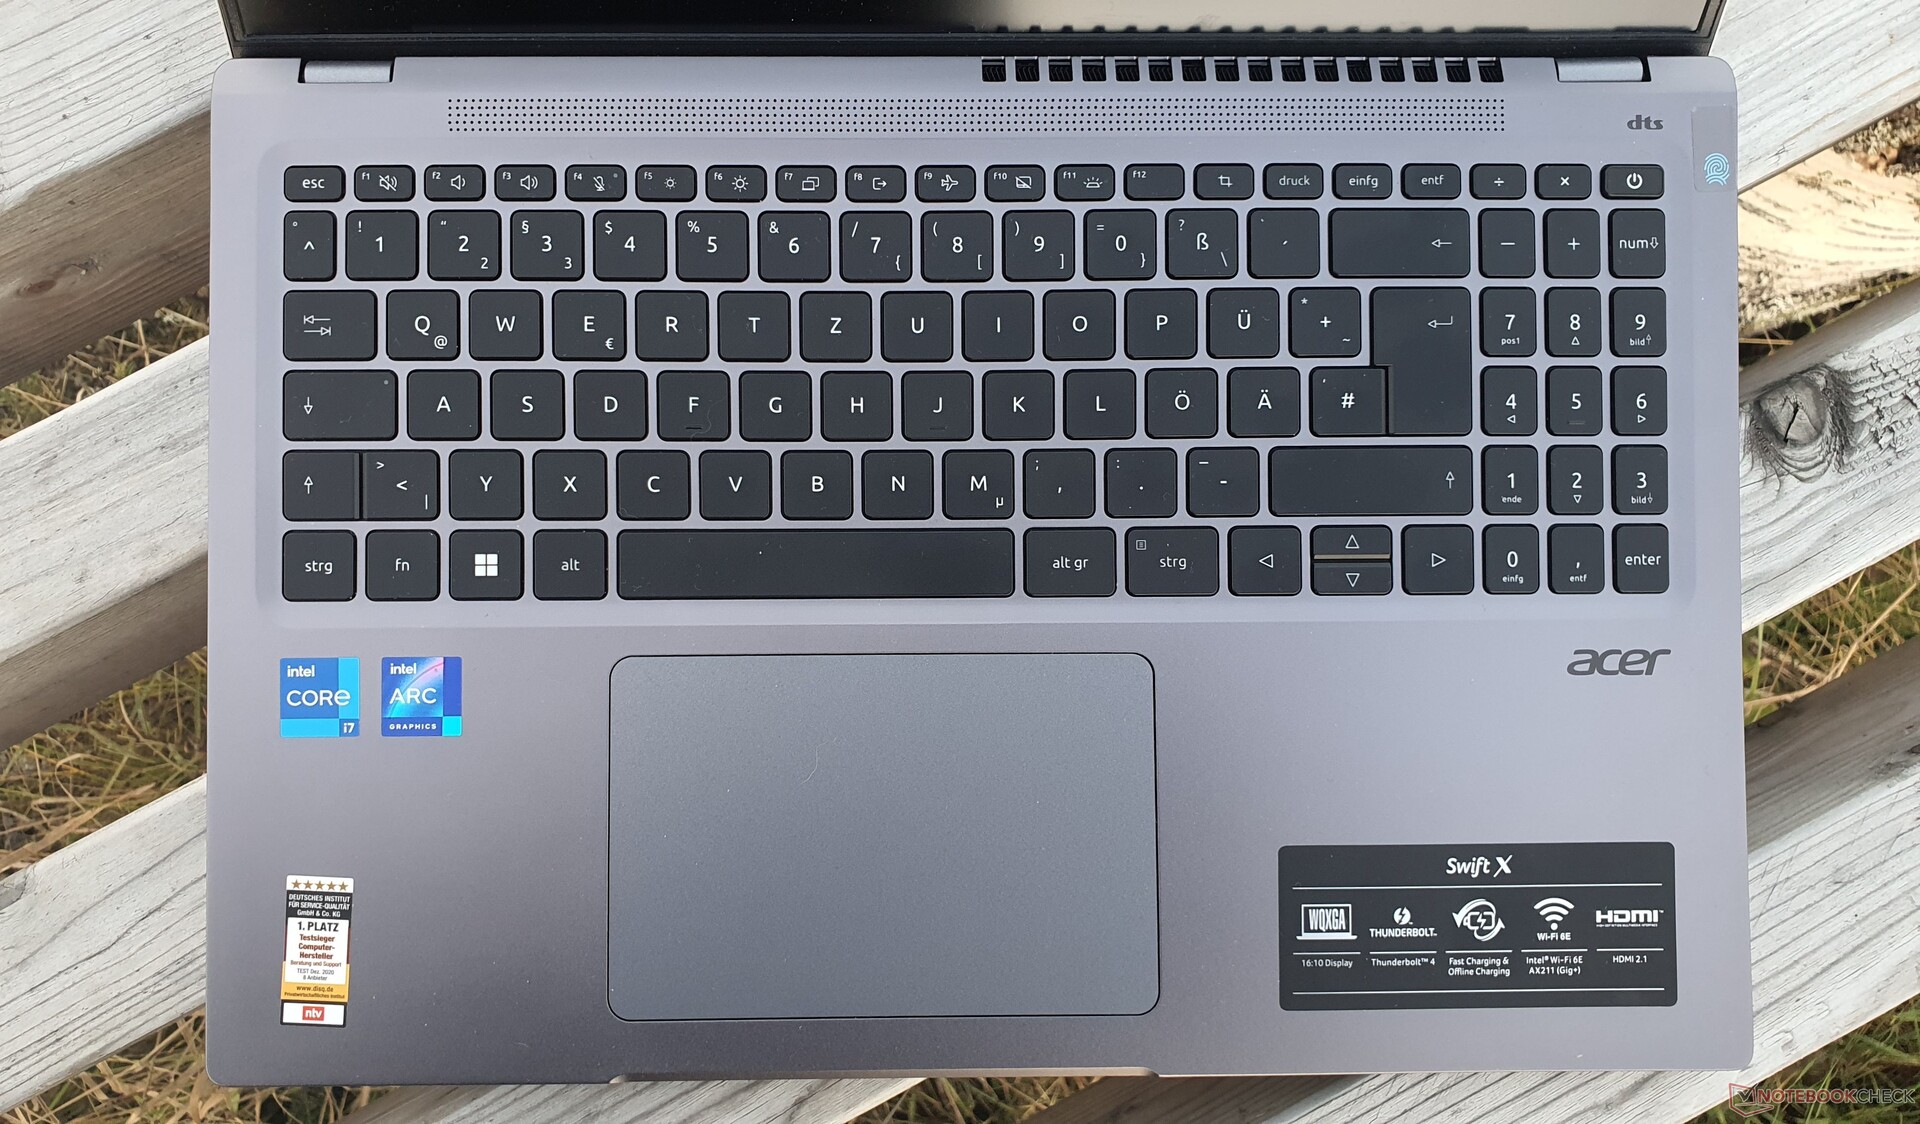
Touchpad
Quest'anno Acer ha dotato lo Swift X 16 del touchpad "OceanGlass". La superficie di 12,7 x 8,3 cm (~5 x 3,3 pollici) è scivolosa e quasi oleosa, rendendo quasi impossibile un input preciso. Anche i movimenti di trascinamento sono molto più difficili da eseguire. I tasti a scatto integrati con una corsa media sono opachi e fanno rumore quando le dita scivolano sul touchpad.
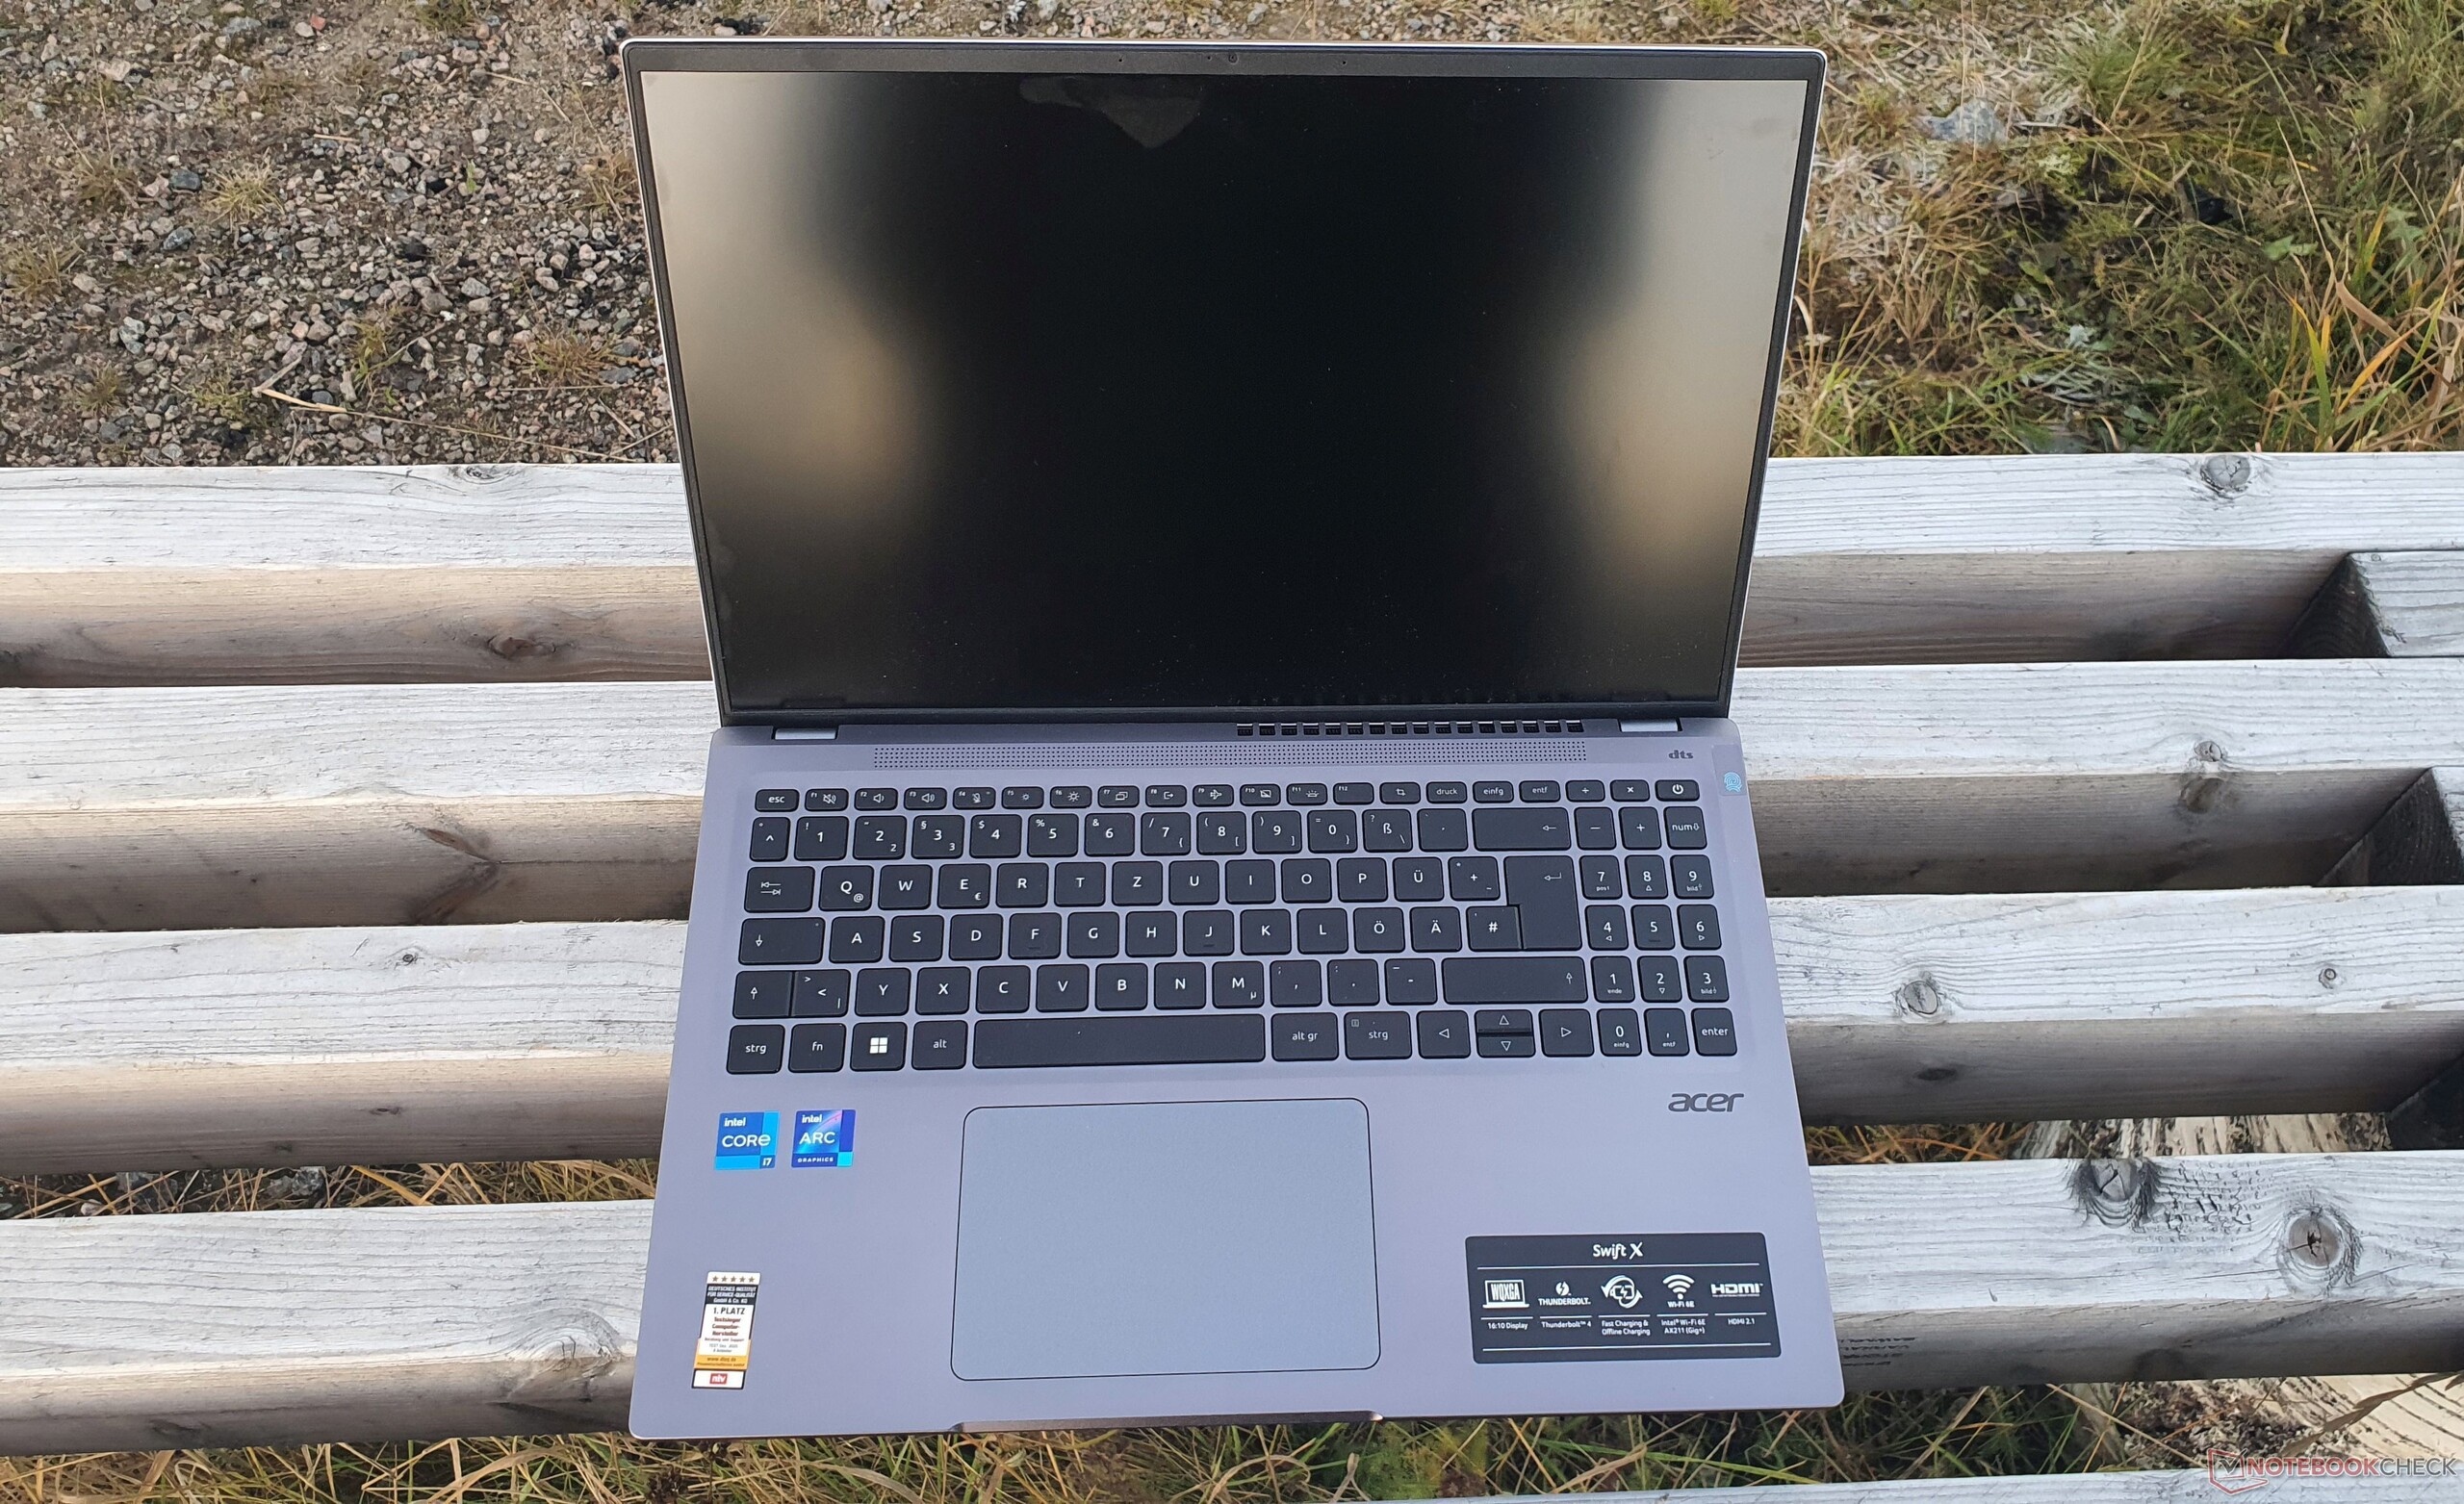
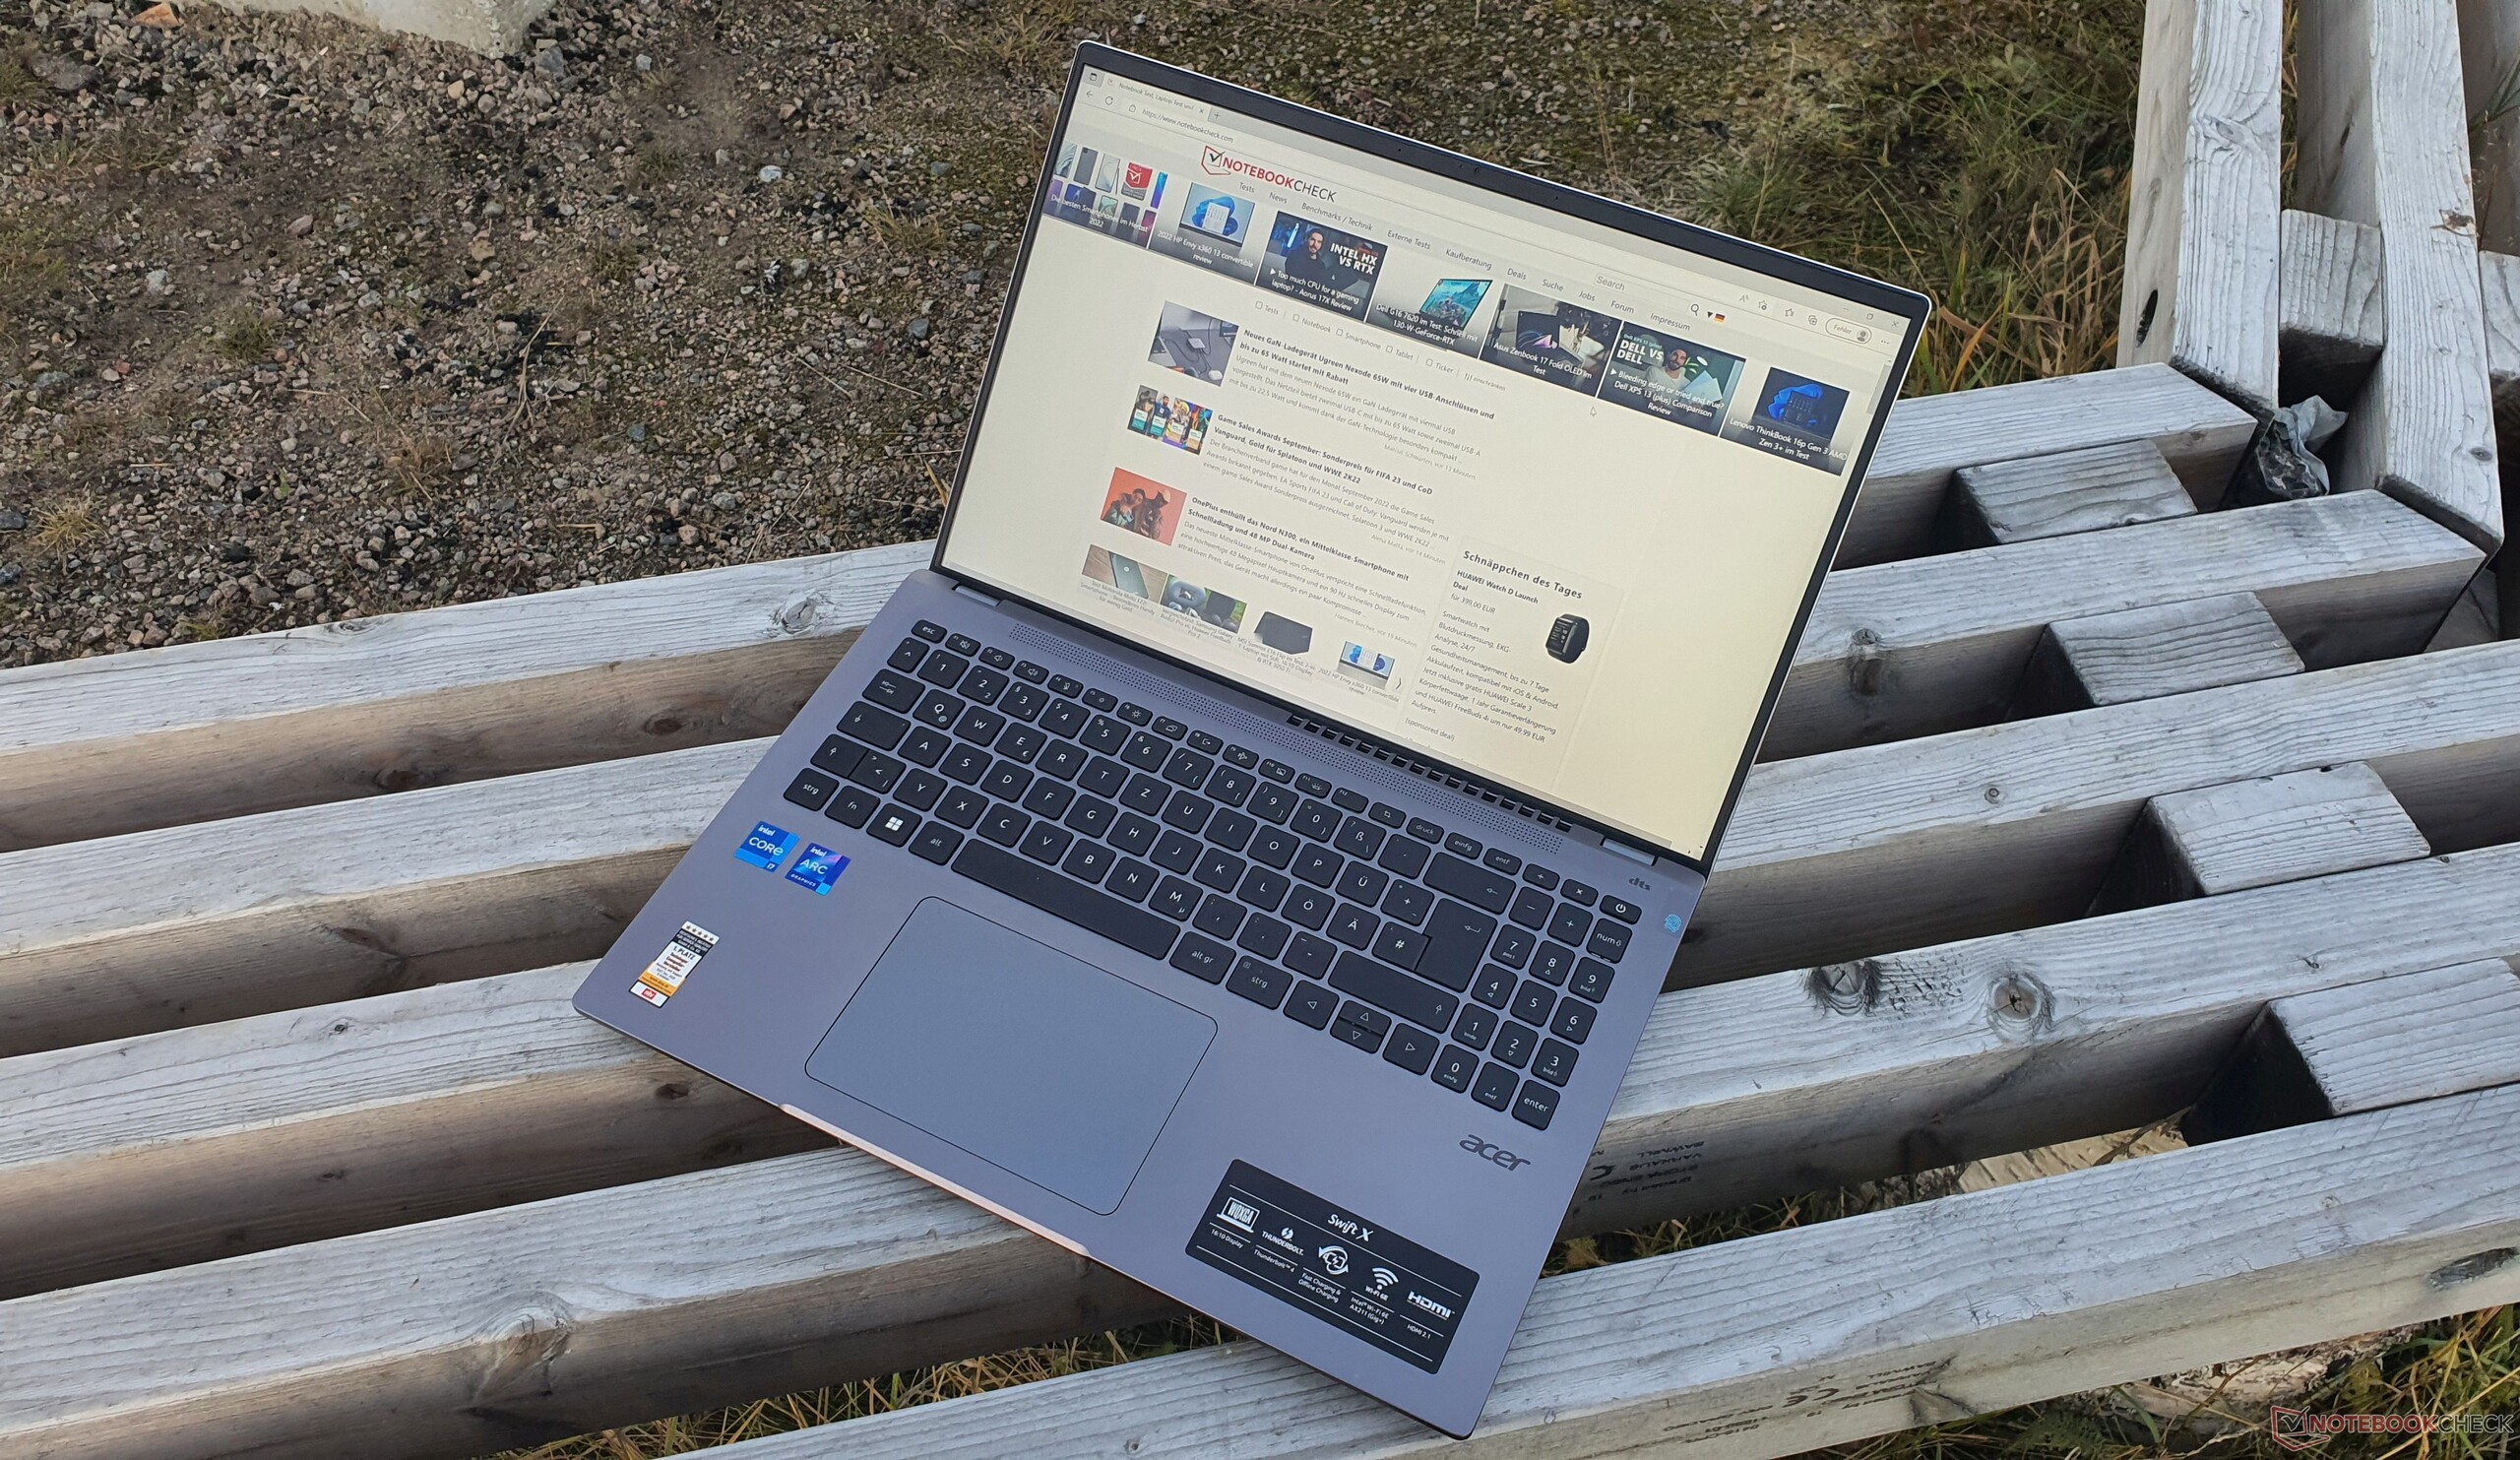
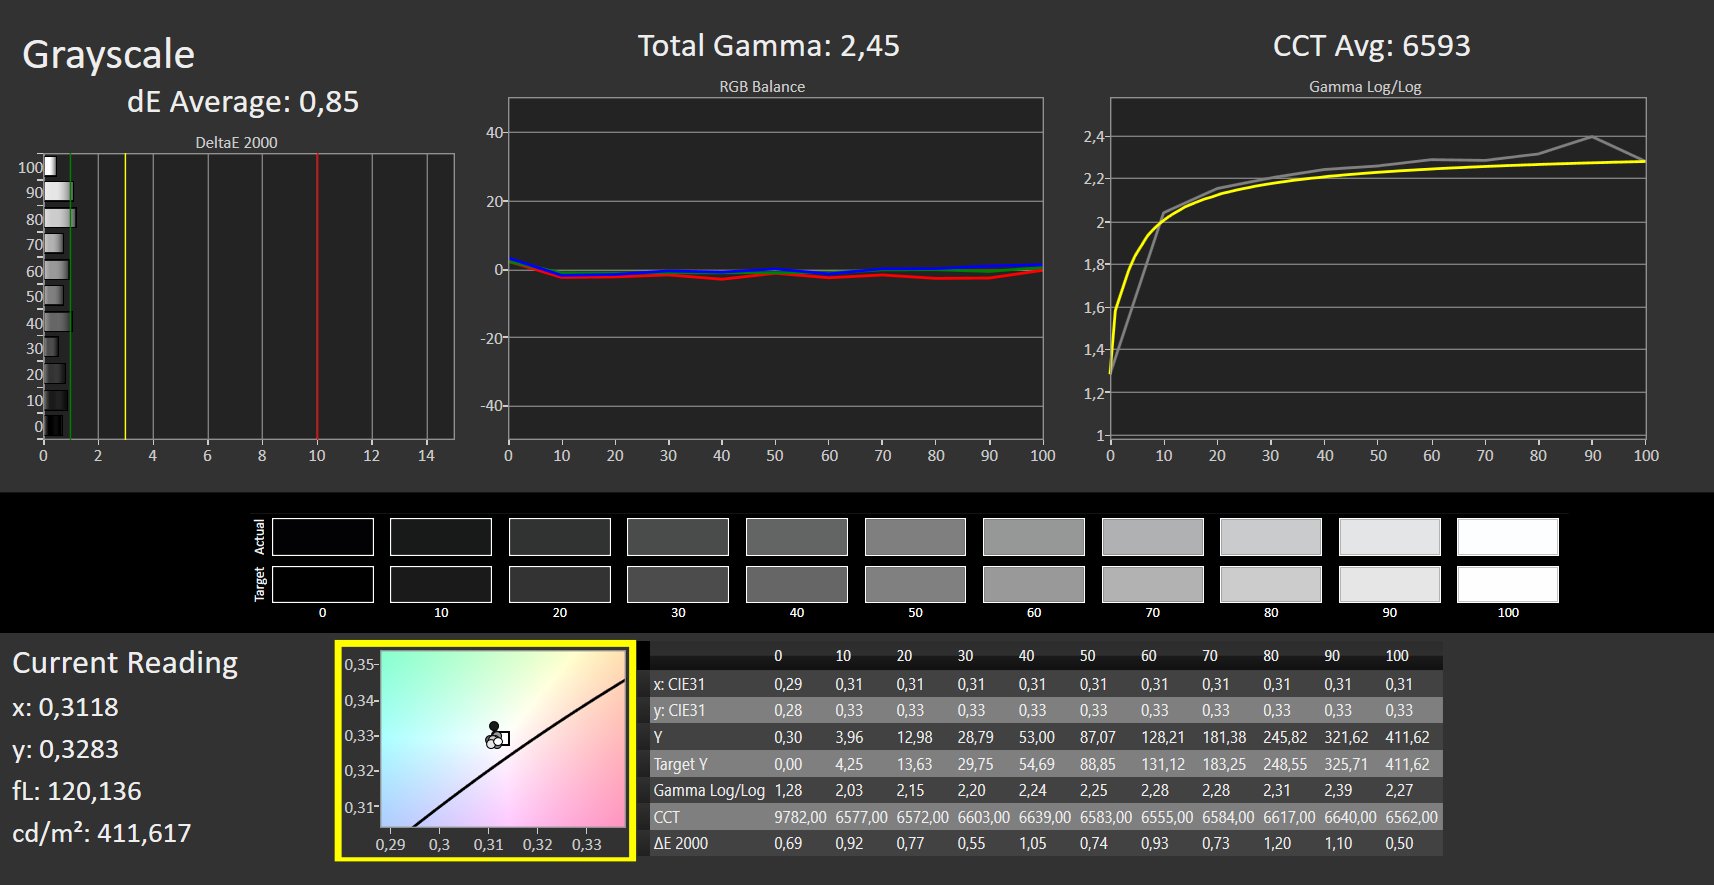
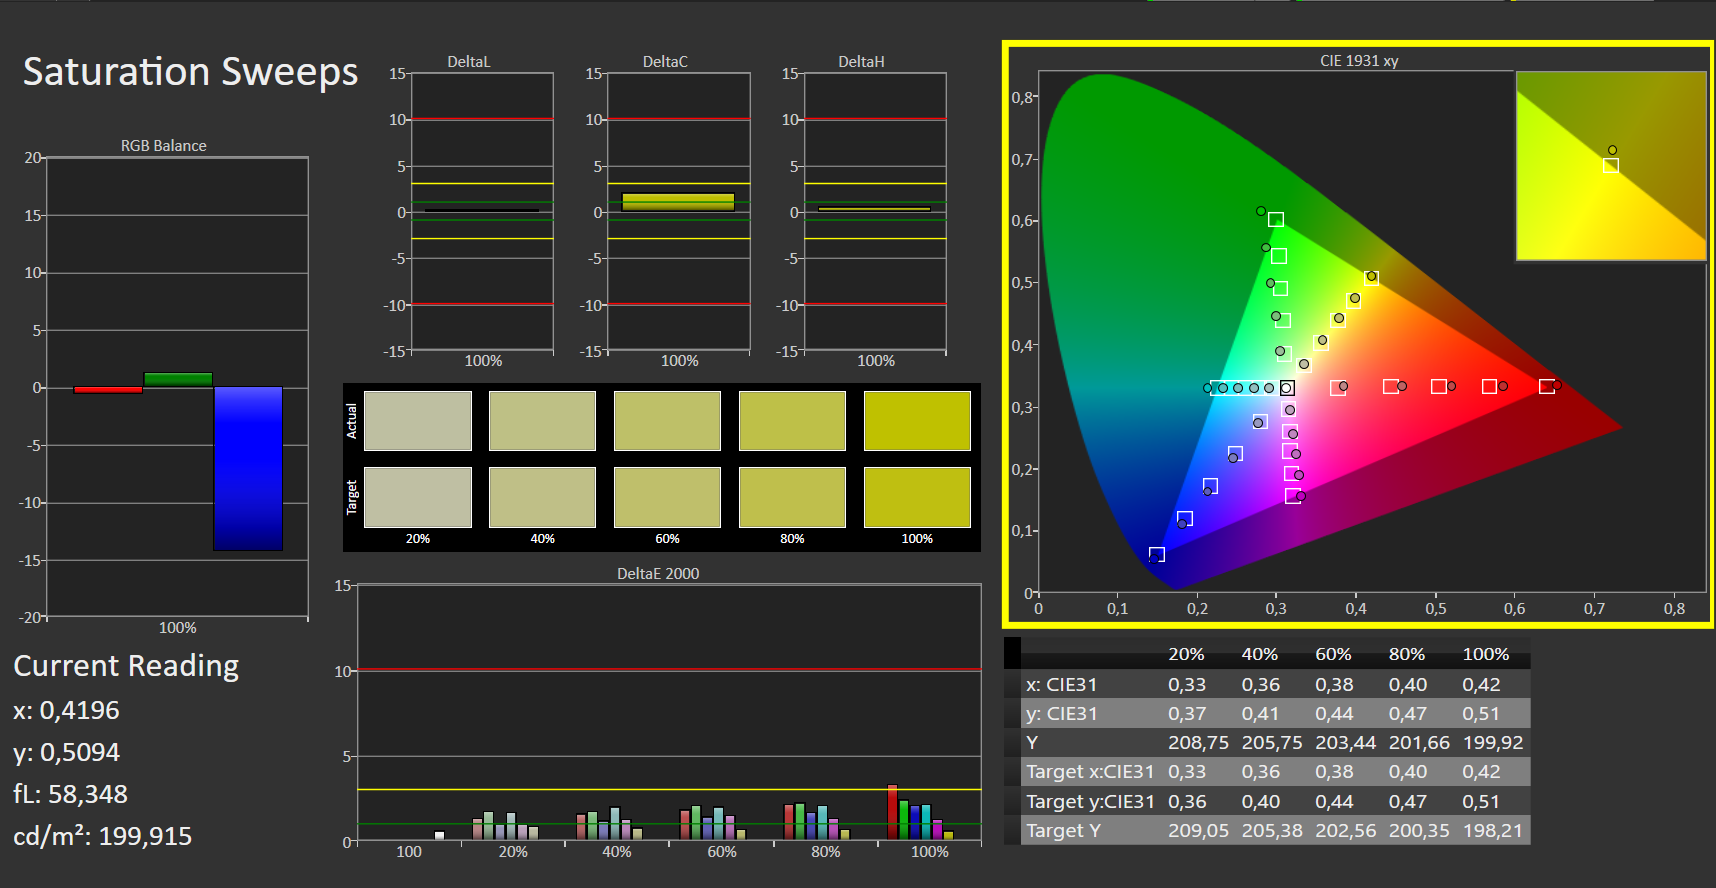
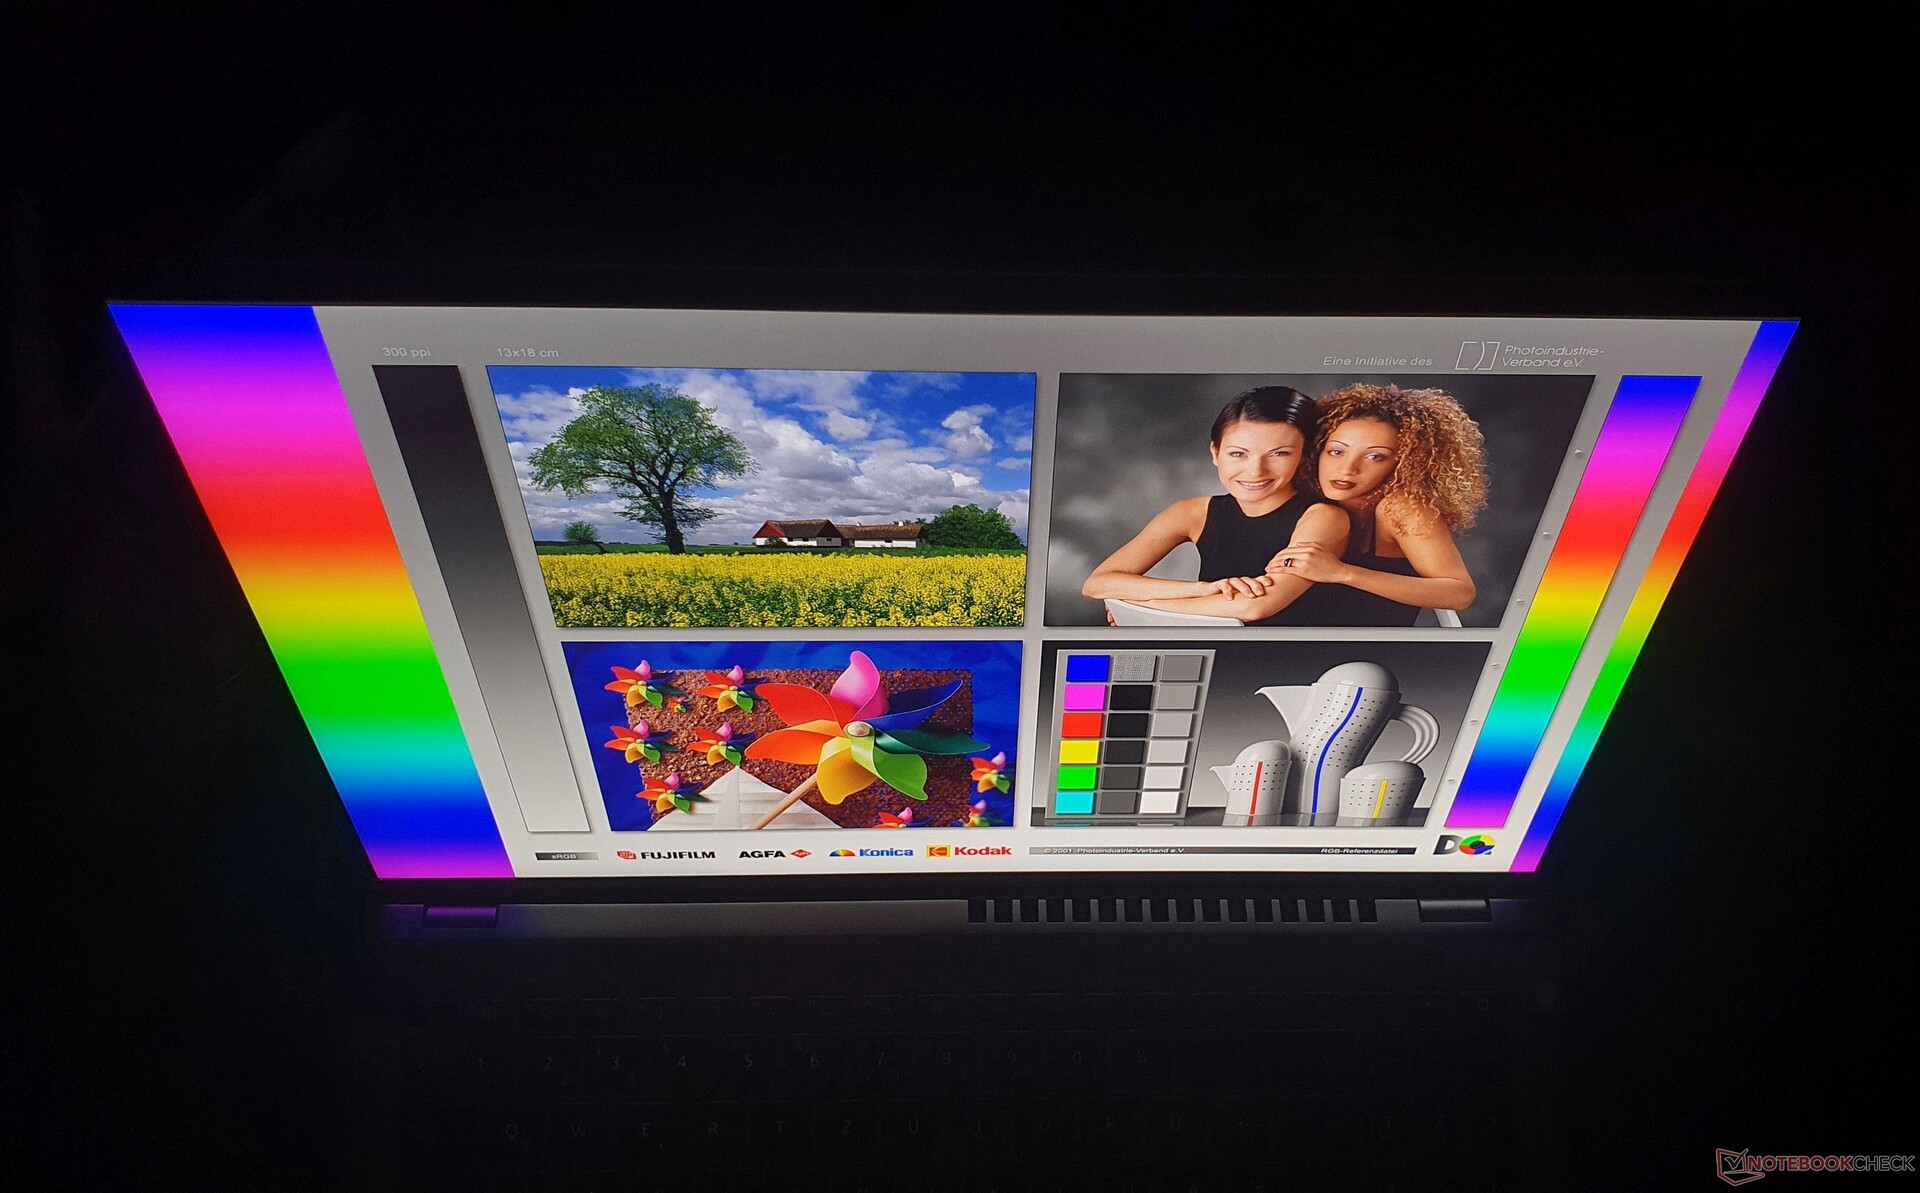
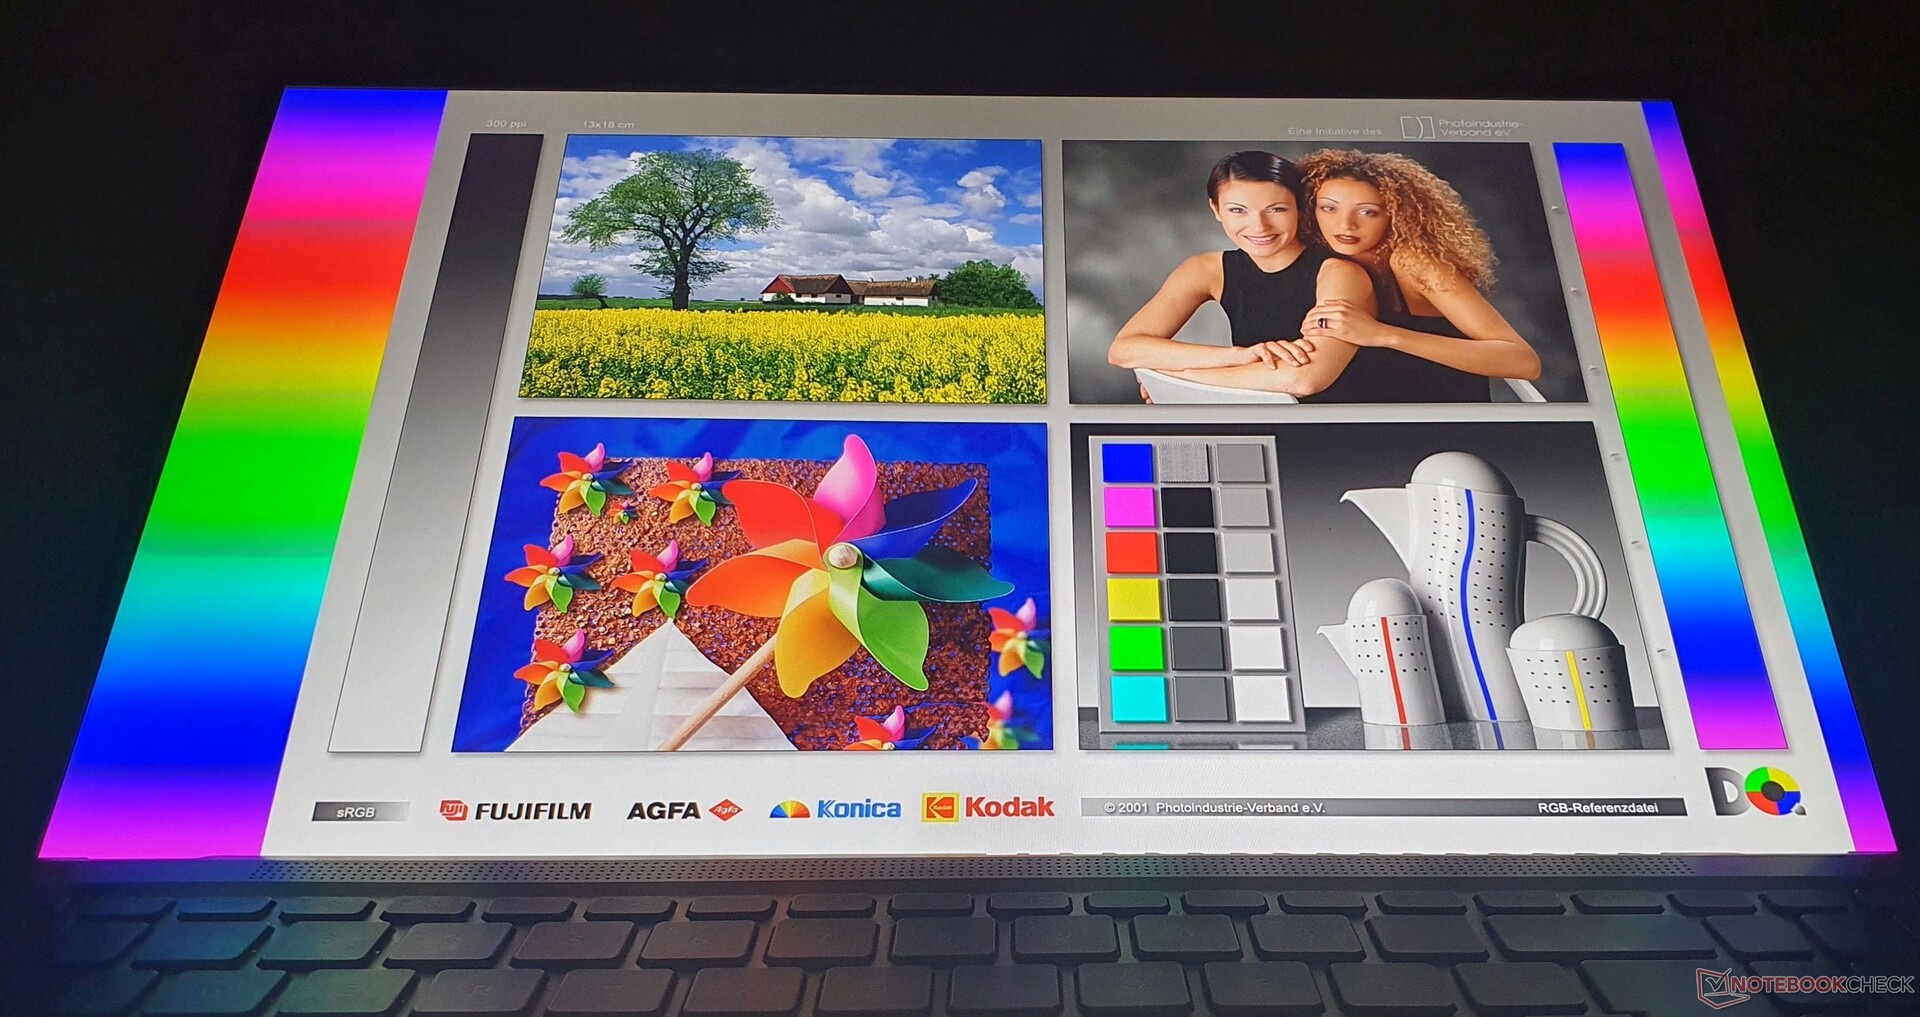
Display: Un pannello luminoso da 2,5K e finalmente 16:10 nello Swift X 16

Il pannello opaco con l'etichetta "B160QAN02.M" è lo stesso del modello fratello. A differenza del predecessore, qui viene utilizzato il formato 16:10 e la luminosità è ora di ben 378 nit.
La risoluzione di 2.560 x 1.600 pixel in un pannello da 16 pollici si traduce in un display nitido. L'Asus Vivobook Pro 16Xe Envy 16 di HPoffrono una risoluzione di 3.840 x 2.400 pixel e pannelli OLED.
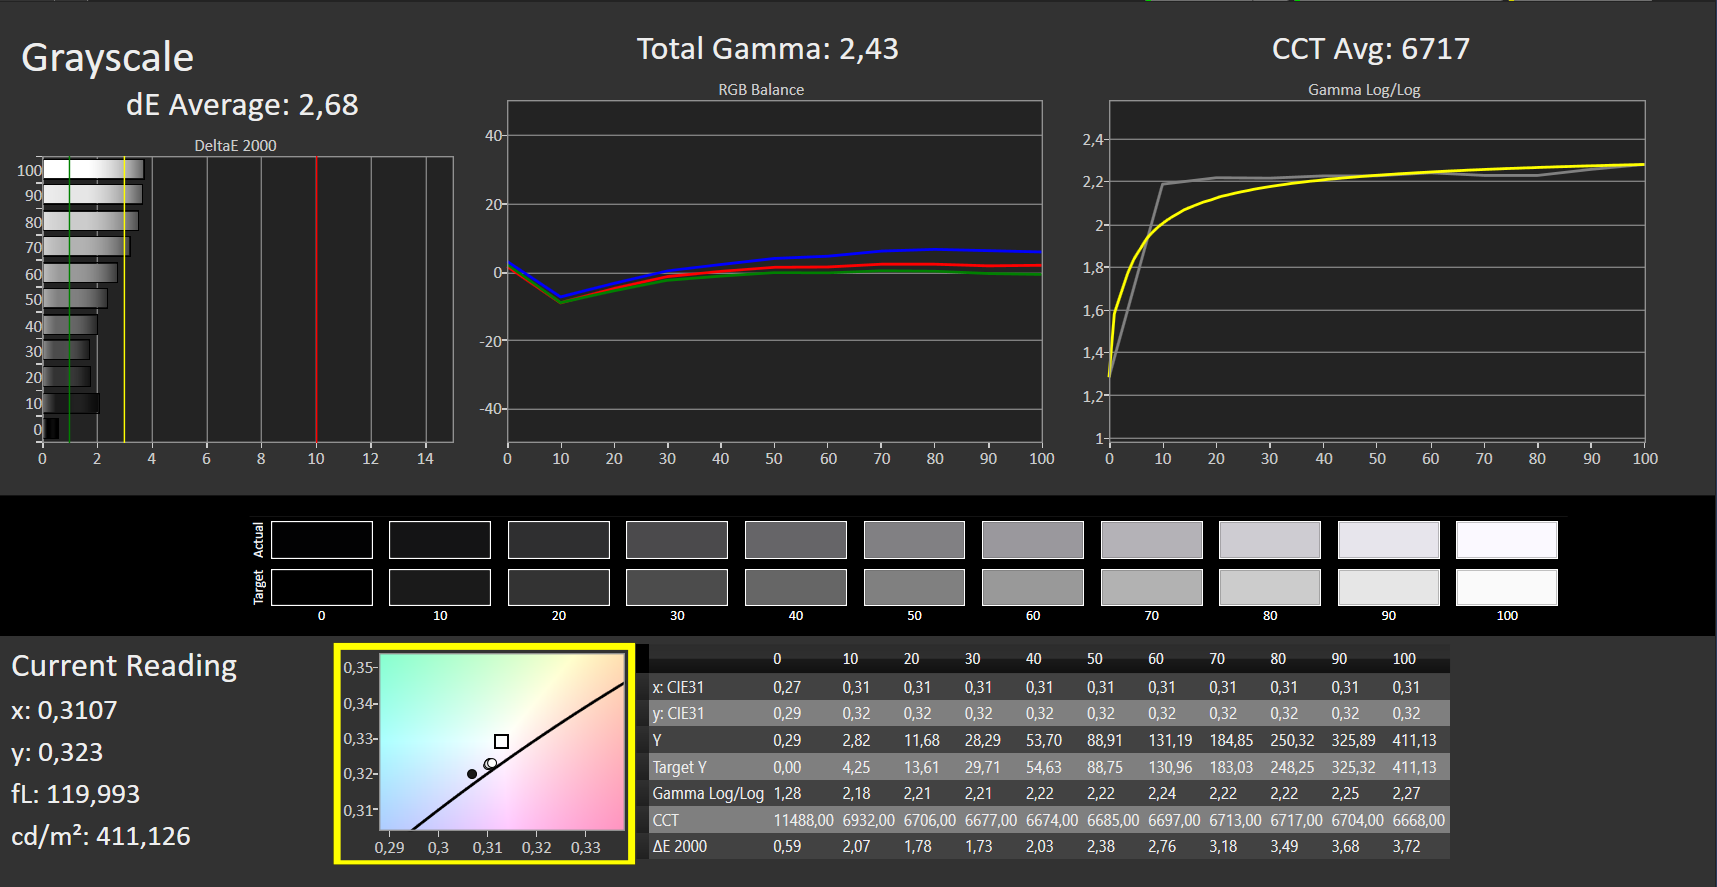
Il contrasto di 1.417:1 e il valore del nero di 0,29 nits garantiscono un nero saturo. Anche il valore del bianco di 6.717K è vicino all'ideale di 6.500K
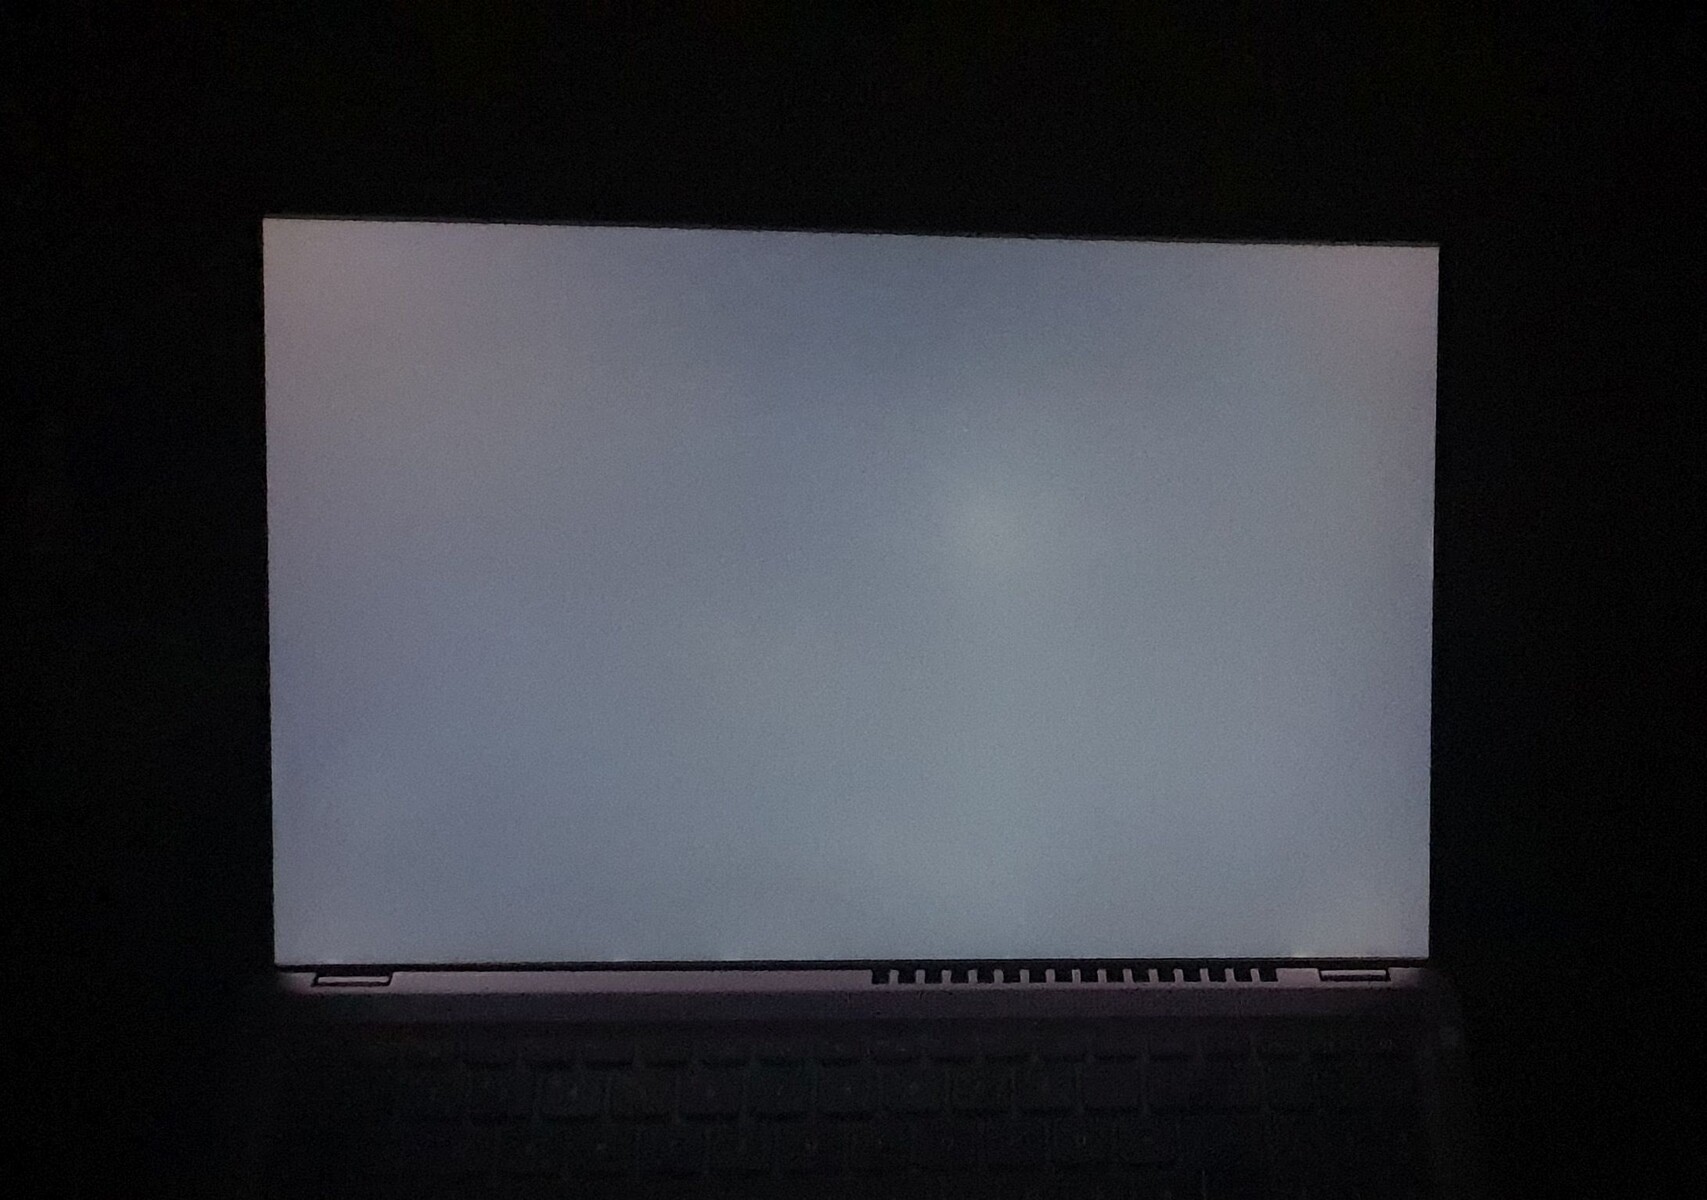
All'83%, la distribuzione della luminosità non è molto uniforme, ma questo non si nota nell'uso quotidiano. In alternativa, è disponibile anche un pannello con 1.920 x 1.200 pixel. Non c'è sfarfallio PWM.
| |||||||||||||||||||||||||
Distribuzione della luminosità: 83 %
Al centro con la batteria: 411 cd/m²
Contrasto: 1417:1 (Nero: 0.29 cd/m²)
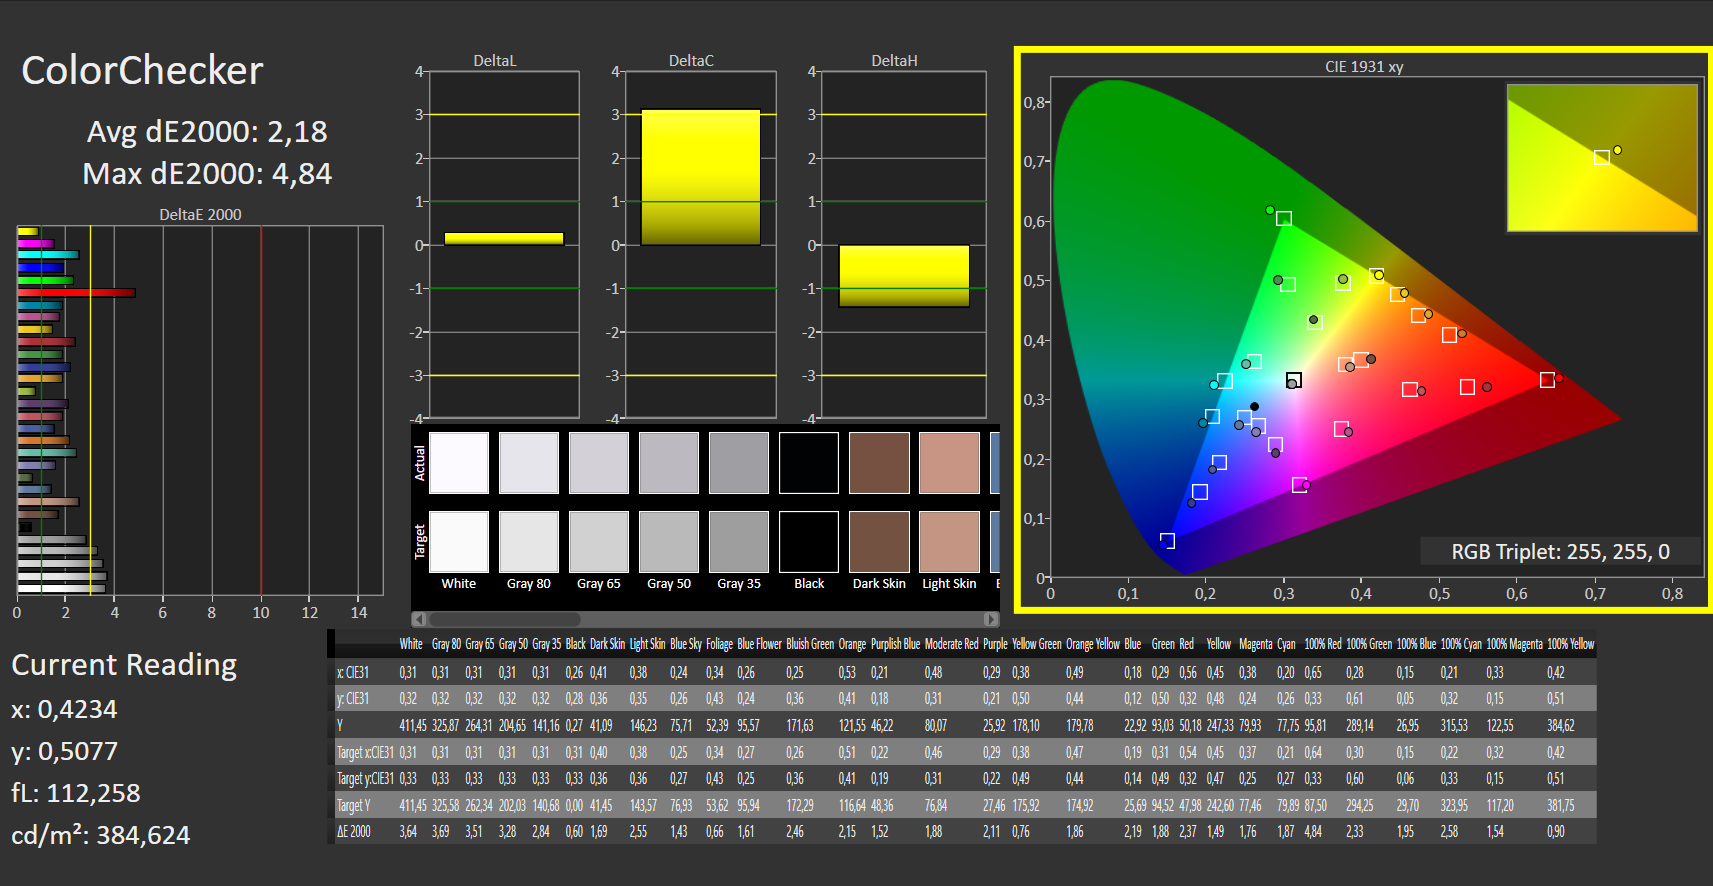
ΔE ColorChecker Calman: 2.18 | ∀{0.5-29.43 Ø4.73}
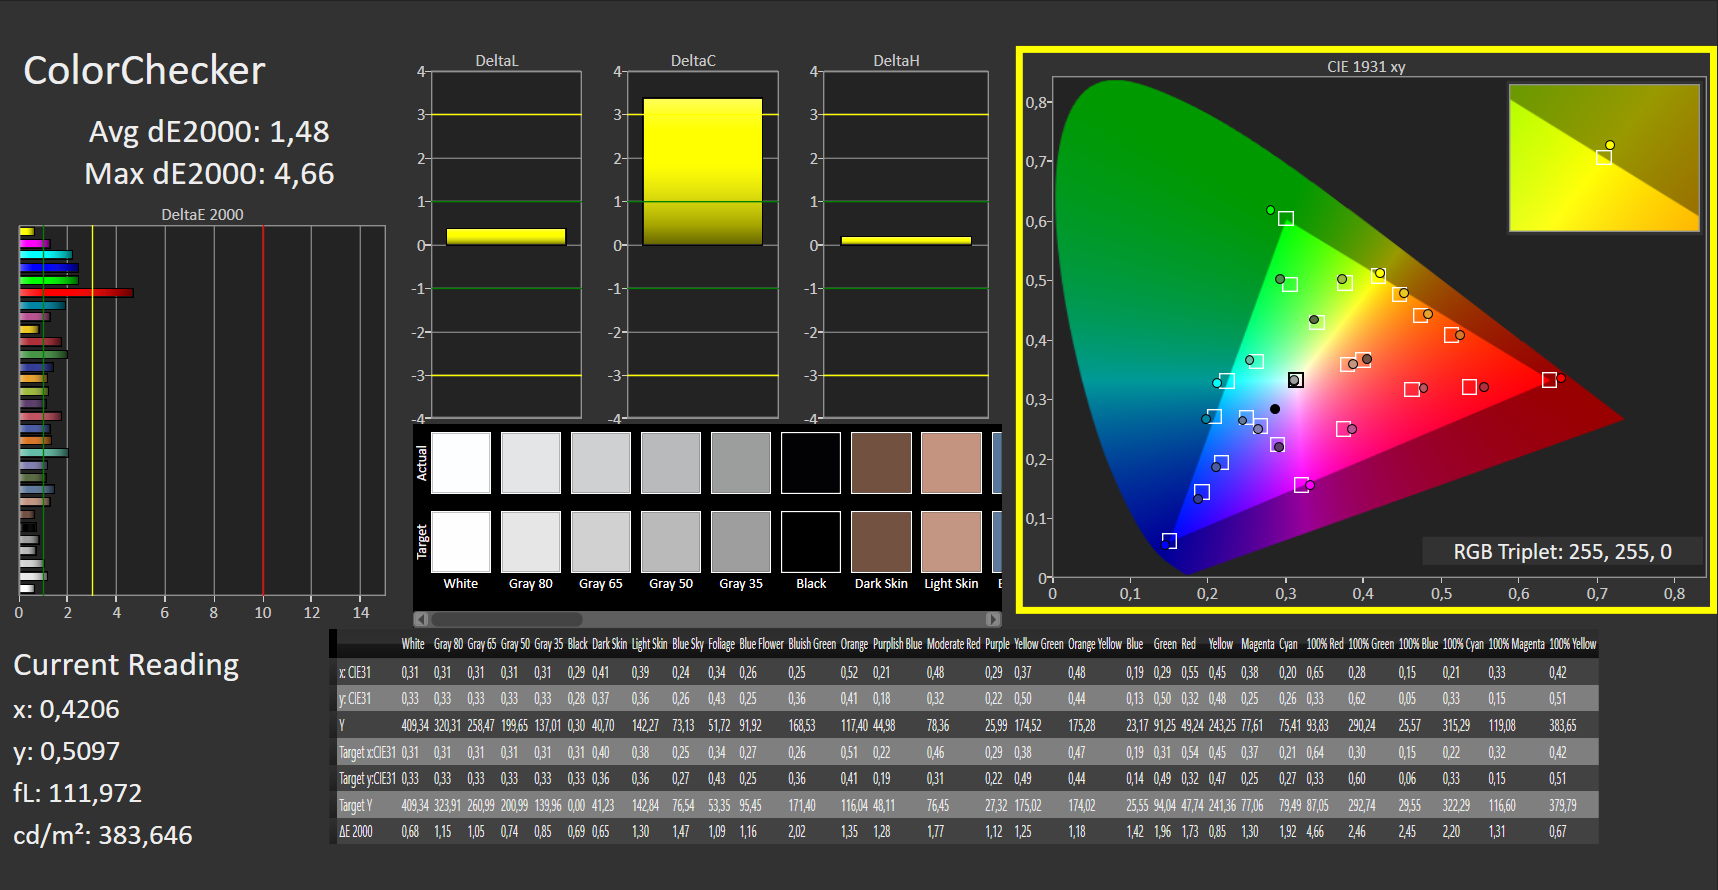
calibrated: 1.48
ΔE Greyscale Calman: 2.68 | ∀{0.09-98 Ø4.97}
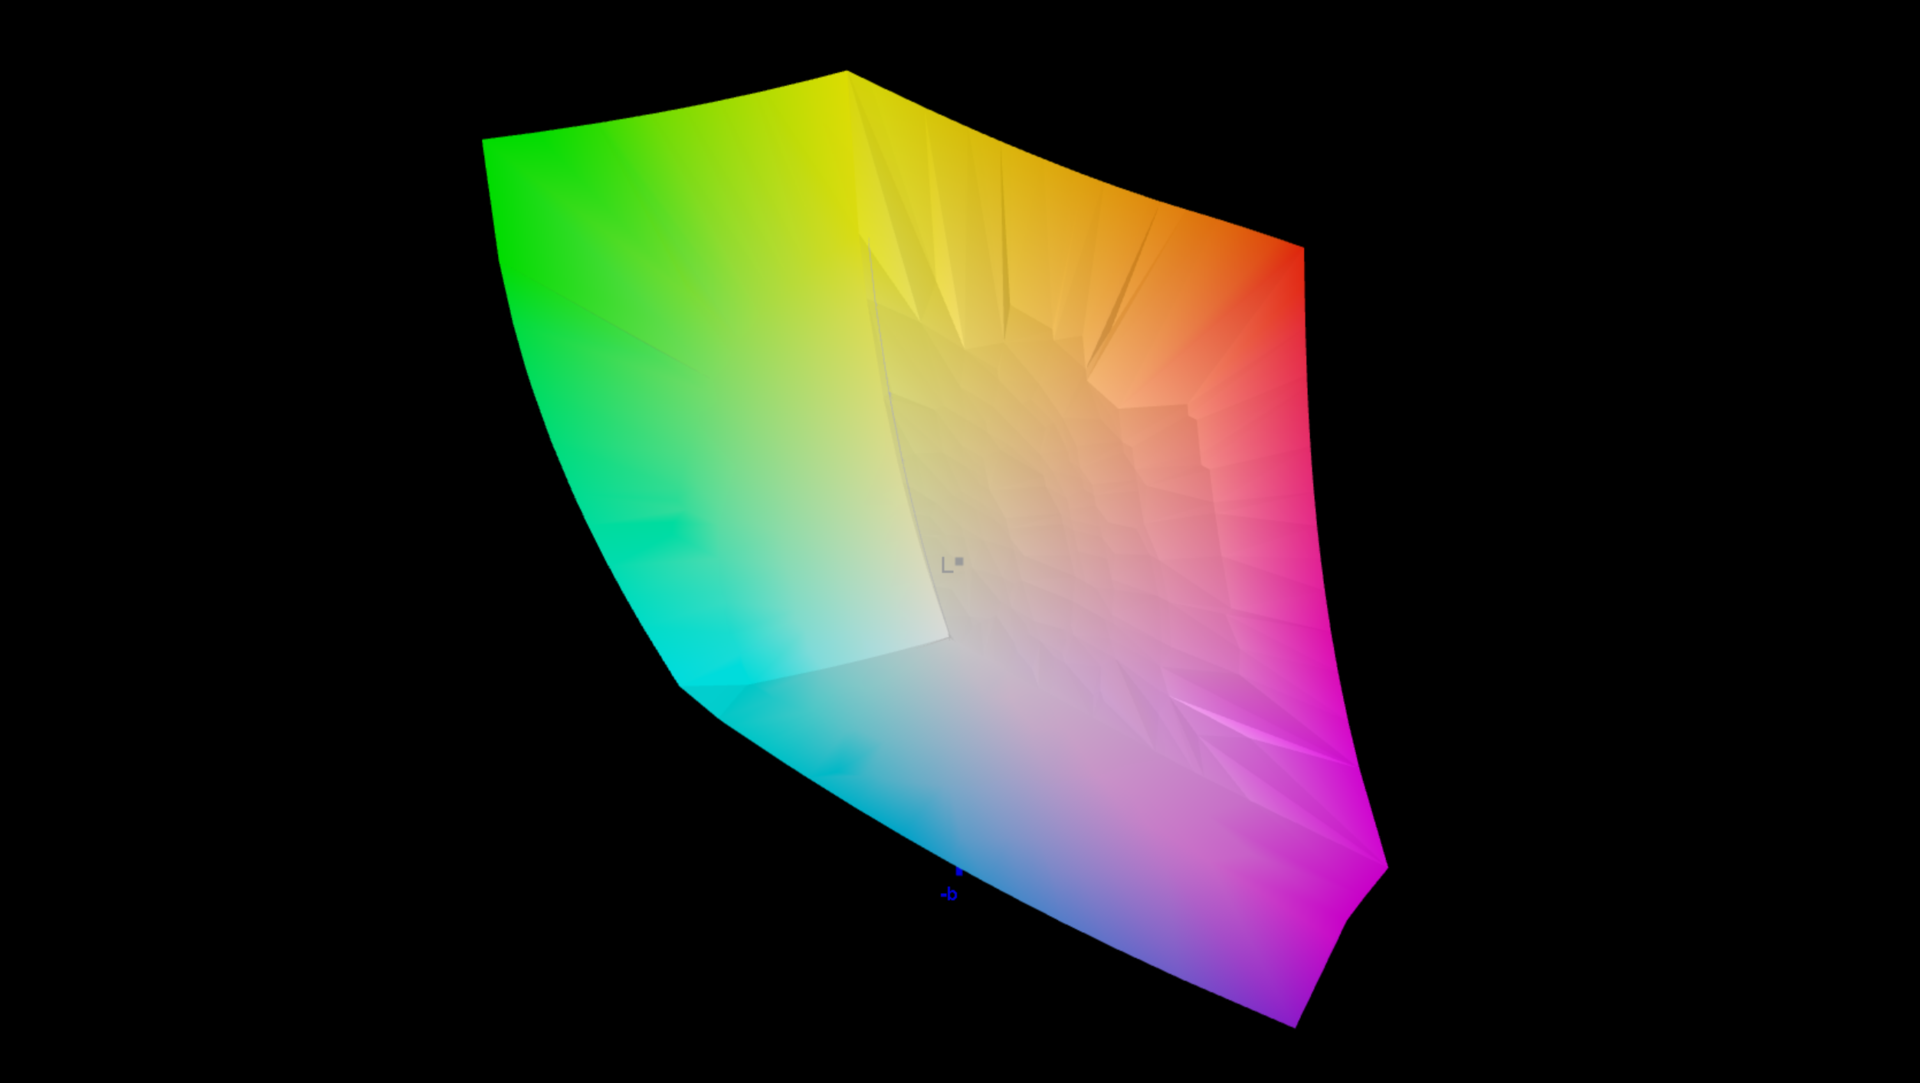
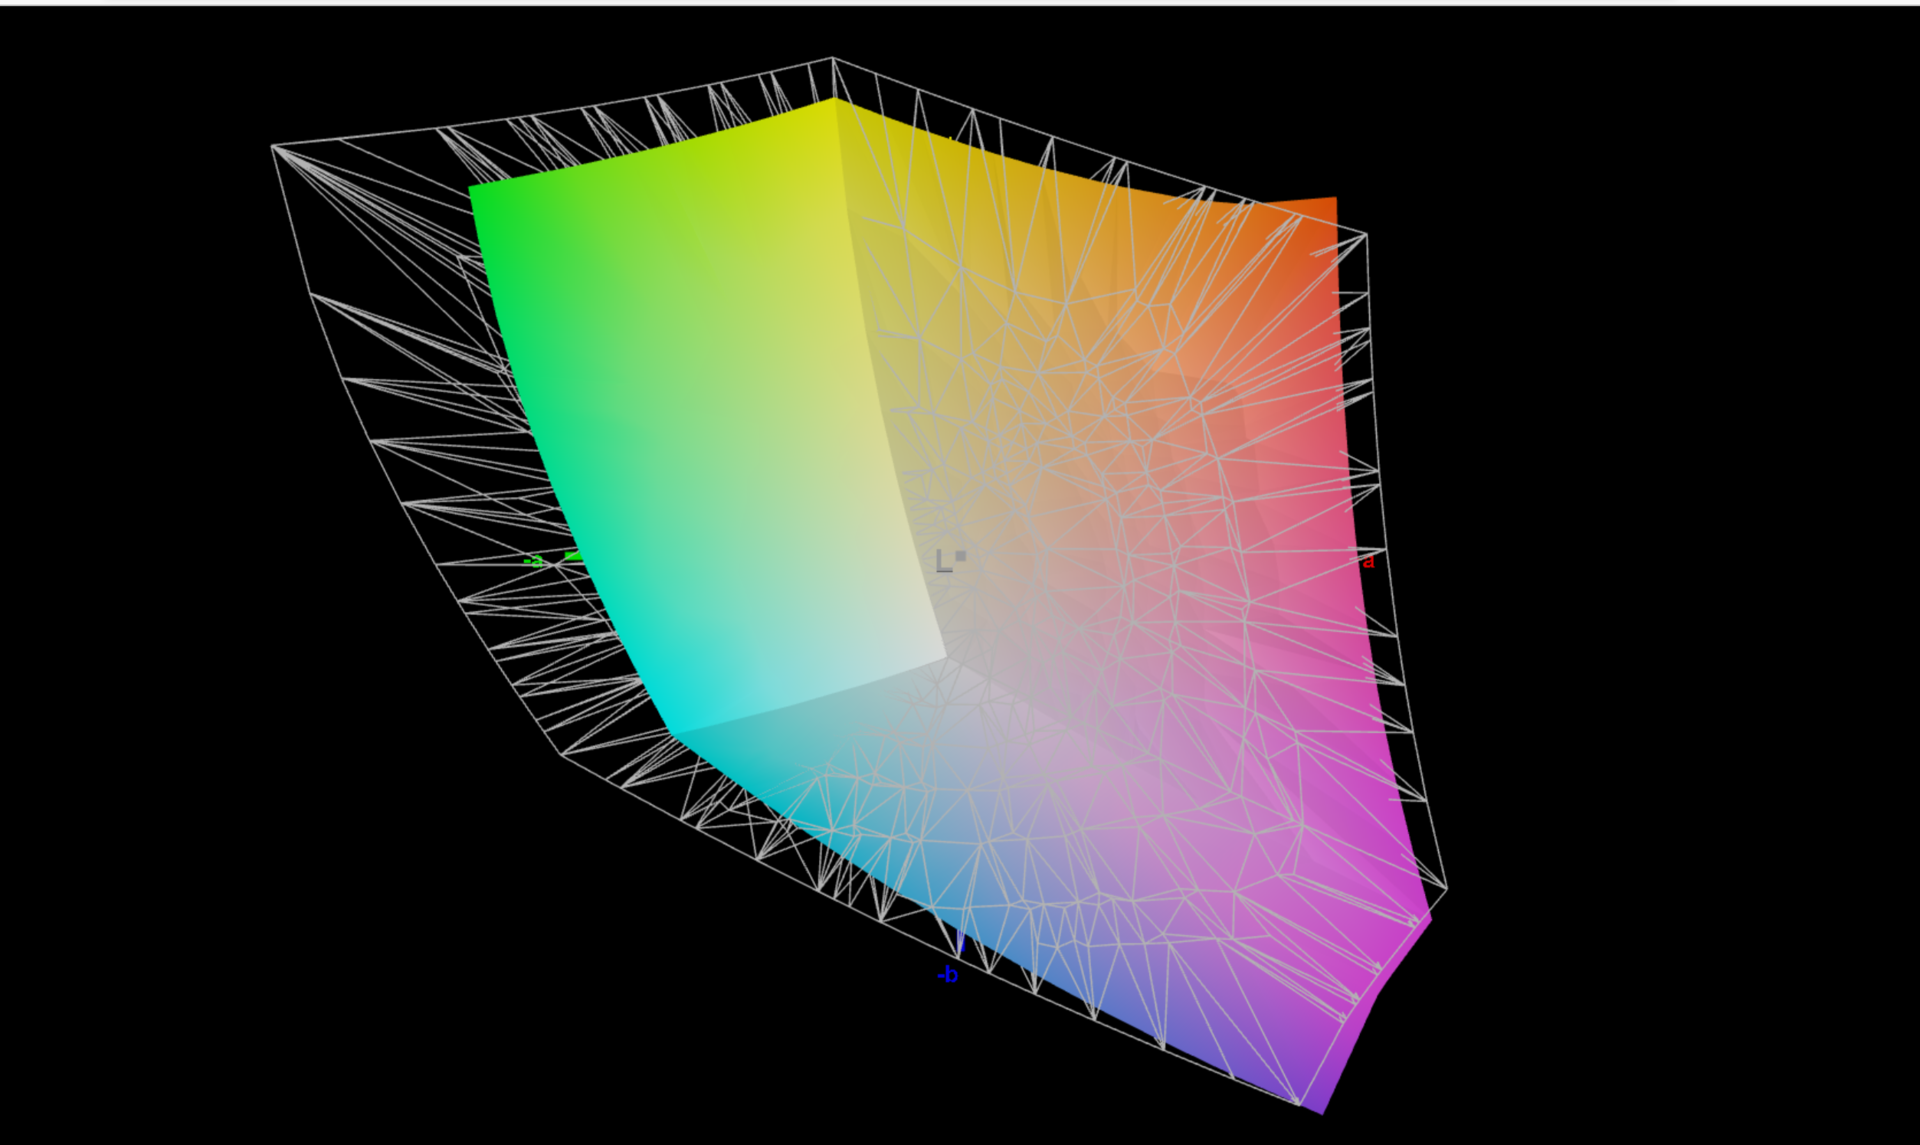
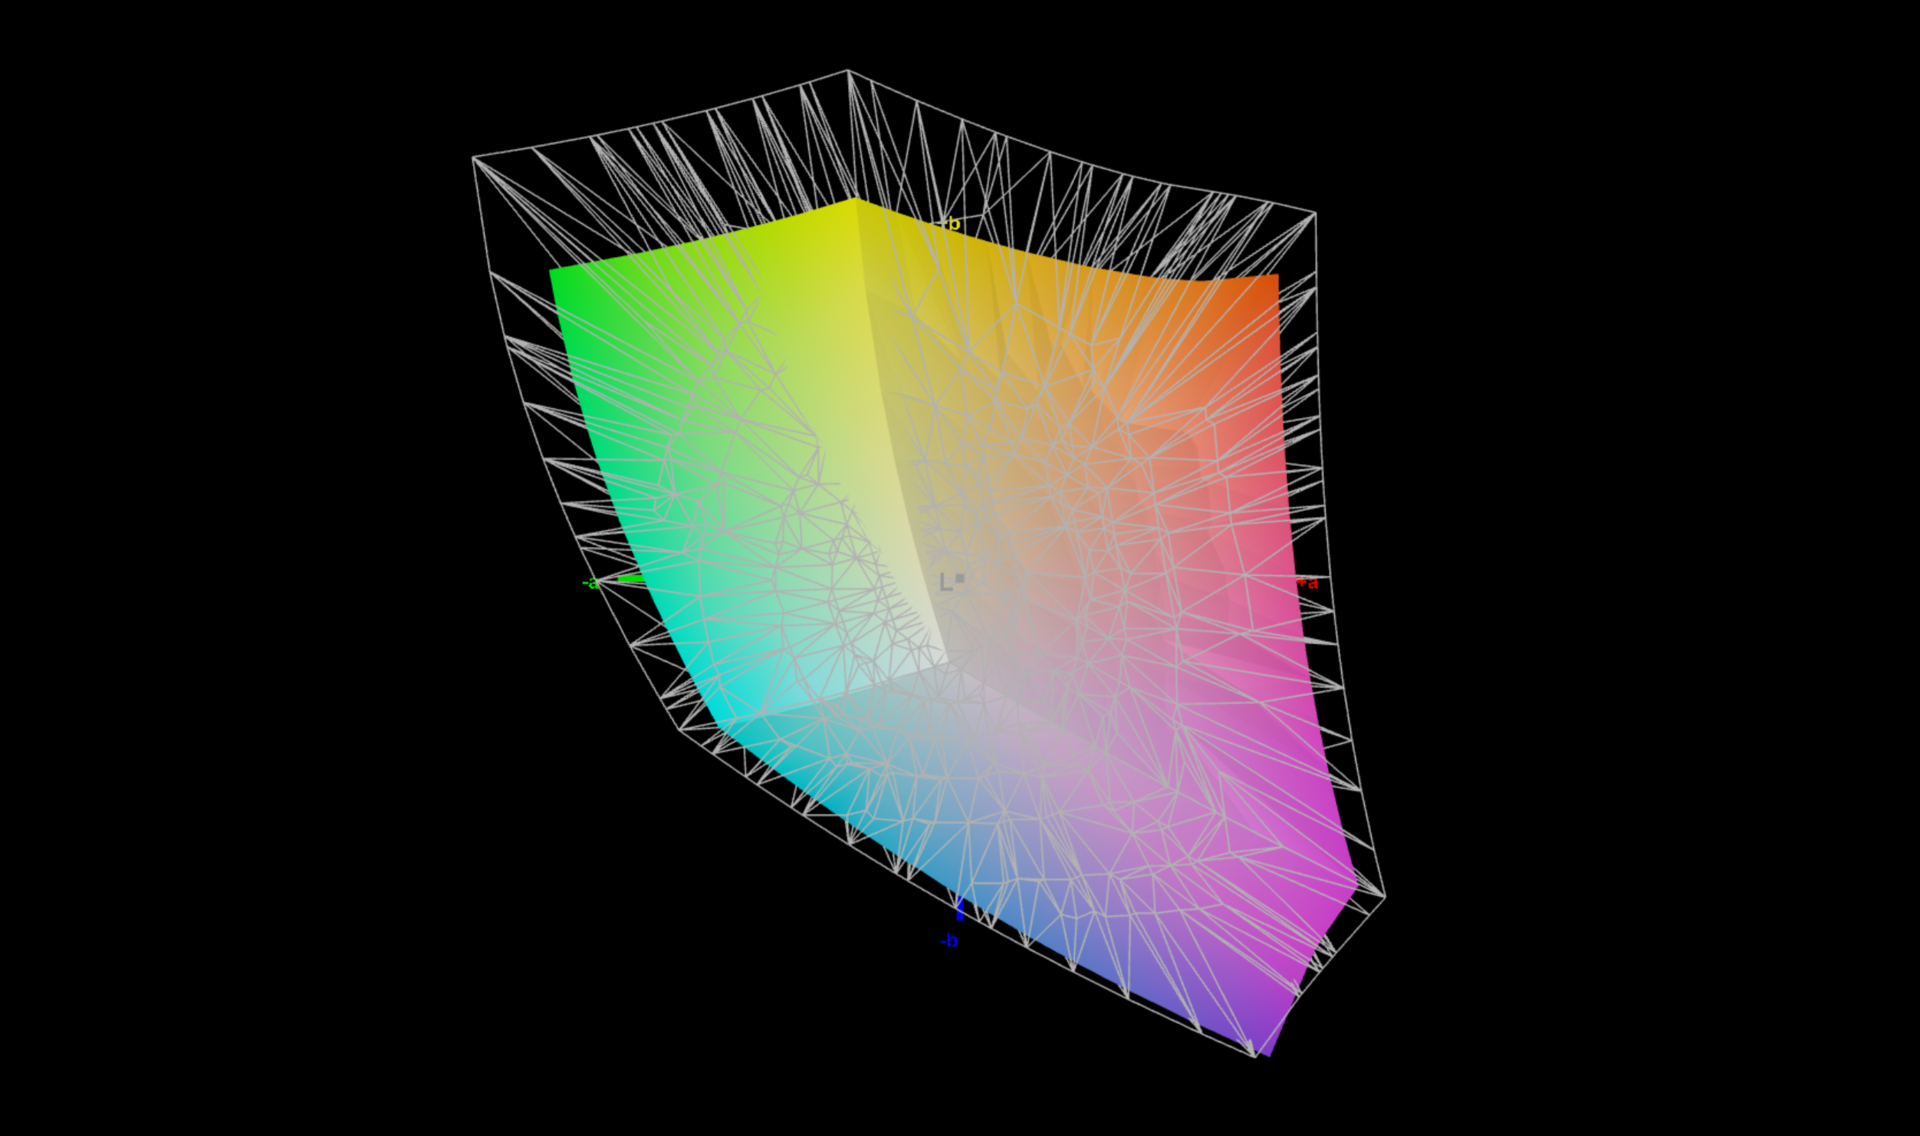
76.6% AdobeRGB 1998 (Argyll 3D)
100% sRGB (Argyll 3D)
76.4% Display P3 (Argyll 3D)
Gamma: 2.43
CCT: 6717 K
| Acer Swift X SFX16-52G-77RX B160QAN02.M, IPS-LED, 2560x1600, 16" | Acer Swift X SFX16-52G-52VE AU Optronics AUOBD9E, , 2560x1600, 16" | Acer Swift X SFX16-51G-5388 Chi Mei N161HCA-EA3, , 1920x1080, 16.1" | Lenovo ThinkBook 16 G4+ IAP LEN160WQXGA, IPS, 2560x1600, 16" | Dell Inspiron 16 Plus 7620 BOE NE16N41, IPS, 3072x1920, 16" | HP Envy 16 h0112nr Samsung SDC4174, OLED, 3840x2400, 16" | Lenovo IdeaPad 5 Pro 16ARH7 AUO B160QAN02.H, IPS, 2560x1600, 16" | Asus Vivobook Pro 16X-M7600QE Samsung ATNA60YV02-0, OLED, 3840x2400, 16.1" | |
|---|---|---|---|---|---|---|---|---|
| Display | -0% | -11% | -6% | -4% | 15% | -10% | 19% | |
| Display P3 Coverage (%) | 76.4 | 75.75 -1% | 65.1 -15% | 69.6 -9% | 70.8 -7% | 99.3 30% | 65 -15% | 99.8 31% |
| sRGB Coverage (%) | 100 | 100 0% | 95.65 -4% | 97.5 -2% | 99.5 0% | 100 0% | 98 -2% | 100 0% |
| AdobeRGB 1998 Coverage (%) | 76.6 | 76.51 0% | 66.75 -13% | 71.7 -6% | 73.2 -4% | 88 15% | 67.2 -12% | 96.9 27% |
| Response Times | -10% | -12% | -6% | -51% | 91% | 55% | 91% | |
| Response Time Grey 50% / Grey 80% * (ms) | 33 ? | 37 ? -12% | 30 ? 9% | 32.7 ? 1% | 38 ? -15% | 2 ? 94% | 14.1 ? 57% | 2 ? 94% |
| Response Time Black / White * (ms) | 15 ? | 16 ? -7% | 20 ? -33% | 16.8 ? -12% | 28 ? -87% | 1.9 ? 87% | 7.1 ? 53% | 2 ? 87% |
| PWM Frequency (Hz) | 240.4 ? | 60 ? | ||||||
| Screen | 14% | 11% | -1% | 10% | 7% | 2% | 12% | |
| Brightness middle (cd/m²) | 411 | 411 0% | 276 -33% | 371 -10% | 288.9 -30% | 328.8 -20% | 415 1% | 392 -5% |
| Brightness (cd/m²) | 378 | 364 -4% | 264 -30% | 357 -6% | 276 -27% | 332 -12% | 409 8% | 396 5% |
| Brightness Distribution (%) | 83 | 81 -2% | 85 2% | 91 10% | 92 11% | 97 17% | 91 10% | 98 18% |
| Black Level * (cd/m²) | 0.29 | 0.295 -2% | 0.16 45% | 0.23 21% | 0.26 10% | 0.32 -10% | ||
| Contrast (:1) | 1417 | 1393 -2% | 1725 22% | 1613 14% | 1111 -22% | 1297 -8% | ||
| Colorchecker dE 2000 * | 2.18 | 1.73 21% | 1.8 17% | 2.6 -19% | 1.88 14% | 1.53 30% | 1.92 12% | 1.74 20% |
| Colorchecker dE 2000 max. * | 4.84 | 2.7 44% | 3.77 22% | 4.4 9% | 4.37 10% | 6.04 -25% | 5.71 -18% | 3.18 34% |
| Colorchecker dE 2000 calibrated * | 1.48 | 1.18 20% | 0.63 57% | 1.3 12% | 0.42 72% | 0.58 61% | 1.85 -25% | |
| Greyscale dE 2000 * | 2.68 | 1.26 53% | 2.76 -3% | 3.7 -38% | 1.4 48% | 1.3 51% | 3.7 -38% | 1.77 34% |
| Gamma | 2.43 91% | 2.35 94% | 2.37 93% | 2.32 95% | 2.3 96% | 2.18 101% | 2.272 97% | 2.22 99% |
| CCT | 6717 97% | 6616 98% | 6564 99% | 7271 89% | 6634 98% | 6362 102% | 7132 91% | 6483 100% |
| Media totale (Programma / Settaggio) | 1% /
8% | -4% /
3% | -4% /
-3% | -15% /
-2% | 38% /
24% | 16% /
7% | 41% /
27% |
* ... Meglio usare valori piccoli
Lo spazio colore sRGB è coperto al 100%, il che consente un'elaborazione delle immagini e dei video meno ambiziosa.
Il valore DeltaE di poco superiore a 2 può essere ridotto a un valore ancora più preciso di 1,48 dopo la nostra calibrazione. Solo il colore rosso continua a mostrare una deviazione significativa, con un valore appena inferiore a 5. È possibile scaricare il nostro profilo di colore calibrato nel riquadro a destra accanto al grafico della distribuzione della luminosità.

Tempi di risposta del Display
| ↔ Tempi di risposta dal Nero al Bianco | ||
|---|---|---|
| 15 ms ... aumenta ↗ e diminuisce ↘ combinato | ↗ 5 ms Incremento |  |
| ↘ 10 ms Calo | ||
| Lo schermo mostra buoni tempi di risposta durante i nostri tests, ma potrebbe essere troppo lento per i gamers competitivi. In confronto, tutti i dispositivi di test variano da 0.1 (minimo) a 240 (massimo) ms. » 36 % di tutti i dispositivi è migliore. Questo significa che i tempi di risposta rilevati sono migliori rispettto alla media di tutti i dispositivi testati (19.9 ms). | ||
| ↔ Tempo di risposta dal 50% Grigio all'80% Grigio | ||
| 33 ms ... aumenta ↗ e diminuisce ↘ combinato | ↗ 15 ms Incremento |  |
| ↘ 18 ms Calo | ||
| Lo schermo mostra tempi di risposta lenti nei nostri tests e sarà insoddisfacente per i gamers. In confronto, tutti i dispositivi di test variano da 0.165 (minimo) a 636 (massimo) ms. » 45 % di tutti i dispositivi è migliore. Questo significa che i tempi di risposta rilevati sono simili alla media di tutti i dispositivi testati (31.1 ms). | ||
Sfarfallio dello schermo / PWM (Pulse-Width Modulation)
| flickering dello schermo / PWM non rilevato |    | ||
In confronto: 52 % di tutti i dispositivi testati non utilizza PWM per ridurre la luminosita' del display. Se è rilevato PWM, una media di 7798 (minimo: 5 - massimo: 343500) Hz è stata rilevata. | |||
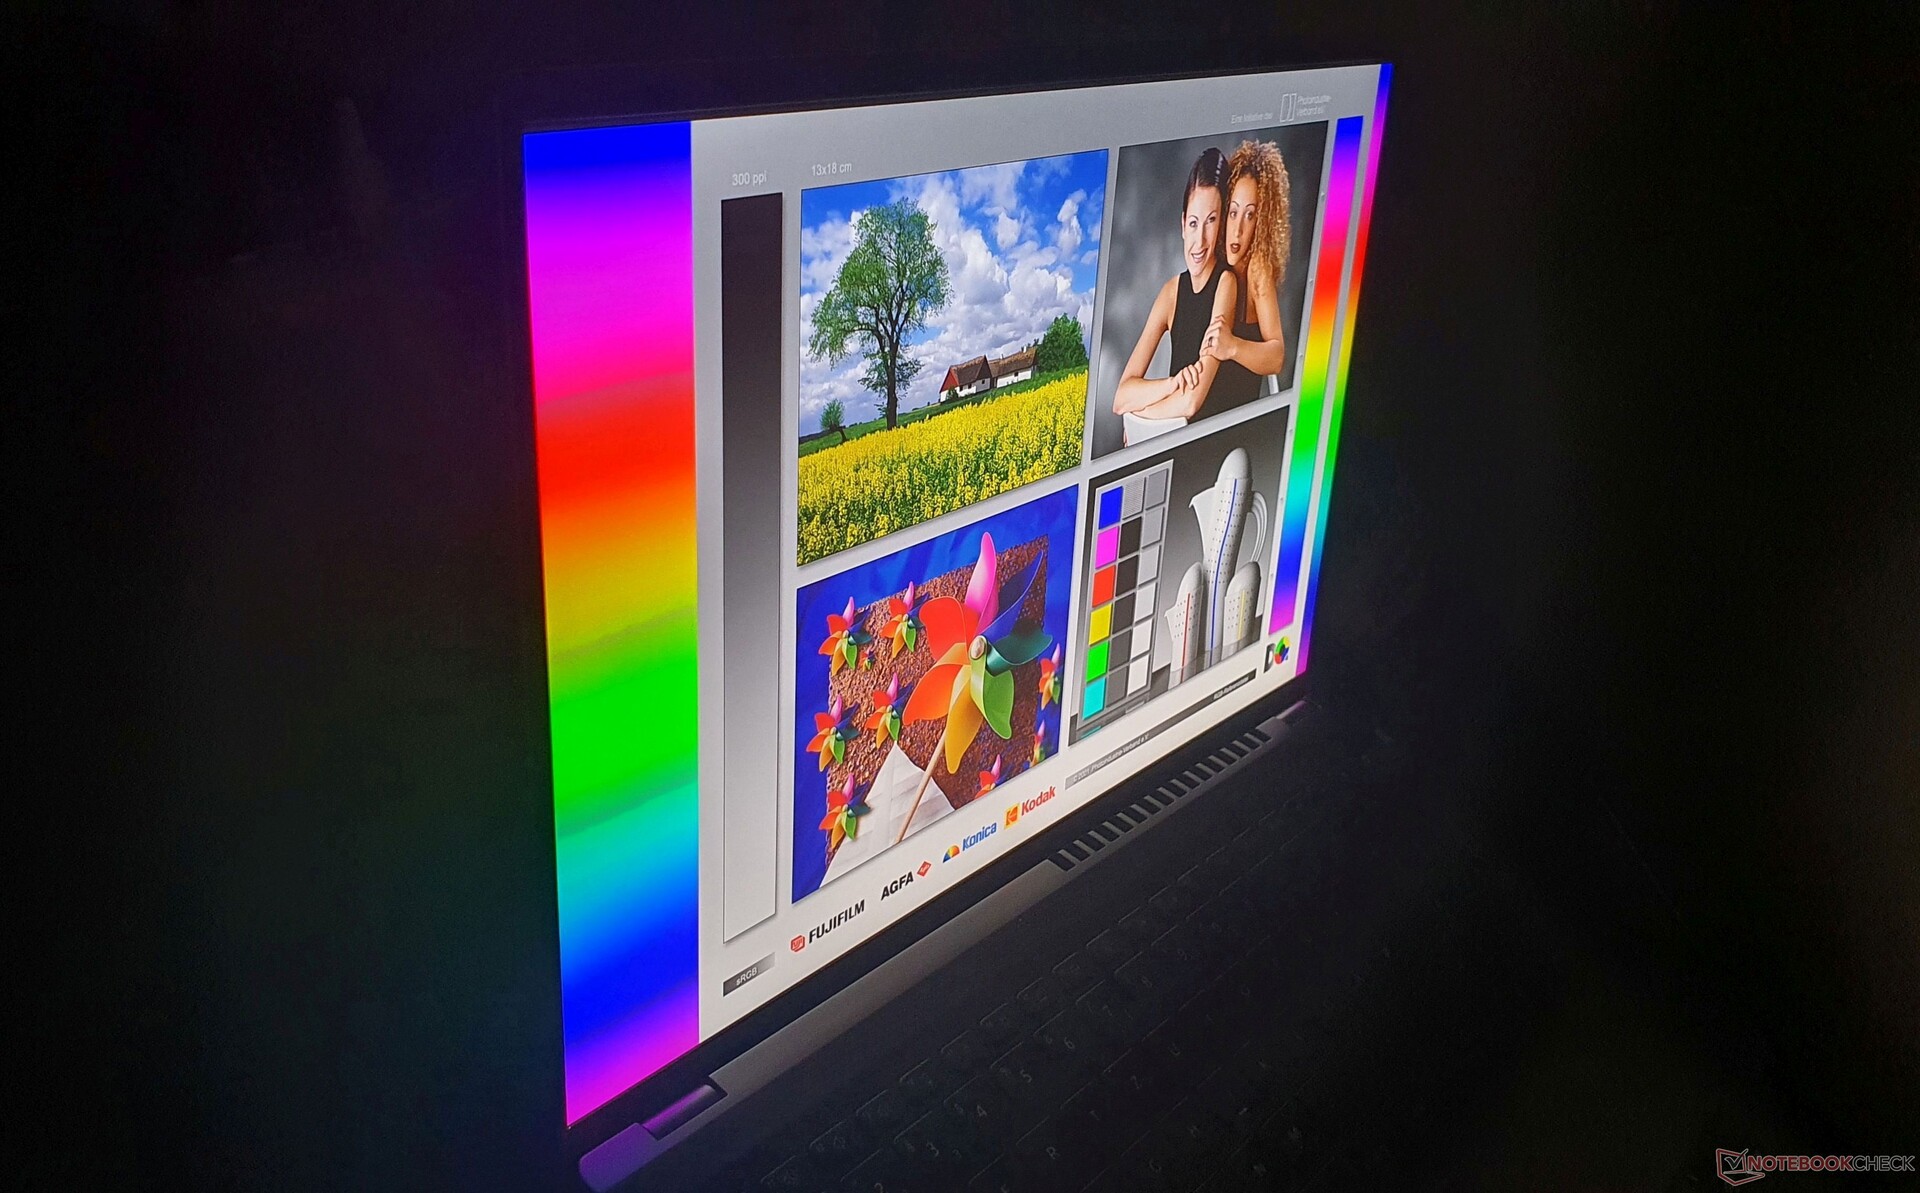
Grazie alla superficie opaca del display, la luminosità di 378 nit è sufficiente per utilizzare l'Acer Swift X 16 anche all'aperto. Tuttavia, è bene evitare la luce diretta del sole.
Prestazioni: Turbo veloce ma Intel Arc A370M debole
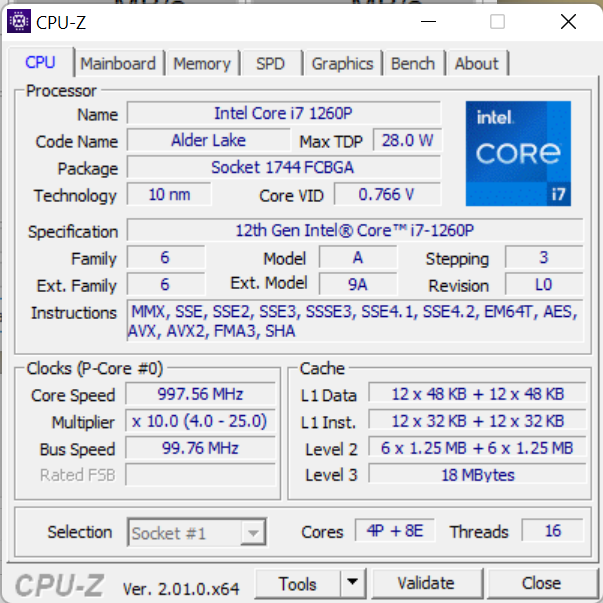
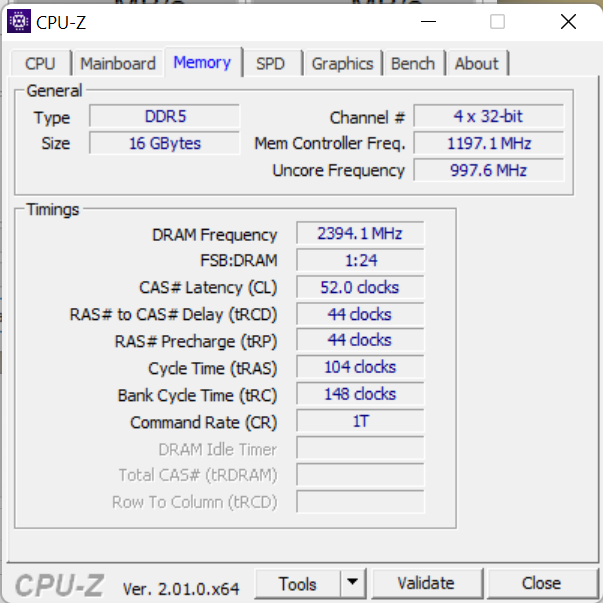
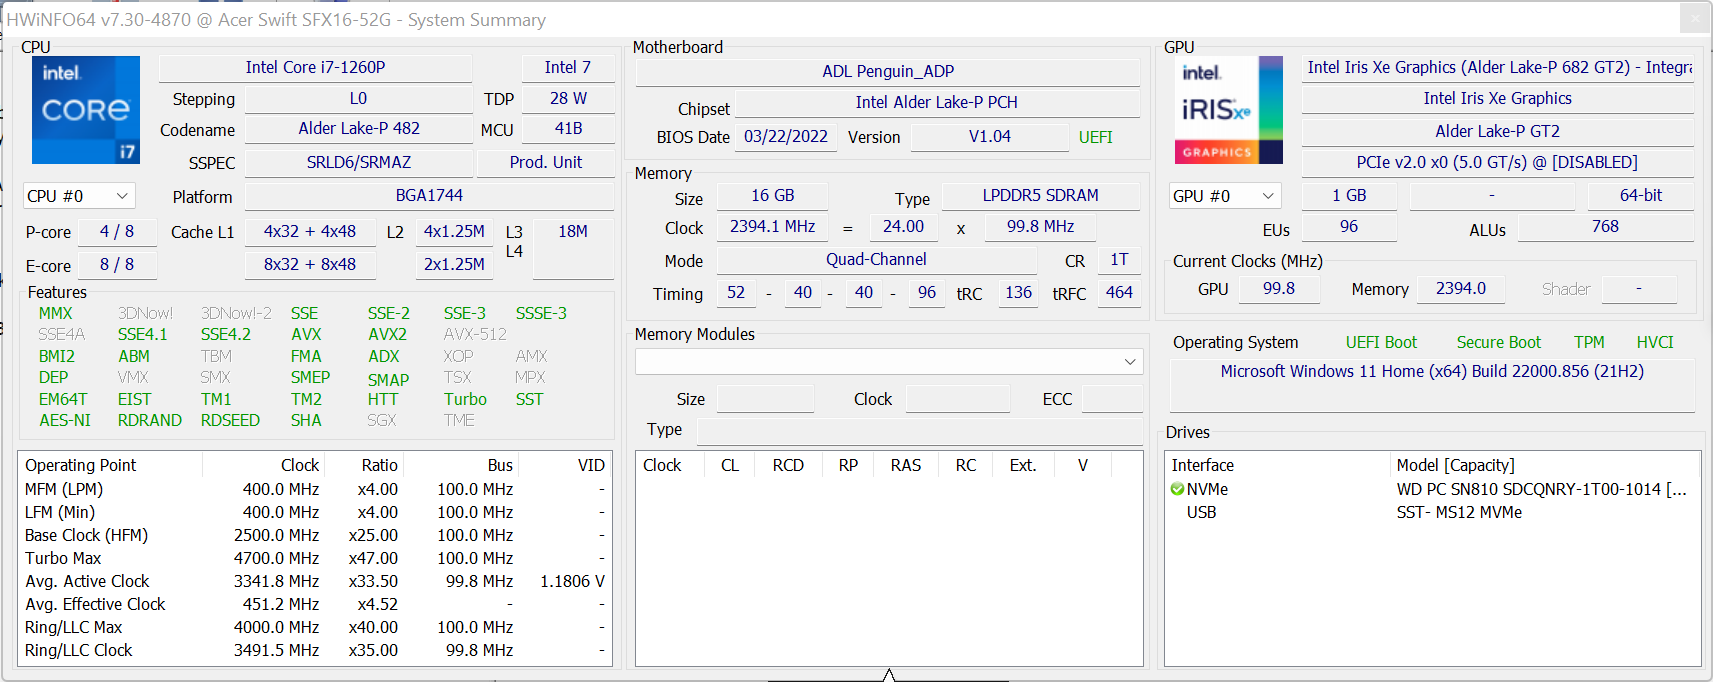
Mentre il modello fratello utilizza un Intel Core i5-1240Pe un'unità SSD PCIe 4.0 da 512 GB, come unica opzione alternativa, la nostra unità di prova è dotata di un Core i7-1260Pe una più veloce unità SSD da 1 TB. Le versioni AMD non sono disponibili. Entrambi i modelli offrono 16 GB di RAM DDR5-4800 saldata e Arc A370M di Intel. Il portatile da 16 pollici è progettato per facilitare il taglio dei video e il consumo dei media, compresi i giochi in Full-HD.
Condizioni di prova
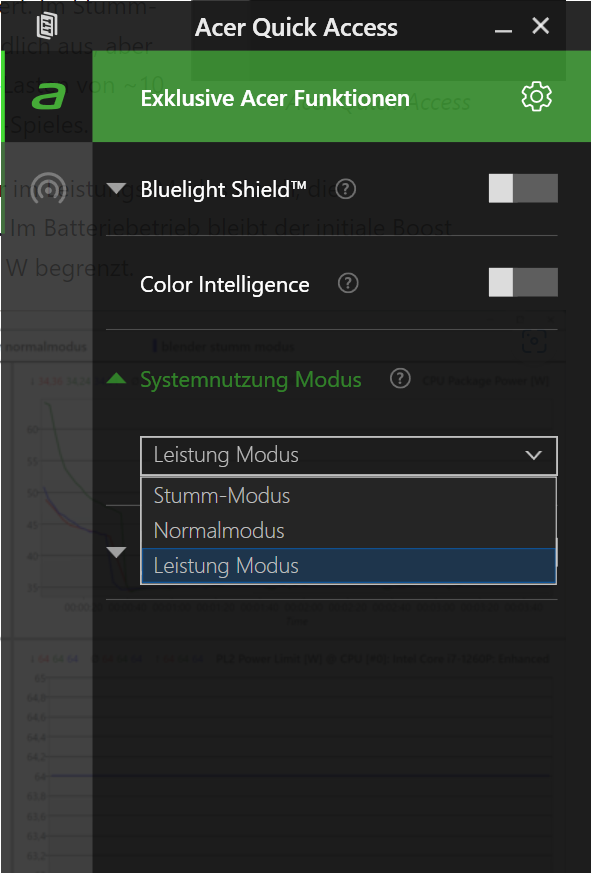
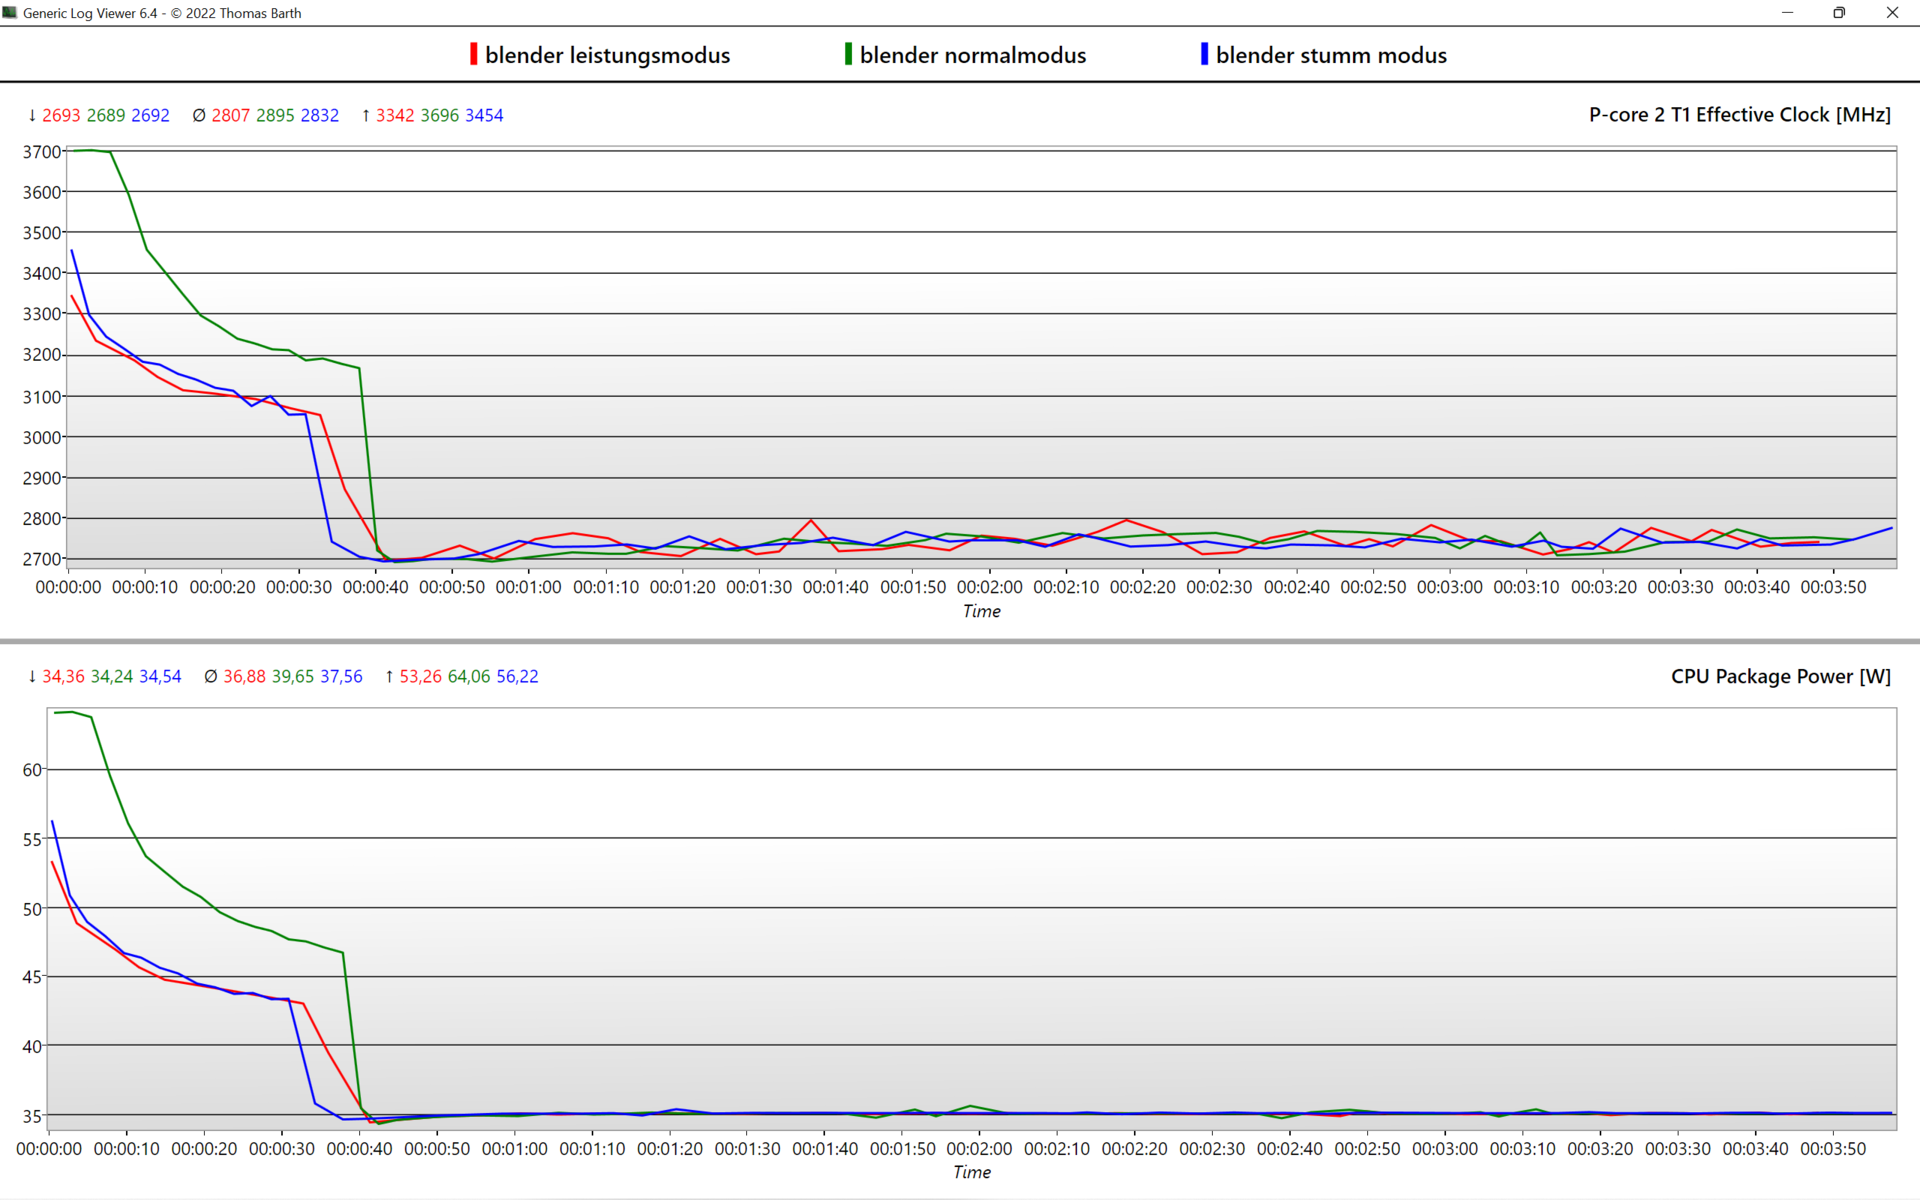
Con "Acer Quick Access" è possibile selezionare tre profili di prestazioni. Tuttavia, essi hanno effetto solo su GPU Arc di Intelcome mostra il grafico sottostante. Anche il comportamento della ventola viene modificato, come spieghiamo nella sezione "Emissioni" qui sotto.
Eseguiamo i nostri test sulle prestazioni in modalità Performance e determiniamo la durata della batteria in modalità Normal. Nel funzionamento a batteria, il boost iniziale di 64 watt è completamente escluso e la CPU è limitata a 28 watt.
| Modalità Performance | Modalità Normale | Modalità Silenziosa | Modalità Batteria | |
|---|---|---|---|---|
| CPU | 64 W > 35 W | 56 W > 35 W | 53 W > 35 W | 28 W |
| GPU | 35 W | 25 W | 20 W | 25 W |
Processore
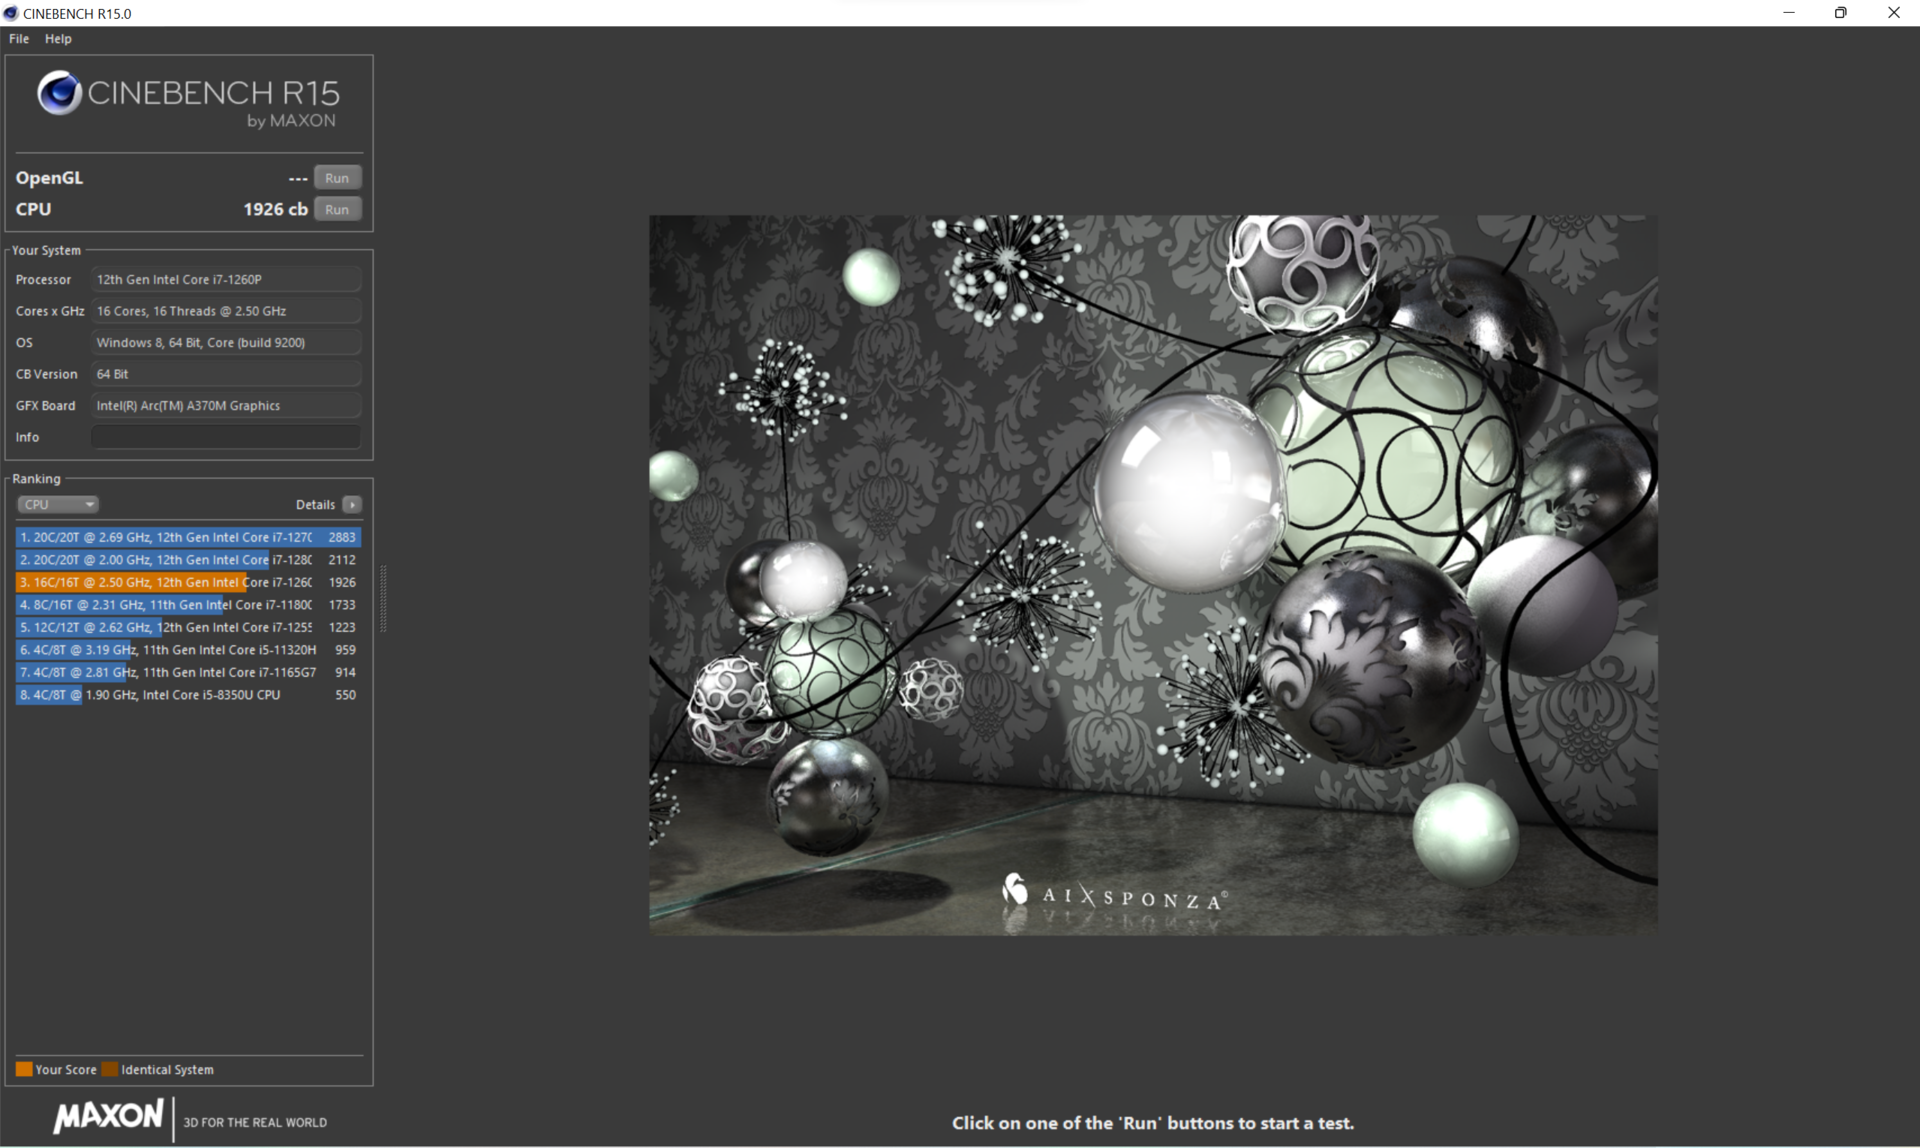
Le prestazioni multicore dell'Intel Core i7-1260Psono allo stesso livello di quelle del Core i5 del modello fratello. C'è solo un vantaggio del 10% nelle prestazioni single-core. Per questo motivo, il sovrapprezzo di 200 euro (~198 dollari) non è giustificato, nonostante l'SSD più grande.
All'inizio, i core P partono con una velocità di clock di 3,7 GHz, prima di scendere gradualmente a 3,2 GHz entro 40 secondi, e quando il limite di potenza di 35 Watt prende piede, alla fine si stabilizzano a 2,8 GHz costanti. Le temperature dei core si stabilizzano a 70 °C (158 °F).
Le prestazioni a lungo termine superano quelle del predecessore con una CPU quad-coredel 65% con lo stesso limite di potenza di 35 Watt. Anche il modello Ryzen 9 5900X nell'Asus Vivobook Pro 16Xè solo marginalmente più veloce nella maggior parte degli scenari. Tuttavia, ilThinkBook 16 G4+e l'Inspiron 16 Plus di Dell Inspiron 16 Plusguidano la classifica con un vantaggio significativo grazie al loro Core i7-12700Hcon limiti di potenza più elevati.
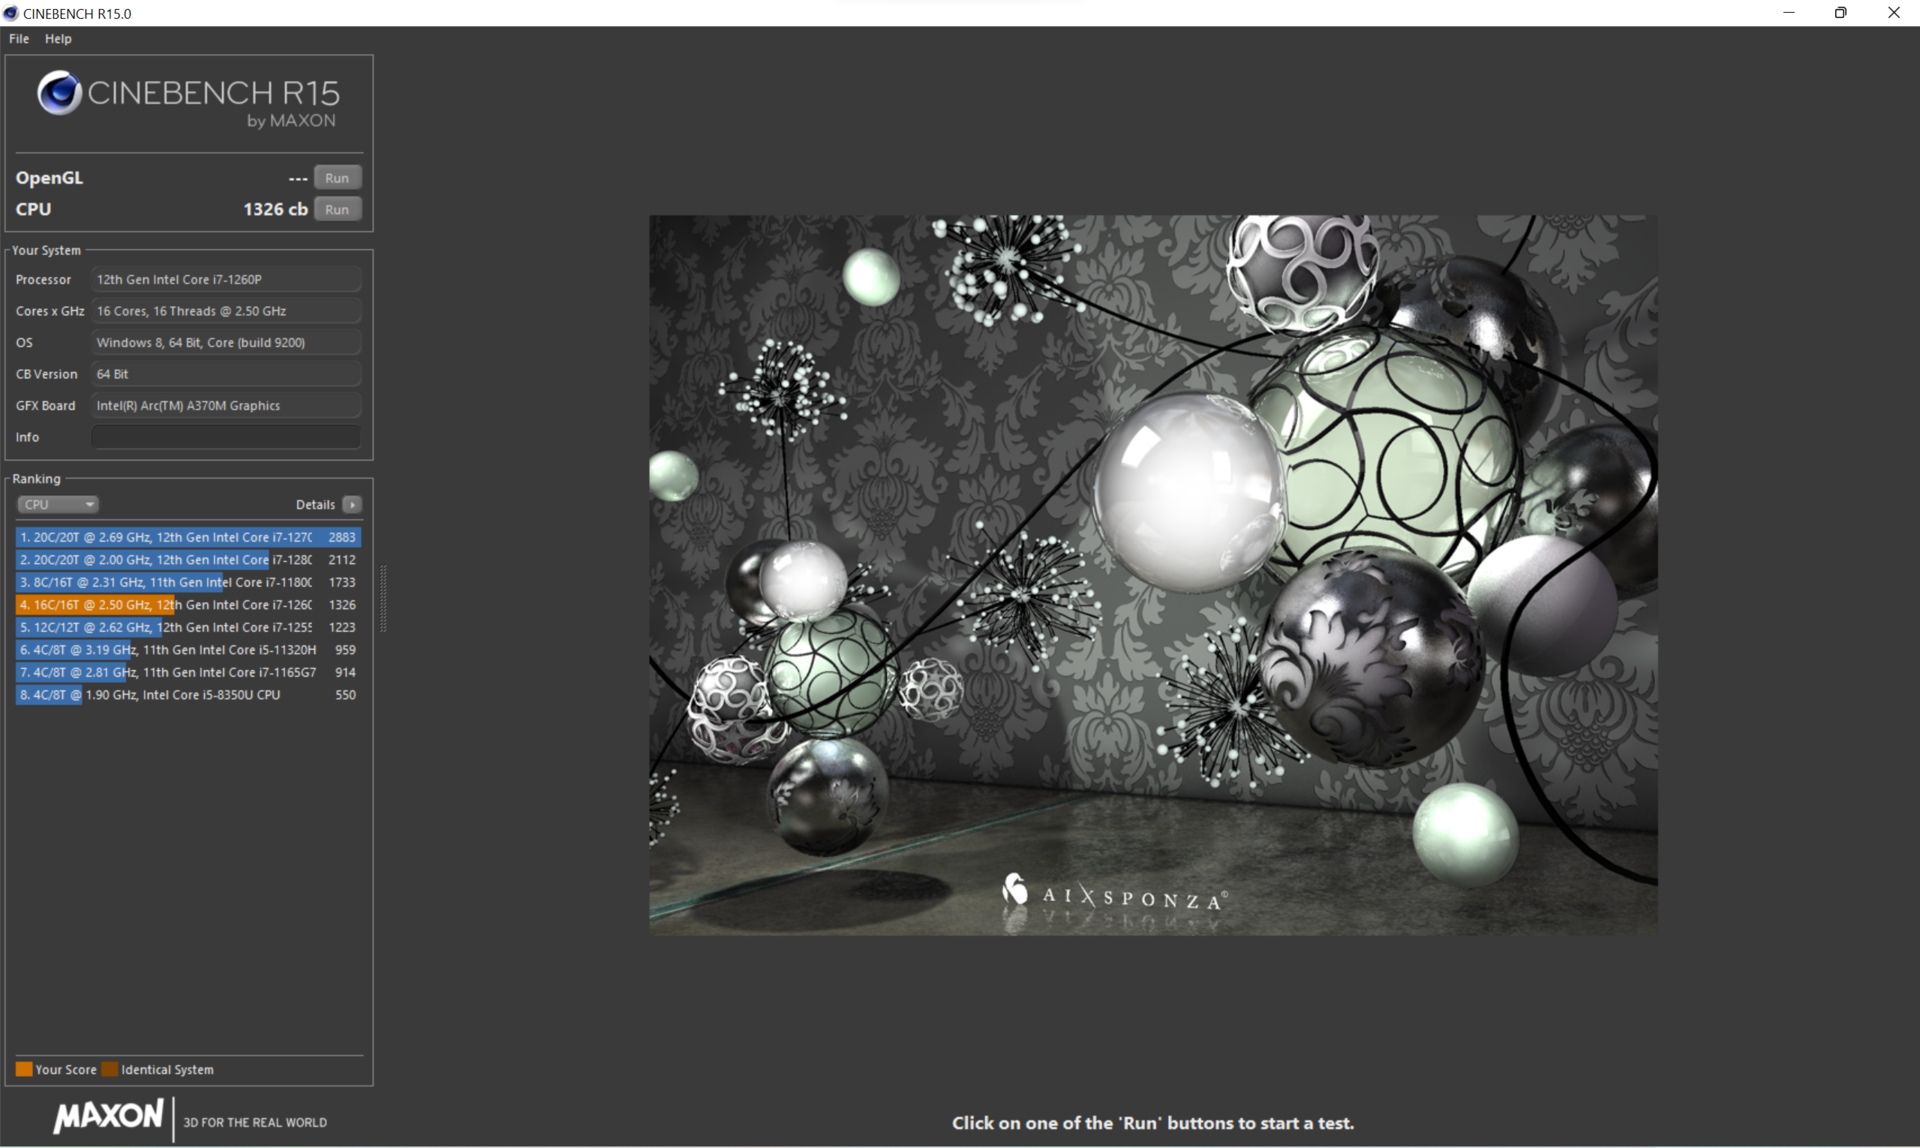
Poiché non c'è Turbo Boost e la potenza è limitata a 28 watt nel funzionamento a batteria, le prestazioni calano dal 20 al 30%, a seconda dello scenario.
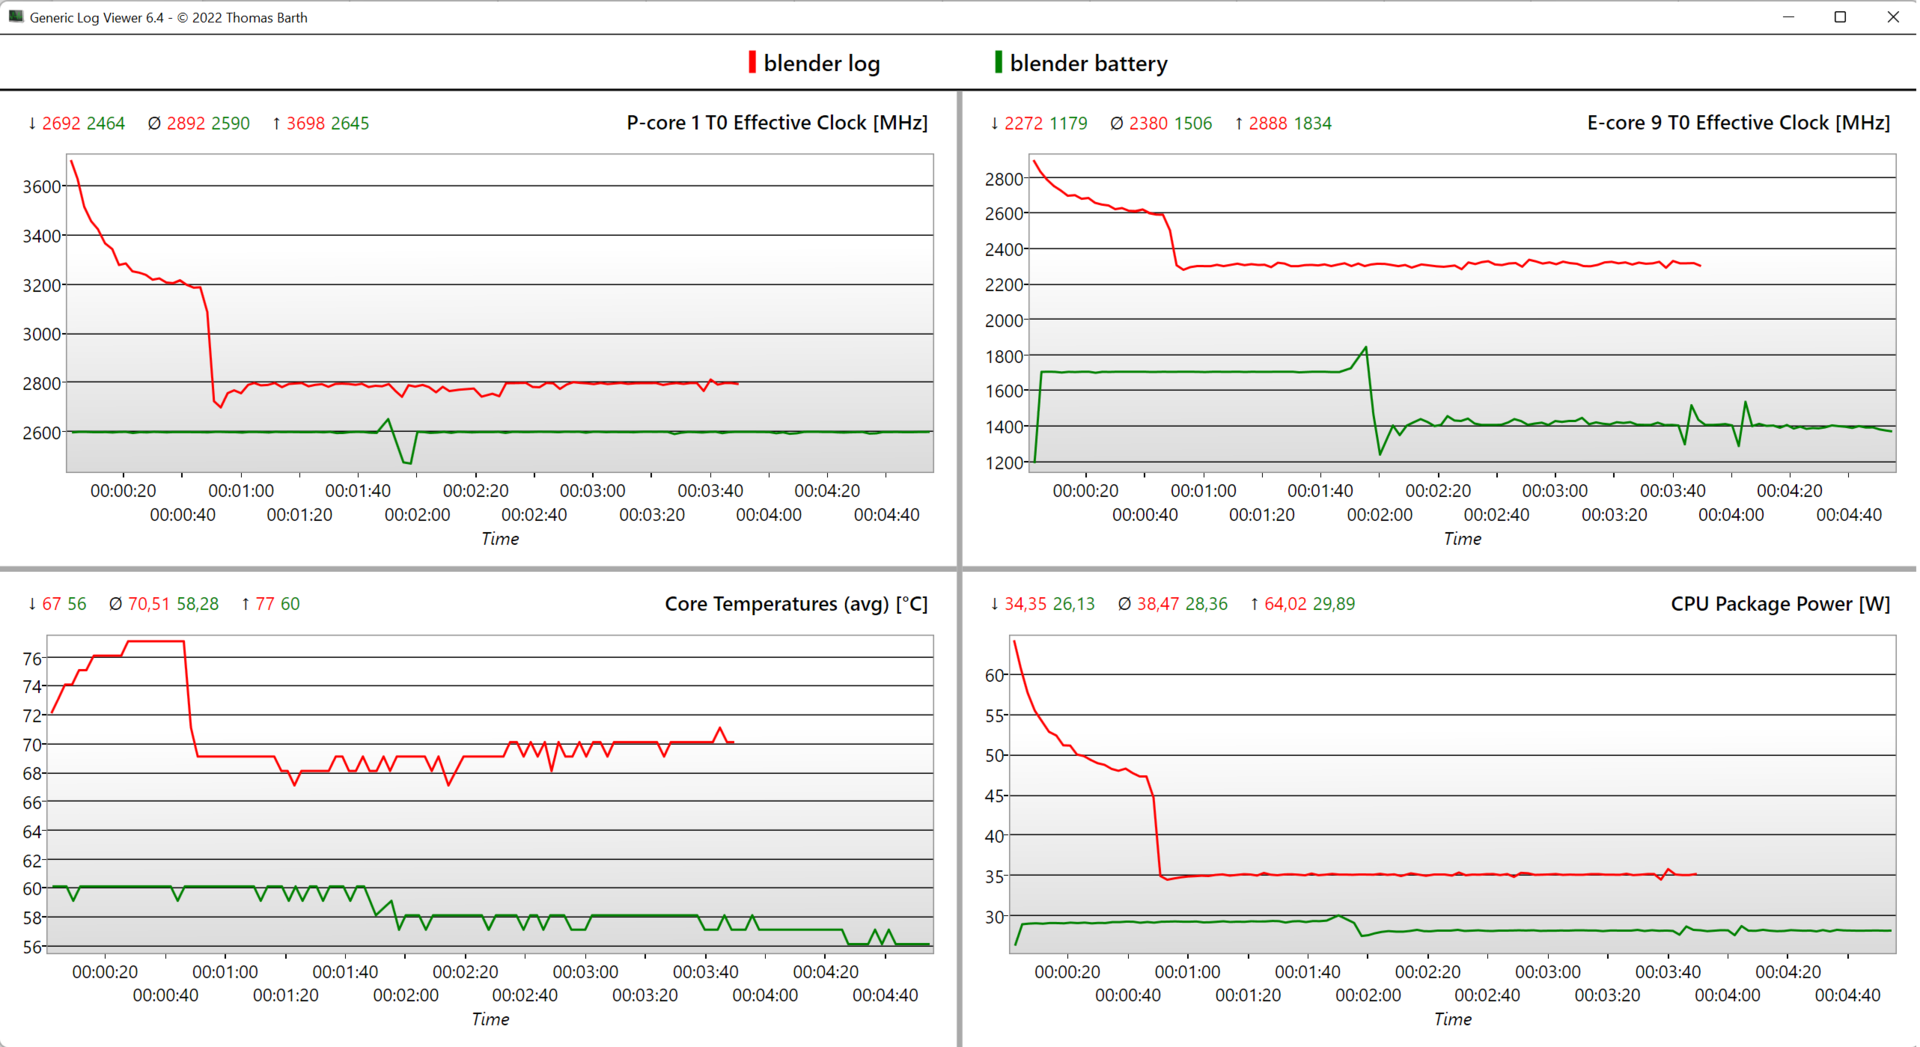
Cinebench R15 Multi Constant Load Test
Cinebench R23: Multi Core | Single Core
Cinebench R20: CPU (Multi Core) | CPU (Single Core)
Cinebench R15: CPU Multi 64Bit | CPU Single 64Bit
Blender: v2.79 BMW27 CPU
7-Zip 18.03: 7z b 4 | 7z b 4 -mmt1
Geekbench 5.5: Multi-Core | Single-Core
HWBOT x265 Benchmark v2.2: 4k Preset
LibreOffice : 20 Documents To PDF
R Benchmark 2.5: Overall mean
| CPU Performance rating | |
| Media della classe Multimedia | |
| Lenovo ThinkBook 16 G4+ IAP | |
| Dell Inspiron 16 Plus 7620 | |
| HP Envy 16 h0112nr | |
| Asus Vivobook Pro 16X-M7600QE | |
| Acer Swift X SFX16-52G-77RX | |
| Acer Swift X SFX16-52G-52VE | |
| Media Intel Core i7-1260P | |
| Lenovo IdeaPad 5 Pro 16ARH7 | |
| Acer Swift X SFX16-51G-5388 | |
| Cinebench R23 / Multi Core | |
| Media della classe Multimedia (4861 - 33362, n=81, ultimi 2 anni) | |
| Lenovo ThinkBook 16 G4+ IAP | |
| Dell Inspiron 16 Plus 7620 | |
| HP Envy 16 h0112nr | |
| Asus Vivobook Pro 16X-M7600QE | |
| Asus Vivobook Pro 16X-M7600QE | |
| Acer Swift X SFX16-52G-77RX | |
| Acer Swift X SFX16-52G-52VE | |
| Media Intel Core i7-1260P (3173 - 12150, n=27) | |
| Lenovo IdeaPad 5 Pro 16ARH7 | |
| Acer Swift X SFX16-51G-5388 | |
| Cinebench R23 / Single Core | |
| Media della classe Multimedia (1128 - 2459, n=73, ultimi 2 anni) | |
| Lenovo ThinkBook 16 G4+ IAP | |
| HP Envy 16 h0112nr | |
| Dell Inspiron 16 Plus 7620 | |
| Acer Swift X SFX16-52G-77RX | |
| Media Intel Core i7-1260P (1155 - 1812, n=25) | |
| Acer Swift X SFX16-52G-52VE | |
| Asus Vivobook Pro 16X-M7600QE | |
| Asus Vivobook Pro 16X-M7600QE | |
| Lenovo IdeaPad 5 Pro 16ARH7 | |
| Acer Swift X SFX16-51G-5388 | |
| Cinebench R20 / CPU (Multi Core) | |
| Media della classe Multimedia (1887 - 12912, n=64, ultimi 2 anni) | |
| Lenovo ThinkBook 16 G4+ IAP | |
| Dell Inspiron 16 Plus 7620 | |
| HP Envy 16 h0112nr | |
| Asus Vivobook Pro 16X-M7600QE | |
| Asus Vivobook Pro 16X-M7600QE | |
| Acer Swift X SFX16-52G-77RX | |
| Acer Swift X SFX16-52G-52VE | |
| Lenovo IdeaPad 5 Pro 16ARH7 | |
| Media Intel Core i7-1260P (1234 - 4748, n=25) | |
| Acer Swift X SFX16-51G-5388 | |
| Cinebench R20 / CPU (Single Core) | |
| Media della classe Multimedia (425 - 853, n=64, ultimi 2 anni) | |
| Lenovo ThinkBook 16 G4+ IAP | |
| HP Envy 16 h0112nr | |
| Dell Inspiron 16 Plus 7620 | |
| Acer Swift X SFX16-52G-77RX | |
| Media Intel Core i7-1260P (448 - 698, n=25) | |
| Acer Swift X SFX16-52G-52VE | |
| Lenovo IdeaPad 5 Pro 16ARH7 | |
| Asus Vivobook Pro 16X-M7600QE | |
| Asus Vivobook Pro 16X-M7600QE | |
| Acer Swift X SFX16-51G-5388 | |
| Cinebench R15 / CPU Multi 64Bit | |
| Media della classe Multimedia (856 - 5224, n=68, ultimi 2 anni) | |
| HP Envy 16 h0112nr | |
| Lenovo ThinkBook 16 G4+ IAP | |
| Dell Inspiron 16 Plus 7620 | |
| Asus Vivobook Pro 16X-M7600QE | |
| Asus Vivobook Pro 16X-M7600QE | |
| Acer Swift X SFX16-52G-77RX | |
| Acer Swift X SFX16-52G-52VE | |
| Lenovo IdeaPad 5 Pro 16ARH7 | |
| Media Intel Core i7-1260P (549 - 2034, n=29) | |
| Acer Swift X SFX16-51G-5388 | |
| Cinebench R15 / CPU Single 64Bit | |
| Media della classe Multimedia (184.8 - 326, n=66, ultimi 2 anni) | |
| Lenovo ThinkBook 16 G4+ IAP | |
| HP Envy 16 h0112nr | |
| Dell Inspiron 16 Plus 7620 | |
| Acer Swift X SFX16-52G-77RX | |
| Asus Vivobook Pro 16X-M7600QE | |
| Asus Vivobook Pro 16X-M7600QE | |
| Lenovo IdeaPad 5 Pro 16ARH7 | |
| Acer Swift X SFX16-52G-52VE | |
| Media Intel Core i7-1260P (165.4 - 260, n=27) | |
| Acer Swift X SFX16-51G-5388 | |
| Blender / v2.79 BMW27 CPU | |
| Acer Swift X SFX16-51G-5388 | |
| Media Intel Core i7-1260P (264 - 906, n=26) | |
| Lenovo IdeaPad 5 Pro 16ARH7 | |
| Acer Swift X SFX16-52G-52VE | |
| Acer Swift X SFX16-52G-77RX | |
| Asus Vivobook Pro 16X-M7600QE | |
| Asus Vivobook Pro 16X-M7600QE | |
| HP Envy 16 h0112nr | |
| Media della classe Multimedia (100 - 557, n=65, ultimi 2 anni) | |
| Dell Inspiron 16 Plus 7620 | |
| Lenovo ThinkBook 16 G4+ IAP | |
| 7-Zip 18.03 / 7z b 4 | |
| Lenovo ThinkBook 16 G4+ IAP | |
| Dell Inspiron 16 Plus 7620 | |
| Media della classe Multimedia (29095 - 130368, n=62, ultimi 2 anni) | |
| Asus Vivobook Pro 16X-M7600QE | |
| Asus Vivobook Pro 16X-M7600QE | |
| HP Envy 16 h0112nr | |
| Acer Swift X SFX16-52G-52VE | |
| Lenovo IdeaPad 5 Pro 16ARH7 | |
| Acer Swift X SFX16-52G-77RX | |
| Media Intel Core i7-1260P (16146 - 47064, n=25) | |
| Acer Swift X SFX16-51G-5388 | |
| 7-Zip 18.03 / 7z b 4 -mmt1 | |
| Media della classe Multimedia (3666 - 7545, n=63, ultimi 2 anni) | |
| Asus Vivobook Pro 16X-M7600QE | |
| Asus Vivobook Pro 16X-M7600QE | |
| HP Envy 16 h0112nr | |
| Lenovo ThinkBook 16 G4+ IAP | |
| Dell Inspiron 16 Plus 7620 | |
| Lenovo IdeaPad 5 Pro 16ARH7 | |
| Media Intel Core i7-1260P (4064 - 5791, n=25) | |
| Acer Swift X SFX16-52G-77RX | |
| Acer Swift X SFX16-52G-52VE | |
| Acer Swift X SFX16-51G-5388 | |
| Geekbench 5.5 / Multi-Core | |
| Media della classe Multimedia (4652 - 20422, n=62, ultimi 2 anni) | |
| HP Envy 16 h0112nr | |
| Lenovo ThinkBook 16 G4+ IAP | |
| Dell Inspiron 16 Plus 7620 | |
| Acer Swift X SFX16-52G-77RX | |
| Acer Swift X SFX16-52G-52VE | |
| Media Intel Core i7-1260P (3866 - 10570, n=25) | |
| Asus Vivobook Pro 16X-M7600QE | |
| Asus Vivobook Pro 16X-M7600QE | |
| Lenovo IdeaPad 5 Pro 16ARH7 | |
| Acer Swift X SFX16-51G-5388 | |
| Geekbench 5.5 / Single-Core | |
| Media della classe Multimedia (805 - 2974, n=62, ultimi 2 anni) | |
| Acer Swift X SFX16-52G-77RX | |
| HP Envy 16 h0112nr | |
| Lenovo ThinkBook 16 G4+ IAP | |
| Dell Inspiron 16 Plus 7620 | |
| Media Intel Core i7-1260P (1436 - 1786, n=25) | |
| Acer Swift X SFX16-52G-52VE | |
| Asus Vivobook Pro 16X-M7600QE | |
| Asus Vivobook Pro 16X-M7600QE | |
| Lenovo IdeaPad 5 Pro 16ARH7 | |
| Acer Swift X SFX16-51G-5388 | |
| HWBOT x265 Benchmark v2.2 / 4k Preset | |
| Media della classe Multimedia (5.26 - 36.1, n=63, ultimi 2 anni) | |
| Lenovo ThinkBook 16 G4+ IAP | |
| Dell Inspiron 16 Plus 7620 | |
| Asus Vivobook Pro 16X-M7600QE | |
| Asus Vivobook Pro 16X-M7600QE | |
| HP Envy 16 h0112nr | |
| Acer Swift X SFX16-52G-77RX | |
| Acer Swift X SFX16-52G-52VE | |
| Lenovo IdeaPad 5 Pro 16ARH7 | |
| Media Intel Core i7-1260P (3.45 - 13.6, n=26) | |
| Acer Swift X SFX16-51G-5388 | |
| LibreOffice / 20 Documents To PDF | |
| Lenovo IdeaPad 5 Pro 16ARH7 | |
| Acer Swift X SFX16-52G-77RX | |
| Asus Vivobook Pro 16X-M7600QE | |
| Asus Vivobook Pro 16X-M7600QE | |
| Acer Swift X SFX16-51G-5388 | |
| Media della classe Multimedia (23.9 - 146.7, n=64, ultimi 2 anni) | |
| Media Intel Core i7-1260P (40.2 - 65.7, n=25) | |
| Acer Swift X SFX16-52G-52VE | |
| Lenovo ThinkBook 16 G4+ IAP | |
| Dell Inspiron 16 Plus 7620 | |
| HP Envy 16 h0112nr | |
| R Benchmark 2.5 / Overall mean | |
| Acer Swift X SFX16-51G-5388 | |
| Acer Swift X SFX16-52G-52VE | |
| Lenovo IdeaPad 5 Pro 16ARH7 | |
| Media Intel Core i7-1260P (0.4559 - 0.727, n=25) | |
| Asus Vivobook Pro 16X-M7600QE | |
| Asus Vivobook Pro 16X-M7600QE | |
| Dell Inspiron 16 Plus 7620 | |
| Acer Swift X SFX16-52G-77RX | |
| Media della classe Multimedia (0.3604 - 0.947, n=63, ultimi 2 anni) | |
| Lenovo ThinkBook 16 G4+ IAP | |
| HP Envy 16 h0112nr | |
* ... Meglio usare valori piccoli
AIDA64: FP32 Ray-Trace | FPU Julia | CPU SHA3 | CPU Queen | FPU SinJulia | FPU Mandel | CPU AES | CPU ZLib | FP64 Ray-Trace | CPU PhotoWorxx
| Performance rating | |
| Media della classe Multimedia | |
| Asus Vivobook Pro 16X-M7600QE | |
| Lenovo ThinkBook 16 G4+ IAP | |
| HP Envy 16 h0112nr | |
| Dell Inspiron 16 Plus 7620 | |
| Lenovo IdeaPad 5 Pro 16ARH7 | |
| Acer Swift X SFX16-52G-77RX | |
| Acer Swift X SFX16-52G-52VE | |
| Media Intel Core i7-1260P | |
| Acer Swift X SFX16-51G-5388 | |
| AIDA64 / FP32 Ray-Trace | |
| Media della classe Multimedia (2214 - 50388, n=60, ultimi 2 anni) | |
| Lenovo ThinkBook 16 G4+ IAP | |
| Asus Vivobook Pro 16X-M7600QE | |
| Asus Vivobook Pro 16X-M7600QE | |
| Dell Inspiron 16 Plus 7620 | |
| HP Envy 16 h0112nr | |
| Lenovo IdeaPad 5 Pro 16ARH7 | |
| Acer Swift X SFX16-52G-52VE | |
| Acer Swift X SFX16-52G-77RX | |
| Media Intel Core i7-1260P (2176 - 10898, n=26) | |
| Acer Swift X SFX16-51G-5388 | |
| AIDA64 / FPU Julia | |
| Asus Vivobook Pro 16X-M7600QE | |
| Asus Vivobook Pro 16X-M7600QE | |
| Media della classe Multimedia (12867 - 201874, n=61, ultimi 2 anni) | |
| Lenovo ThinkBook 16 G4+ IAP | |
| Lenovo IdeaPad 5 Pro 16ARH7 | |
| Dell Inspiron 16 Plus 7620 | |
| HP Envy 16 h0112nr | |
| Acer Swift X SFX16-52G-77RX | |
| Acer Swift X SFX16-52G-52VE | |
| Media Intel Core i7-1260P (11015 - 56906, n=26) | |
| Acer Swift X SFX16-51G-5388 | |
| AIDA64 / CPU SHA3 | |
| Media della classe Multimedia (653 - 8623, n=61, ultimi 2 anni) | |
| Lenovo ThinkBook 16 G4+ IAP | |
| Asus Vivobook Pro 16X-M7600QE | |
| Asus Vivobook Pro 16X-M7600QE | |
| Dell Inspiron 16 Plus 7620 | |
| HP Envy 16 h0112nr | |
| Lenovo IdeaPad 5 Pro 16ARH7 | |
| Acer Swift X SFX16-52G-77RX | |
| Acer Swift X SFX16-52G-52VE | |
| Acer Swift X SFX16-51G-5388 | |
| Media Intel Core i7-1260P (669 - 2709, n=26) | |
| AIDA64 / CPU Queen | |
| Lenovo ThinkBook 16 G4+ IAP | |
| HP Envy 16 h0112nr | |
| Asus Vivobook Pro 16X-M7600QE | |
| Asus Vivobook Pro 16X-M7600QE | |
| Dell Inspiron 16 Plus 7620 | |
| Acer Swift X SFX16-52G-77RX | |
| Lenovo IdeaPad 5 Pro 16ARH7 | |
| Media della classe Multimedia (13483 - 181505, n=49, ultimi 2 anni) | |
| Media Intel Core i7-1260P (42571 - 82493, n=26) | |
| Acer Swift X SFX16-52G-52VE | |
| Acer Swift X SFX16-51G-5388 | |
| AIDA64 / FPU SinJulia | |
| Asus Vivobook Pro 16X-M7600QE | |
| Asus Vivobook Pro 16X-M7600QE | |
| Lenovo ThinkBook 16 G4+ IAP | |
| Lenovo IdeaPad 5 Pro 16ARH7 | |
| Media della classe Multimedia (1240 - 28794, n=61, ultimi 2 anni) | |
| Dell Inspiron 16 Plus 7620 | |
| HP Envy 16 h0112nr | |
| Acer Swift X SFX16-52G-77RX | |
| Acer Swift X SFX16-52G-52VE | |
| Media Intel Core i7-1260P (2901 - 6975, n=26) | |
| Acer Swift X SFX16-51G-5388 | |
| AIDA64 / FPU Mandel | |
| Asus Vivobook Pro 16X-M7600QE | |
| Asus Vivobook Pro 16X-M7600QE | |
| Media della classe Multimedia (6395 - 105740, n=60, ultimi 2 anni) | |
| Lenovo IdeaPad 5 Pro 16ARH7 | |
| Lenovo ThinkBook 16 G4+ IAP | |
| Dell Inspiron 16 Plus 7620 | |
| HP Envy 16 h0112nr | |
| Acer Swift X SFX16-52G-77RX | |
| Acer Swift X SFX16-52G-52VE | |
| Acer Swift X SFX16-51G-5388 | |
| Media Intel Core i7-1260P (5950 - 26376, n=26) | |
| AIDA64 / CPU AES | |
| Asus Vivobook Pro 16X-M7600QE | |
| Asus Vivobook Pro 16X-M7600QE | |
| HP Envy 16 h0112nr | |
| Lenovo ThinkBook 16 G4+ IAP | |
| Media della classe Multimedia (13243 - 126790, n=61, ultimi 2 anni) | |
| Dell Inspiron 16 Plus 7620 | |
| Acer Swift X SFX16-51G-5388 | |
| Acer Swift X SFX16-52G-77RX | |
| Acer Swift X SFX16-52G-52VE | |
| Media Intel Core i7-1260P (16041 - 92356, n=26) | |
| Lenovo IdeaPad 5 Pro 16ARH7 | |
| AIDA64 / CPU ZLib | |
| Lenovo ThinkBook 16 G4+ IAP | |
| Media della classe Multimedia (167.2 - 2022, n=61, ultimi 2 anni) | |
| Dell Inspiron 16 Plus 7620 | |
| Acer Swift X SFX16-52G-52VE | |
| HP Envy 16 h0112nr | |
| Asus Vivobook Pro 16X-M7600QE | |
| Asus Vivobook Pro 16X-M7600QE | |
| Acer Swift X SFX16-52G-77RX | |
| Lenovo IdeaPad 5 Pro 16ARH7 | |
| Media Intel Core i7-1260P (259 - 771, n=26) | |
| Acer Swift X SFX16-51G-5388 | |
| AIDA64 / FP64 Ray-Trace | |
| Media della classe Multimedia (1014 - 26875, n=61, ultimi 2 anni) | |
| Asus Vivobook Pro 16X-M7600QE | |
| Asus Vivobook Pro 16X-M7600QE | |
| Lenovo ThinkBook 16 G4+ IAP | |
| Dell Inspiron 16 Plus 7620 | |
| HP Envy 16 h0112nr | |
| Lenovo IdeaPad 5 Pro 16ARH7 | |
| Acer Swift X SFX16-52G-77RX | |
| Acer Swift X SFX16-52G-52VE | |
| Media Intel Core i7-1260P (1237 - 5858, n=26) | |
| Acer Swift X SFX16-51G-5388 | |
| AIDA64 / CPU PhotoWorxx | |
| Media della classe Multimedia (12860 - 88154, n=61, ultimi 2 anni) | |
| Acer Swift X SFX16-52G-52VE | |
| Acer Swift X SFX16-52G-77RX | |
| Lenovo ThinkBook 16 G4+ IAP | |
| HP Envy 16 h0112nr | |
| Acer Swift X SFX16-51G-5388 | |
| Dell Inspiron 16 Plus 7620 | |
| Media Intel Core i7-1260P (13261 - 43652, n=26) | |
| Lenovo IdeaPad 5 Pro 16ARH7 | |
| Asus Vivobook Pro 16X-M7600QE | |
| Asus Vivobook Pro 16X-M7600QE | |
Prestazioni del sistema
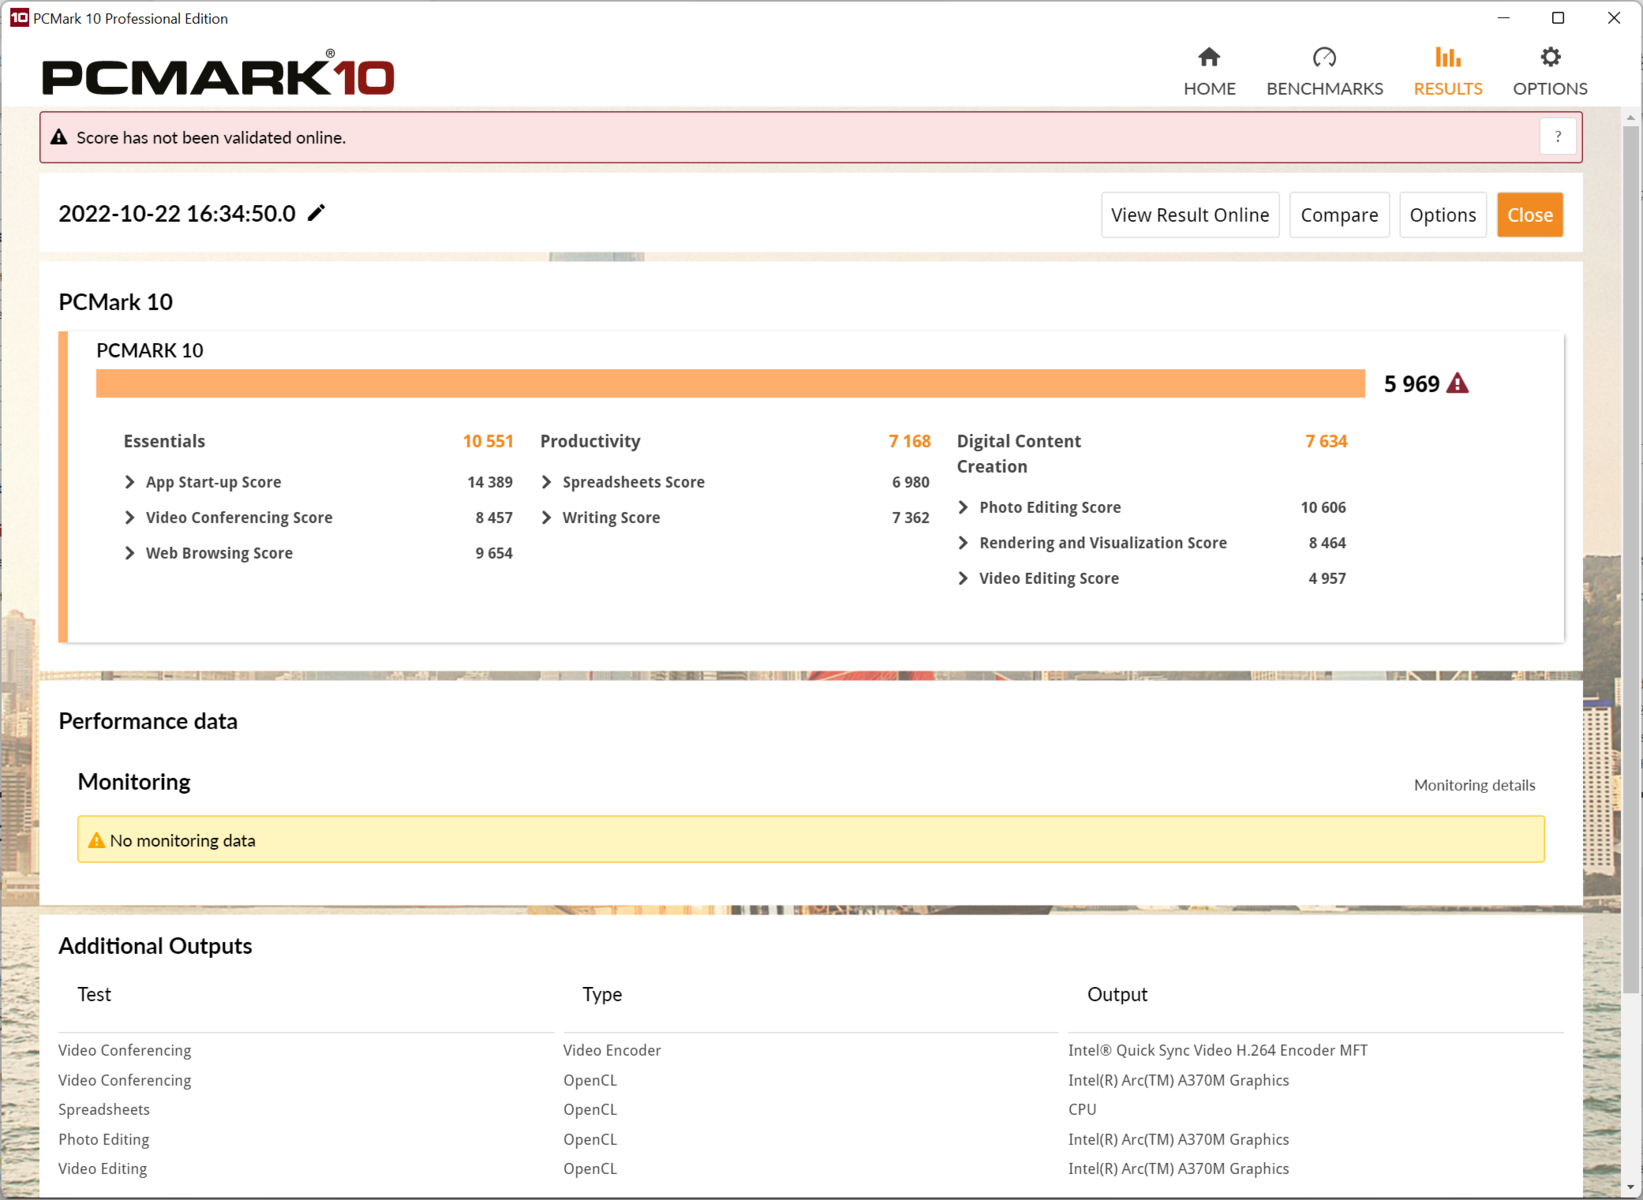
Simile al modello modello fratello, le prestazioni del sistema sono di alto livello, in particolare durante la navigazione web, grazie all'elevato Turbo boost dei processori Intel.
Grazie alla sua RTX 3060, l'HP Envy 16è in grado di avanzare soprattutto nell'area della creazione di contenuti. Durante la navigazione web con CPU, la distanza dal processore Core i7-12700Hutilizzato in quel portatile si riduce a una percentuale compresa tra il 10 e il 15%.
CrossMark: Overall | Productivity | Creativity | Responsiveness
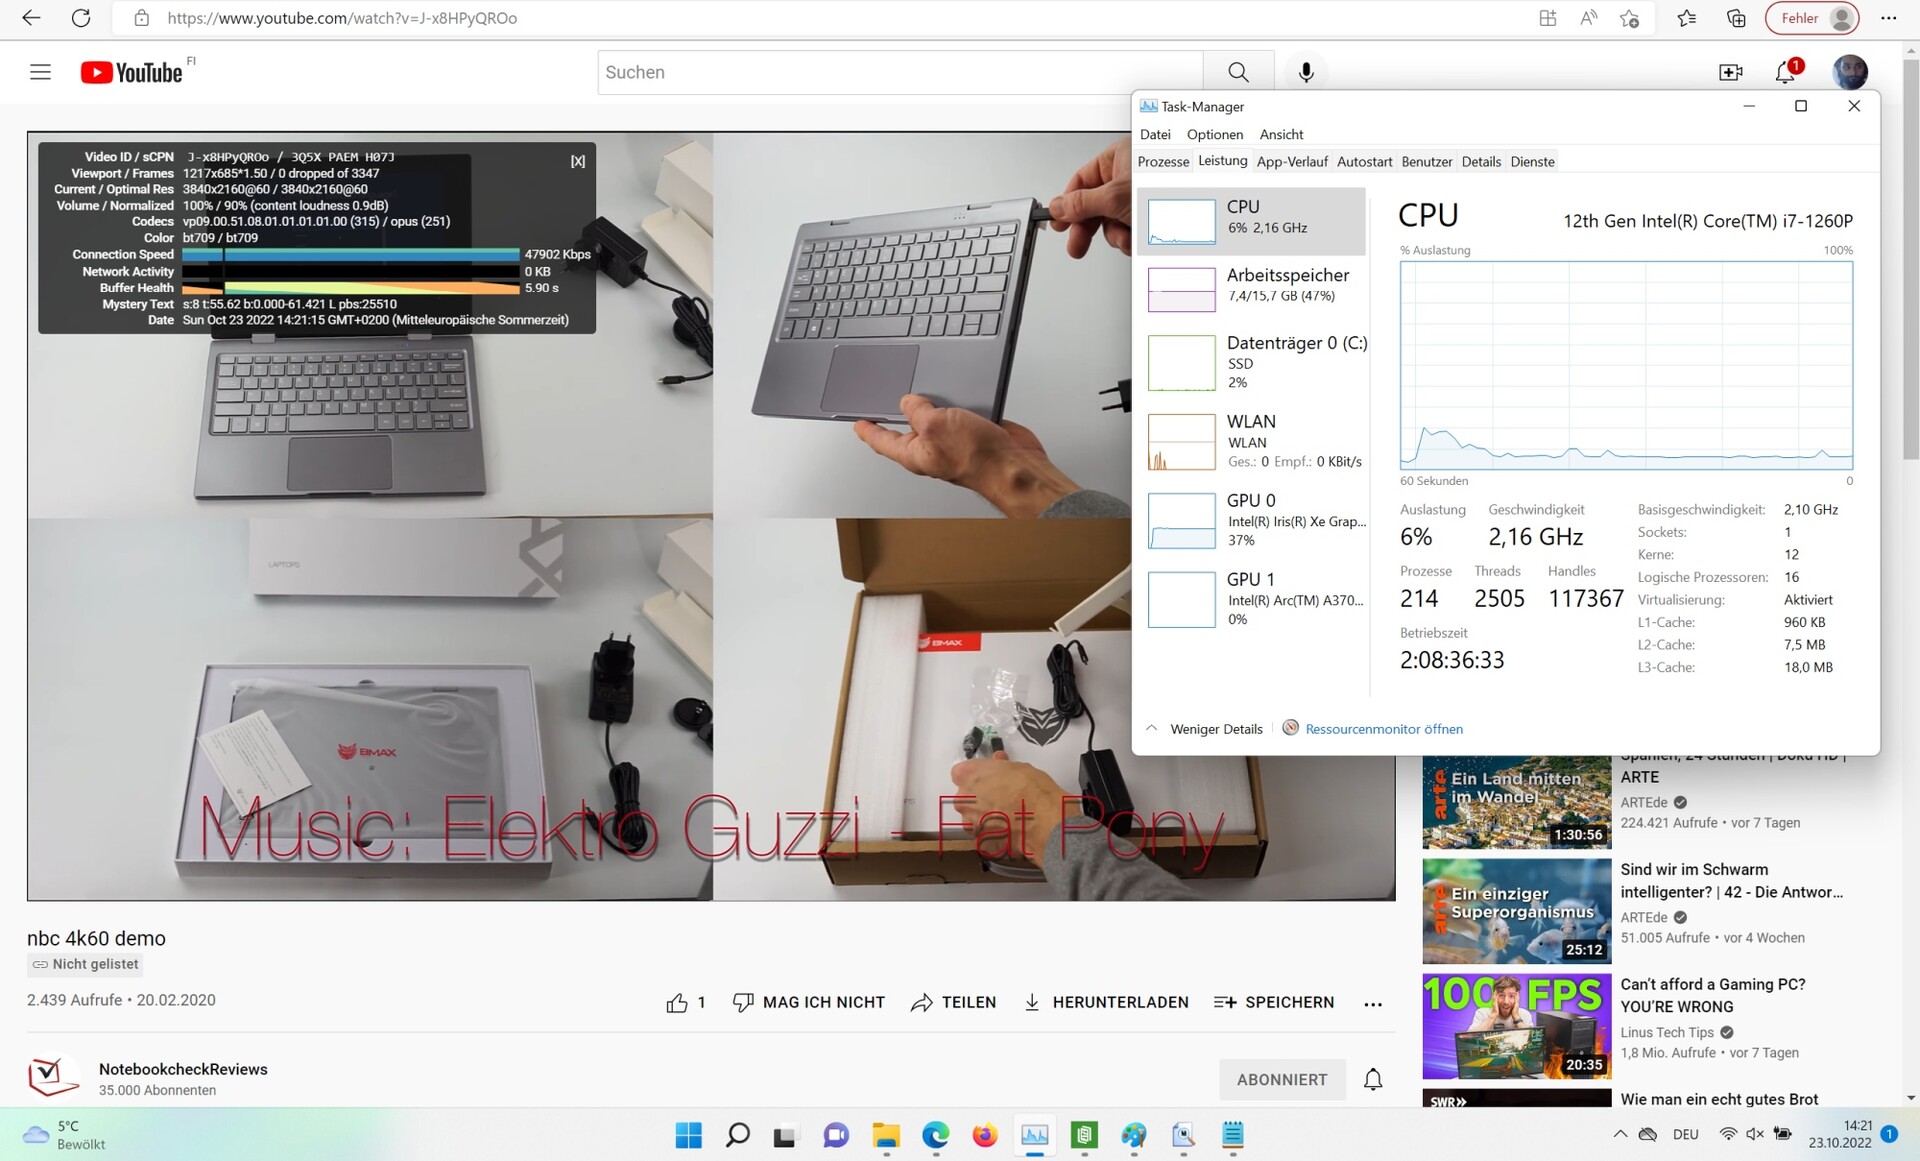
Youtube: 2160p60 CPU Load
Sunspider: 1.0 Total Score
Mozilla Kraken 1.1: Total
Speedometer 2.0: Result 2.0
Octane V2: Total Score
Jetstream 2: 2.0 Total
WebXPRT 3: Overall
WebXPRT 4: Overall
| PCMark 10 / Score | |
| Media della classe Multimedia (4325 - 10386, n=58, ultimi 2 anni) | |
| HP Envy 16 h0112nr | |
| Dell Inspiron 16 Plus 7620 | |
| Asus Vivobook Pro 16X-M7600QE | |
| Acer Swift X SFX16-52G-77RX | |
| Media Intel Core i7-1260P, Intel Arc A370M (n=1) | |
| Acer Swift X SFX16-52G-52VE | |
| Lenovo IdeaPad 5 Pro 16ARH7 | |
| Acer Swift X SFX16-51G-5388 | |
| PCMark 10 / Essentials | |
| HP Envy 16 h0112nr | |
| Acer Swift X SFX16-52G-77RX | |
| Media Intel Core i7-1260P, Intel Arc A370M (n=1) | |
| Media della classe Multimedia (8025 - 11664, n=57, ultimi 2 anni) | |
| Asus Vivobook Pro 16X-M7600QE | |
| Dell Inspiron 16 Plus 7620 | |
| Lenovo IdeaPad 5 Pro 16ARH7 | |
| Acer Swift X SFX16-52G-52VE | |
| Acer Swift X SFX16-51G-5388 | |
| PCMark 10 / Productivity | |
| Media della classe Multimedia (7323 - 18233, n=57, ultimi 2 anni) | |
| Asus Vivobook Pro 16X-M7600QE | |
| HP Envy 16 h0112nr | |
| Dell Inspiron 16 Plus 7620 | |
| Lenovo IdeaPad 5 Pro 16ARH7 | |
| Acer Swift X SFX16-51G-5388 | |
| Acer Swift X SFX16-52G-52VE | |
| Acer Swift X SFX16-52G-77RX | |
| Media Intel Core i7-1260P, Intel Arc A370M (n=1) | |
| PCMark 10 / Digital Content Creation | |
| HP Envy 16 h0112nr | |
| Media della classe Multimedia (3651 - 16240, n=57, ultimi 2 anni) | |
| Dell Inspiron 16 Plus 7620 | |
| Asus Vivobook Pro 16X-M7600QE | |
| Acer Swift X SFX16-52G-77RX | |
| Media Intel Core i7-1260P, Intel Arc A370M (n=1) | |
| Acer Swift X SFX16-52G-52VE | |
| Acer Swift X SFX16-51G-5388 | |
| Lenovo IdeaPad 5 Pro 16ARH7 | |
| CrossMark / Overall | |
| Media della classe Multimedia (866 - 2728, n=67, ultimi 2 anni) | |
| HP Envy 16 h0112nr | |
| Lenovo ThinkBook 16 G4+ IAP | |
| Dell Inspiron 16 Plus 7620 | |
| Acer Swift X SFX16-52G-77RX | |
| Media Intel Core i7-1260P, Intel Arc A370M (n=1) | |
| Acer Swift X SFX16-52G-52VE | |
| Acer Swift X SFX16-51G-5388 | |
| CrossMark / Productivity | |
| Media della classe Multimedia (931 - 2489, n=67, ultimi 2 anni) | |
| HP Envy 16 h0112nr | |
| Lenovo ThinkBook 16 G4+ IAP | |
| Acer Swift X SFX16-52G-77RX | |
| Media Intel Core i7-1260P, Intel Arc A370M (n=1) | |
| Dell Inspiron 16 Plus 7620 | |
| Acer Swift X SFX16-51G-5388 | |
| Acer Swift X SFX16-52G-52VE | |
| CrossMark / Creativity | |
| Media della classe Multimedia (907 - 3465, n=67, ultimi 2 anni) | |
| HP Envy 16 h0112nr | |
| Lenovo ThinkBook 16 G4+ IAP | |
| Dell Inspiron 16 Plus 7620 | |
| Acer Swift X SFX16-52G-77RX | |
| Media Intel Core i7-1260P, Intel Arc A370M (n=1) | |
| Acer Swift X SFX16-52G-52VE | |
| Acer Swift X SFX16-51G-5388 | |
| CrossMark / Responsiveness | |
| Acer Swift X SFX16-52G-77RX | |
| Media Intel Core i7-1260P, Intel Arc A370M (n=1) | |
| HP Envy 16 h0112nr | |
| Lenovo ThinkBook 16 G4+ IAP | |
| Dell Inspiron 16 Plus 7620 | |
| Media della classe Multimedia (605 - 2024, n=67, ultimi 2 anni) | |
| Acer Swift X SFX16-52G-52VE | |
| Acer Swift X SFX16-51G-5388 | |
| Youtube / 2160p60 CPU Load | |
| Media della classe Multimedia (3 - 46, n=58, ultimi 2 anni) | |
| Acer Swift X SFX16-52G-52VE (42, 1) | |
| Lenovo ThinkBook 16 G4+ IAP (43, 8) | |
| Acer Swift X SFX16-52G-77RX (37) | |
| Media Intel Core i7-1260P, Intel Arc A370M (n=1) | |
| Asus Vivobook Pro 16X-M7600QE (76, 38) | |
| Dell Inspiron 16 Plus 7620 (46, 1) | |
| HP Envy 16 h0112nr (45, 3) | |
| Lenovo IdeaPad 5 Pro 16ARH7 (1) | |
| Sunspider / 1.0 Total Score | |
| Lenovo IdeaPad 5 Pro 16ARH7 | |
| Acer Swift X SFX16-52G-77RX | |
| Media Intel Core i7-1260P, Intel Arc A370M (n=1) | |
| Media della classe Multimedia (n=1ultimi 2 anni) | |
| Mozilla Kraken 1.1 / Total | |
| Acer Swift X SFX16-51G-5388 | |
| Lenovo IdeaPad 5 Pro 16ARH7 | |
| Asus Vivobook Pro 16X-M7600QE | |
| Asus Vivobook Pro 16X-M7600QE | |
| Acer Swift X SFX16-52G-77RX | |
| Media Intel Core i7-1260P, Intel Arc A370M (n=1) | |
| Acer Swift X SFX16-52G-52VE | |
| HP Envy 16 h0112nr | |
| Dell Inspiron 16 Plus 7620 | |
| Lenovo ThinkBook 16 G4+ IAP | |
| Media della classe Multimedia (228 - 835, n=74, ultimi 2 anni) | |
| Speedometer 2.0 / Result 2.0 | |
| Media della classe Multimedia (337 - 946, n=35, ultimi 2 anni) | |
| Lenovo ThinkBook 16 G4+ IAP | |
| Acer Swift X SFX16-52G-77RX | |
| Media Intel Core i7-1260P, Intel Arc A370M (n=1) | |
| Octane V2 / Total Score | |
| Media della classe Multimedia (64079 - 153175, n=35, ultimi 2 anni) | |
| Lenovo ThinkBook 16 G4+ IAP | |
| Acer Swift X SFX16-52G-77RX | |
| Media Intel Core i7-1260P, Intel Arc A370M (n=1) | |
| Acer Swift X SFX16-52G-52VE | |
| Acer Swift X SFX16-51G-5388 | |
| Jetstream 2 / 2.0 Total | |
| Media della classe Multimedia (261 - 481, n=36, ultimi 2 anni) | |
| HP Envy 16 h0112nr | |
| Dell Inspiron 16 Plus 7620 | |
| Lenovo ThinkBook 16 G4+ IAP | |
| Acer Swift X SFX16-52G-77RX | |
| Media Intel Core i7-1260P, Intel Arc A370M (n=1) | |
| Acer Swift X SFX16-52G-52VE | |
| Acer Swift X SFX16-51G-5388 | |
| WebXPRT 3 / Overall | |
| Media della classe Multimedia (136.4 - 596, n=70, ultimi 2 anni) | |
| HP Envy 16 h0112nr | |
| Dell Inspiron 16 Plus 7620 | |
| Lenovo ThinkBook 16 G4+ IAP | |
| Asus Vivobook Pro 16X-M7600QE | |
| Acer Swift X SFX16-52G-77RX | |
| Media Intel Core i7-1260P, Intel Arc A370M (n=1) | |
| Acer Swift X SFX16-52G-52VE | |
| Acer Swift X SFX16-51G-5388 | |
| Lenovo IdeaPad 5 Pro 16ARH7 | |
| WebXPRT 4 / Overall | |
| Media della classe Multimedia (167.3 - 402, n=71, ultimi 2 anni) | |
| HP Envy 16 h0112nr | |
| Lenovo ThinkBook 16 G4+ IAP | |
| Dell Inspiron 16 Plus 7620 | |
| Acer Swift X SFX16-52G-77RX | |
| Media Intel Core i7-1260P, Intel Arc A370M (n=1) | |
| Acer Swift X SFX16-52G-52VE | |
| Acer Swift X SFX16-51G-5388 | |
* ... Meglio usare valori piccoli
| PCMark 10 Score | 5969 punti | |
Aiuto | ||
| AIDA64 / Memory Copy | |
| Media della classe Multimedia (21158 - 132135, n=61, ultimi 2 anni) | |
| Acer Swift X SFX16-52G-77RX | |
| Acer Swift X SFX16-52G-52VE | |
| Lenovo ThinkBook 16 G4+ IAP | |
| HP Envy 16 h0112nr | |
| Acer Swift X SFX16-51G-5388 | |
| Dell Inspiron 16 Plus 7620 | |
| Media Intel Core i7-1260P (25125 - 71544, n=25) | |
| Lenovo IdeaPad 5 Pro 16ARH7 | |
| Asus Vivobook Pro 16X-M7600QE | |
| Asus Vivobook Pro 16X-M7600QE | |
| AIDA64 / Memory Read | |
| Media della classe Multimedia (19699 - 174586, n=61, ultimi 2 anni) | |
| Lenovo ThinkBook 16 G4+ IAP | |
| Acer Swift X SFX16-52G-77RX | |
| HP Envy 16 h0112nr | |
| Acer Swift X SFX16-52G-52VE | |
| Dell Inspiron 16 Plus 7620 | |
| Media Intel Core i7-1260P (24983 - 72065, n=25) | |
| Acer Swift X SFX16-51G-5388 | |
| Asus Vivobook Pro 16X-M7600QE | |
| Asus Vivobook Pro 16X-M7600QE | |
| Lenovo IdeaPad 5 Pro 16ARH7 | |
| AIDA64 / Memory Write | |
| Lenovo IdeaPad 5 Pro 16ARH7 | |
| Media della classe Multimedia (17733 - 134998, n=61, ultimi 2 anni) | |
| Acer Swift X SFX16-51G-5388 | |
| Acer Swift X SFX16-52G-77RX | |
| HP Envy 16 h0112nr | |
| Acer Swift X SFX16-52G-52VE | |
| Lenovo ThinkBook 16 G4+ IAP | |
| Dell Inspiron 16 Plus 7620 | |
| Media Intel Core i7-1260P (23512 - 66799, n=25) | |
| Asus Vivobook Pro 16X-M7600QE | |
| Asus Vivobook Pro 16X-M7600QE | |
| AIDA64 / Memory Latency | |
| Lenovo IdeaPad 5 Pro 16ARH7 | |
| Media della classe Multimedia (7 - 535, n=60, ultimi 2 anni) | |
| Acer Swift X SFX16-51G-5388 | |
| Acer Swift X SFX16-52G-77RX | |
| Lenovo ThinkBook 16 G4+ IAP | |
| Acer Swift X SFX16-52G-52VE | |
| Dell Inspiron 16 Plus 7620 | |
| HP Envy 16 h0112nr | |
| Media Intel Core i7-1260P (77.9 - 118.4, n=21) | |
| Asus Vivobook Pro 16X-M7600QE | |
| Asus Vivobook Pro 16X-M7600QE | |
* ... Meglio usare valori piccoli
Latenze DPC
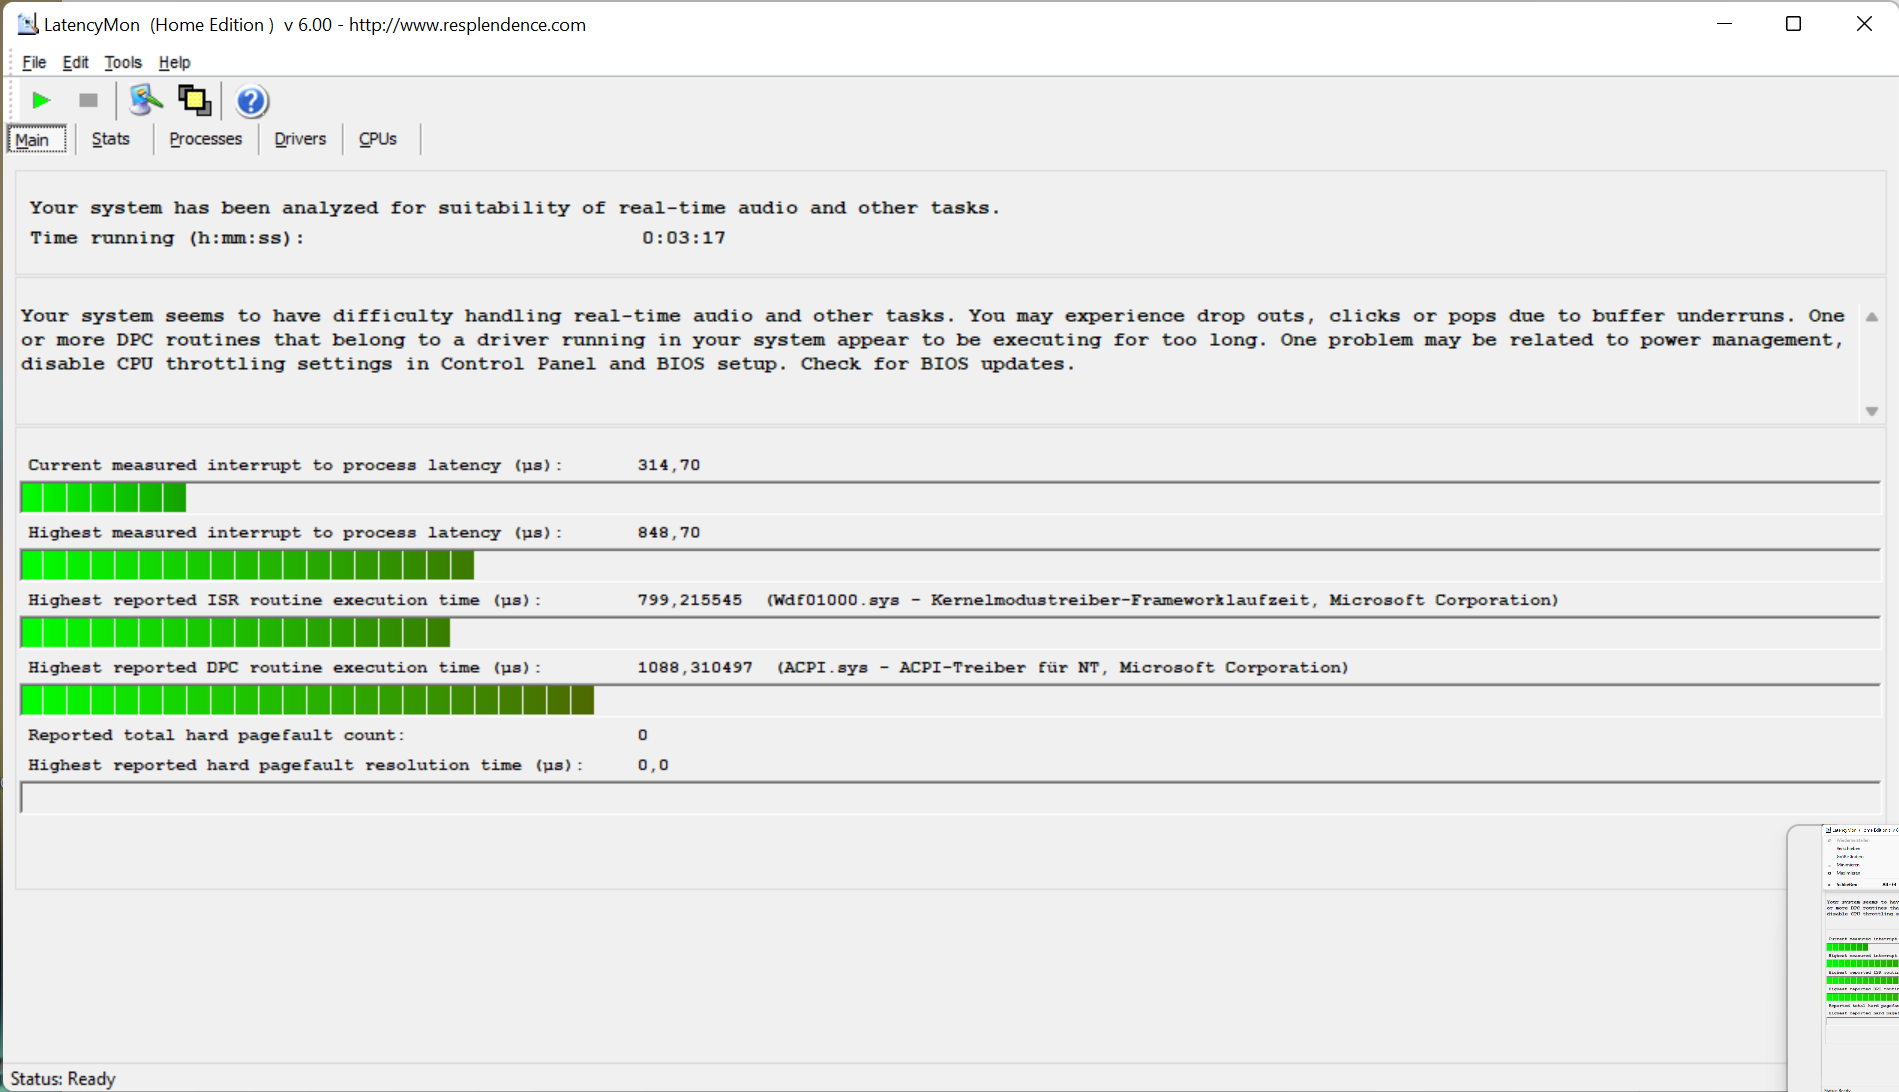
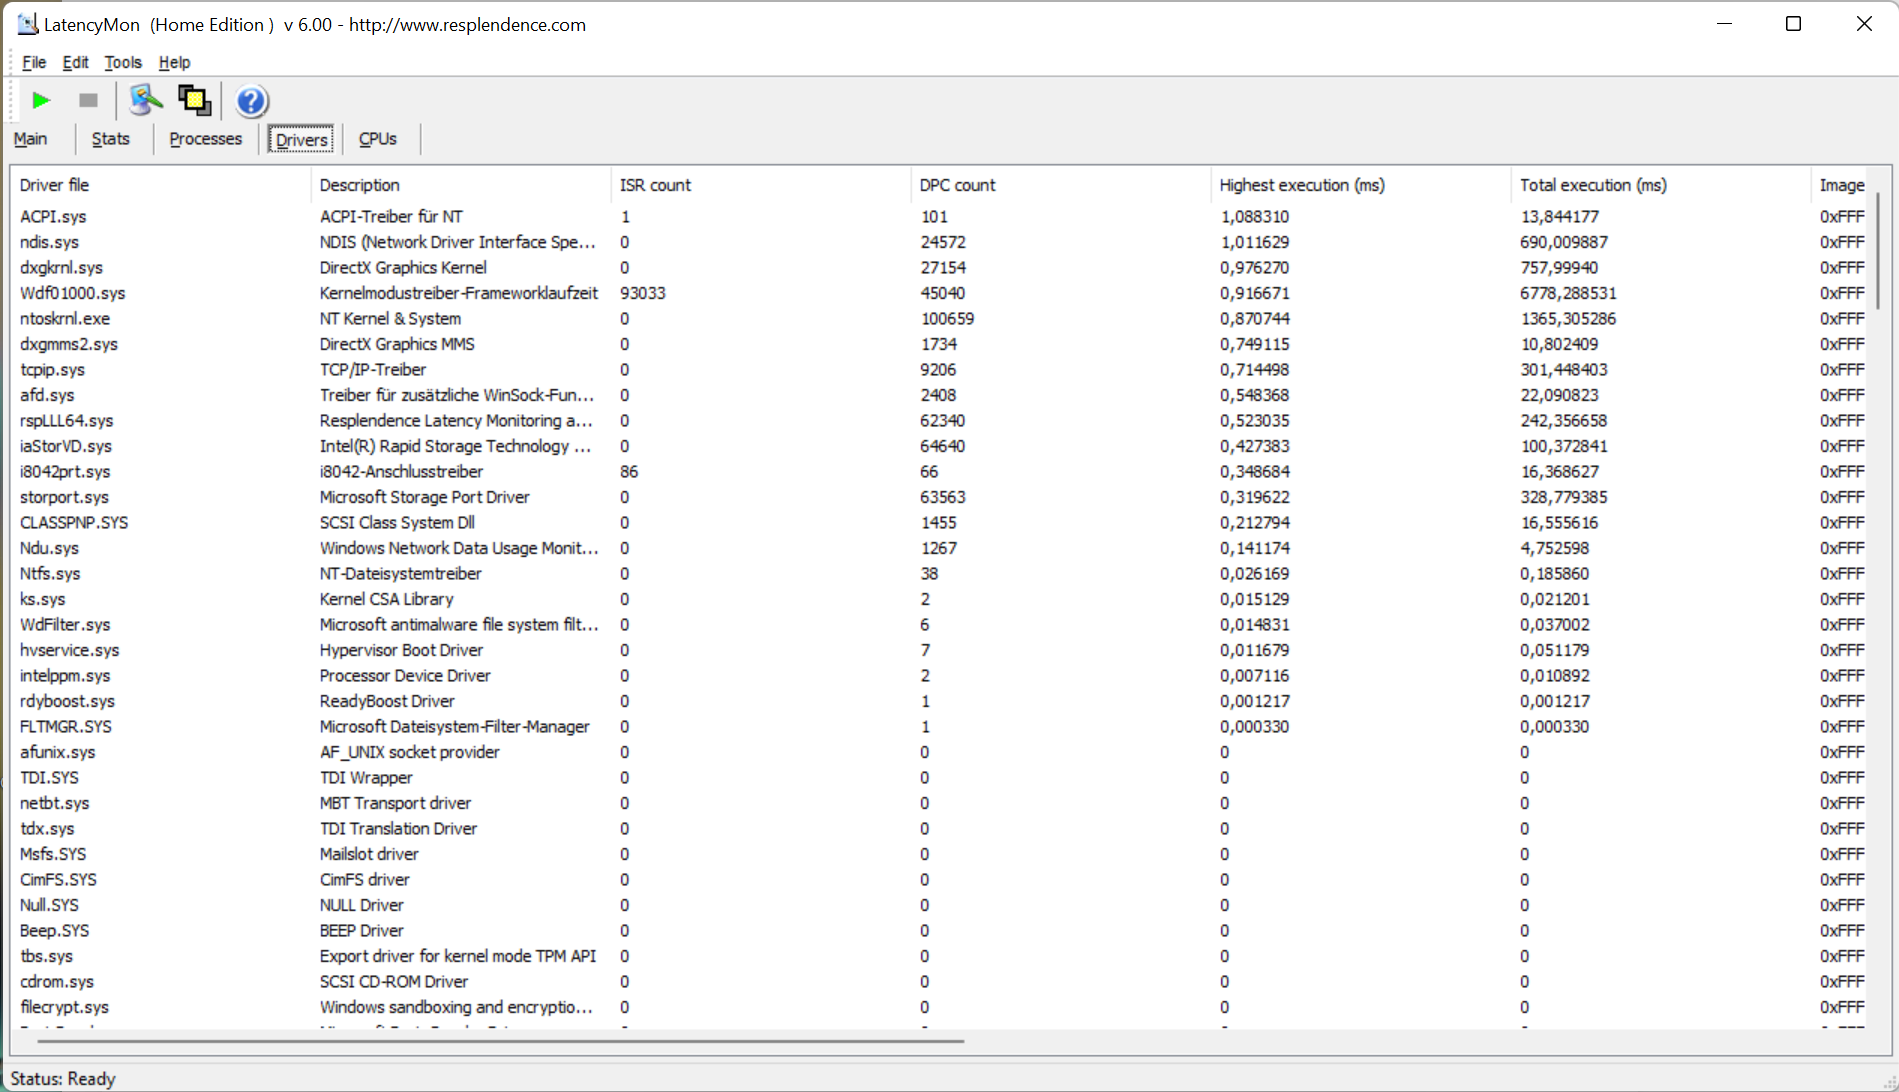
| DPC Latencies / LatencyMon - interrupt to process latency (max), Web, Youtube, Prime95 | |
| Acer Swift X SFX16-51G-5388 | |
| Lenovo ThinkBook 16 G4+ IAP | |
| Asus Vivobook Pro 16X-M7600QE | |
| Acer Swift X SFX16-52G-52VE | |
| Dell Inspiron 16 Plus 7620 | |
| HP Envy 16 h0112nr | |
| Acer Swift X SFX16-52G-77RX | |
| Lenovo IdeaPad 5 Pro 16ARH7 | |
* ... Meglio usare valori piccoli
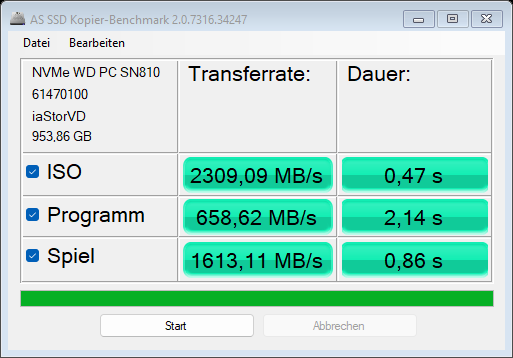
Soluzione di stoccaggio
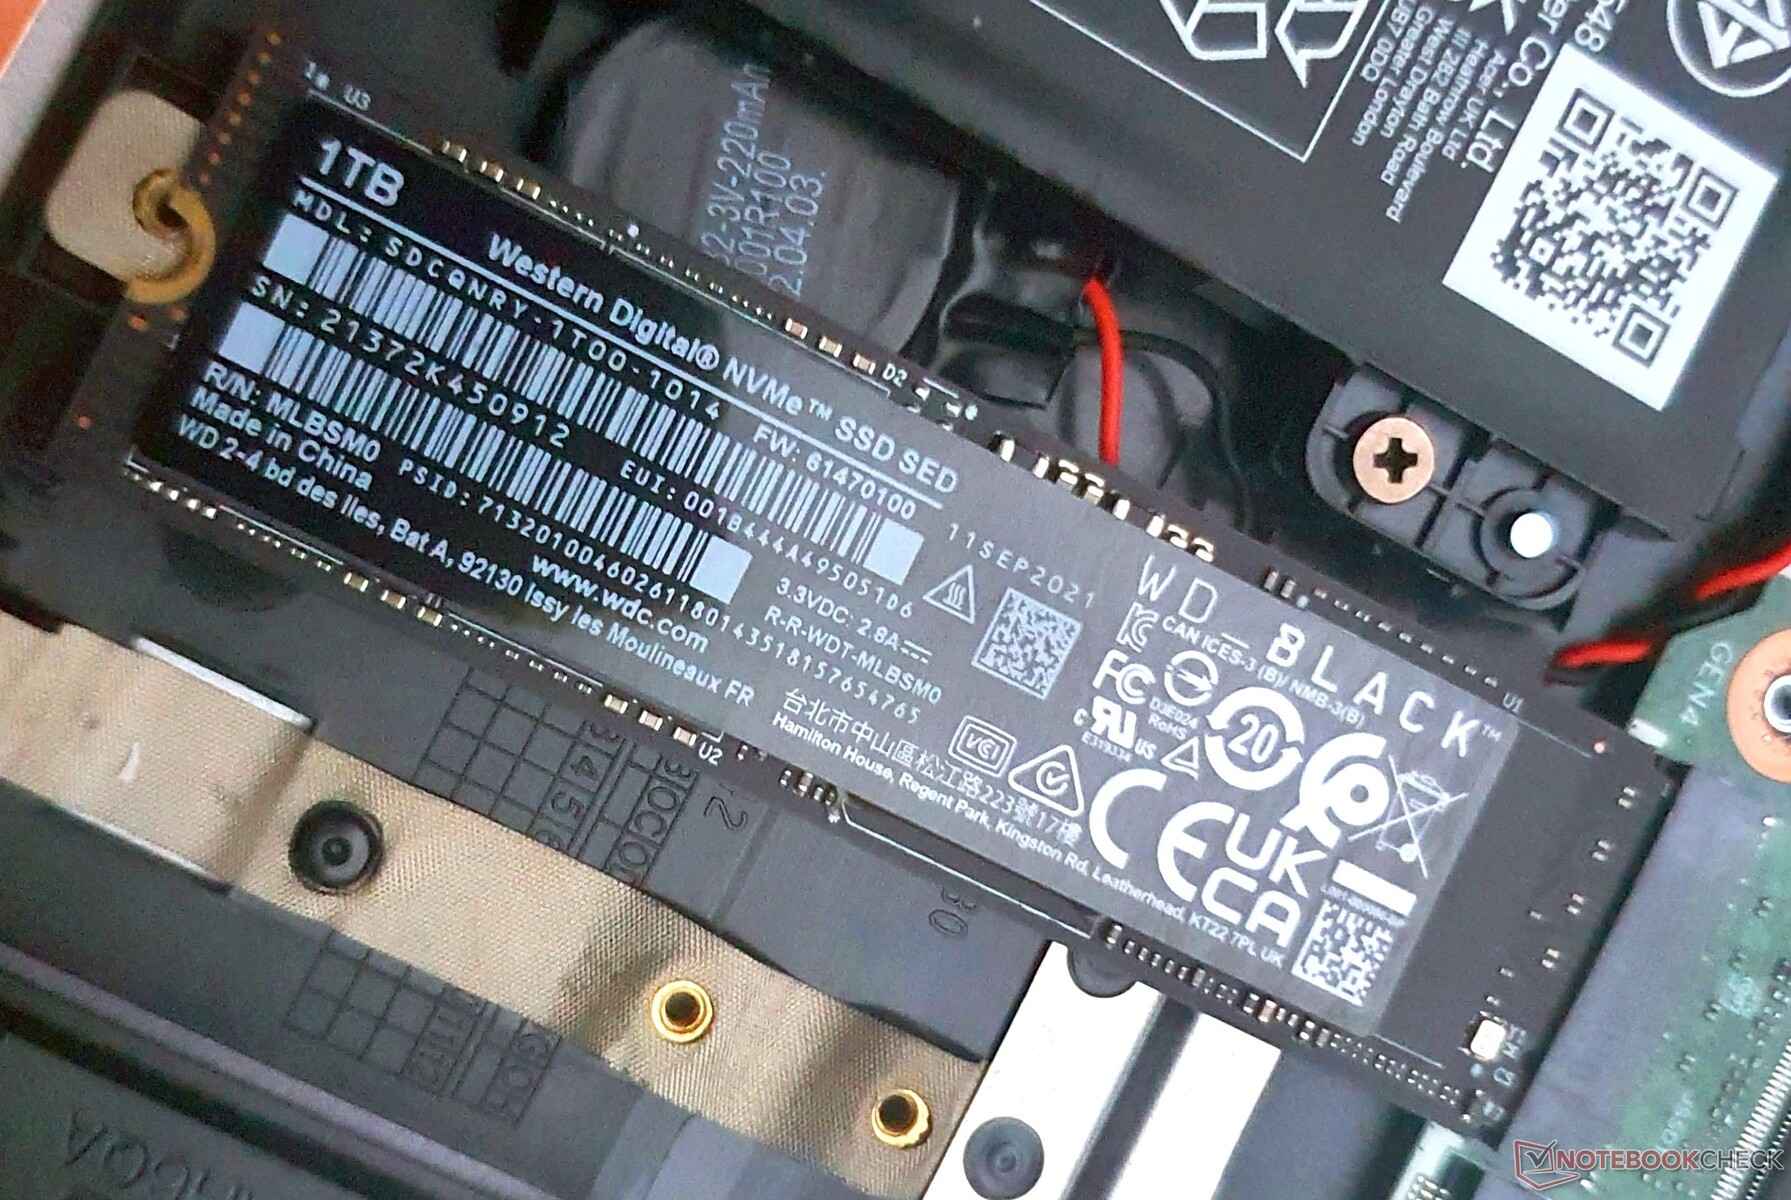
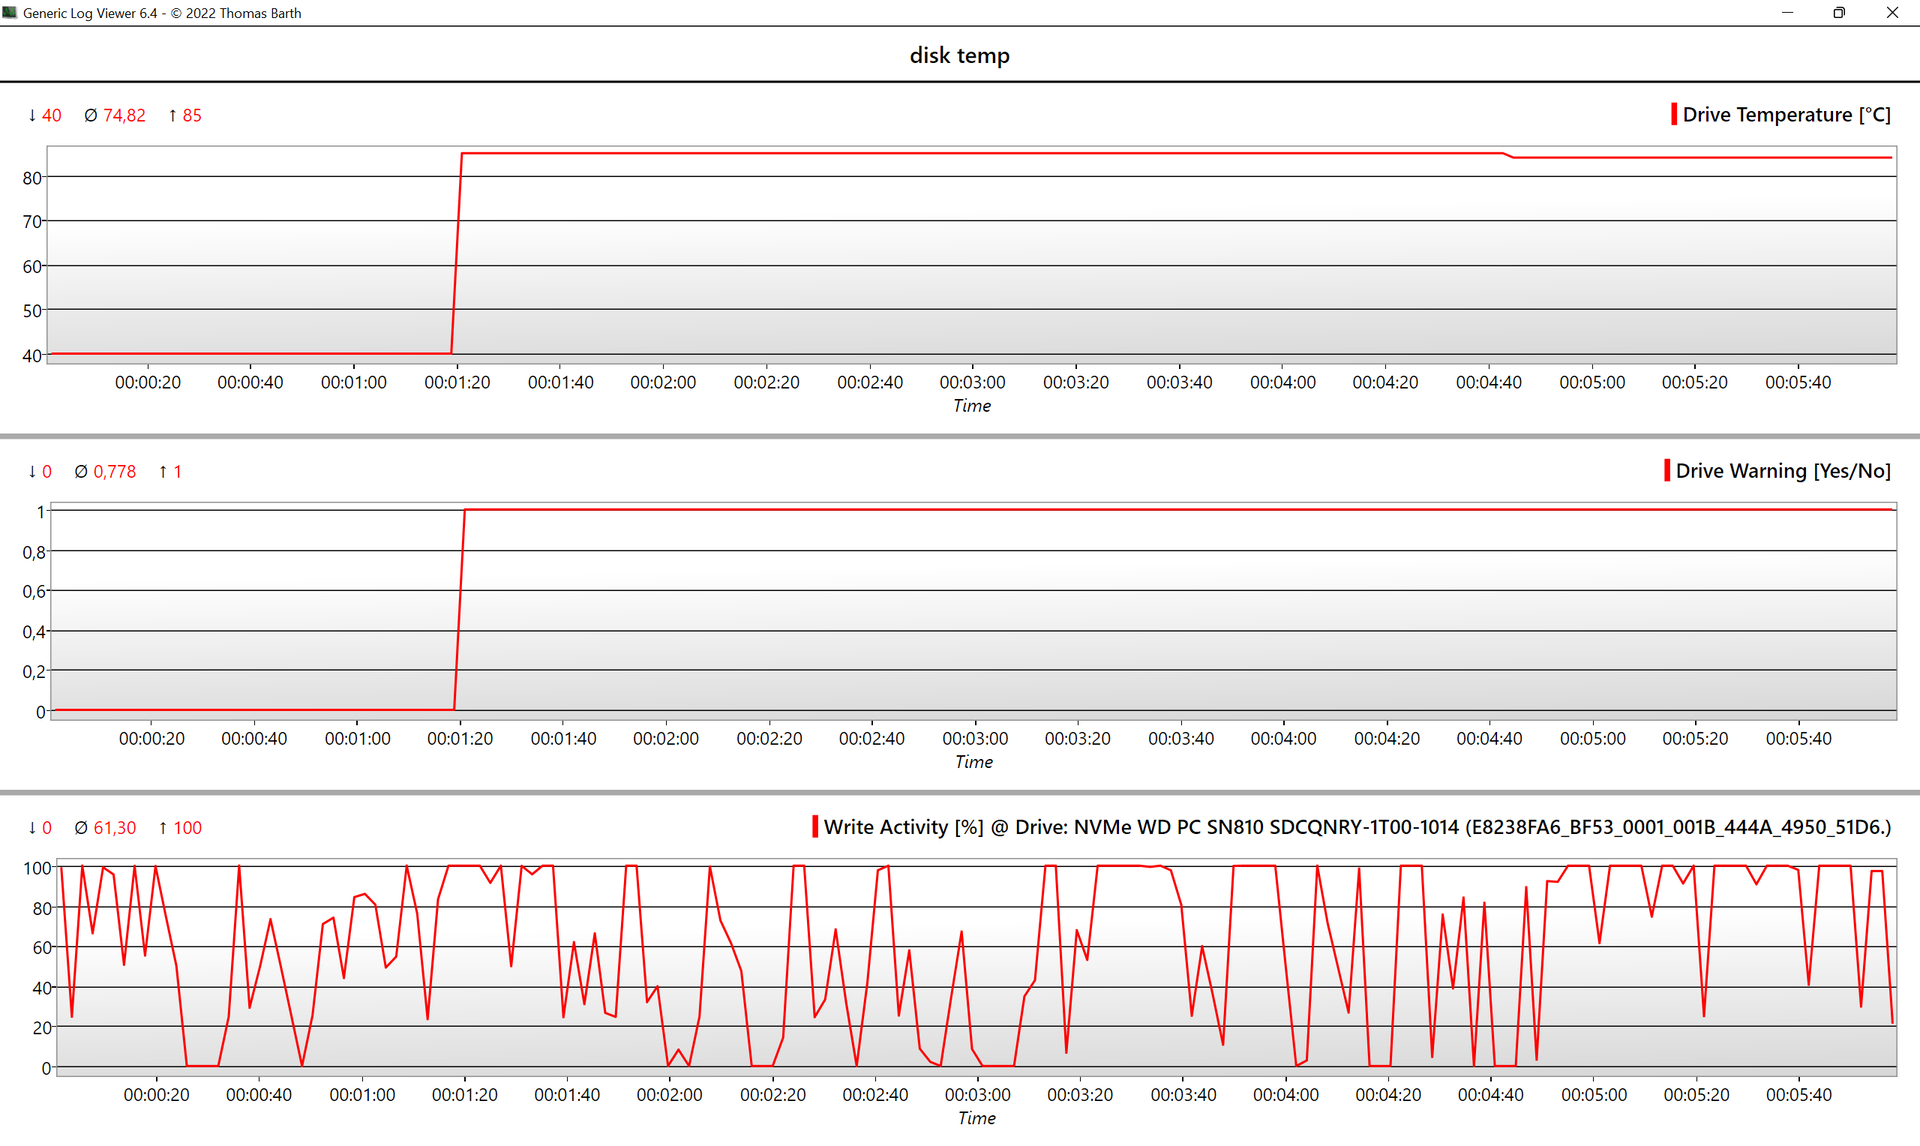
Con le sue elevatissime velocità di trasferimento, l'SSD da 1 TB di Western Digital rende giustizia allo standard PCIe 4.0.
Mentre il predecessore diretto dell'Acer Swift X si posiziona in fondo alla nostra classifica delle prestazioni delle unità SSD, il modello di quest'anno è in grado di posizionarsi in cima, lasciando un po' di distanza ai modelli successivi.
Anche il modello fratello con un'unità SSD da 512 GB viene superato in modo significativo. Tuttavia, le unità SSD di entrambi i modelli subiscono un forte rallentamento a causa del surriscaldamento.
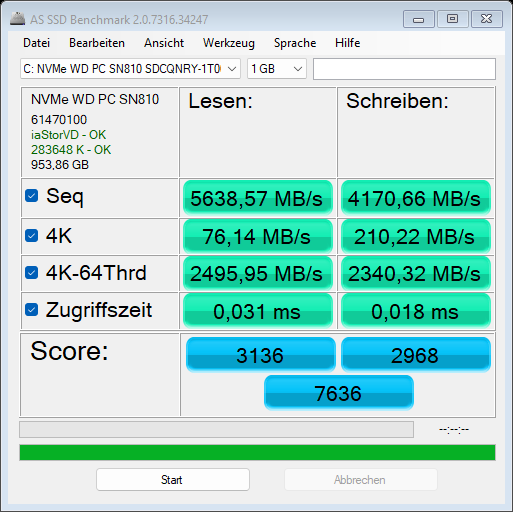
| Acer Swift X SFX16-52G-77RX WDC PC SN810 1TB | Acer Swift X SFX16-52G-52VE Micron 3400 MTFDKBA512TFH 512GB | Acer Swift X SFX16-51G-5388 Samsung PM991 MZVLQ512HBLU | Lenovo ThinkBook 16 G4+ IAP Micron 2450 1TB MTFDKCD1T0TFK | Dell Inspiron 16 Plus 7620 Kioxia BG5 KBG50ZNS512G | Lenovo IdeaPad 5 Pro 16ARH7 Samsung PM9A1 MZVL2512HCJQ | |
|---|---|---|---|---|---|---|
| AS SSD | -39% | -55% | -70% | -69% | -53% | |
| Seq Read (MB/s) | 5639 | 3200 -43% | 2744.12 -51% | 2825 -50% | 2693.29 -52% | 4687.88 -17% |
| Seq Write (MB/s) | 4171 | 3430 -18% | 1559.79 -63% | 1852 -56% | 1683.46 -60% | 2697.07 -35% |
| 4K Read (MB/s) | 76.1 | 63.1 -17% | 51.41 -32% | 58.44 -23% | 65.01 -15% | 61.12 -20% |
| 4K Write (MB/s) | 210.2 | 141.6 -33% | 156.13 -26% | 227.47 8% | 197.81 -6% | 125.7 -40% |
| 4K-64 Read (MB/s) | 2496 | 1354 -46% | 1014.34 -59% | 954.65 -62% | 855.48 -66% | 827.56 -67% |
| 4K-64 Write (MB/s) | 2340 | 1802 -23% | 940.2 -60% | 2413.44 3% | 395.8 -83% | 1884.06 -19% |
| Access Time Read * (ms) | 0.031 | 0.064 -106% | 0.073 -135% | 0.026 16% | 0.078 -152% | 0.073 -135% |
| Access Time Write * (ms) | 0.018 | 0.026 -44% | 0.028 -56% | 0.131 -628% | 0.06 -233% | 0.04 -122% |
| Score Read (Points) | 3136 | 1737 -45% | 1340 -57% | 1296 -59% | 1190 -62% | 1357 -57% |
| Score Write (Points) | 2968 | 2287 -23% | 1252 -58% | 2826 -5% | 762 -74% | 2279 -23% |
| Score Total (Points) | 7636 | 4936 -35% | 3229 -58% | 4750 -38% | 2529 -67% | 4247 -44% |
| Copy ISO MB/s (MB/s) | 2309 | 1363.82 -41% | 2155.05 -7% | 1634.1 -29% | ||
| Copy Program MB/s (MB/s) | 658.6 | 433.2 -34% | 414.57 -37% | 379.46 -42% | ||
| Copy Game MB/s (MB/s) | 1613 | 1055.69 -35% | 1055.89 -35% | 1174.45 -27% | ||
| DiskSpd | -25% | -71% | -50% | -56% | -40% | |
| seq read (MB/s) | 4206 | 2619 -38% | 1248 -70% | 2124 -50% | 2355 -44% | 3304 -21% |
| seq write (MB/s) | 5015 | 3900 -22% | 790 -84% | 2677 -47% | 2020 -60% | 2744 -45% |
| seq q8 t1 read (MB/s) | 6940 | 6439 -7% | 1655 -76% | 3377 -51% | 2569 -63% | 6708 -3% |
| seq q8 t1 write (MB/s) | 5031 | 3911 -22% | 871 -83% | 3241 -36% | 2752 -45% | 4857 -3% |
| 4k q32 t16 read (MB/s) | 2605 | 1522 -42% | 778 -70% | 923 -65% | 652 -75% | 824 -68% |
| 4k q32 t16 write (MB/s) | 2780 | 2390 -14% | 640 -77% | 501 -82% | 408 -85% | 299 -89% |
| 4k q1 t1 read (MB/s) | 88 | 65.3 -26% | 43.2 -51% | 61.2 -30% | 62.7 -29% | 63.4 -28% |
| 4k q1 t1 write (MB/s) | 305 | 208 -32% | 123.5 -60% | 187.8 -38% | 162.6 -47% | 125.7 -59% |
| Media totale (Programma / Settaggio) | -32% /
-33% | -63% /
-61% | -60% /
-62% | -63% /
-64% | -47% /
-47% |
* ... Meglio usare valori piccoli
* ... Meglio usare valori piccoli
Constant Performance Reading: DiskSpd Read Loop, Queue Depth 8
Scheda grafica
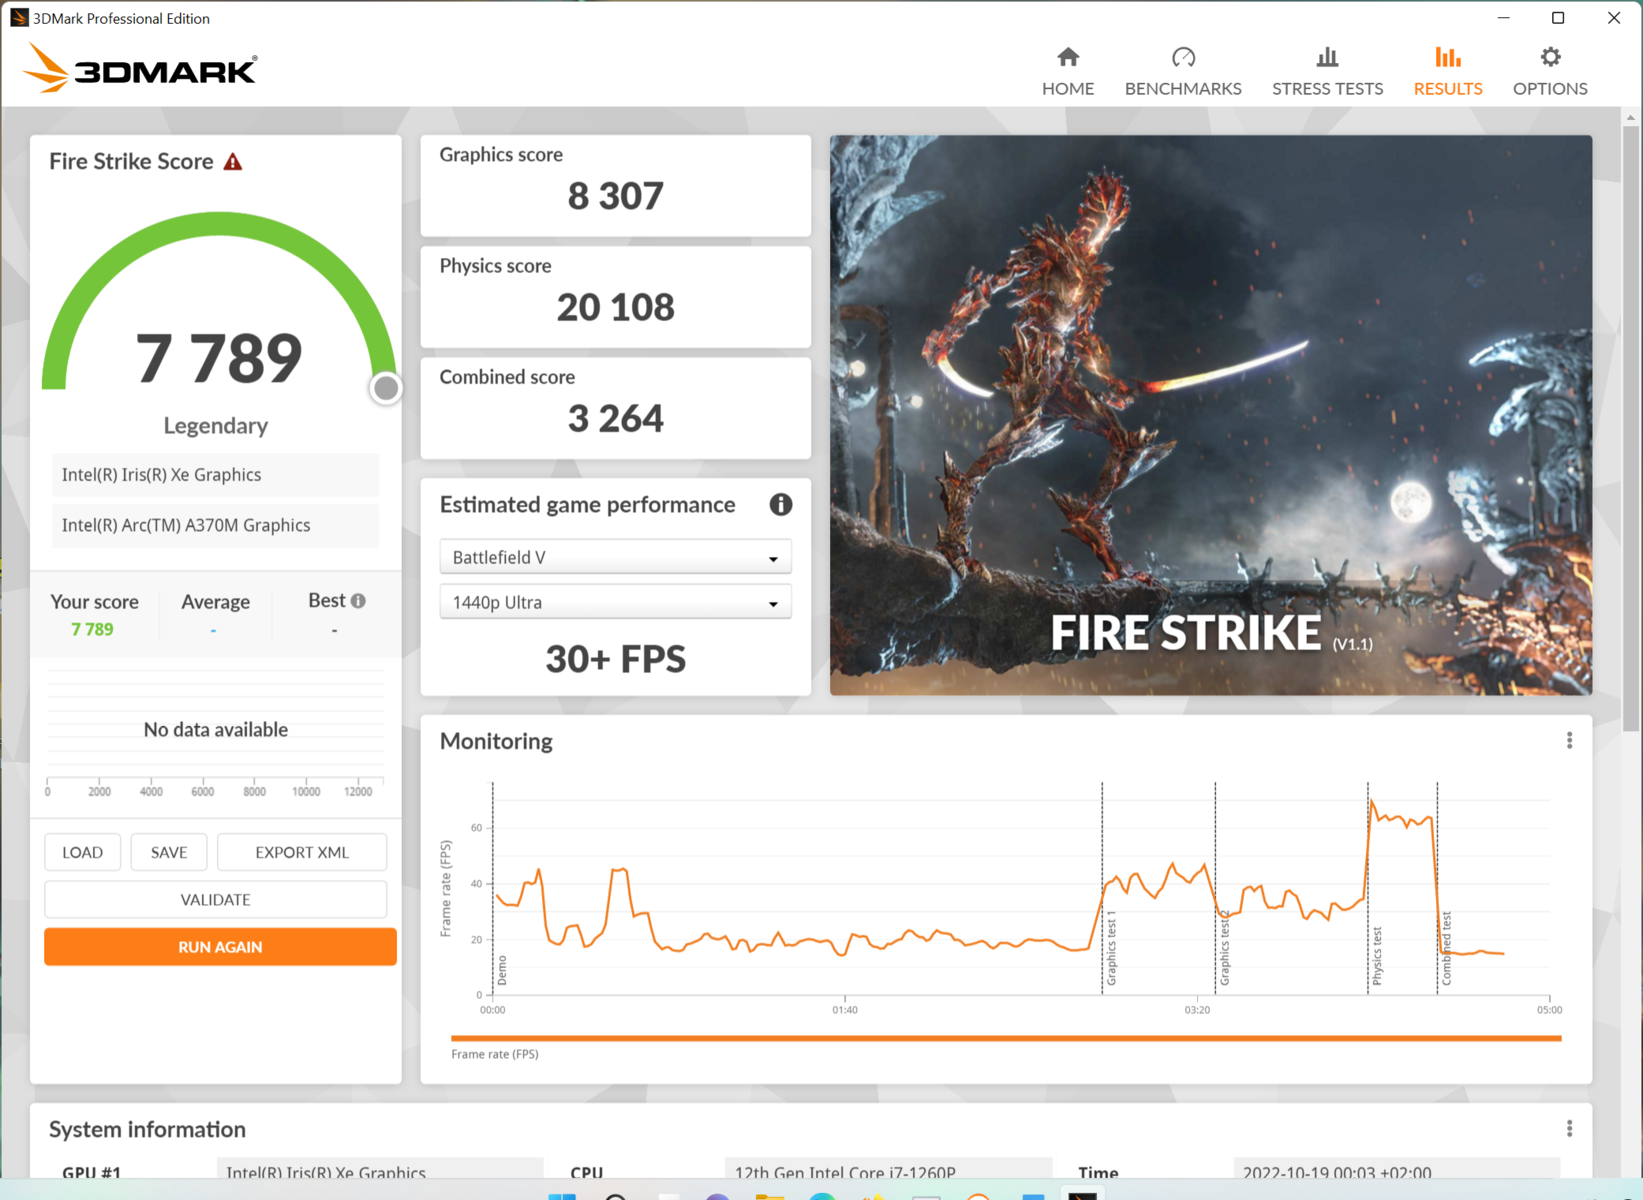
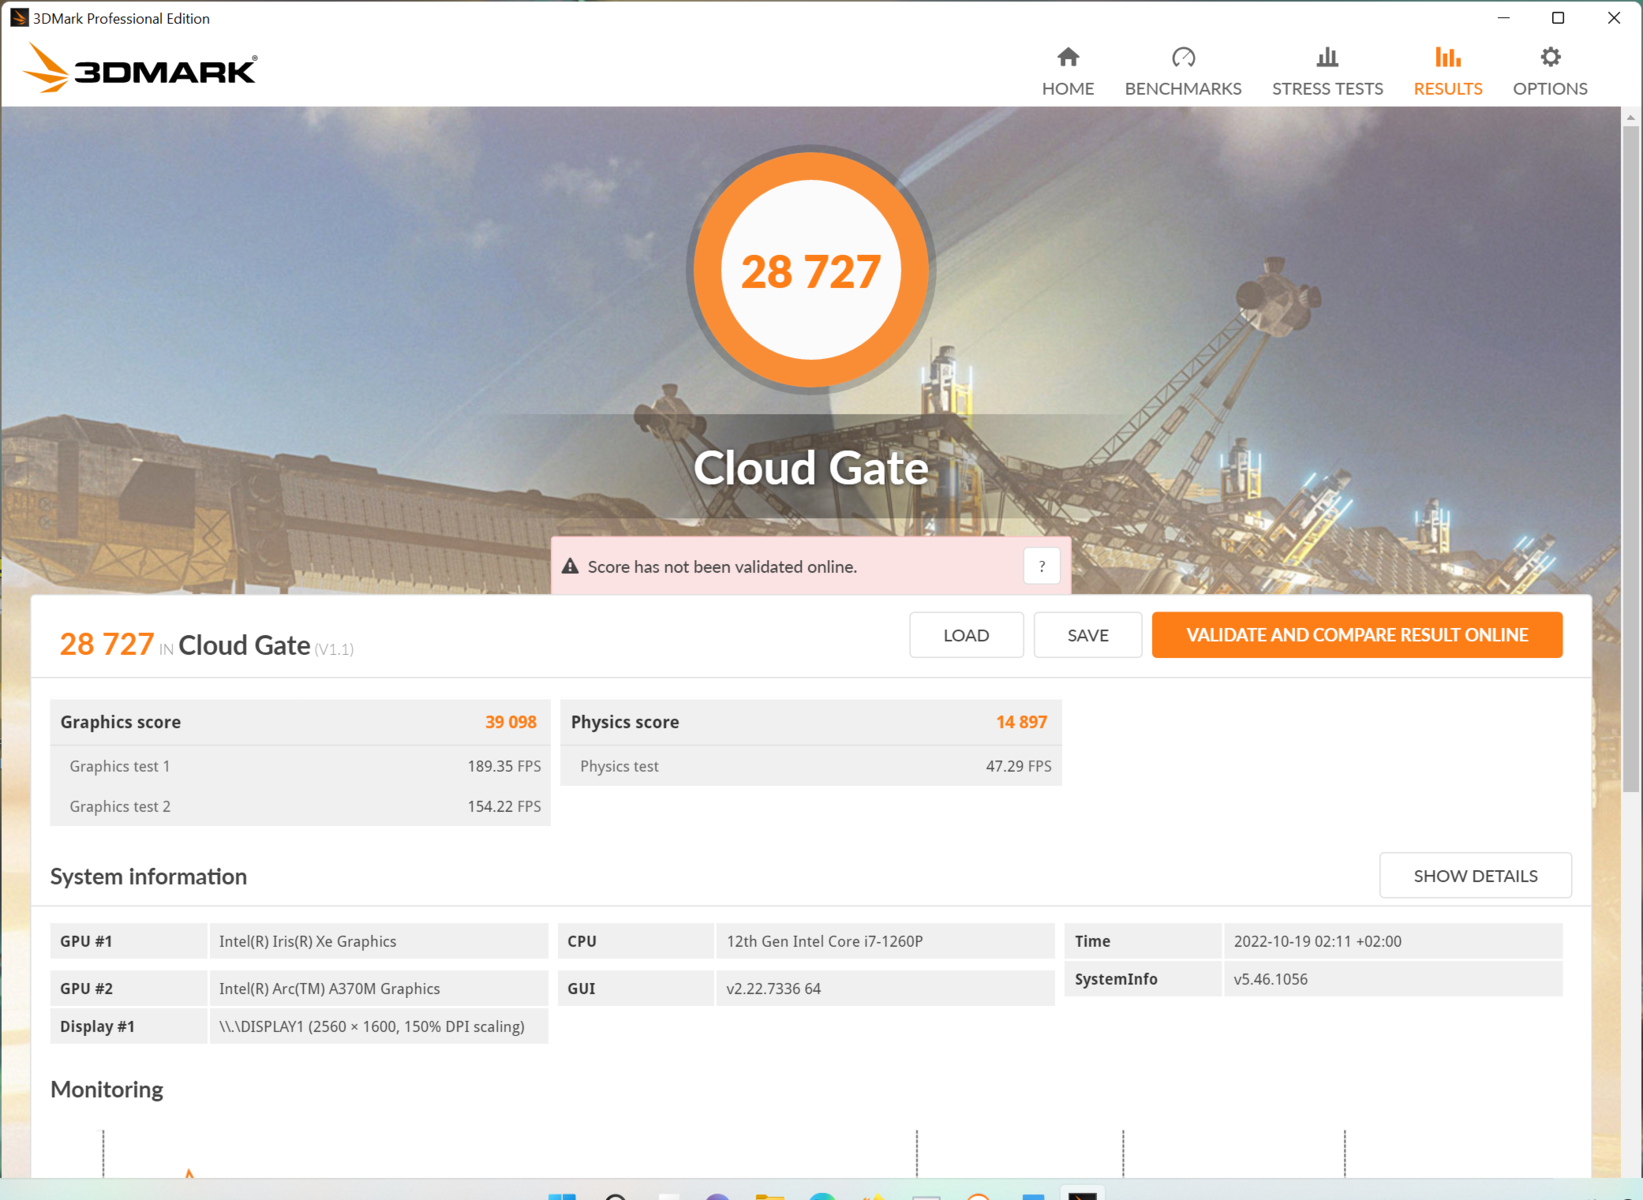
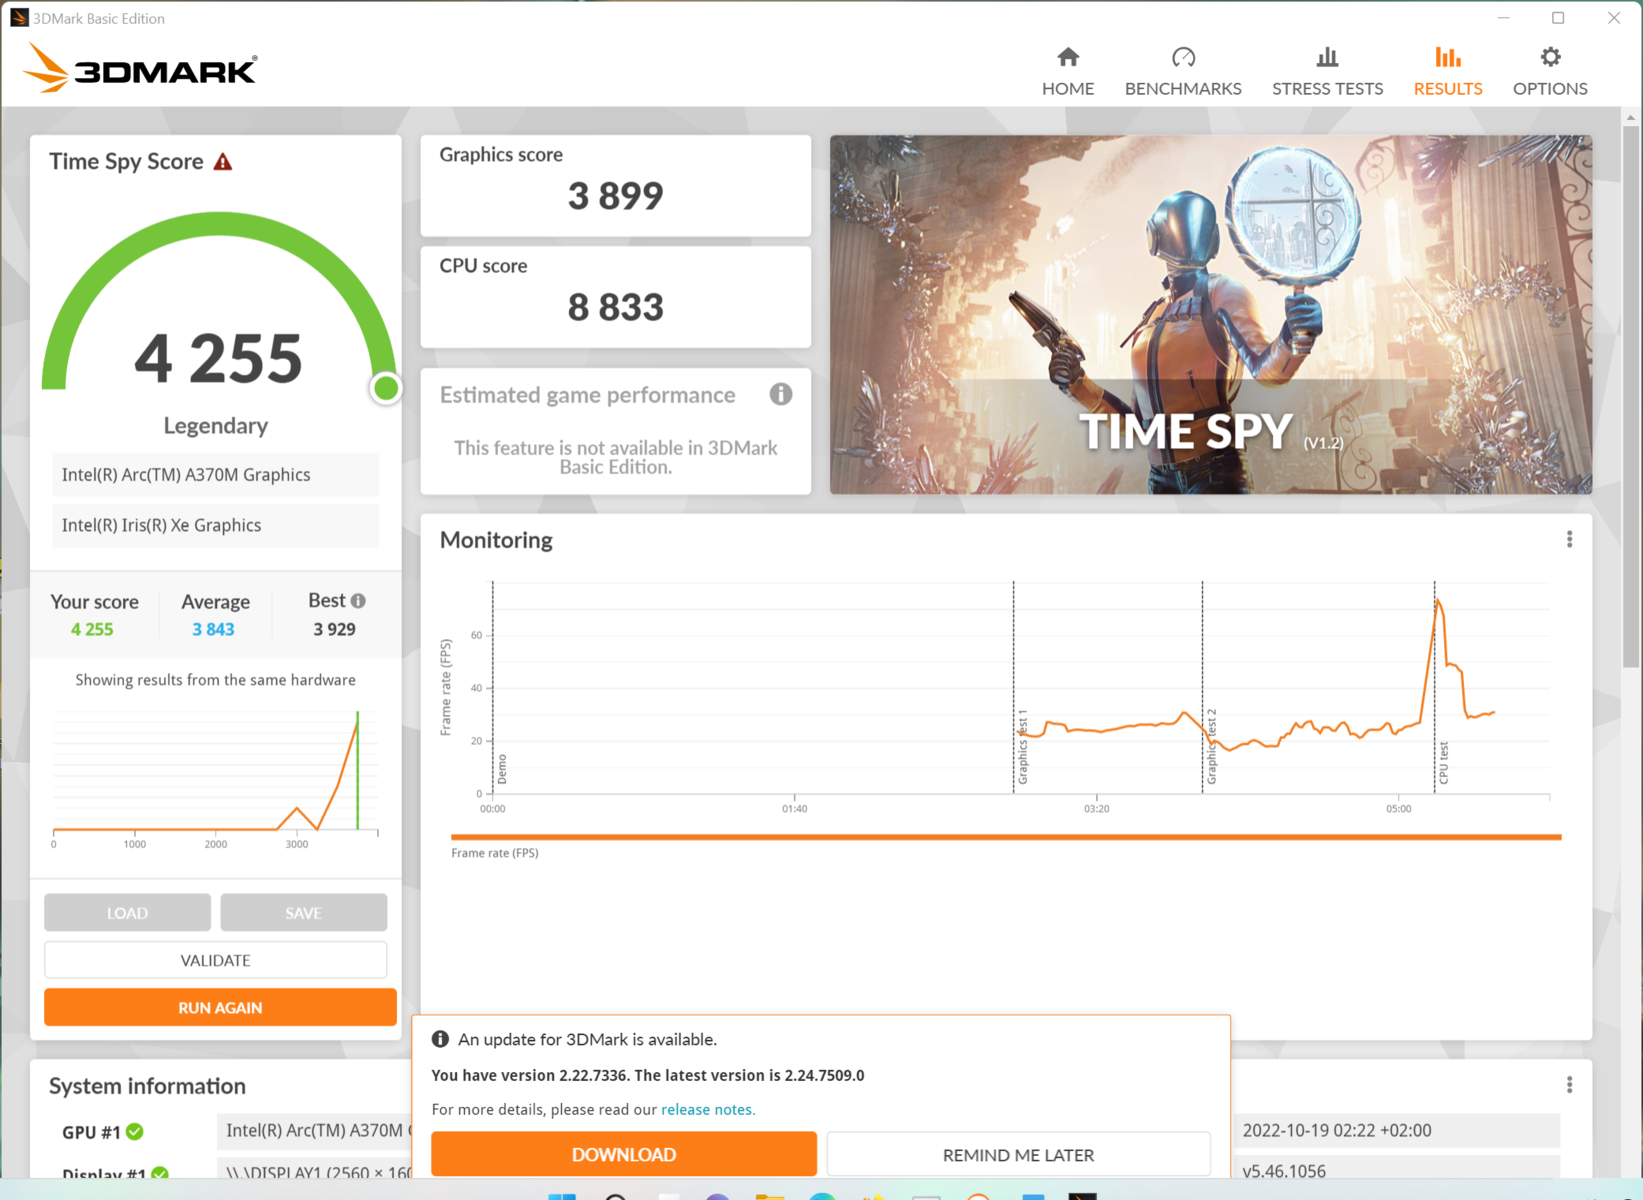
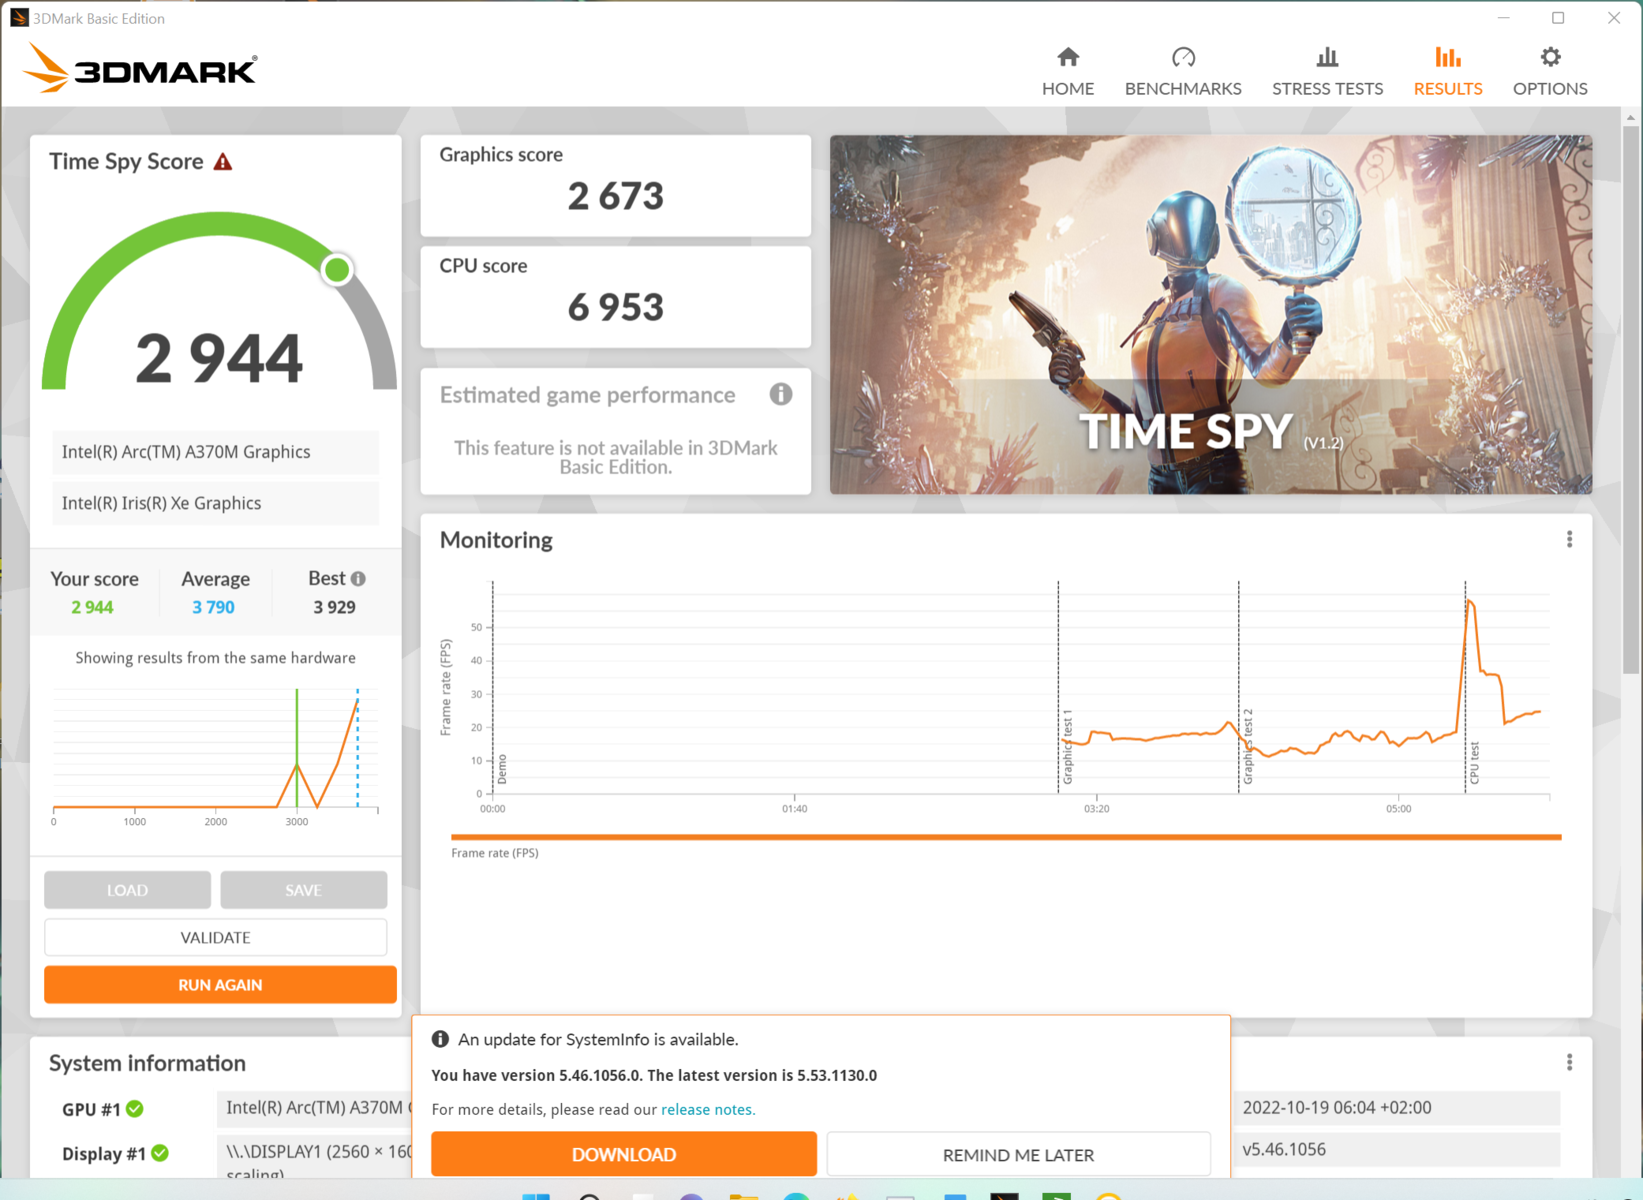
IlIntel Arc A370Mqui utilizzato è la variante con il TGP più basso, pari a 35 watt. In media, la RTX 3050nel modello precedente e l'Asus Vivobook Pro 16Xè circa il 50% più veloce nei benchmark sintetici. Nei benchmark 3D relativi alle workstation, la velocità può arrivare rapidamente al 150 o 200%. Le prestazioni sintetiche di una scheda integrata AMD Radeon 680Msi situa all'incirca al livello dell'Arc A370M.
Nel funzionamento a batteria, le prestazioni grafiche si riducono di un ulteriore 30%.
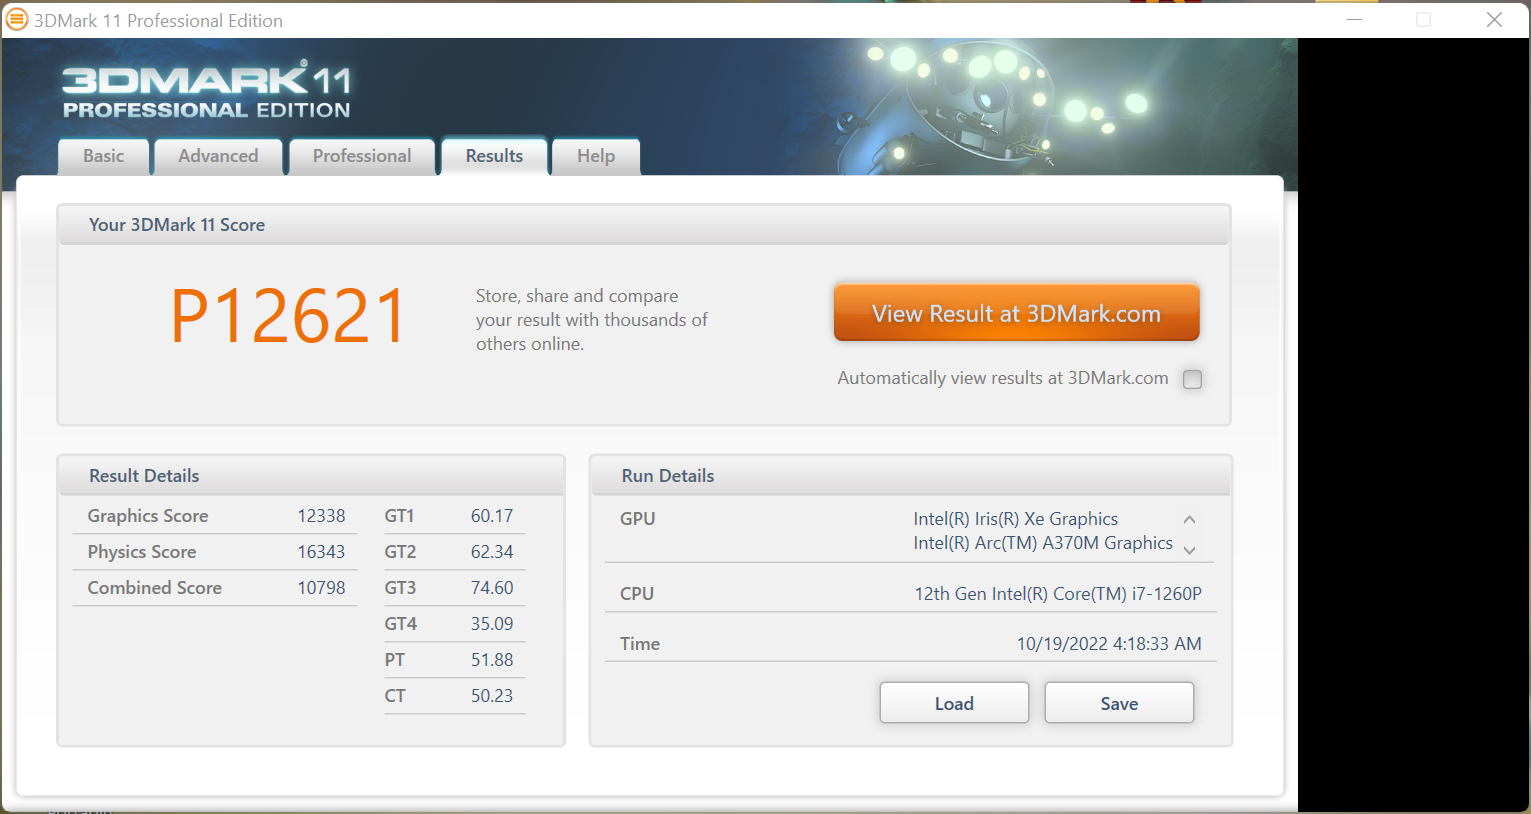
| 3DMark 11 Performance | 12621 punti | |
| 3DMark Cloud Gate Standard Score | 28727 punti | |
| 3DMark Fire Strike Score | 7789 punti | |
| 3DMark Time Spy Score | 4255 punti | |
Aiuto | ||
| Blender | |
| v3.3 Classroom oneAPI/Intel | |
| Acer Swift X SFX16-52G-77RX | |
| v3.3 Classroom HIP/AMD | |
| Lenovo ThinkPad T14 G3-21CF004NGE | |
| v3.3 Classroom CUDA | |
| HP ZBook Firefly 14 G9-6B8A2EA | |
| Acer Swift X SFX16-51G-5388 | |
| HP Envy 16 h0112nr | |
| Dell Inspiron 16 Plus 7620 | |
| v3.3 Classroom CPU | |
| HP ZBook Firefly 14 G9-6B8A2EA | |
| Acer Swift X SFX16-51G-5388 | |
| Acer Swift X SFX16-52G-77RX | |
| Acer Swift X SFX16-52G-52VE | |
| Lenovo ThinkPad T14 G3-21CF004NGE | |
| HP Envy 16 h0112nr | |
| Dell Inspiron 16 Plus 7620 | |
* ... Meglio usare valori piccoli
Prestazioni di gioco
Nei giochi, l'Intel Arc A370M è superato del 60% dalla RTX 3050 Ti nel Vivobook Pro 16Xe di circa il 100% dal Dell Inspiron 16. In alcuni giochi, questo vantaggio diventa estremo, dal 200 al 300%, e ciò è dovuto ad alcune ottimizzazioni insufficienti dei driver dell'unità grafica, ancora piuttosto giovane
GeForceRTX 3060 dell'HP Envy 16 è circa 3 volte più veloce in quasi tutti i casi, mentre una Radeon 680M integrata Radeon 680Mè superata solo del 10-20%.
Se si seleziona una risoluzione inferiore (Full HD) rispetto alla QHD+ nativa e si lasciano i dettagli a livelli medio-alti, la maggior parte dei giochi può essere visualizzata senza problemi. Tuttavia, nei giochi moderni i livelli di dettaglio elevati sono possibili solo raramente.
| The Witcher 3 - 1920x1080 High Graphics & Postprocessing (Nvidia HairWorks Off) | |
| HP Envy 16 h0112nr | |
| Dell Inspiron 16 Plus 7620 | |
| Media della classe Multimedia (22 - 224, n=13, ultimi 2 anni) | |
| Lenovo ThinkBook 16 G4+ IAP | |
| Acer Swift X SFX16-51G-5388 | |
| Acer Swift X SFX16-52G-77RX | |
| Lenovo IdeaCentre AIO 3 24IAP7 | |
| Acer Swift X SFX16-52G-52VE | |
| Lenovo IdeaPad 5 Pro 16ARH7 | |
| Shadow of the Tomb Raider | |
| 1920x1080 High Preset AA:SM | |
| Media della classe Multimedia (26 - 143, n=8, ultimi 2 anni) | |
| Media Intel Arc A370M (39 - 42, n=2) | |
| Acer Swift X SFX16-52G-77RX | |
| 1920x1080 Highest Preset AA:T | |
| Media della classe Multimedia (23 - 129, n=8, ultimi 2 anni) | |
| Acer Swift X SFX16-52G-77RX | |
| Media Intel Arc A370M (n=1) | |
| God of War | |
| 1920x1080 Original Preset | |
| Acer Swift X SFX16-52G-77RX | |
| Media Intel Arc A370M (30 - 31.8, n=3) | |
| Acer Swift X SFX16-52G-52VE | |
| Lenovo IdeaPad 5 Pro 16ARH7 | |
| 1920x1080 High Preset | |
| Acer Swift X SFX16-52G-77RX | |
| Media Intel Arc A370M (24 - 25.6, n=3) | |
| Acer Swift X SFX16-52G-52VE | |
| Lenovo IdeaPad 5 Pro 16ARH7 | |
| GRID Legends | |
| 1920x1080 Ultra Preset | |
| Acer Swift X SFX16-52G-77RX | |
| Media Intel Arc A370M (41.7 - 41.9, n=2) | |
| Acer Swift X SFX16-52G-52VE | |
| 2560x1440 Ultra Preset | |
| Acer Swift X SFX16-52G-77RX | |
| Media Intel Arc A370M (31.3 - 34.4, n=2) | |
| Acer Swift X SFX16-52G-52VE | |
The Witcher 3 FPS Chart
| basso | medio | alto | ultra | QHD | 4K | |
|---|---|---|---|---|---|---|
| GTA V (2015) | 148.6 | 136.9 | 41.4 | 16.4 | 11 | |
| The Witcher 3 (2015) | 168.8 | 100 | 53 | 26.3 | ||
| Dota 2 Reborn (2015) | 99.1 | 83.5 | 68.4 | 66.3 | 39.5 | |
| Final Fantasy XV Benchmark (2018) | 70.4 | 37.9 | 26.3 | 19.3 | ||
| X-Plane 11.11 (2018) | 34.7 | 27.8 | 24 | 22.2 | ||
| Far Cry 5 (2018) | 90 | 49 | 46 | 43 | 29 | |
| Strange Brigade (2018) | 175.8 | 73.2 | 61.4 | 52.1 | ||
| Shadow of the Tomb Raider (2018) | 67 | 49 | 39 | 32 | 20 | |
| God of War (2022) | 35.8 | 31.8 | 25.6 | 20.4 | 12.4 | |
| GRID Legends (2022) | 95.6 | 69.4 | 55 | 41.9 | 34.4 |
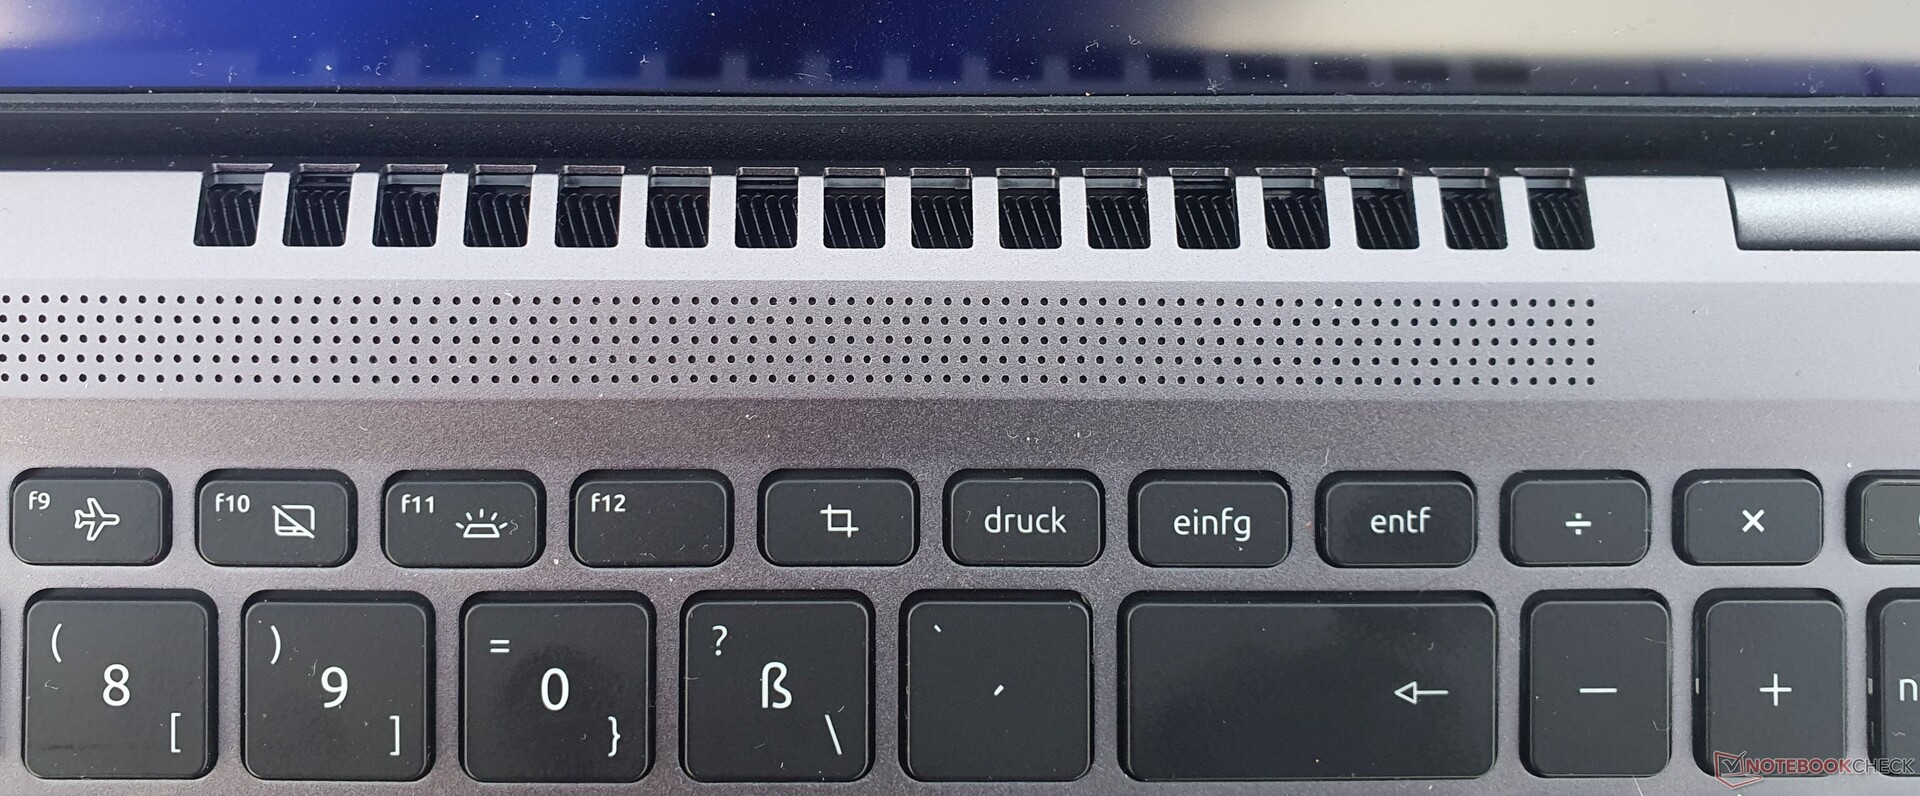
Emissioni: All'Acer Swift X 16 piace soffiare molta aria
Emissioni sonore
Le ventole sono più rumorose in modalità Performance e funzionano per la maggior parte del tempo con un carico molto basso.
In modalità Normale, le ventole sono più silenziose e sono appena percettibili a basso carico. Ma la situazione cambia di nuovo con un carico leggermente superiore.
In modalità Silenziosa, le ventole rimangono spente molto più spesso, ma iniziano a funzionare anche con carichi della CPU di appena il 10% circa, ad esempio quando si scarica un gioco di Steam.
Con una media di 44,7 dB(A), le ventole non sono molto silenziose nemmeno con un carico maggiore. I 36,5 dB(A) del modelloModello Core-i5sono significativamente più silenziosi.
Tuttavia, tutti gli altri dispositivi del nostro test sono altrettanto rumorosi sotto carico. Durante la ricarica, di tanto in tanto si sentono dei rumori elettronici vicino alla porta USB-C.
Rumorosità
| Idle |
| 25 / 25 / 25 dB(A) |
| Sotto carico |
| 44.7 / 45.6 dB(A) |
 | ||
30 dB silenzioso 40 dB(A) udibile 50 dB(A) rumoroso |
||
min: | ||
| Acer Swift X SFX16-52G-77RX A370M, i7-1260P, WDC PC SN810 1TB | Acer Swift X SFX16-52G-52VE A370M, i5-1240P, Micron 3400 MTFDKBA512TFH 512GB | Lenovo ThinkBook 16 G4+ IAP GeForce RTX 2050 Mobile, i7-12700H, Micron 2450 1TB MTFDKCD1T0TFK | Dell Inspiron 16 Plus 7620 GeForce RTX 3050 Ti Laptop GPU, i7-12700H, Kioxia BG5 KBG50ZNS512G | HP Envy 16 h0112nr GeForce RTX 3060 Laptop GPU, i7-12700H, Micron 3400 1TB MTFDKBA1T0TFH | Asus Vivobook Pro 16X-M7600QE GeForce RTX 3050 Ti Laptop GPU, R9 5900HX, SK Hynix HFM001TD3JX013N | |
|---|---|---|---|---|---|---|
| Noise | 3% | 1% | -6% | -1% | -4% | |
| off /ambiente * (dB) | 25 | 25 -0% | 24.2 3% | 23.3 7% | 22.8 9% | 26 -4% |
| Idle Minimum * (dB) | 25 | 25 -0% | 24.2 3% | 25.7 -3% | 22.9 8% | 27 -8% |
| Idle Average * (dB) | 25 | 25 -0% | 24.2 3% | 26.1 -4% | 22.9 8% | 27 -8% |
| Idle Maximum * (dB) | 25 | 26.4 -6% | 24.2 3% | 30.6 -22% | 30.5 -22% | 27.5 -10% |
| Load Average * (dB) | 44.7 | 36.5 18% | 47 -5% | 46.2 -3% | 41.4 7% | 41.7 7% |
| Load Maximum * (dB) | 45.6 | 43 6% | 47 -3% | 49.4 -8% | 51.4 -13% | 45.3 1% |
| Witcher 3 ultra * (dB) | 47 | 49.2 | 51.1 |
* ... Meglio usare valori piccoli
Temperature
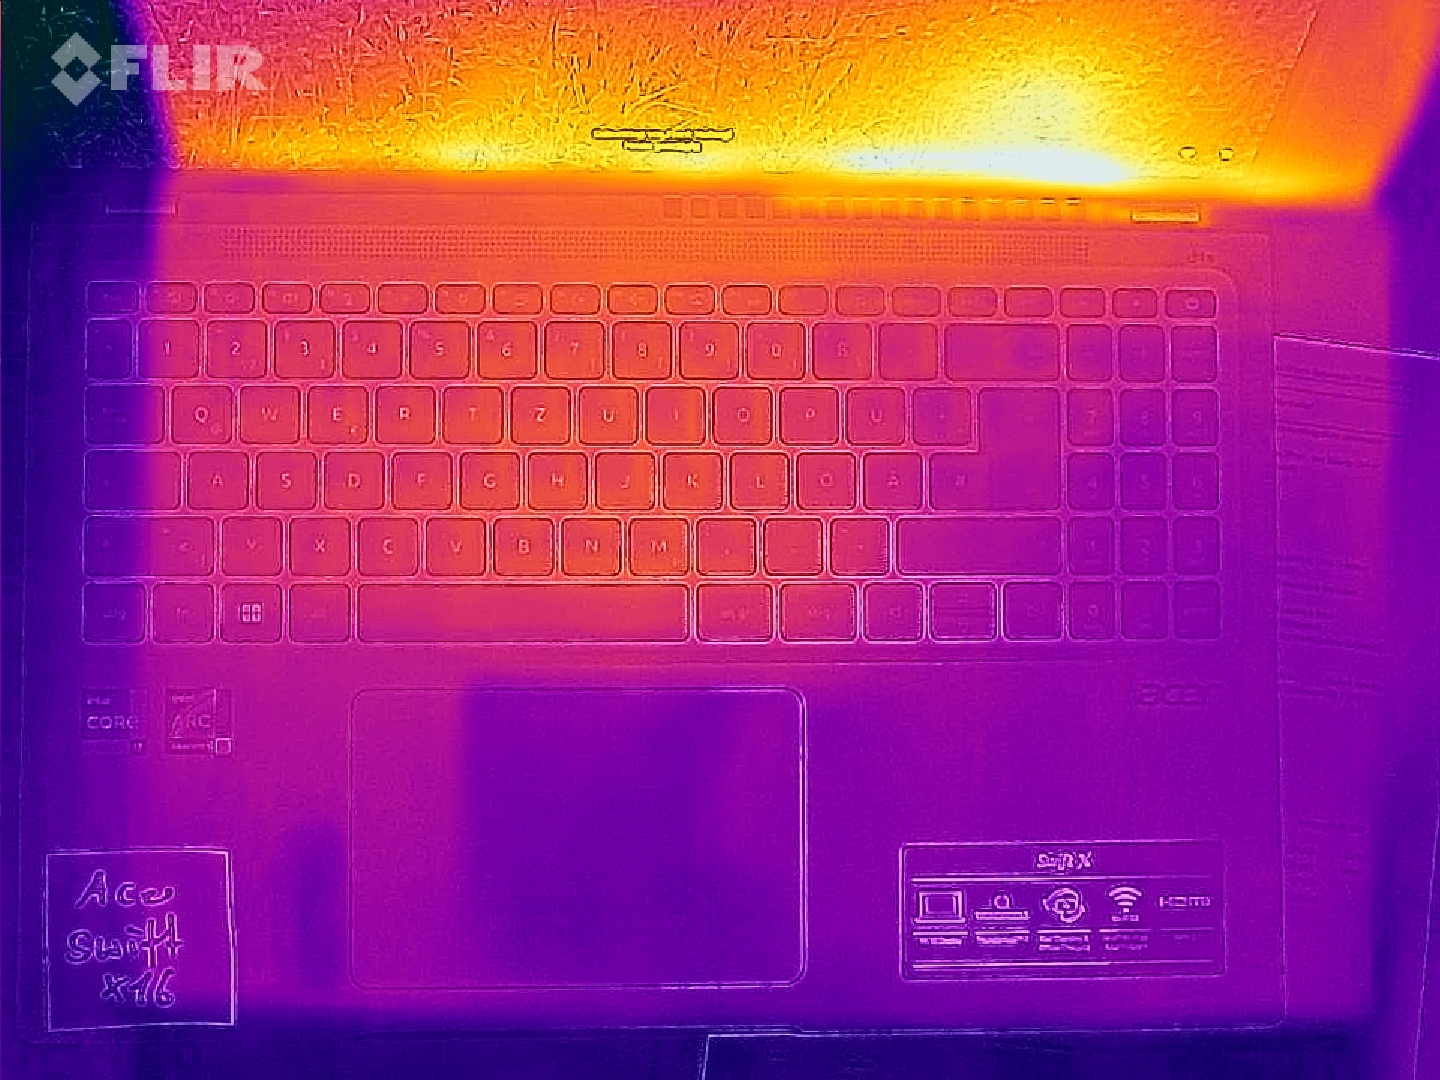
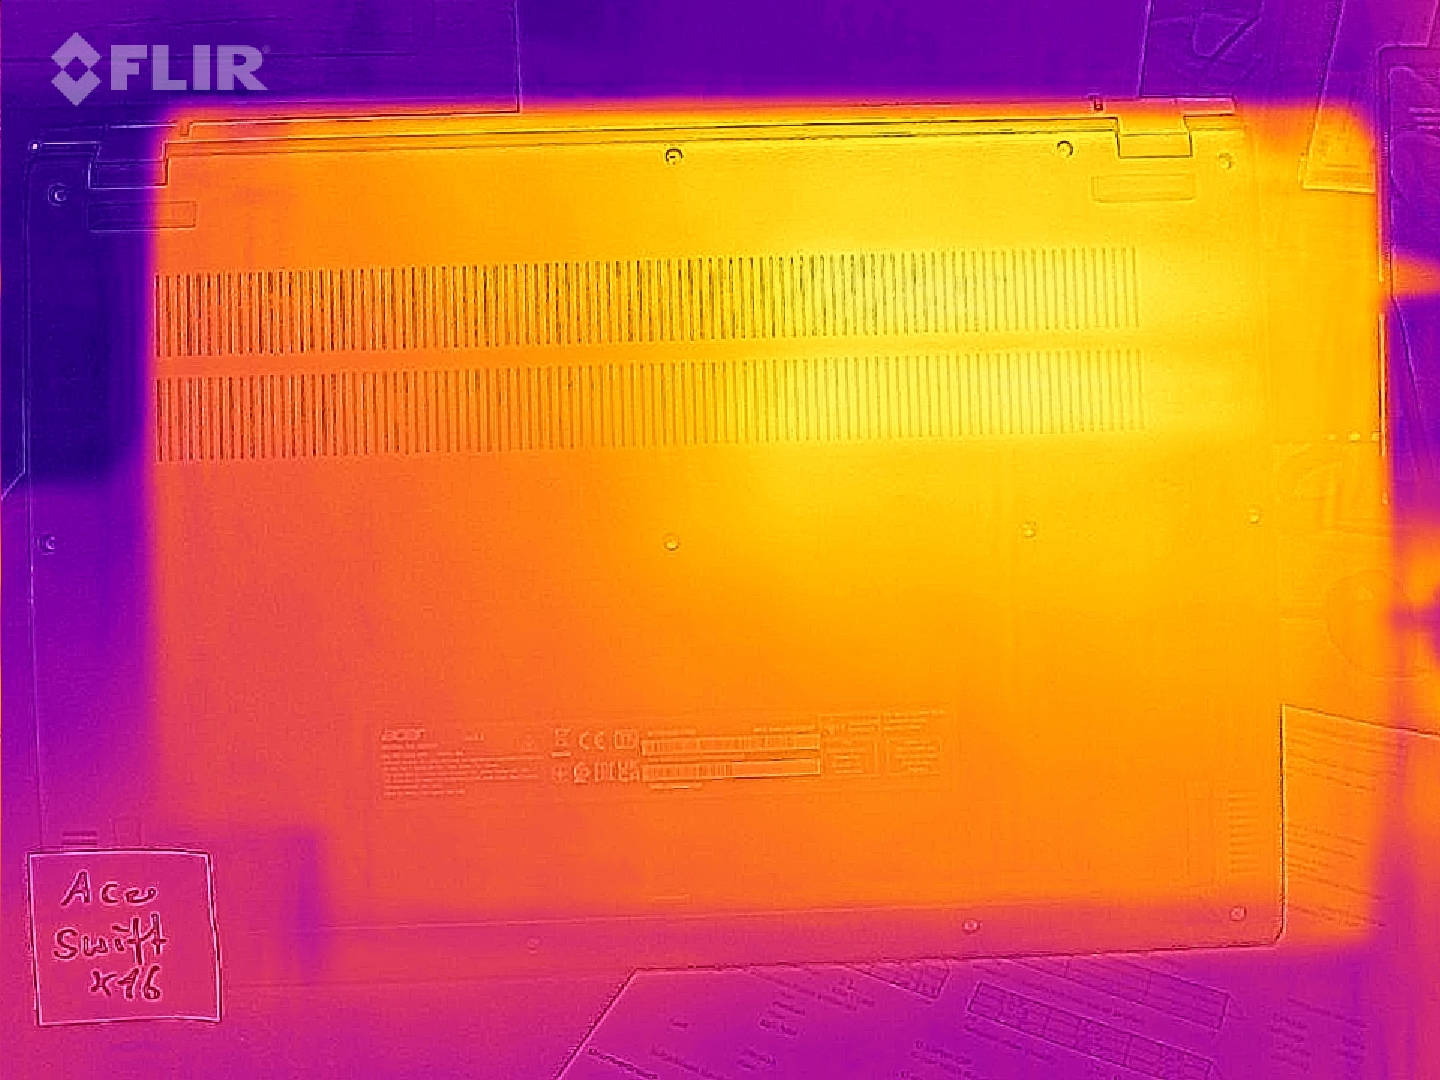
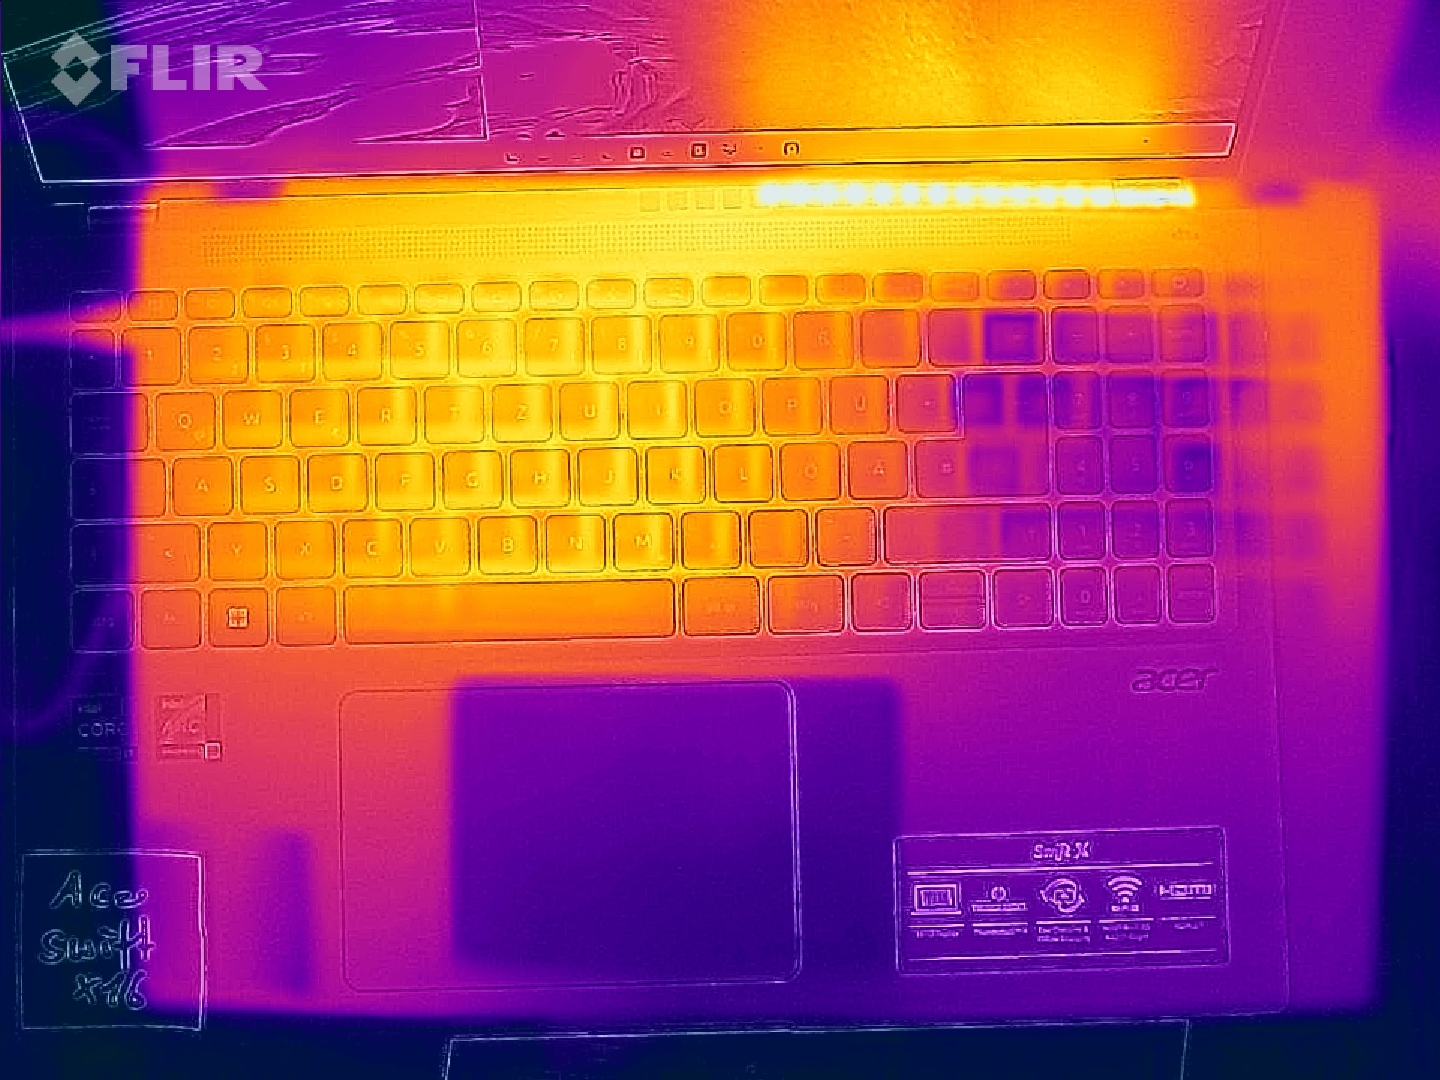
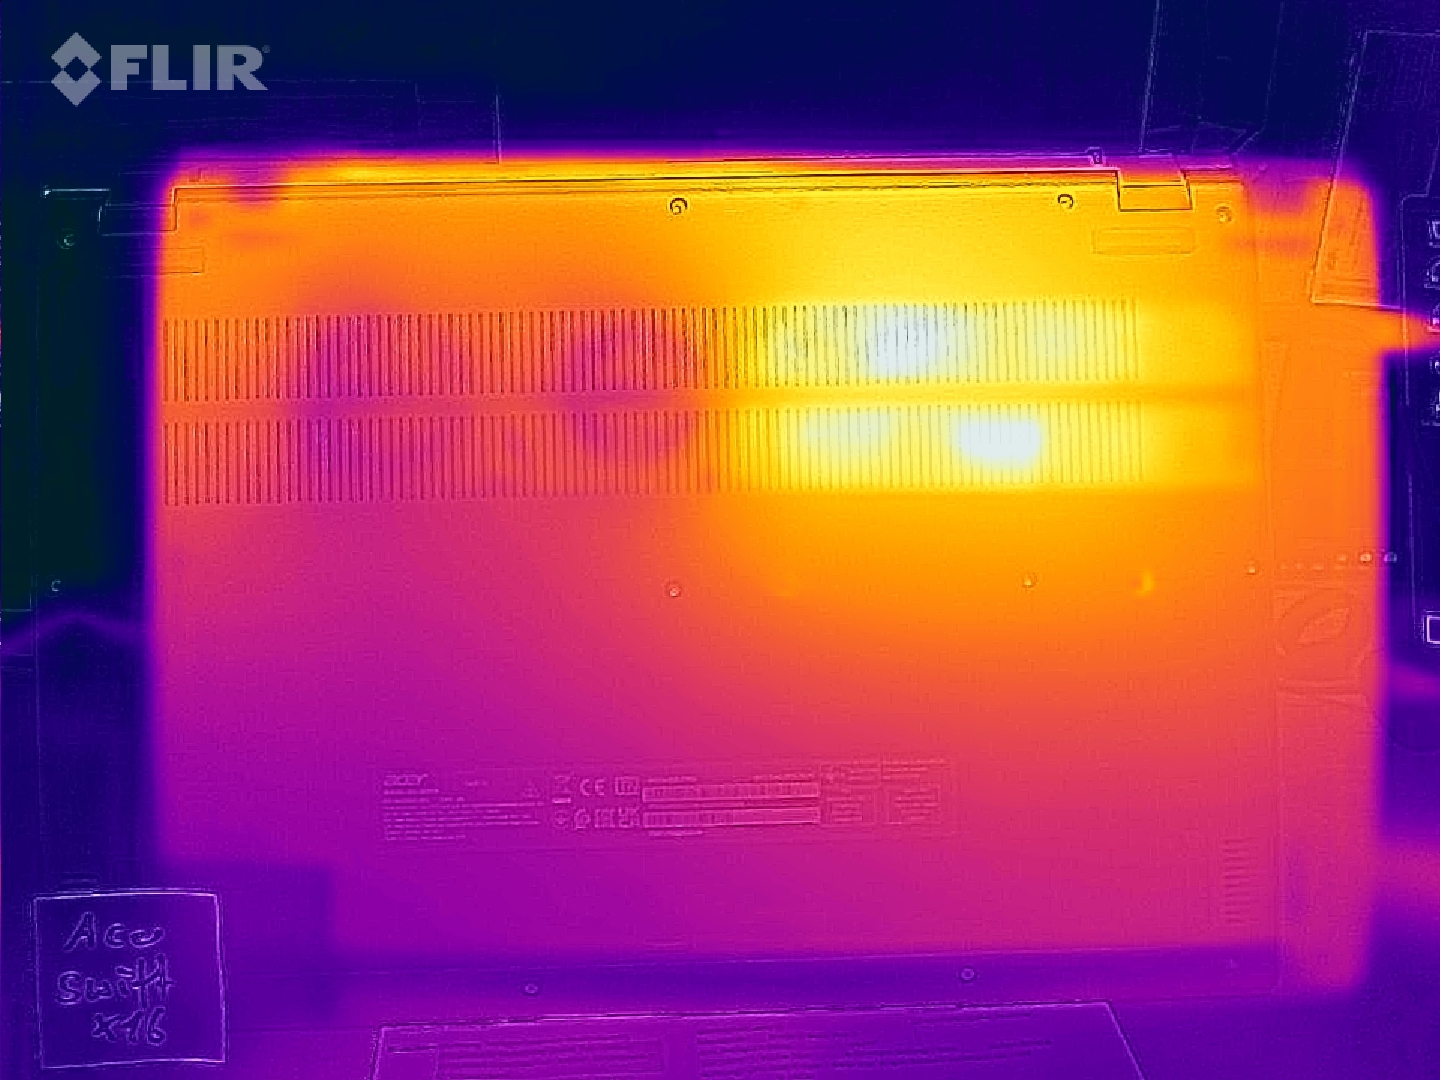
Il sistema di raffreddamento non solo è rumoroso, ma è anche debole. In particolare, l'area sopra la tastiera, vicino alle bocchette della ventola, può diventare fastidiosamente calda a pieno carico, e anche la parte inferiore del dispositivo si riscalda con un hotspot fino a 55,5 °C (131 °F). Anche con componenti più potenti, i concorrenti riescono a rimanere più freschi.
(-) La temperatura massima sul lato superiore è di 49.4 °C / 121 F, rispetto alla media di 36.8 °C / 98 F, che varia da 21 a 71 °C per questa classe Multimedia.
(-) Il lato inferiore si riscalda fino ad un massimo di 55.5 °C / 132 F, rispetto alla media di 39.1 °C / 102 F
(+) In idle, la temperatura media del lato superiore è di 25.9 °C / 79 F, rispetto alla media deld ispositivo di 31.3 °C / 88 F.
(-) I poggiapolsi e il touchpad possono diventare molto caldi al tatto con un massimo di 49.4 °C / 120.9 F.
(-) La temperatura media della zona del palmo della mano di dispositivi simili e'stata di 28.7 °C / 83.7 F (-20.7 °C / -37.2 F).
| Acer Swift X SFX16-52G-77RX Intel Core i7-1260P, Intel Arc A370M | Acer Swift X SFX16-52G-52VE Intel Core i5-1240P, Intel Arc A370M | Lenovo ThinkBook 16 G4+ IAP Intel Core i7-12700H, NVIDIA GeForce RTX 2050 Mobile | Dell Inspiron 16 Plus 7620 Intel Core i7-12700H, NVIDIA GeForce RTX 3050 Ti Laptop GPU | HP Envy 16 h0112nr Intel Core i7-12700H, NVIDIA GeForce RTX 3060 Laptop GPU | Lenovo IdeaPad 5 Pro 16ARH7 AMD Ryzen 5 6600HS, AMD Radeon 660M | Asus Vivobook Pro 16X-M7600QE AMD Ryzen 9 5900HX, NVIDIA GeForce RTX 3050 Ti Laptop GPU | |
|---|---|---|---|---|---|---|---|
| Heat | -0% | 12% | 7% | 3% | 10% | 15% | |
| Maximum Upper Side * (°C) | 49.4 | 52 -5% | 42.9 13% | 46 7% | 45.2 9% | 46 7% | 39.4 20% |
| Maximum Bottom * (°C) | 55.5 | 50.4 9% | 50.6 9% | 45.8 17% | 44 21% | 48 14% | 43.6 21% |
| Idle Upper Side * (°C) | 28.4 | 30 -6% | 26 8% | 29.2 -3% | 33.6 -18% | 28 1% | 27.6 3% |
| Idle Bottom * (°C) | 32.6 | 32.4 1% | 26.5 19% | 31 5% | 32.6 -0% | 27 17% | 27.5 16% |
* ... Meglio usare valori piccoli
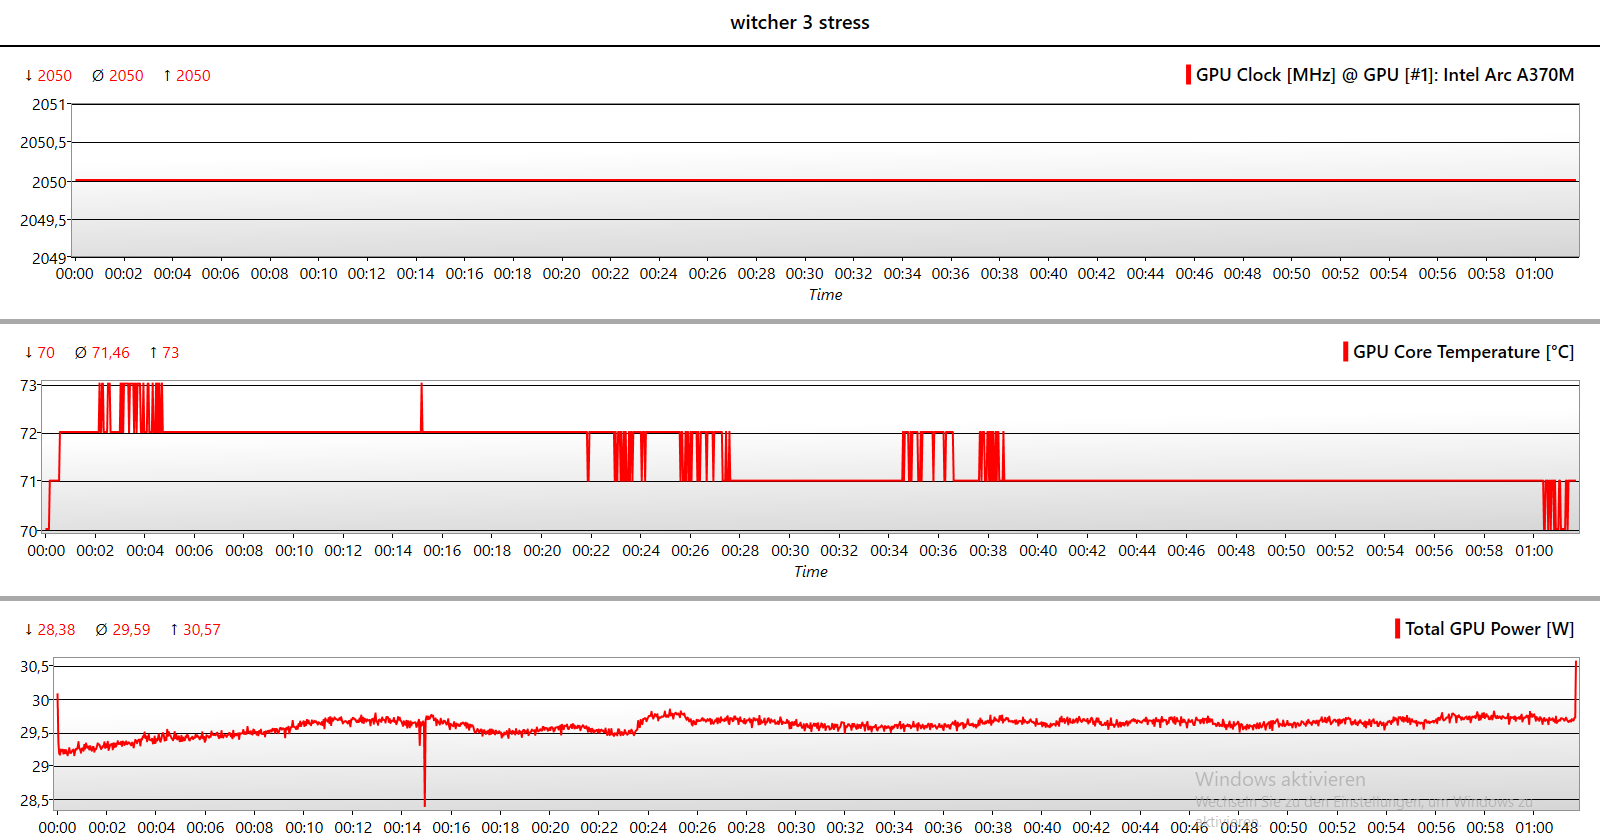
Stress test
Anche nello stress test combinato di Prime95 e FurMark, della durata di un'ora, la velocità di clock della GPU rimane solo del 5% al di sotto del valore massimo. Il processore viene quindi rallentato da 35 a 25 watt, raggiungendo una temperatura di 88 °C (190 °F), mentre la GPU si ferma a 86 °C (187 °F). I core P avranno quindi una velocità di clock di soli 1,75 GHz circa, inferiore alla velocità di clock di base di 2,1 GHz. Durante lo stress puro della CPU, la velocità non scende al di sotto di questo limite.
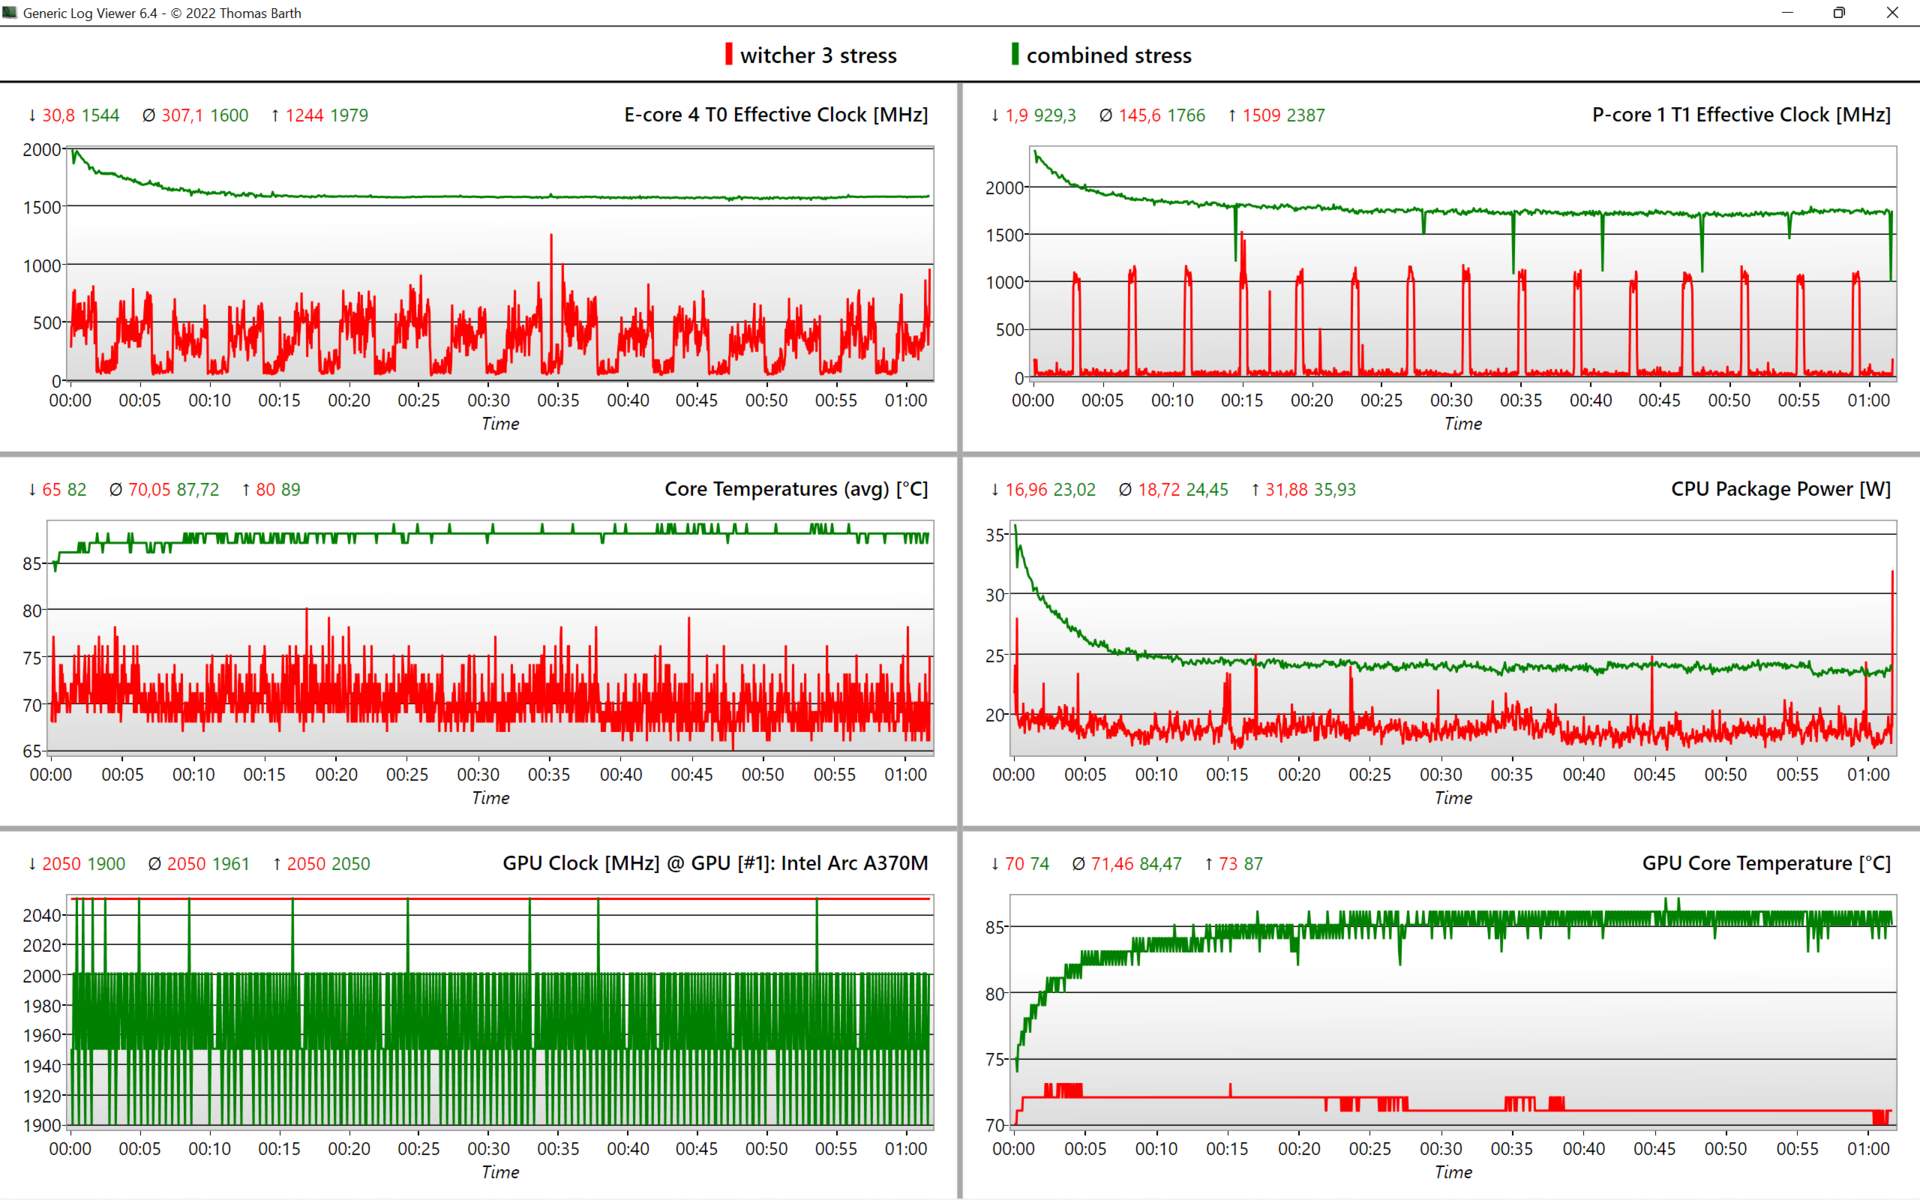
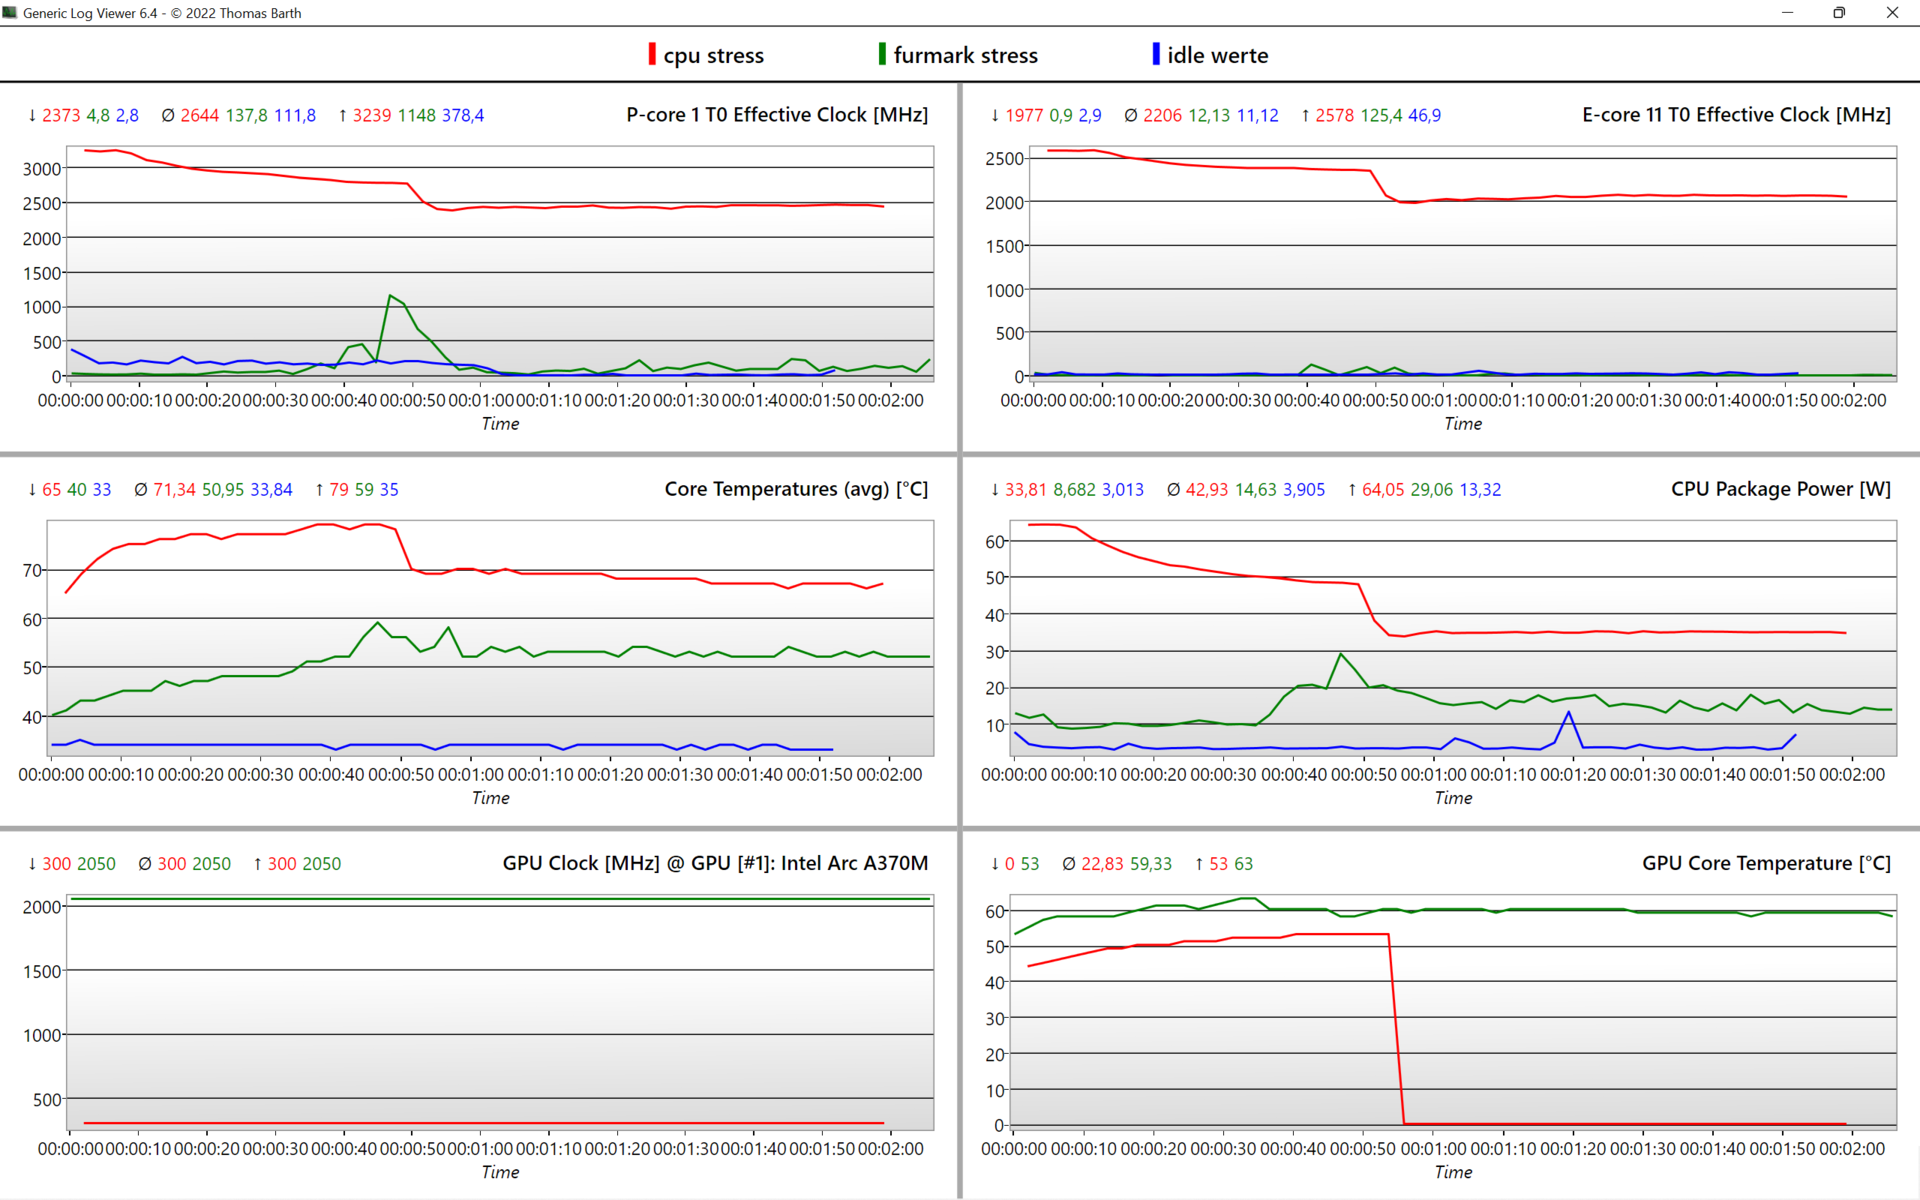
| Clock CPU E-/P-Cores (GHz) | Clock GPU (MHz) | Temperatura media CPU (°C) | Temperatura media GPU (°C) | |
| Sistema inattivo | - | 300 | 34 | 29 |
| Stress Prime95 | 2,1 / 2,5 | 300 | 67 | 53 |
| Prime95 + FurMark Stress | 1,6 / 1,75 | 1.960 | 88 | 86 |
| FurMark Stress | - | 2.050 | 52 | 60 |
| Witcher 3 Stress | 0,3 / 0,15 | 2.050 | 70 | 71 |
Altoparlanti
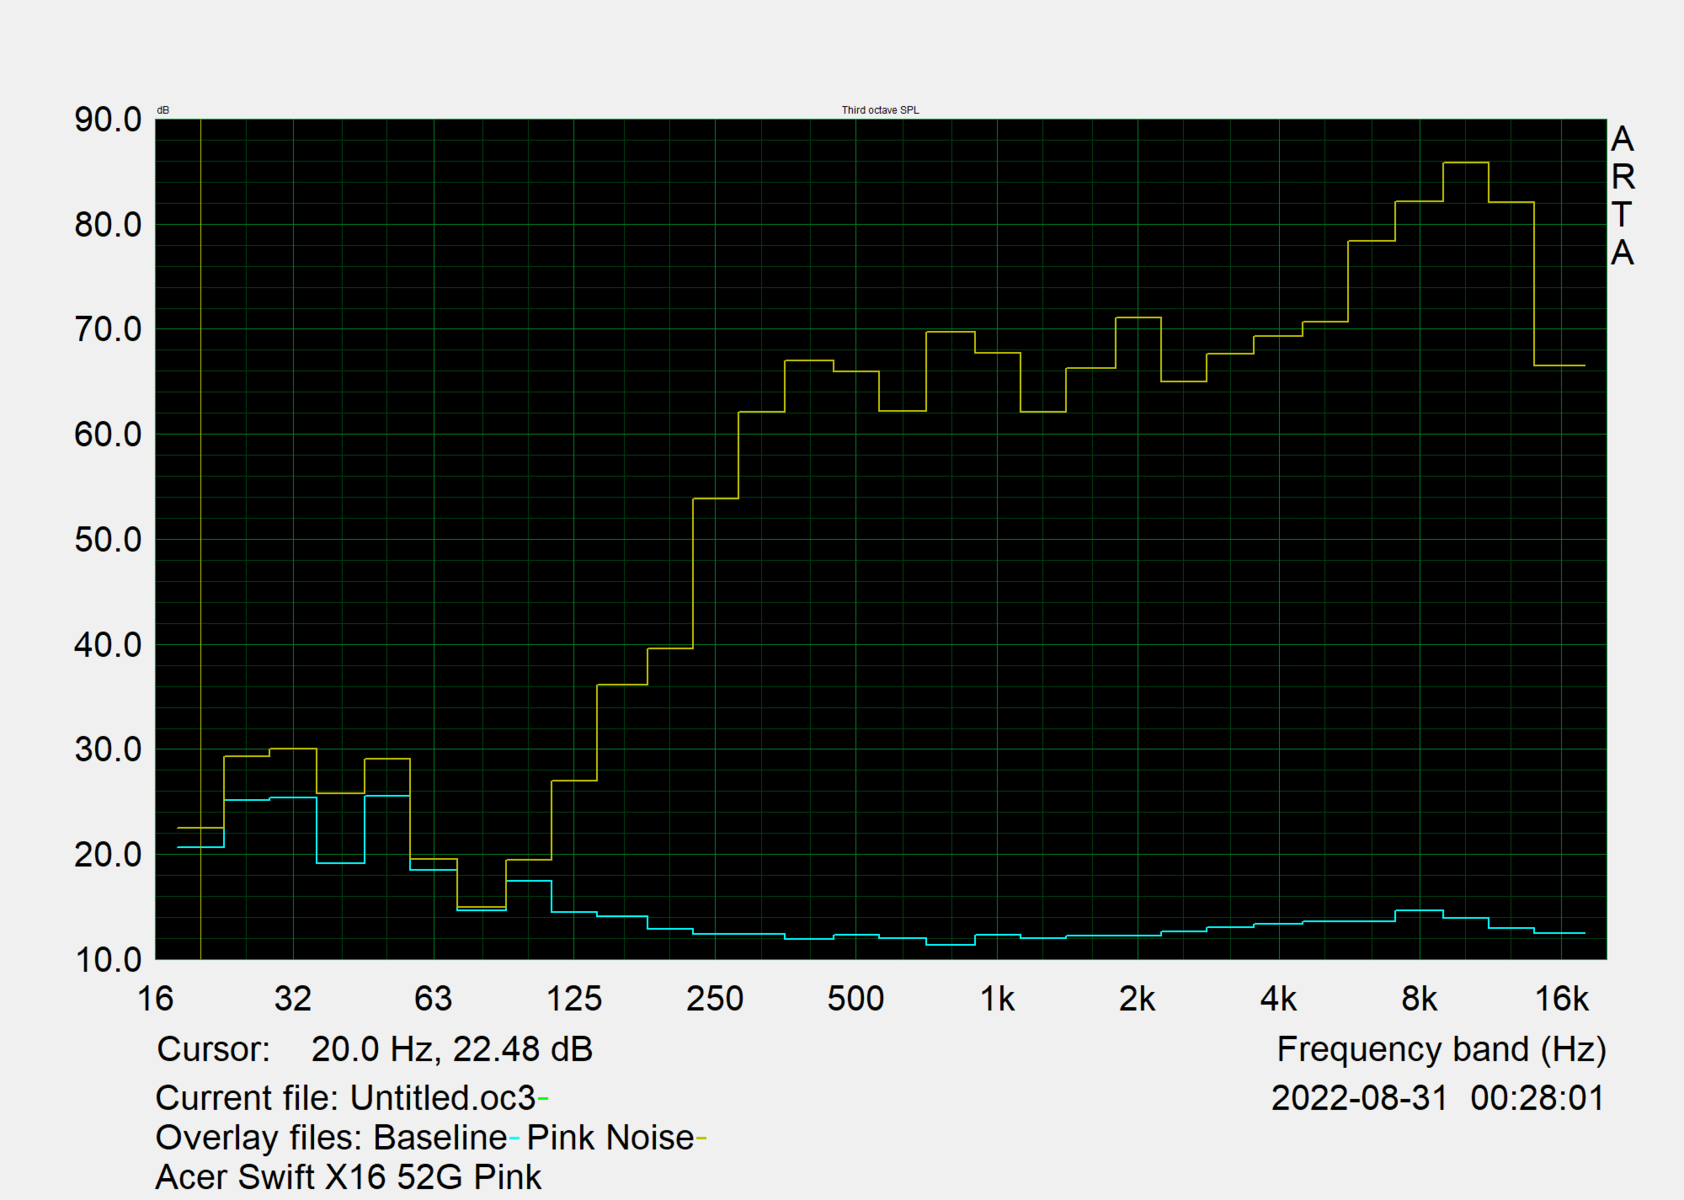
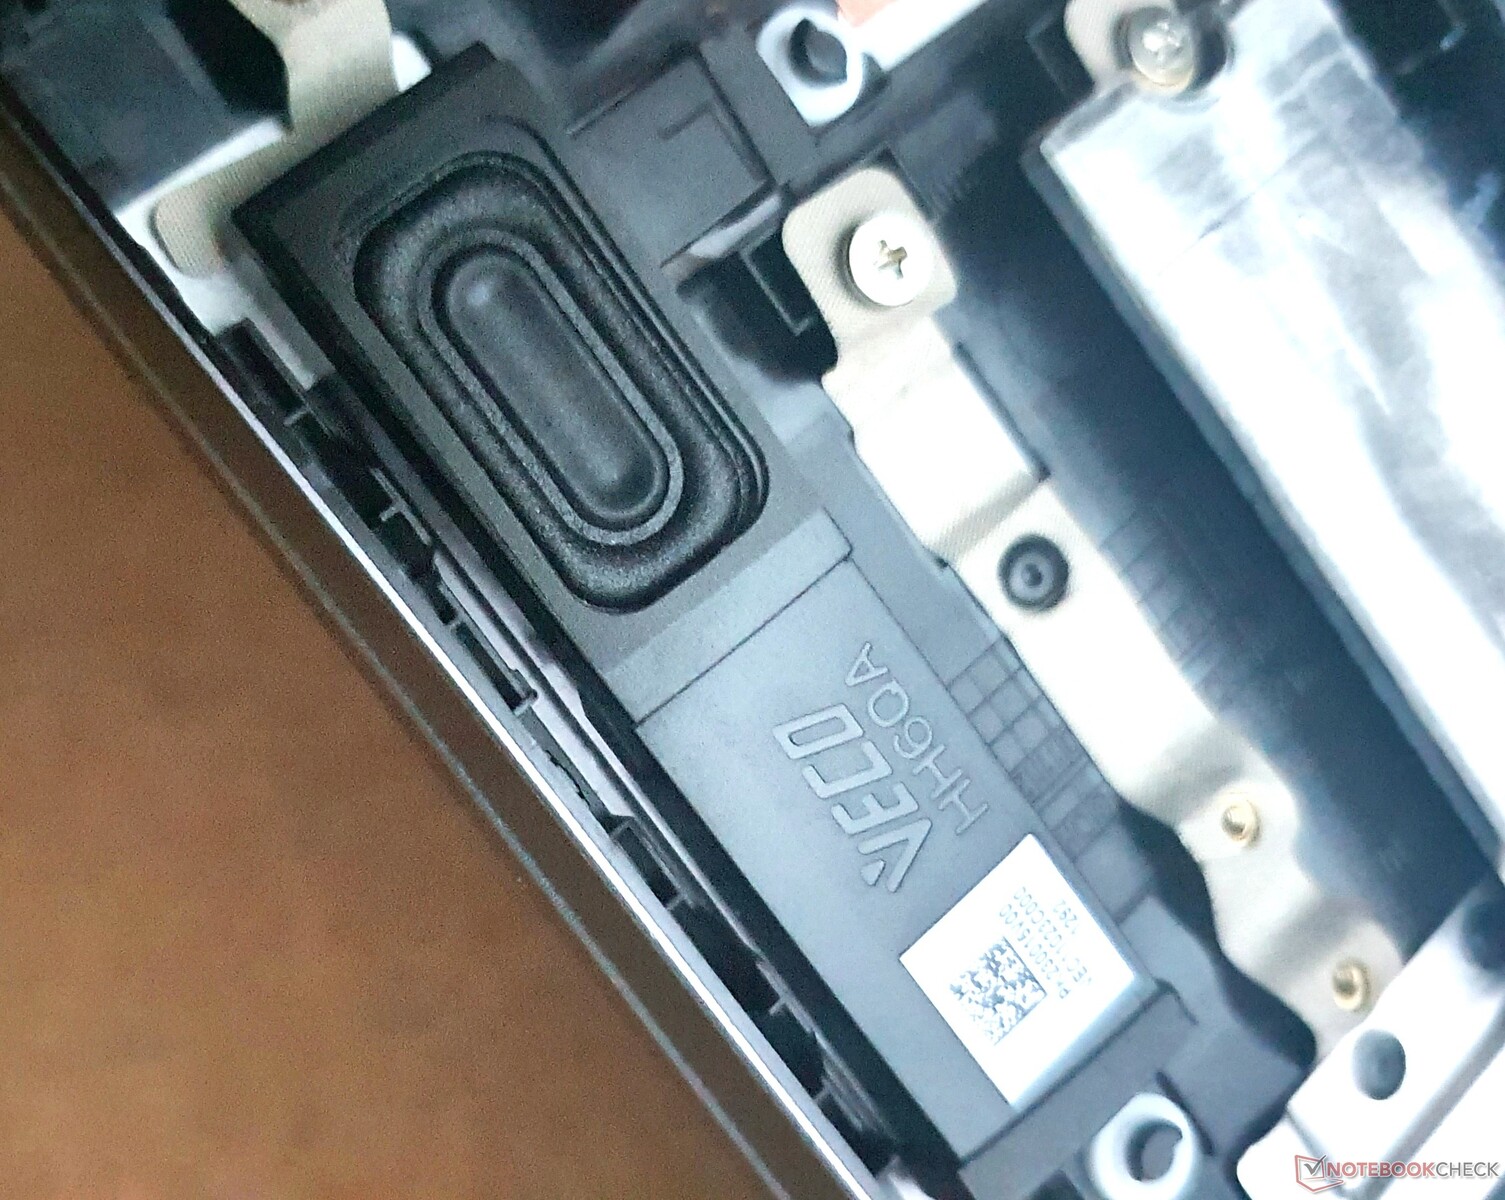
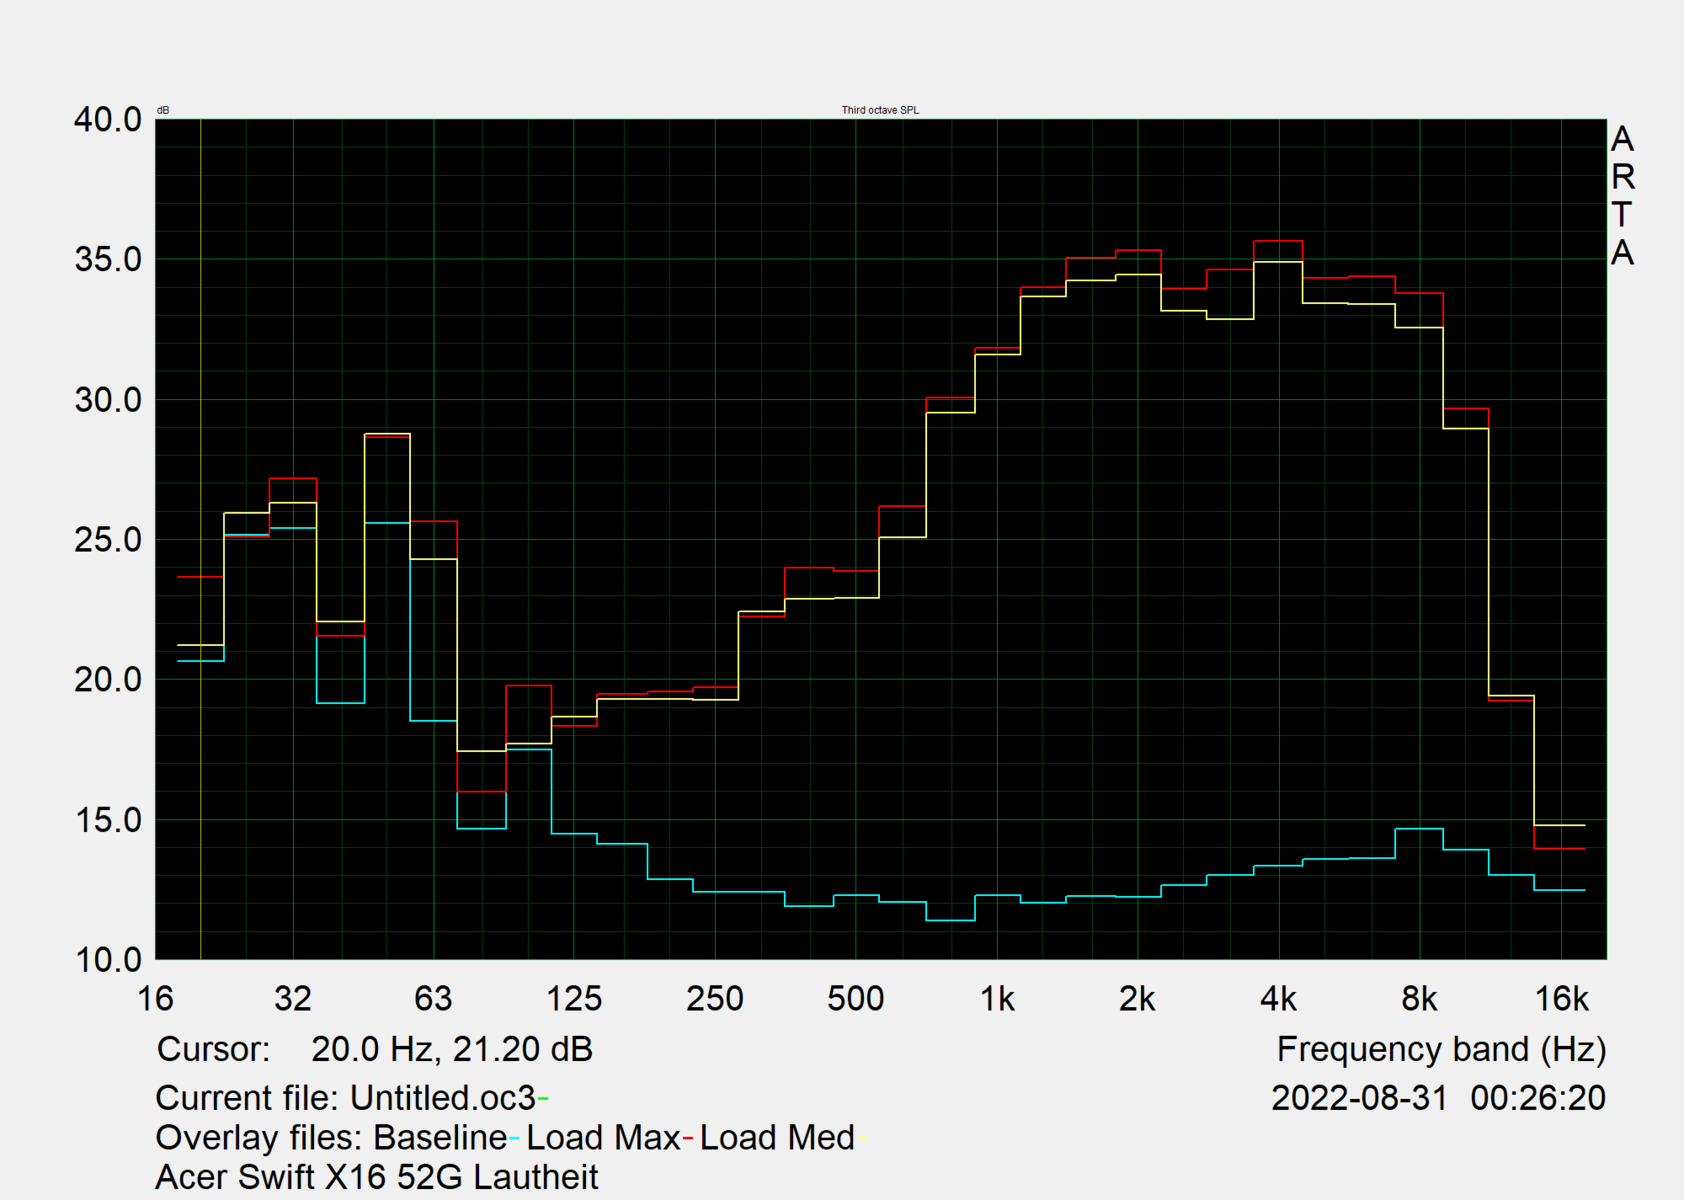
Il suono dei diffusori, che puntano verso l'alto, è povero di bassi e ha una qualità inferiore alla media. Tuttavia, con quasi 88 dB(A), riescono a riempire anche una stanza grande. Se avete bisogno di riprodurre solo le voci, sono sufficienti, ma se volete ascoltare la musica, dovrete utilizzare dispositivi audio esterni tramite la porta audio o il Bluetooth.
Acer Swift X SFX16-52G-77RX analisi audio
(+) | gli altoparlanti sono relativamente potenti (87.8 dB)
Bassi 100 - 315 Hz
(-) | quasi nessun basso - in media 26.8% inferiori alla media
(±) | la linearità dei bassi è media (14.6% delta rispetto alla precedente frequenza)
Medi 400 - 2000 Hz
(+) | medi bilanciati - solo only 2.4% rispetto alla media
(±) | linearità dei medi adeguata (7.9% delta rispetto alla precedente frequenza)
Alti 2 - 16 kHz
(±) | alti elevati - circa 8.1% superiori alla media
(±) | la linearità degli alti è media (7.1% delta rispetto alla precedente frequenza)
Nel complesso 100 - 16.000 Hz
(±) | la linearità complessiva del suono è media (20.6% di differenza rispetto alla media
Rispetto alla stessa classe
» 70% di tutti i dispositivi testati in questa classe è stato migliore, 8% simile, 22% peggiore
» Il migliore ha avuto un delta di 5%, medio di 17%, peggiore di 45%
Rispetto a tutti i dispositivi testati
» 55% di tutti i dispositivi testati in questa classe è stato migliore, 8% similare, 37% peggiore
» Il migliore ha avuto un delta di 4%, medio di 24%, peggiore di 134%
Lenovo ThinkBook 16 G4+ IAP analisi audio
(±) | potenza degli altiparlanti media ma buona (77.6 dB)
Bassi 100 - 315 Hz
(-) | quasi nessun basso - in media 17.3% inferiori alla media
(±) | la linearità dei bassi è media (10.3% delta rispetto alla precedente frequenza)
Medi 400 - 2000 Hz
(+) | medi bilanciati - solo only 4.6% rispetto alla media
(+) | medi lineari (4.6% delta rispetto alla precedente frequenza)
Alti 2 - 16 kHz
(+) | Alti bilanciati - appena 1.6% dalla media
(+) | alti lineari (6.2% delta rispetto alla precedente frequenza)
Nel complesso 100 - 16.000 Hz
(±) | la linearità complessiva del suono è media (15.7% di differenza rispetto alla media
Rispetto alla stessa classe
» 39% di tutti i dispositivi testati in questa classe è stato migliore, 5% simile, 56% peggiore
» Il migliore ha avuto un delta di 5%, medio di 17%, peggiore di 45%
Rispetto a tutti i dispositivi testati
» 24% di tutti i dispositivi testati in questa classe è stato migliore, 5% similare, 71% peggiore
» Il migliore ha avuto un delta di 4%, medio di 24%, peggiore di 134%
Gestione dell'energia: Ampia durata della batteria e basso consumo di Swift X
Consumo di energia
Durante le attività quotidiane, misuriamo circa 7,6 watt, che possono essere battuti solo da pochi dispositivi della classe multimediale, come l'IdeaPad 5 Pro IdeaPad 5 Pro 16.
Circa 70 watt durante il gioco e in altri scenari di carico sono gli stessi che il predecessore con la Nvidia RTX 3050 anche usato. Secondo il nostro database, i dispositivi con GPU RDNA 2 integrata di AMD sono ancora più efficienti, con circa 45 watt. D'altra parte, l'HP Envy 16 con laRTX 3060consuma circa il doppio dell'energia durante il gioco (133 watt).
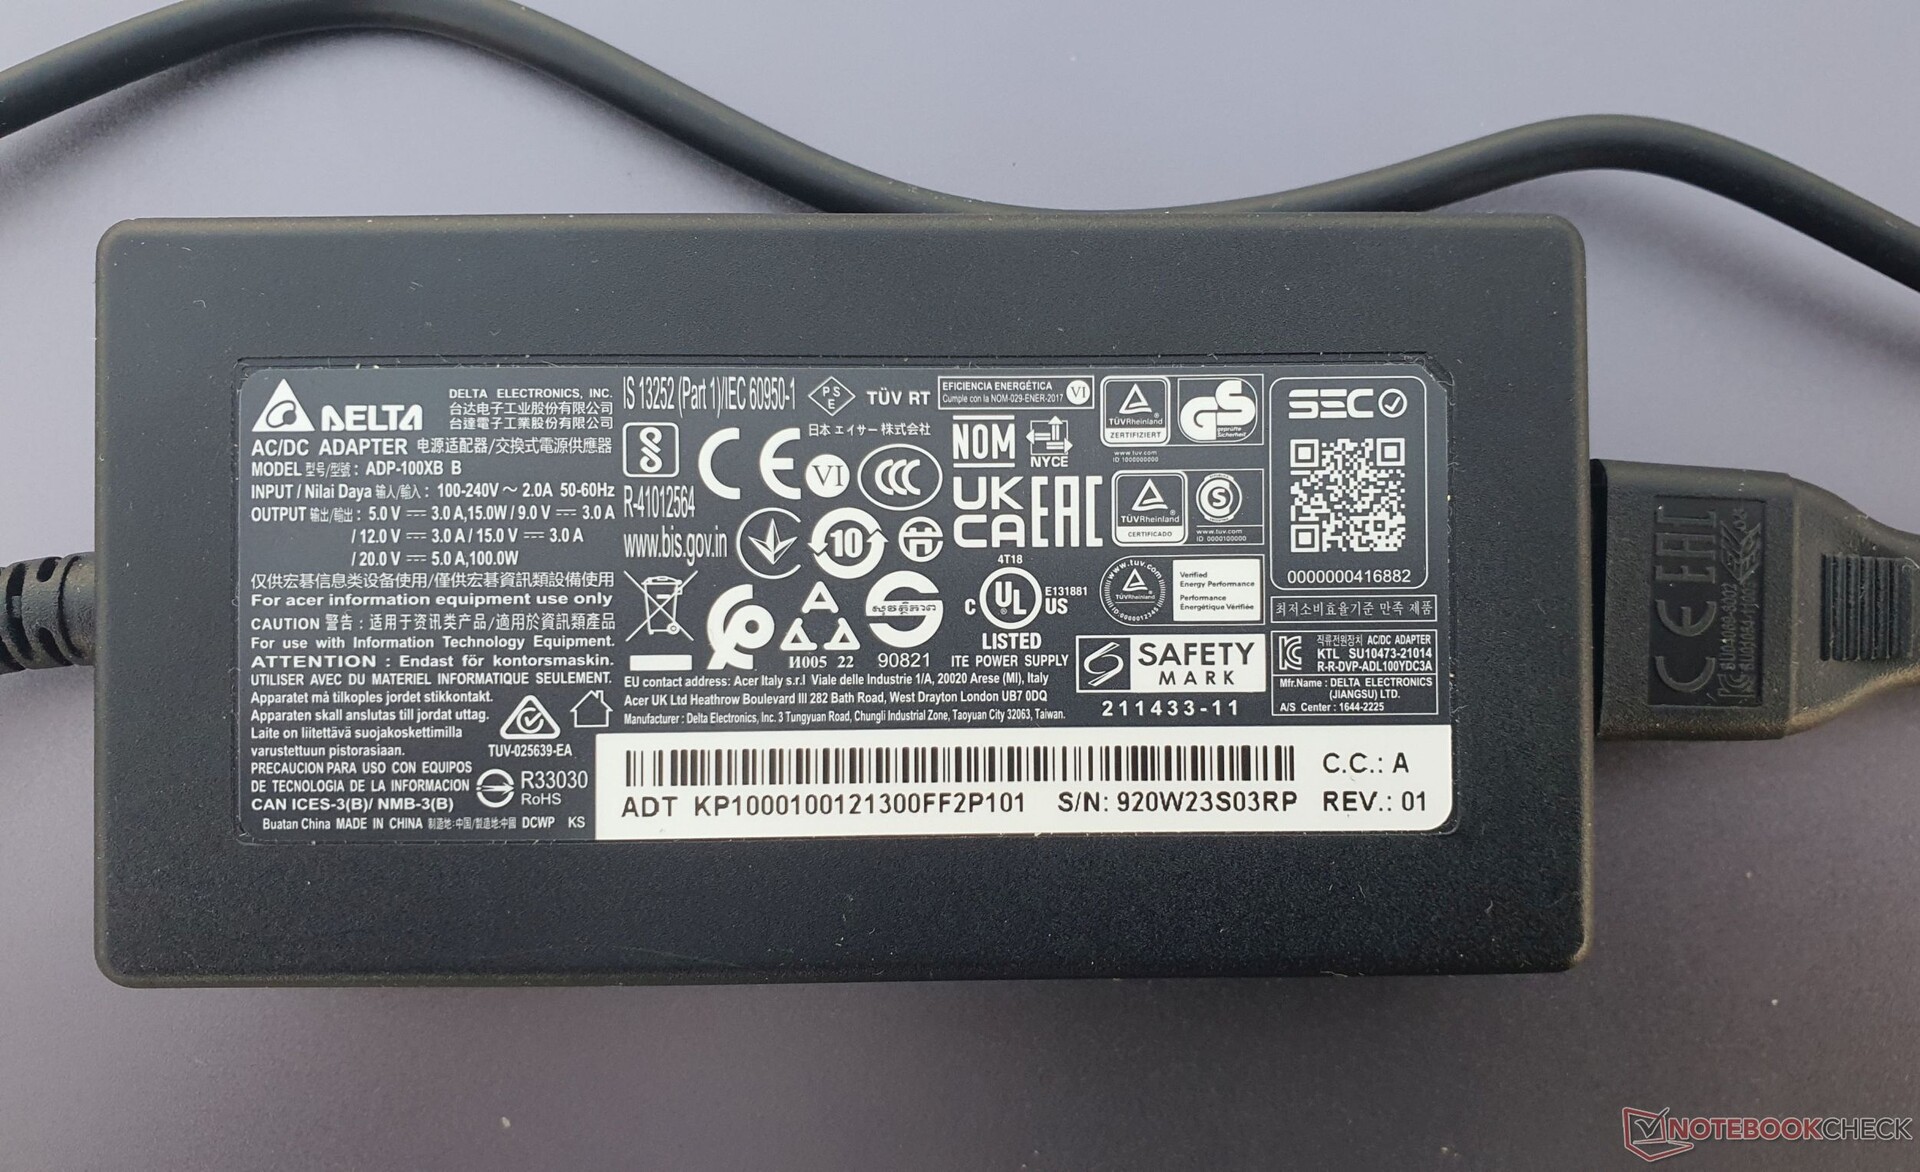
Il caricatore USB-C da 100 Watt è sufficiente, poiché i picchi di carico di poco superiori a 100 Watt si verificano solo durante lo scenario irrealistico del nostro stress test combinato, che non si verificherebbe realmente nel funzionamento quotidiano. Potrebbero verificarsi solo nel primo secondo, ad esempio in caso di carico puro della CPU o durante il gioco.
| Off / Standby | |
| Idle | |
| Sotto carico |
|
Leggenda:
min: | |
| Acer Swift X SFX16-52G-77RX i7-1260P, A370M, WDC PC SN810 1TB, IPS-LED, 2560x1600, 16" | Acer Swift X SFX16-52G-52VE i5-1240P, A370M, Micron 3400 MTFDKBA512TFH 512GB, , 2560x1600, 16" | Lenovo ThinkBook 16 G4+ IAP i7-12700H, GeForce RTX 2050 Mobile, Micron 2450 1TB MTFDKCD1T0TFK, IPS, 2560x1600, 16" | Dell Inspiron 16 Plus 7620 i7-12700H, GeForce RTX 3050 Ti Laptop GPU, Kioxia BG5 KBG50ZNS512G, IPS, 3072x1920, 16" | HP Envy 16 h0112nr i7-12700H, GeForce RTX 3060 Laptop GPU, Micron 3400 1TB MTFDKBA1T0TFH, OLED, 3840x2400, 16" | Asus Vivobook Pro 16X-M7600QE R9 5900HX, GeForce RTX 3050 Ti Laptop GPU, SK Hynix HFM001TD3JX013N, OLED, 3840x2400, 16.1" | Media della classe Multimedia | |
|---|---|---|---|---|---|---|---|
| Power Consumption | -9% | -22% | -54% | -103% | -50% | -19% | |
| Idle Minimum * (Watt) | 3.7 | 5.7 -54% | 5 -35% | 6.8 -84% | 10 -170% | 8.2 -122% | 5.71 ? -54% |
| Idle Average * (Watt) | 7.6 | 8 -5% | 11.2 -47% | 9.6 -26% | 10.9 -43% | 16.2 -113% | 10.1 ? -33% |
| Idle Maximum * (Watt) | 11.1 | 10.4 6% | 11.6 -5% | 17 -53% | 27.8 -150% | 19.7 -77% | 12.4 ? -12% |
| Load Average * (Watt) | 70 | 74 -6% | 89.3 -28% | 117.5 -68% | 116.4 -66% | 65.8 6% | 65 ? 7% |
| Witcher 3 ultra * (Watt) | 68.8 | 65 6% | 83 -21% | 113.1 -64% | 133.7 -94% | 65.6 5% | |
| Load Maximum * (Watt) | 108 | 108.5 -0% | 102 6% | 137.4 -27% | 209.8 -94% | 104 4% | 112.2 ? -4% |
* ... Meglio usare valori piccoli
Power Consumption The Witcher 3 / Stress Test
Power Consumption With External Monitor
Durata della batteria
Nel nostro test WLAN con la luminosità impostata a 150 nits e in modalità Normale di Acer, lo Swift X 16 dura 9 ore. Si tratta di un'ora in più rispetto al predecessore e di 40 minuti in meno rispetto al modello fratello, anche se questo è stato testato in modalità di risparmio energetico
Nel complesso, i valori rientrano nella media di questa categoria. Tuttavia, l'Asus Vivobook Pro 16Xdura più di 11 ore, mentre il modello Dell Inspiron 16 Pluse il Lenovo IdeaPad 5 Pro 16raggiungono valori simili a quelli dello Swift X.
| Acer Swift X SFX16-52G-77RX i7-1260P, A370M, 56 Wh | Acer Swift X SFX16-52G-52VE i5-1240P, A370M, 56 Wh | Acer Swift X SFX16-51G-5388 i5-11320H, GeForce RTX 3050 4GB Laptop GPU, 58.7 Wh | Lenovo ThinkBook 16 G4+ IAP i7-12700H, GeForce RTX 2050 Mobile, 71 Wh | Dell Inspiron 16 Plus 7620 i7-12700H, GeForce RTX 3050 Ti Laptop GPU, 86 Wh | HP Envy 16 h0112nr i7-12700H, GeForce RTX 3060 Laptop GPU, 83 Wh | Lenovo IdeaPad 5 Pro 16ARH7 R5 6600HS, Radeon 660M, 75 Wh | Asus Vivobook Pro 16X-M7600QE R9 5900HX, GeForce RTX 3050 Ti Laptop GPU, 96 Wh | Media della classe Multimedia | |
|---|---|---|---|---|---|---|---|---|---|
| Autonomia della batteria | -6% | 2% | 16% | 7% | 16% | 8% | 12% | 47% | |
| H.264 (h) | 10.4 | 9.8 -6% | 8.4 -19% | 12.6 21% | 16.4 ? 58% | ||||
| WiFi v1.3 (h) | 9.1 | 9.7 7% | 8.1 -11% | 8.2 -10% | 9.6 5% | 7.9 -13% | 9.8 8% | 11.3 24% | 12 ? 32% |
| Load (h) | 1.1 | 0.9 -18% | 1.5 36% | 1.5 36% | 1.2 9% | 1.6 45% | 1.1 0% | 1.675 ? 52% |
Pro
Contro
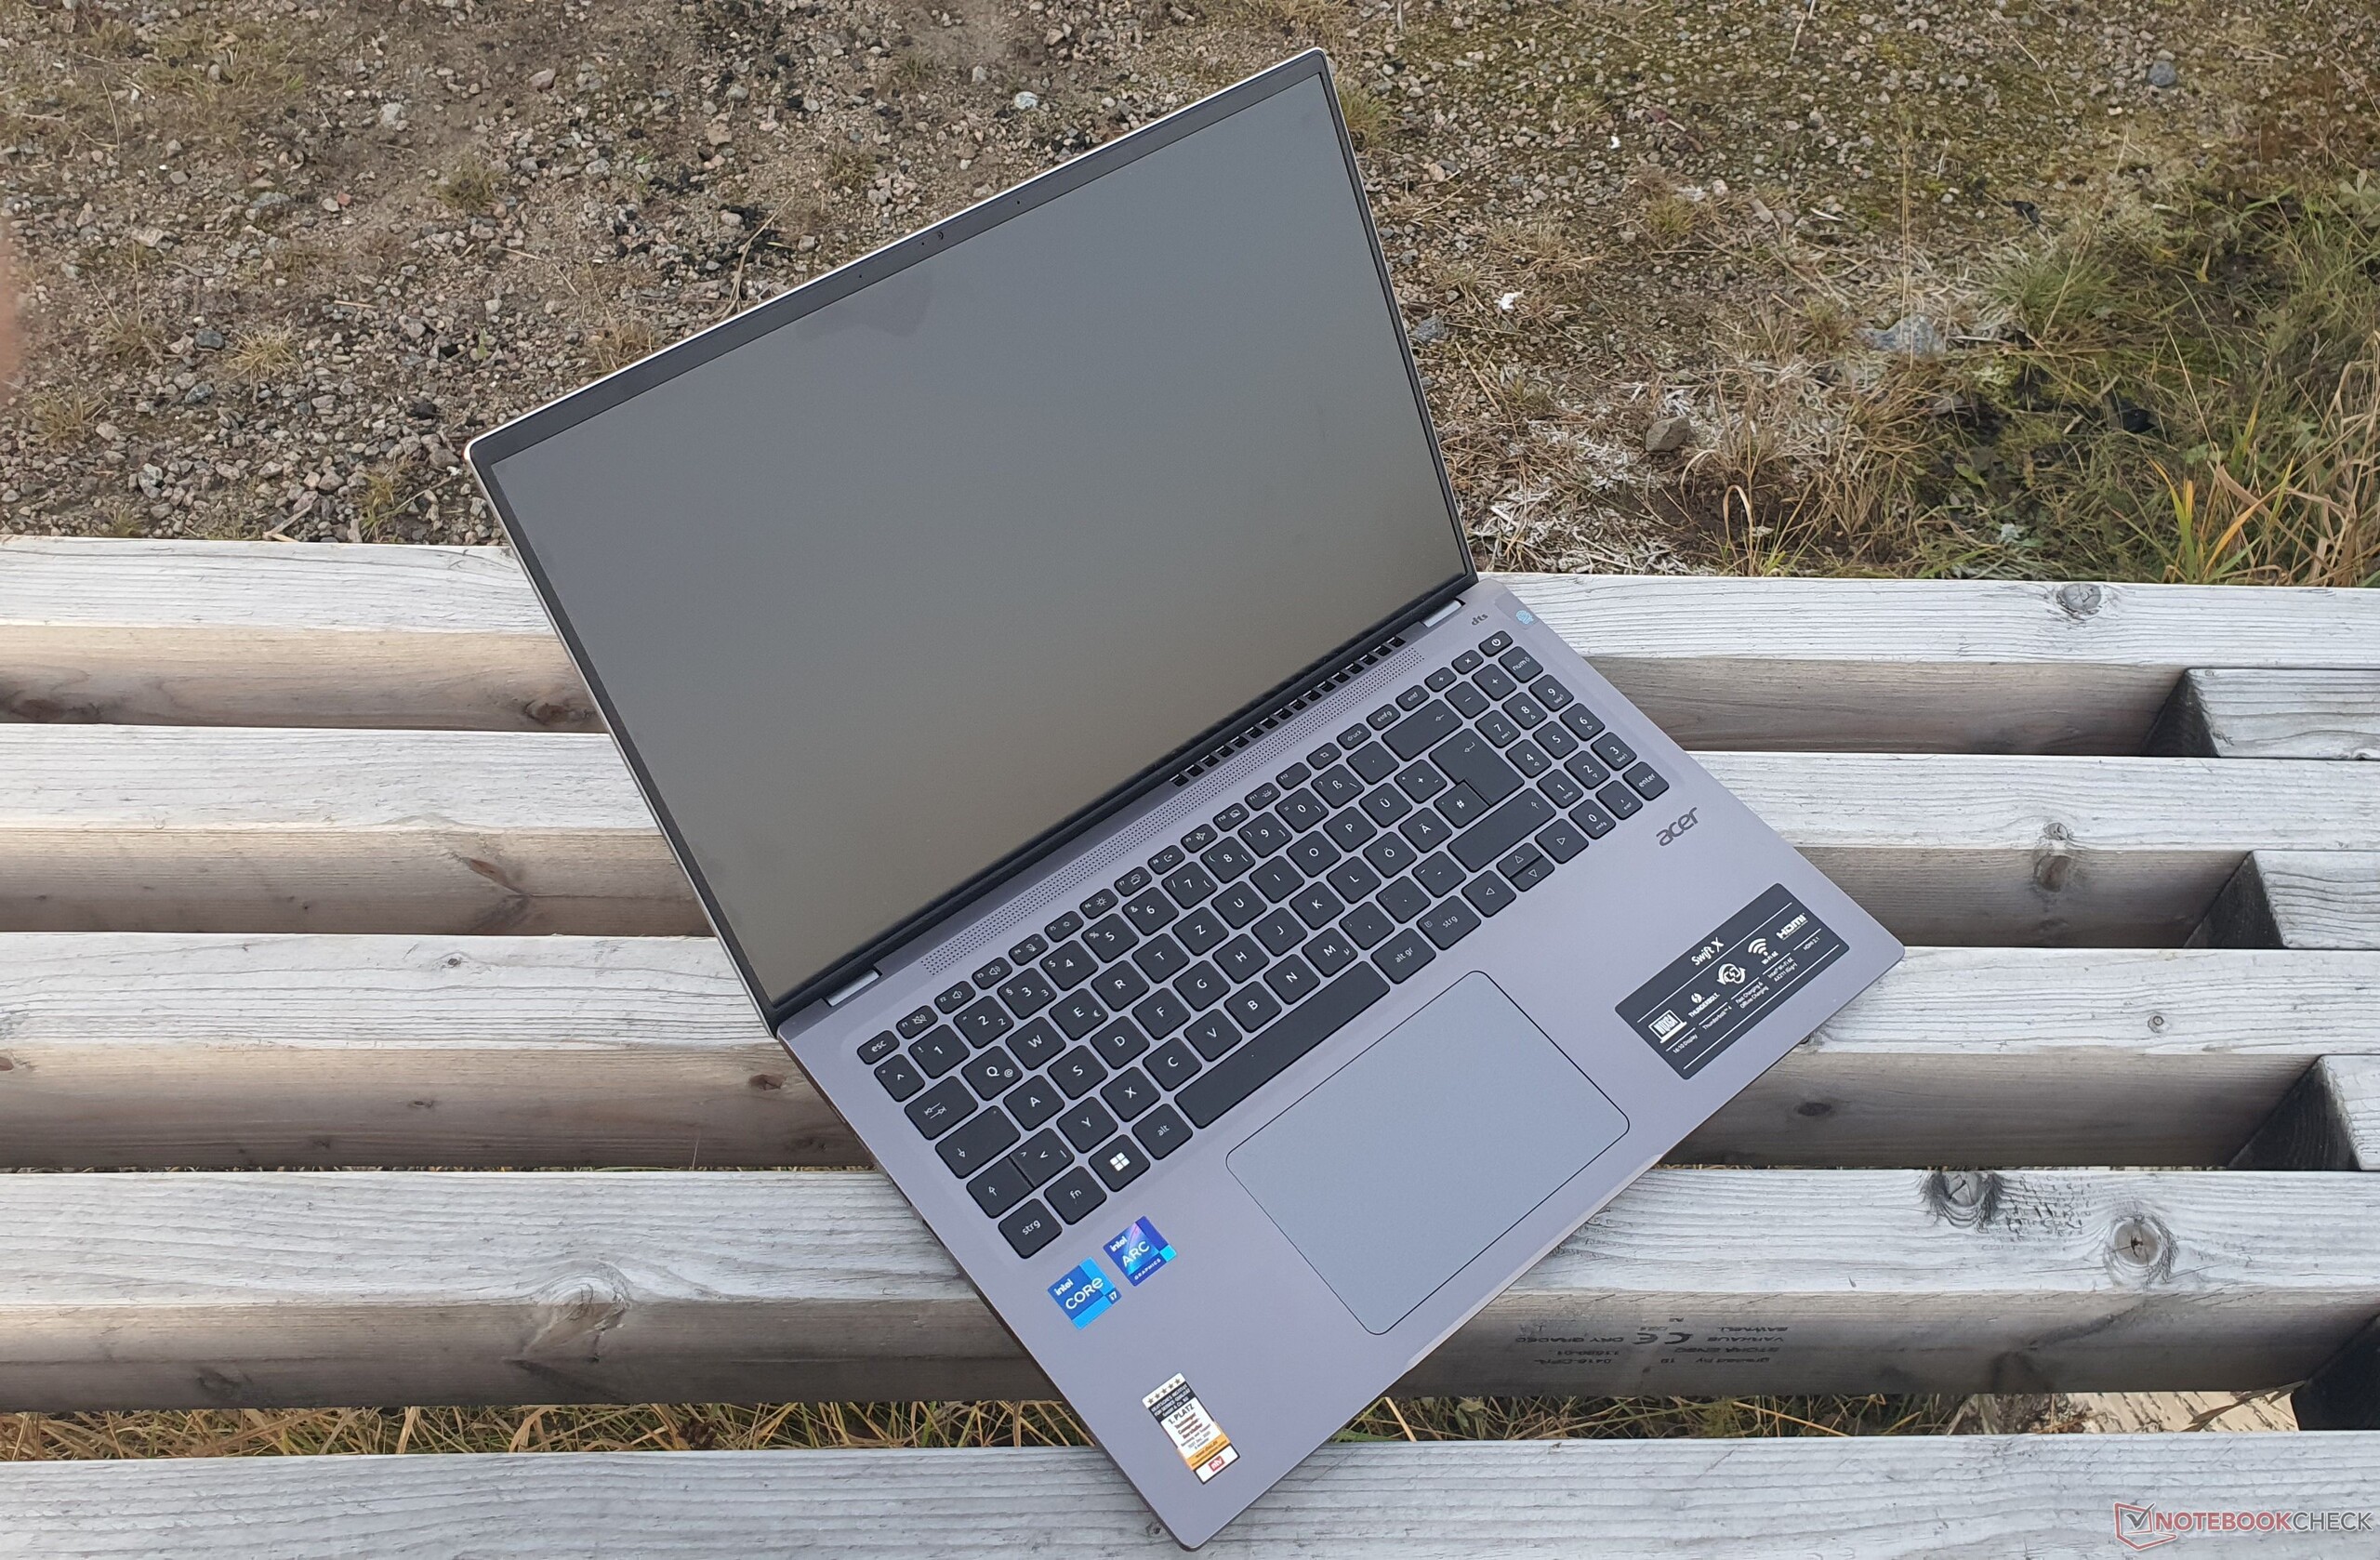
Verdetto: Nonostante i notevoli miglioramenti, l'Acer Swift X 16 non è ancora all'altezza della situazione
L'Acer Swift X 16 (2022) è un portatile compatto da 16 pollici che pesa solo 1,75 kg (~3,96 lb). Molte aree problematiche del predecessore sono state fortunatamente risolte. Il display è ora significativamente più luminoso con 380 nits, offre un'alta risoluzione di 2.560 x 1.600 pixel e ci piace anche il formato 16:10.
Sfortunatamente, la GPU Arc di Intel non è progettata per il lavoro in 3D e non è all'altezza di GeForce.RTX 3050 Tidel DellInspiron 16 Pluse AsusVivoBook Pro 16Xdurante il gioco. D'altra parte, il sistema offre prestazioni elevate grazie alla CPU Alder Lake P di Intel. Inoltre, l'unità SSD PCIe 4.0 integrata è una delle più veloci, anche se soffre di un forte throttling termico. Ma almeno è possibile installare una seconda unità SSD M.2 full-size.
Altri punti positivi sono l'aggiornamento a HDMI 2.1 e la webcam a 1080p, mentre il case continua a essere realizzato in metallo robusto e la tastiera è adatta anche a chi scrive spesso. Tuttavia, il touchpad scivoloso è notevolmente peggiorato.
Nonostante alcuni significativi miglioramenti nel display e nelle prestazioni del sistema, considerando la diminuzione delle prestazioni grafiche dovute all'Intel Arc e le elevate emissioni, il prezzo di 1500 Euro (~$1482) è semplicemente troppo alto
Il comportamento della ventola e le prestazioni di raffreddamento non sono molto impressionanti, gli altoparlanti continuano ad essere pessimi e non è disponibile una versione AMD con una iGPU efficiente. Nel complesso, quindi, non vediamo una giustificazione per il prezzo elevato di 1500 Euro (~$1482). Ma almeno a parità di prestazioni, la versione Core i5 con SSD da 512 GB costa 200 euro (~$198) in meno.
D'altra parte, a costi ancora più bassi, i concorrenti offrono prestazioni superiori sotto molti punti di vista, come ad esempio il ThinkBook 16 G4+ di Lenovo per 1200 Euro (~$1186) o l' IdeaPad 5 Pro 16 a 1000 euro (~$988) L'Envy 16 di HPoffre un mix di multimedia, business e gaming e offre prestazioni nettamente superiori a 1700 euro (~$1680)
Prezzo e disponibilità
Un modello statunitense dell'Acer Swift X, l'SFX16-52G-73U6 con un SSD da 512 GB, 16 GB di RAM, un display da 1920 x 1200 pixel e un Intel Core i7-1260P, può essere ordinato a 1250 dollari direttamente dal negozio online di Acere su Amazon questo modello è attualmente in vendita al prezzo di $1049.
Acer Swift X SFX16-52G-77RX
- 10/25/2022 v7 (old)
Marvin Gollor
Price comparison

