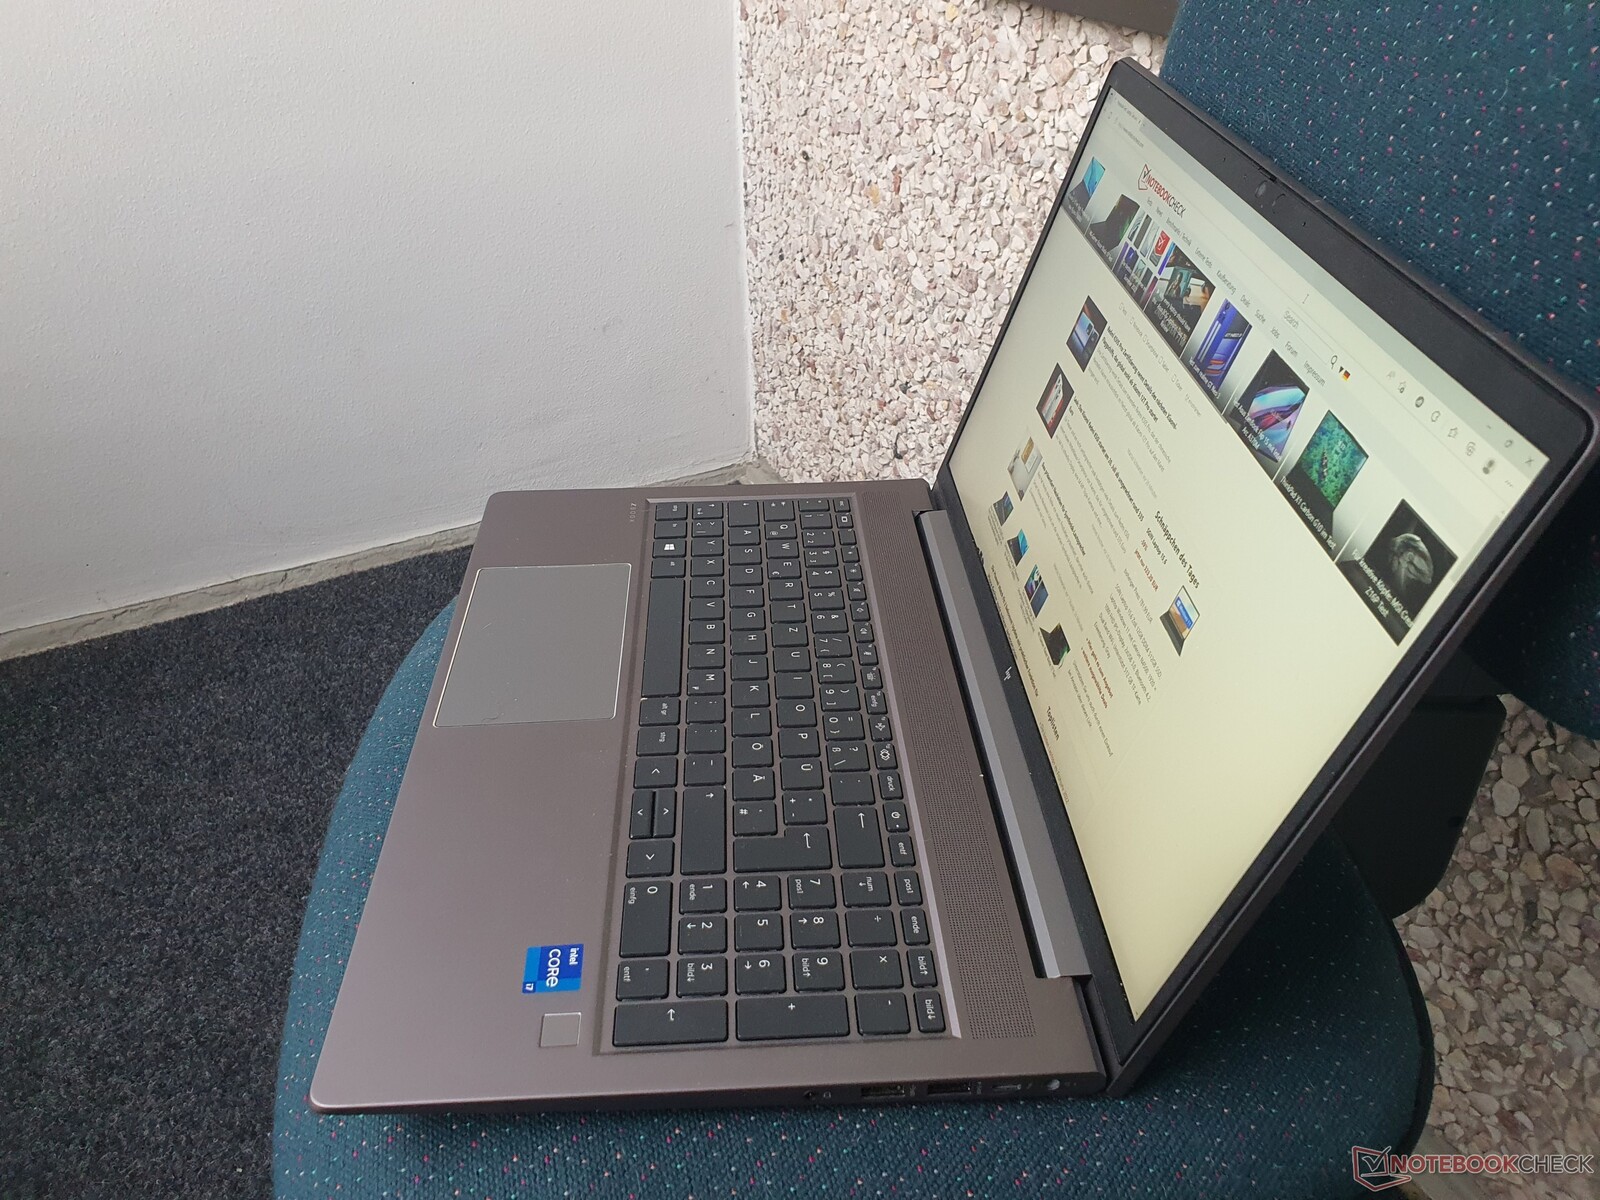
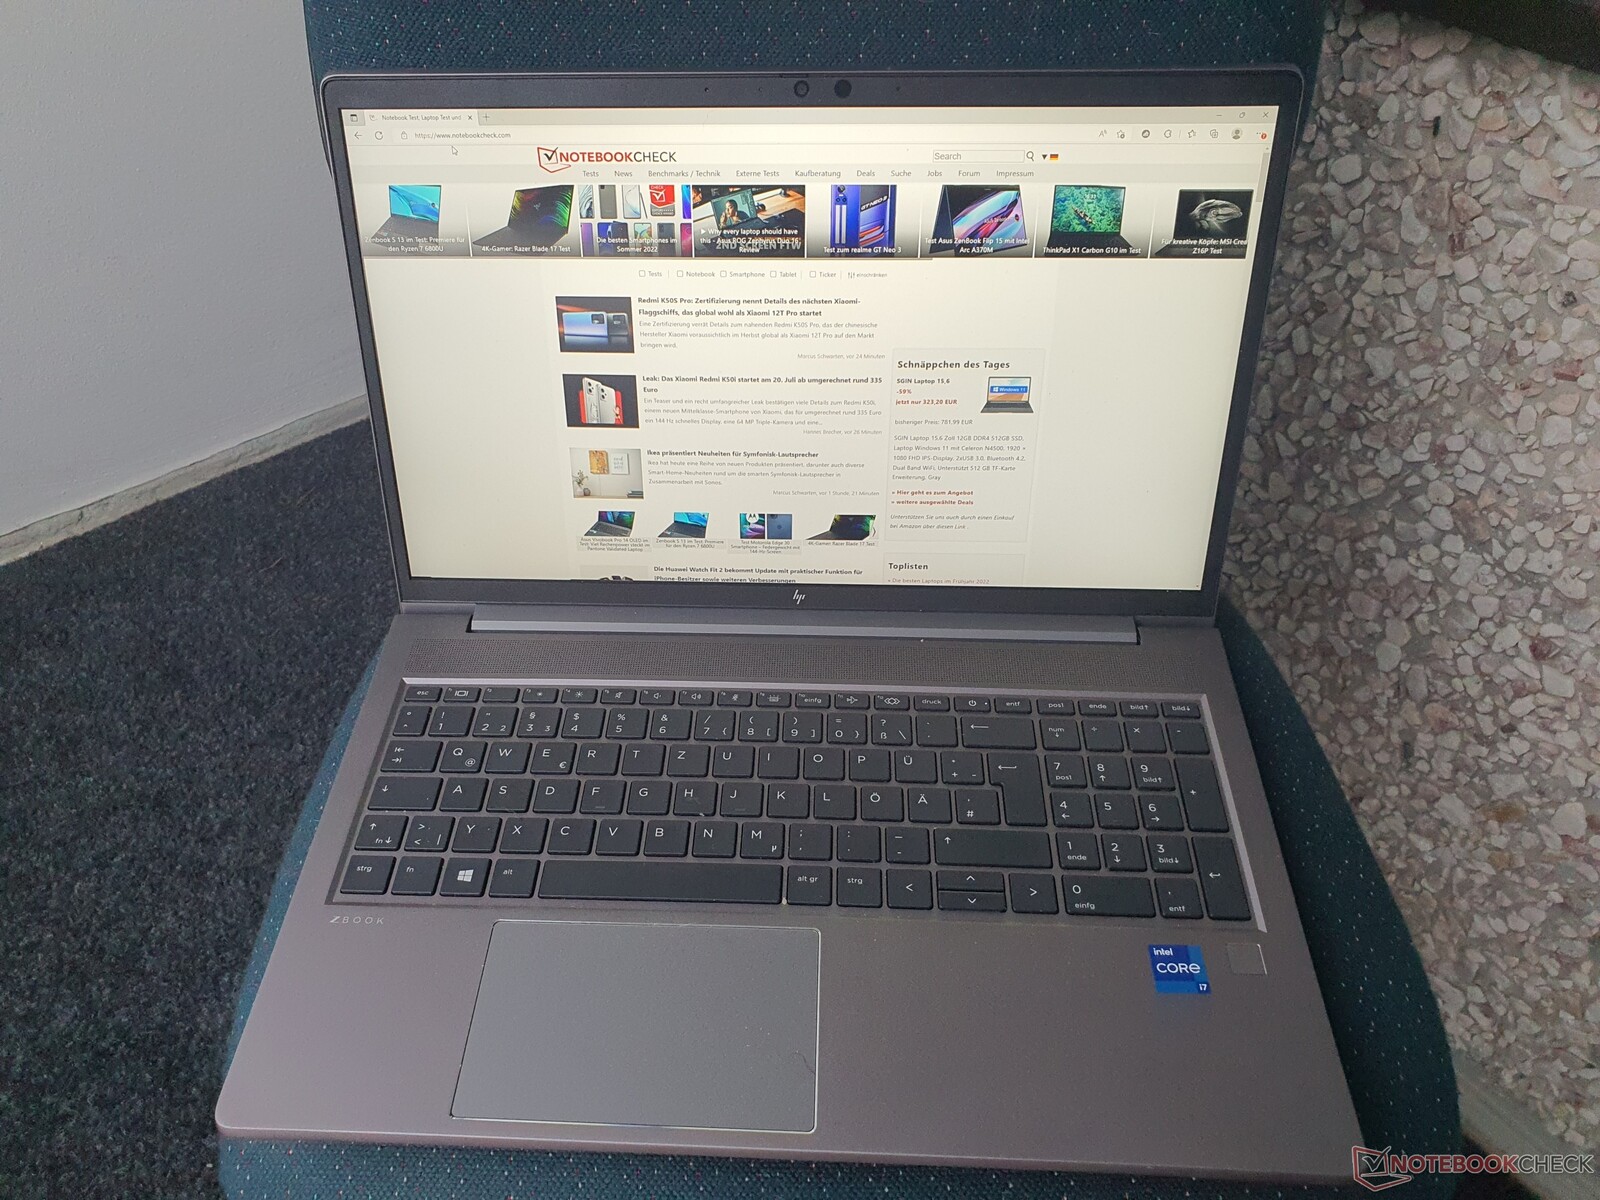
Recensione del portatile HP ZBook Power 15 G8: una economica workstation di alto livello
Come workstation economica, l'HP ZBook Power 15 G8 porta aggiornamenti per CPU e GPU nella generazione attuale, con la configurazione massima che offre un Intel Tiger Lake Core i9-11950He Nvidia RTX A2000. Oltre a un display 4K, sono disponibili anche CPU vPRO, ma purtroppo i processori Xeon e con essi anche la RAM ECC non saranno disponibili quest'anno. Ma il dispositivo offre comunque molte caratteristiche di una workstation di fascia alta.
Per circa 1600 Euro (~$1630), la nostra configurazione è dotata di processori Intel Core i7-11800H, Nvidia T600 come GPU professionale e un display FHD. Come concorrenti diretti nel segmento delle workstation entry-level, abbiamo il Lenovo ThinkPad P15v G2e Precision 3551 di Dell. Il nostro test mostrerà se lo ZBook Power 15 G8, con i suoi componenti abbastanza potenti, offre anche un buon rapporto qualità-prezzo.
Potenziali concorrenti a confronto
Punteggio | Data | Modello | Peso | Altezza | Dimensione | Risoluzione | Prezzo |
|---|---|---|---|---|---|---|---|
| 87.7 % v7 (old) | 07/2022 | HP ZBook Power 15 G8 313S5EA i7-11800H, T600 Laptop GPU | 2 kg | 22.8 mm | 15.60" | 1920x1080 | |
| 90.3 % v7 (old) | 10/2021 | HP ZBook Fury 15 G8 i9-11950H, RTX A5000 Laptop GPU | 2.5 kg | 25.9 mm | 15.60" | 3840x2160 | |
| 87.8 % v7 (old) | 08/2021 | HP ZBook Studio 15 G8 i9-11950H, GeForce RTX 3070 Laptop GPU | 1.9 kg | 18 mm | 15.60" | 3840x2160 | |
| 83.8 % v7 (old) | 04/2021 | HP ZBook Firefly 15 G8 2C9R7EA i7-1165G7, T500 Laptop GPU | 1.8 kg | 19.2 mm | 15.60" | 1920x1080 | |
| 86.2 % v7 (old) | 06/2022 | Lenovo ThinkPad P15v G2 21A9000XGE i7-11800H, T1200 Laptop GPU | 2.3 kg | 22.7 mm | 15.60" | 1920x1080 | |
| 81.2 % v7 (old) | 10/2020 | Dell Precision 3000 3551 i9-10885H, Quadro P620 | 2.2 kg | 24.92 mm | 15.60" | 1920x1080 |
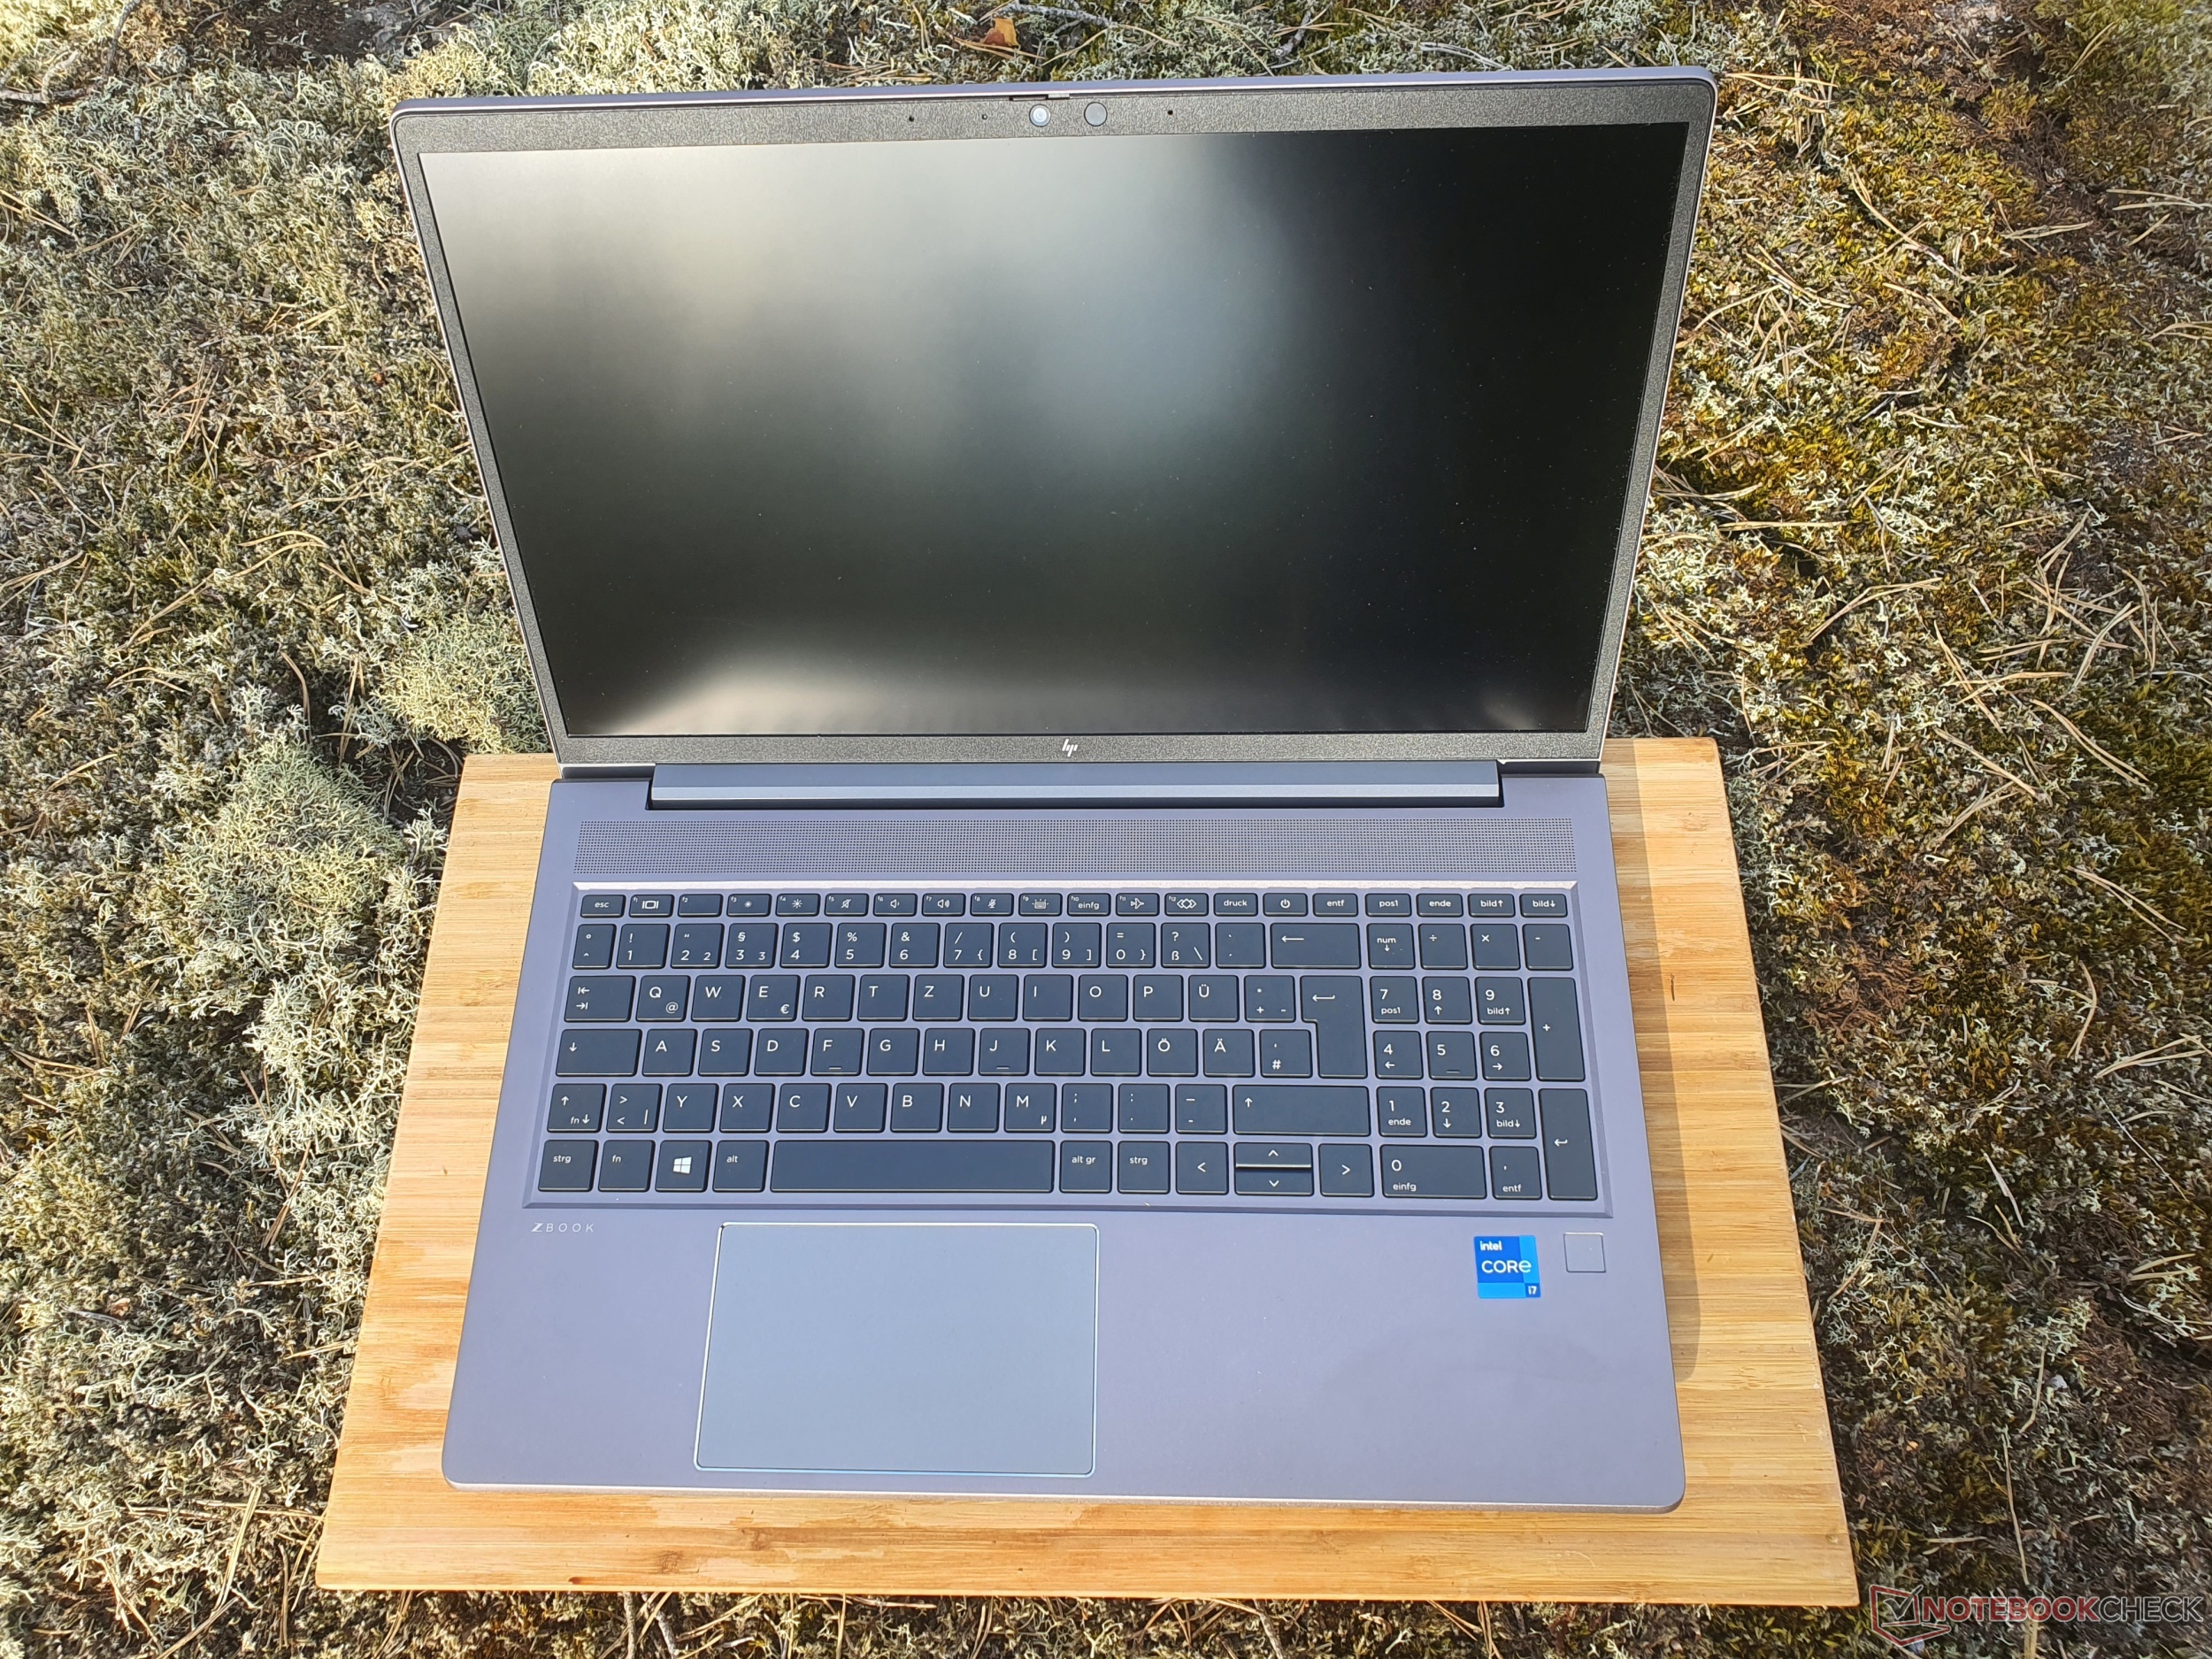
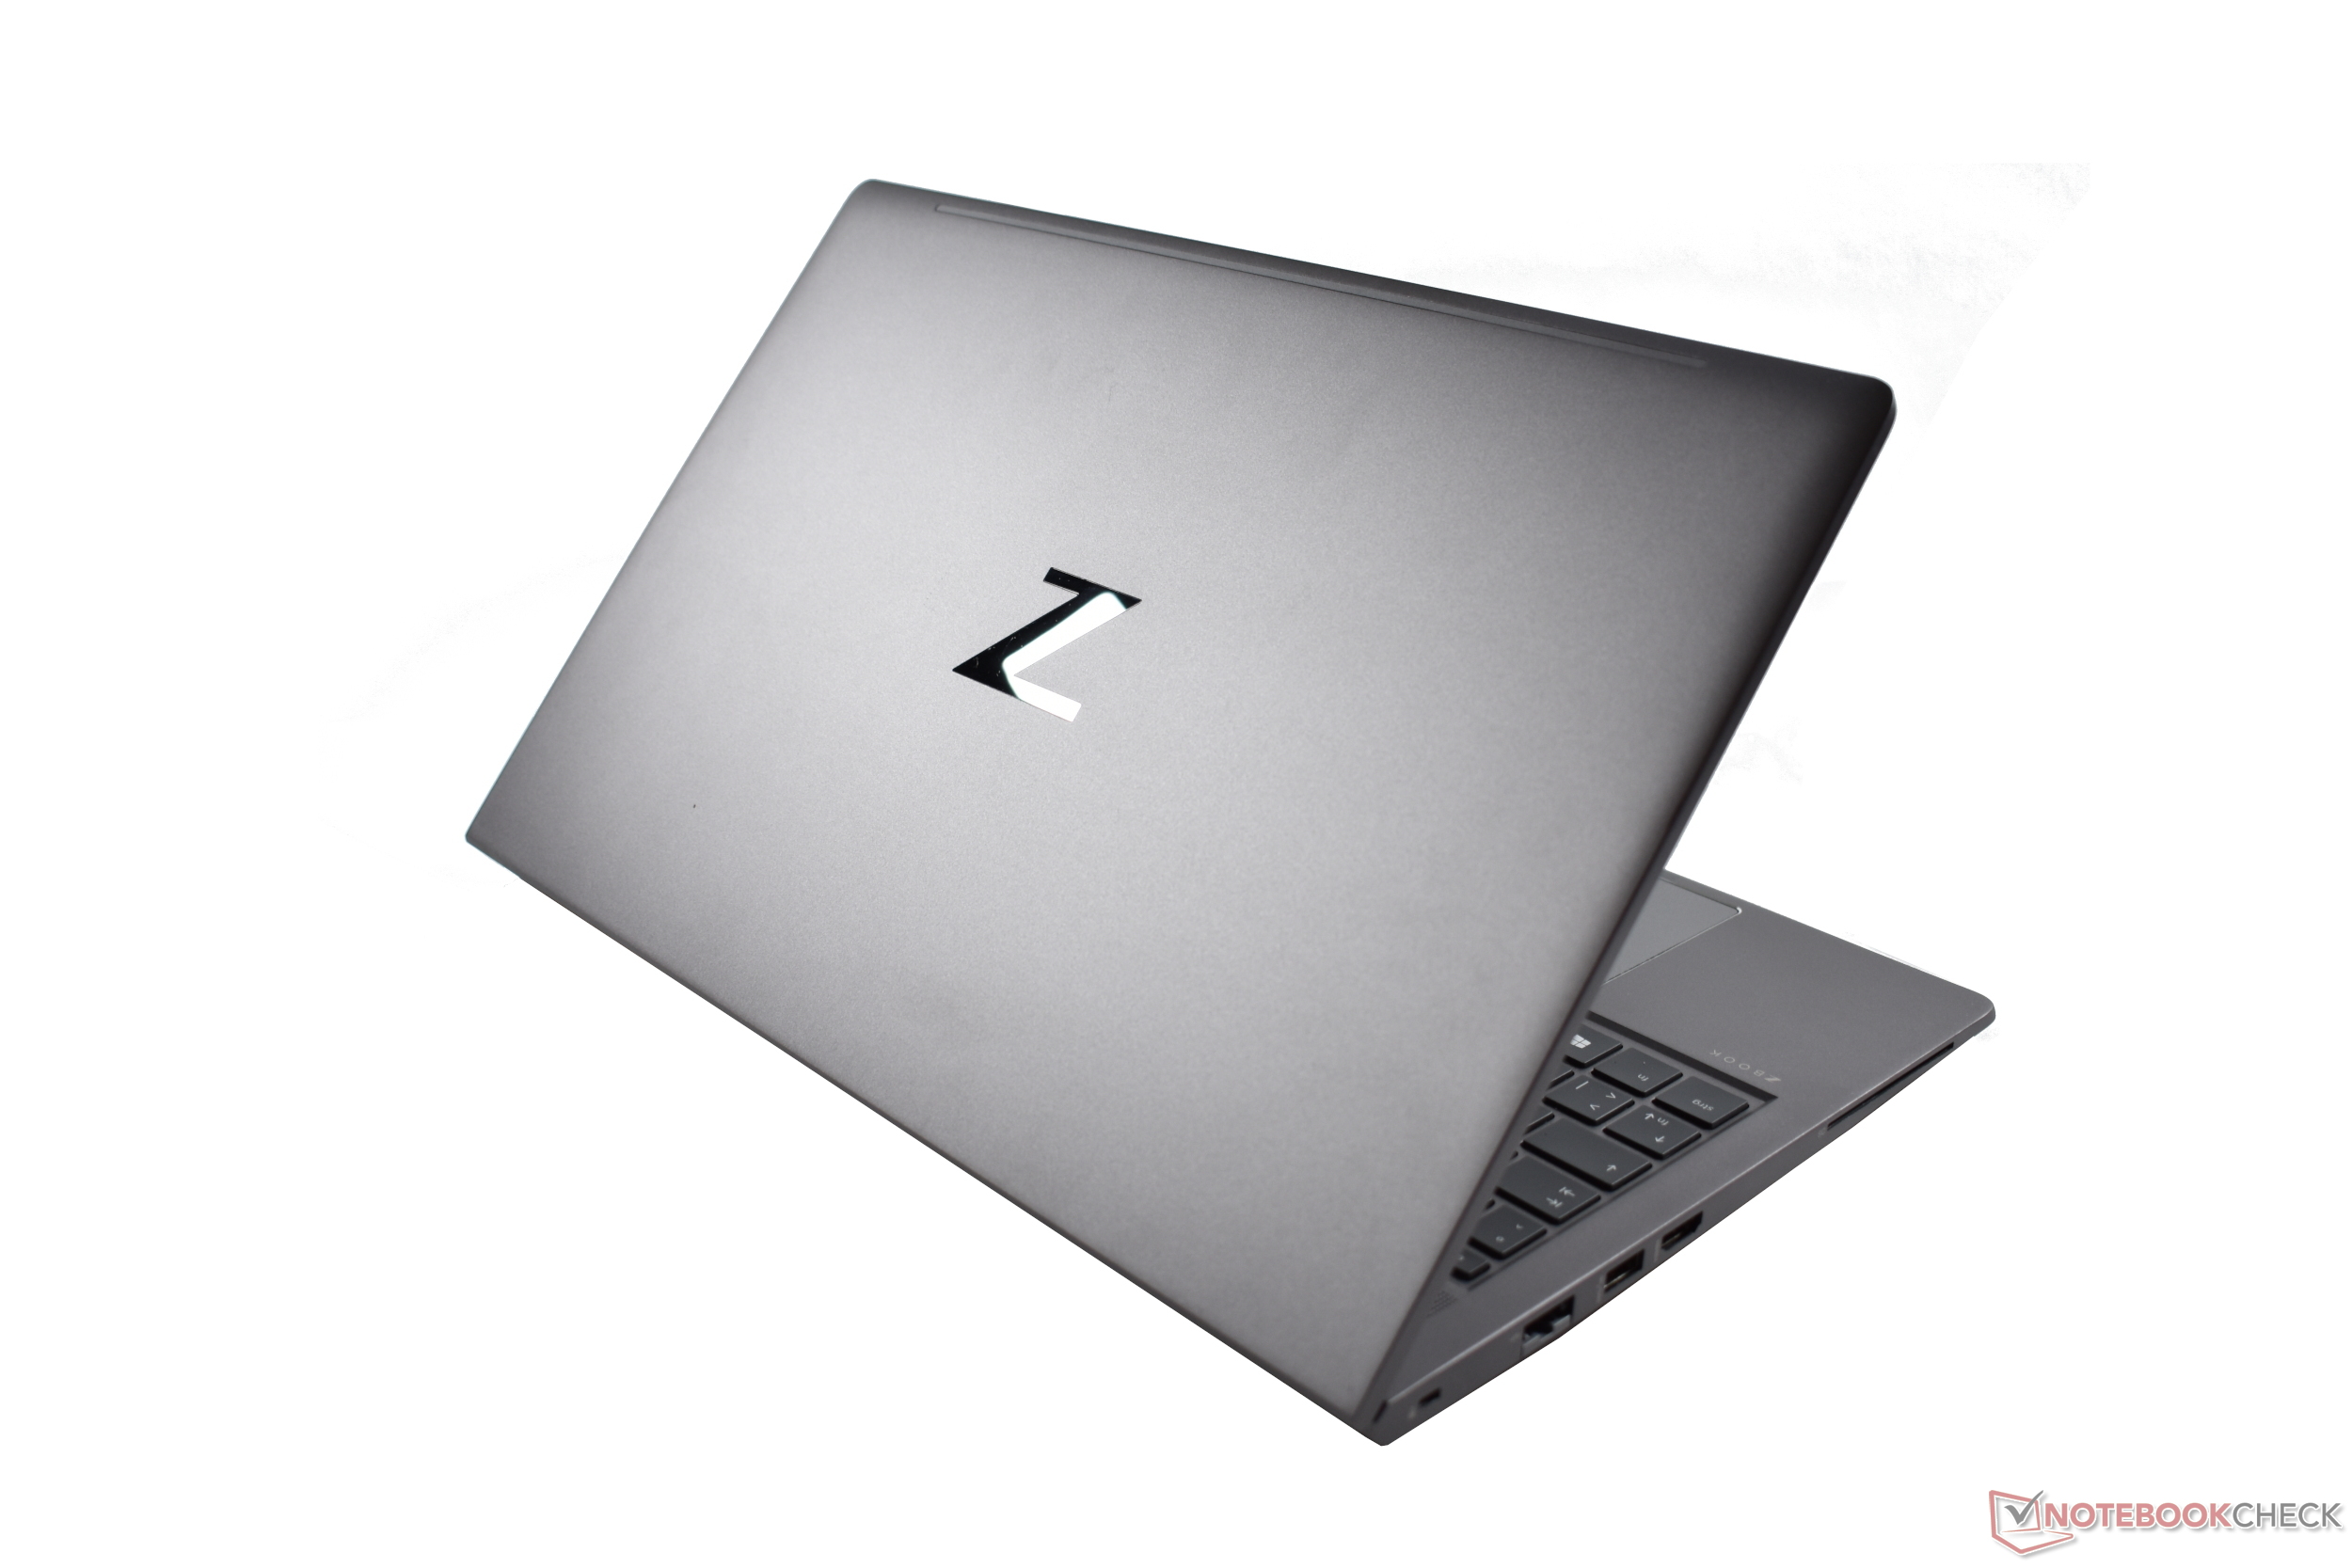
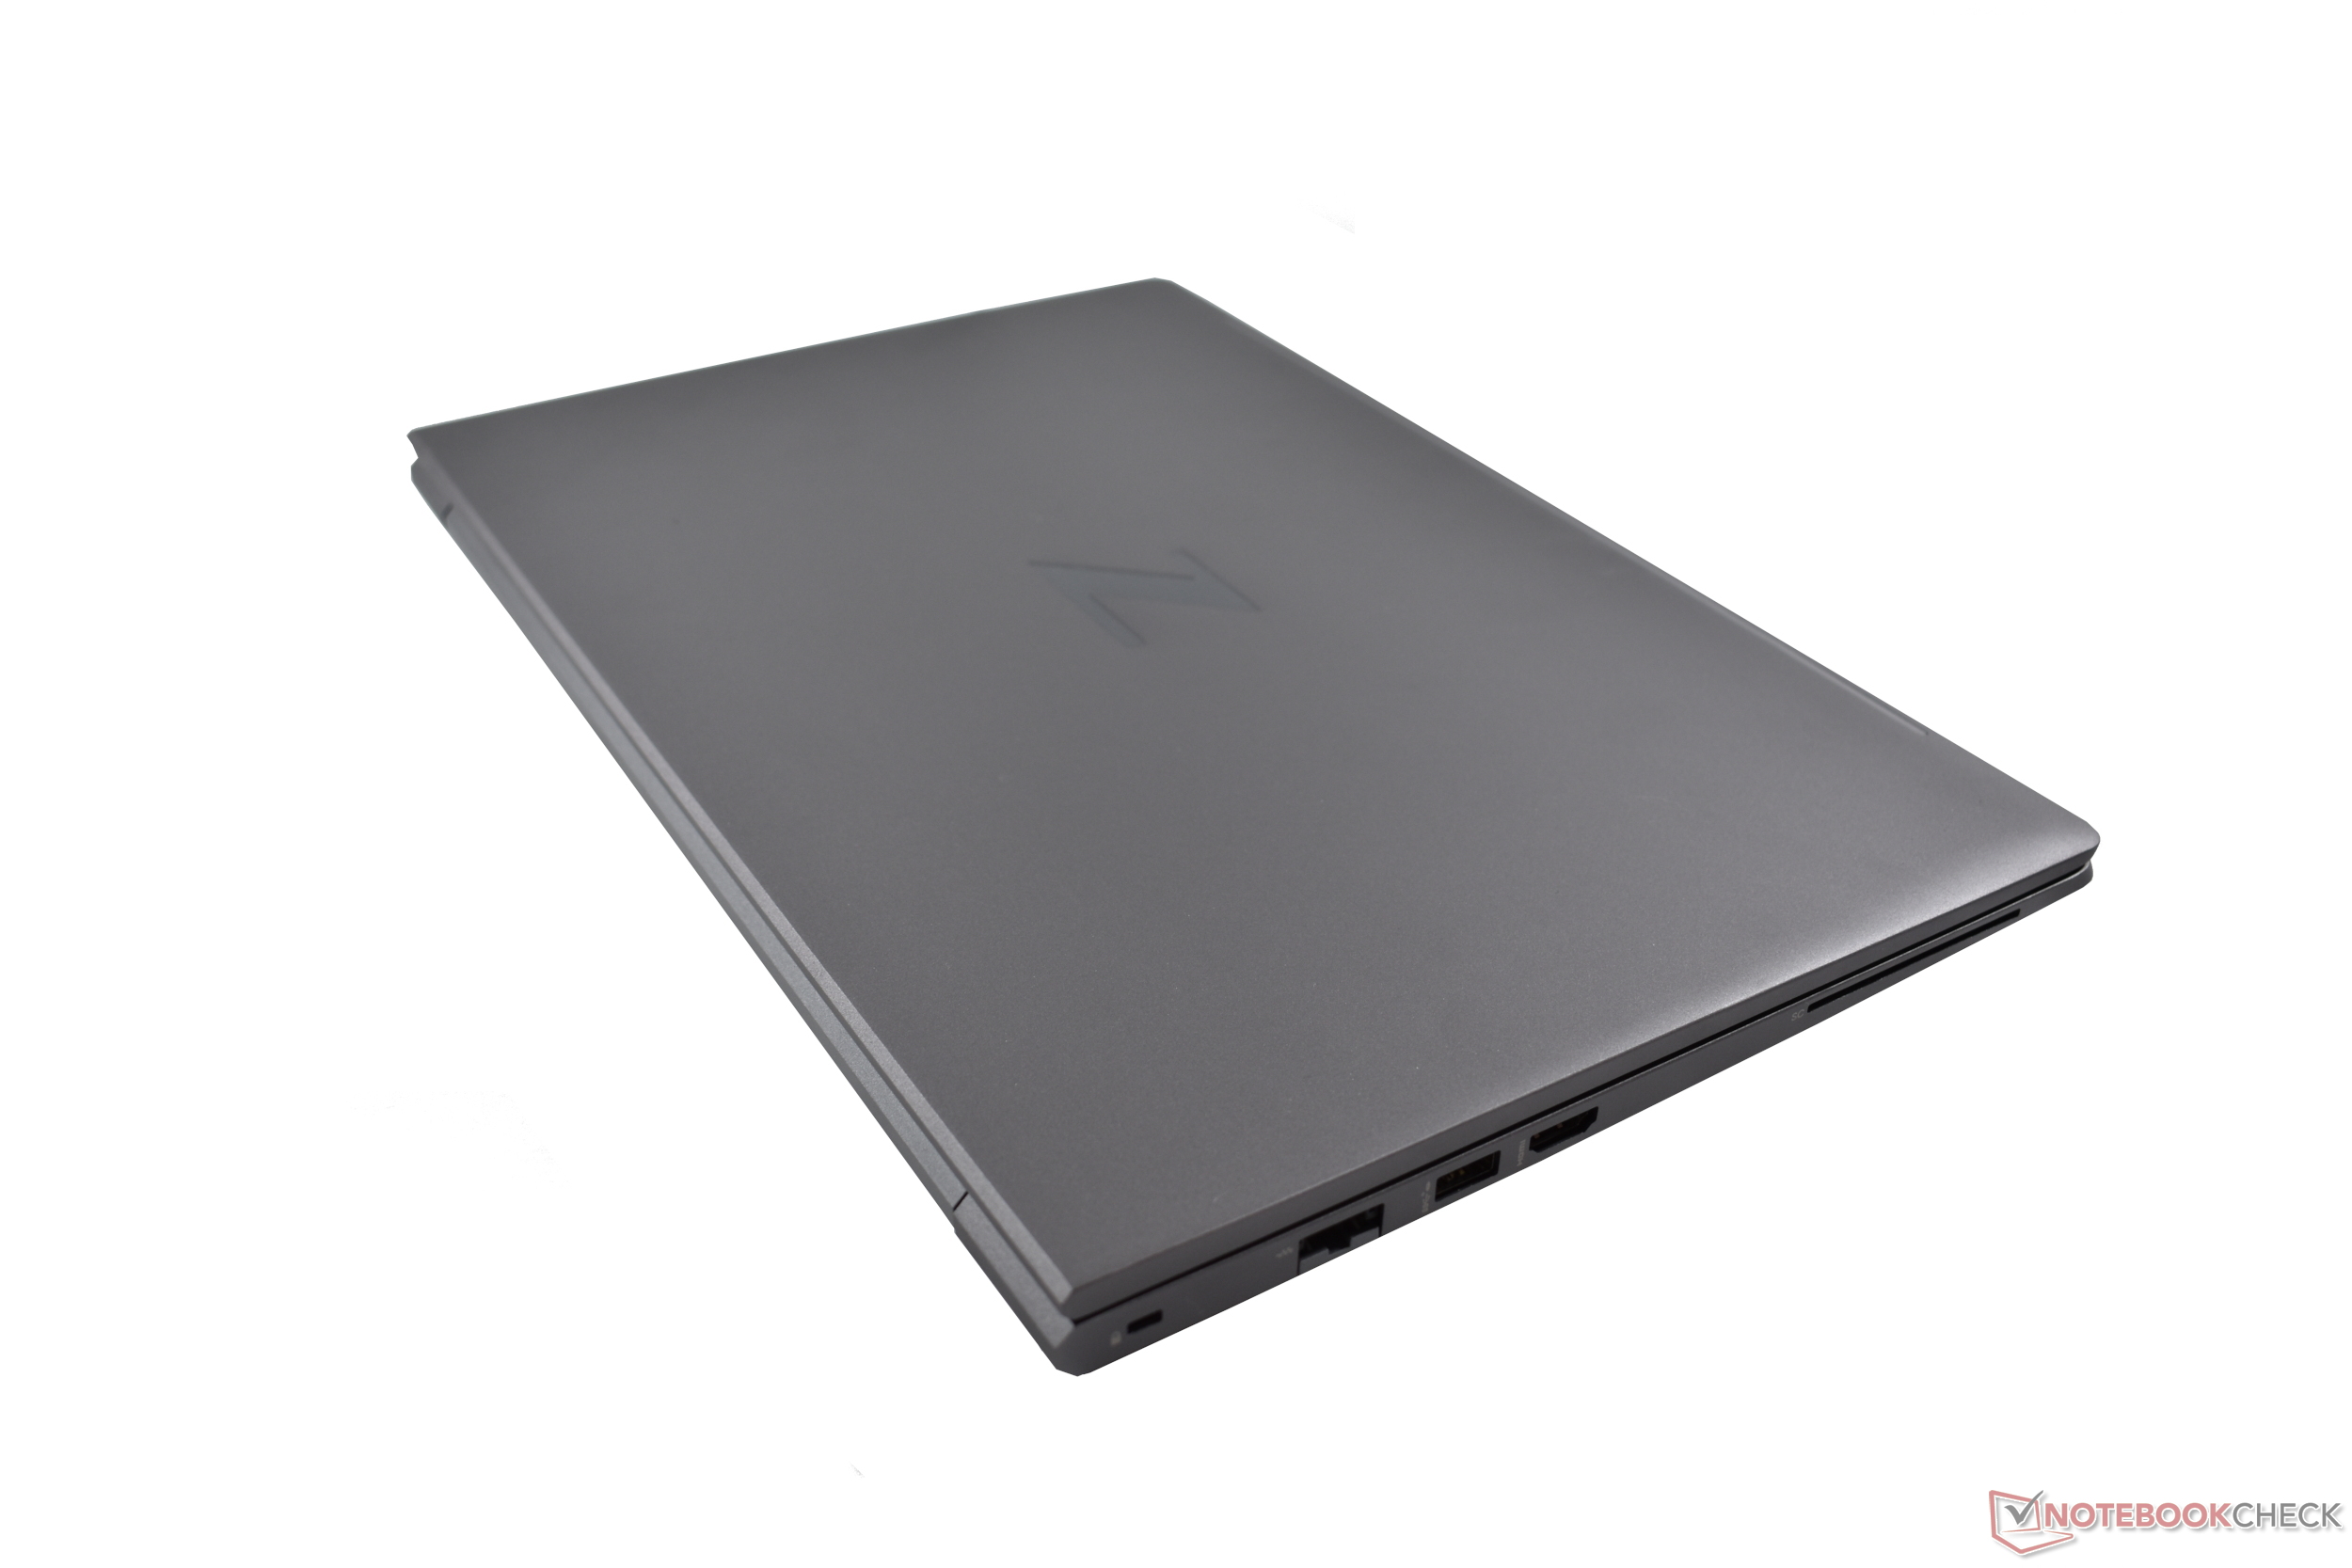
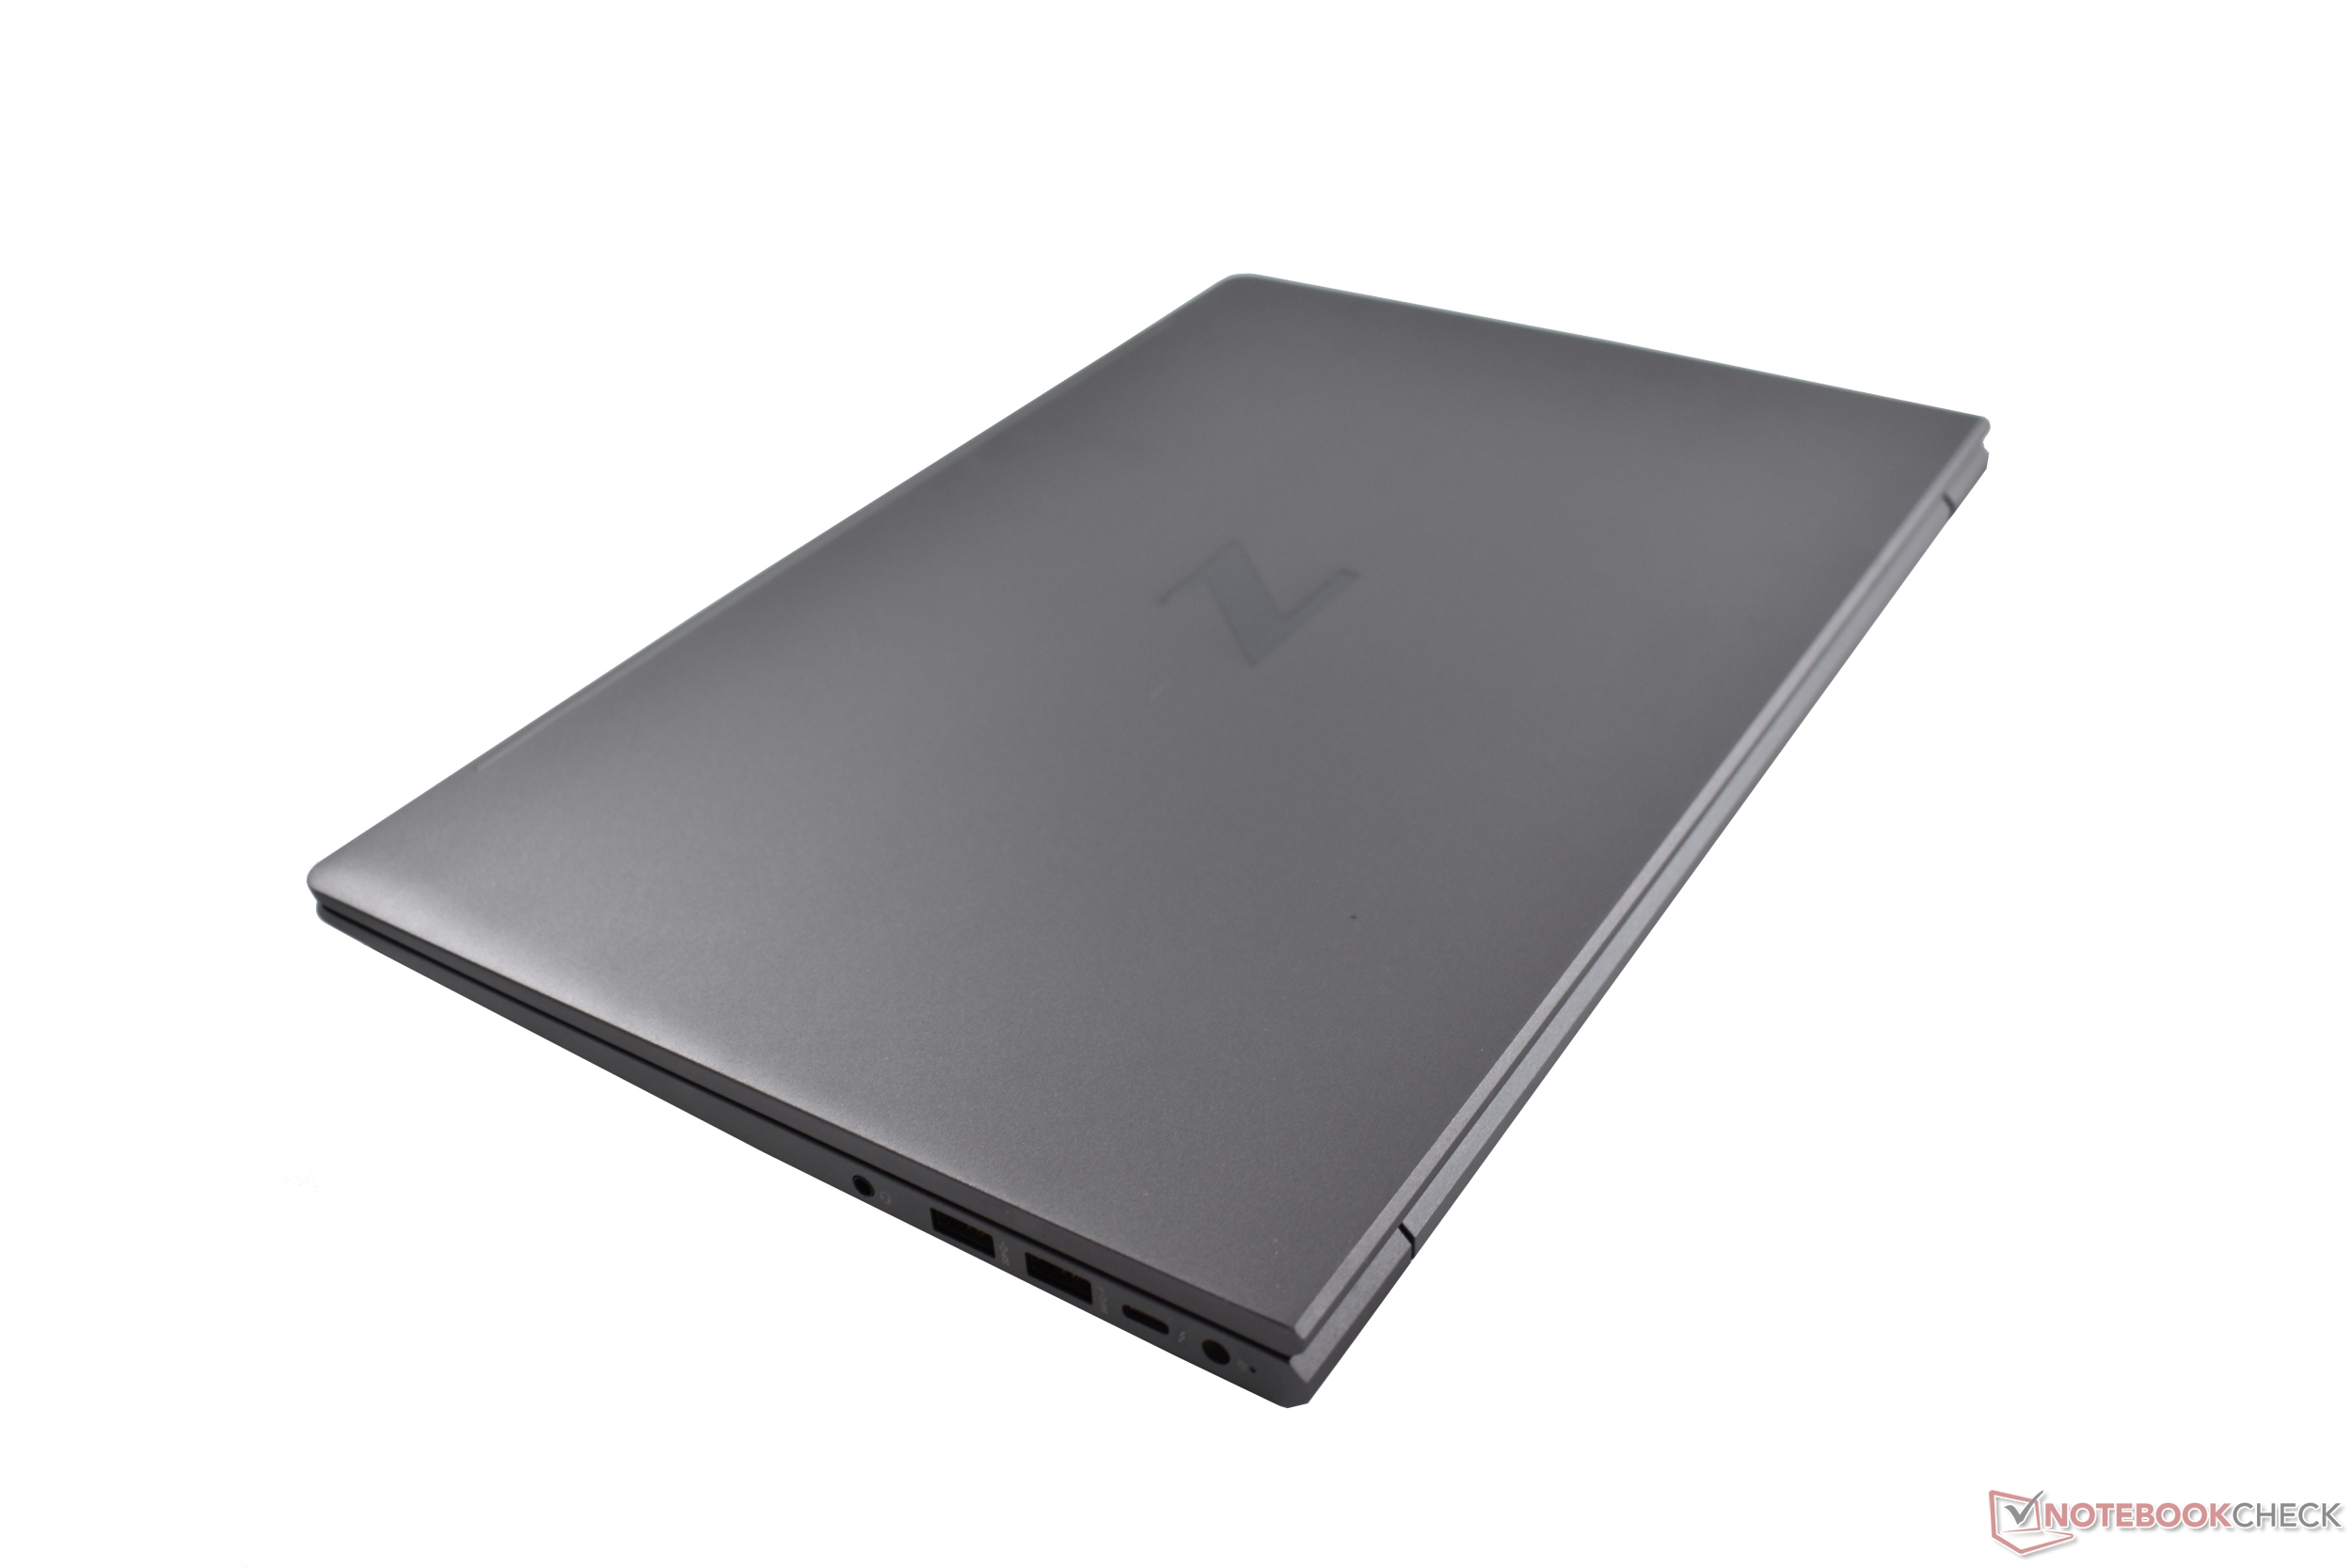
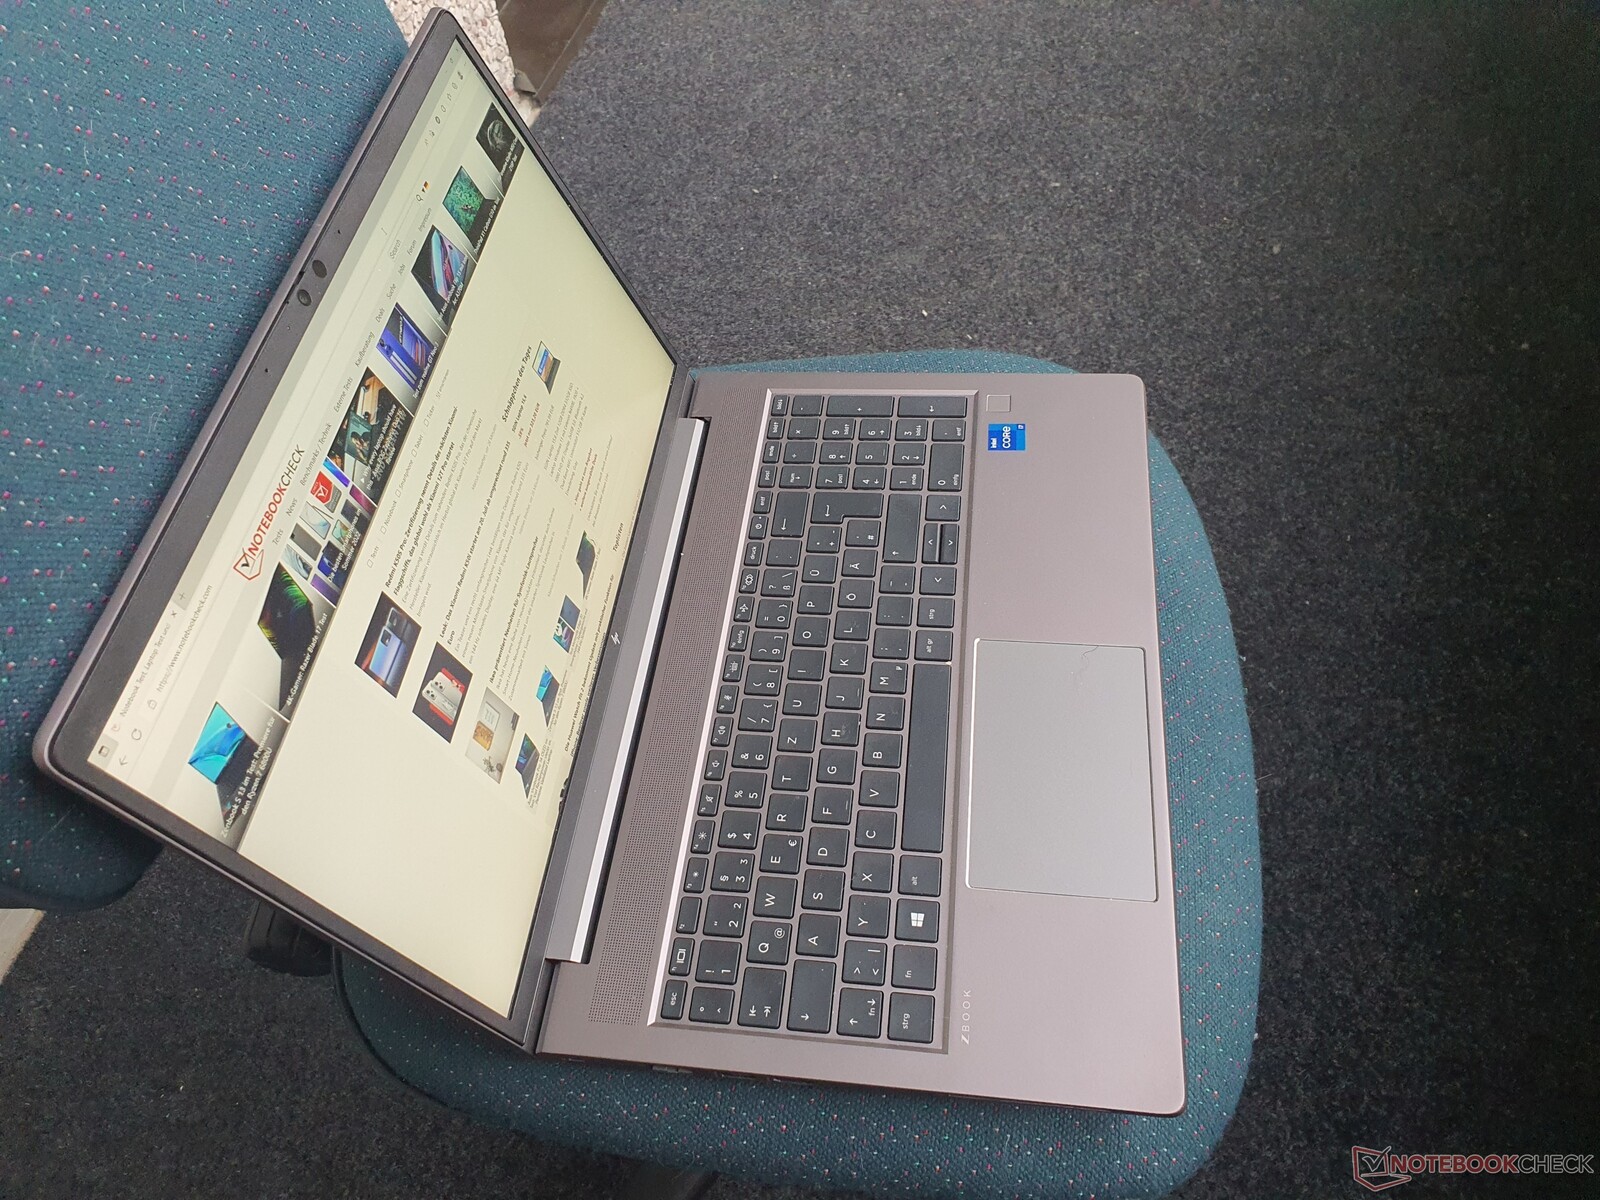
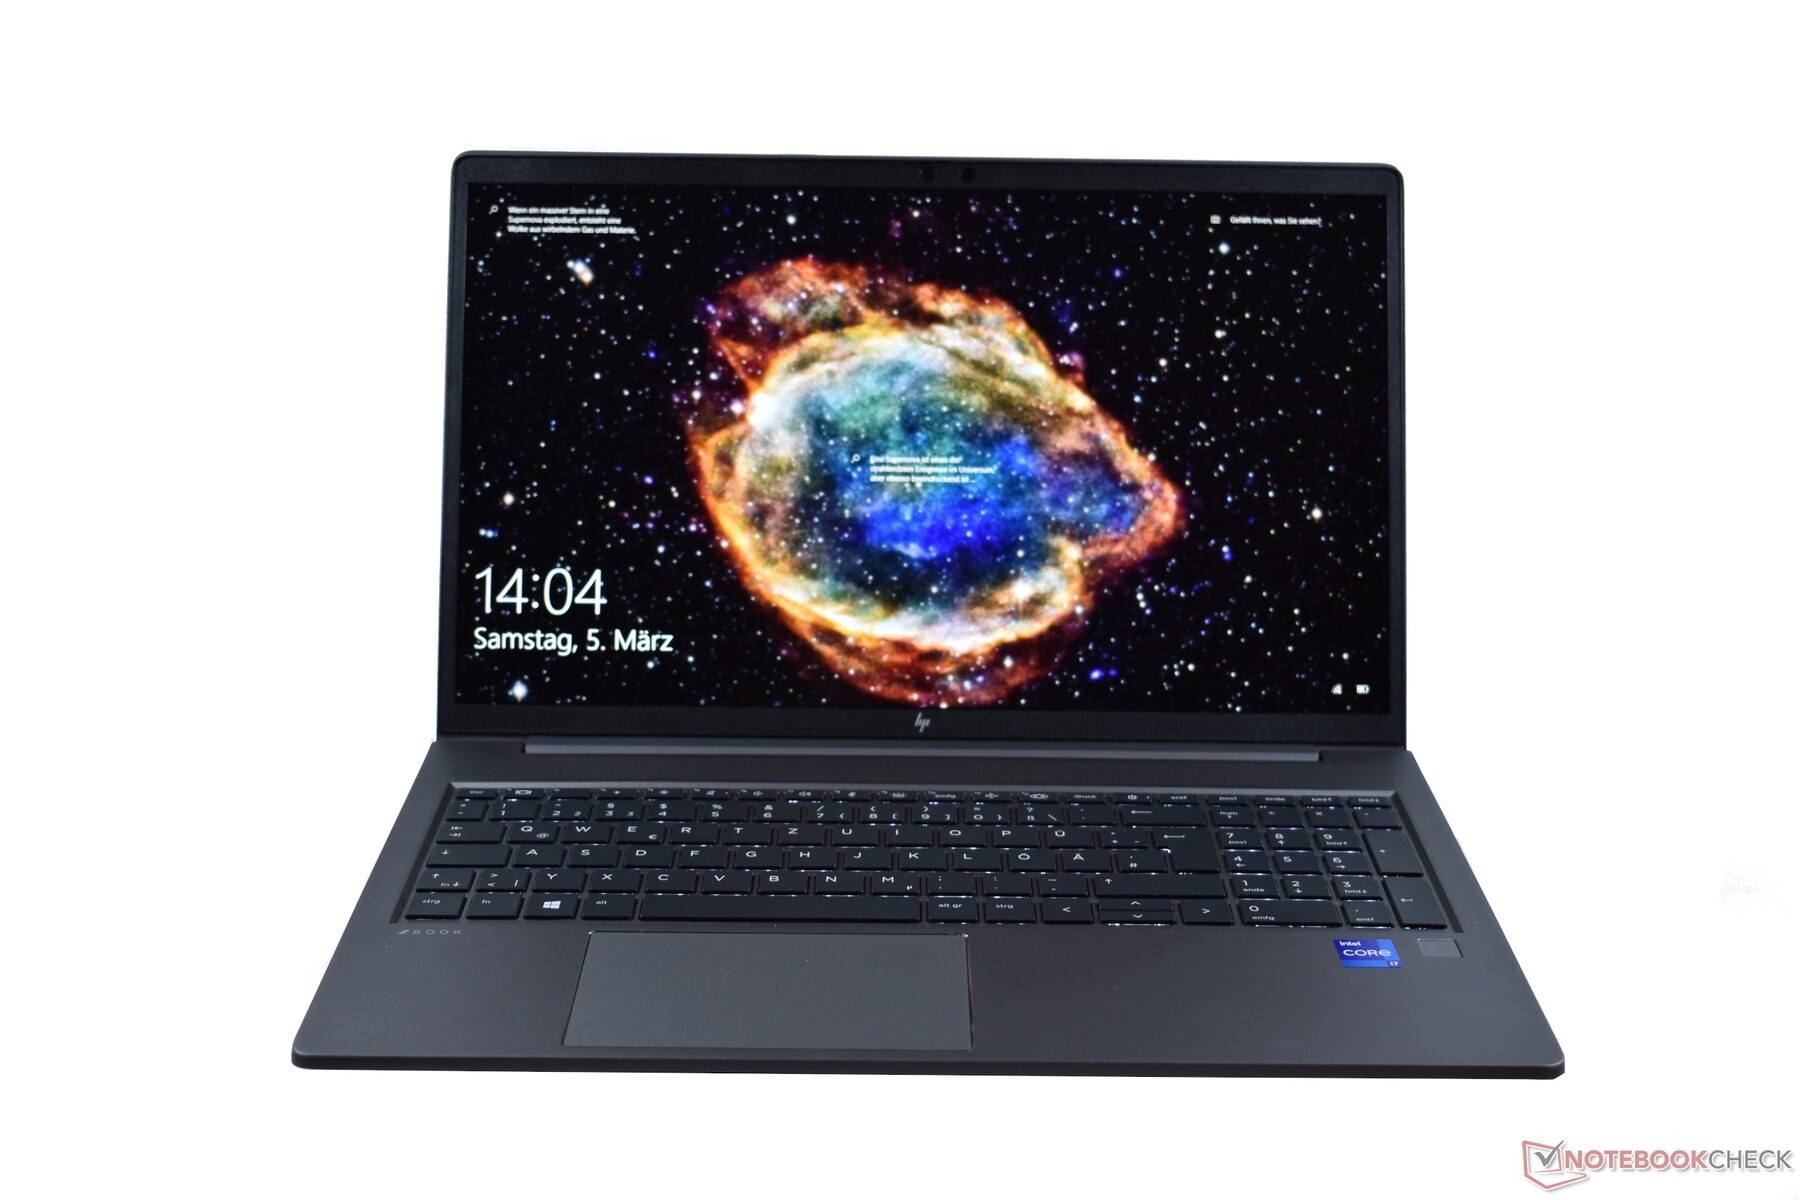
Custodia: ZBook Power in robusto alluminio
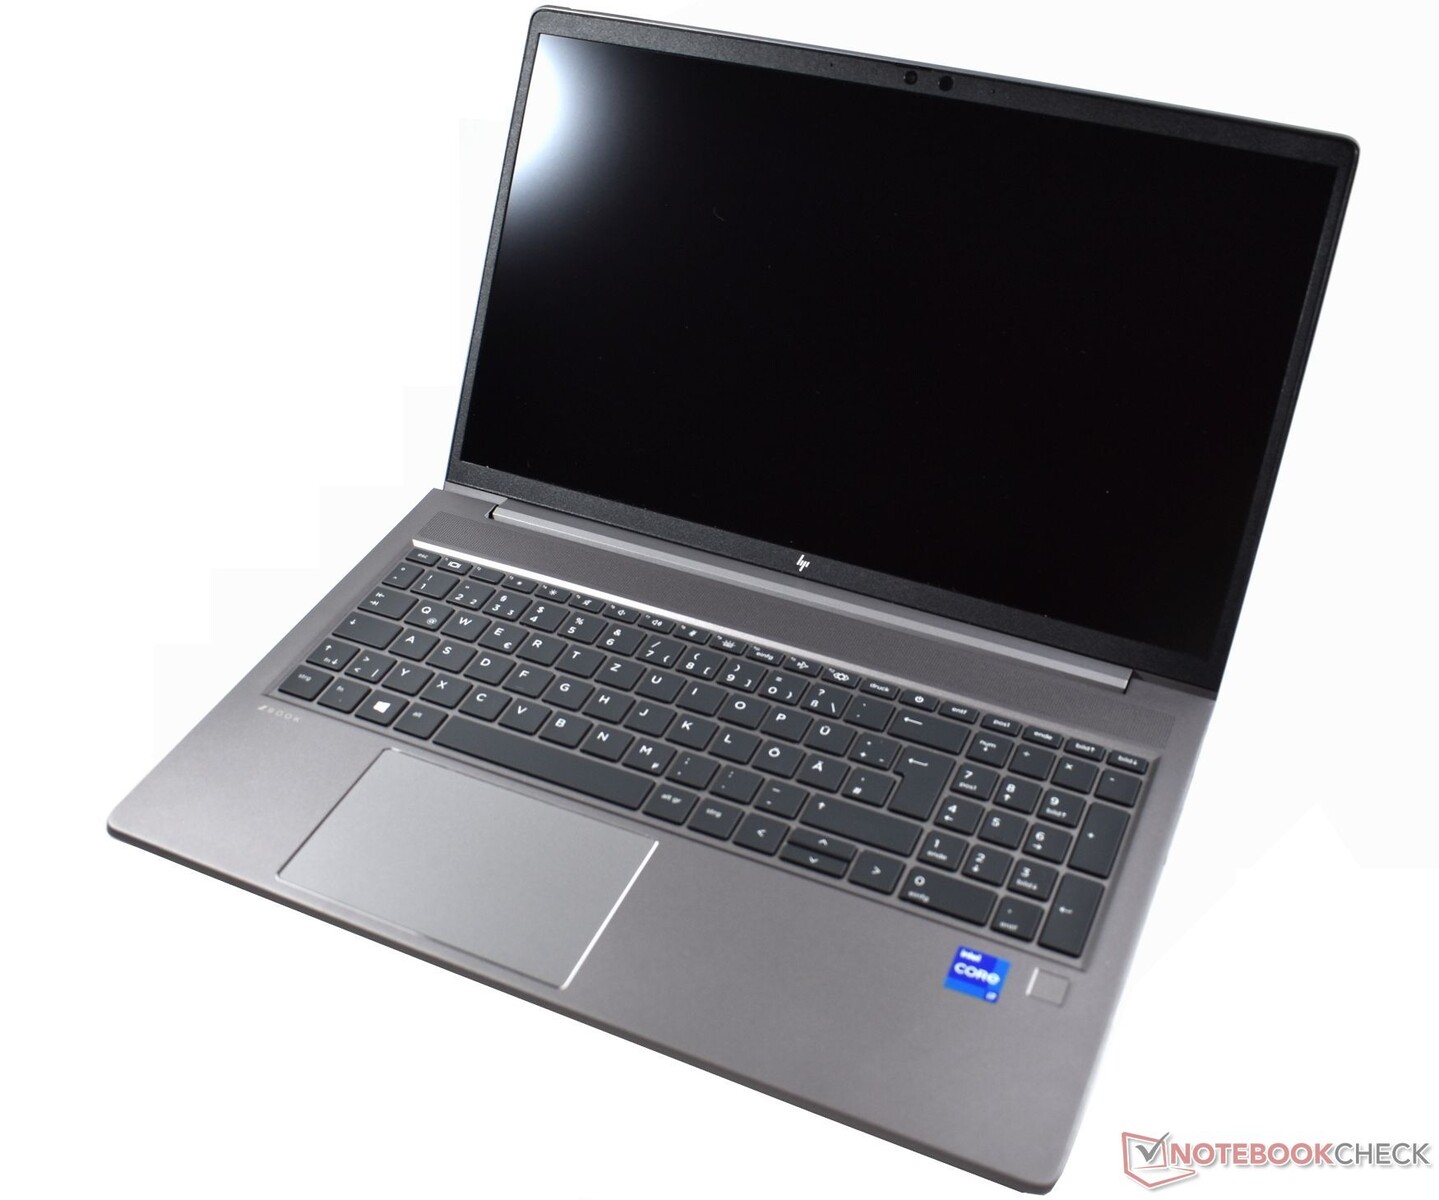
Il case in alluminio grigio scuro conferisce allo ZBook Power 15 un aspetto elegante e una robustezza piuttosto notevole, confermata anche dalla certificazione MIL STD-810H. Anche l'aptica, comprese le superfici opache, non lascia nulla a desiderare.
Il dispositivo mostra una lavorazione pulita e le impronte digitali non sono un problema. Il coperchio può essere aperto con una sola mano e l'ampia cerniera che lo attraversa è estremamente robusta.
D'altra parte, il retro del coperchio può essere facilmente premuto con una pressione singola, anche se questo non porterà a distorsioni dell'immagine. I punti positivi sono il fatto che il coperchio, con le sue sottili cornici, può essere ruotato solo in minima parte e che l'angolo di apertura massimo è di ~180 gradi.
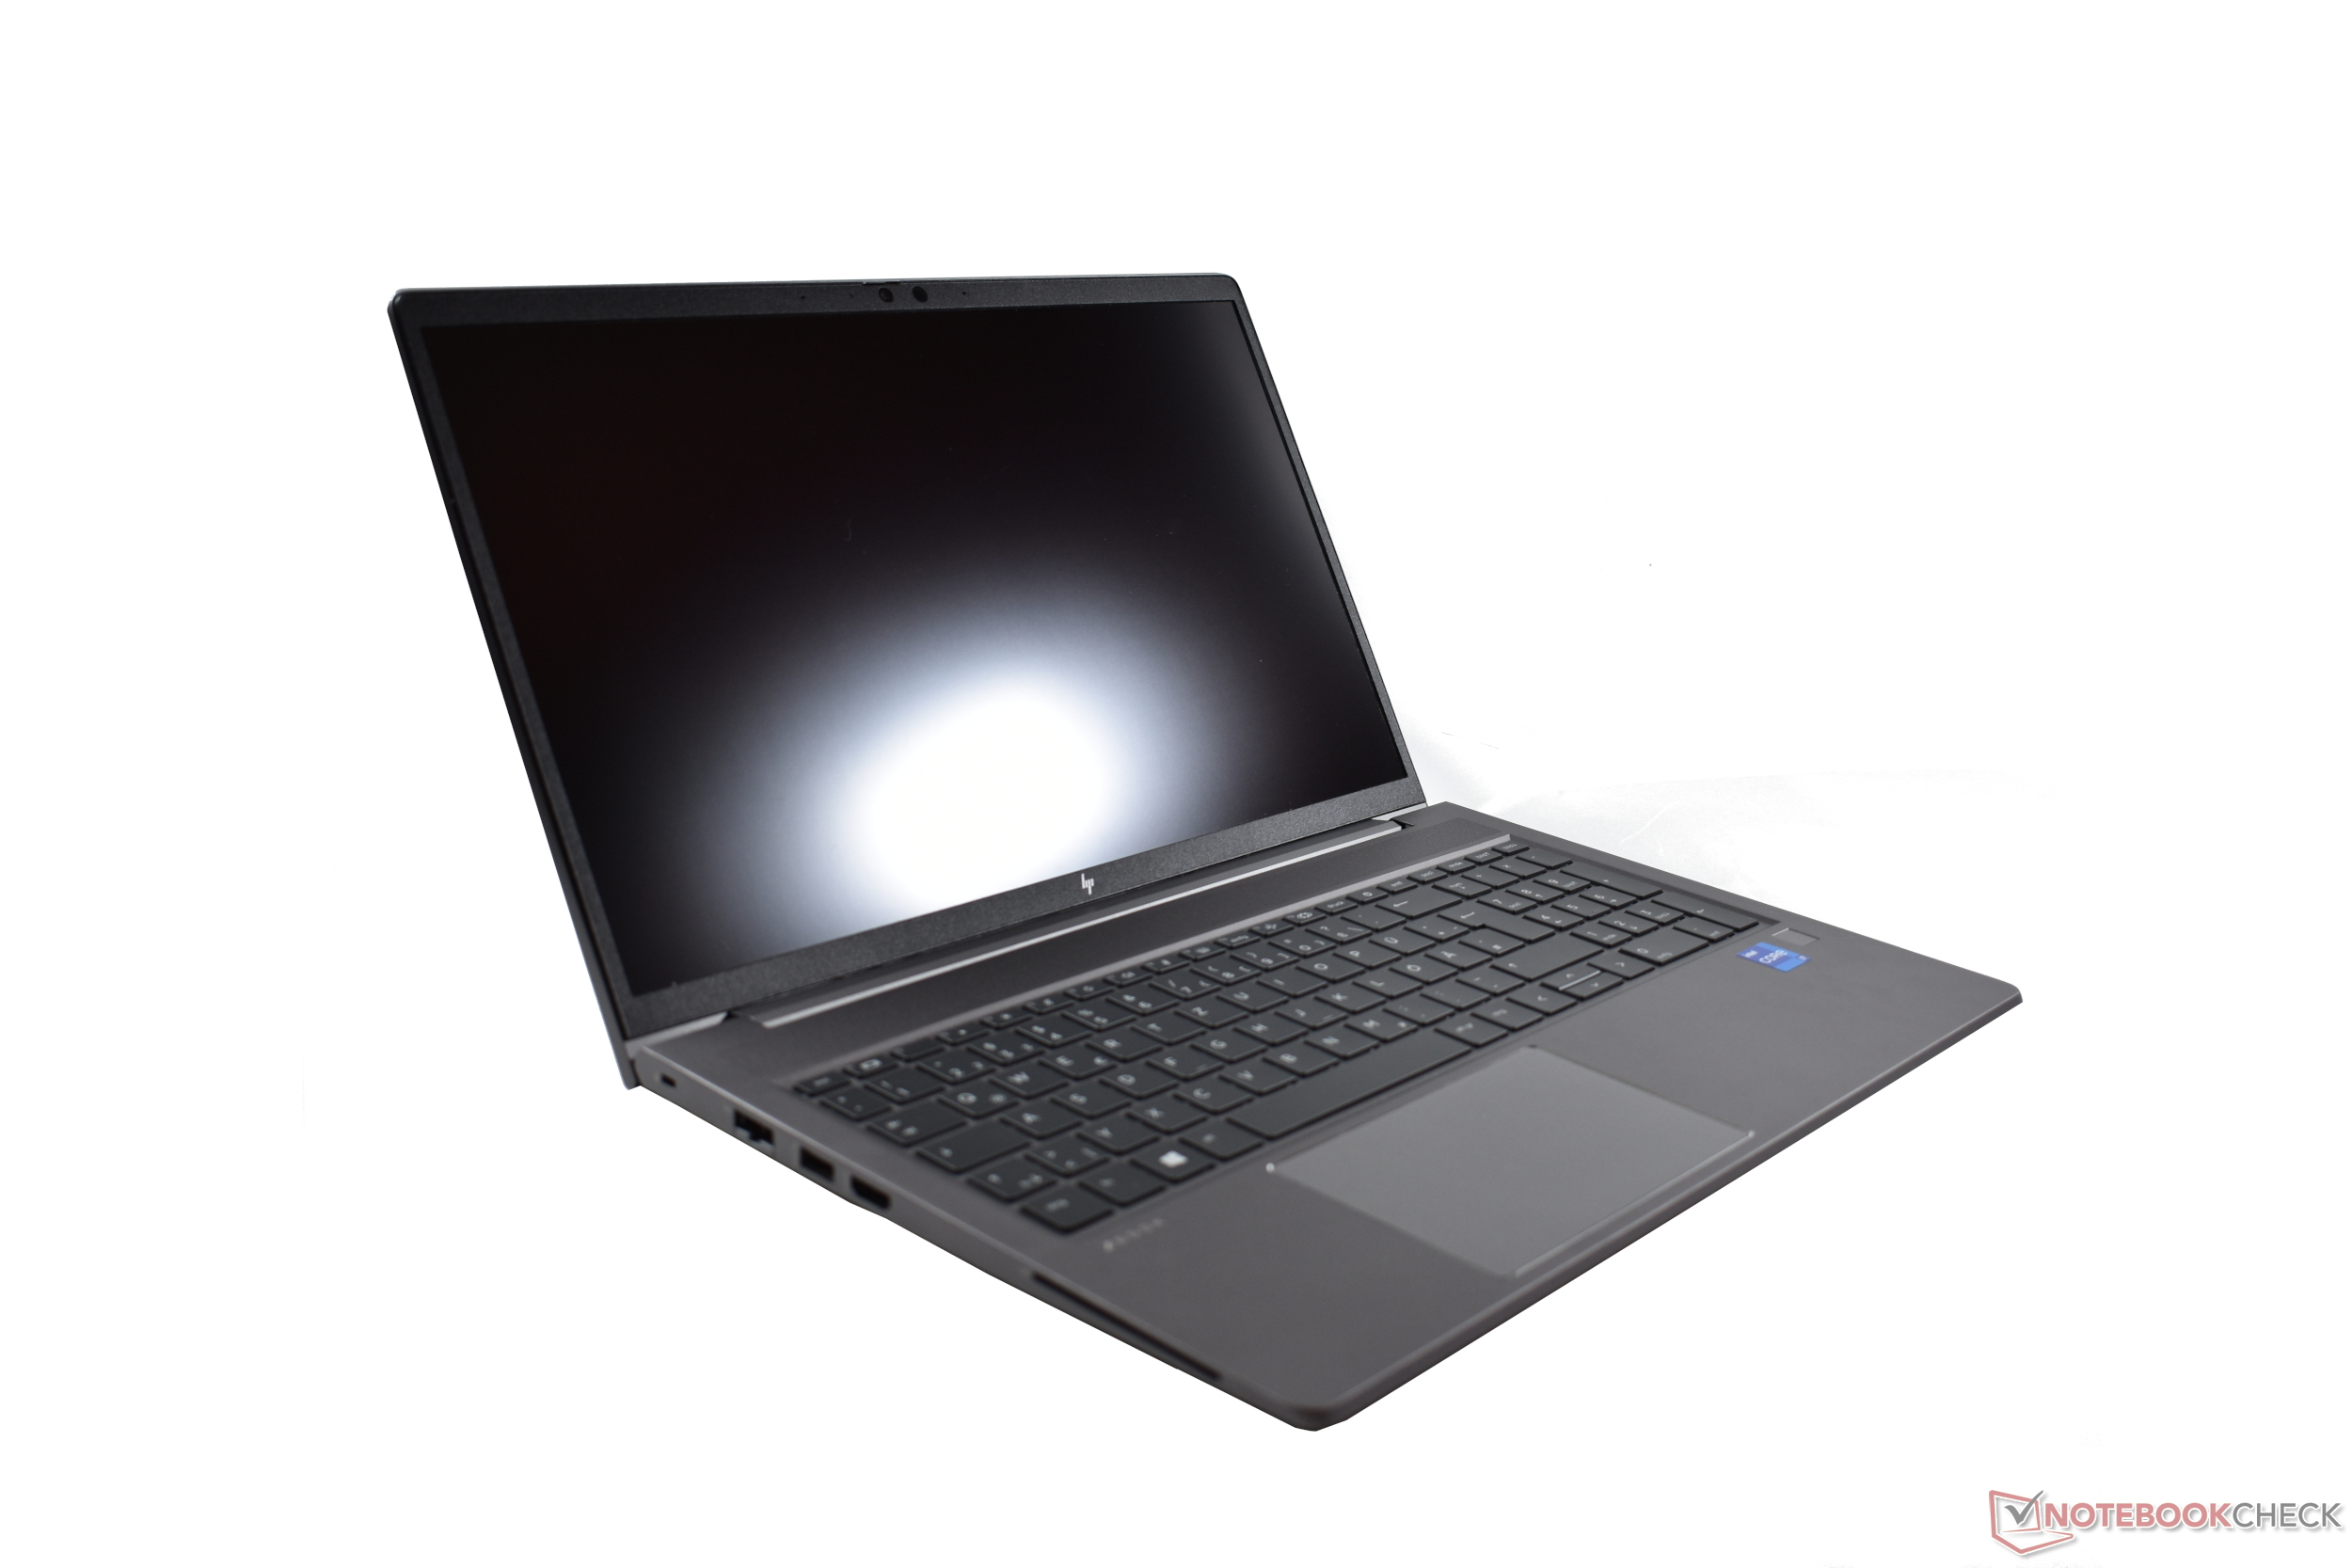
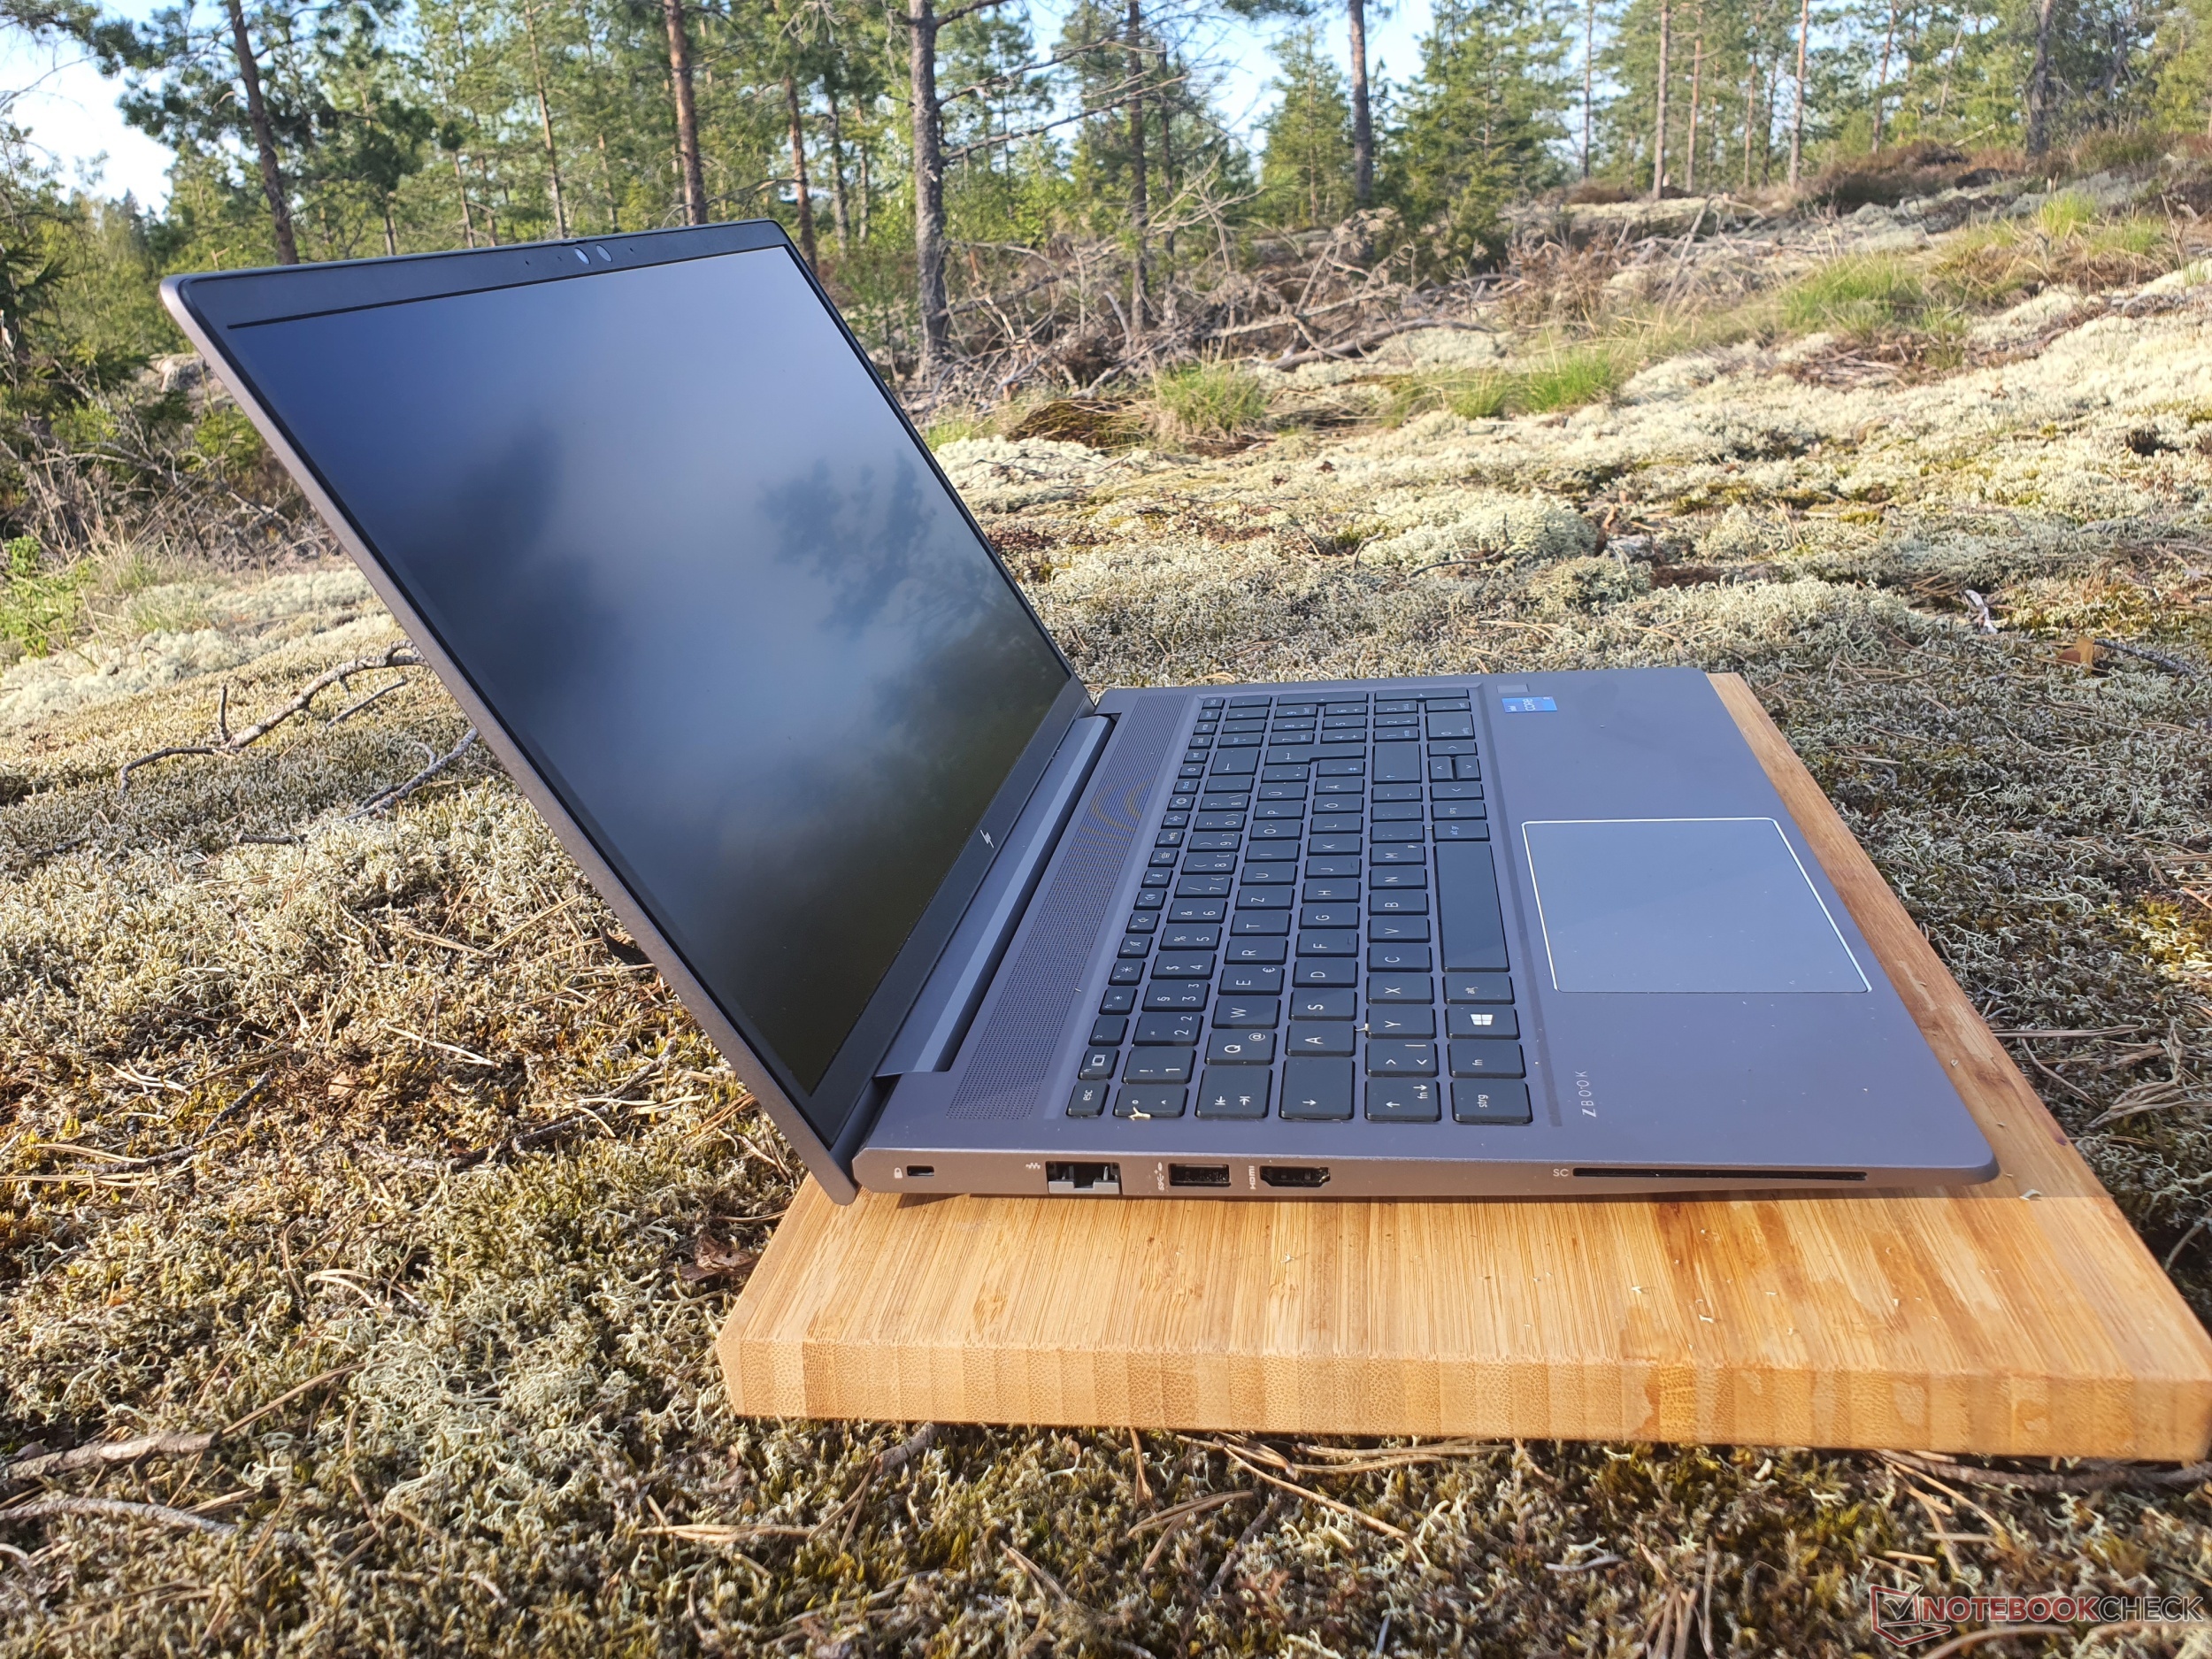
Nel complesso, la workstation è più leggera (1,97 kg) e più compatta rispetto alla concorrenza. Tuttavia, come workstation di fascia alta, lo ZBook Studio 15 è di nuovo più sottile, con i suoi 18 mm (~0,7"), così come la workstation compatta e leggera di HP, il modelloFirefly 15che pesa solo 1,75 kg (~3,96 lb).
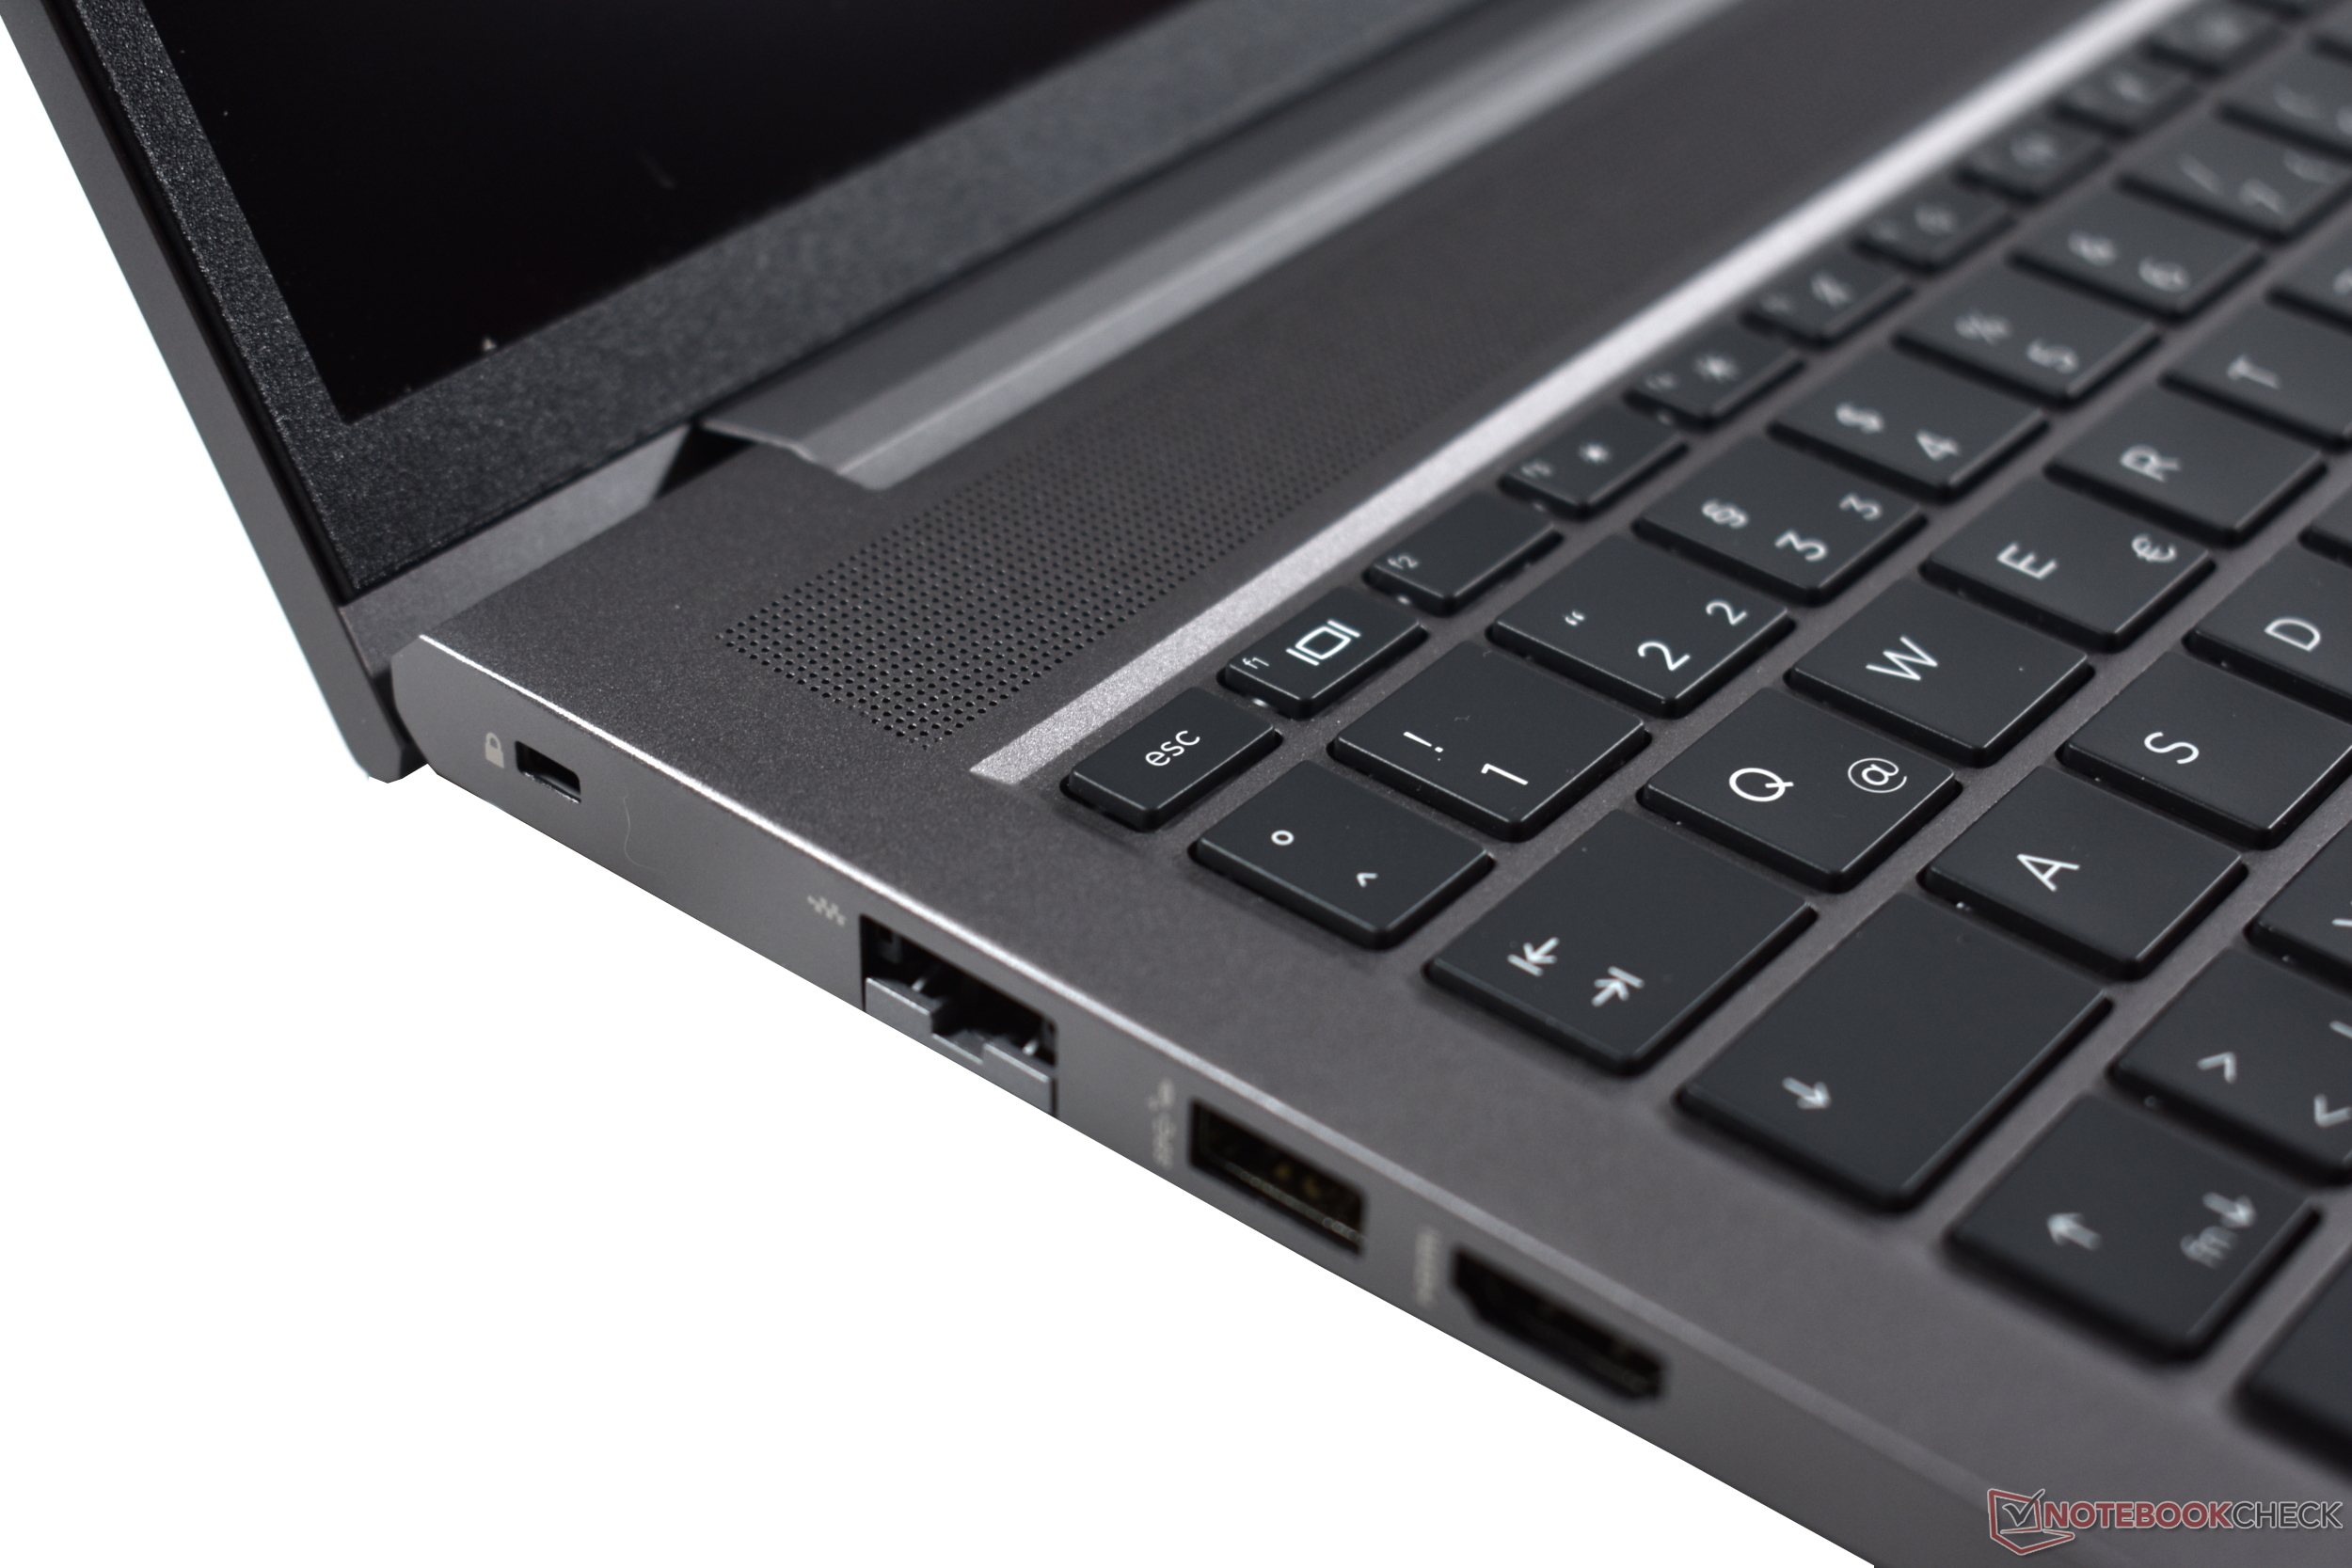
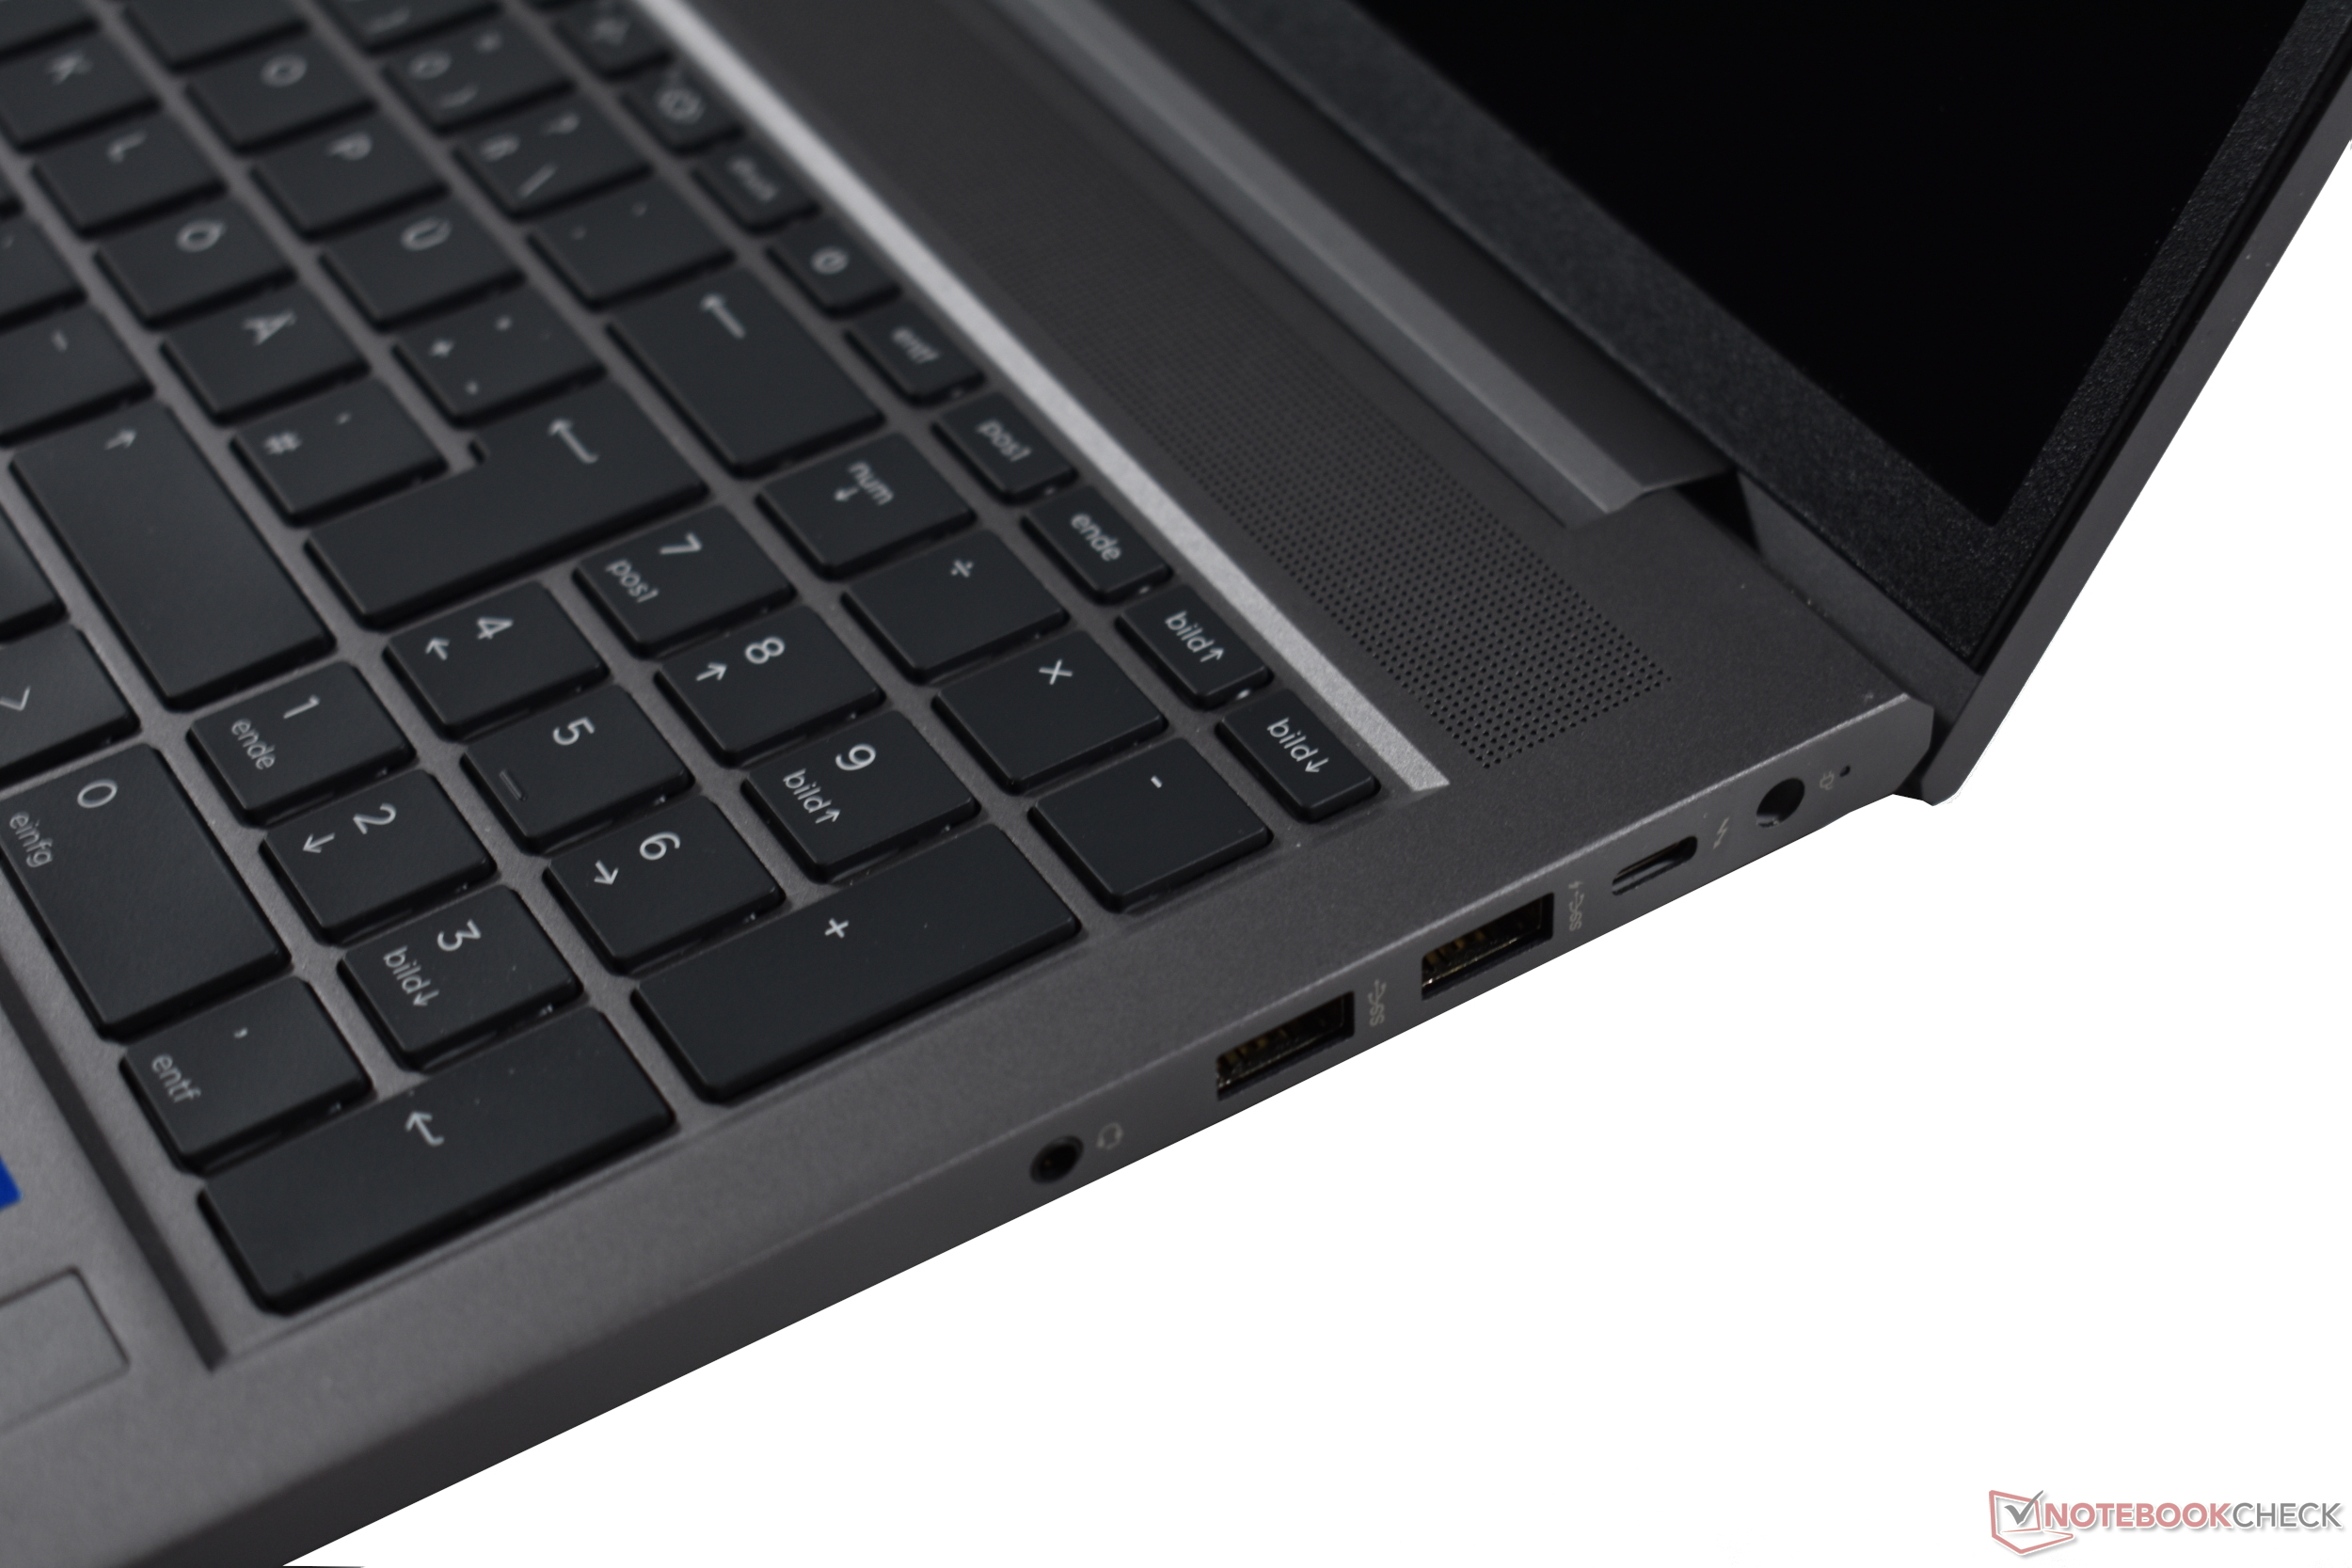
Dotazione: HP ZBook con USB-C PD e WiFi 6 veloce
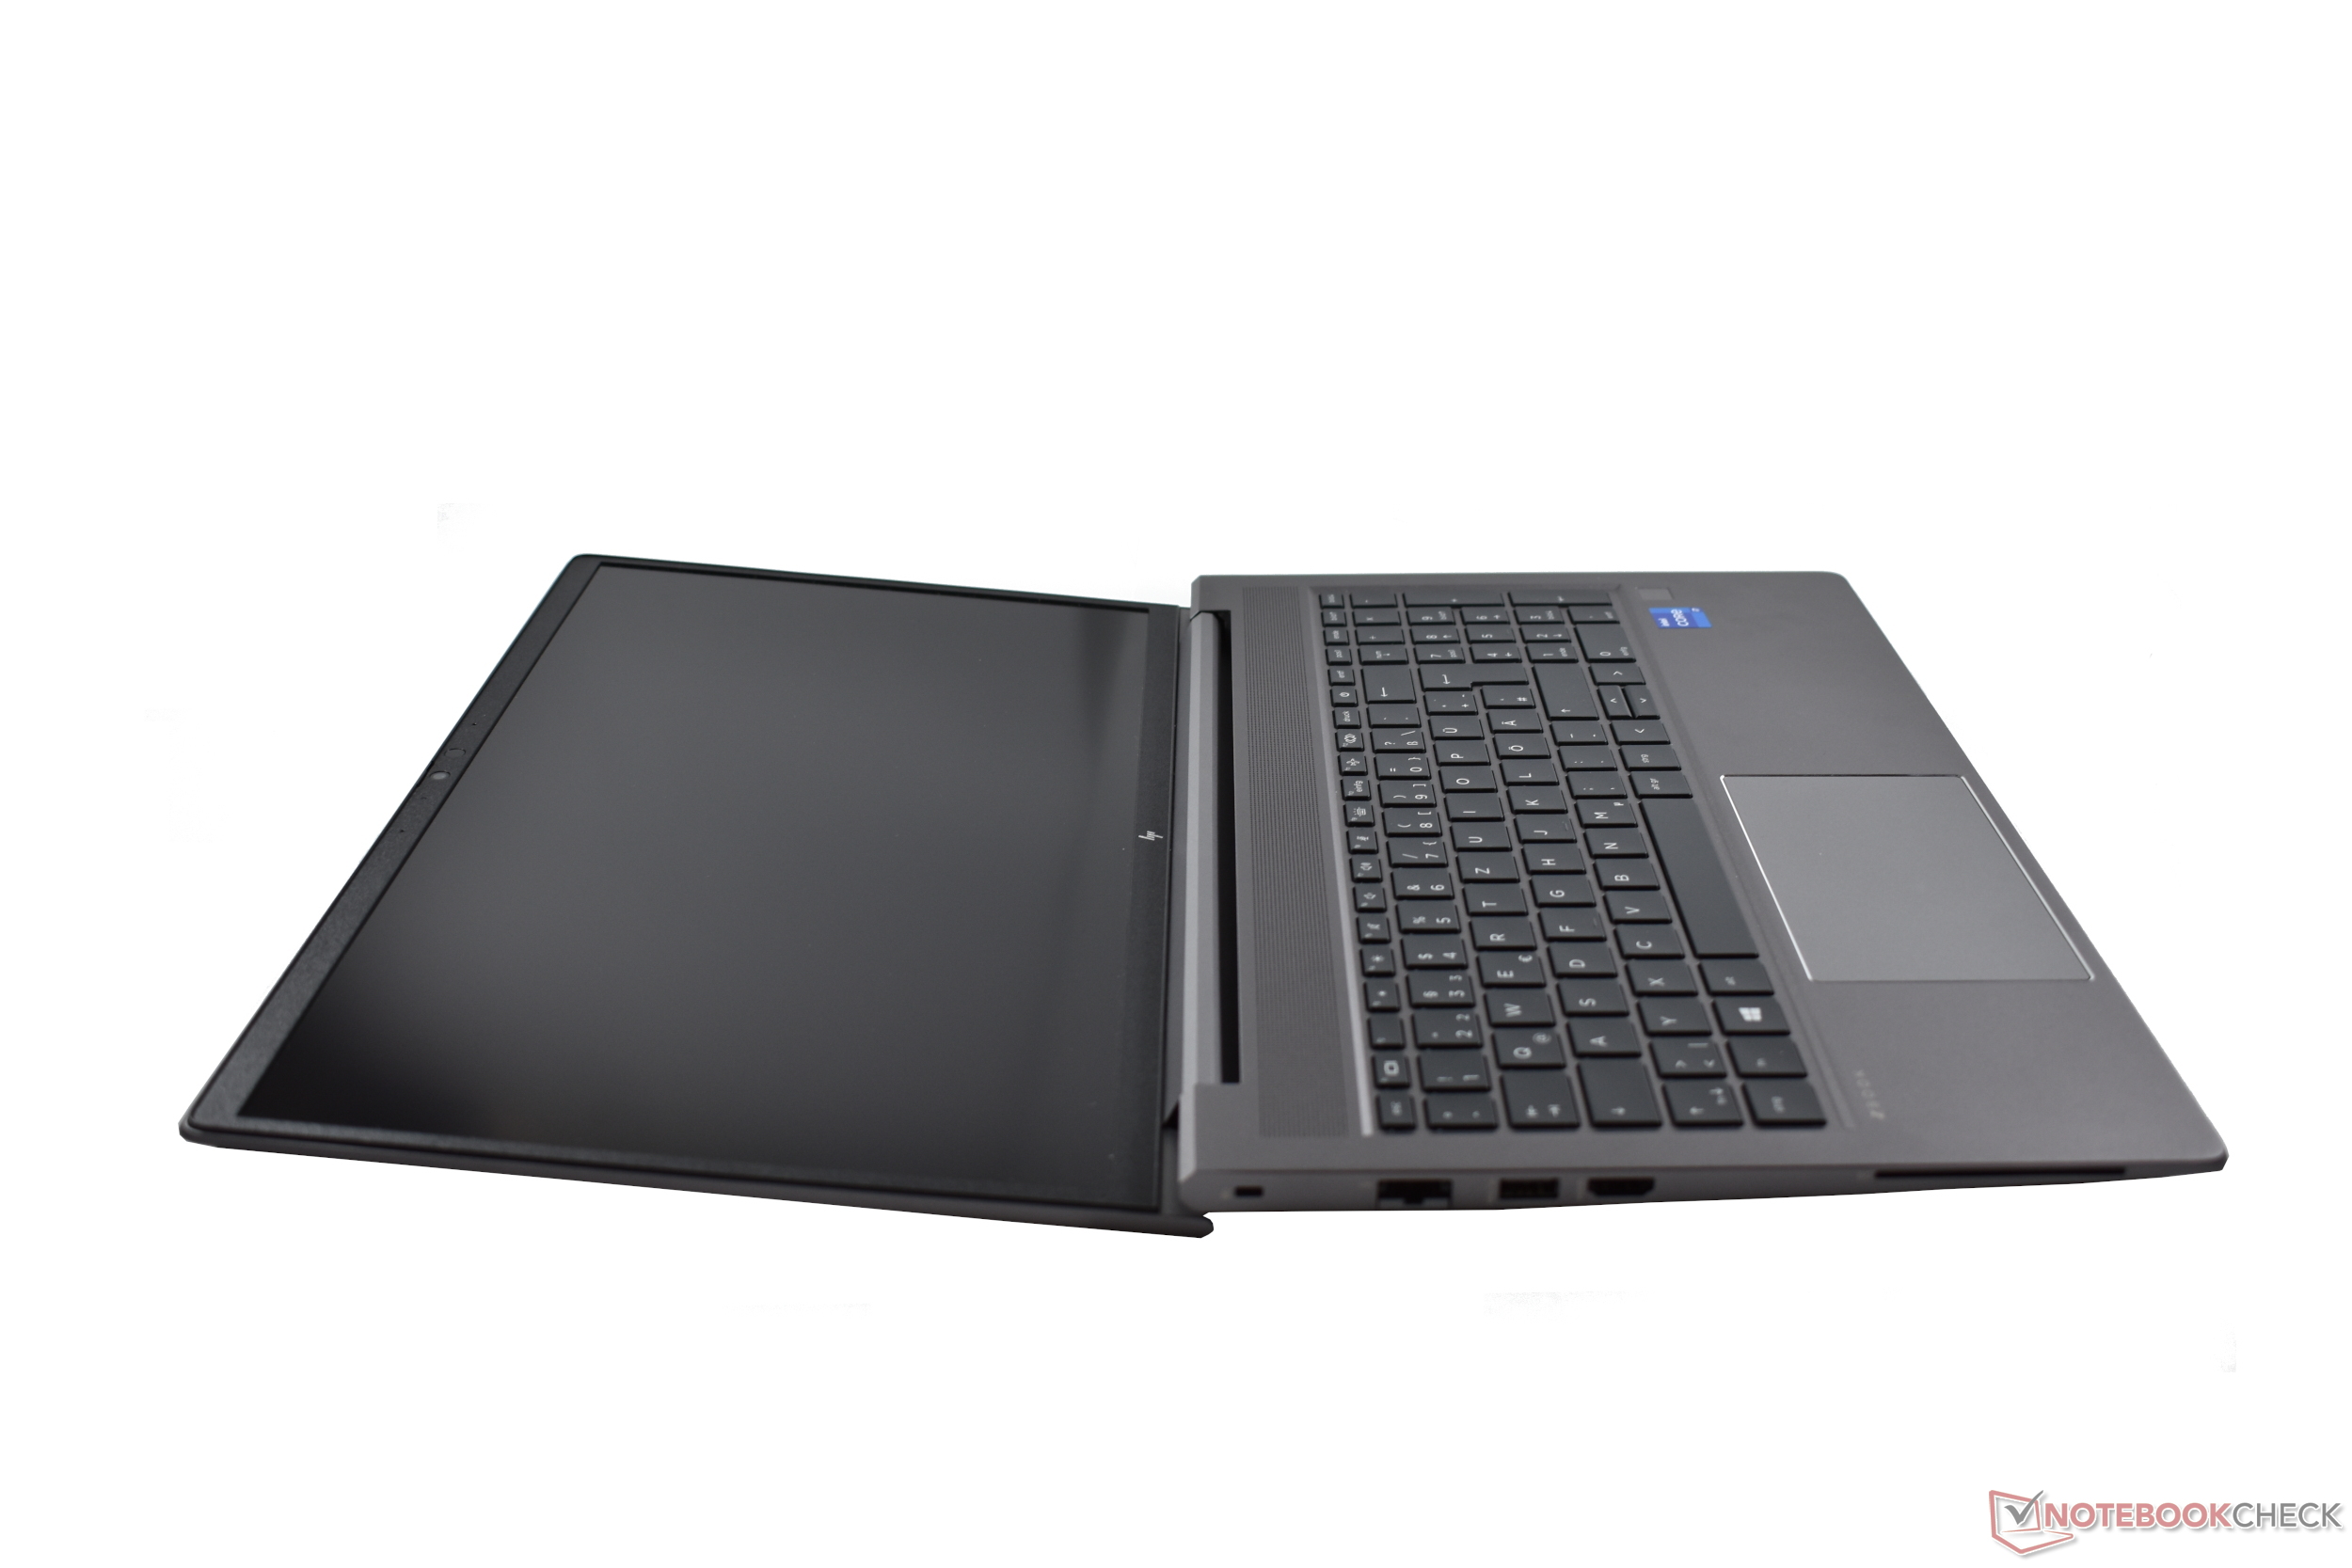
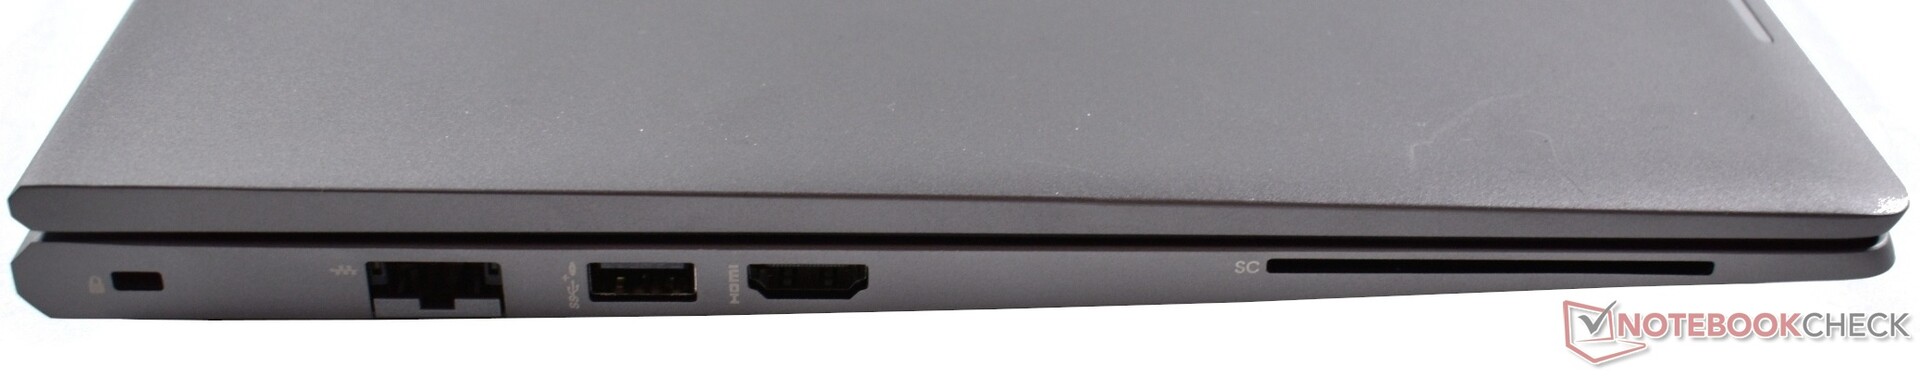
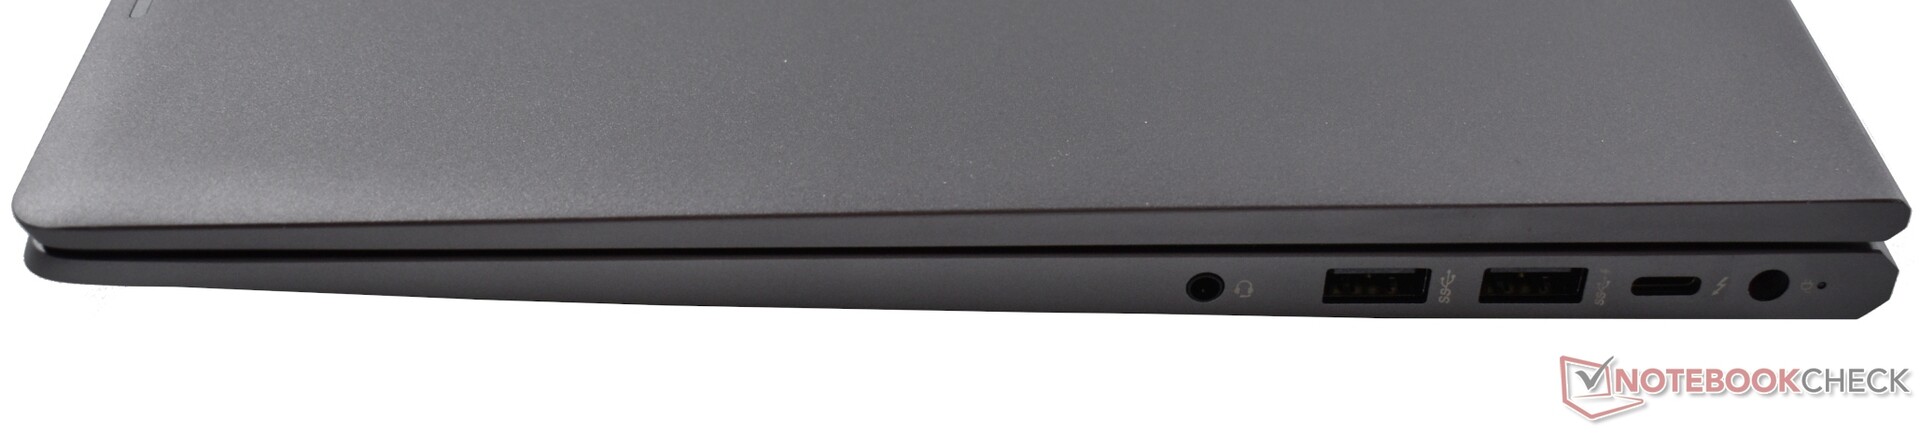
Anche come workstation entry-level, lo ZBook 15 G8 offre molte connessioni importanti: C'è una LAN Gbit (anche se non è da 2,5 Gbps), ci sono un totale di tre porte USB-A 3.1 Gen1 (5 Gbps), mentre c'è solo una connessione Thunderbolt 4, e offre anche DisplayPort 1.4 e Power Delivery in generale. Apprezziamo anche la presenza di HDMI nella versione 2.0.
Il lettore di SmartCard è opzionale, ma è sempre presente il Kensington Lock (nano). Insieme alla porta di ricarica proprietaria, l'intero pacchetto è completato da una porta audio combinata. Manca tuttavia uno slot per schede SD.
Comunicazione
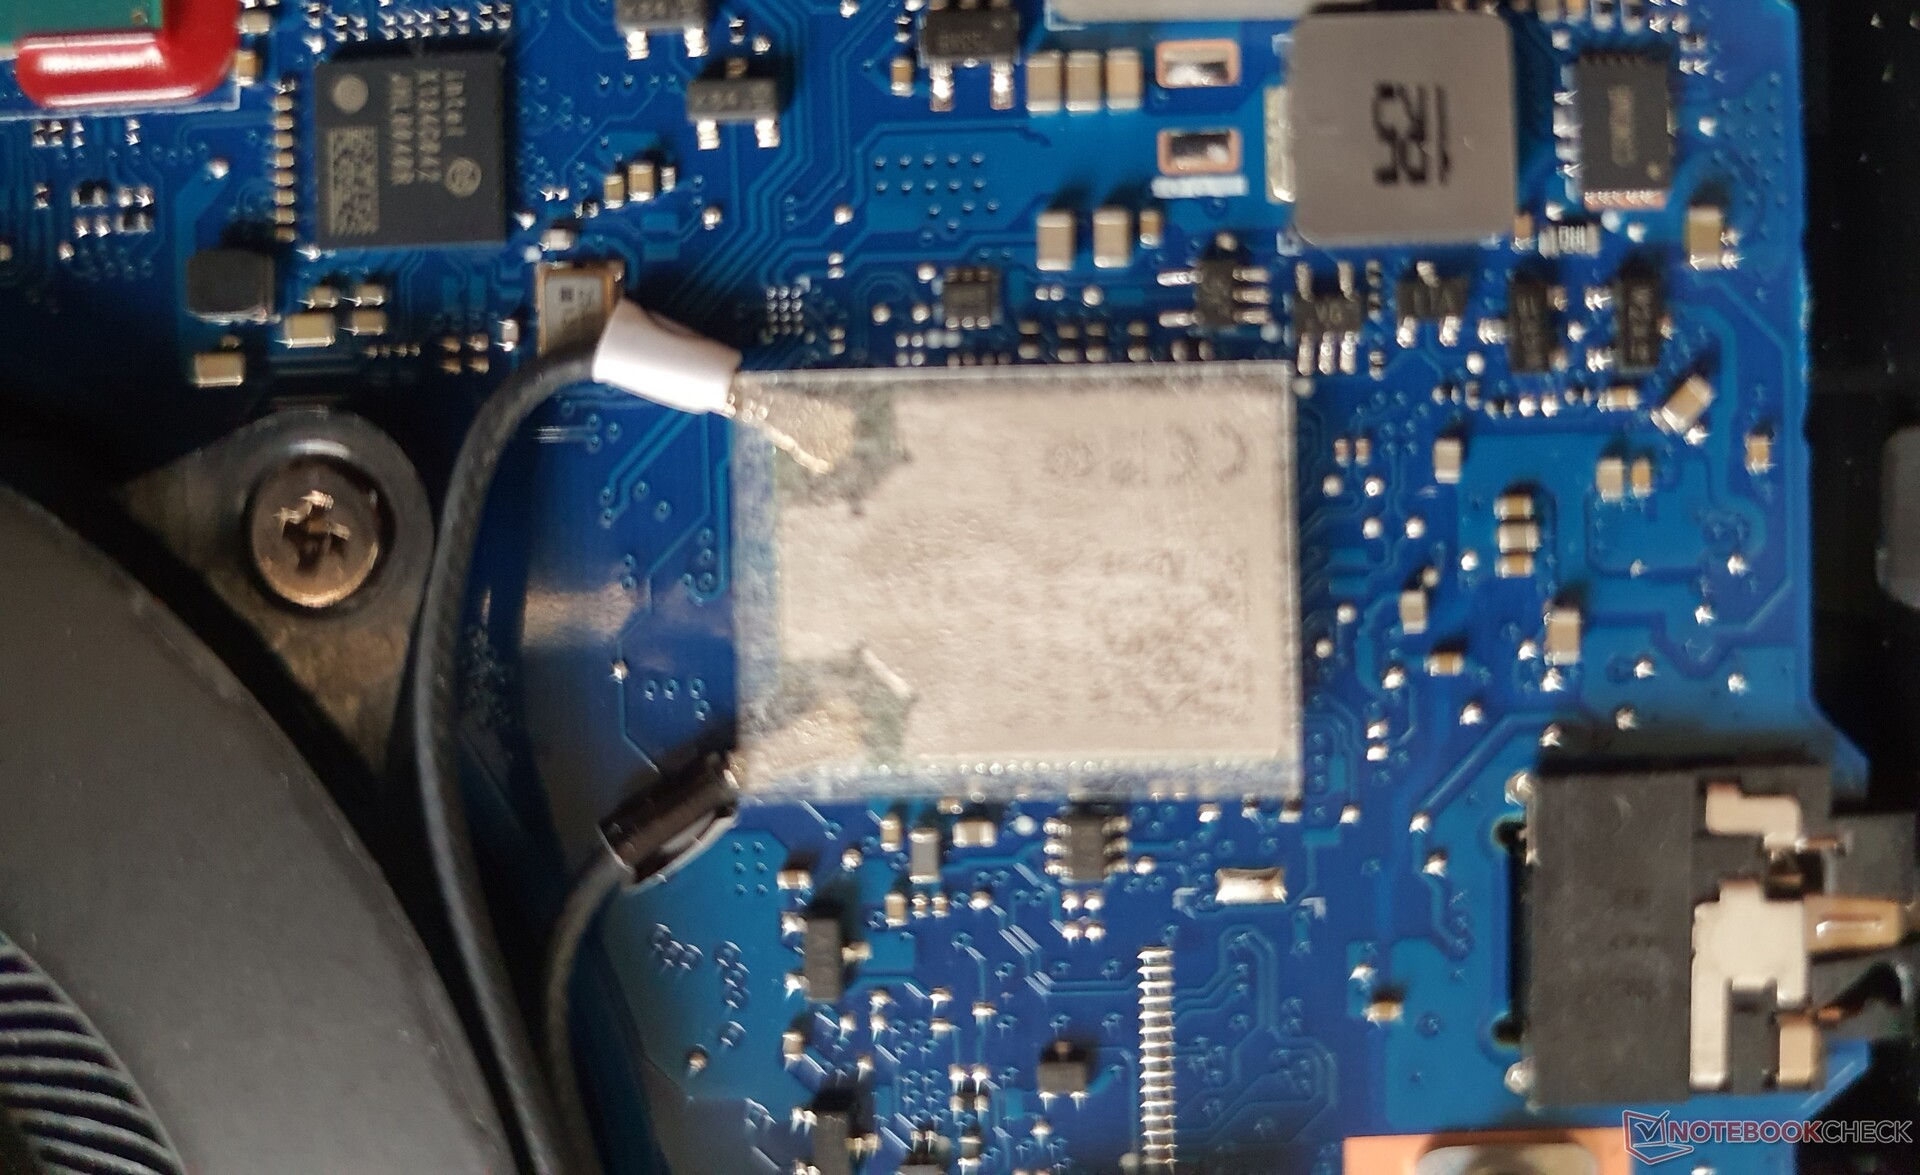
Oltre alla Gbit LAN, il Wi-Fi 6 AX201 + Bluetooth 5.2 di Intel è disponibile anche in forma saldata. ~1,5 Gbps in invio e 1,33 Gbps in ricezione corrispondono all'elevata velocità Wi-Fi della concorrenza. Sebbene non sia presente uno slot WWAN, l'NFC è disponibile come opzione.
Webcam

La webcam a 720p offre un SureShutter (copertura), microfoni a doppio array e infrarossi opzionali per Windows Hello. Tuttavia, la qualità delle immagini è rumorosa.


Sicurezza
HP non prende mezze misure in termini di sicurezza. Per quanto riguarda le opzioni hardware, sono presenti un lettore di SmartCard e una telecamera IR per Windows Hello. Inoltre, è presente un meccanismo per il blocco di sicurezza, un lettore di impronte digitali, TPM 2.0 e un otturatore per la fotocamera.
Per quanto riguarda il software, la sicurezza è garantita da HP System Safeguard contro gli attacchi o gli errori improvvisi del firmware, HP Client Security Manager, HP Sure Click & Sure Sense contro il phishing e il malware e un BIOS "autocurativo".
Accessori
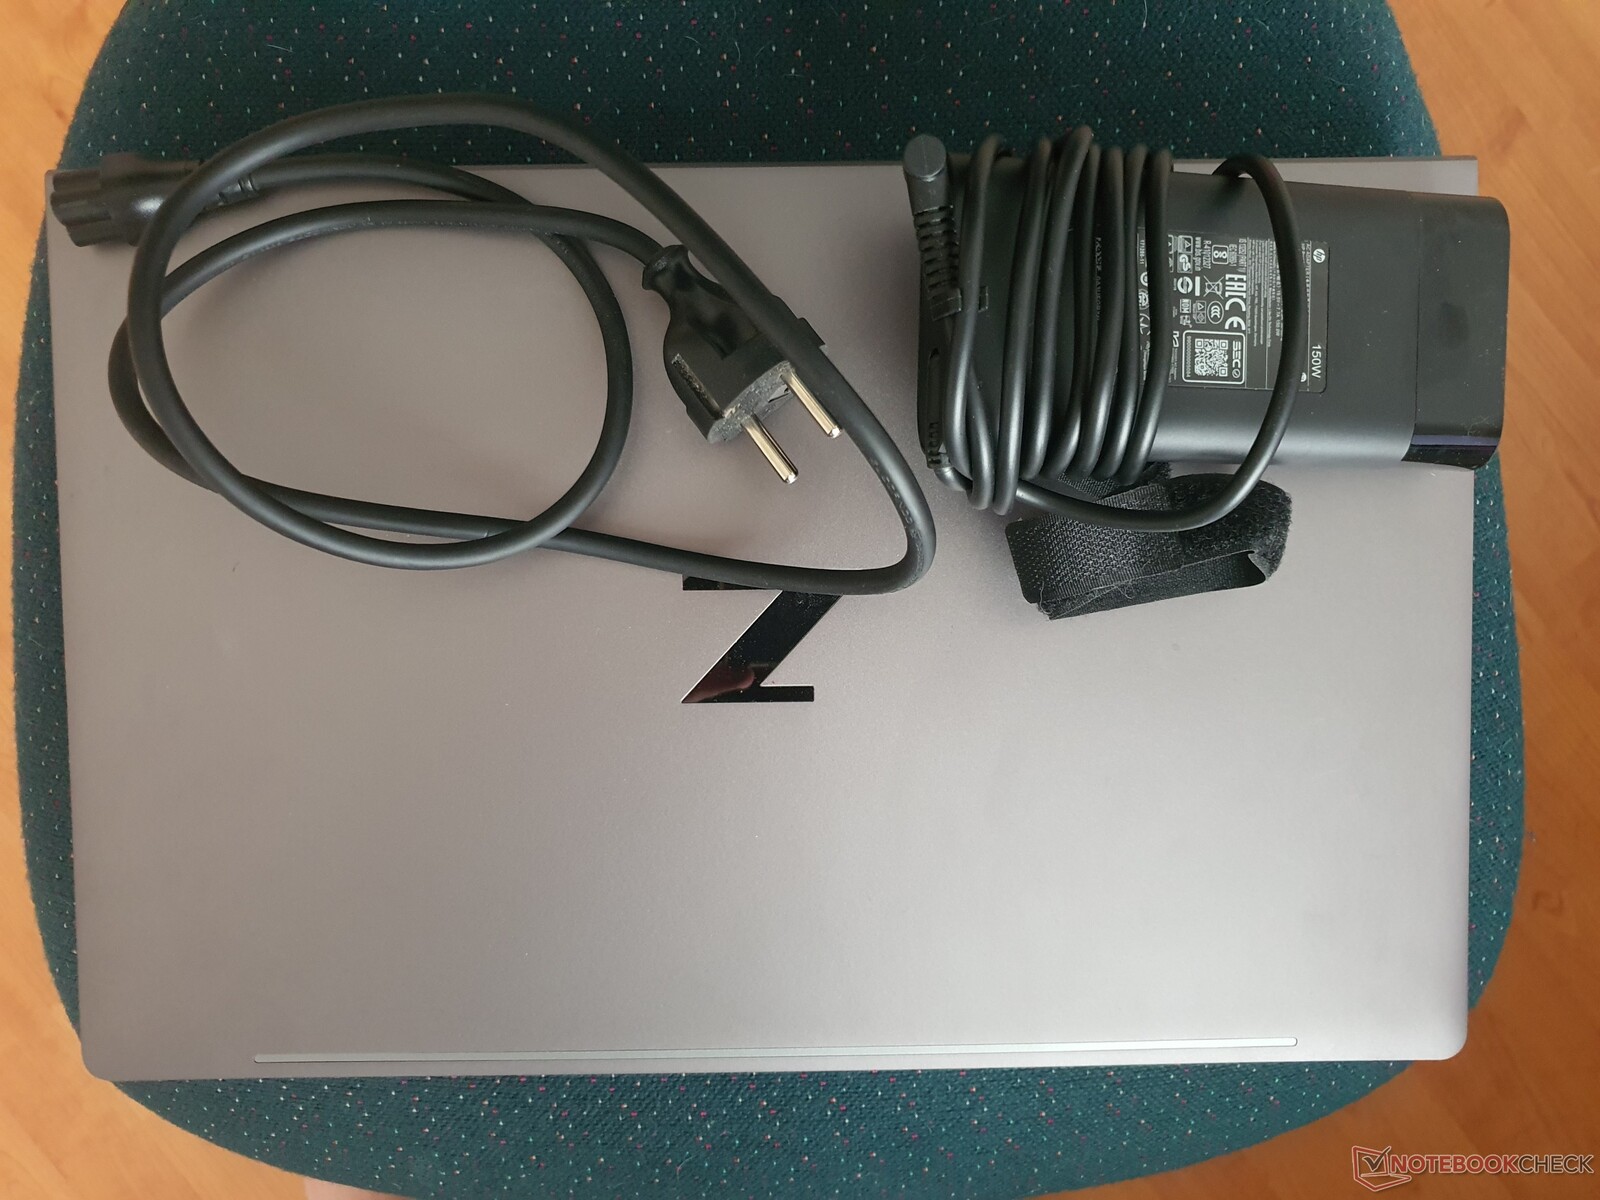
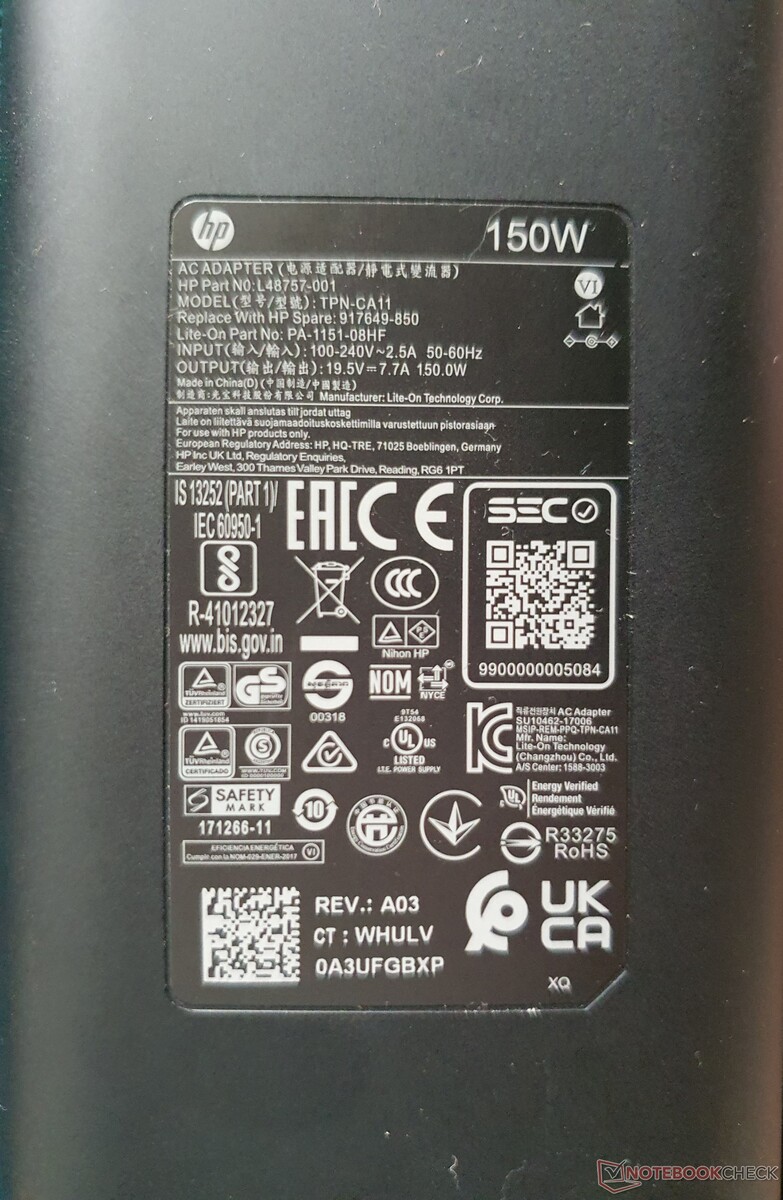
È incluso un alimentatore da 150 watt (120 watt nelle configurazioni senza dGPU). L'imballaggio è privo di plastica (cioè solo il 10%), la maggior parte è costituita da cartone (riciclato al 45%) e carta di cellulosa. In opzione, HP offre diversi dock USB-C/Thunderbolt, ma solo il modello HP TB Dock G2 con cavo combo (circa 200 euro, ~$204) include Power Delivery.
Manutenzione
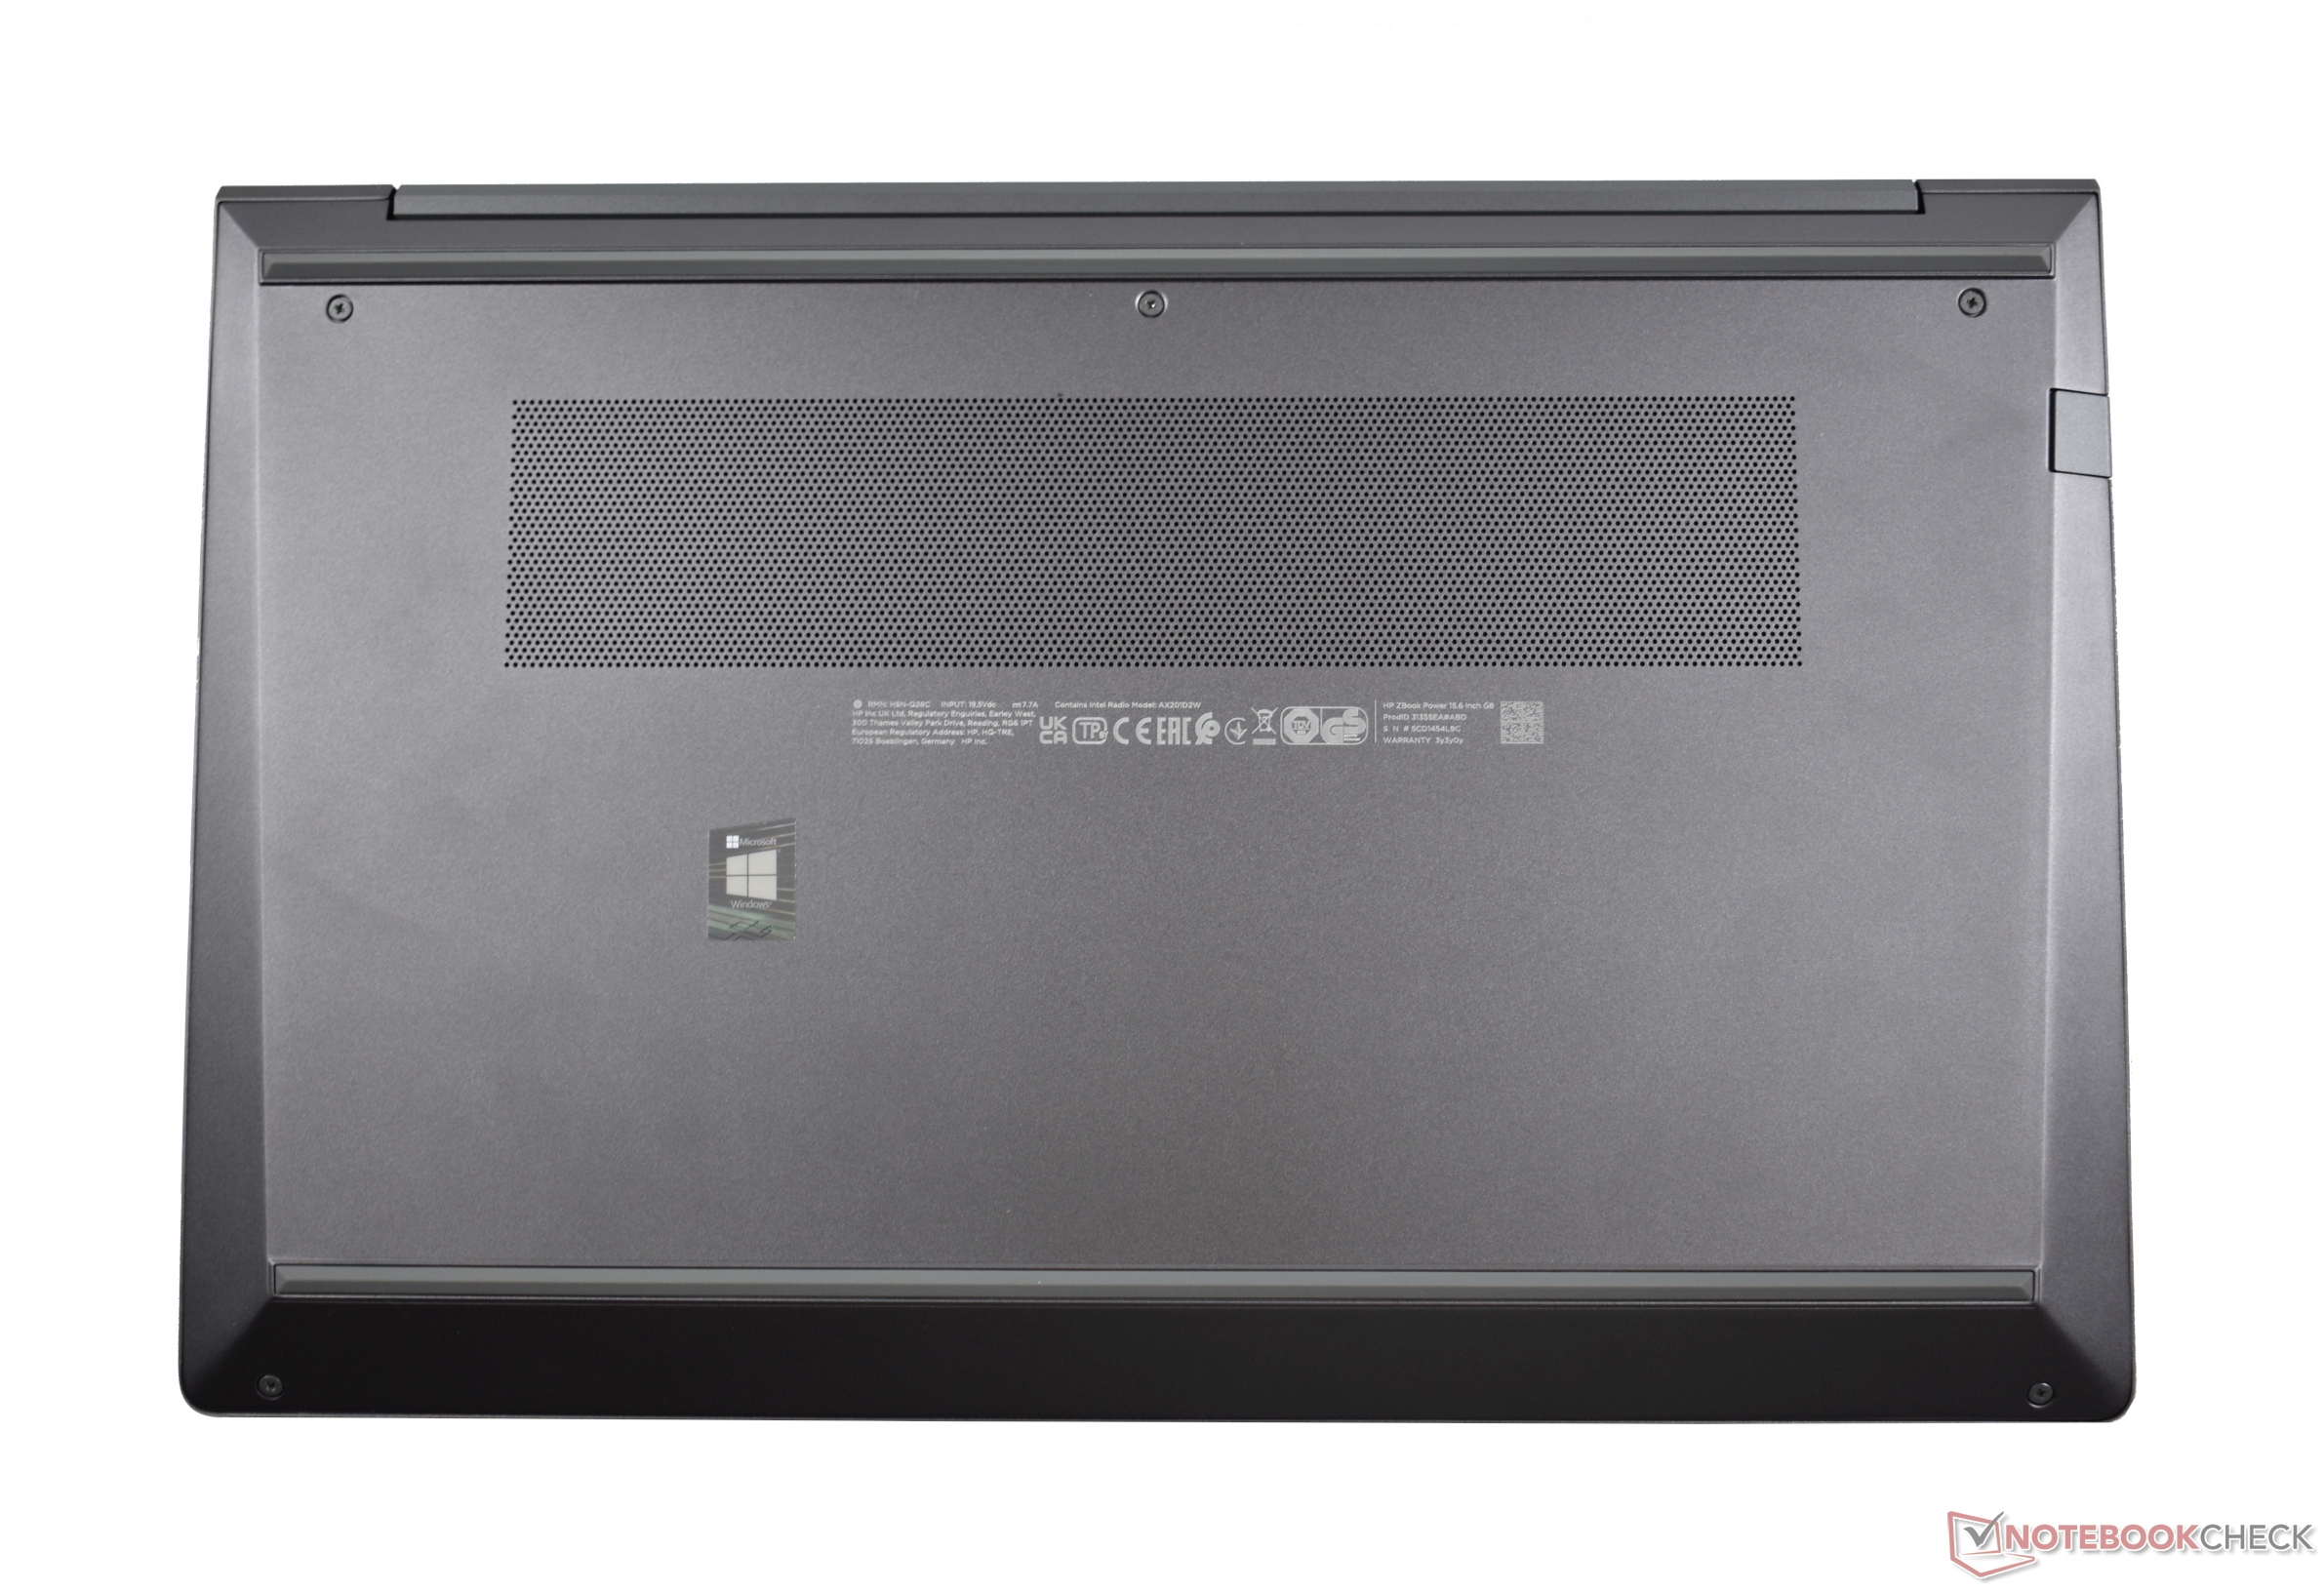
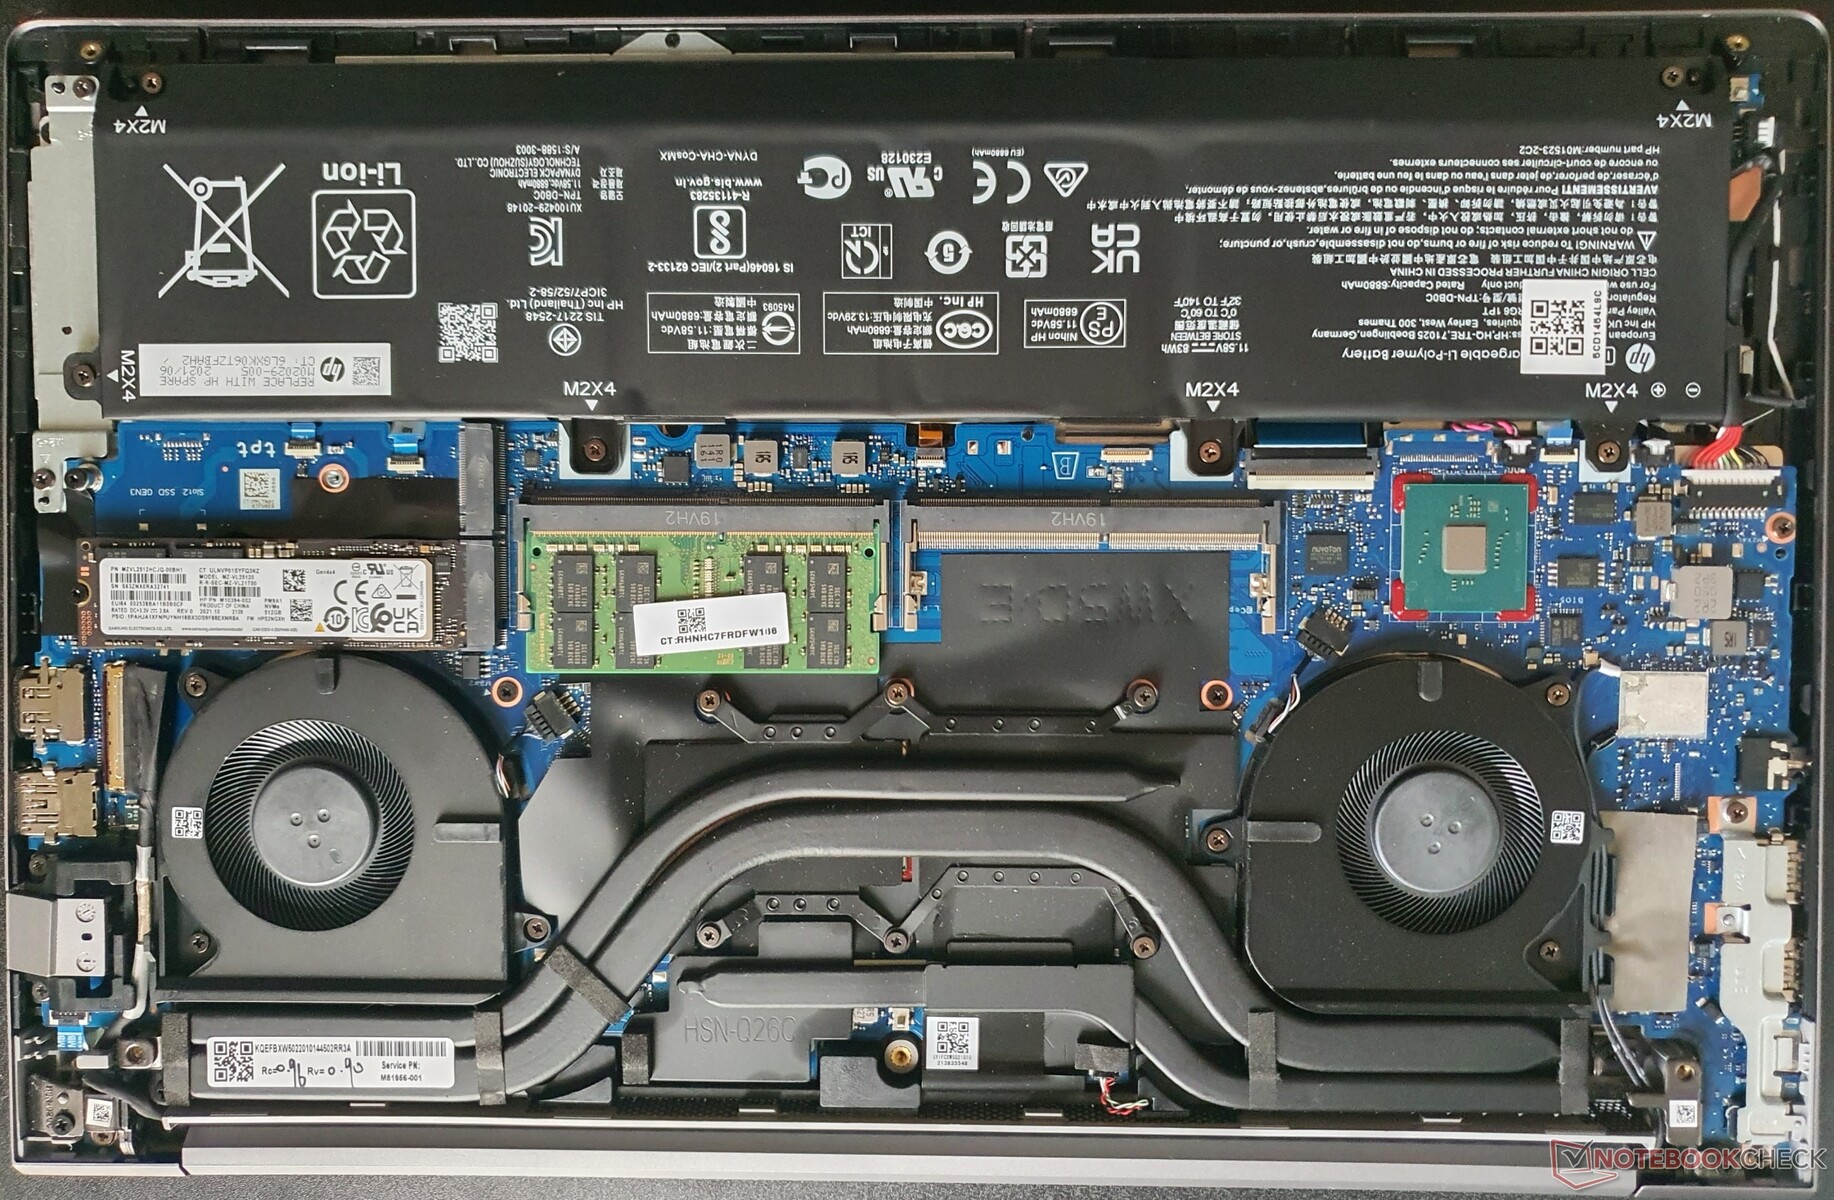
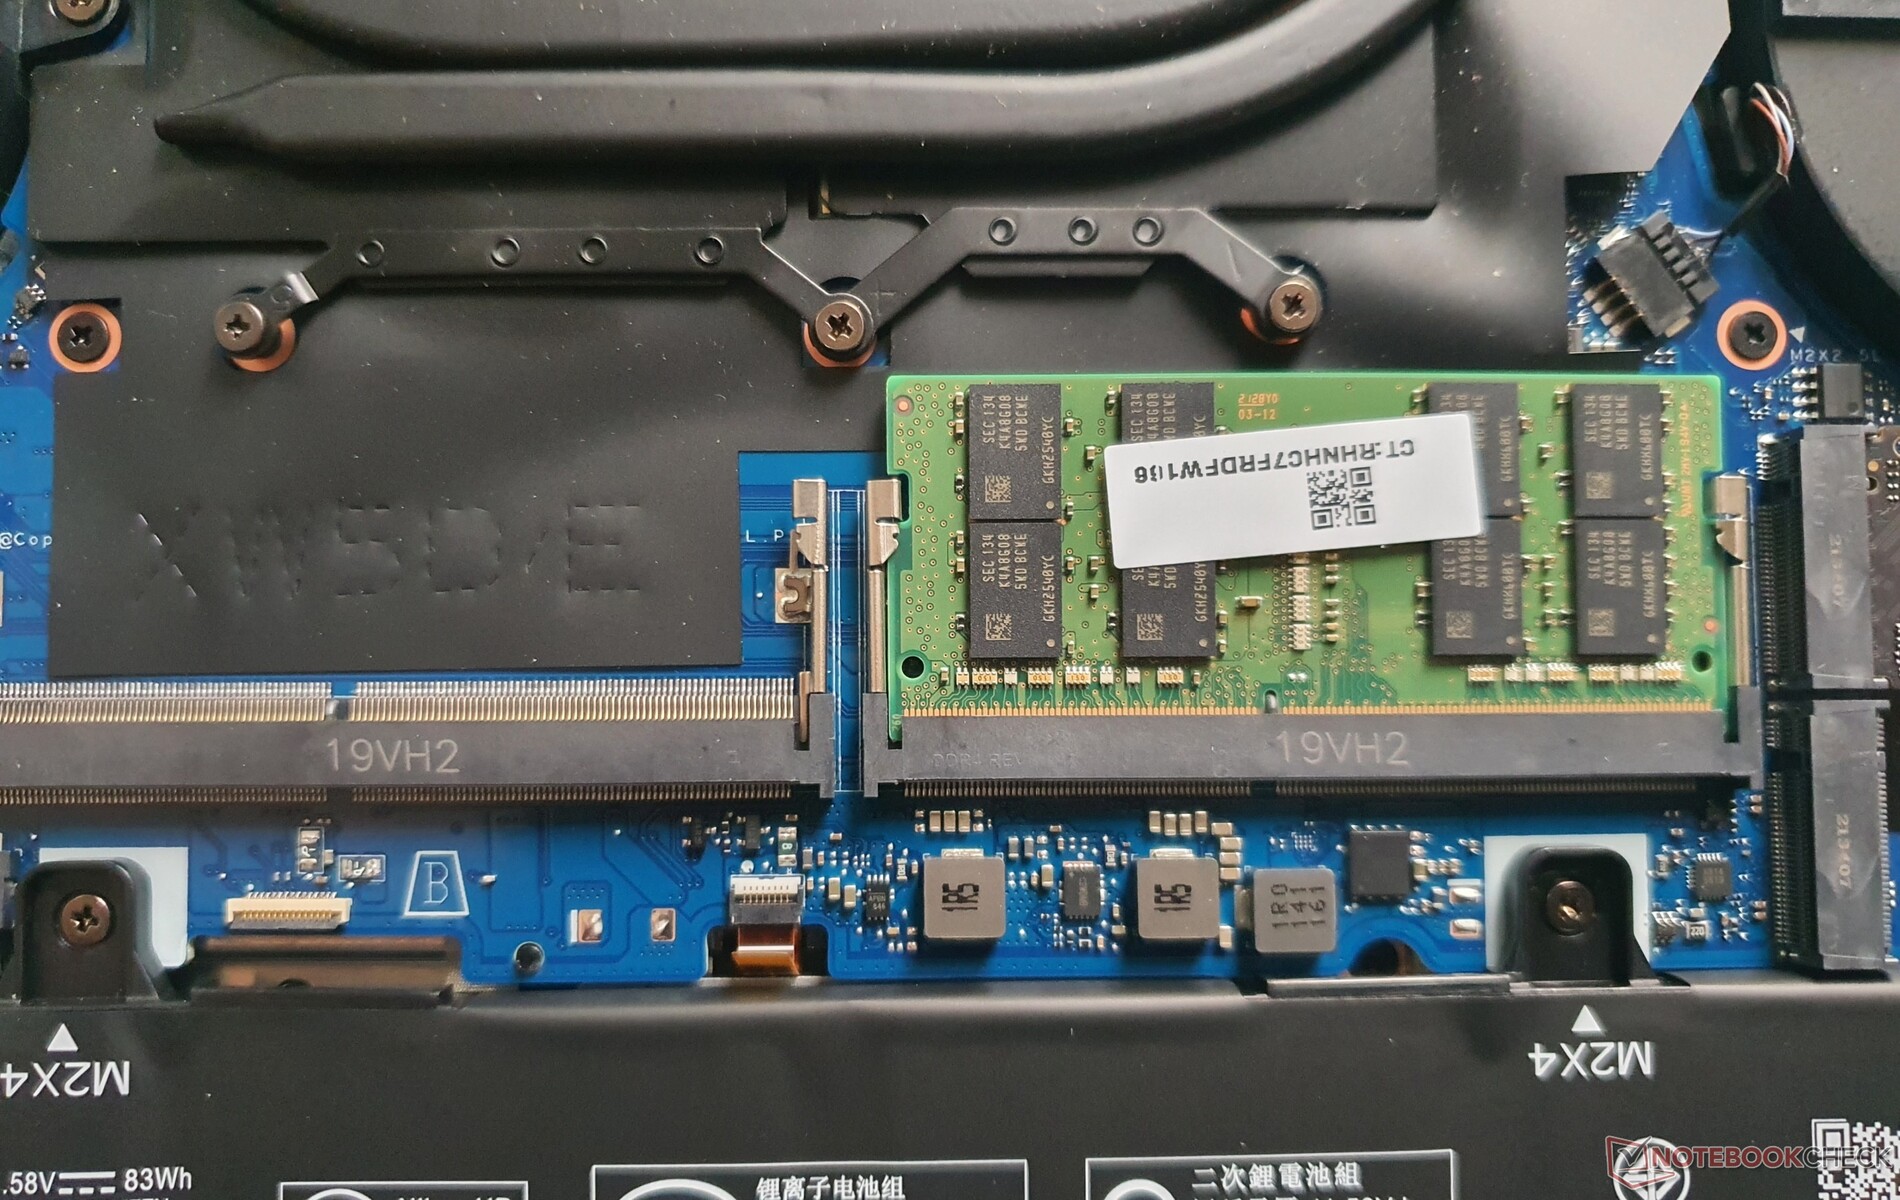
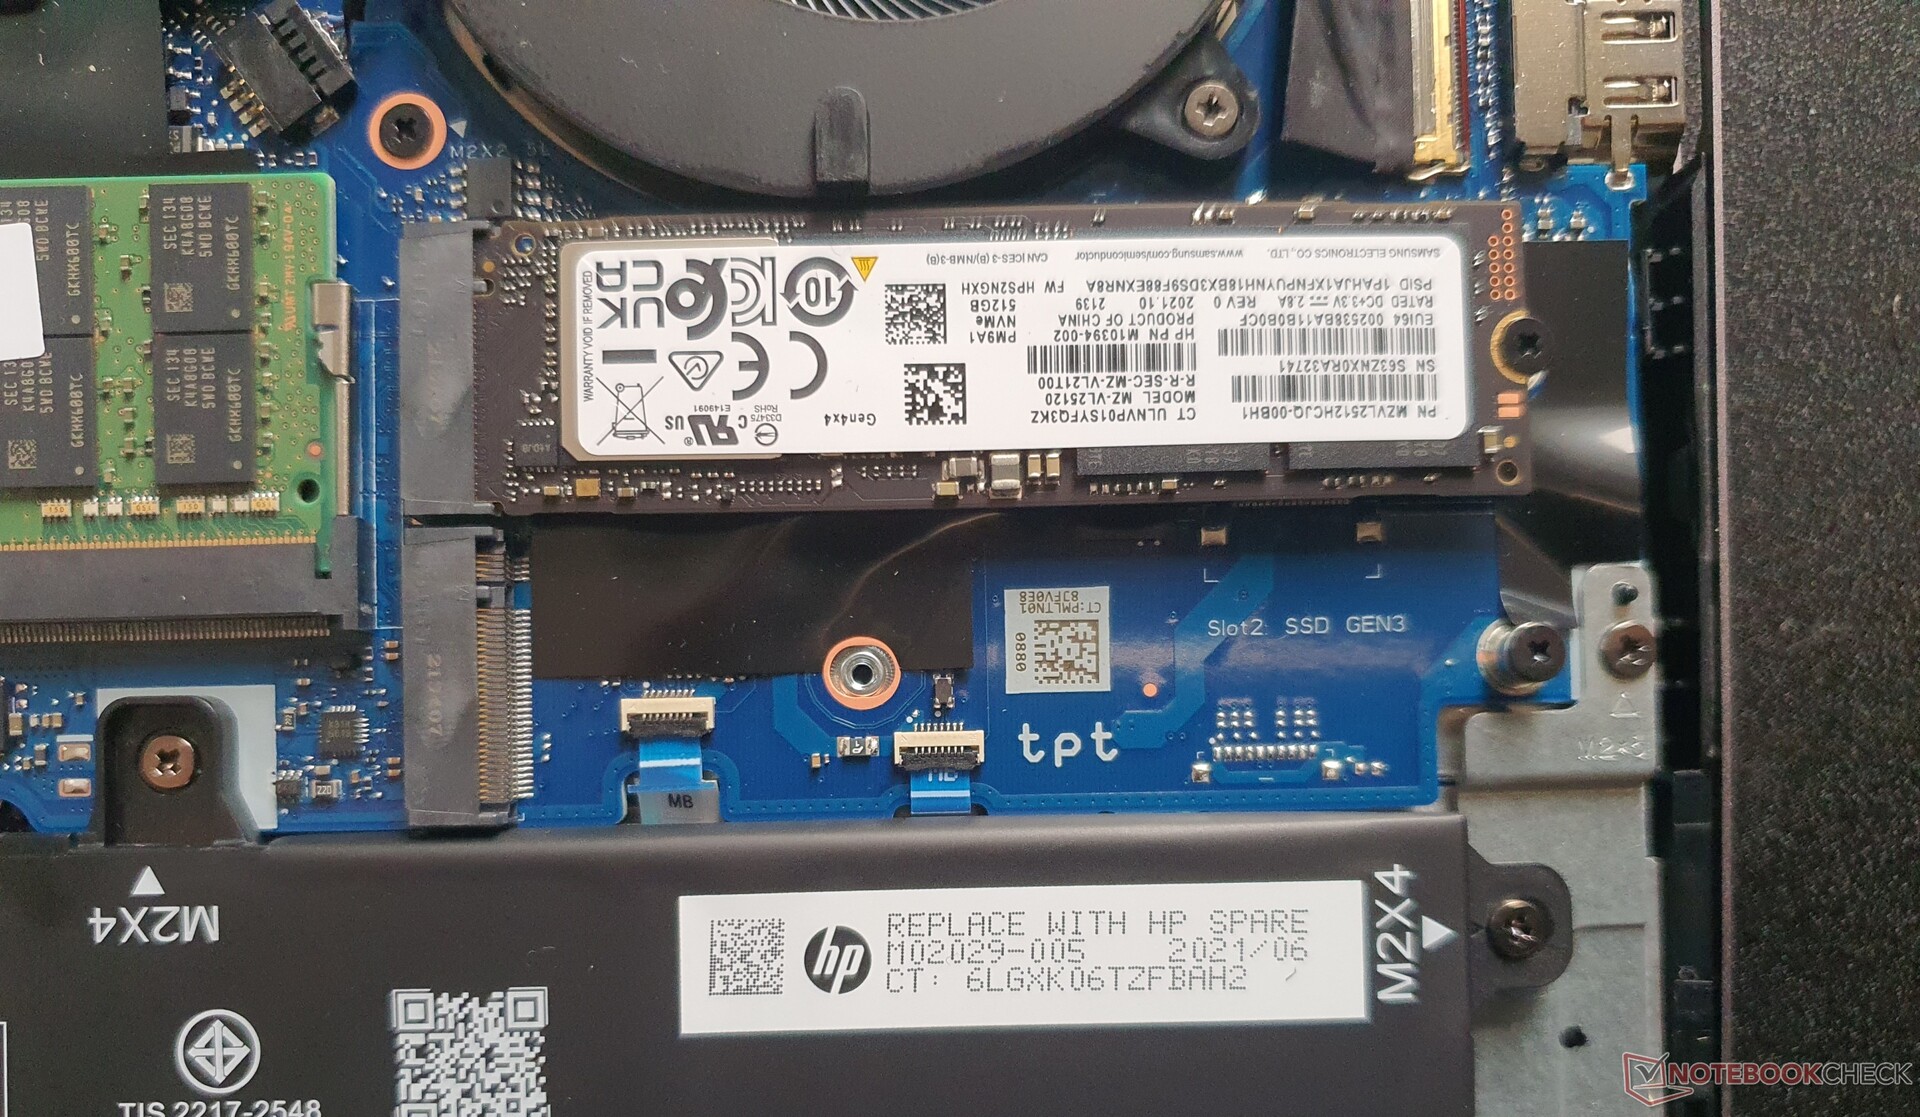
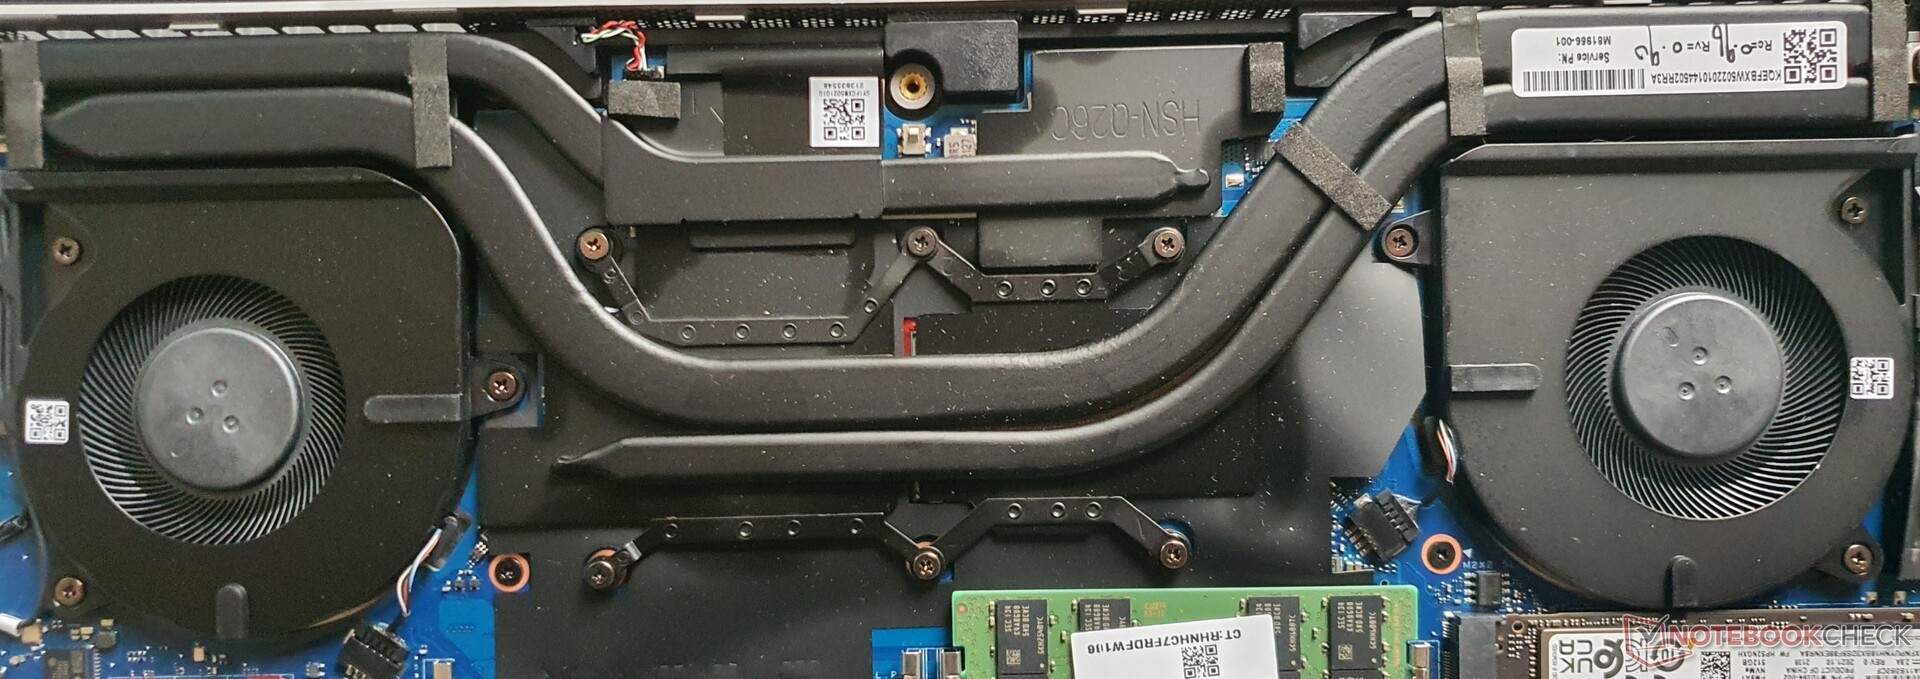
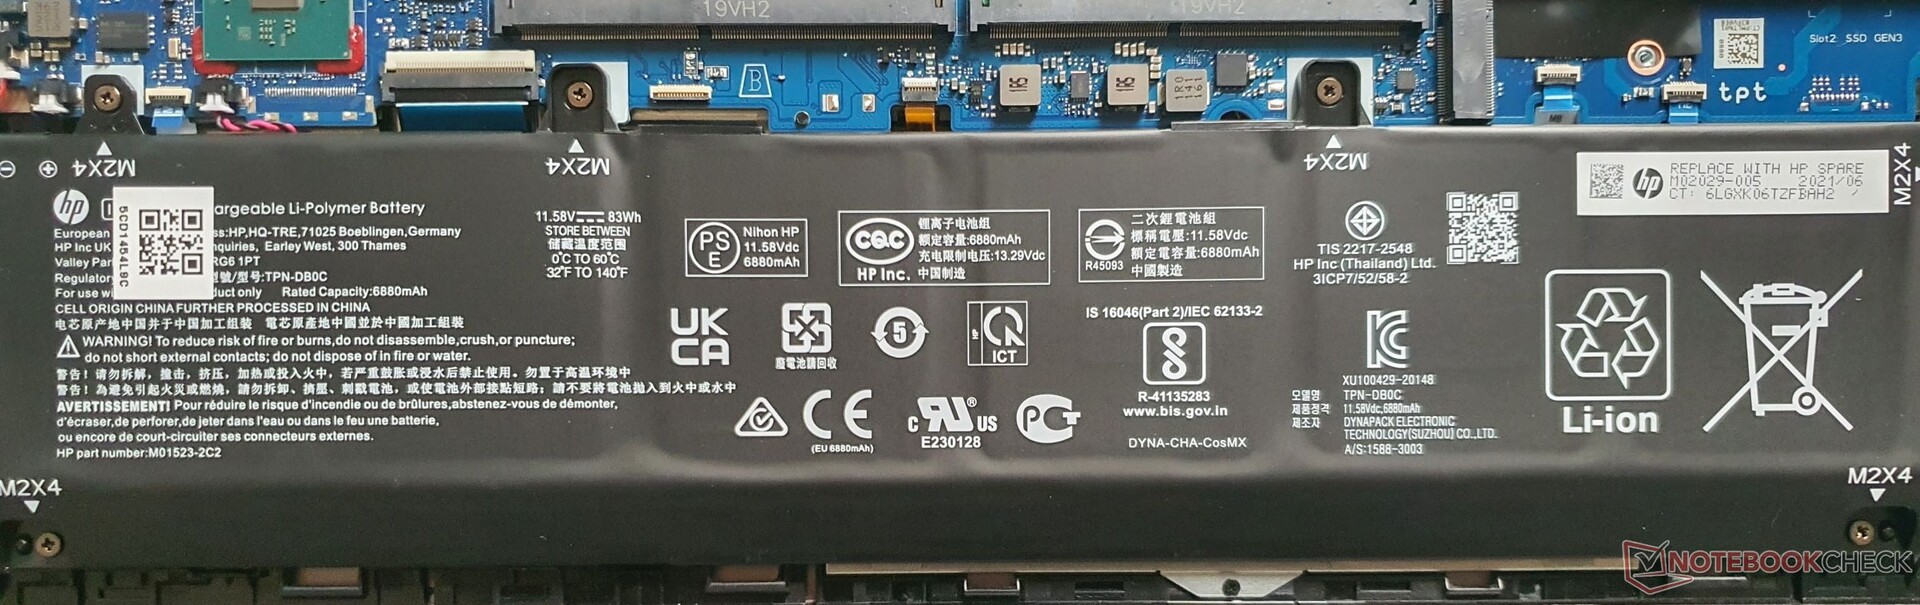
Dopo aver rimosso solo cinque viti Philips, il fondo del case può essere facilmente rimosso con uno strumento di plastica. In questo modo è possibile accedere a 2 DIMM SO e 2 slot M.2-2280, mentre la batteria è sostituibile e il sistema di raffreddamento avvitato può essere mantenuto. Il modulo WLAN è saldato e anche la tastiera è fissa. Non c'è WWAN.
Garanzia
Nell'area di lingua tedesca, HP offre una garanzia standard di 3 anni, che può essere estesa fino a 5 anni. Include il servizio di ritiro e restituzione, mentre l'assistenza in loco ha un costo aggiuntivo. Ciò corrisponde alle politiche di HP per i computer portatili aziendali di fascia alta.
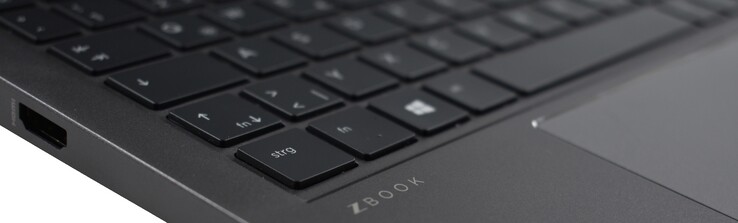
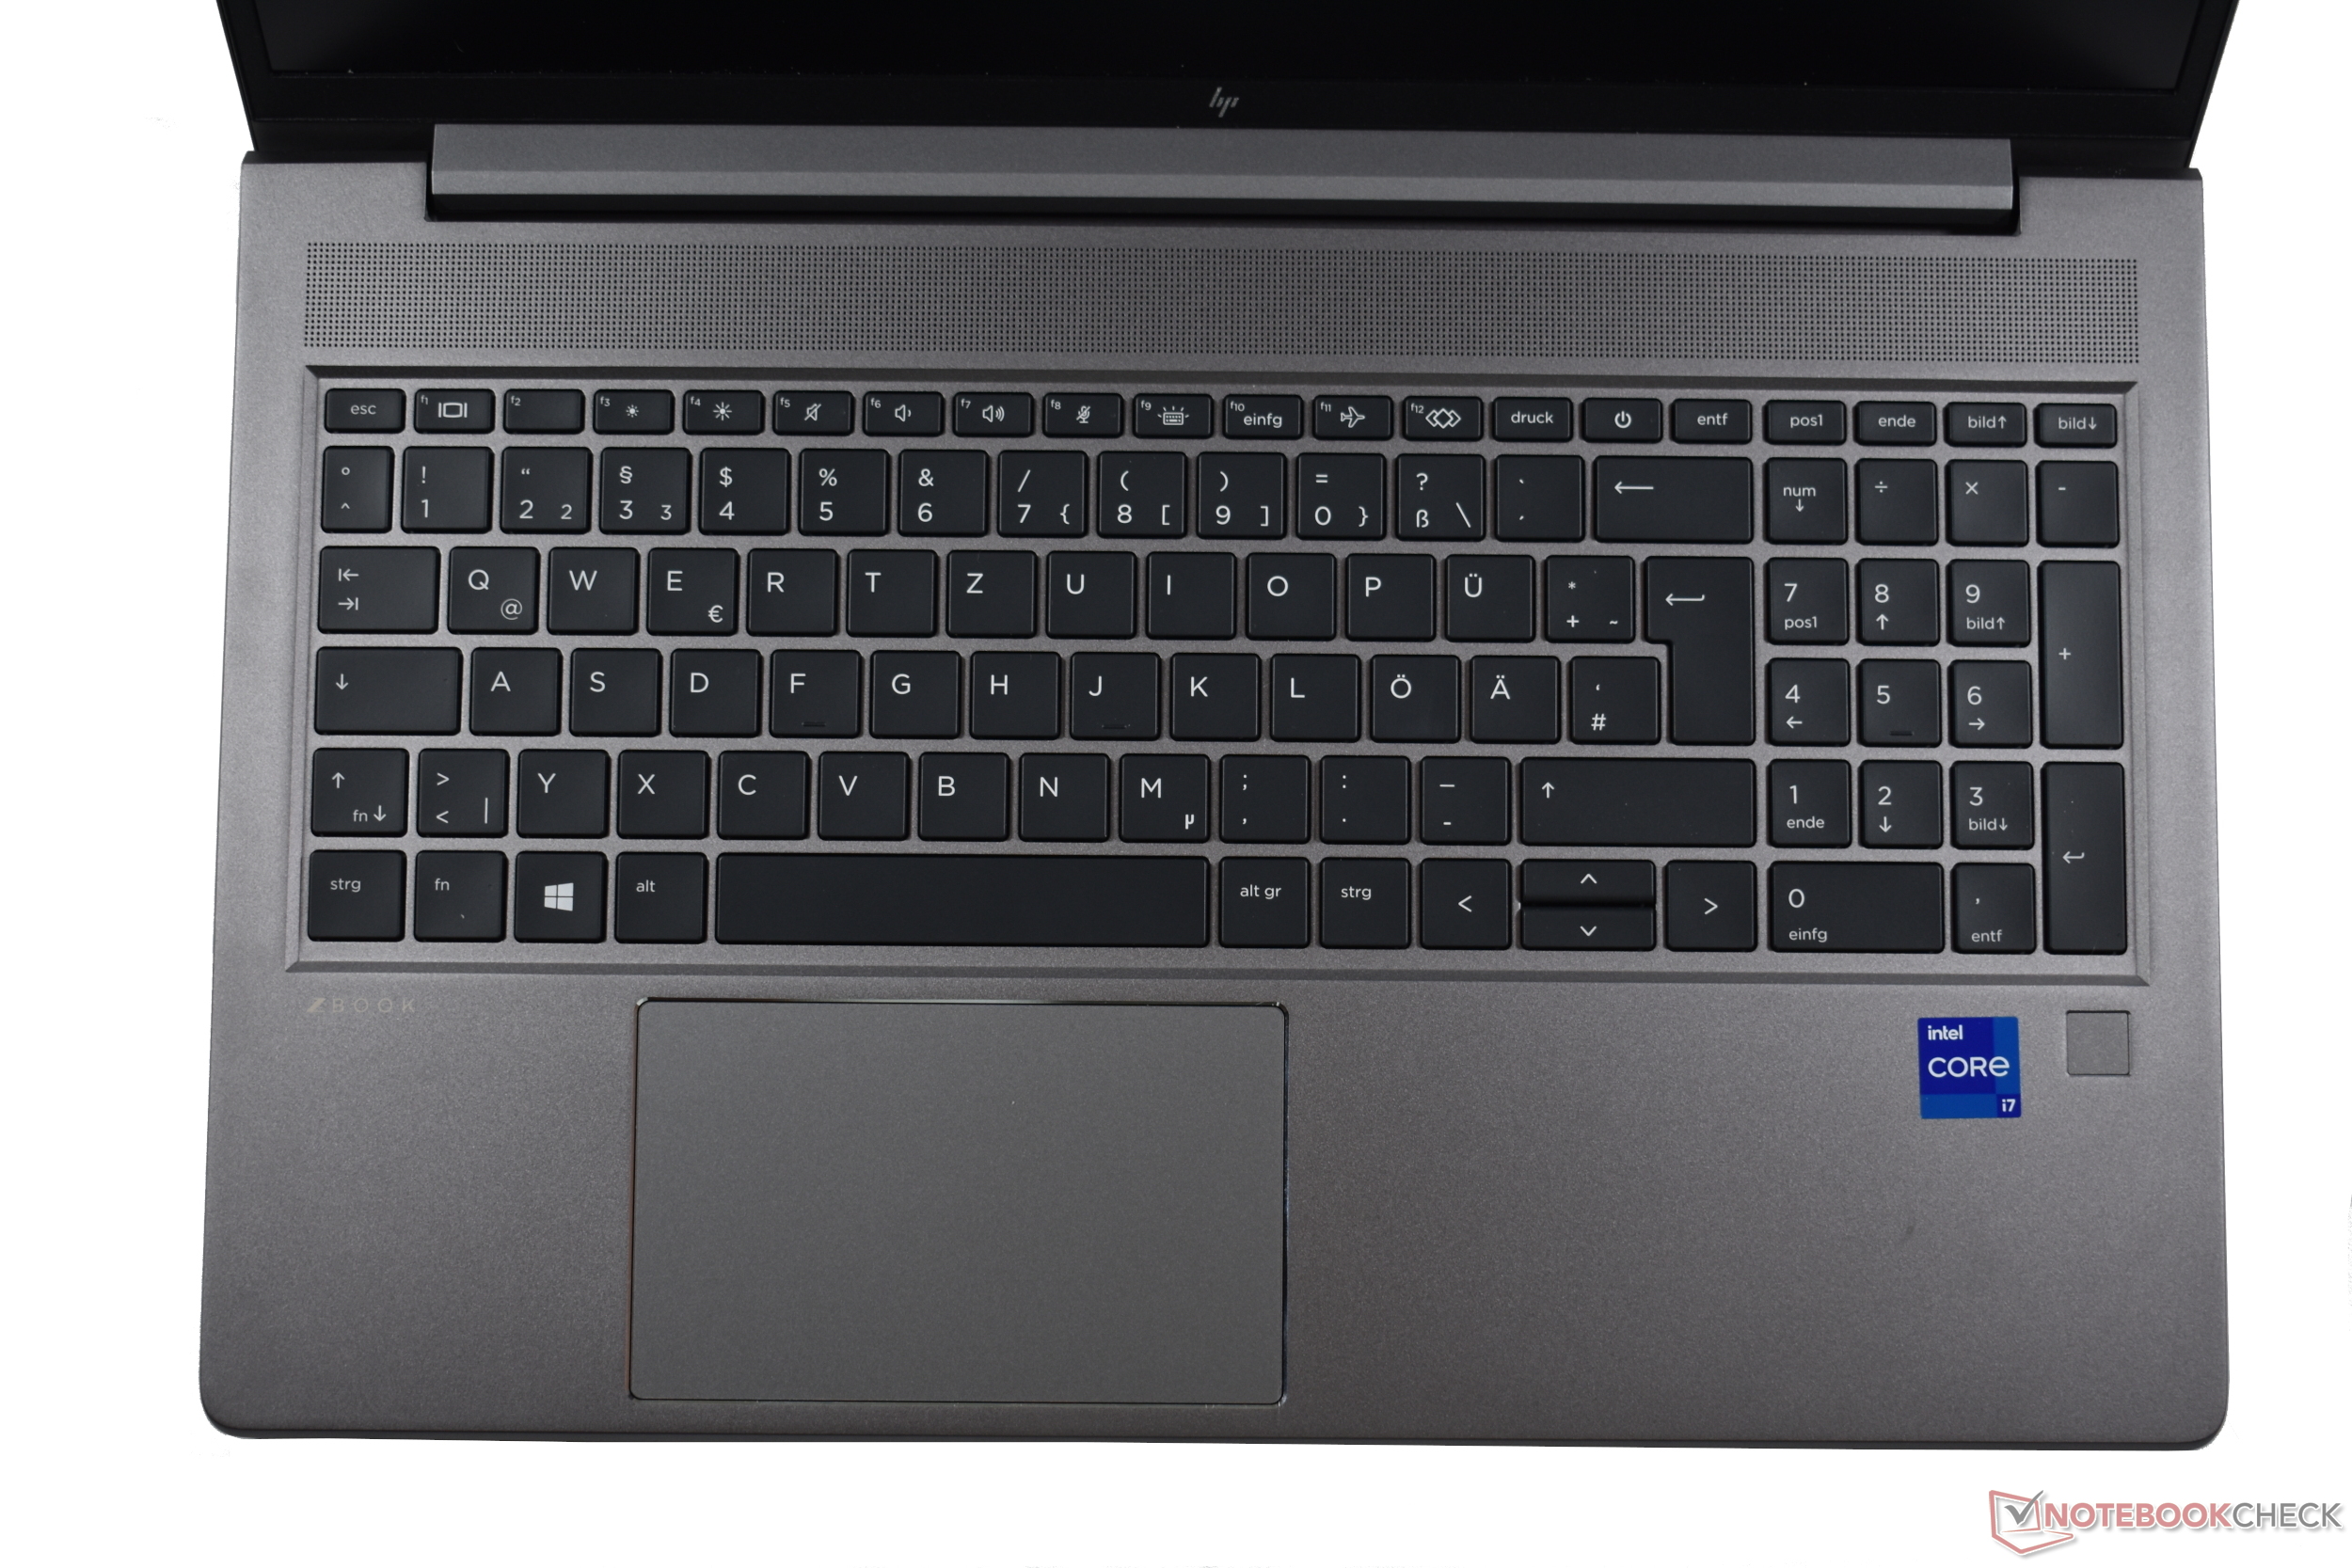
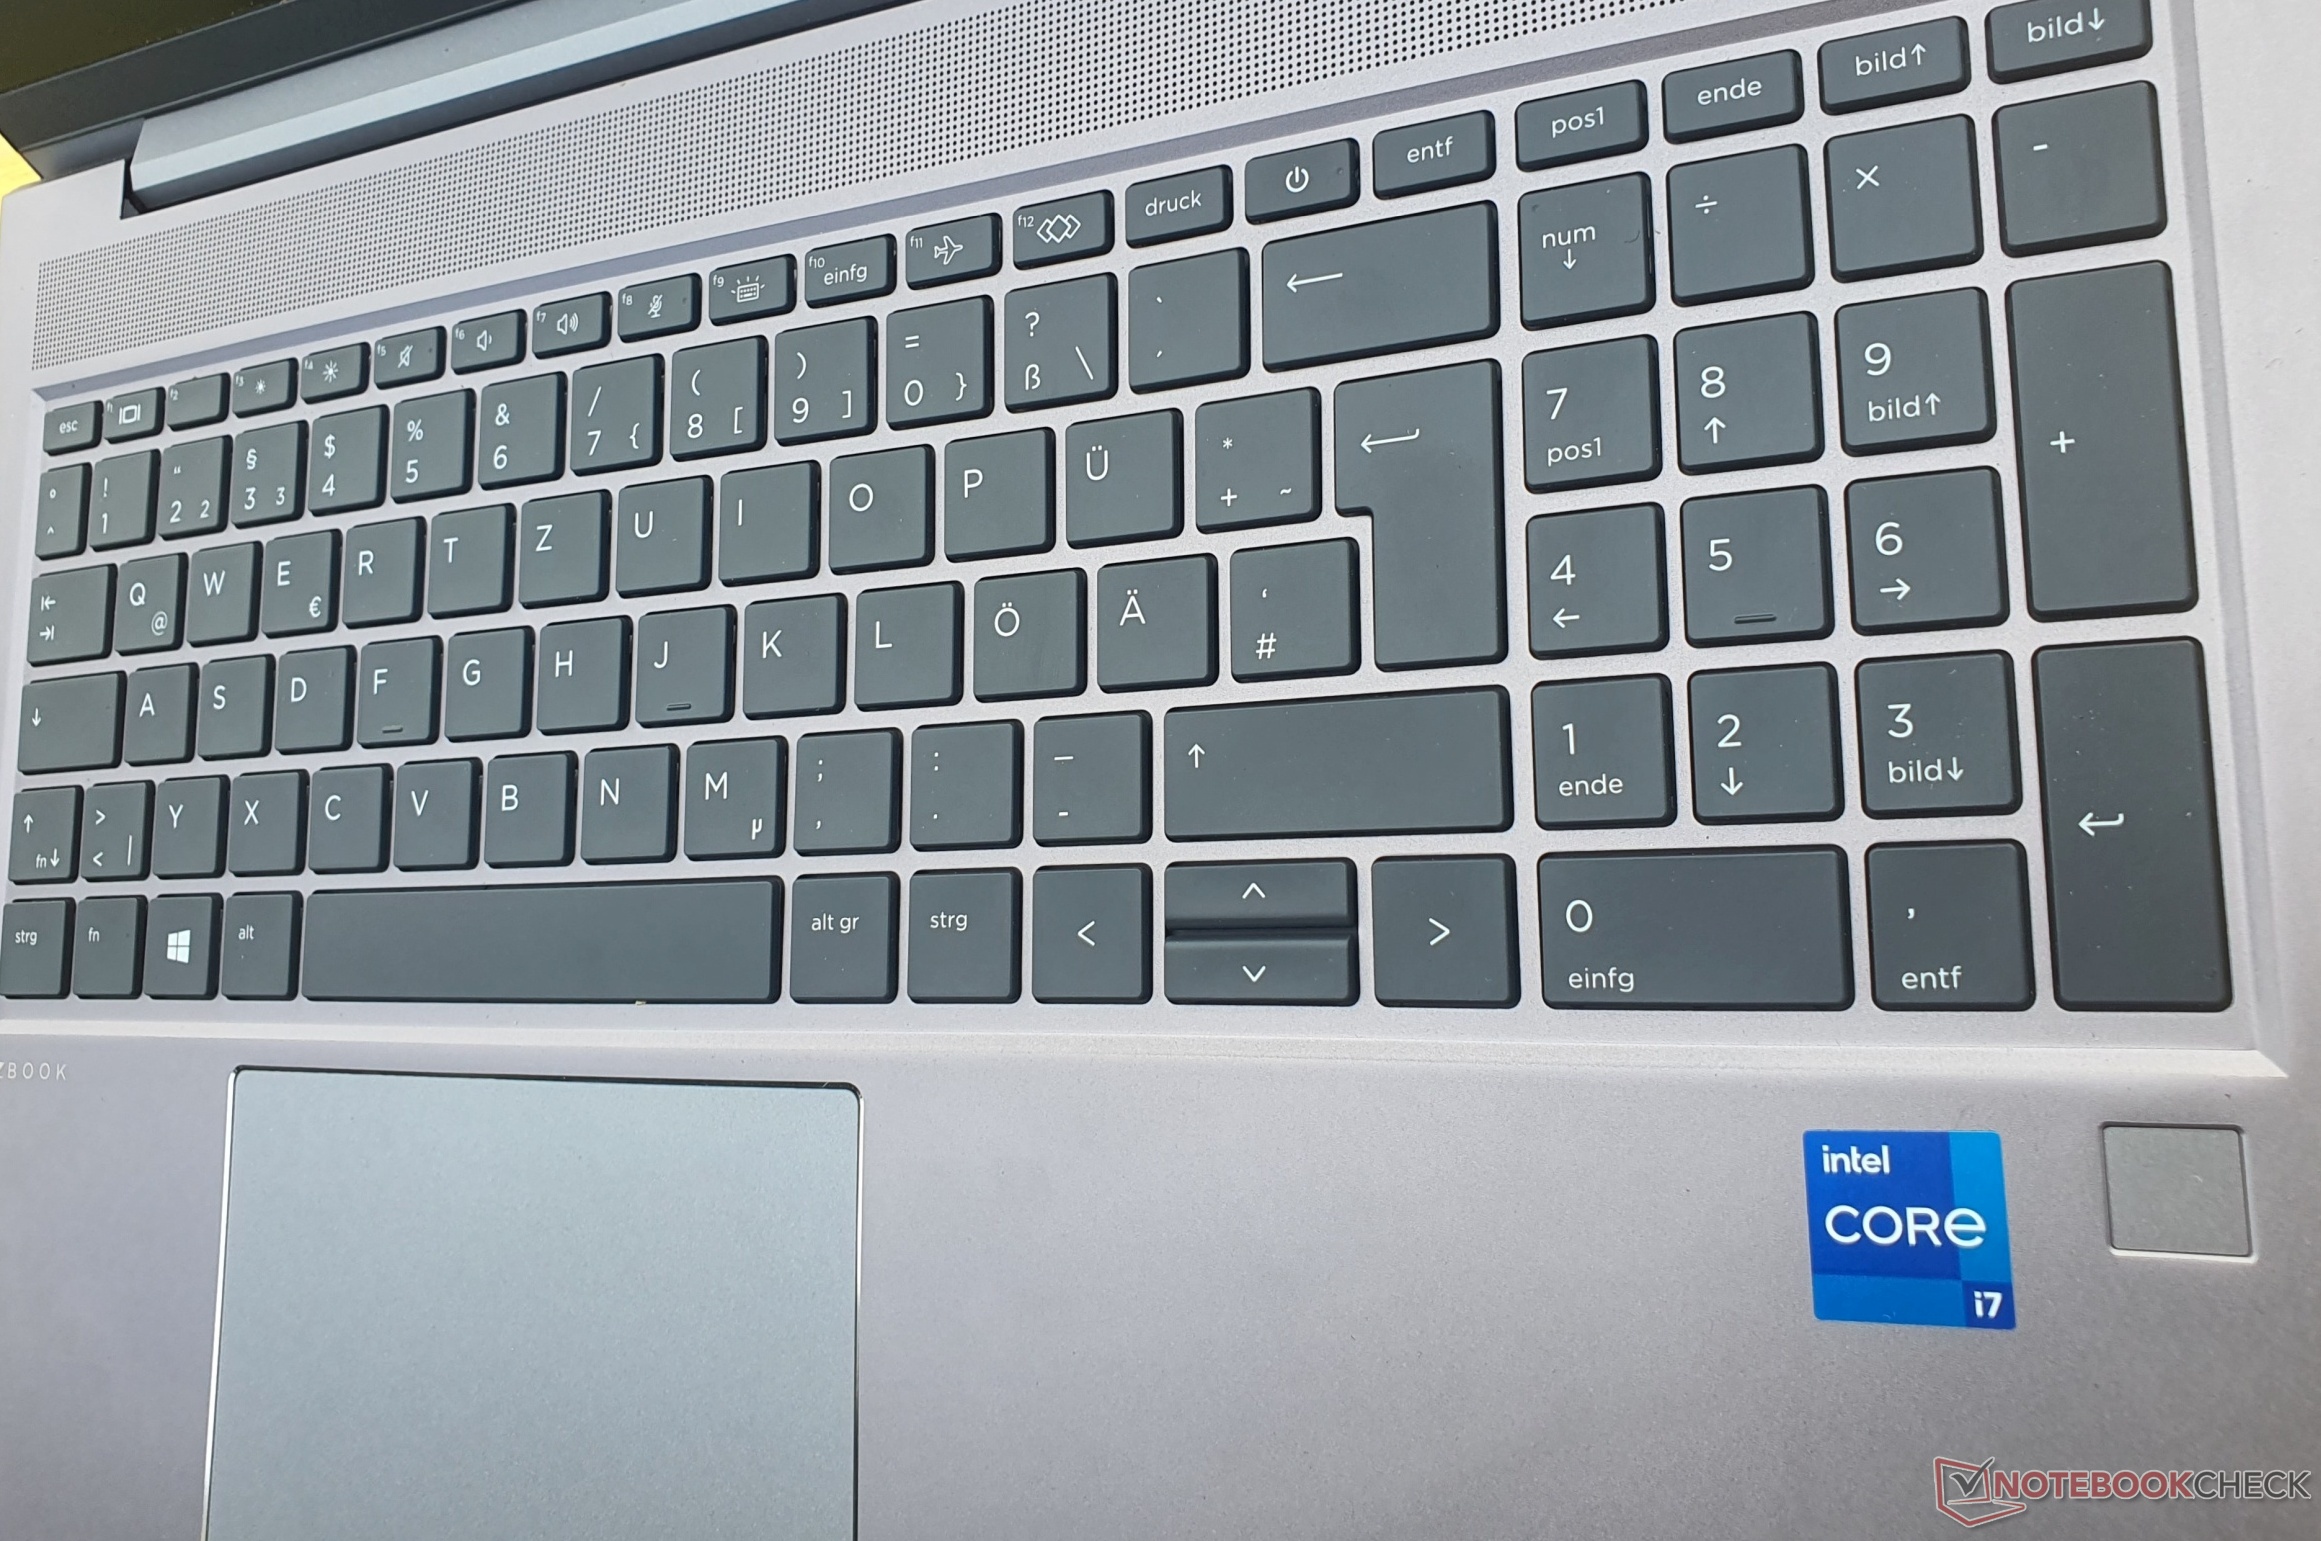
Dispositivi di input: Lo ZBook Power convince con una tastiera nitida
Tastiera
Mentre la tastiera ha tasti e distanze leggermente inferiori (15 × 15 mm, ~0,6 x 0,6 pollici), le scritte sono più grandi. Assomiglia molto a quella dello ZBook Firefly eZBook Furyquindi l'esperienza di digitazione è altrettanto nitida e il punto di pressione è chiaramente visibile. La corsa di ~1,5 mm (~0,06 in) aggiunge un'impressione generale attraente
La tastiera è resistente agli spruzzi e il suo funzionamento è estremamente silenzioso. È possibile esercitare una leggera pressione solo su un singolo punto. Non è necessariamente peggiore di quella del ThinkPad P15v.
Il layout è ben riuscito, ma i tasti più piccoli sono Invio, Shift sinistro, frecce verticali, blocco numeri e la riga superiore. Anche il pulsante di accensione è integrato nella riga superiore, ma se lo si preme accidentalmente il portatile non si spegne. L'illuminazione è a due livelli e la sua durata può essere configurata nel BIOS.
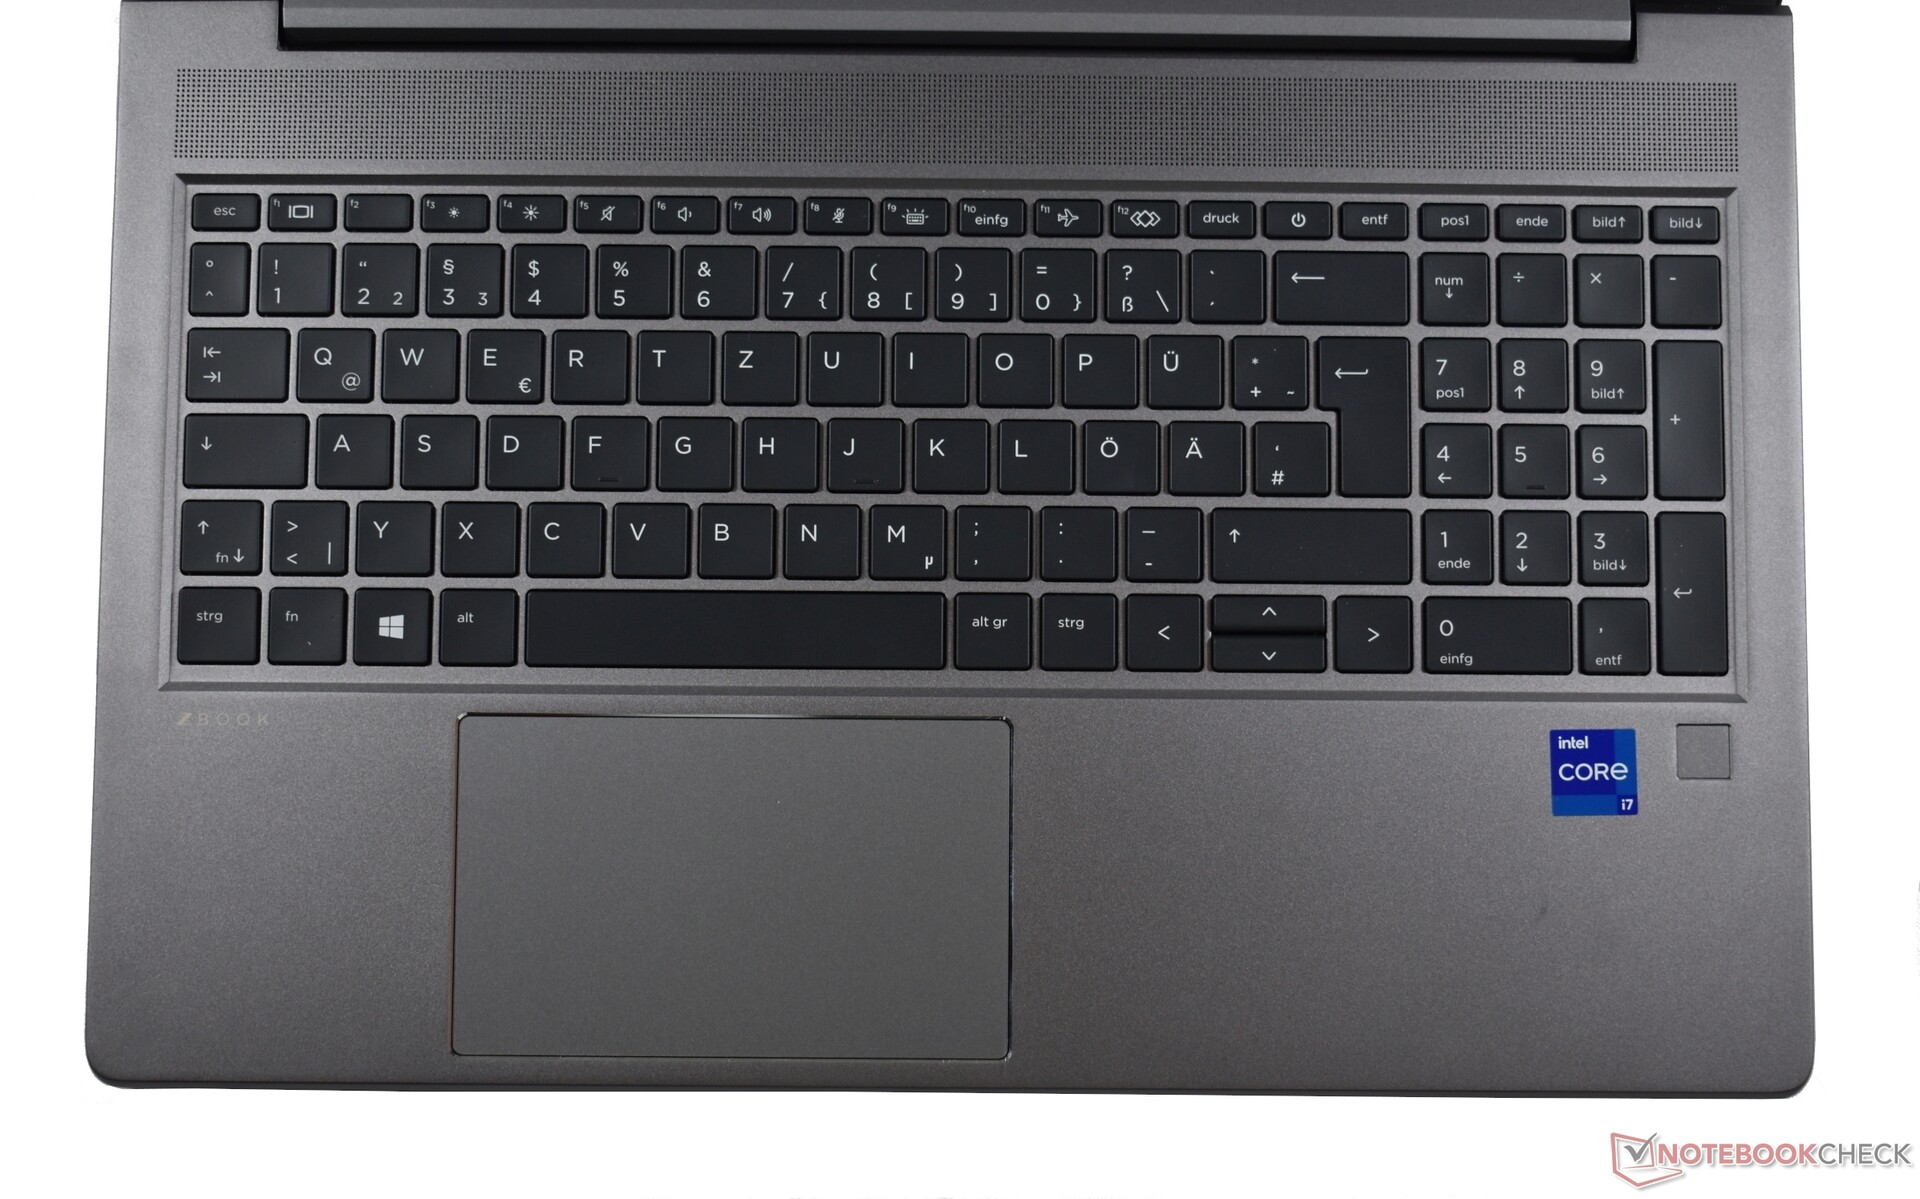
Touchpad
Il display da 11,5 × 7 cm (~4,5 x 2,75 pollici) è estremamente reattivo e preciso. La superficie liscia del vetro offre ottime caratteristiche di scorrimento e tutti i gesti sono implementati in modo impeccabile. I tasti integrati hanno una corsa media e producono un feedback potente e forte.
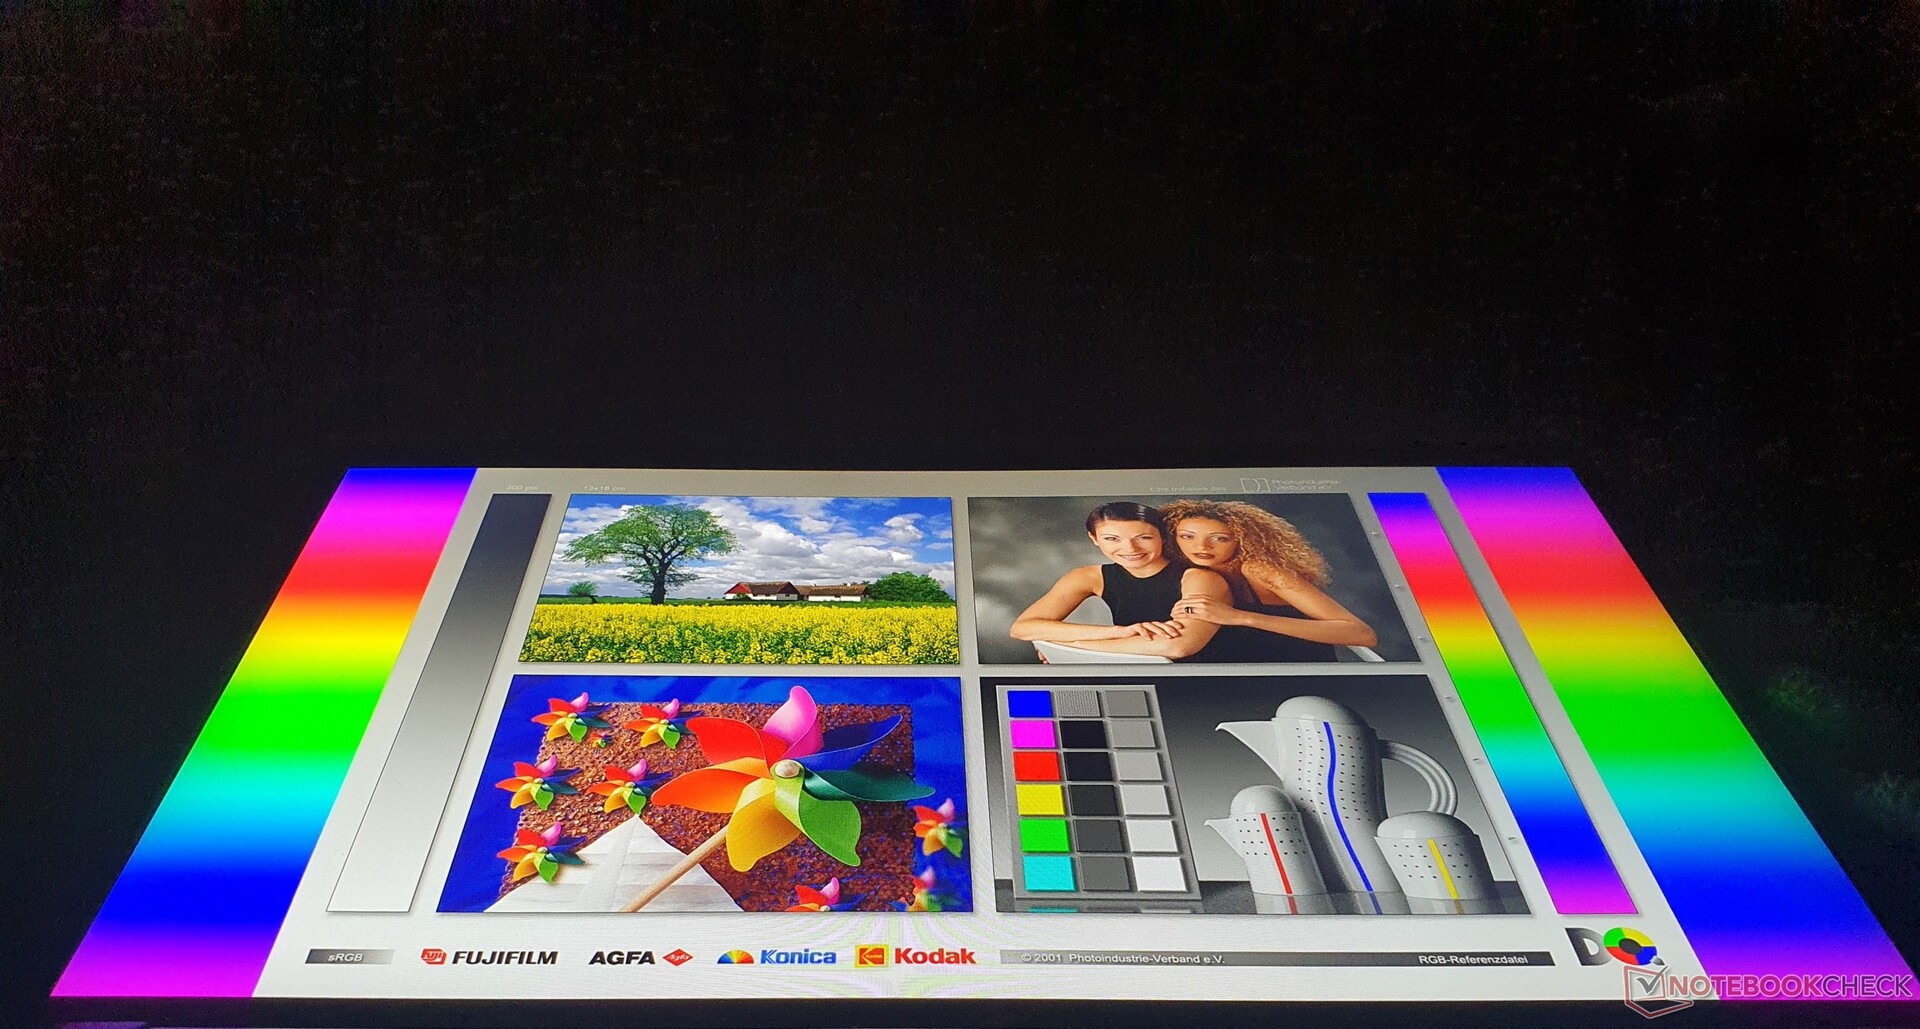
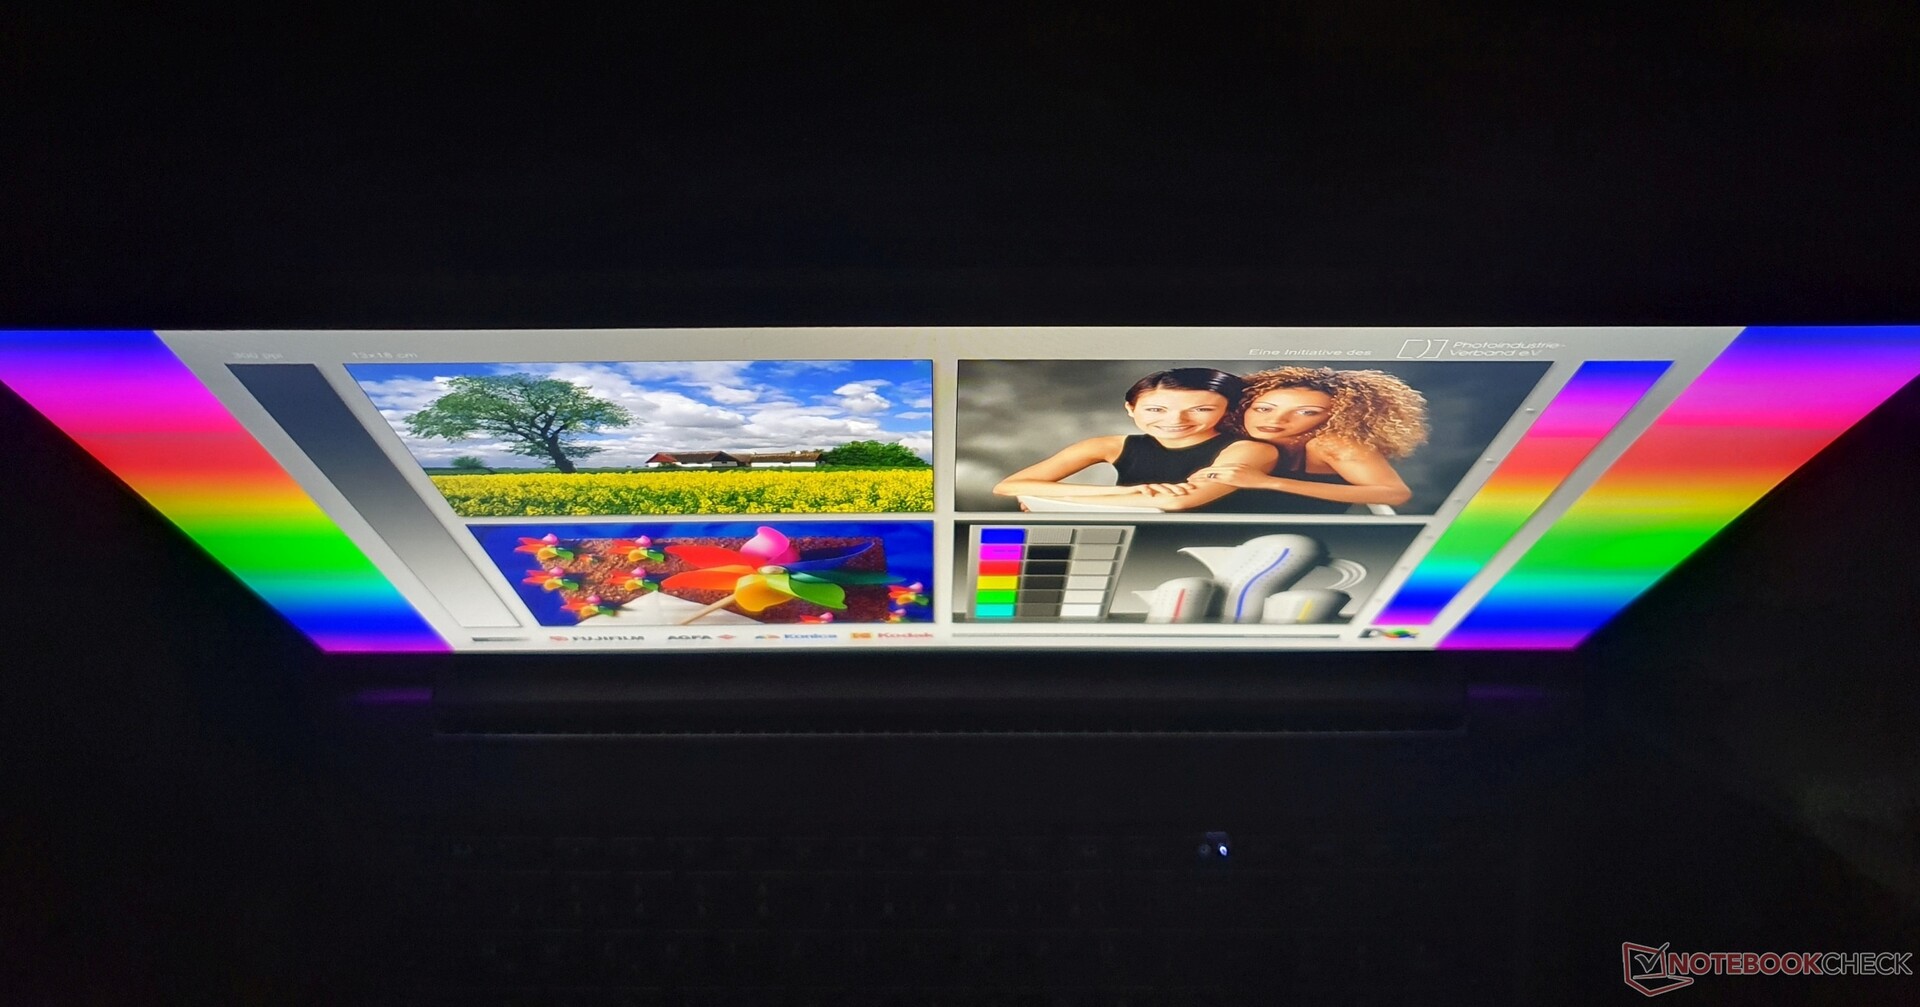
Display FHD luminoso e ad alto contrasto nello ZBook Power

La nostra configurazione include lo stesso pannello IPS FHD opaco da 15,6 pollici, luminoso (400 nit) e a basso consumo (AUOA08B) nel formato 16:9 del predecessore. Viene utilizzato anche in diversi HP Elite e ProBook, oltre che nel modello HP Envy x360 15.
L'opzione 4K (3840 x 2160 pixel) dovrebbe ridurre sensibilmente la durata della batteria e, secondo la scheda tecnica, offre solo una copertura completa dello spazio colore sRGB, come il pannello 4K dello ZBook Firefly G7 - quindi cercherete invano Dreamcolor. Il pannello entry-level utilizza un IPS FHD con solo 250 nits di luminosità e con touch opzionale.
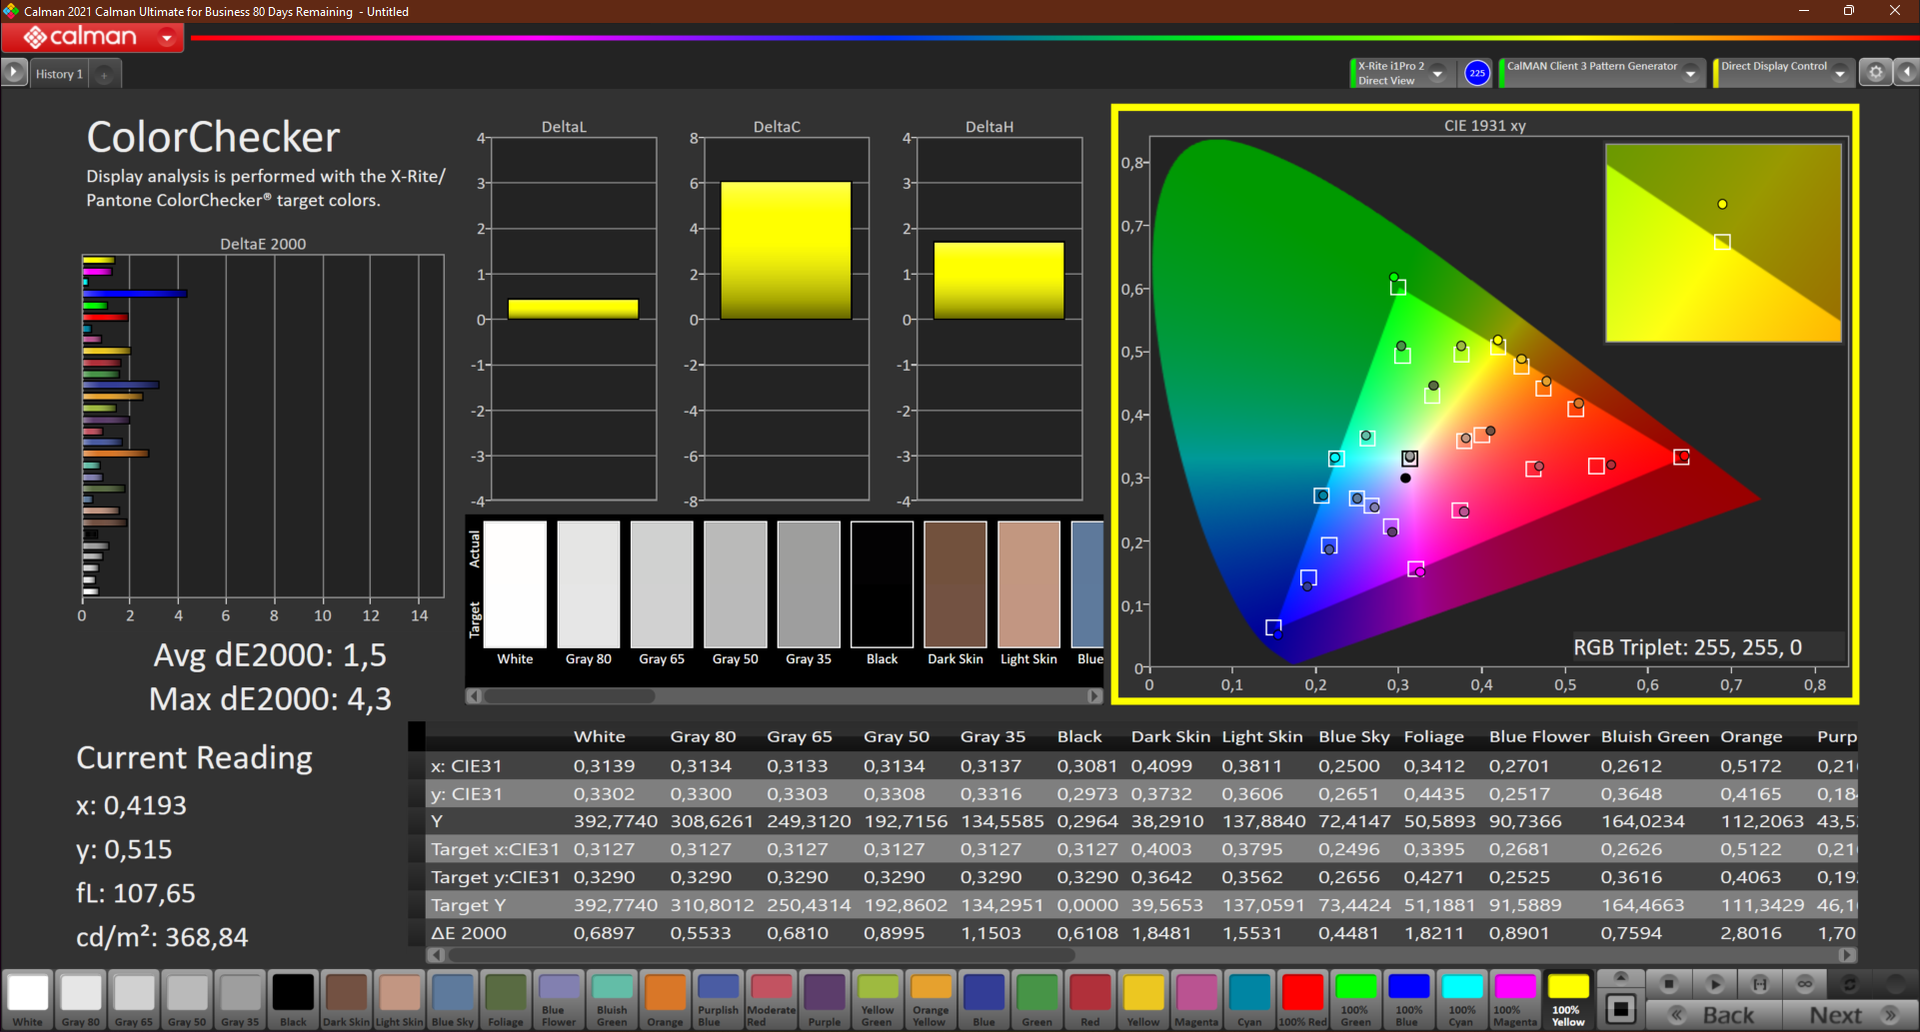
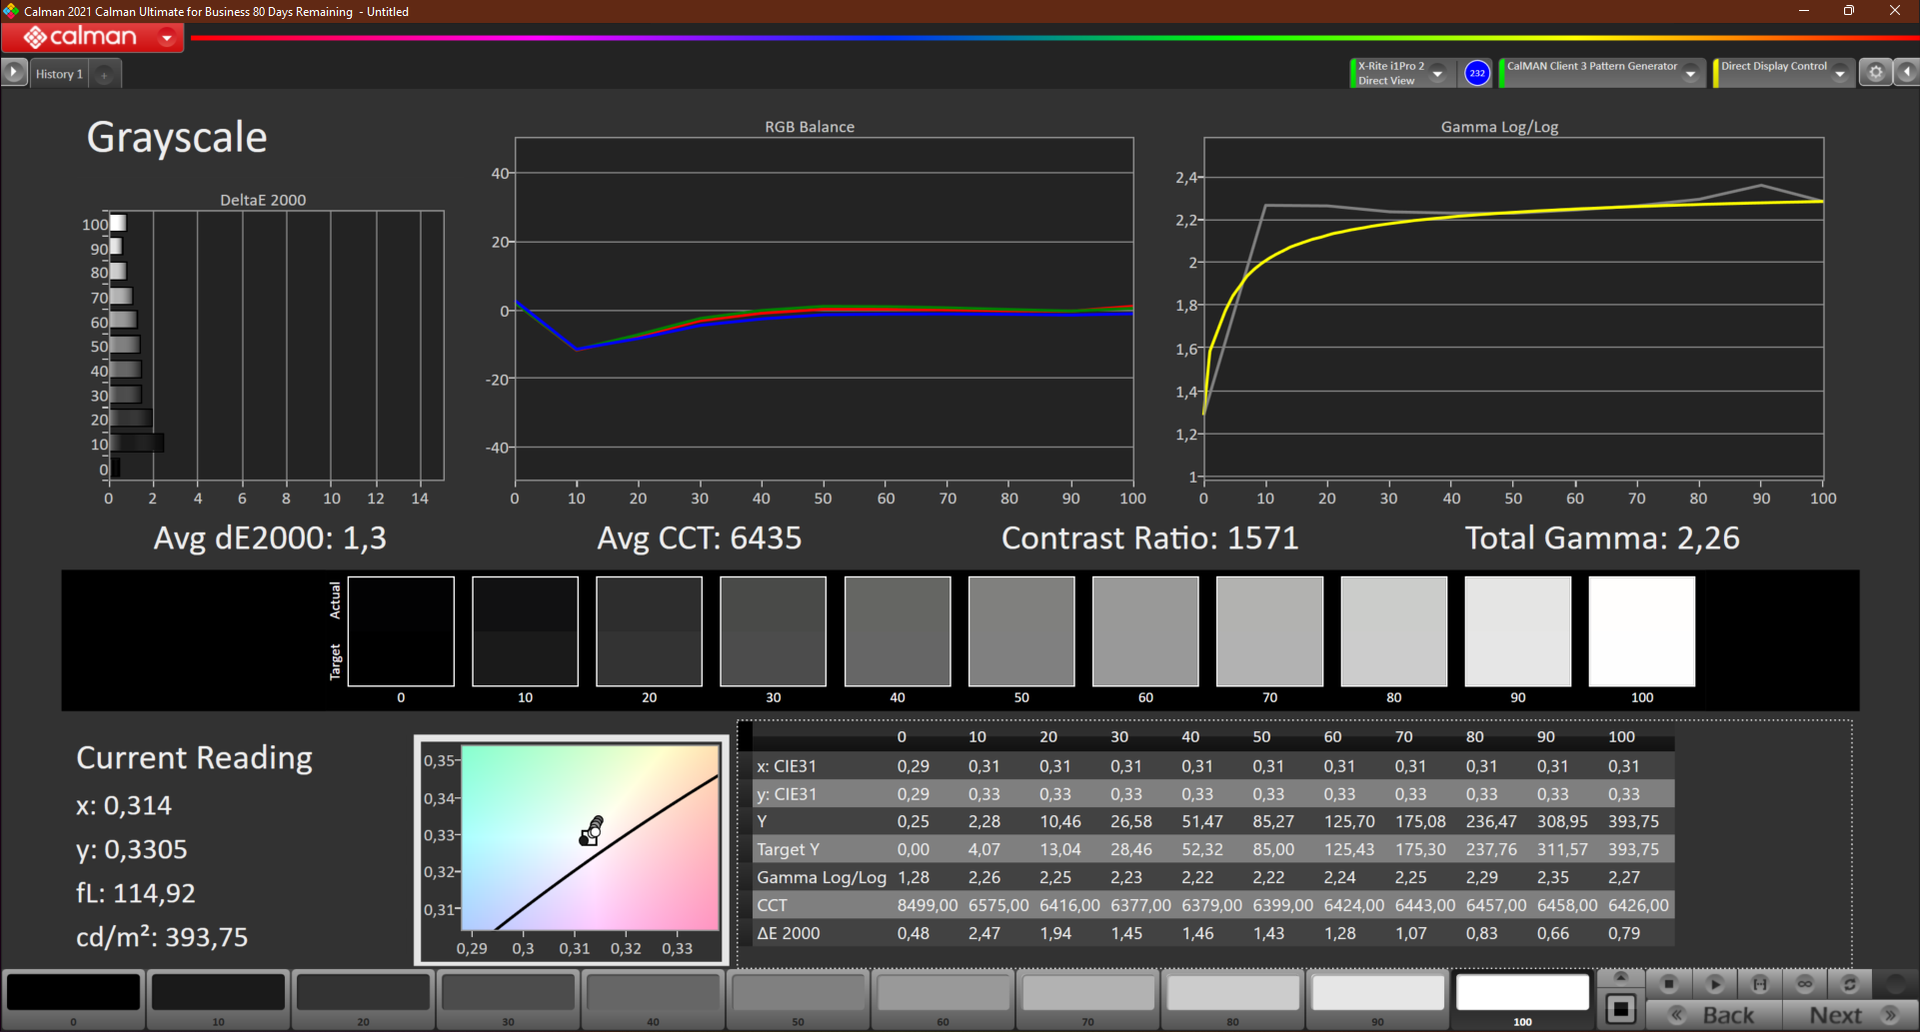
Con una media di 385 nits, il pannello diventa significativamente più luminoso di quello del ThinkPad P15ve Precision 3551. Anche i valori DeltaE (< 2) sono molto più precisi. Il contrasto è di ben 1574:1 e insieme al valore del nero di 0,25 nits produce un nero saturo. I tempi di risposta lenti sono uno svantaggio. Non c'è sfarfallio PWM
| |||||||||||||||||||||||||
Distribuzione della luminosità: 78 %
Al centro con la batteria: 393 cd/m²
Contrasto: 1572:1 (Nero: 0.25 cd/m²)
ΔE ColorChecker Calman: 1.5 | ∀{0.5-29.43 Ø4.71}
calibrated: 1.4
ΔE Greyscale Calman: 1.3 | ∀{0.09-98 Ø4.96}
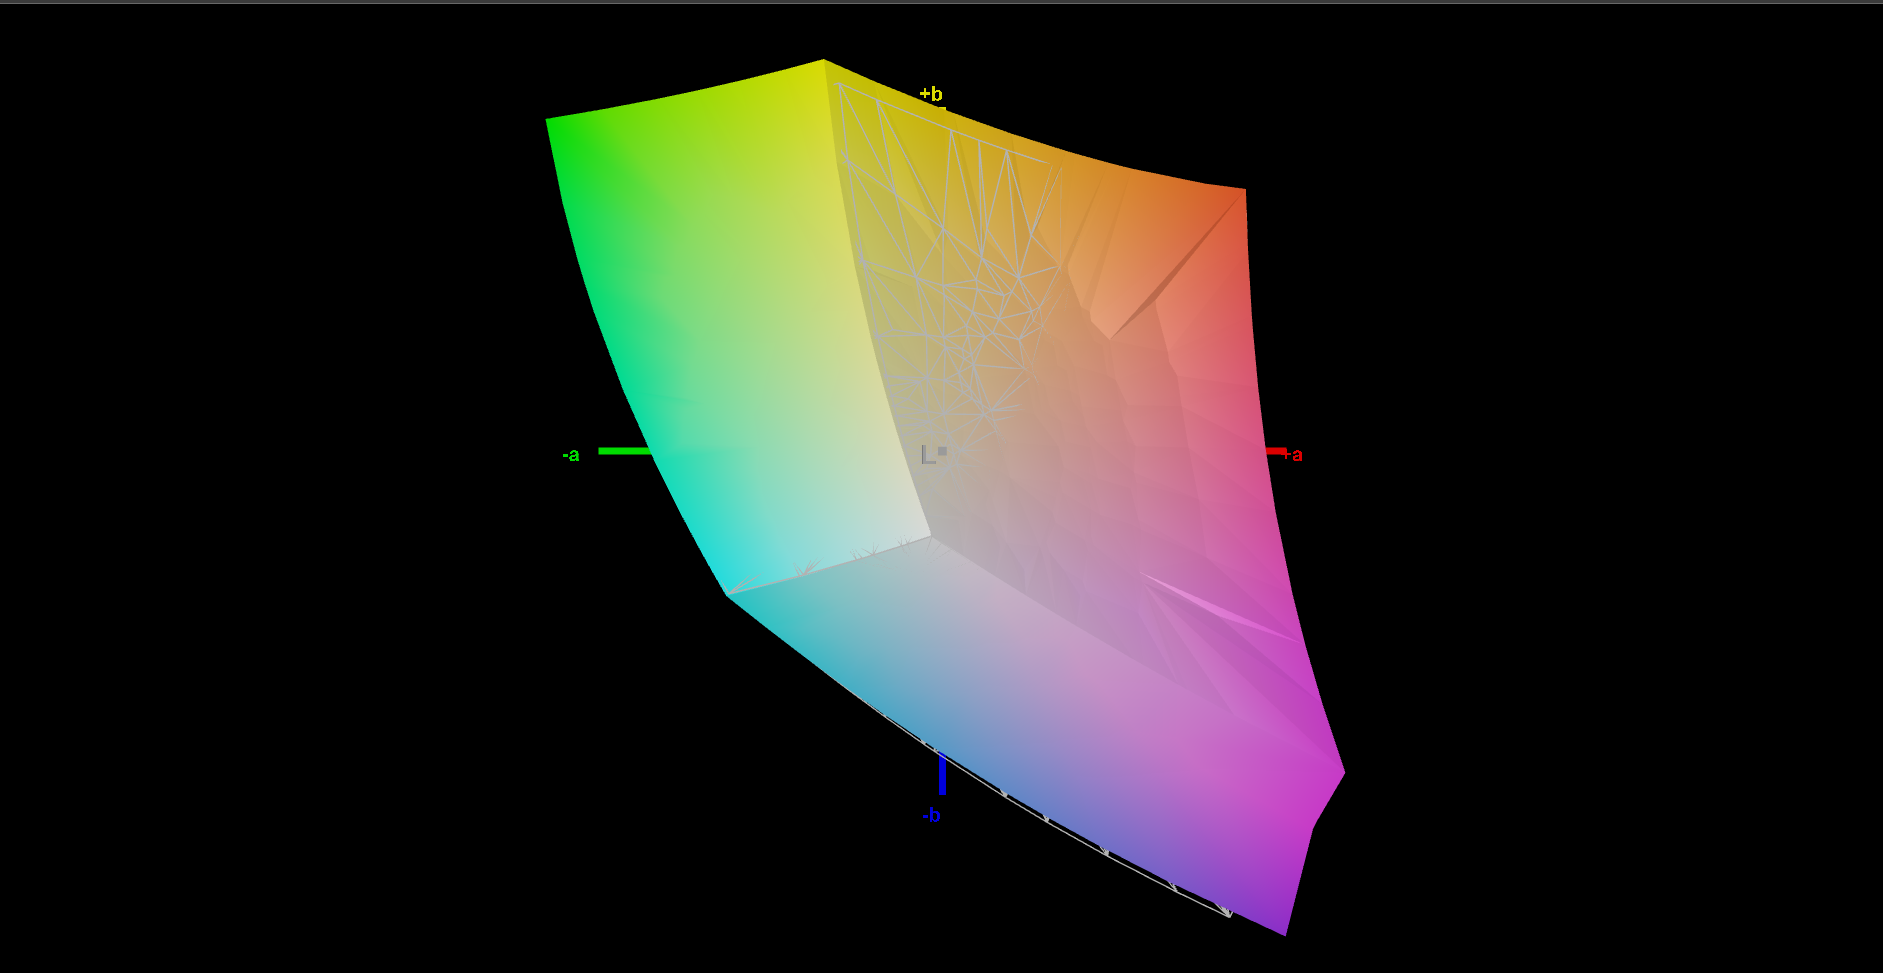
71.3% AdobeRGB 1998 (Argyll 3D)
99% sRGB (Argyll 3D)
70.5% Display P3 (Argyll 3D)
Gamma: 2.26
CCT: 6435 K
| HP ZBook Power 15 G8 313S5EA AUOA08B, IPS LED, 1920x1080, 15.6" | HP ZBook Fury 15 G8 BOE0969, IPS, 3840x2160, 15.6" | HP ZBook Studio 15 G8 SDC4145, OLED, 3840x2160, 15.6" | HP ZBook Firefly 15 G8 2C9R7EA LGD069B, IPS, 1920x1080, 15.6" | Lenovo ThinkPad P15v G2 21A9000XGE N156HCA-EAC, IPS LED, 1920x1080, 15.6" | Dell Precision 3000 3551 LG Philips 156WFD, IPS, 1920x1080, 15.6" | |
|---|---|---|---|---|---|---|
| Display | 20% | 26% | -2% | -36% | -45% | |
| Display P3 Coverage (%) | 70.5 | 95.9 36% | 99.9 42% | 68.6 -3% | 43.7 -38% | 37.5 -47% |
| sRGB Coverage (%) | 99 | 100 1% | 100 1% | 98.5 -1% | 65.1 -34% | 56.5 -43% |
| AdobeRGB 1998 Coverage (%) | 71.3 | 87.3 22% | 95.3 34% | 70 -2% | 45.3 -36% | 38.74 -46% |
| Response Times | 74% | 95% | 12% | 24% | 41% | |
| Response Time Grey 50% / Grey 80% * (ms) | 61 | 14.8 ? 76% | 2.4 ? 96% | 56 ? 8% | 48 ? 21% | 29.6 ? 51% |
| Response Time Black / White * (ms) | 38 ? | 11 ? 71% | 2.4 ? 94% | 32 ? 16% | 28 ? 26% | 26.4 ? 31% |
| PWM Frequency (Hz) | 240.4 ? | |||||
| Screen | -81% | -75% | -90% | -144% | -111% | |
| Brightness middle (cd/m²) | 393 | 626 59% | 379.6 -3% | 397 1% | 305 -22% | 235.5 -40% |
| Brightness (cd/m²) | 385 | 589 53% | 380 -1% | 402 4% | 281 -27% | 228 -41% |
| Brightness Distribution (%) | 78 | 87 12% | 95 22% | 84 8% | 88 13% | 89 14% |
| Black Level * (cd/m²) | 0.25 | 0.58 -132% | 0.13 48% | 0.32 -28% | 0.25 -0% | |
| Contrast (:1) | 1572 | 1079 -31% | 3054 94% | 953 -39% | 942 -40% | |
| Colorchecker dE 2000 * | 1.5 | 5.41 -261% | 5.15 -243% | 5.9 -293% | 5.9 -293% | 5.44 -263% |
| Colorchecker dE 2000 max. * | 4.3 | 9.05 -110% | 7.79 -81% | 9.4 -119% | 20.1 -367% | 13.58 -216% |
| Colorchecker dE 2000 calibrated * | 1.4 | 0.6 57% | 3.1 -121% | 1.1 21% | 4.5 -221% | 5.2 -271% |
| Greyscale dE 2000 * | 1.3 | 6.2 -377% | 2.6 -100% | 8.8 -577% | 5.3 -308% | 3.1 -138% |
| Gamma | 2.26 97% | 2.66 83% | 1.99 111% | 2.47 89% | 2.1 105% | 2.42 91% |
| CCT | 6435 101% | 6101 107% | 6166 105% | 6416 101% | 6307 103% | 7070 92% |
| Color Space (Percent of AdobeRGB 1998) (%) | 63.7 | 35.5 | ||||
| Color Space (Percent of sRGB) (%) | 98.5 | 56.1 | ||||
| Media totale (Programma / Settaggio) | 4% /
-37% | 15% /
-22% | -27% /
-57% | -52% /
-97% | -38% /
-75% |
* ... Meglio usare valori piccoli
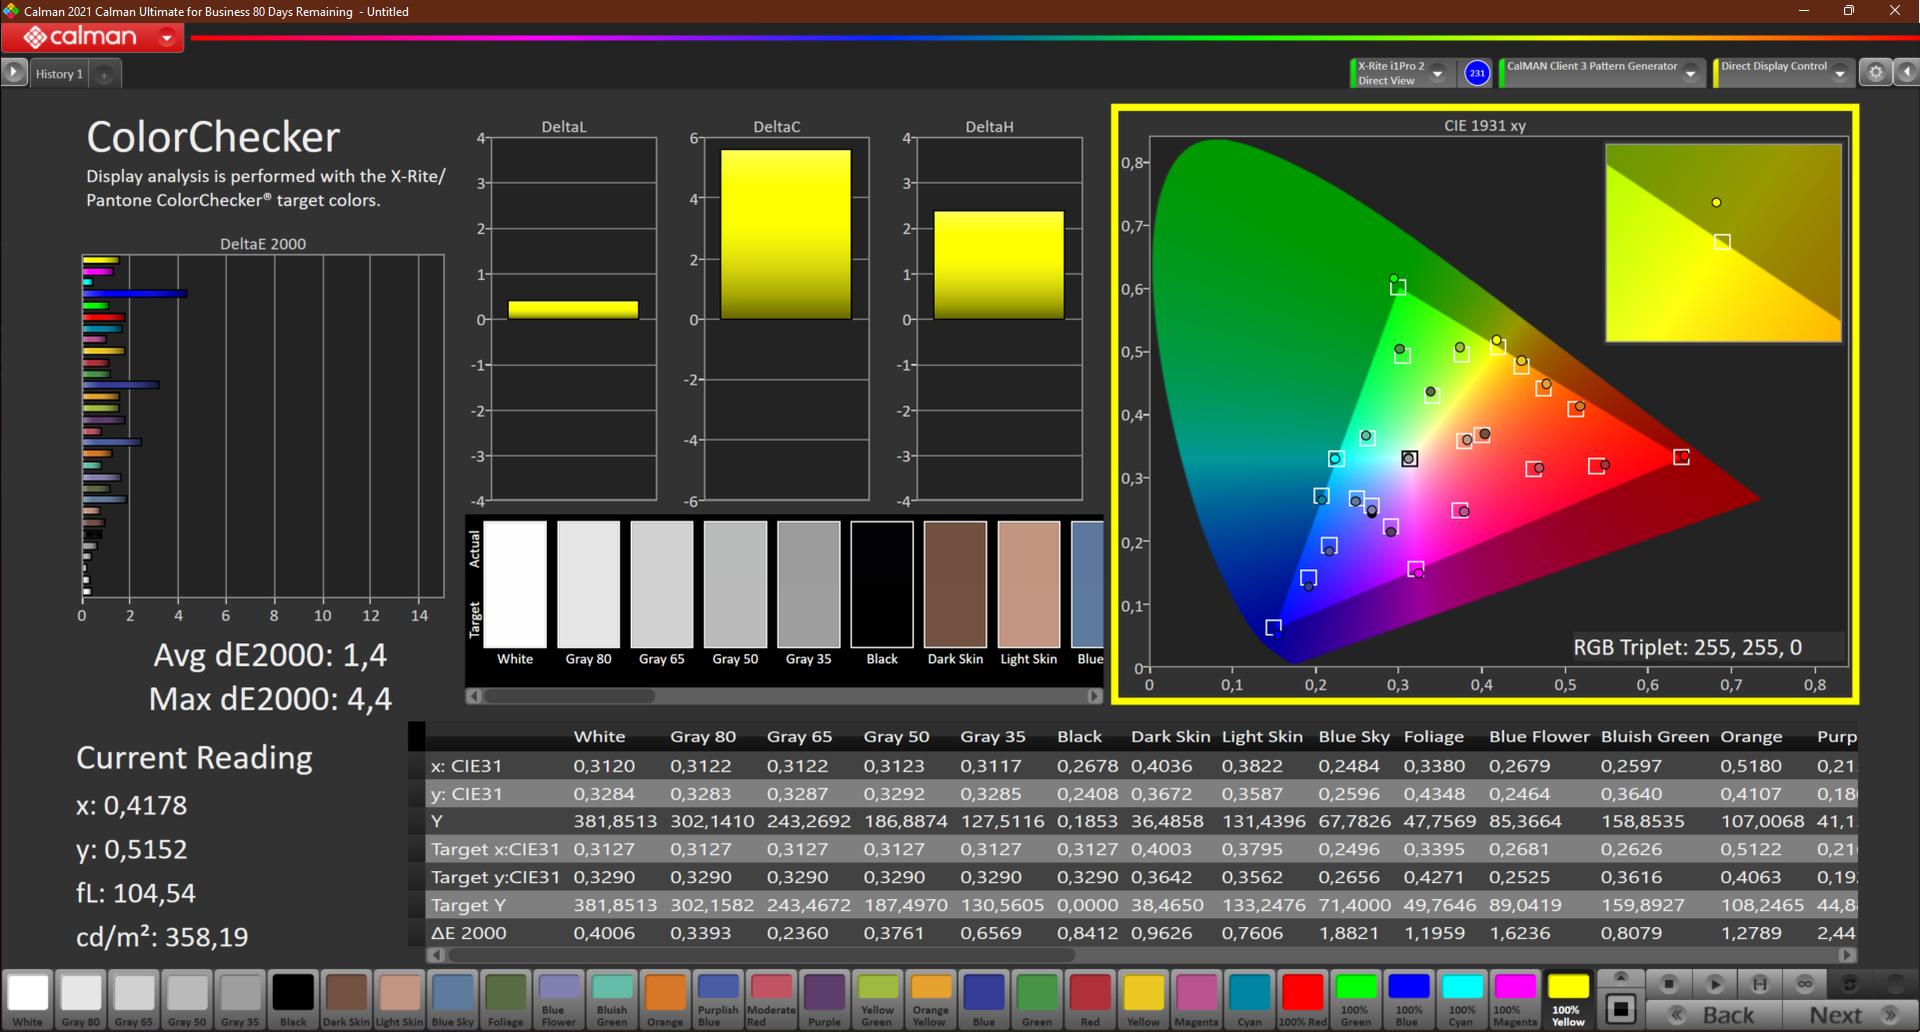
Lo spazio colore sRGB è coperto al 99%, ma viene riprodotto solo il ~71% di DCI-P3 e AdobeRGB. In questo modo è possibile utilizzare il portatile per l'elaborazione di immagini e video a livello semi-professionale. Anche il ThinkPad P15v G2 fa decisamente peggio (sRGB < 57%).
Con un DeltaE di 4,3, la deviazione maggiore è nel colore blu, anche dopo la calibrazione. Tuttavia, il bilanciamento RGB è complessivamente buono. Dopo la calibrazione, il contrasto aumenta addirittura a 2151:1, mentre la luminosità si riduce di soli 10 nits. Come sempre, il nostro profilo colore ICC è disponibile per il download gratuito accanto al grafico della distribuzione della luminosità qui sopra.

Tempi di risposta del Display
| ↔ Tempi di risposta dal Nero al Bianco | ||
|---|---|---|
| 38 ms ... aumenta ↗ e diminuisce ↘ combinato | ↗ 19 ms Incremento | 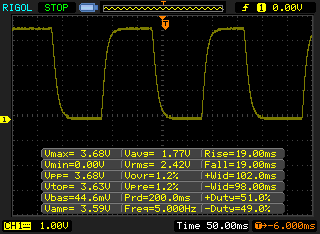 |
| ↘ 19 ms Calo | ||
| Lo schermo mostra tempi di risposta lenti nei nostri tests e sarà insoddisfacente per i gamers. In confronto, tutti i dispositivi di test variano da 0.1 (minimo) a 240 (massimo) ms. » 96 % di tutti i dispositivi è migliore. Questo significa che i tempi di risposta rilevati sono peggiori rispetto alla media di tutti i dispositivi testati (19.8 ms). | ||
| ↔ Tempo di risposta dal 50% Grigio all'80% Grigio | ||
| 61 ms ... aumenta ↗ e diminuisce ↘ combinato | ↗ ms Incremento |  |
| ↘ ms Calo | ||
| Lo schermo mostra tempi di risposta lenti nei nostri tests e sarà insoddisfacente per i gamers. In confronto, tutti i dispositivi di test variano da 0.165 (minimo) a 636 (massimo) ms. » 96 % di tutti i dispositivi è migliore. Questo significa che i tempi di risposta rilevati sono peggiori rispetto alla media di tutti i dispositivi testati (31 ms). | ||
Sfarfallio dello schermo / PWM (Pulse-Width Modulation)
| flickering dello schermo / PWM non rilevato |  | ||
In confronto: 52 % di tutti i dispositivi testati non utilizza PWM per ridurre la luminosita' del display. Se è rilevato PWM, una media di 7757 (minimo: 5 - massimo: 343500) Hz è stata rilevata. | |||
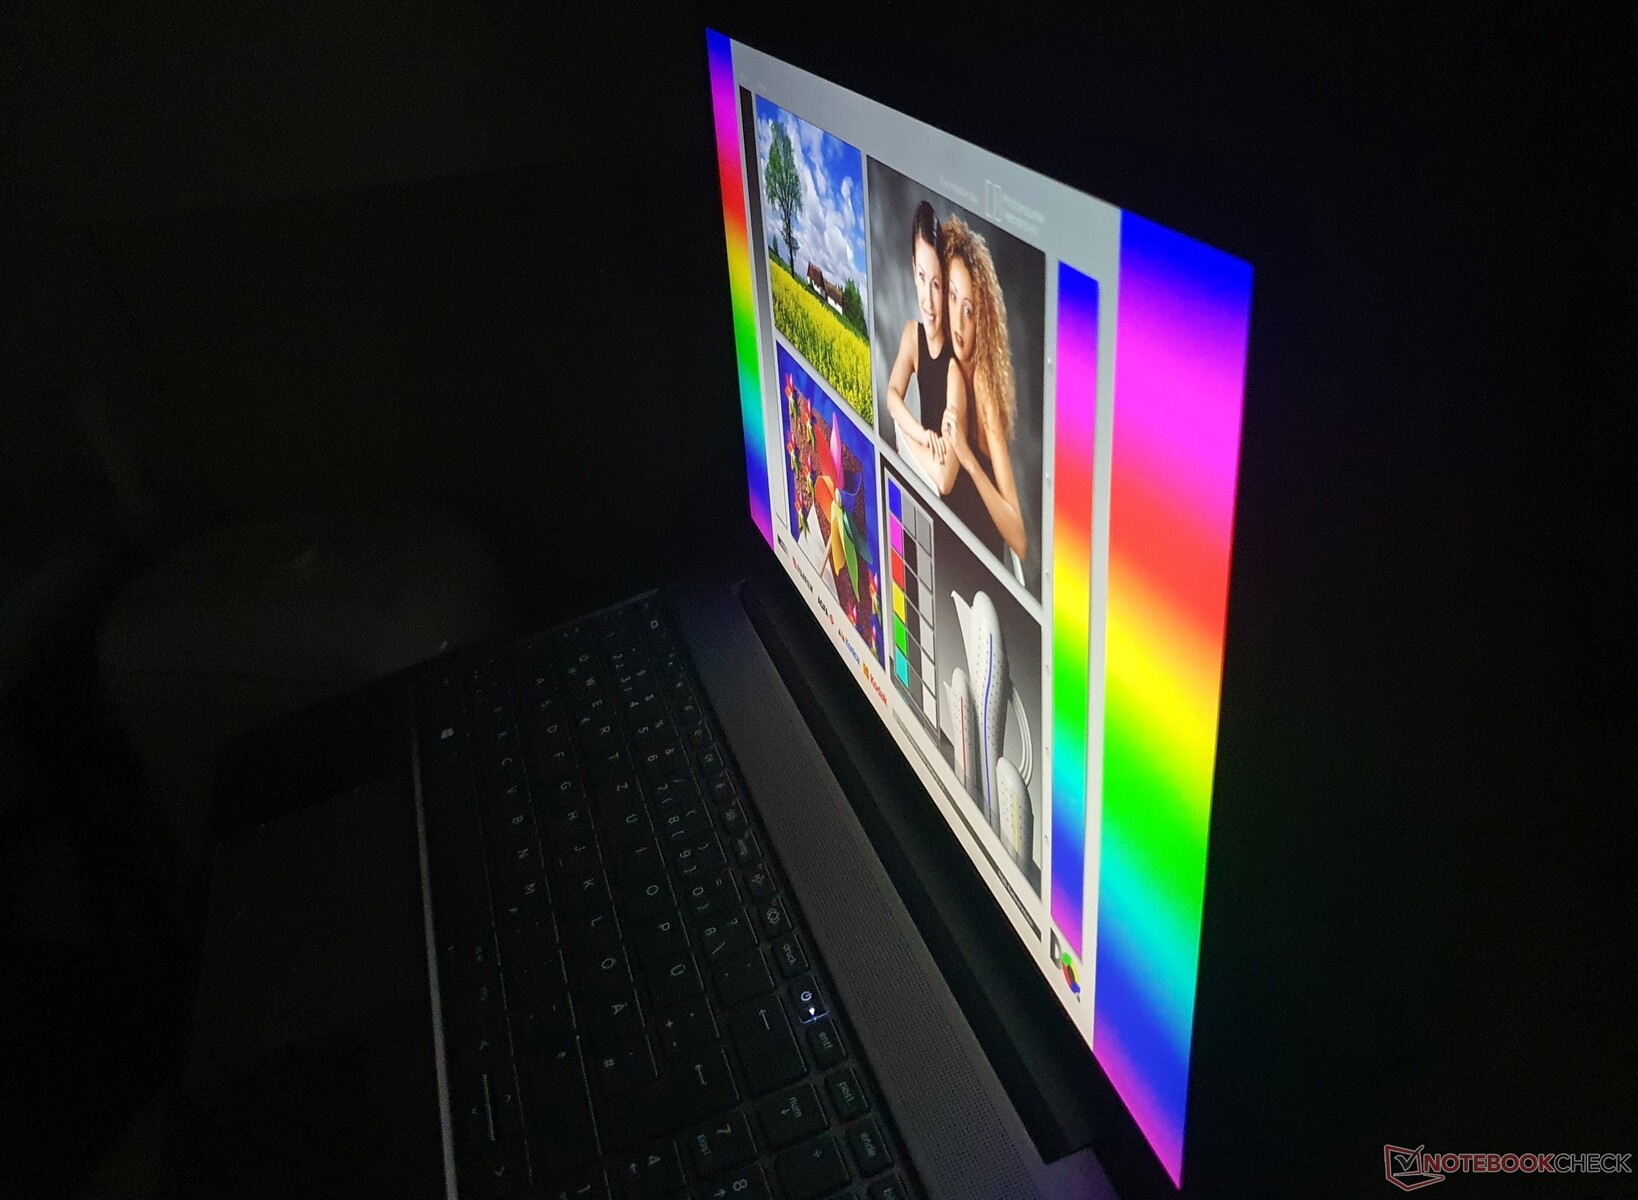
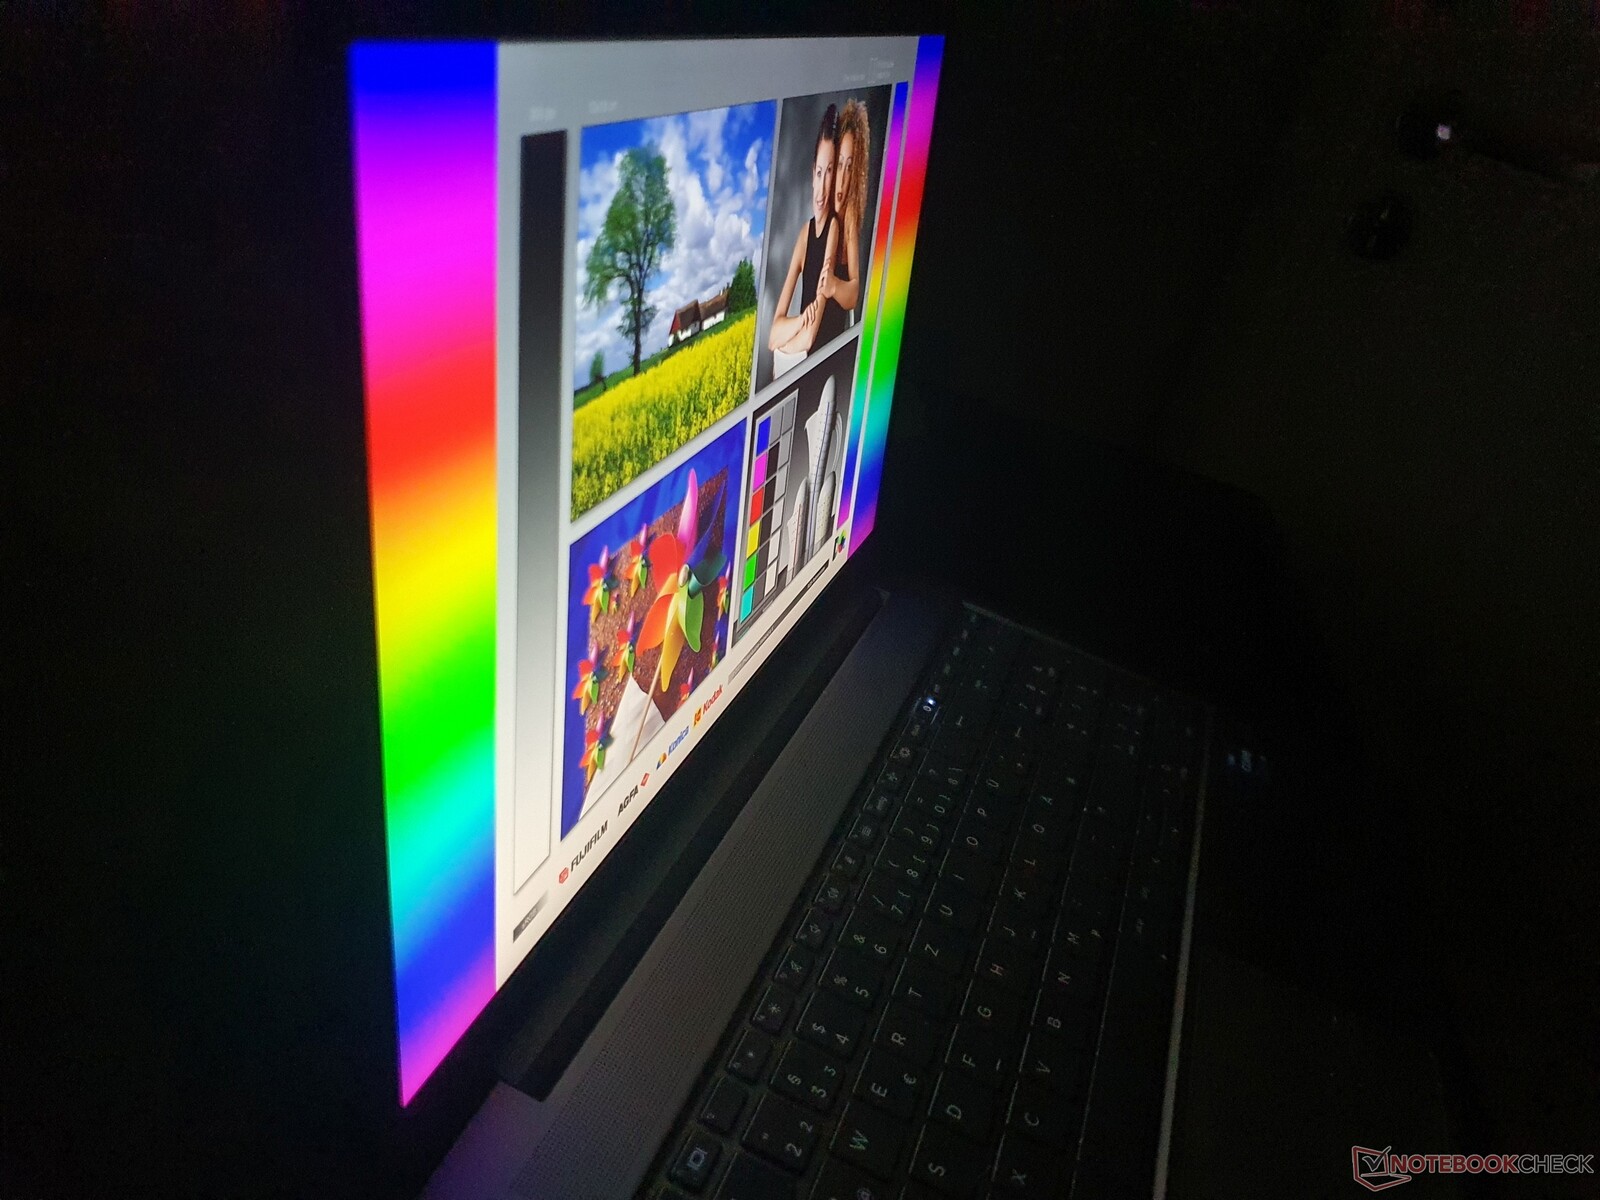
La superficie opaca del display e l'elevata luminosità di 385 nits rendono lo ZBook Power 15 adatto all'uso all'aperto. Tuttavia, è necessario evitare la luce diretta del sole.
Come tipico per i display IPS, la stabilità dell'angolo di visione è di livello molto elevato e non crea mai problemi, ad esempio se si desidera guardare video insieme a più persone.
Prestazioni elevate limitate dall'intelligenza artificiale di HP?
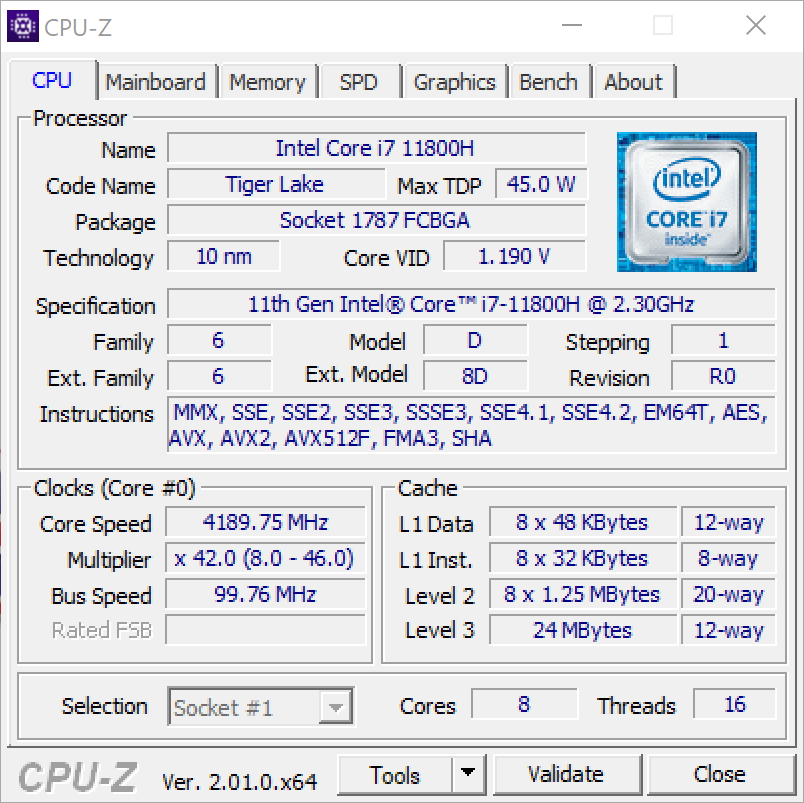
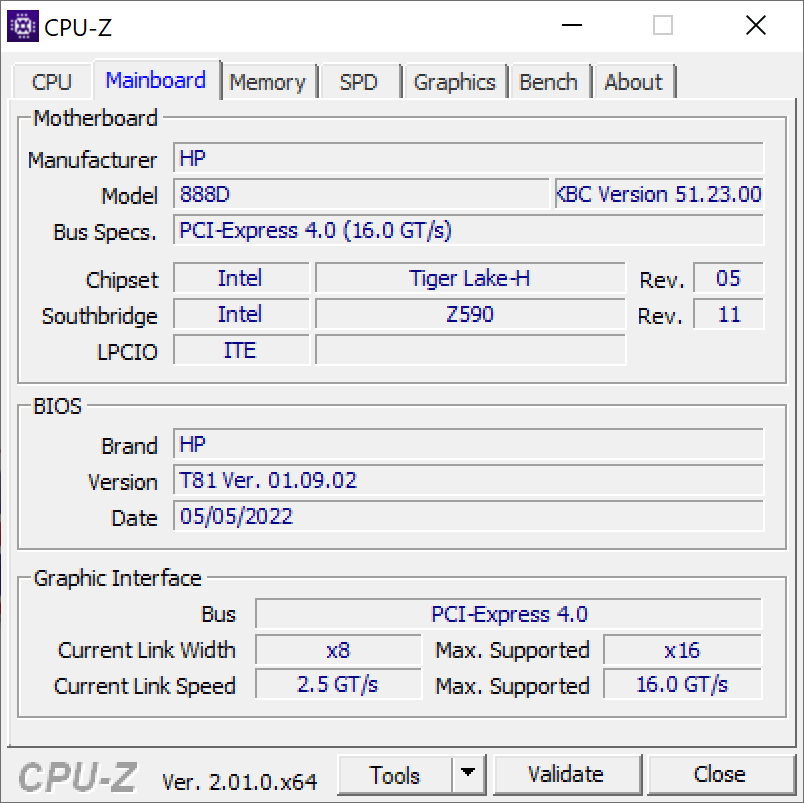
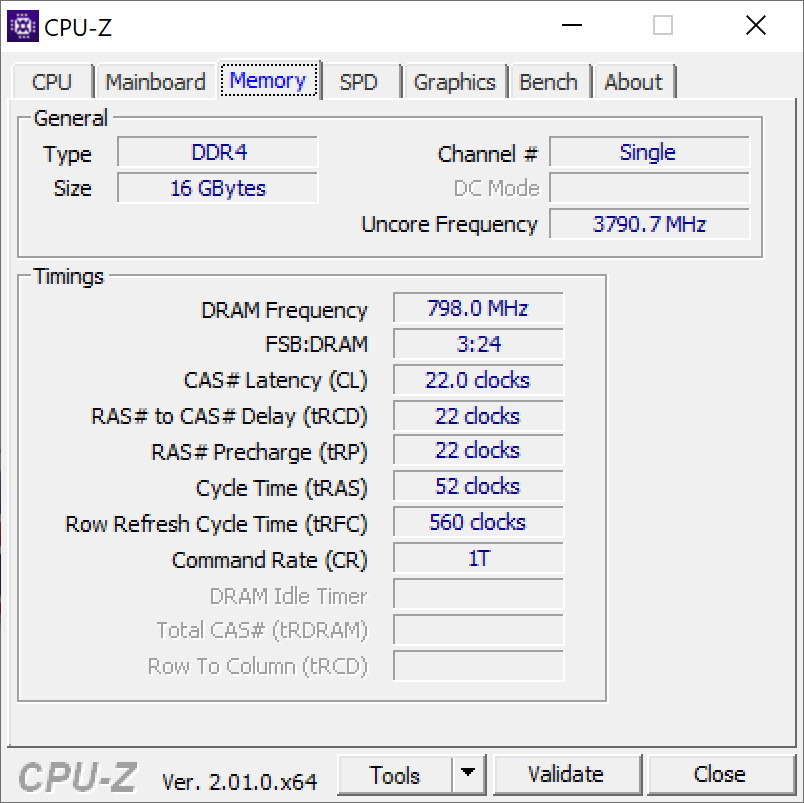
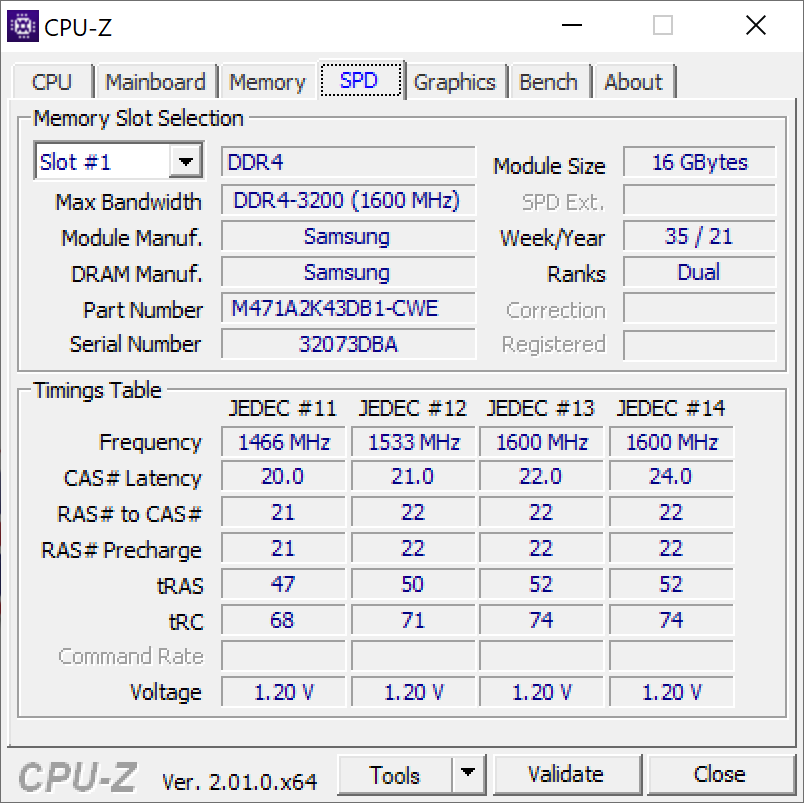
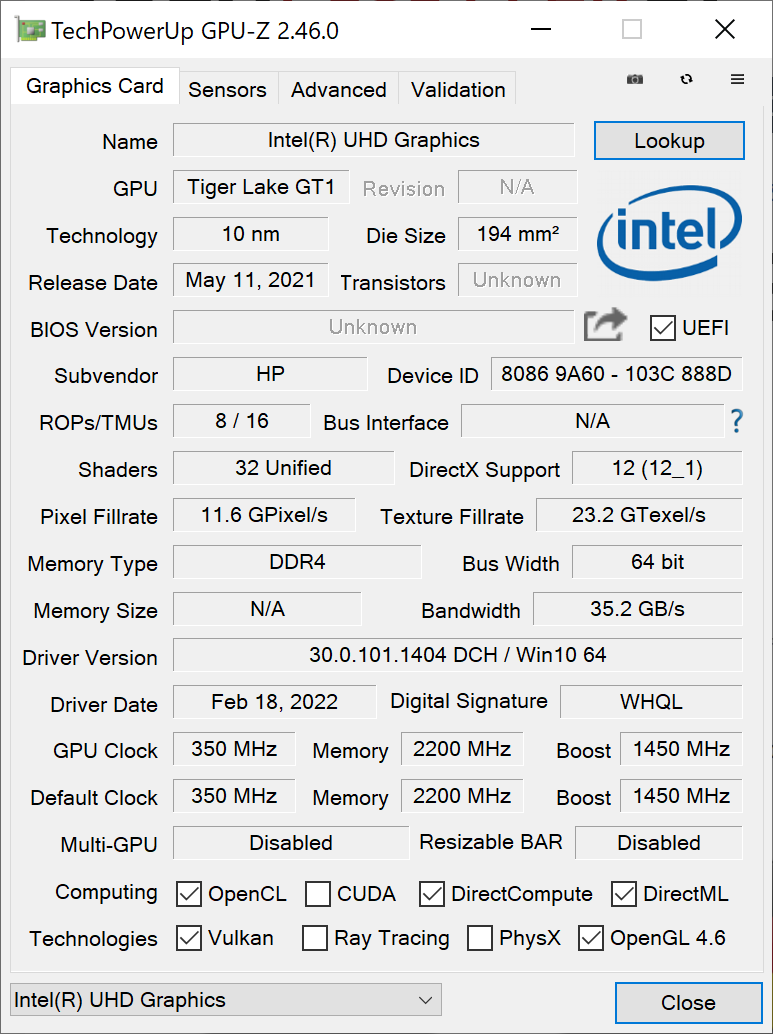
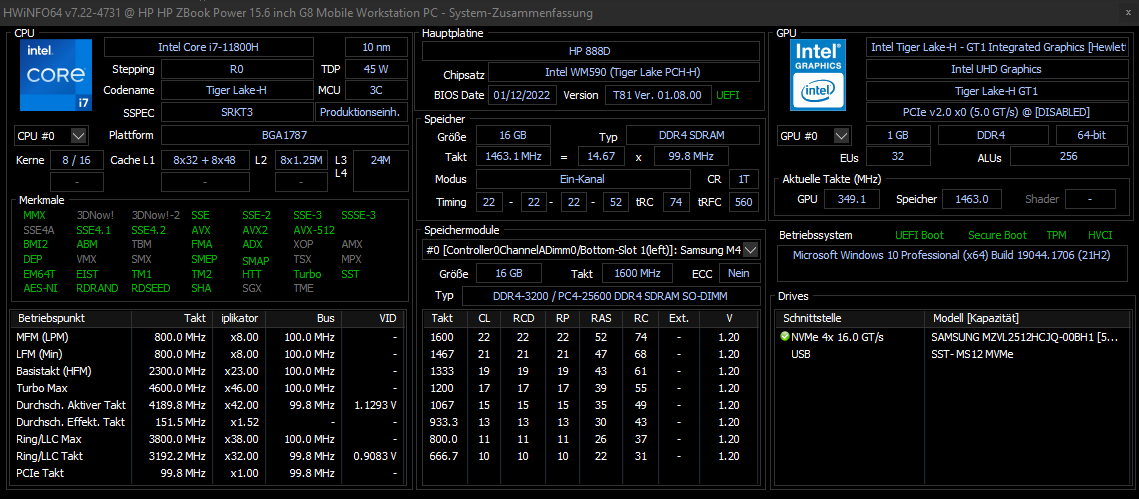
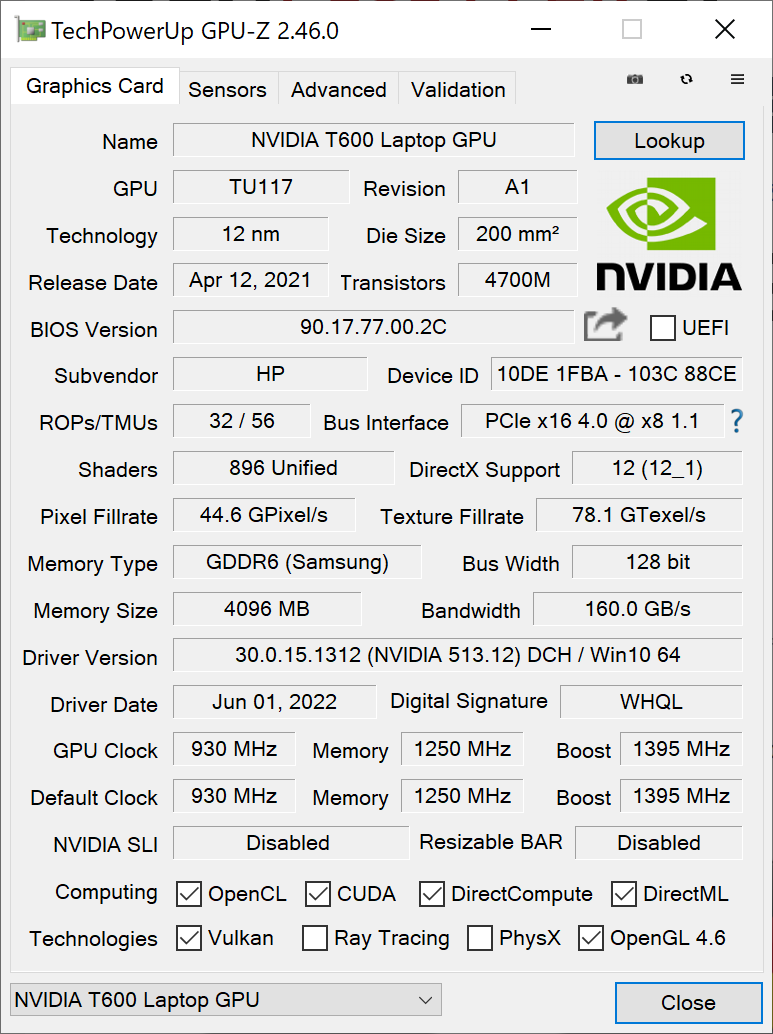
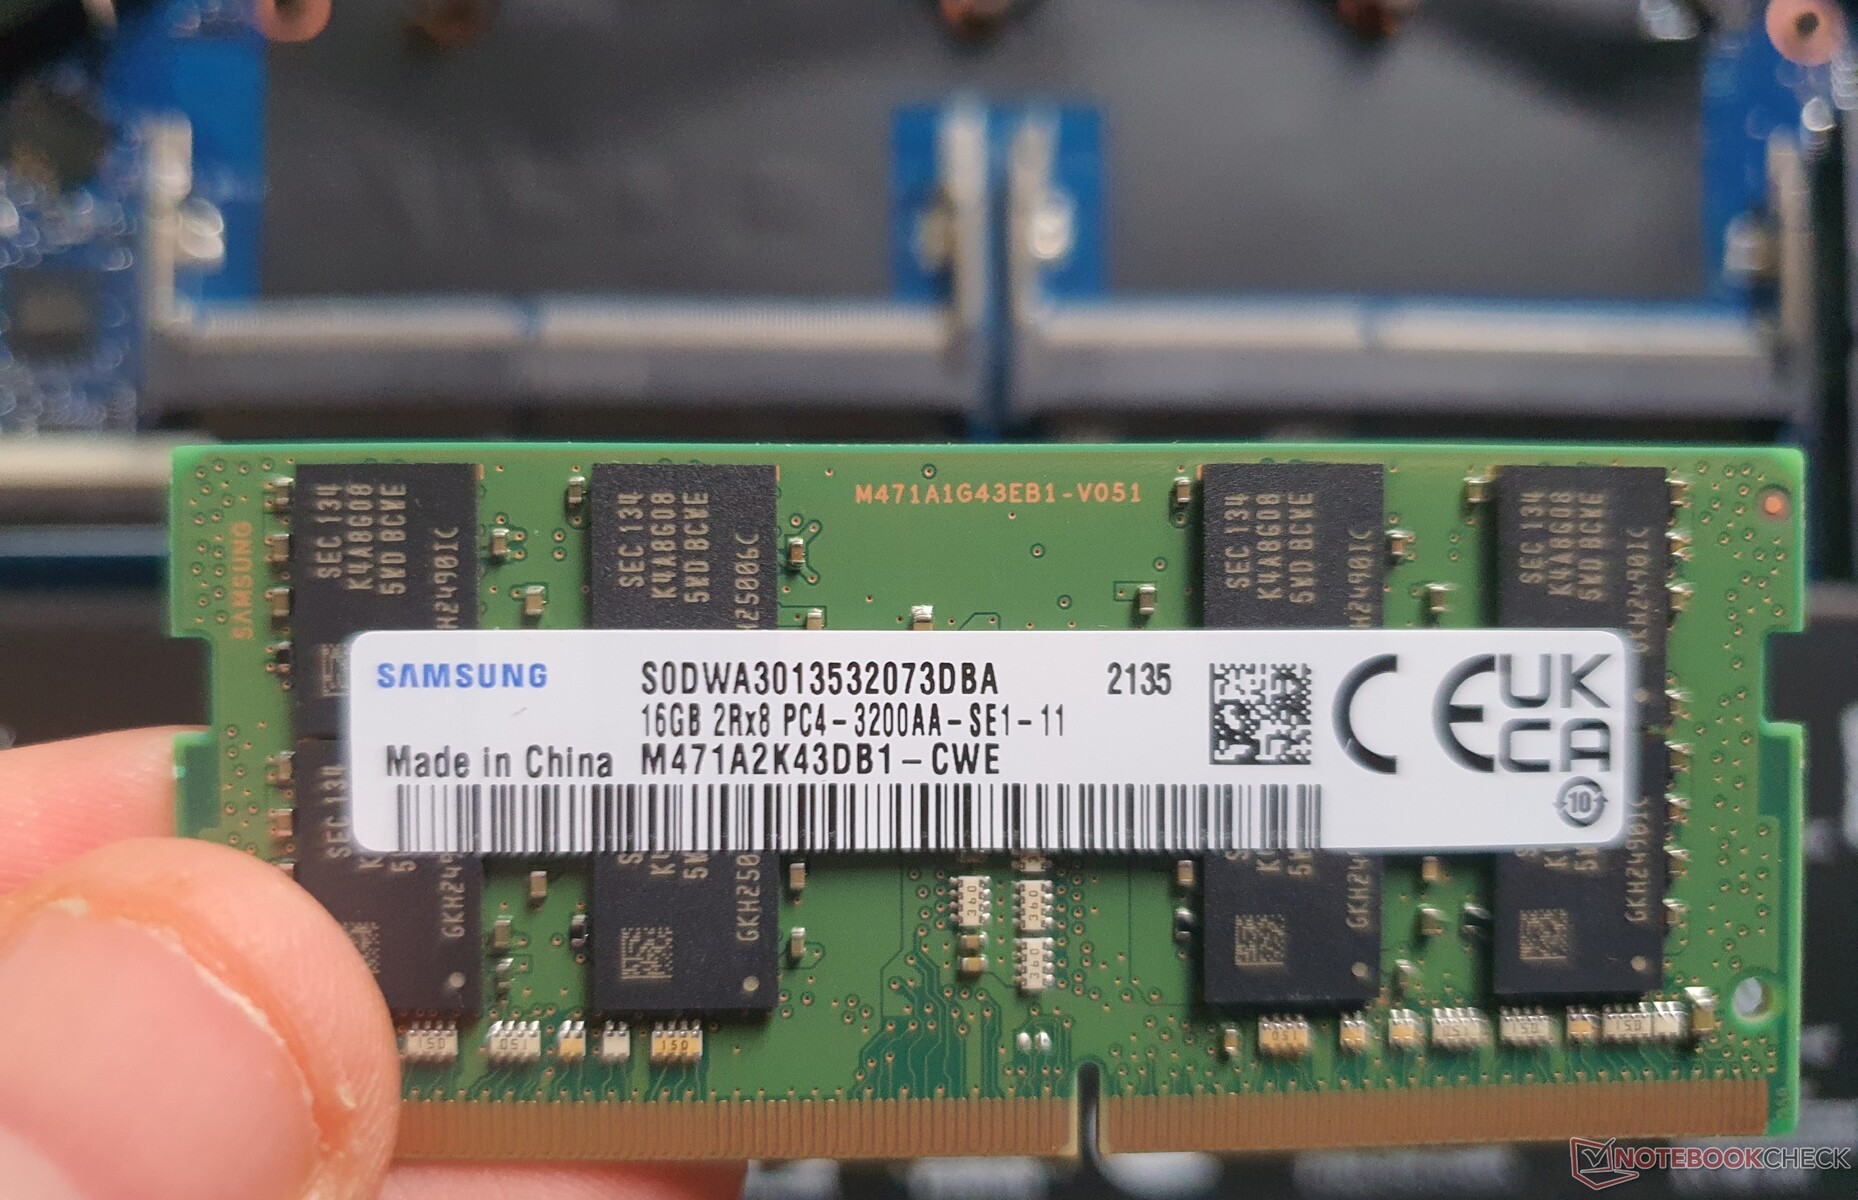
La nostra unità di prova offre un Intel Core i7-11800H (Tiger Lake, senza vPRO) e unaNvidia T600 dGPU, insieme alla scheda integrata Intel UHD Xe (32 EU). Il tutto è completato da un modulo RAM da 16 GB (DDR4-3200 @DDR4-2933) e da un'unità SSD PCIe4x4 da 512 GB. Le CPU Xeon e la RAM ECC non sono disponibili quest'anno.
La configurazione massima comprende i processori IntelCore i9-11950H (vPRO), Nvidia RTX A2000due moduli RAM da 32 GB e due unità SSD M.2-2280 da 2 TB. Sono disponibili anche modelli più economici con un Intel Core i5 (hexa-core) e con o senza GPU Nvidia
Condizioni di prova
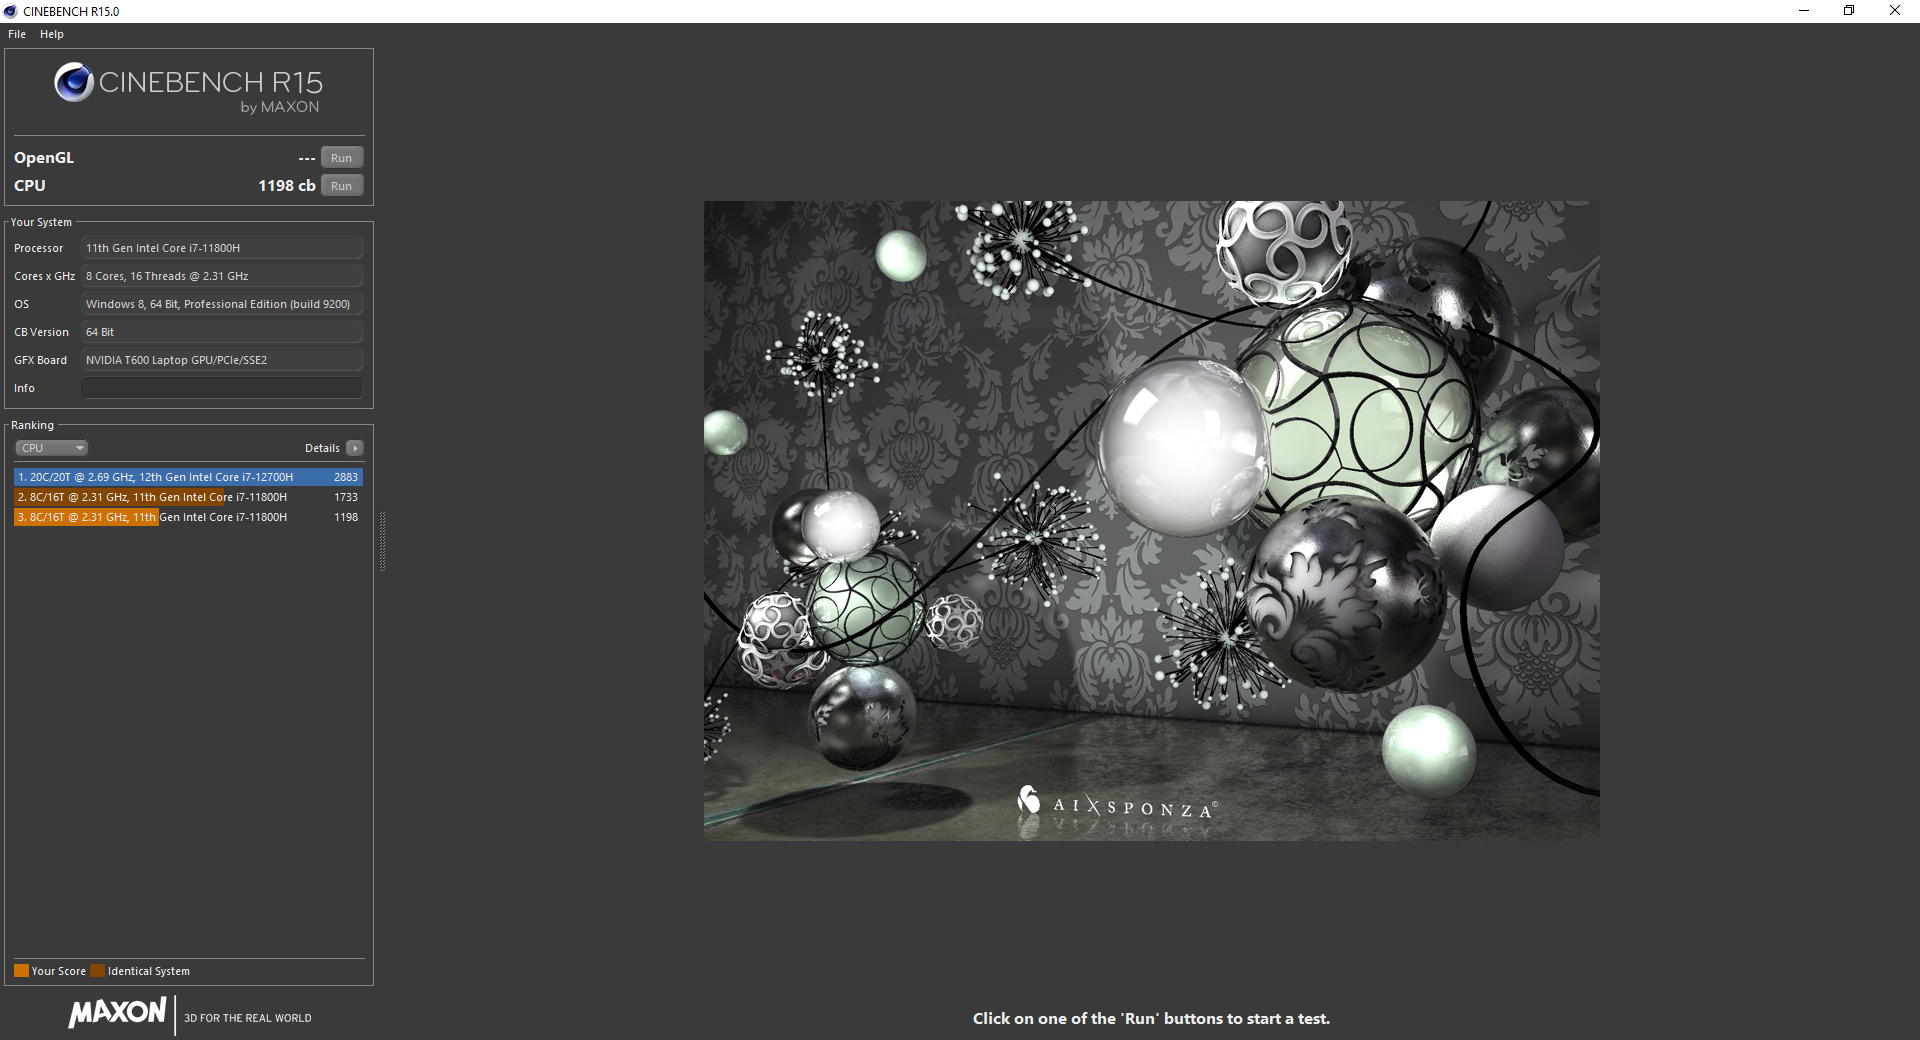
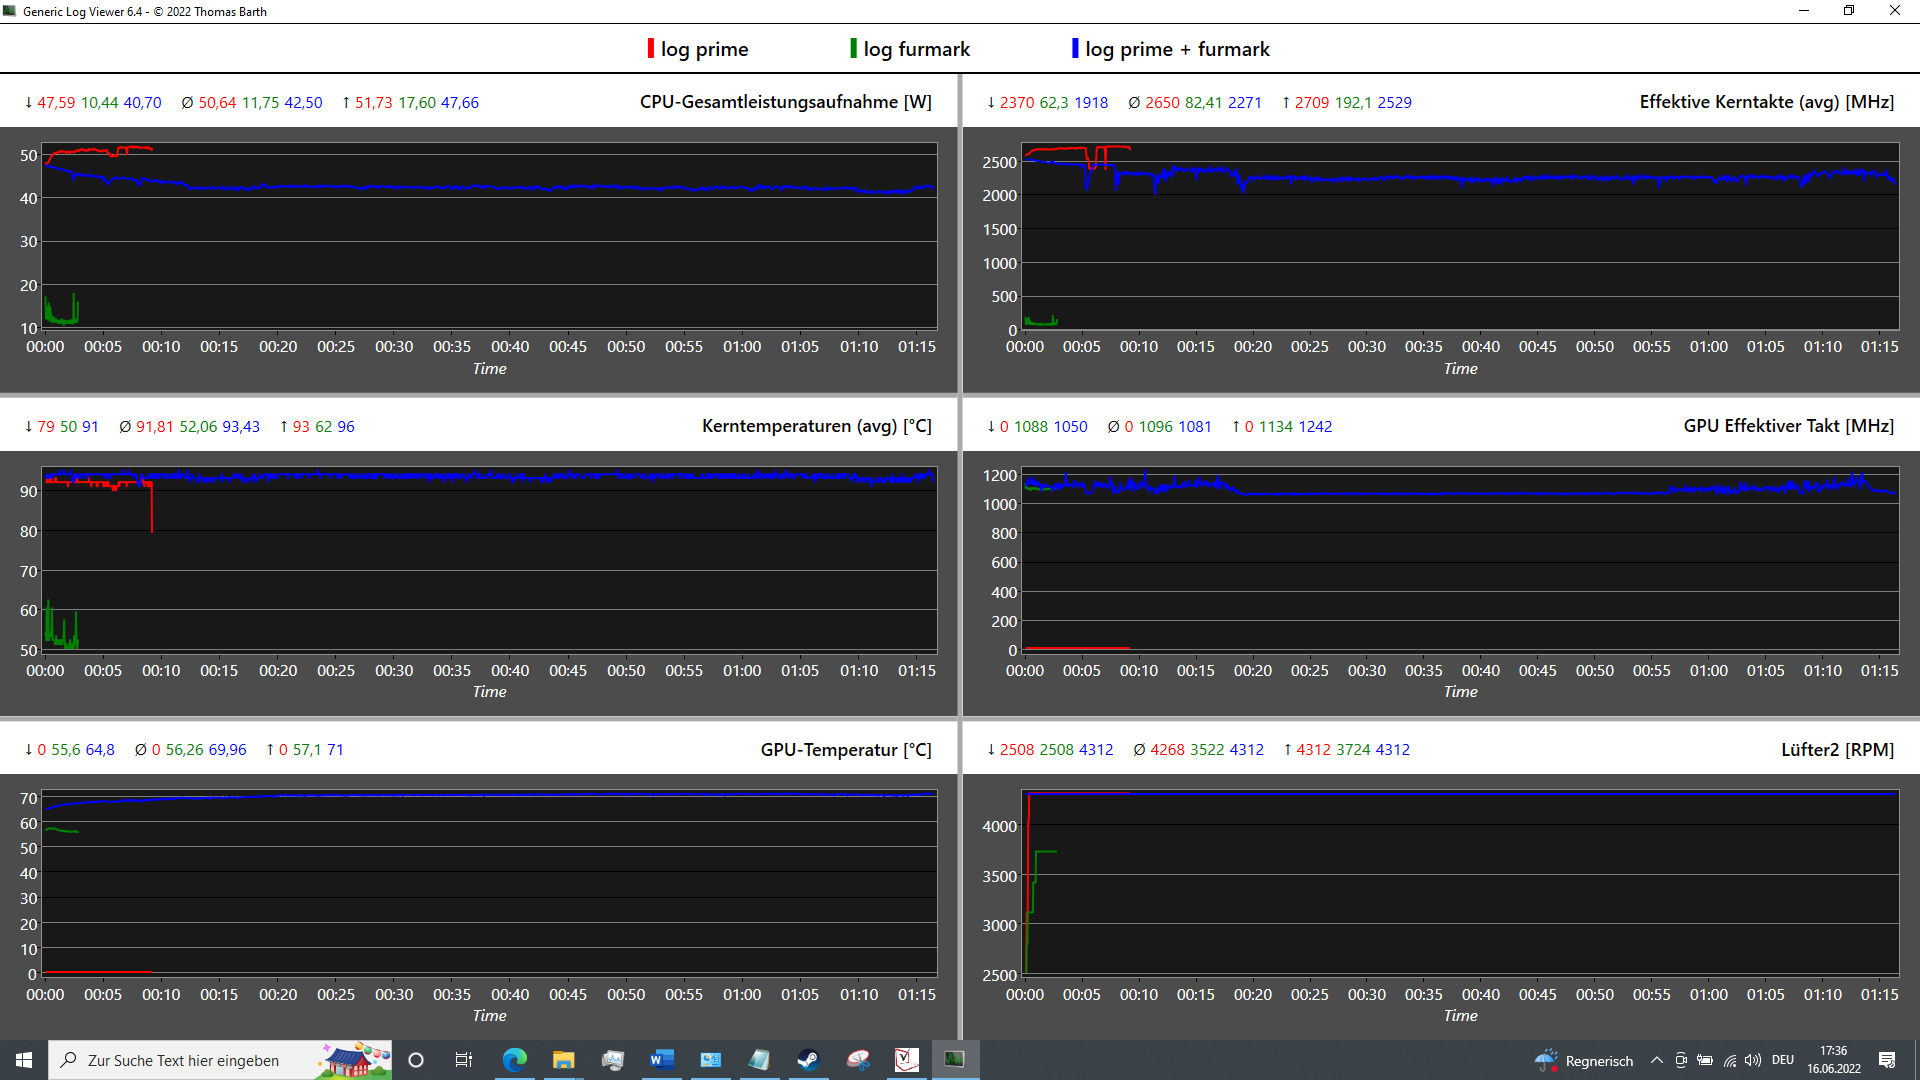
HP controlla le prestazioni e il comportamento della ventola dello ZBook 15 G8 utilizzando un'intelligenza artificiale chiamata "Z Algorithms", che opera con il Dynamic Tuning di Intel. Tuttavia, questo sistema non sembra essere ancora maturo, poiché le prestazioni non sono costanti. Una volta, il nostro ciclo di test Cinebench R15 ha ottenuto 1.550 punti costanti in 25 esecuzioni, mentre un altro ciclo ha ottenuto solo ~1.100 punti e un terzo ~1.300 punti
Un aggiornamento del BIOS da v1.01 a v1.09 non ha migliorato le cose, ma ha portato al contrario: I 2.075 punti inizialmente raggiunti (costante: 1.826) in CBR15 non sono più riproducibili in nessun punto, ma le ventole sono ora significativamente meno aggressive. A seconda del risultato, il consumo costante è stato di 40 watt una volta e 47 watt un'altra volta, o un massimo di 55 watt costantemente.
Processore
Con il comportamento dell'intelligenza artificiale descritto, le prestazioni reali dell'Intel Core i7-11800Hin combinazione con la capacità di raffreddamento è difficile da definire.
Mentre tutti i test della CPU sono stati eseguiti con il vecchio BIOS v1.01, quando l'IA era ancora più benevola, lo ZBook Power 15 ha primeggiato nella maggior parte dei casi. Dopo l'aggiornamento del BIOS, le prestazioni sono appena superiori a quelle del ThinkPad P15v G2in media.
Non sembra esserci più nemmeno un Turbo a breve termine (PL2). Inoltre, le ventole iniziano a girare molto tardi (poco prima del completamento del primo ciclo di lavoro) e sono più silenziose rispetto all'inizio, a causa del nuovo BIOS o di un alimentatore che non funziona correttamente. Nel funzionamento a batteria, le prestazioni si riducono di circa il 25%.
Cinebench R15 Multi Constant Load Test
Cinebench R23: Multi Core | Single Core
Cinebench R20: CPU (Multi Core) | CPU (Single Core)
Cinebench R15: CPU Multi 64Bit | CPU Single 64Bit
Blender: v2.79 BMW27 CPU
7-Zip 18.03: 7z b 4 | 7z b 4 -mmt1
Geekbench 5.5: Multi-Core | Single-Core
HWBOT x265 Benchmark v2.2: 4k Preset
LibreOffice : 20 Documents To PDF
R Benchmark 2.5: Overall mean
Octane V2: Total Score
Jetstream 2: 2.0 Total
| CPU Performance rating | |
| Media della classe Workstation | |
| HP ZBook Studio 15 G8 -1! | |
| HP ZBook Power 15 G8 313S5EA | |
| HP ZBook Fury 15 G8 -3! | |
| Media Intel Core i7-11800H | |
| Lenovo ThinkPad P15v G2 21A9000XGE -3! | |
| Dell Precision 3000 3551 -4! | |
| HP ZBook Firefly 15 G8 2C9R7EA -4! | |
| Cinebench R23 / Multi Core | |
| Media della classe Workstation (14621 - 38520, n=23, ultimi 2 anni) | |
| HP ZBook Power 15 G8 313S5EA | |
| HP ZBook Fury 15 G8 | |
| HP ZBook Studio 15 G8 | |
| Media Intel Core i7-11800H (6508 - 14088, n=48) | |
| Lenovo ThinkPad P15v G2 21A9000XGE | |
| Cinebench R23 / Single Core | |
| Media della classe Workstation (1712 - 2228, n=23, ultimi 2 anni) | |
| HP ZBook Fury 15 G8 | |
| HP ZBook Studio 15 G8 | |
| HP ZBook Power 15 G8 313S5EA | |
| Media Intel Core i7-11800H (1386 - 1522, n=45) | |
| Cinebench R20 / CPU (Multi Core) | |
| Media della classe Workstation (5760 - 15043, n=23, ultimi 2 anni) | |
| HP ZBook Fury 15 G8 | |
| HP ZBook Studio 15 G8 | |
| Media Intel Core i7-11800H (2498 - 5408, n=50) | |
| HP ZBook Power 15 G8 313S5EA | |
| Lenovo ThinkPad P15v G2 21A9000XGE | |
| Dell Precision 3000 3551 | |
| HP ZBook Firefly 15 G8 2C9R7EA | |
| Cinebench R20 / CPU (Single Core) | |
| Media della classe Workstation (671 - 857, n=23, ultimi 2 anni) | |
| HP ZBook Fury 15 G8 | |
| HP ZBook Studio 15 G8 | |
| HP ZBook Firefly 15 G8 2C9R7EA | |
| HP ZBook Power 15 G8 313S5EA | |
| Media Intel Core i7-11800H (520 - 586, n=47) | |
| Lenovo ThinkPad P15v G2 21A9000XGE | |
| Dell Precision 3000 3551 | |
| Cinebench R15 / CPU Multi 64Bit | |
| Media della classe Workstation (2489 - 5810, n=23, ultimi 2 anni) | |
| HP ZBook Power 15 G8 313S5EA | |
| HP ZBook Power 15 G8 313S5EA | |
| Media Intel Core i7-11800H (1342 - 2173, n=50) | |
| HP ZBook Studio 15 G8 | |
| HP ZBook Fury 15 G8 | |
| Lenovo ThinkPad P15v G2 21A9000XGE | |
| Dell Precision 3000 3551 | |
| HP ZBook Firefly 15 G8 2C9R7EA | |
| Cinebench R15 / CPU Single 64Bit | |
| Media della classe Workstation (191.4 - 328, n=23, ultimi 2 anni) | |
| HP ZBook Fury 15 G8 | |
| HP ZBook Studio 15 G8 | |
| HP ZBook Power 15 G8 313S5EA | |
| HP ZBook Firefly 15 G8 2C9R7EA | |
| Media Intel Core i7-11800H (201 - 231, n=46) | |
| Lenovo ThinkPad P15v G2 21A9000XGE | |
| Dell Precision 3000 3551 | |
| Blender / v2.79 BMW27 CPU | |
| HP ZBook Firefly 15 G8 2C9R7EA | |
| Dell Precision 3000 3551 | |
| Lenovo ThinkPad P15v G2 21A9000XGE | |
| Media Intel Core i7-11800H (217 - 454, n=46) | |
| HP ZBook Fury 15 G8 | |
| HP ZBook Power 15 G8 313S5EA | |
| HP ZBook Studio 15 G8 | |
| Media della classe Workstation (91 - 222, n=23, ultimi 2 anni) | |
| 7-Zip 18.03 / 7z b 4 | |
| Media della classe Workstation (60489 - 116969, n=23, ultimi 2 anni) | |
| HP ZBook Fury 15 G8 | |
| HP ZBook Studio 15 G8 | |
| HP ZBook Power 15 G8 313S5EA | |
| Media Intel Core i7-11800H (33718 - 56758, n=46) | |
| Lenovo ThinkPad P15v G2 21A9000XGE | |
| Dell Precision 3000 3551 | |
| HP ZBook Firefly 15 G8 2C9R7EA | |
| 7-Zip 18.03 / 7z b 4 -mmt1 | |
| Media della classe Workstation (5126 - 6960, n=23, ultimi 2 anni) | |
| HP ZBook Studio 15 G8 | |
| HP ZBook Fury 15 G8 | |
| HP ZBook Power 15 G8 313S5EA | |
| Media Intel Core i7-11800H (5138 - 5732, n=46) | |
| HP ZBook Firefly 15 G8 2C9R7EA | |
| Dell Precision 3000 3551 | |
| Lenovo ThinkPad P15v G2 21A9000XGE | |
| Geekbench 5.5 / Multi-Core | |
| Media della classe Workstation (11542 - 25554, n=23, ultimi 2 anni) | |
| Media Intel Core i7-11800H (4655 - 9851, n=40) | |
| HP ZBook Power 15 G8 313S5EA | |
| HP ZBook Studio 15 G8 | |
| Dell Precision 3000 3551 | |
| Lenovo ThinkPad P15v G2 21A9000XGE | |
| HP ZBook Firefly 15 G8 2C9R7EA | |
| Geekbench 5.5 / Single-Core | |
| Media della classe Workstation (1783 - 2183, n=23, ultimi 2 anni) | |
| HP ZBook Studio 15 G8 | |
| Media Intel Core i7-11800H (1429 - 1625, n=40) | |
| HP ZBook Firefly 15 G8 2C9R7EA | |
| HP ZBook Power 15 G8 313S5EA | |
| Lenovo ThinkPad P15v G2 21A9000XGE | |
| Dell Precision 3000 3551 | |
| HWBOT x265 Benchmark v2.2 / 4k Preset | |
| Media della classe Workstation (17.8 - 40.5, n=23, ultimi 2 anni) | |
| HP ZBook Studio 15 G8 | |
| HP ZBook Fury 15 G8 | |
| HP ZBook Power 15 G8 313S5EA | |
| Media Intel Core i7-11800H (7.38 - 17.4, n=46) | |
| Lenovo ThinkPad P15v G2 21A9000XGE | |
| Dell Precision 3000 3551 | |
| HP ZBook Firefly 15 G8 2C9R7EA | |
| LibreOffice / 20 Documents To PDF | |
| Lenovo ThinkPad P15v G2 21A9000XGE | |
| HP ZBook Fury 15 G8 | |
| HP ZBook Studio 15 G8 | |
| Media della classe Workstation (37.1 - 74.7, n=23, ultimi 2 anni) | |
| Media Intel Core i7-11800H (38.6 - 59.9, n=45) | |
| Dell Precision 3000 3551 | |
| HP ZBook Power 15 G8 313S5EA | |
| HP ZBook Firefly 15 G8 2C9R7EA | |
| R Benchmark 2.5 / Overall mean | |
| HP ZBook Power 15 G8 313S5EA | |
| Lenovo ThinkPad P15v G2 21A9000XGE | |
| Dell Precision 3000 3551 | |
| Media Intel Core i7-11800H (0.548 - 0.615, n=46) | |
| HP ZBook Firefly 15 G8 2C9R7EA | |
| HP ZBook Studio 15 G8 | |
| HP ZBook Fury 15 G8 | |
| Media della classe Workstation (0.3825 - 0.603, n=23, ultimi 2 anni) | |
| Octane V2 / Total Score | |
| Media della classe Workstation (112382 - 129420, n=3, ultimi 2 anni) | |
| Media Intel Core i7-11800H (63248 - 70549, n=10) | |
| HP ZBook Power 15 G8 313S5EA | |
| Jetstream 2 / 2.0 Total | |
| Media della classe Workstation (327 - 466, n=4, ultimi 2 anni) | |
| HP ZBook Power 15 G8 313S5EA | |
| HP ZBook Fury 15 G8 | |
| HP ZBook Studio 15 G8 | |
| Media Intel Core i7-11800H (159.8 - 214, n=16) | |
* ... Meglio usare valori piccoli
AIDA64: FP32 Ray-Trace | FPU Julia | CPU SHA3 | CPU Queen | FPU SinJulia | FPU Mandel | CPU AES | CPU ZLib | FP64 Ray-Trace | CPU PhotoWorxx
| Performance rating | |
| Media della classe Workstation | |
| HP ZBook Fury 15 G8 | |
| HP ZBook Studio 15 G8 | |
| HP ZBook Power 15 G8 313S5EA | |
| Media Intel Core i7-11800H | |
| Lenovo ThinkPad P15v G2 21A9000XGE | |
| HP ZBook Firefly 15 G8 2C9R7EA | |
| AIDA64 / FP32 Ray-Trace | |
| Media della classe Workstation (16730 - 61611, n=23, ultimi 2 anni) | |
| HP ZBook Power 15 G8 313S5EA | |
| HP ZBook Fury 15 G8 | |
| HP ZBook Studio 15 G8 | |
| Media Intel Core i7-11800H (8772 - 15961, n=20) | |
| Lenovo ThinkPad P15v G2 21A9000XGE | |
| HP ZBook Firefly 15 G8 2C9R7EA | |
| AIDA64 / FPU Julia | |
| Media della classe Workstation (89597 - 186971, n=23, ultimi 2 anni) | |
| HP ZBook Fury 15 G8 | |
| HP ZBook Studio 15 G8 | |
| HP ZBook Power 15 G8 313S5EA | |
| Media Intel Core i7-11800H (39404 - 65636, n=20) | |
| Lenovo ThinkPad P15v G2 21A9000XGE | |
| HP ZBook Firefly 15 G8 2C9R7EA | |
| AIDA64 / CPU SHA3 | |
| Media della classe Workstation (4178 - 8975, n=23, ultimi 2 anni) | |
| HP ZBook Power 15 G8 313S5EA | |
| HP ZBook Fury 15 G8 | |
| HP ZBook Studio 15 G8 | |
| Media Intel Core i7-11800H (2599 - 4439, n=20) | |
| Lenovo ThinkPad P15v G2 21A9000XGE | |
| HP ZBook Firefly 15 G8 2C9R7EA | |
| AIDA64 / CPU Queen | |
| Media della classe Workstation (60778 - 144411, n=23, ultimi 2 anni) | |
| HP ZBook Studio 15 G8 | |
| HP ZBook Fury 15 G8 | |
| HP ZBook Power 15 G8 313S5EA | |
| Media Intel Core i7-11800H (85233 - 91941, n=20) | |
| Lenovo ThinkPad P15v G2 21A9000XGE | |
| HP ZBook Firefly 15 G8 2C9R7EA | |
| AIDA64 / FPU SinJulia | |
| Media della classe Workstation (8165 - 29343, n=23, ultimi 2 anni) | |
| HP ZBook Fury 15 G8 | |
| HP ZBook Studio 15 G8 | |
| HP ZBook Power 15 G8 313S5EA | |
| Media Intel Core i7-11800H (6420 - 9792, n=20) | |
| Lenovo ThinkPad P15v G2 21A9000XGE | |
| HP ZBook Firefly 15 G8 2C9R7EA | |
| AIDA64 / FPU Mandel | |
| Media della classe Workstation (44497 - 98153, n=23, ultimi 2 anni) | |
| HP ZBook Fury 15 G8 | |
| HP ZBook Power 15 G8 313S5EA | |
| HP ZBook Studio 15 G8 | |
| Media Intel Core i7-11800H (23365 - 39464, n=20) | |
| Lenovo ThinkPad P15v G2 21A9000XGE | |
| HP ZBook Firefly 15 G8 2C9R7EA | |
| AIDA64 / CPU AES | |
| Media Intel Core i7-11800H (74617 - 149388, n=20) | |
| Media della classe Workstation (73133 - 187841, n=23, ultimi 2 anni) | |
| HP ZBook Power 15 G8 313S5EA | |
| HP ZBook Studio 15 G8 | |
| HP ZBook Fury 15 G8 | |
| Lenovo ThinkPad P15v G2 21A9000XGE | |
| HP ZBook Firefly 15 G8 2C9R7EA | |
| AIDA64 / CPU ZLib | |
| Media della classe Workstation (929 - 2148, n=23, ultimi 2 anni) | |
| HP ZBook Power 15 G8 313S5EA | |
| HP ZBook Studio 15 G8 | |
| HP ZBook Fury 15 G8 | |
| Lenovo ThinkPad P15v G2 21A9000XGE | |
| HP ZBook Firefly 15 G8 2C9R7EA | |
| Media Intel Core i7-11800H (461 - 830, n=43) | |
| AIDA64 / FP64 Ray-Trace | |
| Media della classe Workstation (8545 - 32891, n=23, ultimi 2 anni) | |
| HP ZBook Power 15 G8 313S5EA | |
| HP ZBook Fury 15 G8 | |
| HP ZBook Studio 15 G8 | |
| Media Intel Core i7-11800H (4545 - 8717, n=21) | |
| Lenovo ThinkPad P15v G2 21A9000XGE | |
| HP ZBook Firefly 15 G8 2C9R7EA | |
| AIDA64 / CPU PhotoWorxx | |
| Media della classe Workstation (37151 - 93684, n=23, ultimi 2 anni) | |
| HP ZBook Fury 15 G8 | |
| HP ZBook Studio 15 G8 | |
| Media Intel Core i7-11800H (11898 - 26757, n=21) | |
| HP ZBook Firefly 15 G8 2C9R7EA | |
| HP ZBook Power 15 G8 313S5EA | |
| Lenovo ThinkPad P15v G2 21A9000XGE | |
Prestazioni della stazione di lavoro
Le prestazioni nelle applicazioni relative alla workstation sono state valutate con il nuovo BIOS (v1.09). In questo caso, si posiziona circa il 10% dietro al ThinkPad P15v G2con laNvidia T1200mentre il HP Fireflycon laNvidia T500viene superato di circa il 45%. D'altra parte, lo ZBook Fury conRTX A5000offre il doppio delle prestazioni nella maggior parte dei casi.
LaRTX A2000che è il massimo che si può scegliere per lo ZBook Power 15, dovrebbe essere circa il 50% più veloce.
| V-Ray 5 Benchmark | |
| CPU | |
| HP ZBook Fury 15 G8 | |
| Lenovo ThinkPad P15v G2 21A9000XGE | |
| GPU CUDA | |
| Lenovo ThinkPad P15v G2 21A9000XGE | |
| HP ZBook Power 15 G8 313S5EA | |
| Geekbench 5.5 - OpenCL Score | |
| Lenovo ThinkPad P15v G2 21A9000XGE | |
| HP ZBook Power 15 G8 313S5EA | |
| HP ZBook Firefly 15 G8 2C9R7EA | |
| Dell Precision 3000 3551 | |
Prestazioni del sistema
Nonostante la RAM a canale singolo, il sistema funziona senza alcun ritardo, anche quando si lavora con più schede del browser mentre un video YouTube 4K viene eseguito in background.
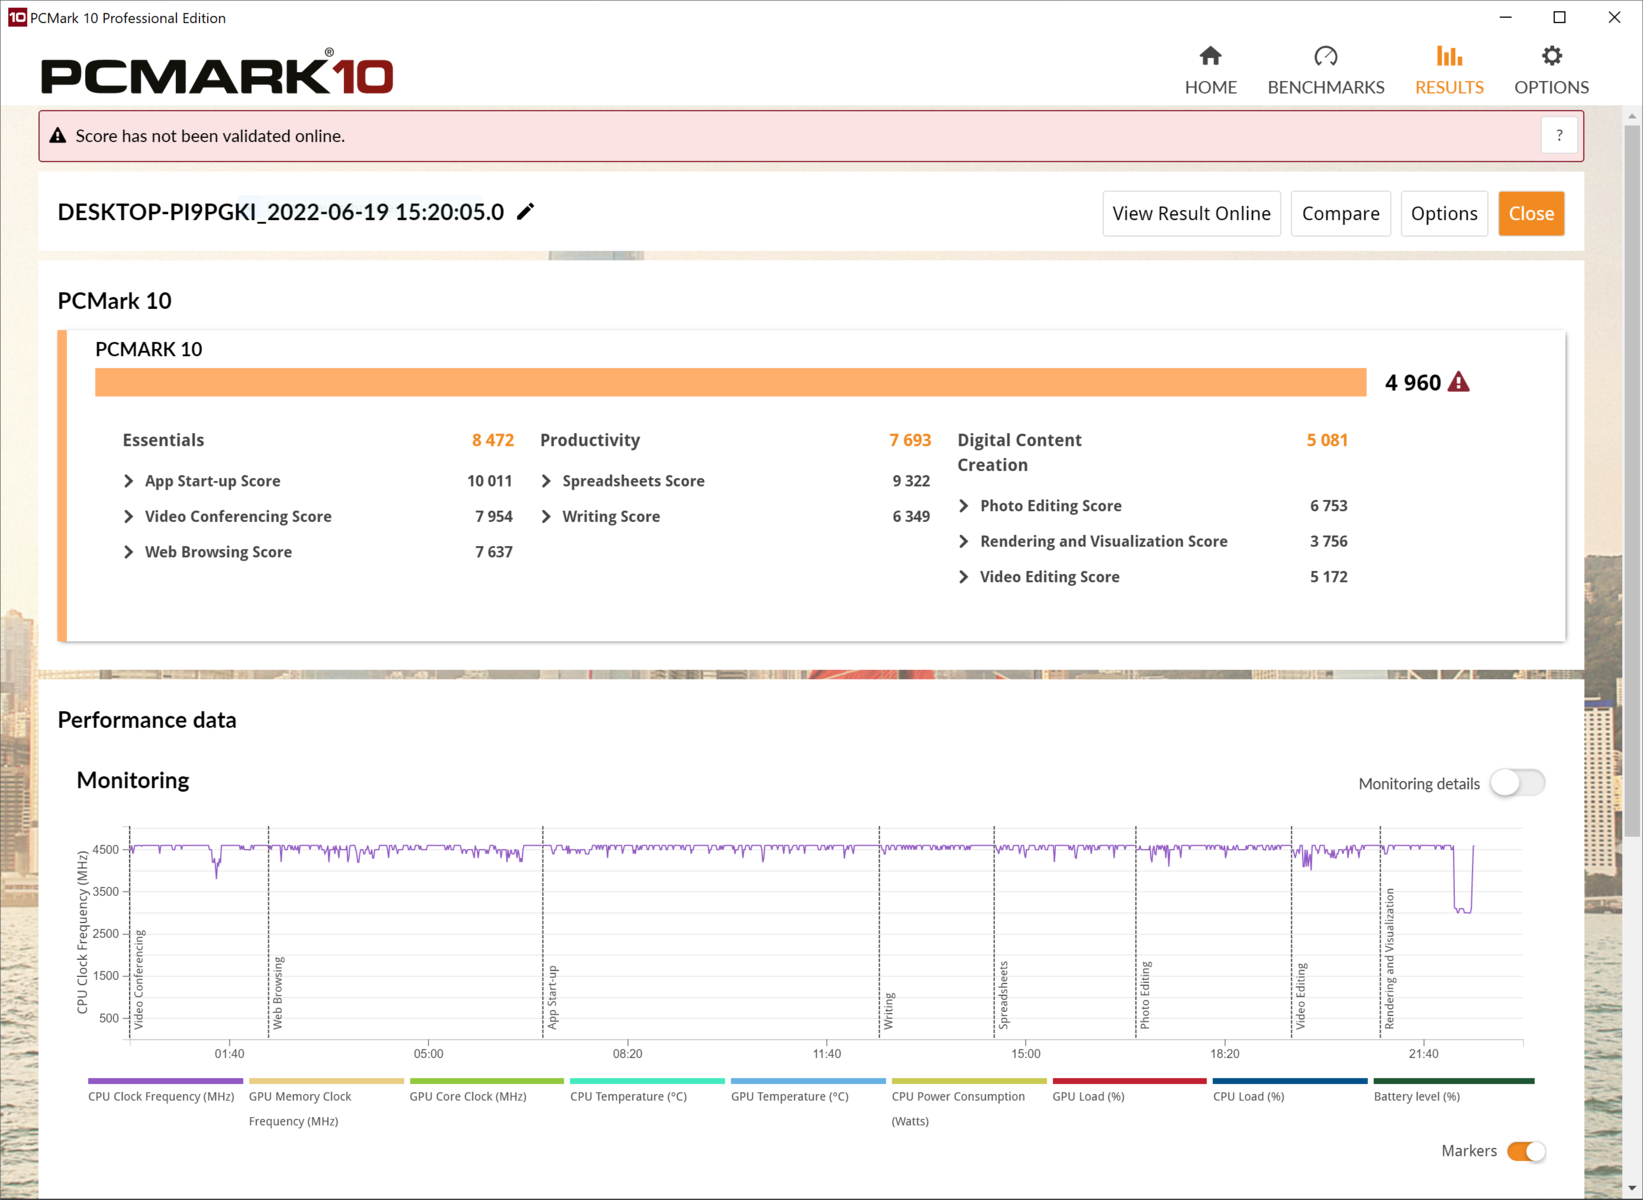
Con il nuovo BIOS, si perde circa il 15% delle prestazioni, tanto che la nostra unità di prova finisce all'ultimo posto nel benchmark PCMark 10. In particolare, il punteggio di Content Creation è sceso di circa il 28%.
CrossMark: Overall | Productivity | Creativity | Responsiveness
| PCMark 10 / Score | |
| Media della classe Workstation (6563 - 10409, n=19, ultimi 2 anni) | |
| HP ZBook Fury 15 G8 | |
| HP ZBook Studio 15 G8 | |
| Lenovo ThinkPad P15v G2 21A9000XGE | |
| HP ZBook Firefly 15 G8 2C9R7EA | |
| Dell Precision 3000 3551 | |
| HP ZBook Power 15 G8 313S5EA | |
| Media Intel Core i7-11800H, NVIDIA T600 Laptop GPU (n=1) | |
| PCMark 10 / Essentials | |
| Media della classe Workstation (9622 - 11157, n=19, ultimi 2 anni) | |
| Dell Precision 3000 3551 | |
| HP ZBook Fury 15 G8 | |
| HP ZBook Studio 15 G8 | |
| Lenovo ThinkPad P15v G2 21A9000XGE | |
| HP ZBook Firefly 15 G8 2C9R7EA | |
| HP ZBook Power 15 G8 313S5EA | |
| Media Intel Core i7-11800H, NVIDIA T600 Laptop GPU (n=1) | |
| PCMark 10 / Productivity | |
| Media della classe Workstation (8789 - 20616, n=19, ultimi 2 anni) | |
| HP ZBook Firefly 15 G8 2C9R7EA | |
| HP ZBook Fury 15 G8 | |
| HP ZBook Studio 15 G8 | |
| Lenovo ThinkPad P15v G2 21A9000XGE | |
| Dell Precision 3000 3551 | |
| HP ZBook Power 15 G8 313S5EA | |
| Media Intel Core i7-11800H, NVIDIA T600 Laptop GPU (n=1) | |
| PCMark 10 / Digital Content Creation | |
| Media della classe Workstation (8108 - 15631, n=19, ultimi 2 anni) | |
| HP ZBook Fury 15 G8 | |
| HP ZBook Studio 15 G8 | |
| Lenovo ThinkPad P15v G2 21A9000XGE | |
| HP ZBook Firefly 15 G8 2C9R7EA | |
| HP ZBook Power 15 G8 313S5EA | |
| Media Intel Core i7-11800H, NVIDIA T600 Laptop GPU (n=1) | |
| Dell Precision 3000 3551 | |
| CrossMark / Overall | |
| Media della classe Workstation (1307 - 2267, n=22, ultimi 2 anni) | |
| HP ZBook Power 15 G8 313S5EA | |
| Media Intel Core i7-11800H, NVIDIA T600 Laptop GPU (n=1) | |
| Lenovo ThinkPad P15v G2 21A9000XGE | |
| CrossMark / Productivity | |
| Media della classe Workstation (1130 - 2122, n=22, ultimi 2 anni) | |
| HP ZBook Power 15 G8 313S5EA | |
| Media Intel Core i7-11800H, NVIDIA T600 Laptop GPU (n=1) | |
| Lenovo ThinkPad P15v G2 21A9000XGE | |
| CrossMark / Creativity | |
| Media della classe Workstation (1657 - 2725, n=22, ultimi 2 anni) | |
| HP ZBook Power 15 G8 313S5EA | |
| Media Intel Core i7-11800H, NVIDIA T600 Laptop GPU (n=1) | |
| Lenovo ThinkPad P15v G2 21A9000XGE | |
| CrossMark / Responsiveness | |
| Media della classe Workstation (993 - 2096, n=22, ultimi 2 anni) | |
| HP ZBook Power 15 G8 313S5EA | |
| Media Intel Core i7-11800H, NVIDIA T600 Laptop GPU (n=1) | |
| Lenovo ThinkPad P15v G2 21A9000XGE | |
| PCMark 10 Score | 4960 punti | |
Aiuto | ||
| AIDA64 / Memory Copy | |
| Media della classe Workstation (56003 - 164795, n=23, ultimi 2 anni) | |
| HP ZBook Fury 15 G8 | |
| HP ZBook Studio 15 G8 | |
| Media Intel Core i7-11800H (24508 - 48144, n=21) | |
| HP ZBook Power 15 G8 313S5EA | |
| HP ZBook Firefly 15 G8 2C9R7EA | |
| Lenovo ThinkPad P15v G2 21A9000XGE | |
| AIDA64 / Memory Read | |
| Media della classe Workstation (55795 - 121563, n=23, ultimi 2 anni) | |
| HP ZBook Studio 15 G8 | |
| HP ZBook Fury 15 G8 | |
| Media Intel Core i7-11800H (25882 - 50365, n=20) | |
| HP ZBook Power 15 G8 313S5EA | |
| Lenovo ThinkPad P15v G2 21A9000XGE | |
| HP ZBook Firefly 15 G8 2C9R7EA | |
| AIDA64 / Memory Write | |
| Media della classe Workstation (55663 - 214520, n=23, ultimi 2 anni) | |
| HP ZBook Studio 15 G8 | |
| HP ZBook Fury 15 G8 | |
| Media Intel Core i7-11800H (22240 - 46214, n=20) | |
| HP ZBook Firefly 15 G8 2C9R7EA | |
| HP ZBook Power 15 G8 313S5EA | |
| Lenovo ThinkPad P15v G2 21A9000XGE | |
| AIDA64 / Memory Latency | |
| Media della classe Workstation (84.5 - 165.2, n=23, ultimi 2 anni) | |
| Lenovo ThinkPad P15v G2 21A9000XGE | |
| HP ZBook Fury 15 G8 | |
| HP ZBook Studio 15 G8 | |
| HP ZBook Power 15 G8 313S5EA | |
| HP ZBook Firefly 15 G8 2C9R7EA | |
| Media Intel Core i7-11800H (71.9 - 104.1, n=44) | |
* ... Meglio usare valori piccoli
Latenze DPC
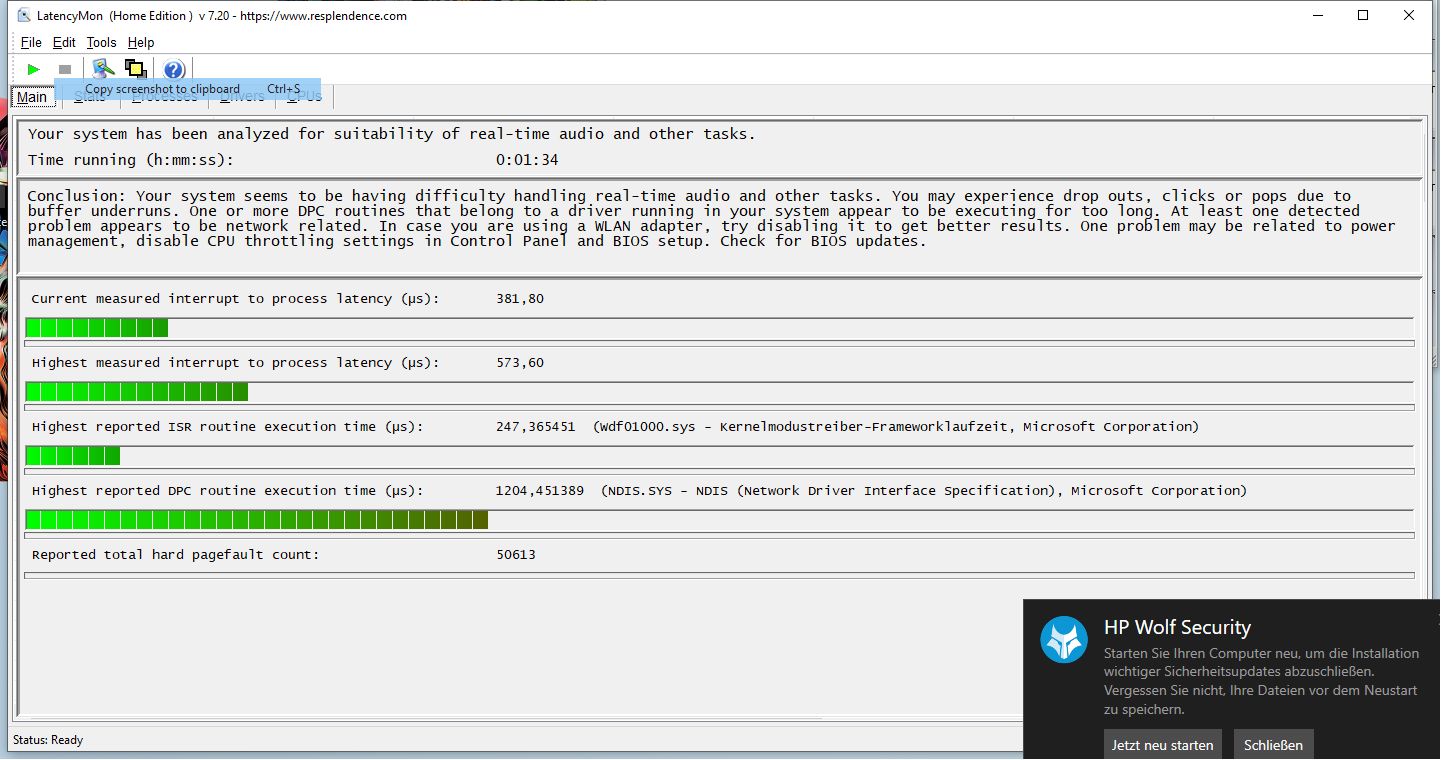
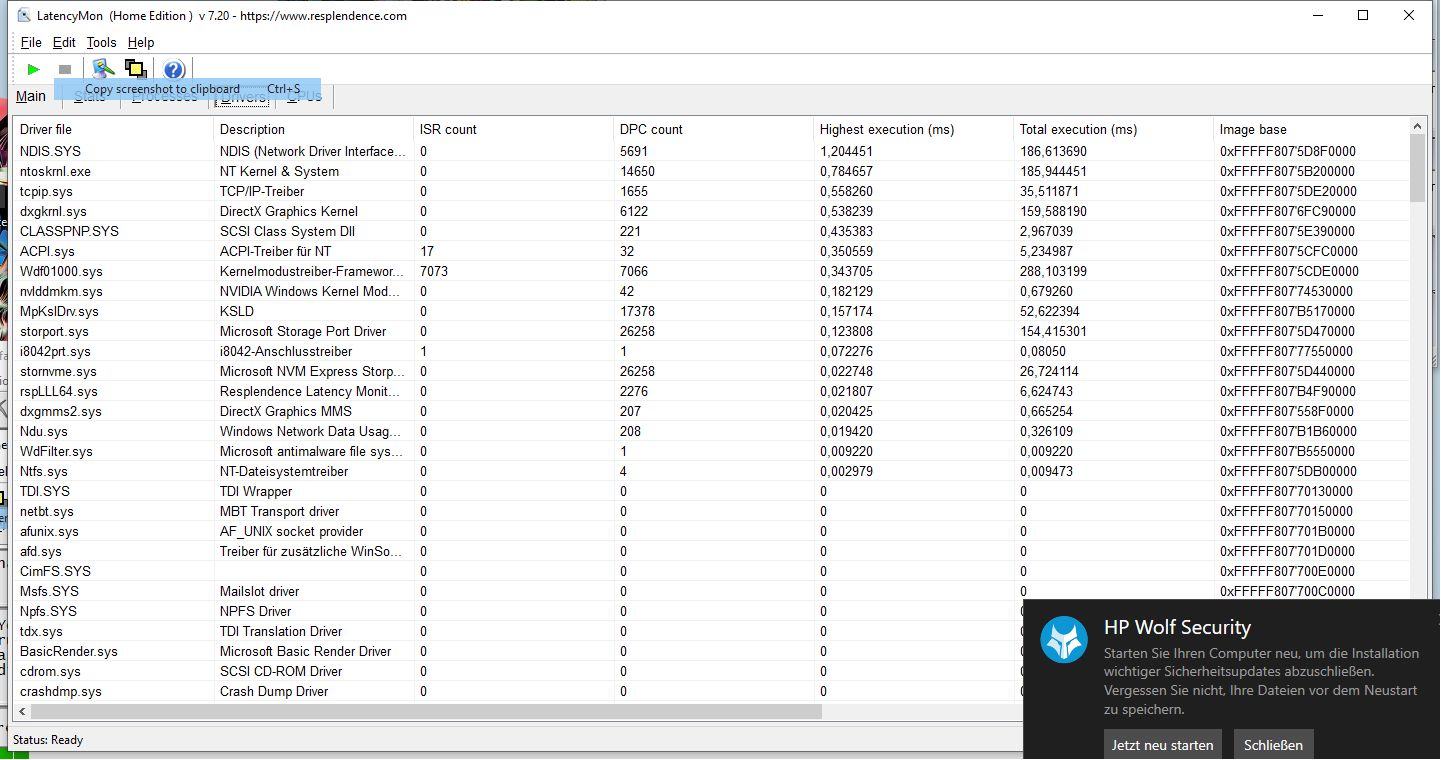
Con soli 537,6 µs, la latenza DPC dello ZBook Power 15 sembra molto buona. Tuttavia, l'analisi mostra ancora che il driver di rete causa alcuni ritardi, per cui l'elaborazione video e audio in tempo reale funzionerà solo senza utilizzare il Wi-Fi AX201 di Intel
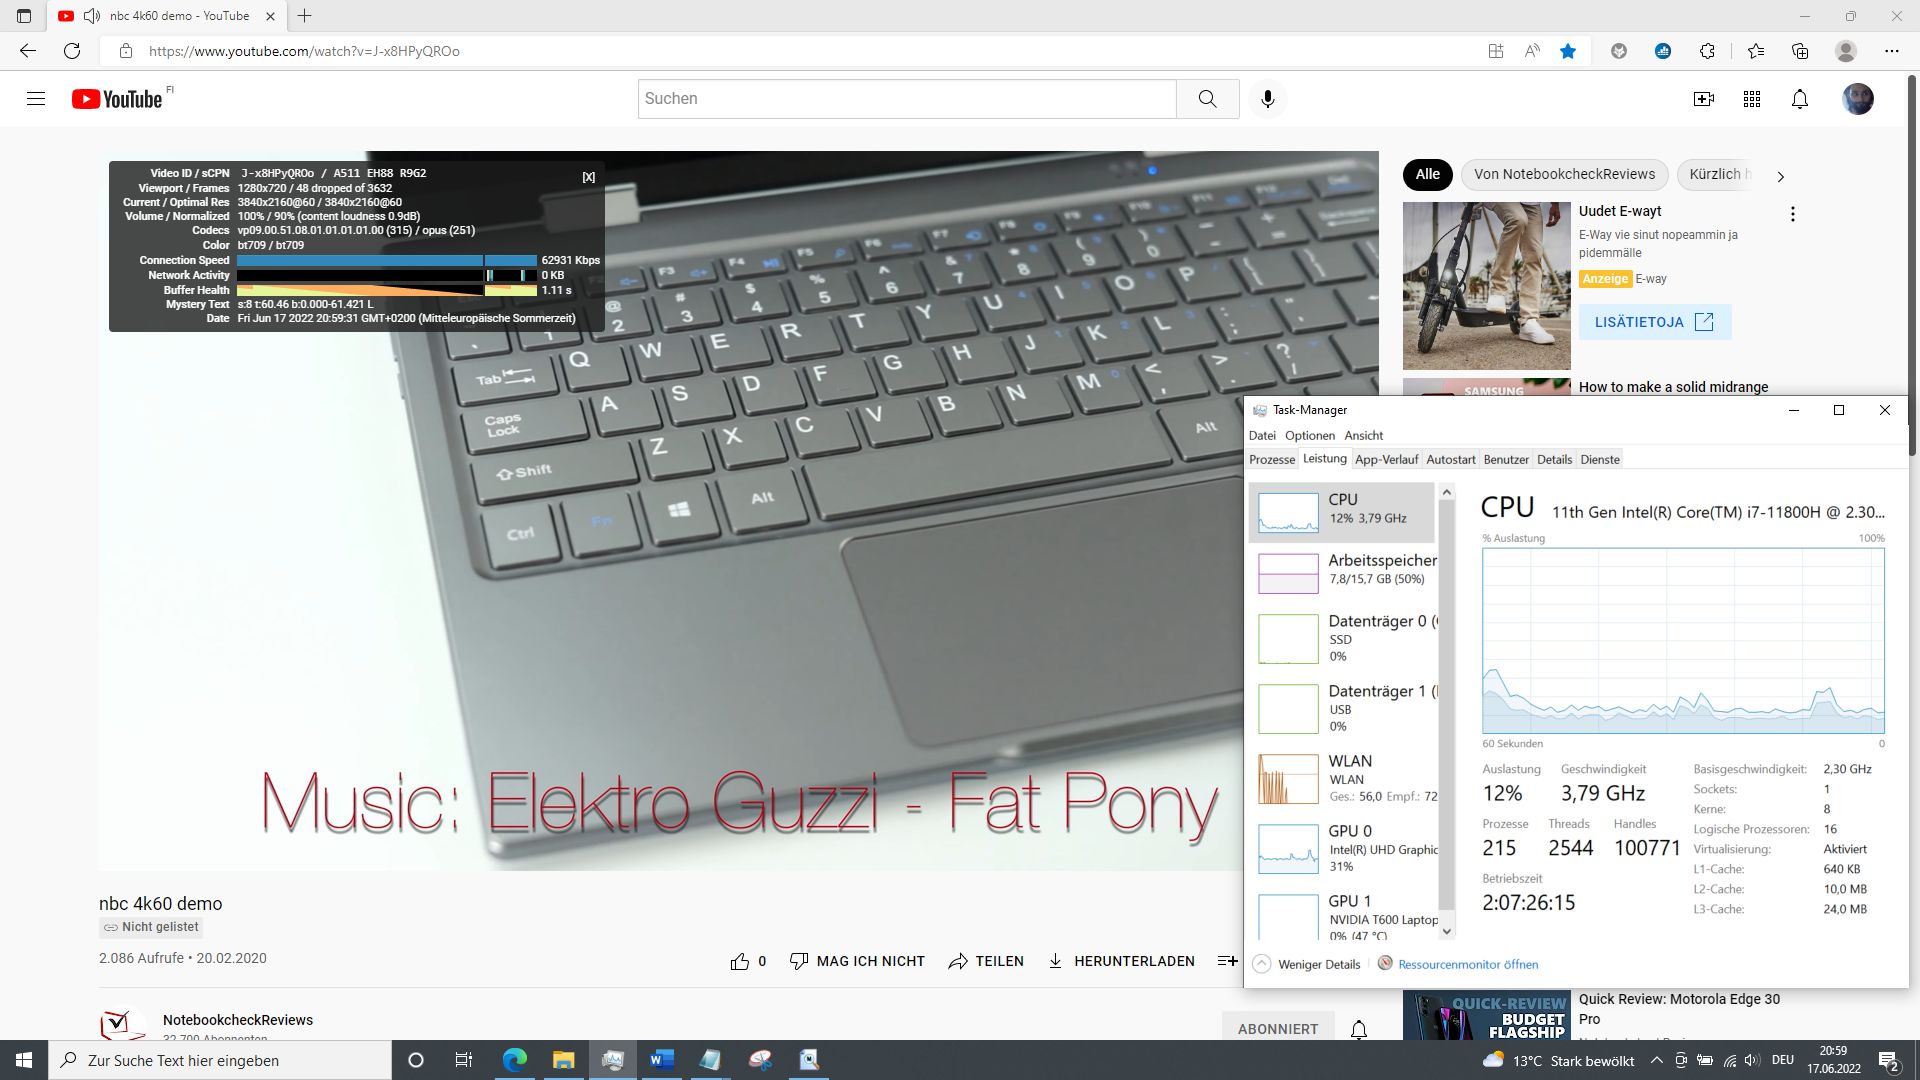
La riproduzione di un video 4K di YouTube causa un carico del 30% sull'iGPU e del 12% sulla CPU, ma si notano comunque alcuni fotogrammi caduti.
| DPC Latencies / LatencyMon - interrupt to process latency (max), Web, Youtube, Prime95 (ordina per valore) | |
| HP ZBook Power 15 G8 313S5EA | |
| HP ZBook Fury 15 G8 | |
| HP ZBook Firefly 15 G8 2C9R7EA | |
| HP ZBook Studio 15 G8 | |
| Dell Precision 3000 3551 | |
| Lenovo ThinkPad P15v G2 21A9000XGE | |
* ... Meglio usare valori piccoli
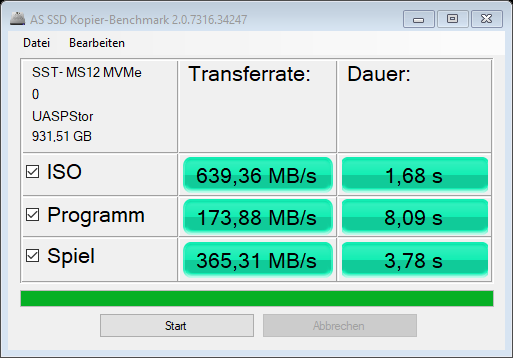
Soluzione di stoccaggio
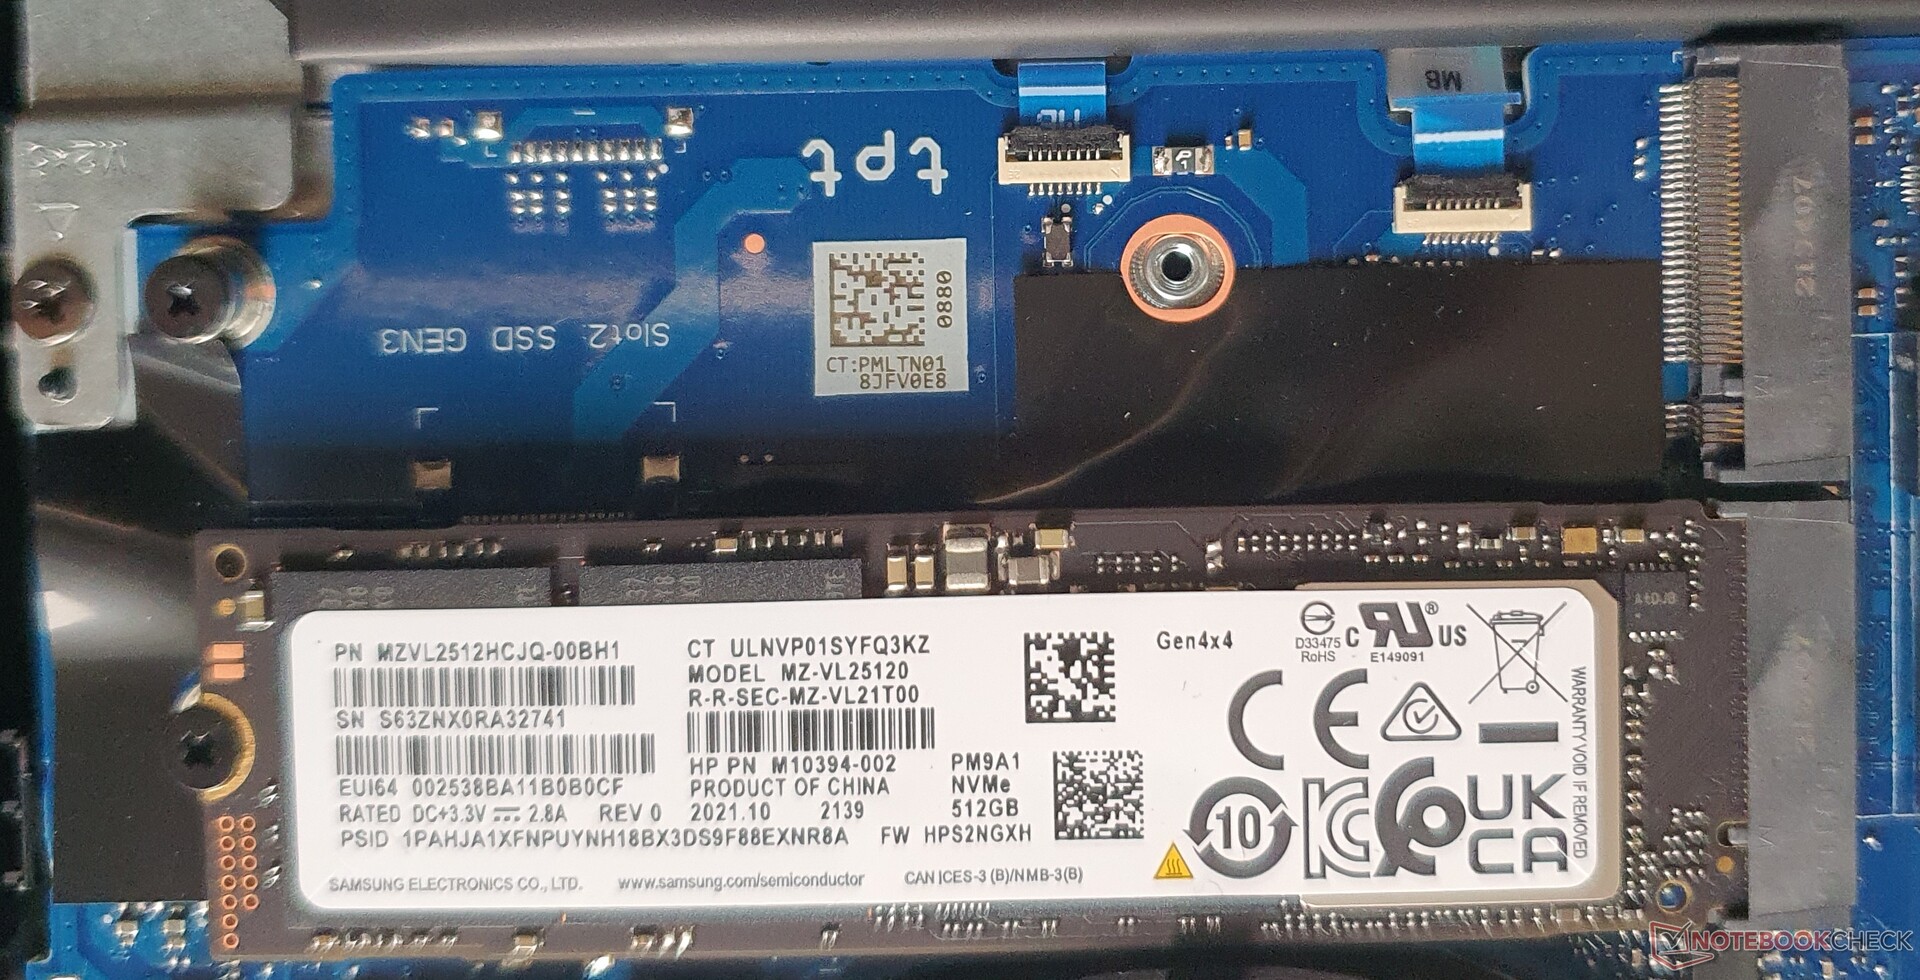
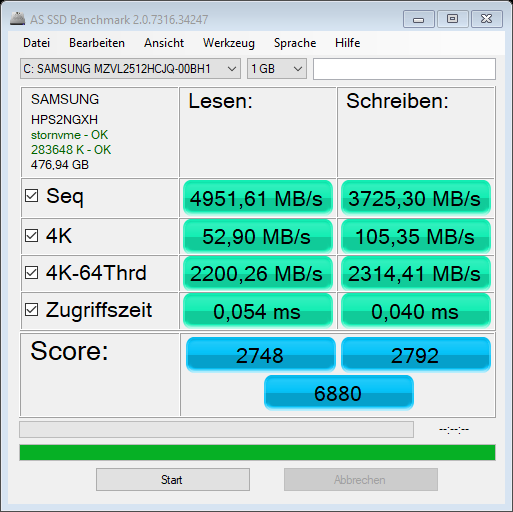
Il Samsung PM9A1 offre spazio per 512 GB, di cui circa 418 GB rimangono disponibili per l'utente in stato di consegna. Grazie al PCIe Gen4x4, le velocità, compresi i valori 4K e i tempi di accesso, sembrano inizialmente molto buone. È disponibile anche un secondo slot (PCIe Gen3x4), entrambi certificati fino a 2 TB.
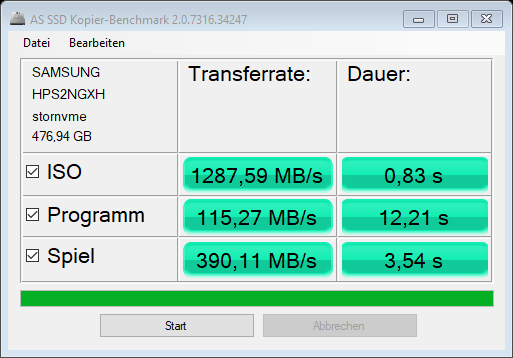
Tuttavia, quando si copia un programma di grandi dimensioni, ad esempio, l'unità SSD AS mostra velocità di trasferimento molto basse, pari a 115 MB/s invece dei 1074 MB/s del modello ZBook Studio 15 G8.ZBook Studio 15 G8. Anche il conveniente Dell Precision 3511 riesce a raggiungere velocità di copia nettamente superiori. Anche la nostra unità SSD esterna da 10 Gbps copia i programmi più velocemente.
| HP ZBook Power 15 G8 313S5EA T600 Laptop GPU, i7-11800H, Samsung PM9A1 MZVL2512HCJQ | HP ZBook Fury 15 G8 RTX A5000 Laptop GPU, i9-11950H, Samsung PM981a MZVLB1T0HBLR | HP ZBook Studio 15 G8 GeForce RTX 3070 Laptop GPU, i9-11950H, Samsung PM981a MZVLB2T0HALB | HP ZBook Firefly 15 G8 2C9R7EA T500 Laptop GPU, i7-1165G7, Toshiba XG6 KXG60ZNV1T02 | Lenovo ThinkPad P15v G2 21A9000XGE T1200 Laptop GPU, i7-11800H, Toshiba XG6 KXG6AZNV512G | Dell Precision 3000 3551 Quadro P620, i9-10885H, Toshiba Kioxia XG6 KXG60PNV512G | |
|---|---|---|---|---|---|---|
| AS SSD | -35% | 64% | -26% | -9% | 24% | |
| Seq Read (MB/s) | 4951 | 2937 -41% | 2953 -40% | 2599 -48% | 2684 -46% | 1833 -63% |
| Seq Write (MB/s) | 3725 | 1688 -55% | 1691 -55% | 1305 -65% | 1352 -64% | 1283 -66% |
| 4K Read (MB/s) | 52.9 | 44.27 -16% | 43.98 -17% | 49.65 -6% | 43.68 -17% | 44.56 -16% |
| 4K Write (MB/s) | 105.35 | 105.8 0% | 105.4 0% | 128.1 22% | 105.56 0% | 112.4 7% |
| 4K-64 Read (MB/s) | 2200.26 | 873 -60% | 1065 -52% | 1157 -47% | 976.92 -56% | 1106 -50% |
| 4K-64 Write (MB/s) | 2314.41 | 1996 -14% | 1957 -15% | 1475 -36% | 1452.09 -37% | 1262 -45% |
| Access Time Read * (ms) | 0.054 | 0.048 11% | 0.04 26% | 0.057 -6% | 0.124 -130% | 0.084 -56% |
| Access Time Write * (ms) | 0.04 | 0.107 -168% | 0.105 -163% | 0.03 25% | 0.038 5% | 0.105 -163% |
| Score Read (Points) | 2748 | 1211 -56% | 1404 -49% | 1467 -47% | 1289 -53% | 1334 -51% |
| Score Write (Points) | 2792 | 2271 -19% | 2232 -20% | 1734 -38% | 1693 -39% | 1503 -46% |
| Score Total (Points) | 6880 | 4046 -41% | 4297 -38% | 3894 -43% | 3582 -48% | 3498 -49% |
| Copy ISO MB/s (MB/s) | 1287.6 | 901 -30% | 2474 92% | 1760.5 37% | 2940 128% | |
| Copy Program MB/s (MB/s) | 115.3 | 118.7 3% | 1074 831% | 355 208% | 733 536% | |
| Copy Game MB/s (MB/s) | 390.1 | 372 -5% | 1929 394% | 849 118% | 1442 270% |
* ... Meglio usare valori piccoli
* ... Meglio usare valori piccoli
Constant Performance Reading: DiskSpd Read Loop, Queue Depth 8
Scheda grafica

IlNvidia T600utilizzata in questo caso è la versione professionale della GeForce GTX 1650 (non-Ti) con 4 GB di VRAM GDDR6 e un TGP da 25 Watt e boost fino a 1395 MHz
In molti benchmark, rimane indietro di circa il 15% rispetto alla Nvidia T1200delThinkPad P15v G2e tra il 30 e il 50% in più rispetto alla Nvidia T500 nel modelloZBook Firefly 15 G8
Nel funzionamento a batteria, si perde circa il 20% della potenza grafica, il che consente comunque di lavorare sulle attività della GPU in modalità mobile.

| 3DMark Performance rating - Percent | |
| Media della classe Workstation | |
| HP ZBook Fury 15 G8 -4! | |
| HP ZBook Studio 15 G8 -4! | |
| HP ZBook Power 15 G8 313S5EA | |
| Media NVIDIA T600 Laptop GPU | |
| Lenovo ThinkPad P15v G2 21A9000XGE -3! | |
| Dell Precision 3000 3551 -3! | |
| HP ZBook Firefly 15 G8 2C9R7EA -4! | |
| 3DMark 06 - 1280x1024 Standard Score AA:0x AF:0x | |
| Media della classe Workstation (53112 - 63693, n=3, ultimi 2 anni) | |
| HP ZBook Power 15 G8 313S5EA | |
| Media NVIDIA T600 Laptop GPU (n=1) | |
| Lenovo ThinkPad P15v G2 21A9000XGE | |
| Dell Precision 3000 3551 | |
| 3DMark Vantage | |
| 1280x1024 P Result | |
| Media della classe Workstation (71988 - 116321, n=3, ultimi 2 anni) | |
| HP ZBook Power 15 G8 313S5EA | |
| Media NVIDIA T600 Laptop GPU (n=1) | |
| 1280x1024 P GPU no PhysX | |
| Media della classe Workstation (66766 - 117151, n=2, ultimi 2 anni) | |
| HP ZBook Power 15 G8 313S5EA | |
| Media NVIDIA T600 Laptop GPU (n=1) | |
| 1280x1024 P CPU no PhysX | |
| Media della classe Workstation (94058 - 113900, n=2, ultimi 2 anni) | |
| HP ZBook Power 15 G8 313S5EA | |
| Media NVIDIA T600 Laptop GPU (n=1) | |
| 3DMark 06 Standard Score | 43438 punti | |
| 3DMark Vantage P Result | 39112 punti | |
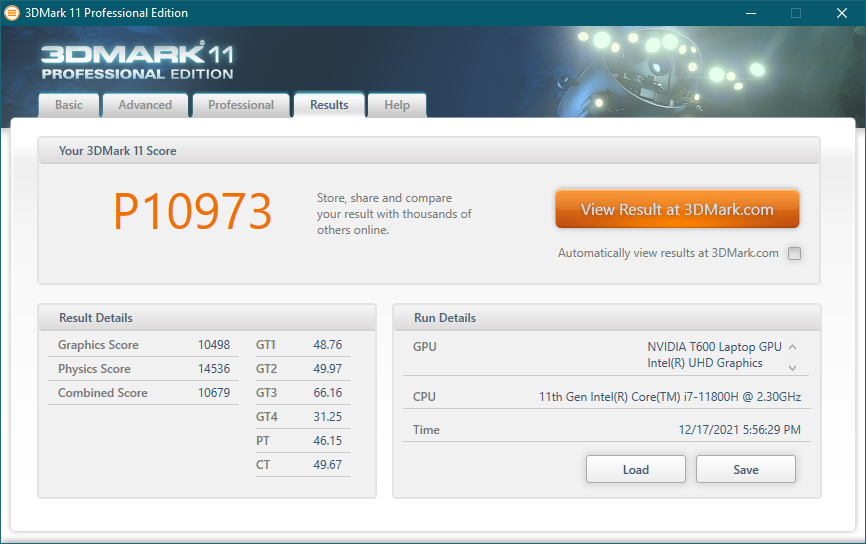
| 3DMark 11 Performance | 10973 punti | |
| 3DMark Ice Storm Standard Score | 76482 punti | |
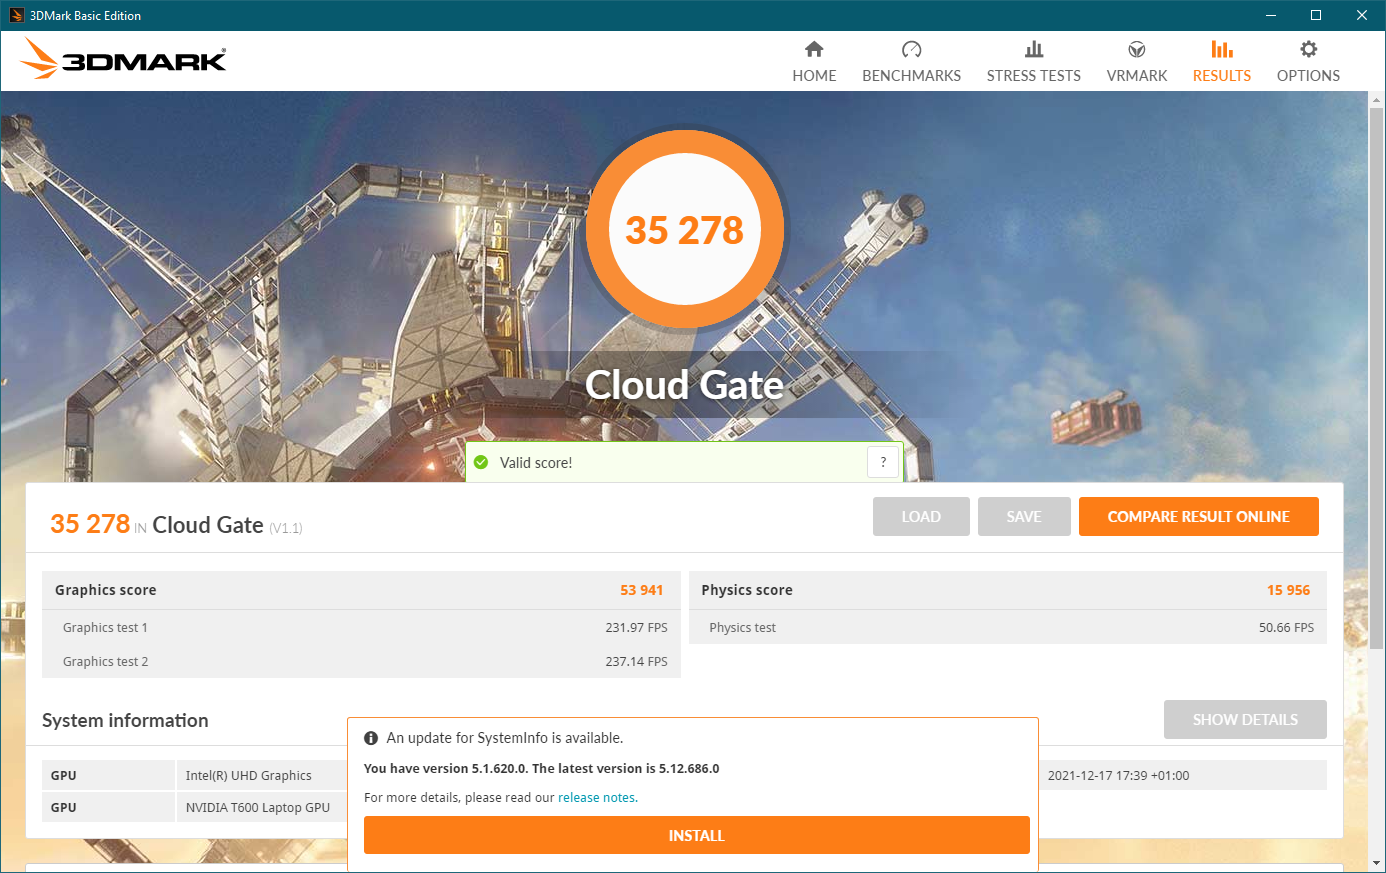
| 3DMark Cloud Gate Standard Score | 35278 punti | |
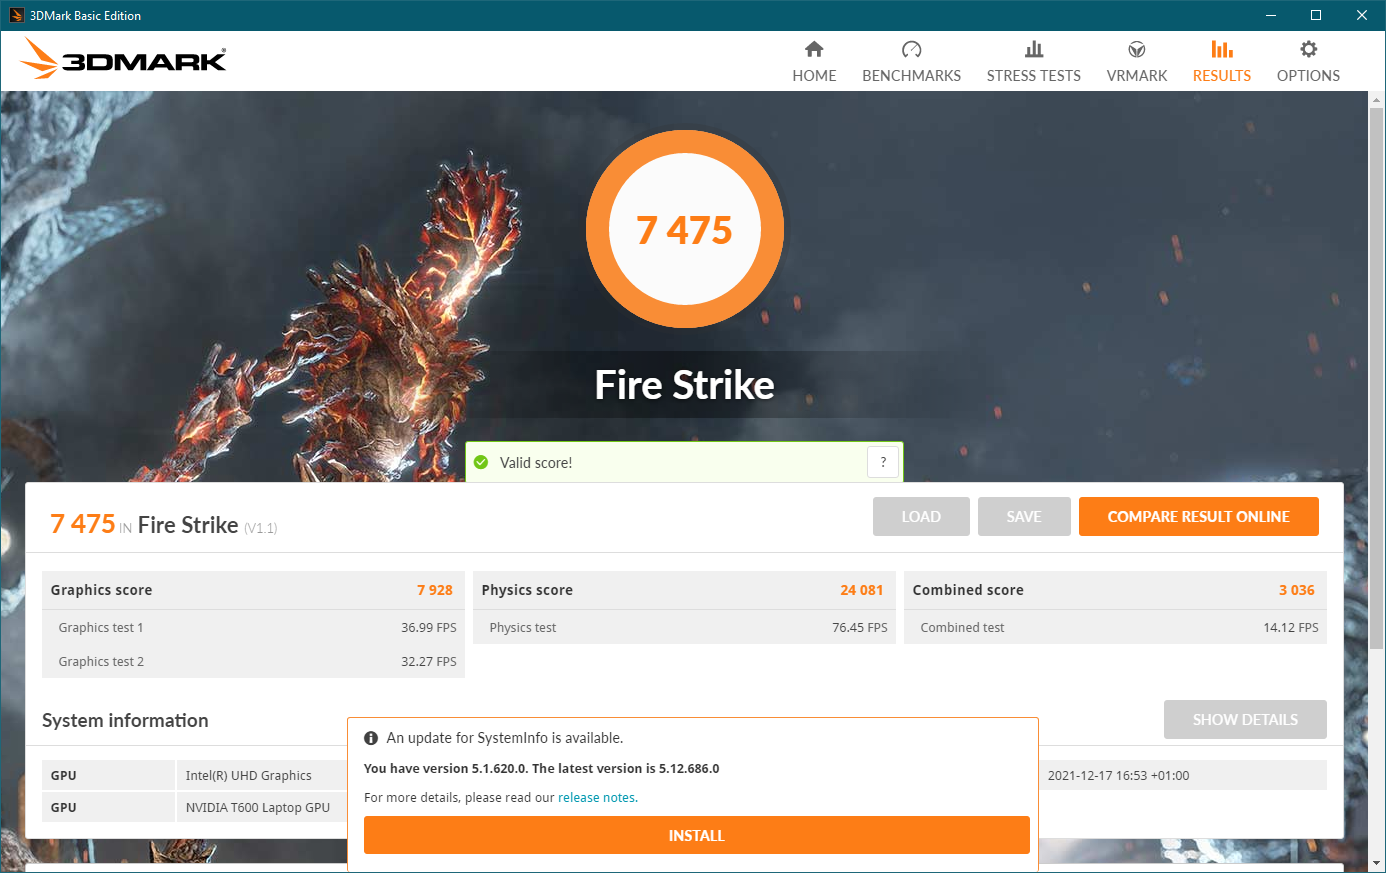
| 3DMark Fire Strike Score | 7475 punti | |
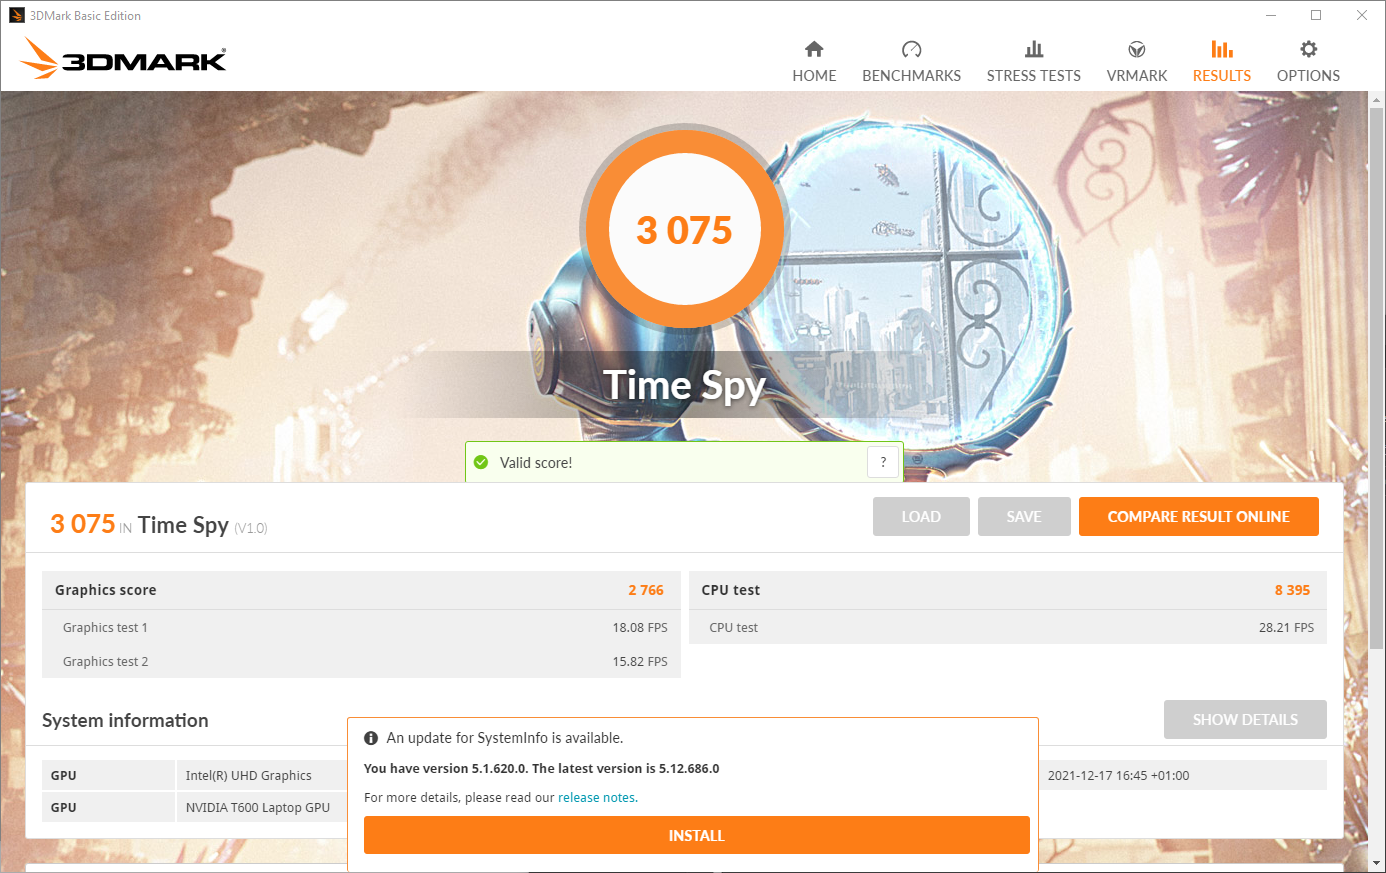
| 3DMark Time Spy Score | 3075 punti | |
Aiuto | ||
Prestazioni di gioco
Durante il gioco, la Nvidia T600 è in grado di mantenere la sua velocità di clock massima. A meno di 60 °C (140 °F), non si scalda particolarmente. Nei giochi moderni, le prestazioni sono sufficienti per dettagli medi a risoluzione Full-HD. Tuttavia, lo ZBook non è progettato per i giochi. In questo scenario il sistema assorbe complessivamente circa 60 watt, di cui 25 watt sono destinati alla GPU.
Anche se il ThinkPad P15vfornisce solo 10 watt in più per la sua dGPU, consuma un totale di 100 watt durante il gioco, mentre l'Nvidia T1200 consuma solo 10 watt in più Nvidia T1200offre solo il 15% in più di fotogrammi al secondo. LoZBook Firefly 15 con laNvidia T500 è mediamente più lento del 40%, ma consuma sempre gli stessi 60 watt durante il gioco. Nel test di The Witcher 3, durato un'ora, non abbiamo notato alcun calo delle prestazioni.
The Witcher 3 FPS Chart
| The Witcher 3 | |
| 1366x768 Medium Graphics & Postprocessing | |
| HP ZBook Studio 15 G8 | |
| HP ZBook Fury 15 G8 | |
| HP ZBook Power 15 G8 313S5EA | |
| Media NVIDIA T600 Laptop GPU (n=1) | |
| Dell Precision 3000 3551 | |
| 1920x1080 High Graphics & Postprocessing (Nvidia HairWorks Off) | |
| Media della classe Workstation (n=1ultimi 2 anni) | |
| HP ZBook Studio 15 G8 | |
| HP ZBook Fury 15 G8 | |
| Lenovo ThinkPad P15v G2 21A9000XGE | |
| HP ZBook Power 15 G8 313S5EA | |
| Media NVIDIA T600 Laptop GPU (n=1) | |
| Dell Precision 3000 3551 | |
| 1920x1080 Ultra Graphics & Postprocessing (HBAO+) | |
| Media della classe Workstation (n=1ultimi 2 anni) | |
| HP ZBook Fury 15 G8 | |
| HP ZBook Studio 15 G8 | |
| Lenovo ThinkPad P15v G2 21A9000XGE | |
| HP ZBook Power 15 G8 313S5EA | |
| Media NVIDIA T600 Laptop GPU (n=1) | |
| HP ZBook Firefly 15 G8 2C9R7EA | |
| Dell Precision 3000 3551 | |
| GTA V | |
| 1366x768 Normal/Off AF:4x | |
| Media della classe Workstation (140.9 - 185.8, n=17, ultimi 2 anni) | |
| HP ZBook Fury 15 G8 | |
| Lenovo ThinkPad P15v G2 21A9000XGE | |
| HP ZBook Power 15 G8 313S5EA | |
| Media NVIDIA T600 Laptop GPU (n=1) | |
| 1920x1080 High/On (Advanced Graphics Off) AA:2xMSAA + FX AF:8x | |
| Media della classe Workstation (44.4 - 179.4, n=21, ultimi 2 anni) | |
| HP ZBook Fury 15 G8 | |
| Lenovo ThinkPad P15v G2 21A9000XGE | |
| HP ZBook Power 15 G8 313S5EA | |
| Media NVIDIA T600 Laptop GPU (n=1) | |
| 1920x1080 Highest AA:4xMSAA + FX AF:16x | |
| Media della classe Workstation (18.1 - 156.1, n=23, ultimi 2 anni) | |
| HP ZBook Fury 15 G8 | |
| Lenovo ThinkPad P15v G2 21A9000XGE | |
| HP ZBook Power 15 G8 313S5EA | |
| Media NVIDIA T600 Laptop GPU (n=1) | |
| Shadow of the Tomb Raider | |
| 1280x720 Lowest Preset | |
| HP ZBook Fury 15 G8 | |
| HP ZBook Power 15 G8 313S5EA | |
| Media NVIDIA T600 Laptop GPU (n=1) | |
| Lenovo ThinkPad P15v G2 21A9000XGE | |
| 1920x1080 Medium Preset | |
| HP ZBook Fury 15 G8 | |
| Lenovo ThinkPad P15v G2 21A9000XGE | |
| HP ZBook Power 15 G8 313S5EA | |
| Media NVIDIA T600 Laptop GPU (n=1) | |
| 1920x1080 High Preset AA:SM | |
| HP ZBook Fury 15 G8 | |
| Lenovo ThinkPad P15v G2 21A9000XGE | |
| HP ZBook Power 15 G8 313S5EA | |
| Media NVIDIA T600 Laptop GPU (n=1) | |
| Elden Ring | |
| 1920x1080 Medium Preset | |
| Lenovo ThinkPad P15v G2 21A9000XGE | |
| HP ZBook Power 15 G8 313S5EA | |
| Media NVIDIA T600 Laptop GPU (n=1) | |
| 1920x1080 High Preset | |
| Lenovo ThinkPad P15v G2 21A9000XGE | |
| HP ZBook Power 15 G8 313S5EA | |
| Media NVIDIA T600 Laptop GPU (n=1) | |
| 1920x1080 Maximum Preset | |
| Lenovo ThinkPad P15v G2 21A9000XGE | |
| HP ZBook Power 15 G8 313S5EA | |
| Media NVIDIA T600 Laptop GPU (n=1) | |
| Resident Evil Village | |
| 1920x1080 Balanced Preset | |
| Lenovo ThinkPad P15v G2 21A9000XGE | |
| HP ZBook Power 15 G8 313S5EA | |
| Media NVIDIA T600 Laptop GPU (n=1) | |
| 1920x1080 Prioritize Graphics Preset | |
| Lenovo ThinkPad P15v G2 21A9000XGE | |
| HP ZBook Power 15 G8 313S5EA | |
| Media NVIDIA T600 Laptop GPU (n=1) | |
| 1920x1080 Max Preset | |
| Lenovo ThinkPad P15v G2 21A9000XGE | |
| HP ZBook Power 15 G8 313S5EA | |
| Media NVIDIA T600 Laptop GPU (n=1) | |
| Vampire Bloodhunt | |
| 1920x1080 Medium Preset | |
| Lenovo ThinkPad P15v G2 21A9000XGE | |
| HP ZBook Power 15 G8 313S5EA | |
| Media NVIDIA T600 Laptop GPU (n=1) | |
| 1920x1080 High Preset | |
| Lenovo ThinkPad P15v G2 21A9000XGE | |
| HP ZBook Power 15 G8 313S5EA | |
| Media NVIDIA T600 Laptop GPU (n=1) | |
| 1920x1080 Ultra Preset | |
| Lenovo ThinkPad P15v G2 21A9000XGE | |
| HP ZBook Power 15 G8 313S5EA | |
| Media NVIDIA T600 Laptop GPU (n=1) | |
| GRID Legends | |
| 1920x1080 Medium Preset | |
| Lenovo ThinkPad P15v G2 21A9000XGE | |
| HP ZBook Power 15 G8 313S5EA | |
| Media NVIDIA T600 Laptop GPU (n=1) | |
| 1920x1080 High Preset | |
| Lenovo ThinkPad P15v G2 21A9000XGE | |
| HP ZBook Power 15 G8 313S5EA | |
| Media NVIDIA T600 Laptop GPU (n=1) | |
| 1920x1080 Ultra Preset | |
| Lenovo ThinkPad P15v G2 21A9000XGE | |
| HP ZBook Power 15 G8 313S5EA | |
| Media NVIDIA T600 Laptop GPU (n=1) | |
| Mafia Definitive Edition | |
| 1280x720 Low Preset | |
| Lenovo ThinkPad P15v G2 21A9000XGE | |
| HP ZBook Power 15 G8 313S5EA | |
| Media NVIDIA T600 Laptop GPU (n=1) | |
| 1920x1080 Medium Preset | |
| Lenovo ThinkPad P15v G2 21A9000XGE | |
| HP ZBook Power 15 G8 313S5EA | |
| Media NVIDIA T600 Laptop GPU (n=1) | |
| 1920x1080 High Preset | |
| Lenovo ThinkPad P15v G2 21A9000XGE | |
| HP ZBook Power 15 G8 313S5EA | |
| Media NVIDIA T600 Laptop GPU (n=1) | |
| Elex 2 | |
| 1920x1080 Medium / On AA:FX AF:16x | |
| Lenovo ThinkPad P15v G2 21A9000XGE | |
| HP ZBook Power 15 G8 313S5EA | |
| Media NVIDIA T600 Laptop GPU (n=1) | |
| 1920x1080 High / On AA:FX AF:16x | |
| Lenovo ThinkPad P15v G2 21A9000XGE | |
| HP ZBook Power 15 G8 313S5EA | |
| Media NVIDIA T600 Laptop GPU (n=1) | |
| 1920x1080 Ultra / On AA:SM AF:16x | |
| Lenovo ThinkPad P15v G2 21A9000XGE | |
| HP ZBook Power 15 G8 313S5EA | |
| Media NVIDIA T600 Laptop GPU (n=1) | |
| Farming Simulator 22 | |
| 1920x1080 Medium Preset | |
| Lenovo ThinkPad P15v G2 21A9000XGE | |
| HP ZBook Power 15 G8 313S5EA | |
| Media NVIDIA T600 Laptop GPU (n=1) | |
| 1920x1080 High Preset | |
| Lenovo ThinkPad P15v G2 21A9000XGE | |
| HP ZBook Power 15 G8 313S5EA | |
| Media NVIDIA T600 Laptop GPU (n=1) | |
| 1920x1080 Very High Preset | |
| Lenovo ThinkPad P15v G2 21A9000XGE | |
| HP ZBook Power 15 G8 313S5EA | |
| Media NVIDIA T600 Laptop GPU (n=1) | |
| Ghostwire Tokyo | |
| 1920x1080 Medium Settings | |
| Lenovo ThinkPad P15v G2 21A9000XGE | |
| HP ZBook Power 15 G8 313S5EA | |
| Media NVIDIA T600 Laptop GPU (n=1) | |
| 1920x1080 High Settings | |
| Lenovo ThinkPad P15v G2 21A9000XGE | |
| HP ZBook Power 15 G8 313S5EA | |
| Media NVIDIA T600 Laptop GPU (n=1) | |
| 1920x1080 Highest Settings | |
| HP ZBook Power 15 G8 313S5EA | |
| Media NVIDIA T600 Laptop GPU (n=1) | |
| Lenovo ThinkPad P15v G2 21A9000XGE | |
| Riders Republic | |
| 1920x1080 Medium Preset | |
| HP ZBook Power 15 G8 313S5EA | |
| Media NVIDIA T600 Laptop GPU (n=1) | |
| Lenovo ThinkPad P15v G2 21A9000XGE | |
| 1920x1080 High Preset | |
| Lenovo ThinkPad P15v G2 21A9000XGE | |
| HP ZBook Power 15 G8 313S5EA | |
| Media NVIDIA T600 Laptop GPU (n=1) | |
| 1920x1080 Ultra Preset | |
| Lenovo ThinkPad P15v G2 21A9000XGE | |
| HP ZBook Power 15 G8 313S5EA | |
| Media NVIDIA T600 Laptop GPU (n=1) | |
| Dying Light 2 | |
| 1920x1080 Low Quality | |
| Lenovo ThinkPad P15v G2 21A9000XGE | |
| HP ZBook Power 15 G8 313S5EA | |
| Media NVIDIA T600 Laptop GPU (n=1) | |
| 1920x1080 Medium Quality | |
| Lenovo ThinkPad P15v G2 21A9000XGE | |
| HP ZBook Power 15 G8 313S5EA | |
| Media NVIDIA T600 Laptop GPU (n=1) | |
| 1920x1080 High Quality | |
| Lenovo ThinkPad P15v G2 21A9000XGE | |
| HP ZBook Power 15 G8 313S5EA | |
| Media NVIDIA T600 Laptop GPU (n=1) | |
| Tiny Tina's Wonderlands | |
| 1920x1080 Medium Preset (DX12) | |
| Media della classe Workstation (115.1 - 233, n=5, ultimi 2 anni) | |
| HP ZBook Power 15 G8 313S5EA | |
| Media NVIDIA T600 Laptop GPU (n=1) | |
| 1920x1080 High Preset (DX12) | |
| Media della classe Workstation (80 - 171.4, n=5, ultimi 2 anni) | |
| HP ZBook Power 15 G8 313S5EA | |
| Media NVIDIA T600 Laptop GPU (n=1) | |
| 1920x1080 Badass Preset (DX12) | |
| Media della classe Workstation (64.4 - 137.1, n=5, ultimi 2 anni) | |
| HP ZBook Power 15 G8 313S5EA | |
| Media NVIDIA T600 Laptop GPU (n=1) | |
| Deathloop | |
| 1920x1080 Medium Preset | |
| HP ZBook Power 15 G8 313S5EA | |
| Media NVIDIA T600 Laptop GPU (n=1) | |
| 1920x1080 High Preset | |
| HP ZBook Power 15 G8 313S5EA | |
| Media NVIDIA T600 Laptop GPU (n=1) | |
| 1920x1080 Ultra Preset | |
| HP ZBook Power 15 G8 313S5EA | |
| Media NVIDIA T600 Laptop GPU (n=1) | |
| Immortals Fenyx Rising | |
| 1920x1080 Medium Preset | |
| HP ZBook Fury 15 G8 | |
| HP ZBook Power 15 G8 313S5EA | |
| Media NVIDIA T600 Laptop GPU (n=1) | |
| 1920x1080 High Preset | |
| HP ZBook Fury 15 G8 | |
| HP ZBook Power 15 G8 313S5EA | |
| Media NVIDIA T600 Laptop GPU (n=1) | |
| 1920x1080 Very High Preset | |
| HP ZBook Fury 15 G8 | |
| HP ZBook Power 15 G8 313S5EA | |
| Media NVIDIA T600 Laptop GPU (n=1) | |
| basso | medio | alto | ultra | |
|---|---|---|---|---|
| GTA V (2015) | 142.6 | 137.6 | 82.3 | 44.1 |
| The Witcher 3 (2015) | 158.6 | 92.7 | 52.2 | 27.6 |
| Dota 2 Reborn (2015) | 149.4 | 127.6 | 115.8 | 107.1 |
| Final Fantasy XV Benchmark (2018) | 86 | 43.9 | 31 | |
| X-Plane 11.11 (2018) | 107.9 | 92.4 | 77 | |
| Far Cry 5 (2018) | 105 | 53 | 49 | 45 |
| Strange Brigade (2018) | 190.4 | 76.2 | 60.7 | 52.7 |
| Shadow of the Tomb Raider (2018) | 98 | 53 | 42 | 36 |
| Mafia Definitive Edition (2020) | 83.6 | 40.4 | 34.9 | |
| Immortals Fenyx Rising (2020) | 72 | 45 | 36 | 31 |
| Resident Evil Village (2021) | 113.6 | 58.6 | 52.1 | 44 |
| Deathloop (2021) | 68.9 | 34.4 | 28.4 | 25.2 |
| Riders Republic (2021) | 91 | 52 | 39 | 30 |
| Farming Simulator 22 (2021) | 175.4 | 87.5 | 63.5 | 53.9 |
| Dying Light 2 (2022) | 31.7 | 23 | 18.3 | |
| GRID Legends (2022) | 104.1 | 71 | 57.7 | 41.9 |
| Elden Ring (2022) | 52.4 | 45 | 39 | 29.9 |
| Elex 2 (2022) | 38.5 | 35.7 | 30.5 | 26.9 |
| Ghostwire Tokyo (2022) | 45.7 | 44.3 | 43.9 | 41.8 |
| Tiny Tina's Wonderlands (2022) | 57.5 | 32.8 | 48.3 | 27.2 |
| Vampire Bloodhunt (2022) | 119 | 64.5 | 61.8 | 60.1 |
Emissioni: La fredda workstation ZBook funziona a volte in modo silenzioso
Emissioni sonore
Il tester ha effettuato le misurazioni solo con il vecchio BIOS, che consentiva comunque una velocità della ventola significativamente più elevata, con un livello di rumore fino a 51db(A) nello scenario di carico. Tuttavia, con il BIOS v1.09, l'AI di HP consente solo una velocità massima della ventola di circa 4300 upm, che potrebbe però essere un vantaggio in ambienti aziendali sensibili.
Grazie alle due ventole e alle tre heat pipe, il raffreddamento dovrebbe essere in grado di dissipare più calore rispetto al ThinkPad P15v G2, i cui 75 watt sono raffreddati con successo dalla singola ventola. Tuttavia, con l'AI limitante, le ventole dell'HP ZBook raffreddano un massimo di 65-80 watt sotto carico combinato (CPU + GPU). Le prese d'aria della ventola si trovano in basso, tra il display e il case, e aspirano l'aria dalla parte inferiore del case, il che rende l'utilizzo in grembo non ottimale.
Durante la normale navigazione in Internet, le ventole rimangono silenziose, ma se siete abituati a lavorare più velocemente in rete, si accendono costantemente e in modo piuttosto rumoroso. Almeno non si sente il rumore della bobina. Con componenti di pari potenza, il ThinkPad P15v G2 di Lenovo è più silenzioso in tutti gli scenari, e anche lo ZBook Fury di HP è più silenzioso. D'altra parte, alle ventole del Dell Precision 3551 piace molto soffiare.
Rumorosità
| Idle |
| 25.54 / 25.54 / 25.54 dB(A) |
| Sotto carico |
| 48.85 / 50.98 dB(A) |
 | ||
30 dB silenzioso 40 dB(A) udibile 50 dB(A) rumoroso |
||
min: | ||
| HP ZBook Power 15 G8 313S5EA T600 Laptop GPU, i7-11800H, Samsung PM9A1 MZVL2512HCJQ | HP ZBook Fury 15 G8 RTX A5000 Laptop GPU, i9-11950H, Samsung PM981a MZVLB1T0HBLR | HP ZBook Studio 15 G8 GeForce RTX 3070 Laptop GPU, i9-11950H, Samsung PM981a MZVLB2T0HALB | HP ZBook Firefly 15 G8 2C9R7EA T500 Laptop GPU, i7-1165G7, Toshiba XG6 KXG60ZNV1T02 | Lenovo ThinkPad P15v G2 21A9000XGE T1200 Laptop GPU, i7-11800H, Toshiba XG6 KXG6AZNV512G | Dell Precision 3000 3551 Quadro P620, i9-10885H, Toshiba Kioxia XG6 KXG60PNV512G | |
|---|---|---|---|---|---|---|
| Noise | 9% | 3% | 14% | 9% | -1% | |
| off /ambiente * (dB) | 25.54 | 24.1 6% | 23.5 8% | 24.1 6% | 25.21 1% | 25.8 -1% |
| Idle Minimum * (dB) | 25.54 | 24.1 6% | 25.3 1% | 24.1 6% | 25.21 1% | 26.2 -3% |
| Idle Average * (dB) | 25.54 | 24.1 6% | 25.3 1% | 24.1 6% | 25.21 1% | 26.2 -3% |
| Idle Maximum * (dB) | 25.54 | 24.8 3% | 25.3 1% | 27.1 -6% | 25.21 1% | 26.2 -3% |
| Load Average * (dB) | 48.85 | 37.8 23% | 41.2 16% | 32.8 33% | 39.09 20% | 51.2 -5% |
| Witcher 3 ultra * (dB) | 46.58 | 44.2 5% | 49.4 -6% | 36.1 22% | 36.6 21% | 42.7 8% |
| Load Maximum * (dB) | 50.98 | 44.2 13% | 49.4 3% | 36.1 29% | 43.53 15% | 50.7 1% |
* ... Meglio usare valori piccoli
Temperature
Gli unici punti più caldi si trovano al centro sopra la tastiera e nel punto corrispondente sul fondo del case, e solo durante lo stress test. Tuttavia, poiché le ventole non accelerano più di tanto, questi punti caldi si notano anche durante il gioco o il rendering, e anche al centro della tastiera. Ma non diventano mai fastidiosamente caldi.
(±) La temperatura massima sul lato superiore è di 41.4 °C / 107 F, rispetto alla media di 38.2 °C / 101 F, che varia da 22.2 a 69.8 °C per questa classe Workstation.
(±) Il lato inferiore si riscalda fino ad un massimo di 41.5 °C / 107 F, rispetto alla media di 41.1 °C / 106 F
(+) In idle, la temperatura media del lato superiore è di 22.9 °C / 73 F, rispetto alla media deld ispositivo di 32 °C / 90 F.
(+) Riproducendo The Witcher 3, la temperatura media per il lato superiore e' di 30.4 °C / 87 F, rispetto alla media del dispositivo di 32 °C / 90 F.
(+) I poggiapolsi e il touchpad sono piu' freddi della temperatura della pelle con un massimo di 28.4 °C / 83.1 F e sono quindi freddi al tatto.
(±) La temperatura media della zona del palmo della mano di dispositivi simili e'stata di 27.8 °C / 82 F (-0.6 °C / -1.1 F).
| HP ZBook Power 15 G8 313S5EA Intel Core i7-11800H, NVIDIA T600 Laptop GPU | HP ZBook Fury 15 G8 Intel Core i9-11950H, NVIDIA RTX A5000 Laptop GPU | HP ZBook Studio 15 G8 Intel Core i9-11950H, NVIDIA GeForce RTX 3070 Laptop GPU | HP ZBook Firefly 15 G8 2C9R7EA Intel Core i7-1165G7, NVIDIA T500 Laptop GPU | Lenovo ThinkPad P15v G2 21A9000XGE Intel Core i7-11800H, NVIDIA T1200 Laptop GPU | Dell Precision 3000 3551 Intel Core i9-10885H, NVIDIA Quadro P620 | |
|---|---|---|---|---|---|---|
| Heat | -18% | -20% | -3% | -21% | -20% | |
| Maximum Upper Side * (°C) | 41.4 | 45.6 -10% | 49 -18% | 41.2 -0% | 53.8 -30% | 47 -14% |
| Maximum Bottom * (°C) | 41.5 | 57.6 -39% | 54.2 -31% | 47.2 -14% | 52.1 -26% | 54.6 -32% |
| Idle Upper Side * (°C) | 23.8 | 26 -9% | 26.2 -10% | 23.7 -0% | 27.6 -16% | 27.8 -17% |
| Idle Bottom * (°C) | 25 | 28.8 -15% | 30.2 -21% | 23.9 4% | 27.7 -11% | 29.2 -17% |
* ... Meglio usare valori piccoli
Stress test
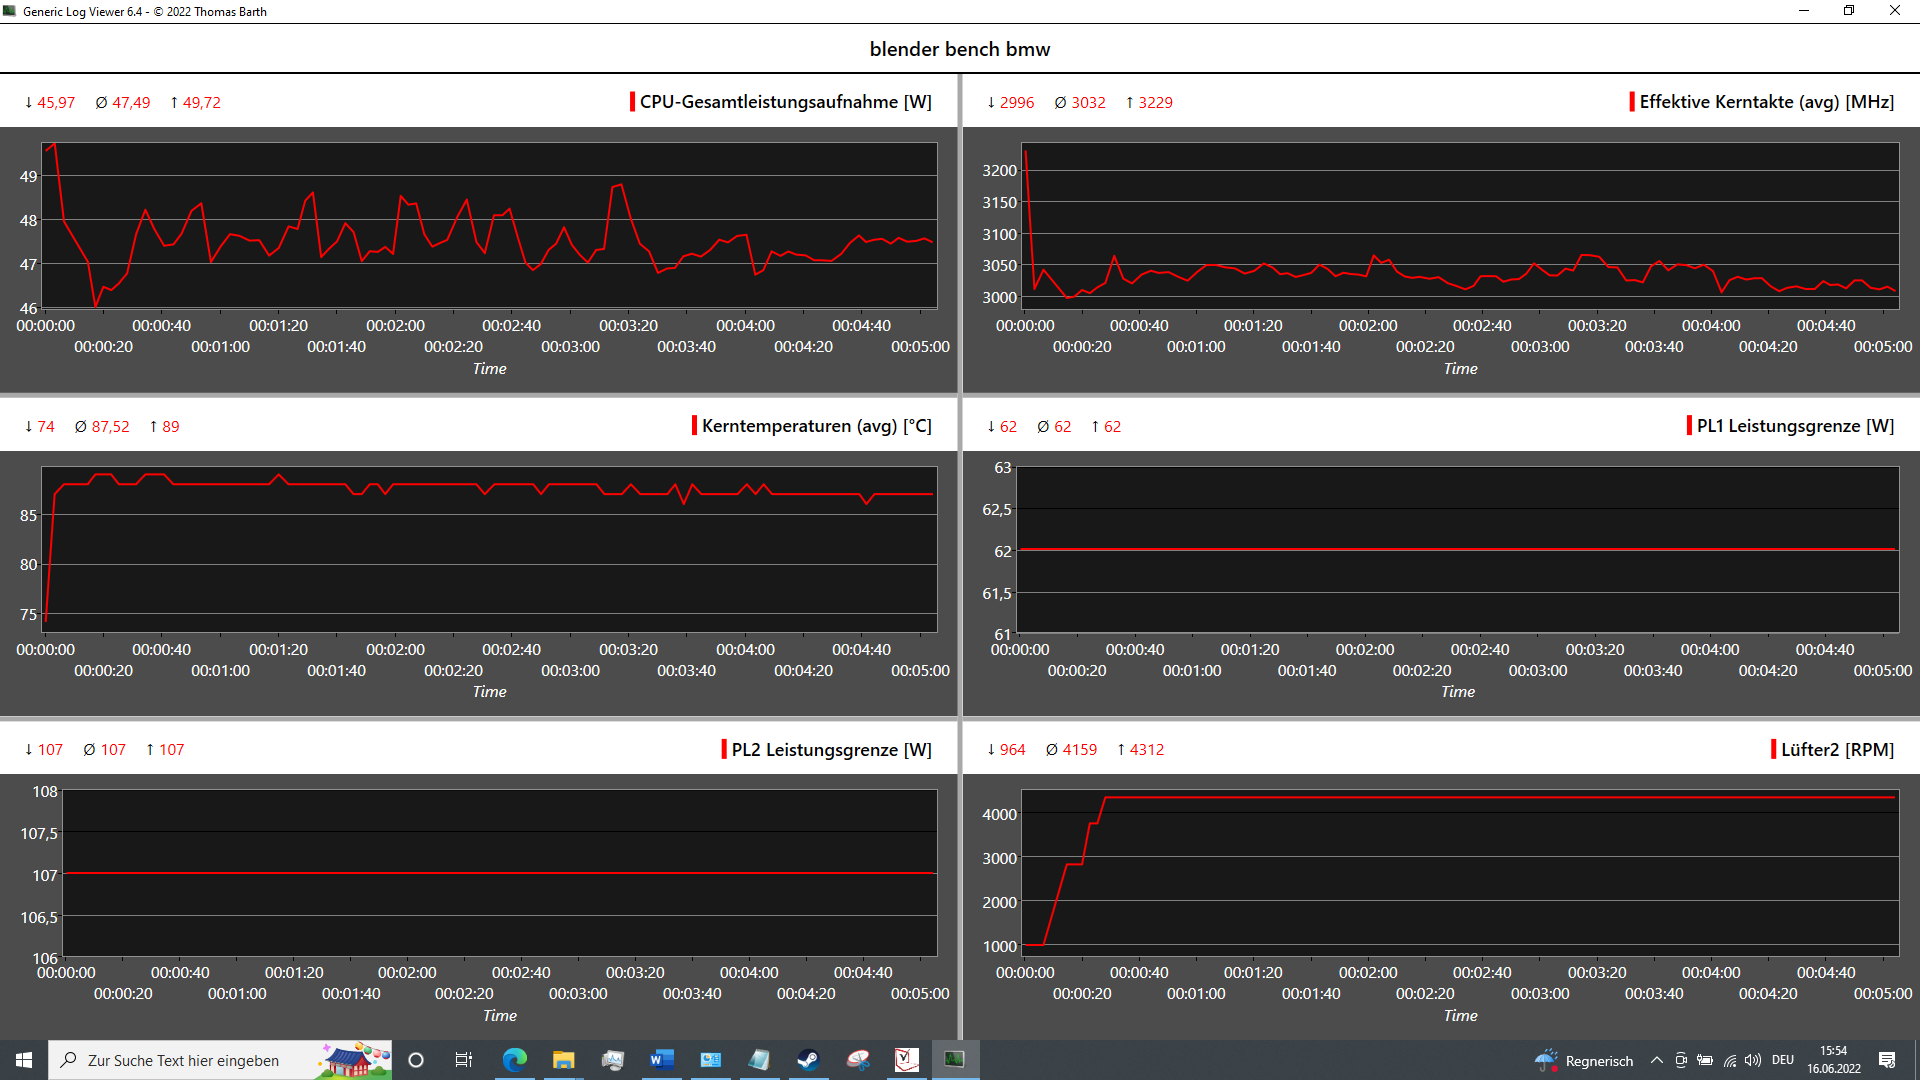
La CPU può beneficiare dell'aggiornamento del BIOS solo durante lo stress test. Nello stress combinato (Prime95 + FurMark), la CPU funziona ancora alla sua velocità di clock di base (2,3 GHz), mentre prima funzionava solo a 1,7 GHz. D'altra parte, a 1080 MHz, la velocità di clock della GPU scende di 150 MHz. Nello stress della CPU pura, vengono mantenuti 2,65 GHz con un consumo energetico di 50 watt e una temperatura di 92 °C (198 °F)
Sotto carico grafico puro, la GPU funziona a ~1100 MHz, che è significativamente inferiore alla sua velocità di boost di 1395 MHz. Tuttavia, la temperatura rimane a soli 56 °C (133 °F), e sospettiamo un'altra incongruenza dell'IA.
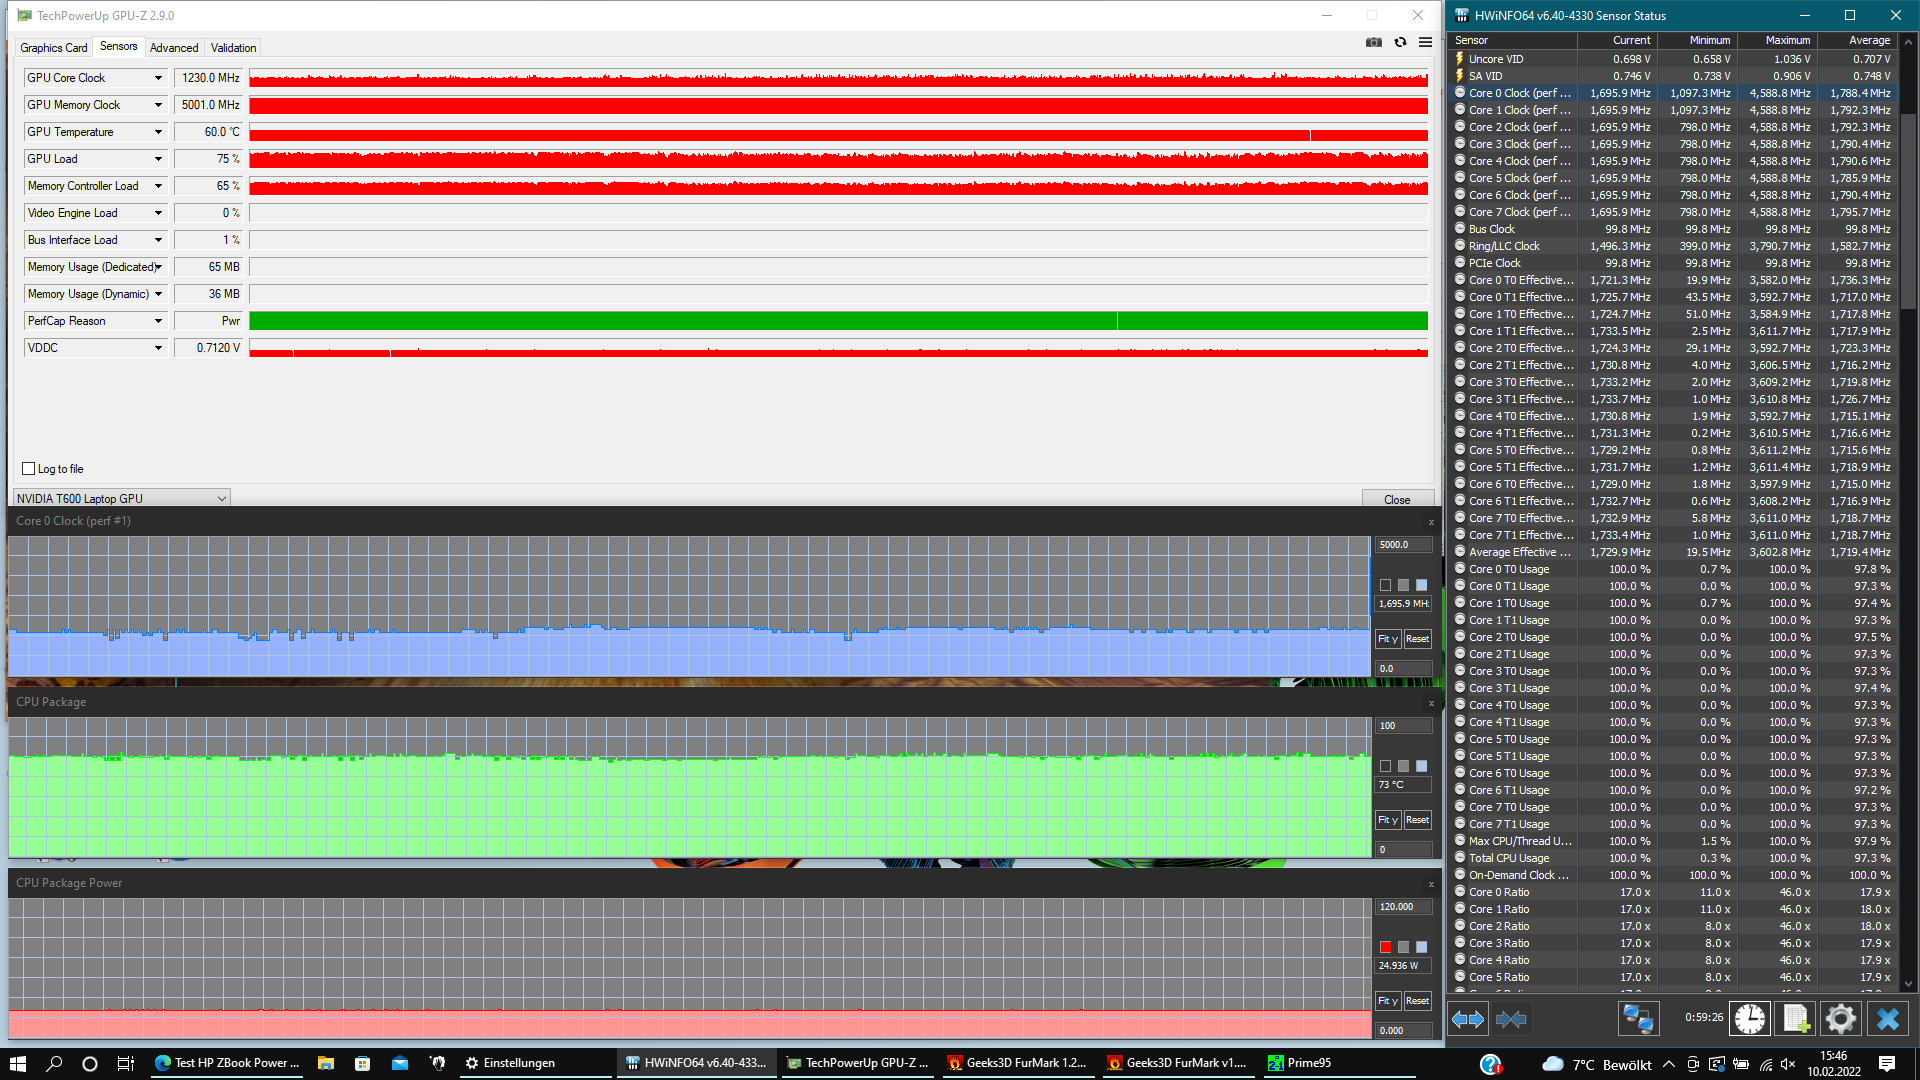
| Clock della CPU (GHz) | Clock della GPU (MHz) | Temperatura media della CPU (°C) | Temperatura media della GPU (°C) | |
| Sistema inattivo | 1,3 | 350 | 35 | 35 |
| Prime95 Stress | 2,65 | 350 | 91,8 | -- |
| Prime95 + FurMark Stress | 2,27 | 1081 | 93,4 | 56 |
| FurMark Stress | 1,3 | 1100 | 52 | 70 |
Altoparlanti
Il suono degli altoparlanti stereo da 2 Watt rivolti verso l'alto è abbastanza bilanciato, ma mancano di bassi e non sono nemmeno particolarmente forti. L'HP Fury 15 è dotato di un sistema audio decisamente più interessante.
Sebbene possa essere sufficiente per le attività d'ufficio, per godere di contenuti multimediali si consiglia di utilizzare la connessione da 3,5 mm o il Bluetooth per le periferiche audio esterne
HP ZBook Power 15 G8 313S5EA analisi audio
(±) | potenza degli altiparlanti media ma buona (72.3 dB)
Bassi 100 - 315 Hz
(-) | quasi nessun basso - in media 23.3% inferiori alla media
(±) | la linearità dei bassi è media (11.8% delta rispetto alla precedente frequenza)
Medi 400 - 2000 Hz
(+) | medi bilanciati - solo only 2.5% rispetto alla media
(+) | medi lineari (5.1% delta rispetto alla precedente frequenza)
Alti 2 - 16 kHz
(+) | Alti bilanciati - appena 4.1% dalla media
(+) | alti lineari (3.1% delta rispetto alla precedente frequenza)
Nel complesso 100 - 16.000 Hz
(±) | la linearità complessiva del suono è media (21.4% di differenza rispetto alla media
Rispetto alla stessa classe
» 77% di tutti i dispositivi testati in questa classe è stato migliore, 6% simile, 18% peggiore
» Il migliore ha avuto un delta di 7%, medio di 17%, peggiore di 35%
Rispetto a tutti i dispositivi testati
» 60% di tutti i dispositivi testati in questa classe è stato migliore, 7% similare, 33% peggiore
» Il migliore ha avuto un delta di 4%, medio di 23%, peggiore di 134%
Lenovo ThinkPad P15v G2 21A9000XGE analisi audio
(-) | altoparlanti non molto potenti (70.7 dB)
Bassi 100 - 315 Hz
(±) | bassi ridotti - in media 13.4% inferiori alla media
(±) | la linearità dei bassi è media (13.6% delta rispetto alla precedente frequenza)
Medi 400 - 2000 Hz
(+) | medi bilanciati - solo only 4.7% rispetto alla media
(+) | medi lineari (6.2% delta rispetto alla precedente frequenza)
Alti 2 - 16 kHz
(+) | Alti bilanciati - appena 3.2% dalla media
(+) | alti lineari (5.7% delta rispetto alla precedente frequenza)
Nel complesso 100 - 16.000 Hz
(±) | la linearità complessiva del suono è media (21.2% di differenza rispetto alla media
Rispetto alla stessa classe
» 76% di tutti i dispositivi testati in questa classe è stato migliore, 6% simile, 18% peggiore
» Il migliore ha avuto un delta di 7%, medio di 17%, peggiore di 35%
Rispetto a tutti i dispositivi testati
» 59% di tutti i dispositivi testati in questa classe è stato migliore, 7% similare, 34% peggiore
» Il migliore ha avuto un delta di 4%, medio di 23%, peggiore di 134%
Gestione dell'alimentazione: Lo ZBook Power è efficiente come un ultrabook
Consumo di energia
Con una media di 6,32 watt, i valori di idle dello ZBook Power 15 sono pari a quelli dei sistemi con CPU da 15 watt. LoZBook Furye ZBook Powerconsumano quasi il triplo. In standby, lo ZBook Power consuma solo 0,95 watt, per cui non sarà necessario ricaricarlo per quasi quattro giorni quando è ripiegato. L'alimentatore da 150 watt è anche in grado di gestire senza problemi i picchi di carico di 110 watt e di ricaricare lo ZBook fino all'80% in circa 1,5 ore.
| Off / Standby | |
| Idle | |
| Sotto carico |
|
Leggenda:
min: | |
| HP ZBook Power 15 G8 313S5EA i7-11800H, T600 Laptop GPU, Samsung PM9A1 MZVL2512HCJQ, IPS LED, 1920x1080, 15.6" | HP ZBook Fury 15 G8 i9-11950H, RTX A5000 Laptop GPU, Samsung PM981a MZVLB1T0HBLR, IPS, 3840x2160, 15.6" | HP ZBook Studio 15 G8 i9-11950H, GeForce RTX 3070 Laptop GPU, Samsung PM981a MZVLB2T0HALB, OLED, 3840x2160, 15.6" | HP ZBook Firefly 15 G8 2C9R7EA i7-1165G7, T500 Laptop GPU, Toshiba XG6 KXG60ZNV1T02, IPS, 1920x1080, 15.6" | Lenovo ThinkPad P15v G2 21A9000XGE i7-11800H, T1200 Laptop GPU, Toshiba XG6 KXG6AZNV512G, IPS LED, 1920x1080, 15.6" | Dell Precision 3000 3551 i9-10885H, Quadro P620, Toshiba Kioxia XG6 KXG60PNV512G, IPS, 1920x1080, 15.6" | Media NVIDIA T600 Laptop GPU | Media della classe Workstation | |
|---|---|---|---|---|---|---|---|---|
| Power Consumption | -130% | -155% | 14% | -33% | -23% | 0% | -94% | |
| Idle Minimum * (Watt) | 4.17 | 8.3 -99% | 11 -164% | 3.3 21% | 5.96 -43% | 5.7 -37% | 4.17 ? -0% | 9.11 ? -118% |
| Idle Average * (Watt) | 6.32 | 19.9 -215% | 18.8 -197% | 5.6 11% | 8.37 -32% | 8.7 -38% | 6.32 ? -0% | 13.8 ? -118% |
| Idle Maximum * (Watt) | 7.1 | 21.8 -207% | 31.7 -346% | 8.7 -23% | 9.05 -27% | 9 -27% | 7.1 ? -0% | 17.9 ? -152% |
| Load Average * (Watt) | 80.41 | 110.9 -38% | 105.2 -31% | 64.4 20% | 91.82 -14% | 100.2 -25% | 80.4 ? -0% | 96 ? -19% |
| Witcher 3 ultra * (Watt) | 62.3 | 165 -165% | 148 -138% | 53 15% | 102 -64% | 56 10% | ||
| Load Maximum * (Watt) | 110.18 | 171.8 -56% | 171.8 -56% | 69 37% | 126.38 -15% | 133.2 -21% | 110.2 ? -0% | 180.3 ? -64% |
* ... Meglio usare valori piccoli
Power Consumption The Witcher 3 / Stress Test
Power Consumption With External Monitor
Durata della batteria
Durante la navigazione web a 150 nits, lo ZBook ha una durata sorprendente di 12:19 ore. Il ThinkPad P15v rimane significativamente indietro con sole ~7,5 ore, mentre Dell Precision 3551riesce a superare la soglia delle 13 ore. Con oltre 2 ore sotto carico, lo ZBook dura abbastanza a lungo, il che è dovuto in parte anche al suo throttling.
| HP ZBook Power 15 G8 313S5EA i7-11800H, T600 Laptop GPU, 83 Wh | HP ZBook Fury 15 G8 i9-11950H, RTX A5000 Laptop GPU, 94 Wh | HP ZBook Studio 15 G8 i9-11950H, GeForce RTX 3070 Laptop GPU, 83 Wh | HP ZBook Firefly 15 G8 2C9R7EA i7-1165G7, T500 Laptop GPU, 56 Wh | Lenovo ThinkPad P15v G2 21A9000XGE i7-11800H, T1200 Laptop GPU, 68 Wh | Dell Precision 3000 3551 i9-10885H, Quadro P620, 97 Wh | Media della classe Workstation | |
|---|---|---|---|---|---|---|---|
| Autonomia della batteria | -50% | -26% | 15% | -26% | 11% | 4% | |
| Reader / Idle (h) | 14.9 | 12.9 -13% | 17.2 15% | 26.1 ? 75% | |||
| H.264 (h) | 10.1 | 15.3 51% | 8 -21% | 10.1 ? 0% | |||
| WiFi v1.3 (h) | 12.3 | 6.2 -50% | 6.2 -50% | 10.5 -15% | 7.5 -39% | 13.6 11% | 8.55 ? -30% |
| Load (h) | 2.1 | 1.8 -14% | 2.3 10% | 0.9 -57% | 1.441 ? -31% |
Pro
Contro
Verdetto: ZBook Power 15 conveniente per i creatori professionali
A un prezzo di circa 1300 euro (~$1324), lo ZBook Power 15 G8 (Core i7, Nvidia T600, 8 GB / 256 GB) offre alcuni chiari vantaggi in termini di prezzo e prestazioni, pur mantenendo molte caratteristiche di una workstation di fascia alta. I punti di forza dello ZBook sono i dispositivi di input, la durata della batteria, le funzioni di sicurezza, l'aggiornabilità e le buone prestazioni della workstation.
Sebbene il display FHD testato non sia del tutto adatto alla progettazione di prodotti e ad Adobe, offre comunque buoni valori di luminosità e contrasto. Il gruppo target di questa configurazione è costituito principalmente da studenti e professionisti nel settore di Autodesk SolidWorks, sviluppo di prodotti, architettura, edilizia, ingegneria, progettazione 2D e creazione di realtà virtuale.
Tra gli svantaggi, l'andamento incostante delle prestazioni, ma non siamo in grado di confermare se ciò sia dovuto all'intelligenza artificiale di HP. Inoltre, questa workstation economica deve fare a meno dei processori Xeon e della RAM ECC. Manca anche la WWAN e il lettore di schede SD e offre solo una porta Thunderbolt 4. Infine, la riproduzione del suono e la webcam sono piuttosto abissali.
"HP ZBook Power 15 G8 è una solida workstation per studenti, ingegneri e (semi)professionisti senza esigenze di fascia alta. Sfortunatamente, il pannello 4K opzionale non amplia affatto il gruppo di riferimento per le attività creative, dove è richiesta un'elevata precisione dei colori. Per il resto, tutti gli altri aspetti fondamentali sono di alto livello"
IlThinkPad P15v G2offre prestazioni e dispositivi di input simili, sempre a un buon prezzo. Tuttavia, è significativamente più silenzioso e offre un lettore di schede SD e forse l'opzione di visualizzazione 4K più accurata dal punto di vista dei colori. D'altro canto, il ThinkPad non supporta la ricarica tramite USB-C e la durata della batteria è notevolmente inferiore. Inoltre, è più pesante e ingombrante Precision 3551 di Dell è anch'esso un campione di resistenza che non è molto peggiore dello ZBook Power, se non in termini di prestazioni grezze, a patto che lo si equipaggi con il display giusto. Tuttavia, il suo successore dovrebbe offrire prestazioni superiori.
Prezzo e disponibilità
Una configurazione della workstation mobile HP ZBook Power G8 con Core i7-11850H, 32 GB di RAM e 512 GB di SSD è attualmente disponibile per ~$2400 su Amazon. Il negozio online HP offre anche molte opzioni configurabili.
HP ZBook Power 15 G8 313S5EA
- 07/07/2022 v7 (old)
Marvin Gollor
Price comparison

