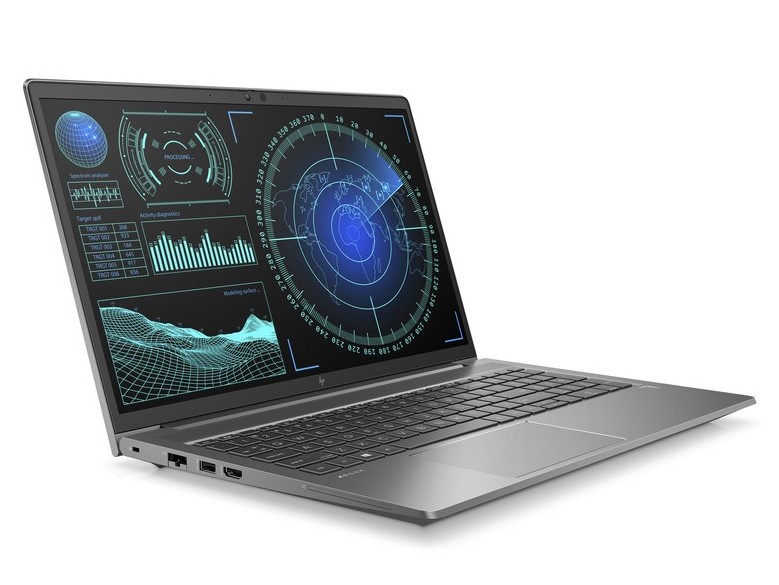
Recensione della workstation HP ZBook Fury 15 G8: La Quadro RTX A5000 è una bestia
Mentre lo ZBook Fury 15 G7 ha rappresentato una massiccia revisione rispetto allo ZBook Fury 15 G6, l'ultimo ZBook Fury 15 G8 è un aggiornamento relativamente minore nel complesso. Il nuovo modello è dotato di CPU Tiger Lake-H e GPU Nvidia Ampere per sostituire le opzioni Comet Lake-H e Nvidia Turing dello scorso anno. Il suo display è stato anche aggiornato da 4K 60 Hz a 4K 120 Hz per essere uno dei pochissimi portatili da 15 pollici con tale opzione di pannello
Le SKU vanno dalla CPU Core i5-11500H con grafica integrata e display 45% NTSC 1080p per circa $2000 USD fino alla CPU Xeon W-11955M vPro con grafica Quadro RTX A5000 e touchscreen lucido 4K UHD 100% DCI-P3 per oltre $6000. La nostra unità di test una configurazione di fascia alta con il Core i9-11950H, RTX A5000, e display 4K120 opaco per circa $5000
I concorrenti in questo spazio includono altre workstation tradizionali da 15,6 pollici come il Dell Precision 7550,Lenovo ThinkPad P15 Gen 2e la serie Serie Fujitsu Celsius. Si consiglia di controllare la nostra recensione esistente sul ZBook Fury 15 G7 per maggiori informazioni sul telaio e le sue caratteristiche, dato che il Fury 15 G8 utilizza lo stesso scheletro.
Altre recensioni di HP
potential competitors in comparison
Punteggio | Data | Modello | Peso | Altezza | Dimensione | Risoluzione | Prezzo |
|---|---|---|---|---|---|---|---|
| 90.3 % v7 (old) | 10/2021 | HP ZBook Fury 15 G8 i9-11950H, RTX A5000 Laptop GPU | 2.5 kg | 25.9 mm | 15.60" | 3840x2160 | |
| 90.2 % v7 (old) | 01/2021 | HP ZBook Fury 15 G7 W-10885M, Quadro RTX 5000 Max-Q | 2.4 kg | 25.9 mm | 15.60" | 3840x2160 | |
| 88.3 % v7 (old) | 10/2021 | Dell Precision 5000 5560 i7-11850H, RTX A2000 Laptop GPU | 2 kg | 18 mm | 15.60" | 3840x2400 | |
| 87.8 % v7 (old) | 08/2021 | HP ZBook Studio 15 G8 i9-11950H, GeForce RTX 3070 Laptop GPU | 1.9 kg | 18 mm | 15.60" | 3840x2160 | |
| 85.3 % v7 (old) | 06/2021 | Lenovo ThinkPad P15s Gen2-20W6000GGE i7-1165G7, T500 Laptop GPU | 1.9 kg | 19.1 mm | 15.60" | 3840x2160 | |
| 82.7 % v7 (old) | 10/2020 | HP ZBook Firefly 15 G7 i7-10610U, Quadro P520 | 1.8 kg | 19.2 mm | 15.60" | 3840x2160 |
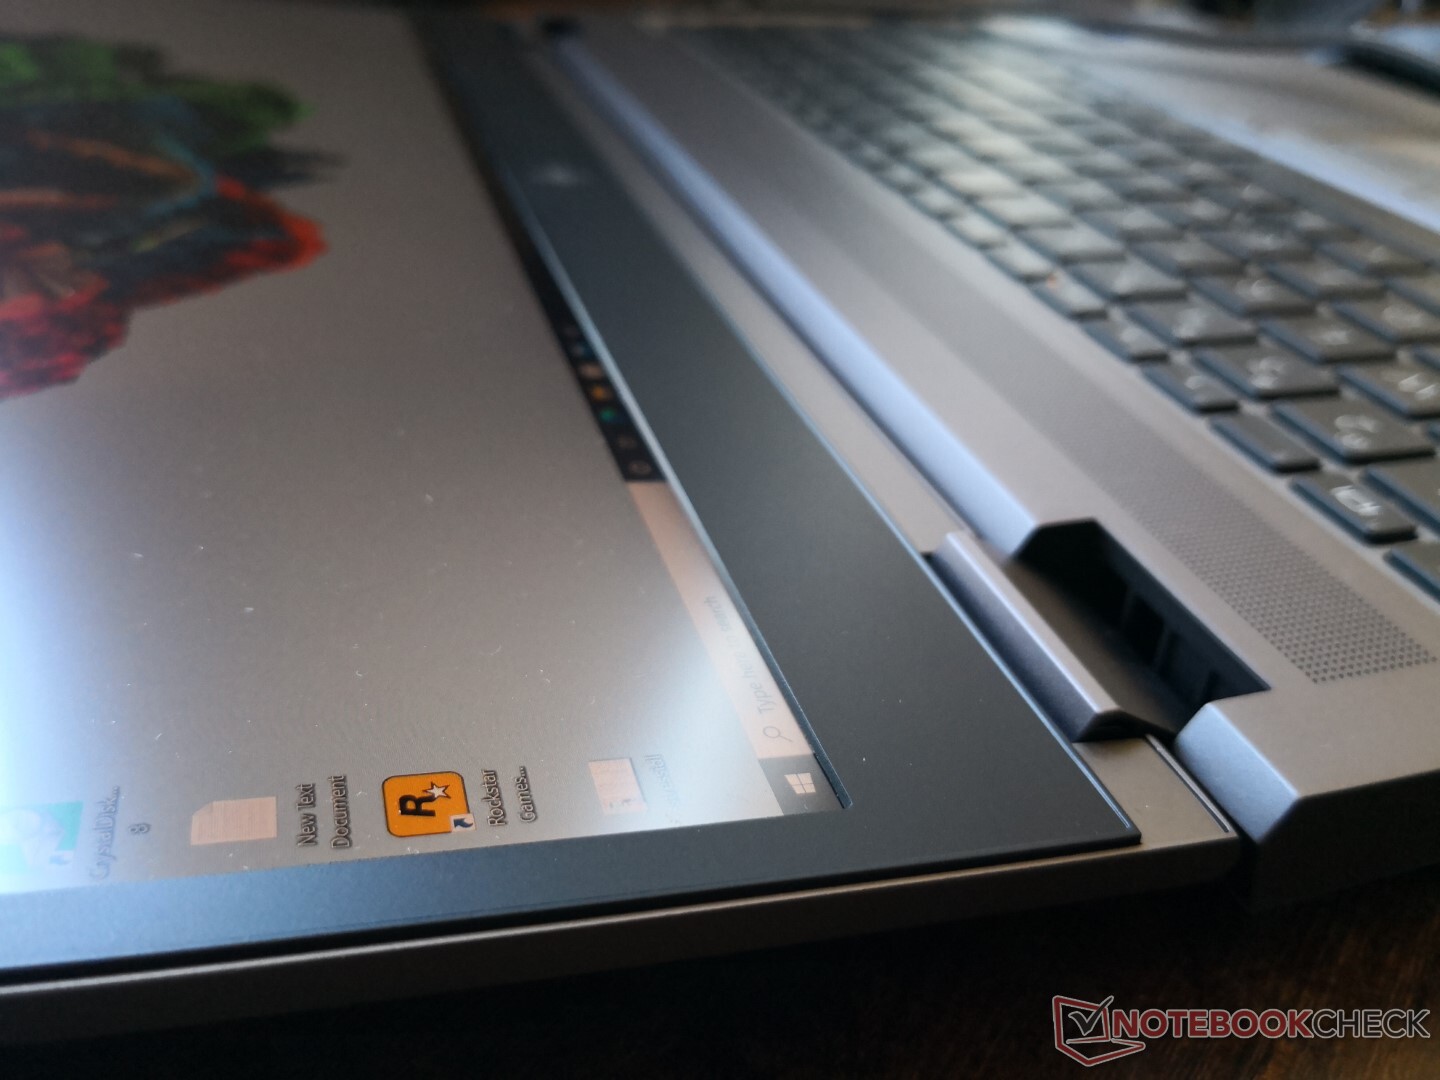
Case - Identico allo ZBook Fury 15 G7
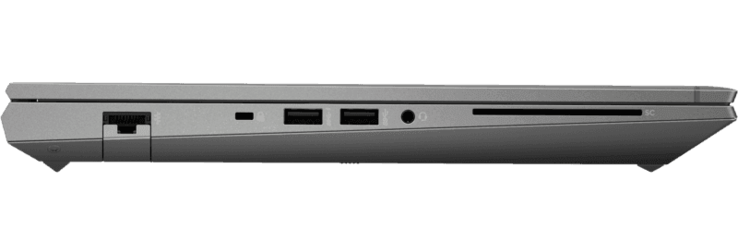
Connettività
Thunderbolt 4 è supportato invece di "solo" Thunderbolt 3 sulla Fury 15 G7. Altrimenti, le porte rimangono identiche anno dopo anno.
Lettore di schede SD
| SD Card Reader | |
| average JPG Copy Test (av. of 3 runs) | |
| Dell Precision 5000 5560 (AV Pro V60) | |
| HP ZBook Fury 15 G7 (Toshiba Exceria Pro SDXC 64 GB UHS-II) | |
| HP ZBook Fury 15 G8 (AV Pro V60) | |
| HP ZBook Studio 15 G8 (AV Pro V60) | |
| Lenovo ThinkPad P15s Gen2-20W6000GGE (AV Pro V60) | |
| maximum AS SSD Seq Read Test (1GB) | |
| HP ZBook Fury 15 G7 (Toshiba Exceria Pro SDXC 64 GB UHS-II) | |
| Dell Precision 5000 5560 (AV Pro V60) | |
| Lenovo ThinkPad P15s Gen2-20W6000GGE (AV Pro V60) | |
| HP ZBook Studio 15 G8 (AV Pro V60) | |
| HP ZBook Fury 15 G8 (AV Pro V60) | |
Comunicazione
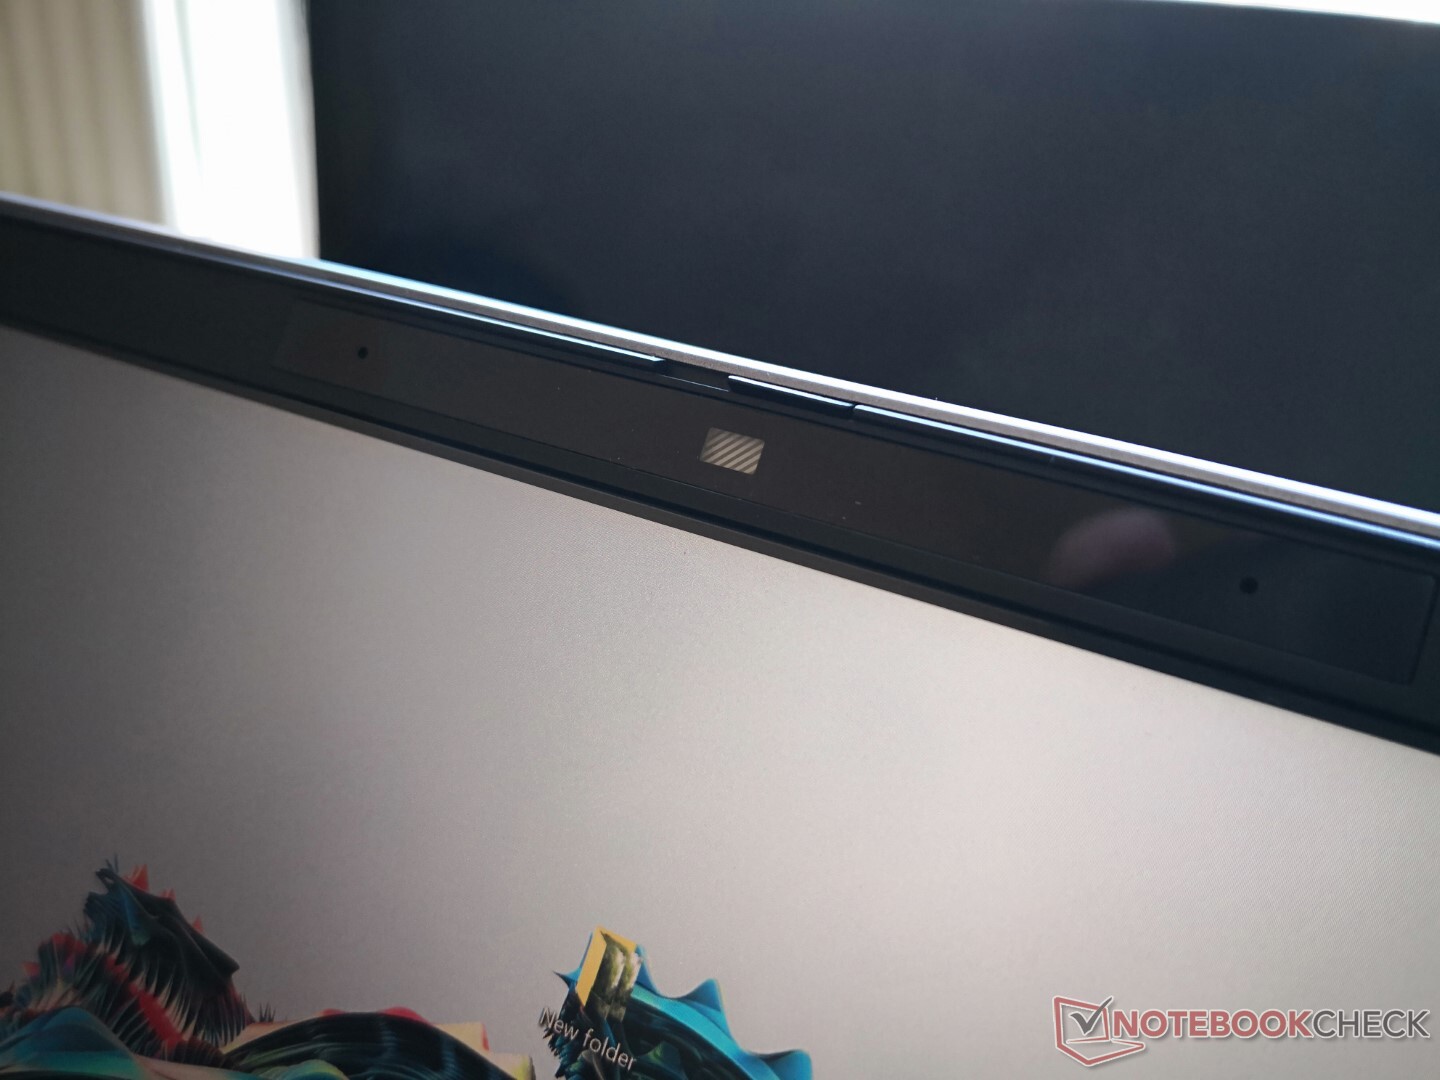
Webcam - Ancora 720p
La qualità della fotocamera rimane scarsa a soli 720p. Alcuni produttori come Razer hanno aggiornato le loro webcam integrate da 720p a 1080p.


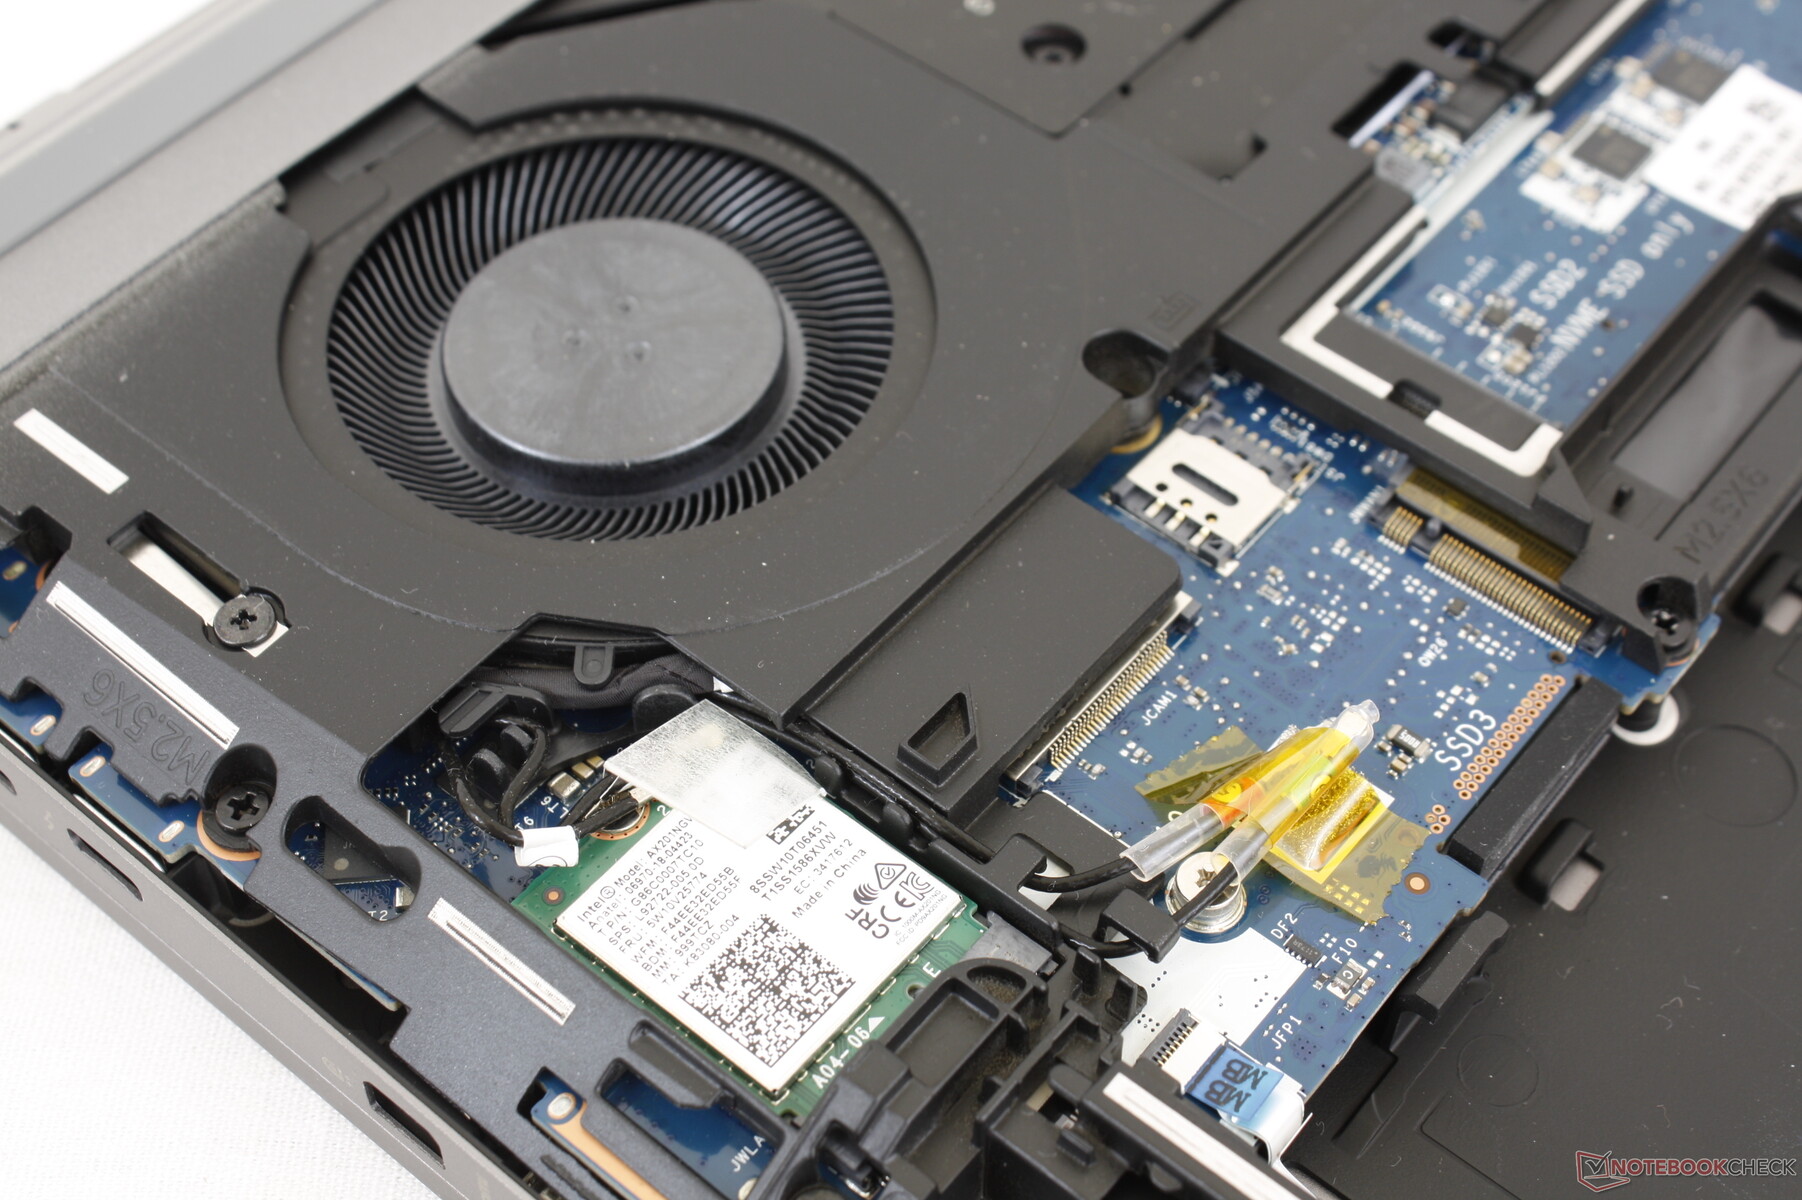
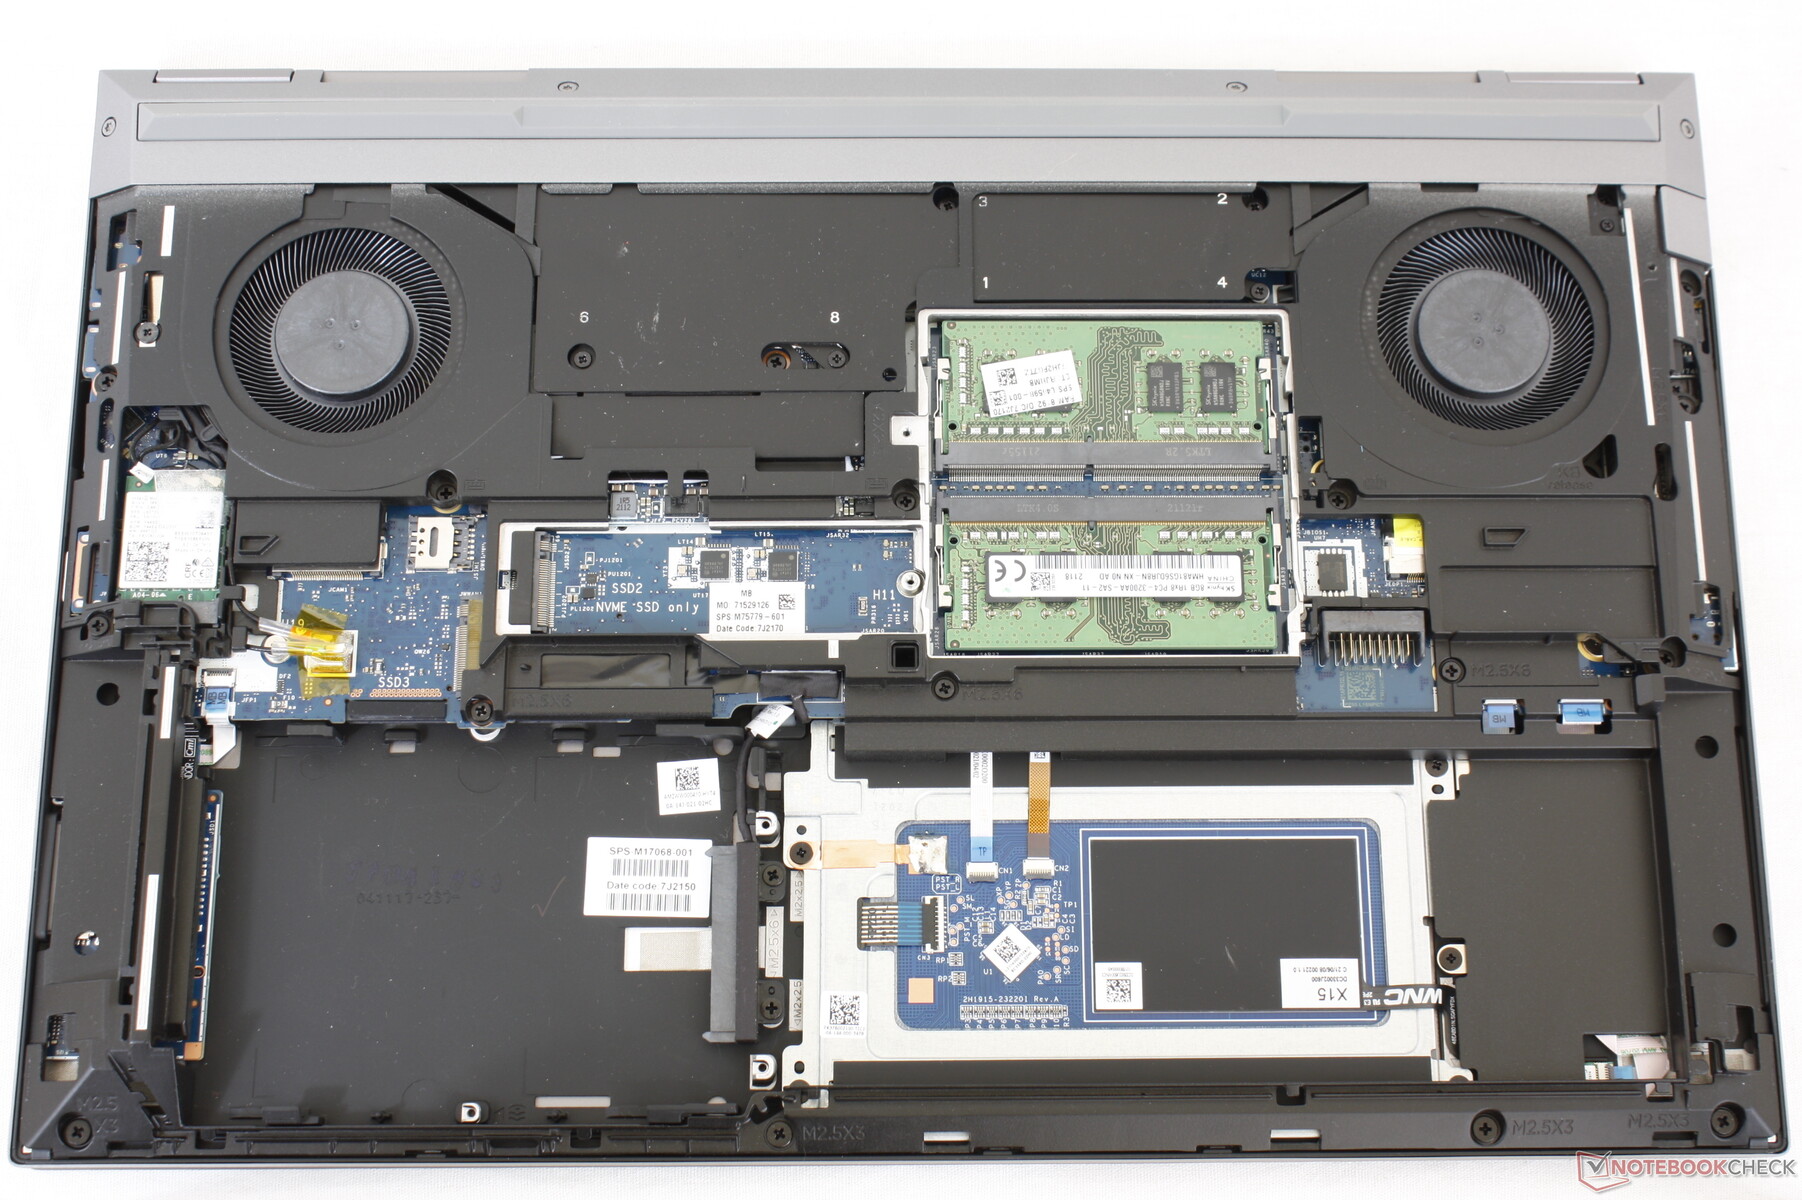
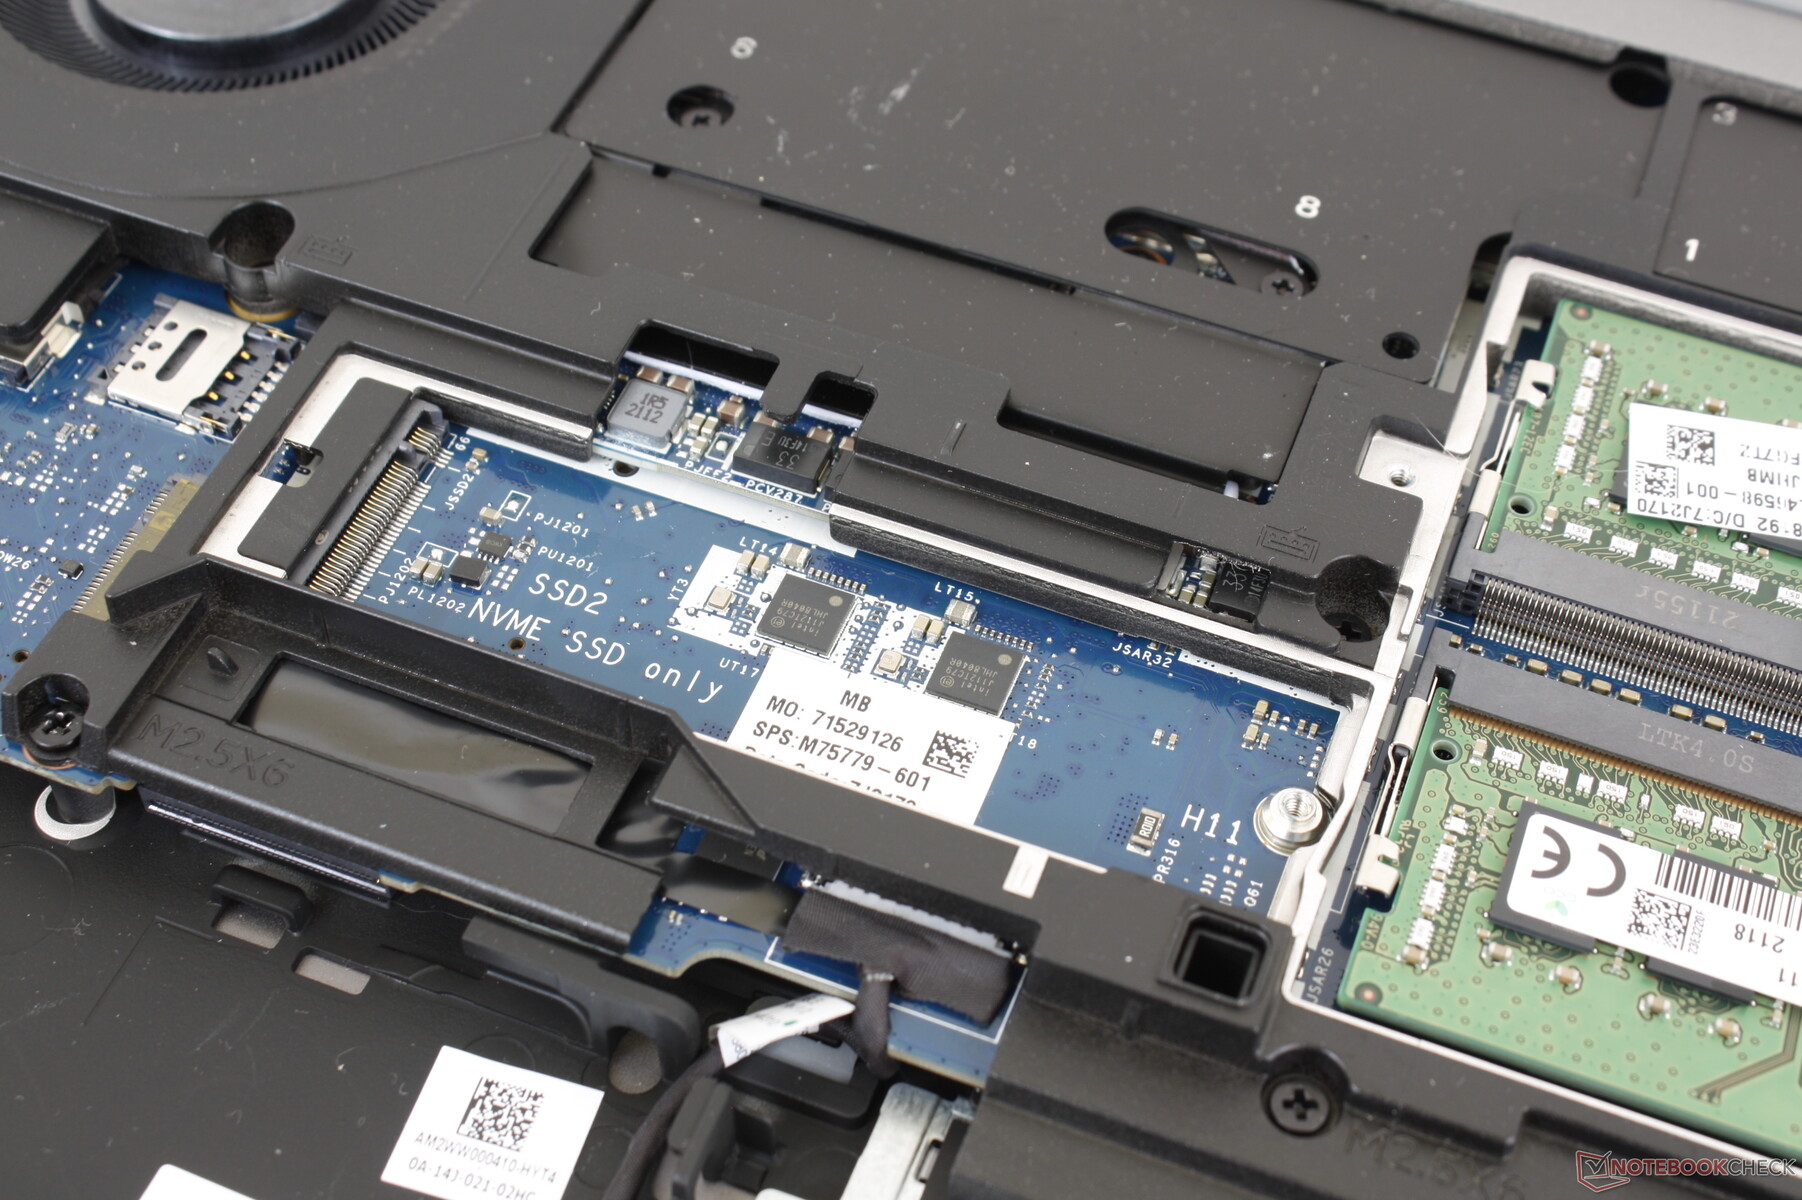
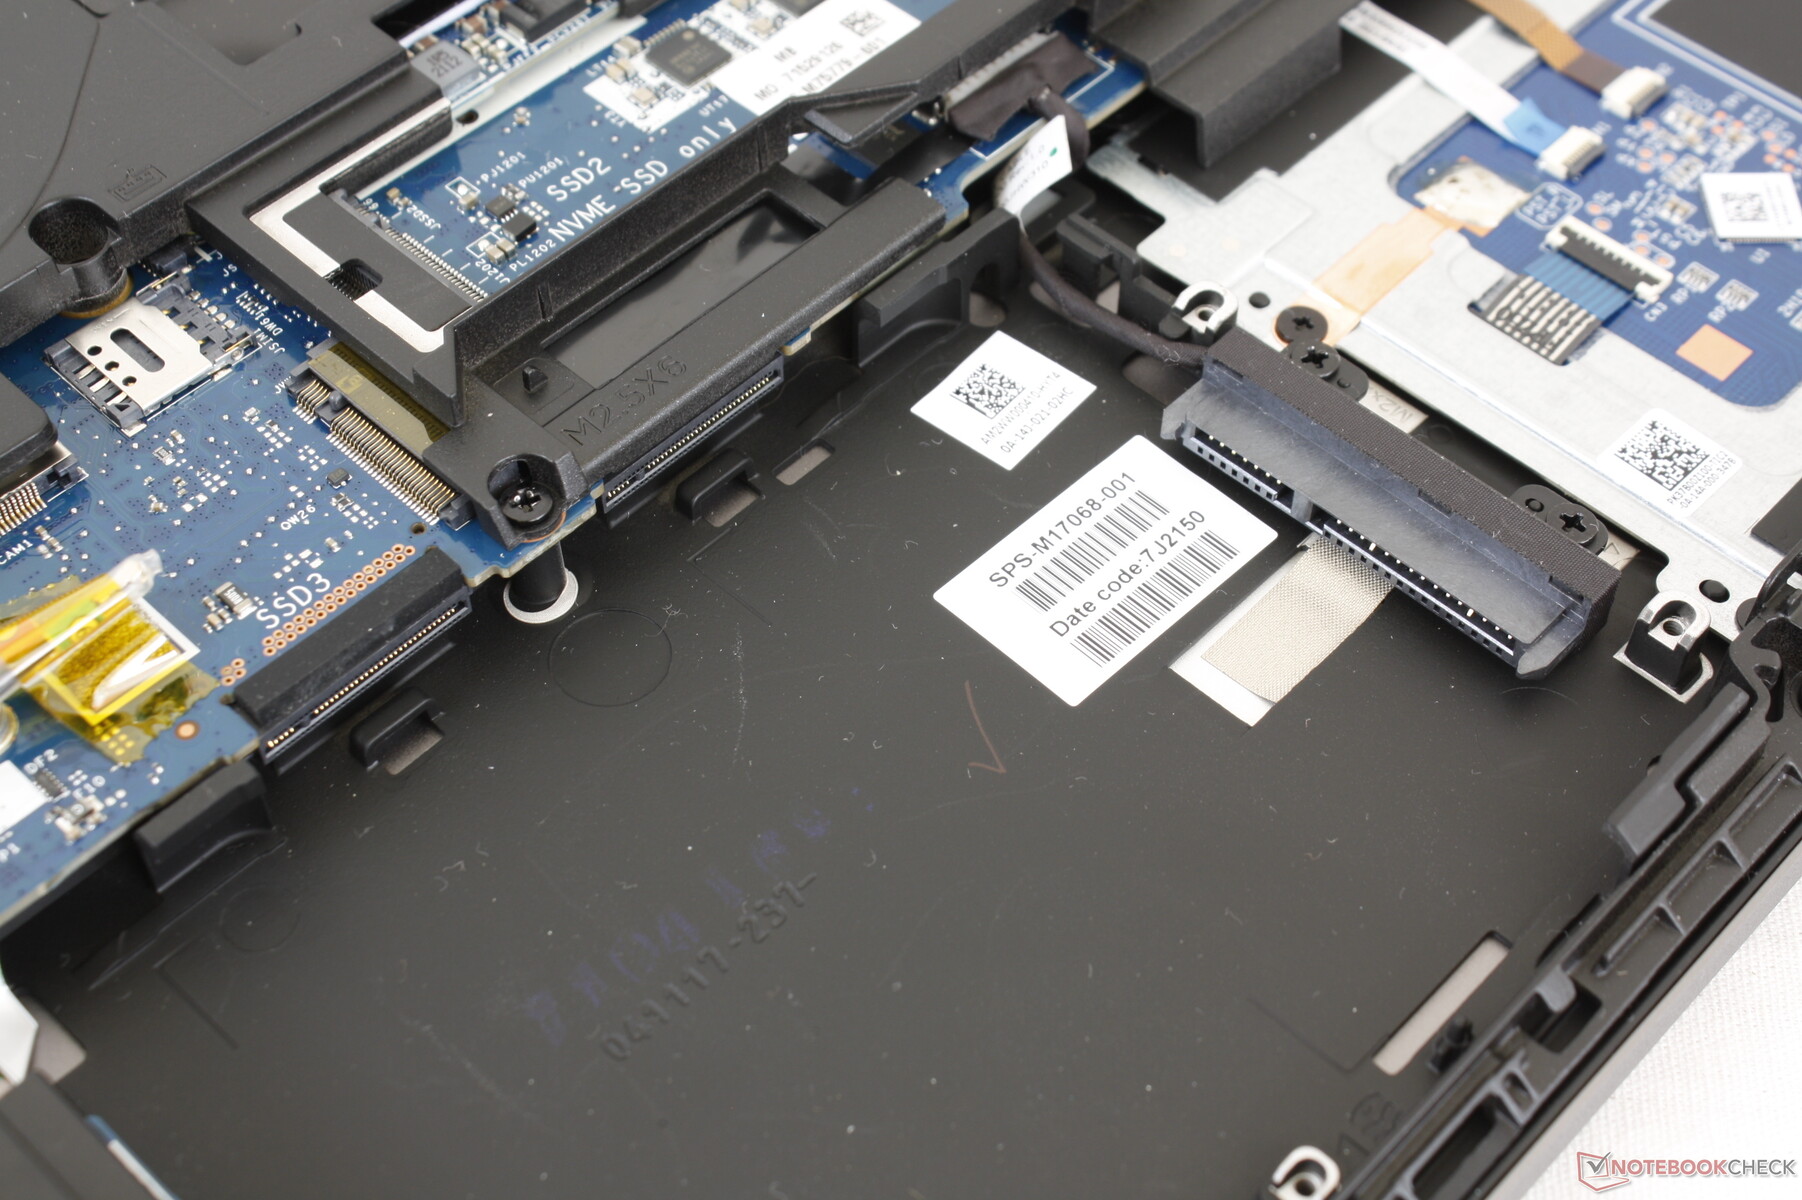
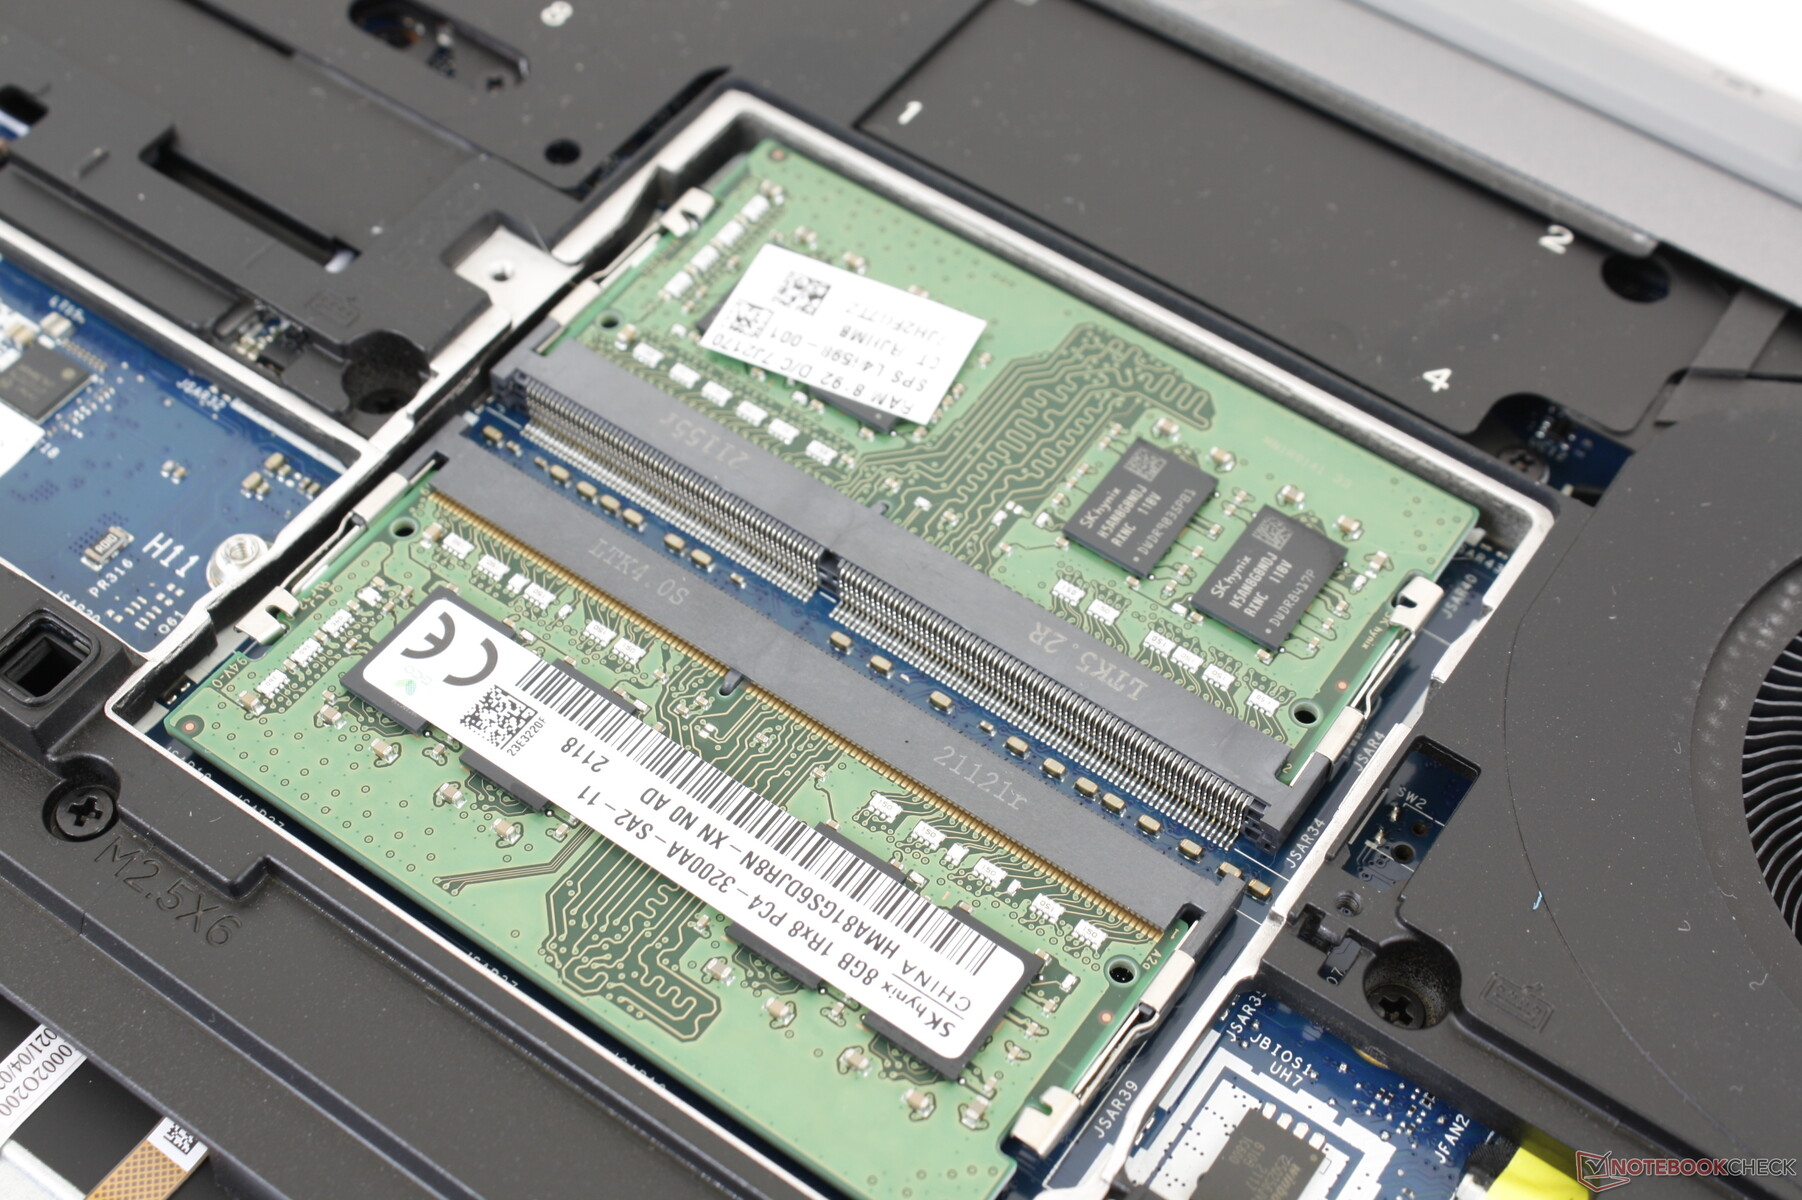
Manutenzione - Tieni pronto un cacciavite
Il pannello inferiore scivola via facilmente - nessun attrezzo o cacciavite richiesto. Una volta all'interno, tuttavia, la maggior parte dei componenti sono comunque sotto piastre metalliche che richiedono un cacciavite Philips per essere rimosse. I componenti aggiuntivi della RAM e dello storage sono sull'altro lato della scheda madre e quindi non sono così facilmente accessibili.
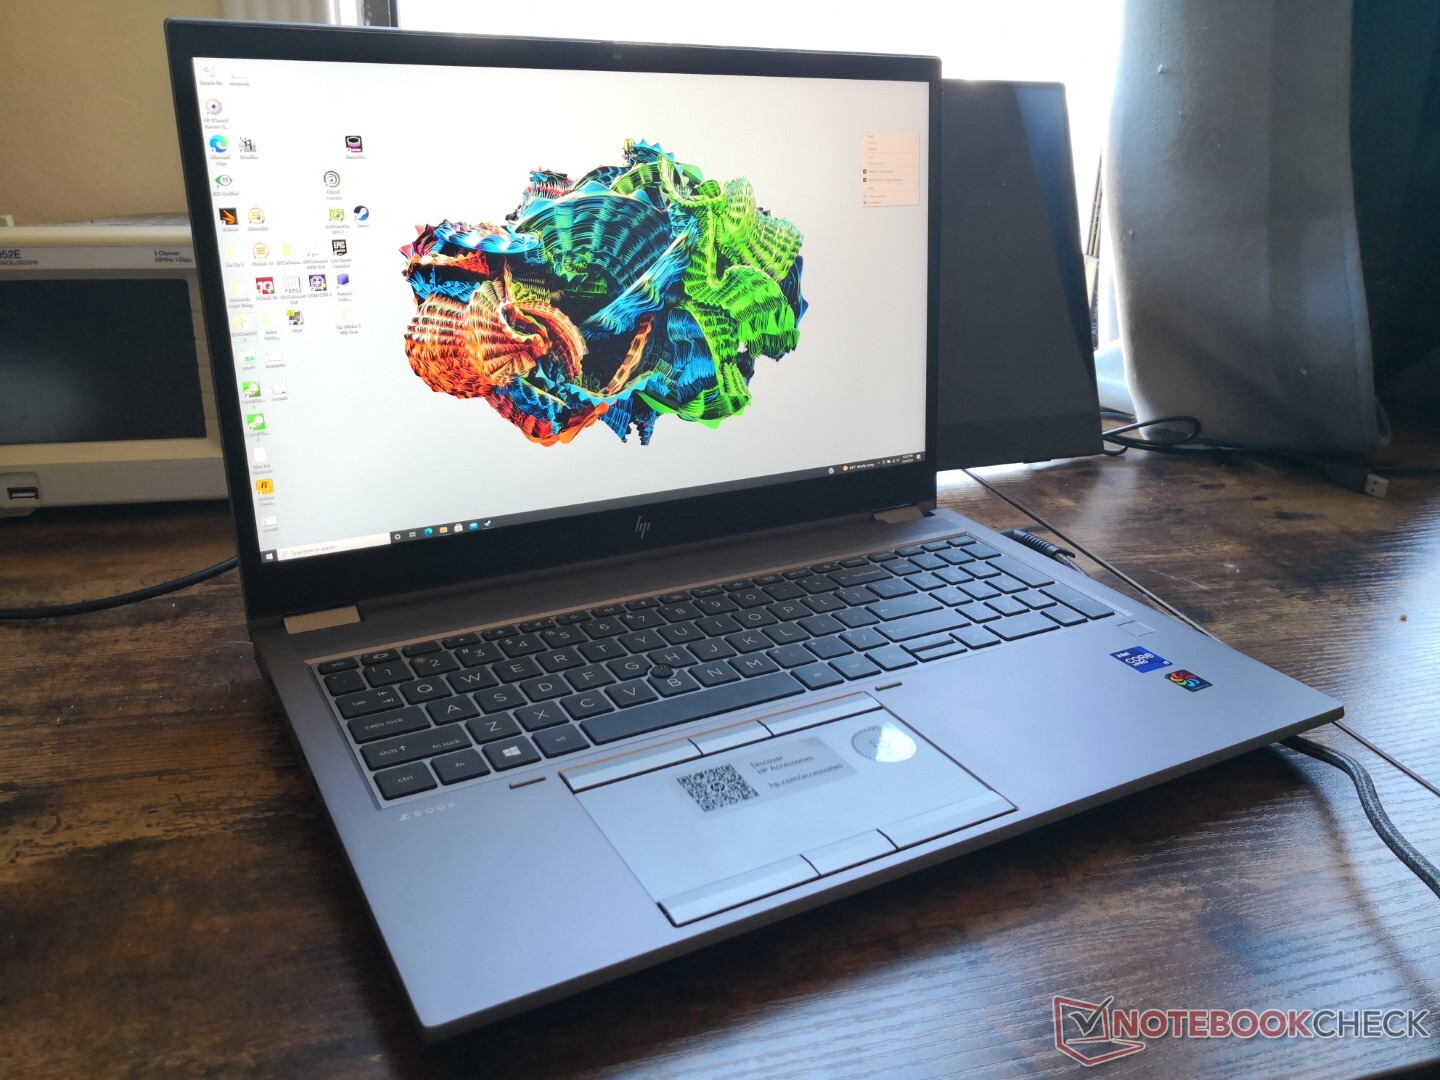
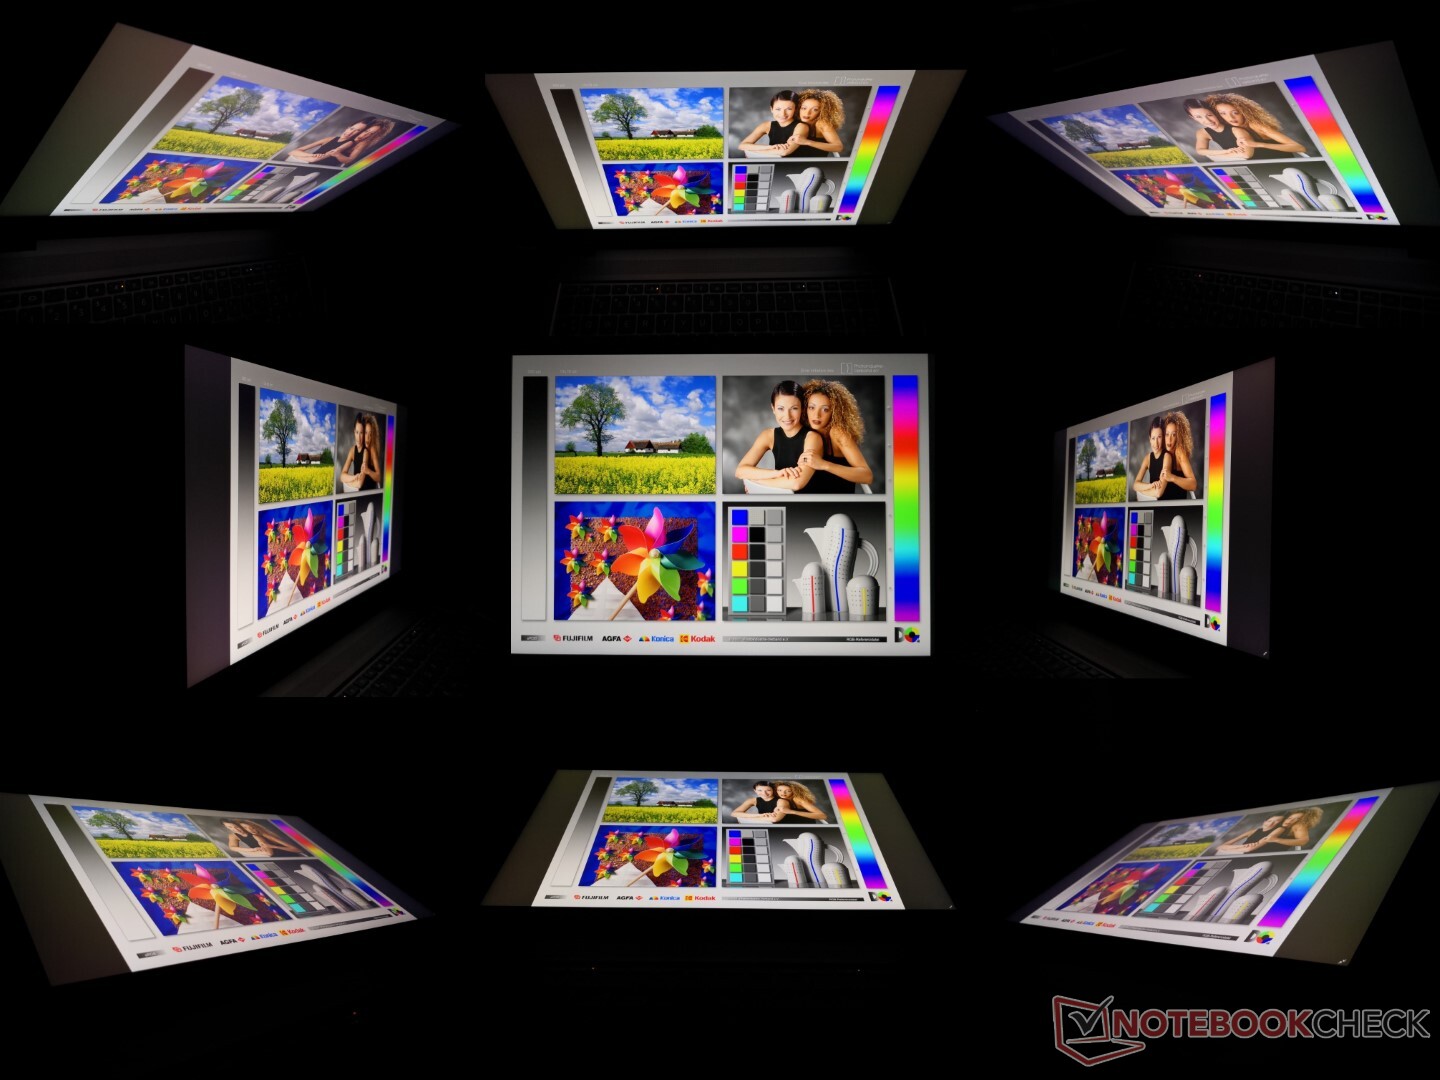
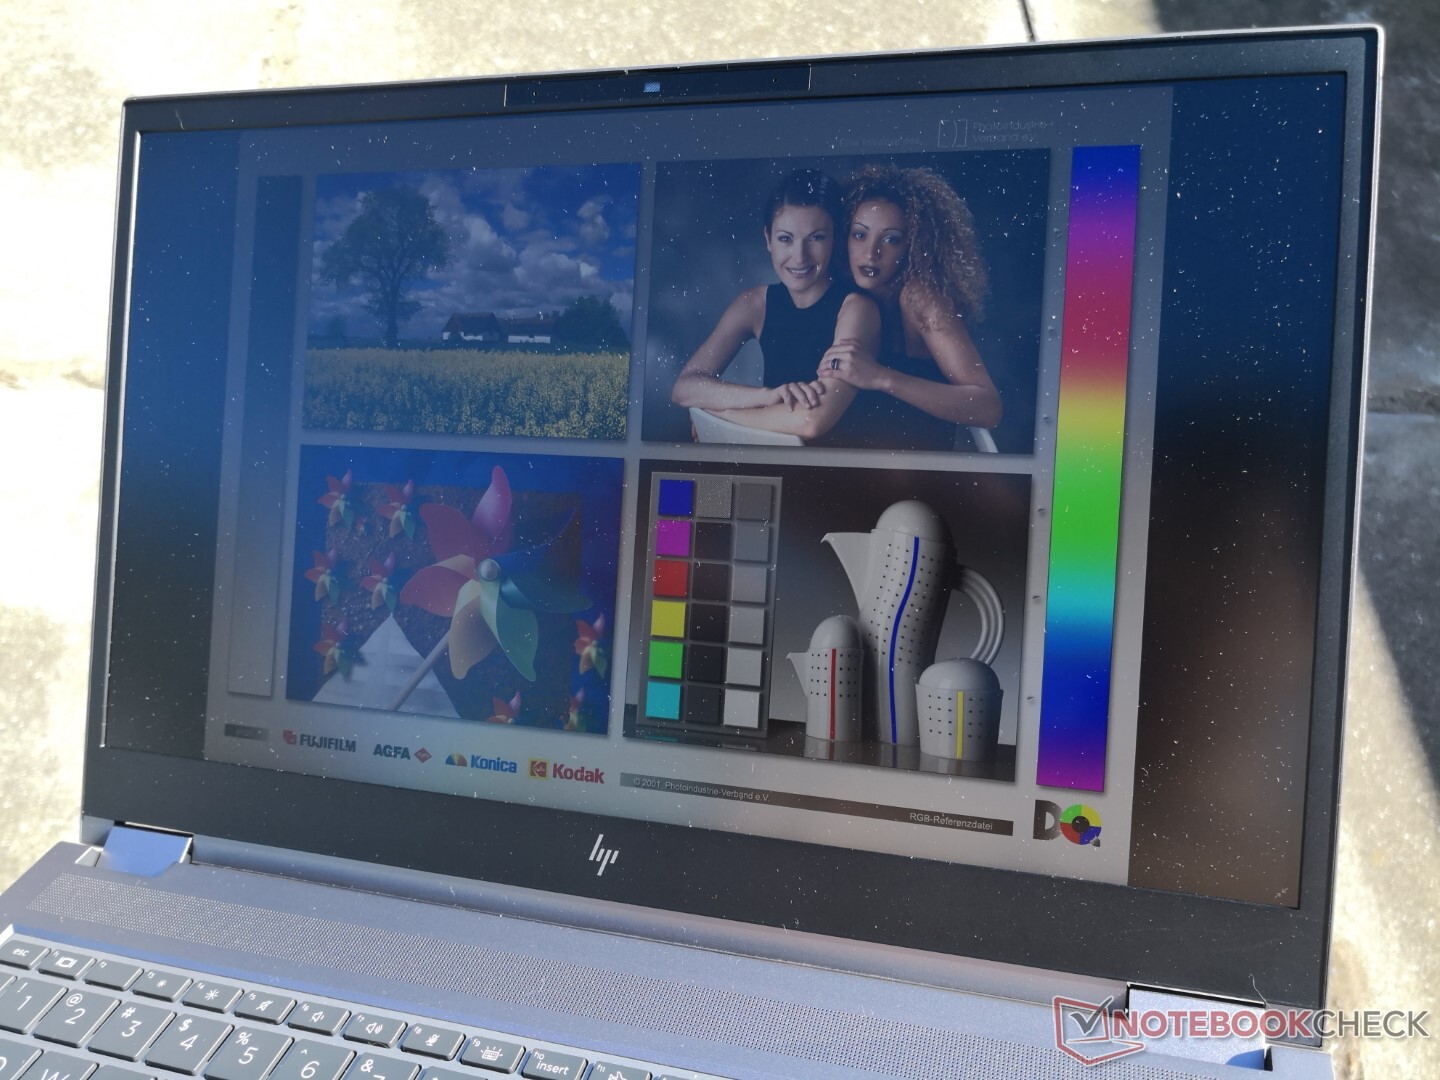
Display - 120 Hz fanno la differenza
Il nuovo pannello 4K 120 Hz sul Fury 15 G8 è un miglioramento significativo rispetto al pannello 4K 60 Hz sul Fury 15 G7 pur avendo la stessa alta risoluzione nativa e ampia copertura di colore. A parte gli ovvi vantaggi di passare da 60 Hz a 120 Hz, il nuovo pannello offre tempi di risposta in bianco e nero e grigio molto più veloci di quasi 4 volte per un ghosting meno evidente soprattutto quando si tratta di grafica in rapido movimento. Sia la luminosità che il contrasto rimangono alti a ~600:1 e >1000:1, rispettivamente
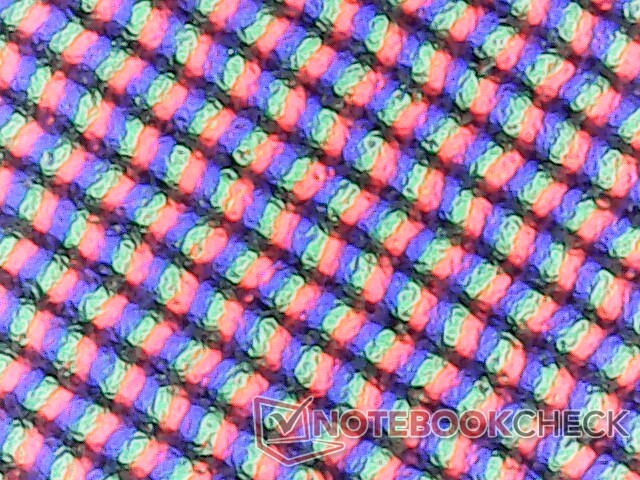
Forse il singolo più grande svantaggio del pannello 4K è che soffre di un po' di granulosità a causa della sovrapposizione opaca e quindi testi e immagini non appaiono così nitidi come avrebbero potuto essere nonostante i PPI molto alti. HP offre opzioni lucide per superare questo specifico inconveniente.
| |||||||||||||||||||||||||
Distribuzione della luminosità: 87 %
Al centro con la batteria: 626 cd/m²
Contrasto: 1079:1 (Nero: 0.58 cd/m²)
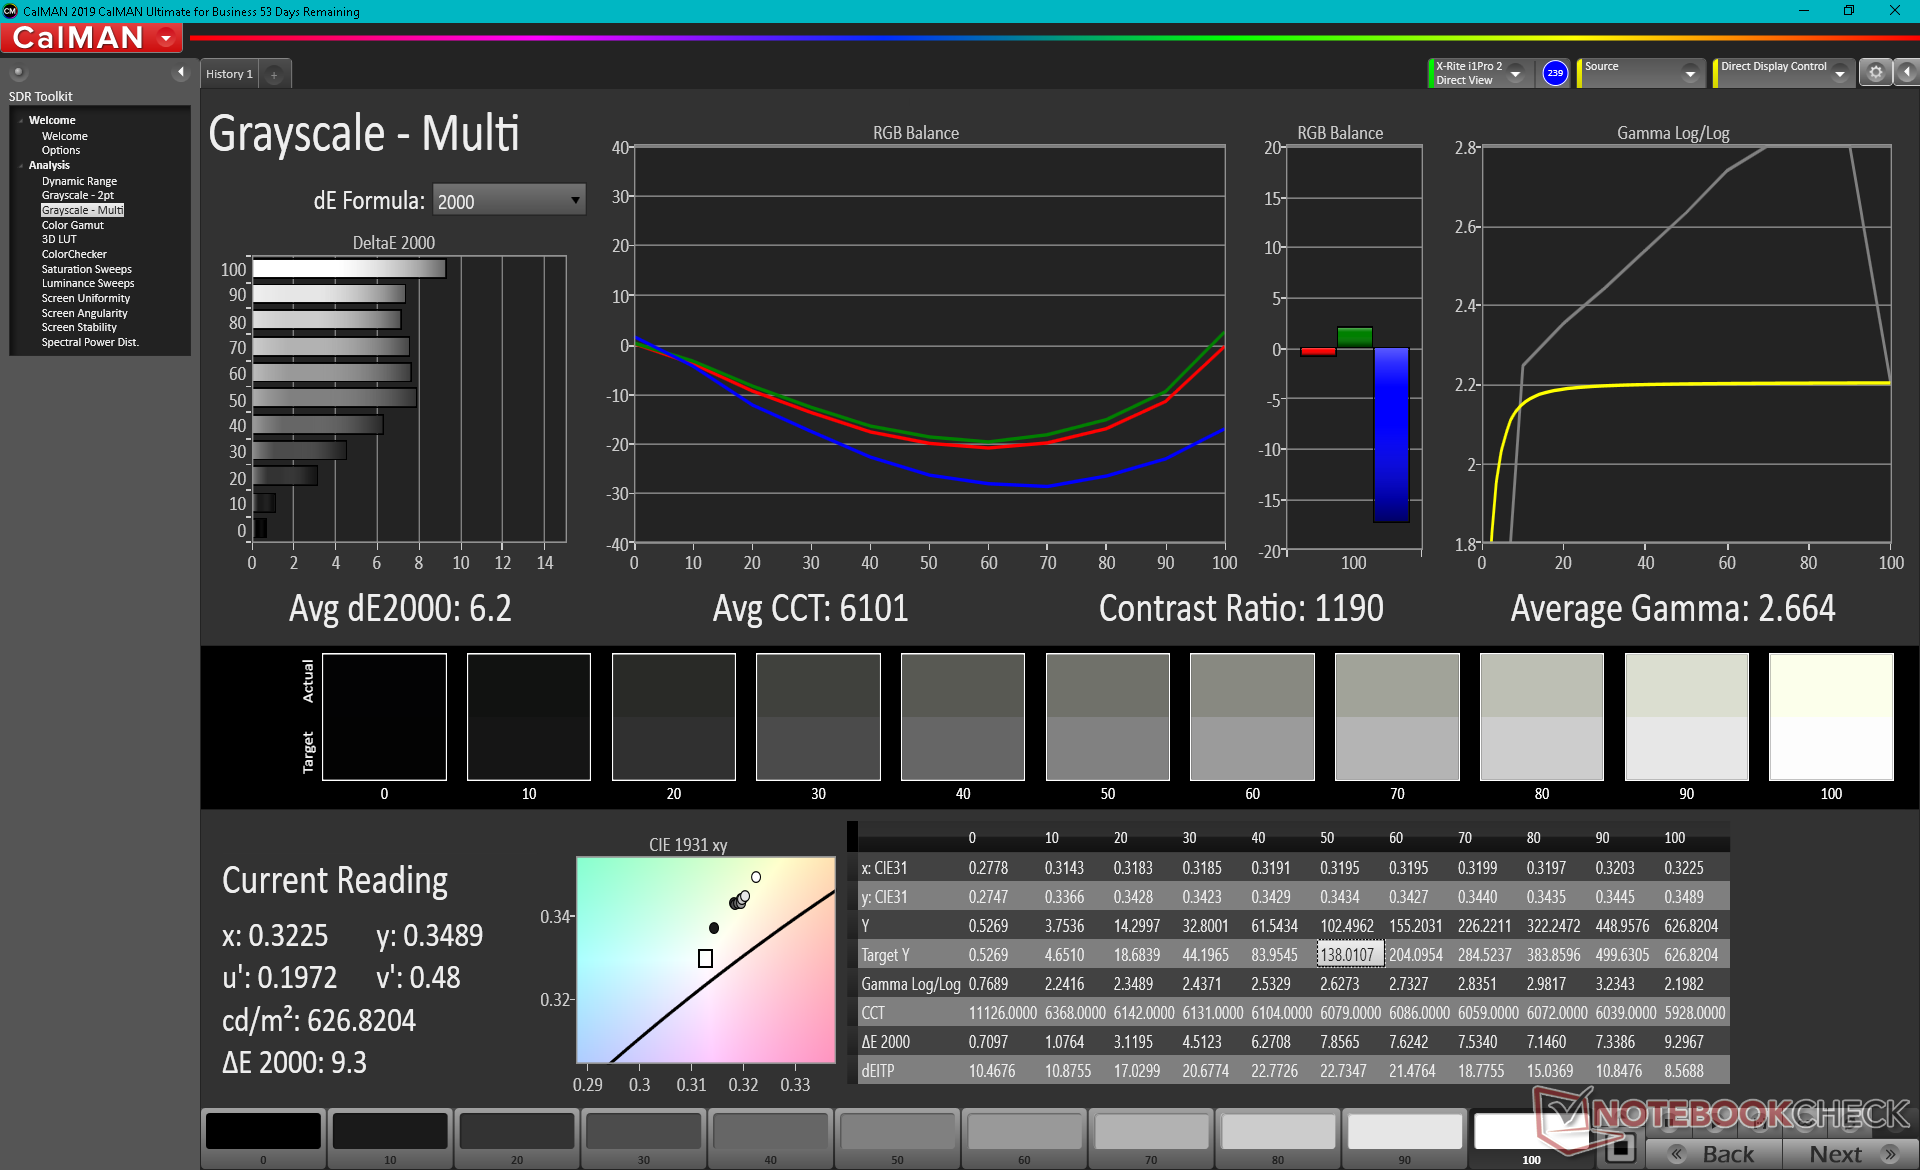
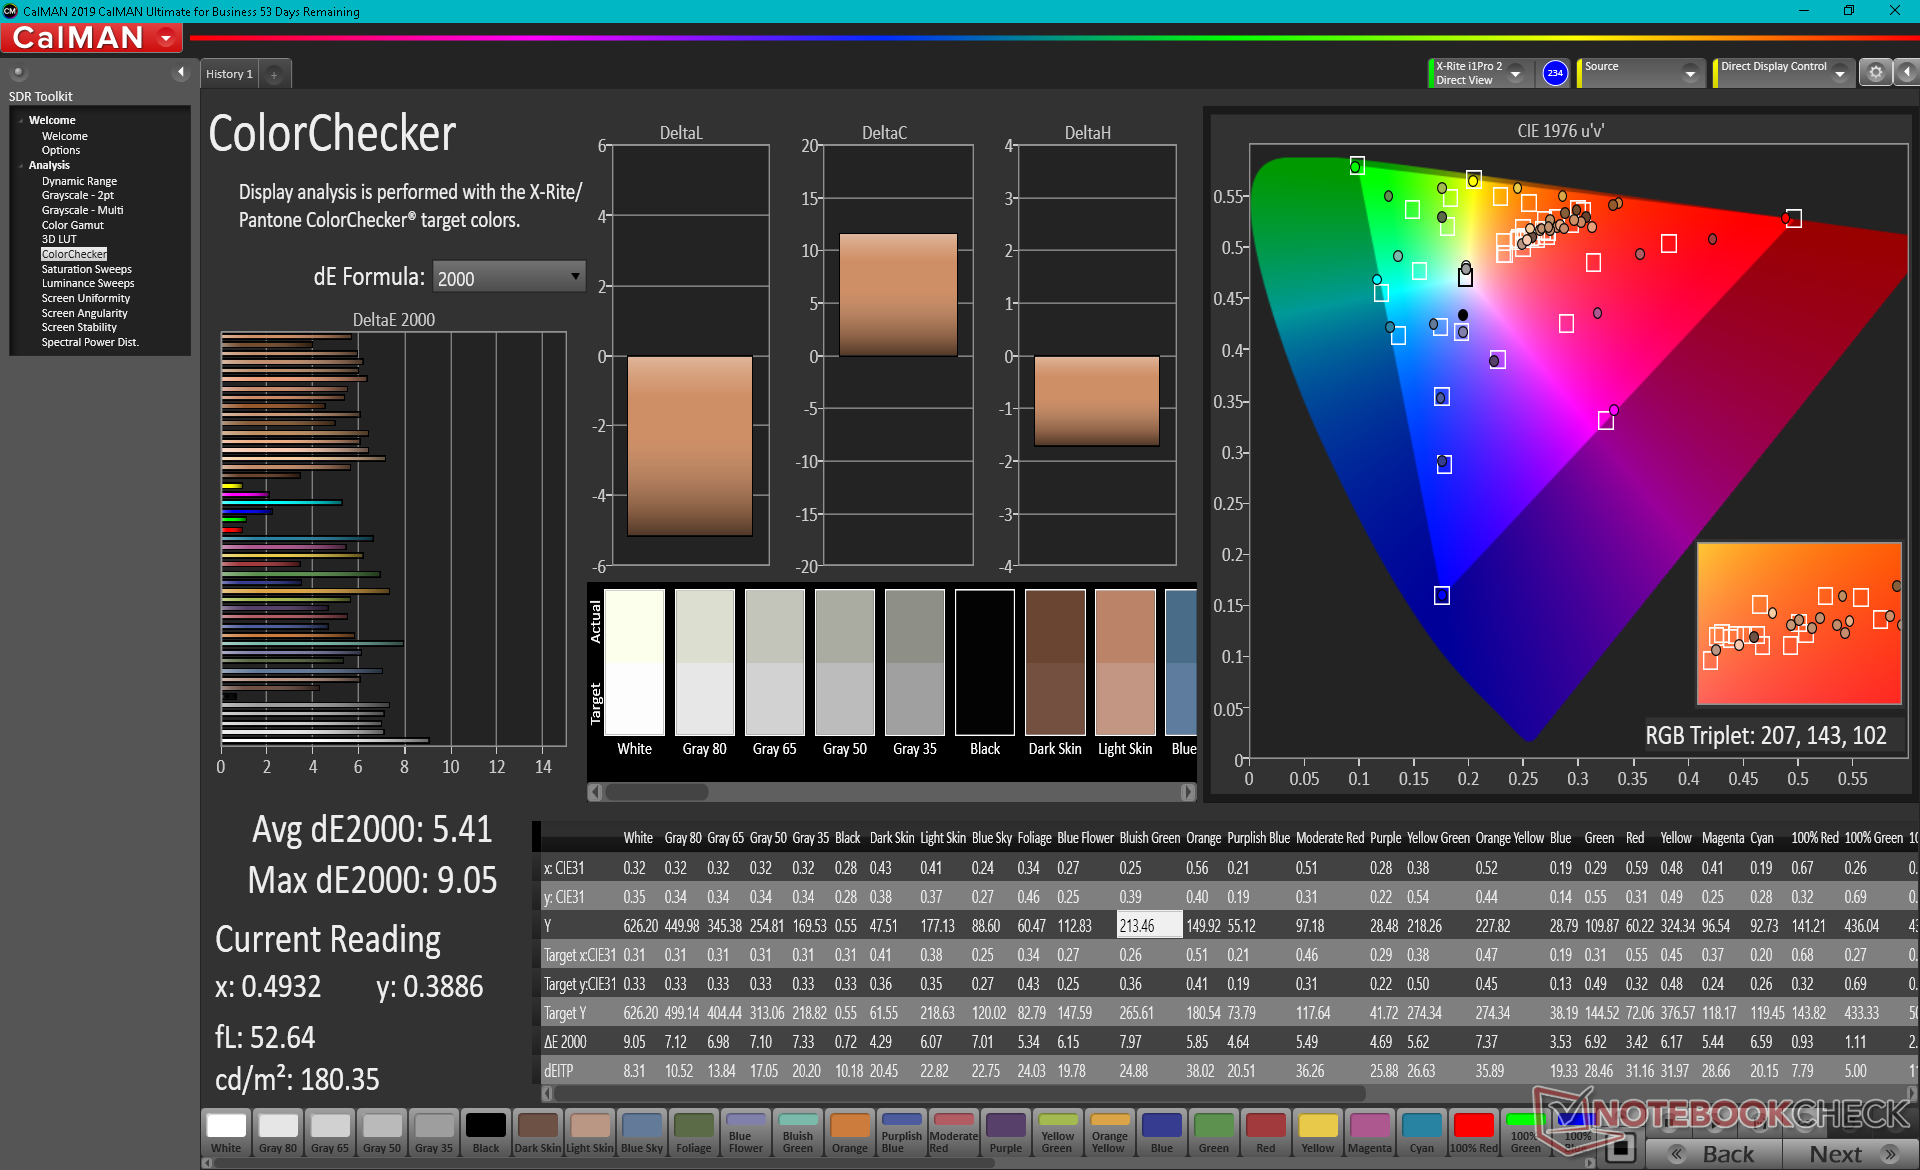
ΔE ColorChecker Calman: 5.41 | ∀{0.5-29.43 Ø4.71}
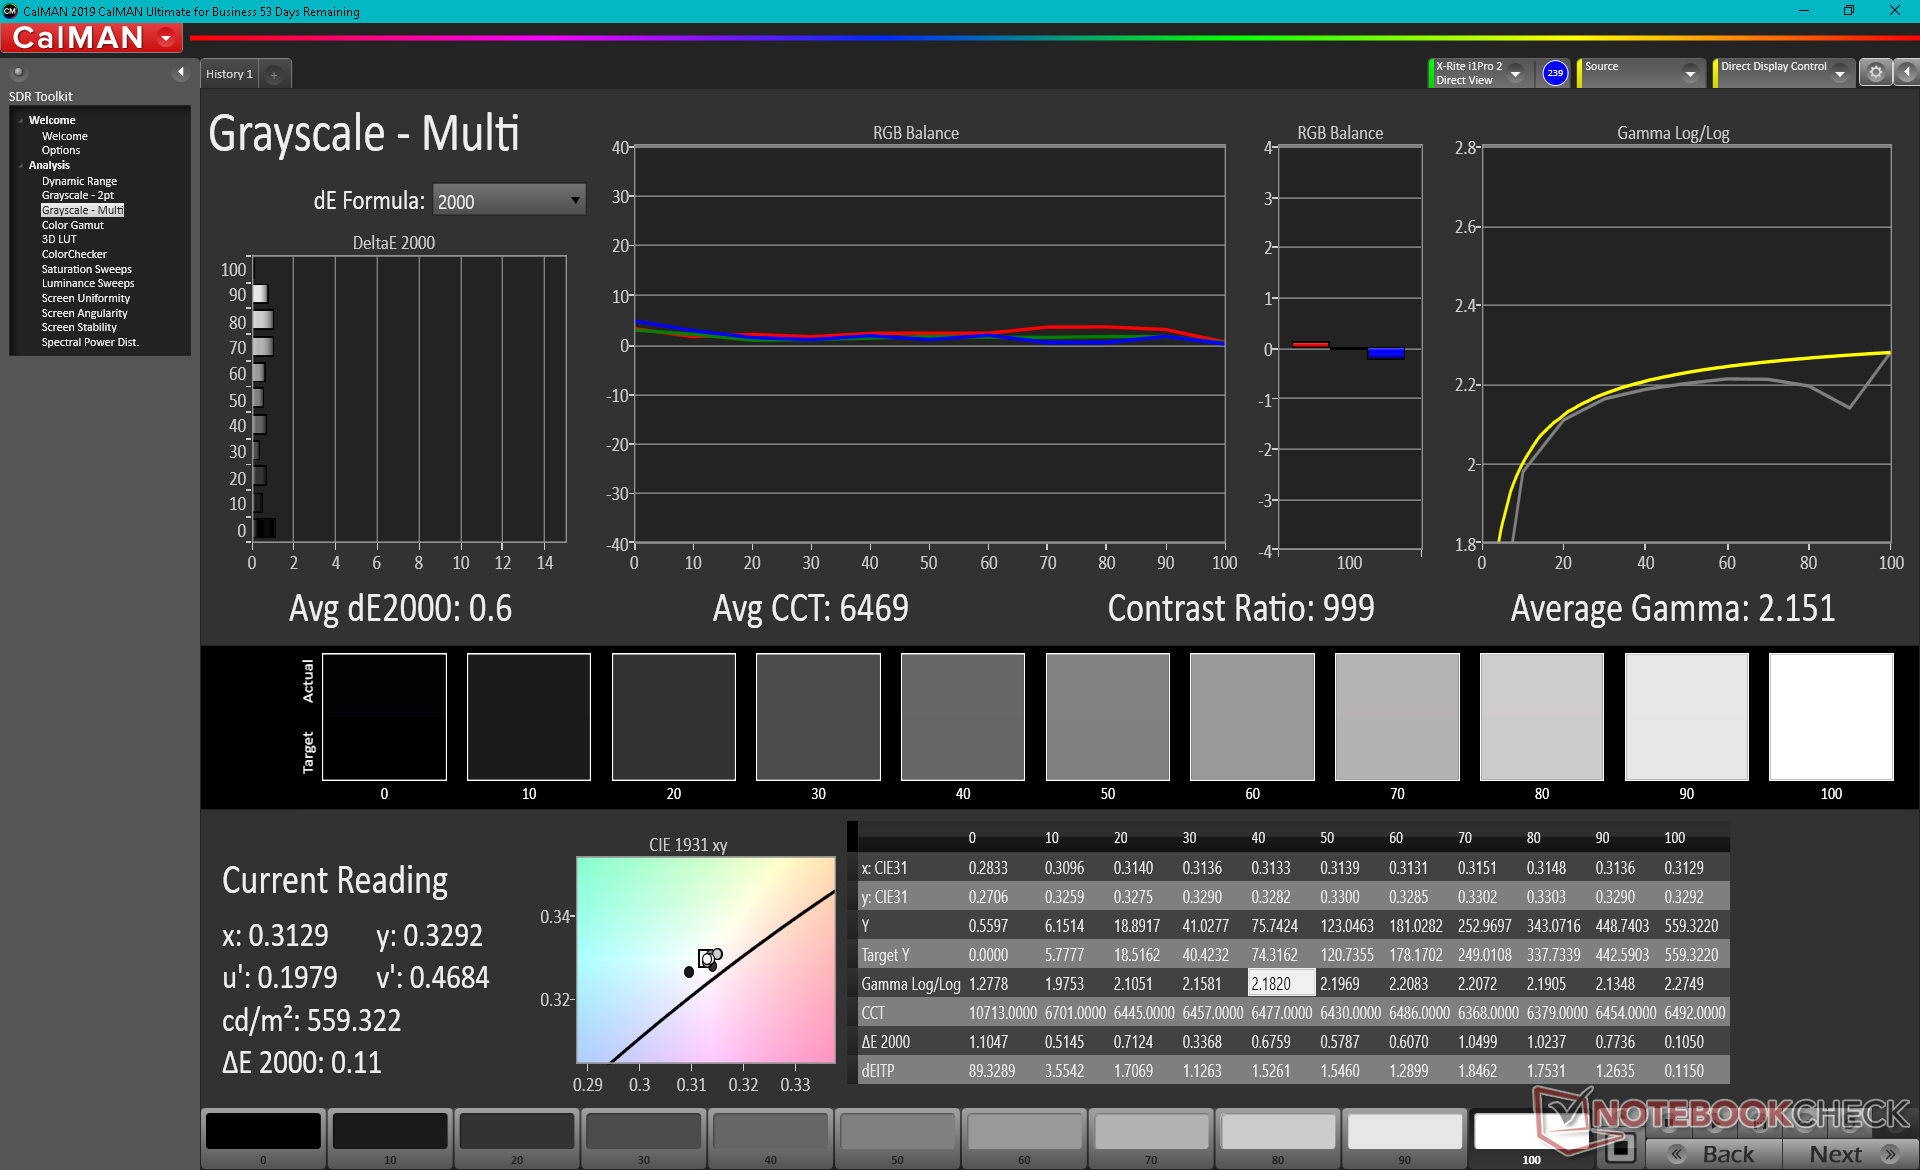
calibrated: 0.6
ΔE Greyscale Calman: 6.2 | ∀{0.09-98 Ø4.96}
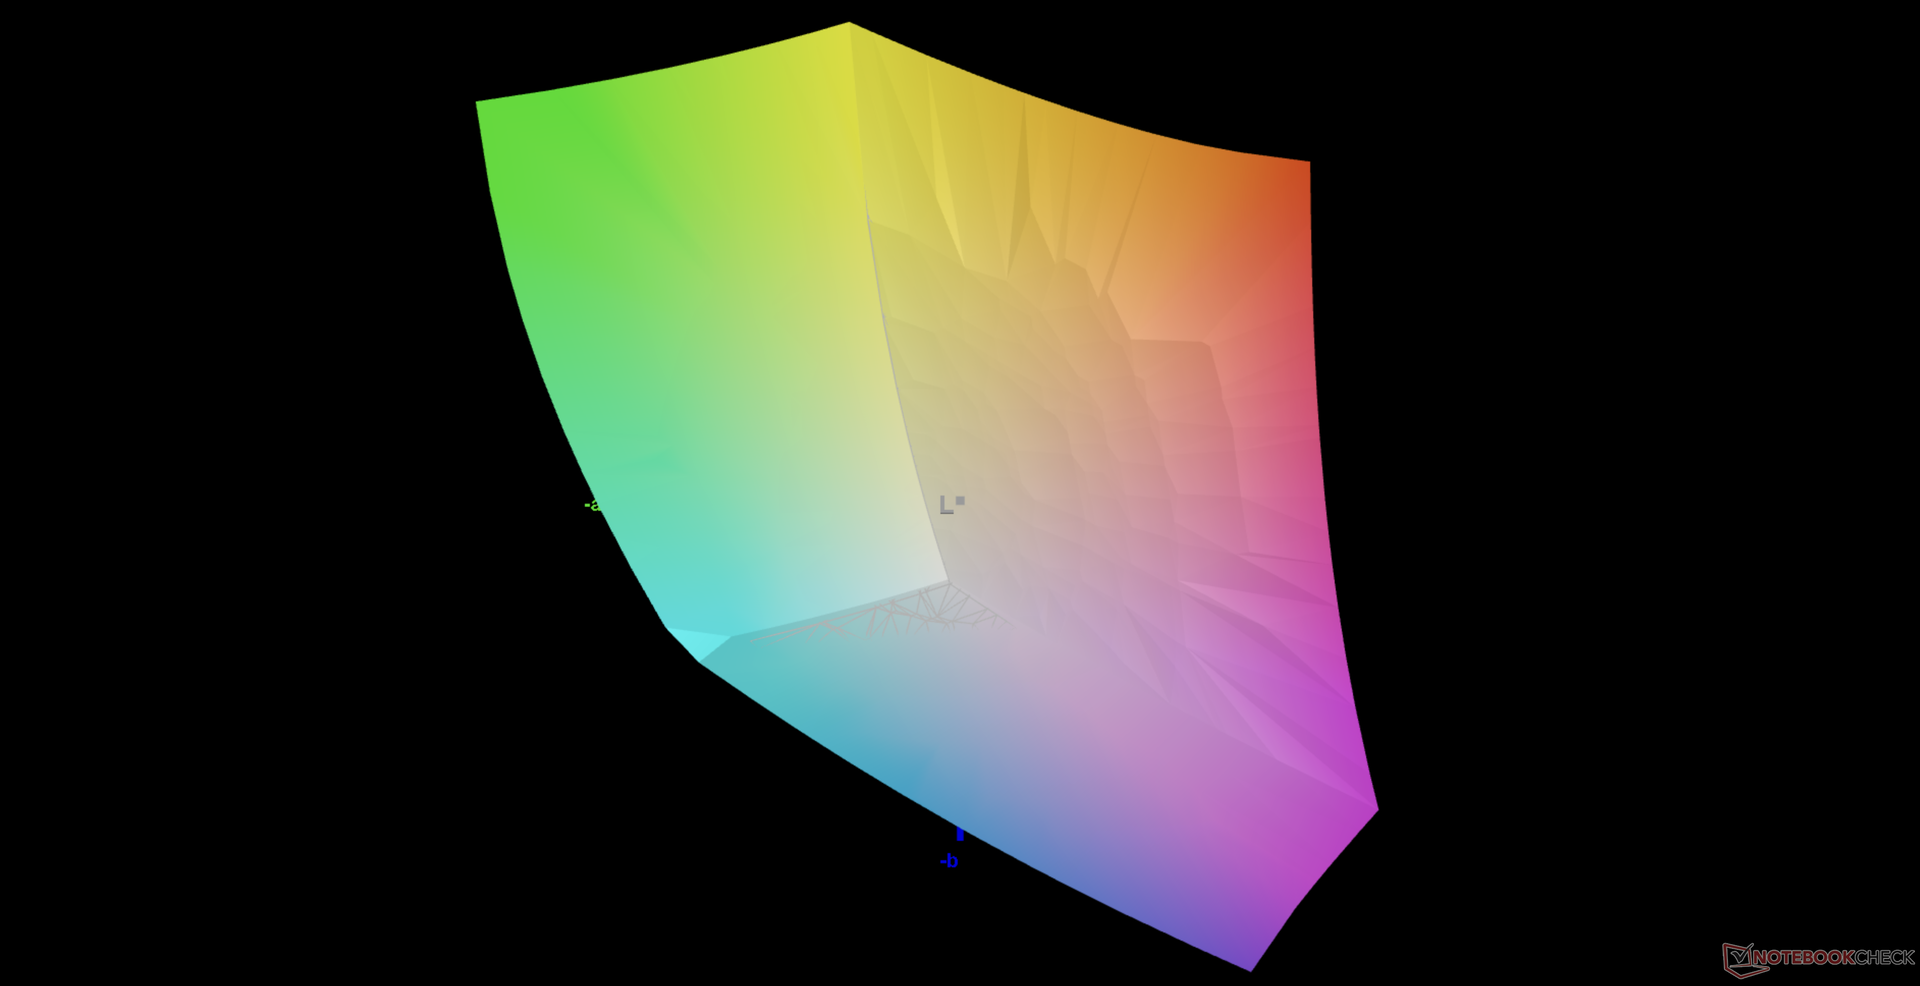
87.3% AdobeRGB 1998 (Argyll 3D)
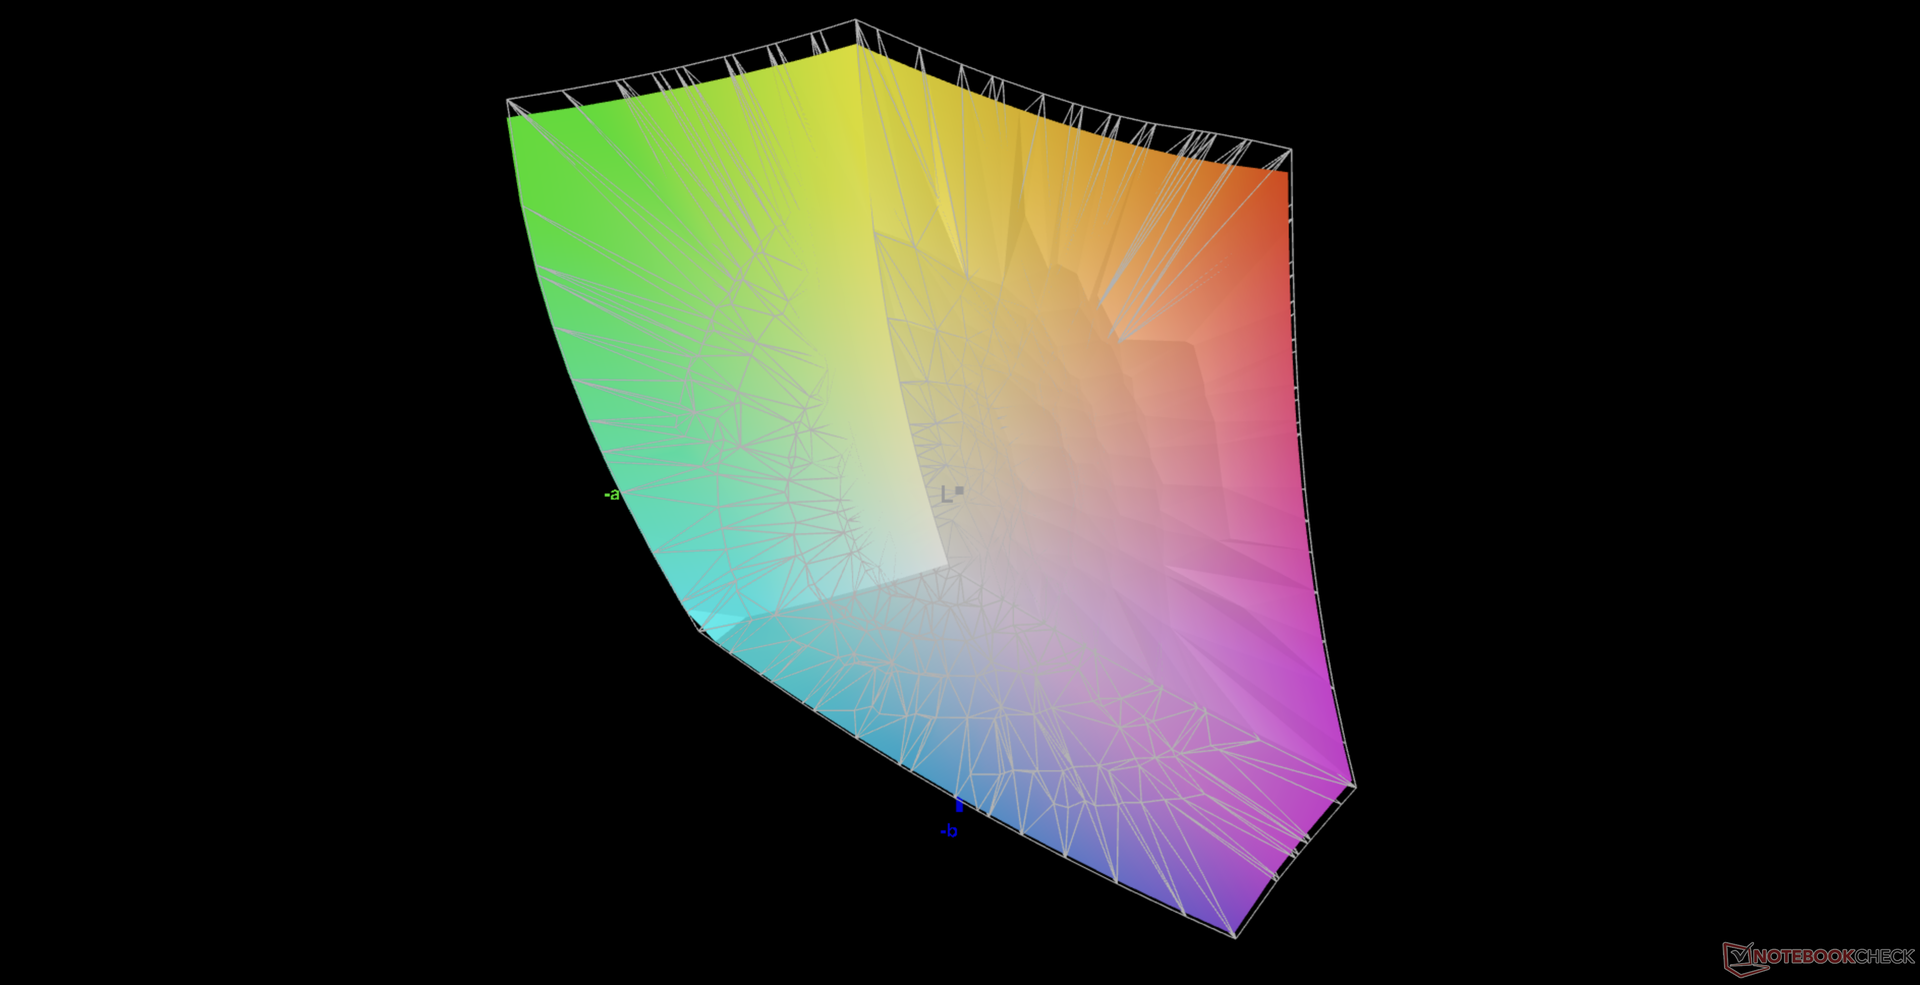
100% sRGB (Argyll 3D)
95.9% Display P3 (Argyll 3D)
Gamma: 2.66
CCT: 6101 K
| HP ZBook Fury 15 G8 BOE0969, IPS, 15.6", 3840x2160 | HP ZBook Fury 15 G7 LG Philips LGD0661, IPS, 15.6", 3840x2160 | Dell Precision 5000 5560 Sharp LQ156R1, IPS, 15.6", 3840x2400 | HP ZBook Studio 15 G8 SDC4145, OLED, 15.6", 3840x2160 | Lenovo ThinkPad P15s Gen2-20W6000GGE MNF601EA1-1, IPS LED, 15.6", 3840x2160 | HP ZBook Firefly 15 G7 LGD064F, IPS LED, 15.6", 3840x2160 | |
|---|---|---|---|---|---|---|
| Display | -1% | 5% | 4% | -0% | -17% | |
| Display P3 Coverage (%) | 95.9 | 95.6 0% | 94.9 -1% | 99.9 4% | 84.5 -12% | 68.8 -28% |
| sRGB Coverage (%) | 100 | 99.8 0% | 100 0% | 100 0% | 98.7 -1% | 97.7 -2% |
| AdobeRGB 1998 Coverage (%) | 87.3 | 84.5 -3% | 100 15% | 95.3 9% | 97.8 12% | 69.8 -20% |
| Response Times | -253% | -198% | 81% | -141% | -189% | |
| Response Time Grey 50% / Grey 80% * (ms) | 14.8 ? | 56 ? -278% | 47.2 ? -219% | 2.4 ? 84% | 40 ? -170% | 44 ? -197% |
| Response Time Black / White * (ms) | 11 ? | 36 ? -227% | 30.4 ? -176% | 2.4 ? 78% | 23.2 ? -111% | 30.8 ? -180% |
| PWM Frequency (Hz) | 240.4 ? | |||||
| Screen | -29% | 7% | -58% | 35% | 5% | |
| Brightness middle (cd/m²) | 626 | 672.8 7% | 501.5 -20% | 379.6 -39% | 604 -4% | 381 -39% |
| Brightness (cd/m²) | 589 | 674 14% | 467 -21% | 380 -35% | 609 3% | 382 -35% |
| Brightness Distribution (%) | 87 | 89 2% | 83 -5% | 95 9% | 91 5% | 92 6% |
| Black Level * (cd/m²) | 0.58 | 0.5 14% | 0.44 24% | 0.34 41% | 0.21 64% | |
| Contrast (:1) | 1079 | 1346 25% | 1140 6% | 1776 65% | 1814 68% | |
| Colorchecker dE 2000 * | 5.41 | 3.48 36% | 4.73 13% | 5.15 5% | 0.9 83% | 3 45% |
| Colorchecker dE 2000 max. * | 9.05 | 9.44 -4% | 8.45 7% | 7.79 14% | 2.6 71% | 5.2 43% |
| Colorchecker dE 2000 calibrated * | 0.6 | 3.03 -405% | 0.51 15% | 3.1 -417% | 0.8 -33% | 1.5 -150% |
| Greyscale dE 2000 * | 6.2 | 3.1 50% | 3.6 42% | 2.6 58% | 1.1 82% | 3.5 44% |
| Gamma | 2.66 83% | 2.04 108% | 2.08 106% | 1.99 111% | 2.15 102% | 2.26 97% |
| CCT | 6101 107% | 6380 102% | 6447 101% | 6166 105% | 6656 98% | 7254 90% |
| Color Space (Percent of AdobeRGB 1998) (%) | 75.2 | 84.5 | 64.3 | |||
| Color Space (Percent of sRGB) (%) | 100 | 98.6 | 97.5 | |||
| Media totale (Programma / Settaggio) | -94% /
-55% | -62% /
-23% | 9% /
-19% | -35% /
2% | -67% /
-27% |
* ... Meglio usare valori piccoli
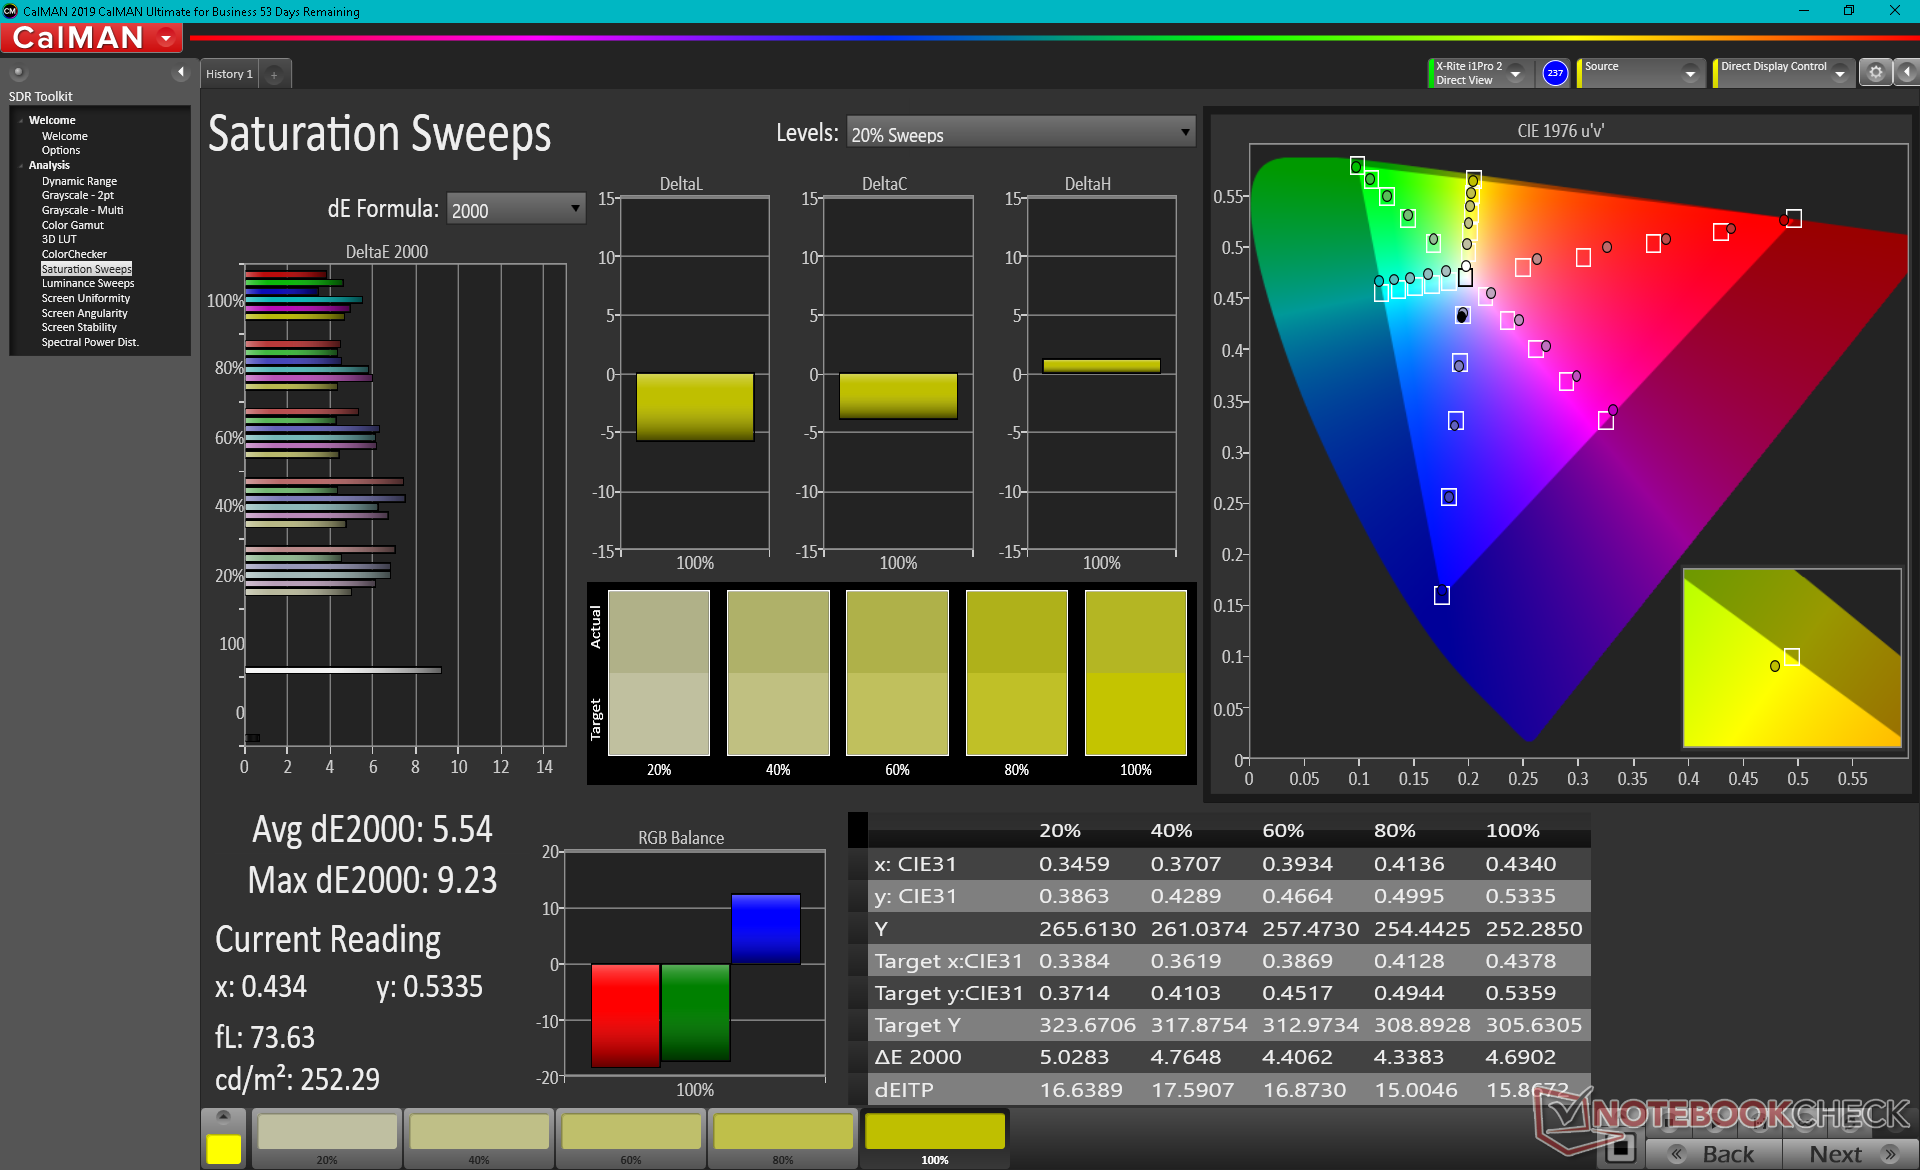
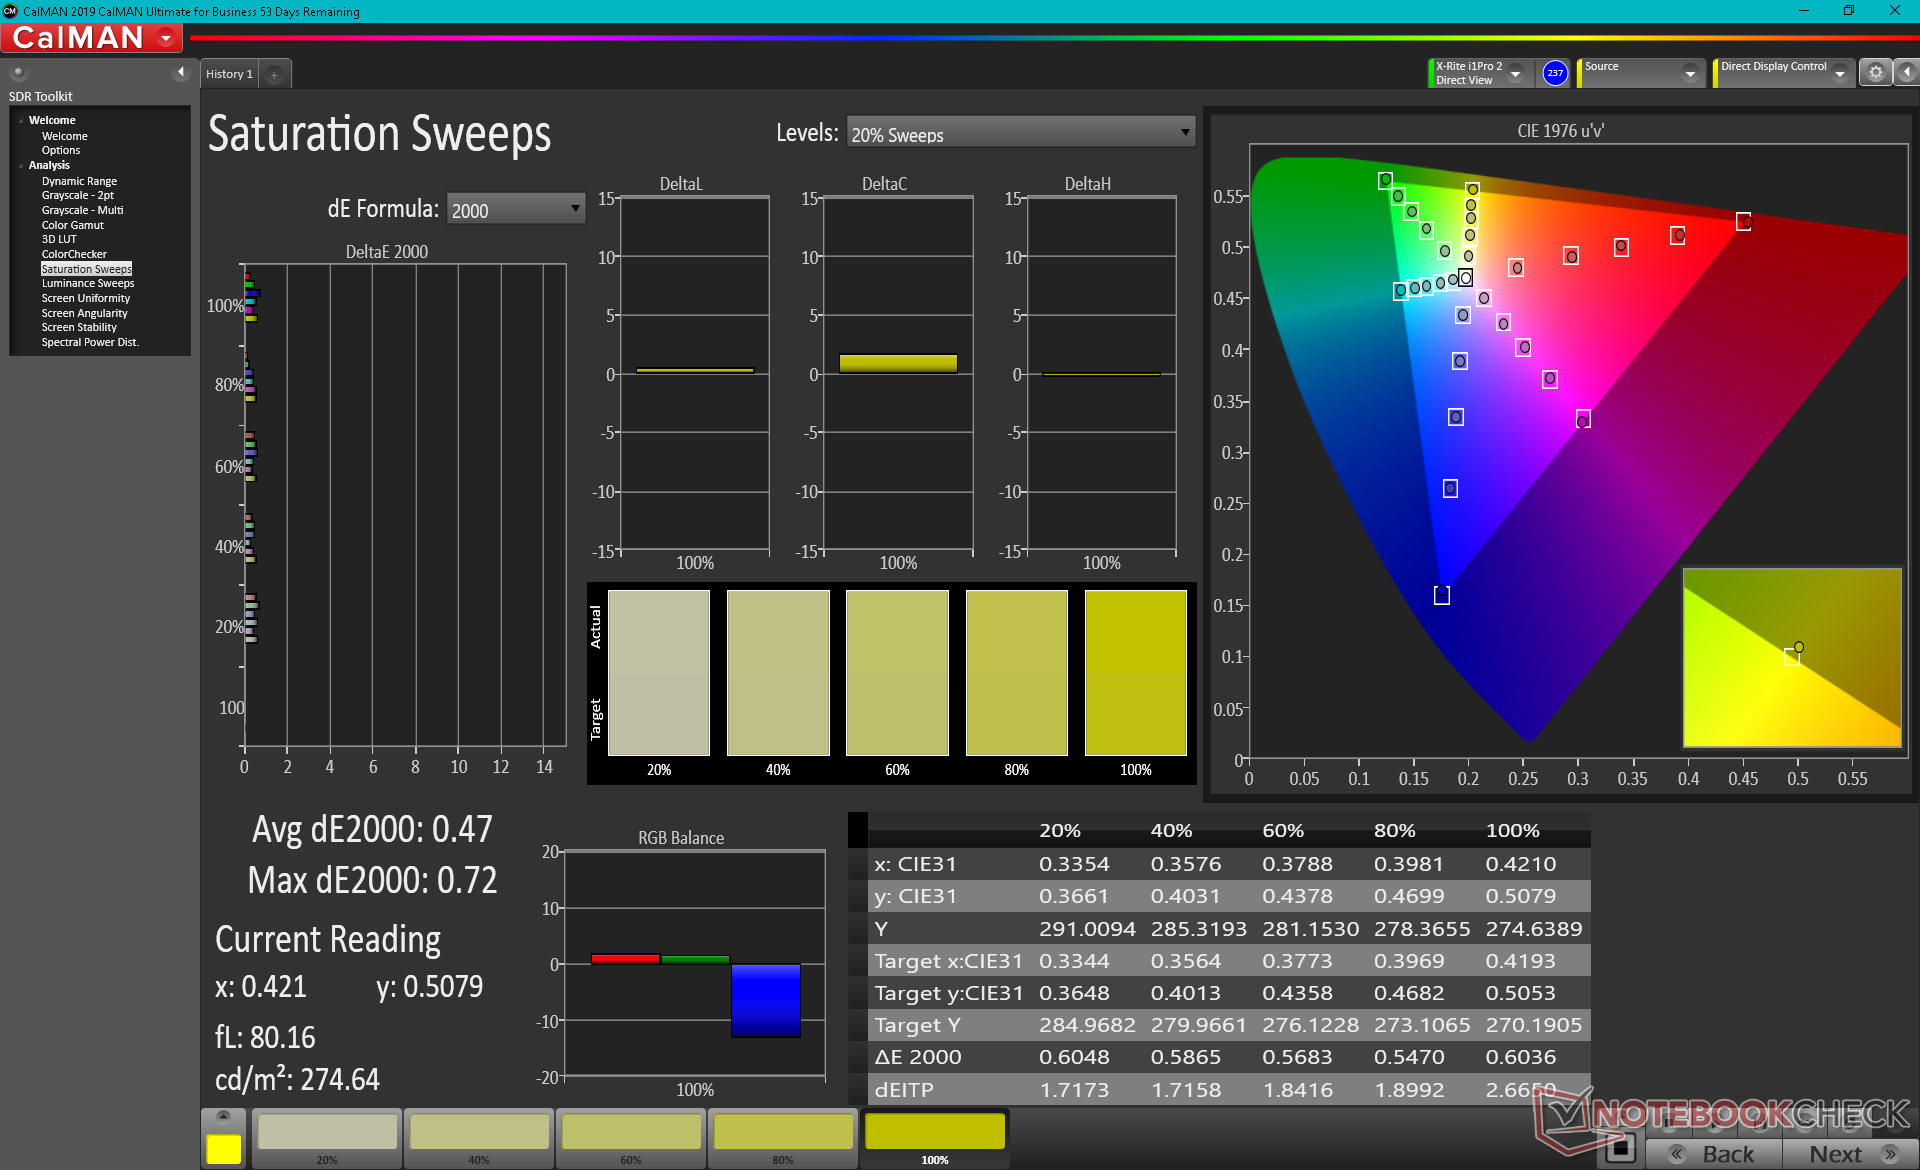
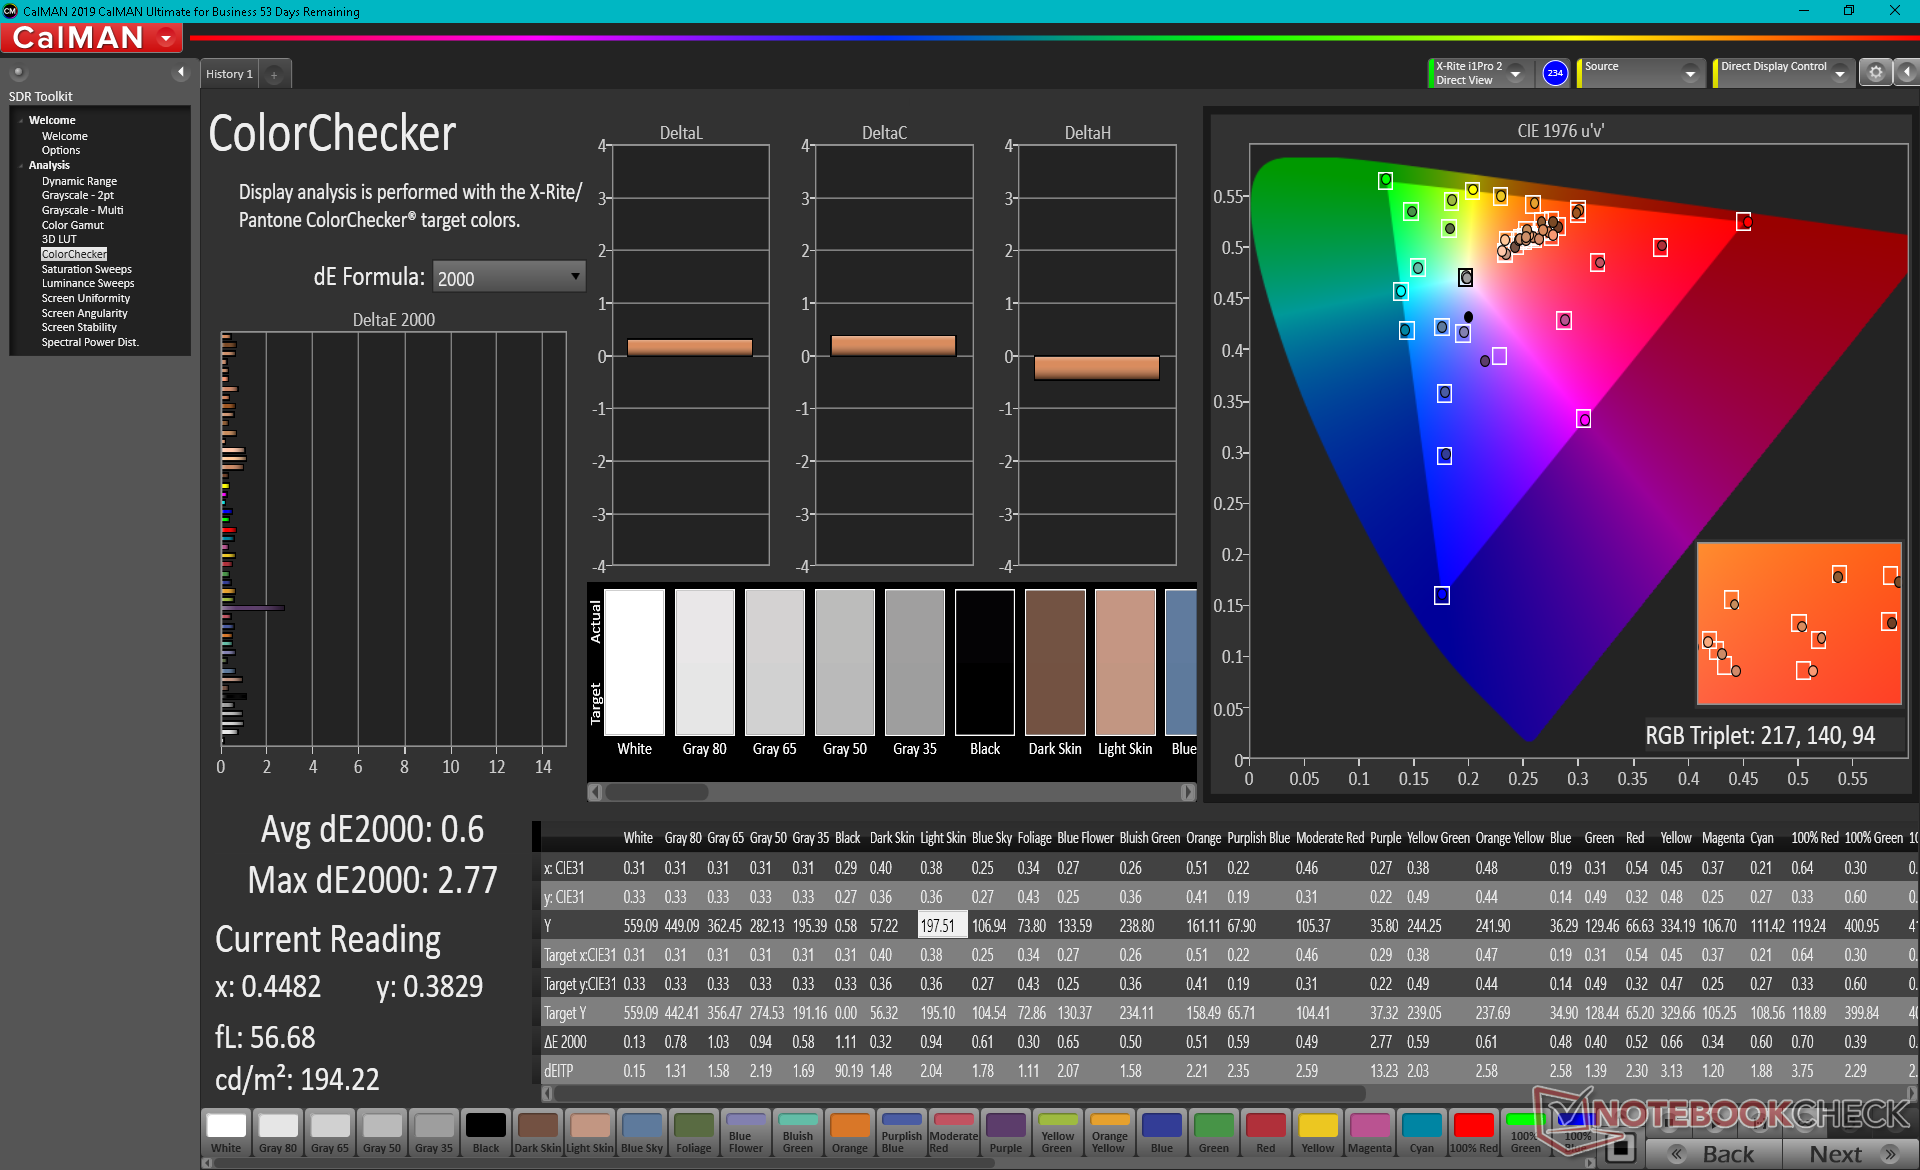
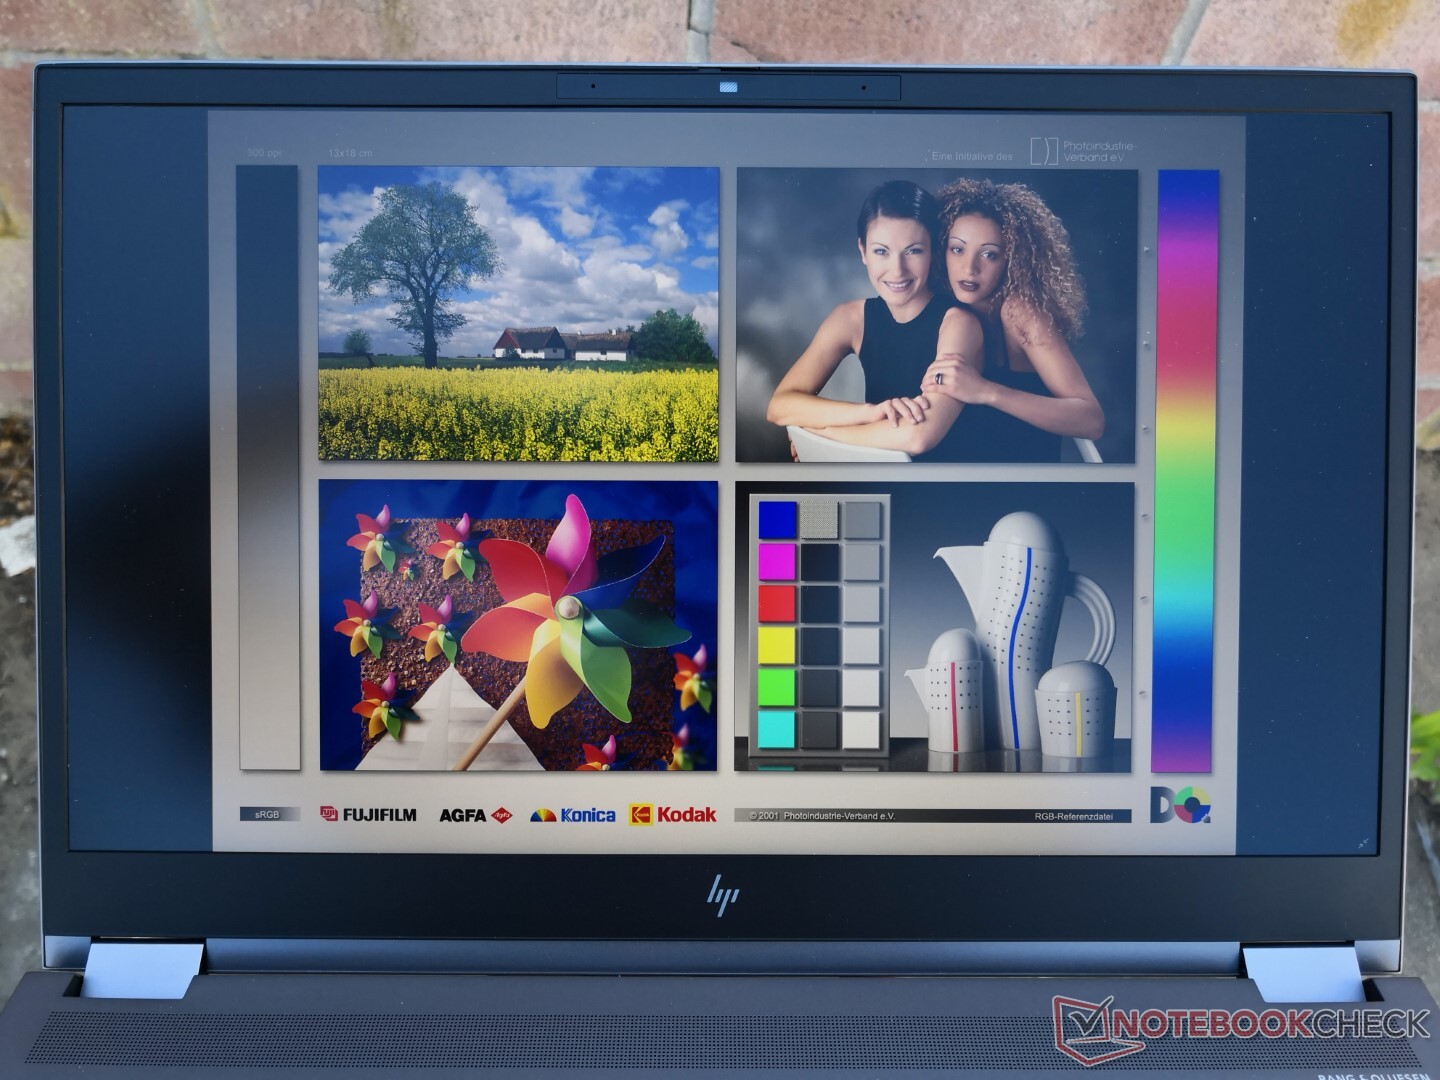
Il nostro colorimetro X-Rite mostra una copertura DCI-P3 del 96 per cento contro il 100 per cento dichiarato da HP. Combinate i colori ampi con i tempi di risposta molto veloci e avrete un pannello 4K che funziona estremamente bene sia per l'editing grafico professionale che per le applicazioni di gioco.
Il display avrebbe potuto essere calibrato meglio fuori dalla scatola rispetto allo standard DCI-P3. I valori medi della scala di grigi e deltaE del colore fuori dalla scatola sono rispettivamente a 6.2 e 5.41, con una temperatura colore troppo calda di 6100. Calibrare il pannello da soli con un colorimetro X-Rite risolve queste carenze.
Tempi di risposta del Display
| ↔ Tempi di risposta dal Nero al Bianco | ||
|---|---|---|
| 11 ms ... aumenta ↗ e diminuisce ↘ combinato | ↗ 7.6 ms Incremento | 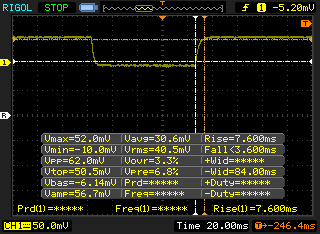 |
| ↘ 3.4 ms Calo | ||
| Lo schermo mostra buoni tempi di risposta durante i nostri tests, ma potrebbe essere troppo lento per i gamers competitivi. In confronto, tutti i dispositivi di test variano da 0.1 (minimo) a 240 (massimo) ms. » 30 % di tutti i dispositivi è migliore. Questo significa che i tempi di risposta rilevati sono migliori rispettto alla media di tutti i dispositivi testati (19.8 ms). | ||
| ↔ Tempo di risposta dal 50% Grigio all'80% Grigio | ||
| 14.8 ms ... aumenta ↗ e diminuisce ↘ combinato | ↗ 7.6 ms Incremento | 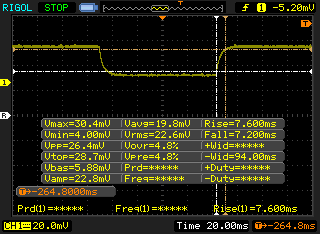 |
| ↘ 7.2 ms Calo | ||
| Lo schermo mostra buoni tempi di risposta durante i nostri tests, ma potrebbe essere troppo lento per i gamers competitivi. In confronto, tutti i dispositivi di test variano da 0.165 (minimo) a 636 (massimo) ms. » 29 % di tutti i dispositivi è migliore. Questo significa che i tempi di risposta rilevati sono migliori rispettto alla media di tutti i dispositivi testati (31 ms). | ||
Sfarfallio dello schermo / PWM (Pulse-Width Modulation)
| flickering dello schermo / PWM non rilevato | 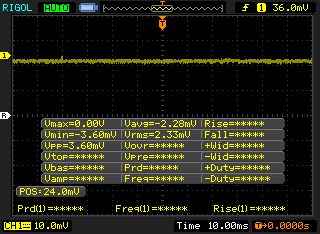 | ||
In confronto: 52 % di tutti i dispositivi testati non utilizza PWM per ridurre la luminosita' del display. Se è rilevato PWM, una media di 7754 (minimo: 5 - massimo: 343500) Hz è stata rilevata. | |||
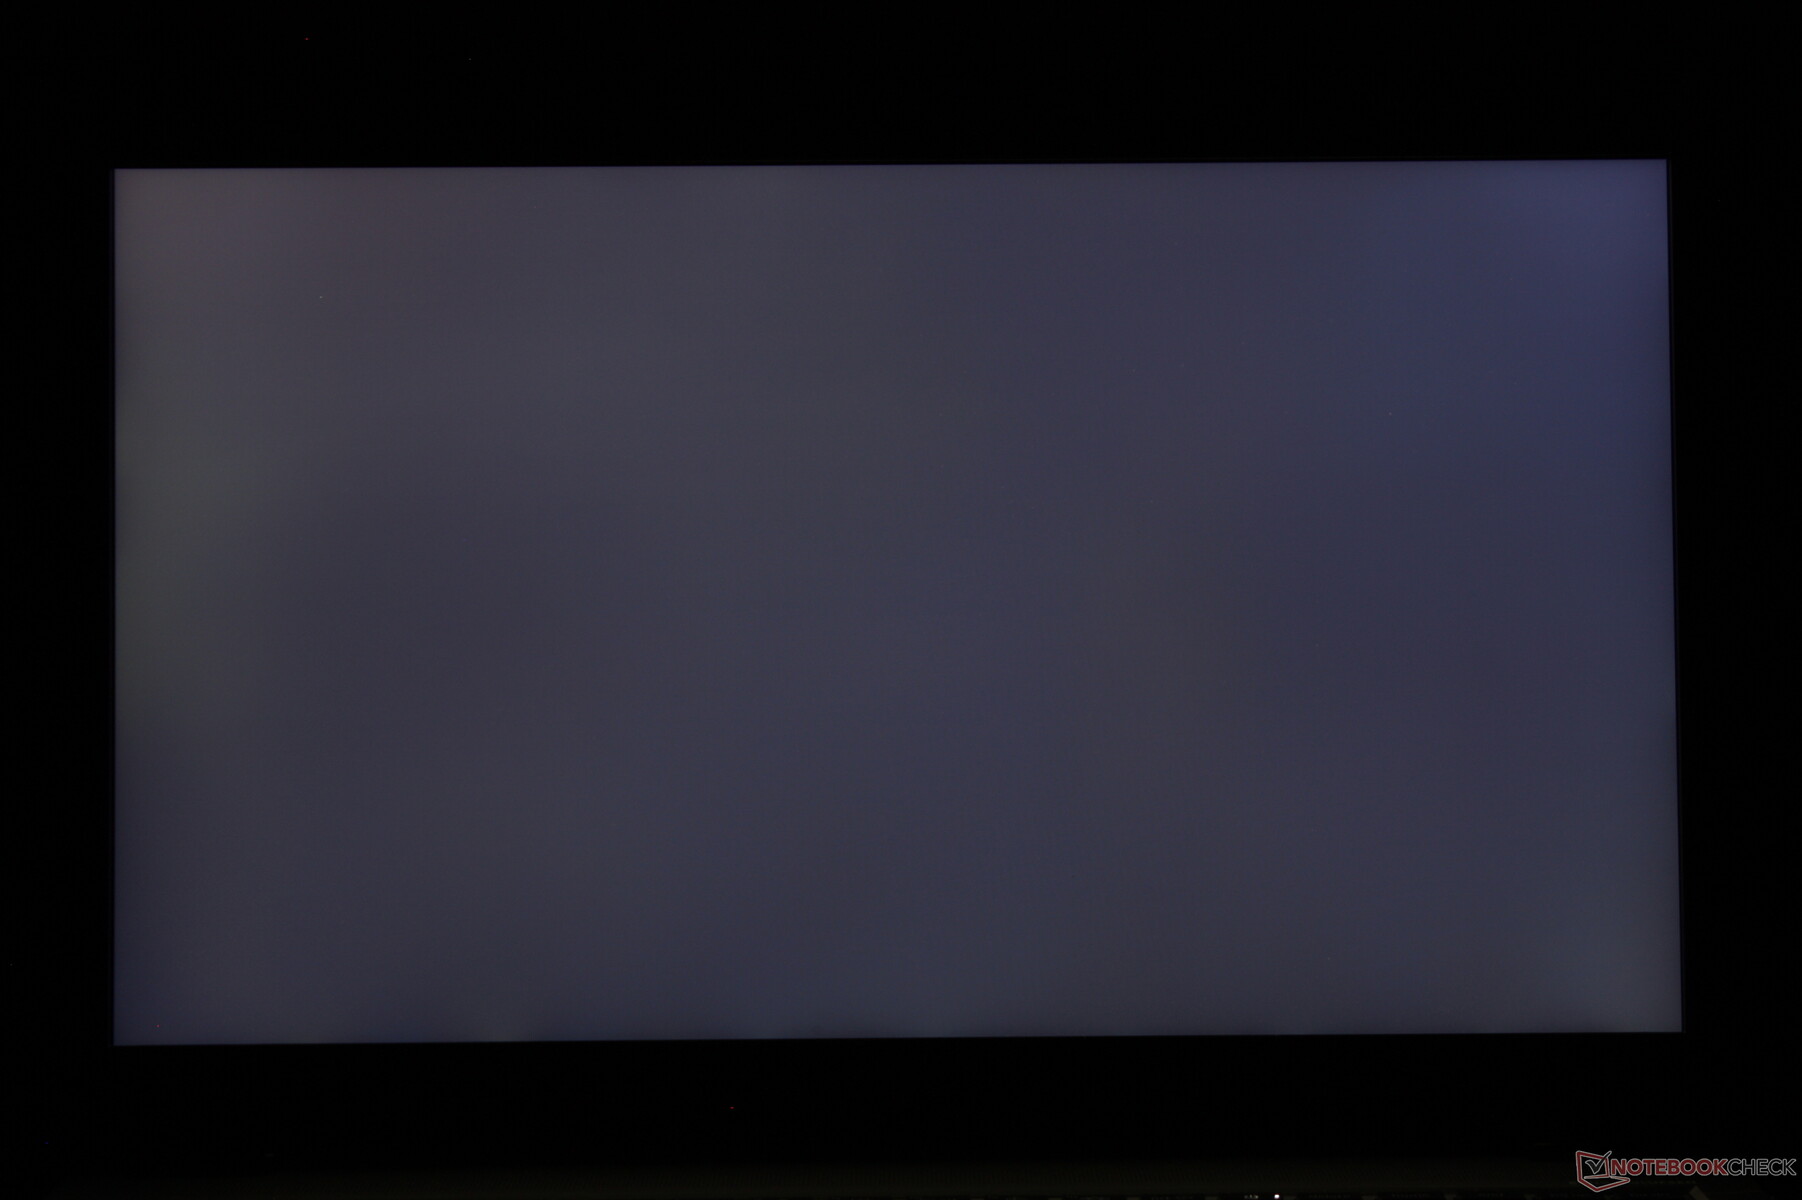
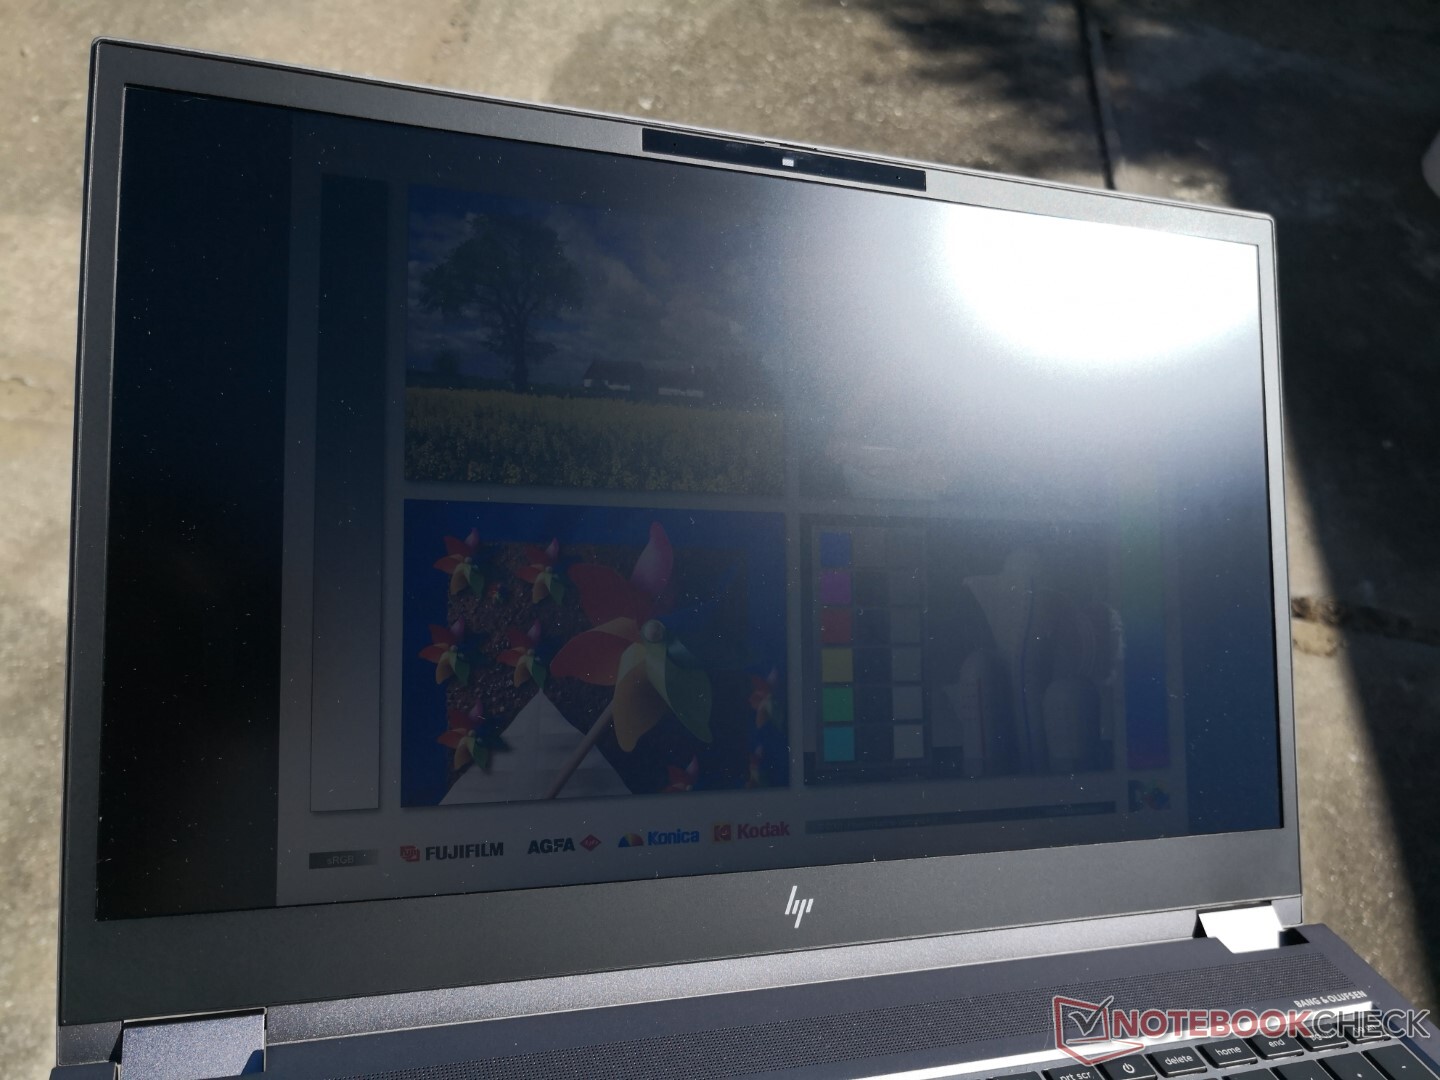
La visibilità all'esterno è migliore che su molte altre workstation grazie alla retroilluminazione extra-luminosa da 600 nit. Anche lo stesso HPZBook Studio 15 G8 o Firefly 15 G7 non si avvicinano ai 400 nit ciascuno alle loro rispettive impostazioni di luminosità massima. Ciononostante, vorrete comunque ridimensionare il carattere in modo appropriato e lavorare all'ombra per massimizzare la visibilità.
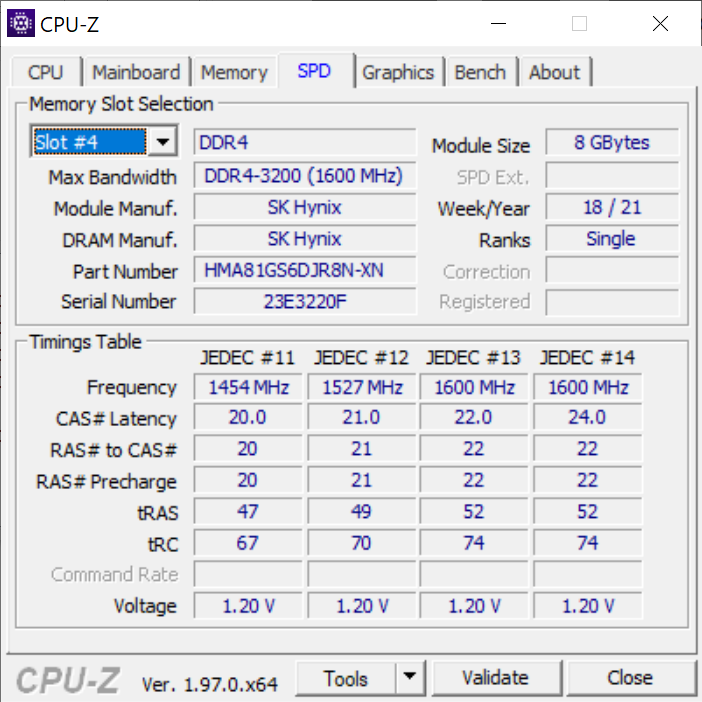
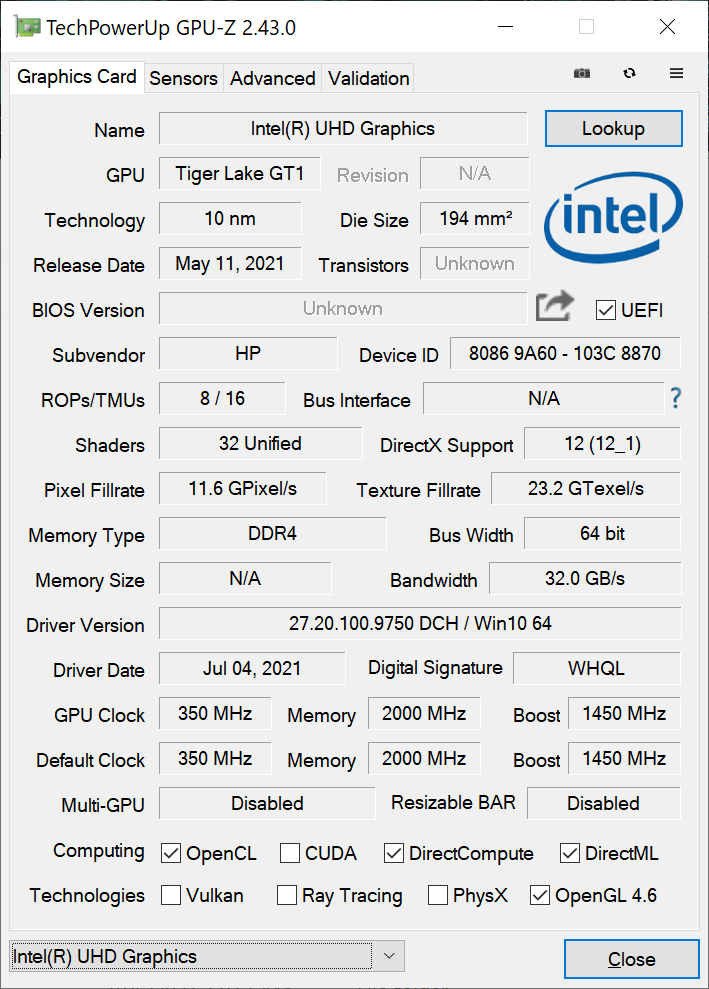
Prestazioni - Intel 11a generazione
Le opzioni della CPU comprendono Tiger Lake-H CPU e entrambe le GPU Nvidia T1200 e RTX serie A fino alla RTX A5000. Sono disponibili anche opzioni Xeon e persino Radeon Pro W6600M per una gamma molto ampia di opzioni configurabili. Le opzioni di fascia alta in particolare sono alcuni dei più veloci processori mobili di classe workstation che si possono trovare su qualsiasi portatile
Resizable Bar e Dynamic Boost 2.0 sono supportati mentre Advanced Optimus e WhisperMode 2.0 non lo sono. Sfortunatamente non c'è nemmeno un interruttore grafico manuale.
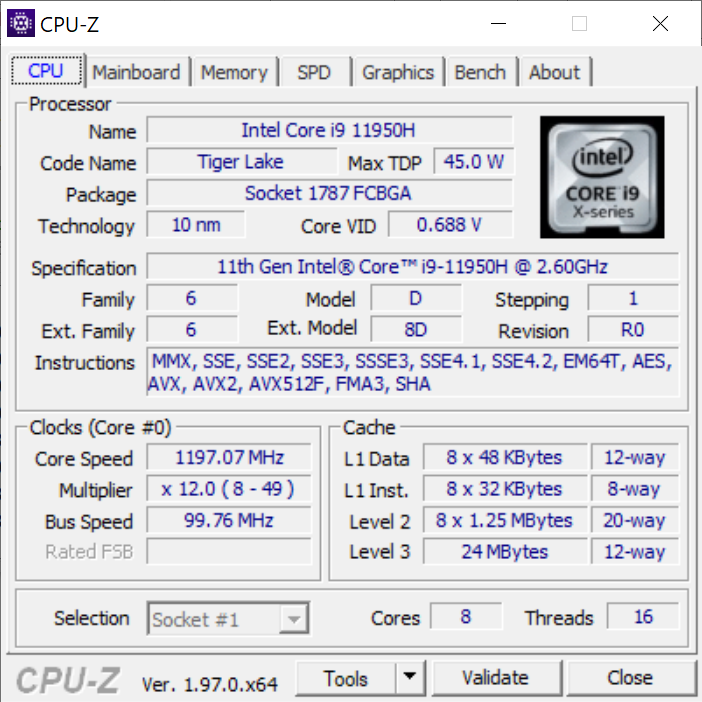
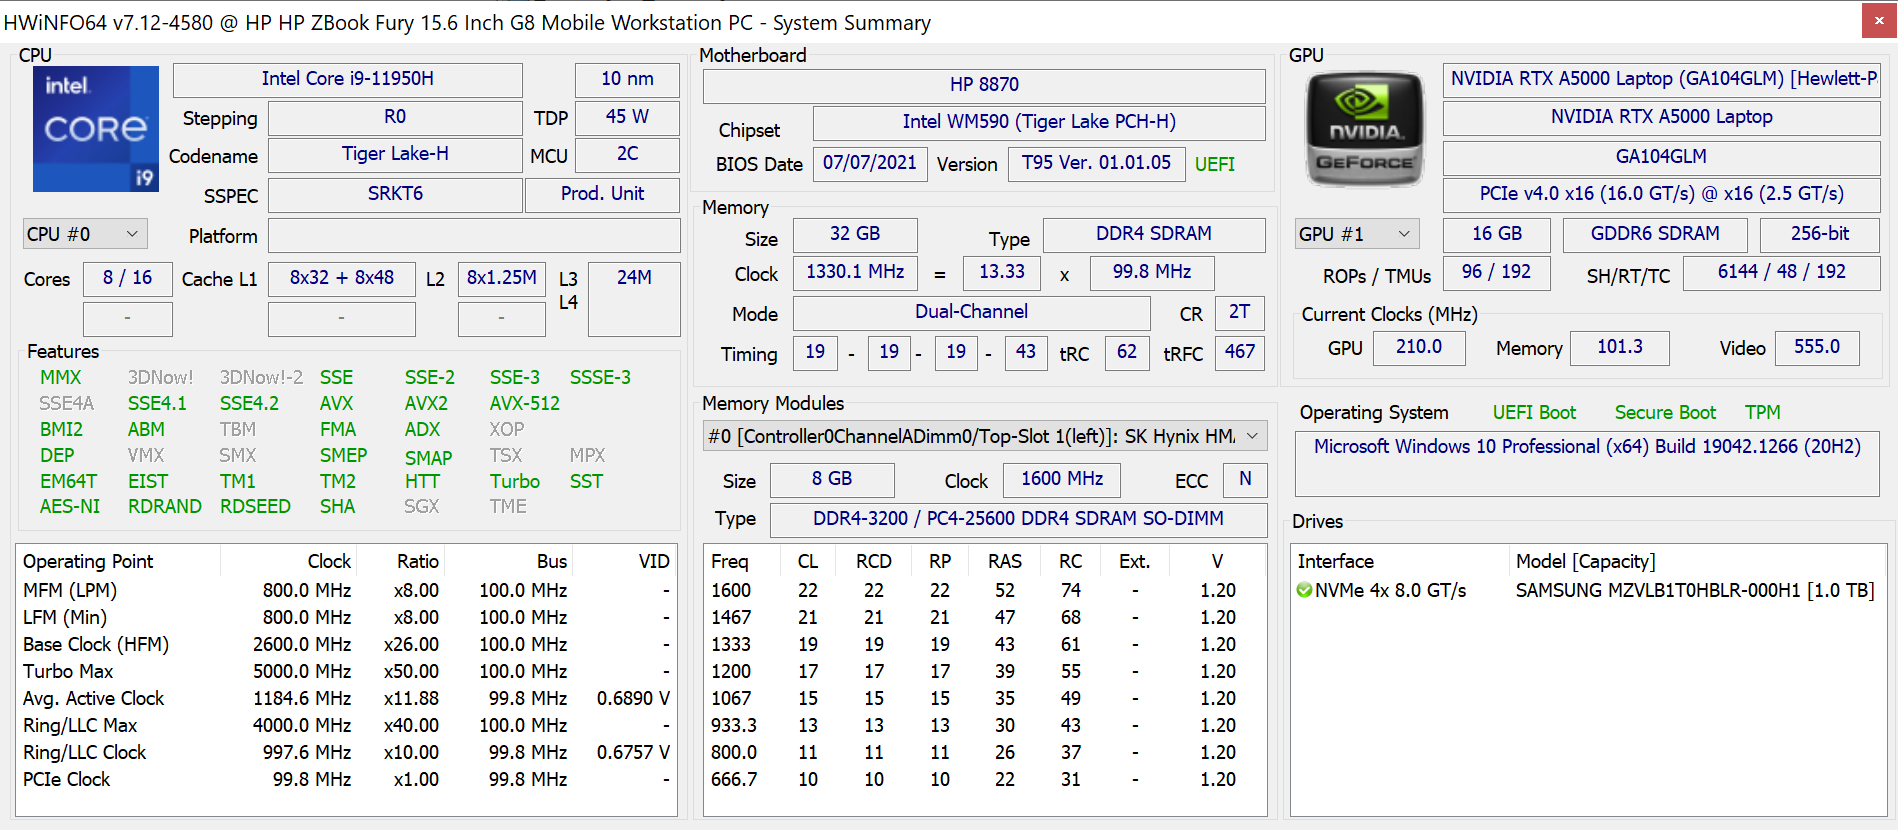
Processore
Le prestazioni della CPU multi-thread sono di pochi punti percentuali inferiori al Core i9-11900H che si trova nel concorrente MSI WS66 che è da aspettarsi dall'integrazione delle caratteristiche vPro Core i9-11950H le prestazioni single-thread, tuttavia, rimangono eccellenti e alla pari con la sua controparte non-vPro. Le prestazioni complessive multi-thread sono circa il 15 per cento più alte dello Xeon W-10885M nello ZBook Fury 15 G7 dell'anno scorso, ma senza alcun supporto per la RAM ECC, ovviamente.
Cinebench R15 Multi Loop
Cinebench R23: Multi Core | Single Core
Cinebench R15: CPU Multi 64Bit | CPU Single 64Bit
Blender: v2.79 BMW27 CPU
7-Zip 18.03: 7z b 4 -mmt1 | 7z b 4
Geekbench 5.5: Single-Core | Multi-Core
HWBOT x265 Benchmark v2.2: 4k Preset
LibreOffice : 20 Documents To PDF
R Benchmark 2.5: Overall mean
| Cinebench R23 / Multi Core | |
| Lenovo Legion 5 15ACH-82JU00C6GE-FL | |
| MSI GS76 Stealth 11UH | |
| Media Intel Core i9-11950H (12048 - 13113, n=4) | |
| HP ZBook Fury 15 G8 | |
| Lenovo ThinkPad P15 G2-20YQ001JGE | |
| Dell Precision 5000 5560 | |
| Gigabyte Aero 15 OLED XC | |
| HP ZBook Fury 15 G7 | |
| Cinebench R23 / Single Core | |
| HP ZBook Fury 15 G8 | |
| Media Intel Core i9-11950H (1569 - 1633, n=4) | |
| MSI GS76 Stealth 11UH | |
| Dell Precision 5000 5560 | |
| Lenovo ThinkPad P15 G2-20YQ001JGE | |
| Lenovo Legion 5 15ACH-82JU00C6GE-FL | |
| HP ZBook Fury 15 G7 | |
| Gigabyte Aero 15 OLED XC | |
| Geekbench 5.5 / Single-Core | |
| Media Intel Core i9-11950H (1623 - 1702, n=3) | |
| MSI GS76 Stealth 11UH | |
| Lenovo ThinkPad P15 G2-20YQ001JGE | |
| Lenovo Legion 5 15ACH-82JU00C6GE-FL | |
| Acer Nitro 5 AN515-45-R05E | |
| HP ZBook Fury 15 G7 | |
| Dell Precision 5550 P91F | |
| Gigabyte Aero 15 OLED XC | |
| Geekbench 5.5 / Multi-Core | |
| MSI GS76 Stealth 11UH | |
| Lenovo ThinkPad P15 G2-20YQ001JGE | |
| Dell Precision 5550 P91F | |
| Media Intel Core i9-11950H (7286 - 8152, n=3) | |
| Gigabyte Aero 15 OLED XC | |
| Lenovo Legion 5 15ACH-82JU00C6GE-FL | |
| HP ZBook Fury 15 G7 | |
| Acer Nitro 5 AN515-45-R05E | |
| HWBOT x265 Benchmark v2.2 / 4k Preset | |
| Lenovo Legion 5 15ACH-82JU00C6GE-FL | |
| MSI GS76 Stealth 11UH | |
| HP ZBook Fury 15 G8 | |
| Media Intel Core i9-11950H (13.8 - 14.5, n=4) | |
| Lenovo ThinkPad P15 G2-20YQ001JGE | |
| Dell Precision 5000 5560 | |
| Gigabyte Aero 15 OLED XC | |
| Acer Nitro 5 AN515-45-R05E | |
| Dell Precision 5550 P91F | |
| HP ZBook Fury 15 G7 | |
| LibreOffice / 20 Documents To PDF | |
| Lenovo Legion 5 15ACH-82JU00C6GE-FL | |
| Gigabyte Aero 15 OLED XC | |
| HP ZBook Fury 15 G7 | |
| Acer Nitro 5 AN515-45-R05E | |
| HP ZBook Fury 15 G8 | |
| MSI GS76 Stealth 11UH | |
| Lenovo ThinkPad P15 G2-20YQ001JGE | |
| Media Intel Core i9-11950H (38.6 - 53.2, n=4) | |
| Dell Precision 5000 5560 | |
| Dell Precision 5550 P91F | |
* ... Meglio usare valori piccoli
Prestazioni del sistema
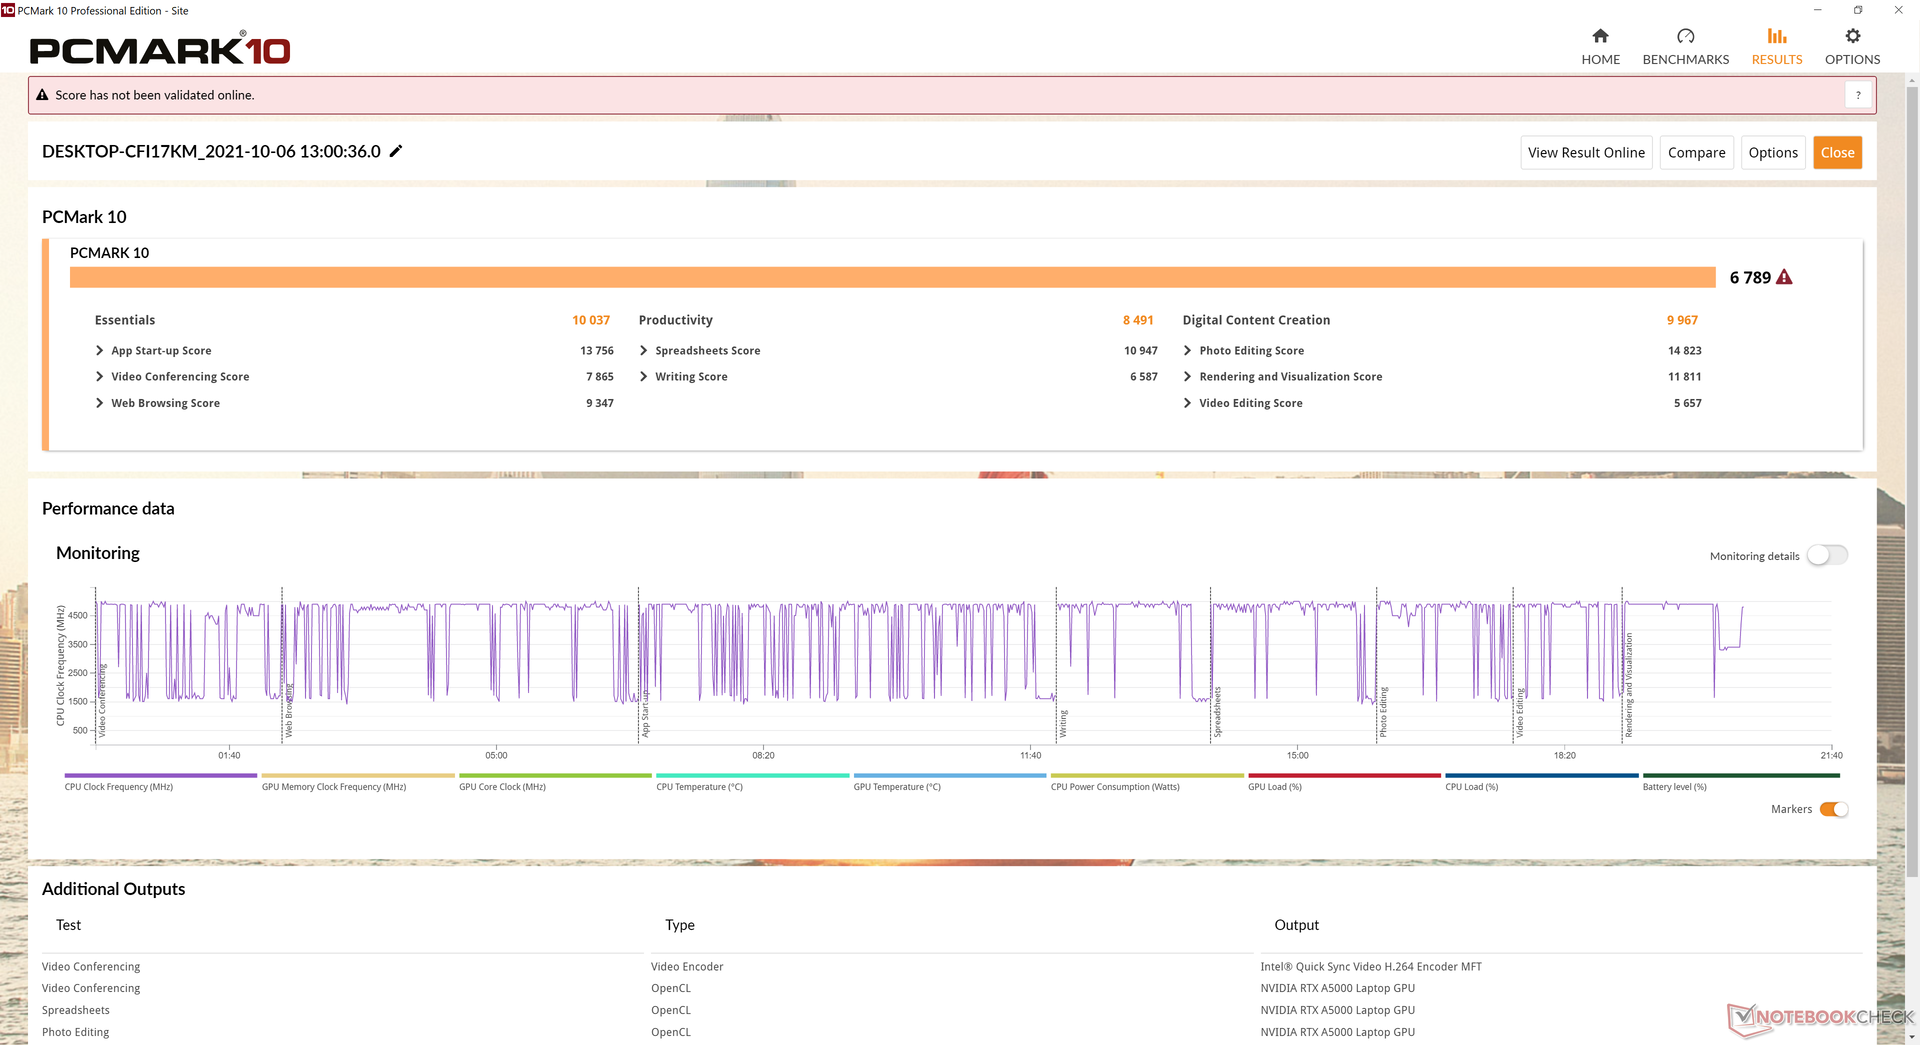
I punteggi PCMark sono costantemente superiori a quelli che abbiamo registrato sulla Fury 15 G7 mentre sono quasi identici a quelli che abbiamo registrato sul più spesso Studio 15 G8 con grafica RTX 3070.
| PCMark 10 / Score | |
| HP ZBook Fury 15 G8 | |
| Media Intel Core i9-11950H, NVIDIA RTX A5000 Laptop GPU (n=1) | |
| HP ZBook Studio 15 G8 | |
| Dell Precision 5000 5560 | |
| HP ZBook Fury 15 G7 | |
| Lenovo ThinkPad P15s Gen2-20W6000GGE | |
| HP ZBook Firefly 15 G7 | |
| PCMark 10 / Essentials | |
| Dell Precision 5000 5560 | |
| HP ZBook Fury 15 G8 | |
| Media Intel Core i9-11950H, NVIDIA RTX A5000 Laptop GPU (n=1) | |
| HP ZBook Studio 15 G8 | |
| Lenovo ThinkPad P15s Gen2-20W6000GGE | |
| HP ZBook Fury 15 G7 | |
| HP ZBook Firefly 15 G7 | |
| PCMark 10 / Productivity | |
| Lenovo ThinkPad P15s Gen2-20W6000GGE | |
| Dell Precision 5000 5560 | |
| HP ZBook Fury 15 G8 | |
| Media Intel Core i9-11950H, NVIDIA RTX A5000 Laptop GPU (n=1) | |
| HP ZBook Studio 15 G8 | |
| HP ZBook Fury 15 G7 | |
| HP ZBook Firefly 15 G7 | |
| PCMark 10 / Digital Content Creation | |
| HP ZBook Fury 15 G8 | |
| Media Intel Core i9-11950H, NVIDIA RTX A5000 Laptop GPU (n=1) | |
| HP ZBook Studio 15 G8 | |
| Dell Precision 5000 5560 | |
| HP ZBook Fury 15 G7 | |
| Lenovo ThinkPad P15s Gen2-20W6000GGE | |
| HP ZBook Firefly 15 G7 | |
| PCMark 10 Score | 6789 punti | |
Aiuto | ||
Latenza DPC
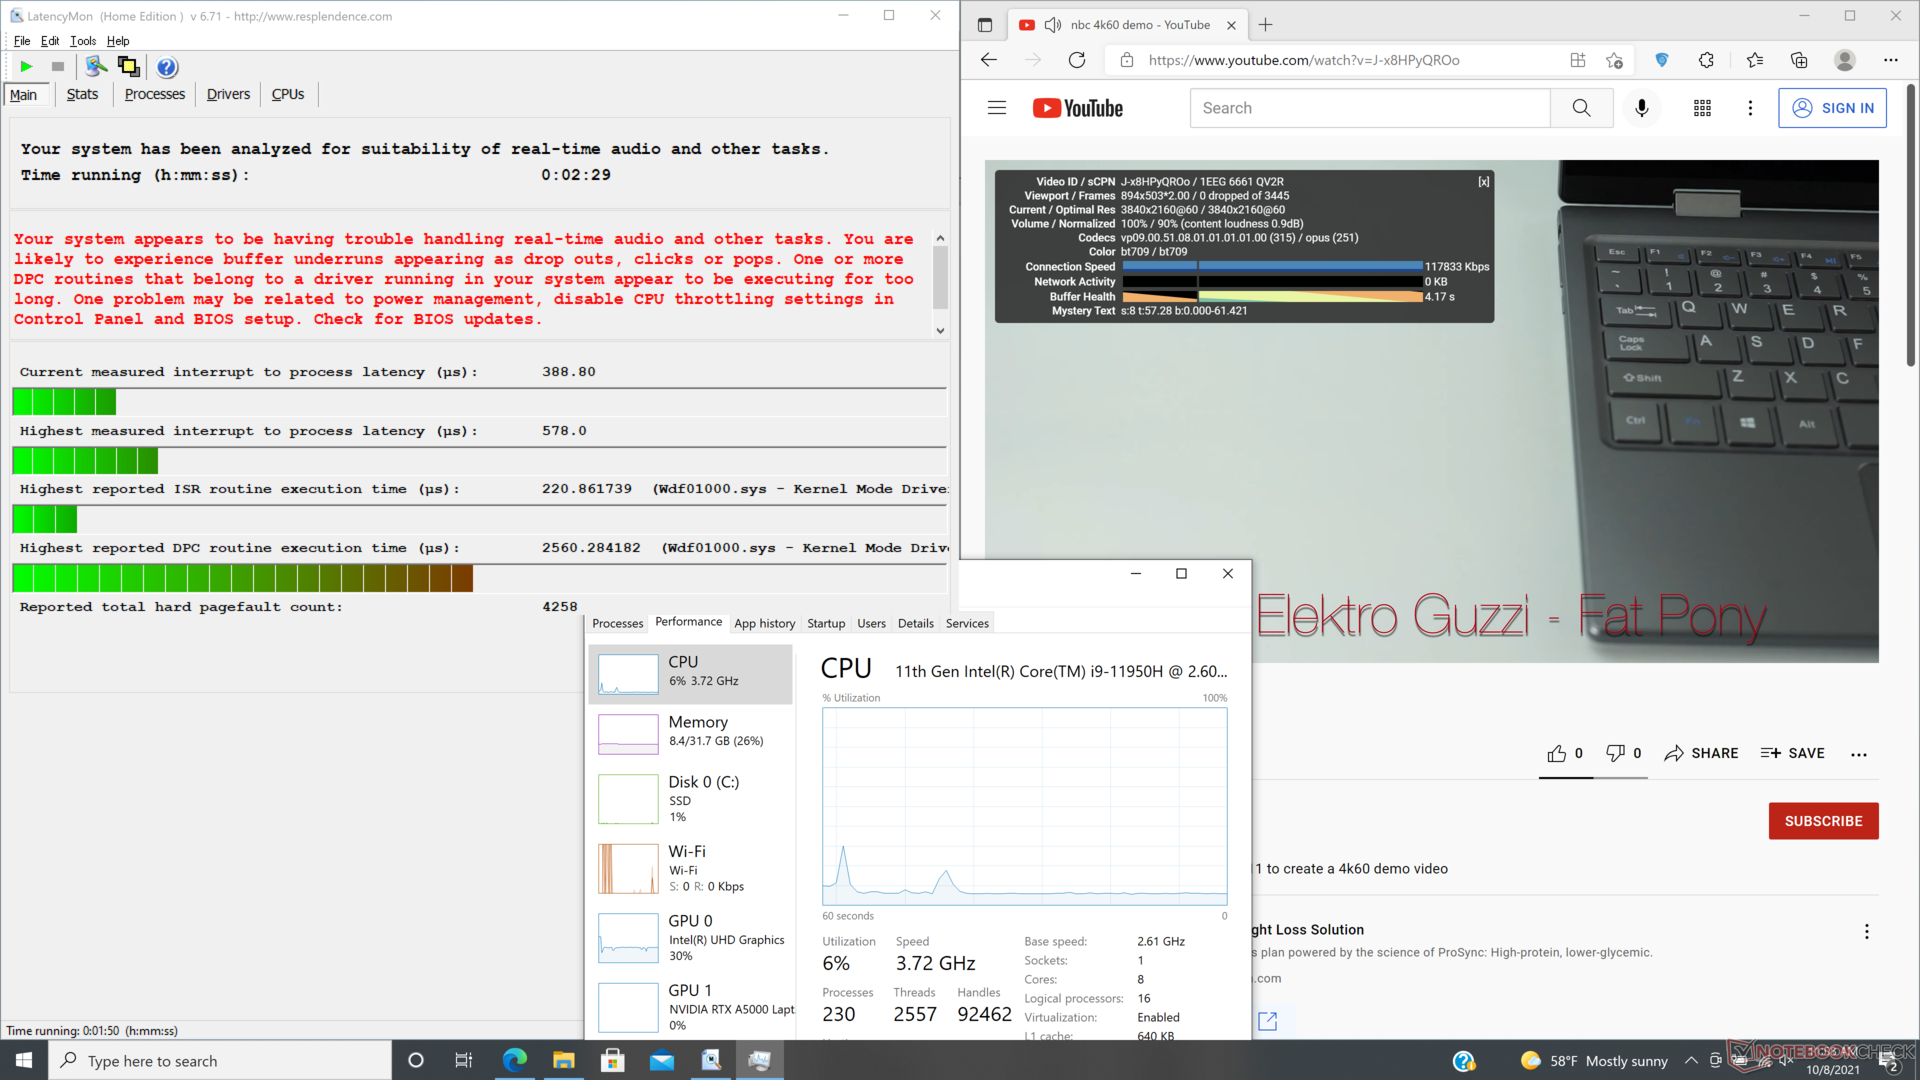
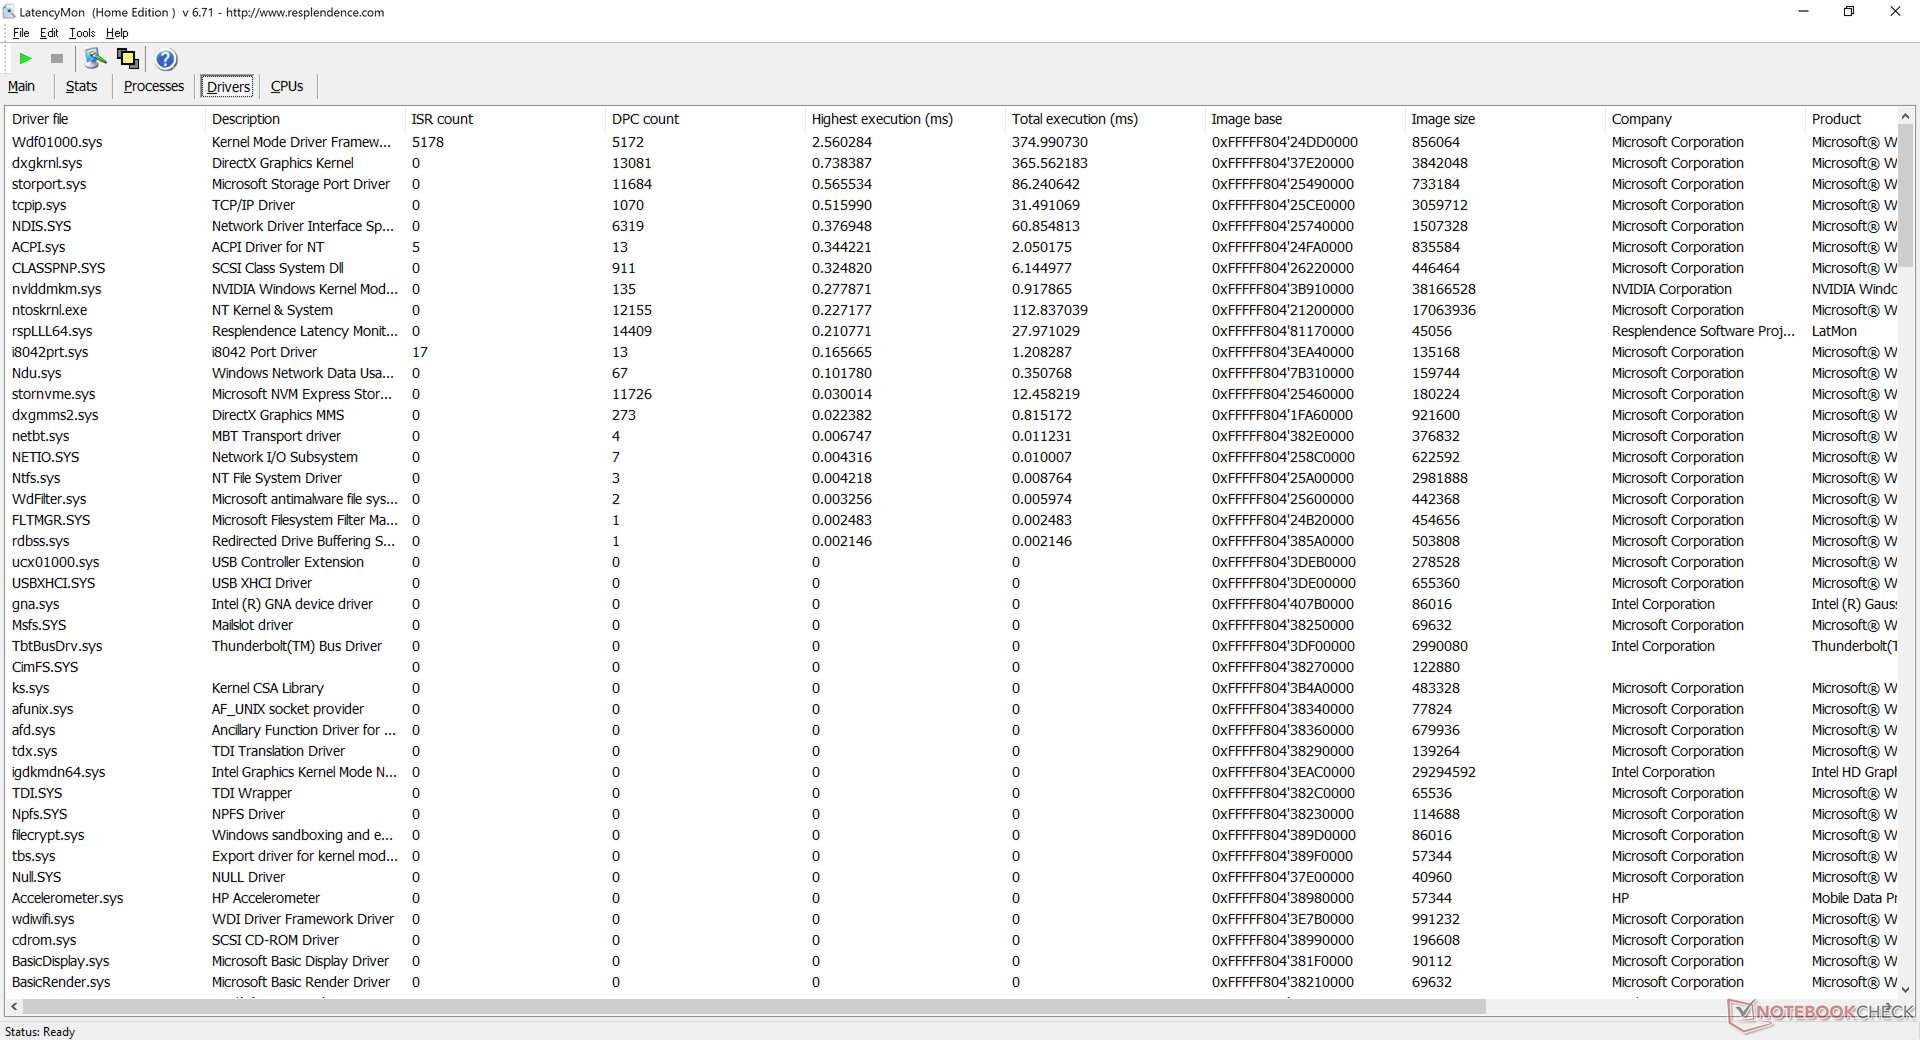
LatencyMon non rivela grandi interruzioni di latenza quando si aprono più schede del browser sulla nostra homepage o quando si esegue lo stress Prime95. I tempi di routine DPC, tuttavia, hanno un picco molto simile a quello che abbiamo osservato sulla Fury 15 G7 dell'anno scorso. La riproduzione di video 4K a 60 FPS è altrimenti liscia e senza cadute di frame.
| DPC Latencies / LatencyMon - interrupt to process latency (max), Web, Youtube, Prime95 | |
| Lenovo ThinkPad P15s Gen2-20W6000GGE | |
| HP ZBook Firefly 15 G7 | |
| HP ZBook Fury 15 G7 | |
| HP ZBook Studio 15 G8 | |
| Dell Precision 5000 5560 | |
| HP ZBook Fury 15 G8 | |
* ... Meglio usare valori piccoli
Dispositivi di archiviazione - Molte opzioni
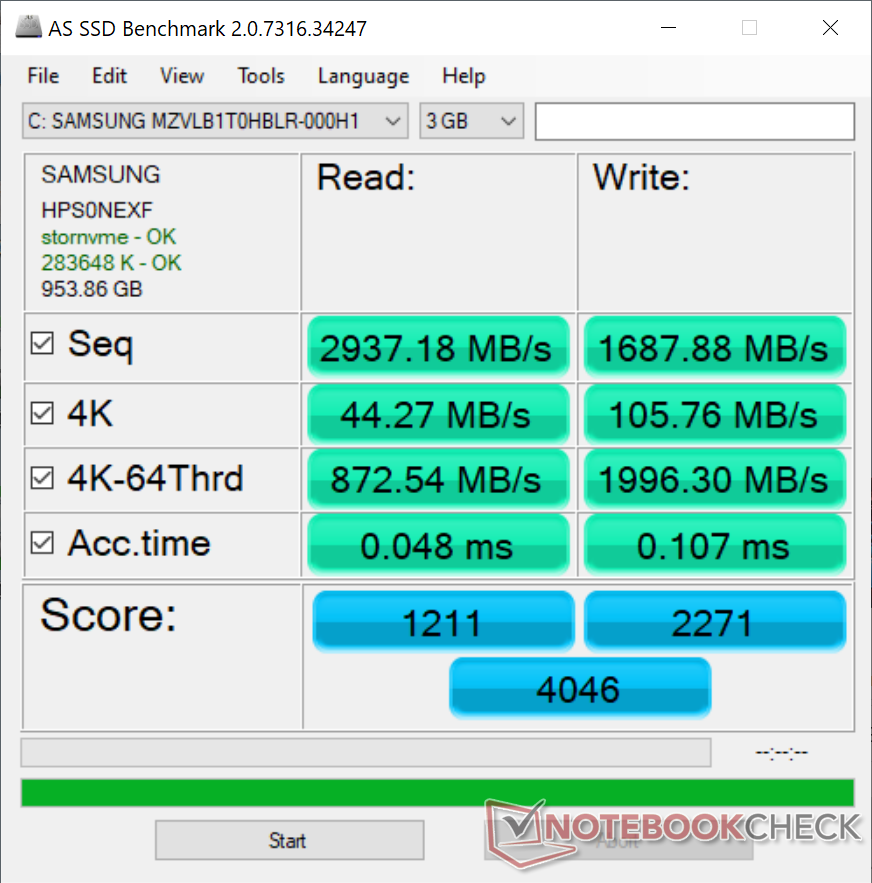
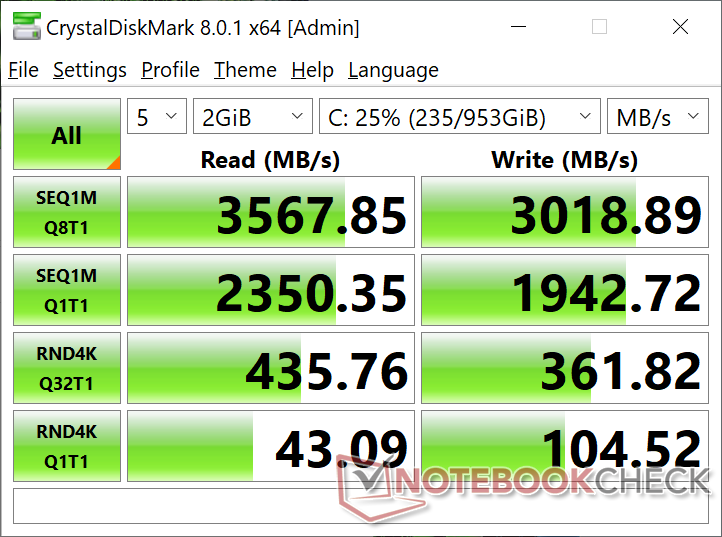
La nostra unità può supportare fino a quattro unità di archiviazione interna (2x M.2 2280, 1x M.2 2242, 1x 2.5 pollici SATA III). È interessante notare che HP non sta offrendo alcuna opzione PCIe4, poiché tutte le attuali SKU sono dotate di SSD PCIe3, come il familiare Samsung PM981a. Abbiamo contattato HP per cercare di confermare se le velocità PCIe4 NVMe sono supportate e aggiorneremo questa pagina di conseguenza.
| HP ZBook Fury 15 G8 Samsung PM981a MZVLB1T0HBLR | HP ZBook Fury 15 G7 Samsung PM981a MZVLB1T0HBLR | Dell Precision 5000 5560 Samsung PM9A1 MZVL22T0HBLB | HP ZBook Studio 15 G8 Samsung PM981a MZVLB2T0HALB | Lenovo ThinkPad P15s Gen2-20W6000GGE WDC PC SN720 SDAQNTW-1T00 | HP ZBook Firefly 15 G7 Toshiba XG6 KXG60ZNV1T02 | |
|---|---|---|---|---|---|---|
| AS SSD | 24% | 93% | 104% | 19% | -1% | |
| Seq Read (MB/s) | 2937 | 2127 -28% | 5169 76% | 2953 1% | 2796 -5% | 2666 -9% |
| Seq Write (MB/s) | 1688 | 1296 -23% | 1986 18% | 1691 0% | 2525 50% | 1257 -26% |
| 4K Read (MB/s) | 44.27 | 54.8 24% | 78 76% | 43.98 -1% | 50.9 15% | 48.04 9% |
| 4K Write (MB/s) | 105.8 | 110.8 5% | 214.6 103% | 105.4 0% | 211.9 100% | 137.5 30% |
| 4K-64 Read (MB/s) | 873 | 1420 63% | 1232 41% | 1065 22% | 1505 72% | 977 12% |
| 4K-64 Write (MB/s) | 1996 | 2012 1% | 2719 36% | 1957 -2% | 949 -52% | 1142 -43% |
| Access Time Read * (ms) | 0.048 | 0.046 4% | 0.024 50% | 0.04 17% | 0.081 -69% | 0.053 -10% |
| Access Time Write * (ms) | 0.107 | 0.099 7% | 0.059 45% | 0.105 2% | 0.019 82% | 0.03 72% |
| Score Read (Points) | 1211 | 1687 39% | 1827 51% | 1404 16% | 1835 52% | 1292 7% |
| Score Write (Points) | 2271 | 2253 -1% | 3133 38% | 2232 -2% | 1413 -38% | 1406 -38% |
| Score Total (Points) | 4046 | 4770 18% | 5753 42% | 4297 6% | 4177 3% | 3297 -19% |
| Copy ISO MB/s (MB/s) | 901 | 2779 208% | 3201 255% | 2474 175% | ||
| Copy Program MB/s (MB/s) | 118.7 | 123.3 4% | 415.8 250% | 1074 805% | ||
| Copy Game MB/s (MB/s) | 372 | 440.8 18% | 1212 226% | 1929 419% | ||
| CrystalDiskMark 5.2 / 6 | 10% | 54% | 7% | 31% | 7% | |
| Write 4K (MB/s) | 96.3 | 114.1 18% | 172.4 79% | 110.5 15% | 237.6 147% | 133.1 38% |
| Read 4K (MB/s) | 51.5 | 57.2 11% | 78.8 53% | 51.8 1% | 54.7 6% | 51.6 0% |
| Write Seq (MB/s) | 1942 | 2580 33% | 2991 54% | 2071 7% | 2603 34% | 1986 2% |
| Read Seq (MB/s) | 2504 | 2527 1% | 3351 34% | 2505 0% | 1889 -25% | 2208 -12% |
| Write 4K Q32T1 (MB/s) | 346.6 | 480.2 39% | 459.2 32% | 429.8 24% | 505 46% | 462.3 33% |
| Read 4K Q32T1 (MB/s) | 408 | 387.6 -5% | 484.3 19% | 418.3 3% | 606 49% | 400.2 -2% |
| Write Seq Q32T1 (MB/s) | 3019 | 2996 -1% | 4761 58% | 3060 1% | 2795 -7% | 3074 2% |
| Read Seq Q32T1 (MB/s) | 3514 | 2853 -19% | 7071 101% | 3539 1% | 3448 -2% | 3268 -7% |
| Media totale (Programma / Settaggio) | 17% /
19% | 74% /
79% | 56% /
69% | 25% /
24% | 3% /
2% |
* ... Meglio usare valori piccoli

Disk Throttling: DiskSpd Read Loop, Queue Depth 8
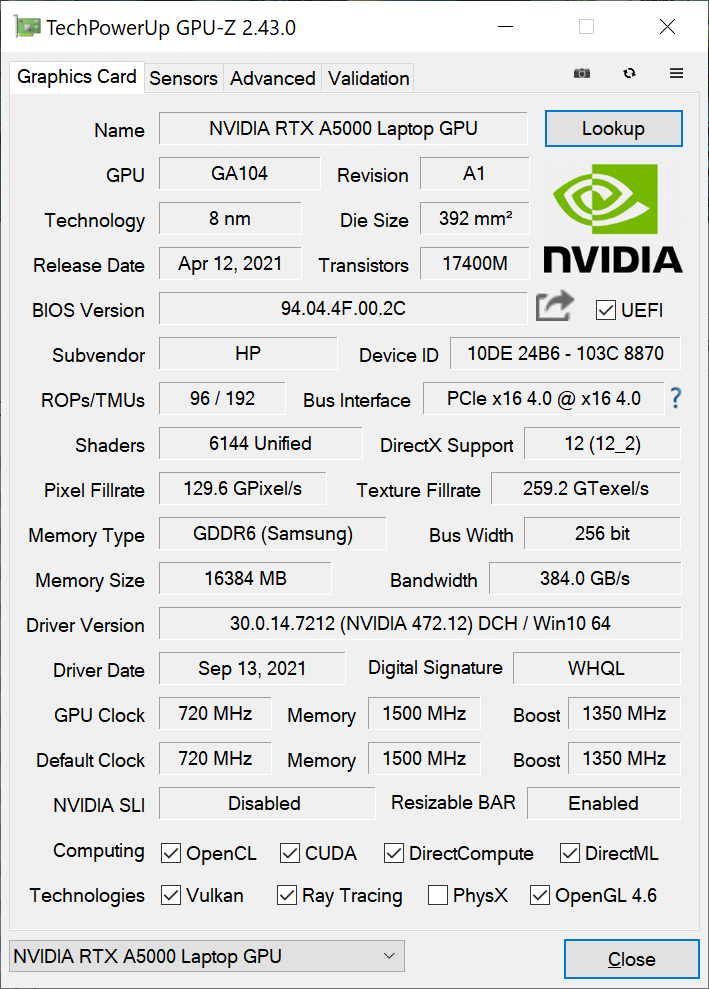
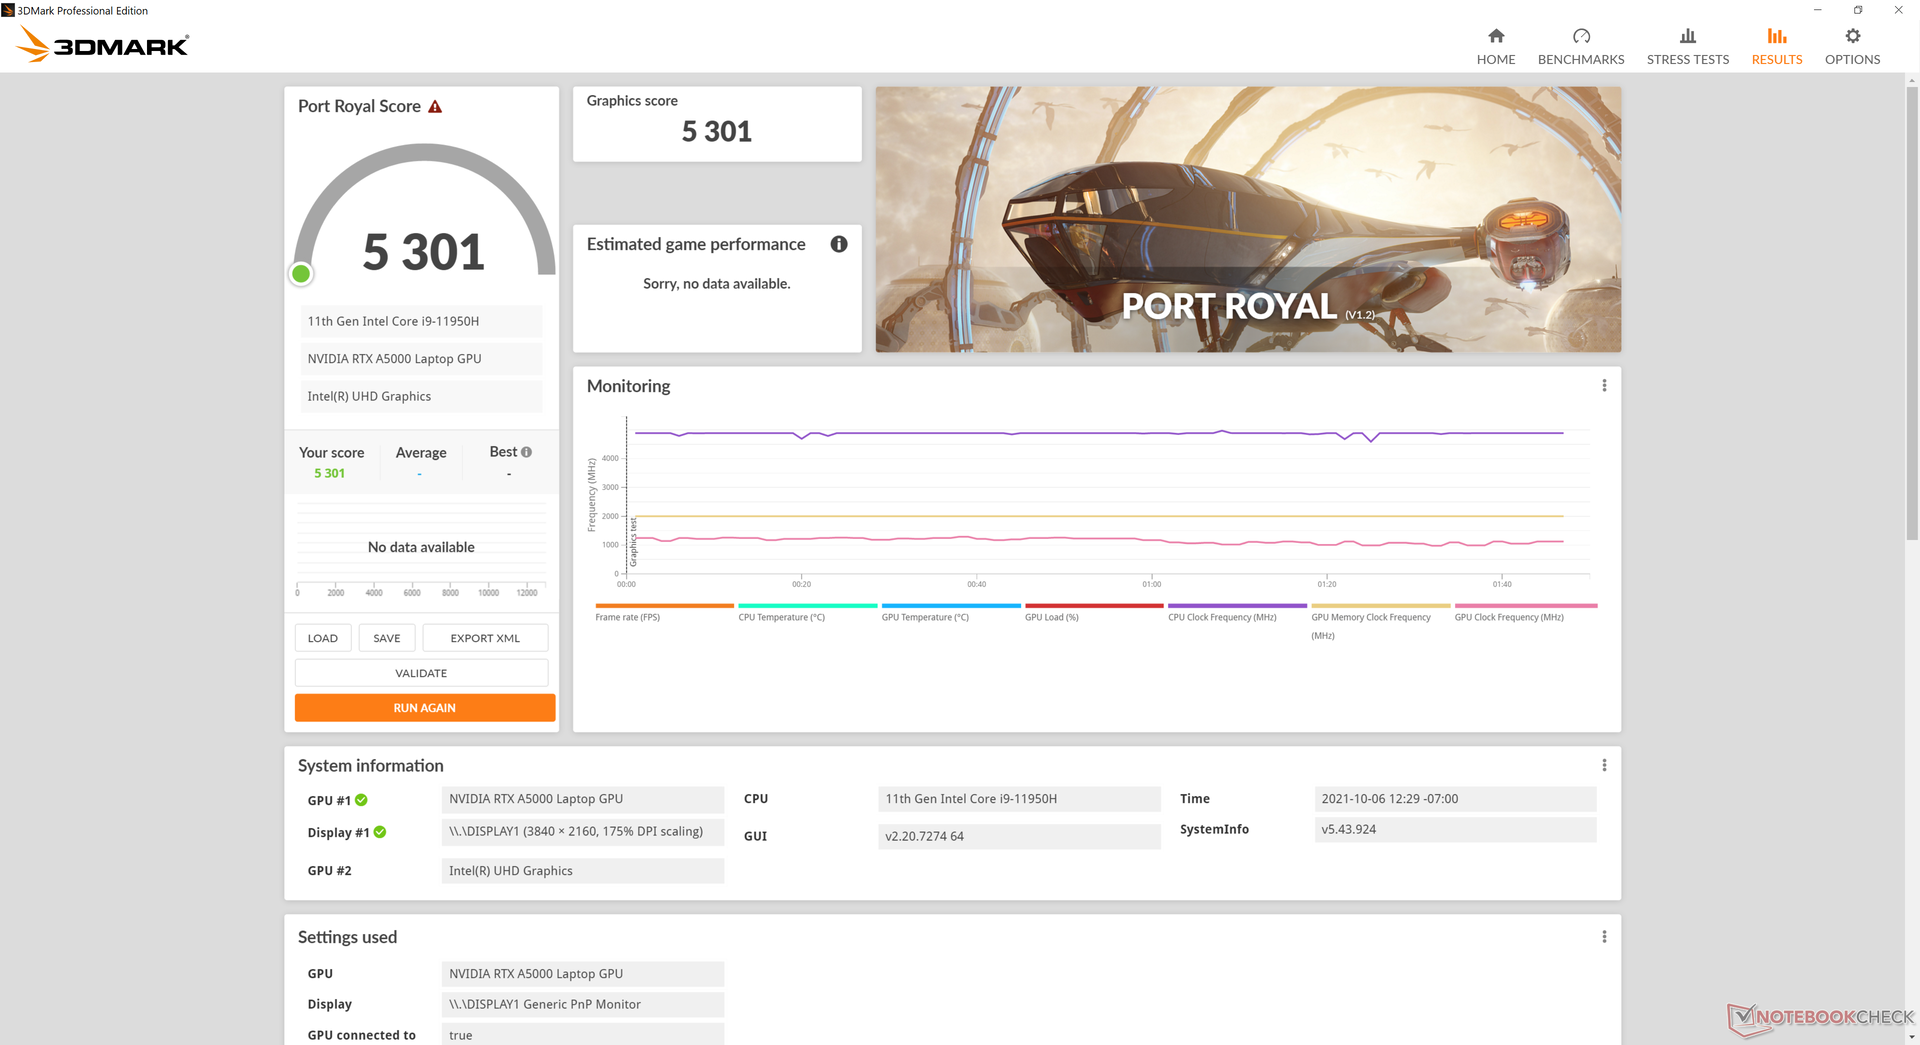
Prestazioni della GPU - Quadro RTX A5000 Powerhouse
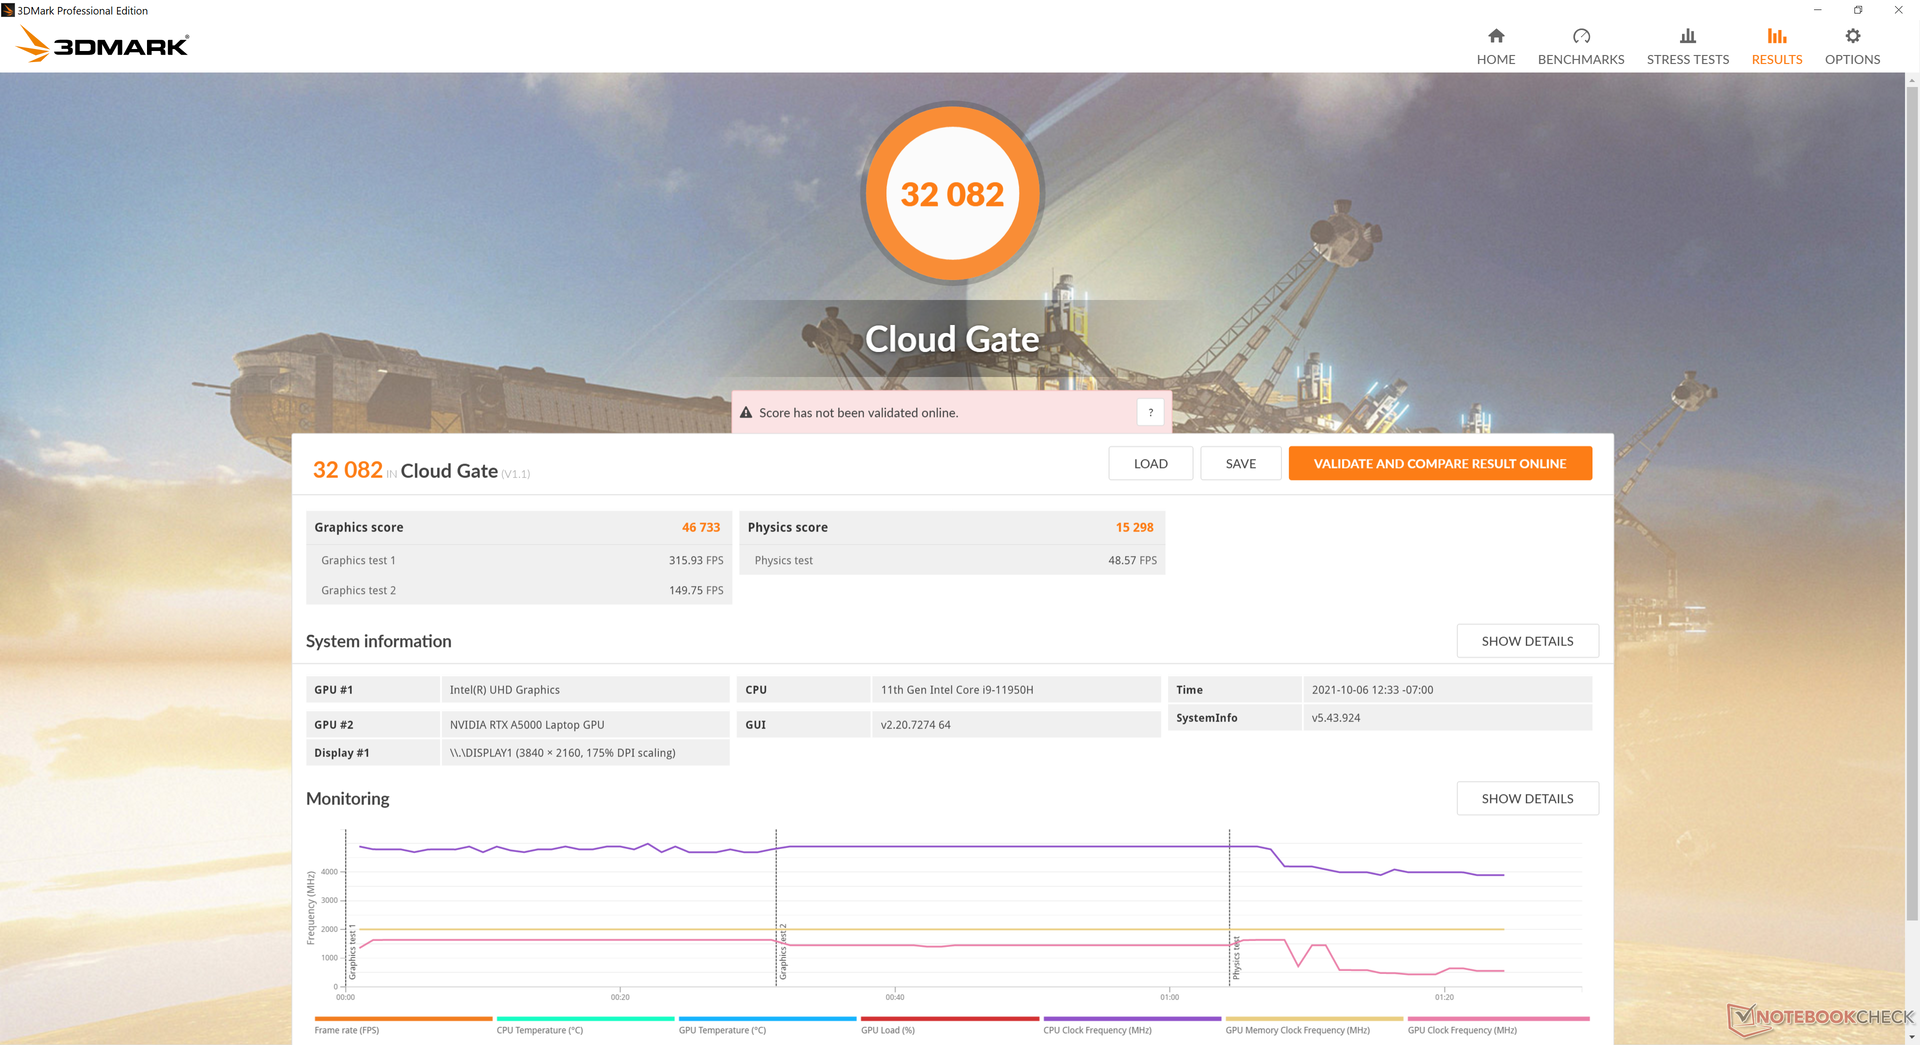
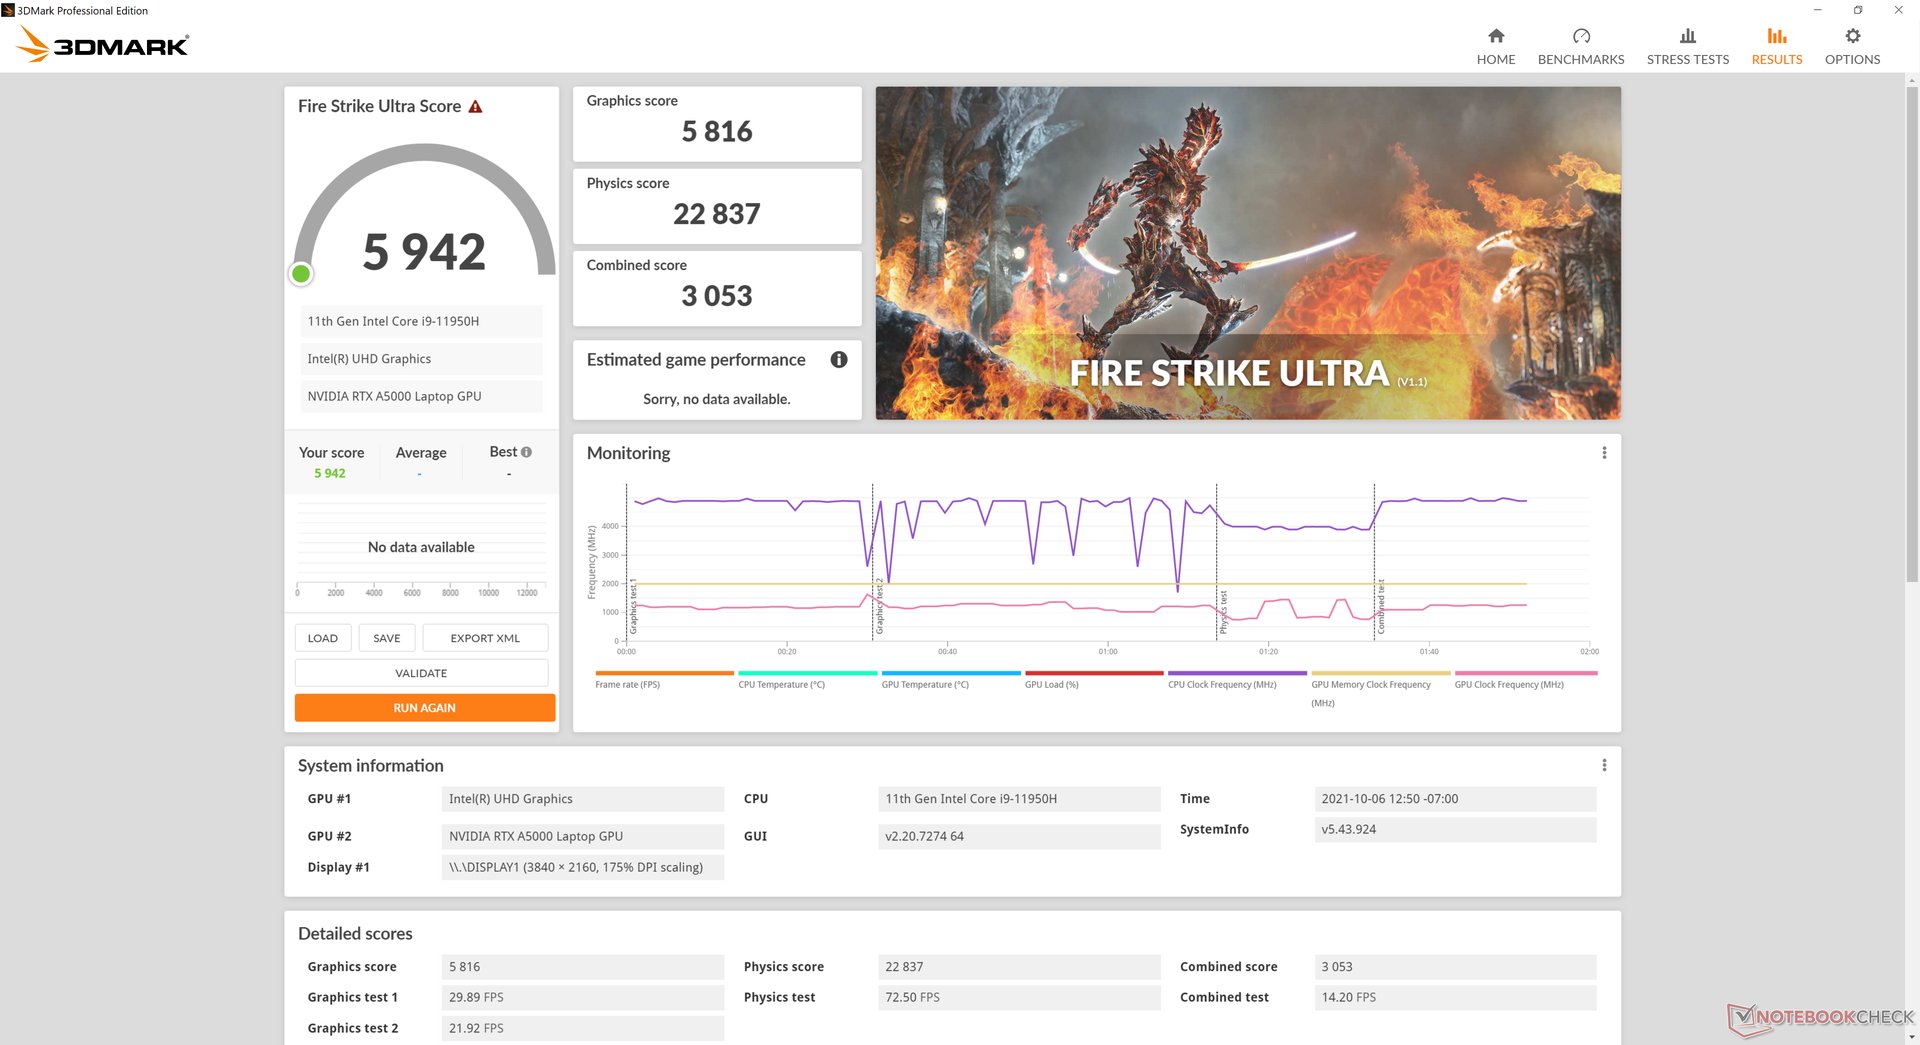
Le prestazioni grafiche grezze si trovano tra la mobile GeForce RTX 3060 e rTX 3070 mobile per essere dal 10 al 20 percento più veloce della Quadro RTX 5000 Max-Q nella vecchia Fury 15 G7. Alcuni sub-benchmark all'interno di SpecViewPerf possono anche vedere un miglioramento del 40-50 per cento
Anche se non è ottimizzato per il gioco, il sistema può sicuramente alimentare anche i titoli più esigenti alla risoluzione QHD. Le prestazioni di gioco complessive sono simili al mobile GeForce RTX 3060 nella maggior parte dei casi.
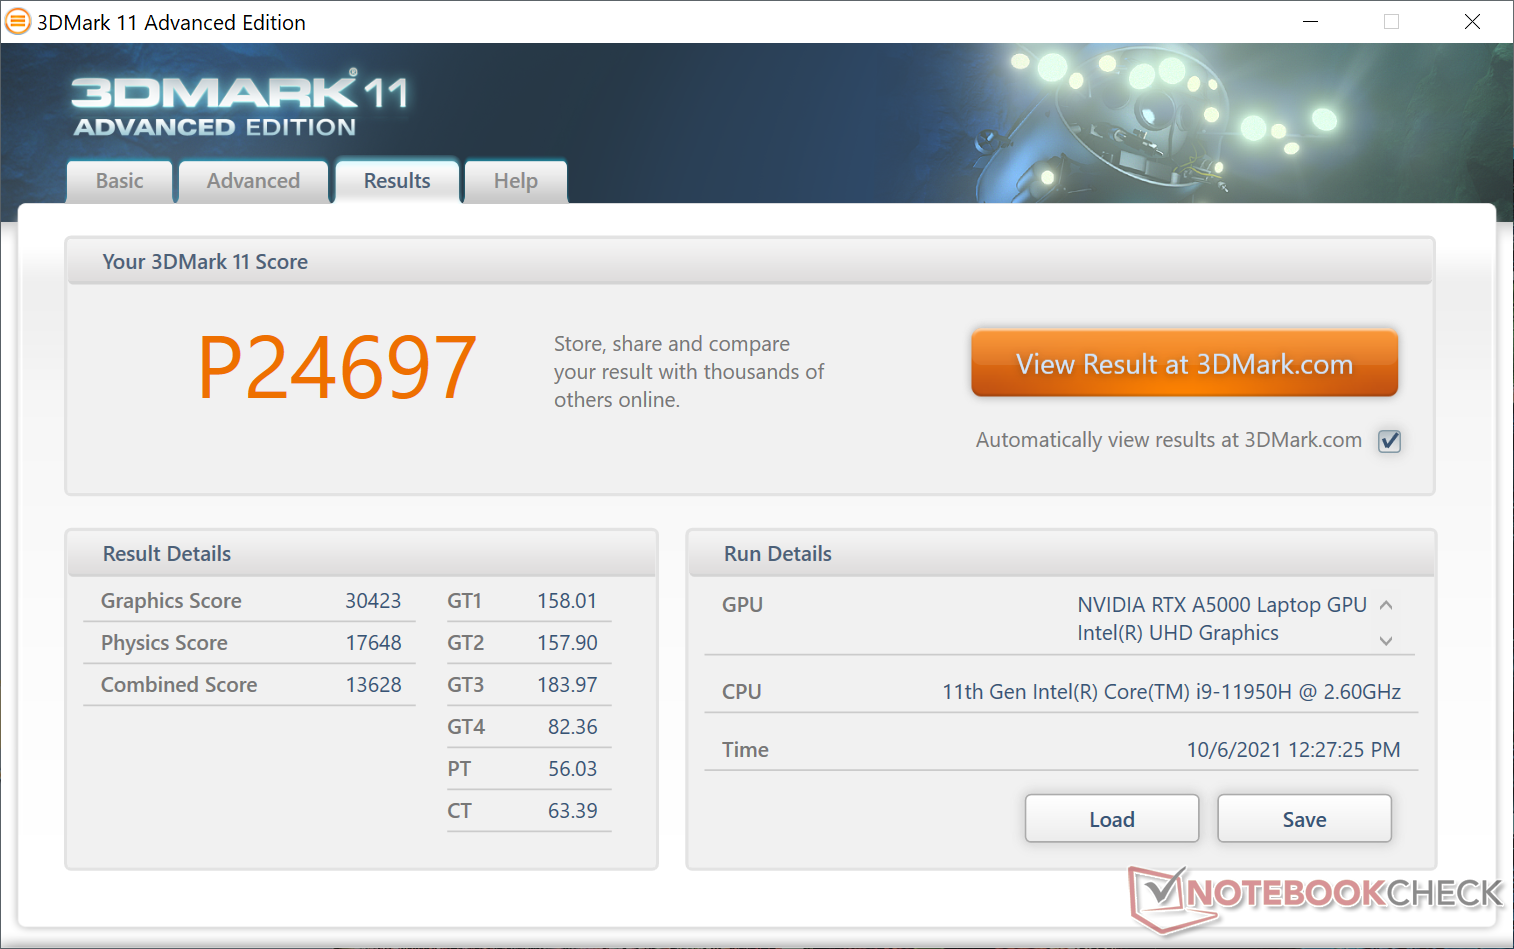
| 3DMark 11 Performance | 24697 punti | |
| 3DMark Cloud Gate Standard Score | 32082 punti | |
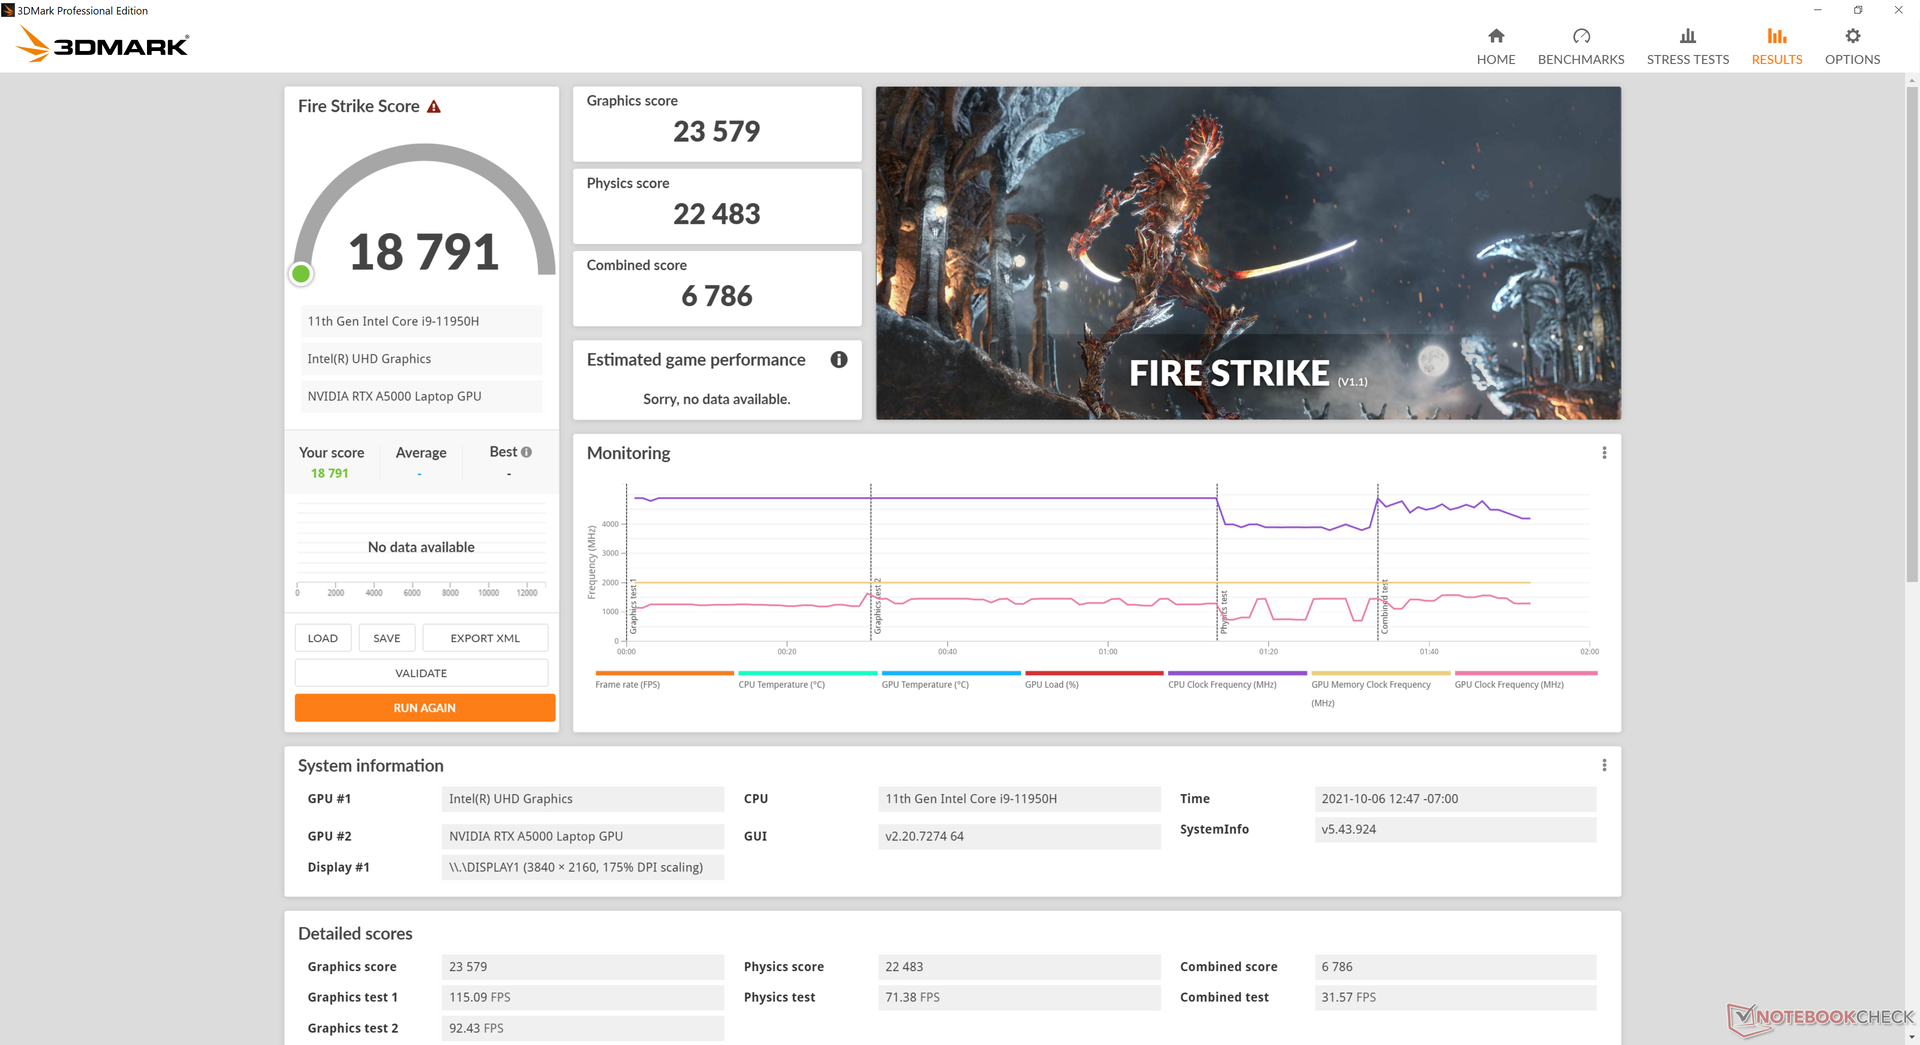
| 3DMark Fire Strike Score | 18791 punti | |
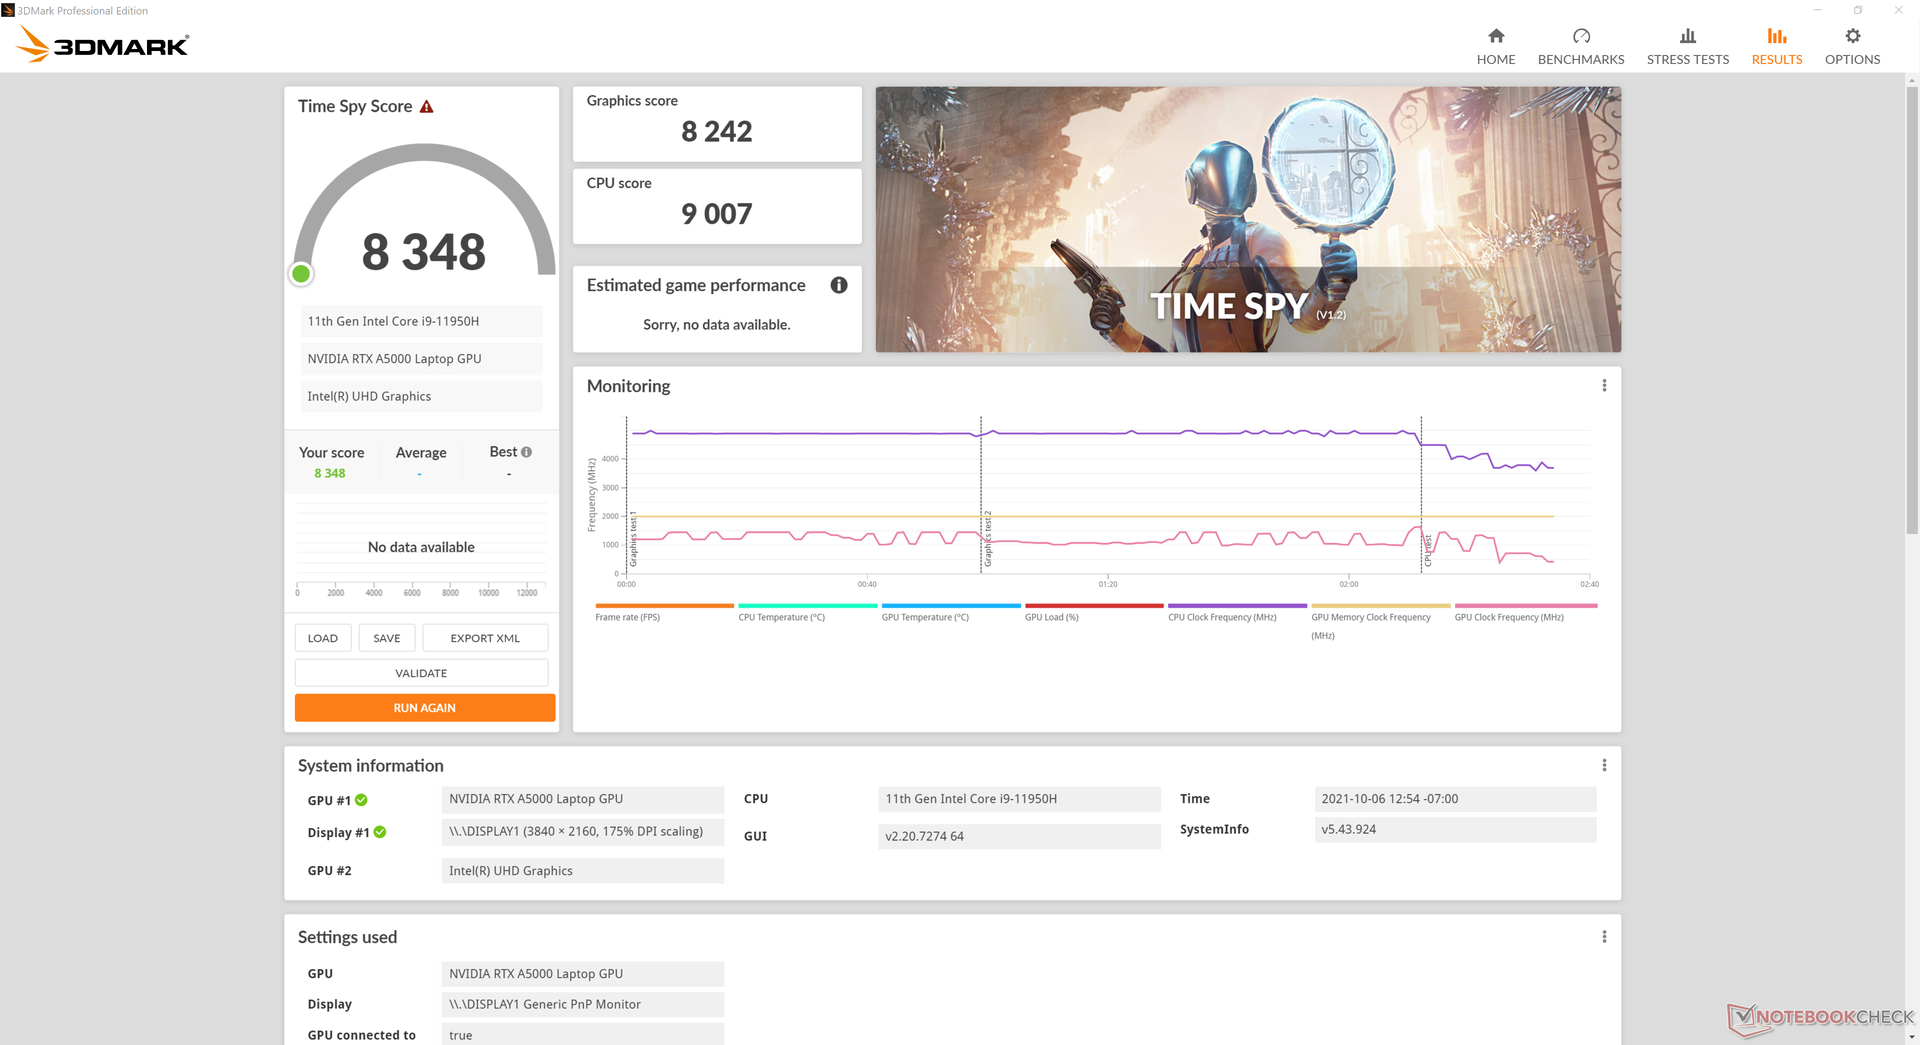
| 3DMark Time Spy Score | 8348 punti | |
Aiuto | ||
Witcher 3 FPS Chart
| basso | medio | alto | ultra | QHD | 4K | |
|---|---|---|---|---|---|---|
| GTA V (2015) | 175 | 169 | 131 | 76.1 | 70.4 | 75.5 |
| The Witcher 3 (2015) | 335.1 | 227.4 | 149.5 | 81.7 | 57.5 | |
| Dota 2 Reborn (2015) | 164 | 148 | 140 | 131 | 95 | |
| Final Fantasy XV Benchmark (2018) | 155 | 110 | 81.1 | 62.6 | 35.4 | |
| X-Plane 11.11 (2018) | 108 | 90.8 | 76.5 | 48.6 | ||
| Far Cry 5 (2018) | 137 | 93 | 90 | 85 | 79 | 44 |
| Strange Brigade (2018) | 337 | 195 | 165 | 147 | 108 | 64 |
| Shadow of the Tomb Raider (2018) | 128 | 109 | 106 | 94 | 71 | 38 |
| Far Cry New Dawn (2019) | 105 | 85 | 78 | 71 | 62 | 43 |
| Metro Exodus (2019) | 154 | 94.8 | 74.5 | 59.8 | 46.3 | 28.5 |
| Borderlands 3 (2019) | 159.6 | 121.6 | 85.9 | 67.1 | 46.8 | 25.6 |
| Gears Tactics (2020) | 145.8 | 181.2 | 120.3 | 94.7 | 66.6 | 34.9 |
| Horizon Zero Dawn (2020) | 133 | 109 | 101 | 91 | 73 | 40 |
| Watch Dogs Legion (2020) | 69 | 64 | 60 | 45 | 43 | 26 |
| Dirt 5 (2020) | 178.1 | 115.2 | 91.7 | 74.8 | 59.5 | 39 |
| Assassin´s Creed Valhalla (2020) | 113 | 76 | 64 | 55 | 44 | 29 |
| Immortals Fenyx Rising (2020) | 123 | 90 | 84 | 80 | 59 | 38 |
| Hitman 3 (2021) | 206.6 | 147.3 | 138.1 | 125.8 | 87.1 | 47.1 |
| F1 2021 (2021) | 164 | 136 | 122 | 85 | 59 | 38 |
Emissions
Rumore di sistema
Le due ventole da ~50 mm nella Fury 15 G8 tendono a salire di giri prima rispetto alla Fury 15 G7 quando vengono introdotti carichi stressanti. Per esempio, siamo in grado di registrare un massimo di 37,8 dB(A) quando si esegue la prima scena di benchmark di 3DMark 06 rispetto a soli 31,7 dB(A) sul vecchio modello. Il rumore complessivo della ventola rimane più silenzioso che sullo ZBook Studio 15 G8 ma molto più forte che sul più lento ZBook Firefly 15 G7.
| HP ZBook Fury 15 G8 RTX A5000 Laptop GPU, i9-11950H, Samsung PM981a MZVLB1T0HBLR | HP ZBook Fury 15 G7 Quadro RTX 5000 Max-Q, W-10885M, Samsung PM981a MZVLB1T0HBLR | Dell Precision 5000 5560 RTX A2000 Laptop GPU, i7-11850H, Samsung PM9A1 MZVL22T0HBLB | HP ZBook Studio 15 G8 GeForce RTX 3070 Laptop GPU, i9-11950H, Samsung PM981a MZVLB2T0HALB | Lenovo ThinkPad P15s Gen2-20W6000GGE T500 Laptop GPU, i7-1165G7, WDC PC SN720 SDAQNTW-1T00 | HP ZBook Firefly 15 G7 Quadro P520, i7-10610U, Toshiba XG6 KXG60ZNV1T02 | |
|---|---|---|---|---|---|---|
| Noise | -5% | 8% | -6% | 2% | -3% | |
| off /ambiente * (dB) | 24.1 | 26.4 -10% | 23.4 3% | 23.5 2% | 24.3 -1% | 29.3 -22% |
| Idle Minimum * (dB) | 24.1 | 26.4 -10% | 23.6 2% | 25.3 -5% | 25.5 -6% | 29.3 -22% |
| Idle Average * (dB) | 24.1 | 26.4 -10% | 23.6 2% | 25.3 -5% | 25.5 -6% | 29.3 -22% |
| Idle Maximum * (dB) | 24.8 | 26.4 -6% | 23.6 5% | 25.3 -2% | 25.5 -3% | 30 -21% |
| Load Average * (dB) | 37.8 | 31.7 16% | 25.8 32% | 41.2 -9% | 35.65 6% | 32.8 13% |
| Witcher 3 ultra * (dB) | 44.2 | 47 -6% | 40.1 9% | 49.4 -12% | 32.8 26% | |
| Load Maximum * (dB) | 44.2 | 47 -6% | 41.4 6% | 49.4 -12% | 35.65 19% | 32.8 26% |
* ... Meglio usare valori piccoli
Rumorosità
| Idle |
| 24.1 / 24.1 / 24.8 dB(A) |
| Sotto carico |
| 37.8 / 44.2 dB(A) |
 | ||
30 dB silenzioso 40 dB(A) udibile 50 dB(A) rumoroso |
||
min: | ||
Temperatura - Raffreddamento della camera di vapore
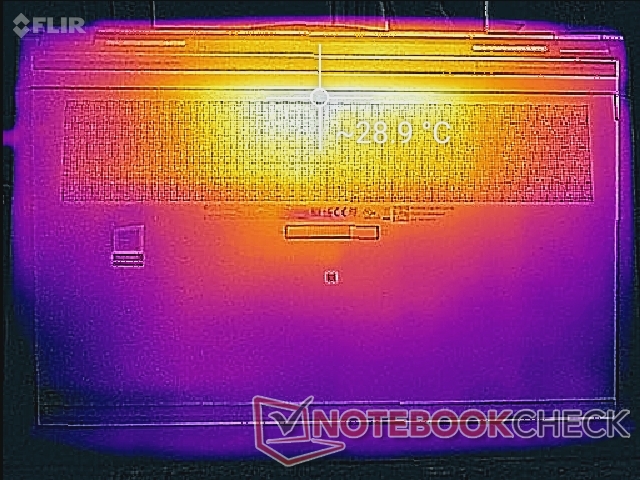
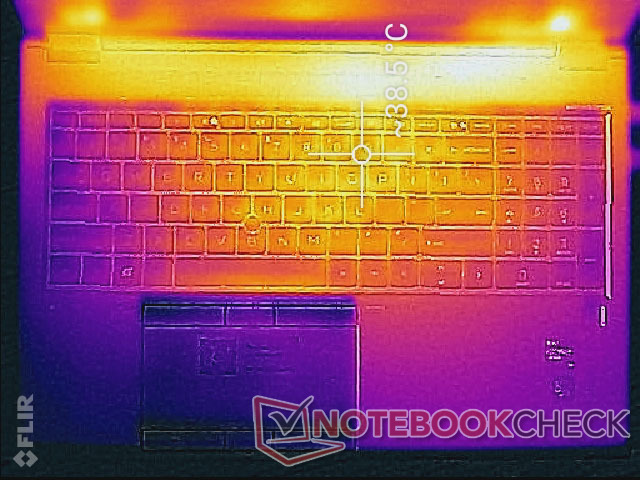
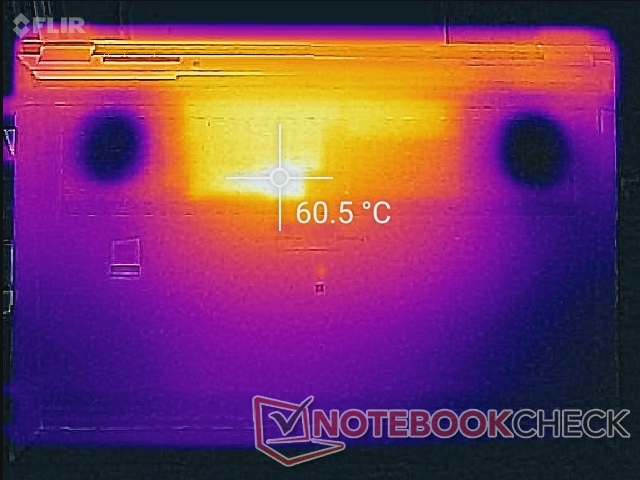
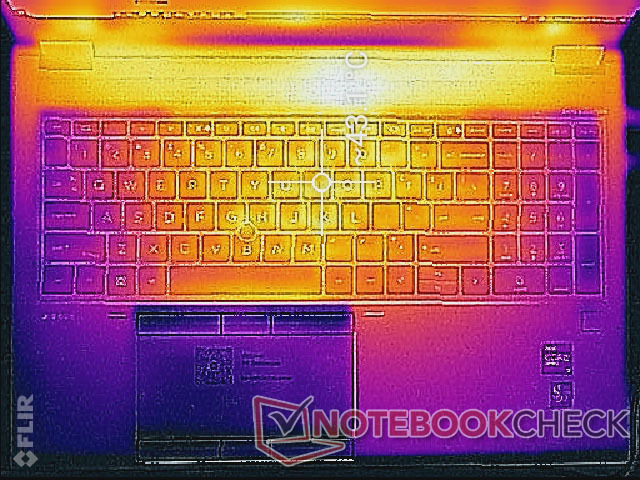
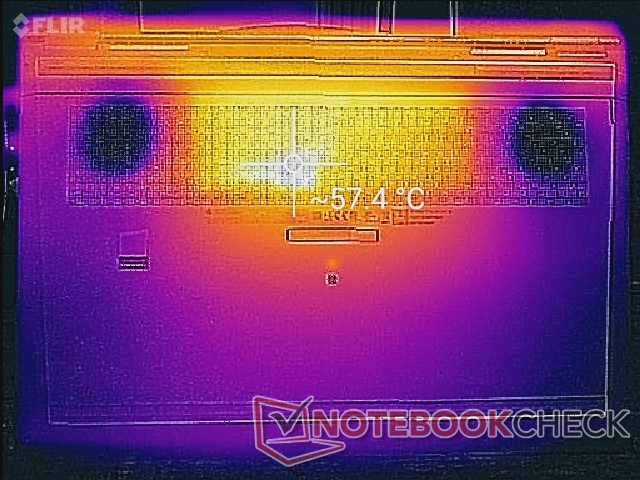
Le temperature superficiali possono raggiungere fino a 43 C e 60 C sulla parte superiore e inferiore, rispettivamente, rispetto a 49 C - 53 C sulla Precision 7550 quando si eseguono carichi impegnativi per periodi prolungati. In altre parole, l'HP è più freddo nella parte superiore a scapito di una parte inferiore più calda, mentre il Dell è più freddo nella parte inferiore a scapito di tasti della tastiera più caldi.
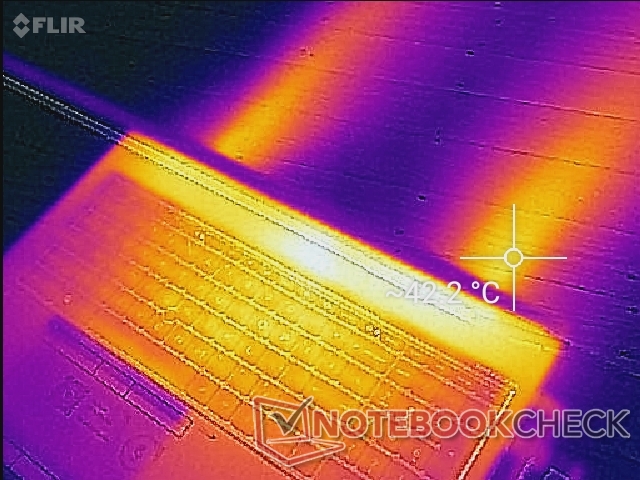
(-) La temperatura massima sul lato superiore è di 45.6 °C / 114 F, rispetto alla media di 38.2 °C / 101 F, che varia da 22.2 a 69.8 °C per questa classe Workstation.
(-) Il lato inferiore si riscalda fino ad un massimo di 57.6 °C / 136 F, rispetto alla media di 41.1 °C / 106 F
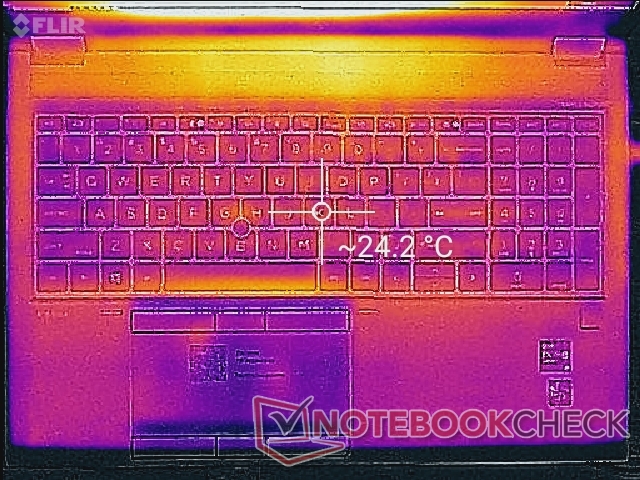
(+) In idle, la temperatura media del lato superiore è di 24.4 °C / 76 F, rispetto alla media deld ispositivo di 32 °C / 90 F.
(±) Riproducendo The Witcher 3, la temperatura media per il lato superiore e' di 34 °C / 93 F, rispetto alla media del dispositivo di 32 °C / 90 F.
(+) I poggiapolsi e il touchpad raggiungono la temperatura massima della pelle (33 °C / 91.4 F) e quindi non sono caldi.
(-) La temperatura media della zona del palmo della mano di dispositivi simili e'stata di 27.8 °C / 82 F (-5.2 °C / -9.4 F).
Test di stress
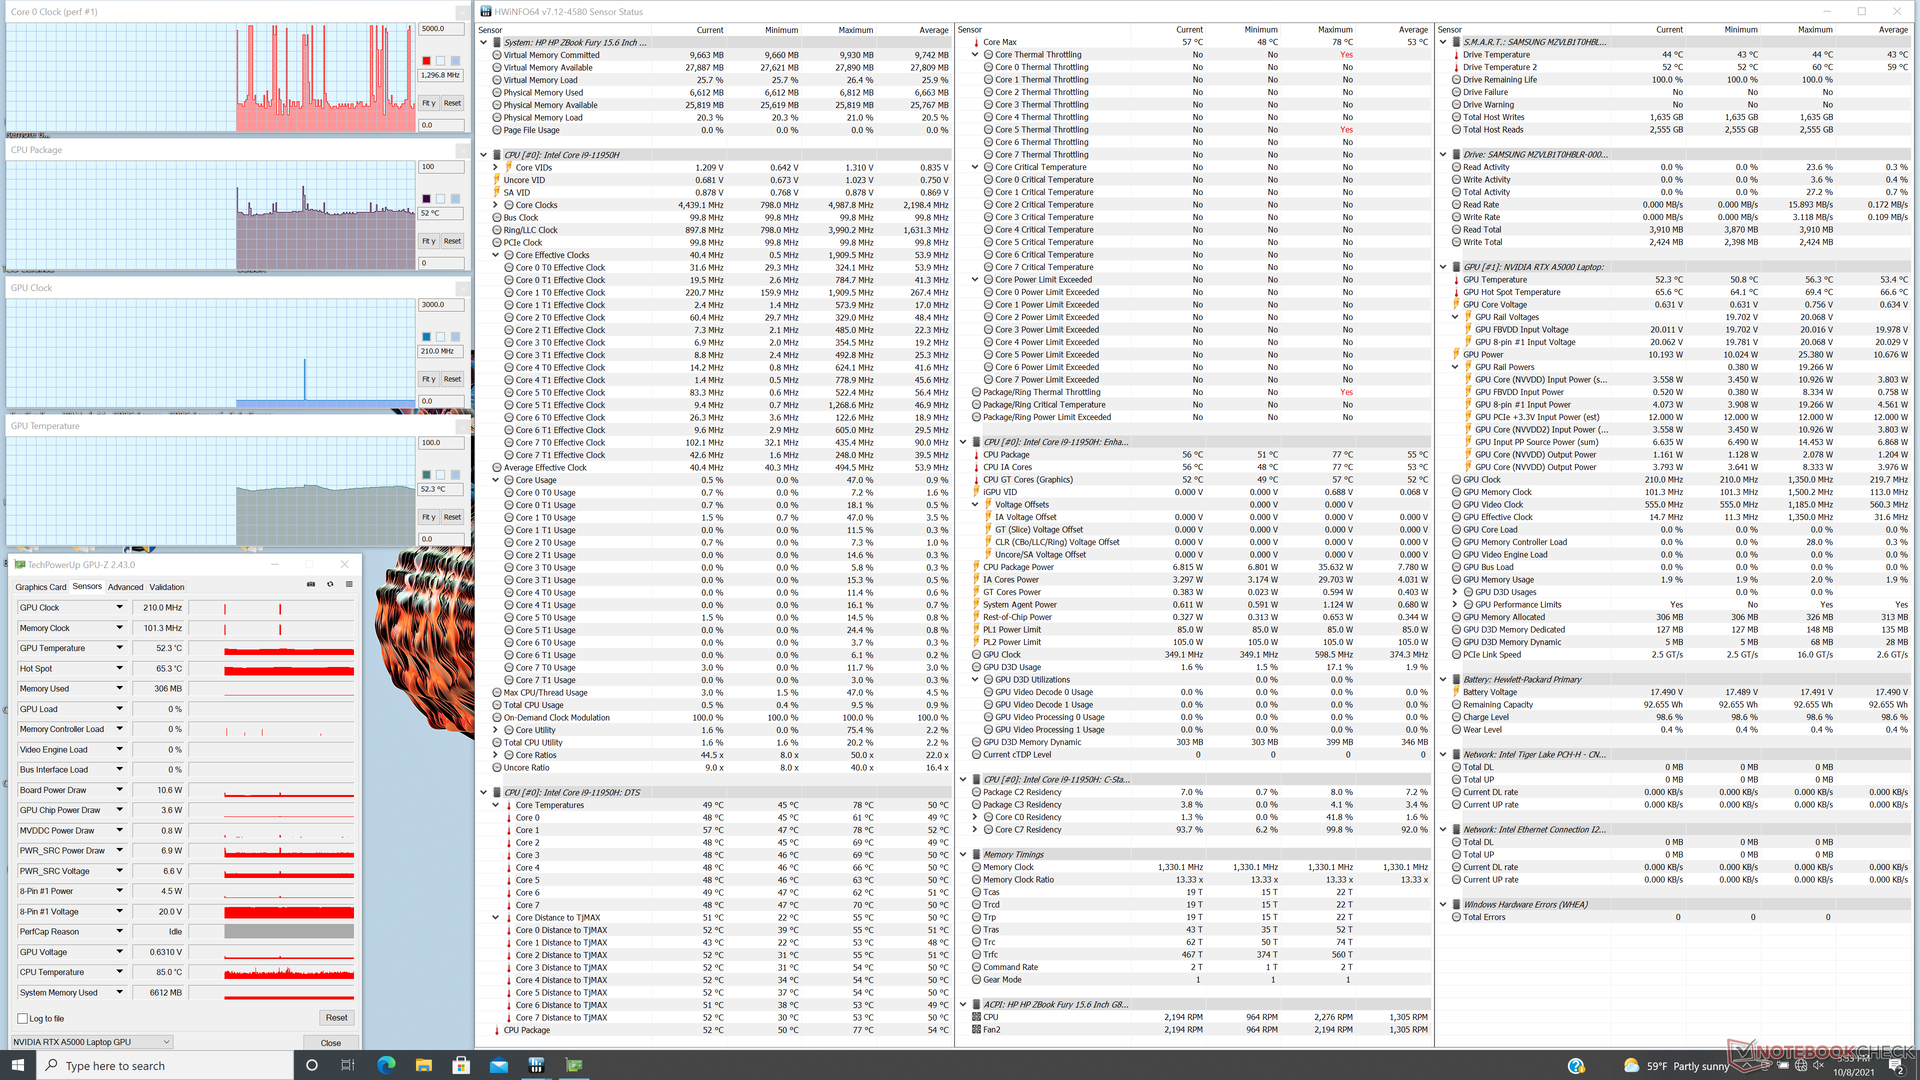
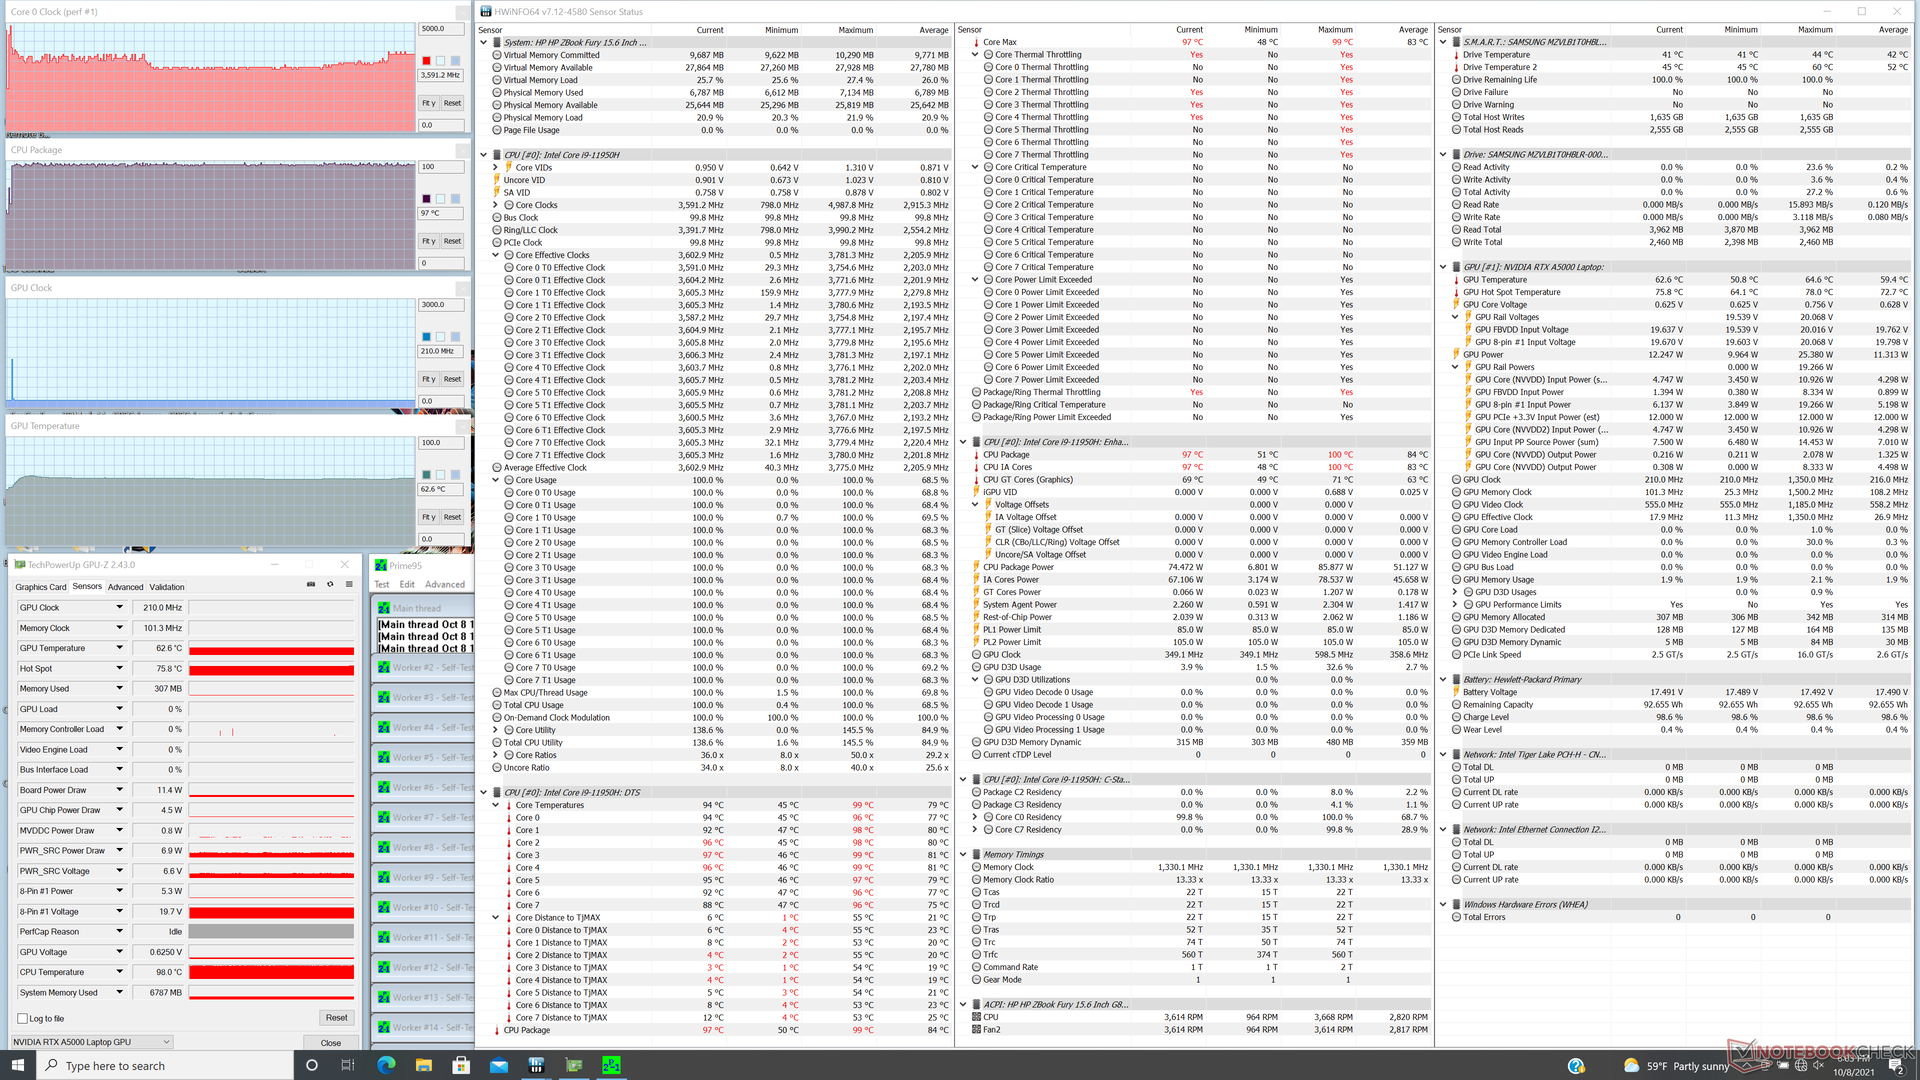
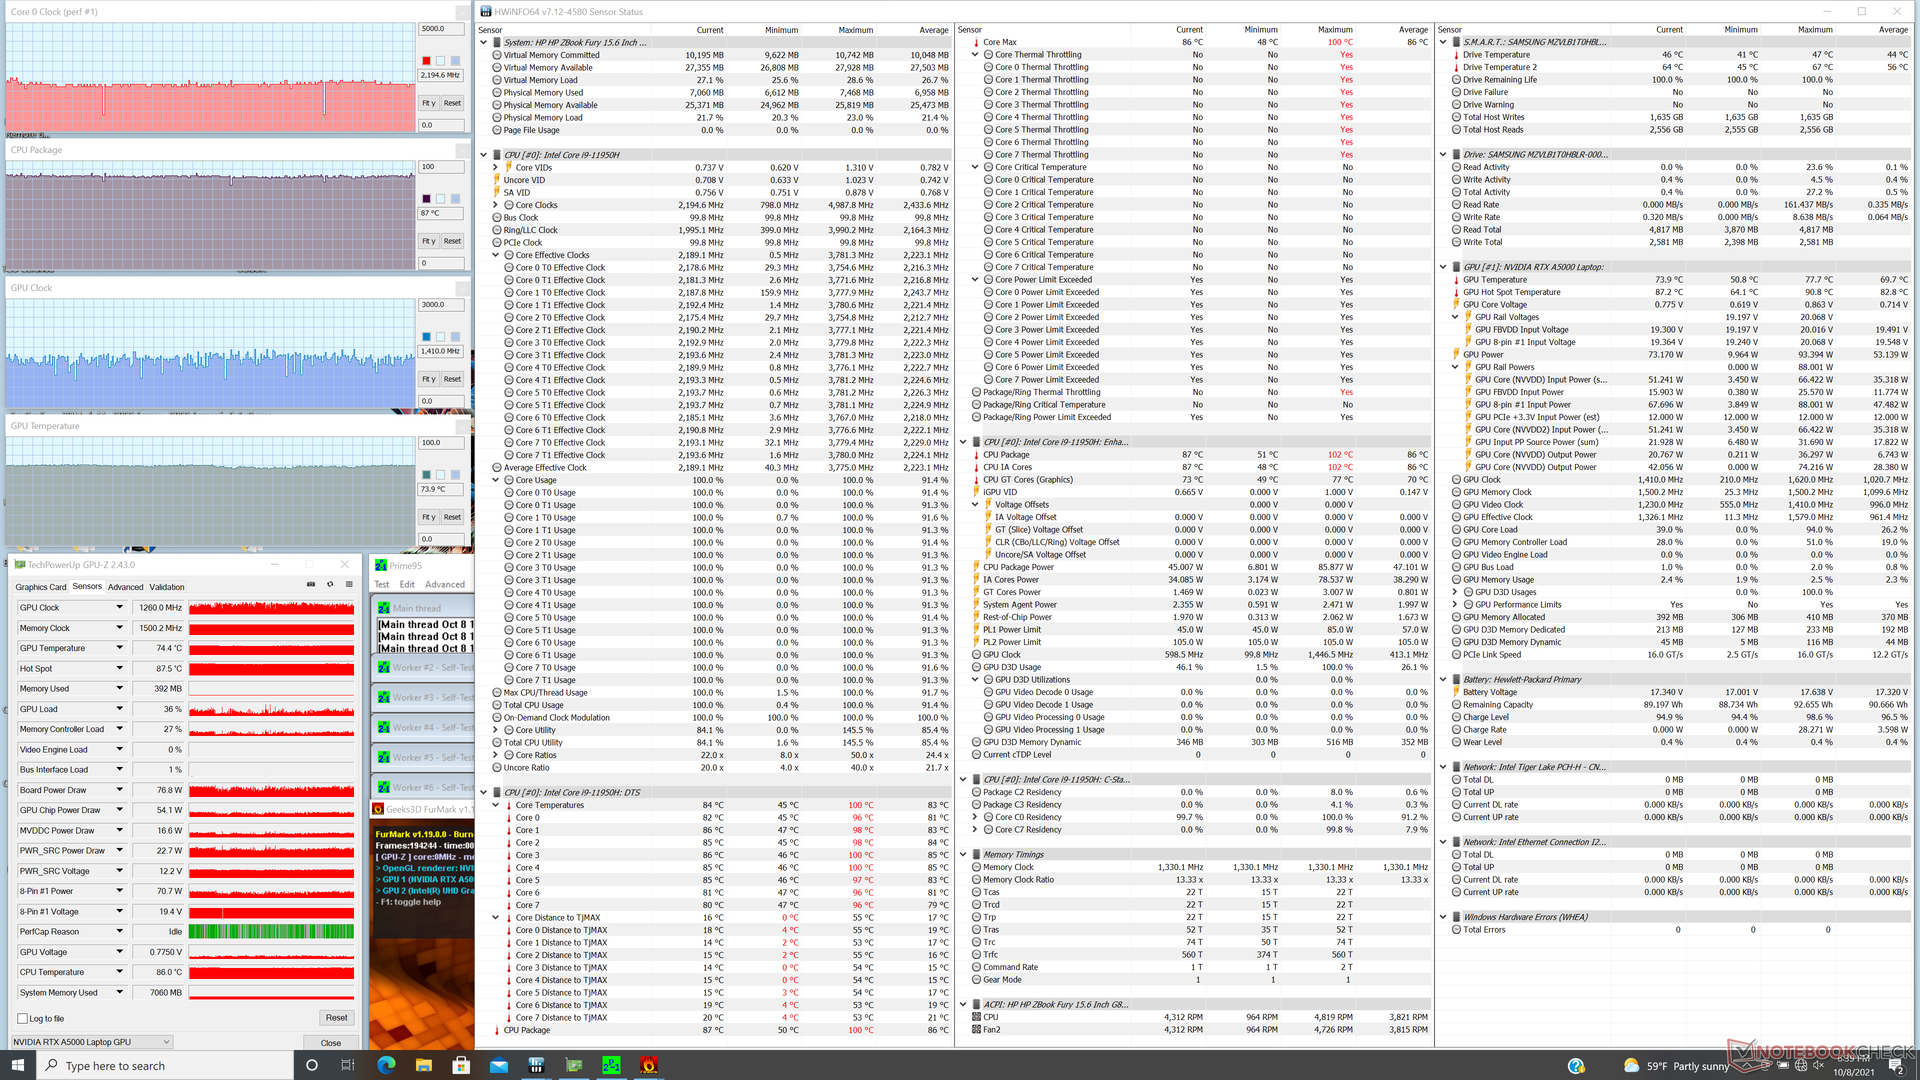
Quando è stata stressata con Prime95, la CPU ha spinto fino a 3,6 GHz per i primi due secondi fino a raggiungere una temperatura del core di 96 C. I tassi di clock si sono poi stabilizzati nell'intervallo da 3,0 a 3,5 GHz mantenendo 96 C. I risultati sono simili a quelli che abbiamo osservato sia sul Dell Precision 7550 che sul vecchio Fury 15 G7 per dimostrare che queste workstation ad alte prestazioni stanno dando la priorità alle prestazioni della CPU anche se ciò significa temperature del core molto più calde in generale.
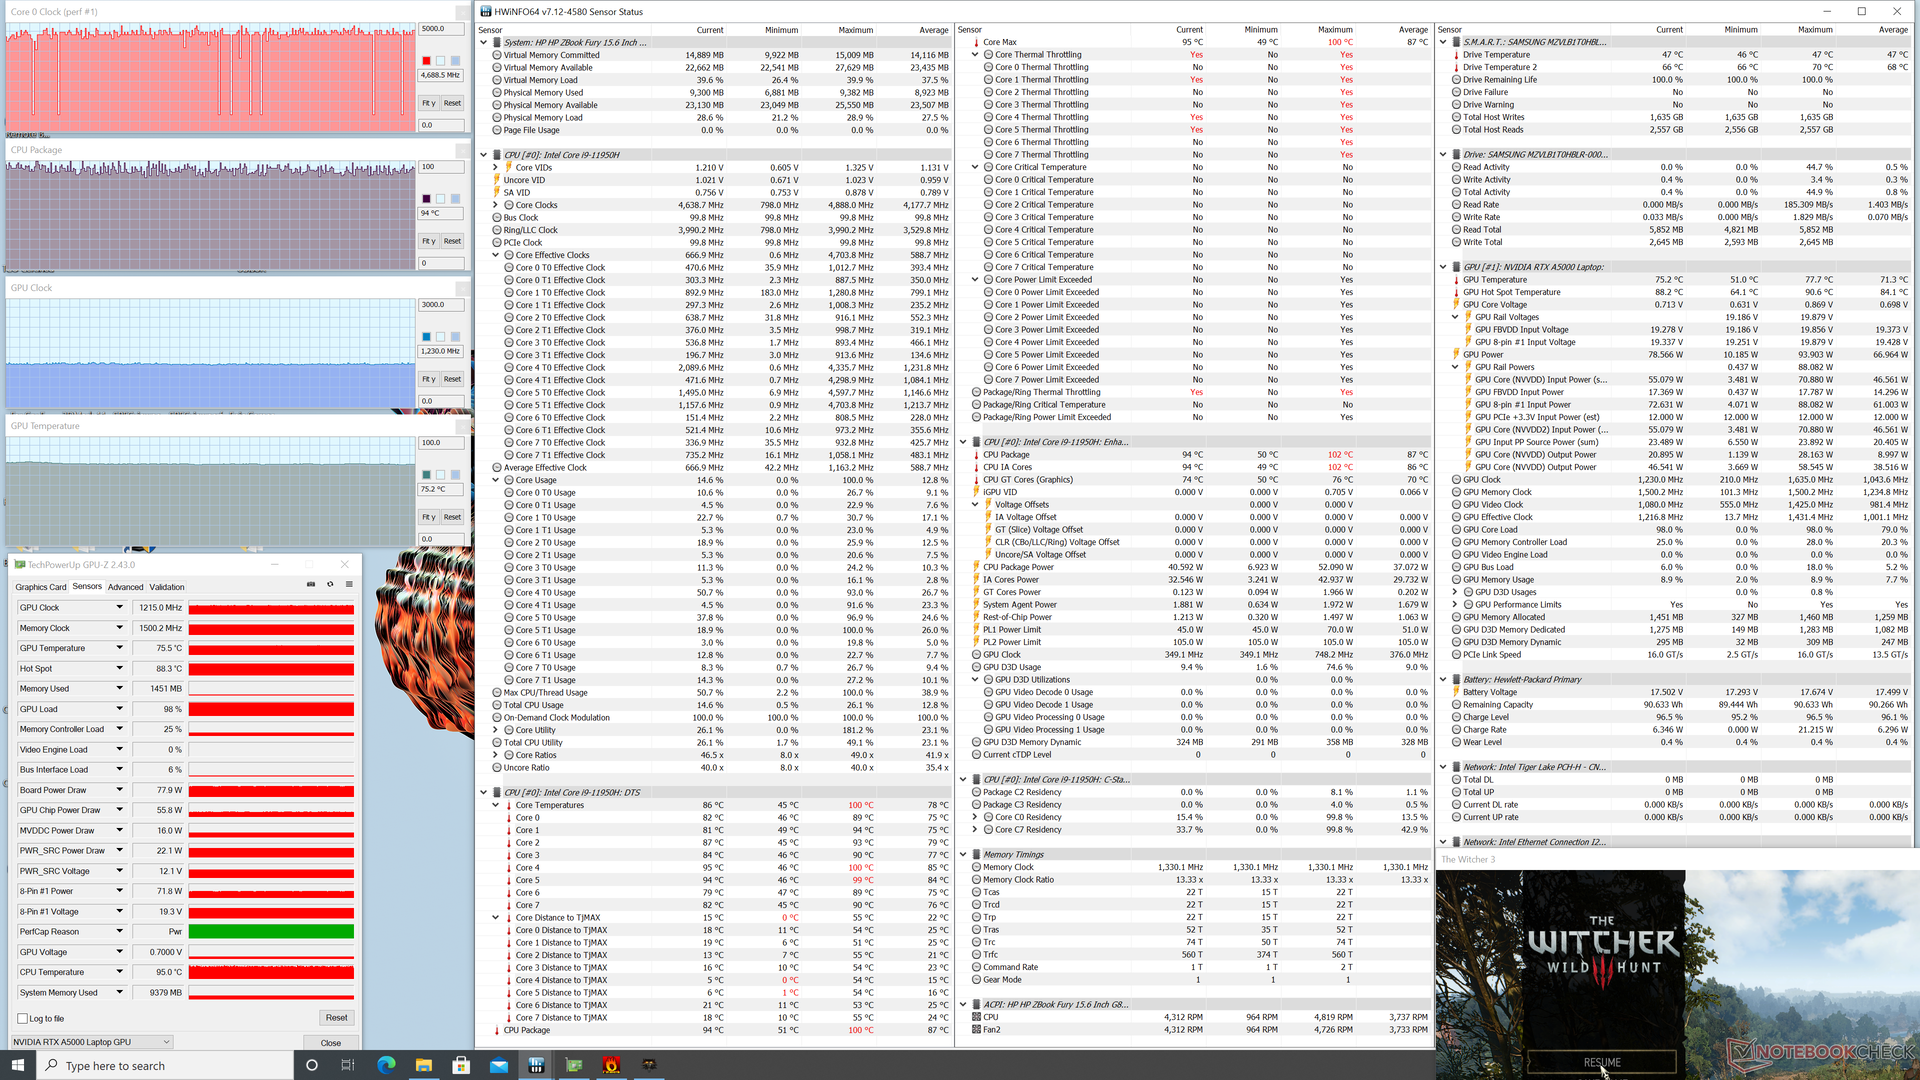
Quando si esegue Witcher 3, le temperature della CPU e della GPU si stabilizzano a 94 C e 75 C, rispettivamente, rispetto a 85 C e 70 C sulla Fury 15 G7. Quindi, l'aumento delle prestazioni anno dopo anno comporta un leggero aumento delle temperature. I processori nel nostro Precision 7550 si stabilizzerebbero a temperature più basse con margini relativamente ampi tra 10 e 20 C quando si esegue lo stesso gioco.
L'assorbimento della scheda GPU si stabilizzerebbe a 78 W quando si eseguono carichi di gioco rispetto al suo obiettivo TGP di 90 W. Siamo in grado di raggiungere un assorbimento di 93 W anche se solo per un breve periodo durante l'inizio del test.
L'esecuzione con le batterie limiterà le prestazioni. Un test 3DMark Fire Strike a batteria restituirebbe punteggi di Fisica e Grafica di 17779 e 6244 punti, rispettivamente, rispetto a 22483 e 23579 punti quando è alimentato.
| Clock della CPU (GHz)Clock della GPU(MHz)Temperatura media dellaCPU (°C)Temperaturamedia dellaGPU (°C) |
| Sistema inattivo |
| StressPrime95 |
| Prime95 + FurMark Stress |
| Witcher 3 Stress |
Altoparlanti

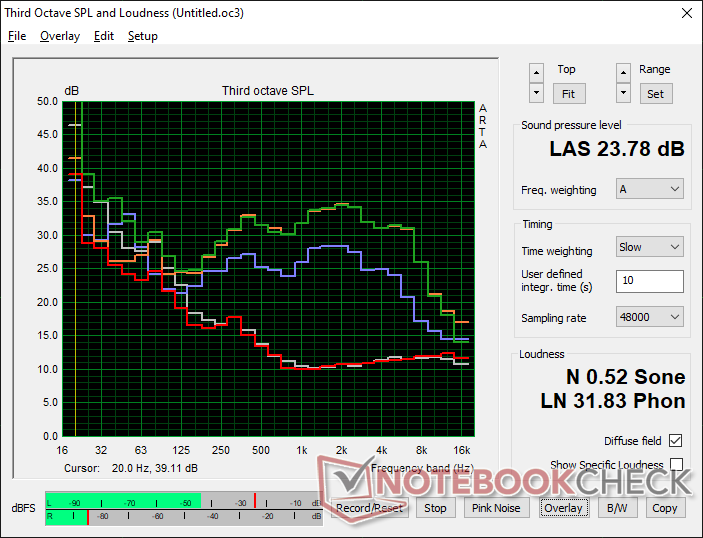
HP ZBook Fury 15 G8 analisi audio
(±) | potenza degli altiparlanti media ma buona (79.8 dB)
Bassi 100 - 315 Hz
(±) | bassi ridotti - in media 10.6% inferiori alla media
(±) | la linearità dei bassi è media (8.8% delta rispetto alla precedente frequenza)
Medi 400 - 2000 Hz
(+) | medi bilanciati - solo only 3.9% rispetto alla media
(+) | medi lineari (4.8% delta rispetto alla precedente frequenza)
Alti 2 - 16 kHz
(+) | Alti bilanciati - appena 2.9% dalla media
(+) | alti lineari (5.3% delta rispetto alla precedente frequenza)
Nel complesso 100 - 16.000 Hz
(+) | suono nel complesso lineare (11.9% differenza dalla media)
Rispetto alla stessa classe
» 17% di tutti i dispositivi testati in questa classe è stato migliore, 4% simile, 79% peggiore
» Il migliore ha avuto un delta di 7%, medio di 17%, peggiore di 35%
Rispetto a tutti i dispositivi testati
» 9% di tutti i dispositivi testati in questa classe è stato migliore, 2% similare, 89% peggiore
» Il migliore ha avuto un delta di 4%, medio di 23%, peggiore di 134%
Apple MacBook 12 (Early 2016) 1.1 GHz analisi audio
(+) | gli altoparlanti sono relativamente potenti (83.6 dB)
Bassi 100 - 315 Hz
(±) | bassi ridotti - in media 11.3% inferiori alla media
(±) | la linearità dei bassi è media (14.2% delta rispetto alla precedente frequenza)
Medi 400 - 2000 Hz
(+) | medi bilanciati - solo only 2.4% rispetto alla media
(+) | medi lineari (5.5% delta rispetto alla precedente frequenza)
Alti 2 - 16 kHz
(+) | Alti bilanciati - appena 2% dalla media
(+) | alti lineari (4.5% delta rispetto alla precedente frequenza)
Nel complesso 100 - 16.000 Hz
(+) | suono nel complesso lineare (10.2% differenza dalla media)
Rispetto alla stessa classe
» 7% di tutti i dispositivi testati in questa classe è stato migliore, 2% simile, 90% peggiore
» Il migliore ha avuto un delta di 5%, medio di 18%, peggiore di 53%
Rispetto a tutti i dispositivi testati
» 5% di tutti i dispositivi testati in questa classe è stato migliore, 1% similare, 94% peggiore
» Il migliore ha avuto un delta di 4%, medio di 23%, peggiore di 134%
Energy Management
Consumo energetico - Display affamato di energia
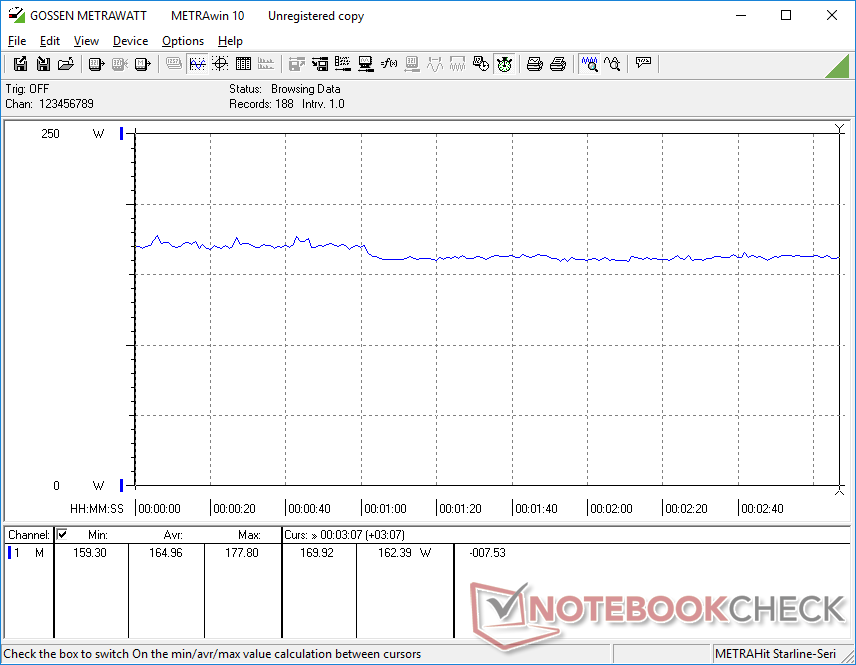
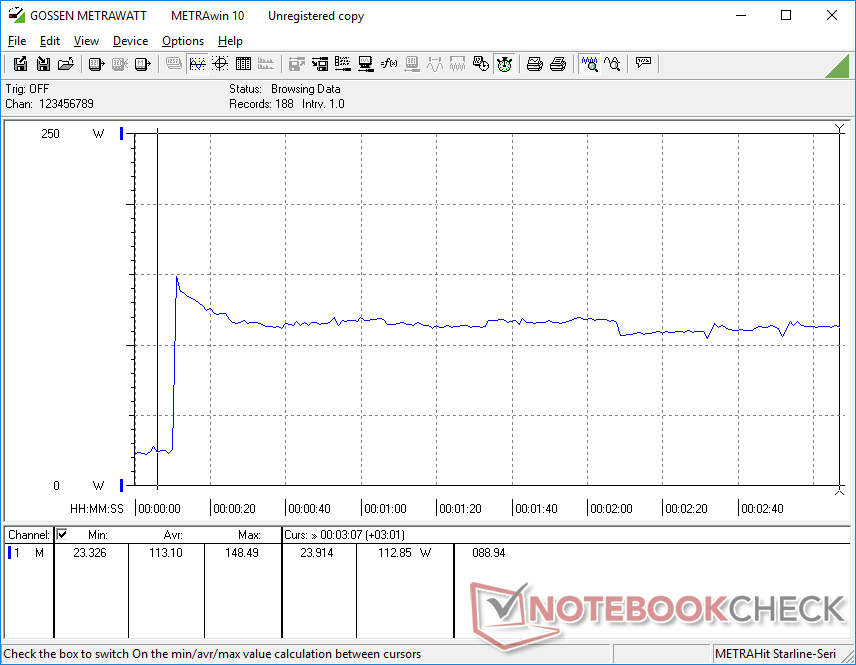
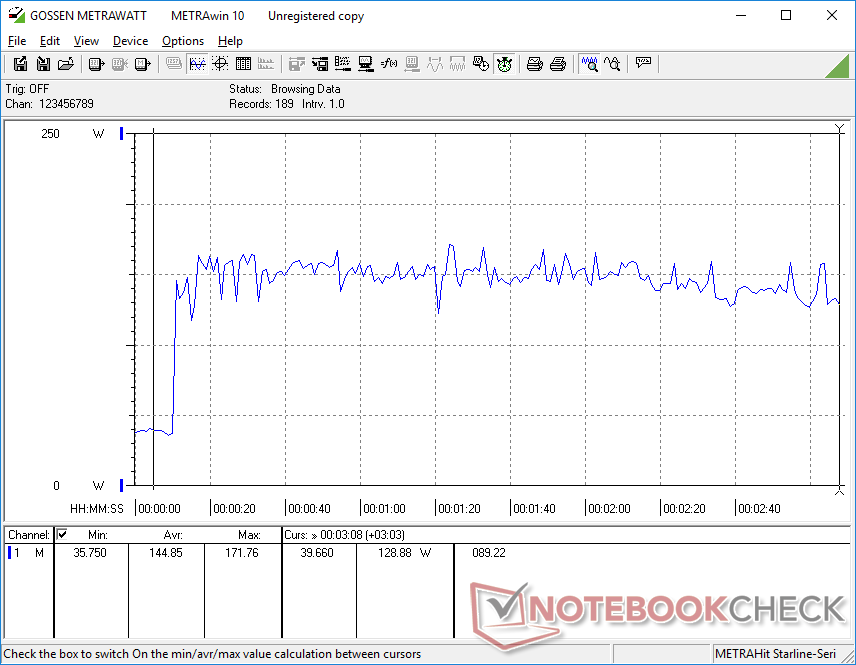
Il sistema assorbe un po' più potenza rispetto al suo immediato predecessore Fury 15 G7, in particolare sotto carichi di elaborazione bassi. La nostra unità si assestava su intervalli leggermente più alti da 8 W a 20 W rispetto ai 4 W a 14 W del modello precedente. Il consumo di energia è altrimenti molto vicino tra i due modelli quando si eseguono carichi esigenti.
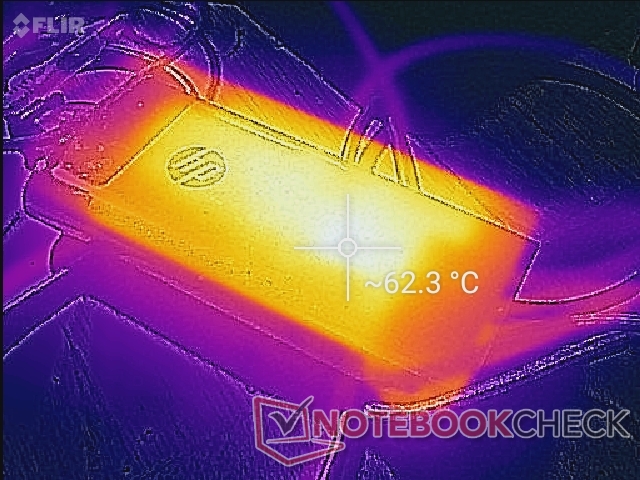
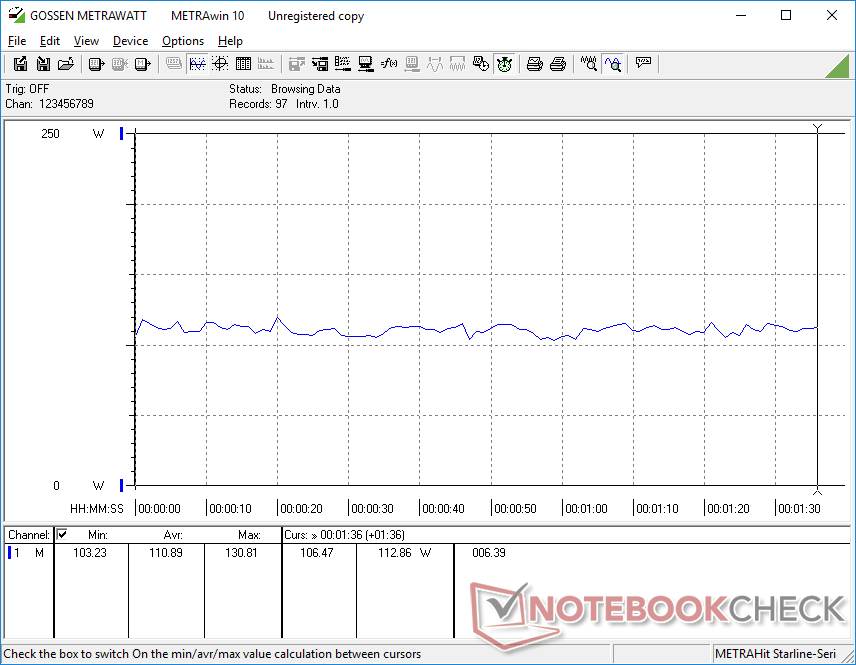
L'esecuzione di carichi estremi (Prime95+FurMark) causerebbe un picco nel consumo di energia fino a 172 W dall'adattatore AC 200 W di medie dimensioni (~15.2 x 7.2 x 2.4 cm). Il sistema continuerà a ricaricarsi anche con carichi elevati, anche se ad un ritmo più lento
Saltando dal minimo al massimo della luminosità si consumano circa 11 W in più rispetto a circa la metà della maggior parte degli Ultrabooks a causa del pannello extra-luminoso del nostro HP.
| Off / Standby | |
| Idle | |
| Sotto carico |
|
Leggenda:
min: | |
| HP ZBook Fury 15 G8 i9-11950H, RTX A5000 Laptop GPU, Samsung PM981a MZVLB1T0HBLR, IPS, 3840x2160, 15.6" | HP ZBook Fury 15 G7 W-10885M, Quadro RTX 5000 Max-Q, Samsung PM981a MZVLB1T0HBLR, IPS, 3840x2160, 15.6" | Dell Precision 5000 5560 i7-11850H, RTX A2000 Laptop GPU, Samsung PM9A1 MZVL22T0HBLB, IPS, 3840x2400, 15.6" | HP ZBook Studio 15 G8 i9-11950H, GeForce RTX 3070 Laptop GPU, Samsung PM981a MZVLB2T0HALB, OLED, 3840x2160, 15.6" | Lenovo ThinkPad P15s Gen2-20W6000GGE i7-1165G7, T500 Laptop GPU, WDC PC SN720 SDAQNTW-1T00, IPS LED, 3840x2160, 15.6" | HP ZBook Firefly 15 G7 i7-10610U, Quadro P520, Toshiba XG6 KXG60ZNV1T02, IPS LED, 3840x2160, 15.6" | |
|---|---|---|---|---|---|---|
| Power Consumption | 11% | 22% | -10% | 49% | 59% | |
| Idle Minimum * (Watt) | 8.3 | 4.6 45% | 6.2 25% | 11 -33% | 5.8 30% | 3.5 58% |
| Idle Average * (Watt) | 19.9 | 13.6 32% | 13.9 30% | 18.8 6% | 13.3 33% | 6.7 66% |
| Idle Maximum * (Watt) | 21.8 | 21.5 1% | 23.8 -9% | 31.7 -45% | 15.6 28% | 9.6 56% |
| Load Average * (Watt) | 110.9 | 113.1 -2% | 95.7 14% | 105.2 5% | 43.2 61% | 60 46% |
| Witcher 3 ultra * (Watt) | 165 | 157.5 5% | 87 47% | 148 10% | 37.1 78% | 49.3 70% |
| Load Maximum * (Watt) | 171.8 | 199 -16% | 132.6 23% | 171.8 -0% | 67.3 61% | 68.6 60% |
* ... Meglio usare valori piccoli
Power Consumption Witcher 3 / Stresstest
Durata della batteria
I tempi di esecuzione della WLAN sono un paio d'ore più brevi sulla Fury 15 G8 rispetto alla Fury 15 G7 anche se impostata sullo stesso profilo bilanciato, luminosità del display e impostazioni grafiche integrate. Sospettiamo che la maggiore frequenza di aggiornamento nativa o la potenziale attività automatica in background possano essere in parte responsabili della durata della batteria notevolmente più breve.
La carica da vuoto a piena capacità richiede circa 90 minuti. La maggior parte dei caricabatterie USB-C funzionerà anche sul sistema, a condizione che la potenza di uscita sia abbastanza alta.
| HP ZBook Fury 15 G8 i9-11950H, RTX A5000 Laptop GPU, 94 Wh | HP ZBook Fury 15 G7 W-10885M, Quadro RTX 5000 Max-Q, 94 Wh | Dell Precision 5000 5560 i7-11850H, RTX A2000 Laptop GPU, 86 Wh | HP ZBook Studio 15 G8 i9-11950H, GeForce RTX 3070 Laptop GPU, 83 Wh | Lenovo ThinkPad P15s Gen2-20W6000GGE i7-1165G7, T500 Laptop GPU, 57 Wh | HP ZBook Firefly 15 G7 i7-10610U, Quadro P520, 53 Wh | |
|---|---|---|---|---|---|---|
| Autonomia della batteria | 39% | 2% | 0% | 24% | 47% | |
| WiFi v1.3 (h) | 6.2 | 8.6 39% | 6.3 2% | 6.2 0% | 7.7 24% | 9.1 47% |
| Reader / Idle (h) | 13.2 | 12 | 12.9 | |||
| Load (h) | 1.3 | 1.8 | 1.8 | 1.9 | 2 |
Pro
Contro
Verdetto - Prestazione furiosa
Lo ZBook Fury 15 G8 spreme più prestazioni dallo stesso telaio Fury 15 G7 che già conosciamo. Gli utenti vedranno guadagni marginali-moderati sia dalla CPU che dalla GPU di ultima generazione, pur mantenendo lo stesso adattatore AC e le caratteristiche fisiche. Non sarebbe realistico aspettarsi una riprogettazione completa dall'alto verso il basso dal Fury 15 G8 quando il salto dal Fury 15 G6 al Fury 15 G7 era già così significativo per la serie. I power user potrebbero voler considerare la Fury 15 G8 se i guadagni di prestazioni sono rilevanti per i loro carichi di lavoro. Altrimenti, la Fury 15 G7 può offrire essenzialmente la stessa esperienza per meno.
La nuova opzione del pannello 4K a 120 Hz merita un elogio forse anche più degli aggiornamenti del processore, poiché il movimento più fluido e la riduzione del ghosting sono molto più evidenti. Questo è sicuramente un pannello che ci piacerebbe vedere su più portatili al di fuori della serie ZBook.
La serie Fury 15 in generale rimane un'eccellente alternativa alle workstation come la MSI WS66, Razer Blade Studio, ZBook Fireflyo Lenovo ThinkPad P1 che sacrificano caratteristiche e opzioni solo per il look più sottile ed elegante.
Prezzo e disponibilità
Lo ZBook Fury 15 G8 non è ampiamente disponibile attraverso i rivenditori di terze parti al momento della scrittura. Almeno una SKU può essere trovata su Walmart, ma gli utenti dovrebbero acquistare direttamente da HP invece per opzioni significativamente più configurabili.
HP ZBook Fury 15 G8
- 10/13/2021 v7 (old)
Allen Ngo
Price comparison

