Recensione del computer portatile HP ZBook Studio 15 G8: Più opzioni che mai
Come suggerisce il nome, l'HP ZBook Studio 15 G8 è il successore dello ZBook Studio 15 G7 con processori aggiornati e nuove caratteristiche non disponibili sui modelli precedenti. Il nuovo modello sostituisce anche lo ZBook Create G7 che era essenzialmente lo stesso portatile dello ZBook Studio G7 anche se con GeForce invece della grafica Quadro. Così, lo ZBook Studio G8 ha consolidato ed ereditato tutte le configurazioni dei due vecchi modelli G7 per una lunga lista di opzioni configurabili che vanno da vPro a non-vPro Tiger Lake-H CPU e sia Quadro che GeForce GPU.
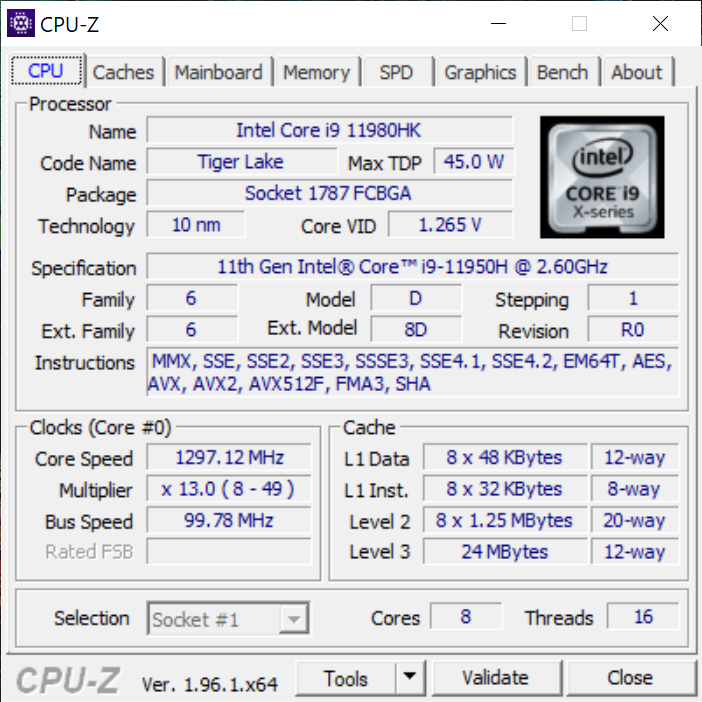
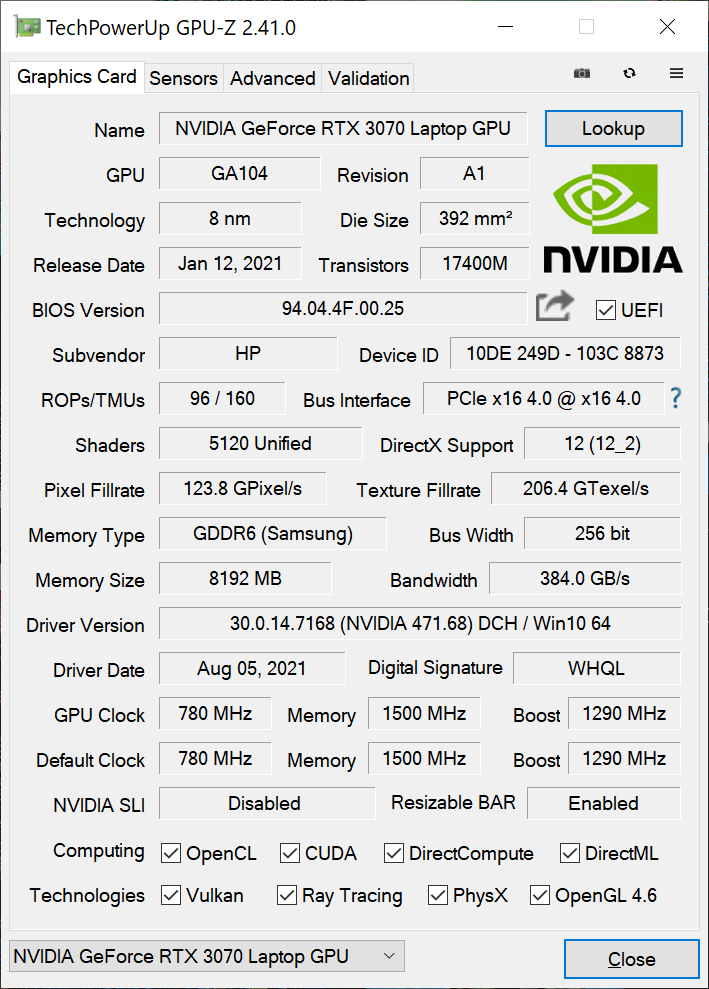
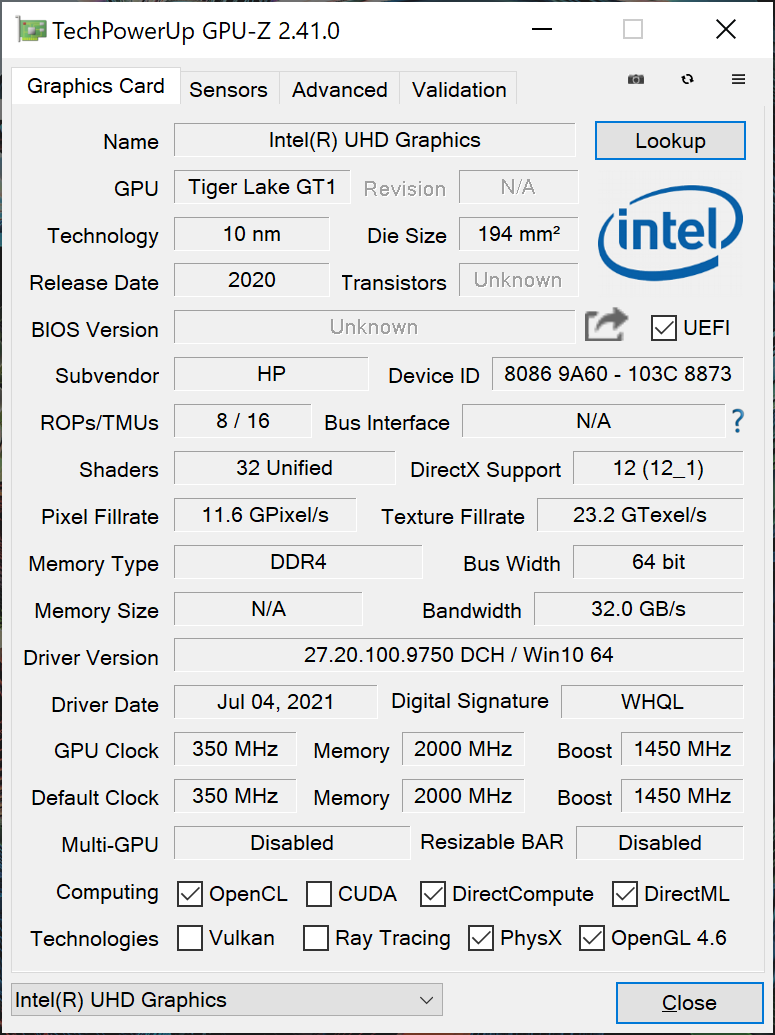
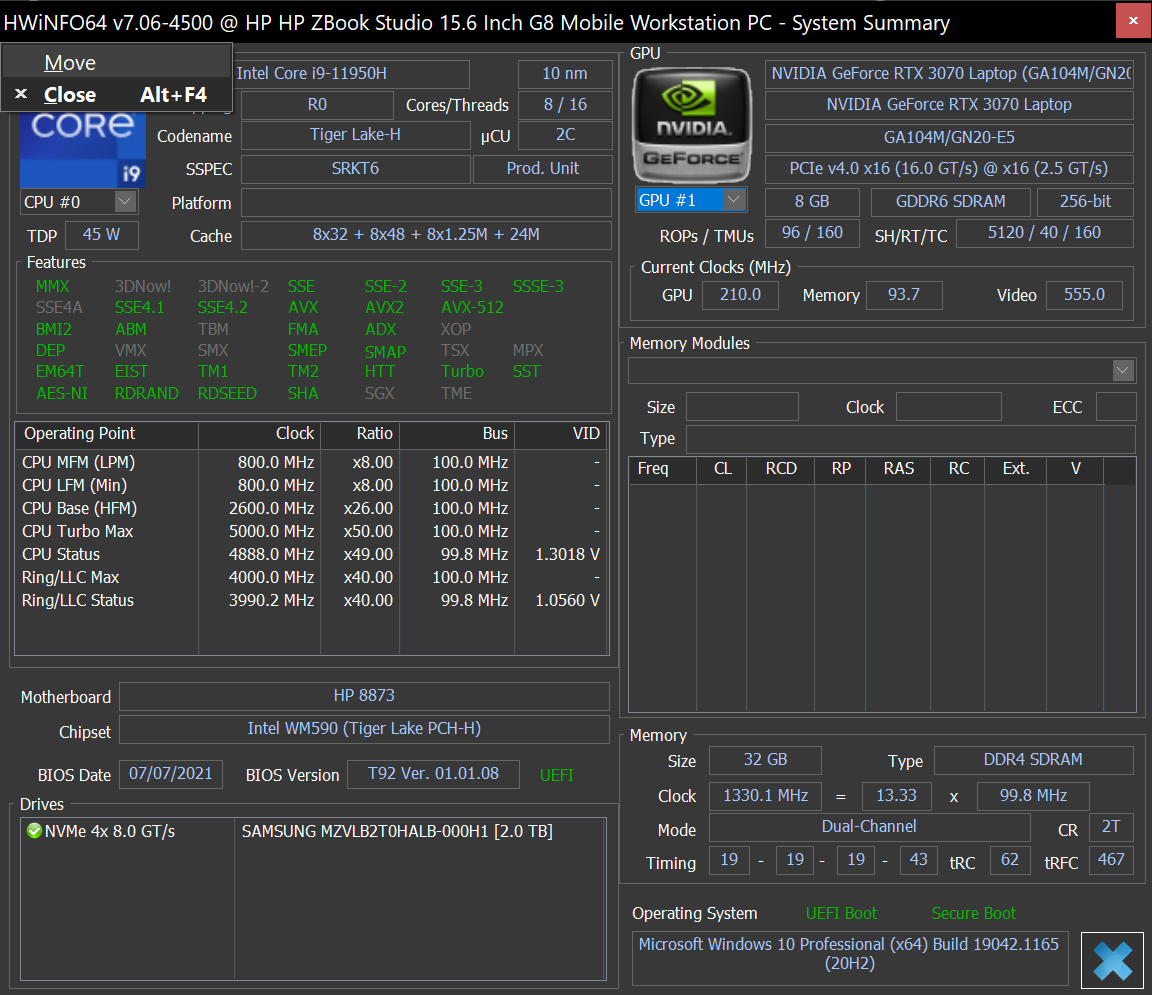
La nostra unità di test è una configurazione di fascia alta equipaggiata con la CPU Core i9-11950H vPro, GPU RTX 3070 e touchscreen OLED 4K per circa 4200 dollari al dettaglio. Versioni inferiori con il Core i7-11800H, solo grafica integrata Iris Xe, display FHD o grafica Quadro T1200 sono disponibili per molto meno. Non ci sono opzioni Xeon, comunque.
I concorrenti diretti includono altre workstations mobili ultrasottili alimentate da Core-H come MSI WS66, Razer Blade 15 Studio, Asus ProArt o Lenovo ThinkPad P15s.
Altre recensioni HP:
Confronto con i potenziali concorrenti
Punteggio | Data | Modello | Peso | Altezza | Dimensione | Risoluzione | Prezzo |
|---|---|---|---|---|---|---|---|
| 87.8 % v7 (old) | 08/2021 | HP ZBook Studio 15 G8 i9-11950H, GeForce RTX 3070 Laptop GPU | 1.9 kg | 18 mm | 15.60" | 3840x2160 | |
| 83.8 % v7 (old) | 04/2021 | HP ZBook Firefly 15 G8 2C9R7EA i7-1165G7, T500 Laptop GPU | 1.8 kg | 19.2 mm | 15.60" | 1920x1080 | |
| 90.6 % v7 (old) | 03/2021 | HP ZBook Studio G7 i9-10885H, Quadro RTX 3000 Max-Q | 2 kg | 18 mm | 15.60" | 3840x2160 | |
| 87.8 % v7 (old) | 09/2020 | Dell Precision 7550 W-10885M, Quadro RTX 5000 Max-Q | 2.8 kg | 27.36 mm | 15.60" | 3840x2160 | |
| 85.3 % v7 (old) | 06/2021 | Lenovo ThinkPad P15s Gen2-20W6000GGE i7-1165G7, T500 Laptop GPU | 1.9 kg | 19.1 mm | 15.60" | 3840x2160 | |
| 83.1 % v7 (old) | 11/2020 | Asus ProArt StudioBook Pro 15 W500G5T i7-9750H, Quadro RTX 5000 Max-Q | 2 kg | 18.9 mm | 15.60" | 3840x2160 |
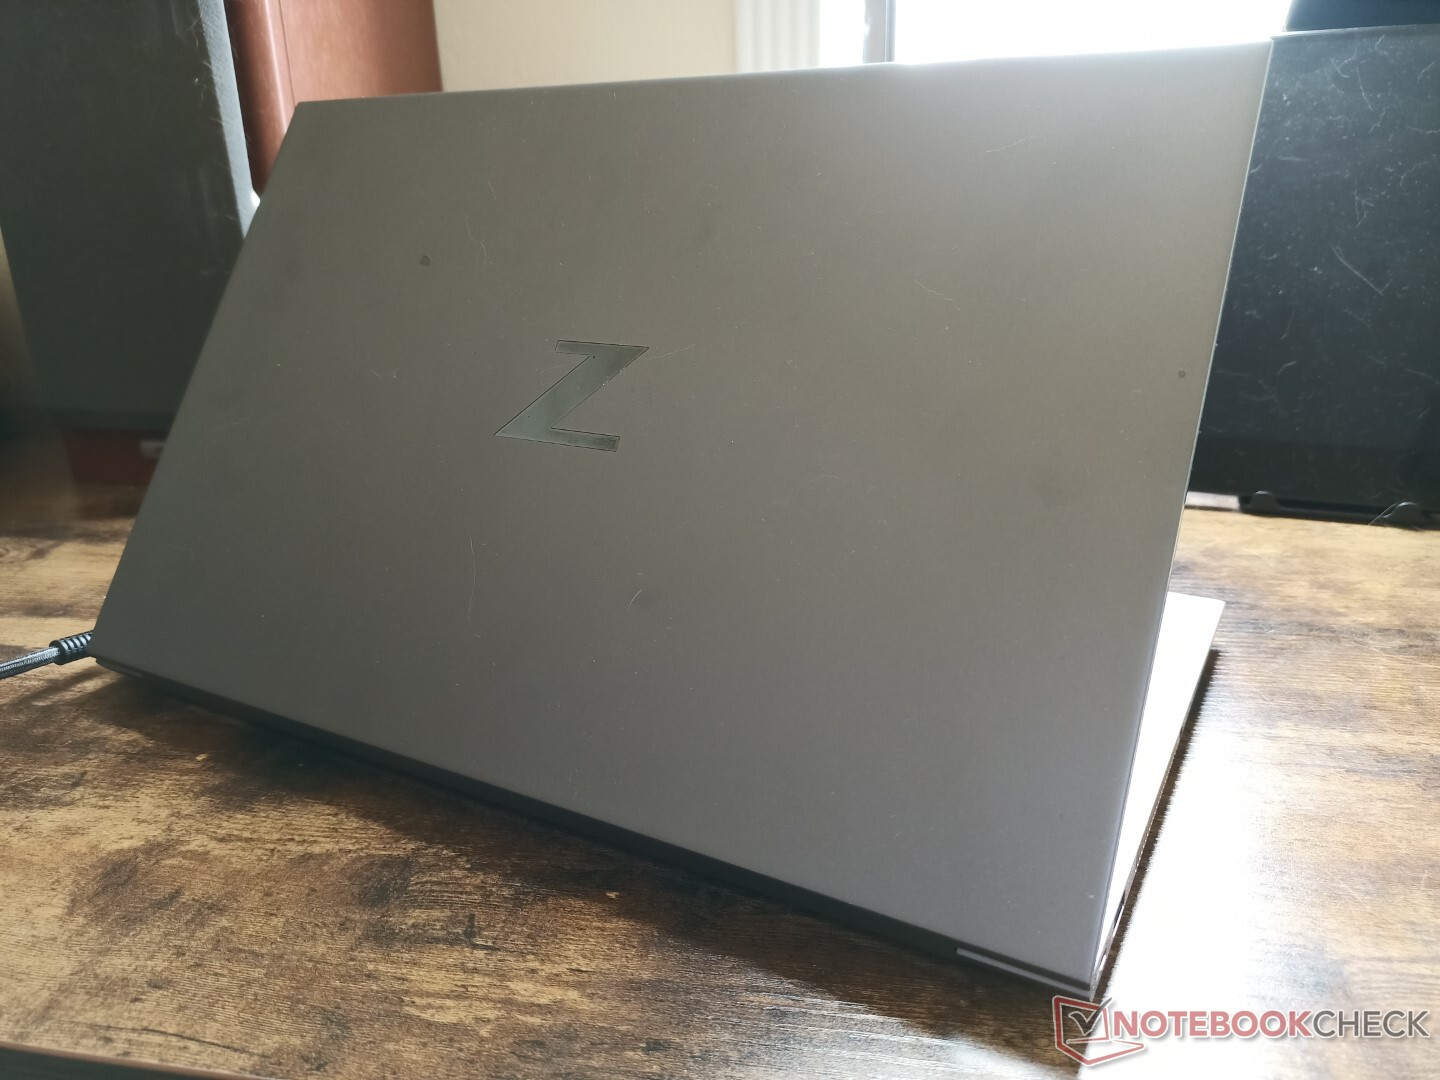
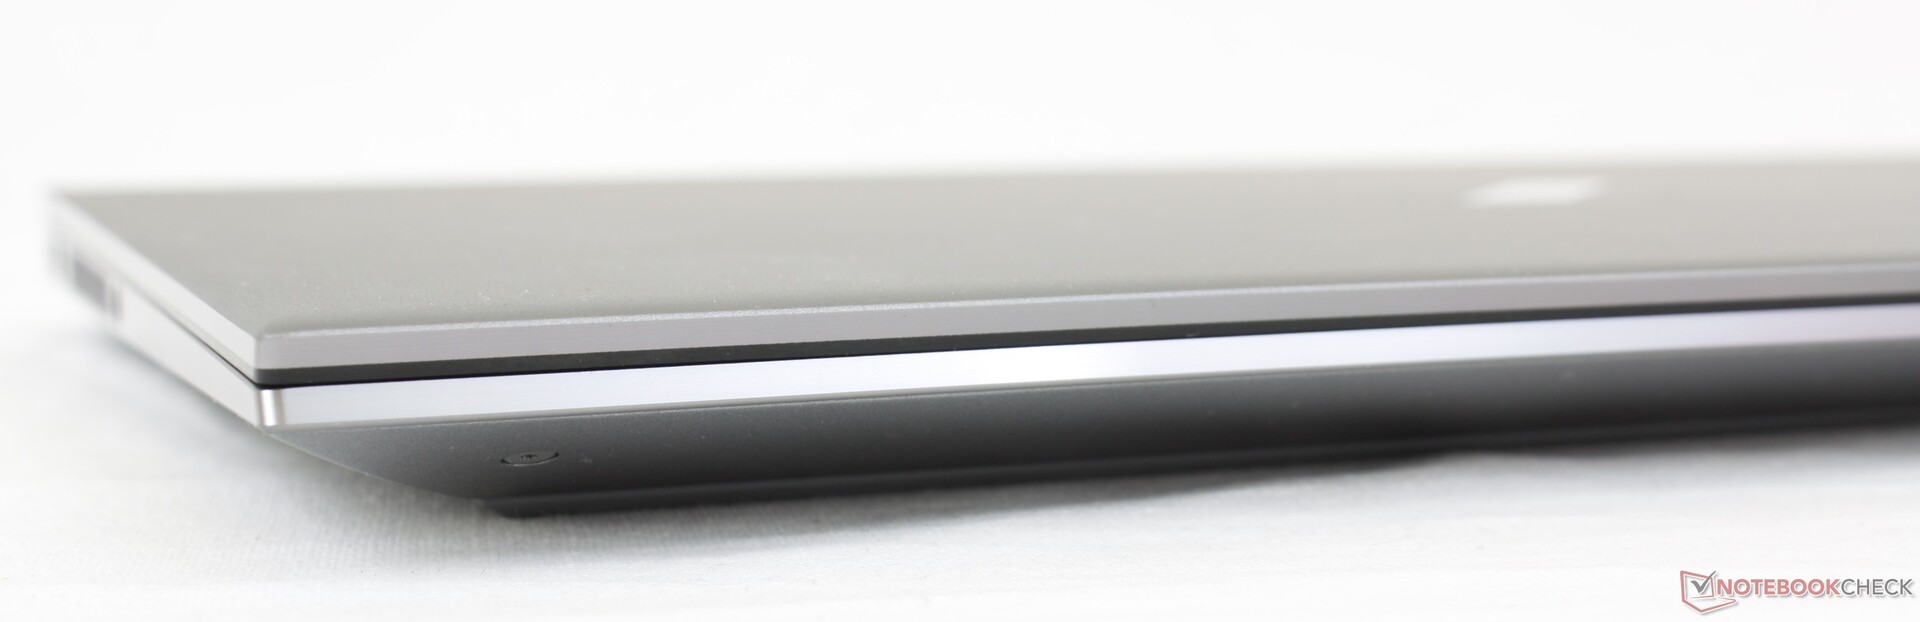
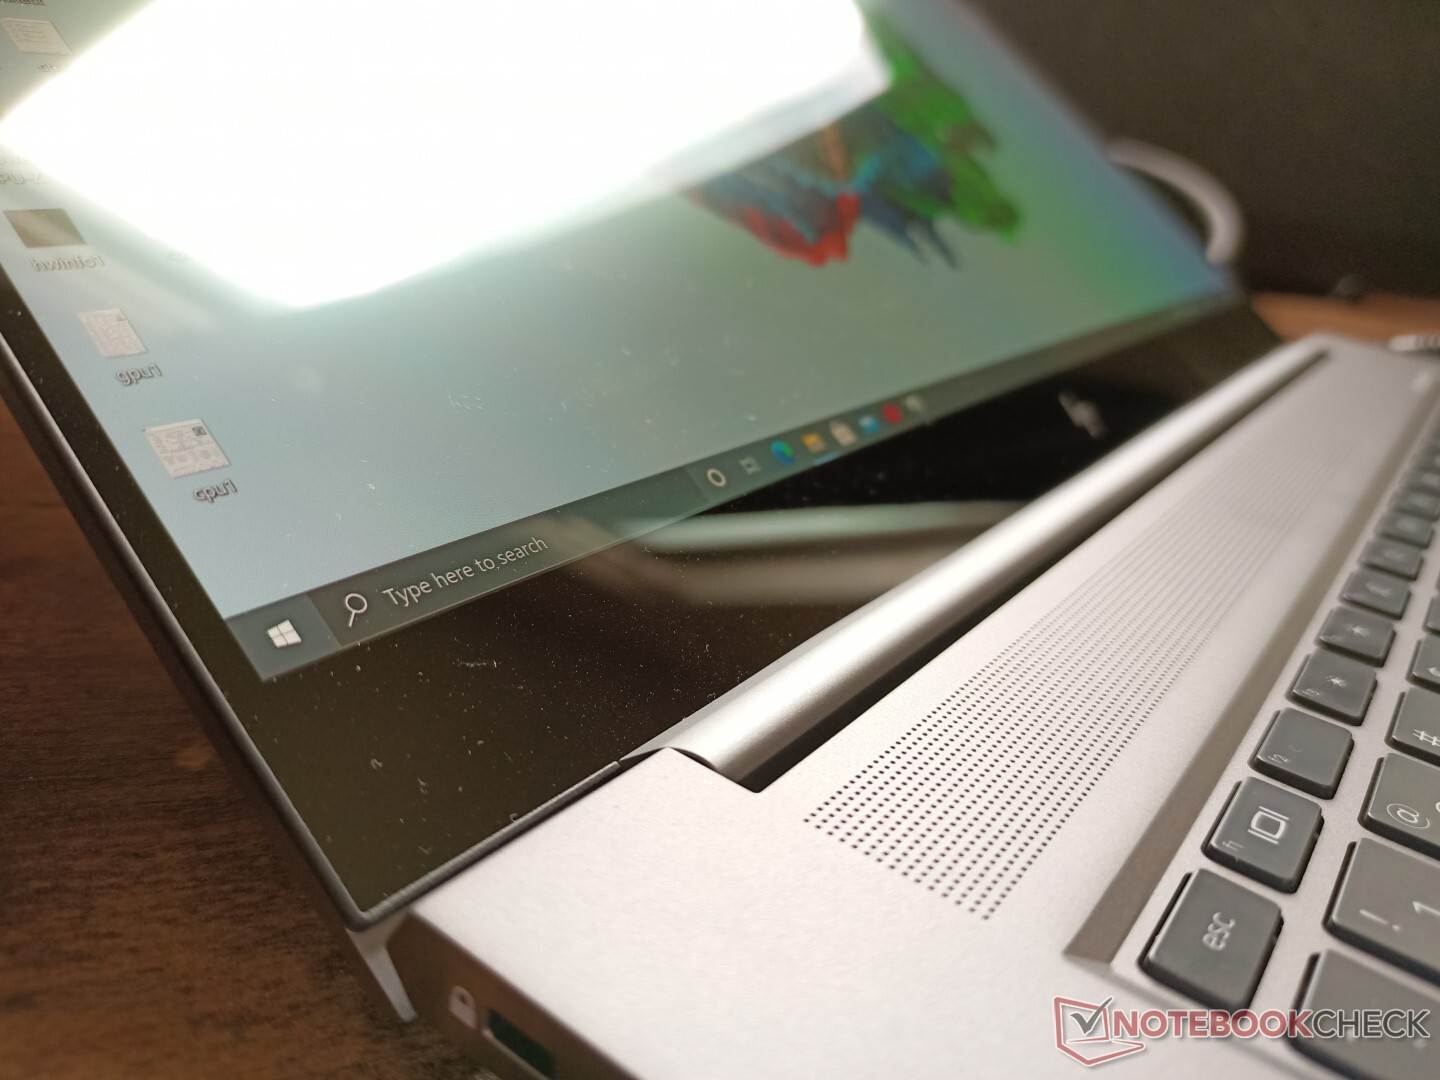
Case - Esteticamente identico allo ZBook 15 G7
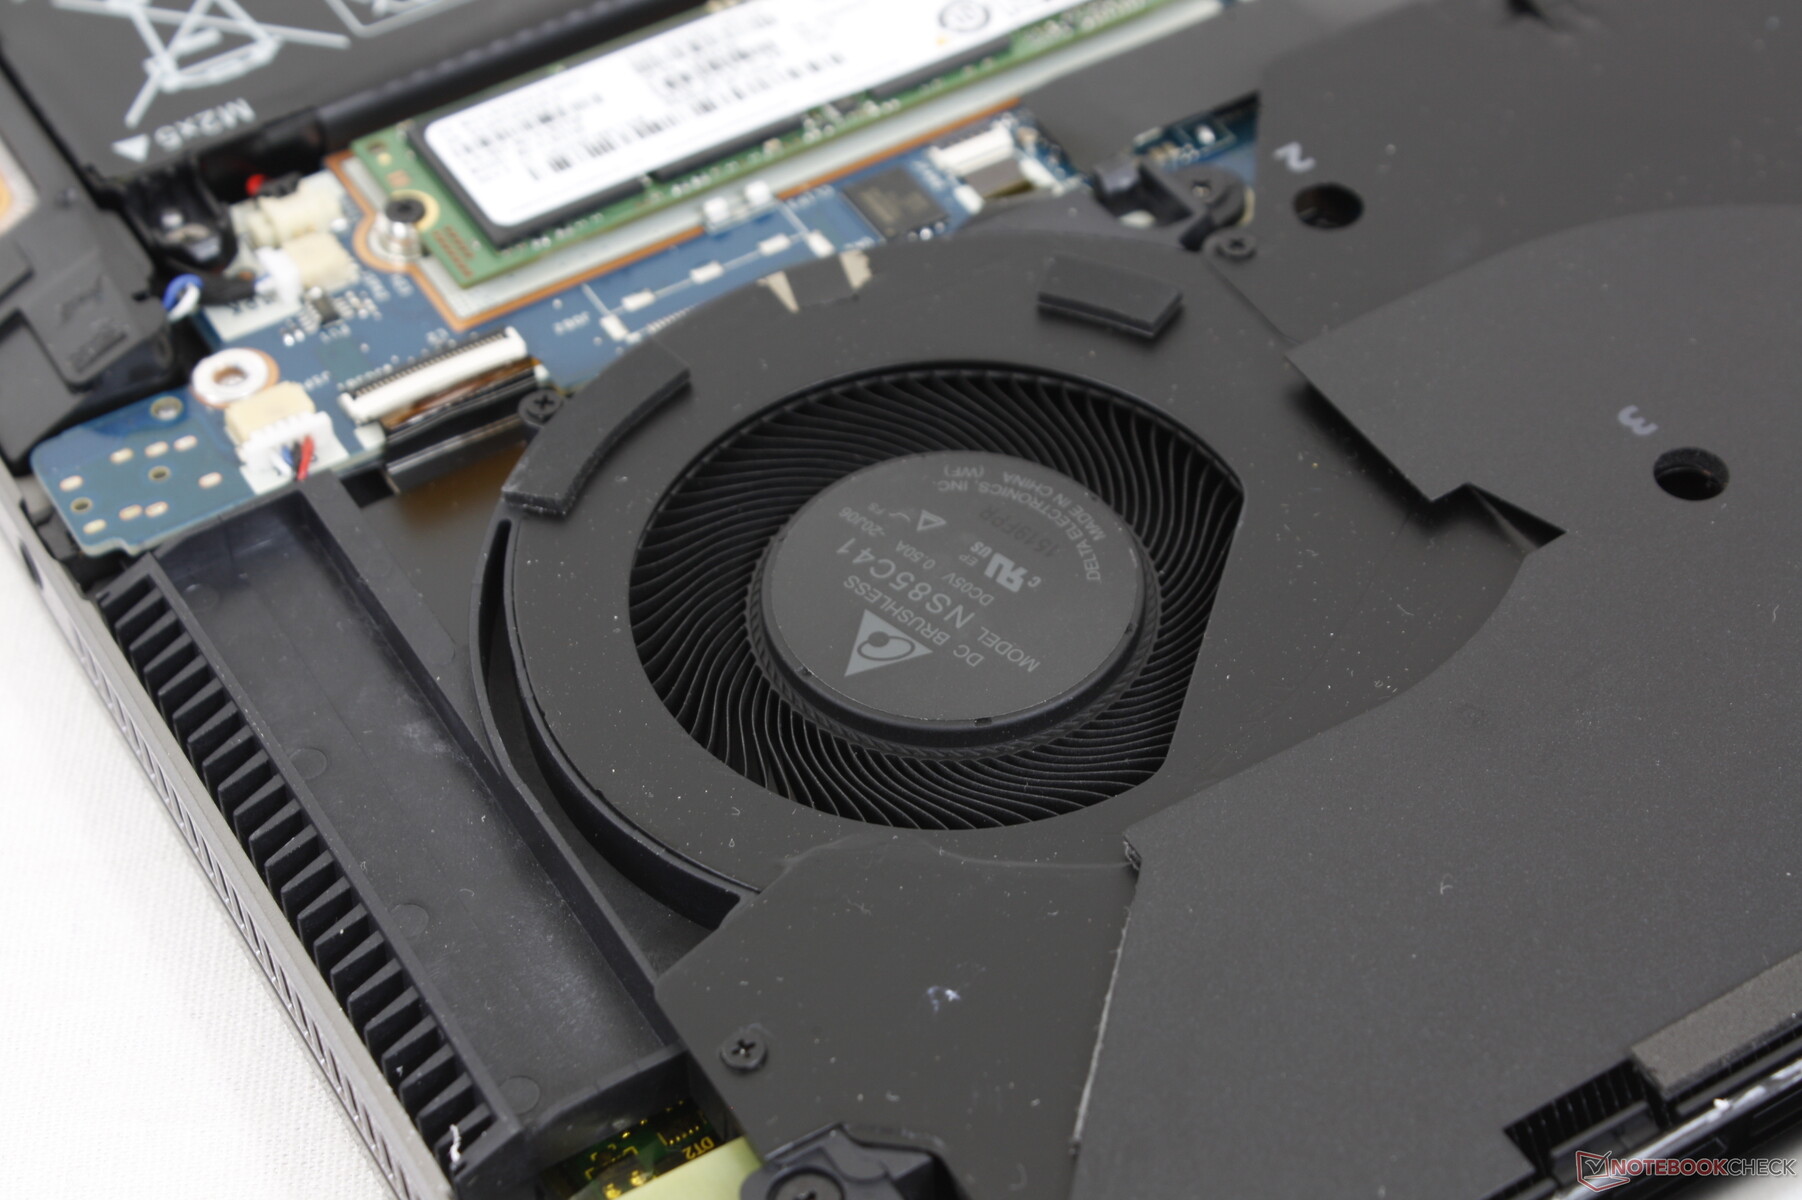
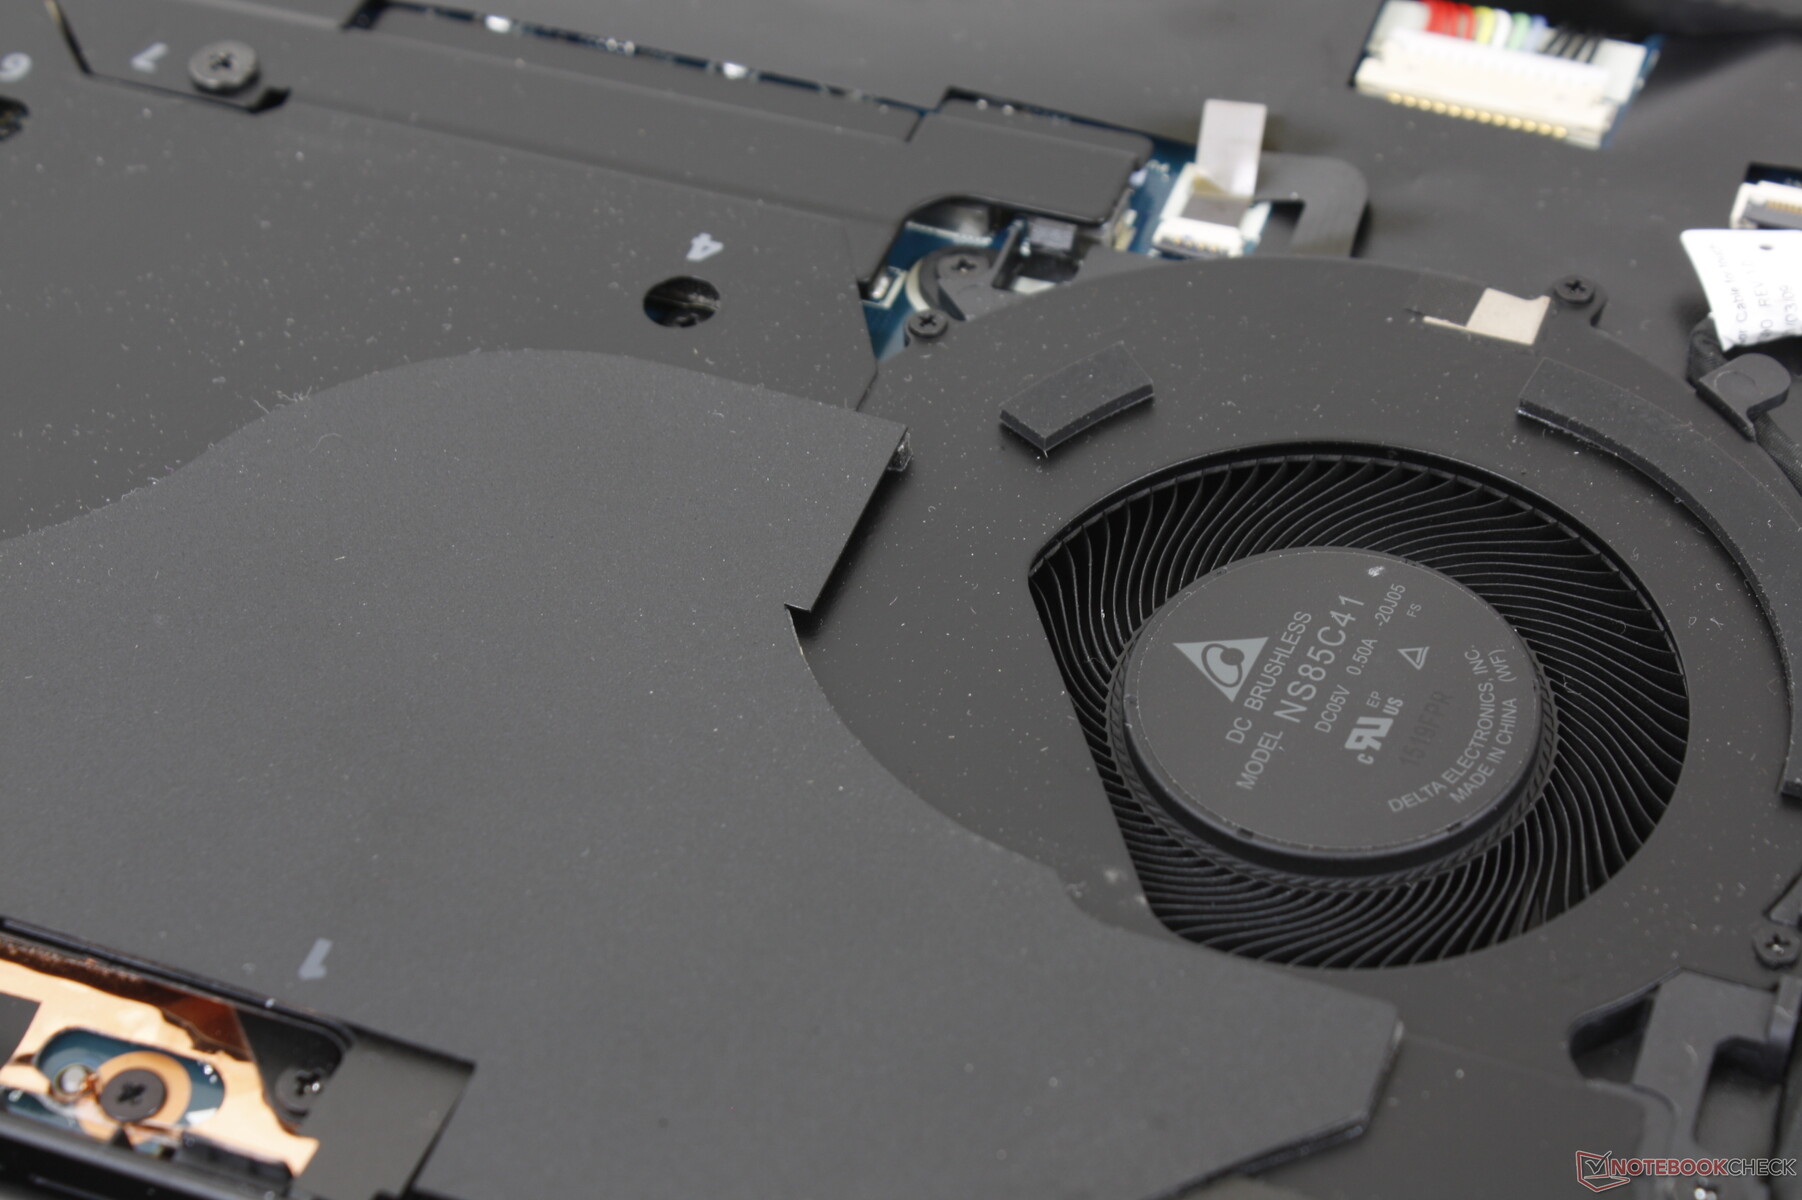
HP non ha cambiato il design esterno dello chassis e quindi i nostri precedenti commenti sullo ZBook Studio 15 G7 valgono anche qui. Invece, i cambiamenti sono interni, compresa l'illuminazione RGB opzionale per tasto e una soluzione di raffreddamento rivista per far entrare più aria rispetto al modello dell'anno scorso.
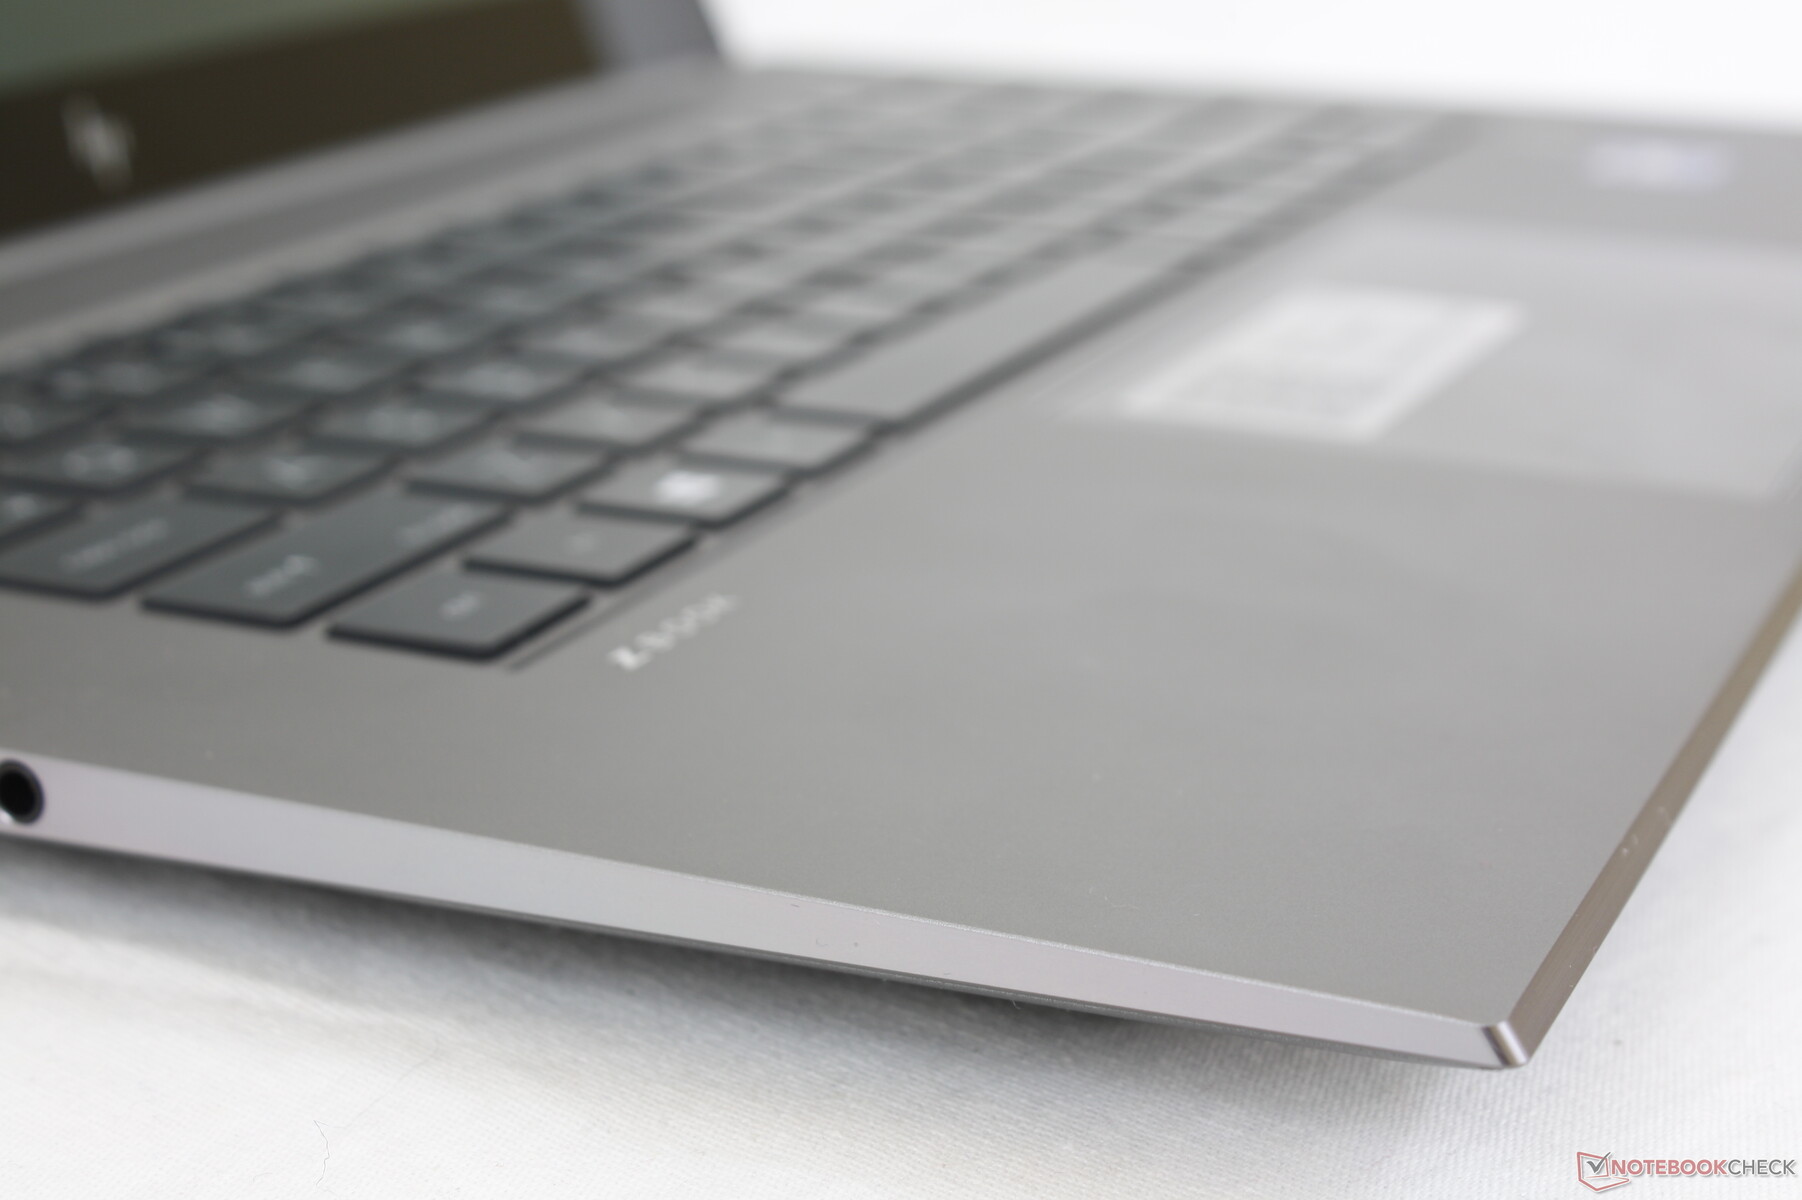
Il modello continua ad essere una delle più piccole workstation da 15,6" disponibili con CPU della serie Core-H e grafica di livello GeForce/Quadro nonostante il suo "vecchio" design dello chassis. È anche più piccolo dello ZBook Firefly G8 che è dotato di interni più lenti del nostro ZBook Studio G8.
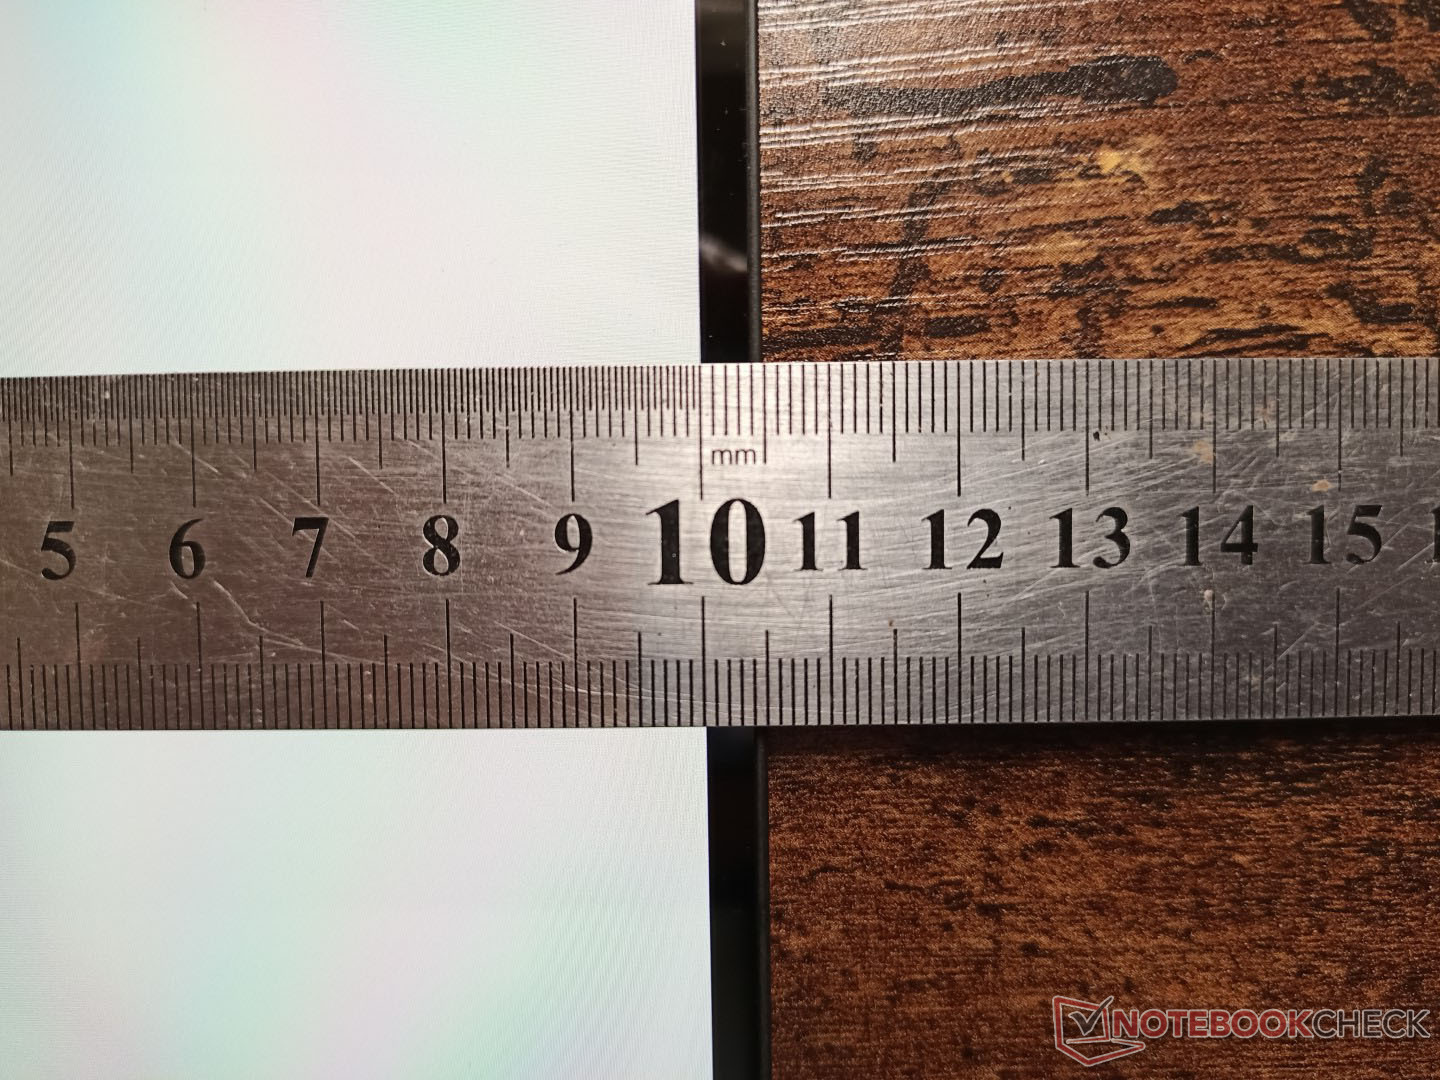
Vale la pena notare che le versioni con touchscreen sono leggermente più spesse delle versioni non touch di un centesimo di pollice (0.70" contro 0.69").
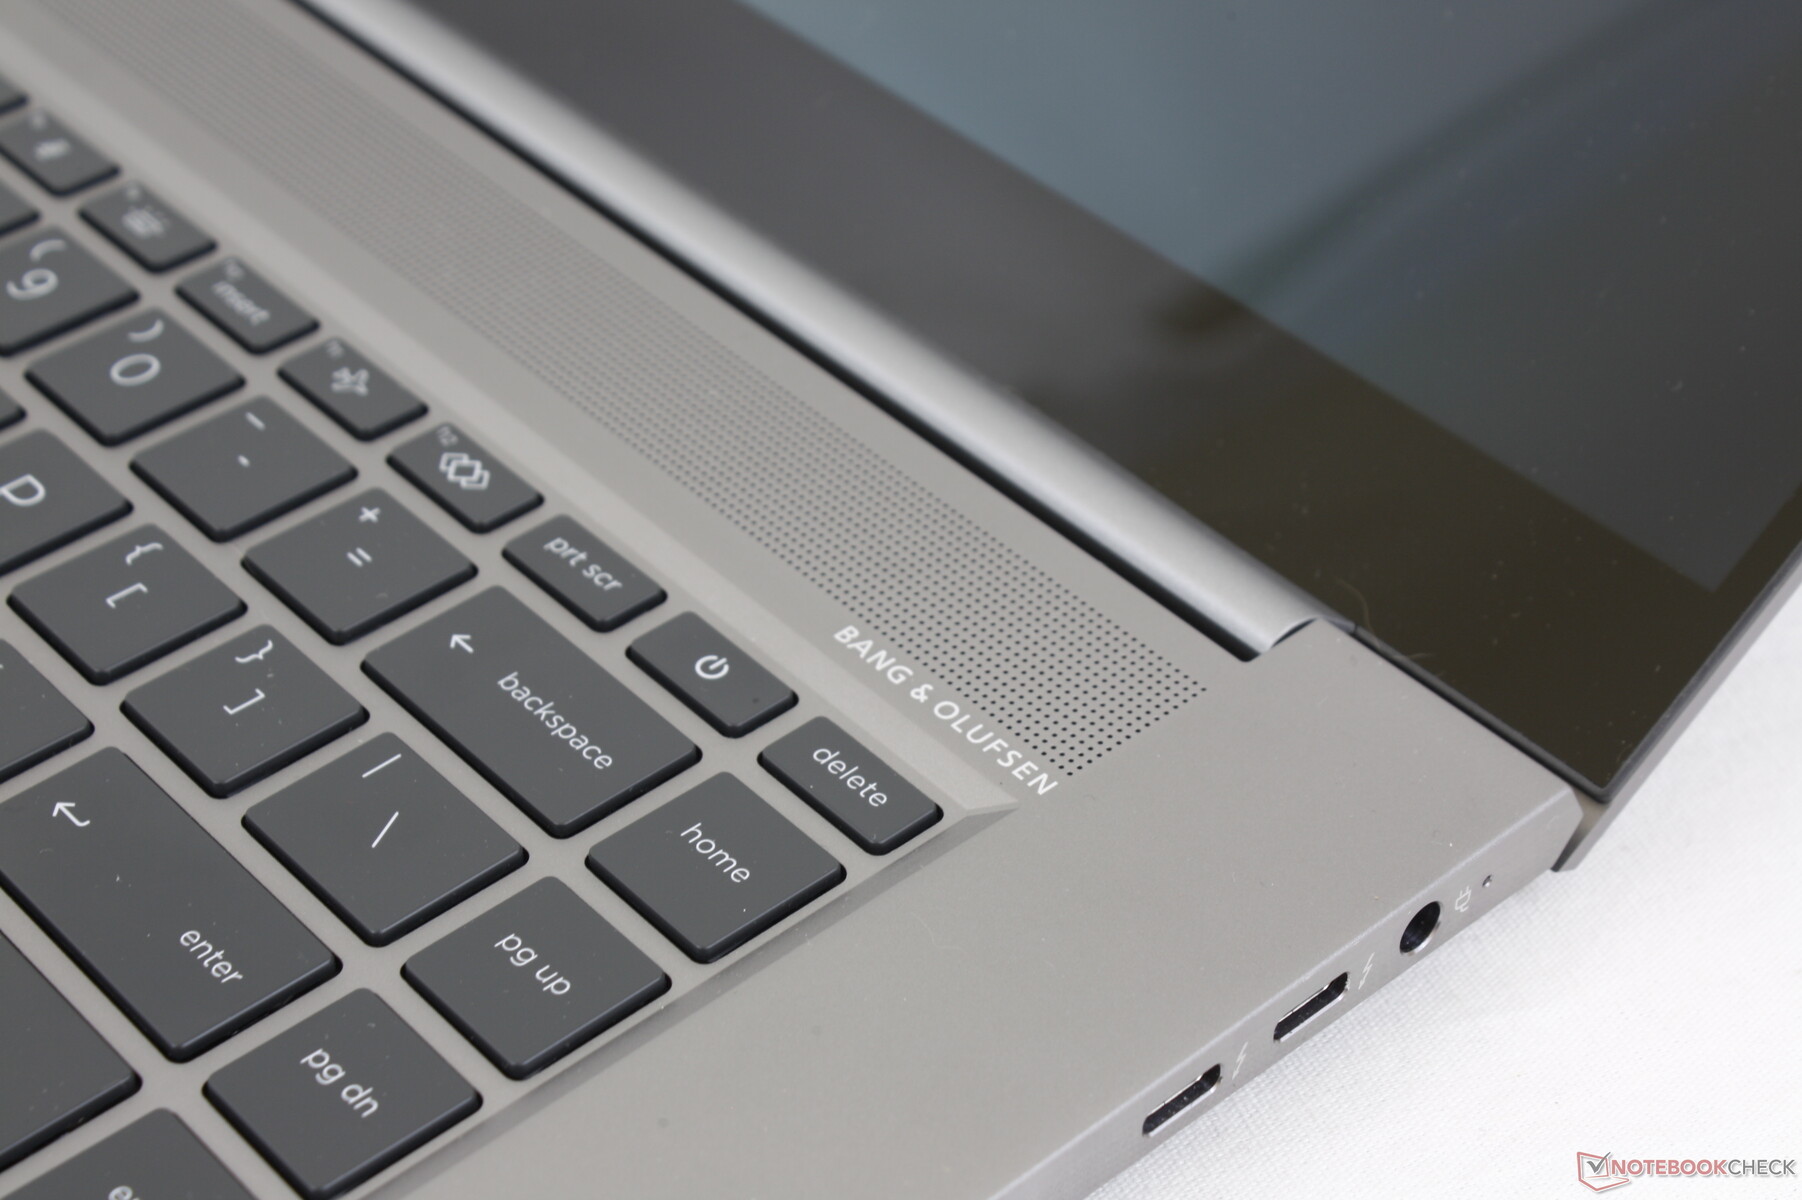
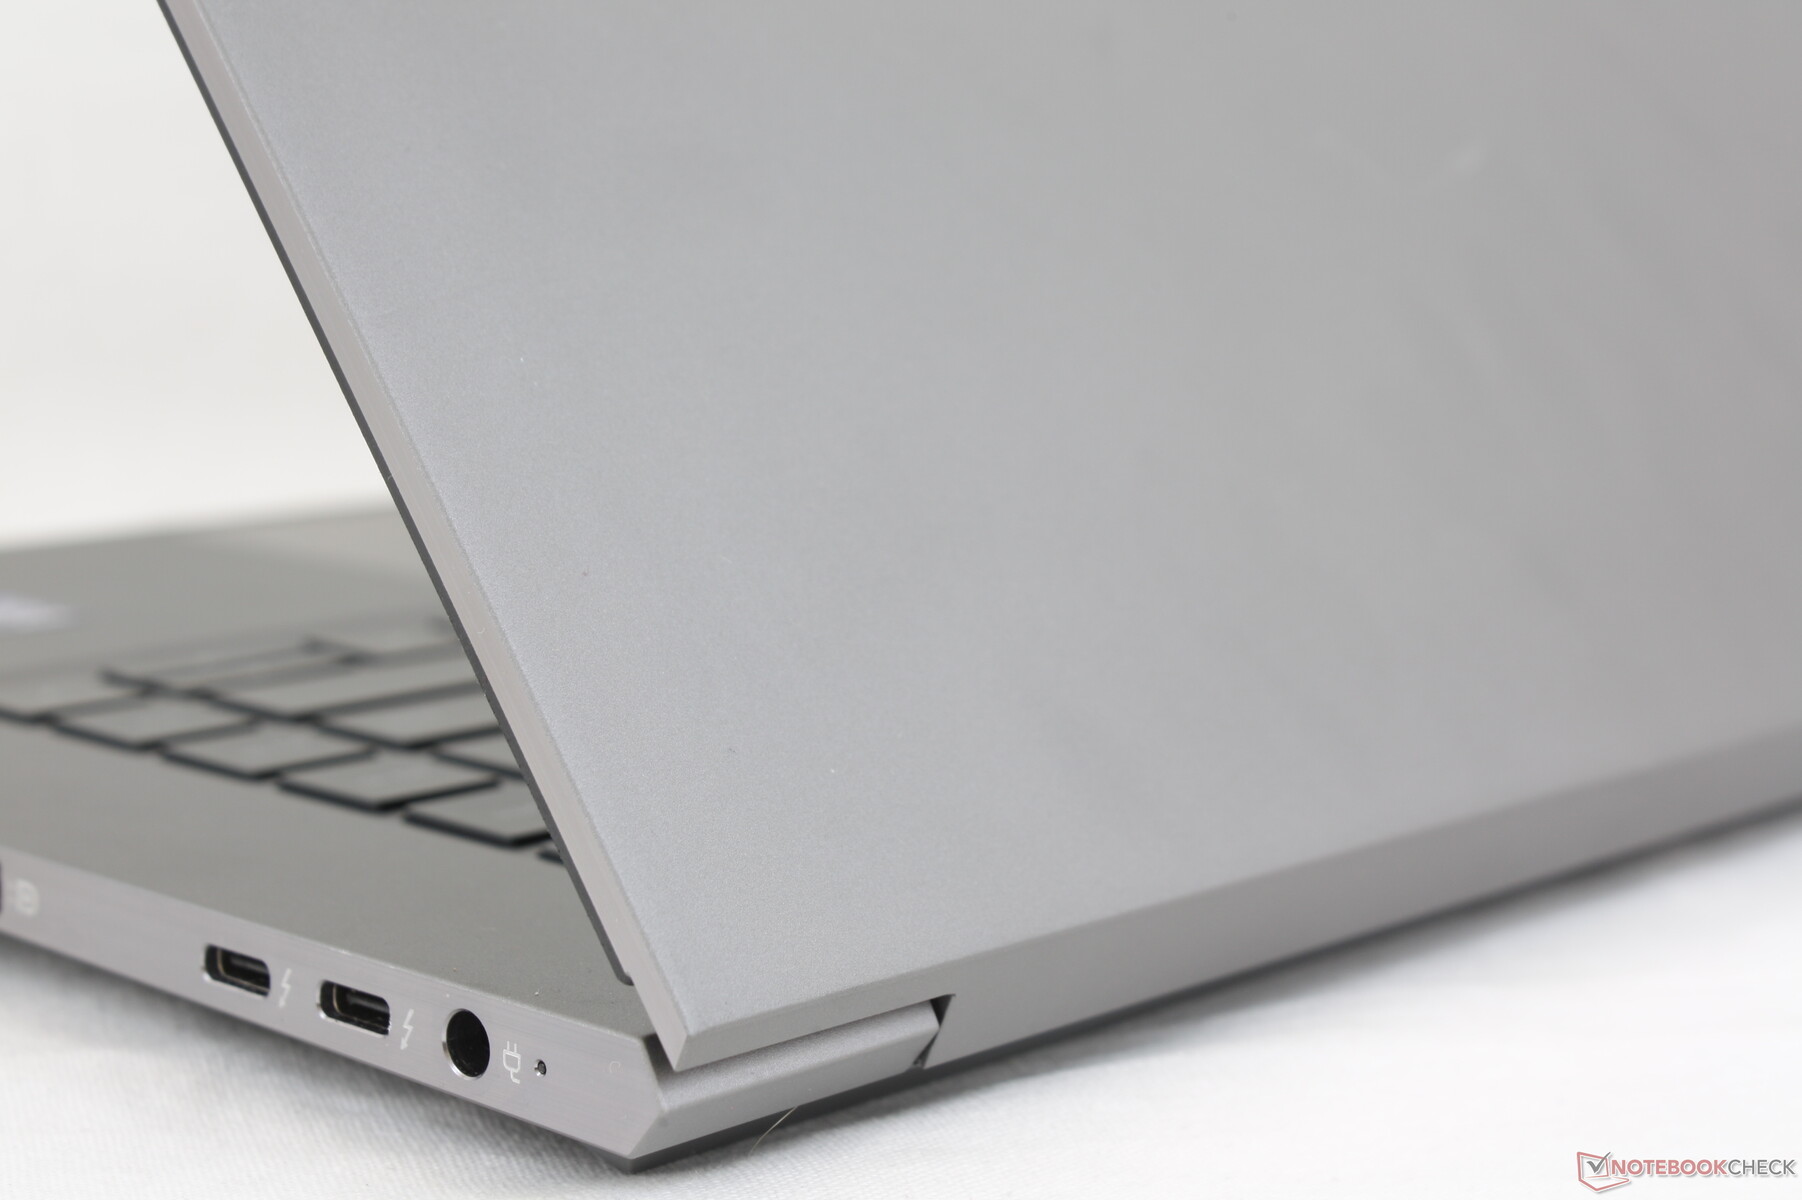
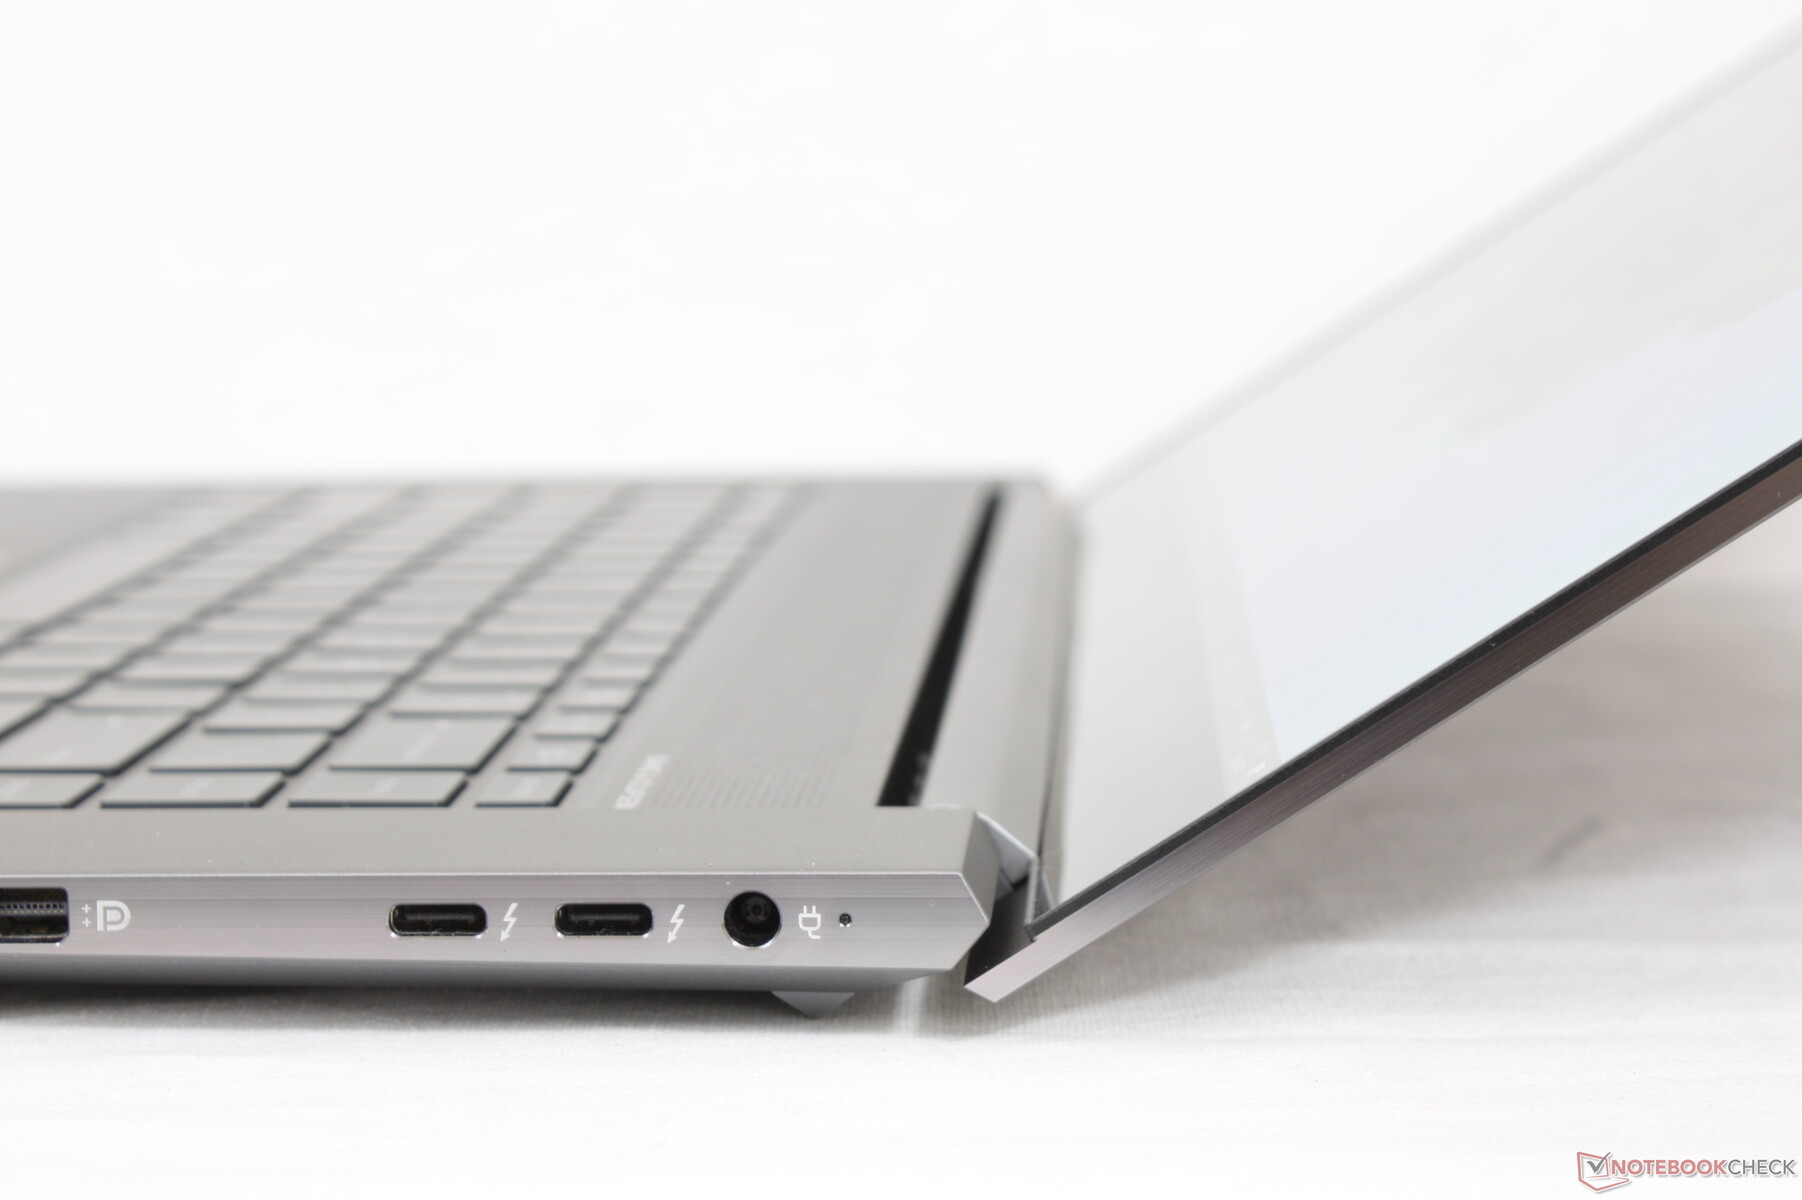
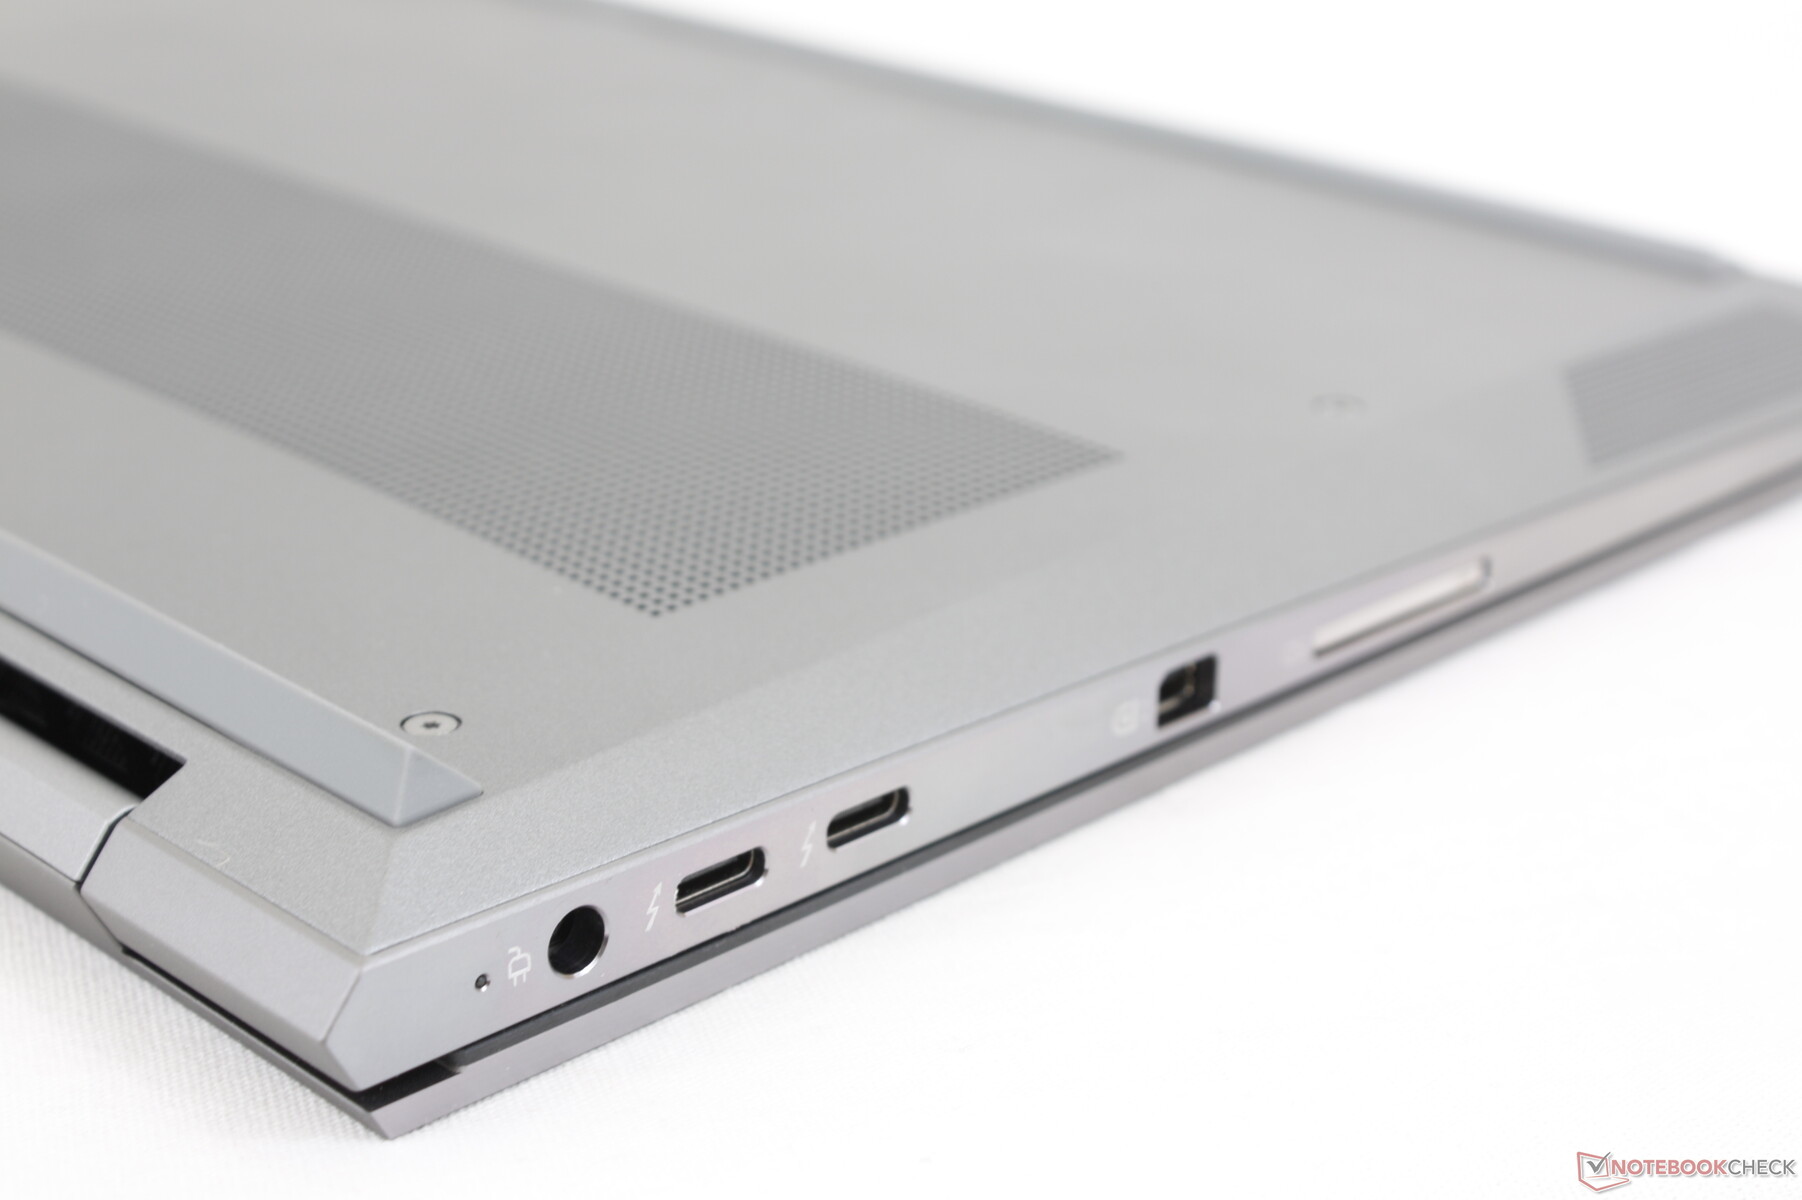
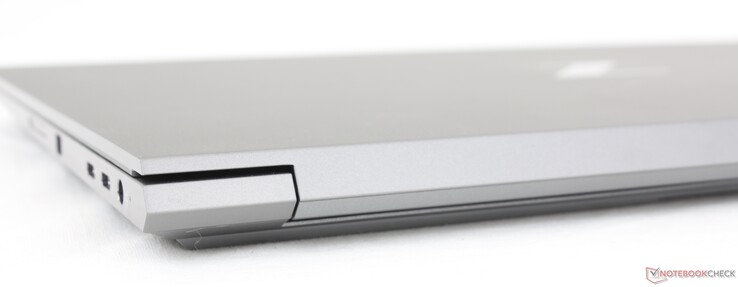
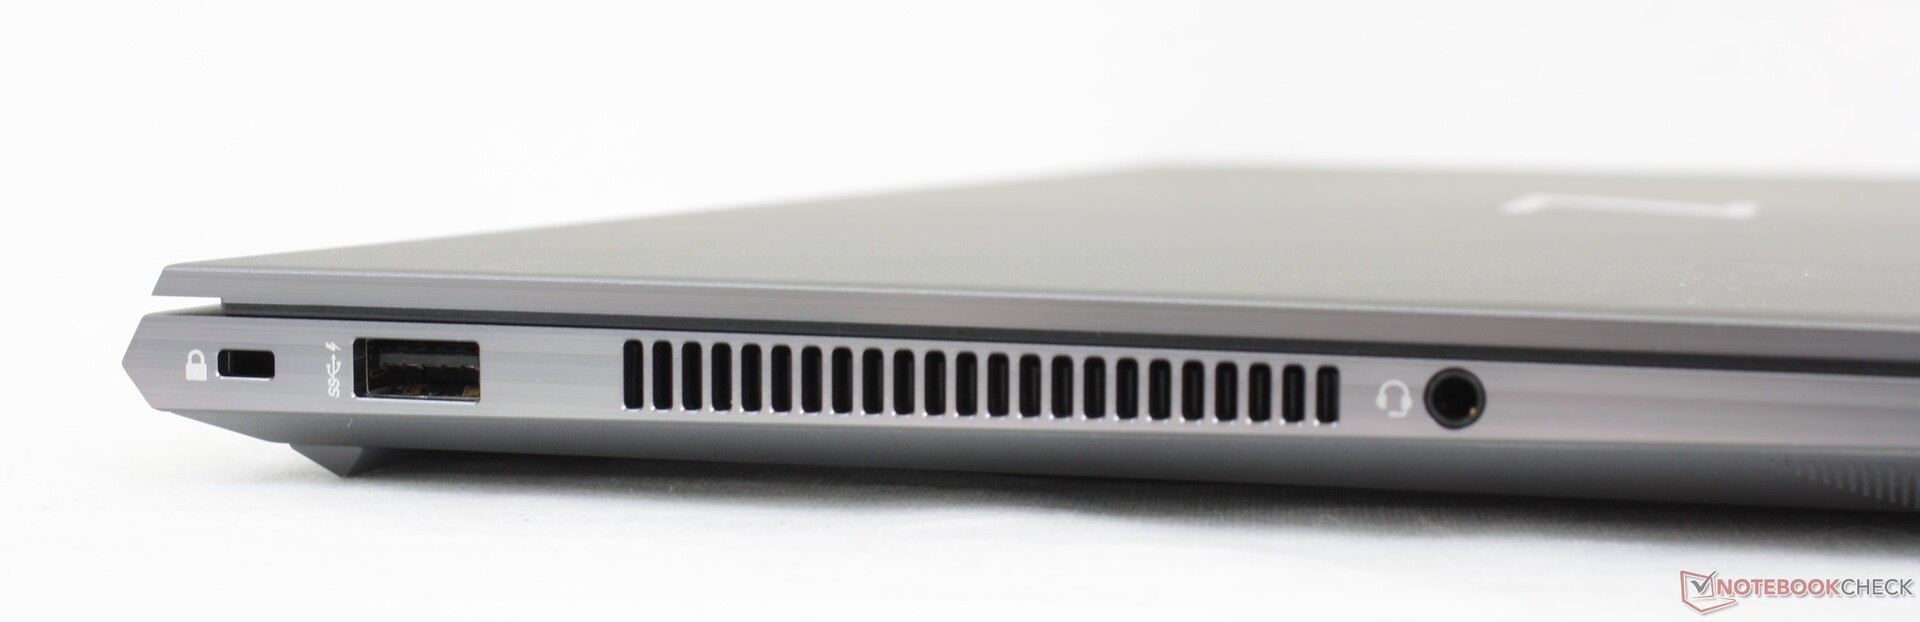
Connettività - Ora con Thunderbolt 4
Le opzioni delle porte sono meno numerose che sul Dell Precision 7550 poiché quest'ultimo integra tutto ciò che è presente sullo ZBook Studio G8 più gigabit RJ-45, HDMI e una porta USB-A extra. Gli utenti dovranno approfittare delle due porte Thunderbolt 4 integrate per sfruttare appieno le capacità di docking del sistema HP.
Il posizionamento delle porte è un po' stretto tra la porta proprietaria dell'adattatore AC e le due porte USB-C lungo il bordo destro. I cavi più spessi o i dispositivi USB-C potrebbero bloccare l'accesso alle porte adiacenti.
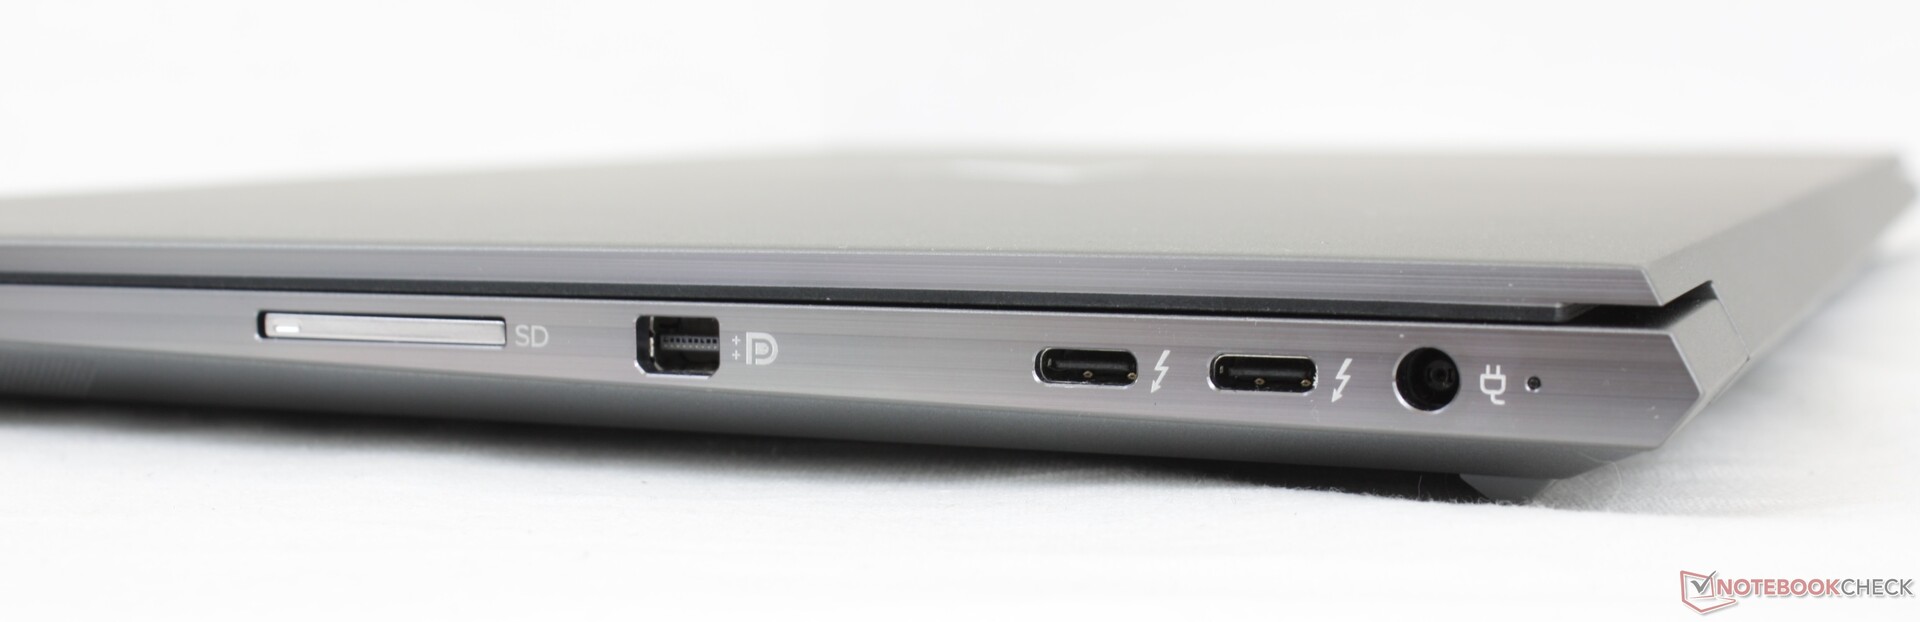
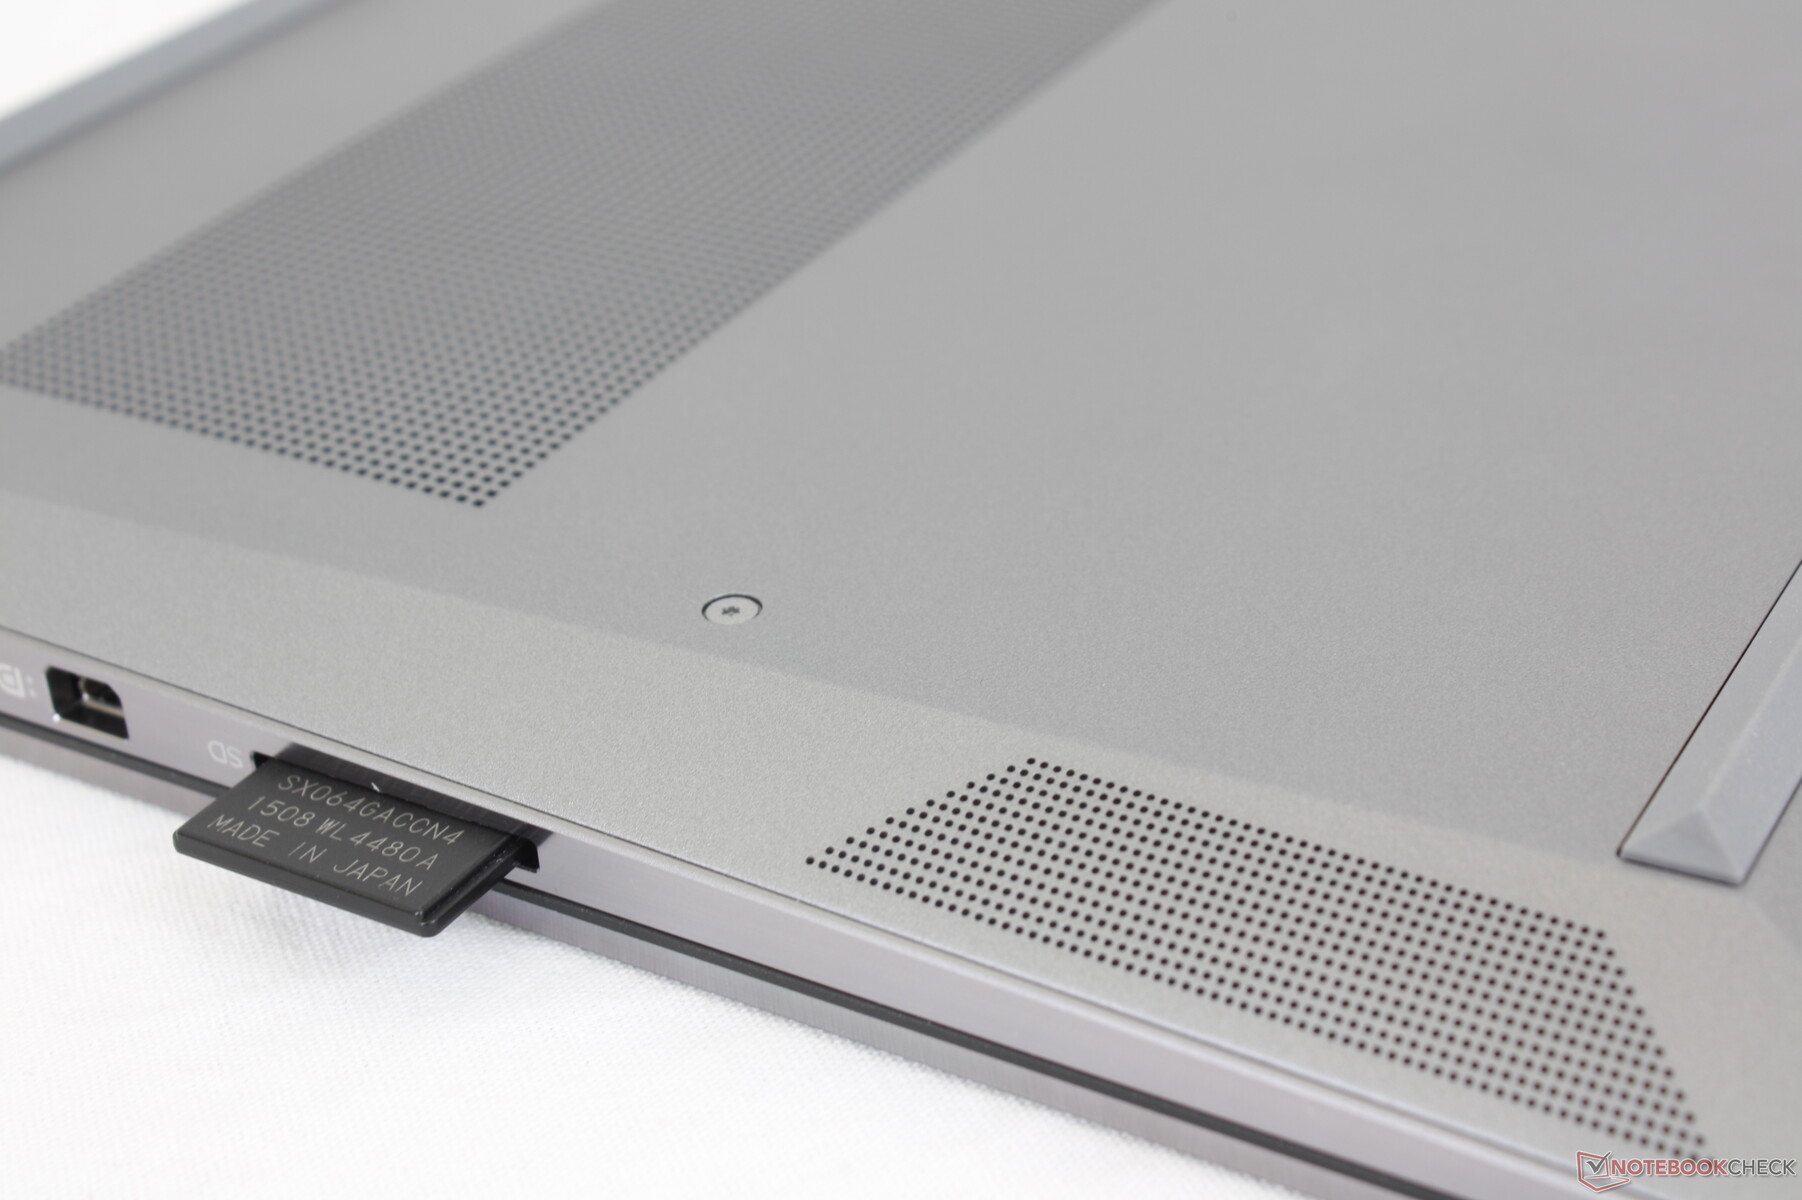
Lettore di schede SD
HP ha effettivamente declassato il lettore di schede SD quest'anno. Spostare 1 GB di immagini dalla nostra scheda di test UHS-II al desktop richiede circa 14 secondi rispetto a meno della metà sullo ZBook Studio G7. Non siamo sicuri del perché HP abbia fatto questo, ma è comunque deludente soprattutto per i creatori di contenuti che si affidano al lettore di schede.
| SD Card Reader | |
| average JPG Copy Test (av. of 3 runs) | |
| Dell Precision 7550 (Toshiba Exceria Pro SDXC 64 GB UHS-II) | |
| HP ZBook Studio G7 (AV Pro V60) | |
| HP ZBook Studio 15 G8 (AV Pro V60) | |
| Lenovo ThinkPad P15s Gen2-20W6000GGE (AV Pro V60) | |
| maximum AS SSD Seq Read Test (1GB) | |
| Dell Precision 7550 (Toshiba Exceria Pro SDXC 64 GB UHS-II) | |
| HP ZBook Studio G7 (AV Pro V60) | |
| Lenovo ThinkPad P15s Gen2-20W6000GGE (AV Pro V60) | |
| HP ZBook Studio 15 G8 (AV Pro V60) | |
Comunicazioni
L'Intel AX201 è dotato di serie di connettività Wi-Fi 6 e Bluetooth 5.2. Le velocità di trasferimento sono stabili a circa 1400 Mbps in entrambe le direzioni quando accoppiato al nostro router di prova Netgear RAX200.
Webcam


Sicurezza
HP ha un'intera suite di software e misure di protezione di basso livello tra cui Sure Click, Secure Erase, BIOSphere, Sure Start, Sure Run, Tamper Lock, Sure View opzionale, e molti altri oltre al solito lettore di impronte digitali e TPM. Un semplice otturatore della webcam è palesemente assente, tuttavia, il che ci sembra un'enorme svista da parte di HP.
Manutenzione
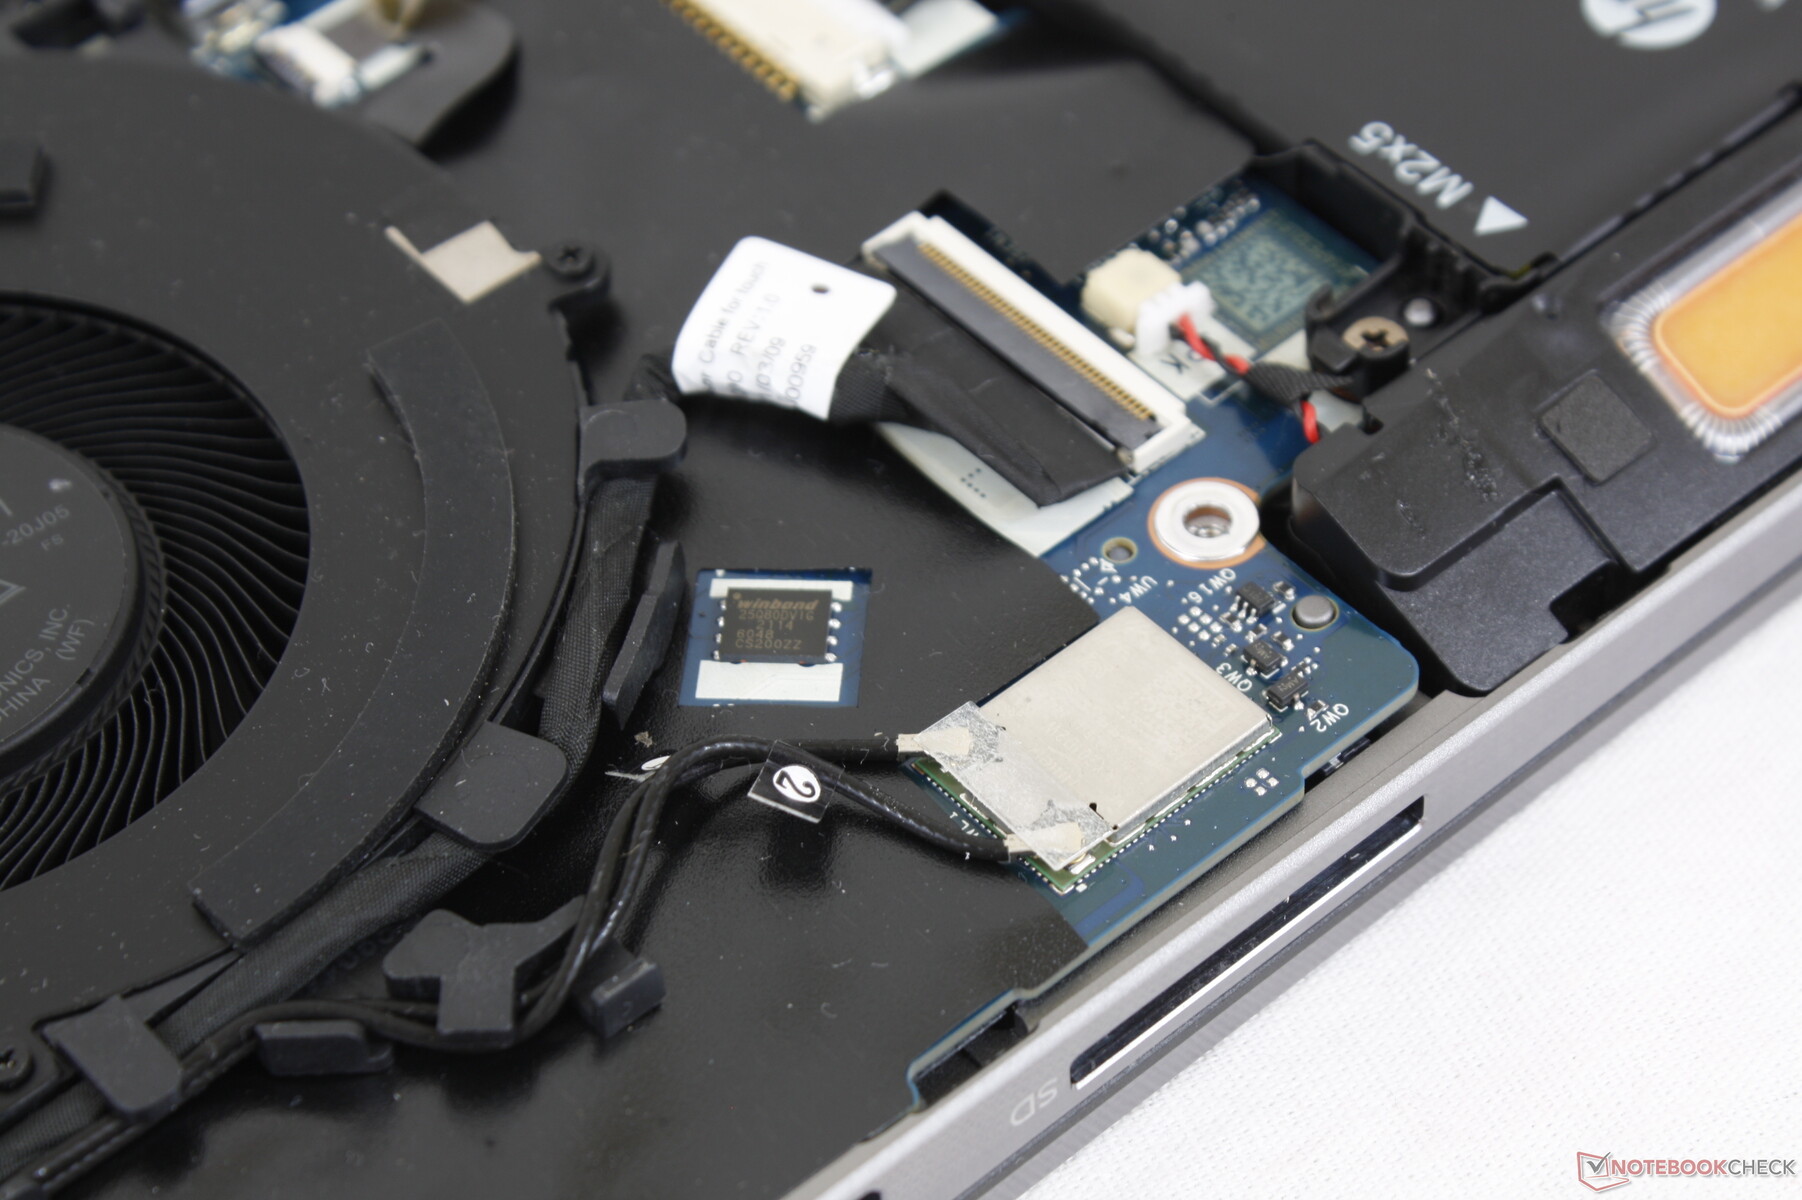
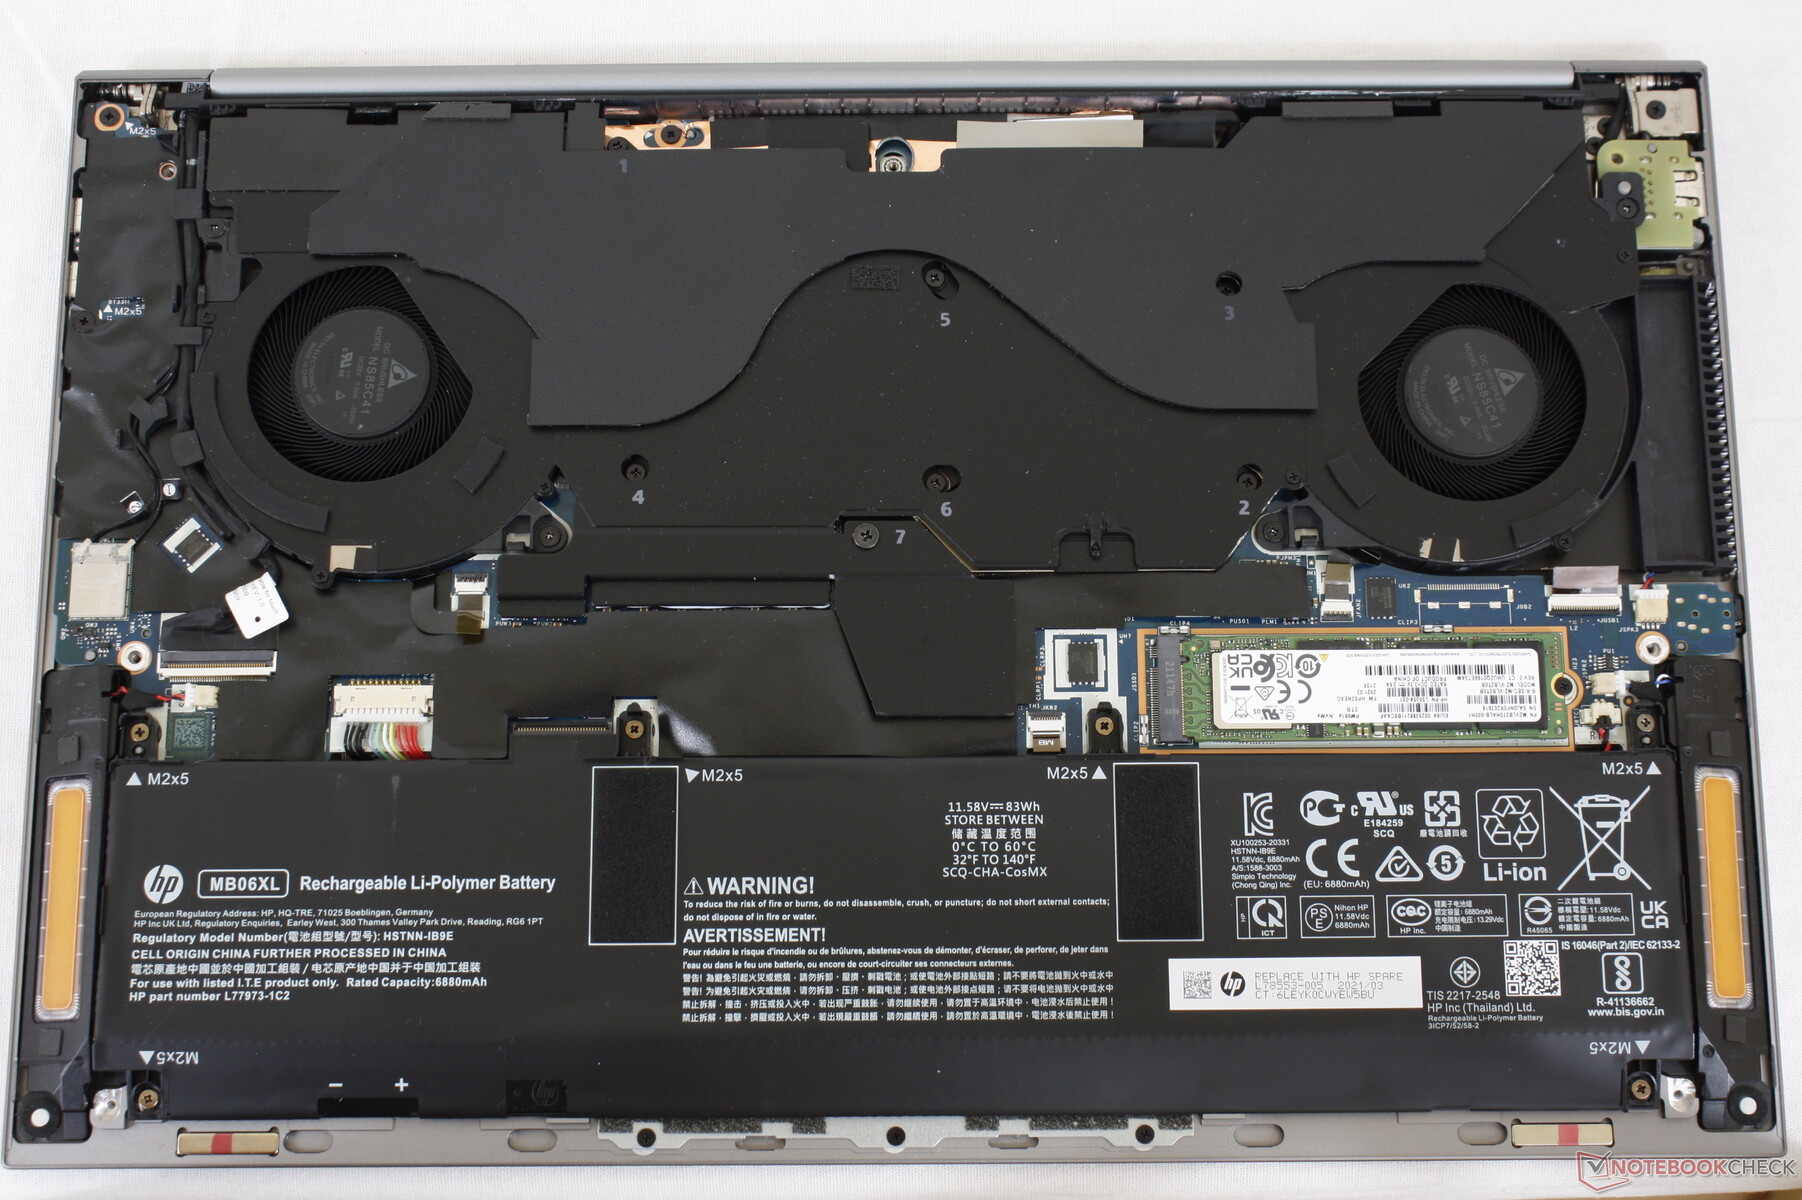
Il pannello inferiore richiede un cacciavite Philips e un bordo affilato per fare leva. Non c'è molto da aggiornare una volta dentro, comunque, dato che i moduli RAM e WLAN sono saldati.
Accessori e garanzia
La confezione non include extra al di fuori dell'adattatore AC e della documentazione. Una garanzia di base di un anno è standard invece della garanzia di due o tre anni che le workstations di fascia alta tendono ad offrire senza costi aggiuntivi.
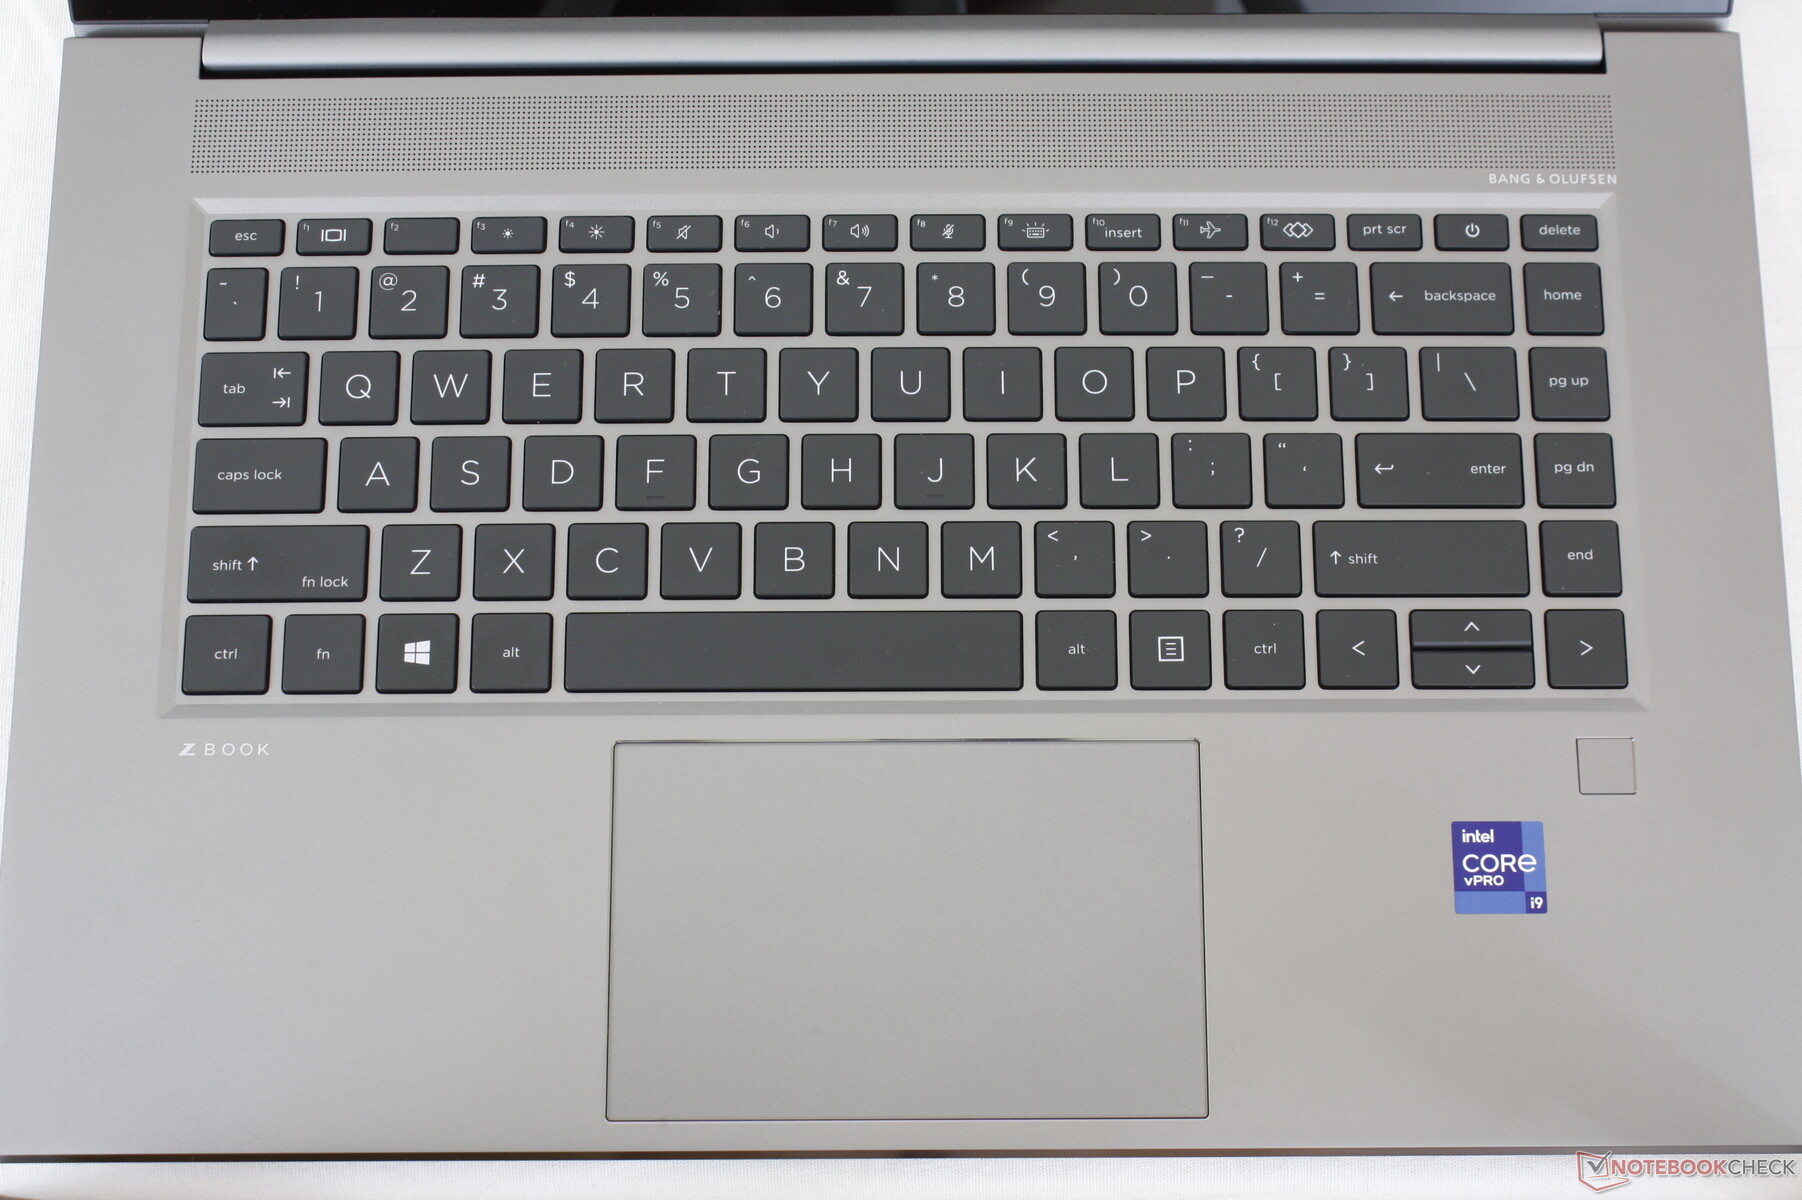
Dispositivi di input - Ci mancano i tasti dedicati del mouse e il TrackPoint
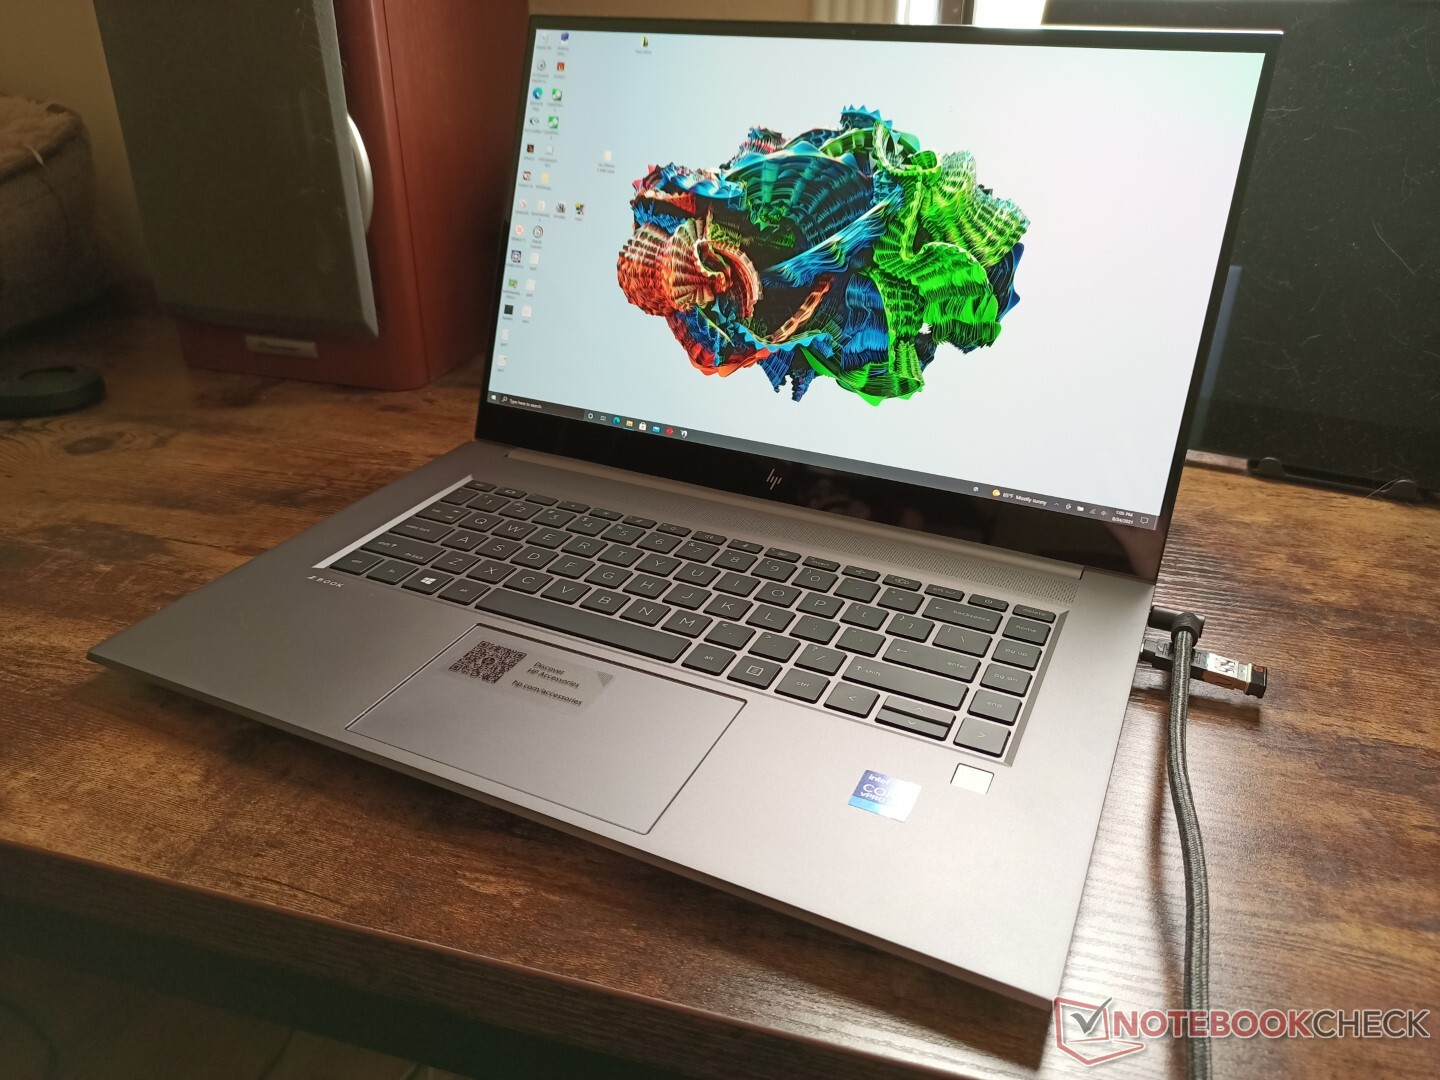
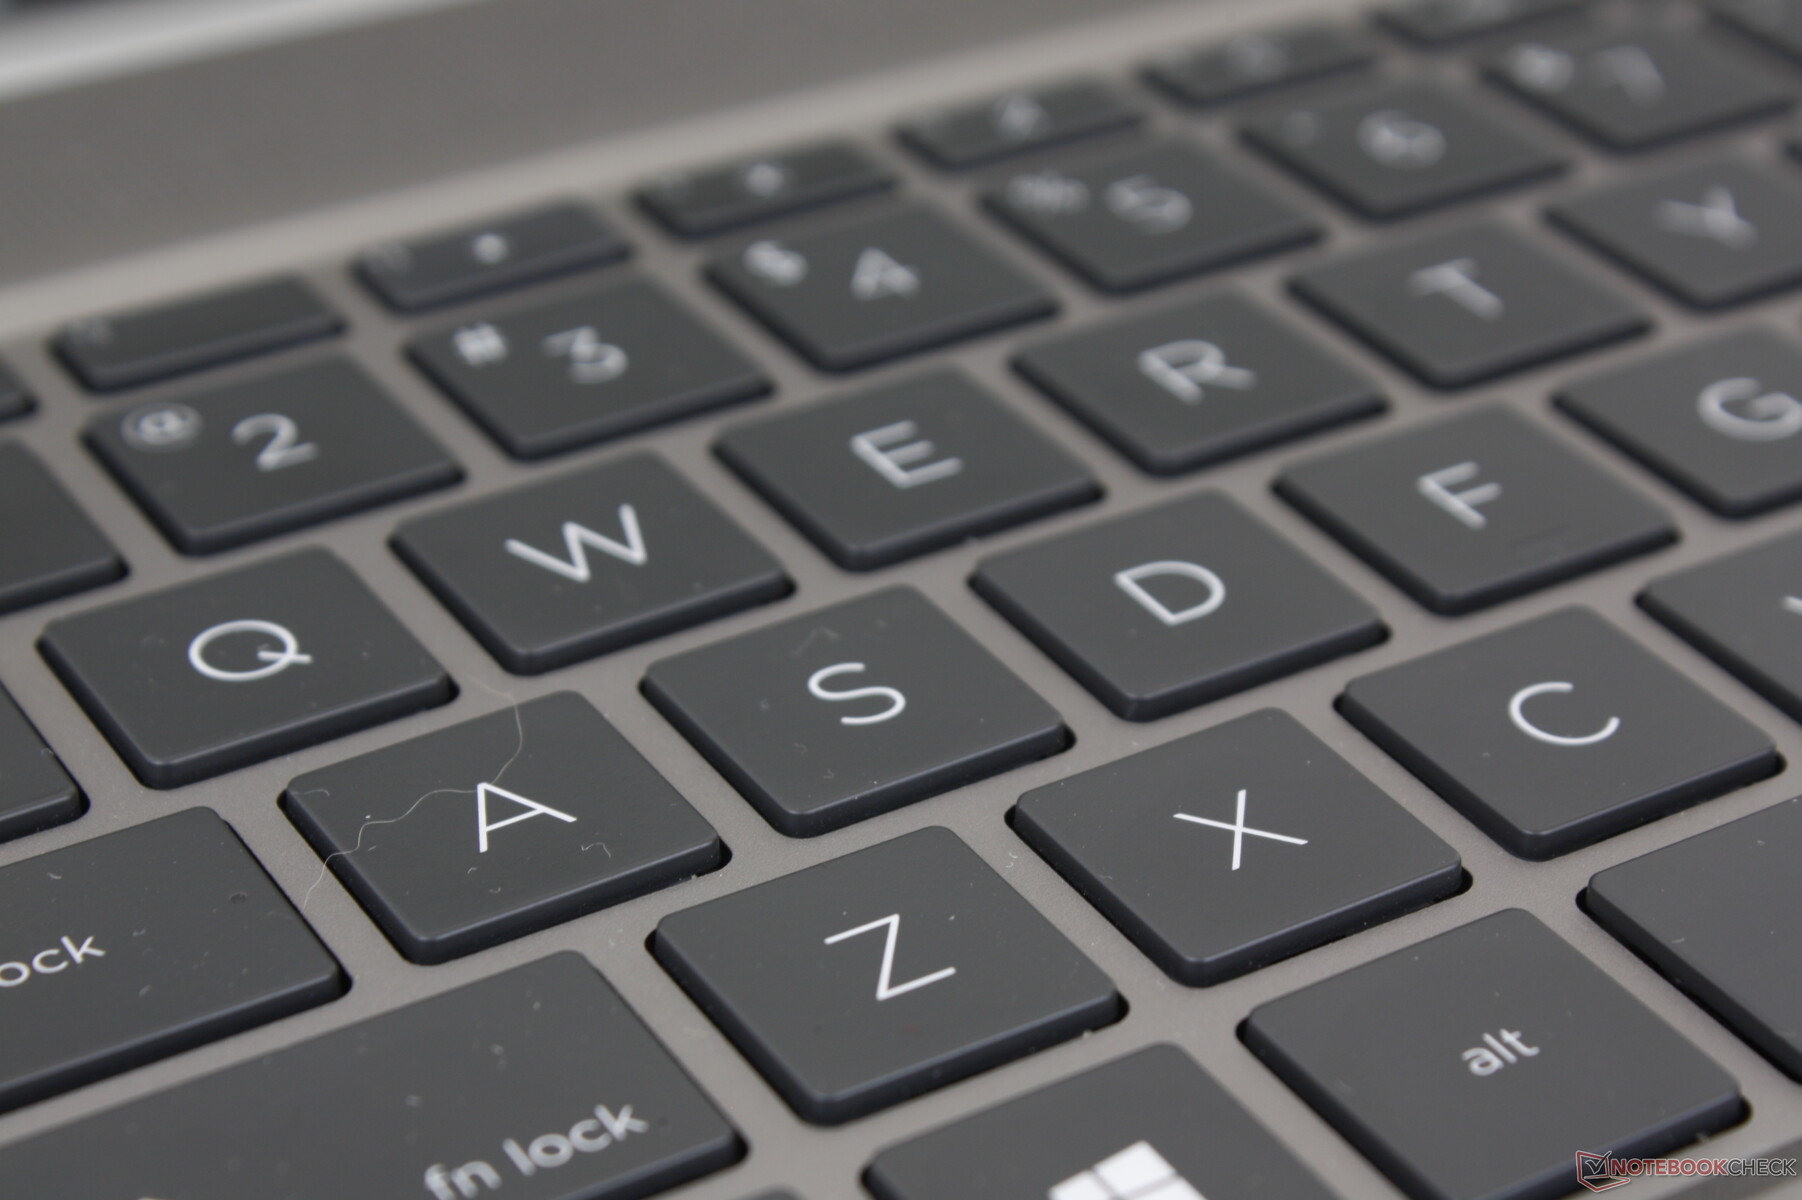
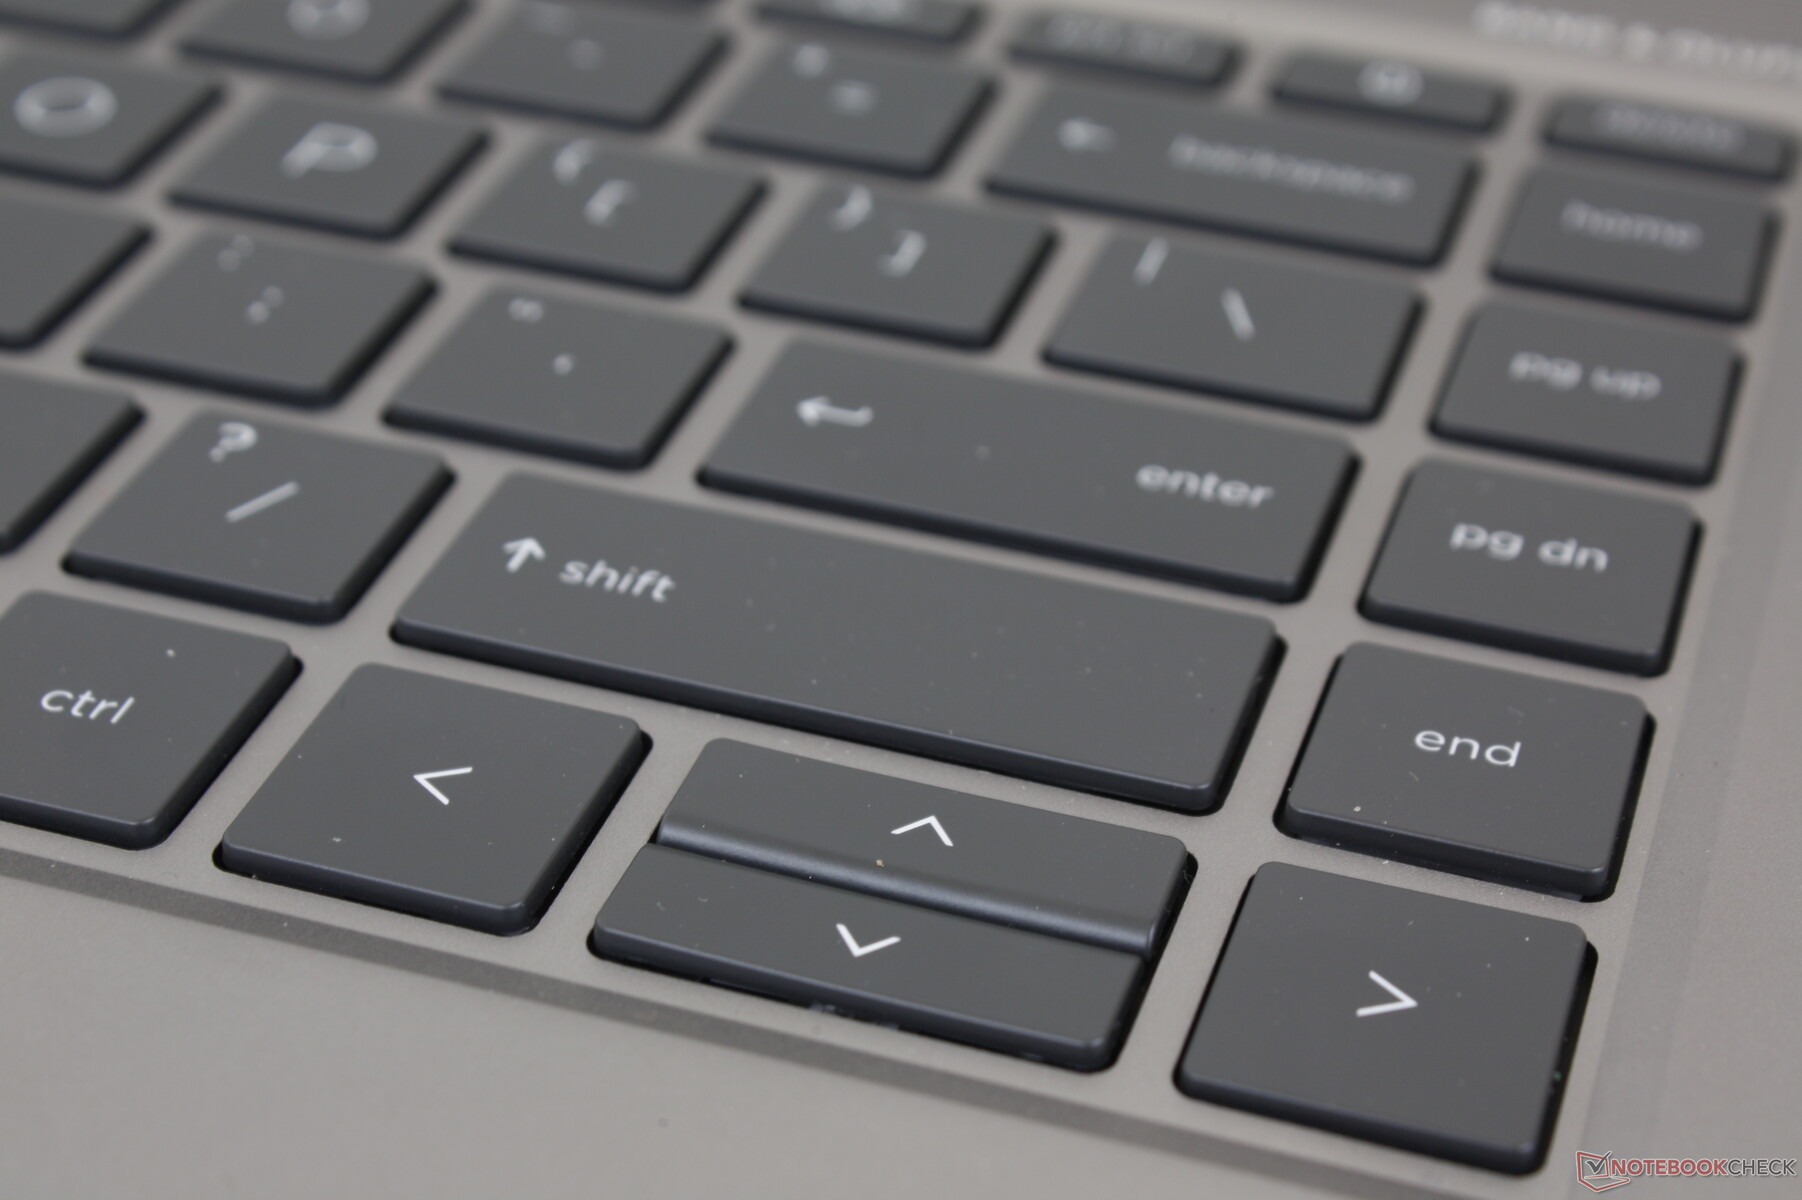
Tastiera
I modelli HP di fascia alta come Envy, Spectre, EliteBook, o ZBook hanno alcune delle migliori tastiere nel mercato dei laptop. I loro tasti tendono ad essere più nitidi e profondi per un feedback più deciso e un'esperienza di digitazione più soddisfacente. Lo svantaggio principale è il rumore dei tasti più forte rispetto ai tasti più morbidi e silenziosi dell'MSI WS66 o del Razer Blade Studio.
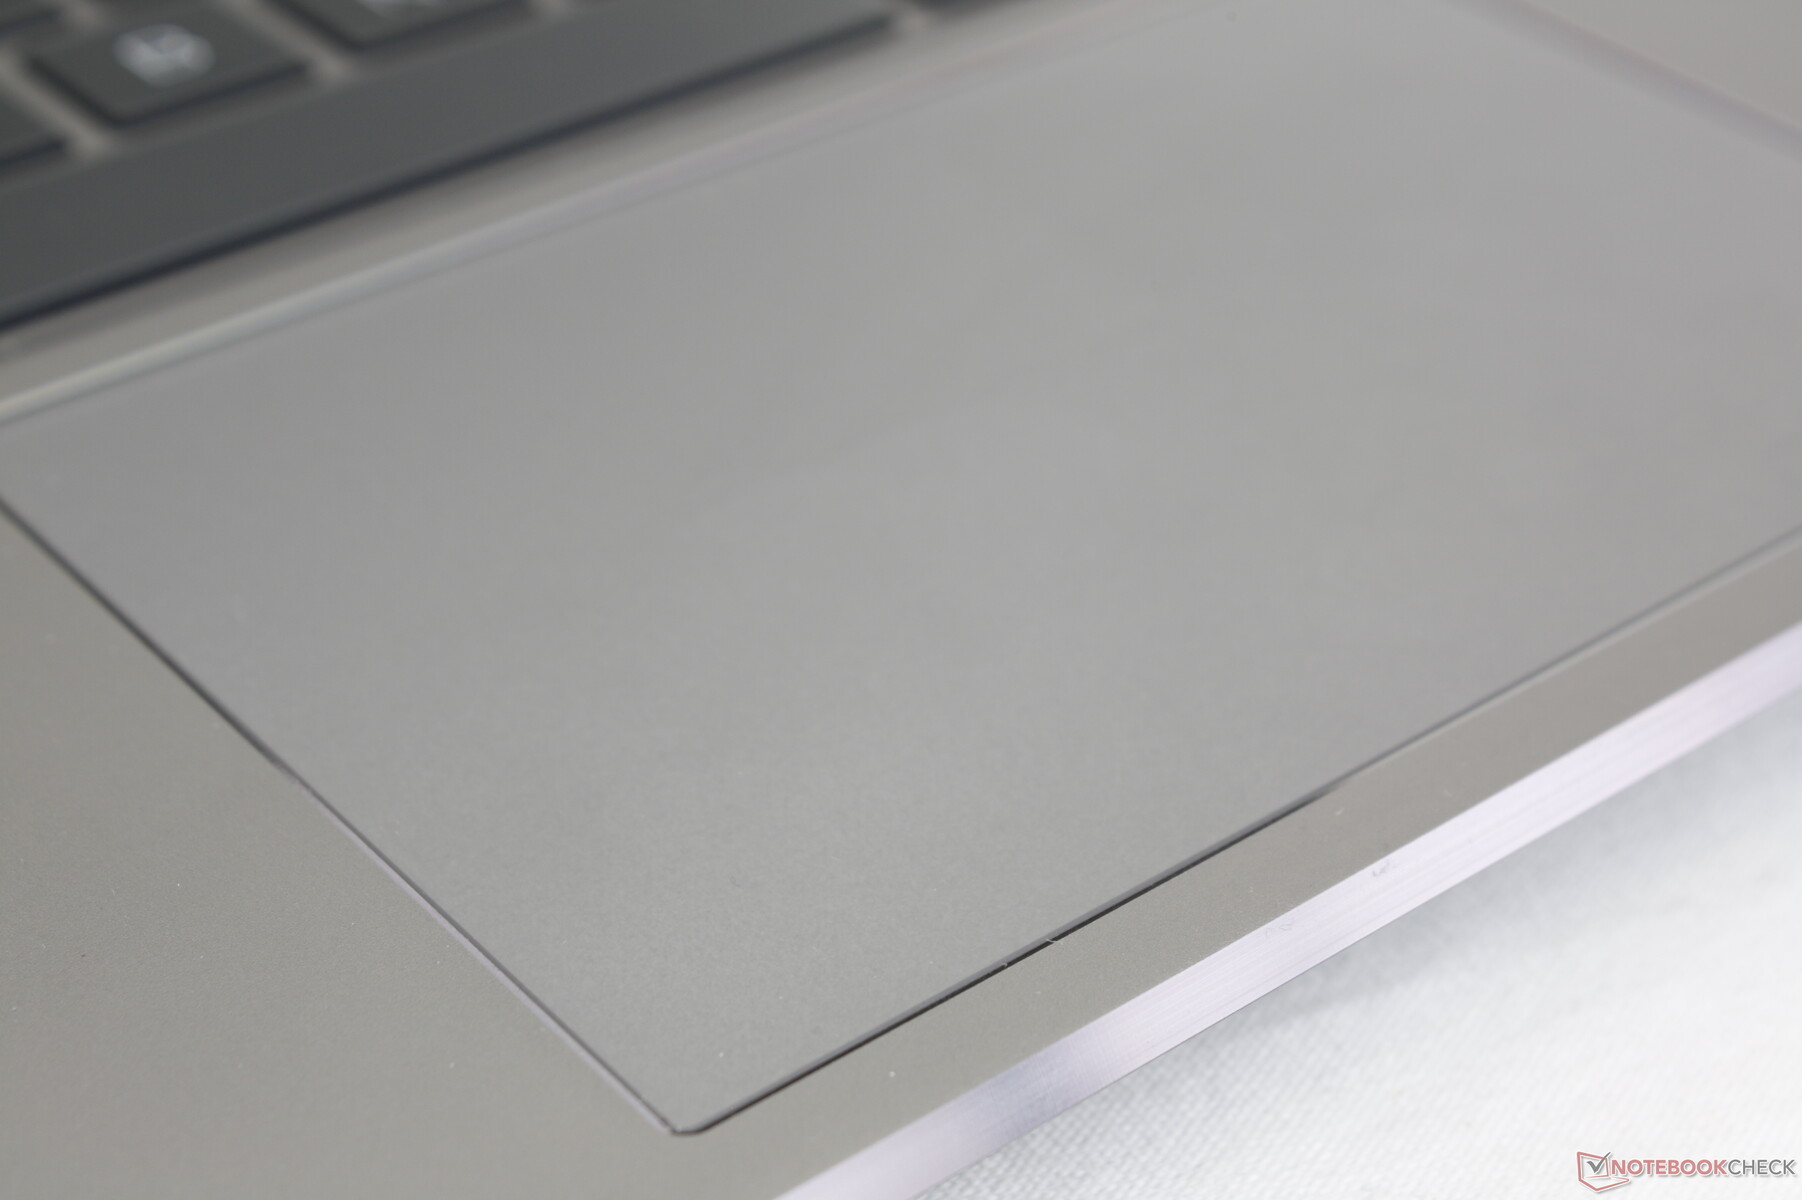
Touchpad
Il clickpad liscio (11,5 x 7,3 cm) non ha pulsanti dedicati a differenza dello ZBook Firefly, ZBook Fury, e la maggior parte delle altre workstations mobili tradizionali. Tuttavia, il clickpad non è così spugnoso come sul Razer Blade Studio per un click più affidabile e input multi-touch.
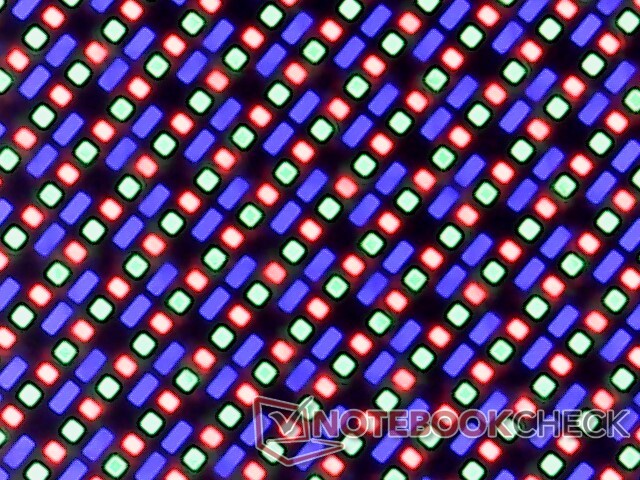
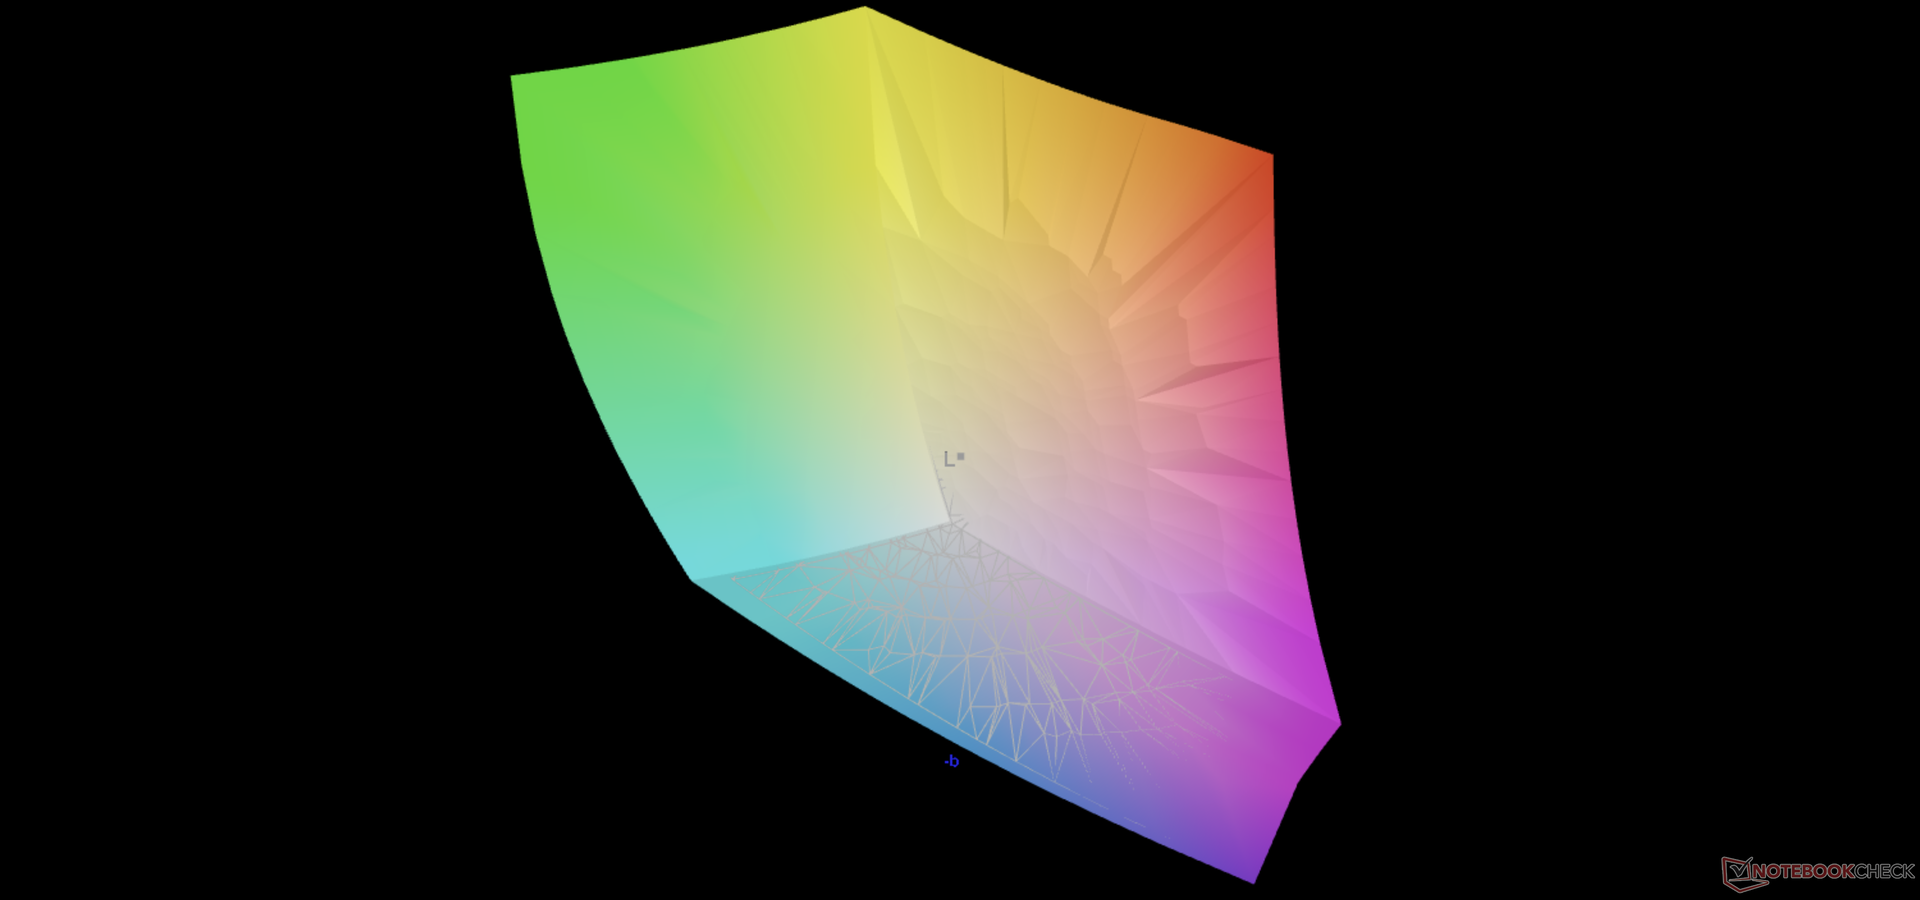
Display - OLED ha alcuni svantaggi
Anche se HP usa LG per la sua opzione 4K IPS, questa opzione 4K OLED viene invece da Samsung. I più grandi vantaggi dell'OLED sono i suoi perfetti livelli di nero, la gamma più ampia e i tempi di risposta estremamente veloci in bianco e nero e grigio-grigio per colori più vivaci e essenzialmente zero ghosting.
D'altra parte, i principali svantaggi di questo pannello OLED sono la sua luminosità di 400 nit, la frequenza di aggiornamento di 60 Hz, la presenza di modulazione di larghezza di impulso e il consumo di energia superiore a IPS. Mentre 400 nits non è affatto fioca, è l'opzione più fioca disponibile per questo modello. Allo stesso modo, la frequenza di aggiornamento di 60 Hz non è necessariamente lenta, ma HP offre 120 Hz solo per IPS. La modulazione di larghezza di impulso o lo sfarfallio dello schermo è presente a frequenze di 240 Hz e 59 Hz a livelli di luminosità da 0 a 52% e 53% e 99%, rispettivamente, che può causare affaticamento della vista per qualcuno. E infine, il maggior consumo di energia è un fatto noto come dettagliato qui su altri portatili che utilizzano una tecnologia OLED simile.

| |||||||||||||||||||||||||
Distribuzione della luminosità: 95 %
Al centro con la batteria: 379.6 cd/m²
Contrasto: ∞:1 (Nero: 0 cd/m²)
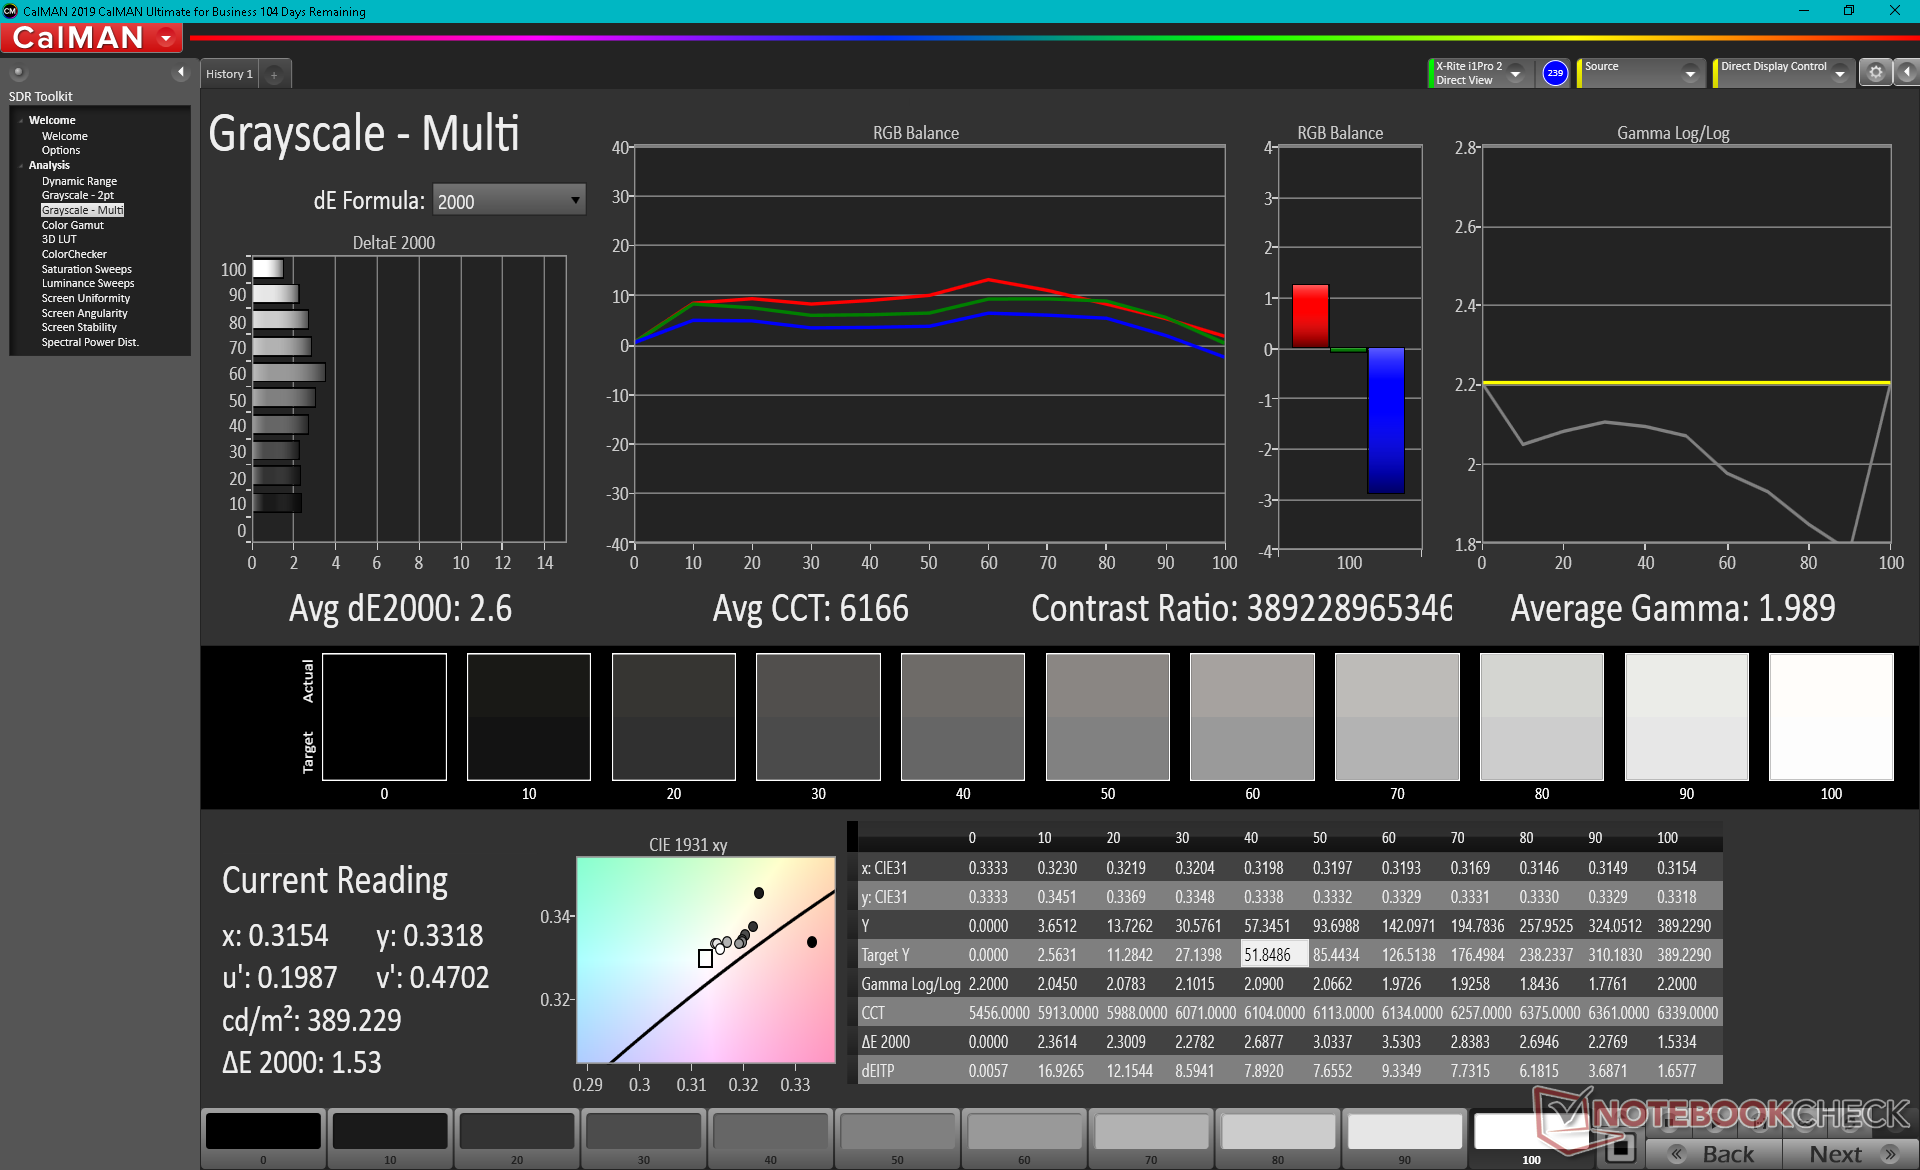
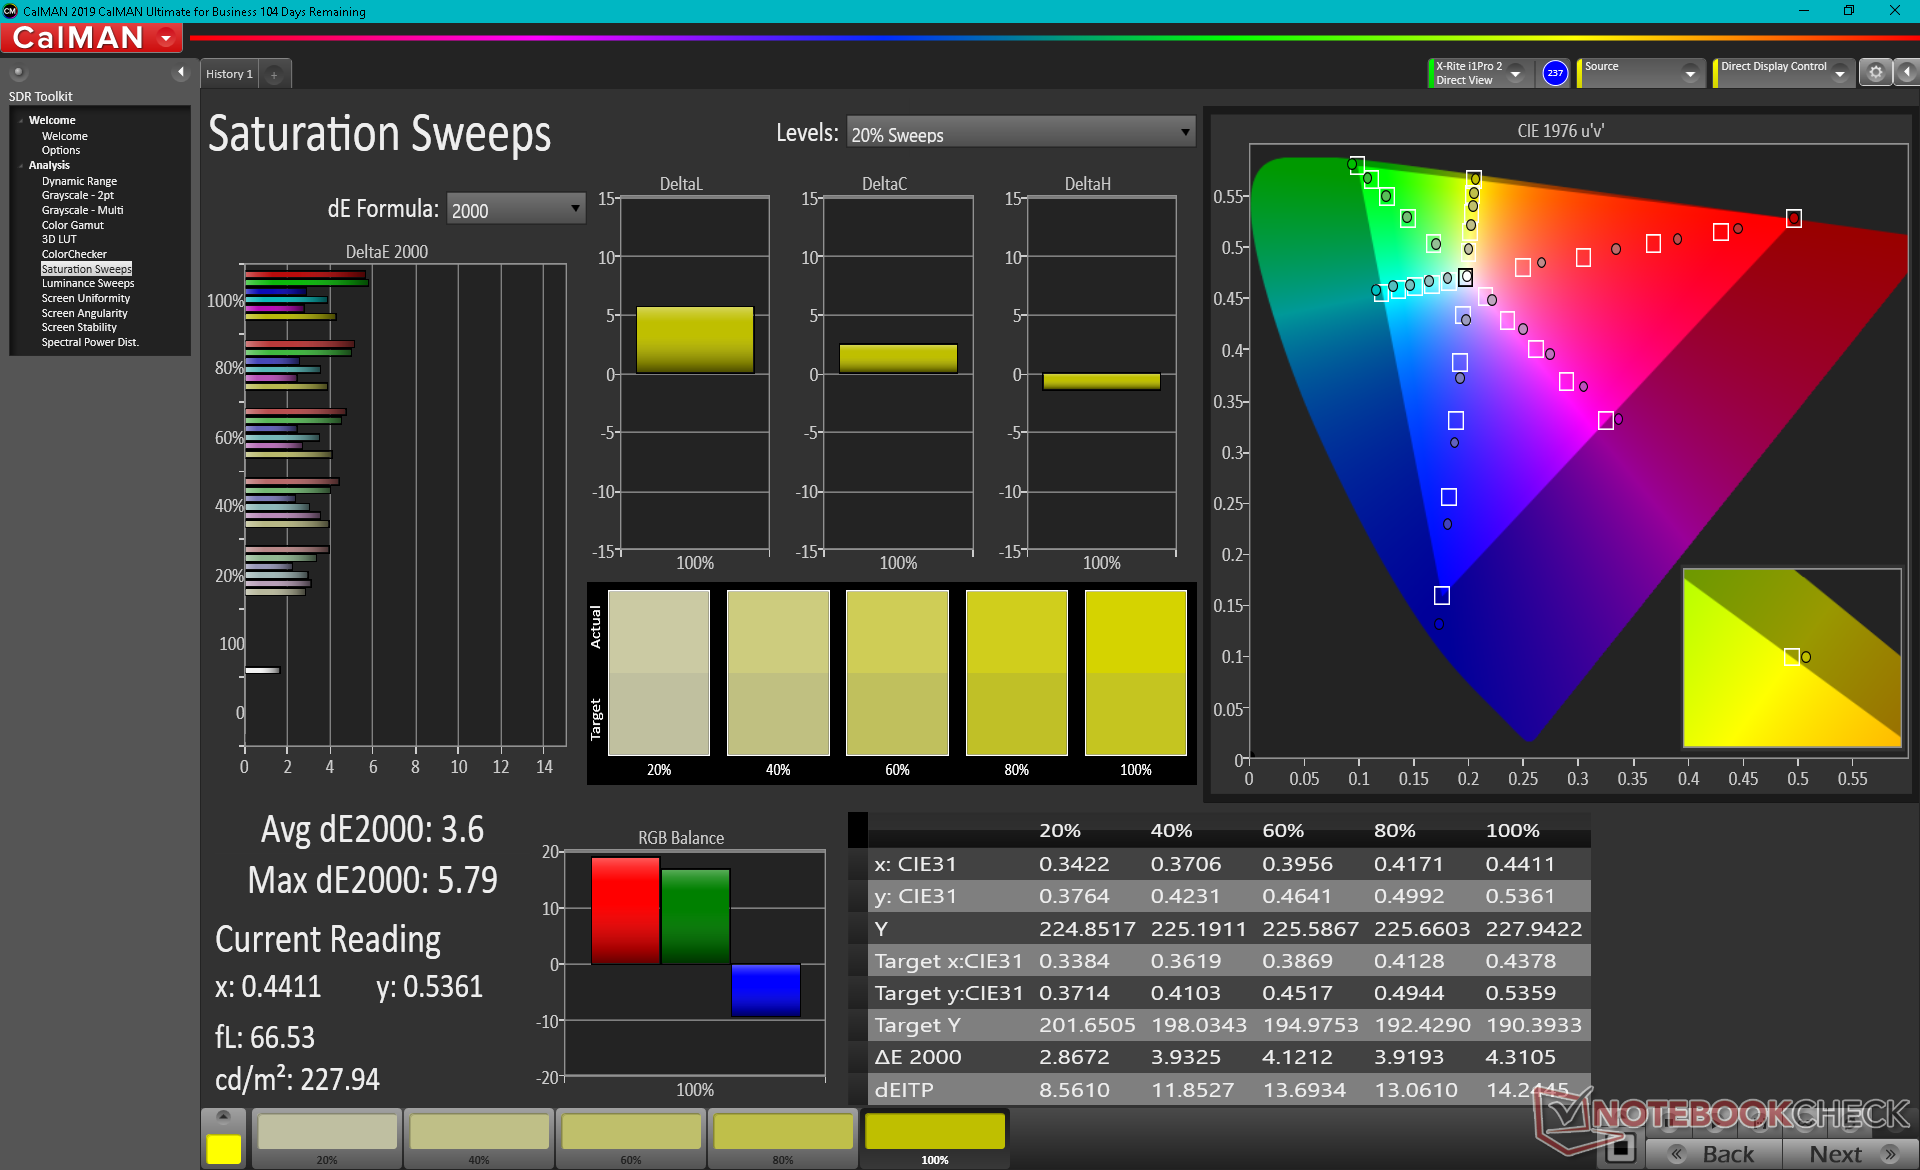
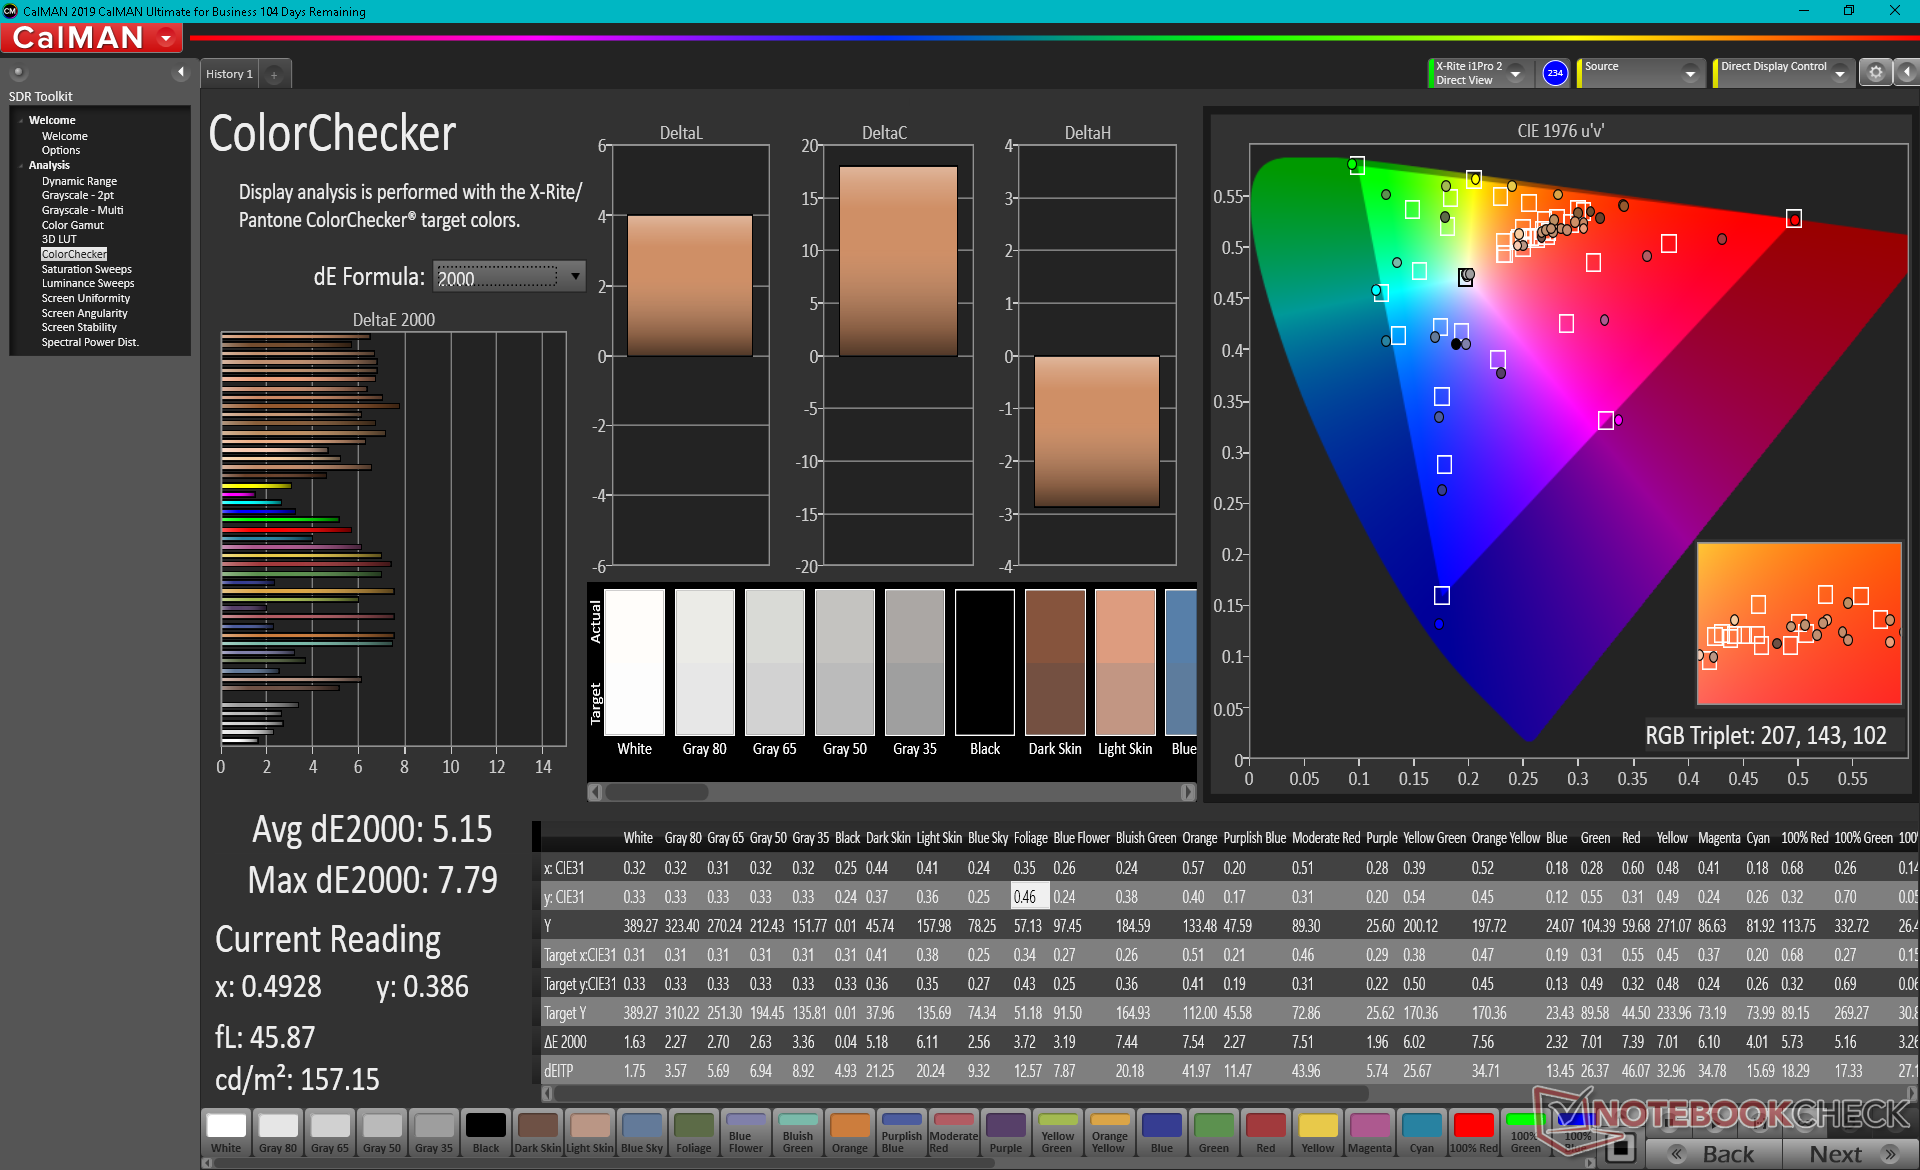
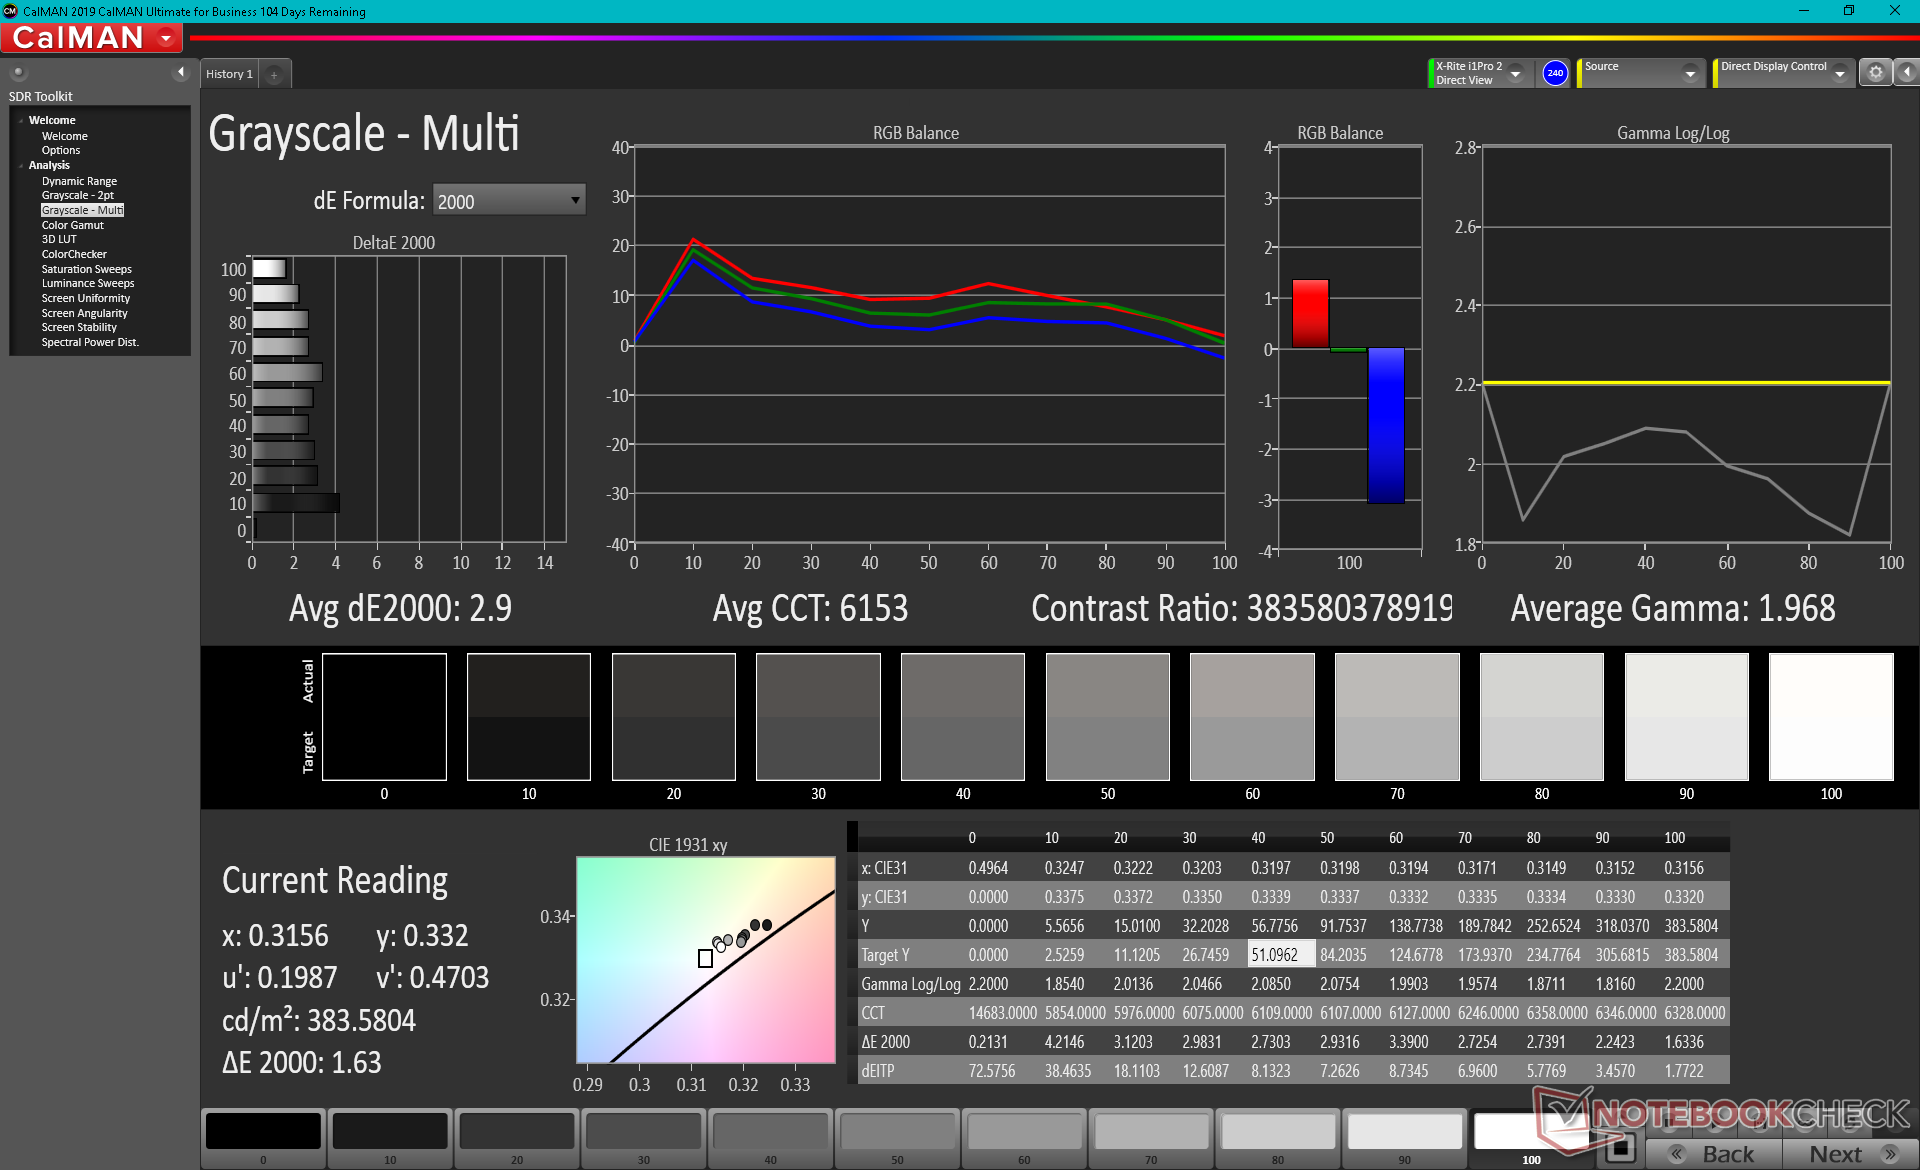
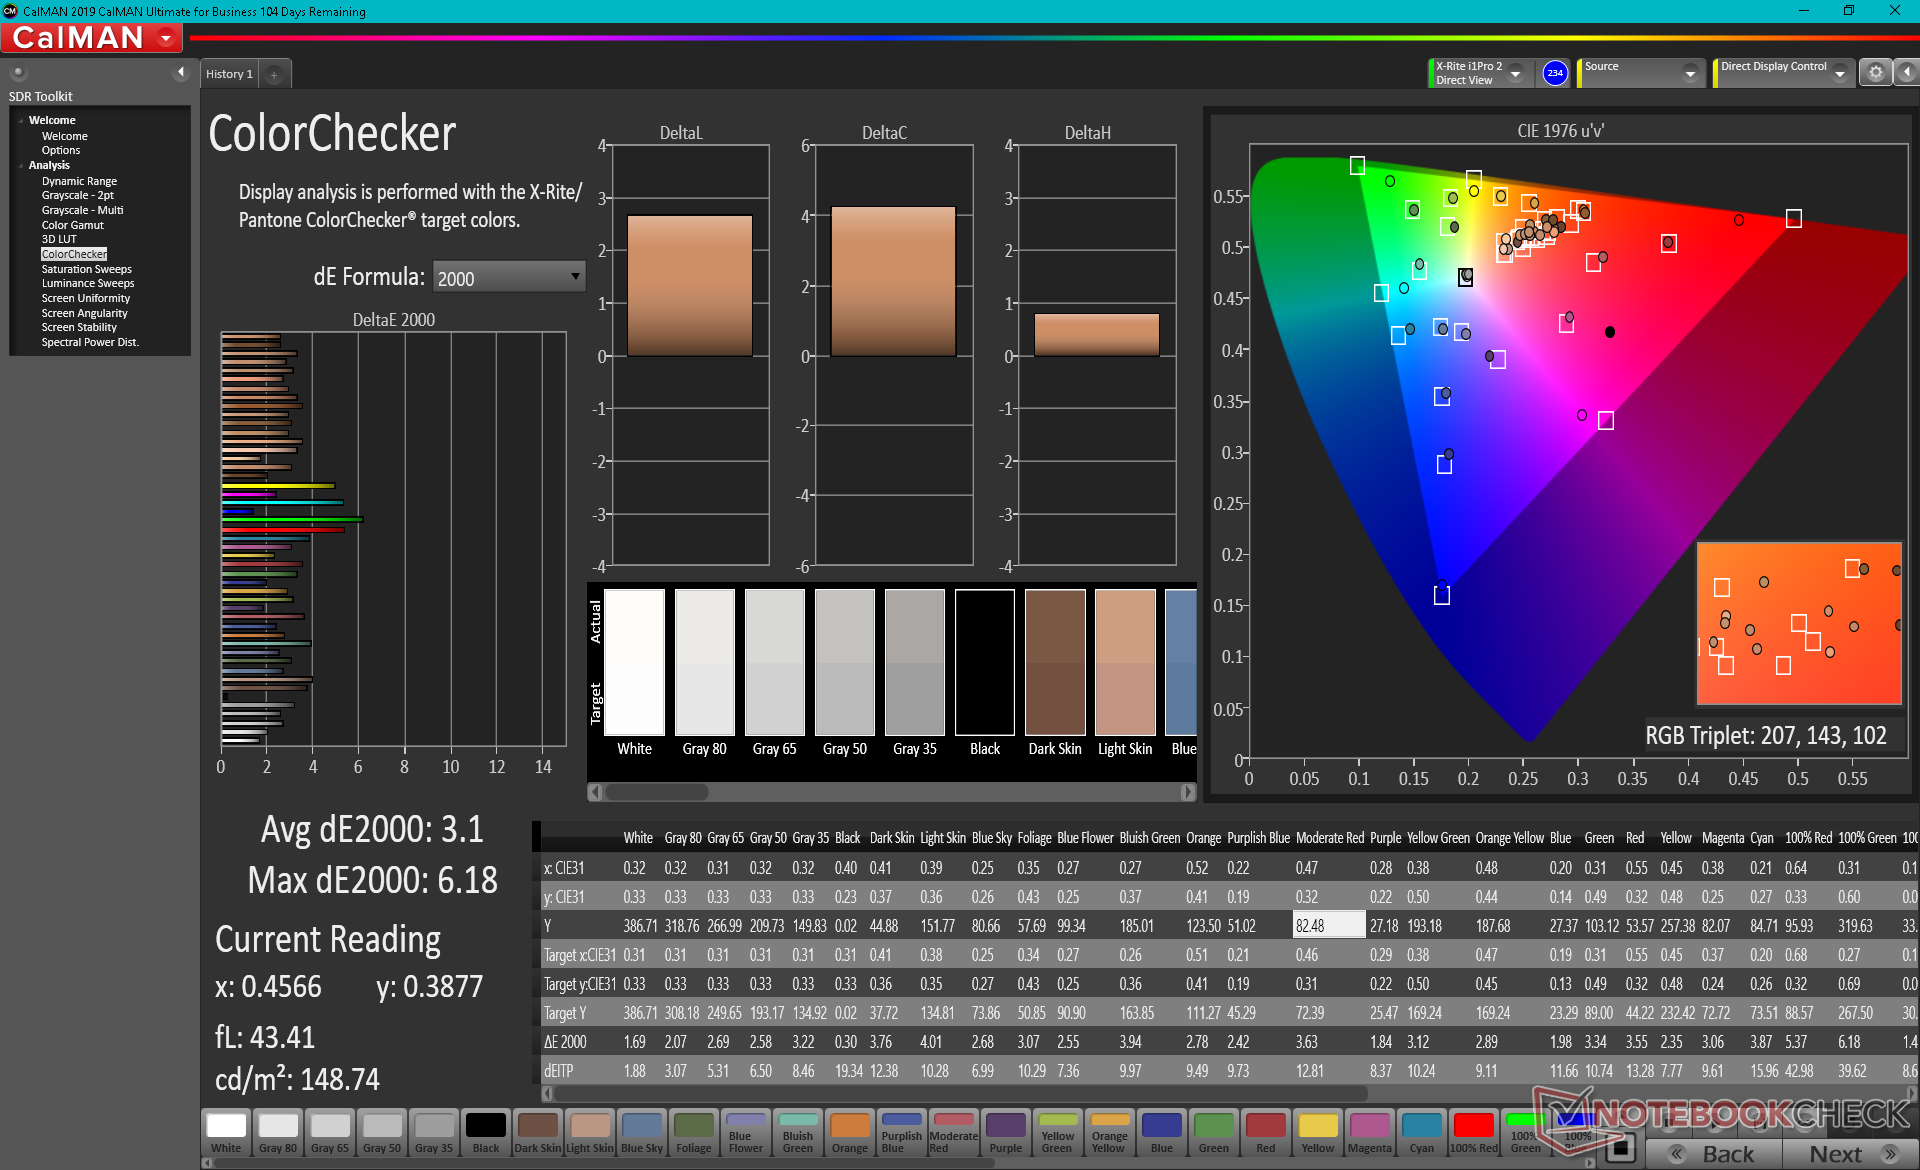
ΔE ColorChecker Calman: 5.15 | ∀{0.5-29.43 Ø4.72}
calibrated: 3.1
ΔE Greyscale Calman: 2.6 | ∀{0.09-98 Ø4.97}
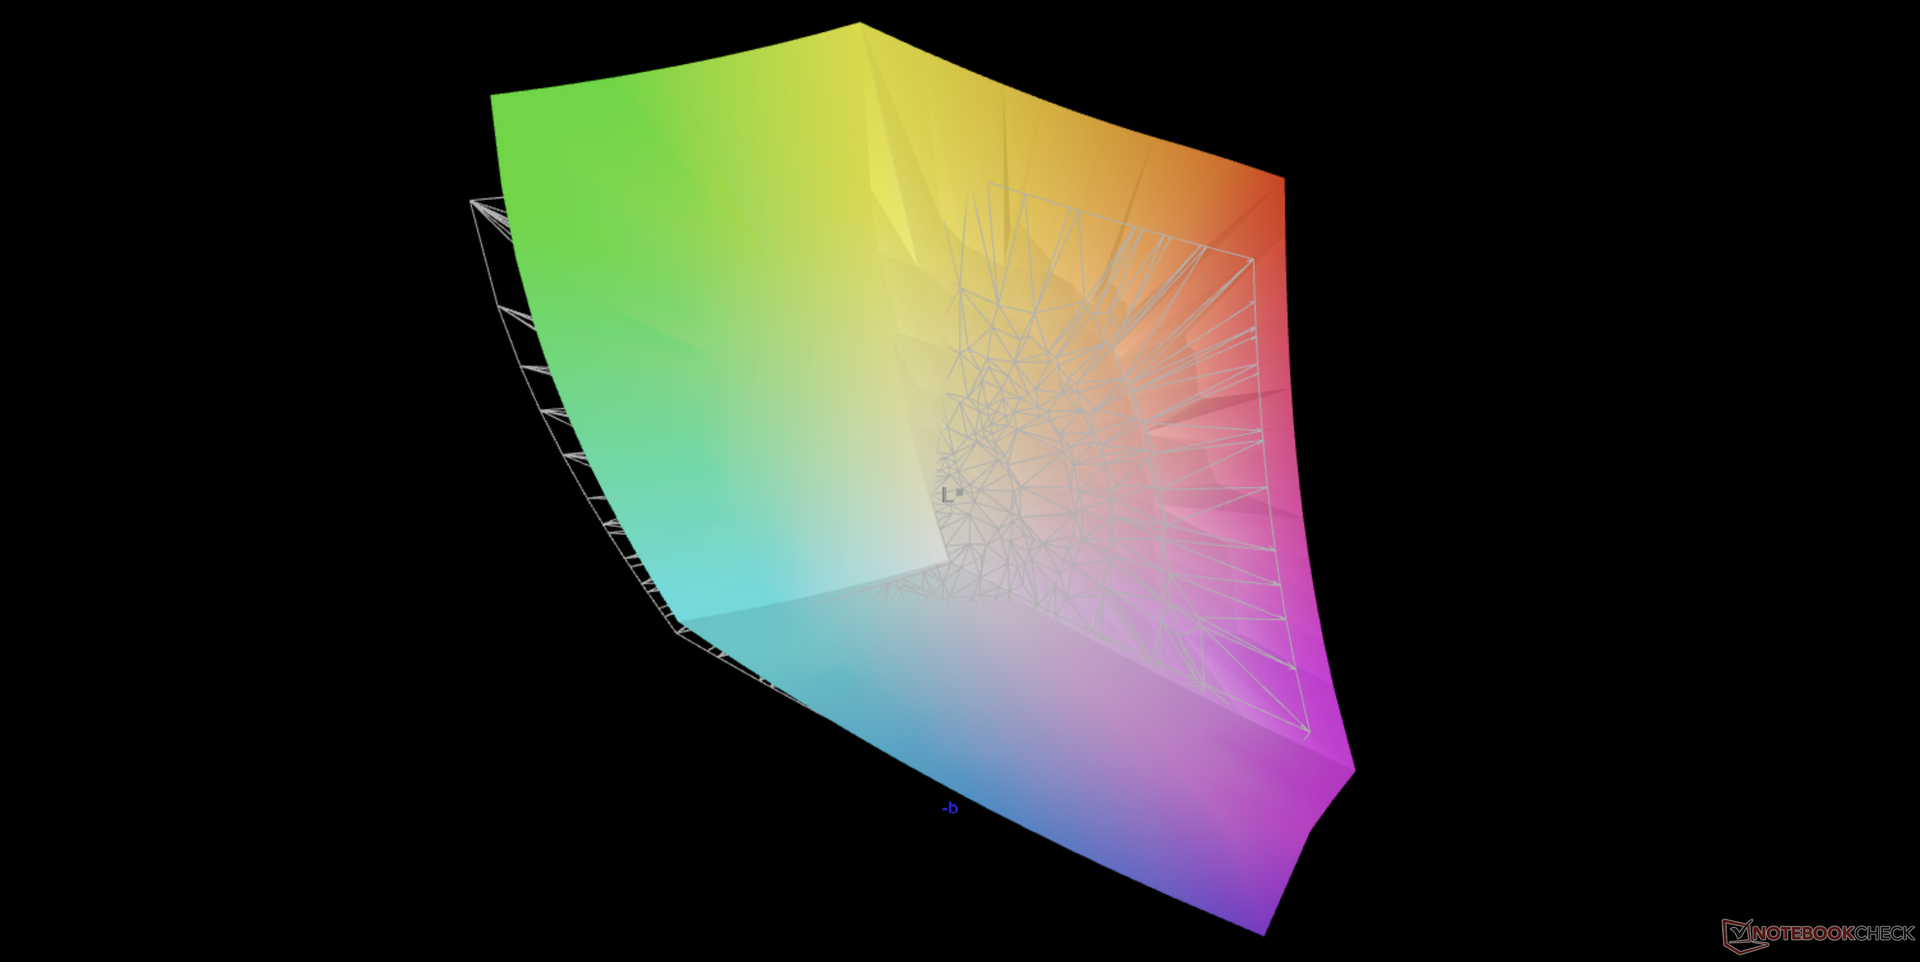
95.3% AdobeRGB 1998 (Argyll 3D)
100% sRGB (Argyll 3D)
99.9% Display P3 (Argyll 3D)
Gamma: 1.99
CCT: 6166 K
| HP ZBook Studio 15 G8 SDC4145, OLED, 15.6", 3840x2160 | HP ZBook Firefly 15 G8 2C9R7EA LGD069B, IPS, 15.6", 1920x1080 | HP ZBook Studio G7 LGD0661, IPS, 15.6", 3840x2160 | Dell Precision 7550 AU Optronics B156ZAN, IPS, 15.6", 3840x2160 | Lenovo ThinkPad P15s Gen2-20W6000GGE MNF601EA1-1, IPS LED, 15.6", 3840x2160 | |
|---|---|---|---|---|---|
| Display | -20% | -4% | -5% | -4% | |
| Display P3 Coverage (%) | 99.9 | 68.6 -31% | 98.2 -2% | 82.1 -18% | 84.5 -15% |
| sRGB Coverage (%) | 100 | 98.5 -1% | 99.9 0% | 99.6 0% | 98.7 -1% |
| AdobeRGB 1998 Coverage (%) | 95.3 | 70 -27% | 86.5 -9% | 96.8 2% | 97.8 3% |
| Response Times | -1733% | -1859% | -1675% | -1217% | |
| Response Time Grey 50% / Grey 80% * (ms) | 2.4 ? | 56 ? -2233% | 56.4 ? -2250% | 51.2 ? -2033% | 40 ? -1567% |
| Response Time Black / White * (ms) | 2.4 ? | 32 ? -1233% | 37.6 ? -1467% | 34 ? -1317% | 23.2 ? -867% |
| PWM Frequency (Hz) | 240.4 ? | ||||
| Screen | -30% | 59% | -11% | 57% | |
| Brightness middle (cd/m²) | 379.6 | 397 5% | 723 90% | 473.5 25% | 604 59% |
| Brightness (cd/m²) | 380 | 402 6% | 707 86% | 461 21% | 609 60% |
| Brightness Distribution (%) | 95 | 84 -12% | 92 -3% | 90 -5% | 91 -4% |
| Black Level * (cd/m²) | 0.13 | 0.35 | 0.55 | 0.34 | |
| Colorchecker dE 2000 * | 5.15 | 5.9 -15% | 1.4 73% | 4.8 7% | 0.9 83% |
| Colorchecker dE 2000 max. * | 7.79 | 9.4 -21% | 2.9 63% | 8.73 -12% | 2.6 67% |
| Colorchecker dE 2000 calibrated * | 3.1 | 1.1 65% | 0.5 84% | 3.08 1% | 0.8 74% |
| Greyscale dE 2000 * | 2.6 | 8.8 -238% | 2 23% | 5.6 -115% | 1.1 58% |
| Gamma | 1.99 111% | 2.47 89% | 2.14 103% | 2.34 94% | 2.15 102% |
| CCT | 6166 105% | 6416 101% | 6484 100% | 7549 86% | 6656 98% |
| Contrast (:1) | 3054 | 2066 | 861 | 1776 | |
| Color Space (Percent of AdobeRGB 1998) (%) | 63.7 | 77.3 | 86.4 | 84.5 | |
| Color Space (Percent of sRGB) (%) | 98.5 | 99.9 | 99.7 | 98.6 | |
| Media totale (Programma / Settaggio) | -594% /
-311% | -601% /
-276% | -564% /
-287% | -388% /
-171% |
* ... Meglio usare valori piccoli
OLED offre tipicamente colori più profondi di IPS e il nostro ZBook Studio G8 non fa eccezione. Gli utenti otterranno una copertura completa di DCI-P3 rispetto alla sola sRGB sulla maggior parte dei pannelli a bassa risoluzione 1080p.
Le misurazioni del colorimetro X-Rite mostrano che la temperatura del colore è leggermente sul lato caldo a circa 6200K invece dei soliti 6500K sulla maggior parte degli altri display calibrati che puntano a sRGB. A differenza della maggior parte dei modelli Dell Precision, HP non ha un software pre-installato qui progettato specificamente per la regolazione dei colori.
Tempi di risposta del Display
| ↔ Tempi di risposta dal Nero al Bianco | ||
|---|---|---|
| 2.4 ms ... aumenta ↗ e diminuisce ↘ combinato | ↗ 1.1 ms Incremento | 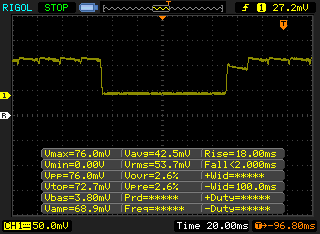 |
| ↘ 1.3 ms Calo | ||
| Lo schermo ha mostrato valori di risposta molto veloci nei nostri tests ed è molto adatto per i gaming veloce. In confronto, tutti i dispositivi di test variano da 0.1 (minimo) a 240 (massimo) ms. » 13 % di tutti i dispositivi è migliore. Questo significa che i tempi di risposta rilevati sono migliori rispettto alla media di tutti i dispositivi testati (19.8 ms). | ||
| ↔ Tempo di risposta dal 50% Grigio all'80% Grigio | ||
| 2.4 ms ... aumenta ↗ e diminuisce ↘ combinato | ↗ 1 ms Incremento | 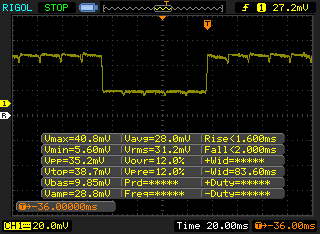 |
| ↘ 1.4 ms Calo | ||
| Lo schermo ha mostrato valori di risposta molto veloci nei nostri tests ed è molto adatto per i gaming veloce. In confronto, tutti i dispositivi di test variano da 0.165 (minimo) a 636 (massimo) ms. » 11 % di tutti i dispositivi è migliore. Questo significa che i tempi di risposta rilevati sono migliori rispettto alla media di tutti i dispositivi testati (31 ms). | ||
Sfarfallio dello schermo / PWM (Pulse-Width Modulation)
| flickering dello schermo / PWM rilevato | 240.4 Hz | ≤ 52 % settaggio luminosita' | 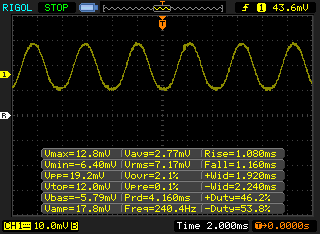  |
Il display sfarfalla a 240.4 Hz (Probabilmente a causa dell'uso di PWM) Flickering rilevato ad una luminosita' di 52 % o inferiore. Non dovrebbe verificarsi flickering o PWM sopra questo valore di luminosita'. La frequenza di 240.4 Hz è relativamente bassa, quindi gli utenti sensibili potrebbero notare il flickering ed accusare stanchezza agli occhi a questo livello di luminosità e a livelli inferiori. In confronto: 52 % di tutti i dispositivi testati non utilizza PWM per ridurre la luminosita' del display. Se è rilevato PWM, una media di 7769 (minimo: 5 - massimo: 343500) Hz è stata rilevata. | |||
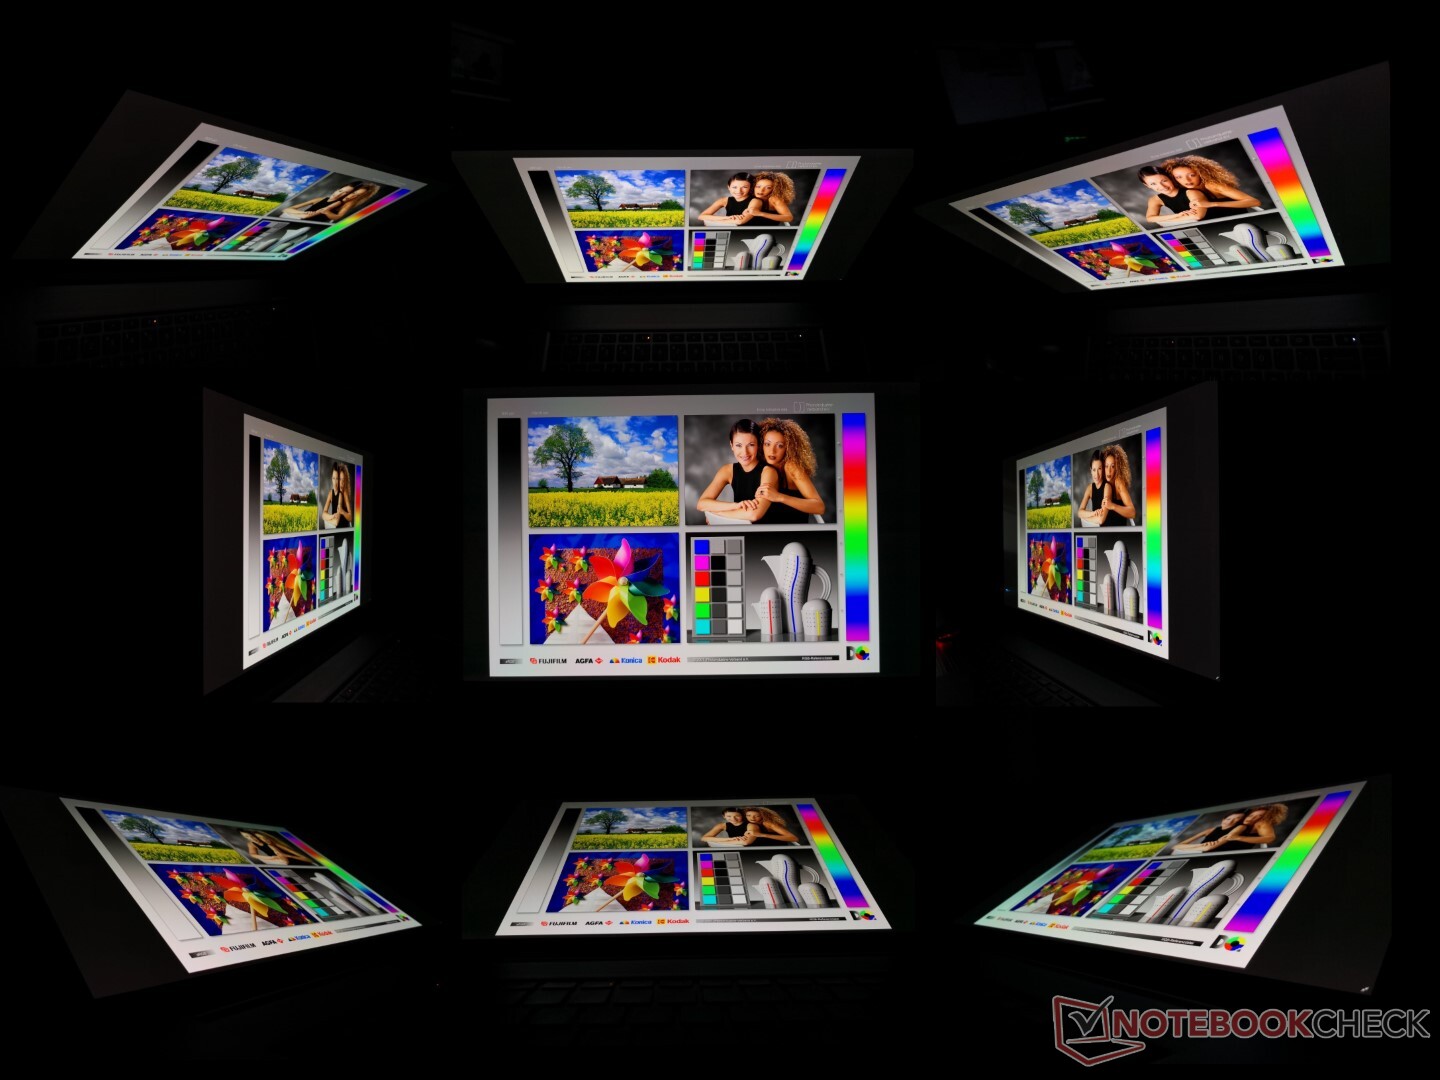
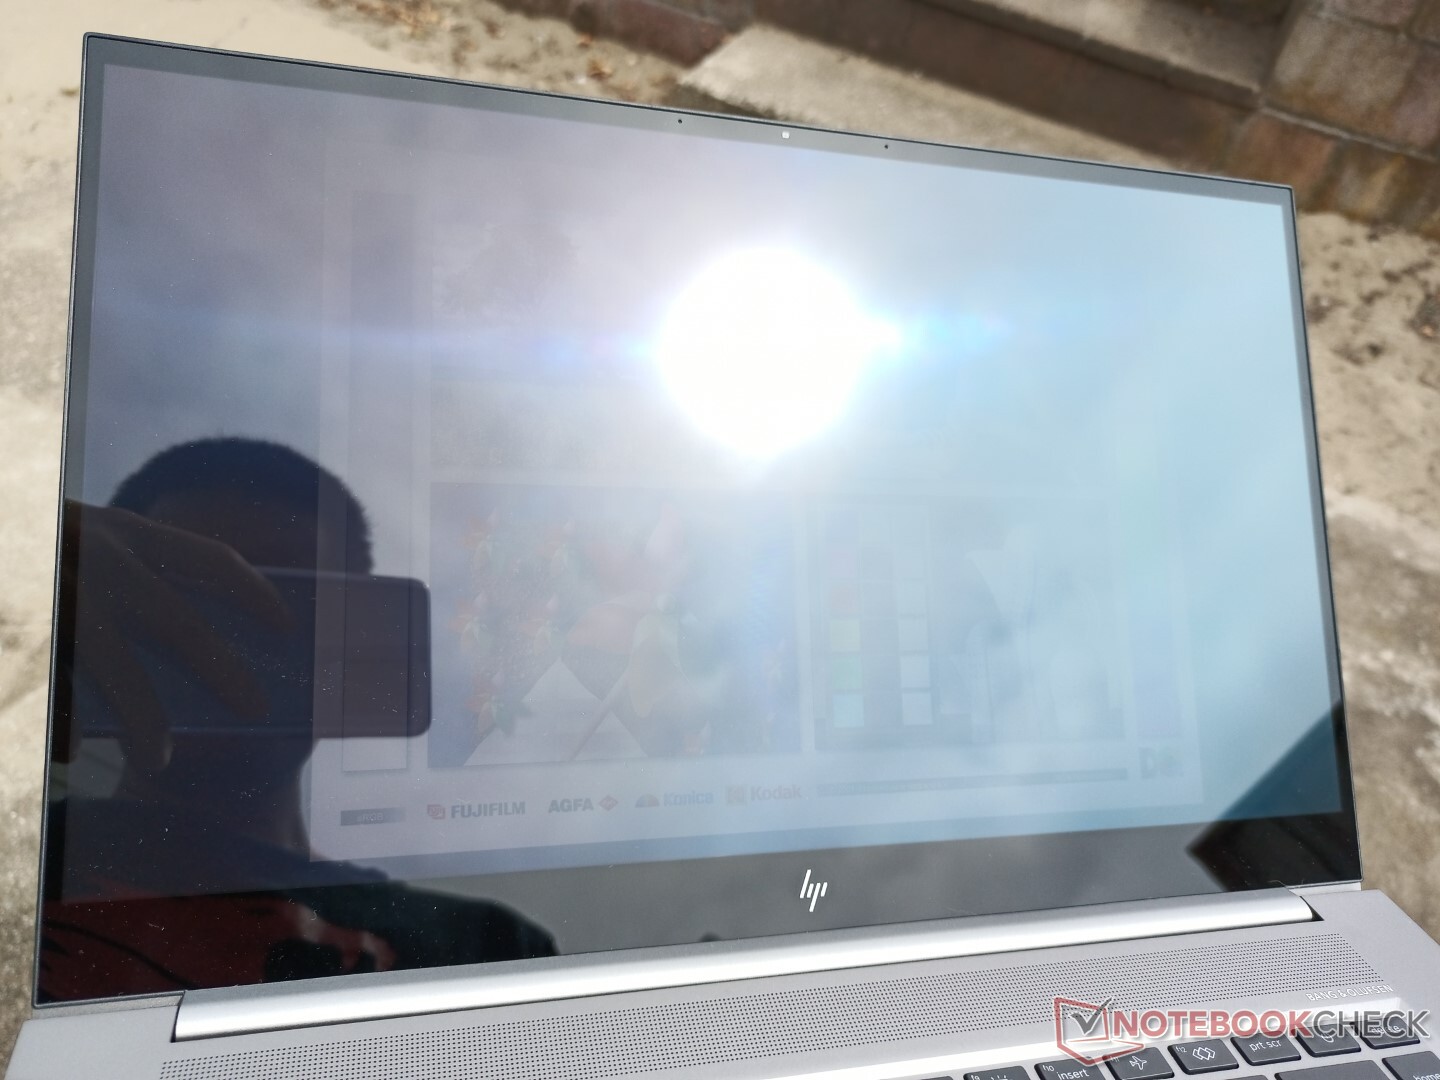
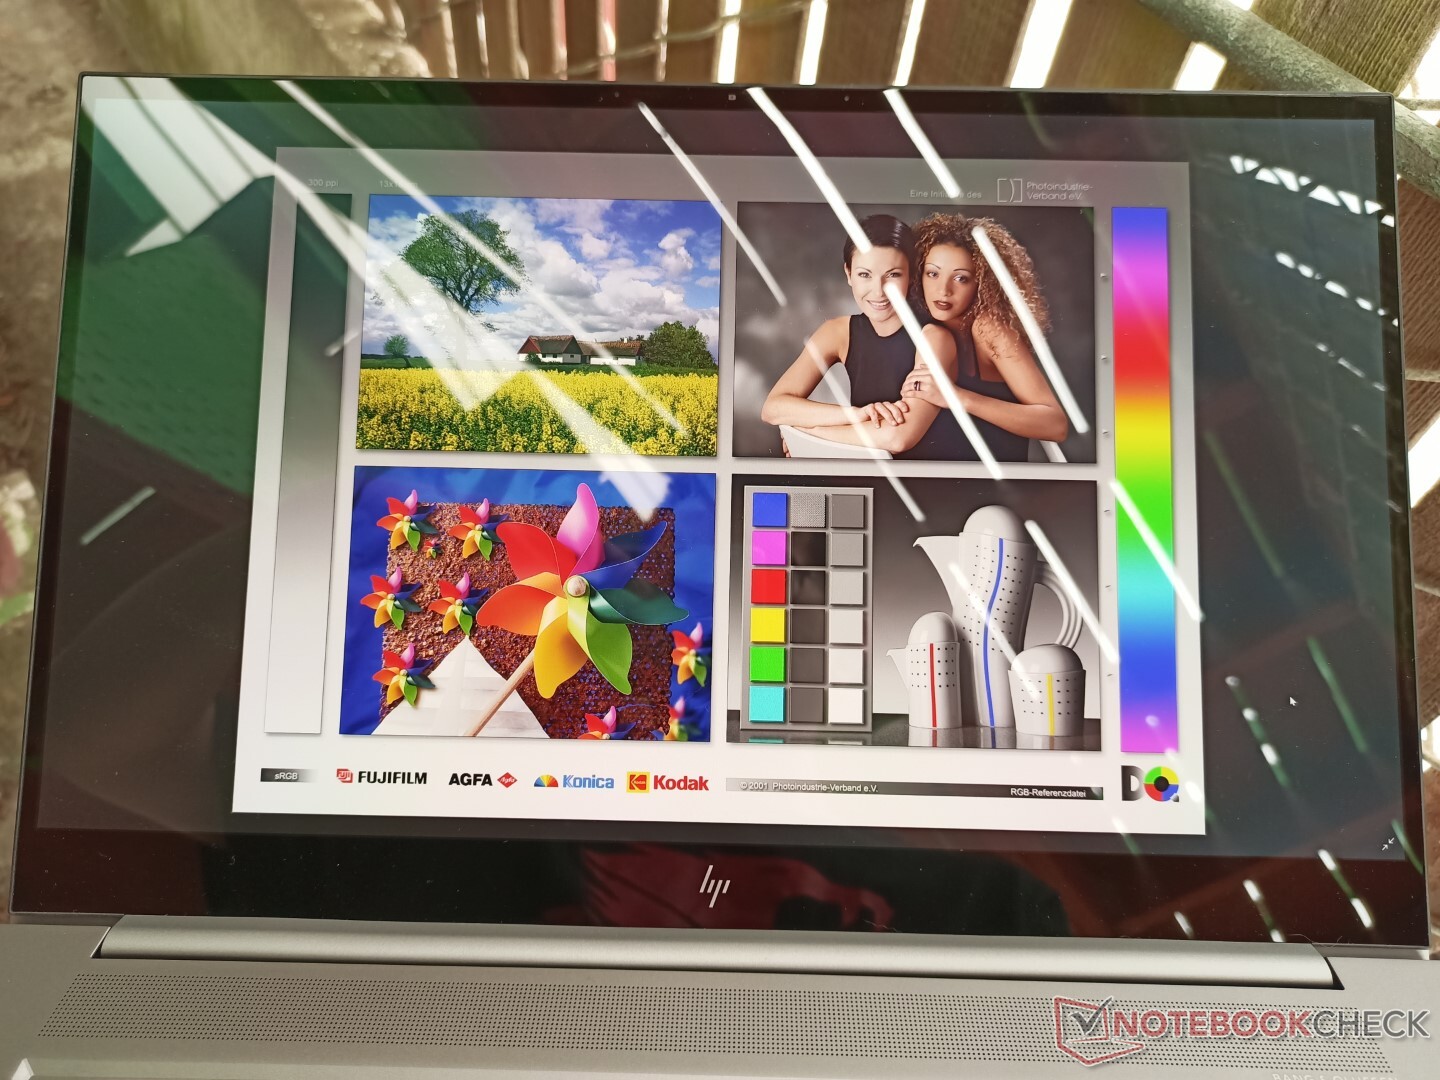
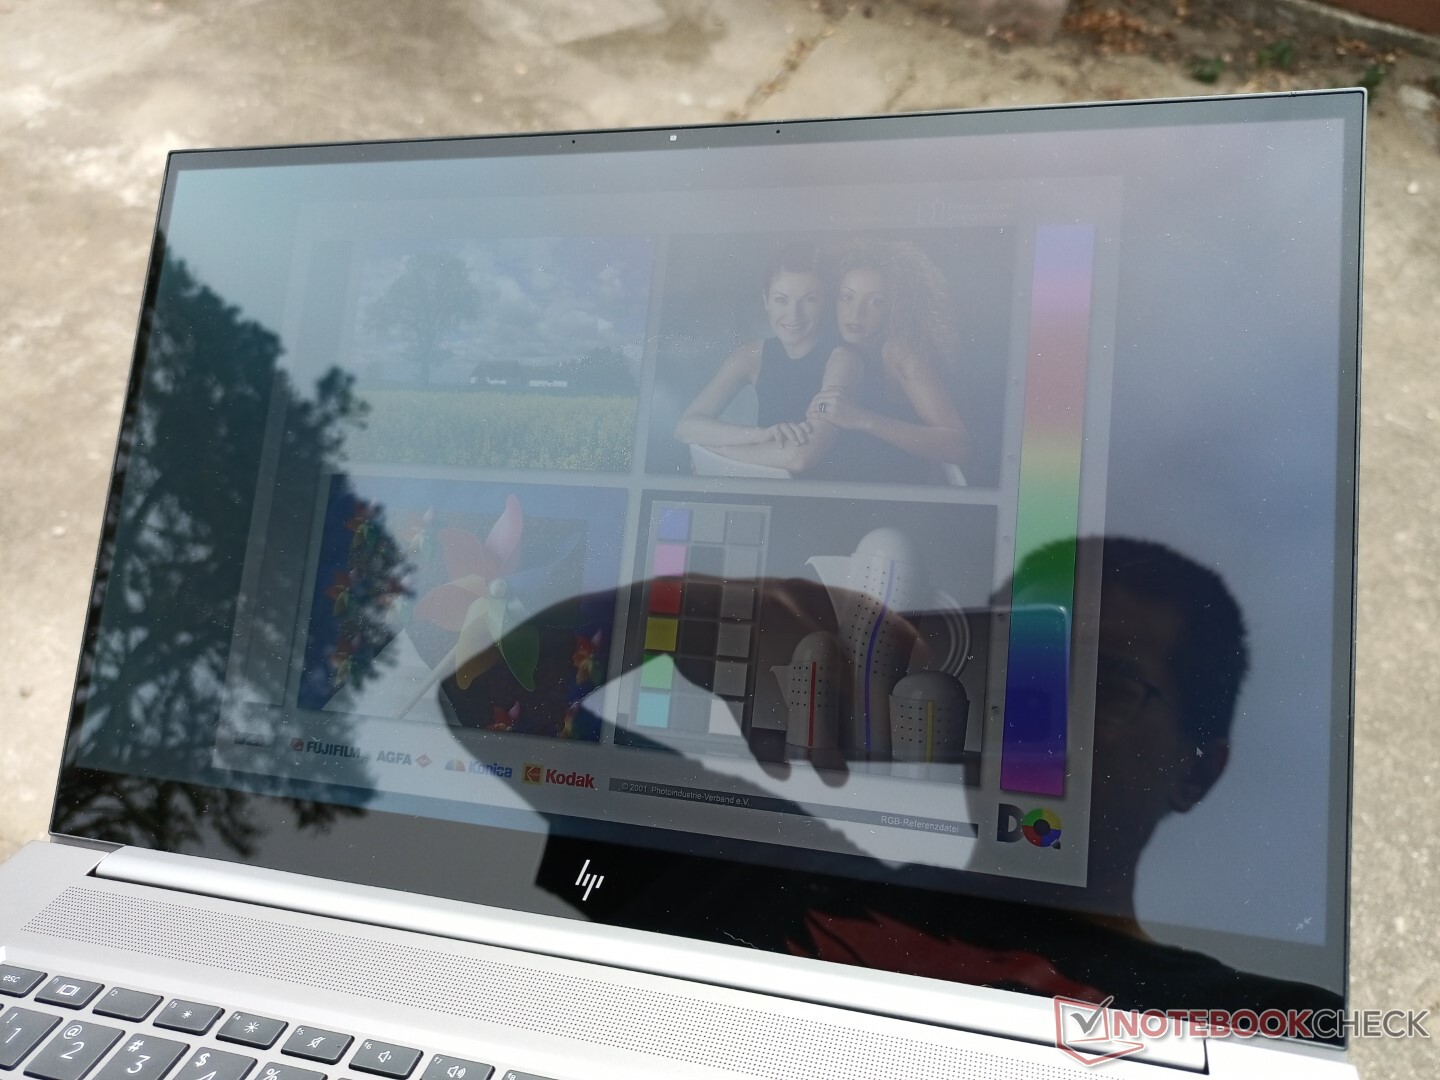
La sovrapposizione lucida contribuisce ad un evidente riverbero quando si è all'aperto, come mostrato dalle immagini qui sotto. Gli utenti che hanno intenzione di usare il portatile all'aperto su base frequente dovrebbero considerare l'aggiornamento all'opzione del pannello da 1000 nit. Sulla base della nostra esperienza con i pannelli da 1000 nit di HP, la luminosità massima del mondo reale sarà più vicina a 700 nits invece di 1000 nits che sarebbe ancora quasi due volte più luminosa del nostro pannello base da 400 nit. Solo il pannello FHD IPS è disponibile con la configurazione 1000-nit, tuttavia.
Prestazioni - Tanto da scegliere
Le opzioni CPU includono l'11° gen Intel Core i7-11800H o i9-11900H insieme ai rispettivi i7-11850H o i9-11950H vPro equivalenti. Queste sono alcune delle più veloci CPU octa-core della serie Core H di Intel al momento che rivaleggiano con la serie AMD Ryzen 9 come il 5900HX.
La GeForce RTX 3070 nel nostro sistema è una variante TGP da 85 W rispetto alla più comune versione da 100 W o superiore sulla maggior parte degli altri portatili. Le prestazioni saranno quindi leggermente più lente, come dimostrano i nostri benchmark della GPU qui sotto. Infatti, è tecnicamente una parte "Max-Q" secondo il pannello di controllo Nvidia. Sia Optimus 1.0 che Resizable Bar sono supportati.
Processore
Come previsto, le prestazioni della CPU sono leggermente inferiori a quelle del Core i9-11900H a causa dell'overhead di prestazioni richiesto per il supporto vPro. Gen-to-gen, le prestazioni multi-thread grezze sono circa il 20-25% più veloci del vecchio Core i9-10885H nello ZBook Studio G7.
La sostenibilità delle prestazioni è stabile senza grandi cali nel tempo quando si esegue CineBench R15 xT in un ciclo continuo.
Cinebench R15 Multi Loop
Cinebench R23: Multi Core | Single Core
Cinebench R15: CPU Multi 64Bit | CPU Single 64Bit
Blender: v2.79 BMW27 CPU
7-Zip 18.03: 7z b 4 -mmt1 | 7z b 4
Geekbench 5.5: Single-Core | Multi-Core
HWBOT x265 Benchmark v2.2: 4k Preset
LibreOffice : 20 Documents To PDF
R Benchmark 2.5: Overall mean
| Cinebench R23 / Multi Core | |
| Asus ROG Strix Scar 15 G533QS | |
| Asus ROG Zephyrus S17 GX703HSD | |
| Media Intel Core i9-11950H (12048 - 13113, n=4) | |
| HP ZBook Studio 15 G8 | |
| Schenker XMG Core 15 Ampere | |
| Dell XPS 15 9510 11800H RTX 3050 Ti OLED | |
| HP ZBook Studio G7 | |
| Cinebench R23 / Single Core | |
| Media Intel Core i9-11950H (1569 - 1633, n=4) | |
| Asus ROG Zephyrus S17 GX703HSD | |
| HP ZBook Studio 15 G8 | |
| Dell XPS 15 9510 11800H RTX 3050 Ti OLED | |
| Asus ROG Strix Scar 15 G533QS | |
| HP ZBook Studio G7 | |
| Schenker XMG Core 15 Ampere | |
| HWBOT x265 Benchmark v2.2 / 4k Preset | |
| Asus ROG Zephyrus S17 GX703HSD | |
| Asus ROG Strix Scar 15 G533QS | |
| HP ZBook Studio 15 G8 | |
| Media Intel Core i9-11950H (13.8 - 14.5, n=4) | |
| Schenker XMG Core 15 Ampere | |
| Asus TUF Gaming A15 FA506QR-AZ061T | |
| MSI WS66 10TMT-207US | |
| HP ZBook Studio G7 | |
| Dell XPS 15 9510 11800H RTX 3050 Ti OLED | |
| Dell Precision 5550 P91F | |
* ... Meglio usare valori piccoli
Prestazioni del sistema
| PCMark 10 / Score | |
| HP ZBook Studio 15 G8 | |
| Dell Precision 7550 | |
| HP ZBook Firefly 15 G8 2C9R7EA | |
| HP ZBook Studio G7 | |
| Lenovo ThinkPad P15s Gen2-20W6000GGE | |
| Asus ProArt StudioBook Pro 15 W500G5T | |
| PCMark 10 / Essentials | |
| HP ZBook Studio 15 G8 | |
| Dell Precision 7550 | |
| Lenovo ThinkPad P15s Gen2-20W6000GGE | |
| HP ZBook Firefly 15 G8 2C9R7EA | |
| Asus ProArt StudioBook Pro 15 W500G5T | |
| HP ZBook Studio G7 | |
| PCMark 10 / Productivity | |
| Lenovo ThinkPad P15s Gen2-20W6000GGE | |
| HP ZBook Firefly 15 G8 2C9R7EA | |
| HP ZBook Studio 15 G8 | |
| Dell Precision 7550 | |
| Asus ProArt StudioBook Pro 15 W500G5T | |
| HP ZBook Studio G7 | |
| PCMark 10 / Digital Content Creation | |
| HP ZBook Studio 15 G8 | |
| Dell Precision 7550 | |
| HP ZBook Studio G7 | |
| HP ZBook Firefly 15 G8 2C9R7EA | |
| Asus ProArt StudioBook Pro 15 W500G5T | |
| Lenovo ThinkPad P15s Gen2-20W6000GGE | |
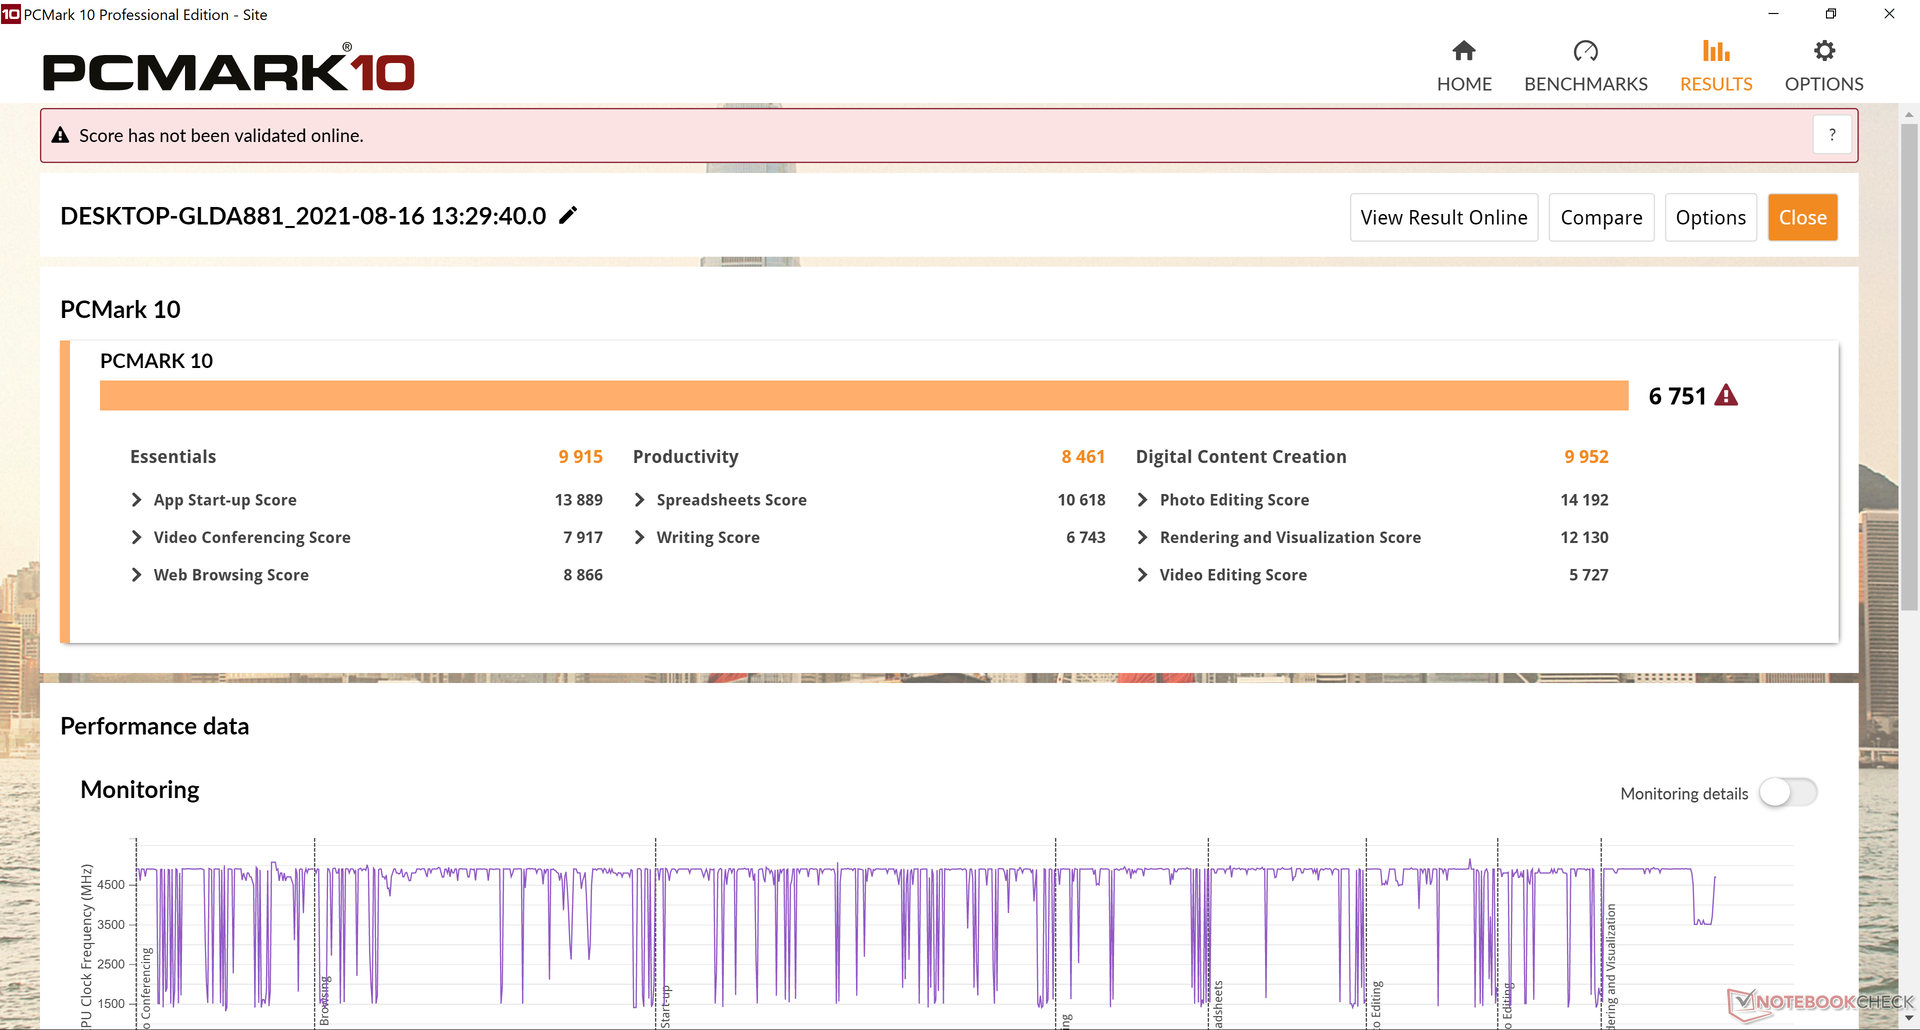
| PCMark 10 Score | 6751 punti | |
Aiuto | ||
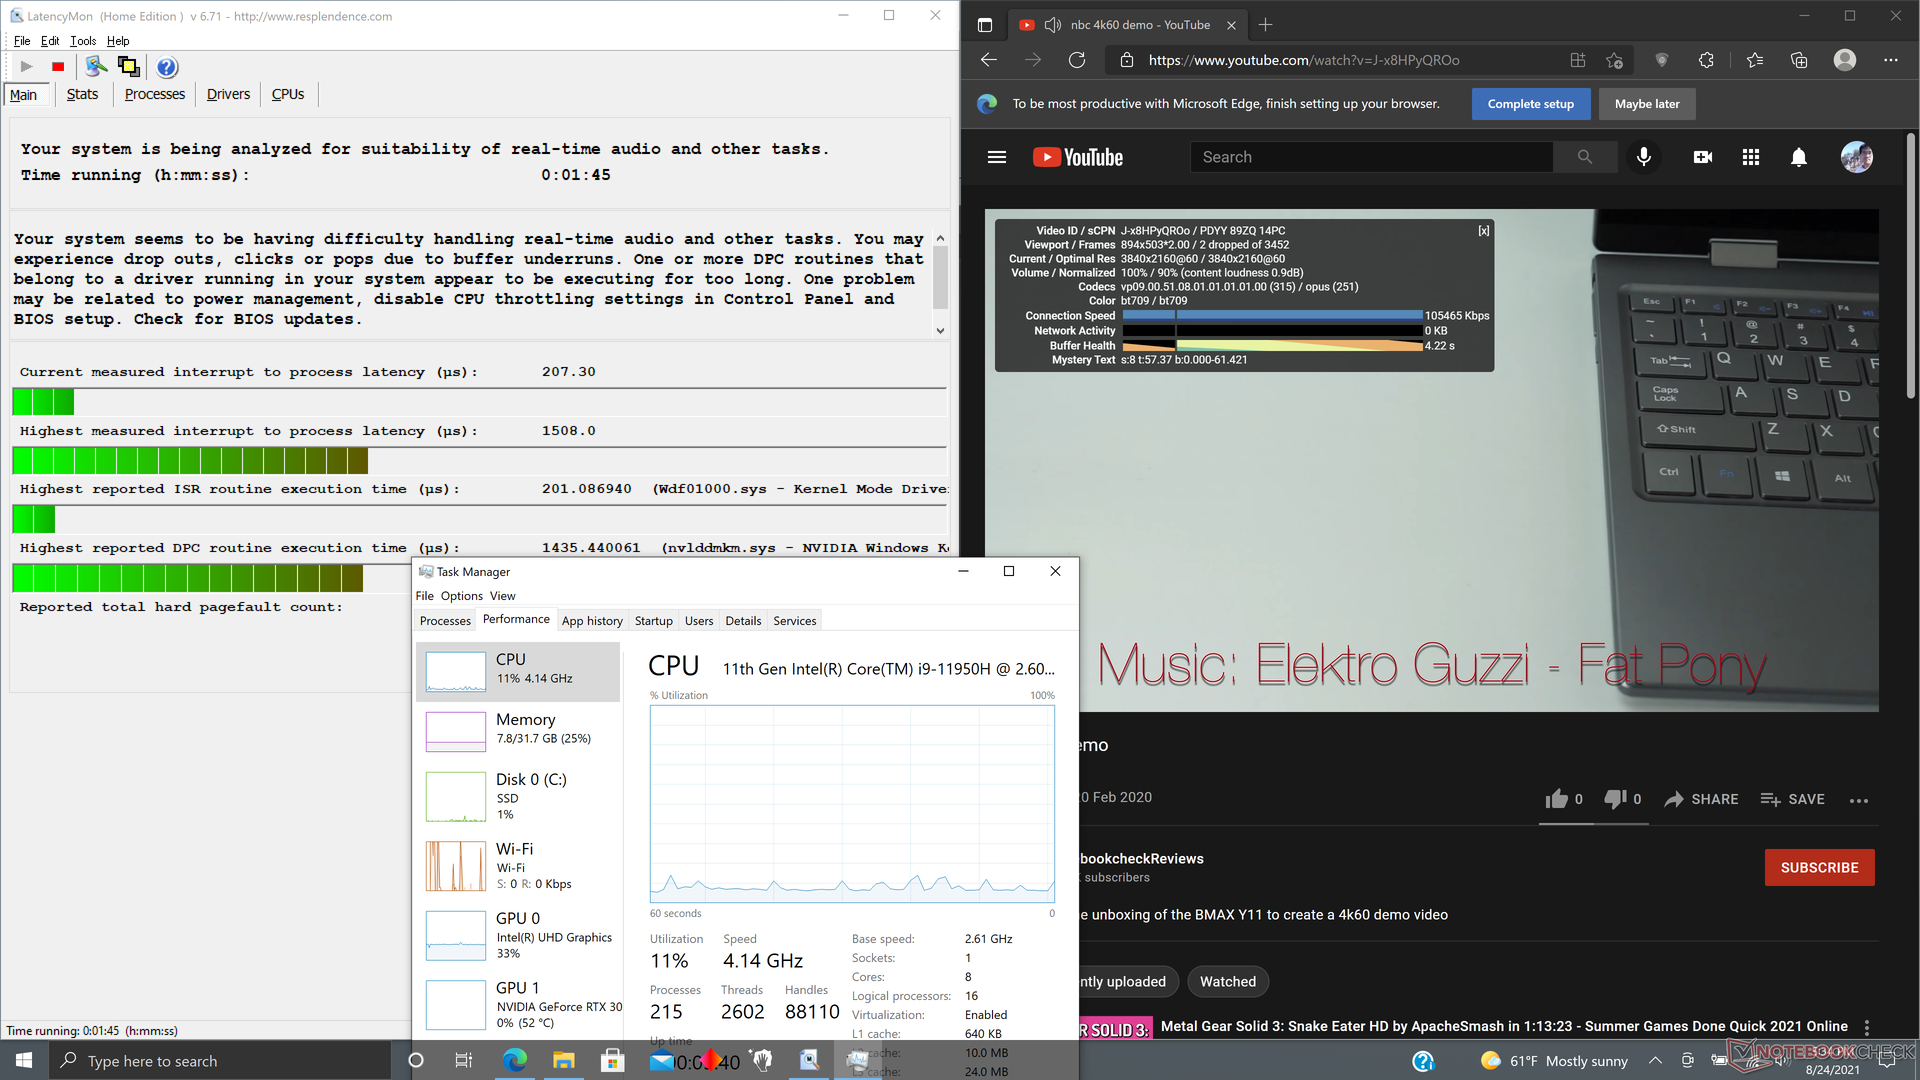
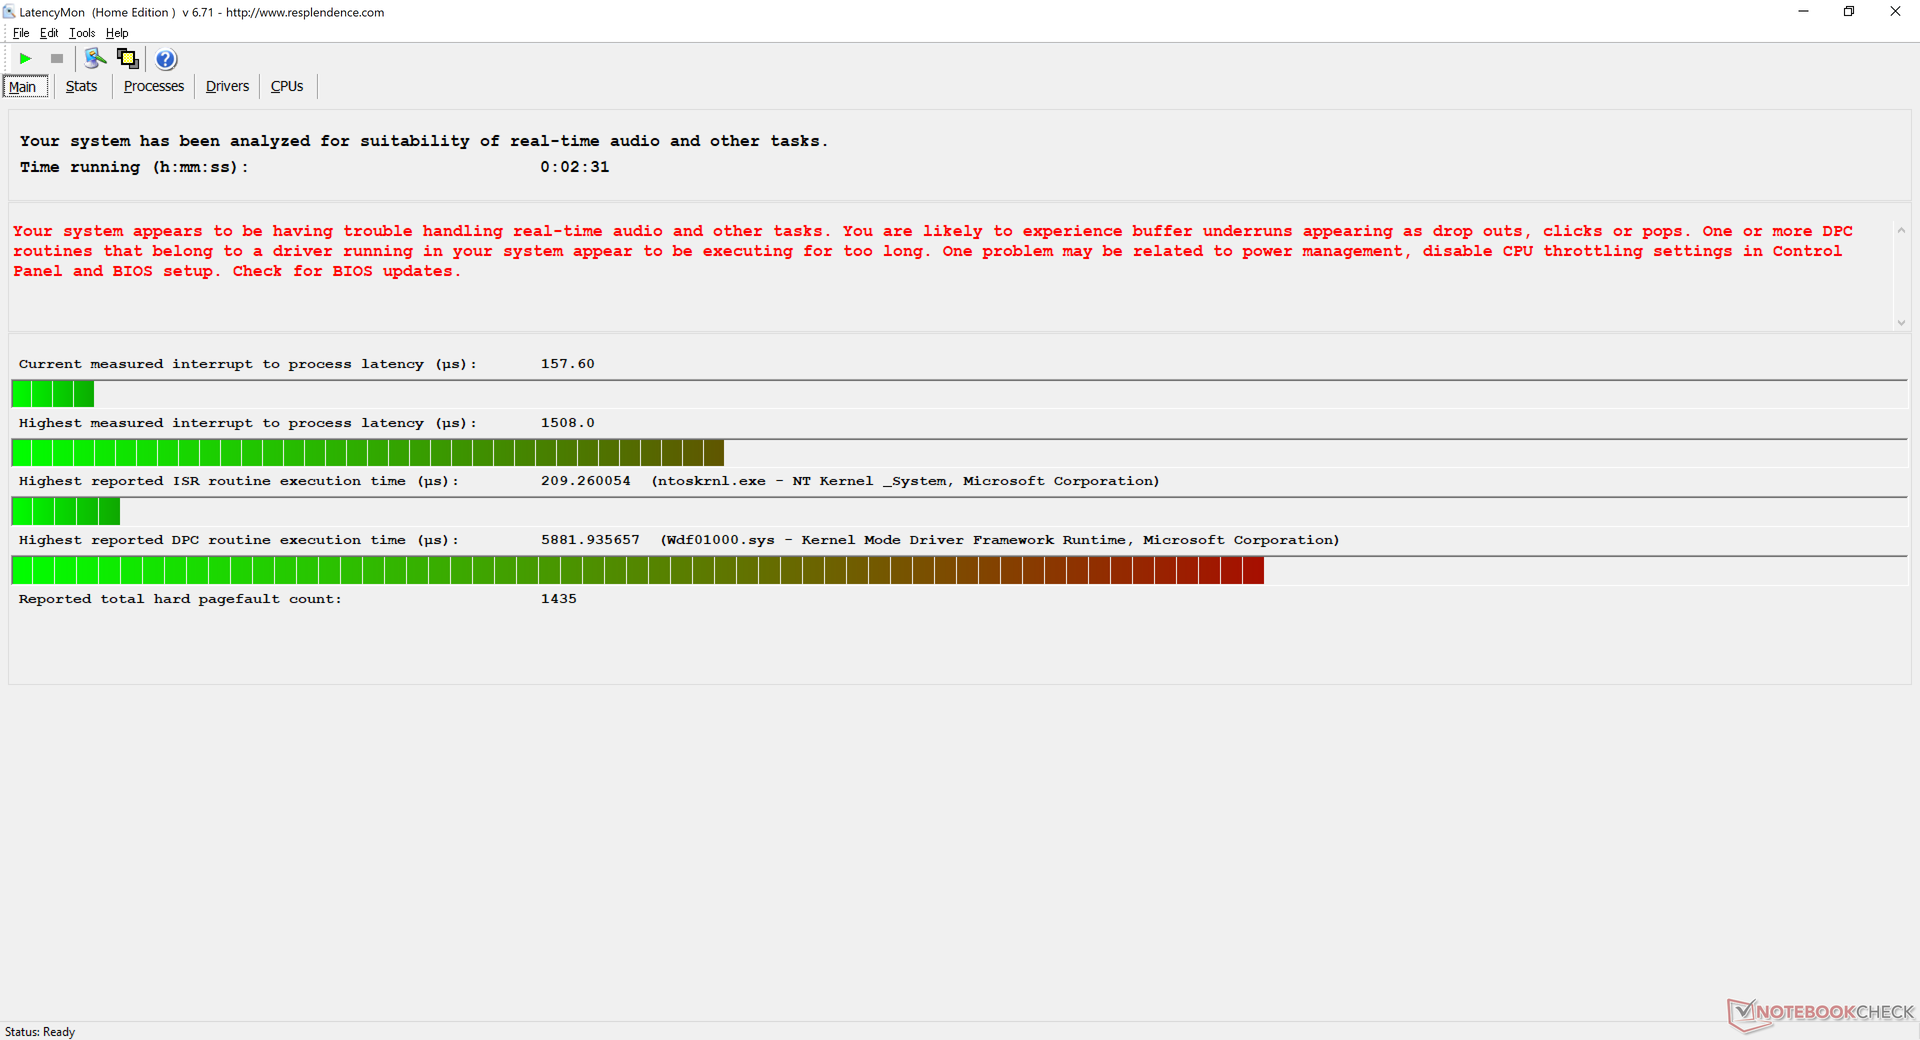
Latenza DPC
LatencyMon rivela problemi di latenza quando si aprono più schede del browser sulla nostra homepage e anche quando si esegue lo stress Prime95. La riproduzione di video 4K a 60 FPS è per il resto fluida con solo 2 fotogrammi persi durante il nostro minuto di test video.
| DPC Latencies / LatencyMon - interrupt to process latency (max), Web, Youtube, Prime95 | |
| Dell Precision 7550 | |
| HP ZBook Studio G7 | |
| Lenovo ThinkPad P15s Gen2-20W6000GGE | |
| Asus ProArt StudioBook Pro 15 W500G5T | |
| HP ZBook Studio 15 G8 | |
| HP ZBook Firefly 15 G8 2C9R7EA | |
* ... Meglio usare valori piccoli
Dispositivi di archiviazione
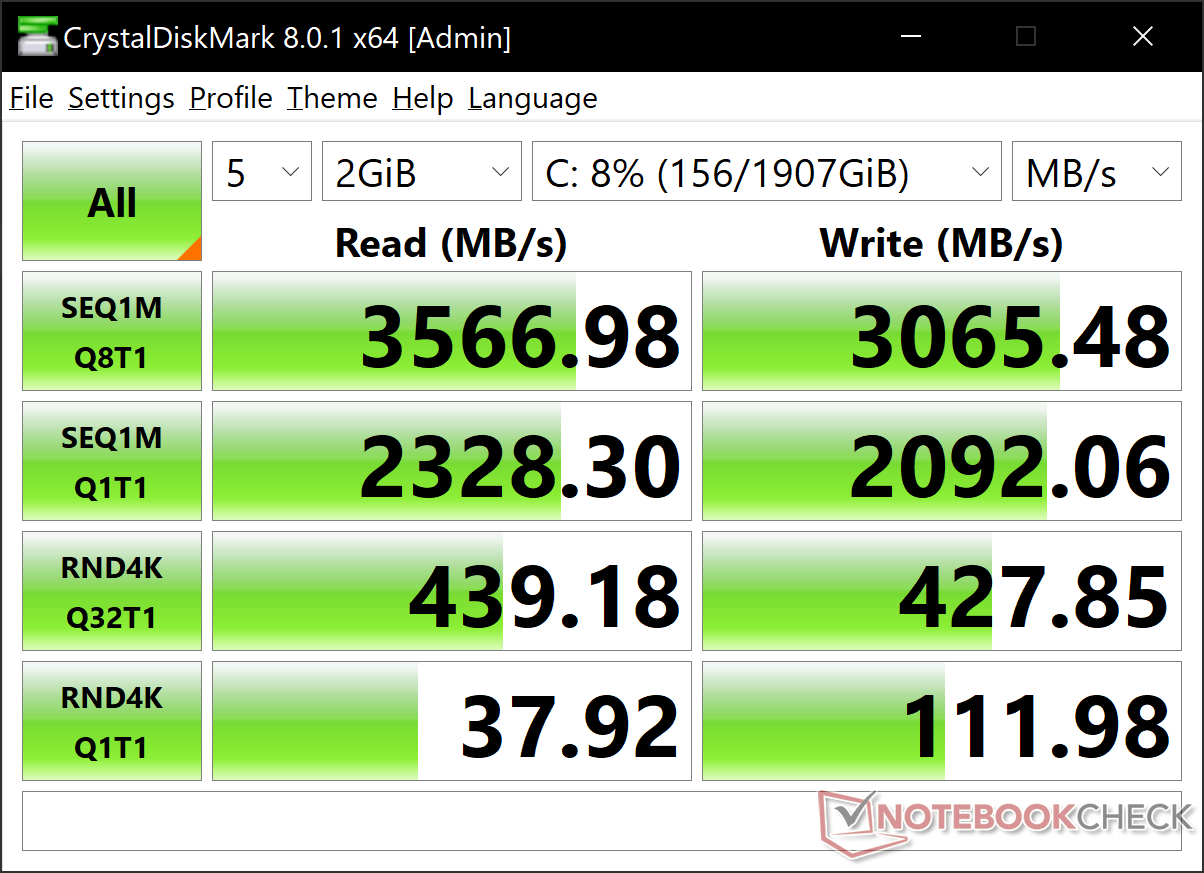
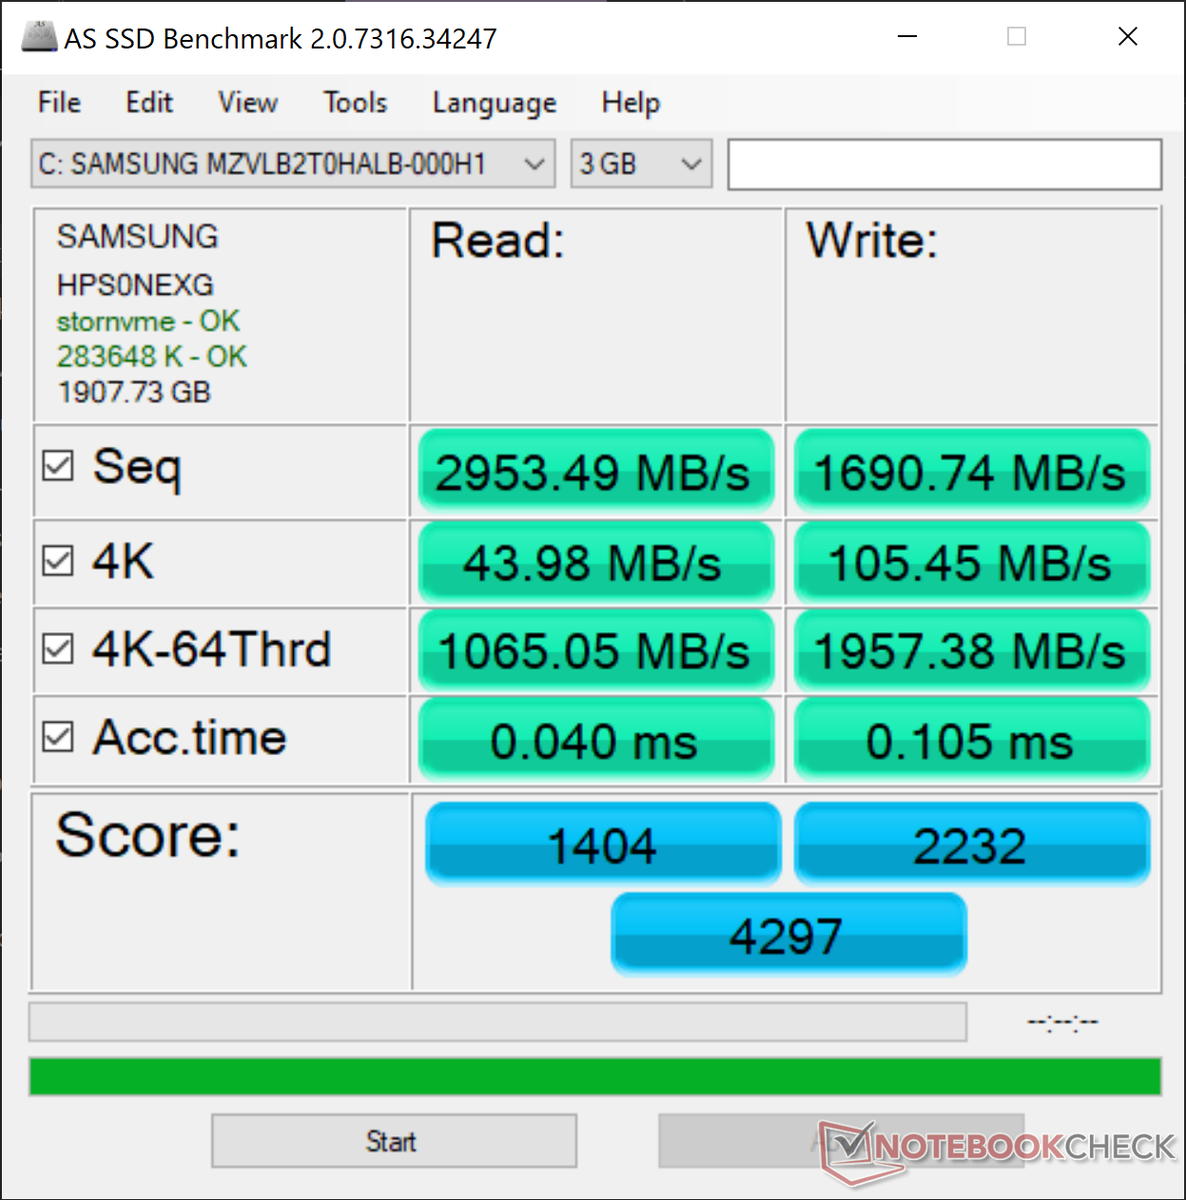
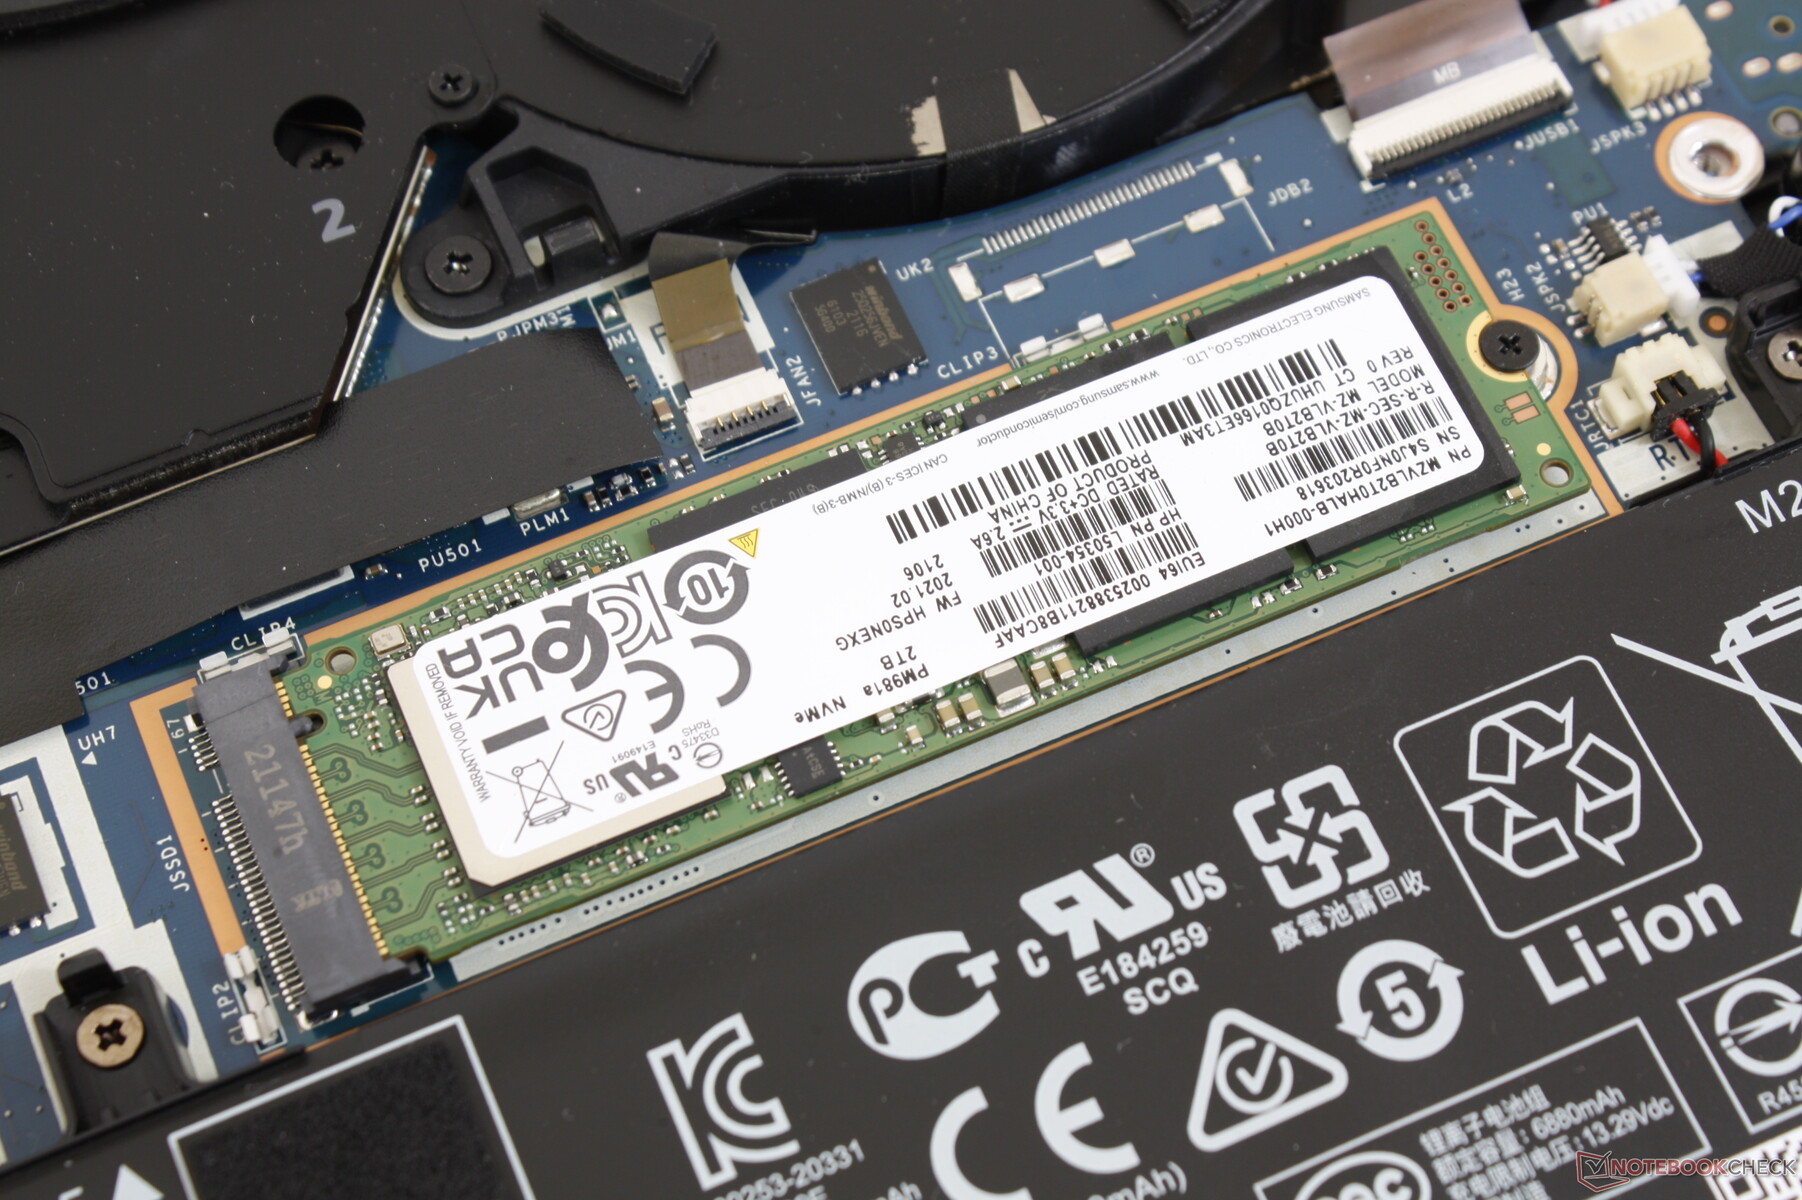
C'è solo un singolo slot interno M.2 2280 PCIe 3 x4 senza opzioni secondarie. Anche se possiamo capire lo spazio limitato disponibile, sarebbe stato bello vedere almeno un aggiornamento a PCIe 4, specialmente per un sistema così costoso. La nostra specifica unità di test è dotata del Samsung MZVLB2T0HALB per veloci velocità di lettura e scrittura sequenziale di 3500 MB/s e 3000 MB/s, rispettivamente. HP offre SSD SED opzionali come un ulteriore livello di sicurezza.
| HP ZBook Studio 15 G8 Samsung PM981a MZVLB2T0HALB | HP ZBook Firefly 15 G8 2C9R7EA Toshiba XG6 KXG60ZNV1T02 | HP ZBook Studio G7 Micron 2300 1TB MTFDHBA1T0TDV | Dell Precision 7550 SK Hynix PC601A NVMe 1TB | Lenovo ThinkPad P15s Gen2-20W6000GGE WDC PC SN720 SDAQNTW-1T00 | Asus ProArt StudioBook Pro 15 W500G5T Samsung SSD PM981 MZVLB1T0HALR | |
|---|---|---|---|---|---|---|
| AS SSD | -1% | -16% | -20% | 11% | 4% | |
| Seq Read (MB/s) | 2953 | 2599 -12% | 2548 -14% | 2028 -31% | 2796 -5% | 2702 -8% |
| Seq Write (MB/s) | 1691 | 1305 -23% | 1312 -22% | 1193 -29% | 2525 49% | 2348 39% |
| 4K Read (MB/s) | 43.98 | 49.65 13% | 45.38 3% | 42.31 -4% | 50.9 16% | 37.59 -15% |
| 4K Write (MB/s) | 105.4 | 128.1 22% | 83 -21% | 105.5 0% | 211.9 101% | 107.1 2% |
| 4K-64 Read (MB/s) | 1065 | 1157 9% | 935 -12% | 1128 6% | 1505 41% | 1491 40% |
| 4K-64 Write (MB/s) | 1957 | 1475 -25% | 2314 18% | 1537 -21% | 949 -52% | 1794 -8% |
| Access Time Read * (ms) | 0.04 | 0.057 -43% | 0.057 -43% | 0.069 -73% | 0.081 -103% | 0.046 -15% |
| Access Time Write * (ms) | 0.105 | 0.03 71% | 0.098 7% | 0.106 -1% | 0.019 82% | 0.034 68% |
| Score Read (Points) | 1404 | 1467 4% | 1235 -12% | 1373 -2% | 1835 31% | 1798 28% |
| Score Write (Points) | 2232 | 1734 -22% | 2528 13% | 1762 -21% | 1413 -37% | 2136 -4% |
| Score Total (Points) | 4297 | 3894 -9% | 4342 1% | 3801 -12% | 4177 -3% | 4835 13% |
| Copy ISO MB/s (MB/s) | 2474 | 3142 27% | 1768 -29% | 2302 -7% | ||
| Copy Program MB/s (MB/s) | 1074 | 126.1 -88% | 627 -42% | 564 -47% | ||
| Copy Game MB/s (MB/s) | 1929 | 477.4 -75% | 1477 -23% | 1336 -31% | ||
| CrystalDiskMark 5.2 / 6 | 1% | -9% | -8% | 22% | 106% | |
| Write 4K (MB/s) | 110.5 | 140.6 27% | 95.5 -14% | 121 10% | 237.6 115% | 1107 902% |
| Read 4K (MB/s) | 51.8 | 52.8 2% | 48.99 -5% | 42.16 -19% | 54.7 6% | 43.38 -16% |
| Write Seq (MB/s) | 2071 | 1844 -11% | 2001 -3% | 2150 4% | 2603 26% | 2387 15% |
| Read Seq (MB/s) | 2505 | 2108 -16% | 1600 -36% | 1755 -30% | 1889 -25% | 2431 -3% |
| Write 4K Q32T1 (MB/s) | 429.8 | 418 -3% | 410.2 -5% | 395.3 -8% | 505 17% | 340.7 -21% |
| Read 4K Q32T1 (MB/s) | 418.3 | 476.8 14% | 394.7 -6% | 381.8 -9% | 606 45% | 397.8 -5% |
| Write Seq Q32T1 (MB/s) | 3060 | 3064 0% | 3148 3% | 2730 -11% | 2795 -9% | 2390 -22% |
| Read Seq Q32T1 (MB/s) | 3539 | 3289 -7% | 3227 -9% | 3468 -2% | 3448 -3% | 3502 -1% |
| Media totale (Programma / Settaggio) | 0% /
-0% | -13% /
-13% | -14% /
-16% | 17% /
15% | 55% /
41% |
* ... Meglio usare valori piccoli

Throttling Disco: DiskSpd Read Loop, Queue Depth 8
Prestazioni della GPU - 85 W TGP
Le prestazioni grafiche sono dal 10% al 15% più lente della media RTX 3070 nel nostro database. Il deficit è abbastanza ampio che anche alcuni vecchi dispositivi con RTX 2070 o RTX 3060 come lo Schenker XMG Core 15 a volte possono superare il nostro sistema RTX 3070 più costoso. Non è un portatile lento con qualsiasi mezzo, ma avrebbe potuto certamente essere più veloce sulla base della nostra esperienza con decine di altri sistemi con la stessa GPU RTX 3070.
Gli utenti possono sostituire la GPU GeForce con la Quadro RTX A3000 o A4000 per massimizzare CAD, CGI e altri carichi di lavoro specifici della workstation.
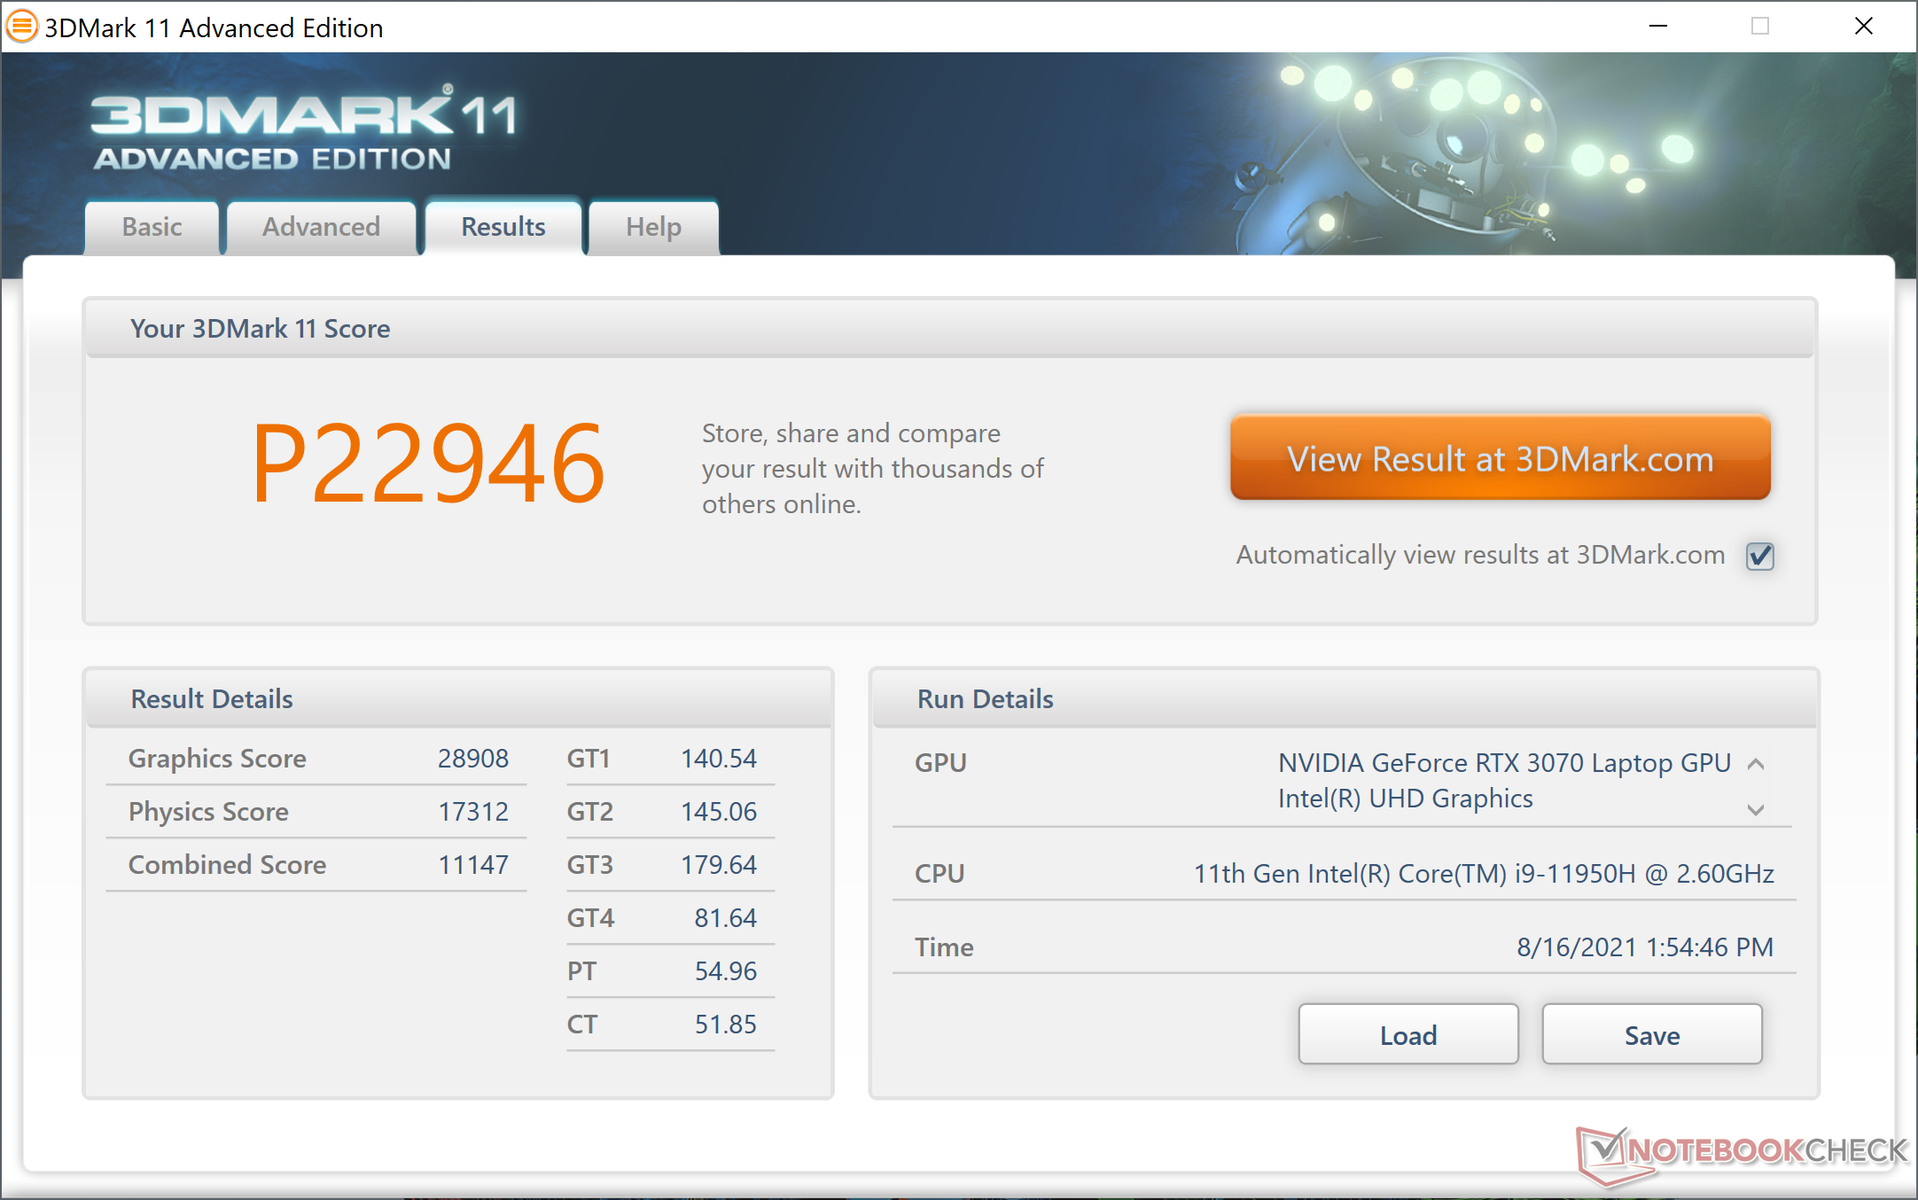
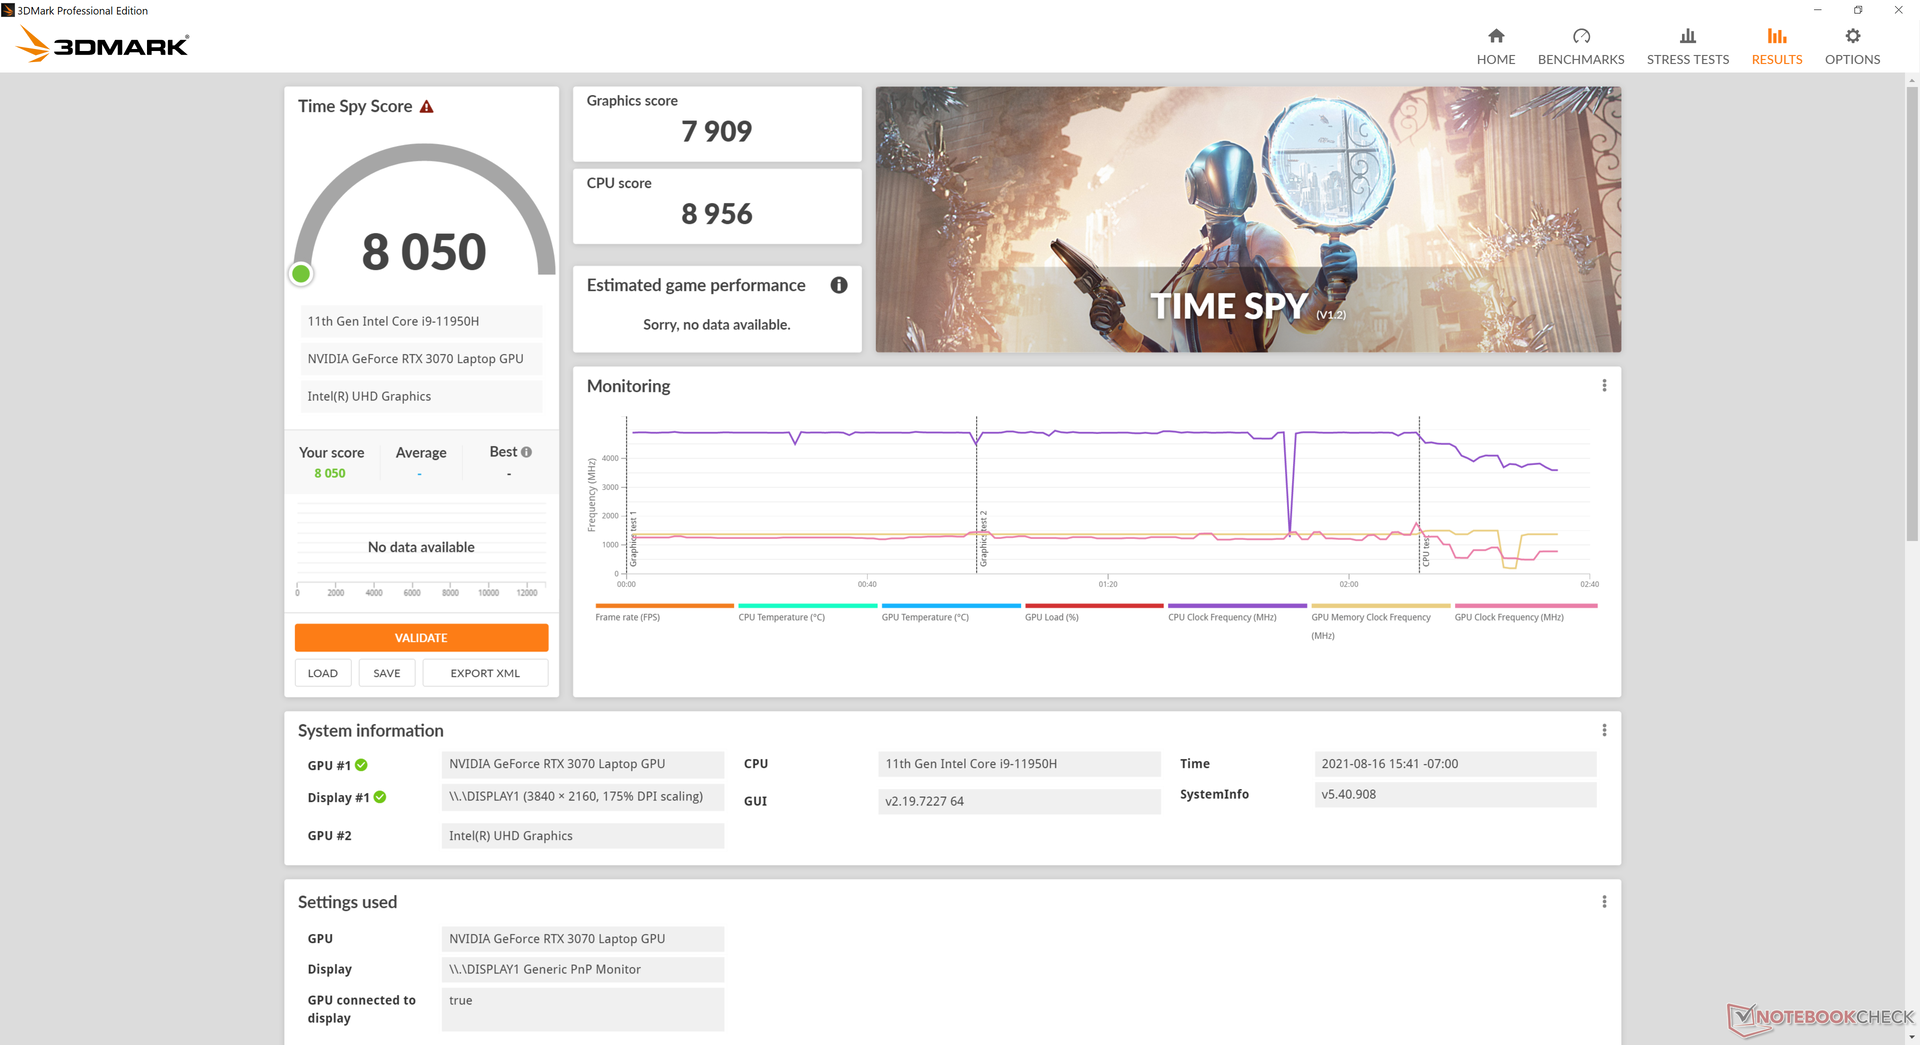

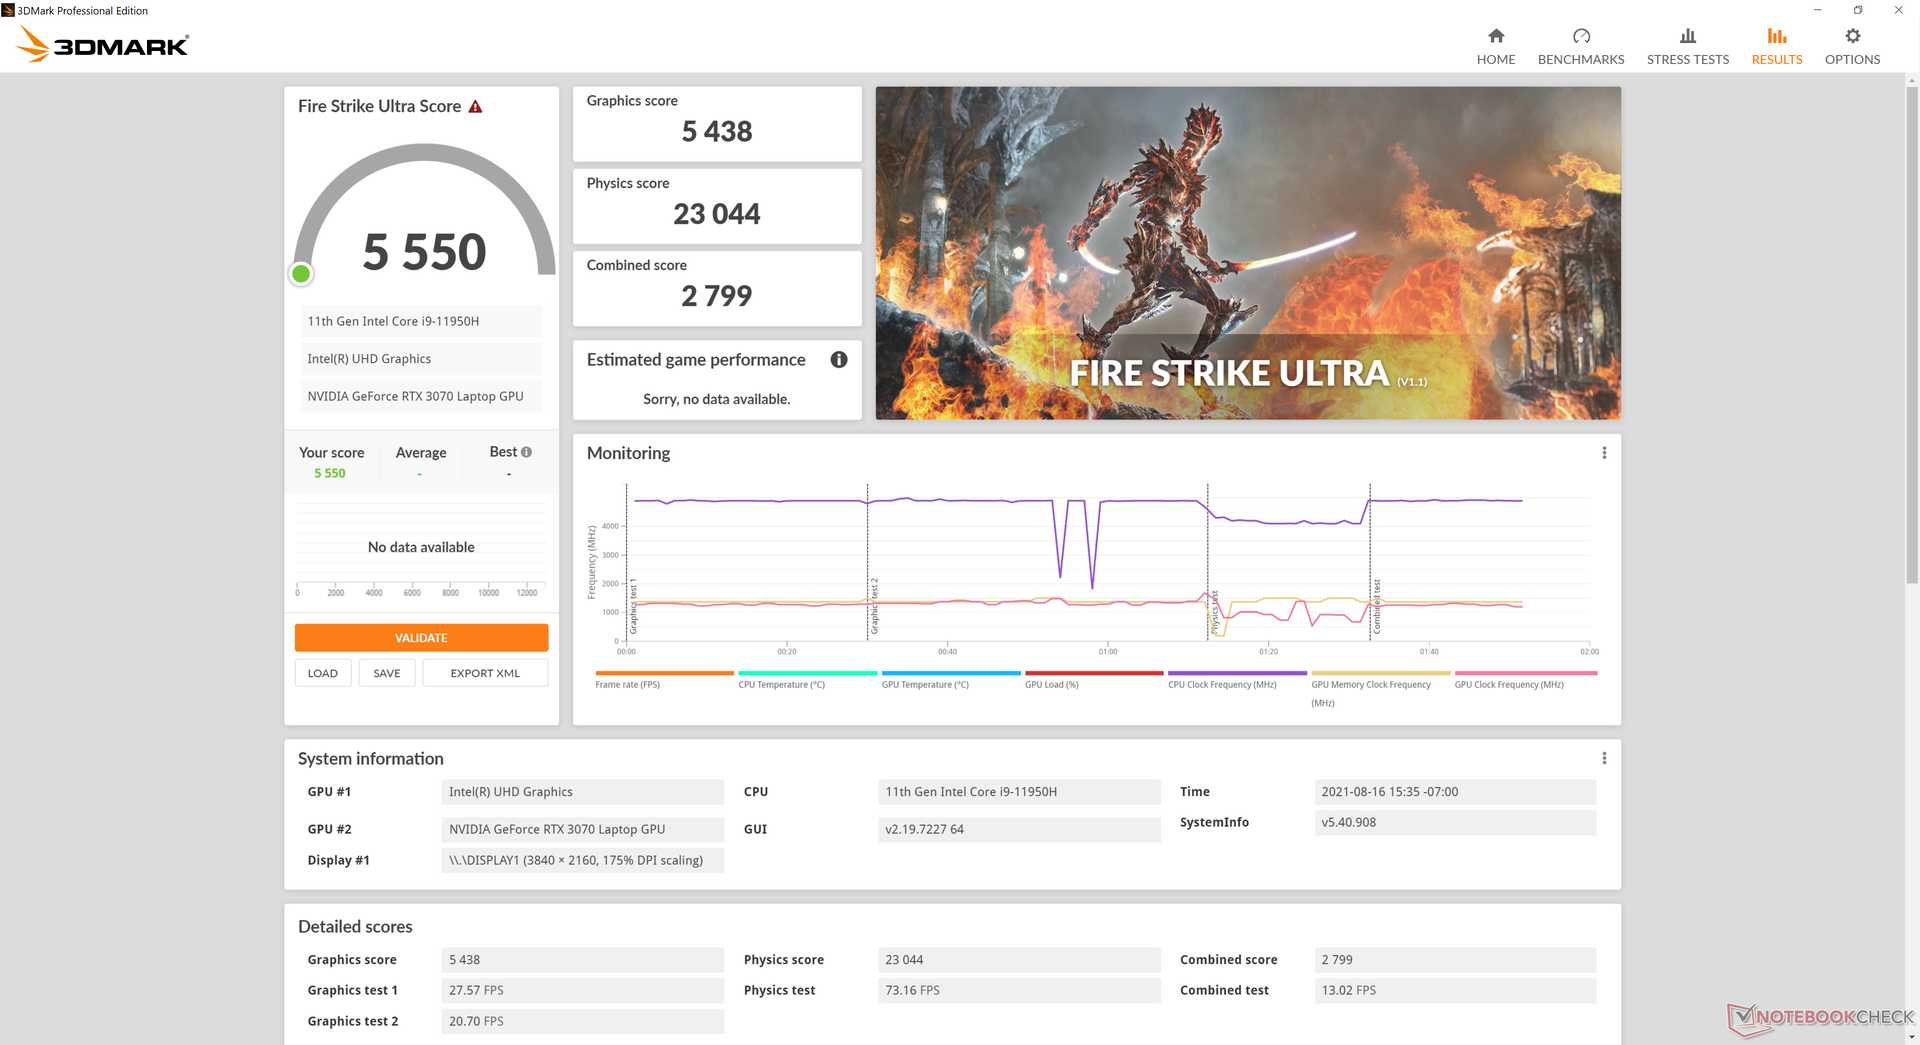
| 3DMark 11 Performance | 22946 punti | |
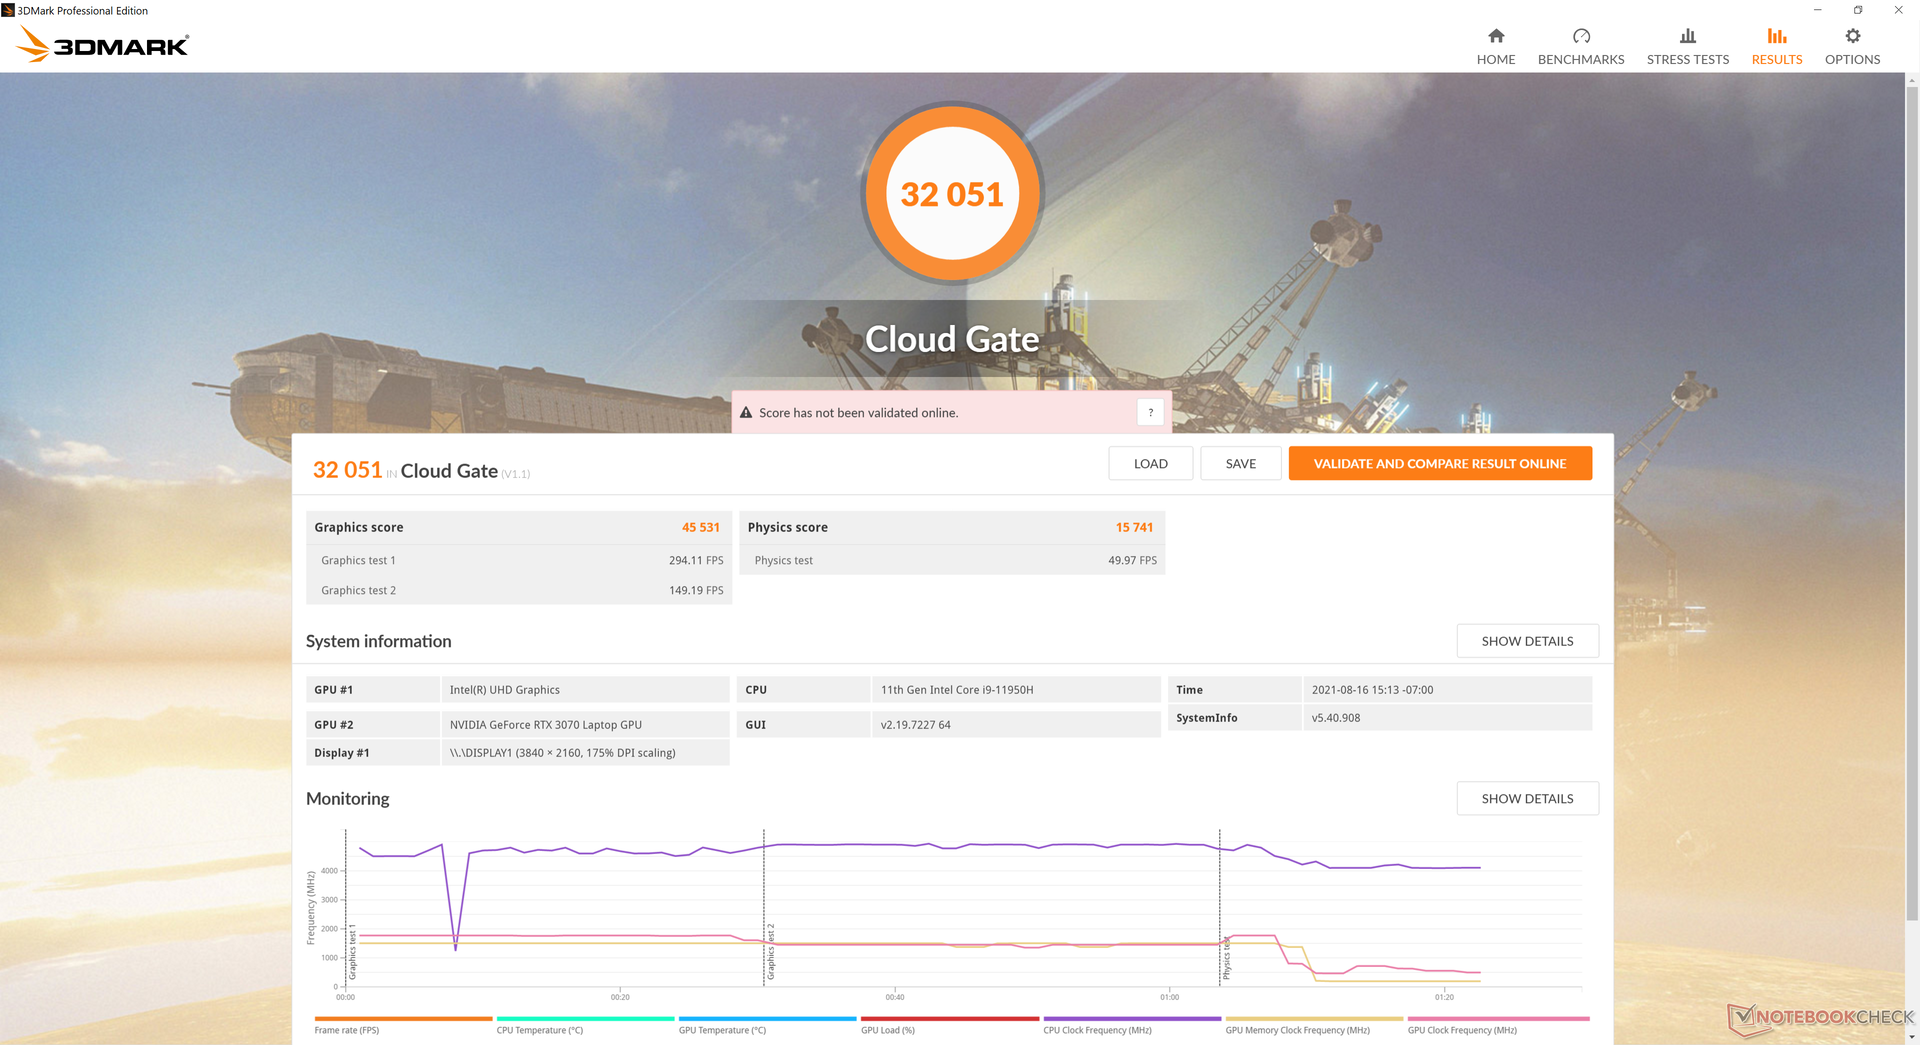
| 3DMark Cloud Gate Standard Score | 32051 punti | |
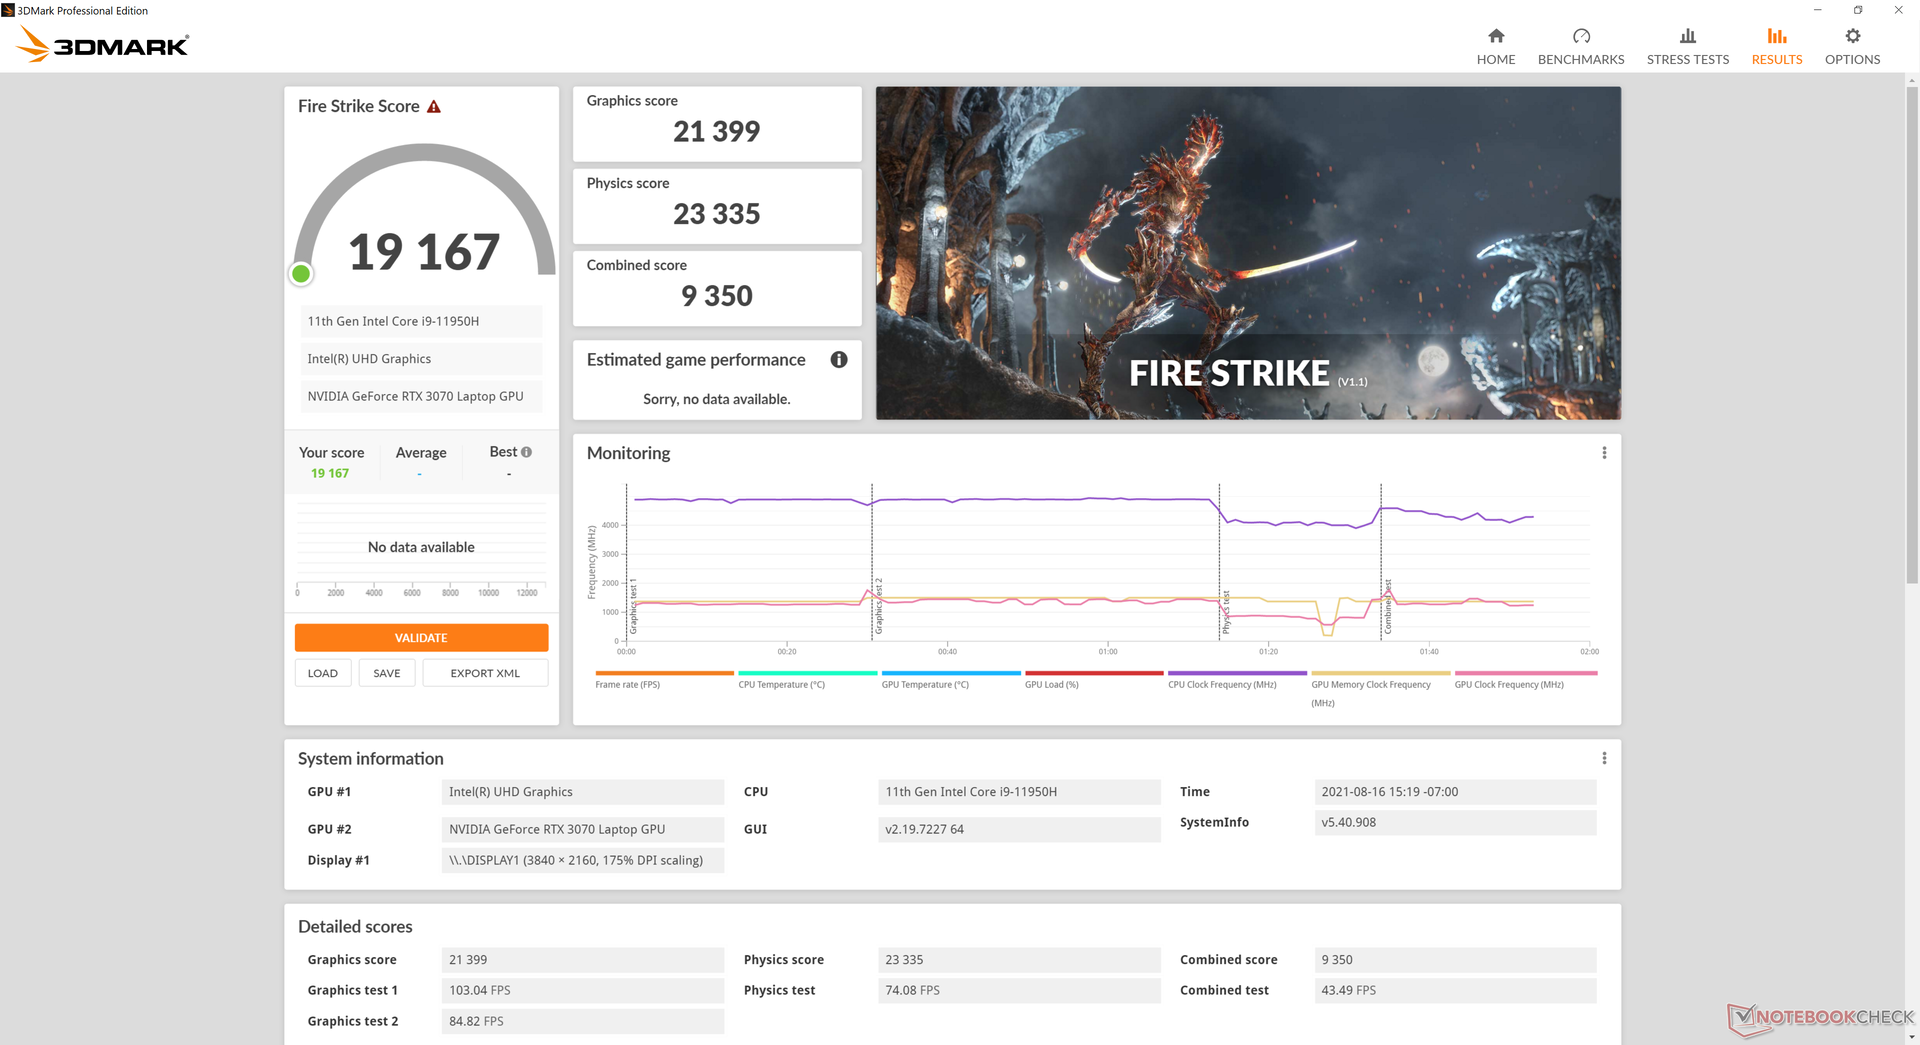
| 3DMark Fire Strike Score | 19167 punti | |
| 3DMark Time Spy Score | 8050 punti | |
Aiuto | ||
Grafico FPS The Witcher 3
| basso | medio | alto | ultra | QHD | 4K | |
|---|---|---|---|---|---|---|
| The Witcher 3 (2015) | 365.9 | 252.2 | 154.2 | 81.5 | 40.3 | |
| Dota 2 Reborn (2015) | 162.5 | 144.1 | 135.8 | 116.3 | 93.1 | |
| Final Fantasy XV Benchmark (2018) | 144 | 104 | 78.5 | 61.3 | 36.2 | |
| X-Plane 11.11 (2018) | 120 | 104 | 83.5 | 54.4 | ||
| Far Cry 5 (2018) | 125 | 100 | 93 | 89 | 81 | 44 |
Emissioni
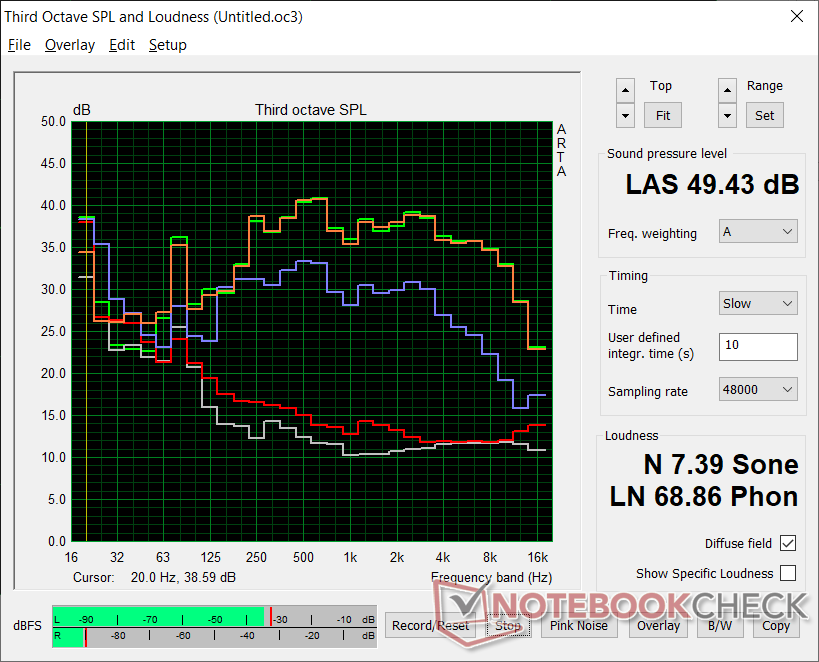
Rumore di sistema - Non più silenzioso
Stipare processori ad alte prestazioni in uno chassis sottile comporta inevitabilmente ventole rumorose. Con quasi 50 dB(A) quando si eseguono giochi o altri carichi elevati, lo ZBook G8 può diventare più rumoroso della concorrenza tra cui il Razer Blade 15 Studio e lo ZBook Studio G7 dello scorso anno. Le ventole non sono mai veramente inattive, il che significa che ci sarà sempre un po' di rumore anche quando sono al minimo sul desktop senza applicazioni in esecuzione. Aspettatevi un rumore tollerabile della ventola fino a 29,3 dB(A) contro un sottofondo di 23,5 dB(A) durante i carichi non impegnativi come l'elaborazione di testi, lo streaming video o la navigazione.
| HP ZBook Studio 15 G8 GeForce RTX 3070 Laptop GPU, i9-11950H, Samsung PM981a MZVLB2T0HALB | HP ZBook Firefly 15 G8 2C9R7EA T500 Laptop GPU, i7-1165G7, Toshiba XG6 KXG60ZNV1T02 | HP ZBook Studio G7 Quadro RTX 3000 Max-Q, i9-10885H, Micron 2300 1TB MTFDHBA1T0TDV | Dell Precision 7550 Quadro RTX 5000 Max-Q, W-10885M, SK Hynix PC601A NVMe 1TB | Lenovo ThinkPad P15s Gen2-20W6000GGE T500 Laptop GPU, i7-1165G7, WDC PC SN720 SDAQNTW-1T00 | Asus ProArt StudioBook Pro 15 W500G5T Quadro RTX 5000 Max-Q, i7-9750H, Samsung SSD PM981 MZVLB1T0HALR | |
|---|---|---|---|---|---|---|
| Noise | 11% | 2% | -7% | 6% | -8% | |
| off /ambiente * (dB) | 23.5 | 24.1 -3% | 24.4 -4% | 25.8 -10% | 24.3 -3% | 25.2 -7% |
| Idle Minimum * (dB) | 25.3 | 24.1 5% | 24.4 4% | 25.8 -2% | 25.5 -1% | 27.9 -10% |
| Idle Average * (dB) | 25.3 | 24.1 5% | 24.4 4% | 25.8 -2% | 25.5 -1% | 27.9 -10% |
| Idle Maximum * (dB) | 25.3 | 27.1 -7% | 27.9 -10% | 25.9 -2% | 25.5 -1% | 27.9 -10% |
| Load Average * (dB) | 41.2 | 32.8 20% | 38.8 6% | 51.2 -24% | 35.65 13% | 47 -14% |
| Witcher 3 ultra * (dB) | 49.4 | 36.1 27% | 46.3 6% | 51.9 -5% | ||
| Load Maximum * (dB) | 49.4 | 36.1 27% | 46.3 6% | 51.9 -5% | 35.65 28% | 46.9 5% |
* ... Meglio usare valori piccoli
Rumorosità
| Idle |
| 25.3 / 25.3 / 25.3 dB(A) |
| Sotto carico |
| 41.2 / 49.4 dB(A) |
 | ||
30 dB silenzioso 40 dB(A) udibile 50 dB(A) rumoroso |
||
min: | ||
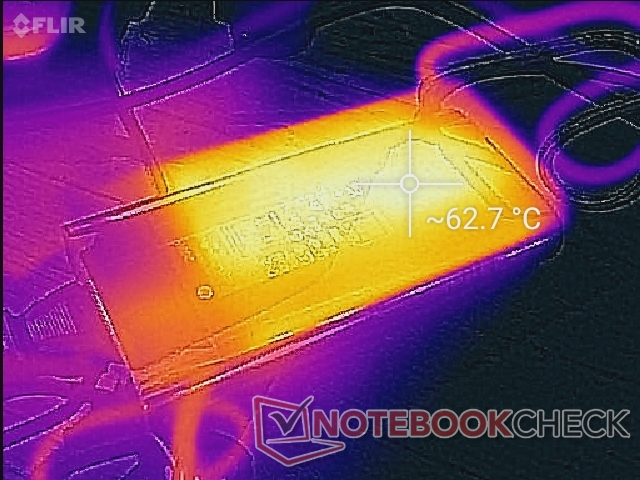
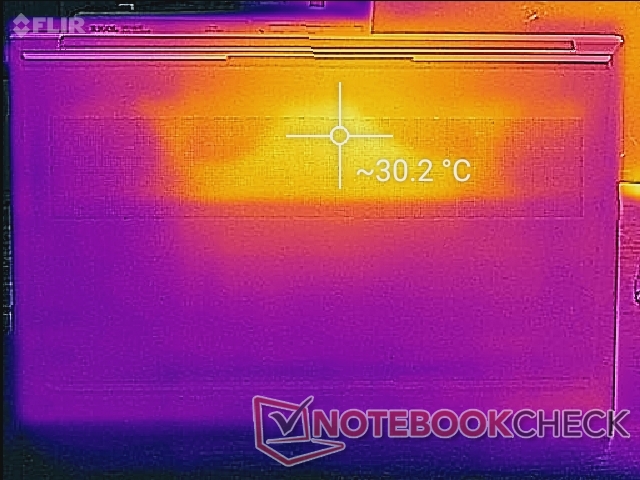
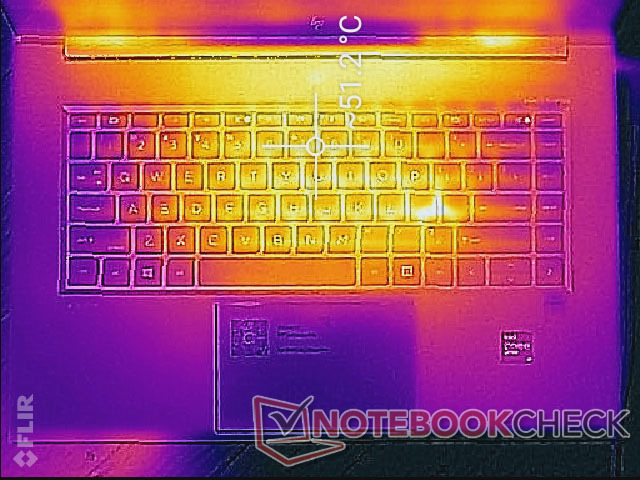
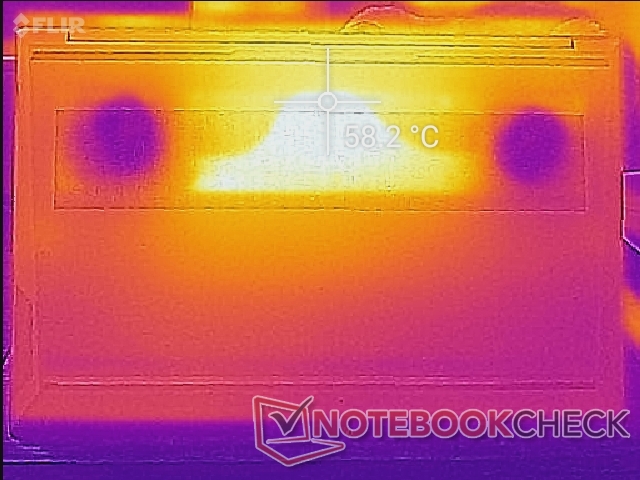
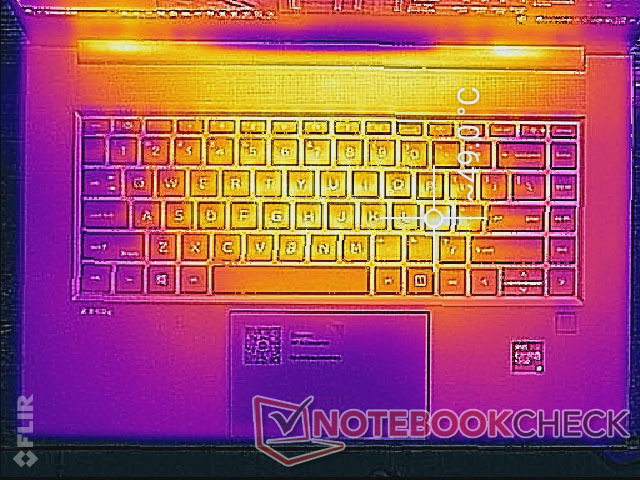
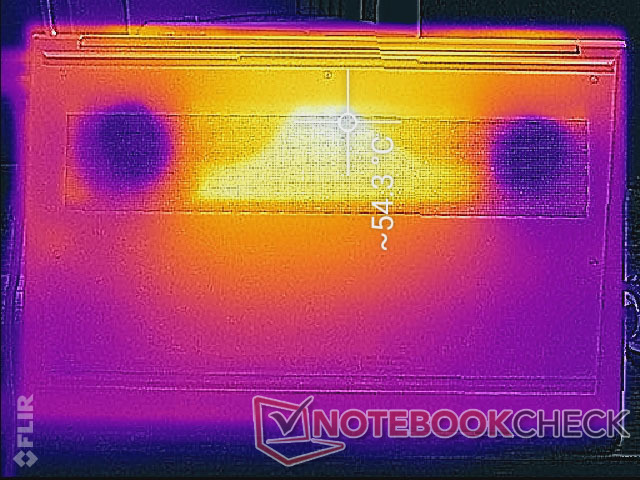
Temperature - Poggiapolsi caldi
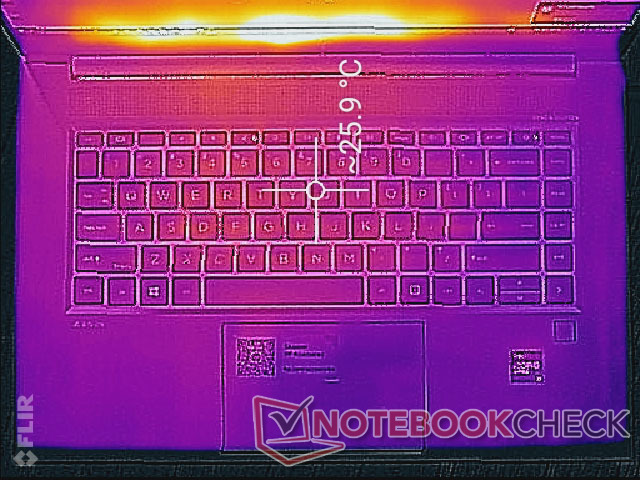
Le temperature sono simmetriche grazie alla soluzione di raffreddamento simmetrico all'interno. Il punto caldo è vicino al centro della tastiera dove può raggiungere oltre 51° C quando si eseguono carichi elevati rispetto ai 49° C del Dell Precision 7550. Anche il poggiapolsi può diventare abbastanza caldo a circa 38° C a causa del design denso della base metallica. Le temperature più calde non sono scomode per le mani, ma sono certamente evidenti.
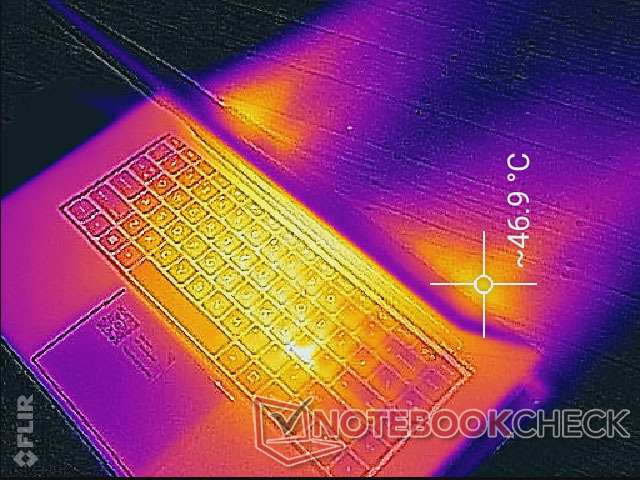
(-) La temperatura massima sul lato superiore è di 49 °C / 120 F, rispetto alla media di 38.2 °C / 101 F, che varia da 22.2 a 69.8 °C per questa classe Workstation.
(-) Il lato inferiore si riscalda fino ad un massimo di 54.2 °C / 130 F, rispetto alla media di 41.1 °C / 106 F
(+) In idle, la temperatura media del lato superiore è di 25.4 °C / 78 F, rispetto alla media deld ispositivo di 32 °C / 90 F.
(-) Riproducendo The Witcher 3, la temperatura media per il lato superiore e' di 43.2 °C / 110 F, rispetto alla media del dispositivo di 32 °C / 90 F.
(±) I poggiapolsi e il touchpad possono diventare molto caldi al tatto con un massimo di 38.4 °C / 101.1 F.
(-) La temperatura media della zona del palmo della mano di dispositivi simili e'stata di 27.8 °C / 82 F (-10.6 °C / -19.1 F).
Stress Test
Sotto lo stress di Prime95, la CPU raggiunge i 4 GHz solo per il primo secondo o due prima di raggiungere una temperatura del core di 97° C. Le frequenze di clock poi si stabilizzano nell'intervallo da 2,8 a 3,3 GHz per evitare che le temperature del core aumentano ulteriormente. L'esecuzione di questo stesso test sullo ZBook Fury 15 G7 mostra risultati di temperatura del core simili.
La CPU e la GPU si stabilizzano a 77° C e 70° C, rispettivamente, durante l'esecuzione The Witcher 3 che è solo leggermente più freddo di quello che abbiamo osservato sul Dell Precision 5750 o ZBook Fury 15 G7.
L'uso della batteria limita molto le prestazioni. Un test 3DMark 11 a batterie restituisce punteggi Physics e Graphics di 10388 e 9950, rispettivamente, rispetto a 17312 e 28908 punti ottenuti quando è collegato all'alimentatore.
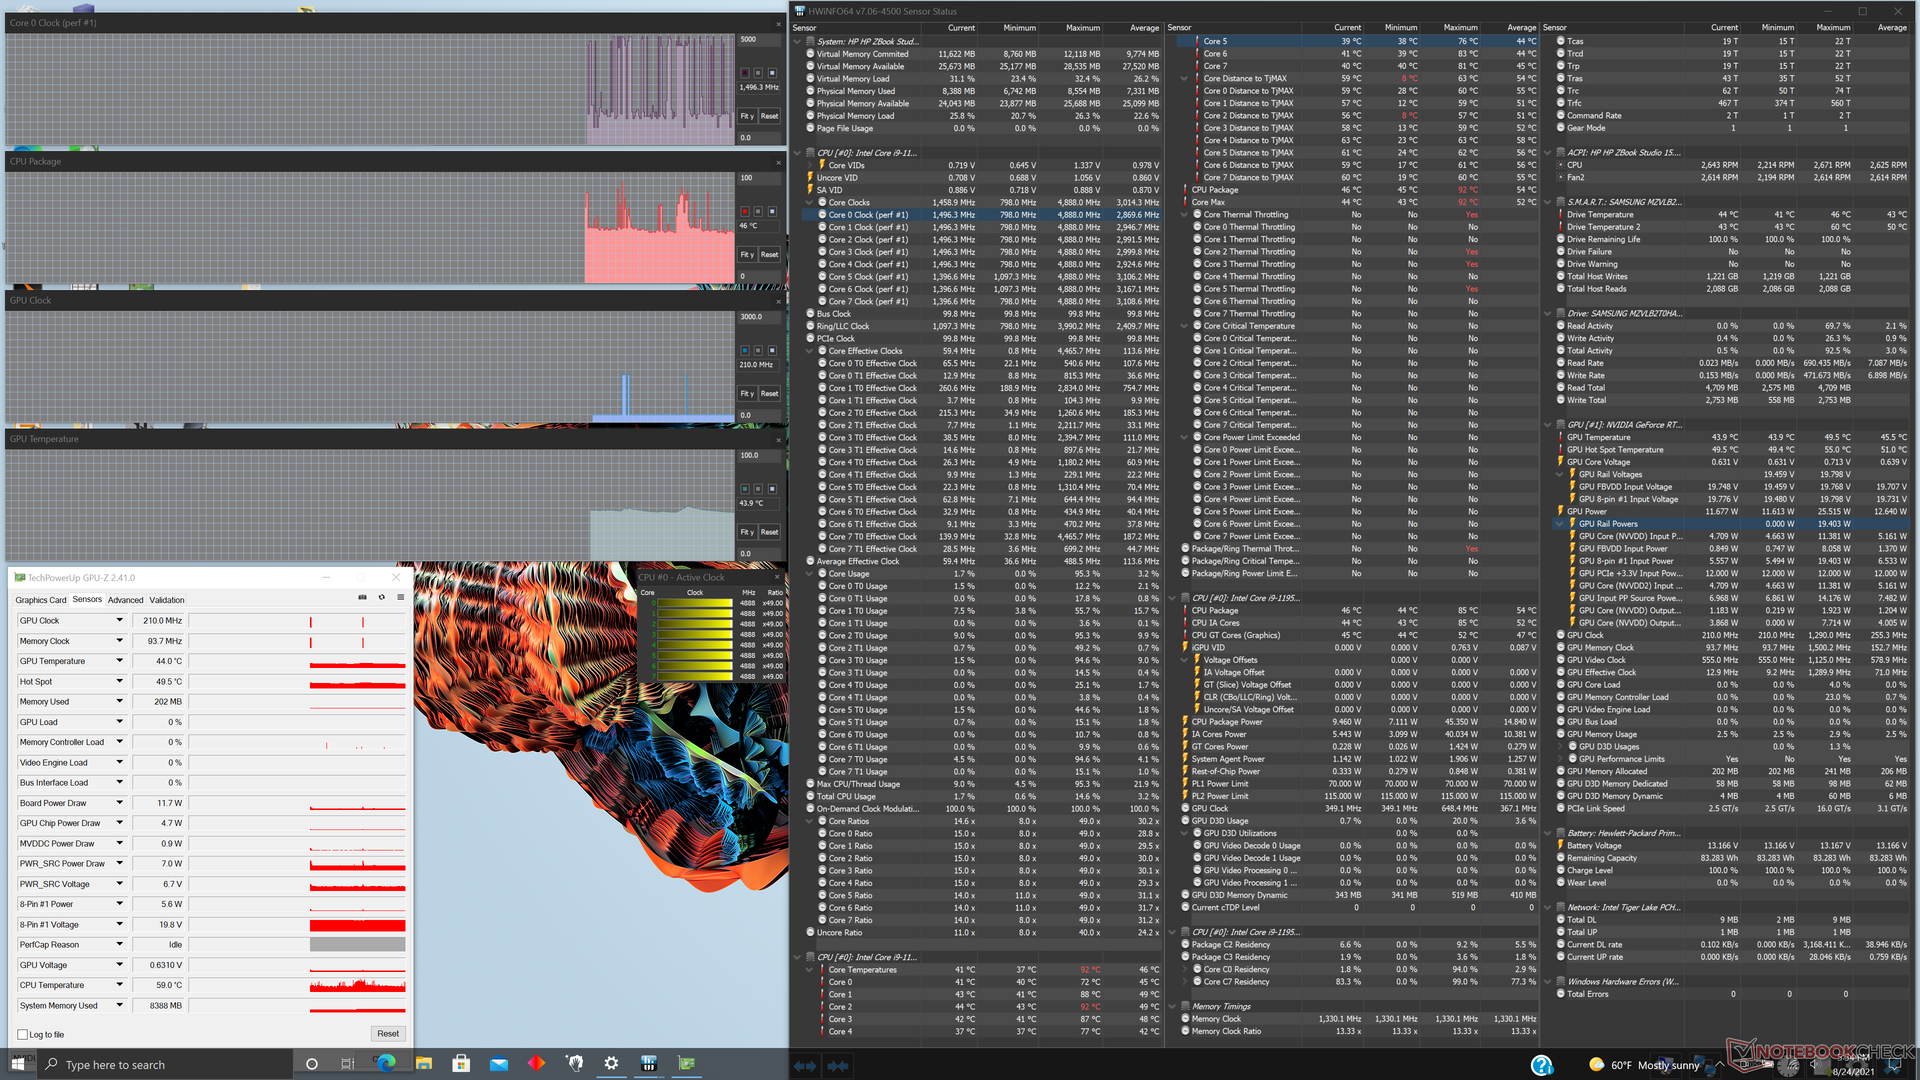
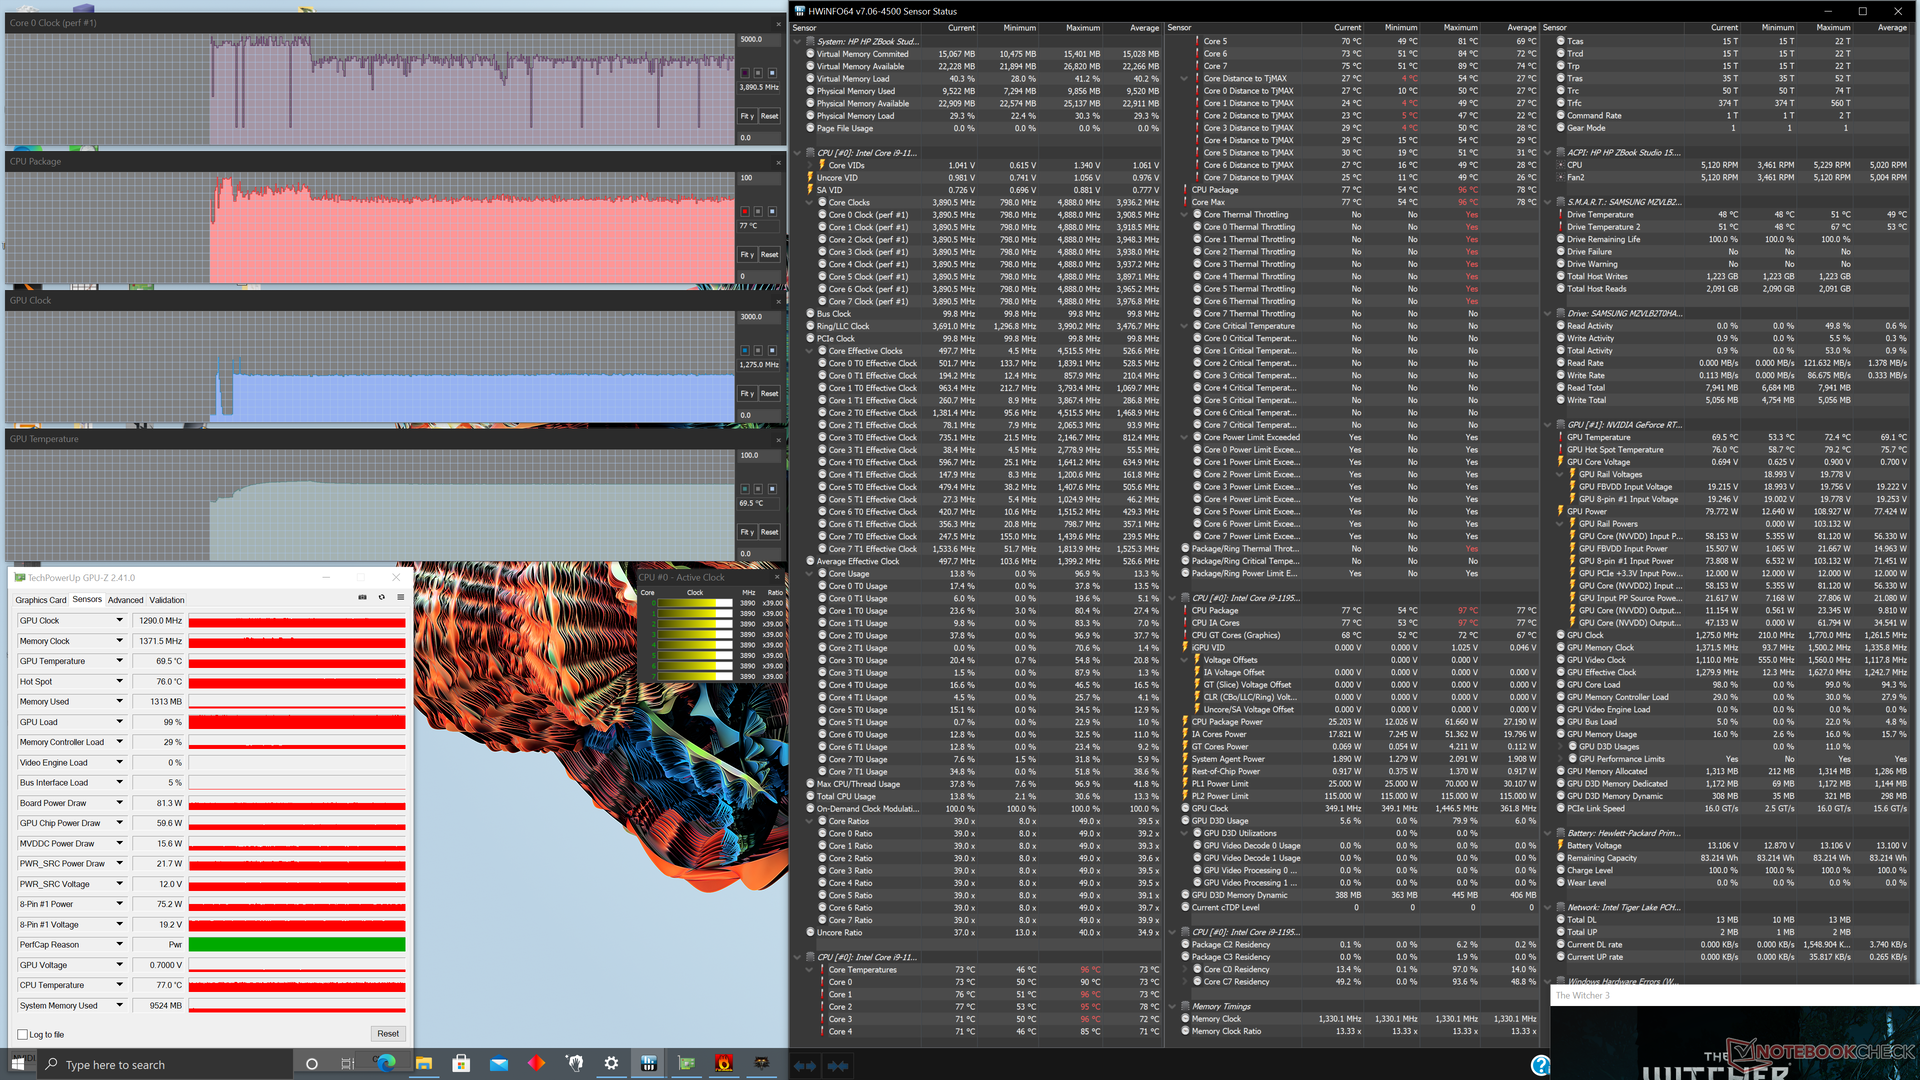
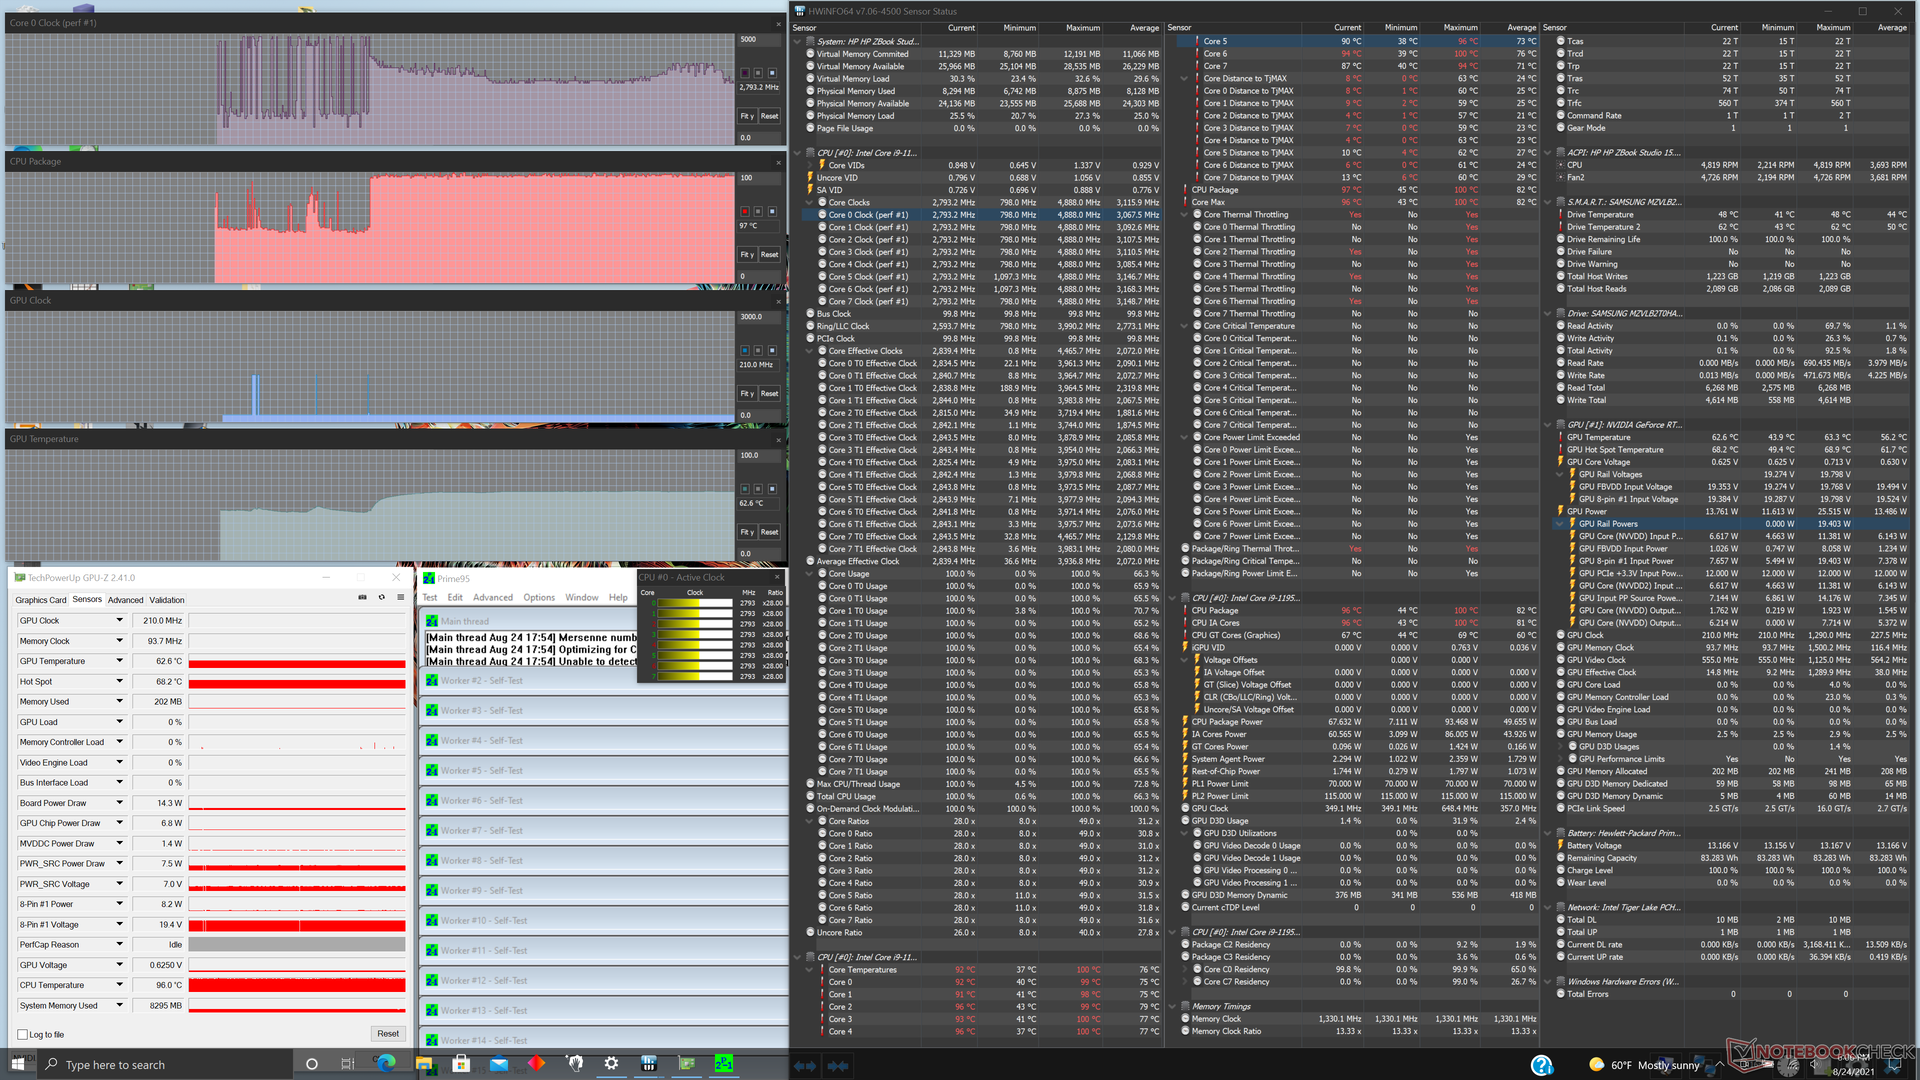
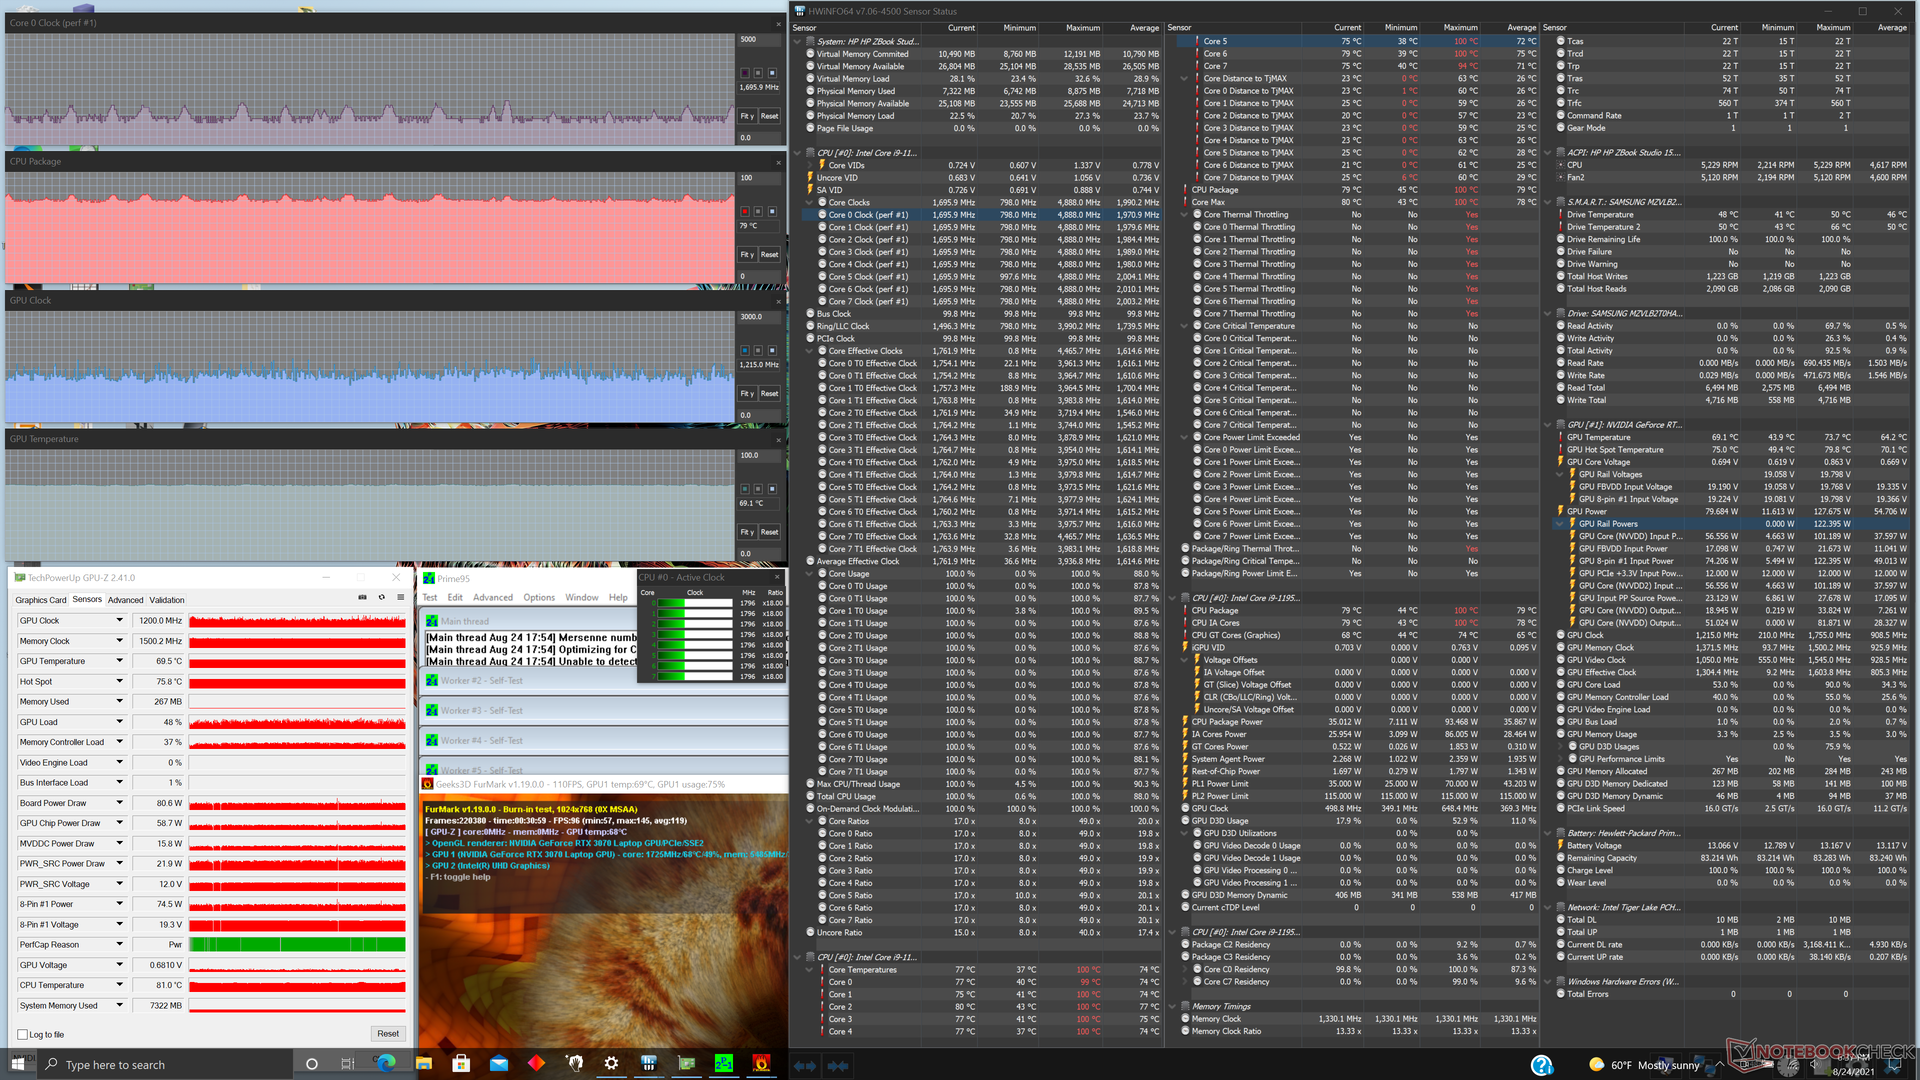
| Clock della CPU (GHz)Clock della GPU(MHz)Temperatura media dellaCPU (°C)Temperaturamedia dellaGPU (°C) |
| Sistema inattivo |
| StressPrime95 |
| Prime95 + FurMark Stress |
| Witcher 3 Stress |
Altoparlanti
I quattro altoparlanti integrati (2x tweeter + 2x woofer) forniscono un suono eccellente con un buon equilibrio e una riproduzione dei bassi decente. La qualità potrebbe facilmente passare su un portatile gaming o multimediale come un HP Omen o un modello della serie MSI GT.


HP ZBook Studio 15 G8 analisi audio
(+) | gli altoparlanti sono relativamente potenti (85.1 dB)
Bassi 100 - 315 Hz
(±) | bassi ridotti - in media 6% inferiori alla media
(±) | la linearità dei bassi è media (8.2% delta rispetto alla precedente frequenza)
Medi 400 - 2000 Hz
(+) | medi bilanciati - solo only 3.8% rispetto alla media
(+) | medi lineari (3.9% delta rispetto alla precedente frequenza)
Alti 2 - 16 kHz
(+) | Alti bilanciati - appena 3.4% dalla media
(+) | alti lineari (6.5% delta rispetto alla precedente frequenza)
Nel complesso 100 - 16.000 Hz
(+) | suono nel complesso lineare (8% differenza dalla media)
Rispetto alla stessa classe
» 1% di tutti i dispositivi testati in questa classe è stato migliore, 1% simile, 99% peggiore
» Il migliore ha avuto un delta di 7%, medio di 17%, peggiore di 35%
Rispetto a tutti i dispositivi testati
» 2% di tutti i dispositivi testati in questa classe è stato migliore, 1% similare, 98% peggiore
» Il migliore ha avuto un delta di 4%, medio di 24%, peggiore di 134%
Apple MacBook 12 (Early 2016) 1.1 GHz analisi audio
(+) | gli altoparlanti sono relativamente potenti (83.6 dB)
Bassi 100 - 315 Hz
(±) | bassi ridotti - in media 11.3% inferiori alla media
(±) | la linearità dei bassi è media (14.2% delta rispetto alla precedente frequenza)
Medi 400 - 2000 Hz
(+) | medi bilanciati - solo only 2.4% rispetto alla media
(+) | medi lineari (5.5% delta rispetto alla precedente frequenza)
Alti 2 - 16 kHz
(+) | Alti bilanciati - appena 2% dalla media
(+) | alti lineari (4.5% delta rispetto alla precedente frequenza)
Nel complesso 100 - 16.000 Hz
(+) | suono nel complesso lineare (10.2% differenza dalla media)
Rispetto alla stessa classe
» 7% di tutti i dispositivi testati in questa classe è stato migliore, 2% simile, 91% peggiore
» Il migliore ha avuto un delta di 5%, medio di 18%, peggiore di 53%
Rispetto a tutti i dispositivi testati
» 5% di tutti i dispositivi testati in questa classe è stato migliore, 1% similare, 94% peggiore
» Il migliore ha avuto un delta di 4%, medio di 24%, peggiore di 134%
Gestione Energetica
Consumo di energia
La nostra versione assorbe più energia della maggior parte delle altre workstation da 15.6 pollici anche quando è inattiva sul desktop a causa del suo pannello OLED. Abbiamo provato che l'OLED può essere significativamente più affamato di energia rispetto al tipico IPS, specialmente quando si visualizzano colori bianchi brillanti. Dal momento che la maggior parte dei contenuti online hanno sfondi bianchi, la nostra unità OLED può consumare fino a 2x o 3x in più di energia solo restando al minimo con l'impostazione di luminosità massima.
L'esecuzione di carichi più elevati come i giochi consumerà circa il 23% in più rispetto allo ZBook G7 con Quadro RTX 3000 Max-Q. Le prestazioni per watt sono ancora superiori sul nostro nuovo modello G8, dato che le prestazioni della CPU e della grafica sono circa il 25% e il 50% superiori, rispettivamente.
Siamo in grado di registrare un consumo massimo di 172 W dall'adattatore AC 200 W di medie dimensioni (~15,3 x 7,5 x 2,4 cm). Il sistema può eseguire carichi elevati e ancora ricaricarsi ad una velocità decente contemporaneamente a differenza della versione precedente del Dell Precision 5750, poi lo ZBook G8 verrà fornito con un più piccolo adattatore AC da 150 W se configurato solo con la grafica Iris Xe.
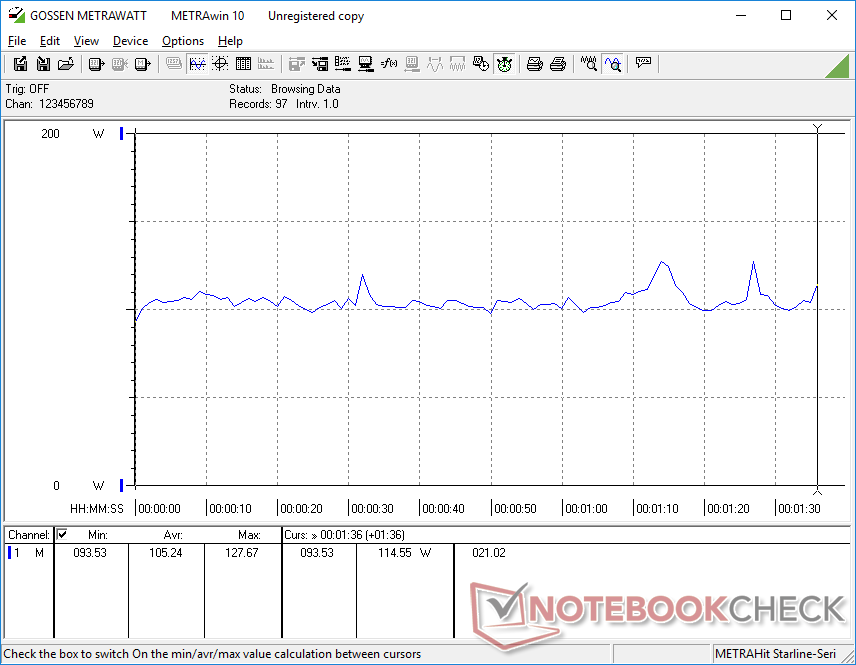
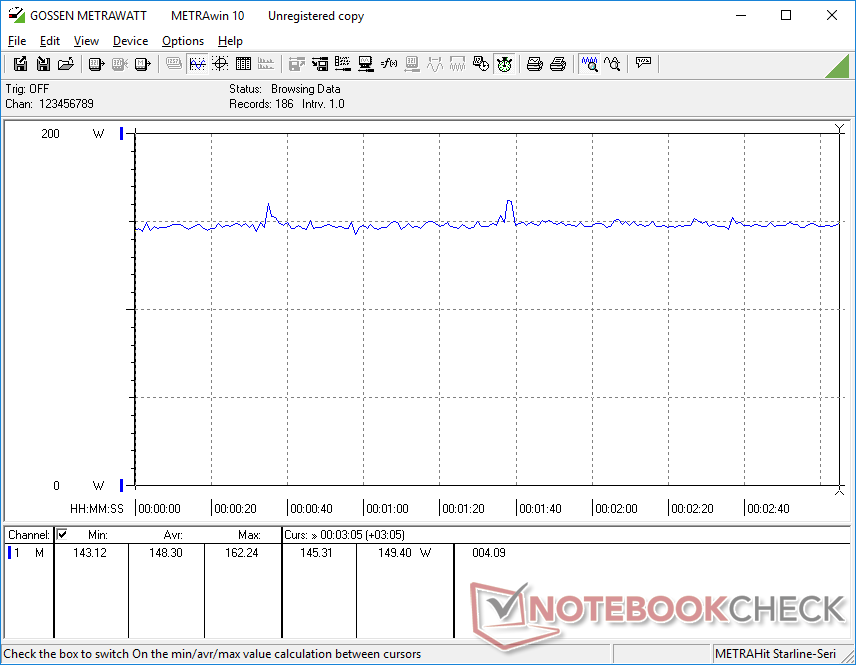
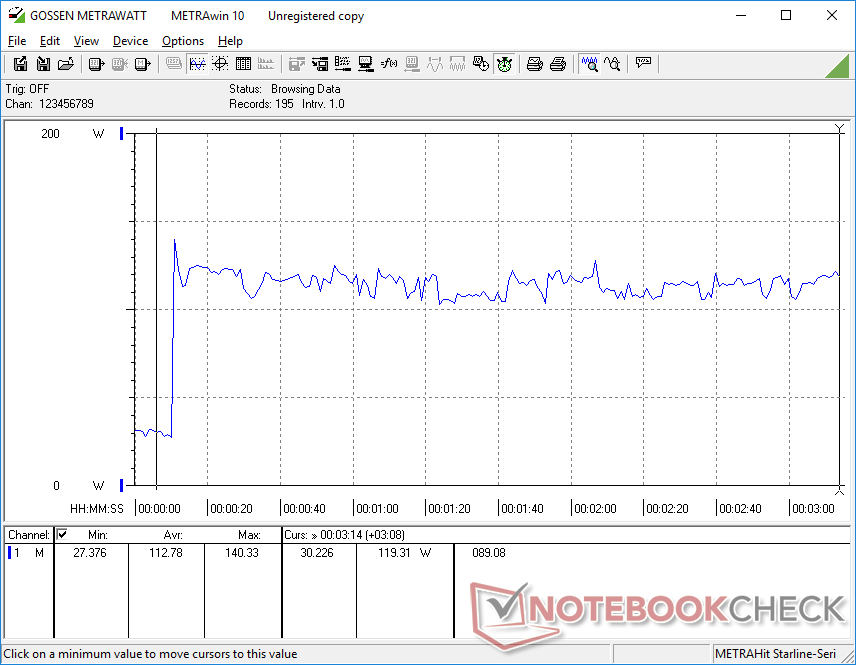
| Off / Standby | |
| Idle | |
| Sotto carico |
|
Leggenda:
min: | |
| HP ZBook Studio 15 G8 i9-11950H, GeForce RTX 3070 Laptop GPU, Samsung PM981a MZVLB2T0HALB, OLED, 3840x2160, 15.6" | HP ZBook Firefly 15 G8 2C9R7EA i7-1165G7, T500 Laptop GPU, Toshiba XG6 KXG60ZNV1T02, IPS, 1920x1080, 15.6" | HP ZBook Studio G7 i9-10885H, Quadro RTX 3000 Max-Q, Micron 2300 1TB MTFDHBA1T0TDV, IPS, 3840x2160, 15.6" | Dell Precision 7550 W-10885M, Quadro RTX 5000 Max-Q, SK Hynix PC601A NVMe 1TB, IPS, 3840x2160, 15.6" | Lenovo ThinkPad P15s Gen2-20W6000GGE i7-1165G7, T500 Laptop GPU, WDC PC SN720 SDAQNTW-1T00, IPS LED, 3840x2160, 15.6" | Asus ProArt StudioBook Pro 15 W500G5T i7-9750H, Quadro RTX 5000 Max-Q, Samsung SSD PM981 MZVLB1T0HALR, IPS, 3840x2160, 15.6" | |
|---|---|---|---|---|---|---|
| Power Consumption | 63% | 19% | 2% | 54% | 6% | |
| Idle Minimum * (Watt) | 11 | 3.3 70% | 5.5 50% | 8.2 25% | 5.8 47% | 11.6 -5% |
| Idle Average * (Watt) | 18.8 | 5.6 70% | 13.7 27% | 16.8 11% | 13.3 29% | 19 -1% |
| Idle Maximum * (Watt) | 31.7 | 8.7 73% | 16.6 48% | 24.4 23% | 15.6 51% | 20.6 35% |
| Load Average * (Watt) | 105.2 | 64.4 39% | 118.4 -13% | 131 -25% | 43.2 59% | 102 3% |
| Witcher 3 ultra * (Watt) | 148 | 53 64% | 120 19% | 156.6 -6% | 37.1 75% | |
| Load Maximum * (Watt) | 171.8 | 69 60% | 203.3 -18% | 201.8 -17% | 67.3 61% | 178 -4% |
* ... Meglio usare valori piccoli
Consumo energetico The Witcher 3 / Stresstest
Durata della batteria - più breve a causa dell'OLED
L'autonomia sembra essere più breve rispetto allo ZBook Studio G7 dell'anno scorso di diverse ore. Siamo stati in grado di ottenere solo poco più di 6 ore di utilizzo nel mondo reale WLAN rispetto alle quasi 8 ore del G7 anche se impostato sulla GPU integrata. Il pannello OLED più affamato di energia sul nostro G8 è un probabile colpevole per la durata della batteria troncata.
La ricarica è fortunatamente veloce con circa 90 minuti nesessari per una carica completa. Gli utenti possono anche ricaricare il sistema tramite USB-C.
| HP ZBook Studio 15 G8 i9-11950H, GeForce RTX 3070 Laptop GPU, 83 Wh | HP ZBook Firefly 15 G8 2C9R7EA i7-1165G7, T500 Laptop GPU, 56 Wh | HP ZBook Studio G7 i9-10885H, Quadro RTX 3000 Max-Q, 83 Wh | Dell Precision 7550 W-10885M, Quadro RTX 5000 Max-Q, 95 Wh | Lenovo ThinkPad P15s Gen2-20W6000GGE i7-1165G7, T500 Laptop GPU, 57 Wh | Asus ProArt StudioBook Pro 15 W500G5T i7-9750H, Quadro RTX 5000 Max-Q, 76 Wh | |
|---|---|---|---|---|---|---|
| Autonomia della batteria | 49% | 8% | -5% | 15% | -24% | |
| Reader / Idle (h) | 12.9 | 11.1 -14% | ||||
| WiFi v1.3 (h) | 6.2 | 10.5 69% | 7.8 26% | 8.9 44% | 7.7 24% | 4.7 -24% |
| Load (h) | 1.8 | 2.3 28% | 1.6 -11% | 1 -44% | 1.9 6% |
Pro
Contro
Valutazione complessiva dello ZBook Studio G8 - Buoni guadagni per la CPU, guadagni poco entusiasmanti per la GPU
HP ha tre modelli ZBook G8 tra cui scegliere al momento: lo ZBook Studio G8, lo ZBook Fury G8 e lo ZBook Firefly G8. Lo spesso Fury G8 soddisfa lo spazio tradizionale della workstation, mentre il sottile e leggero Firefly G8 utilizza il software ULV per una maggiore portabilità. Il nostro ZBook Studio G8 è la soluzione di mezzo per gli utenti che vogliono le prestazioni della serie Core H senza l'ingombro del Firefly.
Questa soluzione di mezzo significa rinunciare ad alcune caratteristiche che si trovano sul Fury. Il pannello inferiore a sgancio rapido, il numpad, i pulsanti del mouse, il TrackPoint, le CPU Xeon, la RAM ECC aggiornabile, l'otturatore della webcam e altro ancora mancano sullo ZBook Studio G8. Gli utenti potrebbero voler considerare il modello Fury più spesso se queste caratteristiche sono desiderabili.
L'affidabile ZBook Studio G8 funziona alla grande e sembra ancora meglio nonostante il suo design dell'anno scorso. Tuttavia, la GeForce RTX 3070 è sottotono, mentre il pannello OLED porta alcuni svantaggi notevoli rispetto alle opzioni IPS più economiche.
Rispetto ai concorrenti più immediati come l'MSI WS66 o il Razer Blade 15 Studio il sistema MSI offre opzioni Xeon mentre entrambi possono contenere fino a due SSD M.2 invece di uno solo. Le temperature della CPU quando si eseguono carichi elevati potrebbero anche essere molto più fresche sull'HP. Anche lo ZBook Studio G8 ha una migliore qualità costruttiva rispetto all'MSI e una tastiera più comoda di entrambe le alternative.
Prezzo e disponibilità
Lo ZBook Studio G8 non è ancora disponibile attraverso i canali di vendita al dettaglio di terze parti al momento della recensione. Gli utenti interessati dovrebbero invece ordinare direttamente da HP dove le opzioni configurabili sono abbondanti. La nostra configurazione specifica viene venduta al dettaglio per circa 4200 dollari.
HP ZBook Studio 15 G8
- 08/31/2022 v7 (old)
Allen Ngo
Price comparison
