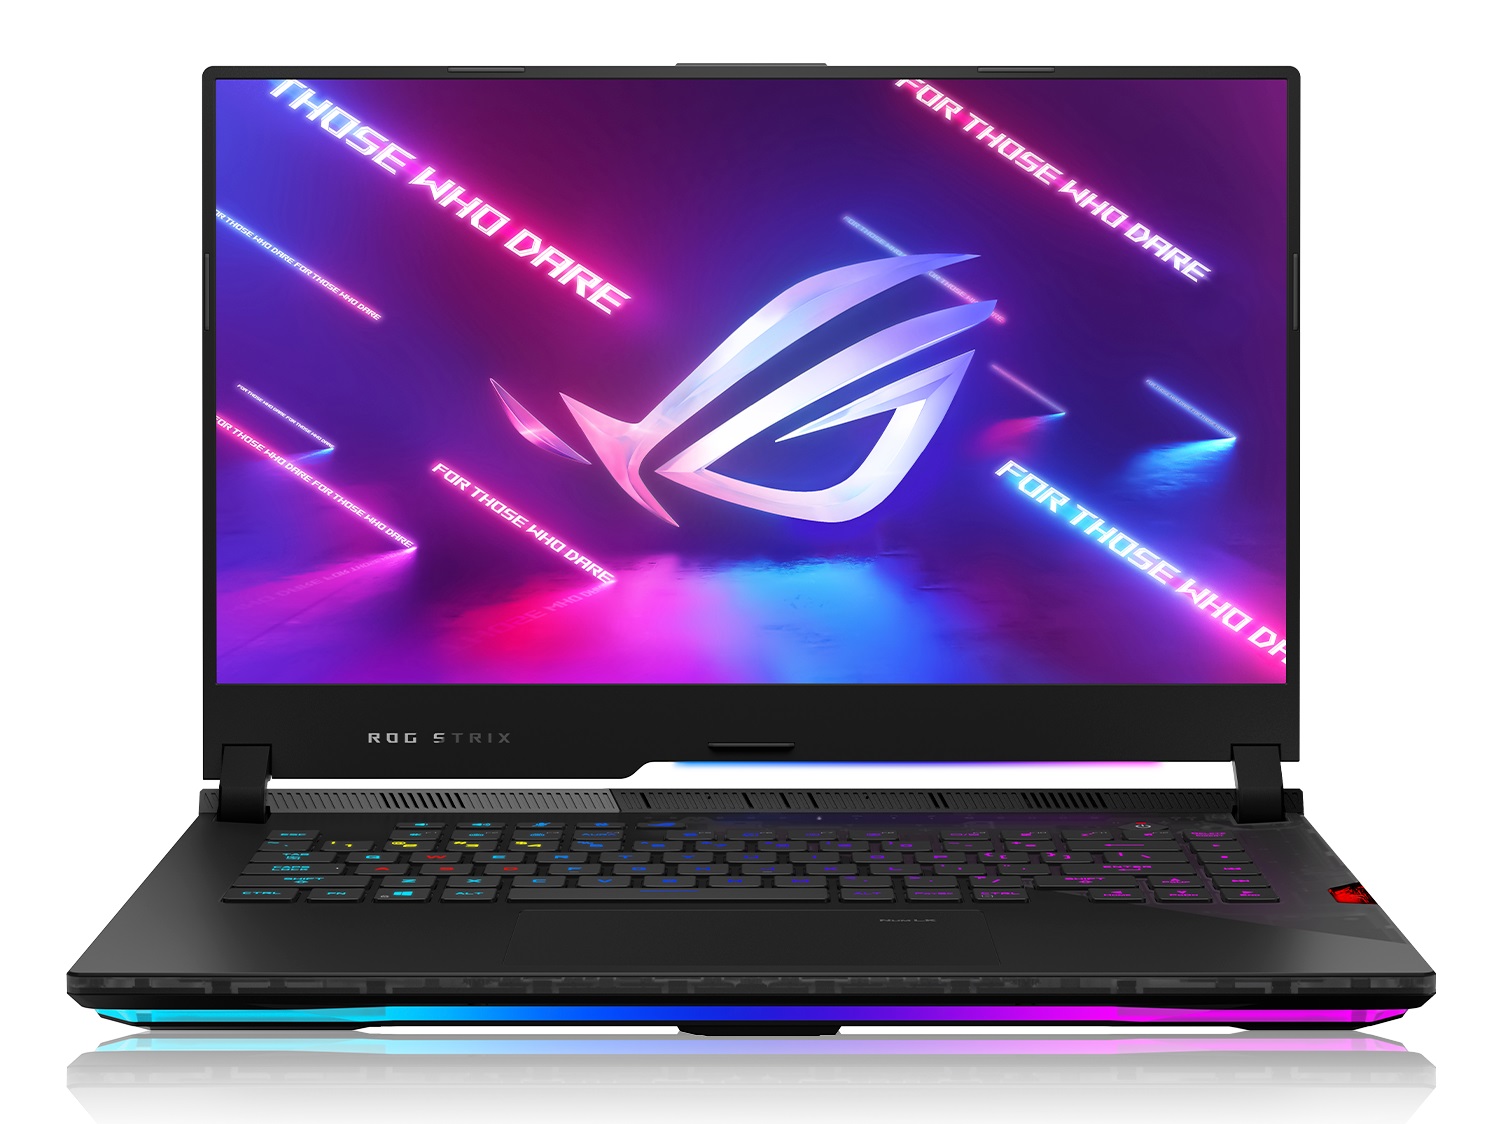
Recensione del portatile Asus ROG Strix Scar 15 G533QS: AMD Zen 3 e 165 Hz 1440p Sweet Spot
La serie Asus ROG Strix Scar 15 ospita i primi computer portatili gaming da 15,62 dell'azienda in contrasto con la più sottile serie ROG Zephyrus S15 o la più ingombrante serie ROG Chimera da 17,3". Succede allo Strix Scar 15 G532 dello scorso anno, introducendo diversi cambiamenti sia all'interno che all'esterno, tra cui il passaggio da Intel a AMD Ryzen Zen 3 CPU.
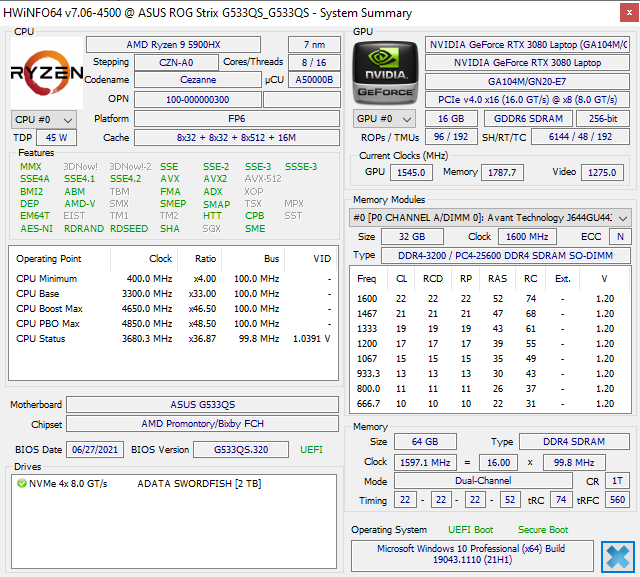
La nostra unità di test è una configurazione di fascia alta equipaggiata con la CPU Ryzen 9 5900HX, CPU GeForce RTX 3080 da 130 W, e display WQHD con 165 Hz di frequenza di aggiornamento e 3 ms di tempi di risposta per un prezzo di circa 3800 dollari al dettaglio. Sono invece disponibili versioni inferiori con Ryzen 7 4800H, RTX 3070 e pannello FHD a 300 Hz. Una versione da 17,3" del nostro Strix Scar 15 G533 è anche disponibile, ovvero Strix Scar 17 G733.
I concorrenti dello Strix Scar 15 includono altri portatili gaming da 15,6" di fascia media e alta come il Razer Blade 15, MSI GE66 o Lenovo Legion C7.
Altre recensioni di computer Asus:
potenziali concorrenti a confronto
Punteggio | Data | Modello | Peso | Altezza | Dimensione | Risoluzione | Prezzo |
|---|---|---|---|---|---|---|---|
| 86.3 % v7 (old) | 07/2021 | Asus ROG Strix Scar 15 G533QS R9 5900HX, GeForce RTX 3080 Laptop GPU | 2.3 kg | 27.2 mm | 15.60" | 2560x1440 | |
| 84.4 % v7 (old) | 07/2020 | Asus ROG Strix Scar 15 G532LWS i9-10980HK, GeForce RTX 2070 Super Mobile | 2.4 kg | 24.9 mm | 15.60" | 1920x1080 | |
| 84.6 % v7 (old) | 07/2020 | MSI GE66 Raider 10SFS i9-10980HK, GeForce RTX 2070 Super Mobile | 2.4 kg | 23 mm | 15.60" | 1920x1080 | |
| 88.9 % v7 (old) | 07/2021 | Razer Blade 15 Advanced (Mid 2021) i7-11800H, GeForce RTX 3080 Laptop GPU | 2 kg | 16.99 mm | 15.60" | 1920x1080 | |
| 84.7 % v7 (old) | 06/2021 | Alienware m15 R5 Ryzen Edition R7 5800H, GeForce RTX 3060 Laptop GPU | 2.5 kg | 22.85 mm | 15.60" | 1920x1080 | |
| 85.5 % v7 (old) | 04/2021 | Lenovo Legion C7 15IMH05 82EH0030GE i7-10875H, GeForce RTX 2070 Max-Q | 2.3 kg | 19.9 mm | 15.60" | 1920x1080 |
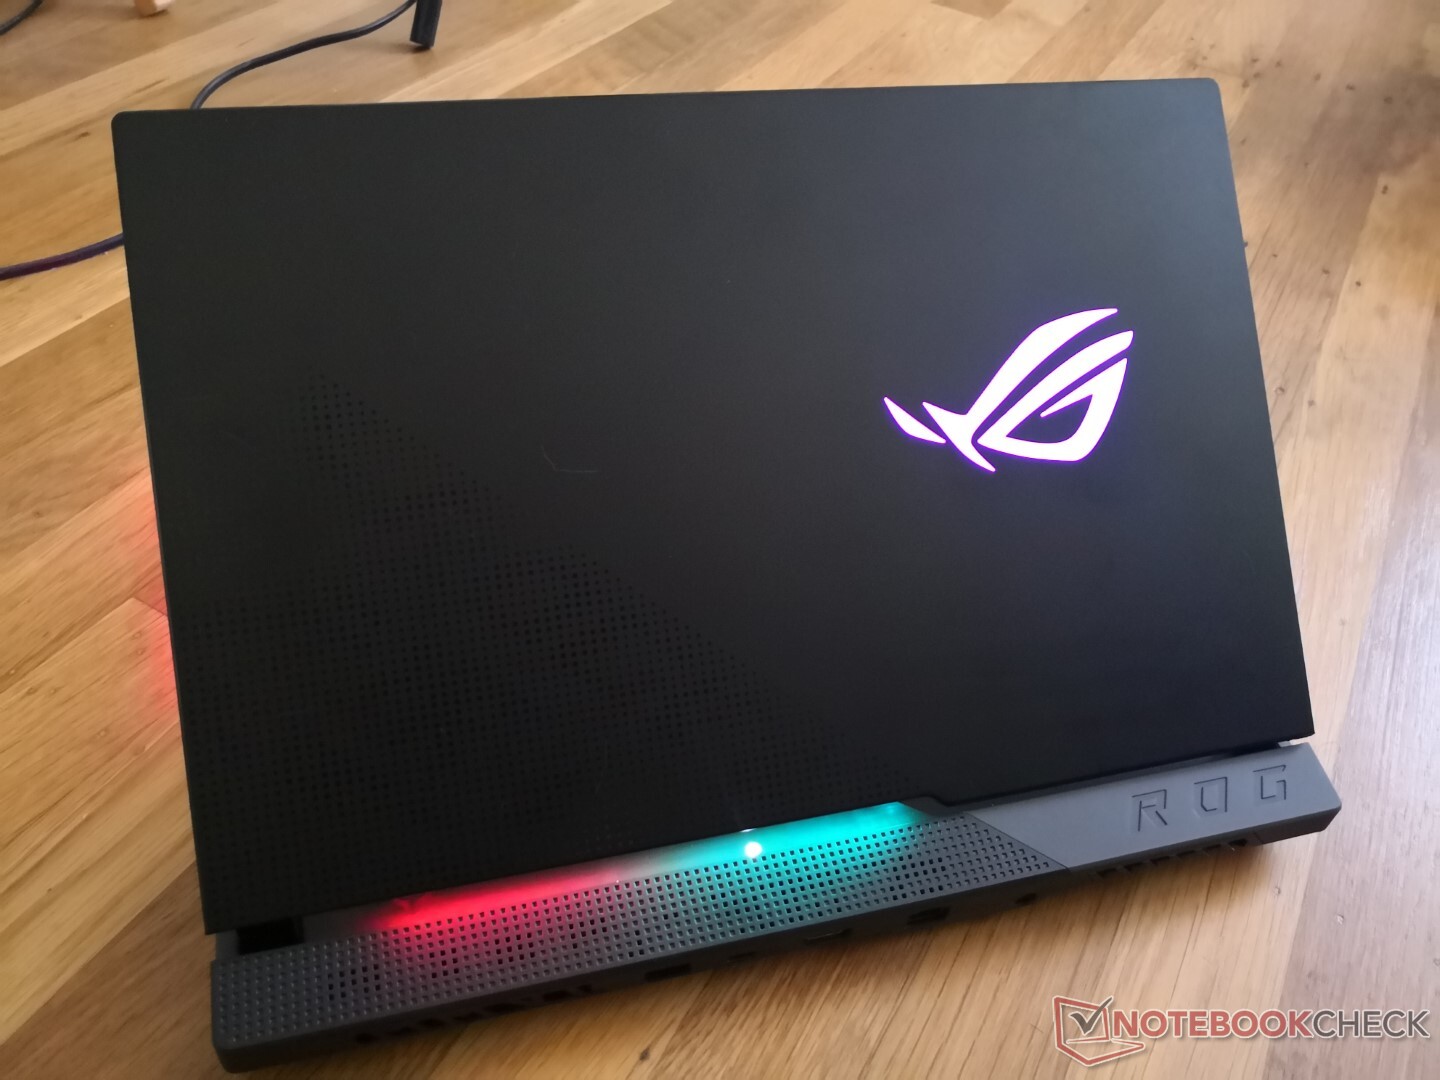
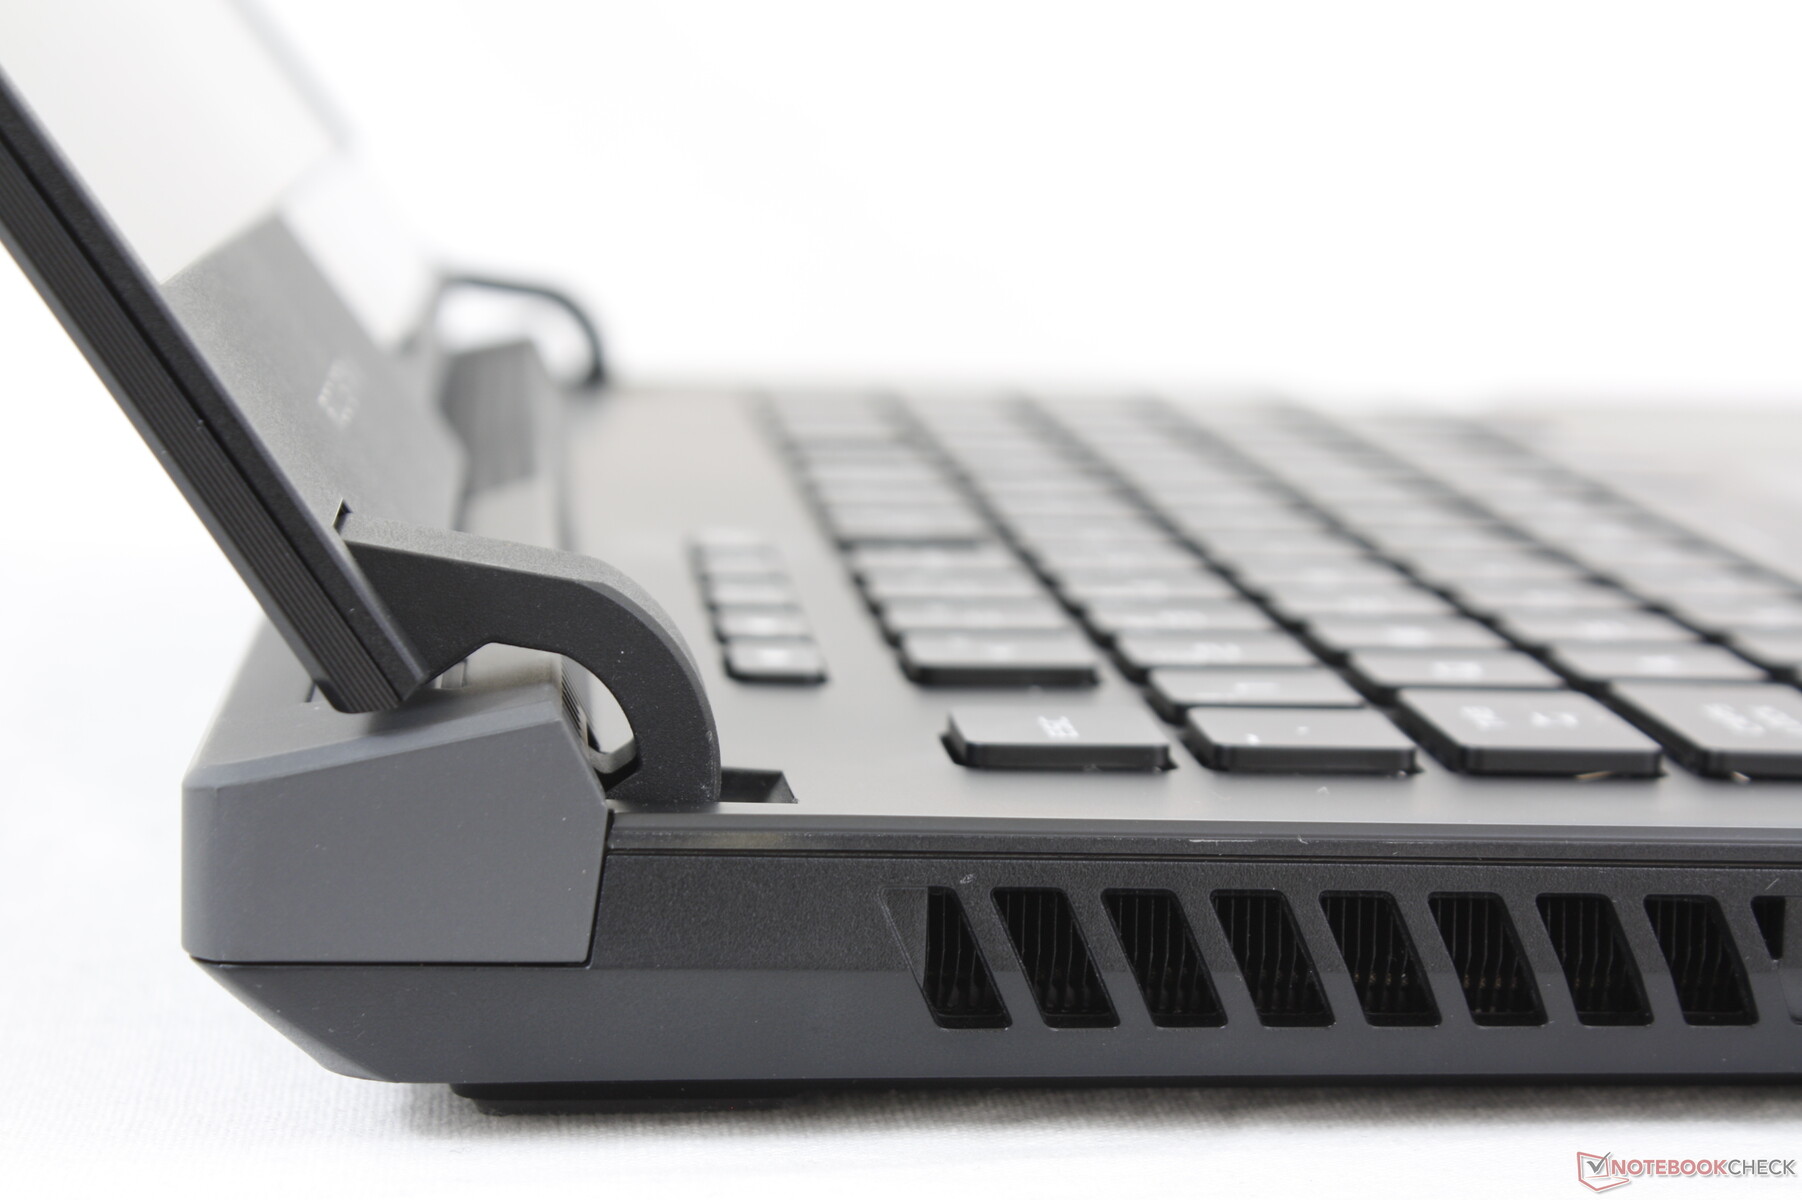
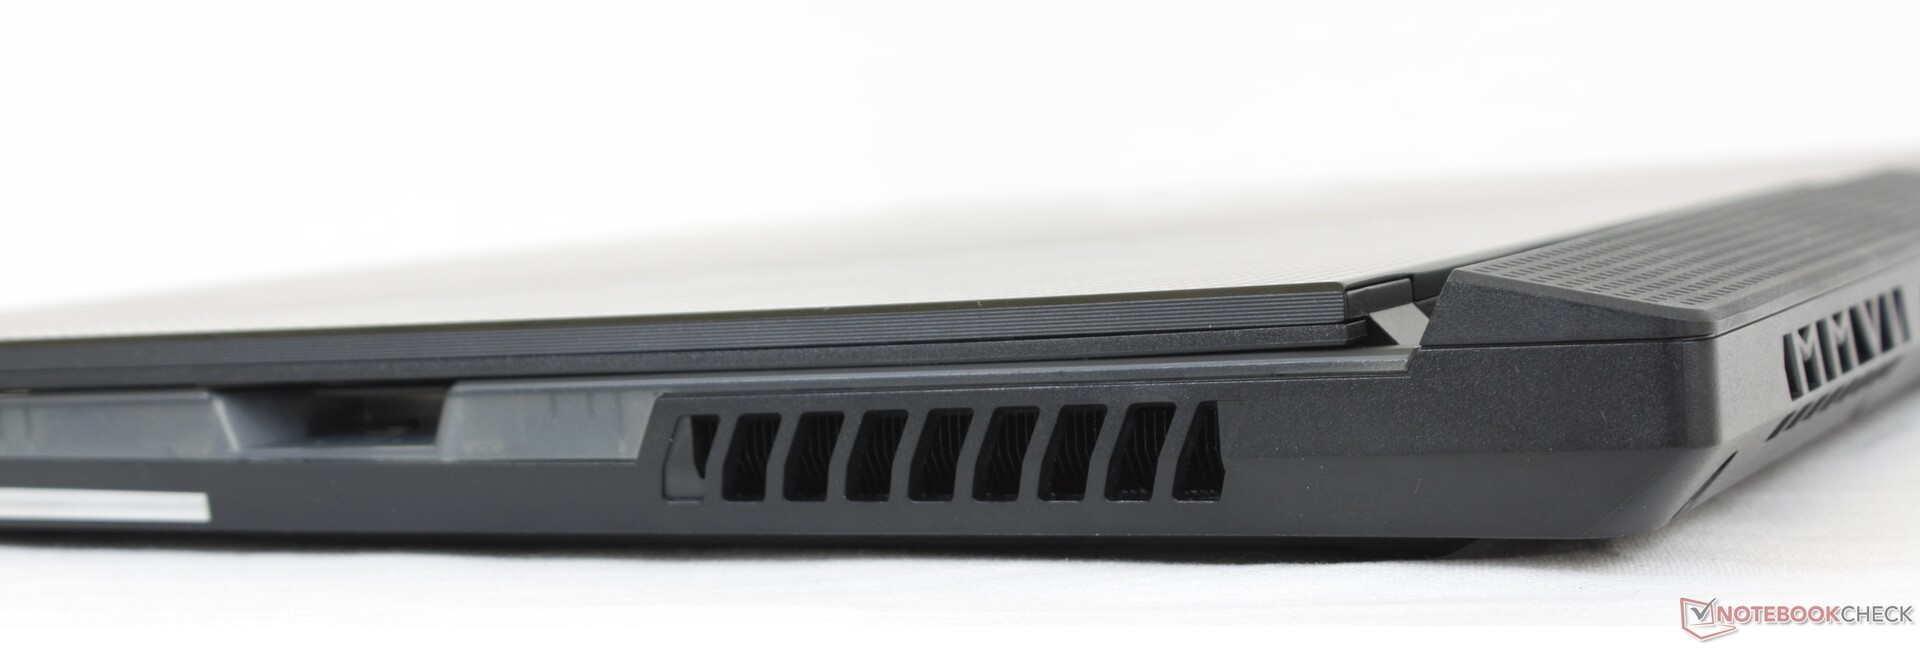
Case - Nuovo look meno plastica
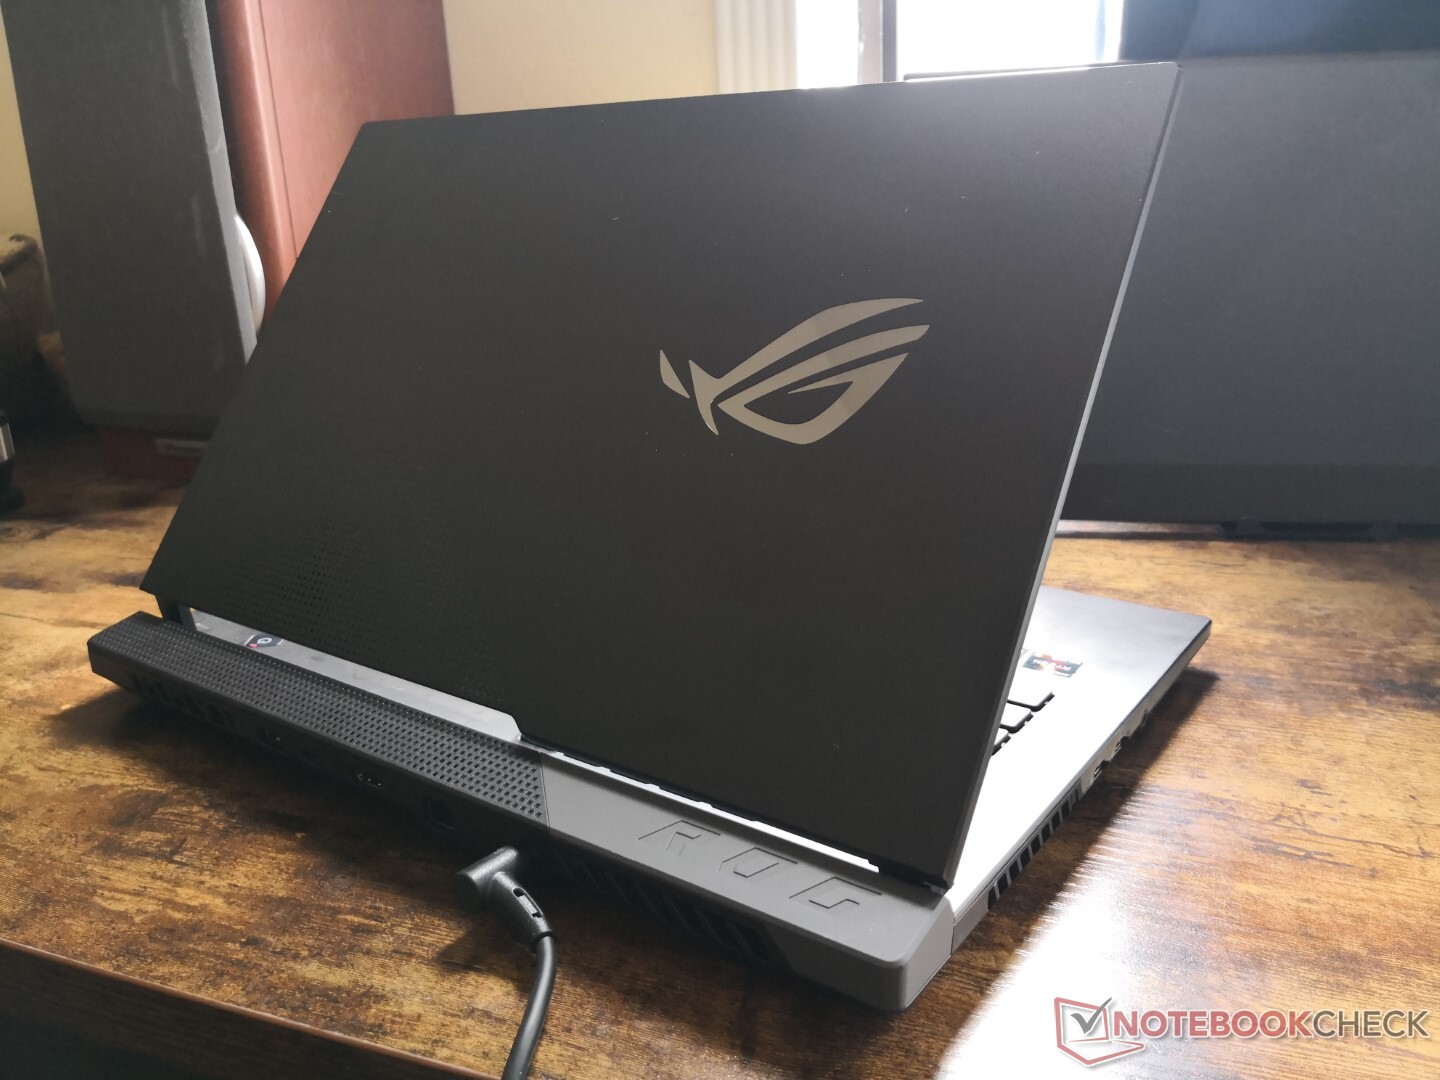
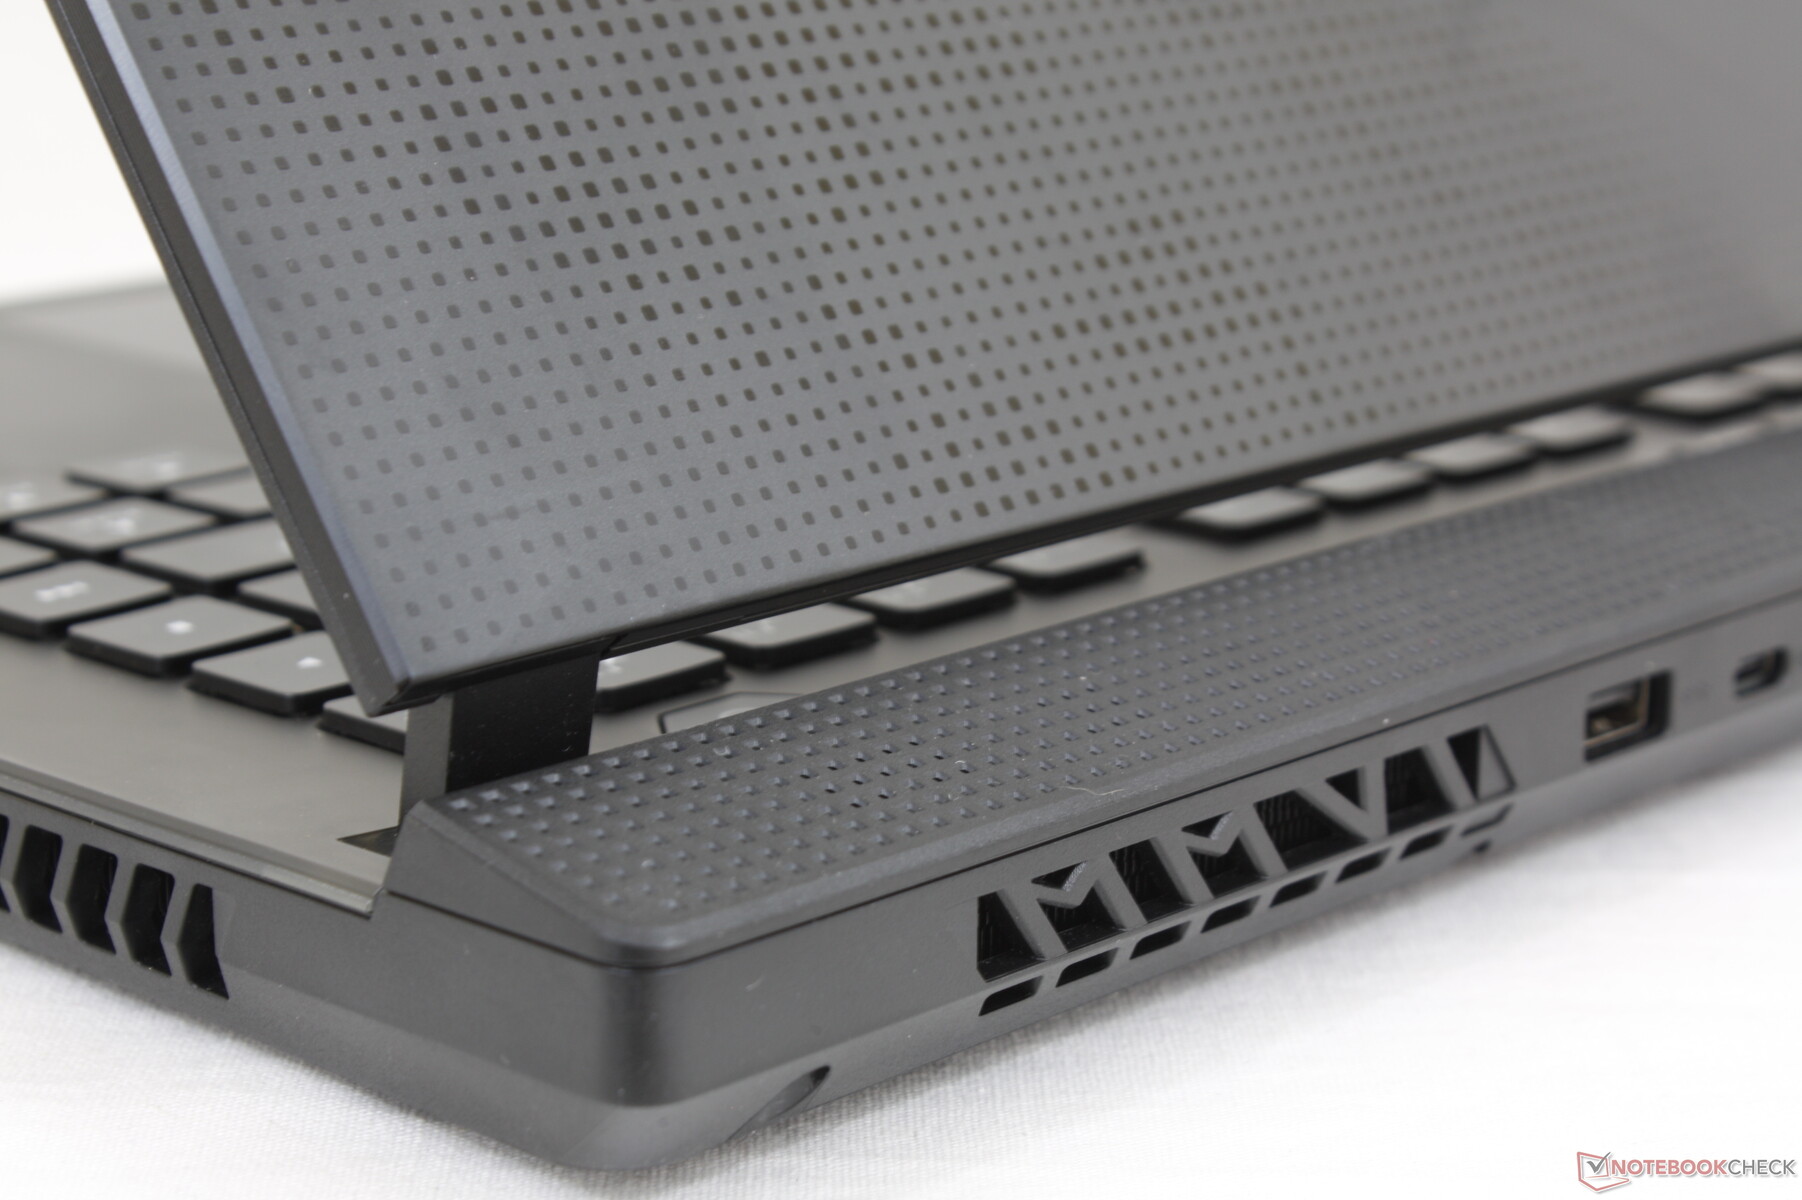
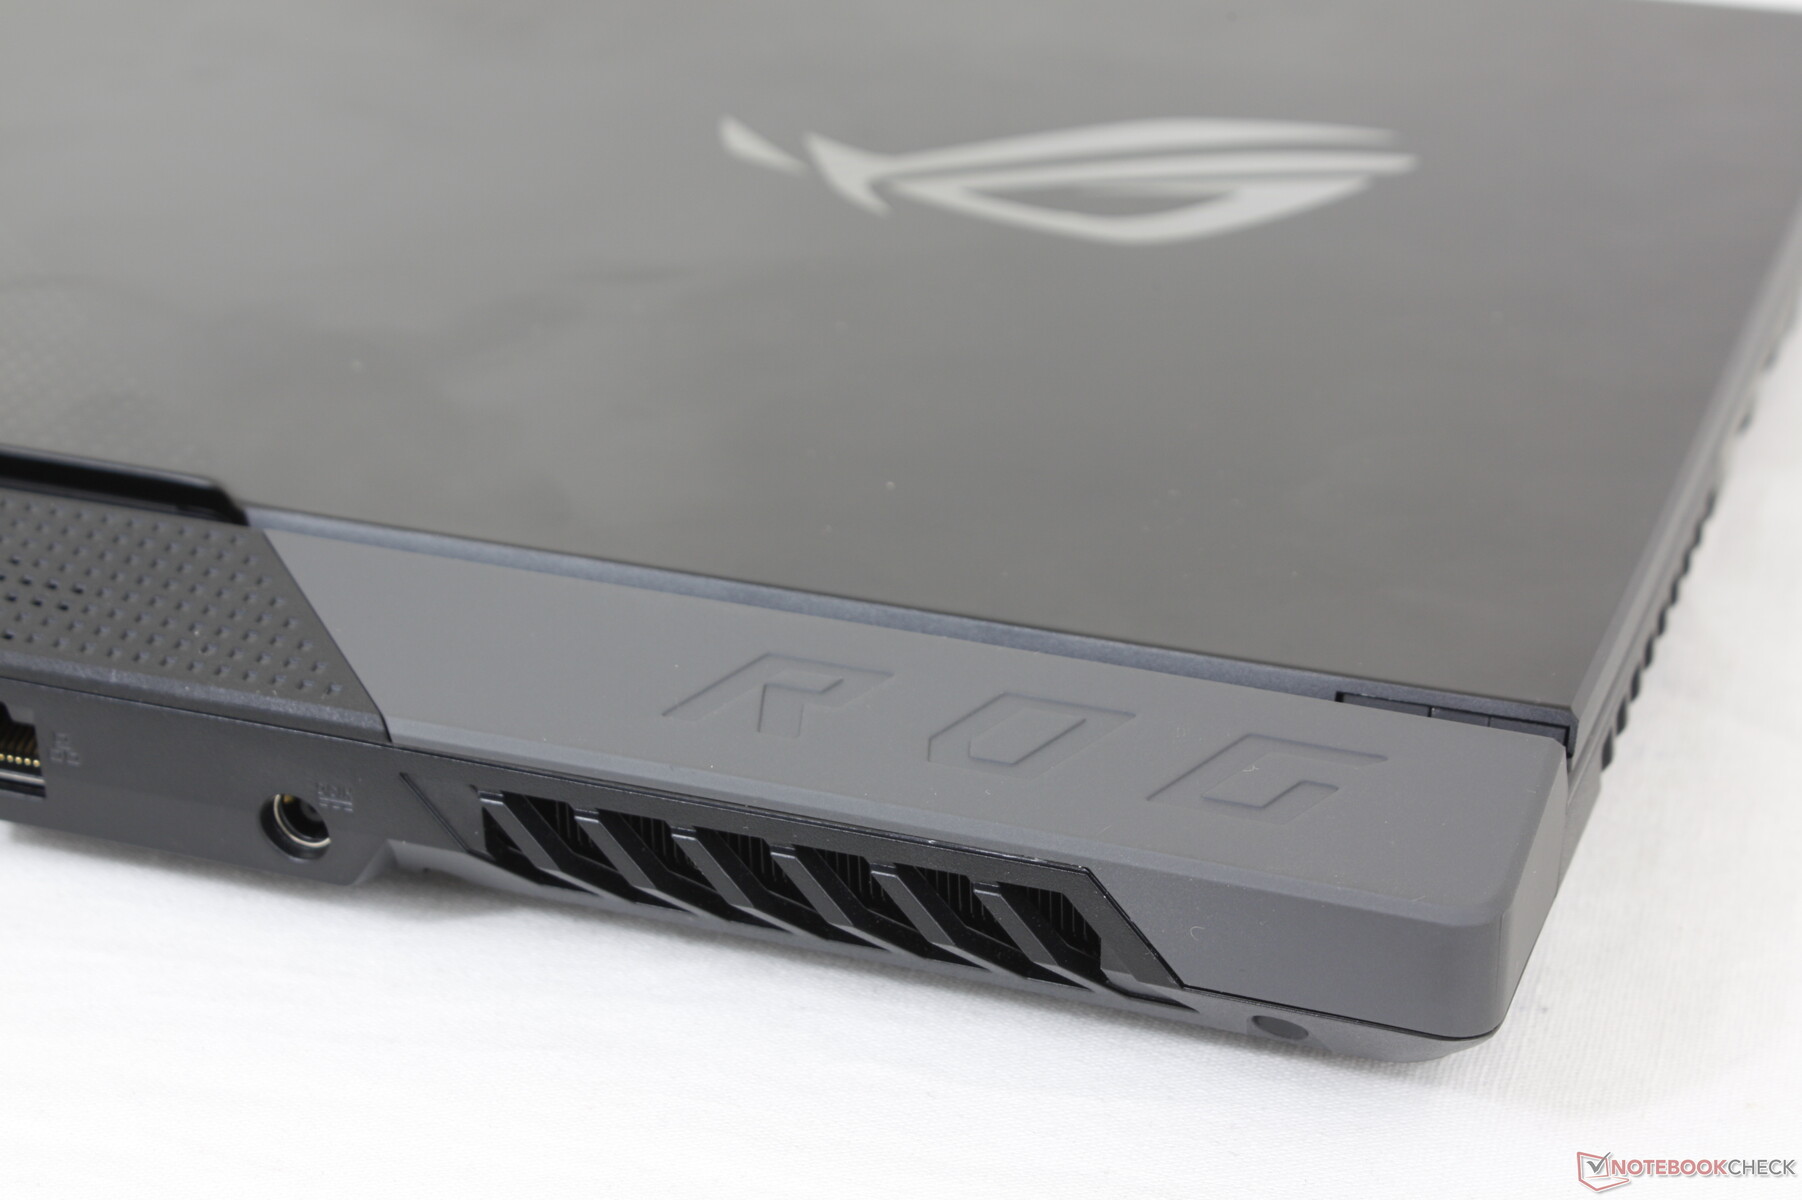
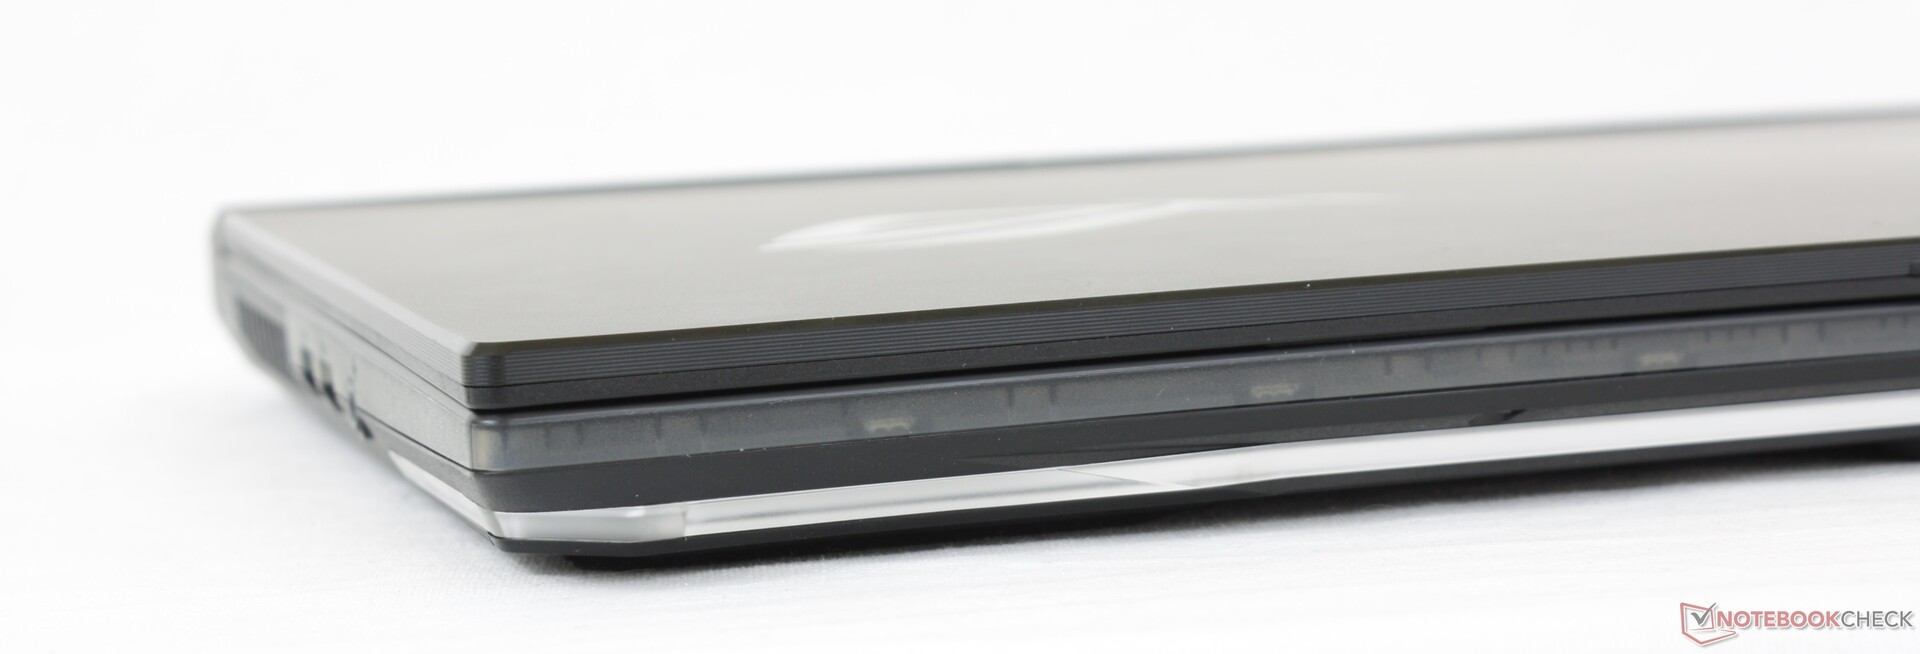
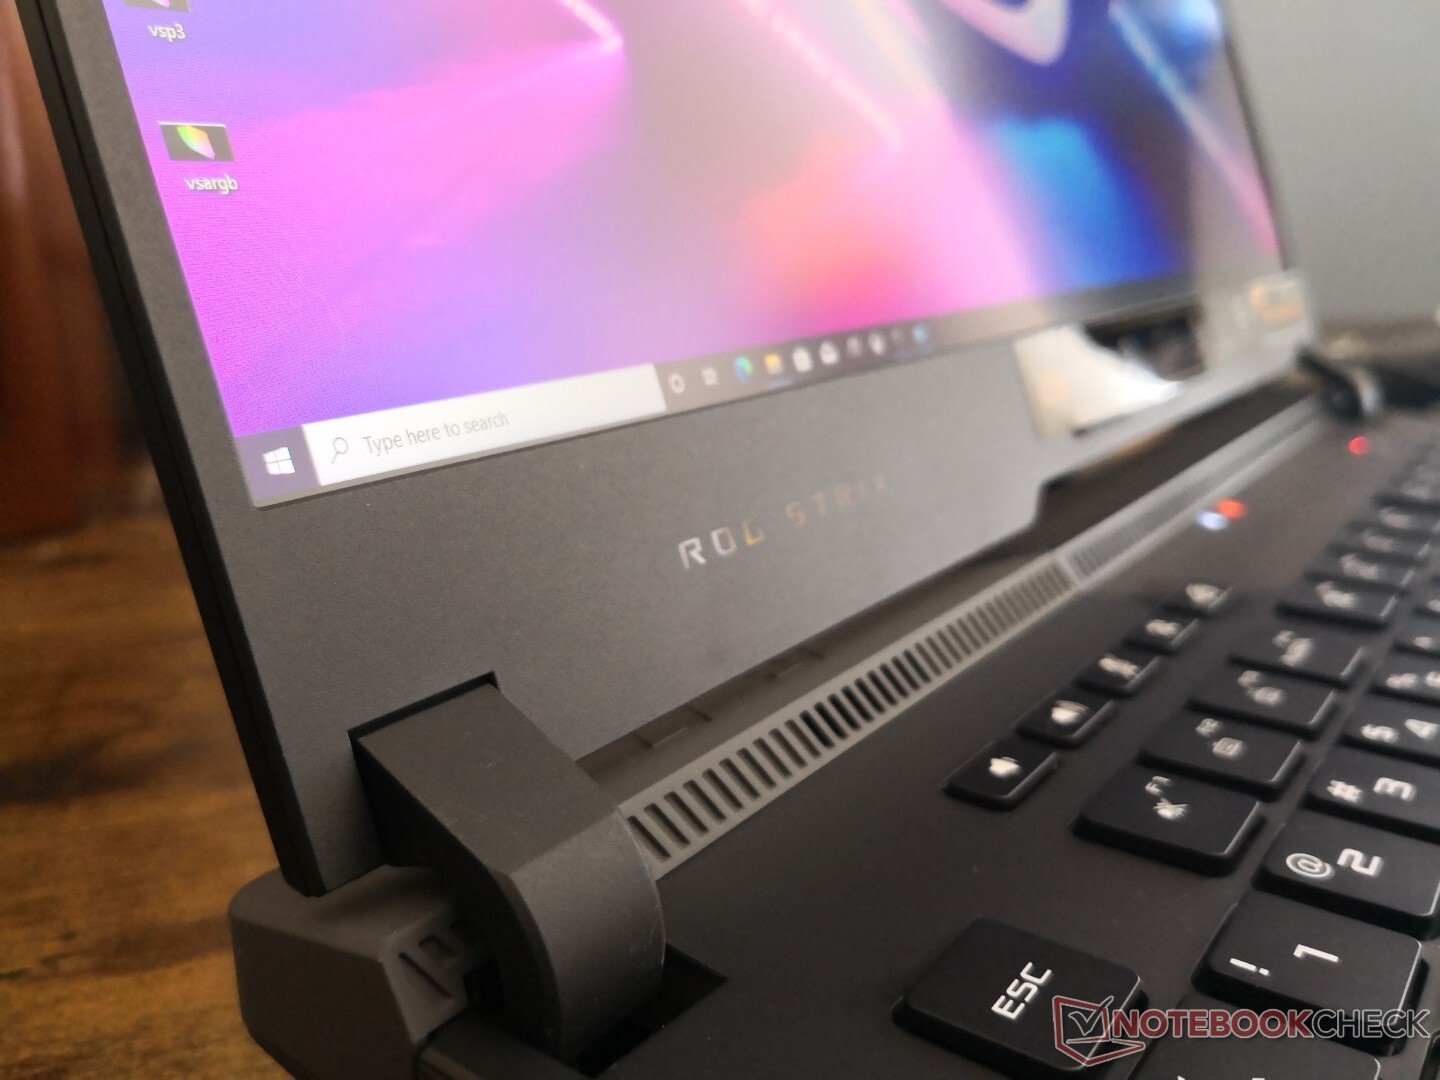
Asus ha rinnovato lo chassis mantenendo l'aspetto generale familiare della serie Strix Scar. La parte posteriore spessa, le grandi cerniere e i LED frontali, ad esempio, sono ancora presenti ma la parte posteriore è più piatta e con una texture diversa mentre i LED frontali sono più corti in lunghezza intorno ai lati. Il bordo destro della tastiera è anche più piatto e ora semitrasparente, un modo facile per distinguere i nuovi modelli ROG da quelli più vecchi. Se presi insieme, i cambiamenti fanno apparire il sistema più elegante e lussuoso senza abbandonare nessuna delle caratteristiche originali dei LED.
Tutti gli aggiornamenti del telaio sembrano essere per lo più estetici e quindi la rigidità sembra essere la stessa del G532, nel bene e nel male. Il G532 non era di scarsa qualità o qualcosa del genere, ma sarebbe stato bello vedere comunque dei miglioramenti evidenti che non fossero solo superficiali.
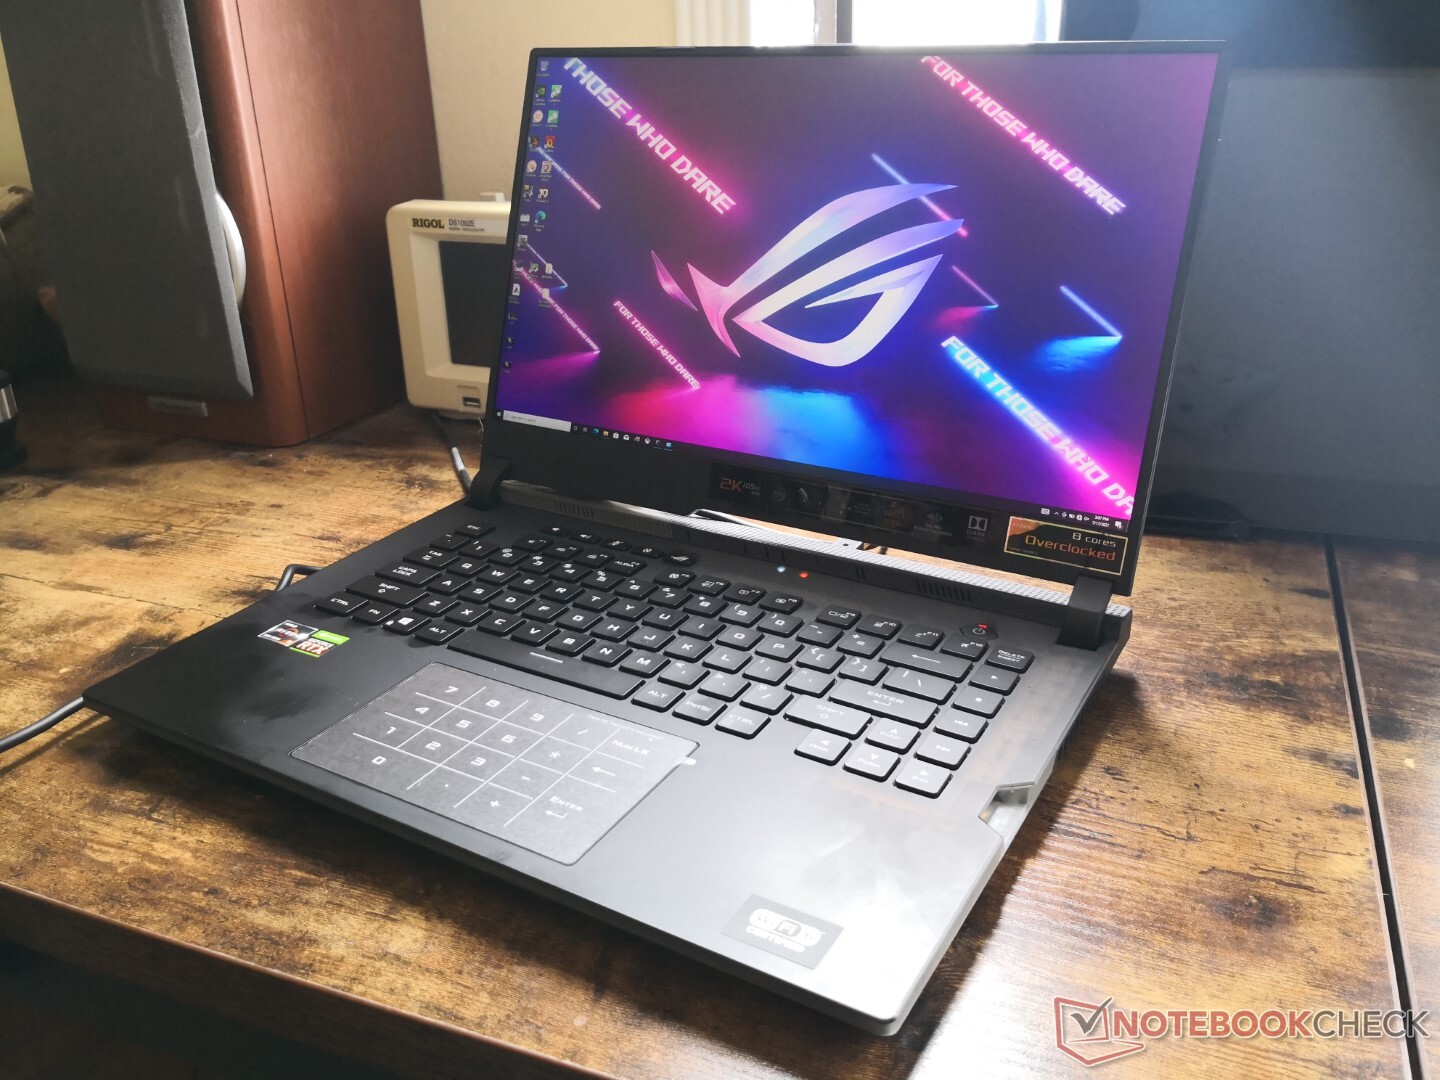
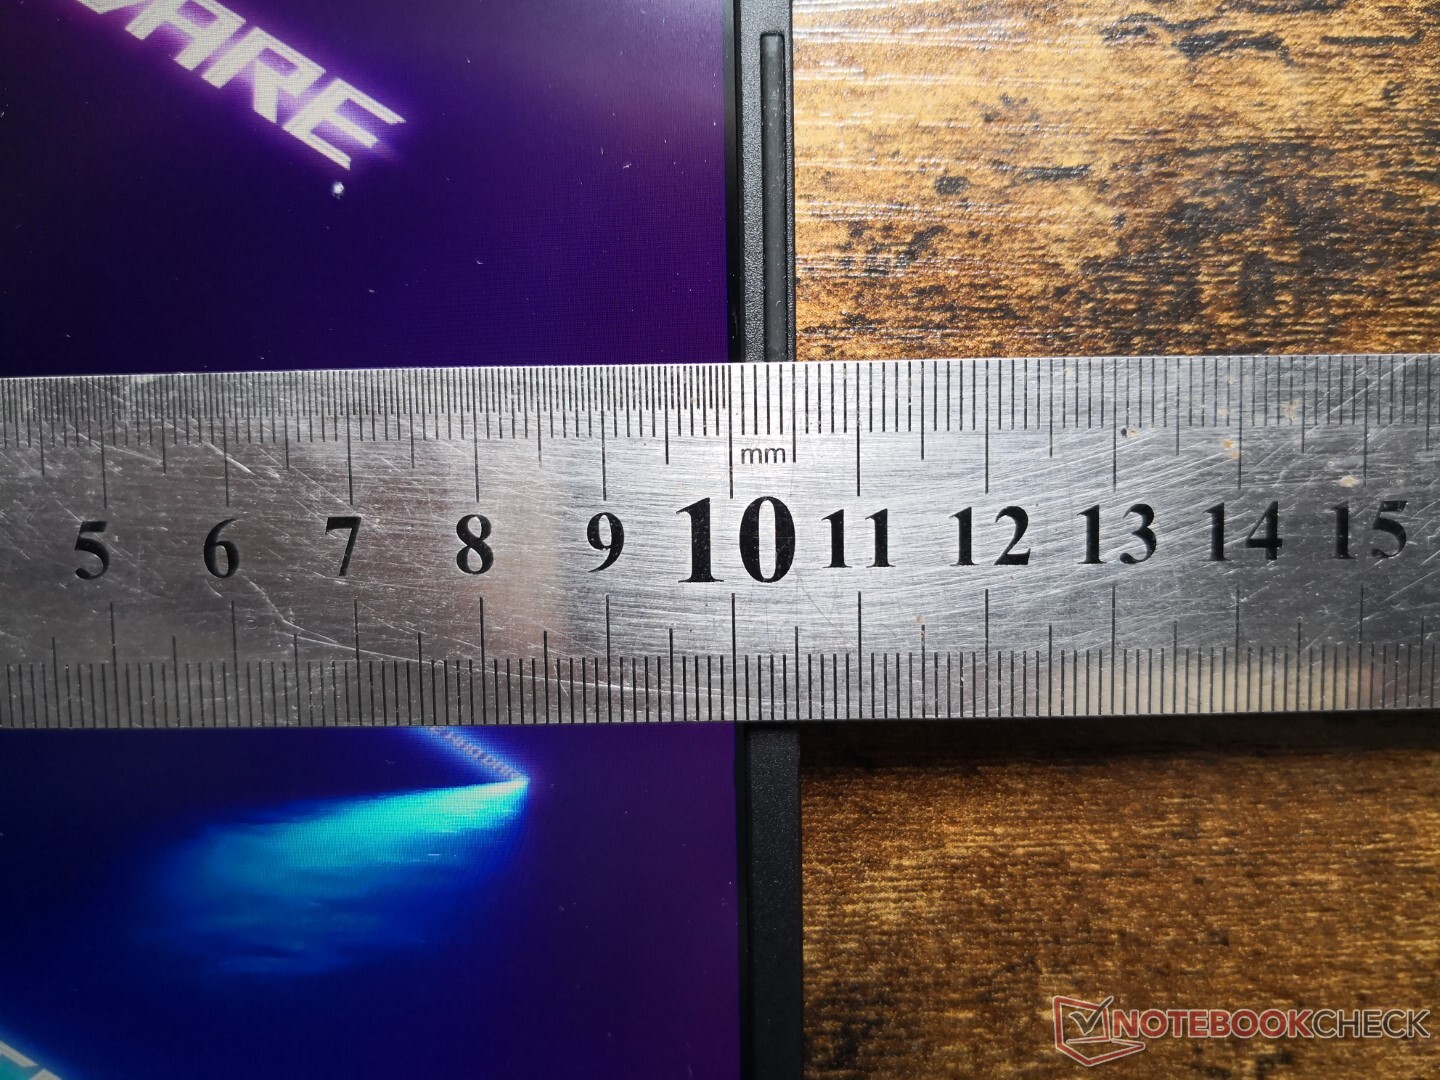
Il nuovo telaio ha un ingombro minore rispetto al vecchio G532 pur essendo leggermente più spesso di circa 2 mm. È ancora un po' grande, tuttavia, soprattutto perché il G532 era già più spesso di molti modelli concorrenti tra cui l'Alienware m15 R5. Il peso complessivo rimane nella media della categoria a circa 2,3 kg.
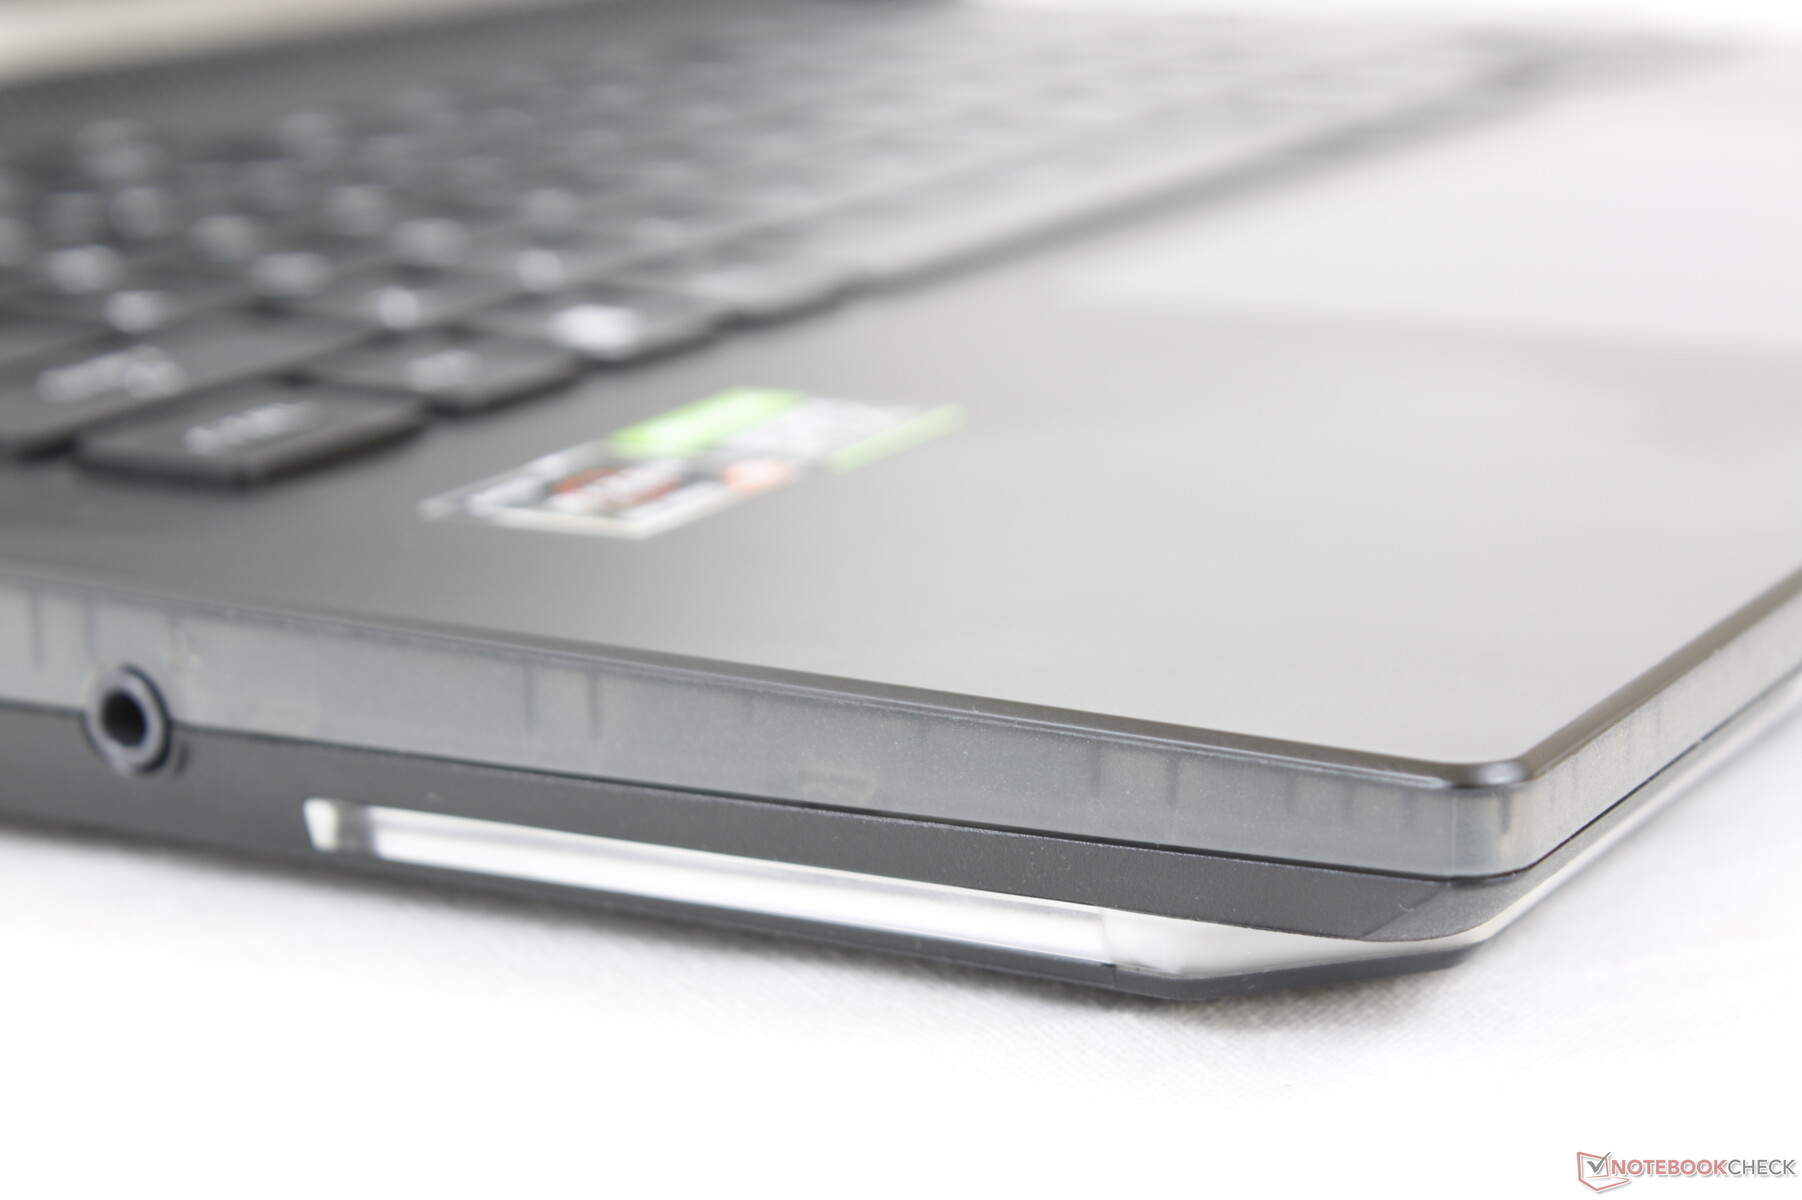
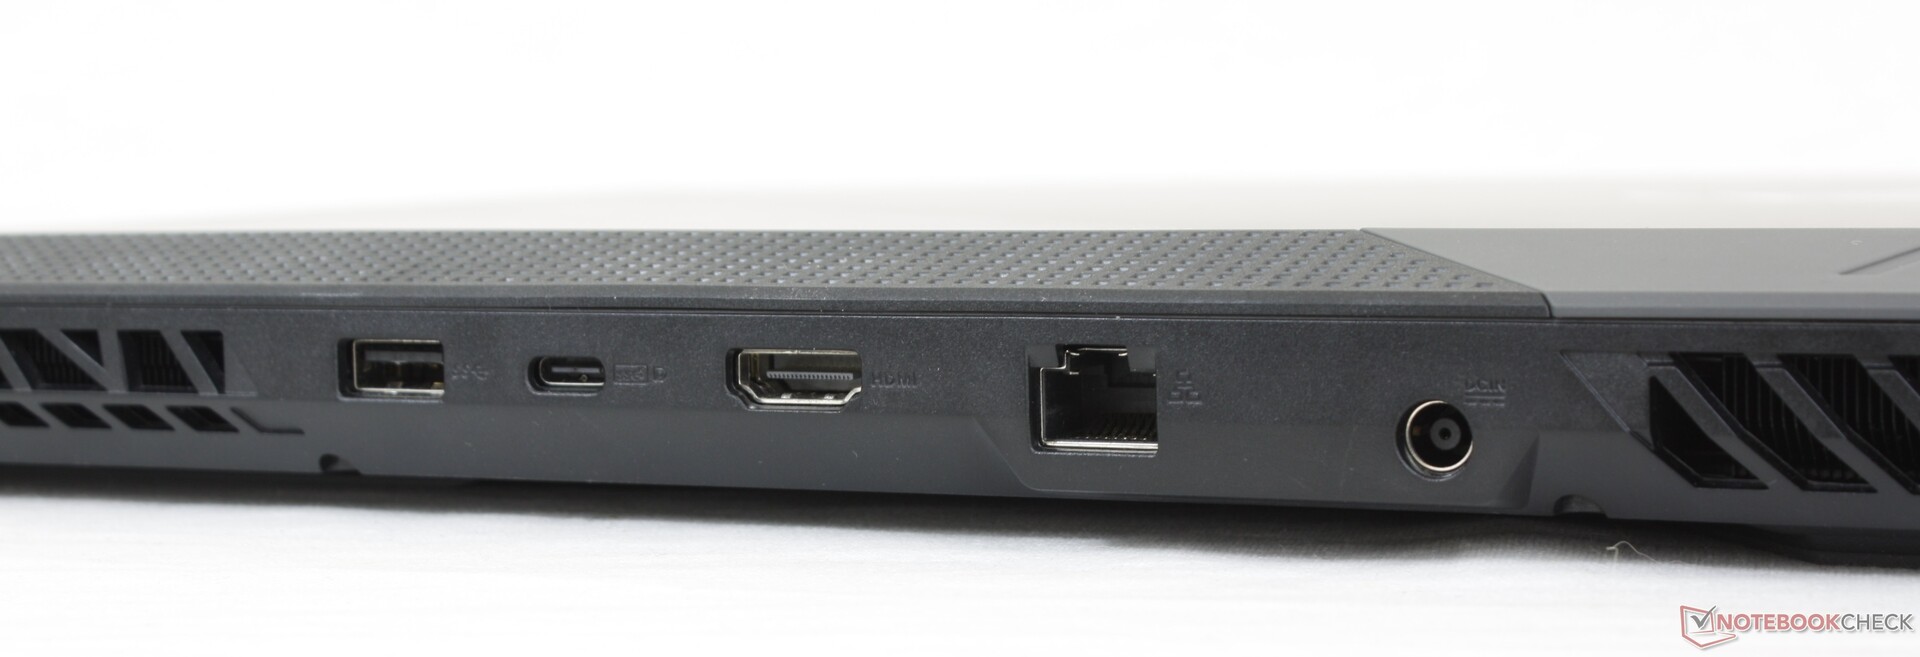
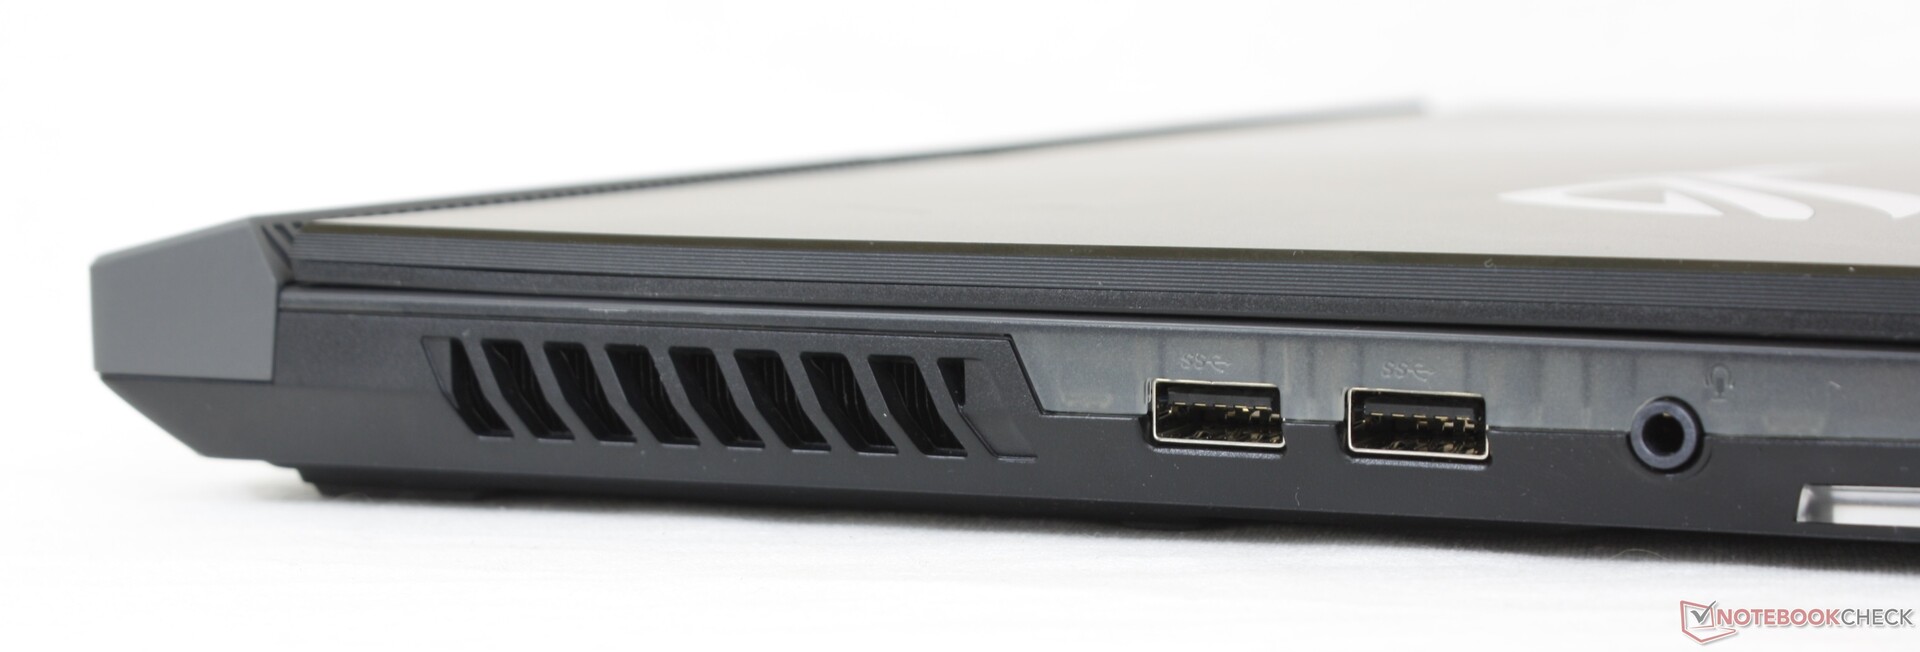
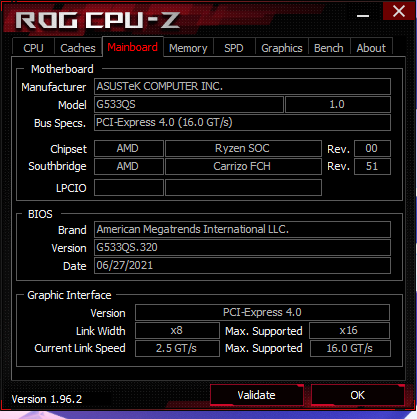
Connessioni - Niente Thunderbolt a differenza della versione Intel
Una delle porte USB-A lungo il bordo sinistro è stata spostata sul retro per la serie G533. Tutte le porte sono per il resto identiche gen-to-gen, compresa la porta USB-C Gen. 2 e la mancanza di supporto Thunderbolt. Sarebbe stato bello vedere almeno 10 Gbps RJ-45 invece della porta standard da 1 Gbps.
Comunicazioni
La nostra unità è stata spedita con il MediaTek MT7921 abilitato al Wi-Fi 6 invece dell'Intel AX201 del G532 dello scorso anno. Il MediaTek è purtroppo un downgrade con velocità di trasferimento che sono costantemente più lente di quelle che abbiamo registrato sulla maggior parte degli altri portatili con il modulo Intel concorrente. Gli utenti possono sempre rimuovere il modulo MediaTek sul G533 per la versione Intel più veloce, se lo desiderano.
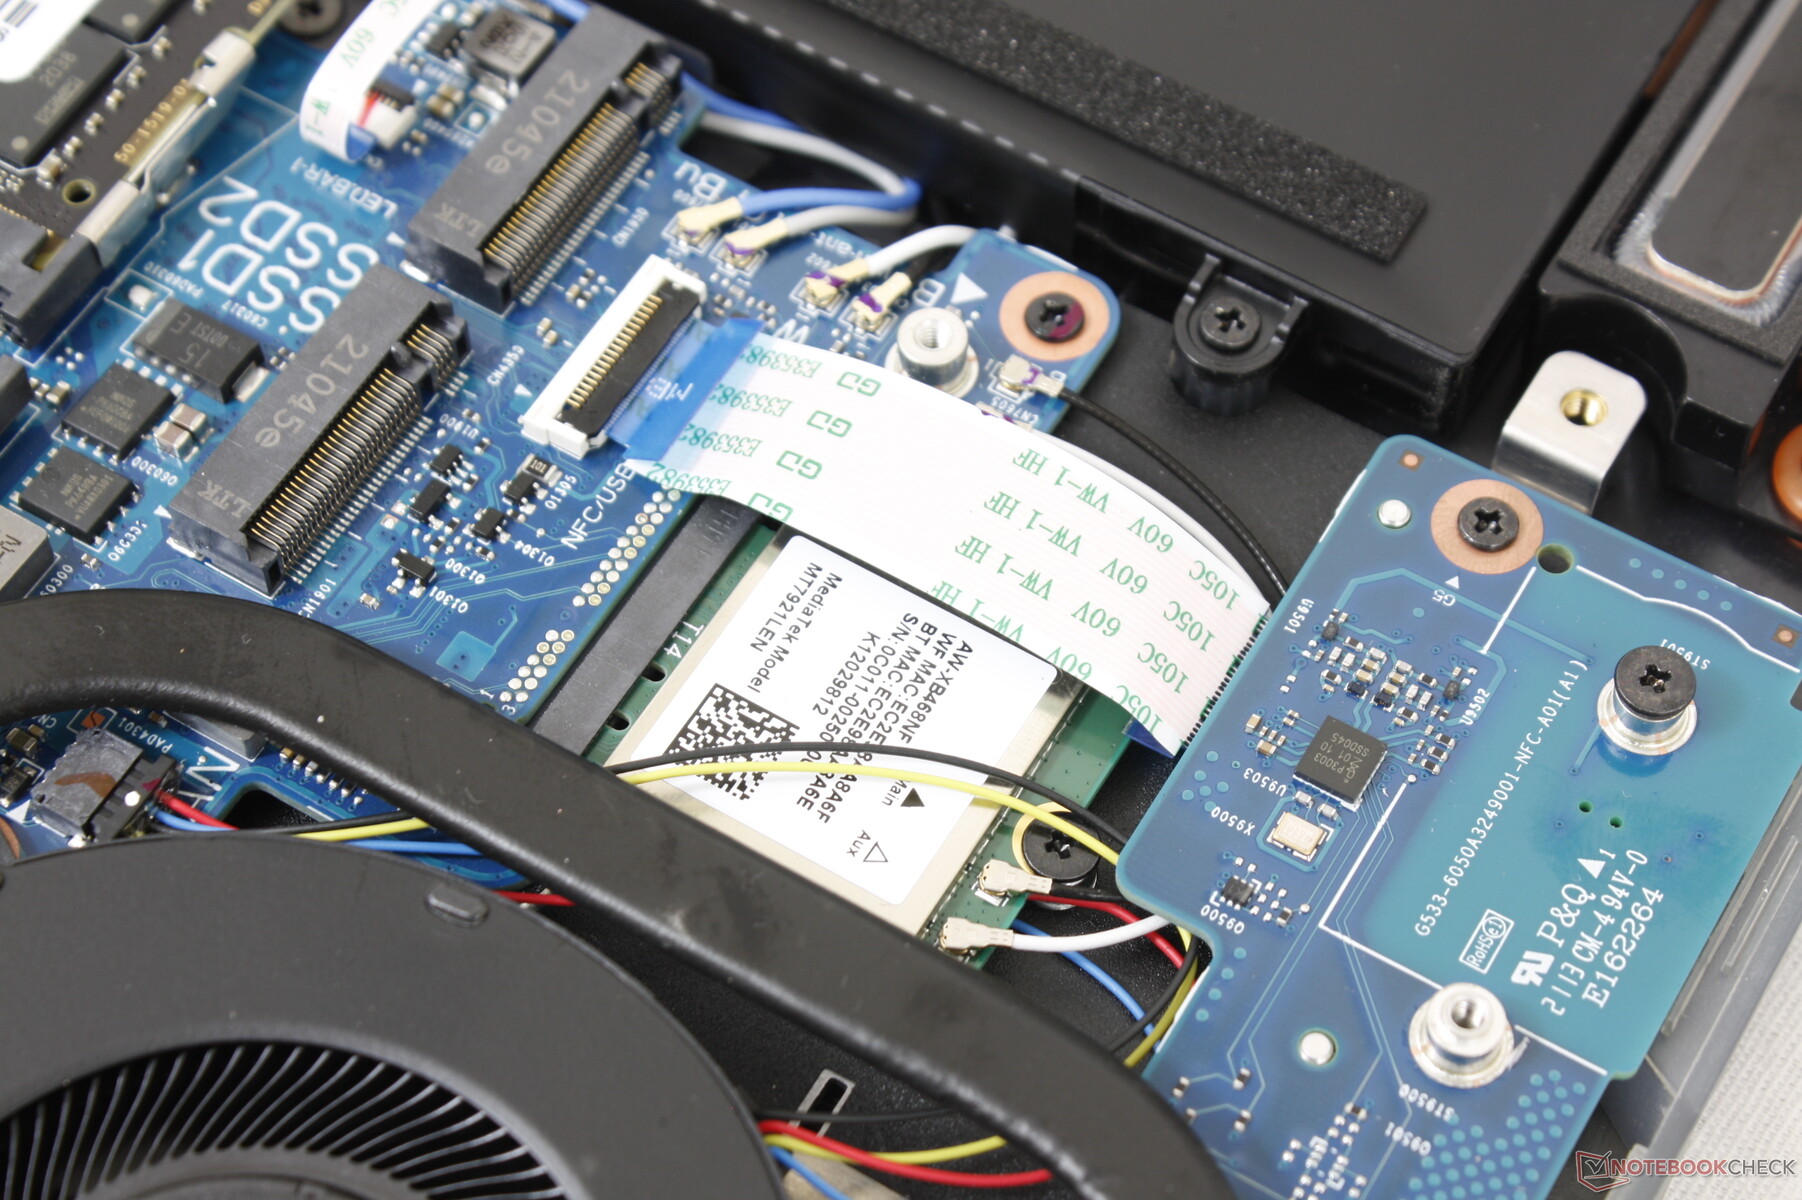
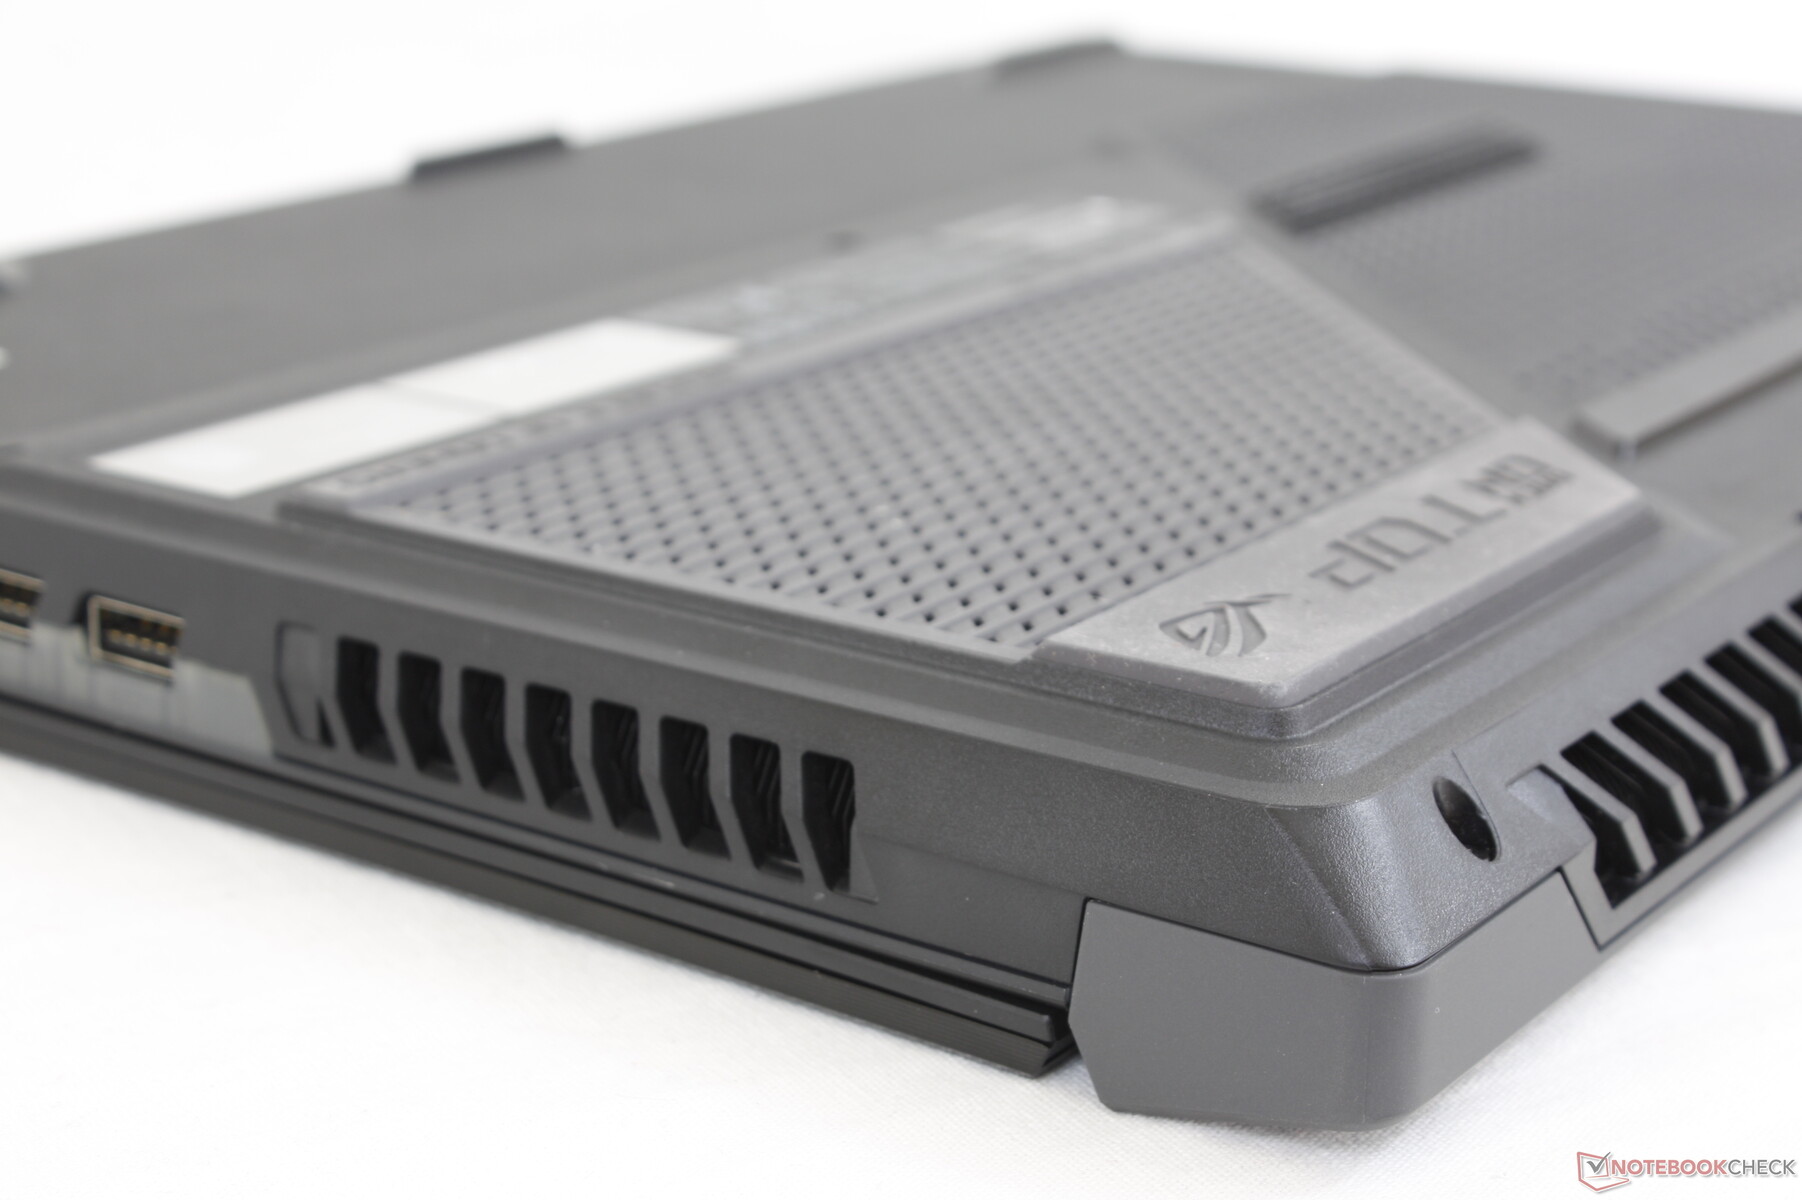
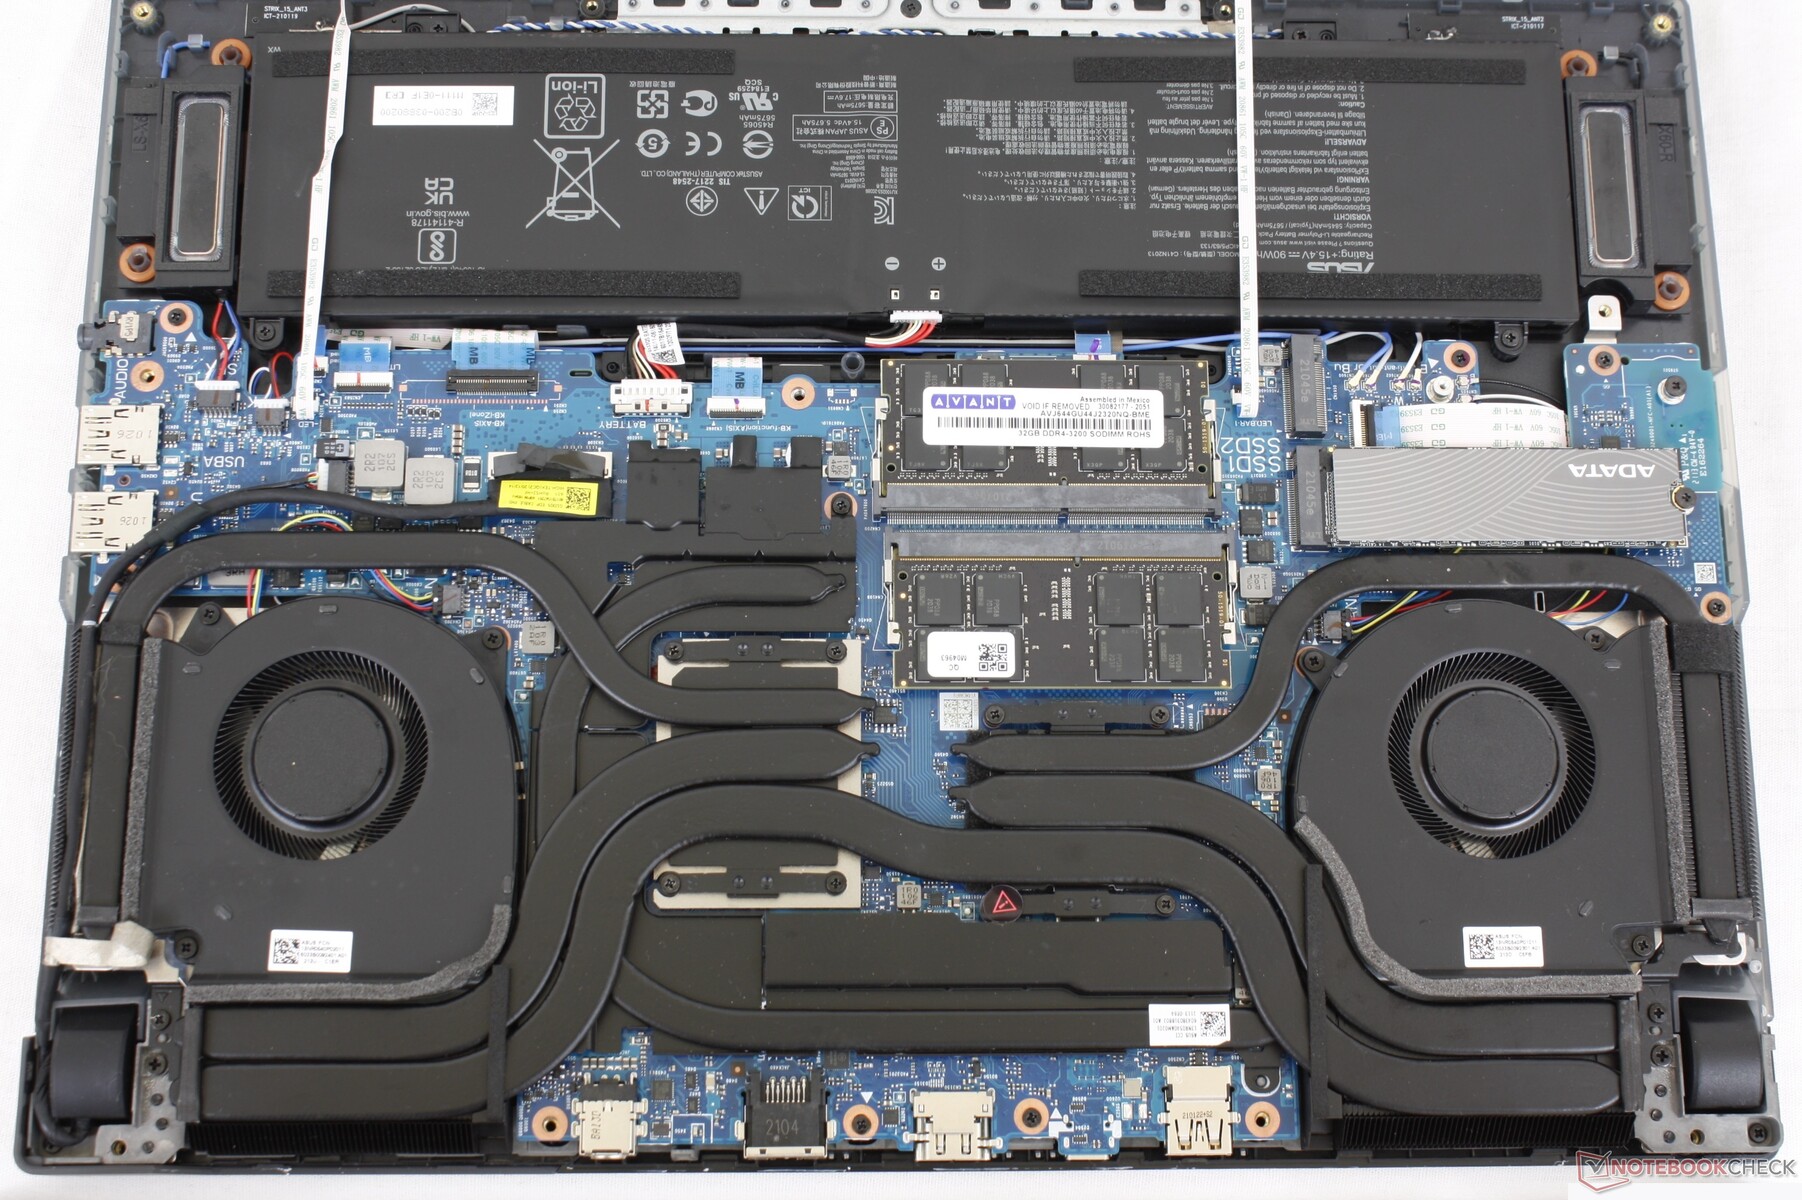
Manutenzione
Il pannello inferiore è facilmente rimovibile solo con un cacciavite Philips e un bordo affilato. Tenete a mente che il pannello inferiore è attaccato alla scheda madre tramite due nastri fragili a differenza della maggior parte degli altri portatili a causa della barra LED RGB lungo il bordo anteriore dello chassis.
Accessori e garanzia
La confezione di vendita include l'Asus Keystone due piastre extra con il logo ROG per l'angolo posteriore del telaio, e la solita documentazione e l'adattatore AC. La garanzia standard limitata di un anno del produttore si applica con opzioni di estensione se acquistata da Xotic PC.
Dispositivi di input
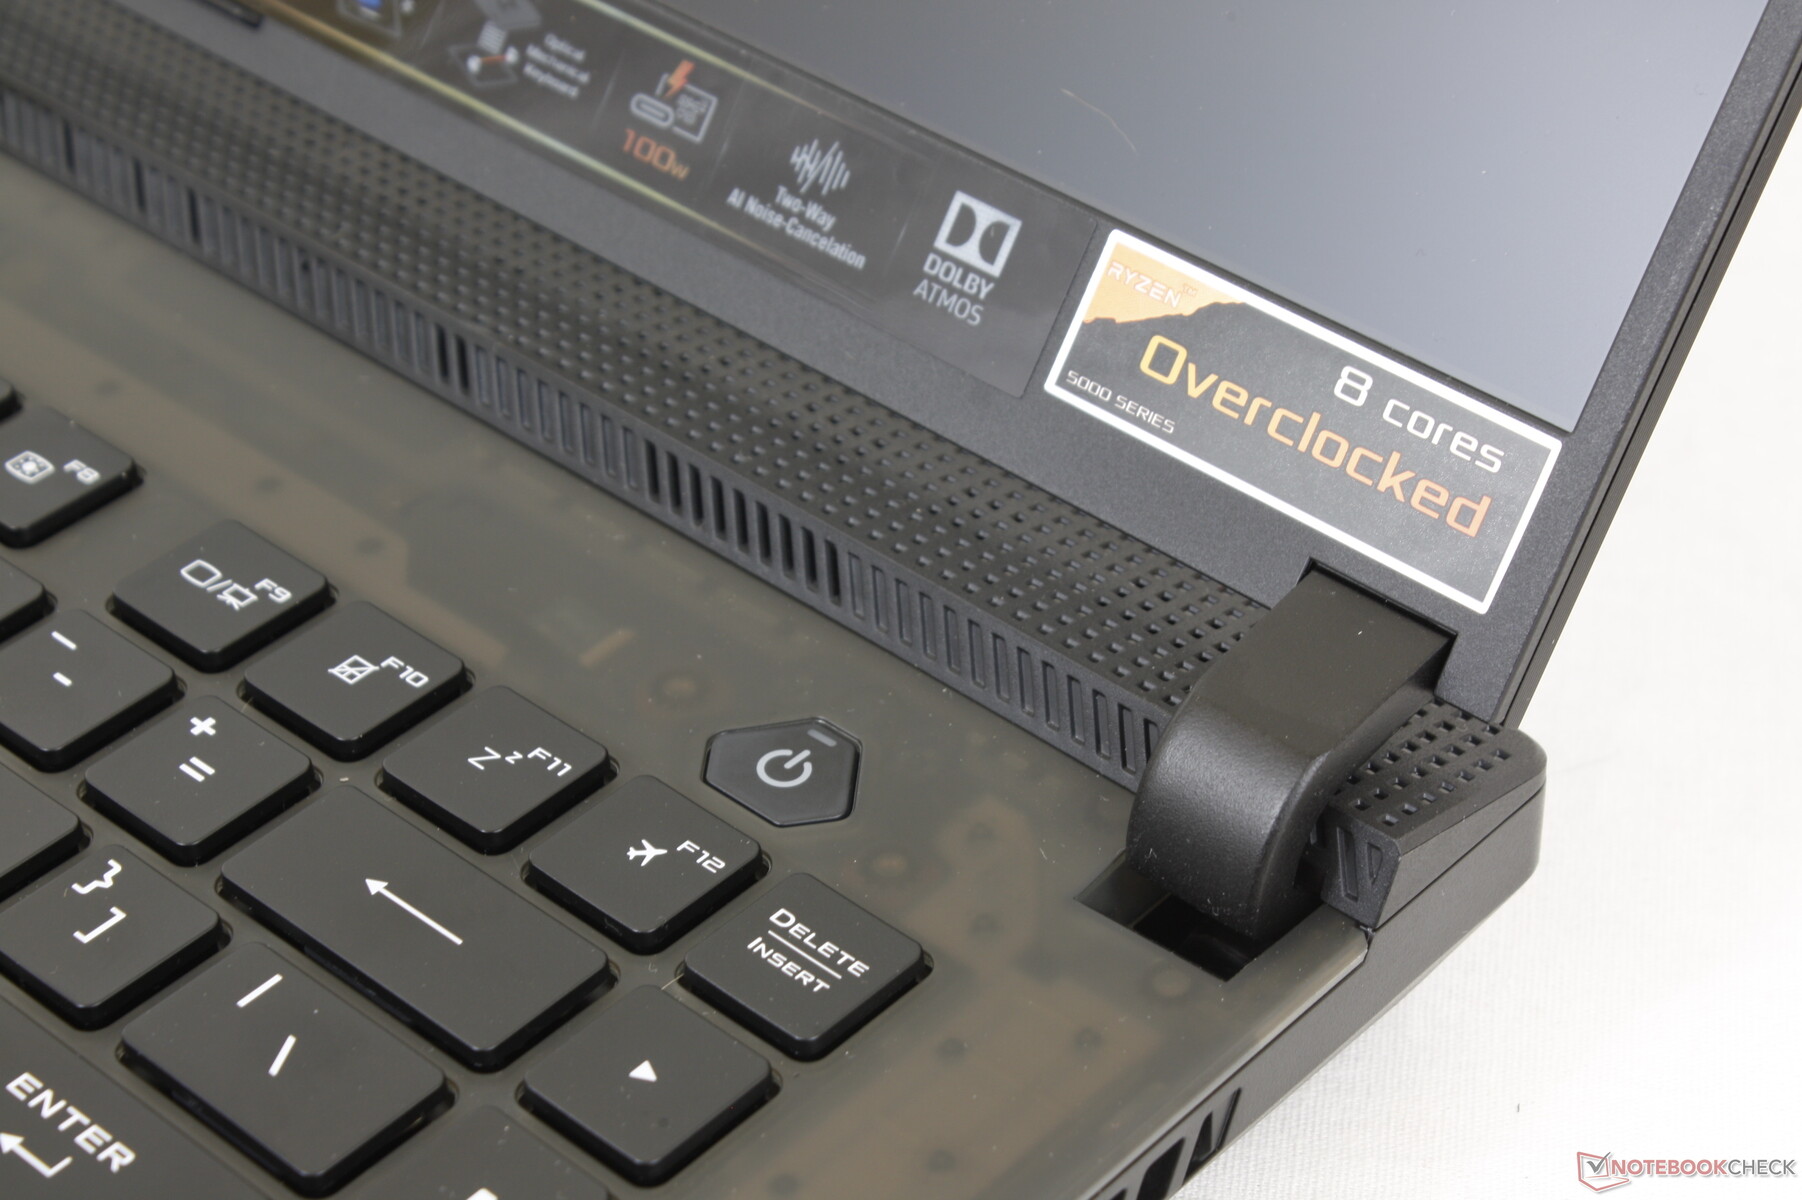
Tastiera
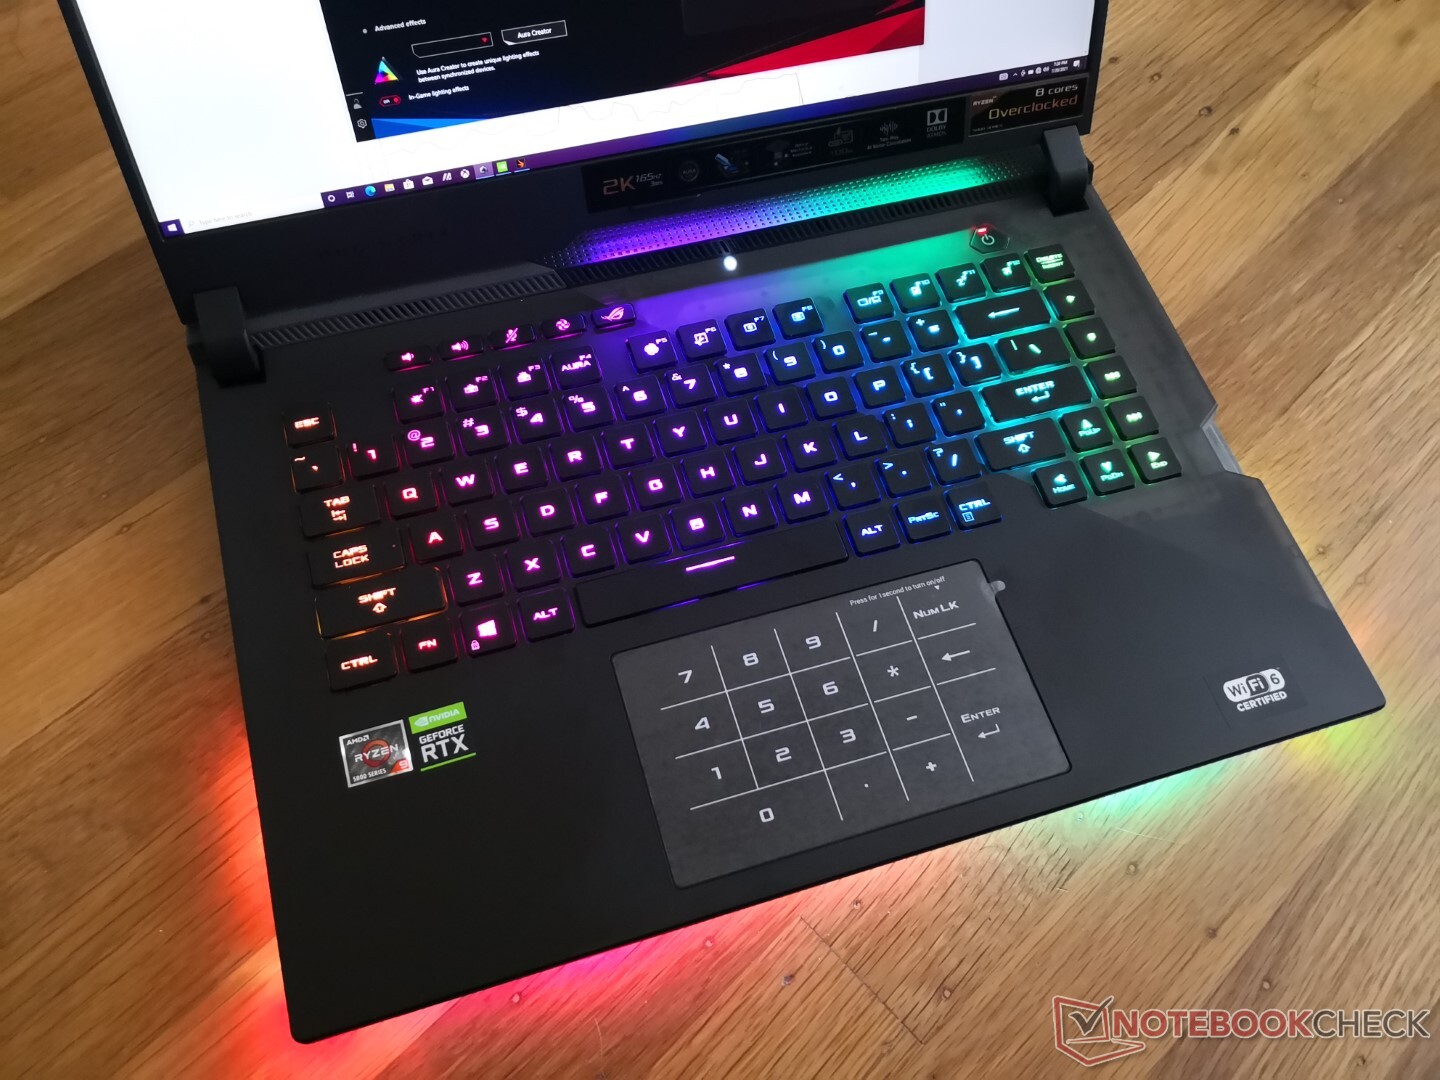
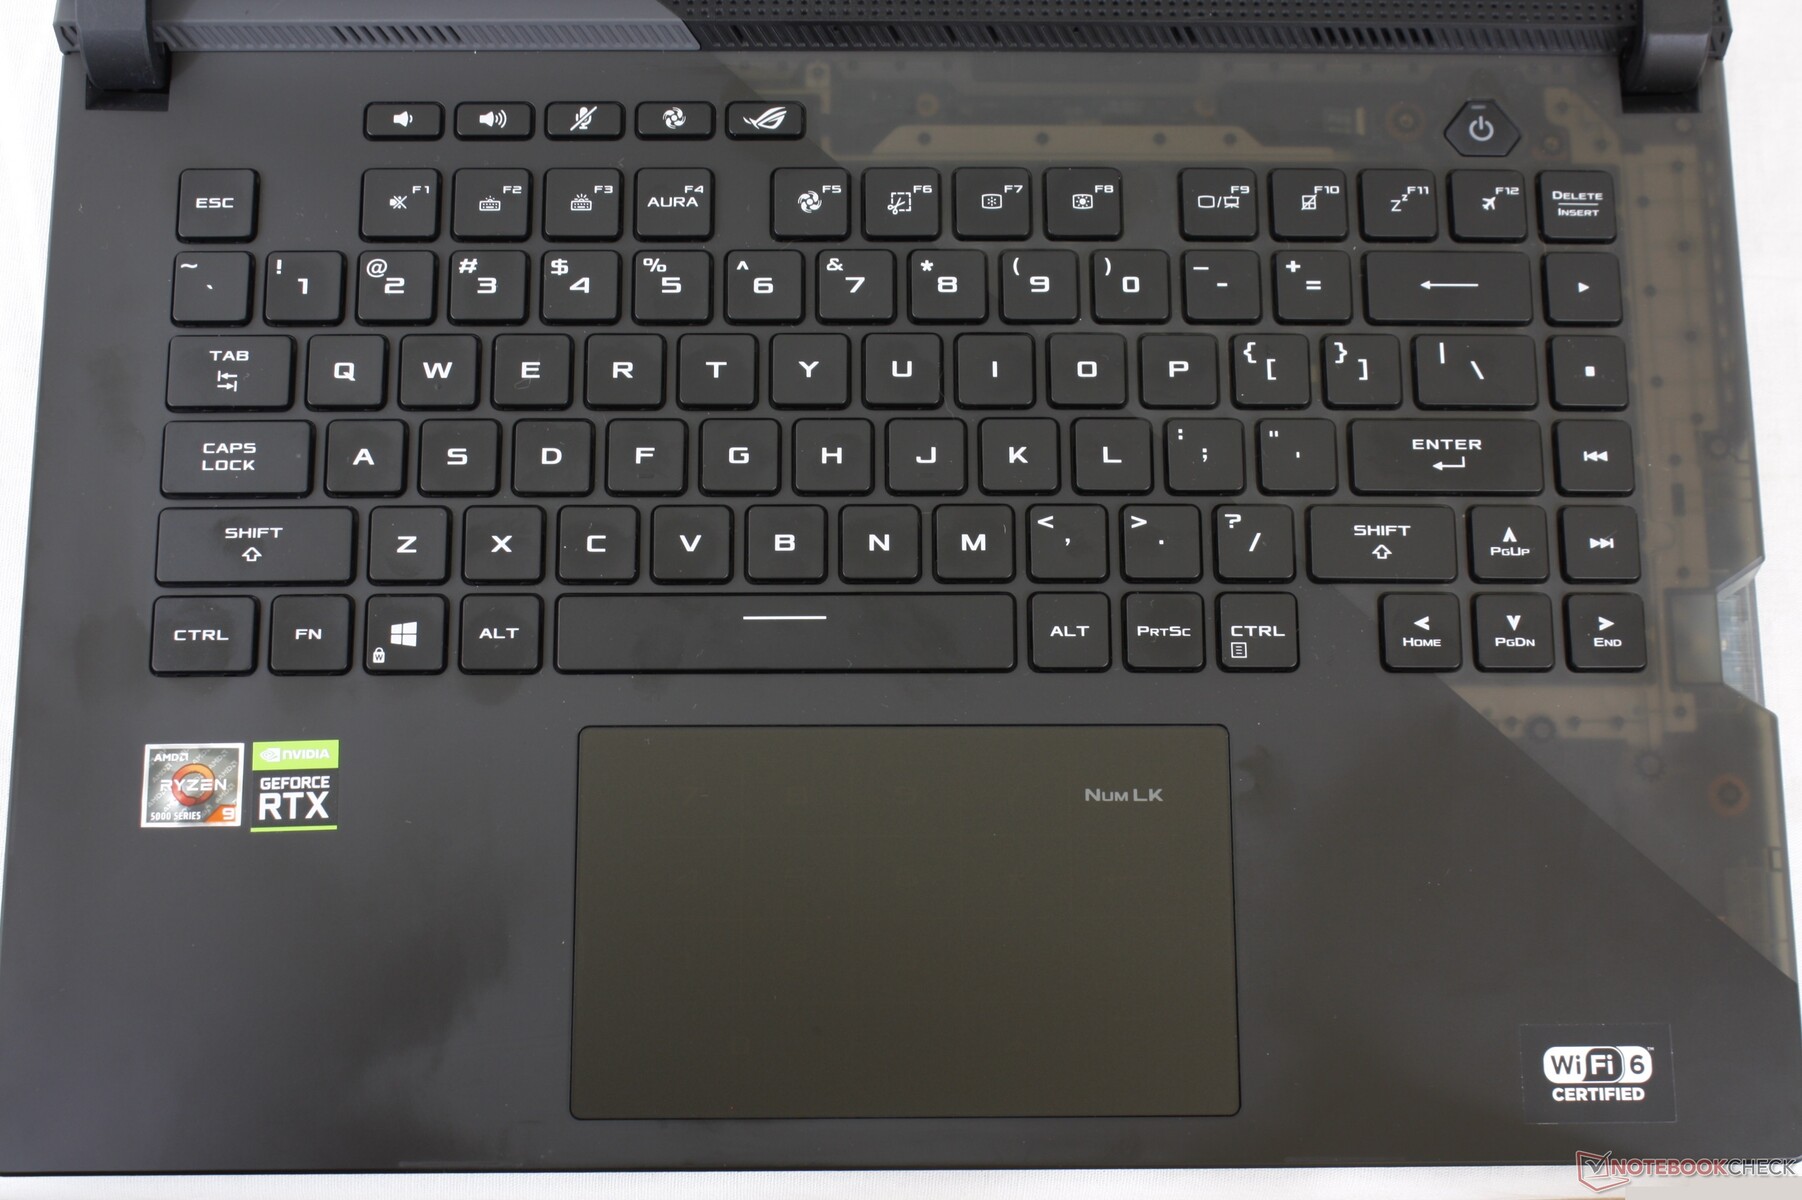
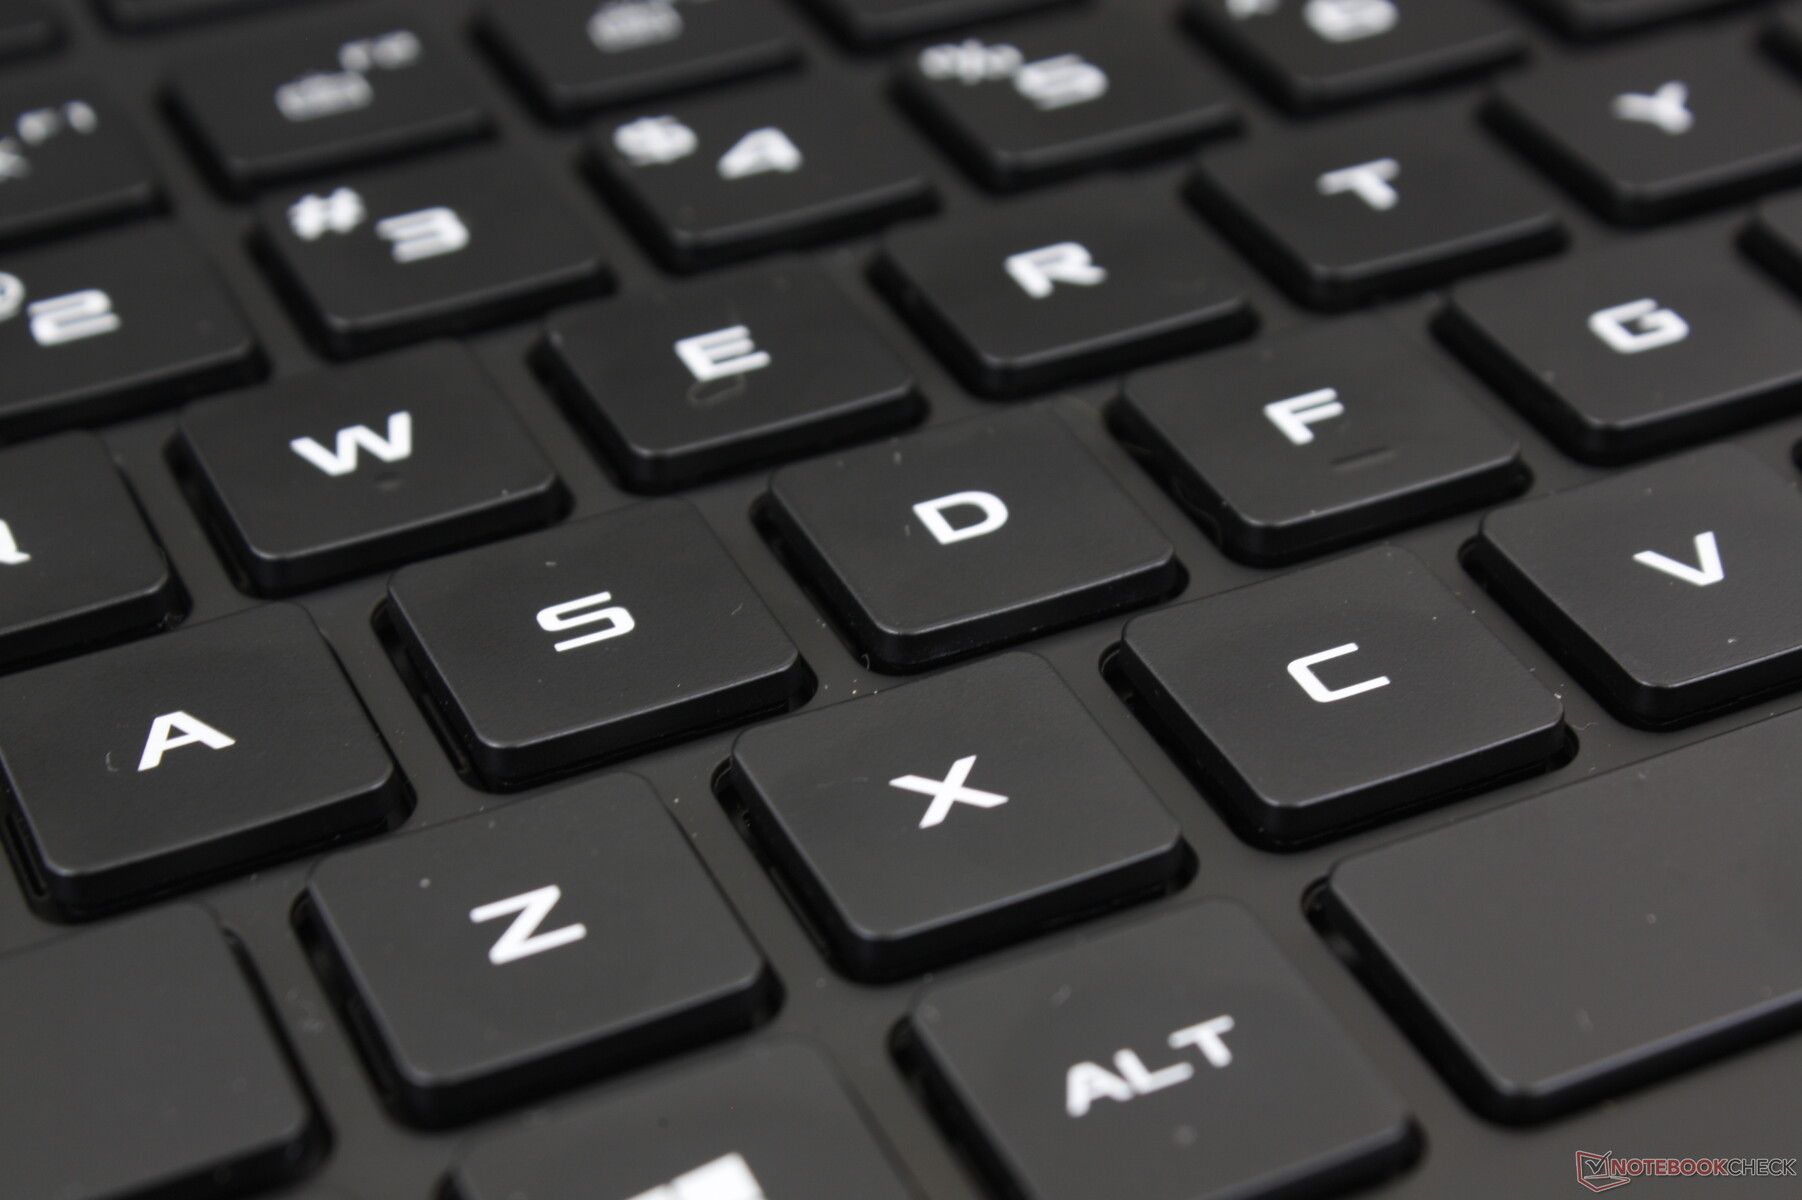
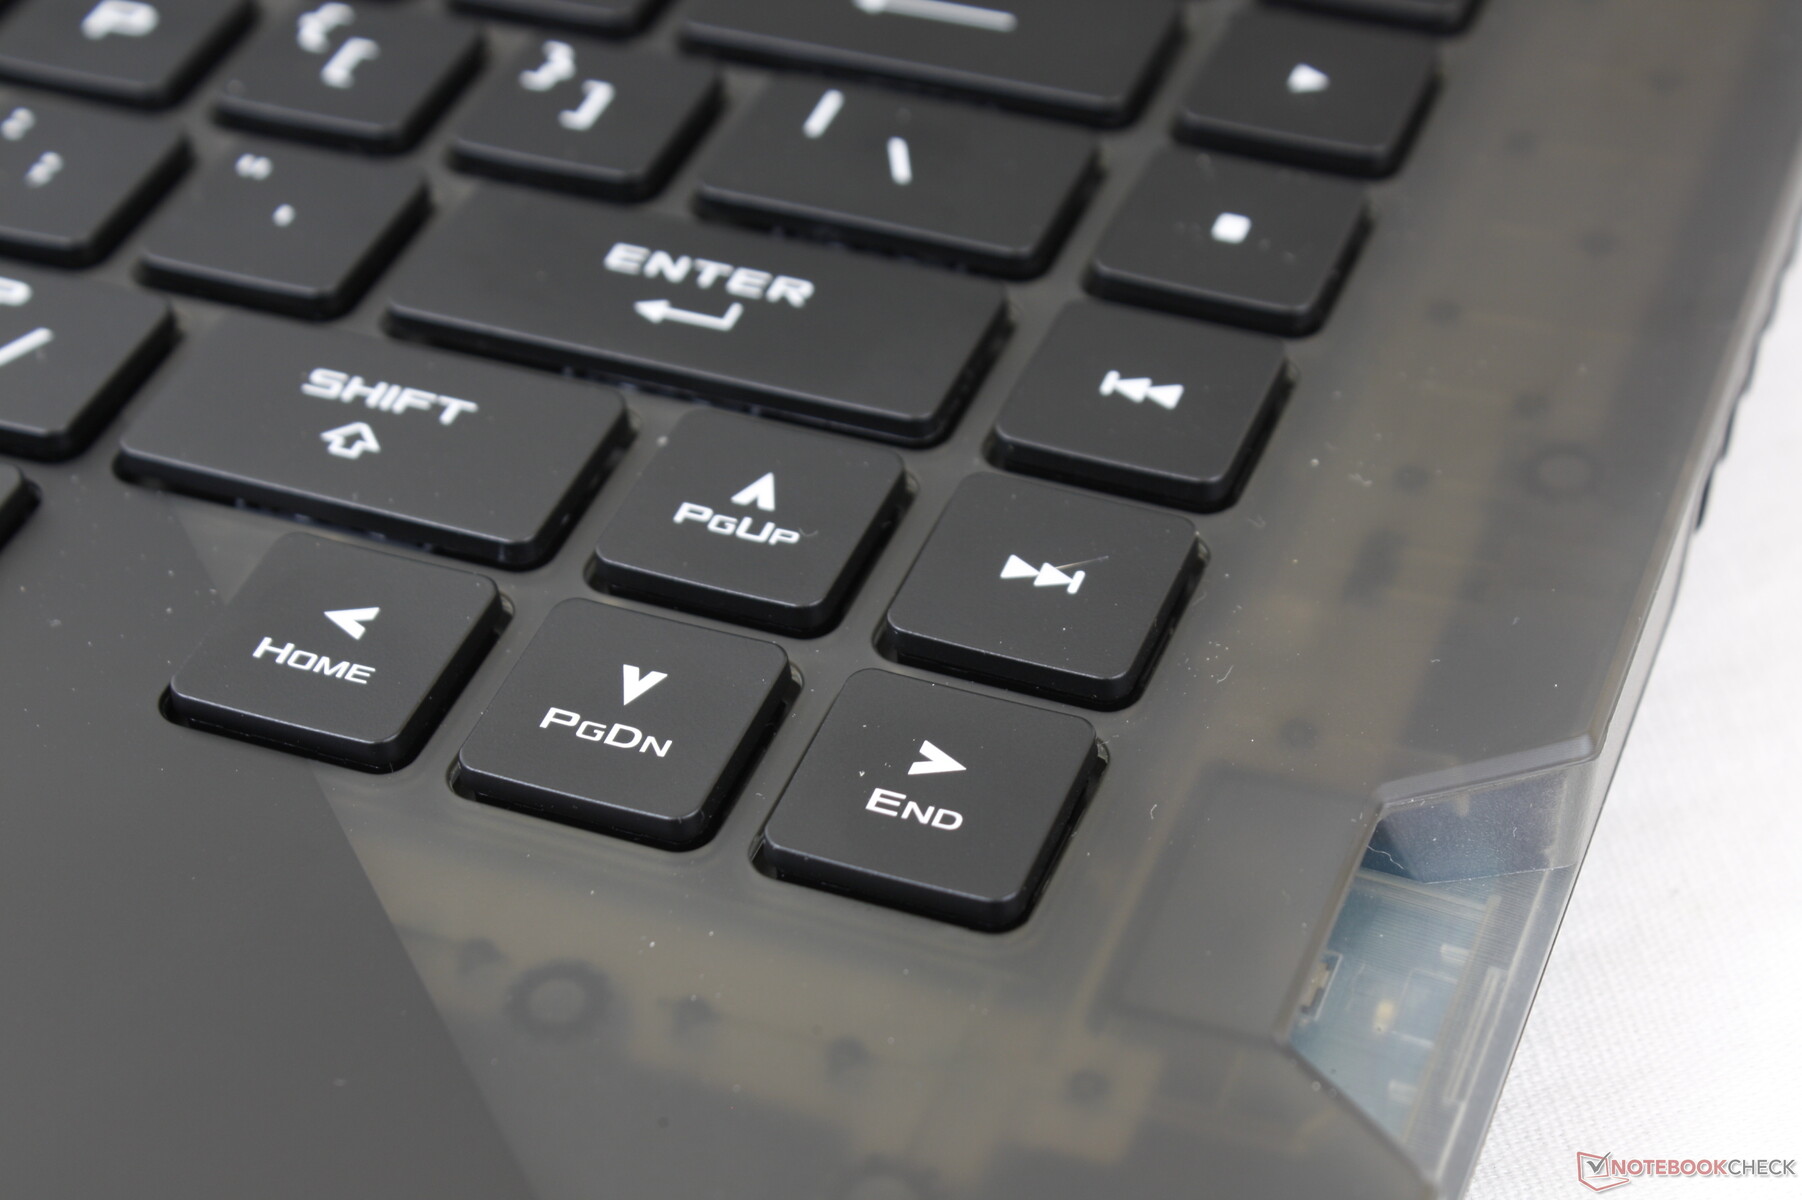
Asus ha completamente rinnovato sia la tastiera che il clickpad del vecchio G532. La tastiera RGB per tasto, in particolare, è ora ottico-meccanica con un layout e una sensazione diversa. Anche altri OEM si sono dilettati con simili switches meccanici come gli ultimi Alienware. Questi tasti sono più rumorosi e cliccabili, cosa che alcuni giocatori potrebbero apprezzare, ma questo cambiamento rende il portatile sfavorevole per aule, biblioteche, dormitori e altri ambienti dove si preferiscono tasti più silenziosi.
Touchpad
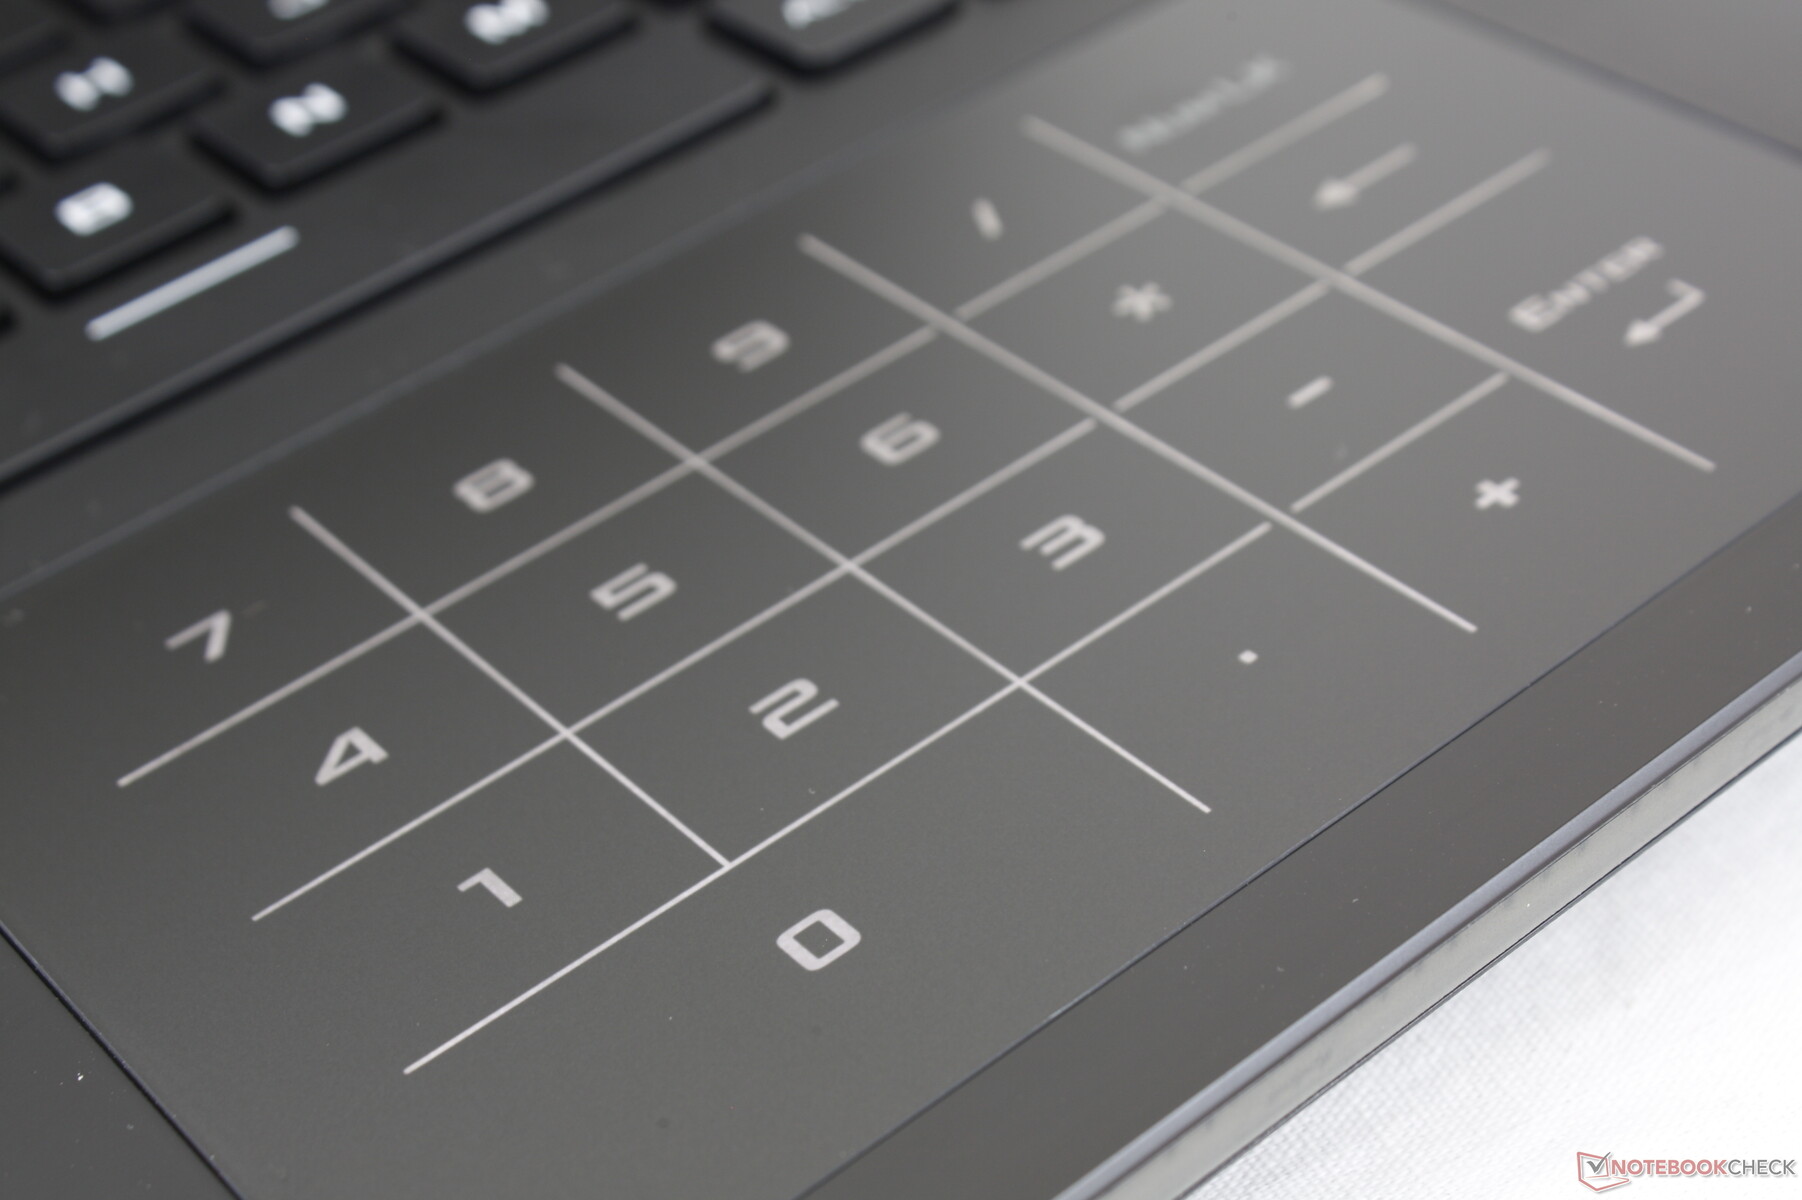
Il nuovo clickpad è più grande di quello del G532(13 x 7.7 cm contro 10.9x 6 cm), dato che Asus ha abbandonato i tasti dedicati al mouse in favore di una superficie più ampia. Il feedback è debole a causa della corsa molto superficiale nonostante il click relativamente forte quando viene premuto. Così, azioni come il drag-and-drop sono più difficili da eseguire questa volta. Il controllo di base del cursore è altrimenti più spazioso e più reattivo di prima, in parte grazie alla maggiore frequenza di aggiornamento del display.
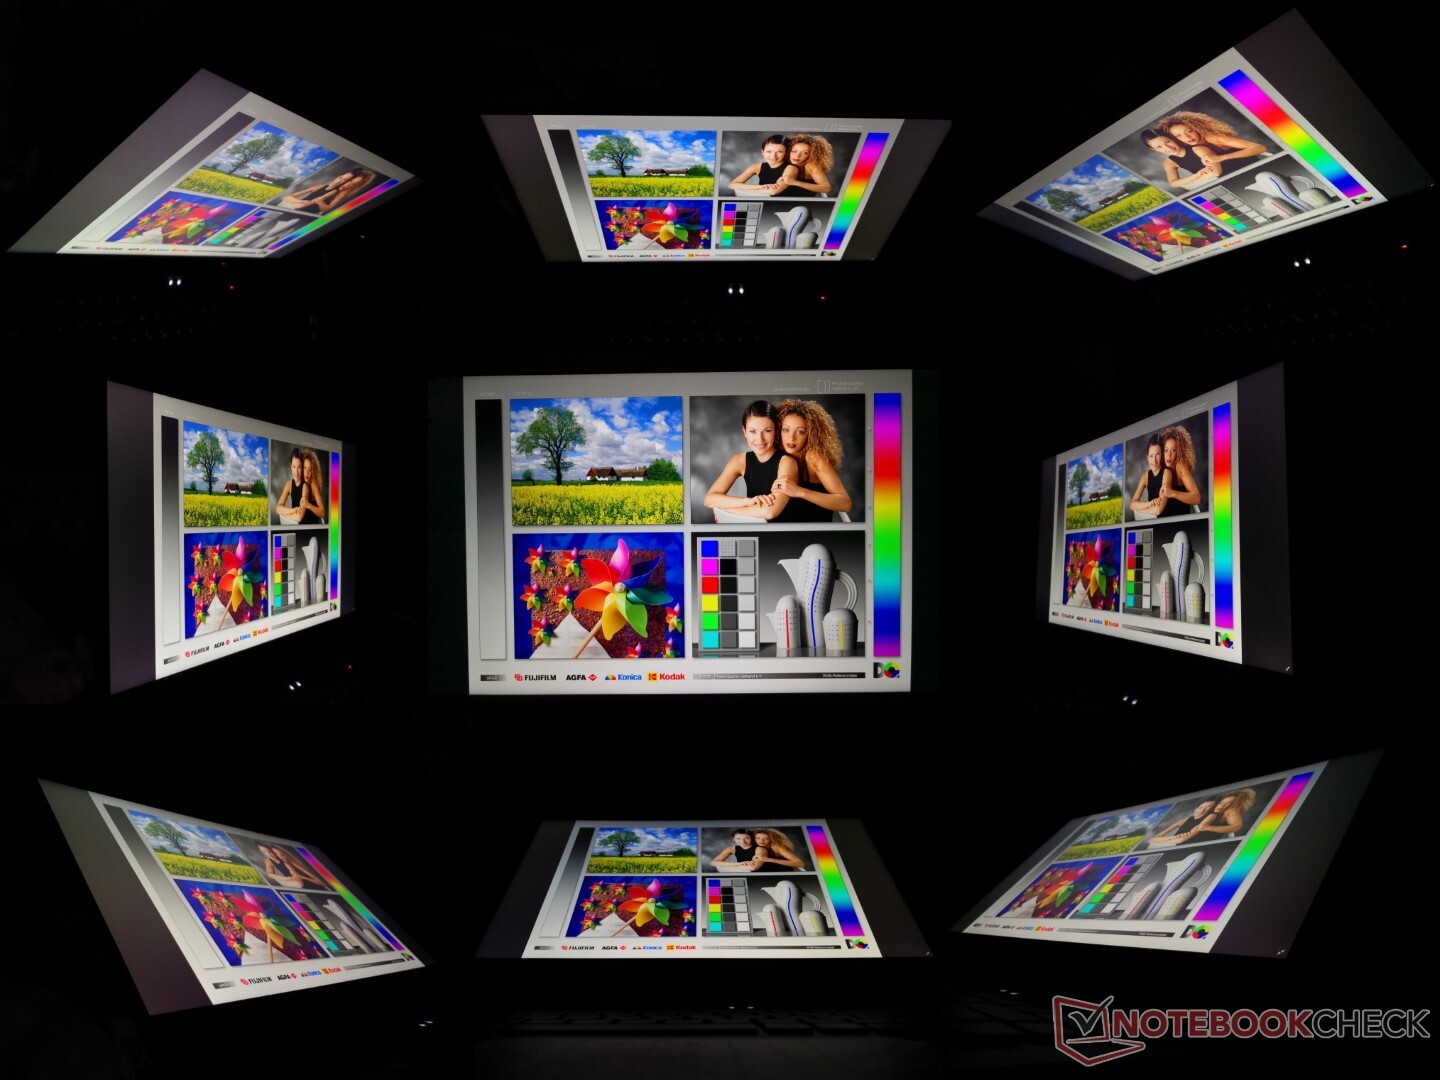
Display
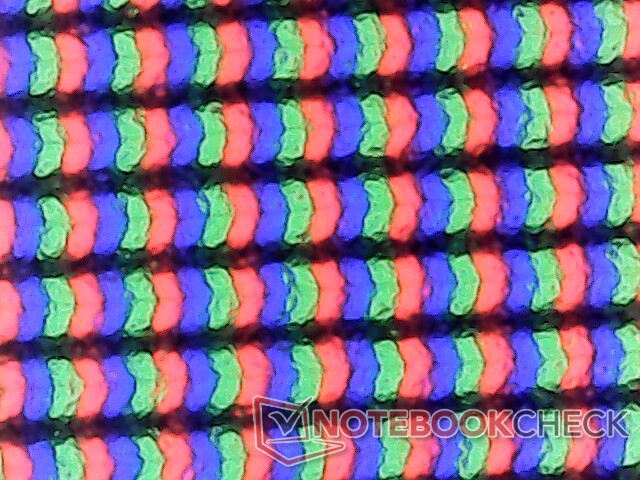
Il pannello IPS BOE NE156QHM-NY1 che si trova sul nostro G533QS è il primo ad apparire nel nostro database. Lo Schenker XMG Neo 15 viene fornito con il pannello NE156QHM-NY2 leggermente diverso che ha la stessa risoluzione nativa 1440p e 165 Hz di frequenza di aggiornamento ma uno spazio colore più stretto (69% P3 invece del 98%). Il nostro pannello 1440p ha apparentemente tutto, compresi i tempi di risposta veloci, i colori profondi e gli elevati valori di aggiornamento. Il contrasto, tuttavia, potrebbe essere un po' meglio con "solo" 900:1.
AMD FreeSync è supportato sul pannello principale.
| |||||||||||||||||||||||||
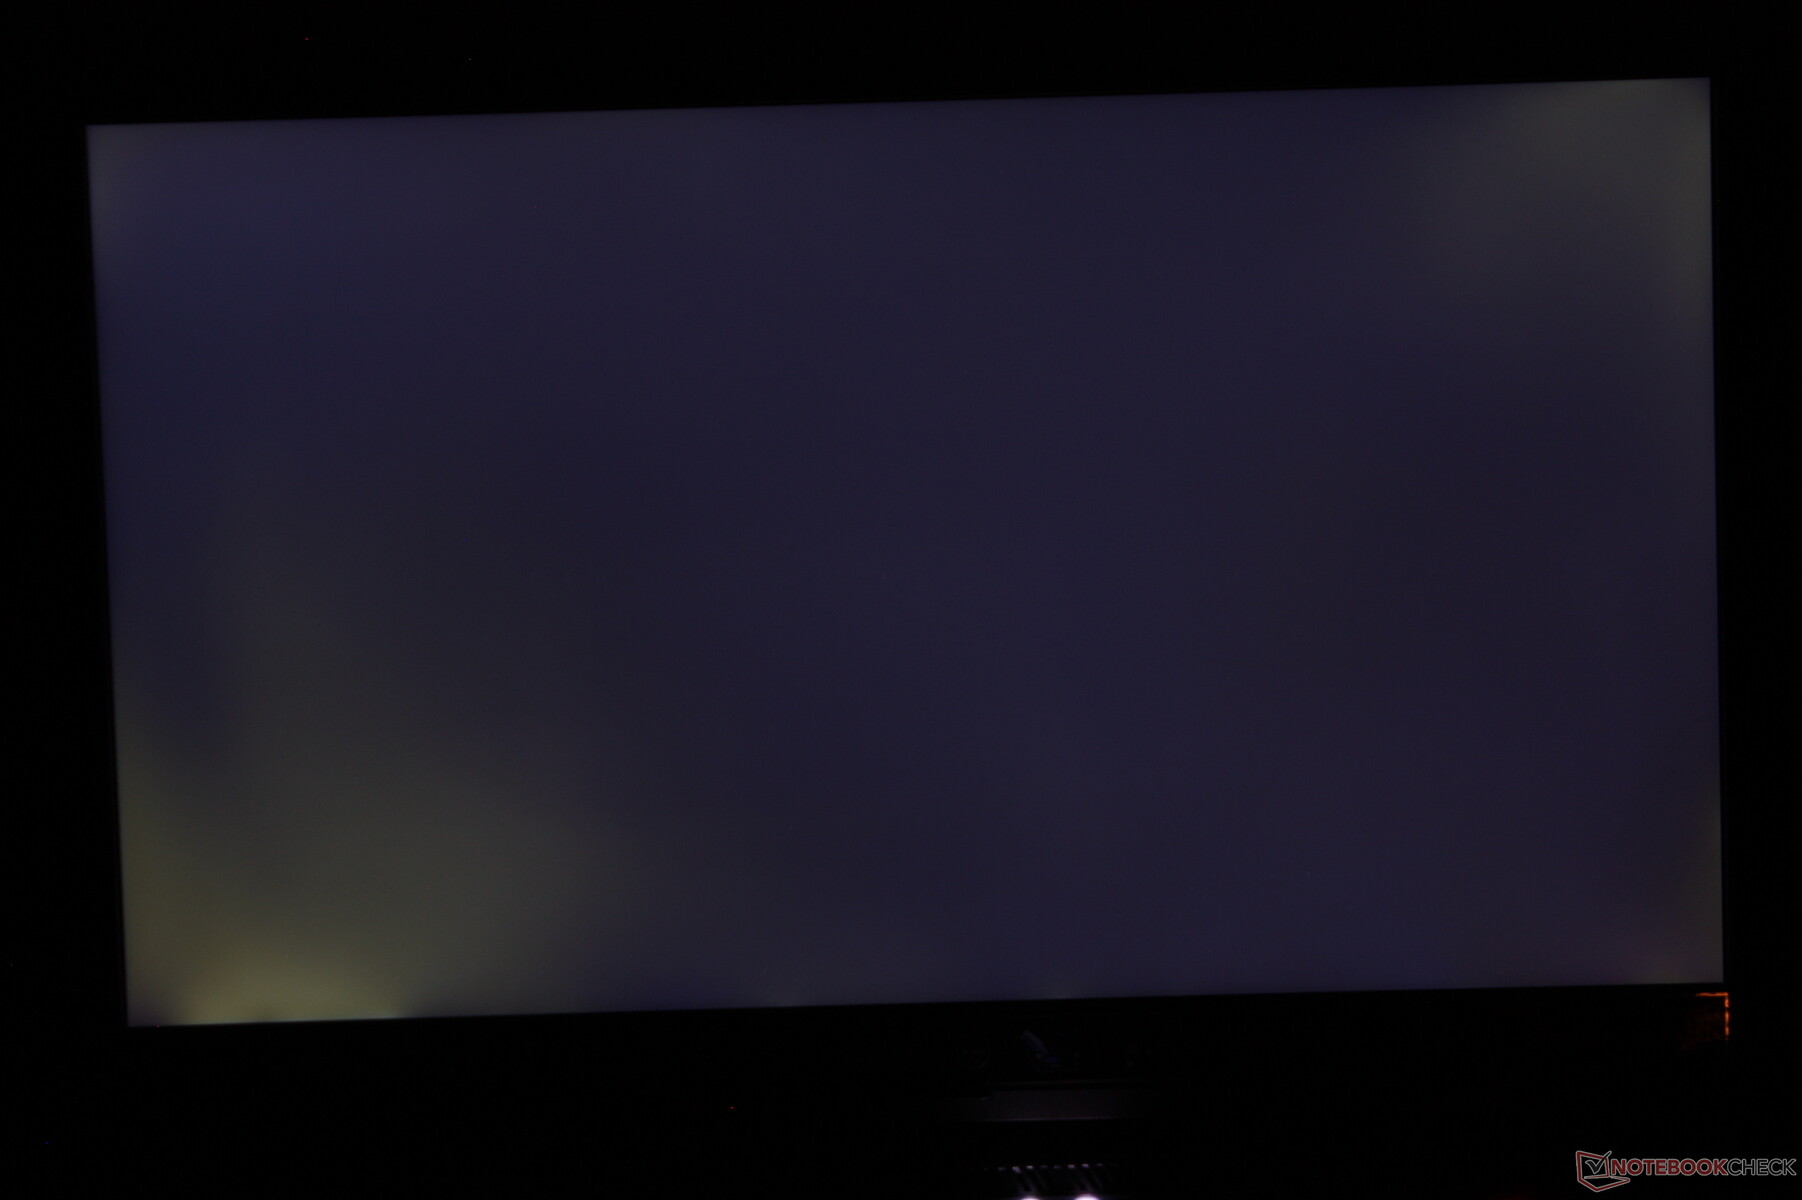
Distribuzione della luminosità: 76 %
Al centro con la batteria: 304.3 cd/m²
Contrasto: 922:1 (Nero: 0.33 cd/m²)
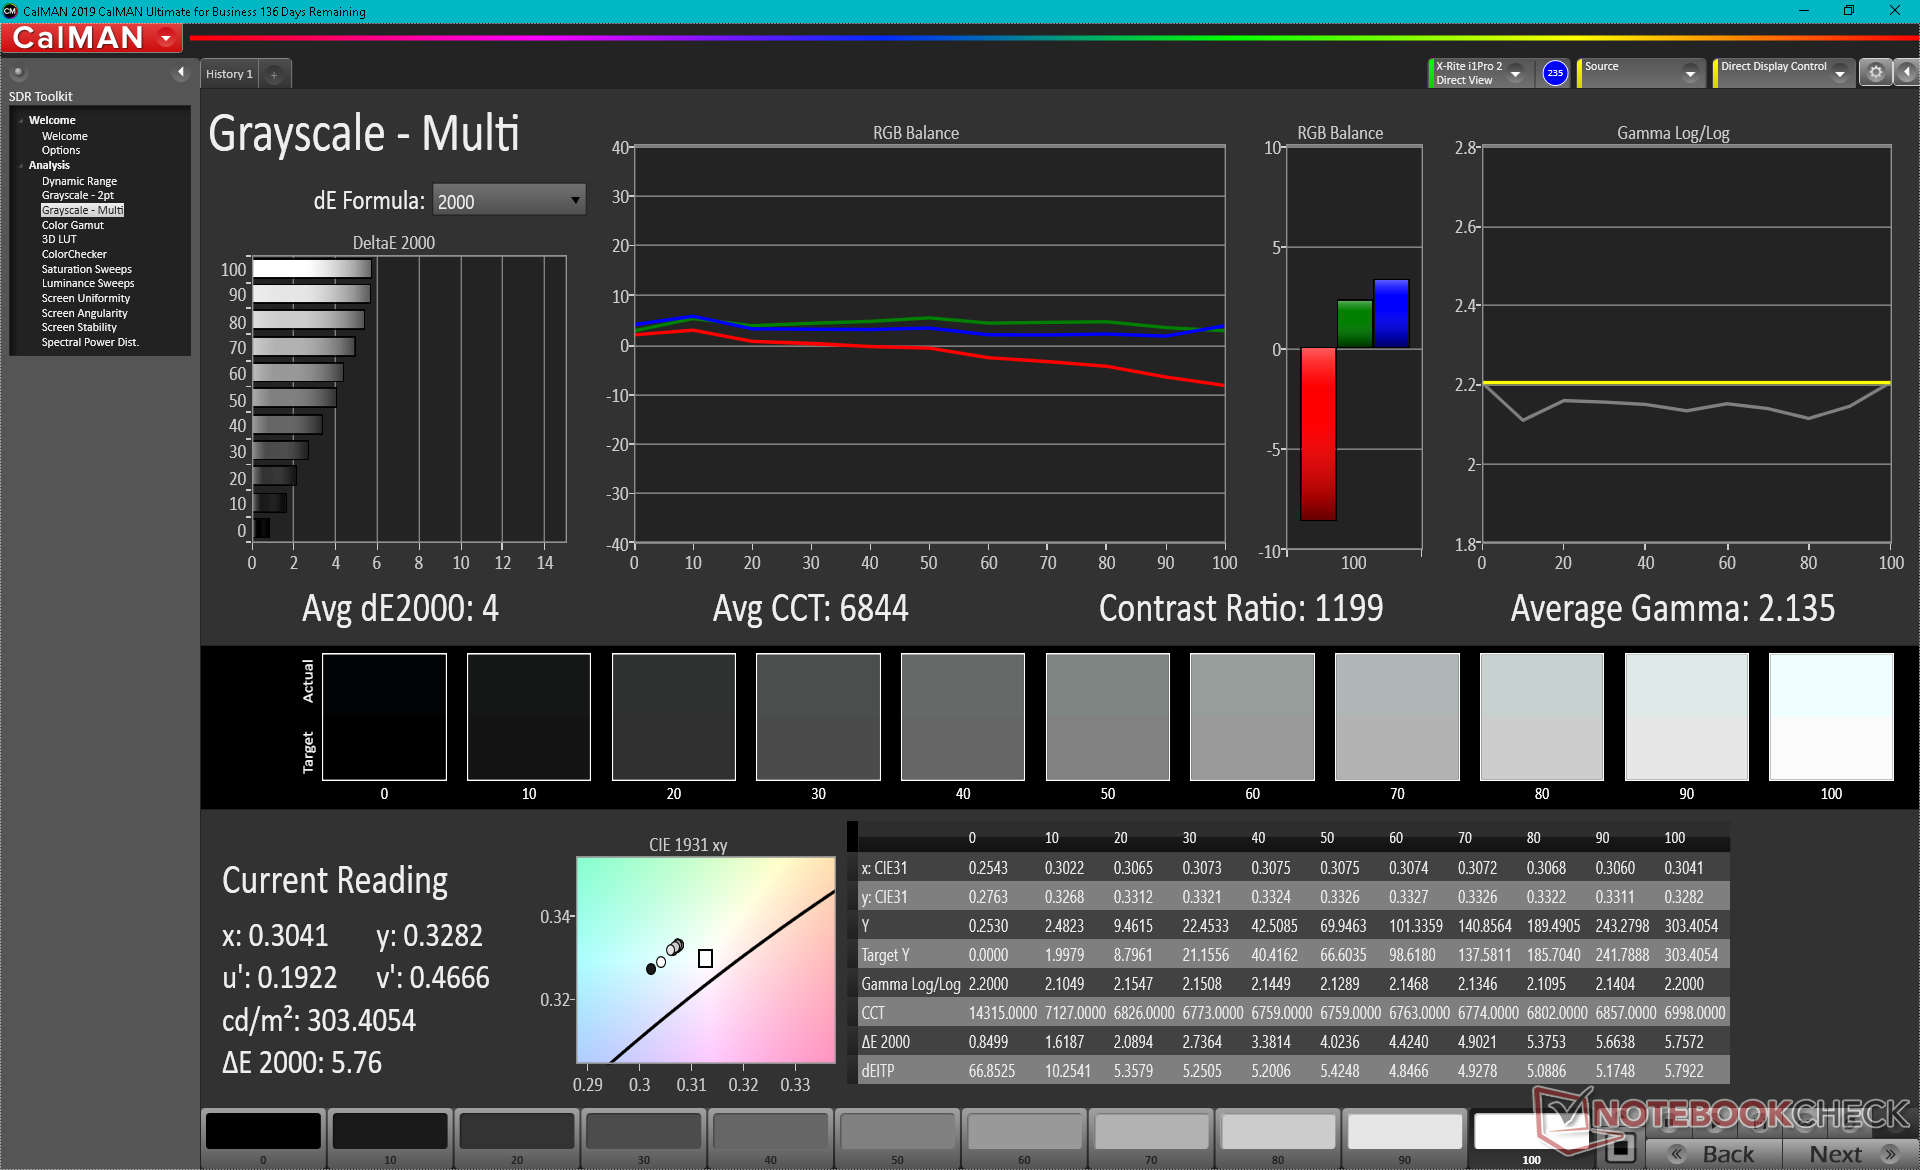
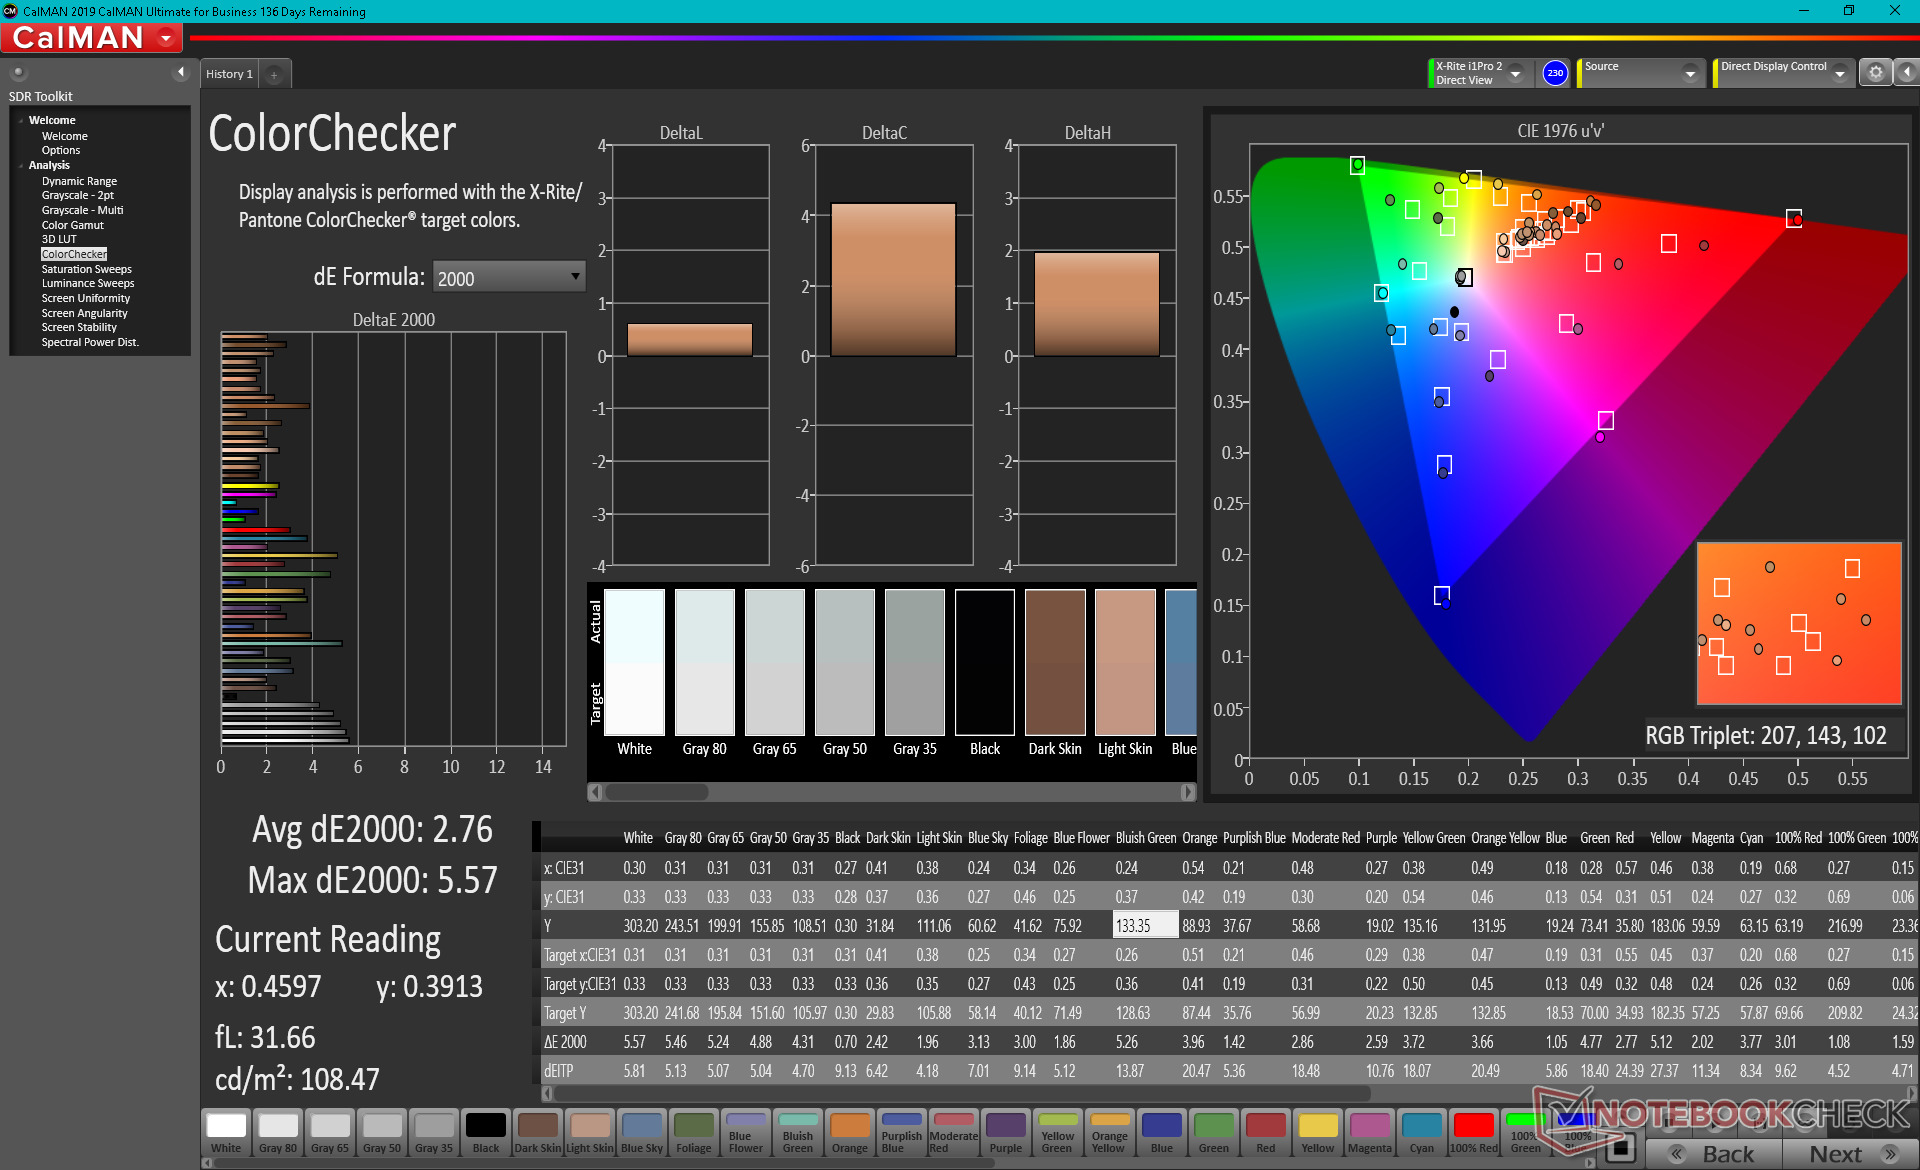
ΔE ColorChecker Calman: 2.76 | ∀{0.5-29.43 Ø4.73}
calibrated: 2.38
ΔE Greyscale Calman: 4 | ∀{0.09-98 Ø4.97}
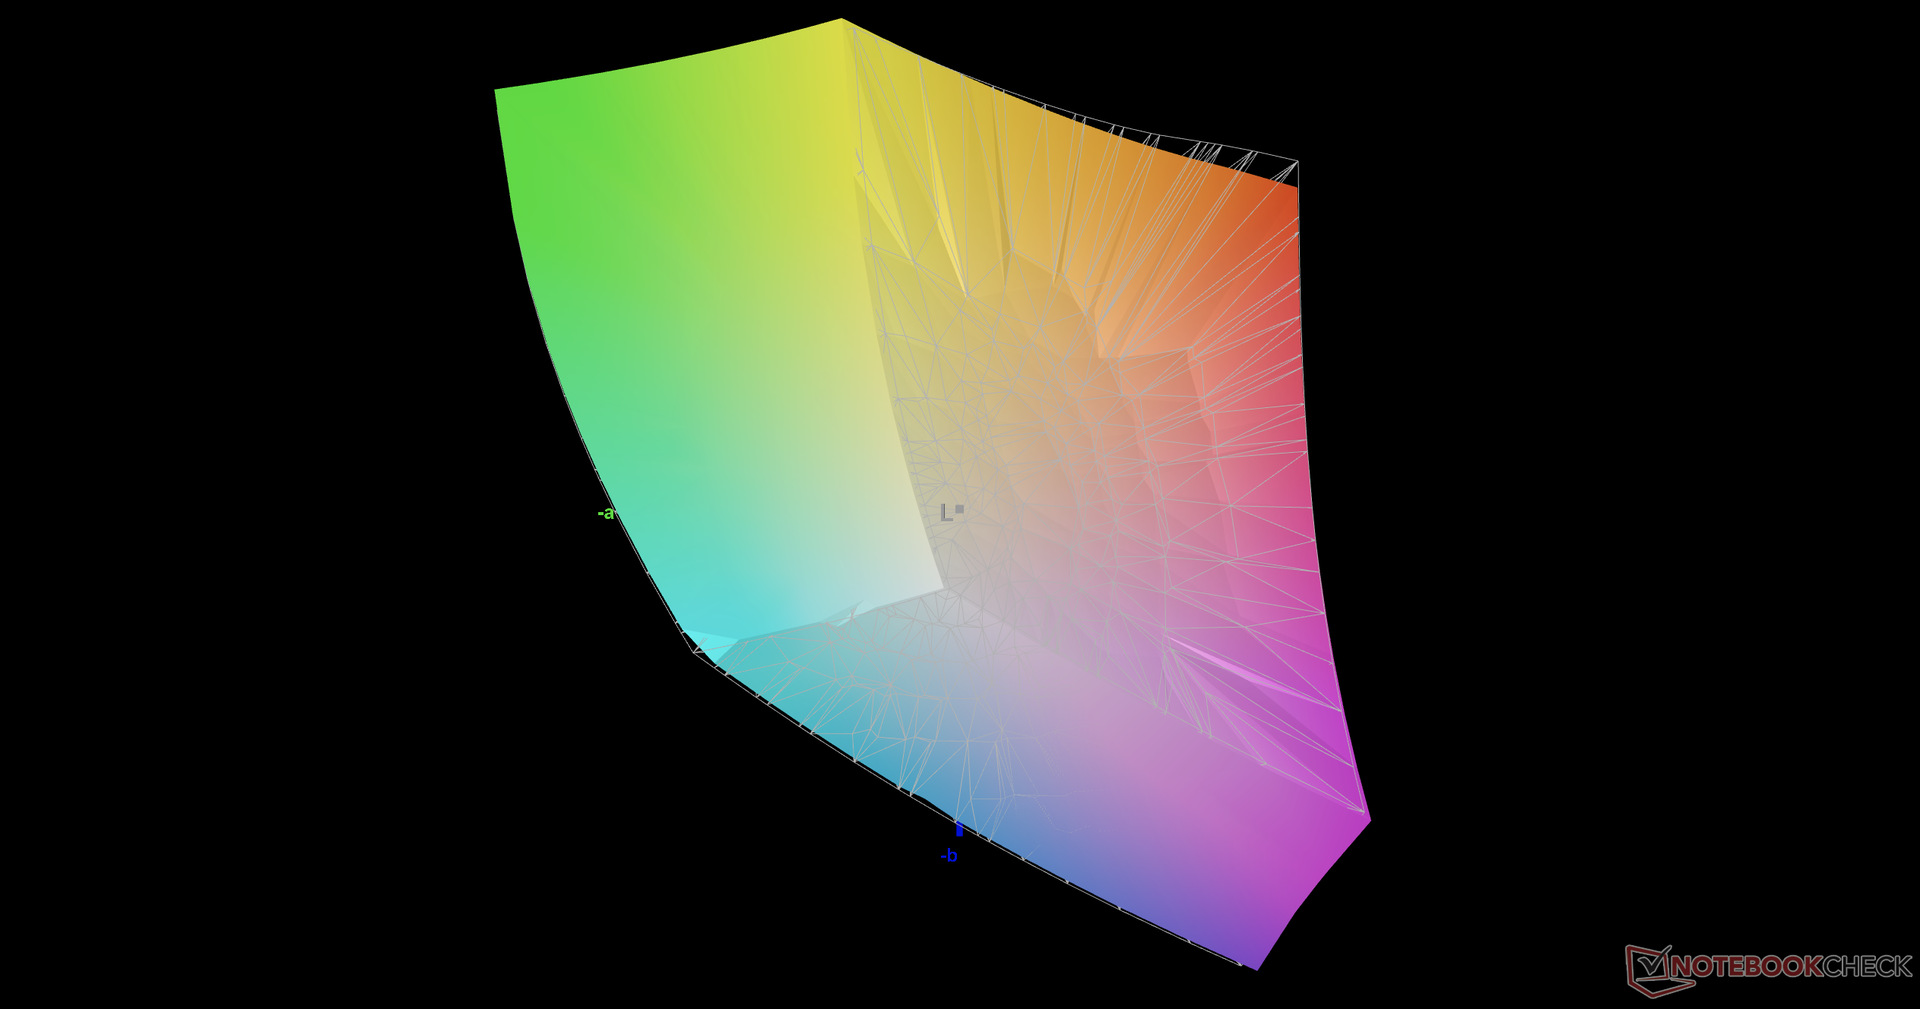
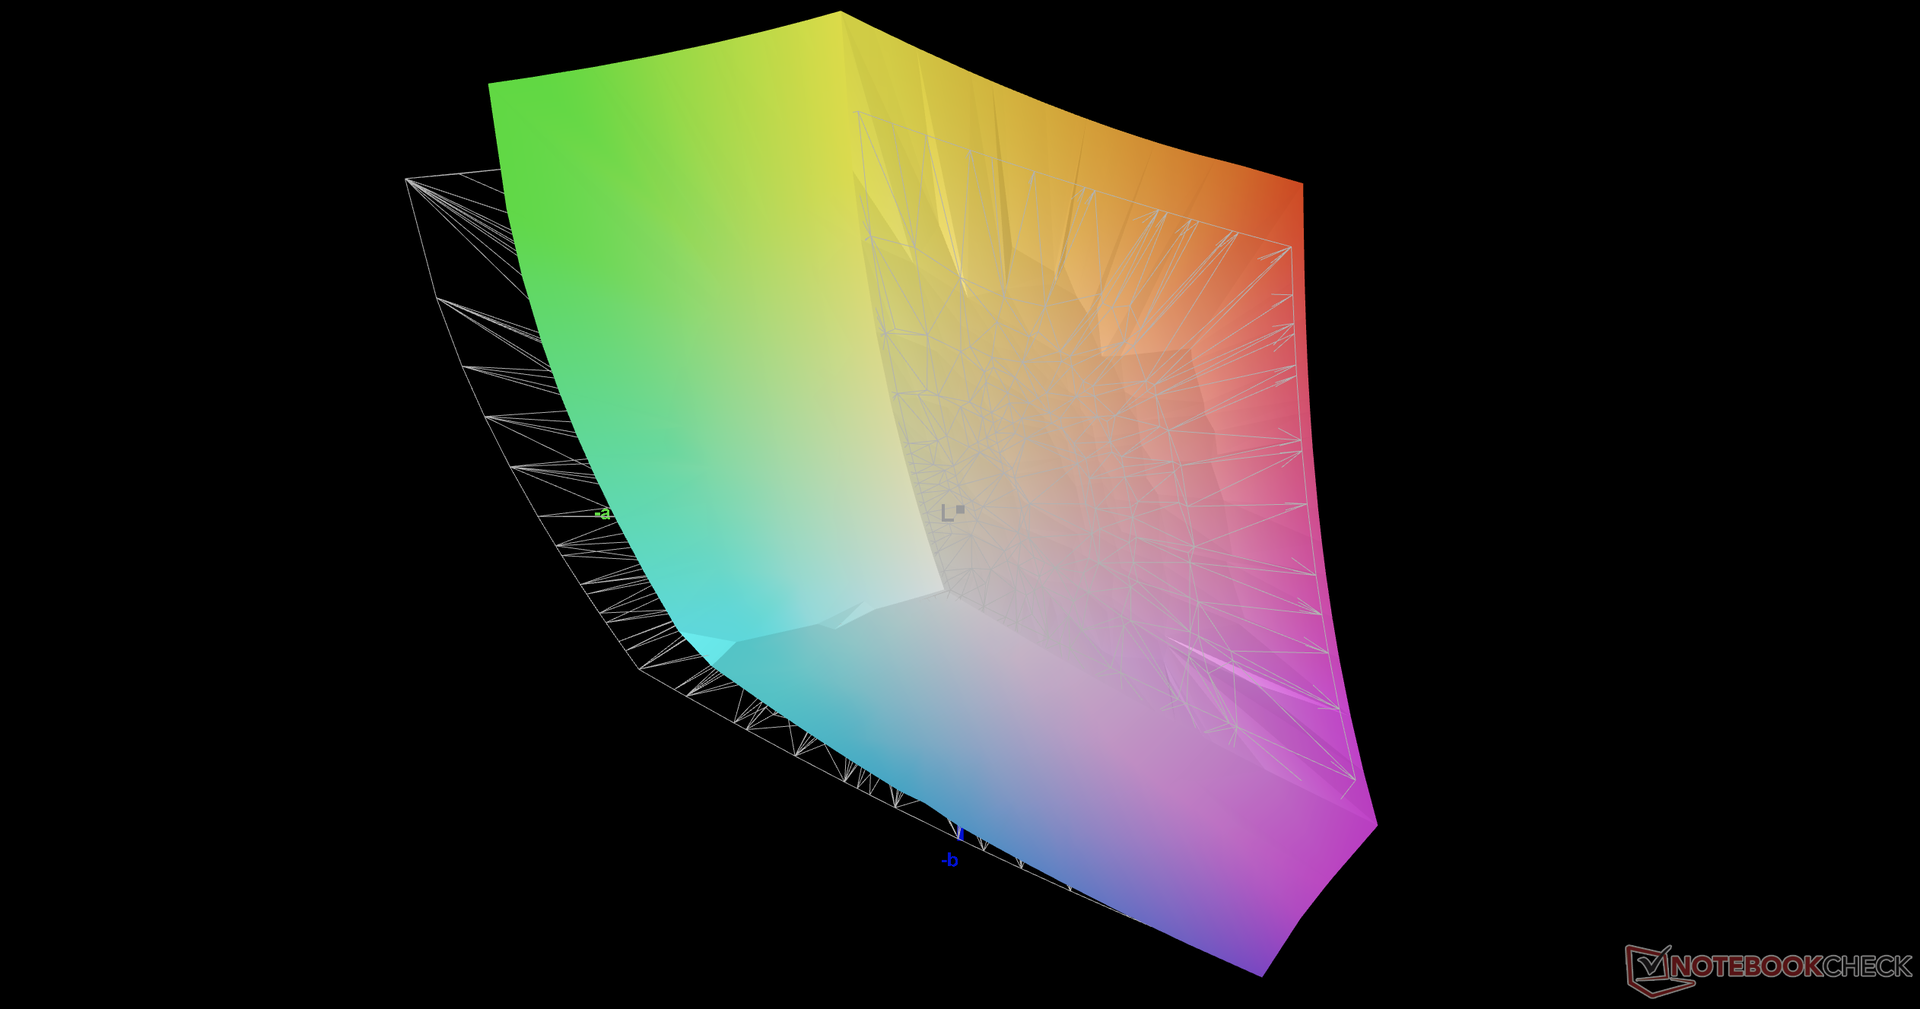
85.3% AdobeRGB 1998 (Argyll 3D)
99.9% sRGB (Argyll 3D)
97.6% Display P3 (Argyll 3D)
Gamma: 2.14
CCT: 6844 K
| Asus ROG Strix Scar 15 G533QS BOE CQ NE156QHM-NY1, IPS, 15.6", 2560x1440 | Asus ROG Strix Scar 15 G532LWS AU Optronics B156HAN12.0, IPS, 15.6", 1920x1080 | MSI GE66 Raider 10SFS Sharp LQ156M1JW03 (SHP14C5), IPS-Level, 15.6", 1920x1080 | Razer Blade 15 Advanced (Mid 2021) TL156VDXP02-0, IPS, 15.6", 1920x1080 | Alienware m15 R5 Ryzen Edition B156HAN, IPS, 15.6", 1920x1080 | Lenovo Legion C7 15IMH05 82EH0030GE BOW CQ NV156FHM-NY5, IPS, 15.6", 1920x1080 | |
|---|---|---|---|---|---|---|
| Display | -15% | -16% | -18% | 4% | ||
| Display P3 Coverage (%) | 97.6 | 69.9 -28% | 68 -30% | 66.9 -31% | 91.9 -6% | |
| sRGB Coverage (%) | 99.9 | 99.6 0% | 99 -1% | 97.1 -3% | 99.8 0% | |
| AdobeRGB 1998 Coverage (%) | 85.3 | 71.4 -16% | 69.8 -18% | 69 -19% | 99.5 17% | |
| Response Times | 12% | -1% | 45% | 52% | 38% | |
| Response Time Grey 50% / Grey 80% * (ms) | 14 ? | 14.4 ? -3% | 16.4 ? -17% | 4.2 ? 70% | 4 ? 71% | 14 ? -0% |
| Response Time Black / White * (ms) | 12.4 ? | 9.2 ? 26% | 10.4 ? 16% | 10 ? 19% | 8.4 ? 32% | 3 ? 76% |
| PWM Frequency (Hz) | 23580 ? | |||||
| Screen | 31% | 27% | 20% | 19% | -31% | |
| Brightness middle (cd/m²) | 304.3 | 307.2 1% | 291 -4% | 353.4 16% | 329 8% | 440 45% |
| Brightness (cd/m²) | 286 | 301 5% | 278 -3% | 340 19% | 321 12% | 414 45% |
| Brightness Distribution (%) | 76 | 91 20% | 91 20% | 92 21% | 92 21% | 87 14% |
| Black Level * (cd/m²) | 0.33 | 0.21 36% | 0.25 24% | 0.31 6% | 0.27 18% | 0.42 -27% |
| Contrast (:1) | 922 | 1463 59% | 1164 26% | 1140 24% | 1219 32% | 1048 14% |
| Colorchecker dE 2000 * | 2.76 | 1.85 33% | 1.19 57% | 2.17 21% | 2.78 -1% | 6.32 -129% |
| Colorchecker dE 2000 max. * | 5.57 | 3.92 30% | 3.04 45% | 5.69 -2% | 4.88 12% | 9.96 -79% |
| Colorchecker dE 2000 calibrated * | 2.38 | 1.26 47% | 1.05 56% | 1.63 32% | 4.13 -74% | |
| Greyscale dE 2000 * | 4 | 2 50% | 1.9 52% | 3.4 15% | 2.5 37% | 7.56 -89% |
| Gamma | 2.14 103% | 2.15 102% | 2.216 99% | 2.2 100% | 2.106 104% | 2.64 83% |
| CCT | 6844 95% | 6479 100% | 7018 93% | 6830 95% | 6201 105% | 7681 85% |
| Color Space (Percent of AdobeRGB 1998) (%) | 65 | 70 | 76 | 88 | ||
| Color Space (Percent of sRGB) (%) | 99.7 | 92 | 99 | 100 | ||
| Media totale (Programma / Settaggio) | 9% /
19% | 3% /
13% | 16% /
15% | 36% /
25% | 4% /
-14% |
* ... Meglio usare valori piccoli
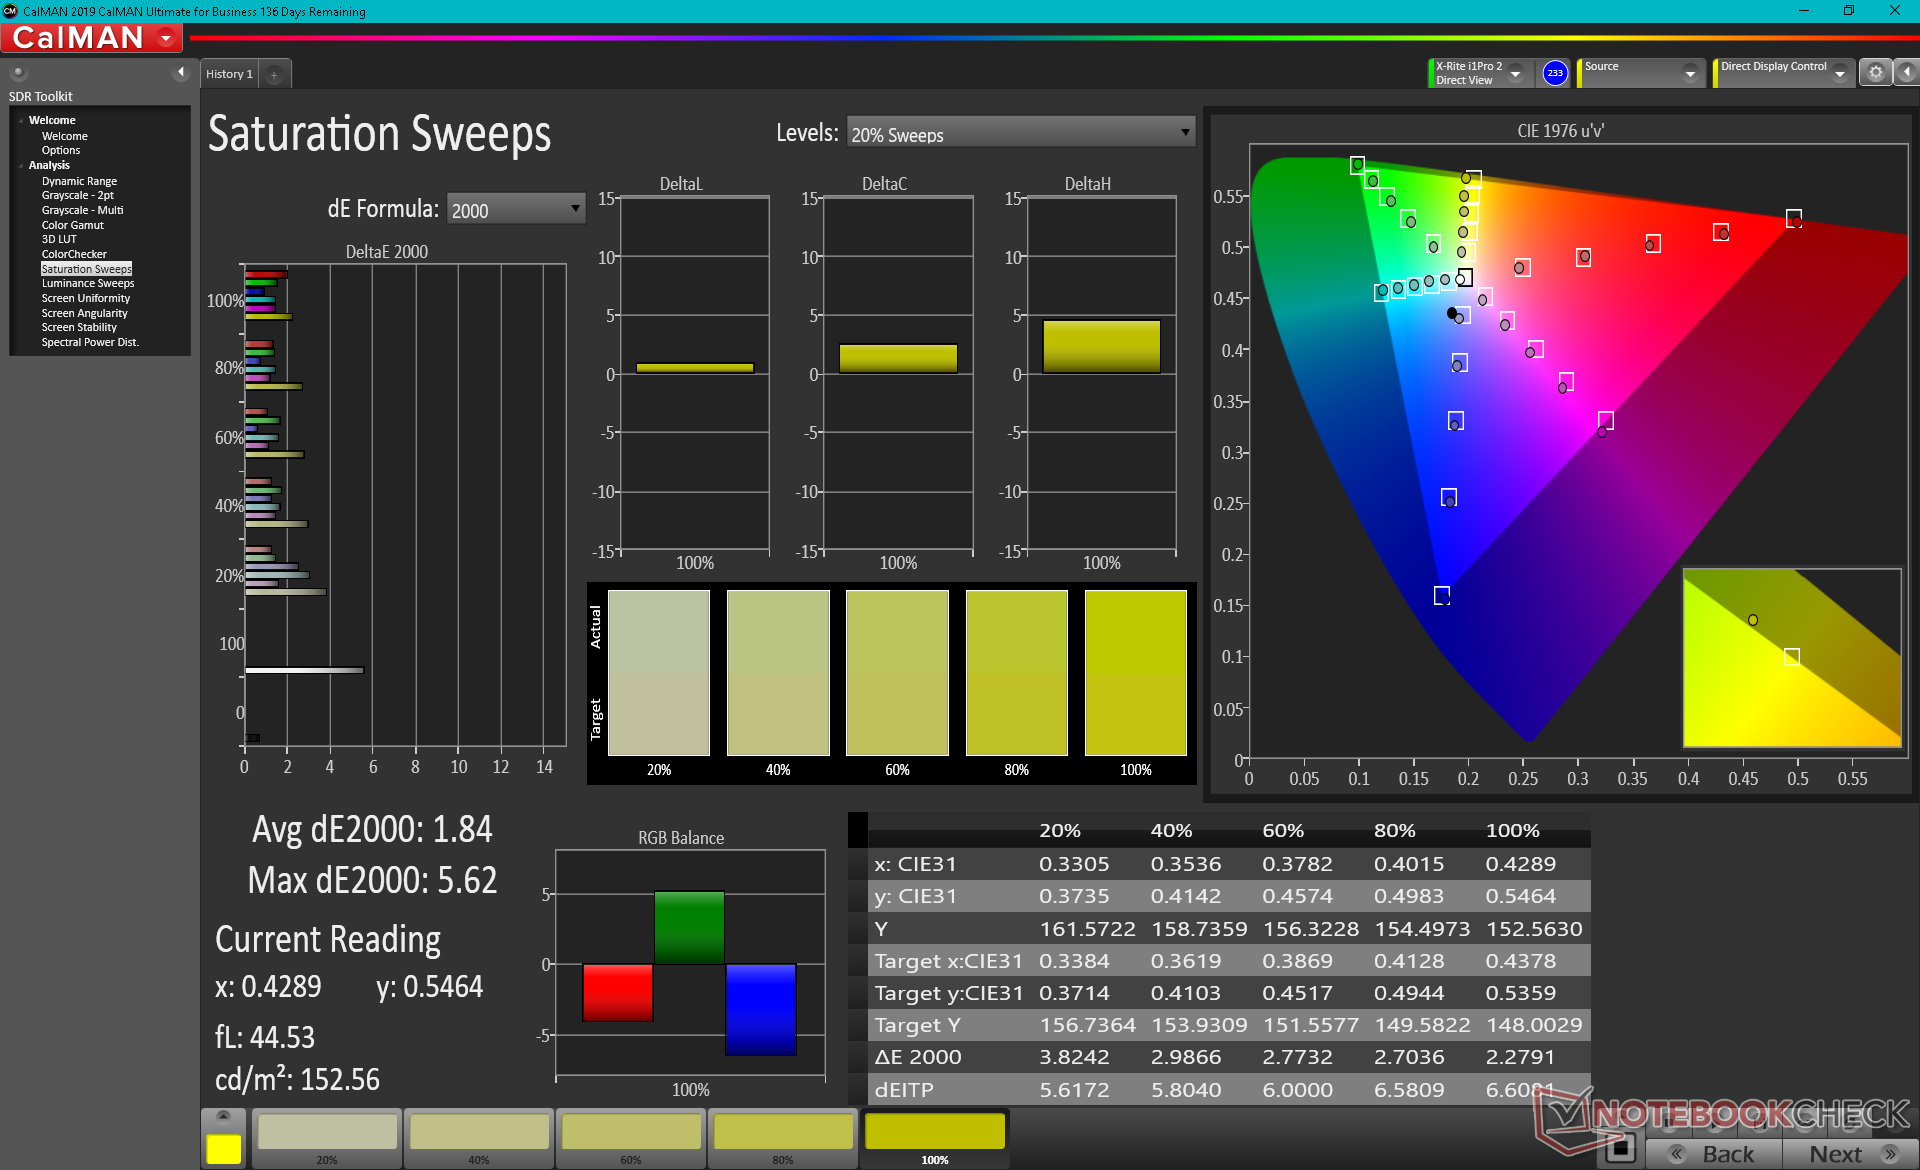
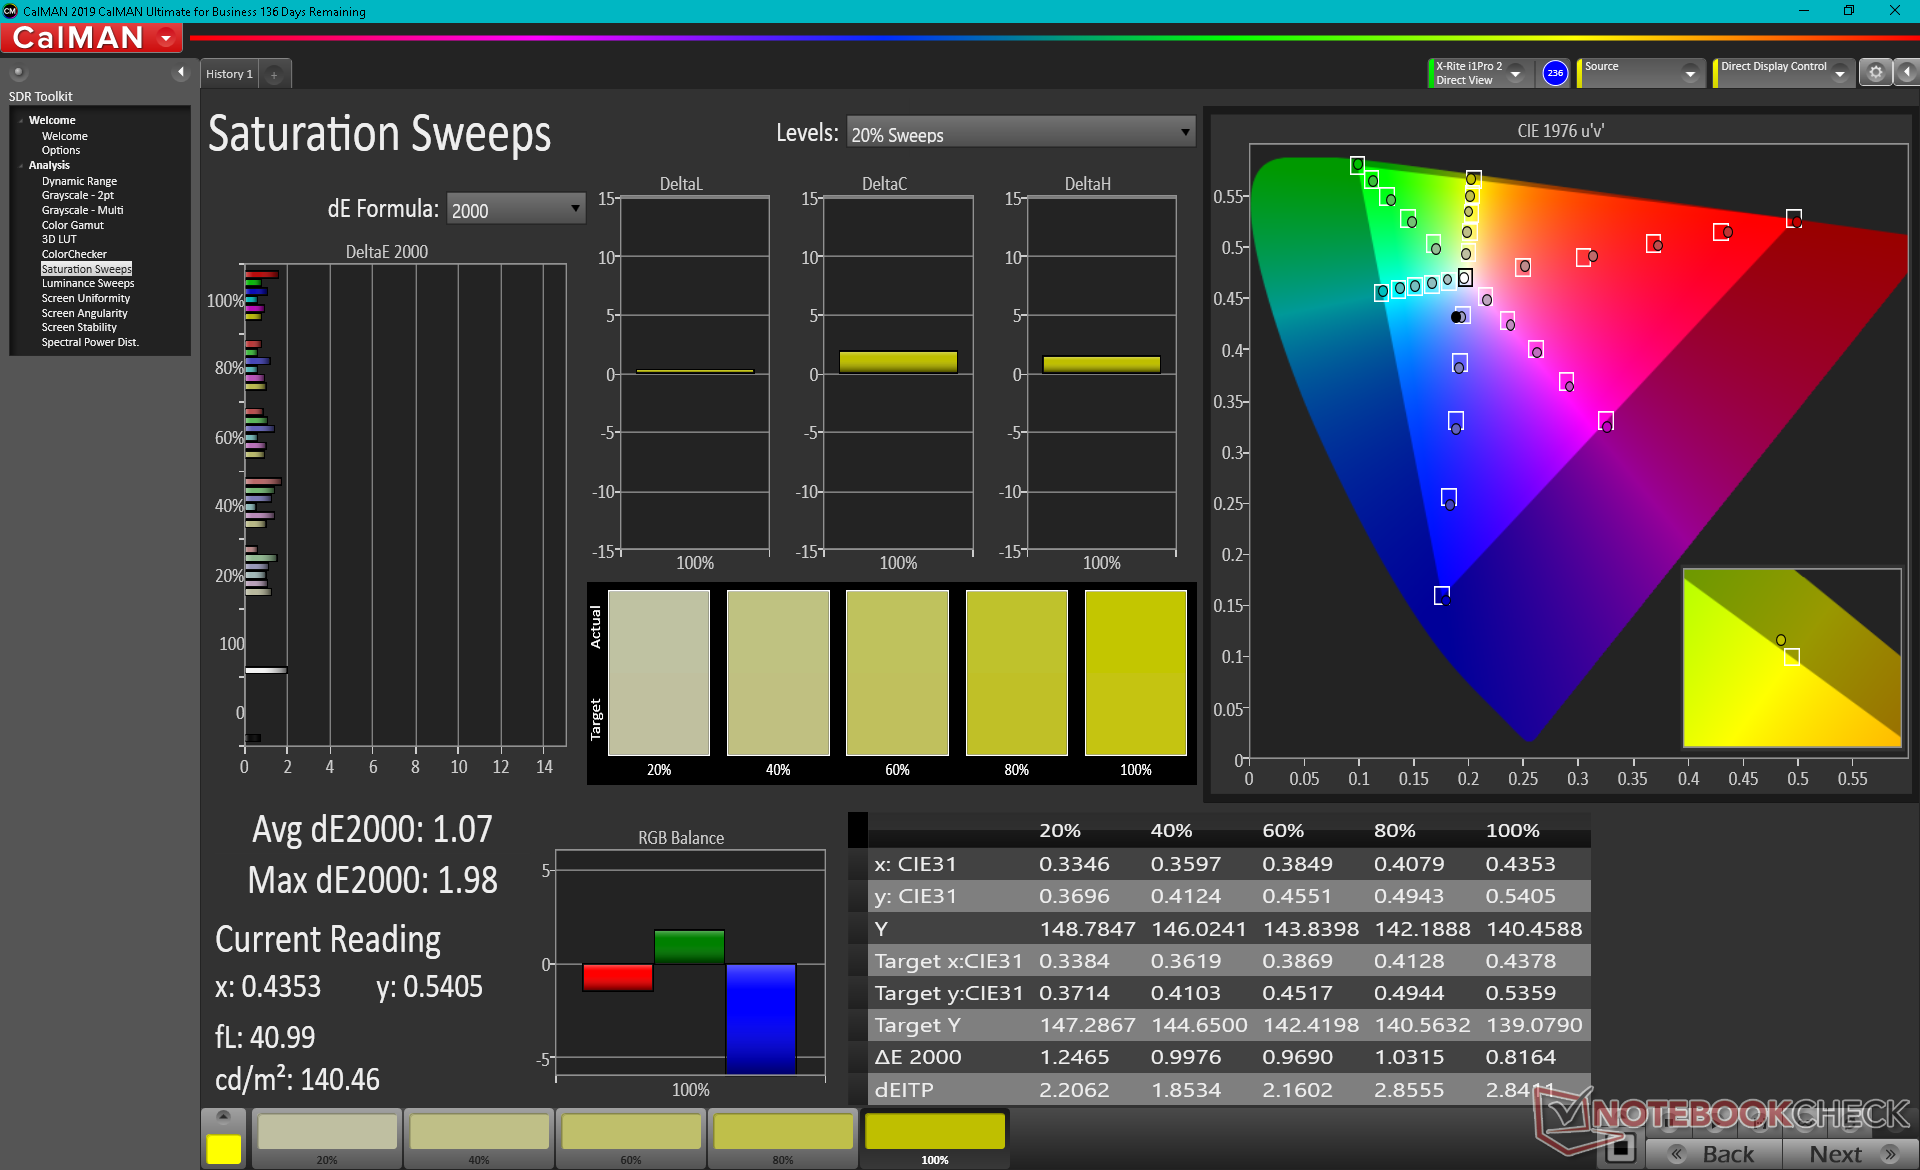
La gamma copre interamente sRGB e circa il 98% di DCI-P3 risultando essere più che sufficiente per il gaming. Questo è uno dei pochi pannelli IPS per laptop con tempi di risposta veloci e colori ampi finendo per essere adatto sia al gaming che alla creazione di contenuti.
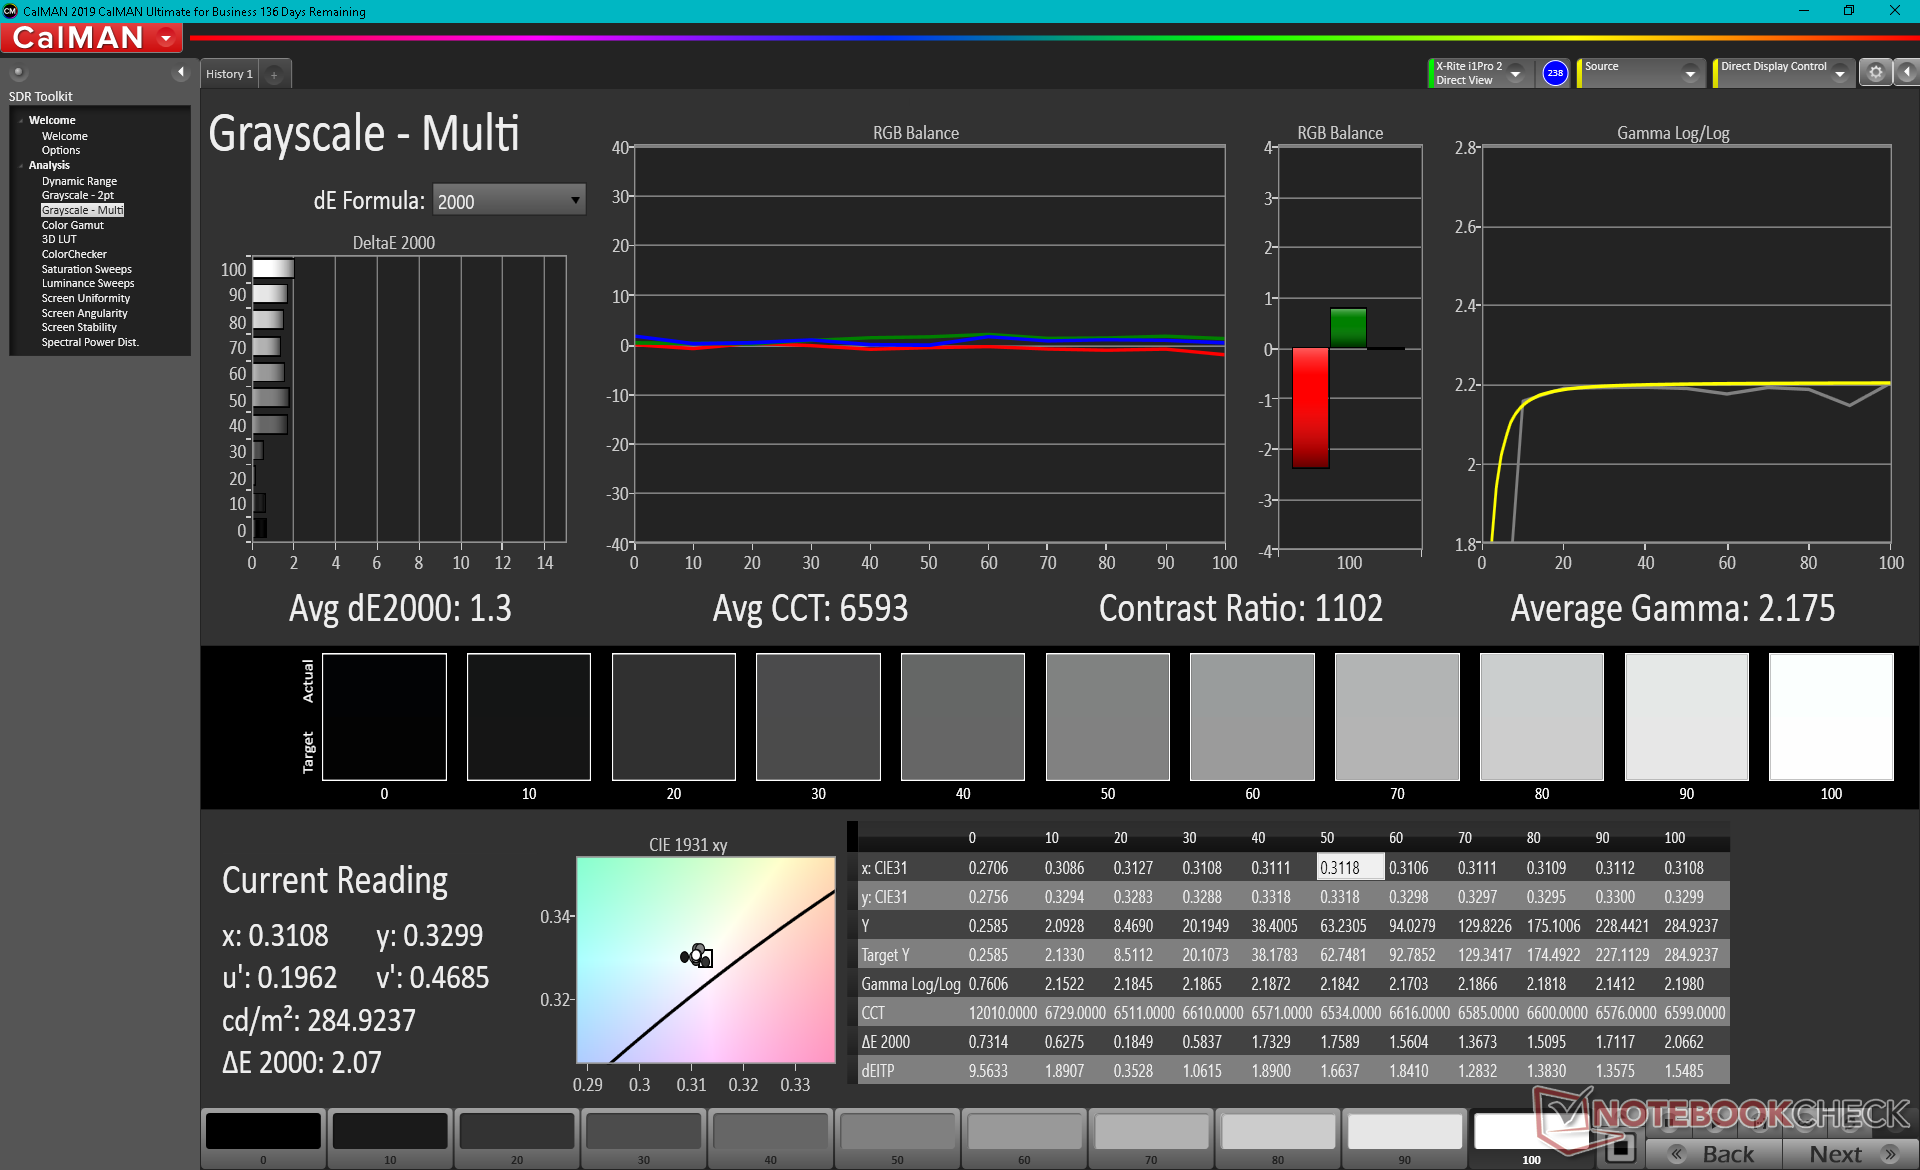
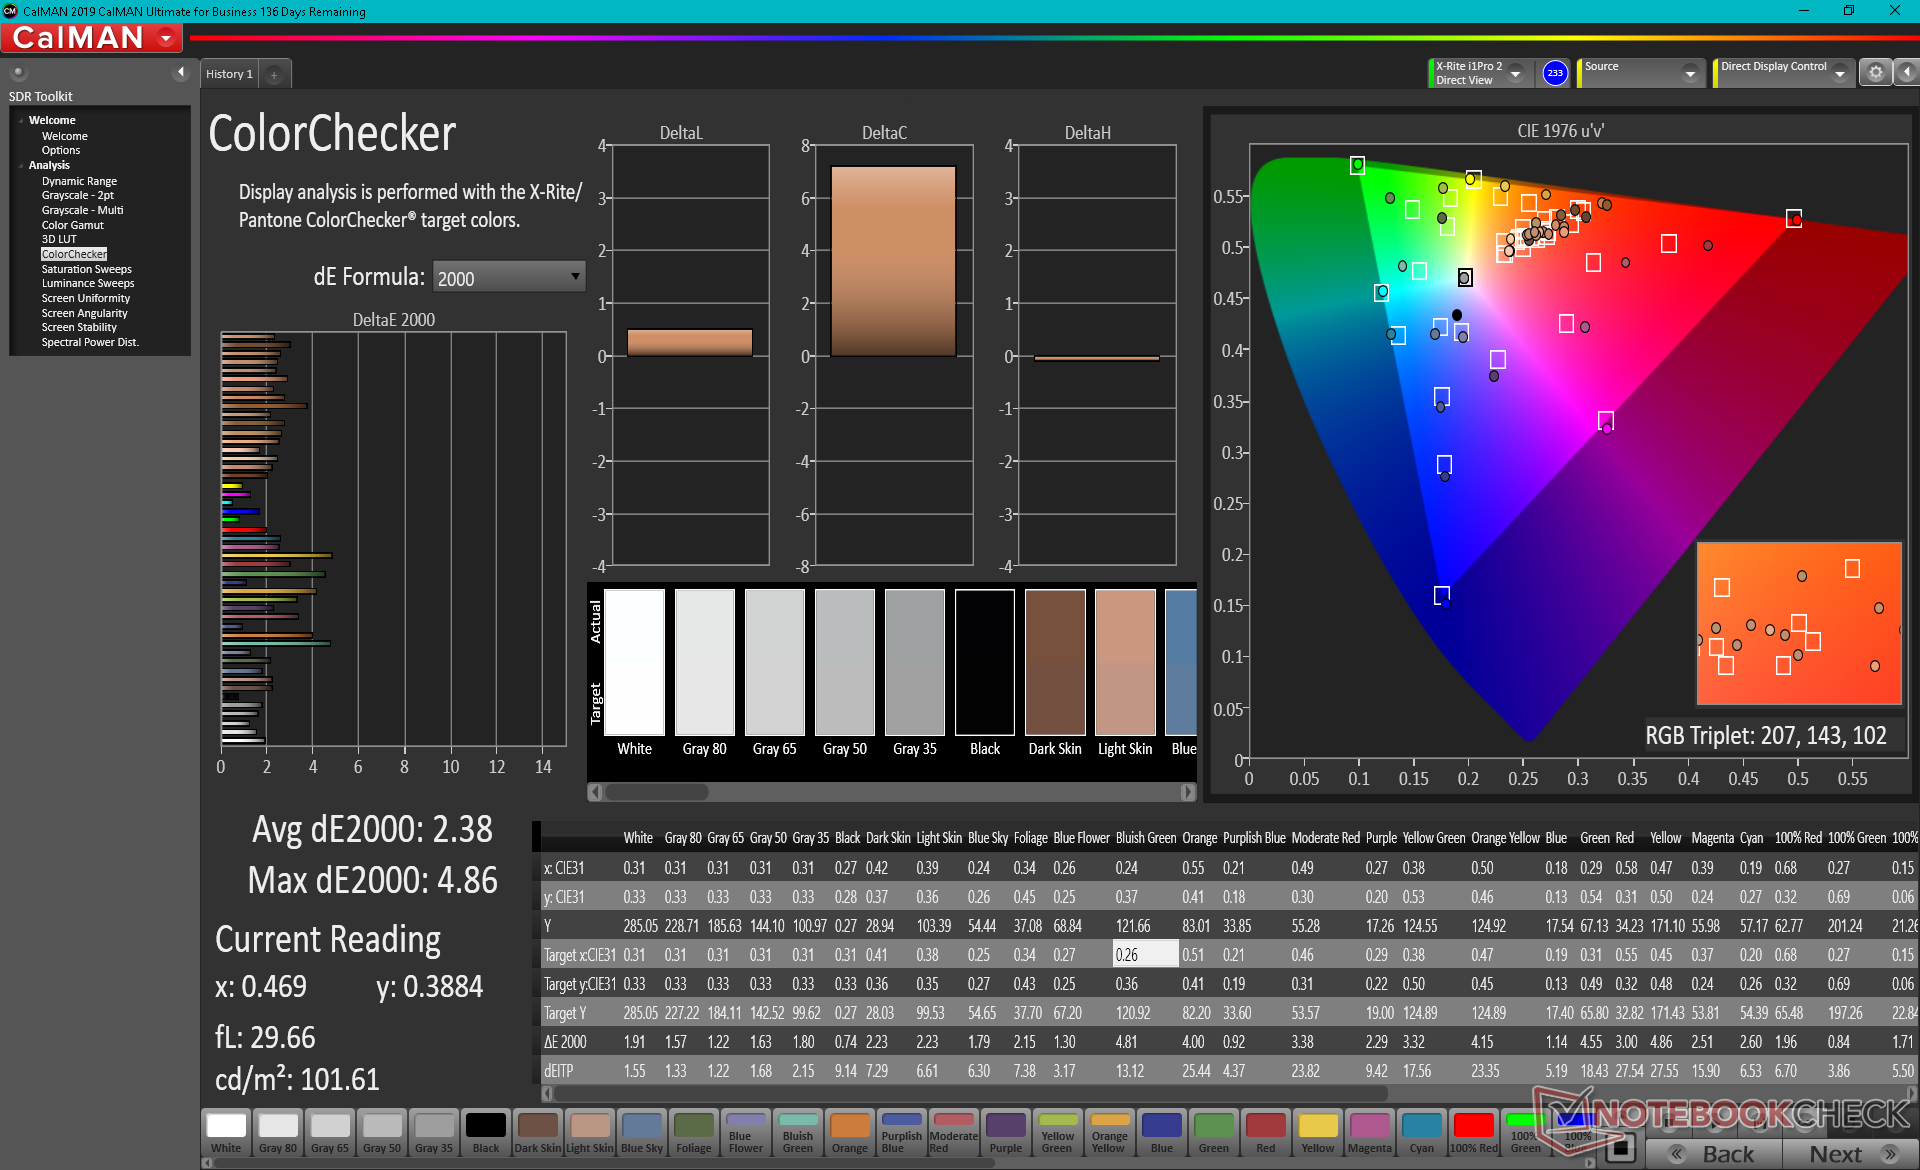
Le misurazioni del colorimetro X-Rite mostrano una temperatura del colore leggermente troppo fredda che, fortunatamente, può essere facilmente risolta con una calibrazione dell'utente finale. I valori medi di DeltaE della scala di grigi e del colore si attesterebbero rispettivamente a 1,3 e 2,38 dopo la calibrazione.
Tempi di risposta del Display
| ↔ Tempi di risposta dal Nero al Bianco | ||
|---|---|---|
| 12.4 ms ... aumenta ↗ e diminuisce ↘ combinato | ↗ 7.2 ms Incremento | 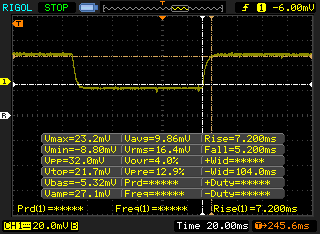 |
| ↘ 5.2 ms Calo | ||
| Lo schermo mostra buoni tempi di risposta durante i nostri tests, ma potrebbe essere troppo lento per i gamers competitivi. In confronto, tutti i dispositivi di test variano da 0.1 (minimo) a 240 (massimo) ms. » 33 % di tutti i dispositivi è migliore. Questo significa che i tempi di risposta rilevati sono migliori rispettto alla media di tutti i dispositivi testati (19.9 ms). | ||
| ↔ Tempo di risposta dal 50% Grigio all'80% Grigio | ||
| 14 ms ... aumenta ↗ e diminuisce ↘ combinato | ↗ 7.2 ms Incremento | 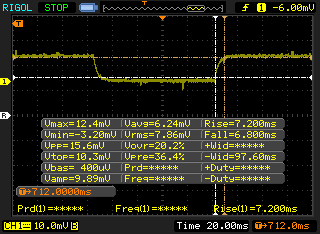 |
| ↘ 6.8 ms Calo | ||
| Lo schermo mostra buoni tempi di risposta durante i nostri tests, ma potrebbe essere troppo lento per i gamers competitivi. In confronto, tutti i dispositivi di test variano da 0.165 (minimo) a 636 (massimo) ms. » 28 % di tutti i dispositivi è migliore. Questo significa che i tempi di risposta rilevati sono migliori rispettto alla media di tutti i dispositivi testati (31.1 ms). | ||
Sfarfallio dello schermo / PWM (Pulse-Width Modulation)
| flickering dello schermo / PWM non rilevato | 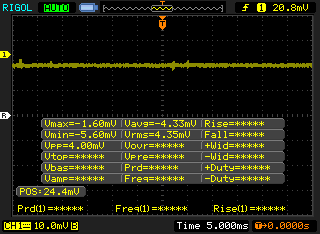 | ||
In confronto: 52 % di tutti i dispositivi testati non utilizza PWM per ridurre la luminosita' del display. Se è rilevato PWM, una media di 7798 (minimo: 5 - massimo: 343500) Hz è stata rilevata. | |||
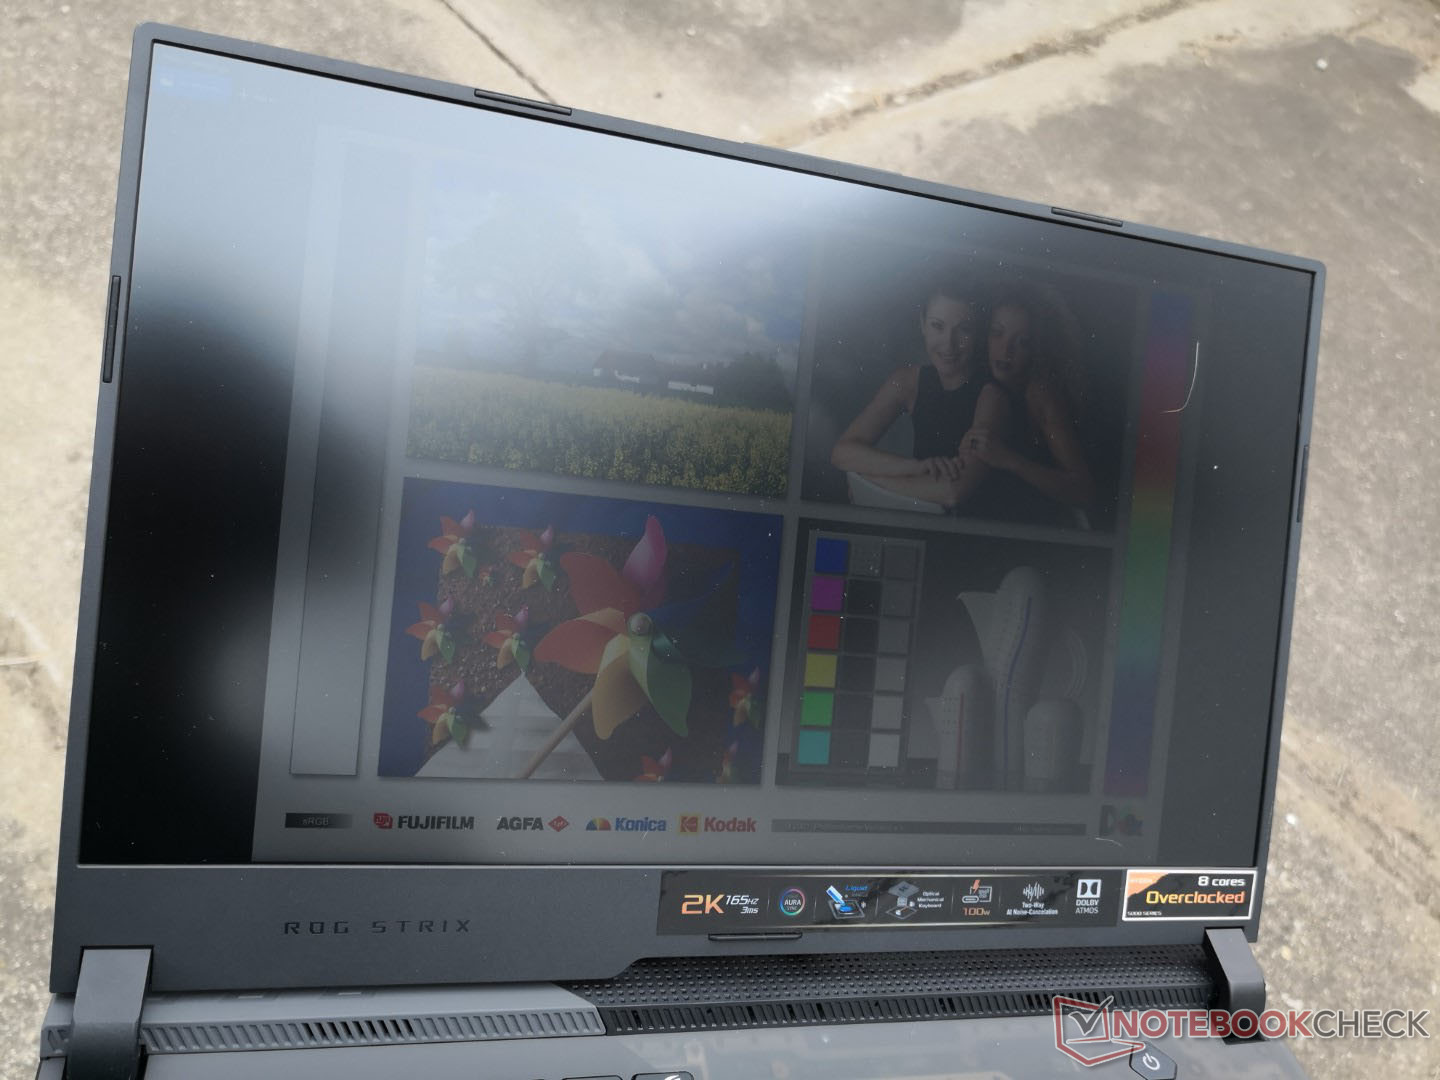
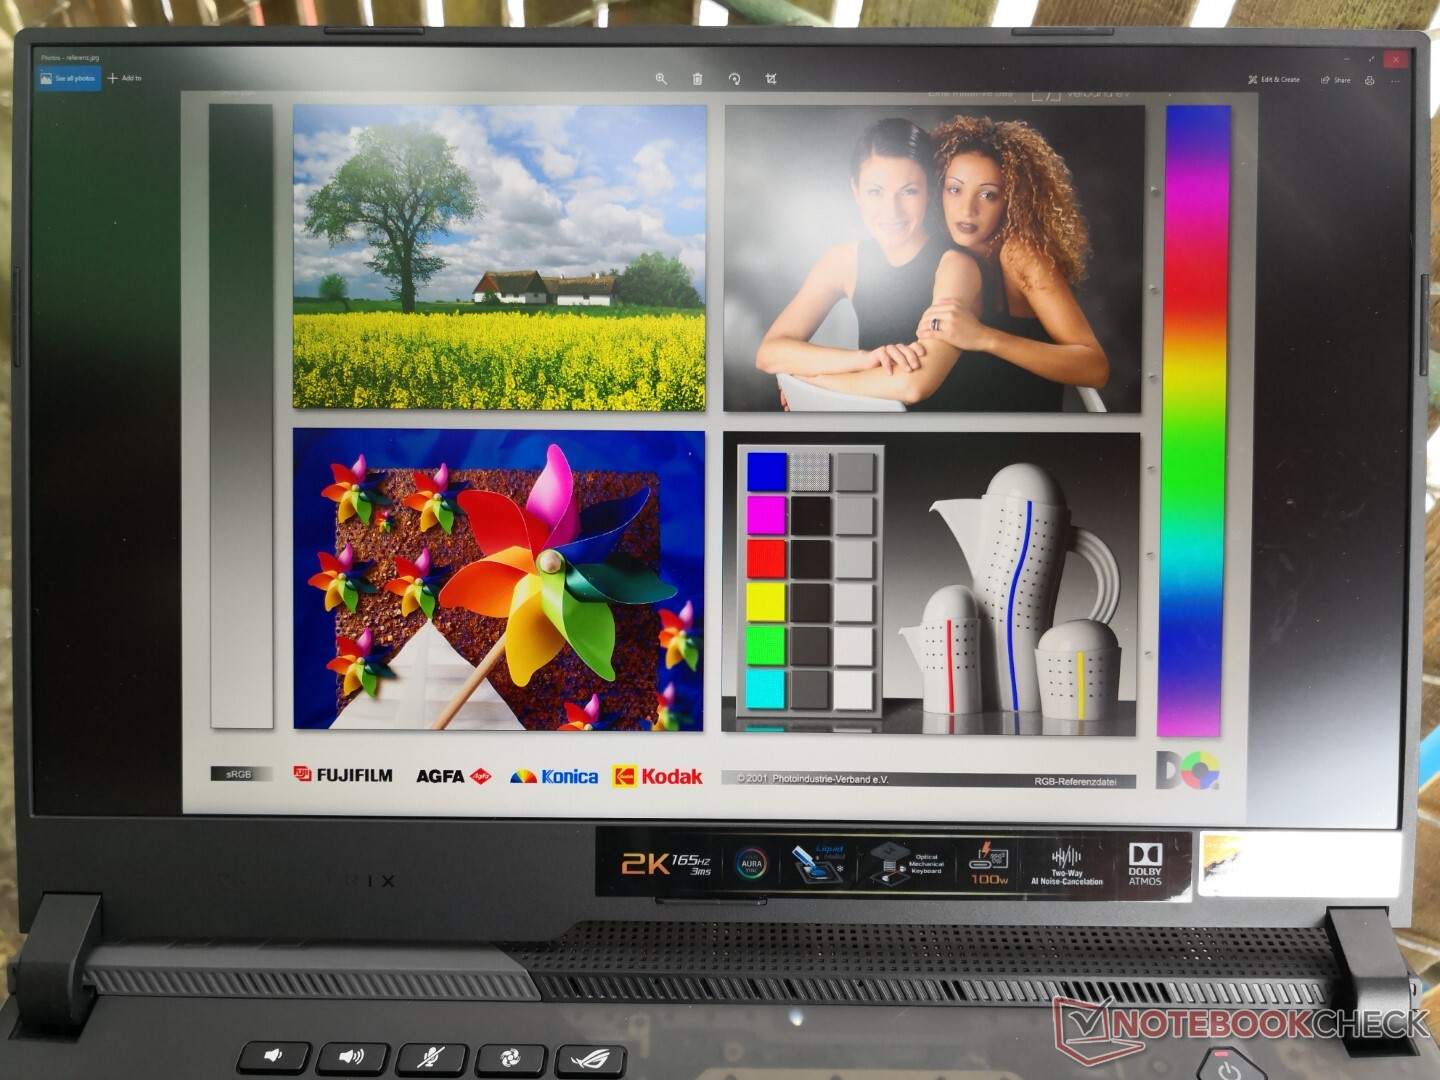
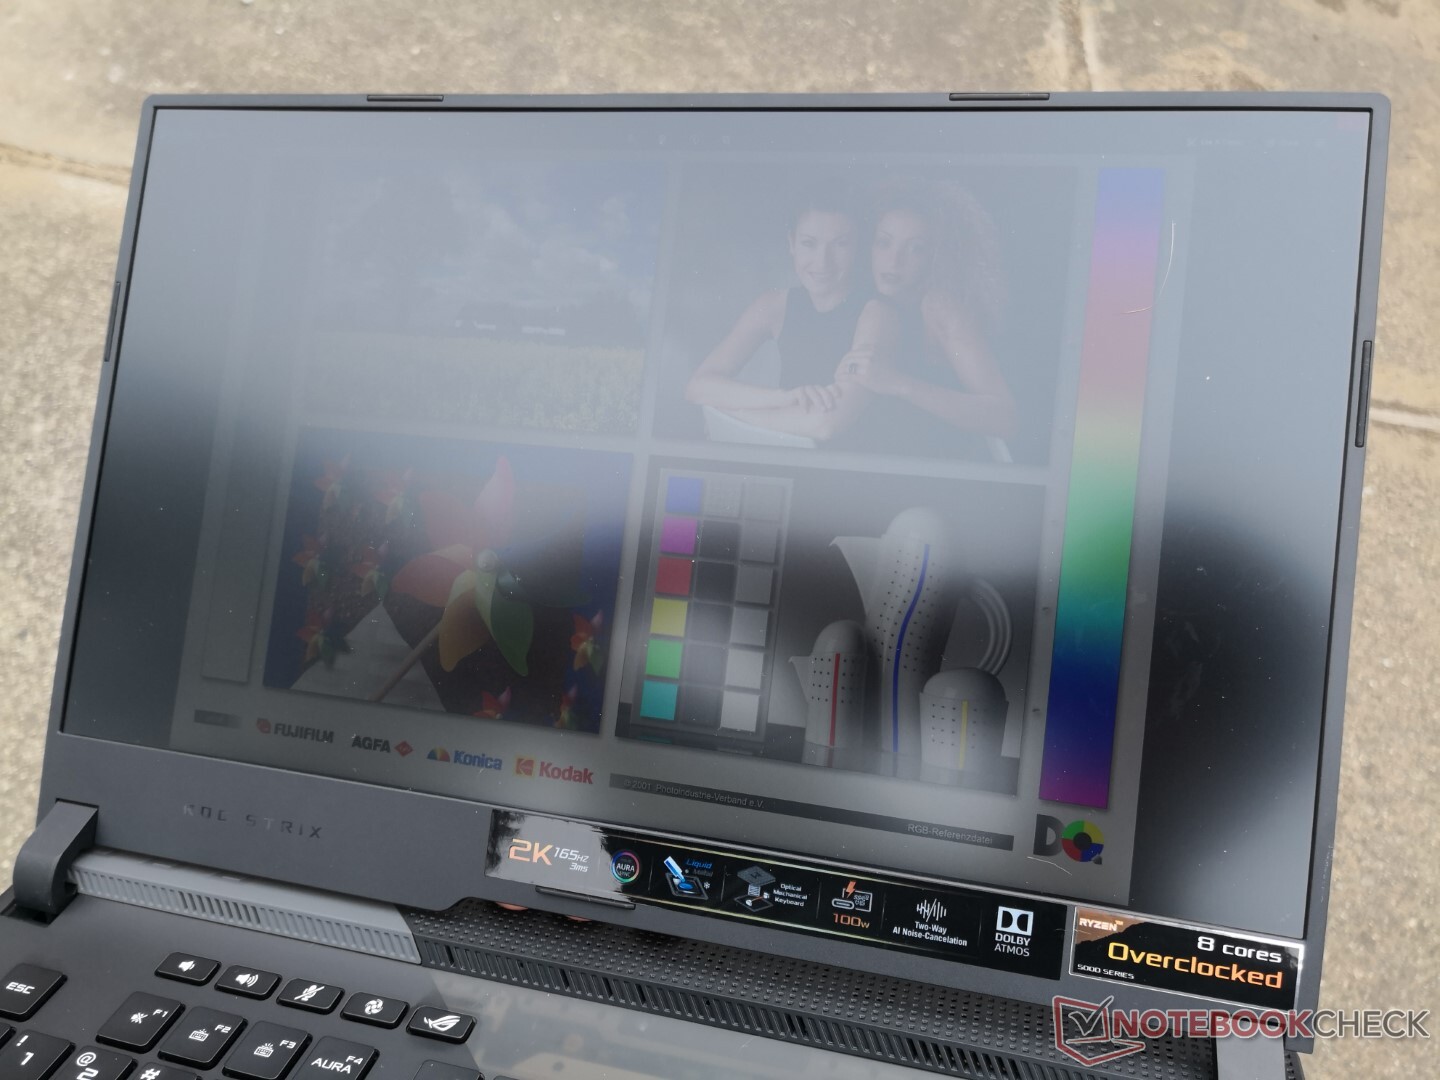
Il display da 300 nit è nella media per un portatile gaming e quindi la visibilità esterna non è particolarmente migliore o peggiore della maggior parte degli altri modelli. Tuttavia, ricordatevi di disabilitare AMD Vari-Bright, altrimenti la luminosità massima scenderà automaticamente da 312 nits a soli 247 nits quando si usa la batteria.
Perfomance - Non c'è bisogno di Intel
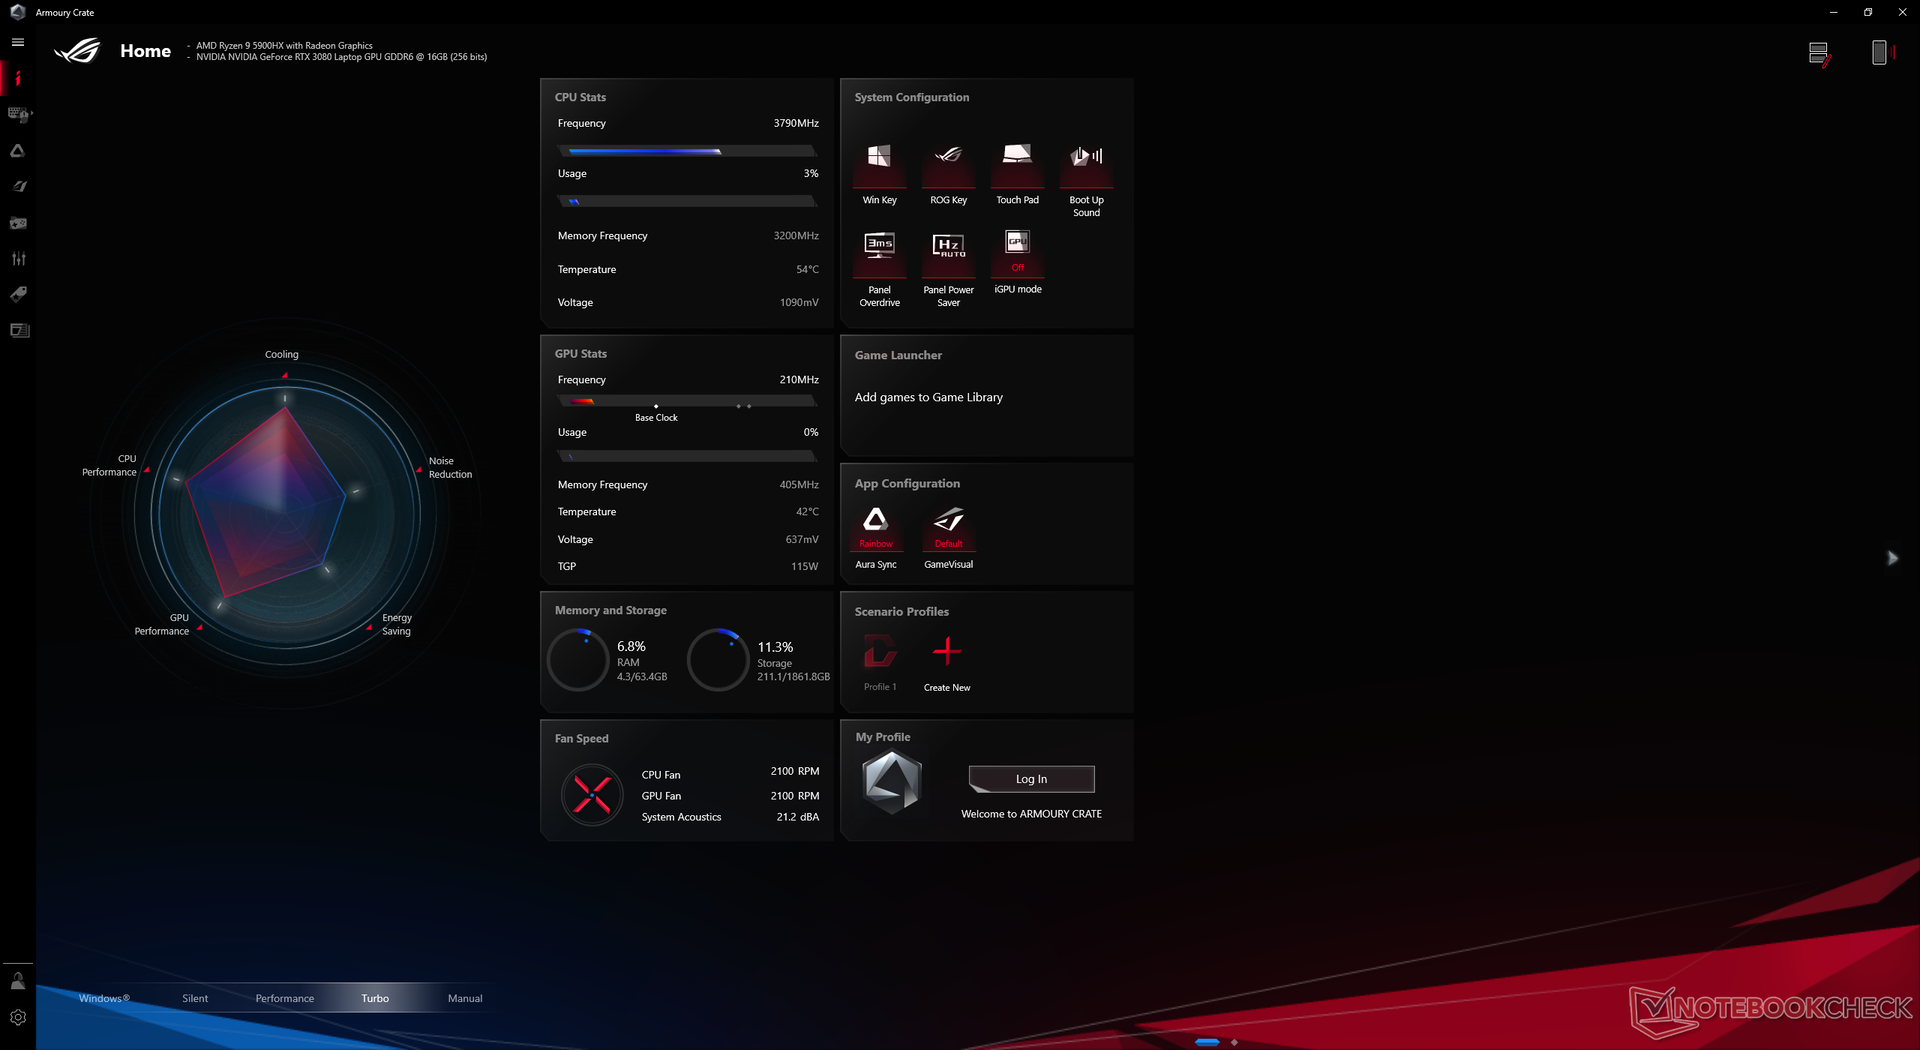
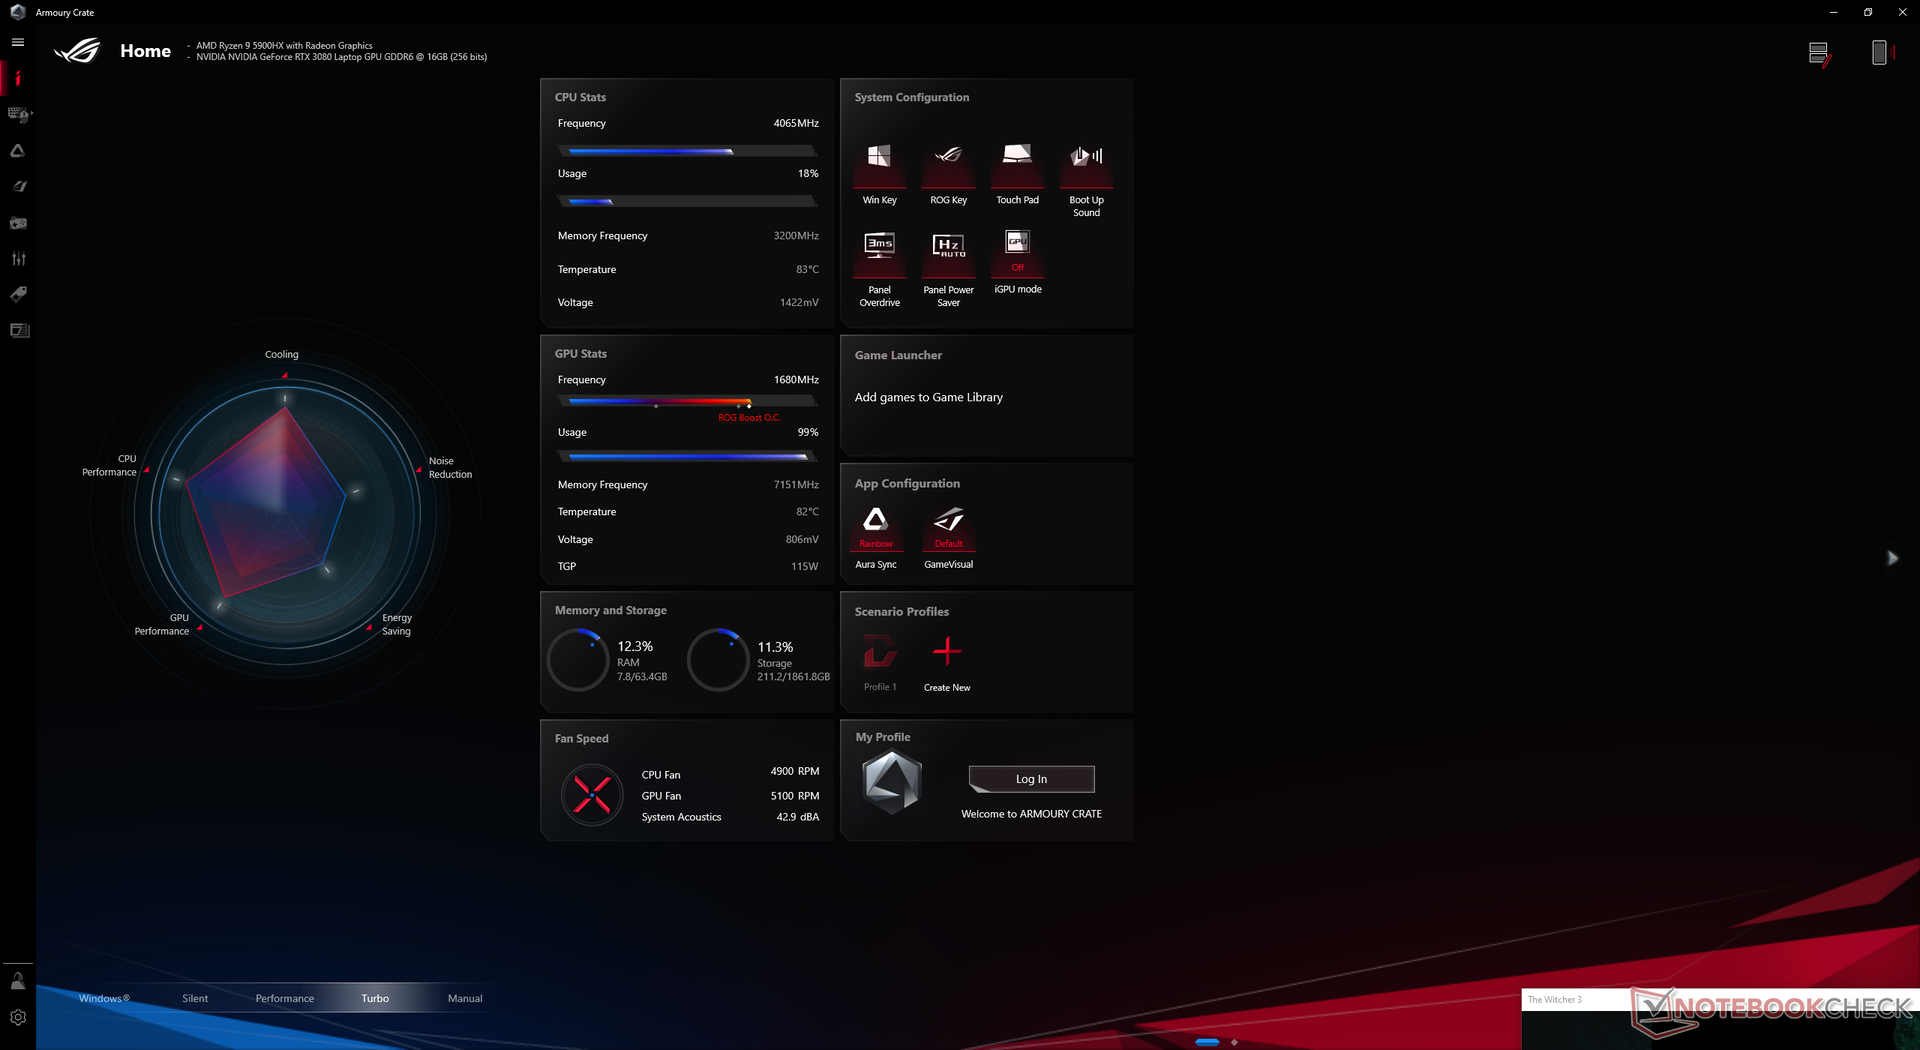
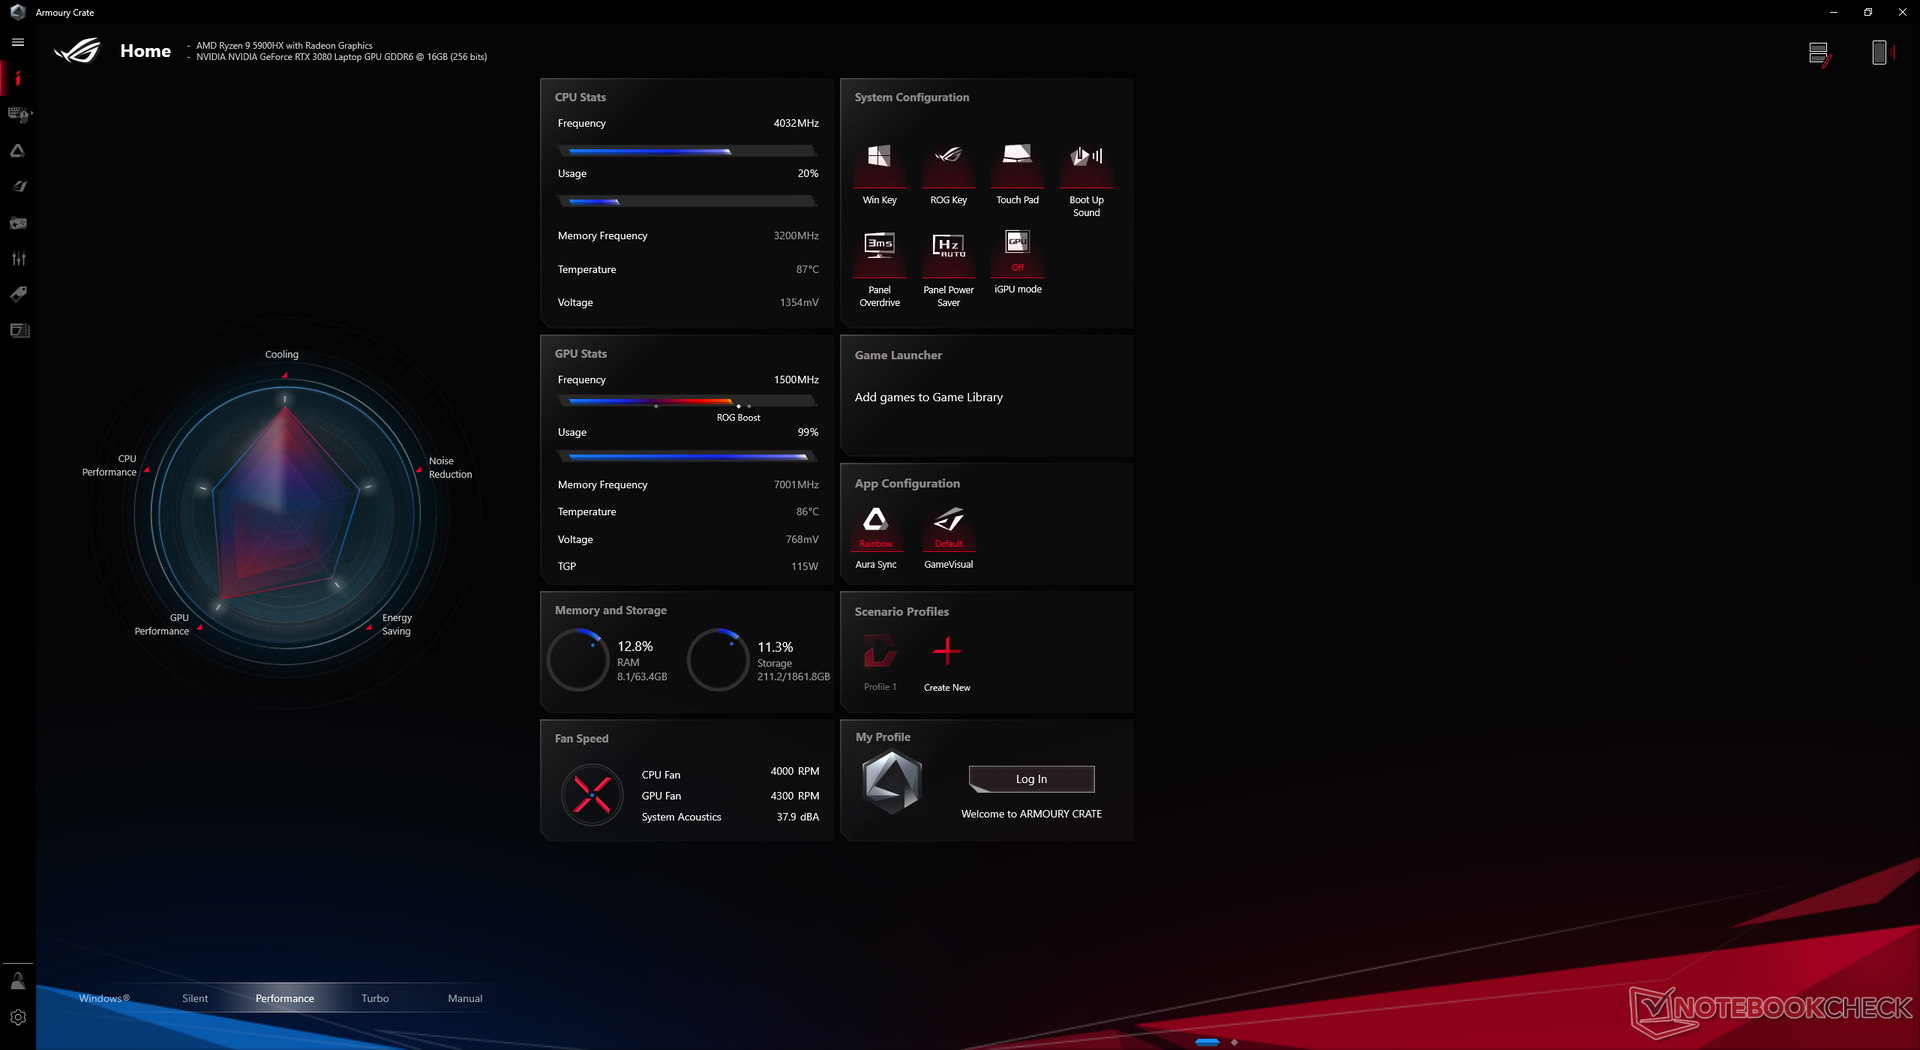
Asus punta decisamente ai gamers appassionati, dato che anche la configurazione di fascia più bassa è ancora dotata del potente Ryzen 7 5800H e della GeForce RTX 3070. La GPU è valutata per 115 W TGP + 15 W boost, ma è in grado di funzionare costantemente a 130 W quando si gioca in modalità Turbo come dimostrerà la nostra sezione Stress Test qui sotto. La nostra unità è stata impostata in modalità Turbo prima di eseguire qualsiasi benchmark per ottenere i punteggi più alti possibili.
Raccomandiamo ai proprietari di familiarizzare con il software Asus Armoury Crate, poiché qui si possono gestire importanti impostazioni di prestazioni, switching grafico e LED.
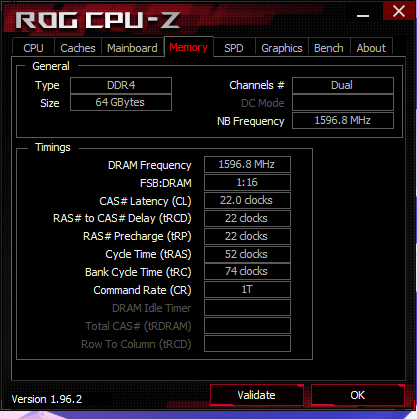
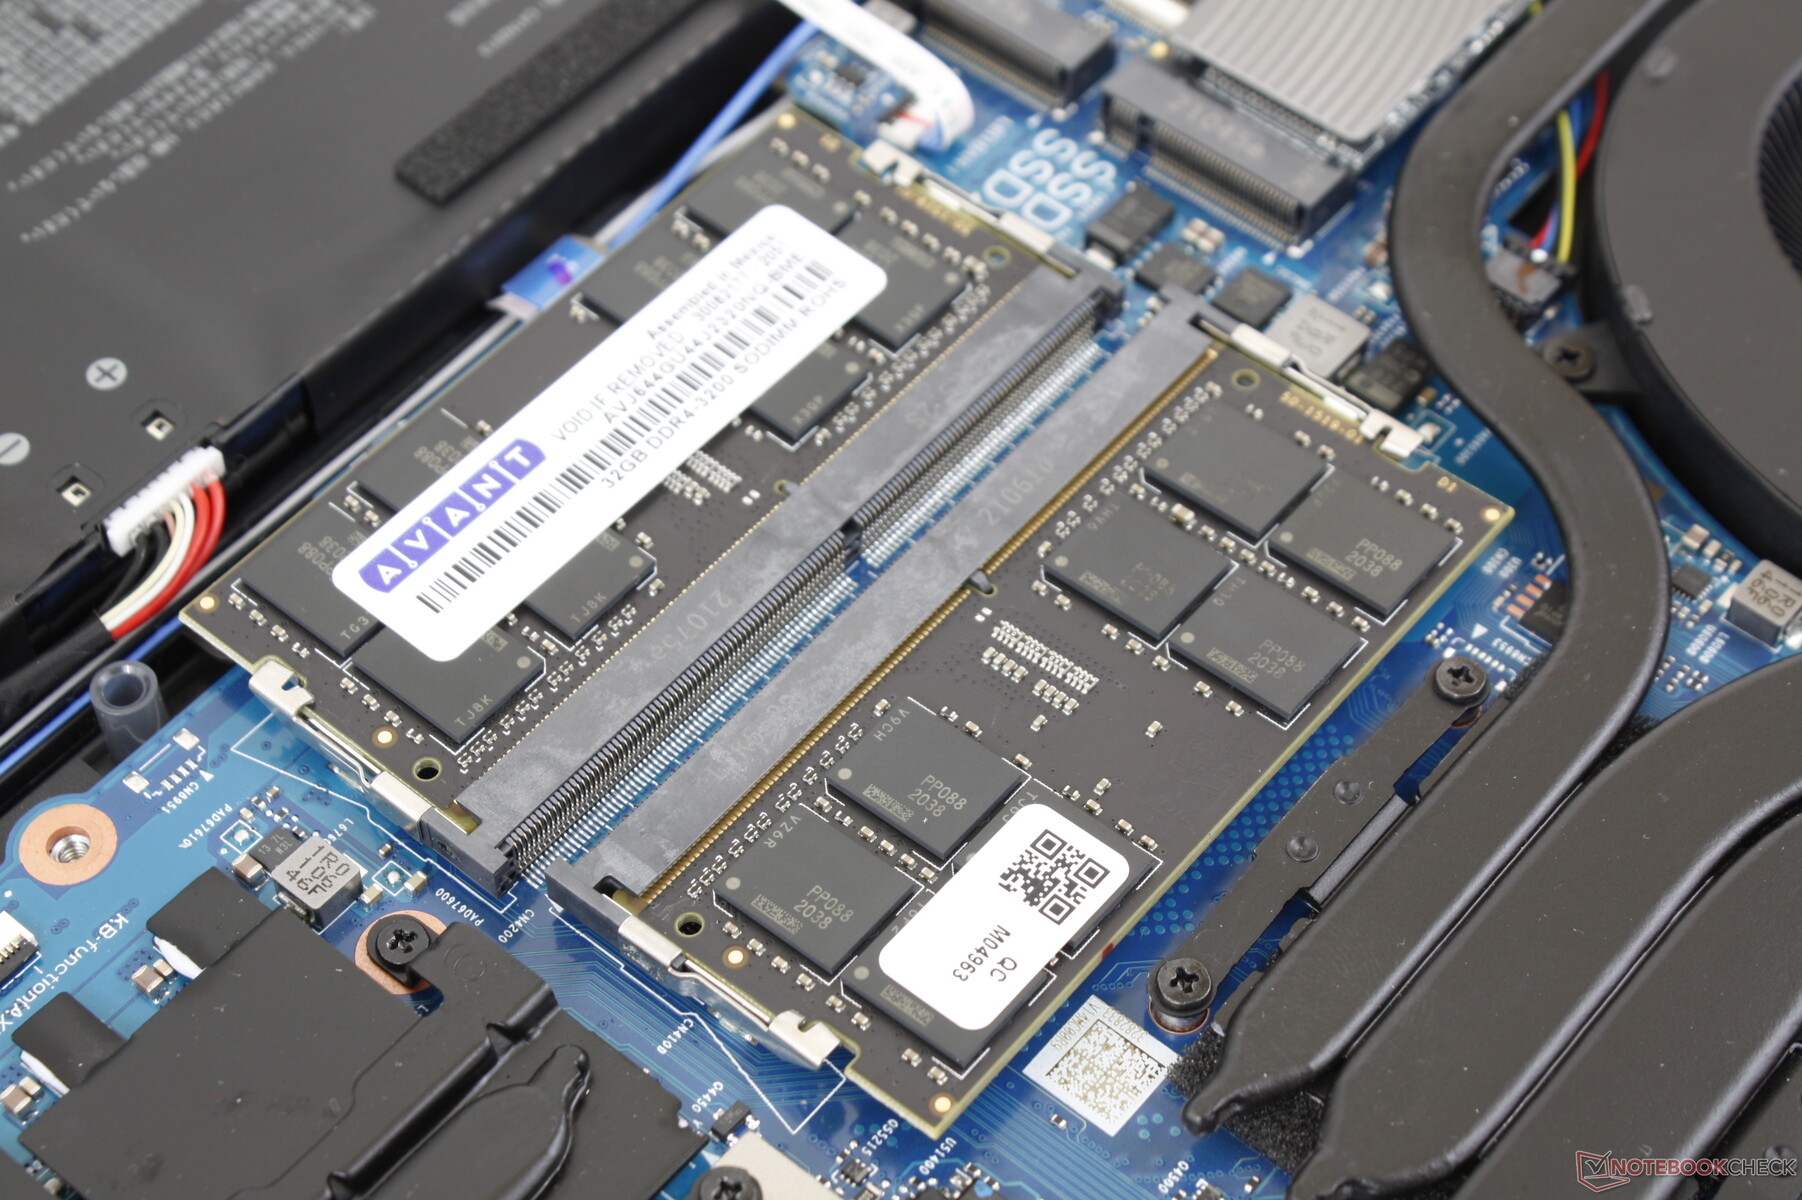
Non c'è RAM saldata a differenza della maggior parte degli Asus Zephyrus.
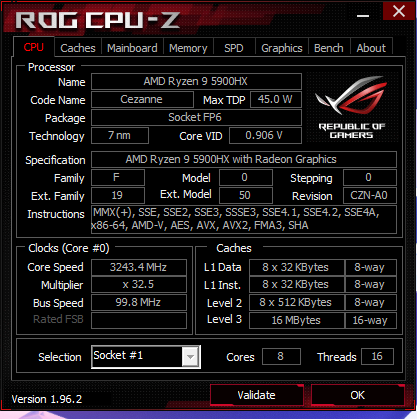
Processore
Le prestazioni sono essenzialmente alla pari con il concorrente Core i9-11900H in entrambe le applicazioni single-thread e multi-thread. Gli utenti che passano a un Ryzen 7 5800H perderanno solo circa il 10-15% di prestazioni multi-thread.
Il Ryzen 9 5900HX quasi non si distingue rispetto al Ryzen 9 5900HS in quanto entrambi i processori saranno più che probabilmente limitati dalla soluzione di raffreddamento del portatile. Il più piccolo Razer Blade 14 per esempio, è dotato della stessa CPU Ryzen 9 5900HX del nostro Asus e tuttavia può avere prestazioni dal 6 al 17% più lente.
La sostenibilità delle prestazioni è eccellente con risultati CineBench R15 xT costanti nel tempo.
Cinebench R15 Multi Loop
Cinebench R23: Multi Core | Single Core
Cinebench R15: CPU Multi 64Bit | CPU Single 64Bit
Blender: v2.79 BMW27 CPU
7-Zip 18.03: 7z b 4 -mmt1 | 7z b 4
Geekbench 5.5: Single-Core | Multi-Core
HWBOT x265 Benchmark v2.2: 4k Preset
LibreOffice : 20 Documents To PDF
R Benchmark 2.5: Overall mean
Cinebench R23: Multi Core | Single Core
Cinebench R15: CPU Multi 64Bit | CPU Single 64Bit
Blender: v2.79 BMW27 CPU
7-Zip 18.03: 7z b 4 -mmt1 | 7z b 4
Geekbench 5.5: Single-Core | Multi-Core
HWBOT x265 Benchmark v2.2: 4k Preset
LibreOffice : 20 Documents To PDF
R Benchmark 2.5: Overall mean
* ... Meglio usare valori piccoli
Prestazioni del sistema
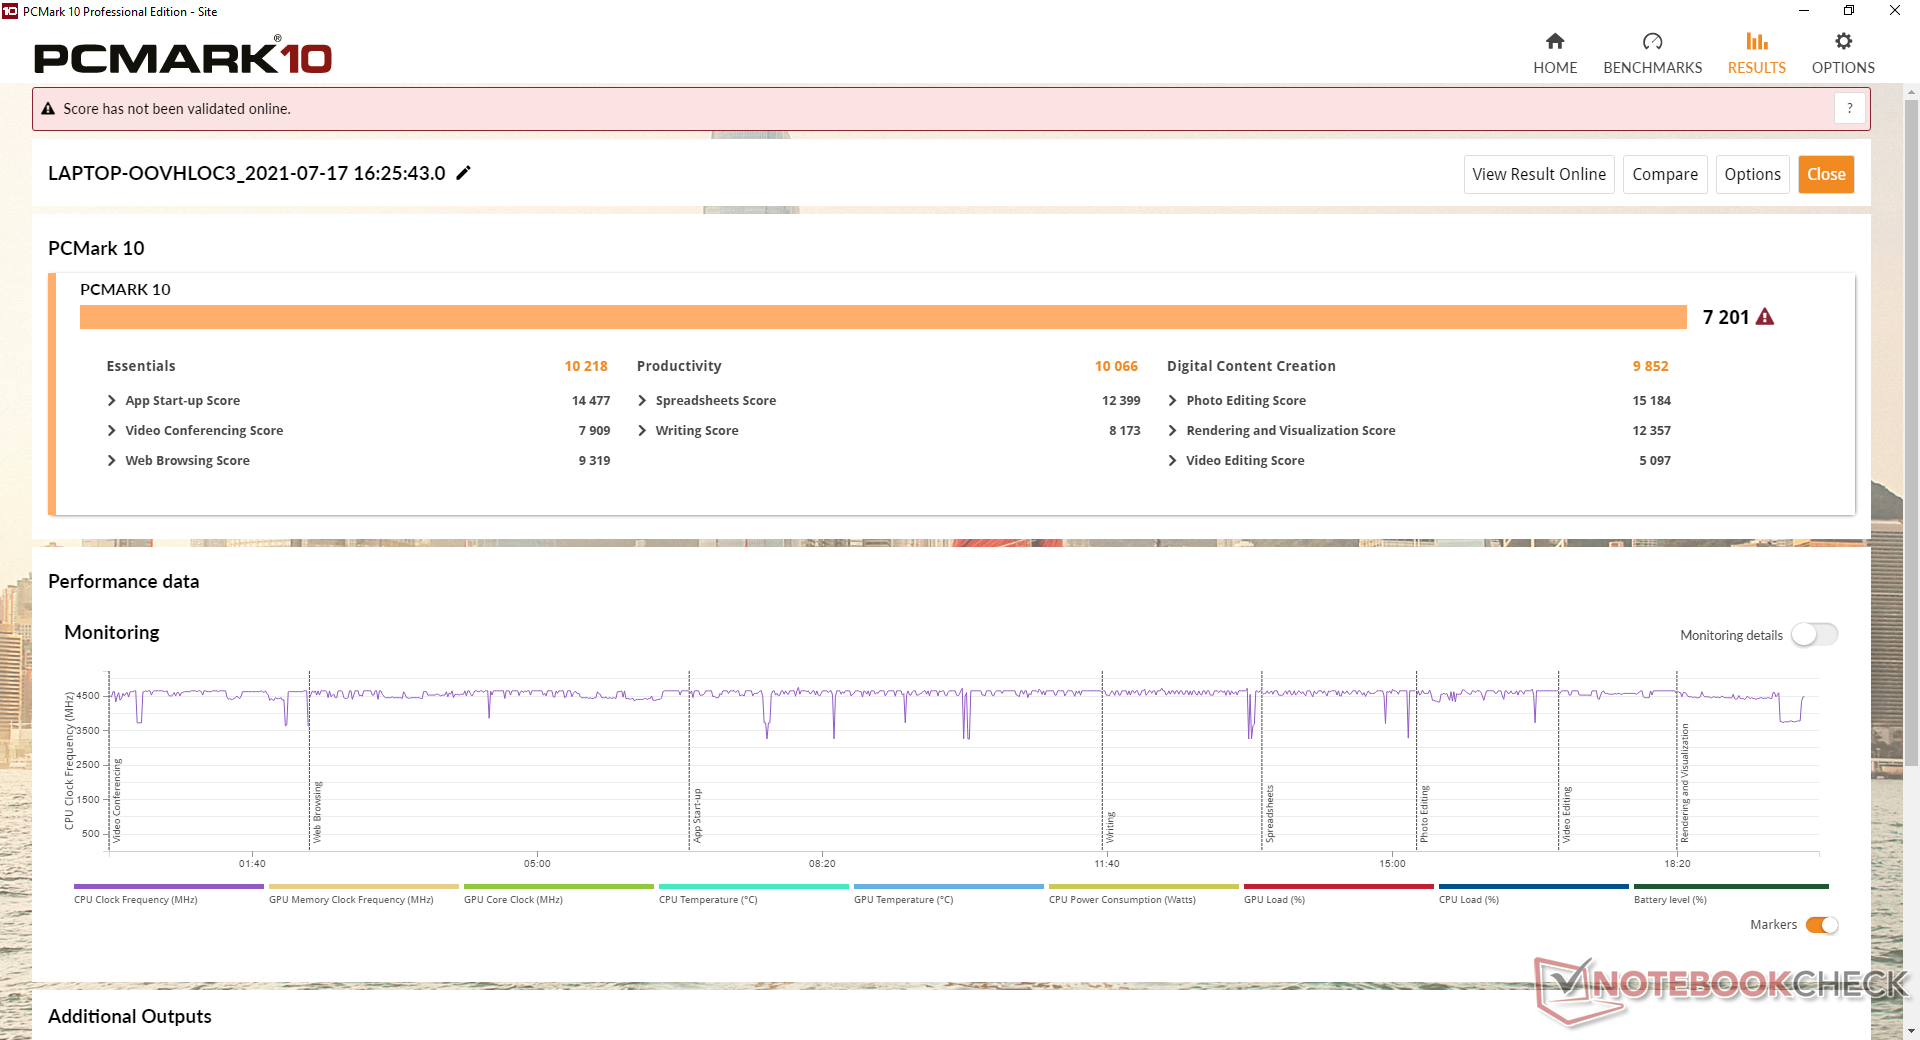
I risultati di PCMark 10 sono costantemente superiori a quelli del G532 equipaggiato con Core i9 dell'anno scorso finendo per essere appena inferiore all'ultimo Razer Blade 15. Il sistema è progettato per eseguire carichi esigenti con aplomb.
| PCMark 10 / Score | |
| Razer Blade 15 Advanced (Mid 2021) | |
| Asus ROG Strix Scar 15 G533QS | |
| Media AMD Ryzen 9 5900HX, NVIDIA GeForce RTX 3080 Laptop GPU (6807 - 7416, n=6) | |
| Alienware m15 R5 Ryzen Edition | |
| Lenovo Legion C7 15IMH05 82EH0030GE | |
| Asus ROG Strix Scar 15 G532LWS | |
| MSI GE66 Raider 10SFS | |
| PCMark 10 / Essentials | |
| Razer Blade 15 Advanced (Mid 2021) | |
| Media AMD Ryzen 9 5900HX, NVIDIA GeForce RTX 3080 Laptop GPU (10018 - 10593, n=6) | |
| Asus ROG Strix Scar 15 G533QS | |
| Asus ROG Strix Scar 15 G532LWS | |
| MSI GE66 Raider 10SFS | |
| Alienware m15 R5 Ryzen Edition | |
| Lenovo Legion C7 15IMH05 82EH0030GE | |
| PCMark 10 / Productivity | |
| Asus ROG Strix Scar 15 G533QS | |
| Media AMD Ryzen 9 5900HX, NVIDIA GeForce RTX 3080 Laptop GPU (8546 - 10066, n=6) | |
| Razer Blade 15 Advanced (Mid 2021) | |
| Alienware m15 R5 Ryzen Edition | |
| Asus ROG Strix Scar 15 G532LWS | |
| Lenovo Legion C7 15IMH05 82EH0030GE | |
| MSI GE66 Raider 10SFS | |
| PCMark 10 / Digital Content Creation | |
| Razer Blade 15 Advanced (Mid 2021) | |
| Media AMD Ryzen 9 5900HX, NVIDIA GeForce RTX 3080 Laptop GPU (9377 - 10582, n=6) | |
| Asus ROG Strix Scar 15 G533QS | |
| Lenovo Legion C7 15IMH05 82EH0030GE | |
| Alienware m15 R5 Ryzen Edition | |
| MSI GE66 Raider 10SFS | |
| Asus ROG Strix Scar 15 G532LWS | |
| PCMark 10 Score | 7201 punti | |
Aiuto | ||
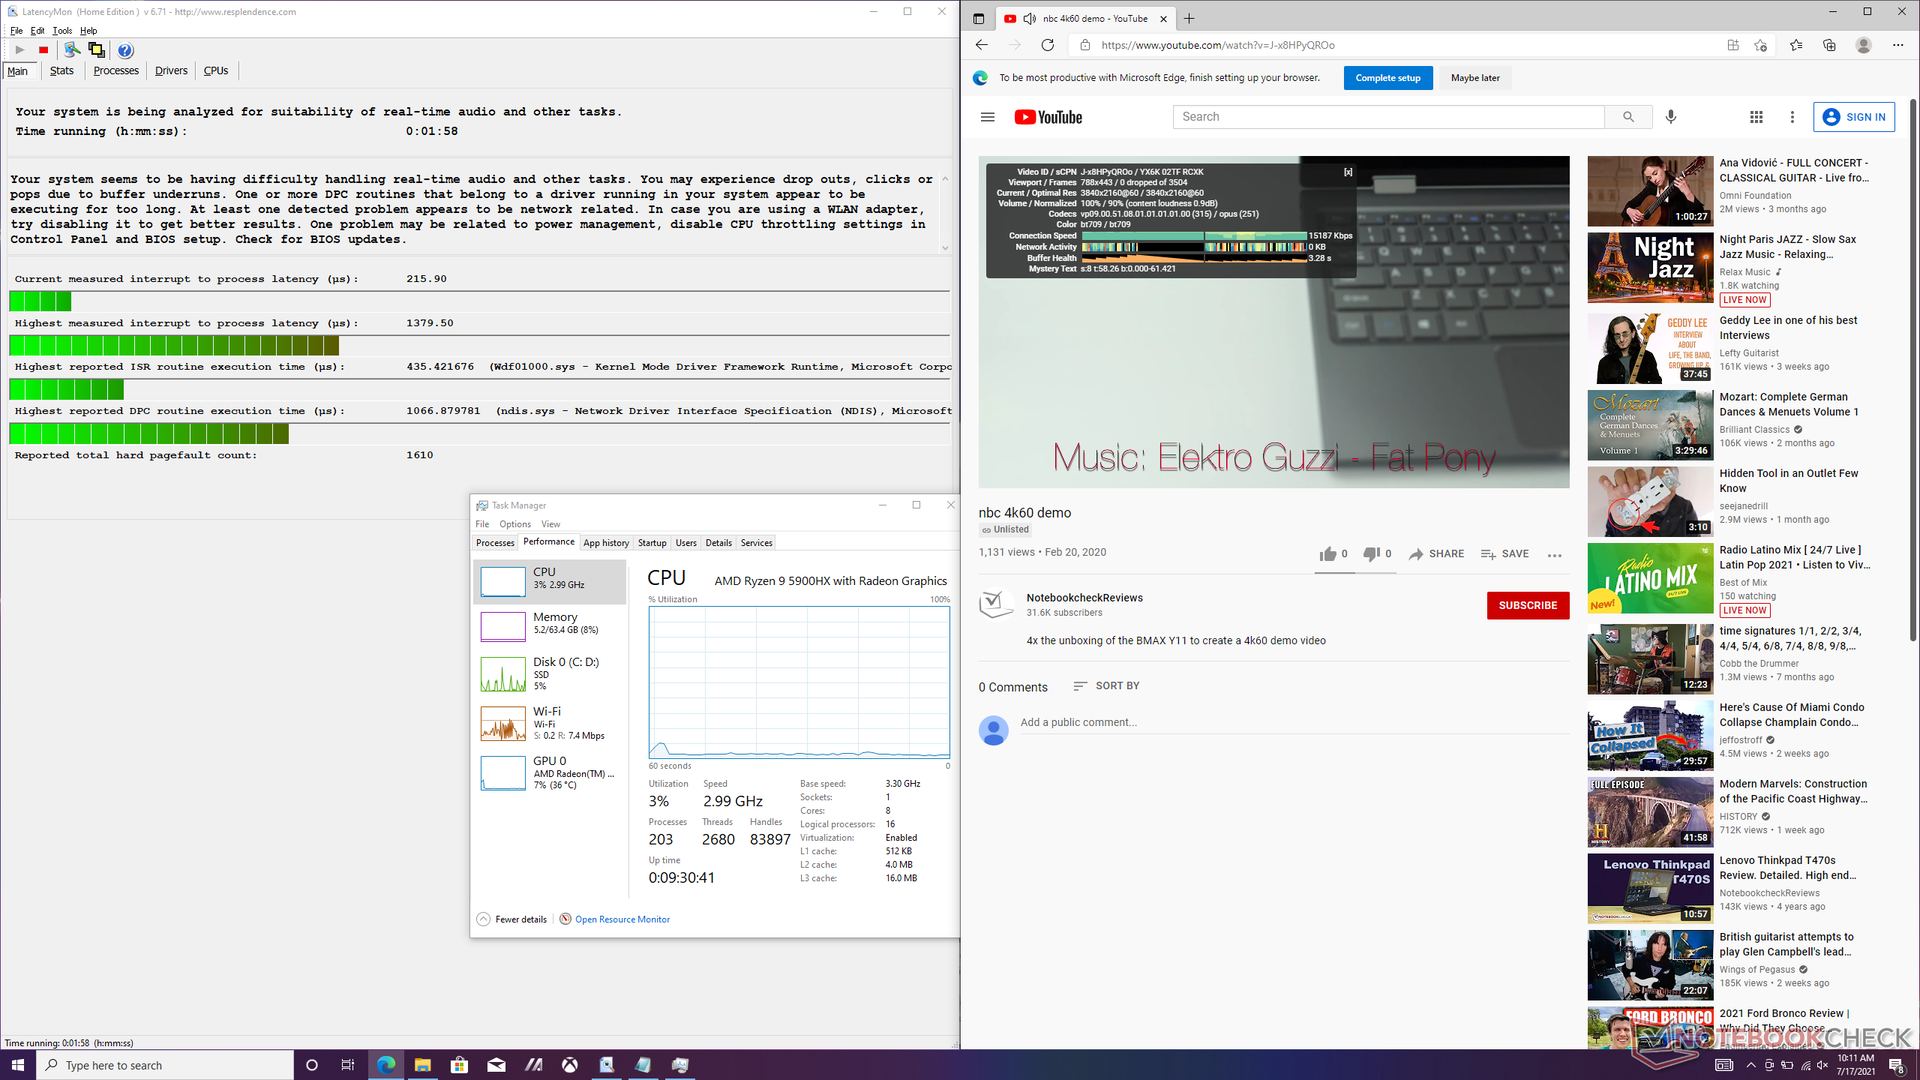
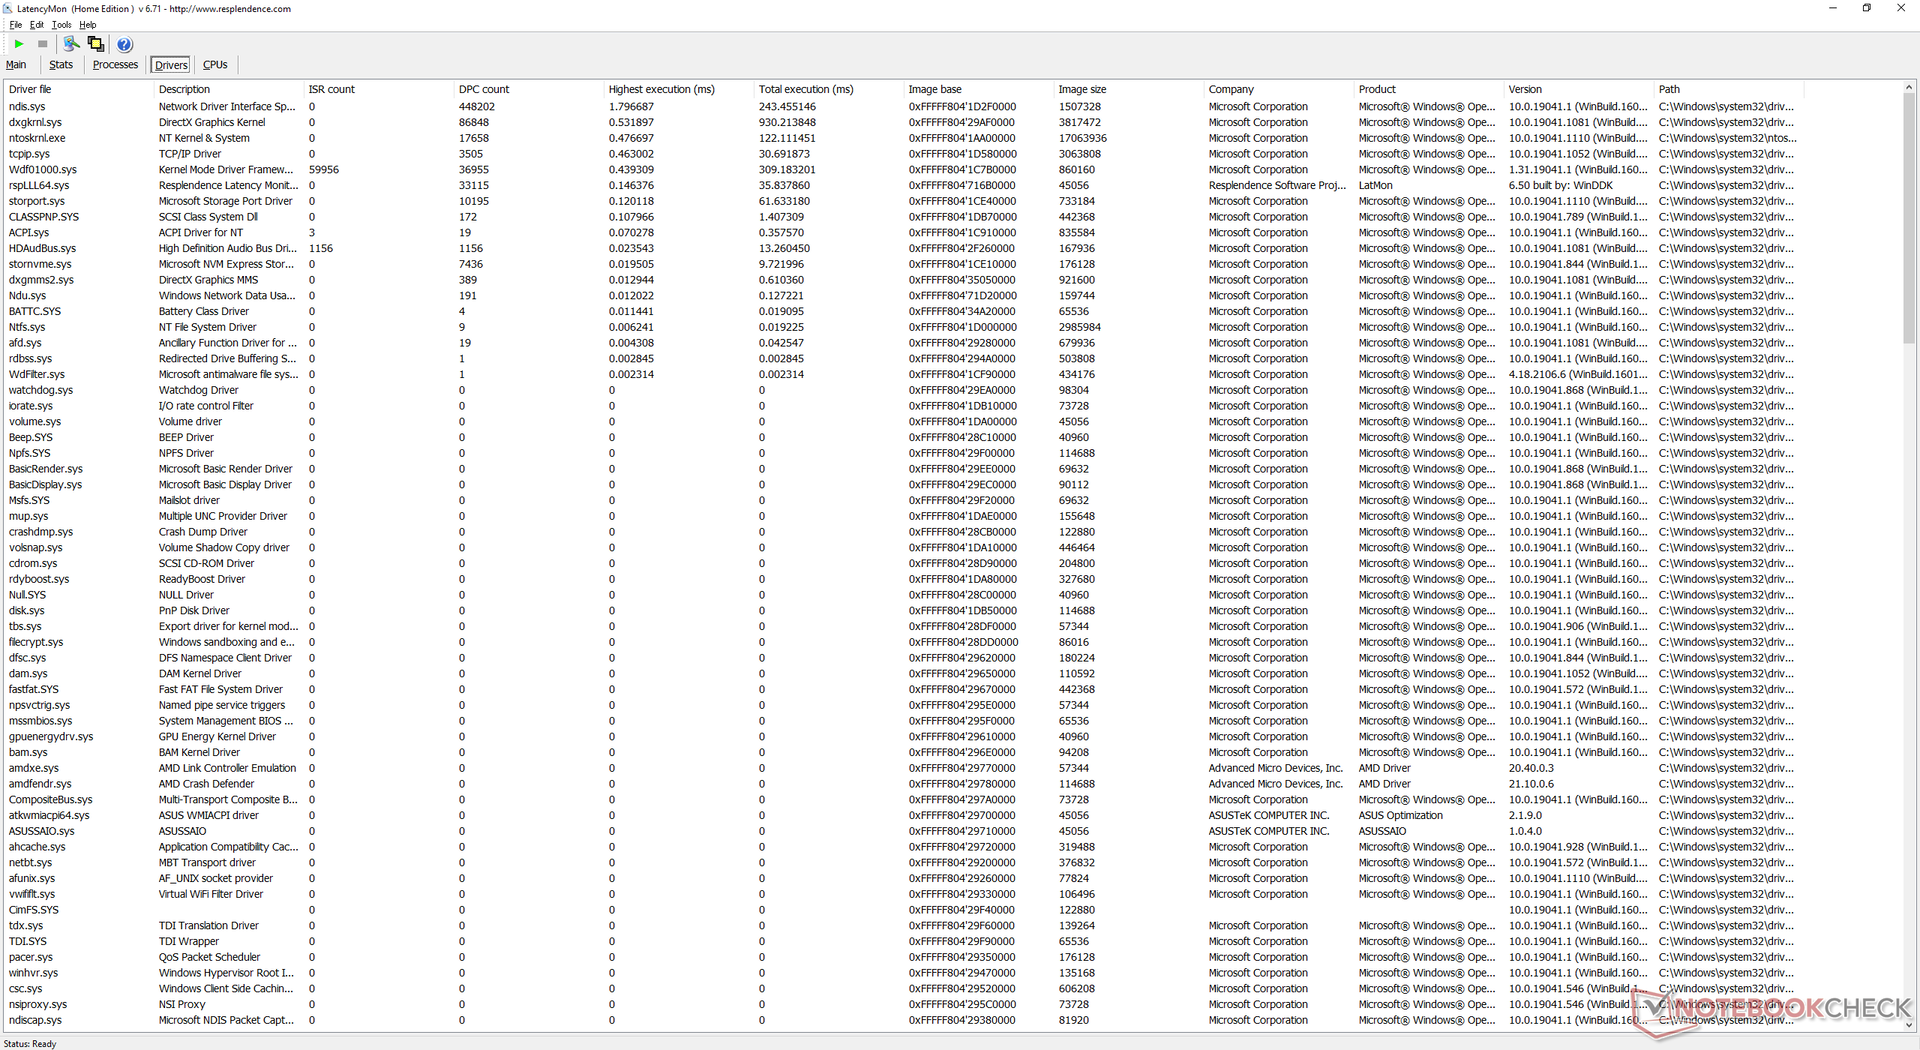
Latenza DPC
LatencyMon mostra piccoli problemi di latenza DPC quando si aprono più schede del browser sulla nostra homepage. La riproduzione di video 4K a 60 FPS è per il resto fluida e senza perdita di fotogrammi.
| DPC Latencies / LatencyMon - interrupt to process latency (max), Web, Youtube, Prime95 | |
| Razer Blade 15 Advanced (Mid 2021) | |
| Lenovo Legion C7 15IMH05 82EH0030GE | |
| Asus ROG Strix Scar 15 G532LWS | |
| Asus ROG Strix Scar 15 G533QS | |
| MSI GE66 Raider 10SFS | |
| Alienware m15 R5 Ryzen Edition | |
* ... Meglio usare valori piccoli
Dispositivi di archiviazione
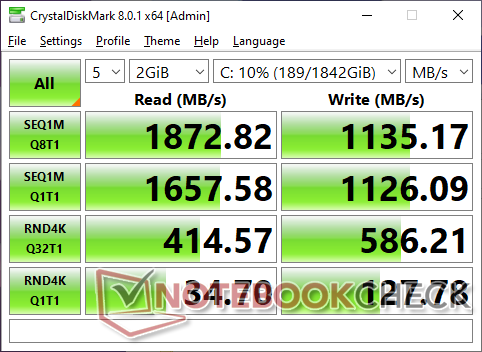
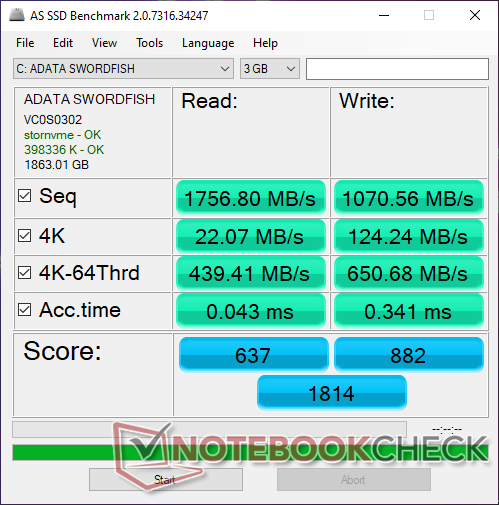
La nostra unità è dotata di un SSD NVMe da 2 TB ADATA Swordfish in contrasto con l'SSD Intel sulla nostra vecchia unità G532. Il produttore pubblicizza, rispettivamente, valori di lettura e scrittura sequenziale di 1800 MB/s e 1200 MB/s, che siamo in grado di confermare nei nostri test. Questo rende l'unità un SSD NVMe di fascia media, mentre unità più costose come il WDC SN730 o il Samsung PM981a possono essere da due a tre volte più veloci.
| Asus ROG Strix Scar 15 G533QS ADATA Swordfish 2 TB | Asus ROG Strix Scar 15 G532LWS 2x Intel SSD 660p 1TB SSDPEKNW010T8 (RAID 0) | MSI GE66 Raider 10SFS WDC PC SN730 SDBPNTY-1T00 | Razer Blade 15 Advanced (Mid 2021) SSSTC CA6-8D1024 | Alienware m15 R5 Ryzen Edition Toshiba KBG40ZNS512G NVMe | Lenovo Legion C7 15IMH05 82EH0030GE Samsung PM981a MZVLB1T0HBLR | |
|---|---|---|---|---|---|---|
| AS SSD | 55% | 143% | 188% | 20% | 86% | |
| Seq Read (MB/s) | 1757 | 1982 13% | 2979 70% | 5739 227% | 2082 18% | 2804 60% |
| Seq Write (MB/s) | 1071 | 1444 35% | 2581 141% | 4201 292% | 825 -23% | 2765 158% |
| 4K Read (MB/s) | 22.07 | 50.3 128% | 47.33 114% | 53.8 144% | 42.41 92% | 44.96 104% |
| 4K Write (MB/s) | 124.2 | 120.1 -3% | 140 13% | 179.2 44% | 98.3 -21% | 98.3 -21% |
| 4K-64 Read (MB/s) | 439.4 | 1016 131% | 1710 289% | 2959 573% | 1255 186% | 1503 242% |
| 4K-64 Write (MB/s) | 651 | 1351 108% | 2188 236% | 1891 190% | 738 13% | 1845 183% |
| Access Time Read * (ms) | 0.043 | 0.044 -2% | 0.05 -16% | 0.027 37% | 0.109 -153% | 0.058 -35% |
| Access Time Write * (ms) | 0.341 | 0.109 68% | 0.026 92% | 0.154 55% | 0.17 50% | 0.038 89% |
| Score Read (Points) | 637 | 1264 98% | 2055 223% | 3587 463% | 1506 136% | 1828 187% |
| Score Write (Points) | 882 | 1615 83% | 2586 193% | 2490 182% | 918 4% | 2220 152% |
| Score Total (Points) | 1814 | 3510 93% | 5673 213% | 7821 331% | 3136 73% | 4983 175% |
| Copy ISO MB/s (MB/s) | 3220 | 3474 8% | 3027 -6% | 1391 -57% | 1904 -41% | |
| Copy Program MB/s (MB/s) | 675 | 751 11% | 1177 74% | 645 -4% | 567 -16% | |
| Copy Game MB/s (MB/s) | 1684 | 1684 0% | 2170 29% | 1101 -35% | 1112 -34% | |
| CrystalDiskMark 5.2 / 6 | 43% | 56% | 170% | 12% | 55% | |
| Write 4K (MB/s) | 134.7 | 128.4 -5% | 158.2 17% | 295.6 119% | 116.9 -13% | 107.9 -20% |
| Read 4K (MB/s) | 34.46 | 53.7 56% | 50.7 47% | 85.7 149% | 44.56 29% | 48.48 41% |
| Write Seq (MB/s) | 1123 | 1875 67% | 1790 59% | 4149 269% | 1552 38% | 2910 159% |
| Read Seq (MB/s) | 1691 | 2315 37% | 2469 46% | 4203 149% | 1682 -1% | 2015 19% |
| Write 4K Q32T1 (MB/s) | 581 | 427.2 -26% | 503 -13% | 715 23% | 497.8 -14% | 413 -29% |
| Read 4K Q32T1 (MB/s) | 423.6 | 440.7 4% | 579 37% | 709 67% | 436.8 3% | 468.9 11% |
| Write Seq Q32T1 (MB/s) | 1131 | 2793 147% | 3102 174% | 4681 314% | 1461 29% | 3016 167% |
| Read Seq Q32T1 (MB/s) | 1859 | 3101 67% | 3413 84% | 6905 271% | 2364 27% | 3533 90% |
| Media totale (Programma / Settaggio) | 49% /
51% | 100% /
106% | 179% /
182% | 16% /
17% | 71% /
75% |
* ... Meglio usare valori piccoli

Throttling disco: DiskSpd Read Loop, Queue Depth 8
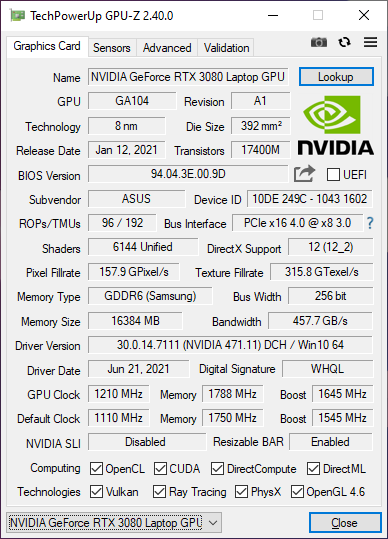
Prestazioni della GPU - GeForce RTX 3080 da 130 W
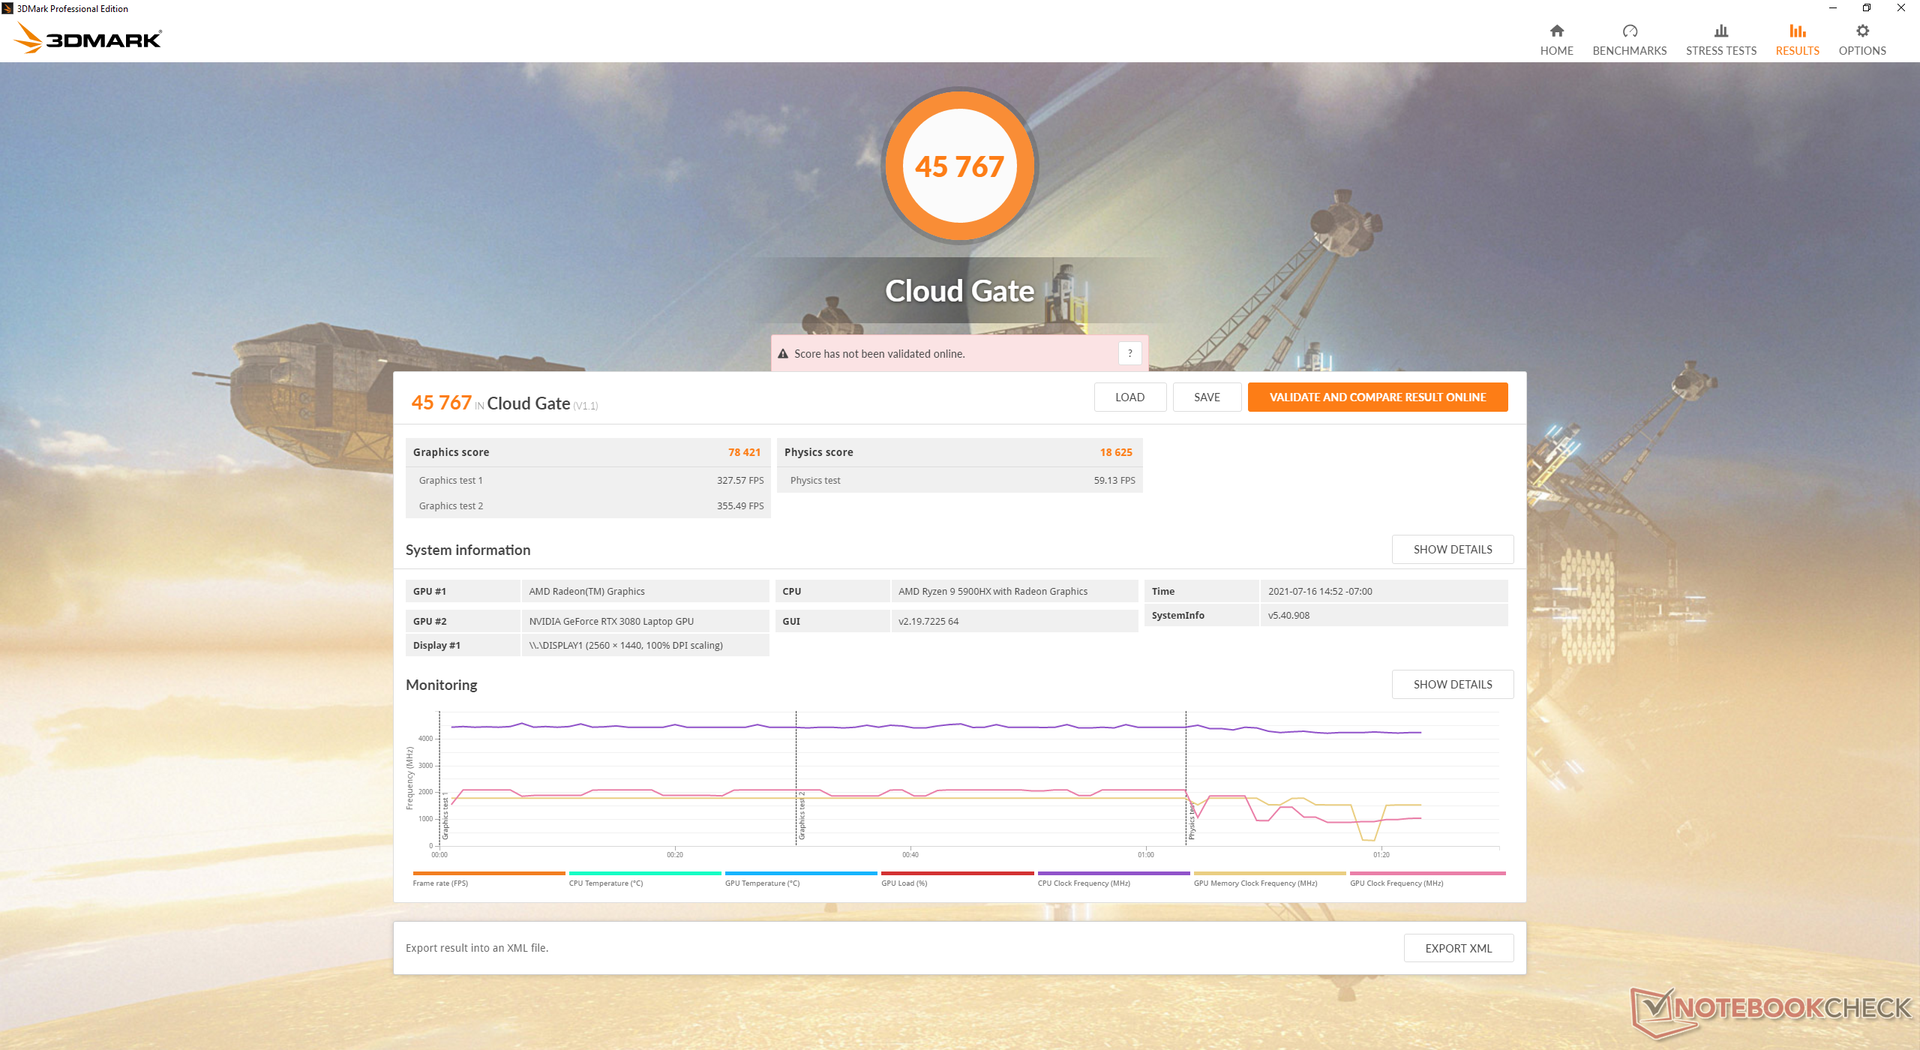
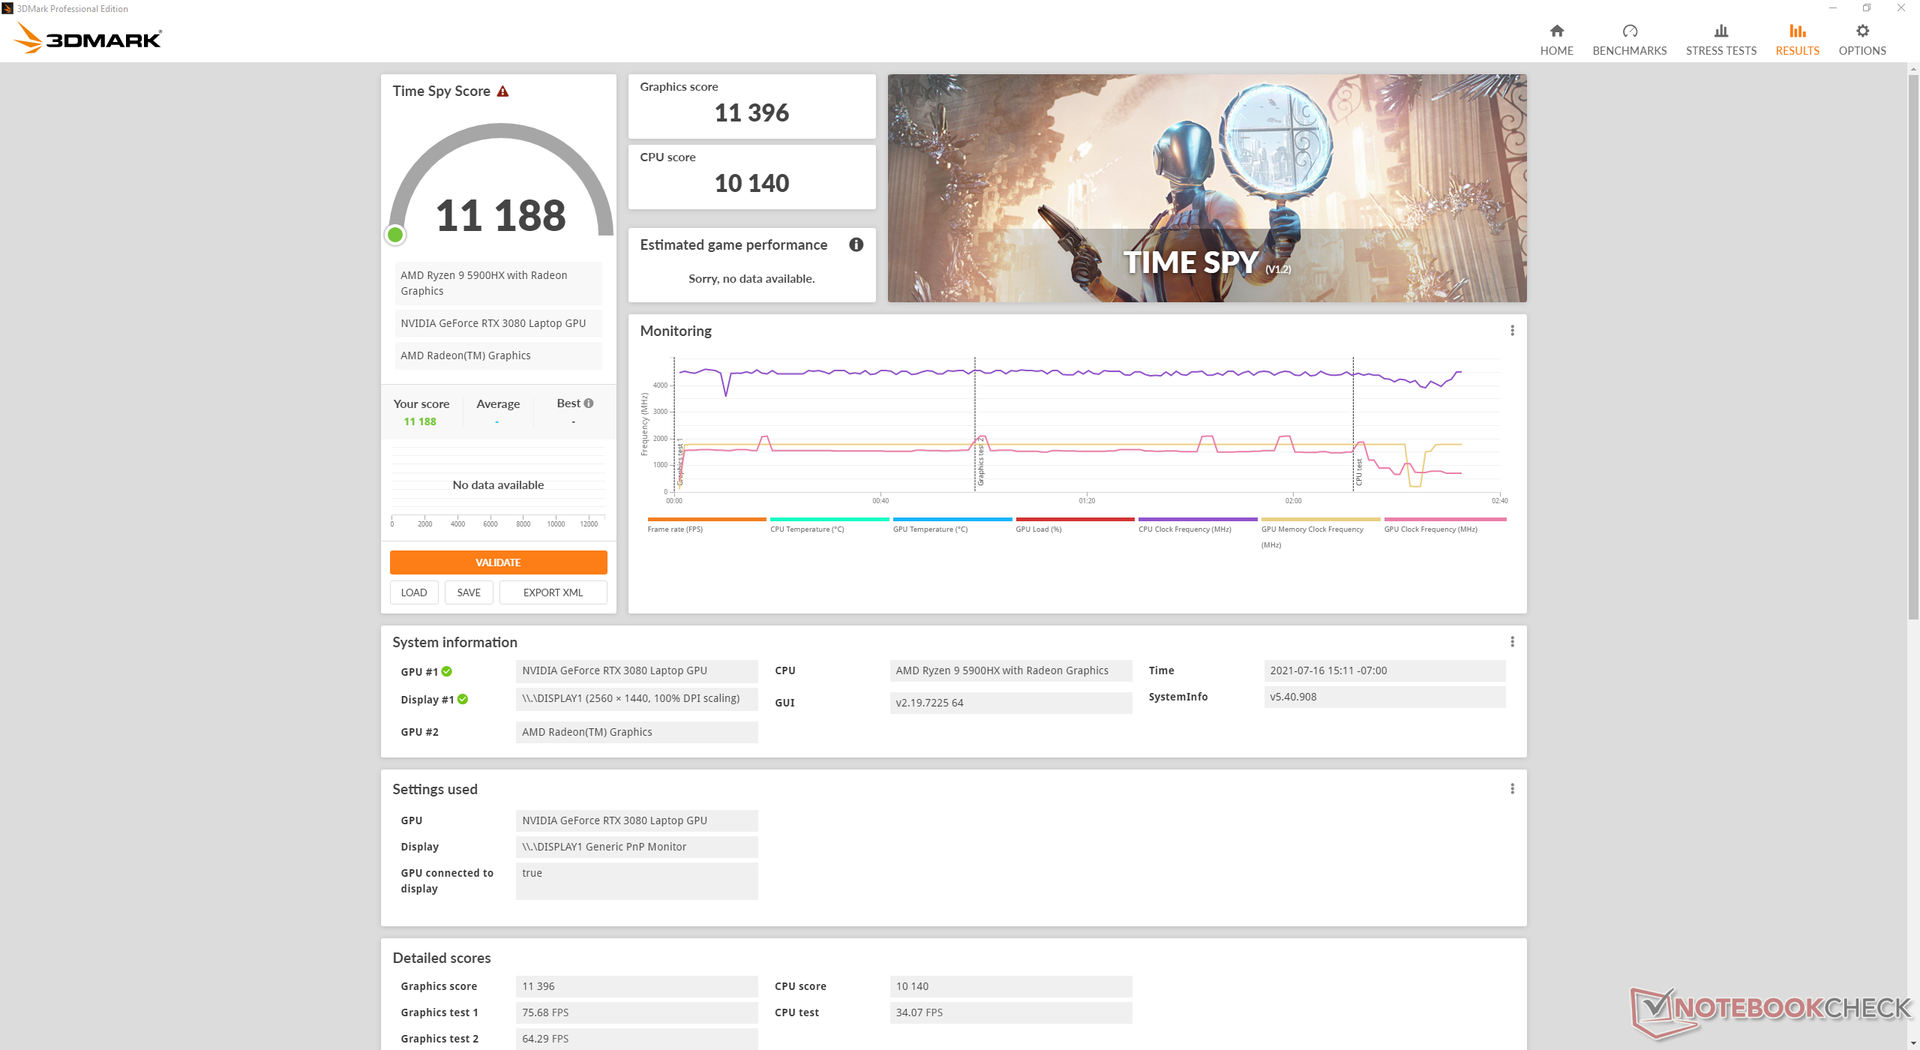
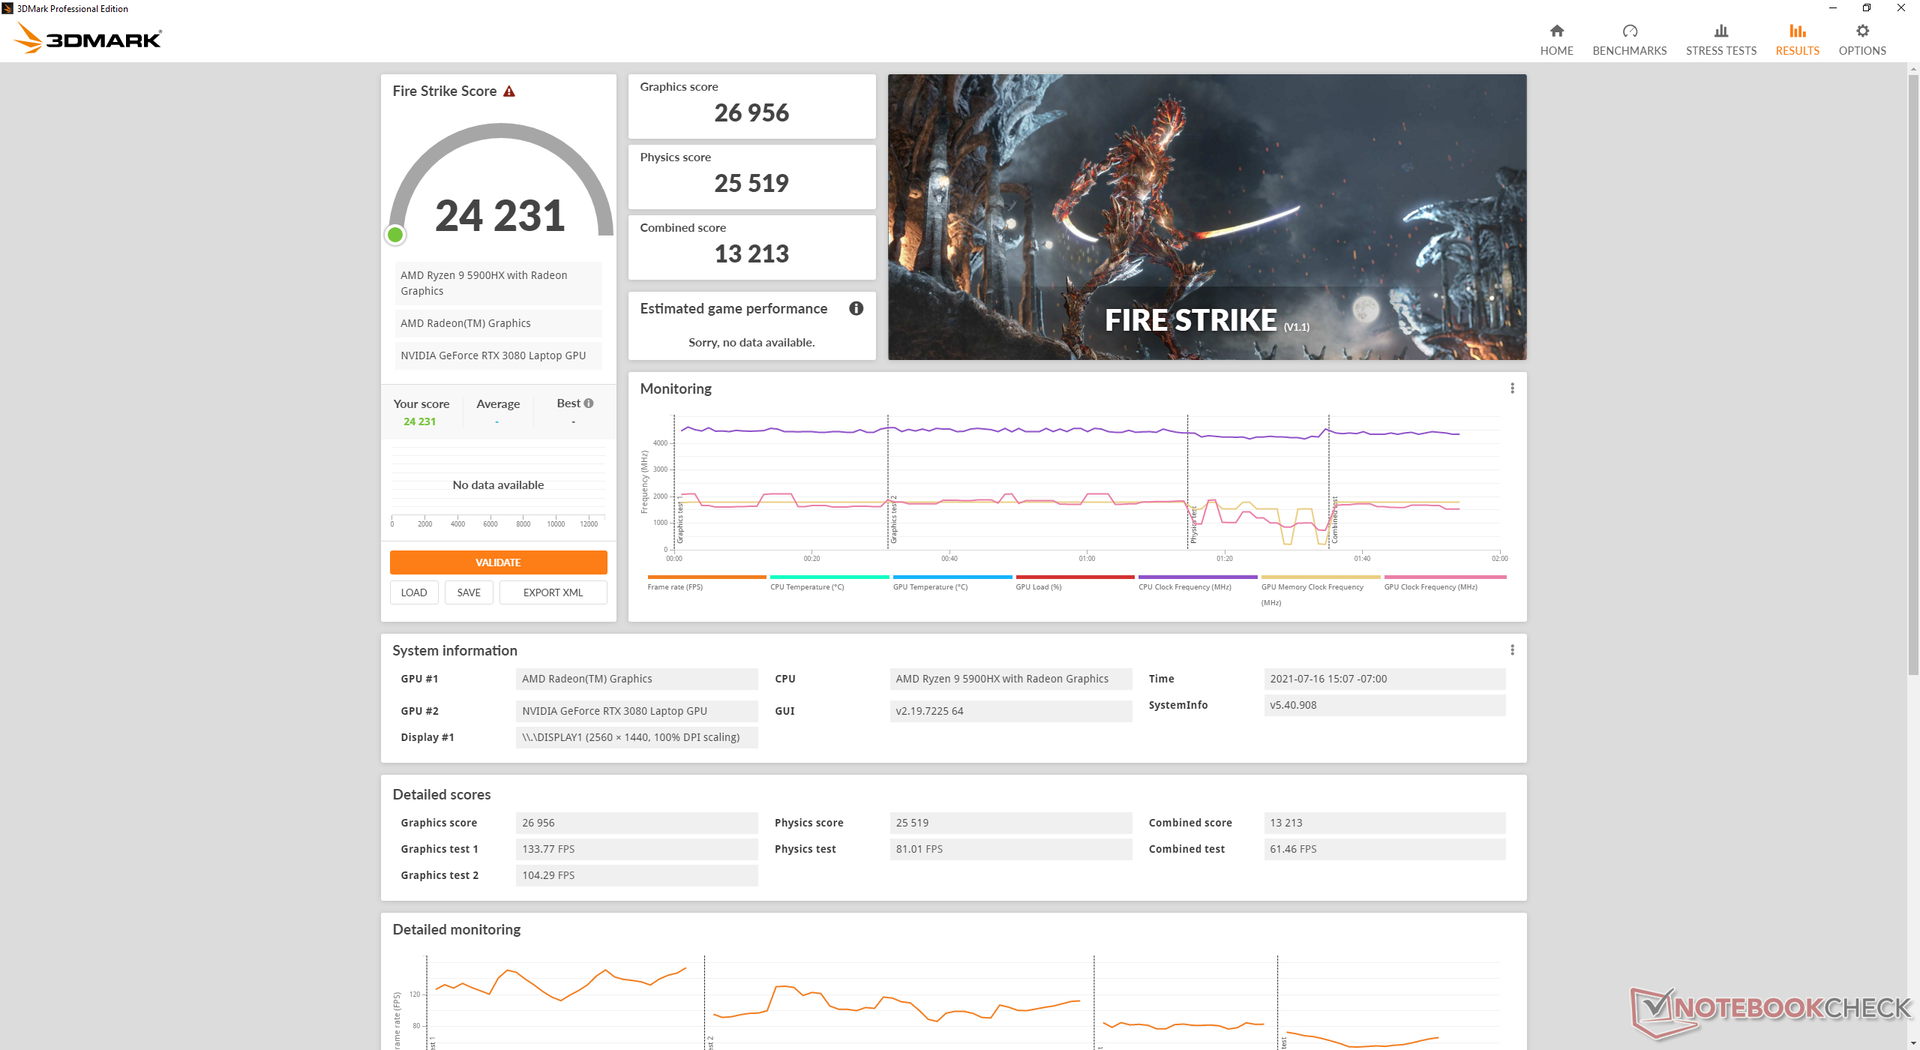
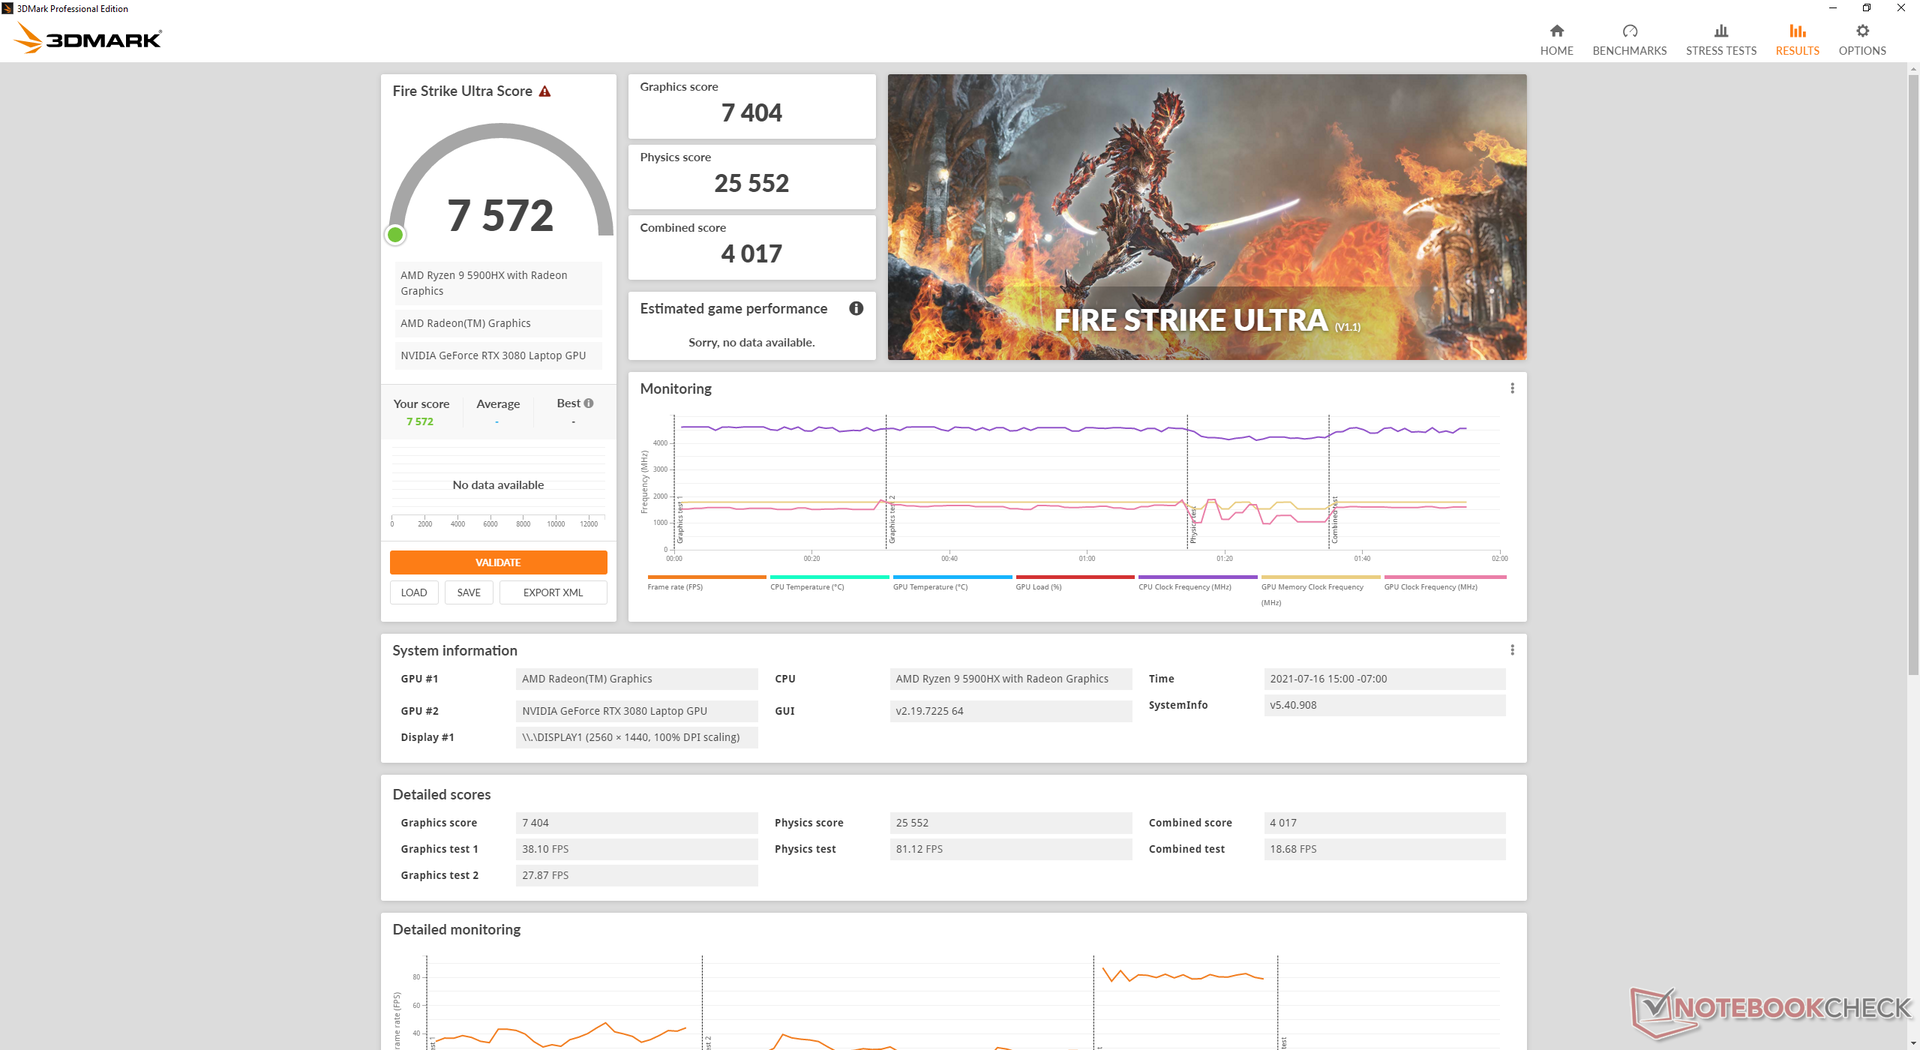
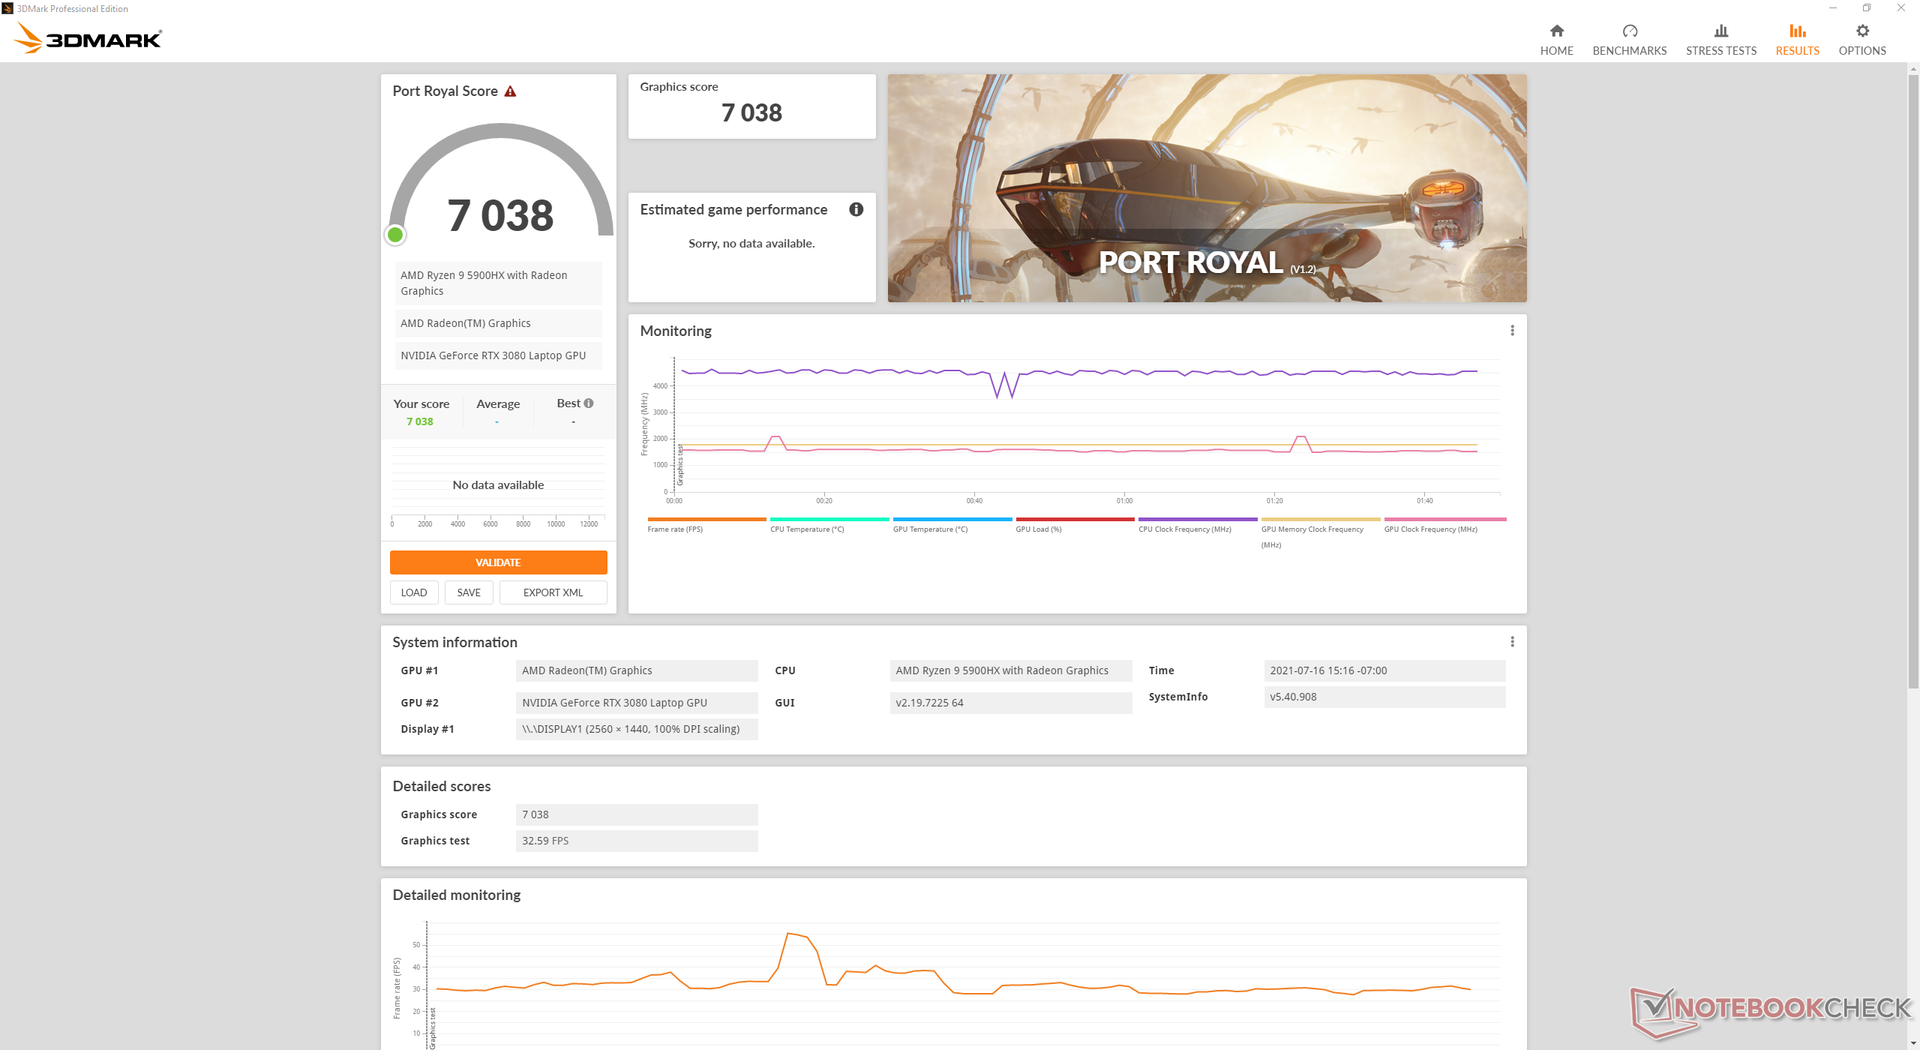
I punteggi di 3DMark sono nella media di come ci aspettiamo lavori una GeForce RTX 3080 laptop. Il più grande Schenker XMG Ultra 17 che viene fornito con una assetata RTX 3080 da 165 W, è in grado di superare la nostra GPU da 130 W di circa il 15%. Gli utenti che passano alla versione RTX 3070 dovrebbero perdere circa il 15% di prestazioni pure.
L'aggiornamento dalla RTX 2070 Super del ROG Strix Scar 15 G532LWS dell'anno scorso alla nostra RTX 3080 vedrà un aumento delle prestazioni di circa il 20-40%. Non è abbastanza per avvicinarsi ai 165 FPS per sfruttare appieno il display a 165 Hz 1440p, ma lo screen tearing e i salti di fotogramma sono generalmente meno evidenti quando gli FPS medi sono superiori a 60 e soprattutto quando FreeSync è attivato.
L'esecuzione di Fire Strike in modalità Performance invece della modalità Turbo porterebbe a punteggi leggermente più bassi Time Spy Physics e Graphics di 9960 e 10742 punti, rispettivamente, rispetto a 10140 e 11396 punti quando è in Turbo.
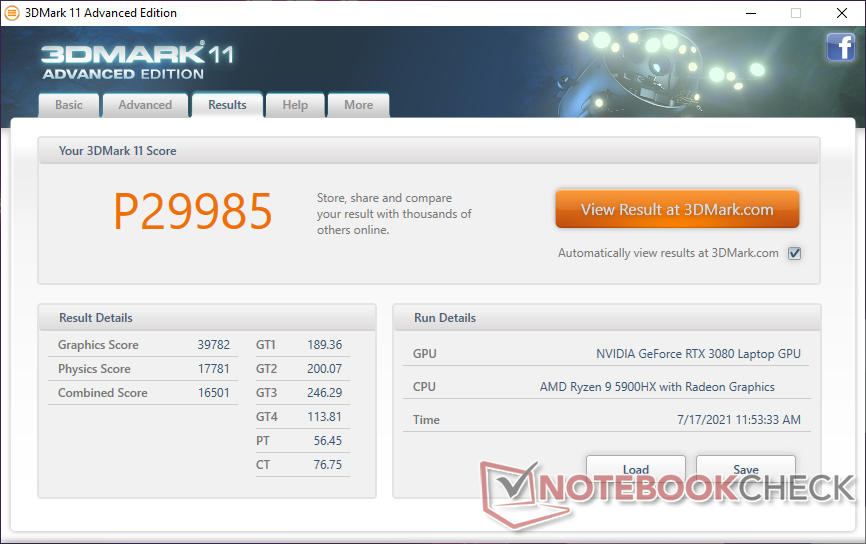
| 3DMark 11 Performance | 29985 punti | |
| 3DMark Cloud Gate Standard Score | 45767 punti | |
| 3DMark Fire Strike Score | 24231 punti | |
| 3DMark Time Spy Score | 11188 punti | |
Aiuto | ||
Grafico FPS The Witcher 3
| basso | medio | alto | ultra | QHD | |
|---|---|---|---|---|---|
| GTA V (2015) | 177 | 171 | 150 | 94.5 | 85.7 |
| The Witcher 3 (2015) | 325 | 270.1 | 189.5 | 105.8 | |
| Dota 2 Reborn (2015) | 147 | 136 | 131 | 119 | |
| Final Fantasy XV Benchmark (2018) | 179 | 139 | 105 | ||
| X-Plane 11.11 (2018) | 103 | 92.3 | 76 | ||
| Strange Brigade (2018) | 337 | 212 | 191 | 174 | 138 |
Emissioni
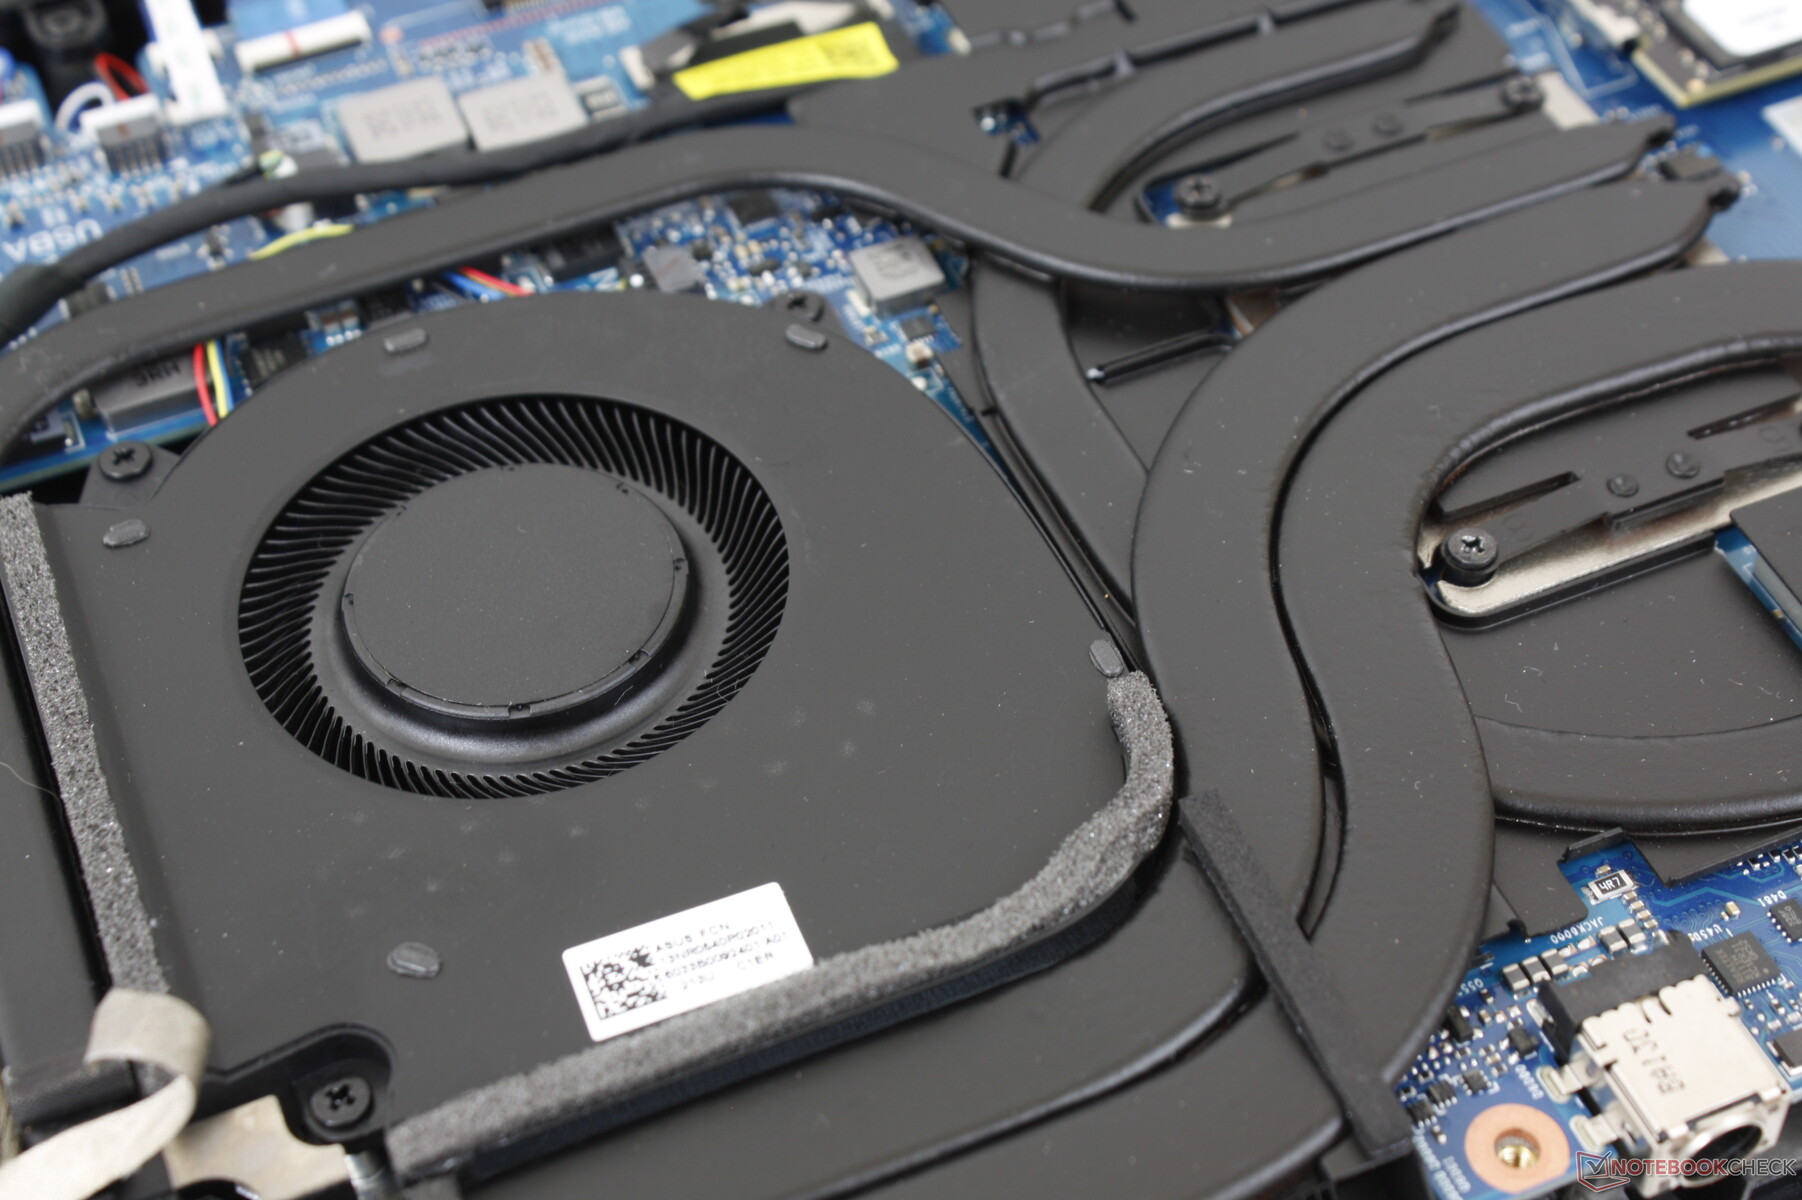
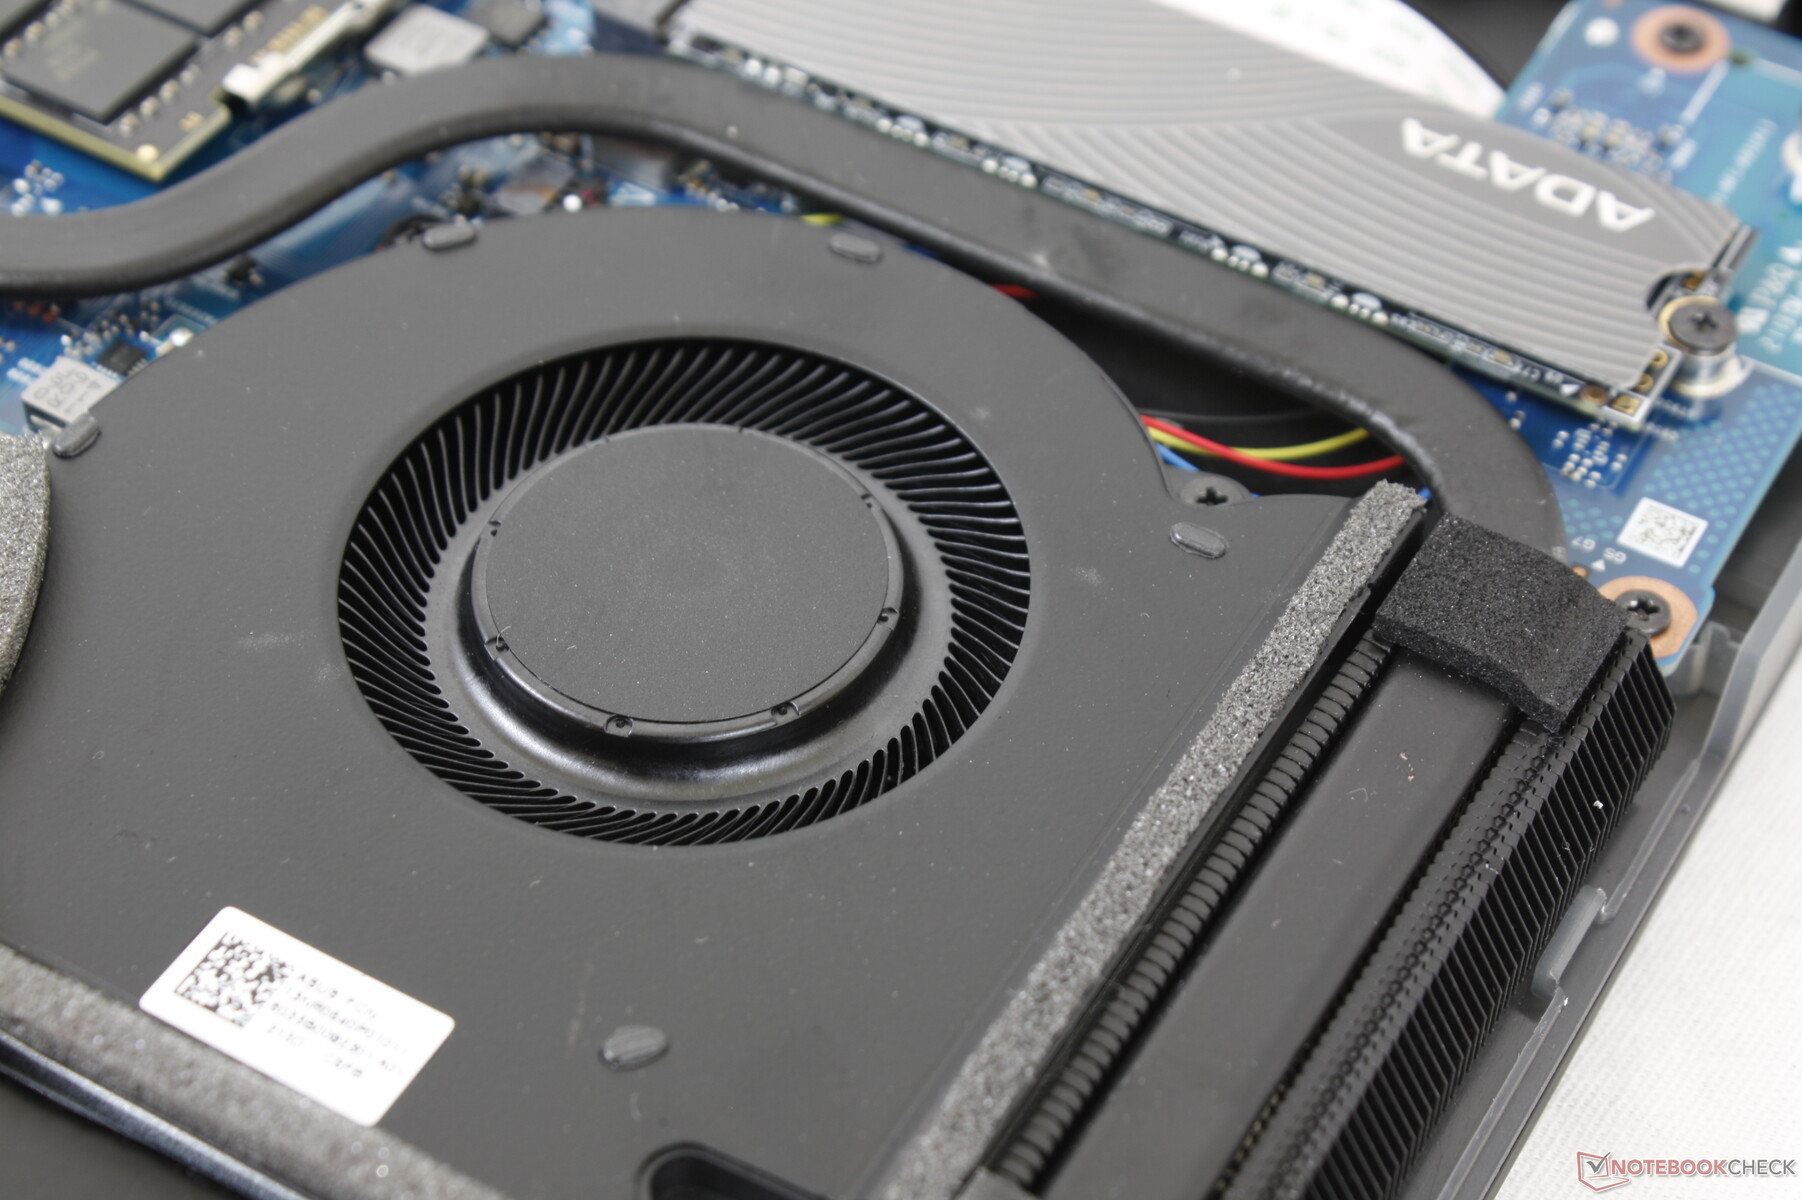
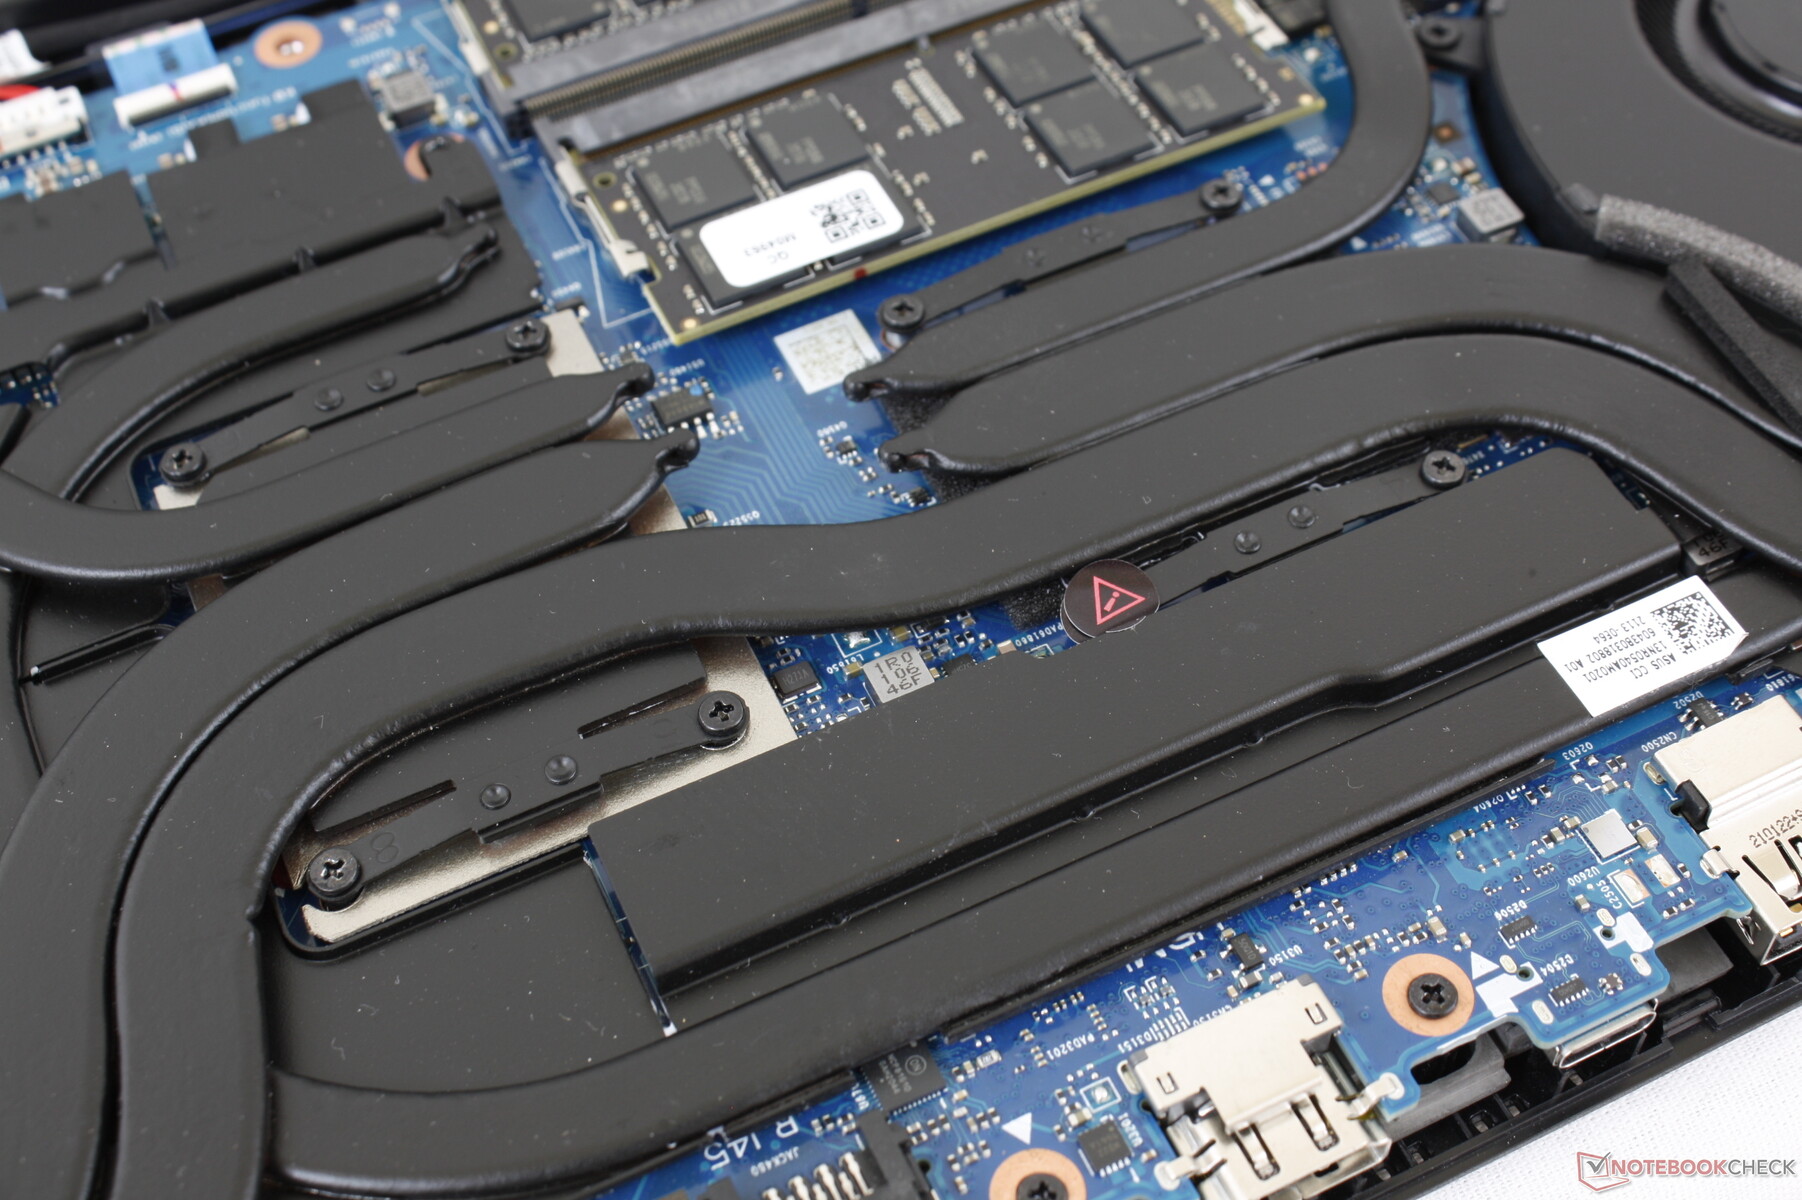
Rumore di sistema - Più silenzioso di prima
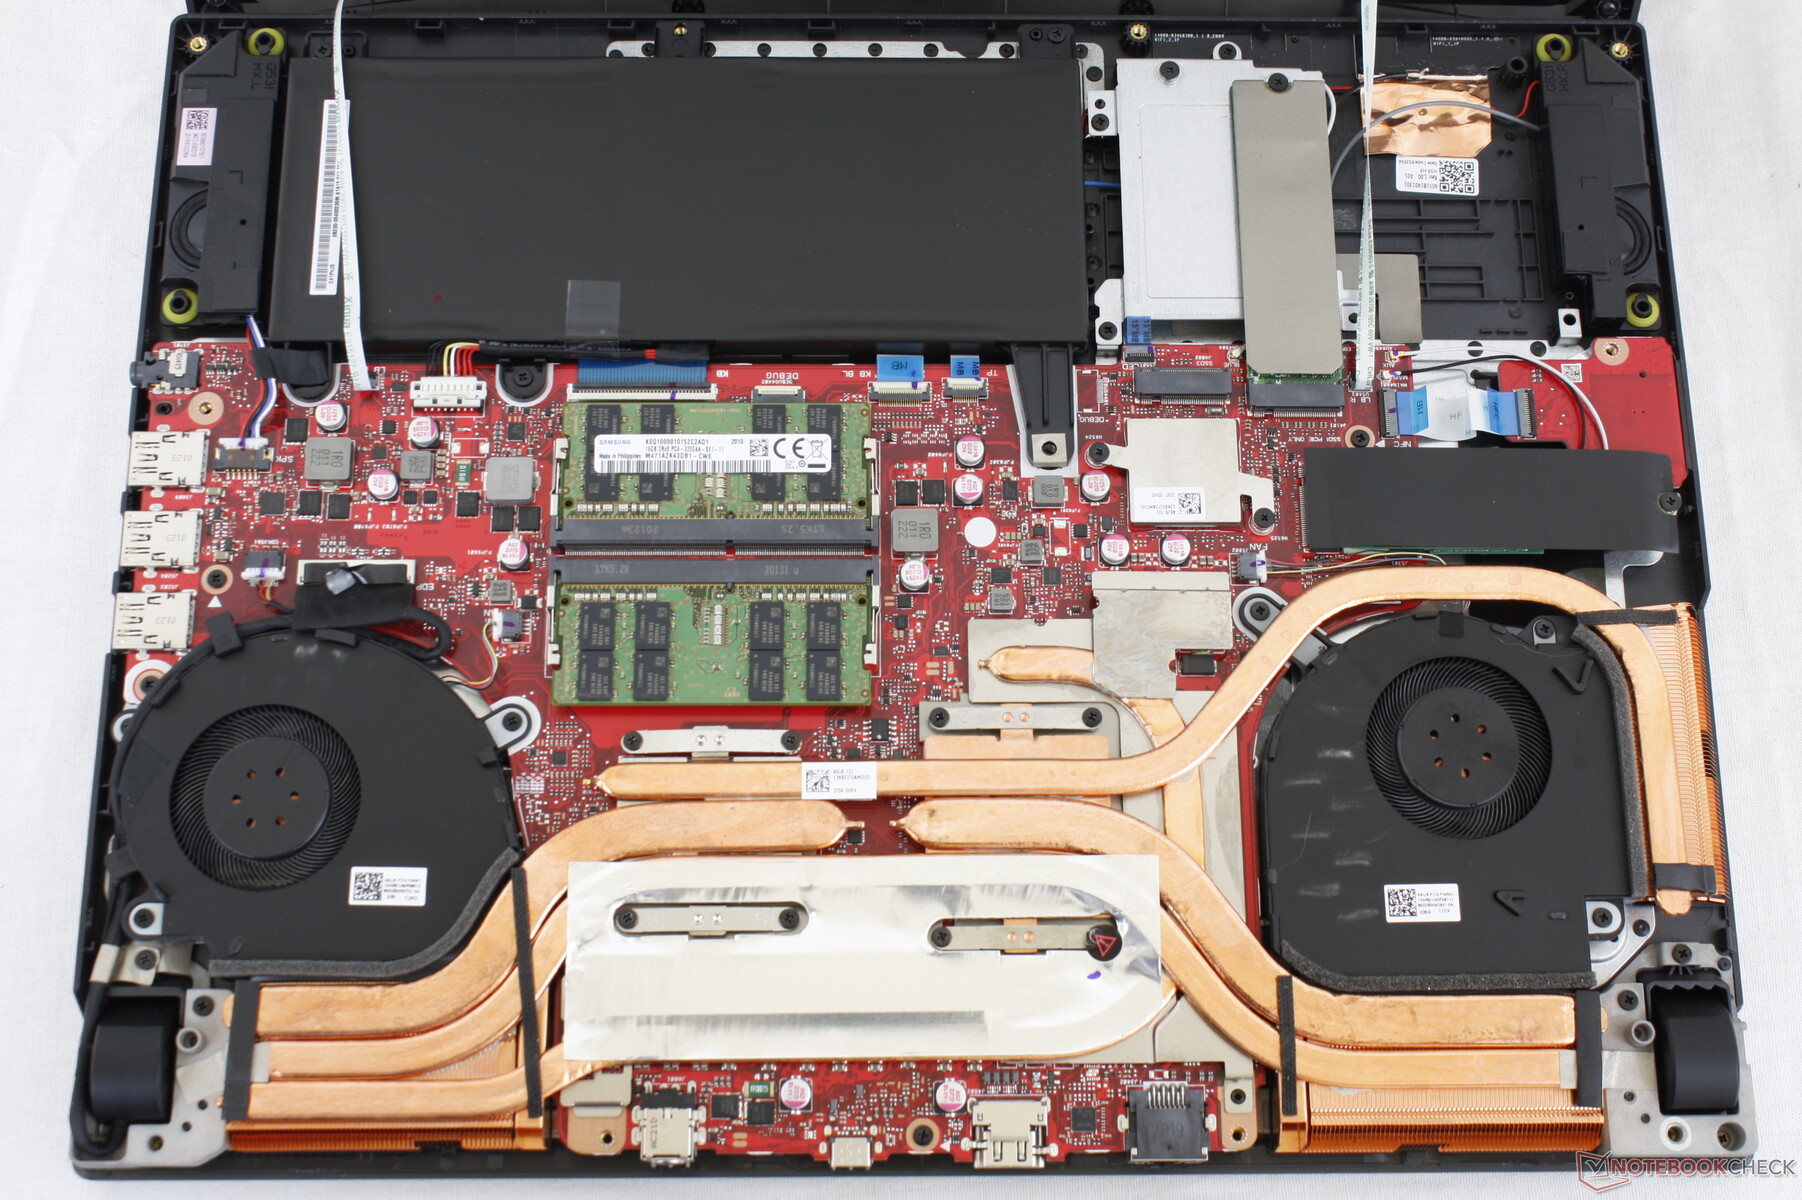
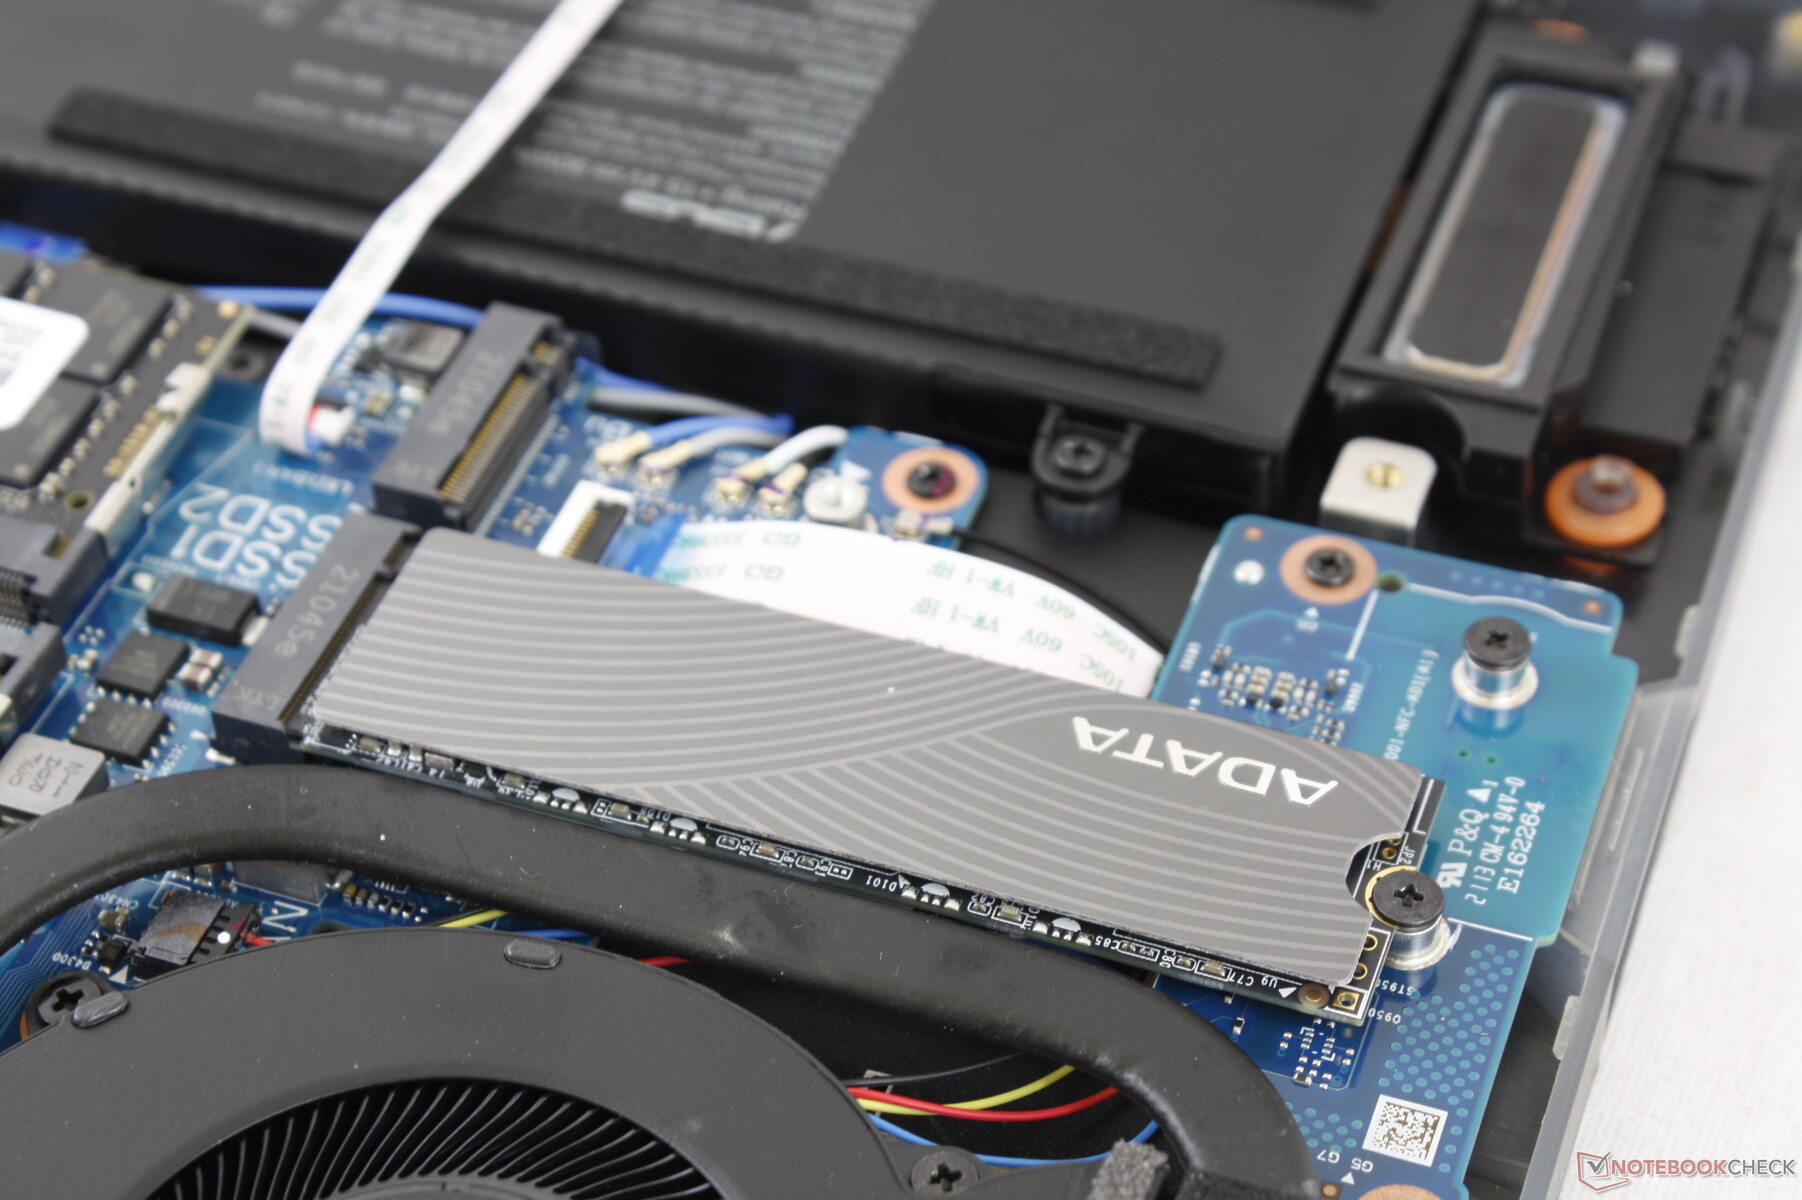
La soluzione di raffreddamento consiste in due ventole gemelle da 45-50 mm, molto simili a quelle del G532, ma con sei tubi di calore in rame più grandi e spessi. La CPU è anche raffreddata a liquido come promesso dal produttore durante il CES 2021.
Il rumore delle ventole è generalmente più silenzioso che sul G532 e più vicino a quello del Razer Blade 15. Il gioco in modalità Turbo indurrà un rumore della ventola di 50,5 dB(A) mentre la modalità Performance indurrà un rumore di 46,8 dB(A). Quindi, le ventole devono girare al massimo per ottenere più prestazioni possibili dalla CPU e dalla GPU come notato sopra.
È importante impostare il sistema in modalità Balanced o Quiet quando la potenza extra non è necessaria, altrimenti le ventole pulseranno frequentemente e inutilmente fino a 37 dB(A). Le ventole rimangono generalmente tra i 30 e i 32 dB(A) contro un fondo silenzioso di 25,5 dB(A) durante la navigazione o lo streaming video in modalità Quiet.
| Asus ROG Strix Scar 15 G533QS GeForce RTX 3080 Laptop GPU, R9 5900HX, ADATA Swordfish 2 TB | Asus ROG Strix Scar 15 G532LWS GeForce RTX 2070 Super Mobile, i9-10980HK, 2x Intel SSD 660p 1TB SSDPEKNW010T8 (RAID 0) | MSI GE66 Raider 10SFS GeForce RTX 2070 Super Mobile, i9-10980HK, WDC PC SN730 SDBPNTY-1T00 | Razer Blade 15 Advanced (Mid 2021) GeForce RTX 3080 Laptop GPU, i7-11800H, SSSTC CA6-8D1024 | Alienware m15 R5 Ryzen Edition GeForce RTX 3060 Laptop GPU, R7 5800H, Toshiba KBG40ZNS512G NVMe | Lenovo Legion C7 15IMH05 82EH0030GE GeForce RTX 2070 Max-Q, i7-10875H, Samsung PM981a MZVLB1T0HBLR | |
|---|---|---|---|---|---|---|
| Noise | -12% | -20% | 6% | 2% | 10% | |
| off /ambiente * (dB) | 25.5 | 26.5 -4% | 30 -18% | 25.1 2% | 24 6% | 24.9 2% |
| Idle Minimum * (dB) | 25.5 | 27.1 -6% | 30 -18% | 25.3 1% | 24 6% | 24.9 2% |
| Idle Average * (dB) | 25.5 | 32.2 -26% | 35 -37% | 25.3 1% | 25 2% | 24.9 2% |
| Idle Maximum * (dB) | 37.1 | 34 8% | 44 -19% | 25.3 32% | 35 6% | 24.9 33% |
| Load Average * (dB) | 39.2 | 52.4 -34% | 53 -35% | 42 -7% | 44 -12% | 34.6 12% |
| Witcher 3 ultra * (dB) | 50.5 | 57.5 -14% | 53 -5% | 45.6 10% | 48 5% | |
| Load Maximum * (dB) | 51.8 | 57.5 -11% | 55 -6% | 51.6 -0% | 50 3% | 47.7 8% |
* ... Meglio usare valori piccoli
Rumorosità
| Idle |
| 25.5 / 25.5 / 37.1 dB(A) |
| Sotto carico |
| 39.2 / 51.8 dB(A) |
 | ||
30 dB silenzioso 40 dB(A) udibile 50 dB(A) rumoroso |
||
min: | ||
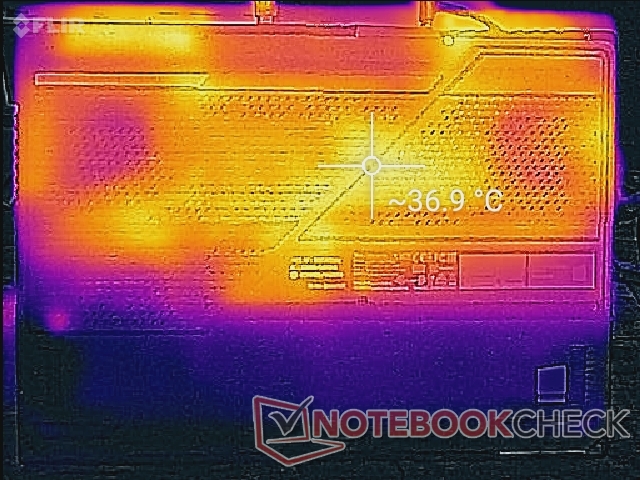
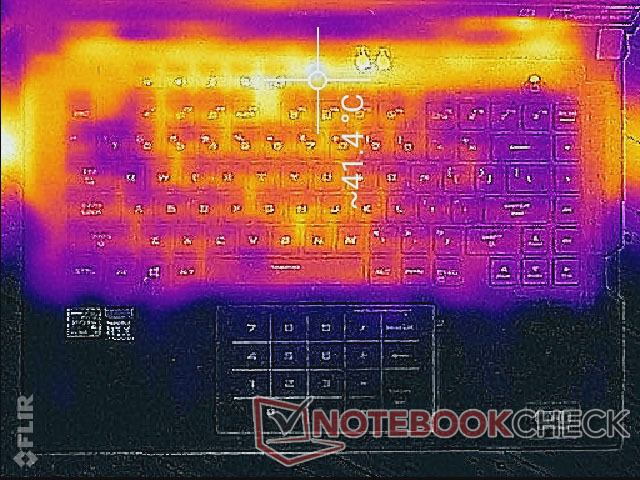
Temperature
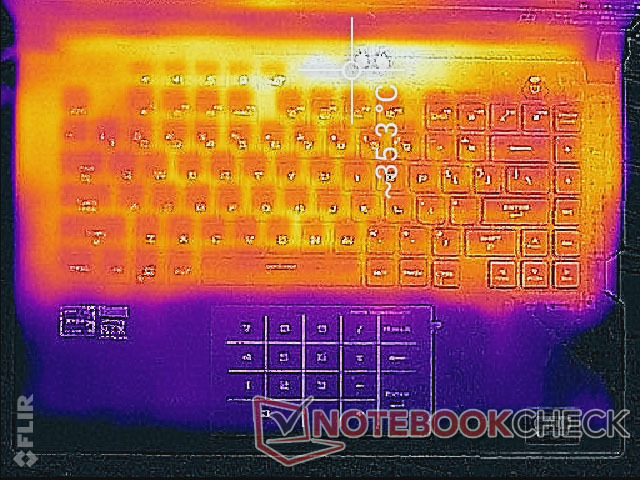
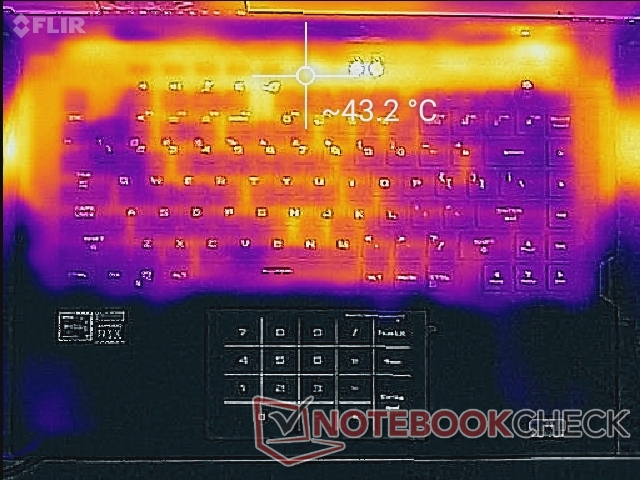
Le temperature della superficie sono quasi sempre calde sui tasti della tastiera e sul pannello inferiore a circa 35° C o più anche quando è al minimo sul desktop. Non è sgradevole, tuttavia, e quindi il sistema non è mai scomodo da digitare. Se si gioca, il centro della tastiera può avvicinarsi ai 40° C mentre i poggiapolsi, i tasti WASD e il tasto Invio rimangono molto più freddi.
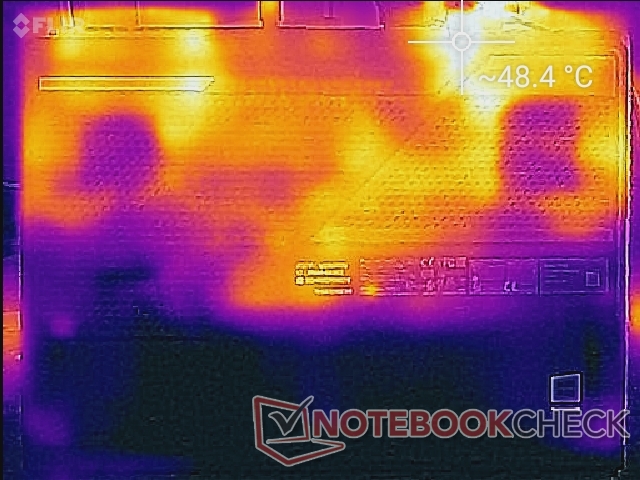
Il calore disperso esce da quattro punti diversi intorno alla parte posteriore dello chassis, rispetto ai soli due della maggior parte degli altri portatili gaming.
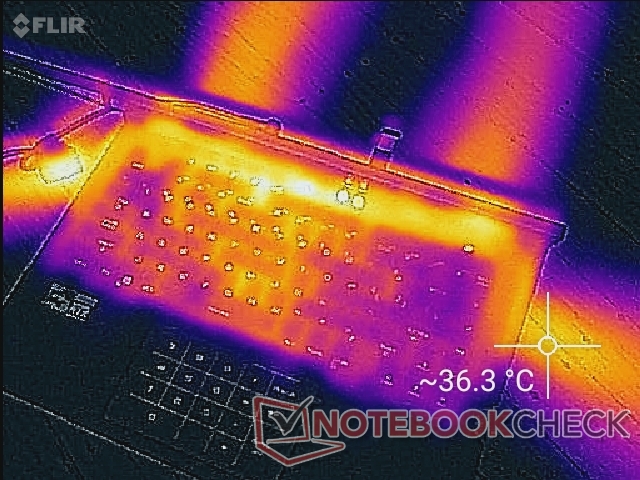
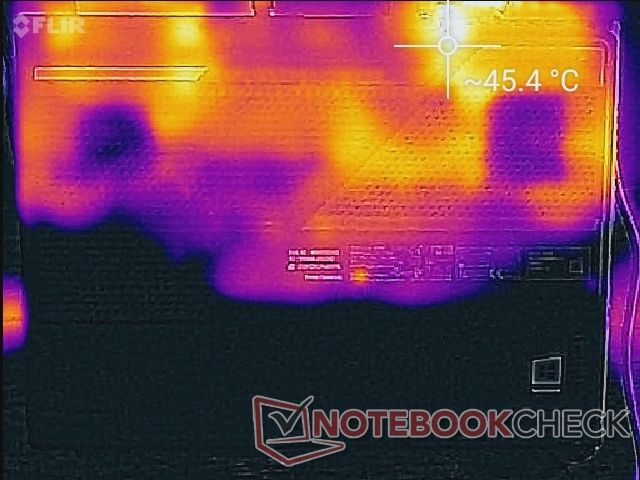
(±) La temperatura massima sul lato superiore è di 43.4 °C / 110 F, rispetto alla media di 40.4 °C / 105 F, che varia da 21.2 a 68.8 °C per questa classe Gaming.
(-) Il lato inferiore si riscalda fino ad un massimo di 48.2 °C / 119 F, rispetto alla media di 43.2 °C / 110 F
(+) In idle, la temperatura media del lato superiore è di 28.4 °C / 83 F, rispetto alla media deld ispositivo di 33.9 °C / 93 F.
(+) Riproducendo The Witcher 3, la temperatura media per il lato superiore e' di 29.9 °C / 86 F, rispetto alla media del dispositivo di 33.9 °C / 93 F.
(+) I poggiapolsi e il touchpad sono piu' freddi della temperatura della pelle con un massimo di 25.6 °C / 78.1 F e sono quindi freddi al tatto.
(+) La temperatura media della zona del palmo della mano di dispositivi simili e'stata di 28.8 °C / 83.8 F (+3.2 °C / 5.7 F).
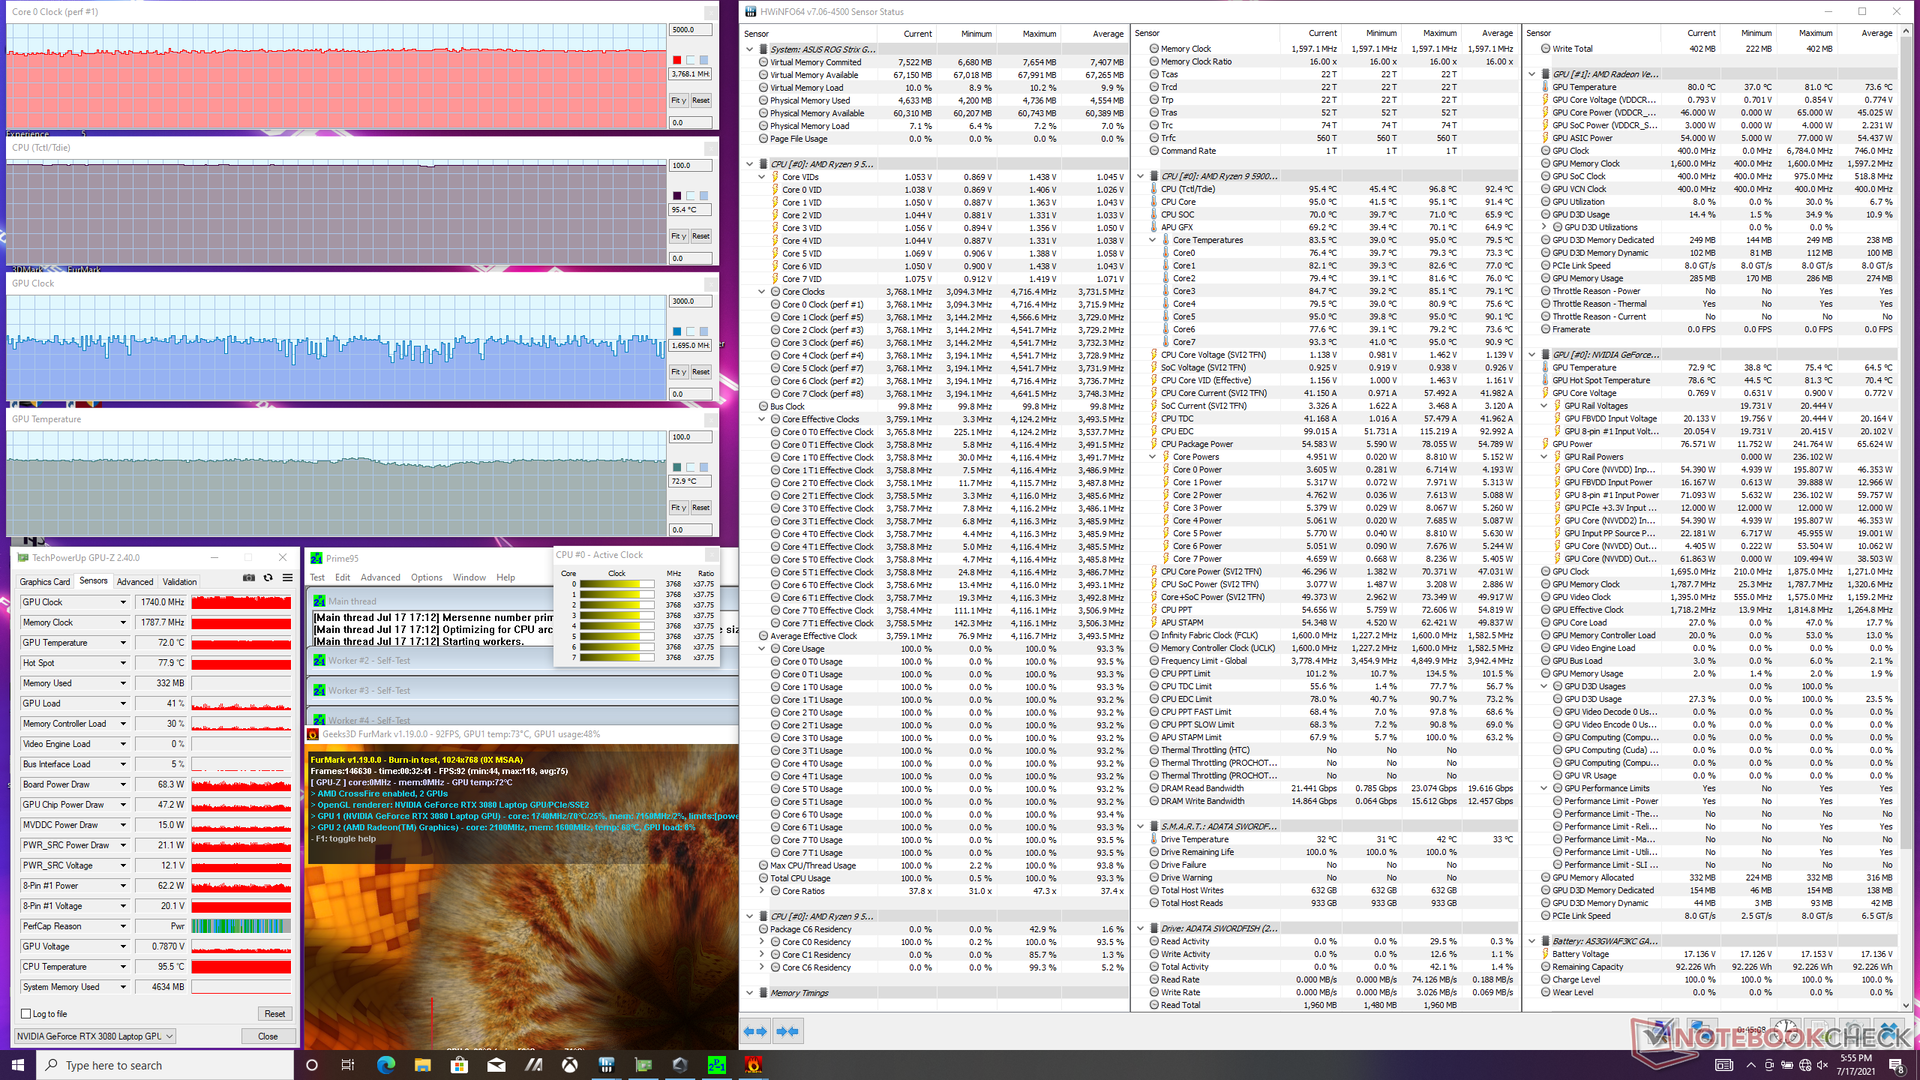
Stress Test
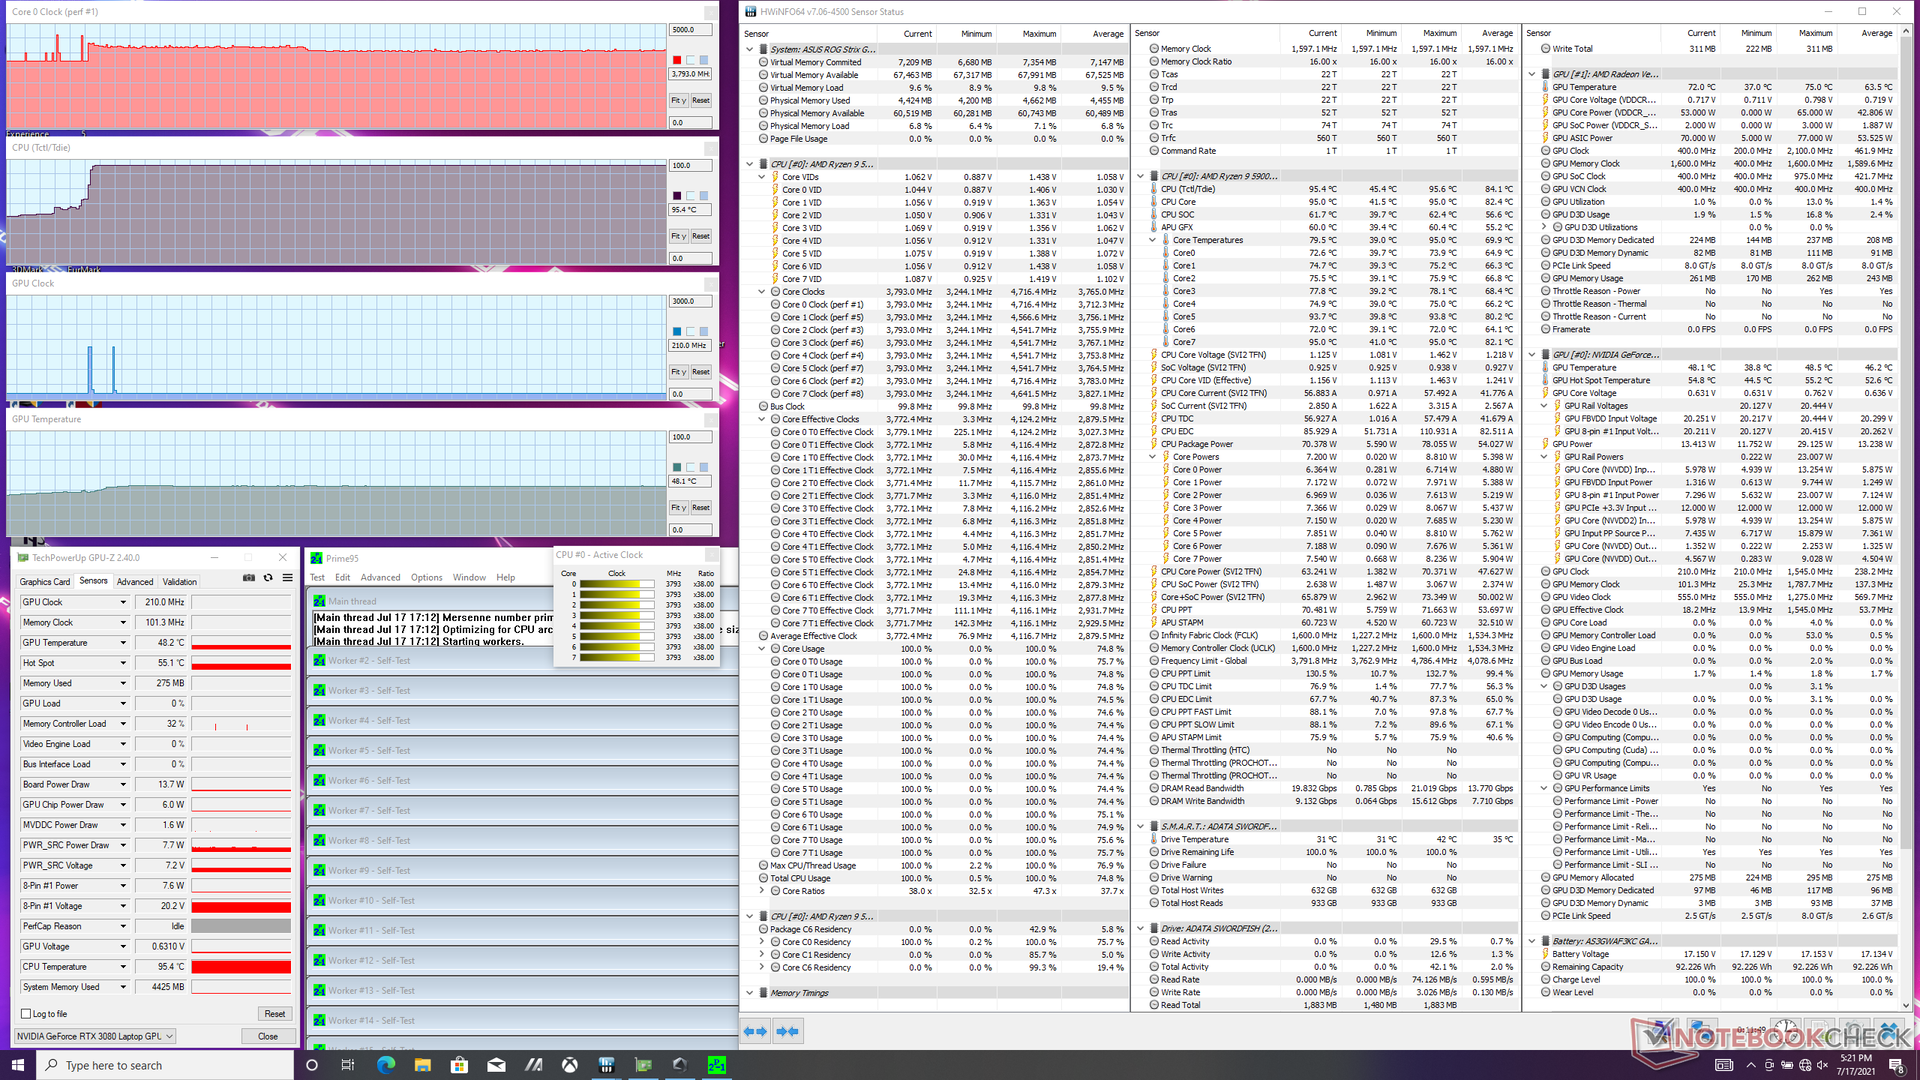
Quando è stato stressato con Prime95 in modalità Turbo, la CPU ha raggiunto i 4,1 GHz solo per un paio di secondi prima di scendere leggermente a un valore stabile di 3,8 GHz e 95° C. Eseguendo questo stesso test sul vecchio G532LWS con il Core i9-10980HK si ottengono rispettivamente una frequenza di clock della CPU stabile e una temperatura di 3,7 GHz e 90° C. Il nostro G533 alimentato da AMD è in grado di fornire più prestazioni anche se con temperature del core leggermente più alte.
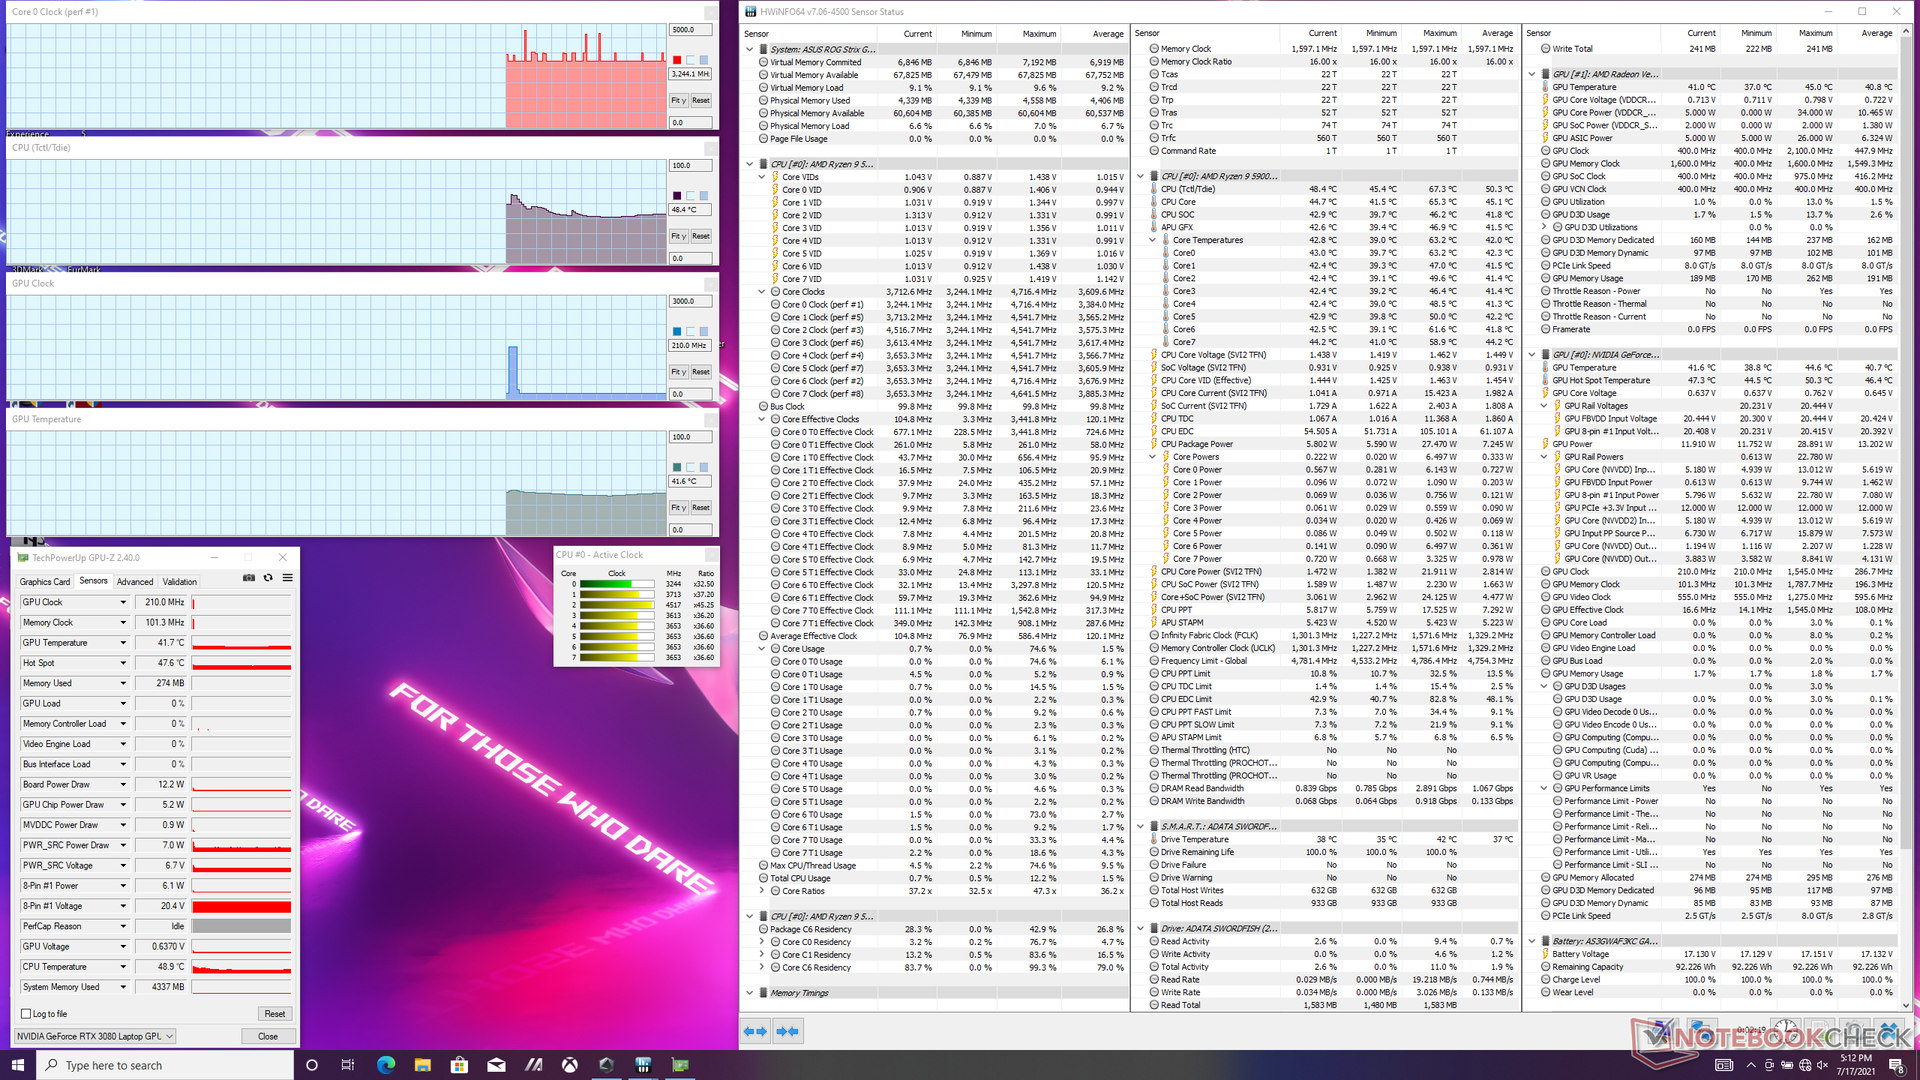
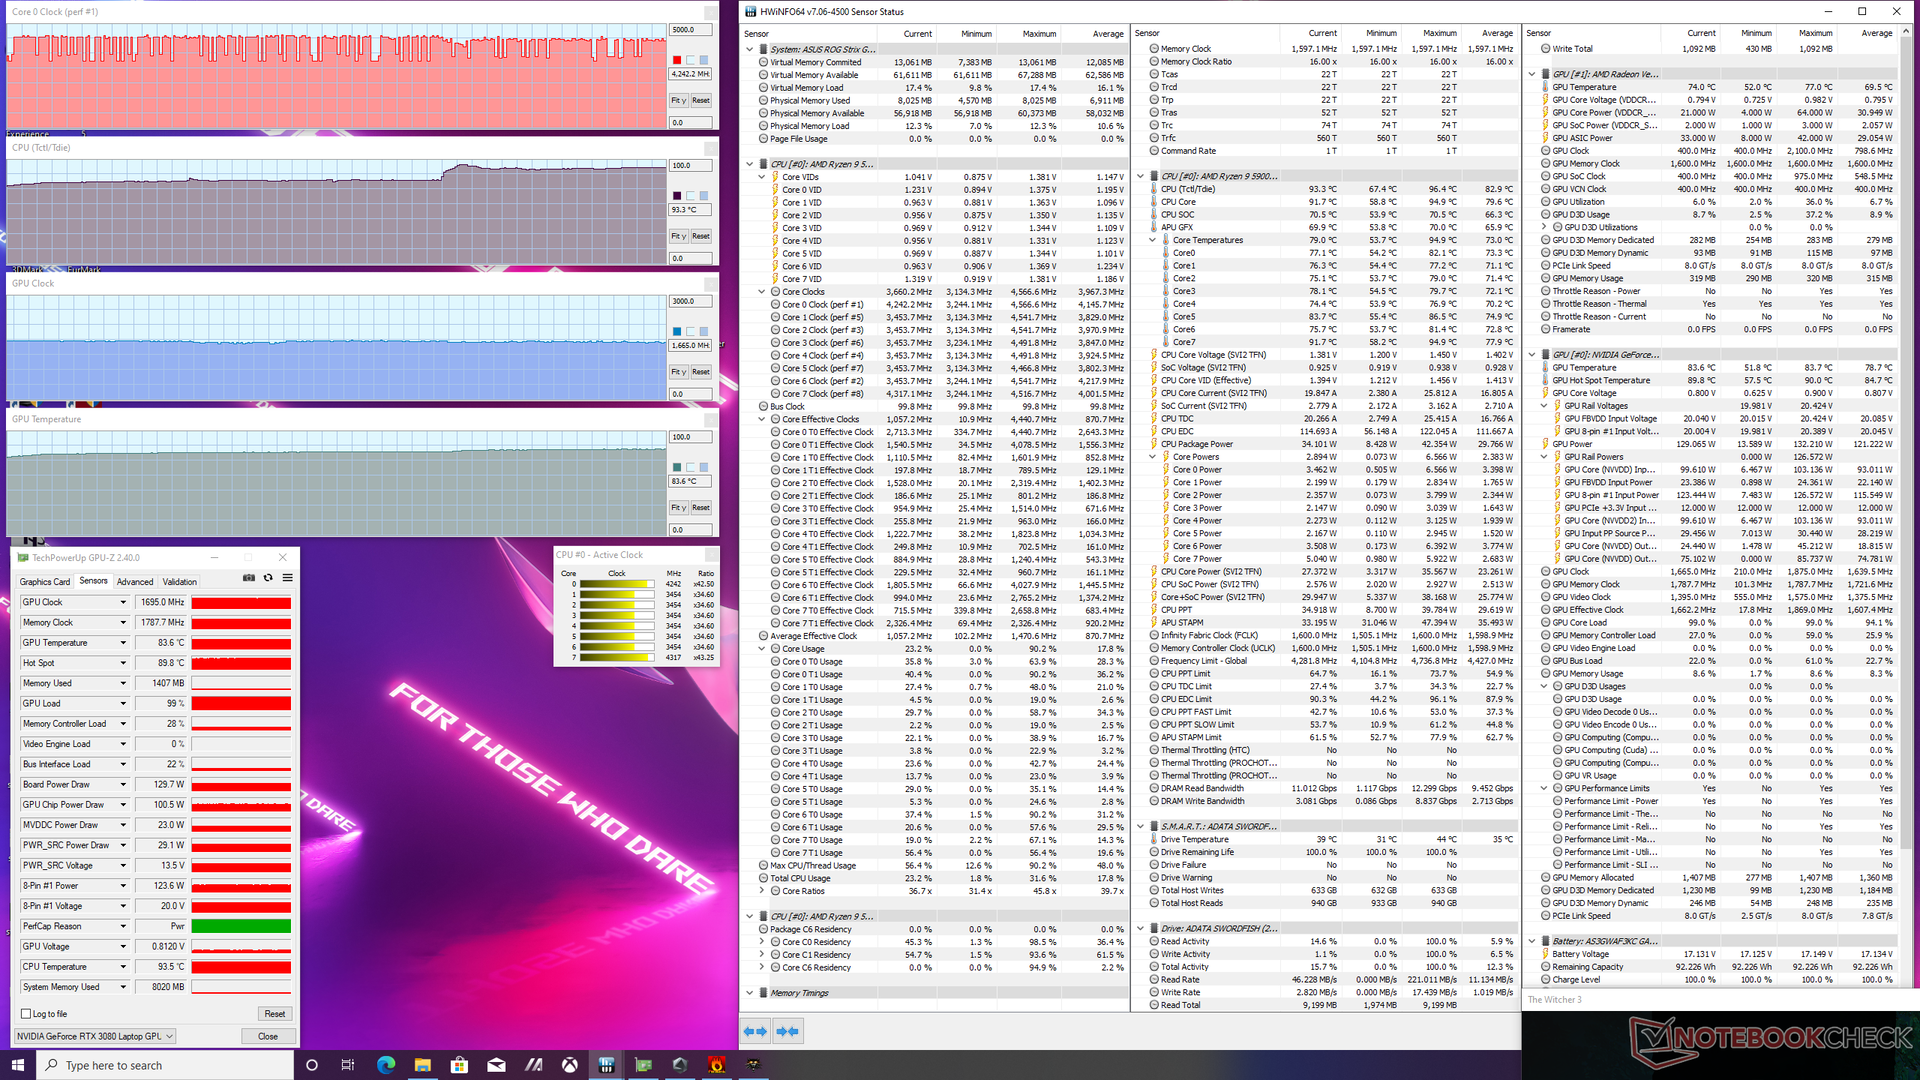
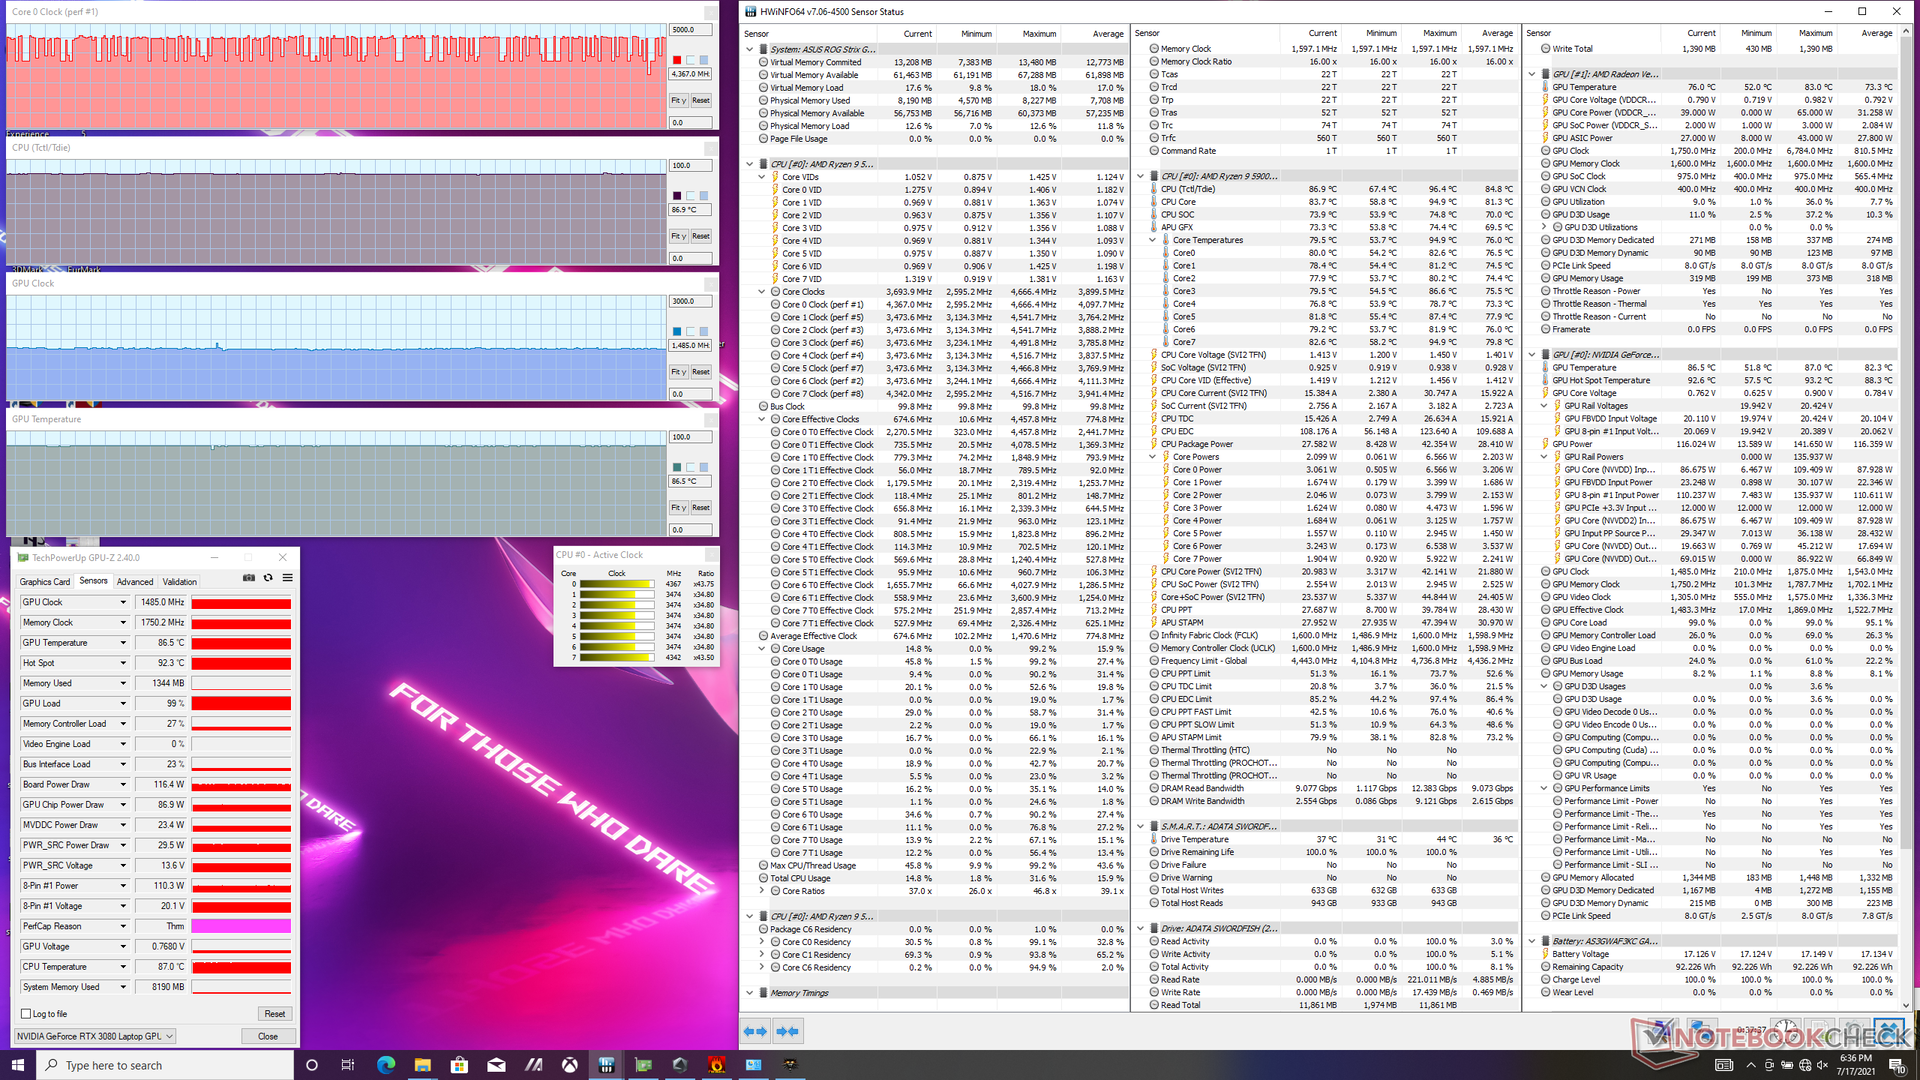
La CPU e la GPU si stabilizzano a 93° C e 84° C, rispettivamente, quando si esegue The Witcher 3 in modalità Turbo rispetto ai 94° C e 78° C del G532LWS dell'anno scorso. Anche l'assorbimento della GPU è relativamente stabile a 129.7 W confermando l'annuncio di Asus di una GPU TGP da 130 W. Eseguendo questo stesso test in modalità Performance invece che in modalità Turbo si otterrà una frequenza di clock del core leggermente inferiore (1695 MHz contro 1485 MHz), una frequenza di clock della memoria (1787.7 MHz contro 1750.2 MHz), e un assorbimento della scheda GPU (129.7 W contro 116.4 W).
L'alimentazione a batteria riduce le prestazioni. Un test su Fire Strike con le batterie restituirebbe punteggi di Physics e Graphics di 23802 e 15793 punti, rispettivamente, rispetto a 25519 e 26956 punti con l'alimentazione di rete. La modalità Turbo è automaticamente disabilitata quando non è alimentato.

| Clock della CPU (GHz)Clock della GPU(MHz)Temperatura media dellaCPU (°C)Temperaturamedia dellaGPU (°C) |
| Sistema inattivo |
| StressPrime95 (modalità Turbo) |
| Prime95 + FurMark Stress (modalità Turbo) |
| Witcher 3 Stress (modalità Turbo) |
| Witcher 3 Stress (Performance mode) |
Casse


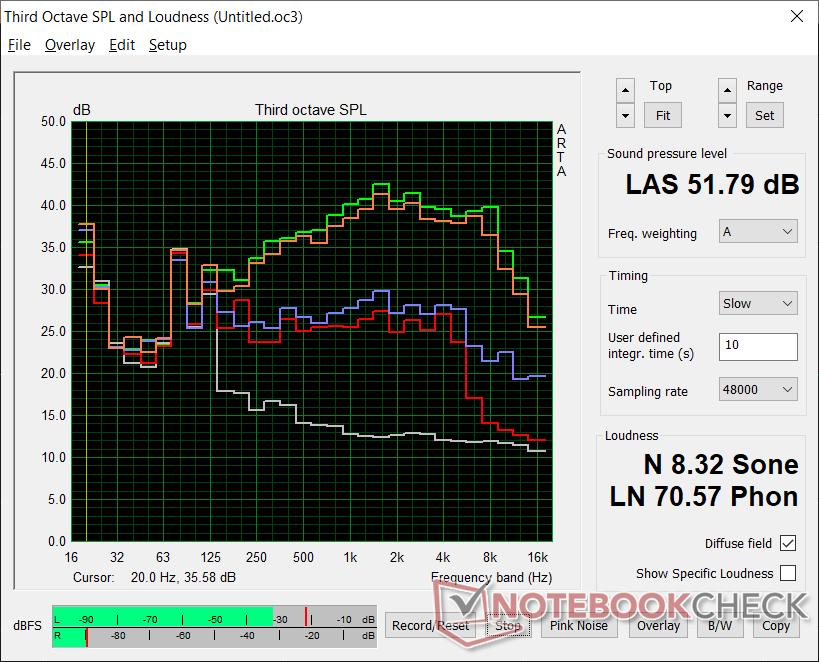
Asus ROG Strix Scar 15 G533QS analisi audio
(±) | potenza degli altiparlanti media ma buona (74.9 dB)
Bassi 100 - 315 Hz
(+) | bassi buoni - solo 4.5% dalla media
(±) | la linearità dei bassi è media (8.2% delta rispetto alla precedente frequenza)
Medi 400 - 2000 Hz
(+) | medi bilanciati - solo only 3.6% rispetto alla media
(±) | linearità dei medi adeguata (8.3% delta rispetto alla precedente frequenza)
Alti 2 - 16 kHz
(+) | Alti bilanciati - appena 3.3% dalla media
(+) | alti lineari (4.7% delta rispetto alla precedente frequenza)
Nel complesso 100 - 16.000 Hz
(+) | suono nel complesso lineare (13.9% differenza dalla media)
Rispetto alla stessa classe
» 22% di tutti i dispositivi testati in questa classe è stato migliore, 7% simile, 71% peggiore
» Il migliore ha avuto un delta di 6%, medio di 18%, peggiore di 132%
Rispetto a tutti i dispositivi testati
» 16% di tutti i dispositivi testati in questa classe è stato migliore, 4% similare, 80% peggiore
» Il migliore ha avuto un delta di 4%, medio di 24%, peggiore di 134%
Apple MacBook 12 (Early 2016) 1.1 GHz analisi audio
(+) | gli altoparlanti sono relativamente potenti (83.6 dB)
Bassi 100 - 315 Hz
(±) | bassi ridotti - in media 11.3% inferiori alla media
(±) | la linearità dei bassi è media (14.2% delta rispetto alla precedente frequenza)
Medi 400 - 2000 Hz
(+) | medi bilanciati - solo only 2.4% rispetto alla media
(+) | medi lineari (5.5% delta rispetto alla precedente frequenza)
Alti 2 - 16 kHz
(+) | Alti bilanciati - appena 2% dalla media
(+) | alti lineari (4.5% delta rispetto alla precedente frequenza)
Nel complesso 100 - 16.000 Hz
(+) | suono nel complesso lineare (10.2% differenza dalla media)
Rispetto alla stessa classe
» 7% di tutti i dispositivi testati in questa classe è stato migliore, 2% simile, 91% peggiore
» Il migliore ha avuto un delta di 5%, medio di 18%, peggiore di 53%
Rispetto a tutti i dispositivi testati
» 5% di tutti i dispositivi testati in questa classe è stato migliore, 1% similare, 94% peggiore
» Il migliore ha avuto un delta di 4%, medio di 24%, peggiore di 134%
Gestione dell'energia
Consumo di energia
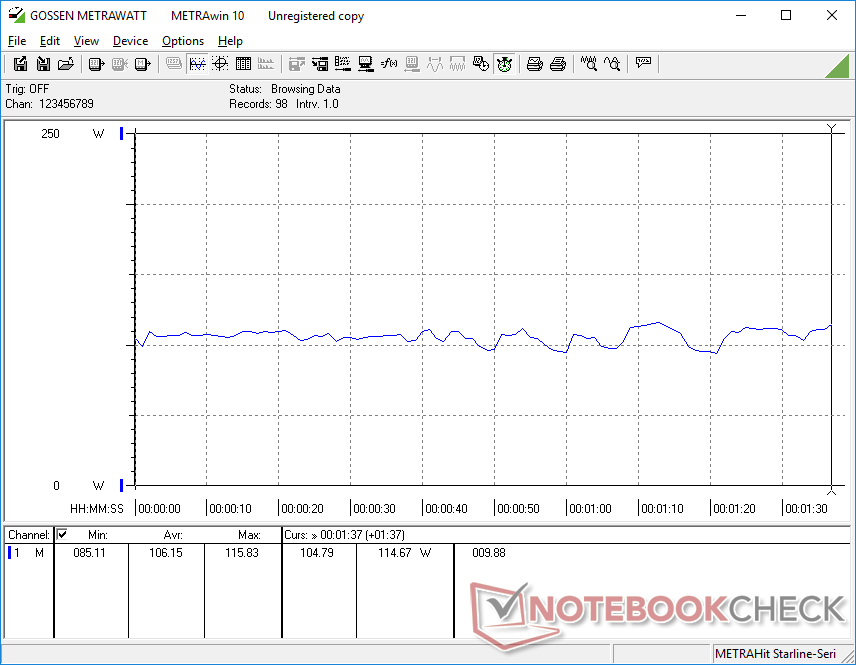
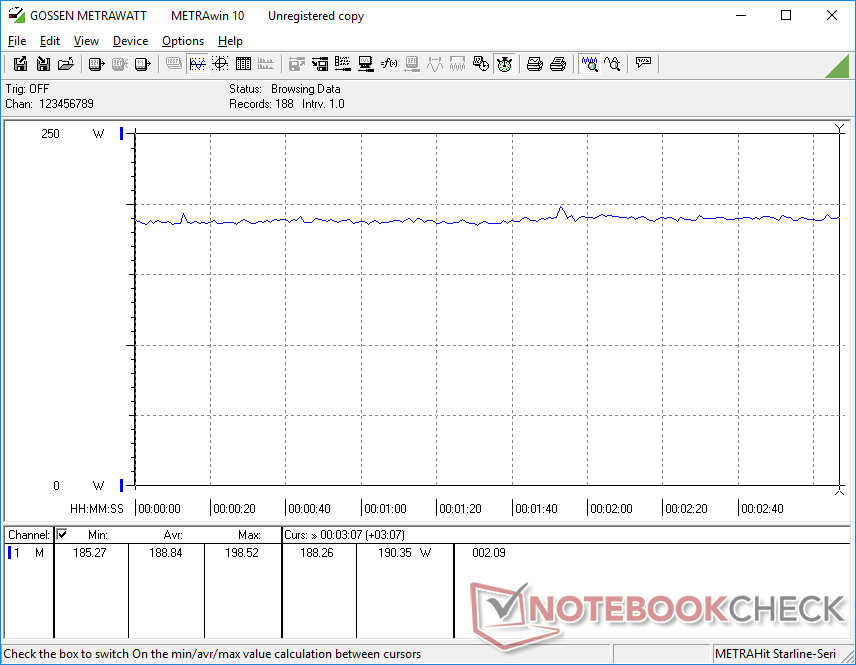
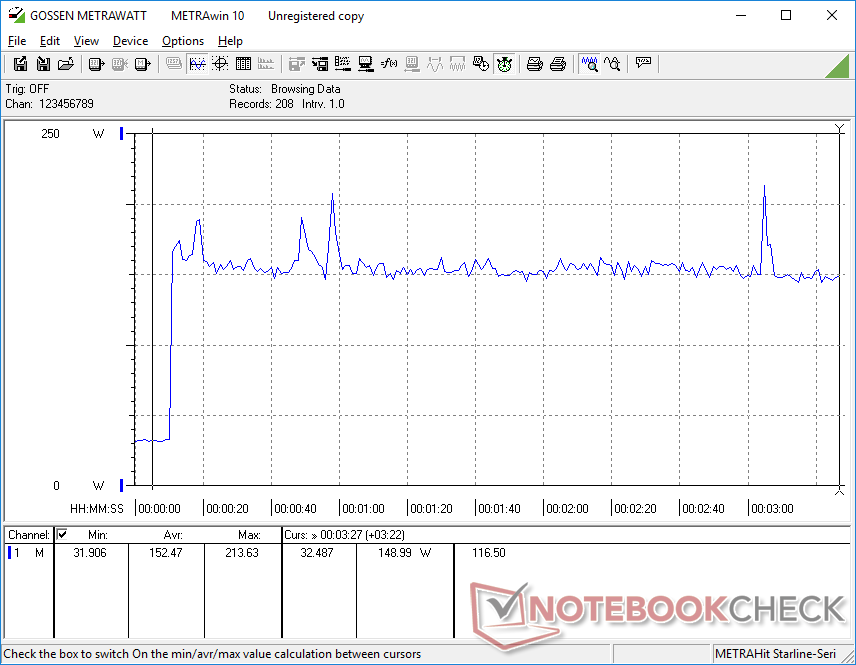
I giochi richiedono un consumo leggermente inferiore rispetto al vecchio G532LWS, nonostante la CPU più veloce, la GPU più veloce e il display a risoluzione più alta per prestazioni complessive più elevate per watt. Il consumo di energia, tuttavia, quando è inattivo sul desktop o durante la navigazione web non è necessariamente inferiore.
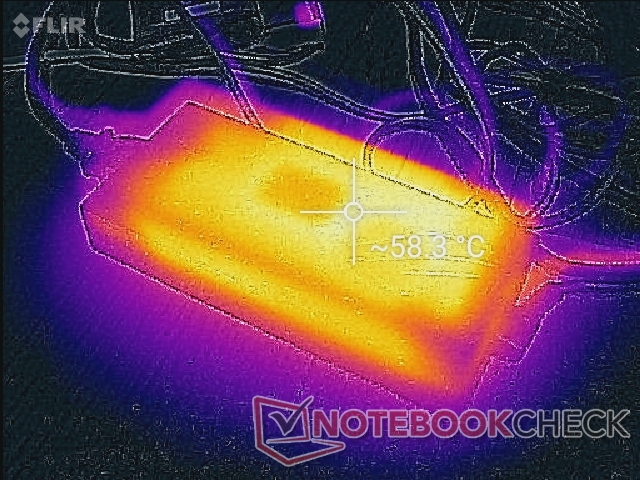
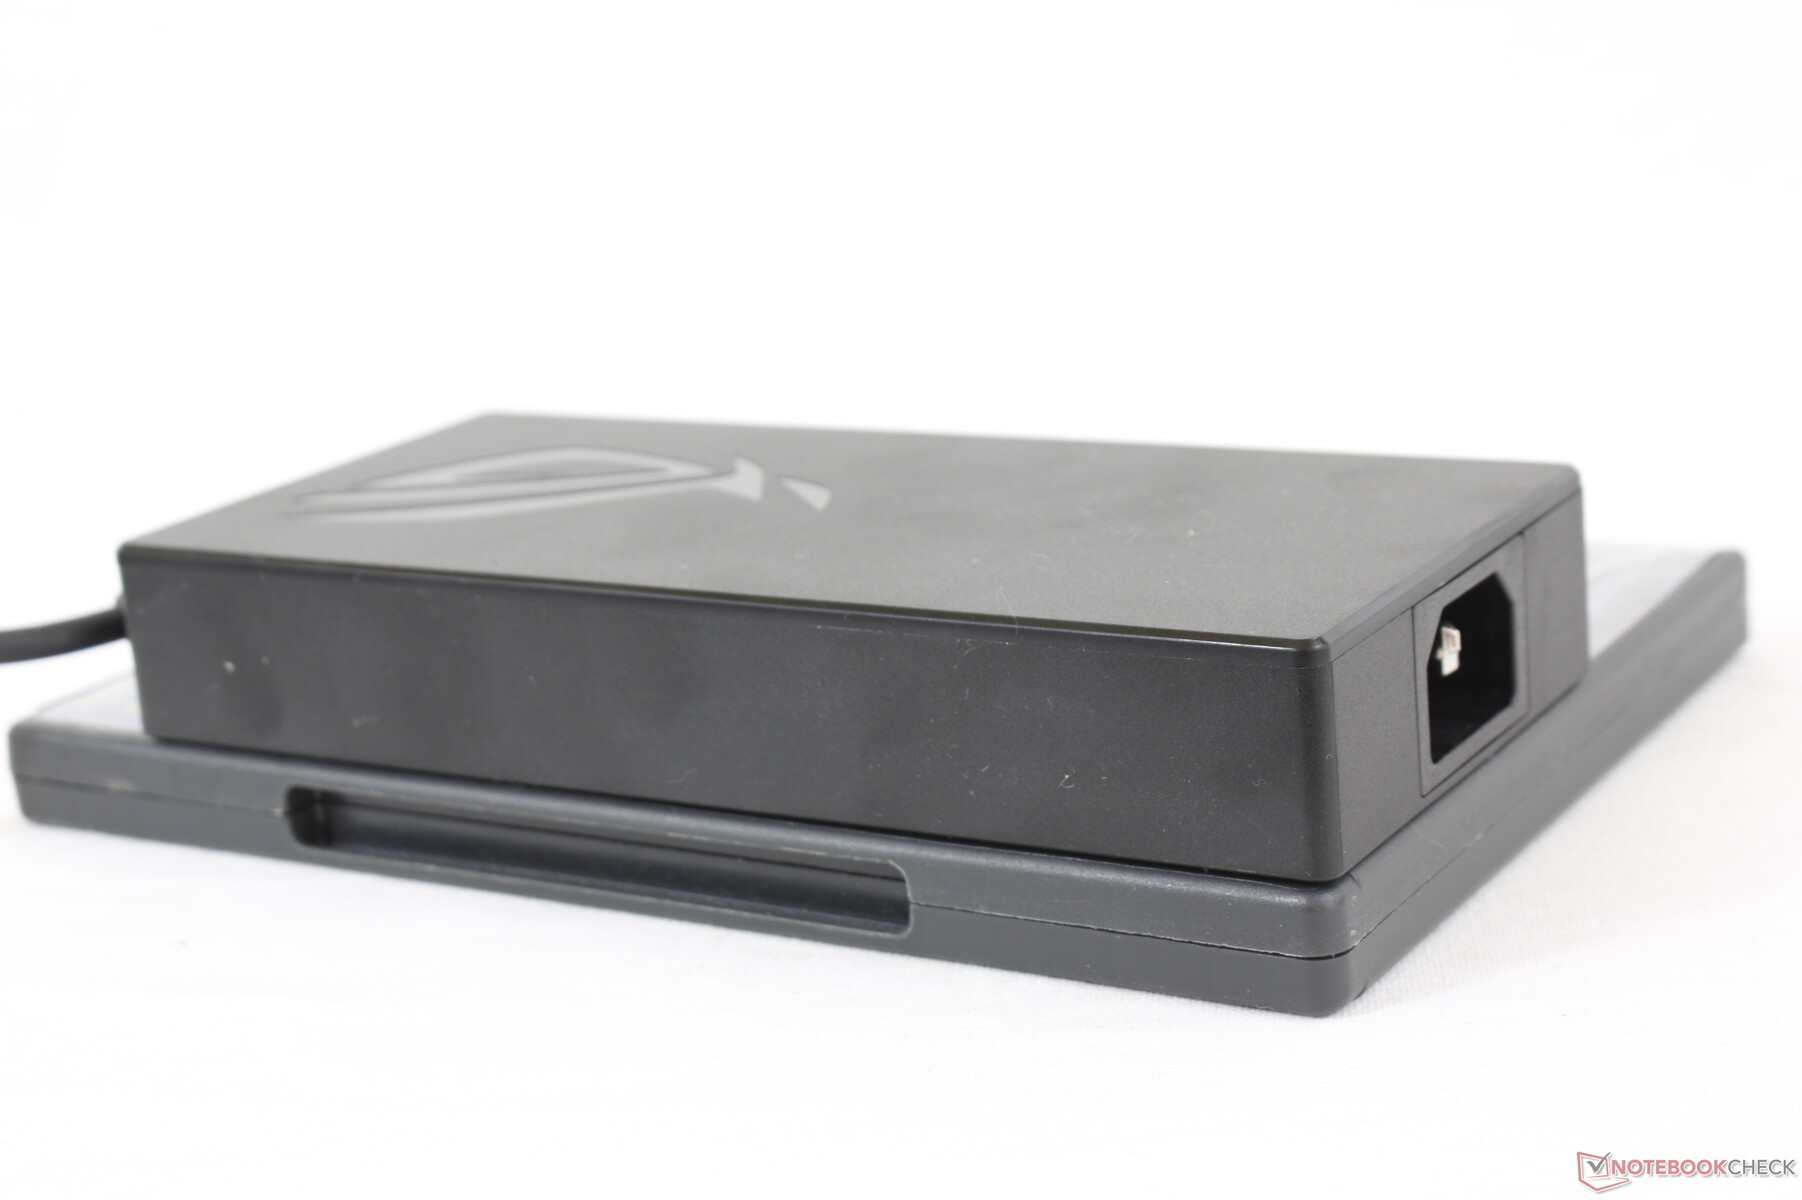
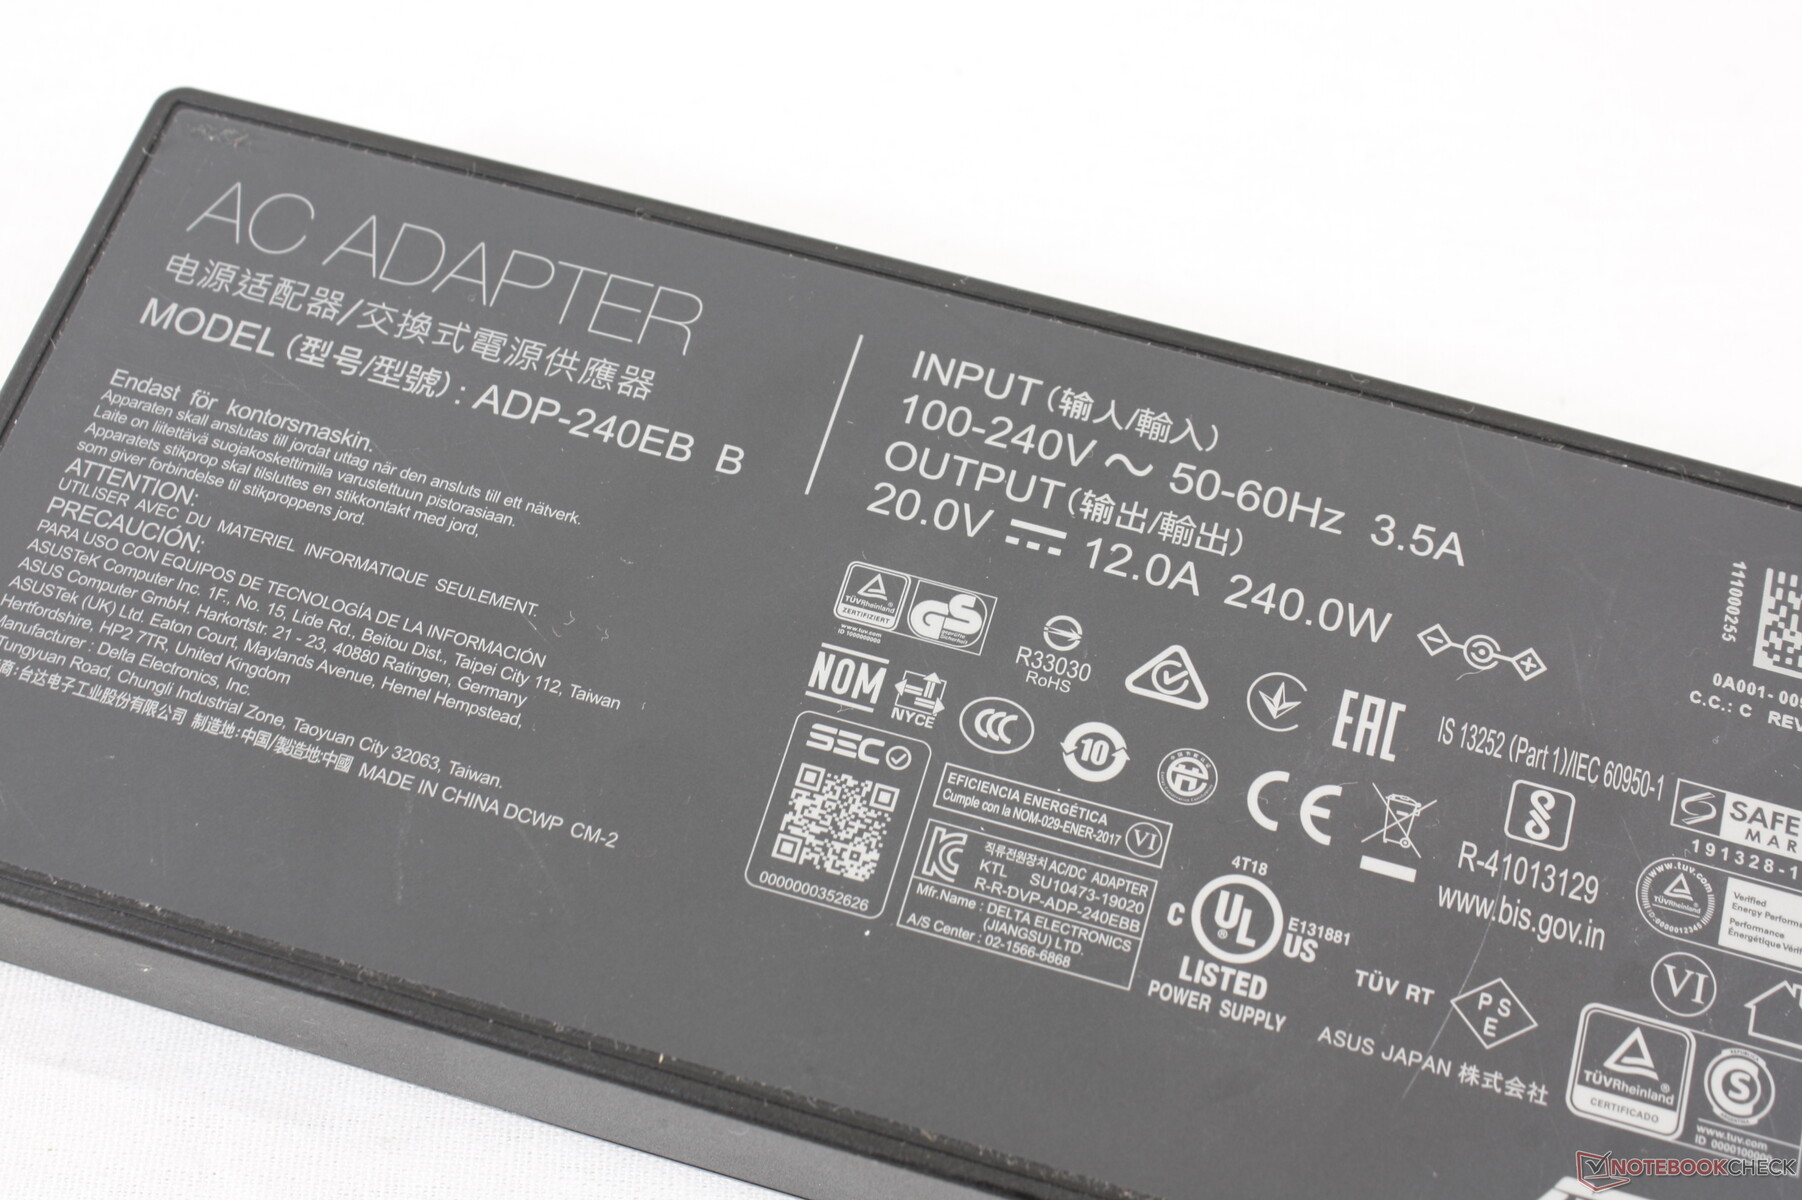
Siamo in grado di misurare un consumo massimo di 214 W dall'adattatore AC da 240 W. L'adattatore è anche leggermente più piccolo di quello del modello dell'anno scorso (16,5 x 7,5 x 2,5 cm contro 18 x 8,5 x 3,6 cm).
| Off / Standby | |
| Idle | |
| Sotto carico |
|
Leggenda:
min: | |
| Asus ROG Strix Scar 15 G533QS R9 5900HX, GeForce RTX 3080 Laptop GPU, ADATA Swordfish 2 TB, IPS, 2560x1440, 15.6" | Asus ROG Strix Scar 15 G532LWS i9-10980HK, GeForce RTX 2070 Super Mobile, 2x Intel SSD 660p 1TB SSDPEKNW010T8 (RAID 0), IPS, 1920x1080, 15.6" | MSI GE66 Raider 10SFS i9-10980HK, GeForce RTX 2070 Super Mobile, WDC PC SN730 SDBPNTY-1T00, IPS-Level, 1920x1080, 15.6" | Razer Blade 15 Advanced (Mid 2021) i7-11800H, GeForce RTX 3080 Laptop GPU, SSSTC CA6-8D1024, IPS, 1920x1080, 15.6" | Alienware m15 R5 Ryzen Edition R7 5800H, GeForce RTX 3060 Laptop GPU, Toshiba KBG40ZNS512G NVMe, IPS, 1920x1080, 15.6" | Lenovo Legion C7 15IMH05 82EH0030GE i7-10875H, GeForce RTX 2070 Max-Q, Samsung PM981a MZVLB1T0HBLR, IPS, 1920x1080, 15.6" | |
|---|---|---|---|---|---|---|
| Power Consumption | -2% | 7% | -23% | 3% | 25% | |
| Idle Minimum * (Watt) | 11.2 | 8 29% | 6 46% | 19.5 -74% | 11 2% | 7.4 34% |
| Idle Average * (Watt) | 16.4 | 9.8 40% | 14 15% | 23.3 -42% | 14 15% | 10.1 38% |
| Idle Maximum * (Watt) | 29.4 | 25.8 12% | 25 15% | 40.1 -36% | 25 15% | 12.6 57% |
| Load Average * (Watt) | 106.2 | 169 -59% | 108 -2% | 98.9 7% | 123 -16% | 114 -7% |
| Witcher 3 ultra * (Watt) | 189 | 201 -6% | 195 -3% | 174 8% | 176 7% | 144 24% |
| Load Maximum * (Watt) | 213.6 | 271.6 -27% | 280 -31% | 214 -0% | 226 -6% | 201 6% |
* ... Meglio usare valori piccoli
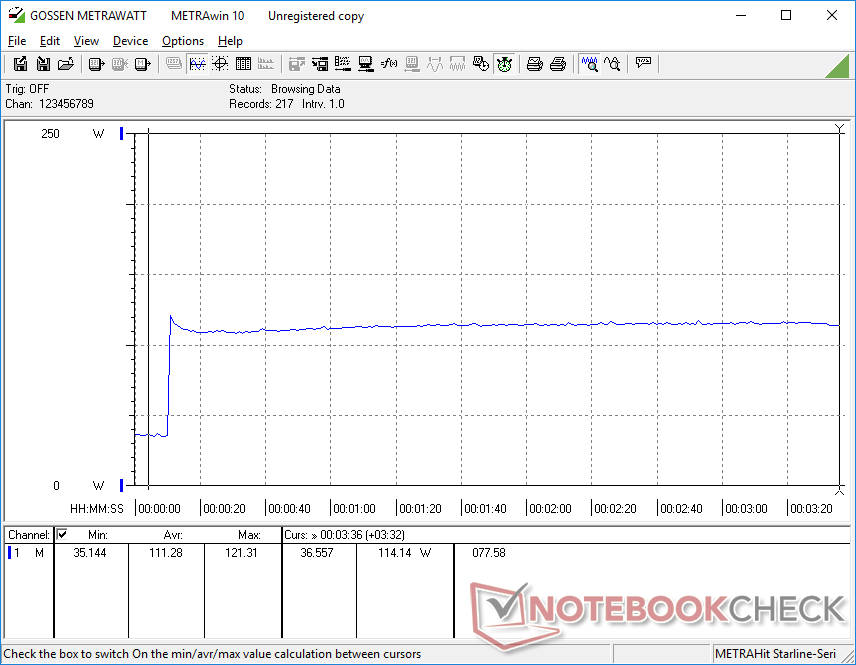
Consumo energetico The Witcher 3 / Stresstest
Durata della batteria - Batteria più grande
L'autonomia è ottima per un portatile gaming arrivando a circa 2 ore in più di quello che abbiamo registrato sul precedente modello G532LWS probabilmente a causa della batteria più grande sul nostro nuovo modello (90 Wh contro 66 Wh). Tuttavia, gli utenti devono abilitare la modalità iGPU tramite Armoury Crate e poi impostare il sistema su Balanced o inferiore per beneficiare della lunga durata della batteria.
La ricarica completa richiede poco più di 1,5 ore. La batteria si carica più lentamente se si gioca, ma fortunatamente non si scarica. La ricarica USB-C con adattatori di terze parti è supportata.
| Asus ROG Strix Scar 15 G533QS R9 5900HX, GeForce RTX 3080 Laptop GPU, 90 Wh | Asus ROG Strix Scar 15 G532LWS i9-10980HK, GeForce RTX 2070 Super Mobile, 66 Wh | MSI GE66 Raider 10SFS i9-10980HK, GeForce RTX 2070 Super Mobile, 99.99 Wh | Razer Blade 15 Advanced (Mid 2021) i7-11800H, GeForce RTX 3080 Laptop GPU, 80 Wh | Alienware m15 R5 Ryzen Edition R7 5800H, GeForce RTX 3060 Laptop GPU, 86 Wh | Lenovo Legion C7 15IMH05 82EH0030GE i7-10875H, GeForce RTX 2070 Max-Q, 80 Wh | |
|---|---|---|---|---|---|---|
| Autonomia della batteria | -18% | -6% | -19% | -11% | -2% | |
| Reader / Idle (h) | 11.1 | 8.1 -27% | 7.6 -32% | 14.7 32% | 12.7 14% | |
| WiFi v1.3 (h) | 7.3 | 4.9 -33% | 6.1 -16% | 5.9 -19% | 5.1 -30% | 5.9 -19% |
| Load (h) | 1.4 | 1.5 7% | 1.8 29% | 0.9 -36% | 1.4 0% | |
| Witcher 3 ultra (h) | 1.6 |
Pro
Contro
Valutazione complessiva dell'Asus Strix Scar 15 G533QS - Un altro potente concorrente AMD di Asus

Lo Strix Scar 15 G533QS è un aggiornamento significativo dal G532LWS che è stato lanciato solo un anno fa. Le prestazioni della CPU sono superiori del 30%, le prestazioni grafiche sono superiori del 30%, la batteria è più grande e più duratura, la tastiera e il clickpad sono completamente rinnovati, le ventole sono più silenziose durante il gioco e il nuovo display da 165 Hz 1440p si abbina molto bene all'hardware di base. È un po' più spesso, tuttavia, ma questo è un piccolo prezzo da pagare per la lunga lista di benefici che vengono con il nuovo modello.
L'ultimo ROG Strix Scar 15 da 15,6" di Asus si sente più completo e più facile da aggiornare rispetto alla più sottile lineup Zephyrus. Tuttavia, i tasti meccanici inevitabilmente rumorosi lo rendono un povero portatile per ambienti sensibili al rumore.
Il più grande concorrente o alternativa all'Asus G533 è l'attuale MSI GE66 dato che entrambi sono dotati di caratteristiche simili tra cui 2x SODIMM, 2x M.2 SSD, e anche una barra luminosa LED RGB sul bordo anteriore. Lo chassis MSI sembra più forte, ma le cerniere dell'Asus sono più grandi e più rigide per un miglior senso di longevità, mentre i suoi switches meccanici dei tasti non sono disponibili sull'MSI.
Prezzo e disponibilità
Asus ROG Strix Scar 15 G533QS
- 07/23/2021 v7 (old)
Allen Ngo
