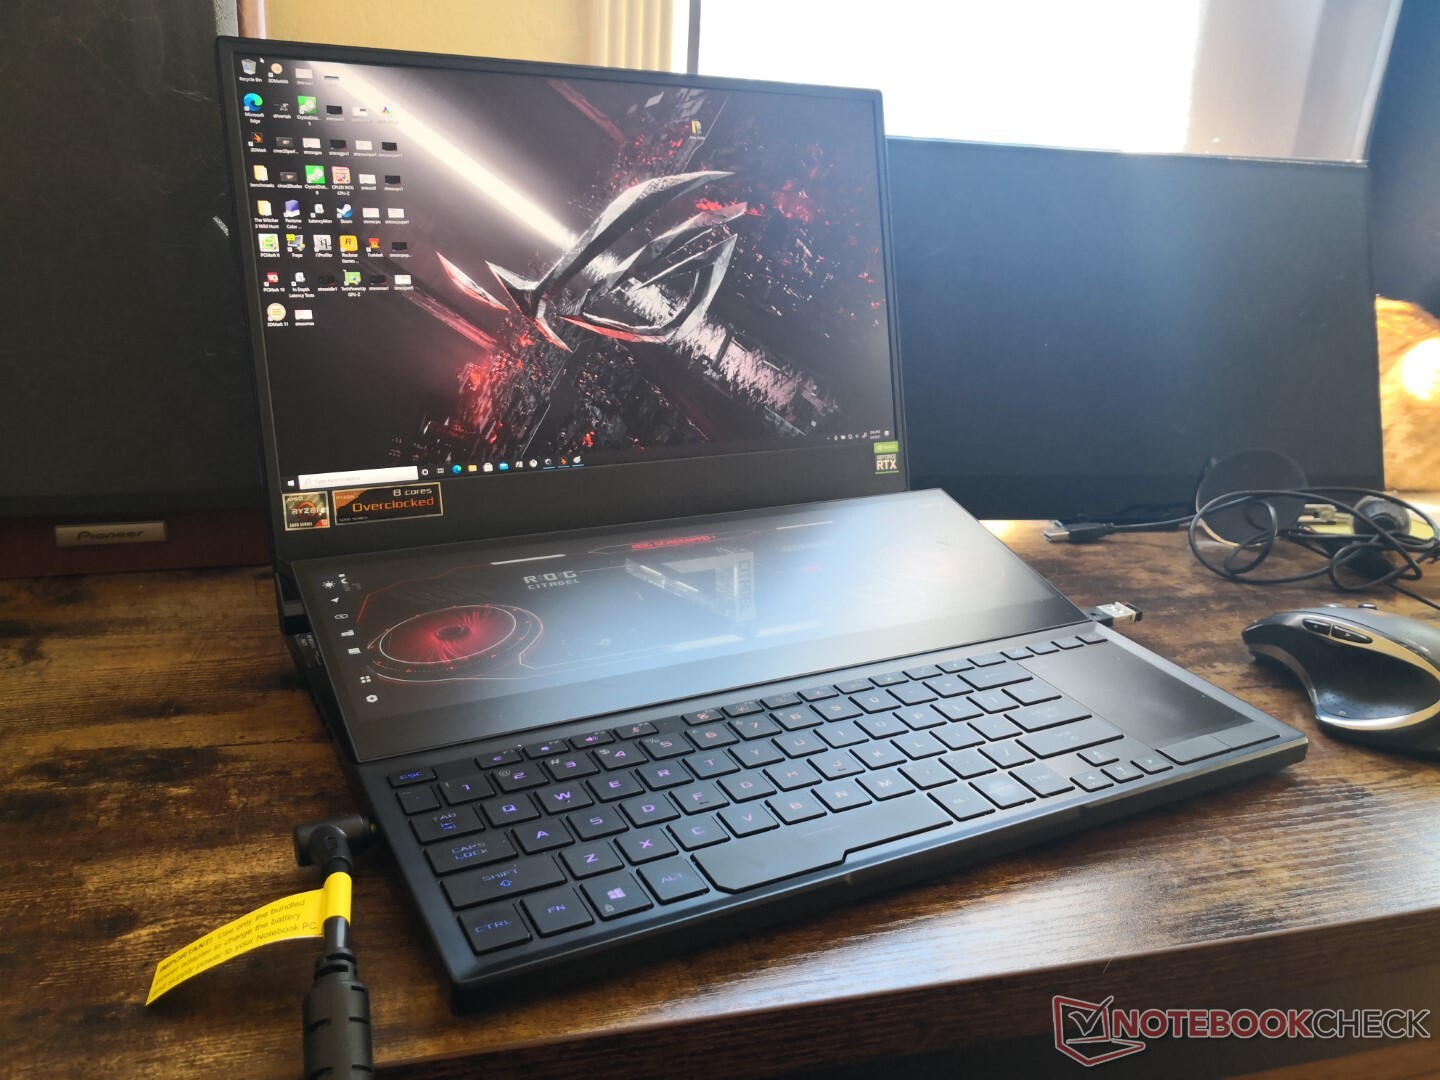
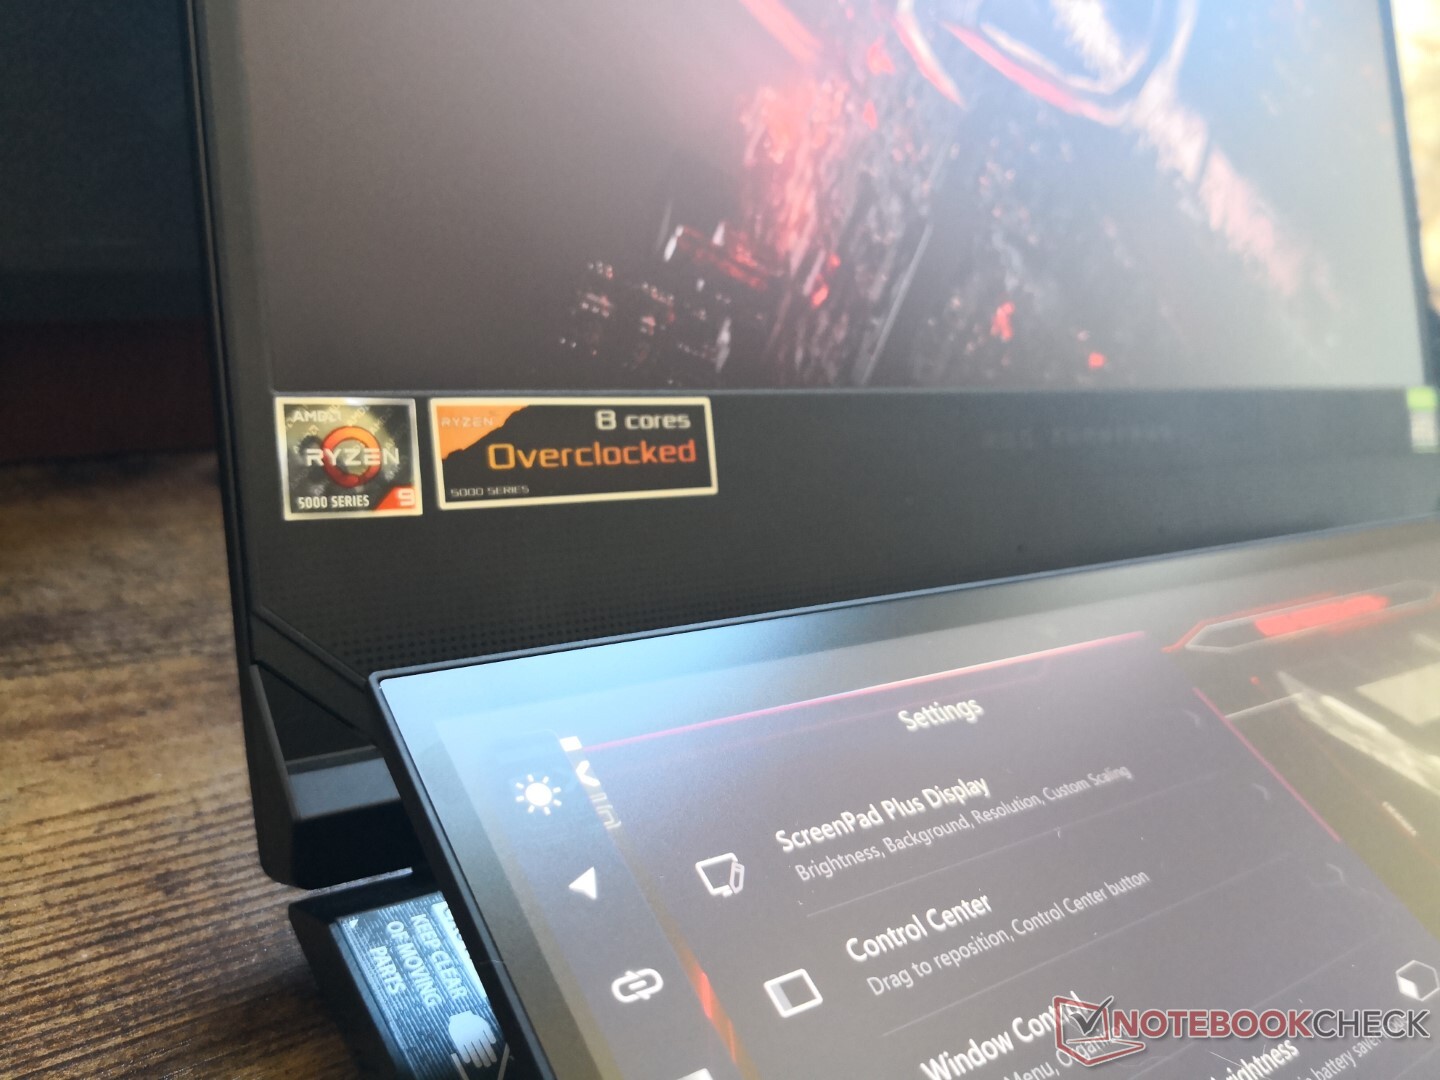
L'AMD Ryzen 9 5900HX è una bestia mobile: Recensione del portatile Asus ROG Zephyrus Duo 15 SE GX551QS

La serie Zephyrus Duo 15 SE GX551 è la versione AMD dello Zephyrus Duo 15 GX550 alimentato da Intel dello scorso anno. Sostituisce efficacemente tutte le CPU Comet Lake di decima generazione con opzioni Zen 3 Cezanne, tra cui il Ryzen 7 5800H e il Ryzen 9 5900HX. Anche la GPU riceve un aggiornamento da Nvidia Pascal a Ampere fino a GeForce RTX 3080 insieme a nuovi pannelli FHD a 300 Hz e 4K a 120 Hz.
A parte le nuove CPU, GPU e il citato display, lo chassis del GX551 del 2021 rimane identico al GX550 del 2020 e quindi vi consigliamo di controllare la nostra recensione del GX550 qui per saperne di più sulle caratteristiche fisiche del sistema. Questa recensione si concentrerà più sul display e sulle prestazioni del GX551 poiché l'Asus è uno dei primi ad essere dotato di una CPU Zen 3 della serie H. Il confronto con le alternative Core i9 come l'MSI GE66, il Lenovo Legion 7, o lo Strix Scar 15 dell'Asus è inevitabile.
La configurazione in esame oggi è la versione di fascia alta dello Zephyrus Duo 15 SE GX551QS che costa circa 3700 dollari al dettaglio.
Altre recensioni Asus:
potential competitors in comparison
Punteggio | Data | Modello | Peso | Altezza | Dimensione | Risoluzione | Prezzo |
|---|---|---|---|---|---|---|---|
| 86.6 % v7 (old) | 02/2021 | Asus ROG Zephyrus Duo 15 SE GX551QS R9 5900HX, GeForce RTX 3080 Laptop GPU | 2.5 kg | 20.9 mm | 15.60" | 3840x2160 | |
| 84.5 % v7 (old) | 07/2020 | Asus ROG Zephyrus Duo 15 GX550LXS i9-10980HK, GeForce RTX 2080 Super Max-Q | 2.5 kg | 20 mm | 15.60" | 3840x2160 | |
| 85.9 % v7 (old) | 08/2020 | Razer Blade 15 RTX 2080 Super Max-Q i7-10875H, GeForce RTX 2080 Super Max-Q | 2.2 kg | 17.8 mm | 15.60" | 1920x1080 | |
| 84.6 % v7 (old) | 11/2019 | Eurocom Sky X4C i9-9900KS i9-9900KS, GeForce RTX 2080 Mobile | 3.6 kg | 38 mm | 15.60" | 1920x1080 | |
| 84.6 % v7 (old) | 07/2020 | MSI GE66 Raider 10SFS i9-10980HK, GeForce RTX 2070 Super Mobile | 2.4 kg | 23 mm | 15.60" | 1920x1080 | |
| 82.8 % v7 (old) | 05/2020 | MSI GS66 Stealth 10SFS i9-10980HK, GeForce RTX 2070 Super Max-Q | 2.2 kg | 20 mm | 15.60" | 1920x1080 |
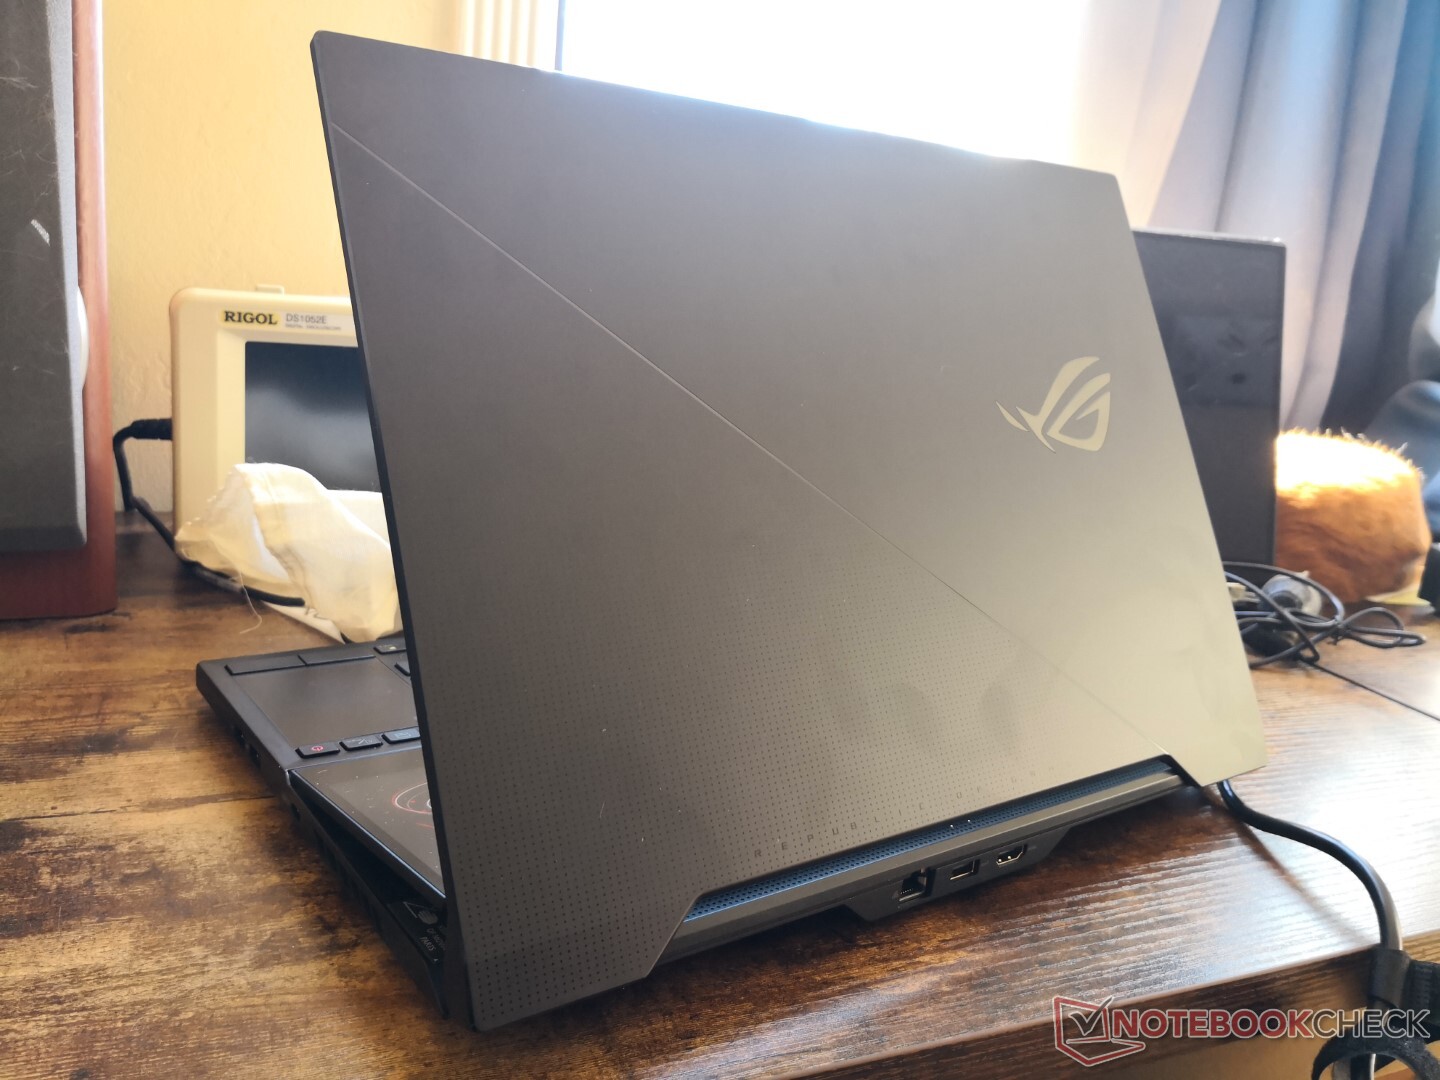
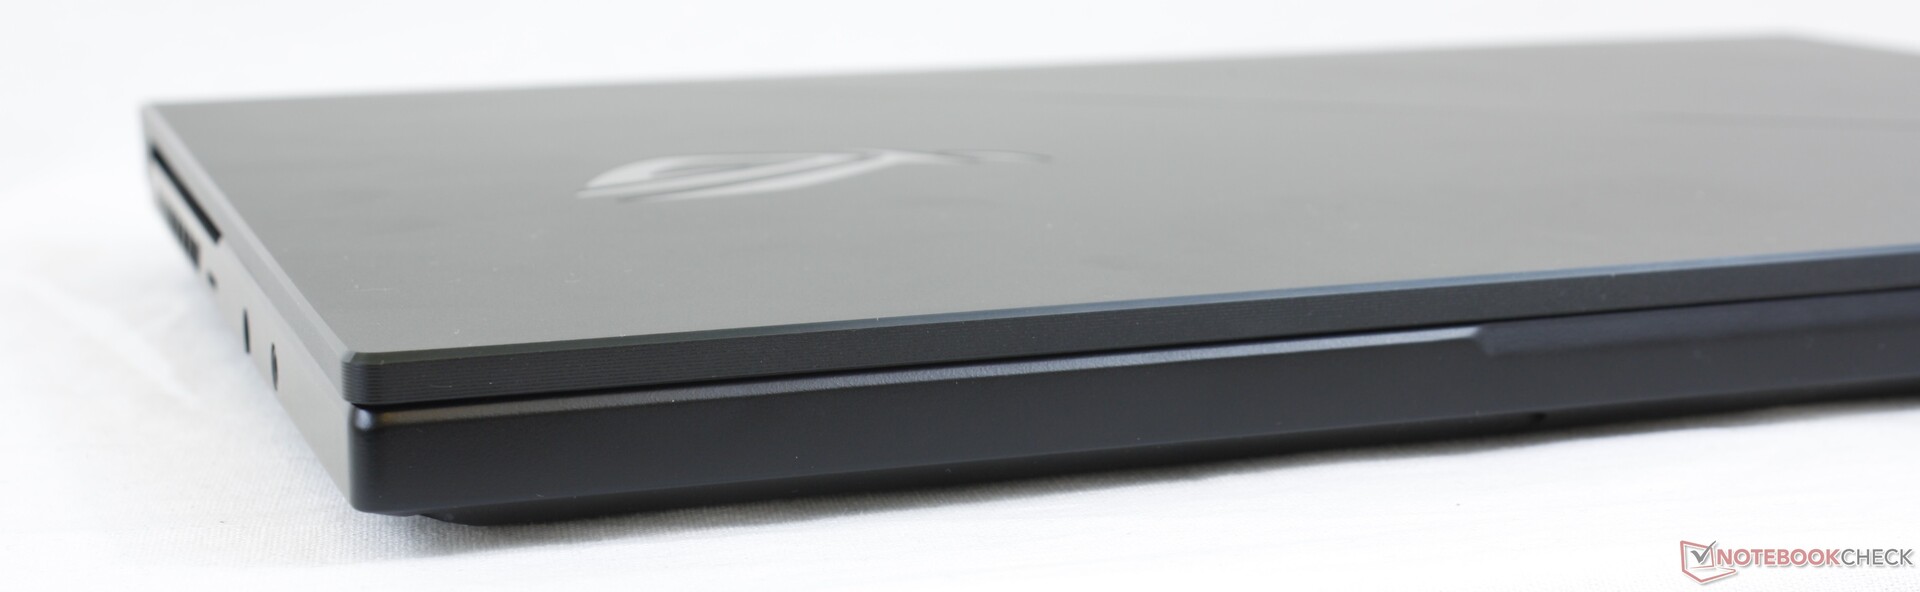
Case
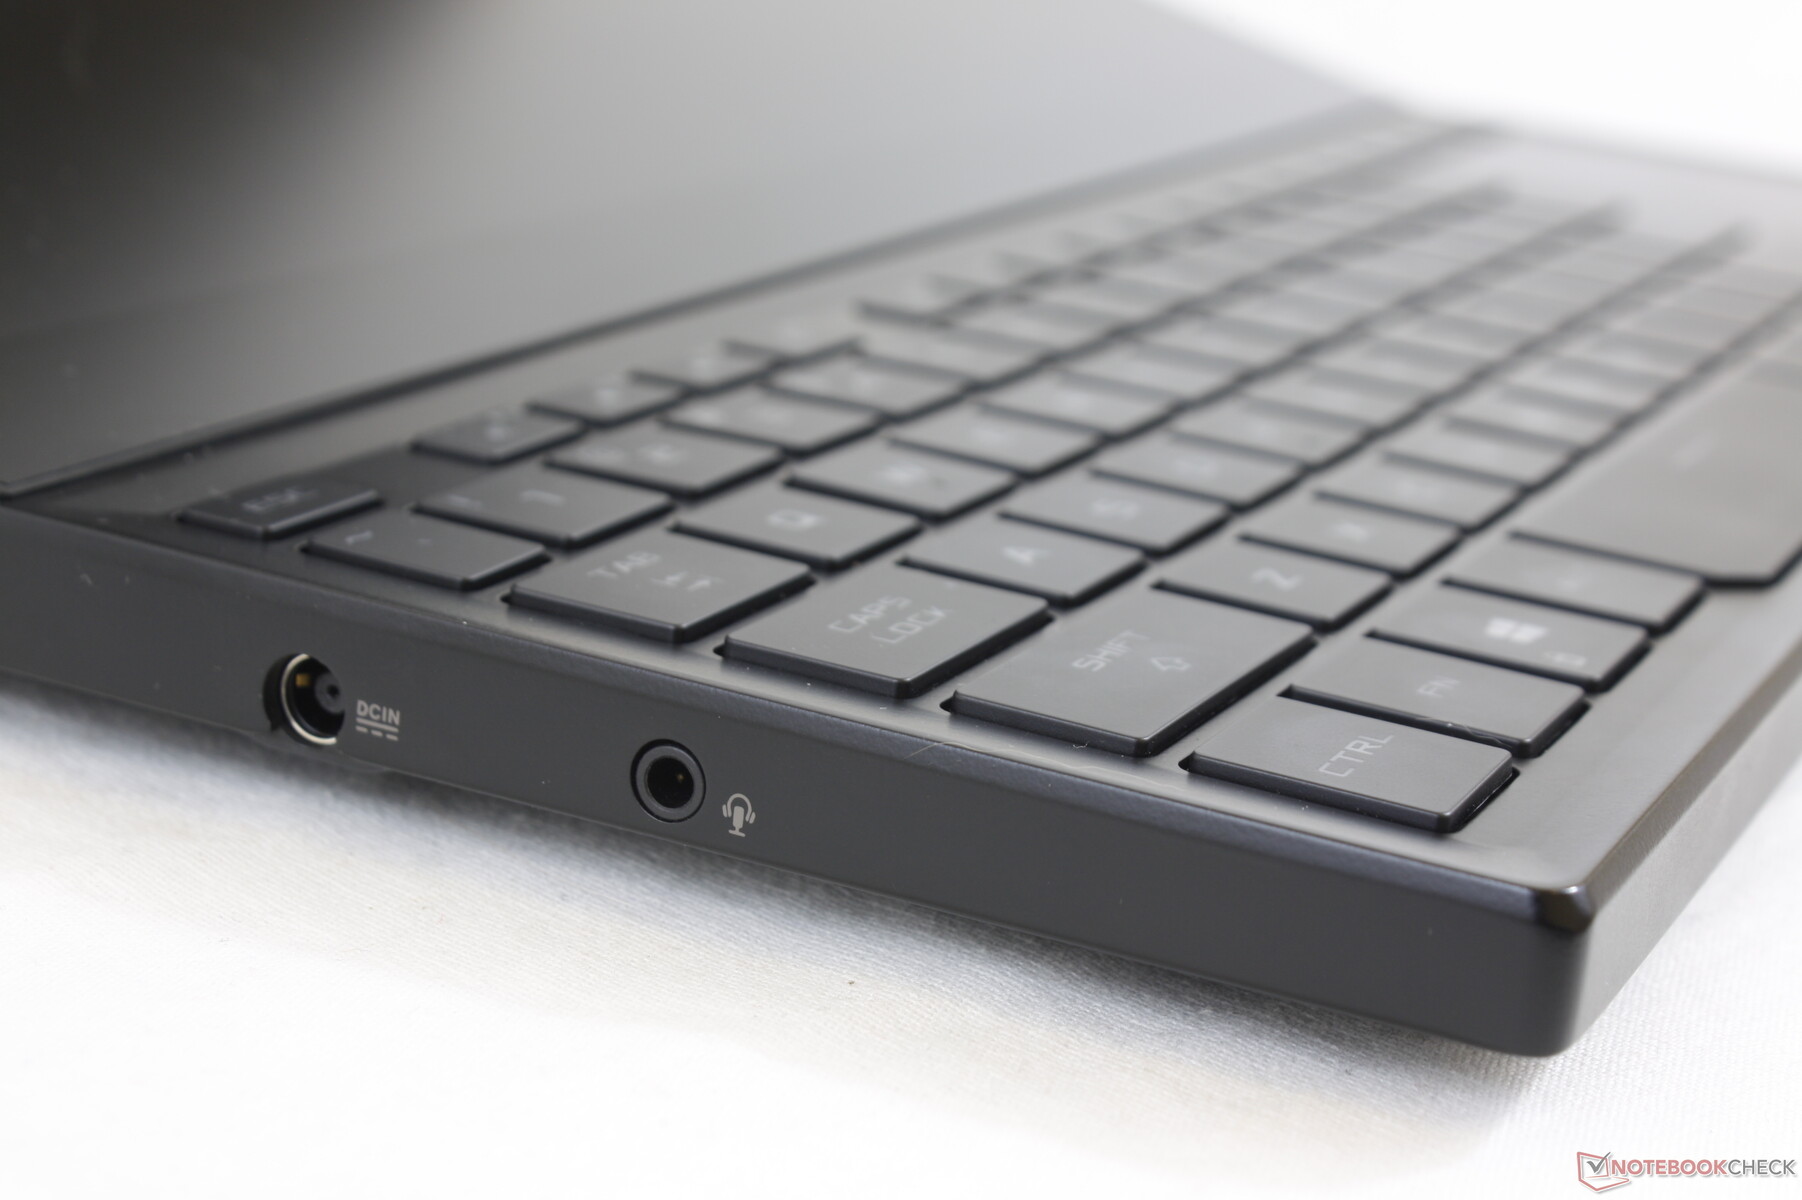
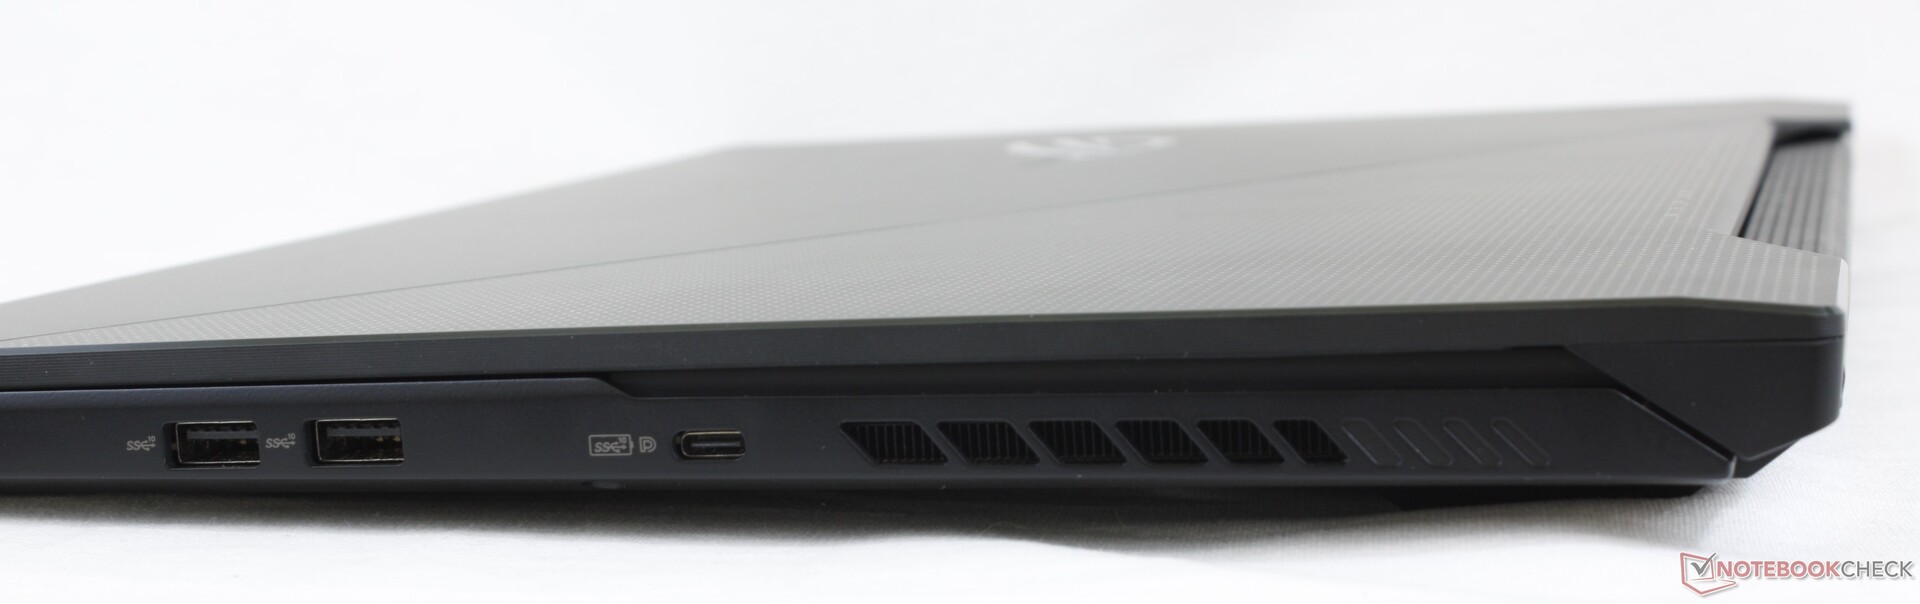
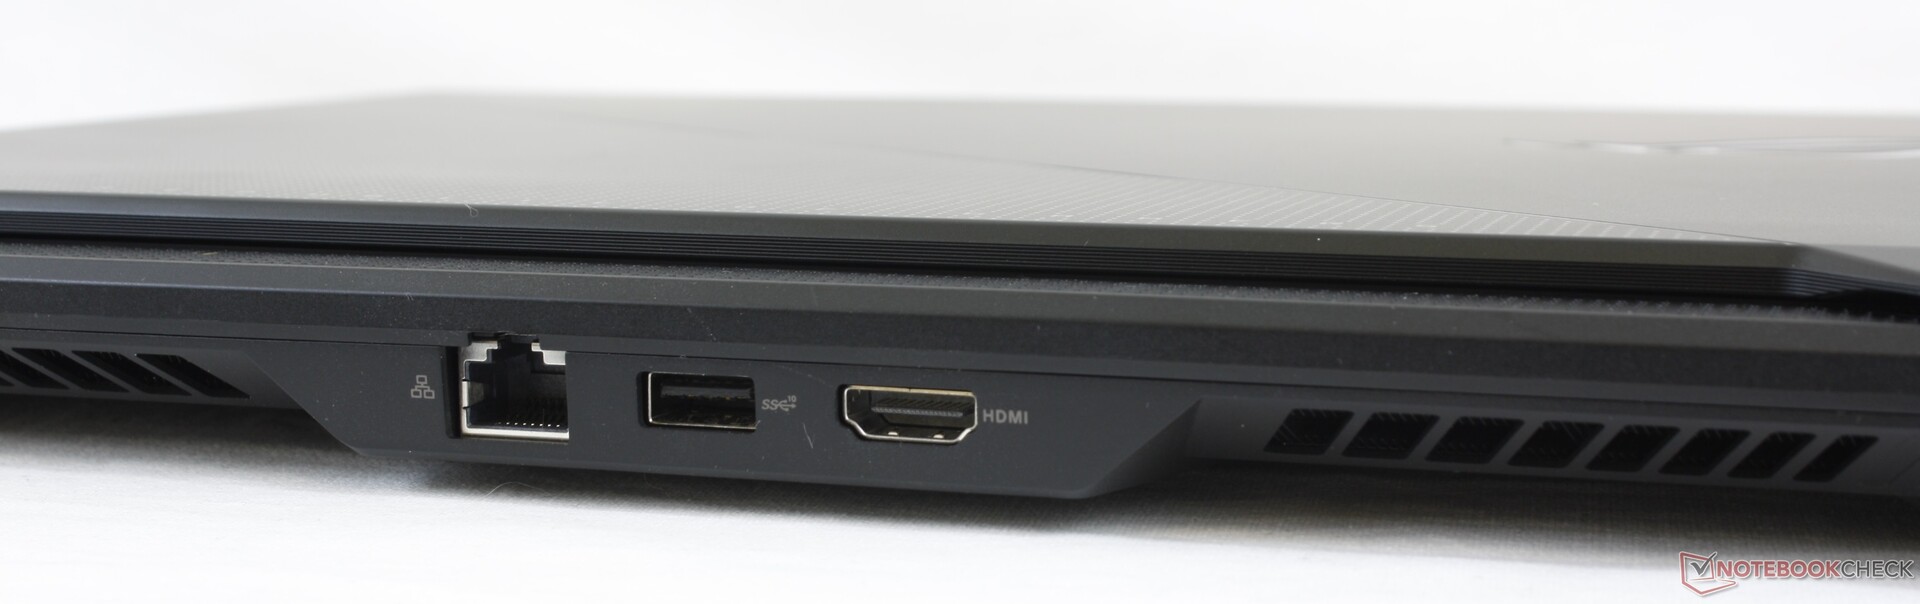
Connessioni
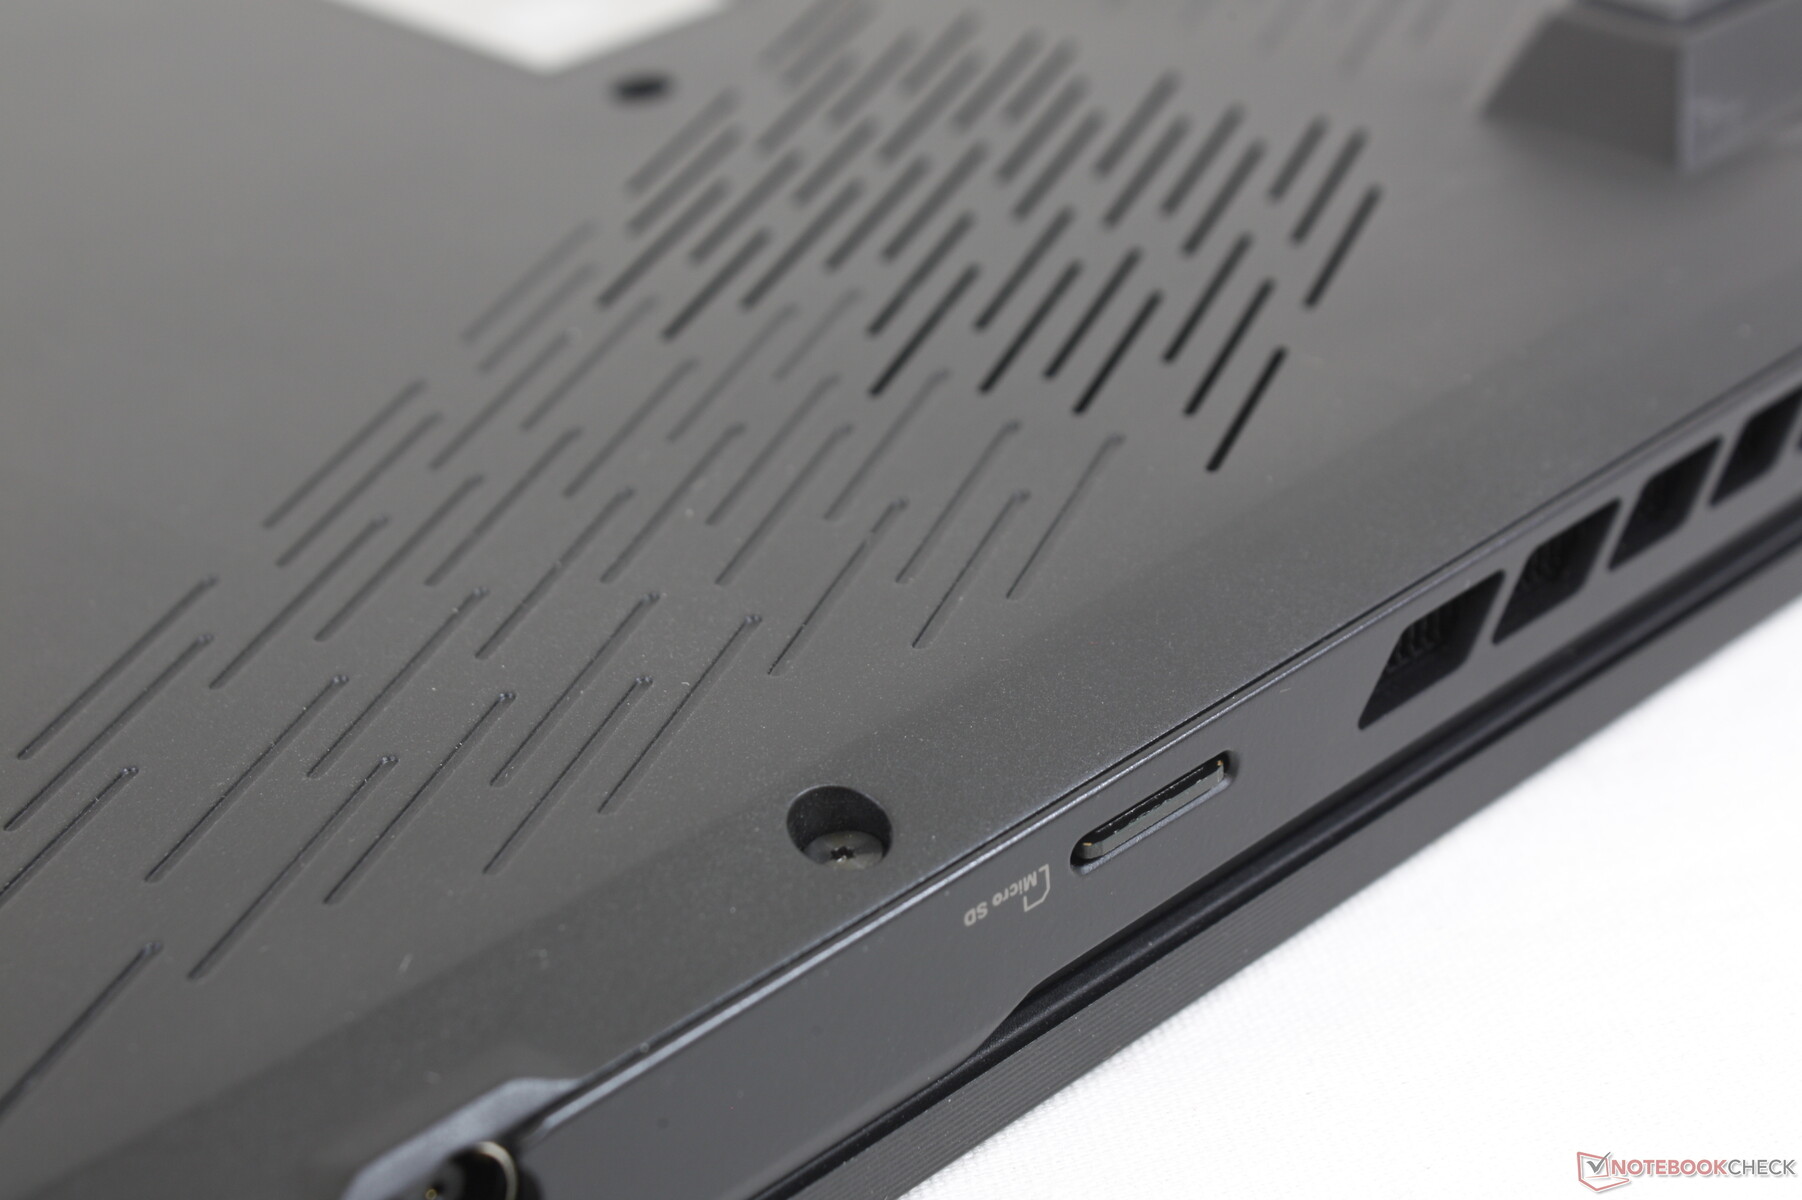
Anche se le porte sono identiche al GX550 dell'anno scorso, la porta USB-C sul GX551 non supporta Thunderbolt probabilmente a causa della mancanza di un controller dedicato sul chipset AMD. Sarebbe stato anche bello vedere 10 Gbit Ethernet invece del solito 1 Gbit.
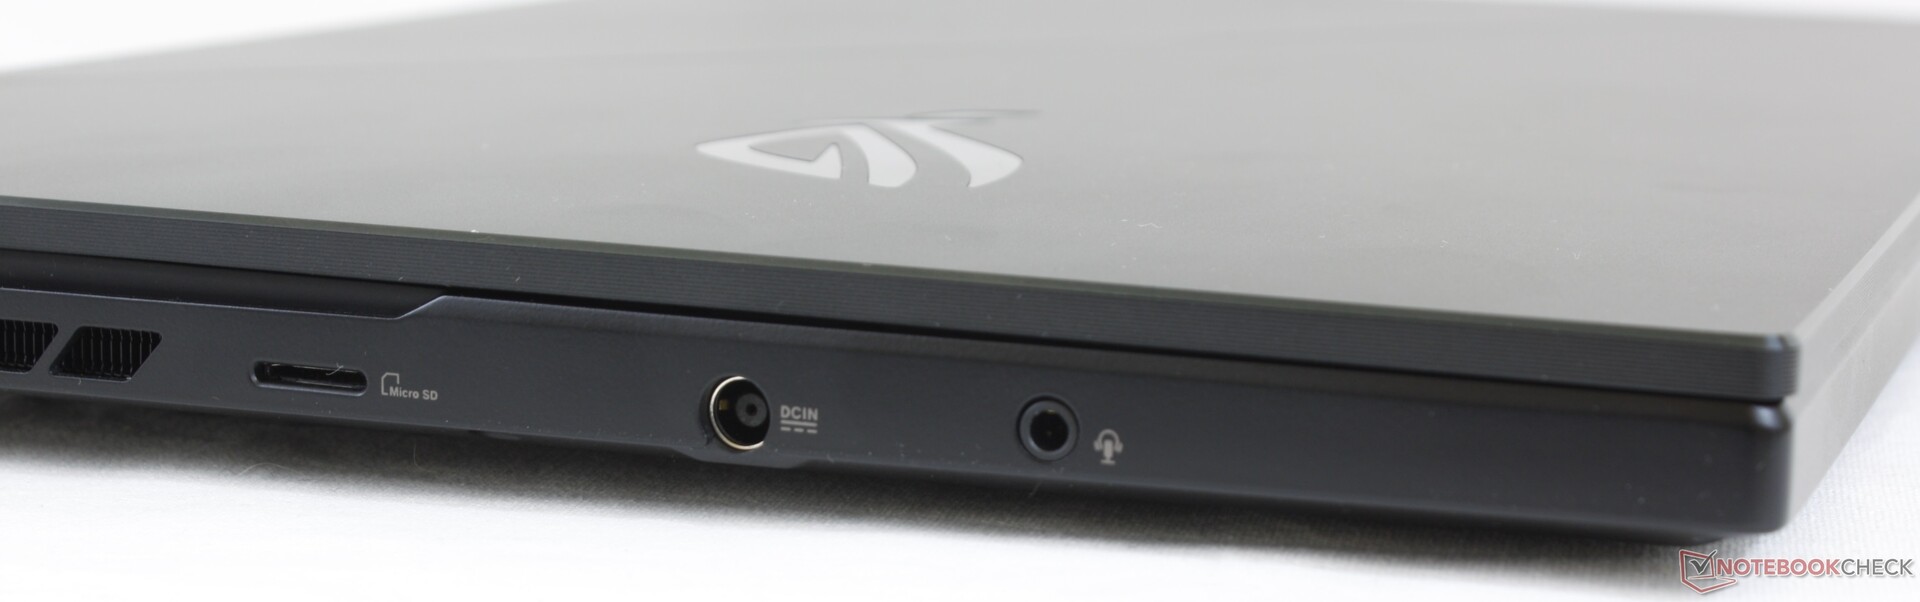
Lettore di schede SD
Asus pubblicizza velocità di trasferimento MicroSD fino a 312 MB/s, ma siamo solo in grado di confermare fino a 217 MB/s poiché siamo limitati alla nostra scheda Toshiba Exceria Pro M501 UHS-II da 32 GB.
| SD Card Reader | |
| average JPG Copy Test (av. of 3 runs) | |
| Razer Blade 15 RTX 2080 Super Max-Q (Toshiba Exceria Pro SDXC 64 GB UHS-II) | |
| Eurocom Sky X4C i9-9900KS (Toshiba Exceria Pro SDXC 64 GB UHS-II) | |
| MSI GE66 Raider 10SFS (Toshiba Exceria Pro SDXC 64 GB UHS-II) | |
| Asus ROG Zephyrus Duo 15 SE GX551QS (Toshiba Exceria Pro M501 microSDXC 32GB) | |
| maximum AS SSD Seq Read Test (1GB) | |
| Asus ROG Zephyrus Duo 15 SE GX551QS (Toshiba Exceria Pro M501 microSDXC 32GB) | |
| Razer Blade 15 RTX 2080 Super Max-Q (Toshiba Exceria Pro SDXC 64 GB UHS-II) | |
| Eurocom Sky X4C i9-9900KS (Toshiba Exceria Pro SDXC 64 GB UHS-II) | |
| MSI GE66 Raider 10SFS (Toshiba Exceria Pro SDXC 64 GB UHS-II) | |
Comunicazioni
L'Intel AX200 è dotato di serie di connessione Wi-Fi 6 e Bluetooth 5.1. Non abbiamo avuto problemi quando è stato accoppiato al nostro router di prova Netgear RAX200.
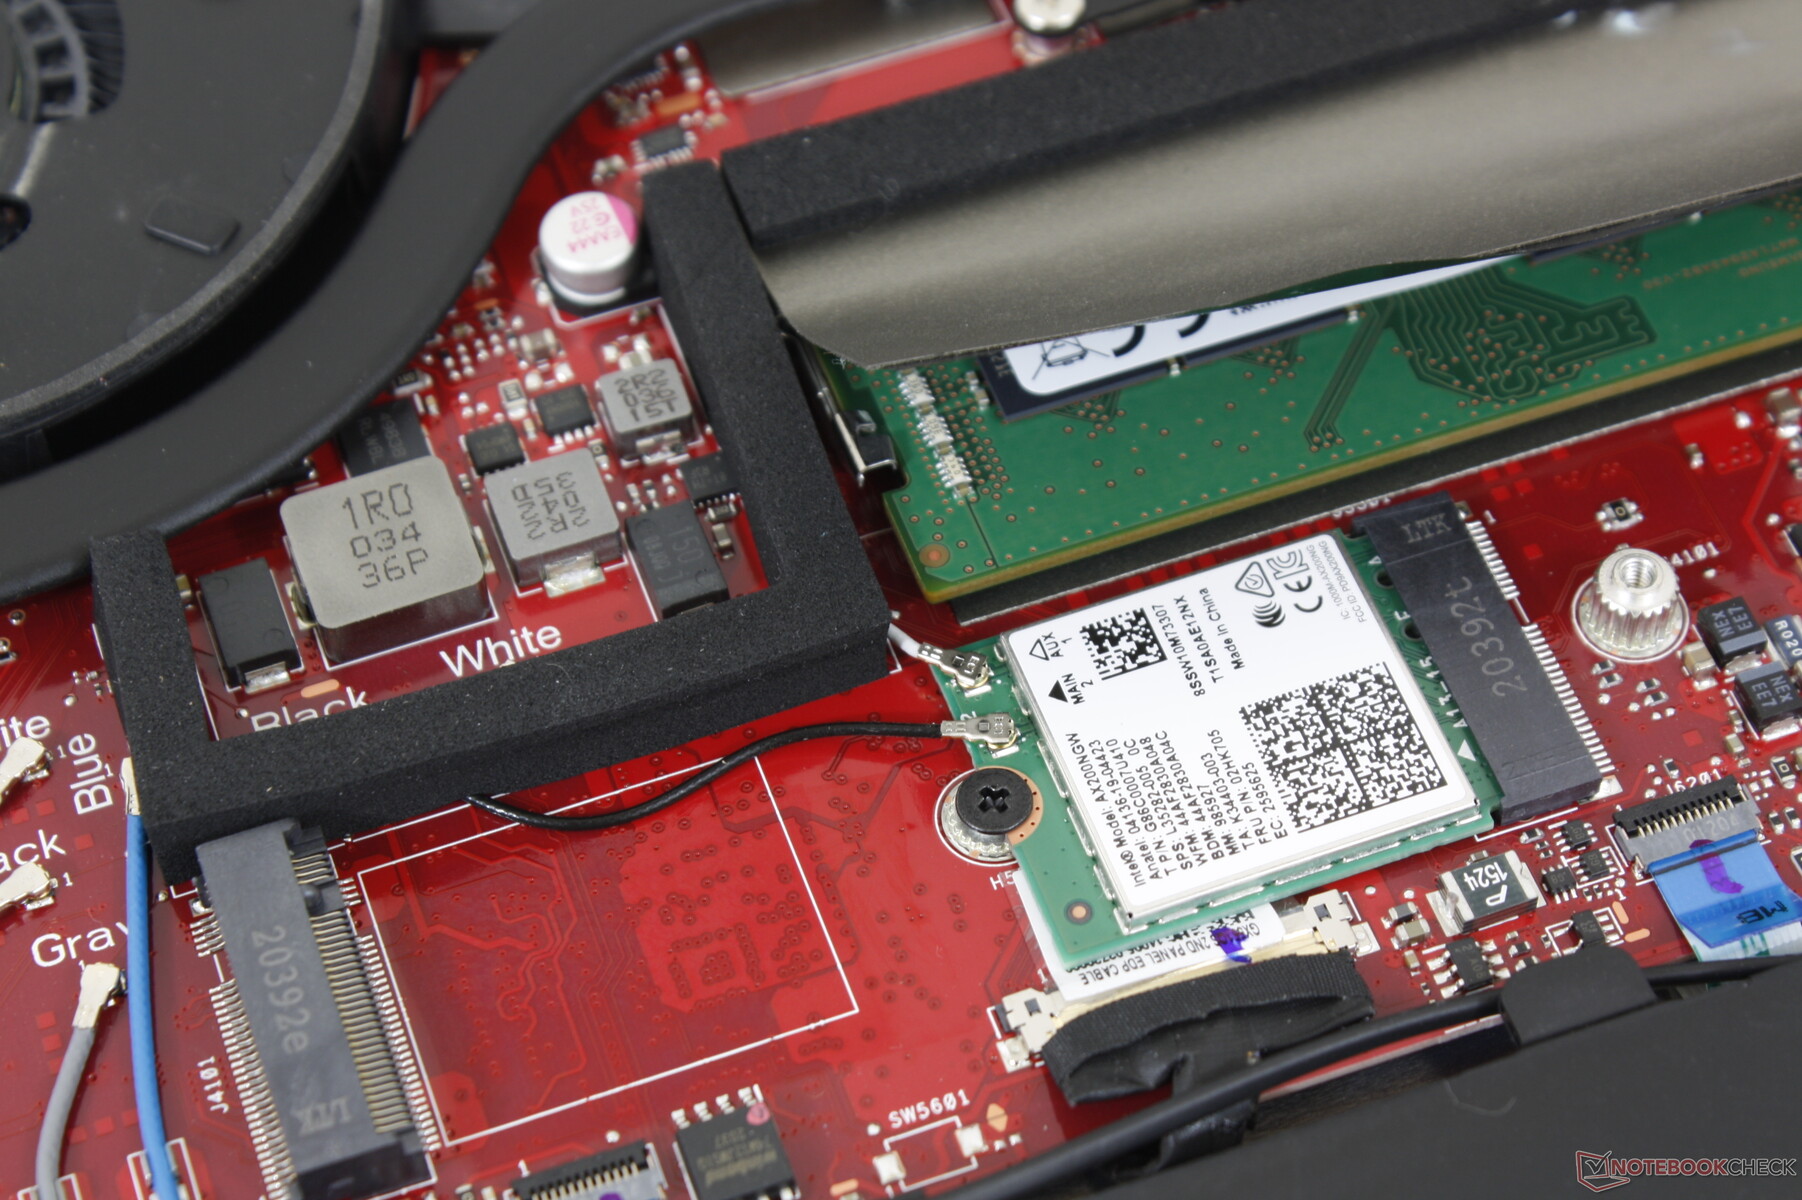
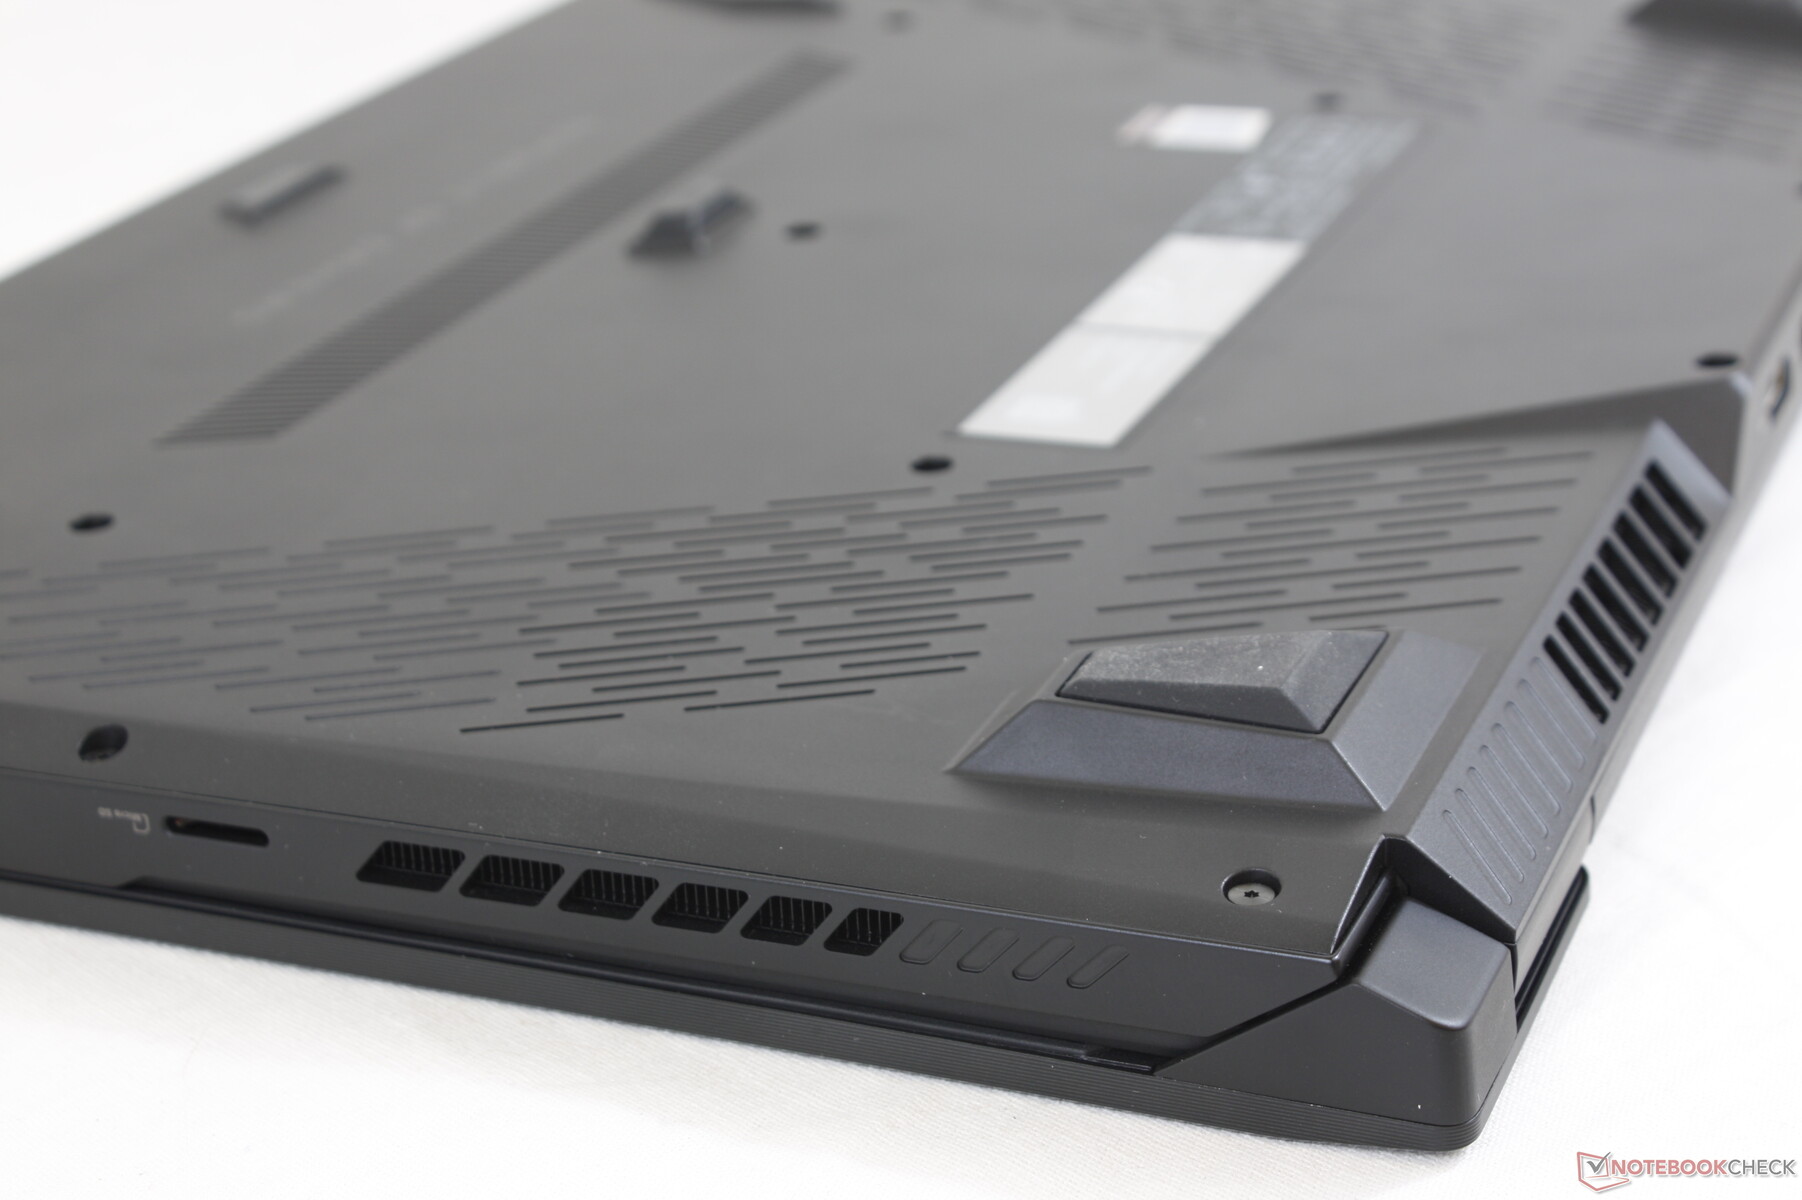
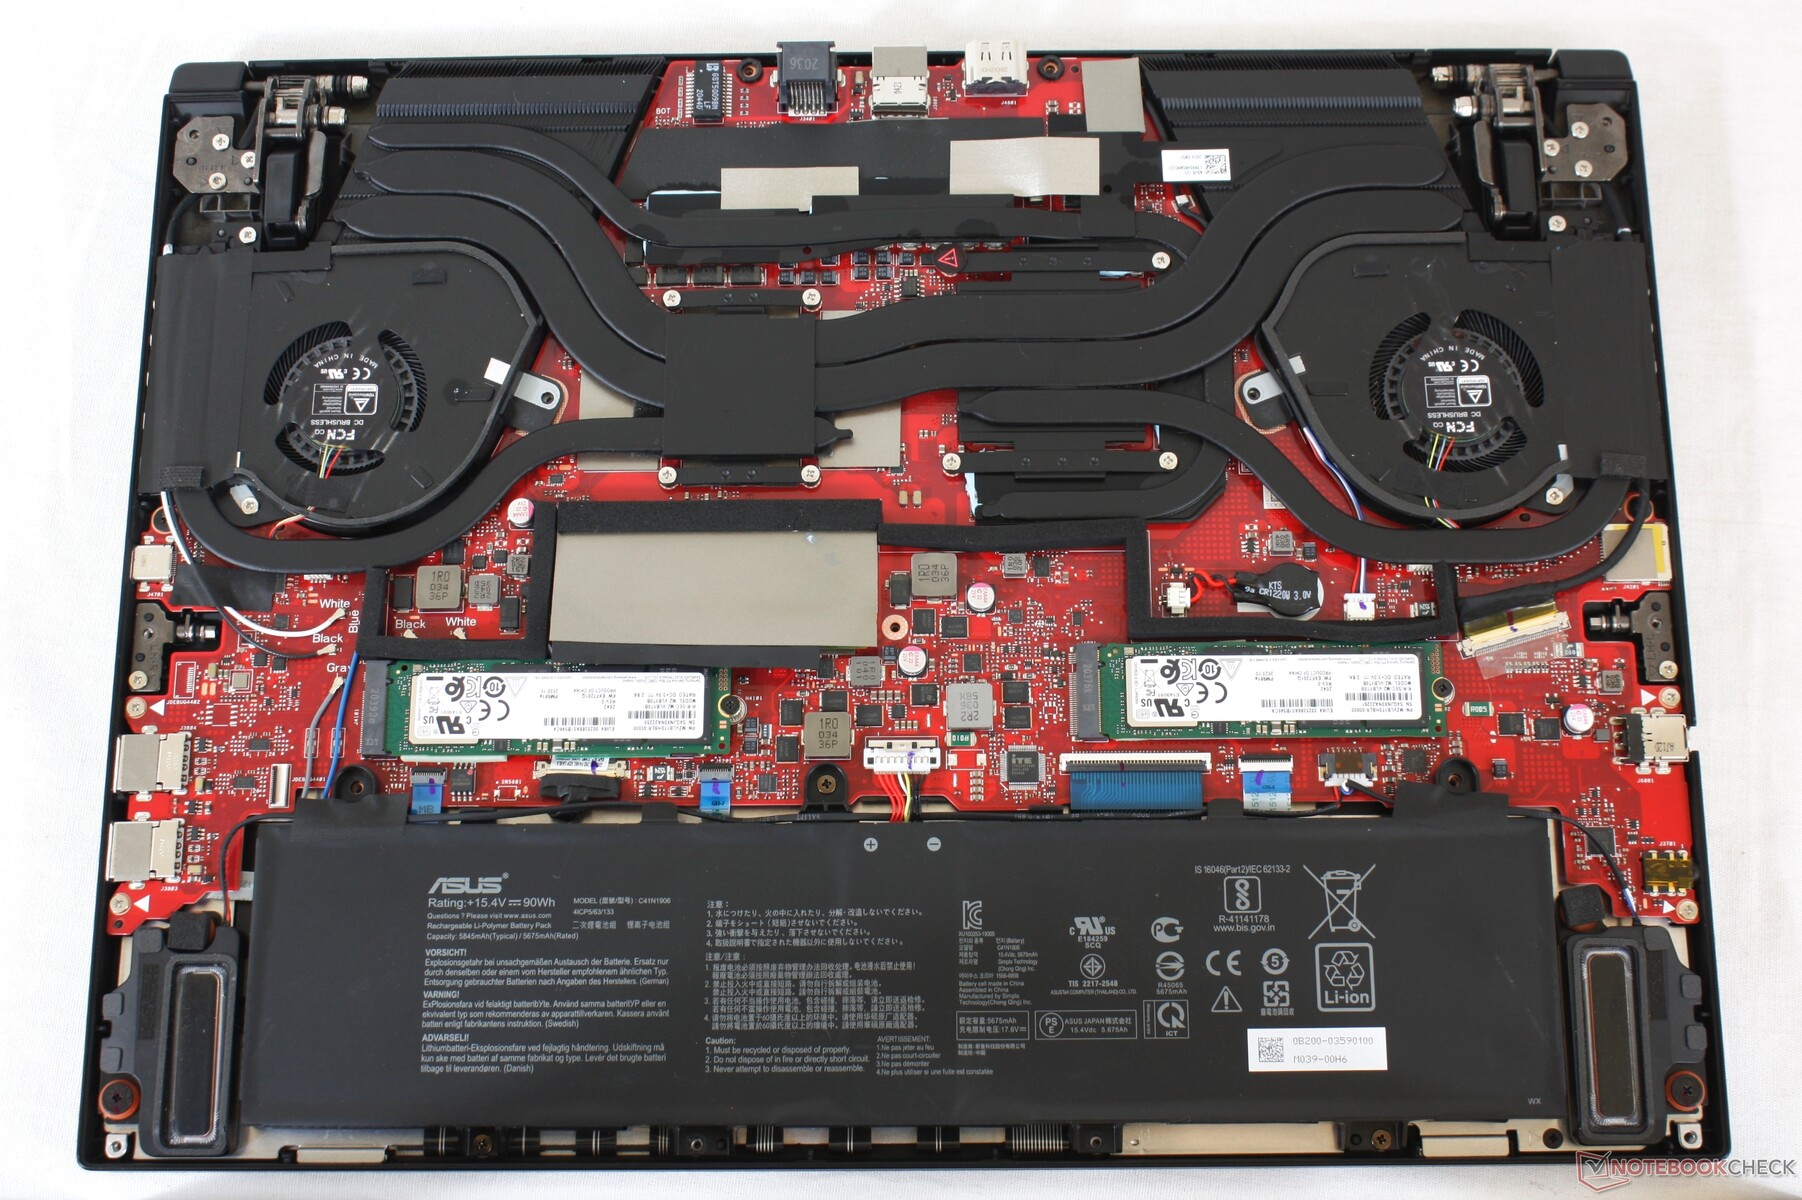
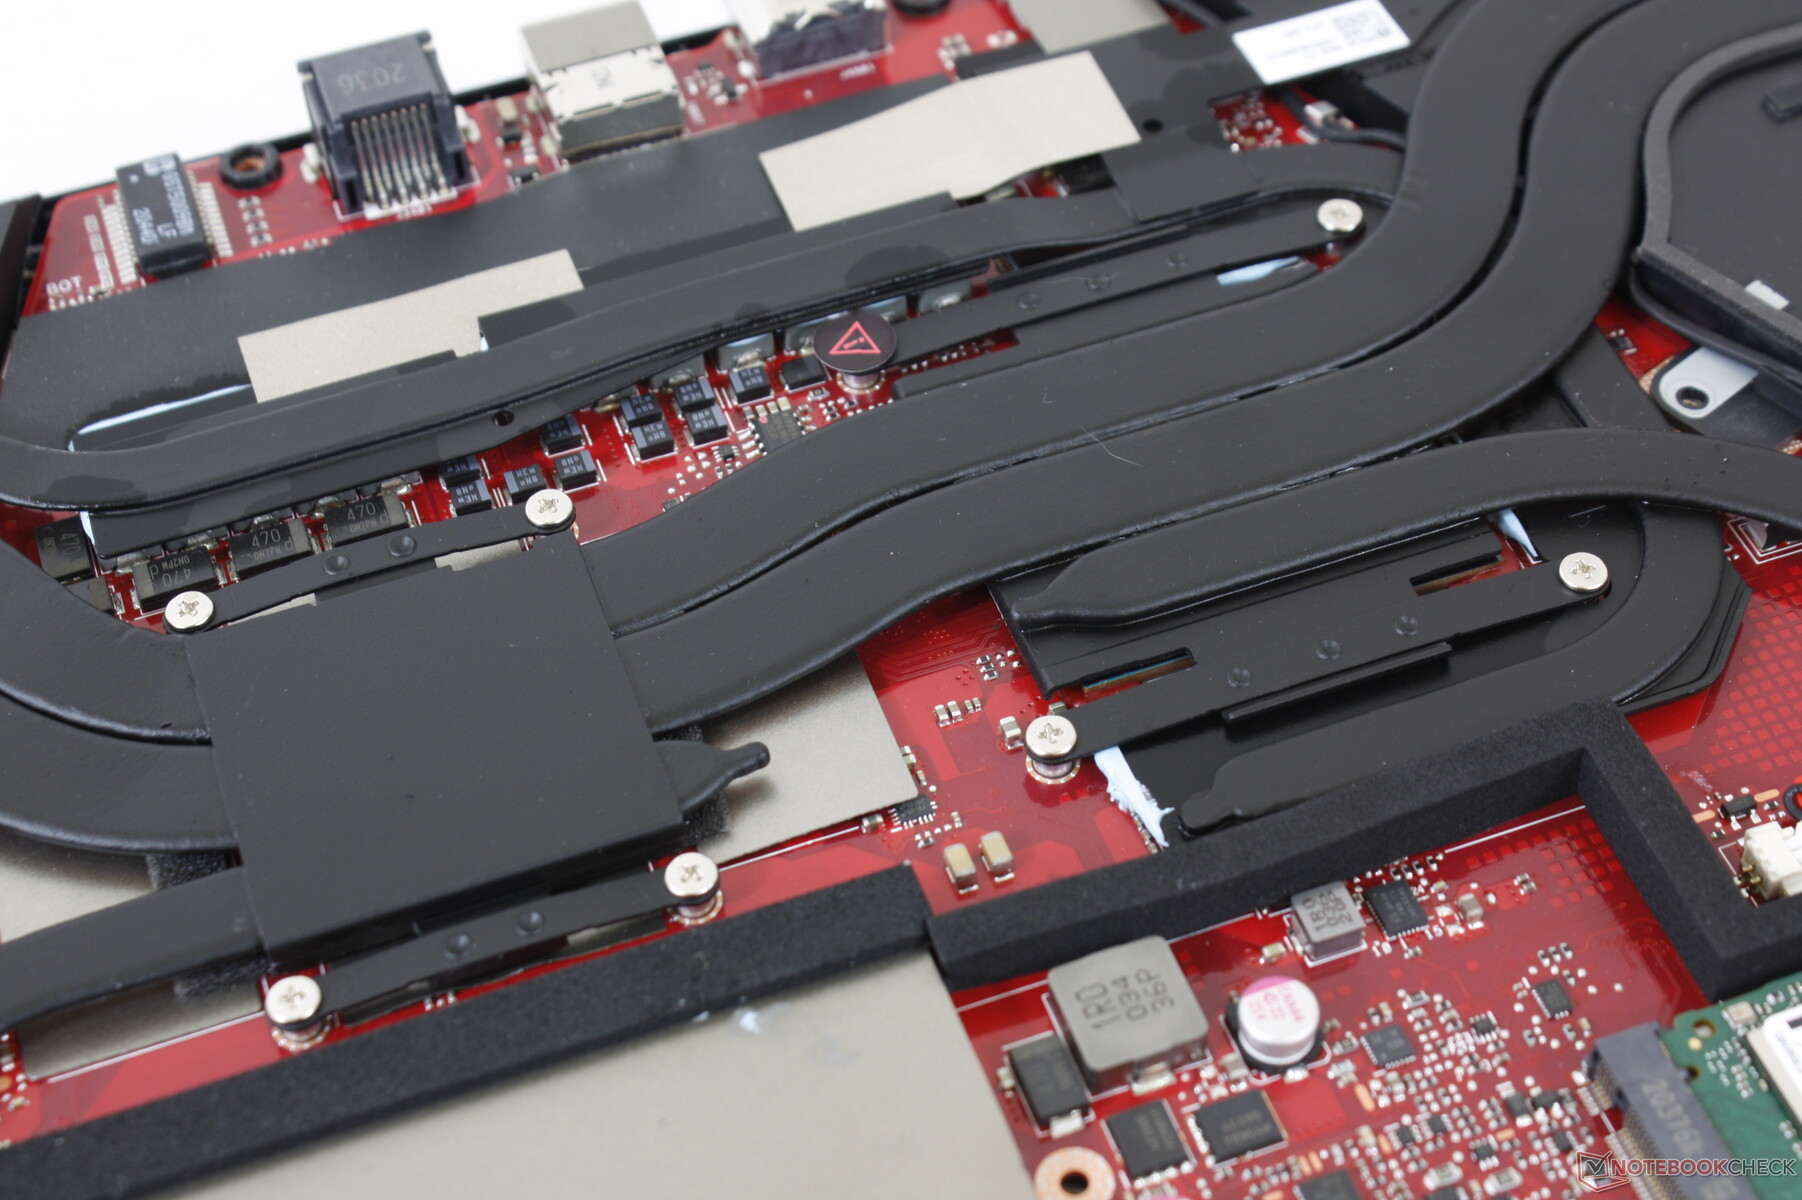
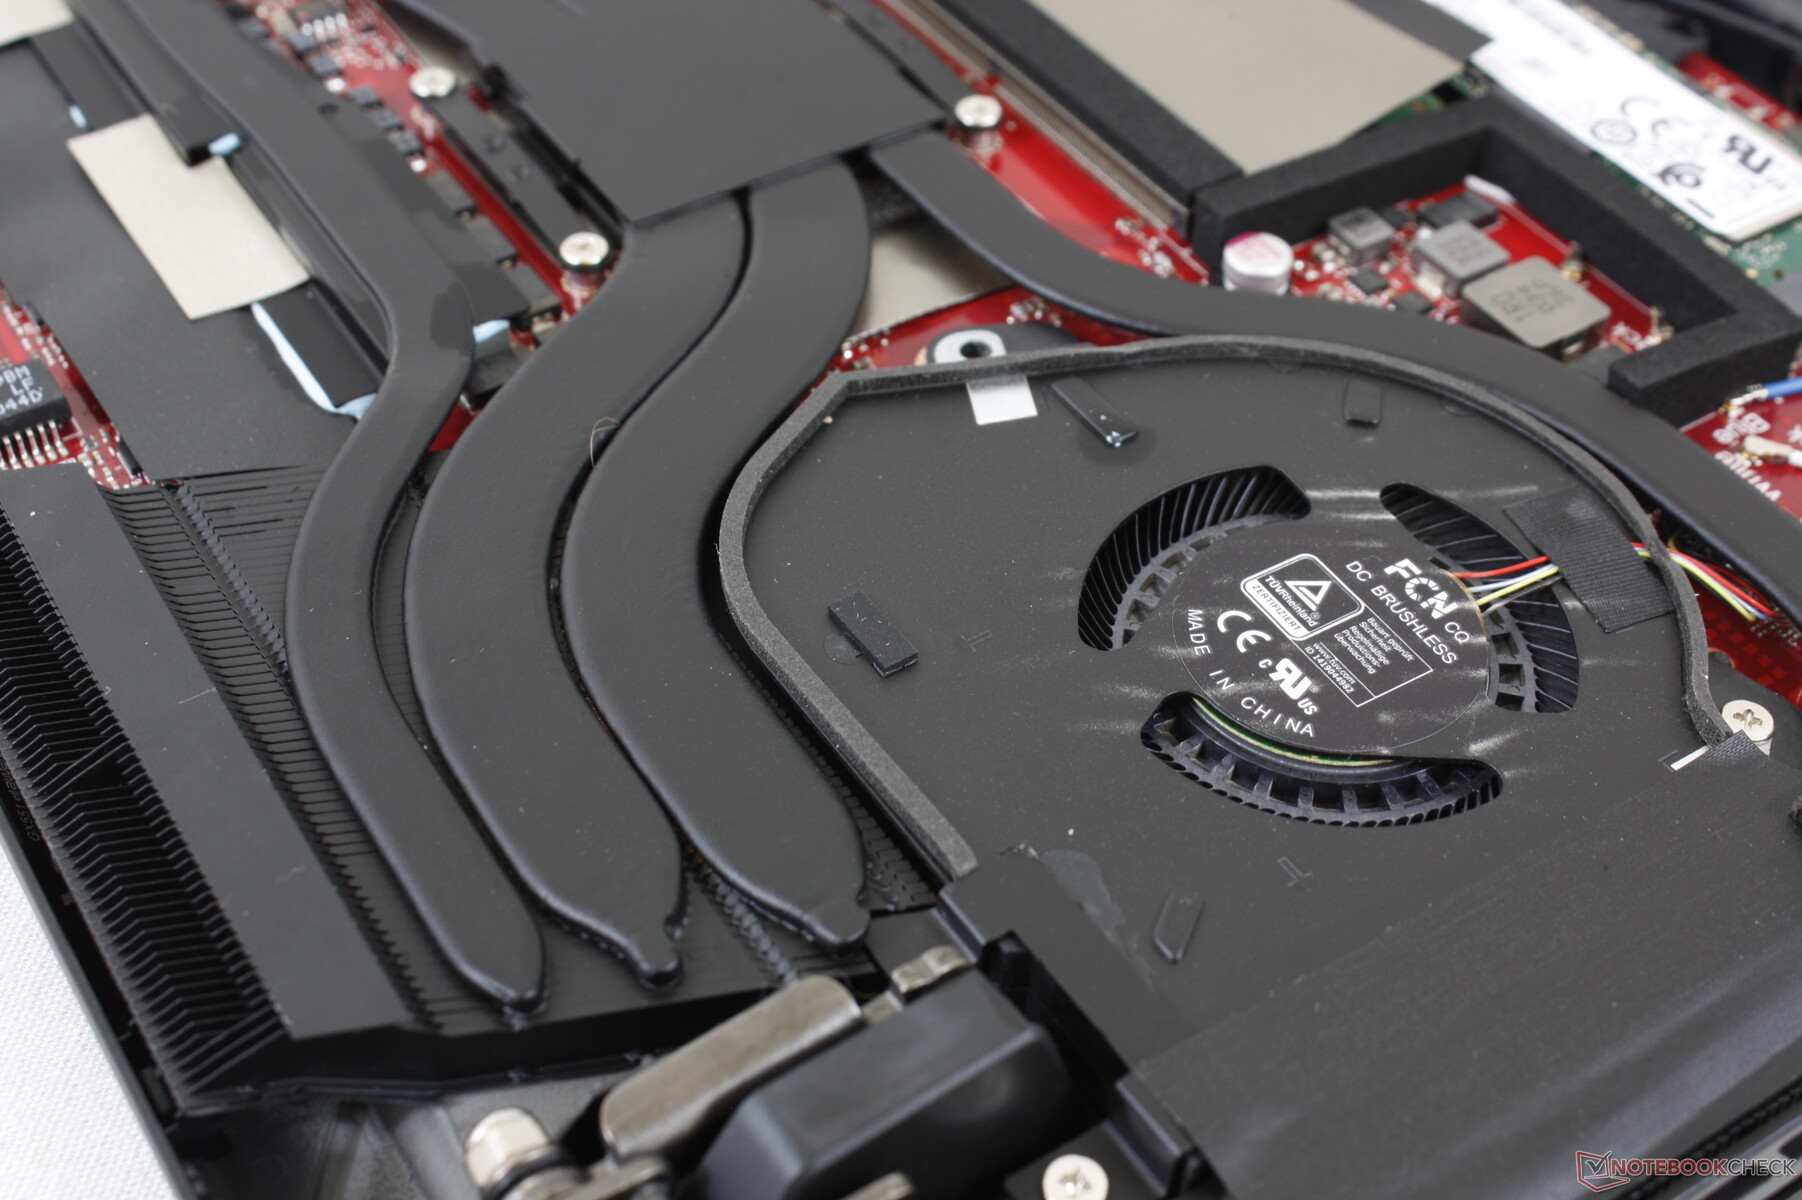
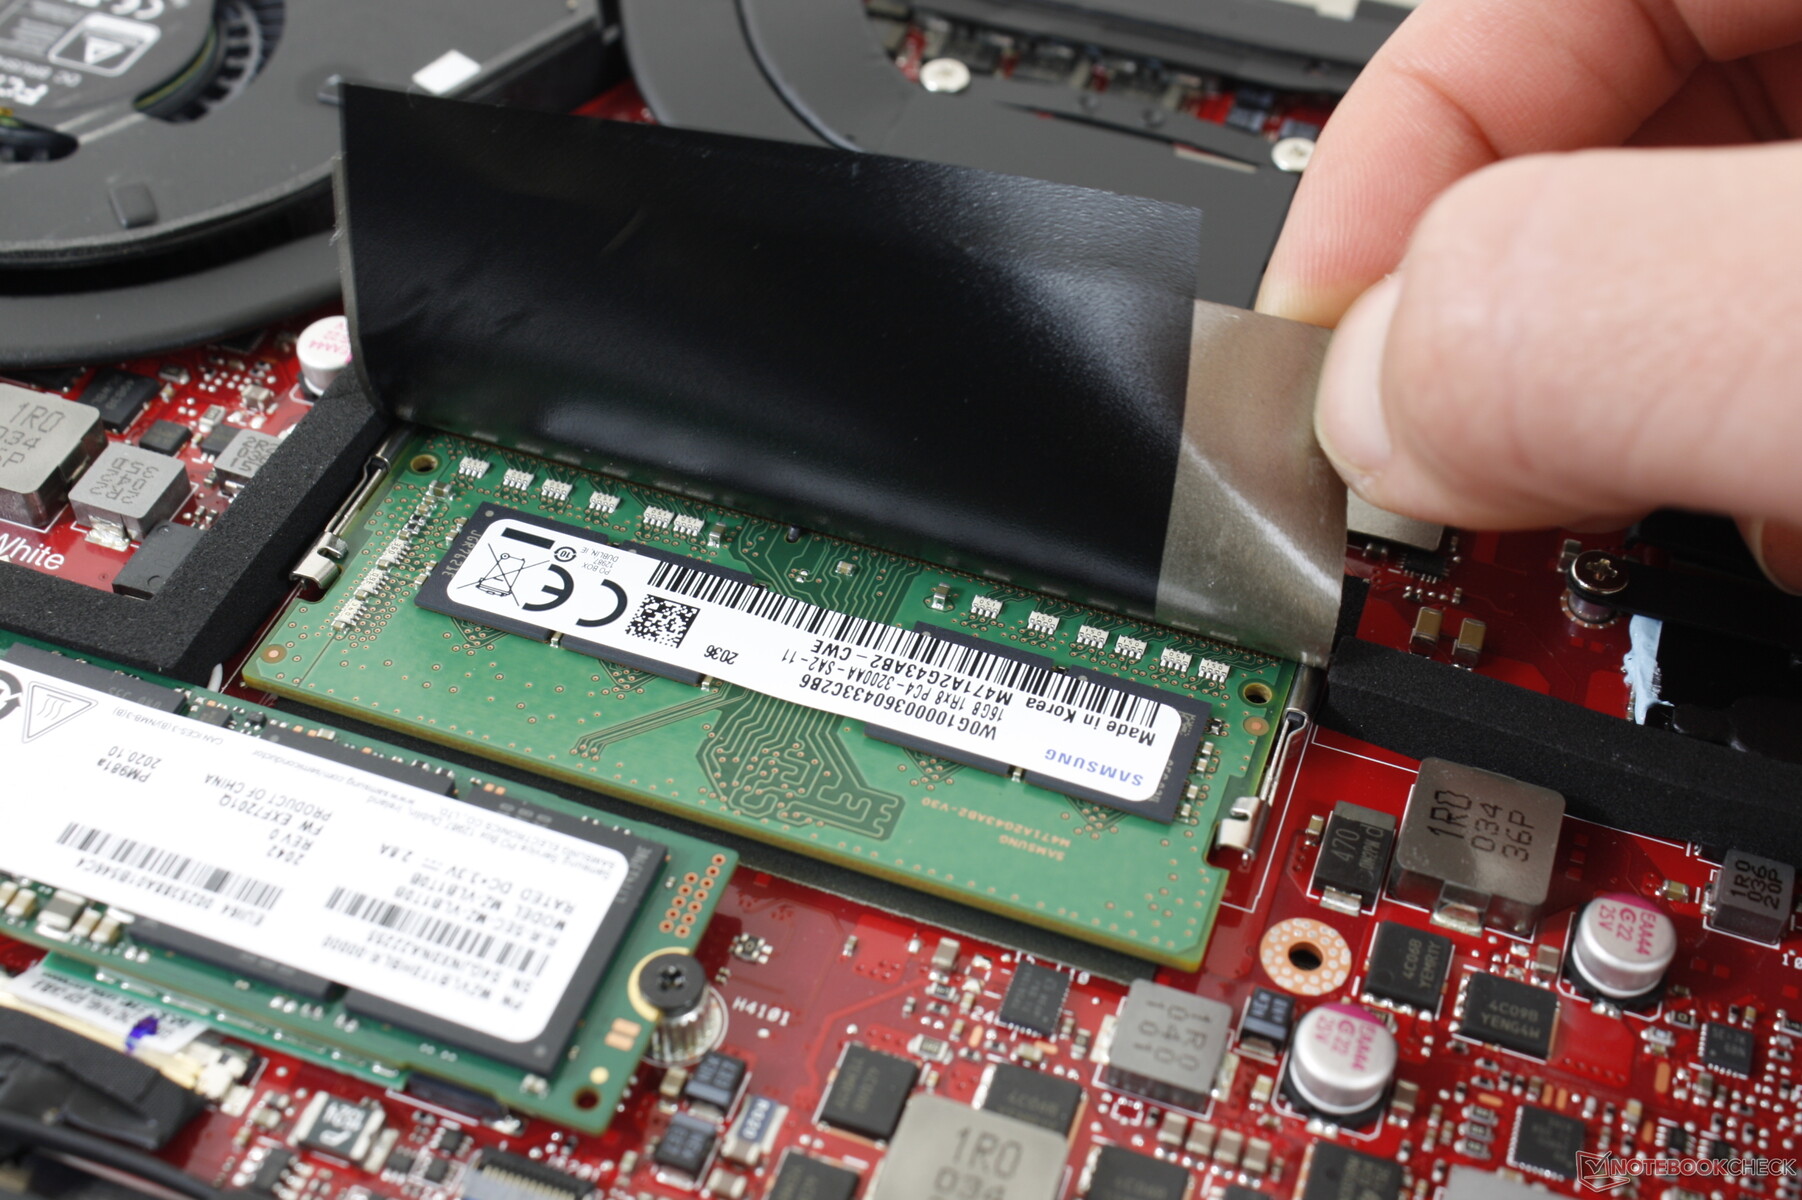
Manutenzione
Il fondo è fissato da quattordici viti T5 Torx e una vite Philips. La manutenzione è comunque relativamente facile.
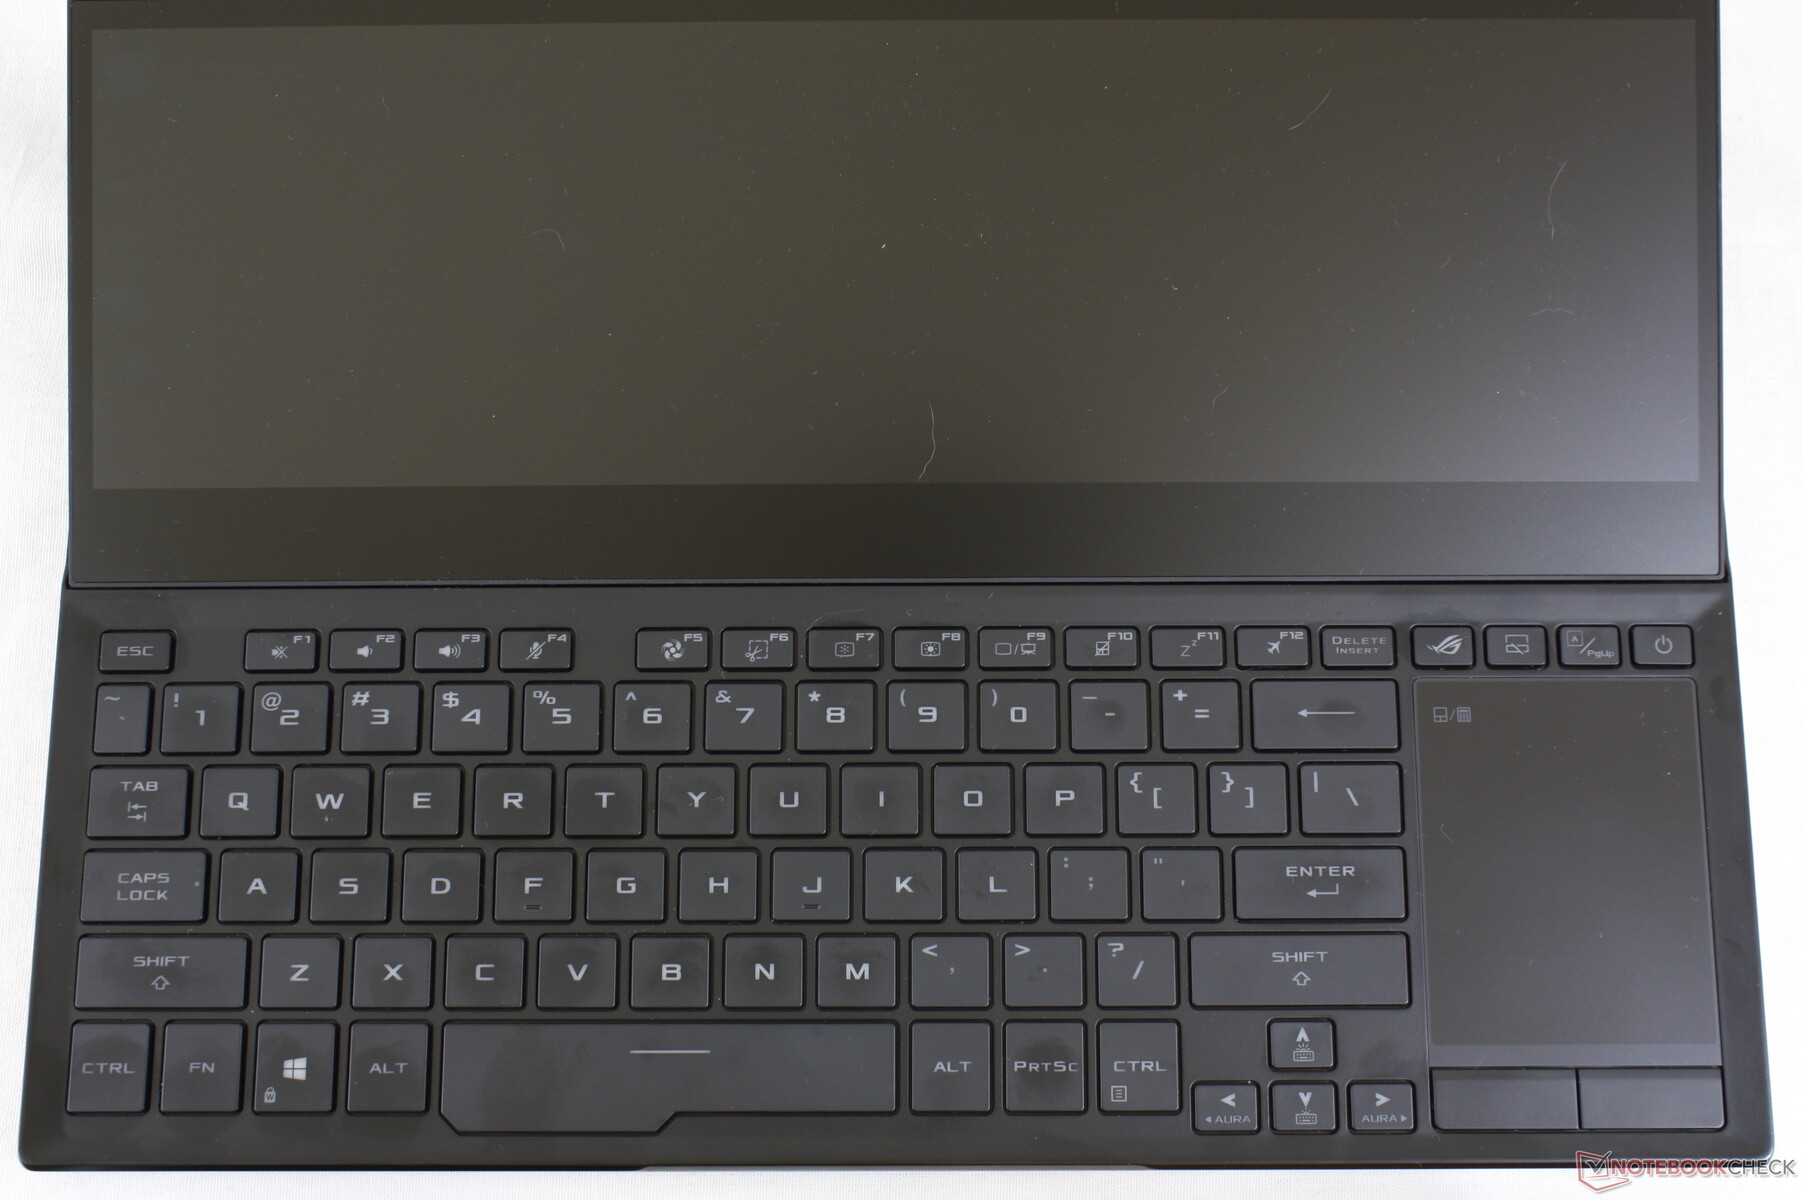
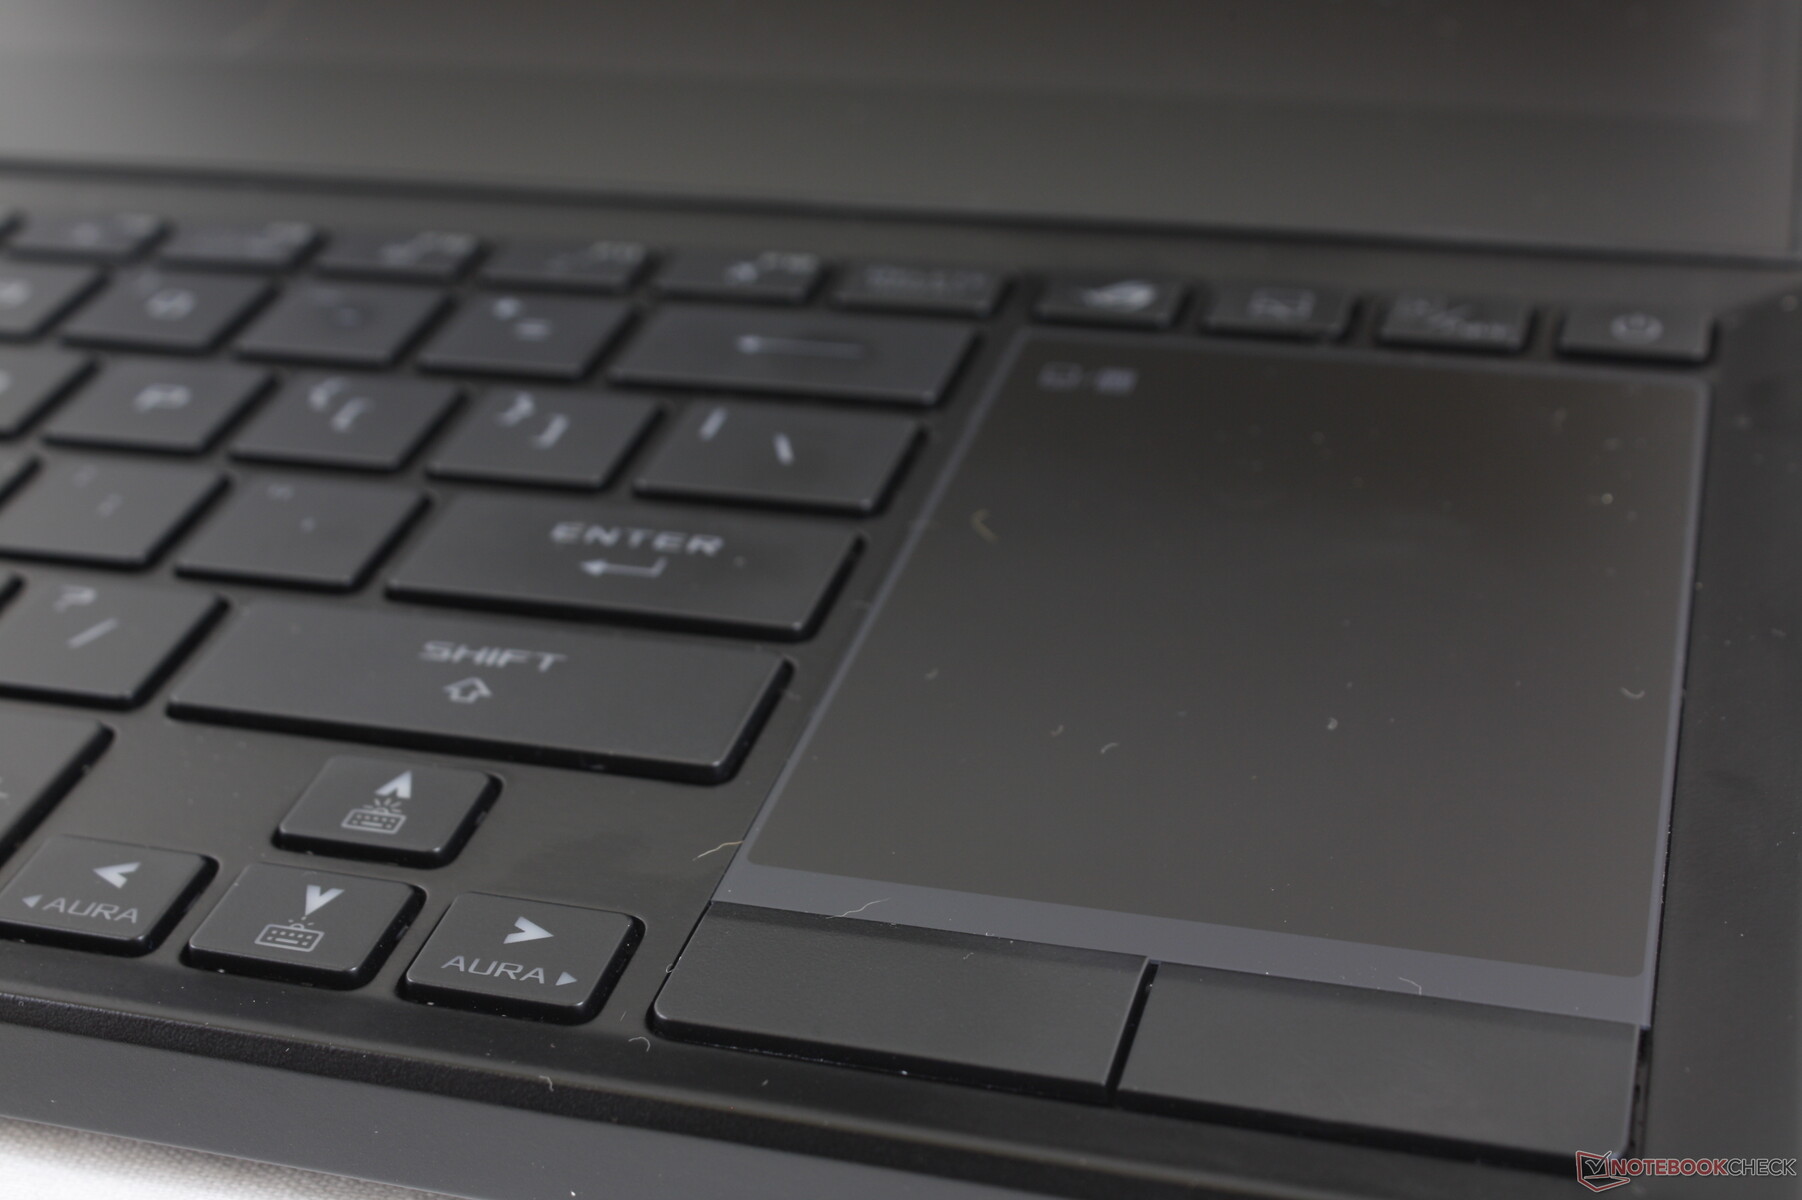
Dispositivi di input

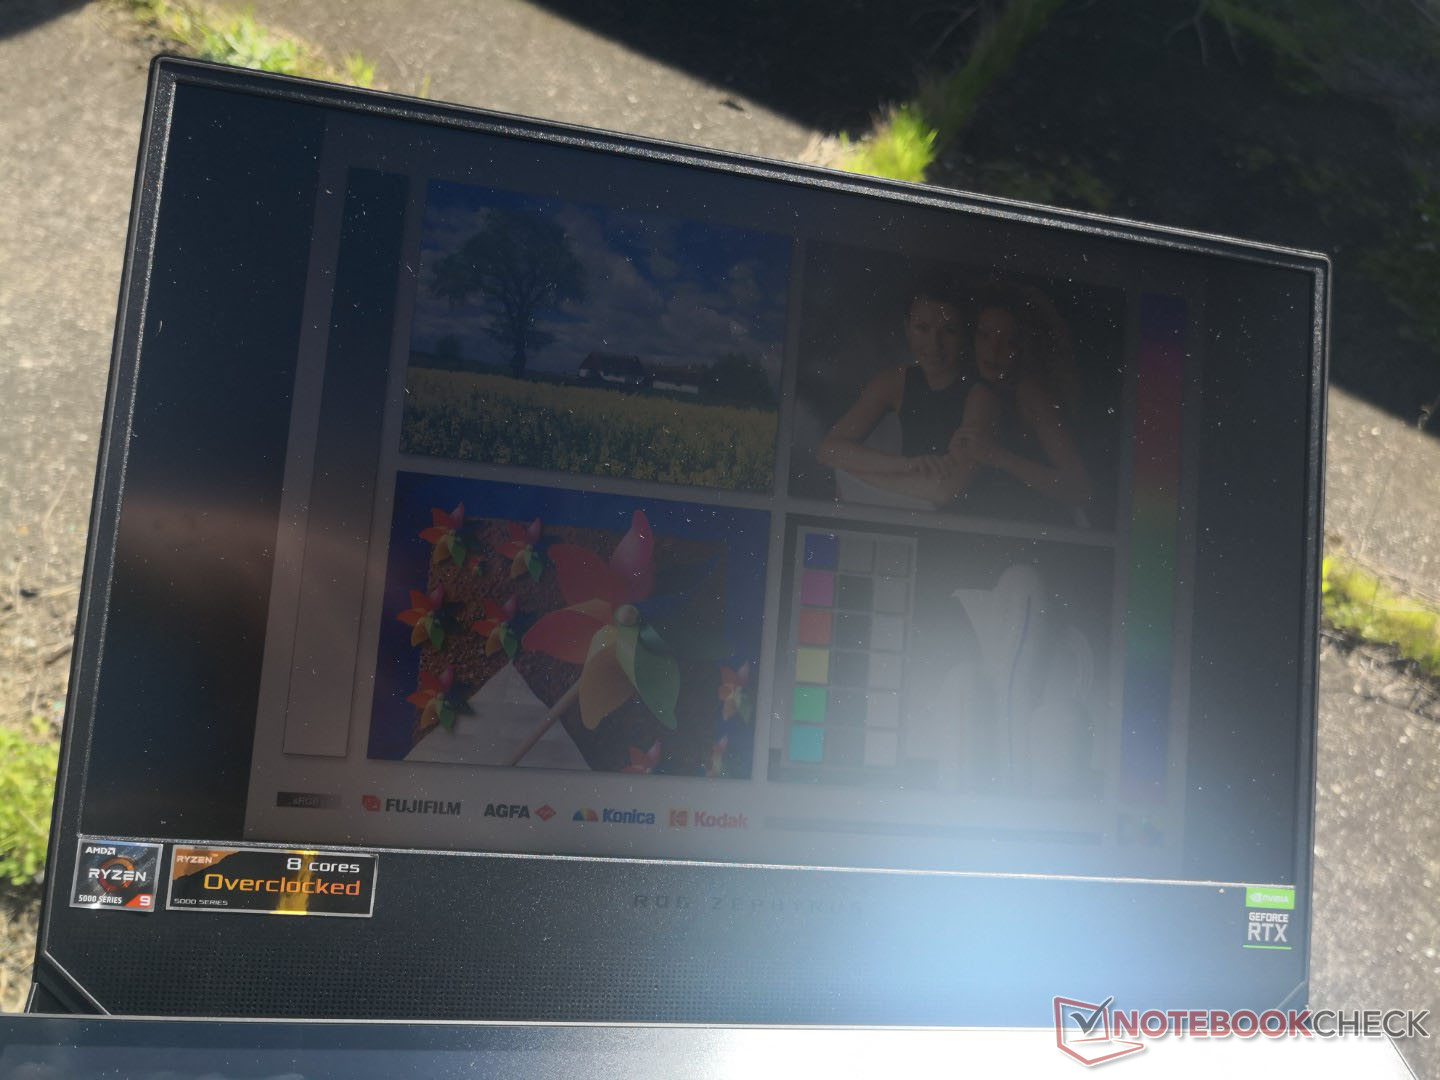
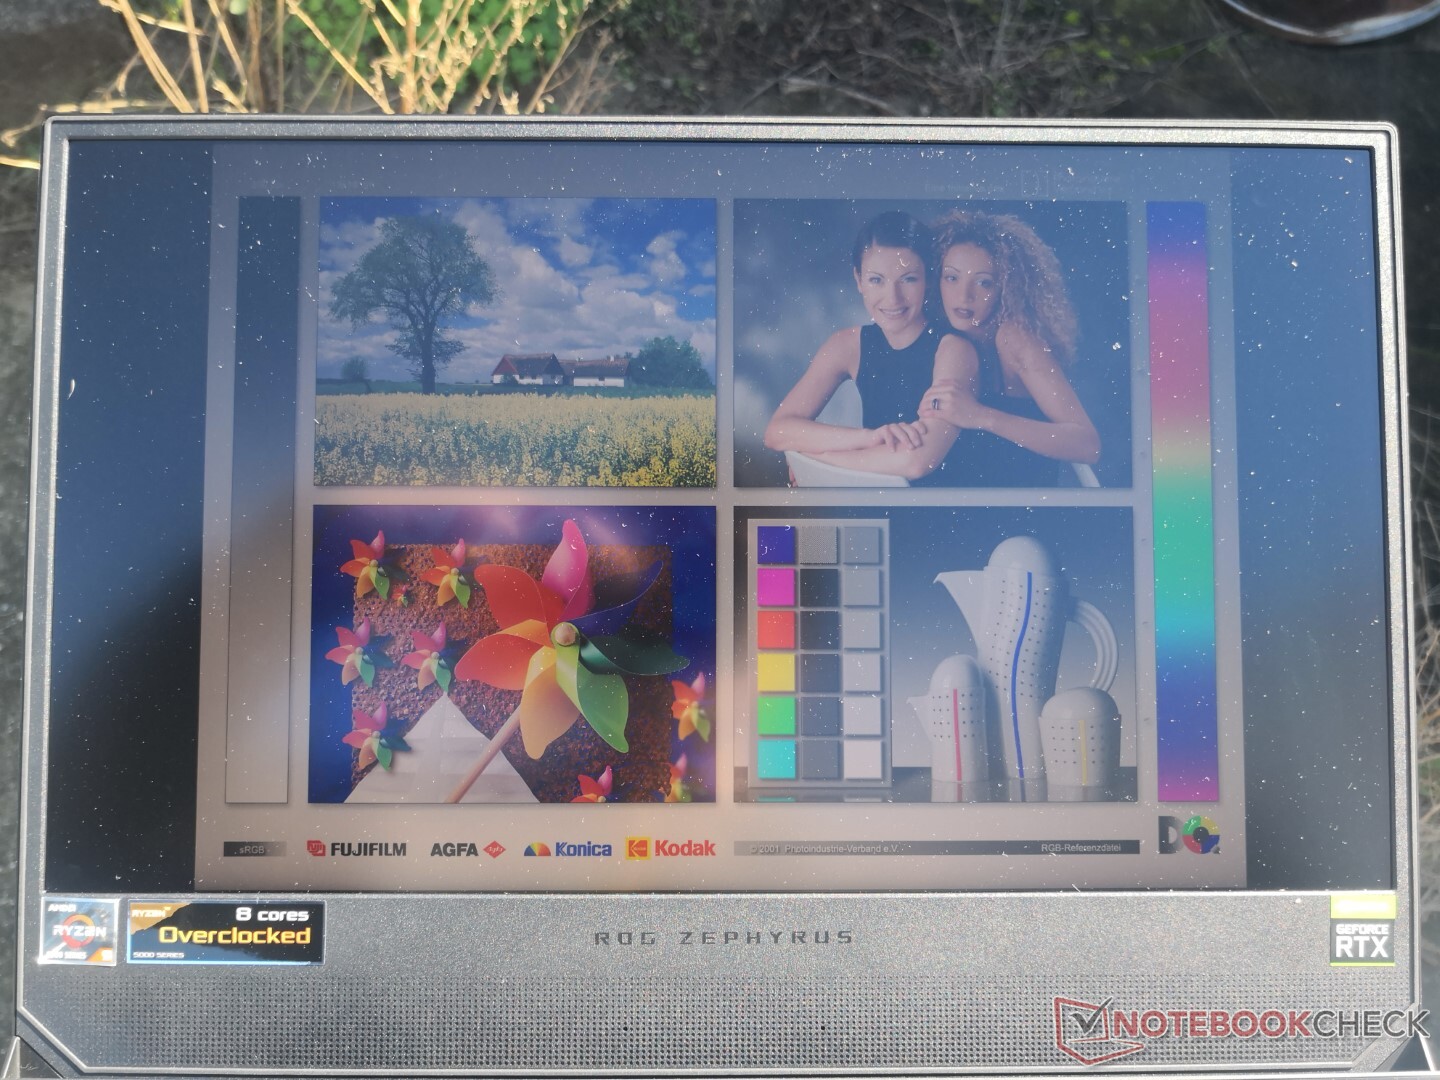
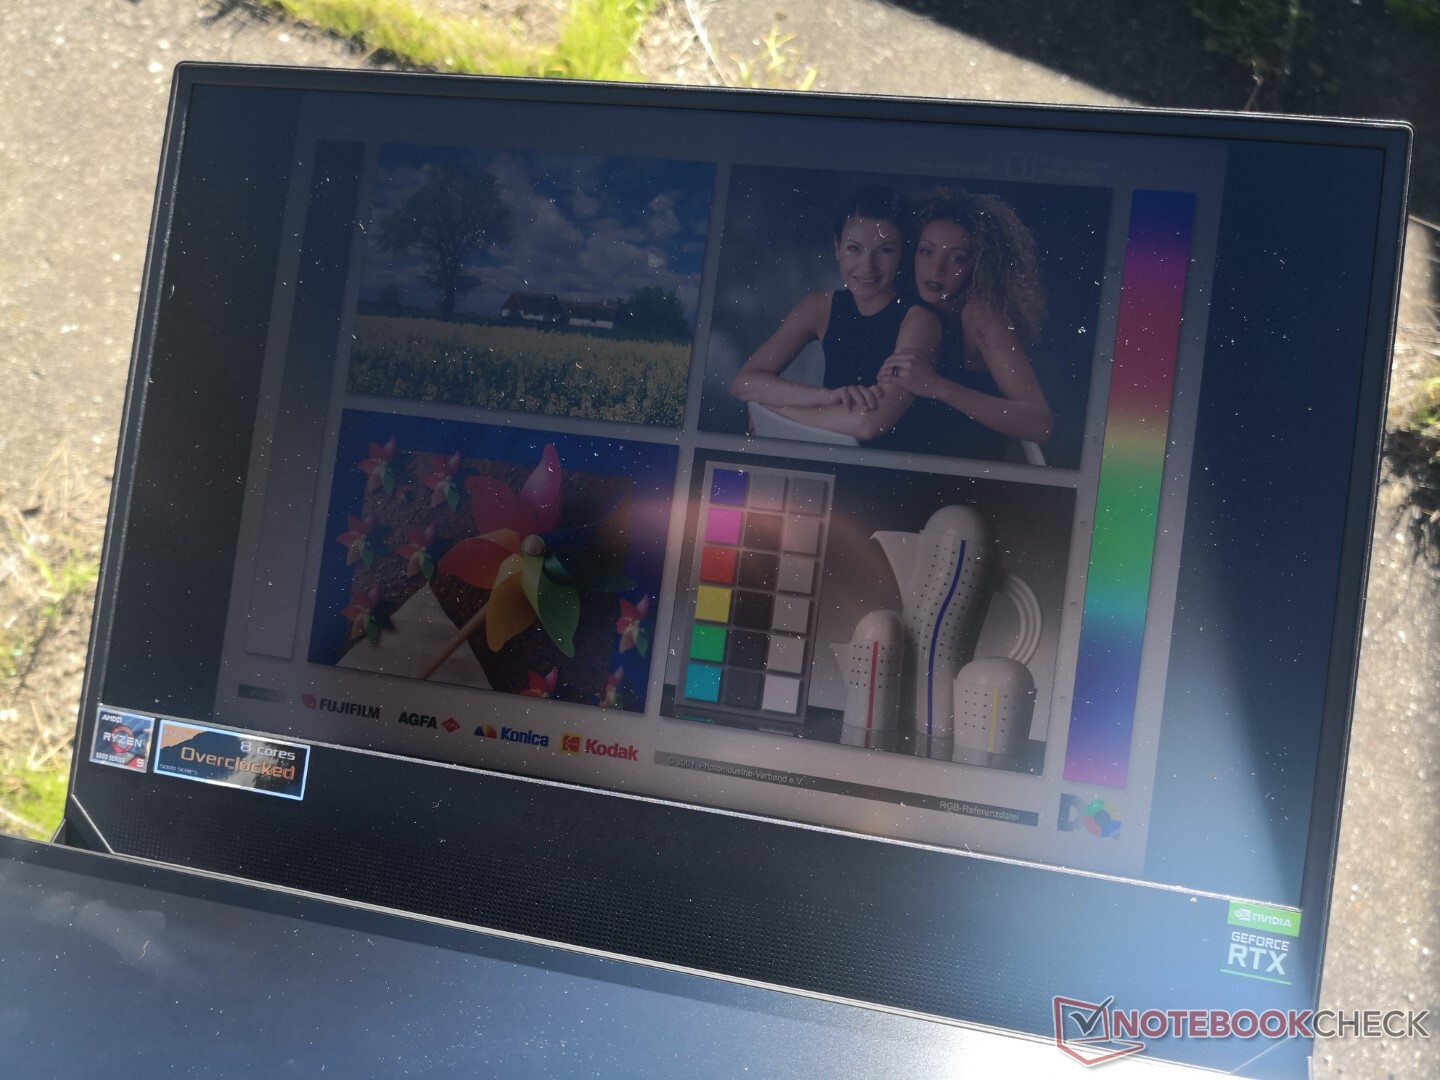
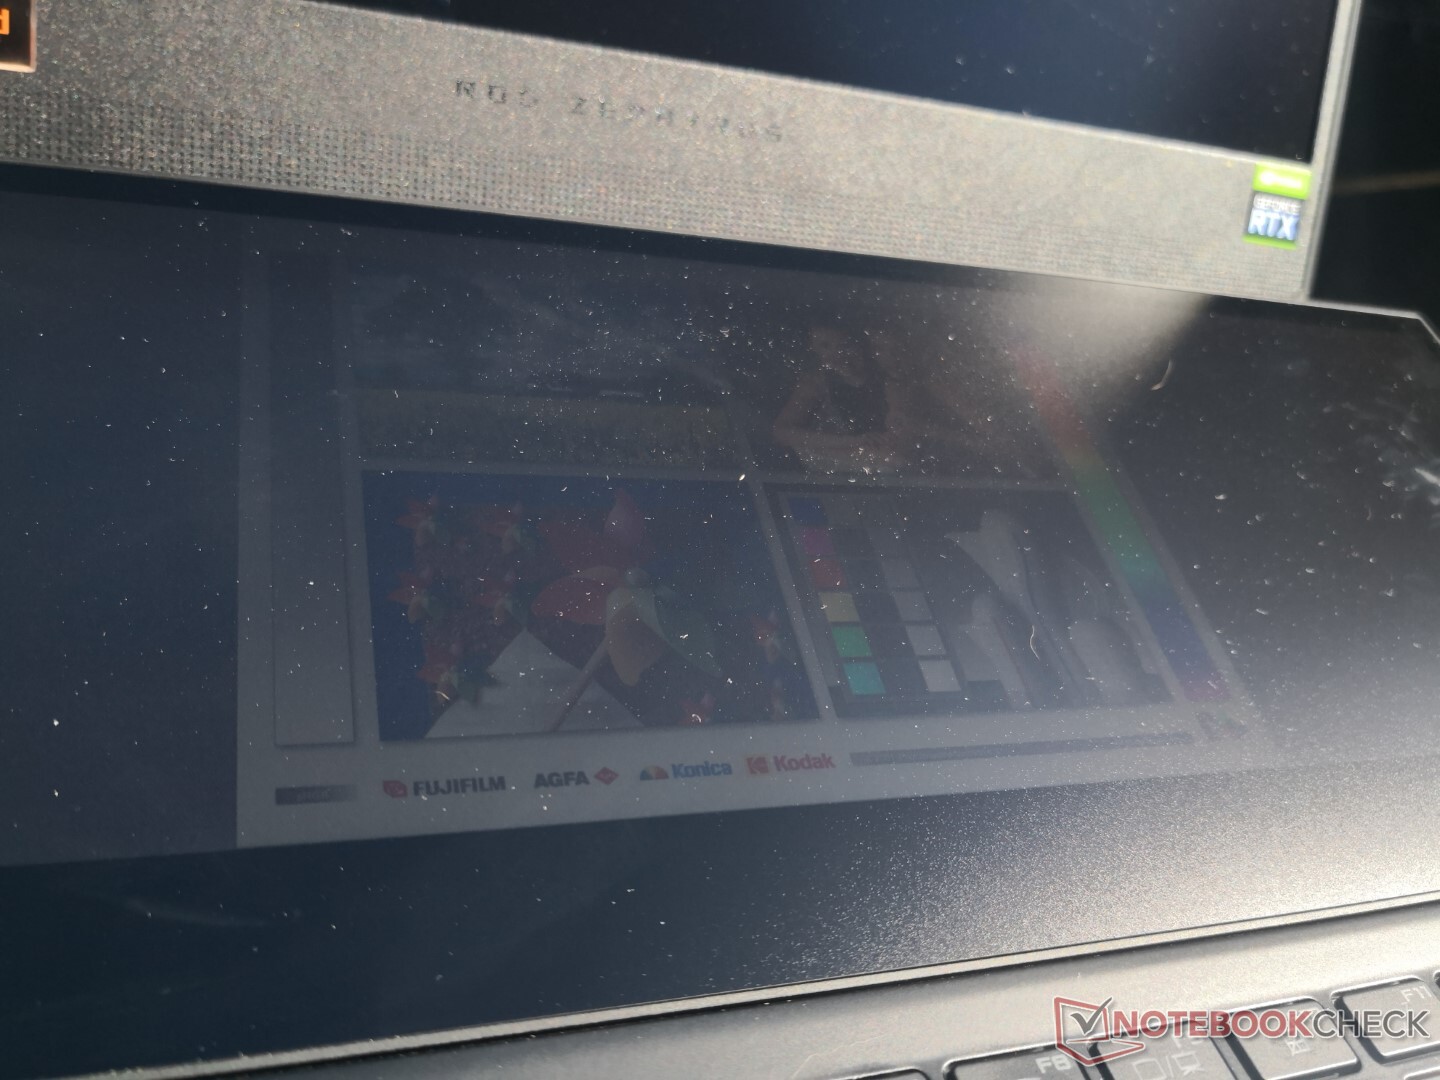
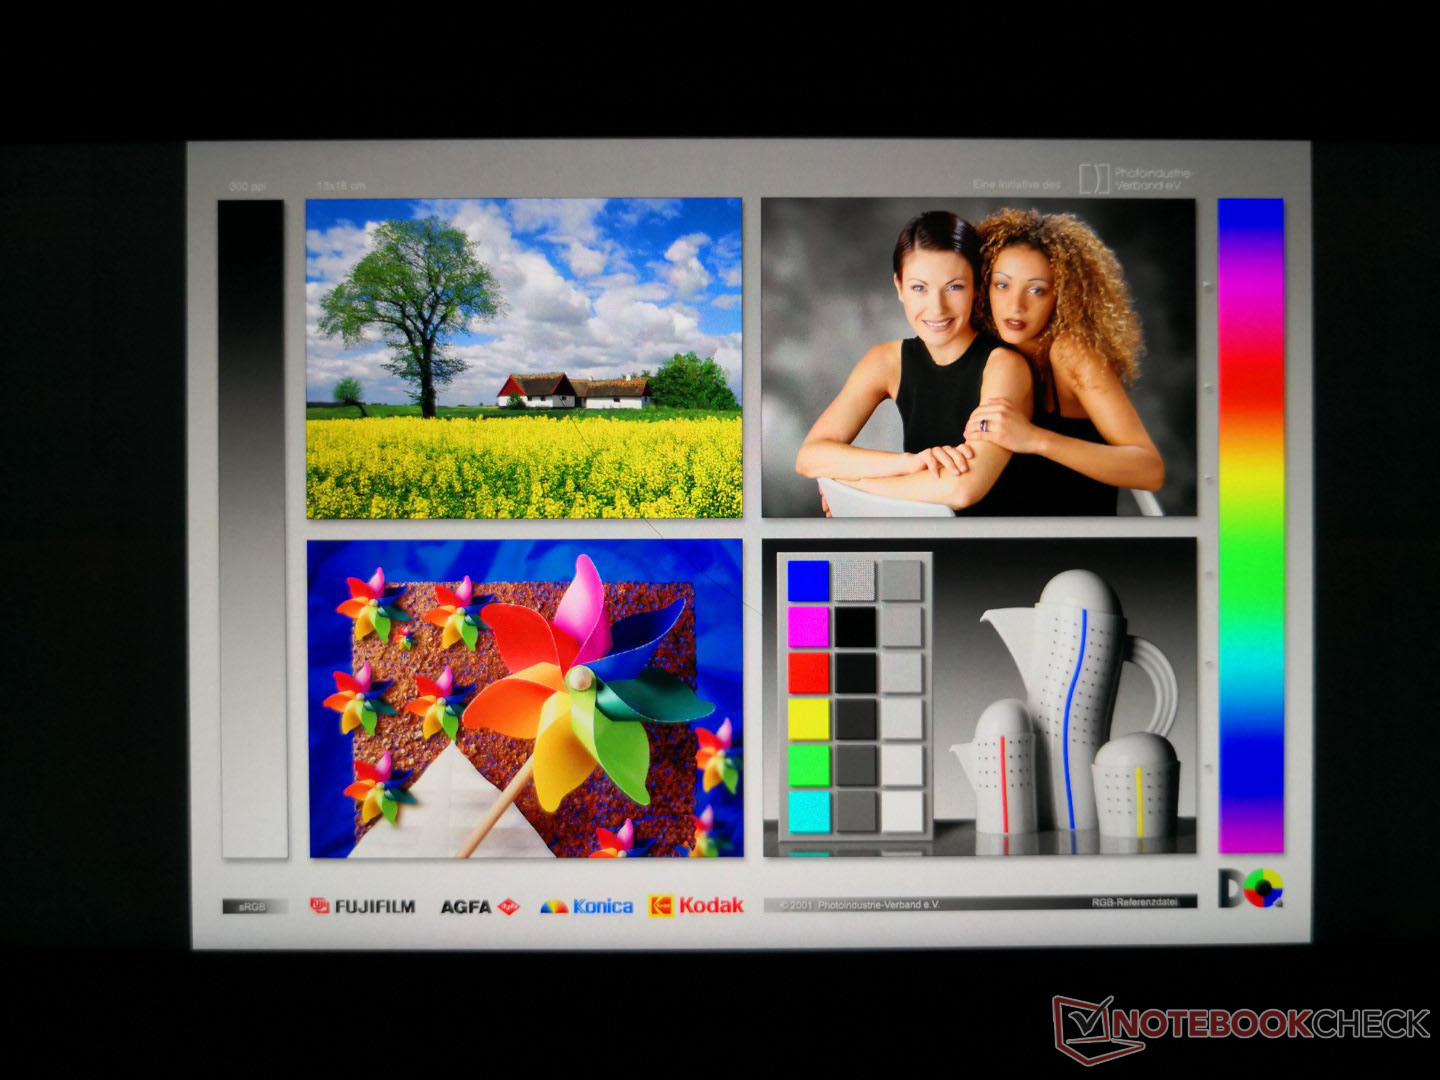
Display
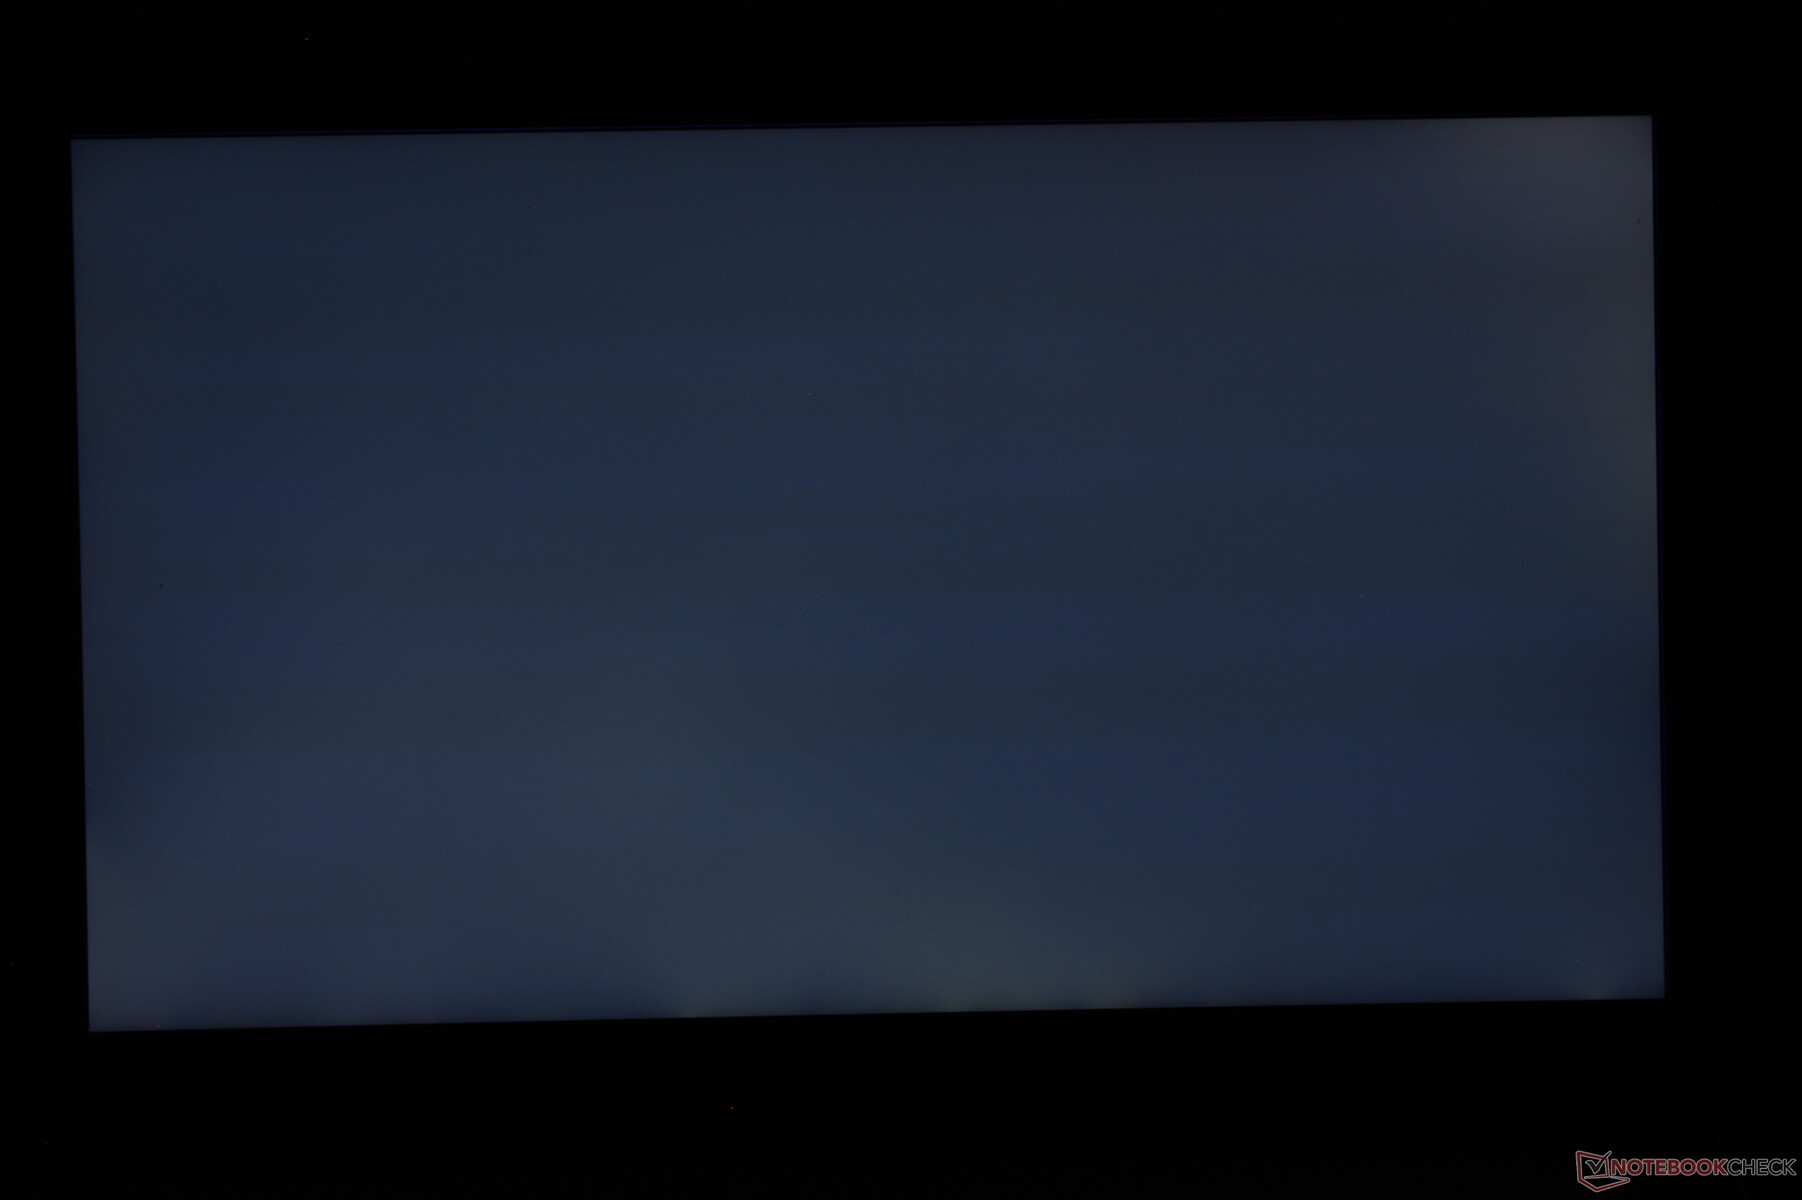
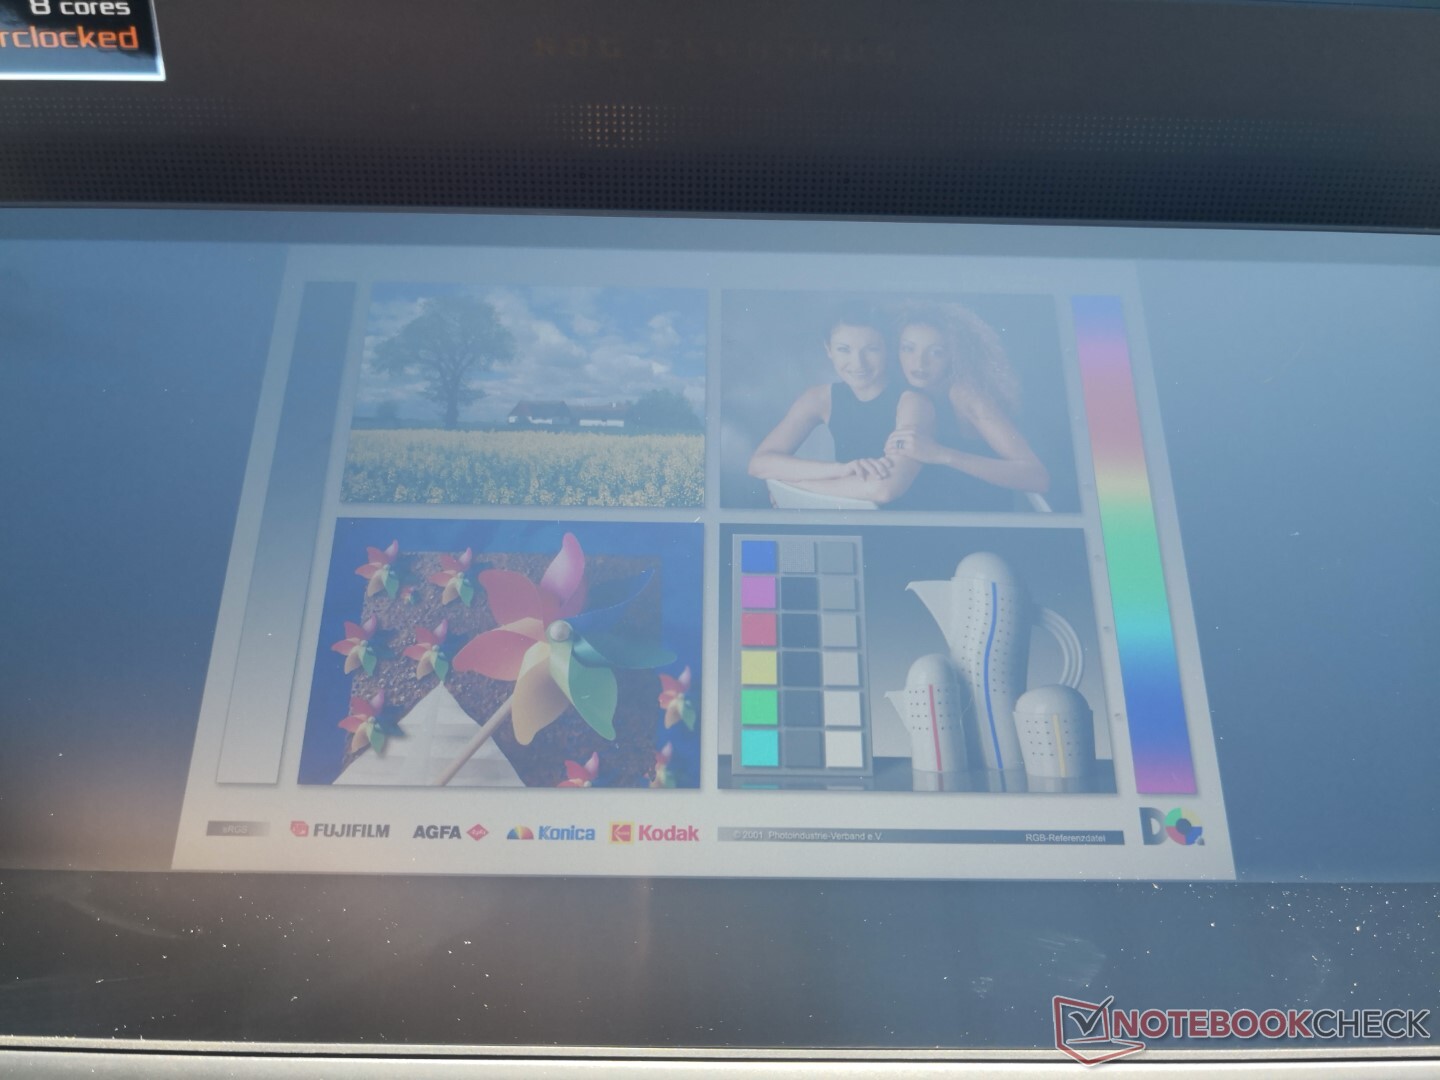
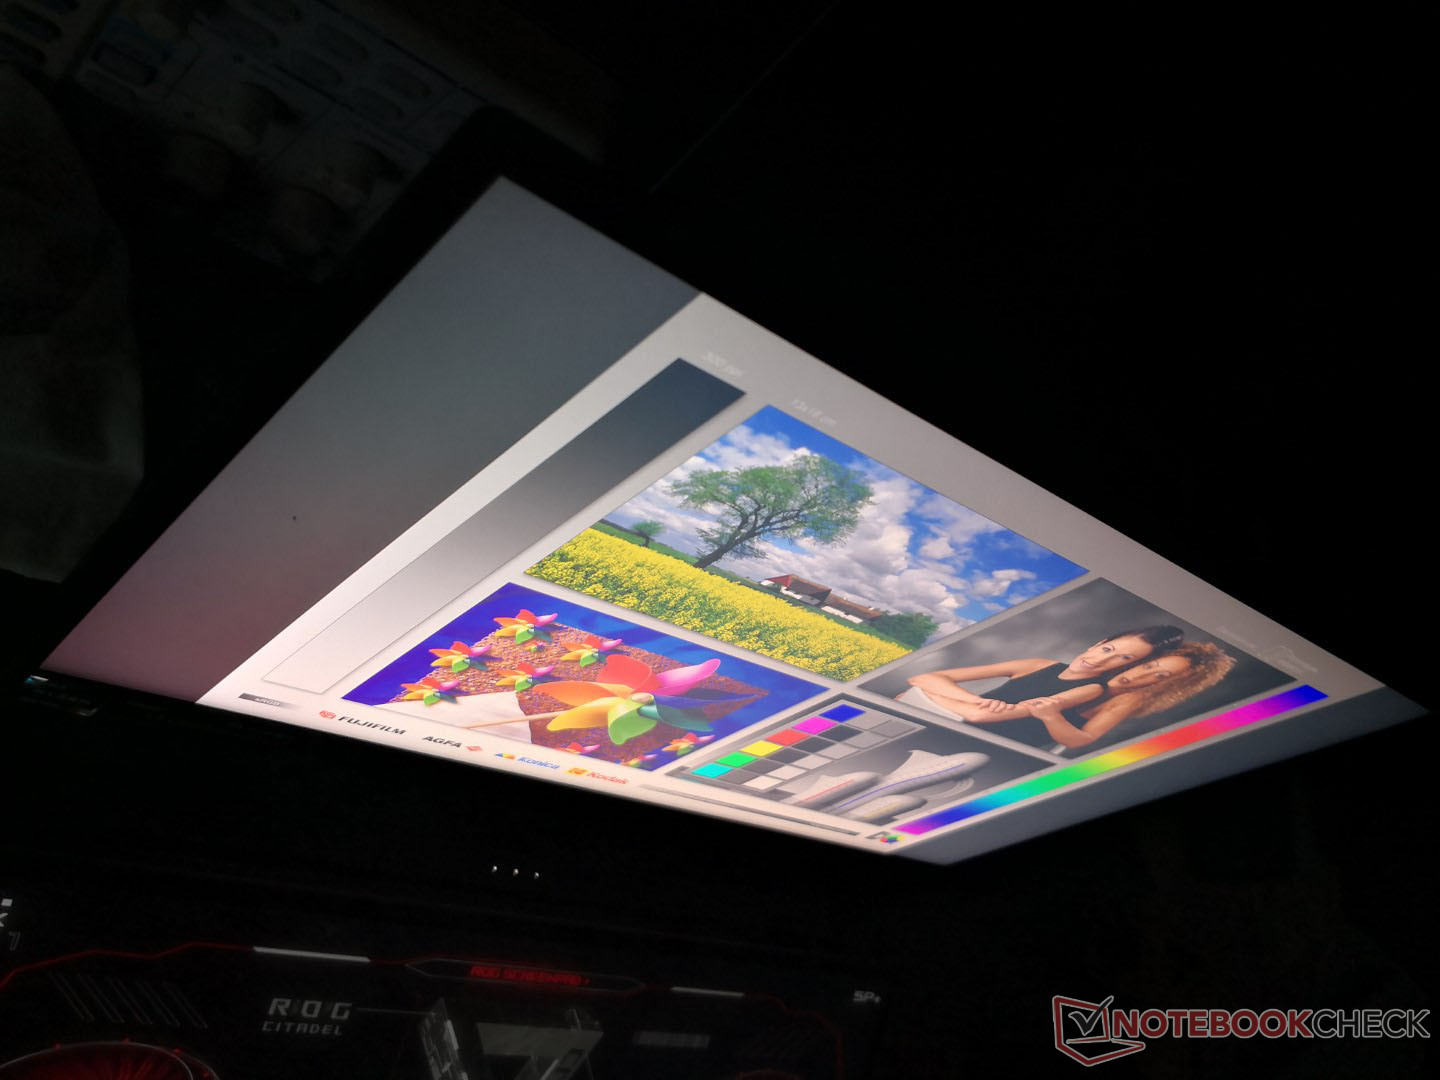
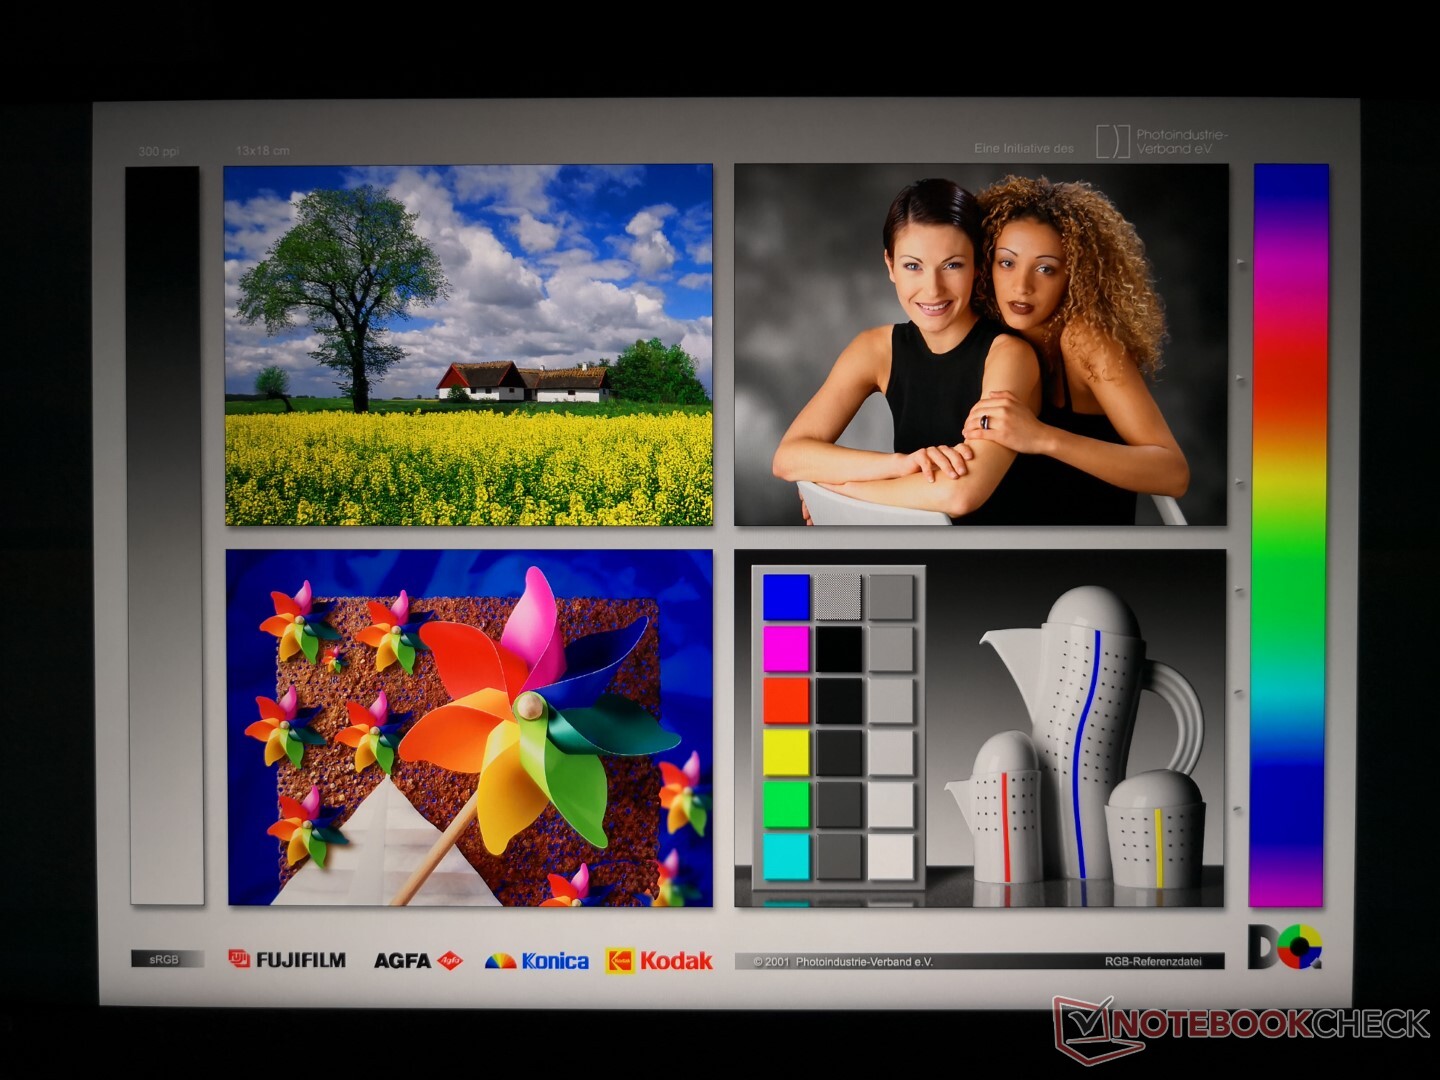
Il nuovo display 4K a 120 Hz è migliorato significativamente rispetto al display 4K a 60 Hz del GX550 dell'anno scorso, oltre all'ovvio aggiornamento della frequenza di aggiornamento. In particolare, i tempi di risposta sono migliorati notevolmente da 30 ms sul GX550 a soli 3 ms a 5 ms sul nuovo pannello. Il gioco e i movimenti del cursore sono notevolmente più fluidi e quasi senza ghosting per una migliore esperienza di gioco. Lo spazio colore e la luminosità rimangono abbastanza invariati gen-to-gen mentre il contrasto è leggermente diminuito, ma questo è un piccolo prezzo da pagare se si considerano i vantaggi ottenuti.
Il pannello supporta anche FreeSync per ridurre le sbavature dello schermo, il che è certamente utile dato che anche la più potente delle GPU non può eseguire tutti i titoli a 4K nativi e 120 FPS costanti.

| |||||||||||||||||||||||||
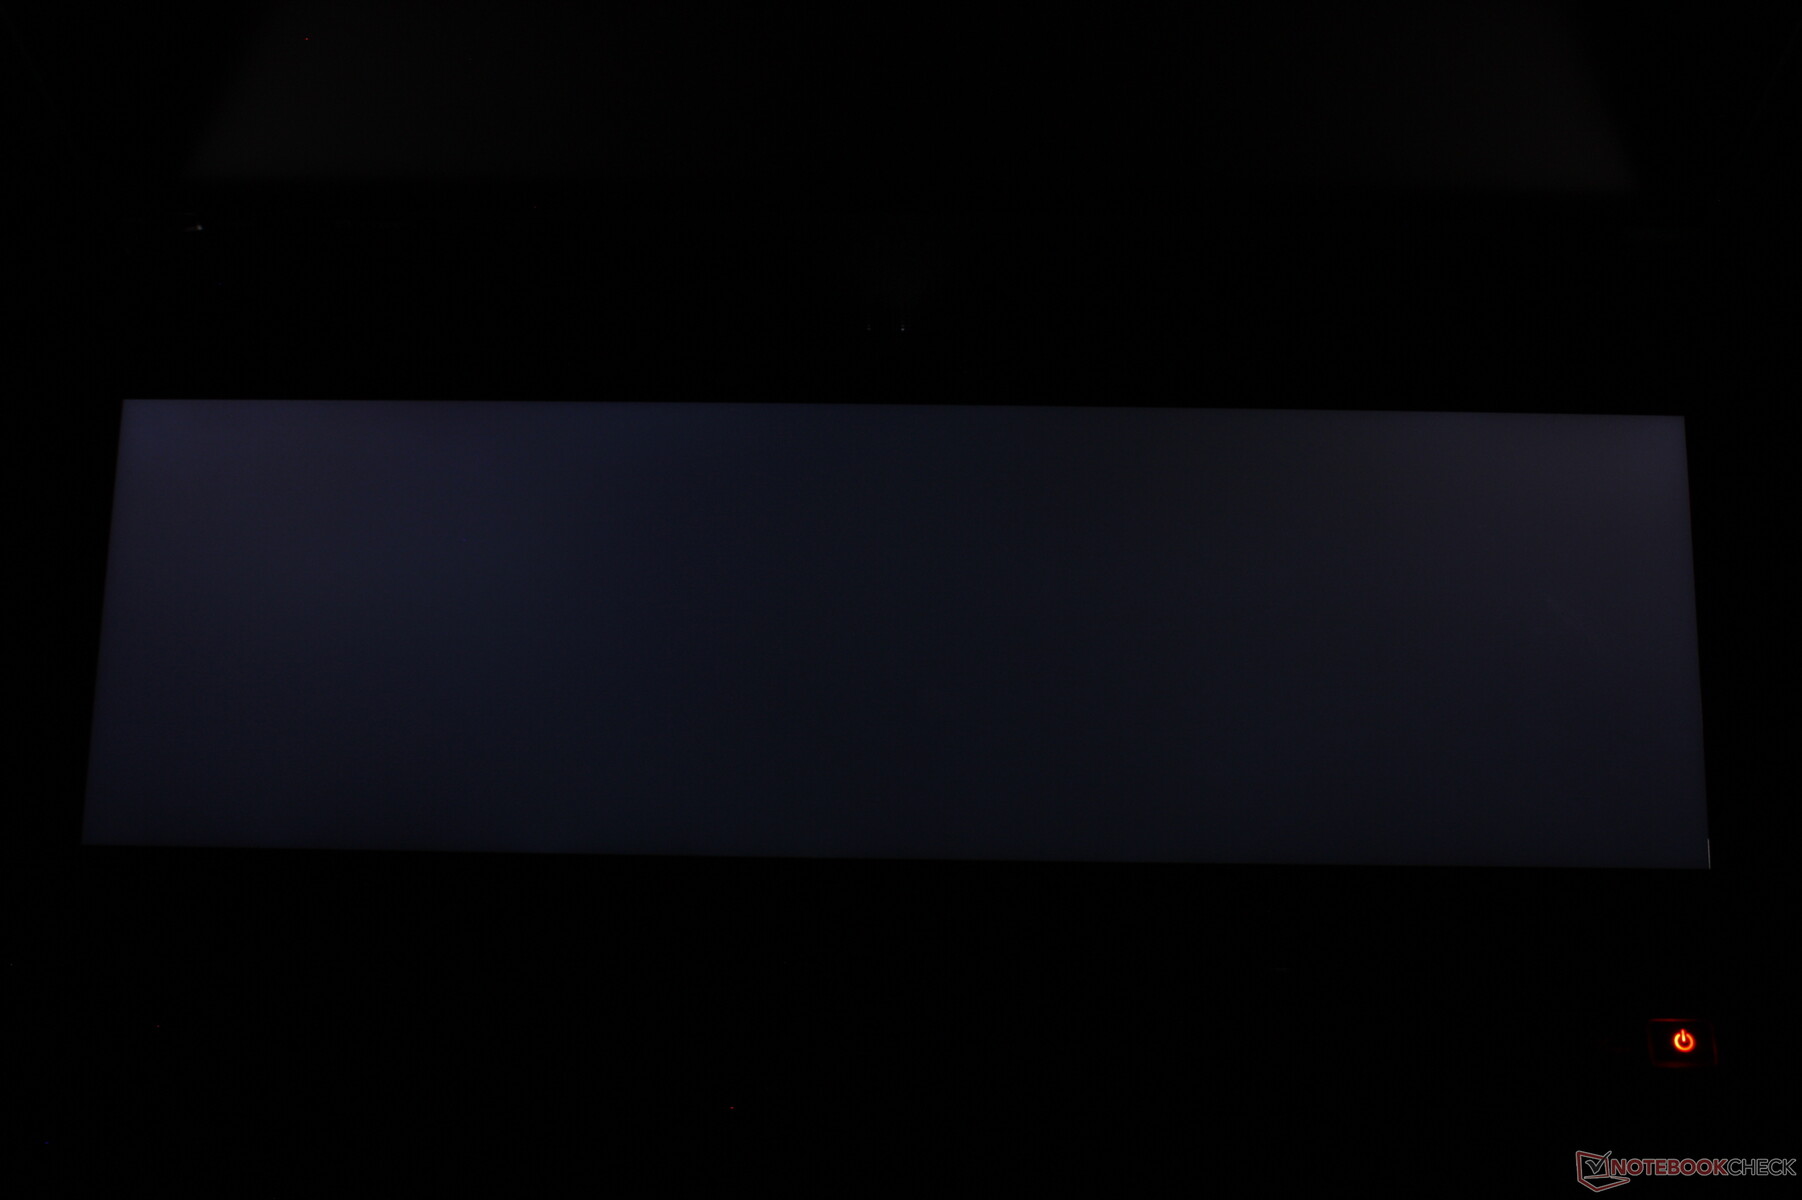
Distribuzione della luminosità: 88 %
Al centro con la batteria: 210 cd/m²
Contrasto: 967:1 (Nero: 0.42 cd/m²)
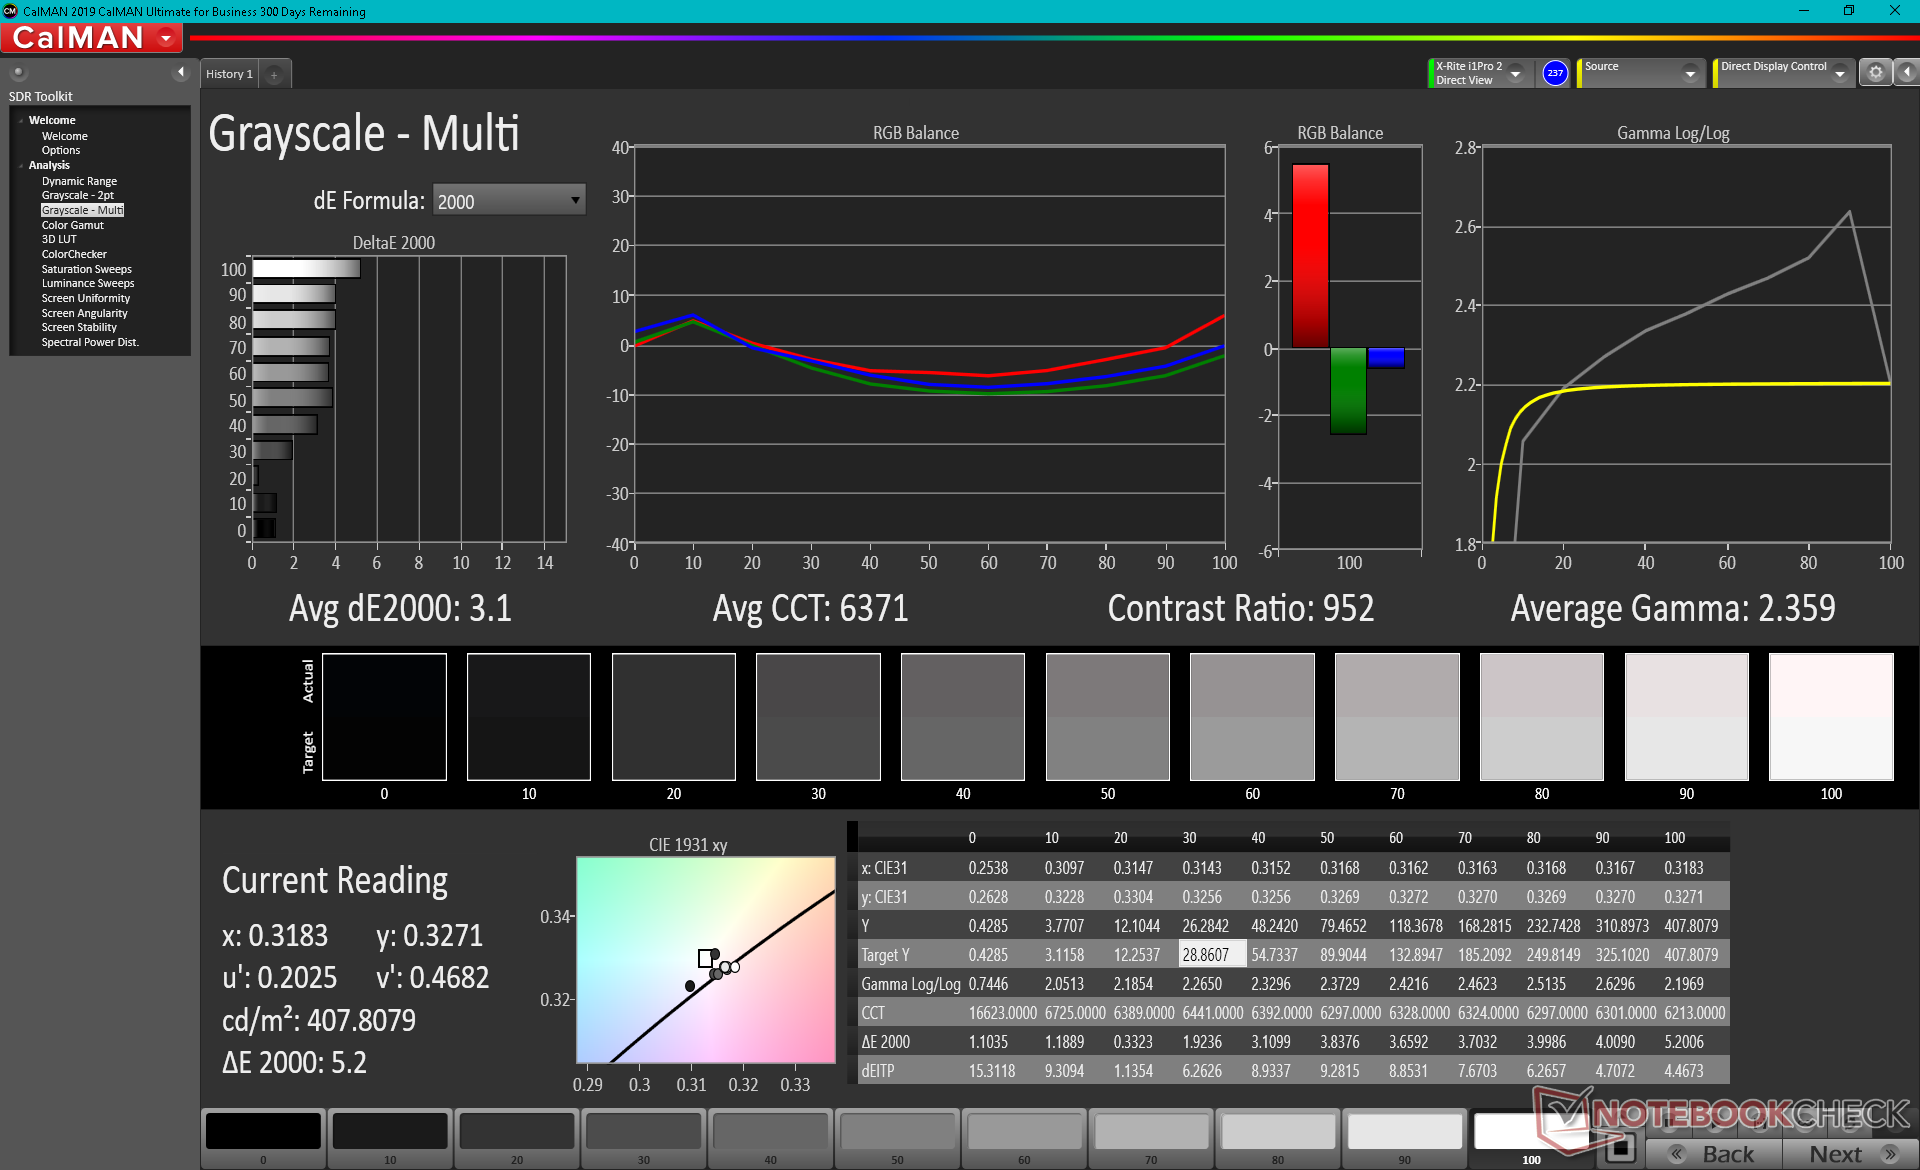
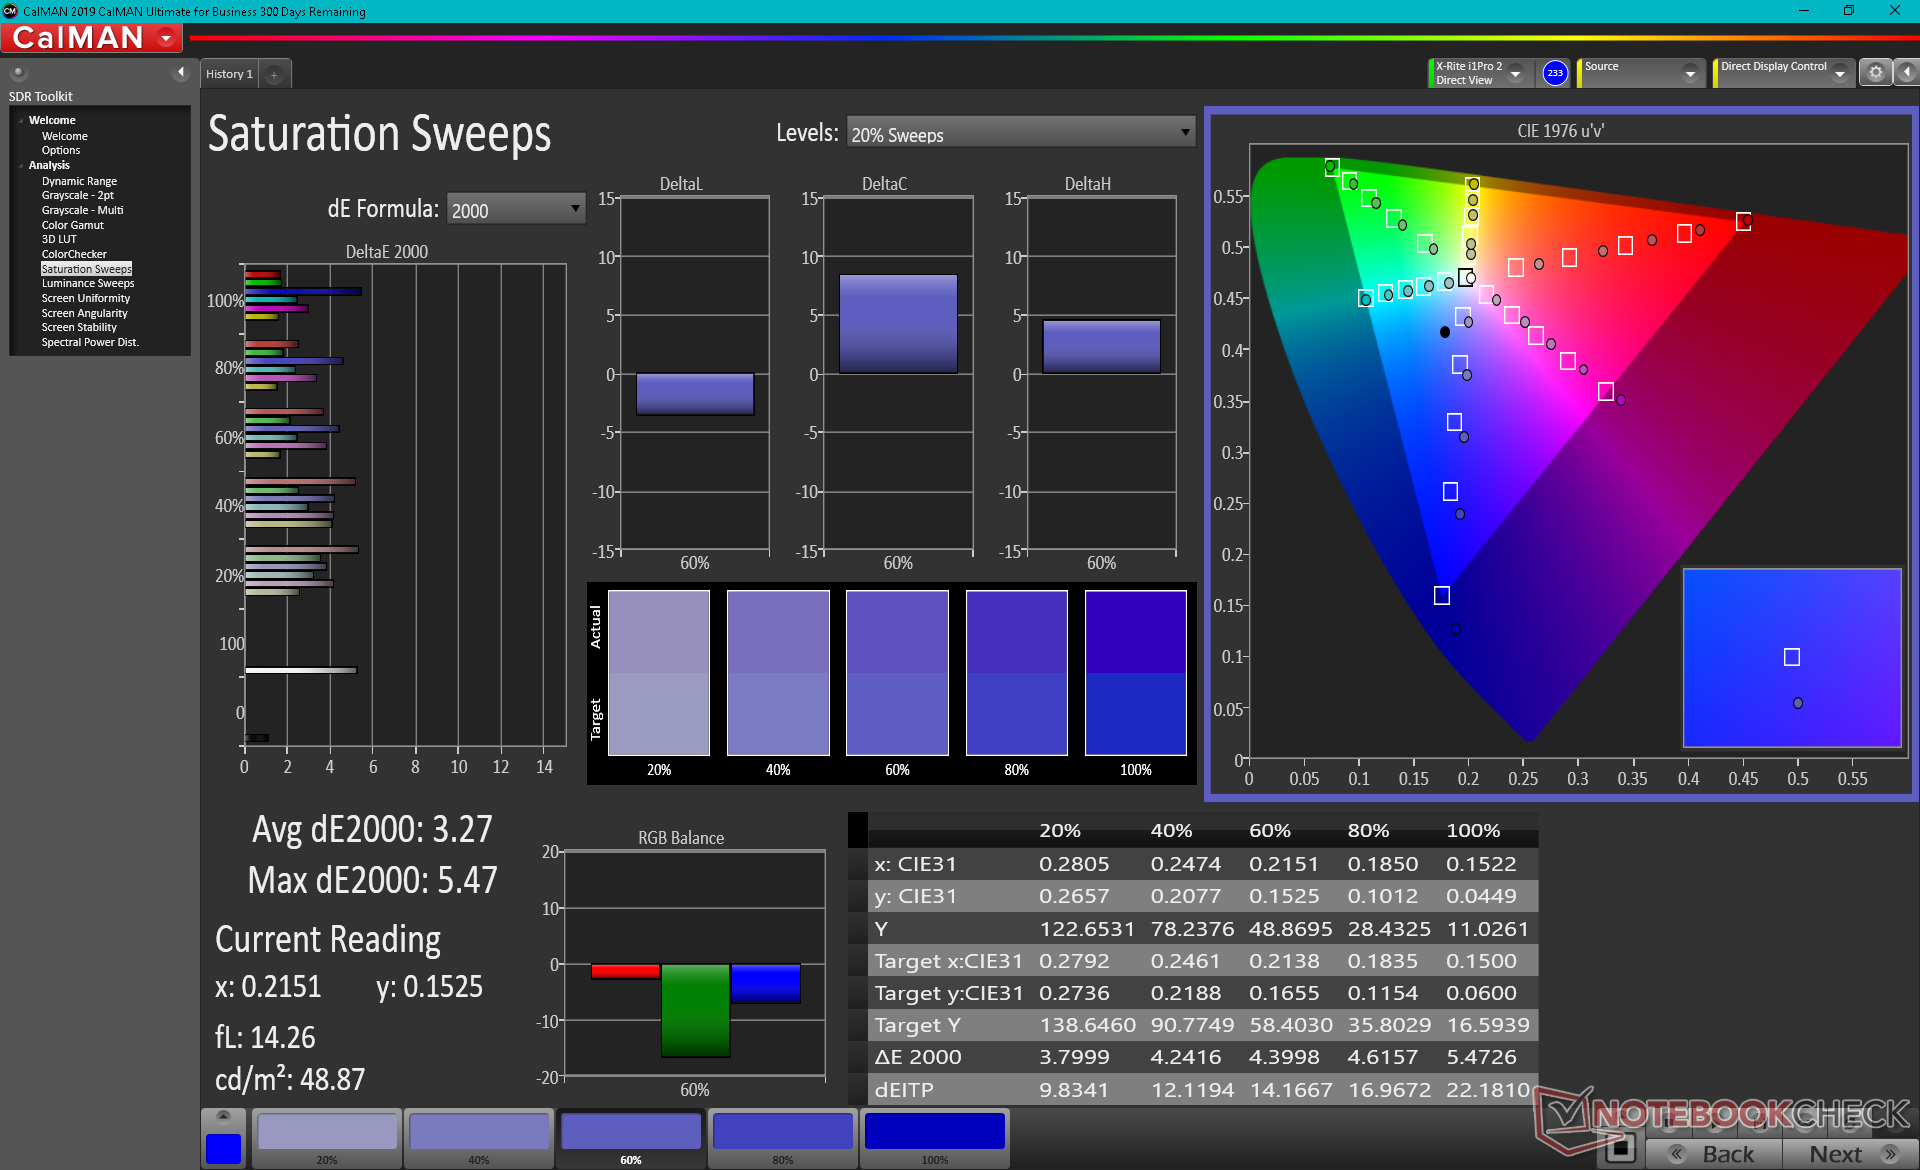
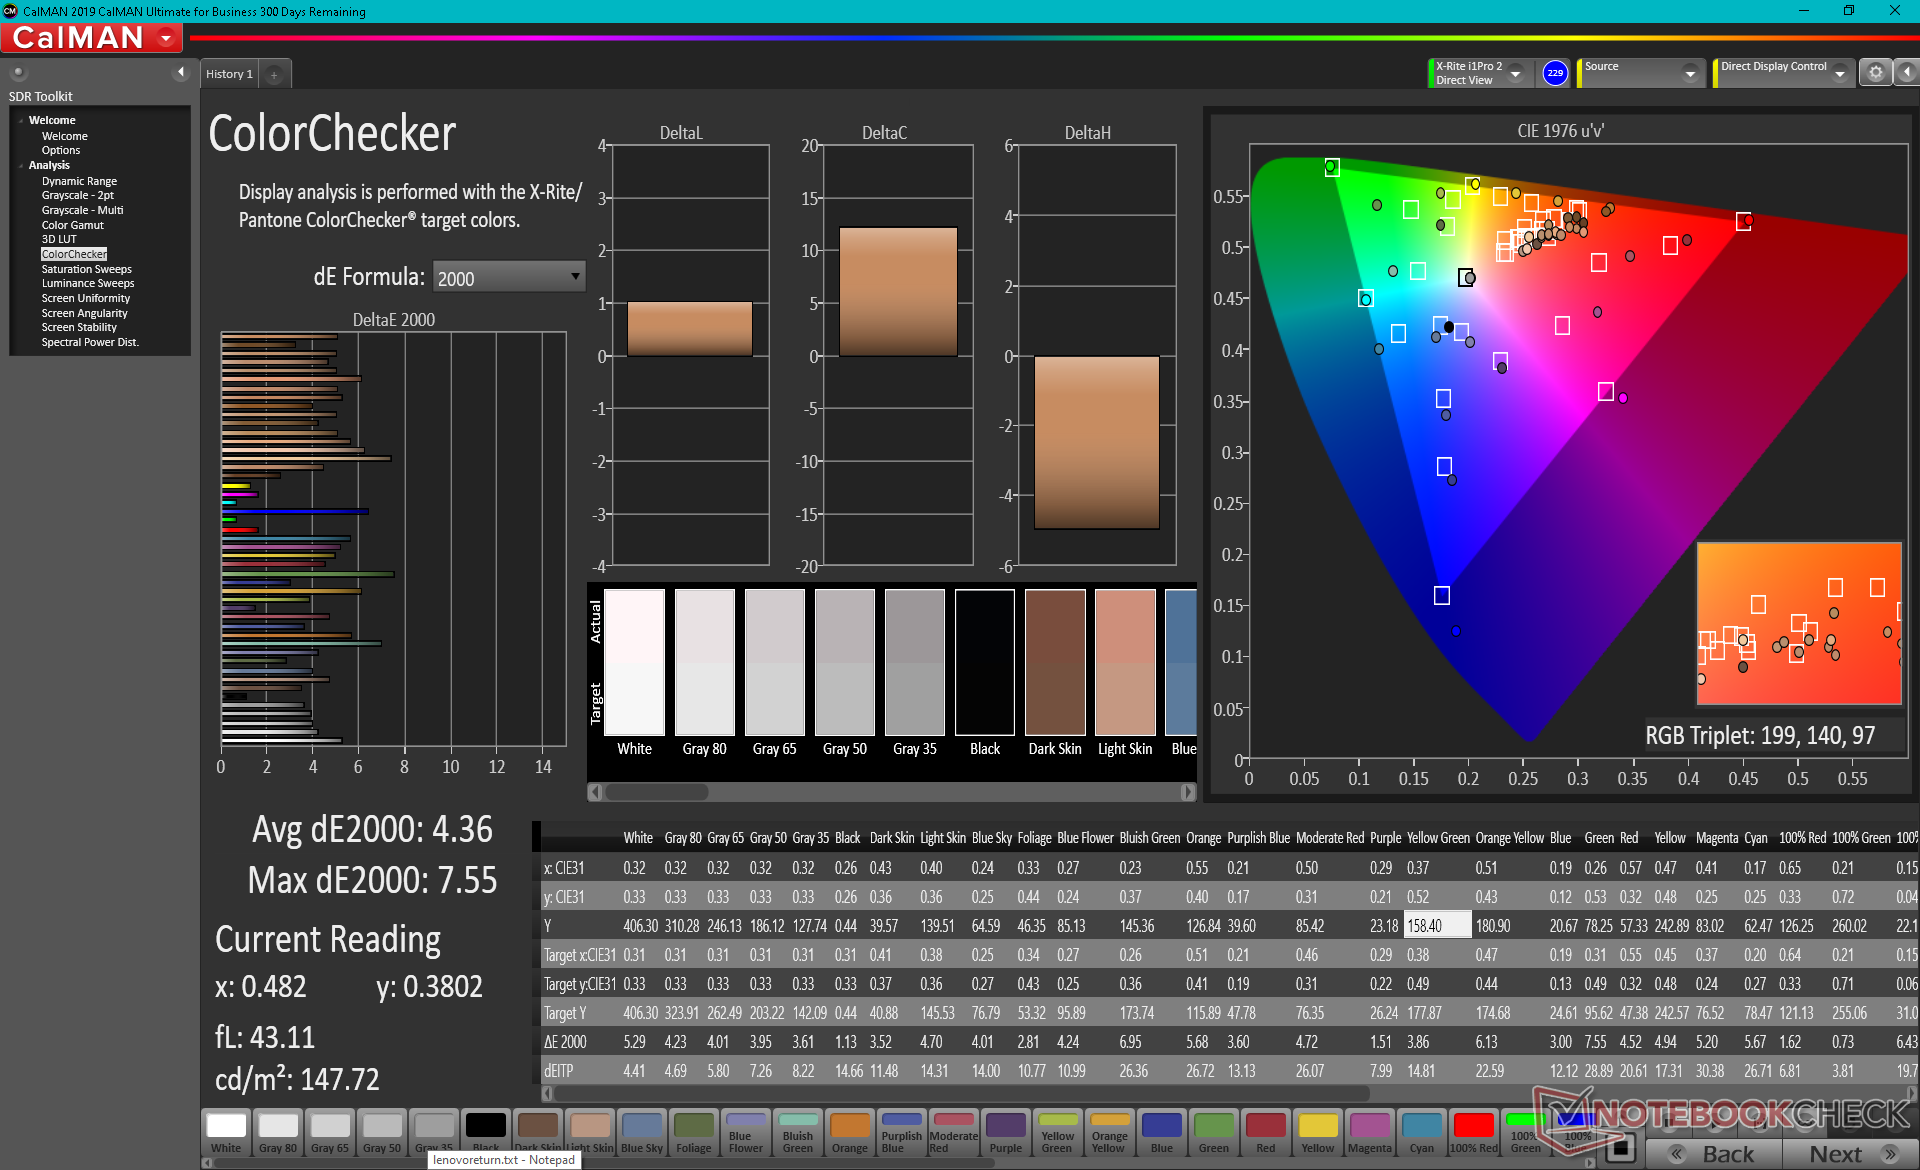
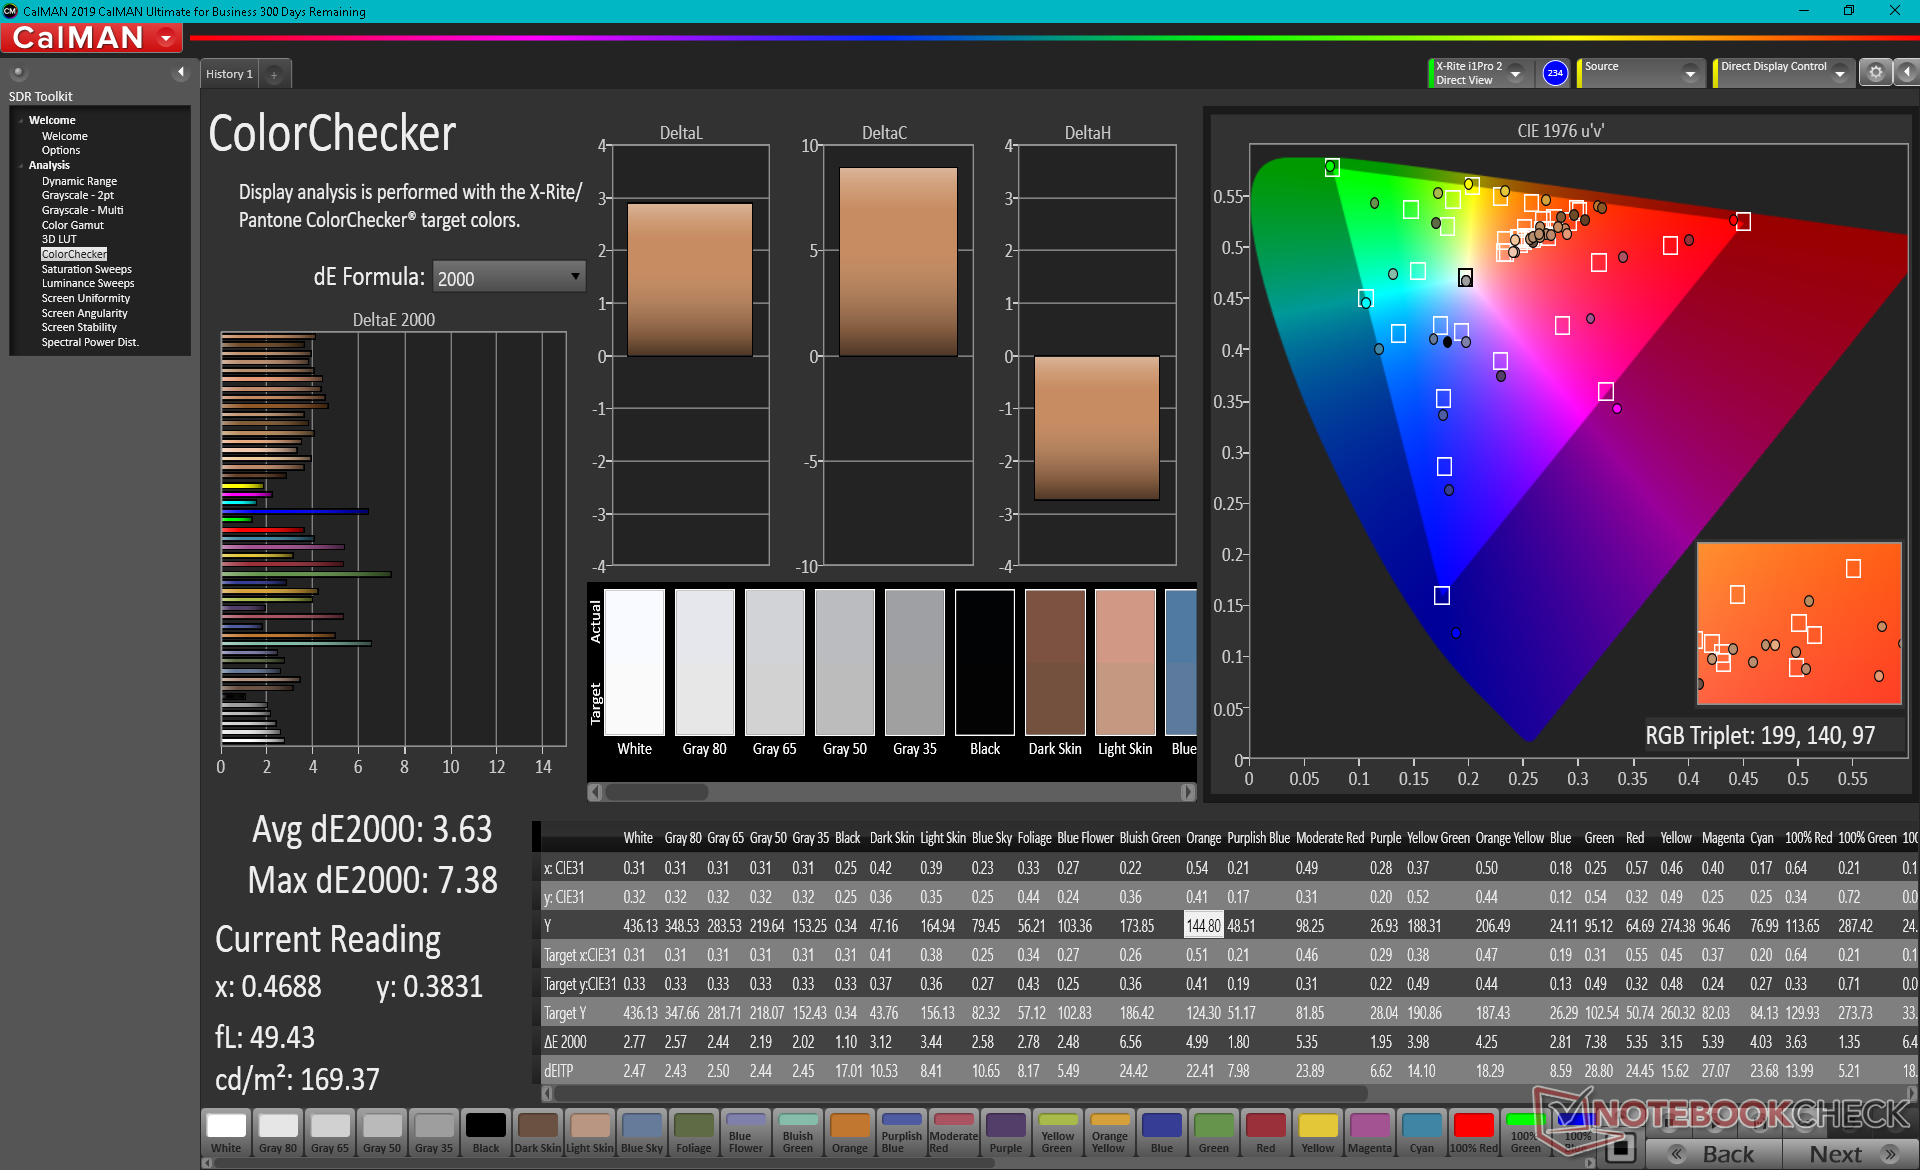
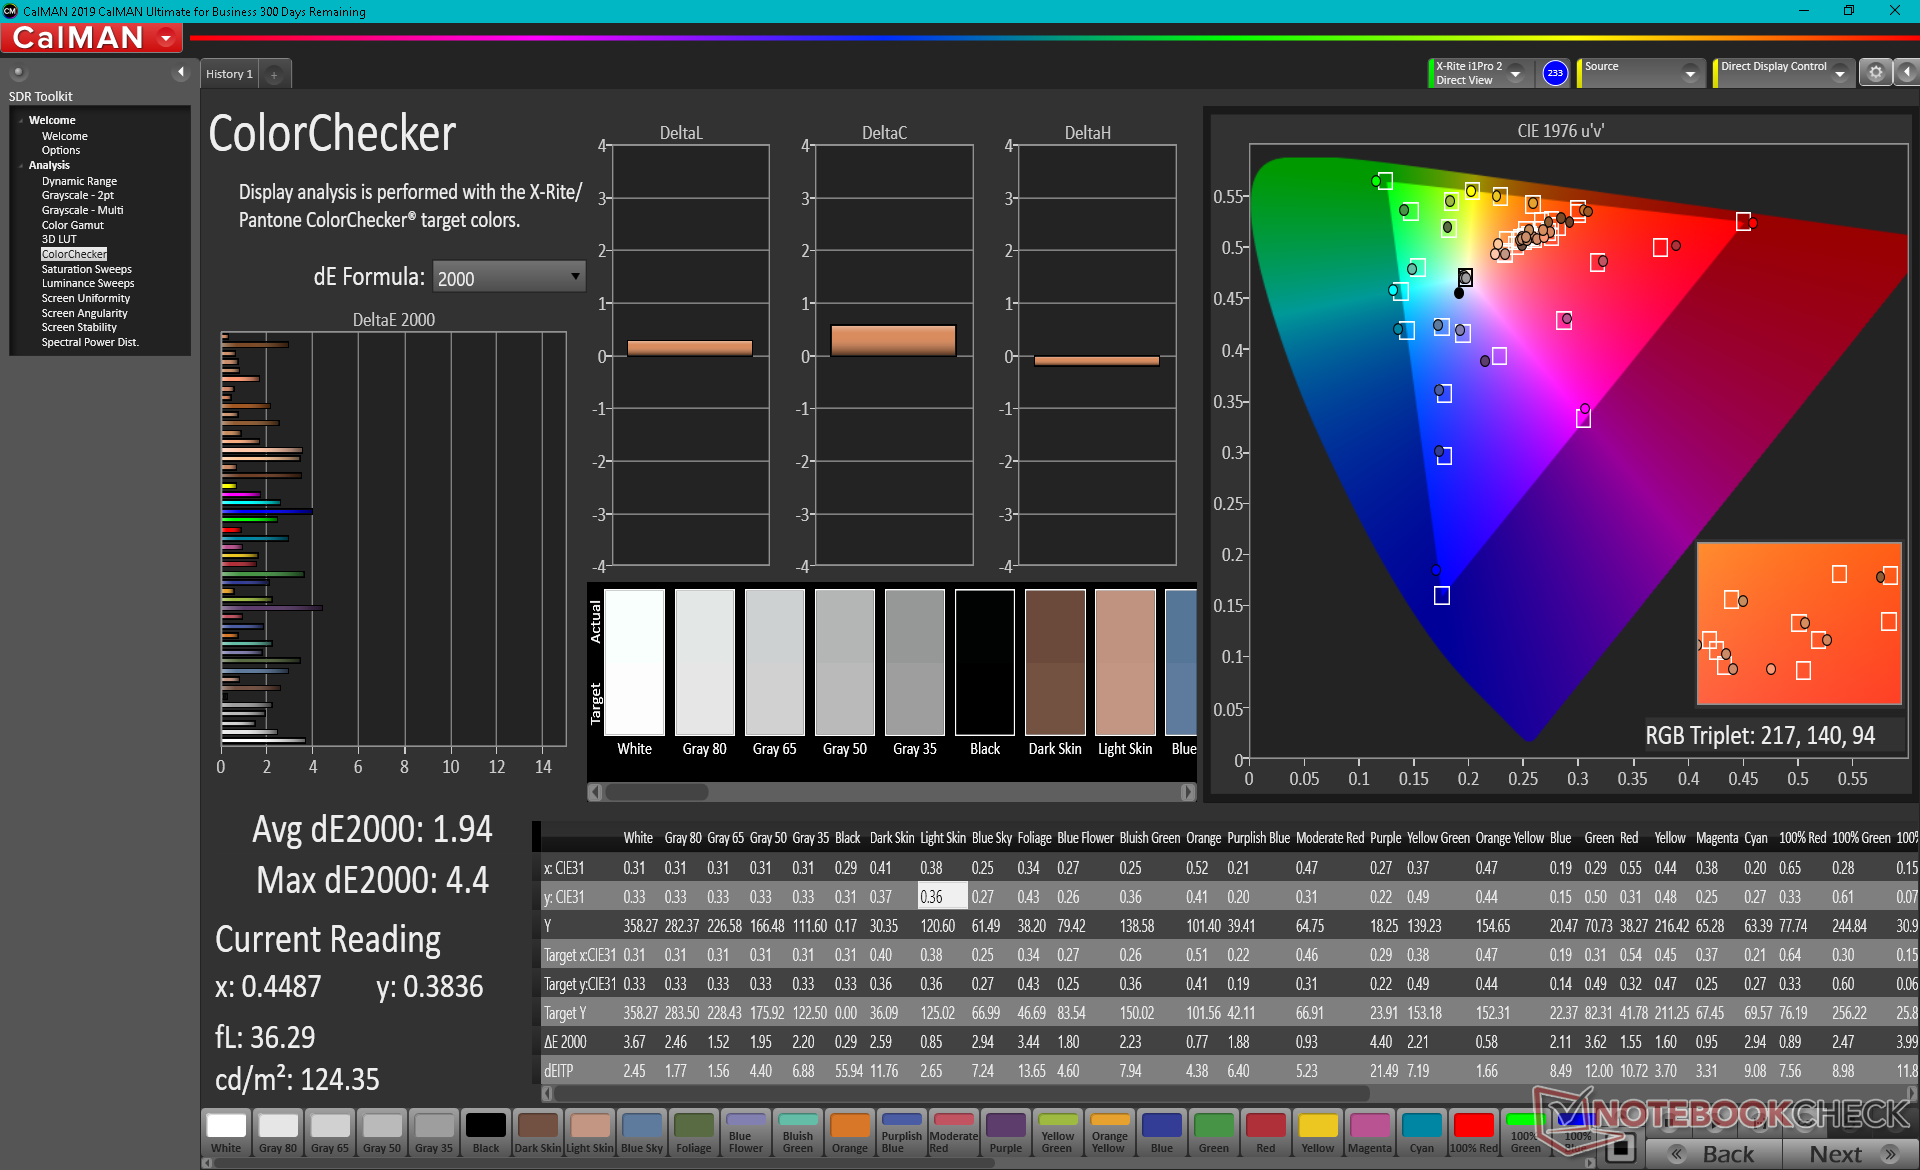
ΔE ColorChecker Calman: 4.36 | ∀{0.5-29.43 Ø4.73}
calibrated: 3.63
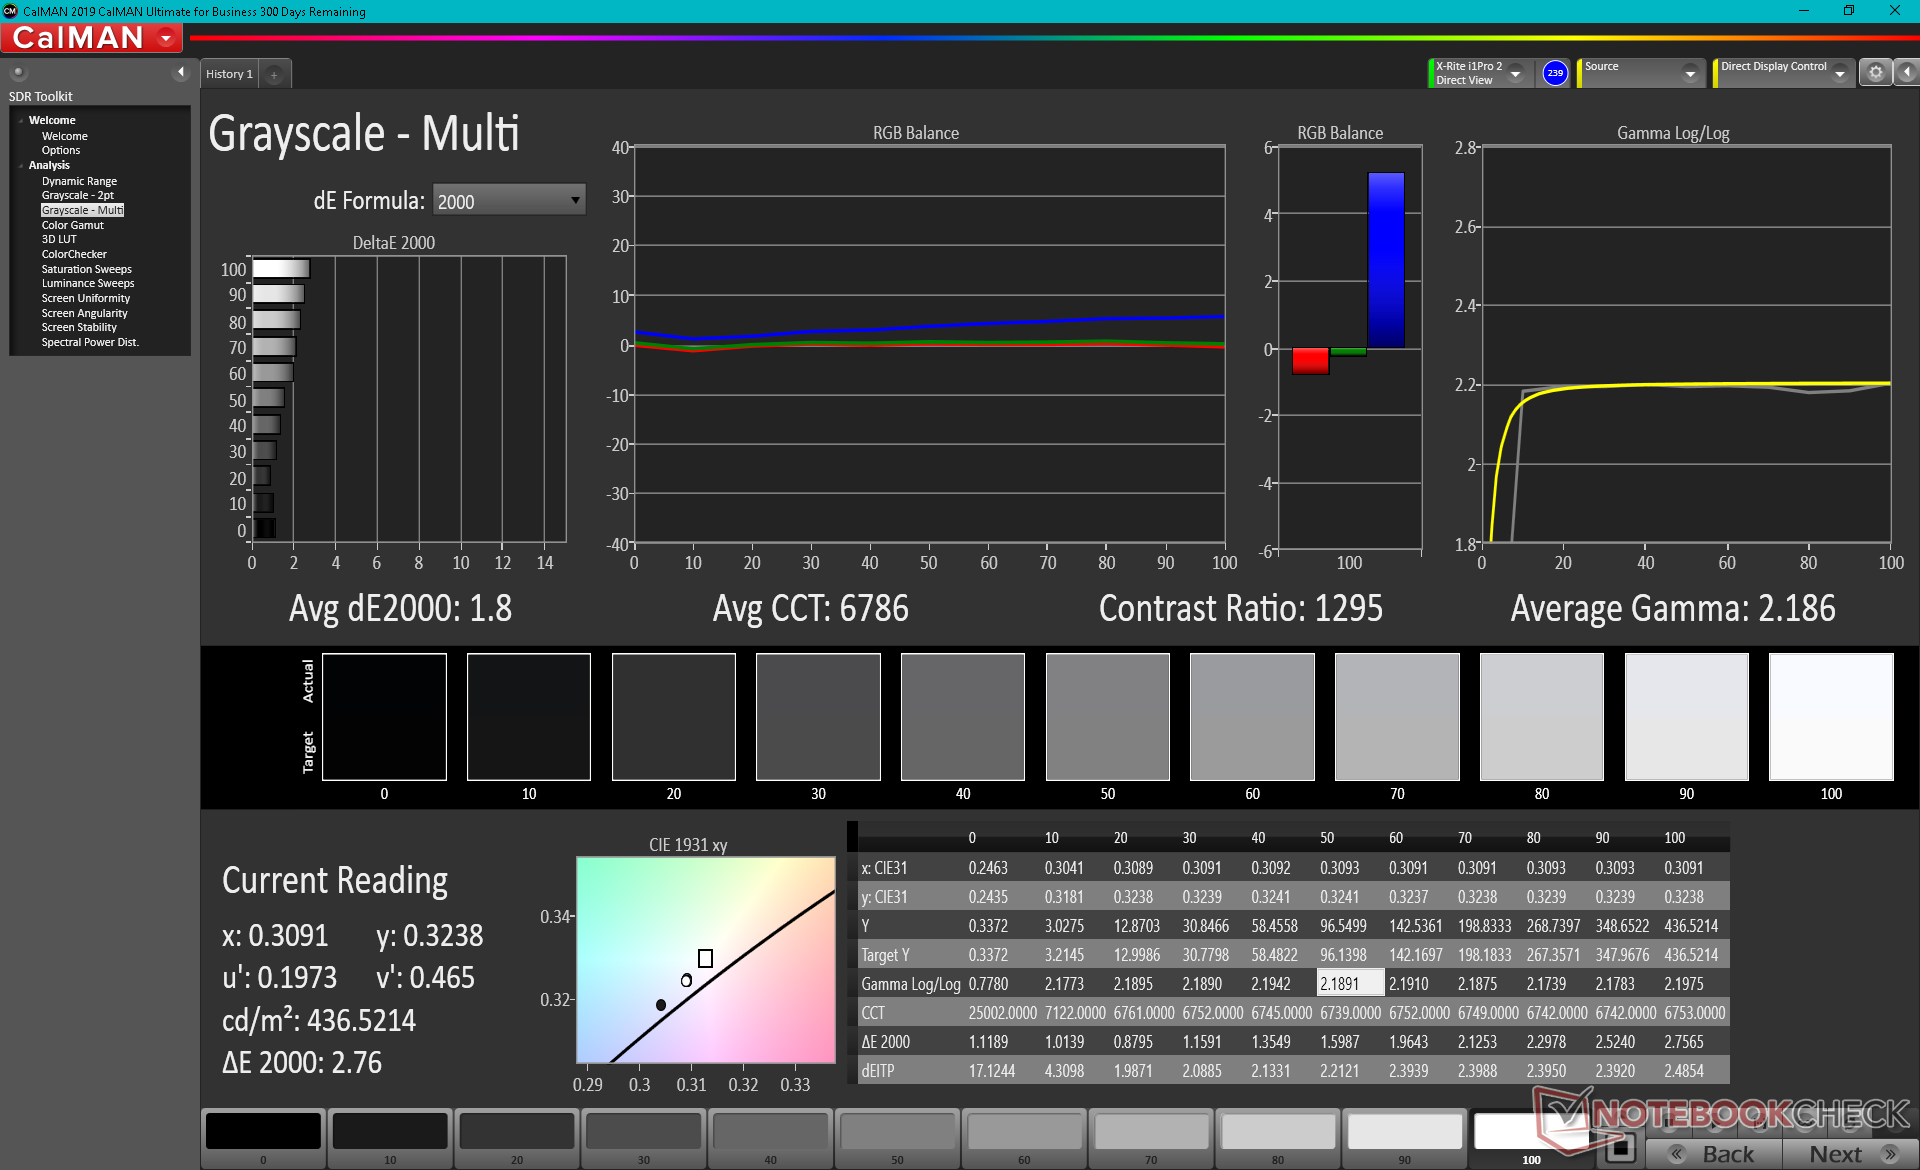
ΔE Greyscale Calman: 3.1 | ∀{0.09-98 Ø4.97}
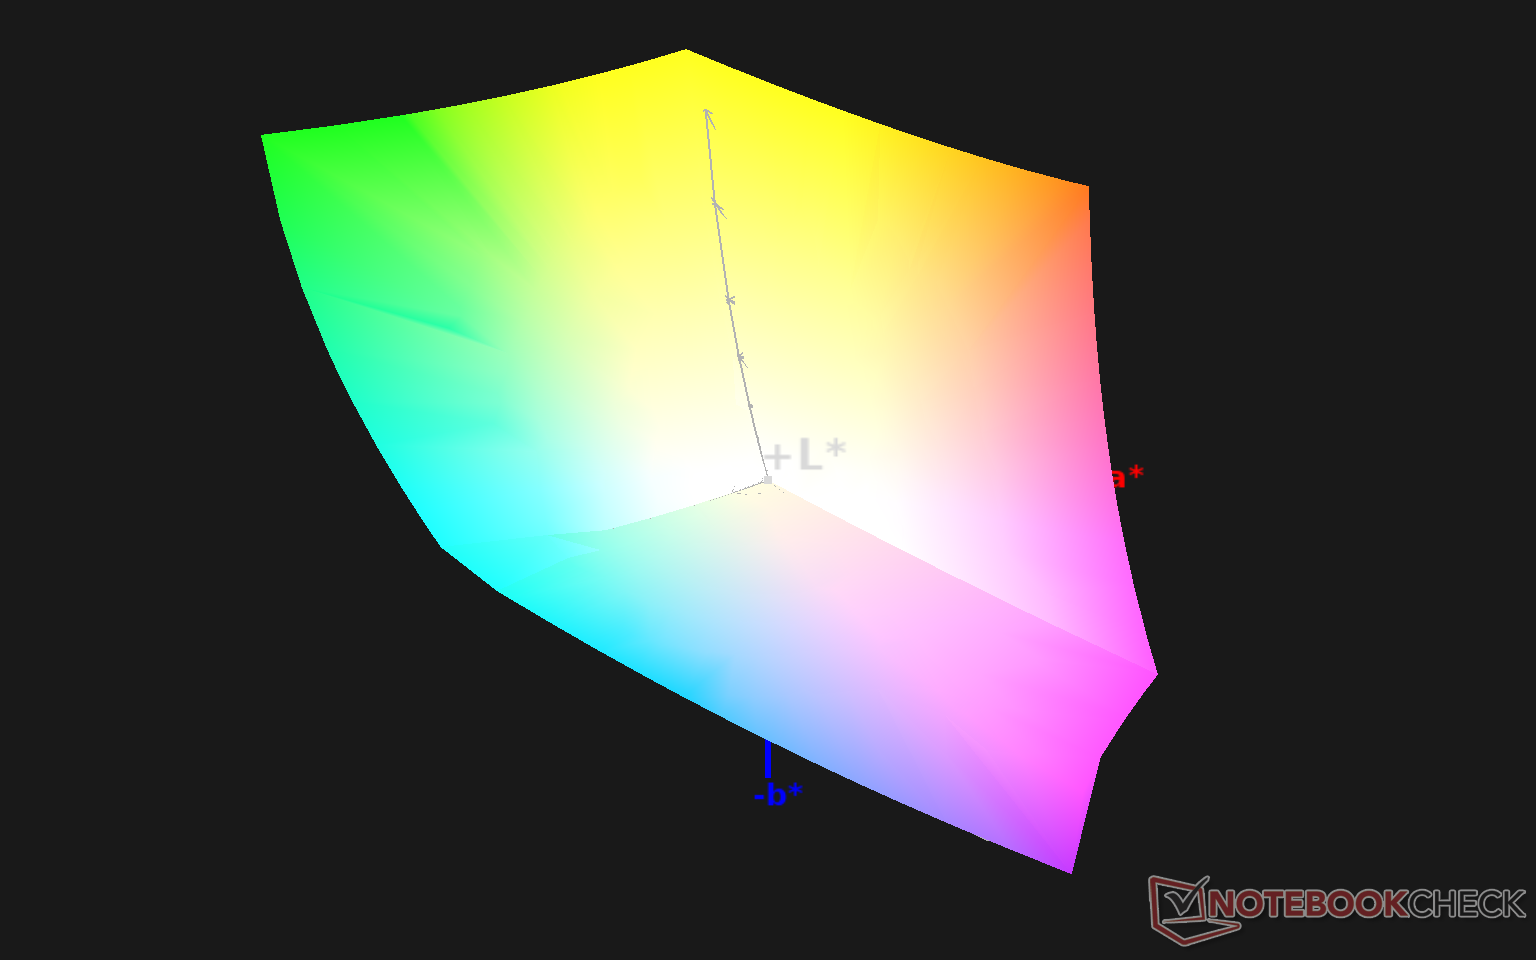
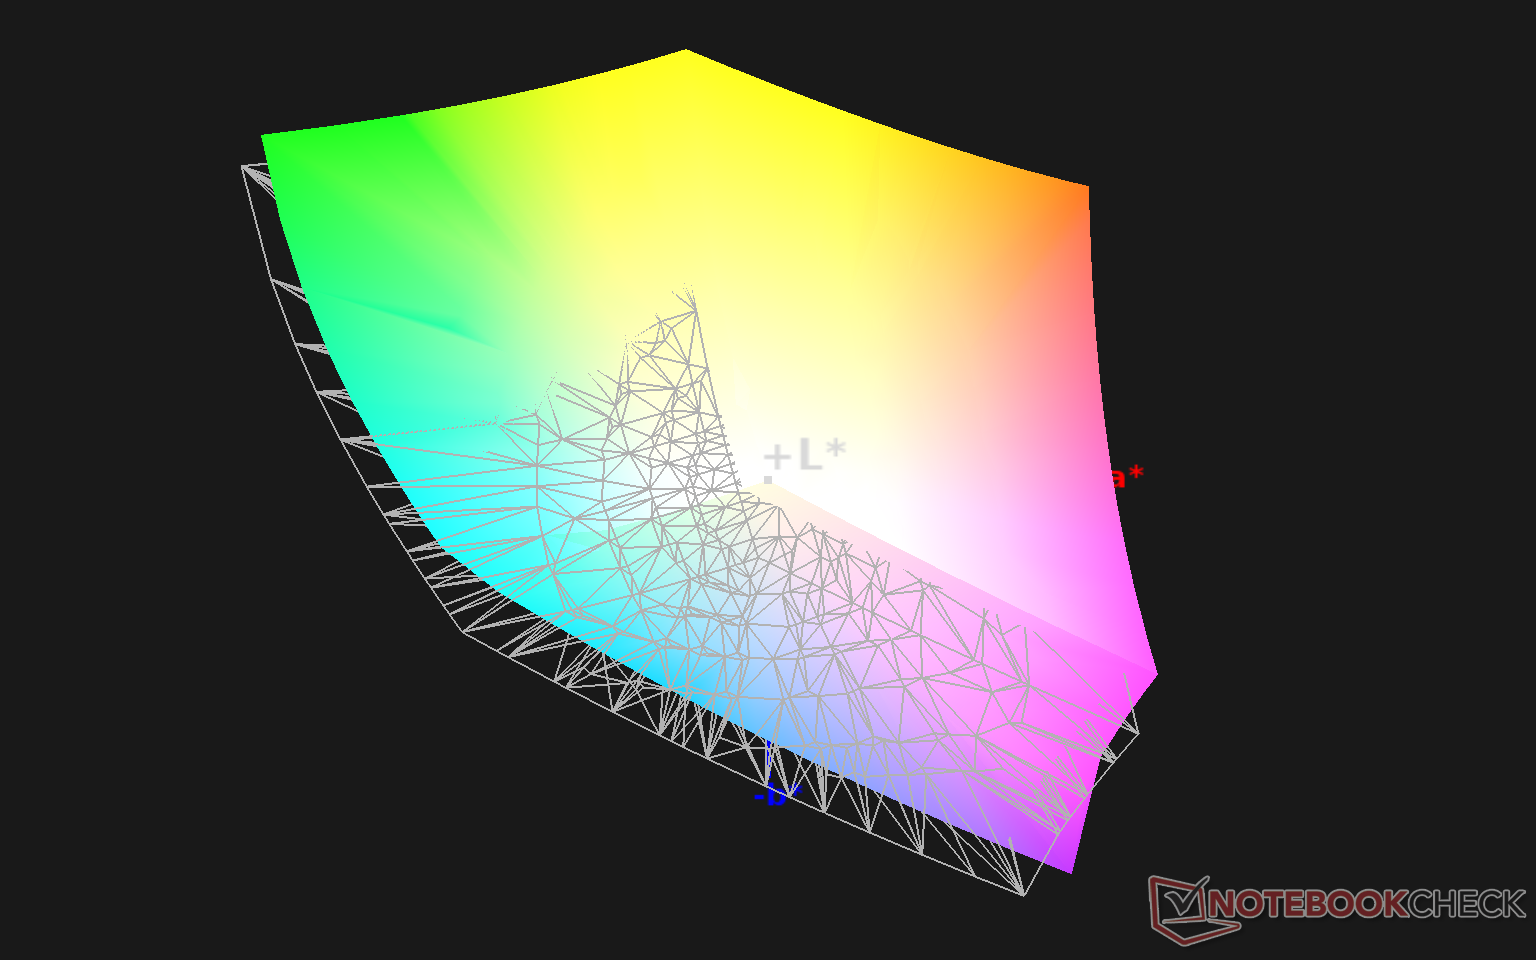
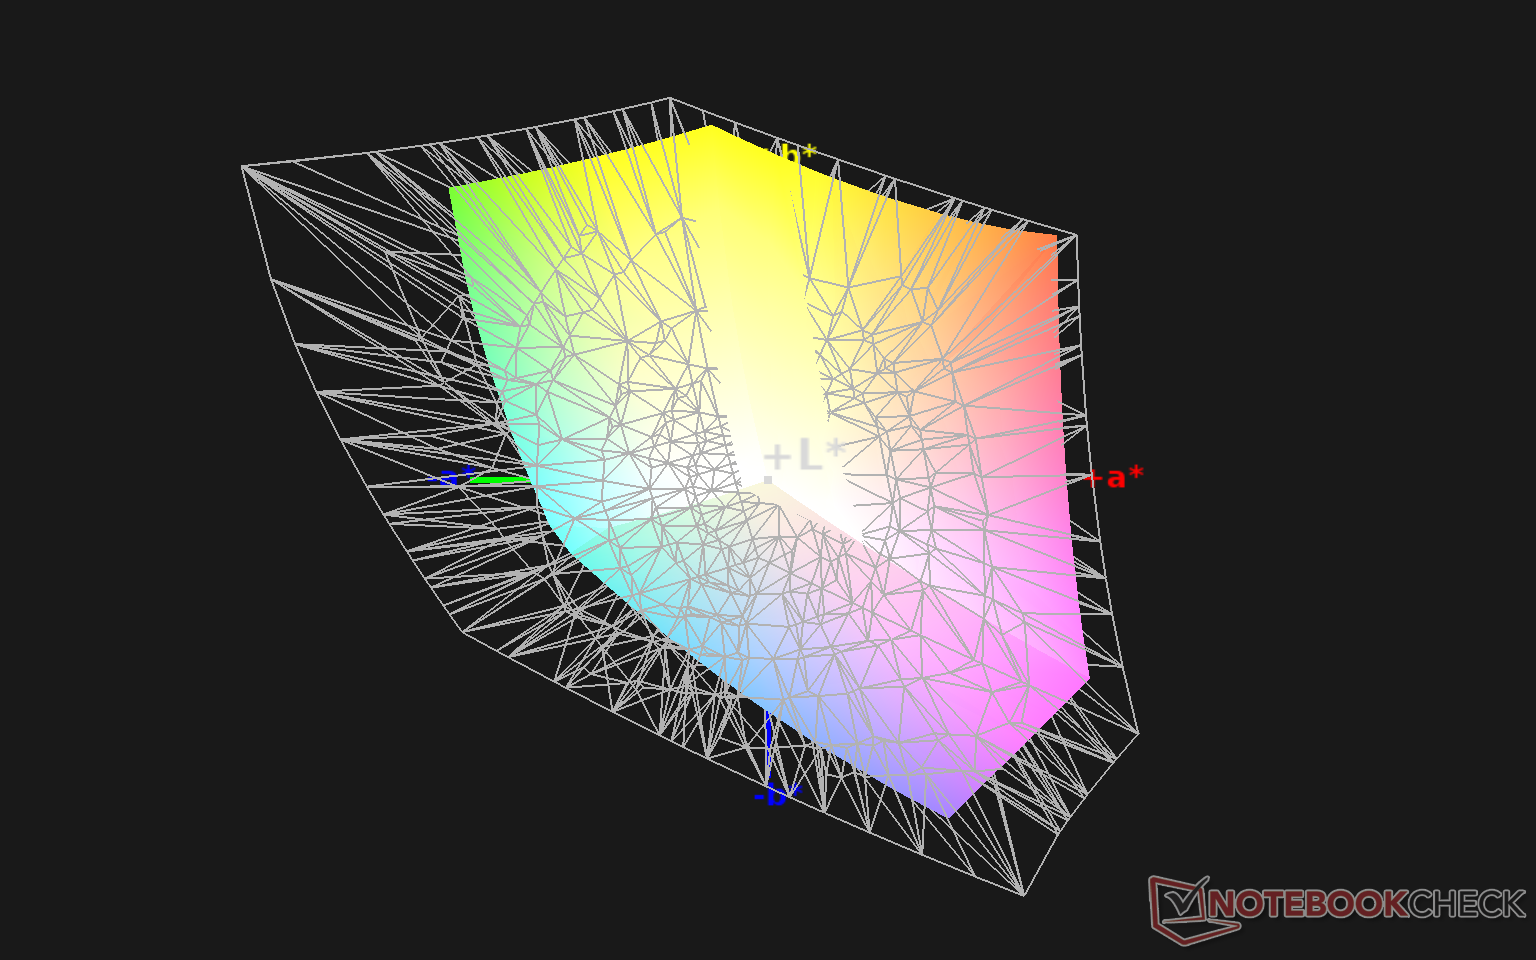
99.9% sRGB (Argyll 1.6.3 3D)
86.7% AdobeRGB 1998 (Argyll 1.6.3 3D)
99.1% AdobeRGB 1998 (Argyll 3D)
99.9% sRGB (Argyll 3D)
89.1% Display P3 (Argyll 3D)
Gamma: 2.36
CCT: 6371 K
| Asus ROG Zephyrus Duo 15 SE GX551QS AU Optronics B156ZAN05.1, IPS, 15.6", 3840x2160 | Asus ROG Zephyrus Duo 15 GX550LXS AU Optronics B156ZAN03.1, IPS, 15.6", 3840x2160 | Razer Blade 15 RTX 2080 Super Max-Q AU Optronics B156HAN12.0, IPS, 15.6", 1920x1080 | Eurocom Sky X4C i9-9900KS AU Optronics B156HAN07.0, IPS, 15.6", 1920x1080 | MSI GE66 Raider 10SFS Sharp LQ156M1JW03 (SHP14C5), IPS-Level, 15.6", 1920x1080 | Asus Zephyrus S15 GX502L B156HAN12.0 (AUOBC8C), IPS, 15.6", 1920x1080 | |
|---|---|---|---|---|---|---|
| Display | -0% | -17% | -24% | -18% | -17% | |
| Display P3 Coverage (%) | 89.1 | 87 -2% | 70.2 -21% | 63.6 -29% | 68 -24% | 69.7 -22% |
| sRGB Coverage (%) | 99.9 | 100 0% | 99 -1% | 90.9 -9% | 99 -1% | 99.7 0% |
| AdobeRGB 1998 Coverage (%) | 99.1 | 99.9 1% | 71.4 -28% | 64.7 -35% | 69.8 -30% | 71.1 -28% |
| Response Times | -362% | 20% | -55% | -50% | -32% | |
| Response Time Grey 50% / Grey 80% * (ms) | 8.2 ? | 56.4 ? -588% | 6 ? 27% | 16.8 ? -105% | 16.4 ? -100% | 14 ? -71% |
| Response Time Black / White * (ms) | 10.4 ? | 24.4 ? -135% | 9 ? 13% | 10.8 ? -4% | 10.4 ? -0% | 9.6 ? 8% |
| PWM Frequency (Hz) | 23580 ? | |||||
| Screen | 28% | 15% | -18% | 15% | 10% | |
| Brightness middle (cd/m²) | 406 | 398 -2% | 347 -15% | 258.8 -36% | 291 -28% | 283 -30% |
| Brightness (cd/m²) | 407 | 385 -5% | 328 -19% | 258 -37% | 278 -32% | 289 -29% |
| Brightness Distribution (%) | 88 | 90 2% | 89 1% | 82 -7% | 91 3% | 90 2% |
| Black Level * (cd/m²) | 0.42 | 0.28 33% | 0.285 32% | 0.28 33% | 0.25 40% | 0.24 43% |
| Contrast (:1) | 967 | 1421 47% | 1218 26% | 924 -4% | 1164 20% | 1179 22% |
| Colorchecker dE 2000 * | 4.36 | 1.53 65% | 2.35 46% | 4.45 -2% | 1.19 73% | 2.26 48% |
| Colorchecker dE 2000 max. * | 7.55 | 3.69 51% | 4.15 45% | 9.85 -30% | 3.04 60% | 5.64 25% |
| Colorchecker dE 2000 calibrated * | 3.63 | 0.77 79% | 1.16 68% | 3 17% | 1.11 69% | |
| Greyscale dE 2000 * | 3.1 | 2.4 23% | 3.04 2% | 5.8 -87% | 1.9 39% | 3.4 -10% |
| Gamma | 2.36 93% | 2.19 100% | 2.35 94% | 2.36 93% | 2.216 99% | 2.228 99% |
| CCT | 6371 102% | 6996 93% | 6658 98% | 7651 85% | 7018 93% | 7249 90% |
| Color Space (Percent of AdobeRGB 1998) (%) | 86.7 | 100 15% | 65 -25% | 58.8 -32% | 70 -19% | 71 -18% |
| Color Space (Percent of sRGB) (%) | 99.9 | 100 0% | 99 -1% | 90.5 -9% | 92 -8% | 93 -7% |
| Media totale (Programma / Settaggio) | -111% /
-26% | 6% /
9% | -32% /
-24% | -18% /
-0% | -13% /
0% |
* ... Meglio usare valori piccoli
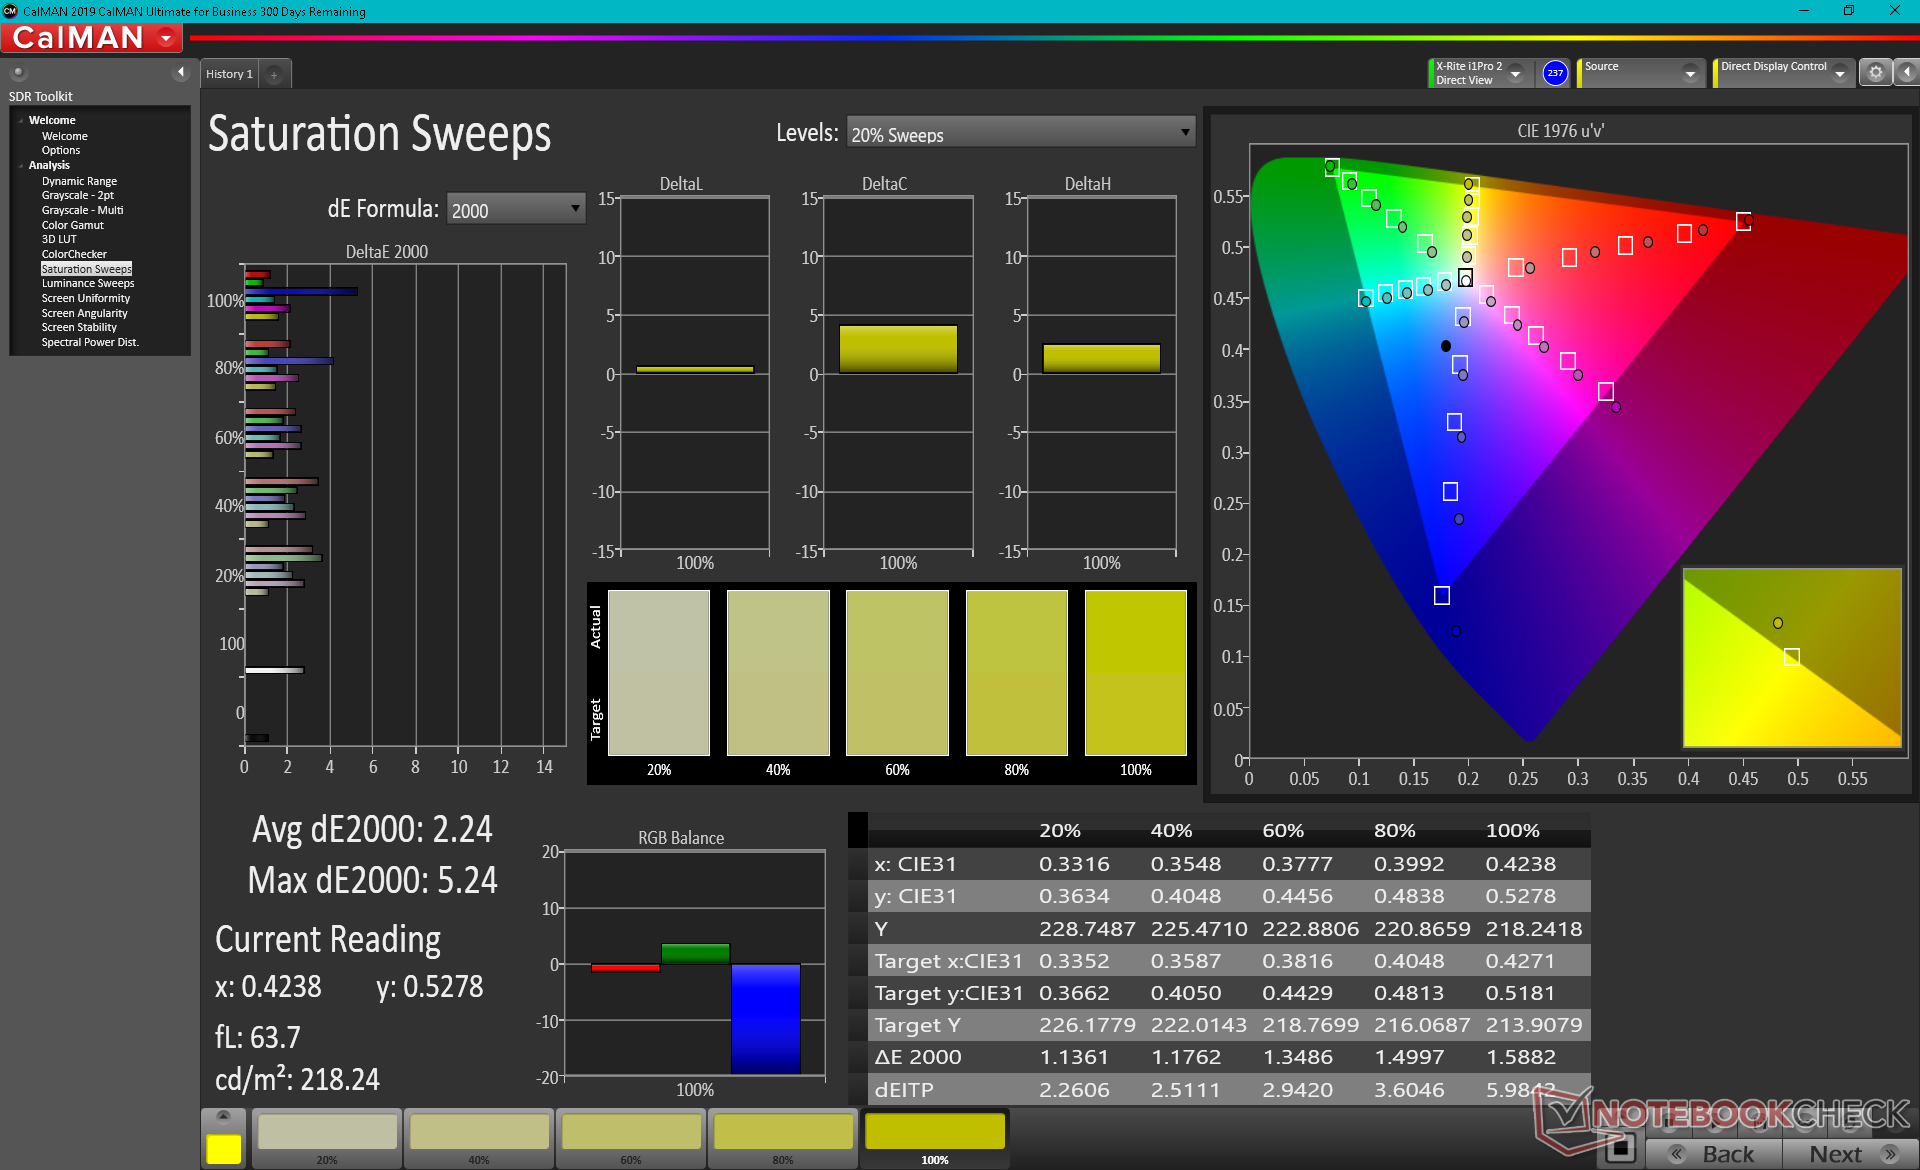
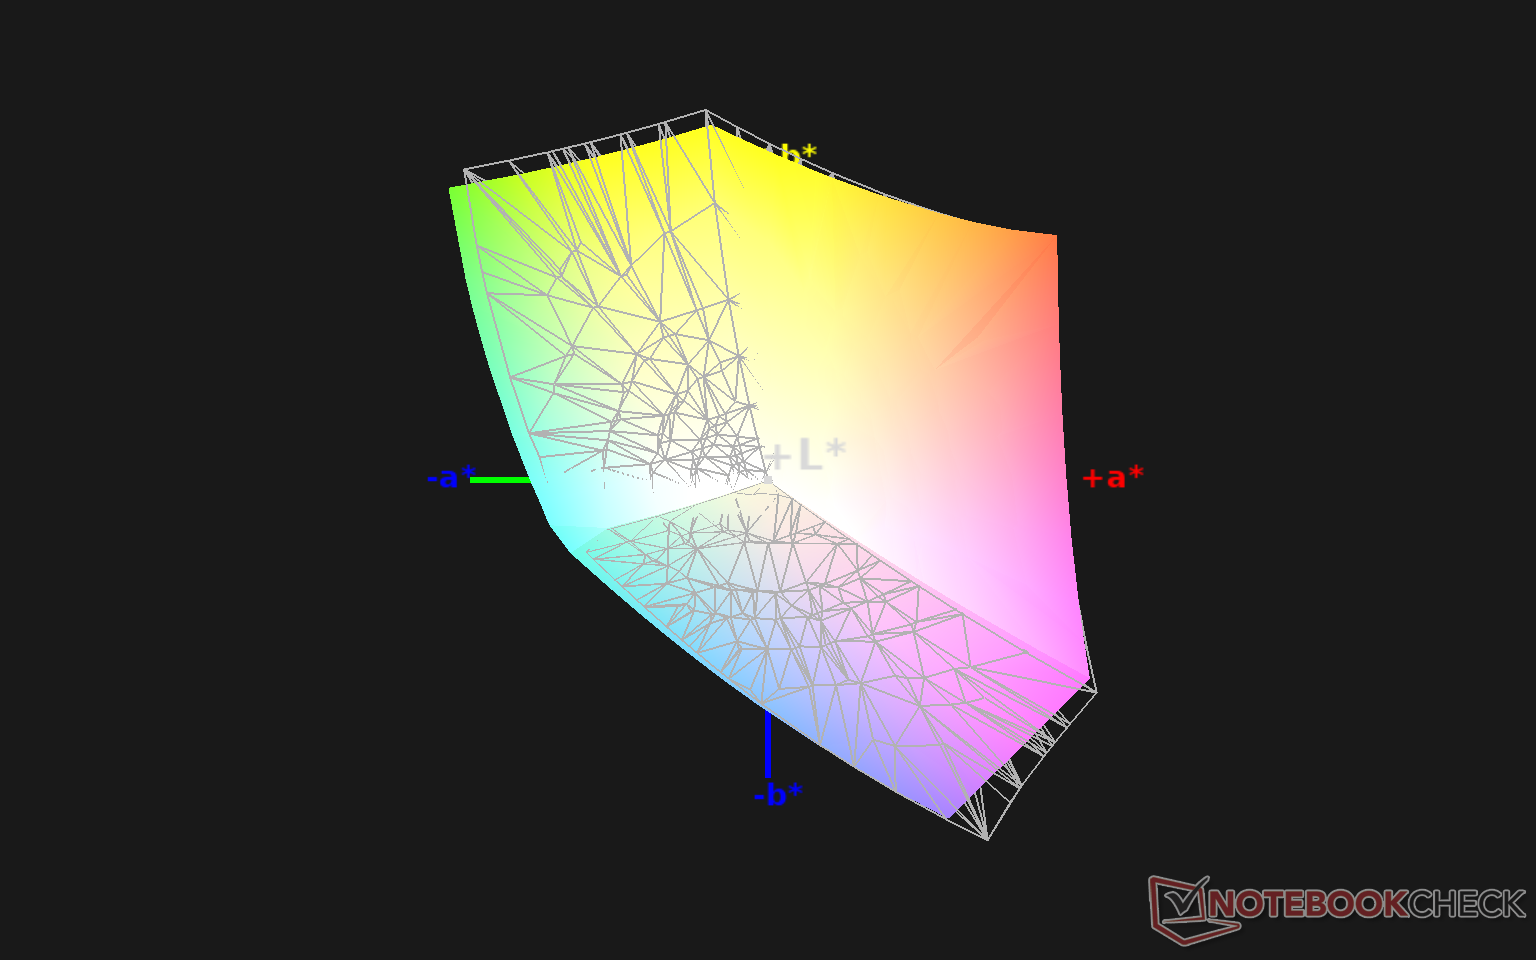
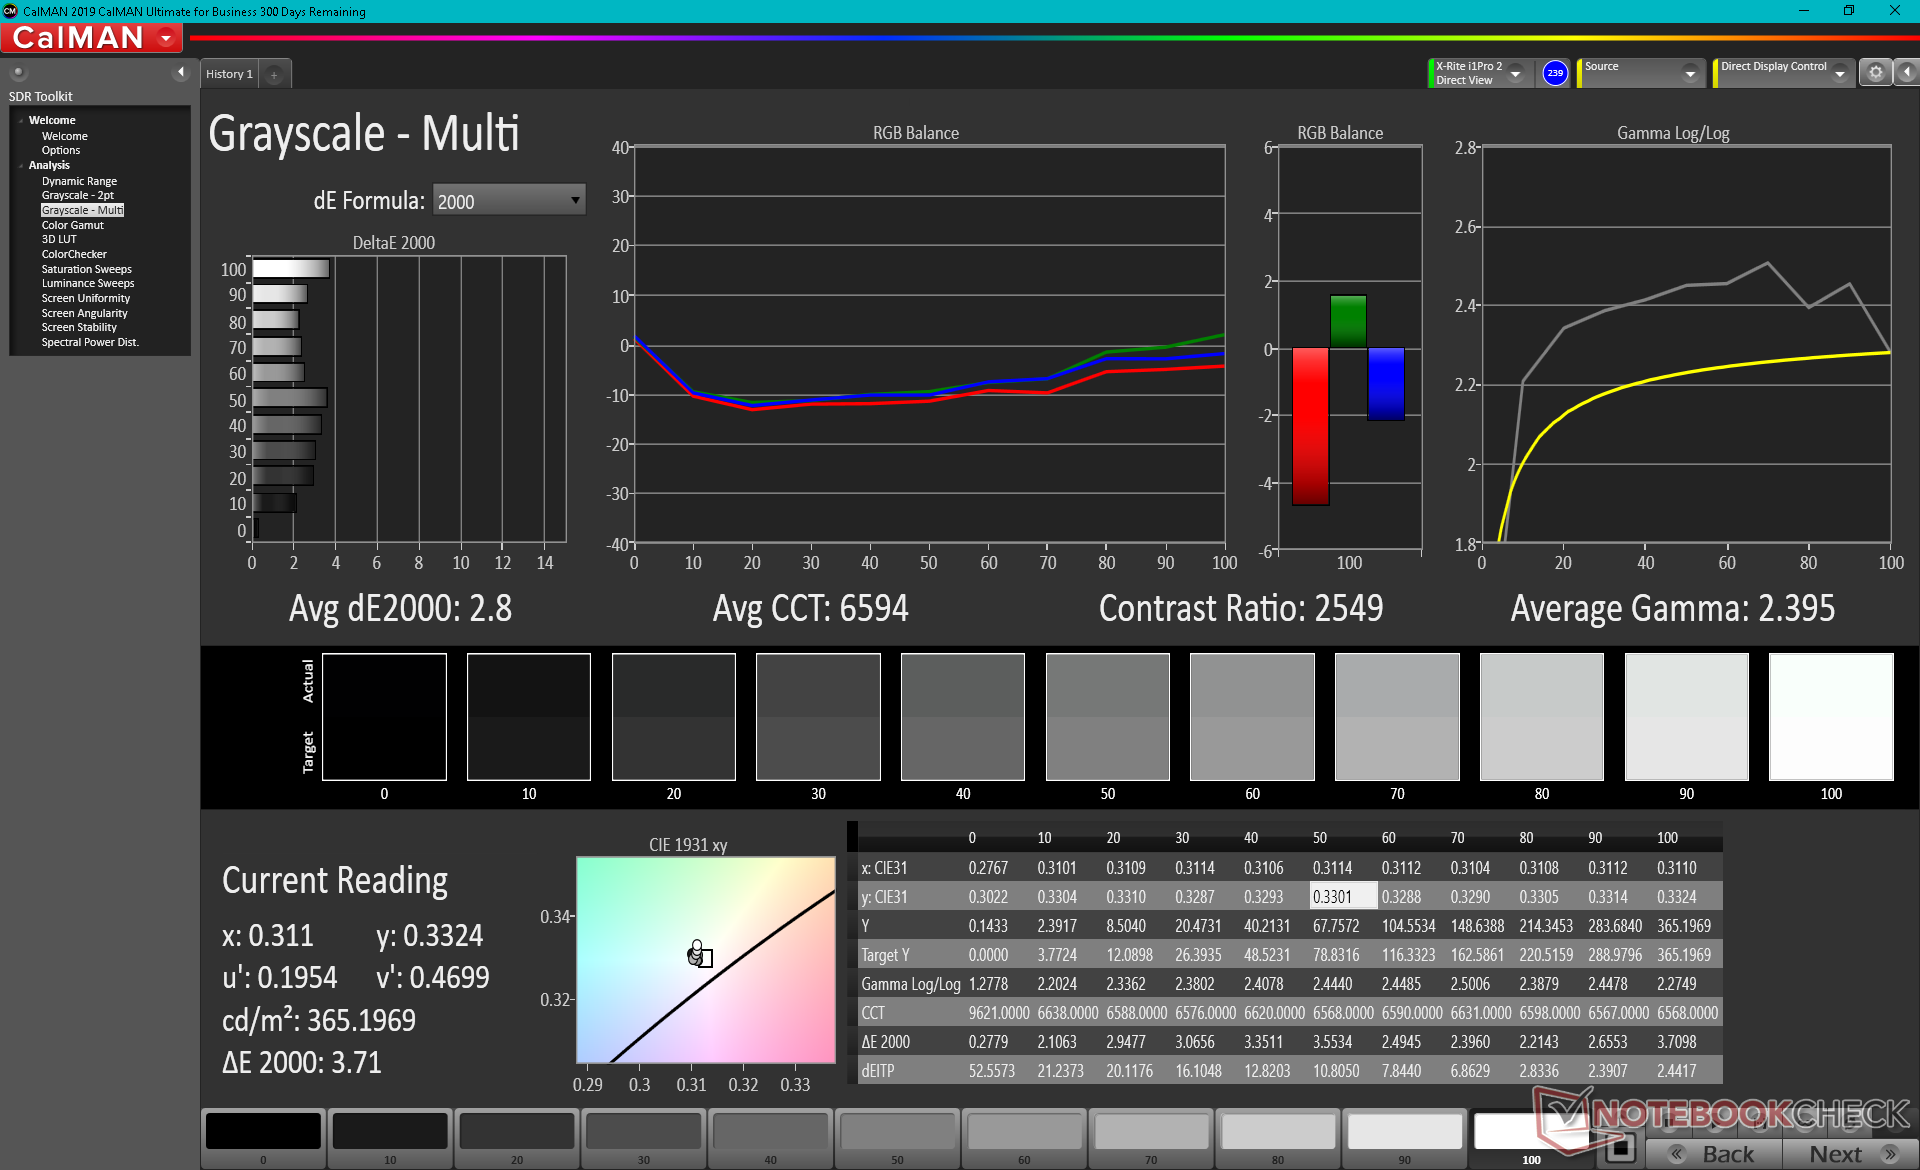
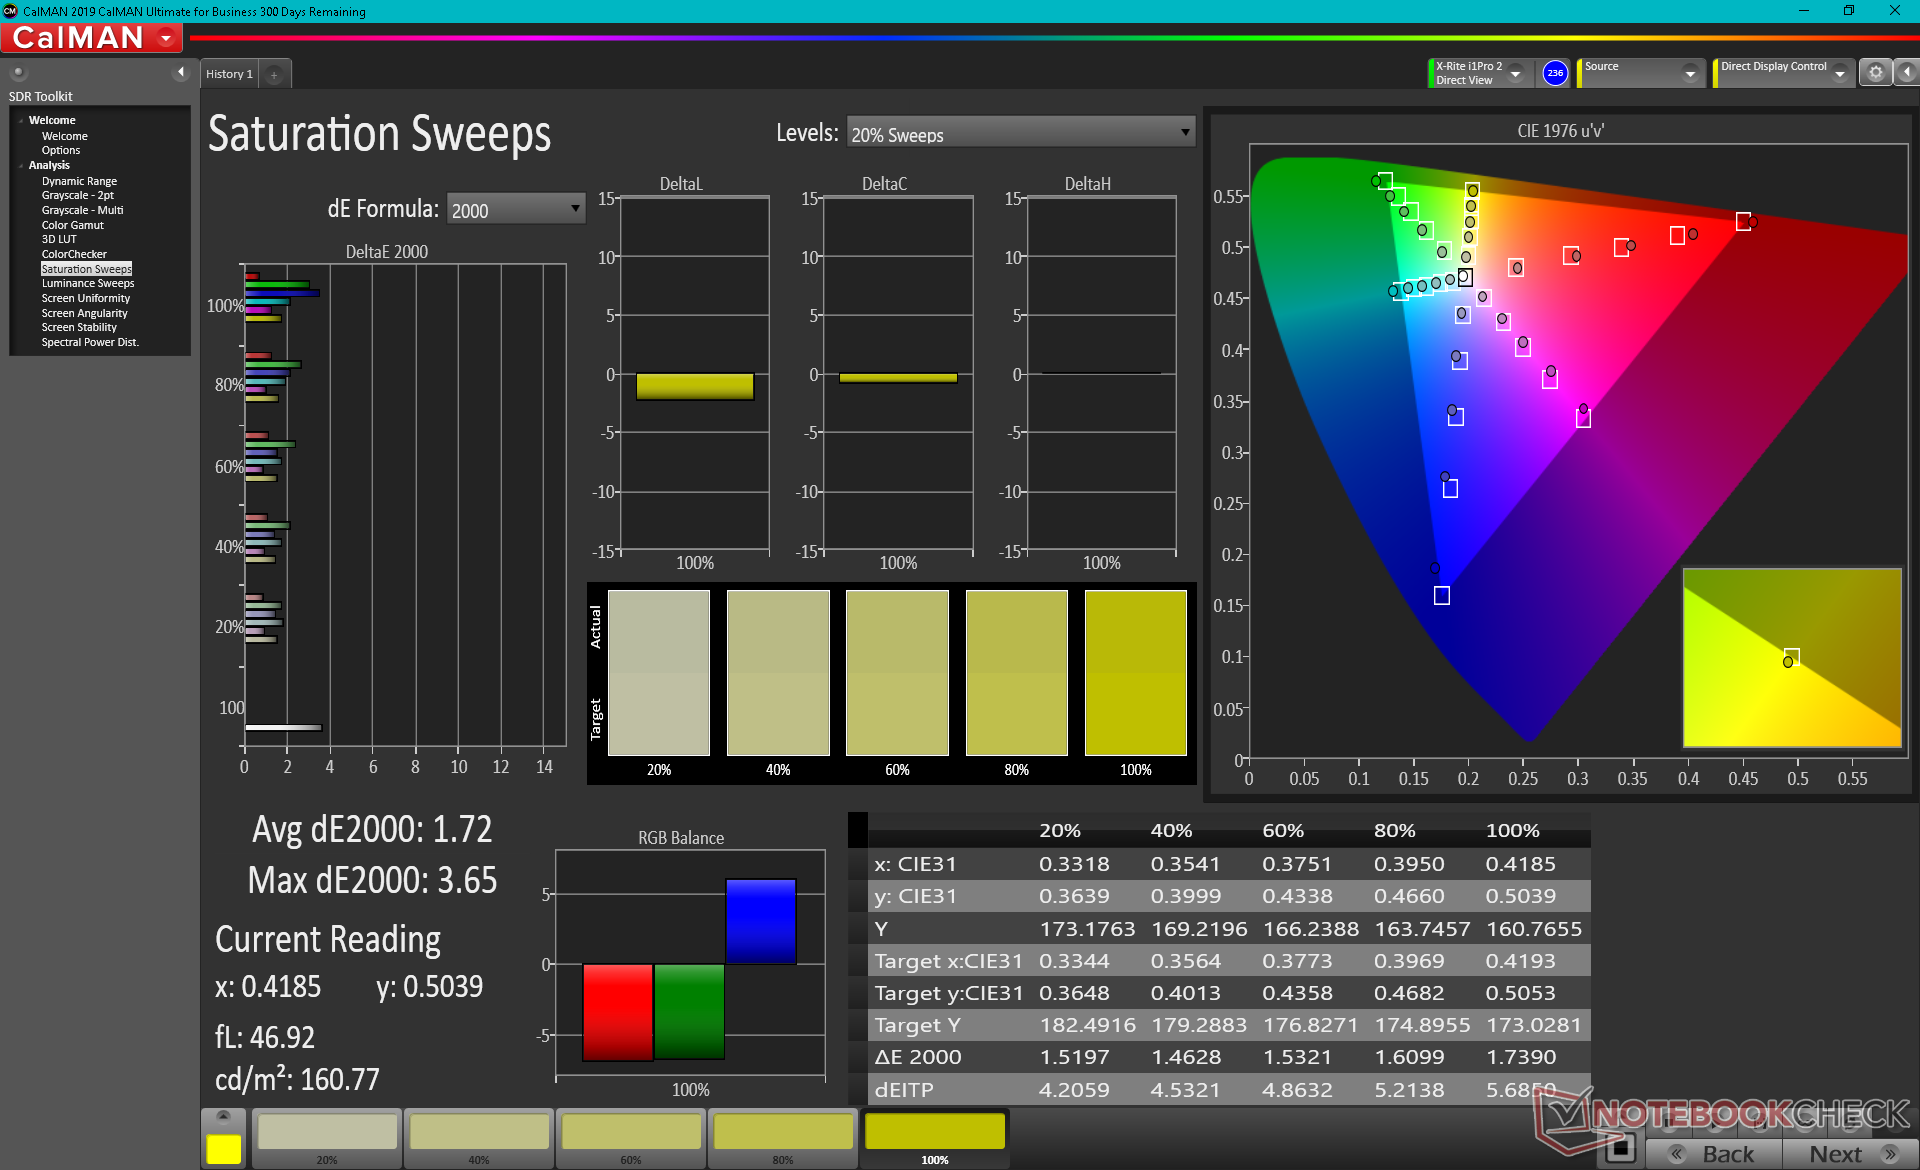
Lo spazio colore copre quasi tutto AdobeRGB, non diversamente dalla maggior parte degli Ultrabooks di punta e dei portatili con pannelli 4K. I colori precisi sono comuni su tali pannelli e quindi sono i veloci tempi di risposta bianco-nero e grigio-grigio che rendono Asus così speciale.
Il pannello principale viene fornito pre-calibrato. Anche così, il nostro colorimetro mostra una temperatura di colore più calda del previsto per una curva gamma squilibrata. La nostra calibrazione risolve questo problema per un DetalE medio di scala di grigi più basso di appena 1,8.
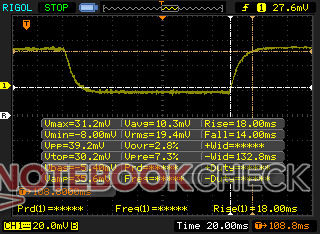
Tempi di risposta del Display
| ↔ Tempi di risposta dal Nero al Bianco | ||
|---|---|---|
| 10.4 ms ... aumenta ↗ e diminuisce ↘ combinato | ↗ 5.2 ms Incremento | 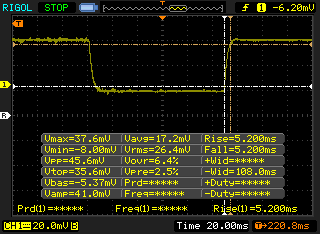 |
| ↘ 5.2 ms Calo | ||
| Lo schermo mostra buoni tempi di risposta durante i nostri tests, ma potrebbe essere troppo lento per i gamers competitivi. In confronto, tutti i dispositivi di test variano da 0.1 (minimo) a 240 (massimo) ms. » 28 % di tutti i dispositivi è migliore. Questo significa che i tempi di risposta rilevati sono migliori rispettto alla media di tutti i dispositivi testati (19.9 ms). | ||
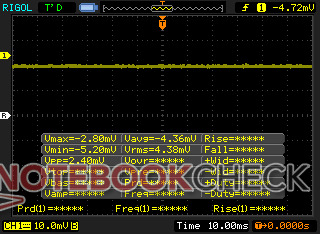
| ↔ Tempo di risposta dal 50% Grigio all'80% Grigio | ||
| 8.2 ms ... aumenta ↗ e diminuisce ↘ combinato | ↗ 3 ms Incremento | 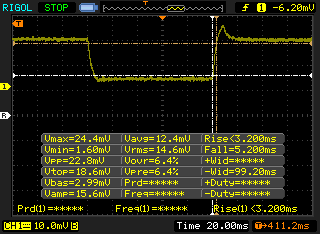 |
| ↘ 5.2 ms Calo | ||
| Lo schermo mostra veloci tempi di risposta durante i nostri tests e dovrebbe esere adatto al gaming In confronto, tutti i dispositivi di test variano da 0.165 (minimo) a 636 (massimo) ms. » 22 % di tutti i dispositivi è migliore. Questo significa che i tempi di risposta rilevati sono migliori rispettto alla media di tutti i dispositivi testati (31.1 ms). | ||
Sfarfallio dello schermo / PWM (Pulse-Width Modulation)
| flickering dello schermo / PWM non rilevato | 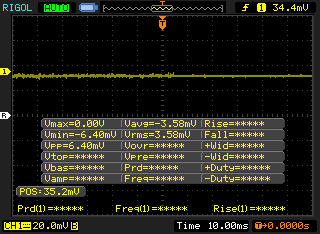 | ||
In confronto: 52 % di tutti i dispositivi testati non utilizza PWM per ridurre la luminosita' del display. Se è rilevato PWM, una media di 7794 (minimo: 5 - massimo: 343500) Hz è stata rilevata. | |||

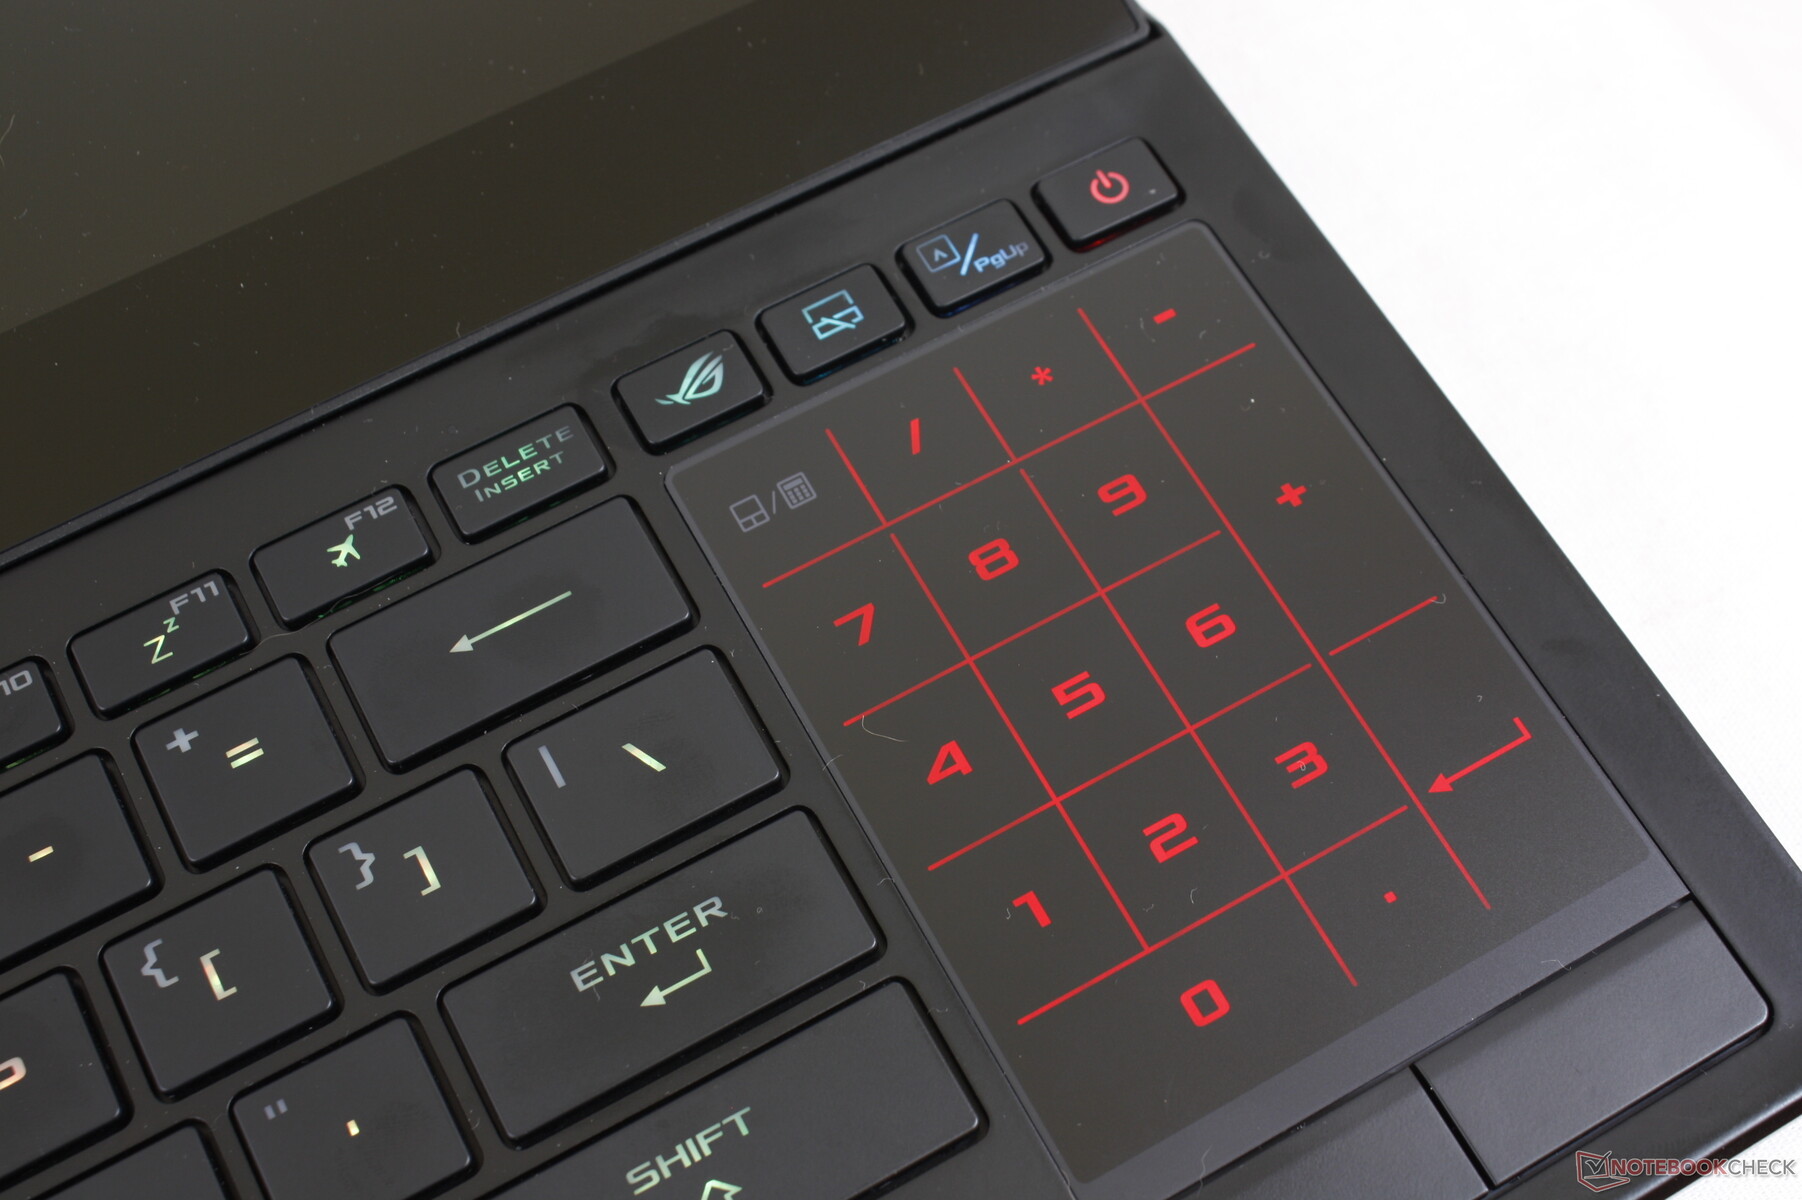
ScreenPad
Il pannello dello ScreenPad rimane esattamente lo stesso del GX550 e quindi i nostri precedenti commenti valgono anche in questo caso. In particolare, la gamma copre solo sRGB mentre la frequenza di aggiornamento è limitata a 60 Hz rispetto alla copertura completa AdobeRGB e alla frequenza di aggiornamento di 120 Hz del display principale. I tempi di risposta sono notevolmente più lenti rispetto al display principale, il che significa che il ghosting sarà più evidente. Testi e immagini sono anche più granulosi a causa dello strato opaco sovrastante più spesso. Il display secondario può essere insostituibile per il multi-tasking, ma non aspettatevi colori perfetti 1:1, contrasto o anche luminosità tra i due schermi.
Il miglioramento più notevole dello ScreenPad è la sua UI ridisegnata che funziona in modo più fluido e reattivo rispetto alla vecchia versione del GX550. Anche il recente ZenBook UX482 ScreenPad utilizza questo software aggiornato. Tuttavia, Asus informa che il GX550 riceverà lo stesso aggiornamento software ad un certo punto in futuro.

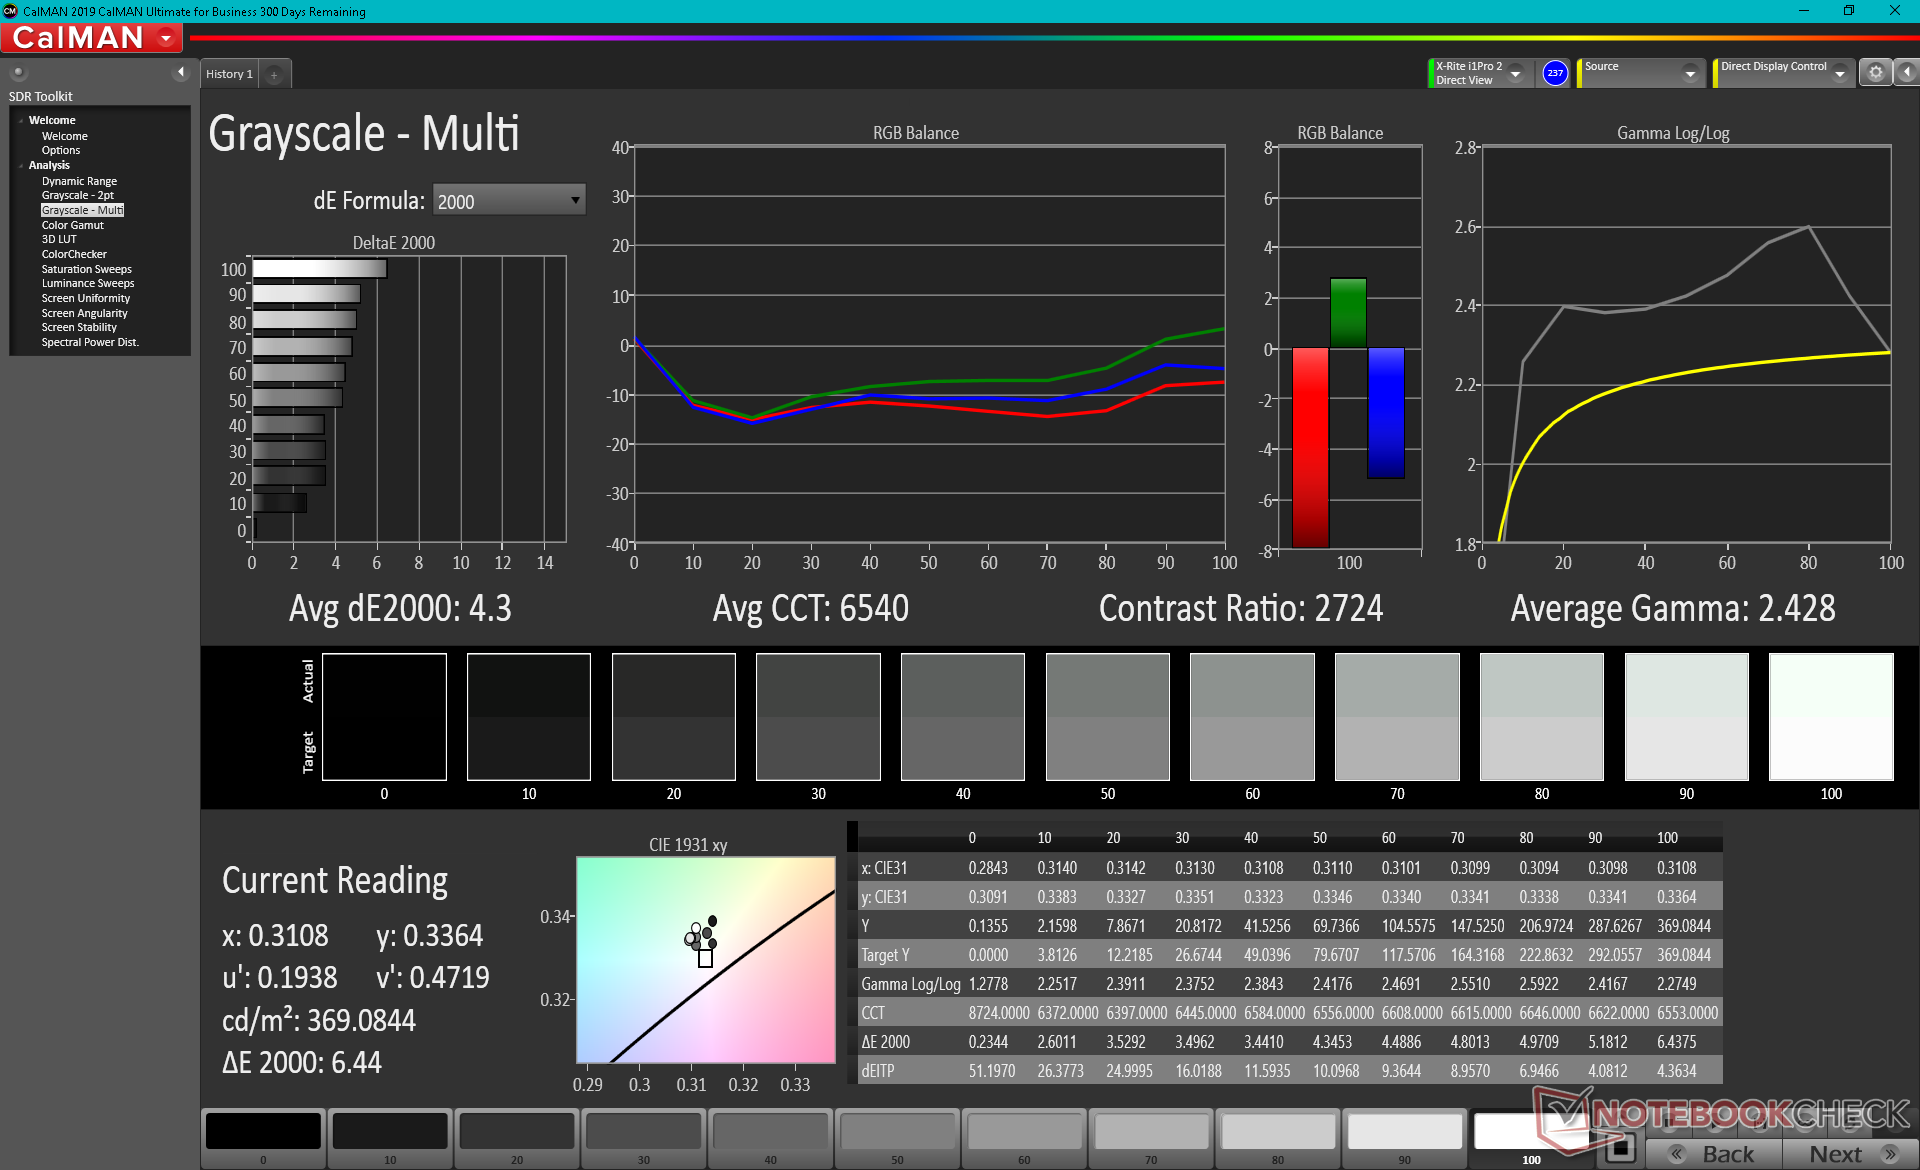

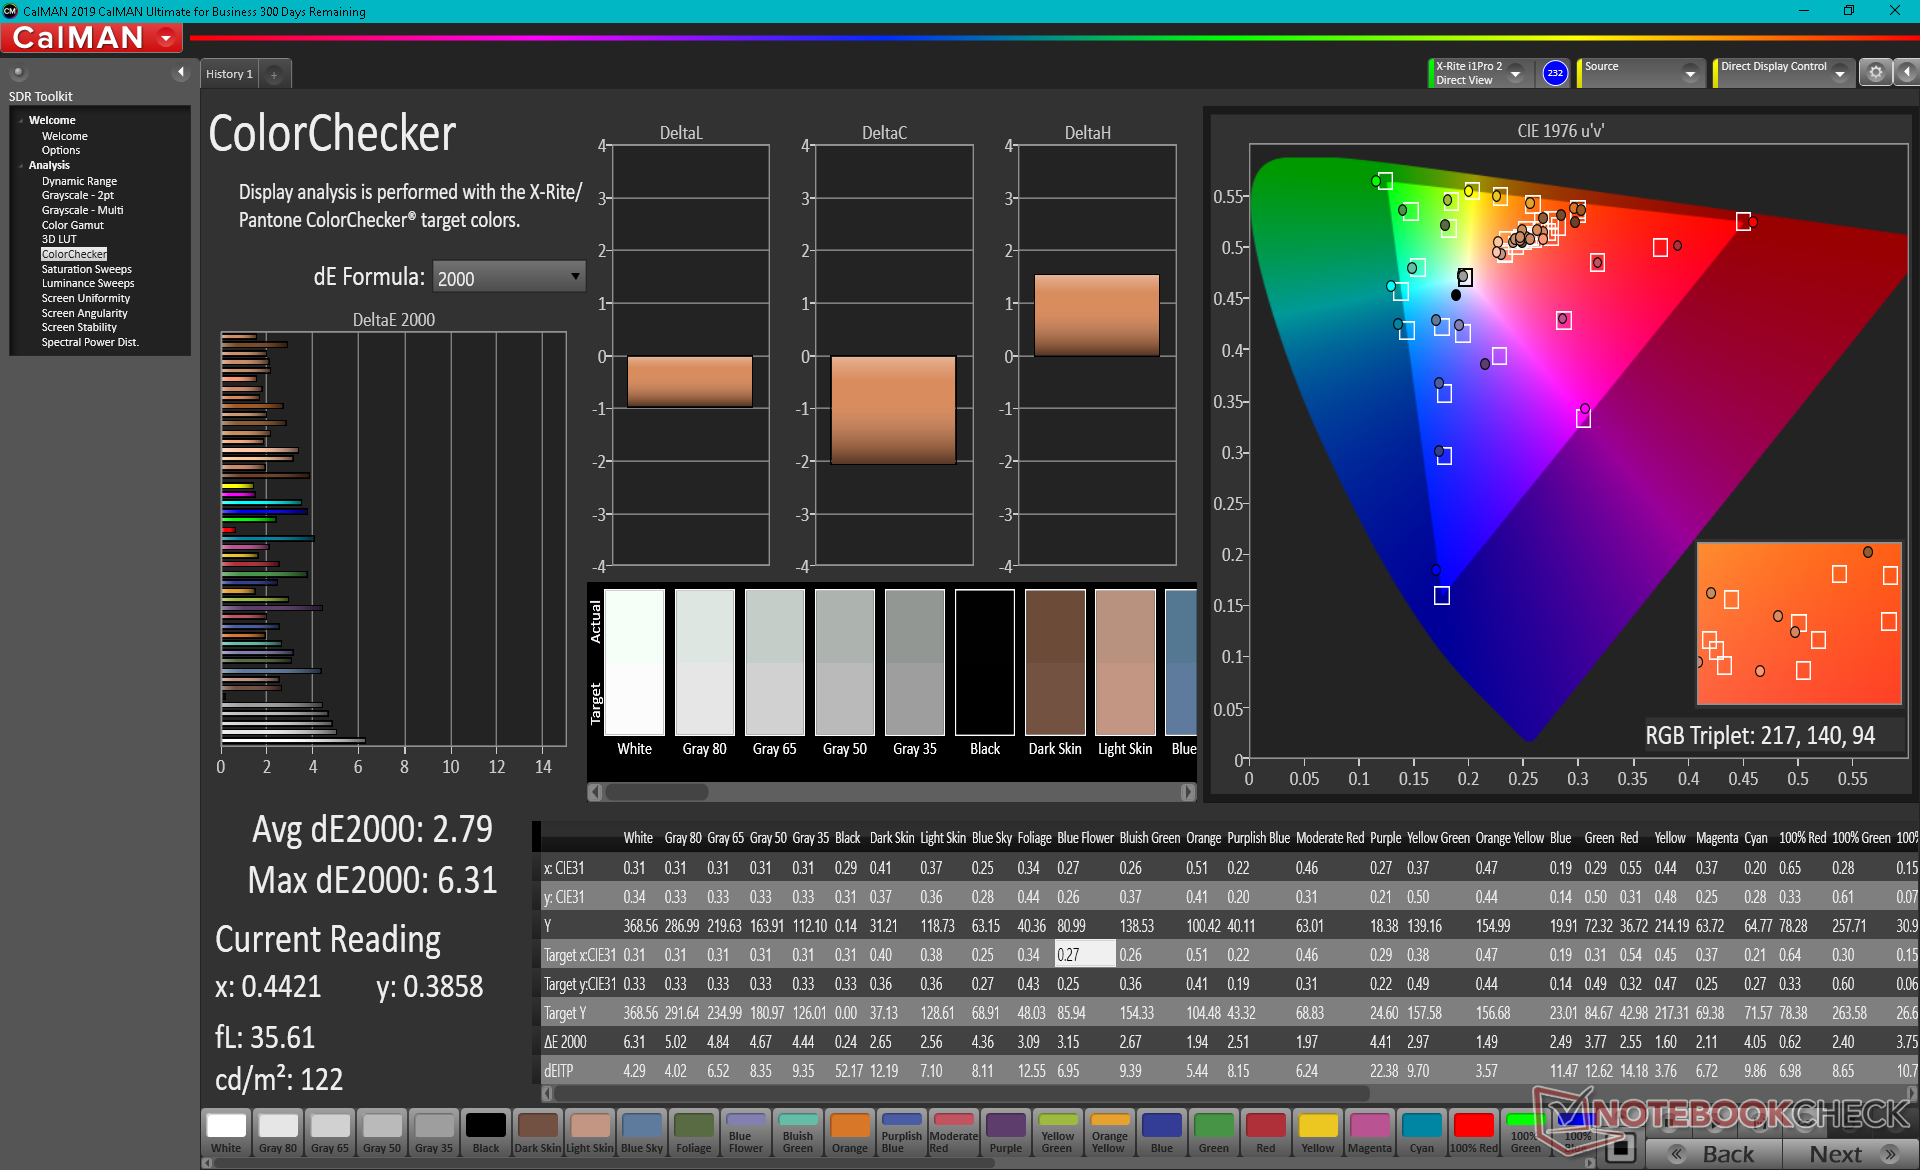


| Dimensione dello schermo, risoluzione nativa | 14,09 pollici, 3840 x 1100 (SKU 4K), 1920 x 550 (SKU FHD) |
| Spazio colore | 95,3 per cento sRGB, 62,6 per cento AdobeRGB |
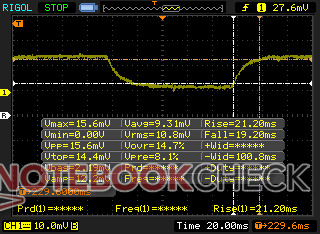
| Tempi di risposta bianco-nero | 18 ms di salita, 14 ms di discesa |
| Tempi di risposta grigio-grigio | 21,2 ms salita, 19,2 ms caduta |
| Luminosità massima | 368.5 nits |
| Rapporto di contrasto 2632:1 | |
| Colorchecker DeltaE2000 | 2.79 |
| Scala di grigi DeltaE2000 | 4.3 |
| Gamma | 2.43 |
| CCT | 6540 |
Performance
Nvidia ha abbandonato il marchio Max-Q e quindi non ci sono più opzioni Max-Q per la GX551 a differenza della GX550. Asus ci ha confermato che la GeForce RTX 3080 nella nostra configurazione punta a un TGP di 130 W.
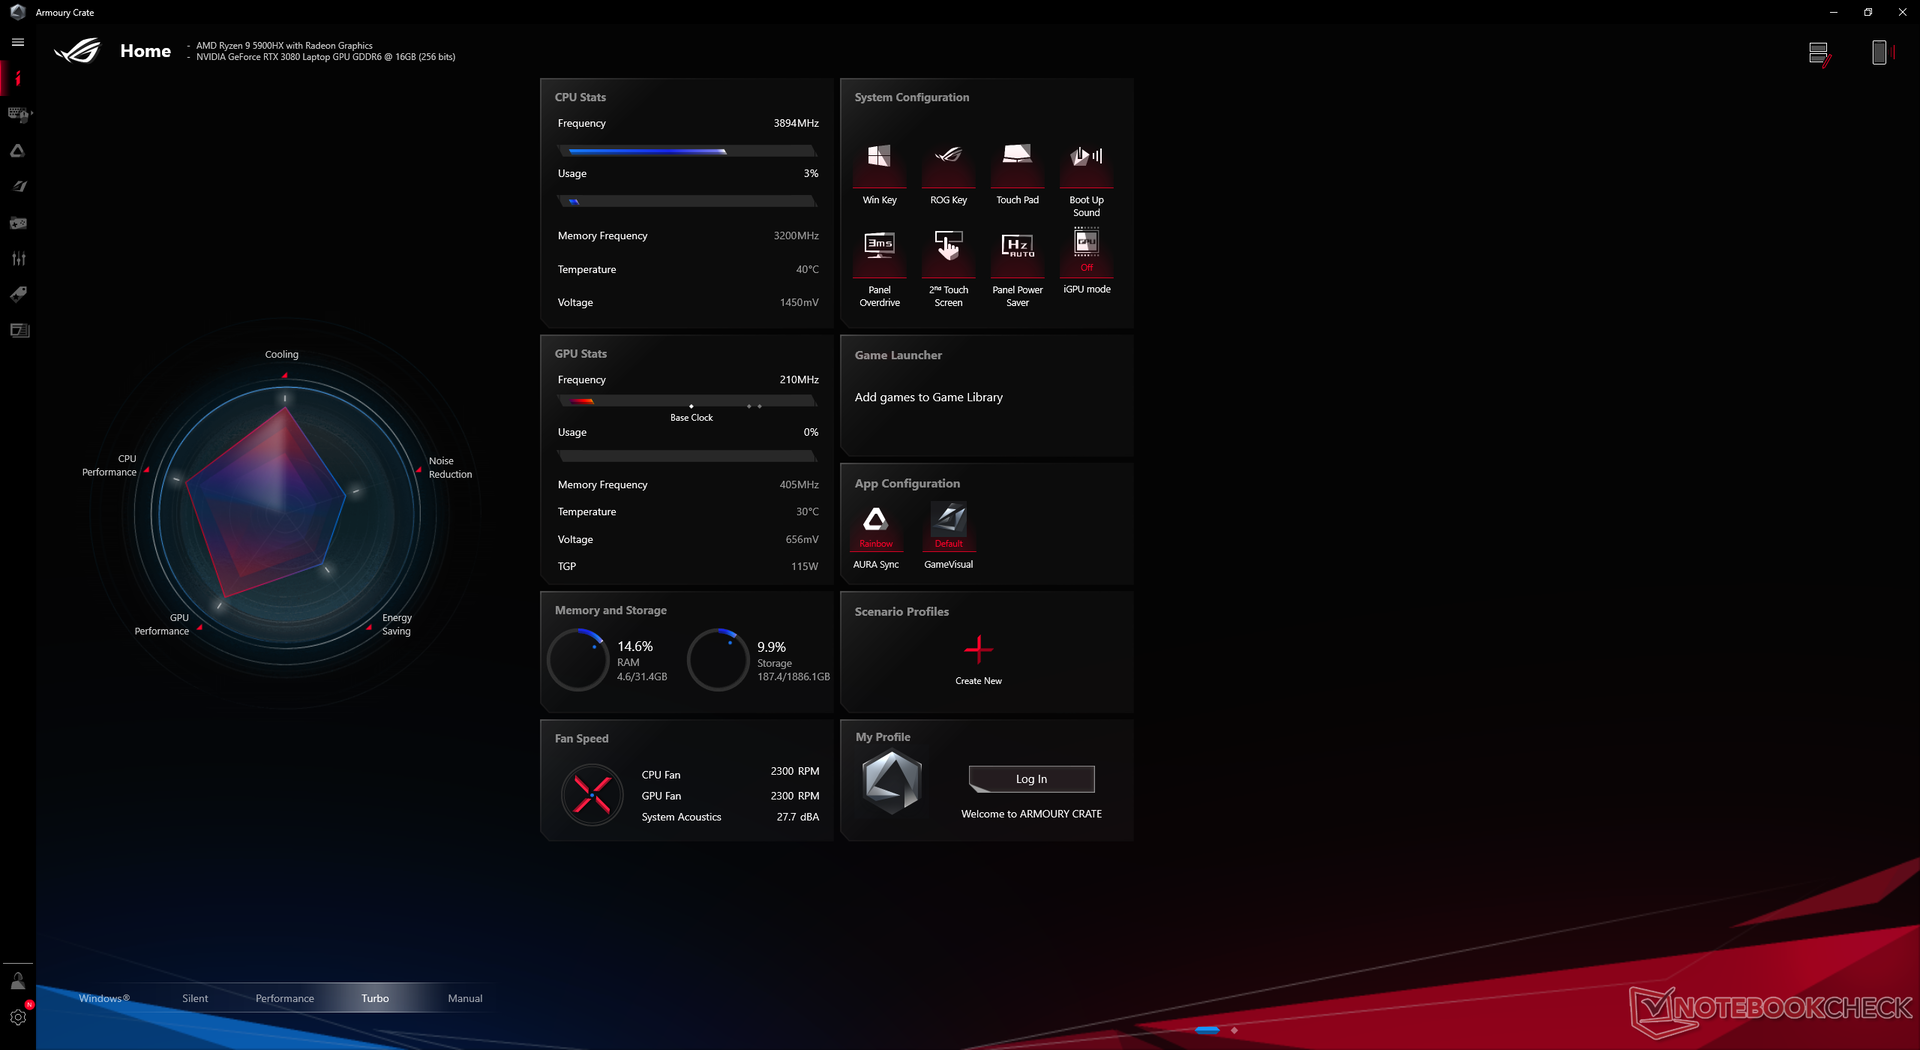
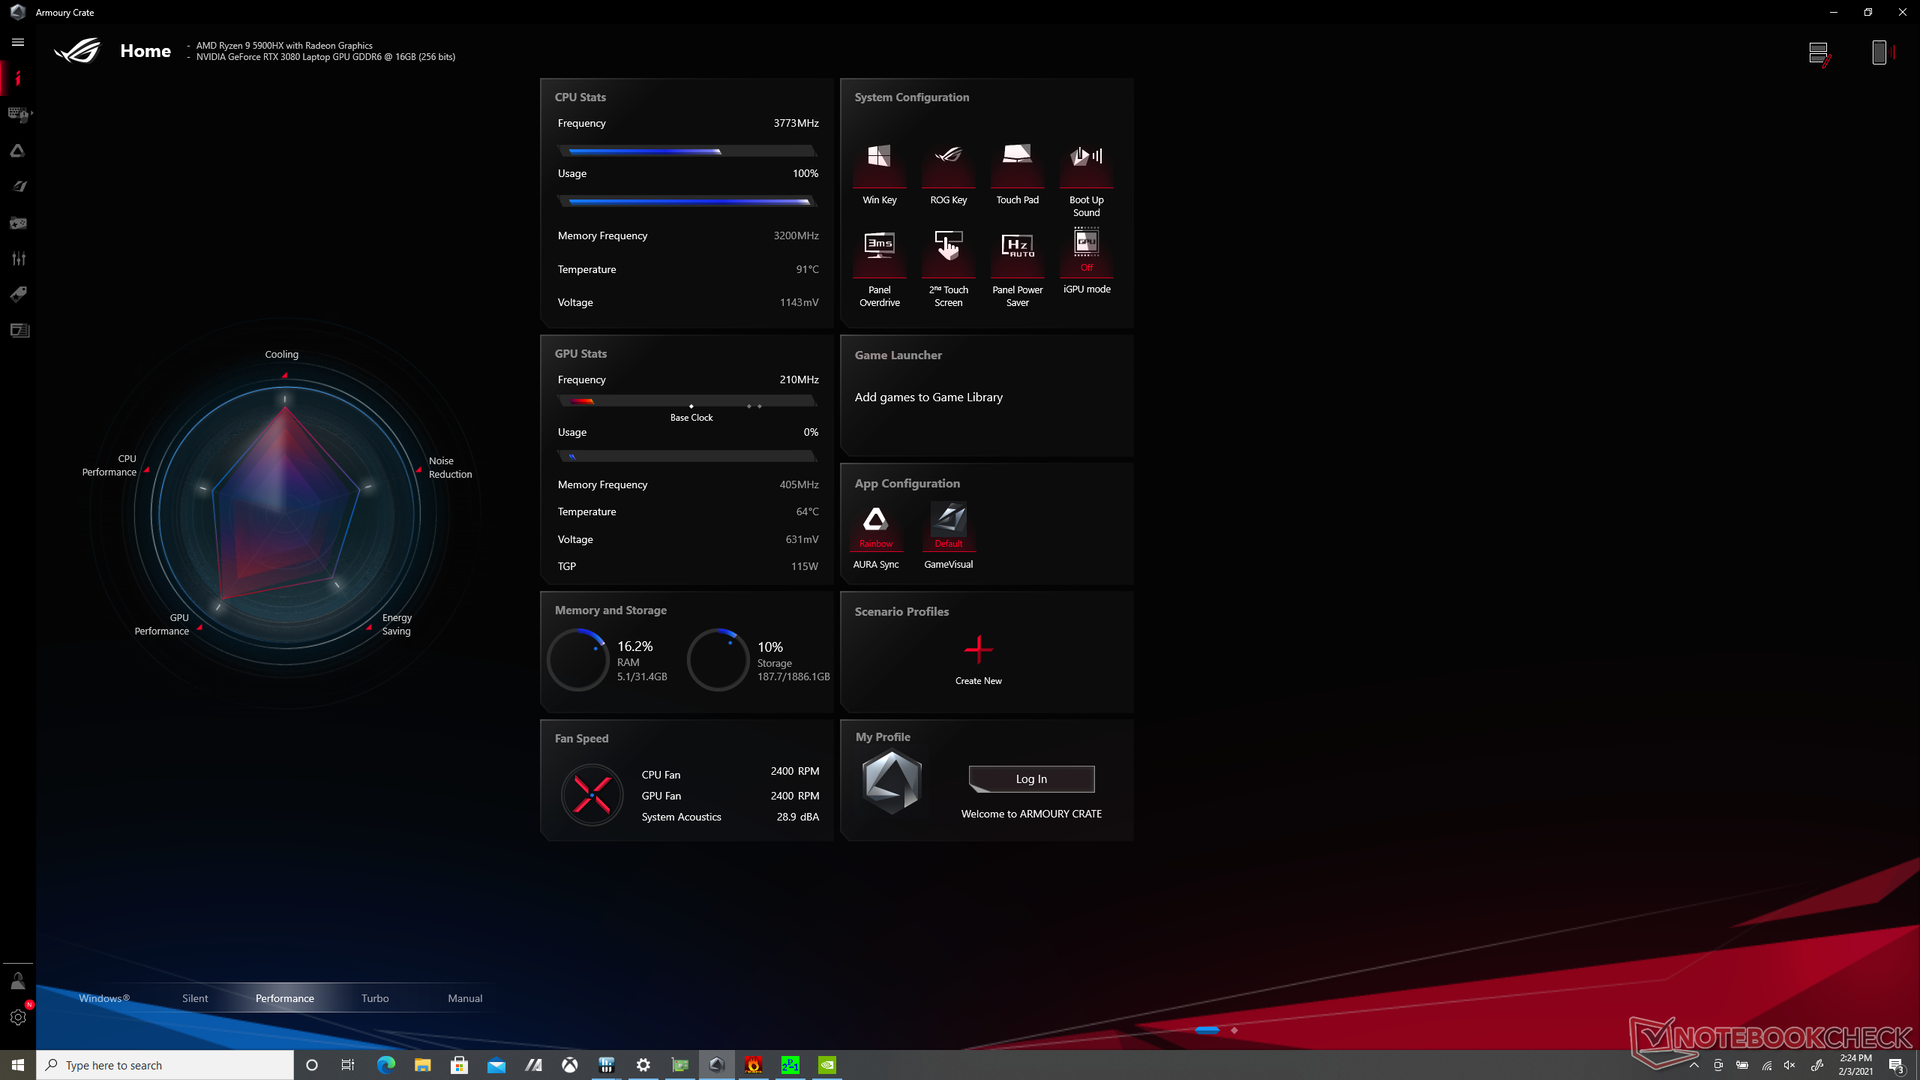
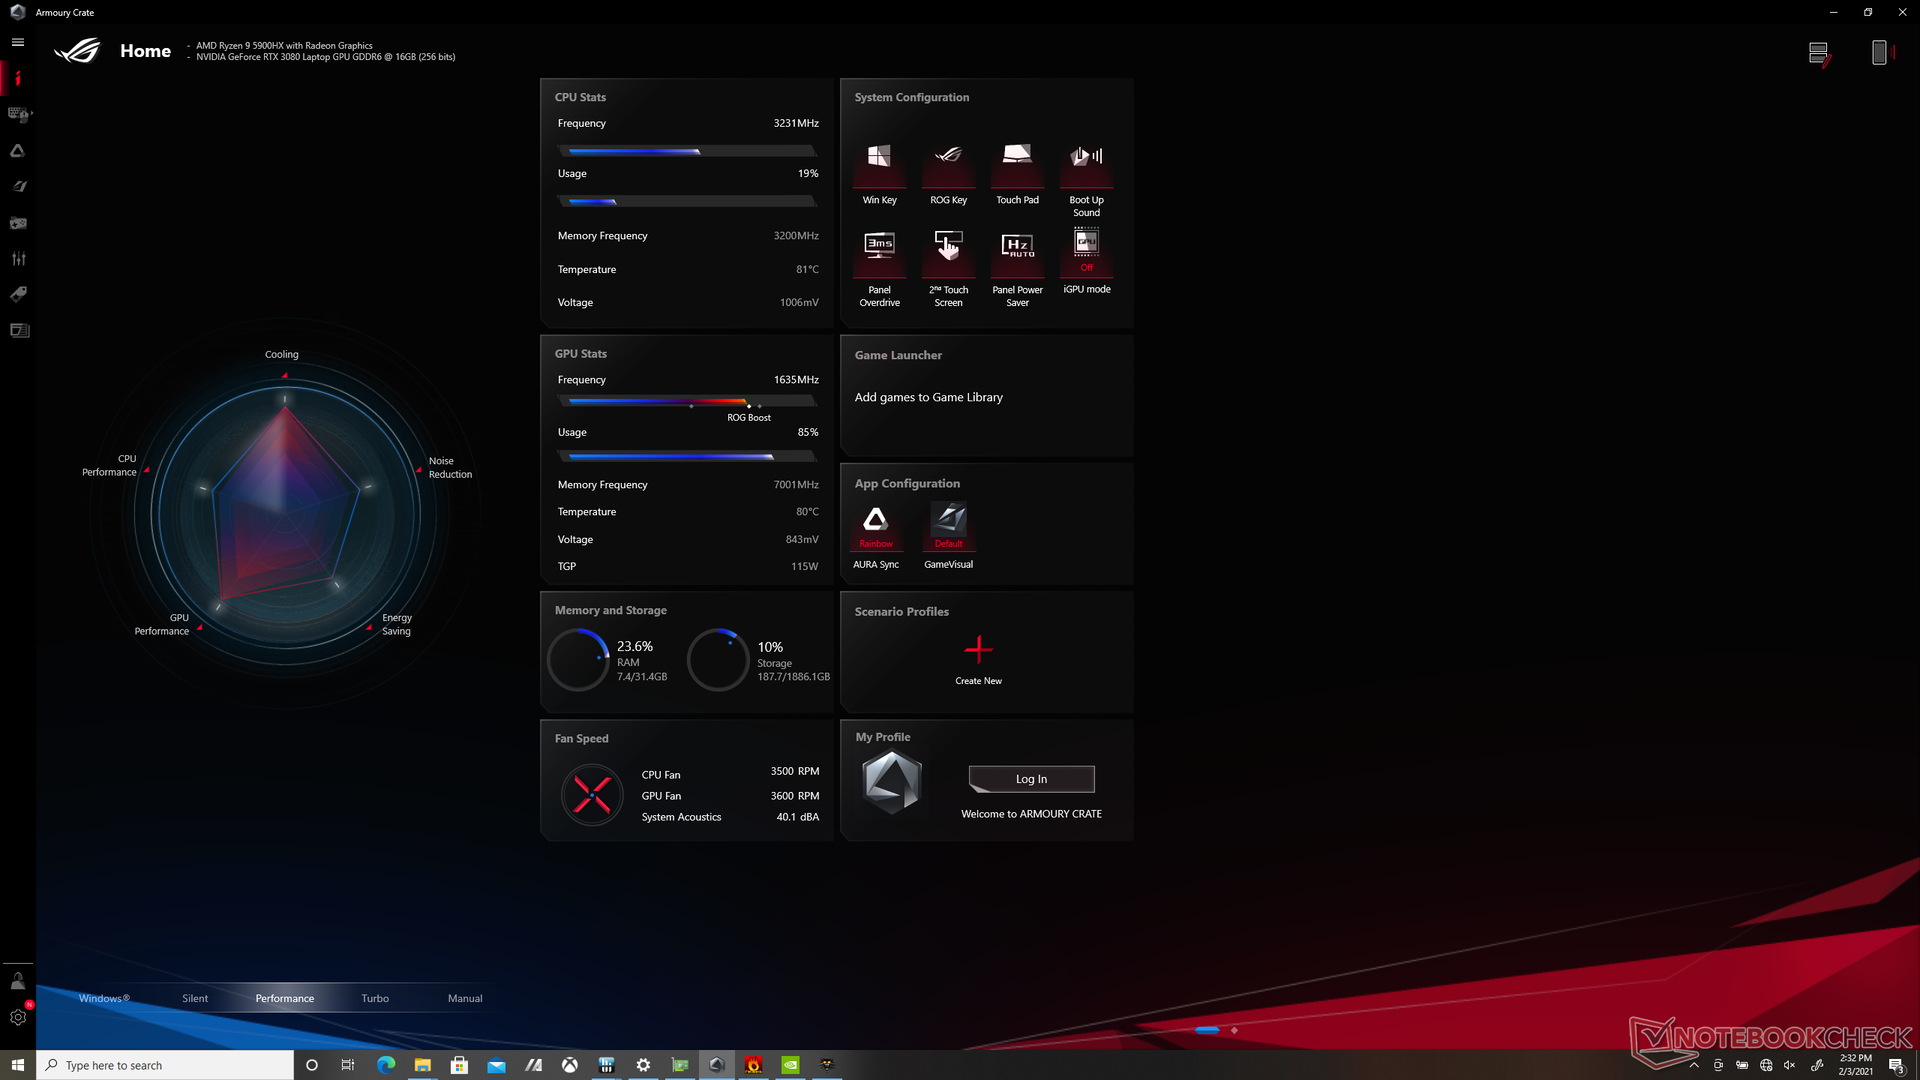
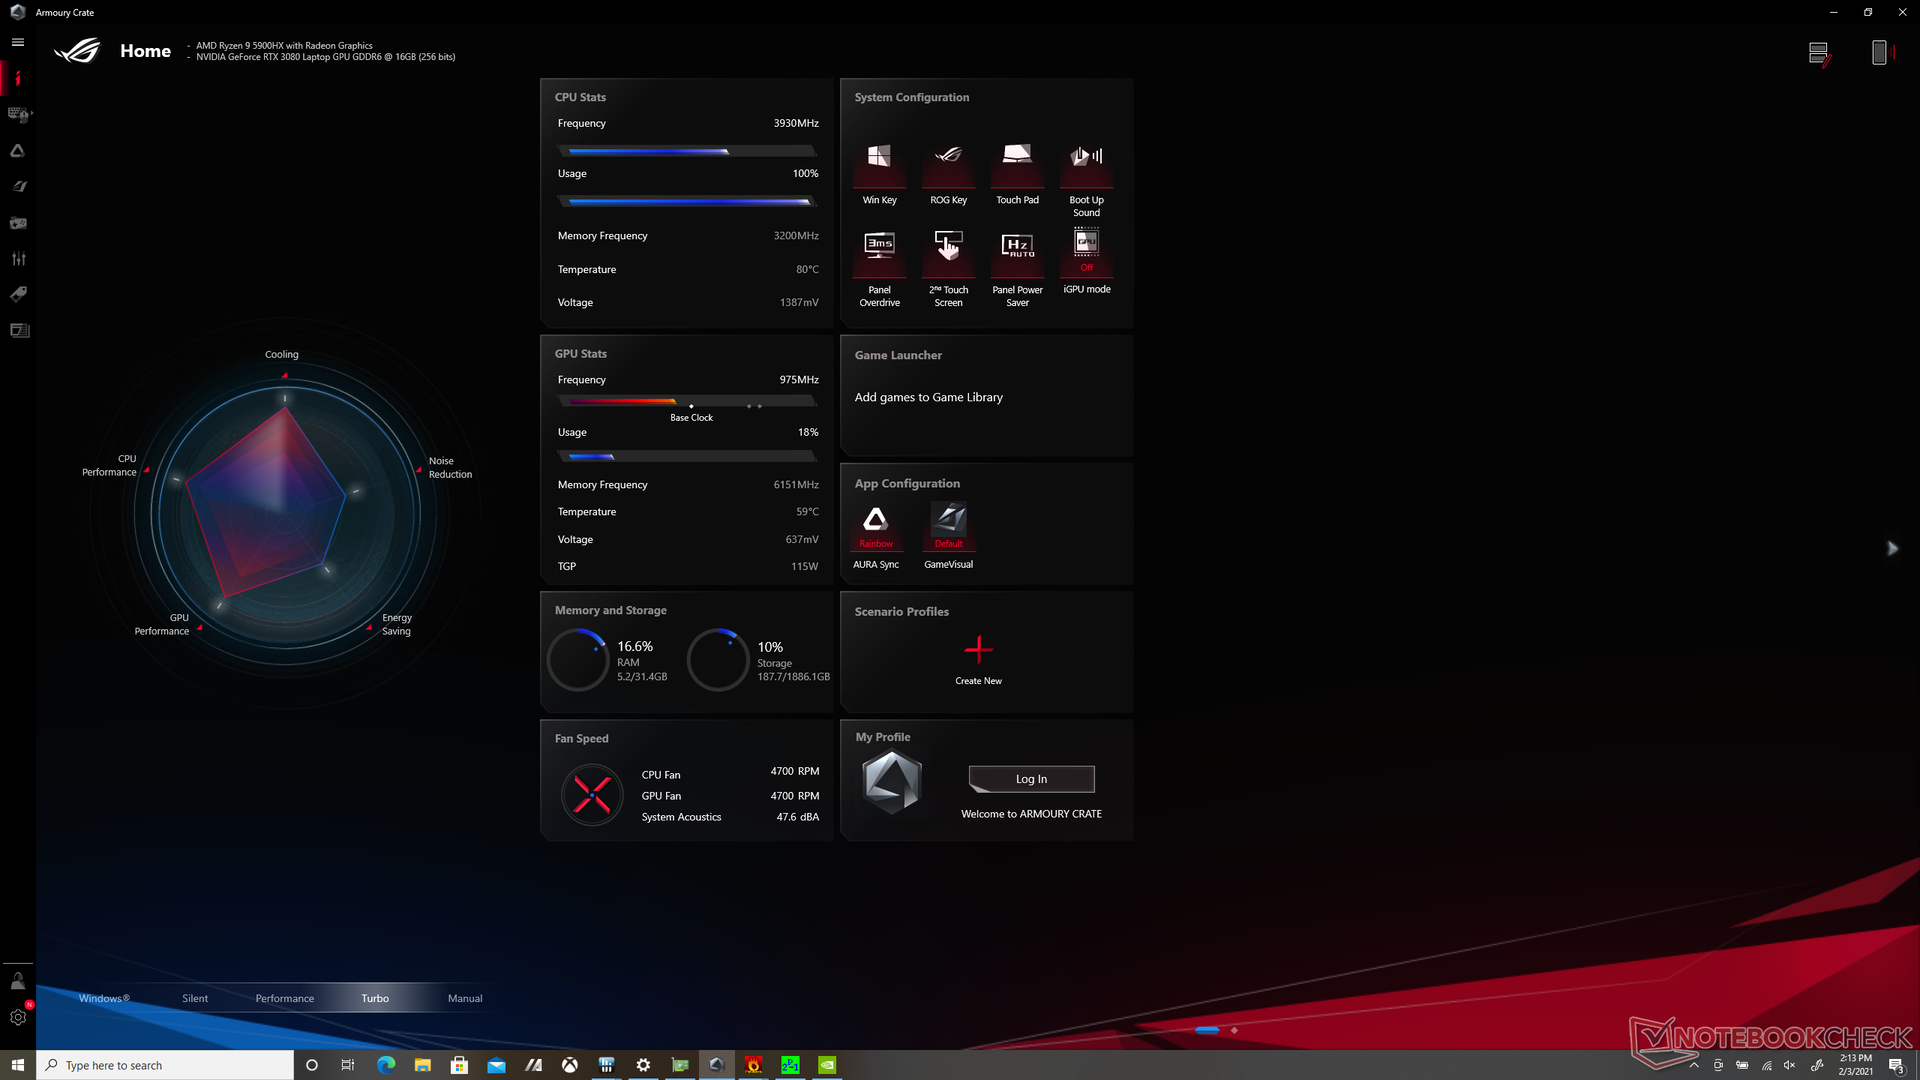
Raccomandiamo ai proprietari di familiarizzare con il software preinstallato Asus Armoury Crate, dato che qui si possono attivare importanti funzioni di sistema, tra cui la modalità Performance e la modalità Turbo.
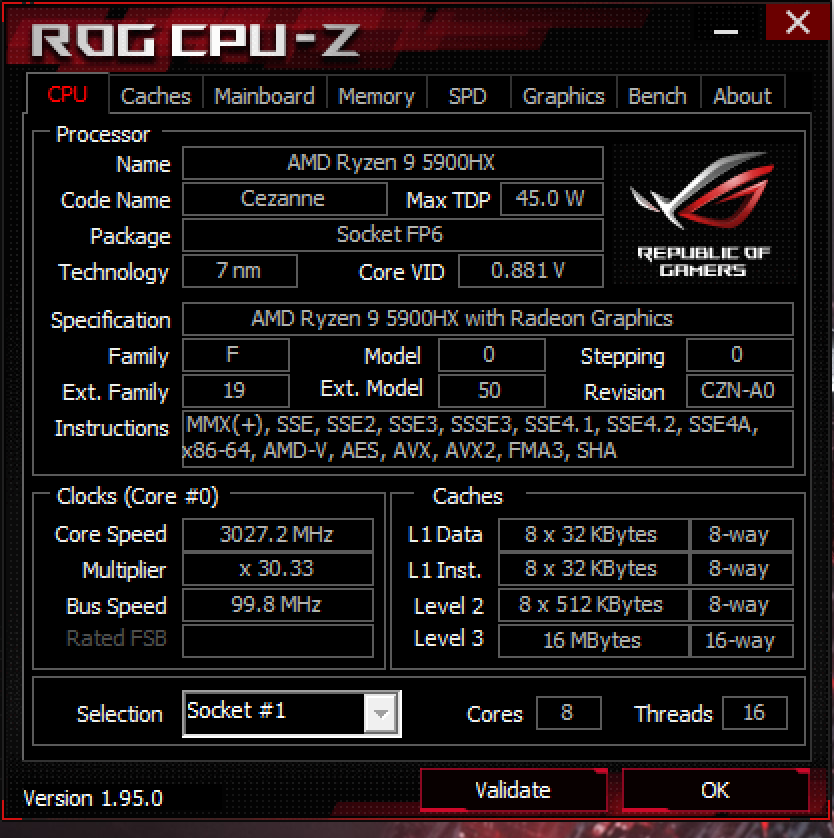
Processore
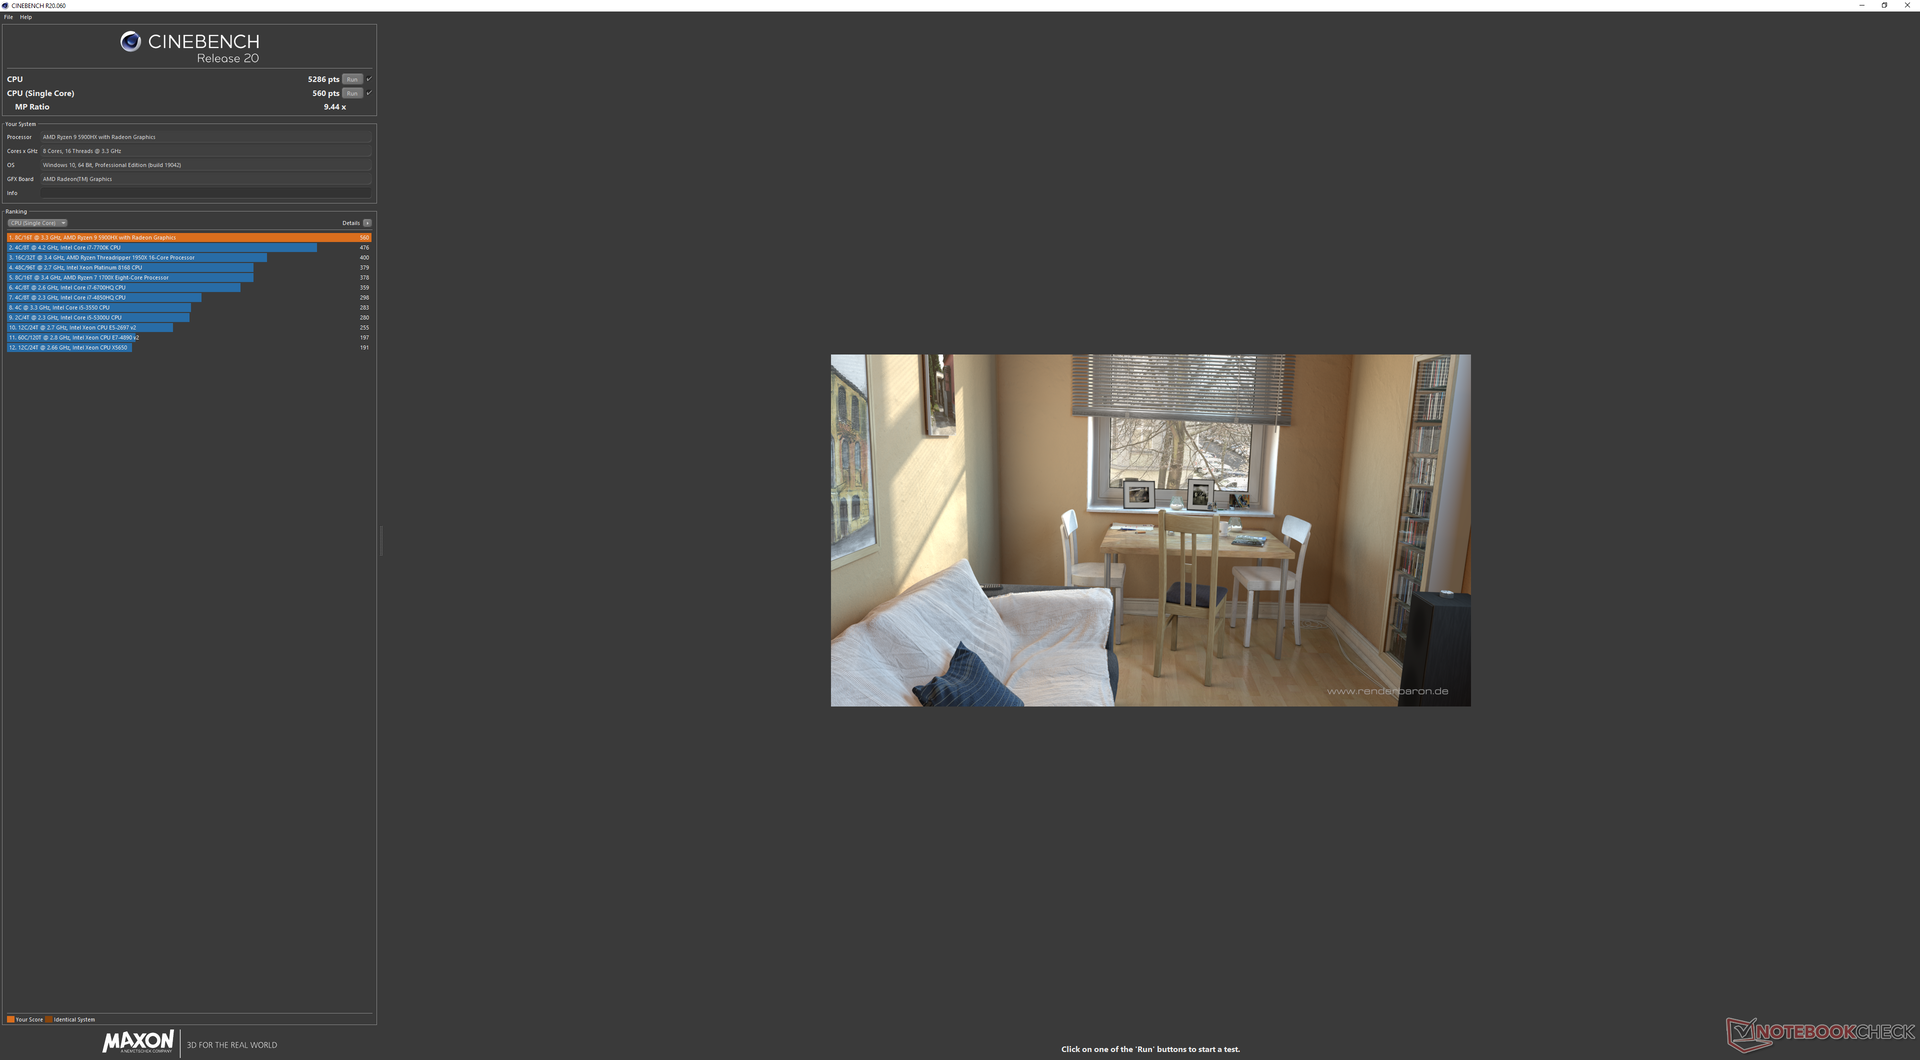
Rispetto al Core i9-10980HK del GX550, il nostro Ryzen 9 5900HX può offrire fino a quasi il 50% di prestazioni multi-thread più veloci. L'ampio divario può essere attribuito all'eccellente sostenibilità delle prestazioni di AMD Turbo Core mentre Intel Turbo Boost ha una durata relativamente breve sul GX550. Questo è esemplificato dal nostro grafico del ciclo CineBench r15 xT qui sotto, dove il punteggio iniziale di 1800 punti sul GX550 scende dal 10 al 15% durante il secondo ciclo in contrasto con i nostri punteggi Ryzen 9 più stretti. Il vantaggio del single-thread va anche al chip AMD di circa il 15% rispetto al Core i9-10980HK. I chip Ryzen sono tradizionalmente rimasti indietro in questo senso rispetto a Intel, ma AMD potrebbe finalmente recuperare il ritardo.
Si noti che optare per la meno costosa Ryzen 7 5800H comporterà un deficit di prestazioni multi-thread di solo circa 7 a 18%. Quindi, otterrete un processore più veloce del Core i9-10980HK indipendentemente da quale opzione Zen 3 sceglierete.
Usando lo Zephyrus in modalità Performance invece che in modalità Turbo si incorre in un deficit di prestazioni della CPU di appena il 5-10% secondo CineBench R20.
Consultate le nostre pagine dedicate al Ryzen 9 5900HX per ulteriori informazioni tecniche e confronti di benchmarks.

Cinebench R15: CPU Multi 64Bit | CPU Single 64Bit
Blender: v2.79 BMW27 CPU
7-Zip 18.03: 7z b 4 -mmt1 | 7z b 4
Geekbench 5.5: Single-Core | Multi-Core
HWBOT x265 Benchmark v2.2: 4k Preset
LibreOffice : 20 Documents To PDF
R Benchmark 2.5: Overall mean
Cinebench R15: CPU Multi 64Bit | CPU Single 64Bit
Blender: v2.79 BMW27 CPU
7-Zip 18.03: 7z b 4 -mmt1 | 7z b 4
Geekbench 5.5: Single-Core | Multi-Core
HWBOT x265 Benchmark v2.2: 4k Preset
LibreOffice : 20 Documents To PDF
R Benchmark 2.5: Overall mean
* ... Meglio usare valori piccoli
Prestazioni del sistema
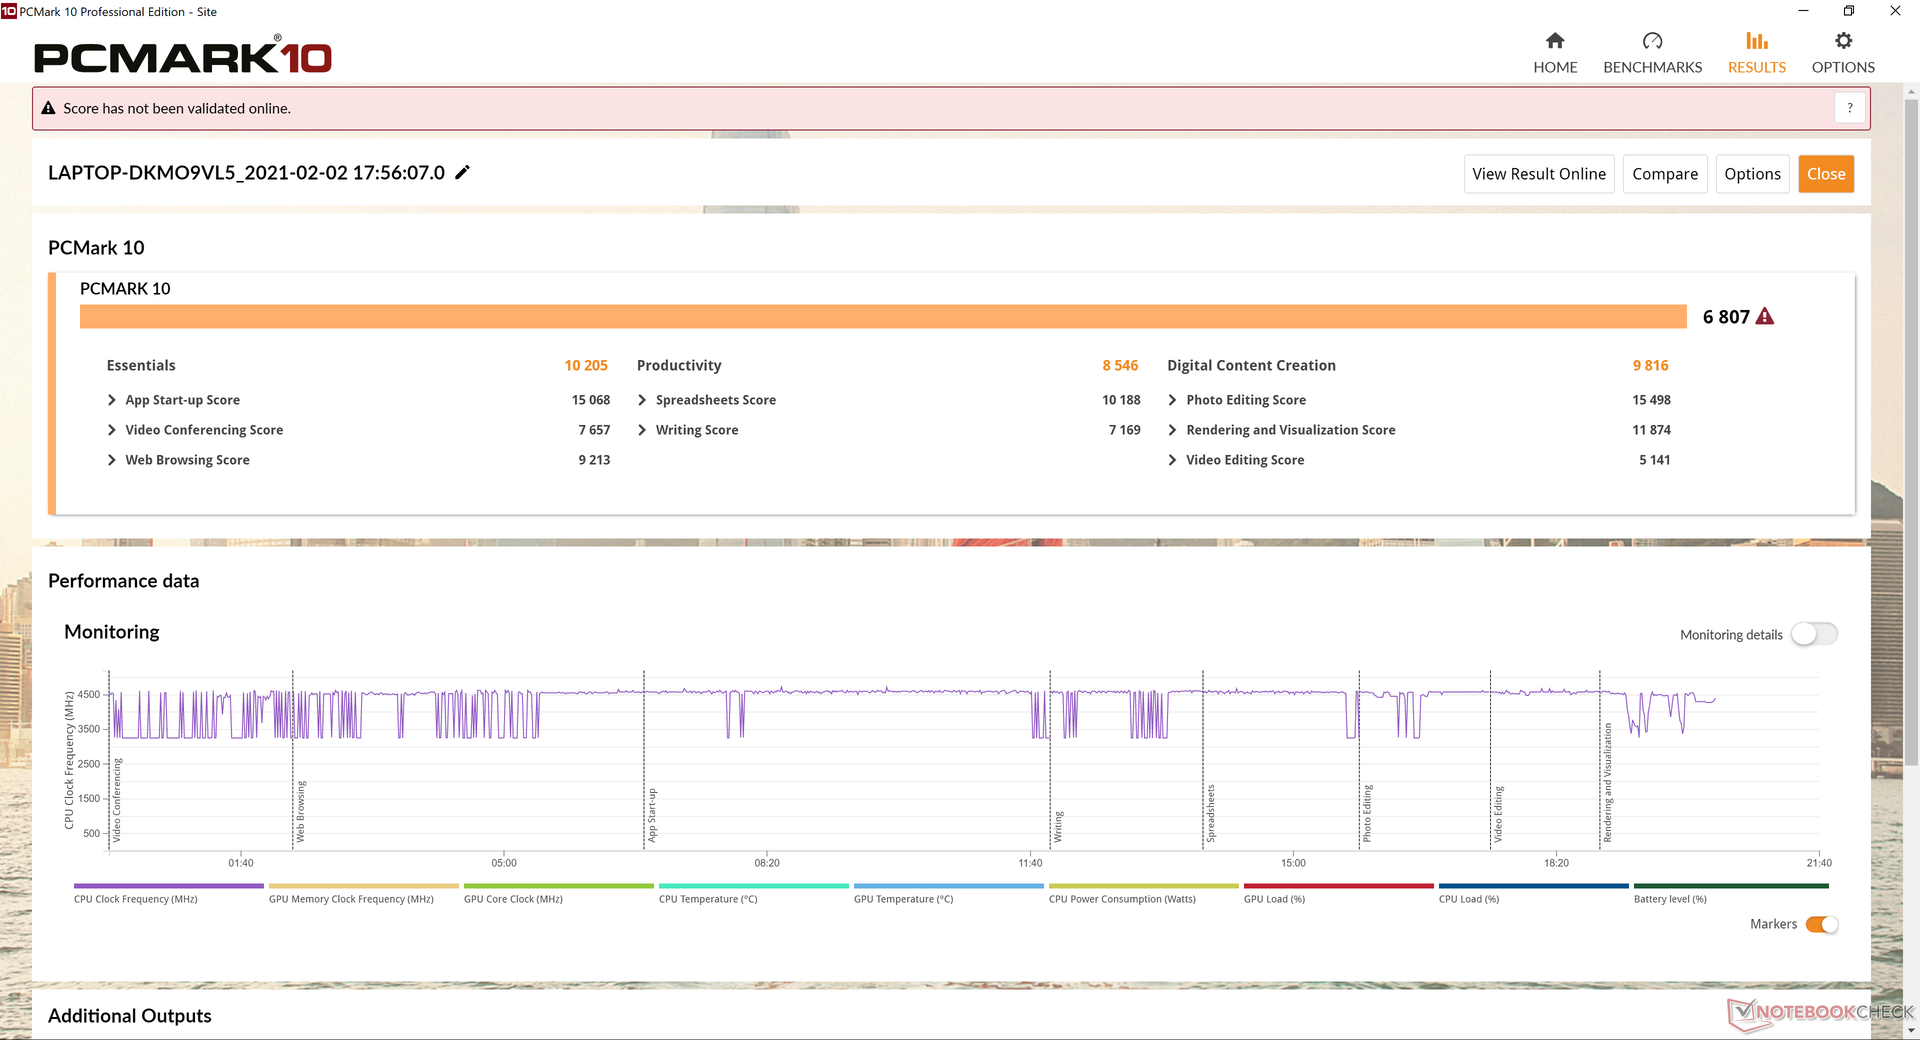
I benchmarks PCMark sono più alti del GX550 dell'anno scorso ma ancora costantemente inferiori all'Eurocom Sky X4C anche se il nostro Asus ospita componenti più nuovi e veloci. Sospettiamo che gli SSD nella nostra unità possano essere in parte responsabili poiché Asus dice che c'è stato un ritardo del driver RAID 0 per le unità in recensione.
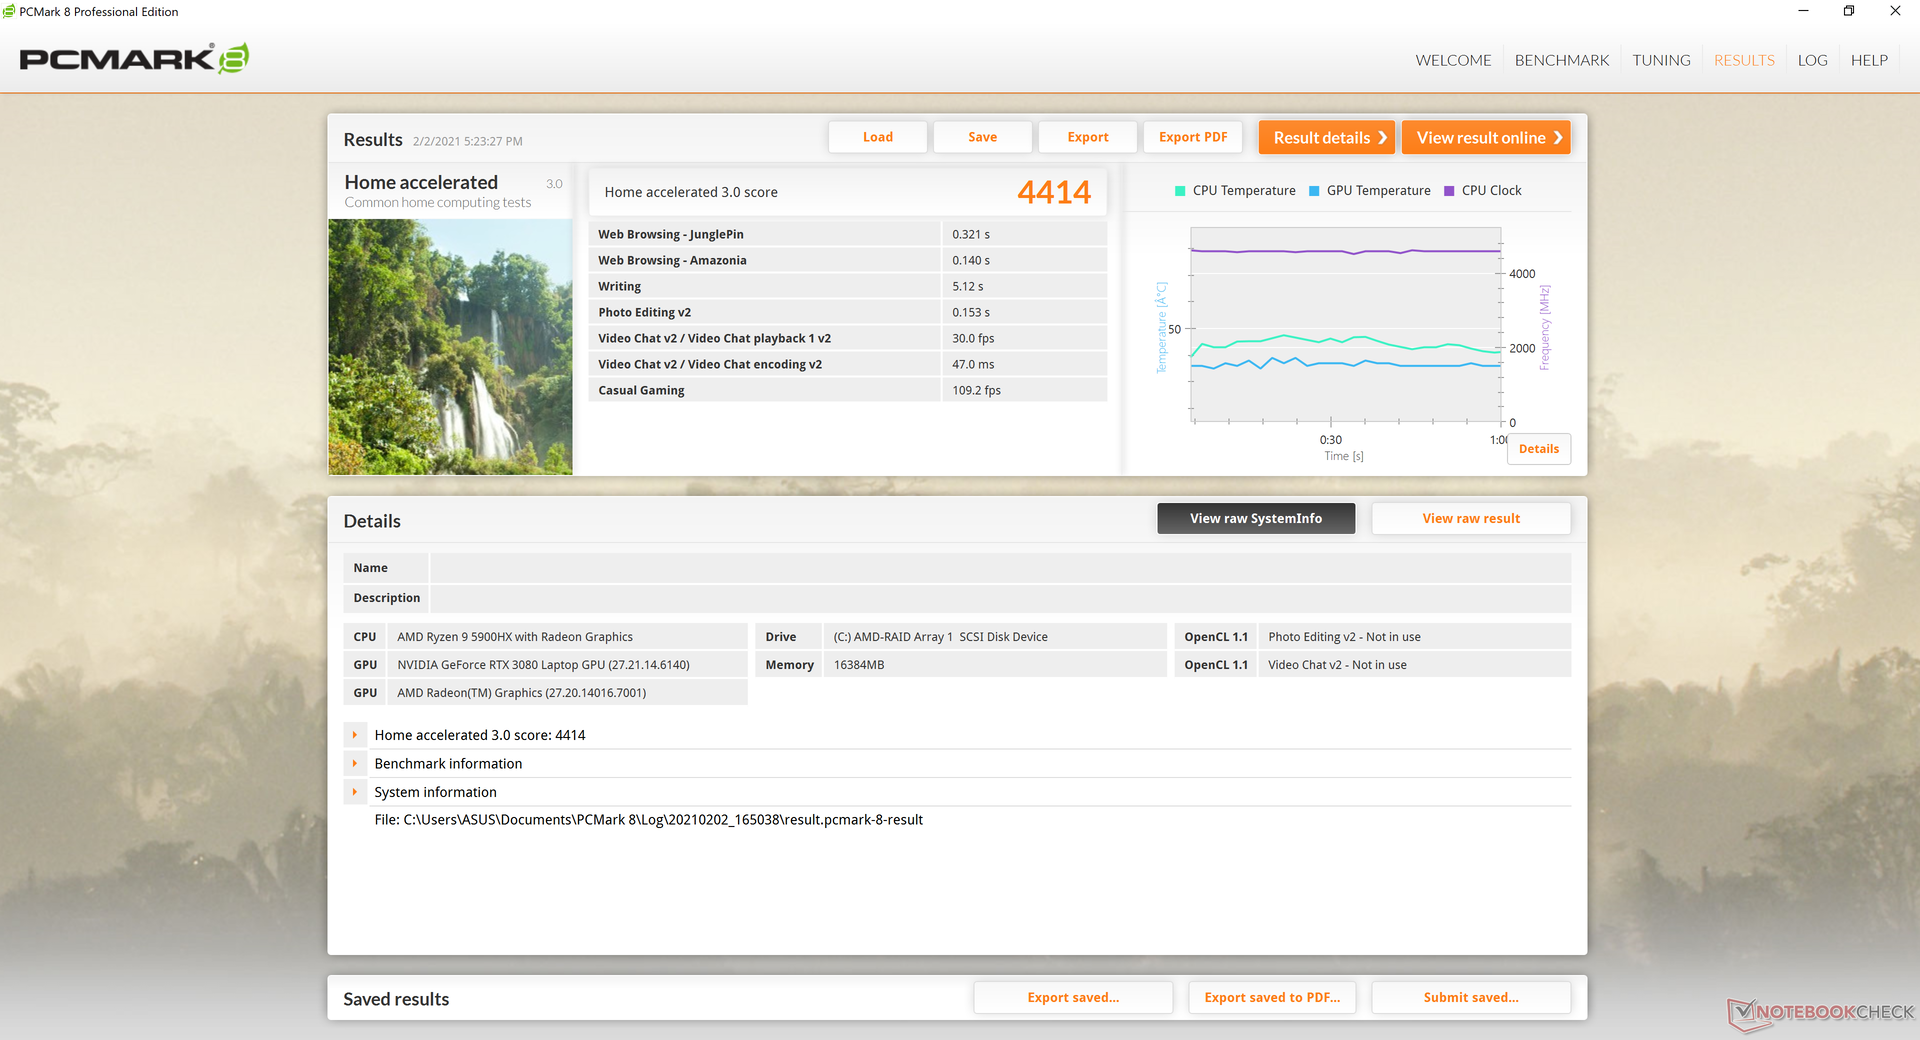

| PCMark 8 Home Score Accelerated v2 | 4414 punti | |
| PCMark 8 Work Score Accelerated v2 | 5006 punti | |
| PCMark 10 Score | 6807 punti | |
Aiuto | ||
Latenza DPC
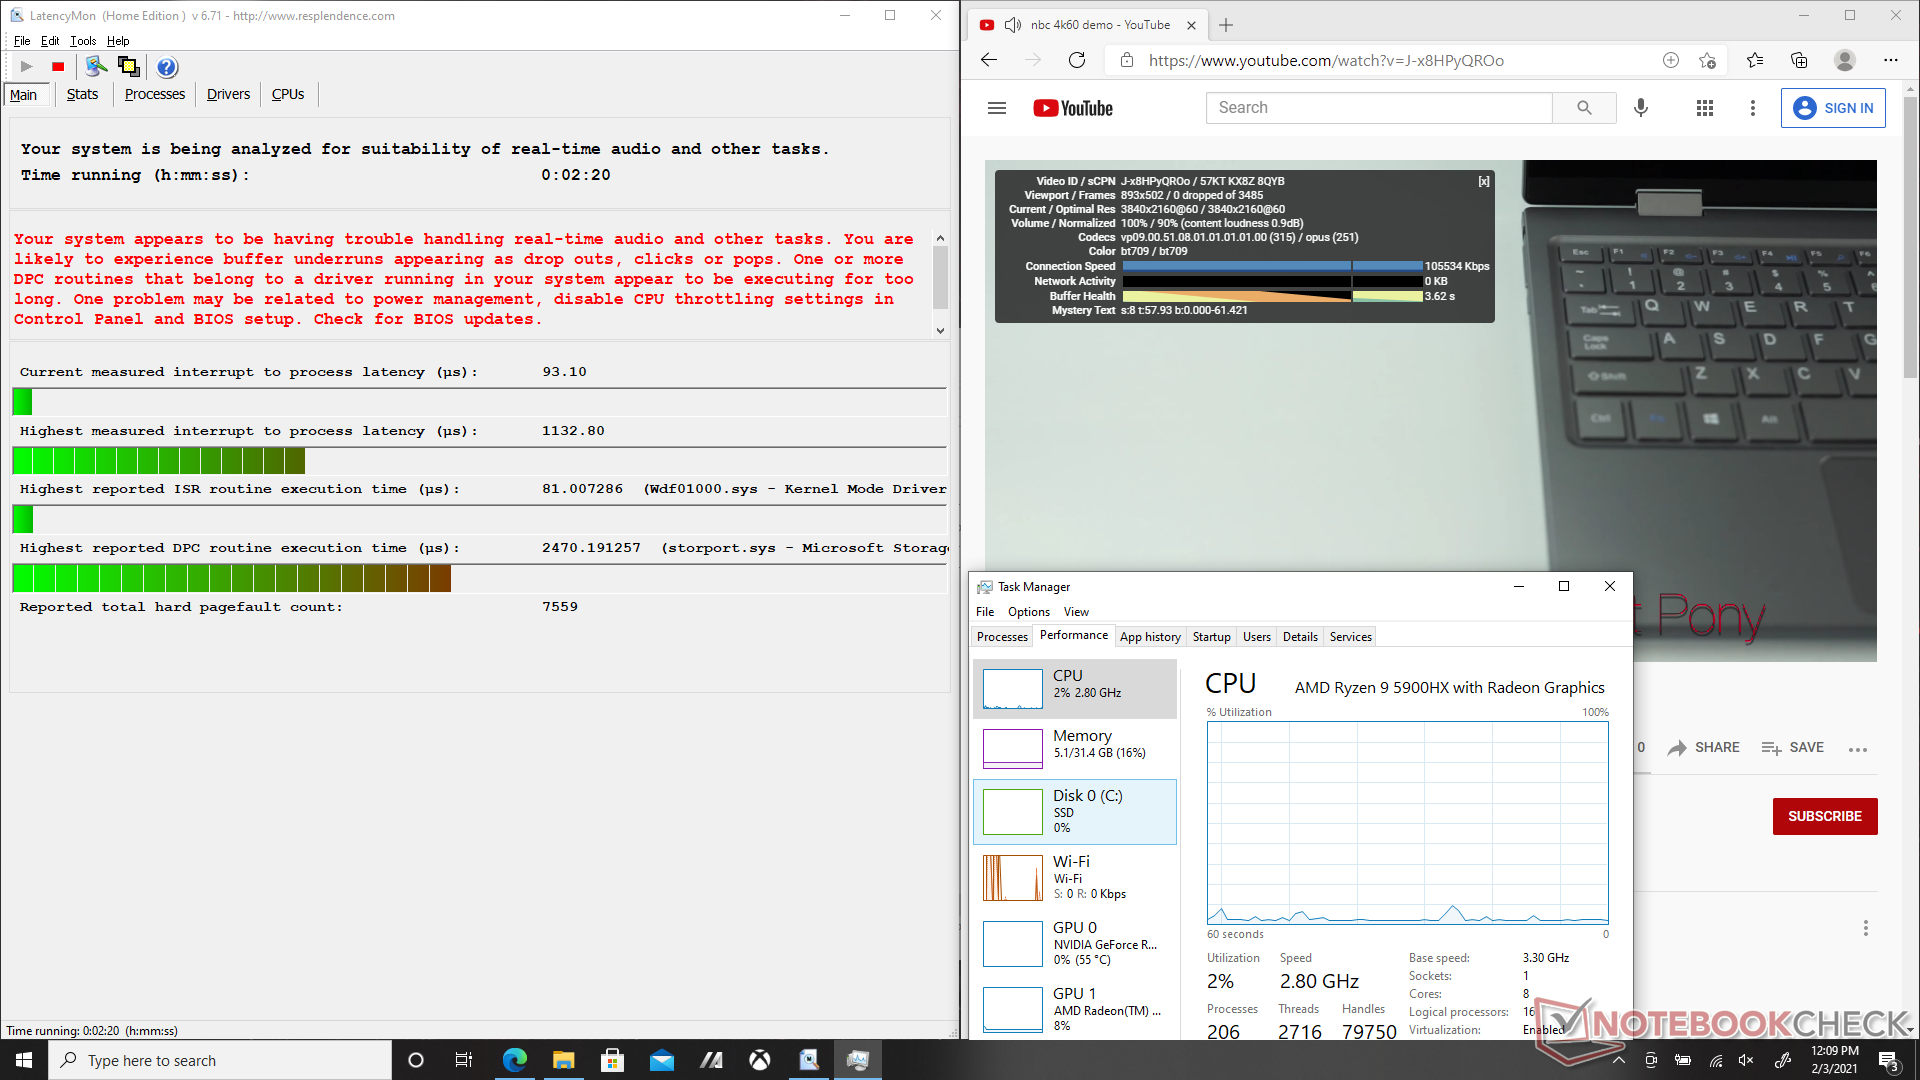
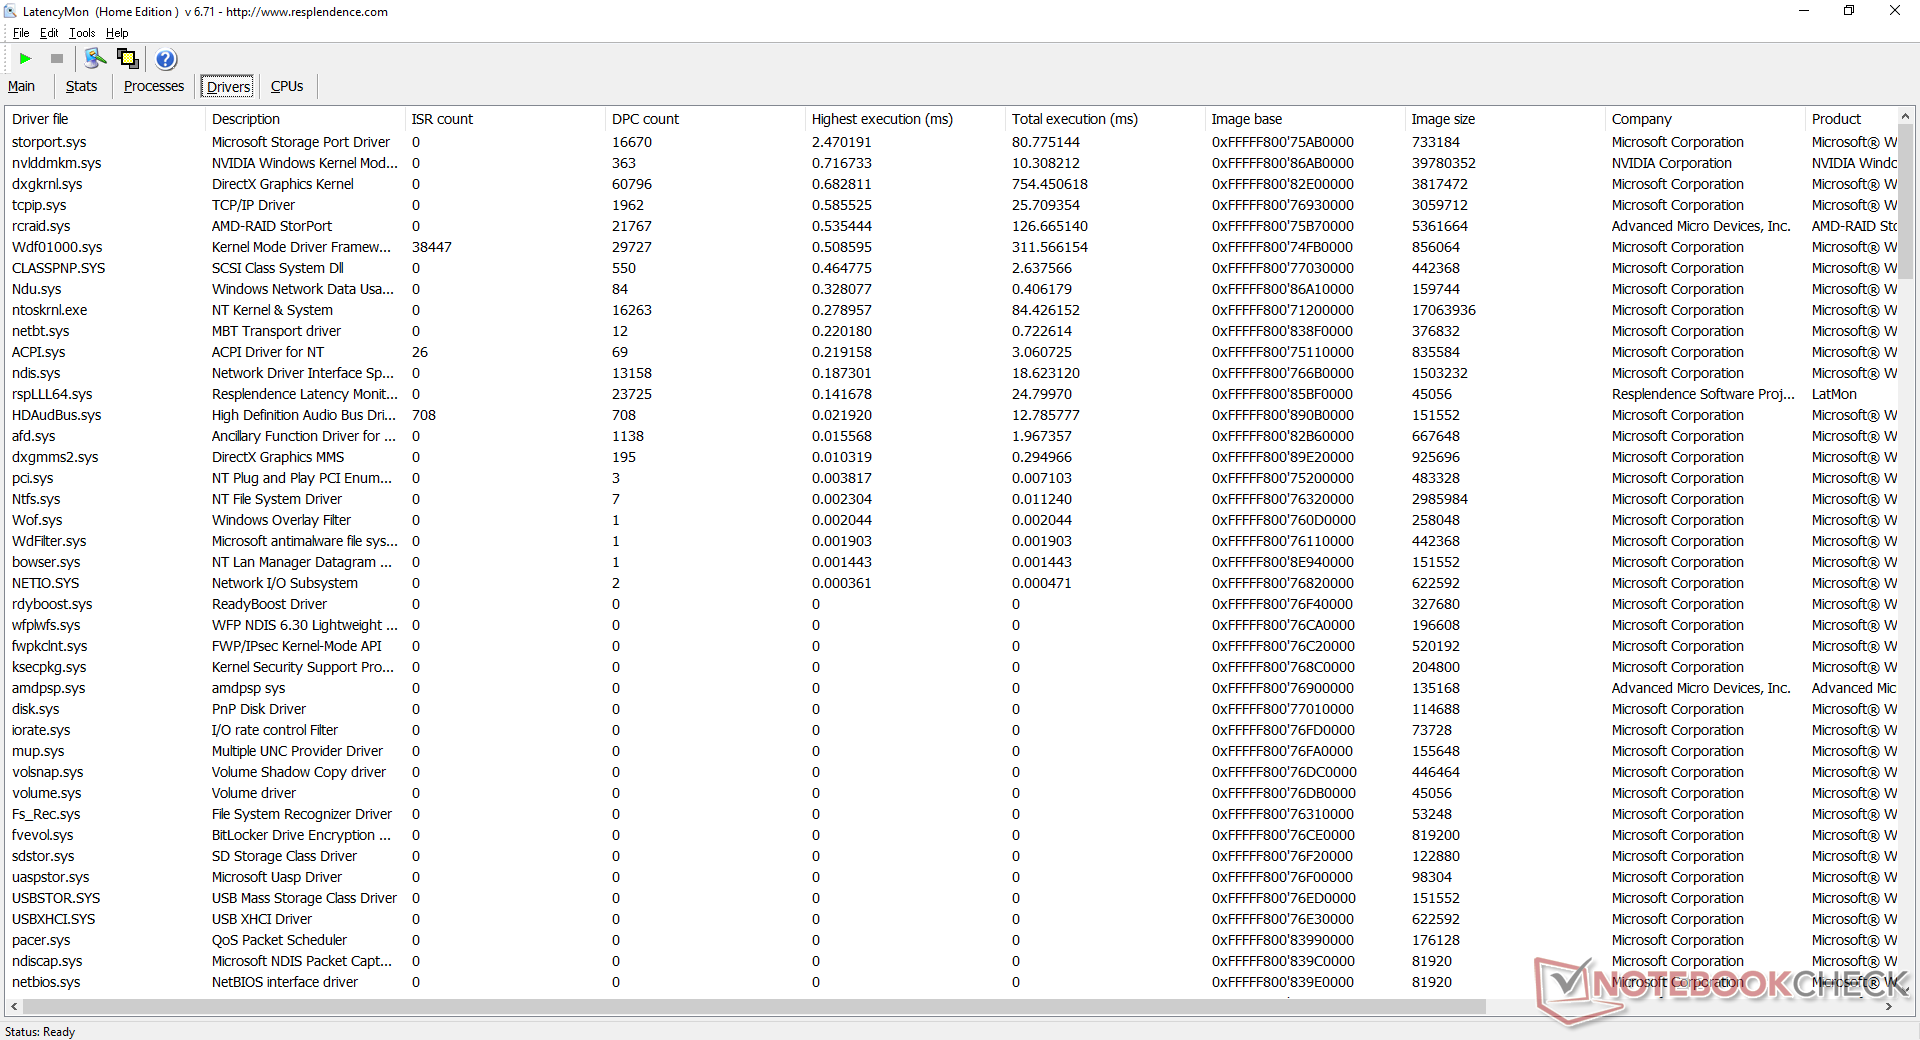
LatencyMon mostra problemi di latenza DPC quando si aprono più schede del browser sulla nostra homepage. Ripetendo questo test in modalità Balanced non si ottiene alcun miglioramento. La riproduzione di video 4K a 60 FPS è altrimenti fluida e senza perdita di frame. L'utilizzo della CPU e della GPU integrata è a una sola cifra, come ci si aspetta da questi componenti ad alta potenza. Un tipico Ultrabook Core i7 Ice Lake si stabilizzerebbe tipicamente intorno al 40-50% di utilizzo della GPU in confronto.
| DPC Latencies / LatencyMon - interrupt to process latency (max), Web, Youtube, Prime95 | |
| Asus ROG Zephyrus Duo 15 GX550LXS | |
| MSI GS66 Stealth 10SFS | |
| Asus ROG Zephyrus Duo 15 SE GX551QS | |
| MSI GE66 Raider 10SFS | |
| Razer Blade 15 RTX 2080 Super Max-Q | |
* ... Meglio usare valori piccoli
Dispositivi di archiviazione
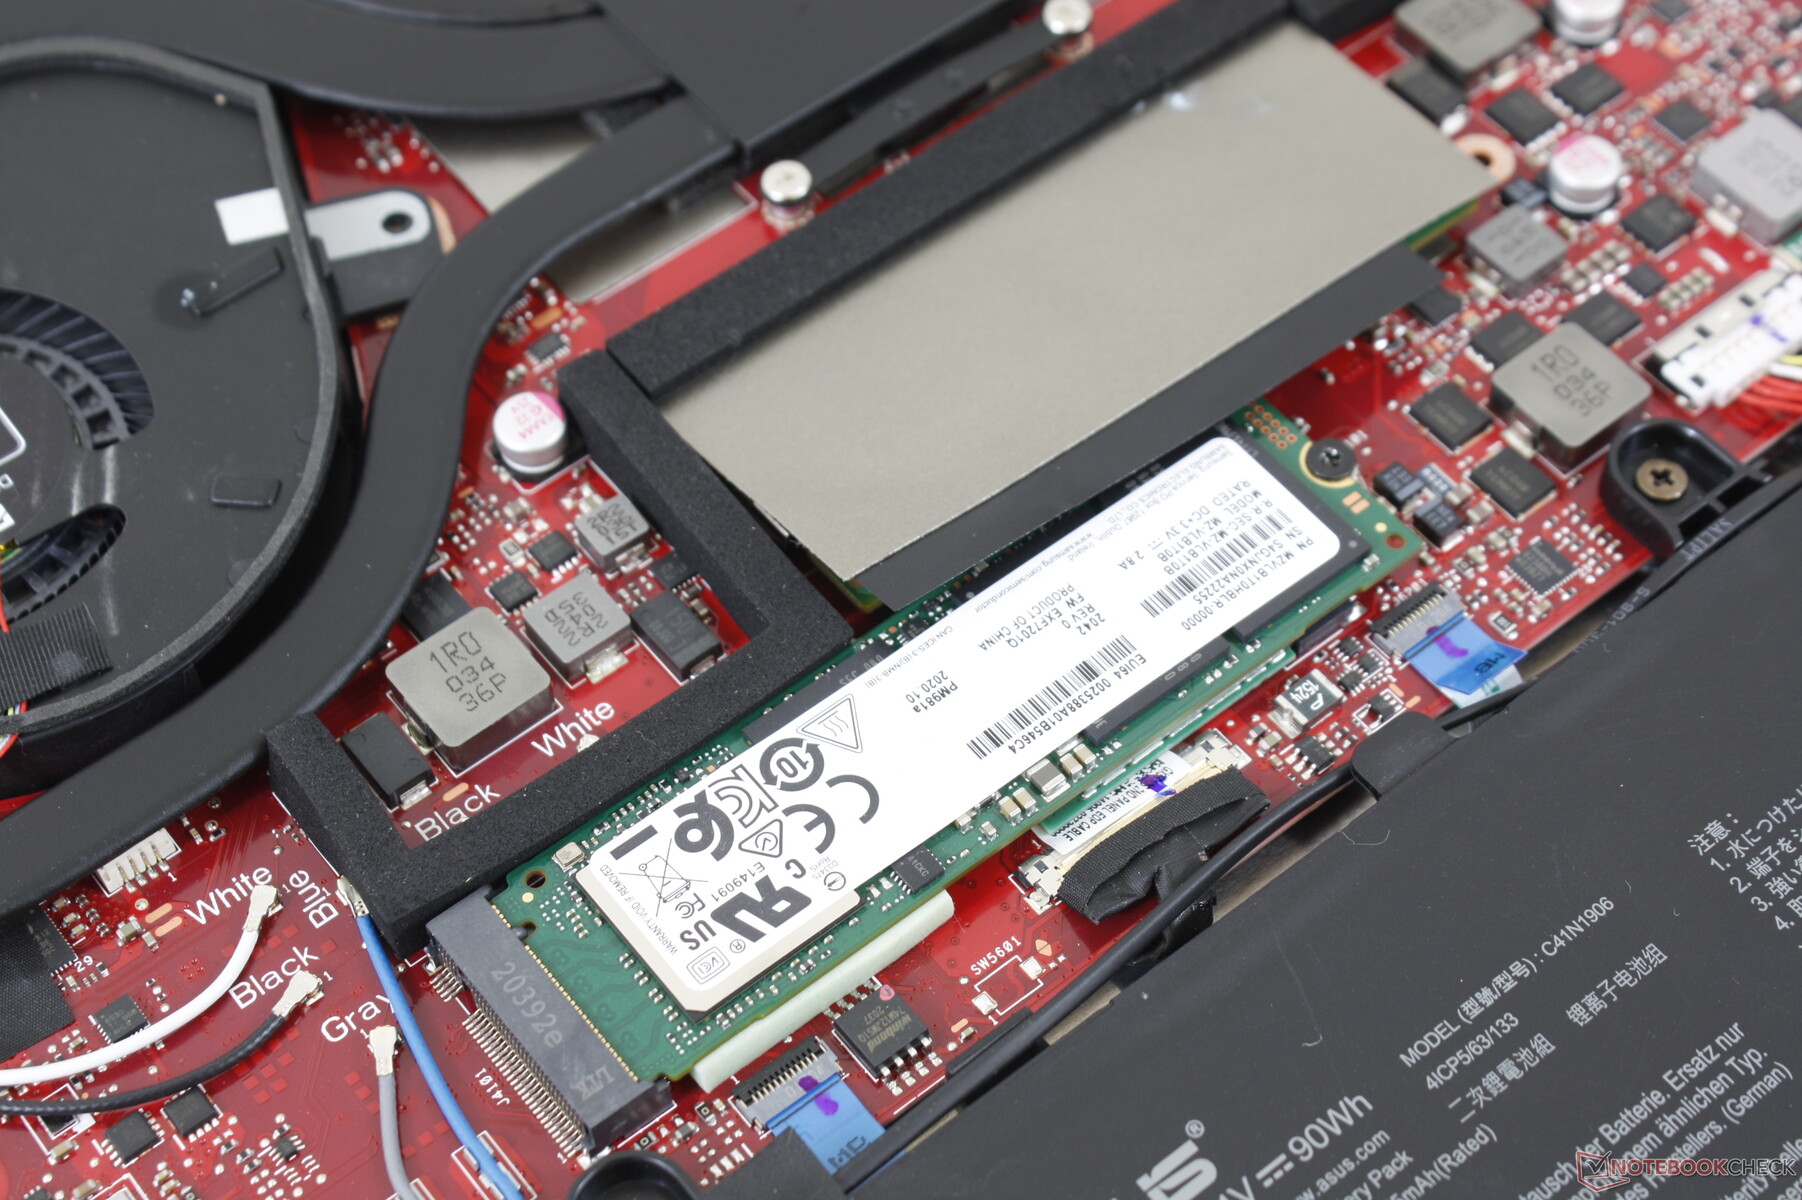
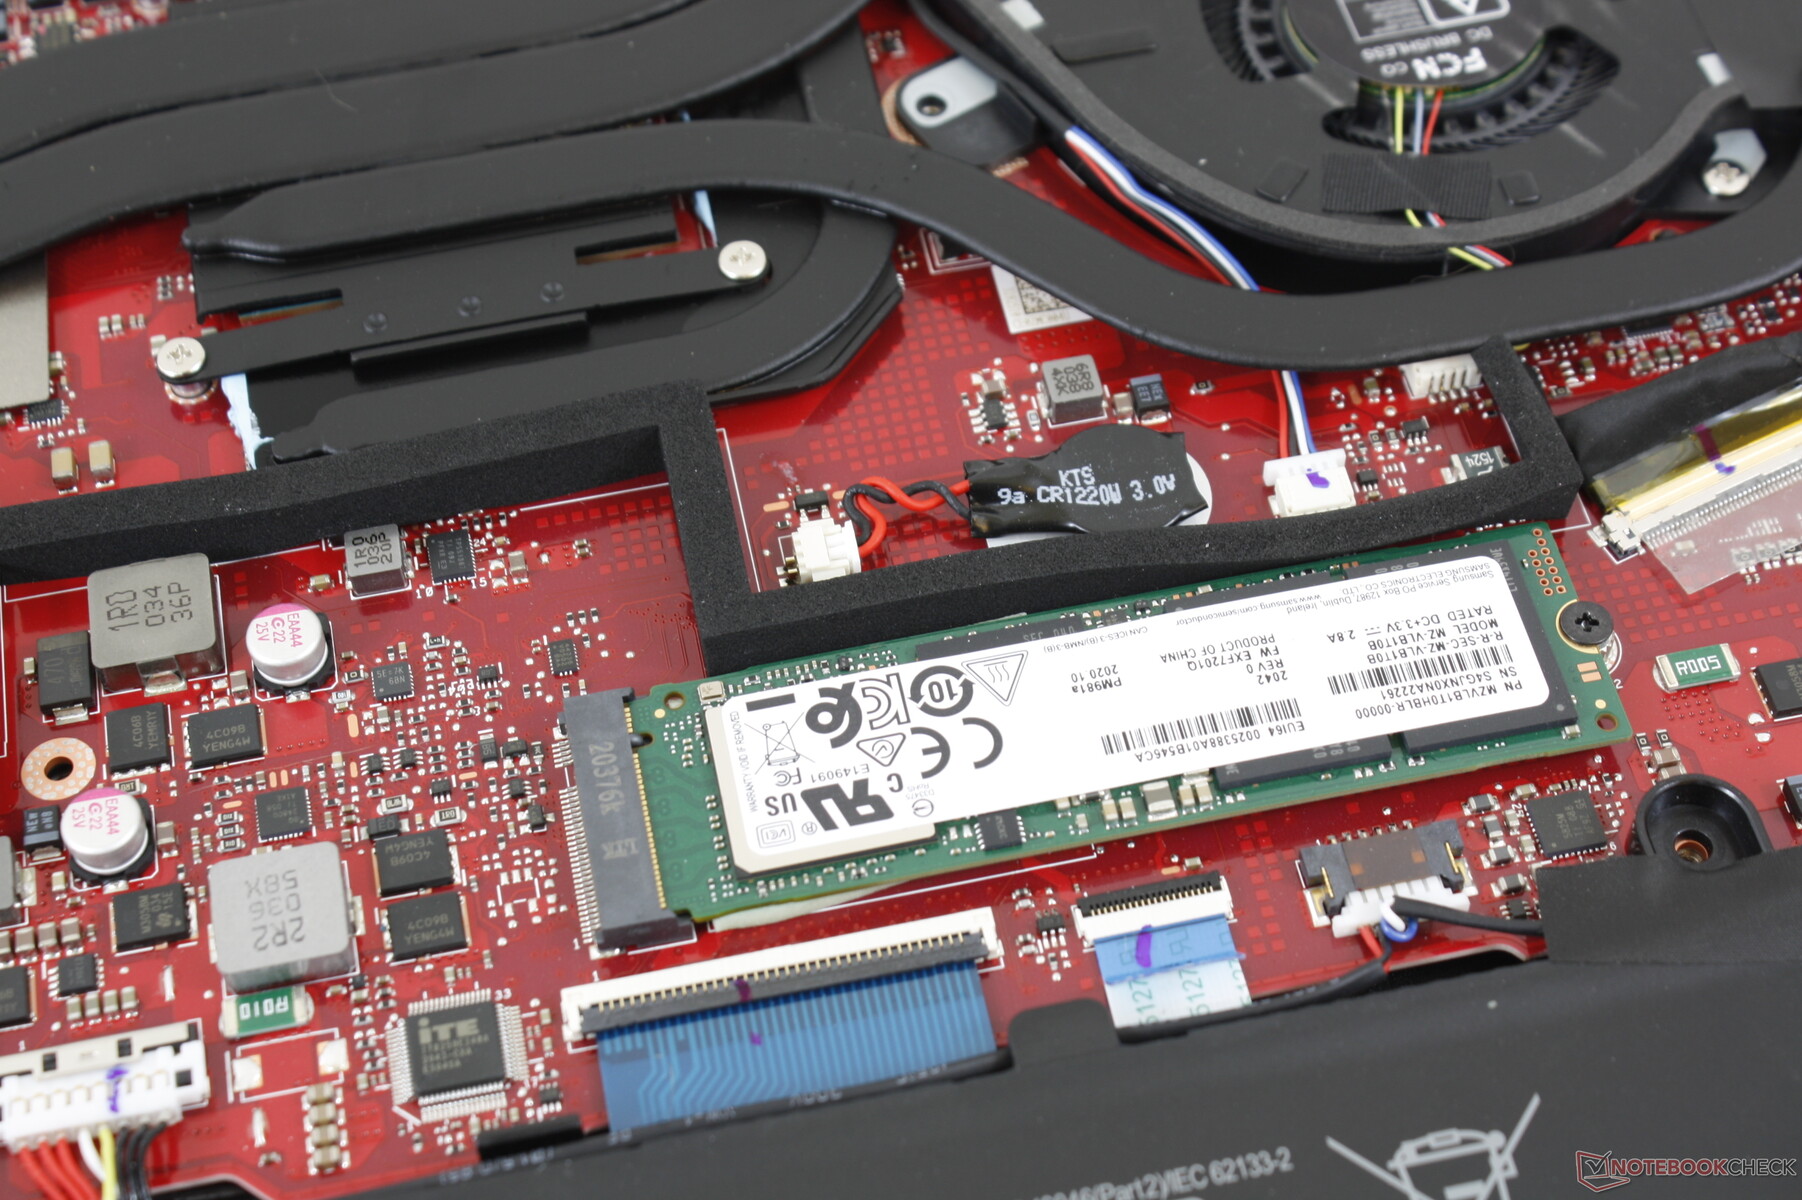
| Asus ROG Zephyrus Duo 15 SE GX551QS 2x Samsung PM981a MZVLB1T0HBLR (RAID 0) | Asus ROG Zephyrus Duo 15 GX550LXS 2x Samsung PM981a MZVLB1T0HBLR (RAID 0) | Eurocom Sky X4C i9-9900KS Samsung SSD 970 Pro 512GB | MSI GE66 Raider 10SFS WDC PC SN730 SDBPNTY-1T00 | MSI GS66 Stealth 10SFS Samsung SSD PM981 MZVLB1T0HALR | |
|---|---|---|---|---|---|
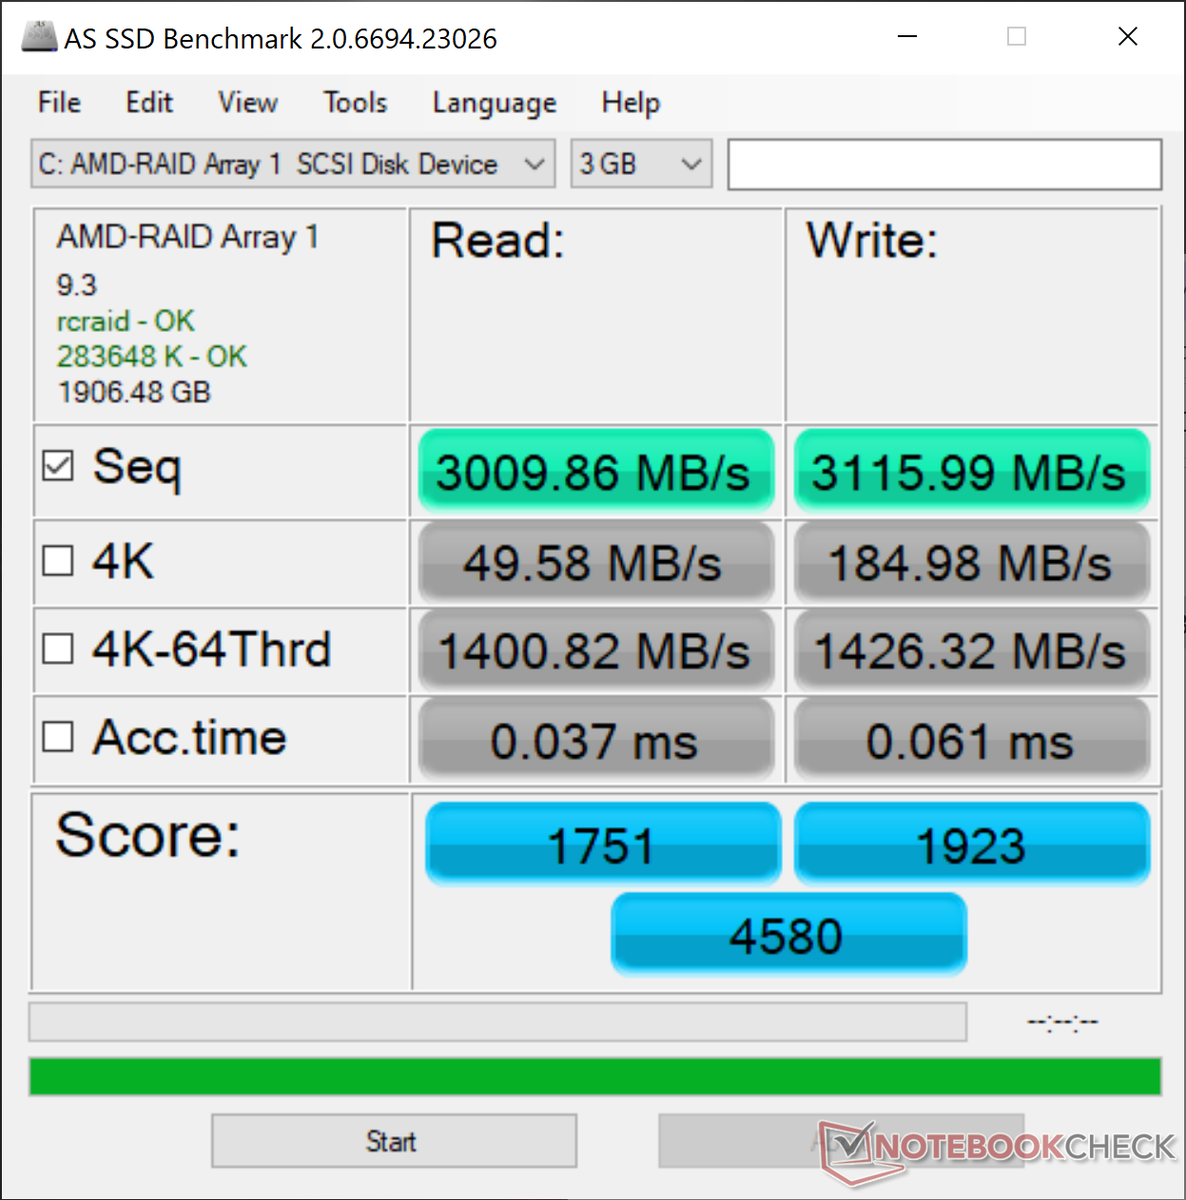
| AS SSD | -11% | -16% | 11% | -10% | |
| Seq Read (MB/s) | 3010 | 2981 -1% | 2280 -24% | 2979 -1% | 1065 -65% |
| Seq Write (MB/s) | 3116 | 2783 -11% | 2198 -29% | 2581 -17% | 2360 -24% |
| 4K Read (MB/s) | 49.58 | 43.98 -11% | 31.67 -36% | 47.33 -5% | 48.09 -3% |
| 4K Write (MB/s) | 185 | 113.9 -38% | 127.3 -31% | 140 -24% | 110.7 -40% |
| 4K-64 Read (MB/s) | 1401 | 1519 8% | 1293 -8% | 1710 22% | 1635 17% |
| 4K-64 Write (MB/s) | 1426 | 1296 -9% | 2124 49% | 2188 53% | 1829 28% |
| Access Time Read * (ms) | 0.037 | 0.062 -68% | 0.078 -111% | 0.05 -35% | 0.071 -92% |
| Access Time Write * (ms) | 0.061 | 0.033 46% | 0.098 -61% | 0.026 57% | 0.034 44% |
| Score Read (Points) | 1751 | 1861 6% | 1552 -11% | 2055 17% | 1790 2% |
| Score Write (Points) | 1923 | 1688 -12% | 2471 28% | 2586 34% | 2176 13% |
| Score Total (Points) | 4580 | 4492 -2% | 4811 5% | 5673 24% | 4950 8% |
| Copy ISO MB/s (MB/s) | 3196 | 2438 -24% | 3007 -6% | ||
| Copy Program MB/s (MB/s) | 710 | 604 -15% | 731 3% | ||
| Copy Game MB/s (MB/s) | 1669 | 1404 -16% | 1756 5% | ||
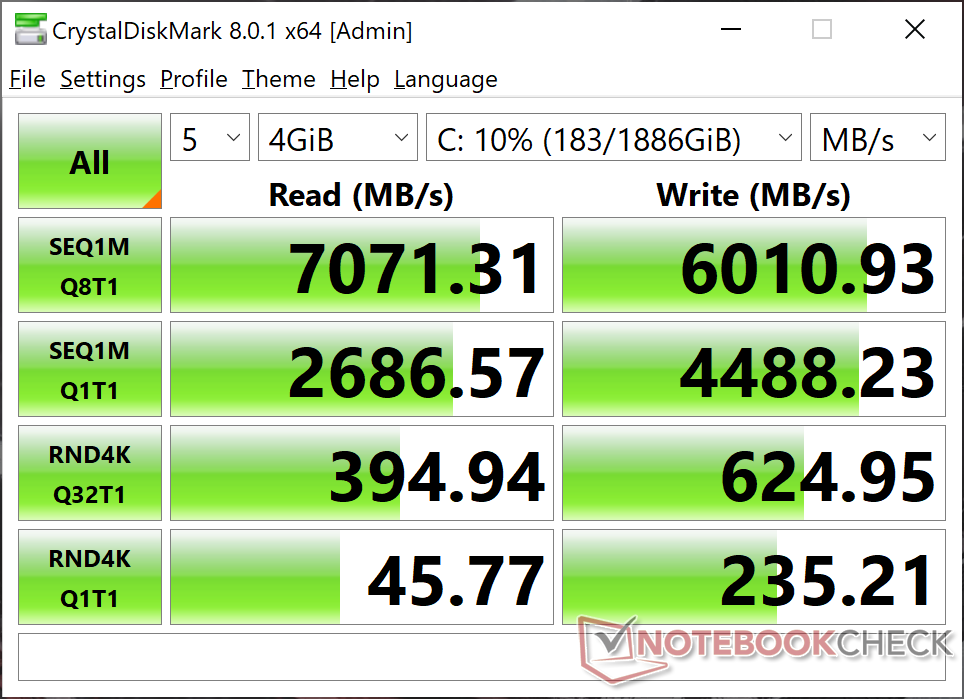
| CrystalDiskMark 5.2 / 6 | -18% | -19% | -20% | -28% | |
| Write 4K (MB/s) | 229.7 | 127.6 -44% | 188.8 -18% | 158.2 -31% | 131.3 -43% |
| Read 4K (MB/s) | 47.13 | 48.4 3% | 63.5 35% | 50.7 8% | 45.84 -3% |
| Write Seq (MB/s) | 4455 | 2958 -34% | 1836 -59% | 1790 -60% | 2370 -47% |
| Read Seq (MB/s) | 2933 | 2984 2% | 1891 -36% | 2469 -16% | 1509 -49% |
| Write 4K Q32T1 (MB/s) | 597 | 472.7 -21% | 490.5 -18% | 503 -16% | 481.5 -19% |
| Read 4K Q32T1 (MB/s) | 387 | 529 37% | 571 48% | 579 50% | 560 45% |
| Write Seq Q32T1 (MB/s) | 5623 | 3431 -39% | 2334 -58% | 3102 -45% | 2392 -57% |
| Read Seq Q32T1 (MB/s) | 7042 | 3536 -50% | 3559 -49% | 3413 -52% | 3232 -54% |
| Media totale (Programma / Settaggio) | -15% /
-13% | -18% /
-17% | -5% /
-2% | -19% /
-18% |
* ... Meglio usare valori piccoli

Throttling Disco: DiskSpd Read Loop, Queue Depth 8
Prestazioni della GPU
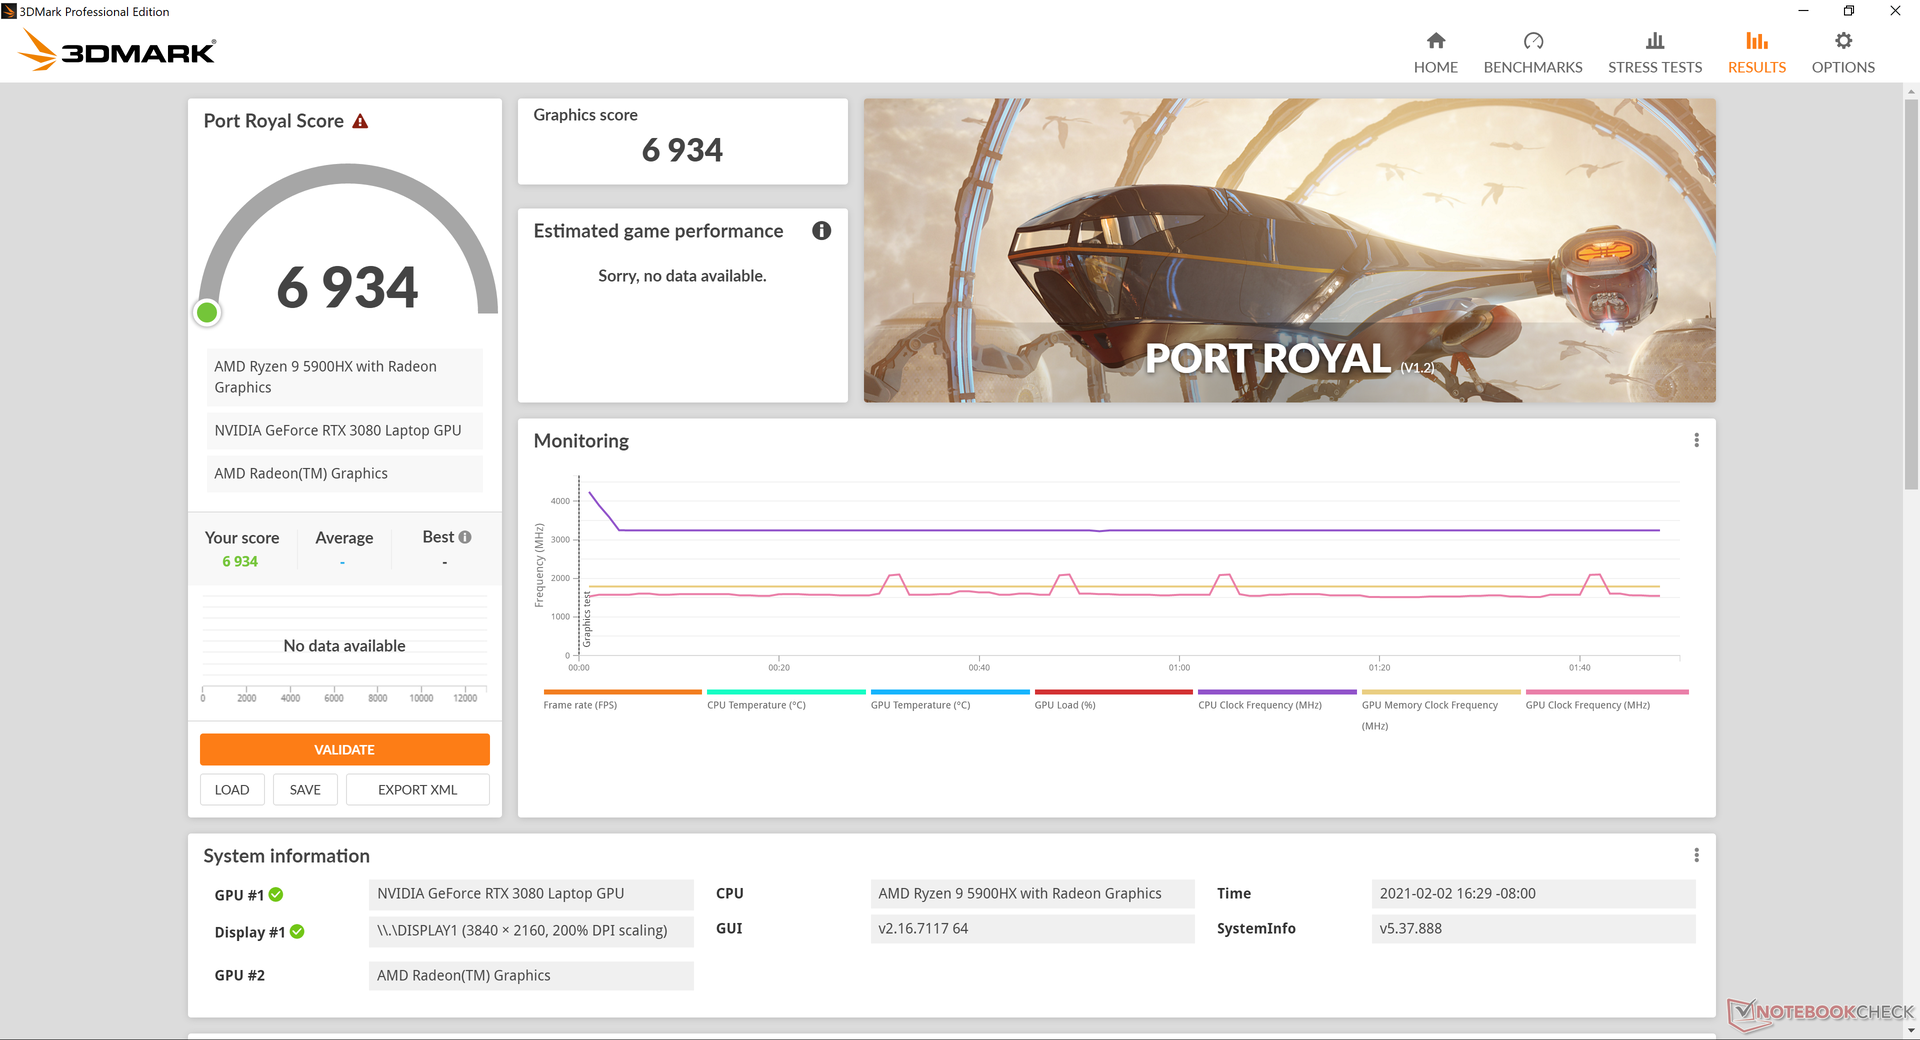
Le prestazioni grafiche sono solo circa il 15% superiori rispetto alla media GeForce RTX 2080 laptop finendo per essere essere lontano grido dalla GeForce RTX 3080 desktop. È ancora una delle più veloci GPU mobili disponibili, ma gli utenti non dovrebbero assolutamente aspettarsi che le prestazioni si avvicinino alla versione desktop, anche se possono condividere lo stesso nome. Invece, le prestazioni saranno più paragonabili a un GeForce RTX 3060 Ti desktop.
Di positivo, le prestazioni grafiche sono significativamente più veloci della GeForce RTX 2080 Max-Q nella GX550 dell'anno scorso di circa il 45%. Non sono tutte cattive notizie a seconda di come si guardano i dati.
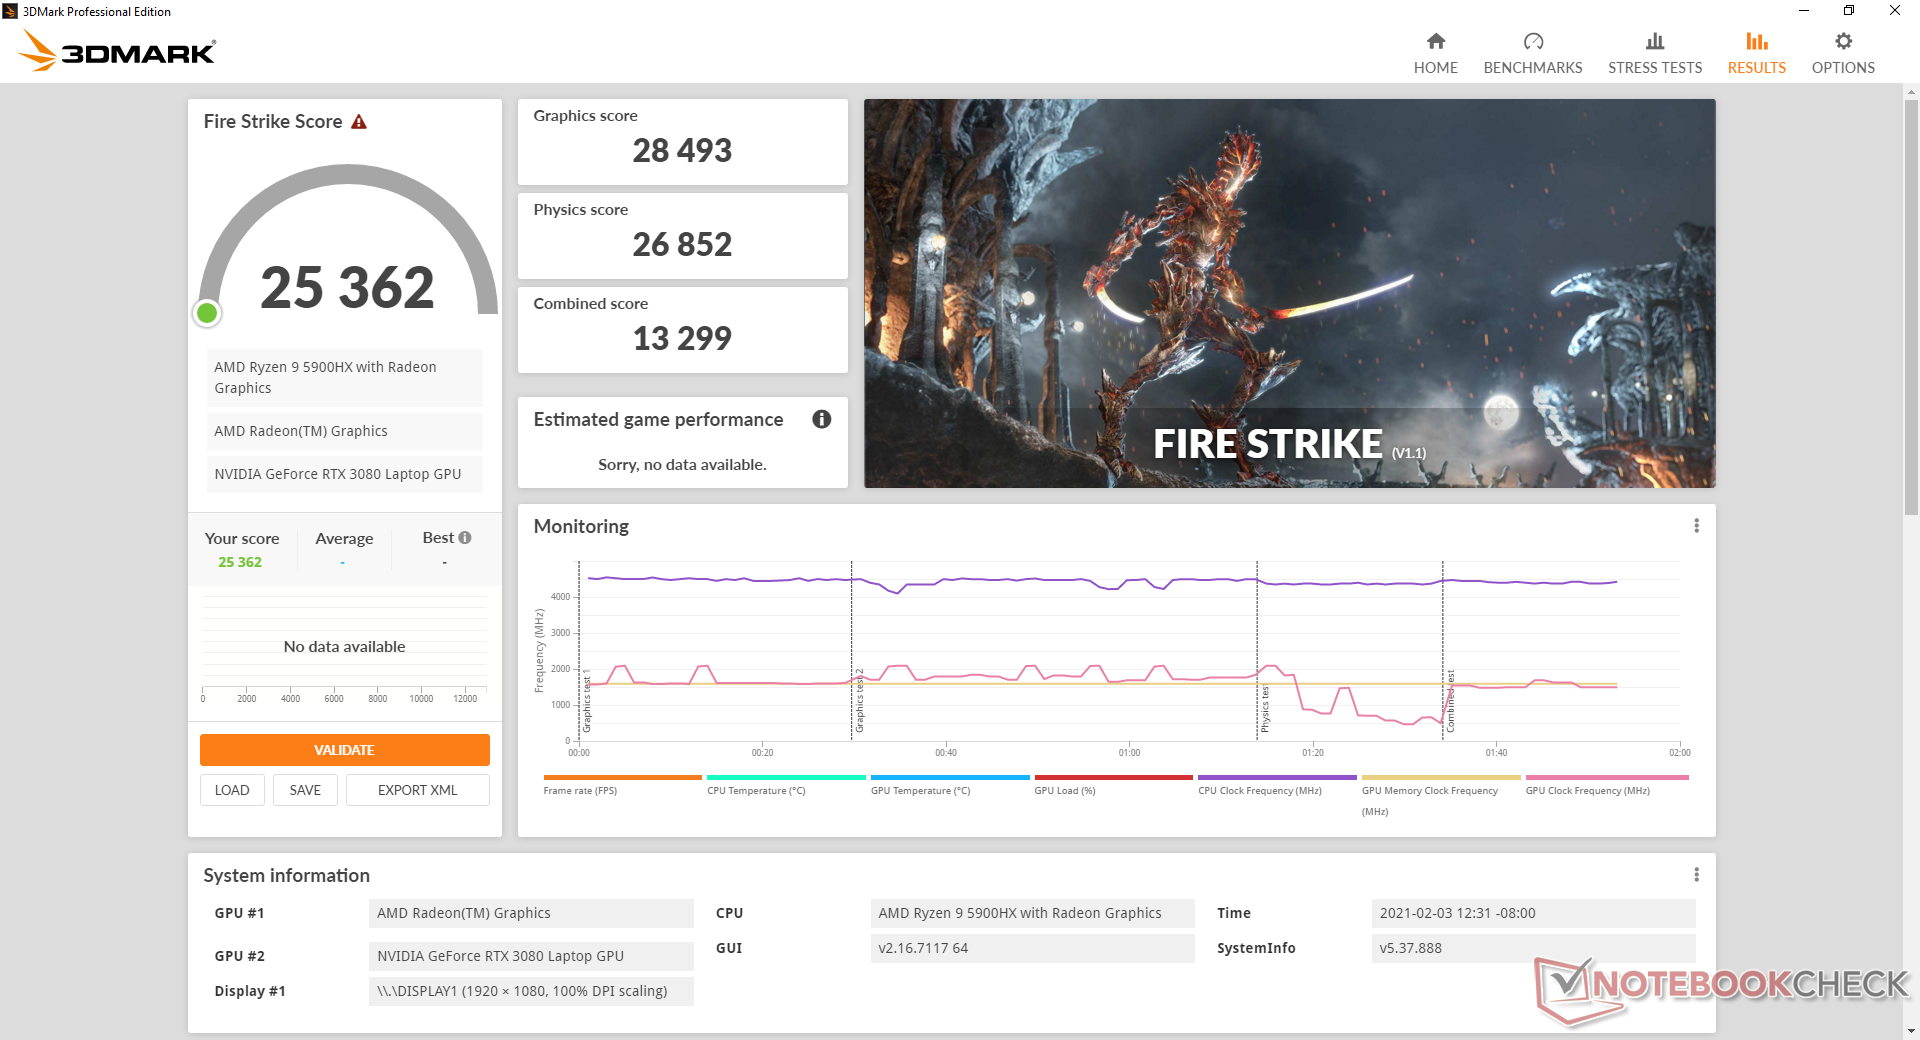
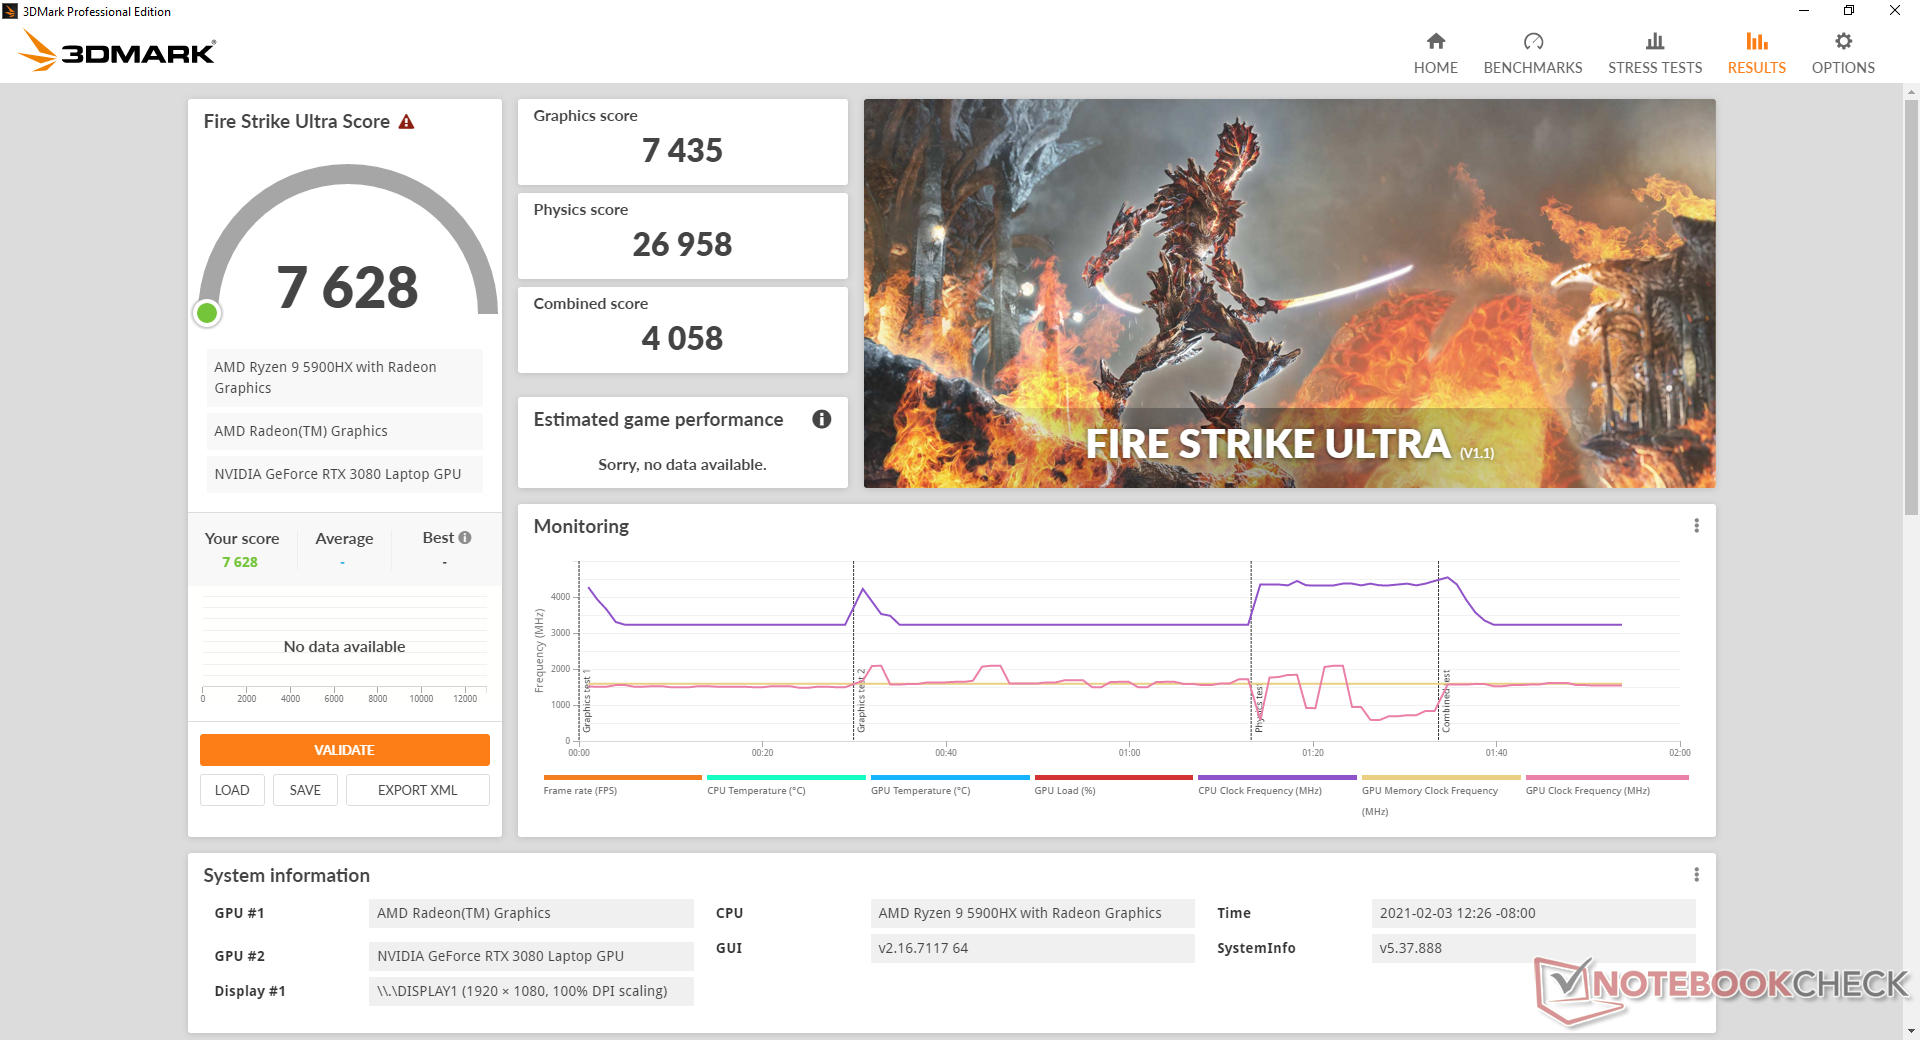
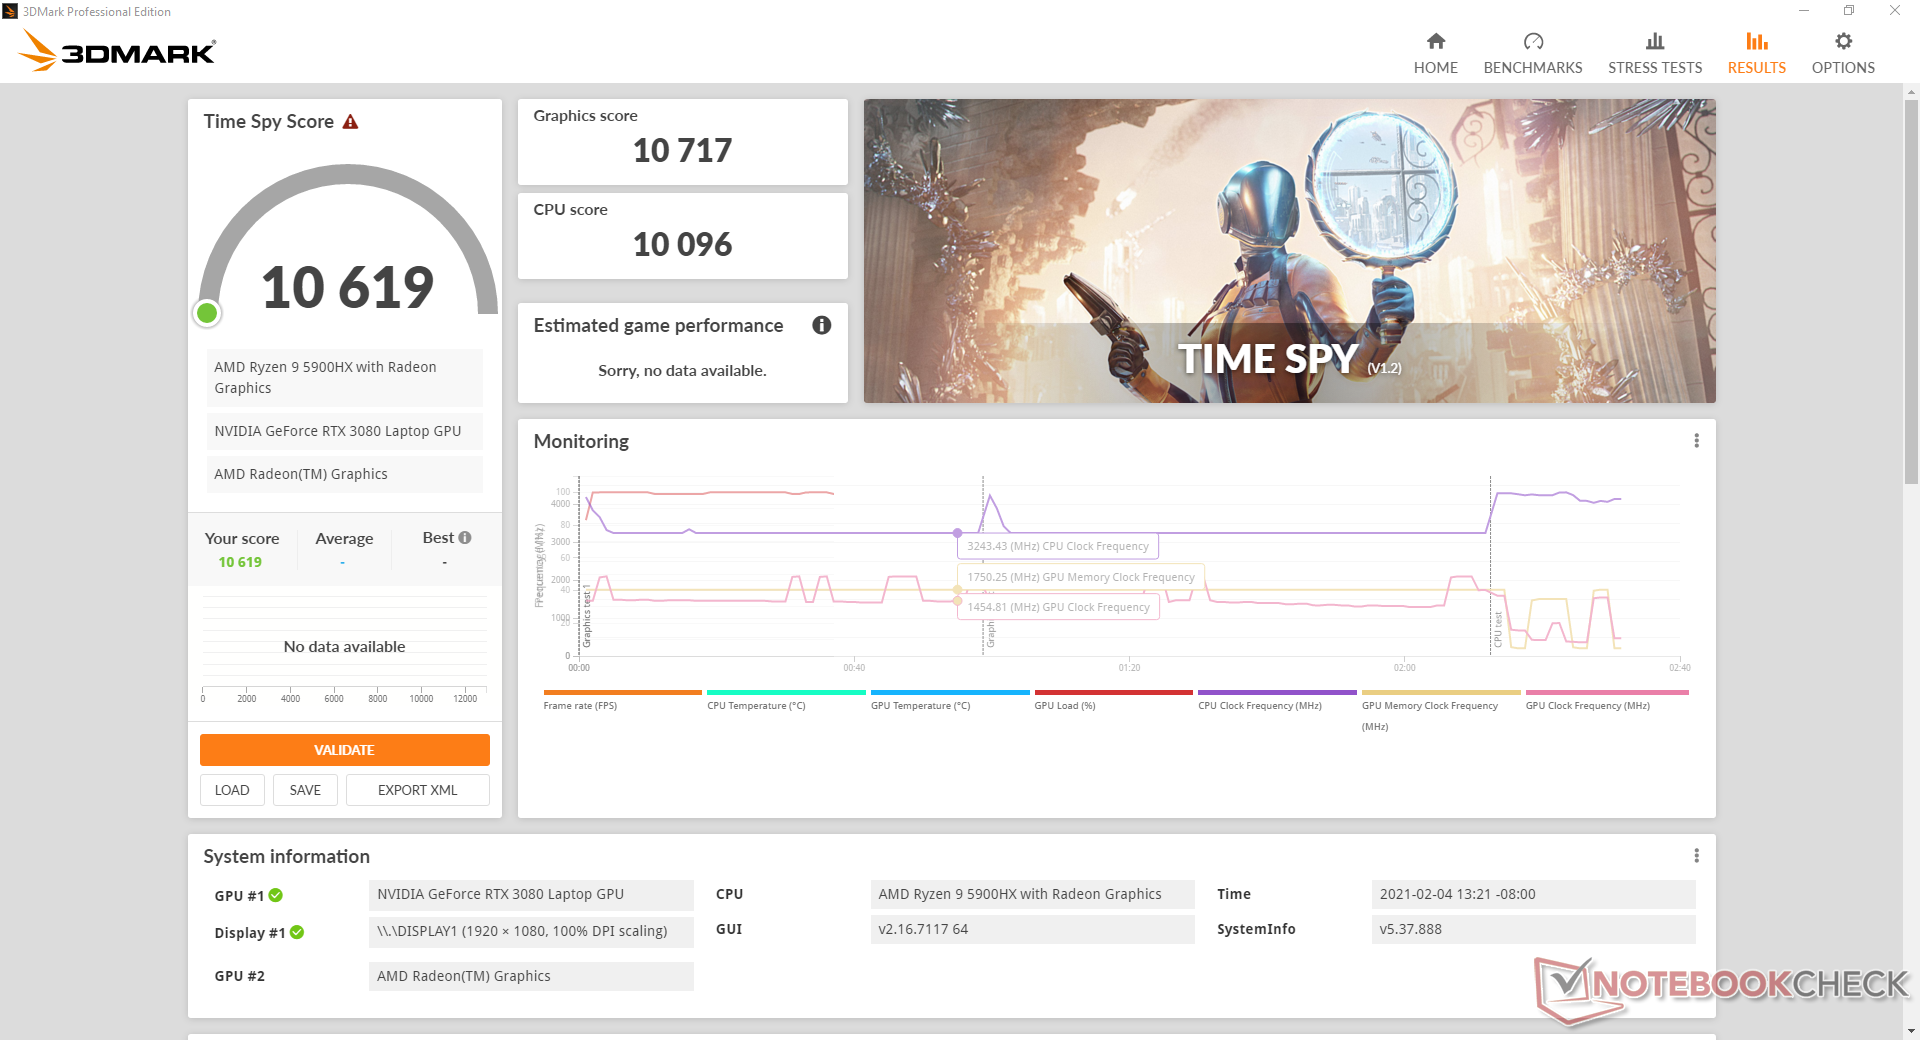
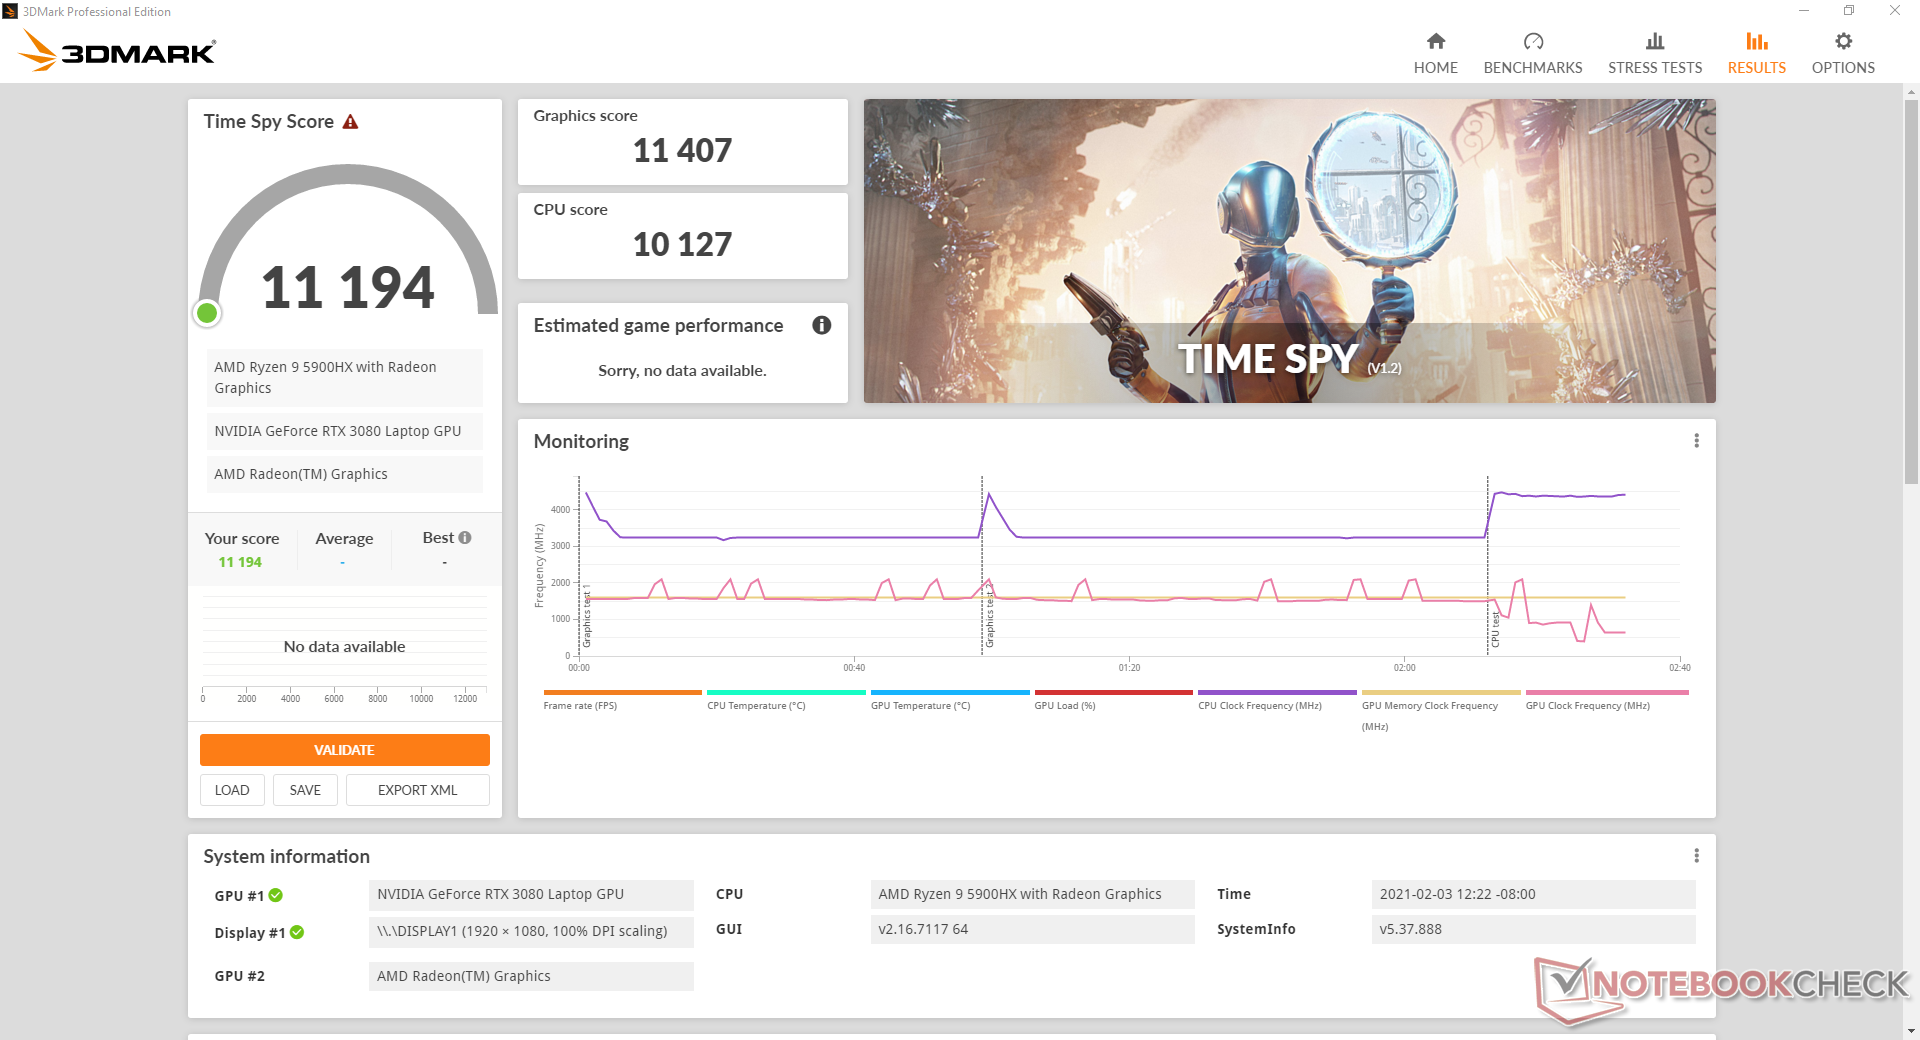
Eseguendo il nostro Zephyrus in modalità Performance invece che in modalità Turbo, si incorrerebbe in un deficit di prestazioni della GPU di appena il 5-10% secondo 3DMark. Se a batteria, i nostri punteggi Fire Strike Physics e Graphics scenderebbero rispettivamente a 24710 e 6478 punti.
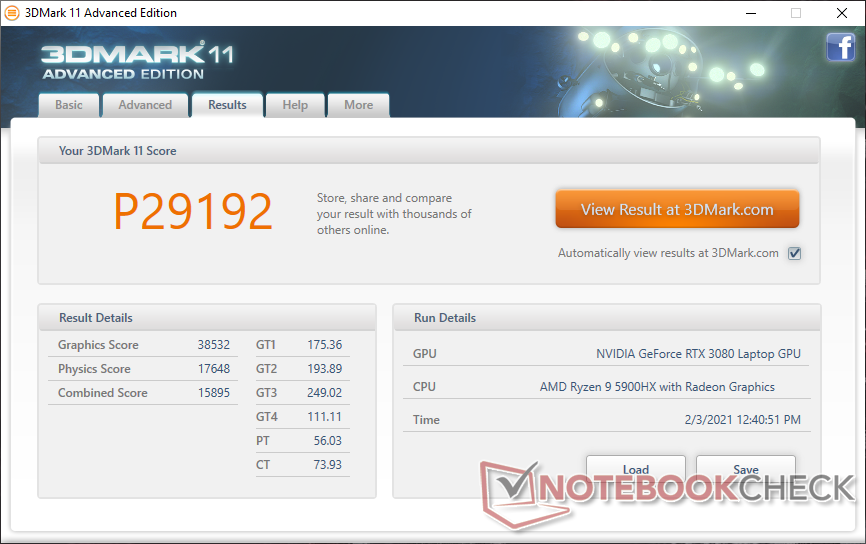
| 3DMark 11 Performance | 29192 punti | |
| 3DMark Cloud Gate Standard Score | 51675 punti | |
| 3DMark Fire Strike Score | 25362 punti | |
| 3DMark Time Spy Score | 11194 punti | |
Aiuto | ||
Prestazioni di gioco
Le prestazioni del mondo reale nei giochi sono costantemente più veloci di GeForce RTX 2080 Max-Q, soprattutto quando si gioca a risoluzioni più elevate oltre 1080p. Aspettatevi fino al 50% di incremento dei frame rate se si gioca a 4K rispetto al 30-40% a 1080p.
GTA V non si caricava correttamente sulla nostra unità nonostante i molteplici tentativi di reinstallazione.
| basso | medio | alto | ultra | QHD | 4K | |
|---|---|---|---|---|---|---|
| BioShock Infinite (2013) | 374 | 186.2 | ||||
| The Witcher 3 (2015) | 341.7 | 187.2 | 104.6 | 80.4 | ||
| Dota 2 Reborn (2015) | 144 | 139 | 124 | 119 | 99.9 | |
| Final Fantasy XV Benchmark (2018) | 177 | 133 | 105 | 81.3 | 49.5 | |
| X-Plane 11.11 (2018) | 107 | 93 | 77 | 60.9 | ||
| Far Cry 5 (2018) | 138 | 119 | 114 | 107 | 96 | 59 |
| Strange Brigade (2018) | 346 | 205 | 188 | 174 | 136 | 84.2 |
| Shadow of the Tomb Raider (2018) | 140 | 123 | 121 | 116 | 93 | 55 |
| Total War: Three Kingdoms (2019) | 270.2 | 148.6 | 108.4 | 83.8 | 56.8 | 29 |
| Doom Eternal (2020) | 323.2 | 197.5 | 183.1 | 183.7 | 145.8 | 83.4 |
| Gears Tactics (2020) | 127.6 | 187.8 | 142.8 | 114.7 | 85.9 | 47.2 |
| F1 2020 (2020) | 256 | 199 | 191 | 150 | 119 | 73 |
Emissioni
Rumore di sistema
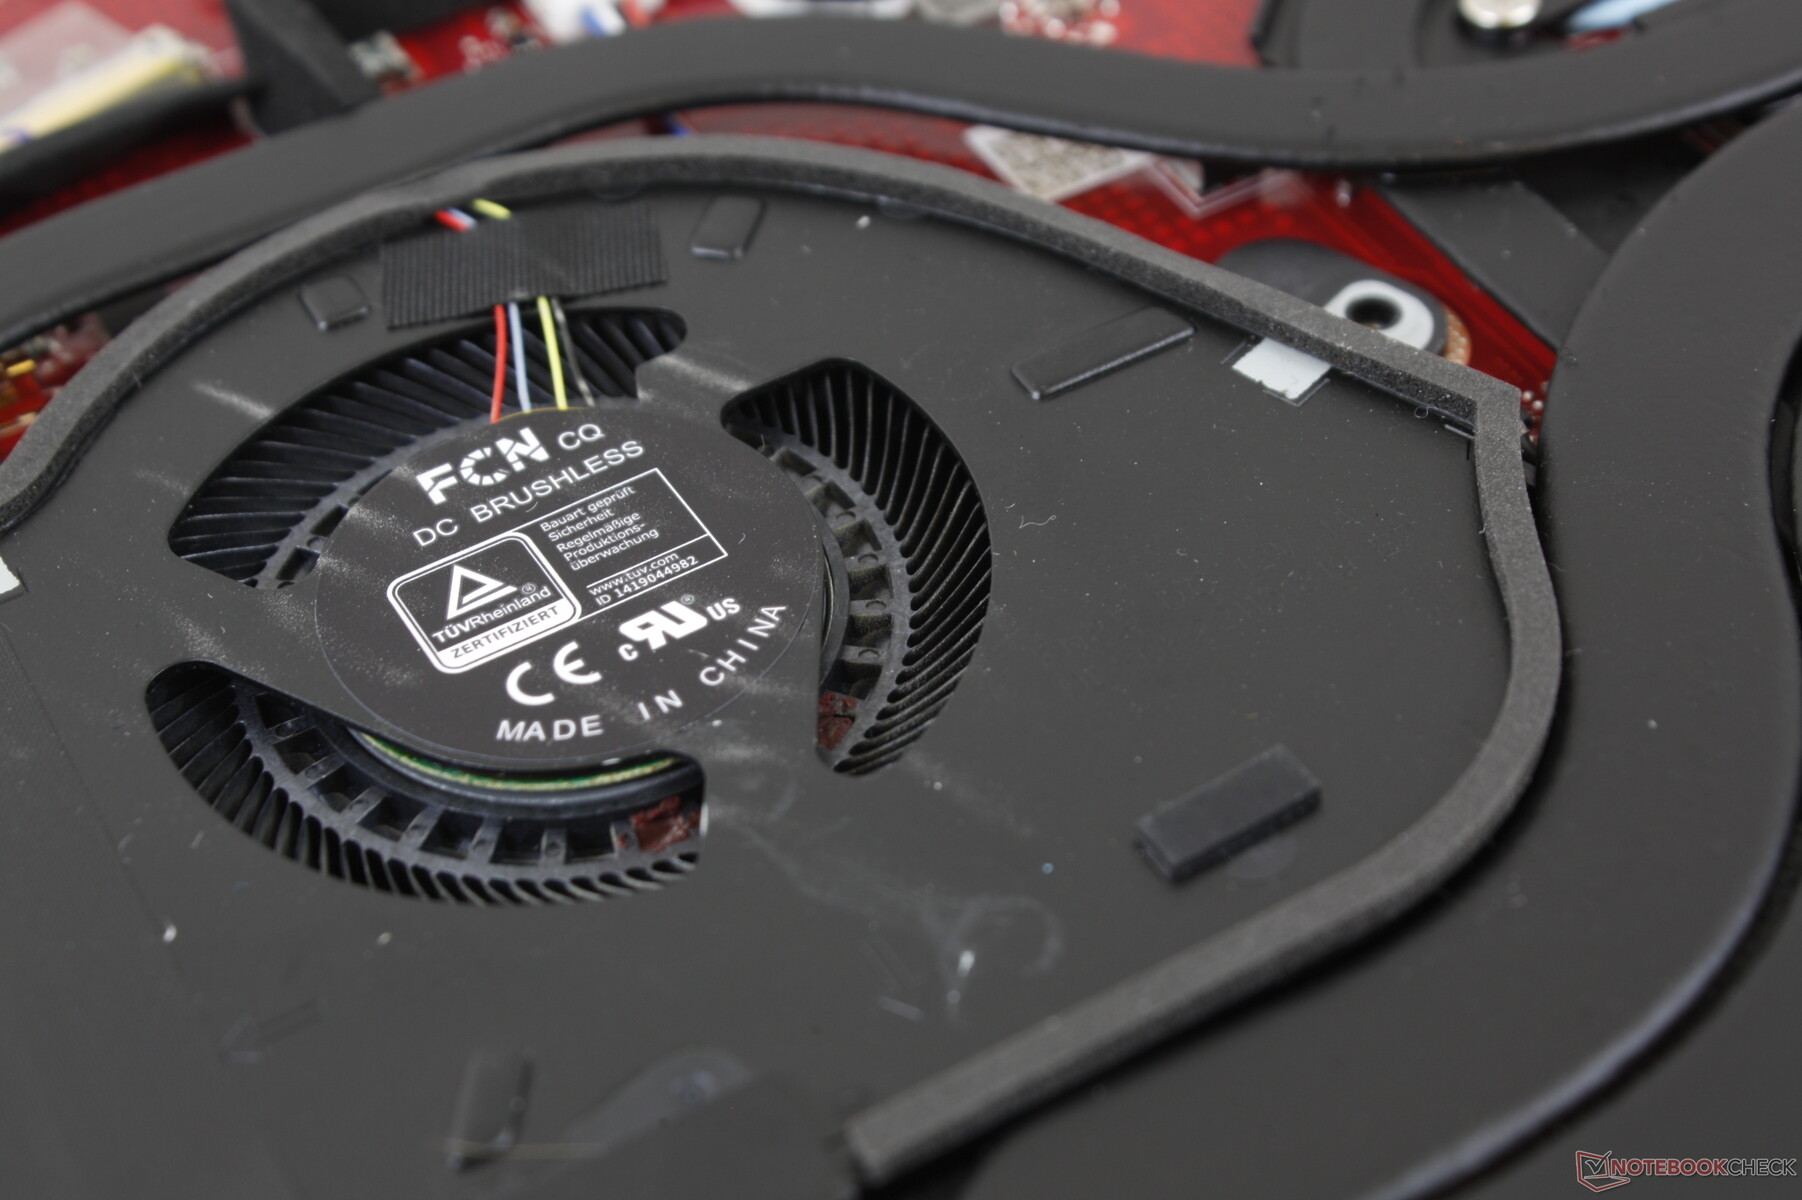
Il rumore e il comportamento delle ventole sembrano essere migliorati rispetto al GX550. Per esempio, entrambe le ventole saranno effettivamente inattive a 0 RPM anche se impostate in modalità Turbo per un'esperienza silenziosa finché i carichi di sistema sono molto bassi. Tuttavia, non è consigliabile essere in modalità Turbo a tempo indeterminato perché le ventole pulsano più frequentemente quando si naviga in rete o si fa streaming video. Eseguendo la prima scena di benchmark di 3DMark 06 il rumore della ventola scende a soli 31,2 dB(A) se in modalità Performance.
La differenza di rumore della ventola tra la modalità Performance e la modalità Turbo può essere drastica. Quando si esegue The Witcher 3 in modalità Performance, il rumore della ventola oscillera tra 35 e 44,5 dB(A) mentre la modalità Turbo causa un rumore fisso a 53,5 dB(A). Aspettatevi che le ventole pulsino più frequentemente e sensibilmente se giocate in modalità Performance.
| Asus ROG Zephyrus Duo 15 SE GX551QS GeForce RTX 3080 Laptop GPU, R9 5900HX, 2x Samsung PM981a MZVLB1T0HBLR (RAID 0) | Asus ROG Zephyrus Duo 15 GX550LXS GeForce RTX 2080 Super Max-Q, i9-10980HK, 2x Samsung PM981a MZVLB1T0HBLR (RAID 0) | Razer Blade 15 RTX 2080 Super Max-Q GeForce RTX 2080 Super Max-Q, i7-10875H, Samsung PM981a MZVLB1T0HBLR | Eurocom Sky X4C i9-9900KS GeForce RTX 2080 Mobile, i9-9900KS, Samsung SSD 970 Pro 512GB | MSI GE66 Raider 10SFS GeForce RTX 2070 Super Mobile, i9-10980HK, WDC PC SN730 SDBPNTY-1T00 | MSI GS66 Stealth 10SFS GeForce RTX 2070 Super Max-Q, i9-10980HK, Samsung SSD PM981 MZVLB1T0HALR | |
|---|---|---|---|---|---|---|
| Noise | -20% | -13% | -9% | -30% | -25% | |
| off /ambiente * (dB) | 27 | 30 -11% | 30.1 -11% | 28.1 -4% | 30 -11% | 30 -11% |
| Idle Minimum * (dB) | 27 | 33 -22% | 30.1 -11% | 28.5 -6% | 30 -11% | 32 -19% |
| Idle Average * (dB) | 27 | 34 -26% | 30.1 -11% | 28.7 -6% | 35 -30% | 34 -26% |
| Idle Maximum * (dB) | 27 | 35 -30% | 30.1 -11% | 29.5 -9% | 44 -63% | 39 -44% |
| Load Average * (dB) | 31.2 | 48 -54% | 46.8 -50% | 31.2 -0% | 53 -70% | 53 -70% |
| Witcher 3 ultra * (dB) | 44.5 | 48 -8% | 48.4 -9% | 55.1 -24% | 53 -19% | 48 -8% |
| Load Maximum * (dB) | 53.5 | 49 8% | 46 14% | 59.3 -11% | 55 -3% | 53 1% |
* ... Meglio usare valori piccoli
Rumorosità
| Idle |
| 27 / 27 / 27 dB(A) |
| Sotto carico |
| 31.2 / 53.5 dB(A) |
 | ||
30 dB silenzioso 40 dB(A) udibile 50 dB(A) rumoroso |
||
min: | ||
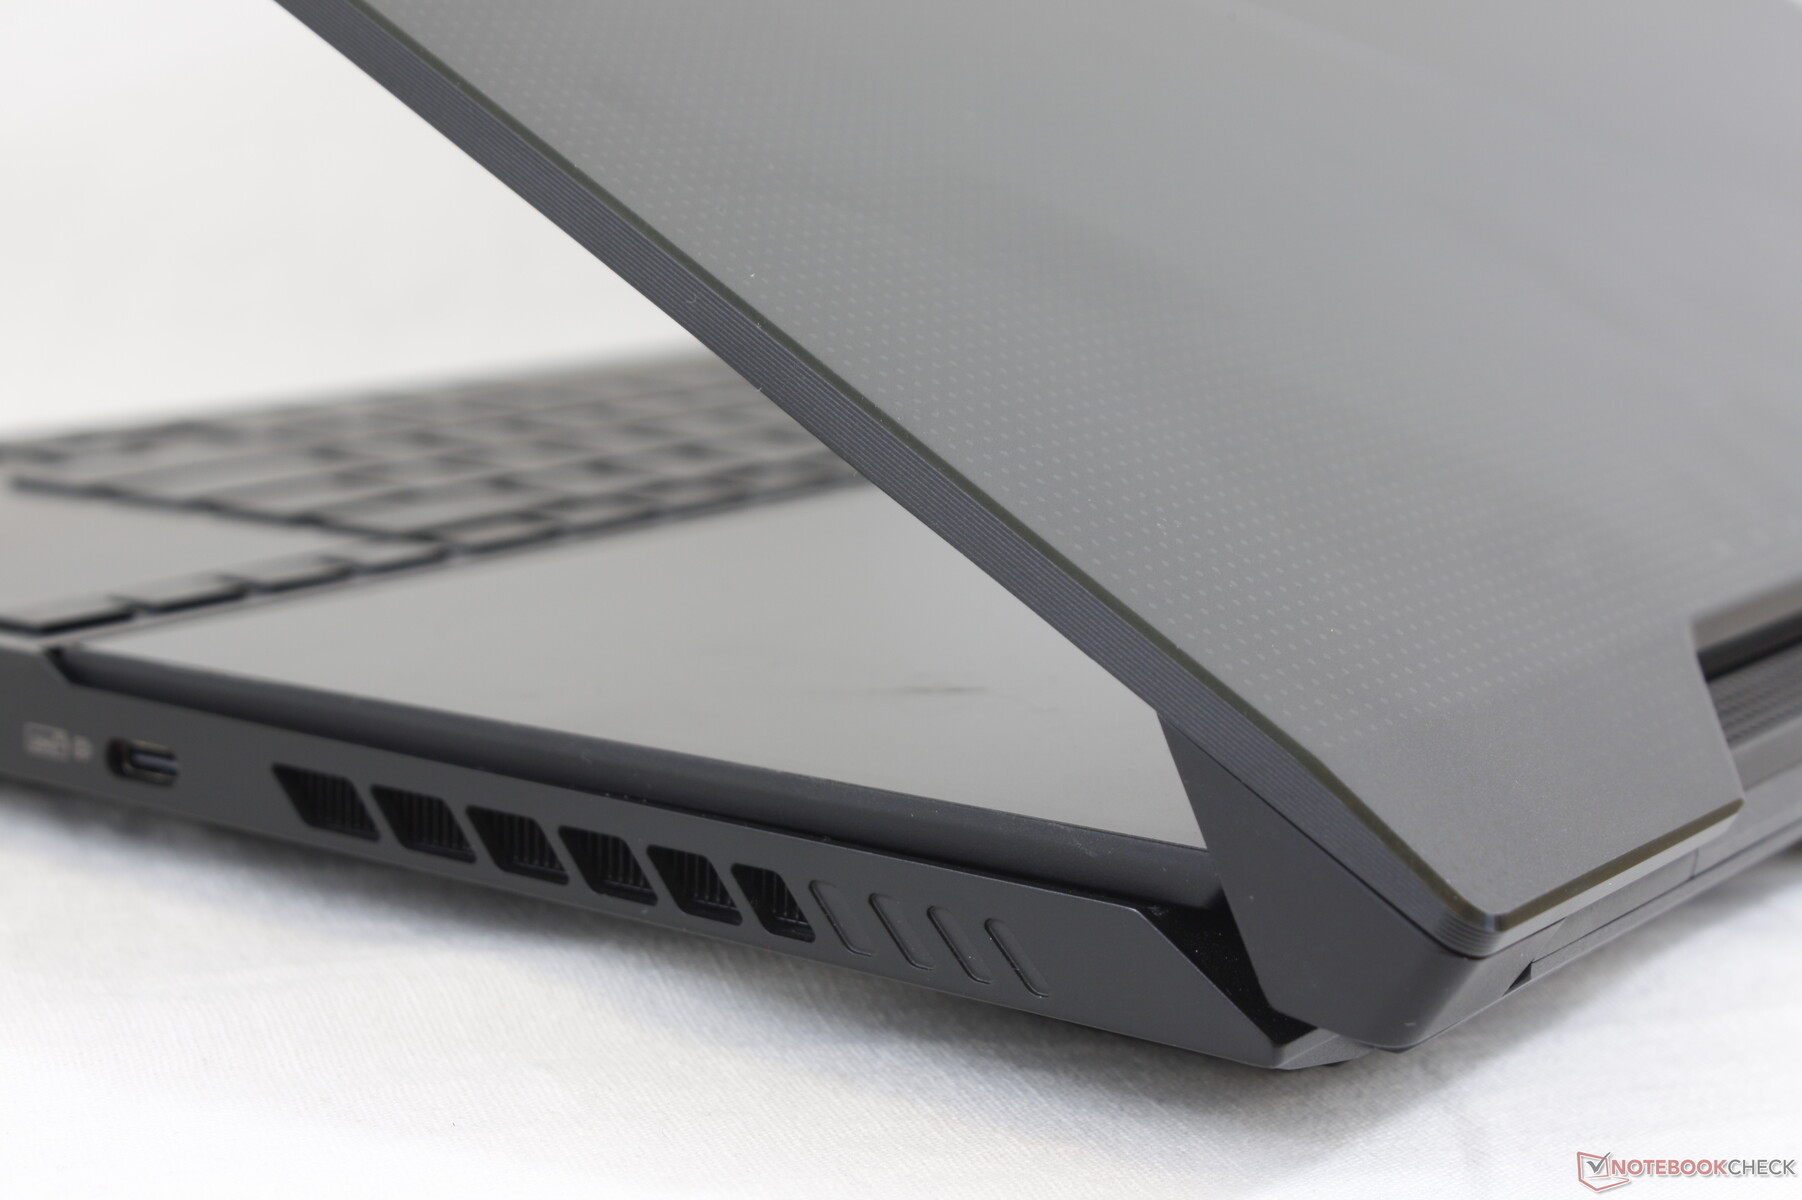
Temperature
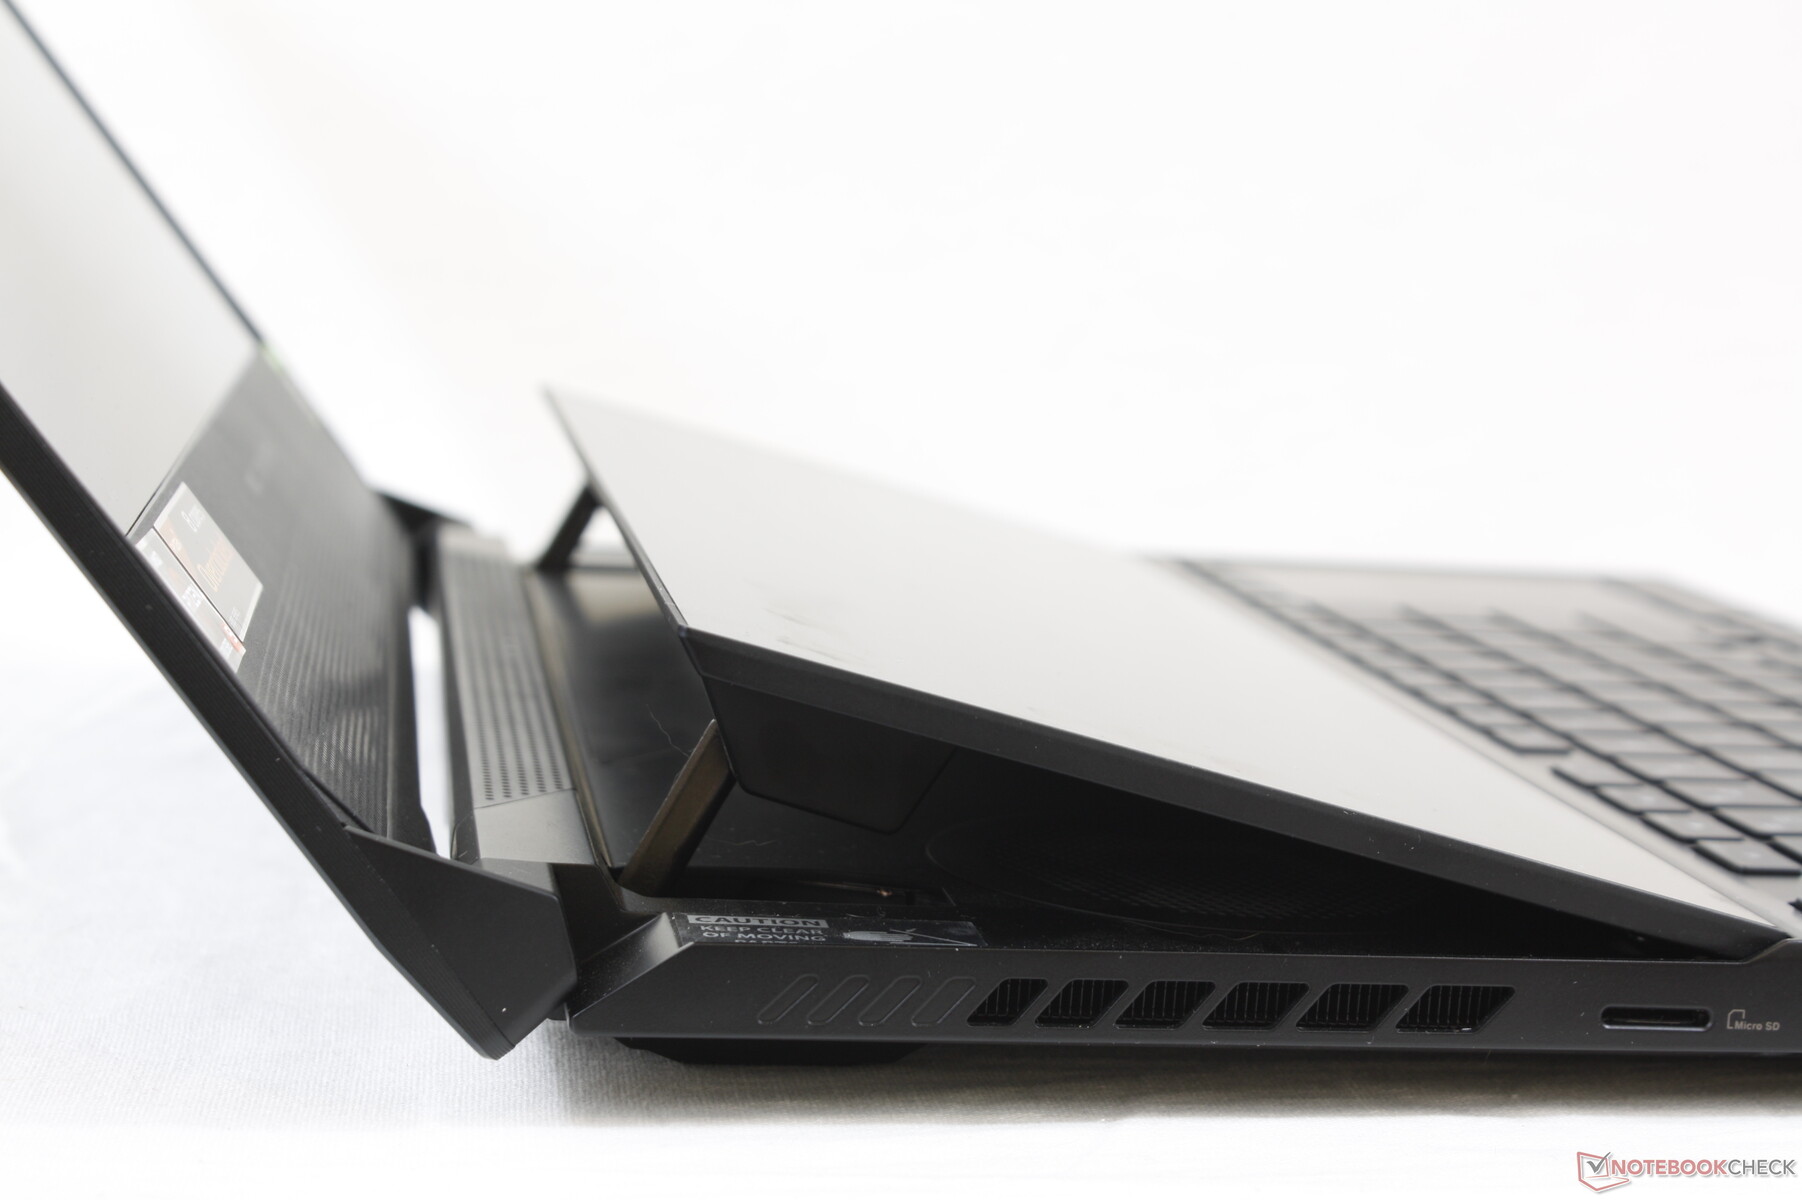
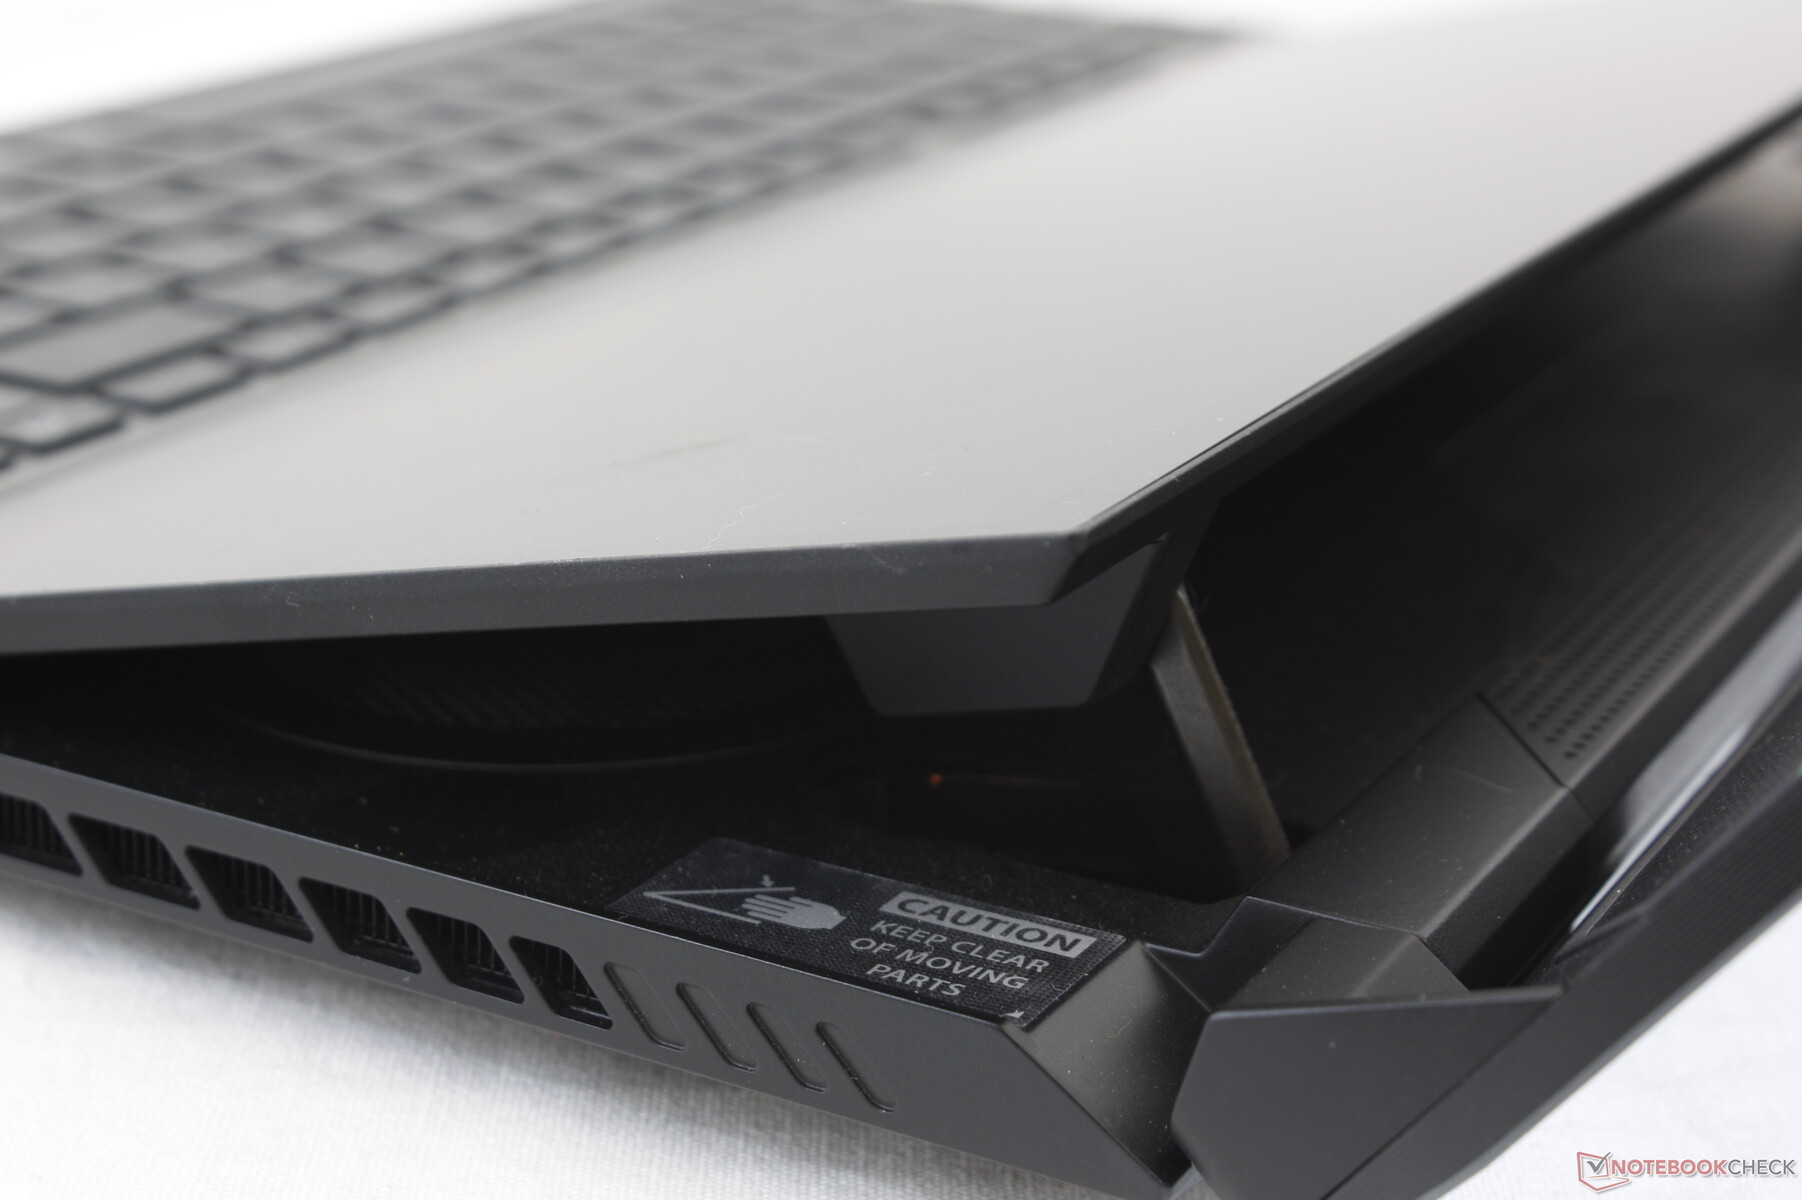
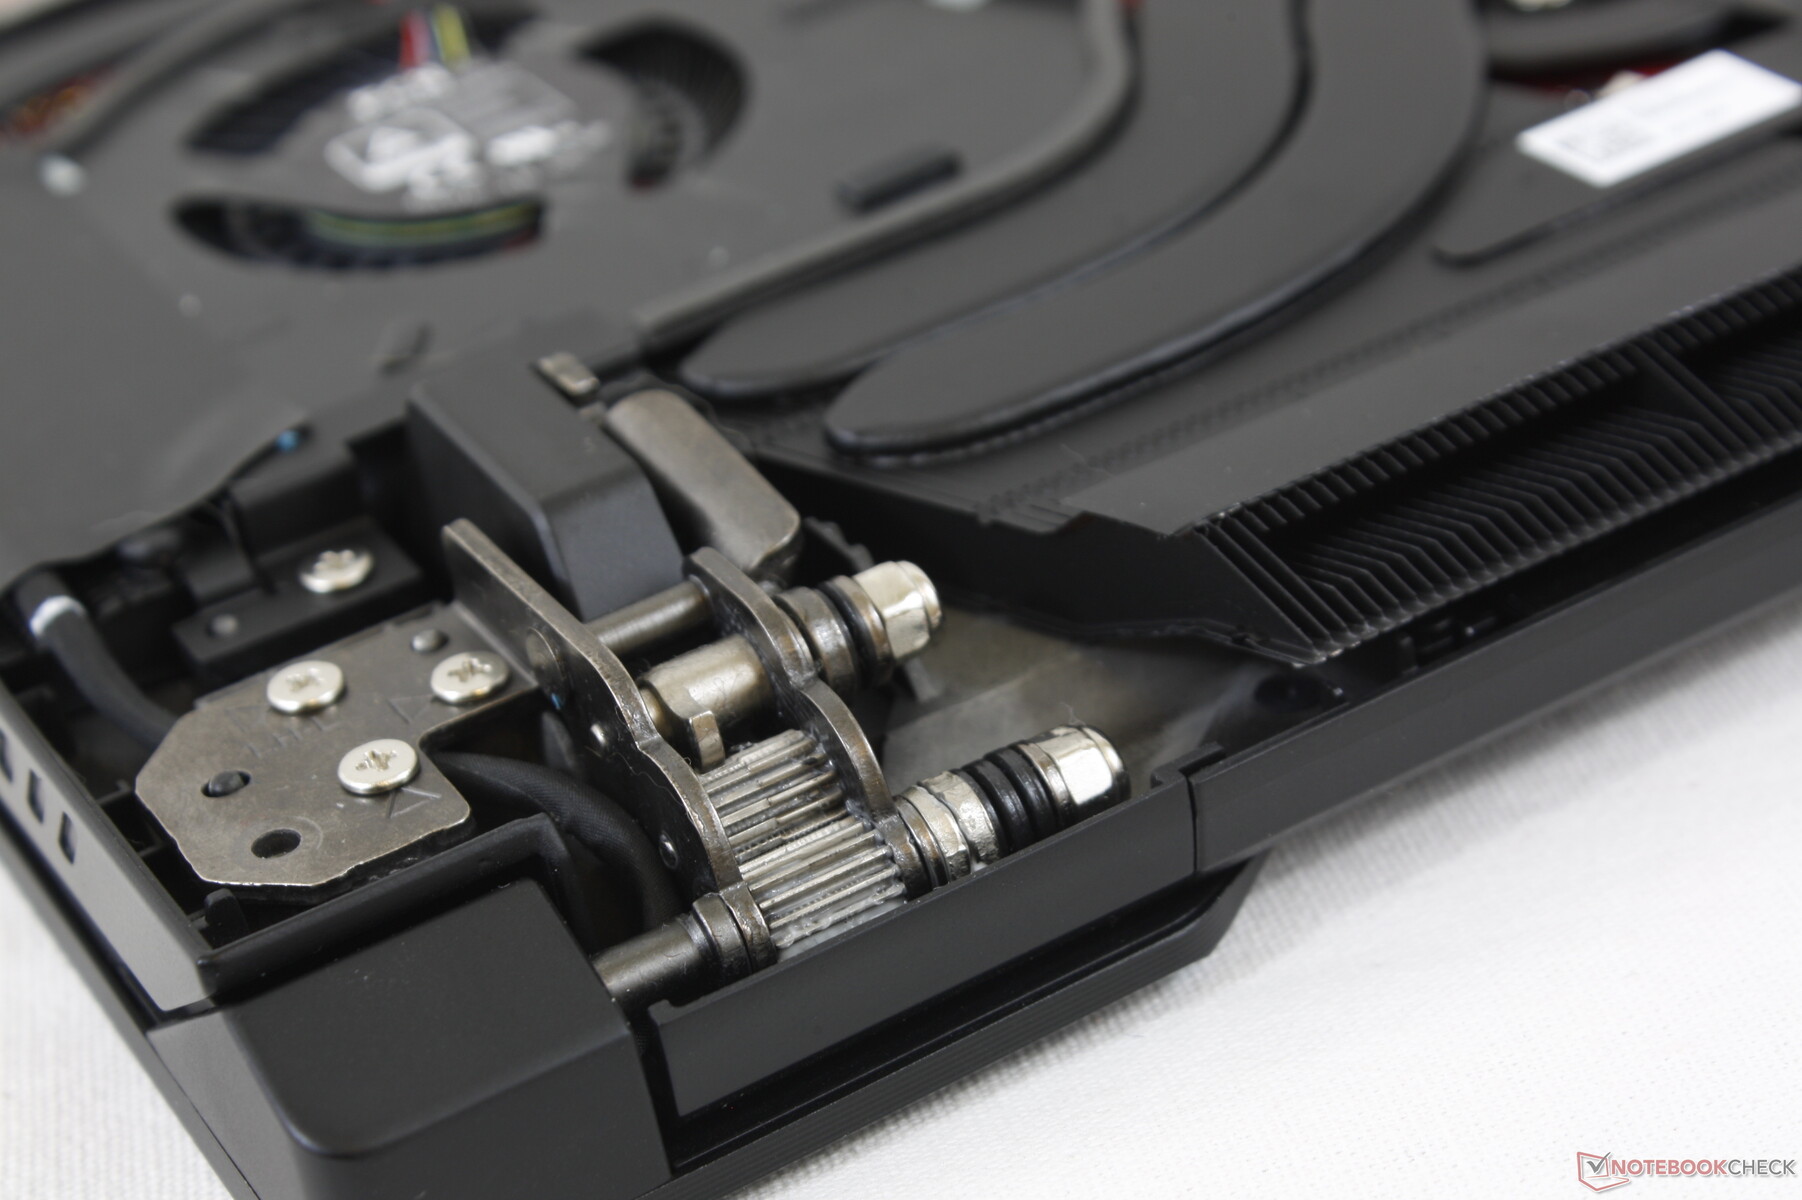
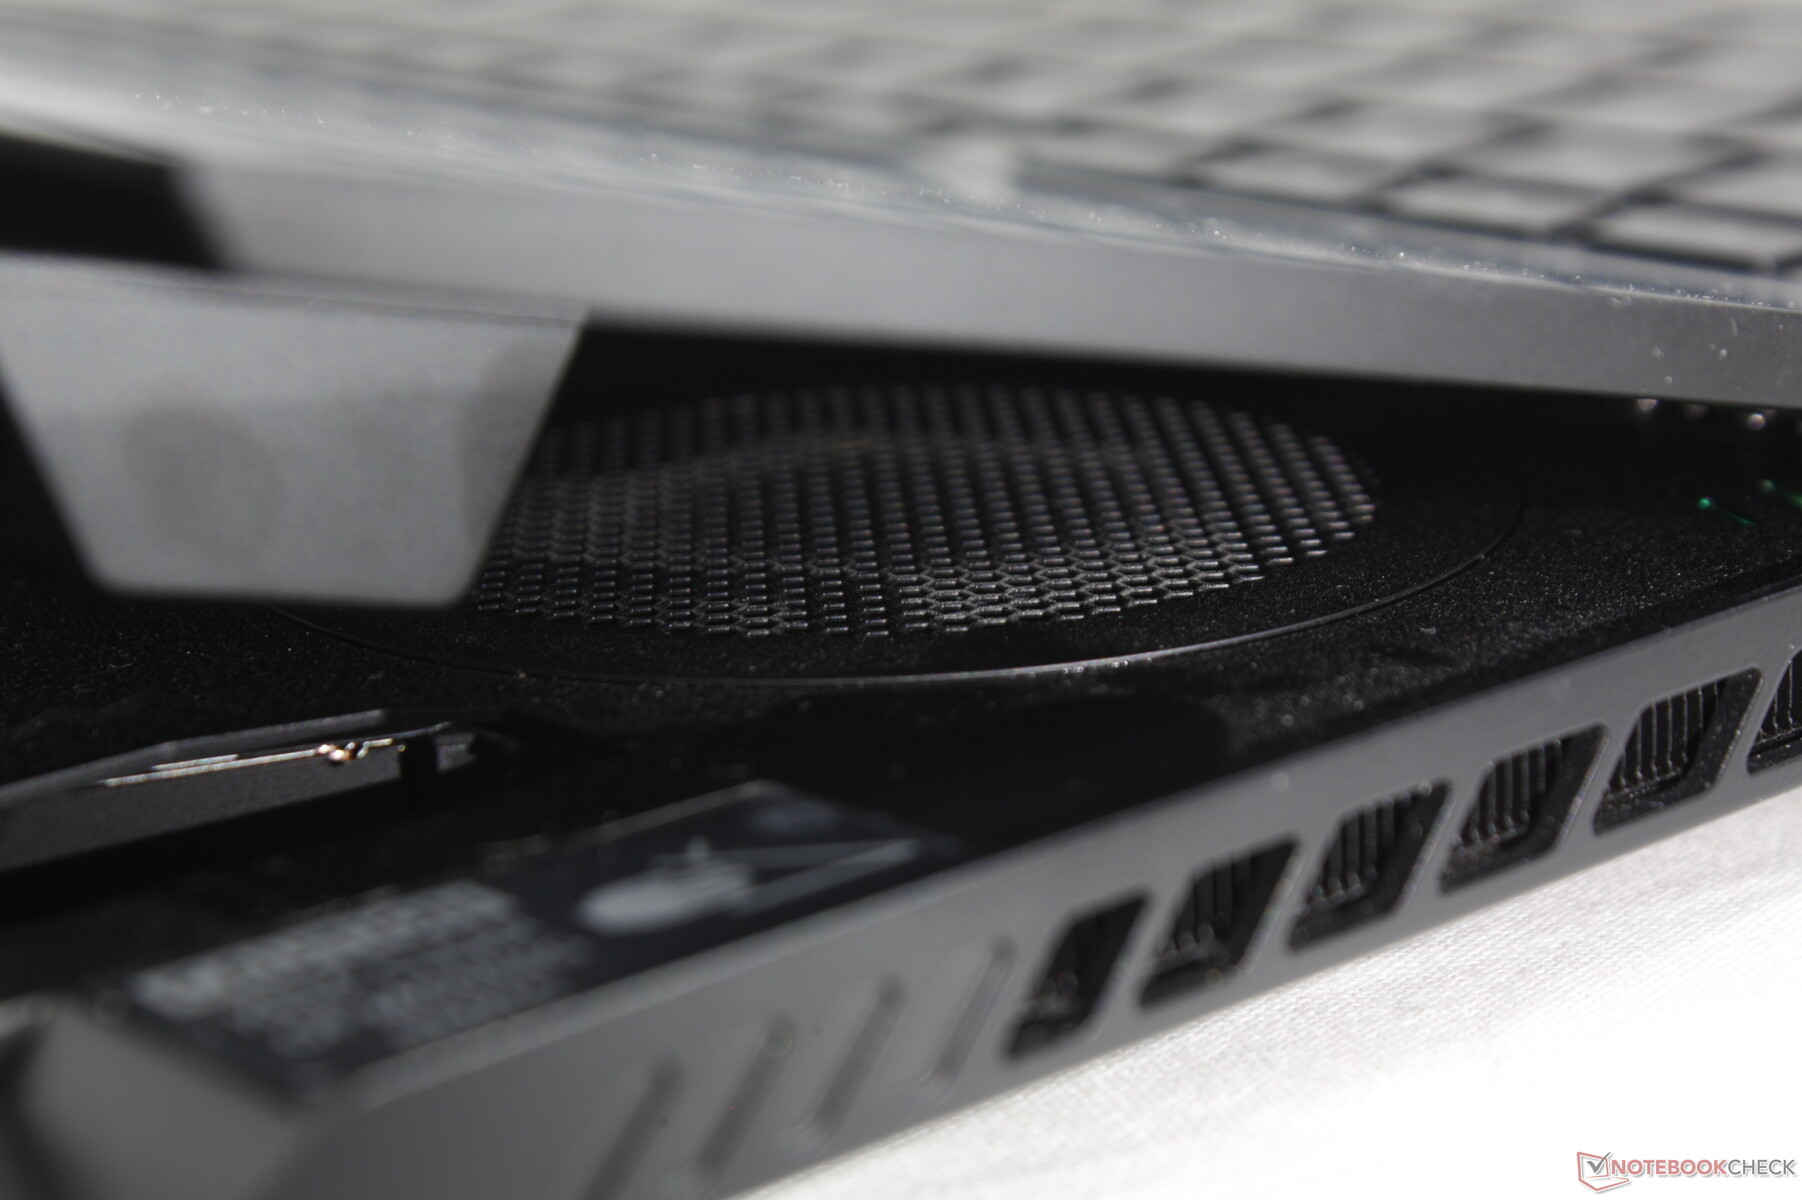
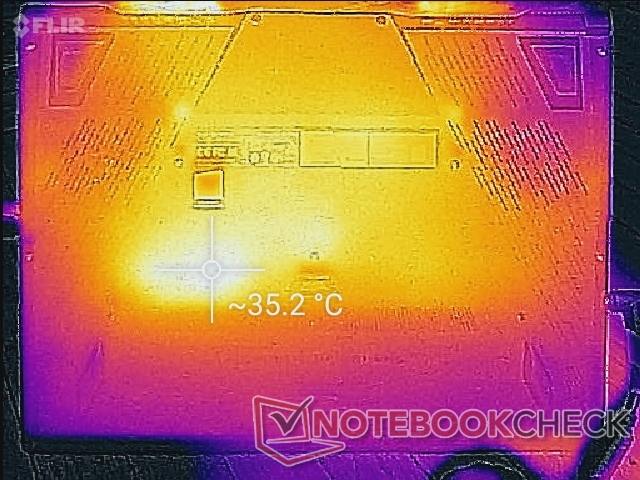
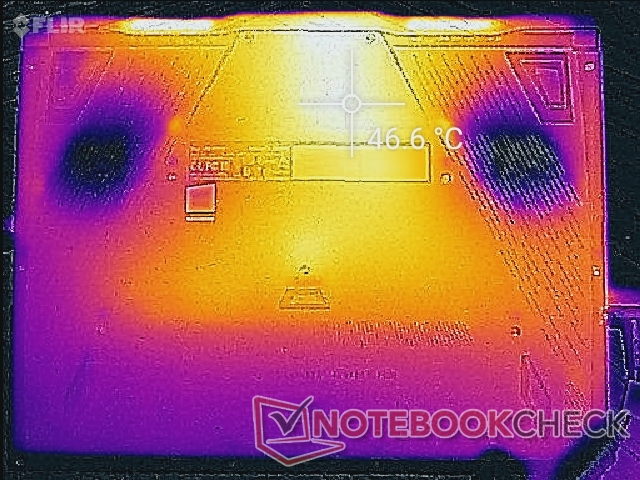
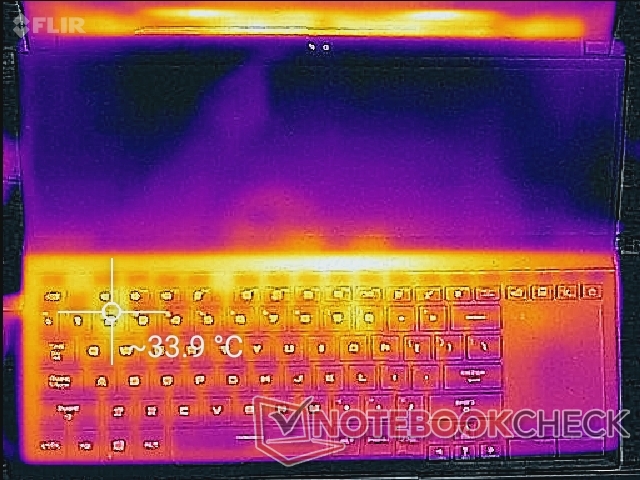
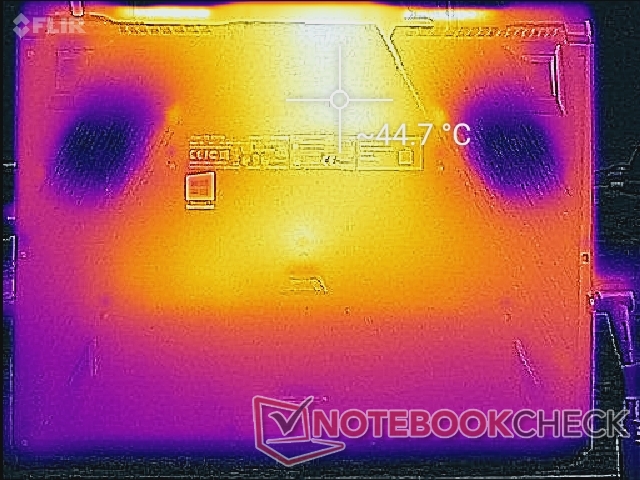
Le temperature di superficie sono meno di un problema qui sul GX551 rispetto alla maggior parte degli altri portatili da gioco grazie al design unico di Asus con doppio schermo. Il flusso d'aria è massimizzato attraverso lo spazio tra il display secondario e la base con griglie di scarico su tre lati del telaio. La tastiera anteriore si trova lontano dai processori. I punti caldi sul fondo possono arrivare a 47° C, il che non sarà un problema se si gioca su una scrivania adeguata.
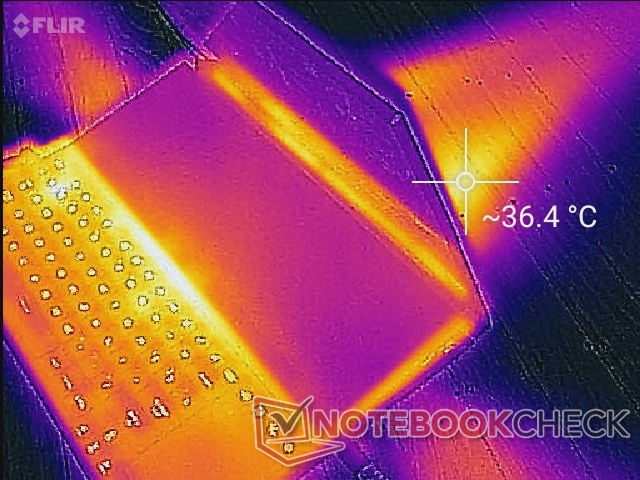
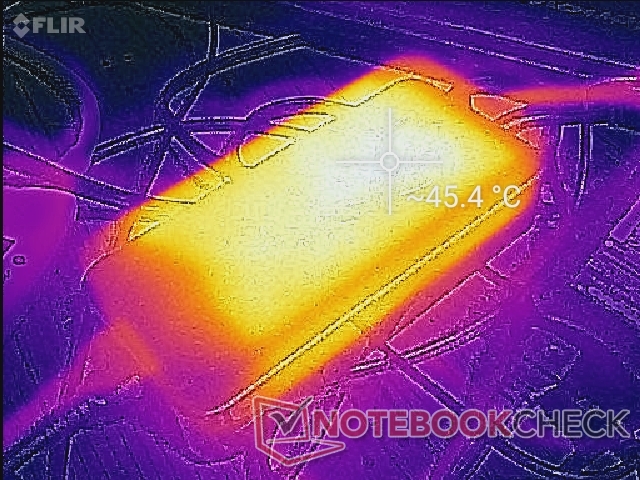
(+) La temperatura massima sul lato superiore è di 33.4 °C / 92 F, rispetto alla media di 40.4 °C / 105 F, che varia da 21.2 a 68.8 °C per questa classe Gaming.
(±) Il lato inferiore si riscalda fino ad un massimo di 45 °C / 113 F, rispetto alla media di 43.2 °C / 110 F
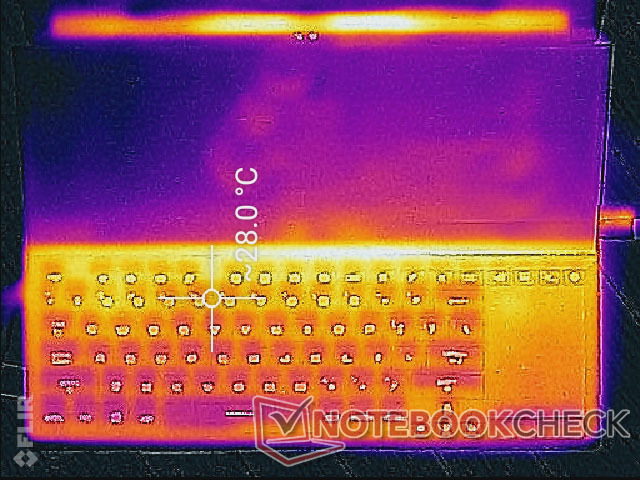
(+) In idle, la temperatura media del lato superiore è di 26.7 °C / 80 F, rispetto alla media deld ispositivo di 33.9 °C / 93 F.
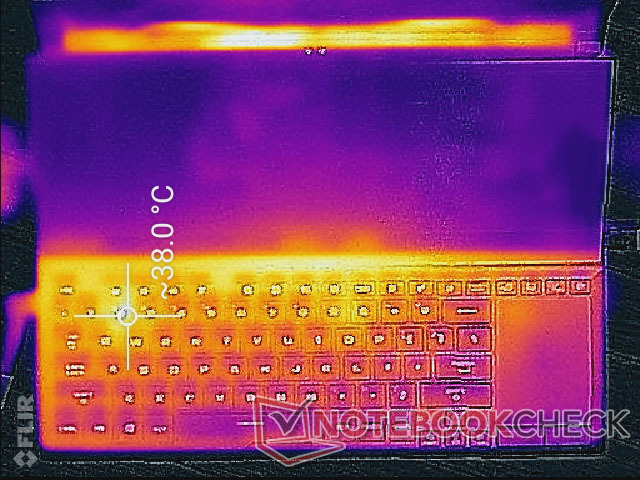
(+) Riproducendo The Witcher 3, la temperatura media per il lato superiore e' di 28.4 °C / 83 F, rispetto alla media del dispositivo di 33.9 °C / 93 F.
(±) I poggiapolsi e il touchpad possono diventare molto caldi al tatto con un massimo di 38 °C / 100.4 F.
(-) La temperatura media della zona del palmo della mano di dispositivi simili e'stata di 28.8 °C / 83.8 F (-9.2 °C / -16.6 F).
Stress Test
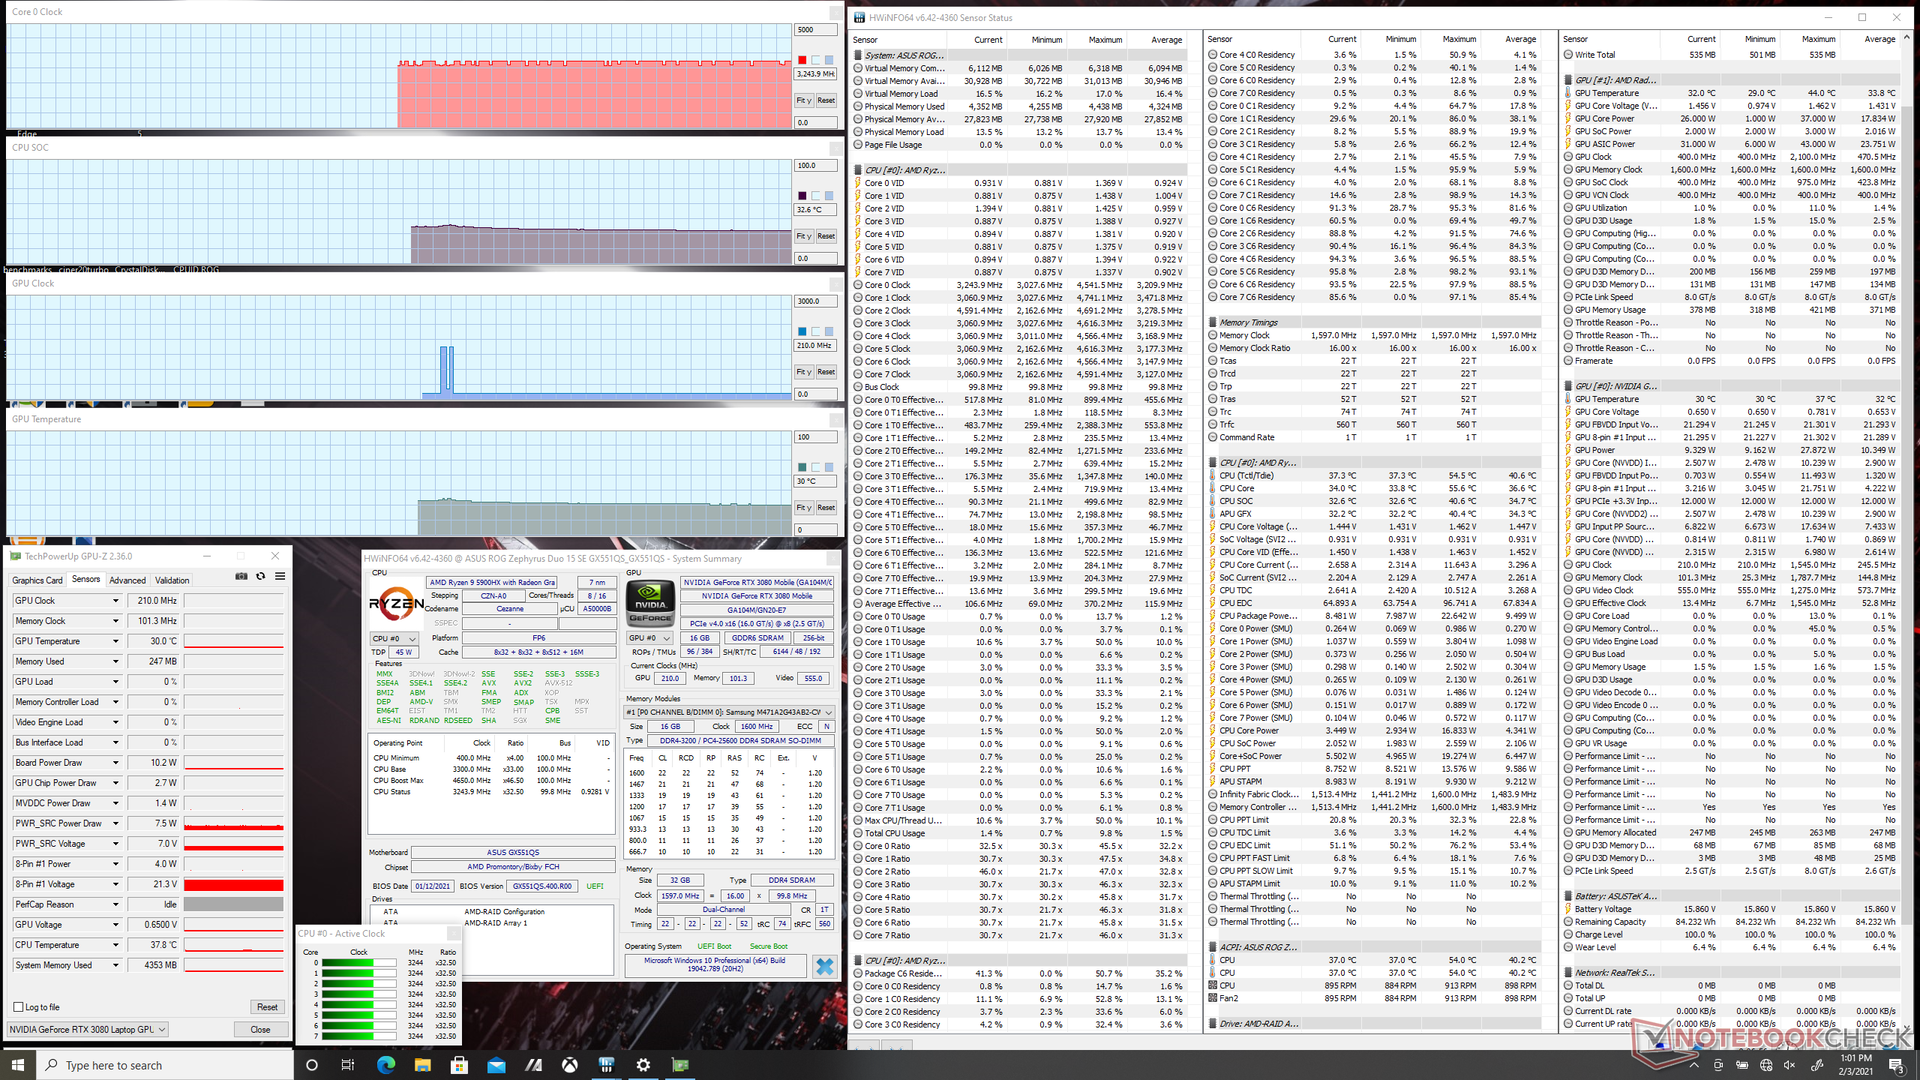
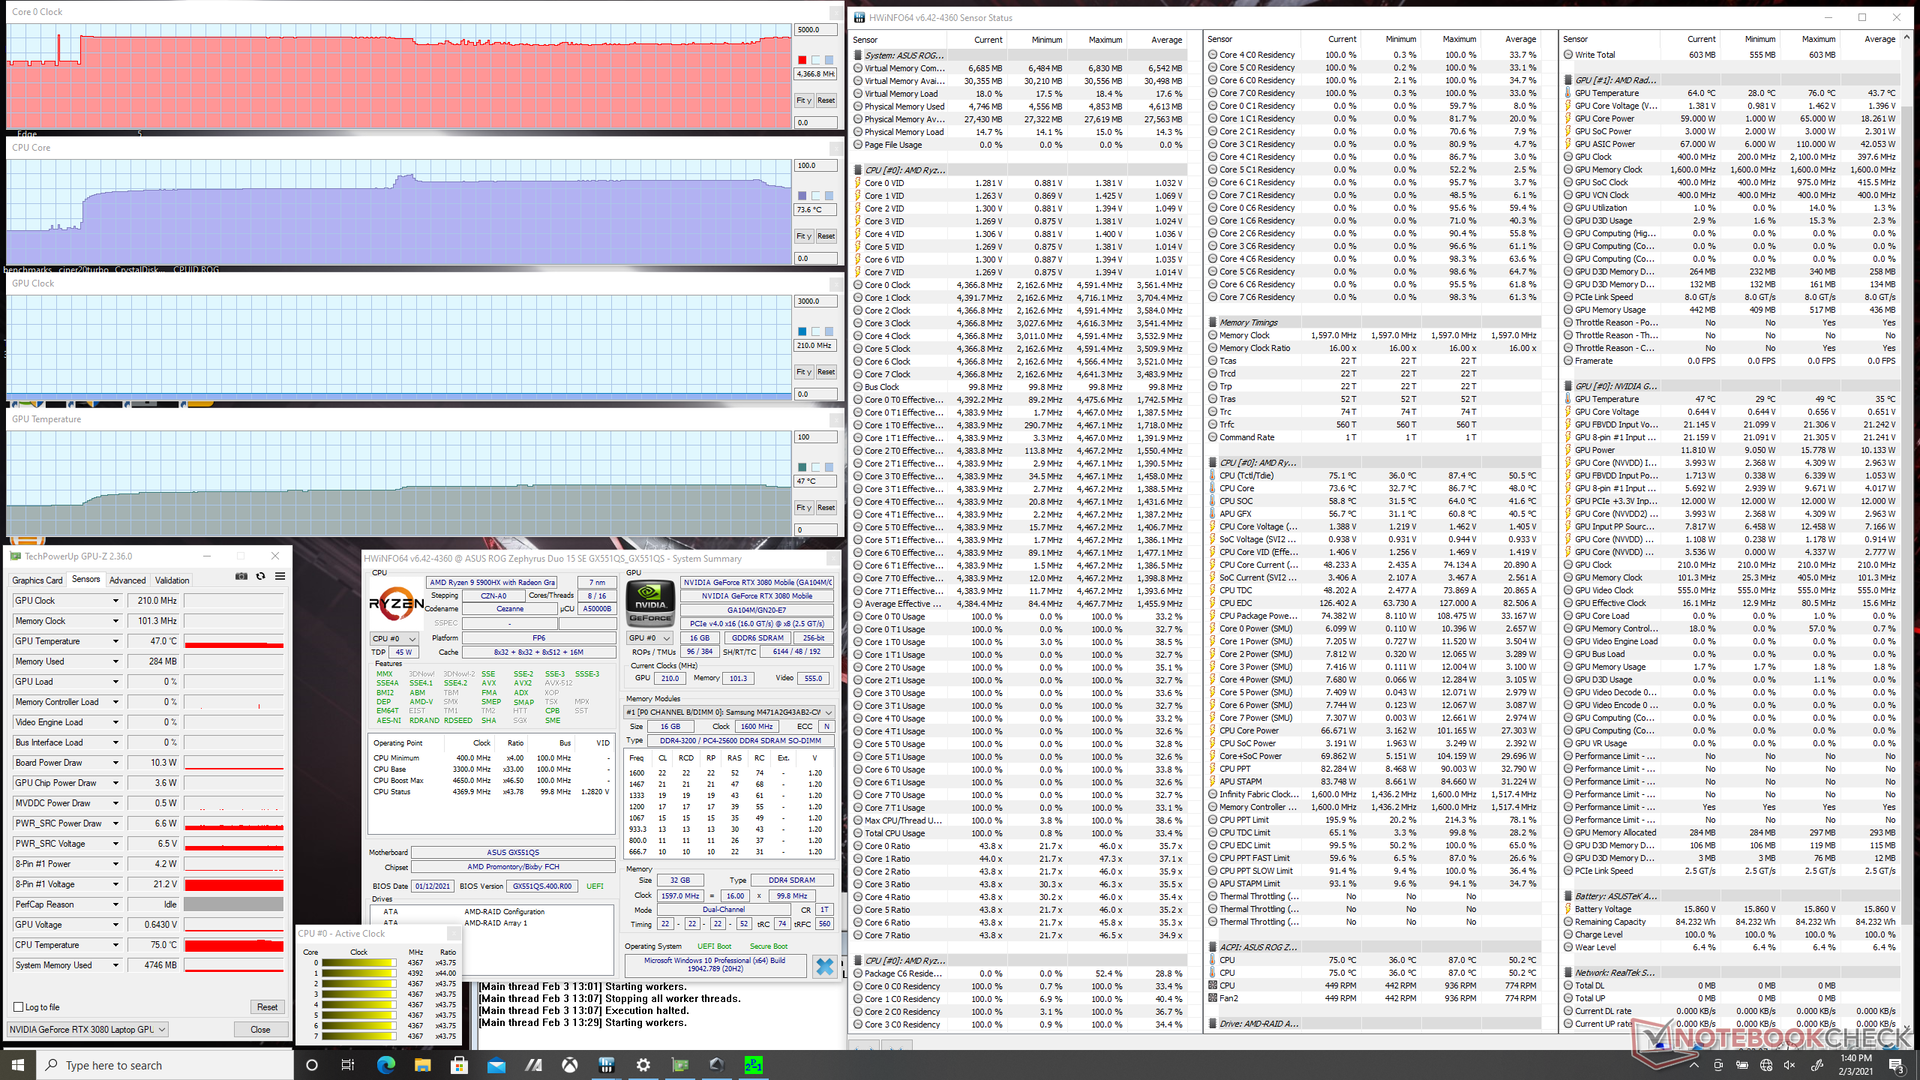
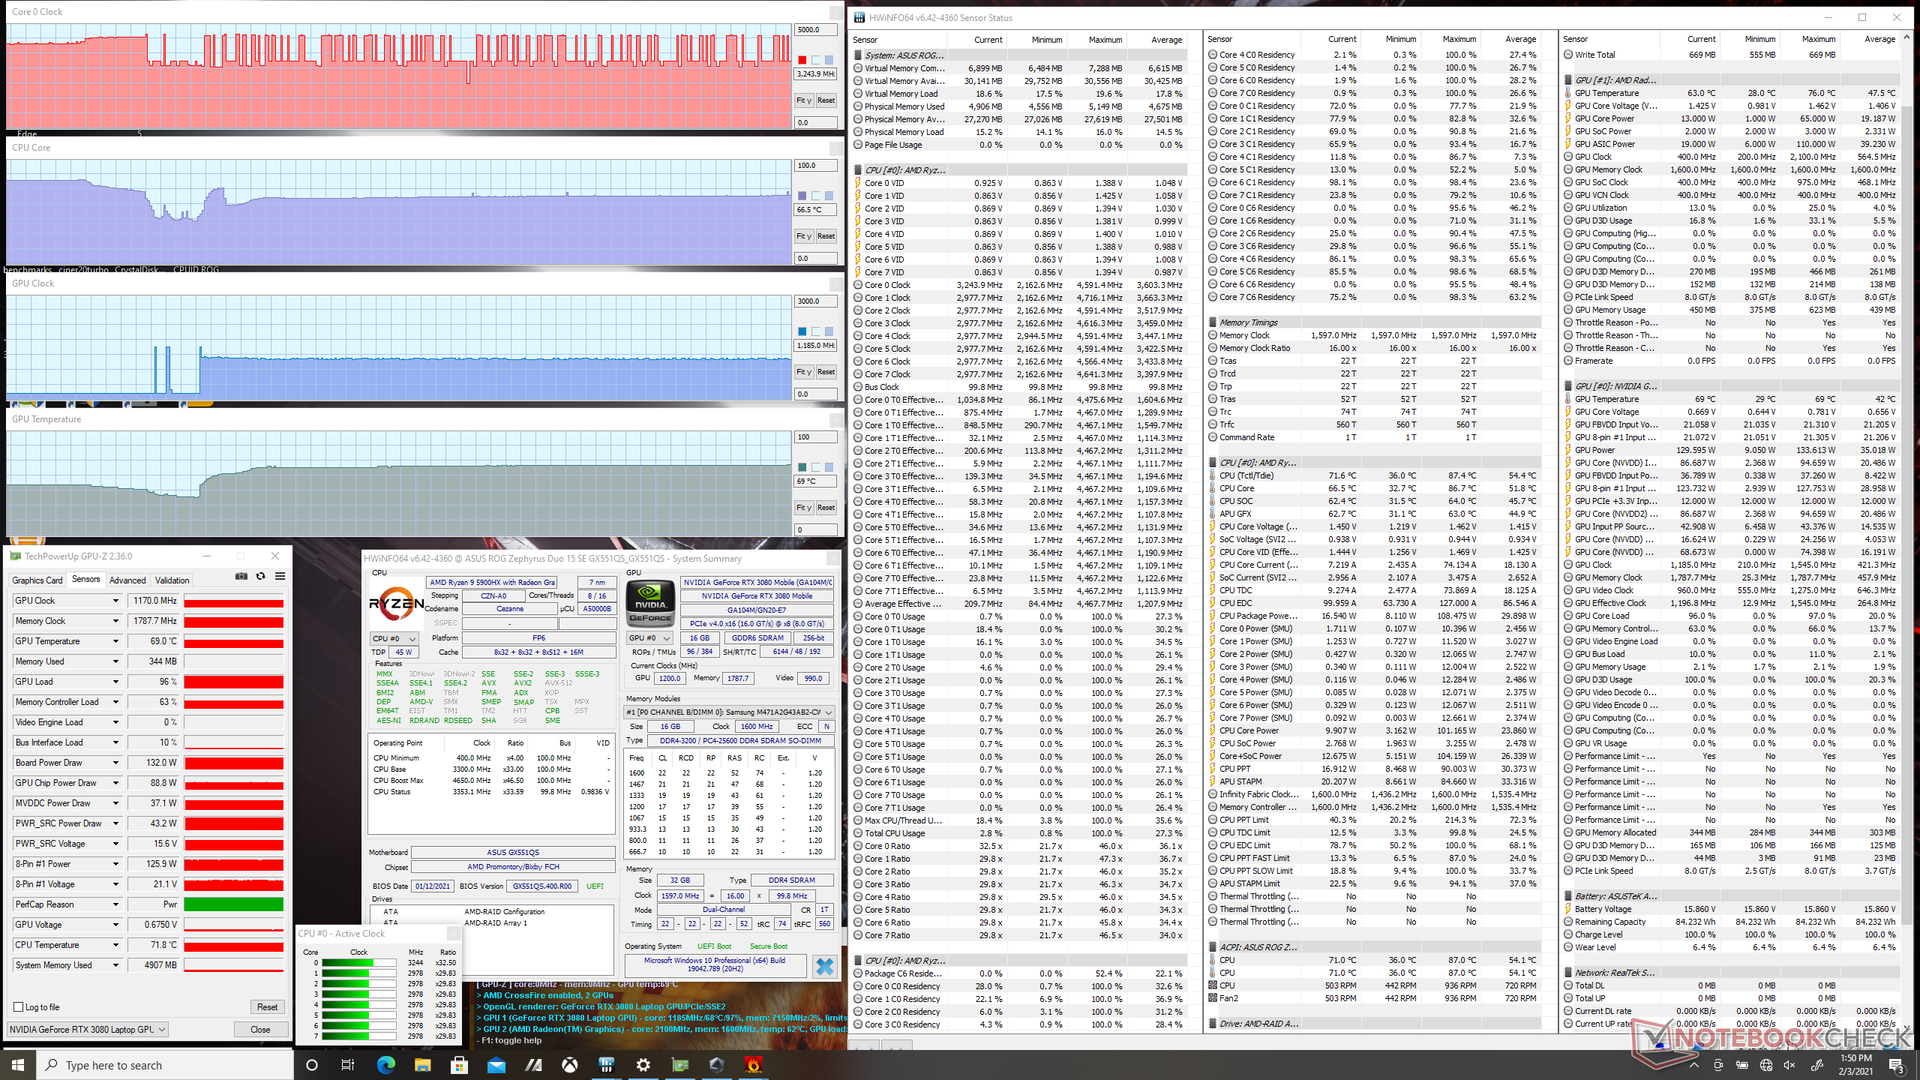
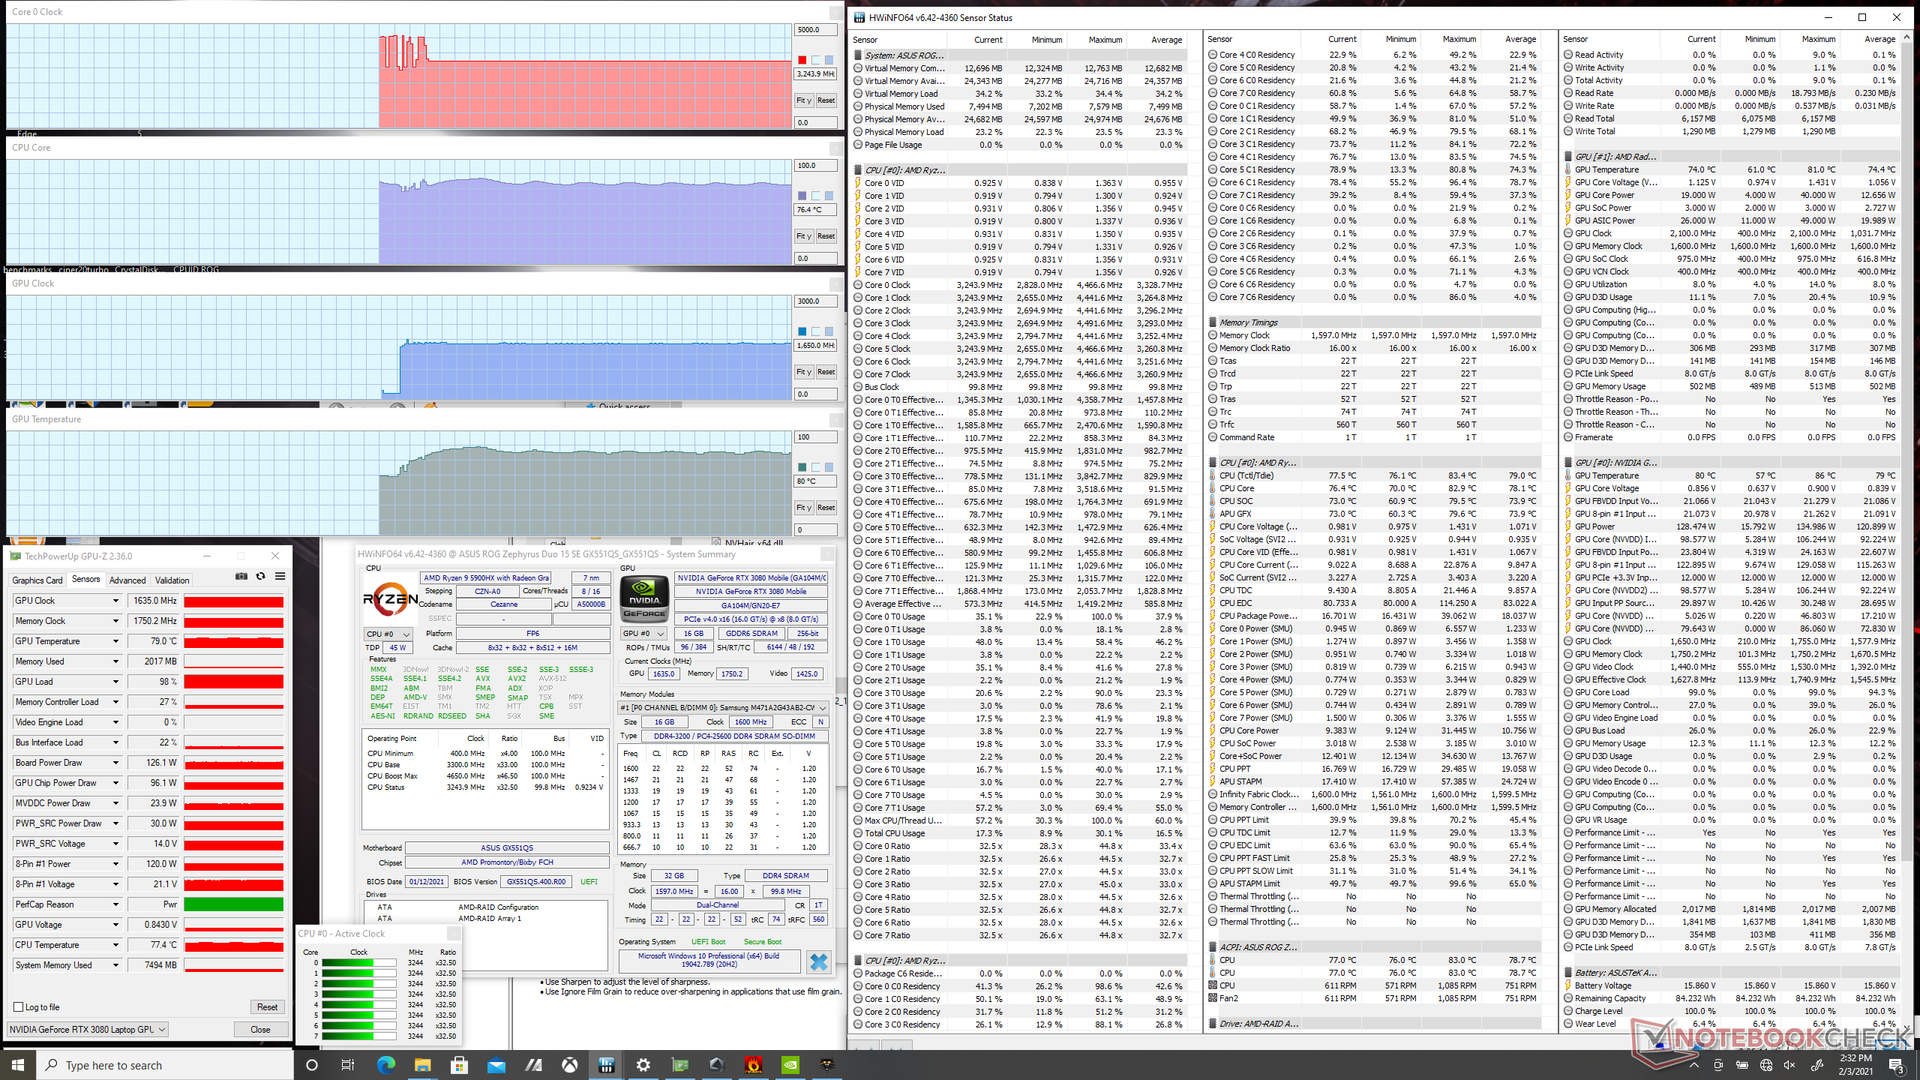
Abbiamo stressato il portatile sotto diversi carichi per identificare qualsiasi potenziale problema di throttling o stabilità. Quando si esegue Prime95 in modalità Turbo, la CPU raggiunge e si stabilizza a 4.4 GHz per alcuni minuti prima di scendere leggermente a 4.0-4.4 GHz. La temperatura del core si stabilizza a circa 75° C. Se in modalità Performance, la frequenza di clock scenderebbe invece a 3,8 GHz ma si stabilizza a una temperatura del core più alta di 91° C a causa dei minori giri della ventola.
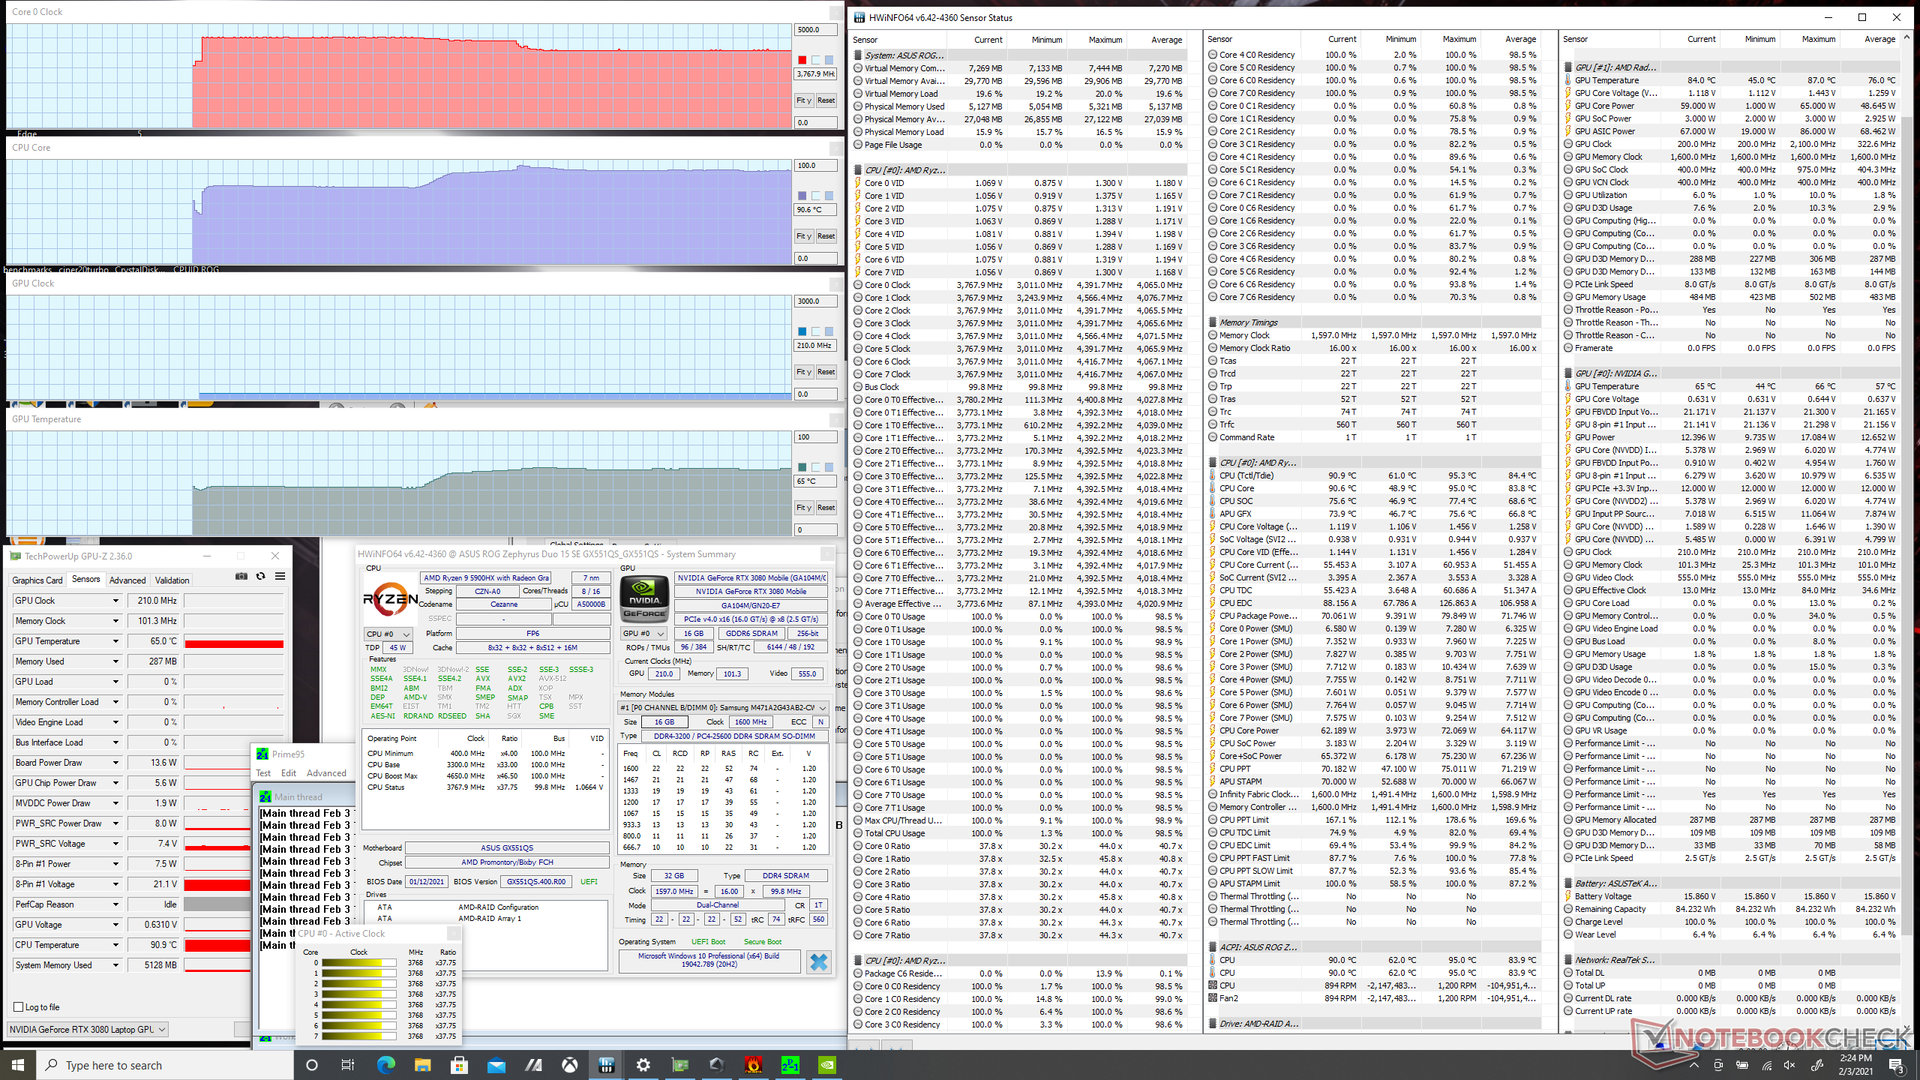

Quando si esegue FurMark in modalità Turbo, la GPU GeForce RTX 3080 si stabilizza a soli 69° C. L'assorbimento della scheda sarebbe anche stabile a 132 W contro i 130 W nominali del TGP.
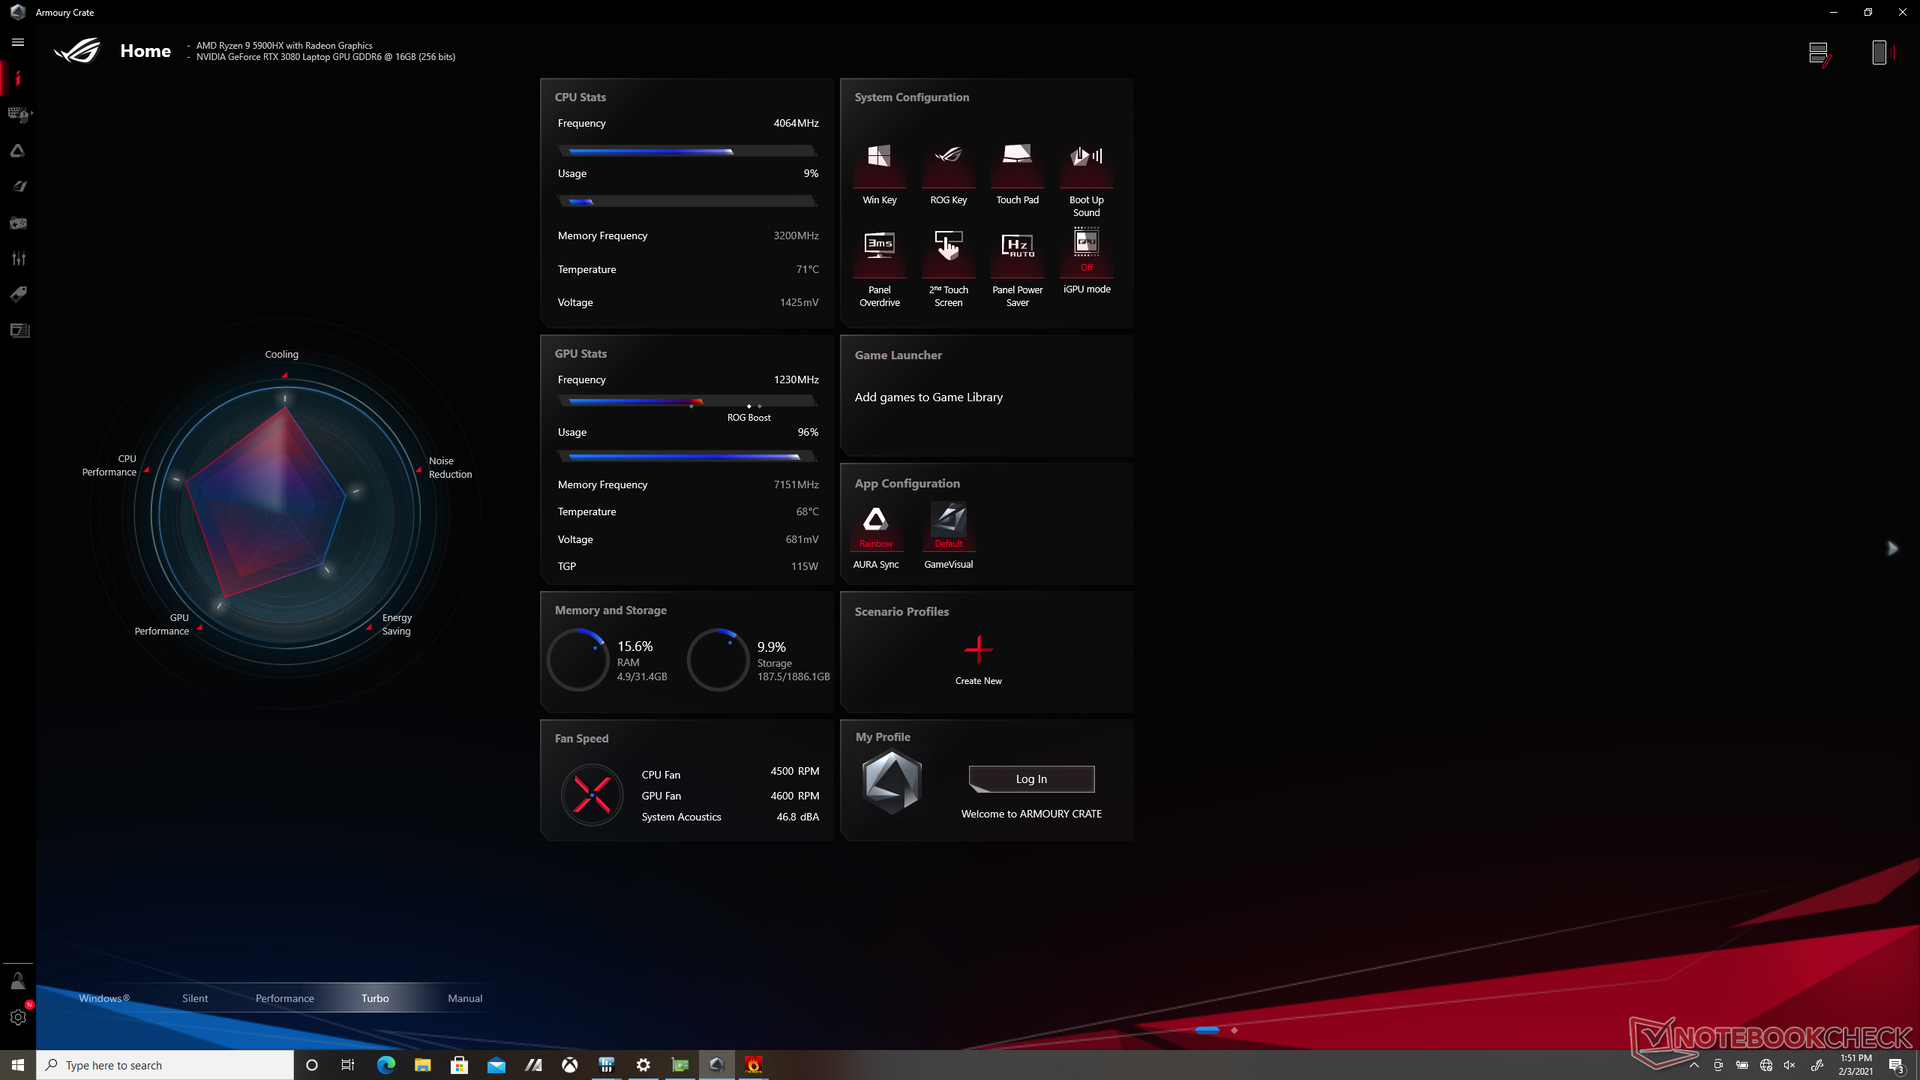
L'esecuzione di The Witcher 3 in modalità Turbo si traduce in frequenze di clock della GPU stabili e una temperatura di 1770 MHz e 68° C, rispettivamente, rispetto a 1650 MHz e 80° C se in modalità Performance. I giri della ventola, tuttavia, possono variare da 4100 a 4800 in modalità Turbo contro i soli 3500-3600 della modalità Performance. Quindi, l'esperienza di gioco più silenziosa in modalità Performance potrebbe valere il minore sacrificio in potenza grafica per alcuni proprietari.
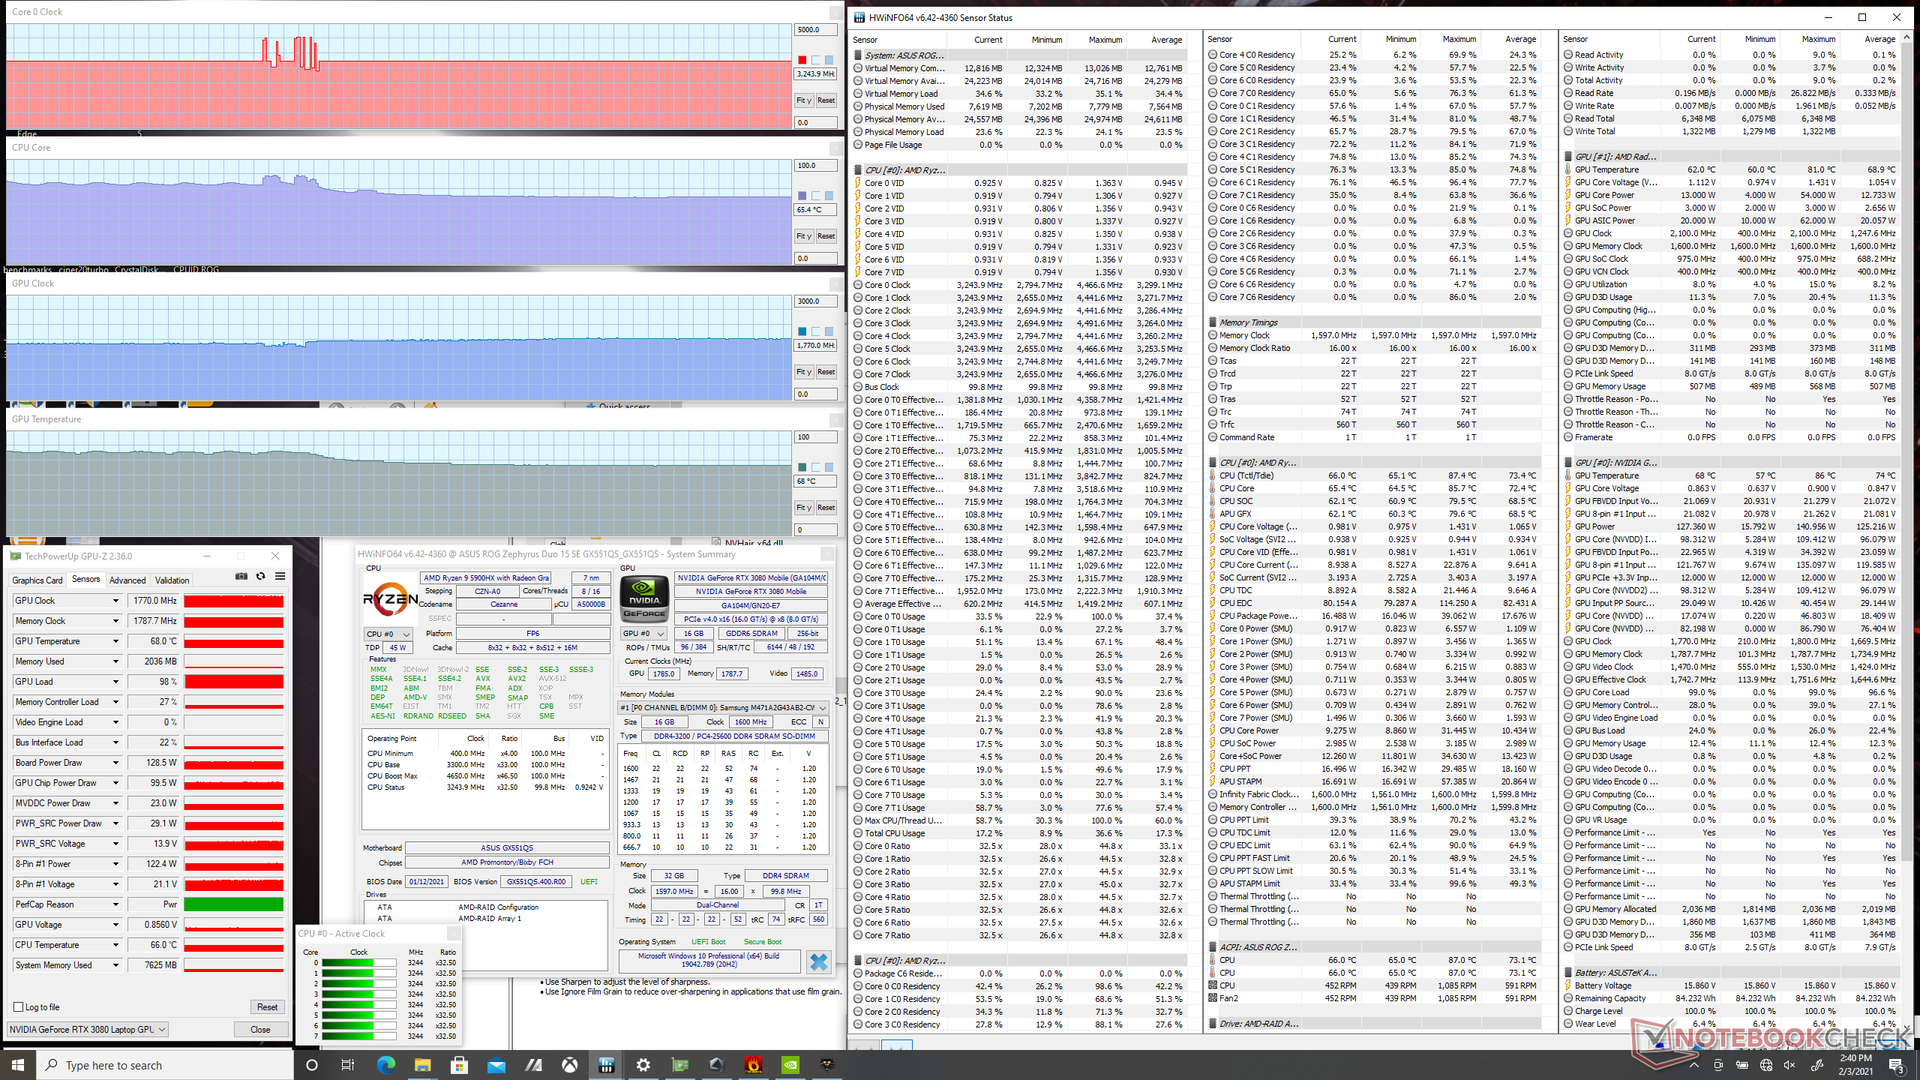

L'esecuzione simultanea di Prime95 e FurMark stressa sia la CPU che la GPU al massimo del calore. Anche così, le temperature di CPU e GPU non sono così calde a soli 78° C e 62° C, rispettivamente, probabilmente a causa delle potenti ventole. Le frequenze di clock della CPU si accendono rapidamente tra 400 MHz e 4,4 GHz in modo piuttosto insolito, come mostrato dallo screenshot qui sotto. Un comportamento di clock rate più costante sarebbe stato preferibile.
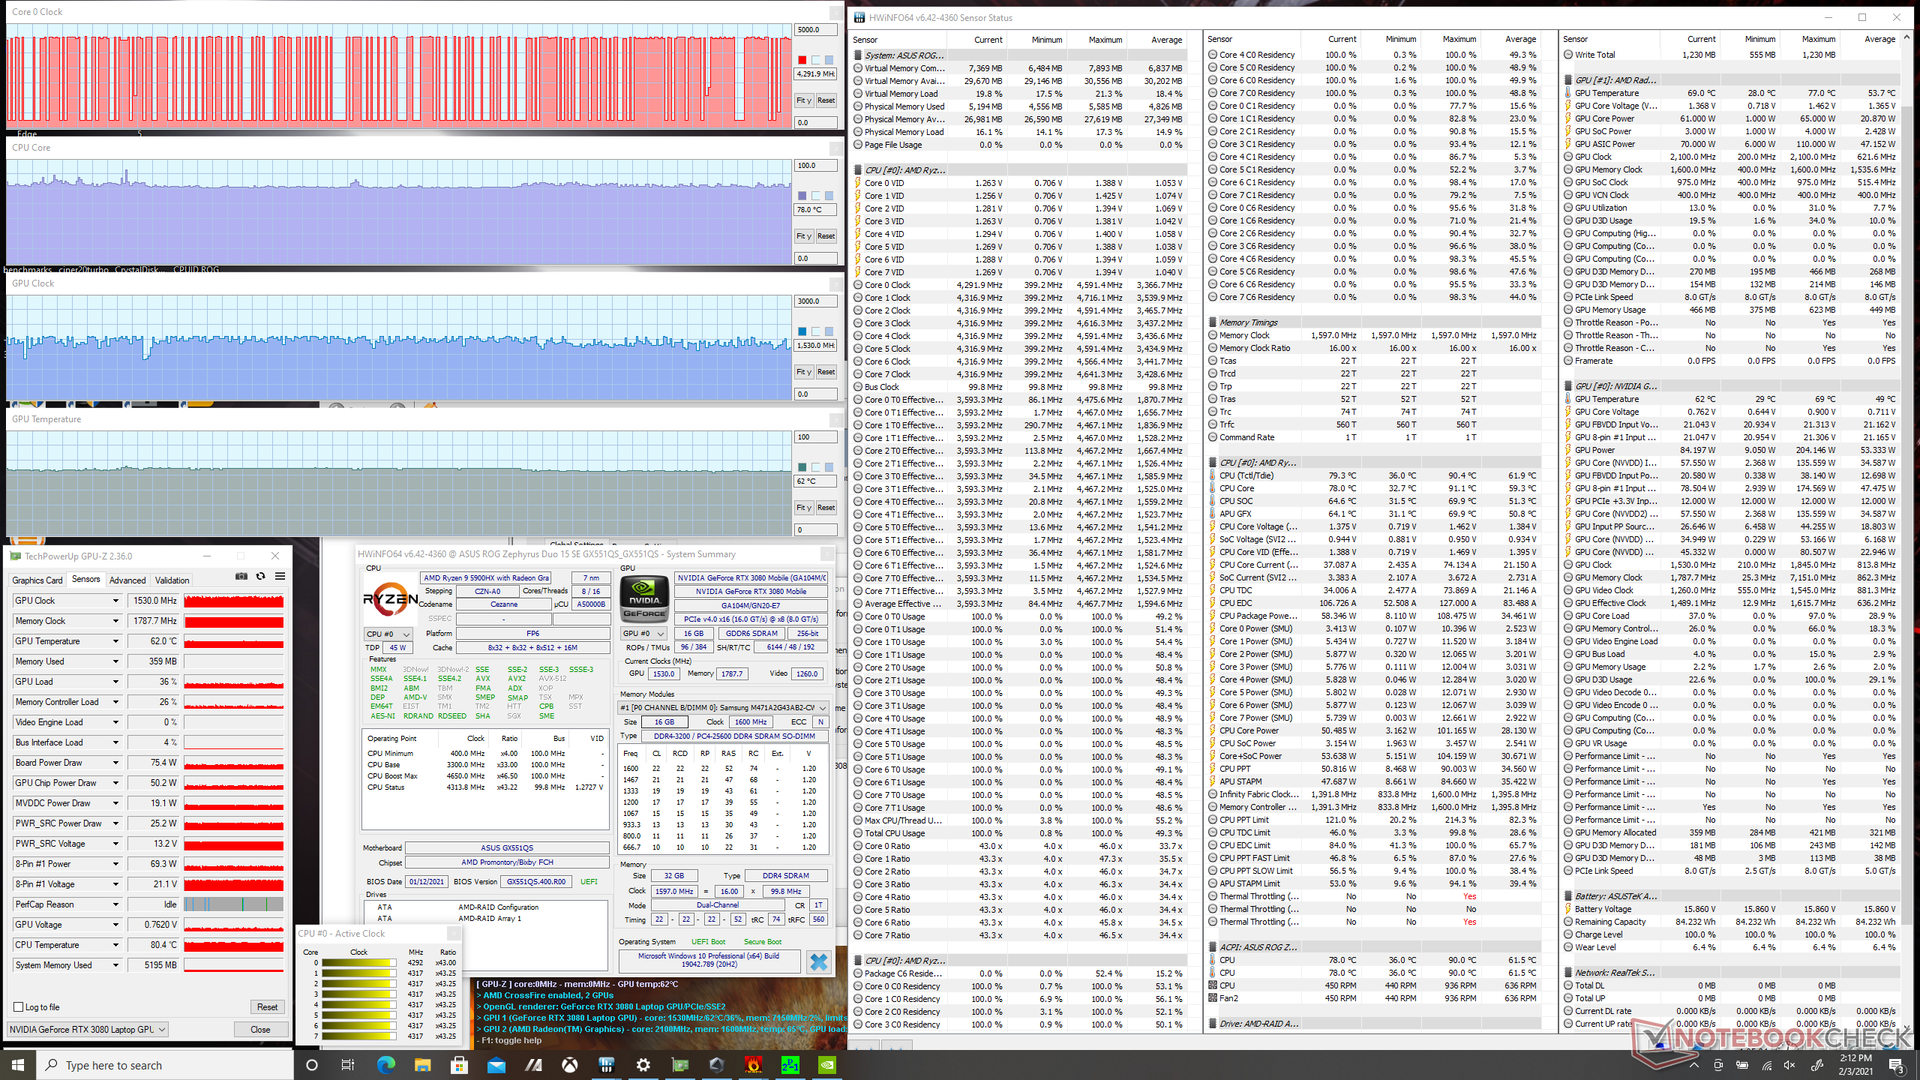
| Clock della CPU (GHz)Clock della GPU(MHz)Temperatura media dellaCPU (°C)Temperaturamedia dellaGPU (°C) |
| Stress Prime95 (modalità Performance) |
| Prime95 Stress (modalità Turbo) |
| StressFurMark (modalità Turbo) |
| Prime95 + FurMark Stress(modalità Turbo) |
| Witcher 3 Stress (Performance mode) |
| Witcher 3 Stress (modalità Turbo) |
Casse


Asus ROG Zephyrus Duo 15 SE GX551QS analisi audio
(±) | potenza degli altiparlanti media ma buona (79.8 dB)
Bassi 100 - 315 Hz
(±) | bassi ridotti - in media 9.1% inferiori alla media
(±) | la linearità dei bassi è media (13.4% delta rispetto alla precedente frequenza)
Medi 400 - 2000 Hz
(+) | medi bilanciati - solo only 3.3% rispetto alla media
(+) | medi lineari (5.8% delta rispetto alla precedente frequenza)
Alti 2 - 16 kHz
(+) | Alti bilanciati - appena 3.2% dalla media
(+) | alti lineari (5.6% delta rispetto alla precedente frequenza)
Nel complesso 100 - 16.000 Hz
(+) | suono nel complesso lineare (11.3% differenza dalla media)
Rispetto alla stessa classe
» 8% di tutti i dispositivi testati in questa classe è stato migliore, 3% simile, 88% peggiore
» Il migliore ha avuto un delta di 6%, medio di 18%, peggiore di 132%
Rispetto a tutti i dispositivi testati
» 7% di tutti i dispositivi testati in questa classe è stato migliore, 2% similare, 91% peggiore
» Il migliore ha avuto un delta di 4%, medio di 24%, peggiore di 134%
Apple MacBook 12 (Early 2016) 1.1 GHz analisi audio
(+) | gli altoparlanti sono relativamente potenti (83.6 dB)
Bassi 100 - 315 Hz
(±) | bassi ridotti - in media 11.3% inferiori alla media
(±) | la linearità dei bassi è media (14.2% delta rispetto alla precedente frequenza)
Medi 400 - 2000 Hz
(+) | medi bilanciati - solo only 2.4% rispetto alla media
(+) | medi lineari (5.5% delta rispetto alla precedente frequenza)
Alti 2 - 16 kHz
(+) | Alti bilanciati - appena 2% dalla media
(+) | alti lineari (4.5% delta rispetto alla precedente frequenza)
Nel complesso 100 - 16.000 Hz
(+) | suono nel complesso lineare (10.2% differenza dalla media)
Rispetto alla stessa classe
» 7% di tutti i dispositivi testati in questa classe è stato migliore, 2% simile, 91% peggiore
» Il migliore ha avuto un delta di 5%, medio di 18%, peggiore di 53%
Rispetto a tutti i dispositivi testati
» 5% di tutti i dispositivi testati in questa classe è stato migliore, 1% similare, 94% peggiore
» Il migliore ha avuto un delta di 4%, medio di 24%, peggiore di 134%
Gestione dell'energia
Consumo di energia
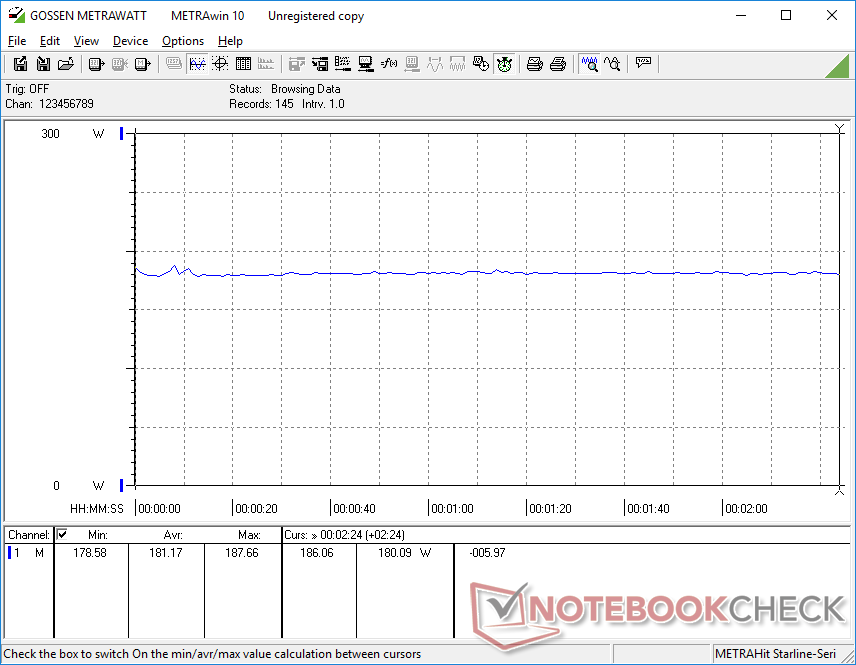
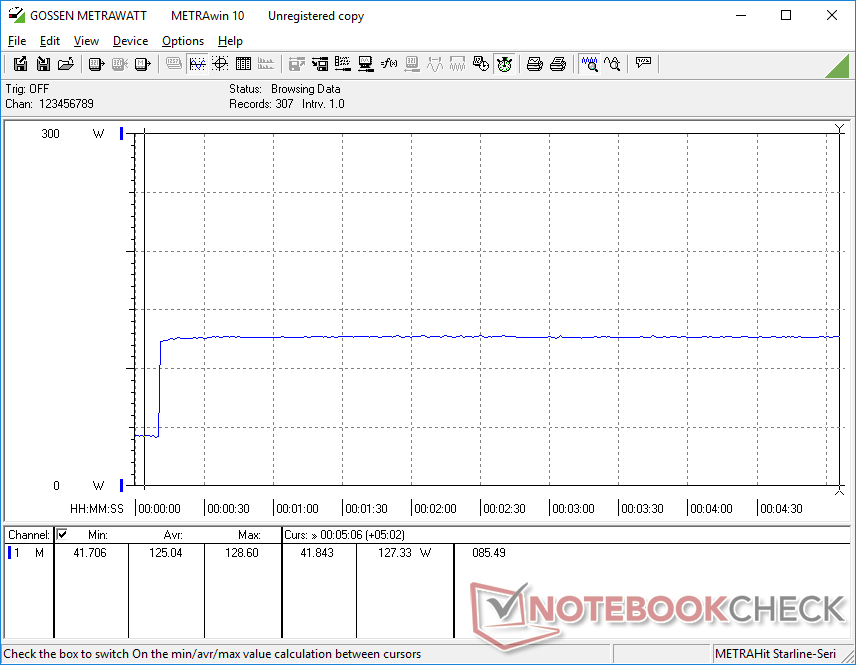
Il consumo di energia non è lontano da quello che abbiamo registrato sul GX550. L'inattività sul desktop richiede tra 16 W e 30 W a seconda dell'impostazione della luminosità, quale GPU (integrata o discreta) è attiva, e se lo ScreenPad è acceso o no. L'impostazione dello ScreenPad alla massima luminosità richiede altri 7 W rispetto al semplice spegnimento.
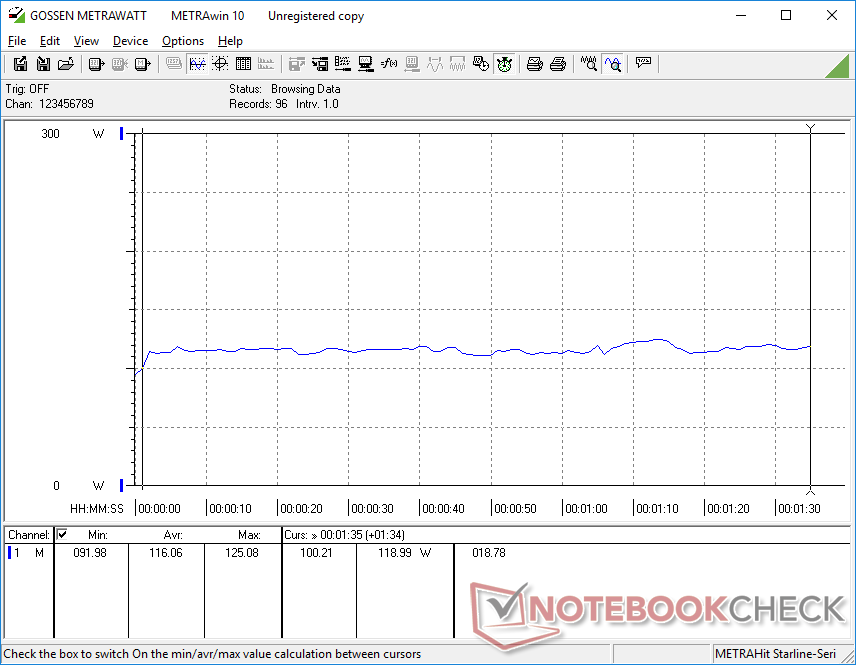
L'esecuzione di The Witcher 3 consuma circa 181 W per essere il 20% più esigente del GX550 dell'anno scorso. La spinta grafica grezza è molto maggiore, tuttavia, il che significa che le prestazioni per watt sono ancora a favore del più recente GX551. Questo è particolarmente vero se si confrontano le prestazioni della CPU, dal momento che il Ryzen 9 5900HX è entro appena il 10% del Core i9-10900K nonostante le loro enormi differenze di TDP.
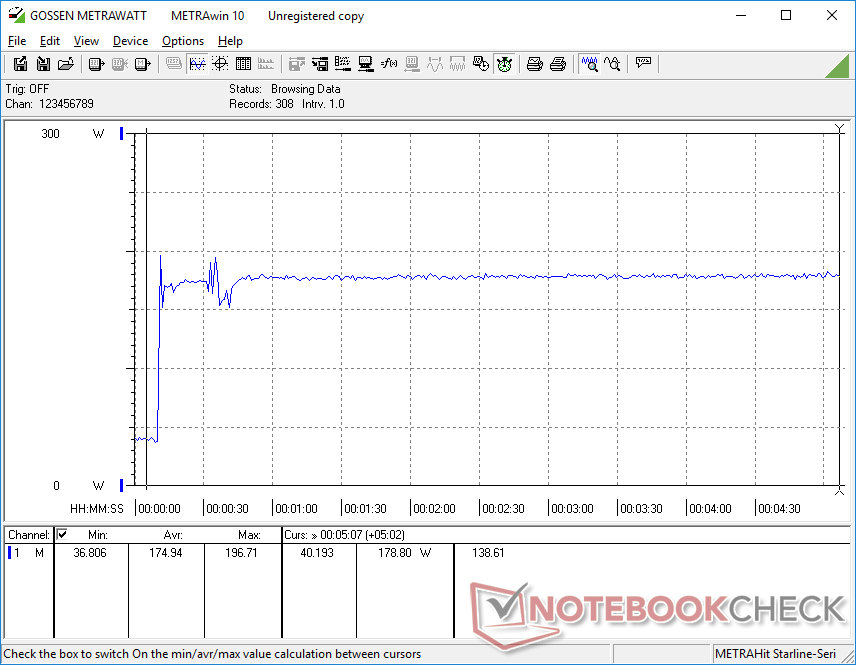
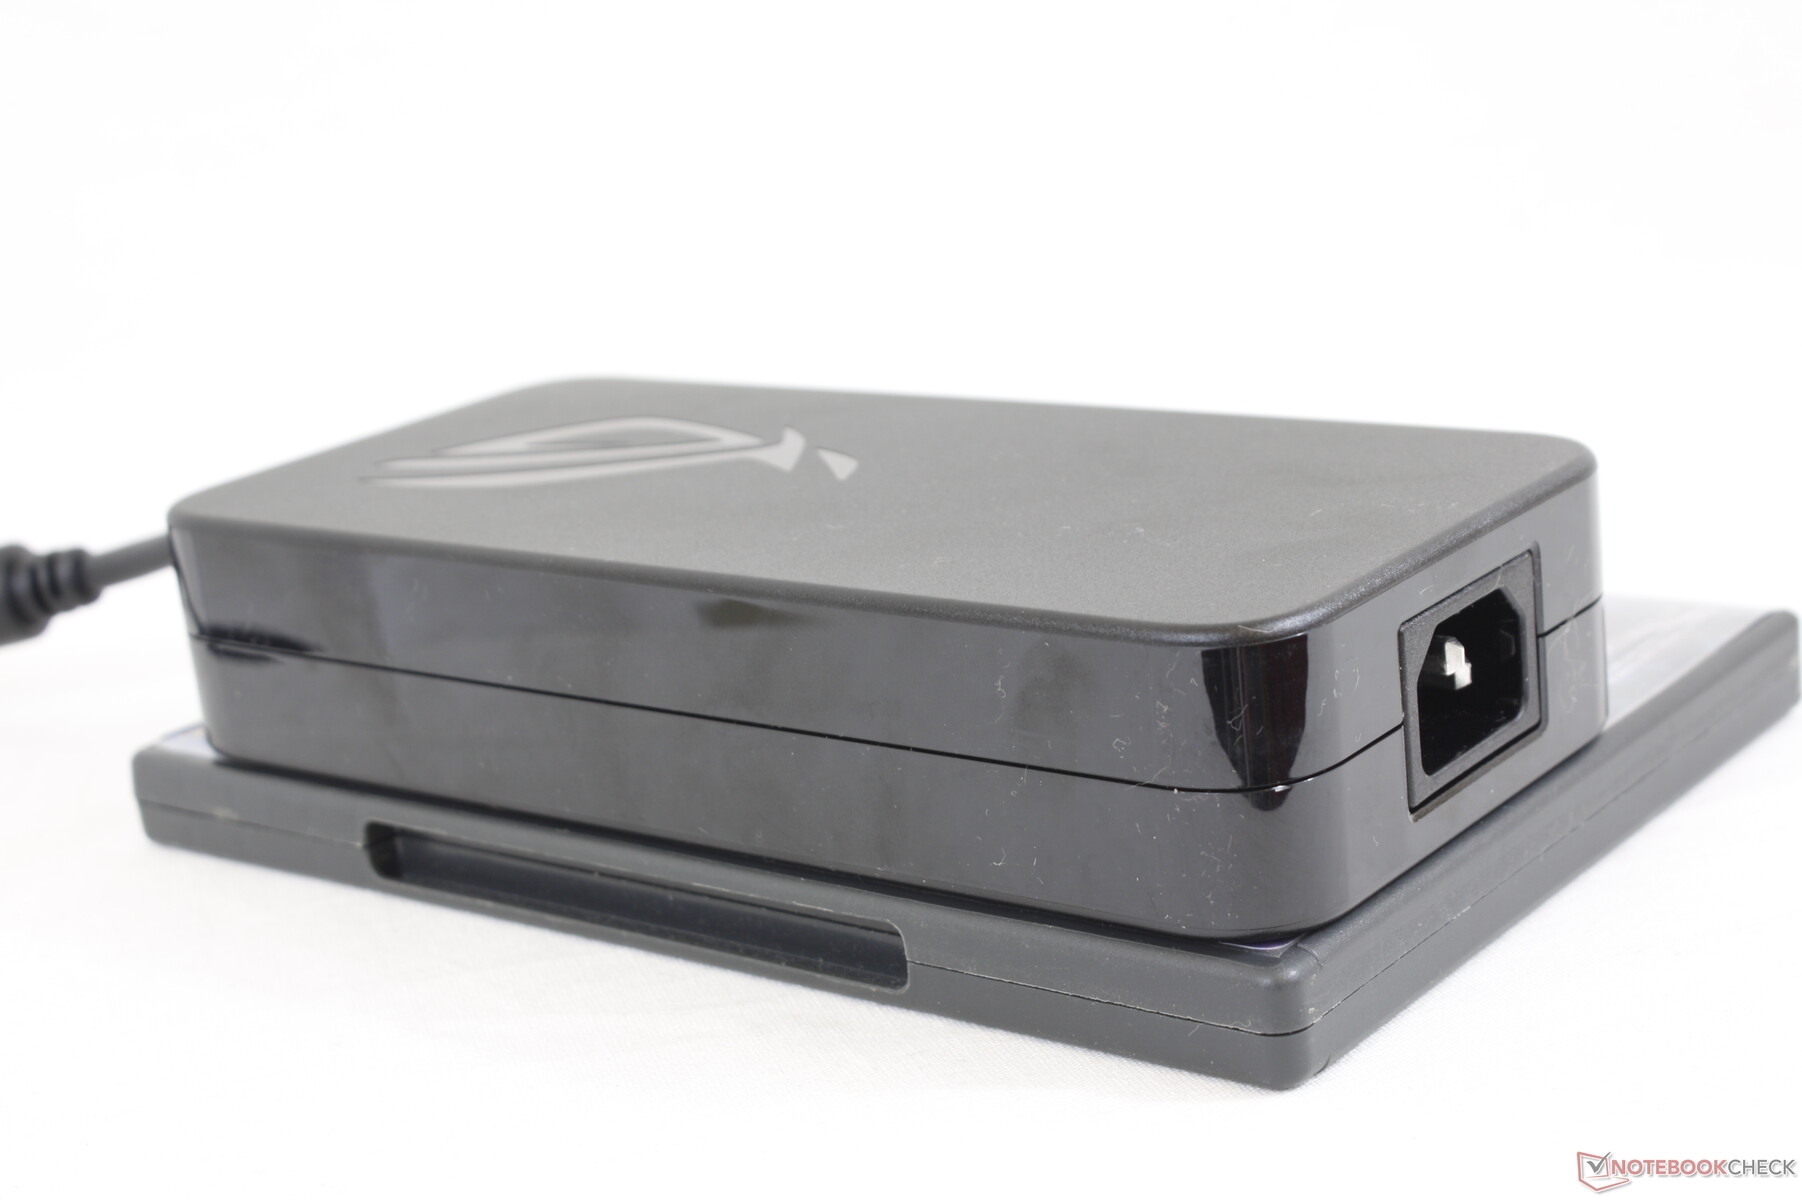
Siamo in grado di registrare un massimo di 196,7 W dal grande (~17,8 x 8,4 x 3,5 cm) adattatore AC da 280 W quando si esegue Prime95 e FurMark contemporaneamente. Questo overhead è insolitamente grande il che ci fa interrogare se le ripide fluttuazioni del clock della CPU menzionate nella nostra sezione Stress Test sopra potrebbero essere un bug. L'adattatore AC è sicuramente in grado di erogare più potenza al portatile e tuttavia il portatile non sembra mai richiederla.
| Off / Standby | |
| Idle | |
| Sotto carico |
|
Leggenda:
min: | |
| Asus ROG Zephyrus Duo 15 SE GX551QS R9 5900HX, GeForce RTX 3080 Laptop GPU, 2x Samsung PM981a MZVLB1T0HBLR (RAID 0), IPS, 3840x2160, 15.6" | Asus ROG Zephyrus Duo 15 GX550LXS i9-10980HK, GeForce RTX 2080 Super Max-Q, 2x Samsung PM981a MZVLB1T0HBLR (RAID 0), IPS, 3840x2160, 15.6" | Razer Blade 15 RTX 2080 Super Max-Q i7-10875H, GeForce RTX 2080 Super Max-Q, Samsung PM981a MZVLB1T0HBLR, IPS, 1920x1080, 15.6" | Eurocom Sky X4C i9-9900KS i9-9900KS, GeForce RTX 2080 Mobile, Samsung SSD 970 Pro 512GB, IPS, 1920x1080, 15.6" | MSI GE66 Raider 10SFS i9-10980HK, GeForce RTX 2070 Super Mobile, WDC PC SN730 SDBPNTY-1T00, IPS-Level, 1920x1080, 15.6" | MSI GS66 Stealth 10SFS i9-10980HK, GeForce RTX 2070 Super Max-Q, Samsung SSD PM981 MZVLB1T0HALR, IPS, 1920x1080, 15.6" | |
|---|---|---|---|---|---|---|
| Power Consumption | -16% | 26% | -57% | 16% | 14% | |
| Idle Minimum * (Watt) | 16.3 | 23 -41% | 10.6 35% | 33.4 -105% | 6 63% | 13 20% |
| Idle Average * (Watt) | 22.5 | 30 -33% | 13.1 42% | 40.5 -80% | 14 38% | 16 29% |
| Idle Maximum * (Watt) | 39.9 | 39 2% | 15.8 60% | 44 -10% | 25 37% | 27 32% |
| Load Average * (Watt) | 116.1 | 156 -34% | 131 -13% | 121.9 -5% | 108 7% | 109 6% |
| Witcher 3 ultra * (Watt) | 181.2 | 152 16% | 146 19% | 258.2 -42% | 195 -8% | 155 14% |
| Load Maximum * (Watt) | 196.7 | 208 -6% | 169 14% | 397.6 -102% | 280 -42% | 236 -20% |
* ... Meglio usare valori piccoli
Durata della batteria
Aspettatevi una autonomia WLAN reale di oltre cinque ore quando entrambi i display sono impostati a 150 nits sul profilo di alimentazione Balanced con la GPU integrata attiva. I risultati sono circa due ore più lunghi di quelli che abbiamo visto sul GX550, ma è comunque nella media per un portatile gaming.
La ricarica completa richiede circa 2-2,5 ore. Il sistema può anche ricaricarsi via USB-C con un input fino a 100 W che possiamo confermare sulla nostra unità di prova. Asus non sembra raccomandarlo, tuttavia, forse a causa dei problemi di ricarica USB-C esistenti con lo Zephyrus G14.
| Asus ROG Zephyrus Duo 15 SE GX551QS R9 5900HX, GeForce RTX 3080 Laptop GPU, 90 Wh | Asus ROG Zephyrus Duo 15 GX550LXS i9-10980HK, GeForce RTX 2080 Super Max-Q, 90 Wh | Razer Blade 15 RTX 2080 Super Max-Q i7-10875H, GeForce RTX 2080 Super Max-Q, 80 Wh | Eurocom Sky X4C i9-9900KS i9-9900KS, GeForce RTX 2080 Mobile, 82 Wh | MSI GE66 Raider 10SFS i9-10980HK, GeForce RTX 2070 Super Mobile, 99.99 Wh | MSI GS66 Stealth 10SFS i9-10980HK, GeForce RTX 2070 Super Max-Q, 99.99 Wh | |
|---|---|---|---|---|---|---|
| Autonomia della batteria | -8% | 34% | -47% | 26% | 27% | |
| Reader / Idle (h) | 6.8 | 8 18% | 8.7 28% | 7.6 12% | 8.4 24% | |
| WiFi v1.3 (h) | 5.3 | 3.1 -42% | 6.1 15% | 2.8 -47% | 6.1 15% | 6.1 15% |
| Load (h) | 1.2 | 1.2 0% | 1.9 58% | 1.8 50% | 1.7 42% |
Pro
Contro
Valutazione complessiva dell'Asus ROG Zephyrus Duo 15 SE GX551QS
Potrebbe non sembrare dall'esterno, ma Asus ha fatto importanti aggiornamenti interni per aumentare le prestazioni in modo significativo ripetto al vecchio GX550. I portatili gaming di fascia alta non devono più essere esclusivi della serie Intel Core, ora che le opzioni mobili AMD Ryzen hanno superato anche i più veloci sistemi Core i9 della decima generazione, compreso lo Zephyrus Duo 15 GX550 di Asus.
A parte la CPU Zen 3, anche il nuovo pannello 4K a 120 Hz merita un riconoscimento. A differenza della maggior parte dei pannelli 4K da 15,6 pollici del passato, questo nuovo pannello ha tempi di risposta bianco-nero e grigio-grigio più veloci che ora sono molto più vicini alle comuni opzioni a 144 Hz, 240 Hz o 300 Hz 1080p. La differenza si nota soprattutto quando si gioca a giochi 3D in rapido movimento.
Non è economico, ma l'Asus ROG Zephyrus Duo 15 SE GX551QS è dotato di un nuovo hardware e supera il modello precedente con un ampio margine. Lo ScreenPad non è cambiato affatto a parte la sua UI più fluida che arriverà anche sul GX550.
Il problema principale con i nuovi vantaggi è che non sono speciali per il GX551. Altri portatili alla fine hanno le stesse opzioni di CPU, GPU e display 4K, per un livello simile di prestazioni. Inoltre, lo chassis e lo ScreenPad non sono cambiati, il che significa che tutti i precedenti svantaggi del GX550 dell'anno scorso rimangono. Se non vi sono piaciuti i tasti della tastiera poco profondi, il piccolo clickpad, le ampie dimensioni o la mancanza di una webcam sul GX550, allora le vostre opinioni non cambieranno sul GX551. Anche le pulsazioni della ventola quando si gioca in modalità Performance avrebbero potuto essere migliorate.
Prezzo e disponibilità
Asus ROG Zephyrus Duo 15 SE GX551QS
- 02/07/2021 v7 (old)
Allen Ngo
Price comparison
