Recensione del computer portatile Asus ROG Strix G17 G713QE: la GeForce RTX 3050 Ti trascina in basso un ottimo sistema

La serie ROG Strix G17 G713 succede alla serie Serie G712 eliminando Intel per AMD e aggiornando la maggior parte delle versioni alla grafica GeForce Ampere. Le opzioni configurabili sono estese con non meno di 16 (!) versioni individuali tutte dettagliate qui sulla pagina ufficiale del prodotto Asus. Le opzioni sono successivamente massicce e vanno dalla CPU Zen 2 Ryzen 7 4800H alla Zen 3 Ryzen 9 5900HX e grafica GeForce GTX 1650 65 W fino alla GeForce RTX 3070 130 W. Anche le opzioni del display variano molto dal pannello base 144 Hz FHD al 165 Hz QHD o 300 Hz FHD con colori più pieni. Anche le capacità della batteria, lo spessore e gli adattatori AC sono diversi a seconda della grafica.
La nostra unità di test di oggi è una versione di fascia media dotata di CPU Ryzen 7 5800H, GPU RTX 3050 Ti da 95 W e display FHD da 144 Hz. I concorrenti in questa gamma includono altri portatili gaming da 17,3 pollici entry-level a midrange come l'MSI Katana GF76, l'Acer Nitro 5, il Dell serie G o il Lenovo Legion 5.
Altre recensioni Asus:
Confronto con i potenziali concorrenti
Punteggio | Data | Modello | Peso | Altezza | Dimensione | Risoluzione | Prezzo |
|---|---|---|---|---|---|---|---|
| 83.4 % v7 (old) | 08/2021 | Asus ROG Strix G17 G713QE-RB74 R7 5800H, GeForce RTX 3050 Ti Laptop GPU | 2.5 kg | 24.6 mm | 17.30" | 1920x1080 | |
| 81.1 % v7 (old) | 08/2021 | Acer Nitro 5 AN517-53-54DQ i5-11300H, GeForce RTX 3050 4GB Laptop GPU | 2.6 kg | 25 mm | 17.30" | 1920x1080 | |
| 80.4 % v7 (old) | 06/2021 | MSI Katana GF76 11UE i7-11800H, GeForce RTX 3060 Laptop GPU | 2.7 kg | 25.2 mm | 17.30" | 1920x1080 | |
| 86.6 % v7 (old) | 05/2021 | Asus Strix Scar 17 G733QSA-XS99 R9 5900HX, GeForce RTX 3080 Laptop GPU | 2.8 kg | 28.3 mm | 17.30" | 1920x1080 | |
| 83.3 % v7 (old) | 02/2021 | MSI Alpha 17 A4DEK R7 4800H, Radeon RX 5600M | 2.6 kg | 28 mm | 17.30" | 1920x1080 | |
| 83.1 % v7 (old) | 10/2020 | Asus Strix G17 G712LWS i7-10750H, GeForce RTX 2070 Super Mobile | 2.8 kg | 26.5 mm | 17.30" | 1920x1080 |
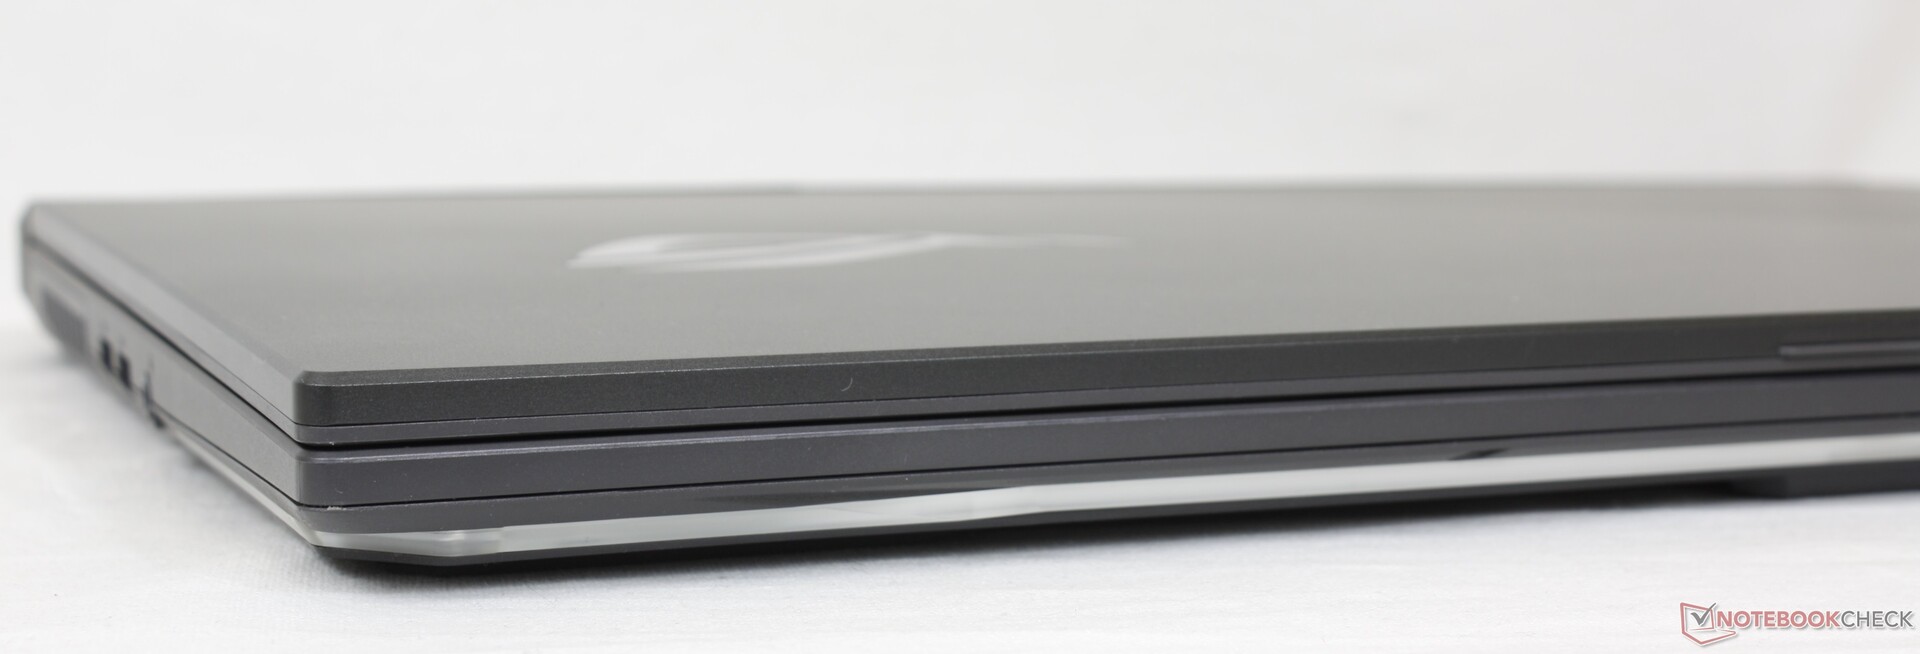
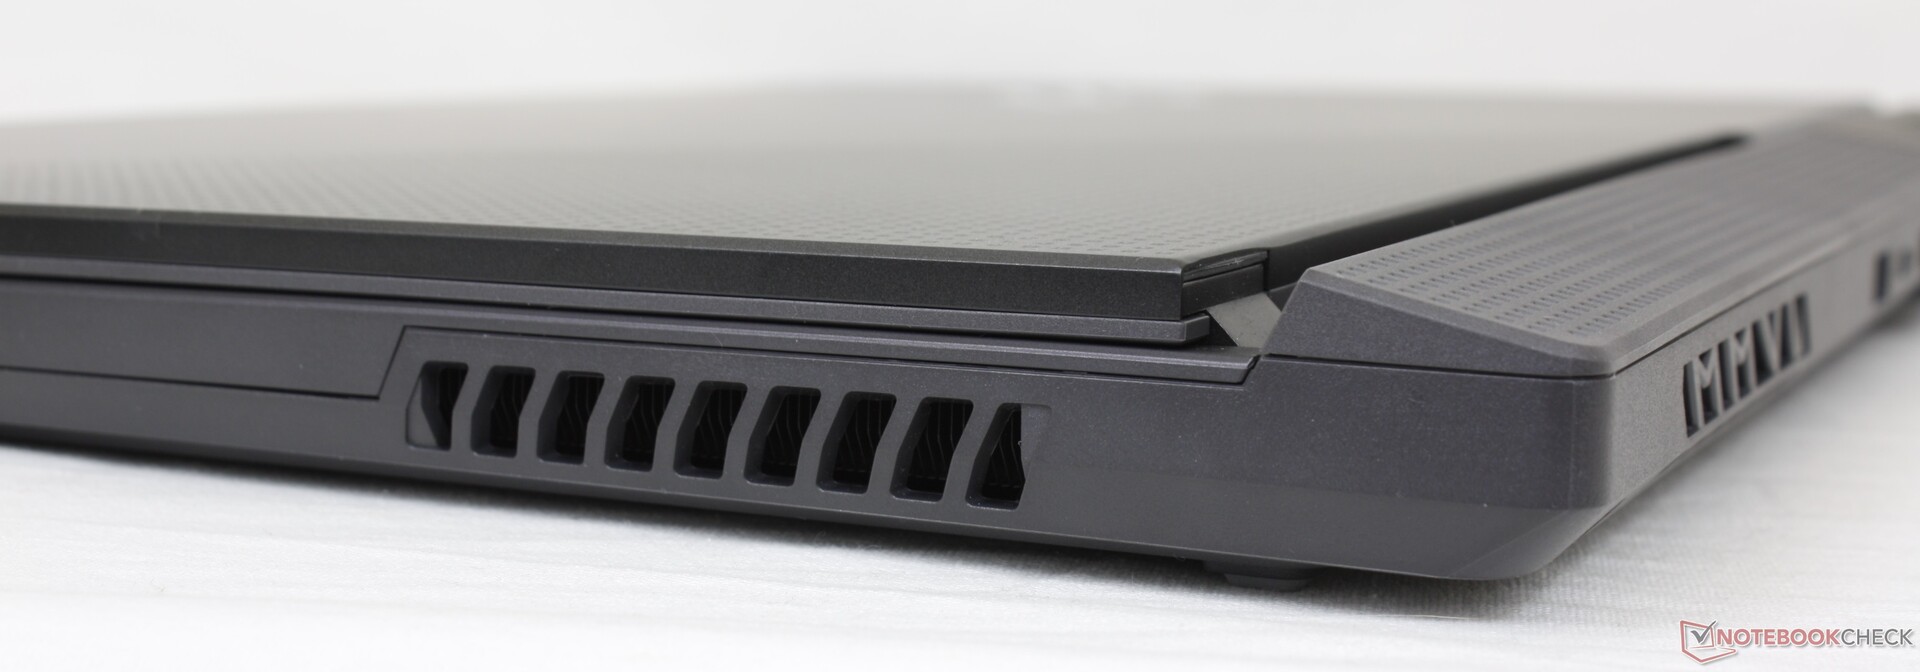
Case - Familiare, ma diverso
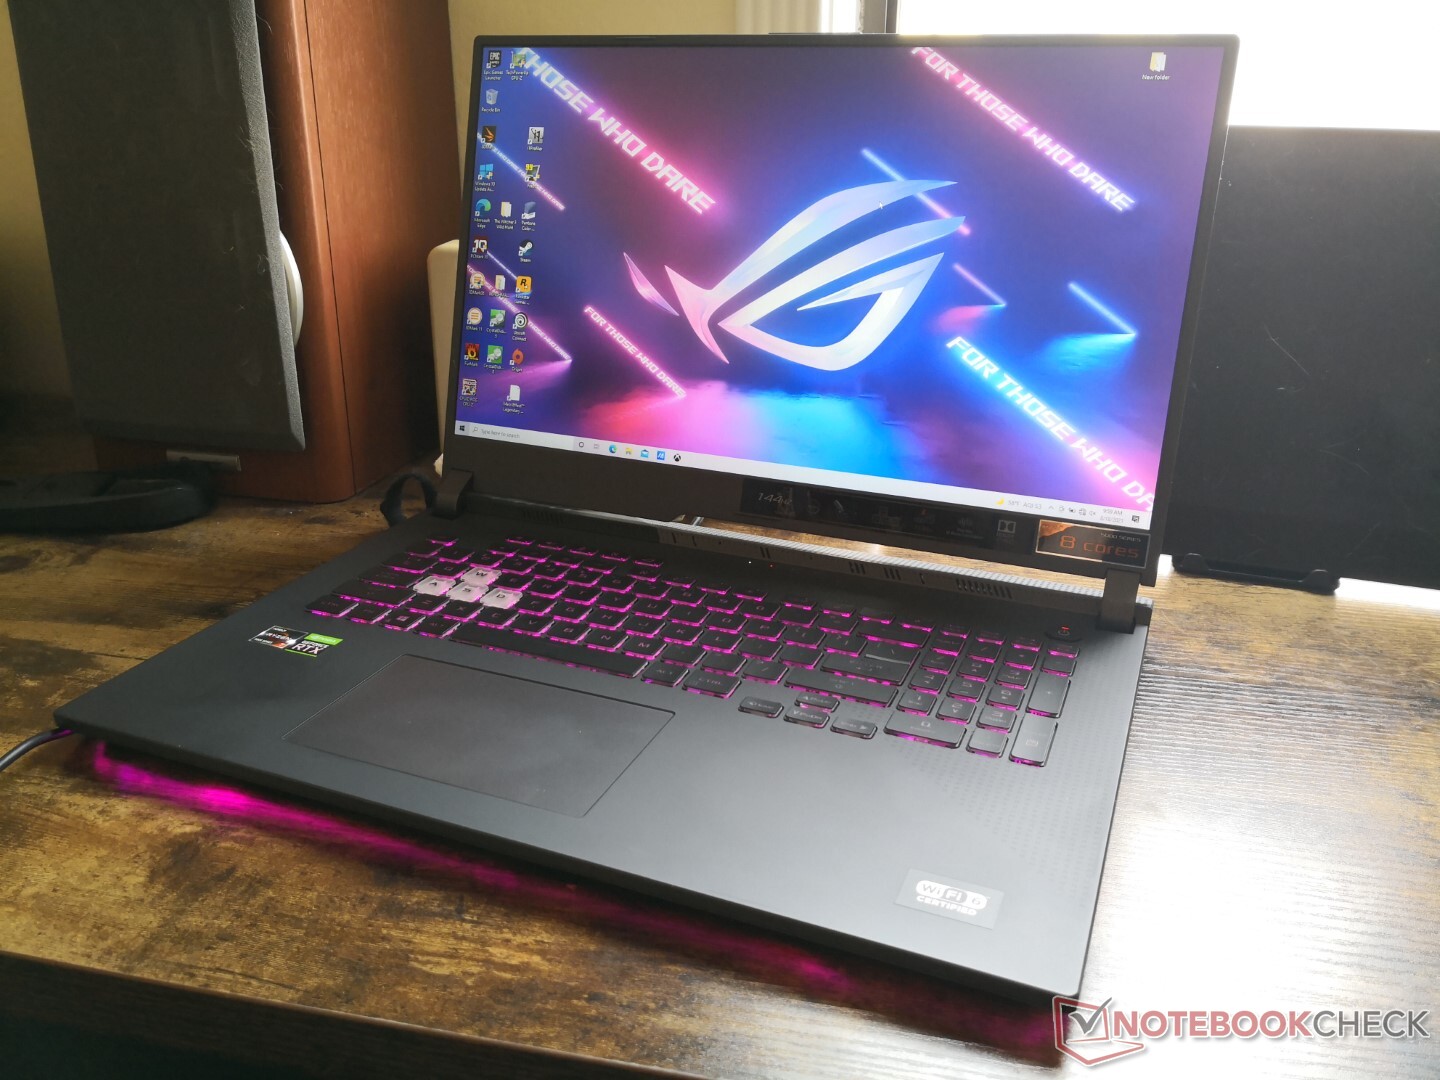
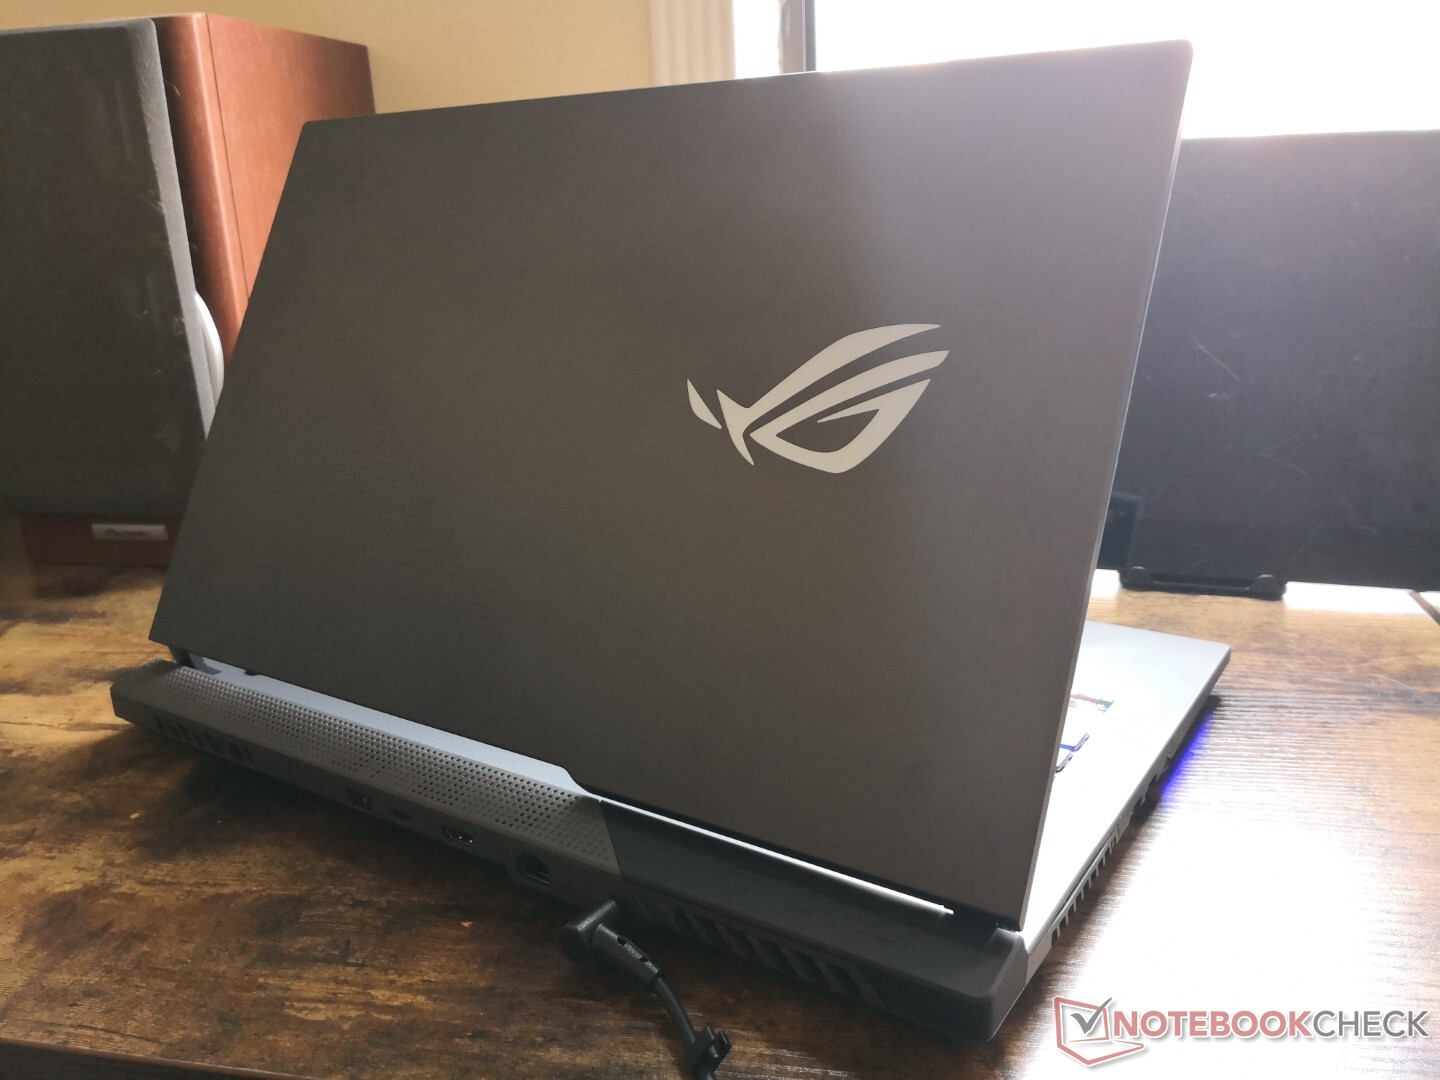
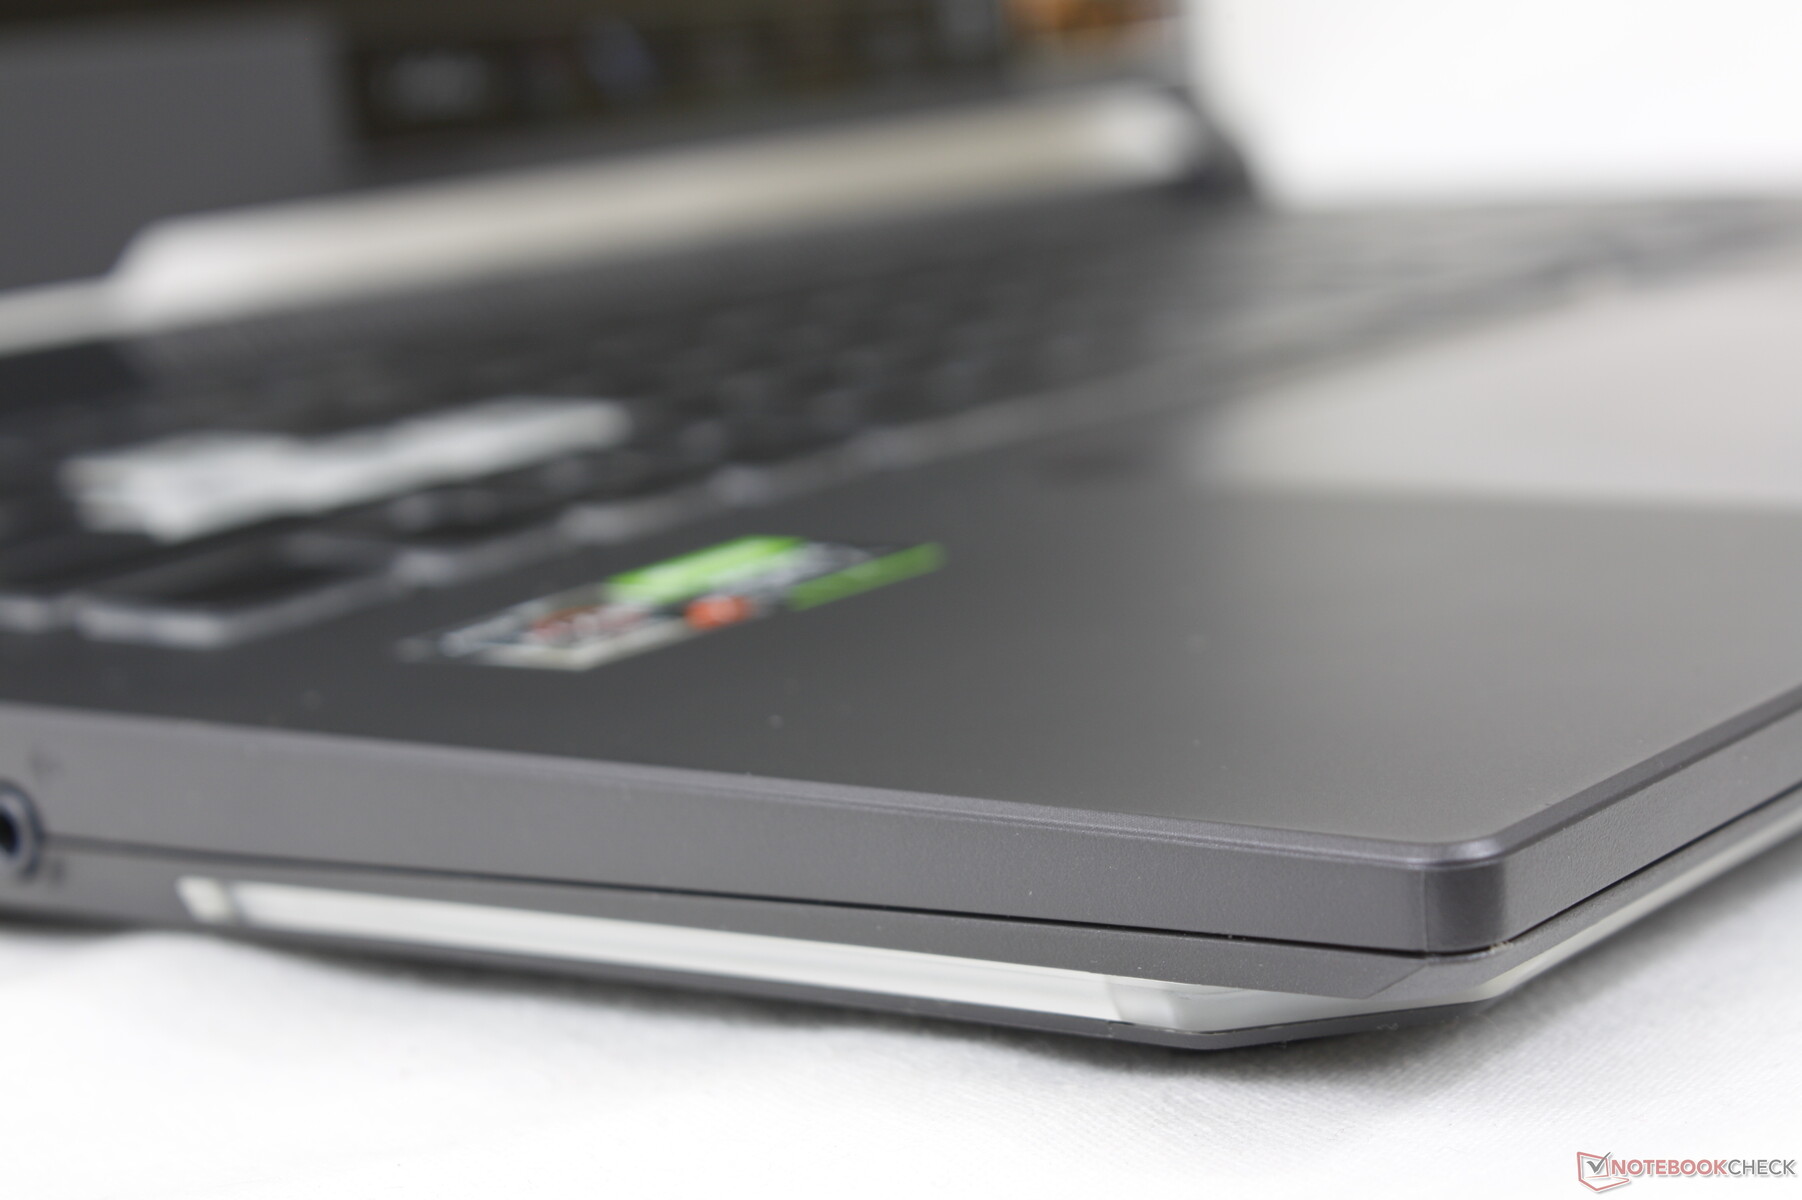
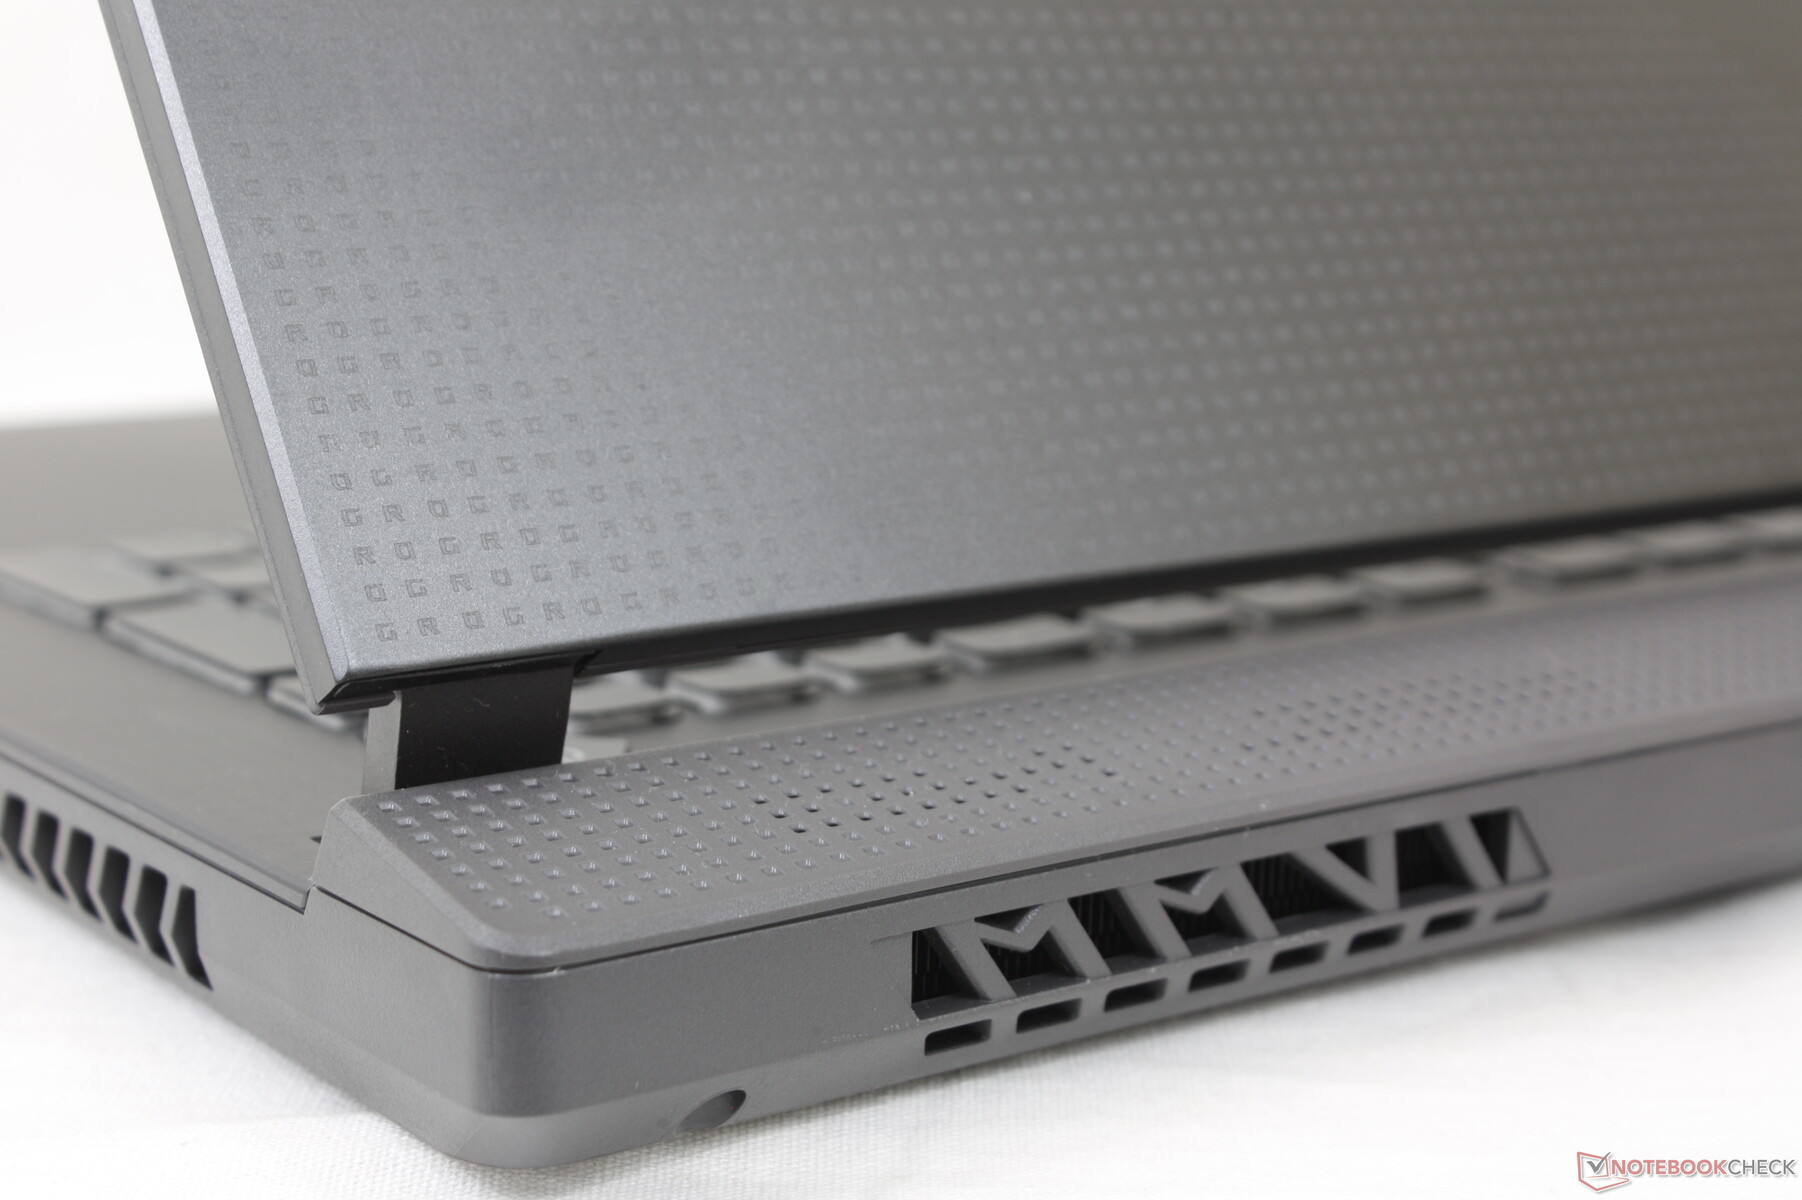
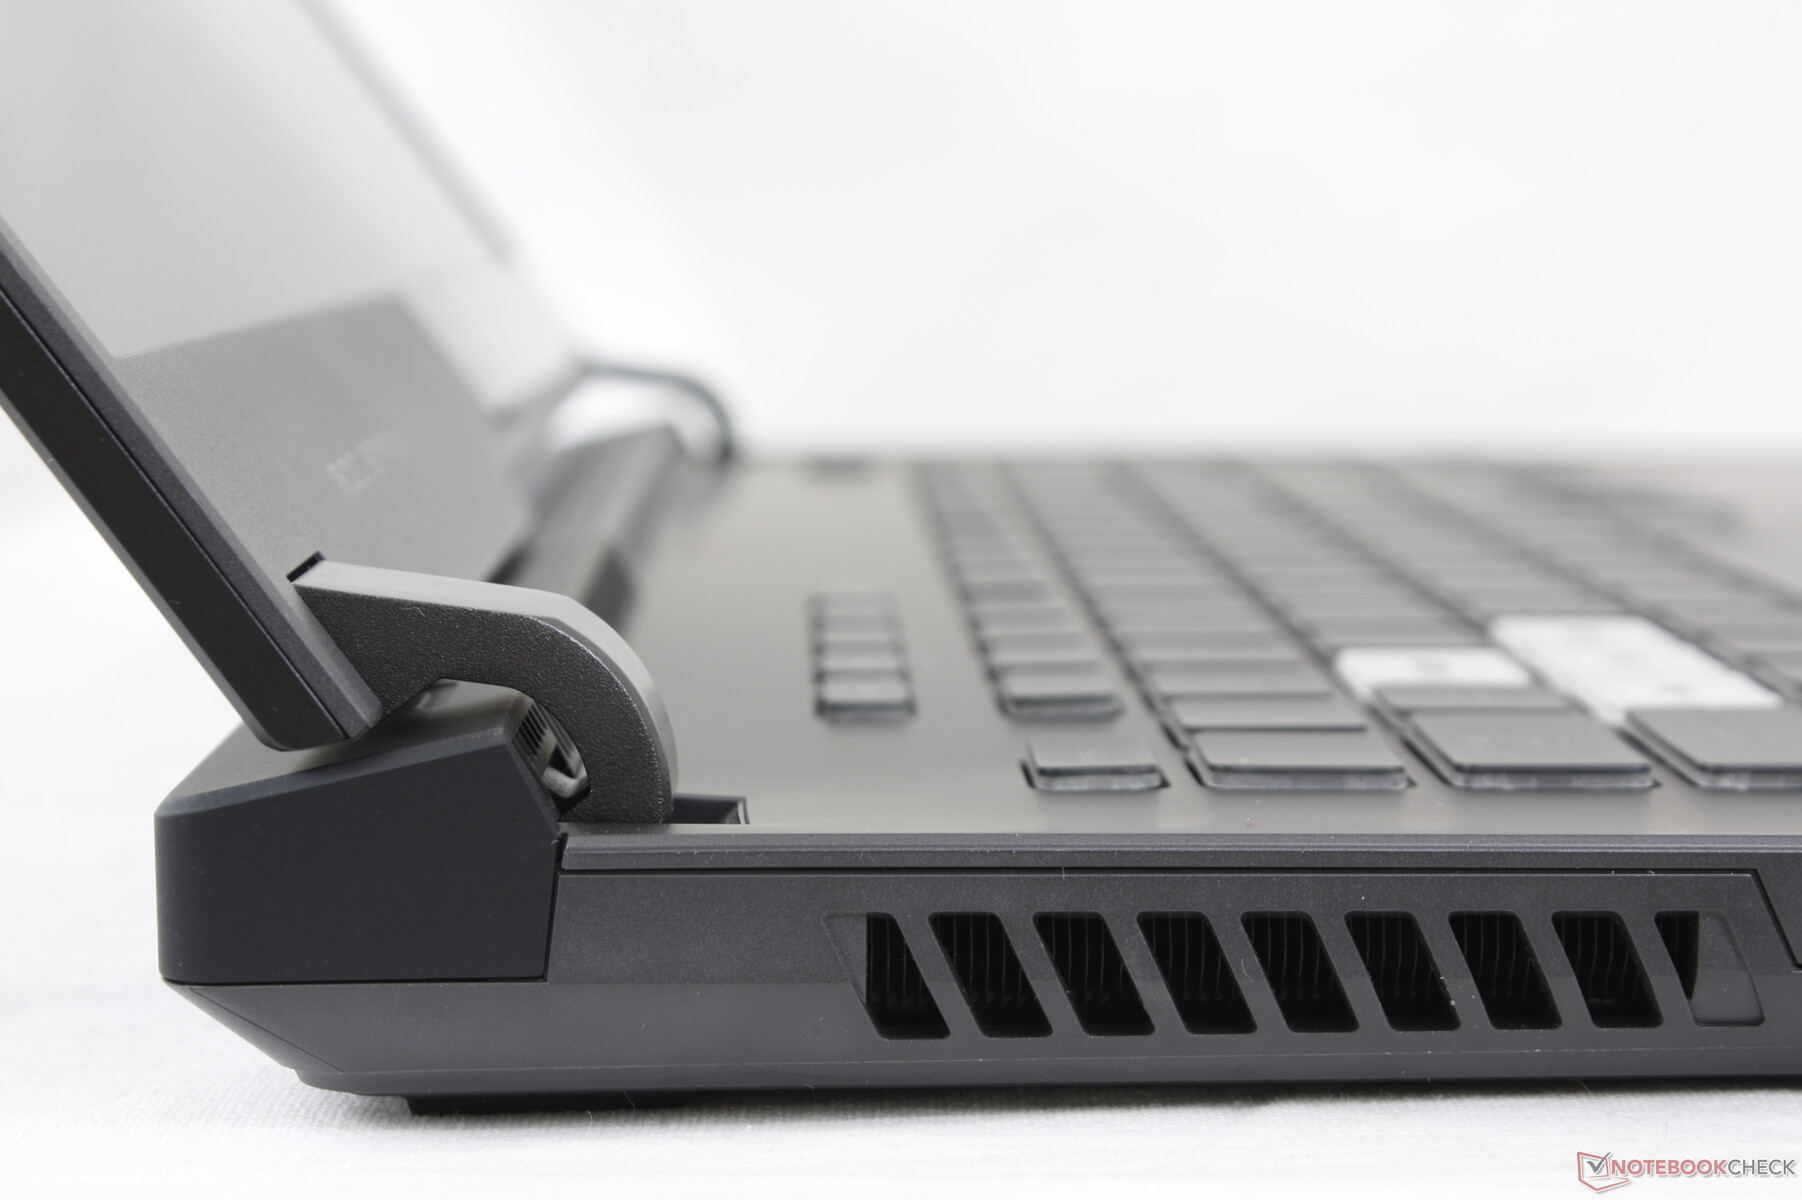
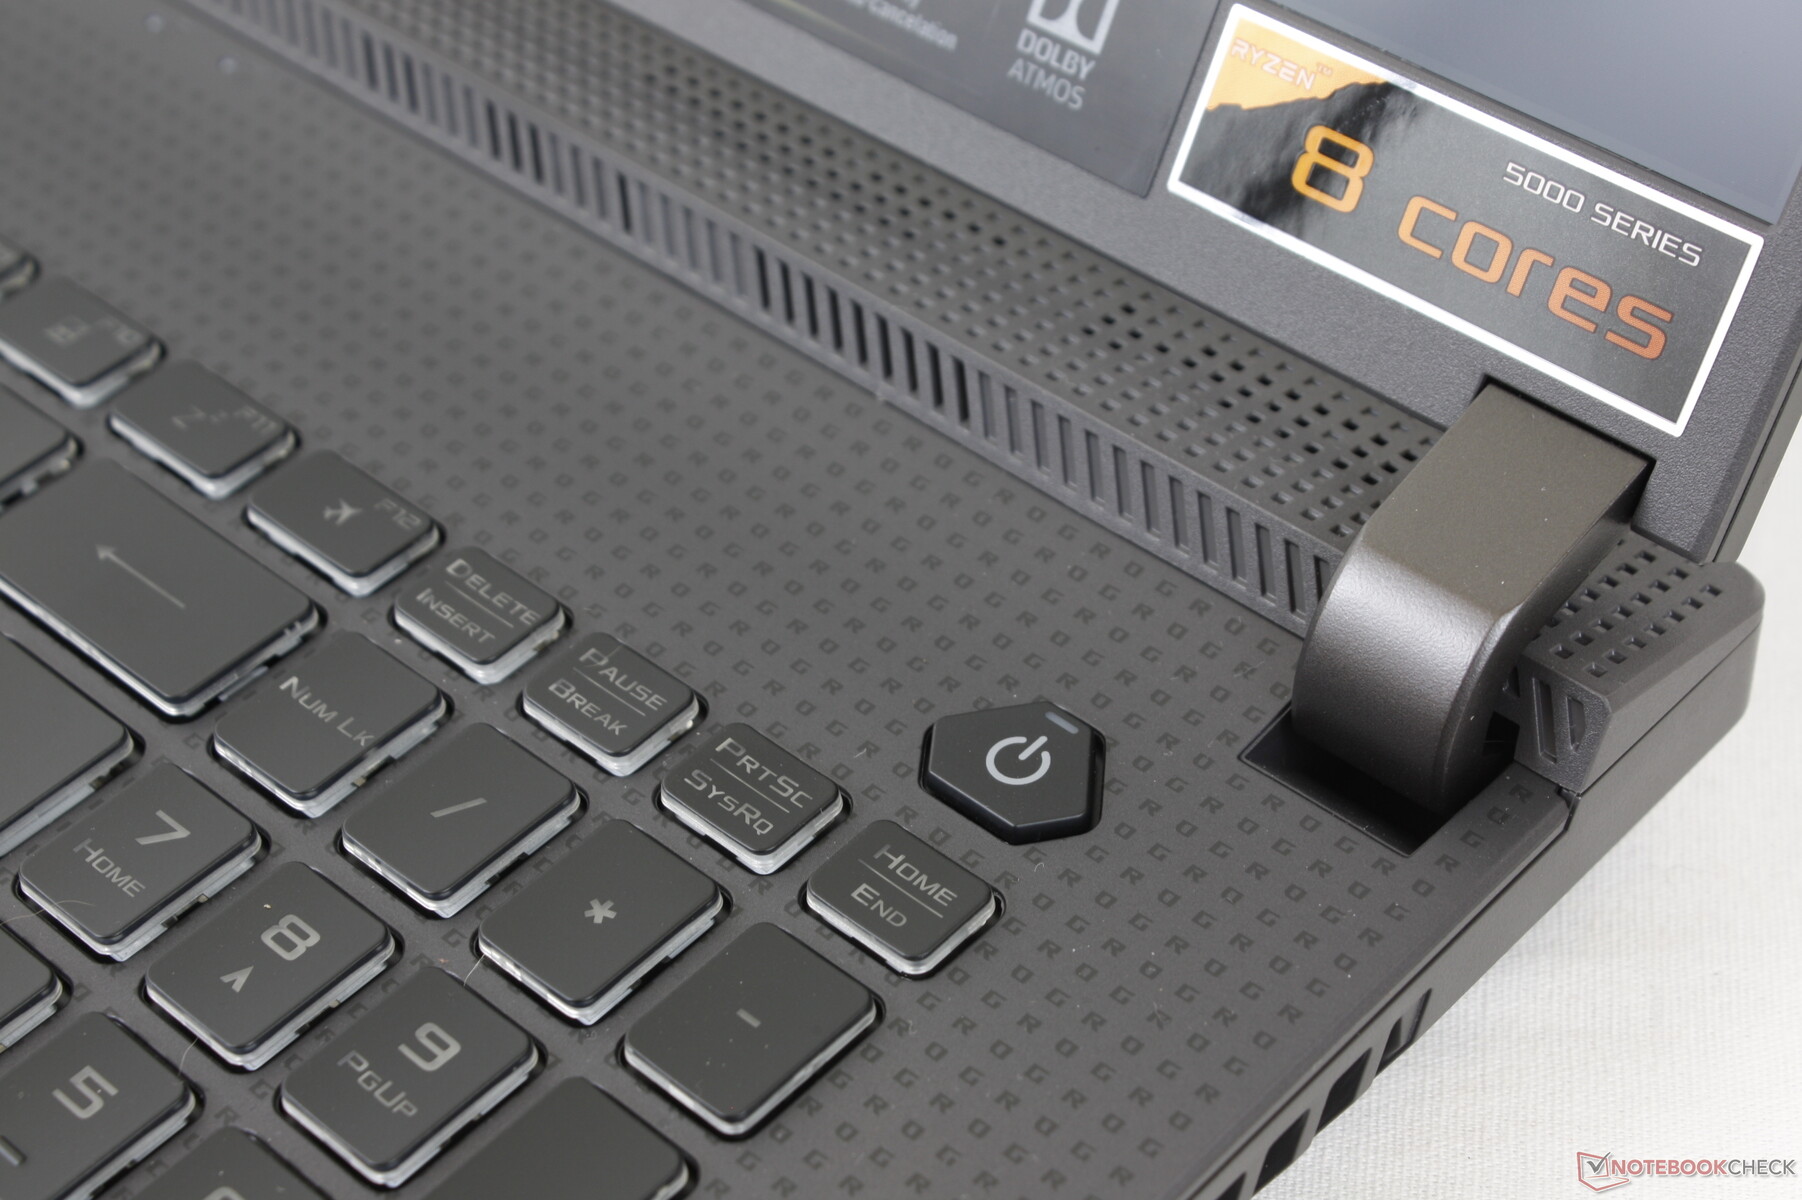
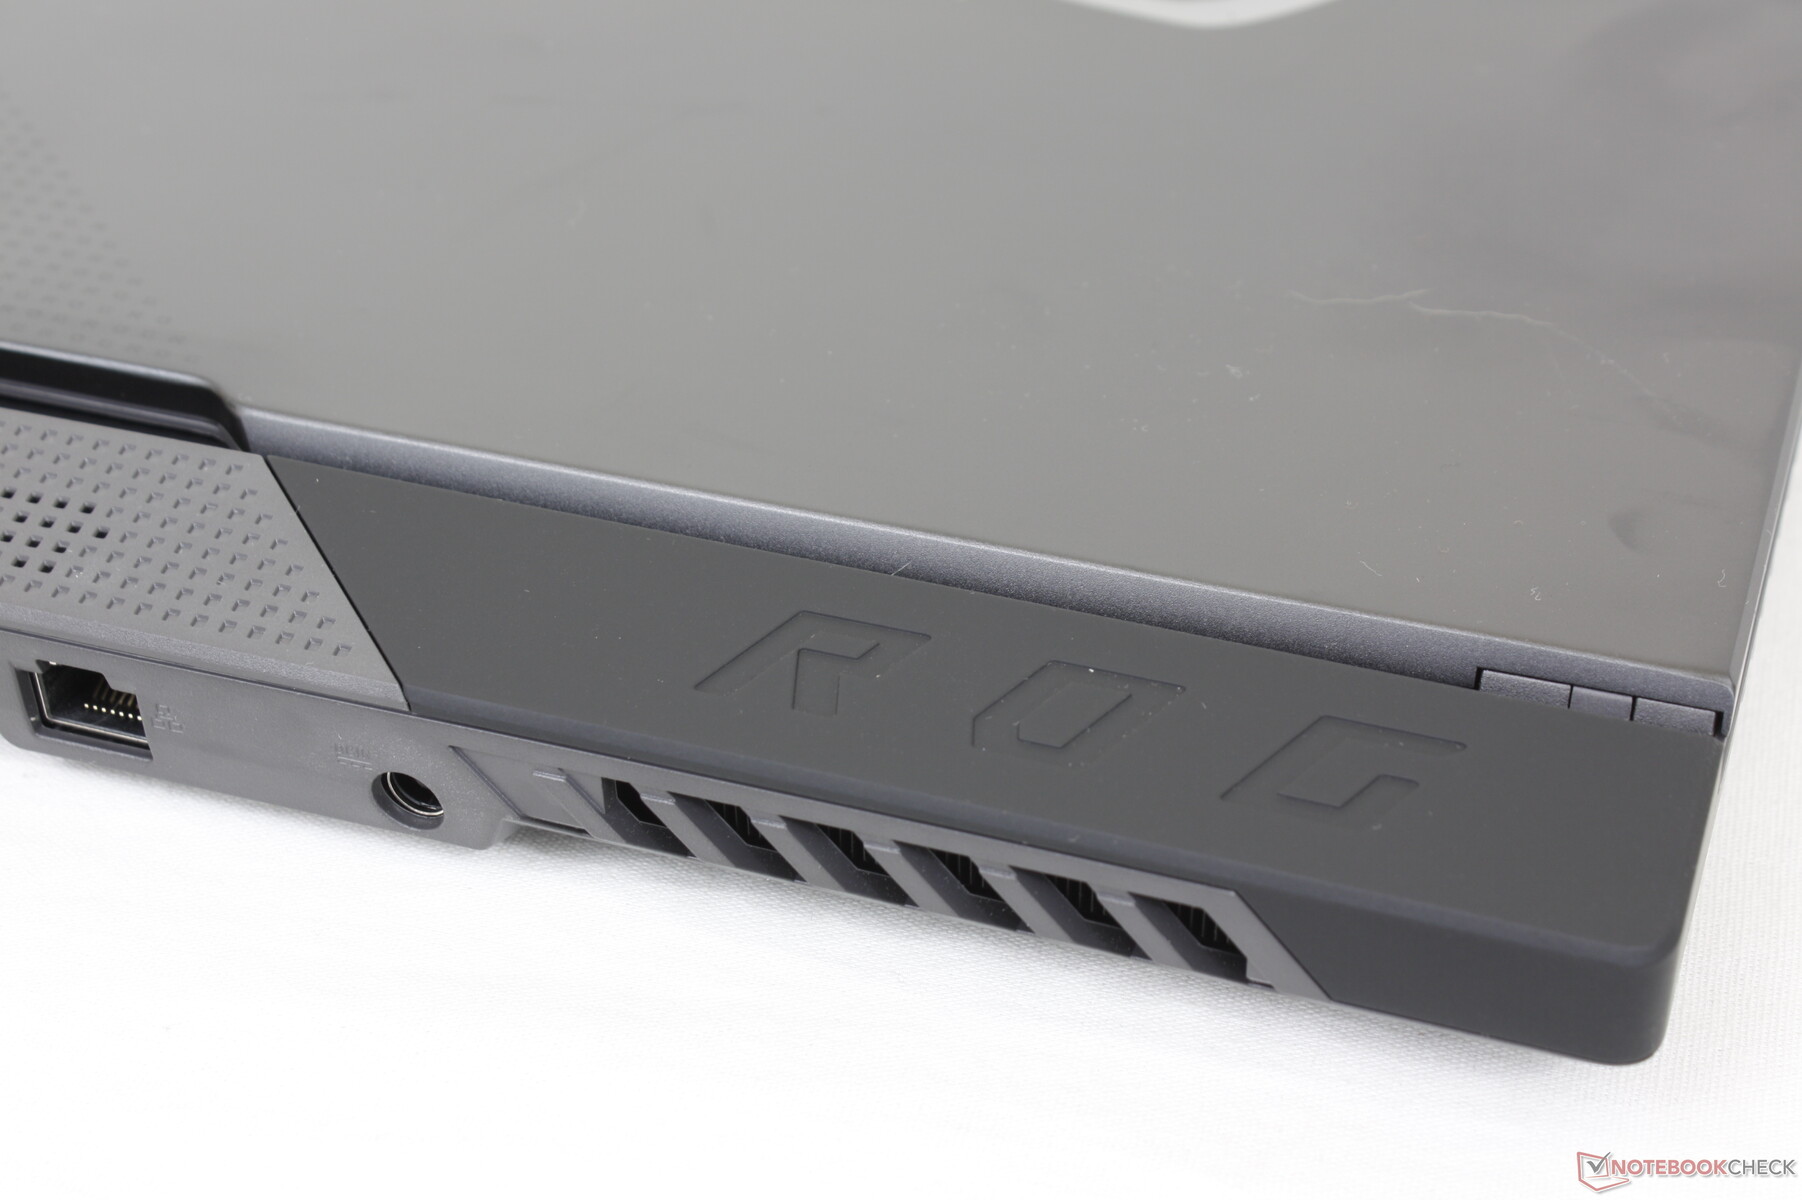
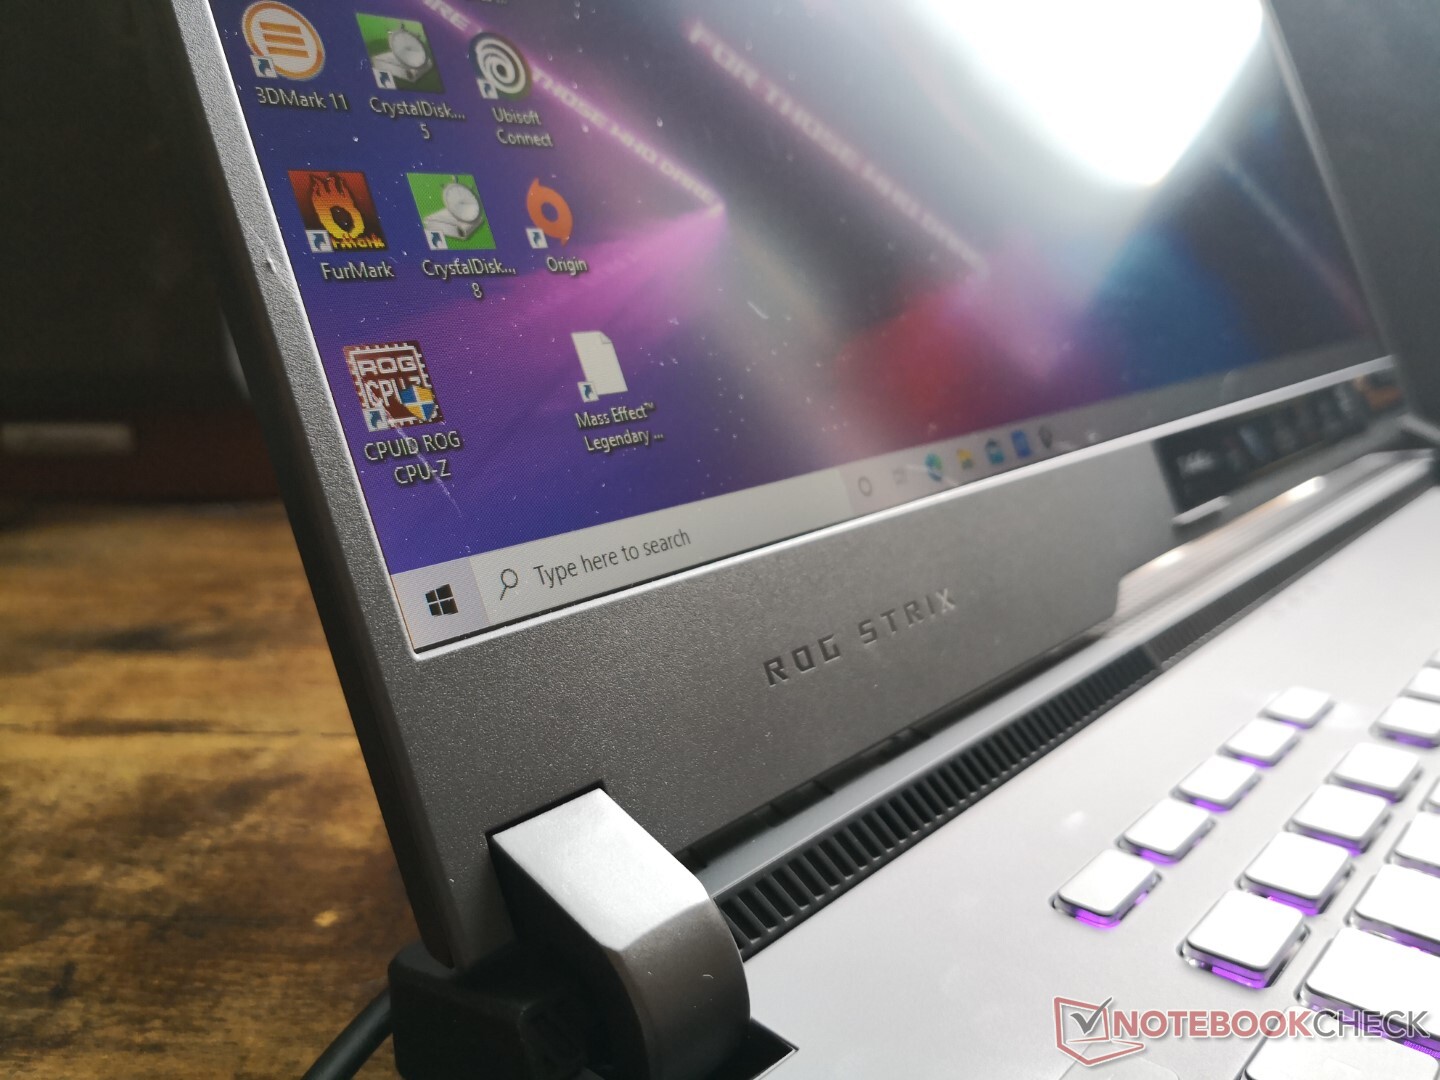
Può essere difficile distinguere tutti i diversi modelli ROG Strix poiché condividono lo stesso design estetico. La parte posteriore estesa "jet engine", le grandi cerniere visibili, la spessa cornice del mento, la tastiera leggermente gommata e la mancanza di una webcam integrata sono tutte invariate rispetto alle generazioni precedenti. Le differenze principali riguardano lo stile, in quanto alcune parti dello chassis sono ora più piatte e lisce per un look più elegante. Il bordo destro e la cover esterna, per esempio, sono impreziositi da un nuovo motivo ROG che non è presente sui modelli precedenti.
La rigidità del telaio non è migliorata rispetto al G712 dello scorso anno. Tuttavia, è ancora più forte della serie MSI GF o GP, soprattutto per quanto riguarda le cerniere.
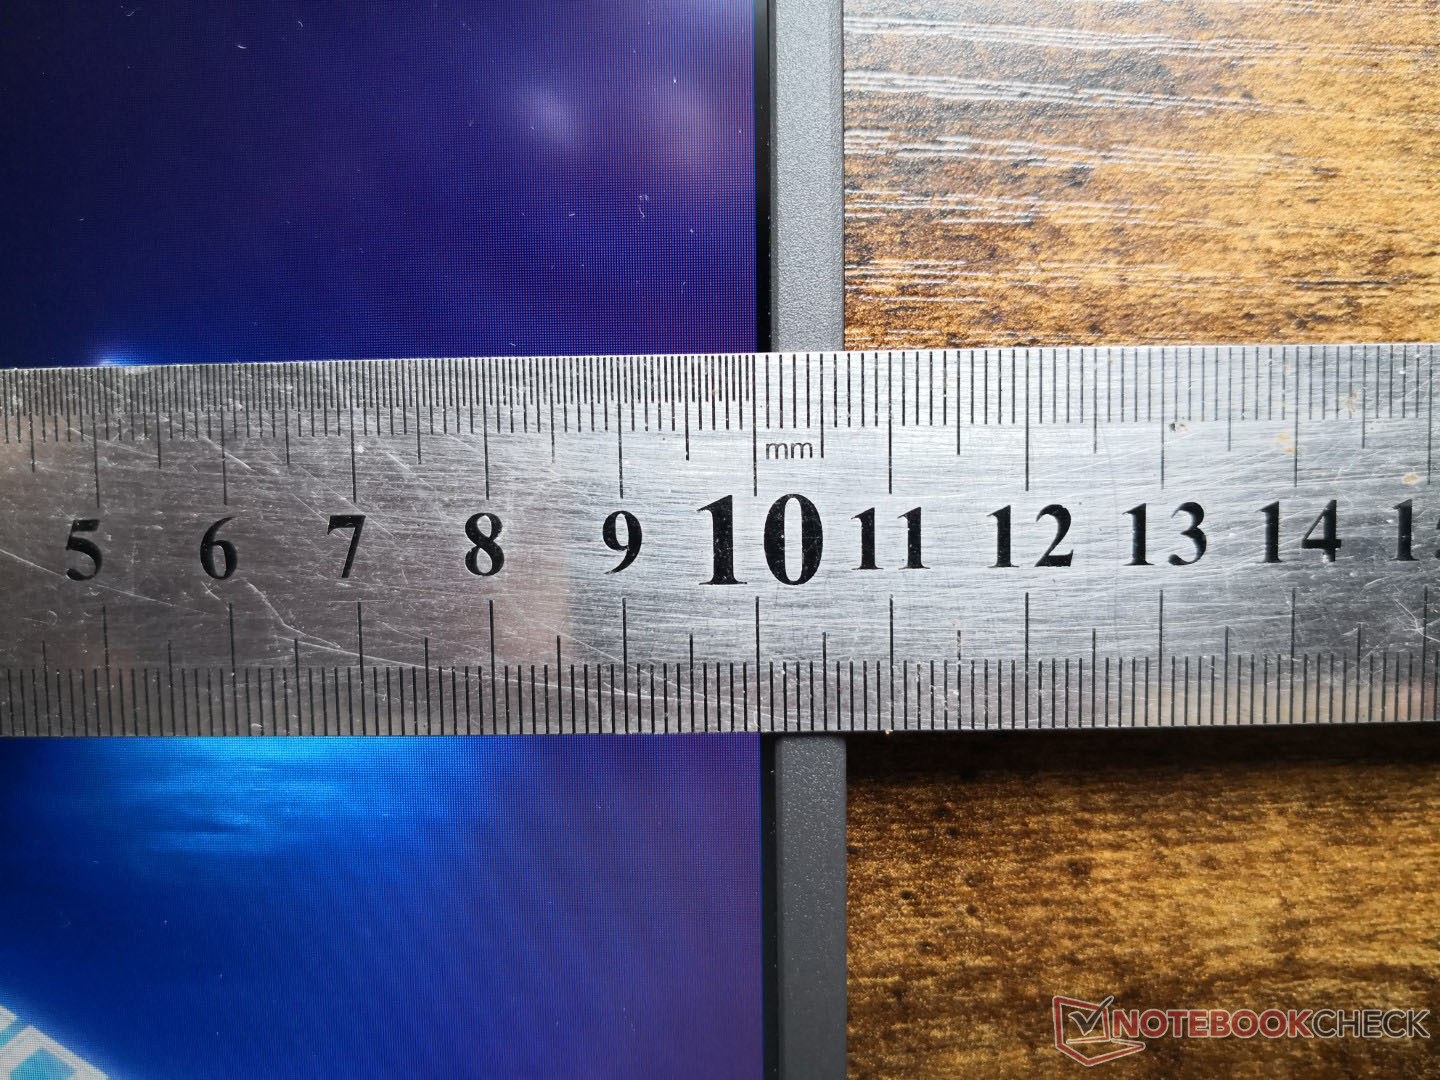
Purtroppo, il G713 è disponibile in due versioni che differiscono sia nel peso che nelle dimensioni a seconda della configurazione. La nostra unità specifica è la versione più piccola con uno spessore e un peso di 2,46 cm e 2,5 kg, rispettivamente, mentre le configurazioni con RTX 3060 o più veloce sono più spesse (2,83 cm) e più pesanti (2,7+ kg). Si tratta di un sistema pesante a prescindere, che si colloca tra il più sottile Zephyrus S17 e il più spesso Lenovo Legion 5.
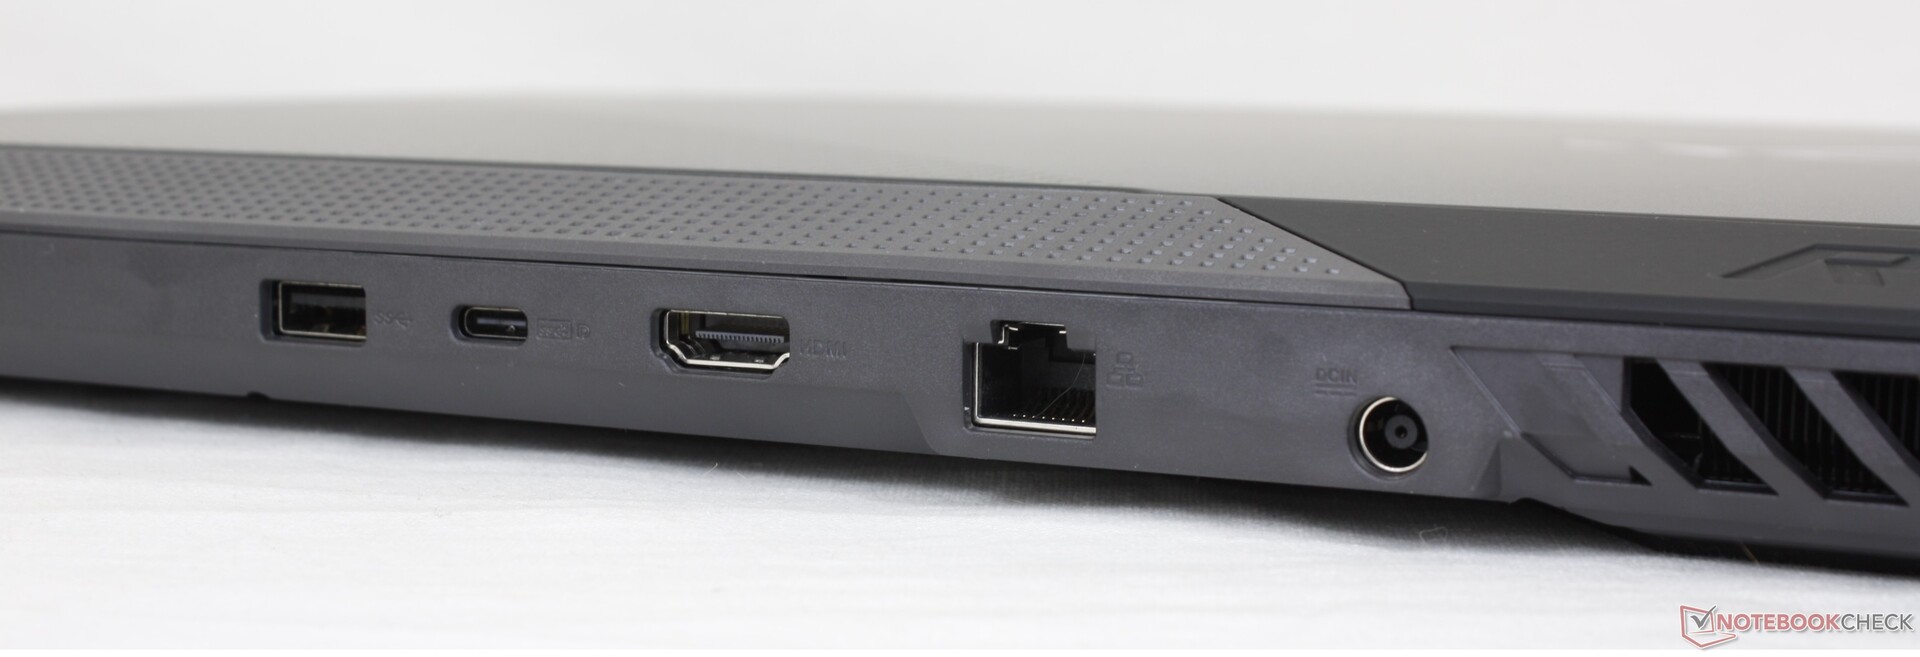
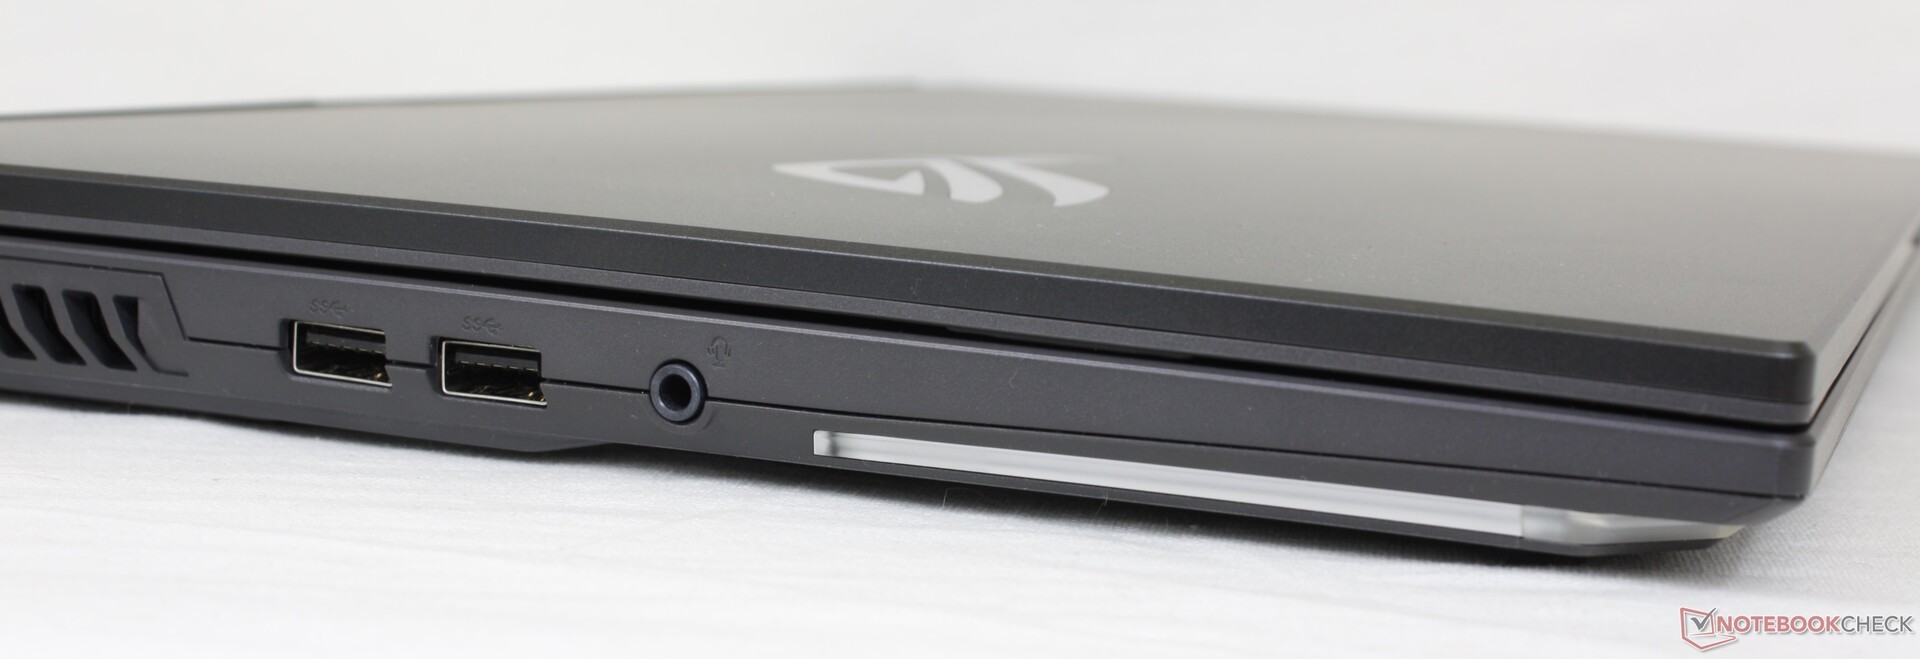
Connettività - No Thunderbolt
Le porte sono identiche al più costoso G733QS ma senza l'Asus Keystone in quanto il produttore ama riservare questa caratteristica solo ai suoi modelli di punta. Il posizionamento delle porte può essere sfavorevole per alcuni utenti in quanto non ci sono porte lungo il bordo destro mentre le porte lungo il retro possono essere difficili da raggiungere.
Comunicazioni
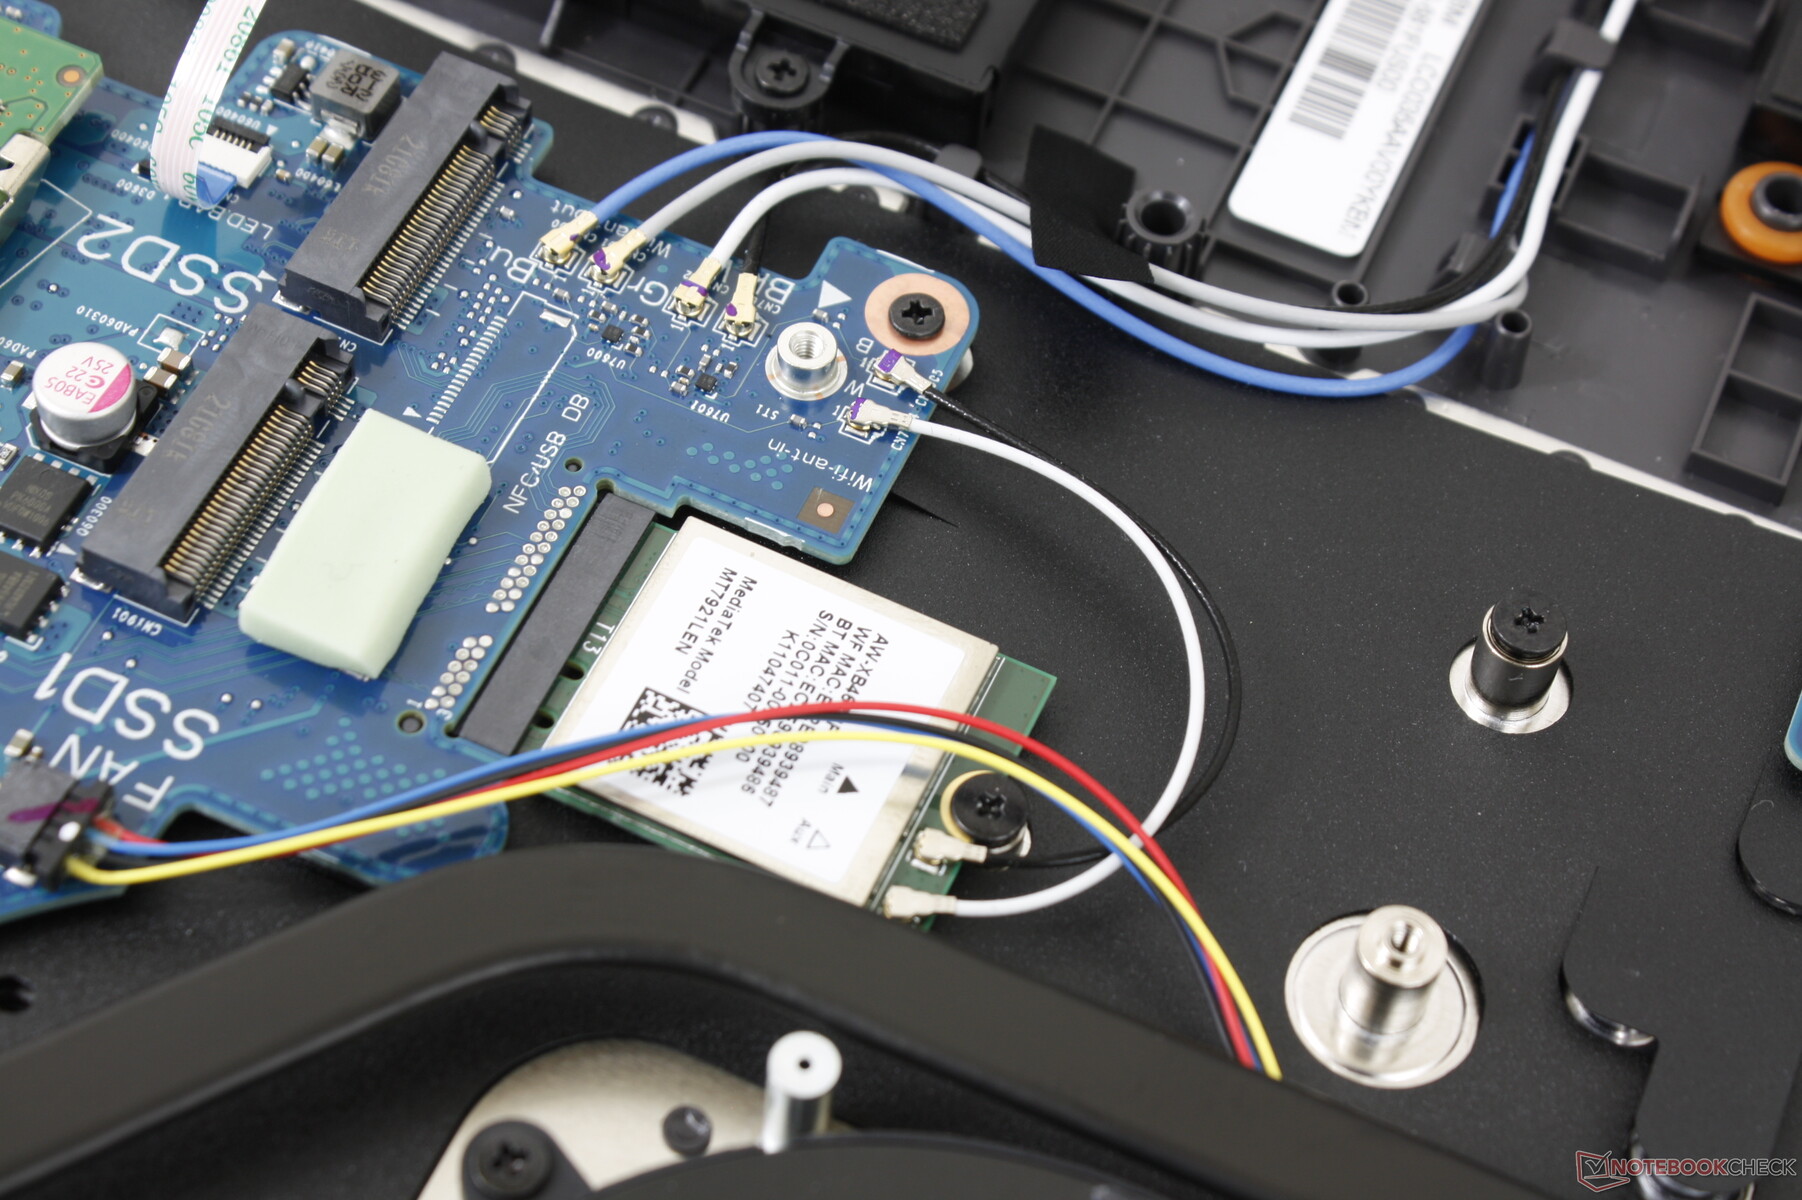
Il MediaTek MT7921 abilitato al Wi-Fi 6 compete contro la più comune serie Intel AX200/201. Anche se affidabile in termini di navigazione e streaming video, le sue prestazioni non sono così veloci come quelle della soluzione Intel che supera regolarmente 1 Gbps.
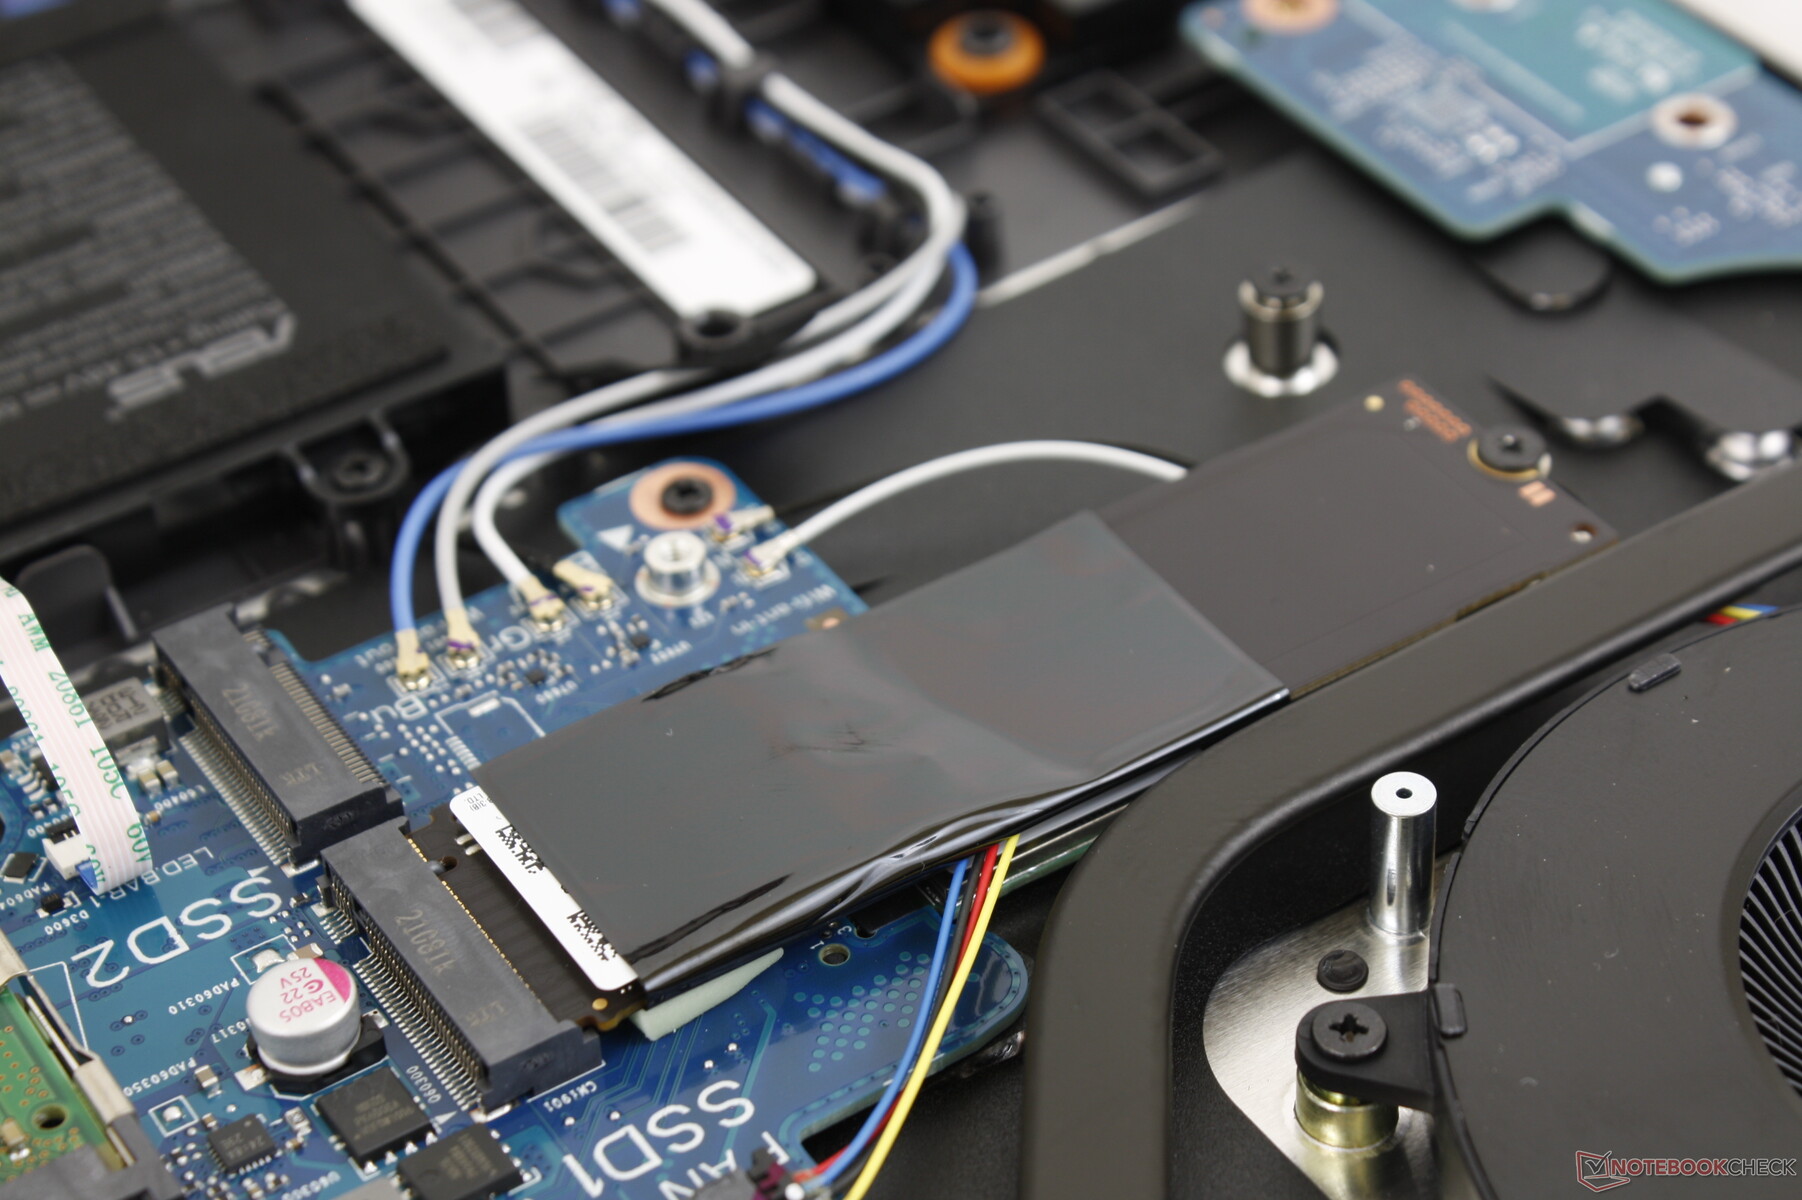
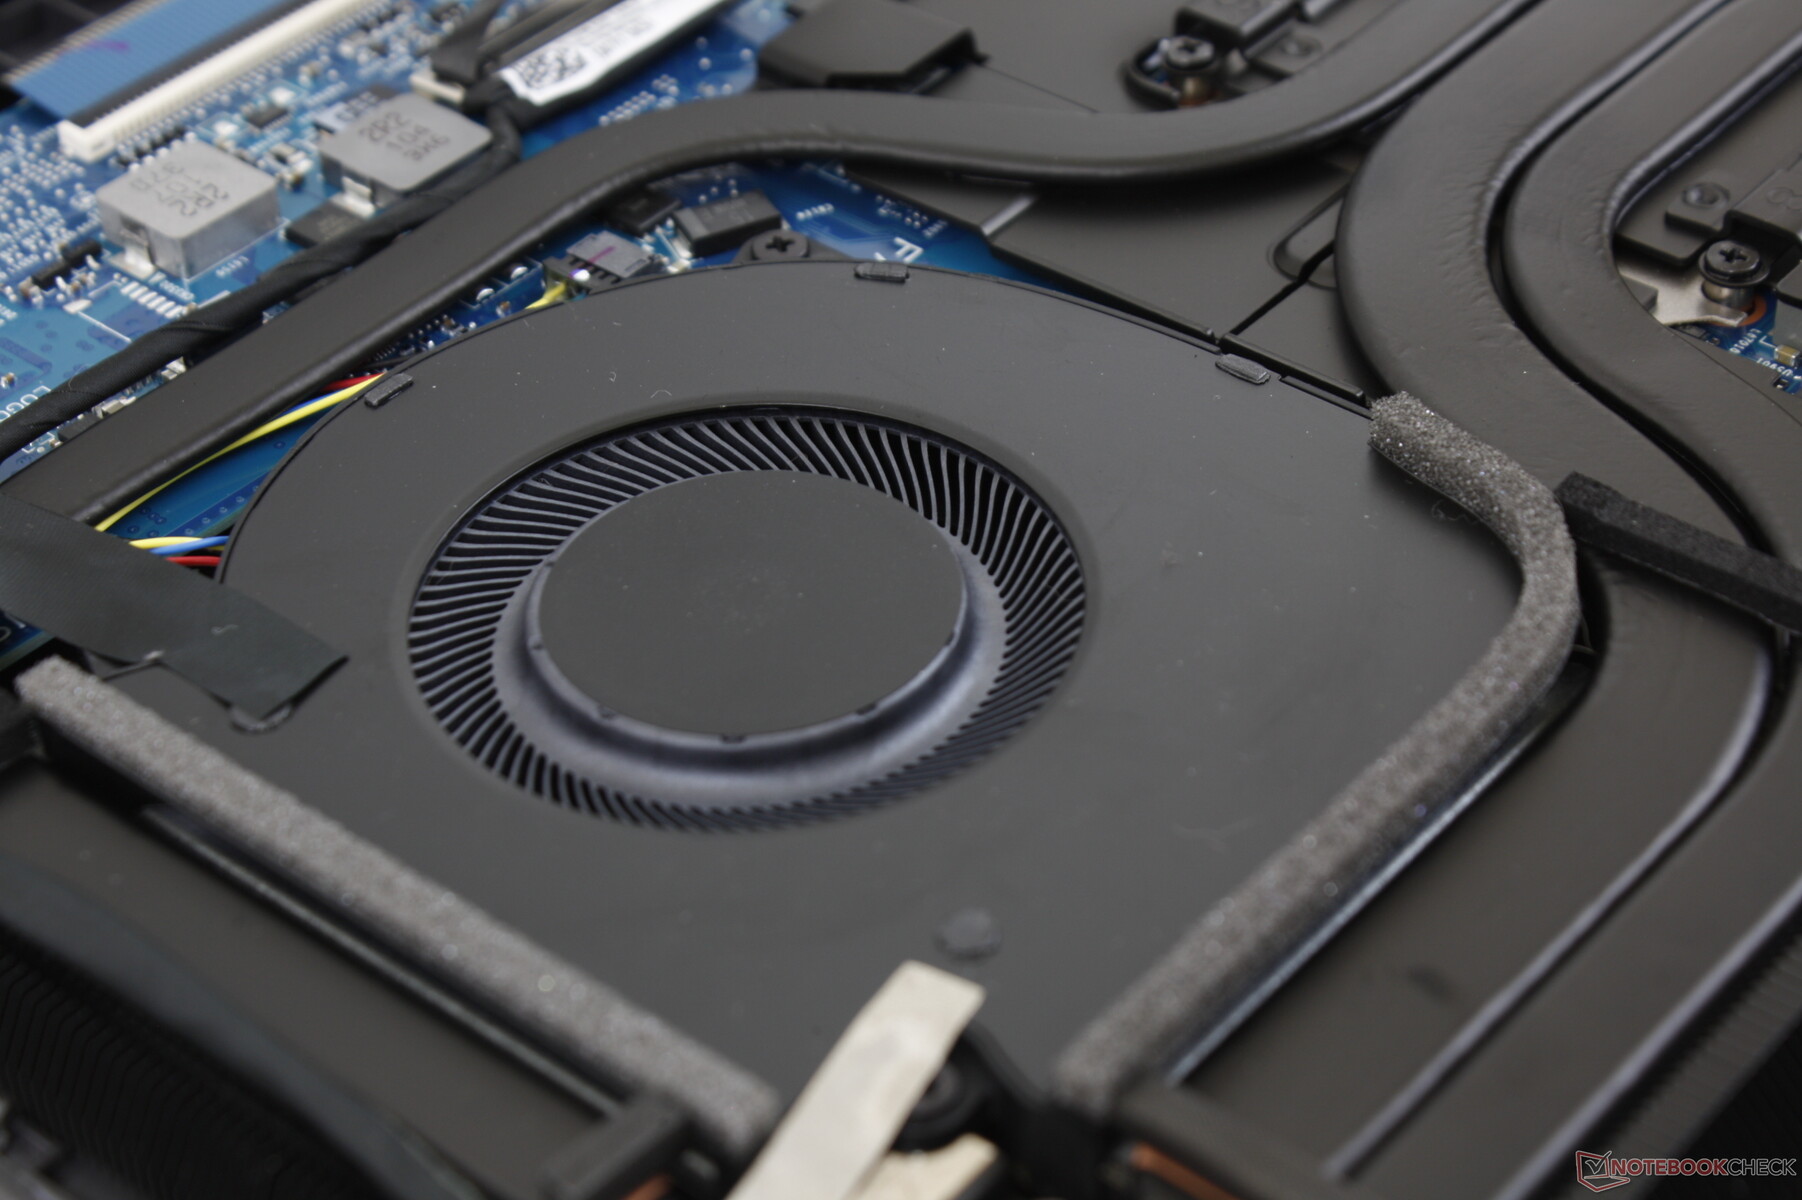
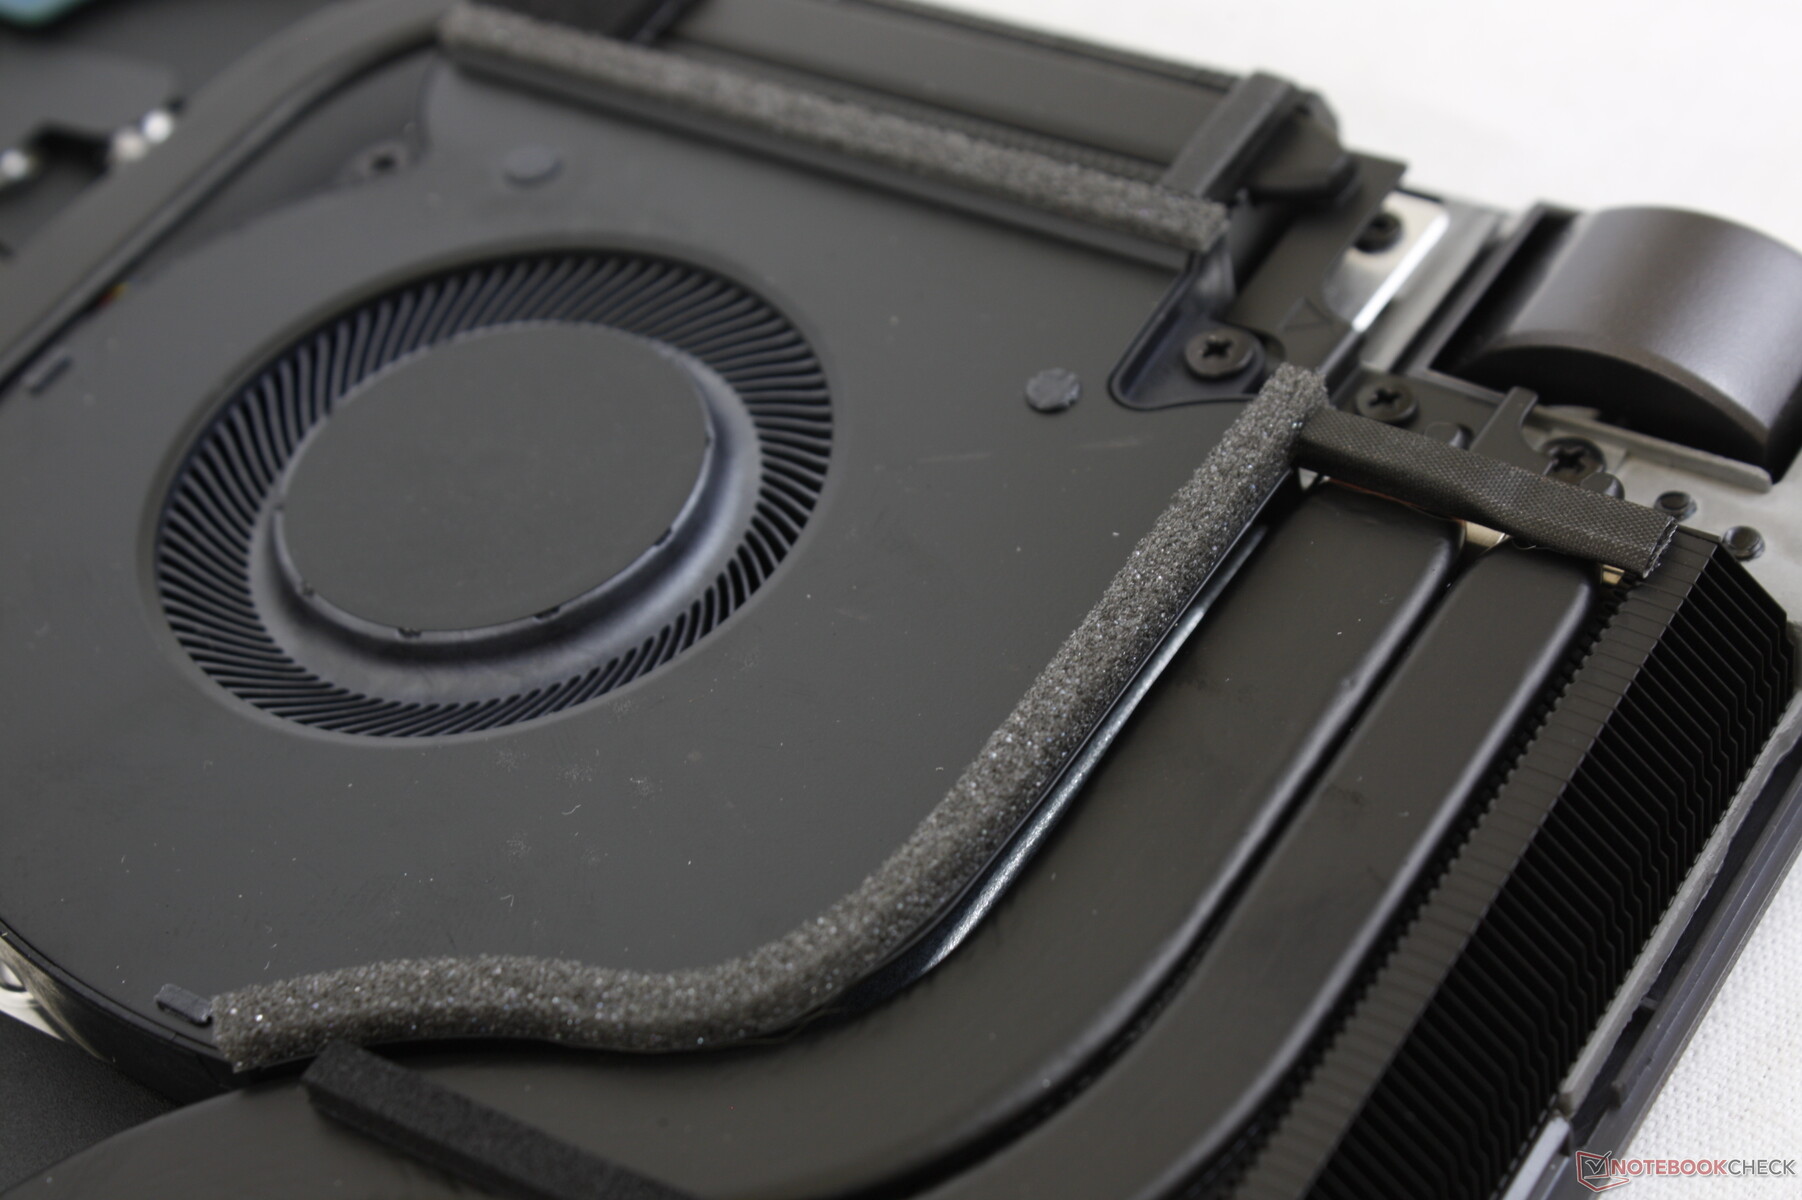
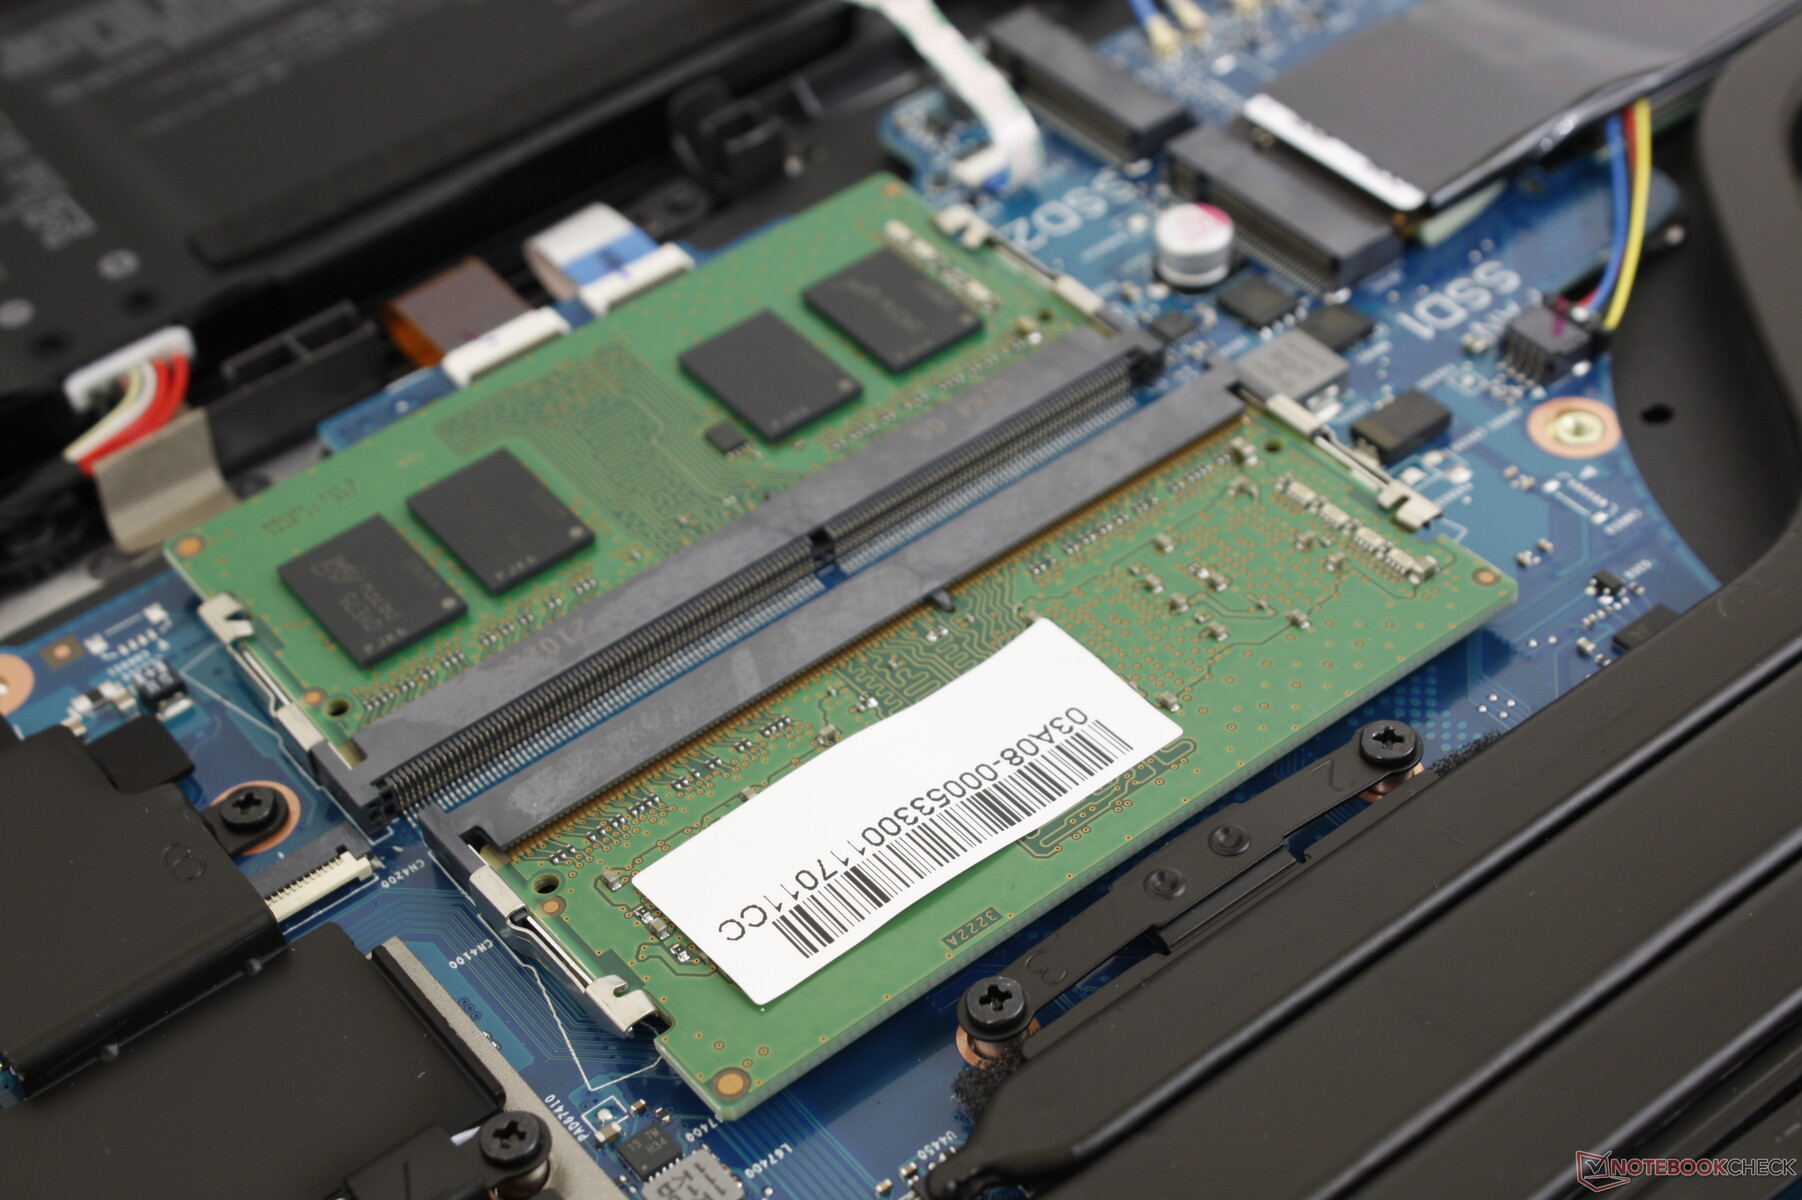
Manutenzione - Aggiornamenti facili
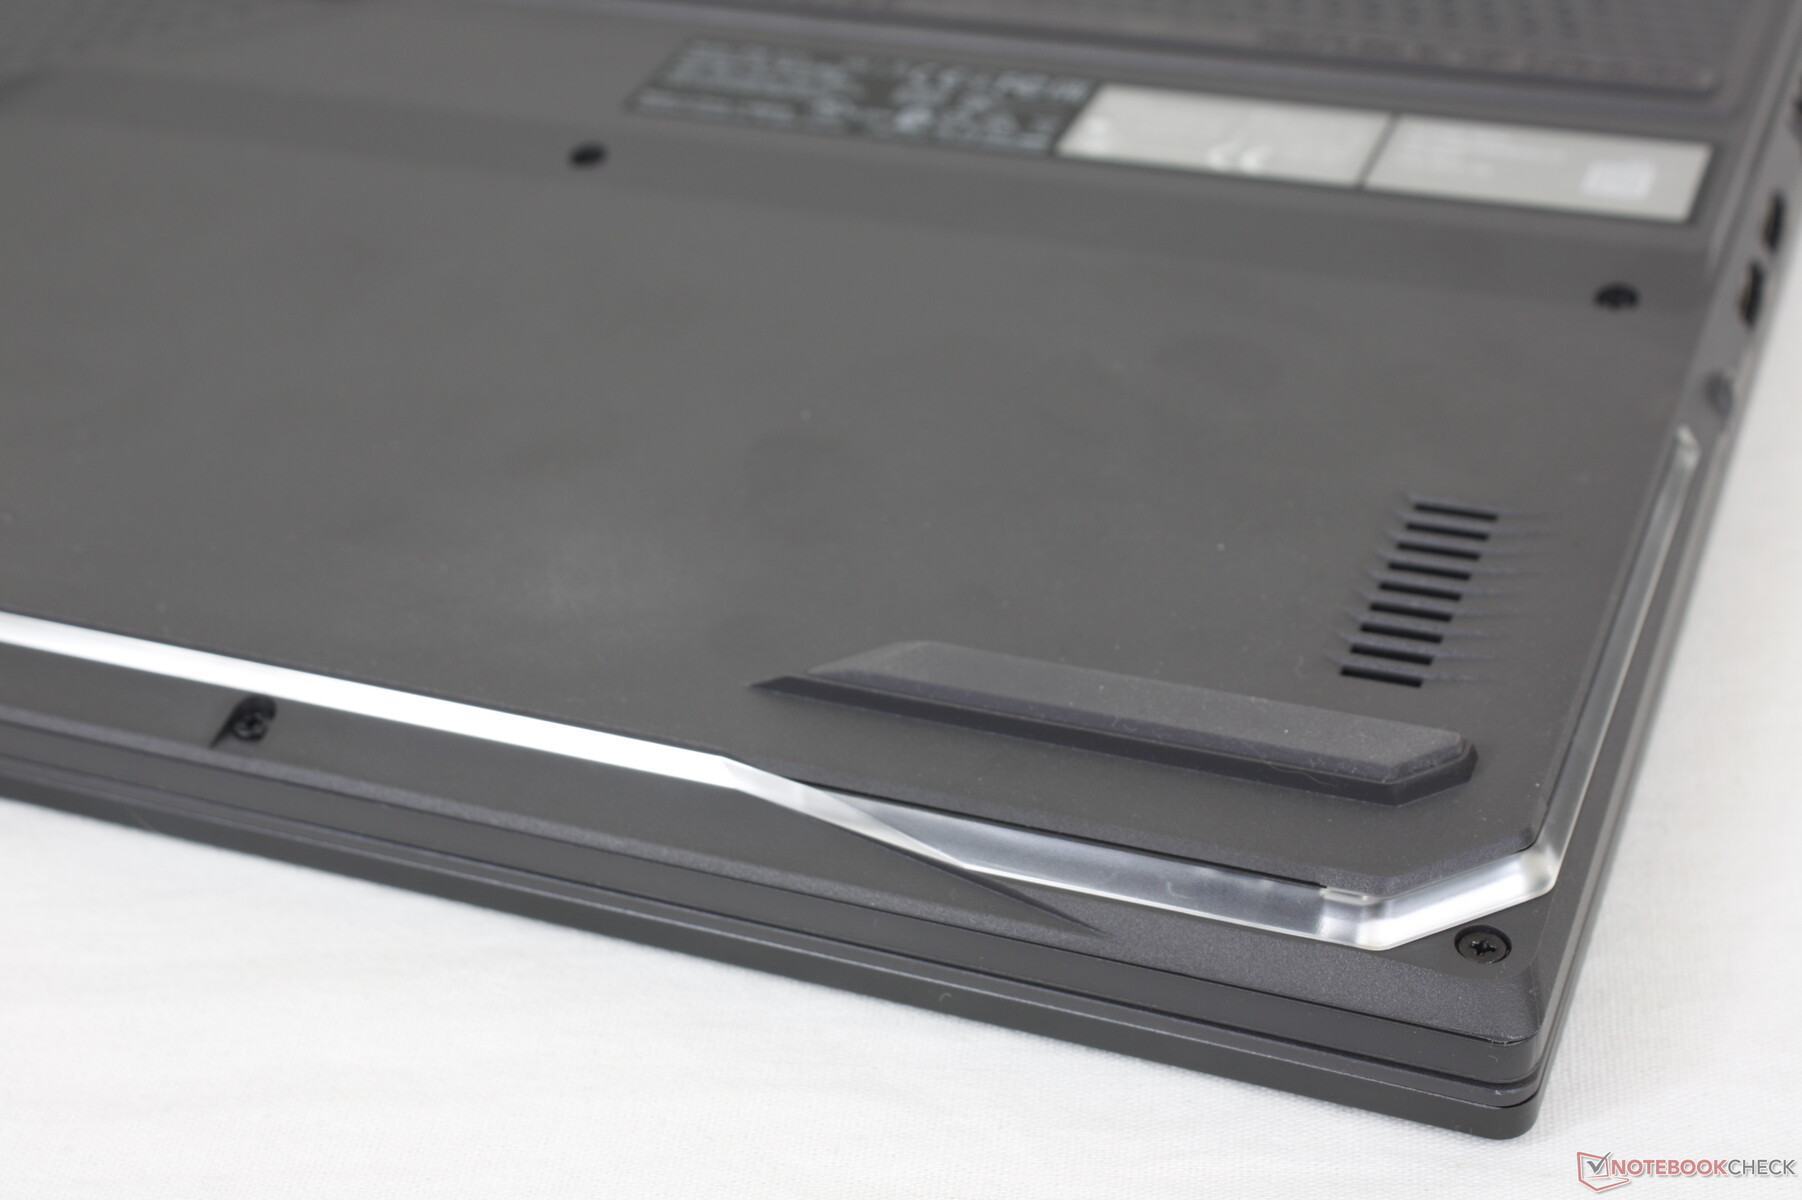
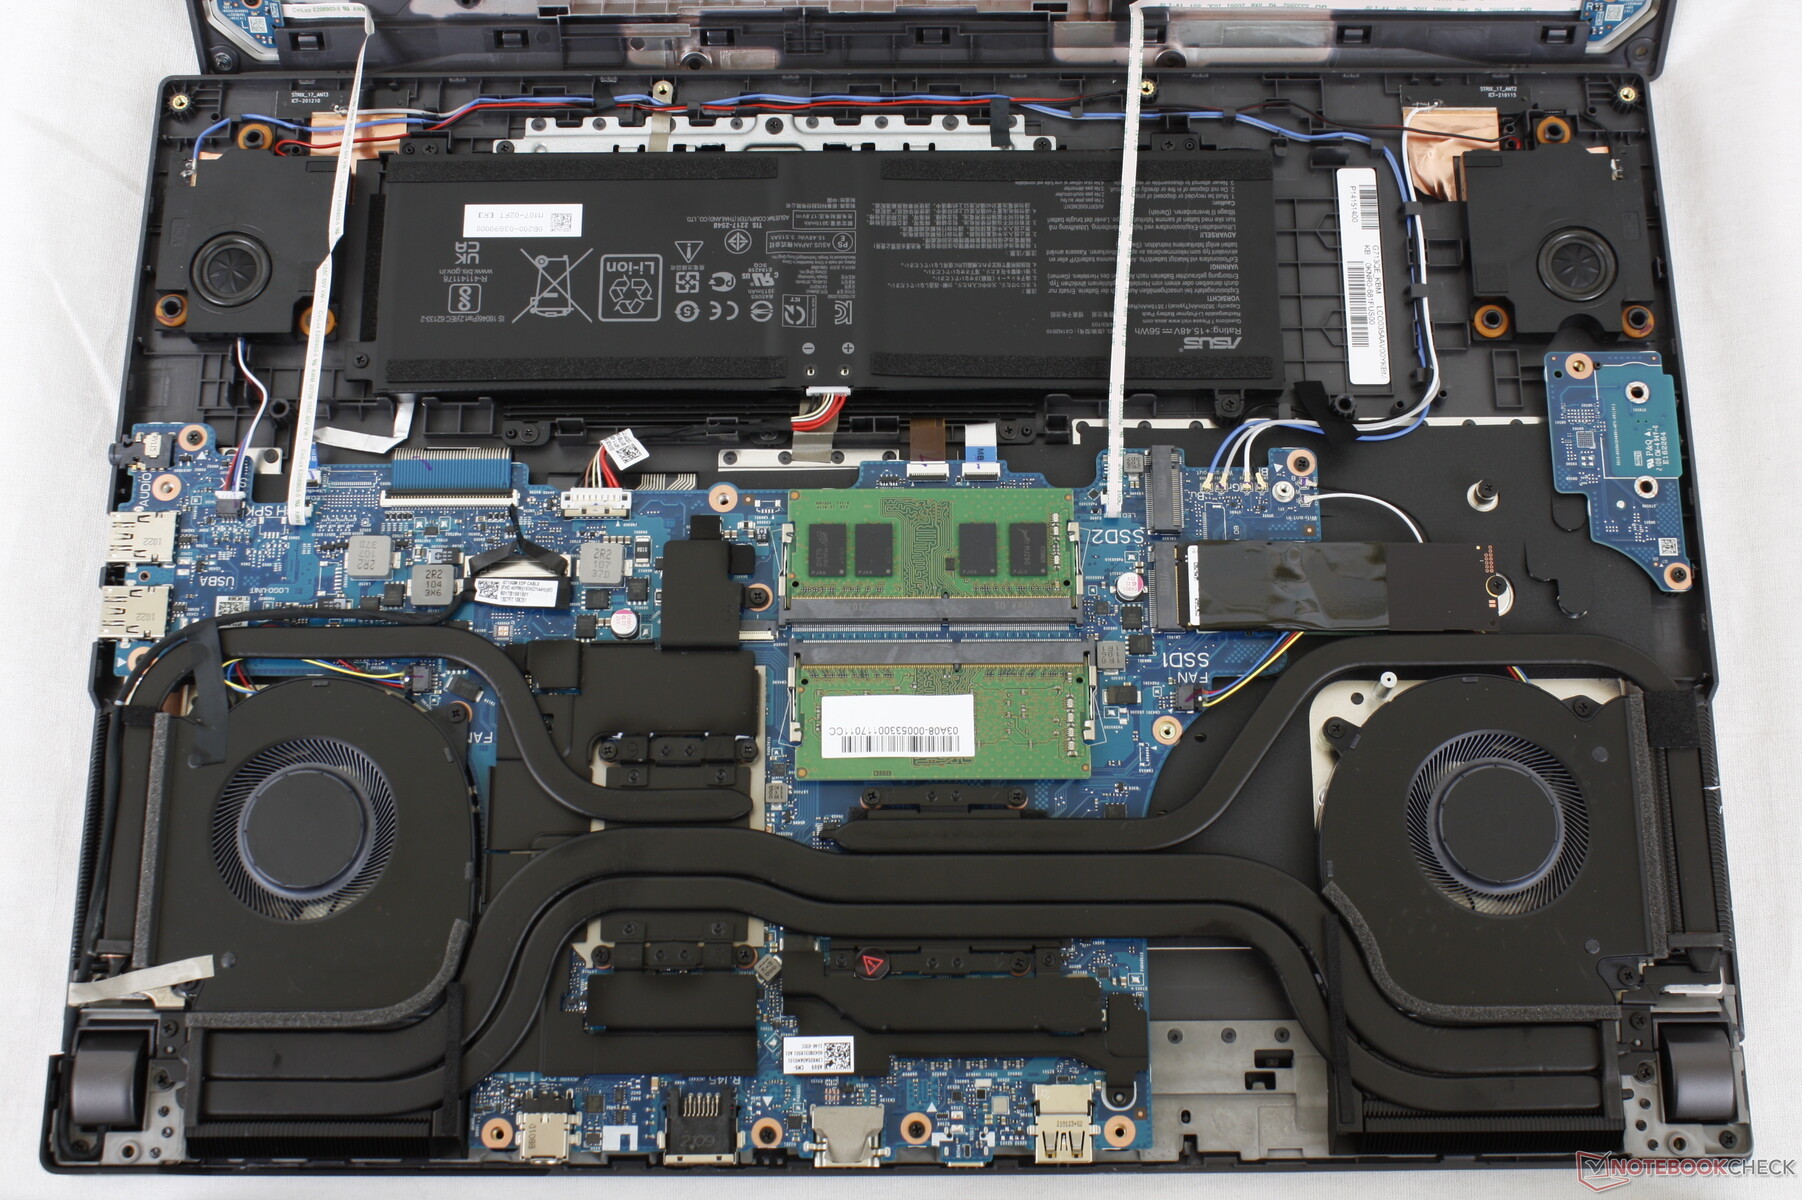
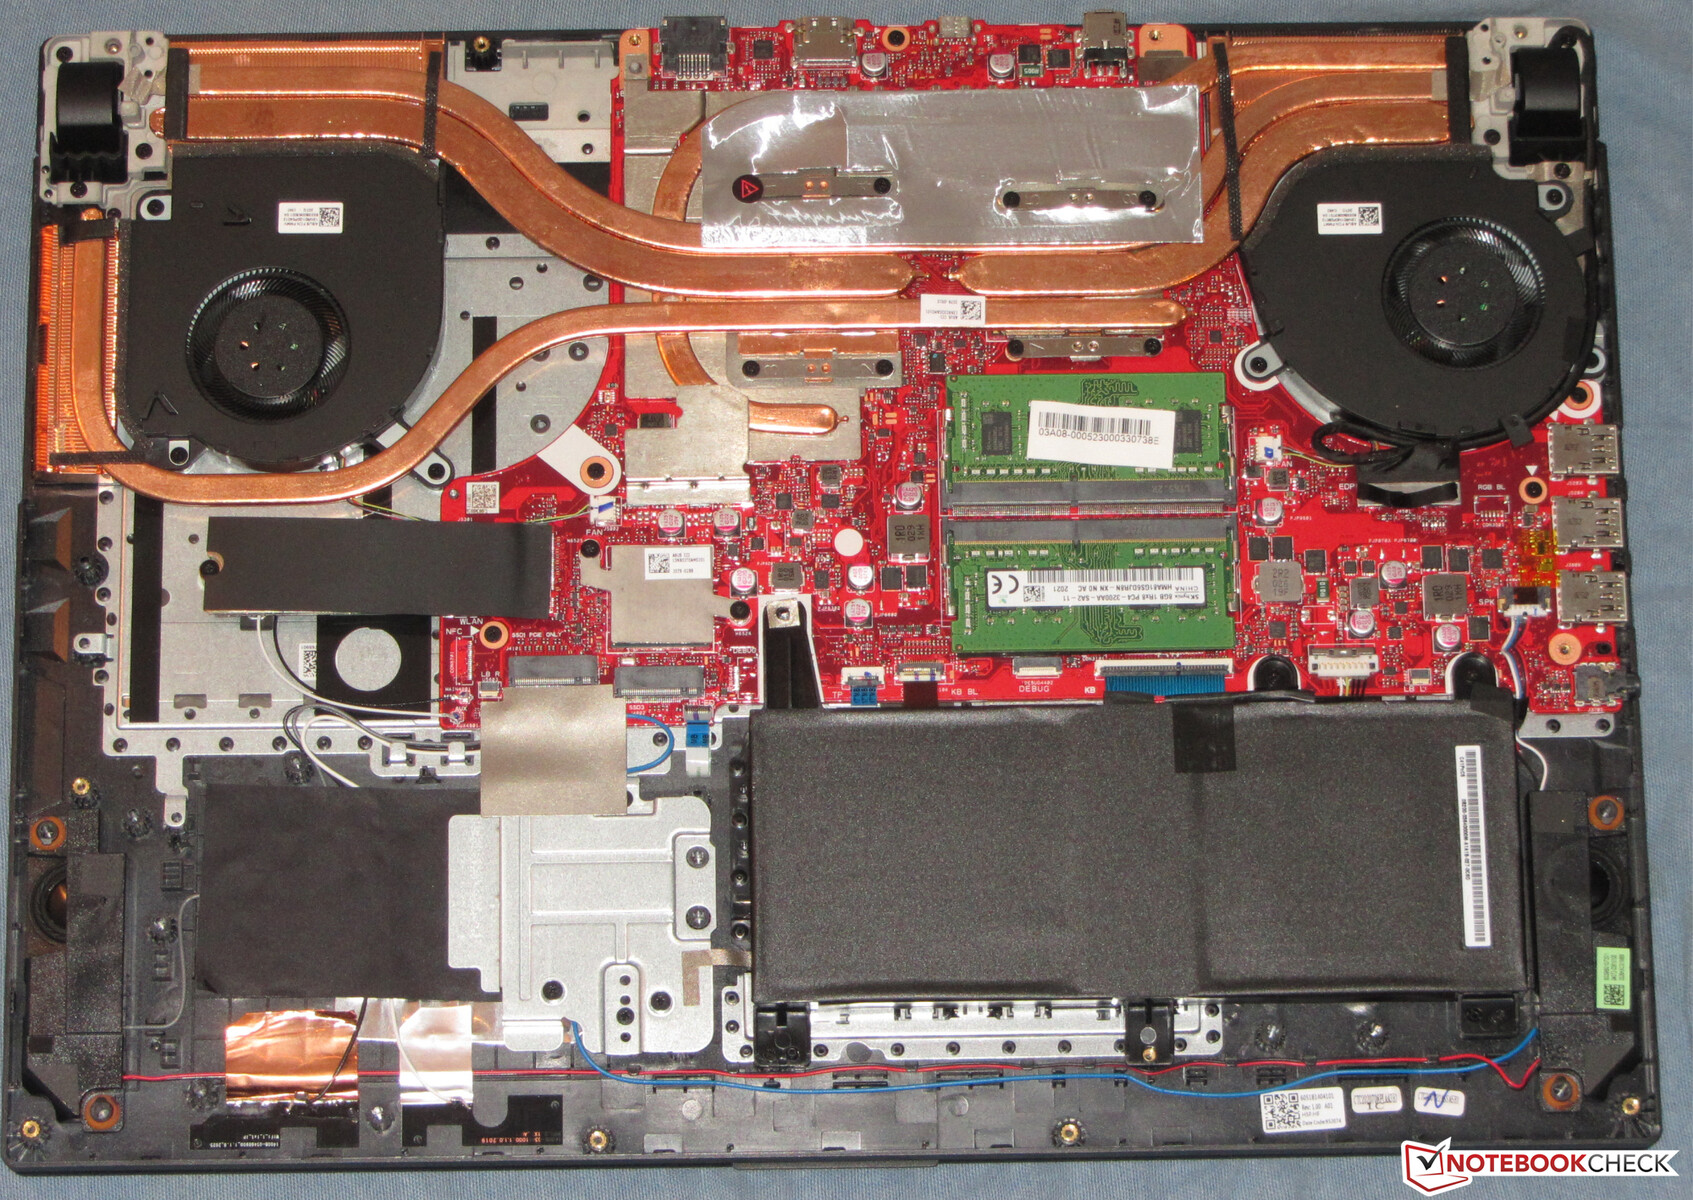
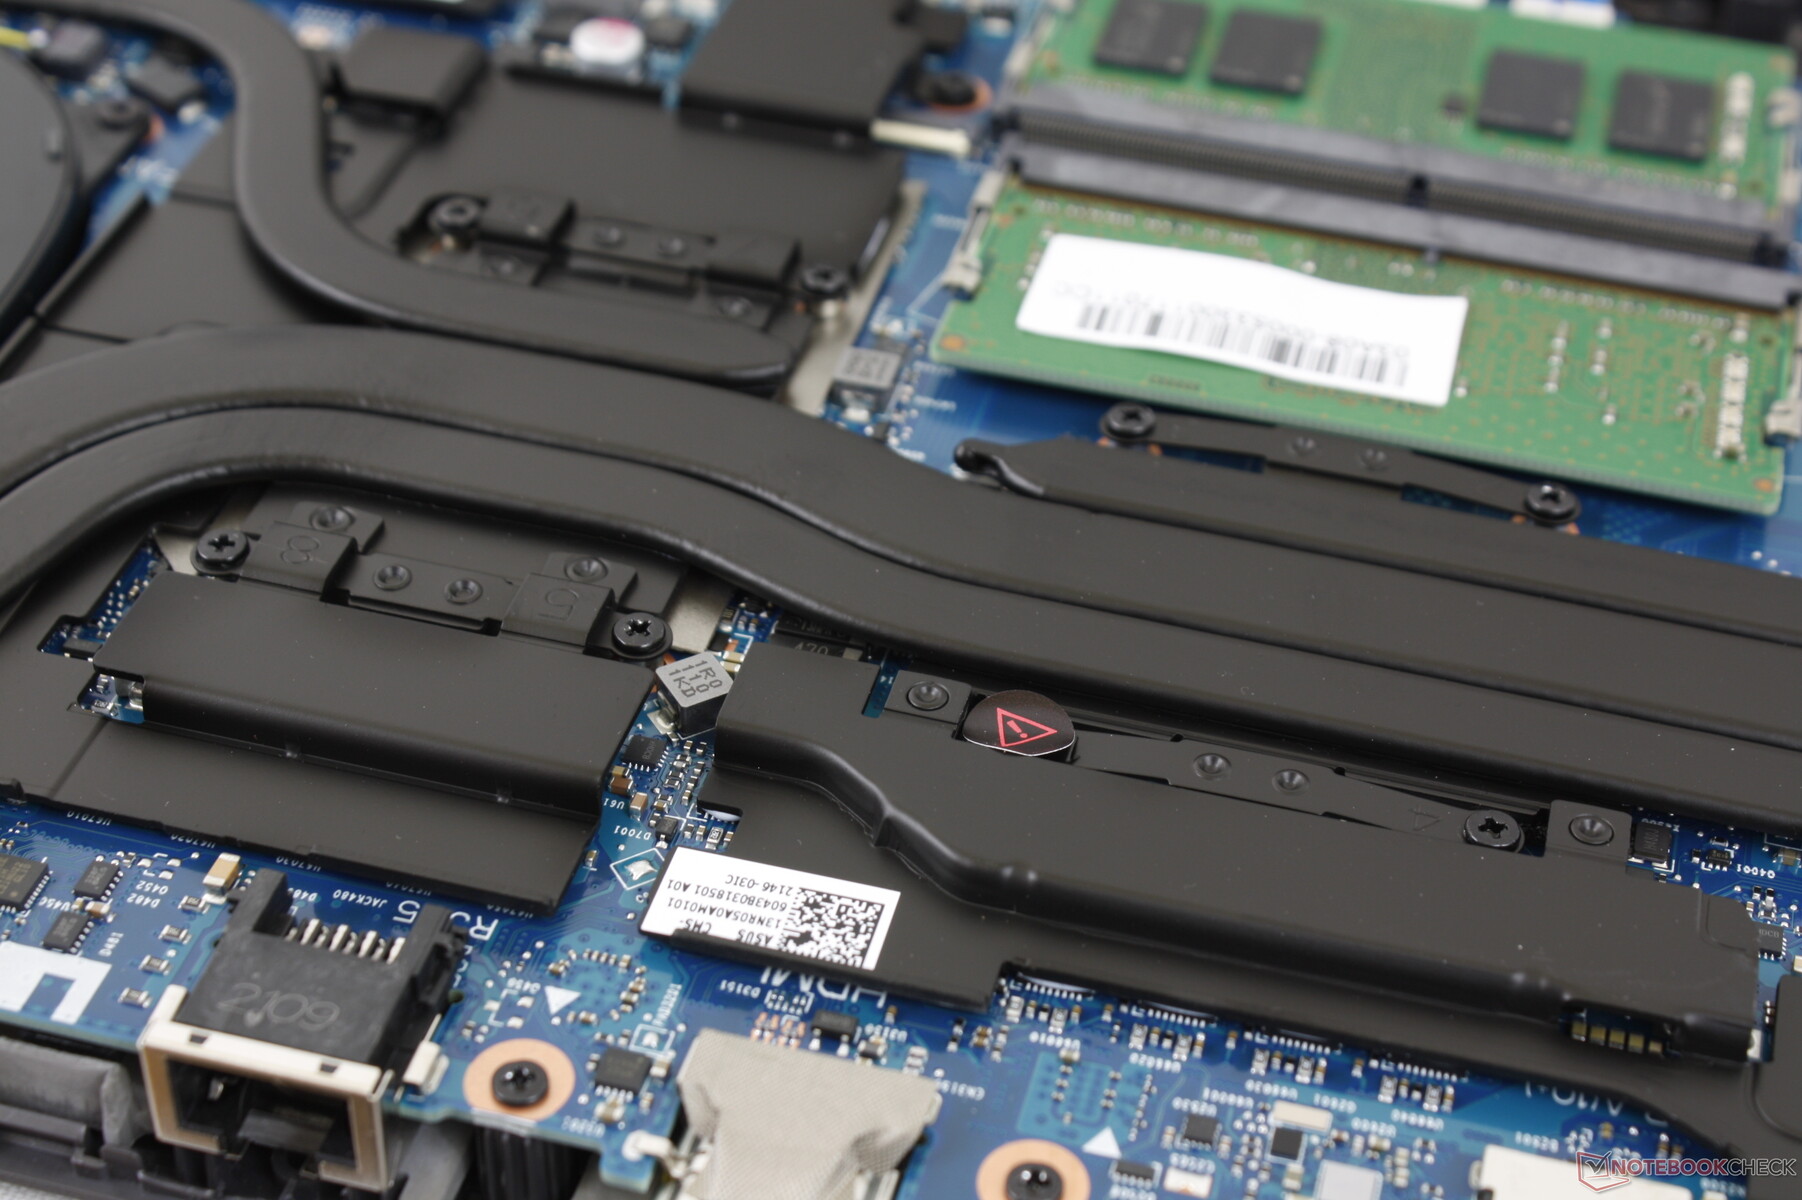
Il pannello inferiore è saldamente agganciato alla base e quindi è necessario uno strumento piatto per lo smontaggio. Internamente, il sistema differisce significativamente dal G712 in termini di batteria, altoparlanti e dimensioni della soluzione di raffreddamento.
Assicuratevi di non danneggiare i due fragili nastri che collegano il pannello inferiore alla scheda madre. Questi nastri non sono presenti sulla maggior parte degli altri portatili poiché il G713 ha dei LED personalizzabili lungo il bordo anteriore.
Accessori e garanzia
Non ci sono extra nella confezione al di fuori dell'adattatore AC e della documentazione. Si applica la solita garanzia limitata di un anno del produttore.
Dispositivi di input
Tastiera
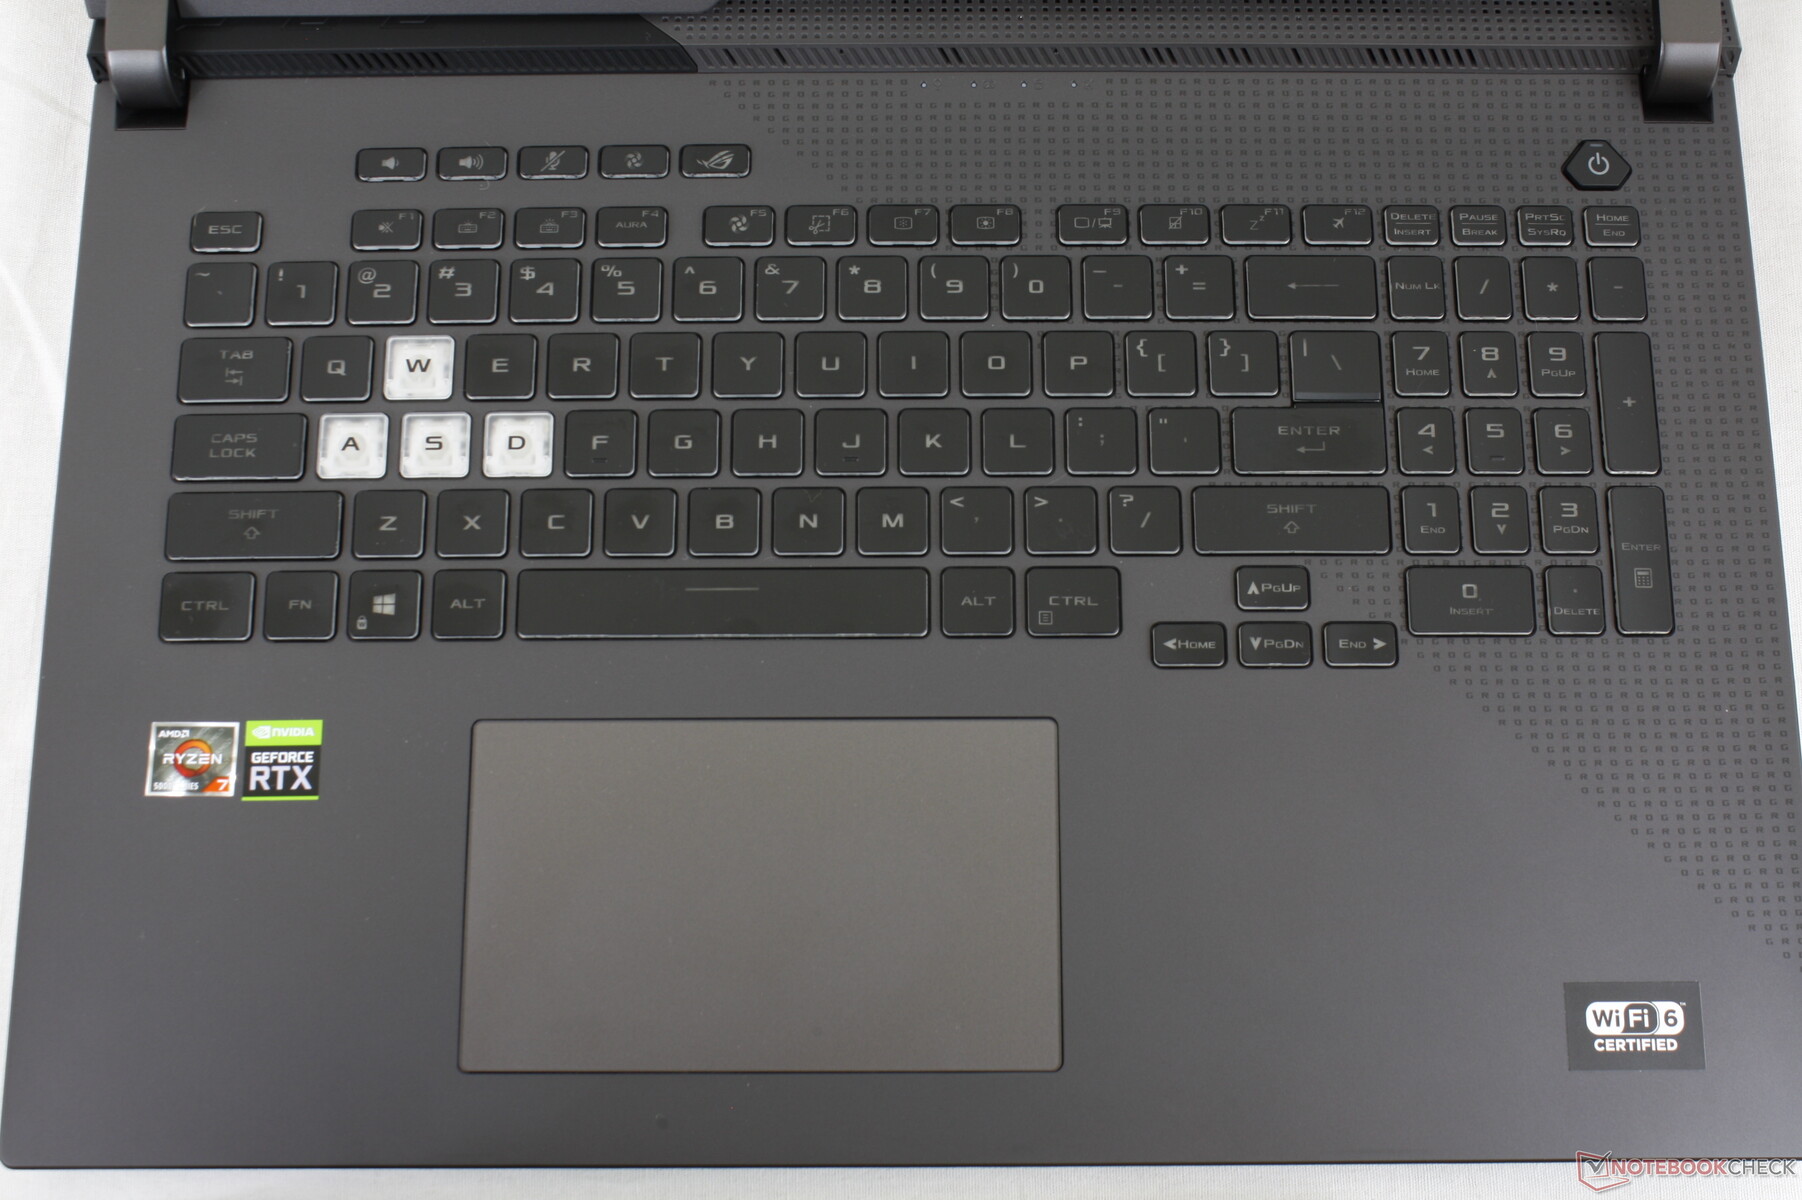
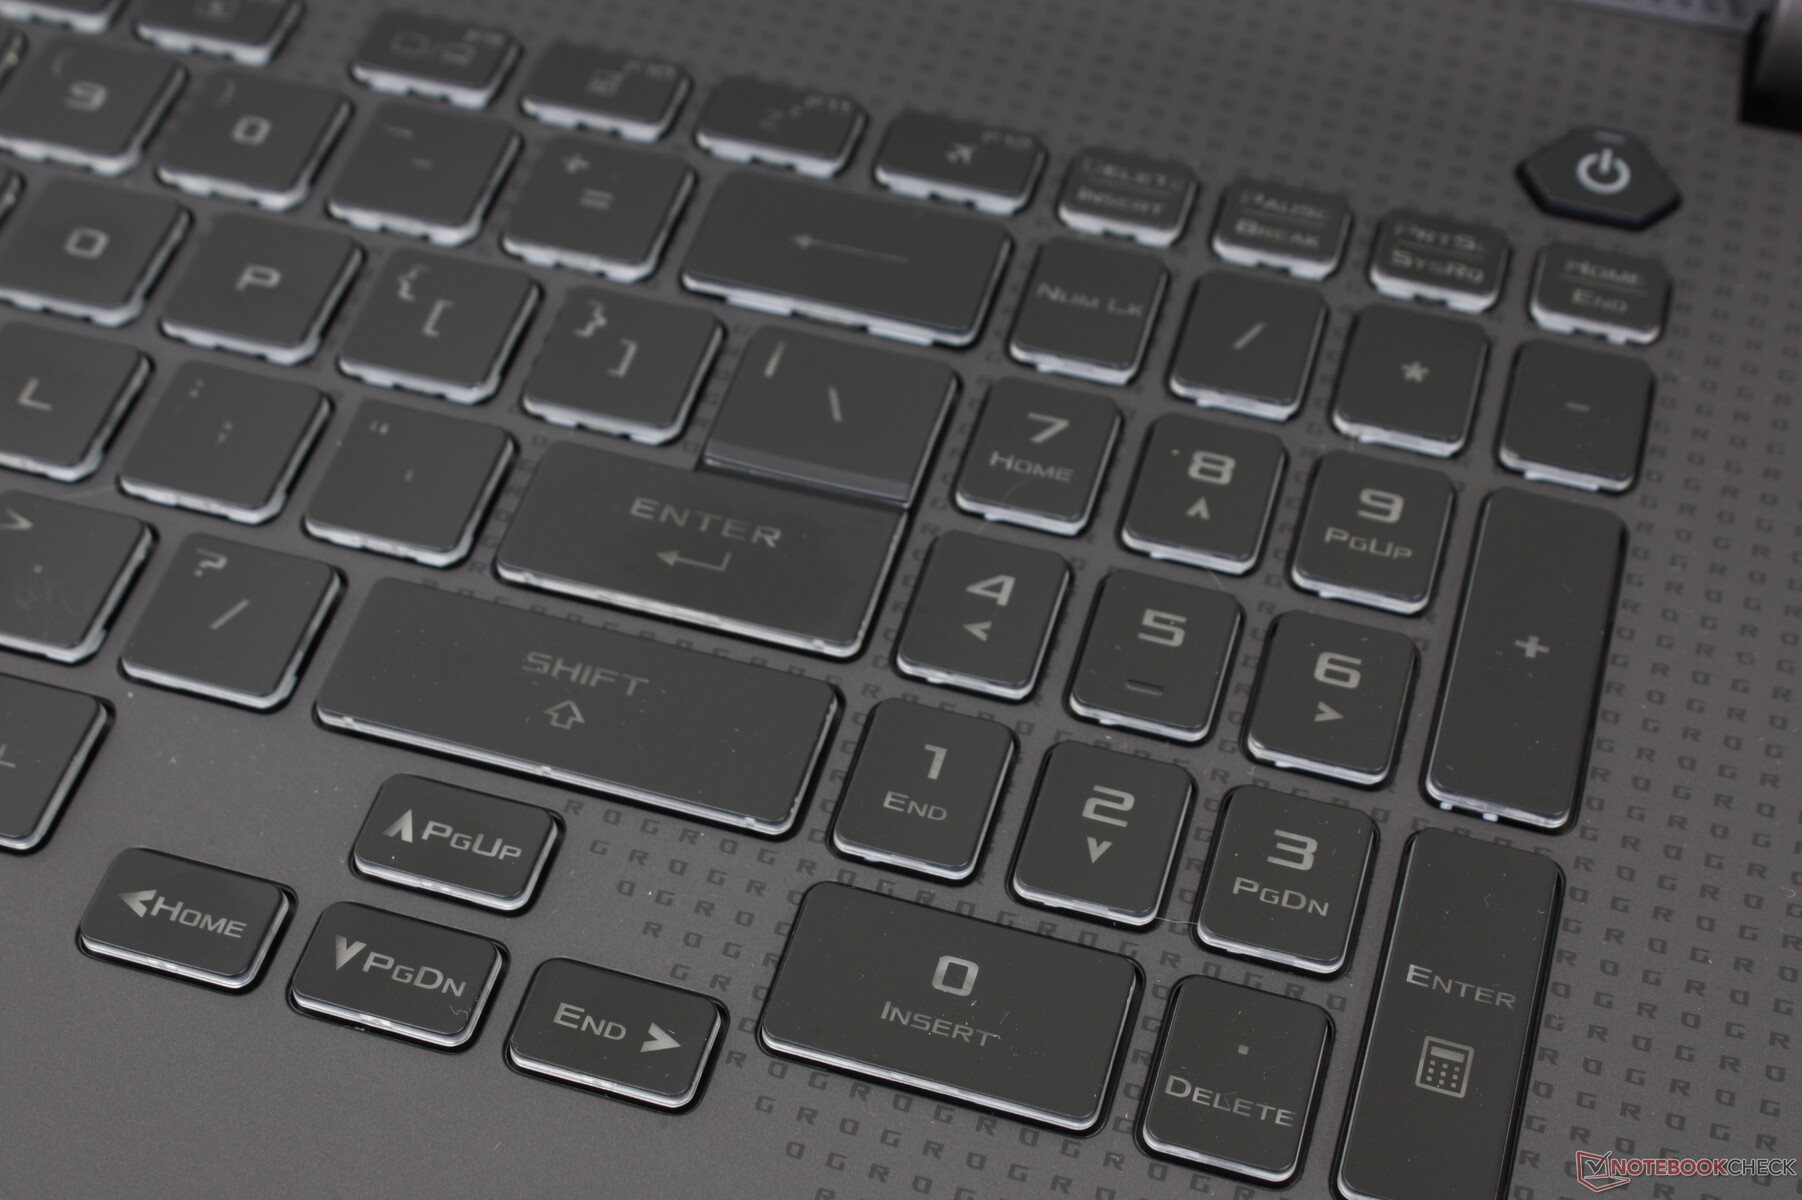
A parte i modelli di punta più recenti con switches meccanici, l'esperienza di digitazione sulla maggior parte dei portatili ROG Strix è quasi identica poiché tutti utilizzano un design simile dello chassis. I tasti hanno un feedback più profondo e soddisfacente che su un portatile Razer, ma con un rumore più forte rispetto all'MSI Katana. Il tastierino numerico e le frecce rimangono più piccoli e più stretti rispetto ai tasti principali della QWERTY.
L'illuminazione RGB a quattro zone è disponibile sulla maggior parte delle versioni mentre le versioni di fascia alta hanno un'illuminazione RGB per tasto.
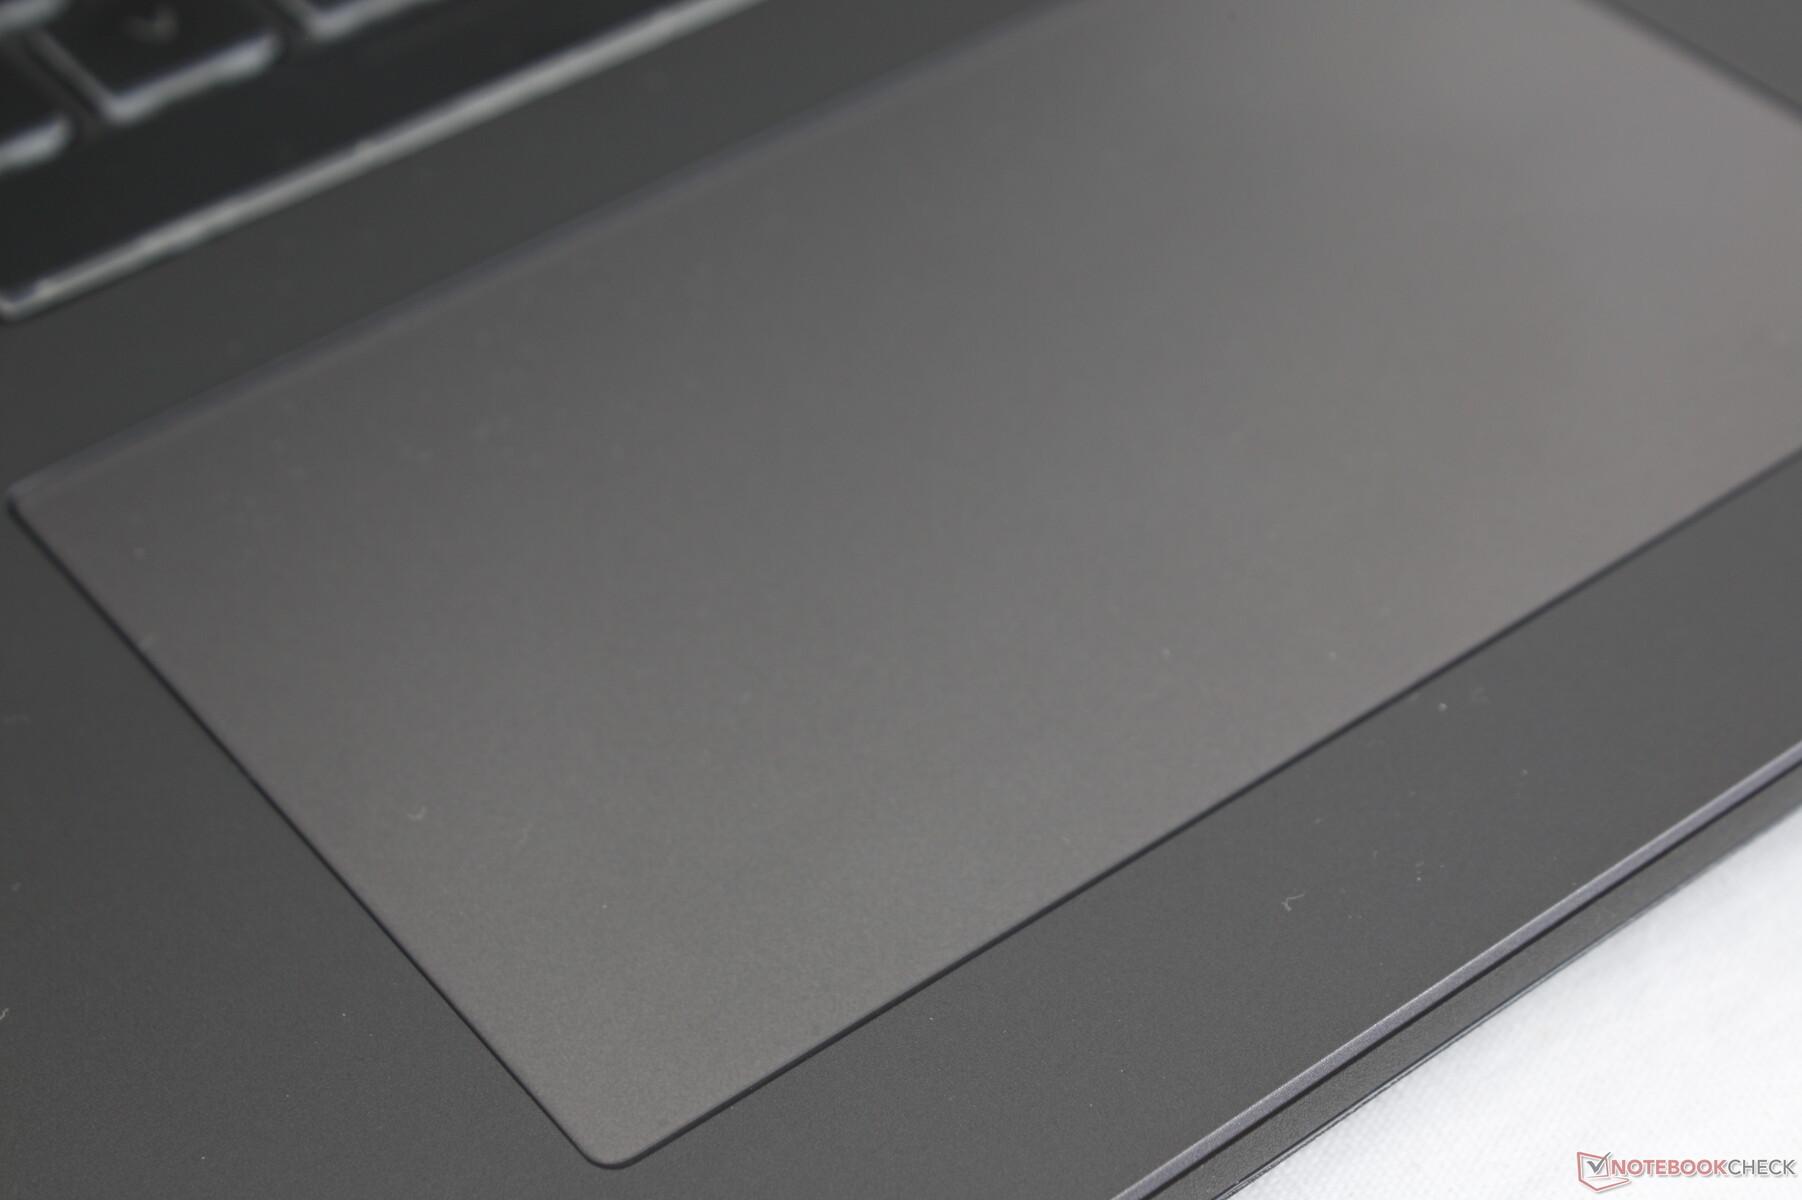
Touchpad
Il clickpad è più grande di quello del G733 (13 x 7,7 cm contro 10,8 x 6 cm) poiché Asus ha abbandonato i pulsanti del mouse dedicati in favore di una superficie più ampia. Lo scorrimento sul clickpad è fluido e con pochissimo appiccicamento alle basse velocità. Nel frattempo, i tasti integrati sono rumorosi e relativamente saldi per un click soddisfacente quando vengono premuti.

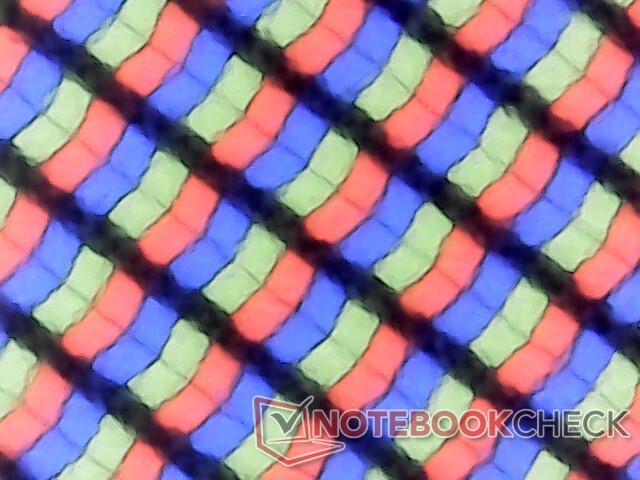
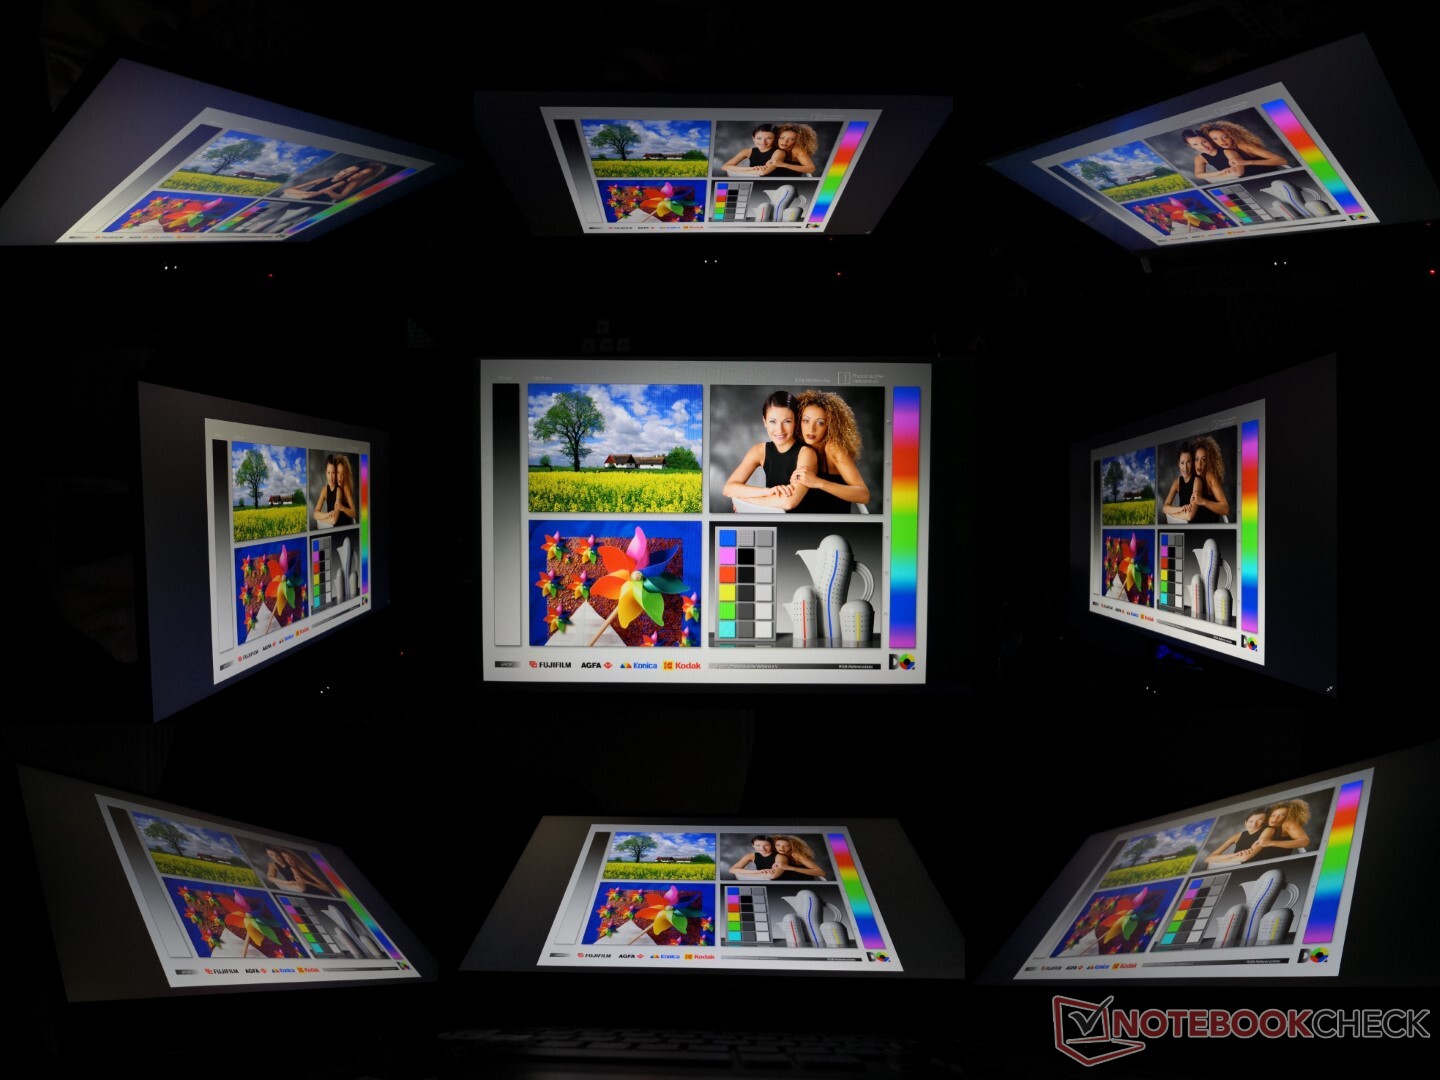
Display - Alta frequenza di aggiornamento, colori ridotti
La nostra configurazione Asus utilizza lo stesso pannello IPS AU Optronics B173HAN04.9 che si trova sul concorrente MSI Katana avendo caratteristiche simili tra loro. Questo pannello 1080p è notevole per la sua frequenza di aggiornamento nativa di 144 Hz e il supporto FreeSync, ma è deficitario per i tempi di risposta e precisione del colore.
Asus offre almeno altre due opzioni di pannello (1080p 300 Hz e 1440p 165 Hz) ognuna con caratteristiche diverse dalla nostra unità 1080p 144 Hz, inclusi tempi di risposta più veloci e/o colori più profondi. Quindi, le nostre misurazioni qui sotto riflettono solo l'opzione 1080p 144 Hz.

| |||||||||||||||||||||||||
Distribuzione della luminosità: 92 %
Al centro con la batteria: 270.5 cd/m²
Contrasto: 1424:1 (Nero: 0.19 cd/m²)
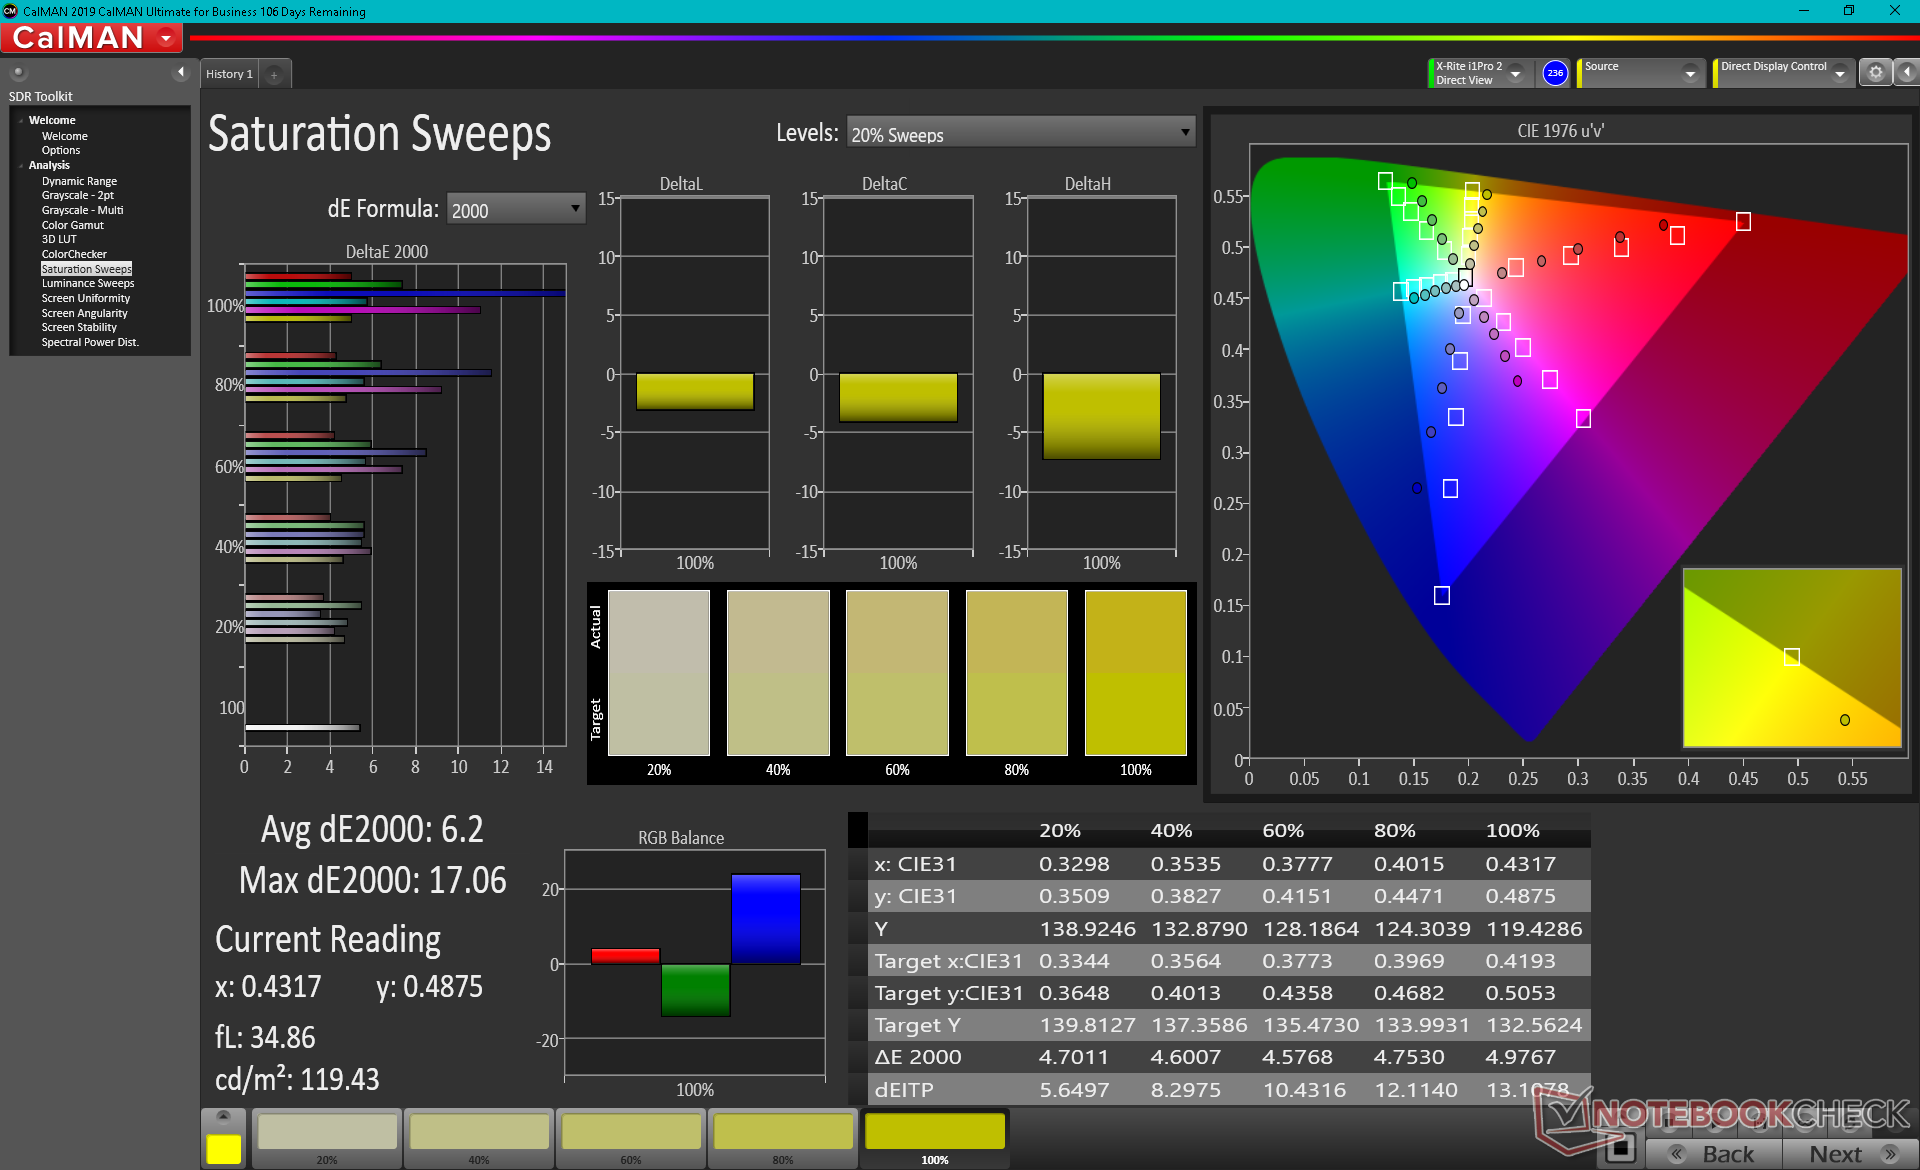
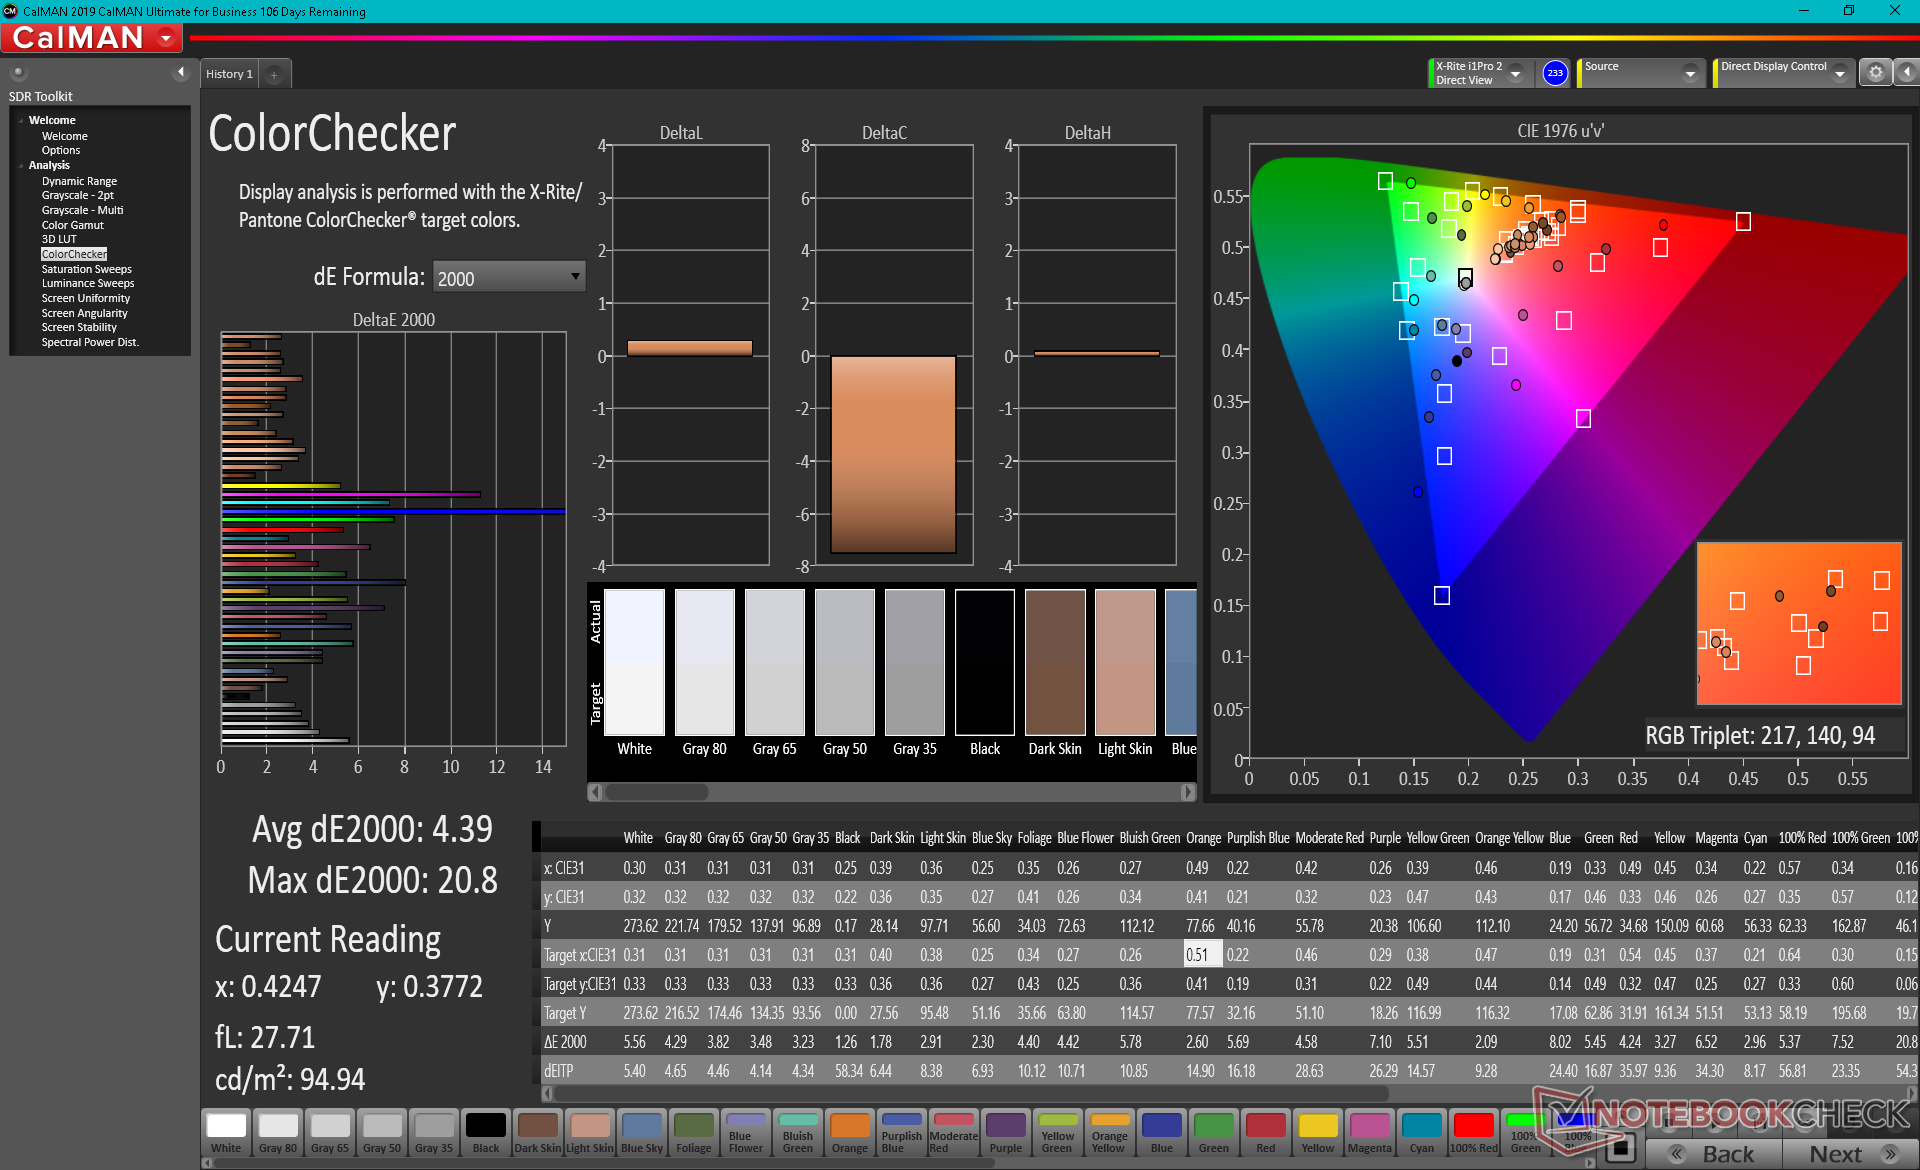
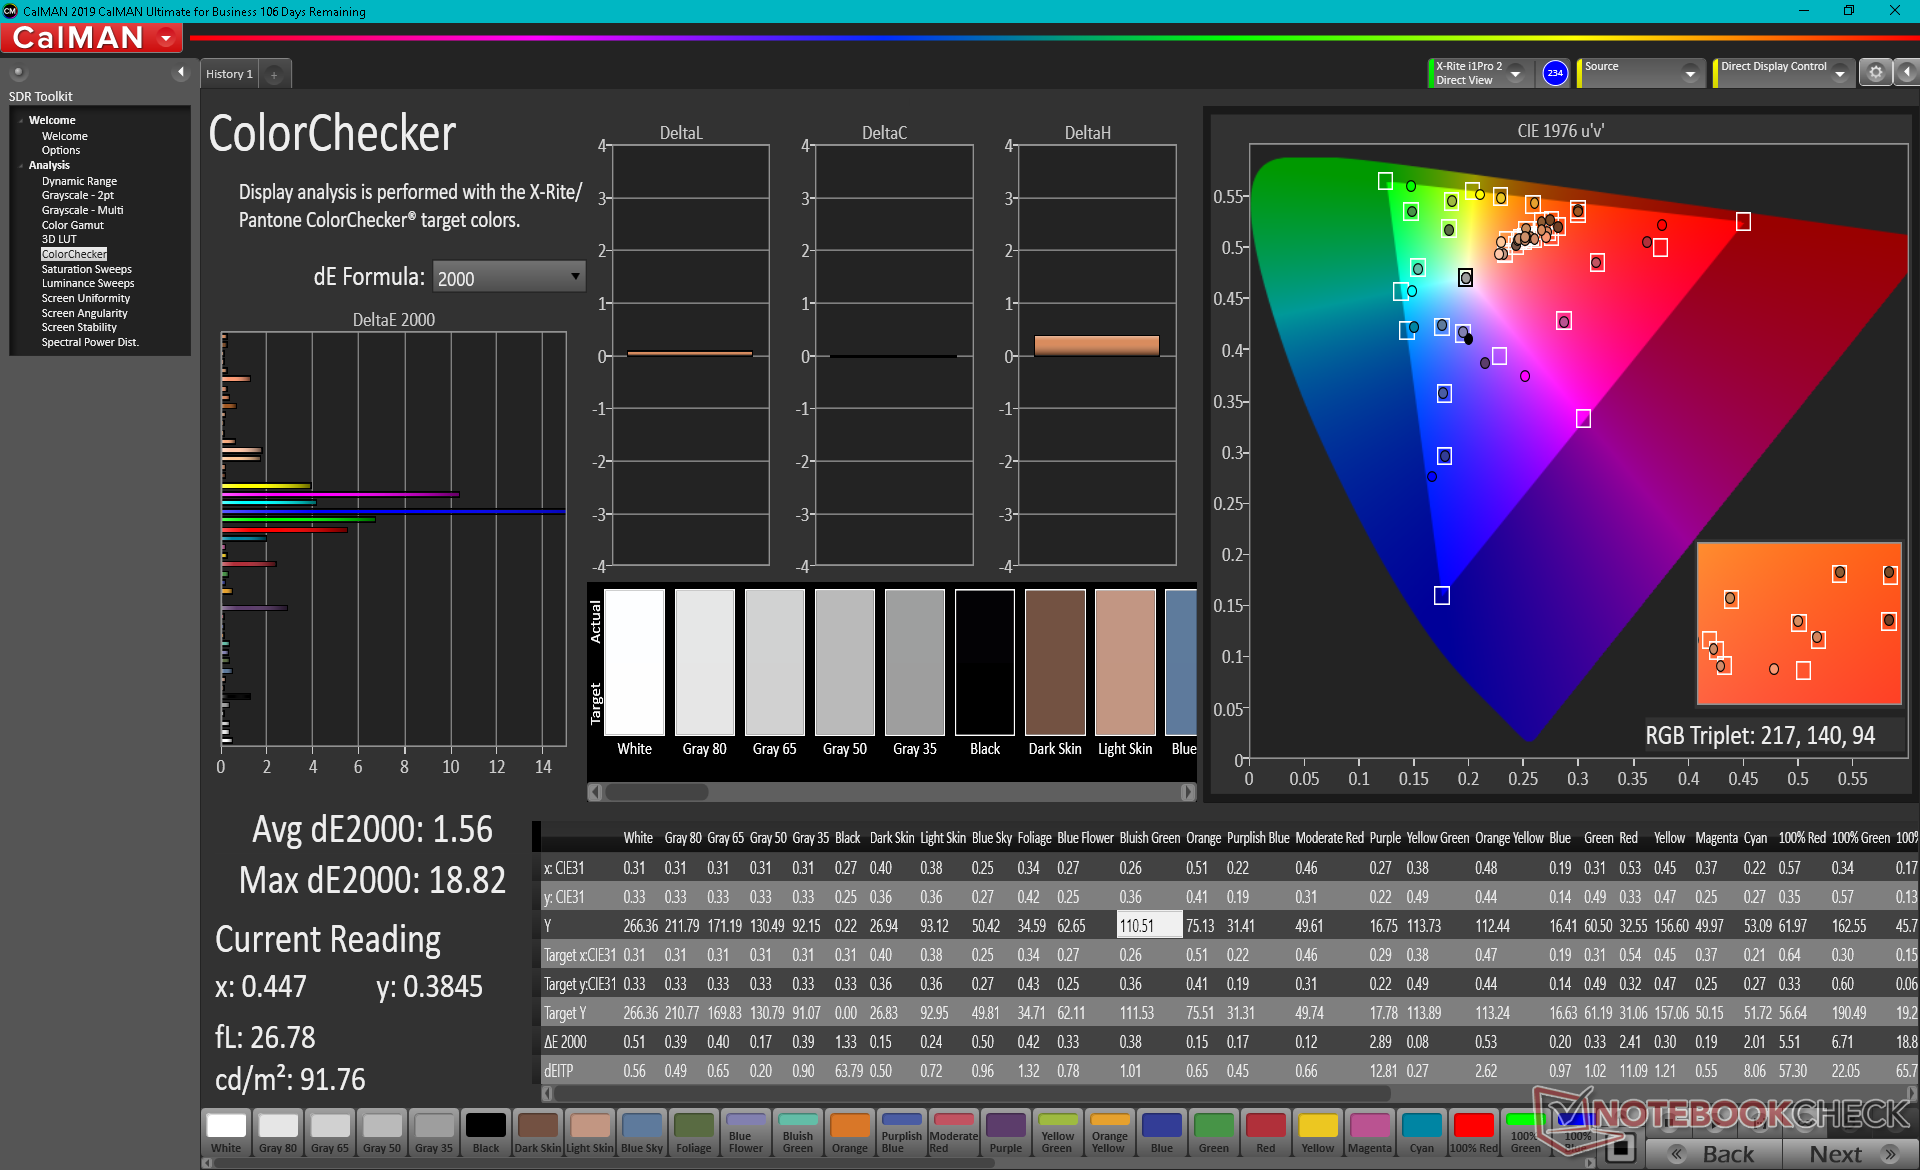
ΔE ColorChecker Calman: 4.39 | ∀{0.5-29.43 Ø4.73}
calibrated: 1.56
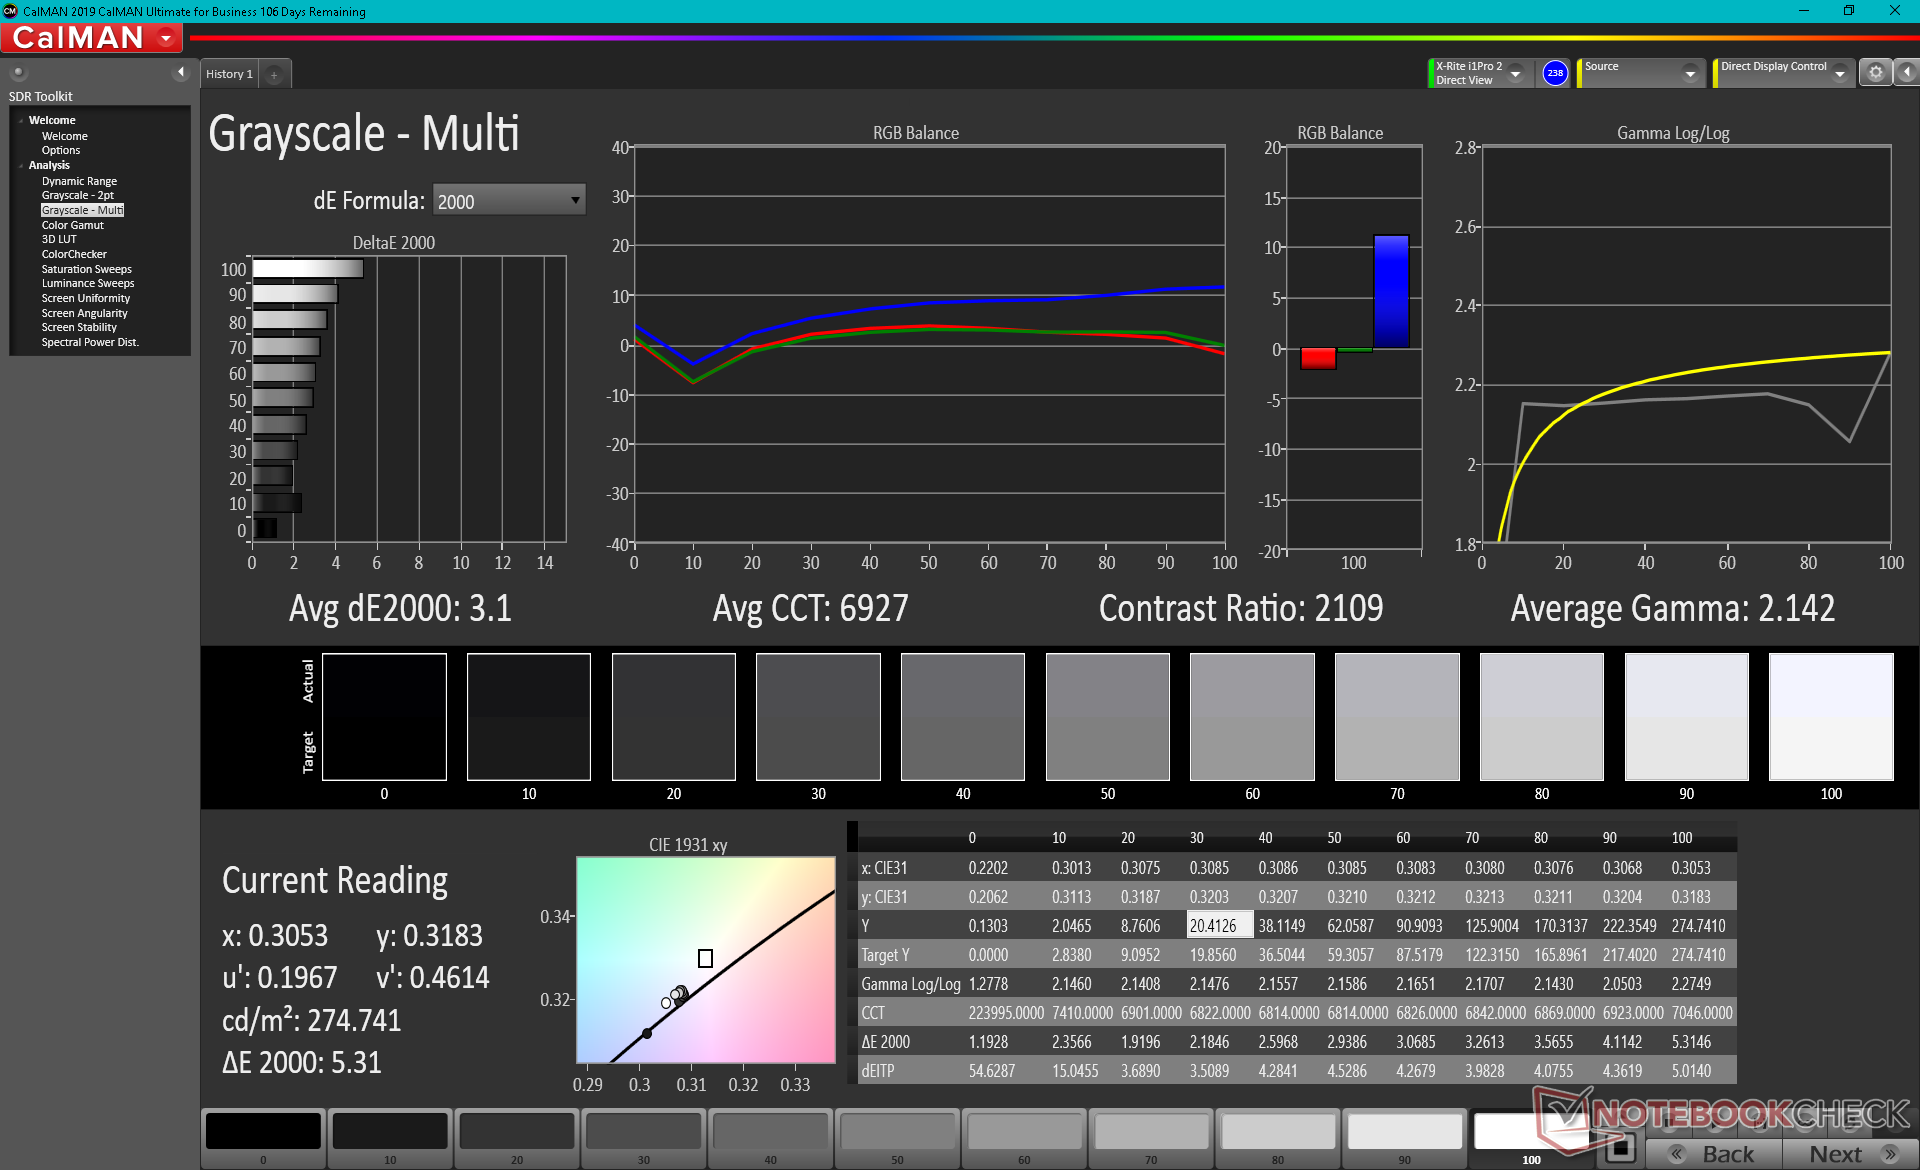
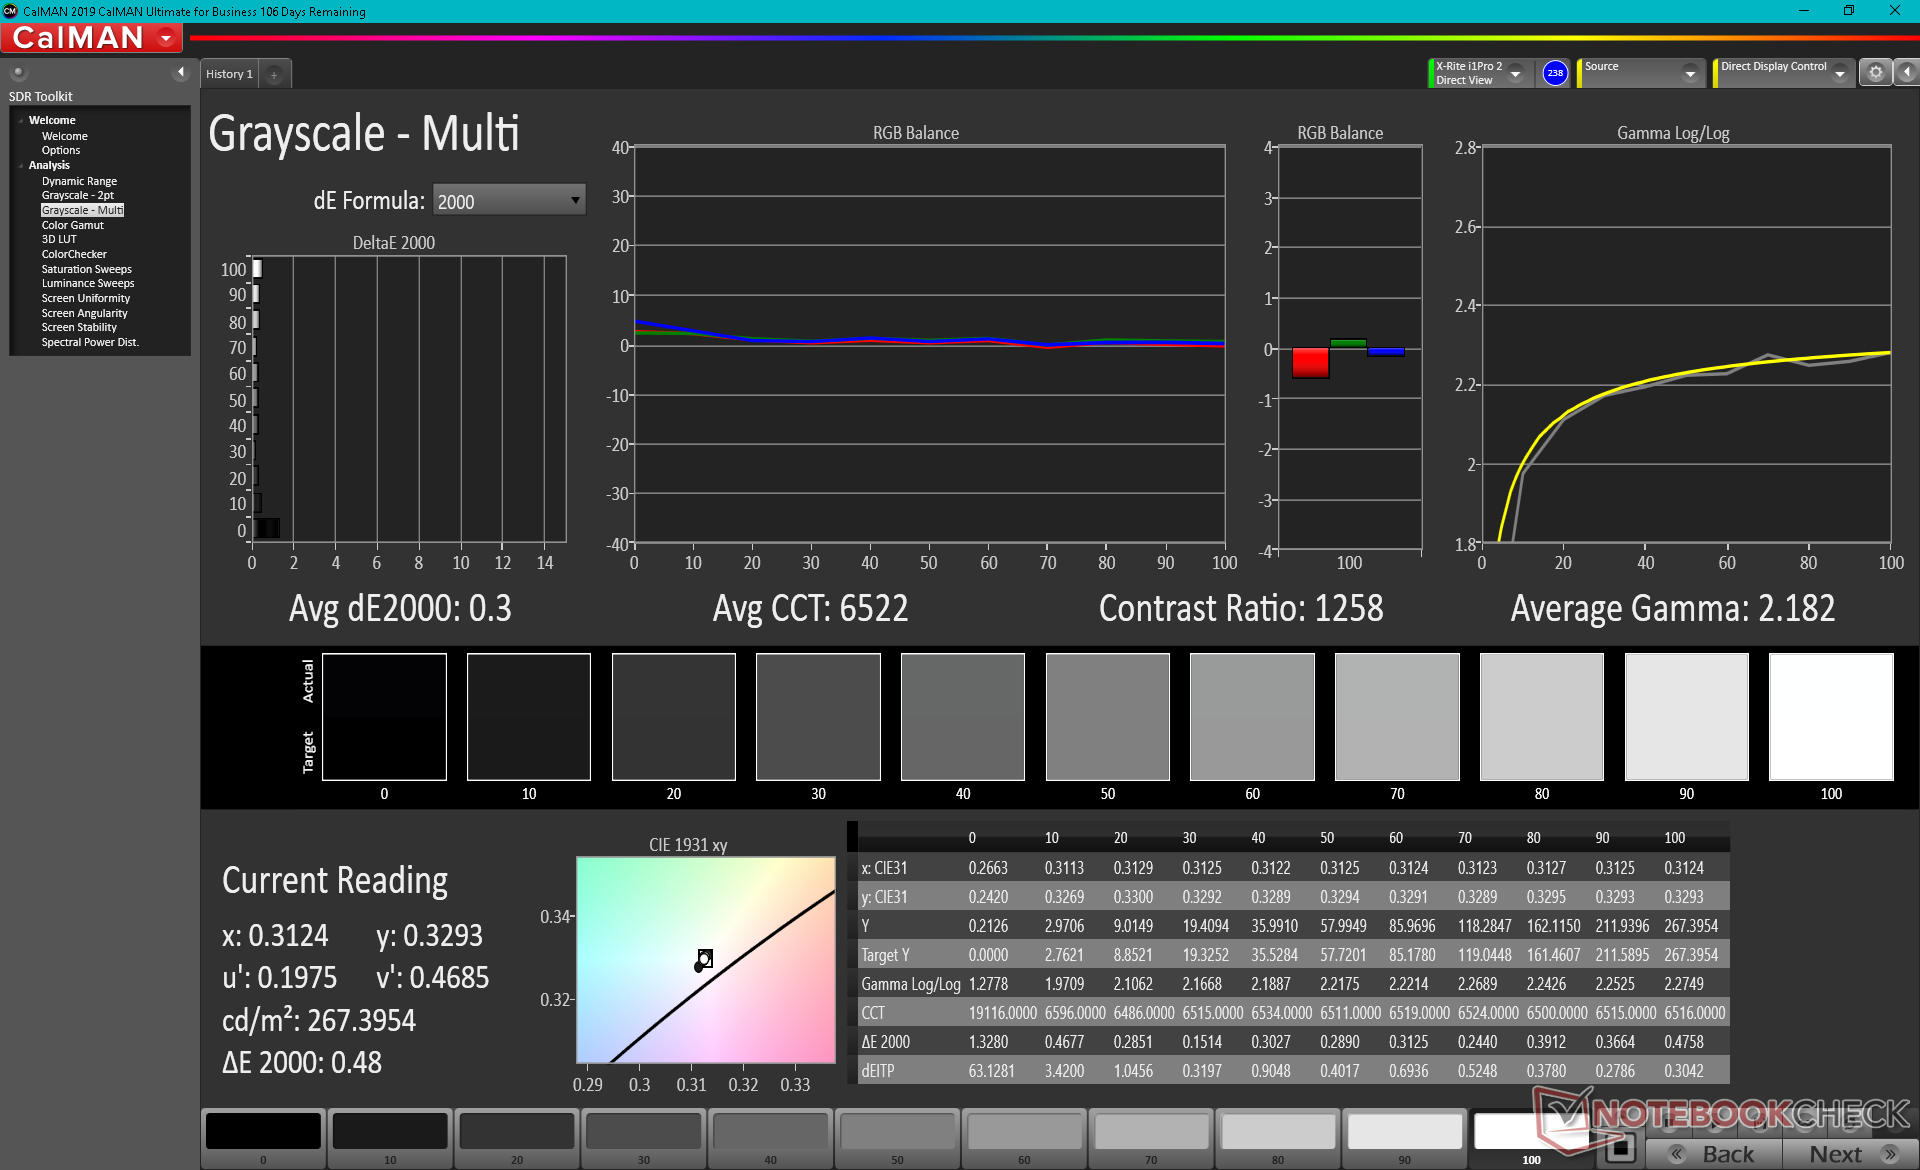
ΔE Greyscale Calman: 3.1 | ∀{0.09-98 Ø4.97}
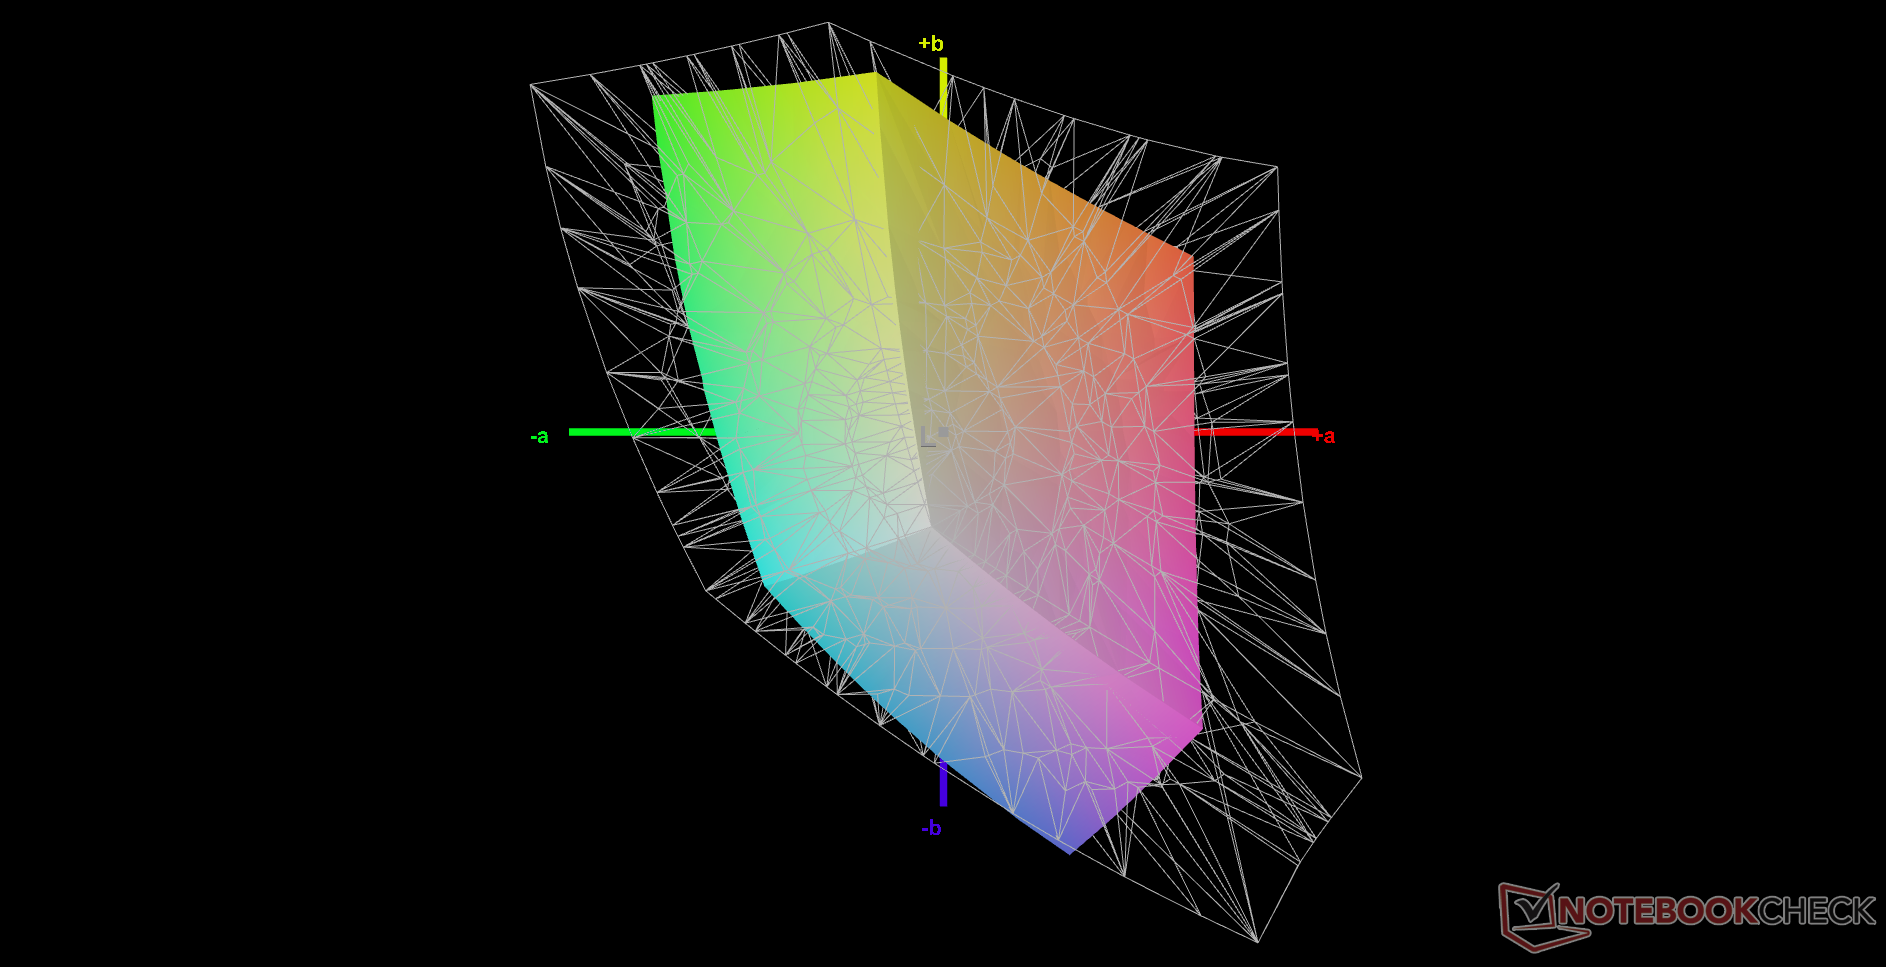
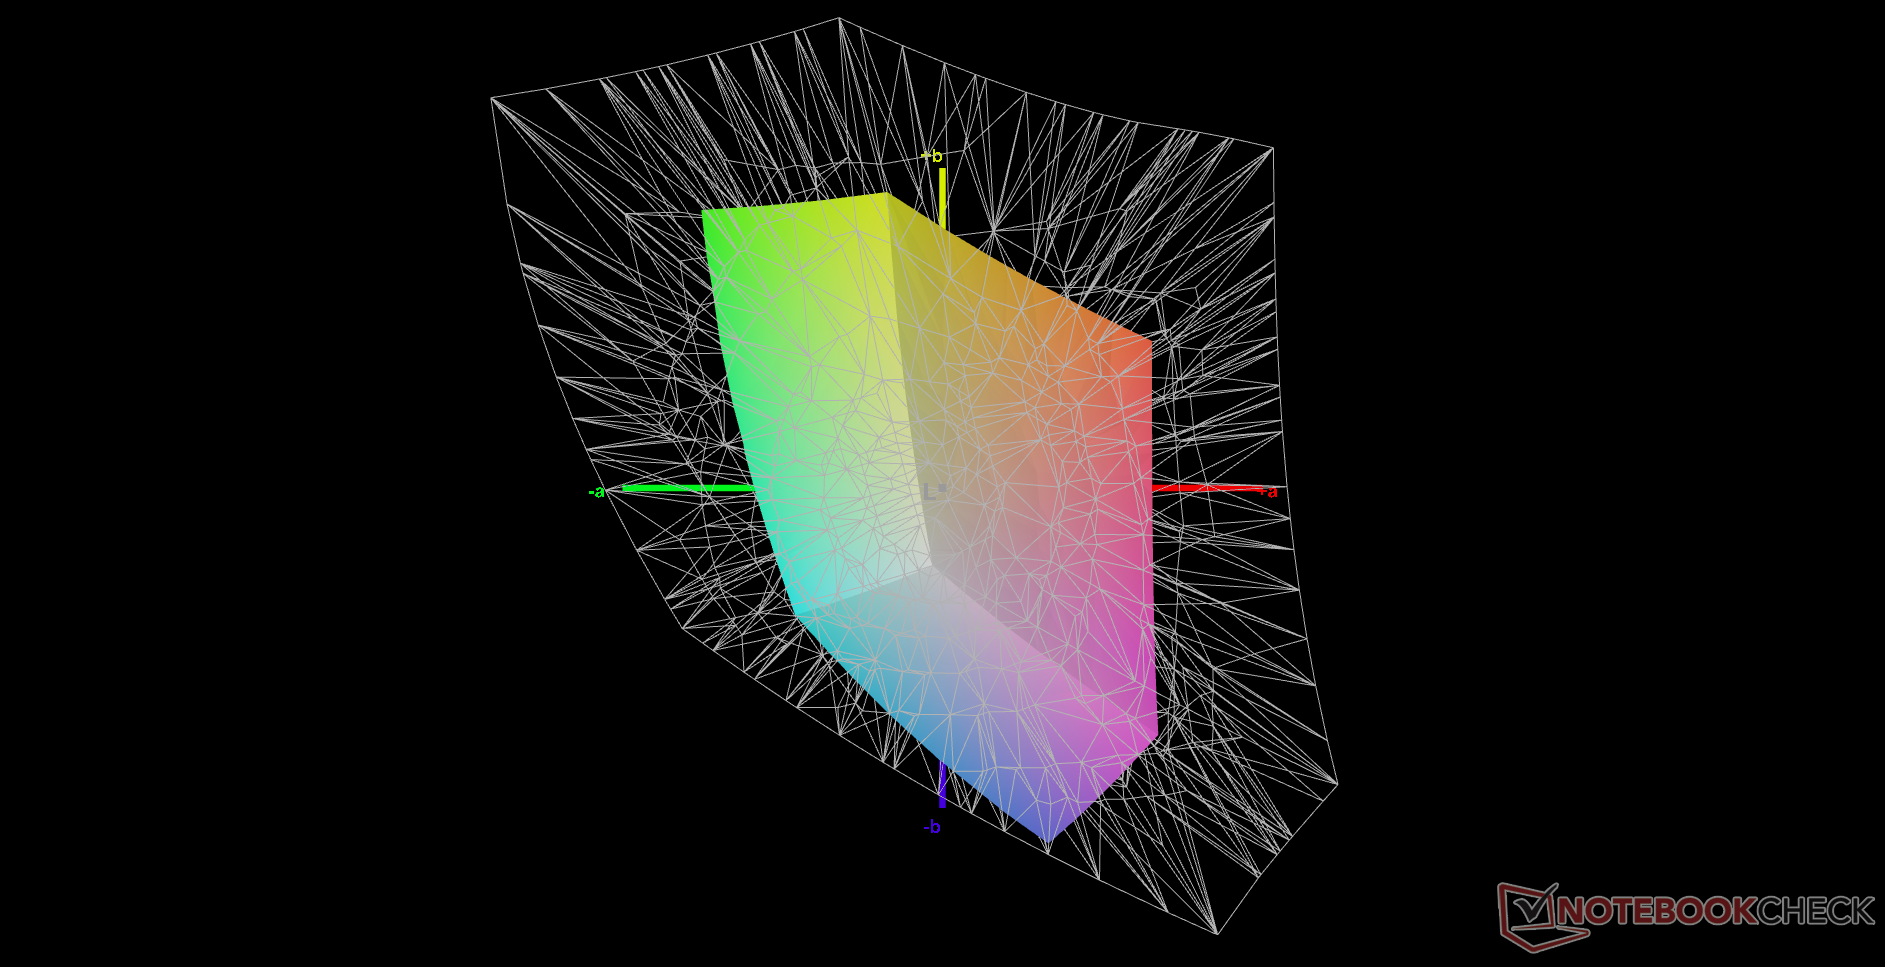
41.6% AdobeRGB 1998 (Argyll 3D)
60.3% sRGB (Argyll 3D)
40.2% Display P3 (Argyll 3D)
Gamma: 2.14
CCT: 6927 K
| Asus ROG Strix G17 G713QE-RB74 AU Optronics B173HAN04.9, IPS, 17.3", 1920x1080 | Acer Nitro 5 AN517-53-54DQ BOE NV173FHM-NX4 (BOE09B4), IPS, 17.3", 1920x1080 | MSI Katana GF76 11UE AU Optronics B173HAN04.9, IPS, 17.3", 1920x1080 | Asus Strix Scar 17 G733QSA-XS99 AU Optronics B173HAN05.4, IPS, 17.3", 1920x1080 | MSI Alpha 17 A4DEK AU Optronics AUO978F, IPS, 17.3", 1920x1080 | Asus Strix G17 G712LWS LG Philips LP173WFG-SPB3, IPS, 17.3", 1920x1080 | |
|---|---|---|---|---|---|---|
| Display | -9% | -1% | 72% | -2% | 61% | |
| Display P3 Coverage (%) | 40.2 | 36.7 -9% | 39.8 -1% | 71 77% | 39.55 -2% | 65.2 62% |
| sRGB Coverage (%) | 60.3 | 55 -9% | 59.5 -1% | 99.4 65% | 59.2 -2% | 96.8 61% |
| AdobeRGB 1998 Coverage (%) | 41.6 | 37.9 -9% | 41.12 -1% | 72.2 74% | 40.86 -2% | 66.4 60% |
| Response Times | 5% | -36% | 60% | -51% | 46% | |
| Response Time Grey 50% / Grey 80% * (ms) | 26.8 ? | 24.8 ? 7% | 36.8 ? -37% | 6.6 ? 75% | 40 ? -49% | 14.4 ? 46% |
| Response Time Black / White * (ms) | 19.2 ? | 18.8 ? 2% | 26 ? -35% | 10.8 ? 44% | 29.2 ? -52% | 10.4 ? 46% |
| PWM Frequency (Hz) | ||||||
| Screen | -23% | -18% | 16% | -21% | 5% | |
| Brightness middle (cd/m²) | 270.5 | 286 6% | 260 -4% | 303.8 12% | 254 -6% | 323 19% |
| Brightness (cd/m²) | 269 | 261 -3% | 251 -7% | 292 9% | 254 -6% | 300 12% |
| Brightness Distribution (%) | 92 | 83 -10% | 85 -8% | 85 -8% | 93 1% | 89 -3% |
| Black Level * (cd/m²) | 0.19 | 0.23 -21% | 0.26 -37% | 0.23 -21% | 0.23 -21% | 0.31 -63% |
| Contrast (:1) | 1424 | 1243 -13% | 1000 -30% | 1321 -7% | 1104 -22% | 1042 -27% |
| Colorchecker dE 2000 * | 4.39 | 4.92 -12% | 3.9 11% | 1.87 57% | 4.12 6% | 3.01 31% |
| Colorchecker dE 2000 max. * | 20.8 | 19.29 7% | 20.64 1% | 3.26 84% | 19.66 5% | 7.65 63% |
| Colorchecker dE 2000 calibrated * | 1.56 | 4.73 -203% | 3.71 -138% | 1.45 7% | 3.78 -142% | 1 36% |
| Greyscale dE 2000 * | 3.1 | 1.9 39% | 1.6 48% | 2.7 13% | 3.2 -3% | 3.8 -23% |
| Gamma | 2.14 103% | 2.175 101% | 2.068 106% | 2.26 97% | 2.179 101% | 2.154 102% |
| CCT | 6927 94% | 6782 96% | 6511 100% | 6436 101% | 6754 96% | 7507 87% |
| Color Space (Percent of AdobeRGB 1998) (%) | 65.6 | 41 | 66 | |||
| Color Space (Percent of sRGB) (%) | 99.4 | 59 | 90 | |||
| Media totale (Programma / Settaggio) | -9% /
-16% | -18% /
-17% | 49% /
34% | -25% /
-21% | 37% /
23% |
* ... Meglio usare valori piccoli
La gamma è limitata a solo il 60% di sRGB il che indica un display inadatto all'editing grafico professionale. Infatti, tali pannelli sono comuni sui portatili gaming economici dove i tempi di risposta spesso hanno la priorità sulla precisione dei colori. Asus offre pannelli di fascia alta con copertura completa sRGB o P3 su questa particolare serie G713 per coprire tutte le basi.
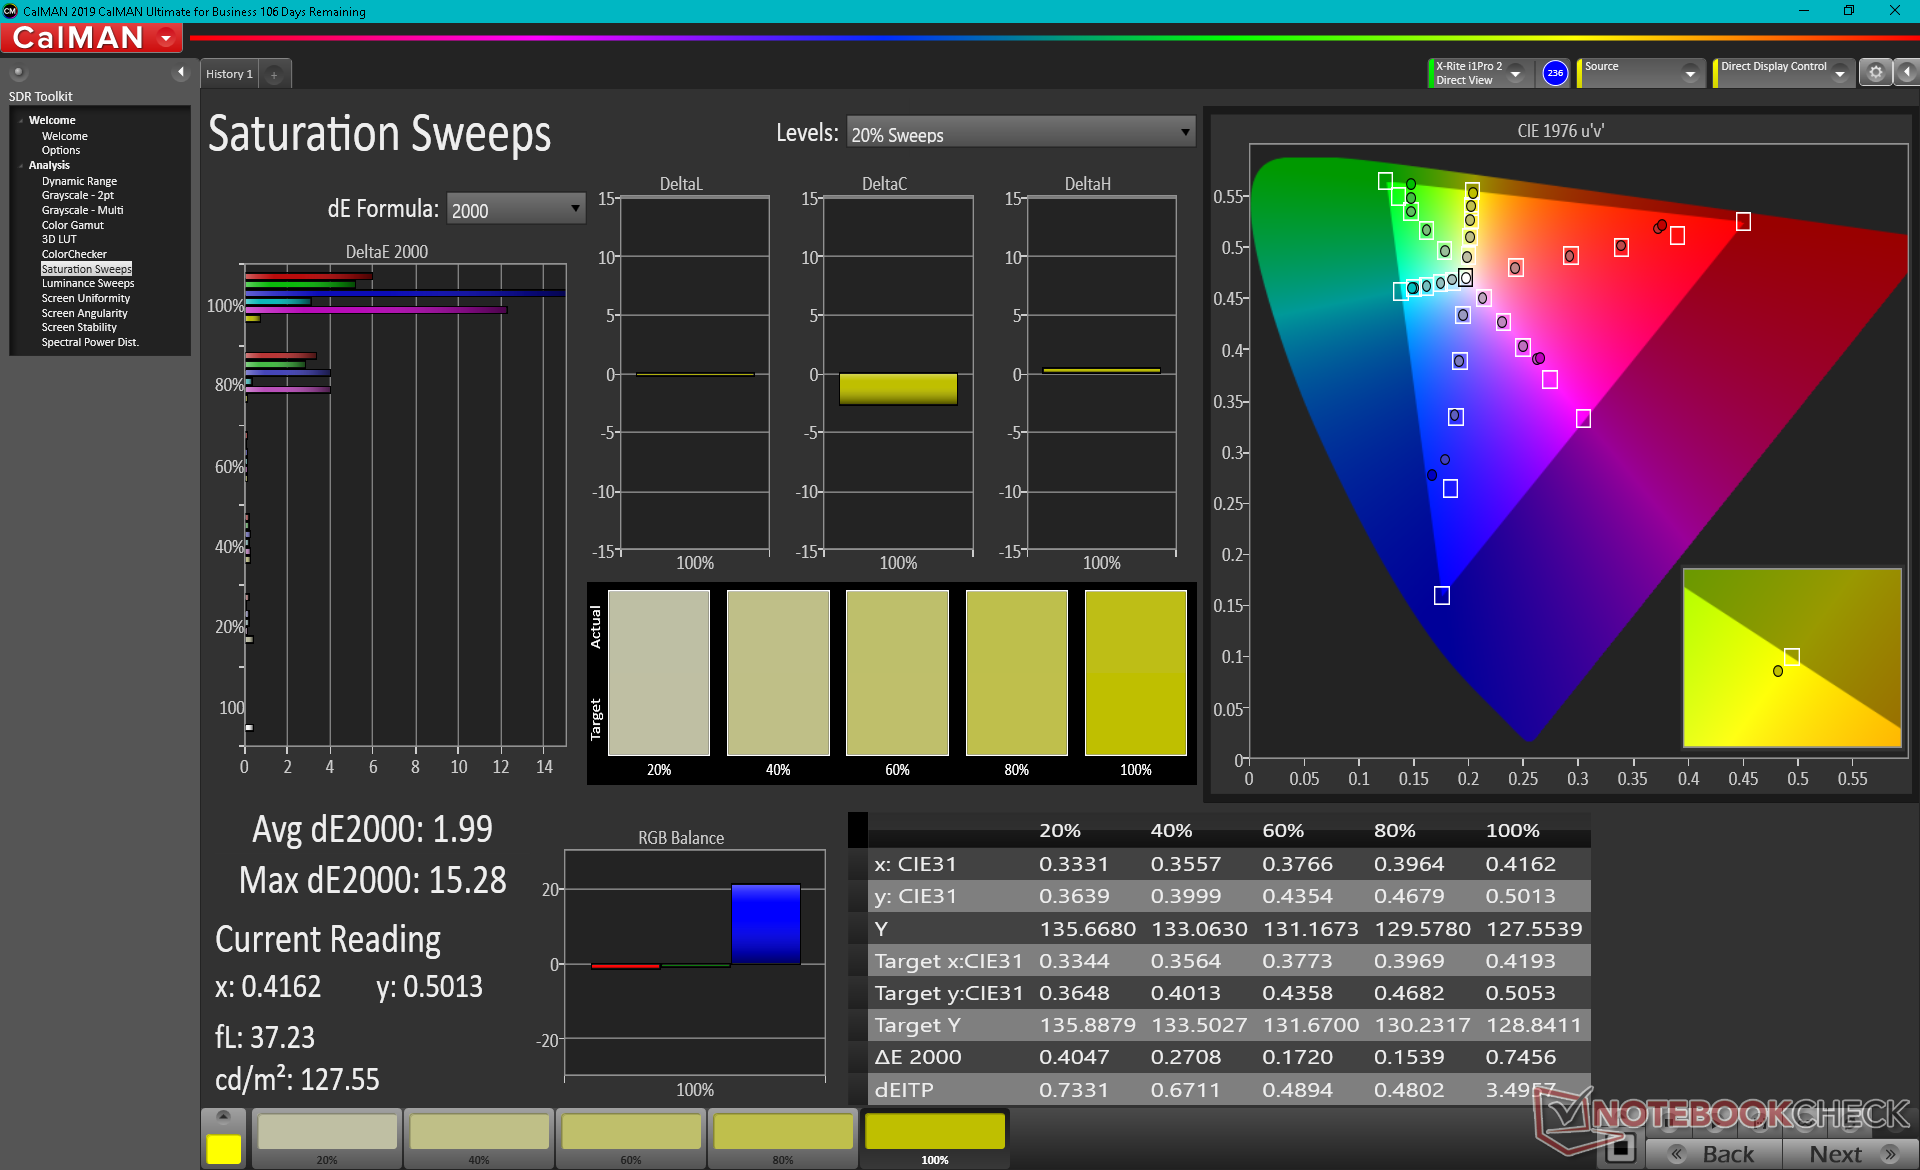
Anche se non è male, i colori e la scala di grigi hanno margine di miglioramento. Calibrando il display noi stessi miglioreremmo i valori medi di scala di grigi e colore DeltaE da 3.1 e 4.39 a soli 0.3 e 1.56, rispettivamente. Tuttavia, i colori diventano inevitabilmente molto più imprecisi a livelli di saturazione più alti a causa del limitato spazio colore menzionato sopra.
Tempi di risposta del Display
| ↔ Tempi di risposta dal Nero al Bianco | ||
|---|---|---|
| 19.2 ms ... aumenta ↗ e diminuisce ↘ combinato | ↗ 10.8 ms Incremento | 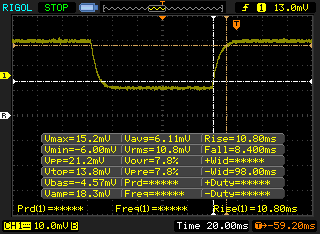 |
| ↘ 8.4 ms Calo | ||
| Lo schermo mostra buoni tempi di risposta durante i nostri tests, ma potrebbe essere troppo lento per i gamers competitivi. In confronto, tutti i dispositivi di test variano da 0.1 (minimo) a 240 (massimo) ms. » 42 % di tutti i dispositivi è migliore. Questo significa che i tempi di risposta rilevati sono simili alla media di tutti i dispositivi testati (19.9 ms). | ||
| ↔ Tempo di risposta dal 50% Grigio all'80% Grigio | ||
| 26.8 ms ... aumenta ↗ e diminuisce ↘ combinato | ↗ 14 ms Incremento | 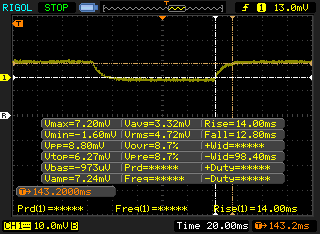 |
| ↘ 12.8 ms Calo | ||
| Lo schermo mostra tempi di risposta relativamente lenti nei nostri tests e potrebbe essere troppo lento per i gamers. In confronto, tutti i dispositivi di test variano da 0.165 (minimo) a 636 (massimo) ms. » 36 % di tutti i dispositivi è migliore. Questo significa che i tempi di risposta rilevati sono migliori rispettto alla media di tutti i dispositivi testati (31.1 ms). | ||
Sfarfallio dello schermo / PWM (Pulse-Width Modulation)
| flickering dello schermo / PWM non rilevato | 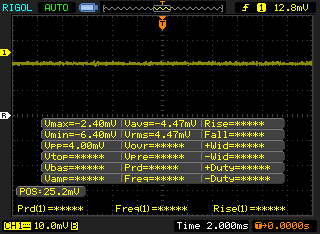 | ||
In confronto: 52 % di tutti i dispositivi testati non utilizza PWM per ridurre la luminosita' del display. Se è rilevato PWM, una media di 7794 (minimo: 5 - massimo: 343500) Hz è stata rilevata. | |||
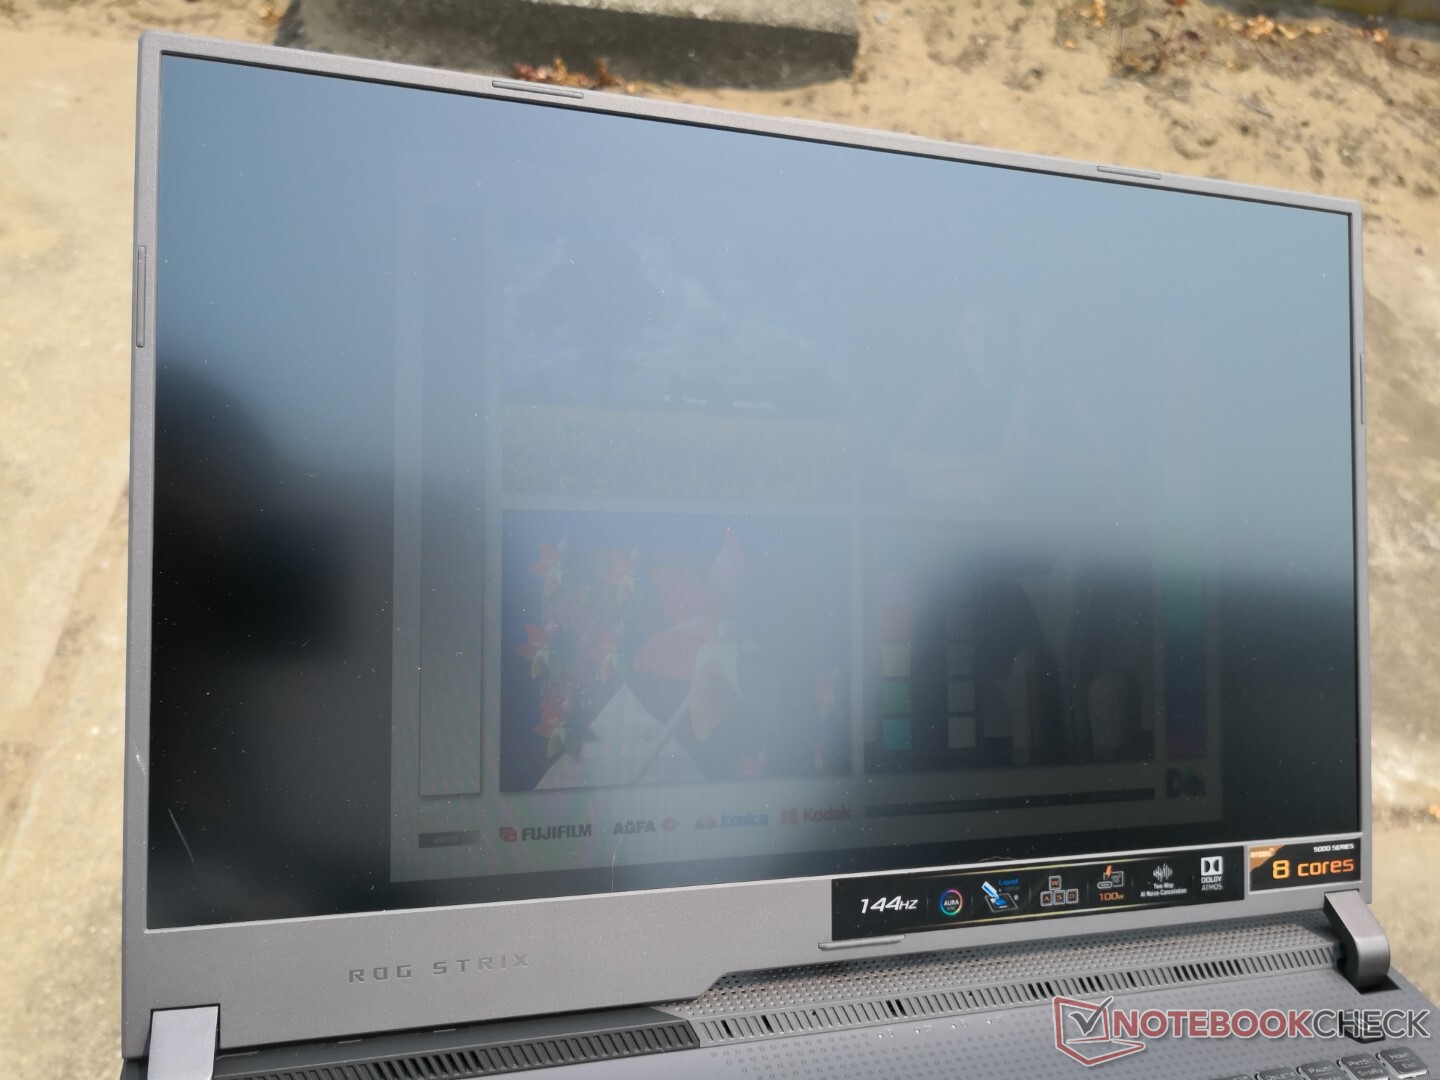
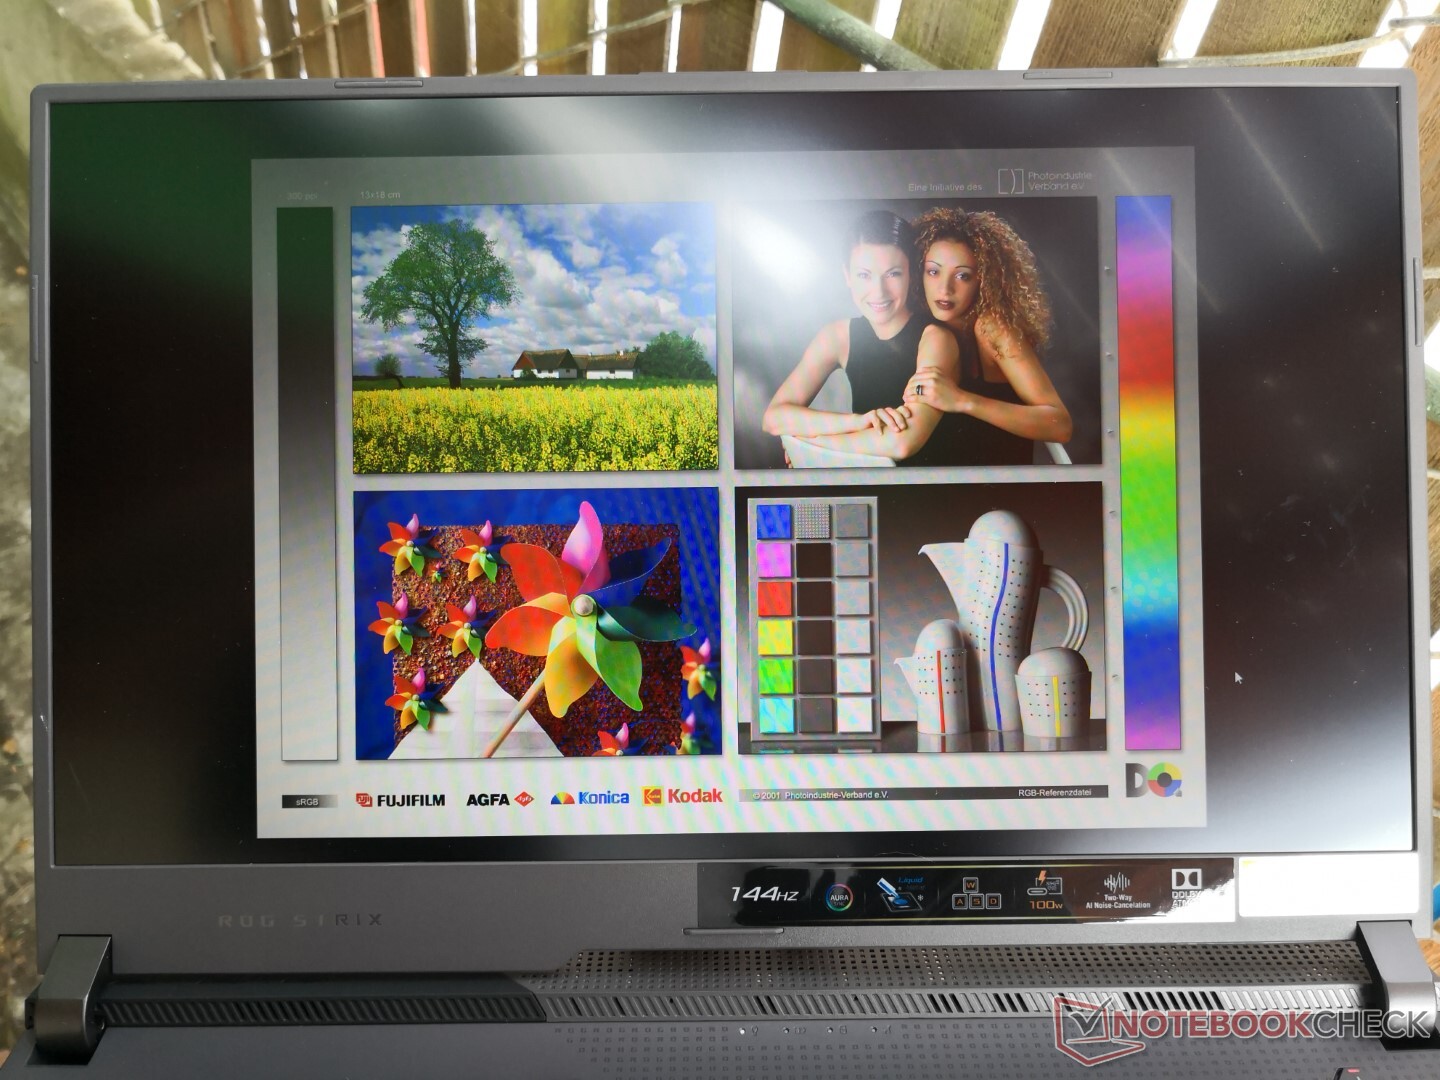
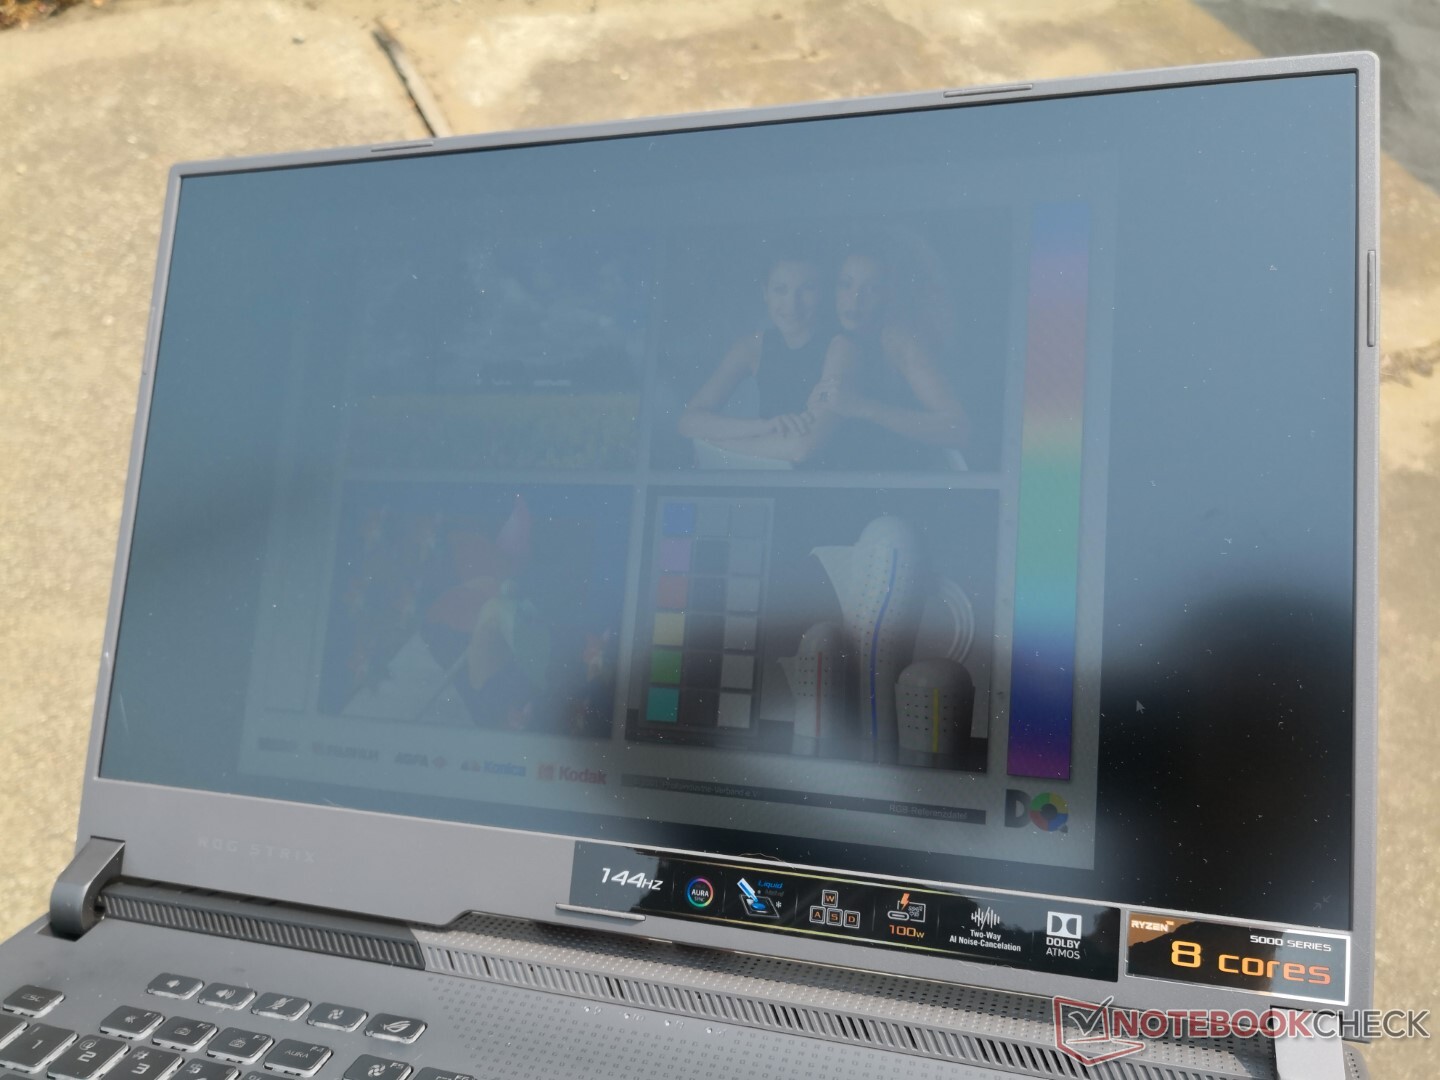
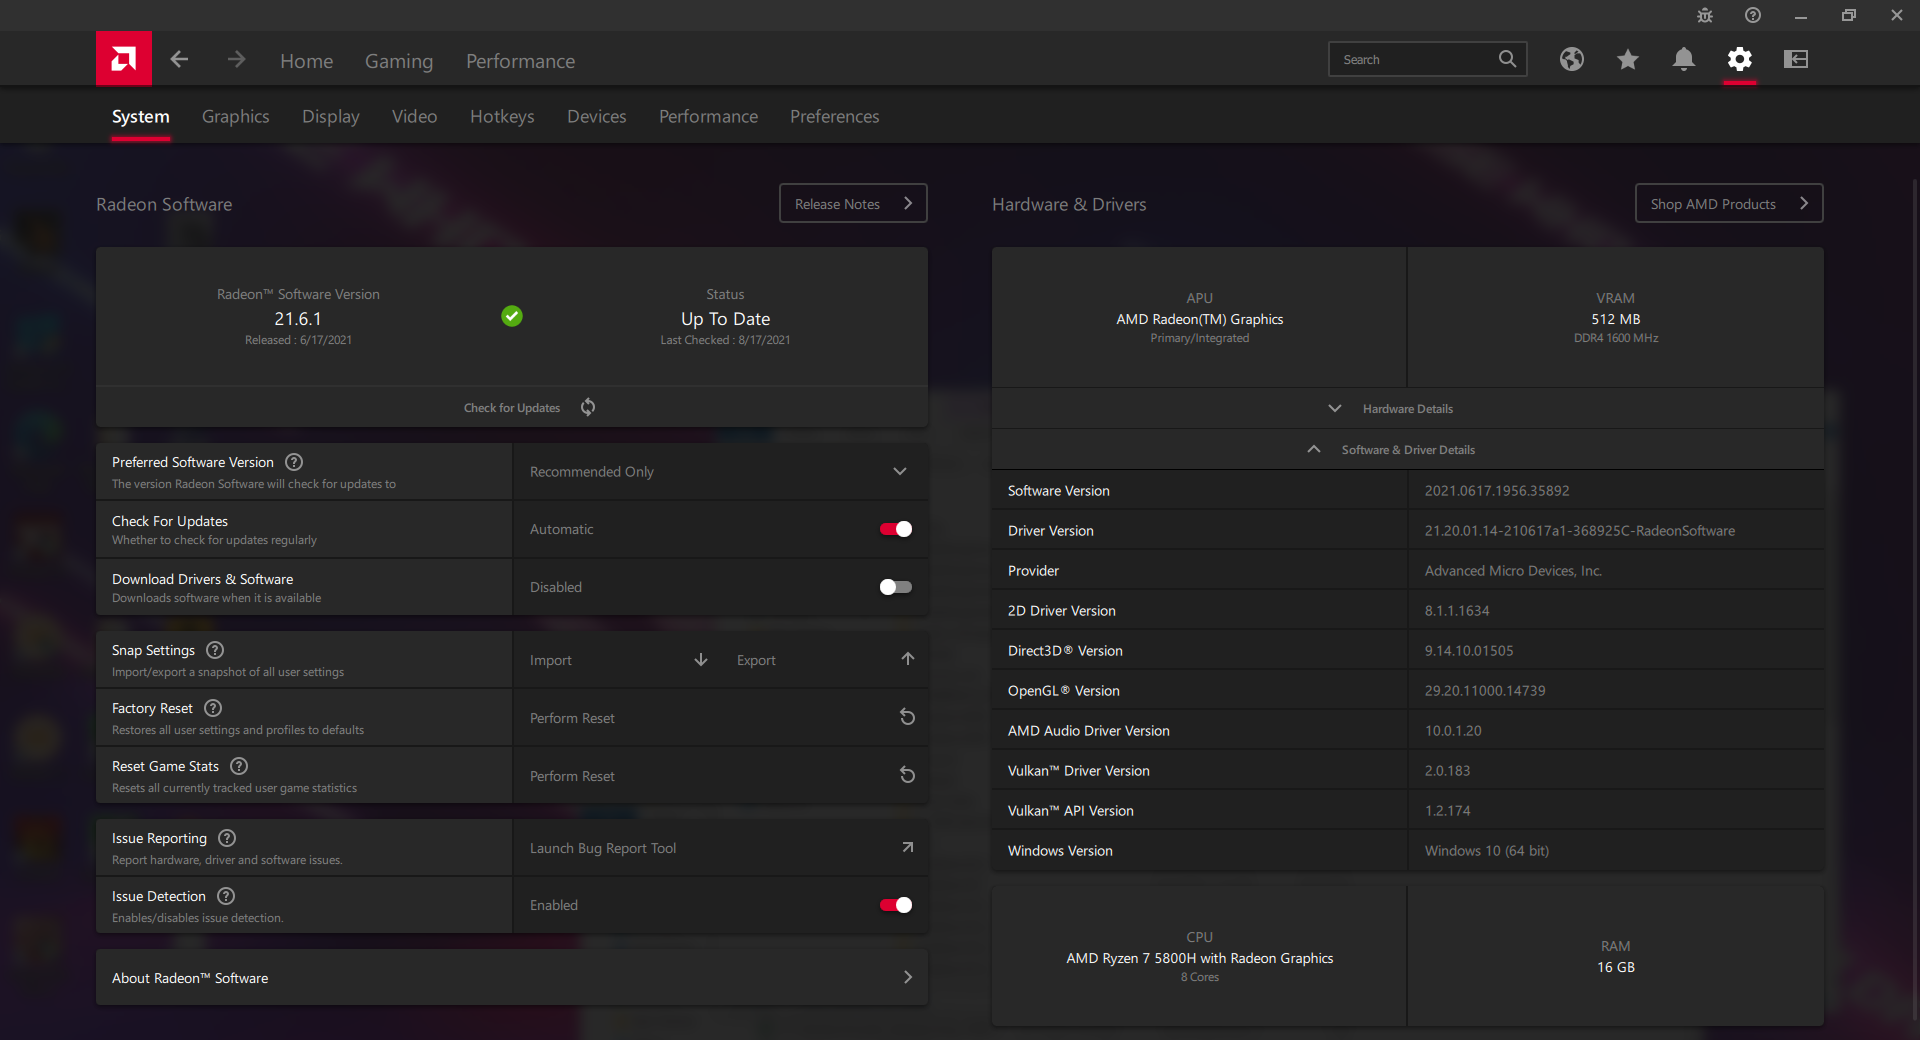
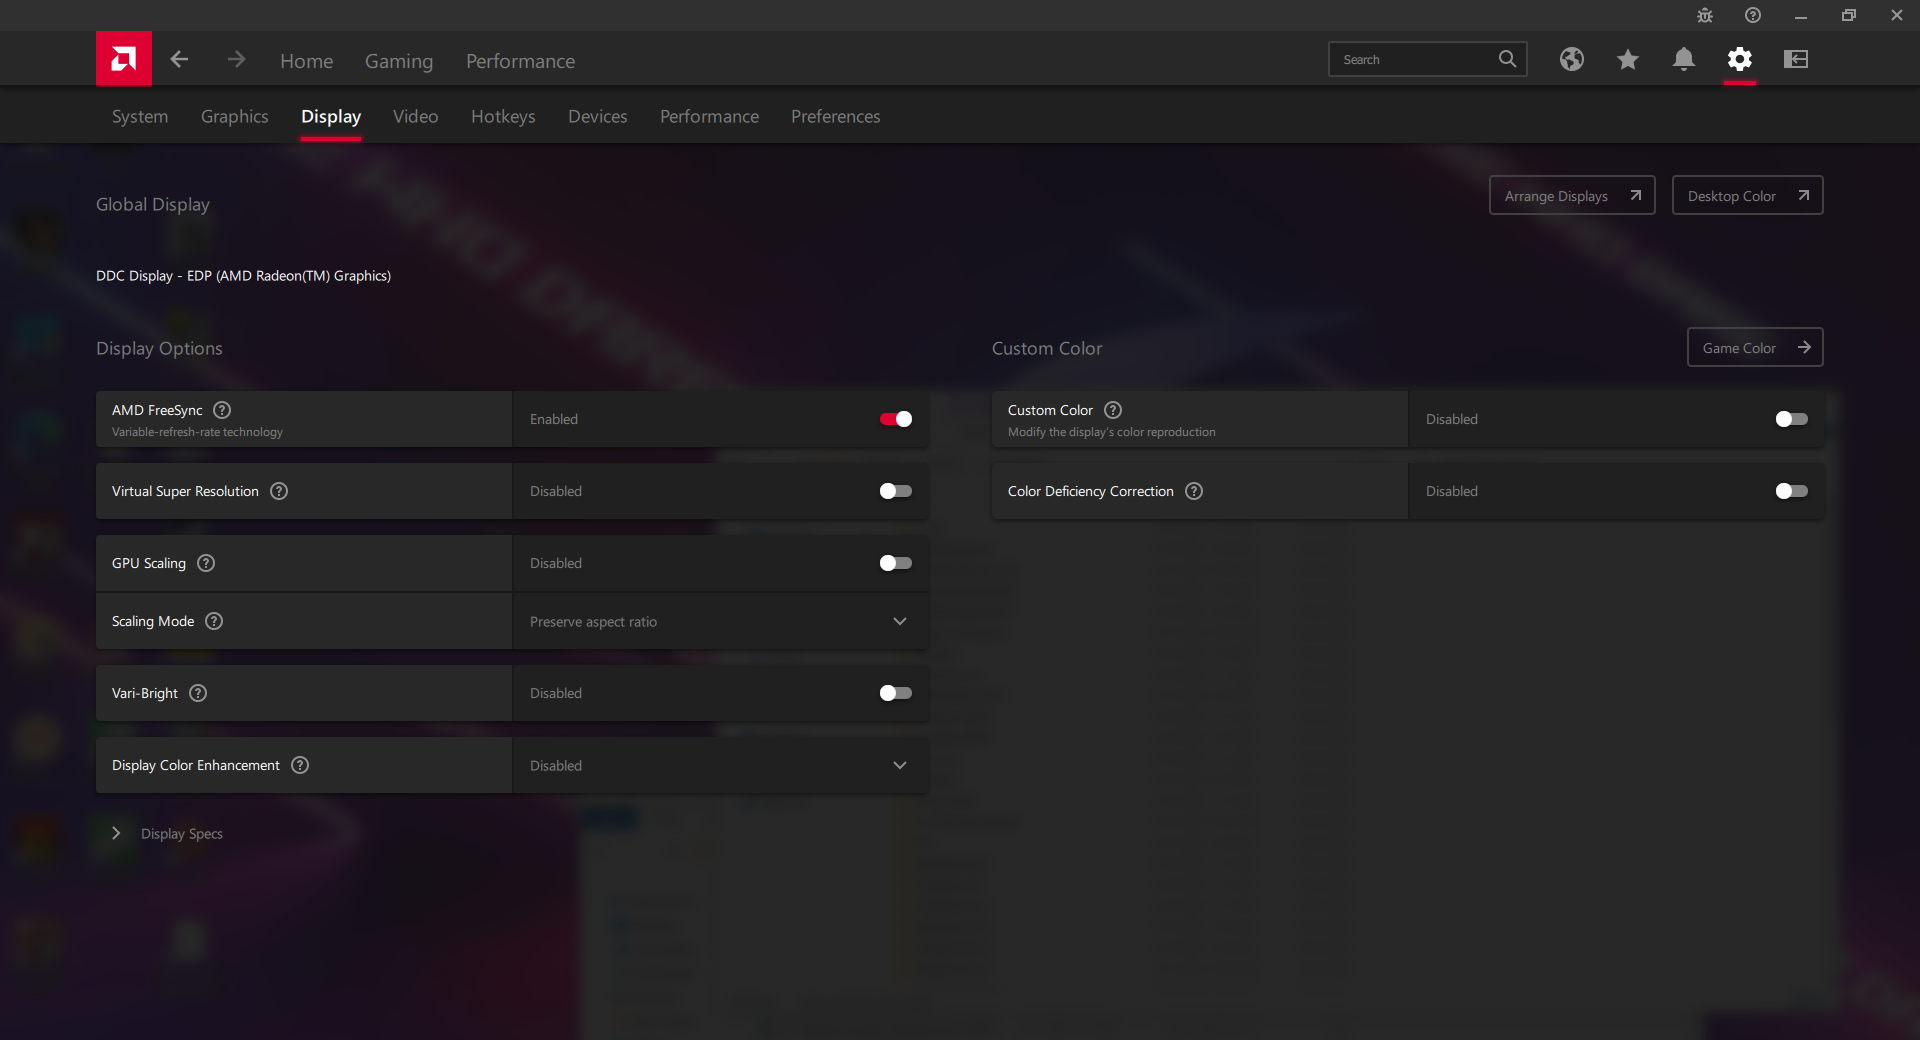
La luminosità massima è circa nella media per un portatile gaming da 17,3 pollici e quindi la visibilità esterna non è niente di speciale sul G713. Ricordatevi di disabilitare AMD Vari-Bright attraverso il software AMD Radeon o altrimenti la luminosità massima scenderà a soli 175 nits quando è alimentato a batteria.
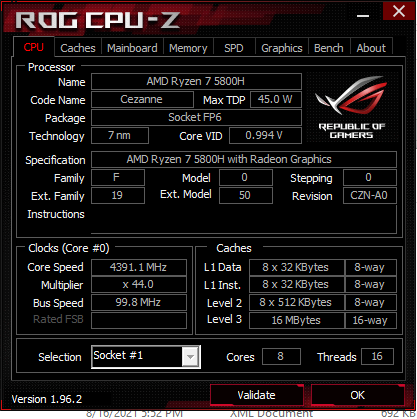
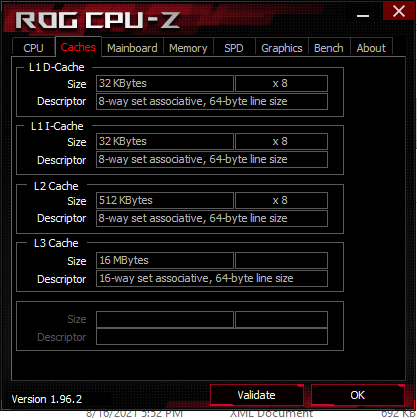
Prestazioni - Processore di livello Core i9
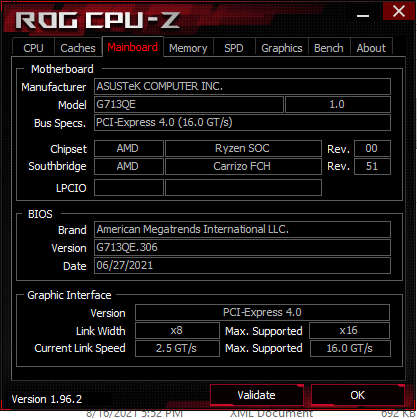
Tutte le configurazioni G713 al momento sono dotate solo di CPU AMD, nel bene e nel male. Mentre le serie Zen 2 e Zen 3 possono spesso superare le migliori CPU Core-H di Intel, mancano di supporto per PCIe 4 e Thunderbolt 4, il che potrebbe infastidire alcuni giocatori.
Sul lato grafico, le GPU vanno dalla GeForce GTX 1650 fino alla RTX 3070 per fare appello a una gamma molto ampia di budget. Resizable Bar e FreeSync sono supportati mentre Advanced Optimus non lo è. Un interruttore manuale per disabilitare la GPU Nvidia dedicata può essere trovato attraverso il software Asus Armoury Crate.
La nostra unità è stata impostata in modalità Turbo prima di eseguire qualsiasi benchmarks di prestazioni qui sotto per ottenere i migliori punteggi possibili.
Processore
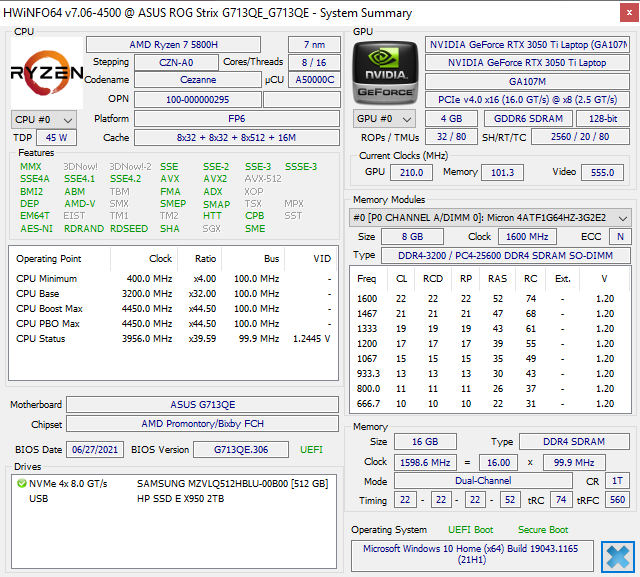
Le prestazioni della CPU sono eccellenti e rivaleggia con i processori Core i9 11th gen Tiger Lake-H di Intel. Il concorrente Core i9-11900H per esempio, offre prestazioni multi-thread simili ma prestazioni single-thread leggermente più veloci come al solito quando si confrontano le CPU Intel e AMD. Gen-to-gen, il Ryzen 7 5800H è solo marginalmente più veloce del Ryzen 7 4800H poiché la serie Zen 2 H era già un enorme salto rispetto al Ryzen 7 3750H.
La sostenibilità delle prestazioni è anche eccellente, senza cali di punteggio nel tempo quando si esegue CineBench R15 xT in un ciclo continuo. Tuttavia, è difficile raccomandare il Ryzen 9 5900HX rispetto al Ryzen 7 5800H dato che hanno prestazioni quasi identiche.
Cinebench R15 Multi Loop
Cinebench R23: Multi Core | Single Core
Cinebench R15: CPU Multi 64Bit | CPU Single 64Bit
Blender: v2.79 BMW27 CPU
7-Zip 18.03: 7z b 4 -mmt1 | 7z b 4
Geekbench 5.5: Single-Core | Multi-Core
HWBOT x265 Benchmark v2.2: 4k Preset
LibreOffice : 20 Documents To PDF
R Benchmark 2.5: Overall mean
| Cinebench R23 / Multi Core | |
| Asus Strix Scar 17 G733QSA-XS99 | |
| Asus ROG Strix G17 G713QE-RB74 | |
| Asus ROG Zephyrus S17 GX703HSD | |
| Acer Nitro 5 AN517-41-R9S5 | |
| Media AMD Ryzen 7 5800H (8812 - 13214, n=29) | |
| Medion Erazer Beast X20 | |
| Huawei MateBook D 16-53011VFJ | |
| Cinebench R23 / Single Core | |
| Asus ROG Zephyrus S17 GX703HSD | |
| Asus Strix Scar 17 G733QSA-XS99 | |
| Acer Nitro 5 AN517-41-R9S5 | |
| Asus ROG Strix G17 G713QE-RB74 | |
| Media AMD Ryzen 7 5800H (1294 - 1441, n=29) | |
| Medion Erazer Beast X20 | |
| Huawei MateBook D 16-53011VFJ | |
Cinebench R23: Multi Core | Single Core
Cinebench R15: CPU Multi 64Bit | CPU Single 64Bit
Blender: v2.79 BMW27 CPU
7-Zip 18.03: 7z b 4 -mmt1 | 7z b 4
Geekbench 5.5: Single-Core | Multi-Core
HWBOT x265 Benchmark v2.2: 4k Preset
LibreOffice : 20 Documents To PDF
R Benchmark 2.5: Overall mean
* ... Meglio usare valori piccoli
Prestazioni del sistema
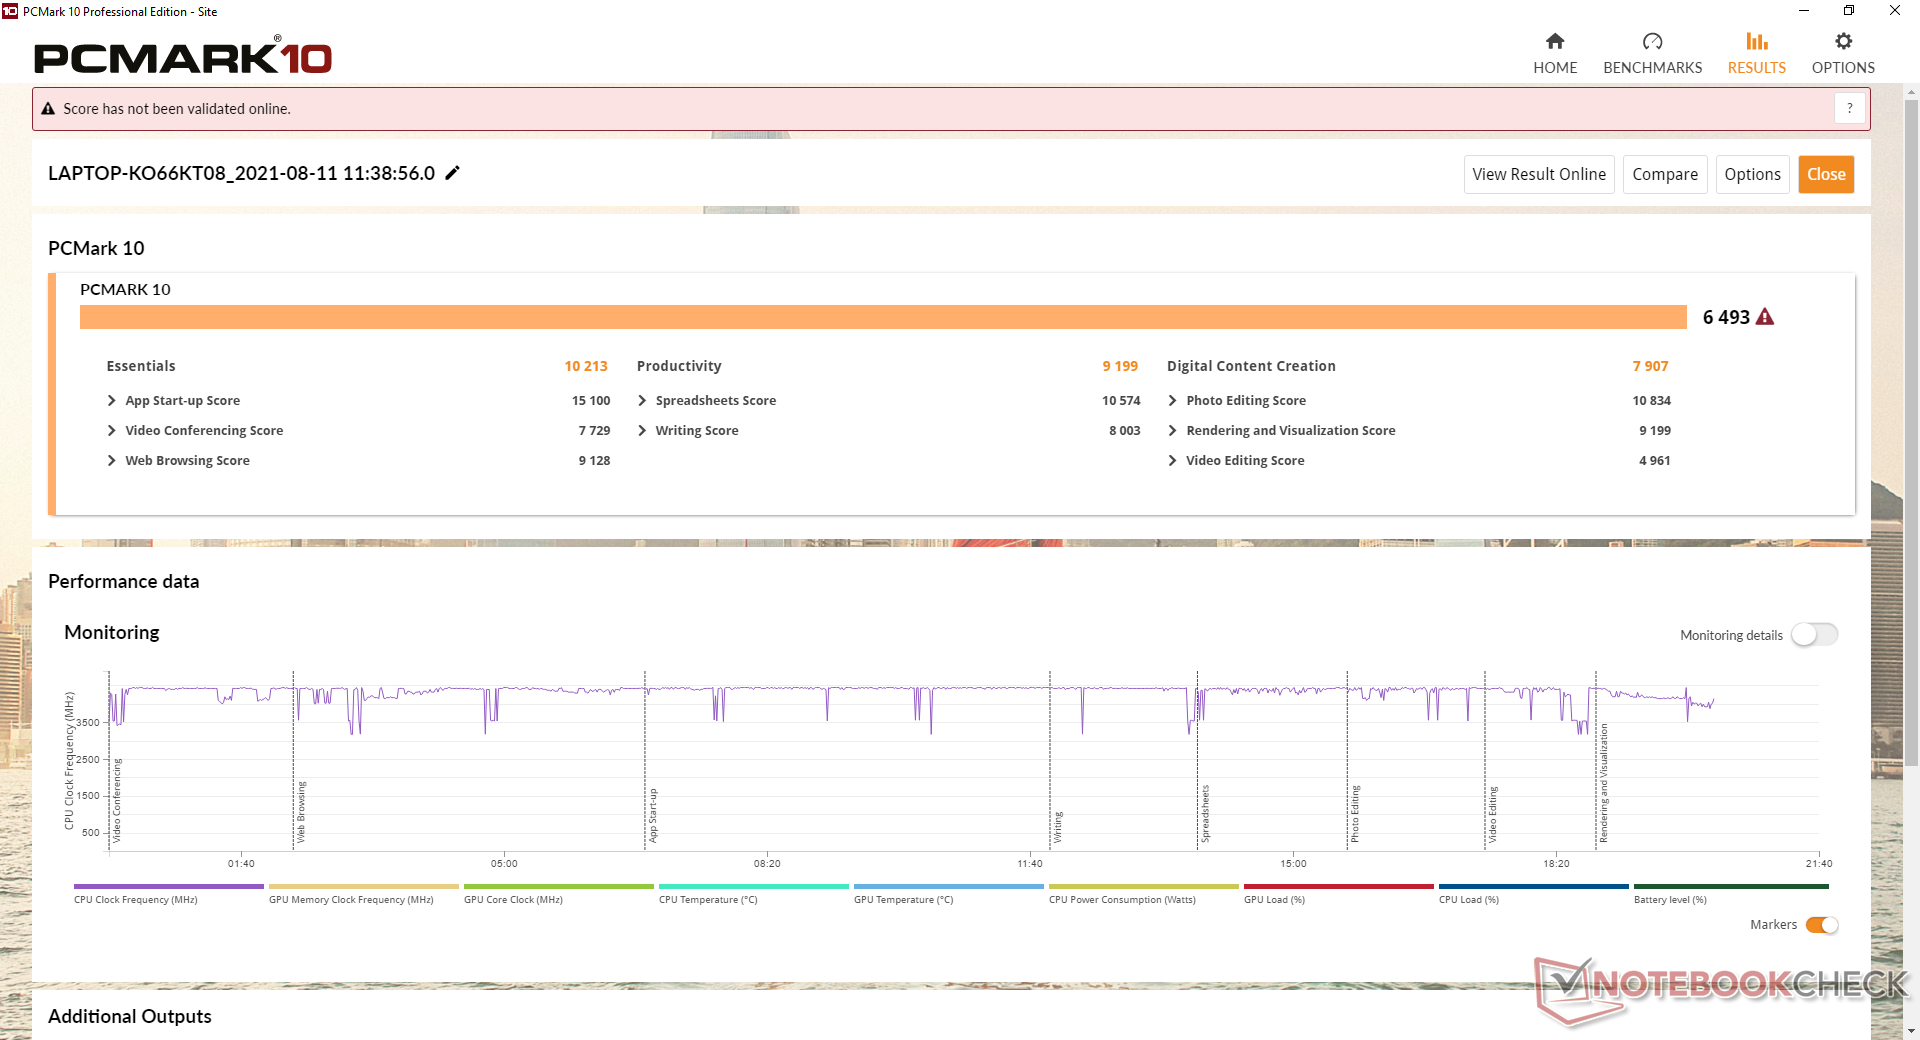
I risultati di PCMark 10 sono leggermente più alti del previsto, probabilmente a causa della CPU Ryzen 7 molto veloce, ma la più lenta RTX 3050 Ti fa scendere tutto. Almeno i risultati sono costantemente più alti dell'MSI Alpha 17 alimentato solo da hardware AMD.
| PCMark 10 / Score | |
| Asus Strix Scar 17 G733QSA-XS99 | |
| MSI Katana GF76 11UE | |
| Asus ROG Strix G17 G713QE-RB74 | |
| Media AMD Ryzen 7 5800H, NVIDIA GeForce RTX 3050 Ti Laptop GPU (6098 - 6493, n=2) | |
| MSI Alpha 17 A4DEK | |
| Acer Nitro 5 AN517-53-54DQ | |
| Asus Strix G17 G712LWS | |
| PCMark 10 / Essentials | |
| Asus Strix Scar 17 G733QSA-XS99 | |
| Asus ROG Strix G17 G713QE-RB74 | |
| Media AMD Ryzen 7 5800H, NVIDIA GeForce RTX 3050 Ti Laptop GPU (9631 - 10213, n=2) | |
| MSI Katana GF76 11UE | |
| Asus Strix G17 G712LWS | |
| Acer Nitro 5 AN517-53-54DQ | |
| MSI Alpha 17 A4DEK | |
| PCMark 10 / Productivity | |
| Asus Strix Scar 17 G733QSA-XS99 | |
| Asus ROG Strix G17 G713QE-RB74 | |
| Media AMD Ryzen 7 5800H, NVIDIA GeForce RTX 3050 Ti Laptop GPU (8625 - 9199, n=2) | |
| MSI Katana GF76 11UE | |
| Acer Nitro 5 AN517-53-54DQ | |
| Asus Strix G17 G712LWS | |
| MSI Alpha 17 A4DEK | |
| PCMark 10 / Digital Content Creation | |
| Asus Strix Scar 17 G733QSA-XS99 | |
| MSI Katana GF76 11UE | |
| MSI Alpha 17 A4DEK | |
| Asus ROG Strix G17 G713QE-RB74 | |
| Media AMD Ryzen 7 5800H, NVIDIA GeForce RTX 3050 Ti Laptop GPU (7408 - 7907, n=2) | |
| Acer Nitro 5 AN517-53-54DQ | |
| Asus Strix G17 G712LWS | |
| PCMark 10 Score | 6493 punti | |
Aiuto | ||
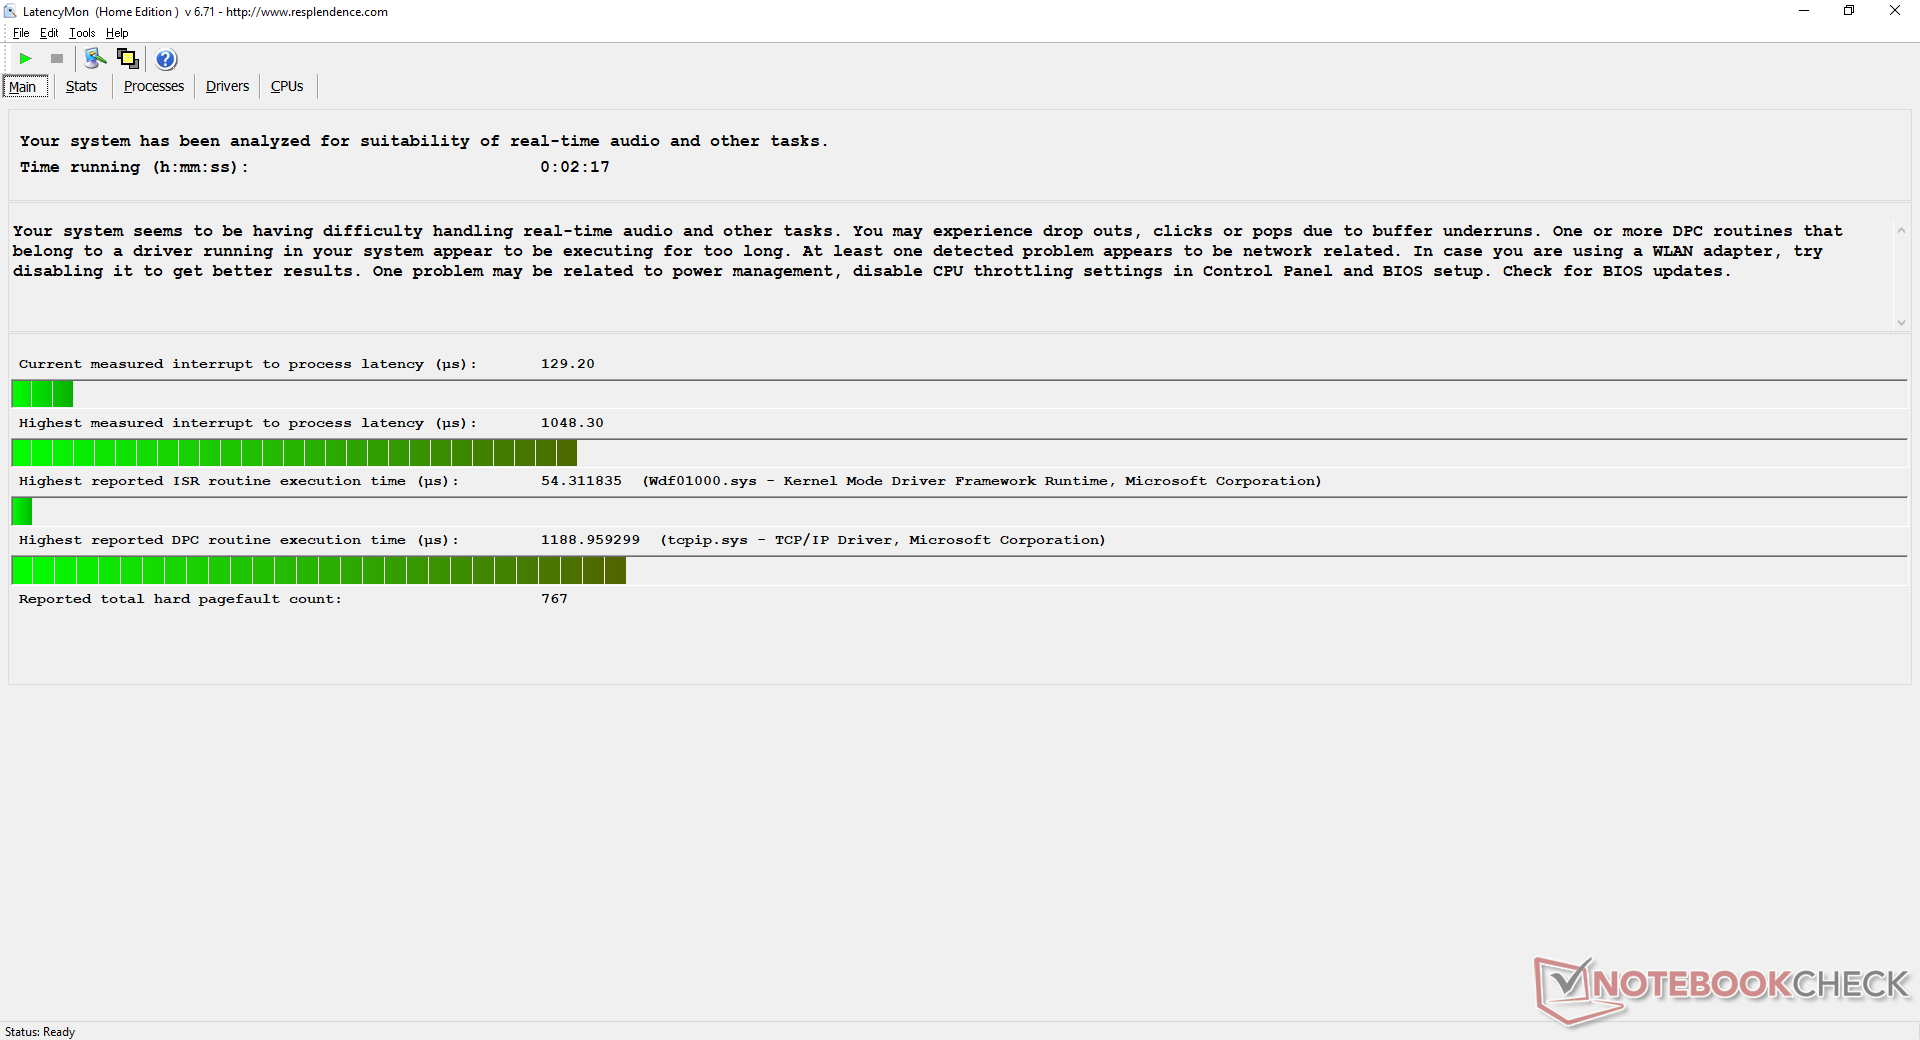
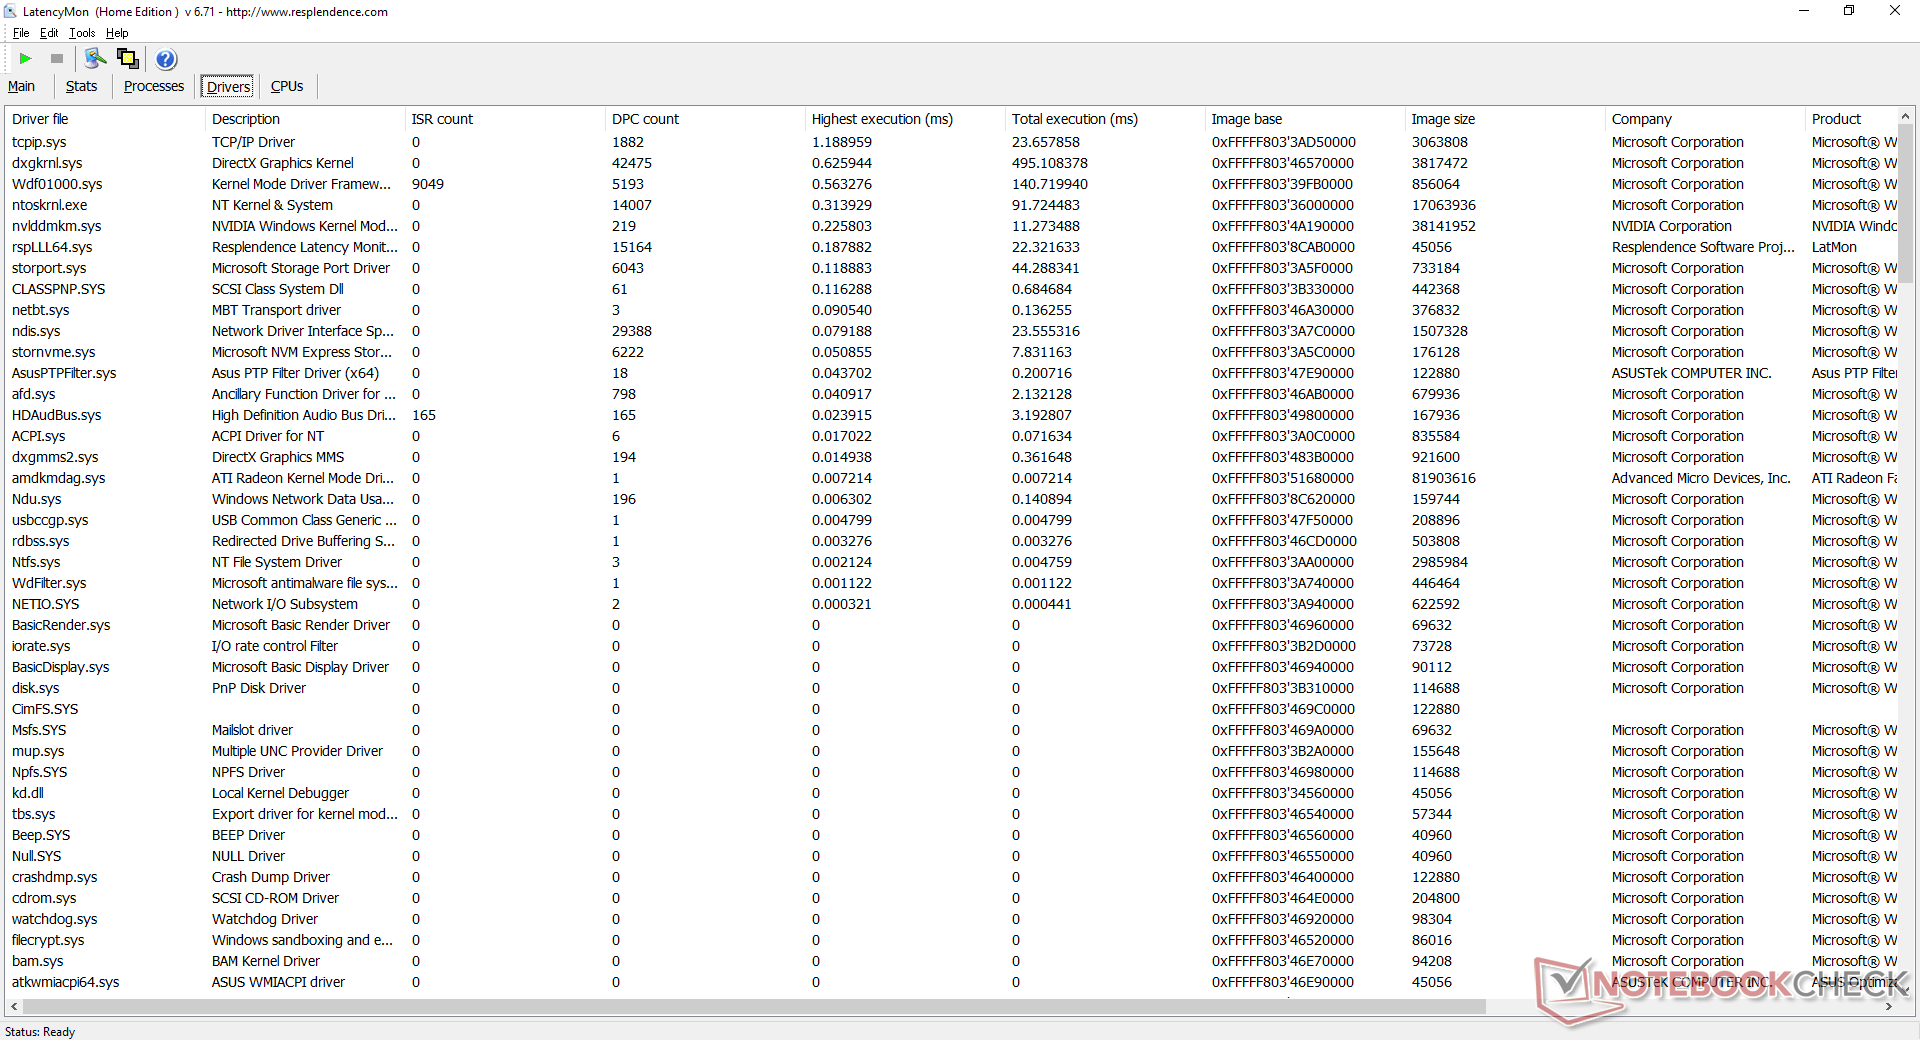
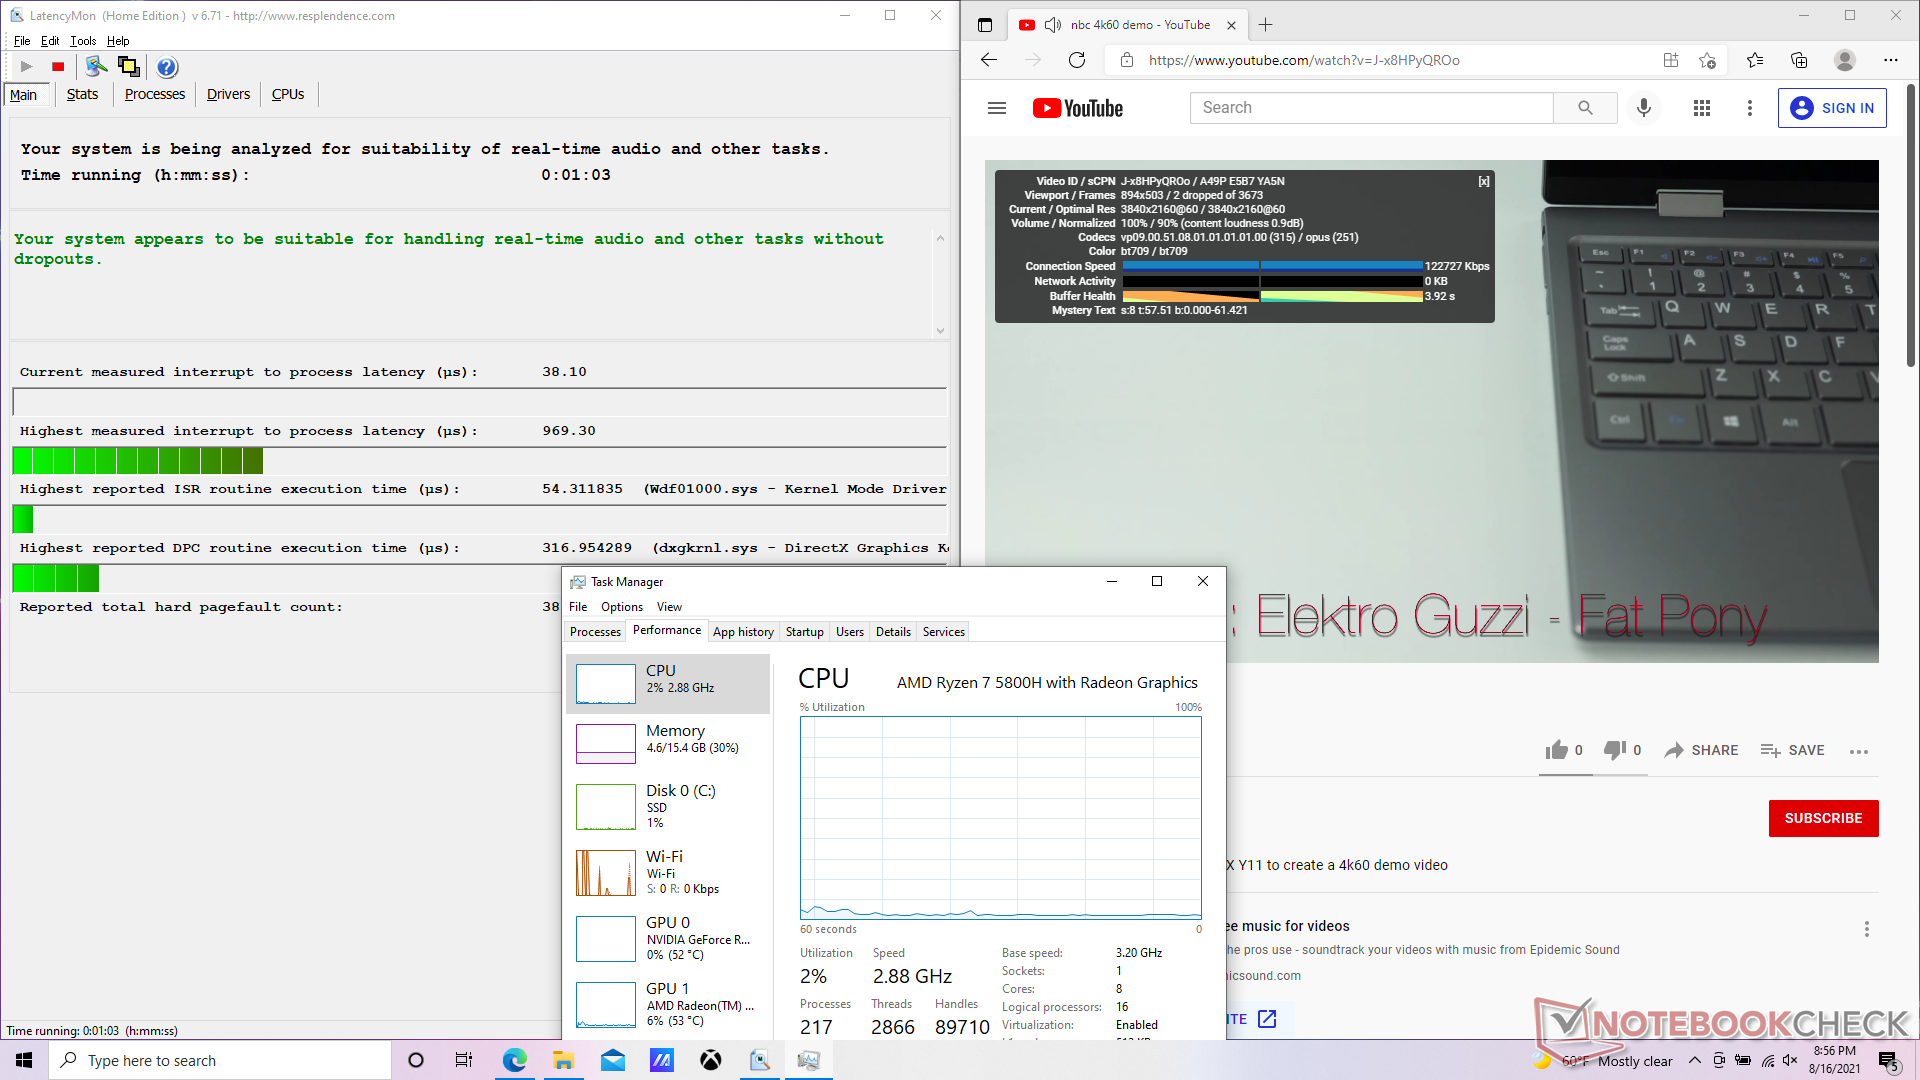
Latenza DPC
LatencyMon mostra piccoli problemi di latenza quando si aprono più schede del browser sulla nostra homepage. La riproduzione di video 4K a 60 FPS è per il resto fluida con solo 2 fotogrammi persi durante il nostro minuto di test.
| DPC Latencies / LatencyMon - interrupt to process latency (max), Web, Youtube, Prime95 | |
| MSI Alpha 17 A4DEK | |
| MSI Katana GF76 11UE | |
| Asus Strix G17 G712LWS | |
| Acer Nitro 5 AN517-53-54DQ | |
| Asus ROG Strix G17 G713QE-RB74 | |
| Asus Strix Scar 17 G733QSA-XS99 | |
* ... Meglio usare valori piccoli
Dispositivi di archiviazione - Nessuna unità da 2,5 pollici
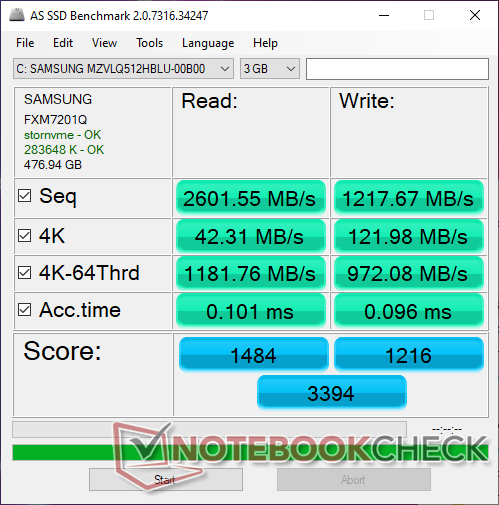
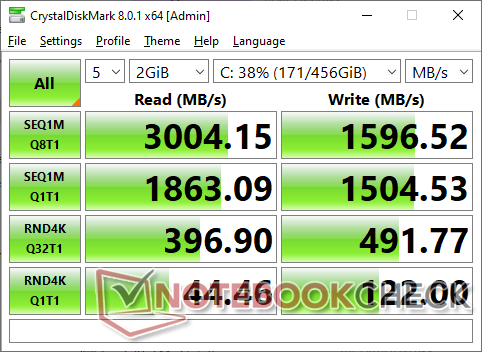
Il Samsung PM991a MZVLQ512HBLU è un SSD NVMe PCIe 3 di fascia media superiore con valori teorici di lettura e scrittura sequenziale di 3100 MB/s e 1800 MB/s, rispettivamente, per essere più lento del PM981a che può raggiungere velocità fino a 3500 MB/s e 2900 MB/s. I proprietari possono installare fino a due SSD M.2 NVMe interni.
| Asus ROG Strix G17 G713QE-RB74 Samsung PM991 MZVLQ512HBLU | Acer Nitro 5 AN517-53-54DQ SK Hynix BC711 HFM512GD3HX015N | MSI Katana GF76 11UE Kingston OM8PCP3512F-AB | Asus Strix G17 G712LWS Intel SSD 660p 1TB SSDPEKNW010T8 | Lenovo IdeaPad 5 Pro 16IHU6 Samsung SSD PM981a MZVLB512HBJQ | |
|---|---|---|---|---|---|
| AS SSD | 60% | -42% | -11% | 43% | |
| Seq Read (MB/s) | 2602 | 2859 10% | 1704 -35% | 1778 -32% | 2541 -2% |
| Seq Write (MB/s) | 1218 | 2693 121% | 716 -41% | 1478 21% | 2555 110% |
| 4K Read (MB/s) | 42.31 | 68.8 63% | 37.77 -11% | 49.76 18% | 56 32% |
| 4K Write (MB/s) | 122 | 154.5 27% | 66 -46% | 117.9 -3% | 129.6 6% |
| 4K-64 Read (MB/s) | 1182 | 1860 57% | 441.2 -63% | 591 -50% | 1633 38% |
| 4K-64 Write (MB/s) | 972 | 1680 73% | 735 -24% | 875 -10% | 1863 92% |
| Access Time Read * (ms) | 0.101 | 0.043 57% | 0.191 -89% | 0.082 19% | 0.077 24% |
| Access Time Write * (ms) | 0.096 | 0.028 71% | 0.053 45% | 0.041 57% | 0.029 70% |
| Score Read (Points) | 1484 | 2214 49% | 649 -56% | 818 -45% | 1944 31% |
| Score Write (Points) | 1216 | 2104 73% | 872 -28% | 1140 -6% | 2248 85% |
| Score Total (Points) | 3394 | 5451 61% | 1816 -46% | 2377 -30% | 5192 53% |
| Copy ISO MB/s (MB/s) | 1538 | 912 -41% | 1495 -3% | 2246 46% | |
| Copy Program MB/s (MB/s) | 805 | 278.9 -65% | 446 -45% | 861 7% | |
| Copy Game MB/s (MB/s) | 1418 | 144.6 -90% | 697 -51% | 1552 9% | |
| CrystalDiskMark 5.2 / 6 | 58% | -19% | 4% | 43% | |
| Write 4K (MB/s) | 120.8 | 206.1 71% | 107.3 -11% | 141.1 17% | 203 68% |
| Read 4K (MB/s) | 44.19 | 77.8 76% | 45.46 3% | 60.9 38% | 52.3 18% |
| Write Seq (MB/s) | 1518 | 2842 87% | 978 -36% | 1681 11% | 2138 41% |
| Read Seq (MB/s) | 1828 | 2552 40% | 1255 -31% | 1602 -12% | 1974 8% |
| Write 4K Q32T1 (MB/s) | 492.5 | 583 18% | 579 18% | 406.6 -17% | 640 30% |
| Read 4K Q32T1 (MB/s) | 390.7 | 663 70% | 299.6 -23% | 470.2 20% | 707 81% |
| Write Seq Q32T1 (MB/s) | 1602 | 3014 88% | 978 -39% | 1759 10% | 2973 86% |
| Read Seq Q32T1 (MB/s) | 3086 | 3556 15% | 1977 -36% | 1932 -37% | 3559 15% |
| Media totale (Programma / Settaggio) | 59% /
59% | -31% /
-34% | -4% /
-6% | 43% /
43% |
* ... Meglio usare valori piccoli

Throttling Disco: DiskSpd Read Loop, Queue Depth 8
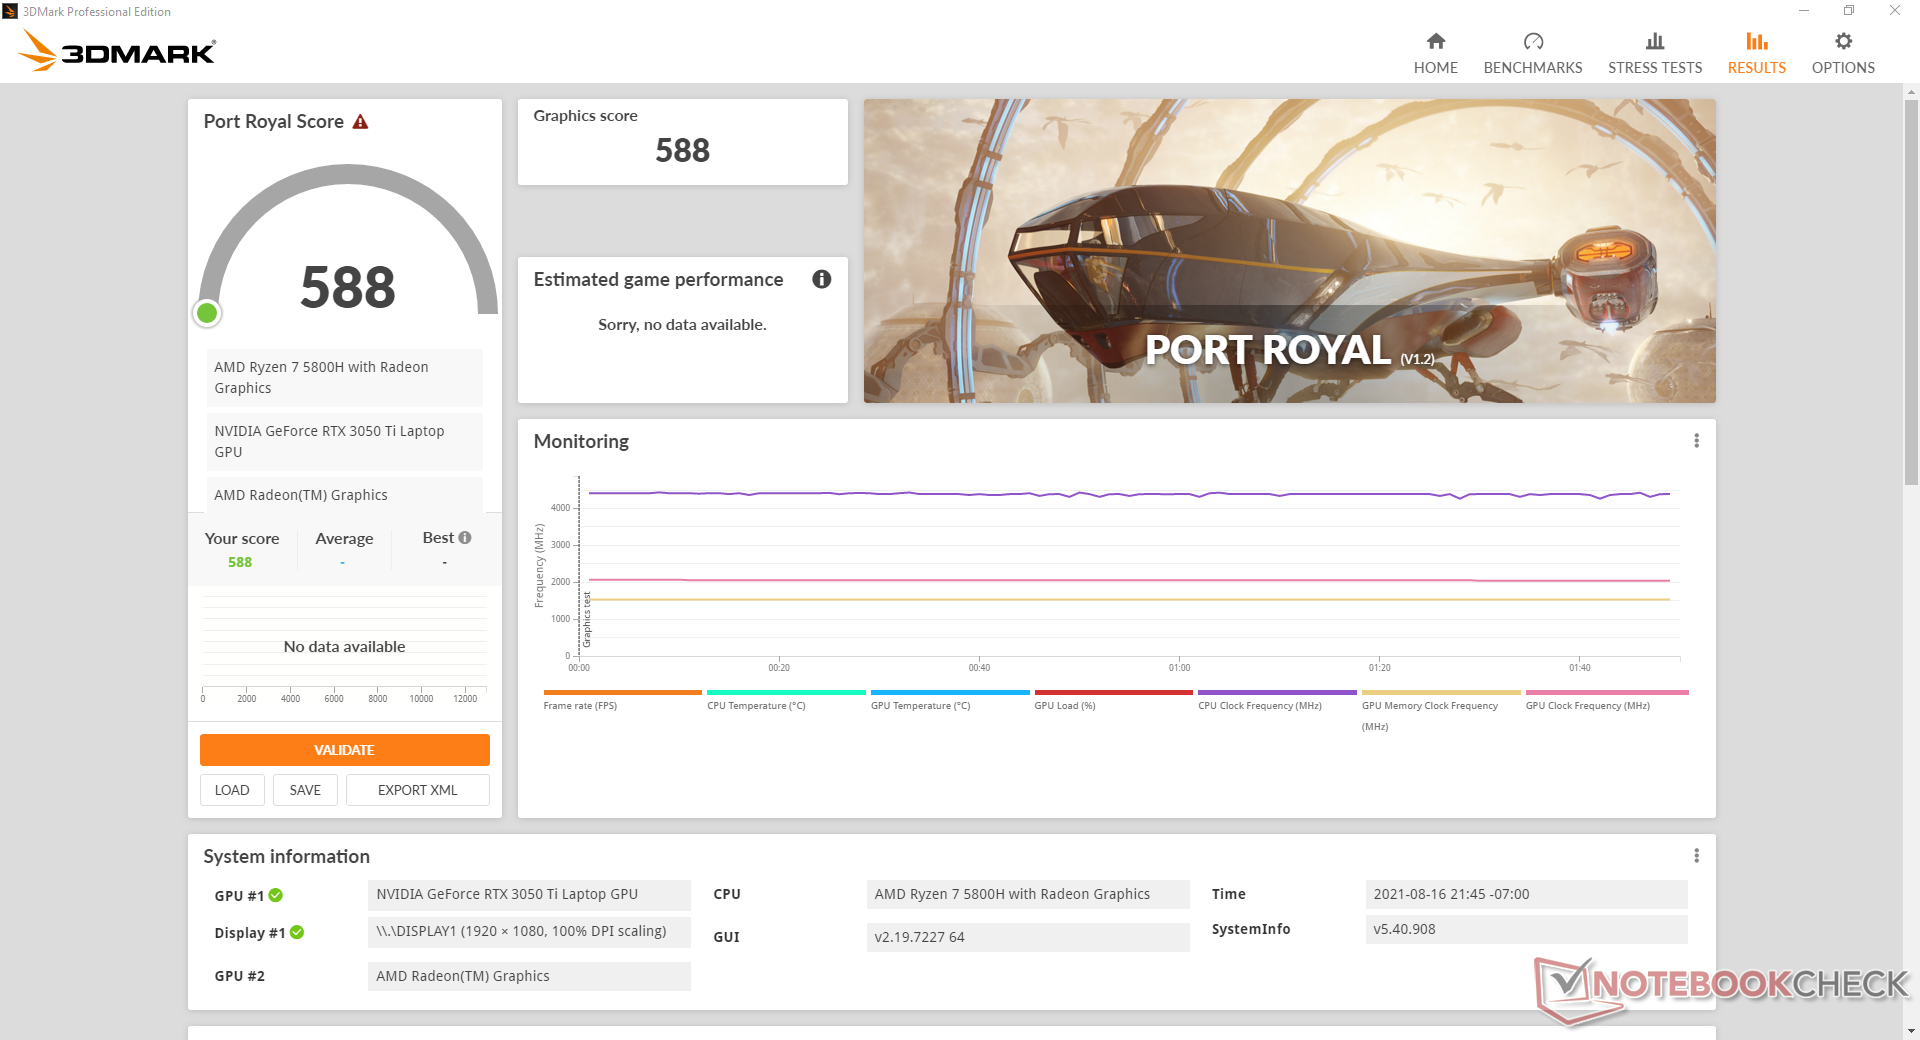
Prestazioni della GPU - Più lenta della GeForce GTX 1660 Ti
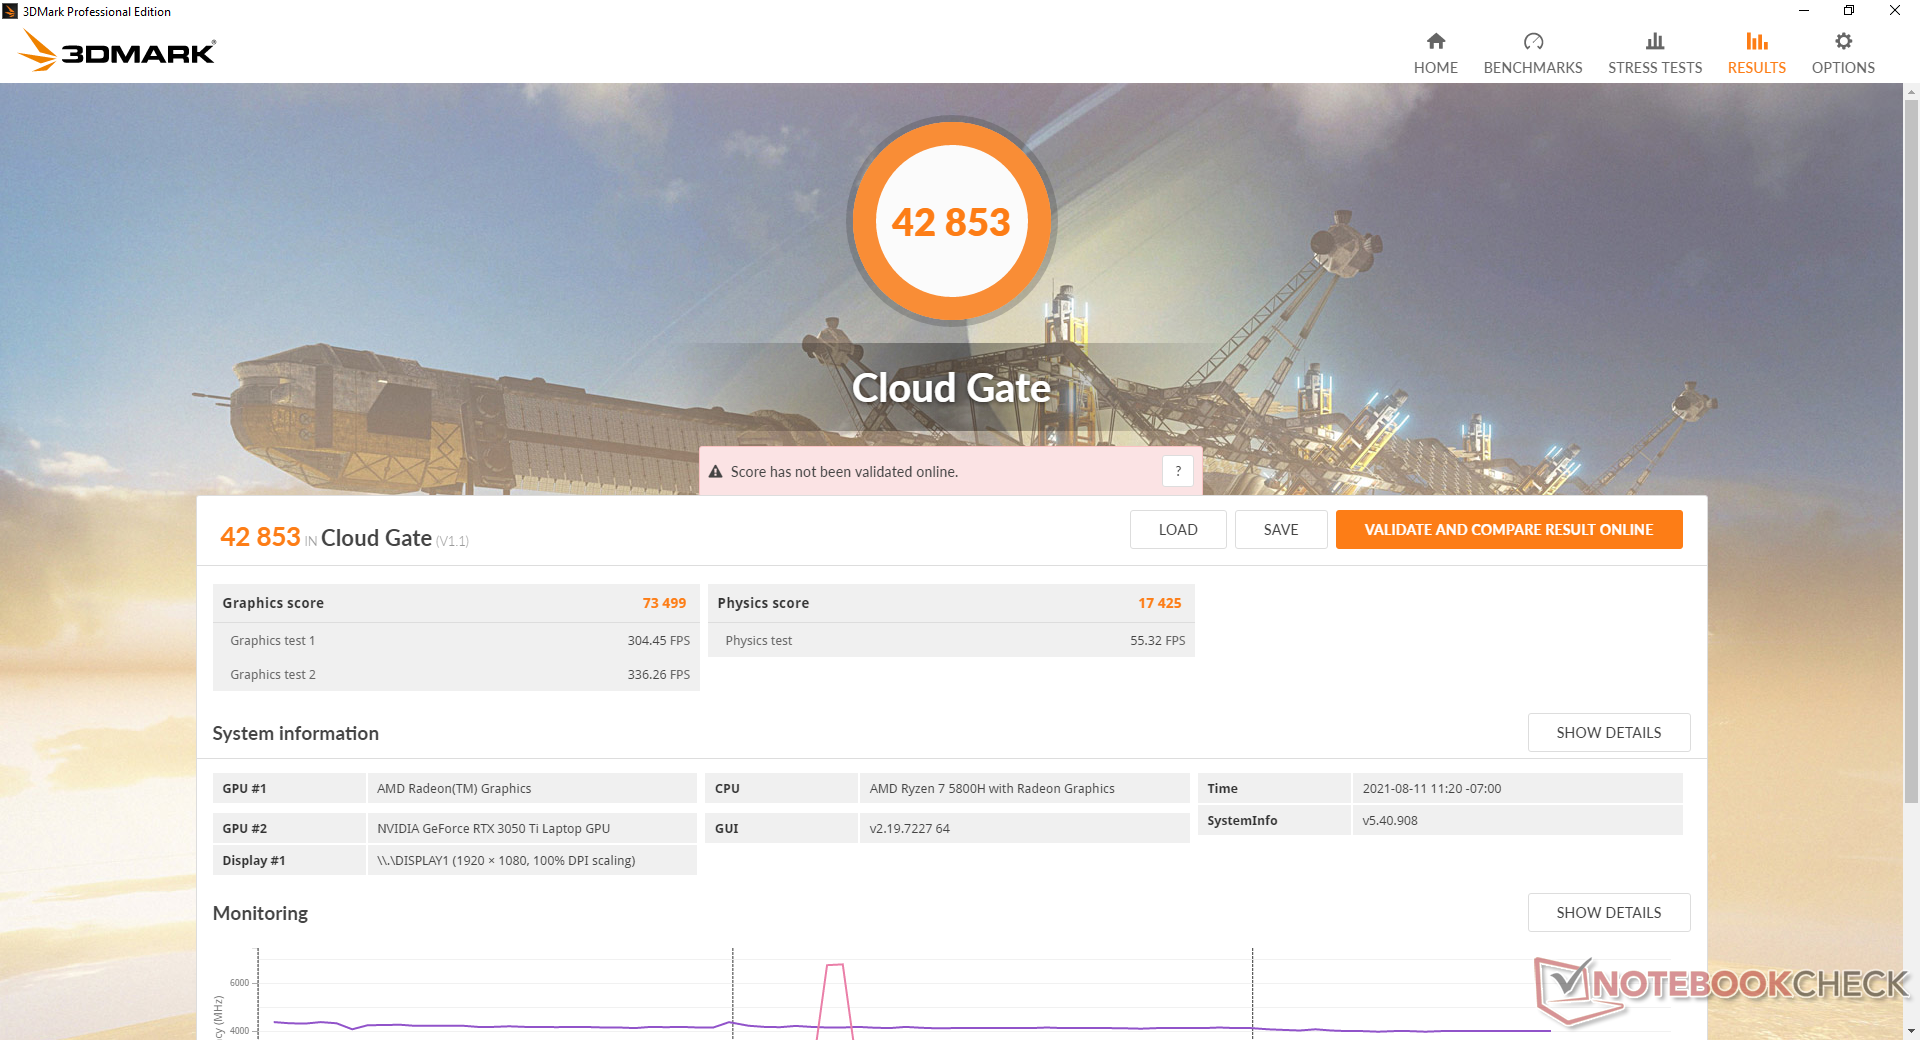
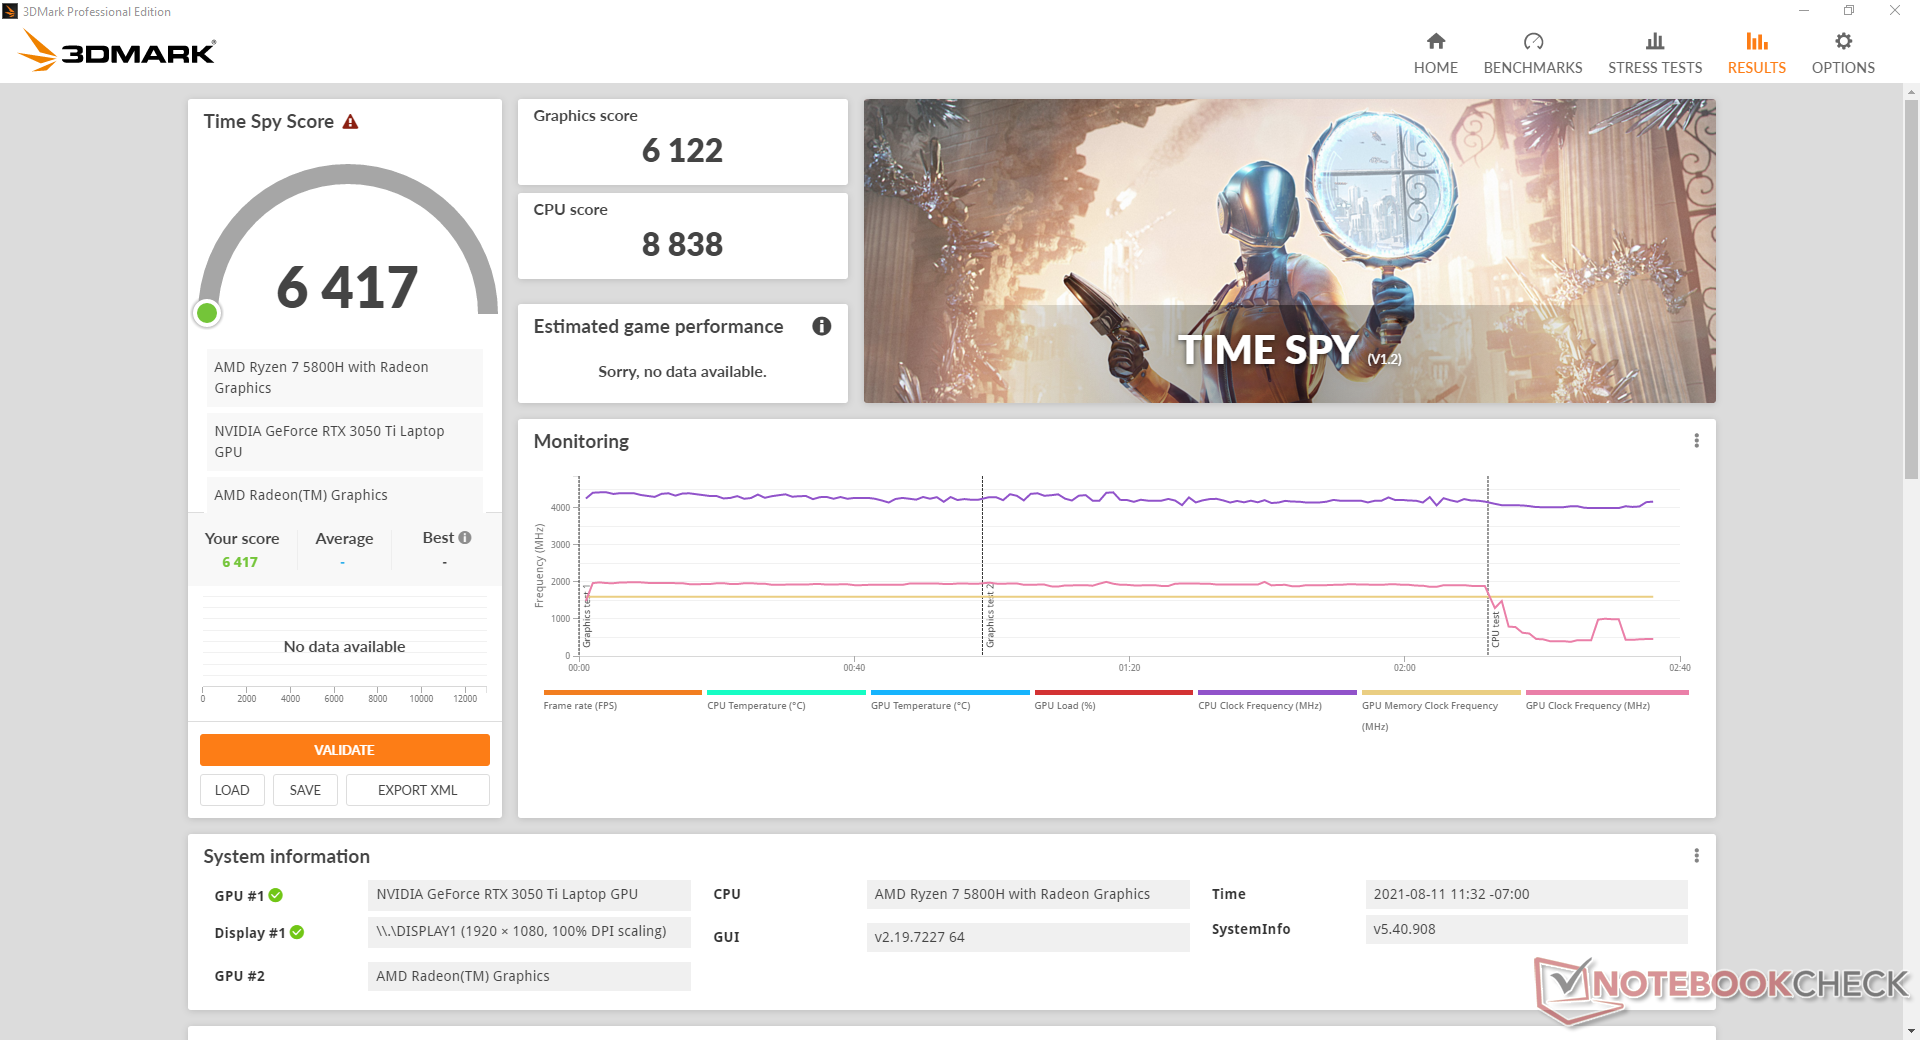
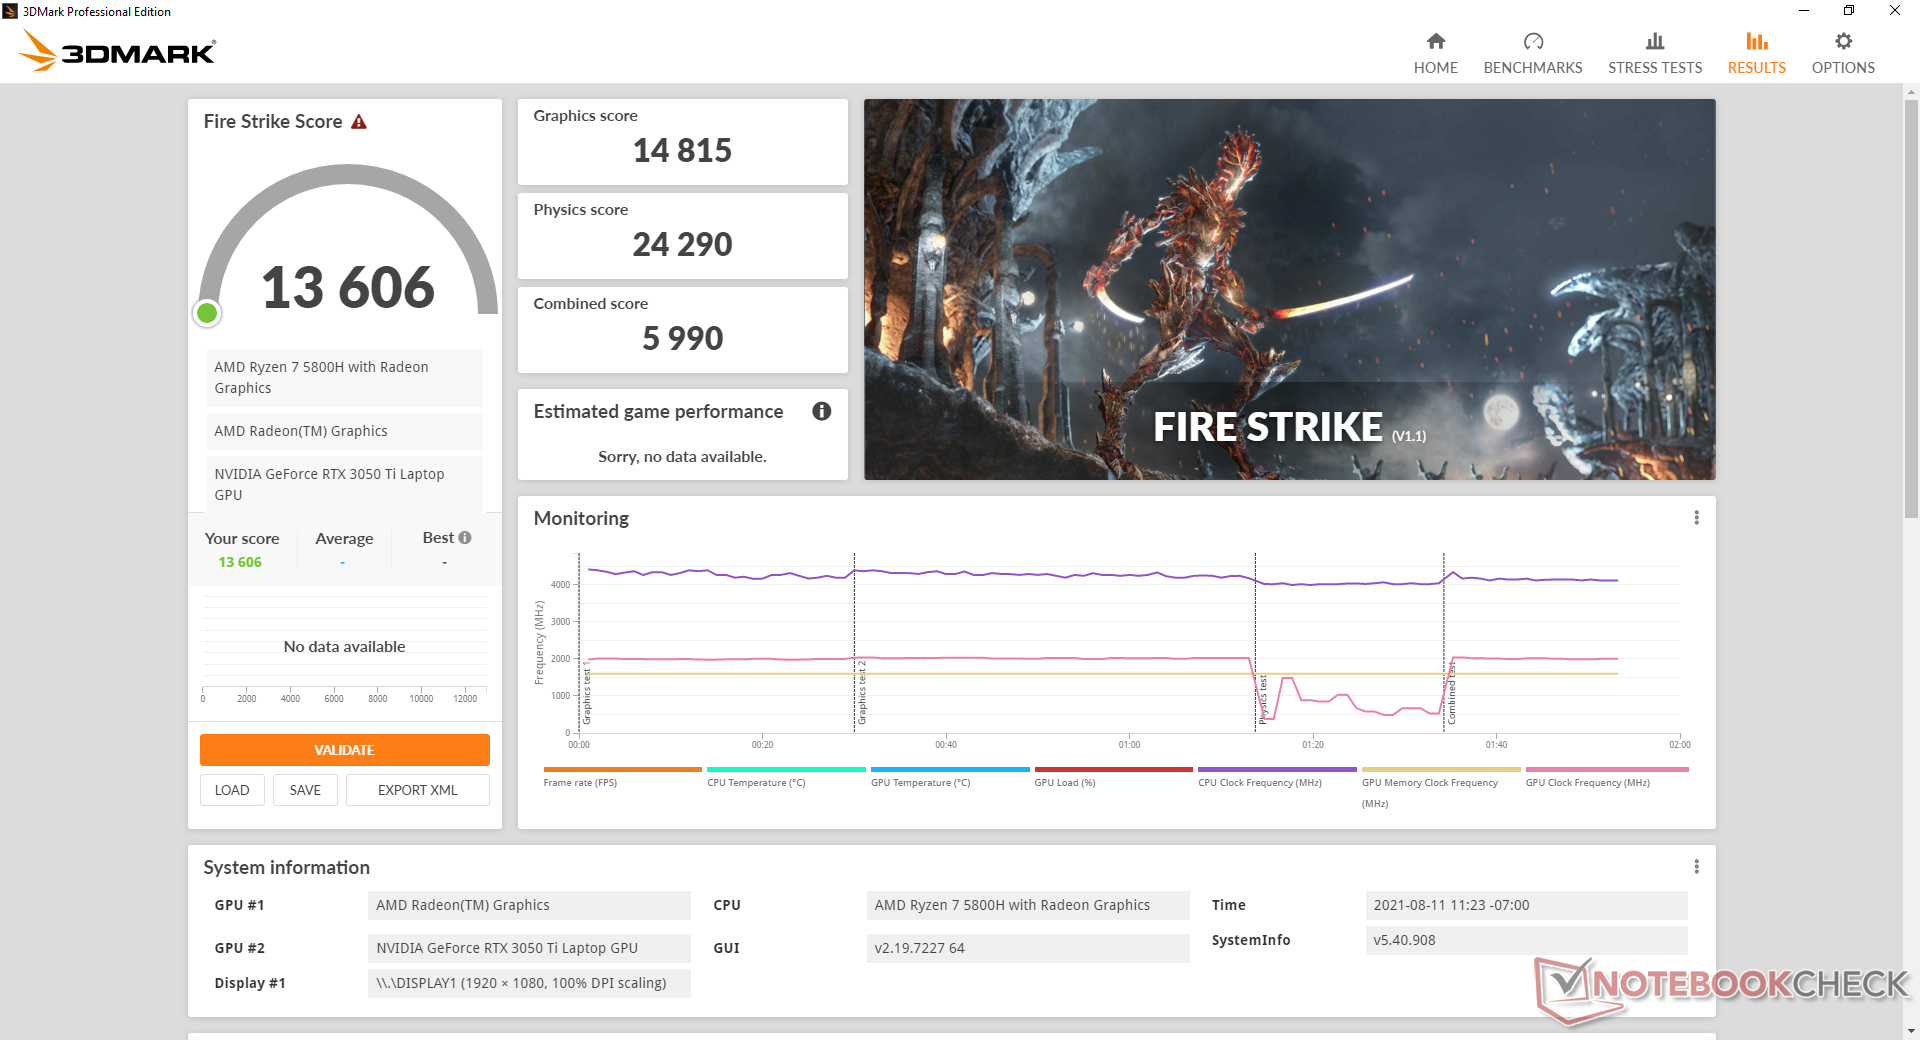
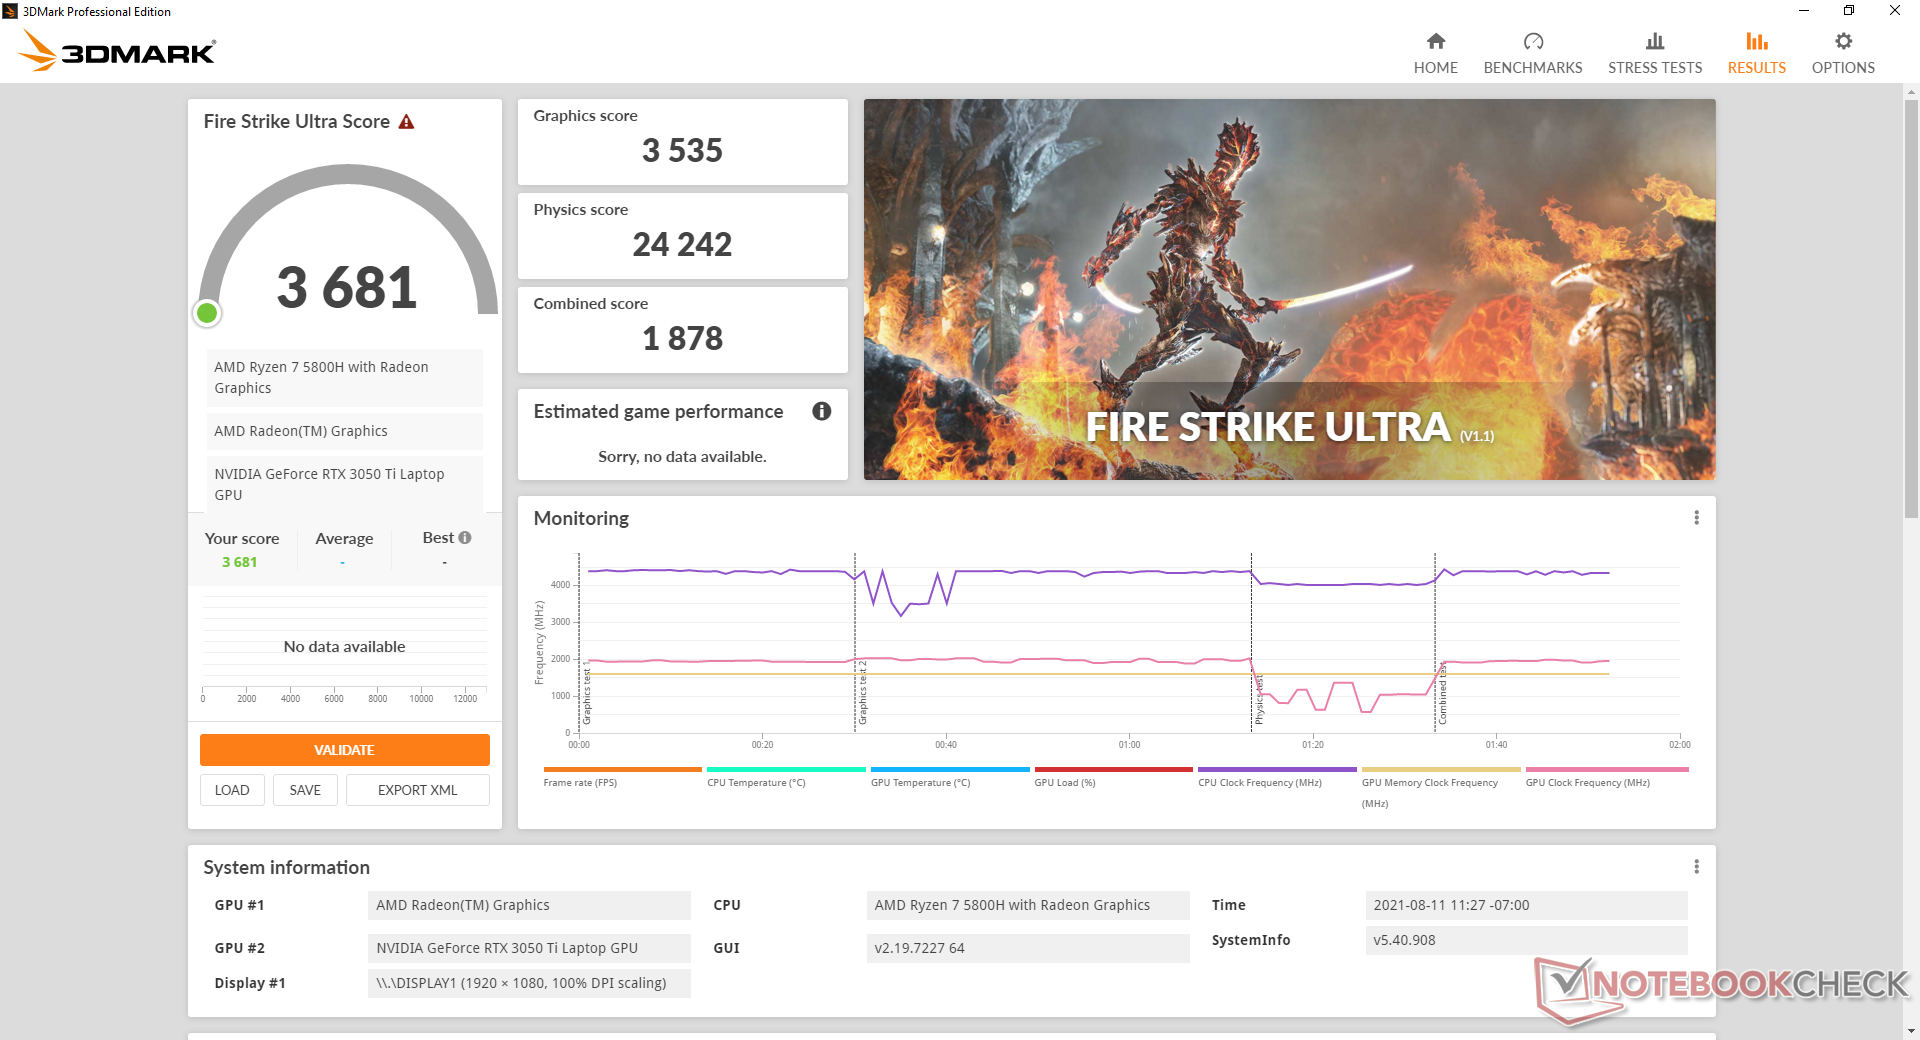
Le prestazioni grafiche sono deludenti per una scheda grafica basata su RTX. I risultati di 3DMark sono dal 16% al 25% più veloci della RTX 3050 nell'Acer Nitro 5 finendo per essere alla pari con la meno costosa GeForce GTX 1660 Ti nel migliore dei casi. Infatti, la GTX 1660 Ti sarà ancora più veloce della nostra RTX 3050 Ti nella maggior parte degli scenari di gioco, specialmente con impostazioni più elevate di 1080p. Passando alla RTX 3060 darà agli utenti una spinta grafica dal 40% al 50%.
Le prestazioni grafiche caleranno leggermente se non si esegue in modalità Asus Turbo, come esemplificato dalla nostra sezione Stress Test qui sotto.
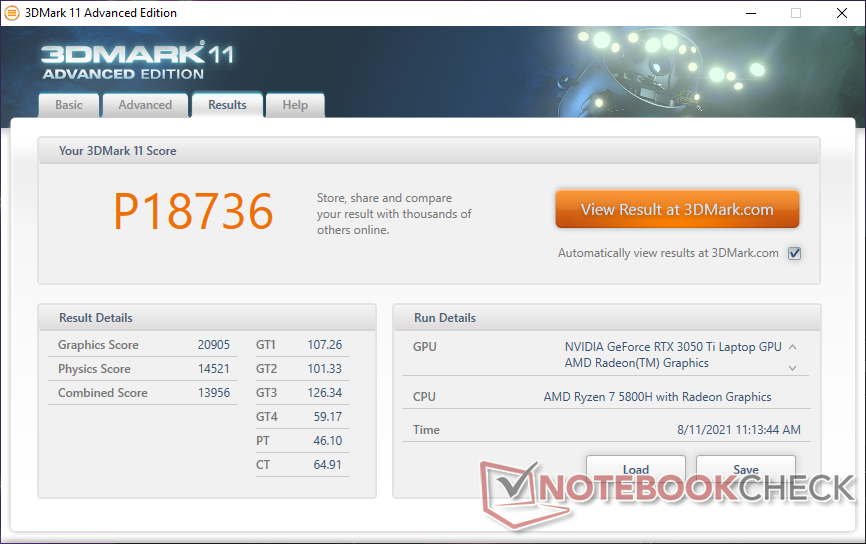
| 3DMark 11 Performance | 18736 punti | |
| 3DMark Cloud Gate Standard Score | 42853 punti | |
| 3DMark Fire Strike Score | 13606 punti | |
| 3DMark Time Spy Score | 6417 punti | |
Aiuto | ||
L'esecuzione di The Witcher 3 per un'ora intera mostra prestazioni stabili, salvo un calo inaspettato a 20 FPS. Il calo indica un'attività in background che interrompe il gioco e che è potenzialmente legata al software Asus preinstallato o ad altri pop up. Fortunatamente, questo non si verifica su base periodica.
Grafico FPS The Witcher 3
| basso | medio | alto | ultra | |
|---|---|---|---|---|
| GTA V (2015) | 172 | 122 | 72.2 | |
| The Witcher 3 (2015) | 262.3 | 104.2 | 58.4 | |
| Dota 2 Reborn (2015) | 134 | 131 | 111 | 107 |
| Final Fantasy XV Benchmark (2018) | 132 | 81.8 | 56.6 | |
| X-Plane 11.11 (2018) | 94.1 | 81.6 | 68.4 | |
| Far Cry 5 (2018) | 125 | 101 | 94 | 89 |
| Strange Brigade (2018) | 227 | 134 | 114 | 100 |
| Shadow of the Tomb Raider (2018) | 115 | 92 | 83 | 72 |
| Far Cry New Dawn (2019) | 94 | 80 | 78 | 70 |
| Metro Exodus (2019) | 126.3 | 71.2 | 55.3 | 43.5 |
| Borderlands 3 (2019) | 123.5 | 88 | 56.8 | 36.8 |
| Gears Tactics (2020) | 125.9 | 136.4 | 90.6 | 64.7 |
| Horizon Zero Dawn (2020) | 52 | 47 | 44 | 41 |
| Watch Dogs Legion (2020) | 44 | 46 | 42 | 28 |
| Dirt 5 (2020) | 111.8 | 77.4 | 67.3 | 53.3 |
| Assassin´s Creed Valhalla (2020) | 84 | 53 | 34 | 24 |
| Immortals Fenyx Rising (2020) | 89 | 73 | 58 | 54 |
| Hitman 3 (2021) | 121.3 | 95.3 | 82.7 | 79.8 |
| F1 2021 (2021) | 200 | 141 | 125 | 69 |
Emissioni — Rumoroso solo durante il Gaming
Rumorosità
Il rumore delle ventole è strettamente legato ai profili di alimentazione Armoury Crate. Questa volta, però, Asus sembra aver migliorato il comportamento delle ventole. Mentre le ventole sui vecchi modelli Strix aumentavano automaticamente i giri al massimo quando si impostava la modalità Turbo, sembrano essere più silenziose indipendentemente dalla modalità fino a quando la potenza extra non è effettivamente necessaria. Gli utenti possono trasmettere video ed eseguire altre attività leggere in modalità Turbo senza che le ventole pulsino costantemente.
C'è una notevole differenza di rumore delle ventole tra la modalità Performance e la modalità Turbo. Il gaming in modalità Performance si traduce in un rumore costante della ventola di 46.4 dB(A) mentre la modalità Turbo lo aumenta a 49.9 dB(A). Le ventole più rumorose sono accompagnate da prestazioni grafiche più veloci, come mostrato nella nostra sezione Stress Test qui sotto.
| Asus ROG Strix G17 G713QE-RB74 GeForce RTX 3050 Ti Laptop GPU, R7 5800H, Samsung PM991 MZVLQ512HBLU | Acer Nitro 5 AN517-53-54DQ GeForce RTX 3050 4GB Laptop GPU, i5-11300H, SK Hynix BC711 HFM512GD3HX015N | MSI Katana GF76 11UE GeForce RTX 3060 Laptop GPU, i7-11800H, Kingston OM8PCP3512F-AB | Asus Strix Scar 17 G733QSA-XS99 GeForce RTX 3080 Laptop GPU, R9 5900HX, 2x Samsung PM981a MZVLB1T0HBLR (RAID 0) | MSI Alpha 17 A4DEK Radeon RX 5600M, R7 4800H, Kingston OM8PCP3512F-AB | Asus Strix G17 G712LWS GeForce RTX 2070 Super Mobile, i7-10750H, Intel SSD 660p 1TB SSDPEKNW010T8 | |
|---|---|---|---|---|---|---|
| Noise | -8% | -23% | 1% | -12% | -22% | |
| off /ambiente * (dB) | 24.9 | 25 -0% | 25 -0% | 25 -0% | 25 -0% | 25 -0% |
| Idle Minimum * (dB) | 25.1 | 25 -0% | 33 -31% | 25.2 -0% | 31 -24% | 32 -27% |
| Idle Average * (dB) | 25.1 | 31 -24% | 34 -35% | 25.2 -0% | 32 -27% | 34 -35% |
| Idle Maximum * (dB) | 25.1 | 33 -31% | 35 -39% | 25.2 -0% | 33 -31% | 37 -47% |
| Load Average * (dB) | 36.3 | 43 -18% | 53 -46% | 30.7 15% | 38 -5% | 51 -40% |
| Witcher 3 ultra * (dB) | 49.9 | 44 12% | 49 2% | 51.3 -3% | 46 8% | 50 -0% |
| Load Maximum * (dB) | 49.9 | 47 6% | 57 -14% | 51.3 -3% | 54 -8% | 53 -6% |
* ... Meglio usare valori piccoli
Rumorosità
| Idle |
| 25.1 / 25.1 / 25.1 dB(A) |
| Sotto carico |
| 36.3 / 49.9 dB(A) |
 | ||
30 dB silenzioso 40 dB(A) udibile 50 dB(A) rumoroso |
||
min: | ||
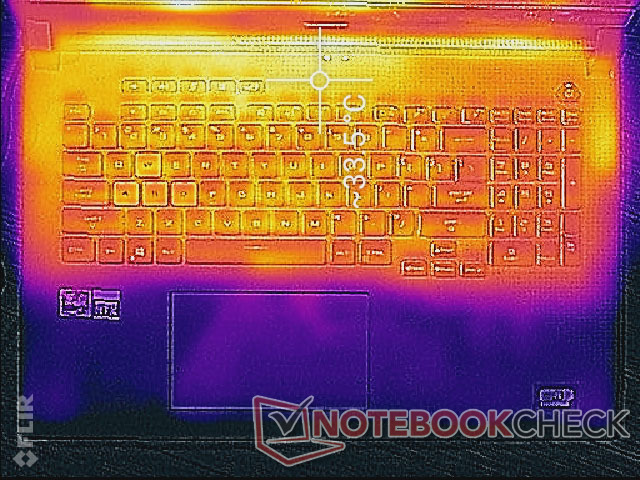
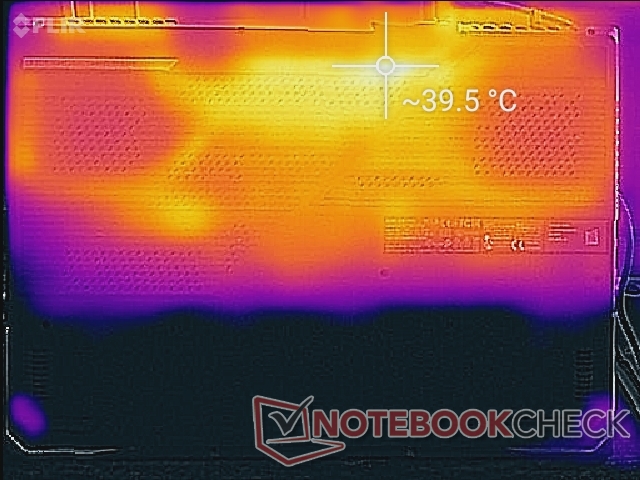
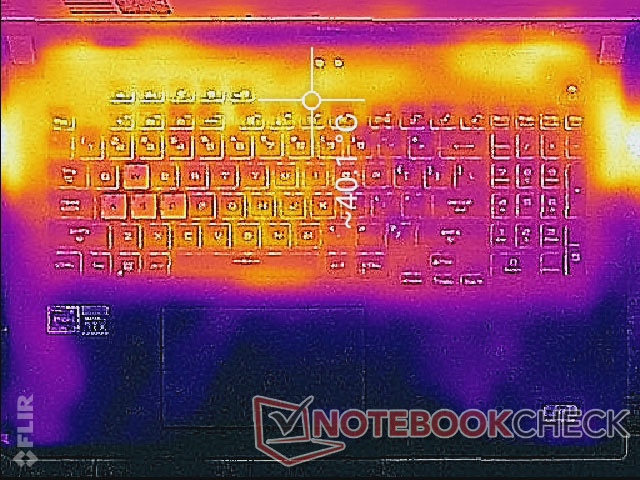
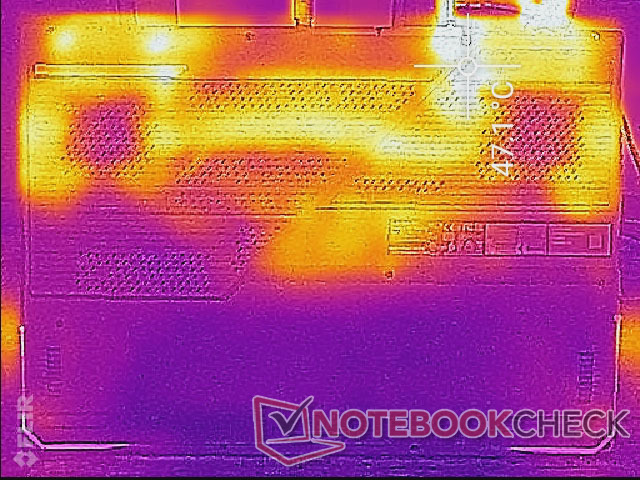
Temperature - Quasi sempre caldo
Le temperature di superficie sono fredde lungo i quadranti anteriori mentre crescono costantemente più calde verso la parte posteriore. Dato che le ventole interne amano stare al minimo quando i carichi di elaborazione sono bassi, i punti caldi arrivano fino a 33° C e 40° C sui punti caldi superiori e inferiori, rispettivamente.
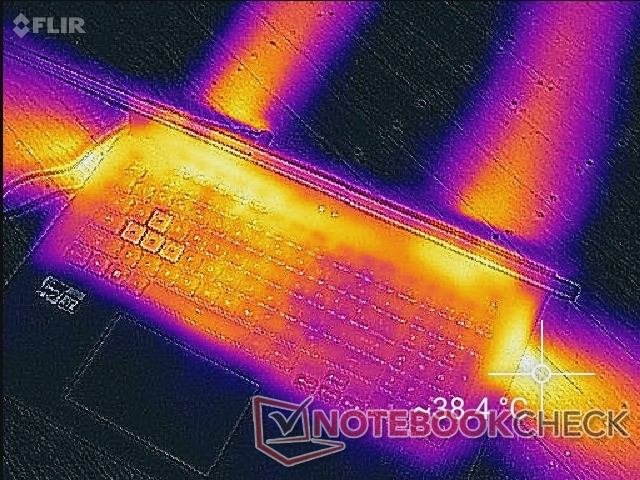
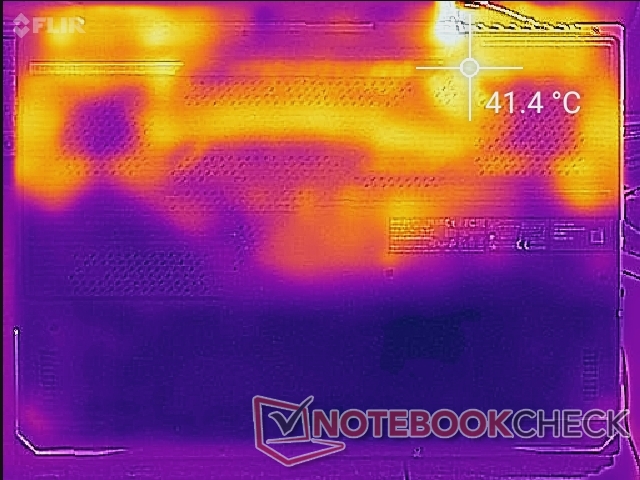
(±) La temperatura massima sul lato superiore è di 43.8 °C / 111 F, rispetto alla media di 40.4 °C / 105 F, che varia da 21.2 a 68.8 °C per questa classe Gaming.
(-) Il lato inferiore si riscalda fino ad un massimo di 47.2 °C / 117 F, rispetto alla media di 43.2 °C / 110 F
(+) In idle, la temperatura media del lato superiore è di 29.5 °C / 85 F, rispetto alla media deld ispositivo di 33.9 °C / 93 F.
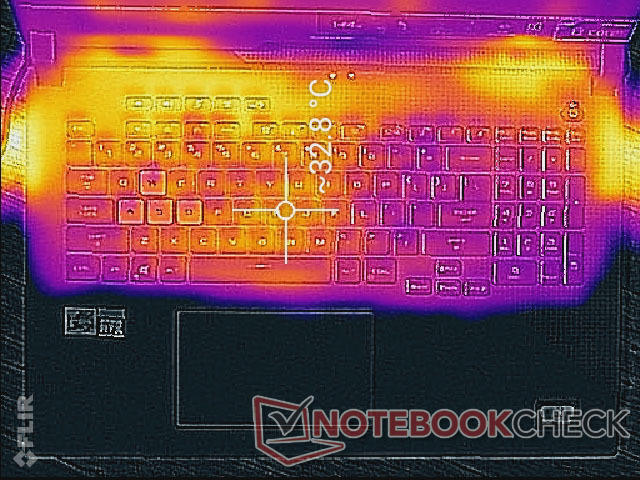
(+) Riproducendo The Witcher 3, la temperatura media per il lato superiore e' di 28.8 °C / 84 F, rispetto alla media del dispositivo di 33.9 °C / 93 F.
(+) I poggiapolsi e il touchpad sono piu' freddi della temperatura della pelle con un massimo di 29.6 °C / 85.3 F e sono quindi freddi al tatto.
(±) La temperatura media della zona del palmo della mano di dispositivi simili e'stata di 28.8 °C / 83.8 F (-0.8 °C / -1.5 F).
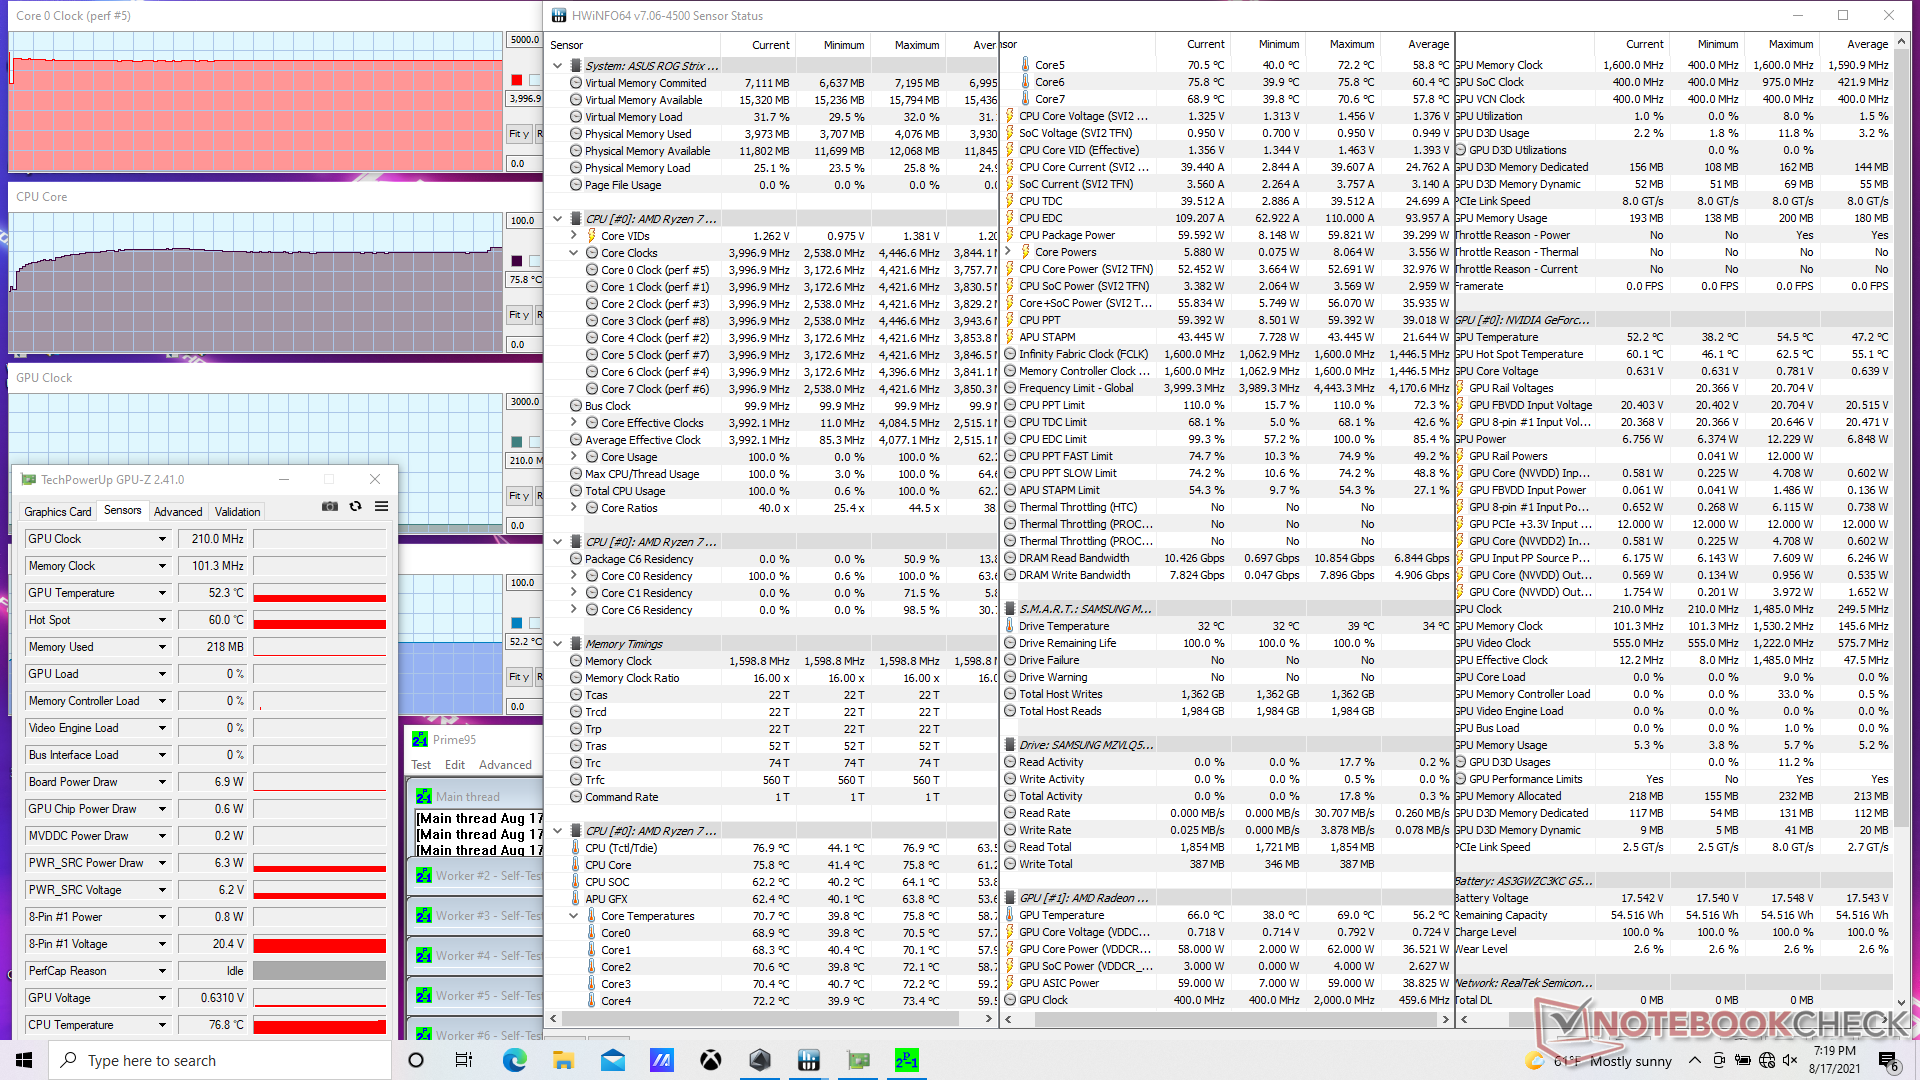
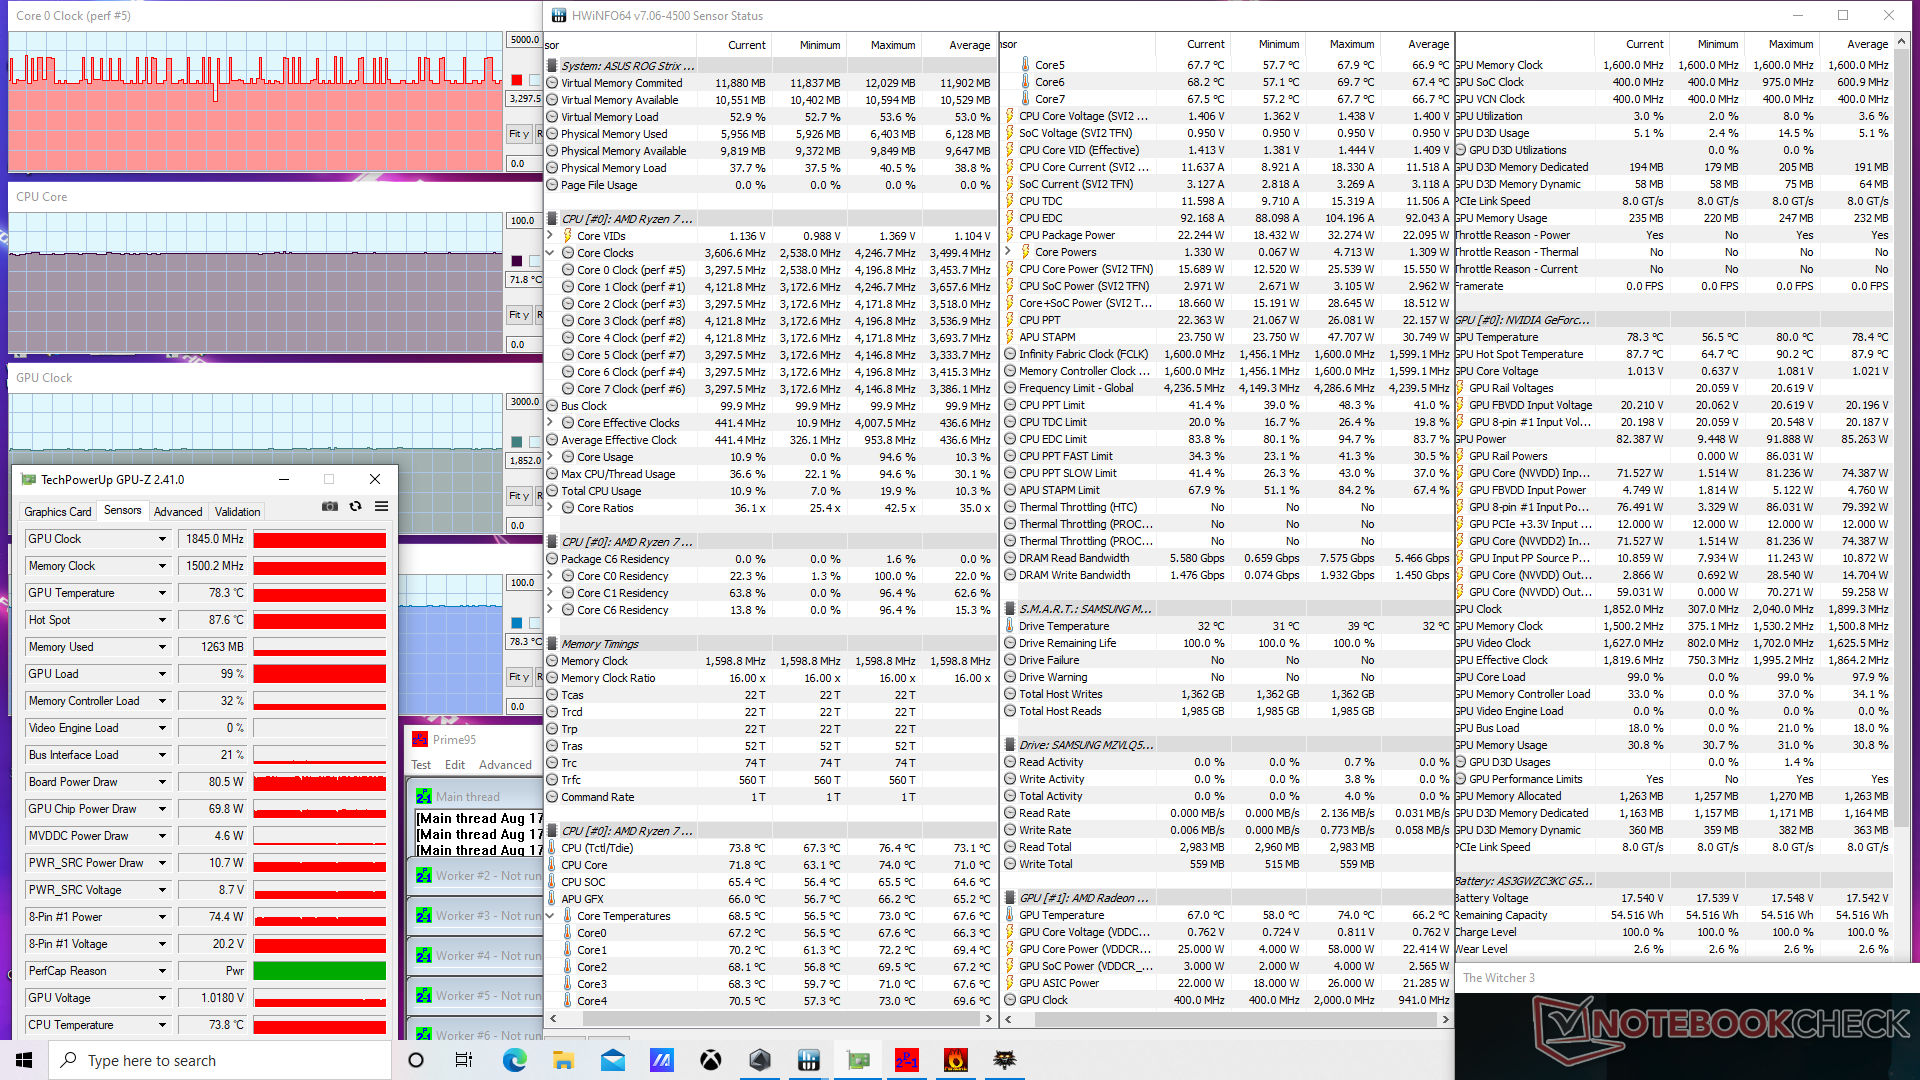
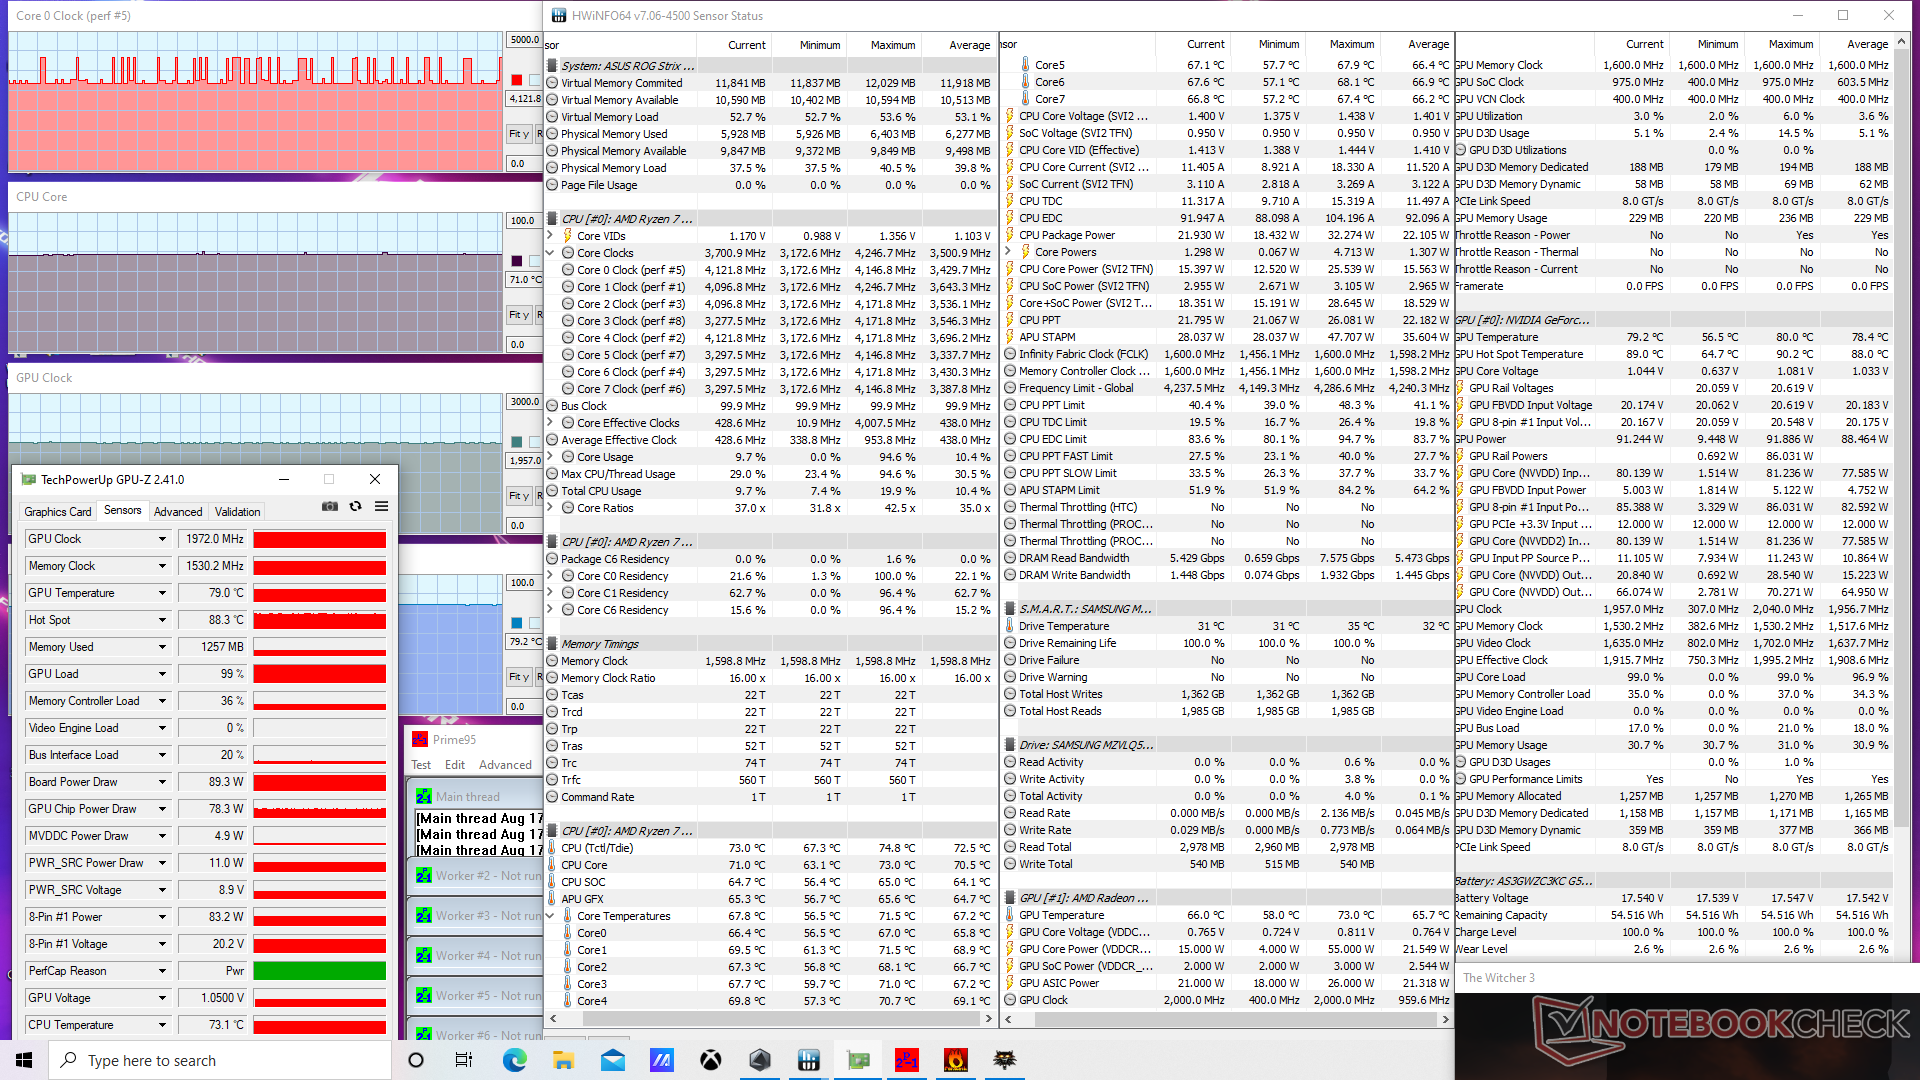
Stress Test - Eccellente sostenibilità del boost della CPU
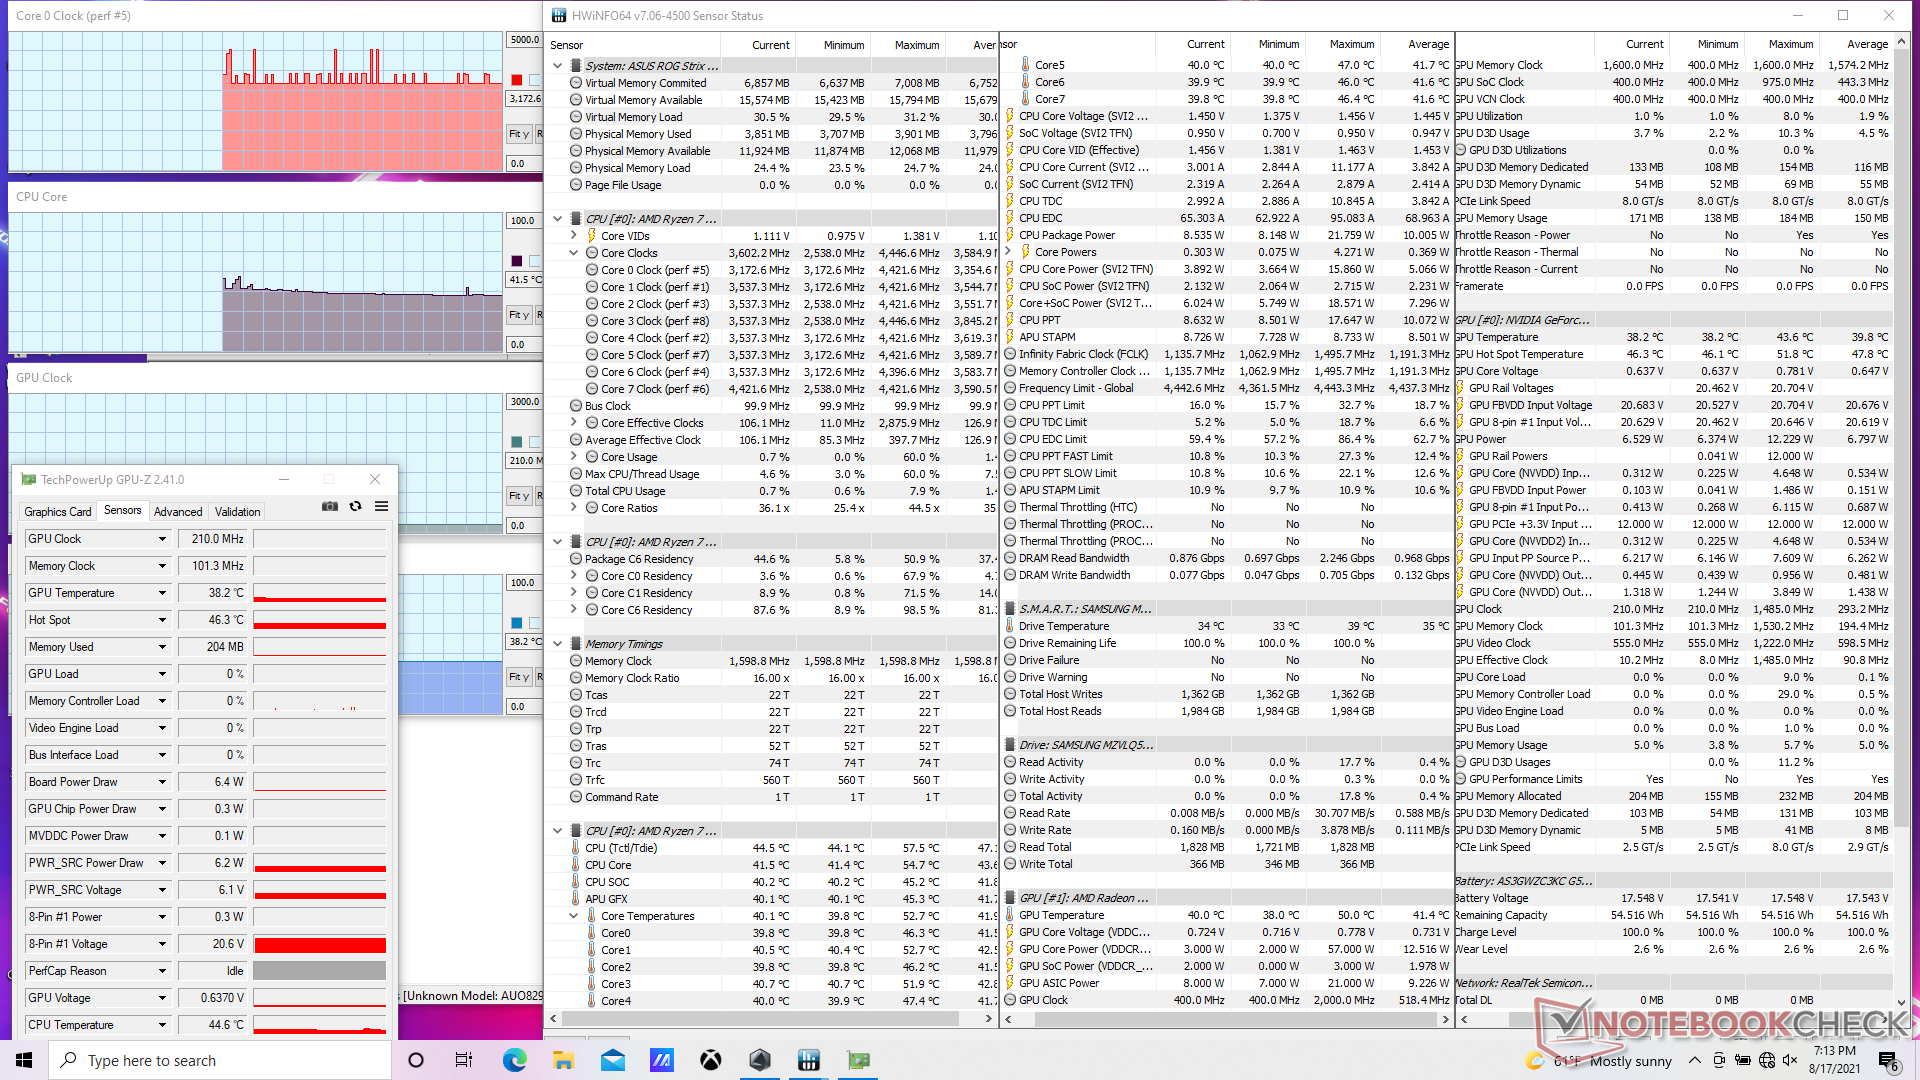
Sotto stress di Prime95, la CPU si spingeva momentaneamente a 4,1 GHz prima di stabilizzarsi a 4 GHz e 76 C. La frequenza di clock Boost massima nominale del Ryzen 7 5800H è di 4,4 GHz e quindi i 4 GHz stabili sono rispettabili. La CPU arriva al massimo a 84° C quando è sottoposta a carichi estremi per lunghi periodi.
La CPU e la GPU si stabilizzano a 72° C e 78° C, rispettivamente, quando si esegue The Witcher 3. È interessante notare che queste temperature rimangono più o meno le stesse indipendentemente dall'impostazione della modalità Turbo, ma la maggior parte dei giocatori vorrà comunque attivare la modalità Turbo poiché le frequenze di clock di GPU e memoria diventano leggermente più veloci (da 1845 MHz a 1972 MHz GPU e da 1500 MHz a 1530 MHz memoria) al costo di ventole più rumorose. L'assorbimento massimo della GPU passerebbe anche da 80 W a 90 W in modalità Turbo, che è vicino alla pubblicità di Asus di una GPU TGP a 95 W.
L'alimentazione a batteria limita le prestazioni grafiche, soprattutto perché la modalità Turbo è disponibile solo quando è collegata alla rete. Un test 3DMark 11 a batteria restituirebbe punteggi di Physica e Graphics di 13986 e 12434 punti, rispettivamente, rispetto a 14521 e 20905 punti ottenuti con il collegamento da rete elettrica.

| Clock della CPU (GHz)Clock della GPU(MHz)Temperatura media dellaCPU (°C)Temperaturamedia dellaGPU (°C) |
| Sistema inattivo |
| StressPrime95 (Turbo on) |
| Prime95 + FurMark Stress (Turbo on) |
| Witcher 3 Stress (Turbo off) |
| Witcher 3 Stress (Turbo on) |
Altoparlanti
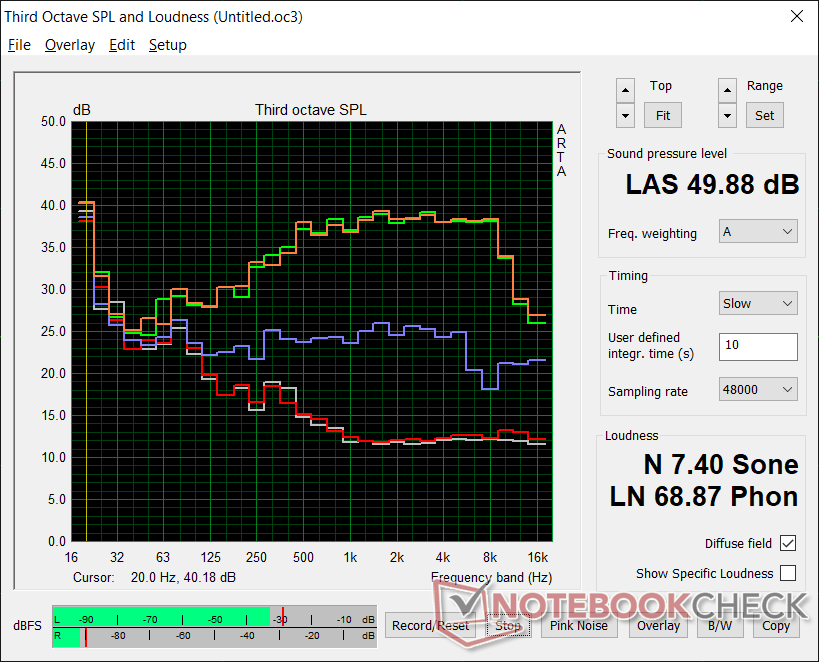
Gli altoparlanti stereo da 2 W sono relativamente deboli. Anche gli altoparlanti del più piccolo HP Pavilion Aero 13 da 13 pollici sono più potenti e hanno una gamma più ampia di quelli del nostro Strix G17.


Asus ROG Strix G17 G713QE-RB74 analisi audio
(±) | potenza degli altiparlanti media ma buona (73.5 dB)
Bassi 100 - 315 Hz
(±) | bassi ridotti - in media 13% inferiori alla media
(±) | la linearità dei bassi è media (9.8% delta rispetto alla precedente frequenza)
Medi 400 - 2000 Hz
(±) | medi elevati - circa 5.6% superiore alla media
(+) | medi lineari (6.5% delta rispetto alla precedente frequenza)
Alti 2 - 16 kHz
(+) | Alti bilanciati - appena 3.4% dalla media
(±) | la linearità degli alti è media (12% delta rispetto alla precedente frequenza)
Nel complesso 100 - 16.000 Hz
(±) | la linearità complessiva del suono è media (16.9% di differenza rispetto alla media
Rispetto alla stessa classe
» 44% di tutti i dispositivi testati in questa classe è stato migliore, 11% simile, 45% peggiore
» Il migliore ha avuto un delta di 6%, medio di 18%, peggiore di 132%
Rispetto a tutti i dispositivi testati
» 30% di tutti i dispositivi testati in questa classe è stato migliore, 8% similare, 62% peggiore
» Il migliore ha avuto un delta di 4%, medio di 24%, peggiore di 134%
Apple MacBook 12 (Early 2016) 1.1 GHz analisi audio
(+) | gli altoparlanti sono relativamente potenti (83.6 dB)
Bassi 100 - 315 Hz
(±) | bassi ridotti - in media 11.3% inferiori alla media
(±) | la linearità dei bassi è media (14.2% delta rispetto alla precedente frequenza)
Medi 400 - 2000 Hz
(+) | medi bilanciati - solo only 2.4% rispetto alla media
(+) | medi lineari (5.5% delta rispetto alla precedente frequenza)
Alti 2 - 16 kHz
(+) | Alti bilanciati - appena 2% dalla media
(+) | alti lineari (4.5% delta rispetto alla precedente frequenza)
Nel complesso 100 - 16.000 Hz
(+) | suono nel complesso lineare (10.2% differenza dalla media)
Rispetto alla stessa classe
» 7% di tutti i dispositivi testati in questa classe è stato migliore, 2% simile, 91% peggiore
» Il migliore ha avuto un delta di 5%, medio di 18%, peggiore di 53%
Rispetto a tutti i dispositivi testati
» 5% di tutti i dispositivi testati in questa classe è stato migliore, 1% similare, 94% peggiore
» Il migliore ha avuto un delta di 4%, medio di 24%, peggiore di 134%
Gestione energetica — Scase prestazioni della GPU per Watt
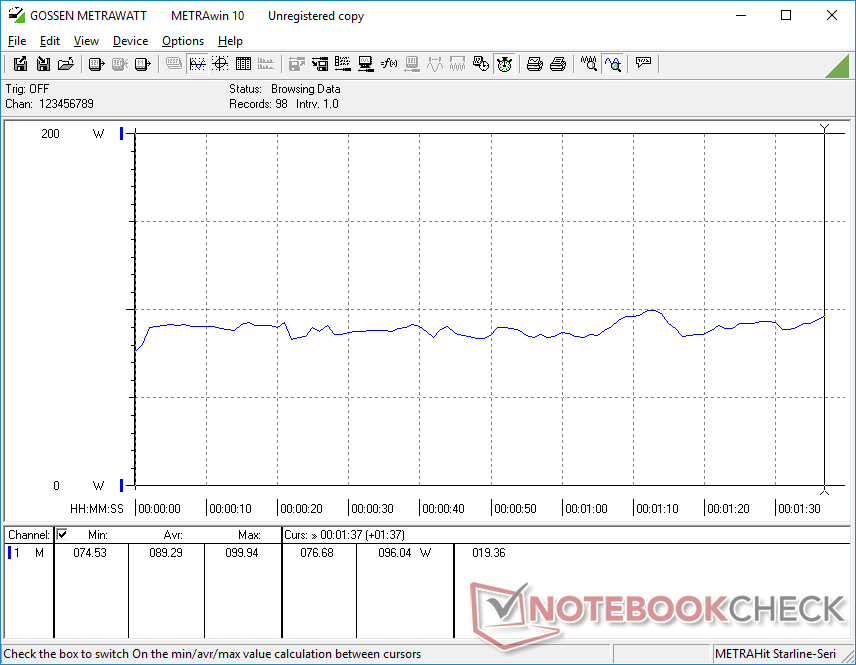
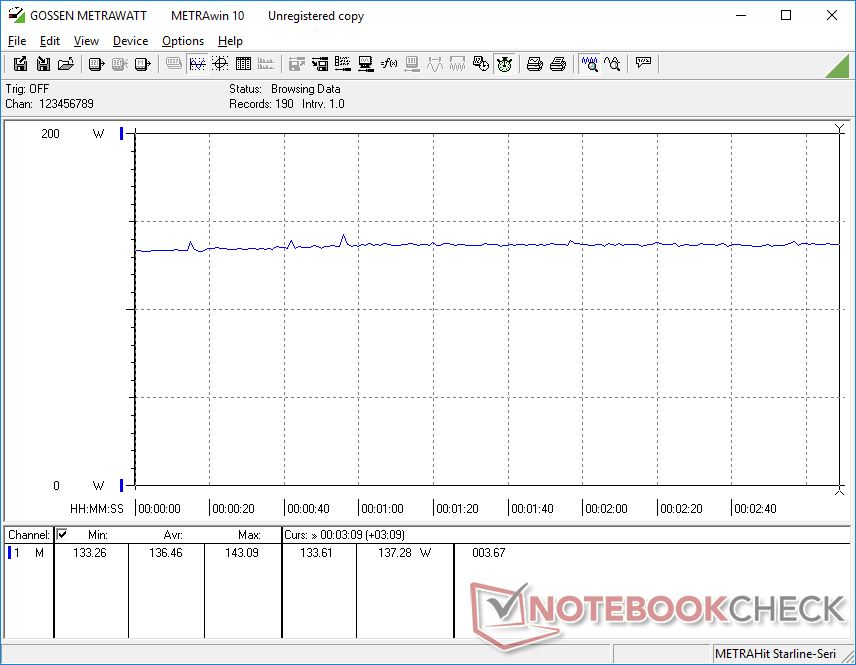
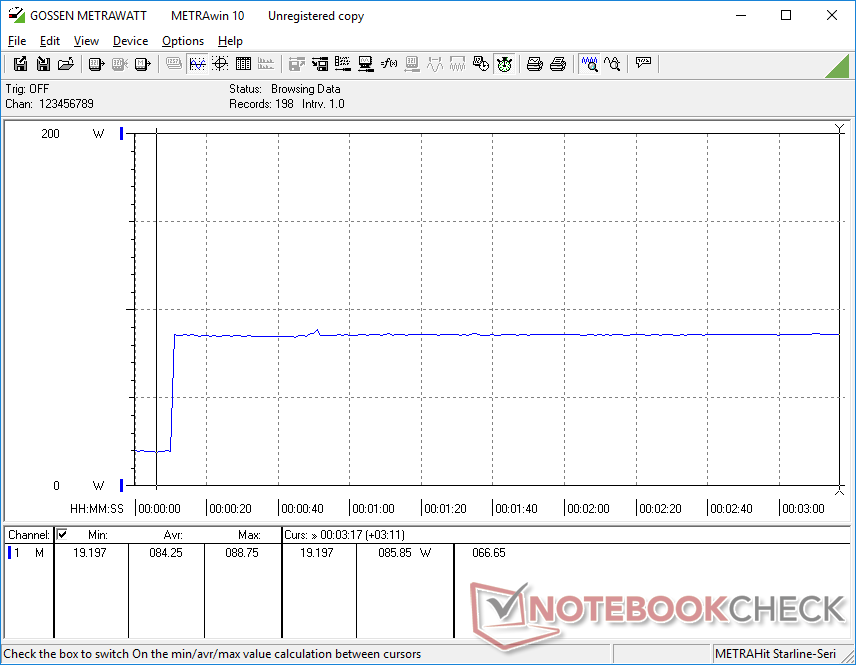
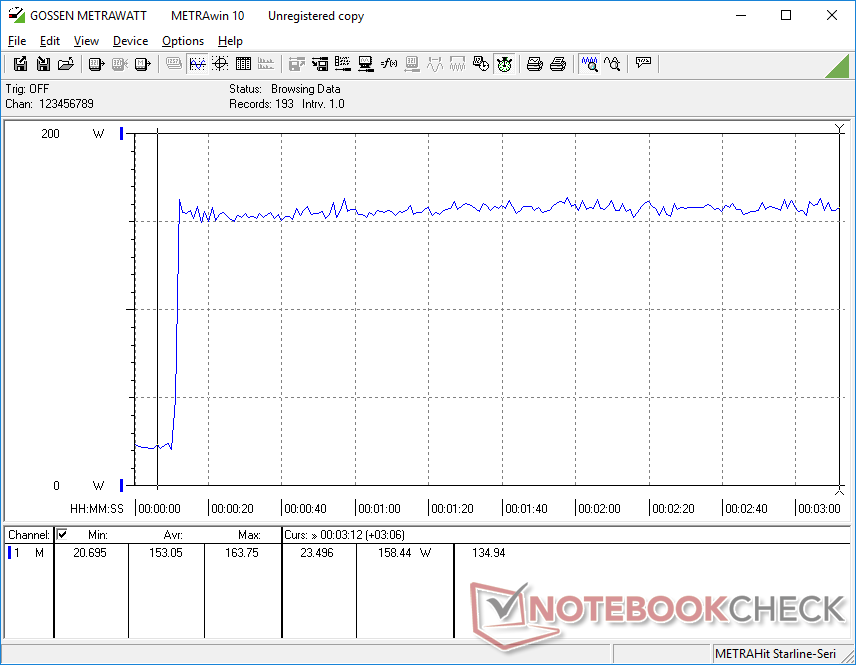
Consumo di energia
Il consumo energetico complessivo è vicino a quello che abbiamo osservato sull'MSI Katana con la più veloce GPU RTX 3060. L'esecuzione di The Witcher 3 consuma circa il 9% in meno di energia sul nostro Asus nonostante il suo deficit di prestazioni grafiche del 30% per mostrare prestazioni più povere per watt dalla RTX 3050 Ti.
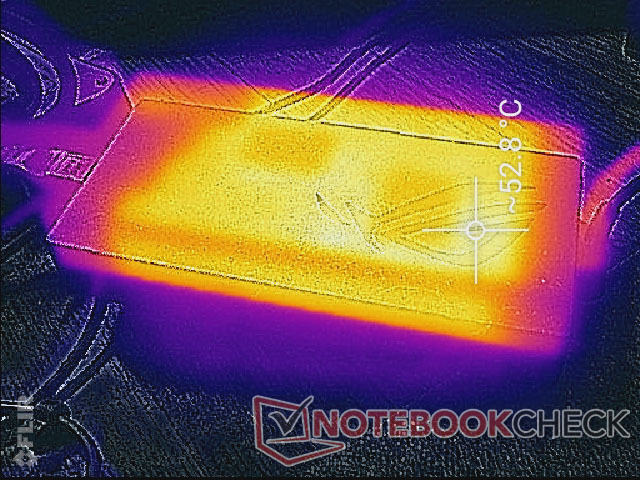
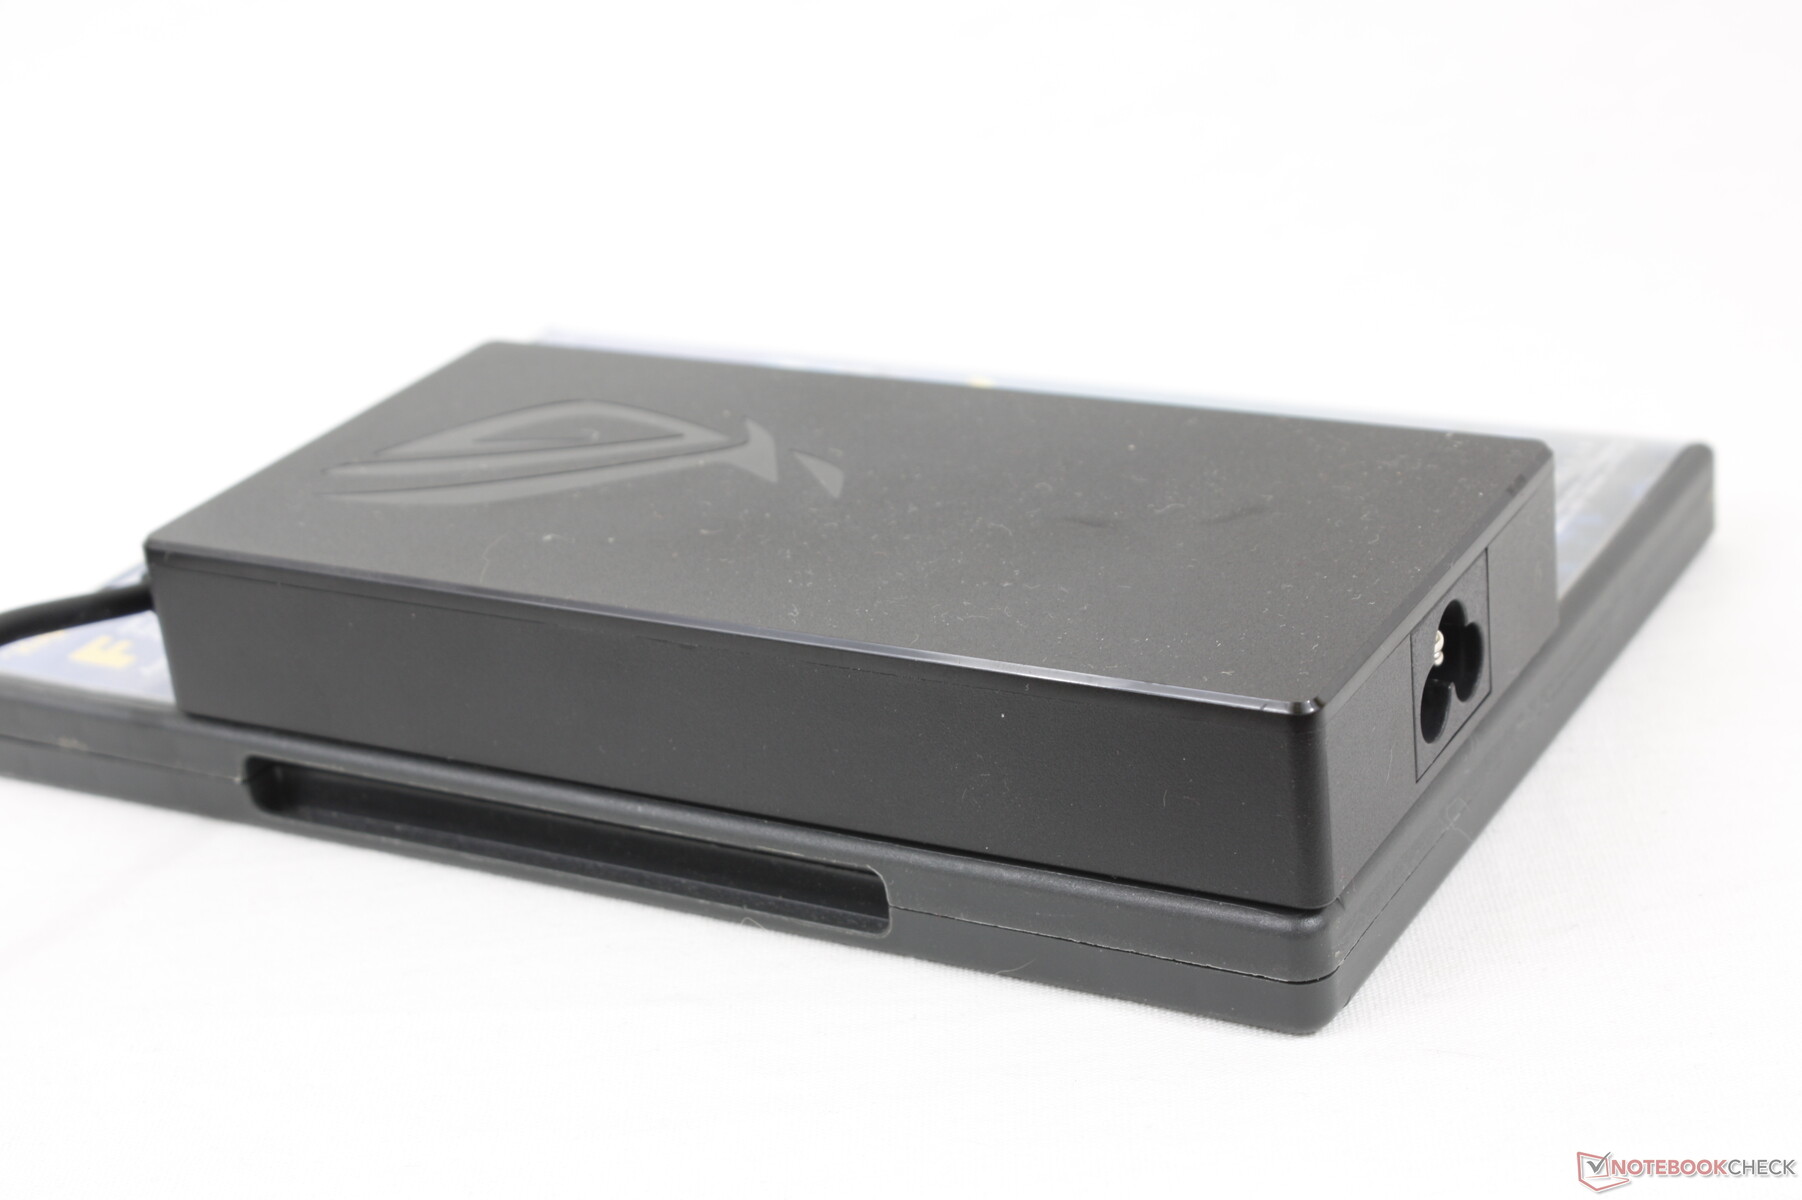
Siamo in grado di registrare un consumo massimo di 163 W dall'adattatore AC 200 W di medie dimensioni (~15,2 x 7,3 x 2,3 cm). La nostra configurazione non ha problemi a caricare e a far girare i giochi simultaneamente. Altre versioni possono venire con adattatori più piccoli da 160 W o più grandi da 240 W a seconda dell'opzione grafica.
| Off / Standby | |
| Idle | |
| Sotto carico |
|
Leggenda:
min: | |
| Asus ROG Strix G17 G713QE-RB74 R7 5800H, GeForce RTX 3050 Ti Laptop GPU, Samsung PM991 MZVLQ512HBLU, IPS, 1920x1080, 17.3" | Acer Nitro 5 AN517-53-54DQ i5-11300H, GeForce RTX 3050 4GB Laptop GPU, SK Hynix BC711 HFM512GD3HX015N, IPS, 1920x1080, 17.3" | MSI Katana GF76 11UE i7-11800H, GeForce RTX 3060 Laptop GPU, Kingston OM8PCP3512F-AB, IPS, 1920x1080, 17.3" | Asus Strix Scar 17 G733QSA-XS99 R9 5900HX, GeForce RTX 3080 Laptop GPU, 2x Samsung PM981a MZVLB1T0HBLR (RAID 0), IPS, 1920x1080, 17.3" | MSI Alpha 17 A4DEK R7 4800H, Radeon RX 5600M, Kingston OM8PCP3512F-AB, IPS, 1920x1080, 17.3" | Asus Strix G17 G712LWS i7-10750H, GeForce RTX 2070 Super Mobile, Intel SSD 660p 1TB SSDPEKNW010T8, IPS, 1920x1080, 17.3" | |
|---|---|---|---|---|---|---|
| Power Consumption | 28% | -4% | -25% | 2% | -26% | |
| Idle Minimum * (Watt) | 9.2 | 4 57% | 9 2% | 10.9 -18% | 9 2% | 10 -9% |
| Idle Average * (Watt) | 12.6 | 9 29% | 13 -3% | 14.7 -17% | 12 5% | 14 -11% |
| Idle Maximum * (Watt) | 23.3 | 15 36% | 20 14% | 26.8 -15% | 18 23% | 25 -7% |
| Load Average * (Watt) | 89.3 | 85 5% | 102 -14% | 106.7 -19% | 76 15% | 134 -50% |
| Witcher 3 ultra * (Watt) | 136 | 104 24% | 149 -10% | 192.4 -41% | 136 -0% | 186 -37% |
| Load Maximum * (Watt) | 162.7 | 135 17% | 187 -15% | 228.4 -40% | 222 -36% | 230 -41% |
* ... Meglio usare valori piccoli
Consumo Energetico The Witcher 3 / Stresstest
Durata della batteria
La capacità della batteria è inferiore a quella del G712 di ultima generazione (56 Wh contro 66 Wh), ma l'autonomia resta più o meno la stessa con 5,5-6 ore di uso reale della WLAN quando è attivo il profilo di alimentazione Balanced con la GPU integrata. Il più costoso Strix Scar 17 G733 può durare diverse ore in più grazie alla sua batteria molto più grande da 90 Wh. Le configurazioni G713 di fascia alta sono dotate di una batteria più grande da 90 Wh invece della base da 56 Wh per una maggiore durata della batteria.
La ricarica completa richiede circa 1,5 ore. La ricarica USB-C PD è supportata anche se ad una velocità inferiore.
| Asus ROG Strix G17 G713QE-RB74 R7 5800H, GeForce RTX 3050 Ti Laptop GPU, 56 Wh | Acer Nitro 5 AN517-53-54DQ i5-11300H, GeForce RTX 3050 4GB Laptop GPU, 57 Wh | MSI Katana GF76 11UE i7-11800H, GeForce RTX 3060 Laptop GPU, 53 Wh | Asus Strix Scar 17 G733QSA-XS99 R9 5900HX, GeForce RTX 3080 Laptop GPU, 90 Wh | MSI Alpha 17 A4DEK R7 4800H, Radeon RX 5600M, 65 Wh | Asus Strix G17 G712LWS i7-10750H, GeForce RTX 2070 Super Mobile, 66 Wh | |
|---|---|---|---|---|---|---|
| Autonomia della batteria | 35% | -26% | 34% | 18% | 6% | |
| Reader / Idle (h) | 11.1 | 17.4 57% | 4.8 -57% | 13.3 20% | 10.5 -5% | 9.1 -18% |
| WiFi v1.3 (h) | 6 | 7.2 20% | 3.7 -38% | 9.3 55% | 7.3 22% | 5.5 -8% |
| Load (h) | 1.1 | 1.4 27% | 1.3 18% | 1.4 27% | 1.5 36% | 1.6 45% |
| Witcher 3 ultra (h) | 0.8 |
Pro
Contro
Valutazione complessiva dell'Asus ROG Strix G17 G713 - Scegliete con cura la vostra versione
Come detto prima, ci sono non meno di 16 configurazioni dell'Asus ROG Strix G17 G713 con vari spessori, peso, adattatori AC, display, capacità della batteria, illuminazione RGB e altro ancora. I potenziali acquirenti dovrebbero selezionare le rispettive versioni con attenzione guardando le specifiche sul sito ufficiale di Asus che dettaglia tutte le differenze tra loro.
Per la nostra configurazione di test in particolare, sia la CPU AMD Zen 3 che la veloce frequenza di aggiornamento del display a 144 Hz meritano un elogio. La RTX 3050 e la RTX 3050 Ti sono più difficili da raccomandare, tuttavia, dato che i loro livelli di prestazioni seguono al meglio la vecchia GTX 1660 Ti. L'aggiornamento alla RTX 3060 o superiore darà prestazioni per watt significativamente più elevate.
Sfortunatamente, optare per la RTX 3060 o più veloce comporta alcuni svantaggi perché tali versioni sono più spesse, più pesanti e con adattatori CA più grandi rispetto alla nostra RTX 3050 Ti. La convenzione di denominazione di Asus è particolarmente confusa a questo proposito, dato che la serie G713 consiste in realtà di due modelli distinti e tuttavia condividono quasi gli stessi nomi di vendita. La solida base, le cerniere rigide e la facile aggiornabilità sono comunque migliori della maggior parte degli altri portatili gaming economici tra cui l'HP Pavilion Gaming, il Lenovo Legion 5, l'MSI Katana o il Dell serie G5 al costo di un ingombro maggiore.
Prezzo e disponibilità
Asus ROG Strix G17 G713QE-RB74
- 08/20/2021 v7 (old)
Allen Ngo
Price comparison
