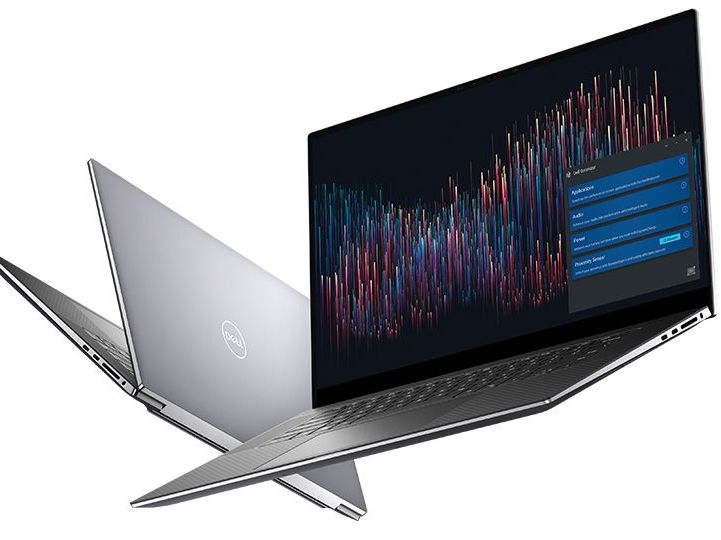
Recensione della workstation Dell Precision 5750: l'XPS 17 per i professionisti
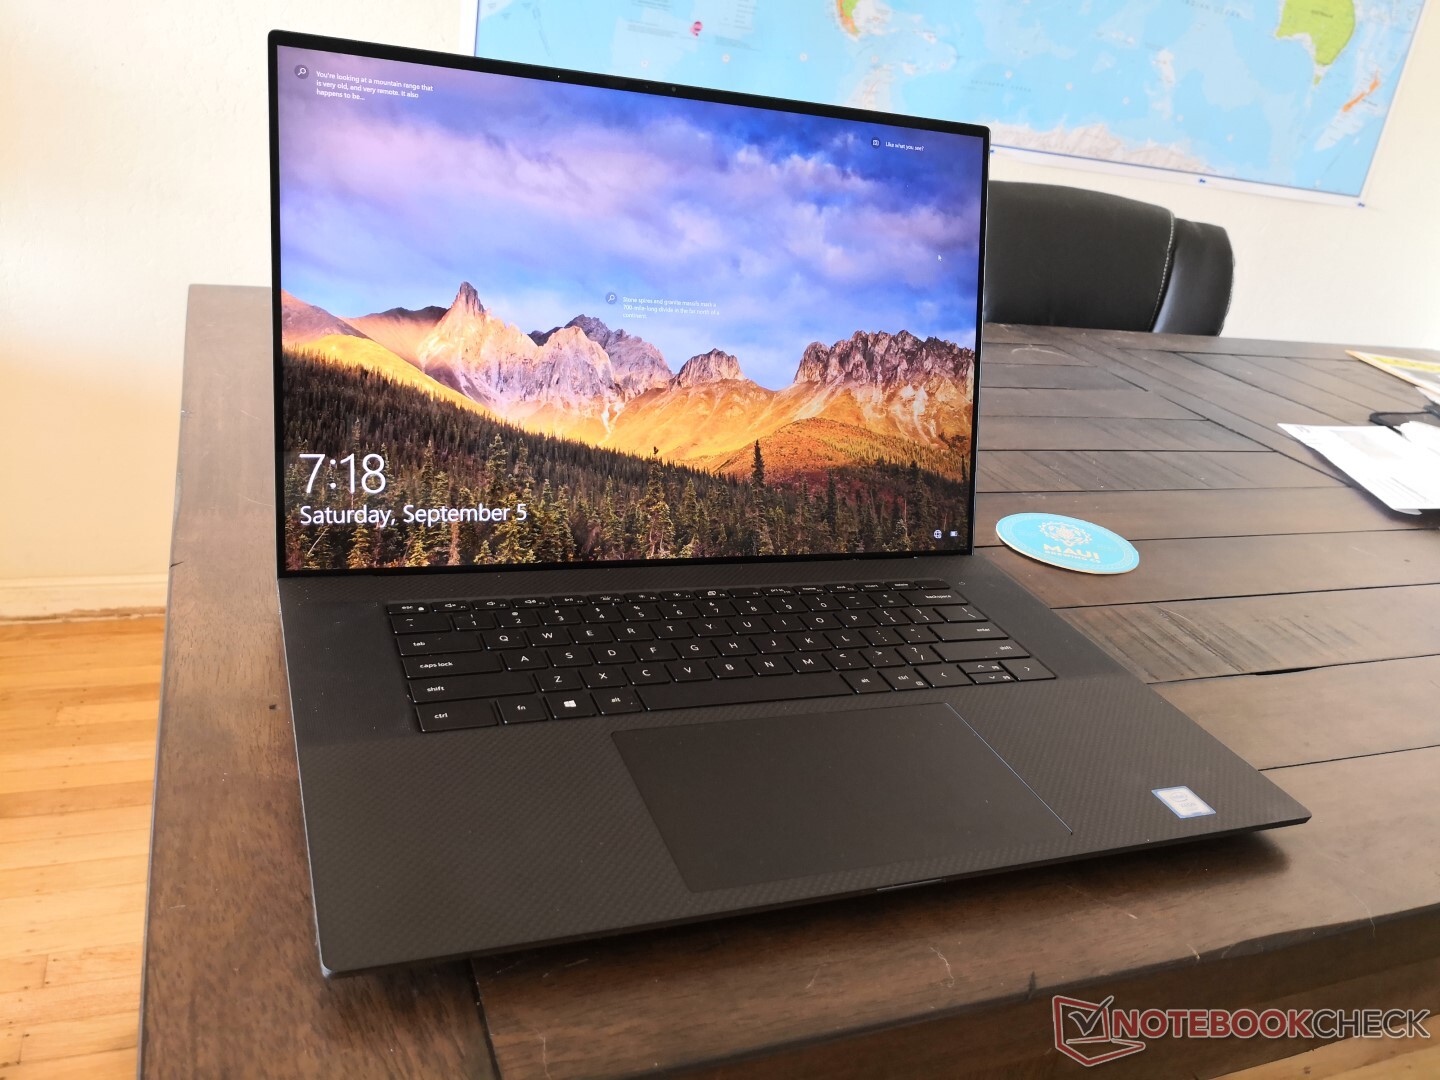
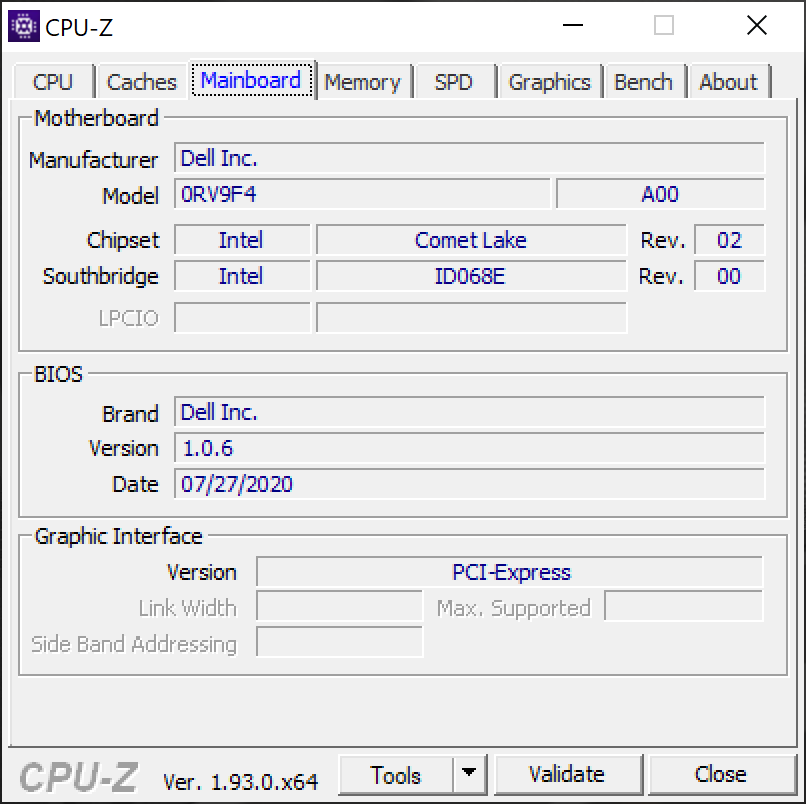
Proprio come il Precision 5550 da 15,6 pollici è la versione workstation dell'XPS 15 9500, il Precision 5750 da 17,3 pollici è la versione workstation dell'XPS 17 9700. Raccomandiamo di dare un'occhiata alla nostra recensione dell'XPS 17, poiché tutti i nostri commenti esistenti sul telaio e le sue caratteristiche fisiche valgono anche qui per il Precision 5750.
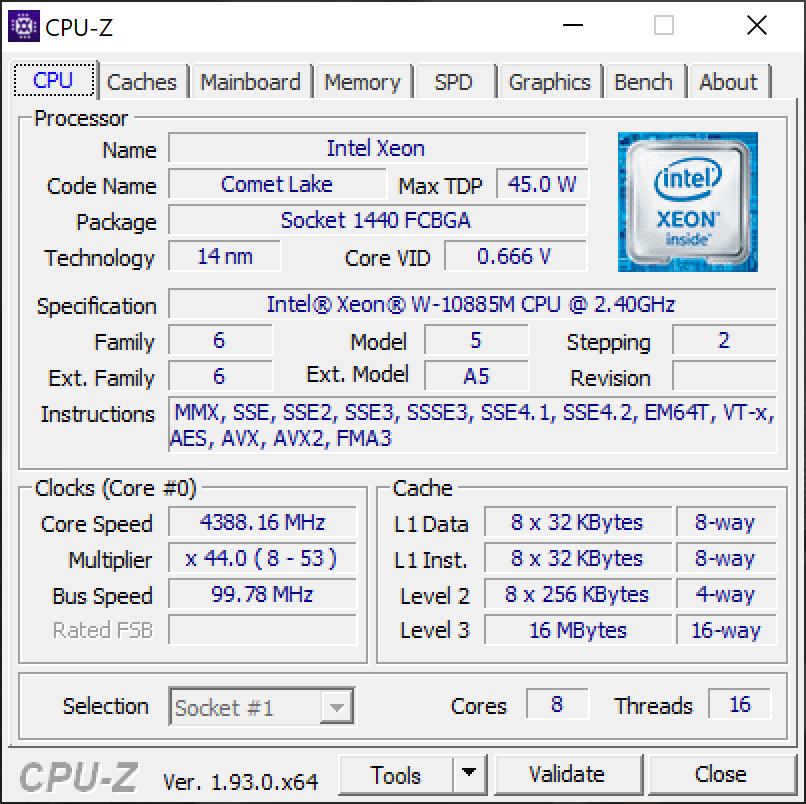
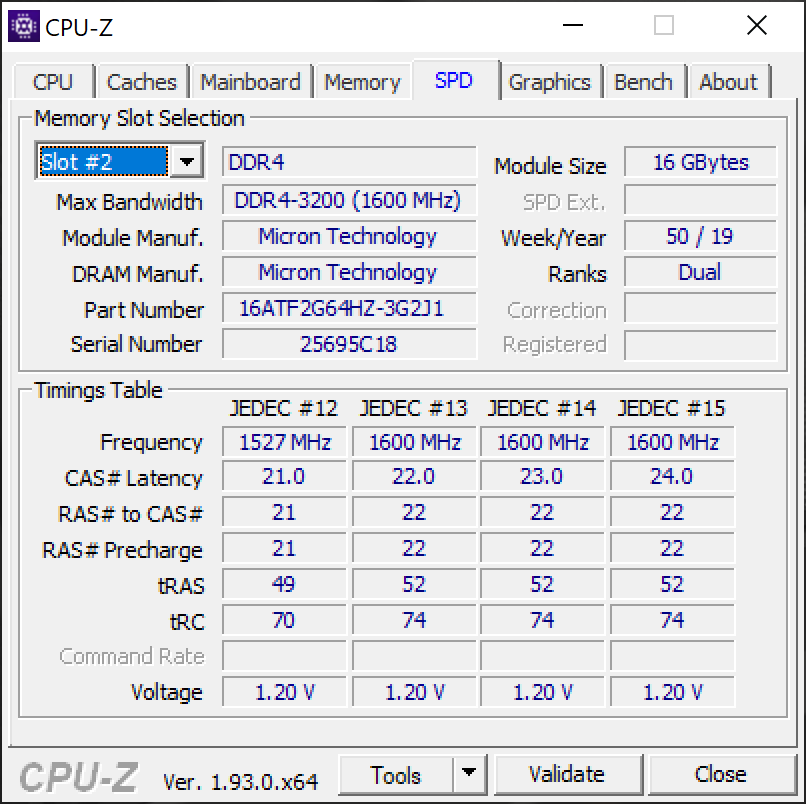
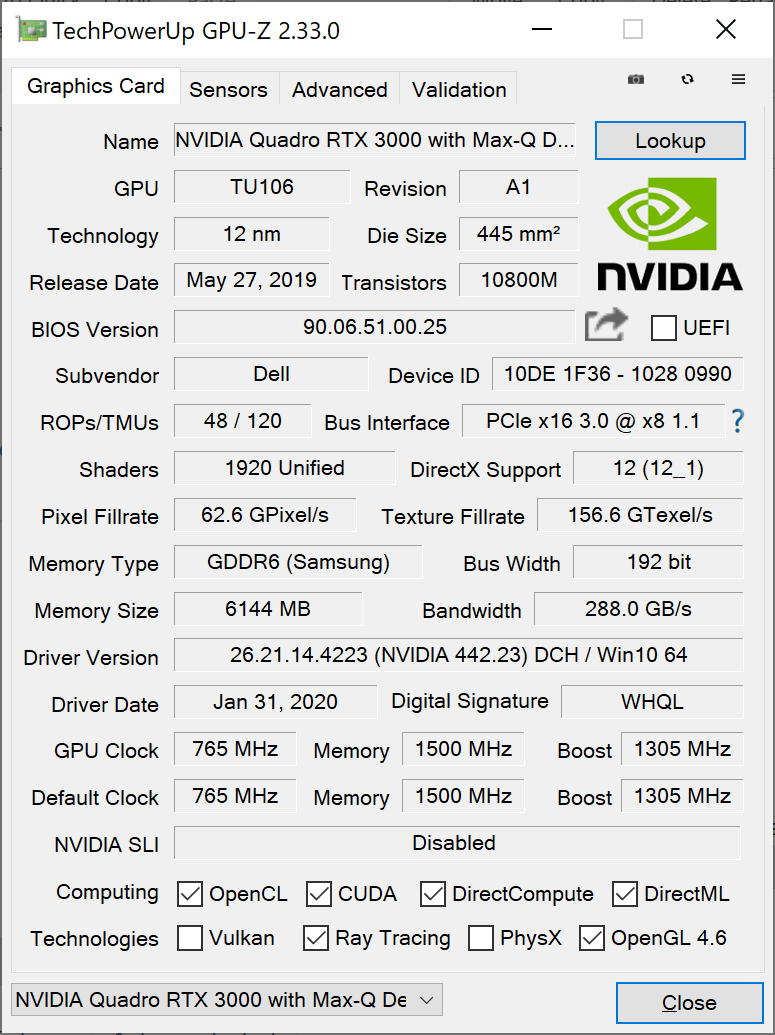
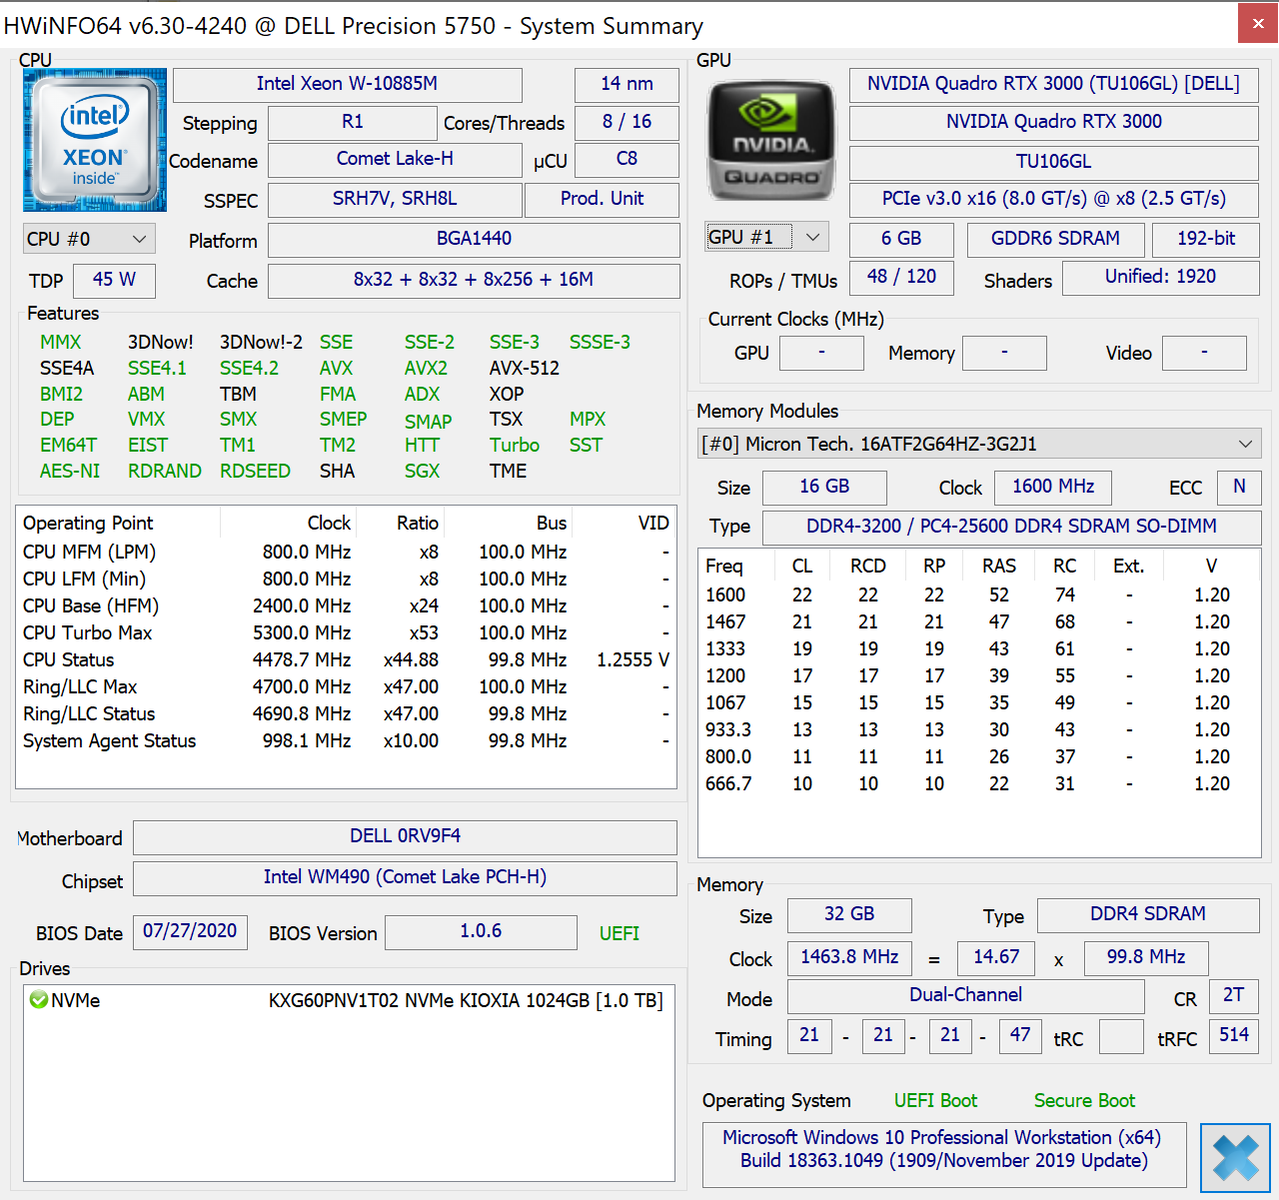
La nostra unità è una versione di fascia alta con la CPU Xeon W-10885M, la GPU Quadro RTX 3000 Max-Q, il touchscreen lucido 16:10 2400p e 32 GB di RAM DDR4 per circa $3800 USD. Sono disponibili anche versioni minori con il Core i5-10400H, UHD Graphics 630 integrato, display opaco a 1200p e 8 GB di RAM per molto meno.
Il Precision 5750 compete con le workstations ultrasottili da 17,3 pollici come l'MSI WS75, Razer Blade Pro Studio, o la serie Asus ProArt StudioBook.
Altre recensioni Dell:
Punteggio | Data | Modello | Peso | Altezza | Dimensione | Risoluzione | Prezzo |
|---|---|---|---|---|---|---|---|
| 87 % v7 (old) | 09/2020 | Dell Precision 5000 5750 P92F W-10885M, Quadro RTX 3000 Max-Q | 2.5 kg | 19.5 mm | 17.00" | 3840x2400 | |
| 86.4 % v7 (old) | 05/2020 | Asus ProArt StudioBook Pro 17 W700G3T i7-9750H, Quadro RTX 3000 Max-Q | 2.5 kg | 18.4 mm | 17.00" | 1920x1200 | |
| 83.8 % v7 (old) | 07/2019 | MSI WS75 9TL-636 i7-9750H, Quadro RTX 4000 (Laptop) | 2.3 kg | 18.95 mm | 17.30" | 1920x1080 | |
| 85.7 % v7 (old) | 05/2019 | Dell Precision 7730 i7-8850H, Quadro P3200 | 3.3 kg | 30 mm | 17.30" | 1920x1080 | |
| 86.6 % v7 (old) | 12/2019 | Lenovo ThinkPad P73-20QR002DGE i7-9850H, Quadro RTX 3000 (Laptop) | 3.5 kg | 31 mm | 17.30" | 1920x1080 | |
| 84.8 % v7 (old) | 11/2019 | MSI WE75 9TK i7-9750H, Quadro RTX 3000 (Laptop) | 2.6 kg | 27.5 mm | 17.30" | 1920x1080 |
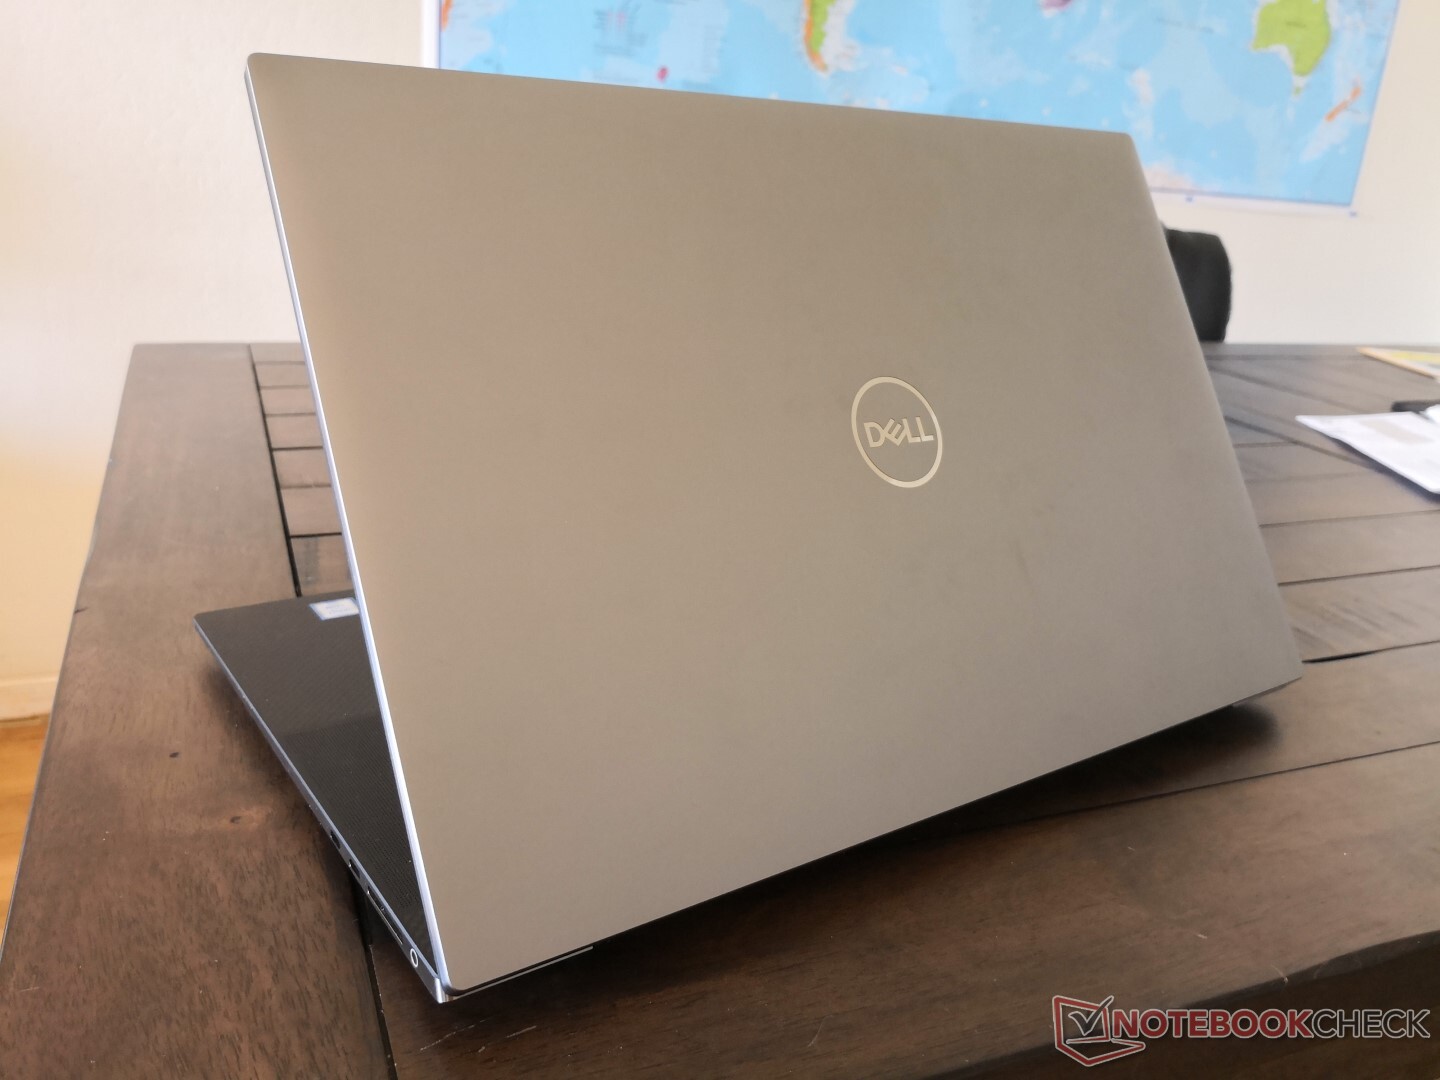
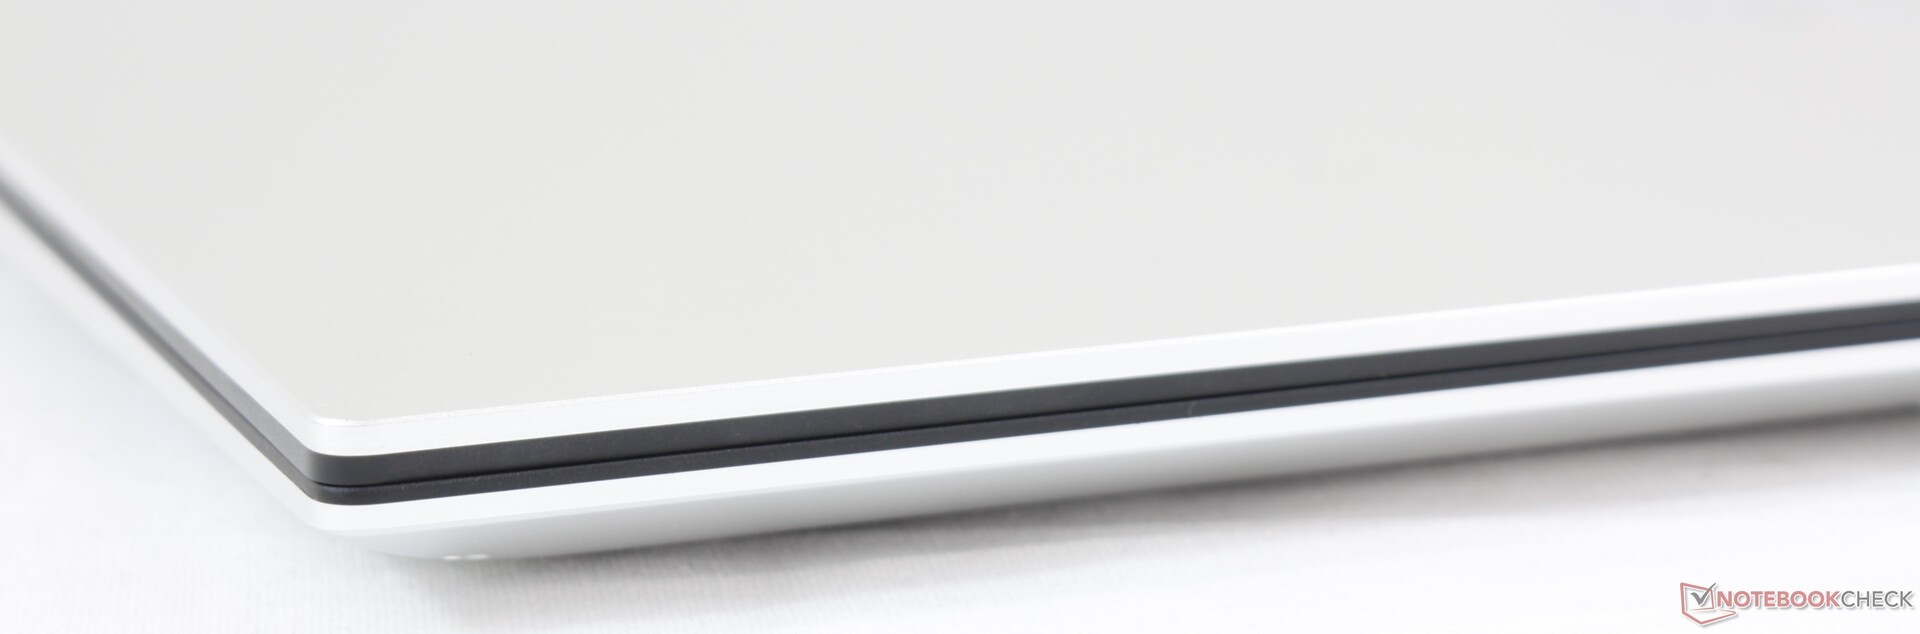
Case
Connettività
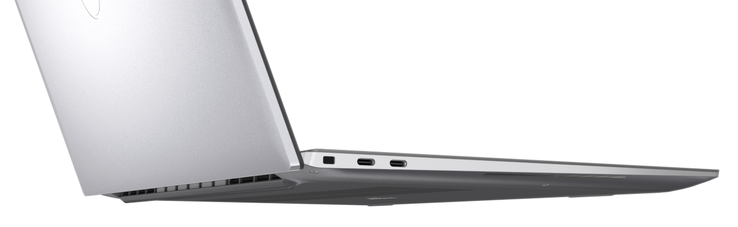
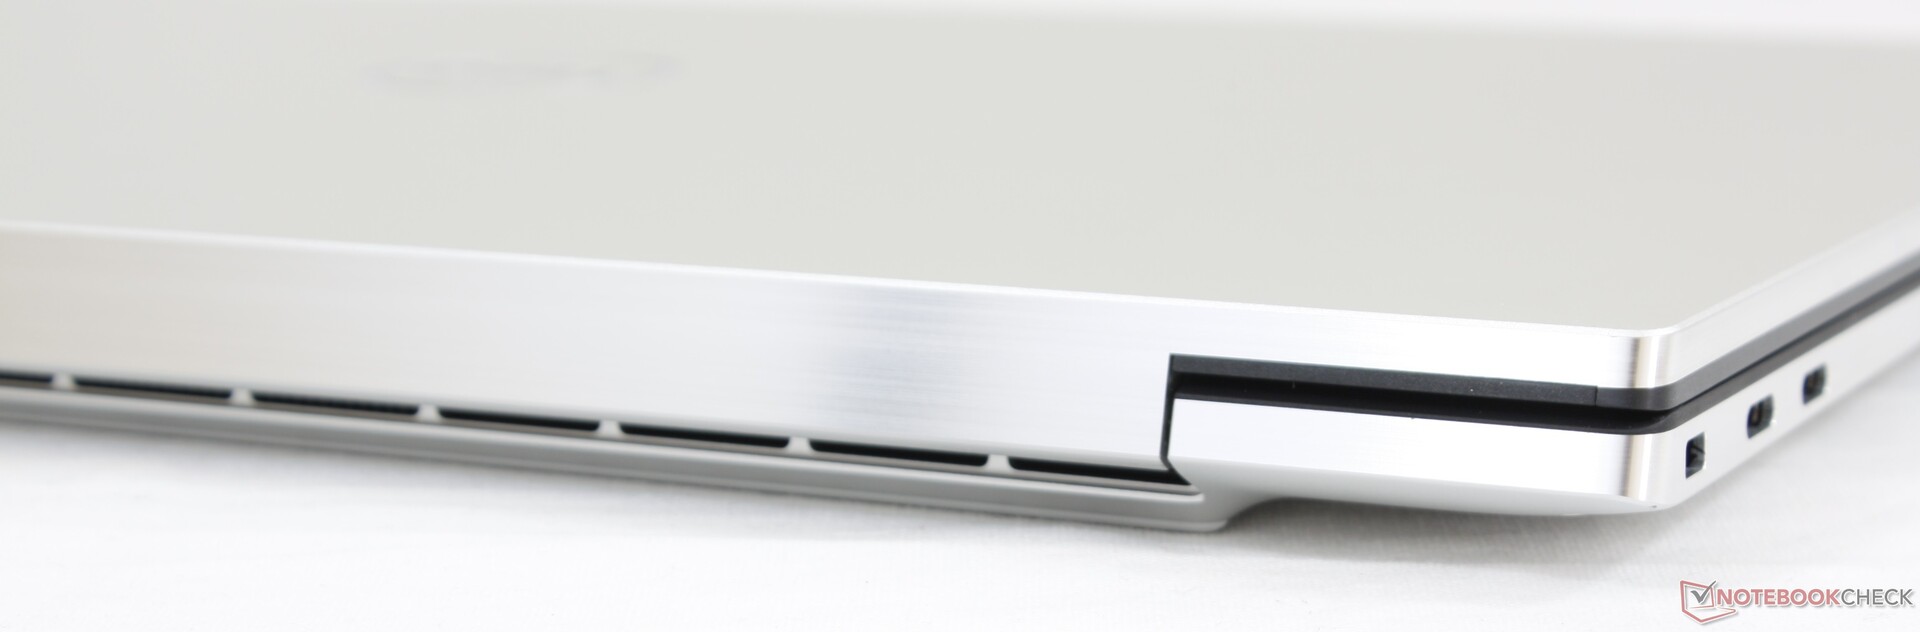
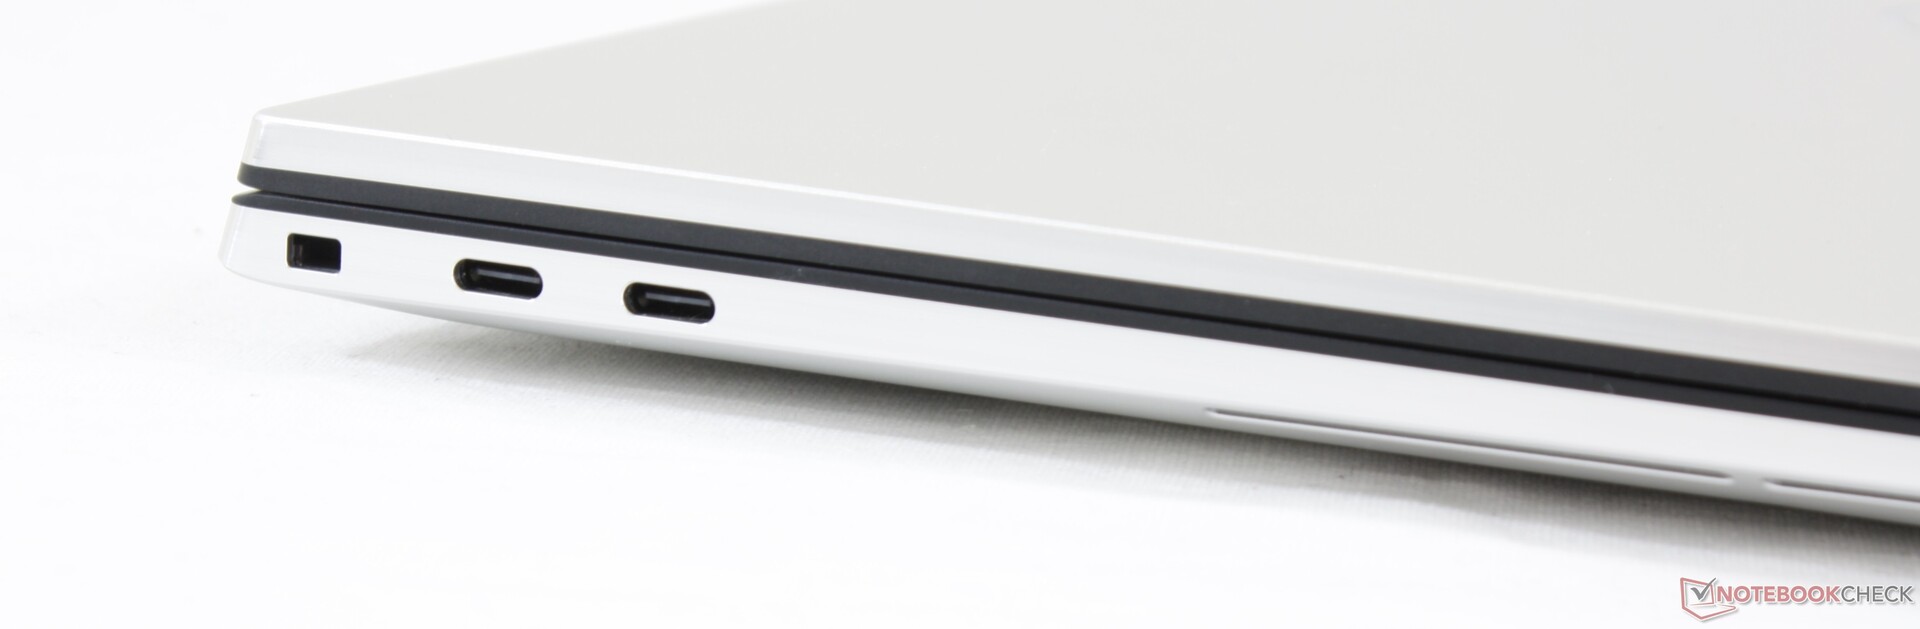
Le opzioni delle porte sono deludenti o sorprendenti a seconda di ciò che si sta cercando. Se vi piace avere 4 porte Thunderbolt 3, allora questa Precision fa al caso vostro. Se volete HDMI, RJ-45 o USB-A, allora preparatevi ad affidarvi ad adattatori o docking station. Ogni altra workstation in questa categoria di dimensioni offre una più ampia varietà di porte integrate rispetto al Precision 5750.
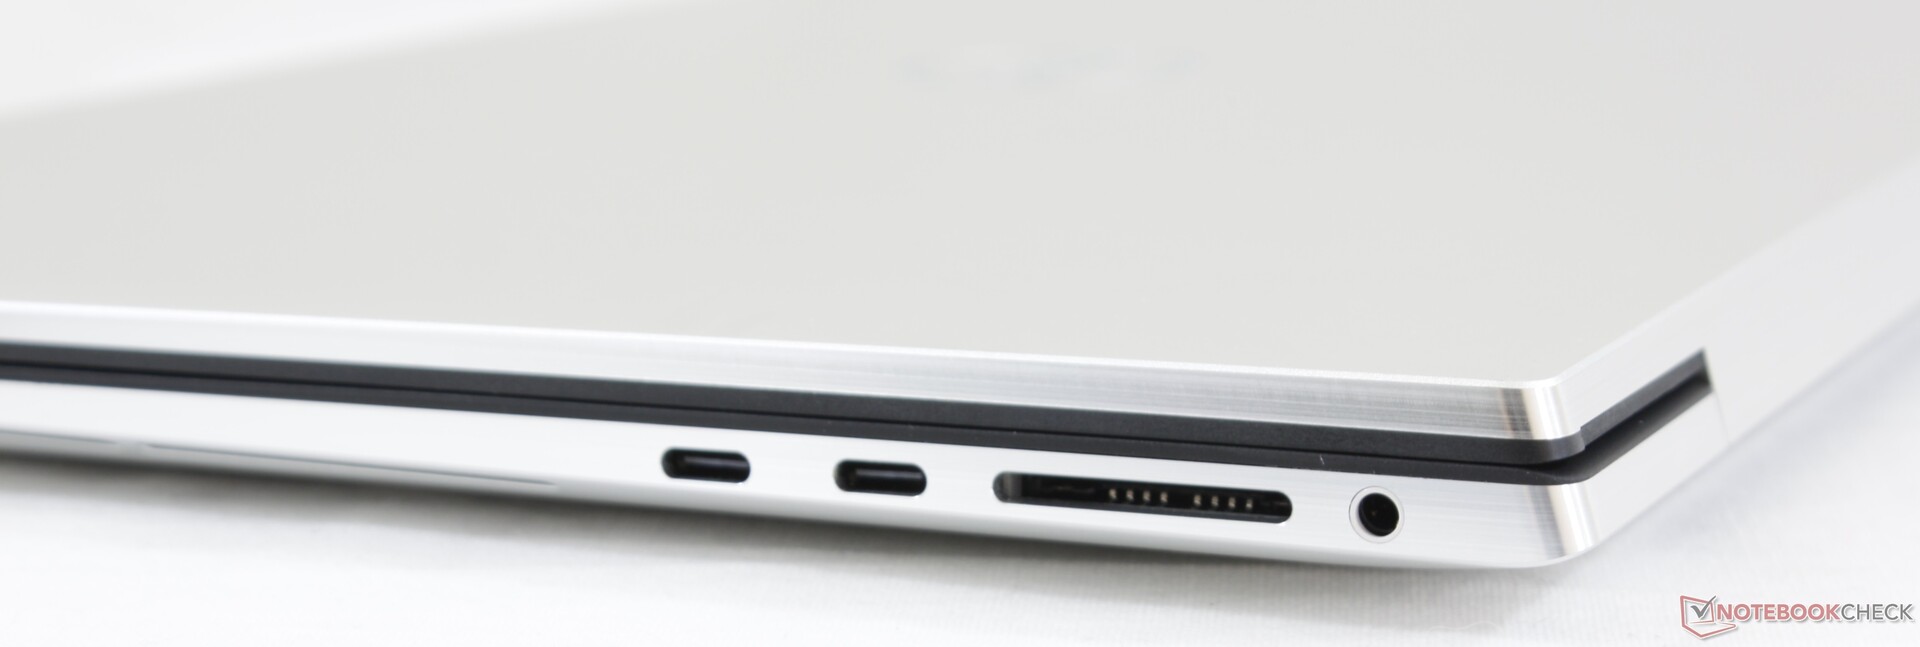
Lettore schede SD
Le velocità di trasferimento dal lettore di schede SD integrato sono molto veloci. Il trasferimento di 1 GB di immagini dalla nostra scheda di test UHS-II al desktop richiede circa 7 secondi.
| SD Card Reader | |
| average JPG Copy Test (av. of 3 runs) | |
| Dell Precision 7730 (Toshiba Exceria Pro SDXC 64 GB UHS-II) | |
| Lenovo ThinkPad P73-20QR002DGE (Toshiba Exceria Pro SDXC 64 GB UHS-II) | |
| Asus ProArt StudioBook Pro 17 W700G3T (Toshiba Exceria Pro SDXC 64 GB UHS-II) | |
| MSI WS75 9TL-636 (Toshiba Exceria Pro M501 64 GB UHS-II) | |
| Dell Precision 5000 5750 P92F (Toshiba Exceria Pro SDXC 64 GB UHS-II) | |
| MSI WE75 9TK (Toshiba Exceria Pro SDXC 64 GB UHS-II) | |
| maximum AS SSD Seq Read Test (1GB) | |
| Asus ProArt StudioBook Pro 17 W700G3T (Toshiba Exceria Pro SDXC 64 GB UHS-II) | |
| Dell Precision 7730 (Toshiba Exceria Pro SDXC 64 GB UHS-II) | |
| MSI WS75 9TL-636 (Toshiba Exceria Pro M501 64 GB UHS-II) | |
| Lenovo ThinkPad P73-20QR002DGE (Toshiba Exceria Pro SDXC 64 GB UHS-II) | |
| Dell Precision 5000 5750 P92F (Toshiba Exceria Pro SDXC 64 GB UHS-II) | |
| MSI WE75 9TK (Toshiba Exceria Pro SDXC 64 GB UHS-II) | |
Comunicazioni
L'Intel AX201 viene fornito di serie per la connettività Wi-Fi 6. Non abbiamo riscontrato alcun problema quando ci siamo collegati al nostro router di prova Netgear RAX200.
Webcam


Sicurezza
Le stesse funzioni di sicurezza disponibili sul Precision 5550 si trovano qui sul Precision 5750, compreso il sensore di prossimità ExpressSign-in. Non c'è l'otturatore della webcam, che riteniamo sia stata una svista di Dell durante la fase di progettazione dello chassis dell'XPS 17/Precision 5750.
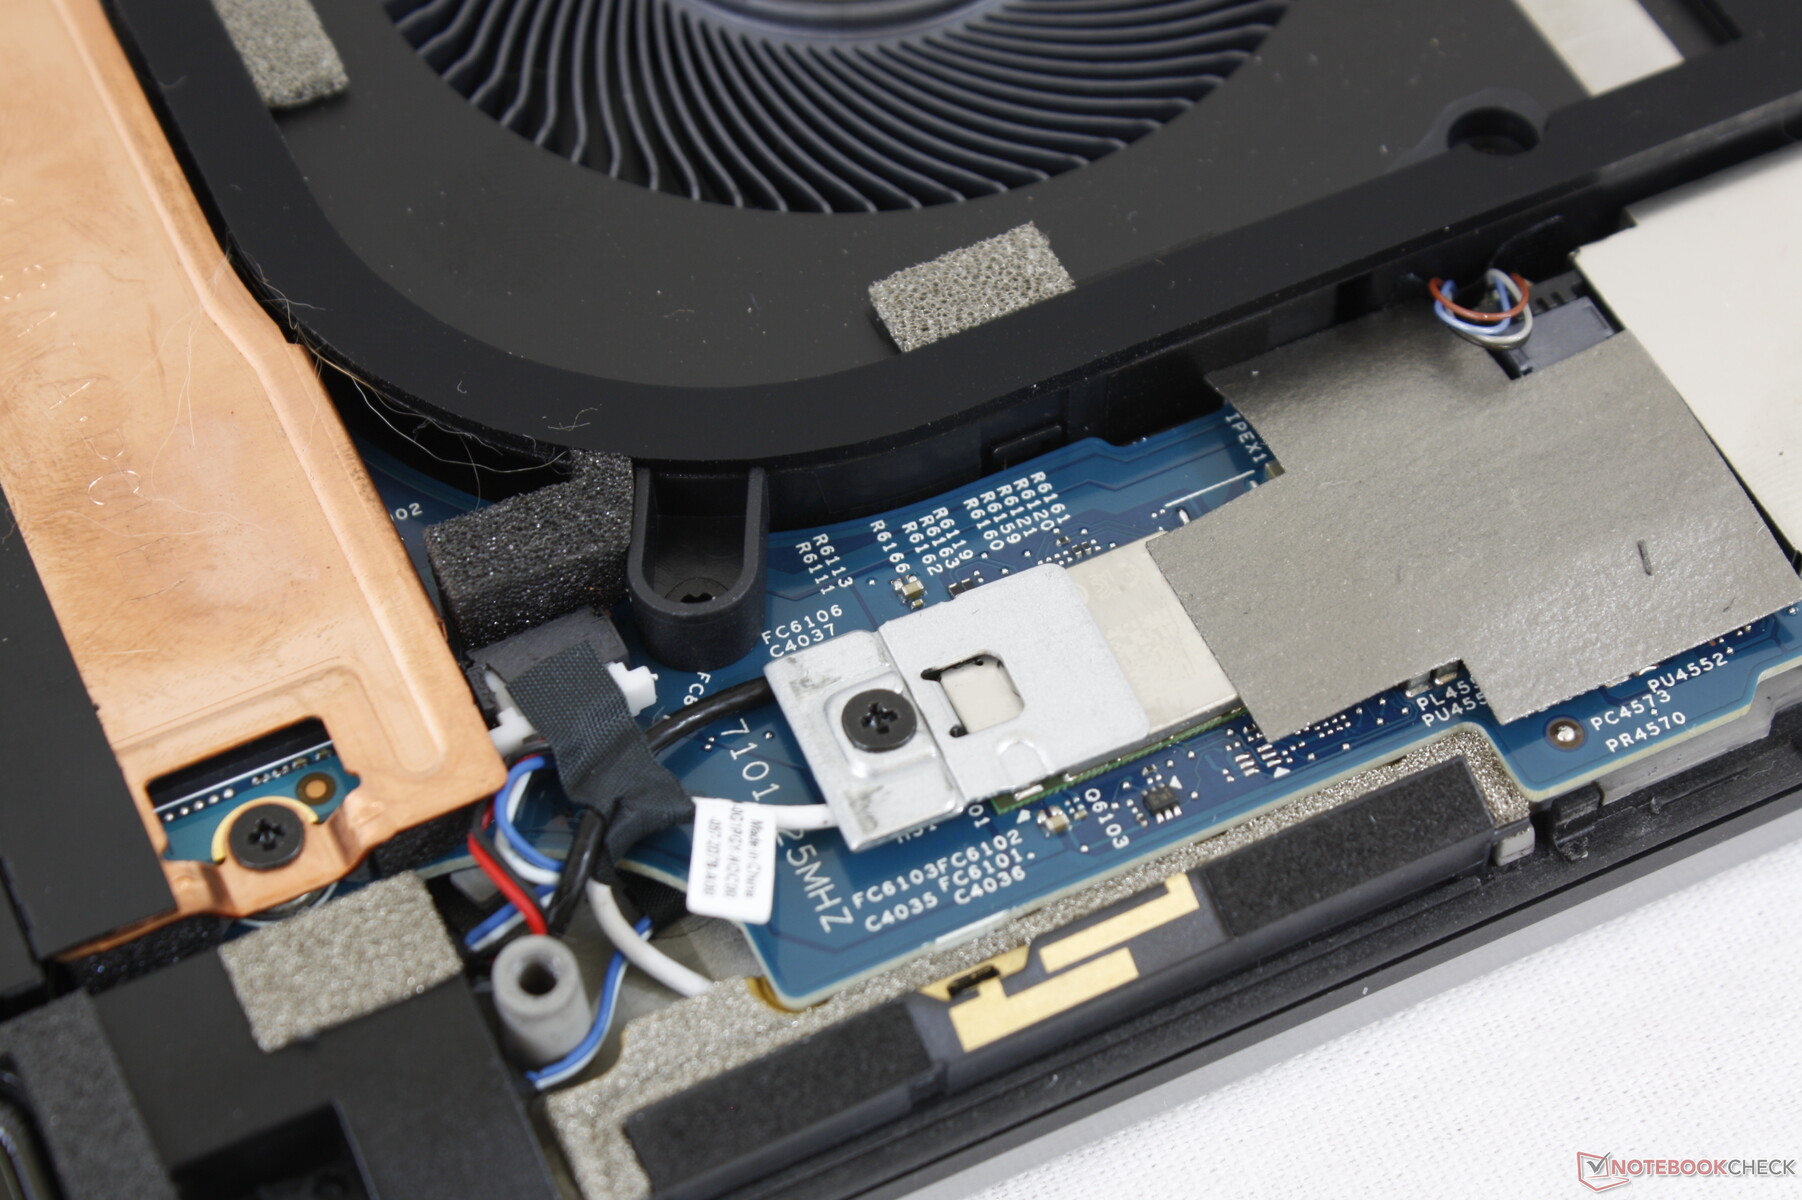
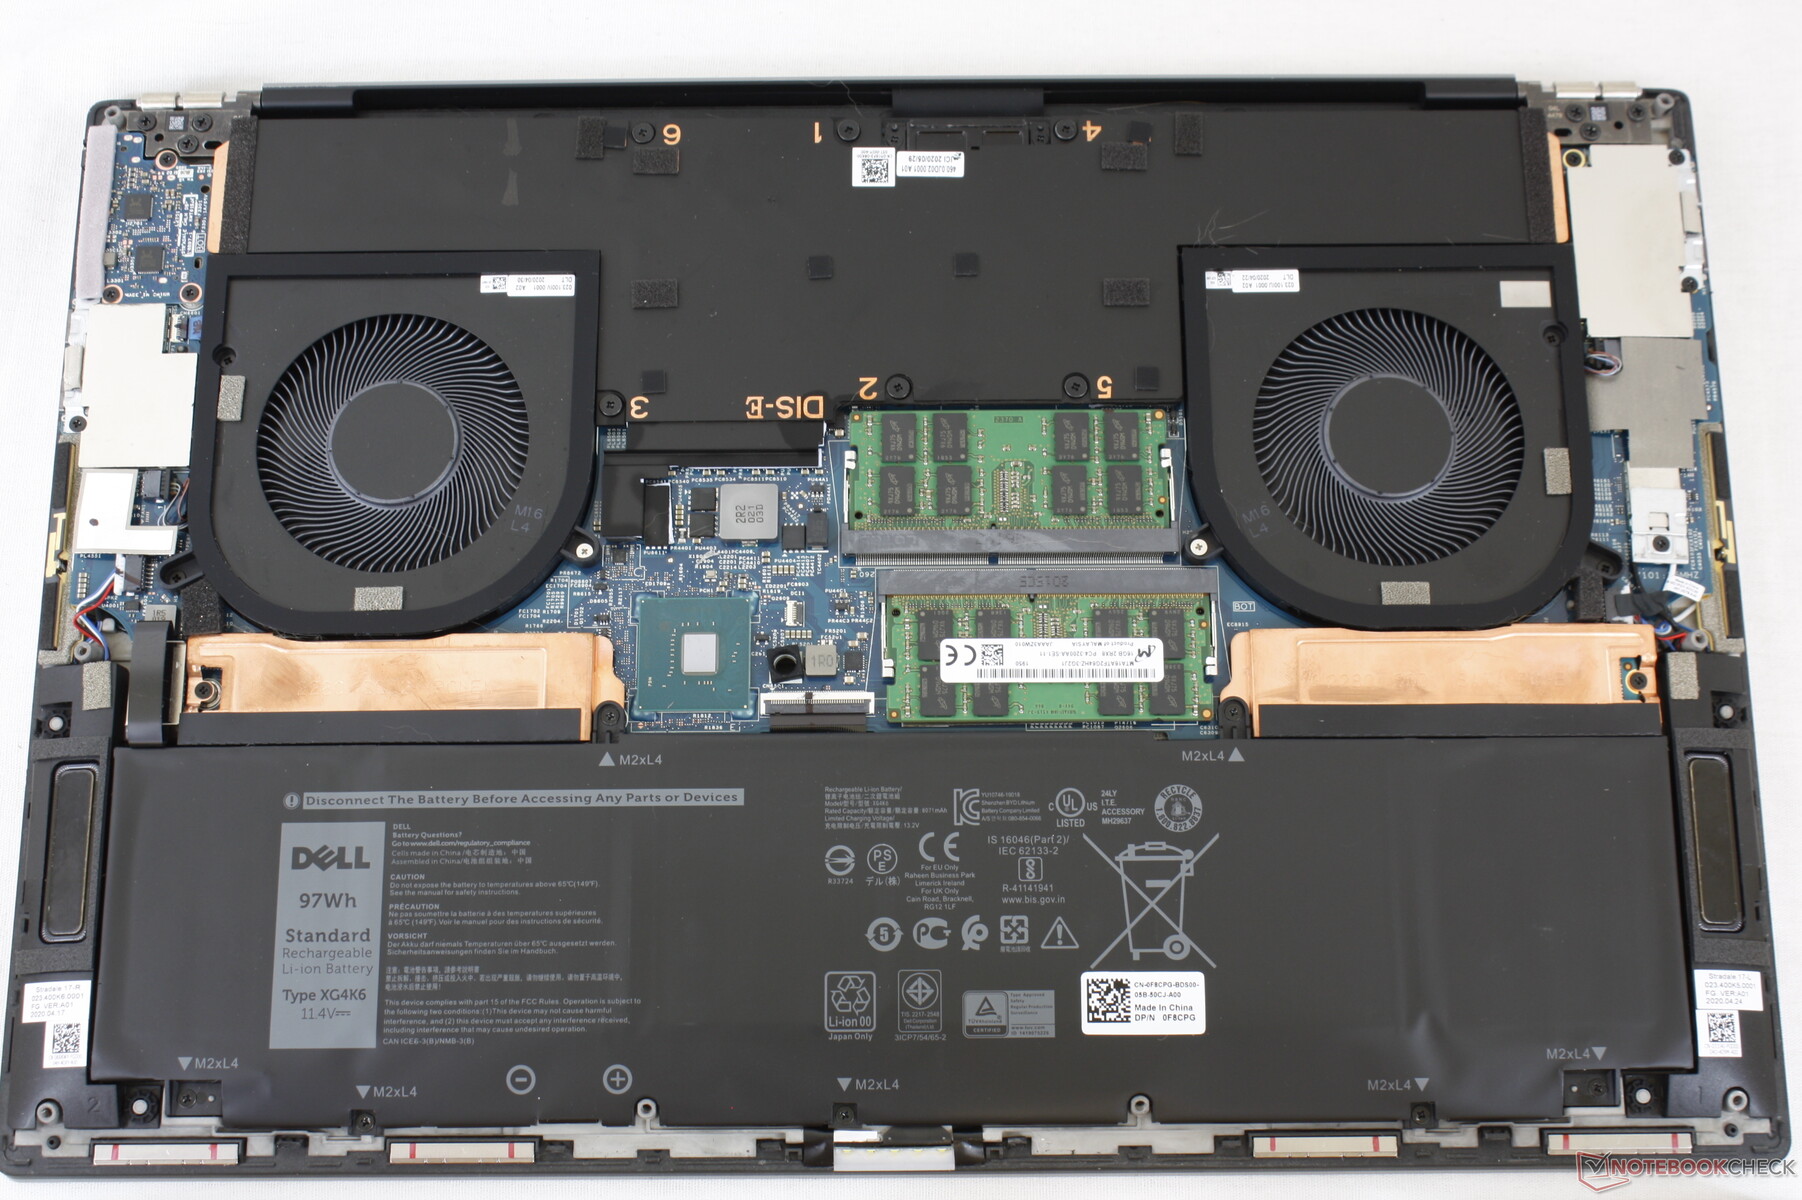
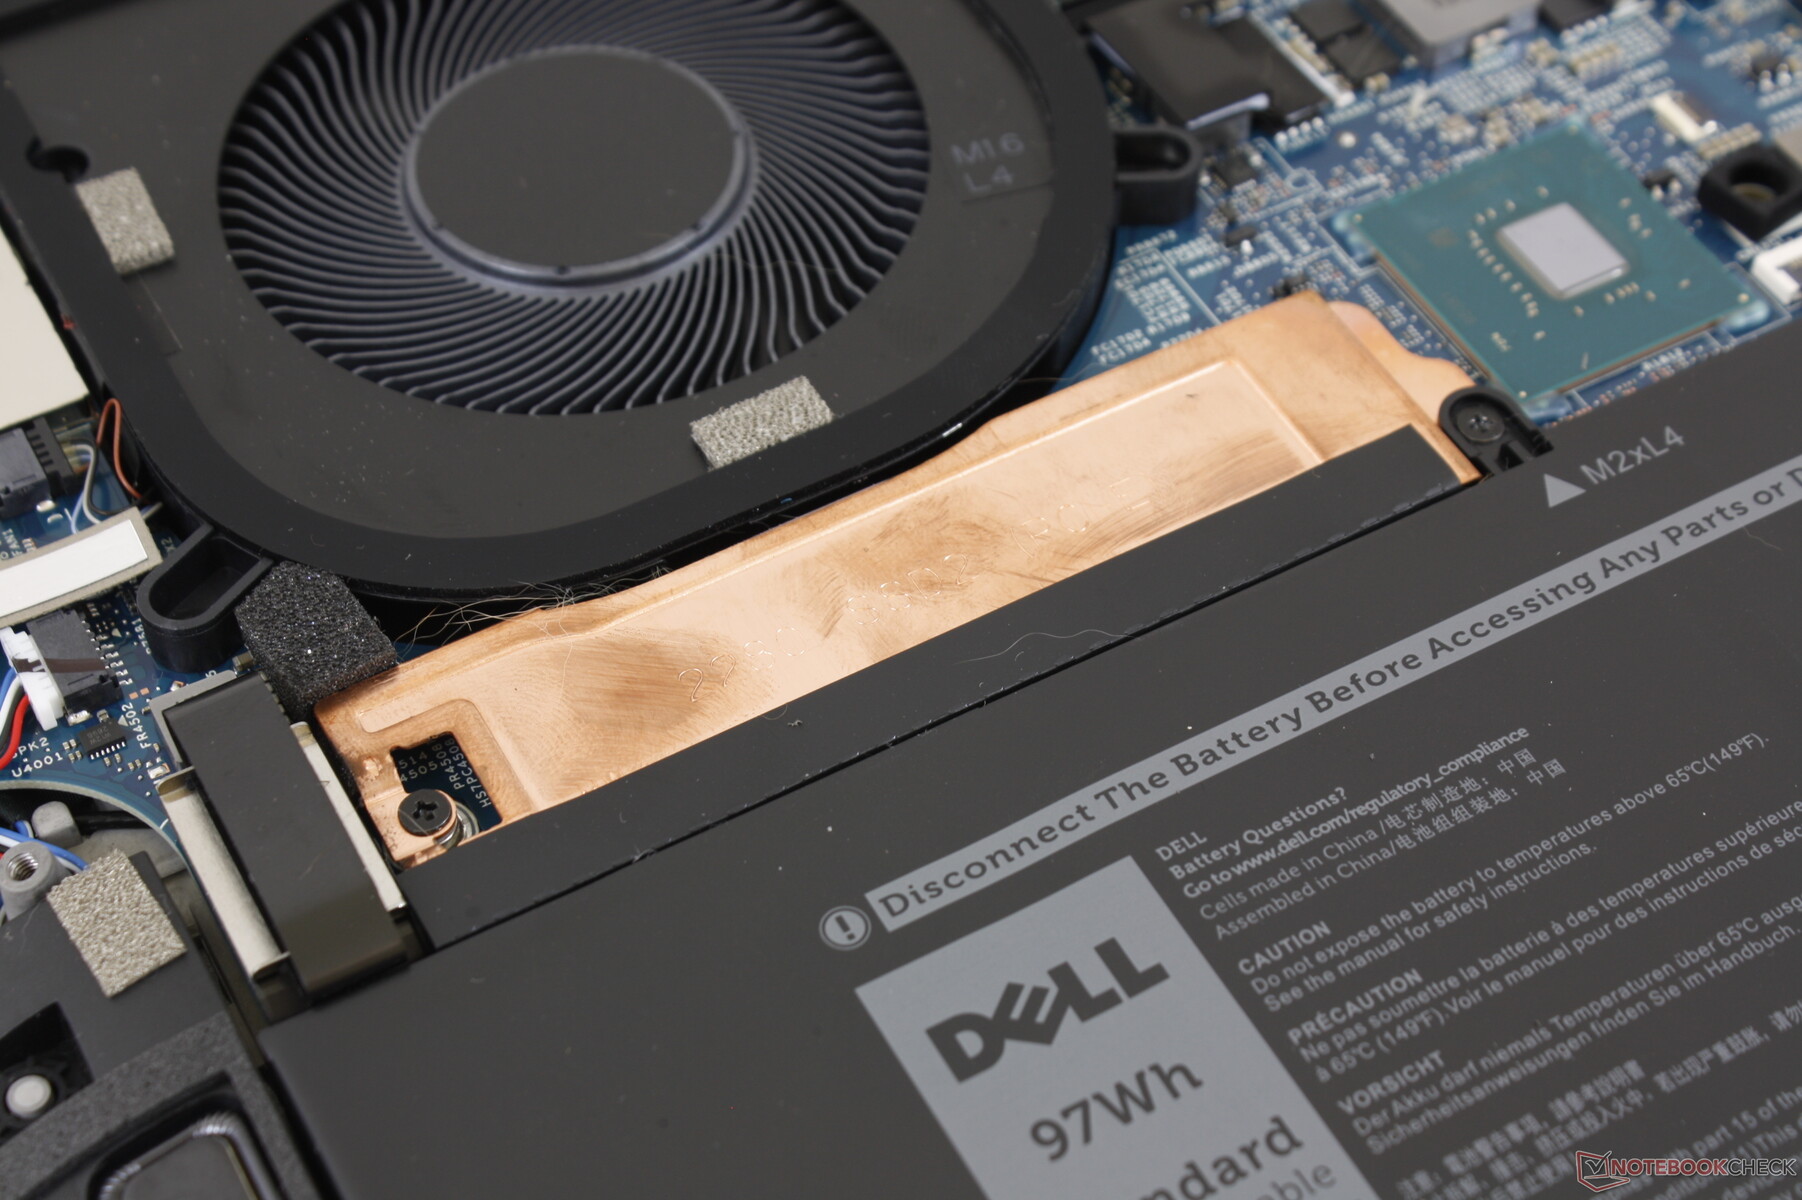
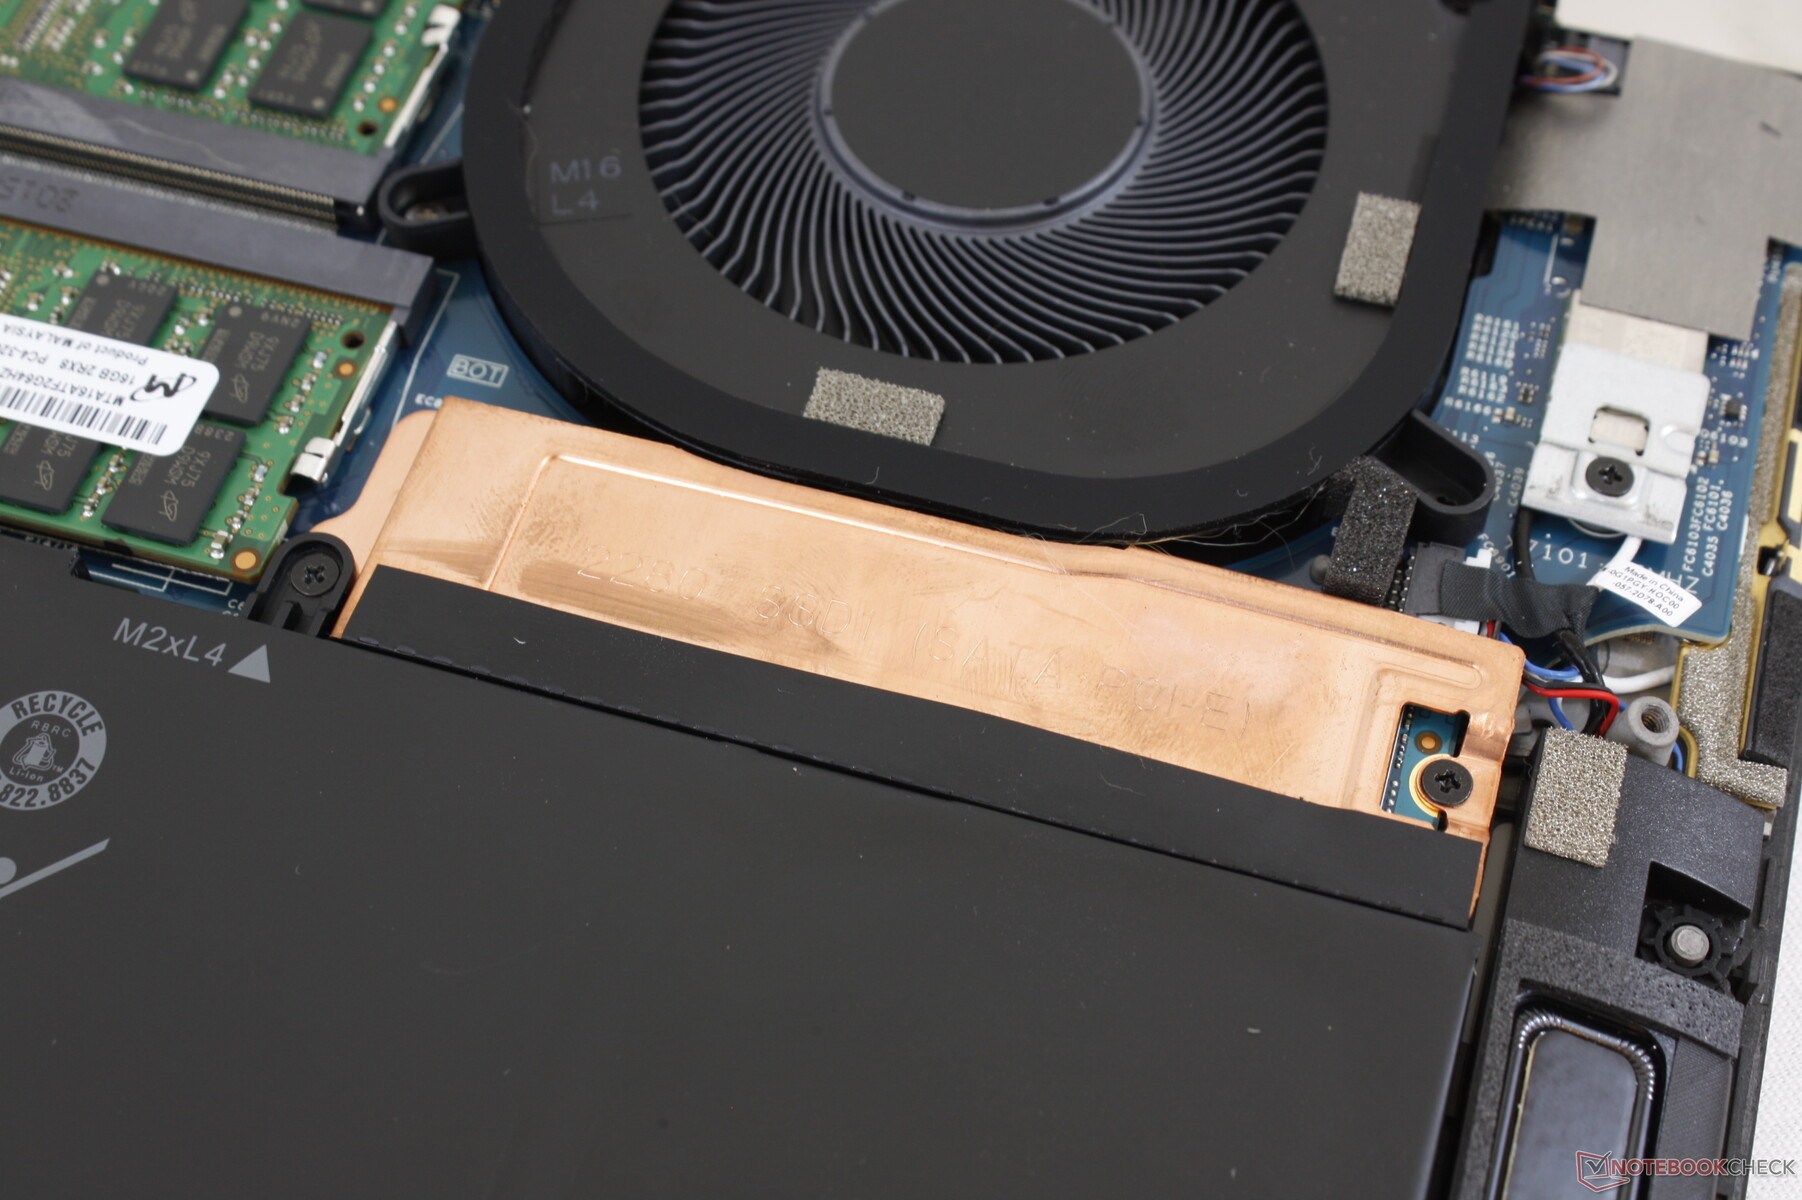
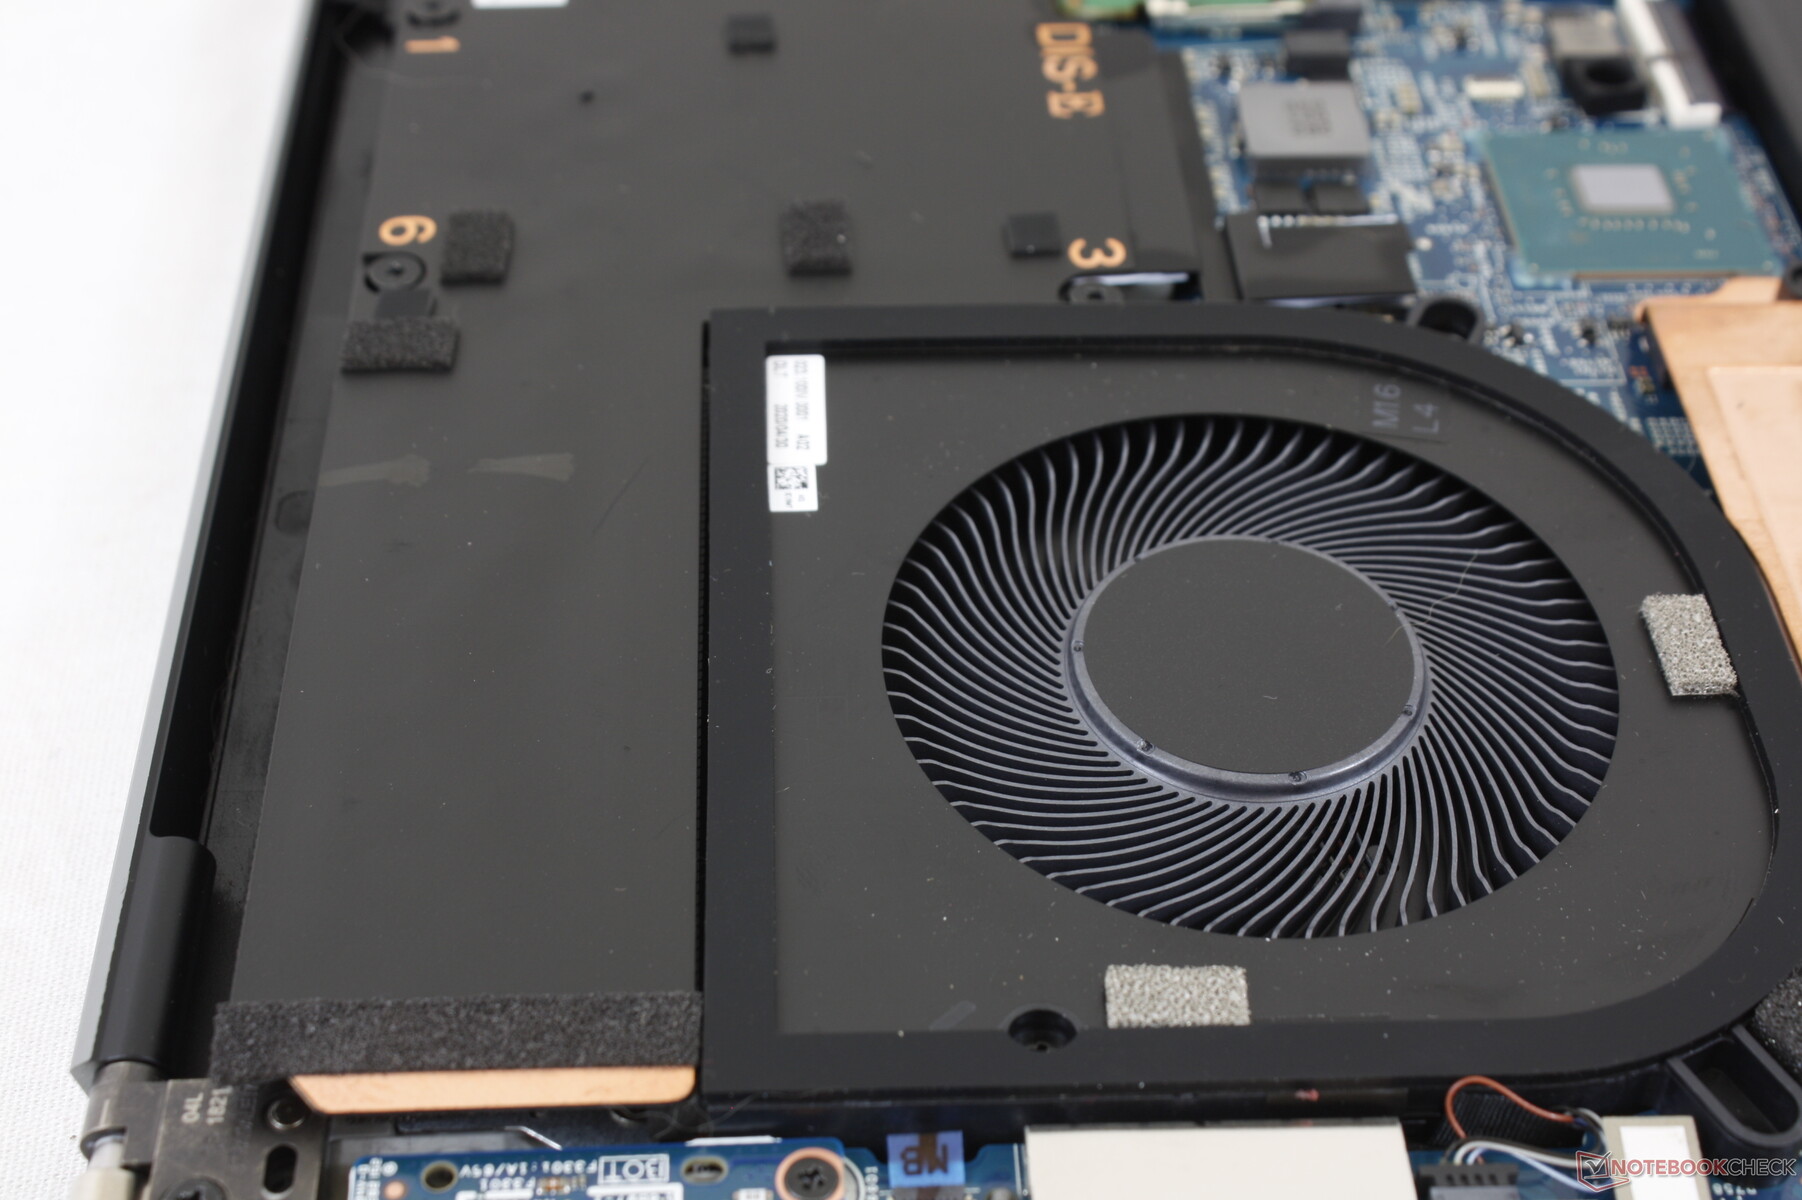
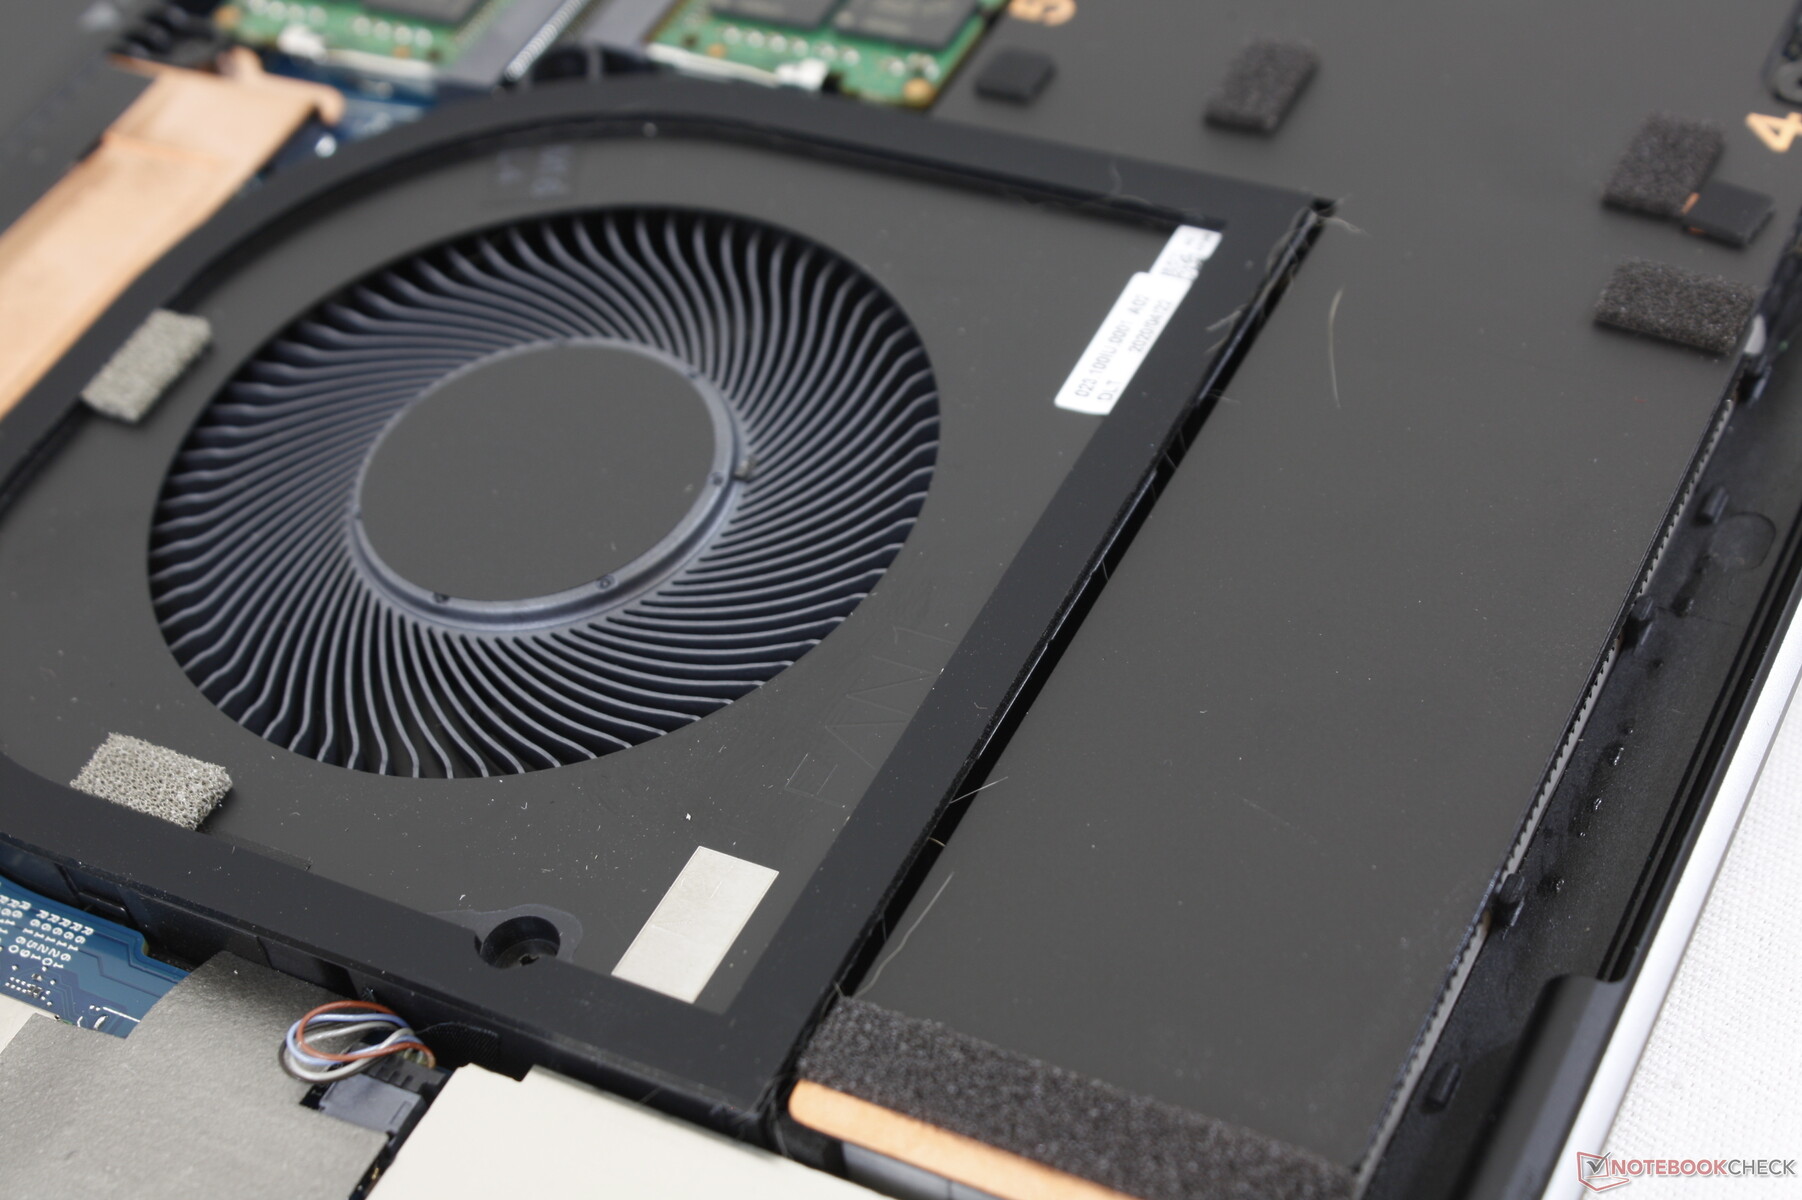
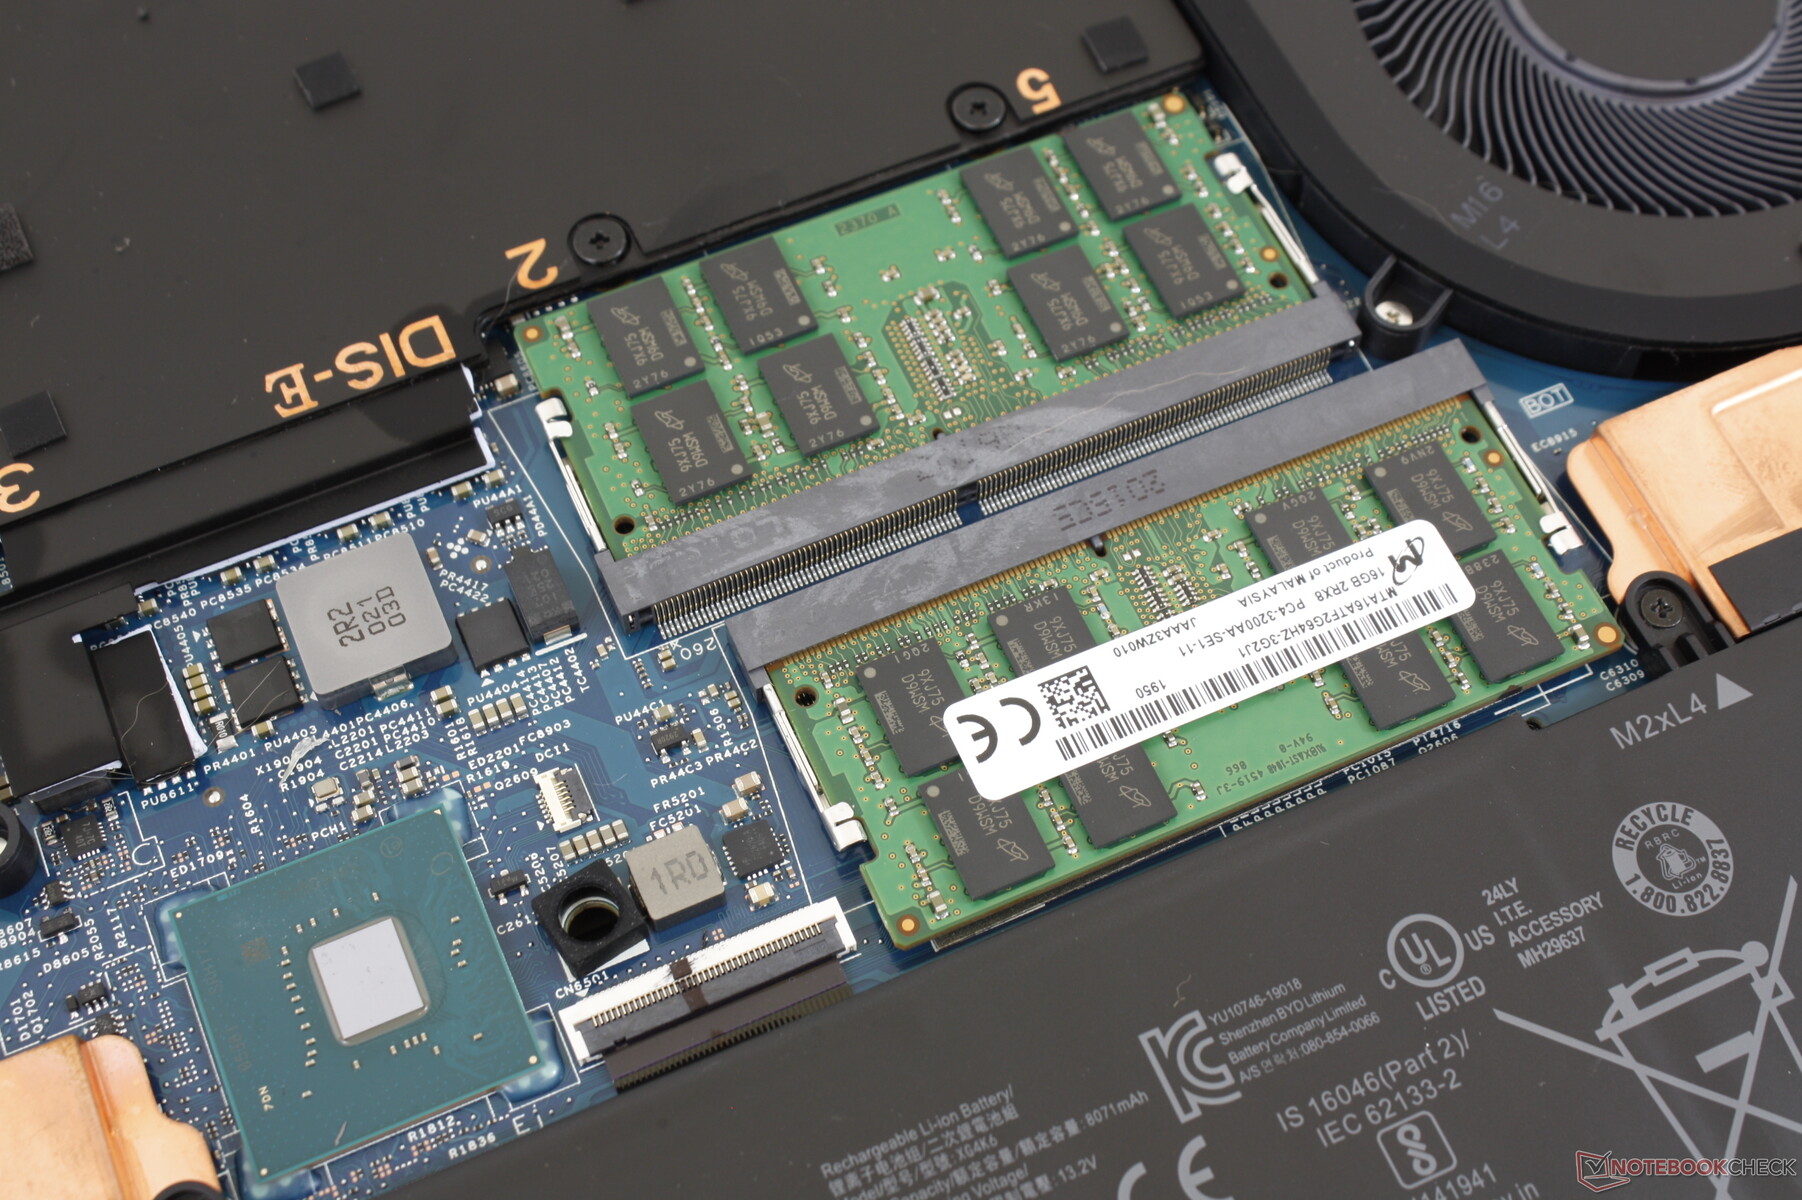
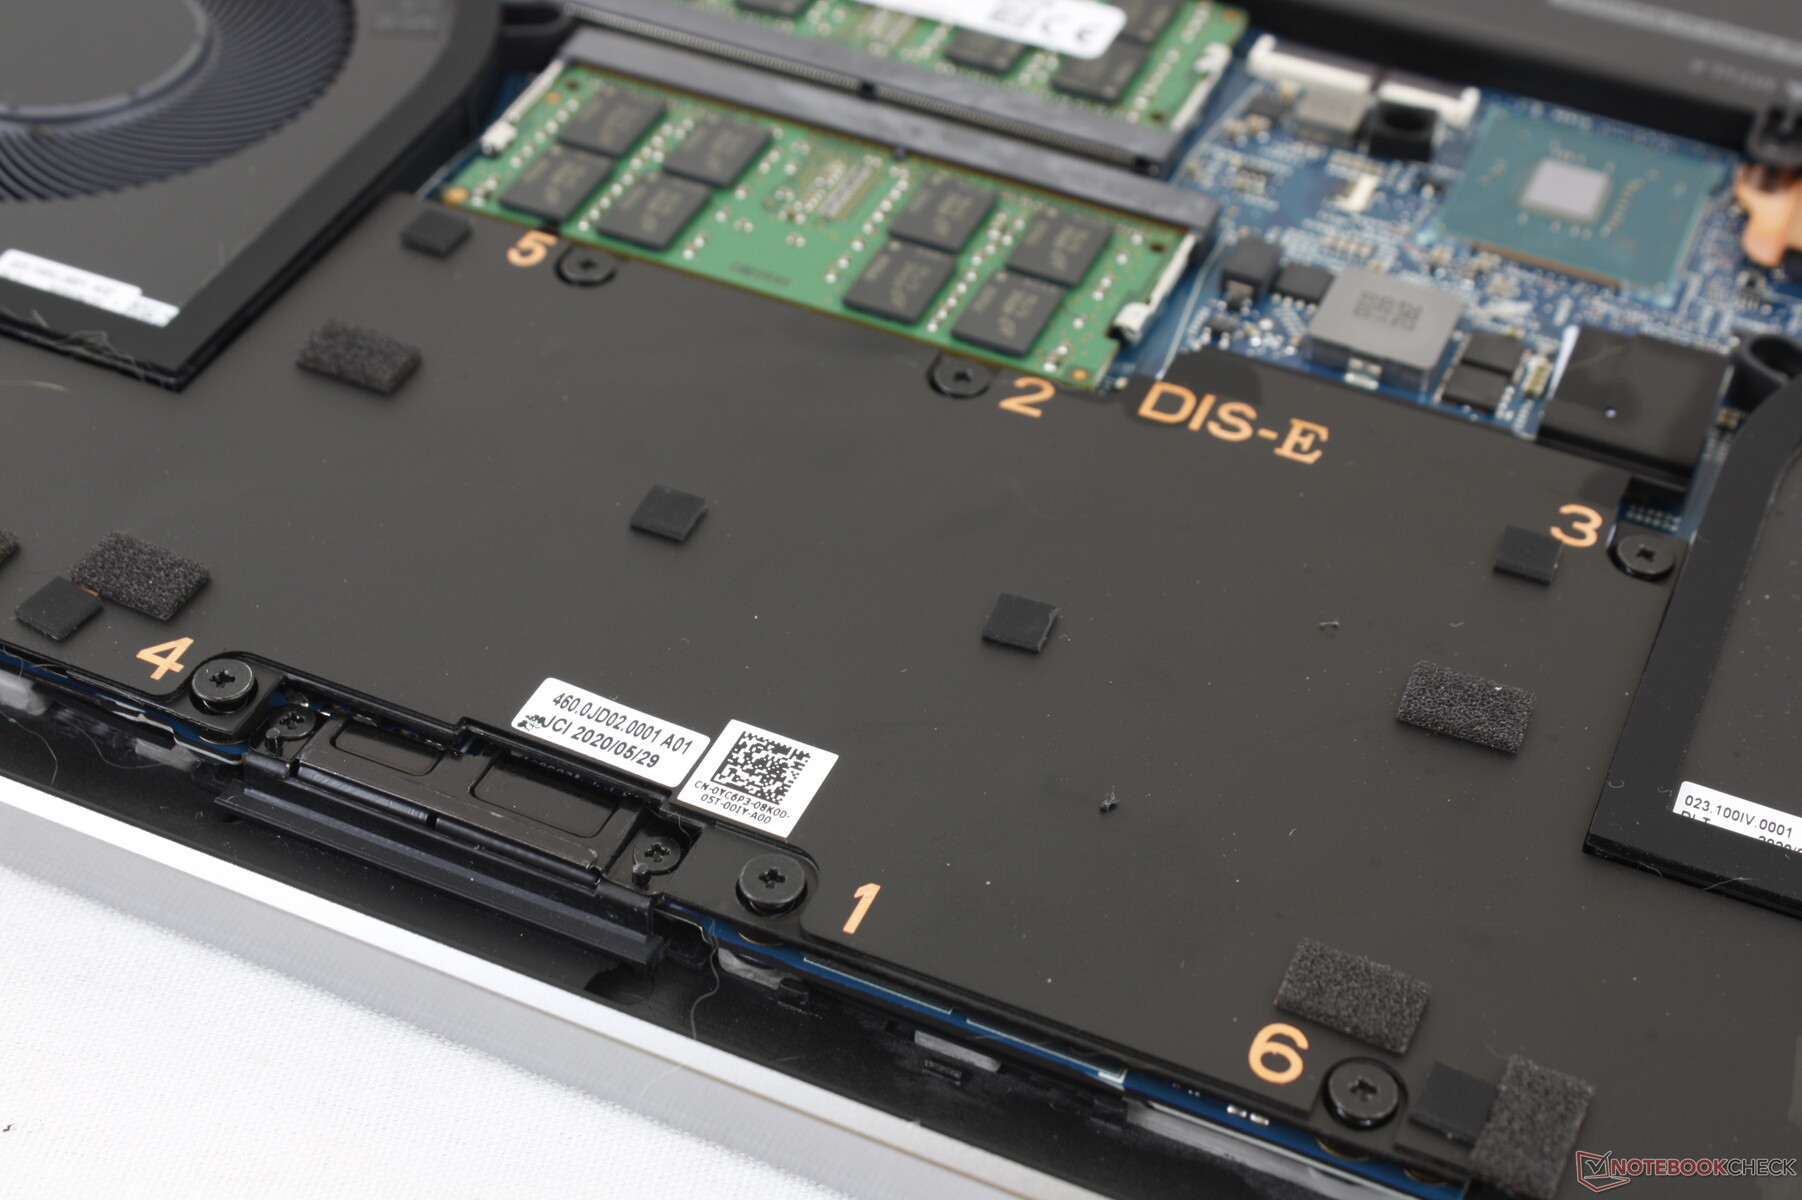
Manutenzione
Accessori e Garanzia
Un adattatore da USB-C a HDMI e USB-A è incluso in ogni confezione. La garanzia standard è di un solo anno rispetto ai tre anni delle tradizionali workstation full-size come la Precision 7550.
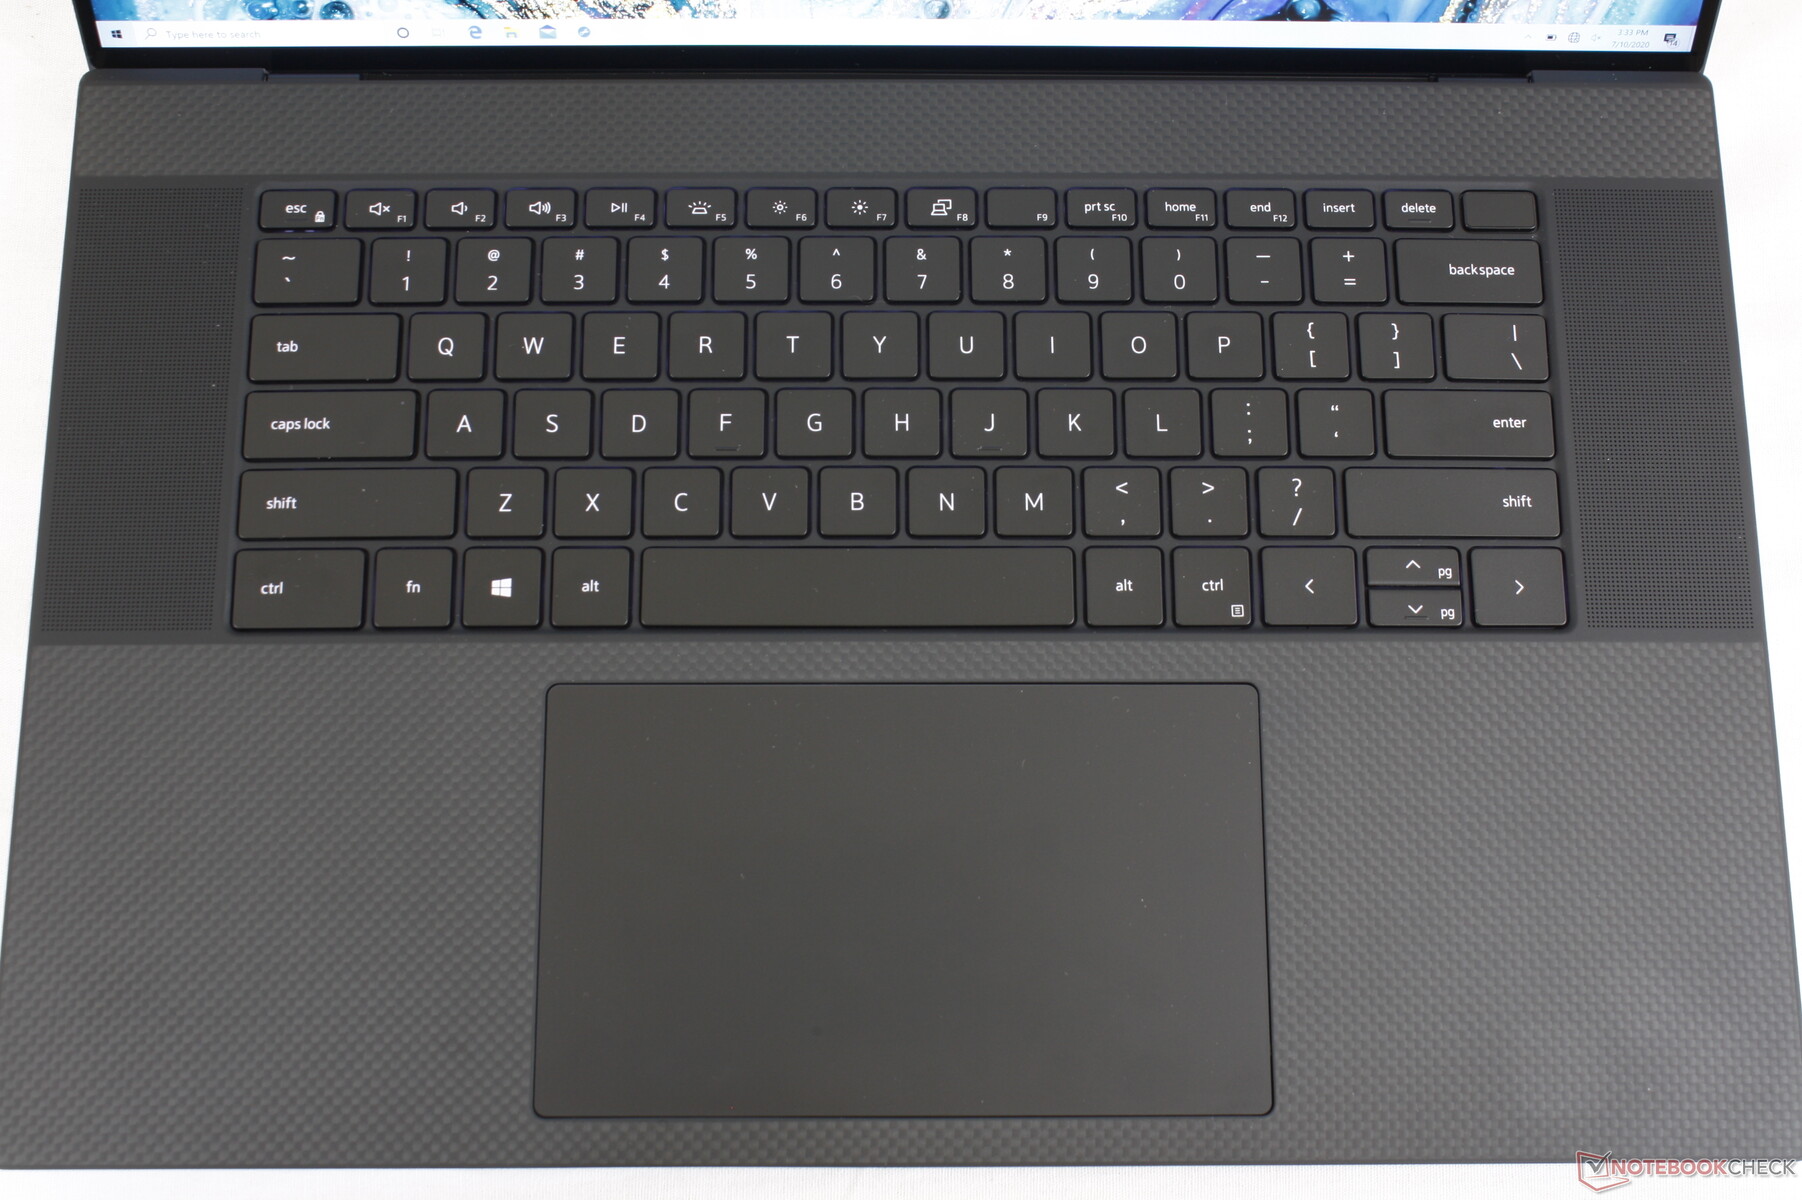
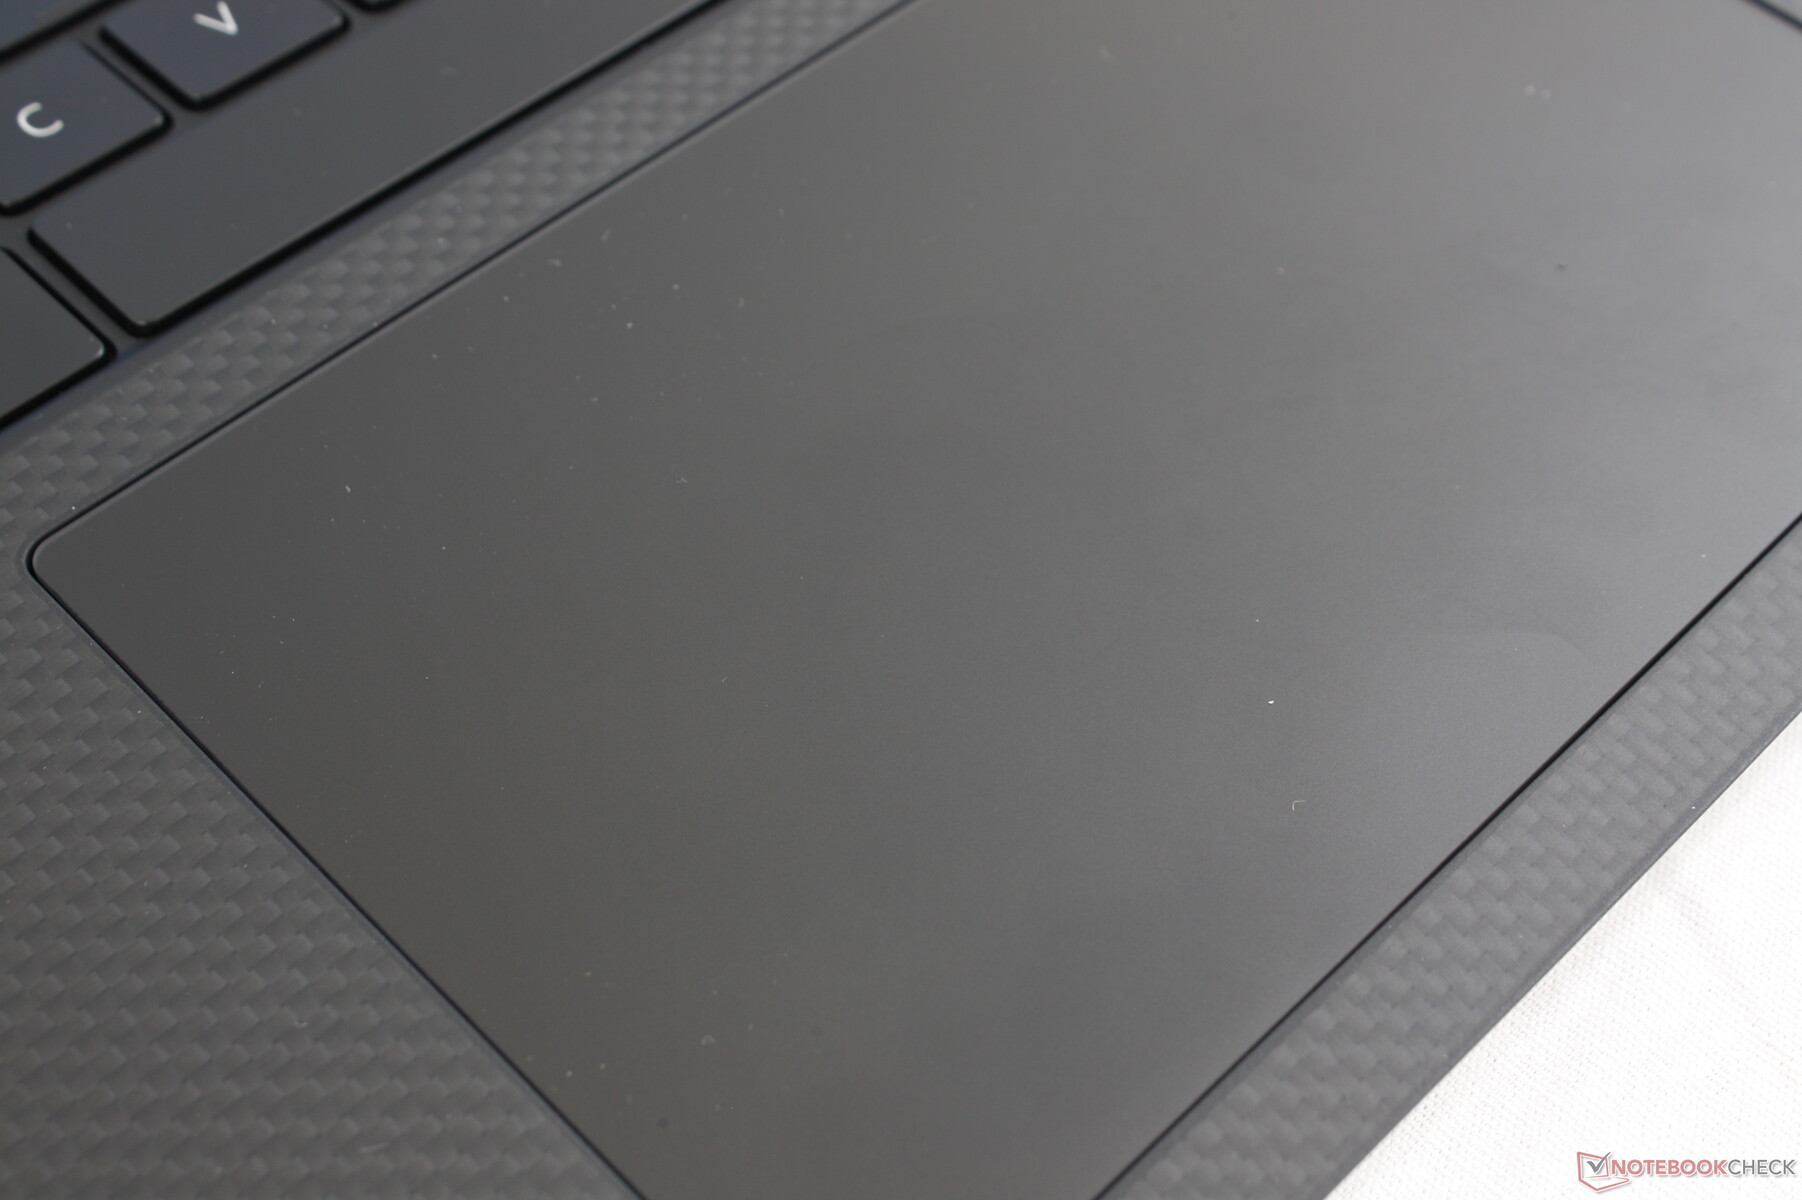
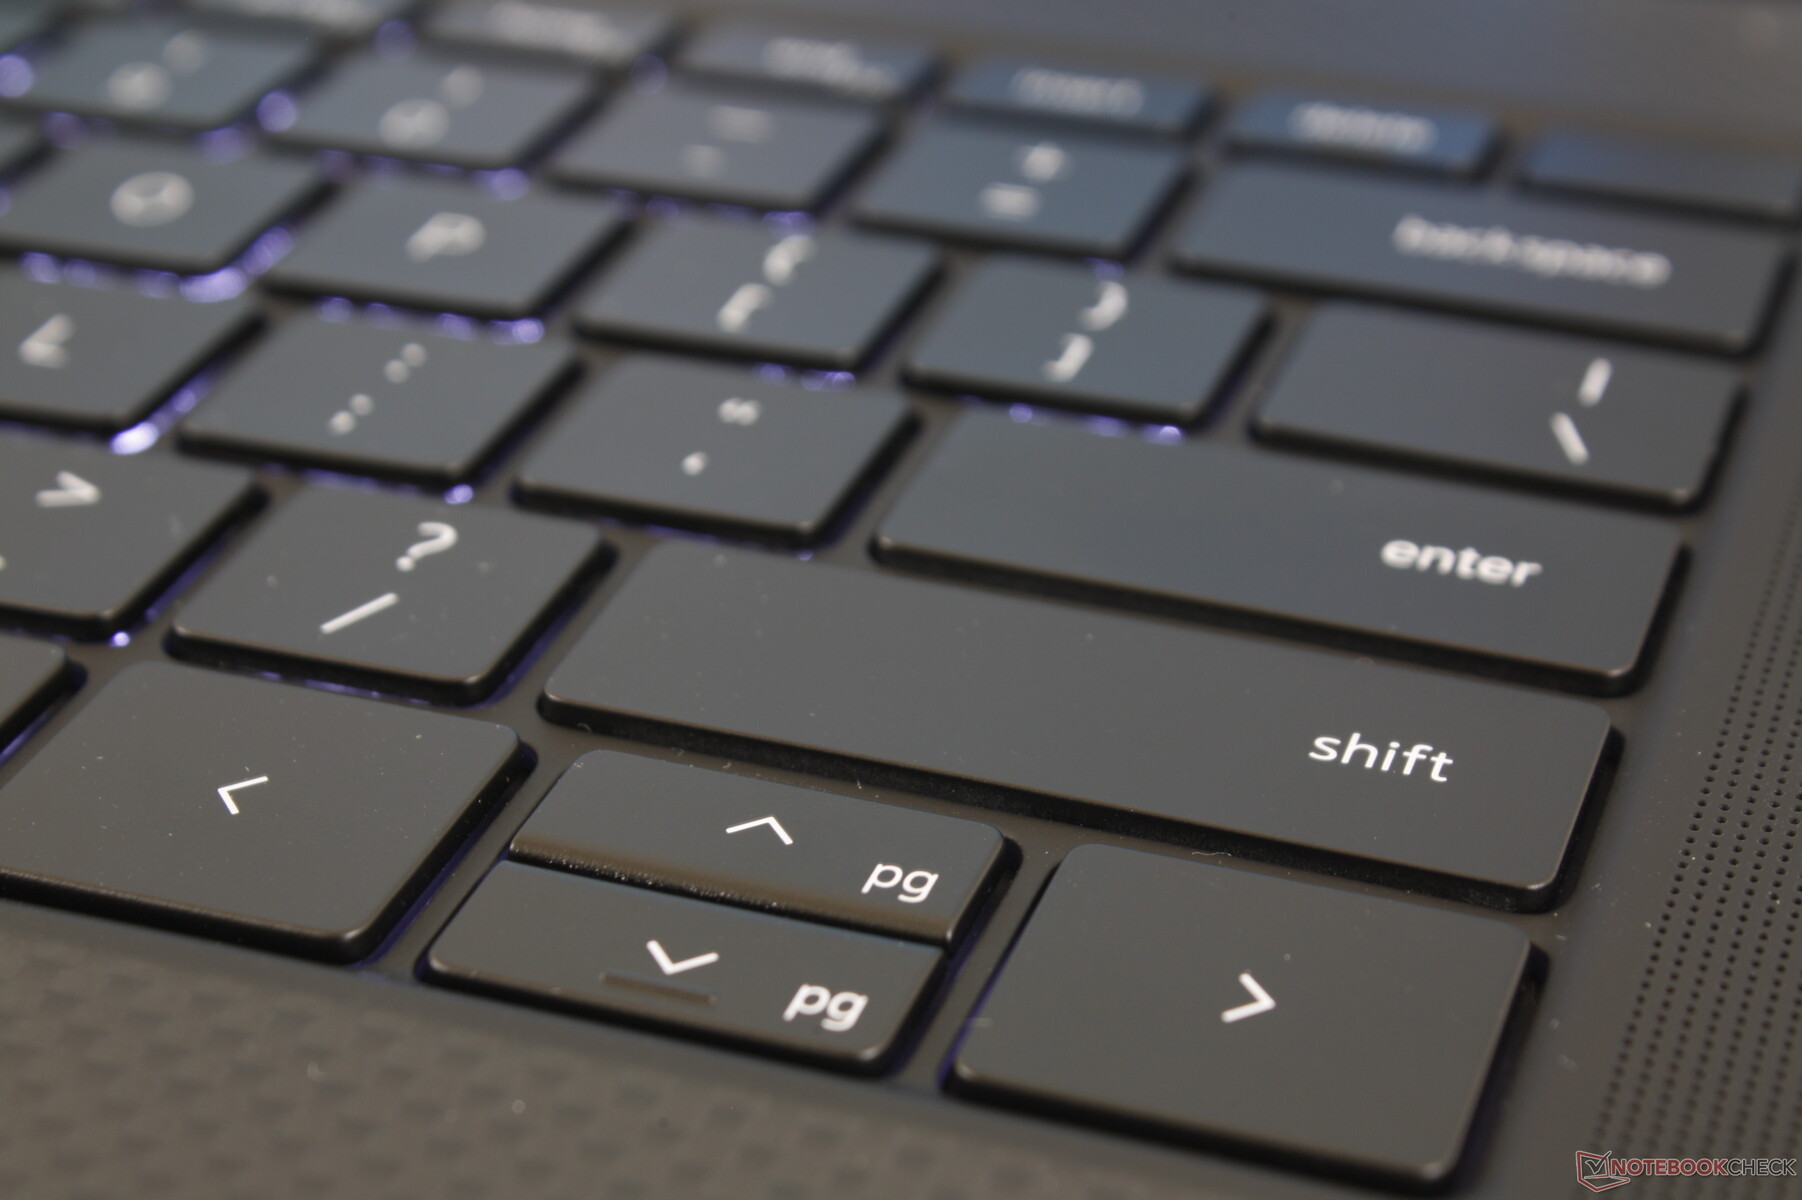
Dispositivi di Input

Display
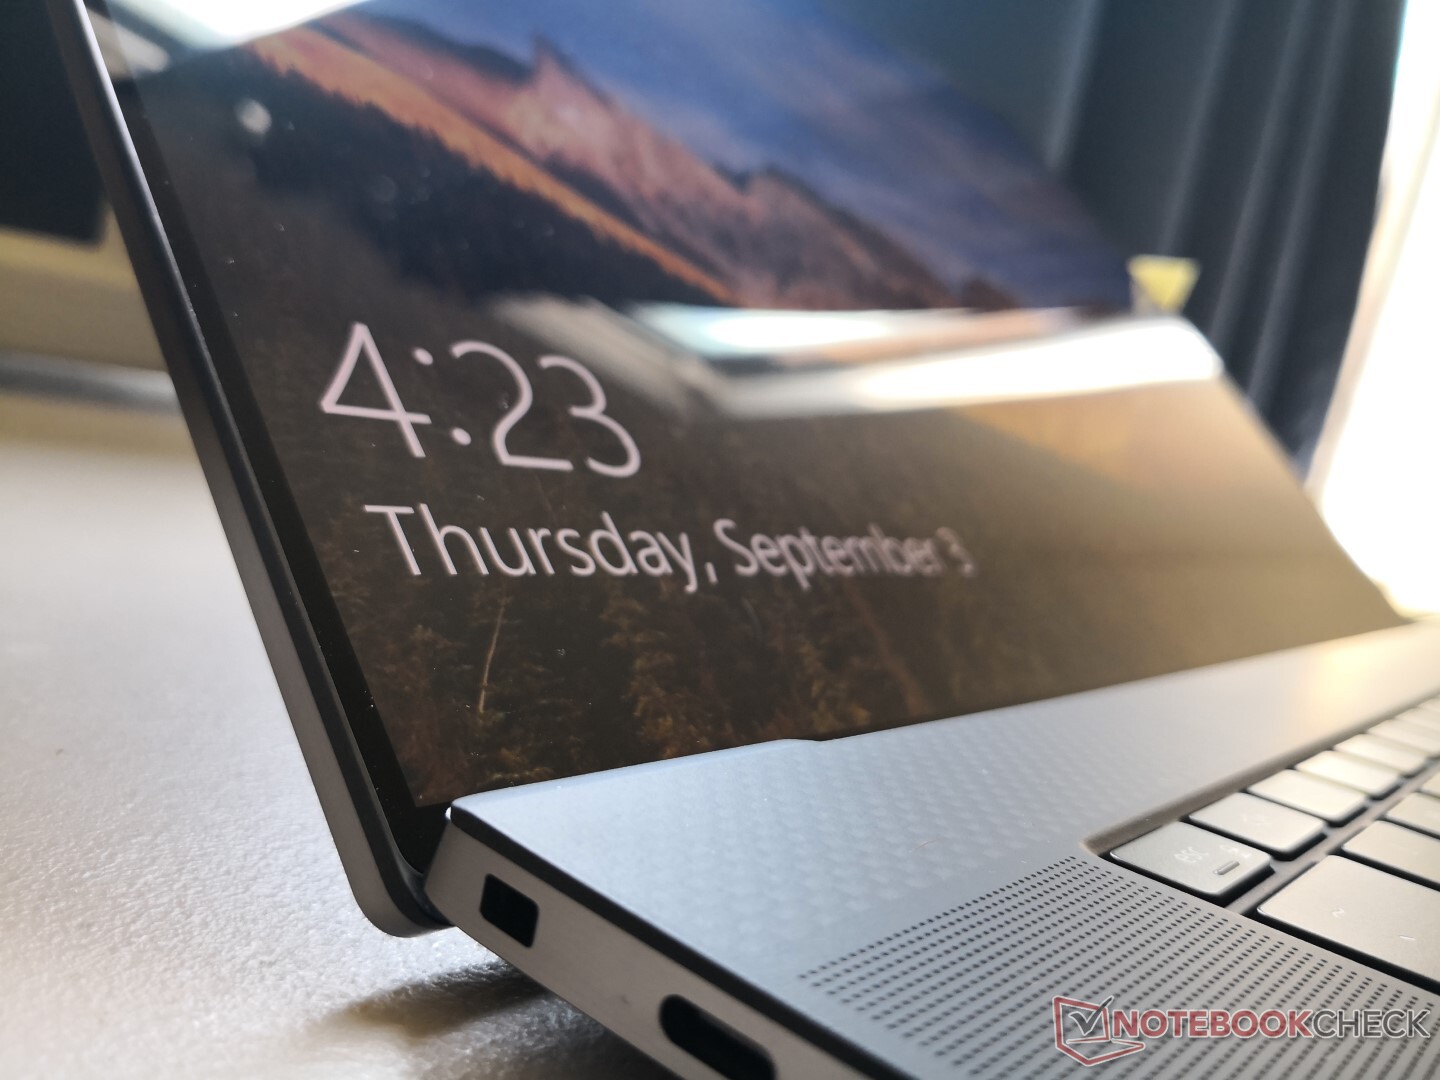
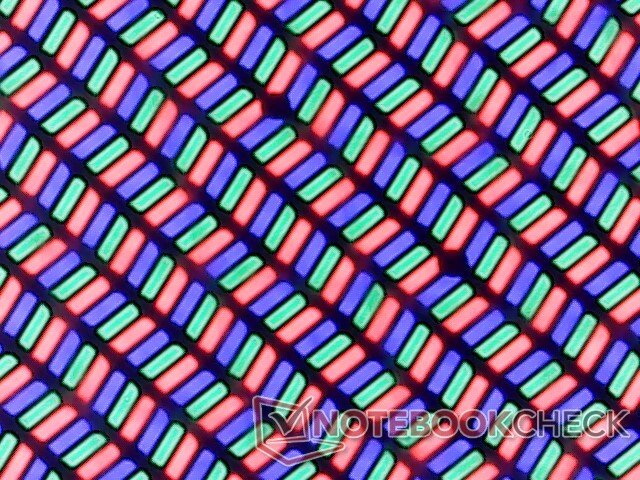
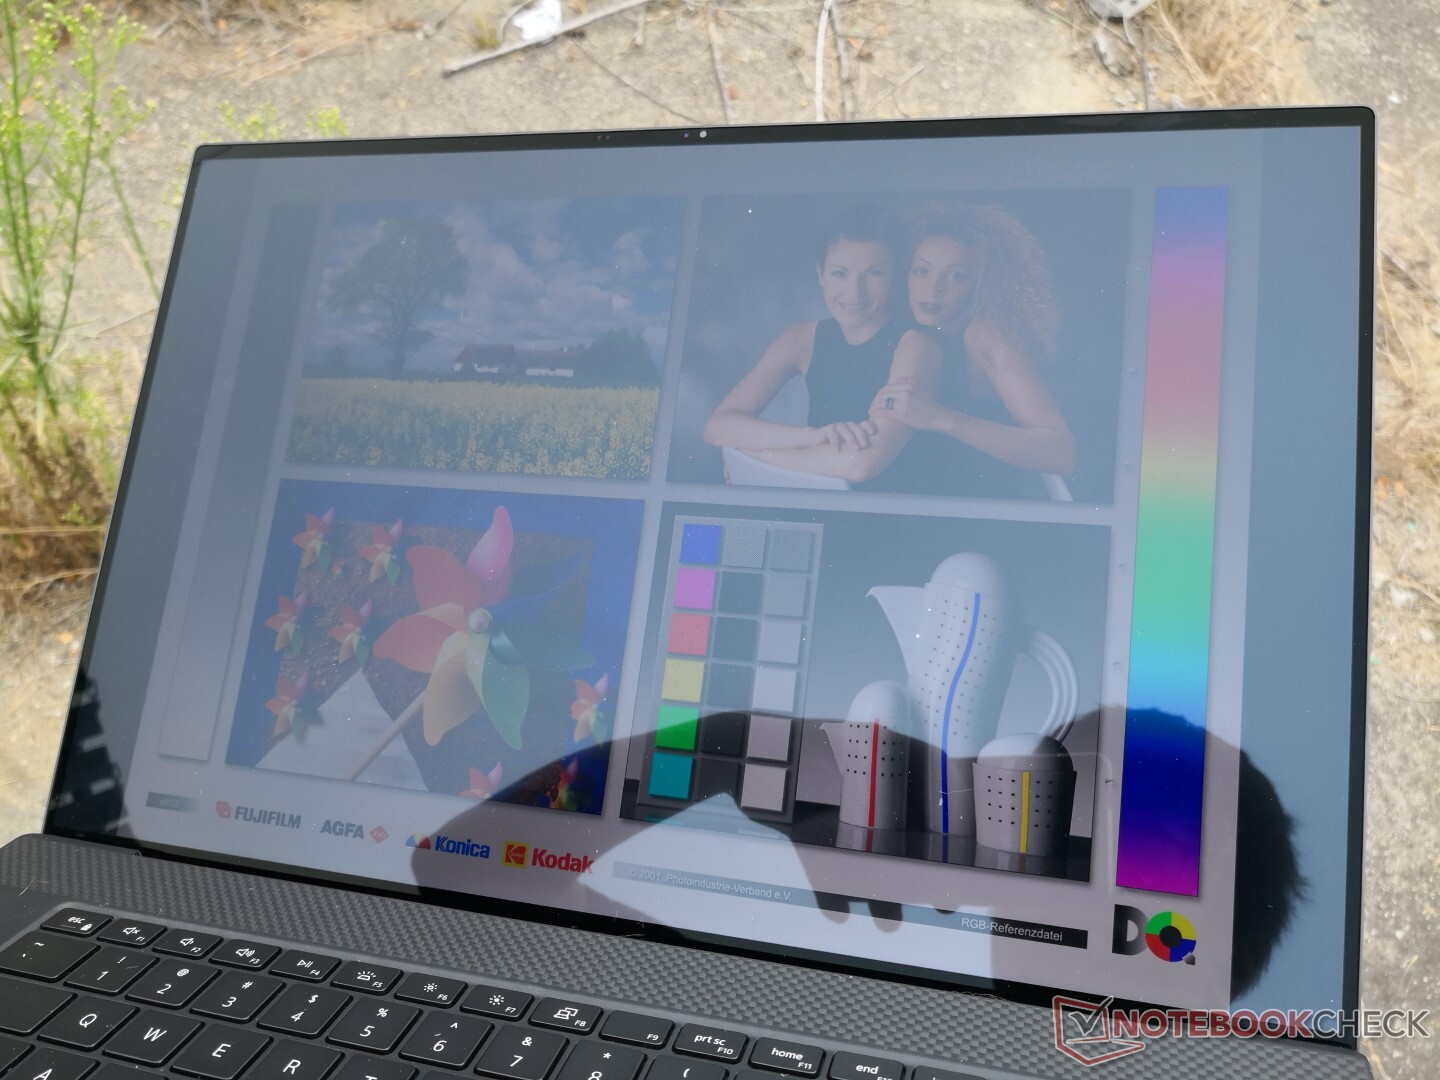
Dell utilizza lo stesso pannello IPS Sharp LQ170R1 e il controller SHP14D6 per entrambi i modelli XPS 17 e Precision 5750 per la stessa esperienza visiva tra i due modelli. Rispetto ai display della maggior parte delle altre workstation, l'XPS 17 offre un rapporto d'aspetto non comune di 16:10 sia con touchscreen che con immagini più nitide grazie al rivestimento lucido. È anche più luminoso a quasi 500 nits rispetto alla media di ~300 nits.
I tempi di risposta sono relativamente lenti per il ghosting visibile, ma questo è comune sui pannelli dei laptop 4K.


| |||||||||||||||||||||||||
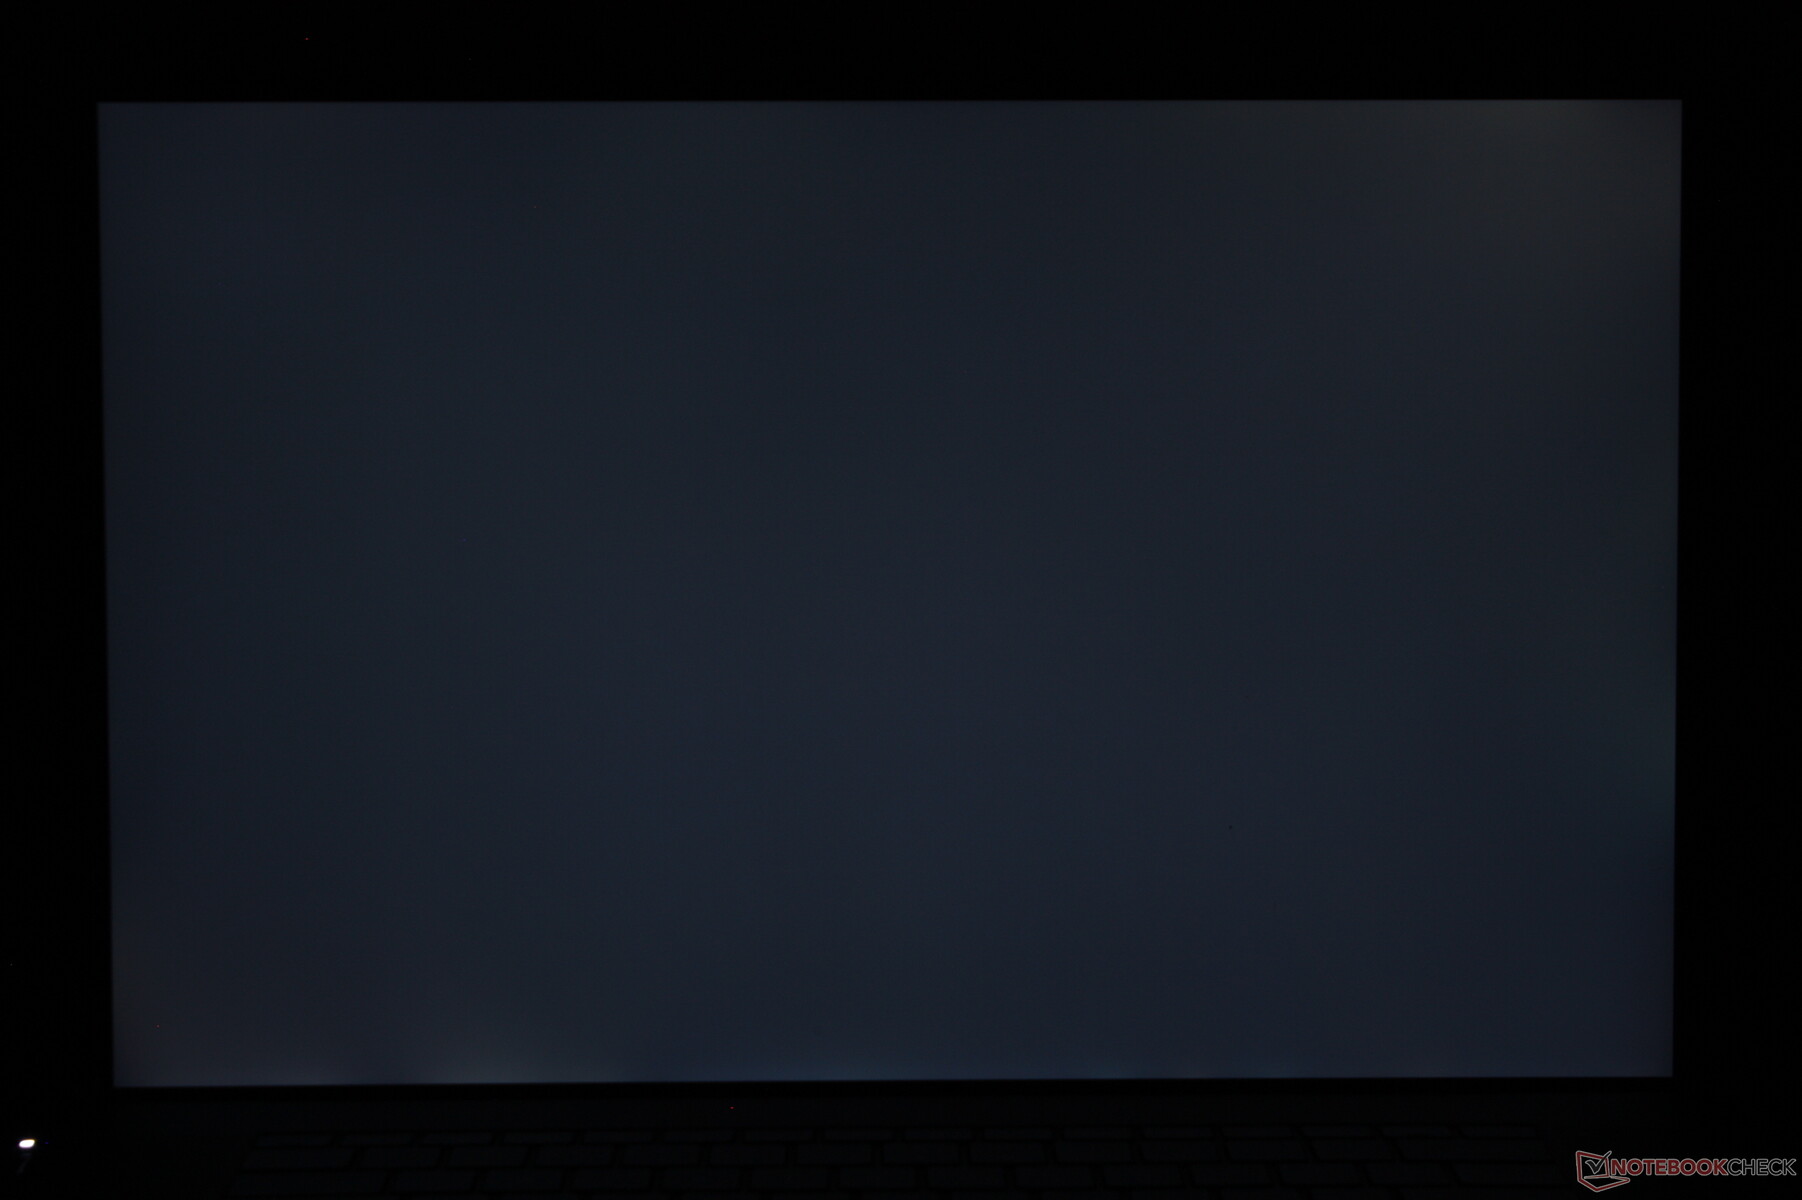
Distribuzione della luminosità: 90 %
Al centro con la batteria: 483.8 cd/m²
Contrasto: 1308:1 (Nero: 0.37 cd/m²)
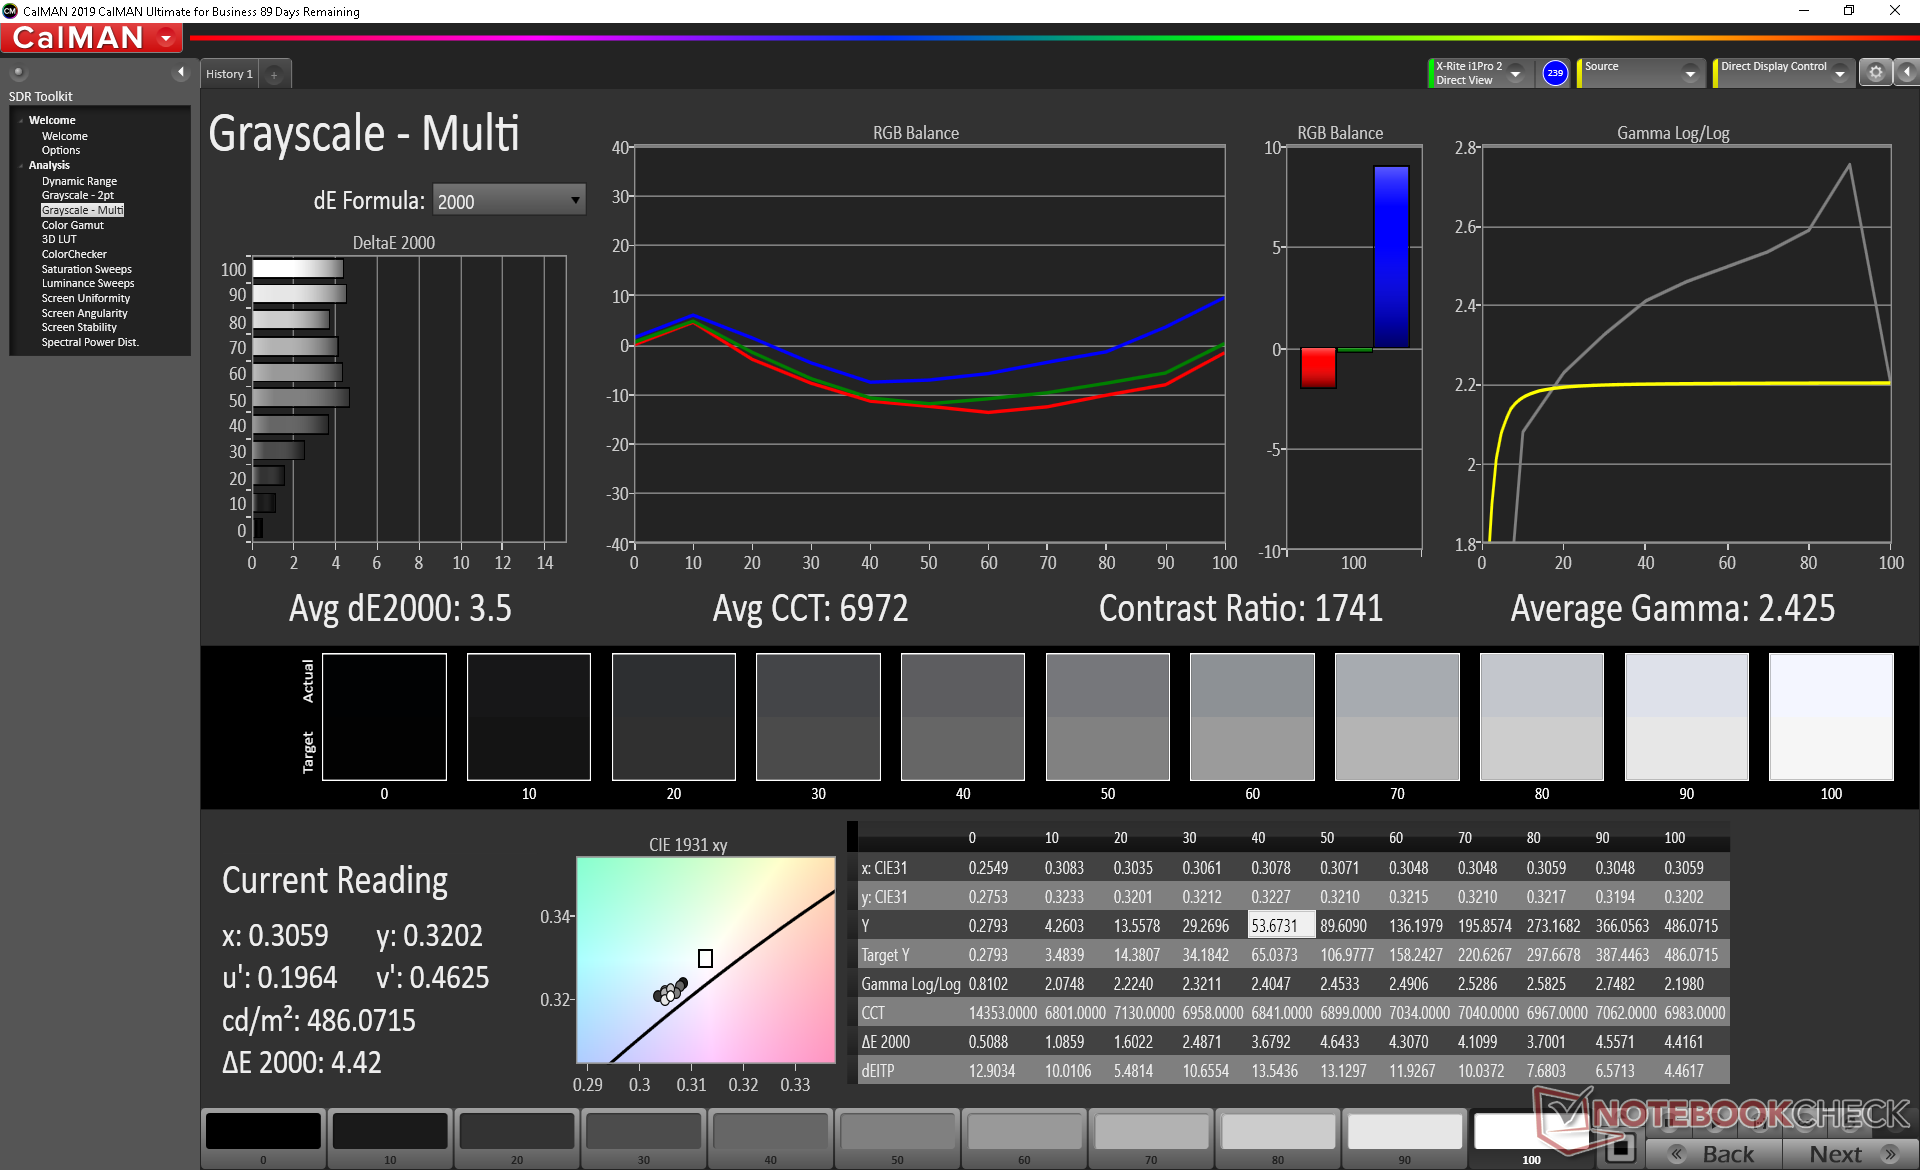
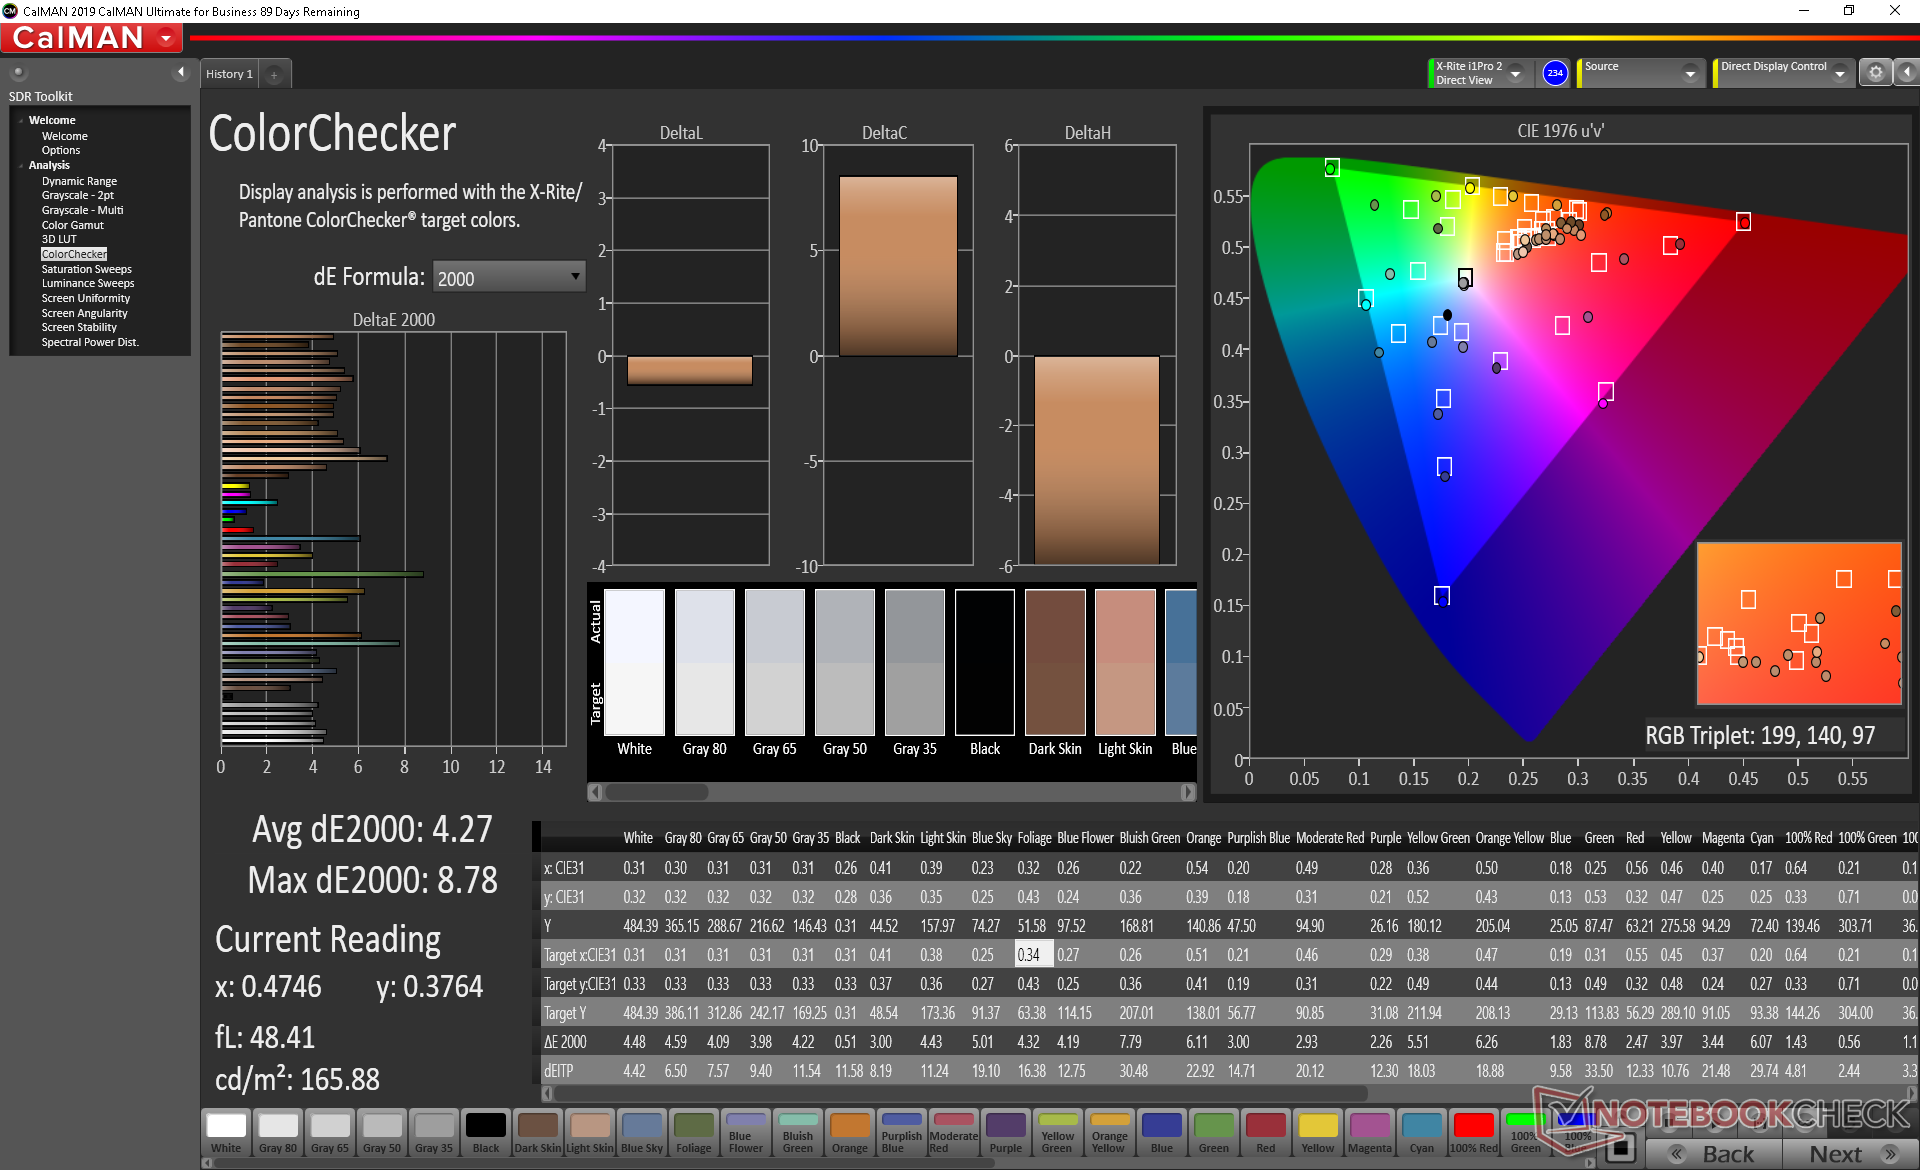
ΔE ColorChecker Calman: 4.27 | ∀{0.5-29.43 Ø4.72}
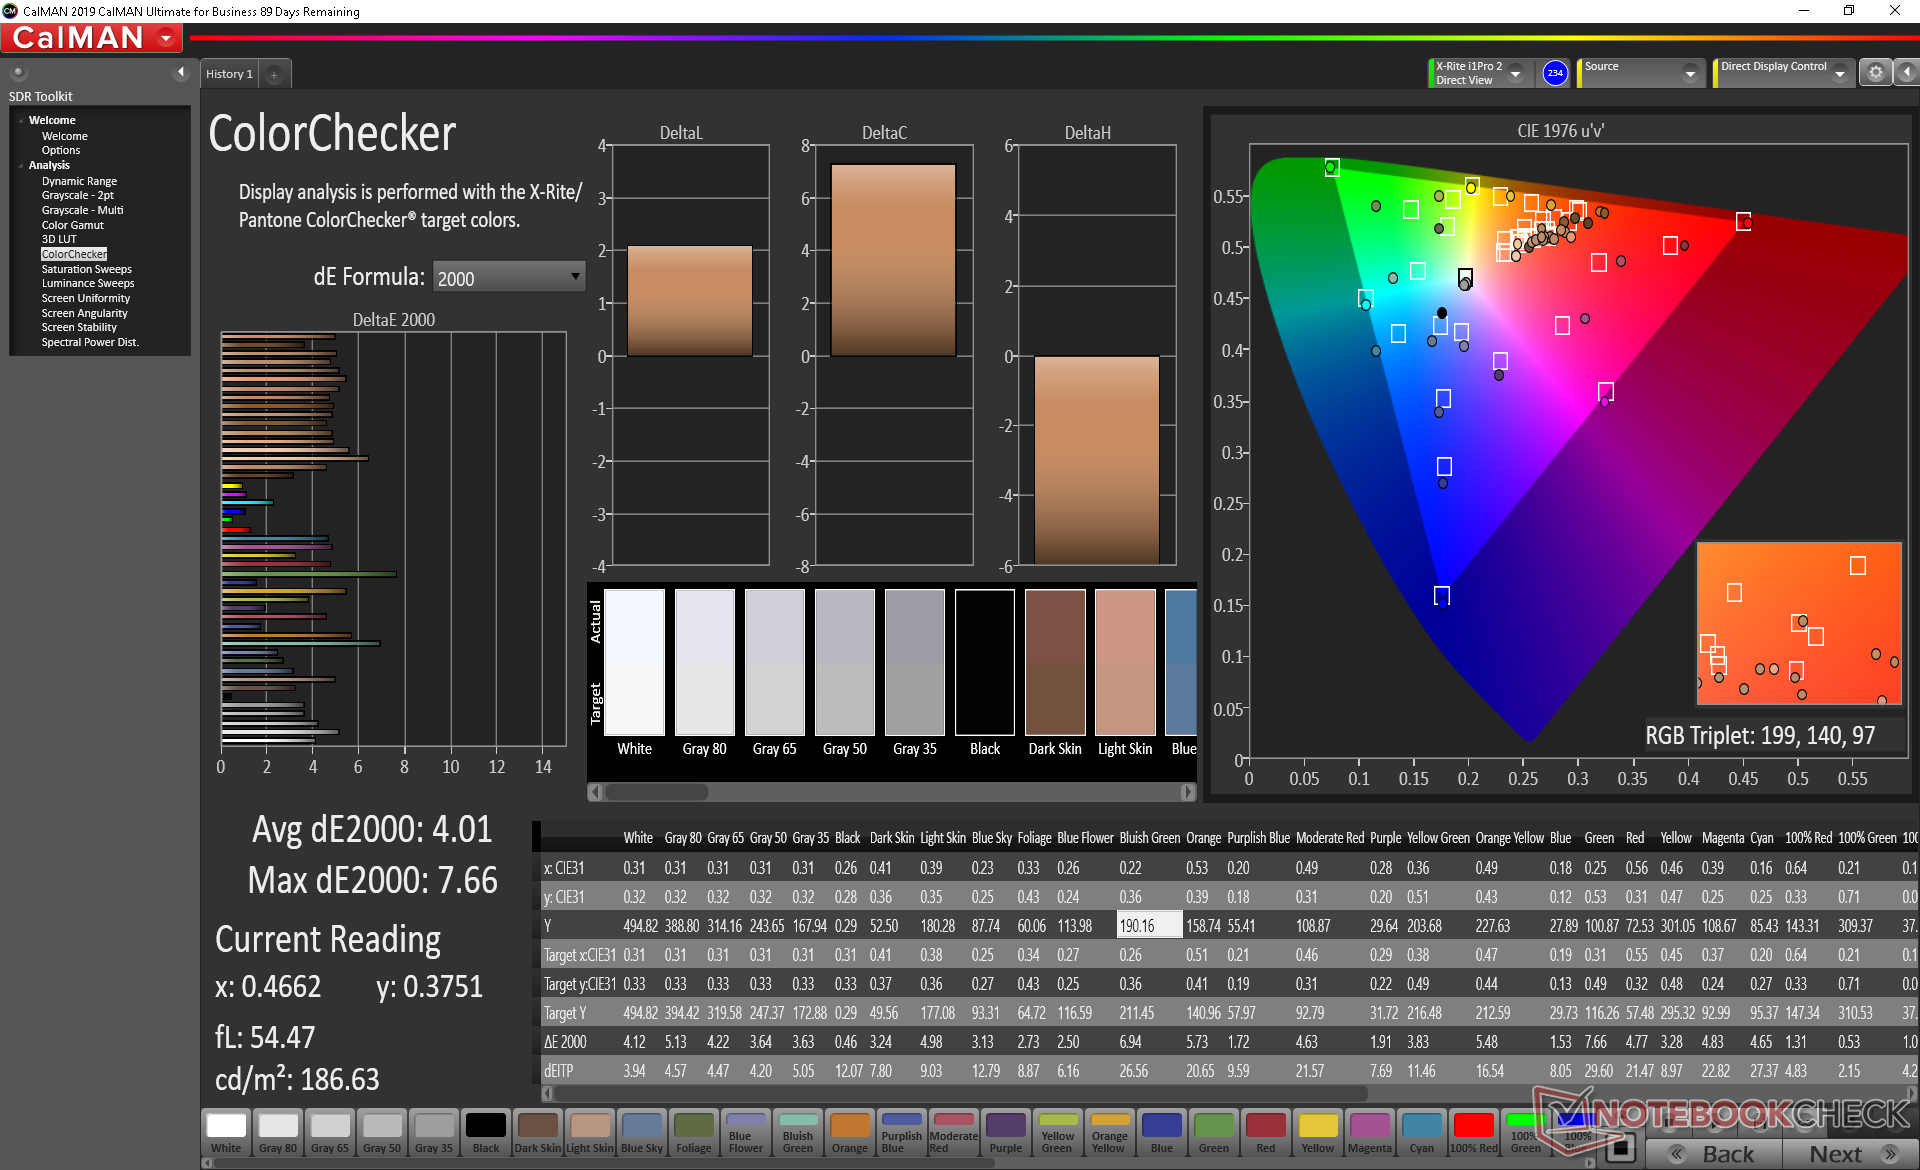
calibrated: 4.01
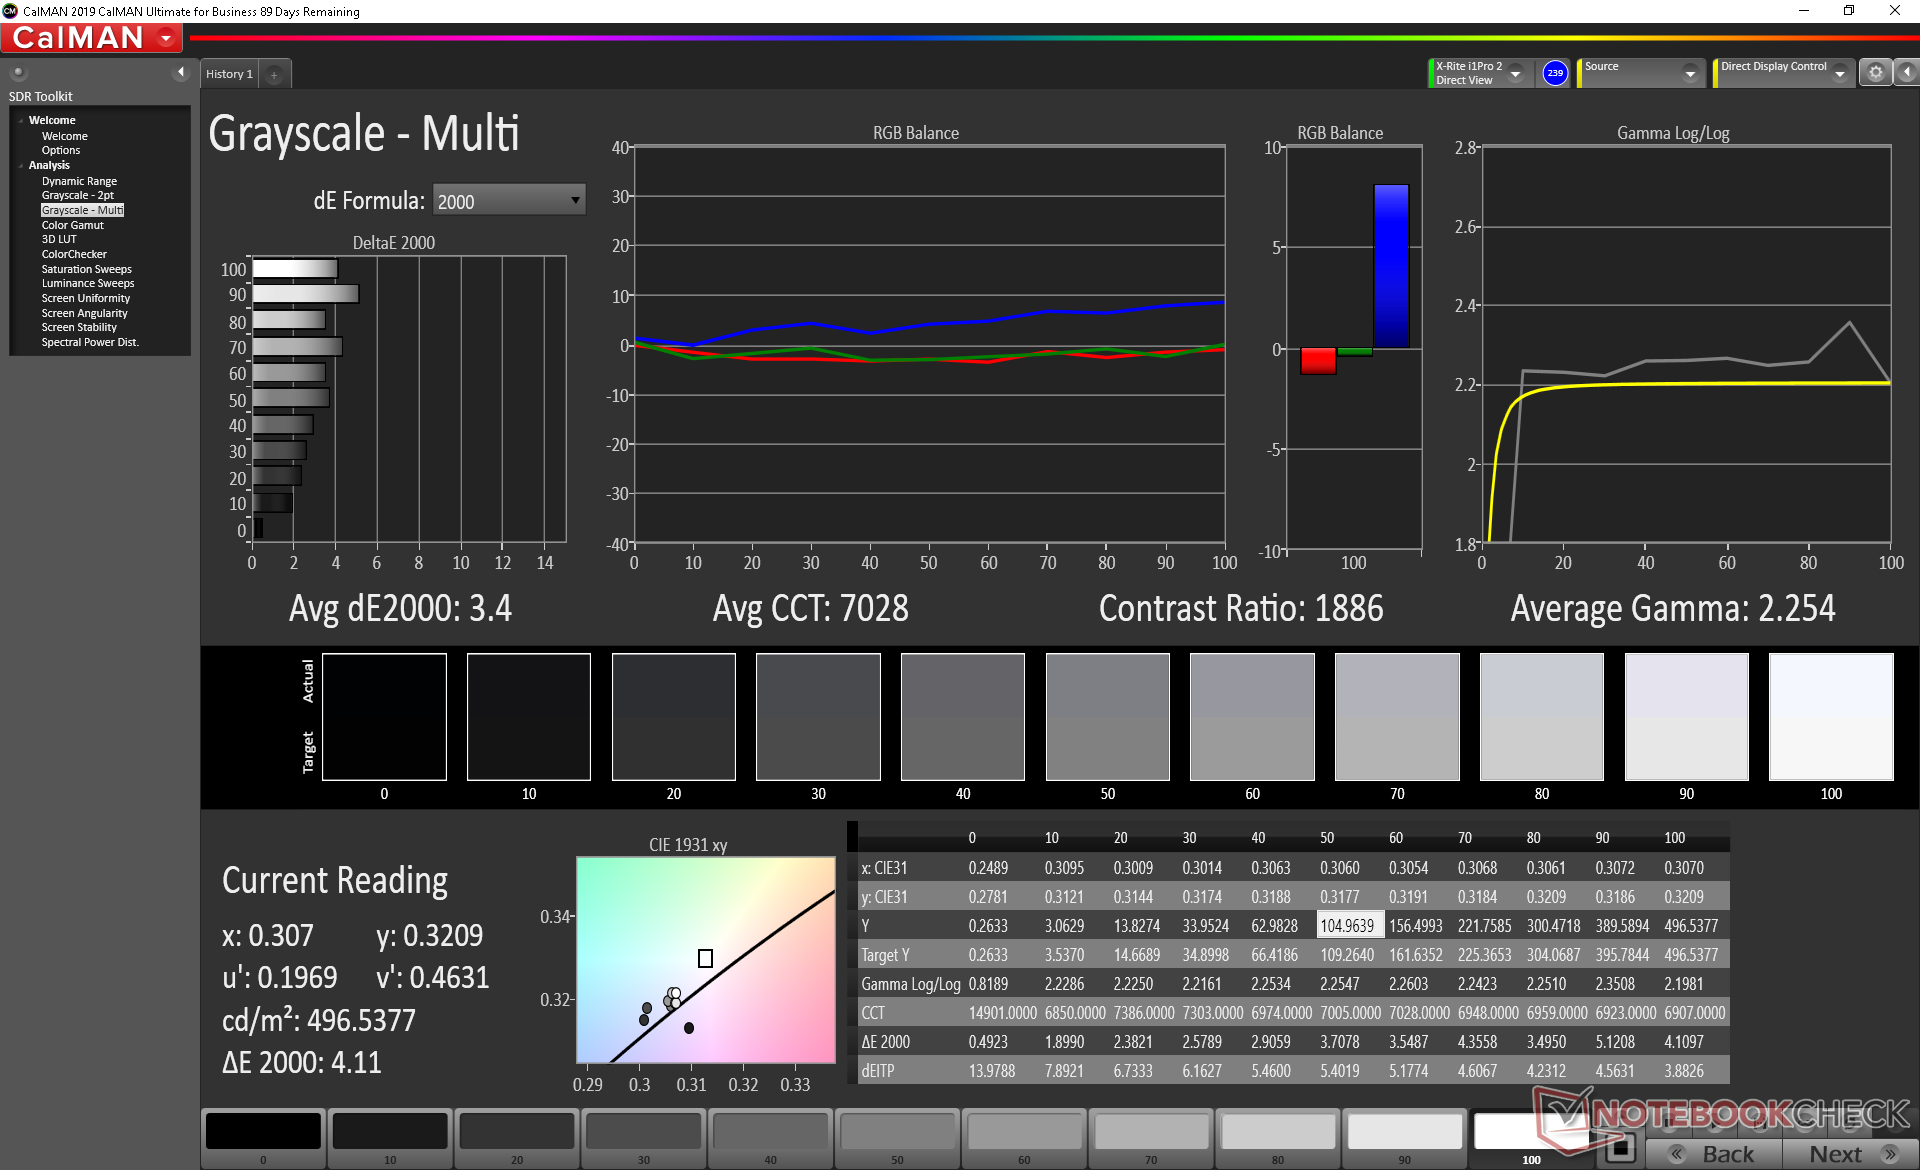
ΔE Greyscale Calman: 3.5 | ∀{0.09-98 Ø4.97}
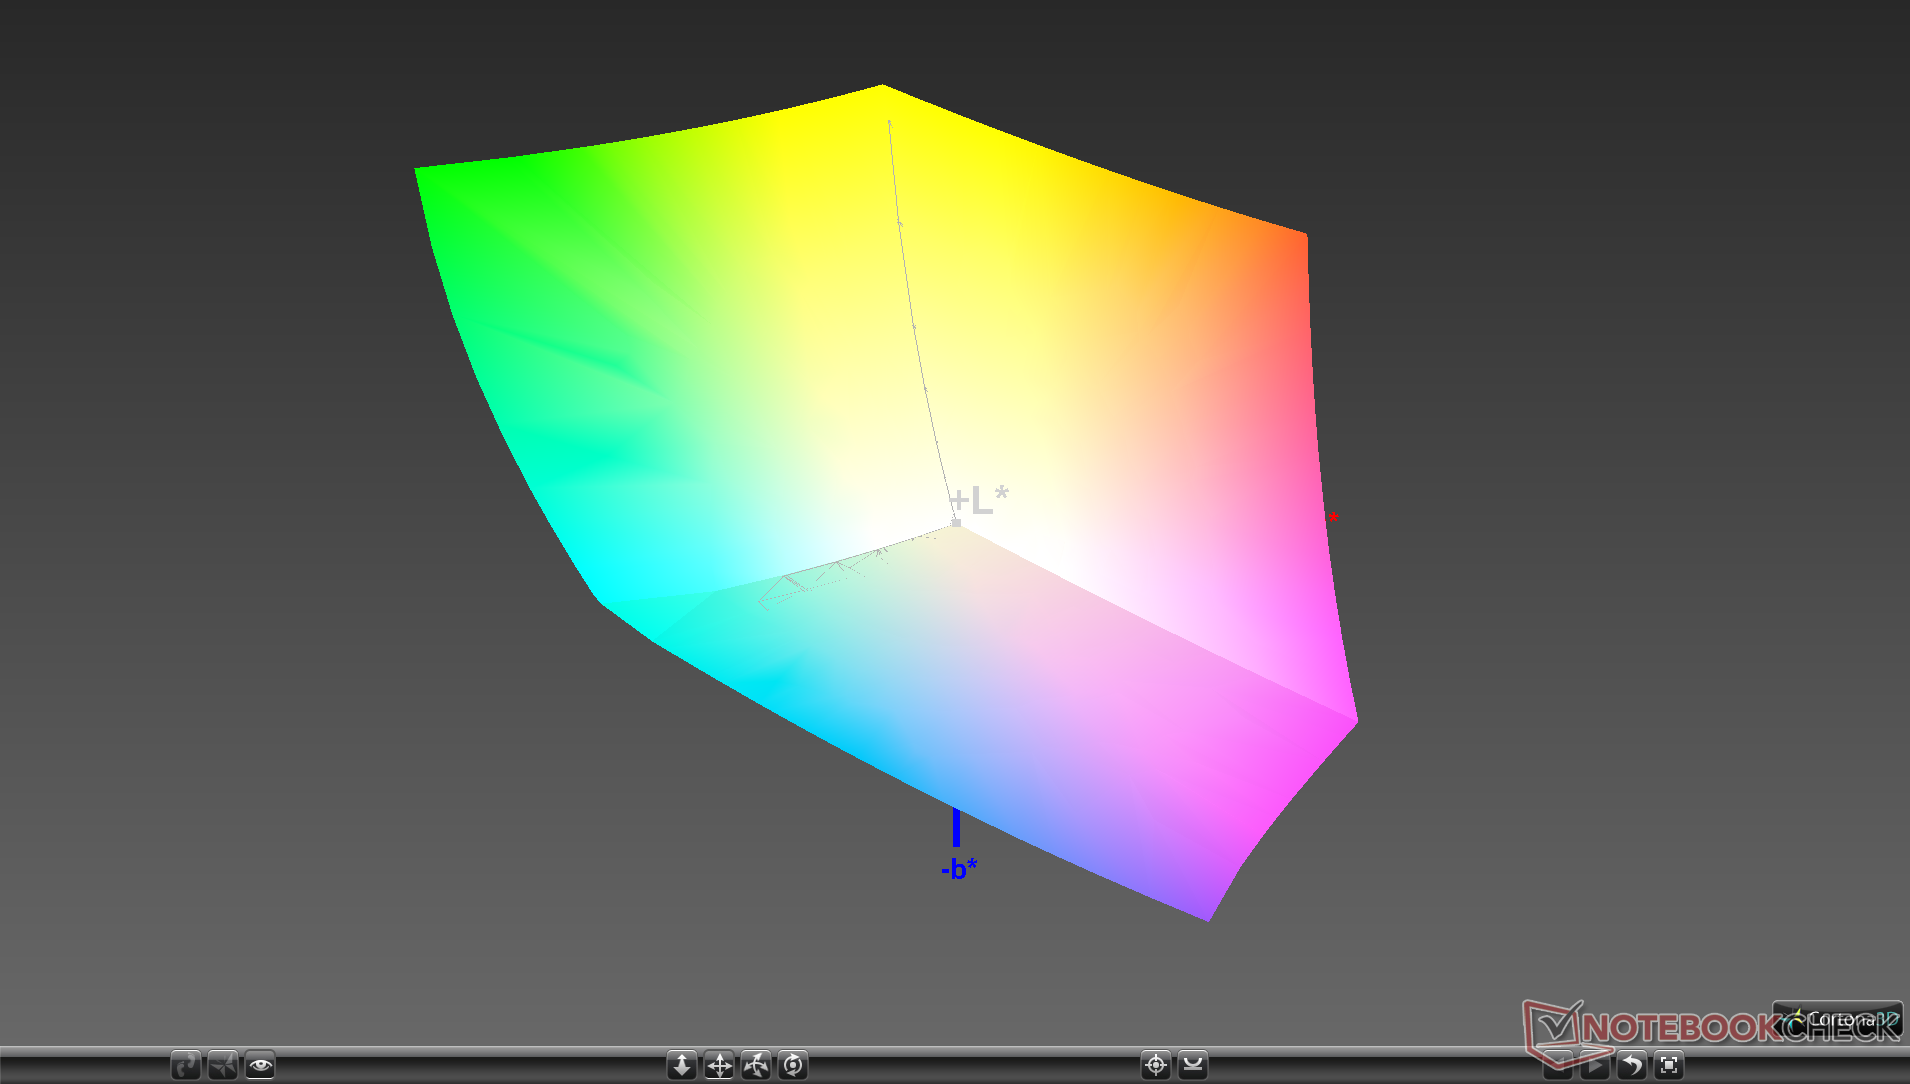
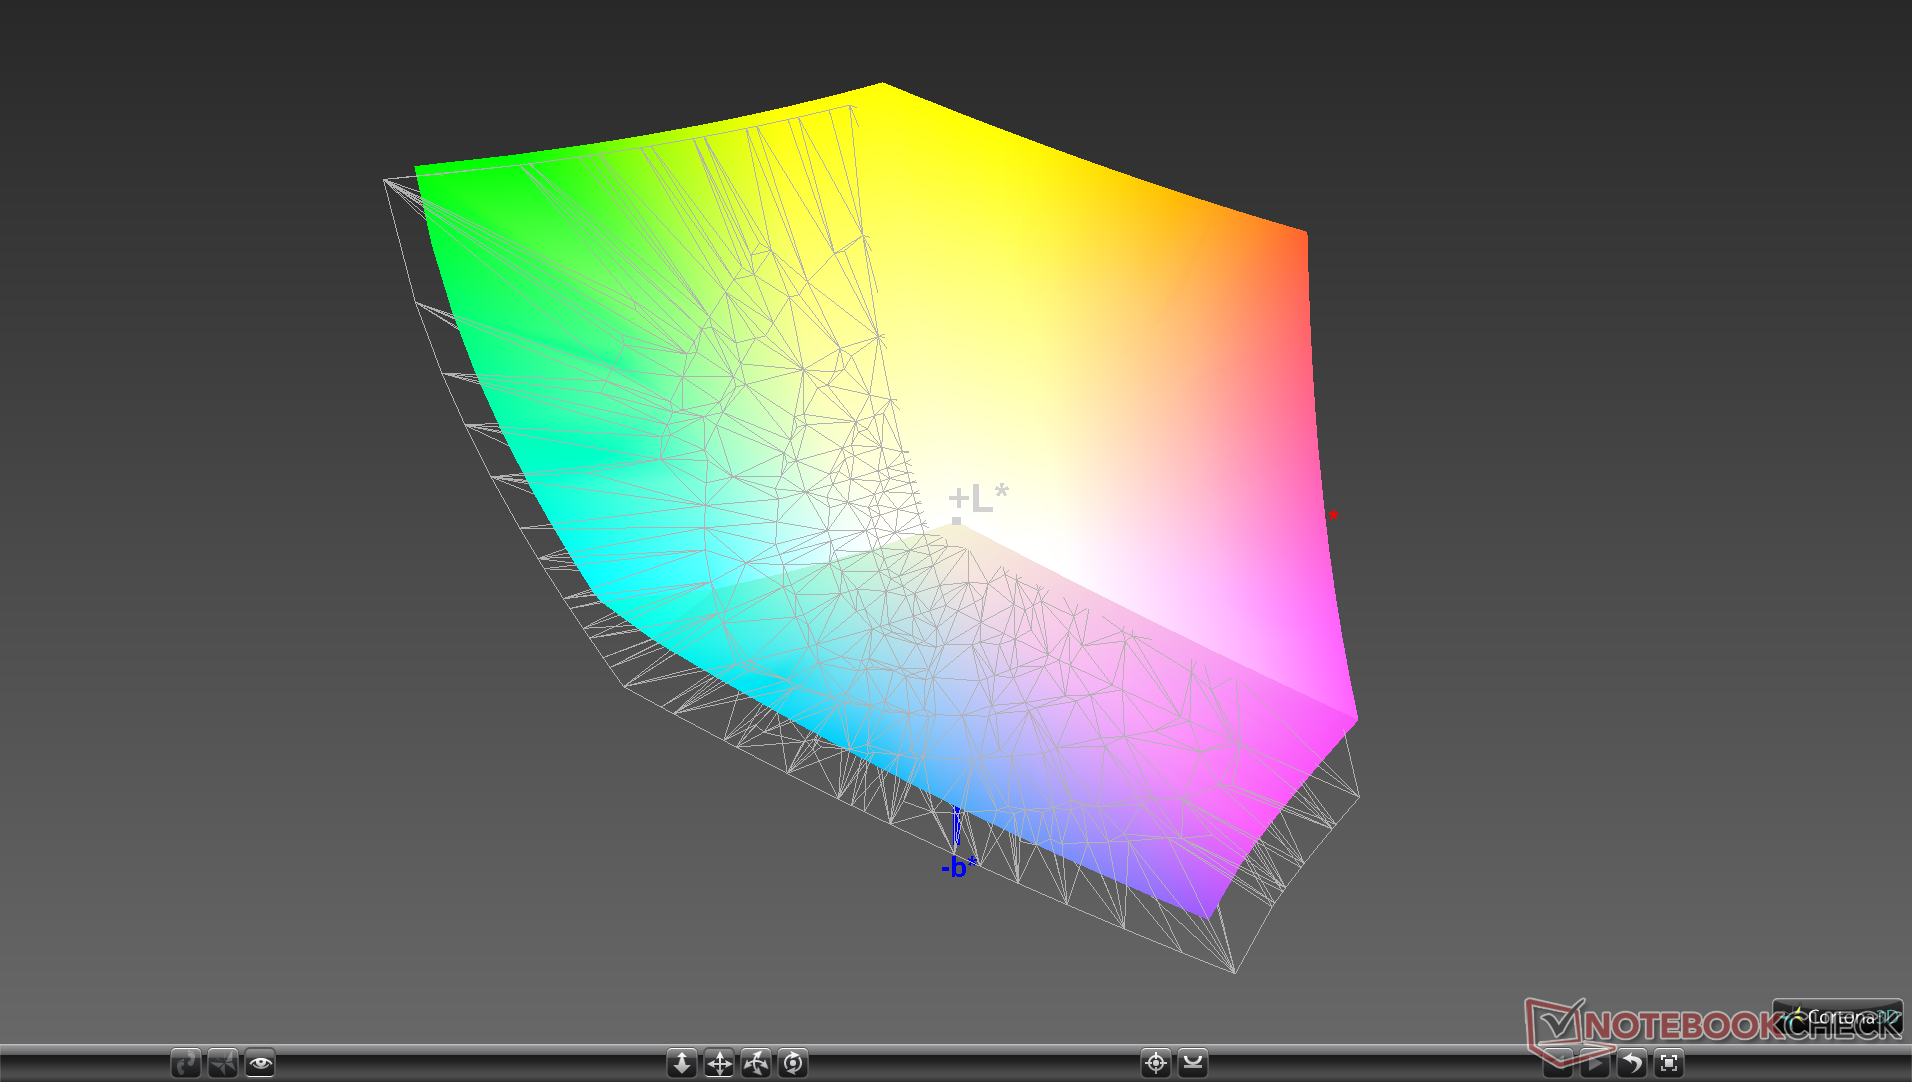
99.9% sRGB (Argyll 1.6.3 3D)
86.7% AdobeRGB 1998 (Argyll 1.6.3 3D)
97.7% AdobeRGB 1998 (Argyll 3D)
99.7% sRGB (Argyll 3D)
83.6% Display P3 (Argyll 3D)
Gamma: 2.43
CCT: 1741 K
| Dell Precision 5000 5750 P92F Sharp LQ170R1, IPS, 17", 3840x2400 | Asus ProArt StudioBook Pro 17 W700G3T 170PUW1-A00, IPS, 17", 1920x1200 | MSI WS75 9TL-636 B173HAN04.2, IPS, 17.3", 1920x1080 | Dell Precision 7730 B173HAN01.3, IPS LED, 17.3", 1920x1080 | Lenovo ThinkPad P73-20QR002DGE N173HCE-E31, IPS LED, 17.3", 1920x1080 | MSI WE75 9TK AU Optronics B173HAN04.2, IPS, 17.3", 1920x1080 | |
|---|---|---|---|---|---|---|
| Display | 1% | -22% | -20% | -19% | -23% | |
| Display P3 Coverage (%) | 83.6 | 96.2 15% | 64.5 -23% | 65 -22% | 67.5 -19% | 63.2 -24% |
| sRGB Coverage (%) | 99.7 | 99.8 0% | 91.1 -9% | 93.4 -6% | 94.2 -6% | 89.9 -10% |
| AdobeRGB 1998 Coverage (%) | 97.7 | 84.7 -13% | 65.8 -33% | 66.3 -32% | 67.8 -31% | 64.3 -34% |
| Response Times | 7% | 11% | -7% | 11% | 17% | |
| Response Time Grey 50% / Grey 80% * (ms) | 41.2 ? | 41.2 ? -0% | 39.2 ? 5% | 48.8 ? -18% | 40 ? 3% | 30.8 ? 25% |
| Response Time Black / White * (ms) | 34 ? | 29.6 ? 13% | 28.4 ? 16% | 32.8 ? 4% | 28 ? 18% | 31.2 ? 8% |
| PWM Frequency (Hz) | 25000 ? | |||||
| Screen | 17% | -3% | 12% | -12% | 0% | |
| Brightness middle (cd/m²) | 483.8 | 323 -33% | 300 -38% | 322 -33% | 333 -31% | 287.3 -41% |
| Brightness (cd/m²) | 457 | 308 -33% | 288 -37% | 316 -31% | 310 -32% | 280 -39% |
| Brightness Distribution (%) | 90 | 88 -2% | 86 -4% | 84 -7% | 83 -8% | 89 -1% |
| Black Level * (cd/m²) | 0.37 | 0.36 3% | 0.25 32% | 0.24 35% | 0.39 -5% | 0.26 30% |
| Contrast (:1) | 1308 | 897 -31% | 1200 -8% | 1342 3% | 854 -35% | 1105 -16% |
| Colorchecker dE 2000 * | 4.27 | 1.1 74% | 3.9 9% | 2.2 48% | 4.4 -3% | 2.98 30% |
| Colorchecker dE 2000 max. * | 8.78 | 3.3 62% | 6 32% | 4.6 48% | 7.5 15% | 5.08 42% |
| Colorchecker dE 2000 calibrated * | 4.01 | 0.8 80% | 2.3 43% | 1.9 53% | 2 50% | 3.06 24% |
| Greyscale dE 2000 * | 3.5 | 0.8 77% | 4.3 -23% | 1.6 54% | 5.1 -46% | 3 14% |
| Gamma | 2.43 91% | 2.23 99% | 2.2 100% | 2.19 100% | 2.39 92% | 2.28 96% |
| CCT | 1741 373% | 6479 100% | 7391 88% | 6621 98% | 7061 92% | 6993 93% |
| Color Space (Percent of AdobeRGB 1998) (%) | 86.7 | 75.7 -13% | 59.2 -32% | 60.4 -30% | 61.1 -30% | 58.1 -33% |
| Color Space (Percent of sRGB) (%) | 99.9 | 99.8 0% | 91 -9% | 93.3 -7% | 94 -6% | 89.5 -10% |
| Media totale (Programma / Settaggio) | 8% /
12% | -5% /
-5% | -5% /
4% | -7% /
-10% | -2% /
-2% |
* ... Meglio usare valori piccoli
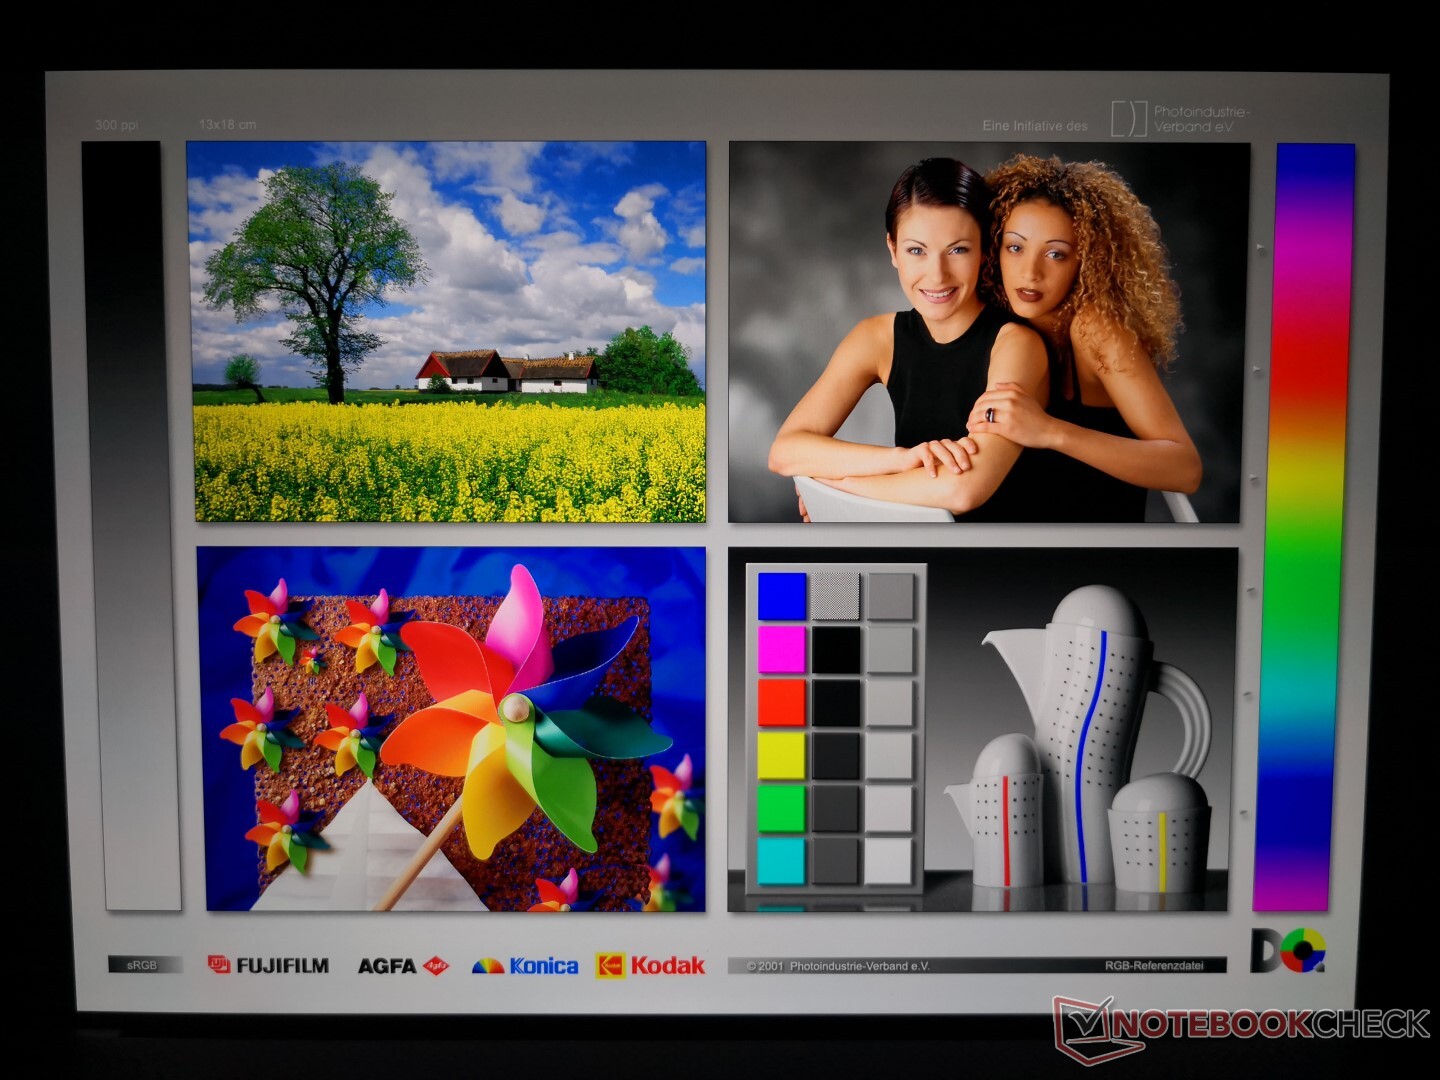
Lo spazio colore copre tutto lo sRGB e circa l'87% dello spazio 3D AdobeRGB, che è standard per la maggior parte dei pannelli UHD 4K. Le opzioni FHD minori in genere coprono solo il 60% circa di AdobeRGB.
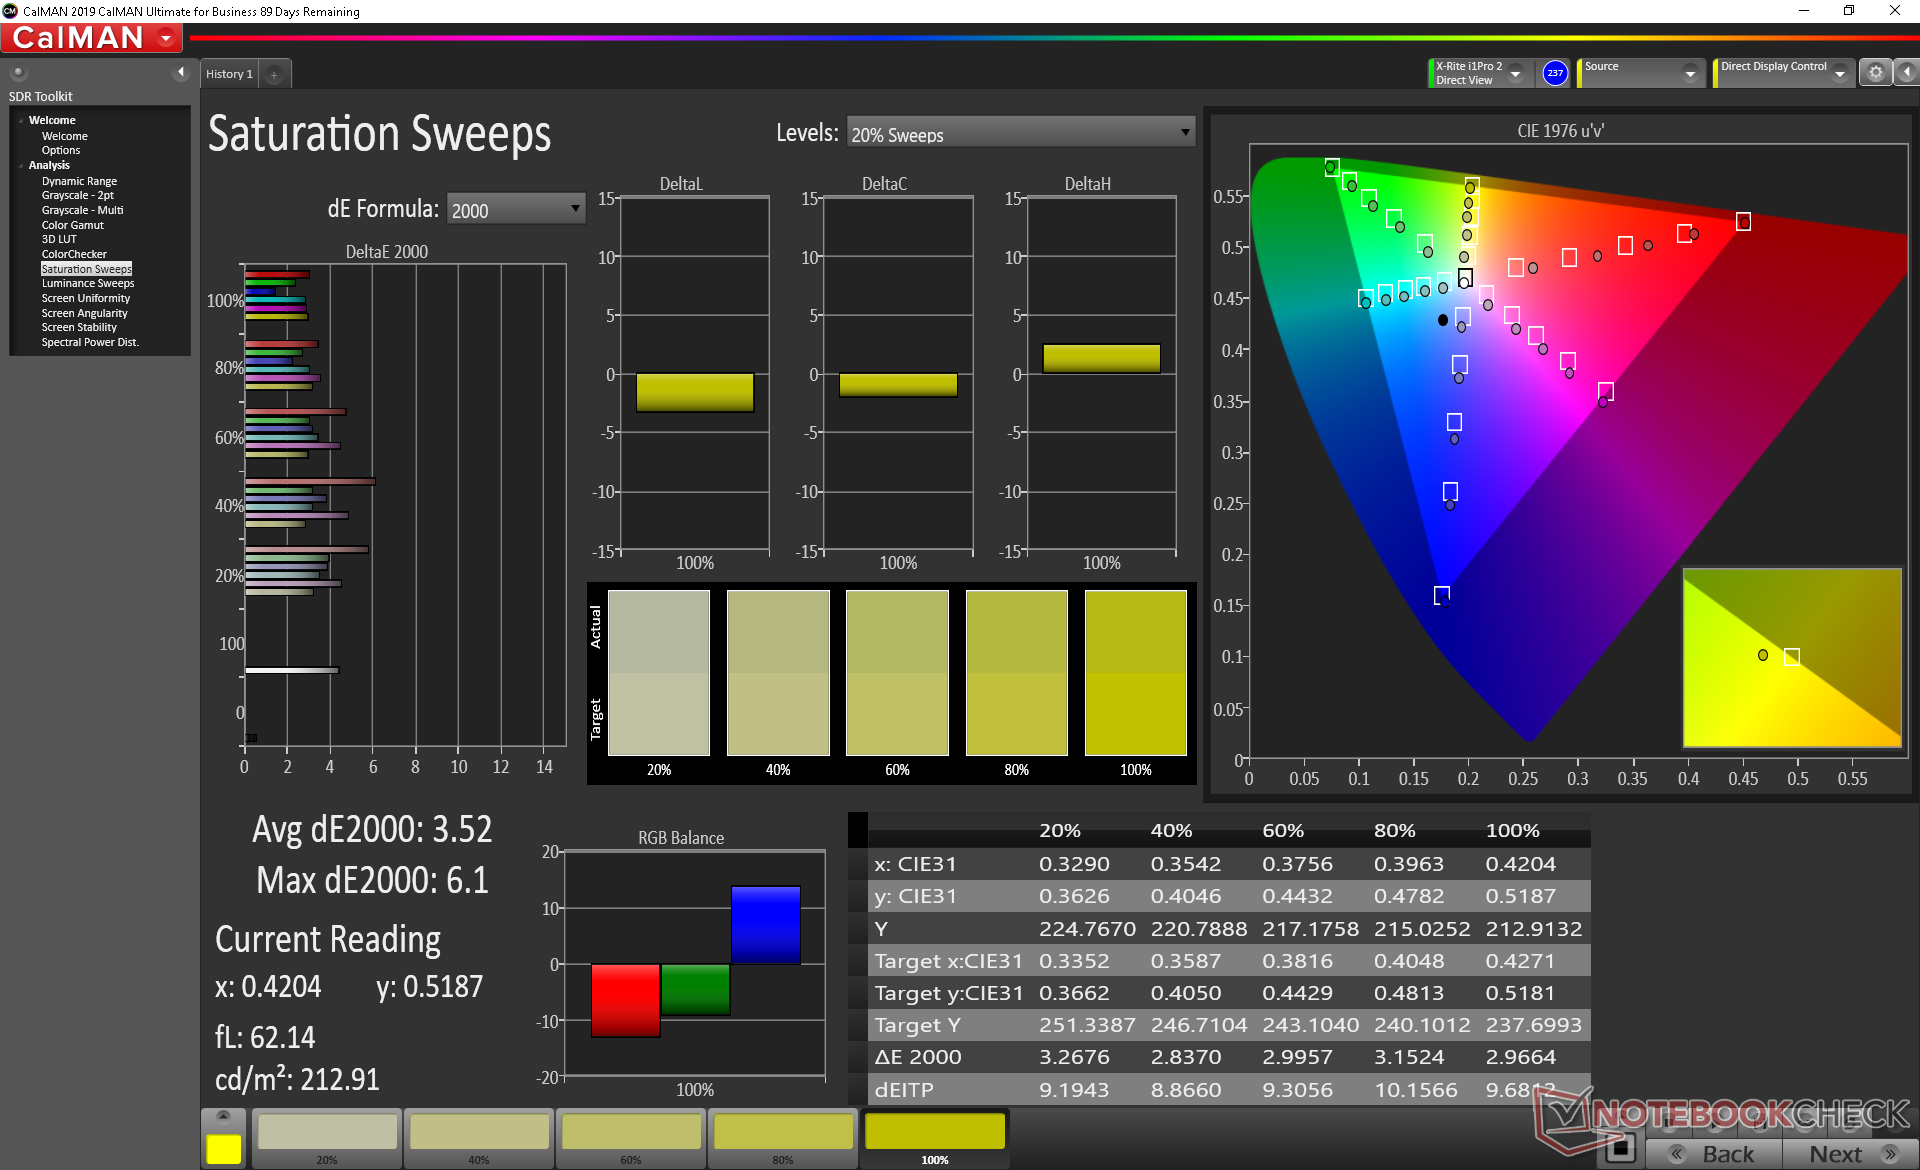
Le misurazioni X-Rite mostrano un display decentemente calibrato. Calibrare ulteriormente il pannello da soli migliorerebbe i colori e la bilancia RGB, ma solo con leggeri margini.

Tempi di risposta del Display
| ↔ Tempi di risposta dal Nero al Bianco | ||
|---|---|---|
| 34 ms ... aumenta ↗ e diminuisce ↘ combinato | ↗ 20 ms Incremento | 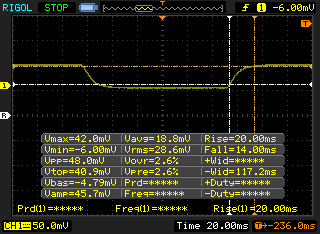 |
| ↘ 14 ms Calo | ||
| Lo schermo mostra tempi di risposta lenti nei nostri tests e sarà insoddisfacente per i gamers. In confronto, tutti i dispositivi di test variano da 0.1 (minimo) a 240 (massimo) ms. » 91 % di tutti i dispositivi è migliore. Questo significa che i tempi di risposta rilevati sono peggiori rispetto alla media di tutti i dispositivi testati (19.8 ms). | ||
| ↔ Tempo di risposta dal 50% Grigio all'80% Grigio | ||
| 41.2 ms ... aumenta ↗ e diminuisce ↘ combinato | ↗ 18.4 ms Incremento | 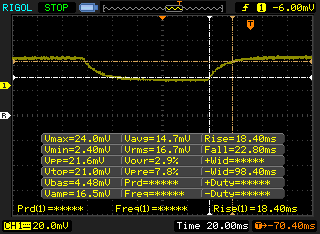 |
| ↘ 22.8 ms Calo | ||
| Lo schermo mostra tempi di risposta lenti nei nostri tests e sarà insoddisfacente per i gamers. In confronto, tutti i dispositivi di test variano da 0.165 (minimo) a 636 (massimo) ms. » 66 % di tutti i dispositivi è migliore. Questo significa che i tempi di risposta rilevati sono peggiori rispetto alla media di tutti i dispositivi testati (31 ms). | ||
Sfarfallio dello schermo / PWM (Pulse-Width Modulation)
| flickering dello schermo / PWM non rilevato | 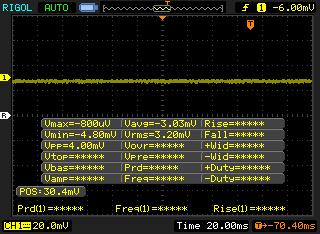 | ||
In confronto: 52 % di tutti i dispositivi testati non utilizza PWM per ridurre la luminosita' del display. Se è rilevato PWM, una media di 7781 (minimo: 5 - massimo: 343500) Hz è stata rilevata. | |||
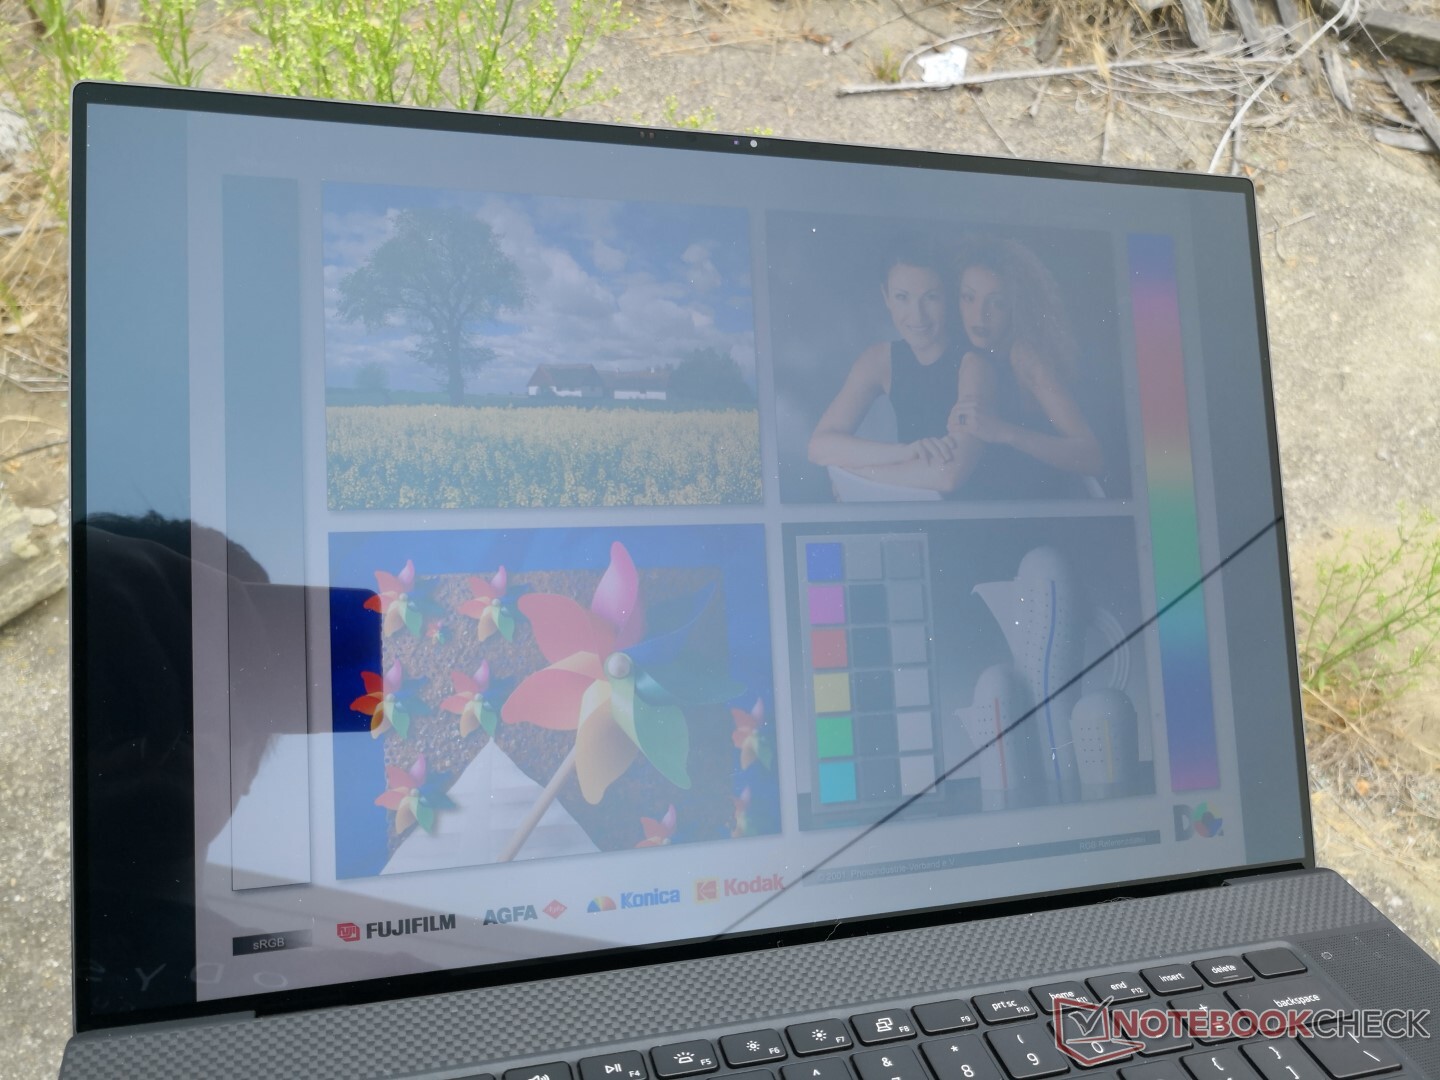
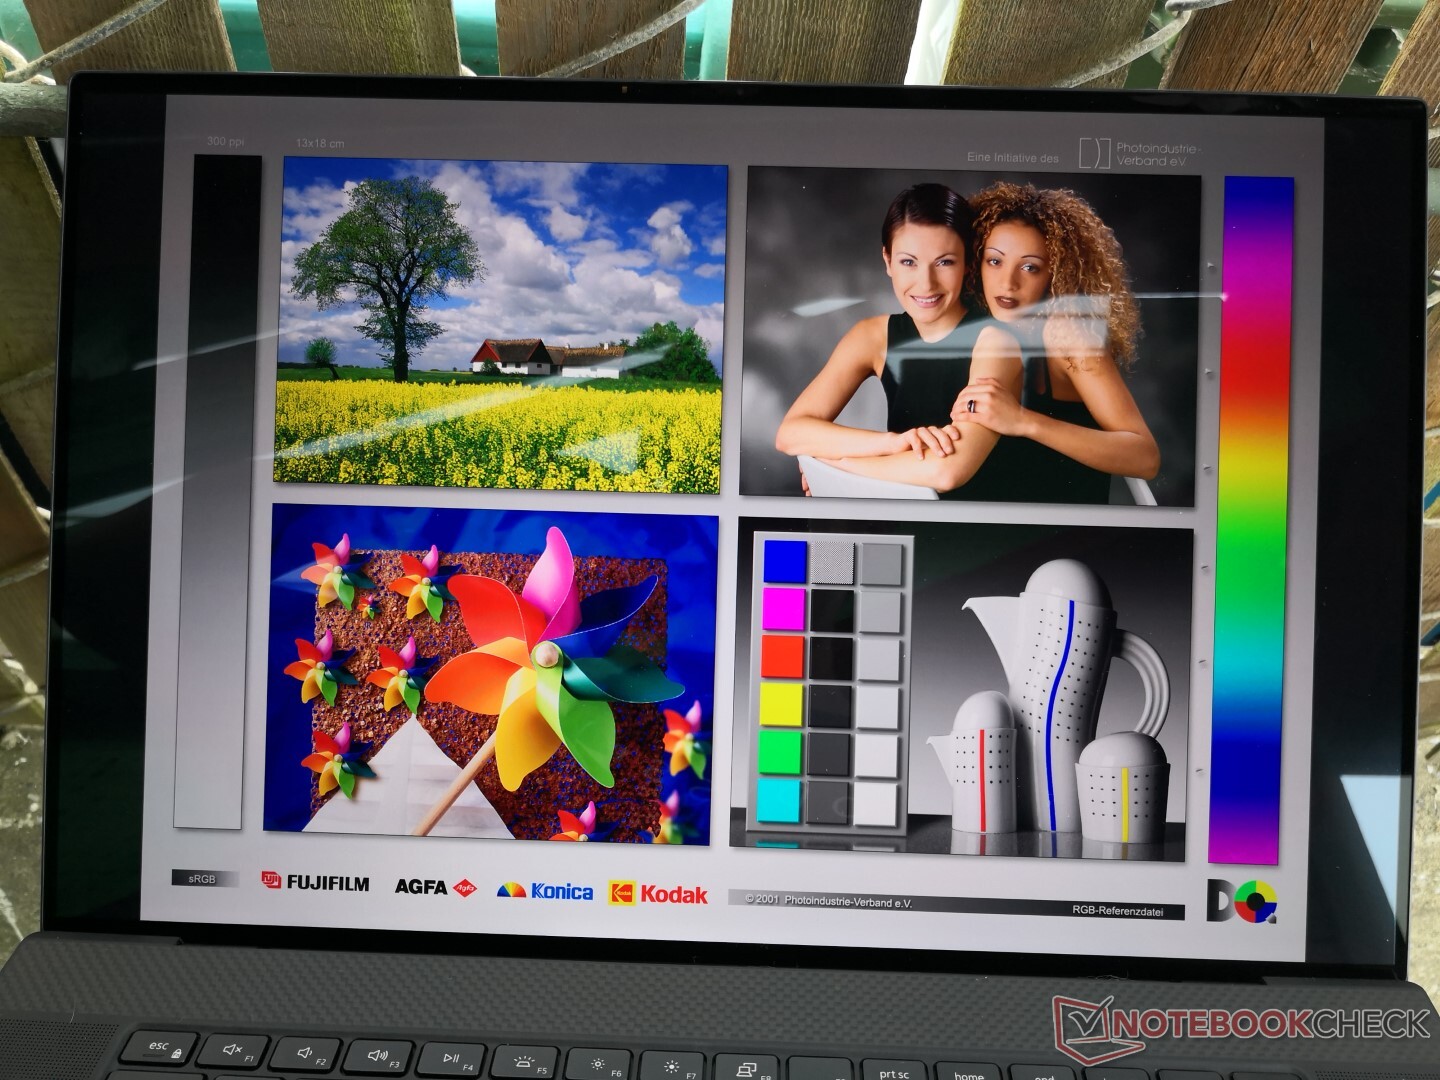
La visibilità all'aperto è migliore di molte altre workstation da 17 pollici grazie alla retroilluminazione più brillante. Tuttavia, l'abbagliamento del pannello lucido nega gran parte di questo vantaggio. Gli utenti non possono configurare contemporaneamente sia l'UHD opaco che quello 4K.
Prestazioni
Ci sono molte opzioni di CPU tra cui il Core i5-10400H, i7-10750H, i7-10850H, i7-10875H, i9-10885H, Xeon W-10855M, e Xeon W-10885M. Gli utenti che vogliono il supporto vPro dovrebbero evitare l'i7-10750H mentre gli utenti che vogliono il supporto RAM ECC dovrebbero considerare solo le opzioni Xeon.
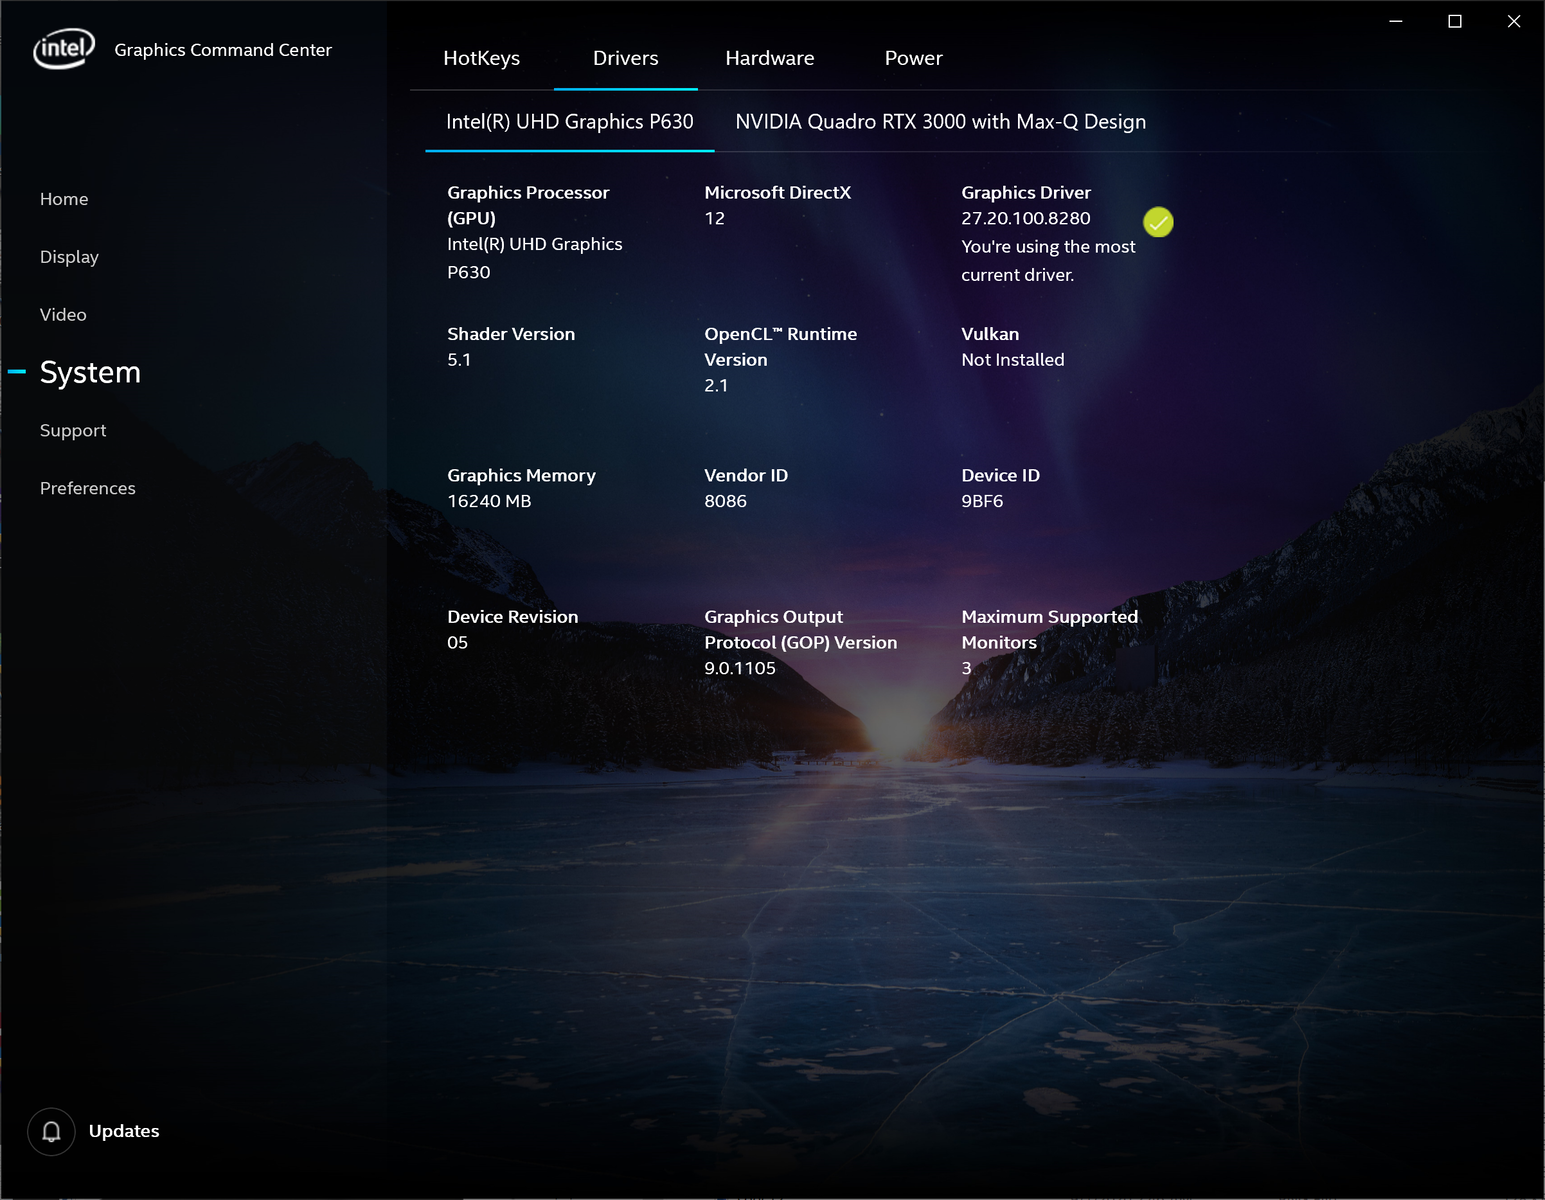
Le opzioni grafiche includono solo UHD Graphics 630 integrato o la Quadro T2000 o Quadro RTX 3000 Max-Q con Optimus. La RAM può essere configurata fino a 64 GB o solo la metà se invece è configurata con ECC.
Abbiamo eseguito tutti i benchmarks delle prestazioni riportati di seguito sulla modalità Ultra Performance di Dell per ottenere i migliori punteggi possibili.
Processore
Lo Xeon W-10885M in entrambe le nostre unità di prova di Precision 5750 e 7550 restituisce risultati simili al Core i9-10980HK nell'MSI WS66. Alcuni portatili con il Core i9 sono in grado di funzionare più velocemente come l'Alienware m17 R3 di Dell, ma la differenza è solo del 12% circa. Siamo in grado di osservare un calo di prestazioni di circa il 9% nel tempo quando si esegue CineBench R15 xT in loop a causa delle limitazioni del sistema di raffreddamento sovrastante.
Si veda la nostra pagina dedicata allo Xeon W-10885M per maggiori informazioni tecniche e confronti di benchmarks. L'aggiornamento dall'opzione base quad-core Core i5-10400H al nostro Xeon W Xeon octa-core consentirà di ottenere prestazioni multi-thread circa il 90% più veloci.
Cinebench R15: CPU Multi 64Bit | CPU Single 64Bit
Blender: v2.79 BMW27 CPU
7-Zip 18.03: 7z b 4 -mmt1 | 7z b 4
Geekbench 5.5: Single-Core | Multi-Core
HWBOT x265 Benchmark v2.2: 4k Preset
LibreOffice : 20 Documents To PDF
R Benchmark 2.5: Overall mean
| HWBOT x265 Benchmark v2.2 / 4k Preset | |
| Corsair One i160 | |
| Dell Precision 5000 5750 P92F | |
| Eluktronics RP-17 | |
| MSI WS66 10TMT-207US | |
| Media Intel Xeon W-10885M (8.89 - 13.6, n=3) | |
| Dell Precision 5550 P91F | |
| MSI GS66 Stealth 10SE-045 | |
| Dell Precision 7730 | |
| Lenovo ThinkPad P73-20QR002DGE | |
| Acer ConceptD 3 Pro CN315-71P-73W1 | |
| Dell XPS 15 9500 Core i5 | |
| LibreOffice / 20 Documents To PDF | |
| Dell XPS 15 9500 Core i5 | |
| MSI GS66 Stealth 10SE-045 | |
| Eluktronics RP-17 | |
| Acer ConceptD 9 Pro | |
| Acer ConceptD 3 Pro CN315-71P-73W1 | |
| Media Intel Xeon W-10885M (44.4 - 58.1, n=3) | |
| Dell Precision 5000 5750 P92F | |
| MSI WS66 10TMT-207US | |
| Dell Precision 5550 P91F | |
| R Benchmark 2.5 / Overall mean | |
| Acer ConceptD 3 Pro CN315-71P-73W1 | |
| Dell XPS 15 9500 Core i5 | |
| MSI GS66 Stealth 10SE-045 | |
| Dell Precision 5550 P91F | |
| Eluktronics RP-17 | |
| MSI WS66 10TMT-207US | |
| Dell Precision 5000 5750 P92F | |
| Media Intel Xeon W-10885M (0.551 - 0.57, n=3) | |
* ... Meglio usare valori piccoli
Prestazioni di sistema
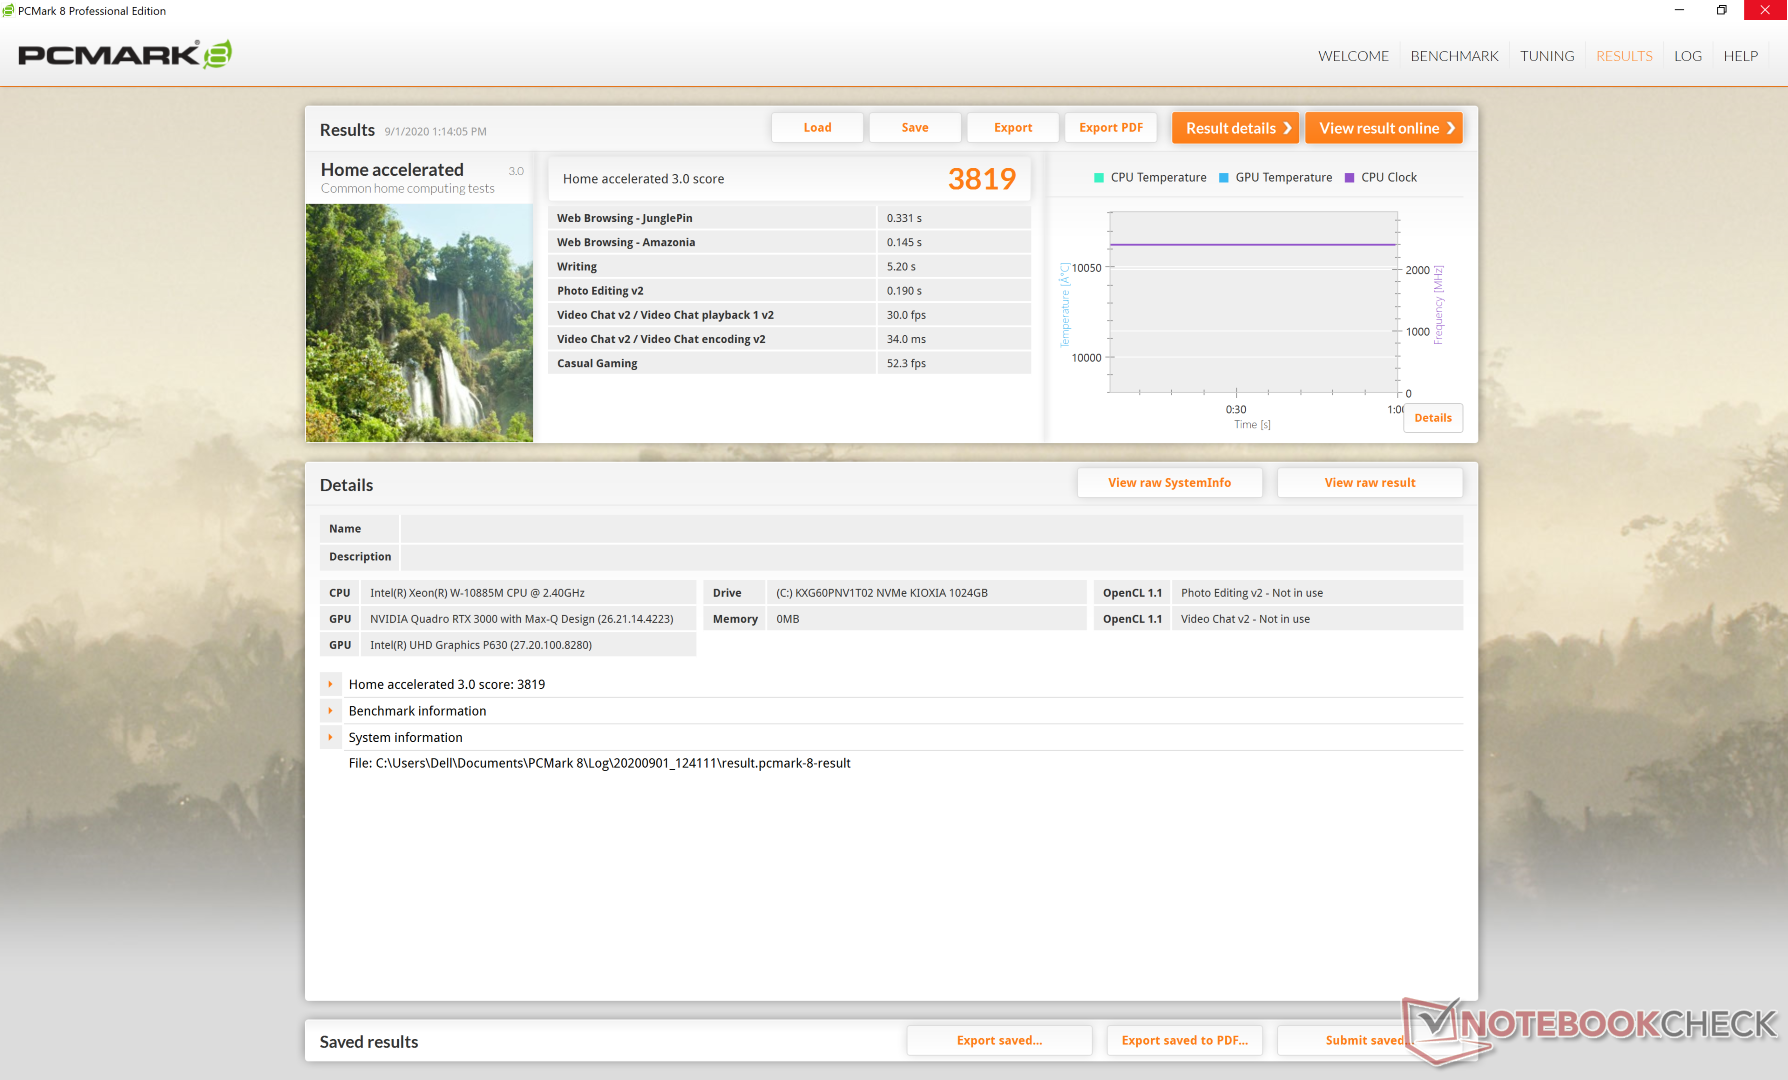
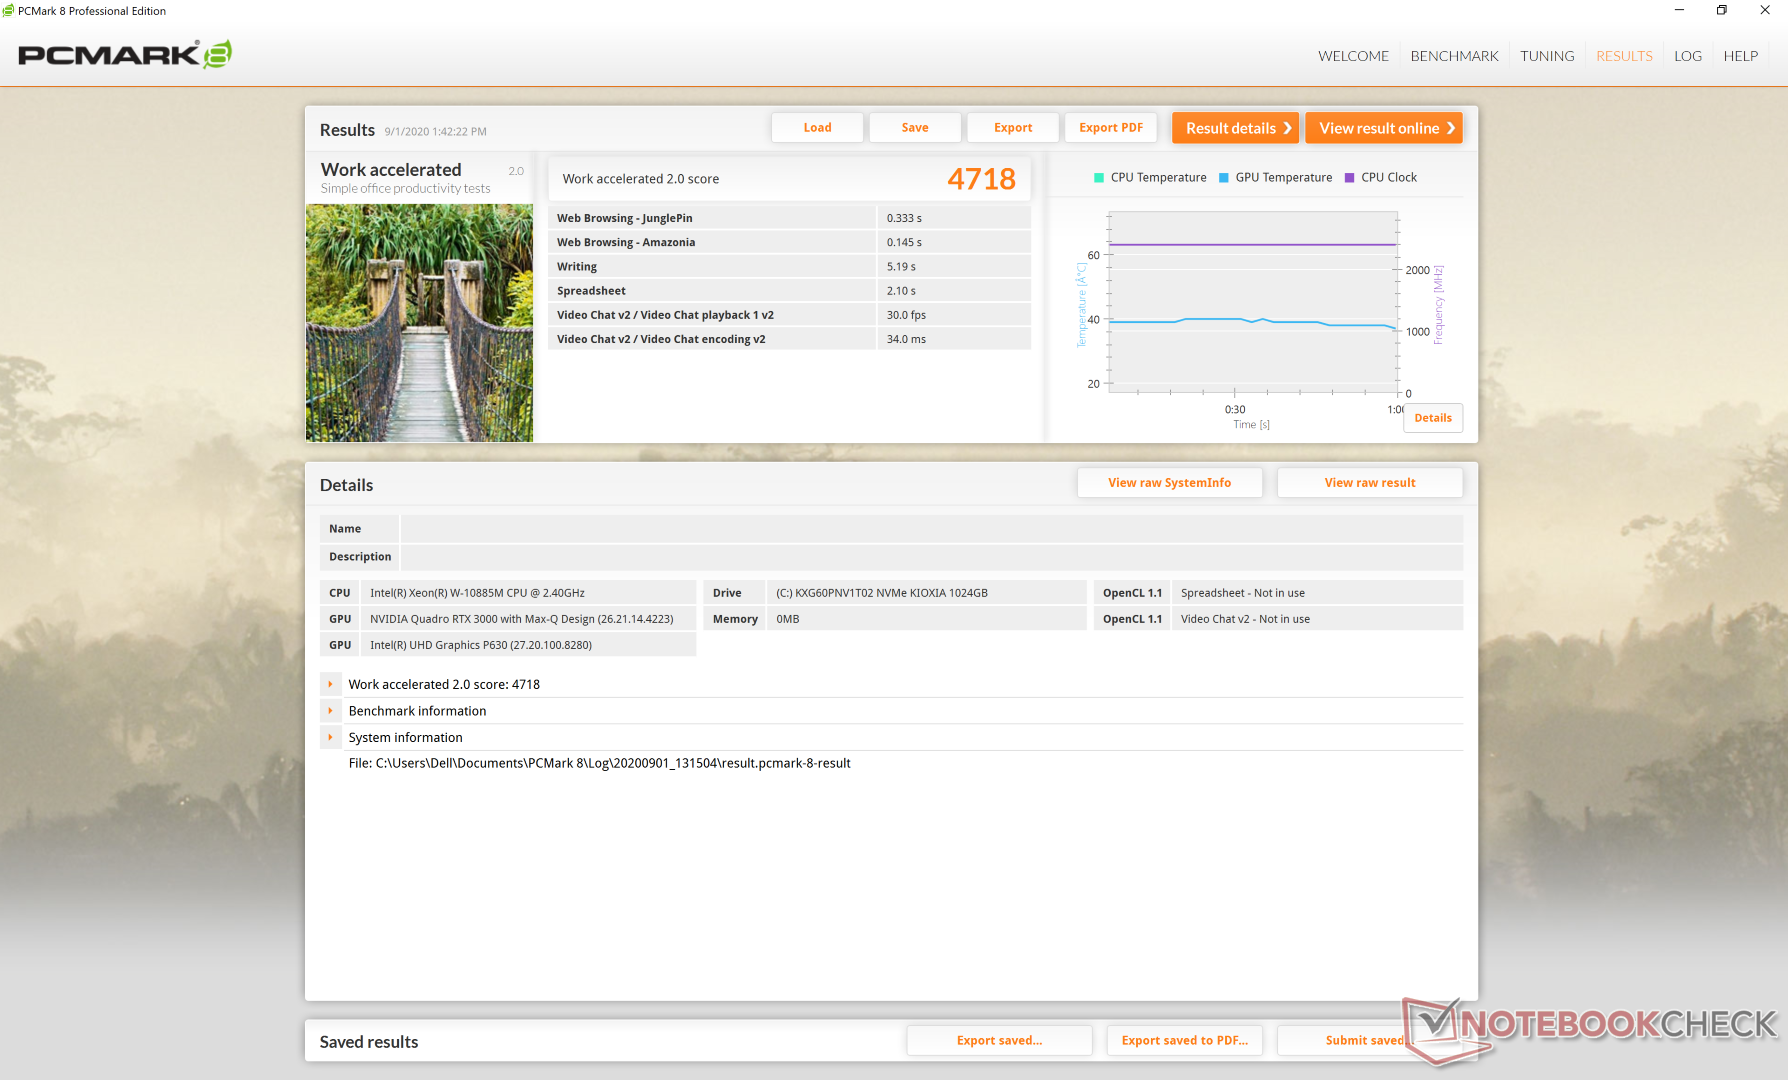
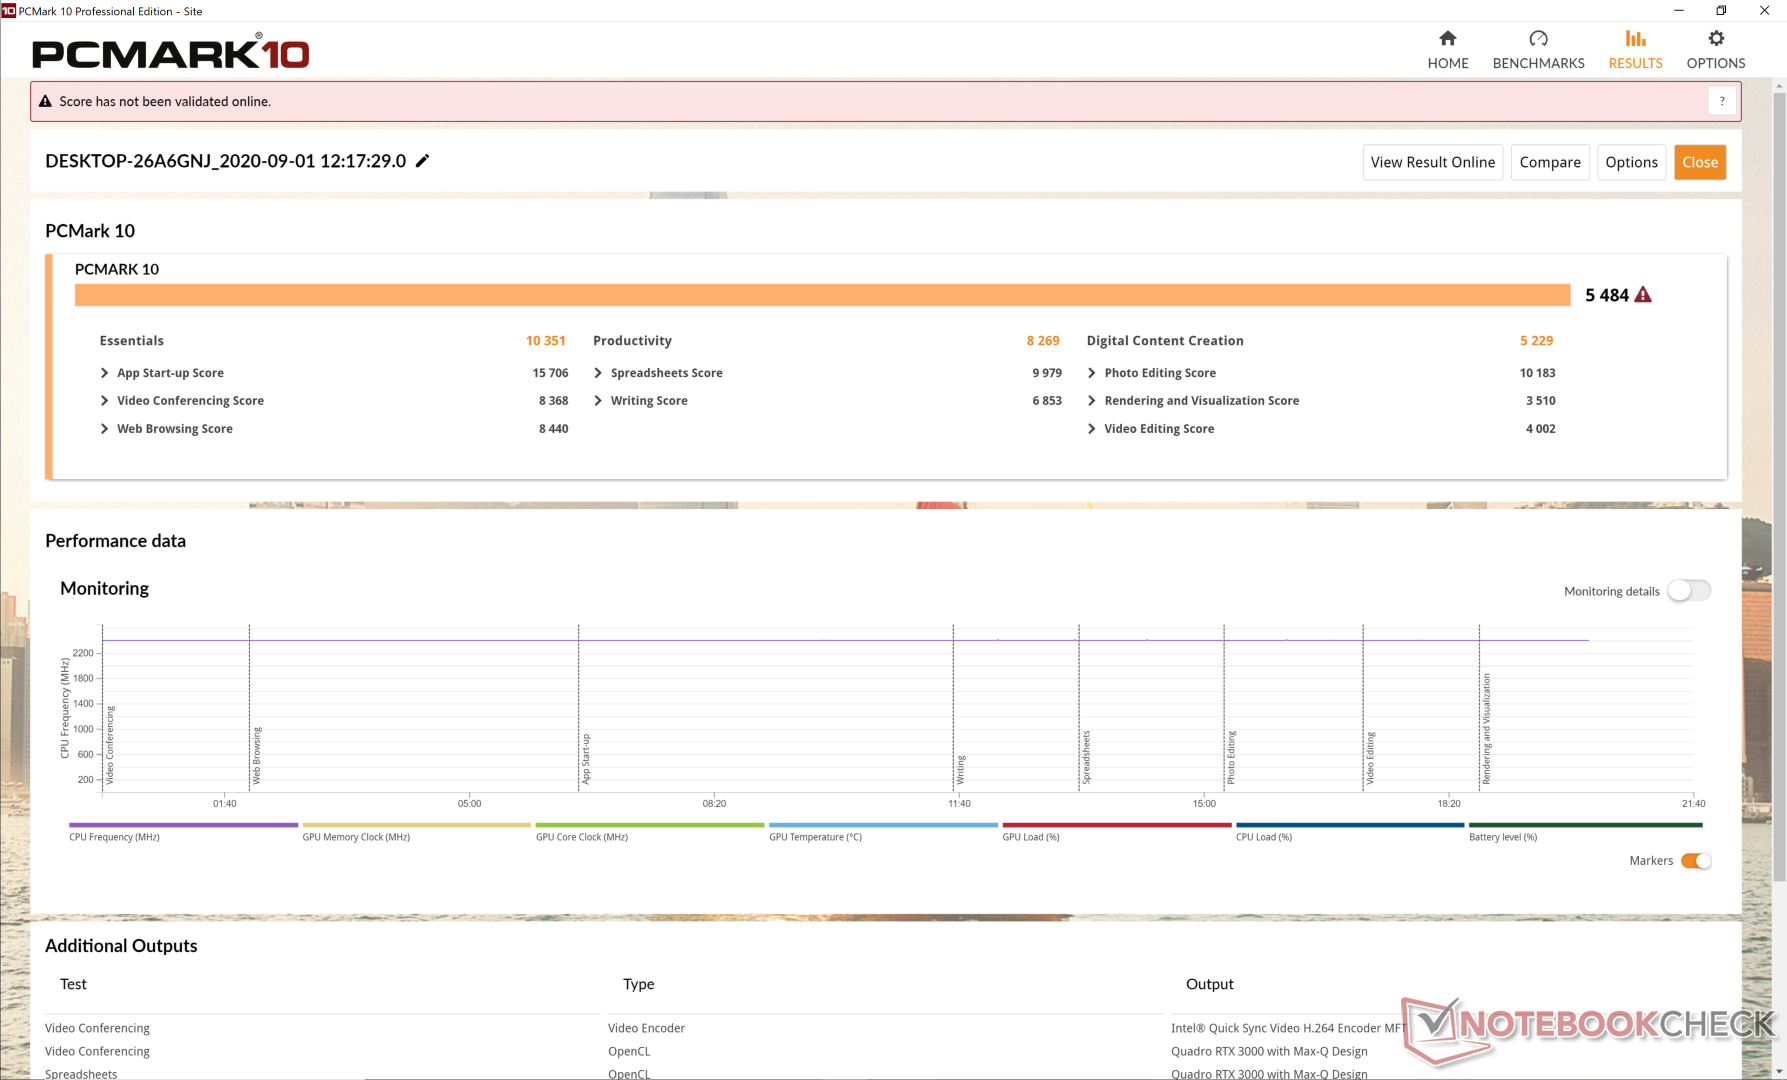
| PCMark 8 Home Score Accelerated v2 | 3819 punti | |
| PCMark 8 Work Score Accelerated v2 | 4718 punti | |
| PCMark 10 Score | 5484 punti | |
Aiuto | ||
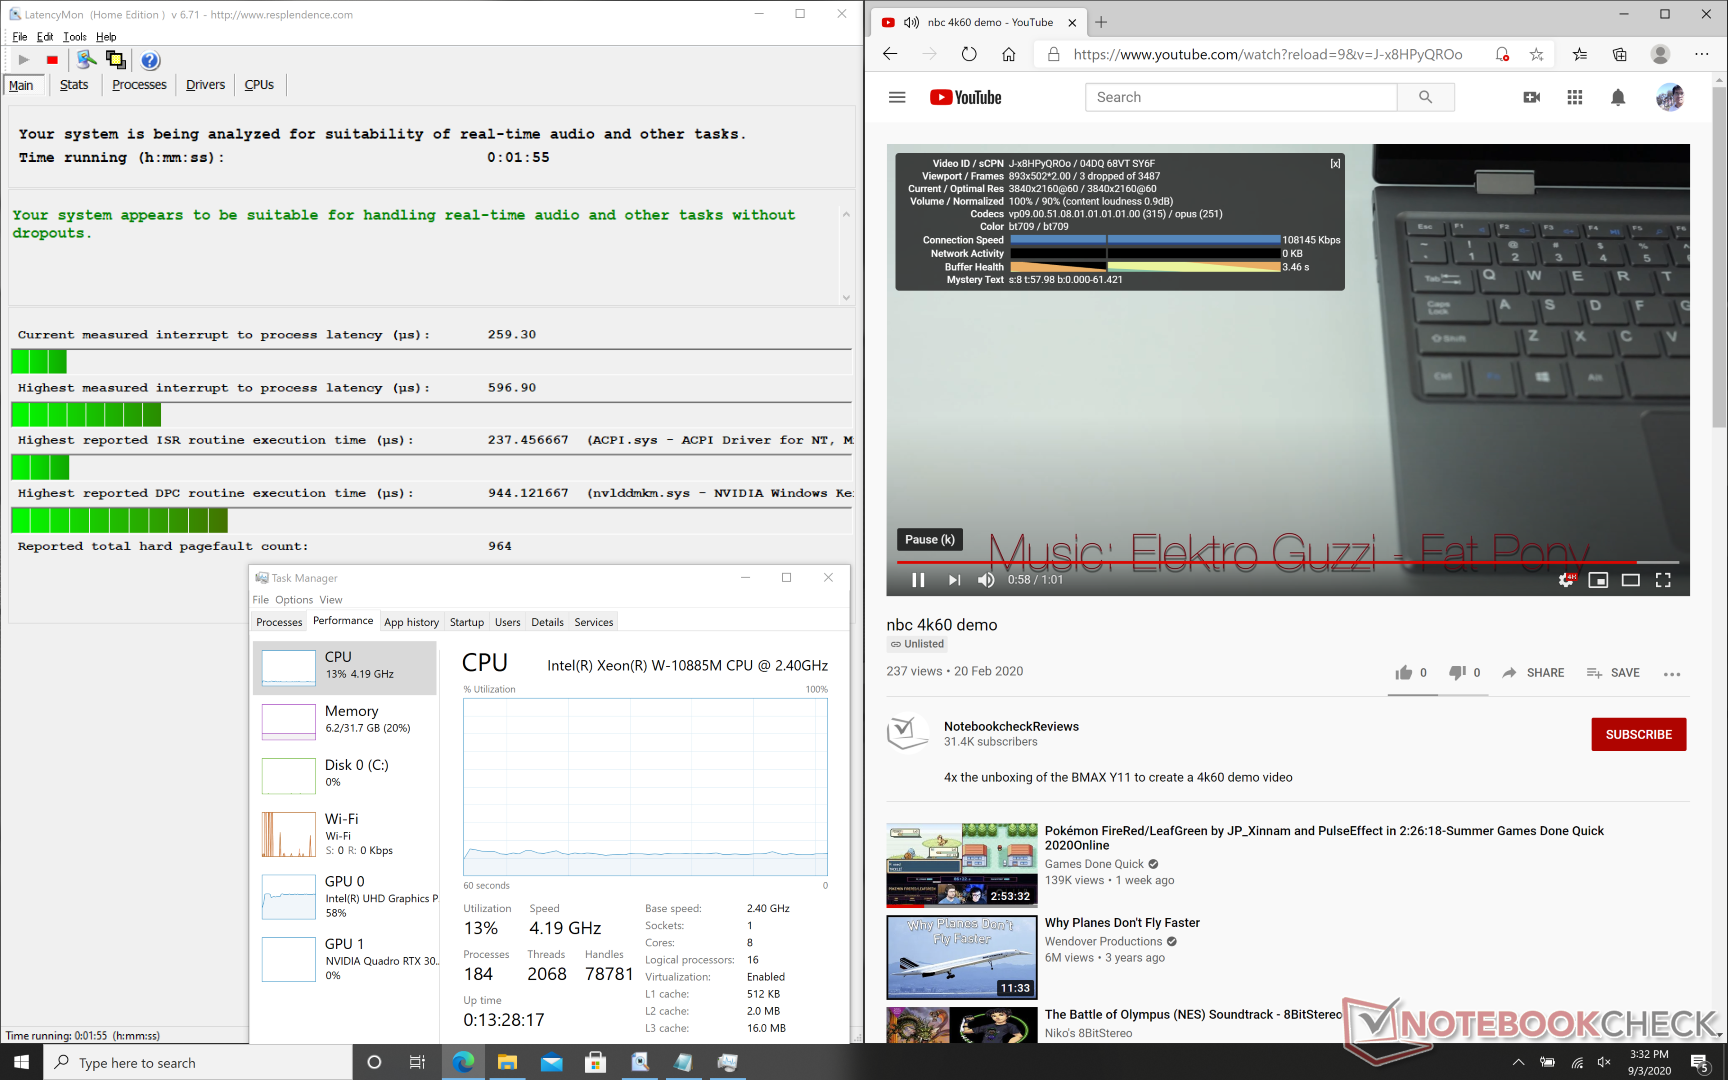
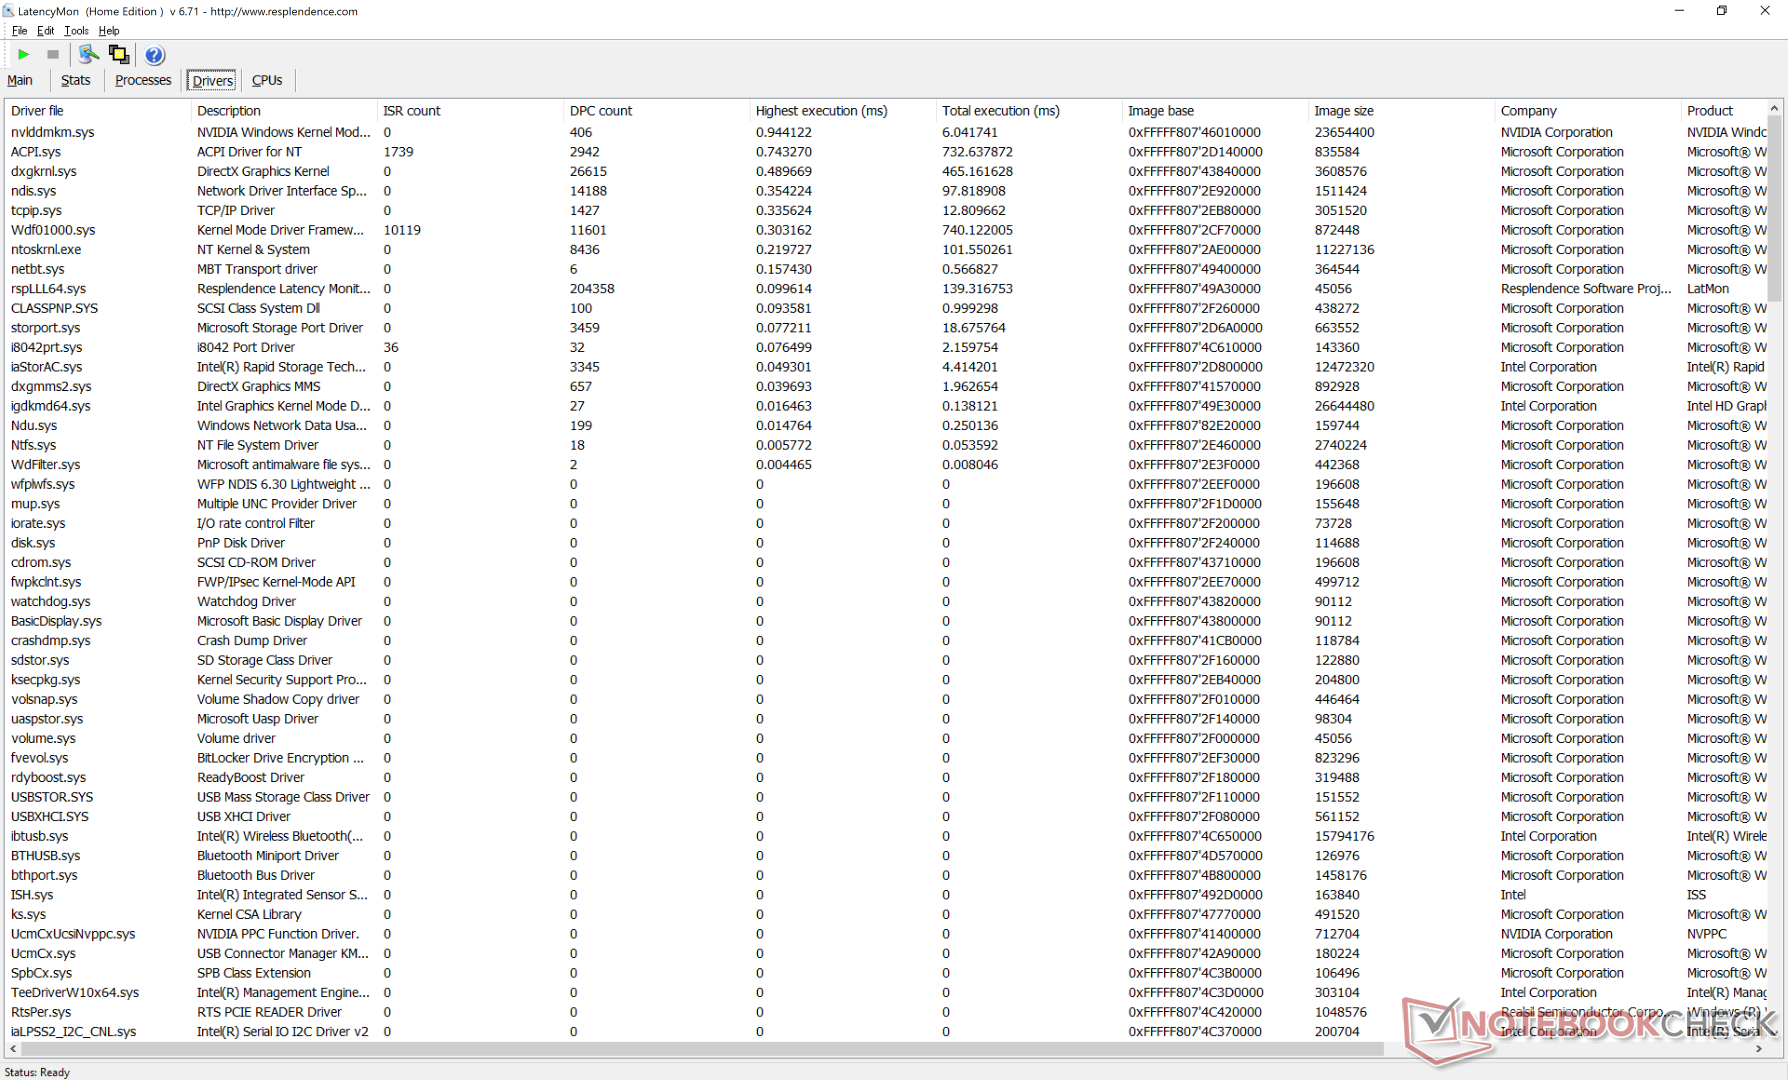
Latenza DPC
LatencyMon non presenta problemi di latenza del DPC di rilievo, in contrasto con quanto notato sul Precision 7550. È interessante notare che abbiamo registrato tre cali di fotogrammi durante il nostro test video di 4K60 di un minuto.
| DPC Latencies / LatencyMon - interrupt to process latency (max), Web, Youtube, Prime95 | |
| Dell Precision 7550 | |
| MSI WS66 10TMT-207US | |
| Eluktronics RP-17 | |
| Acer ConceptD 3 Pro CN315-71P-73W1 | |
| Acer ConceptD 9 Pro | |
| Razer Blade 15 Studio Edition 2020 | |
| Dell Precision 5000 5750 P92F | |
| Dell Precision 5550 P91F | |
* ... Meglio usare valori piccoli
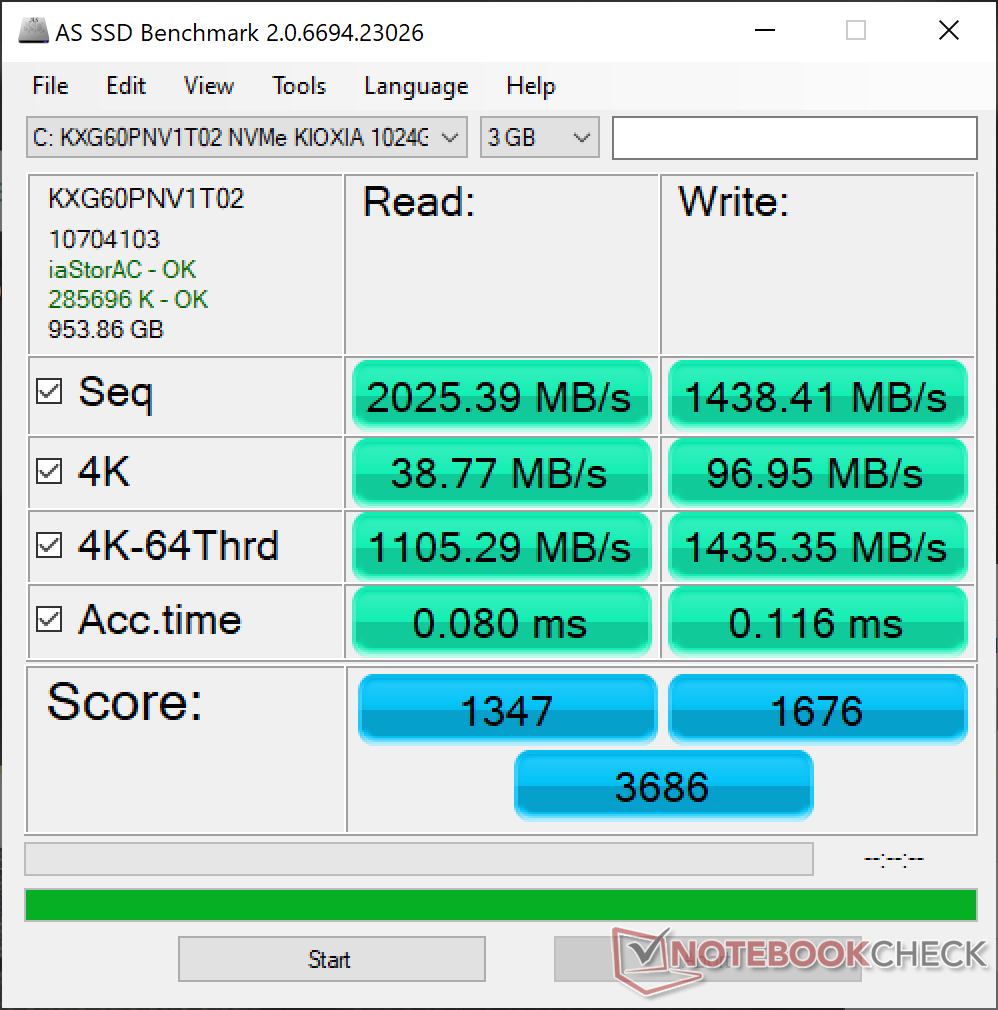
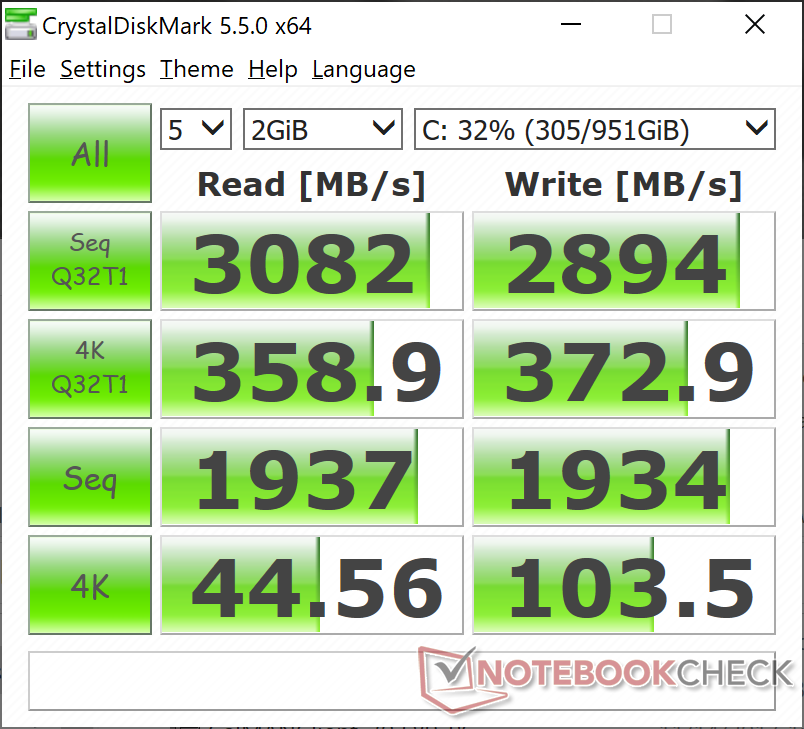
Dispositivi di archiviazione
La nostra unità viene fornita con un Toshiba Kioxia XG6 a differenza del Micron 2200S sul nostro XPS 17. A differenza della serie Razer Blade Studio che utilizza quasi esclusivamente SSD Samsung, è più difficile sapere cosa verrà spedito con la vostra Dell Precision poiché alla Dell piace rifornirsi da vari produttori. Tuttavia, il Toshiba XG6 è comunque un SSD di fascia alta con velocità di trasferimento paragonabili al Samsung PM981.
Consultate la nostra tabella di HDD ed SSD per ulteriori informazioni tecniche e benchmarks.
| Dell Precision 5000 5750 P92F Toshiba Kioxia XG6 KXG60PNV1T02 | Asus ProArt StudioBook Pro 17 W700G3T Samsung SSD PM981 MZVLB1T0HALR | MSI WS75 9TL-636 Samsung SSD PM981 MZVLB1T0HALR | Dell Precision 7730 Samsung SSD PM981 MZVLB512HAJQ | Lenovo ThinkPad P73-20QR002DGE Intel SSD Pro 7600p SSDPEKKF512G8L | MSI WE75 9TK Samsung SSD PM981 MZVLB512HAJQ | |
|---|---|---|---|---|---|---|
| AS SSD | 44% | 23% | 15% | 3% | 7% | |
| Seq Read (MB/s) | 2025 | 2958 46% | 870 -57% | 2697 33% | 2693 33% | 1308 -35% |
| Seq Write (MB/s) | 1438 | 2350 63% | 2247 56% | 1789 24% | 1542 7% | 1871 30% |
| 4K Read (MB/s) | 38.77 | 56.6 46% | 53.4 38% | 50.5 30% | 62.6 61% | 48.35 25% |
| 4K Write (MB/s) | 96.9 | 106.1 9% | 123.2 27% | 105.9 9% | 149.5 54% | 106.6 10% |
| 4K-64 Read (MB/s) | 1105 | 1836 66% | 1673 51% | 1139 3% | 871 -21% | 1510 37% |
| 4K-64 Write (MB/s) | 1435 | 1789 25% | 1826 27% | 1714 19% | 1006 -30% | 1715 20% |
| Access Time Read * (ms) | 0.08 | 0.061 24% | 0.05 37% | 0.061 24% | 0.058 27% | 0.103 -29% |
| Access Time Write * (ms) | 0.116 | 0.036 69% | 0.033 72% | 0.037 68% | 0.067 42% | 0.106 9% |
| Score Read (Points) | 1347 | 2189 63% | 1813 35% | 1460 8% | 1203 -11% | 1689 25% |
| Score Write (Points) | 1676 | 2130 27% | 2173 30% | 1999 19% | 1309 -22% | 2008 20% |
| Score Total (Points) | 3686 | 5411 47% | 4989 35% | 4168 13% | 3088 -16% | 4594 25% |
| Copy ISO MB/s (MB/s) | 2609 | 3154 21% | 3259 25% | 1716 -34% | 2343 -10% | |
| Copy Program MB/s (MB/s) | 740 | 533 -28% | 435.6 -41% | 542 -27% | 526 -29% | |
| Copy Game MB/s (MB/s) | 1624 | 1349 -17% | 1273 -22% | 1375 -15% | 1506 -7% | |
| CrystalDiskMark 5.2 / 6 | 19% | -1% | -7% | 16% | 19% | |
| Write 4K (MB/s) | 103.5 | 147.6 43% | 103.5 0% | 103.2 0% | 154.3 49% | 135.4 31% |
| Read 4K (MB/s) | 44.56 | 47.57 7% | 41.88 -6% | 41.39 -7% | 66.4 49% | 56.6 27% |
| Write Seq (MB/s) | 1934 | 2222 15% | 1931 0% | 1880 -3% | 1561 -19% | 1972 2% |
| Read Seq (MB/s) | 1937 | 2543 31% | 1286 -34% | 2350 21% | 2460 27% | 2101 8% |
| Write 4K Q32T1 (MB/s) | 372.9 | 459.2 23% | 414.3 11% | 282.3 -24% | 438 17% | 527 41% |
| Read 4K Q32T1 (MB/s) | 358.9 | 515 43% | 470.2 31% | 314.3 -12% | 568 58% | 578 61% |
| Write Seq Q32T1 (MB/s) | 2894 | 2167 -25% | 2393 -17% | 1881 -35% | 1581 -45% | 1985 -31% |
| Read Seq Q32T1 (MB/s) | 3082 | 3430 11% | 3425 11% | 3216 4% | 2724 -12% | 3358 9% |
| Write 4K Q8T8 (MB/s) | 1484 | 1000 | ||||
| Read 4K Q8T8 (MB/s) | 1536 | 928 | ||||
| Media totale (Programma / Settaggio) | 32% /
33% | 11% /
15% | 4% /
7% | 10% /
8% | 13% /
11% |
* ... Meglio usare valori piccoli

Throttling disco: DiskSpd Read Loop, Queue Depth 8
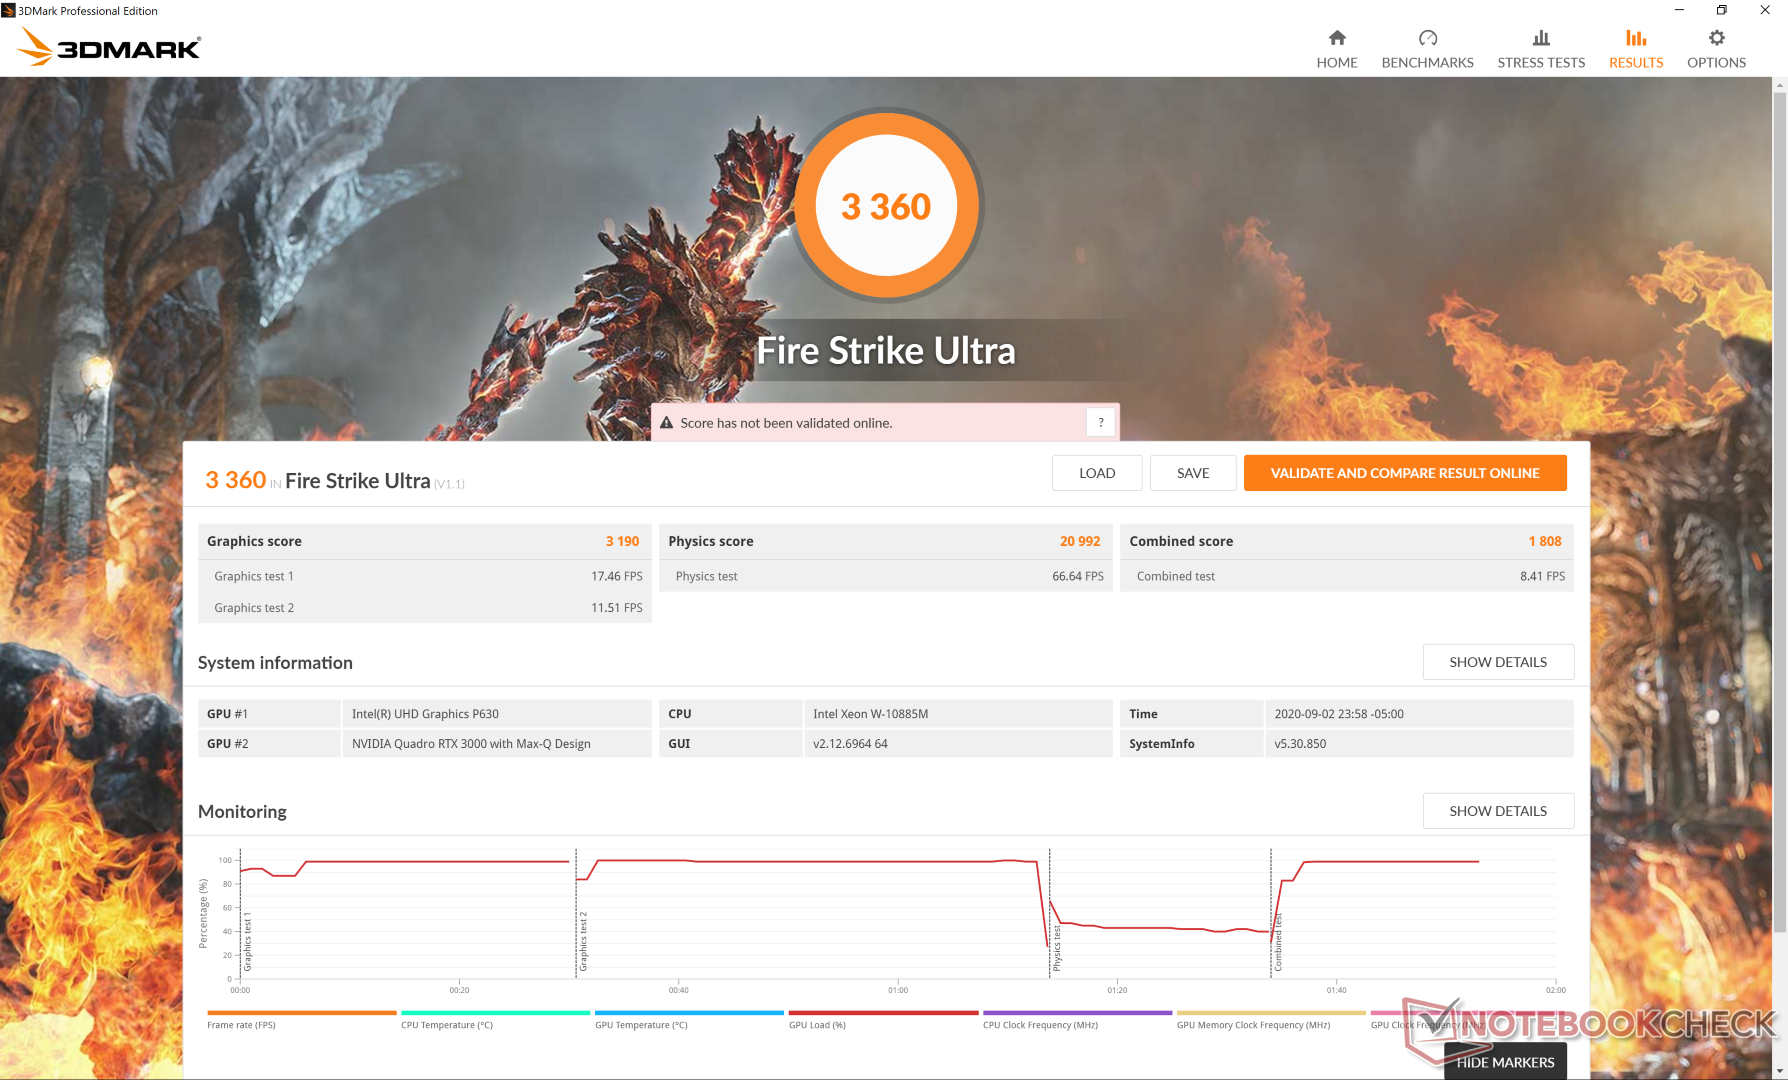
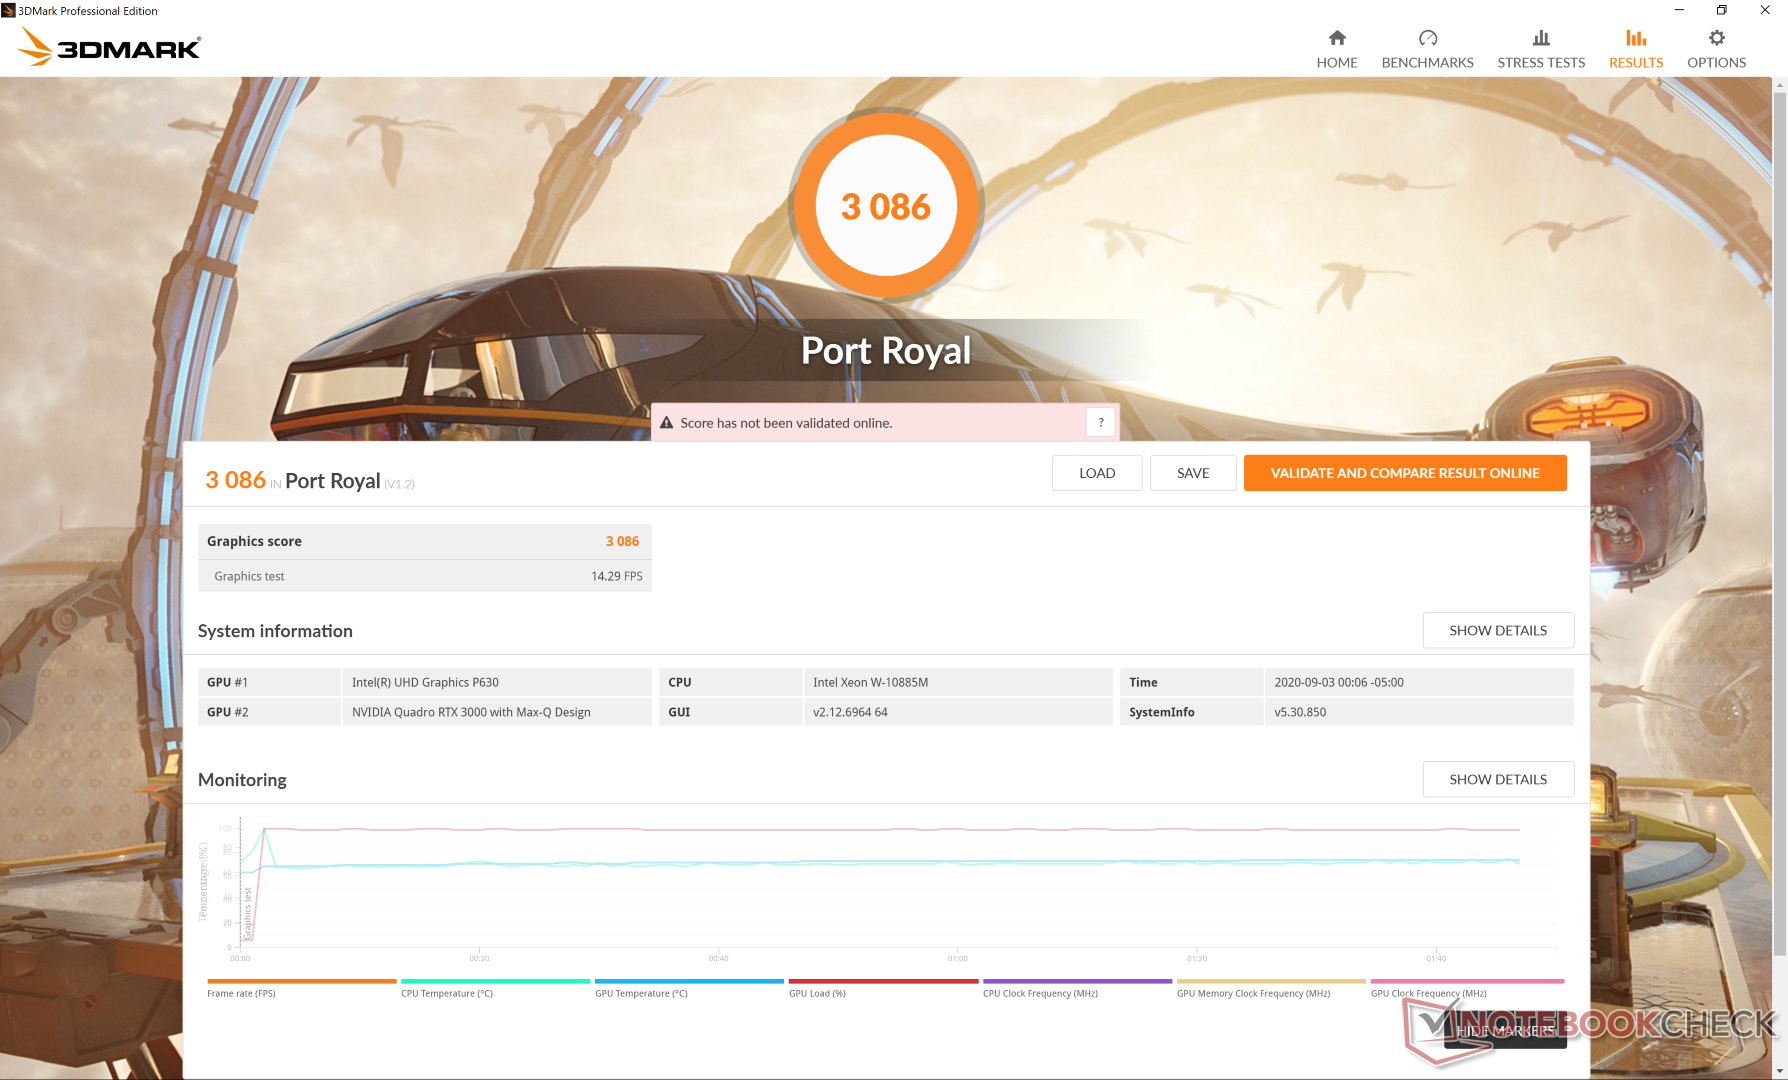
Prestazioni GPU
Le prestazioni grafiche sono molto simili a quelle della GeForce GTX 1660 Ti mobile, ma con caratteristiche RT accelerate dall'hardware. È interessante notare che Specviewperf mostra che la nostra Quadro RTX 3000 Max-Q supera la Quadro RTX 3000 mobile standard nel Lenovo ThinkPad P73 il più delle volte. La scelta della configurazione minore di Quadro T2000 si tradurrà in un calo del 40% delle prestazioni grafiche. Non possiamo confermare se l'opzione T2000 minore sarà la Quadro T2000 standard o la Quadro T2000 Max-Q.
Consultate la nostra pagina dedicata alla Quadro RTX 3000 Max-Q per maggiori informazioni tecniche e benchmark di confronto.
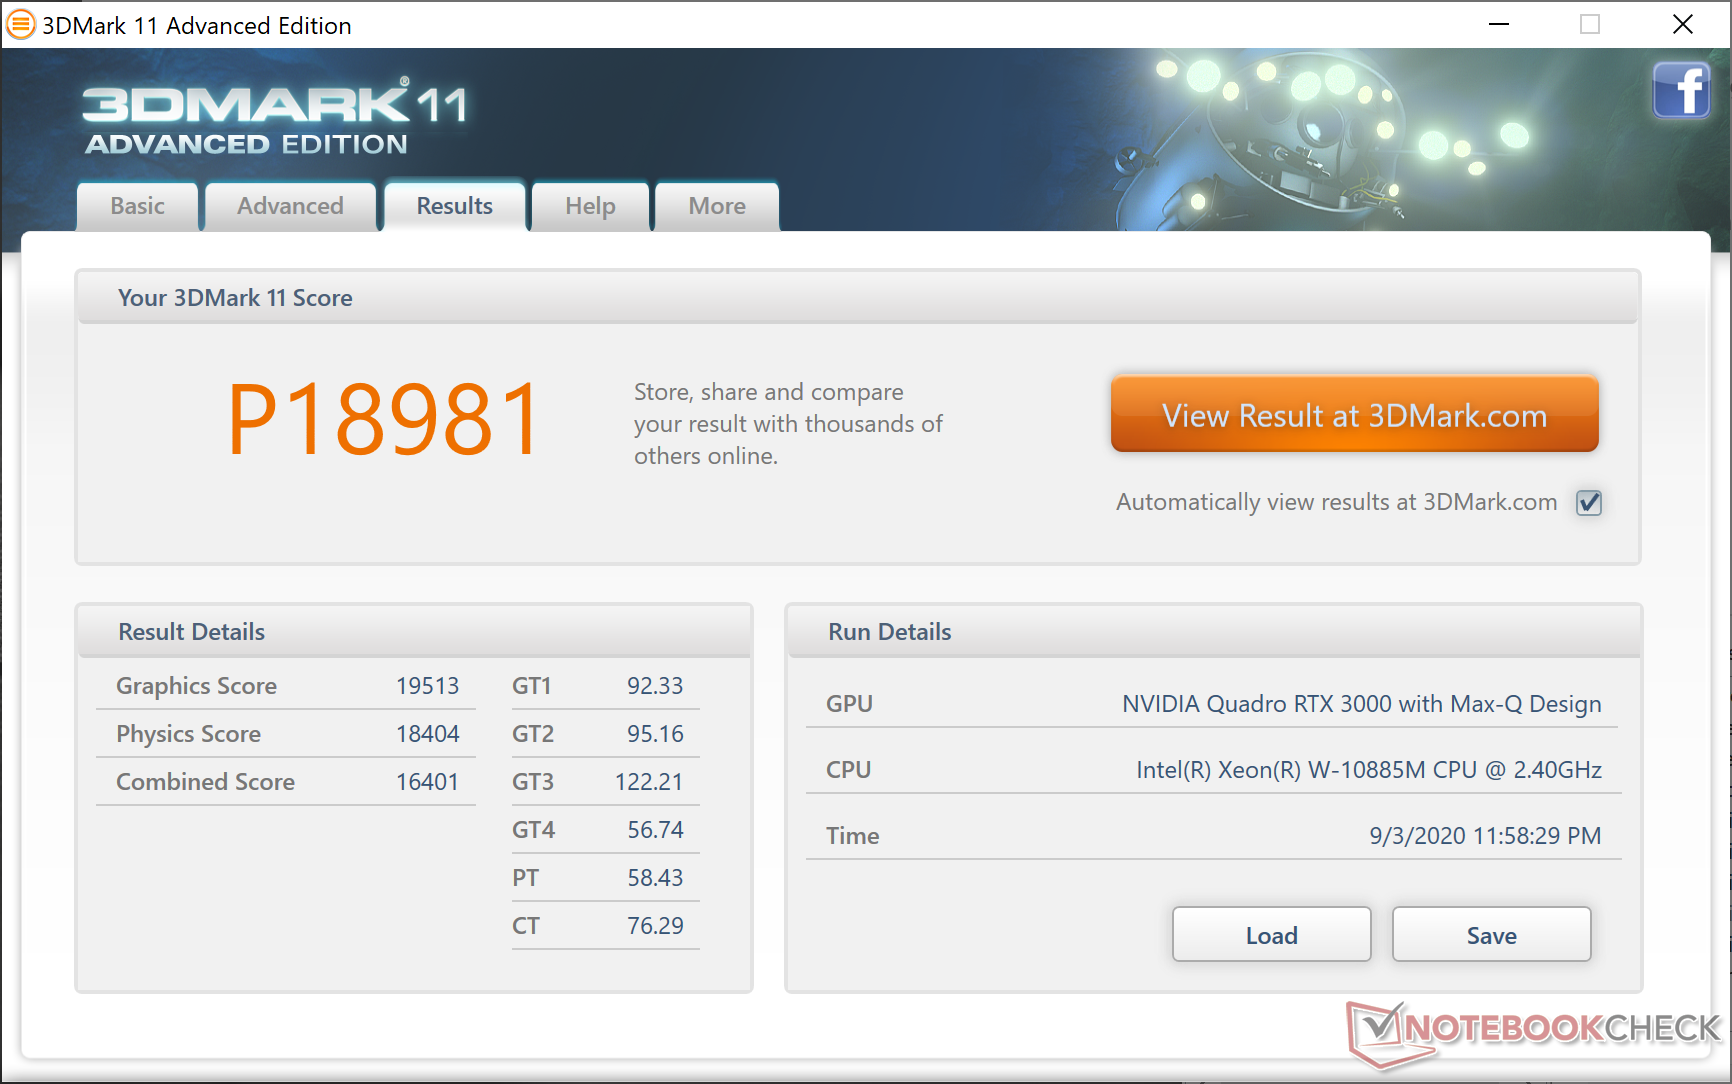
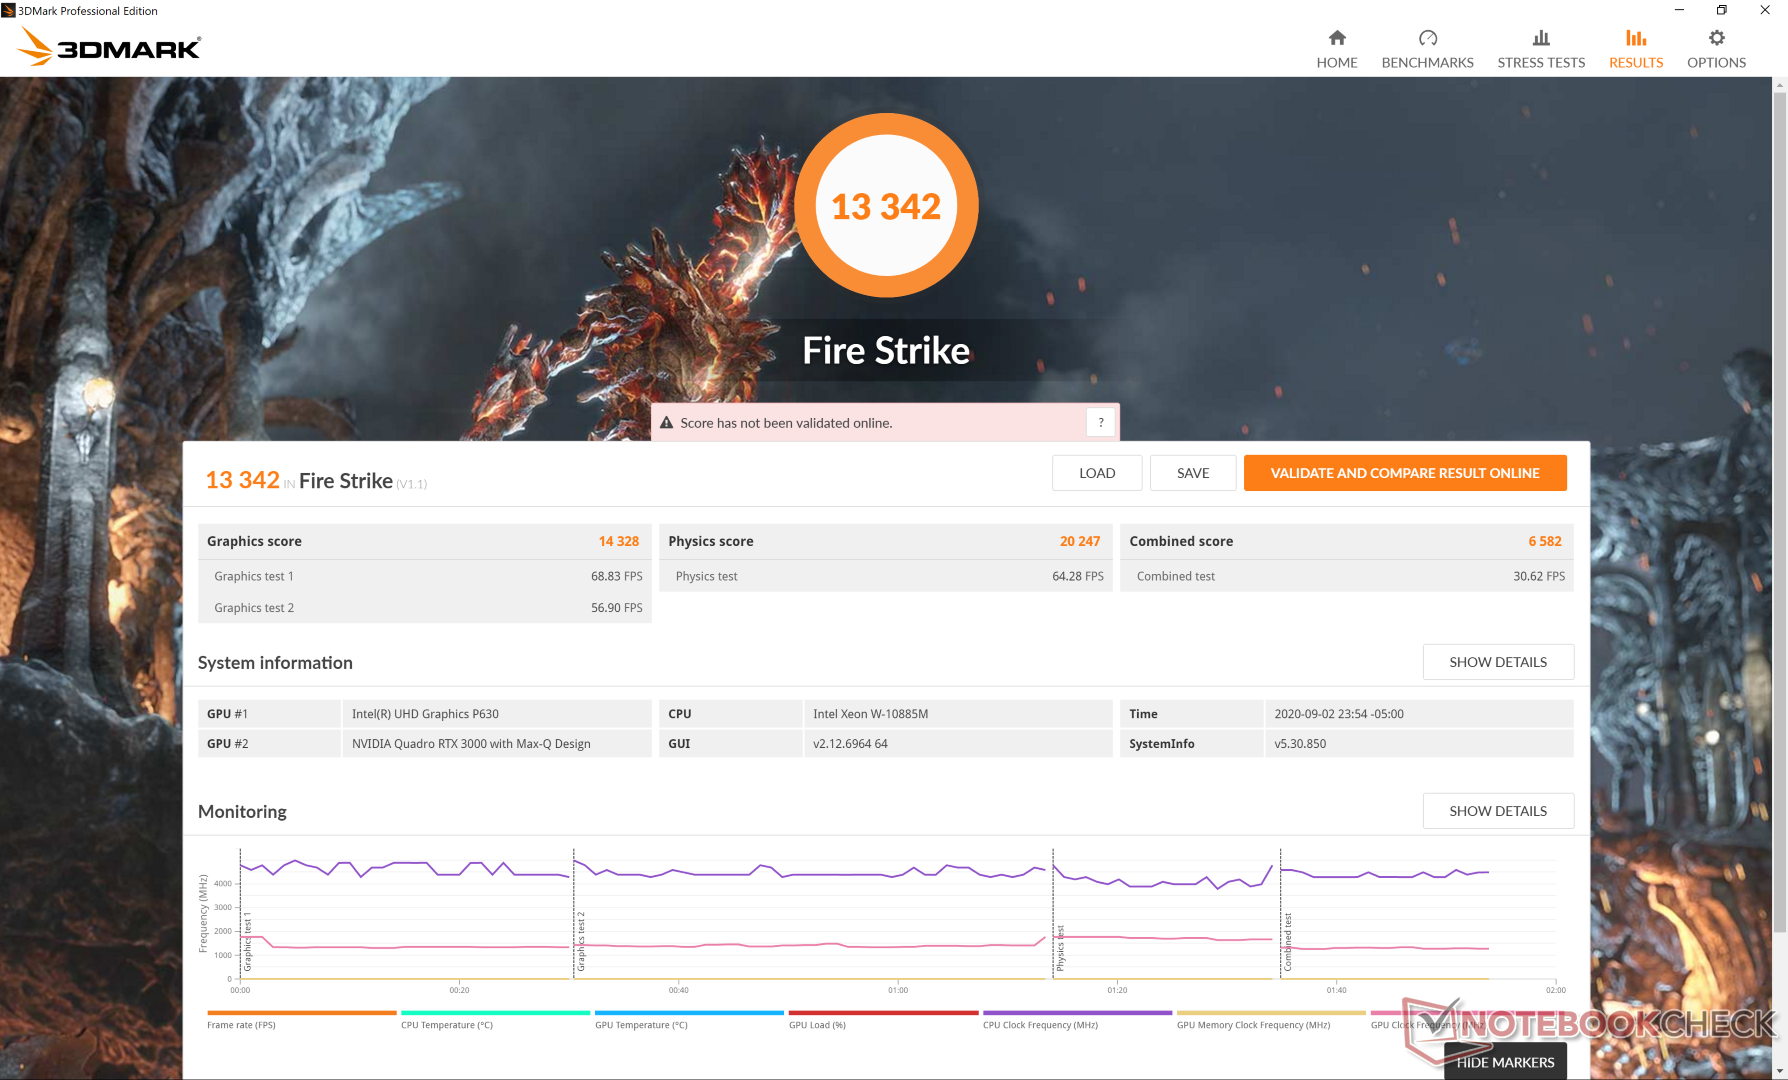
| 3DMark 11 Performance | 18981 punti | |
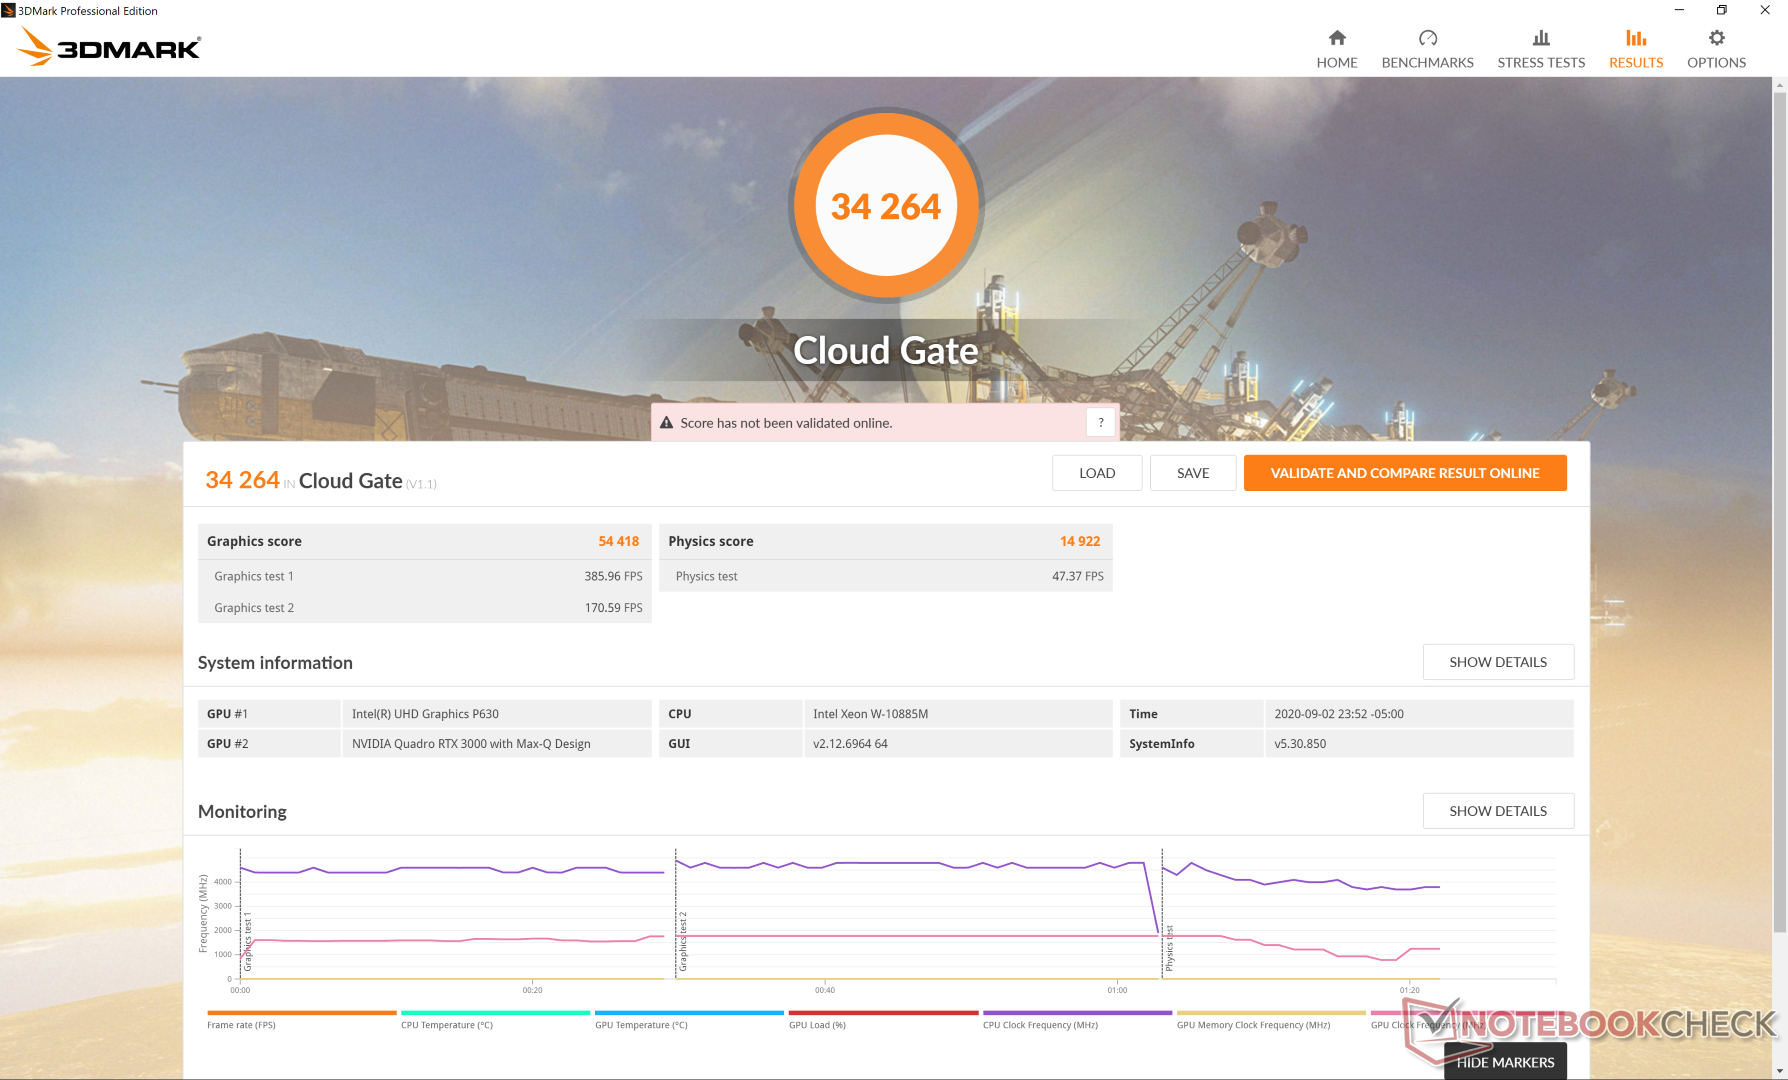
| 3DMark Cloud Gate Standard Score | 34264 punti | |
| 3DMark Fire Strike Score | 13342 punti | |
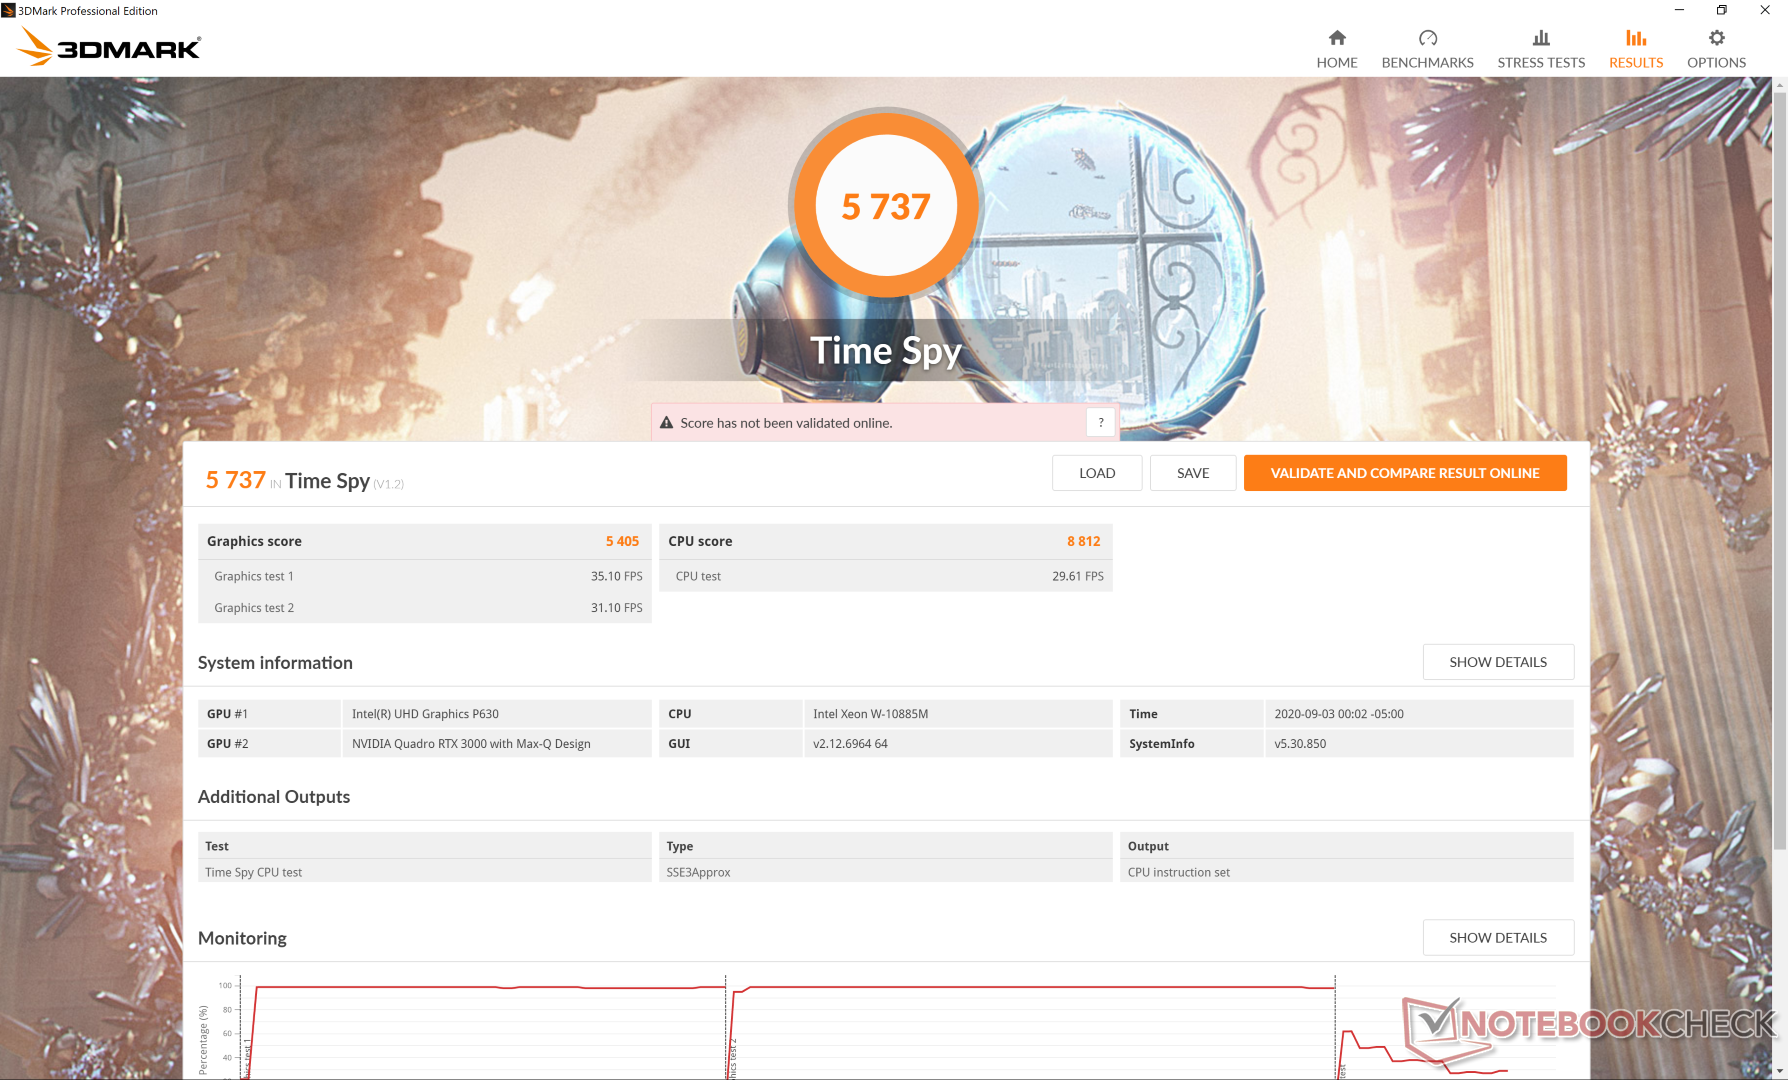
| 3DMark Time Spy Score | 5737 punti | |
Aiuto | ||
| basso | medio | alto | ultra | QHD | 4K | |
|---|---|---|---|---|---|---|
| The Witcher 3 (2015) | 304.7 | 189.4 | 107.4 | 57.2 | 36.5 | |
| Dota 2 Reborn (2015) | 145 | 133 | 126 | 120 | 77.6 | |
| Final Fantasy XV Benchmark (2018) | 149 | 79.1 | 59.5 | 43.8 | 25.9 | |
| X-Plane 11.11 (2018) | 117 | 106 | 85.8 | 67.6 |
Emissioni
Rumorosità
| Dell Precision 5000 5750 P92F Quadro RTX 3000 Max-Q, W-10885M, Toshiba Kioxia XG6 KXG60PNV1T02 | Asus ProArt StudioBook Pro 17 W700G3T Quadro RTX 3000 Max-Q, i7-9750H, Samsung SSD PM981 MZVLB1T0HALR | MSI WS75 9TL-636 Quadro RTX 4000 (Laptop), i7-9750H, Samsung SSD PM981 MZVLB1T0HALR | Dell Precision 7730 Quadro P3200, i7-8850H, Samsung SSD PM981 MZVLB512HAJQ | Lenovo ThinkPad P73-20QR002DGE Quadro RTX 3000 (Laptop), i7-9850H, Intel SSD Pro 7600p SSDPEKKF512G8L | MSI WE75 9TK Quadro RTX 3000 (Laptop), i7-9750H, Samsung SSD PM981 MZVLB512HAJQ | |
|---|---|---|---|---|---|---|
| Noise | 11% | 2% | 6% | 12% | 1% | |
| off /ambiente * (dB) | 27.5 | 29.4 -7% | 29.4 -7% | 29.7 -8% | 29.3 -7% | 28.5 -4% |
| Idle Minimum * (dB) | 27.5 | 29.4 -7% | 29.4 -7% | 29.7 -8% | 29.3 -7% | 29 -5% |
| Idle Average * (dB) | 27.5 | 29.9 -9% | 30.1 -9% | 29.7 -8% | 29.3 -7% | 29 -5% |
| Idle Maximum * (dB) | 27.5 | 29.9 -9% | 30.9 -12% | 29.7 -8% | 29.3 -7% | 31.5 -15% |
| Load Average * (dB) | 44.8 | 31.6 29% | 40.7 9% | 31.4 30% | 30.2 33% | 32 29% |
| Witcher 3 ultra * (dB) | 52.5 | 31.6 40% | 41.9 20% | 37.9 28% | 30.7 42% | 44.7 15% |
| Load Maximum * (dB) | 52.5 | 31.6 40% | 42.7 19% | 44.2 16% | 33.1 37% | 56.5 -8% |
* ... Meglio usare valori piccoli
Rumorosità
| Idle |
| 27.5 / 27.5 / 27.5 dB(A) |
| Sotto carico |
| 44.8 / 52.5 dB(A) |
 | ||
30 dB silenzioso 40 dB(A) udibile 50 dB(A) rumoroso |
||
min: | ||
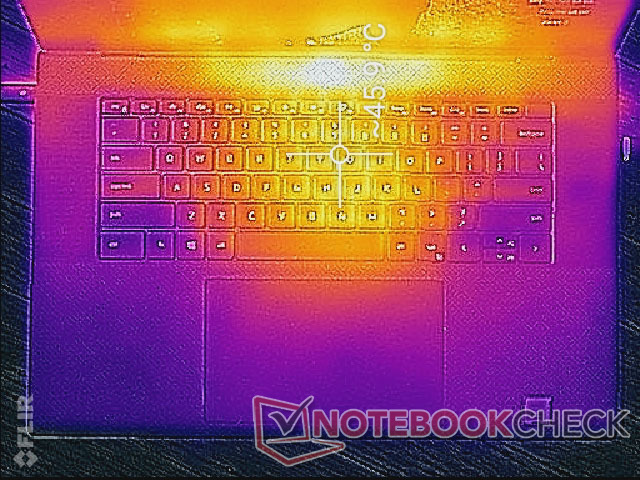
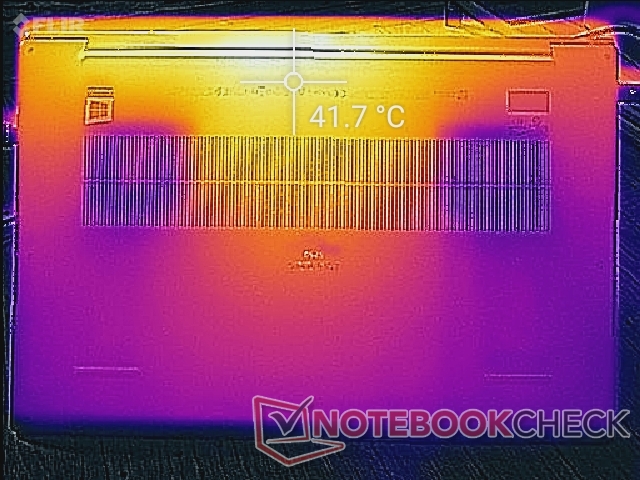
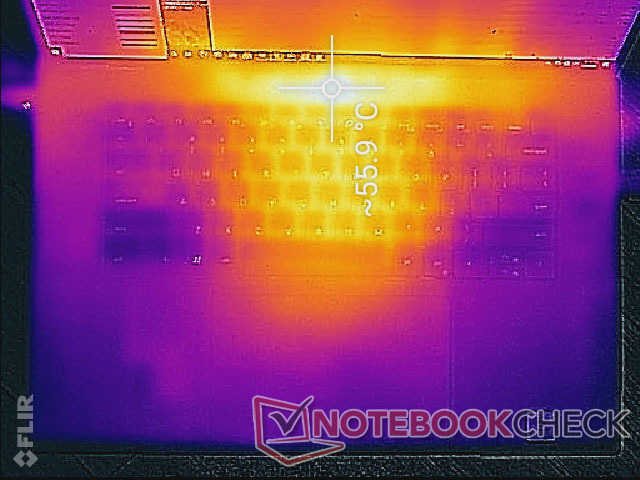
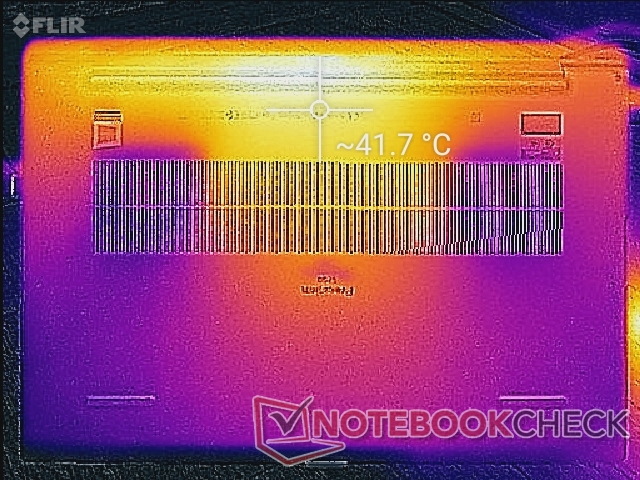
Temperature
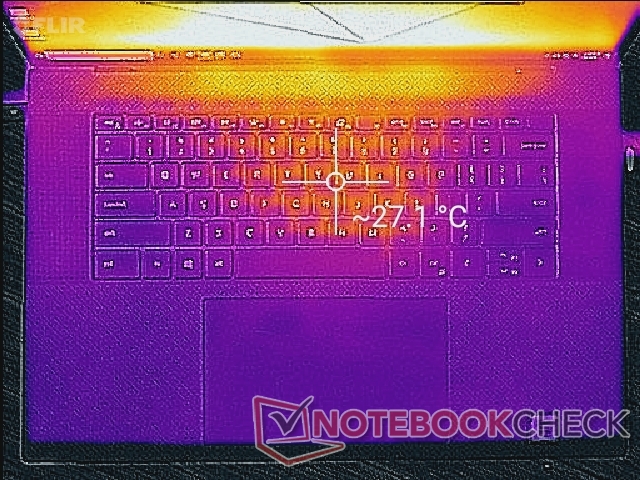
Lo sviluppo delle temperature di superficie è simmetrico con punti caldi vicino al centro della tastiera e sul retro. In caso di carichi elevati, il centro della tastiera può raggiungere oltre 46 °C, che non è poi così diverso da quello che abbiamo notato sul più spesso Asus ProArt StudioBook Pro 17. Tuttavia, l'MSI WS66 10TMT è in grado di restare leggermente più fresco e con Quadro RTX 5000 Max-Q molto più potente.
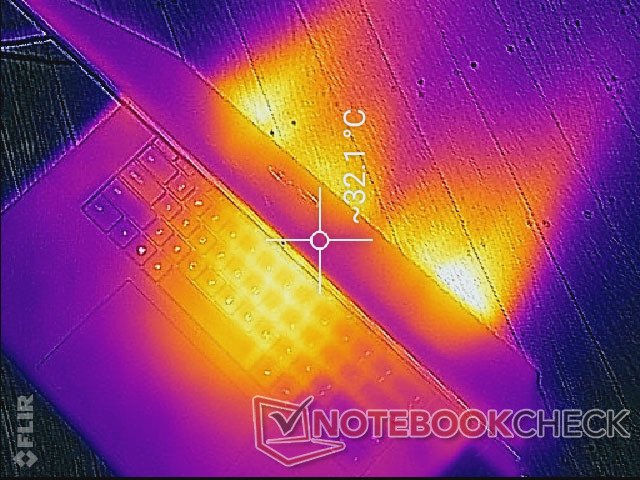
(-) La temperatura massima sul lato superiore è di 55.6 °C / 132 F, rispetto alla media di 38.2 °C / 101 F, che varia da 22.2 a 69.8 °C per questa classe Workstation.
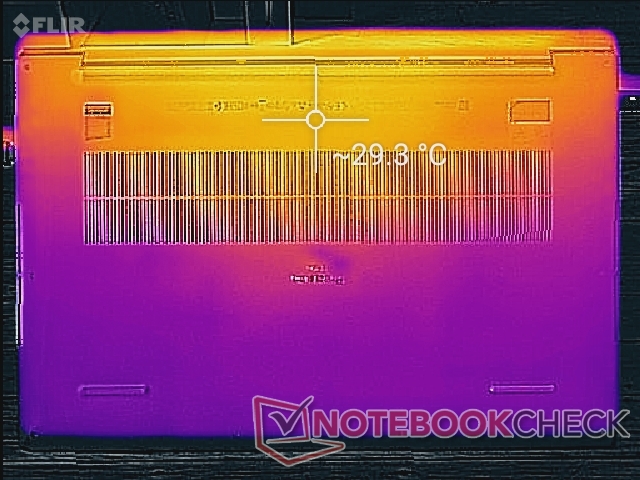
(±) Il lato inferiore si riscalda fino ad un massimo di 42 °C / 108 F, rispetto alla media di 41.1 °C / 106 F
(+) In idle, la temperatura media del lato superiore è di 25.2 °C / 77 F, rispetto alla media deld ispositivo di 32 °C / 90 F.
(±) Riproducendo The Witcher 3, la temperatura media per il lato superiore e' di 36 °C / 97 F, rispetto alla media del dispositivo di 32 °C / 90 F.
(+) I poggiapolsi e il touchpad raggiungono la temperatura massima della pelle (33.6 °C / 92.5 F) e quindi non sono caldi.
(-) La temperatura media della zona del palmo della mano di dispositivi simili e'stata di 27.8 °C / 82 F (-5.8 °C / -10.5 F).
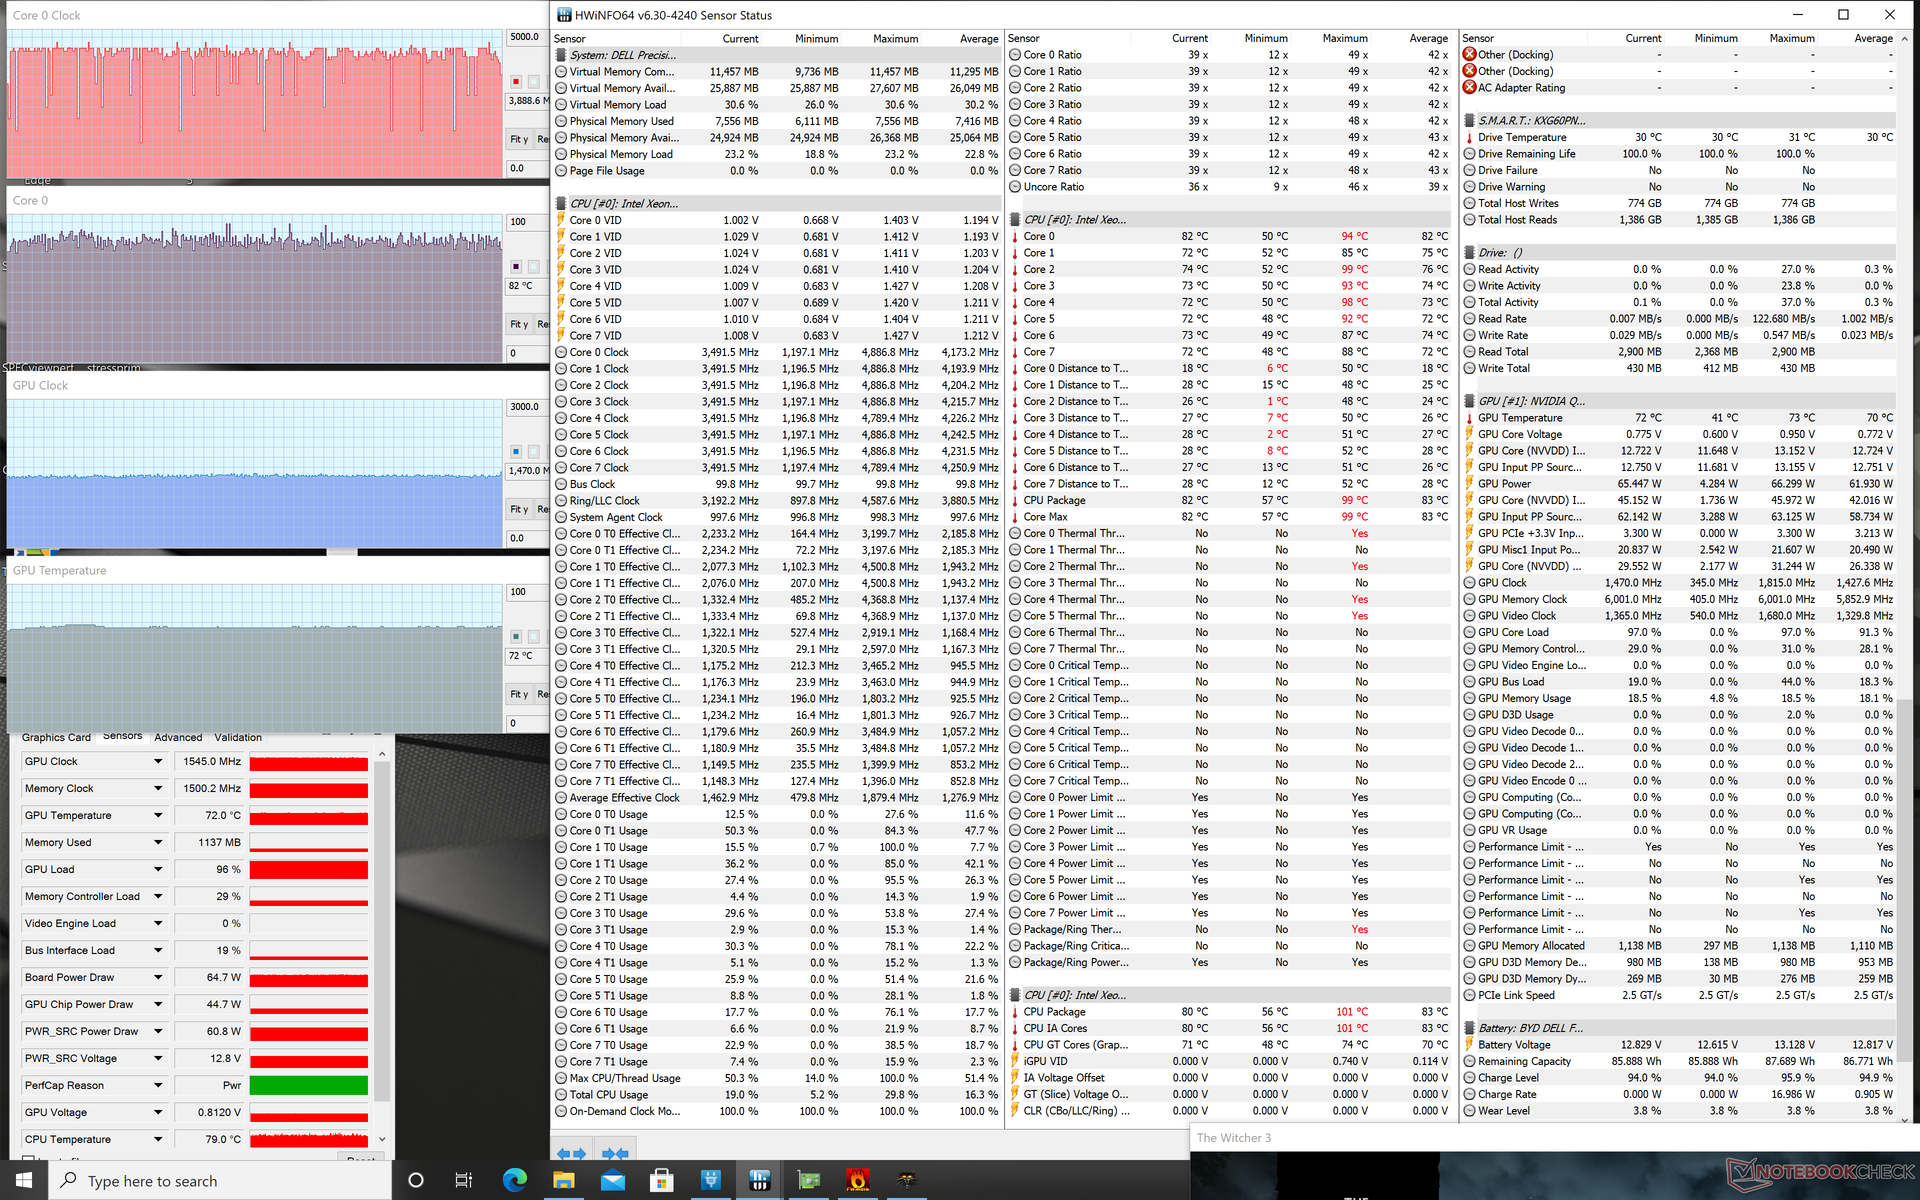
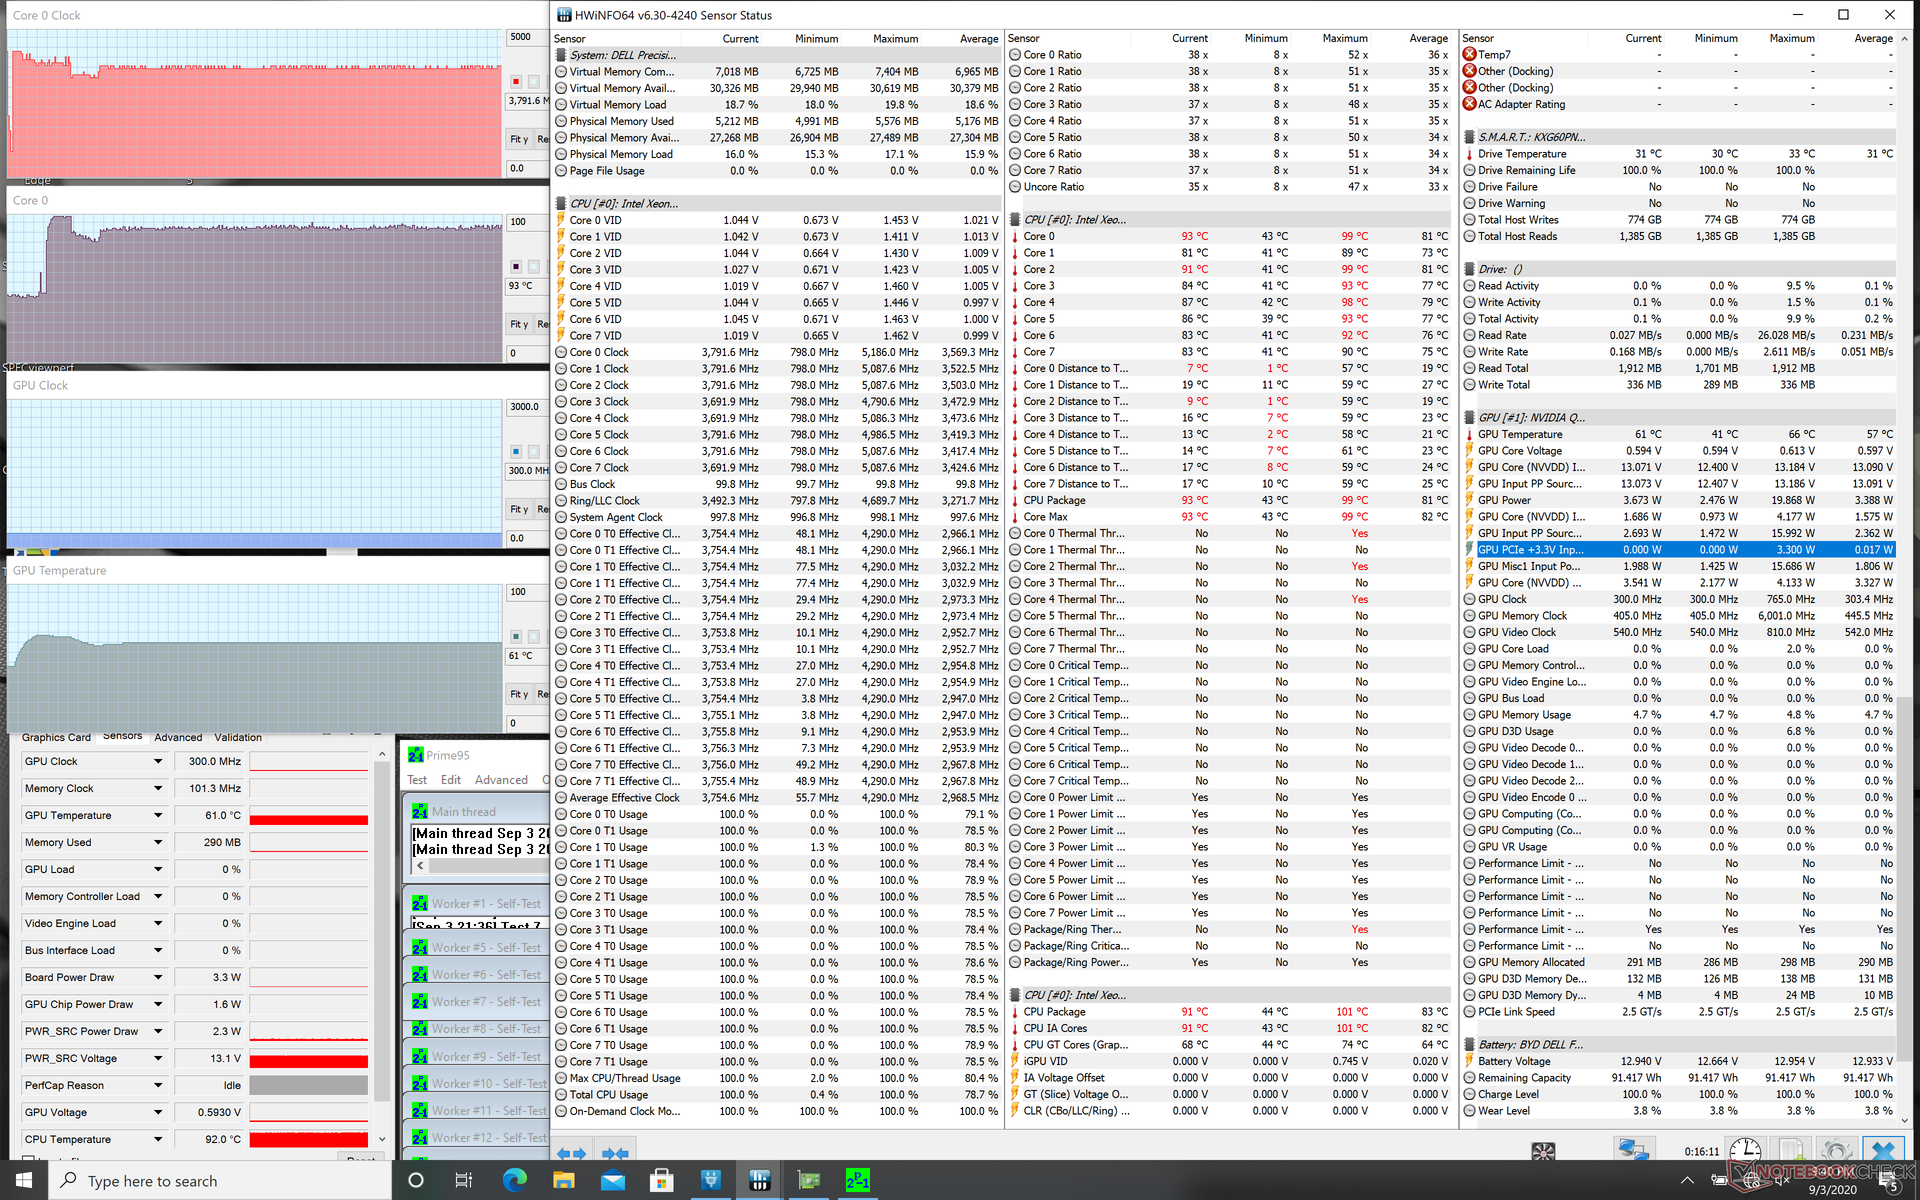
Stress Test
Quando si esegue il Prime95 per stressare la CPU, le velocità di clock aumenterebbero a 4,3 GHz solo per i primi secondi fino a quando la temperatura del core raggiunge i 99 °C. Il processore scende poi a 3,5 GHz e 84 °C temporaneamente prima di risalire e stabilizzarsi a 3,7-3,8 GHz e 93 °C. Le configurazioni XPS di fascia alta non hanno paura di far funzionare i loro processori a temperature molto più calde rispetto alla concorrenza e il Precision 5750 non è diverso.
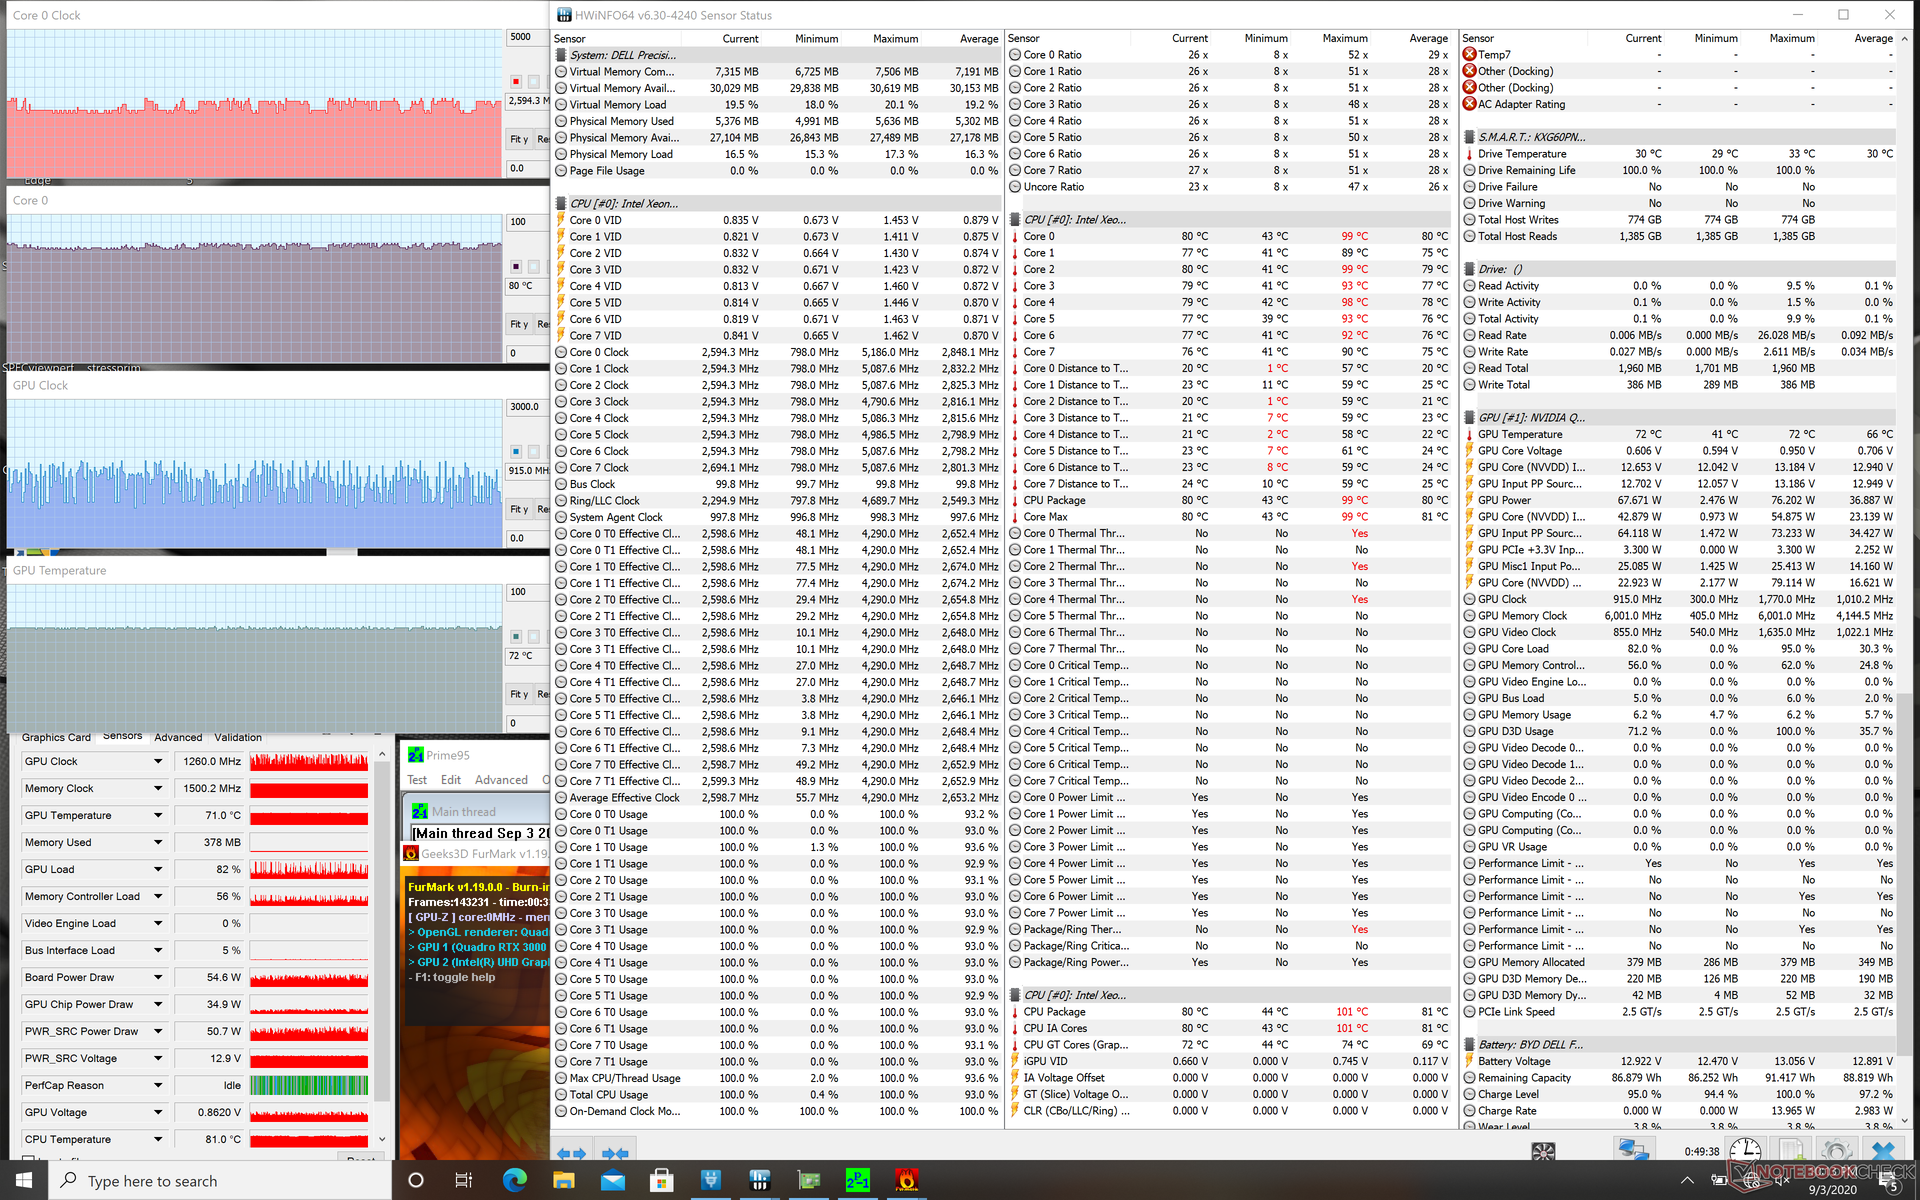
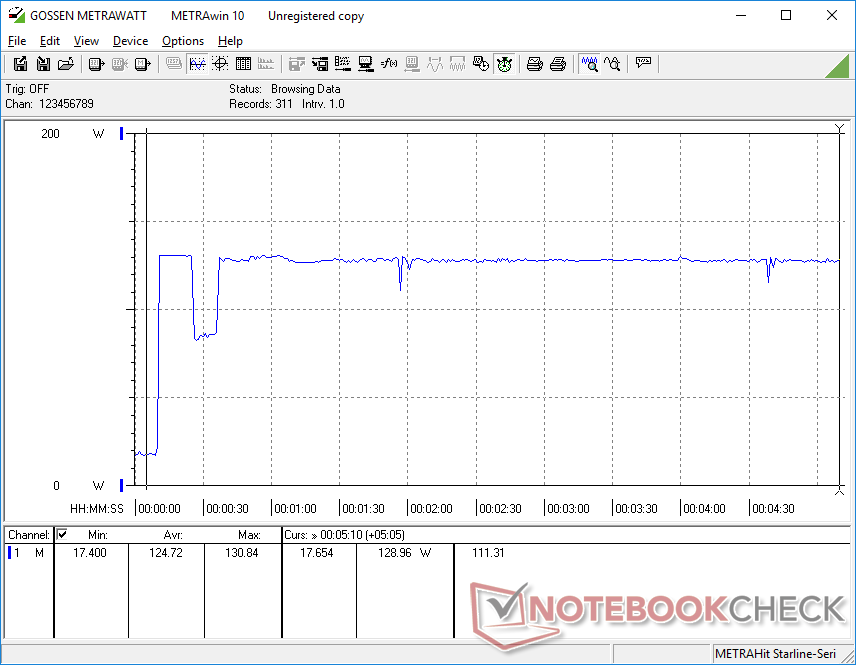
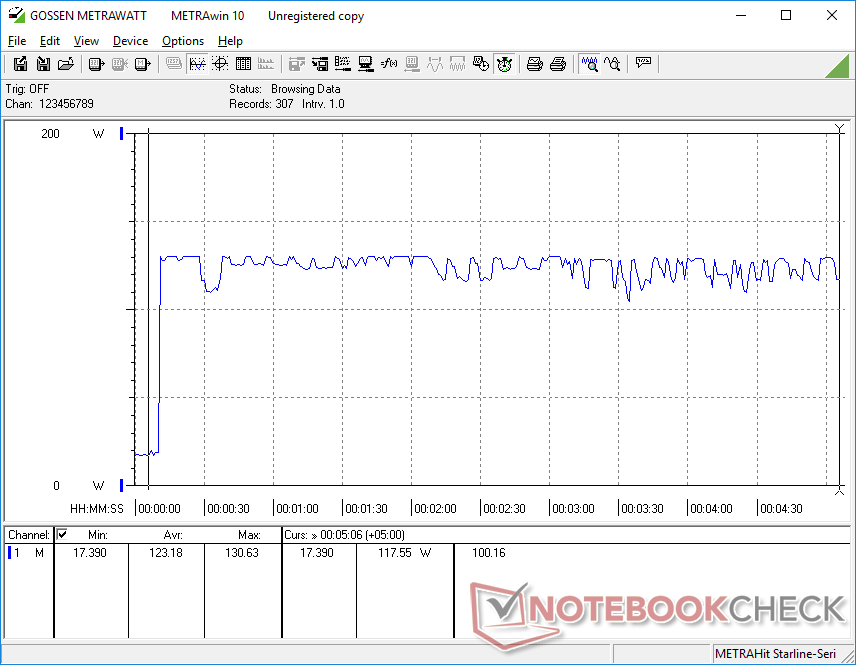
Quando si eseguono contemporaneamente Prime95 e FurMark, le velocità di clock delle GPU oscillano selvaggiamente tra i 930 e i 1770 MHz, mentre gli altri portatili sono più costanti. Sospettiamo che ciò sia dovuto al fatto che le sue prestazioni sono limitate dall'alimentatore da 130 W, come descritto in dettaglio nella nostra sezione Consumo energetico.
Il funzionamento a batteria limiterà le prestazioni. Un test di Fire Strike sulle batterie restituirebbe i punteggi Physics e Graphics di 15189 e 4404 punti, rispettivamente, rispetto a 20247 e 14328 punti con l'alimentazione di rete.
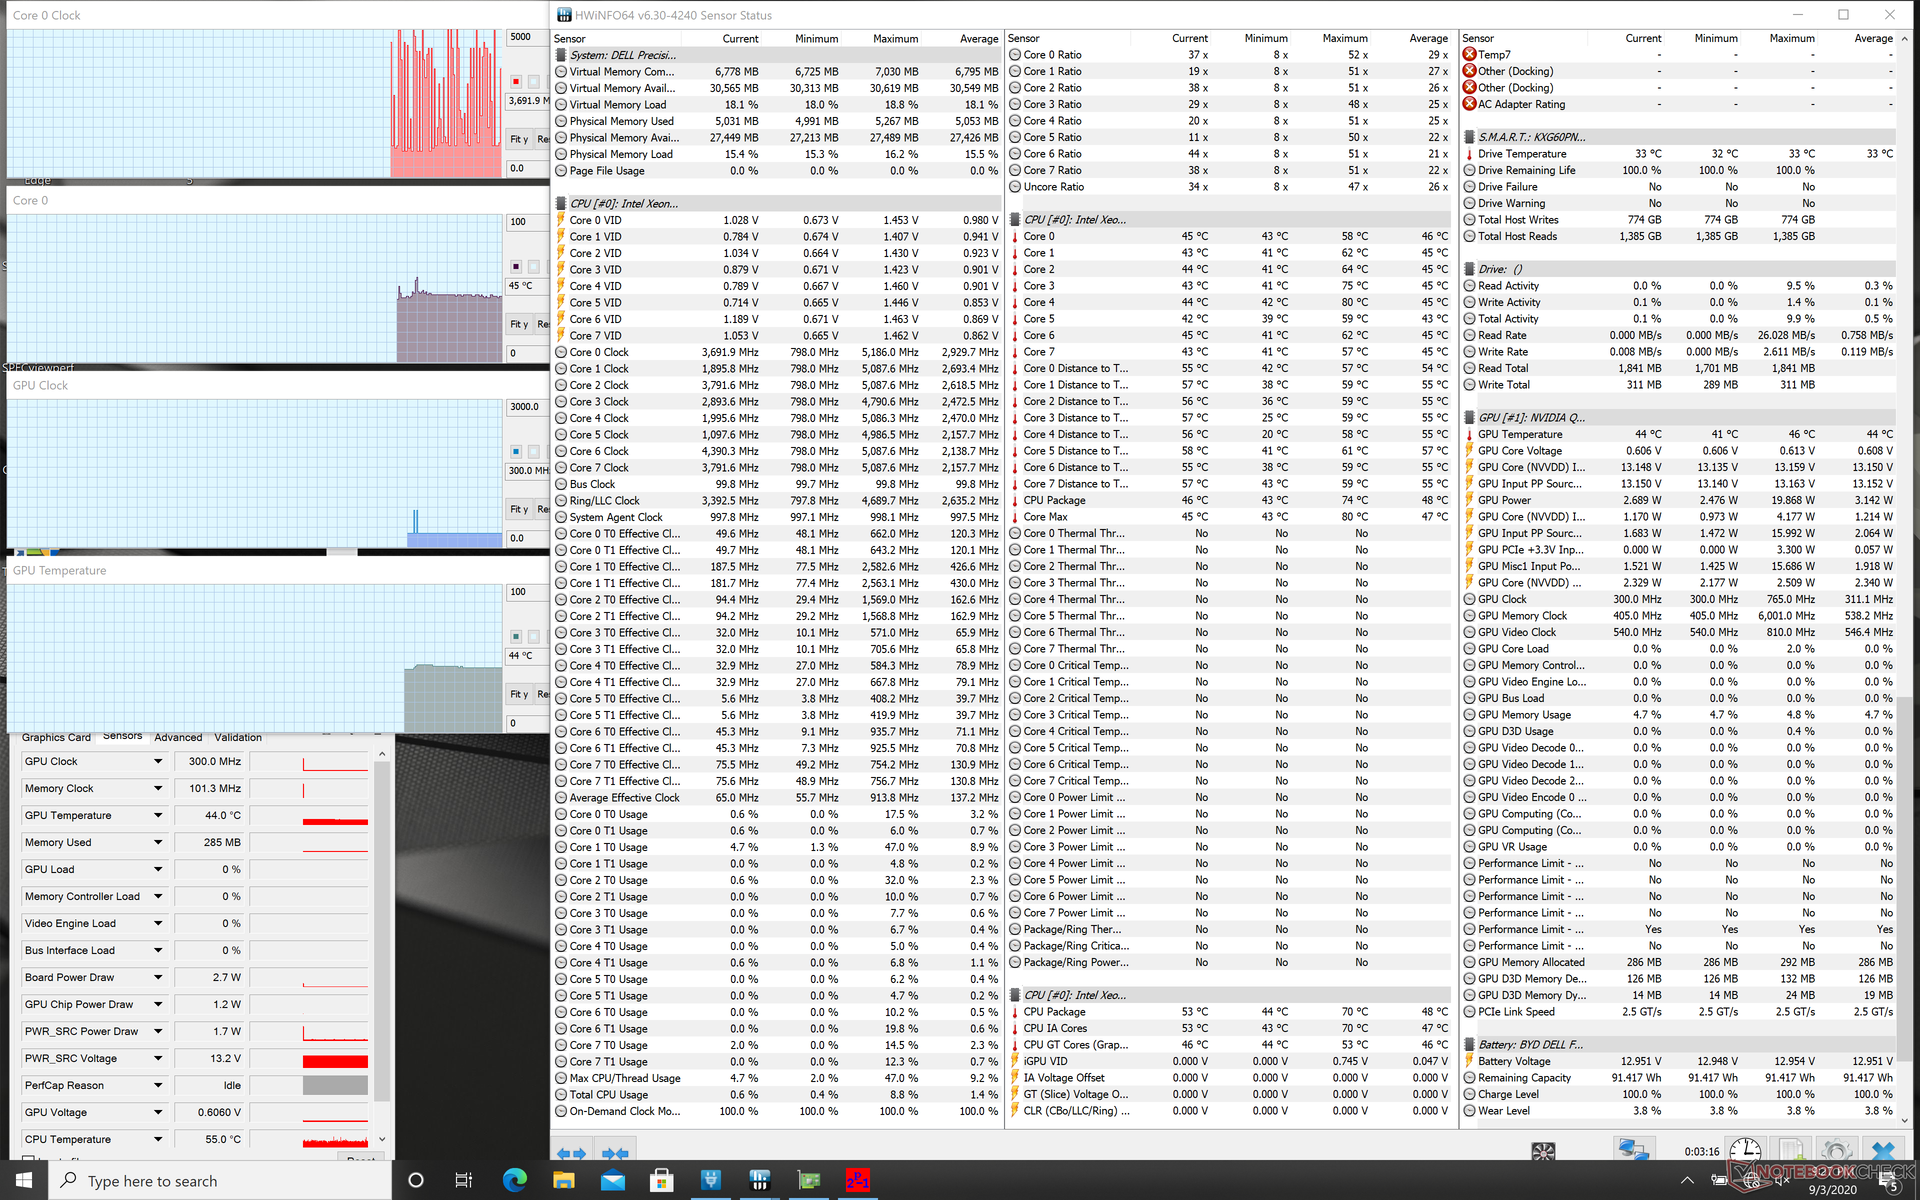
| CPU Clock (GHz) | GPU Clock (MHz) | Average CPU Temperature (°C) | Average GPU Temperature (°C) | |
| System Idle | -- | -- | 45 | 44 |
| Prime95 Stress | 3.7 - 3.8 | -- | 93 | 61 |
| Prime95 + FurMark Stress | 2.3 - 2.6 | 930 - 1770 | 78 - 81 | 70 |
| Witcher 3 Stress | ~4.2 | 1545 | ~82 | 72 |
Altoparlanti
")

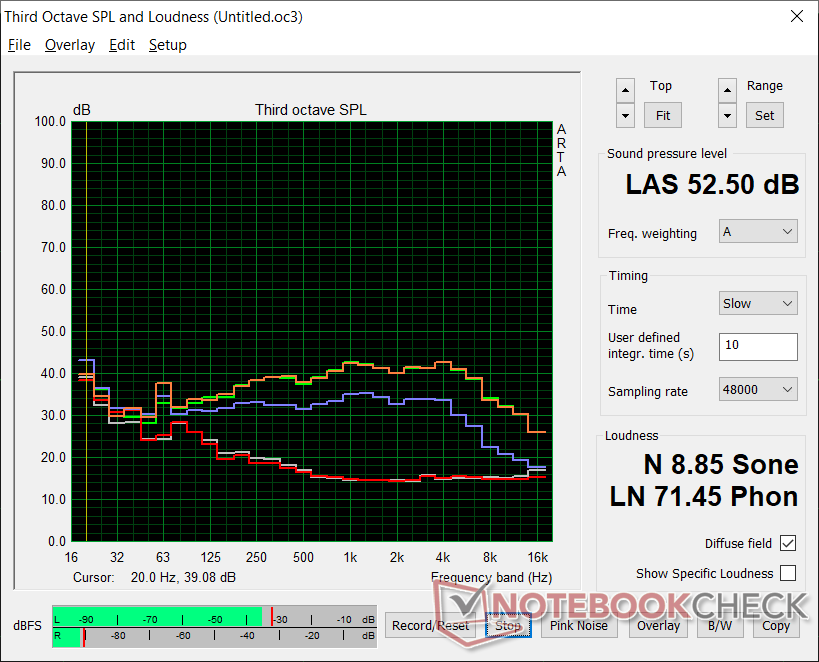
Dell Precision 5000 5750 P92F analisi audio
(+) | gli altoparlanti sono relativamente potenti (85.6 dB)
Bassi 100 - 315 Hz
(±) | bassi ridotti - in media 7.4% inferiori alla media
(±) | la linearità dei bassi è media (8.7% delta rispetto alla precedente frequenza)
Medi 400 - 2000 Hz
(+) | medi bilanciati - solo only 3.6% rispetto alla media
(+) | medi lineari (3.8% delta rispetto alla precedente frequenza)
Alti 2 - 16 kHz
(±) | alti elevati - circa 5.3% superiori alla media
(+) | alti lineari (5.6% delta rispetto alla precedente frequenza)
Nel complesso 100 - 16.000 Hz
(+) | suono nel complesso lineare (10.5% differenza dalla media)
Rispetto alla stessa classe
» 7% di tutti i dispositivi testati in questa classe è stato migliore, 6% simile, 87% peggiore
» Il migliore ha avuto un delta di 7%, medio di 17%, peggiore di 35%
Rispetto a tutti i dispositivi testati
» 5% di tutti i dispositivi testati in questa classe è stato migliore, 1% similare, 93% peggiore
» Il migliore ha avuto un delta di 4%, medio di 24%, peggiore di 134%
Apple MacBook 12 (Early 2016) 1.1 GHz analisi audio
(+) | gli altoparlanti sono relativamente potenti (83.6 dB)
Bassi 100 - 315 Hz
(±) | bassi ridotti - in media 11.3% inferiori alla media
(±) | la linearità dei bassi è media (14.2% delta rispetto alla precedente frequenza)
Medi 400 - 2000 Hz
(+) | medi bilanciati - solo only 2.4% rispetto alla media
(+) | medi lineari (5.5% delta rispetto alla precedente frequenza)
Alti 2 - 16 kHz
(+) | Alti bilanciati - appena 2% dalla media
(+) | alti lineari (4.5% delta rispetto alla precedente frequenza)
Nel complesso 100 - 16.000 Hz
(+) | suono nel complesso lineare (10.2% differenza dalla media)
Rispetto alla stessa classe
» 7% di tutti i dispositivi testati in questa classe è stato migliore, 2% simile, 91% peggiore
» Il migliore ha avuto un delta di 5%, medio di 18%, peggiore di 53%
Rispetto a tutti i dispositivi testati
» 5% di tutti i dispositivi testati in questa classe è stato migliore, 1% similare, 94% peggiore
» Il migliore ha avuto un delta di 4%, medio di 24%, peggiore di 134%
Gestione Energetica
Consumo energetico
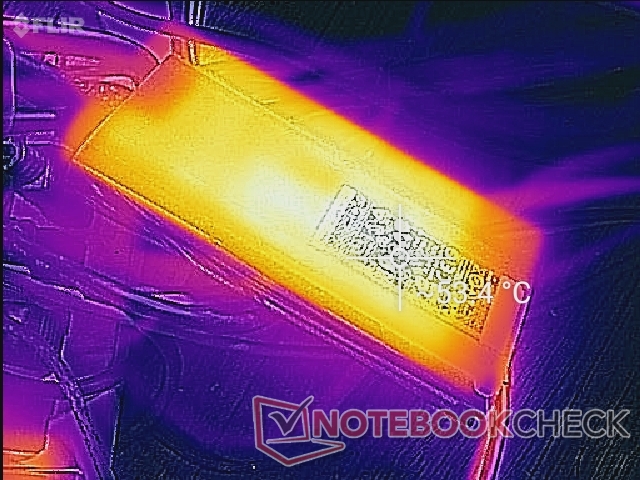
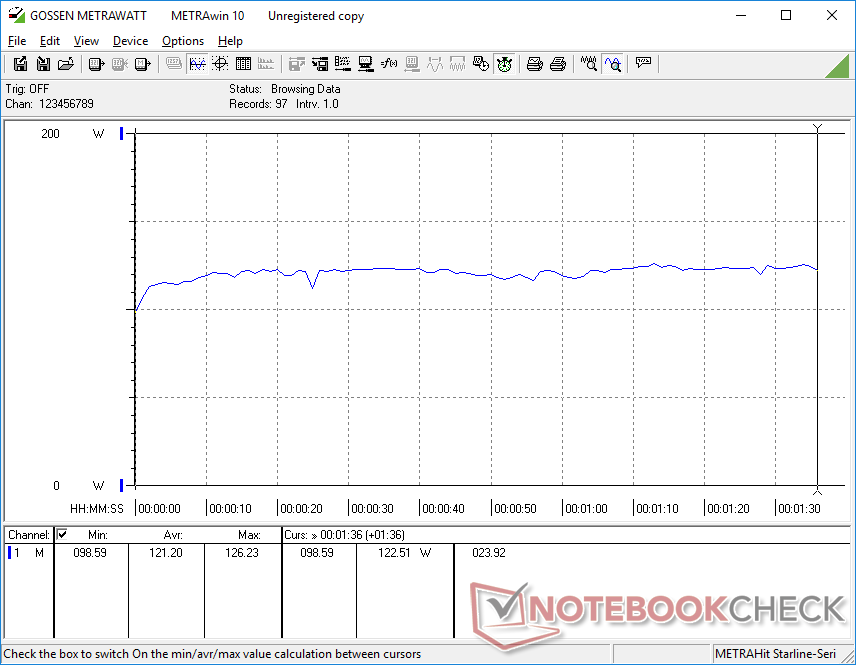
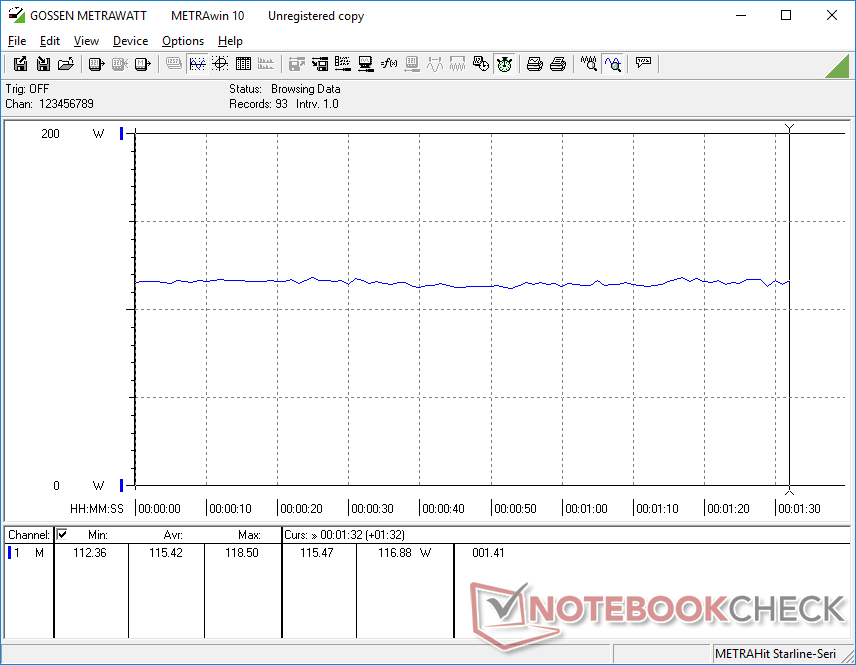
Inattivo sul desktop consuma circa 6 W minimo o fino a 17 W quando è attivo il profilo ad alte prestazioni con la GPU Quadro. Quando si eseguono carichi elevati come i giochi, il consumo medio è di circa 115 W o il 25% in meno rispetto al ThinkPad P53 equipaggiato con la Quadro RTX 3000 a piena potenza.
Il consumo massimo quando si eseguono carichi estremi è inferiore al previsto grazie all'alimentatore da 130 W relativamente piccolo (~14,3 x 6,5 x 2,3 cm). In confronto, l'Asus ProArt StudioBook Pro 17 viene fornito con la stessa GPU e tuttavia è in grado di assorbire oltre 180 W grazie al suo più grande alimentatore. Pertanto, il Precision 5750 non è adatto per l'esecuzione di carichi di elaborazione estremi per periodi prolungati, come esemplificato dalle fluttuazioni dei clock delle GPU nella nostra sezione Stress Test di cui sopra. La batteria si carica anche molto lentamente quando si trova sotto tali carichi a causa del soffitto basso di 130 W. Non abbiamo riscontrato alcun problema di scarica della batteria quando è collegata a una presa di corrente alternata, a differenza di alcune delle prime unità XPS 17.
| Off / Standby | |
| Idle | |
| Sotto carico |
|
Leggenda:
min: | |
| Dell Precision 5000 5750 P92F W-10885M, Quadro RTX 3000 Max-Q, Toshiba Kioxia XG6 KXG60PNV1T02, IPS, 3840x2400, 17" | Asus ProArt StudioBook Pro 17 W700G3T i7-9750H, Quadro RTX 3000 Max-Q, Samsung SSD PM981 MZVLB1T0HALR, IPS, 1920x1200, 17" | MSI WS75 9TL-636 i7-9750H, Quadro RTX 4000 (Laptop), Samsung SSD PM981 MZVLB1T0HALR, IPS, 1920x1080, 17.3" | Dell Precision 7730 i7-8850H, Quadro P3200, Samsung SSD PM981 MZVLB512HAJQ, IPS LED, 1920x1080, 17.3" | Lenovo ThinkPad P73-20QR002DGE i7-9850H, Quadro RTX 3000 (Laptop), Intel SSD Pro 7600p SSDPEKKF512G8L, IPS LED, 1920x1080, 17.3" | MSI WE75 9TK i7-9750H, Quadro RTX 3000 (Laptop), Samsung SSD PM981 MZVLB512HAJQ, IPS, 1920x1080, 17.3" | |
|---|---|---|---|---|---|---|
| Power Consumption | -17% | -47% | -25% | -13% | -30% | |
| Idle Minimum * (Watt) | 6.3 | 11.3 -79% | 16.4 -160% | 10.1 -60% | 8.9 -41% | 12.1 -92% |
| Idle Average * (Watt) | 14.2 | 16 -13% | 21.6 -52% | 18 -27% | 12.8 10% | 18.4 -30% |
| Idle Maximum * (Watt) | 17.3 | 16.8 3% | 22.9 -32% | 19.7 -14% | 16.4 5% | 18.8 -9% |
| Load Average * (Watt) | 121.2 | 93.6 23% | 88 27% | 89.6 26% | 108.4 11% | 95.1 22% |
| Witcher 3 ultra * (Watt) | 115.4 | 106 8% | 137 -19% | 134 -16% | 153 -33% | 135.5 -17% |
| Load Maximum * (Watt) | 130.7 | 186.6 -43% | 193 -48% | 204 -56% | 166 -27% | 203.7 -56% |
* ... Meglio usare valori piccoli
Autonomia della batteria
L'autonomia è ampia grazie alla grande capacità della batteria e al supporto di Optimus. Siamo in grado di registrare appena meno di 11 ore di utilizzo della WLAN nel mondo reale quando navighiamo sul web con una luminosità di 150 nits sul profilo di potenza bilanciata.
La ricarica completa richiede circa 2 ore.
| Dell Precision 5000 5750 P92F W-10885M, Quadro RTX 3000 Max-Q, 97 Wh | Asus ProArt StudioBook Pro 17 W700G3T i7-9750H, Quadro RTX 3000 Max-Q, 57 Wh | MSI WS75 9TL-636 i7-9750H, Quadro RTX 4000 (Laptop), 82 Wh | Dell Precision 7730 i7-8850H, Quadro P3200, 92 Wh | Lenovo ThinkPad P73-20QR002DGE i7-9850H, Quadro RTX 3000 (Laptop), 99 Wh | MSI WE75 9TK i7-9750H, Quadro RTX 3000 (Laptop), 65 Wh | |
|---|---|---|---|---|---|---|
| Autonomia della batteria | -35% | -38% | -41% | -17% | -50% | |
| Reader / Idle (h) | 18.2 | 12.6 -31% | 11 -40% | |||
| WiFi v1.3 (h) | 10.9 | 5.9 -46% | 6.6 -39% | 5.6 -49% | 11.1 2% | 4.9 -55% |
| Load (h) | 2.2 | 1.7 -23% | 1.2 -45% | 1.5 -32% | 1.4 -36% | 1 -55% |
Pro
Contro
Giudizio Complessivo
Il Precision 5750 è per gli utenti che non hanno bisogno di alcuna delle caratteristiche ausiliarie del più grande Precision 7750 e preferiscono perderle completamente a favore di un design più sottile, più elegante e più portatile. Se si viaggia molto e non ci si preoccupa di un sistema barebone che è in parte Ultrabook e in parte workstation, allora questa Precision svolge bene questo ruolo. Si raccomanda di avere monitor Thunderbolt 3 e docking station per sfruttare al meglio il sistema.
A parte i sacrifici hardware, ci sono alcuni altri inconvenienti da tenere a mente. In primo luogo, è un peccato che la garanzia di base sia di soli 12 mesi rispetto ai 36 mesi del più grande Precision 7750 quasi come se Dell considerasse il Precision 5550 come il modello inferiore. In secondo luogo, le temperature della CPU saranno piuttosto elevate e con un valore di ricarica della batteria più lento quando si eseguono carichi impegnativi. Quest'ultimo è dovuto al piccolo alimentatore da 130 W che favorisce la portabilità rispetto a un output superiore. E' evidente che Dell ha progettato il sistema per eccellere nei carichi di lavoro "esplosivi" mentre il più grande e potente Precision 7550/7570 farà meglio nei carichi di lavoro sostenuti. E infine, la mancanza di qualsiasi tipo di shutter per webcam è strana da vedere su un design di telaio così nuovo.
Il Precision 5750 è volutamente leggero nelle caratteristiche hardware a favore di un design più portatile. Se volete una workstation da 17 pollici più adatta ai viaggi, allora la Precision 5750 farà al caso vostro.
Dell Precision 5000 5750 P92F
- 09/07/2020 v7 (old)
Allen Ngo
Price comparison
