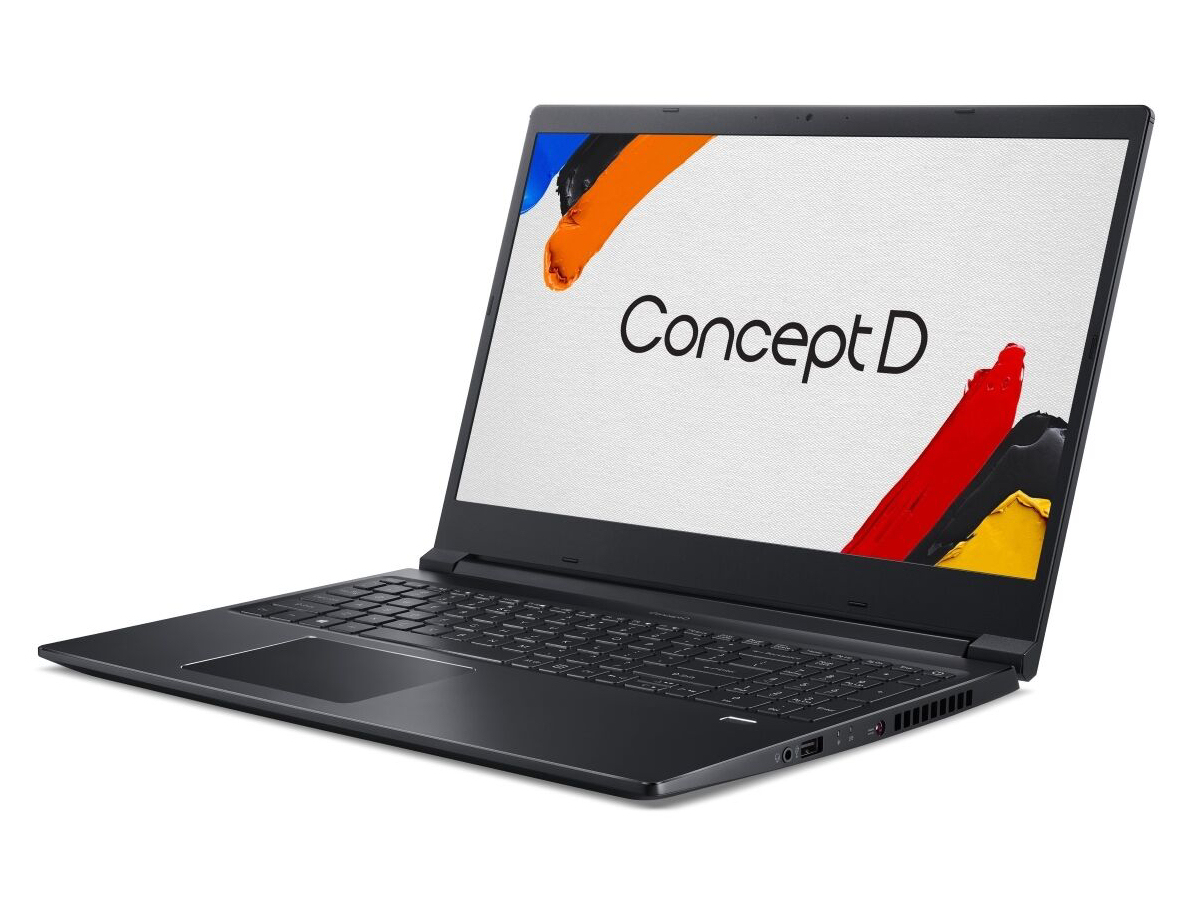
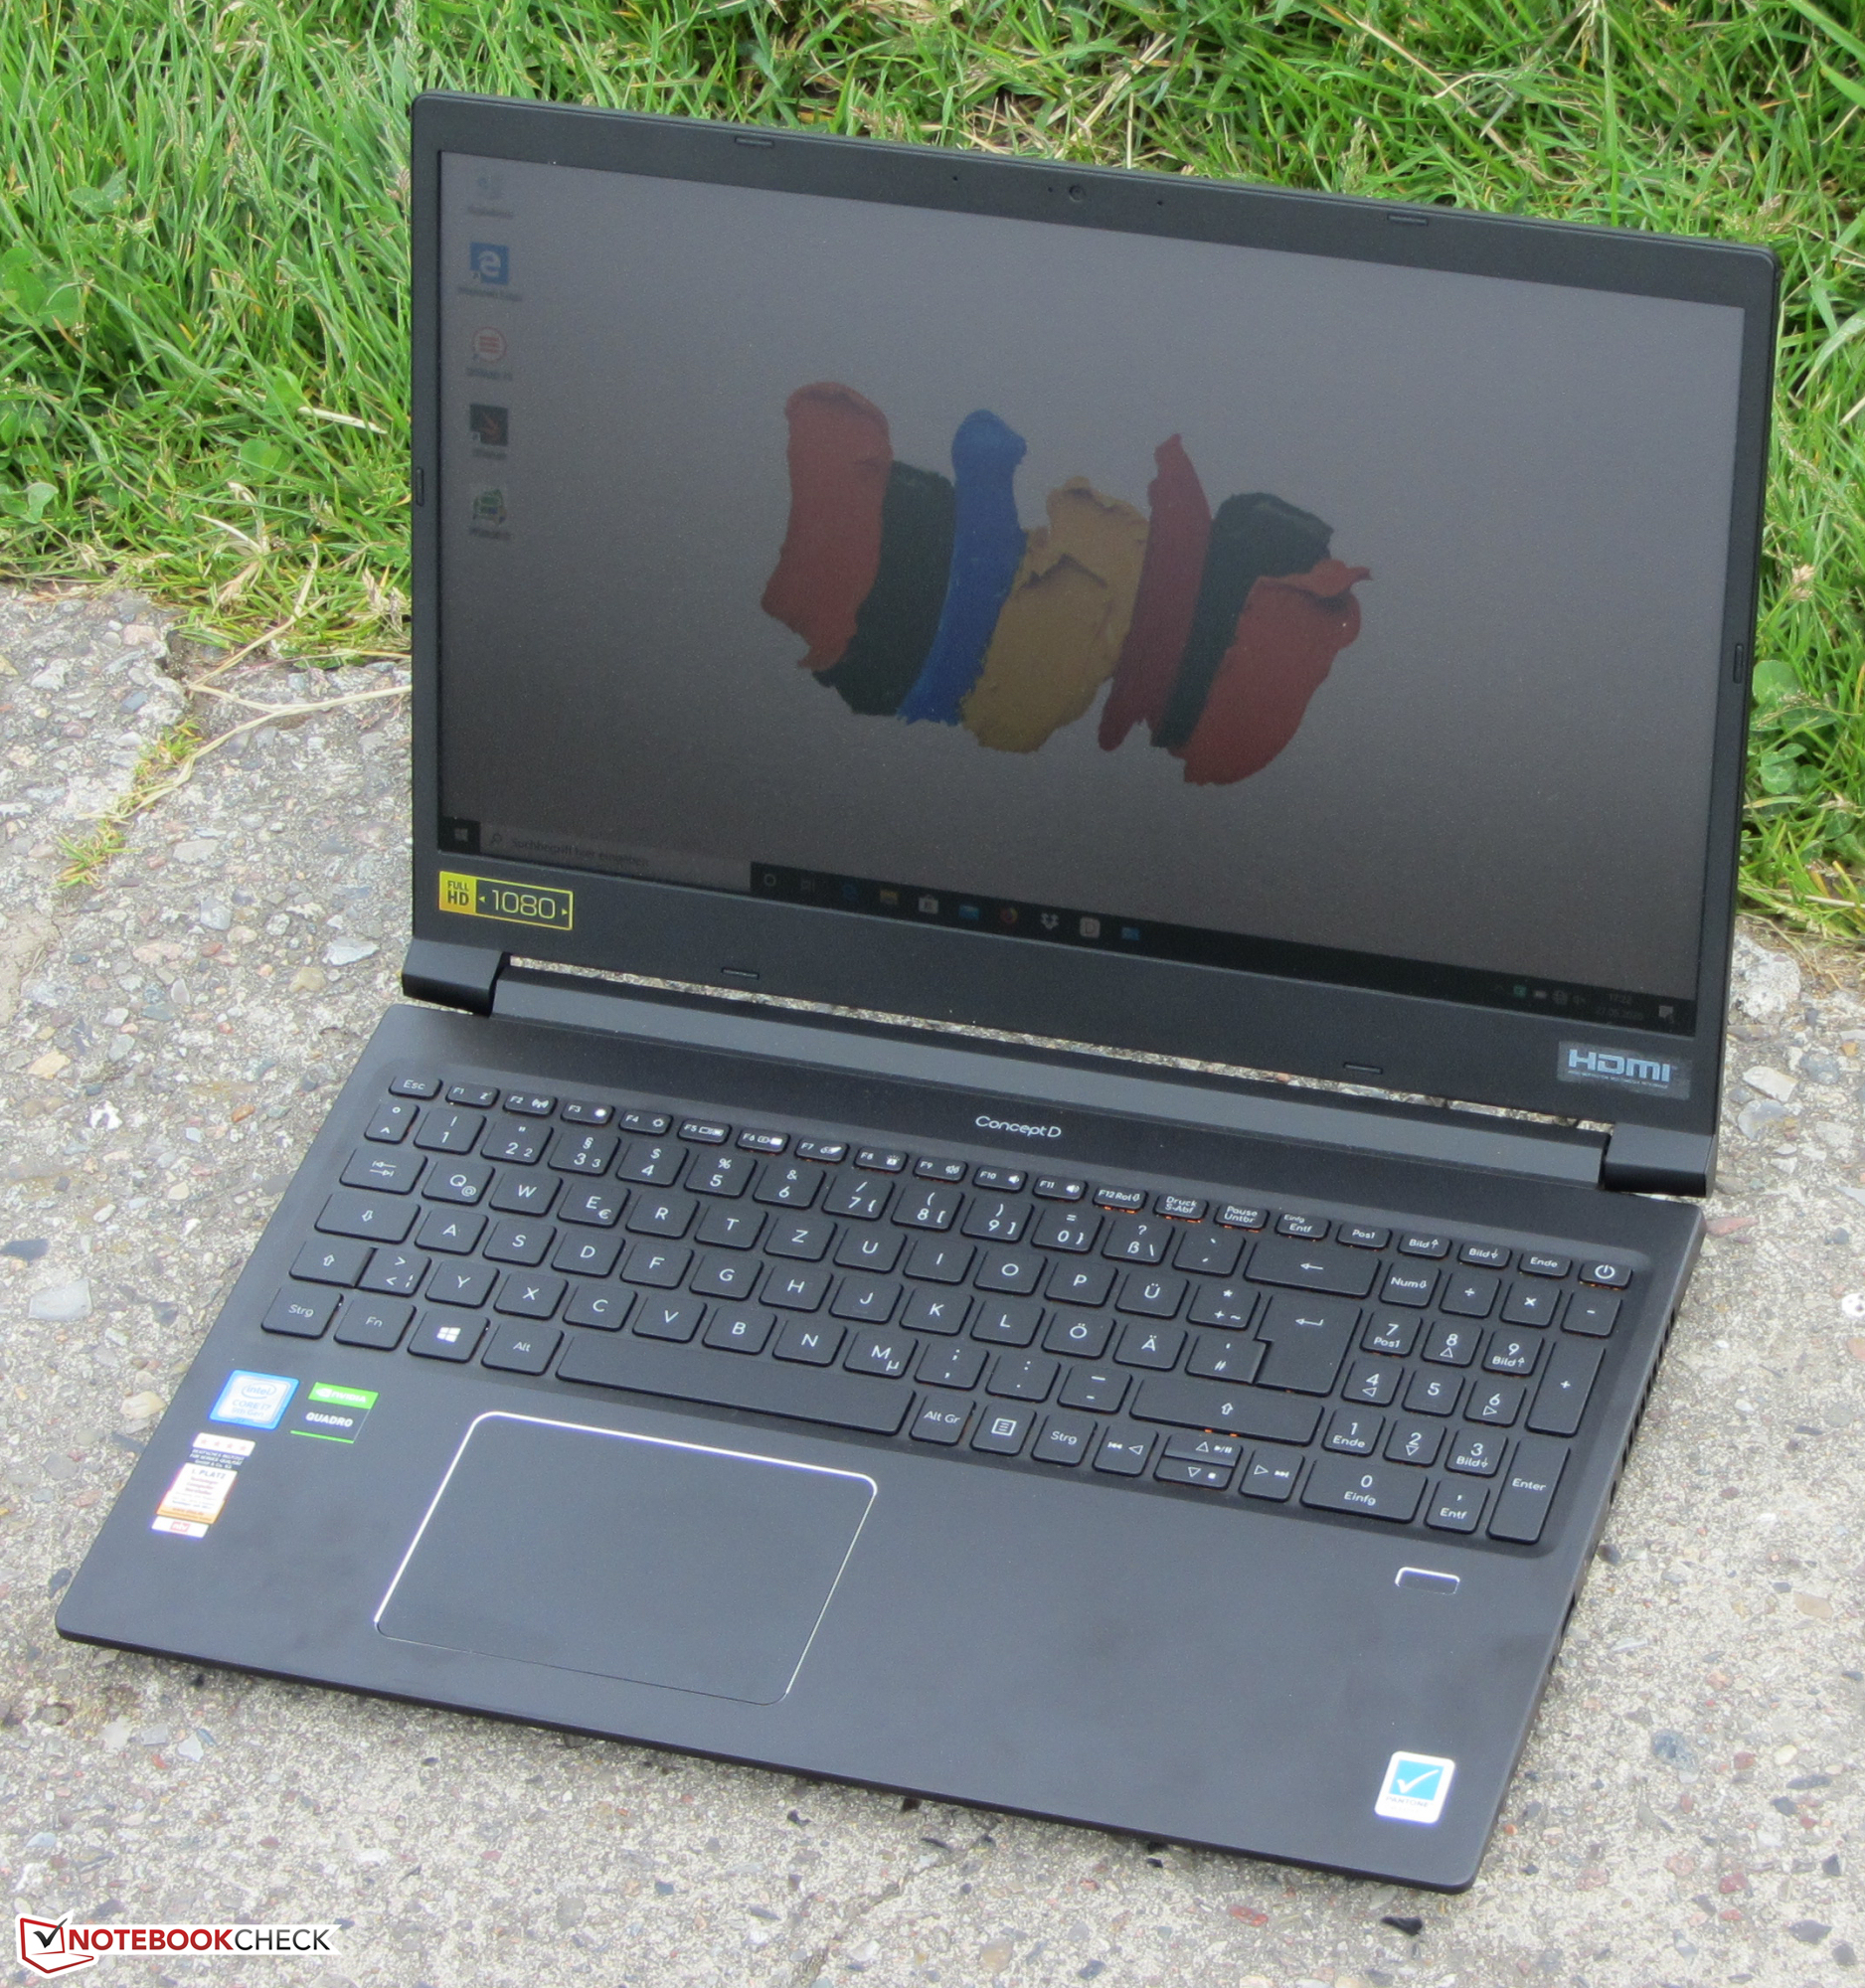
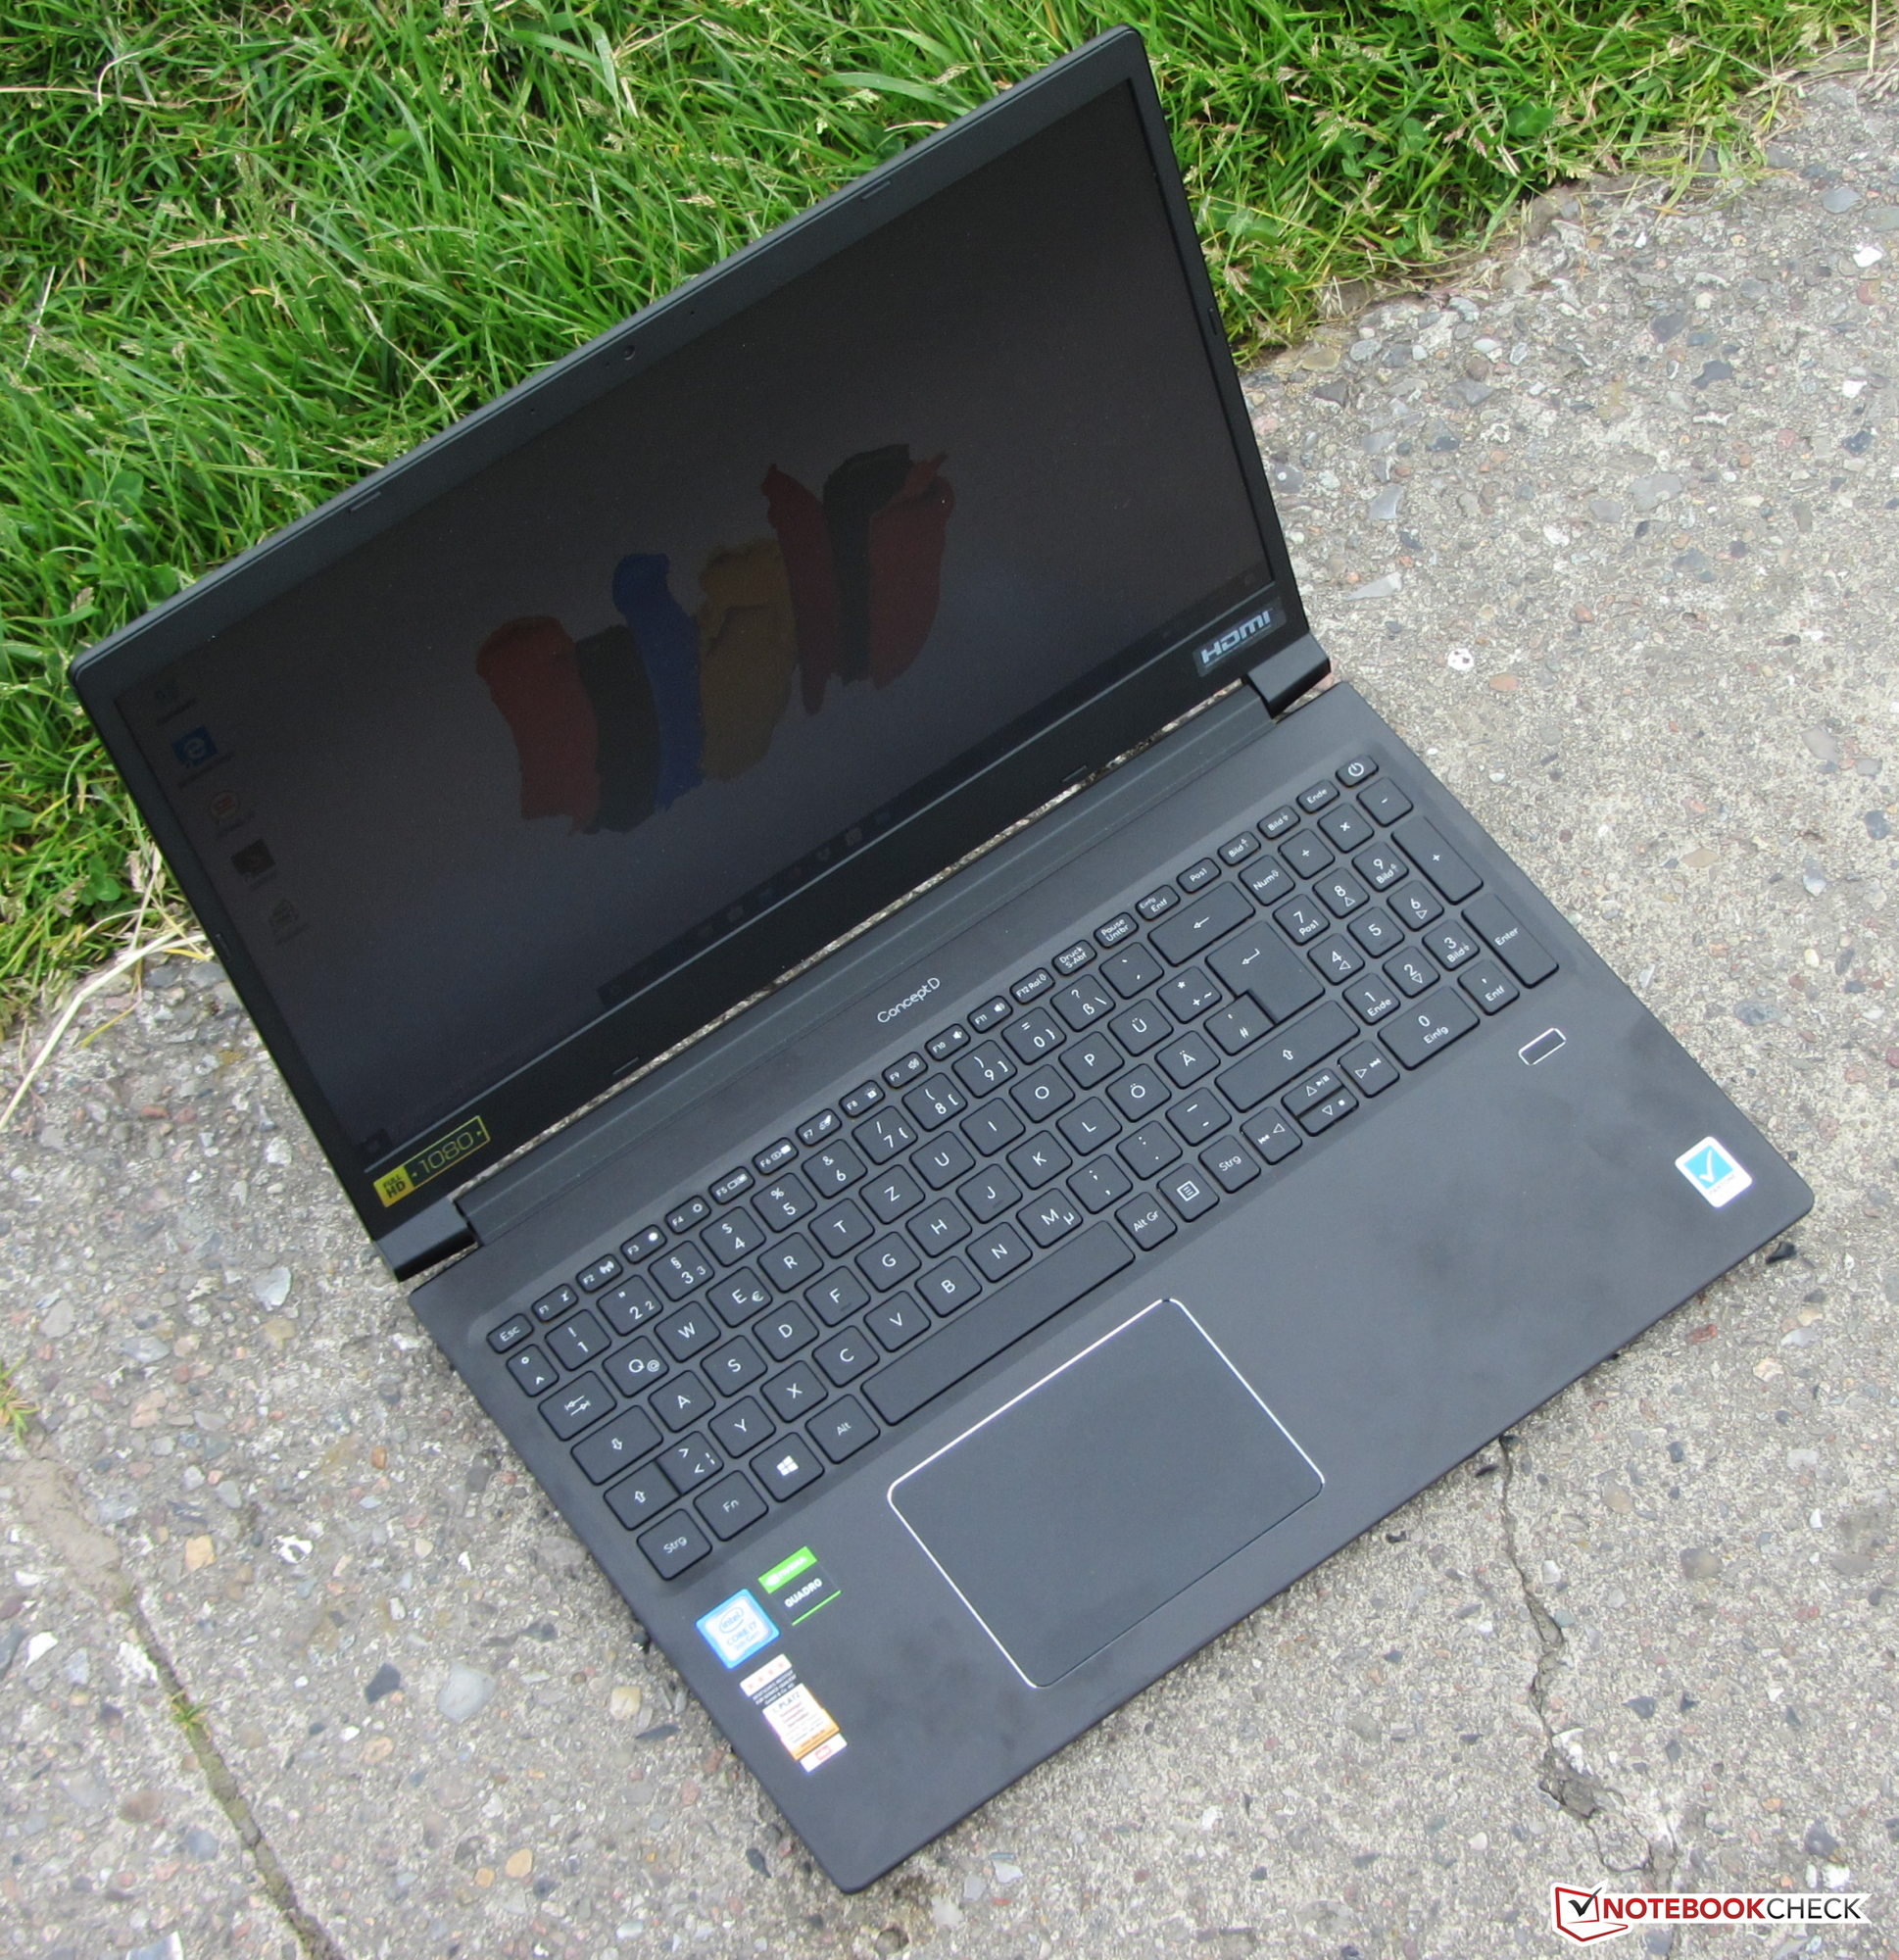
Recensione del Laptop Acer ConceptD 3 Pro CN315-71P: workstation Mobile con spazio per 3 drives
Punteggio | Data | Modello | Peso | Altezza | Dimensione | Risoluzione | Prezzo |
|---|---|---|---|---|---|---|---|
| 82.1 % v7 (old) | 06/2020 | Acer ConceptD 3 Pro CN315-71P-73W1 i7-9750H, Quadro T1000 (Laptop) | 2.4 kg | 23.4 mm | 15.60" | 1920x1080 | |
| 81.2 % v7 (old) | 11/2019 | Lenovo ThinkPad P53s-20N6001NGE i7-8565U, Quadro P520 | 1.9 kg | 19.95 mm | 15.60" | 1920x1080 | |
| 80.8 % v7 (old) | 10/2019 | HP ZBook 15u G6 6TP54EA i7-8565U, Radeon Pro WX 3200 | 1.6 kg | 19 mm | 15.60" | 3840x2160 | |
| 85.6 % v6 (old) | 04/2019 | Fujitsu Celsius H780 i7-8850H, Quadro P2000 | 2.8 kg | 31.9 mm | 15.60" | 1920x1080 | |
| 87.8 % v7 (old) | 08/2019 | Lenovo ThinkPad P1 2019-20QT000RGE i7-9850H, Quadro T1000 (Laptop) | 1.7 kg | 18.4 mm | 15.60" | 1920x1080 |
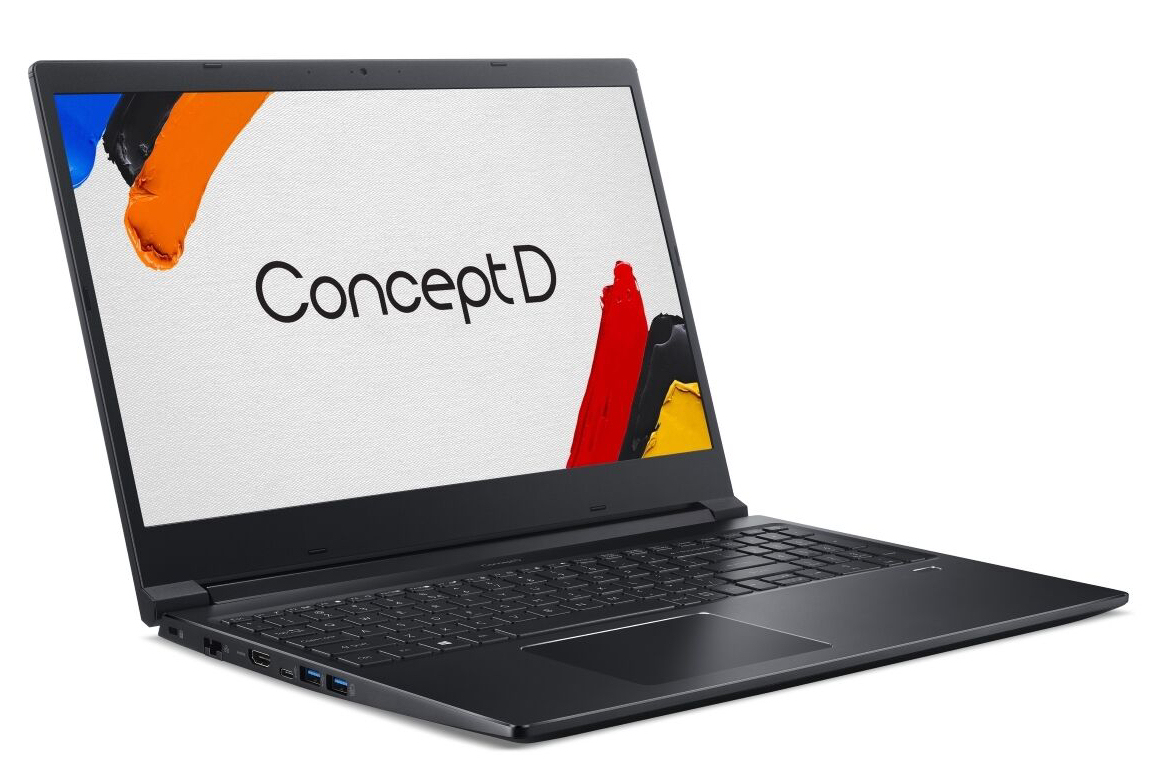
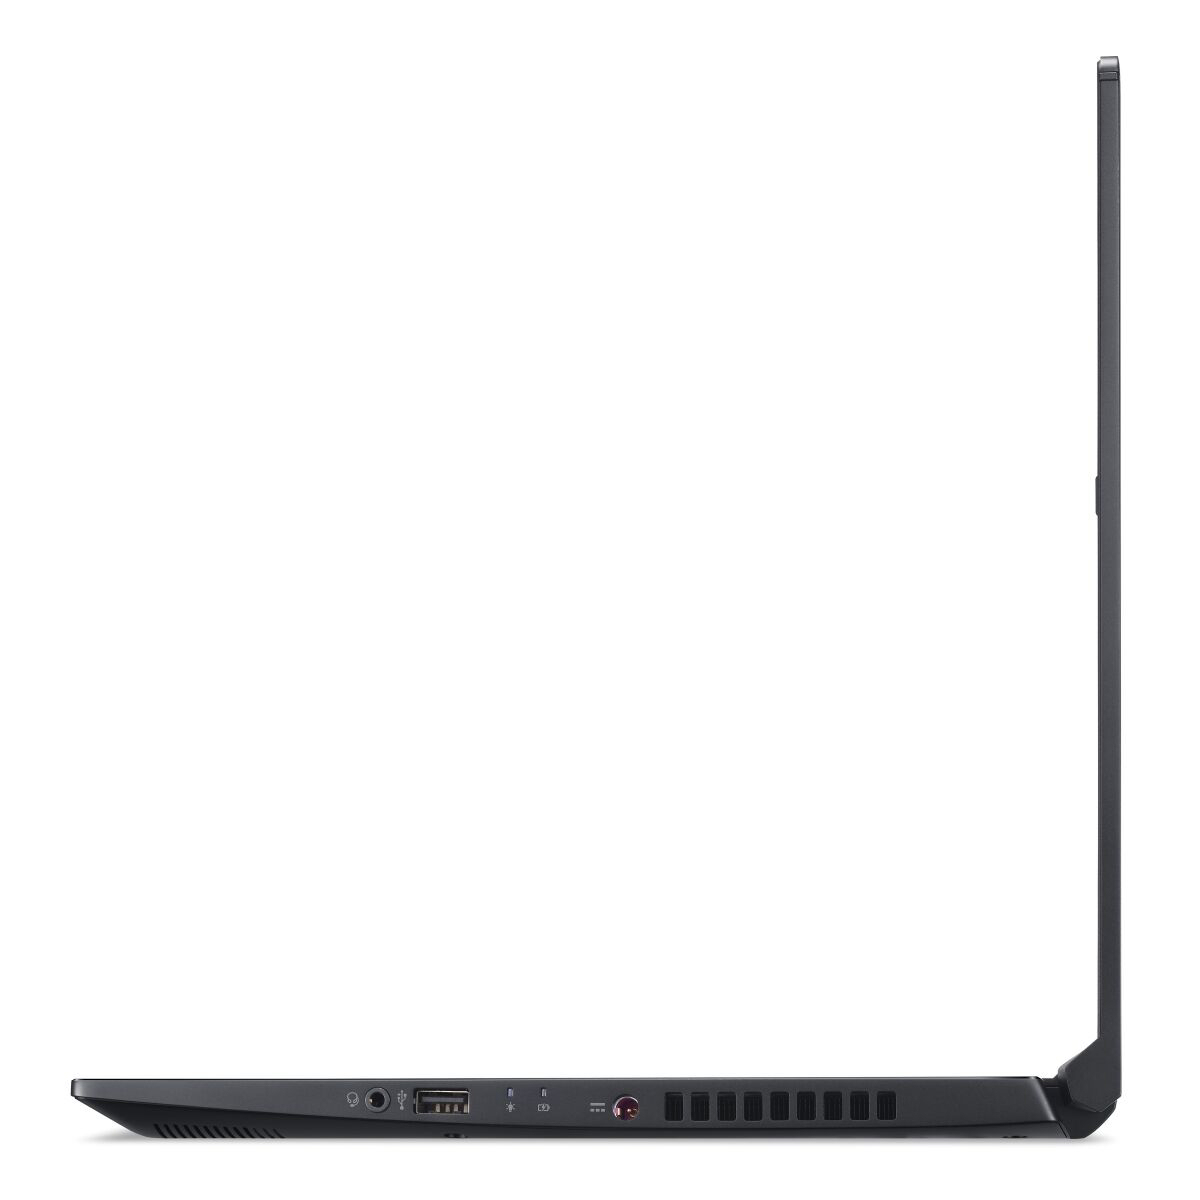
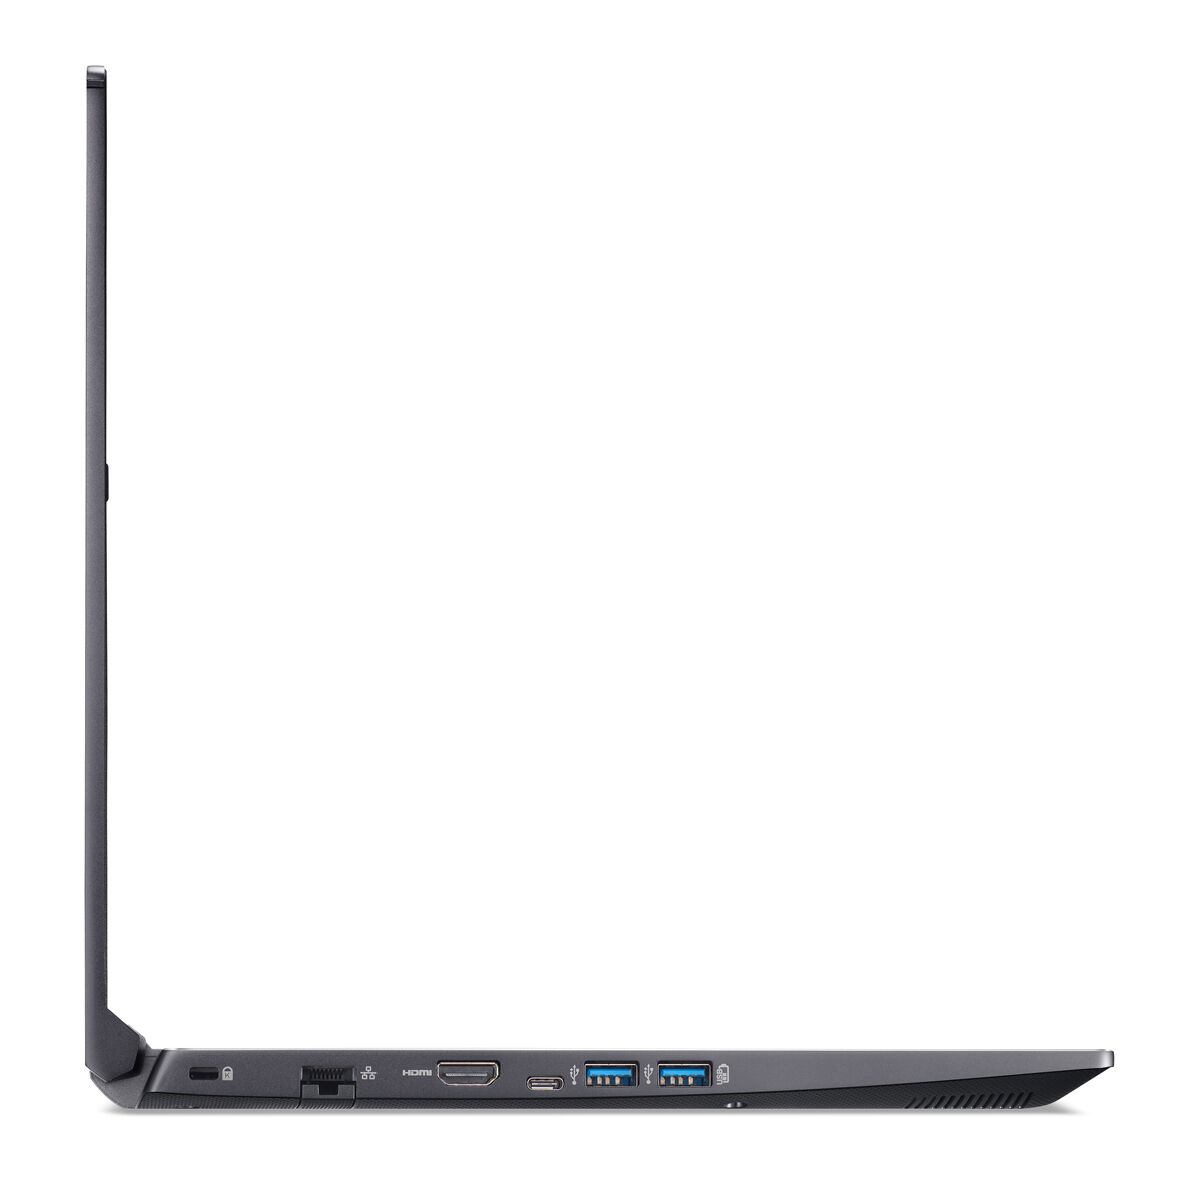
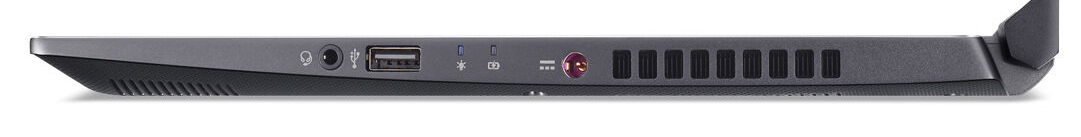
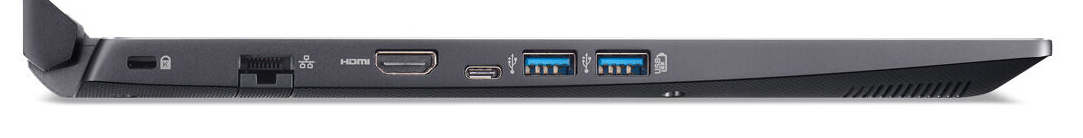
Disposizione porte

, i7-9750H, WDC PC SN720 SDAPNTW-512G")
, i7-9750H, WDC PC SN720 SDAPNTW-512G")
| |||||||||||||||||||||||||
Distribuzione della luminosità: 85 %
Al centro con la batteria: 343 cd/m²
Contrasto: 1559:1 (Nero: 0.22 cd/m²)
ΔE ColorChecker Calman: 3.73 | ∀{0.5-29.43 Ø4.72}
calibrated: 1.43
ΔE Greyscale Calman: 4.24 | ∀{0.09-98 Ø4.97}
100% sRGB (Argyll 1.6.3 3D)
78% AdobeRGB 1998 (Argyll 1.6.3 3D)
87.2% AdobeRGB 1998 (Argyll 3D)
99.9% sRGB (Argyll 3D)
97.9% Display P3 (Argyll 3D)
Gamma: 2.2
CCT: 6329 K
| Acer ConceptD 3 Pro CN315-71P-73W1 IPS, 1920x1080, 15.6" | Lenovo ThinkPad P53s-20N6001NGE IPS, 1920x1080, 15.6" | HP ZBook 15u G6 6TP54EA IPS, 3840x2160, 15.6" | Fujitsu Celsius H780 IPS LED, 1920x1080, 15.6" | Lenovo ThinkPad P1 2019-20QT000RGE IPS LED, 1920x1080, 15.6" | Acer Aspire 7 A715-74G-50U5 IPS, 1920x1080, 15.6" | |
|---|---|---|---|---|---|---|
| Display | -52% | -17% | -25% | -24% | -53% | |
| Display P3 Coverage (%) | 97.9 | 39.58 -60% | 69.2 -29% | 66.3 -32% | 62.4 -36% | 38.3 -61% |
| sRGB Coverage (%) | 99.9 | 57.6 -42% | 97.1 -3% | 85.9 -14% | 91.5 -8% | 57.5 -42% |
| AdobeRGB 1998 Coverage (%) | 87.2 | 40.89 -53% | 69.7 -20% | 62.8 -28% | 63.4 -27% | 39.57 -55% |
| Response Times | -54% | -72% | -19% | 16% | -26% | |
| Response Time Grey 50% / Grey 80% * (ms) | 33 ? | 51.2 ? -55% | 68.8 ? -108% | 38 ? -15% | 34.4 ? -4% | 41 ? -24% |
| Response Time Black / White * (ms) | 22 ? | 33.6 ? -53% | 29.6 -35% | 26.8 ? -22% | 14 ? 36% | 28 ? -27% |
| PWM Frequency (Hz) | 20830 ? | 26040 ? | ||||
| Screen | -53% | -1% | -25% | -2% | -33% | |
| Brightness middle (cd/m²) | 343 | 260 -24% | 451 31% | 271 -21% | 542 58% | 271 -21% |
| Brightness (cd/m²) | 309 | 243 -21% | 434 40% | 260 -16% | 528 71% | 256 -17% |
| Brightness Distribution (%) | 85 | 88 4% | 89 5% | 86 1% | 84 -1% | 91 7% |
| Black Level * (cd/m²) | 0.22 | 0.18 18% | 0.25 -14% | 0.29 -32% | 0.41 -86% | 0.26 -18% |
| Contrast (:1) | 1559 | 1444 -7% | 1804 16% | 934 -40% | 1322 -15% | 1042 -33% |
| Colorchecker dE 2000 * | 3.73 | 6 -61% | 4.4 -18% | 3.9 -5% | 3.5 6% | 3.63 3% |
| Colorchecker dE 2000 max. * | 6.51 | 19.2 -195% | 6.7 -3% | 10.2 -57% | 7.8 -20% | 7.13 -10% |
| Colorchecker dE 2000 calibrated * | 1.43 | 4.3 -201% | 1.8 -26% | 2.9 -103% | 1.3 9% | 4.62 -223% |
| Greyscale dE 2000 * | 4.24 | 4.2 1% | 5 -18% | 2.6 39% | 4.8 -13% | 2.21 48% |
| Gamma | 2.2 100% | 2.49 88% | 2.31 95% | 2.29 96% | 2.33 94% | 2.5 88% |
| CCT | 6329 103% | 6865 95% | 7717 84% | 6517 100% | 7690 85% | 6383 102% |
| Color Space (Percent of AdobeRGB 1998) (%) | 78 | 37.6 -52% | 63 -19% | 56.1 -28% | 58.8 -25% | 36 -54% |
| Color Space (Percent of sRGB) (%) | 100 | 59.2 -41% | 97 -3% | 85.8 -14% | 91.1 -9% | 57 -43% |
| Media totale (Programma / Settaggio) | -53% /
-53% | -30% /
-13% | -23% /
-24% | -3% /
-4% | -37% /
-36% |
* ... Meglio usare valori piccoli
Tempi di risposta del Display
| ↔ Tempi di risposta dal Nero al Bianco | ||
|---|---|---|
| 22 ms ... aumenta ↗ e diminuisce ↘ combinato | ↗ 14 ms Incremento | 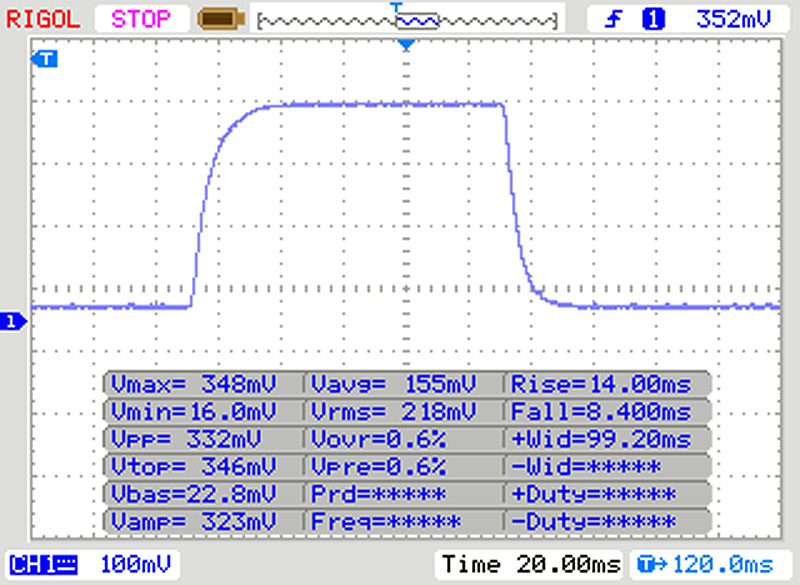 |
| ↘ 8 ms Calo | ||
| Lo schermo mostra buoni tempi di risposta durante i nostri tests, ma potrebbe essere troppo lento per i gamers competitivi. In confronto, tutti i dispositivi di test variano da 0.1 (minimo) a 240 (massimo) ms. » 49 % di tutti i dispositivi è migliore. Questo significa che i tempi di risposta rilevati sono peggiori rispetto alla media di tutti i dispositivi testati (19.8 ms). | ||
| ↔ Tempo di risposta dal 50% Grigio all'80% Grigio | ||
| 33 ms ... aumenta ↗ e diminuisce ↘ combinato | ↗ 17 ms Incremento | 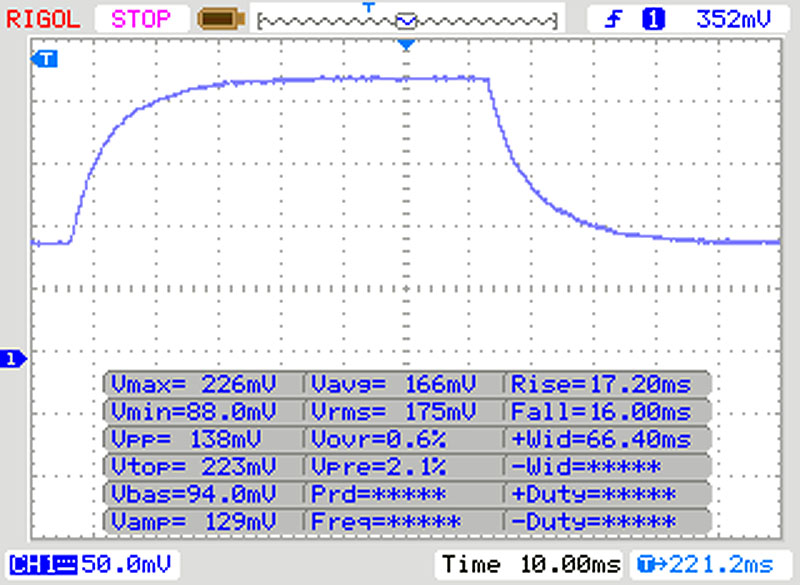 |
| ↘ 16 ms Calo | ||
| Lo schermo mostra tempi di risposta lenti nei nostri tests e sarà insoddisfacente per i gamers. In confronto, tutti i dispositivi di test variano da 0.165 (minimo) a 636 (massimo) ms. » 45 % di tutti i dispositivi è migliore. Questo significa che i tempi di risposta rilevati sono simili alla media di tutti i dispositivi testati (31 ms). | ||
Sfarfallio dello schermo / PWM (Pulse-Width Modulation)
| flickering dello schermo / PWM non rilevato | 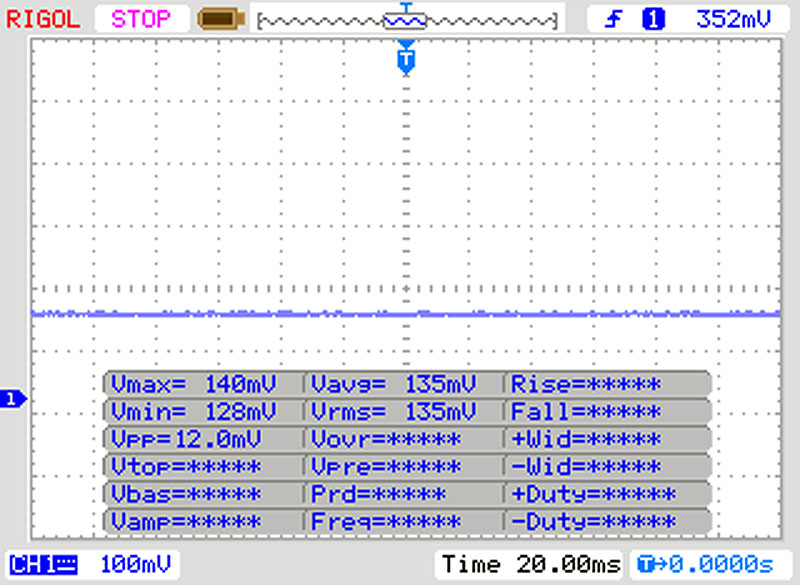 | ||
In confronto: 52 % di tutti i dispositivi testati non utilizza PWM per ridurre la luminosita' del display. Se è rilevato PWM, una media di 7763 (minimo: 5 - massimo: 343500) Hz è stata rilevata. | |||
| LibreOffice - 20 Documents To PDF | |
| Media Intel Core i7-9750H (54.5 - 64.7, n=9) | |
| Acer ConceptD 3 Pro CN315-71P-73W1 | |
| Media della classe Workstation (37.1 - 74.7, n=24, ultimi 2 anni) | |
| R Benchmark 2.5 - Overall mean | |
| Acer ConceptD 3 Pro CN315-71P-73W1 | |
| Media Intel Core i7-9750H (0.608 - 0.695, n=14) | |
| Media della classe Workstation (0.3825 - 0.603, n=24, ultimi 2 anni) | |
| Mozilla Kraken 1.1 - Total | |
| HP ZBook 15u G6 6TP54EA | |
| Acer Aspire 7 A715-74G-50U5 (Edge 44) | |
| Acer ConceptD 3 Pro CN315-71P-73W1 (Edge 44) | |
| Acer ConceptD 3 Pro CN315-71P-73W1 (Chrome 82) | |
| Media Intel Core i7-9750H (845 - 1713, n=54) | |
| Lenovo ThinkPad P1 2019-20QT000RGE (Edge) | |
| Media della classe Workstation (411 - 538, n=24, ultimi 2 anni) | |
| Octane V2 - Total Score | |
| Media della classe Workstation (92715 - 129420, n=4, ultimi 2 anni) | |
| Lenovo ThinkPad P1 2019-20QT000RGE (Edge) | |
| Media Intel Core i7-9750H (22874 - 39708, n=47) | |
| Acer Aspire 7 A715-74G-50U5 (Edge 44) | |
| Acer ConceptD 3 Pro CN315-71P-73W1 (Edge 44) | |
| HP ZBook 15u G6 6TP54EA | |
| JetStream 1.1 - 1.1 Total | |
| Fujitsu Celsius H780 (Edge) | |
| Acer ConceptD 3 Pro CN315-71P-73W1 (Edge 44) | |
| Media Intel Core i7-9750H (212 - 280, n=47) | |
| Acer Aspire 7 A715-74G-50U5 (Edge 44) | |
| HP ZBook 15u G6 6TP54EA | |
* ... Meglio usare valori piccoli
| PCMark 8 Home Score Accelerated v2 | 4024 punti | |
| PCMark 8 Creative Score Accelerated v2 | 3753 punti | |
| PCMark 8 Work Score Accelerated v2 | 5341 punti | |
| PCMark 10 Score | 4558 punti | |
Aiuto | ||
| DPC Latencies / LatencyMon - interrupt to process latency (max), Web, Youtube, Prime95 | |
| Acer ConceptD 3 Pro CN315-71P-73W1 | |
* ... Meglio usare valori piccoli

| Acer ConceptD 3 Pro CN315-71P-73W1 WDC PC SN720 SDAPNTW-512G | Lenovo ThinkPad P53s-20N6001NGE Intel SSD 760p SSDPEKKW256G8 | HP ZBook 15u G6 6TP54EA Samsung SSD PM981 MZVLB512HAJQ | Fujitsu Celsius H780 Samsung SSD PM981 MZVLB512HAJQ | Lenovo ThinkPad P1 2019-20QT000RGE WDC PC SN720 SDAQNTW-512G | Acer Aspire 7 A715-74G-50U5 WDC PC SN520 SDAPNUW-512G | Media WDC PC SN720 SDAPNTW-512G | Media della classe Workstation | |
|---|---|---|---|---|---|---|---|---|
| CrystalDiskMark 5.2 / 6 | 30% | 3% | -13% | 16% | -15% | -4% | 97% | |
| Write 4K (MB/s) | 113.2 | 195.9 73% | 156 38% | 98.3 -13% | 162.2 43% | 113.3 0% | 110 ? -3% | 171.1 ? 51% |
| Read 4K (MB/s) | 31.1 | 74.9 141% | 45.73 47% | 40.18 29% | 43.71 41% | 42.7 37% | 36.9 ? 19% | 70.6 ? 127% |
| Write Seq (MB/s) | 2540 | 1194 -53% | 1158 -54% | 1777 -30% | 2441 -4% | 1457 -43% | 1976 ? -22% | 3945 ? 55% |
| Read Seq (MB/s) | 2005 | 2309 15% | 1132 -44% | 1247 -38% | 1753 -13% | 1432 -29% | 1710 ? -15% | 4364 ? 118% |
| Write 4K Q32T1 (MB/s) | 331.4 | 507 53% | 369.2 11% | 344.7 4% | 397.6 20% | 347.5 5% | 339 ? 2% | 502 ? 51% |
| Read 4K Q32T1 (MB/s) | 368.3 | 624 69% | 573 56% | 383.1 4% | 520 41% | 382.6 4% | 417 ? 13% | 615 ? 67% |
| Write Seq Q32T1 (MB/s) | 2535 | 1206 -52% | 1969 -22% | 2019 -20% | 2519 -1% | 1454 -43% | 2218 ? -13% | 6623 ? 161% |
| Read Seq Q32T1 (MB/s) | 3427 | 3091 -10% | 3138 -8% | 2076 -39% | 3448 1% | 1726 -50% | 2940 ? -14% | 8509 ? 148% |
Lettura del carico continuo: DiskSpd look lettura, Profondità coda 8
| 3DMark 06 Standard Score | 36258 punti | |
| 3DMark 11 Performance | 11919 punti | |
| 3DMark Ice Storm Standard Score | 103033 punti | |
| 3DMark Cloud Gate Standard Score | 26945 punti | |
| 3DMark Fire Strike Score | 7783 punti | |
| 3DMark Time Spy Score | 3474 punti | |
Aiuto | ||
| BioShock Infinite - 1920x1080 Ultra Preset, DX11 (DDOF) | |
| Acer Aspire 7 A715-74G-50U5 | |
| Acer ConceptD 3 Pro CN315-71P-73W1 | |
| Media NVIDIA Quadro T1000 (Laptop) (72.9 - 86.6, n=2) | |
| Lenovo ThinkPad P1 2019-20QT000RGE | |
| Lenovo ThinkPad P53s-20N6001NGE | |
| HP ZBook 15u G6 6TP54EA | |
| The Witcher 3 - 1920x1080 Ultra Graphics & Postprocessing (HBAO+) | |
| Media della classe Workstation (51 - 91.7, n=2, ultimi 2 anni) | |
| Acer Aspire 7 A715-74G-50U5 | |
| Acer ConceptD 3 Pro CN315-71P-73W1 | |
| Media NVIDIA Quadro T1000 (Laptop) (30.9 - 37.9, n=3) | |
| Lenovo ThinkPad P1 2019-20QT000RGE | |
| Fujitsu Celsius H780 | |
| Lenovo ThinkPad P53s-20N6001NGE | |
| HP ZBook 15u G6 6TP54EA | |
| Gears Tactics - 1920x1080 High Preset | |
| Acer ConceptD 3 Pro CN315-71P-73W1 | |
| Media NVIDIA Quadro T1000 (Laptop) (n=1) | |
| Doom Eternal - 1920x1080 High Preset | |
| Acer ConceptD 3 Pro CN315-71P-73W1 | |
| Media NVIDIA Quadro T1000 (Laptop) (n=1) | |
| Red Dead Redemption 2 - 1920x1080 Medium Settings | |
| Acer ConceptD 3 Pro CN315-71P-73W1 | |
| Media NVIDIA Quadro T1000 (Laptop) (n=1) | |
| Star Wars Jedi Fallen Order - 1920x1080 Epic Preset | |
| Acer ConceptD 3 Pro CN315-71P-73W1 | |
| Media NVIDIA Quadro T1000 (Laptop) (n=1) | |
| basso | medio | alto | ultra | |
|---|---|---|---|---|
| BioShock Infinite (2013) | 316.4 | 241 | 216.3 | 86.6 |
| GTA V (2015) | 170.1 | 153.9 | 93.8 | 41.7 |
| The Witcher 3 (2015) | 190.7 | 115.9 | 62.8 | 37.9 |
| Dota 2 Reborn (2015) | 141.4 | 124.8 | 113.6 | 106.7 |
| Rainbow Six Siege (2015) | 244.3 | 197.9 | 139.3 | 117.9 |
| For Honor (2017) | 199.8 | 77.5 | 74.3 | 56.7 |
| Final Fantasy XV Benchmark (2018) | 56.1 | 49.2 | 34 | |
| X-Plane 11.11 (2018) | 79.7 | 66.2 | 57.1 | |
| World of Tanks enCore (2018) | 491.9 | 199.3 | 77.1 | |
| Far Cry 5 (2018) | 107 | 62 | 57 | 53 |
| Shadow of the Tomb Raider (2018) | 101 | 58 | 50 | 45 |
| Assassin´s Creed Odyssey (2018) | 82 | 55 | 50 | 29 |
| Battlefield V (2018) | 138.1 | 76.5 | 66.6 | 59.4 |
| Apex Legends (2019) | 144 | 92.7 | 69 | 68.7 |
| Metro Exodus (2019) | 93.3 | 43.4 | 31.9 | 25.5 |
| Dirt Rally 2.0 (2019) | 232.8 | 100.5 | 79.4 | 42.5 |
| The Division 2 (2019) | 111 | 61 | 48 | 35 |
| Anno 1800 (2019) | 94.5 | 73.4 | 45.2 | 23.1 |
| Rage 2 (2019) | 123.7 | 55.2 | 45.7 | 45.1 |
| Total War: Three Kingdoms (2019) | 182.3 | 62.5 | 37.5 | 25.6 |
| F1 2019 (2019) | 178 | 105 | 92 | 79 |
| Control (2019) | 136.8 | 42.4 | 31.2 | |
| Borderlands 3 (2019) | 117.9 | 58.7 | 38 | 28.5 |
| FIFA 20 (2019) | 208 | 171.3 | 160.3 | 148.9 |
| Ghost Recon Breakpoint (2019) | 93 | 53 | 47 | 32 |
| GRID 2019 (2019) | 125.4 | 76.8 | 65.2 | 42.8 |
| Call of Duty Modern Warfare 2019 (2019) | 96.7 | 61.2 | 50.8 | 44 |
| Need for Speed Heat (2019) | 86 | 60.5 | 51.9 | 46.9 |
| Star Wars Jedi Fallen Order (2019) | 67.3 | 57.6 | 50.4 | |
| Red Dead Redemption 2 (2019) | 87.9 | 46.7 | 29.9 | 19.4 |
| Escape from Tarkov (2020) | 121.4 | 87.9 | 67.8 | 56 |
| Hunt Showdown (2020) | 134.1 | 51 | 44.4 | |
| Doom Eternal (2020) | 150 | 78 | 64.3 | |
| Gears Tactics (2020) | 190.9 | 91.8 | 58.4 | 43.5 |
Rumorosità
| Idle |
| 31.2 / 31.2 / 31.5 dB(A) |
| Sotto carico |
| 38.4 / 41.2 dB(A) |
 | ||
30 dB silenzioso 40 dB(A) udibile 50 dB(A) rumoroso |
||
min: | ||
(±) La temperatura massima sul lato superiore è di 42 °C / 108 F, rispetto alla media di 38.2 °C / 101 F, che varia da 22.2 a 69.8 °C per questa classe Workstation.
(-) Il lato inferiore si riscalda fino ad un massimo di 50.6 °C / 123 F, rispetto alla media di 41.1 °C / 106 F
(+) In idle, la temperatura media del lato superiore è di 24.4 °C / 76 F, rispetto alla media deld ispositivo di 32 °C / 90 F.
(±) Riproducendo The Witcher 3, la temperatura media per il lato superiore e' di 36.8 °C / 98 F, rispetto alla media del dispositivo di 32 °C / 90 F.
(+) I poggiapolsi e il touchpad sono piu' freddi della temperatura della pelle con un massimo di 29.6 °C / 85.3 F e sono quindi freddi al tatto.
(±) La temperatura media della zona del palmo della mano di dispositivi simili e'stata di 27.8 °C / 82 F (-1.8 °C / -3.3 F).
Acer ConceptD 3 Pro CN315-71P-73W1 analisi audio
(-) | altoparlanti non molto potenti (63 dB)
Bassi 100 - 315 Hz
(-) | quasi nessun basso - in media 22.7% inferiori alla media
(±) | la linearità dei bassi è media (11.6% delta rispetto alla precedente frequenza)
Medi 400 - 2000 Hz
(+) | medi bilanciati - solo only 1.7% rispetto alla media
(+) | medi lineari (4.7% delta rispetto alla precedente frequenza)
Alti 2 - 16 kHz
(+) | Alti bilanciati - appena 1.8% dalla media
(+) | alti lineari (5% delta rispetto alla precedente frequenza)
Nel complesso 100 - 16.000 Hz
(±) | la linearità complessiva del suono è media (21.2% di differenza rispetto alla media
Rispetto alla stessa classe
» 76% di tutti i dispositivi testati in questa classe è stato migliore, 6% simile, 18% peggiore
» Il migliore ha avuto un delta di 7%, medio di 17%, peggiore di 35%
Rispetto a tutti i dispositivi testati
» 59% di tutti i dispositivi testati in questa classe è stato migliore, 7% similare, 34% peggiore
» Il migliore ha avuto un delta di 4%, medio di 24%, peggiore di 134%
Lenovo ThinkPad P1 2019-20QT000RGE analisi audio
(±) | potenza degli altiparlanti media ma buona (74 dB)
Bassi 100 - 315 Hz
(±) | bassi ridotti - in media 10.6% inferiori alla media
(±) | la linearità dei bassi è media (13% delta rispetto alla precedente frequenza)
Medi 400 - 2000 Hz
(+) | medi bilanciati - solo only 4.4% rispetto alla media
(+) | medi lineari (5.9% delta rispetto alla precedente frequenza)
Alti 2 - 16 kHz
(+) | Alti bilanciati - appena 2.4% dalla media
(±) | la linearità degli alti è media (8.2% delta rispetto alla precedente frequenza)
Nel complesso 100 - 16.000 Hz
(±) | la linearità complessiva del suono è media (16.7% di differenza rispetto alla media
Rispetto alla stessa classe
» 46% di tutti i dispositivi testati in questa classe è stato migliore, 9% simile, 45% peggiore
» Il migliore ha avuto un delta di 7%, medio di 17%, peggiore di 35%
Rispetto a tutti i dispositivi testati
» 29% di tutti i dispositivi testati in questa classe è stato migliore, 7% similare, 64% peggiore
» Il migliore ha avuto un delta di 4%, medio di 24%, peggiore di 134%
| Off / Standby | |
| Idle | |
| Sotto carico |
|
Leggenda:
min: | |
Pro
Contro
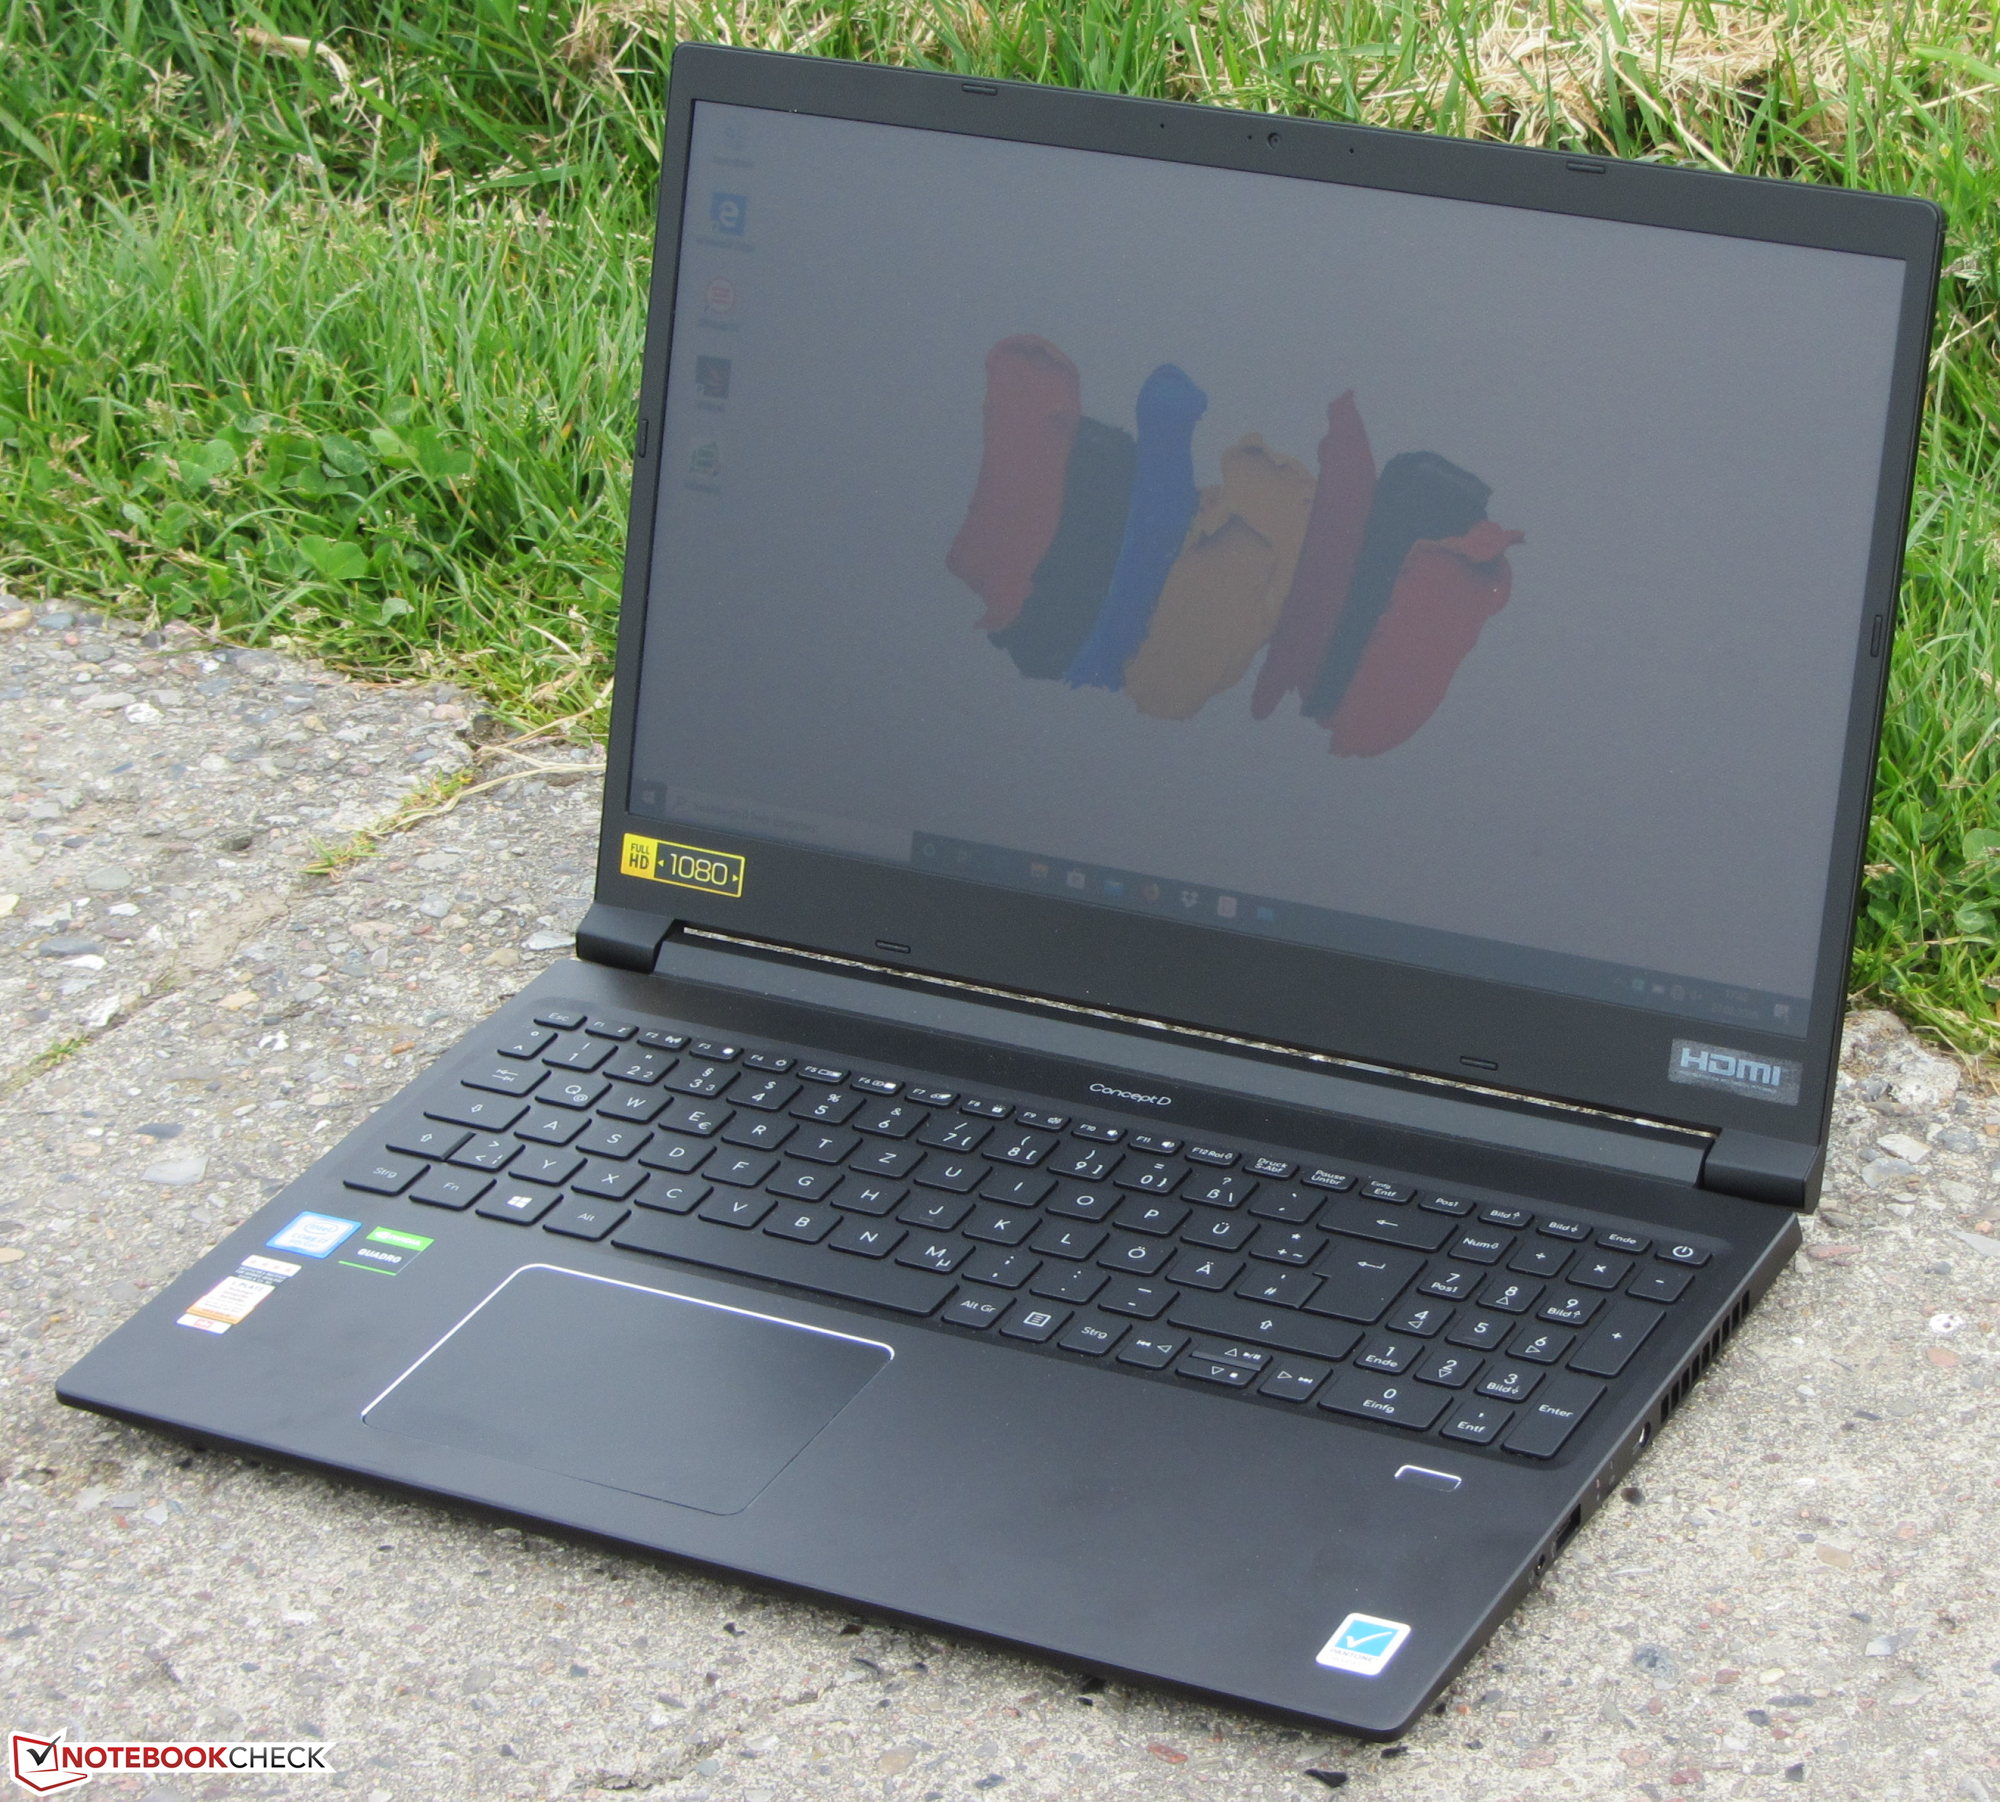
Con un processore Core i7-9750H e un core grafico Quadro T1000, questa workstation è dotata di una tecnologia all'avanguardia. Anche se non si tratta di un portatile gaming, l'hardware integrato gestisce tutti i giochi moderni senza problemi sullo schermo.
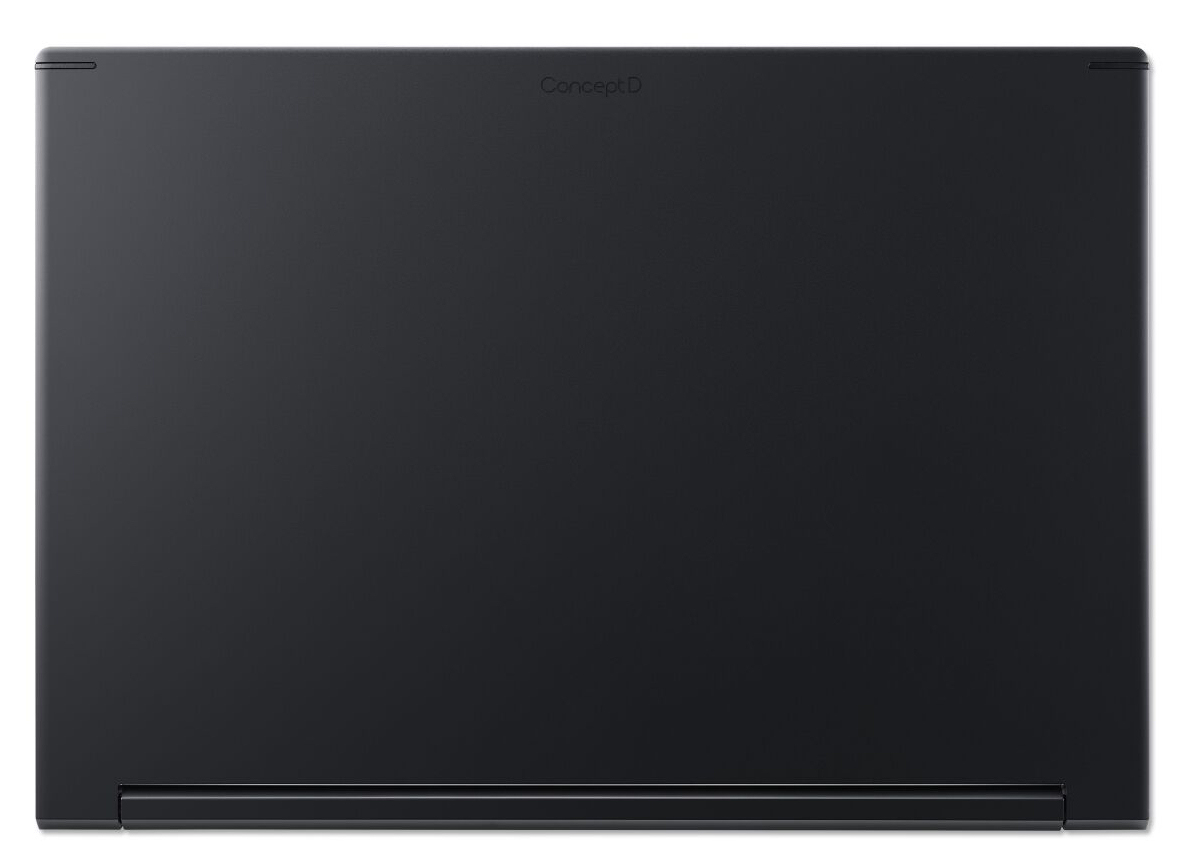
Con il ConceptD 3 Pro CN315-71P, Acer ha creato una workstation da 15,6 pollici completa che offre anche una buona autonomia della batteria.
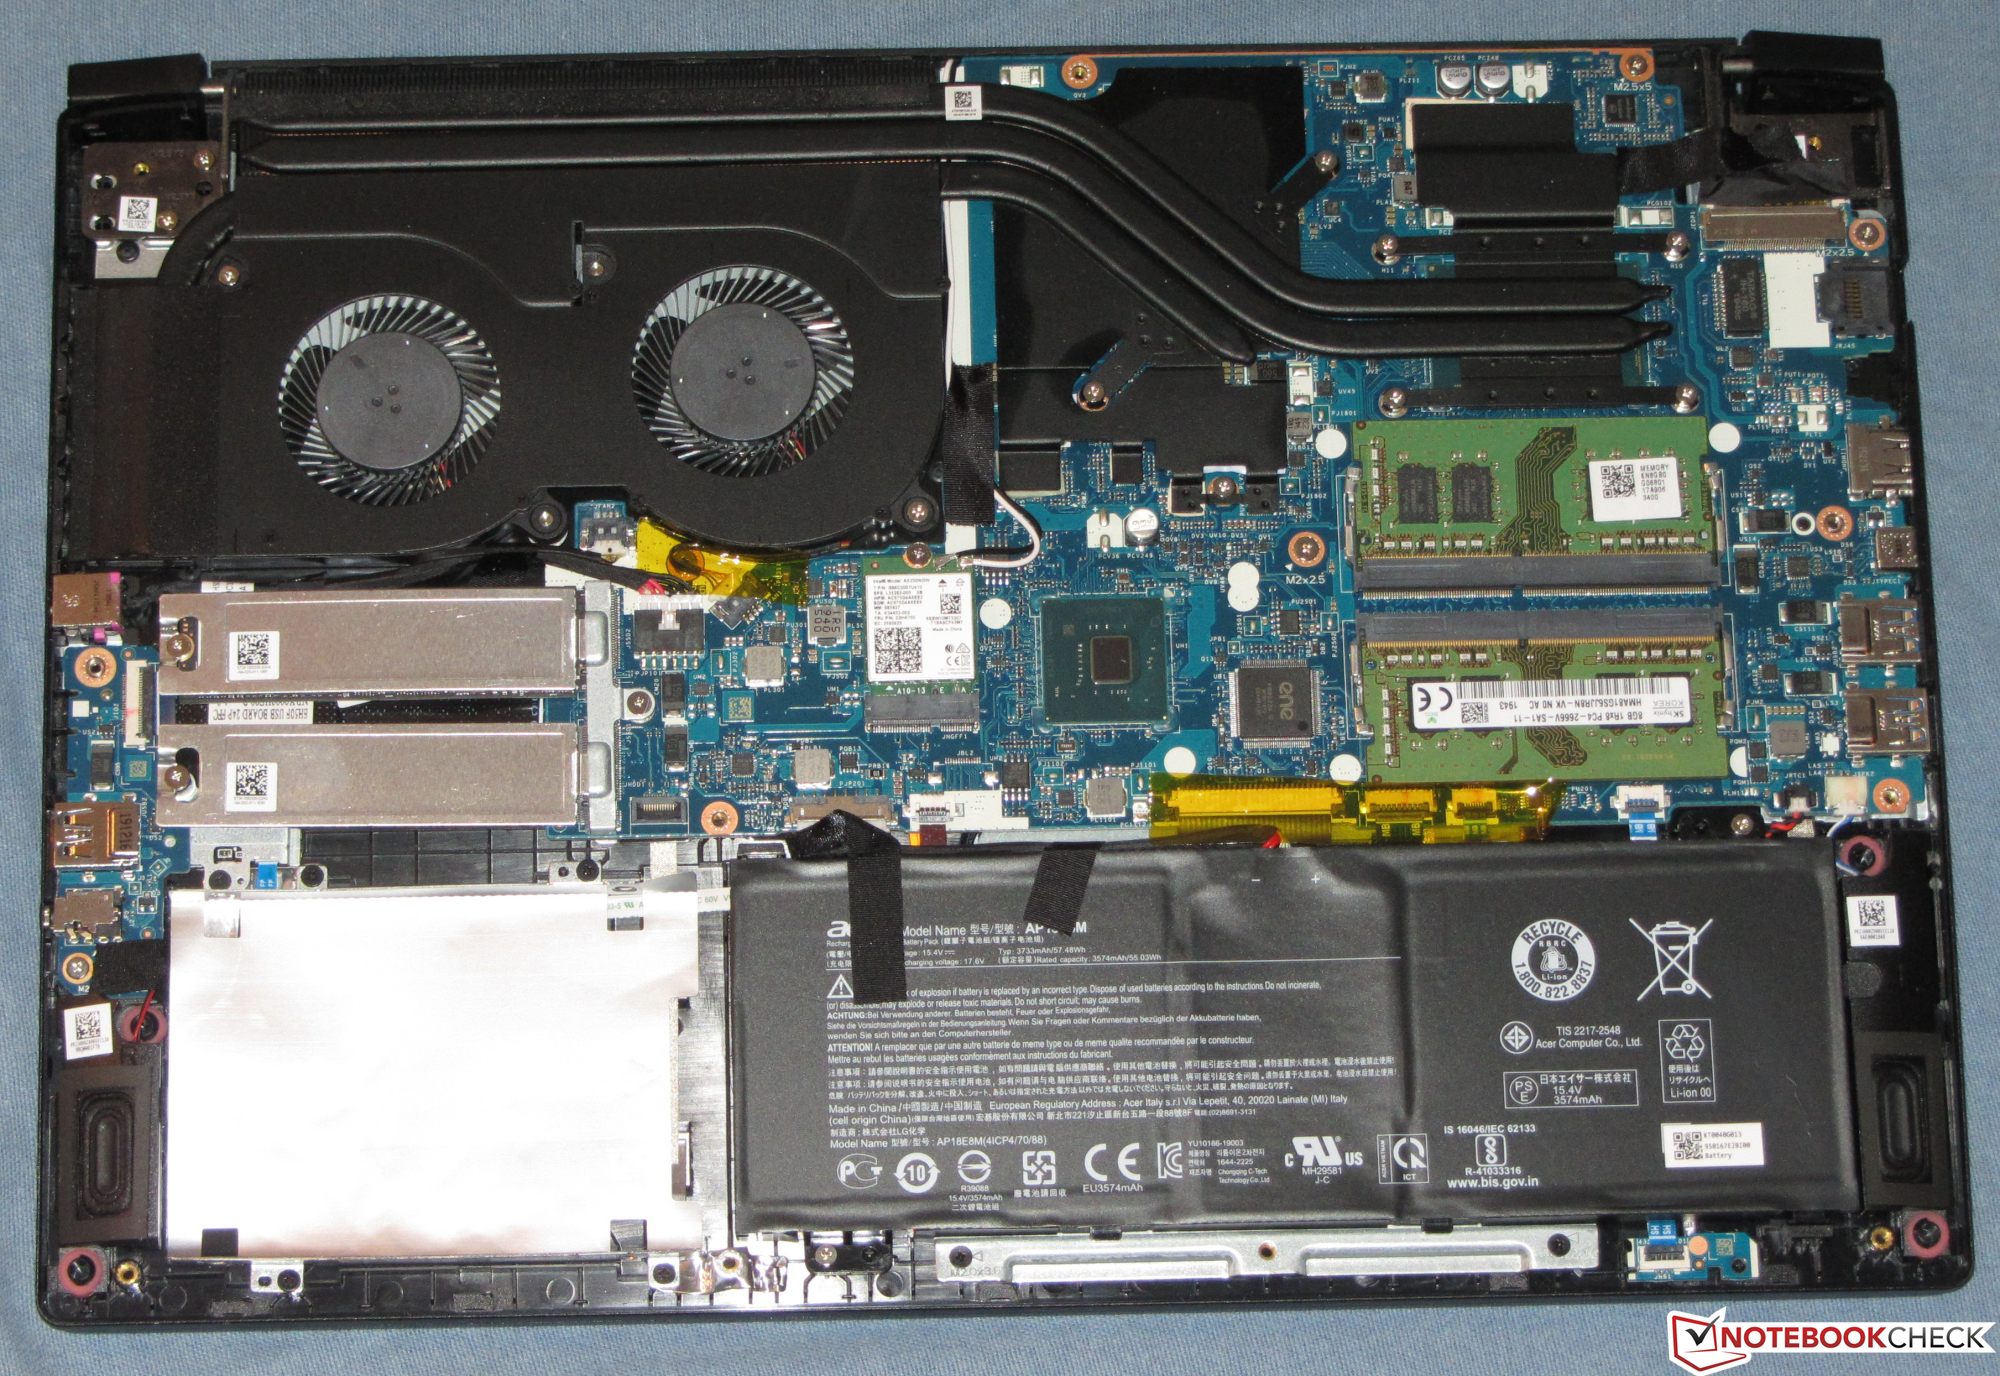
Un SSD NVMe da 512 GB assicura un sistema veloce. Se lo spazio di memoria si esaurisce, può essere aggiornato senza problemi. Inoltre, il laptop offre spazio per un secondo SSD M.2 2280 (NVMe/SATA) e per un dispositivo di memorizzazione da 2,5 pollici.
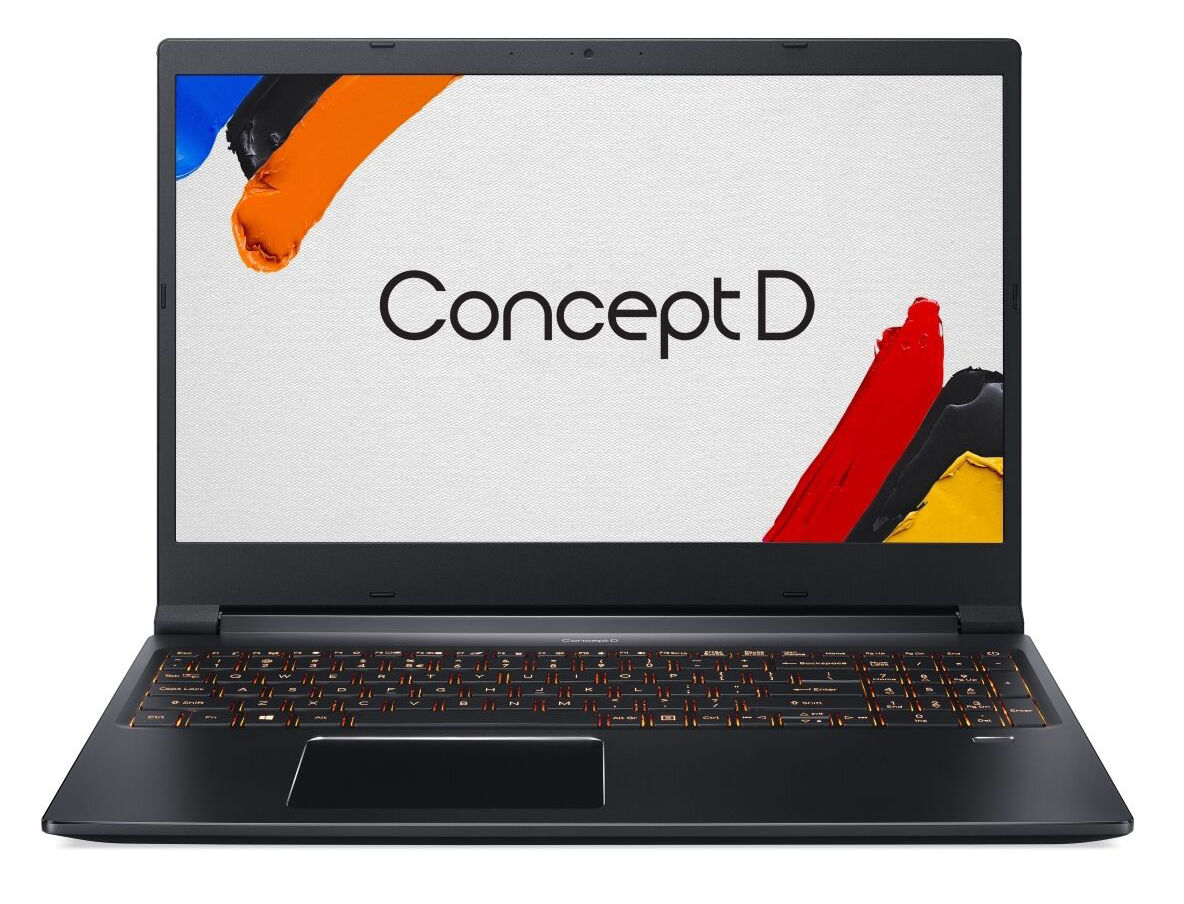
Il display Full HD IPS opaco si presenta con un buon contrasto, angoli di visualizzazione stabili, una buona luminosità e - grazie alla certificazione Pantone - un'ottima riproduzione dei colori. Lo spazio colore sRGB ha una copertura del 100%. Il portatile Acer non manca di resistenza. Inoltre, questa workstation completa il nostro test pratico WLAN dopo 8:04 h. C'è anche una tastiera retroilluminata adatta all'uso quotidiano.
Ci manca una porta Thunderbolt 3. Questo permetterebbe il collegamento di una GPU esterna più potente o di una soluzione di docking estesa. Purtroppo, Acer fornisce alla workstation solo una semplice porta USB Type-C (USB 3.2 Gen 1), che non offre nemmeno DisplayPort via USB-C
Acer ConceptD 3 Pro CN315-71P-73W1
- 06/10/2020 v7 (old)
Sascha Mölck
Price comparison
