Recensione del Dell Precision 5680: Ada Lovelace domina sulle workstation

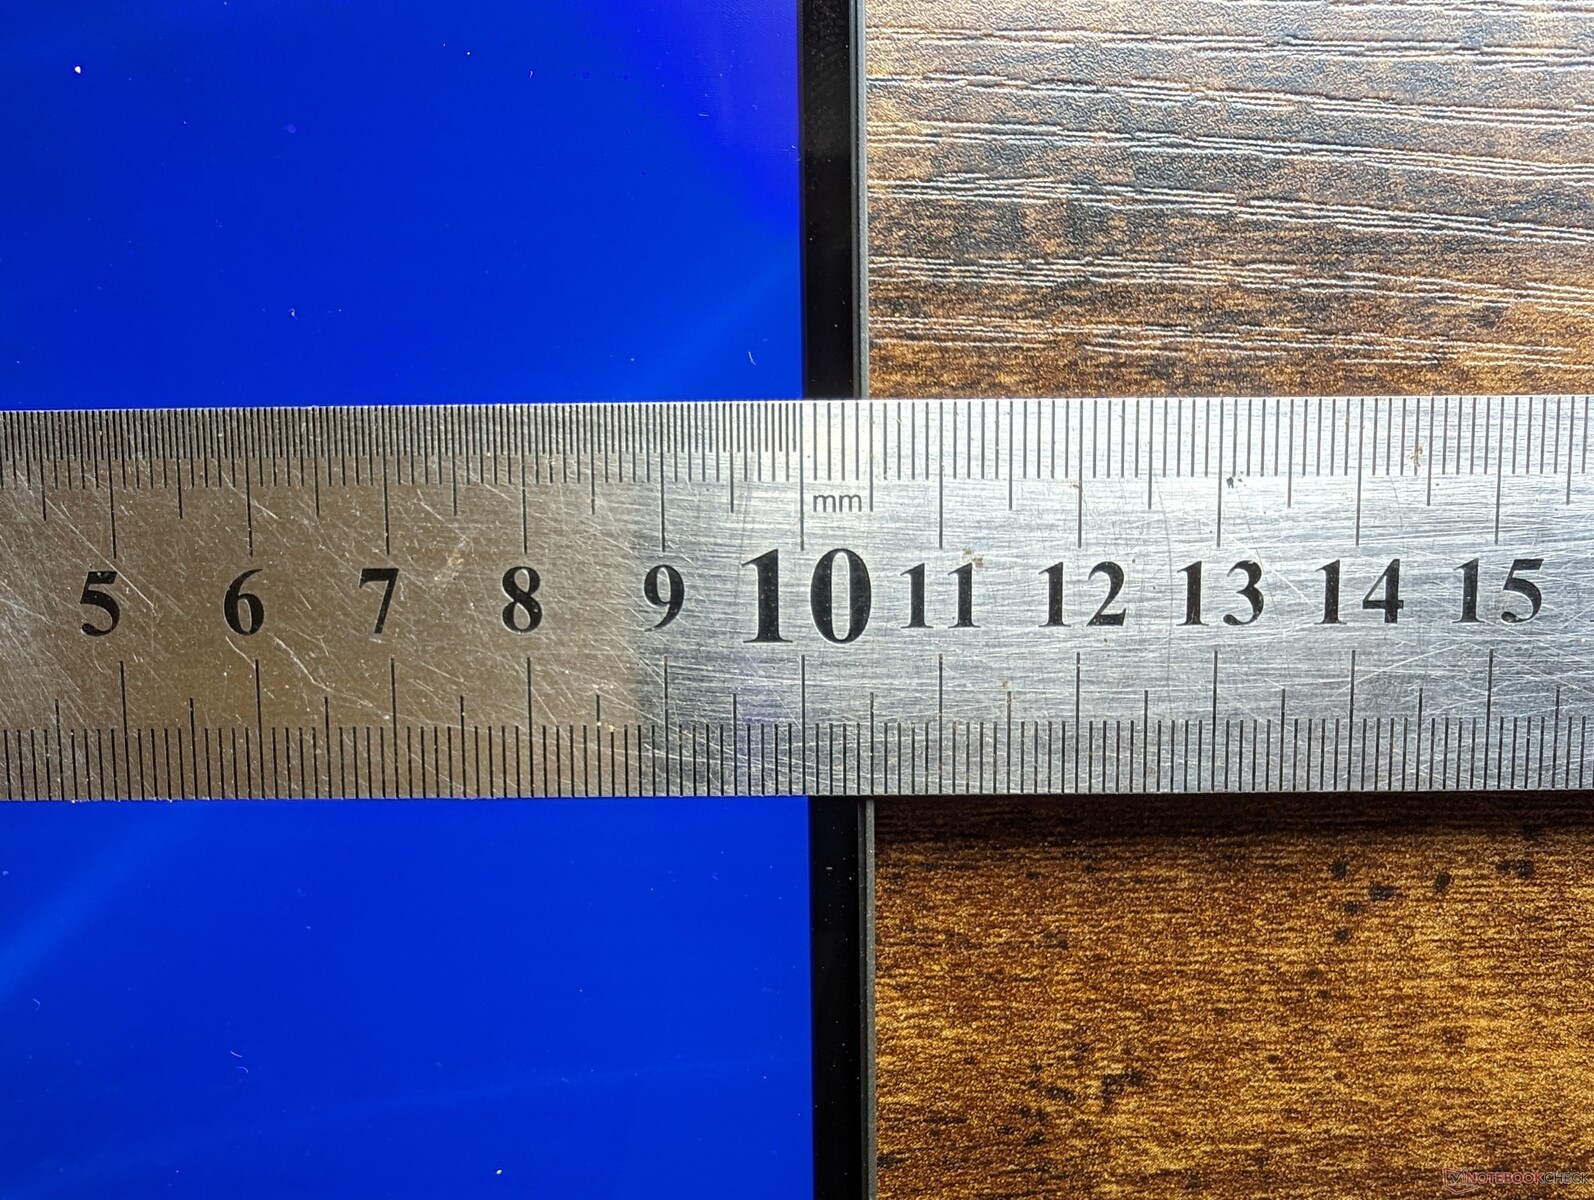
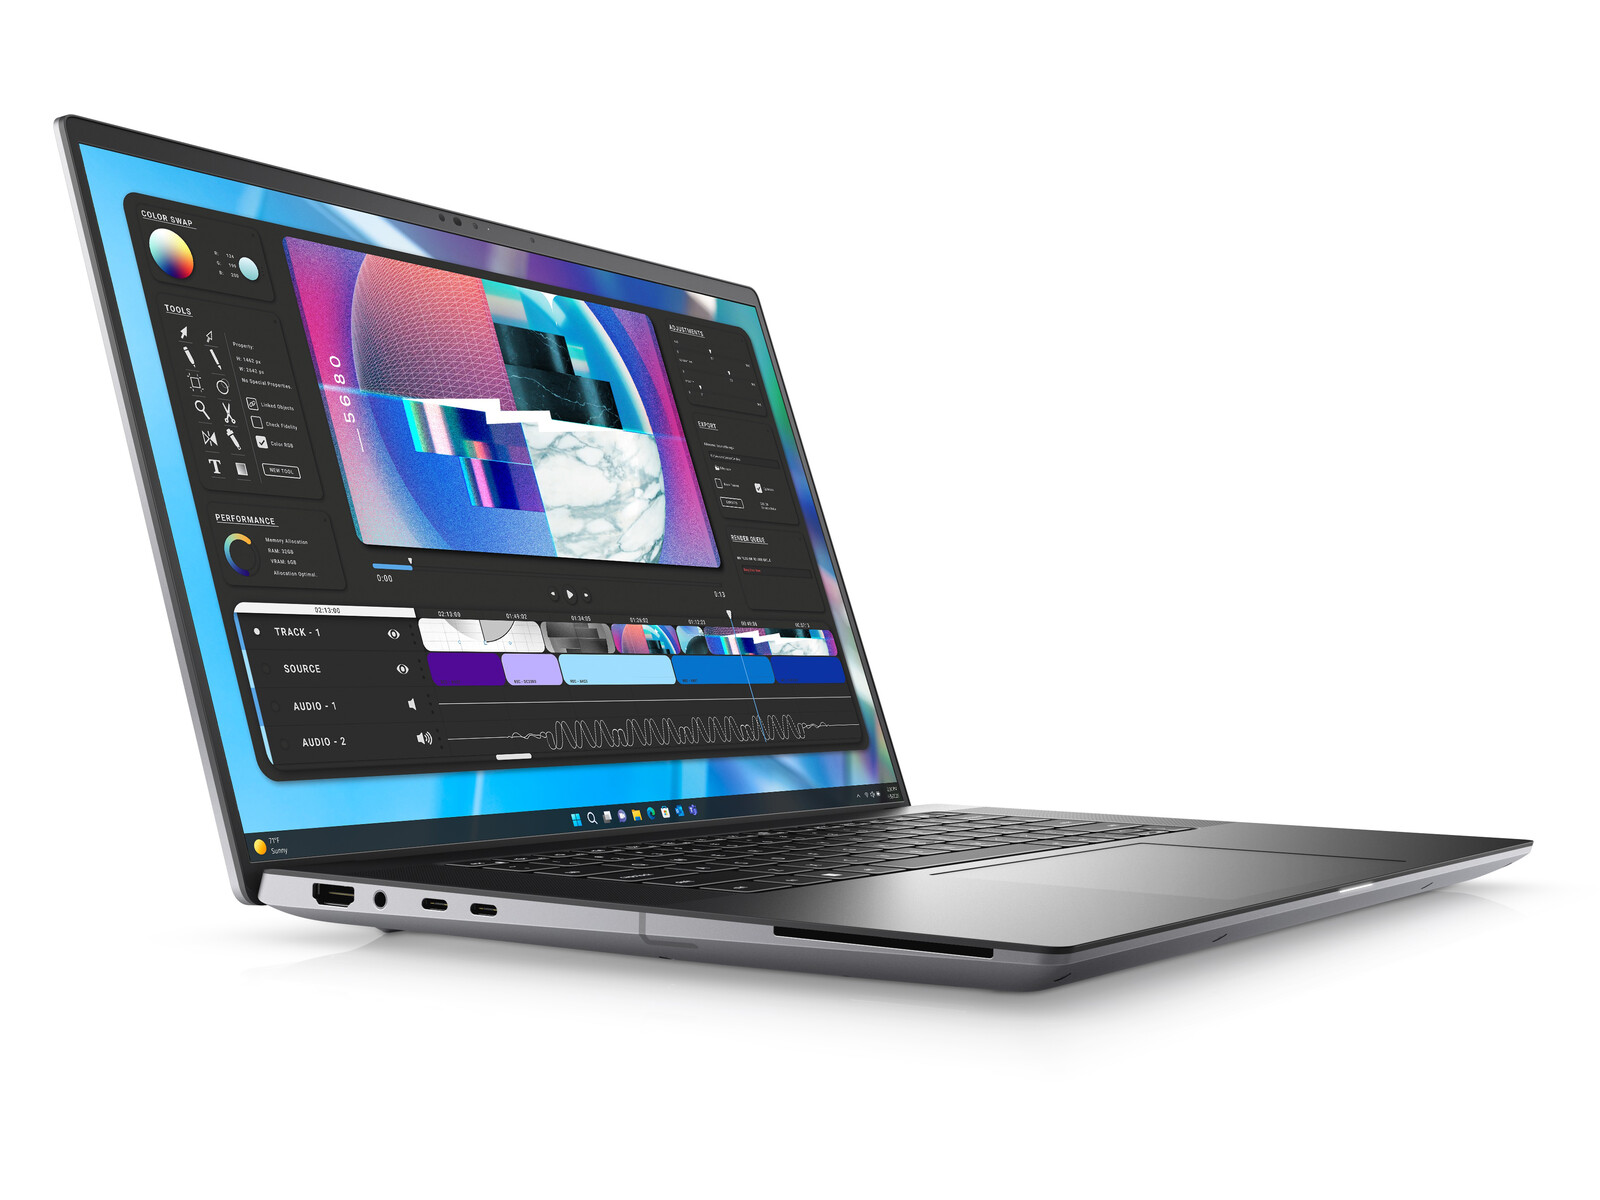
Precision 5680 è il primo modello da 16 pollici della serie Precision 5000, che si affianca al modello da 14 pollici già esistente Precision 5470e 15 pollici Precision 5560e 17 pollici Precision 5750. Si tratta di una workstation mobile di fascia alta, più sottile e leggera di un modello 7000 Precision modello 7000 anche se con meno funzioni ausiliarie integrate.
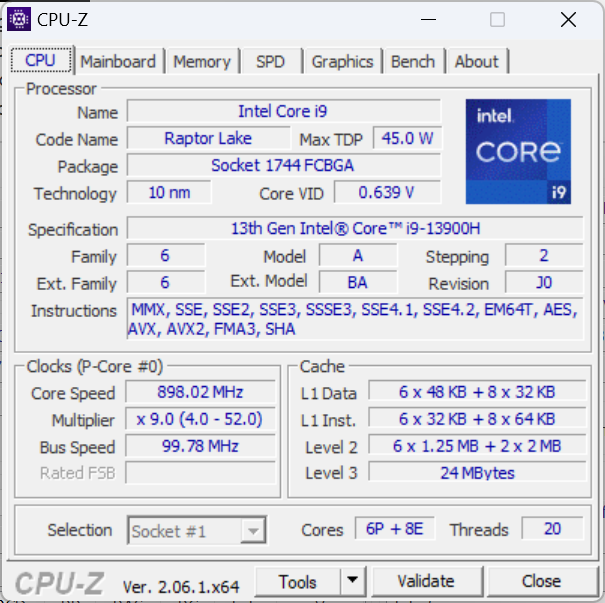
La nostra unità di prova è una configurazione di fascia alta con CPU Raptor Lake-H Core i9-13900H di 13a generazione, GPU Nvidia RTX 5000 da 75 W e touchscreen OLED da 2400p per circa 6500 dollari. Sono disponibili SKU inferiori con Core i5-13600H, senza GPU discreta e display IPS da 1200p per un prezzo di partenza inferiore di circa 2490 dollari.
Questa è anche una delle prime workstation ad essere fornita con la GPU mobile RTX 5000 Ada Lovelace, che non deve essere confusa con la Quadro RTX 5000 basata su Turing Quadro RTX 5000 o la GPU RTX A5000 basata su Ampere RTX A5000.
I concorrenti in questo spazio includono altre workstation da 16 pollici come il modelloHP ZBook Fury 16 G9,Lenovo ThinkPad P16 G1,MSI CreatorPro Z16Po la serie Asus ProArt StudioBook 16.
Altre recensioni Dell:
Potenziali concorrenti a confronto
Punteggio | Data | Modello | Peso | Altezza | Dimensione | Risoluzione | Prezzo |
|---|---|---|---|---|---|---|---|
| 89 % v7 (old) | 08/2023 | Dell Precision 5000 5680 i9-13900H, RTX 5000 Ada Generation Laptop | 2.3 kg | 22.17 mm | 16.00" | 3840x2400 | |
| 89.1 % v7 (old) | 12/2022 | Dell Precision 7000 7670 Performance i9-12950HX, RTX A5500 Laptop GPU | 2.8 kg | 25.95 mm | 16.00" | 3840x2400 | |
| 91 % v7 (old) | 06/2023 | HP ZBook Fury 16 G9 i9-12950HX, RTX A5500 Laptop GPU | 2.6 kg | 28.5 mm | 16.00" | 3840x2400 | |
| 91 % v7 (old) | 02/2023 | Lenovo ThinkPad P16 G1 RTX A5500 i9-12950HX, RTX A5500 Laptop GPU | 3 kg | 30.23 mm | 16.00" | 3840x2400 | |
| 84.3 % v7 (old) | 11/2022 | MSI CreatorPro Z16P B12UKST i7-12700H, RTX A3000 Laptop GPU | 2.4 kg | 19 mm | 16.00" | 2560x1600 | |
| 89.6 % v7 (old) | 01/2023 | Asus ExpertBook B6 Flip B6602FC2 i9-12950HX, RTX A2000 Laptop GPU | 2.8 kg | 27.2 mm | 16.00" | 2560x1600 |
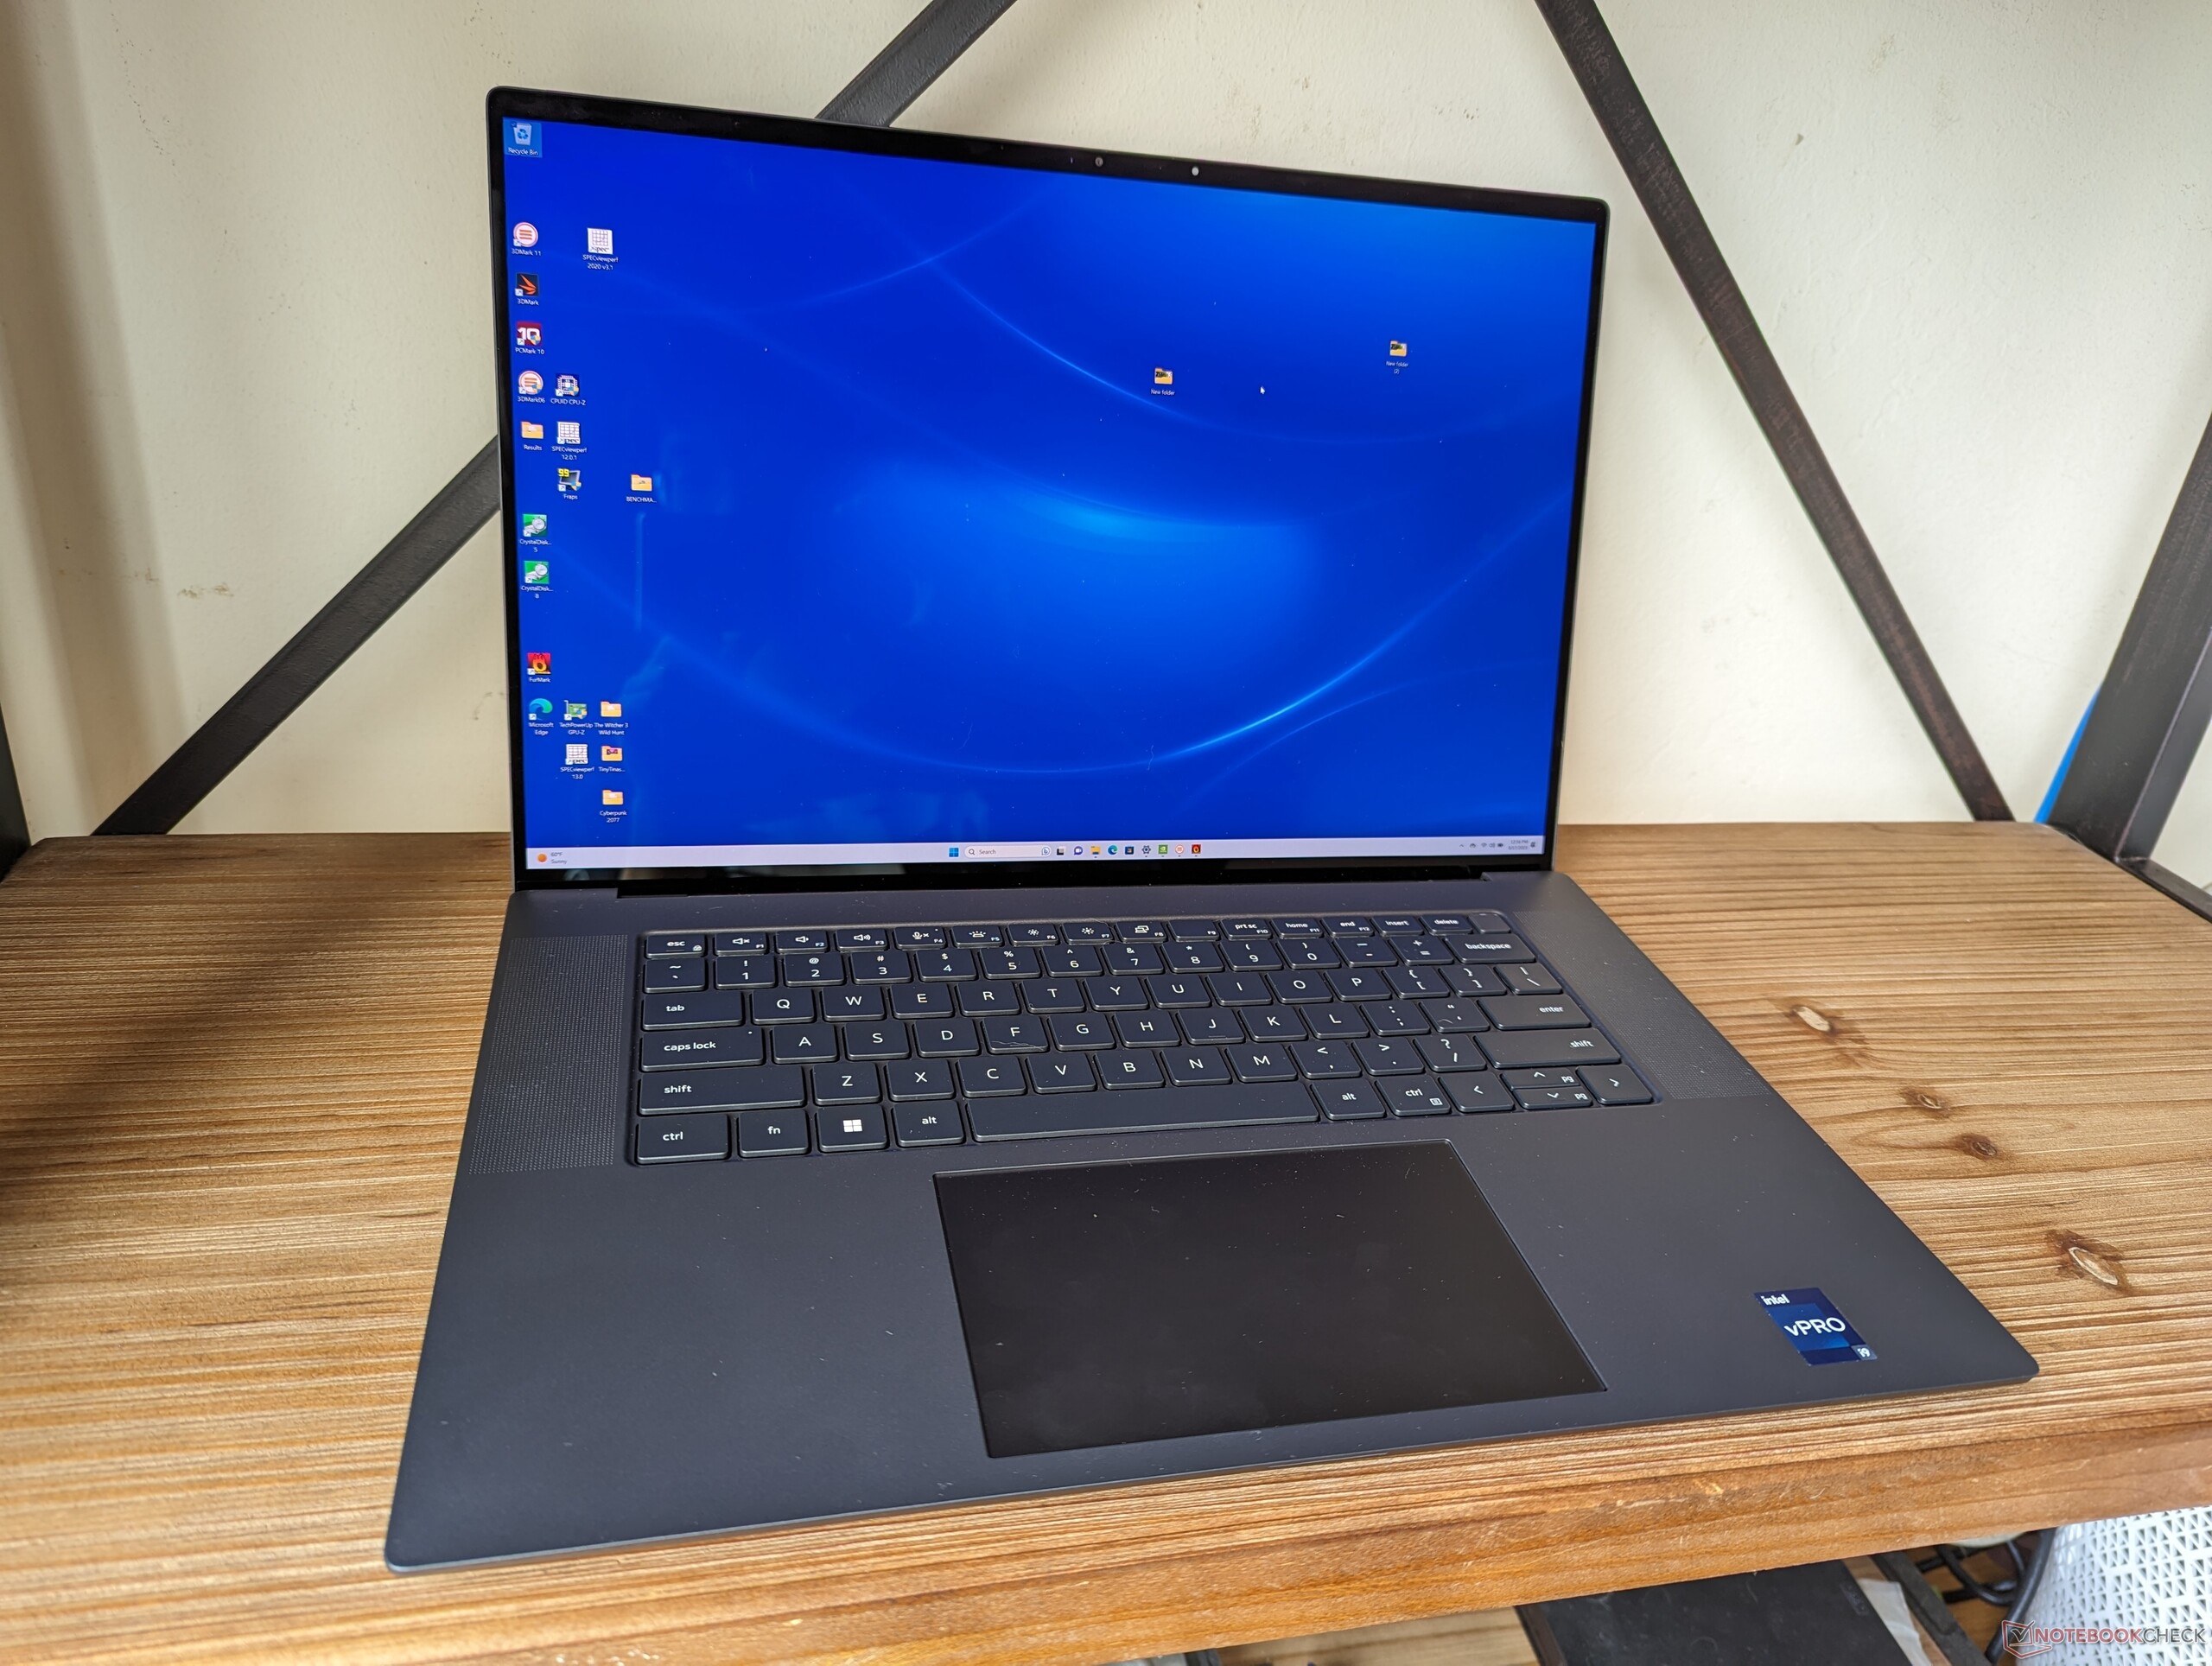
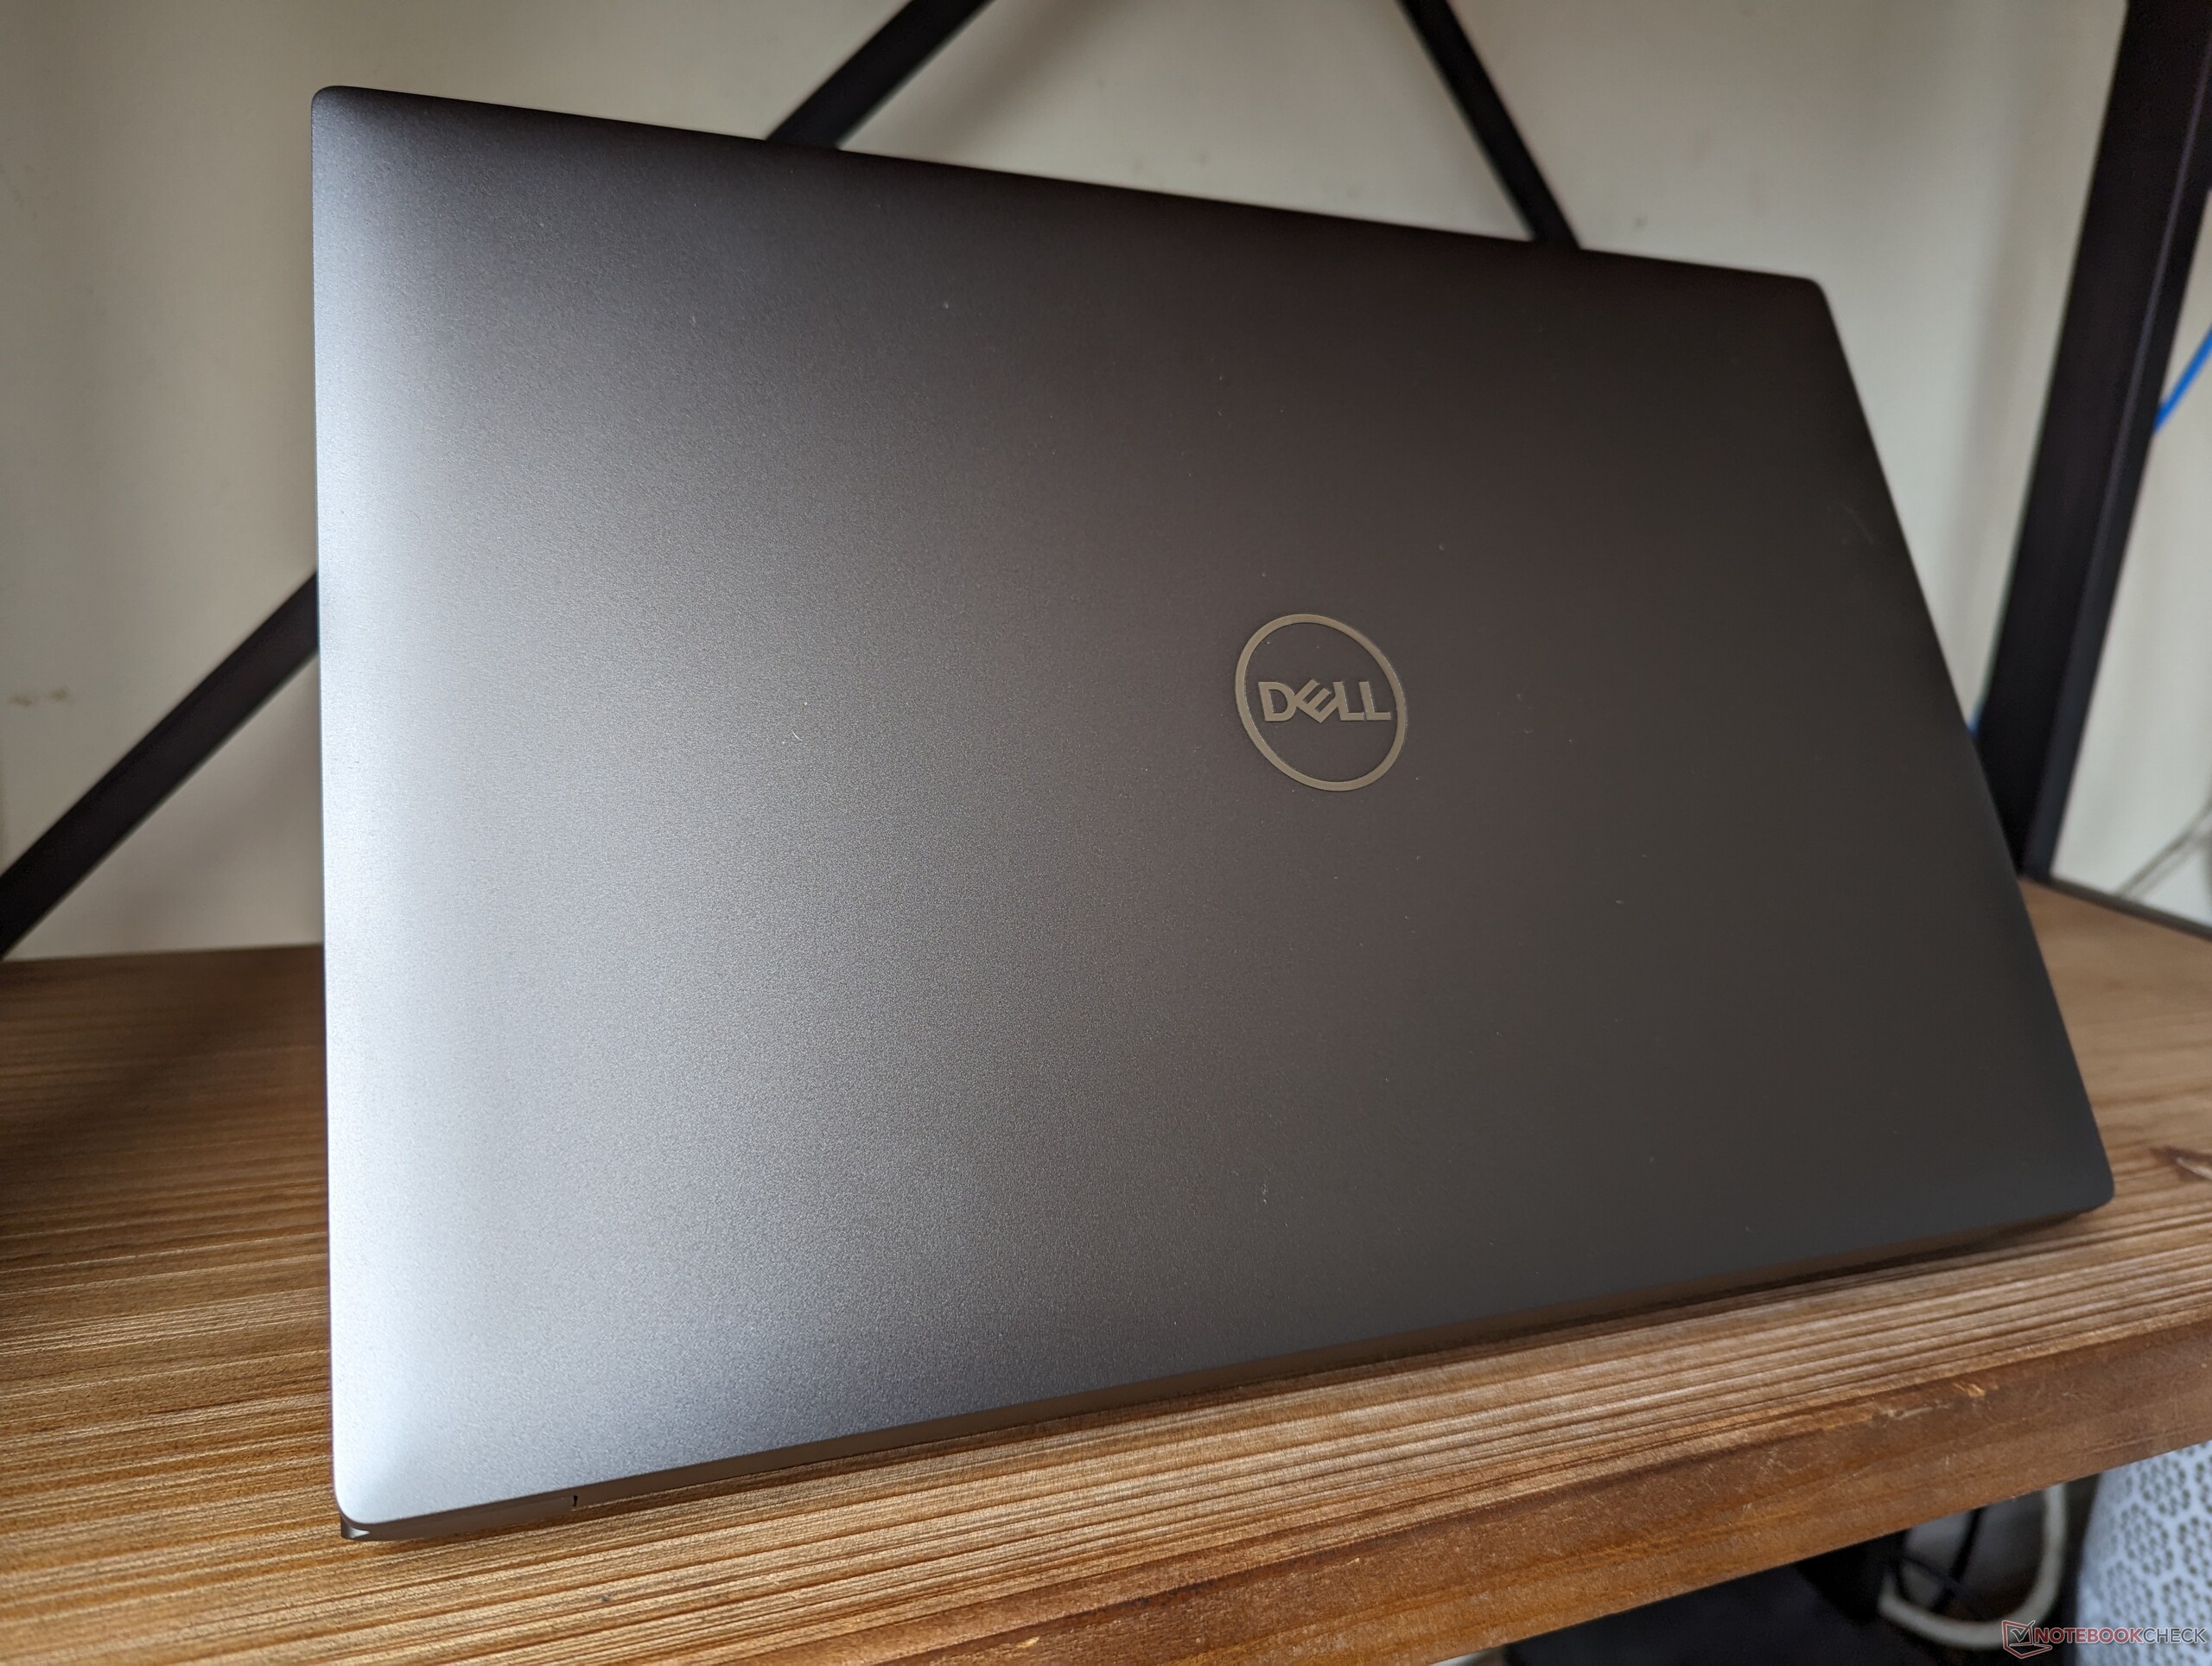
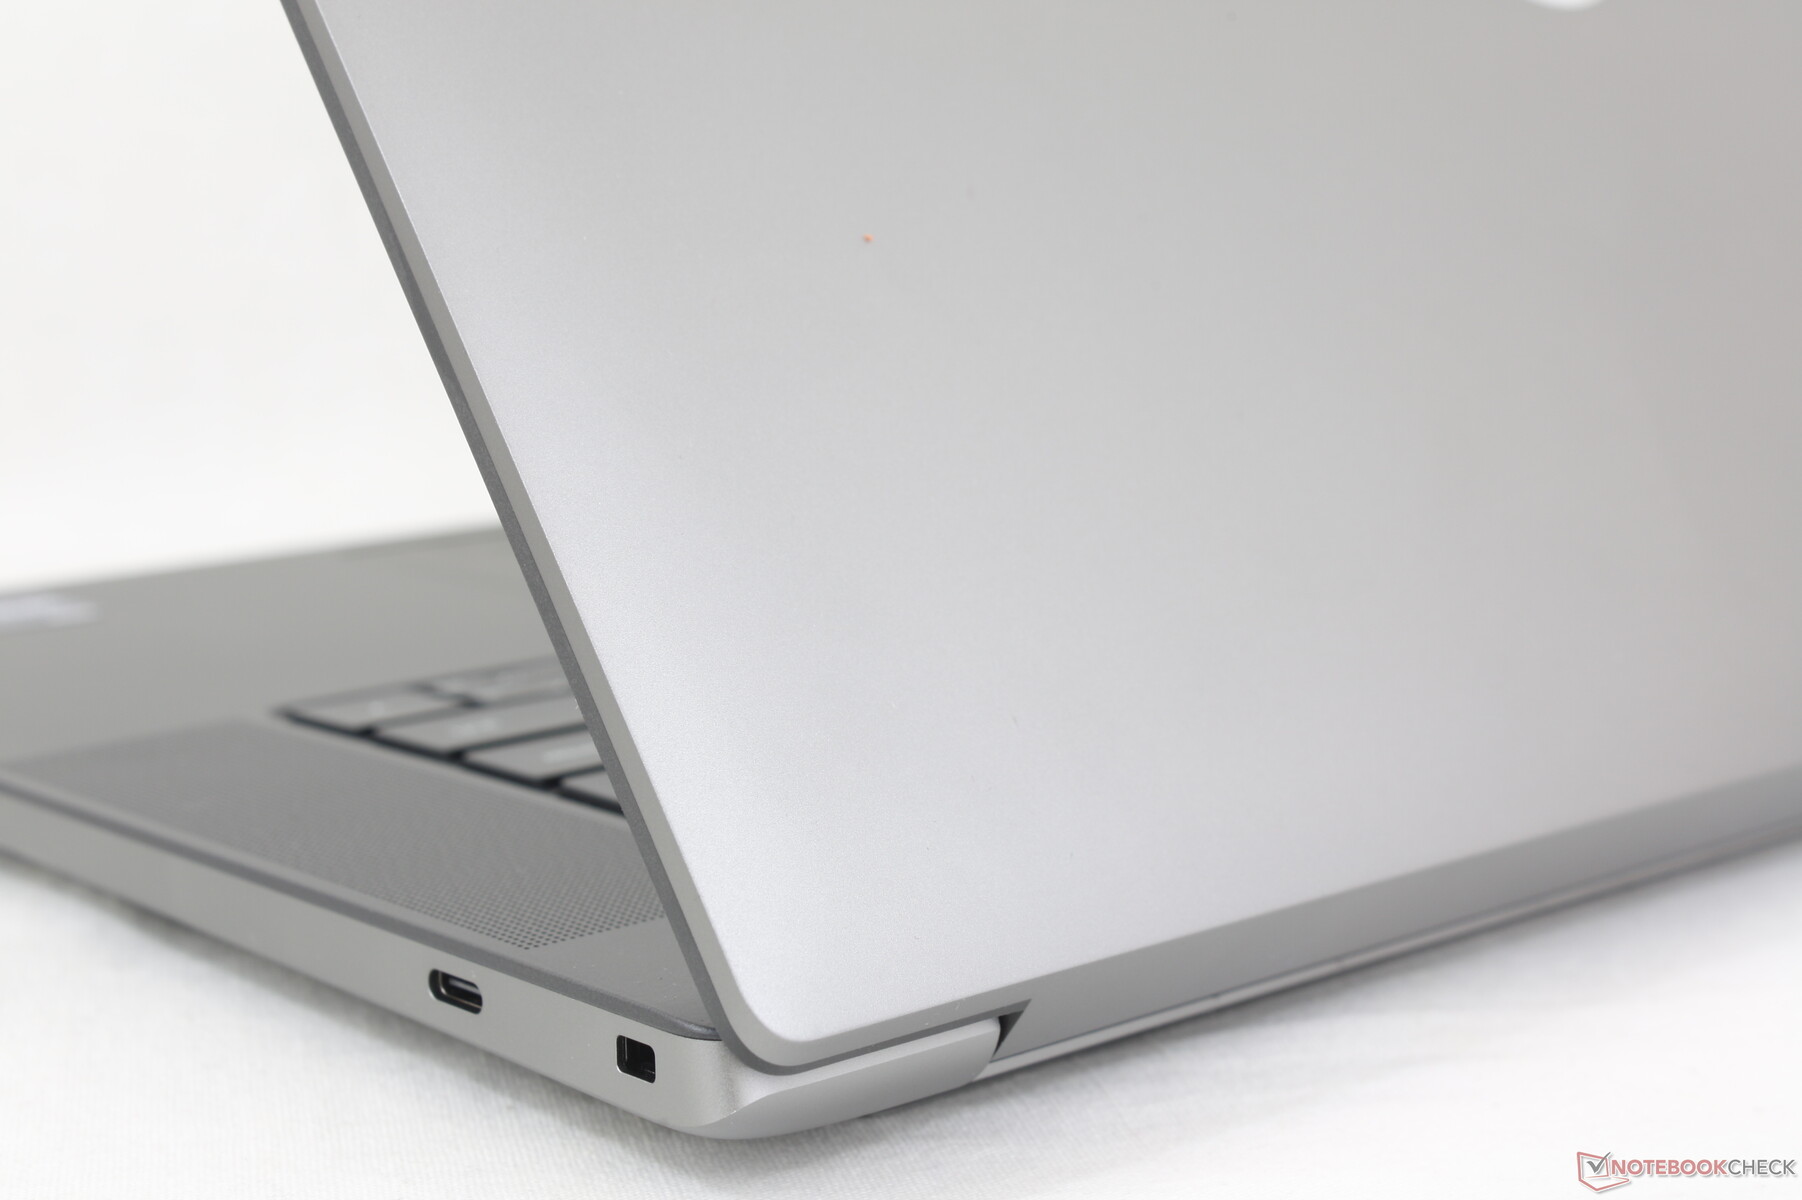
Custodia - Radici XPS
L'ispirazione per il design di Precision 5680 è ovvia, in quanto si tratta essenzialmente della versione da 16 pollici dell'XPS 15 pollici XPS 15 e 17 pollici XPS 17. Se avete già avuto esperienza con un modello XPS, allora il Precision 5680 vi sembrerà immediatamente familiare. Sembra che preceda un ipotetico "XPS 16" e non saremmo sorpresi di vedere un modello simile nel prossimo futuro con uno chassis basato su Precision 5680.
La qualità costruttiva si confronta positivamente con alternative come lo ZBook Fury 16 G9 o ilCreatorPro Z16P che sono anch'essi costituiti principalmente da leghe metalliche per una prima impressione di solidità.
Con soli 2,3 kg, Precision 5680 è una delle workstation da 16 pollici più leggere disponibili sul mercato. CreatorPro Z16P eHP ZBook Fury 16 G9ad esempio, sono più pesanti rispettivamente di circa 100 e 300 g, oltre ad avere un ingombro maggiore rispetto al nostro Dell. Il Precision 5680 è sorprendentemente portatile considerando le sue prestazioni.
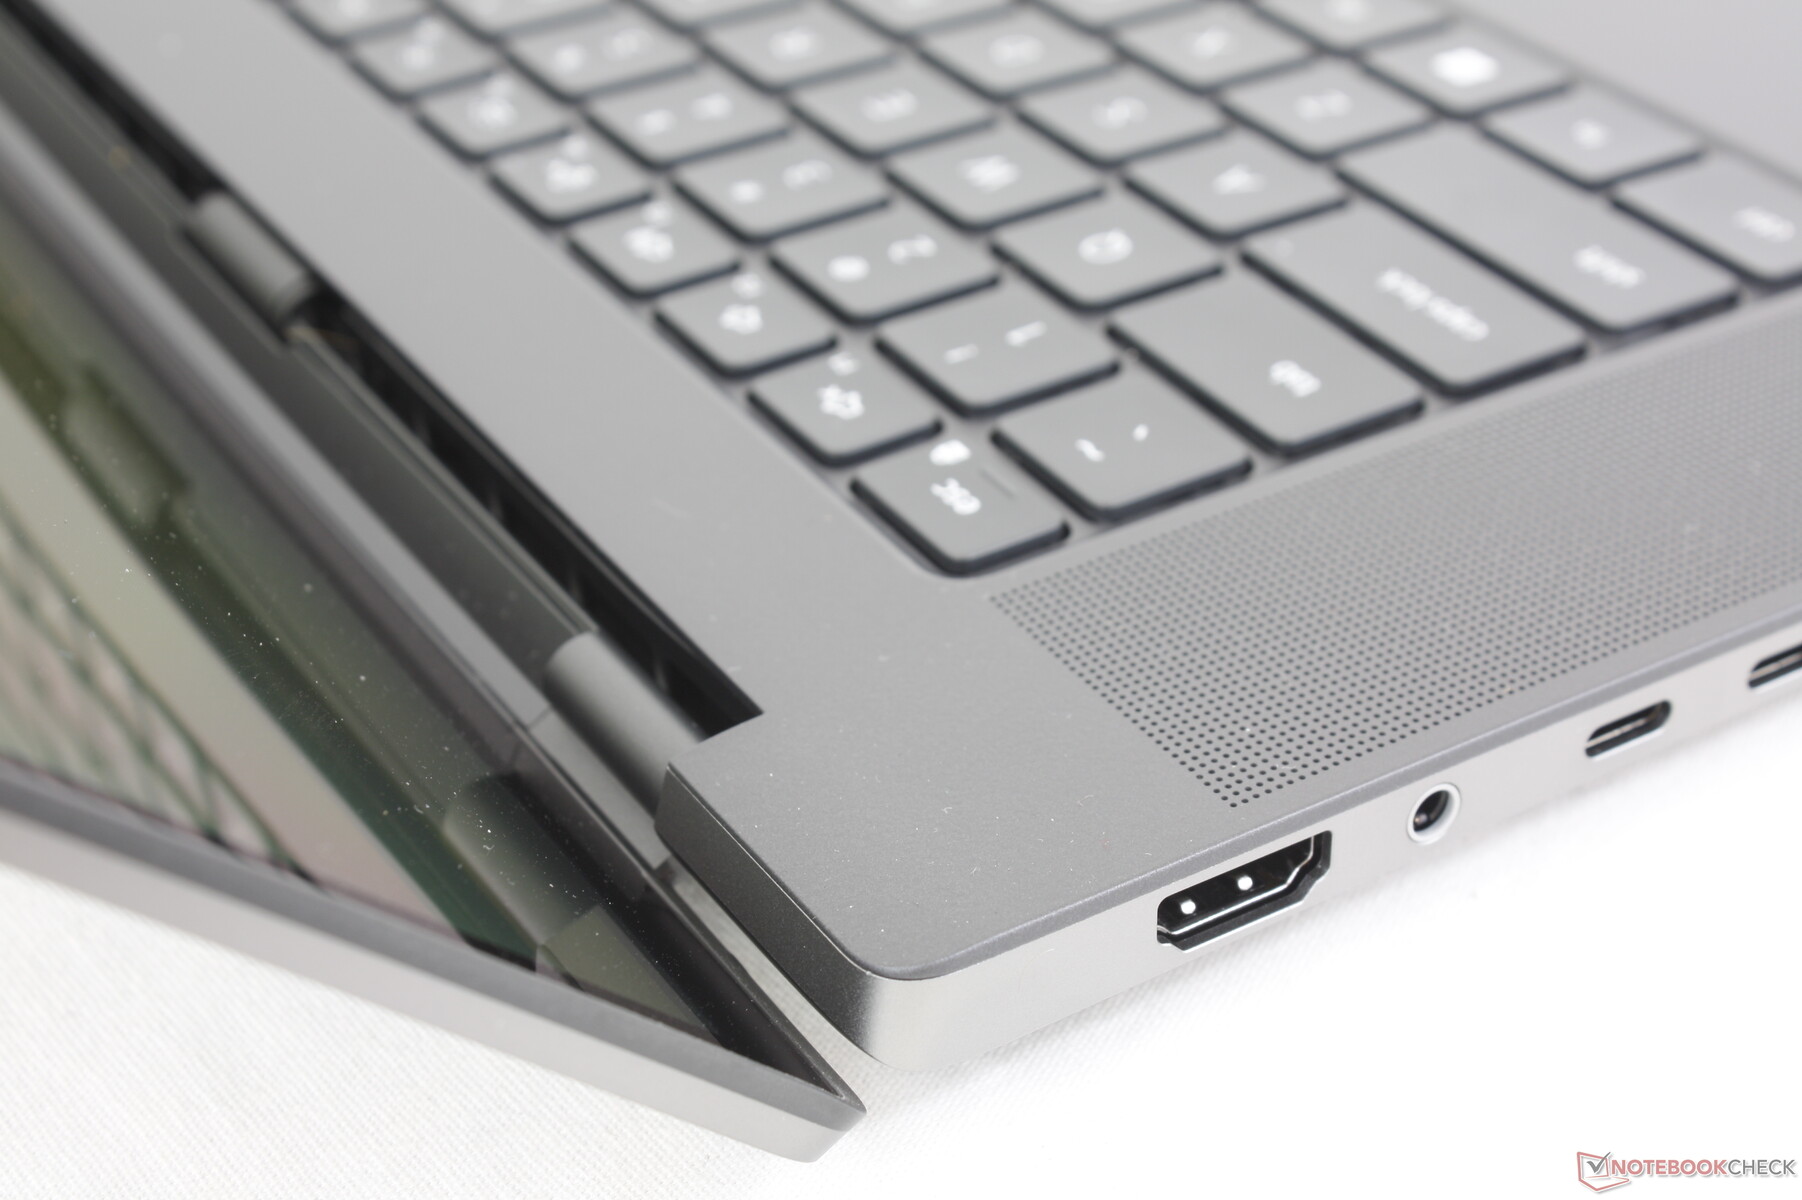
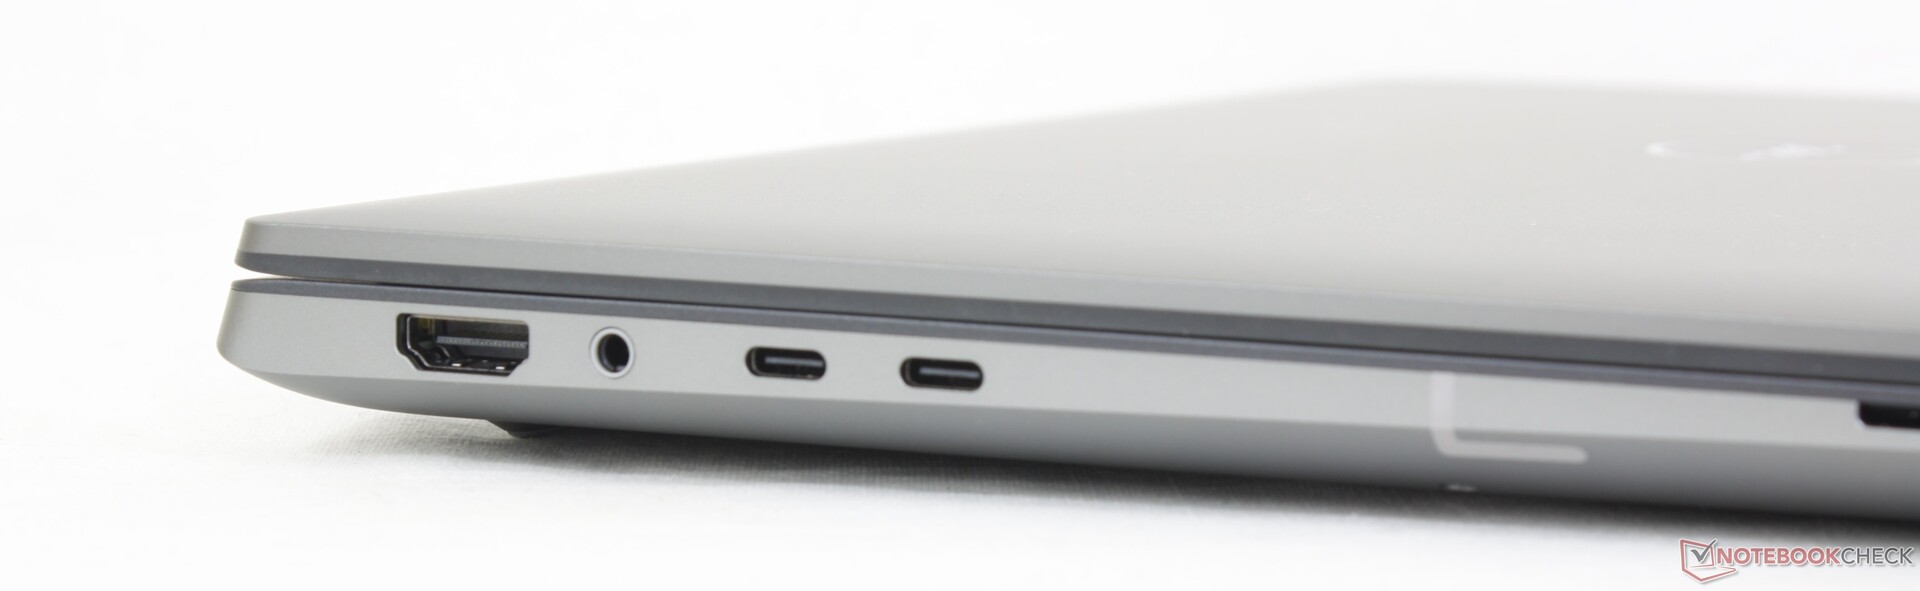
Connettività: non molto per una workstation
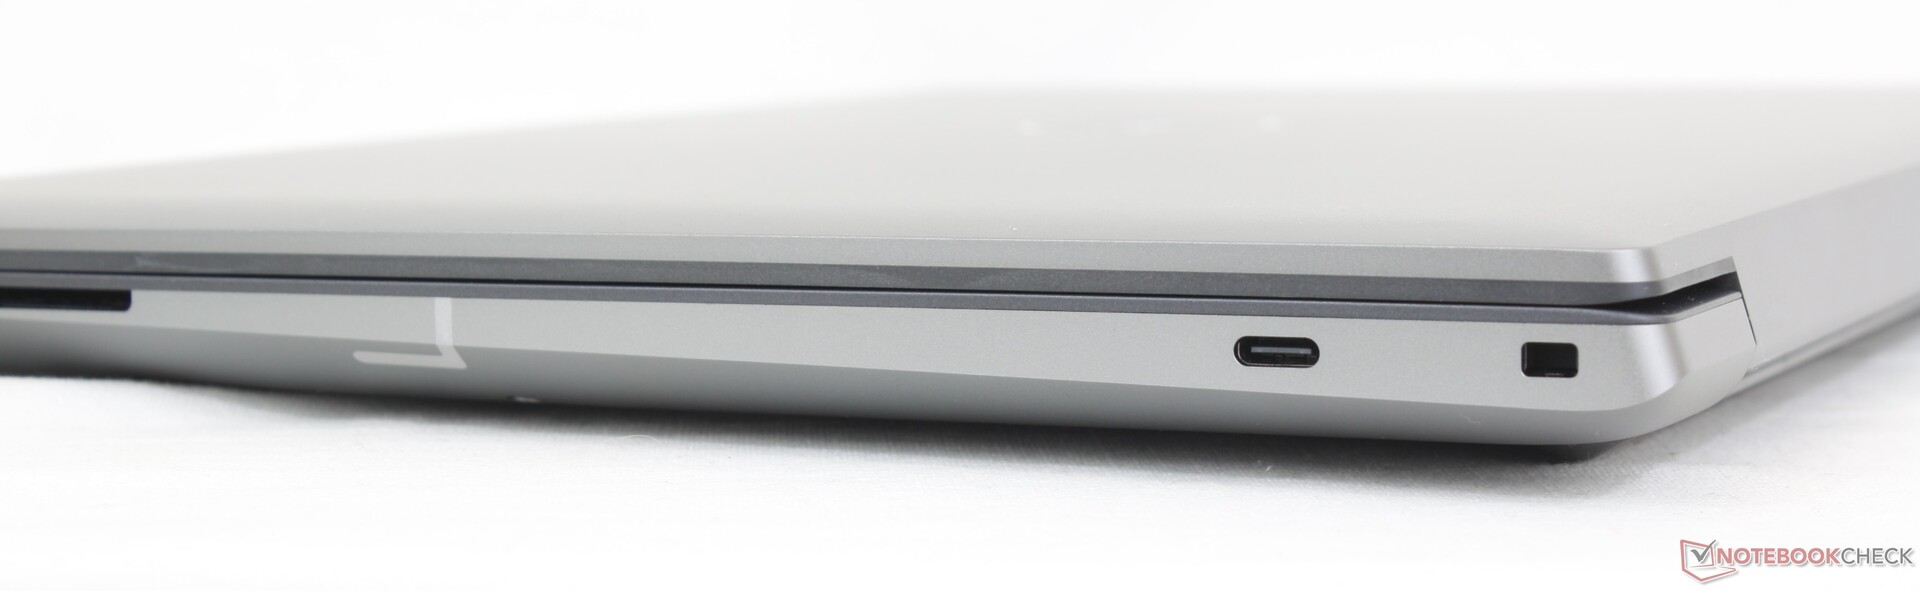
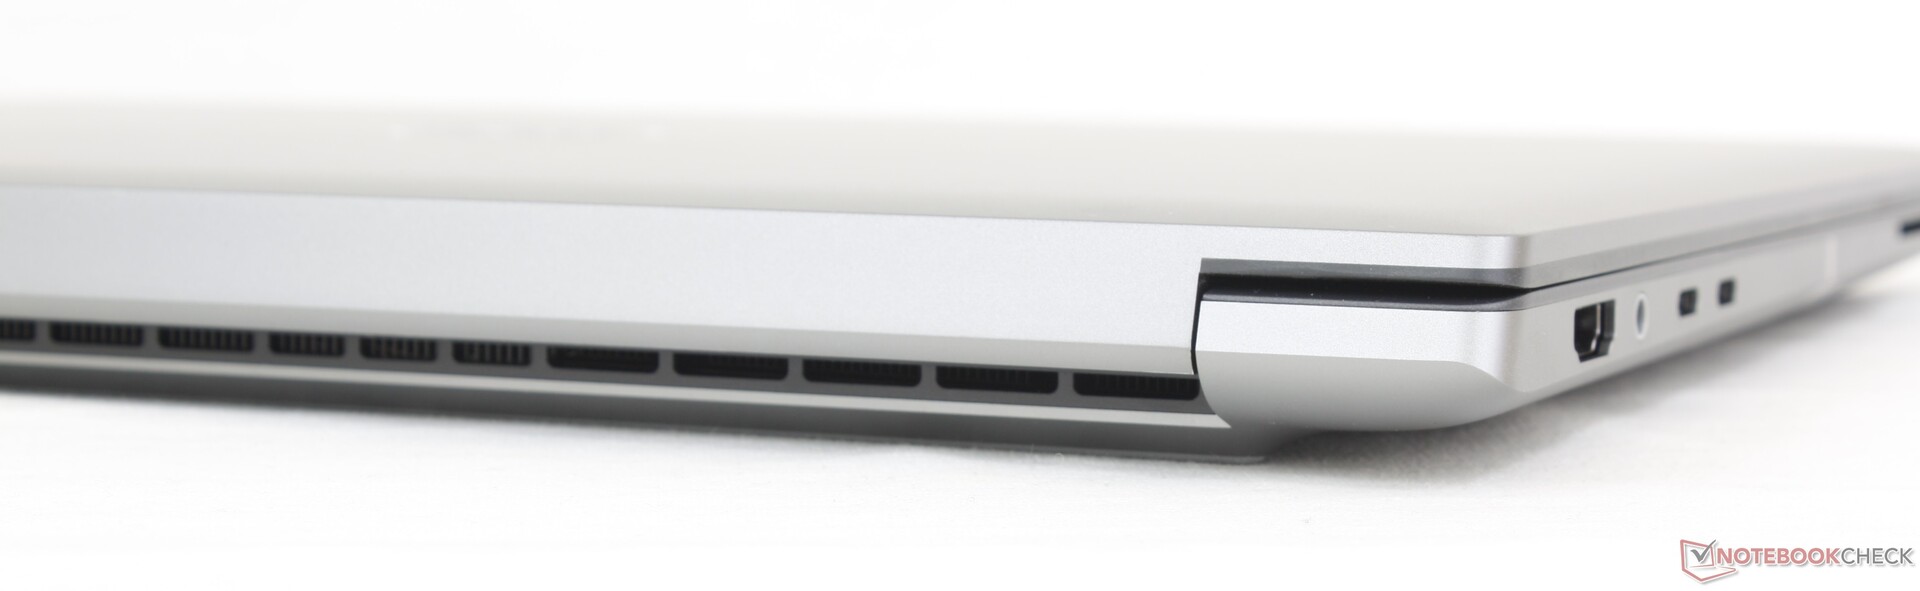
Le opzioni delle porte sono all'avanguardia, nel bene e nel male. È migliore nel senso che ogni porta è altamente versatile quando si tratta di adattatori e periferiche, ma è anche peggiore nel senso che non ci sono porte di base come USB o RJ-45 a grandezza naturale. Alternative come il ThinkPad P1 G4 o l' ExpertBook B6 Flip offrono una maggiore varietà di porte rispetto al nostro Dell. Di conseguenza, preparatevi ad affidarvi ad adattatori o docking station quando utilizzate il Precision 5680.
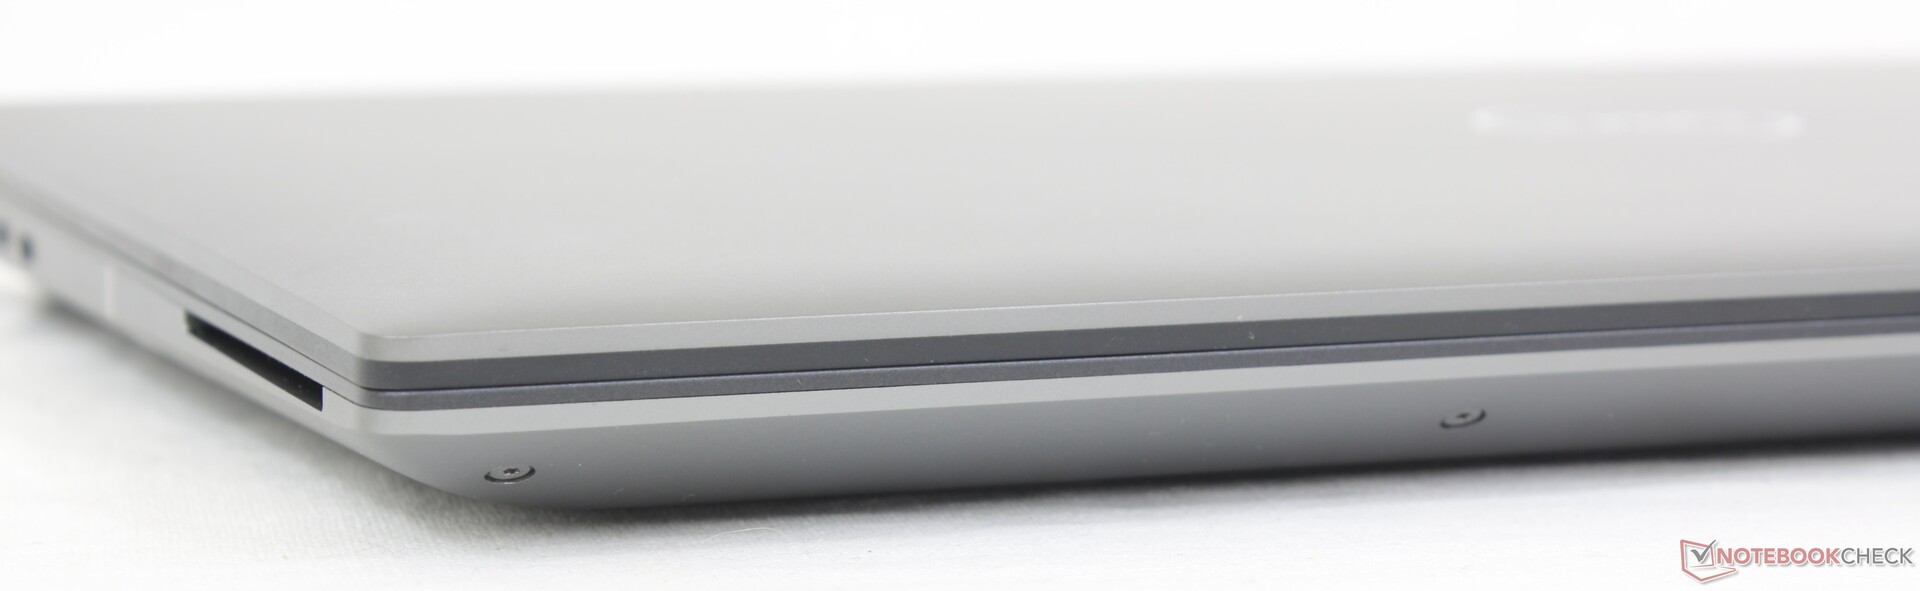
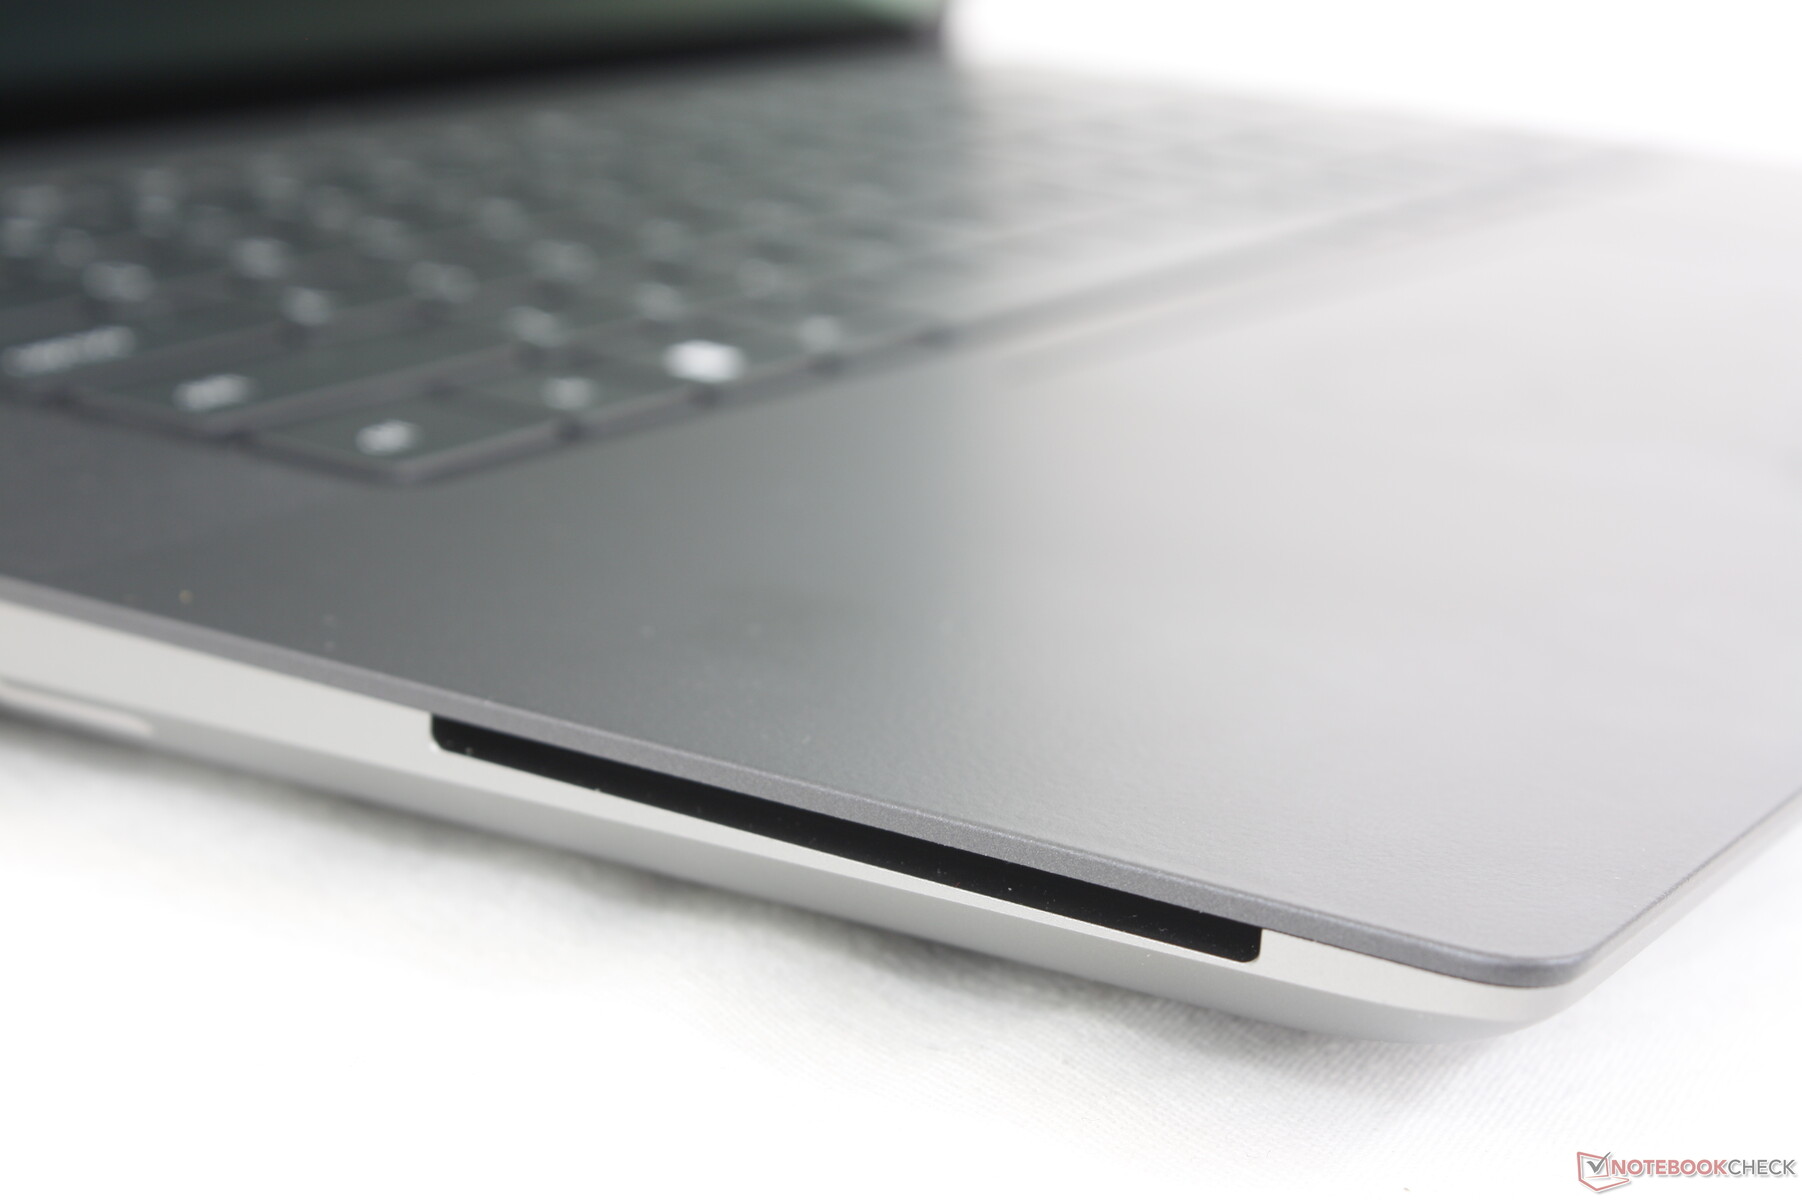
Lettore di schede SD
I modelli XPS e Precision sono dotati di lettori di schede SD integrati tra i più veloci e questo vale anche per il nostro Precision 5680. Le velocità di lettura sono due volte superiori a quelle dello ZBook Fury 16 G9 o del ThinkPad P16 G1 e quindi ci vogliono solo 5-6 secondi per trasferire 1 GB di dati dalla nostra scheda di prova UHS-II al desktop.
| SD Card Reader | |
| average JPG Copy Test (av. of 3 runs) | |
| Dell Precision 5000 5680 (Toshiba Exceria Pro SDXC 64 GB UHS-II) | |
| Dell Precision 7000 7670 Performance (Toshiba Exceria Pro SDXC 64 GB UHS-II) | |
| MSI CreatorPro Z16P B12UKST (AV Pro V60) | |
| HP ZBook Fury 16 G9 (PNY EliteX-PRO60) | |
| Lenovo ThinkPad P16 G1 RTX A5500 (Toshiba Exceria Pro SDXC 64 GB UHS-II) | |
| maximum AS SSD Seq Read Test (1GB) | |
| Dell Precision 7000 7670 Performance (Toshiba Exceria Pro SDXC 64 GB UHS-II) | |
| Dell Precision 5000 5680 (Toshiba Exceria Pro SDXC 64 GB UHS-II) | |
| HP ZBook Fury 16 G9 (PNY EliteX-PRO60) | |
| MSI CreatorPro Z16P B12UKST (AV Pro V60) | |
| Lenovo ThinkPad P16 G1 RTX A5500 (Toshiba Exceria Pro SDXC 64 GB UHS-II) | |
Comunicazione
L'Intel AX211 è dotato di connettività Wi-Fi 6E e Bluetooth 5.3. La velocità di trasferimento è stata costante quando è stato accoppiato alla nostra rete Asus AXE11000 a 6GHz.
Le opzioni WAN purtroppo non sono supportate, a differenza del concorrente ZBook Fury 16 G9.
Webcam
Dell ha aumentato la webcam da 1 MP sul Precision 5550 a 2 MP sul nostro Precision 5680. Nonostante ciò, non c'è ancora un otturatore integrato per la privacy.


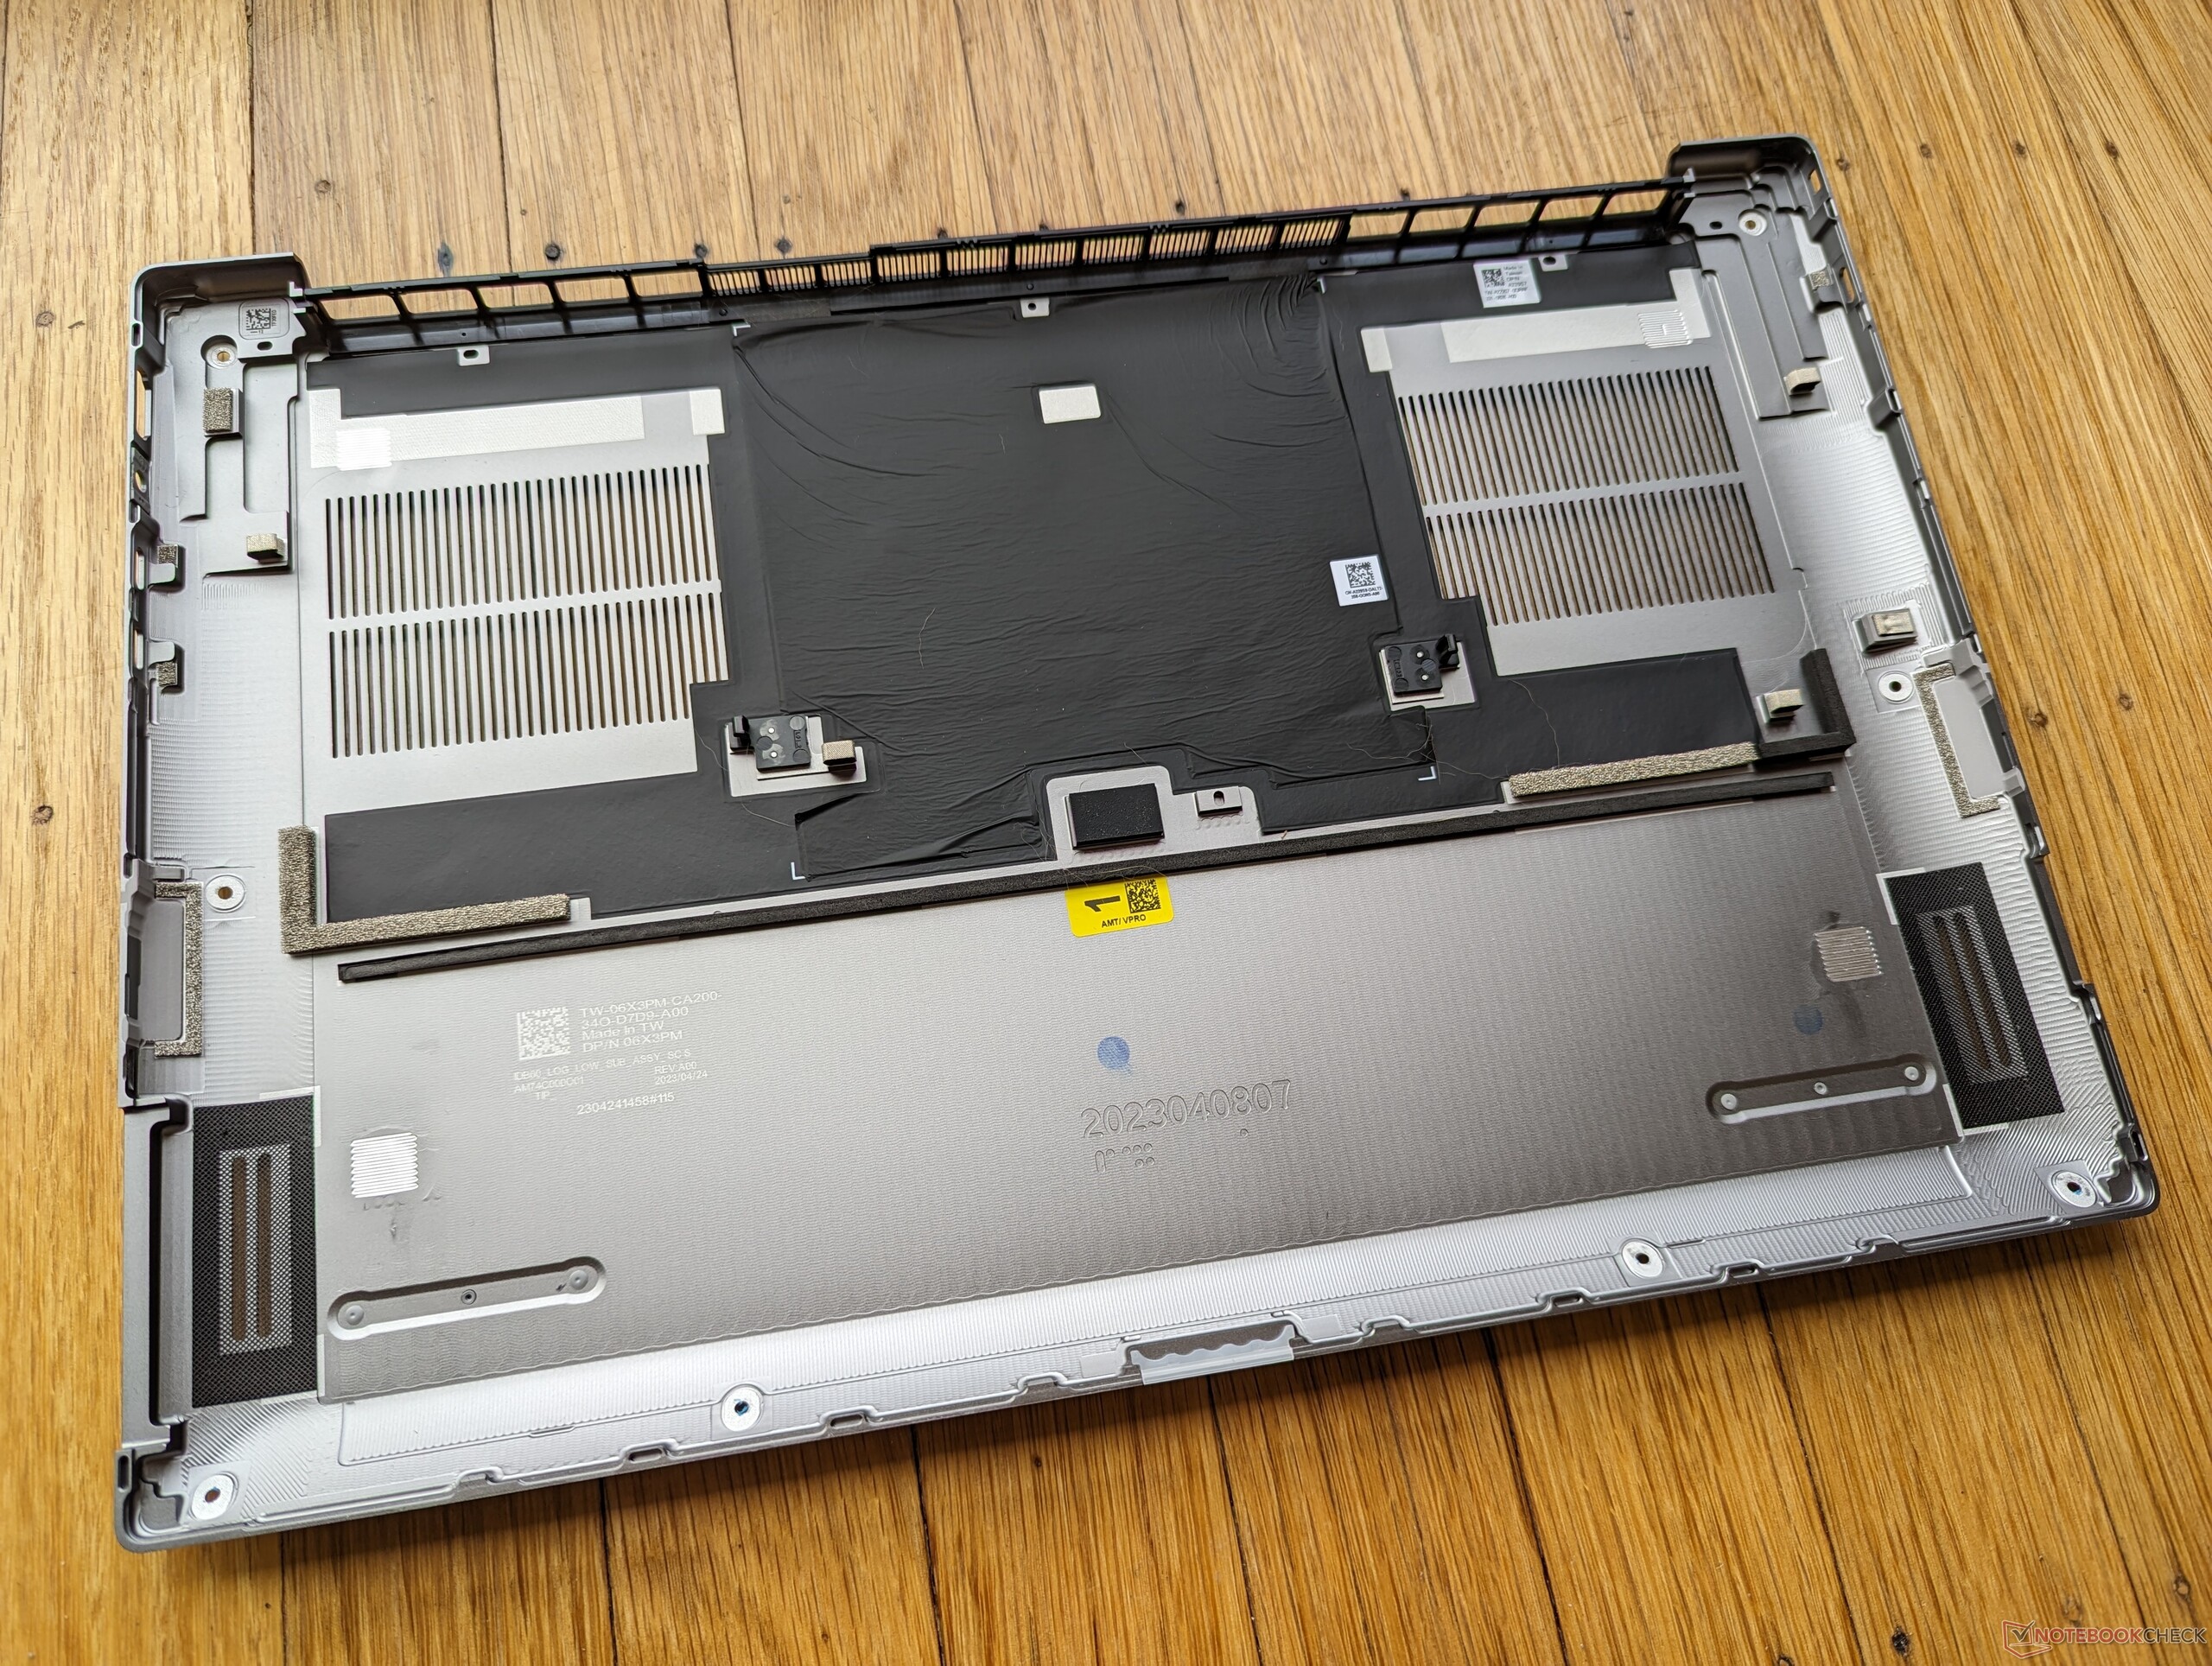
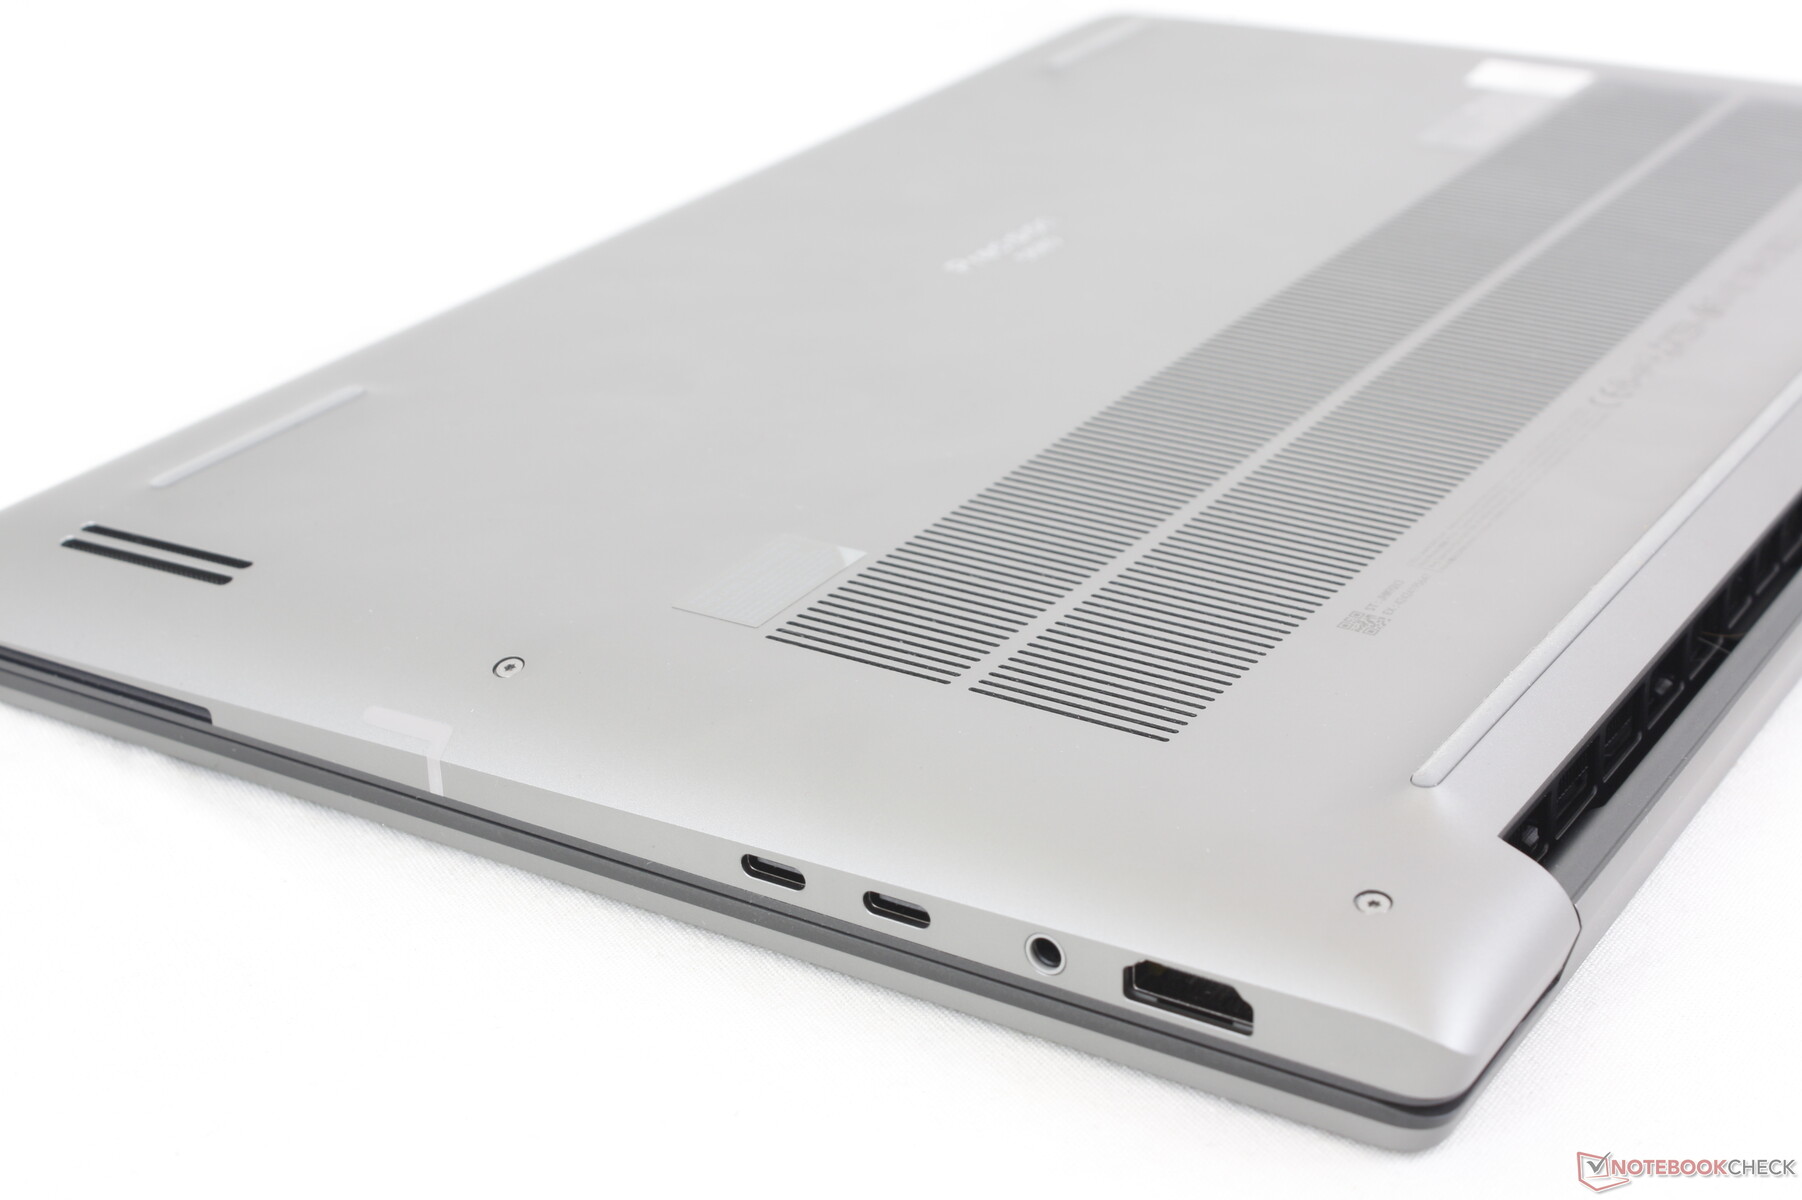
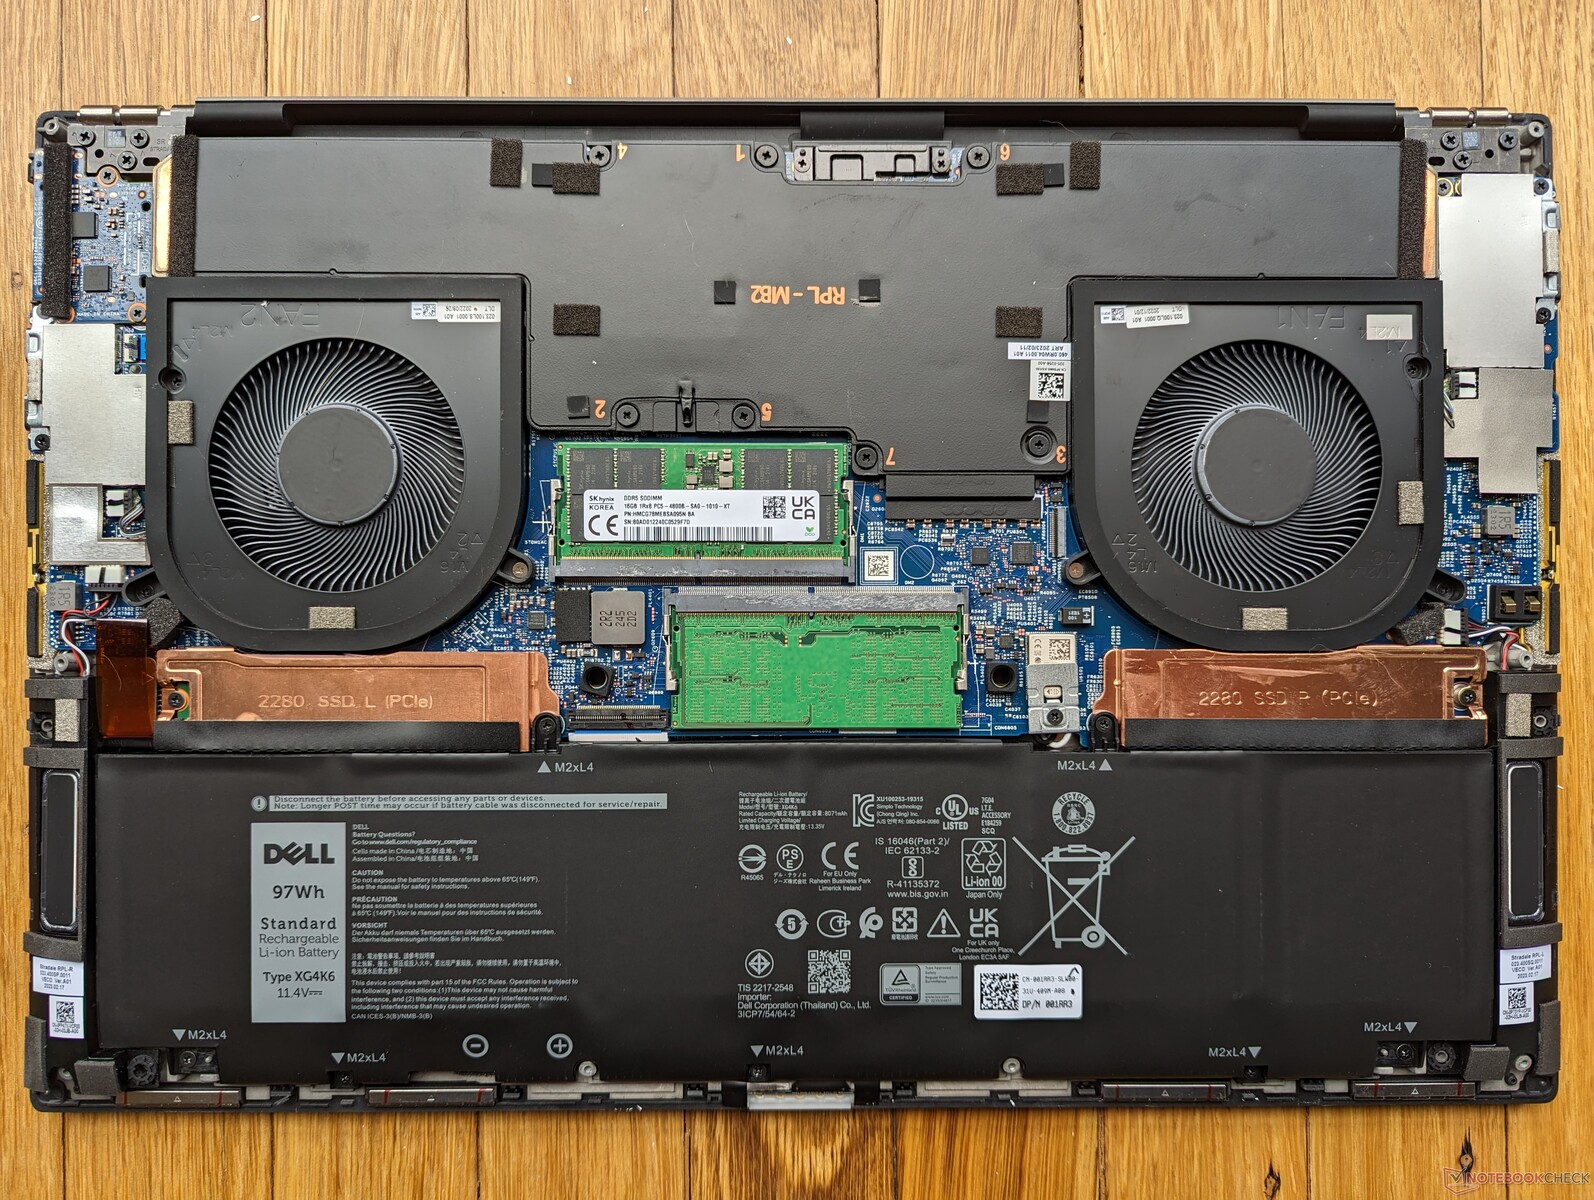
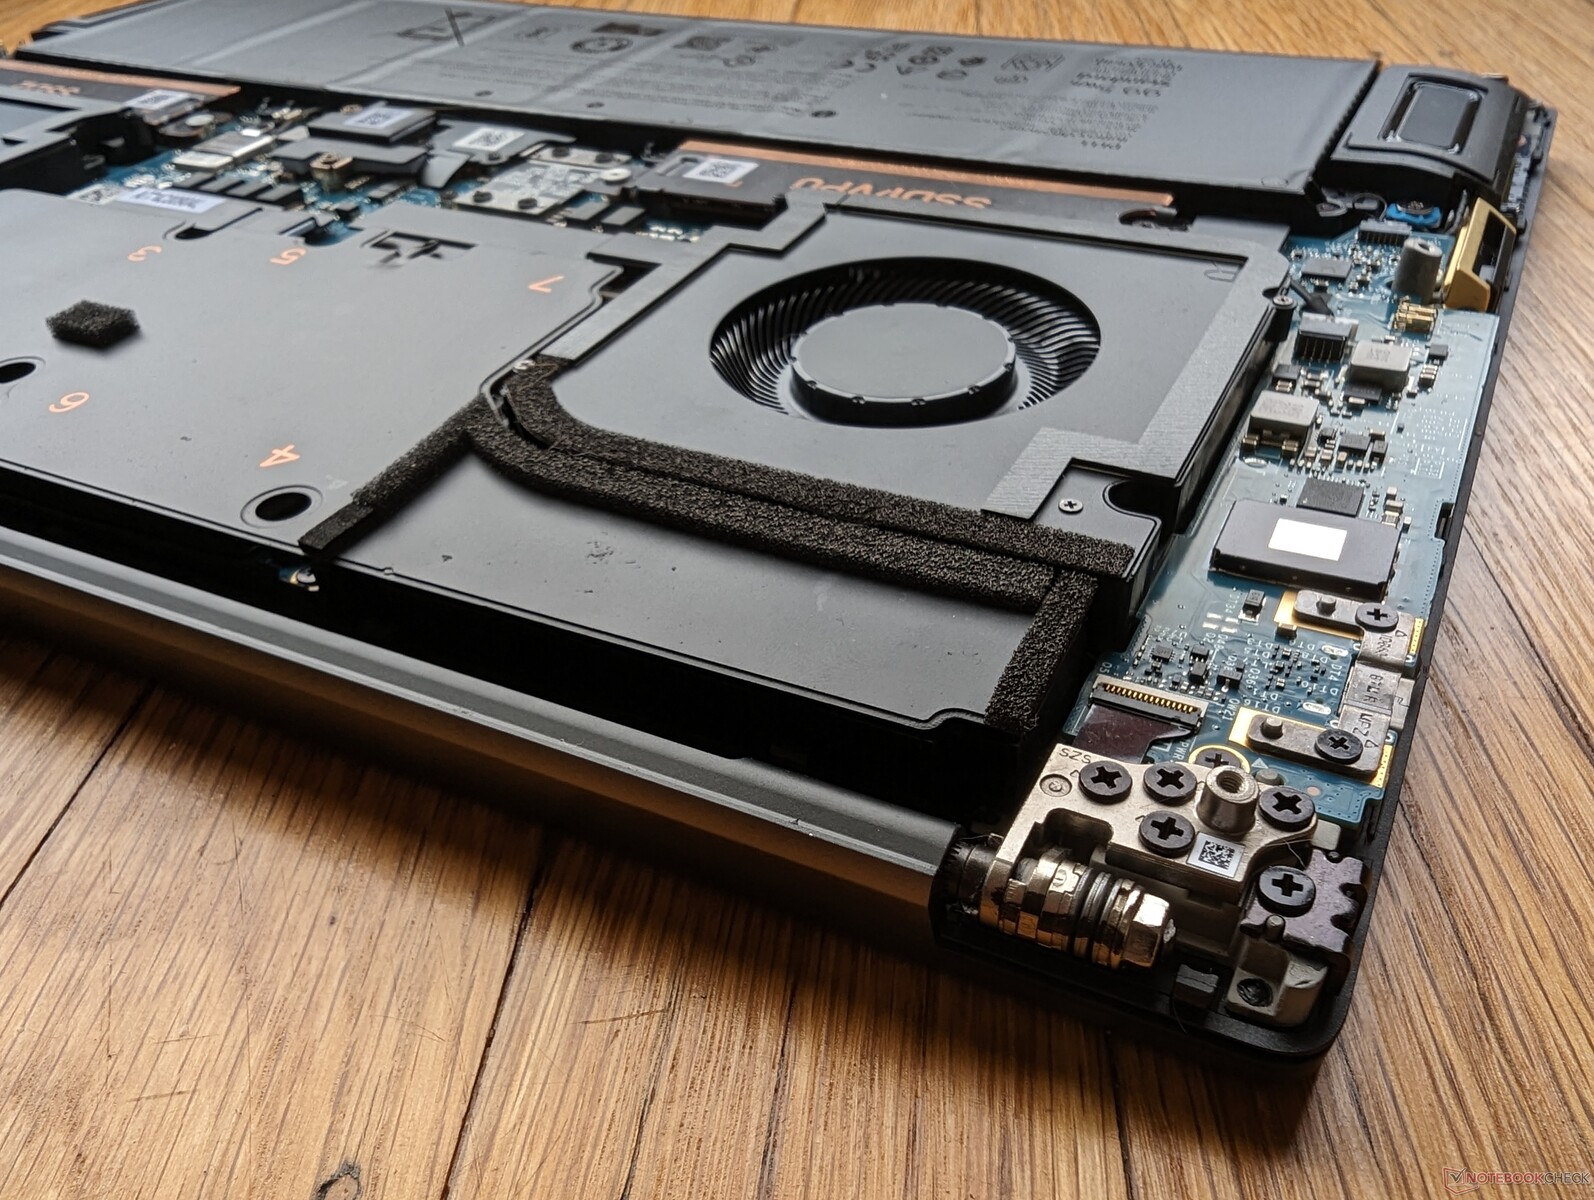
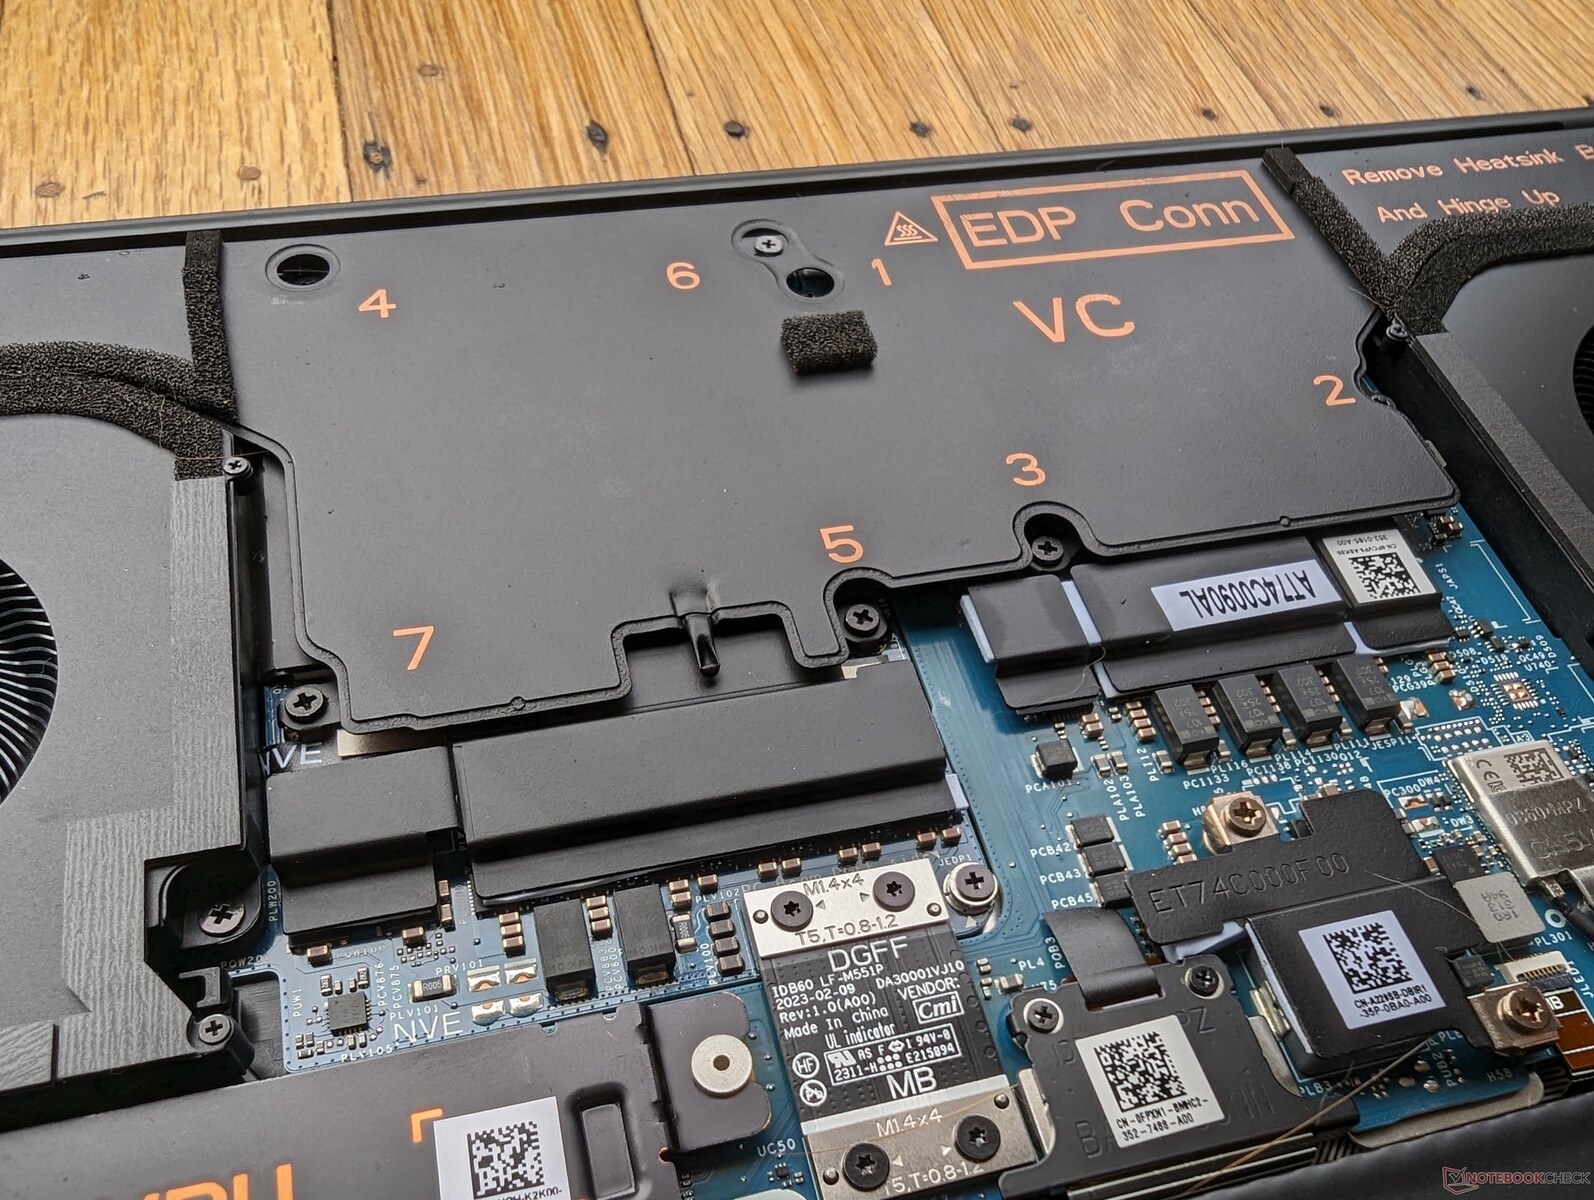
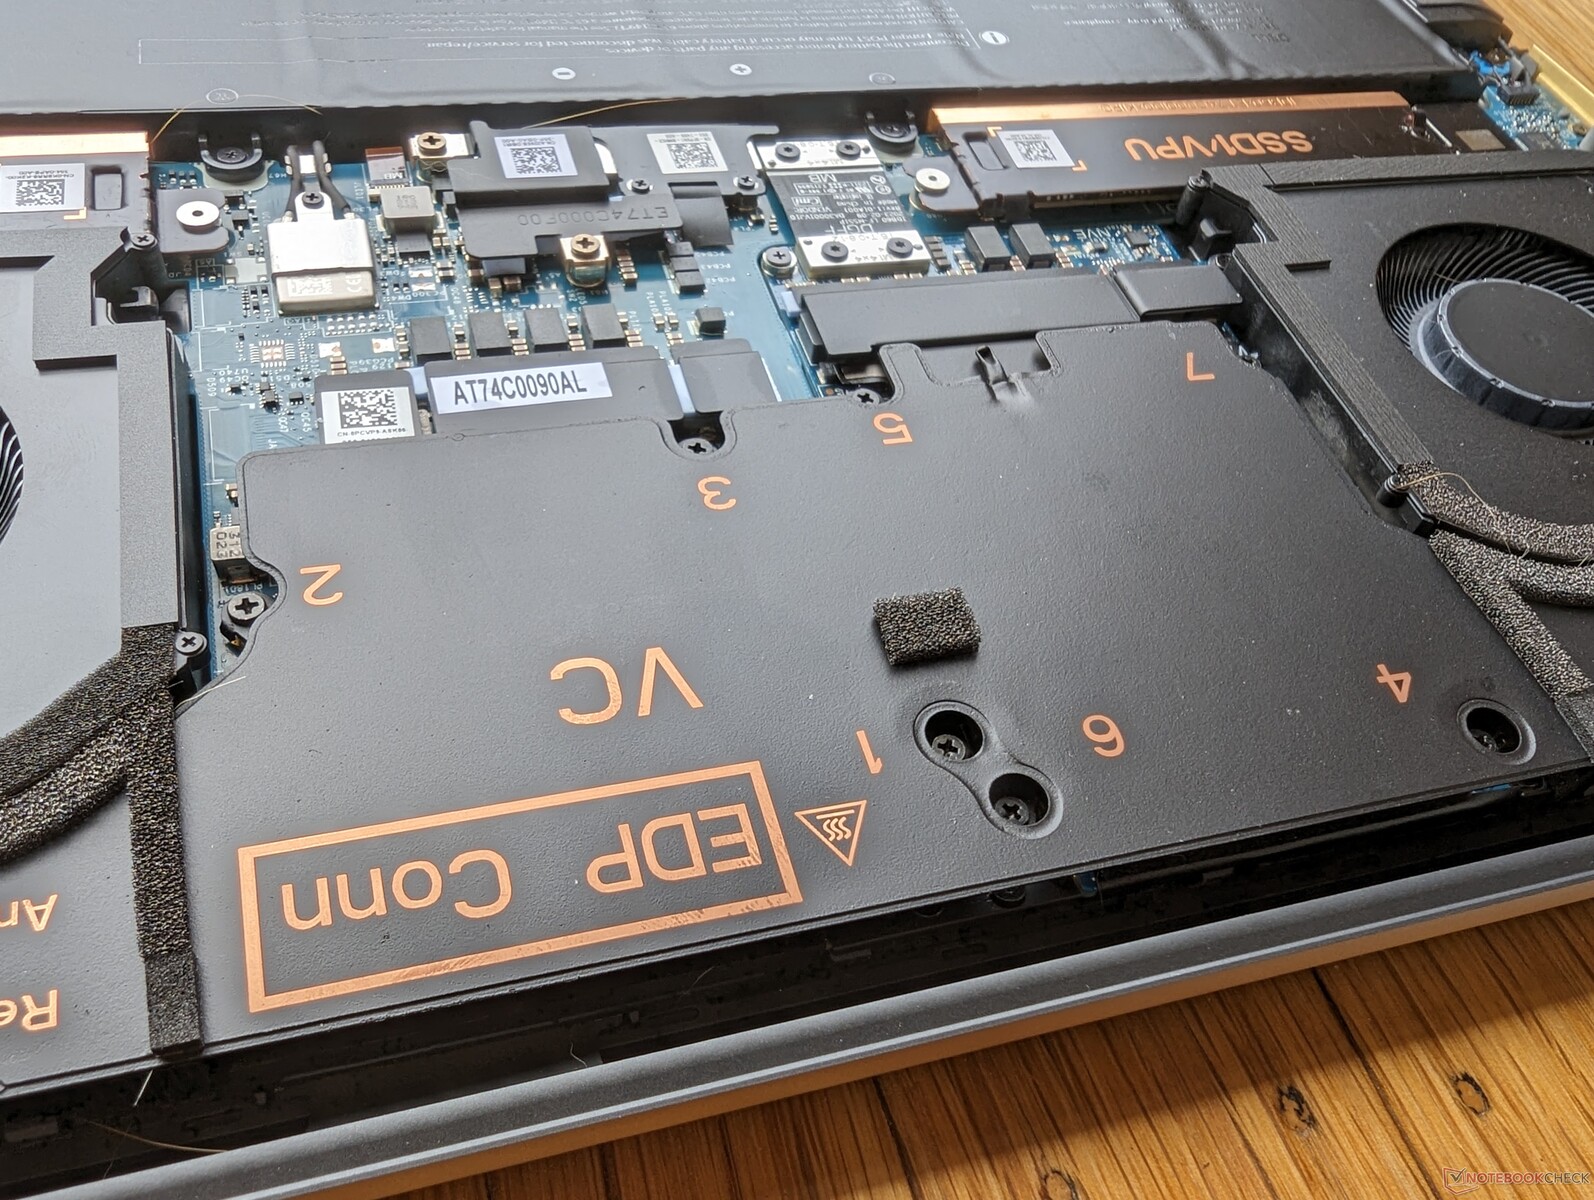
Manutenzione
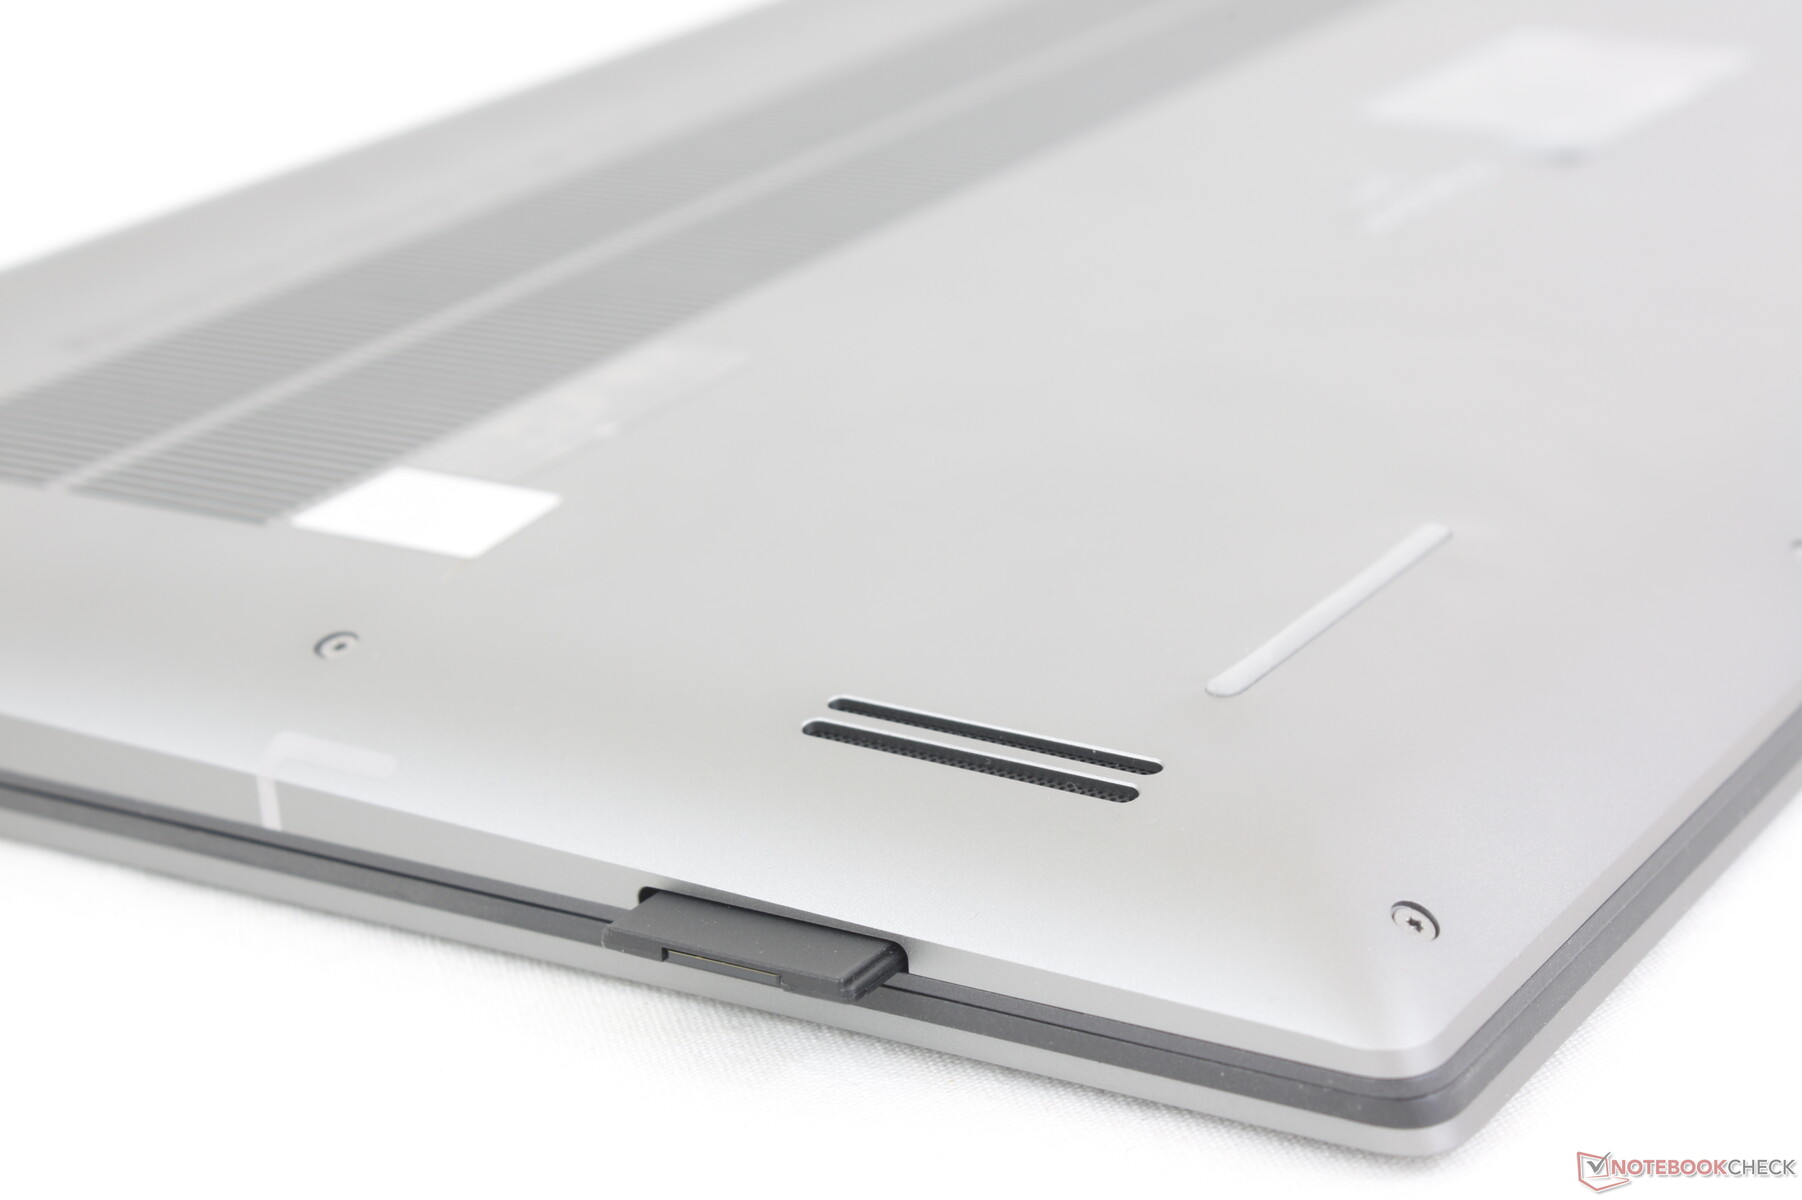
Il pannello inferiore è un po' più difficile da rimuovere di quanto ci si aspettasse, poiché i bordi della piastra metallica sono affilati e ben serrati, proprio come nell'XPS 15 o nell'XPS 17. Per la manutenzione del sistema si consiglia di utilizzare una vite Torx e un bordo piatto.
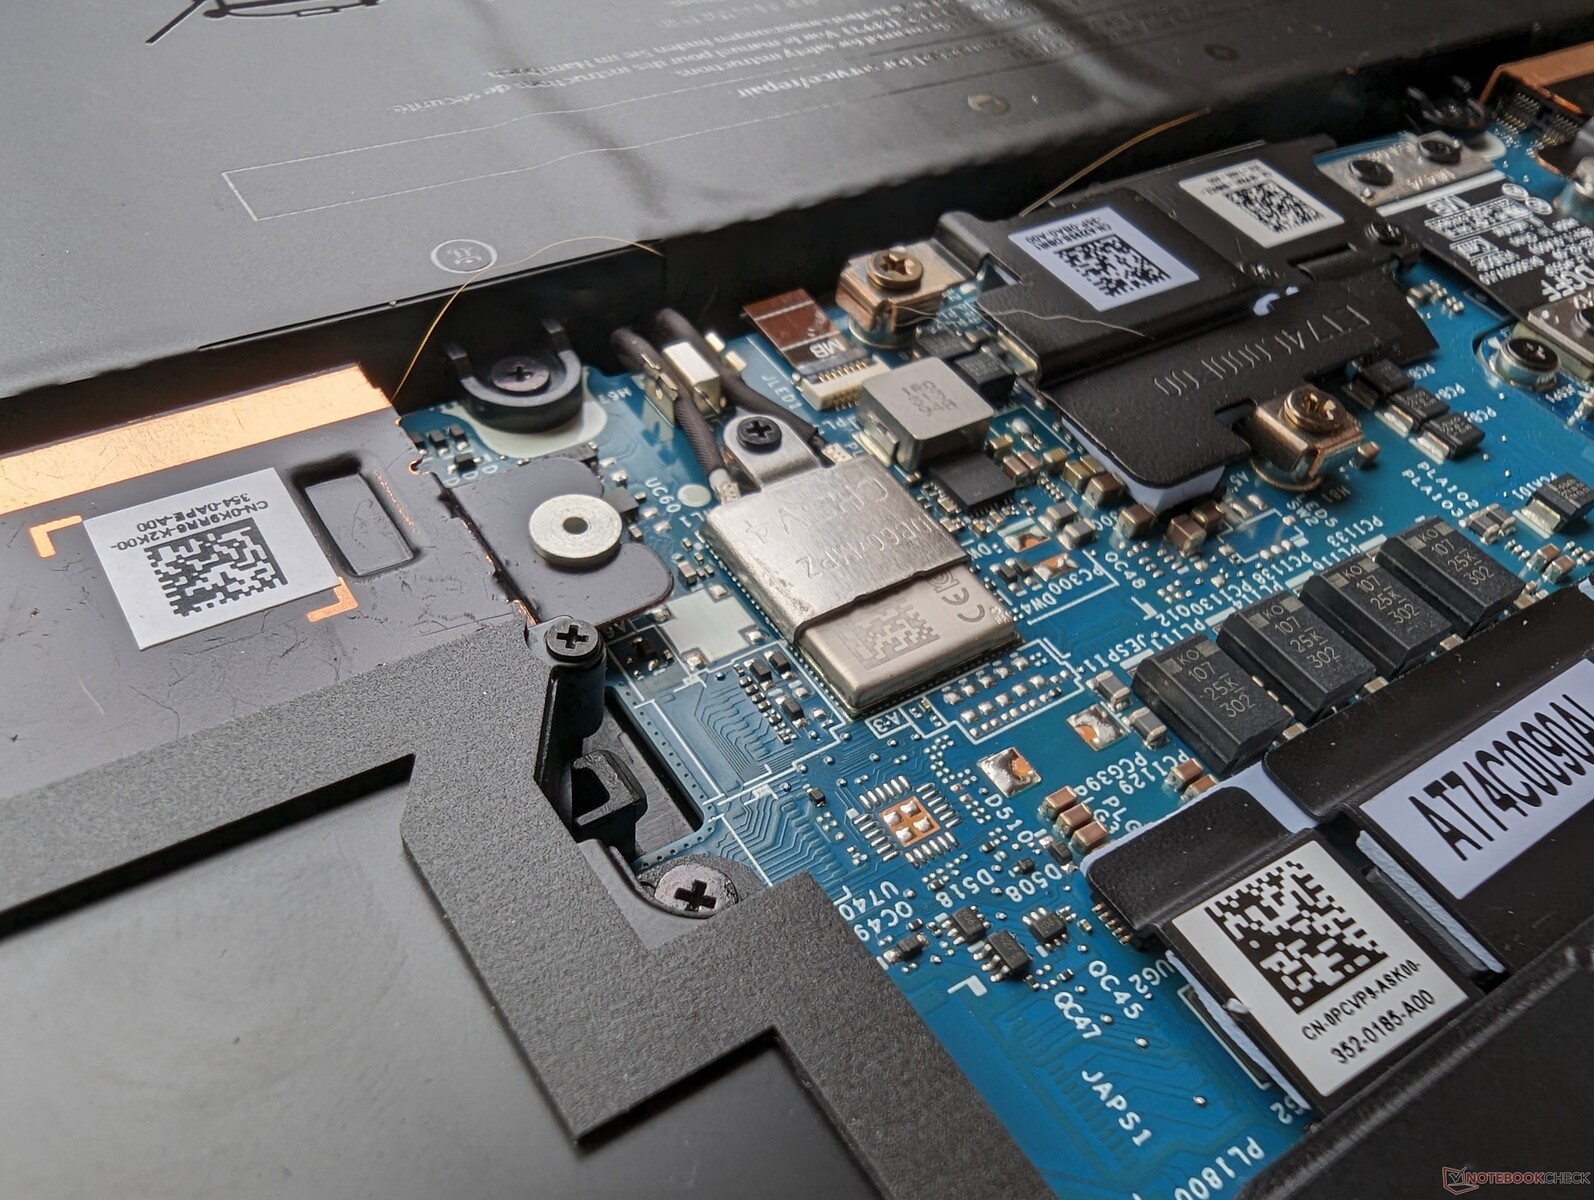
Entrambi i moduli WLAN e RAM sono saldati, a differenza della maggior parte delle altre workstation con schermo di queste dimensioni. Sia i moduli altamente integrati che le opzioni di porta limitate sono probabilmente degli svantaggi per il design altrimenti elegante e il peso relativamente basso.
Accessori e garanzia
La confezione include un piccolo adattatore da USB-C a USB-A per compensare l'assenza di porte USB a grandezza naturale sul sistema.
Se acquistato negli Stati Uniti, il prodotto è coperto da una garanzia limitata di tre anni con riparazione in loco.
Dispositivi di input - leggermente diversi da quelli dell'XPS
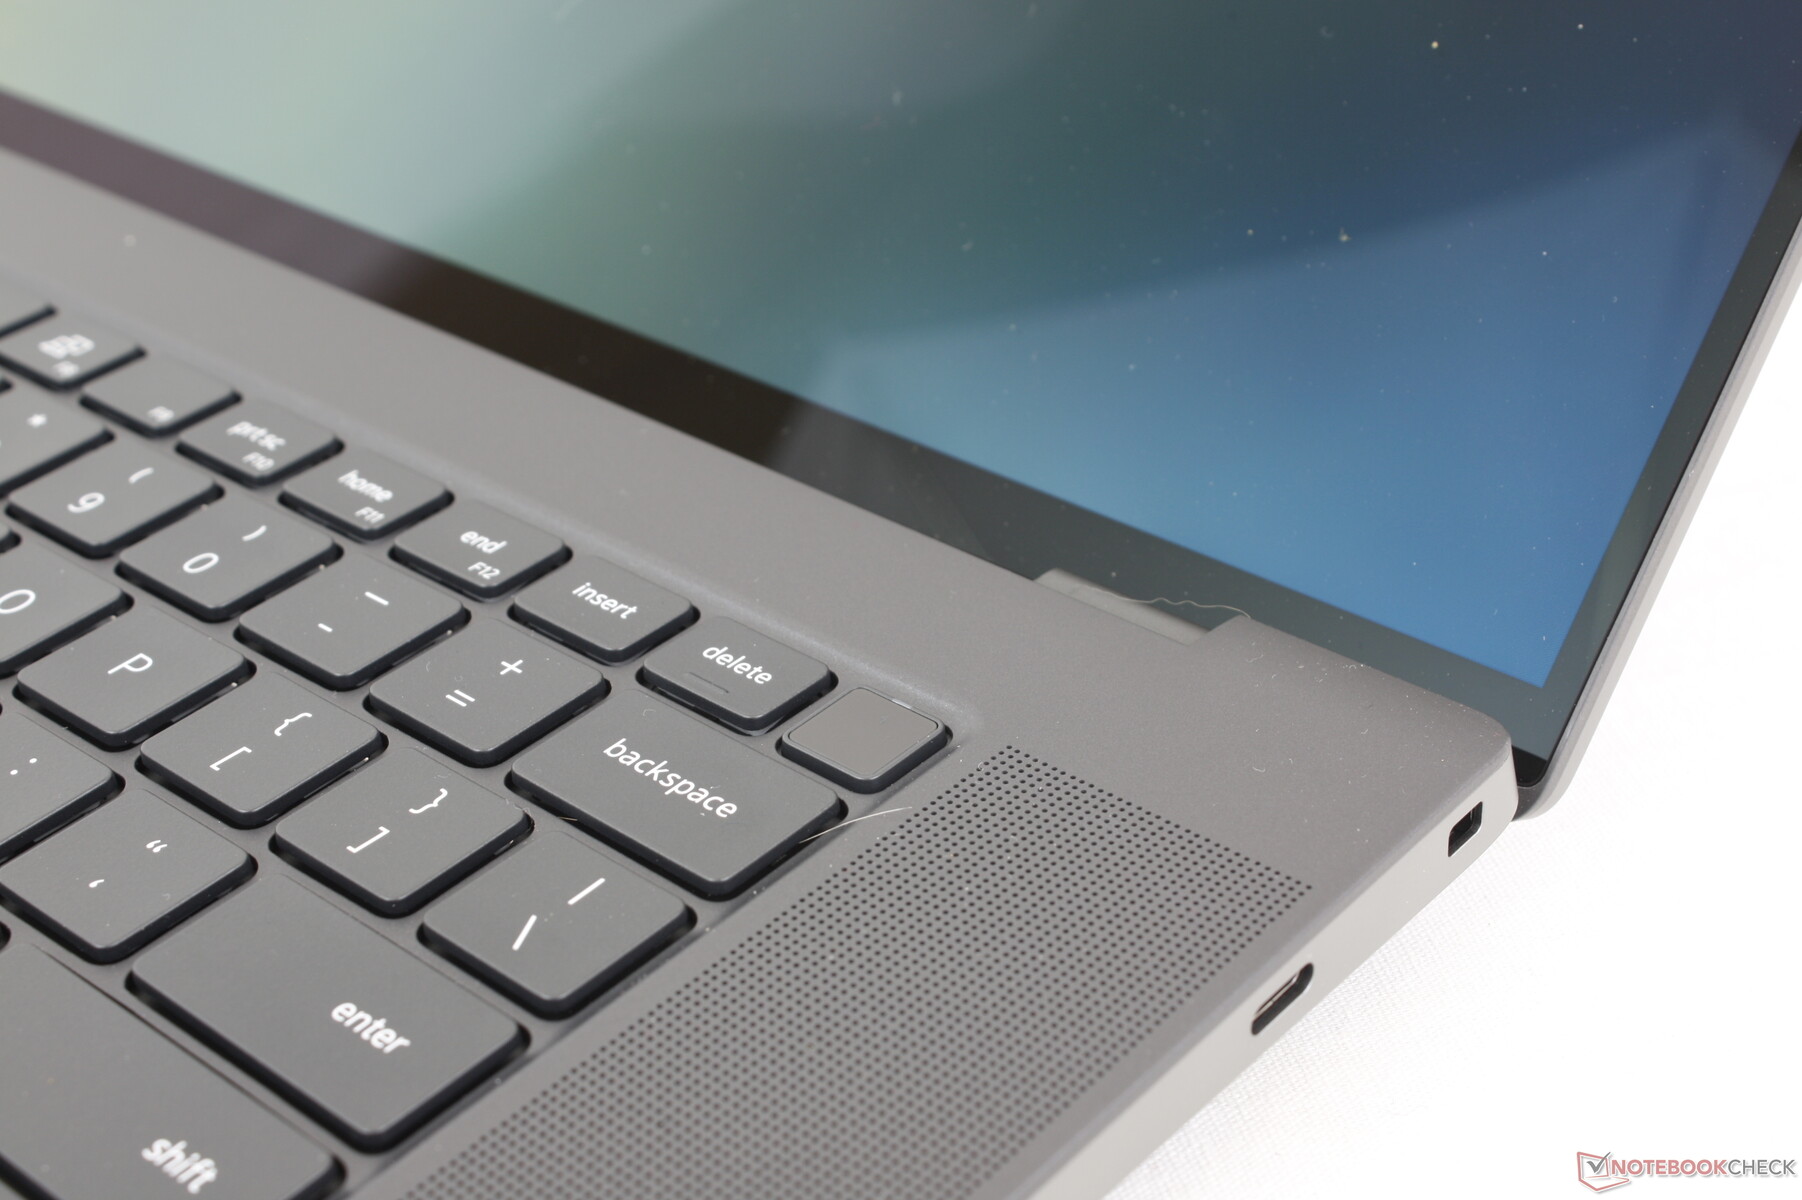
Tastiera
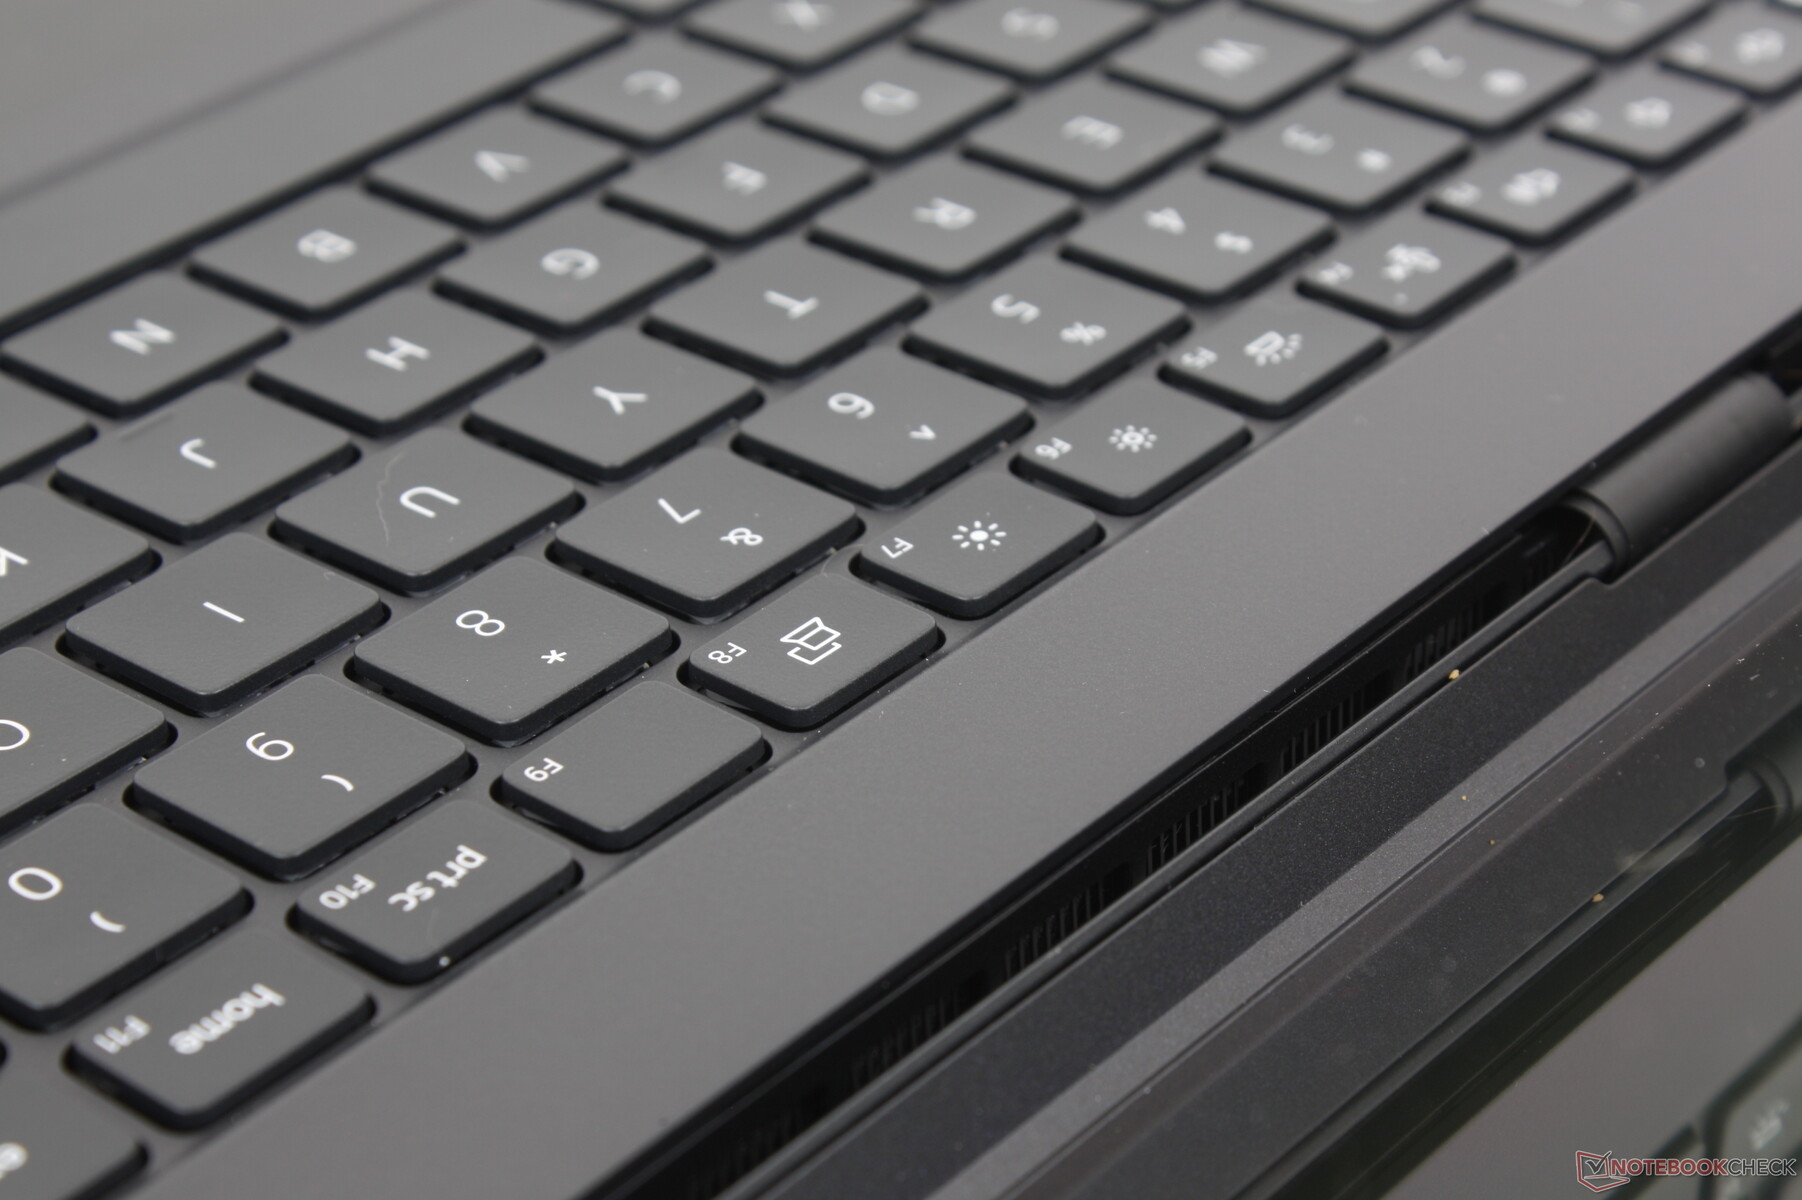
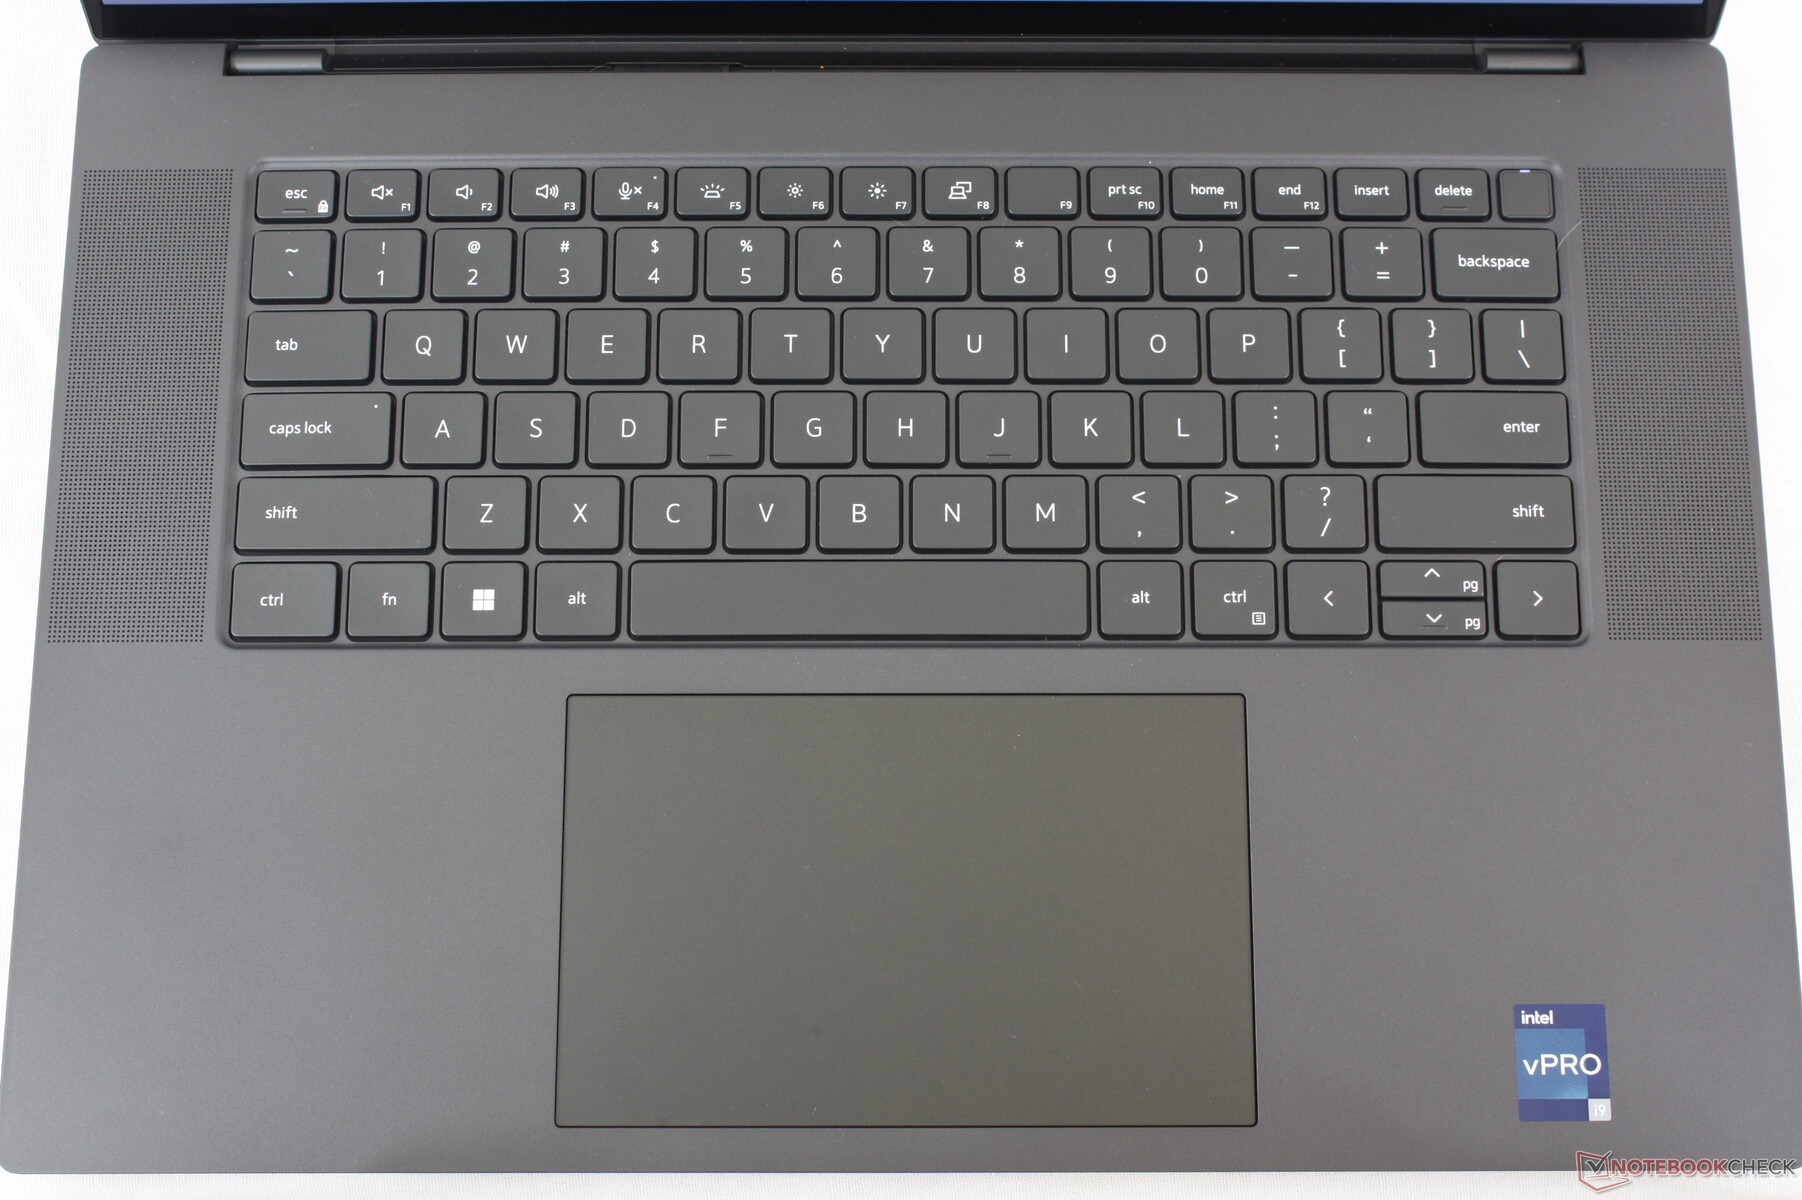
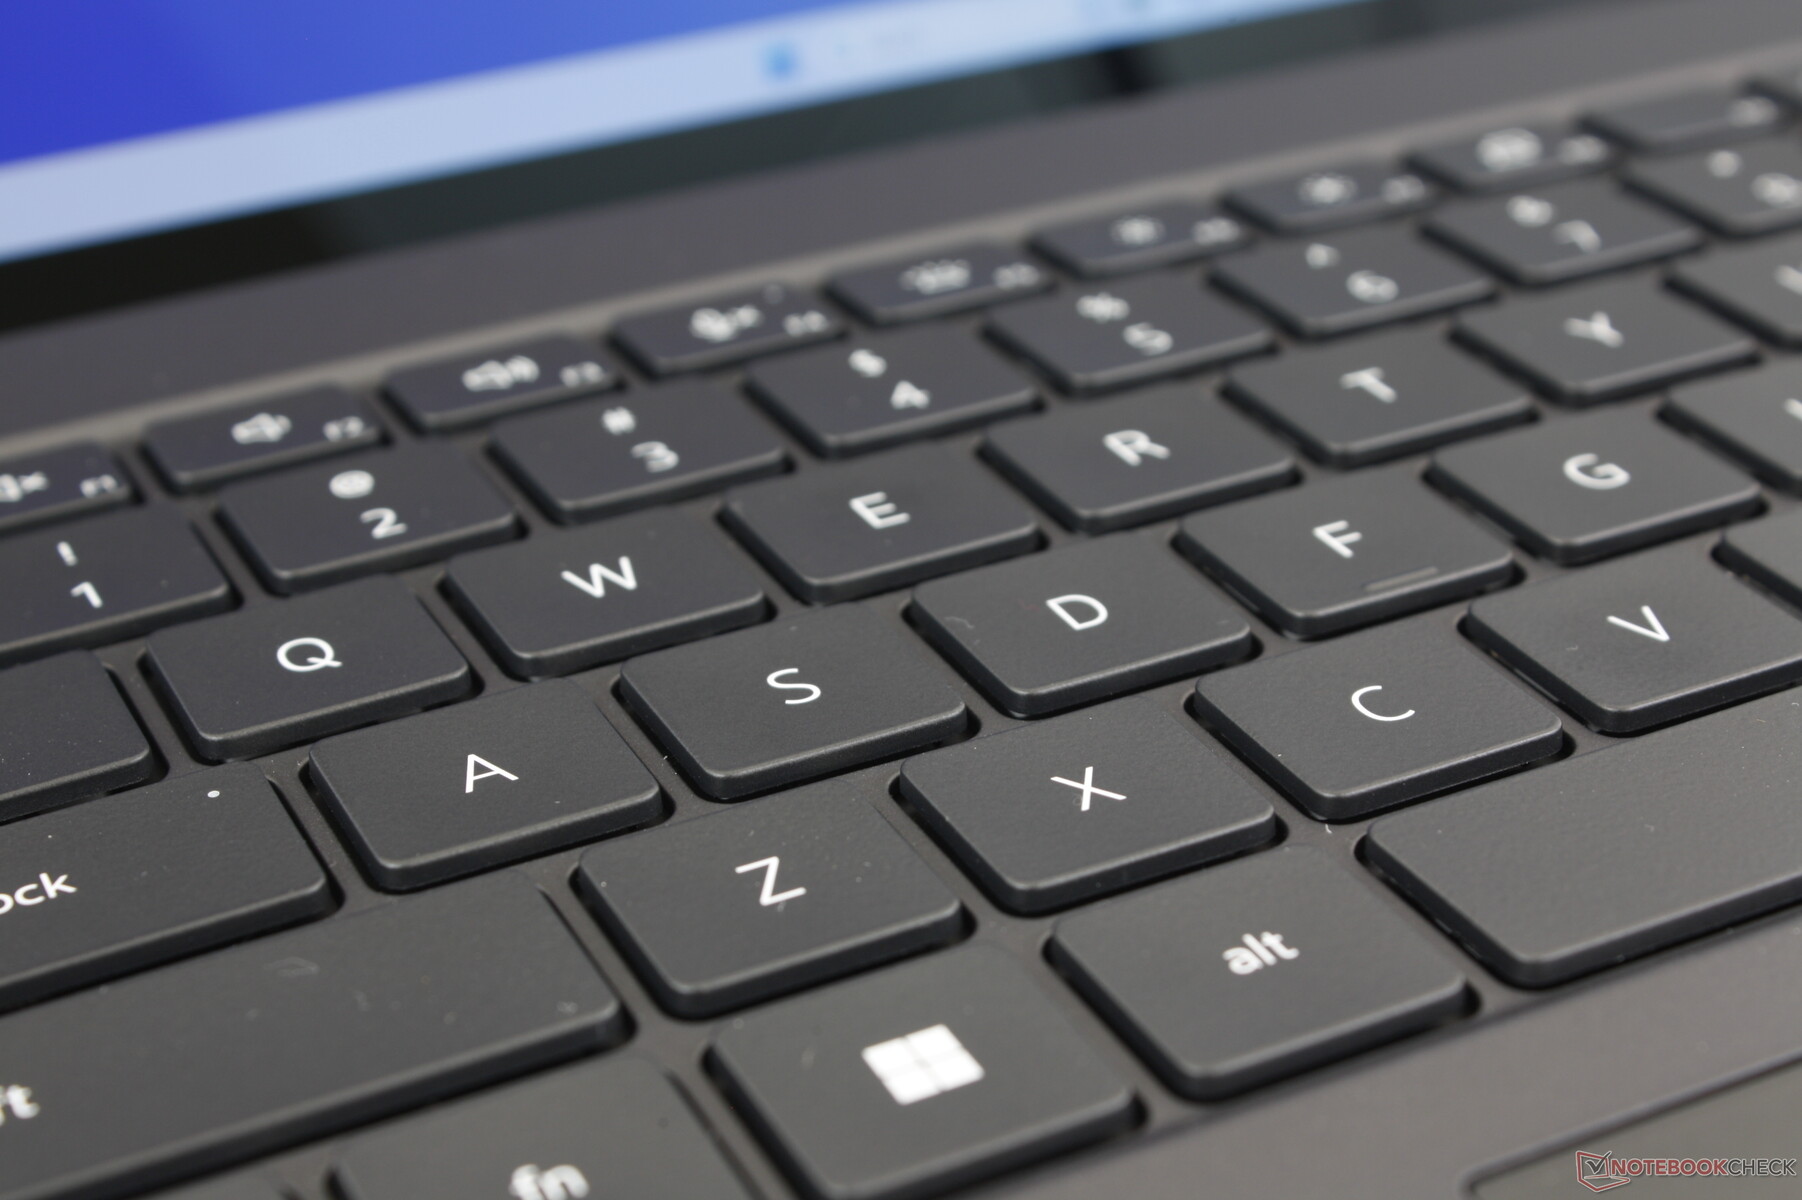
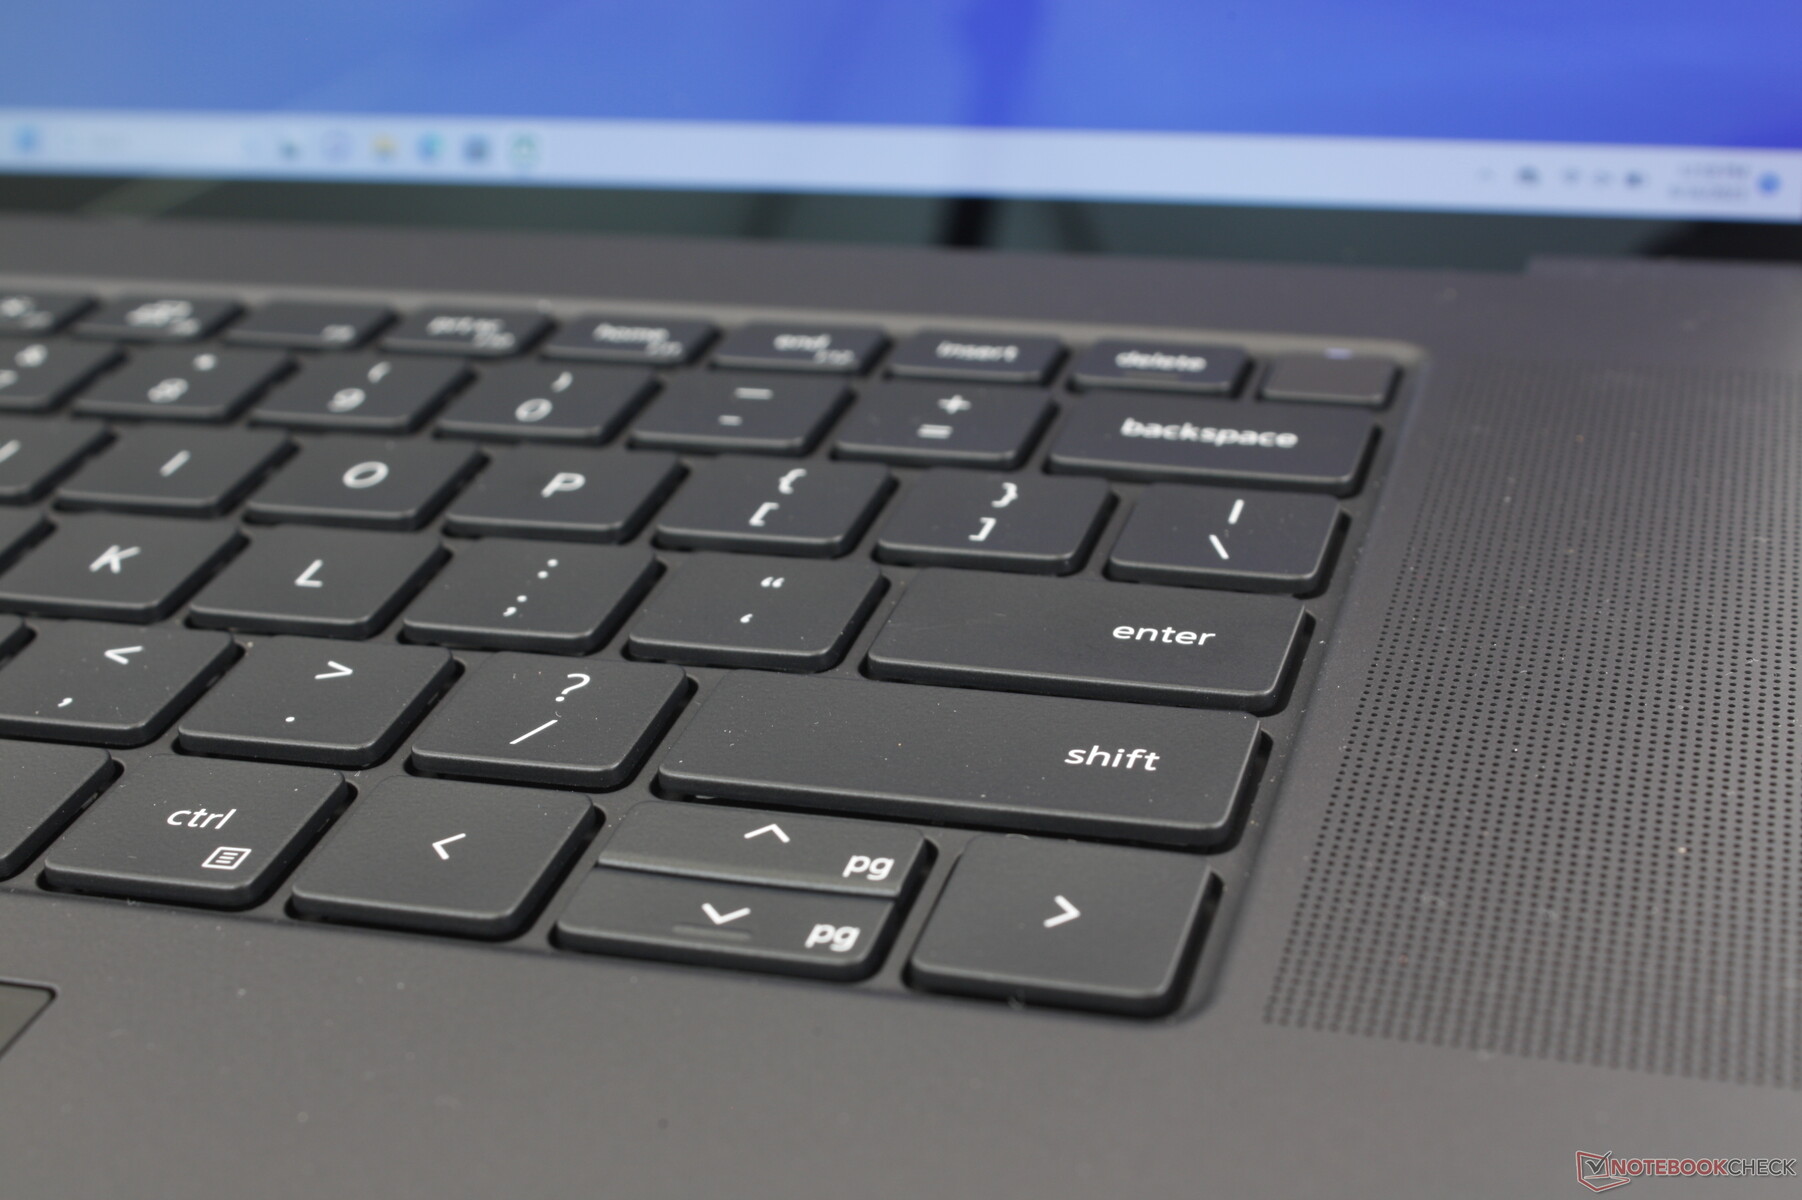
A prima vista la tastiera può sembrare identica a quella dell'XPS 15 o del Precision 5550, ma ci sono un paio di cambiamenti importanti. In primo luogo, la fila superiore di tasti funzione è ora più grande, poiché alcuni possessori di XPS 15 si sono lamentati del fatto che fossero troppo stretti. In secondo luogo, alcuni tasti lungo i bordi sono ora leggermente più corti, compresi i tasti Backspace, Invio, Maiusc, Tab, Ctrl e Shift. Per il resto, l'esperienza di digitazione rimane invariata per una sensazione di familiarità con l'XPS.
Touchpad
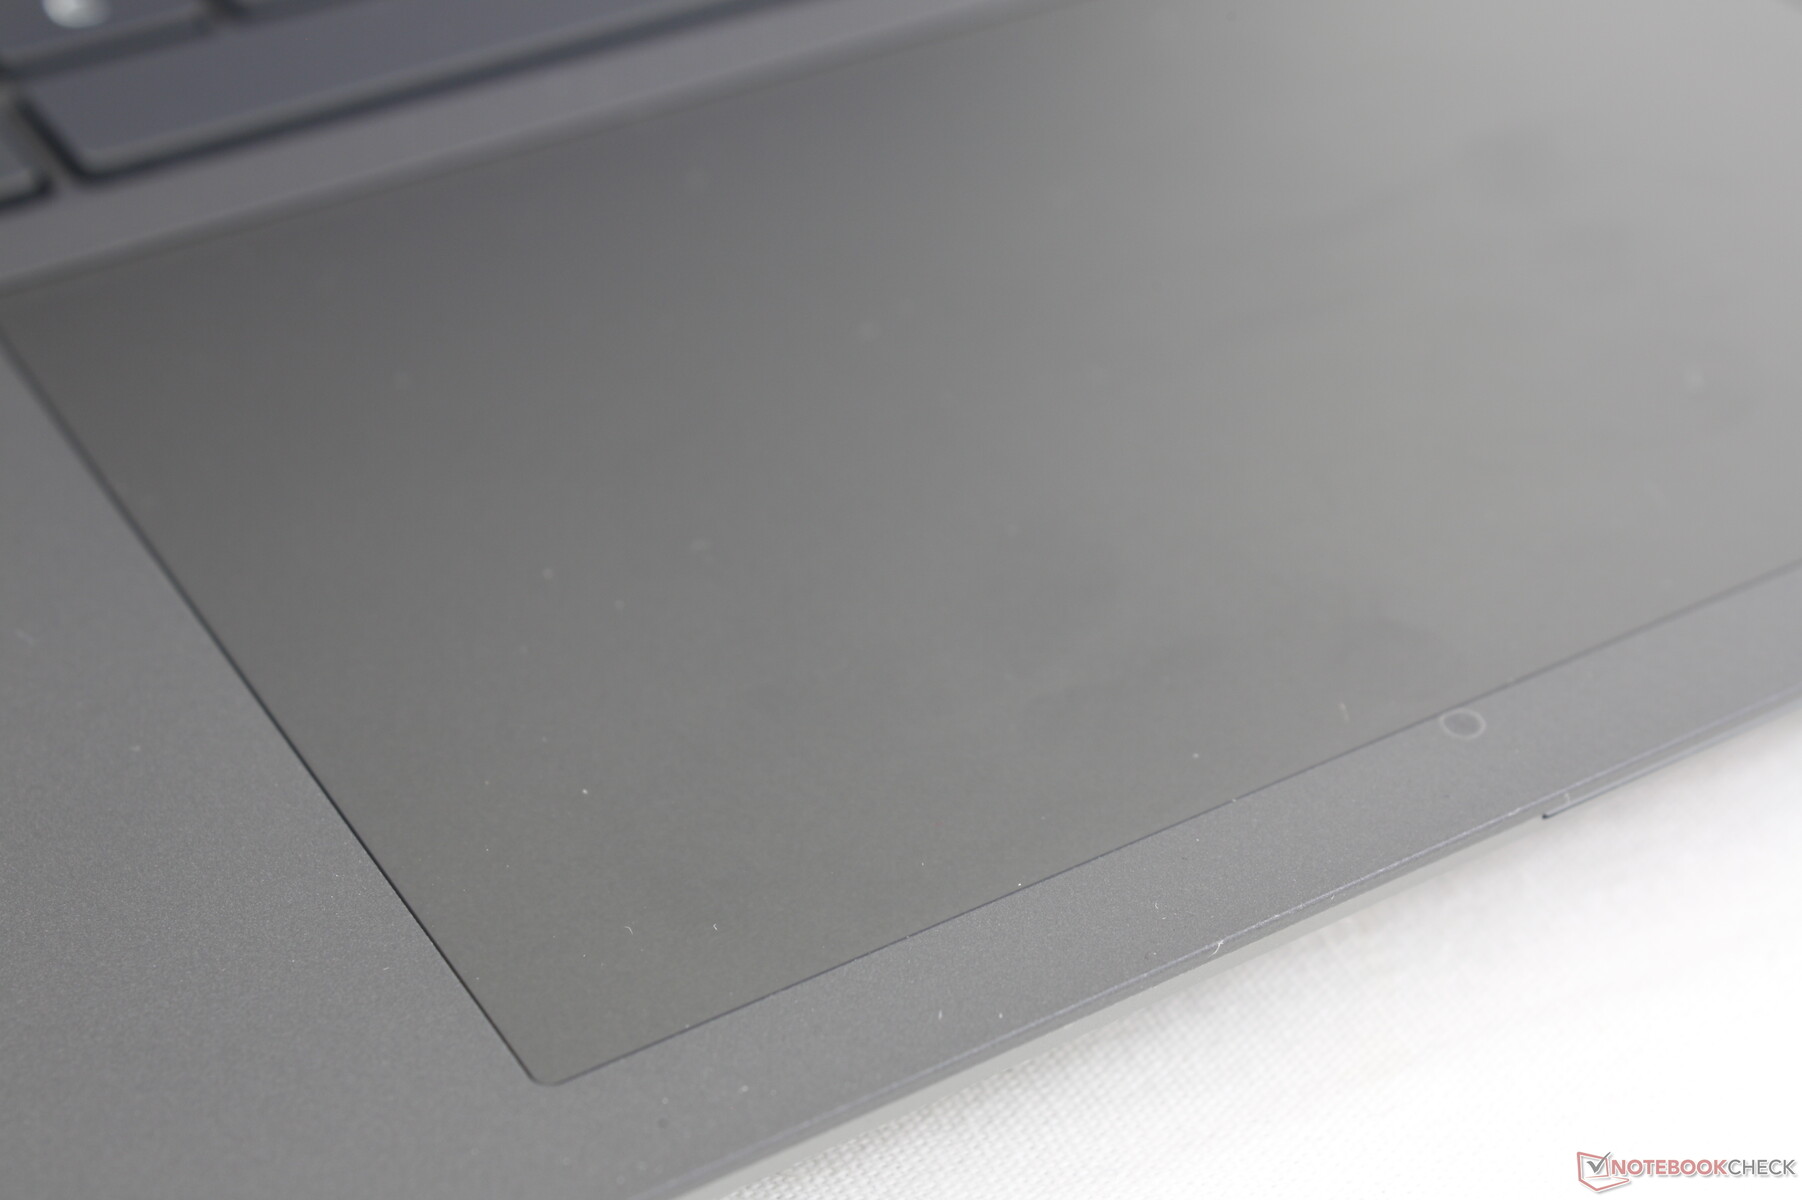
Il clickpad è in realtà più piccolo di quello del Precision 5550 da 15 pollici (13,7 x 8,5 cm contro 15,1 x 9 cm), nonostante le dimensioni maggiori dello schermo. Nonostante ciò, risulta comunque spazioso, con proprietà di scorrimento fluide e affidabili, proprio come quelle dell'XPS 15.
Purtroppo, il feedback quando si fa clic sul clickpad aptico è quasi inesistente. In effetti, non c'è quasi nessuna corsa o feedback sonoro. Per un'azione di trascinamento più accurata, si consiglia di utilizzare un mouse.
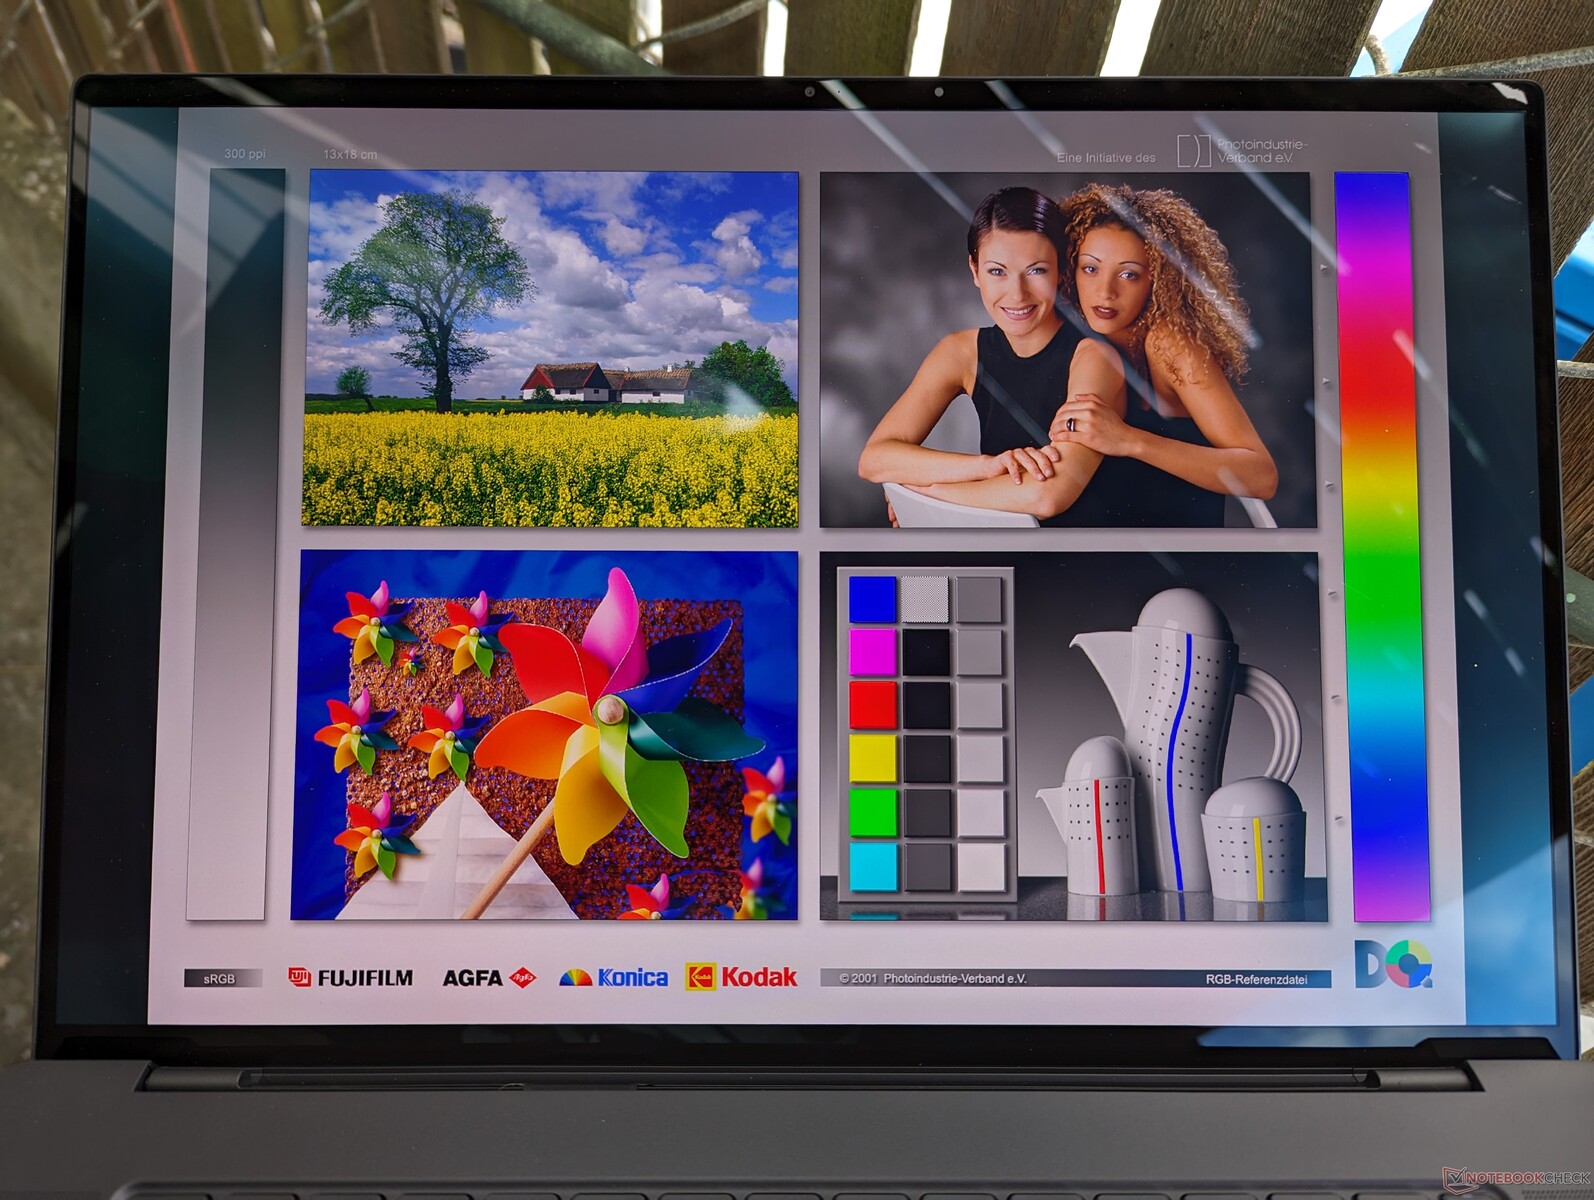
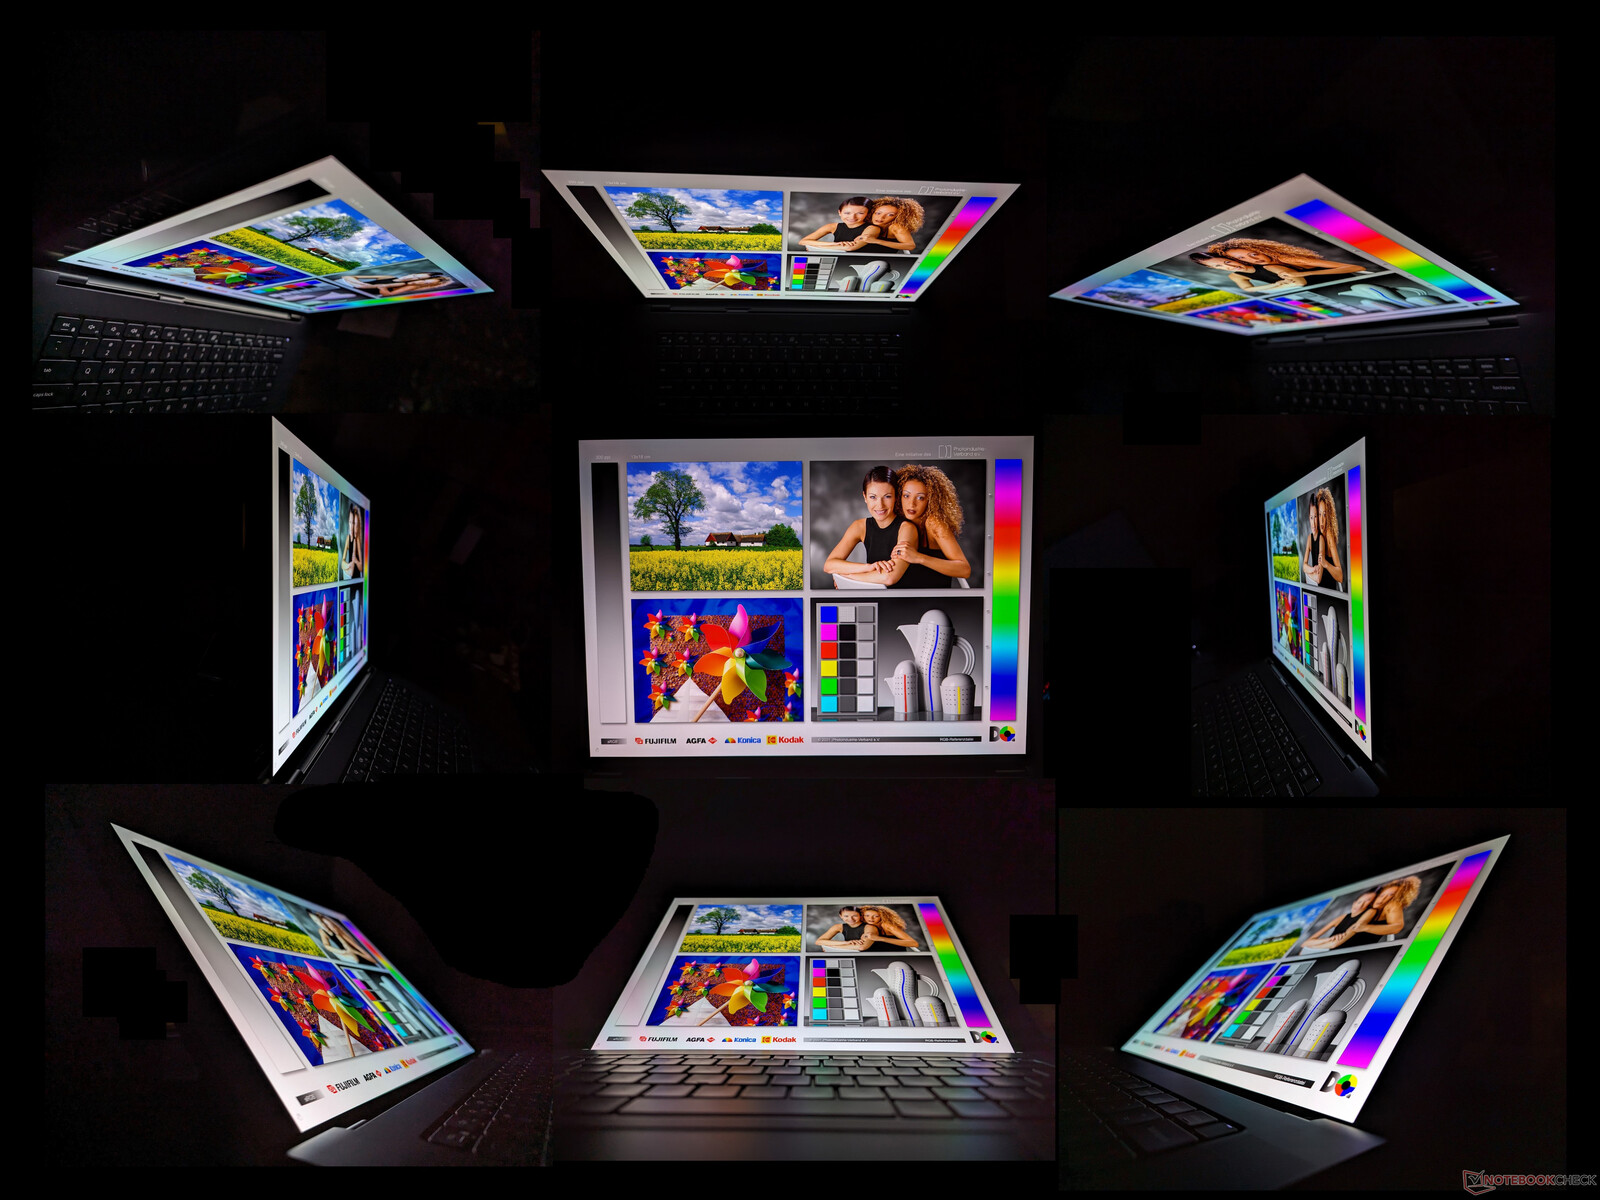
Display
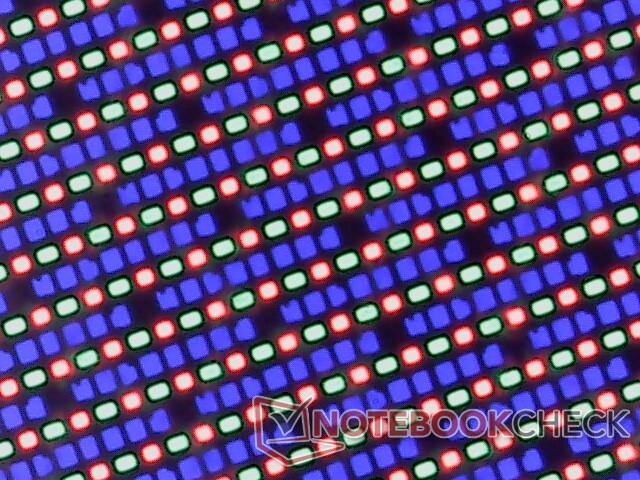
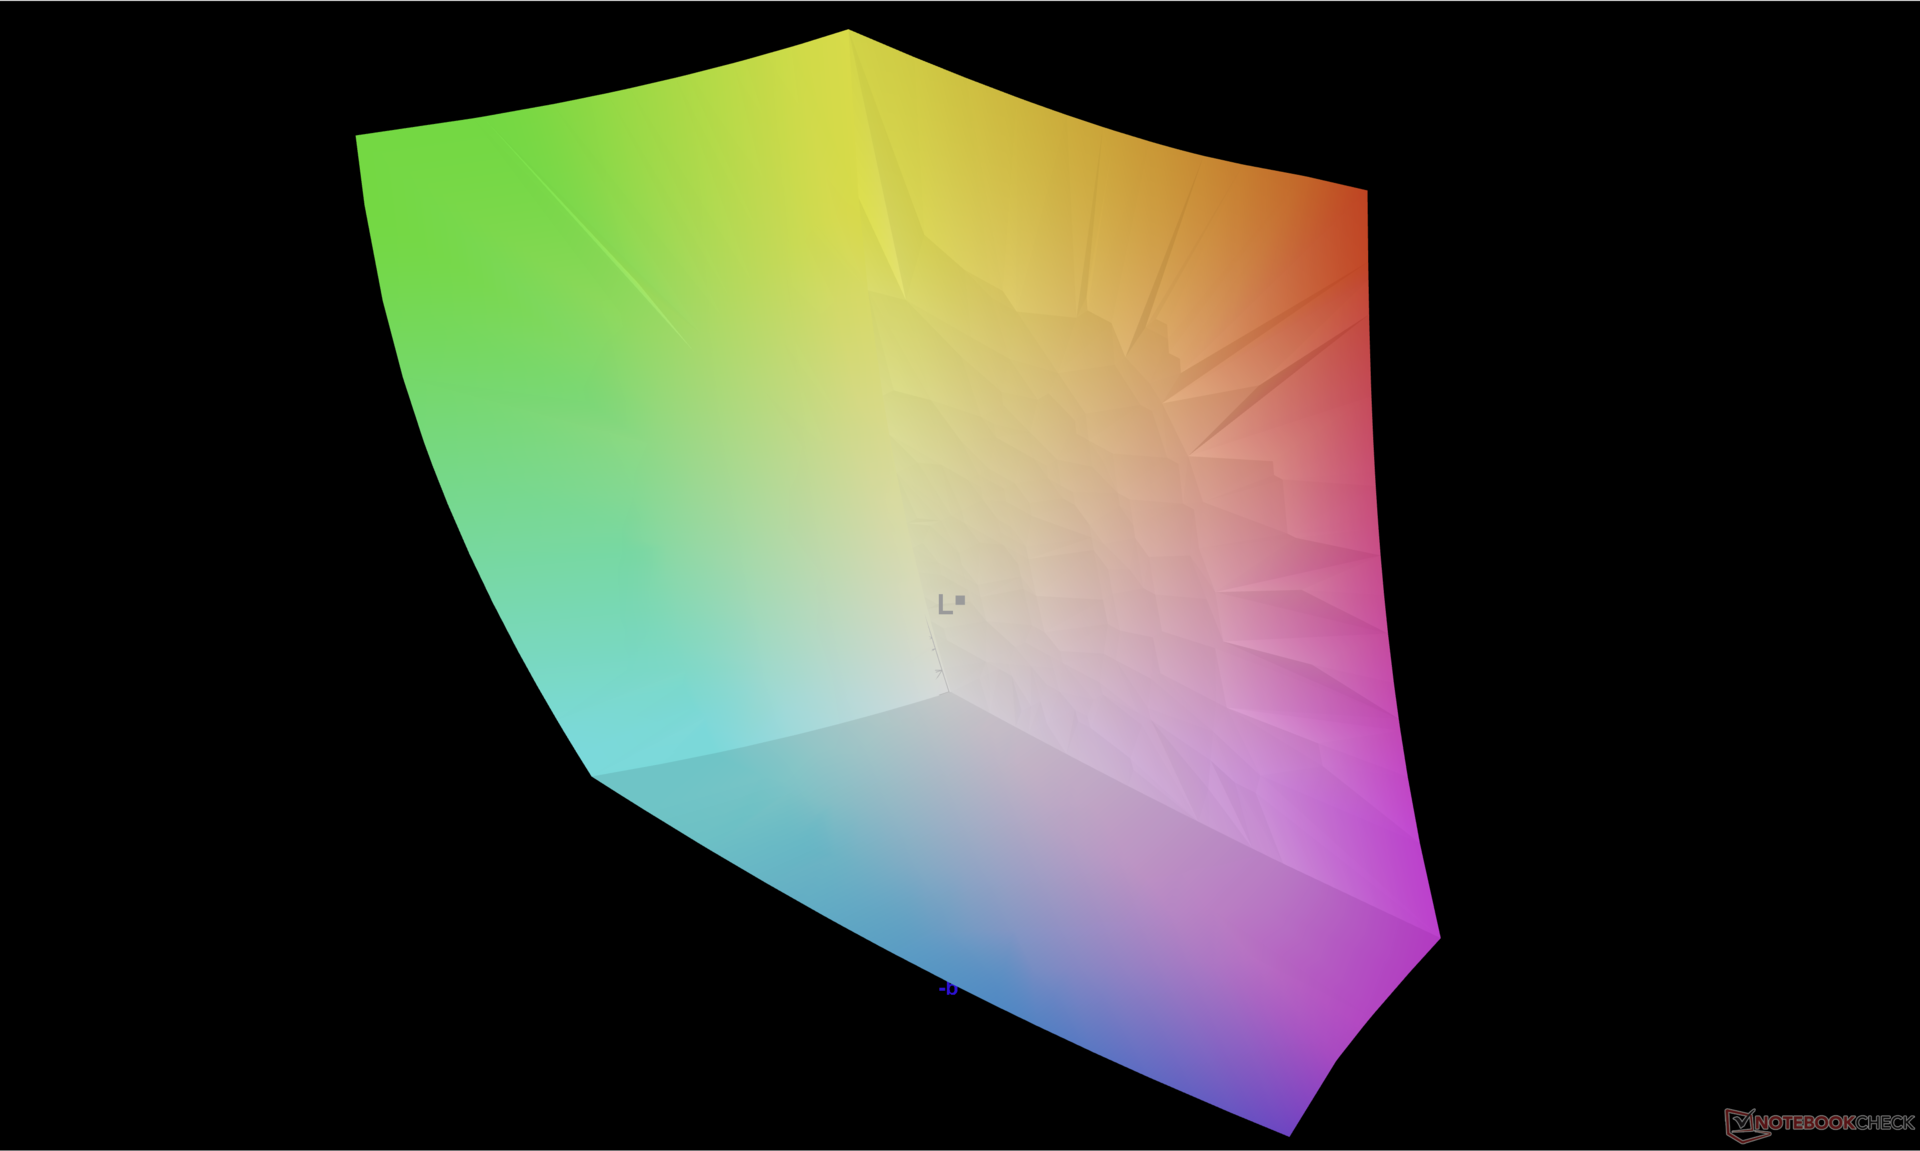
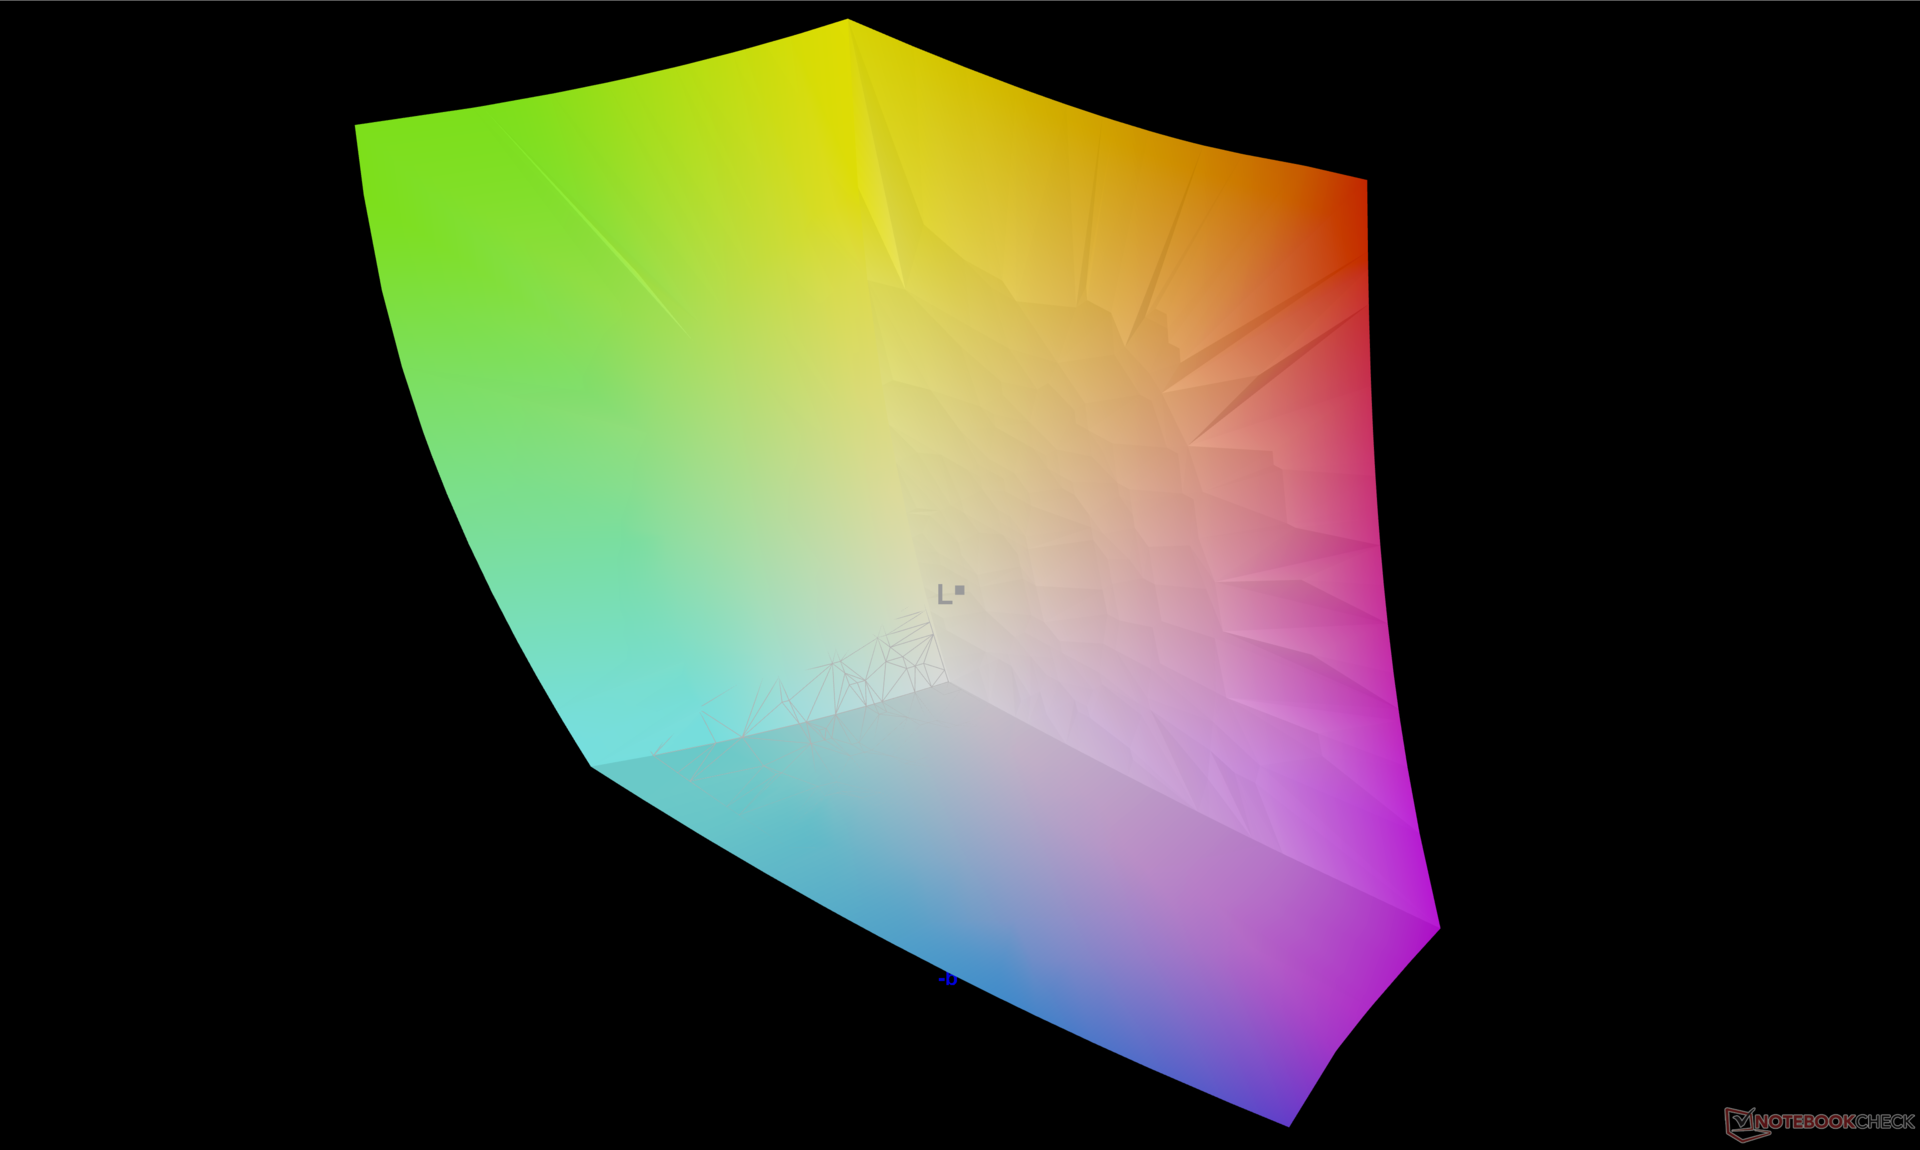
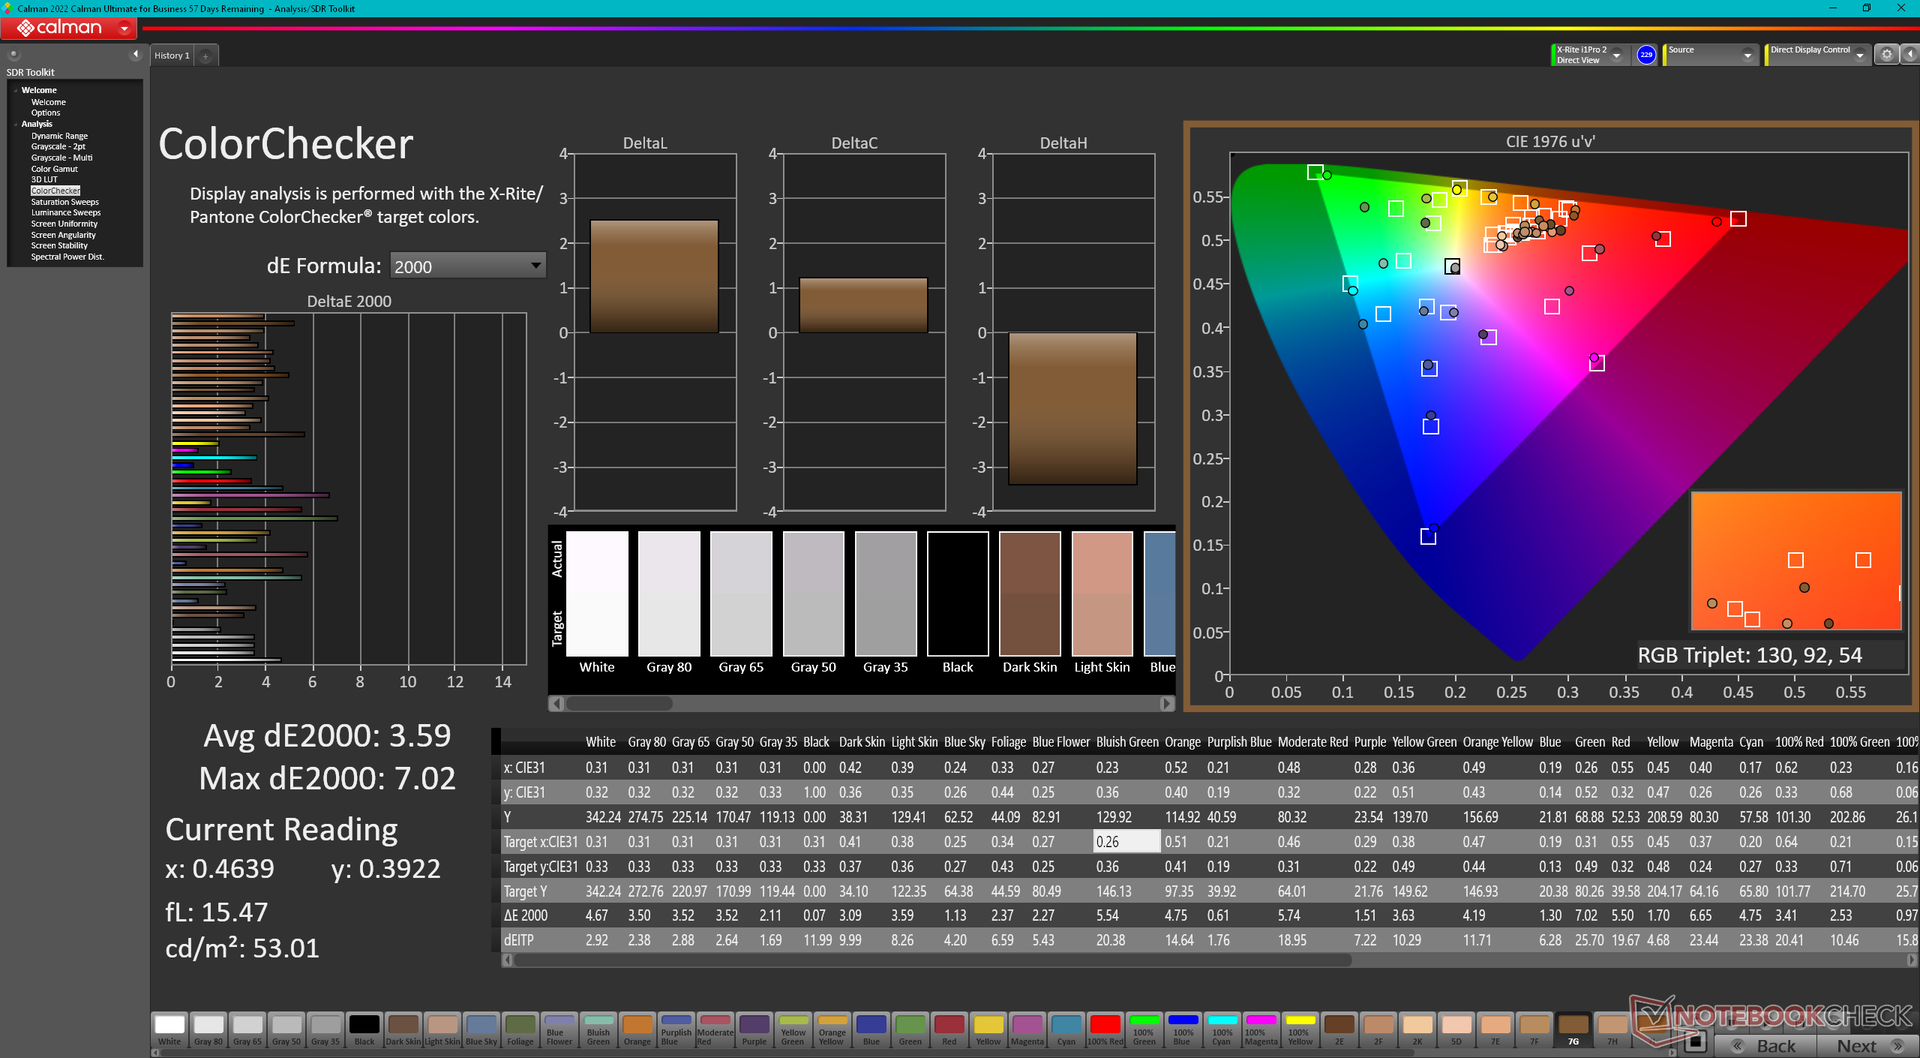
Dell utilizza lo stesso pannello OLED Samsung 160YV03 sia per il suo Precision 5680 da 16 pollici che per il 7670 da 16 pollici Precision 7670. Pertanto, entrambi i modelli offrono la stessa esperienza visiva grazie a tempi di risposta simili, colori DCI-P3 completi e livelli di luminosità uniformi, come mostra la tabella di confronto qui sotto. Ci auguriamo di poter vedere nel prossimo futuro opzioni con una frequenza di aggiornamento più elevata.
| |||||||||||||||||||||||||
Distribuzione della luminosità: 98 %
Al centro con la batteria: 345.7 cd/m²
Contrasto: ∞:1 (Nero: 0 cd/m²)
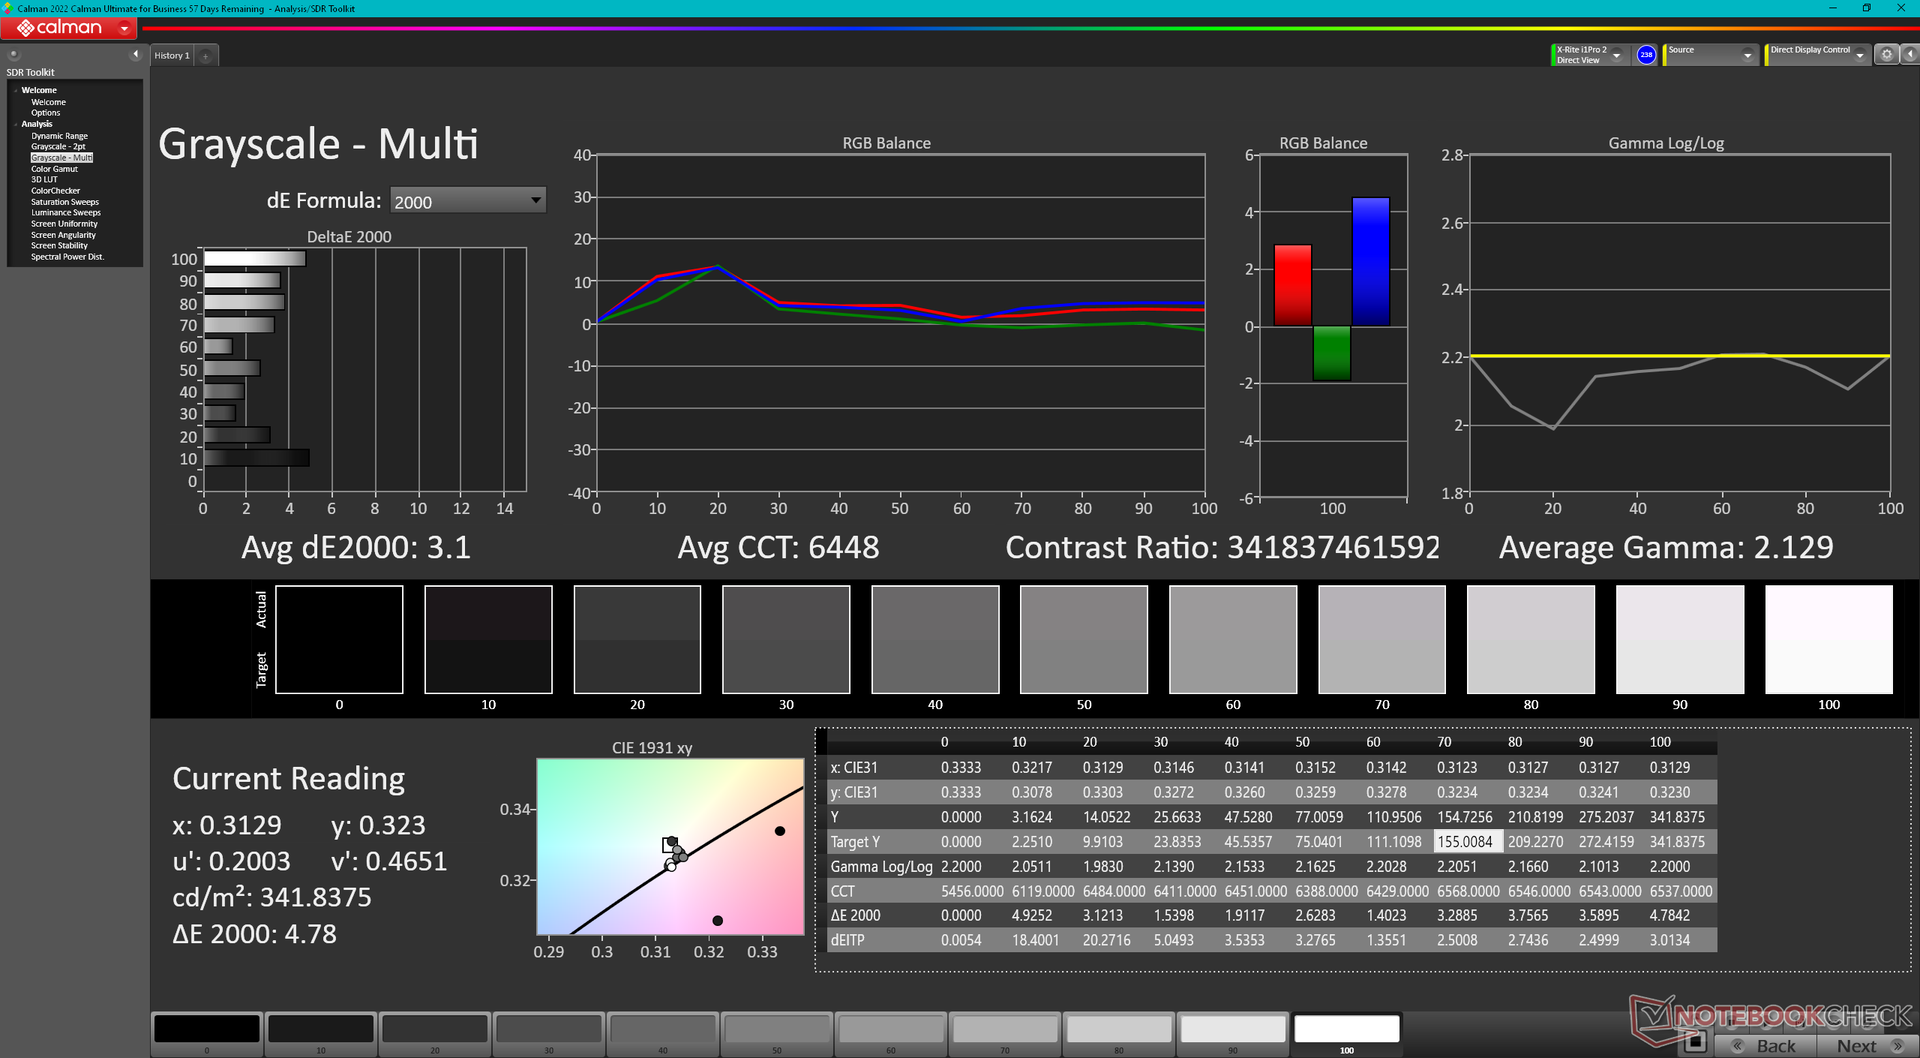
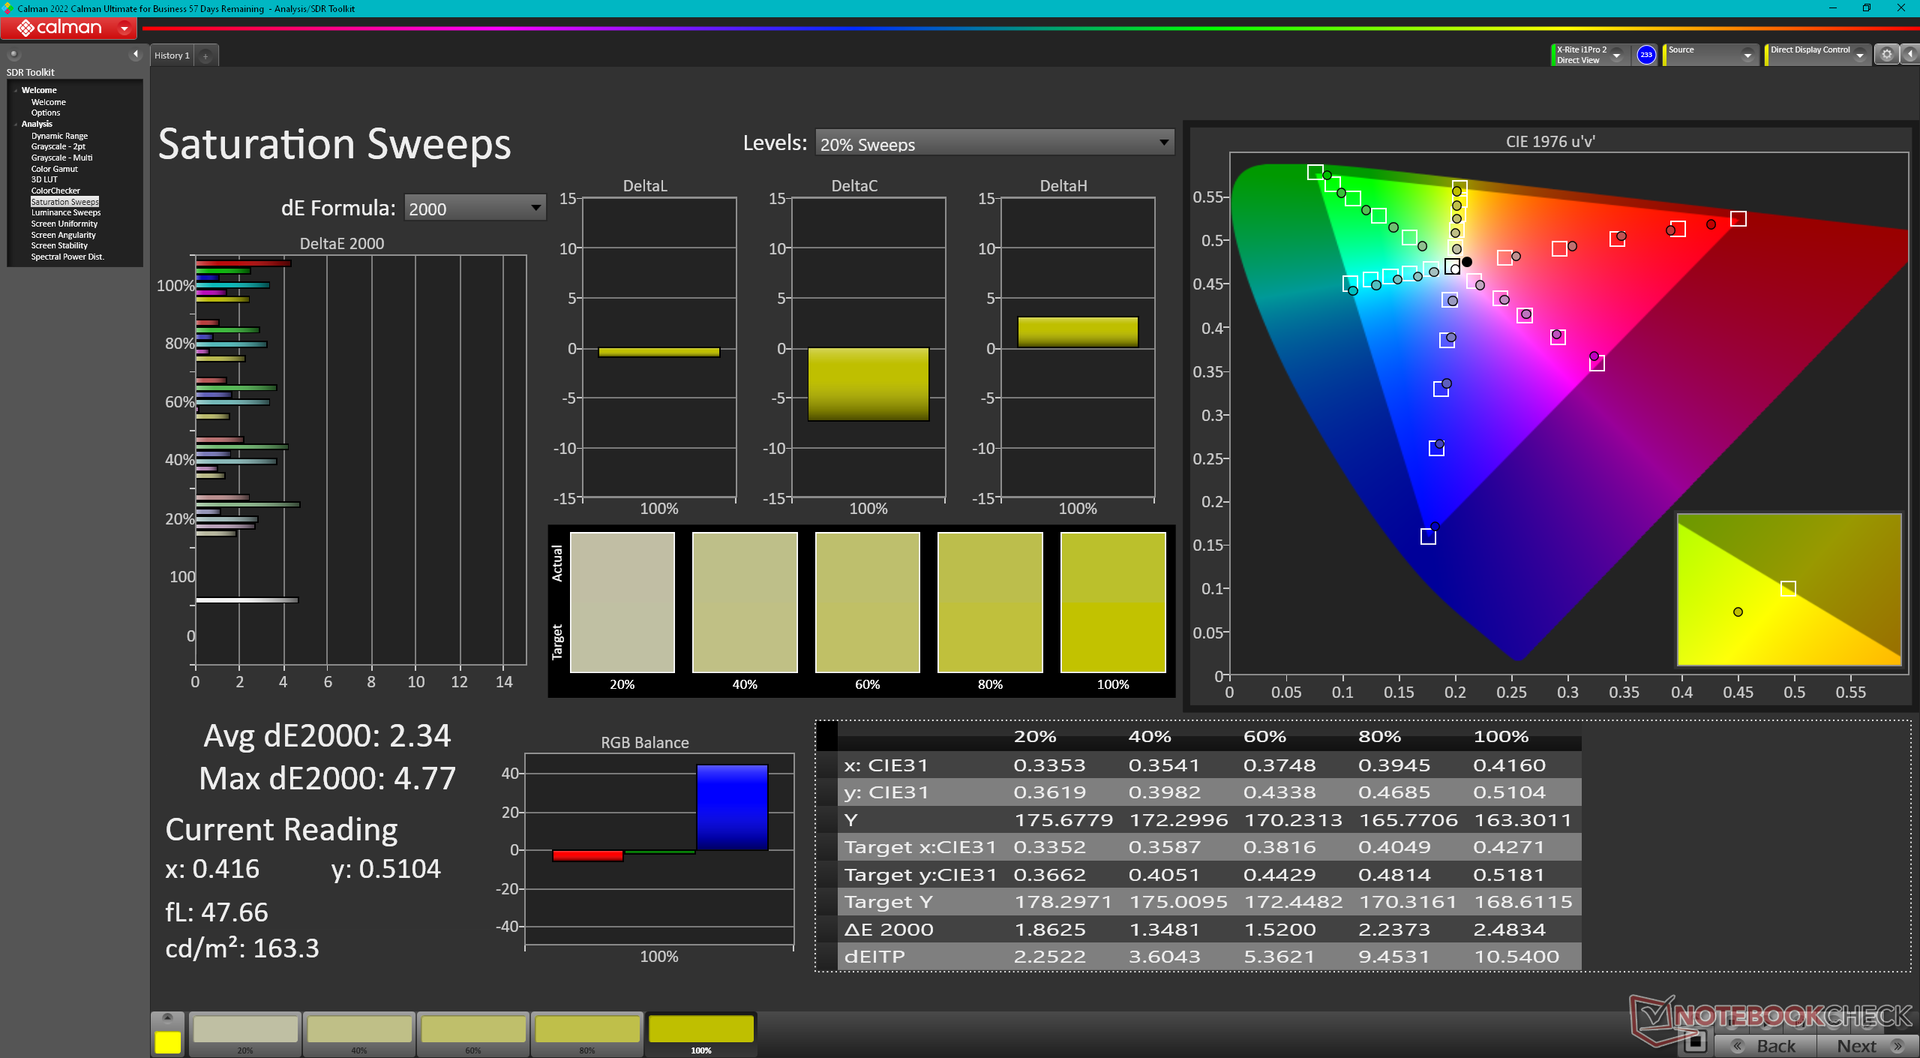
ΔE ColorChecker Calman: 3.59 | ∀{0.5-29.43 Ø4.72}
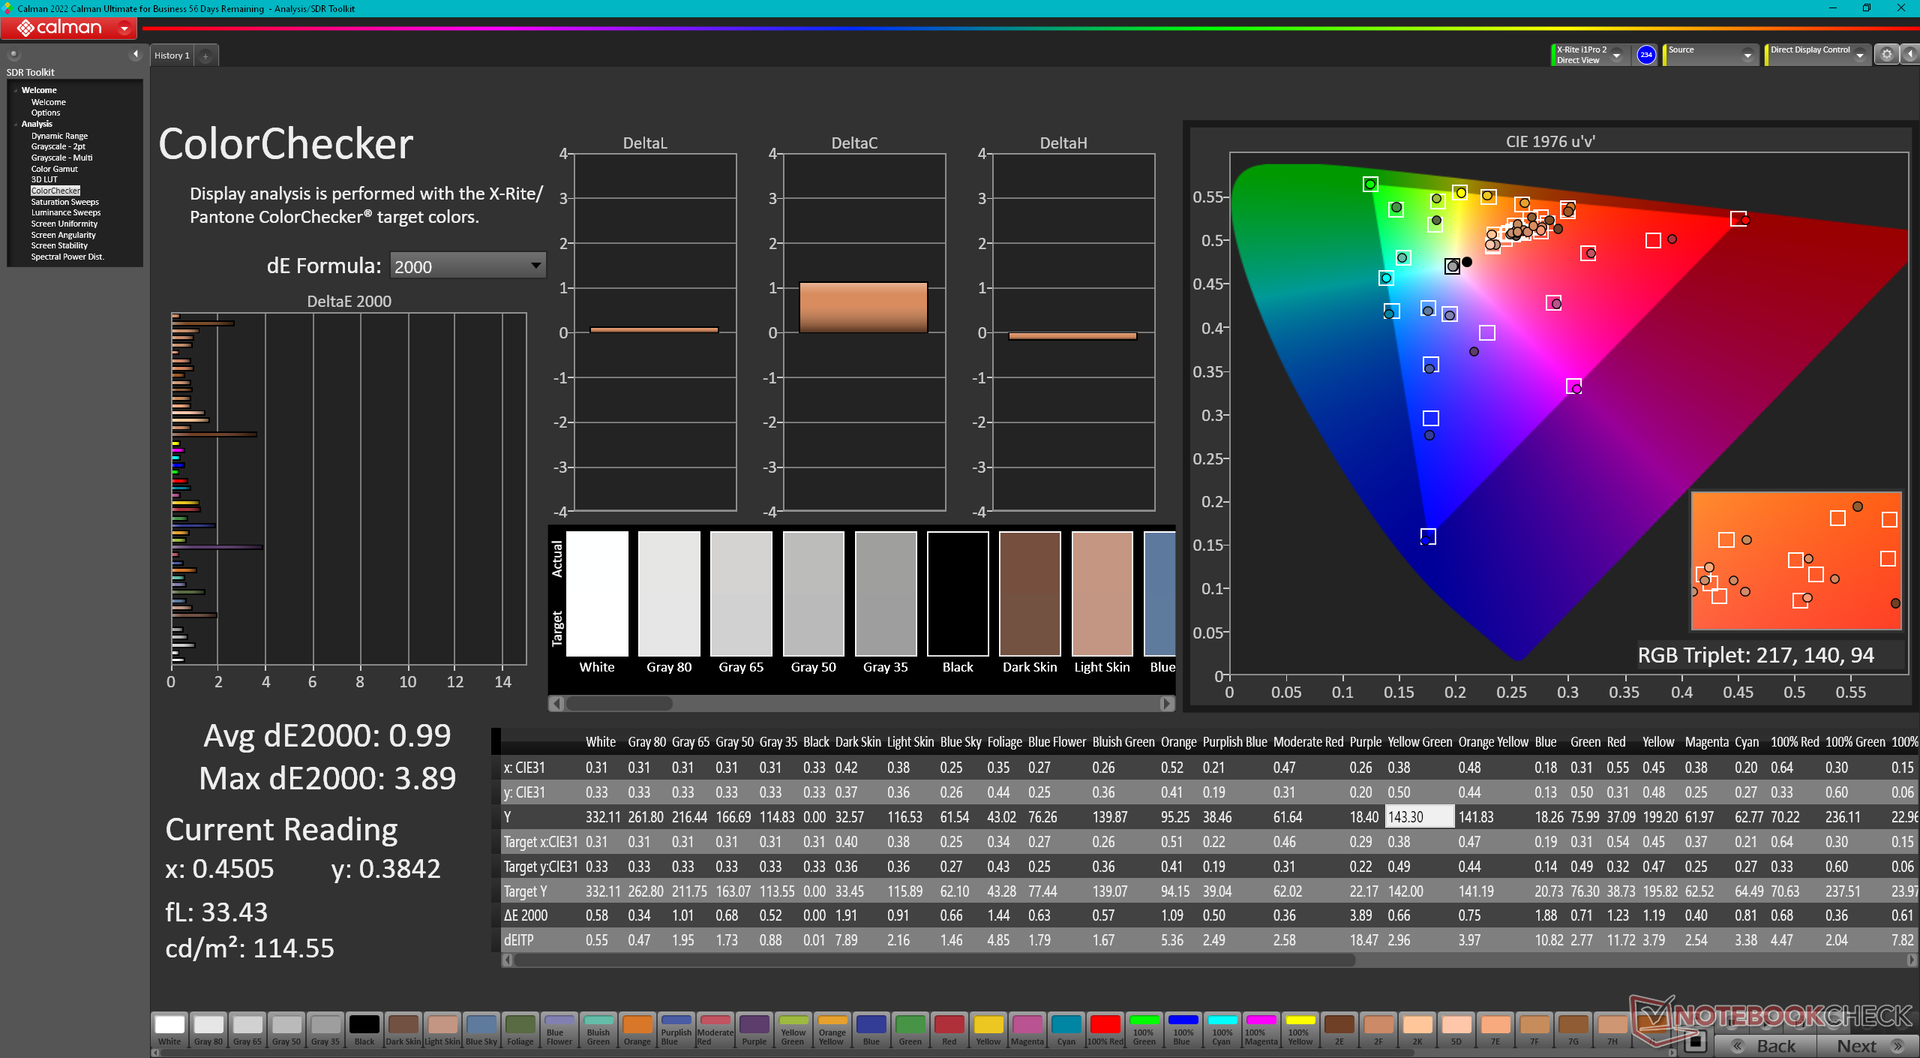
calibrated: 0.99
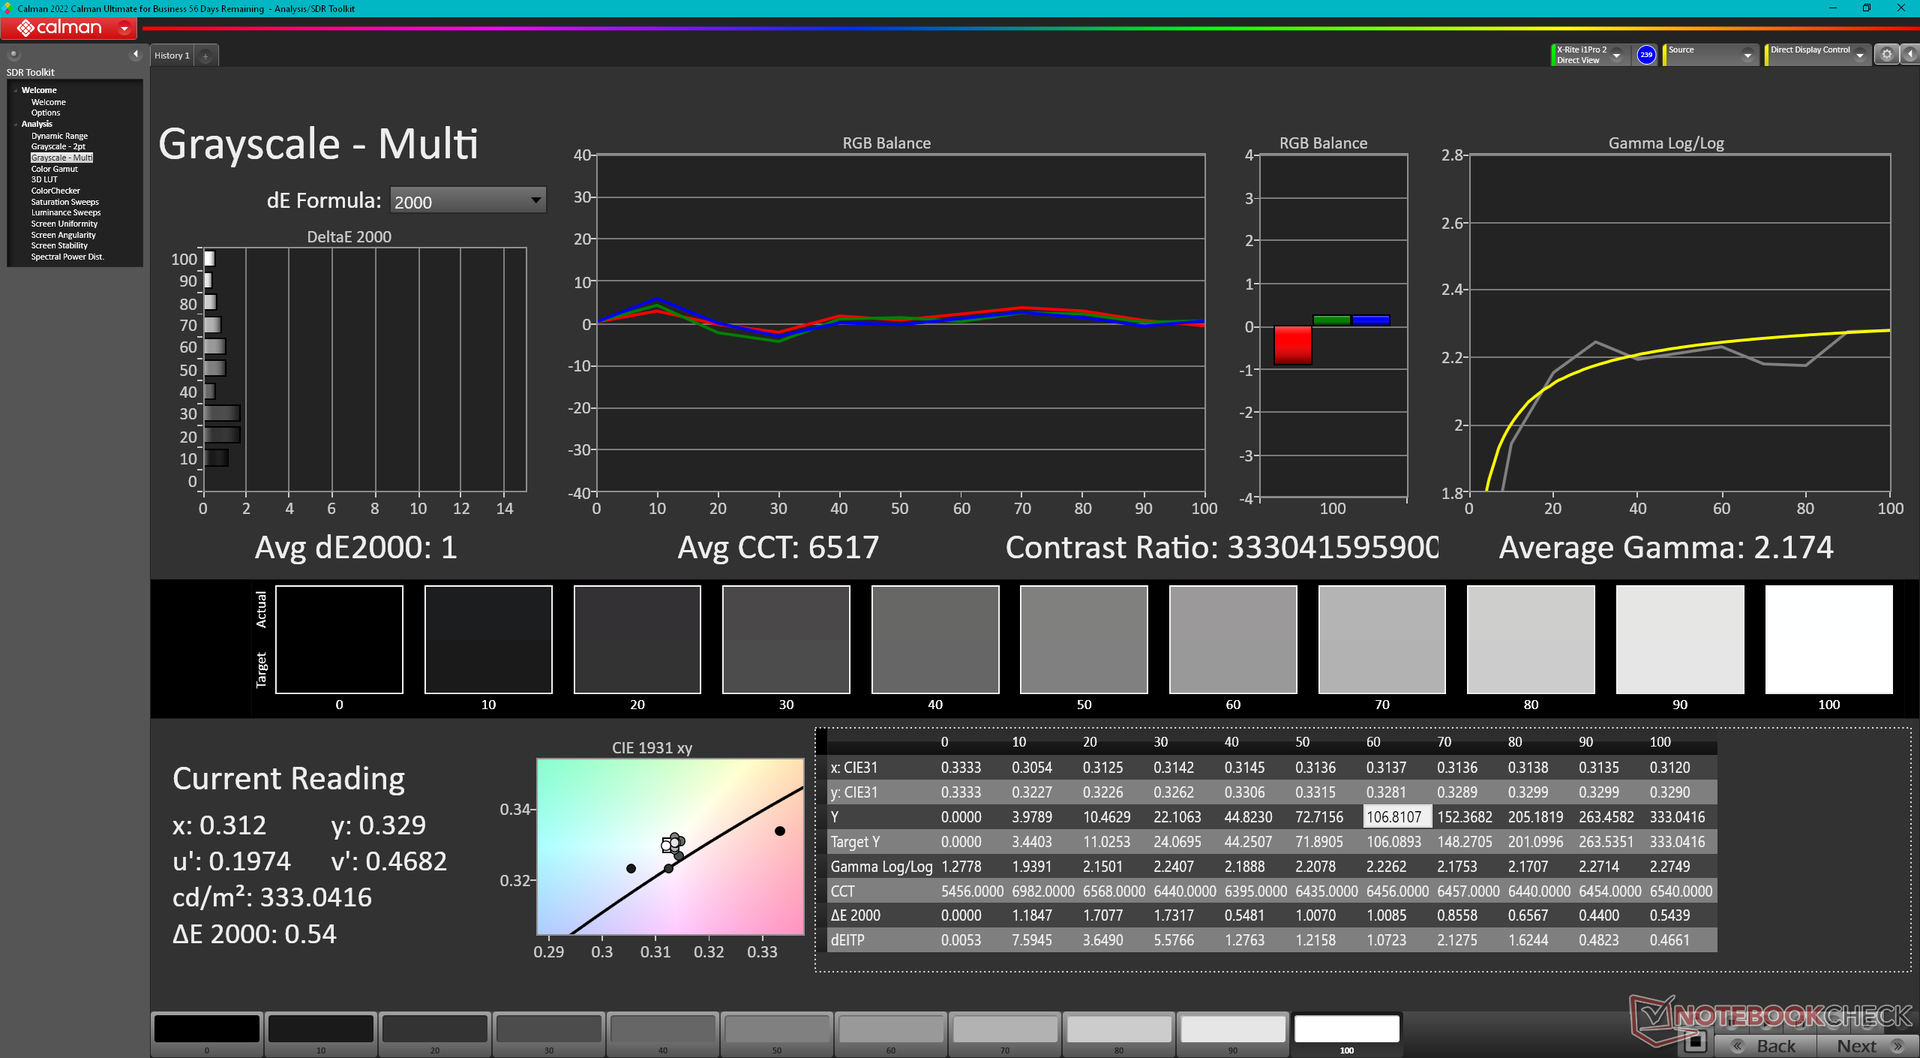
ΔE Greyscale Calman: 3.1 | ∀{0.09-98 Ø4.97}
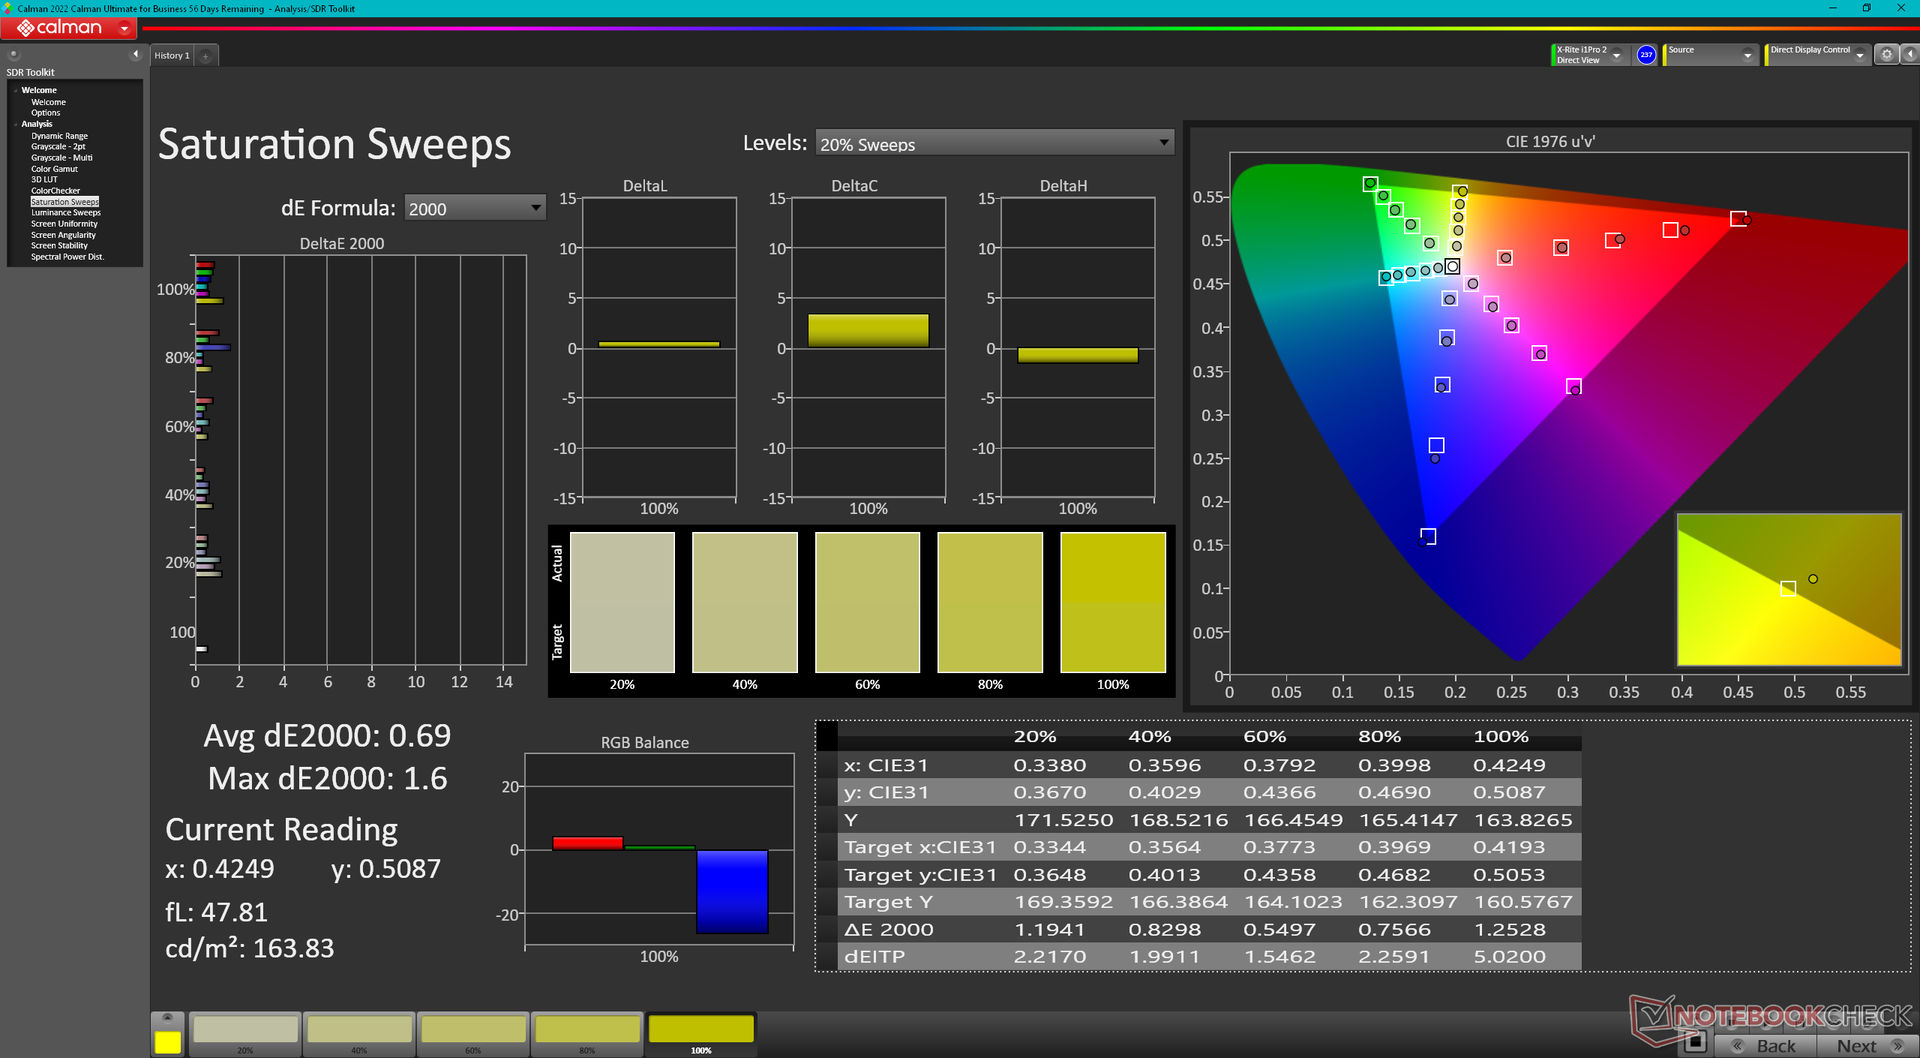
97.5% AdobeRGB 1998 (Argyll 3D)
100% sRGB (Argyll 3D)
99.9% Display P3 (Argyll 3D)
Gamma: 2.13
CCT: 6448 K
| Dell Precision 5000 5680 Samsung 160YV03, OLED, 3840x2400, 16" | Dell Precision 7000 7670 Performance Samsung 160YV03, OLED, 3840x2400, 16" | HP ZBook Fury 16 G9 BOE0A52, IPS, 3840x2400, 16" | Lenovo ThinkPad P16 G1 RTX A5500 LP160UQ1-SPB1, IPS, 3840x2400, 16" | MSI CreatorPro Z16P B12UKST B160QAN02.N, IPS, 2560x1600, 16" | Asus ExpertBook B6 Flip B6602FC2 AU Optronics Model: AUOE495, IPS, 2560x1600, 16" | |
|---|---|---|---|---|---|---|
| Display | 0% | -5% | -7% | -4% | -5% | |
| Display P3 Coverage (%) | 99.9 | 99.9 0% | 97.4 -3% | 82.9 -17% | 97.6 -2% | 97.9 -2% |
| sRGB Coverage (%) | 100 | 100 0% | 99.9 0% | 98.9 -1% | 99.9 0% | 99.89 0% |
| AdobeRGB 1998 Coverage (%) | 97.5 | 98.1 1% | 86.3 -11% | 95.9 -2% | 87.4 -10% | 85.52 -12% |
| Response Times | -9% | -551% | -2297% | -490% | -1452% | |
| Response Time Grey 50% / Grey 80% * (ms) | 1.68 ? | 1.84 ? -10% | 13.7 ? -715% | 45.6 ? -2614% | 12.8 ? -662% | 36 ? -2043% |
| Response Time Black / White * (ms) | 1.77 ? | 1.92 ? -8% | 8.6 ? -386% | 36.8 ? -1979% | 7.4 ? -318% | 17 ? -860% |
| PWM Frequency (Hz) | 60 ? | 59.52 ? | ||||
| Screen | -5% | -33% | 33% | 30% | -6% | |
| Brightness middle (cd/m²) | 345.7 | 325.2 -6% | 530.5 53% | 601.9 74% | 407 18% | 440 27% |
| Brightness (cd/m²) | 349 | 328 -6% | 476 36% | 569 63% | 388 11% | 418 20% |
| Brightness Distribution (%) | 98 | 97 -1% | 83 -15% | 77 -21% | 88 -10% | 82 -16% |
| Black Level * (cd/m²) | 0.57 | 0.47 | 0.36 | 0.3 | ||
| Colorchecker dE 2000 * | 3.59 | 4.59 -28% | 2.26 37% | 2.45 32% | 1.3 64% | 2.81 22% |
| Colorchecker dE 2000 max. * | 7.02 | 7.65 -9% | 4.46 36% | 2.5 64% | 4.62 34% | |
| Colorchecker dE 2000 calibrated * | 0.99 | 4.73 -378% | 0.7 29% | 2.99 -202% | ||
| Greyscale dE 2000 * | 3.1 | 2.5 19% | 1 68% | 2.6 16% | 2.1 32% | 0.91 71% |
| Gamma | 2.13 103% | 2.1 105% | 2.28 96% | 2.3 96% | 2.26 97% | 2.2 100% |
| CCT | 6448 101% | 6541 99% | 6543 99% | 6805 96% | 6437 101% | 6600 98% |
| Contrast (:1) | 931 | 1281 | 1131 | 1467 | ||
| Media totale (Programma / Settaggio) | -5% /
-4% | -196% /
-119% | -757% /
-401% | -155% /
-65% | -488% /
-247% |
* ... Meglio usare valori piccoli
Il display è calibrato in modo decente, con valori medi di deltaE compresi tra 3 e 4. Il nostro profilo ICM calibrato è disponibile gratuitamente per il download qui sopra.
Tempi di risposta del Display
| ↔ Tempi di risposta dal Nero al Bianco | ||
|---|---|---|
| 1.77 ms ... aumenta ↗ e diminuisce ↘ combinato | ↗ 0.8 ms Incremento | 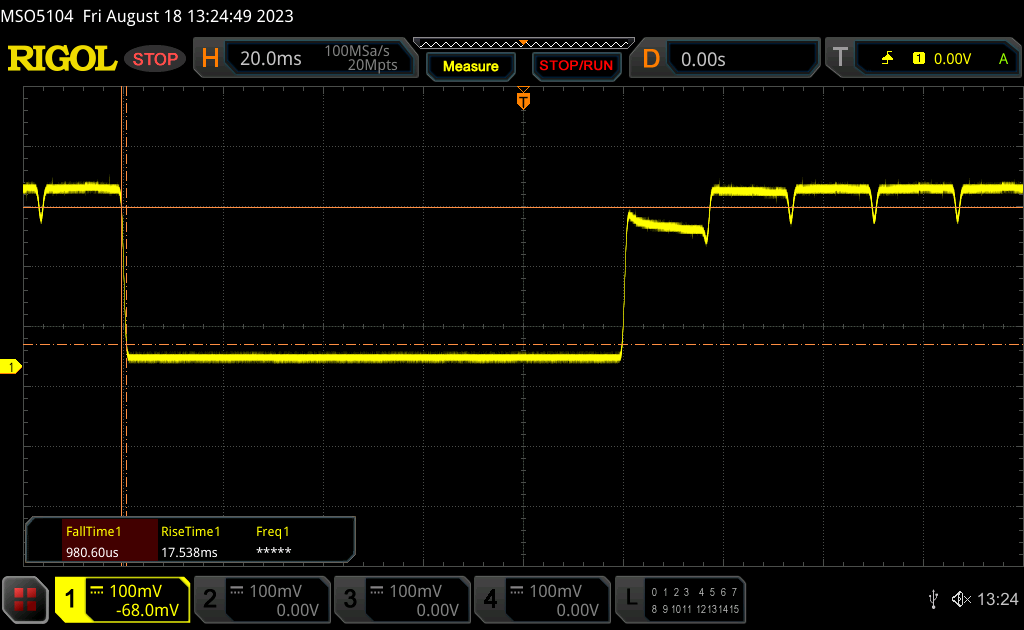 |
| ↘ 0.97 ms Calo | ||
| Lo schermo ha mostrato valori di risposta molto veloci nei nostri tests ed è molto adatto per i gaming veloce. In confronto, tutti i dispositivi di test variano da 0.1 (minimo) a 240 (massimo) ms. » 10 % di tutti i dispositivi è migliore. Questo significa che i tempi di risposta rilevati sono migliori rispettto alla media di tutti i dispositivi testati (19.8 ms). | ||
| ↔ Tempo di risposta dal 50% Grigio all'80% Grigio | ||
| 1.68 ms ... aumenta ↗ e diminuisce ↘ combinato | ↗ 0.97 ms Incremento | 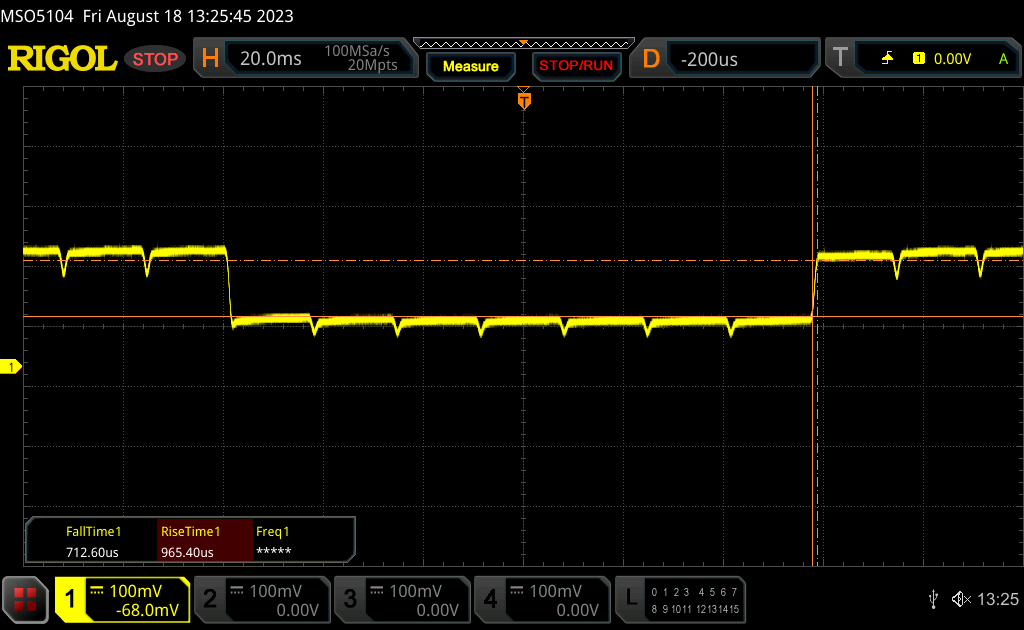 |
| ↘ 0.71 ms Calo | ||
| Lo schermo ha mostrato valori di risposta molto veloci nei nostri tests ed è molto adatto per i gaming veloce. In confronto, tutti i dispositivi di test variano da 0.165 (minimo) a 636 (massimo) ms. » 8 % di tutti i dispositivi è migliore. Questo significa che i tempi di risposta rilevati sono migliori rispettto alla media di tutti i dispositivi testati (31 ms). | ||
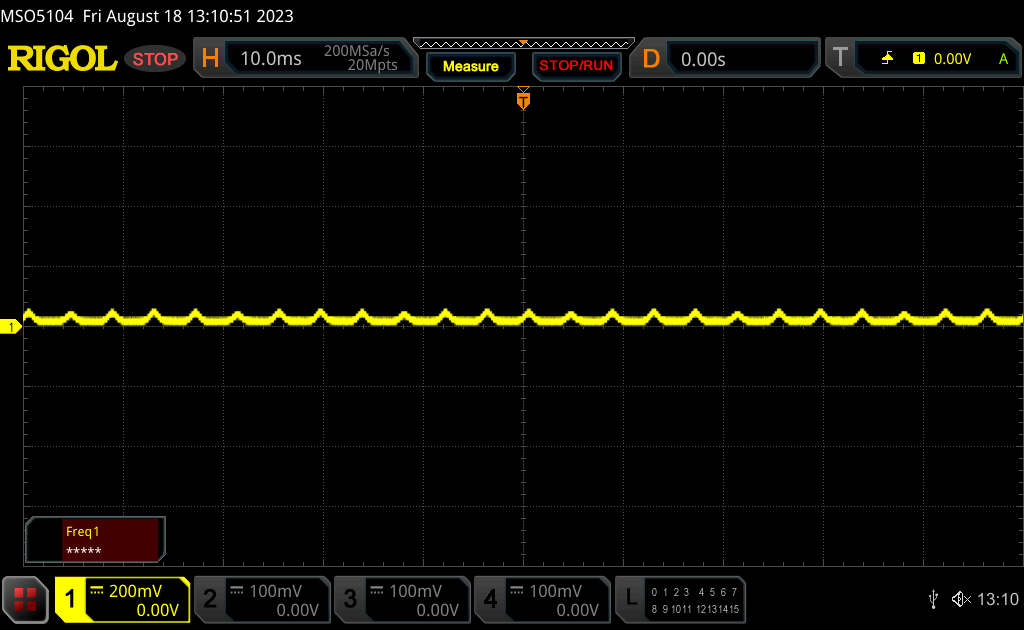
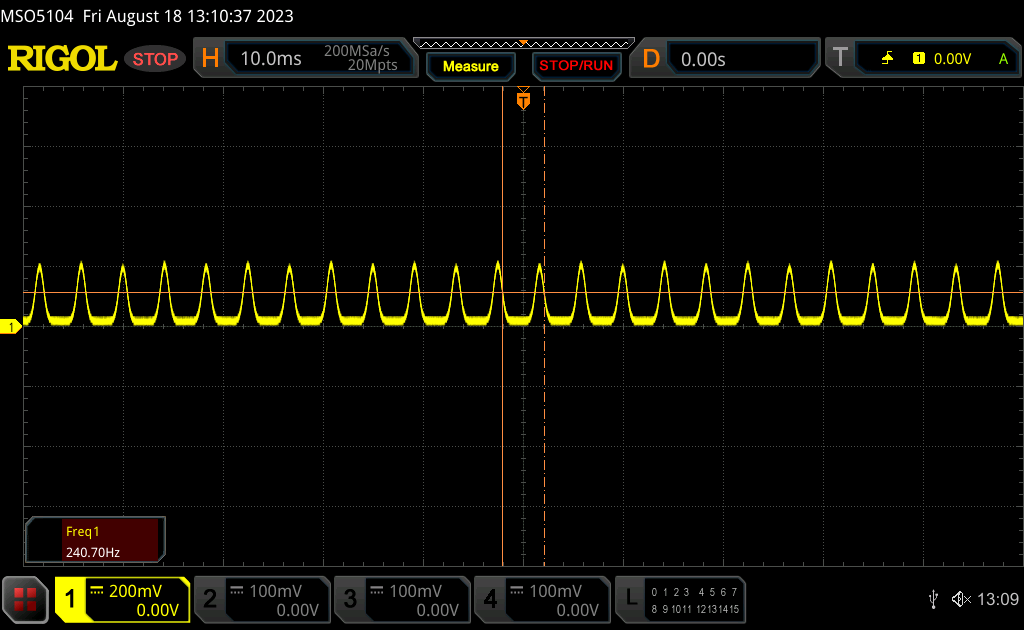
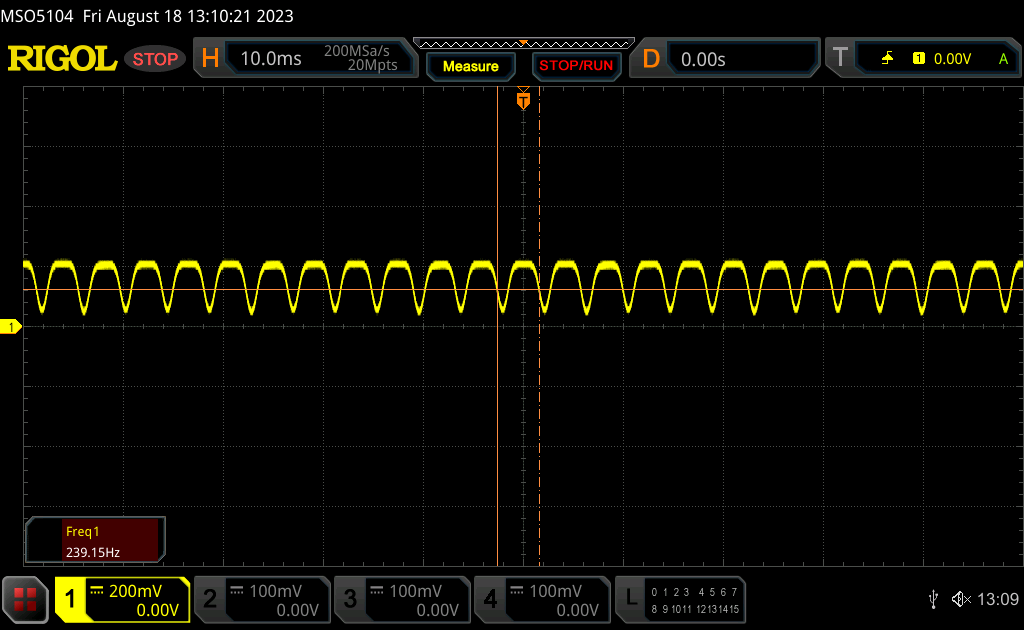
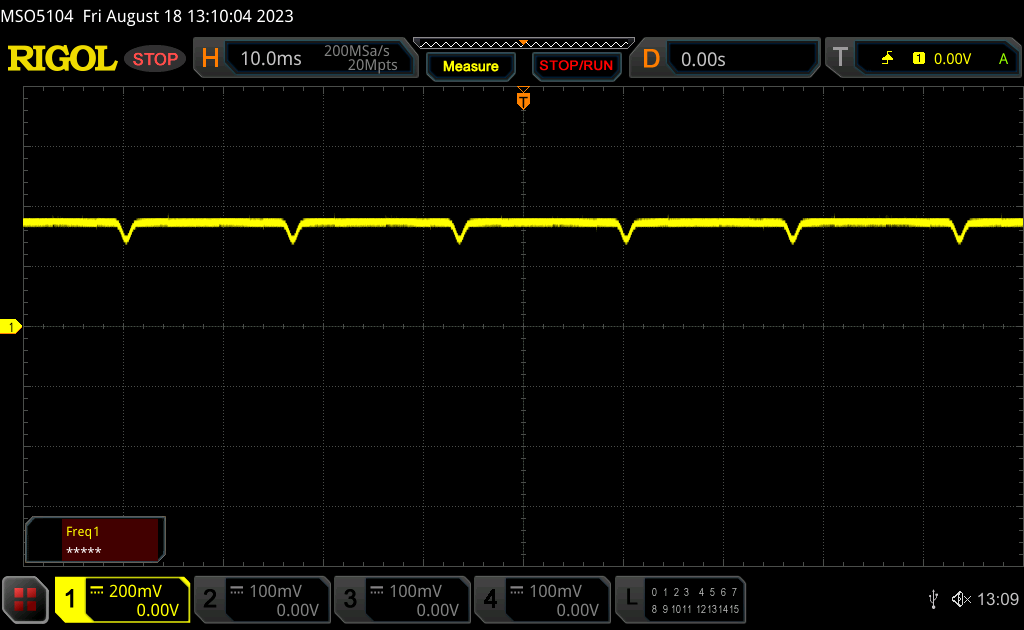
Sfarfallio dello schermo / PWM (Pulse-Width Modulation)
| flickering dello schermo / PWM rilevato | 60 Hz | ≤ 100 % settaggio luminosita' | 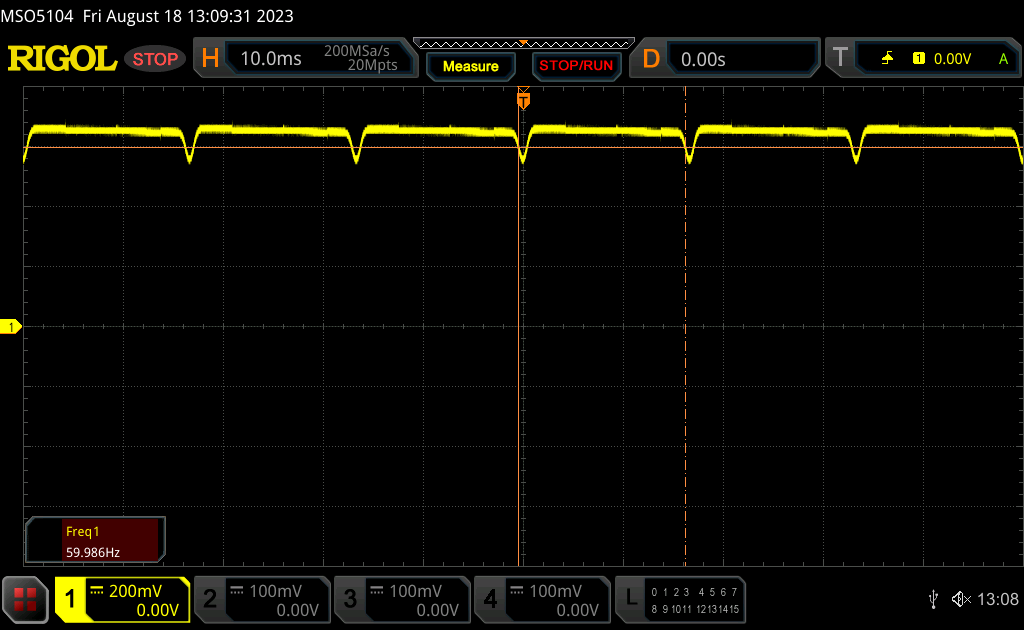 |
Il display sfarfalla a 60 Hz (Probabilmente a causa dell'uso di PWM) Flickering rilevato ad una luminosita' di 100 % o inferiore. Non dovrebbe verificarsi flickering o PWM sopra questo valore di luminosita'. La frequenza di 60 Hz è molto bassa, quindi il flickering potrebbe causare stanchezza agli occhi e mal di testa con un utilizzo prolungato. In confronto: 52 % di tutti i dispositivi testati non utilizza PWM per ridurre la luminosita' del display. Se è rilevato PWM, una media di 7765 (minimo: 5 - massimo: 343500) Hz è stata rilevata. | |||
Lo sfarfallio è presente a tutti i livelli di luminosità, come negli smartphone e in altri computer portatili dotati di pannelli OLED. La frequenza sarebbe stabile a 239 Hz da 0 al 54% di luminosità e a 60 Hz dal 55 al 100% di luminosità.
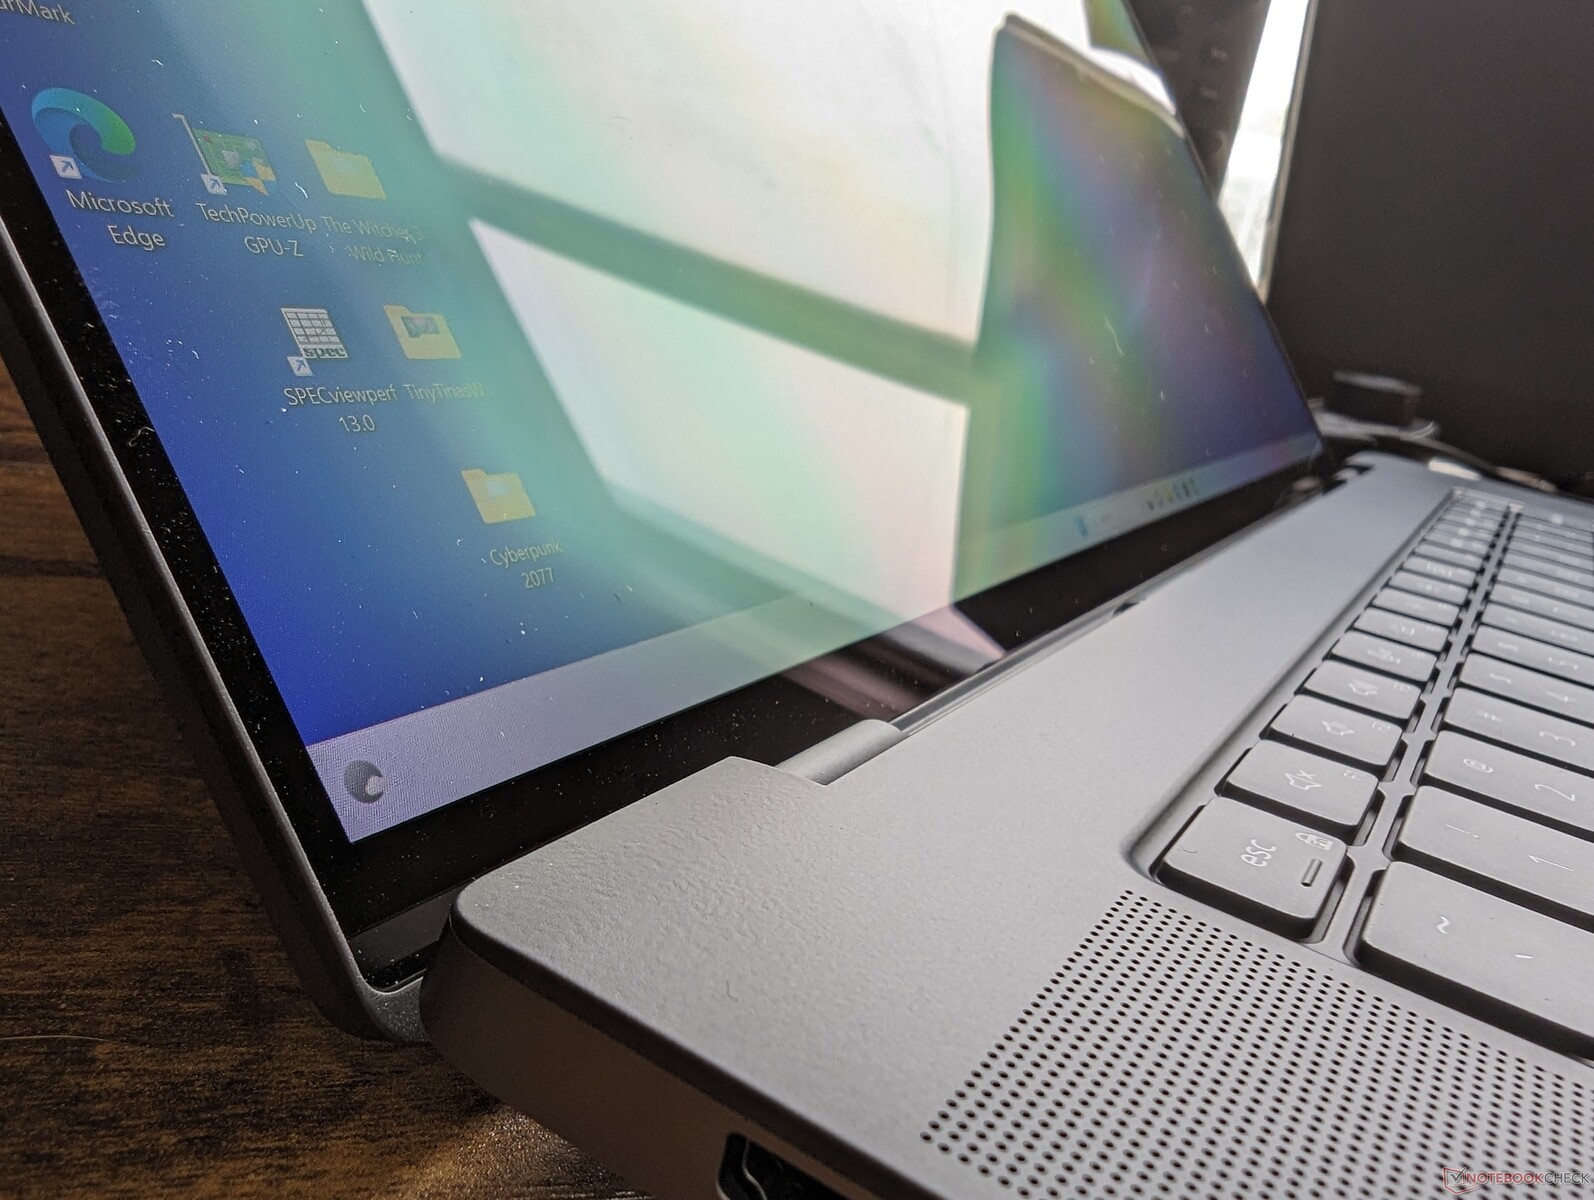
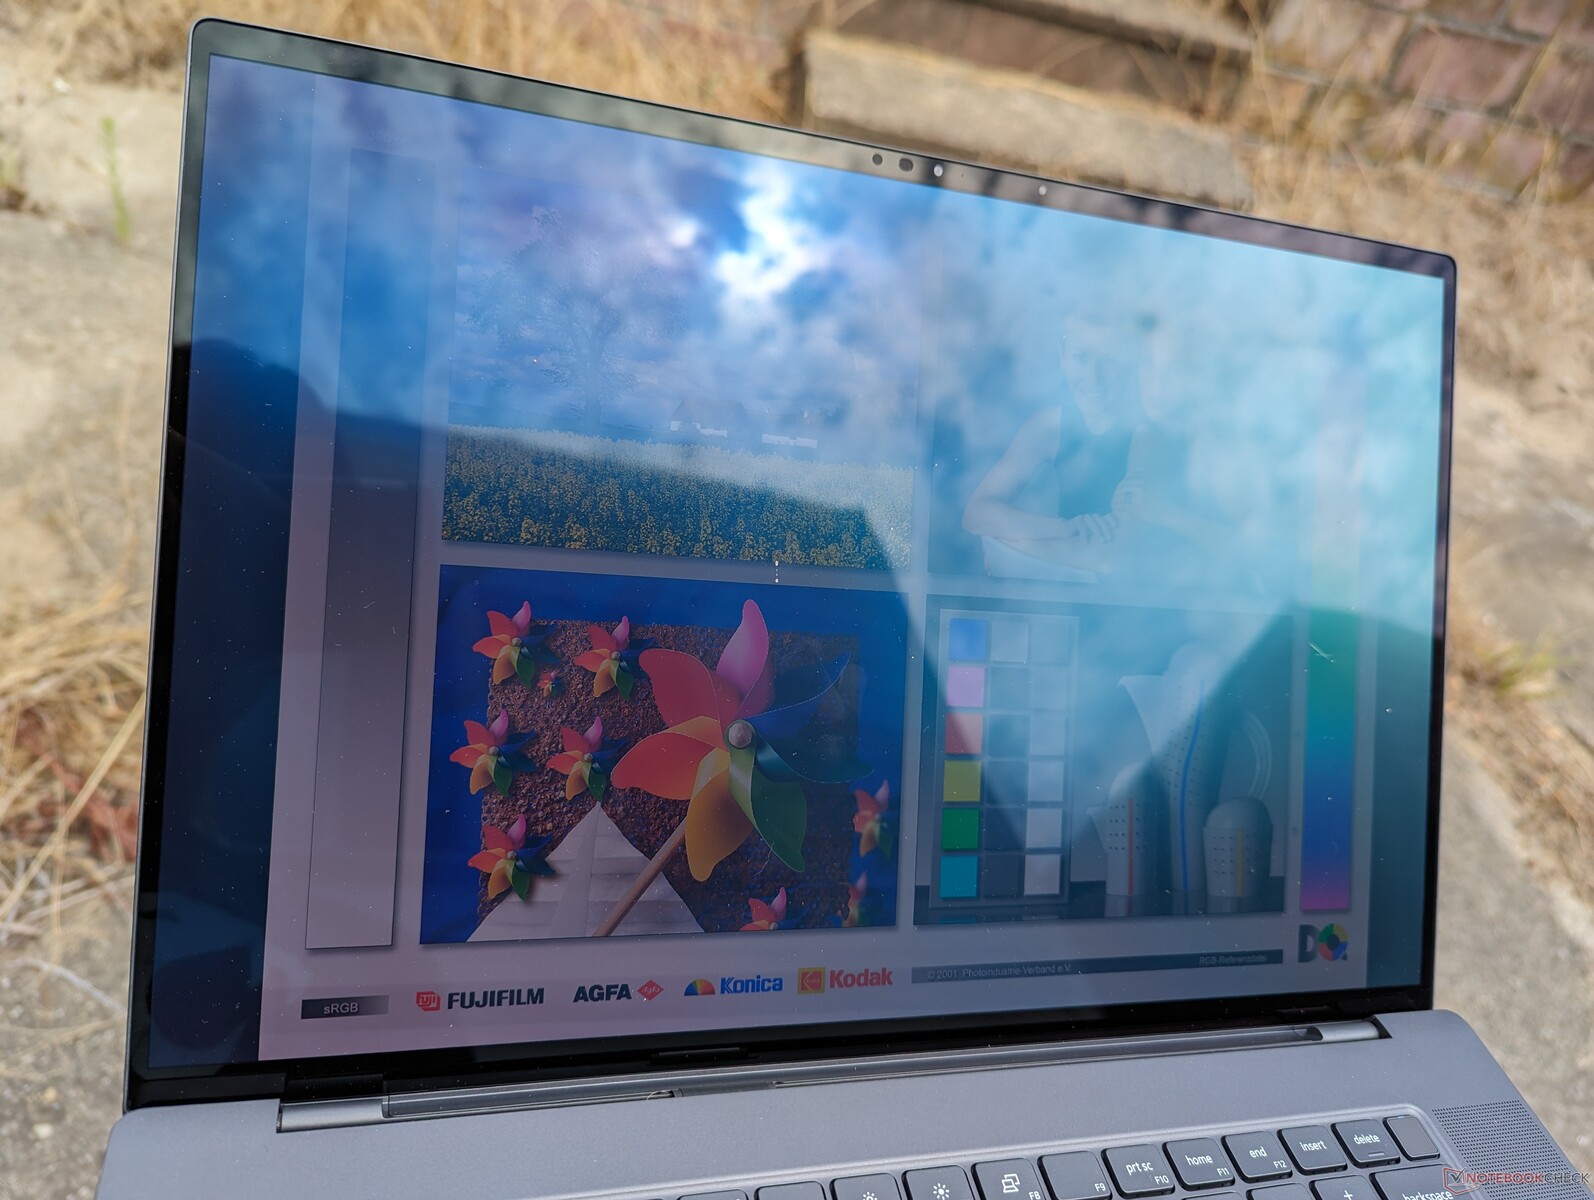
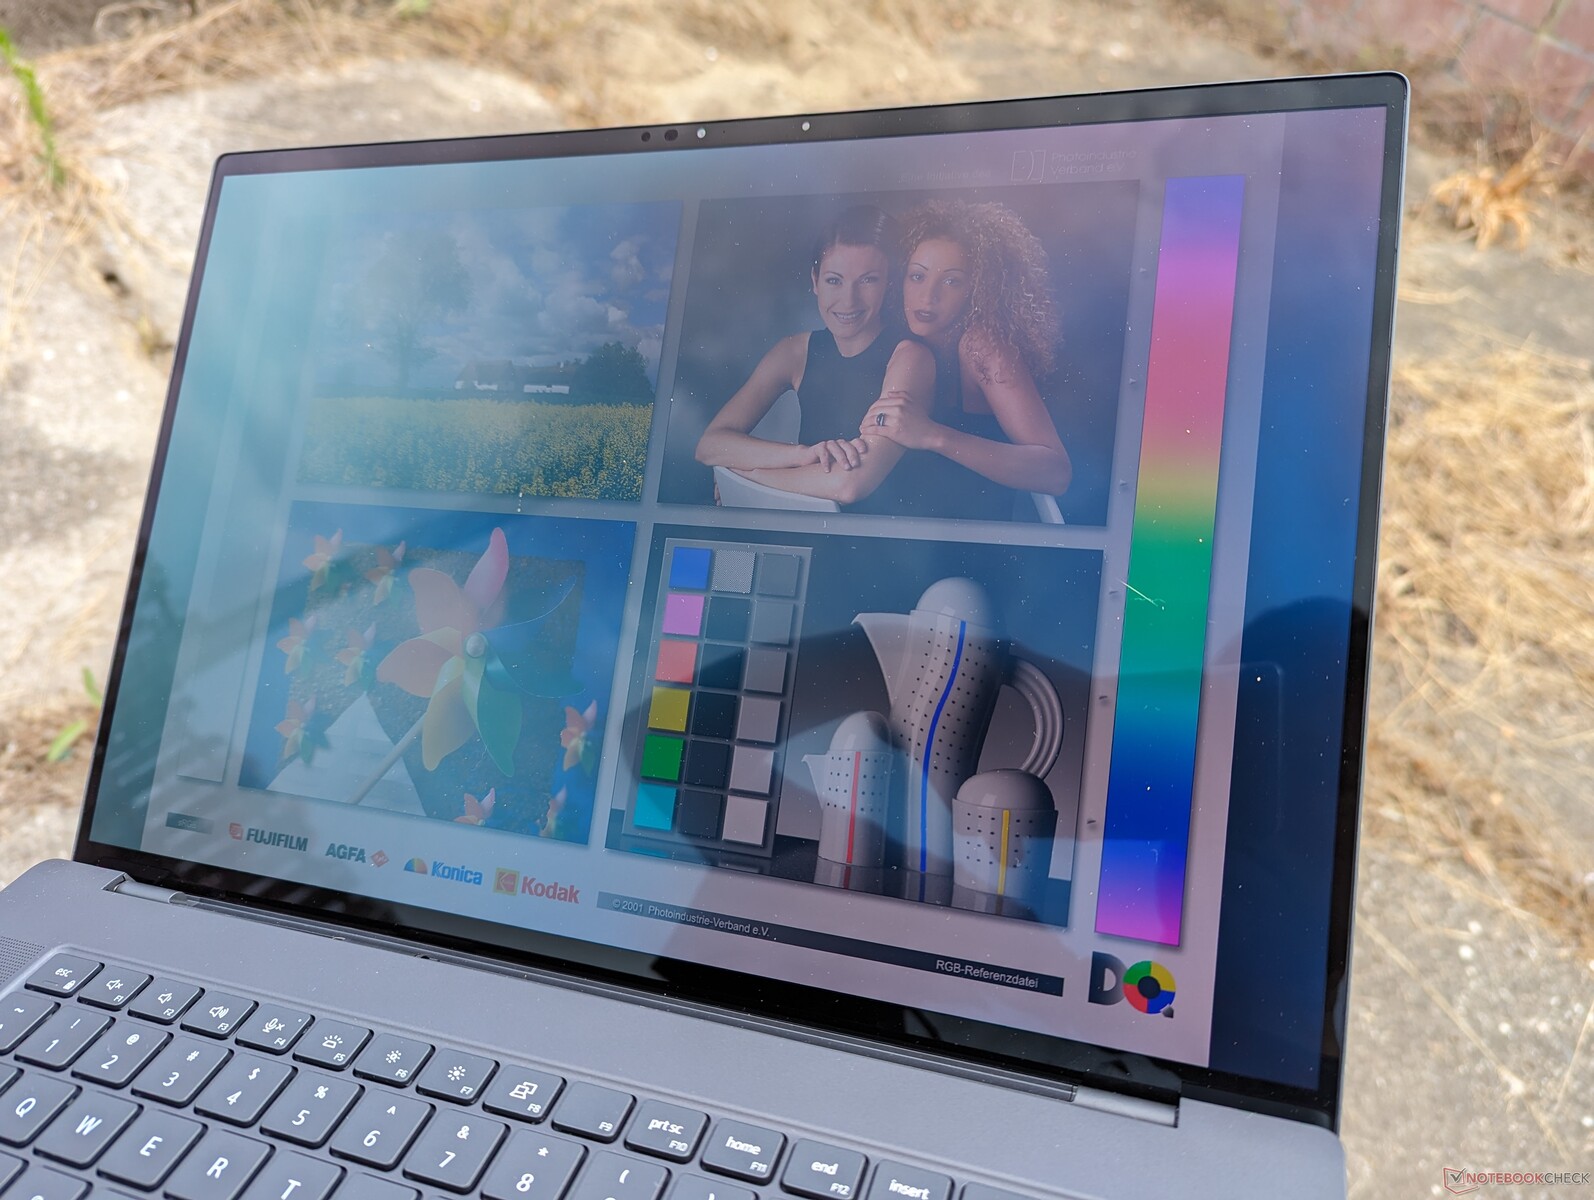
La visibilità all'aperto è nella media, poiché il touchscreen OLED lucido da 350 nit non è altrettanto luminoso dei display IPS dello ZBook Fury 16 G9 o del ThinkPad P16 G1 ThinkPad P16 G1 che possono raggiungere i 500-600 nit.
Prestazioni - Intel 13th Gen Raptor Lake-H
Condizioni di test
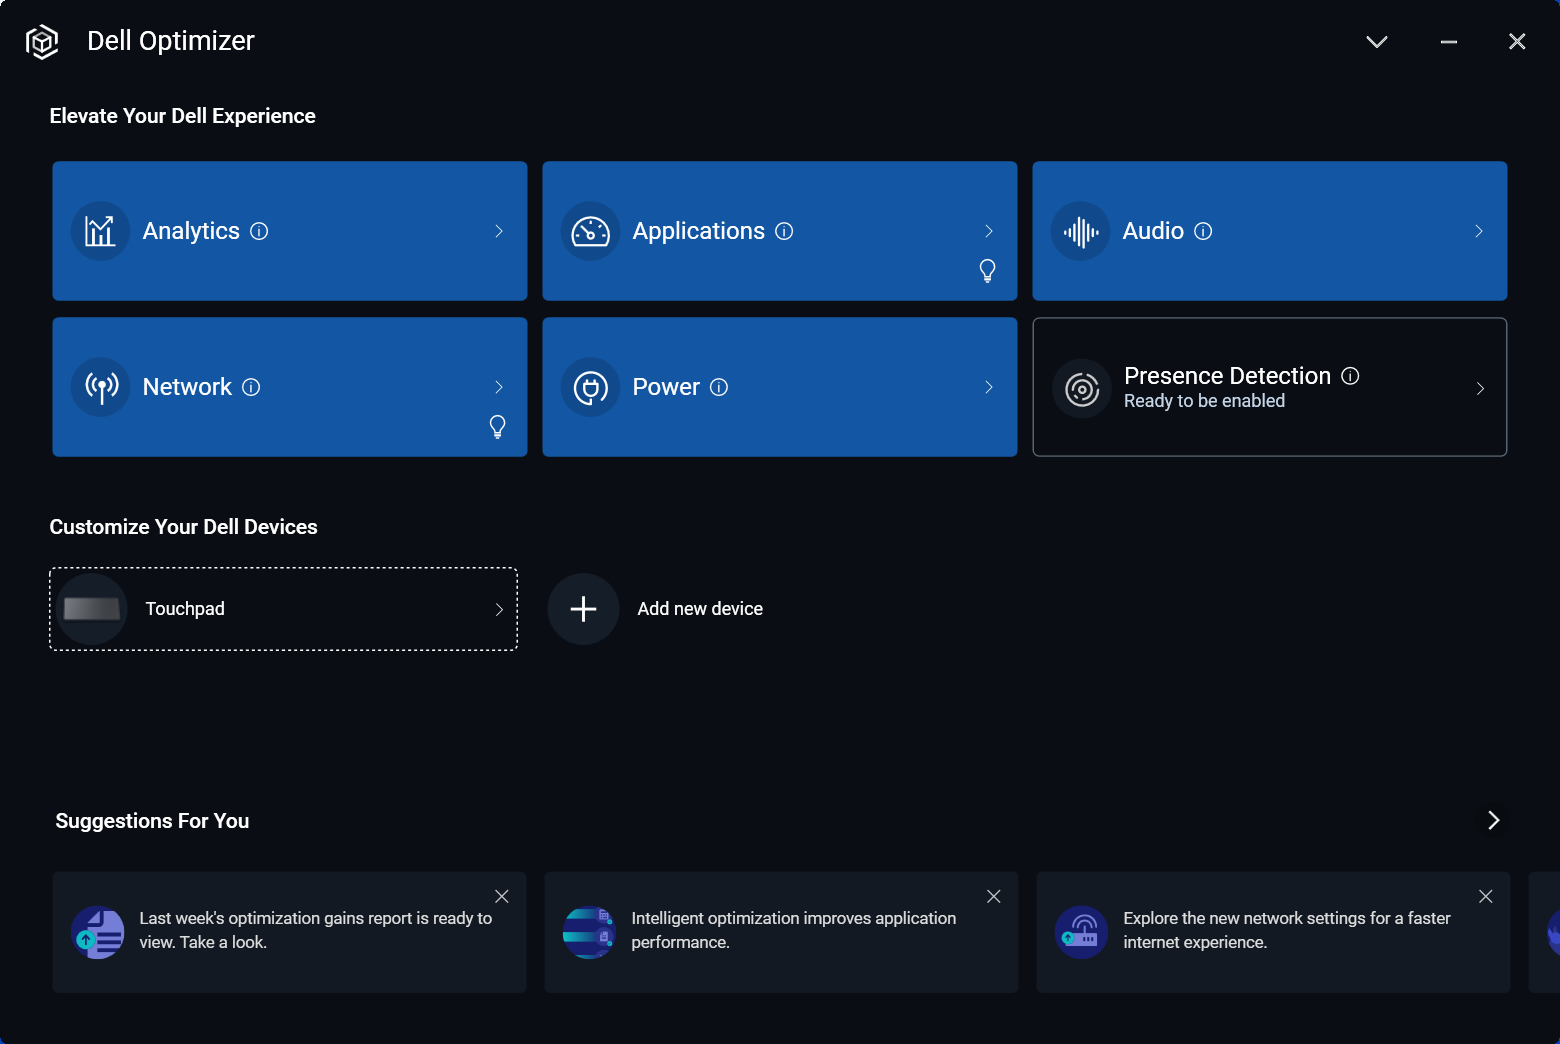
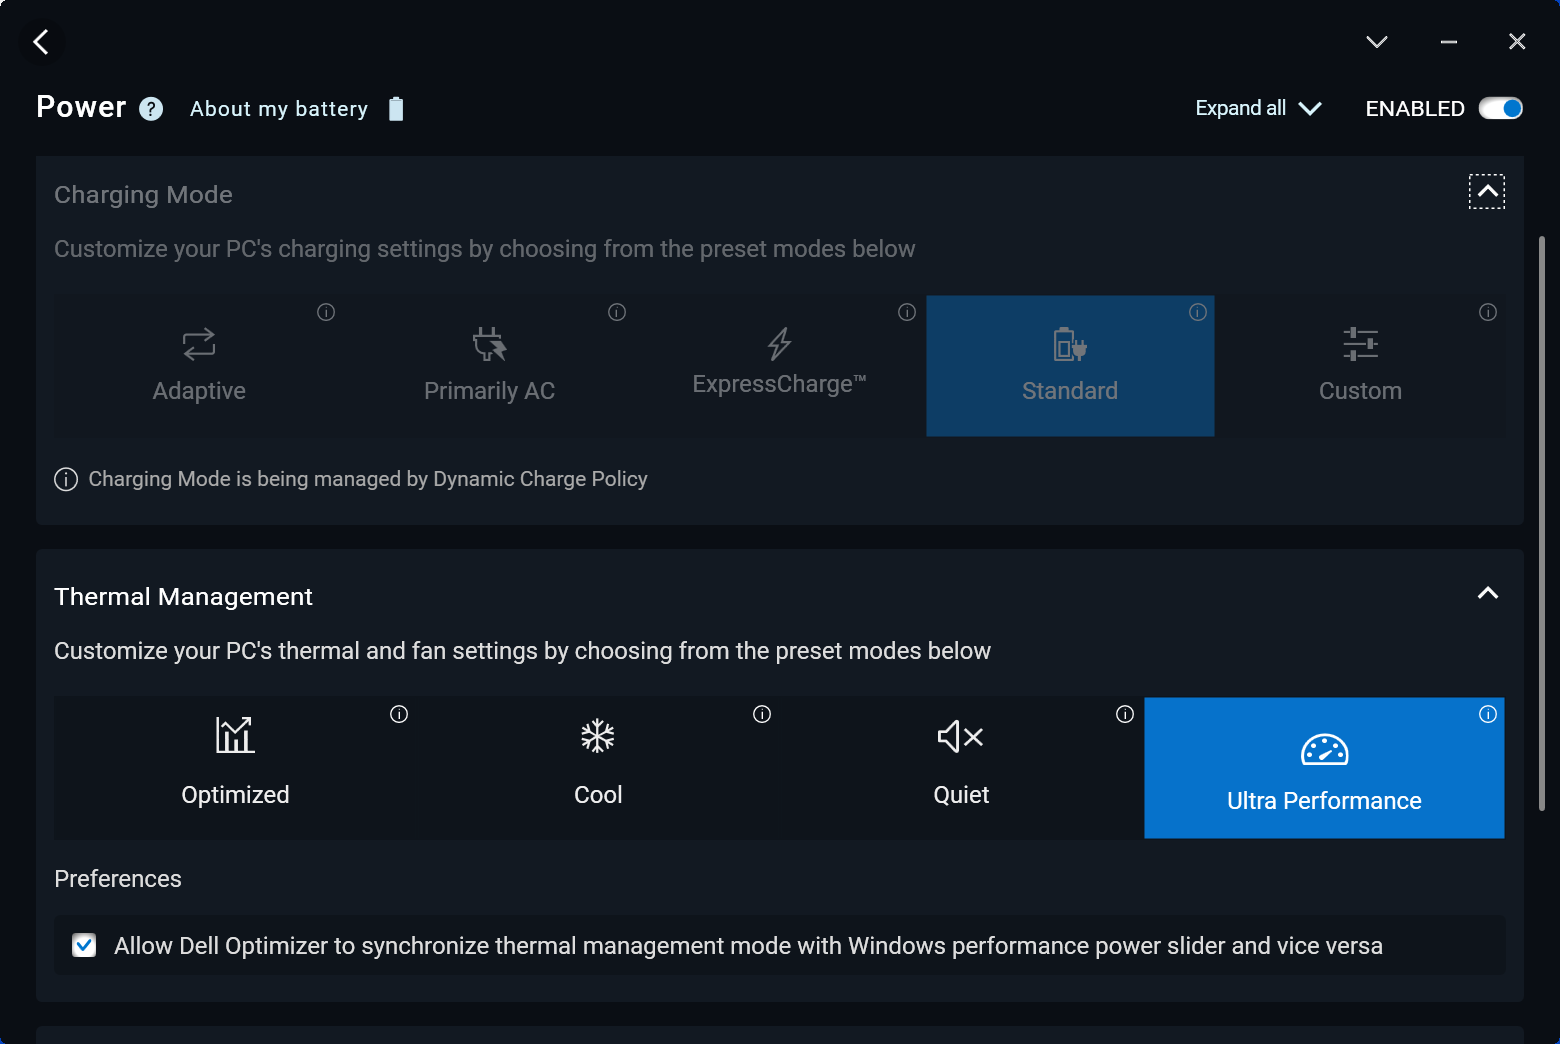
Abbiamo impostato la nostra unità in modalità Ultra Performance tramite il software Dell Optimizer prima di eseguire i benchmark qui sotto. I profili energetici di Optimizer possono essere sincronizzati con i profili energetici di Windows, a differenza dei profili energetici specializzati della maggior parte degli altri produttori.
Advanced Optimus o Optimus 2.0 non sono supportati. Tuttavia, una novità per le GPU workstation Ada Lovelace è la modalità ECC VRAM che può essere attivata o disattivata tramite il pannello di controllo Nvidia. Quando si attiva questa funzione è necessario un riavvio.
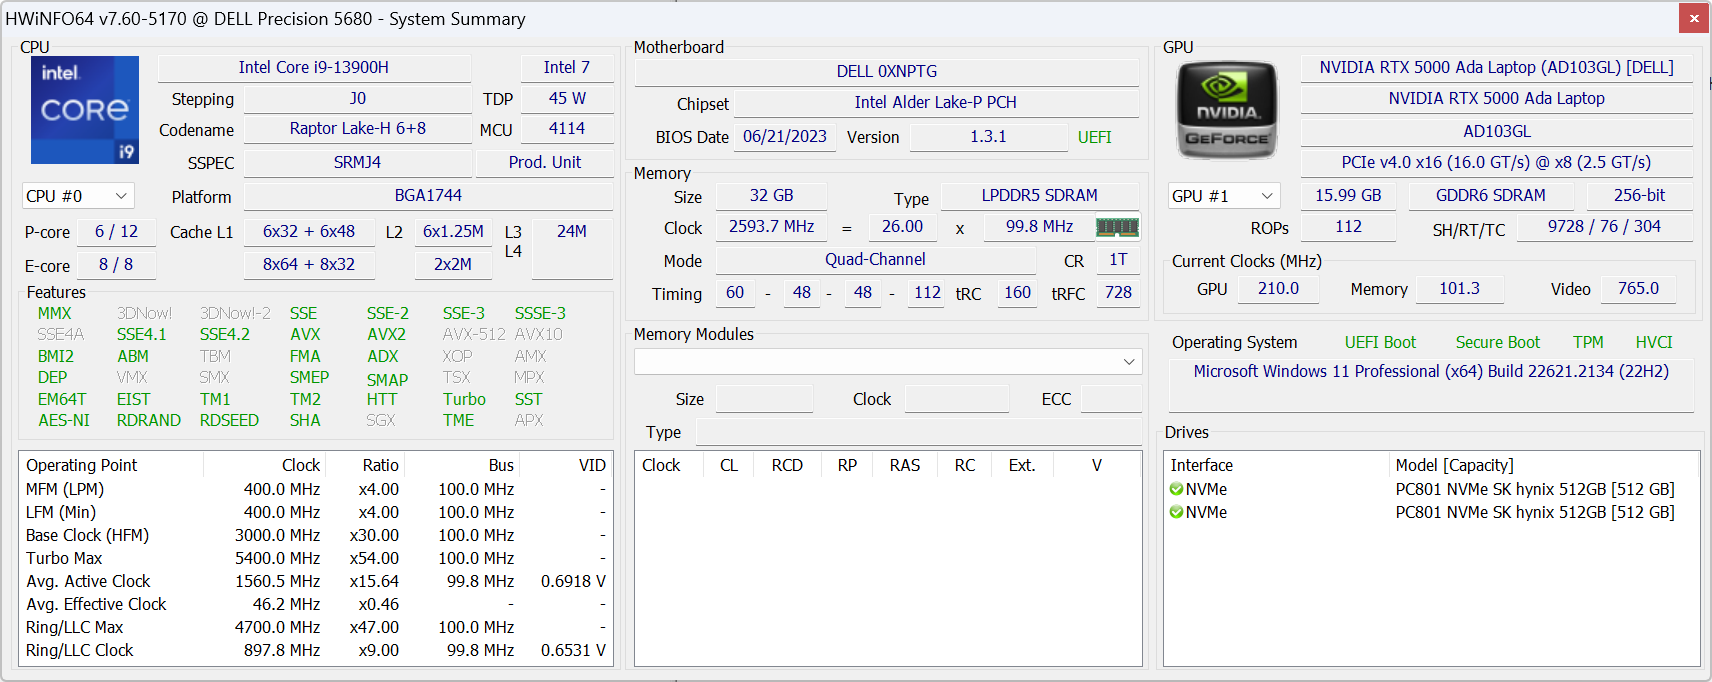
Processore
Il Core i9-13900H di 13a generazione Core i9-13900H è deludente, nel senso che non rappresenta un notevole salto di qualità rispetto al Core i9-13900H di 12a generazione dello scorso anno Core i9-12900H. Le prestazioni, ad esempio, sono sostanzialmente identiche a quelle del modelloAsus ProArt StudioBook 16 con il vecchio Core i9-12900H, salvo un piccolo incremento del 5-10% nelle operazioni a thread singolo. È un peccato che Precision 5680 non offra un Core i9-13900HX Core i9-13900HX che avrebbe fornito un incremento di prestazioni molto più significativo rispetto a qualsiasi processore mobile Alder Lake-H.
Si noti inoltre che non ci sono opzioni per processori Xeon o di classe W, il che significa che la serie Precision 5680 non supporta la RAM ECC.
Il downgrade al Core i7-13700H dal nostro i9-13900H dovrebbe ridurre le prestazioni multi-thread di circa il 20% in base al tempo trascorso con il processoreSchenker Vision 16 Pro.
Cinebench R15 Multi Loop
Cinebench R23: Multi Core | Single Core
Cinebench R20: CPU (Multi Core) | CPU (Single Core)
Cinebench R15: CPU Multi 64Bit | CPU Single 64Bit
Blender: v2.79 BMW27 CPU
7-Zip 18.03: 7z b 4 | 7z b 4 -mmt1
Geekbench 5.5: Multi-Core | Single-Core
HWBOT x265 Benchmark v2.2: 4k Preset
LibreOffice : 20 Documents To PDF
R Benchmark 2.5: Overall mean
* ... Meglio usare valori piccoli
AIDA64: FP32 Ray-Trace | FPU Julia | CPU SHA3 | CPU Queen | FPU SinJulia | FPU Mandel | CPU AES | CPU ZLib | FP64 Ray-Trace | CPU PhotoWorxx
| Performance rating | |
| Lenovo ThinkPad P16 G1 RTX A5500 | |
| HP ZBook Fury 16 G9 | |
| Dell Precision 5000 5680 | |
| MSI CreatorPro Z16P B12UKST | |
| Asus ExpertBook B6 Flip B6602FC2 | |
| Media Intel Core i9-13900H | |
| Dell Precision 7000 7670 Performance | |
| AIDA64 / FP32 Ray-Trace | |
| Lenovo ThinkPad P16 G1 RTX A5500 | |
| HP ZBook Fury 16 G9 | |
| Asus ExpertBook B6 Flip B6602FC2 | |
| Dell Precision 5000 5680 | |
| Dell Precision 7000 7670 Performance | |
| Media Intel Core i9-13900H (6788 - 19557, n=25) | |
| MSI CreatorPro Z16P B12UKST | |
| AIDA64 / FPU Julia | |
| HP ZBook Fury 16 G9 | |
| Lenovo ThinkPad P16 G1 RTX A5500 | |
| Asus ExpertBook B6 Flip B6602FC2 | |
| Dell Precision 5000 5680 | |
| Dell Precision 7000 7670 Performance | |
| Media Intel Core i9-13900H (22551 - 95579, n=25) | |
| MSI CreatorPro Z16P B12UKST | |
| AIDA64 / CPU SHA3 | |
| Lenovo ThinkPad P16 G1 RTX A5500 | |
| HP ZBook Fury 16 G9 | |
| MSI CreatorPro Z16P B12UKST | |
| Media Intel Core i9-13900H (2491 - 4270, n=25) | |
| Dell Precision 5000 5680 | |
| Asus ExpertBook B6 Flip B6602FC2 | |
| Dell Precision 7000 7670 Performance | |
| AIDA64 / CPU Queen | |
| Dell Precision 5000 5680 | |
| Media Intel Core i9-13900H (65121 - 120936, n=25) | |
| Lenovo ThinkPad P16 G1 RTX A5500 | |
| Dell Precision 7000 7670 Performance | |
| Asus ExpertBook B6 Flip B6602FC2 | |
| HP ZBook Fury 16 G9 | |
| MSI CreatorPro Z16P B12UKST | |
| AIDA64 / FPU SinJulia | |
| Lenovo ThinkPad P16 G1 RTX A5500 | |
| HP ZBook Fury 16 G9 | |
| Asus ExpertBook B6 Flip B6602FC2 | |
| Dell Precision 7000 7670 Performance | |
| Dell Precision 5000 5680 | |
| Media Intel Core i9-13900H (6108 - 11631, n=25) | |
| MSI CreatorPro Z16P B12UKST | |
| AIDA64 / FPU Mandel | |
| HP ZBook Fury 16 G9 | |
| Lenovo ThinkPad P16 G1 RTX A5500 | |
| Asus ExpertBook B6 Flip B6602FC2 | |
| Dell Precision 5000 5680 | |
| Media Intel Core i9-13900H (11283 - 48474, n=25) | |
| Dell Precision 7000 7670 Performance | |
| MSI CreatorPro Z16P B12UKST | |
| AIDA64 / CPU ZLib | |
| Lenovo ThinkPad P16 G1 RTX A5500 | |
| HP ZBook Fury 16 G9 | |
| Media Intel Core i9-13900H (789 - 1254, n=25) | |
| Asus ExpertBook B6 Flip B6602FC2 | |
| MSI CreatorPro Z16P B12UKST | |
| Dell Precision 5000 5680 | |
| Dell Precision 7000 7670 Performance | |
| AIDA64 / FP64 Ray-Trace | |
| Lenovo ThinkPad P16 G1 RTX A5500 | |
| HP ZBook Fury 16 G9 | |
| Asus ExpertBook B6 Flip B6602FC2 | |
| Dell Precision 5000 5680 | |
| Dell Precision 7000 7670 Performance | |
| Media Intel Core i9-13900H (3655 - 10716, n=25) | |
| MSI CreatorPro Z16P B12UKST | |
| AIDA64 / CPU PhotoWorxx | |
| Dell Precision 5000 5680 | |
| MSI CreatorPro Z16P B12UKST | |
| Dell Precision 7000 7670 Performance | |
| Lenovo ThinkPad P16 G1 RTX A5500 | |
| Media Intel Core i9-13900H (10871 - 50488, n=25) | |
| HP ZBook Fury 16 G9 | |
| Asus ExpertBook B6 Flip B6602FC2 | |
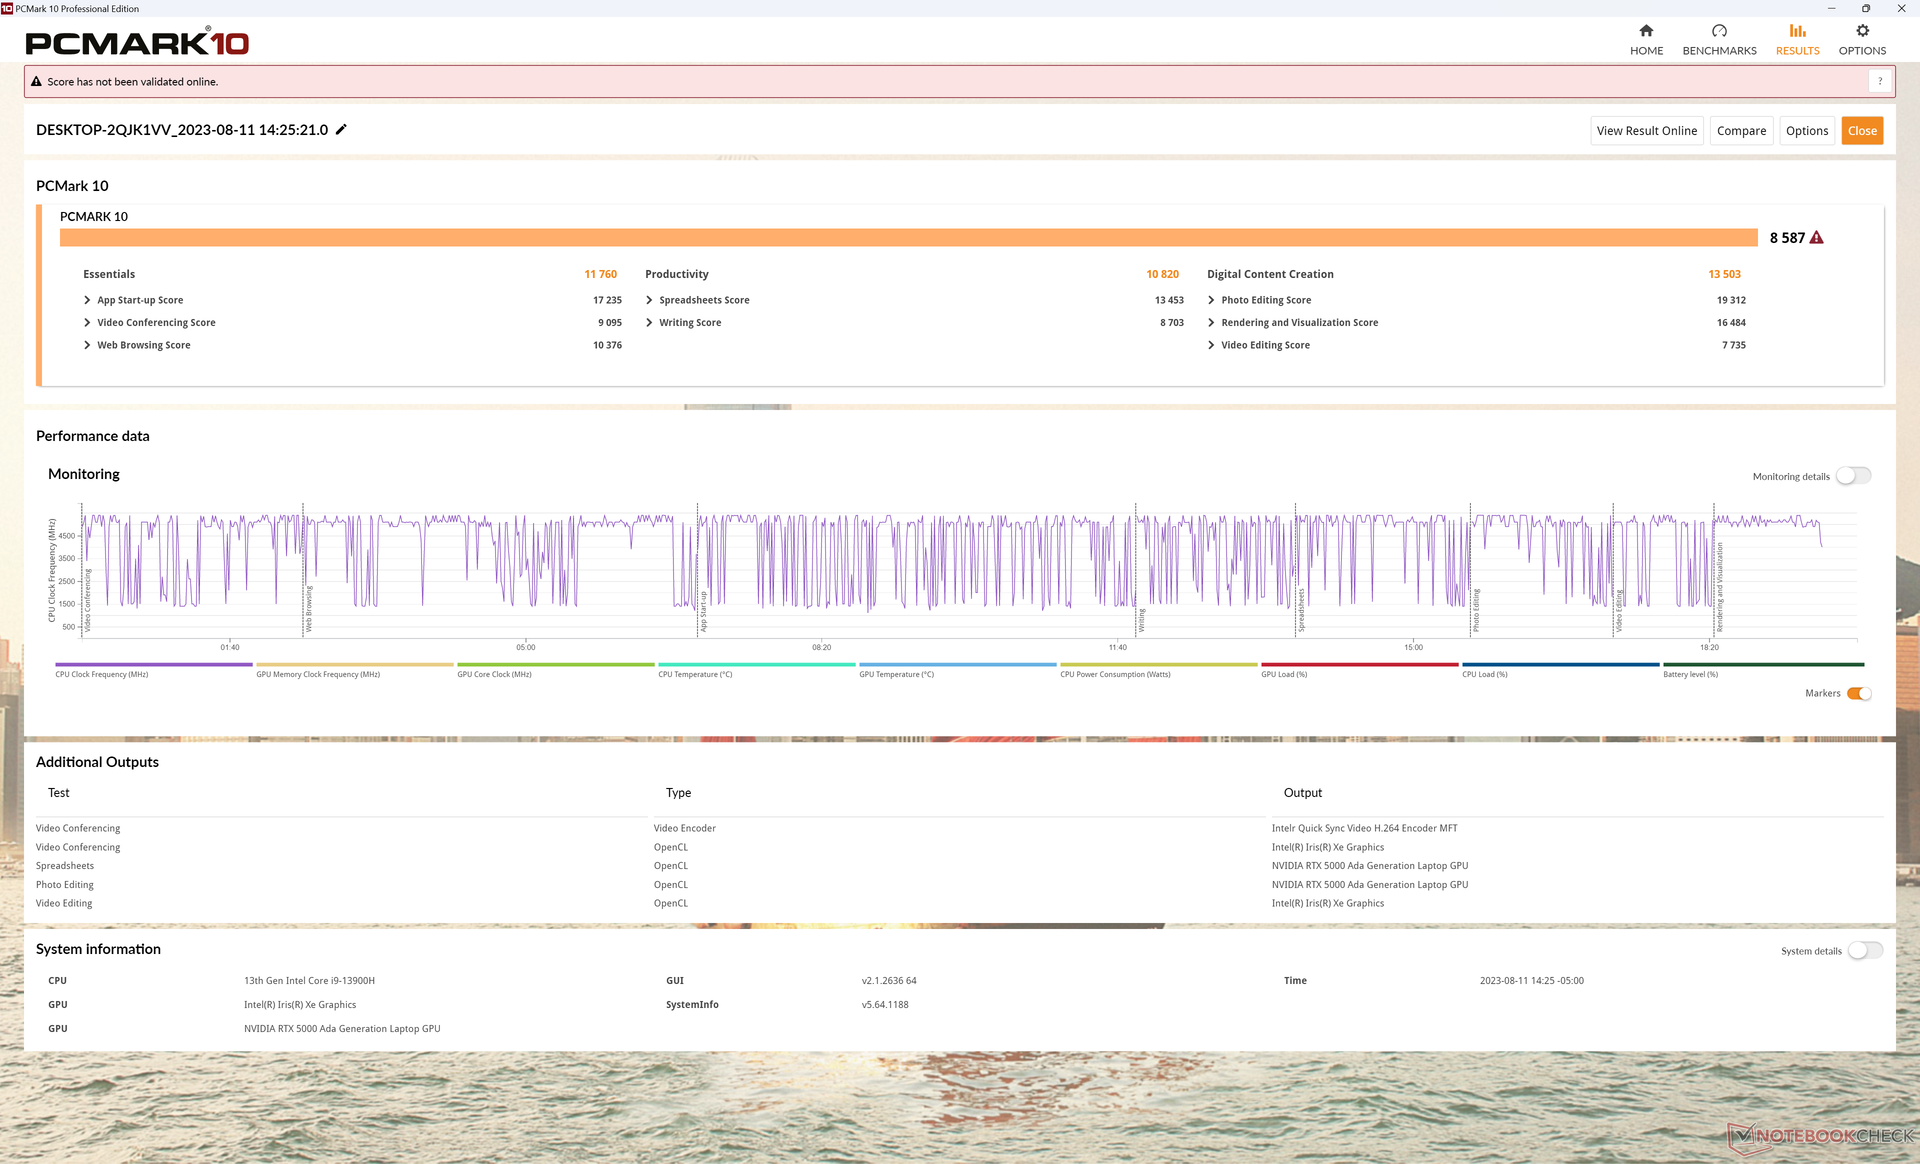
Prestazioni del sistema
I punteggi di PCMark sono superiori a quelli della maggior parte delle altre workstation con margini relativamente ampi, compresi persino alcuni modelli potenti come l'HP ZBook Fury 16 G9 o il modello 7670.Precision prestazioni della 7670. Ciò può essere attribuito alla nostra configurazione SSD RAID 0 e alla GPU RTX 5000, mentre la maggior parte delle altre workstation utilizza SSD singole e GPU di vecchia generazione.
CrossMark: Overall | Productivity | Creativity | Responsiveness
| PCMark 10 / Score | |
| Dell Precision 5000 5680 | |
| Media Intel Core i9-13900H, NVIDIA RTX 5000 Ada Generation Laptop (n=1) | |
| Asus ExpertBook B6 Flip B6602FC2 | |
| Lenovo ThinkPad P16 G1 RTX A5500 | |
| MSI CreatorPro Z16P B12UKST | |
| HP ZBook Fury 16 G9 | |
| Dell Precision 7000 7670 Performance | |
| PCMark 10 / Essentials | |
| Dell Precision 5000 5680 | |
| Media Intel Core i9-13900H, NVIDIA RTX 5000 Ada Generation Laptop (n=1) | |
| Dell Precision 7000 7670 Performance | |
| HP ZBook Fury 16 G9 | |
| Lenovo ThinkPad P16 G1 RTX A5500 | |
| Asus ExpertBook B6 Flip B6602FC2 | |
| MSI CreatorPro Z16P B12UKST | |
| PCMark 10 / Productivity | |
| Dell Precision 5000 5680 | |
| Media Intel Core i9-13900H, NVIDIA RTX 5000 Ada Generation Laptop (n=1) | |
| Asus ExpertBook B6 Flip B6602FC2 | |
| Lenovo ThinkPad P16 G1 RTX A5500 | |
| MSI CreatorPro Z16P B12UKST | |
| HP ZBook Fury 16 G9 | |
| Dell Precision 7000 7670 Performance | |
| PCMark 10 / Digital Content Creation | |
| Dell Precision 5000 5680 | |
| Media Intel Core i9-13900H, NVIDIA RTX 5000 Ada Generation Laptop (n=1) | |
| Lenovo ThinkPad P16 G1 RTX A5500 | |
| MSI CreatorPro Z16P B12UKST | |
| Dell Precision 7000 7670 Performance | |
| HP ZBook Fury 16 G9 | |
| Asus ExpertBook B6 Flip B6602FC2 | |
| CrossMark / Overall | |
| Asus ExpertBook B6 Flip B6602FC2 | |
| MSI CreatorPro Z16P B12UKST | |
| Dell Precision 5000 5680 | |
| Media Intel Core i9-13900H, NVIDIA RTX 5000 Ada Generation Laptop (n=1) | |
| HP ZBook Fury 16 G9 | |
| Lenovo ThinkPad P16 G1 RTX A5500 | |
| Dell Precision 7000 7670 Performance | |
| CrossMark / Productivity | |
| Asus ExpertBook B6 Flip B6602FC2 | |
| MSI CreatorPro Z16P B12UKST | |
| Dell Precision 5000 5680 | |
| Media Intel Core i9-13900H, NVIDIA RTX 5000 Ada Generation Laptop (n=1) | |
| HP ZBook Fury 16 G9 | |
| Lenovo ThinkPad P16 G1 RTX A5500 | |
| Dell Precision 7000 7670 Performance | |
| CrossMark / Creativity | |
| Lenovo ThinkPad P16 G1 RTX A5500 | |
| Dell Precision 5000 5680 | |
| Media Intel Core i9-13900H, NVIDIA RTX 5000 Ada Generation Laptop (n=1) | |
| Asus ExpertBook B6 Flip B6602FC2 | |
| HP ZBook Fury 16 G9 | |
| MSI CreatorPro Z16P B12UKST | |
| Dell Precision 7000 7670 Performance | |
| CrossMark / Responsiveness | |
| MSI CreatorPro Z16P B12UKST | |
| Asus ExpertBook B6 Flip B6602FC2 | |
| HP ZBook Fury 16 G9 | |
| Dell Precision 5000 5680 | |
| Media Intel Core i9-13900H, NVIDIA RTX 5000 Ada Generation Laptop (n=1) | |
| Dell Precision 7000 7670 Performance | |
| Lenovo ThinkPad P16 G1 RTX A5500 | |
| PCMark 10 Score | 8587 punti | |
Aiuto | ||
| AIDA64 / Memory Copy | |
| Dell Precision 5000 5680 | |
| Dell Precision 7000 7670 Performance | |
| Lenovo ThinkPad P16 G1 RTX A5500 | |
| MSI CreatorPro Z16P B12UKST | |
| Media Intel Core i9-13900H (37448 - 74486, n=25) | |
| HP ZBook Fury 16 G9 | |
| Asus ExpertBook B6 Flip B6602FC2 | |
| AIDA64 / Memory Read | |
| Dell Precision 7000 7670 Performance | |
| Dell Precision 5000 5680 | |
| MSI CreatorPro Z16P B12UKST | |
| Lenovo ThinkPad P16 G1 RTX A5500 | |
| Media Intel Core i9-13900H (41599 - 75433, n=25) | |
| Asus ExpertBook B6 Flip B6602FC2 | |
| HP ZBook Fury 16 G9 | |
| AIDA64 / Memory Write | |
| Dell Precision 5000 5680 | |
| MSI CreatorPro Z16P B12UKST | |
| Dell Precision 7000 7670 Performance | |
| Media Intel Core i9-13900H (36152 - 88505, n=25) | |
| Lenovo ThinkPad P16 G1 RTX A5500 | |
| Asus ExpertBook B6 Flip B6602FC2 | |
| HP ZBook Fury 16 G9 | |
| AIDA64 / Memory Latency | |
| MSI CreatorPro Z16P B12UKST | |
| Asus ExpertBook B6 Flip B6602FC2 | |
| Dell Precision 5000 5680 | |
| HP ZBook Fury 16 G9 | |
| Lenovo ThinkPad P16 G1 RTX A5500 | |
| Media Intel Core i9-13900H (75.8 - 102.3, n=25) | |
| Dell Precision 7000 7670 Performance | |
* ... Meglio usare valori piccoli
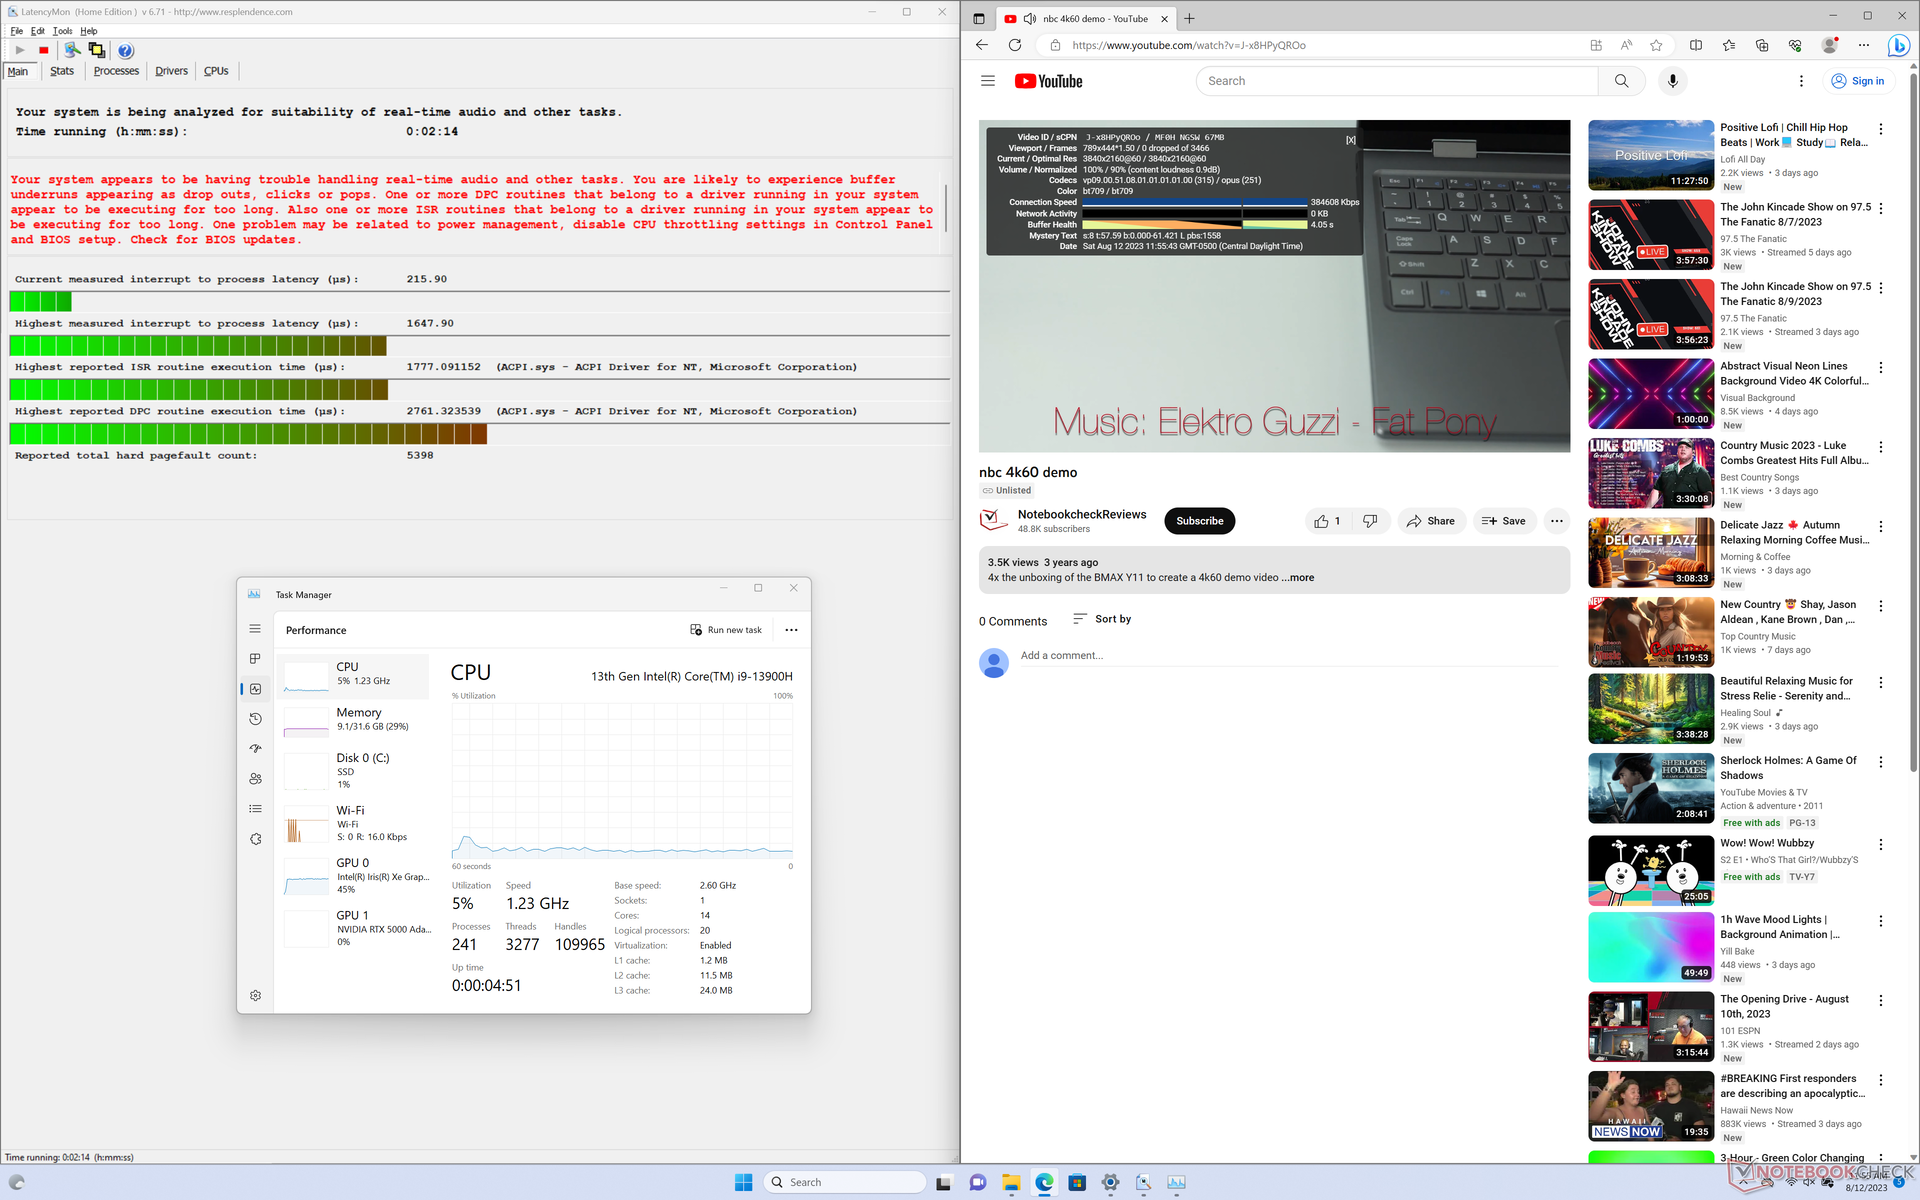
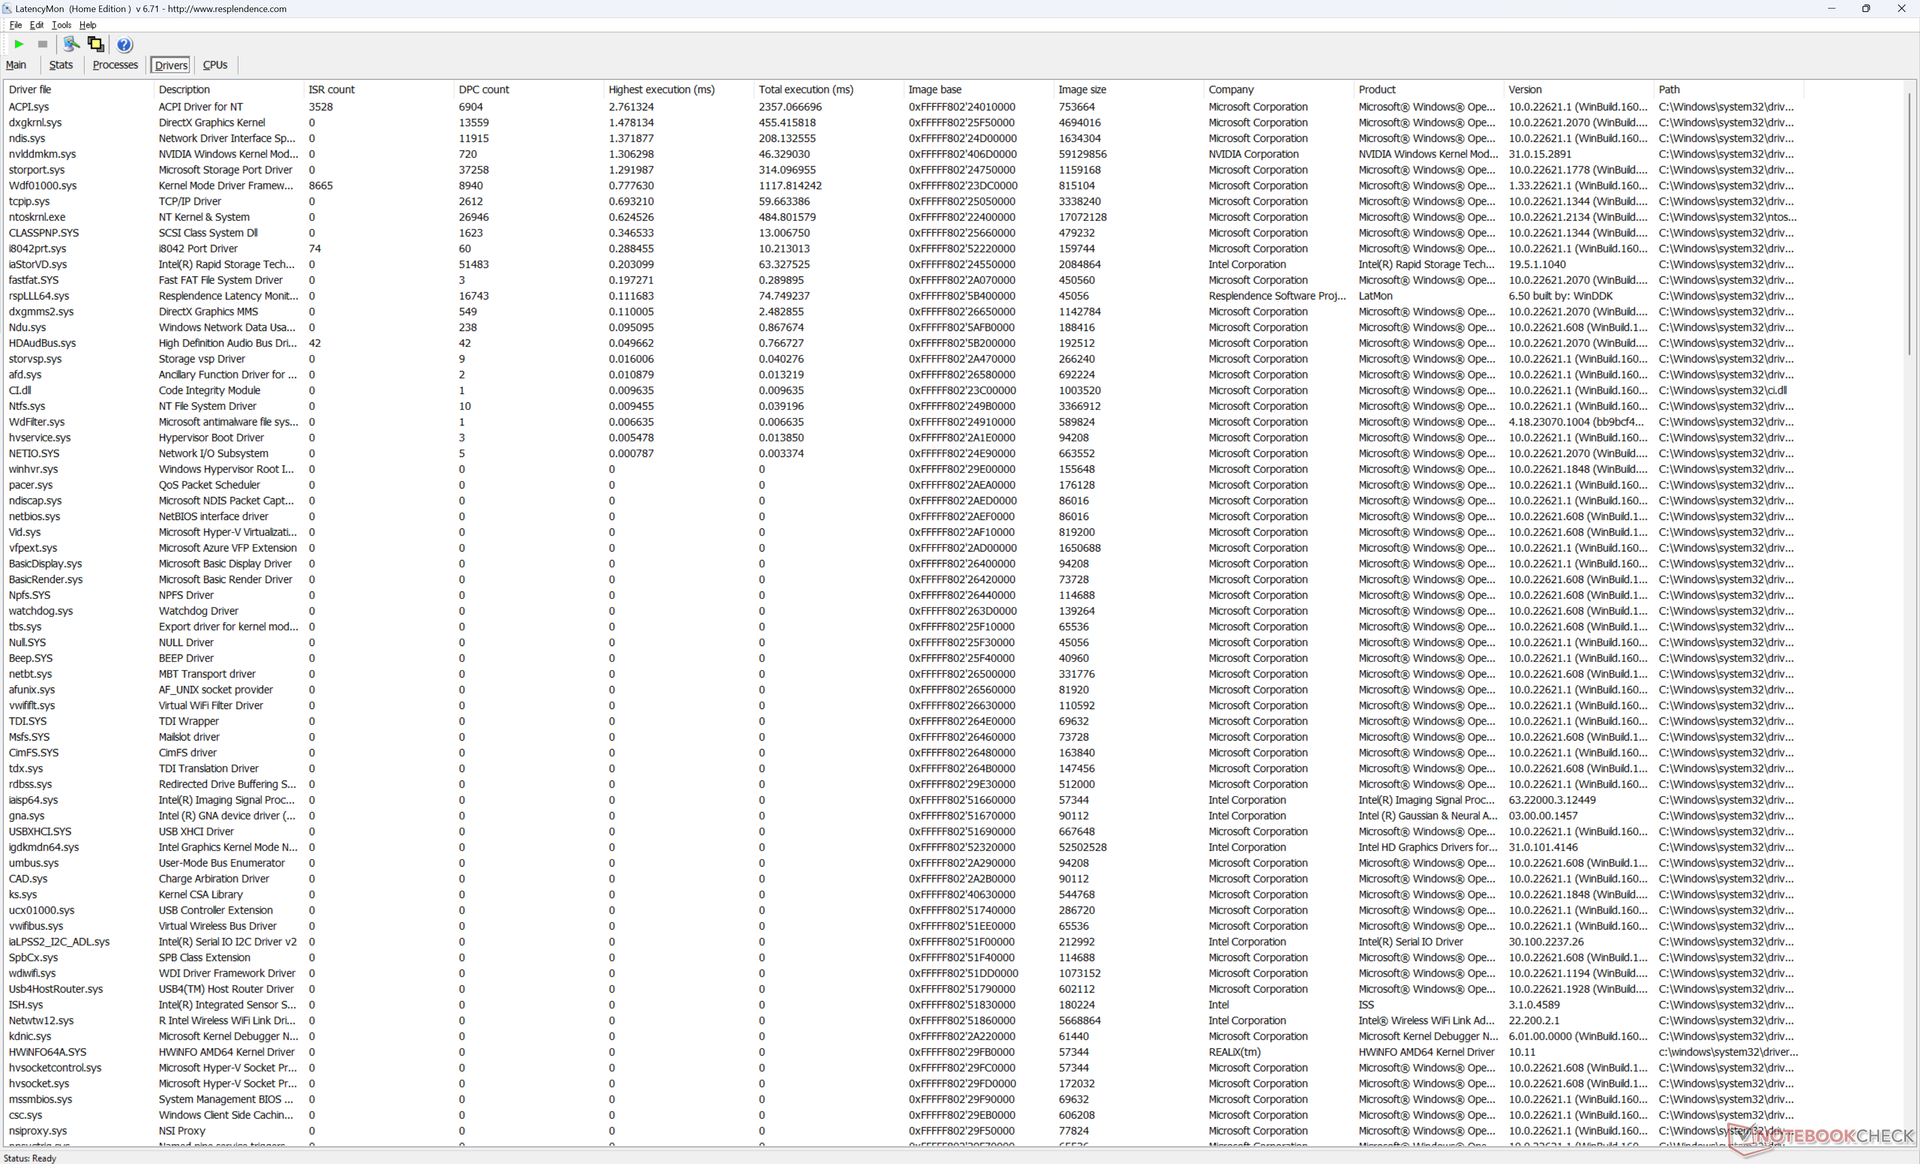
Latenza DPC
LatencyMon rivela lievi problemi di DPC quando si aprono più schede del browser della nostra homepage, simili a quelli osservati su Precision 7670. la riproduzione di video 4K a 60 FPS è invece perfetta, senza alcuna perdita di fotogrammi.
| DPC Latencies / LatencyMon - interrupt to process latency (max), Web, Youtube, Prime95 | |
| HP ZBook Fury 16 G9 | |
| Asus ExpertBook B6 Flip B6602FC2 | |
| Dell Precision 7000 7670 Performance | |
| Dell Precision 5000 5680 | |
| Lenovo ThinkPad P16 G1 RTX A5500 | |
| MSI CreatorPro Z16P B12UKST | |
* ... Meglio usare valori piccoli
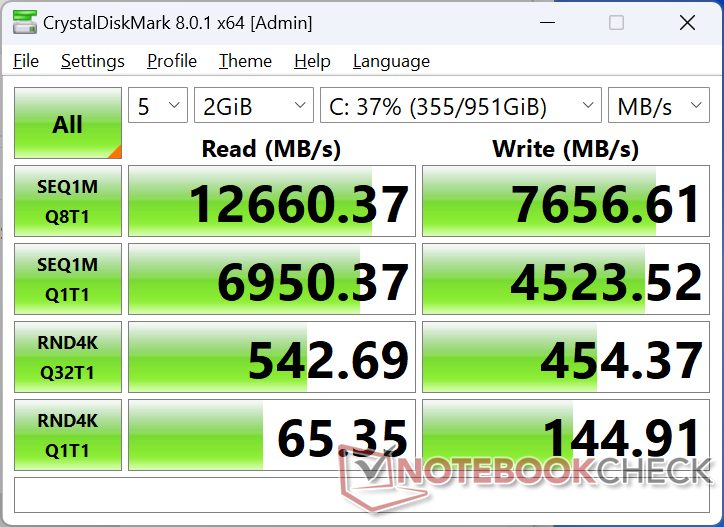
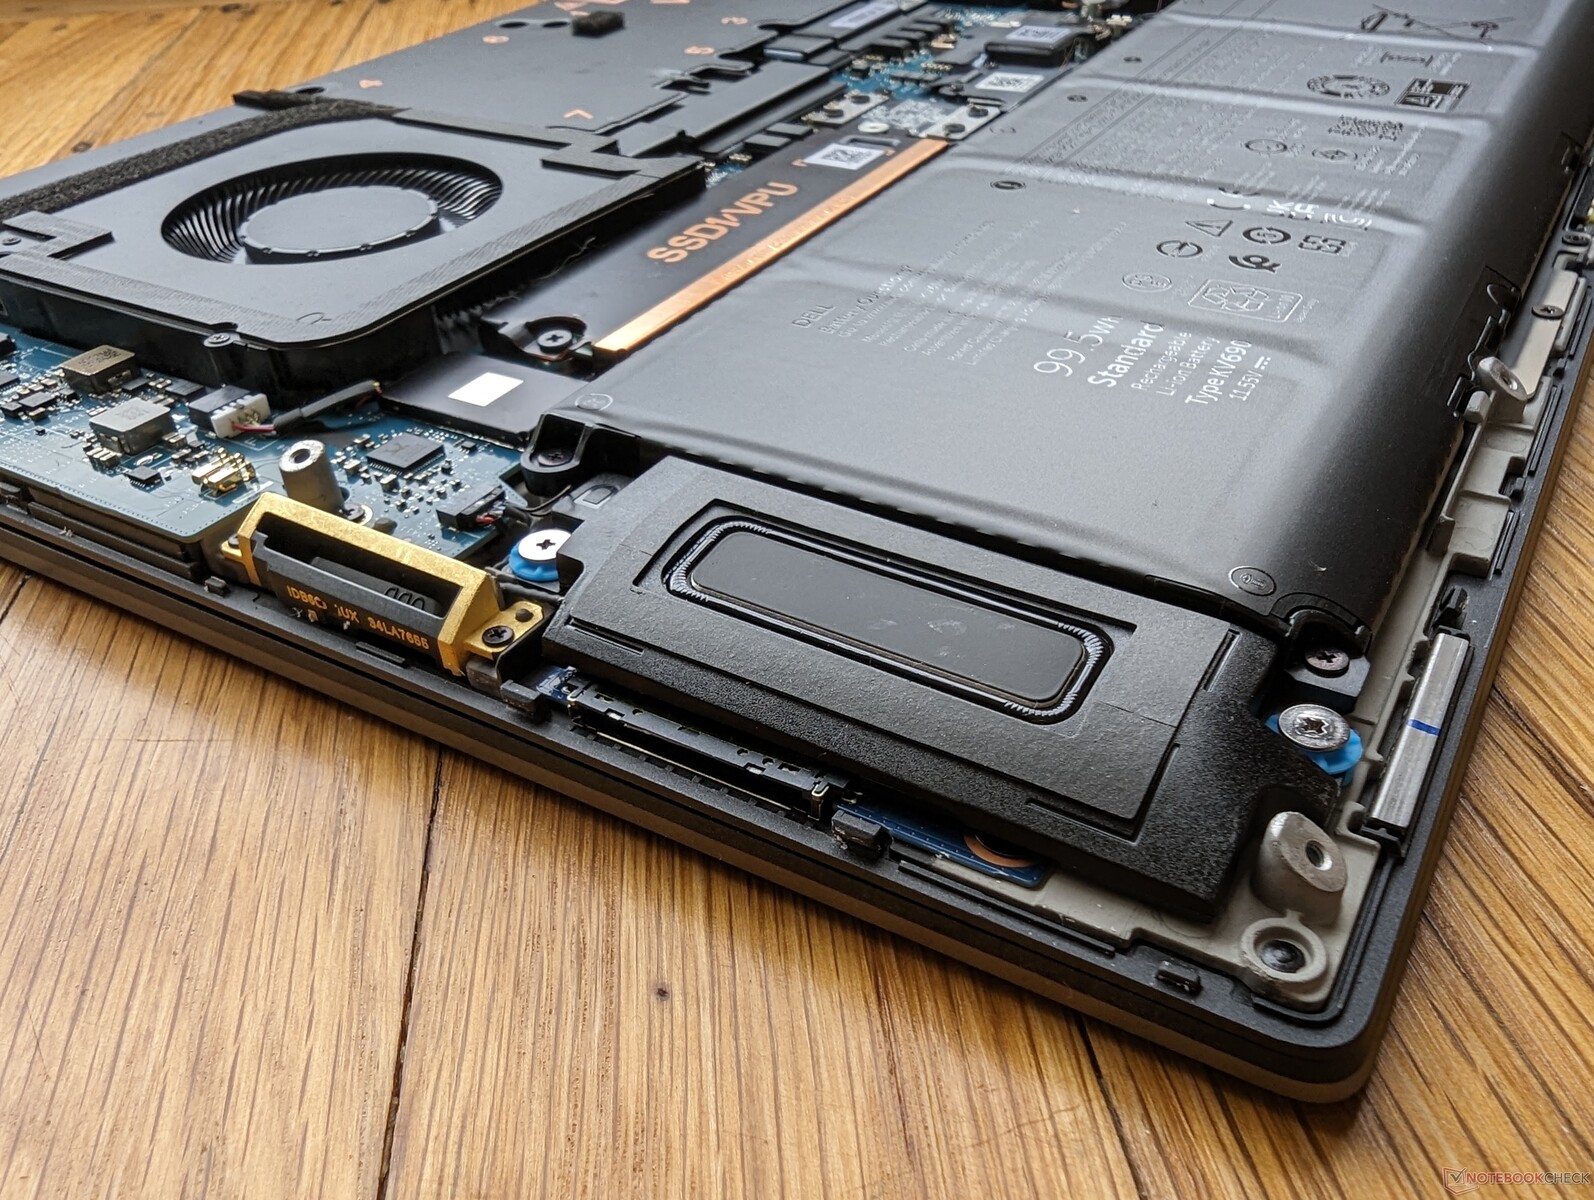
Dispositivi di archiviazione - Fino a due SSD PCIe4 x4 NVMe
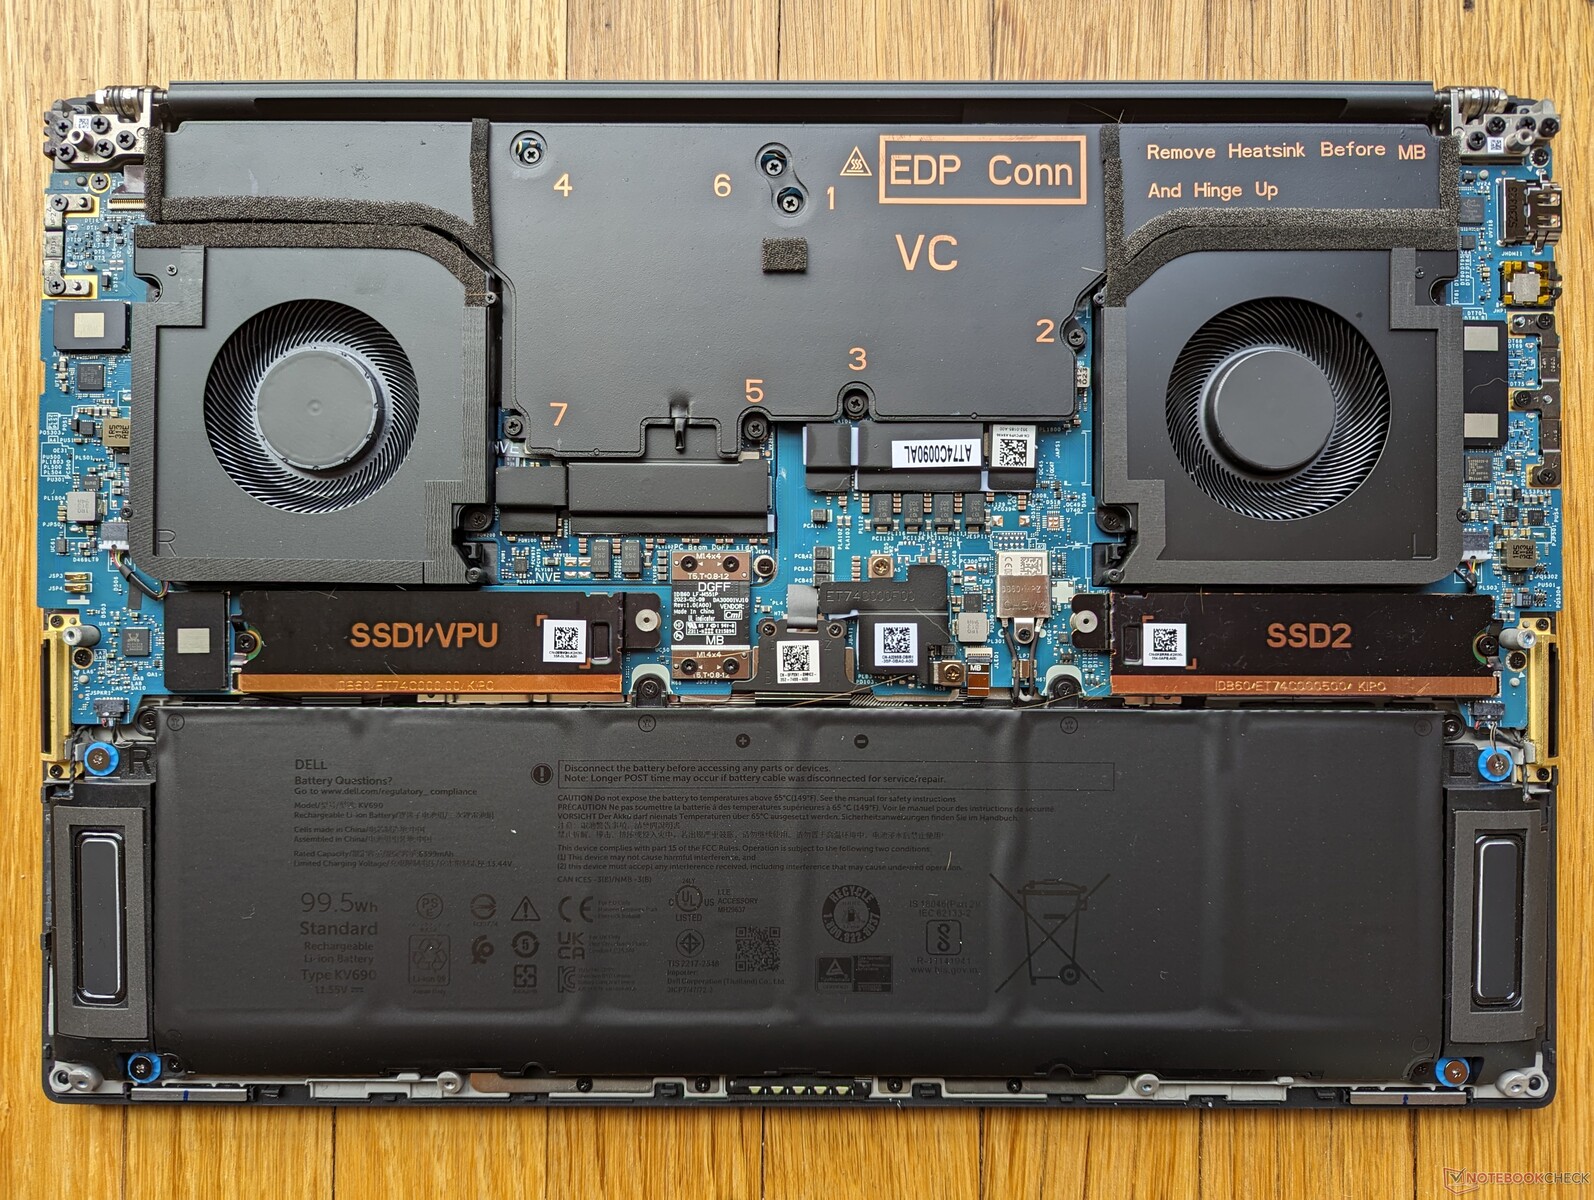
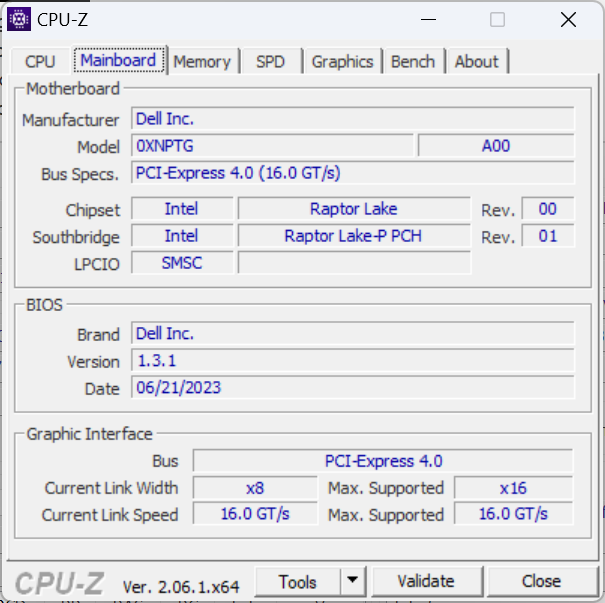
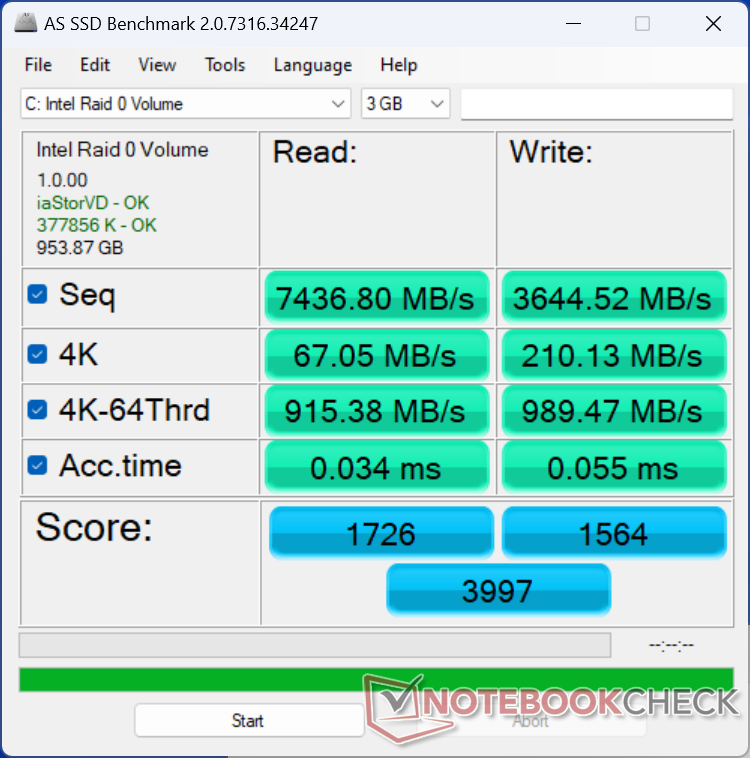
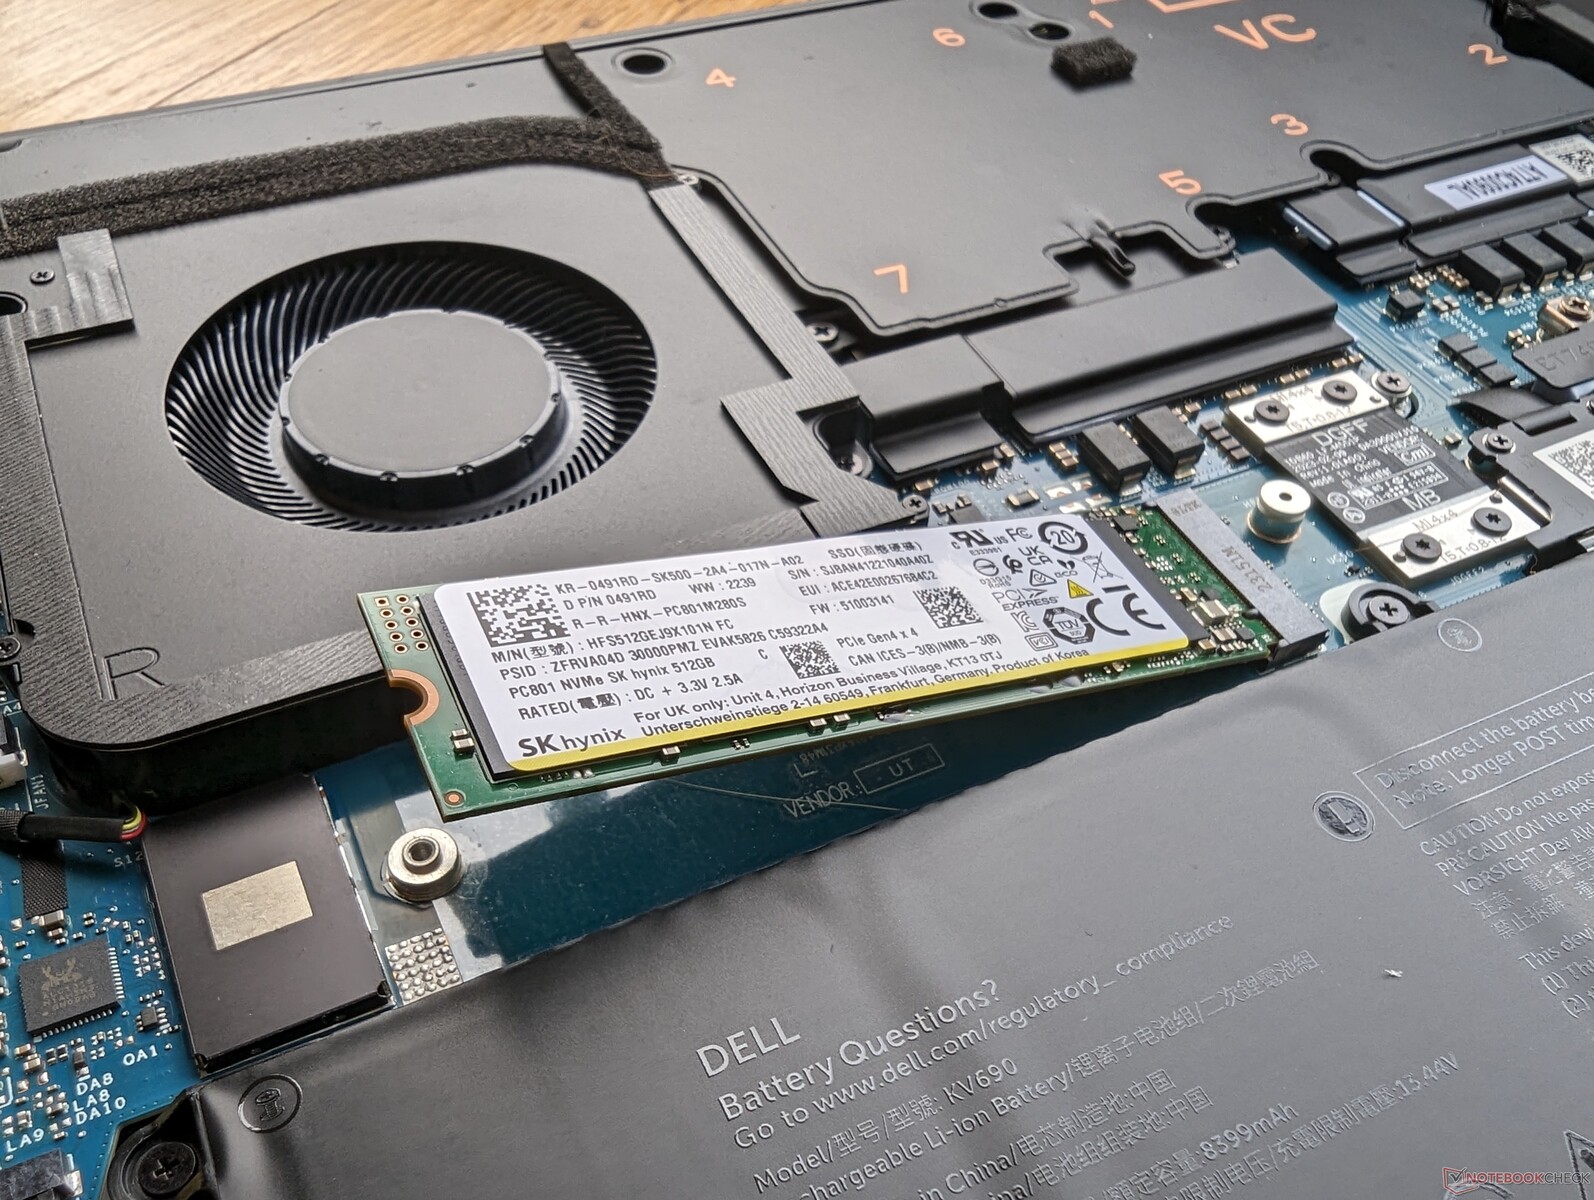
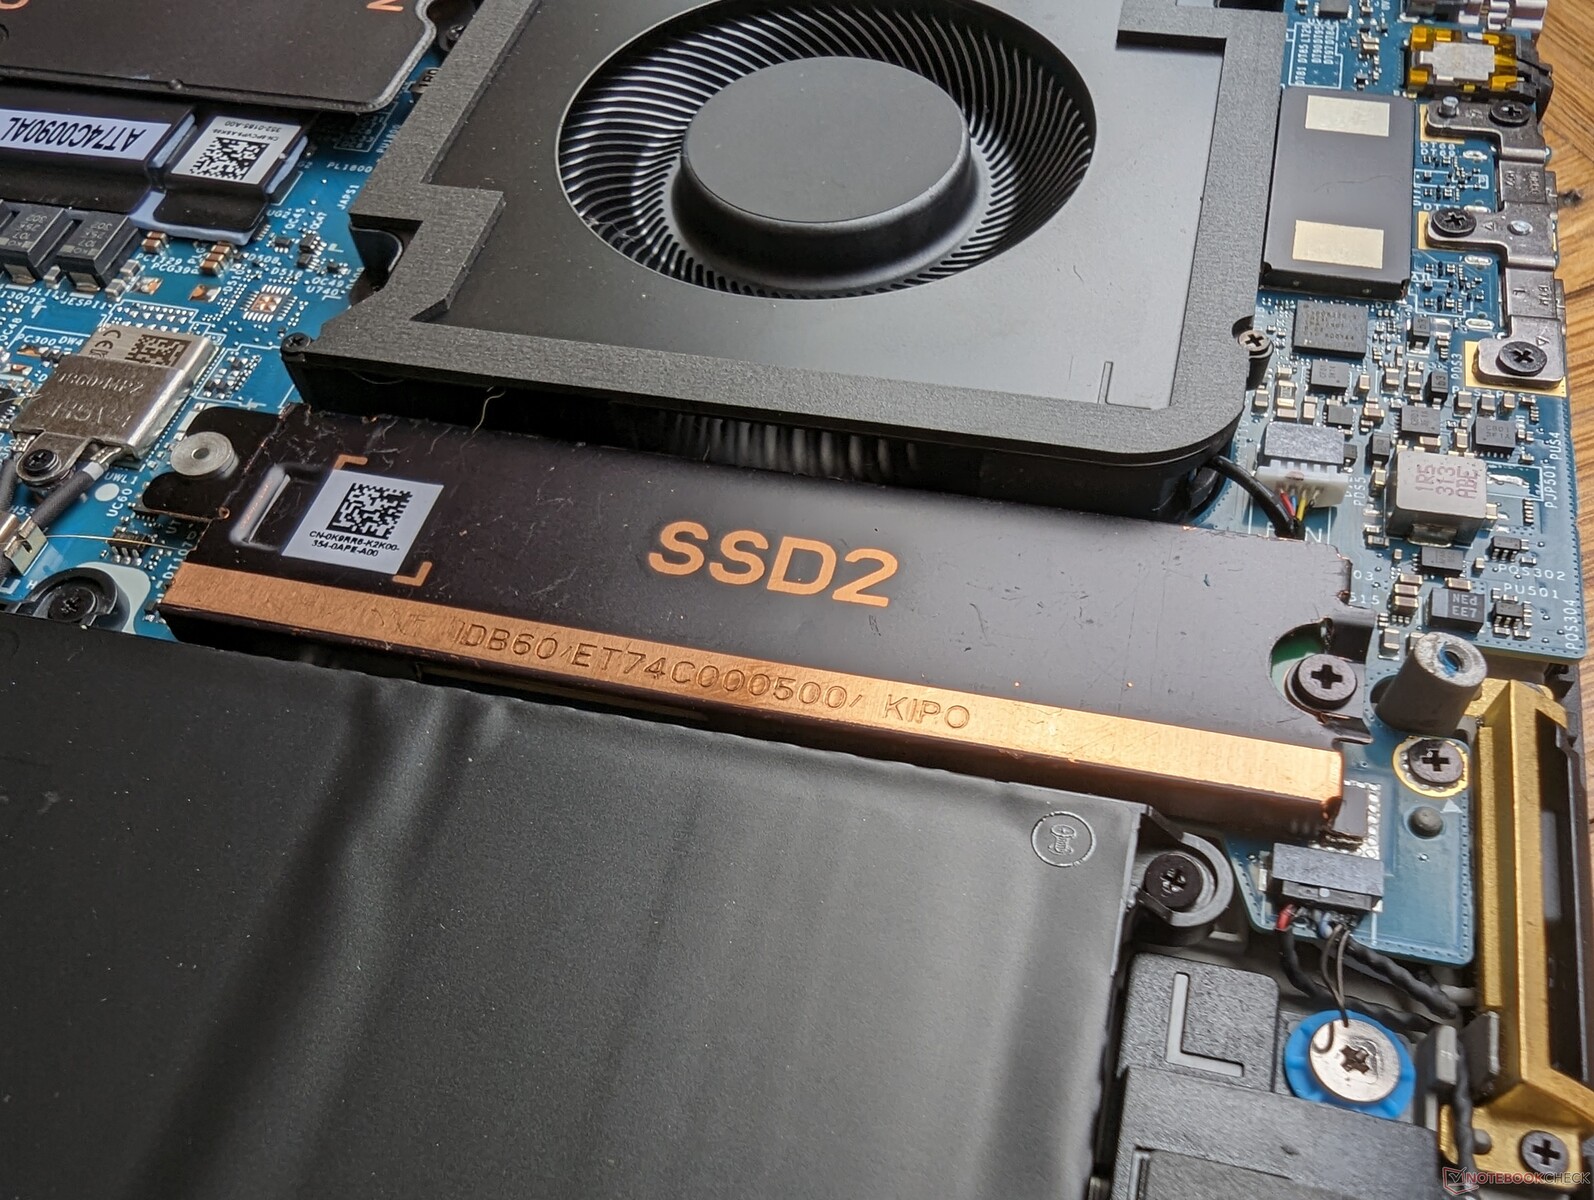
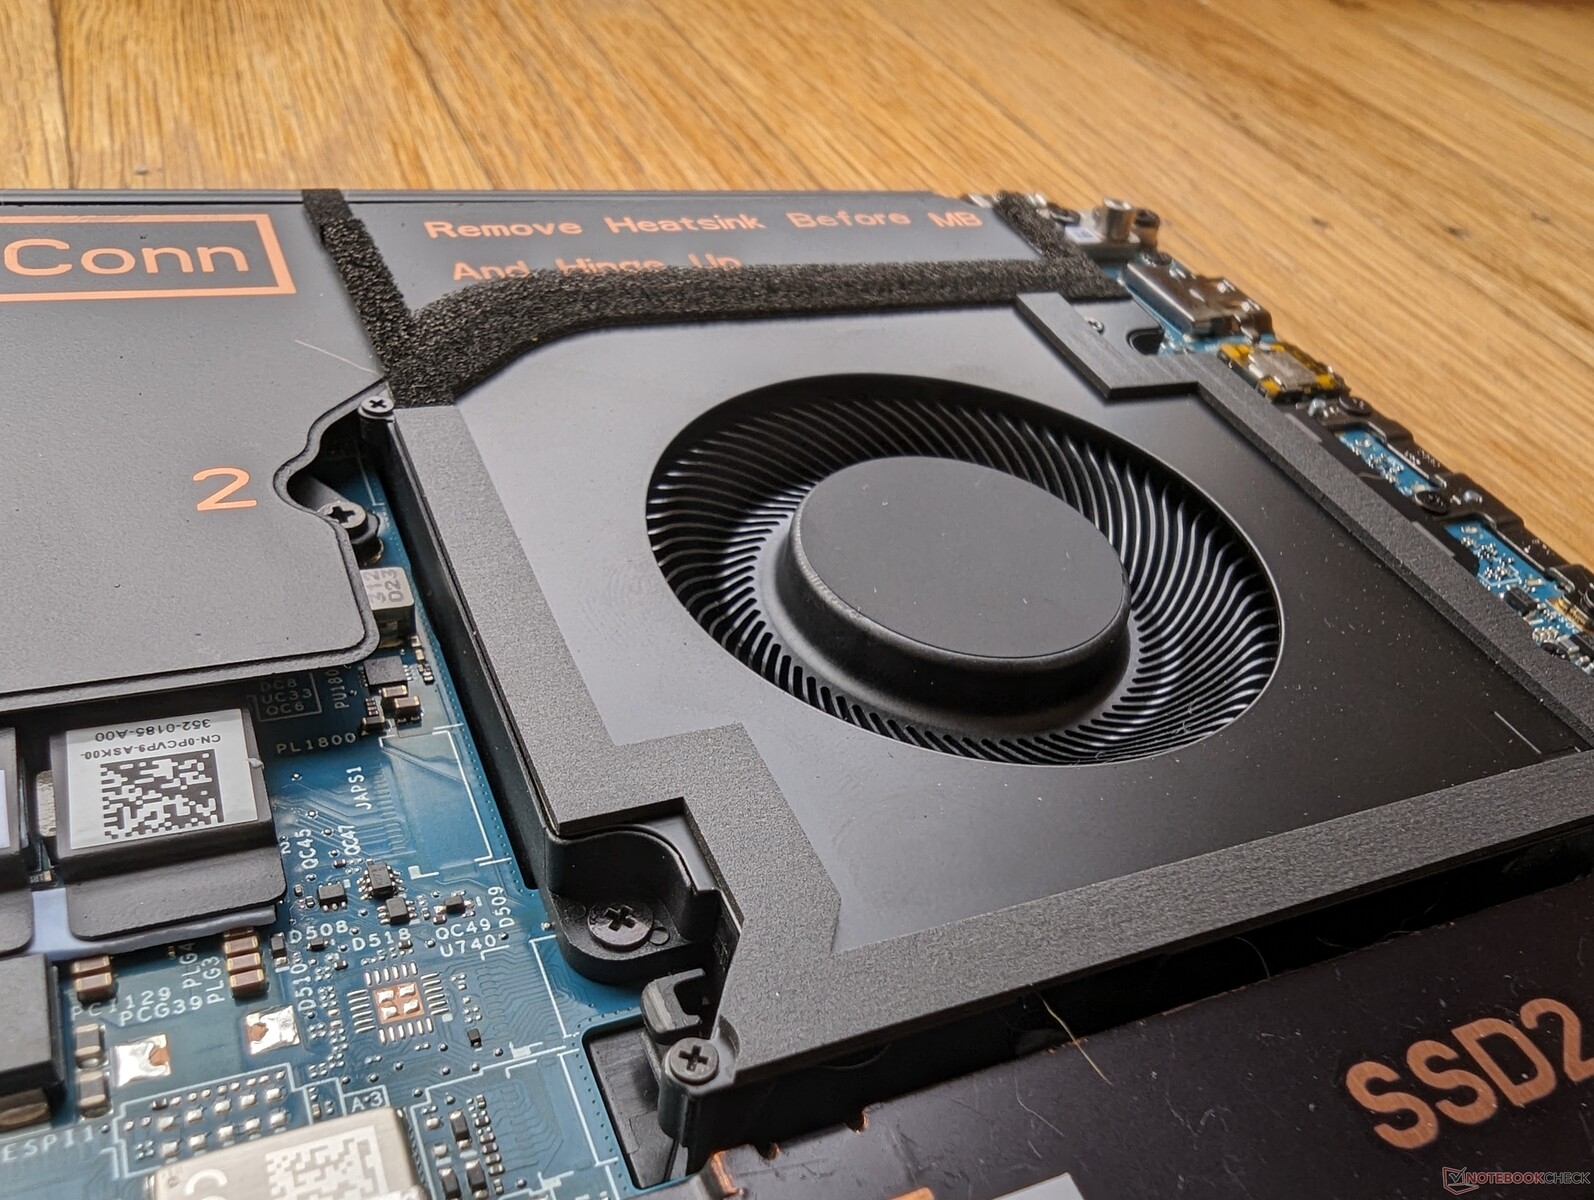
La nostra unità di prova viene fornita con lo stesso SK hynix PC801 PCIe4 x4 NVMe in configurazione RAID 0, come quelle della serie Precision 7670. Mentre il supporto PCIe5, come in alcuni portatili da gioco sarebbe stato gradito, al momento non è una caratteristica importante, vista la rarità delle unità SSD PCIe5. Dell offre opzioni di SSD con crittografia automatica per una maggiore sicurezza.
Ogni slot per SSD M.2 è dotato di un diffusore di calore in rame, come mostrato di seguito, per favorire il raffreddamento. Ogni unità nella nostra unità non ha avuto problemi a mantenere elevate velocità di trasferimento di ~5400 MB/s per lunghi periodi e non ha mostrato problemi di throttling.

* ... Meglio usare valori piccoli
Disk Throttling: DiskSpd Read Loop, Queue Depth 8
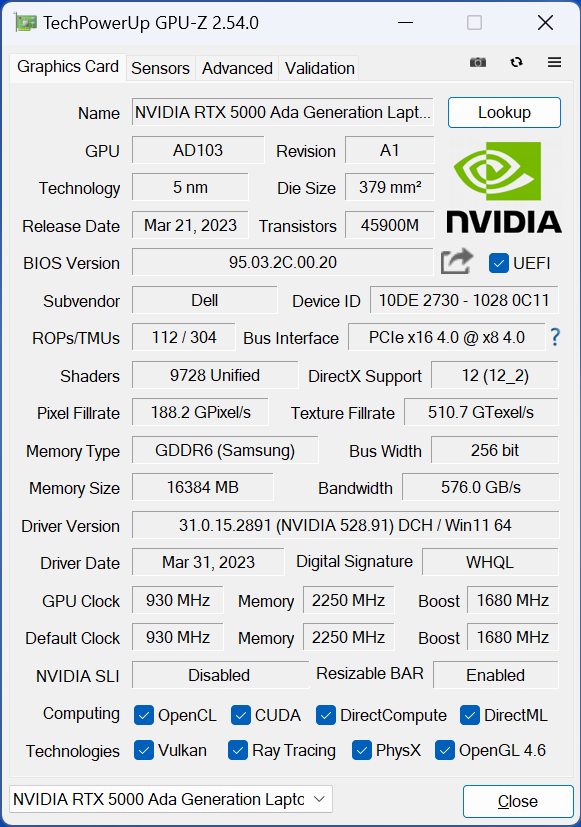
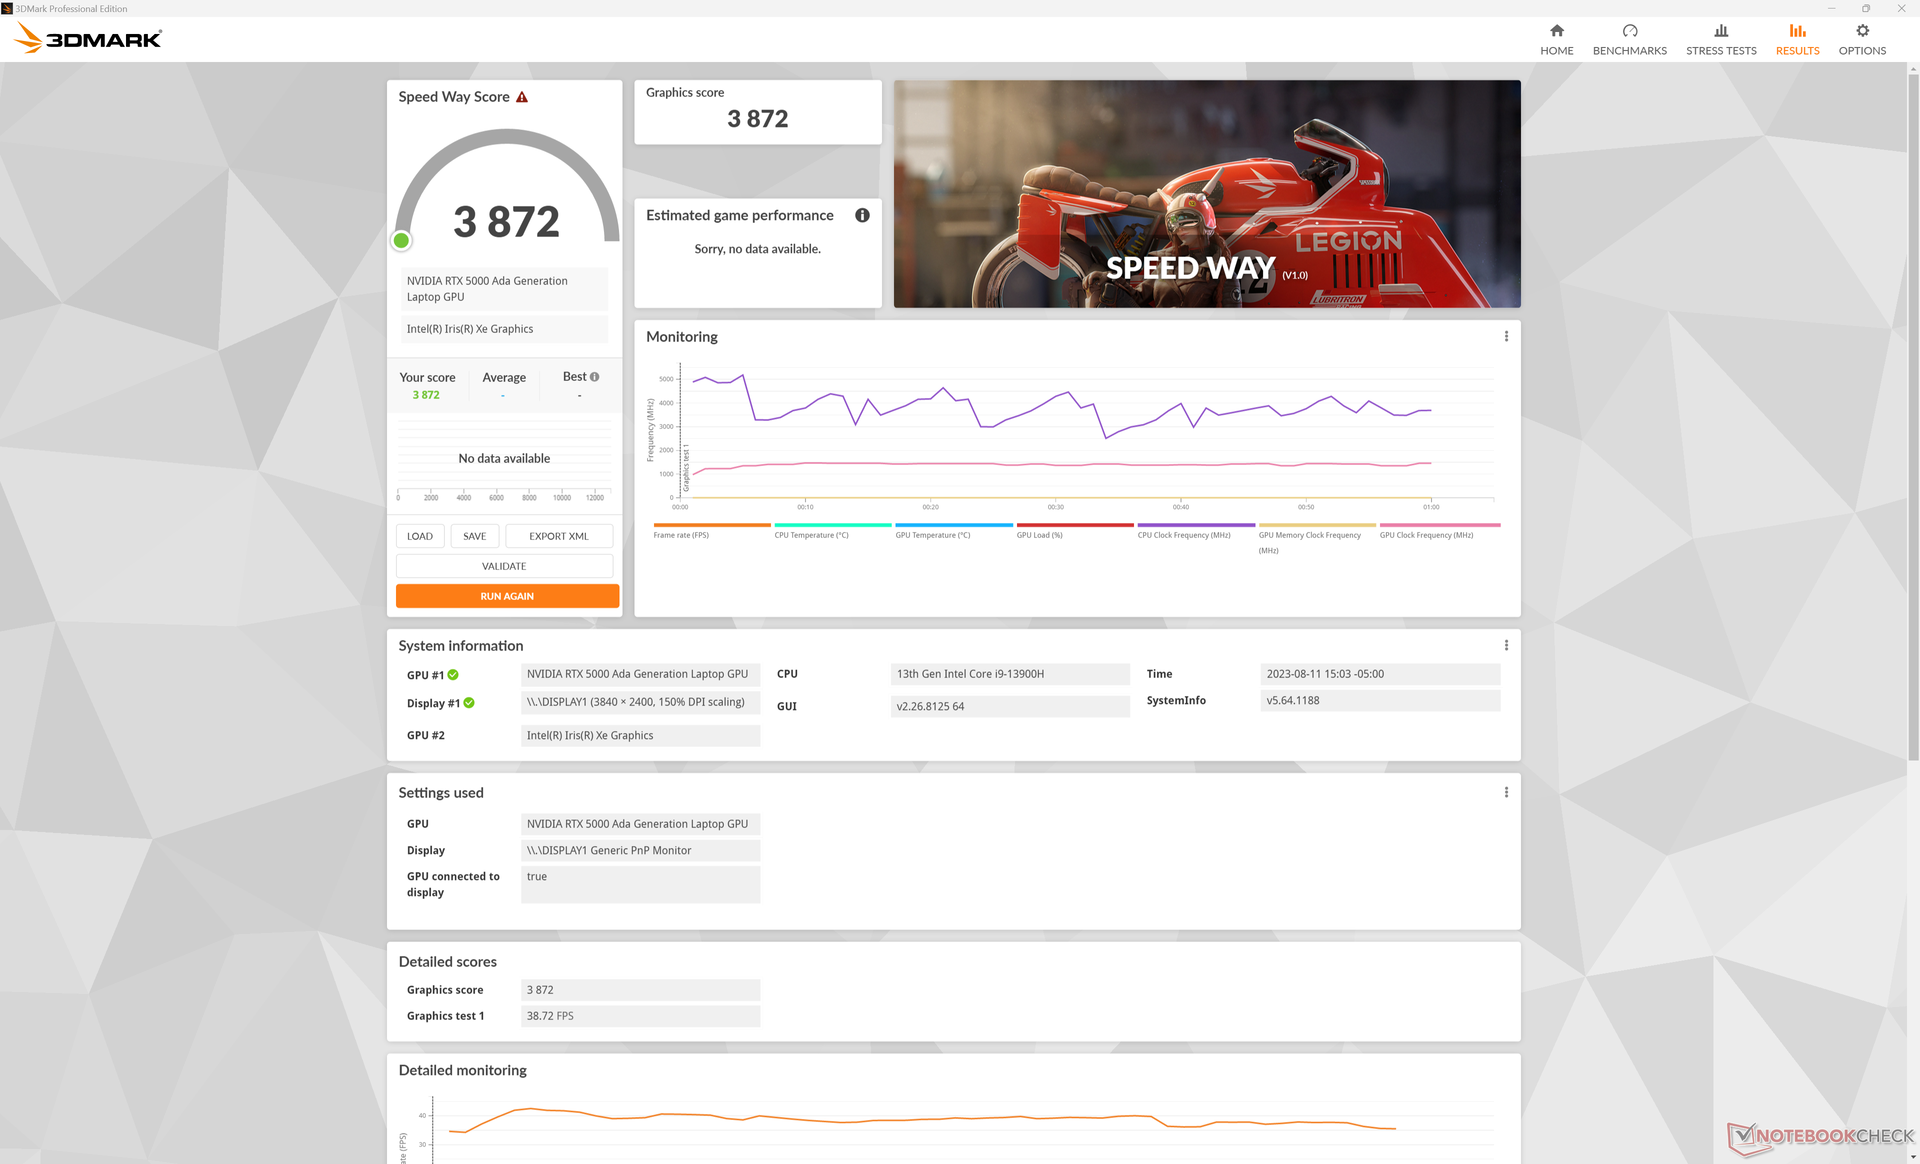
Prestazioni della GPU - 70 W Nvidia Ada Lovelace
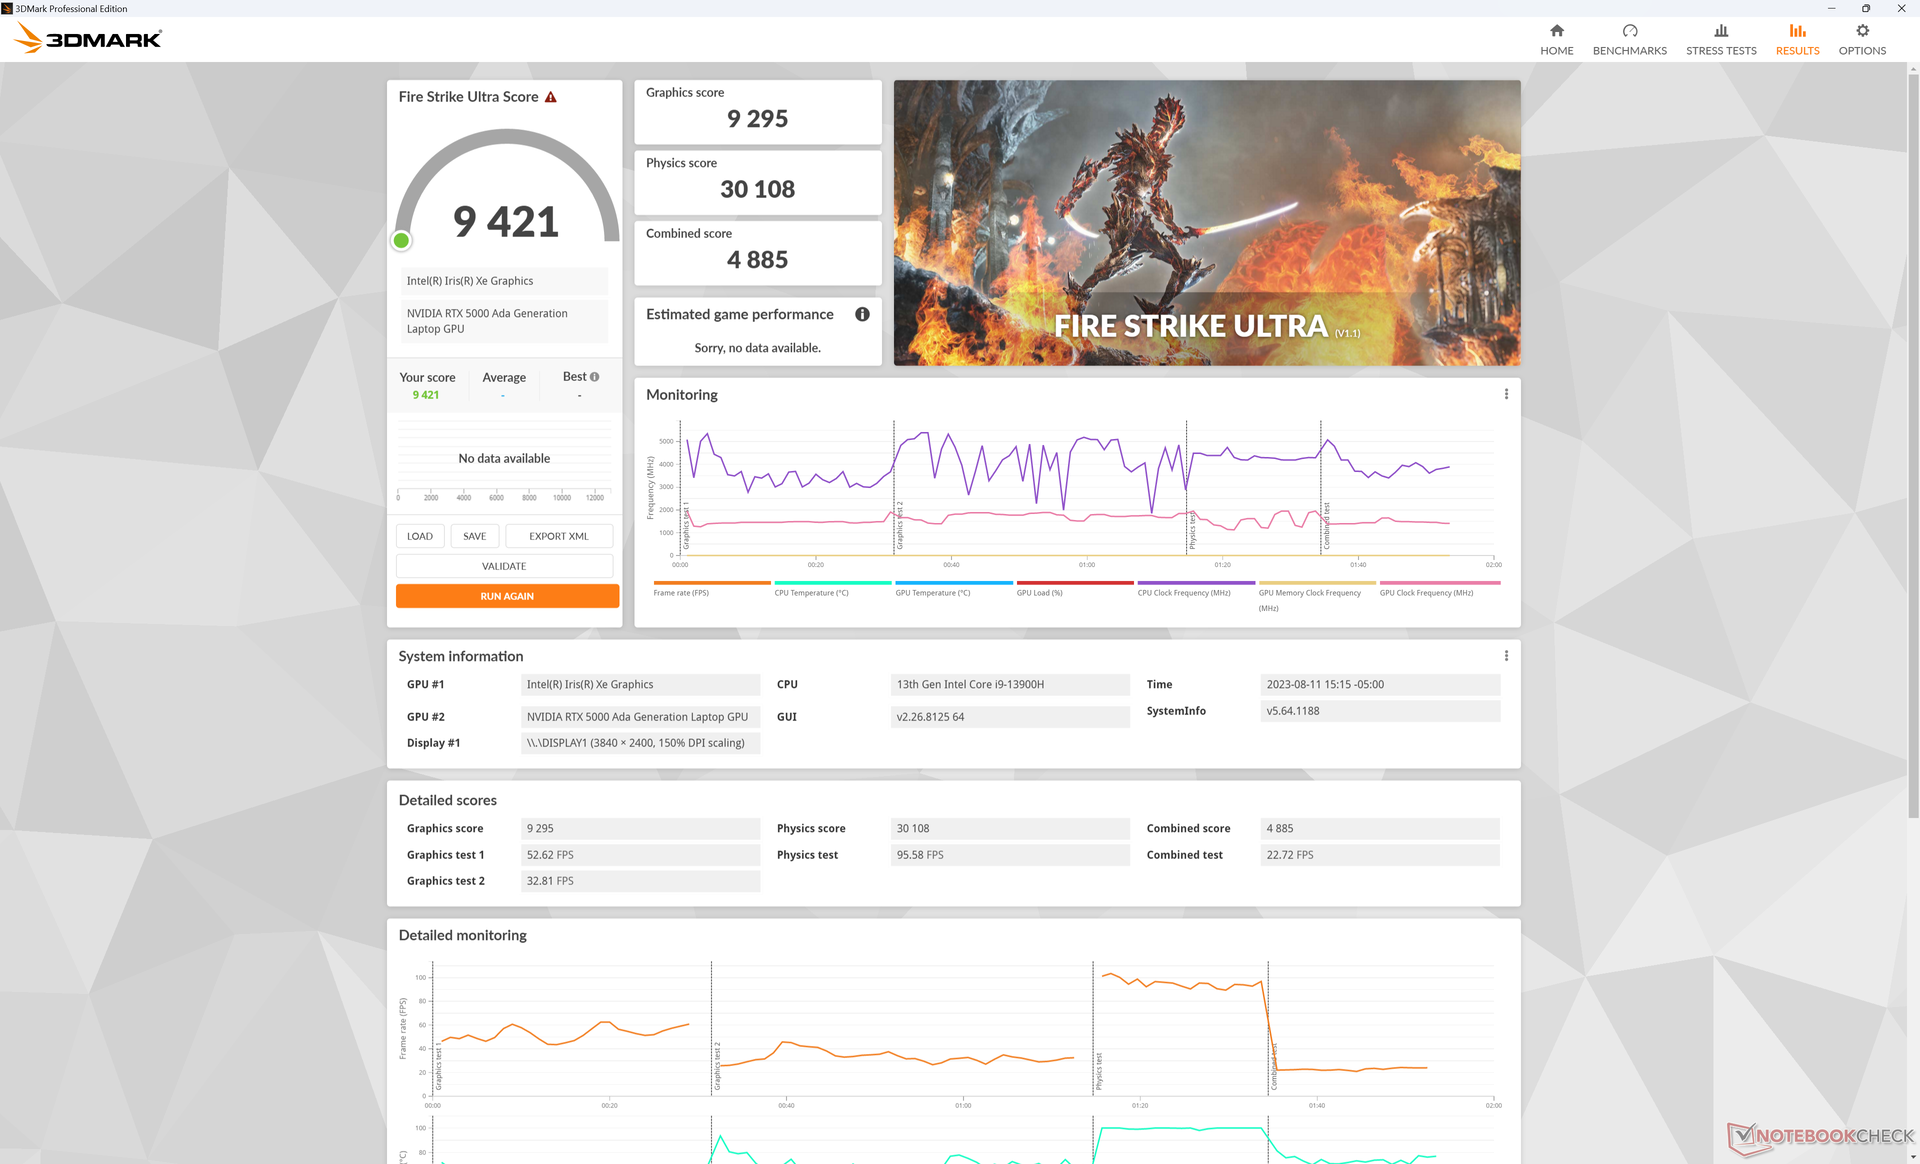
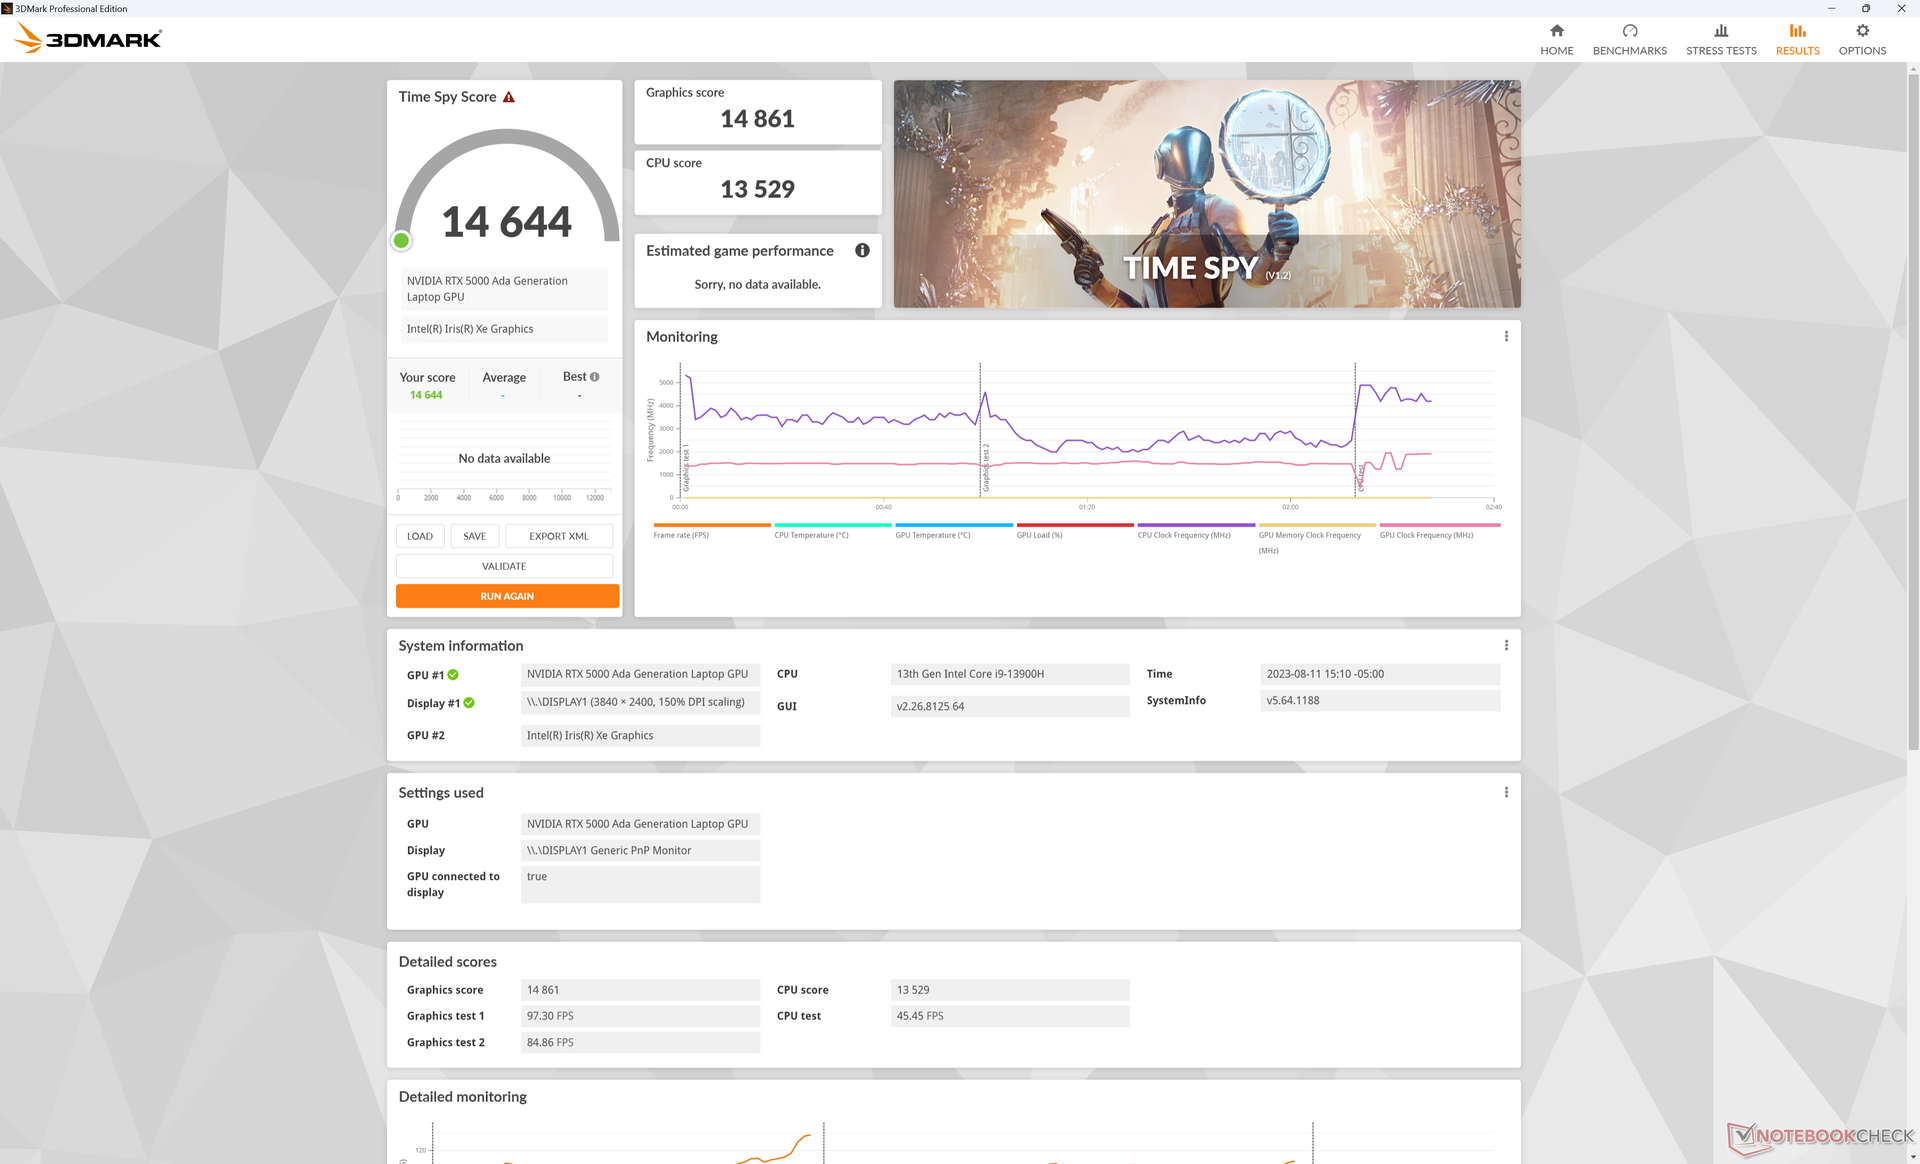
Il nuovo RTX 5000 offre notevoli vantaggi in termini di prestazioni rispetto al modello dello scorso anno RTX A5000 e A5500 soprattutto nelle applicazioni DX12 e nell'accelerazione CUDA di Blender. Time Spy il nostro Precision, ad esempio, ha ottenuto un punteggio dal 30 al 40% superiore rispetto al modello MSI WE76.MSI WE76 o del Lenovo ThinkPad P16 G1, ciascuno dei quali utilizza le vecchie GPU Ampere. I vantaggi si estendono anche alla maggior parte dei subtest di Specviewperf.
L'attivazione della modalità ECC VRAM non sembra avere un impatto sulle velocità di clock della memoria, ma la VRAM massima disponibile diminuisce da 16384 MB a 15360 MB secondo GPU-Z.
Si noti che non c'è un impatto significativo sulle prestazioni della GPU quando si passa dalla modalità Performance alla modalità Balanced, come mostrano i risultati di Fire Strike qui sotto. Al contrario, le prestazioni della CPU subirebbero un notevole calo.
| Profilo di potenza | Punteggio fisico | Punteggio grafico | Punteggio combinato |
| Potenza della batteria | 20938 (-31%) | 27514 (-10%) | 8910 (-31%) |
| Modalità bilanciata | 24828 (-18%) | 30588 (-0%) | 11365 (-12%) |
| Modalità Performance | 30237 | 30422 | 12907 |
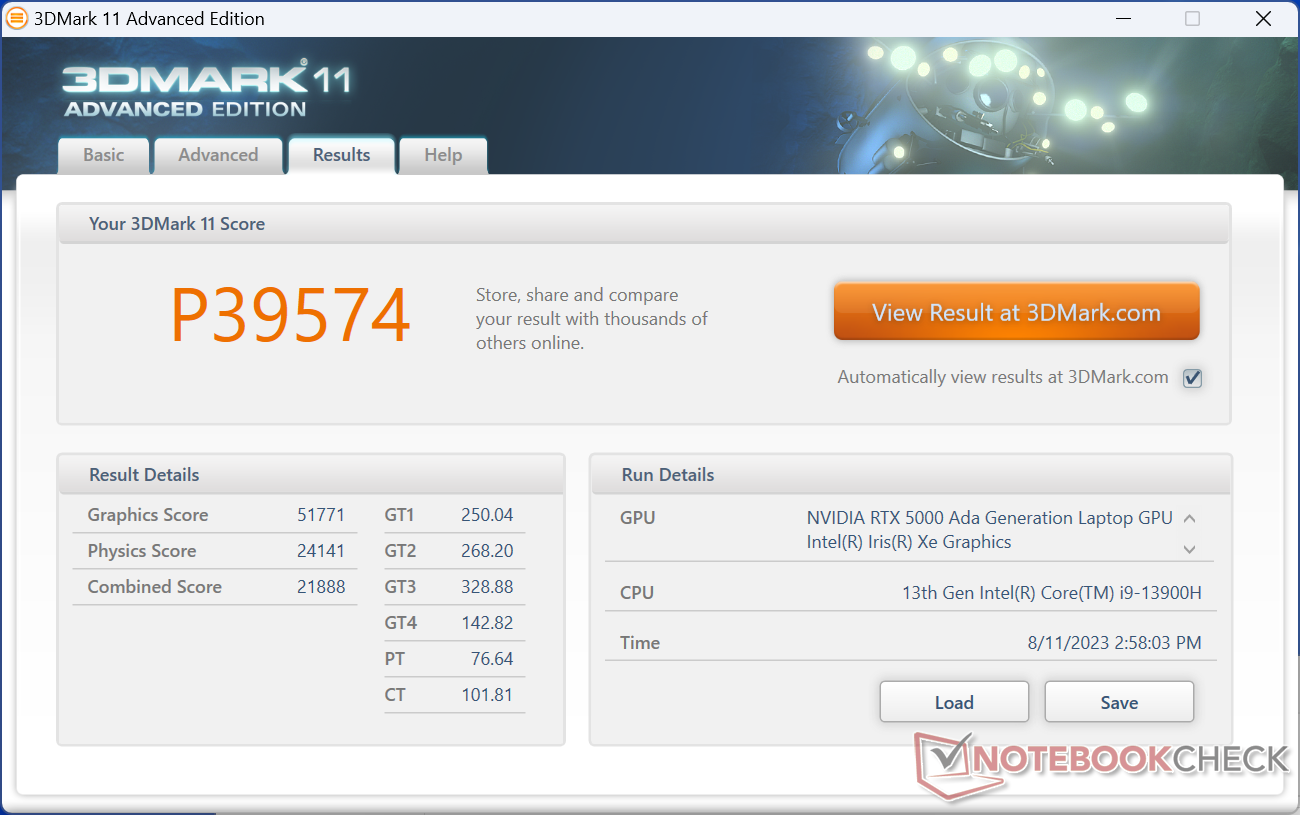
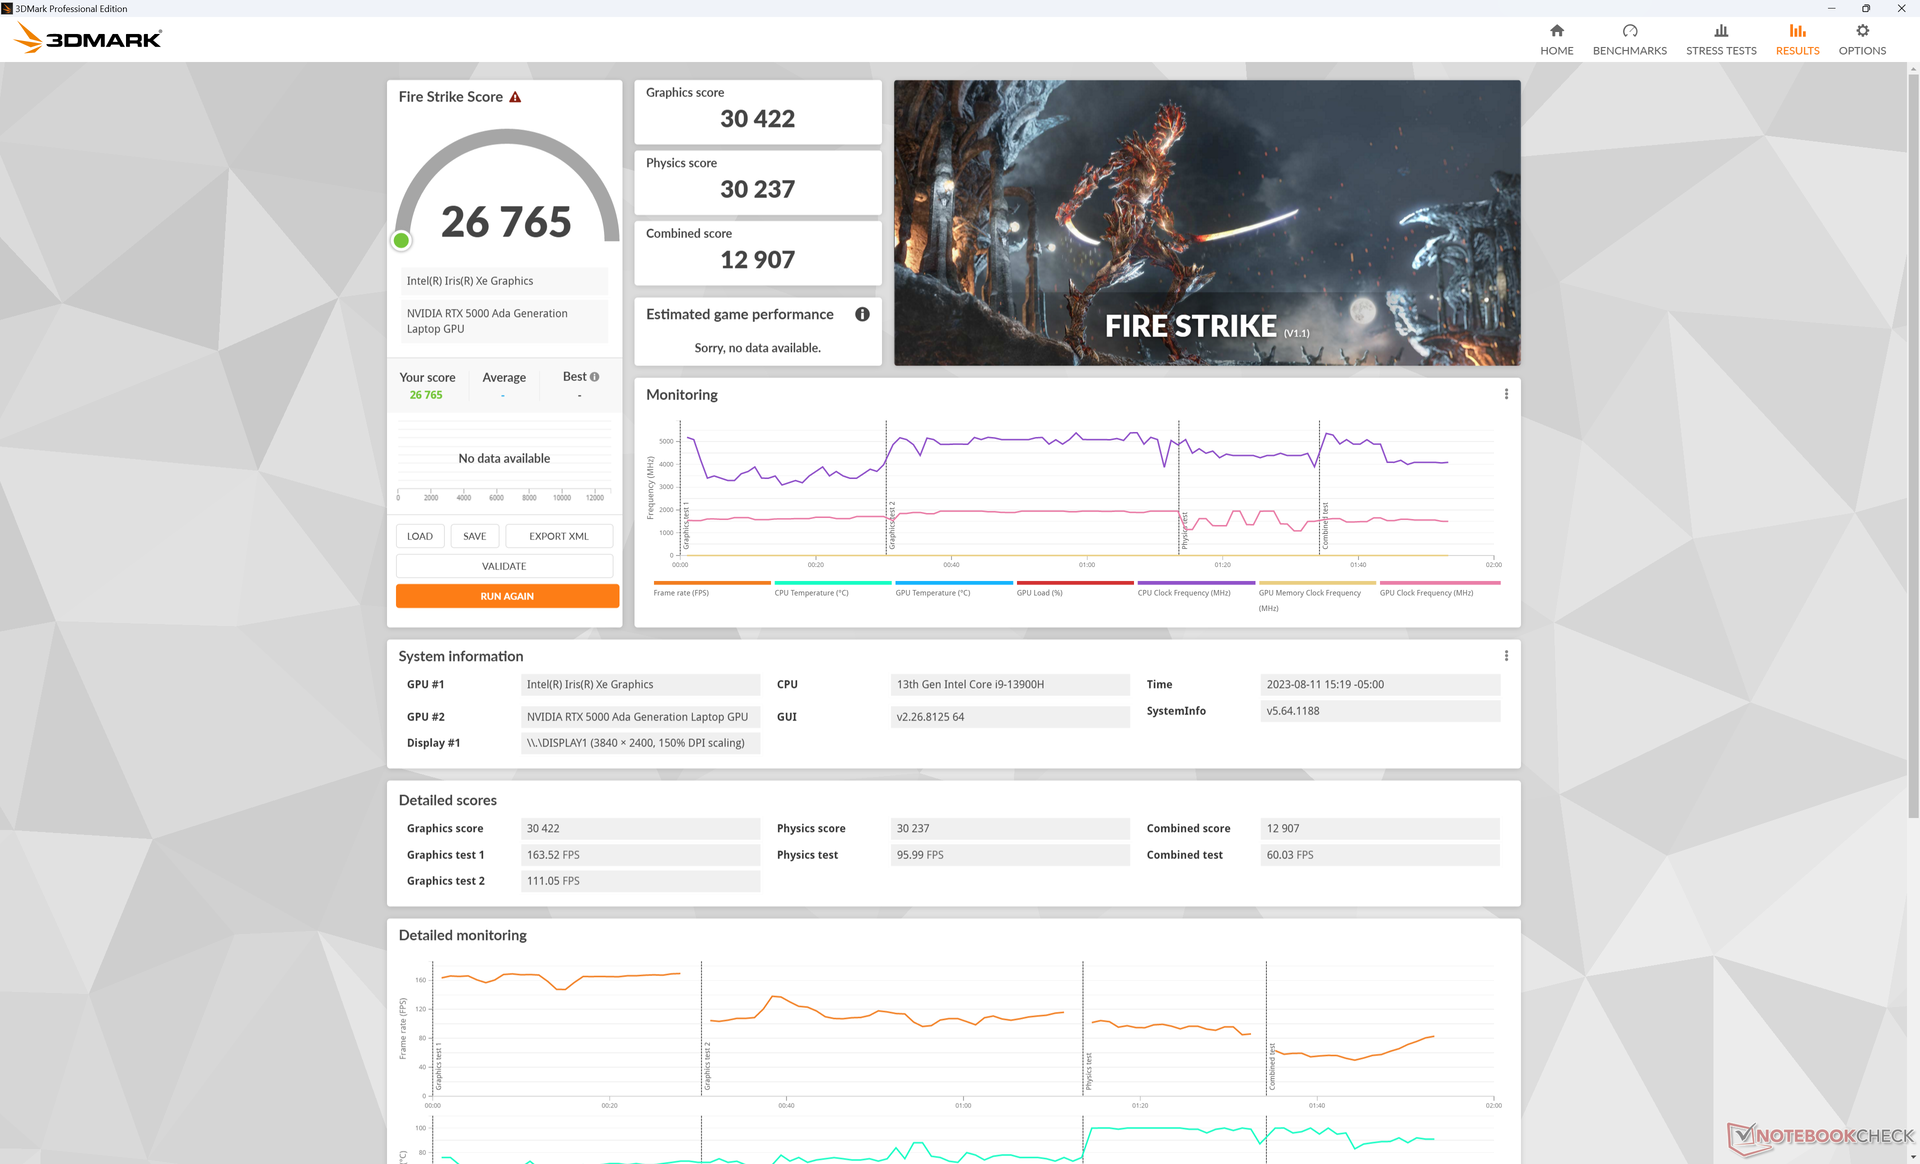
| 3DMark 11 Performance | 39574 punti | |
| 3DMark Fire Strike Score | 26765 punti | |
| 3DMark Time Spy Score | 14644 punti | |
Aiuto | ||
* ... Meglio usare valori piccoli
Prestazioni di gioco
Pur non essendo un portatile da gioco, Precision 5680 è comunque in grado di giocare ai titoli più recenti e impegnativi senza problemi di compatibilità durante i test. Le prestazioni di gioco complessive si collocano tra la RTX 4060 mobile di GeForce e la RTX 4070 mobile rTX 4070 mobile che si trovano su portatili dedicati al gioco come l' HP Omen Transcend 16.
Witcher 3 FPS Chart
| basso | medio | alto | ultra | QHD | 4K | |
|---|---|---|---|---|---|---|
| GTA V (2015) | 185.4 | 179.7 | 175.3 | 117.1 | 106.6 | 108 |
| The Witcher 3 (2015) | 412.7 | 329.6 | 256 | 137 | 97 | |
| Dota 2 Reborn (2015) | 178 | 161.7 | 154 | 144 | 142.5 | |
| Final Fantasy XV Benchmark (2018) | 196.3 | 165.6 | 127.4 | 100.8 | 60.4 | |
| X-Plane 11.11 (2018) | 155.3 | 133 | 102.4 | 86.2 | ||
| Far Cry 5 (2018) | 145 | 132 | 129 | 132 | 114 | 70 |
| Cyberpunk 2077 1.6 (2022) | 124.9 | 122.7 | 107.7 | 100 | 66.2 | 32.2 |
| Tiny Tina's Wonderlands (2022) | 220 | 202.3 | 152.6 | 125 | 90.1 | 50.9 |
| F1 22 (2022) | 232 | 218 | 202 | 84.5 | 56.1 | 28.8 |
| Returnal (2023) | 98 | 94 | 90 | 81 | 60 | 34 |
Emissioni: silenzioso per la maggior parte del tempo
Rumore del sistema
I livelli di rumore sono molto simili a quelli delPrecision 5550 anche se il nostro Precision 5680 ha una GPU significativamente più veloce. Le ventole tendono a oscillare nella fascia medio-alta dei 20 dB(A) quando si eseguono carichi poco impegnativi come i browser web, mentre carichi più impegnativi inducono un rumore costante di 51 dB(A).
È interessante notare che il livello massimo di rumorosità delle ventole in modalità Bilanciata è lo stesso della modalità Prestazioni.
Rumorosità
| Idle |
| 23 / 23 / 23 dB(A) |
| Sotto carico |
| 37.2 / 51 dB(A) |
 | ||
30 dB silenzioso 40 dB(A) udibile 50 dB(A) rumoroso |
||
min: | ||
| Dell Precision 5000 5680 RTX 5000 Ada Generation Laptop, i9-13900H, 2x SK hynix PC801 HFS512GEJ9X101N RAID 0 | Dell Precision 7000 7670 Performance RTX A5500 Laptop GPU, i9-12950HX | HP ZBook Fury 16 G9 RTX A5500 Laptop GPU, i9-12950HX, Micron 3400 1TB MTFDKBA1T0TFH | Lenovo ThinkPad P16 G1 RTX A5500 RTX A5500 Laptop GPU, i9-12950HX, WDC PC SN810 2TB | MSI CreatorPro Z16P B12UKST RTX A3000 Laptop GPU, i7-12700H, Samsung PM9A1 MZVL21T0HCLR | Asus ExpertBook B6 Flip B6602FC2 RTX A2000 Laptop GPU, i9-12950HX, Samsung PM9A1 MZVL21T0HCLR | |
|---|---|---|---|---|---|---|
| Noise | -11% | -2% | 3% | -8% | -30% | |
| off /ambiente * (dB) | 22.8 | 23.9 -5% | 22.6 1% | 23.1 -1% | 24.1 -6% | 26 -14% |
| Idle Minimum * (dB) | 23 | 24 -4% | 22.7 1% | 23.1 -0% | 27.1 -18% | 32.4 -41% |
| Idle Average * (dB) | 23 | 24 -4% | 22.7 1% | 23.1 -0% | 27.1 -18% | 32.4 -41% |
| Idle Maximum * (dB) | 23 | 38 -65% | 28.8 -25% | 23.1 -0% | 27.1 -18% | 32.4 -41% |
| Load Average * (dB) | 37.2 | 46.3 -24% | 36.2 3% | 28.9 22% | 42.9 -15% | 51.9 -40% |
| Witcher 3 ultra * (dB) | 51 | 41.9 18% | 49.5 3% | 51.6 -1% | 44 14% | |
| Load Maximum * (dB) | 51 | 47.9 6% | 49.3 3% | 51.4 -1% | 47 8% | 52.1 -2% |
* ... Meglio usare valori piccoli
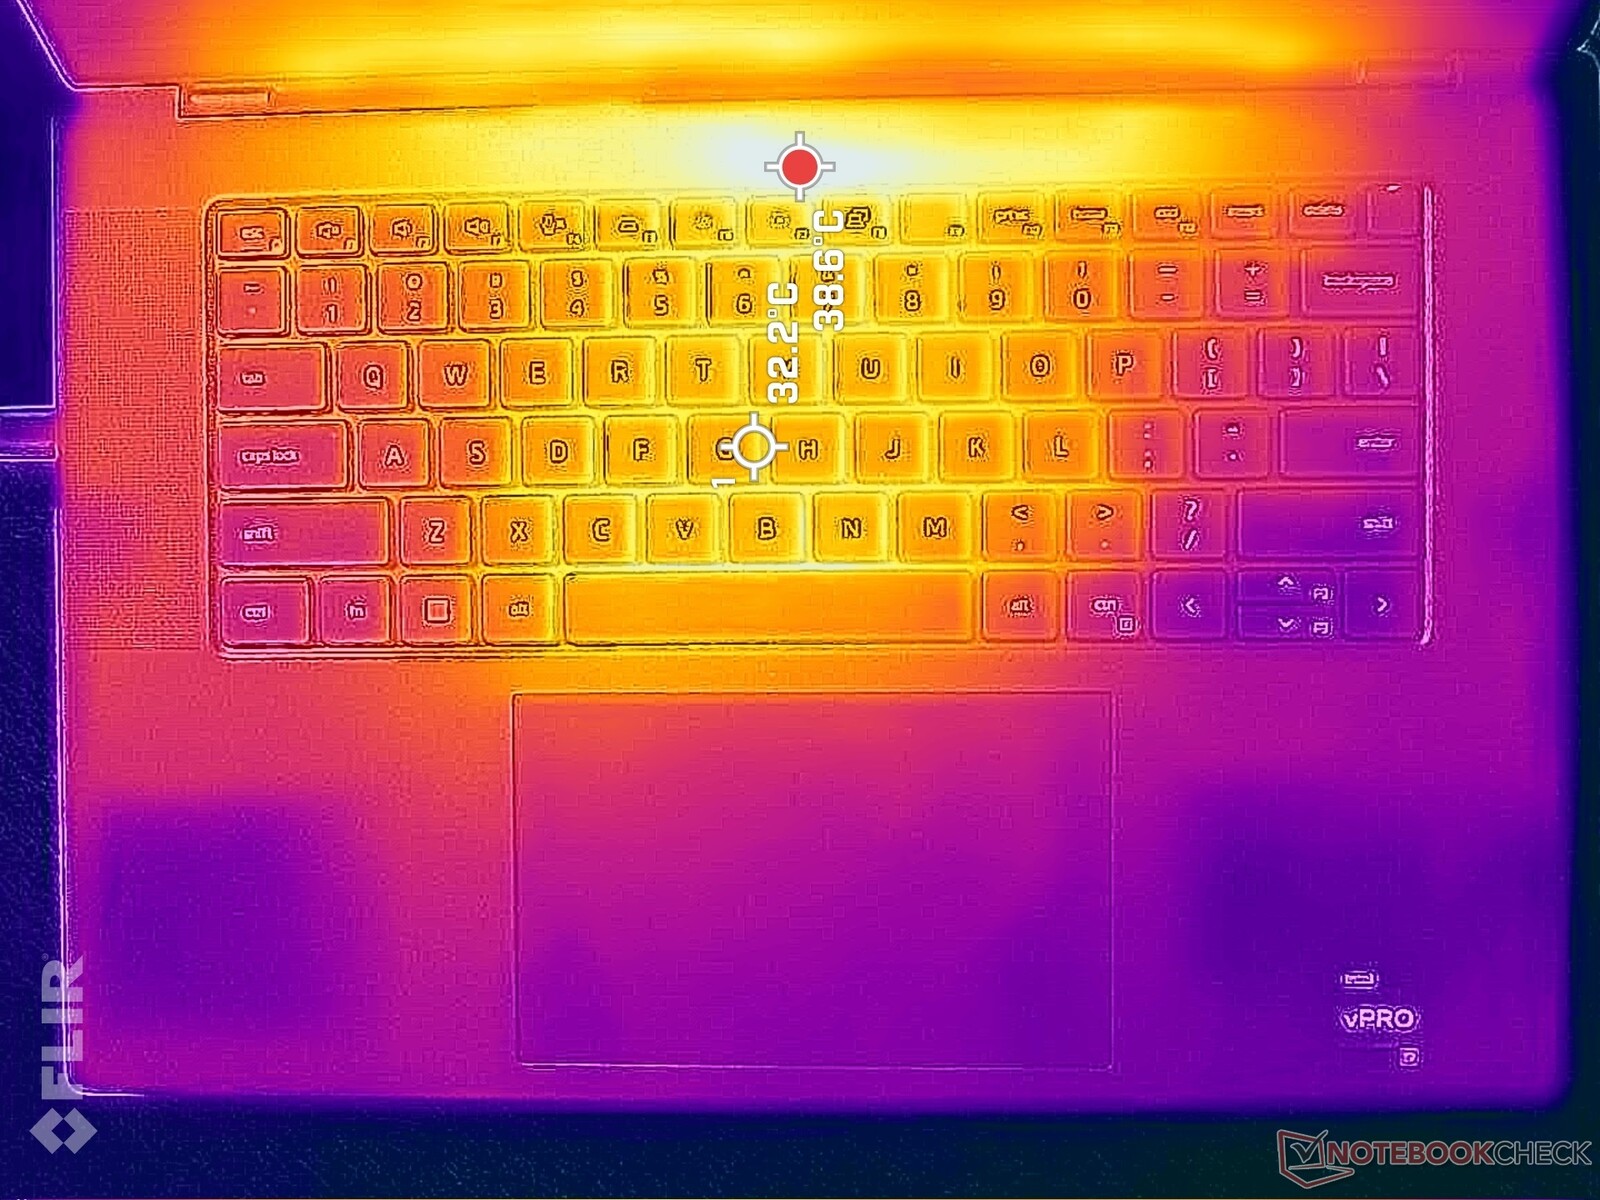
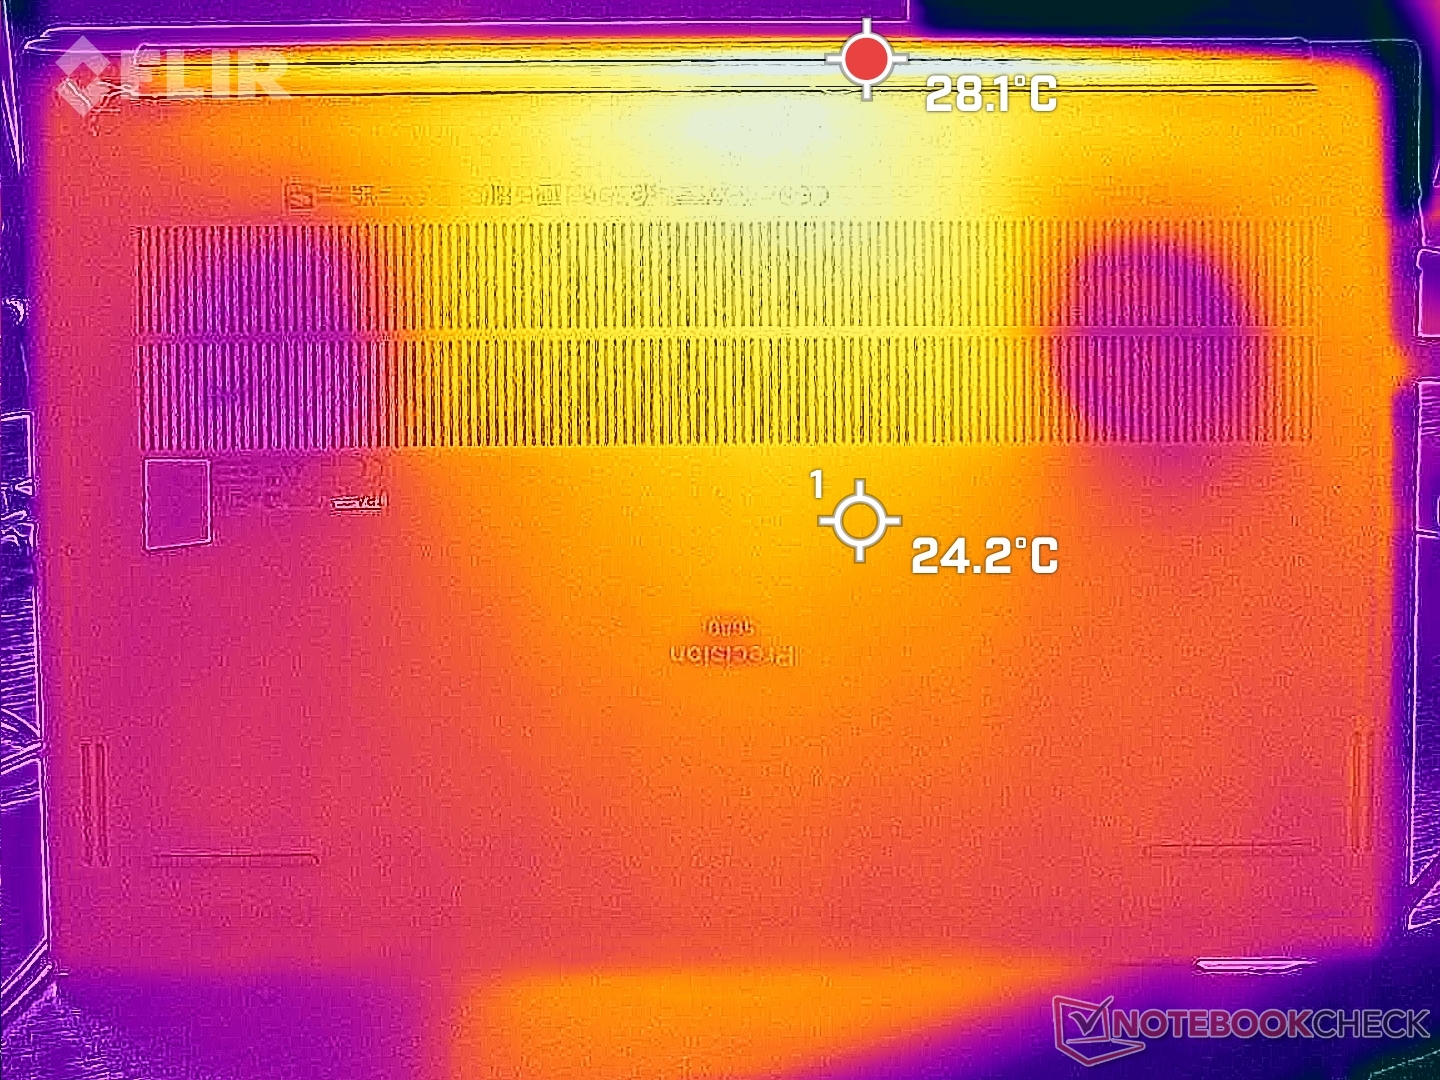
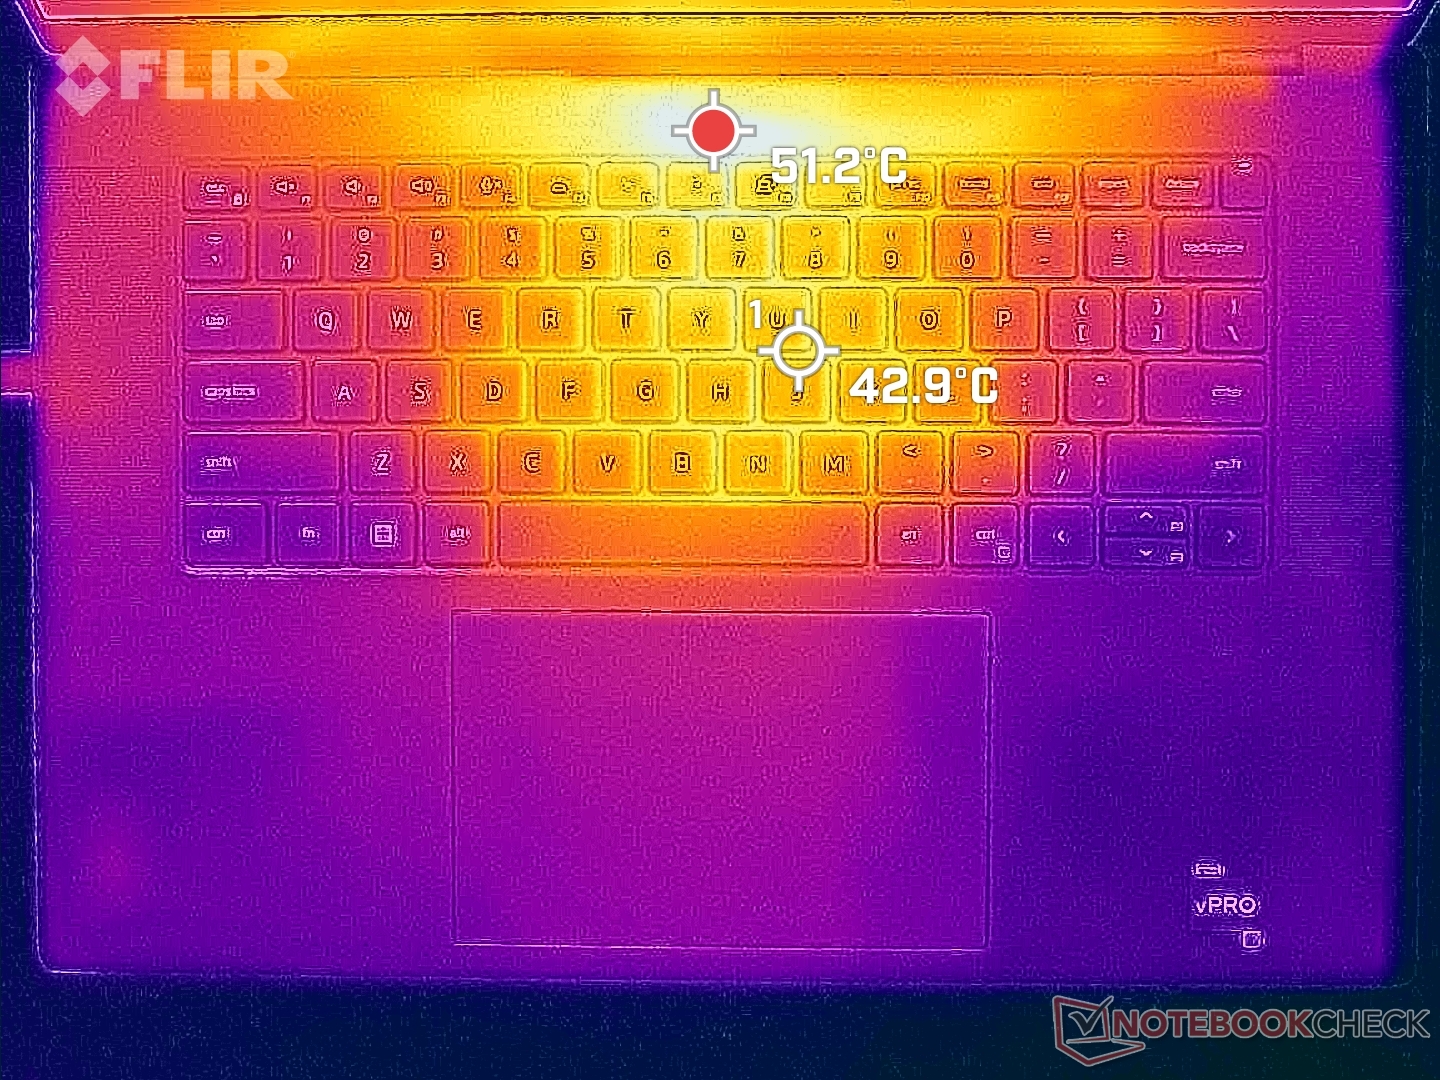
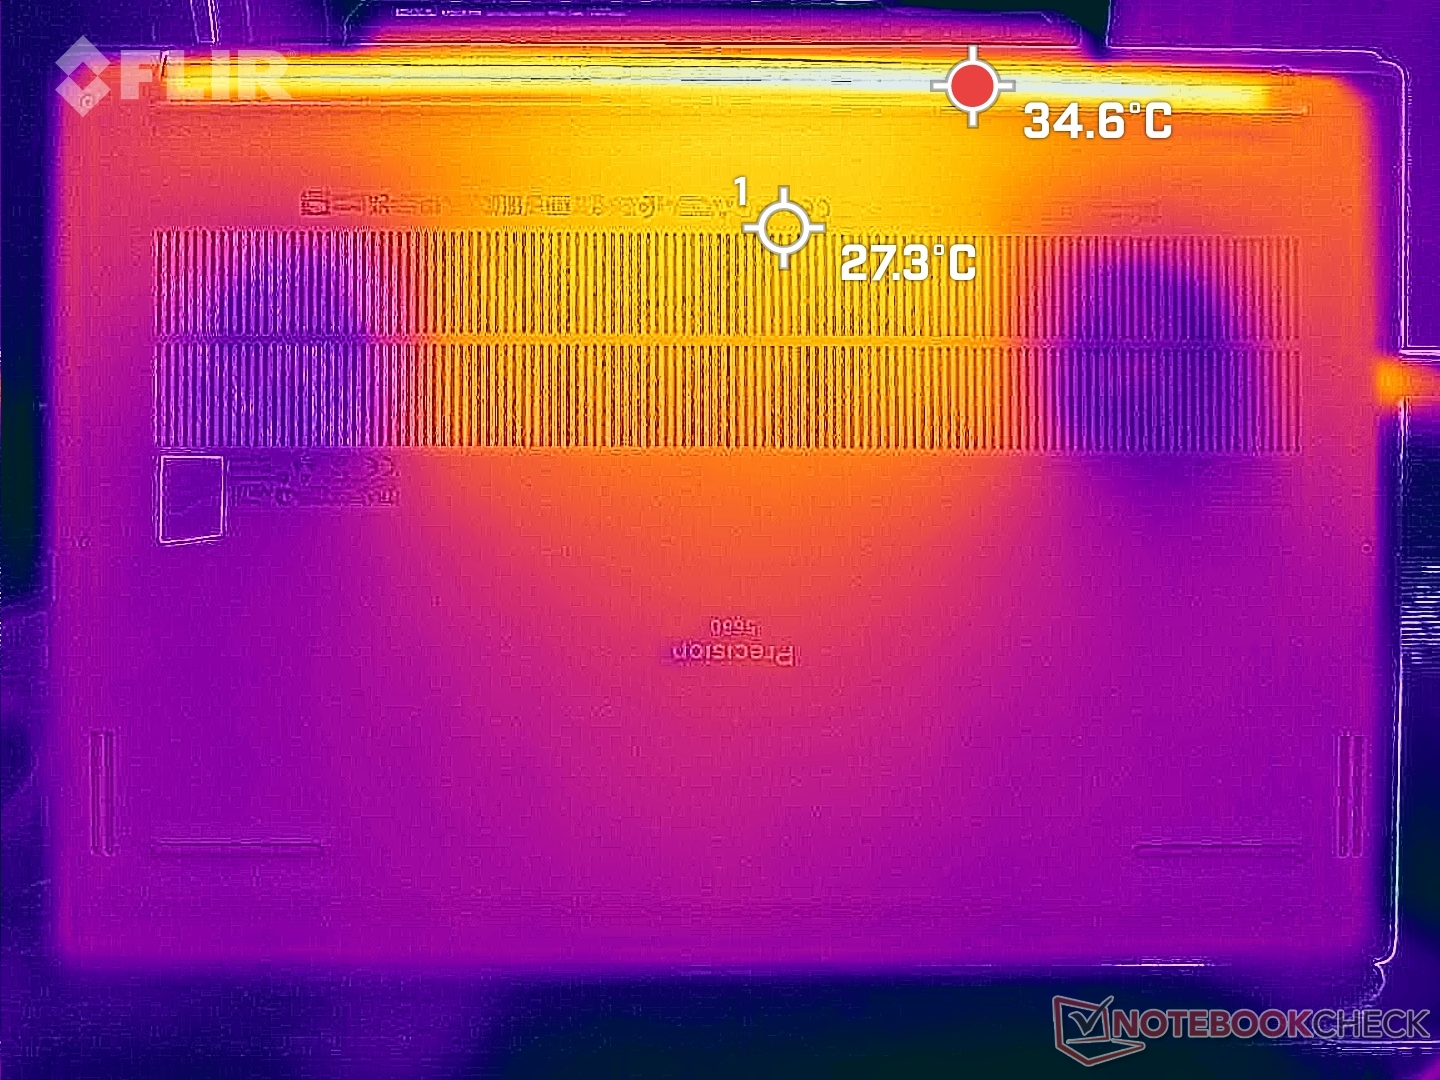
Temperatura
Le temperature superficiali al minimo sono più calde del previsto, poiché le ventole tendono a rimanere inattive fino a quando non sono necessarie. I punti caldi possono raggiungere i 37 C e i 32 C rispettivamente sul lato superiore e inferiore, rispetto ai 30 C del lato inferiore.ExpertBook B6 Flip.
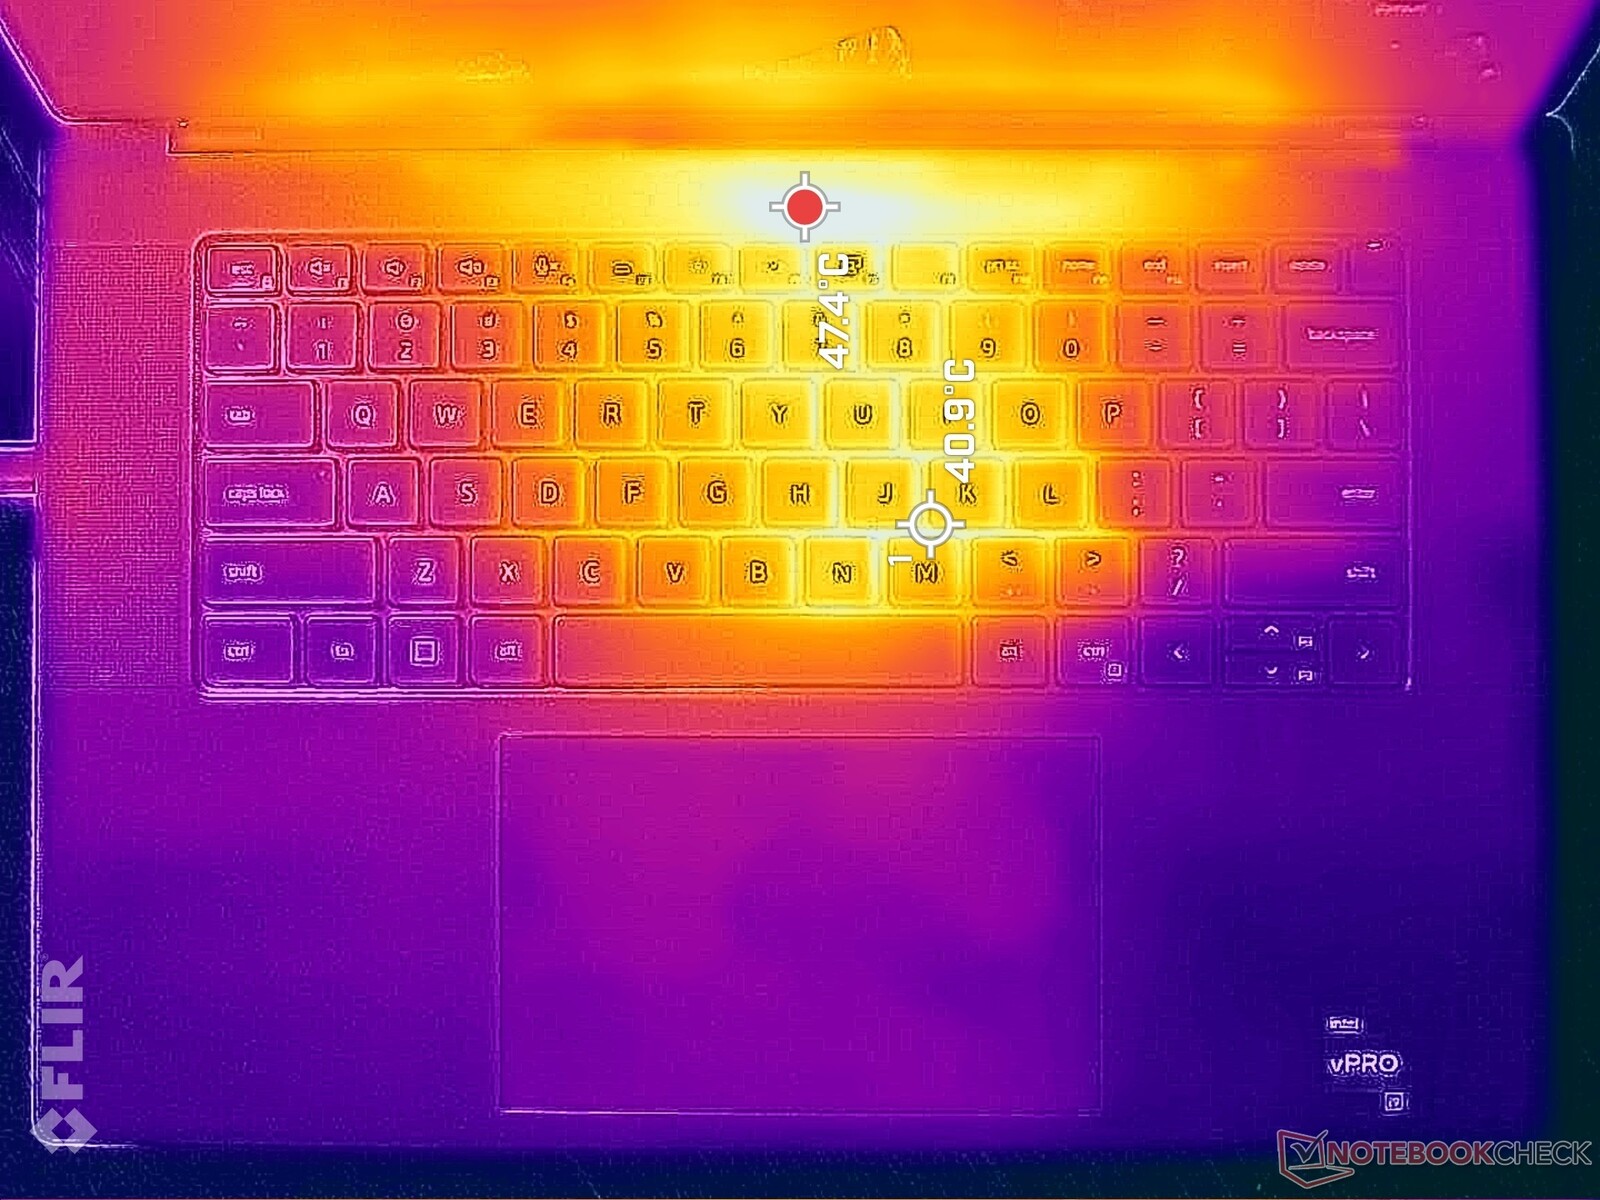
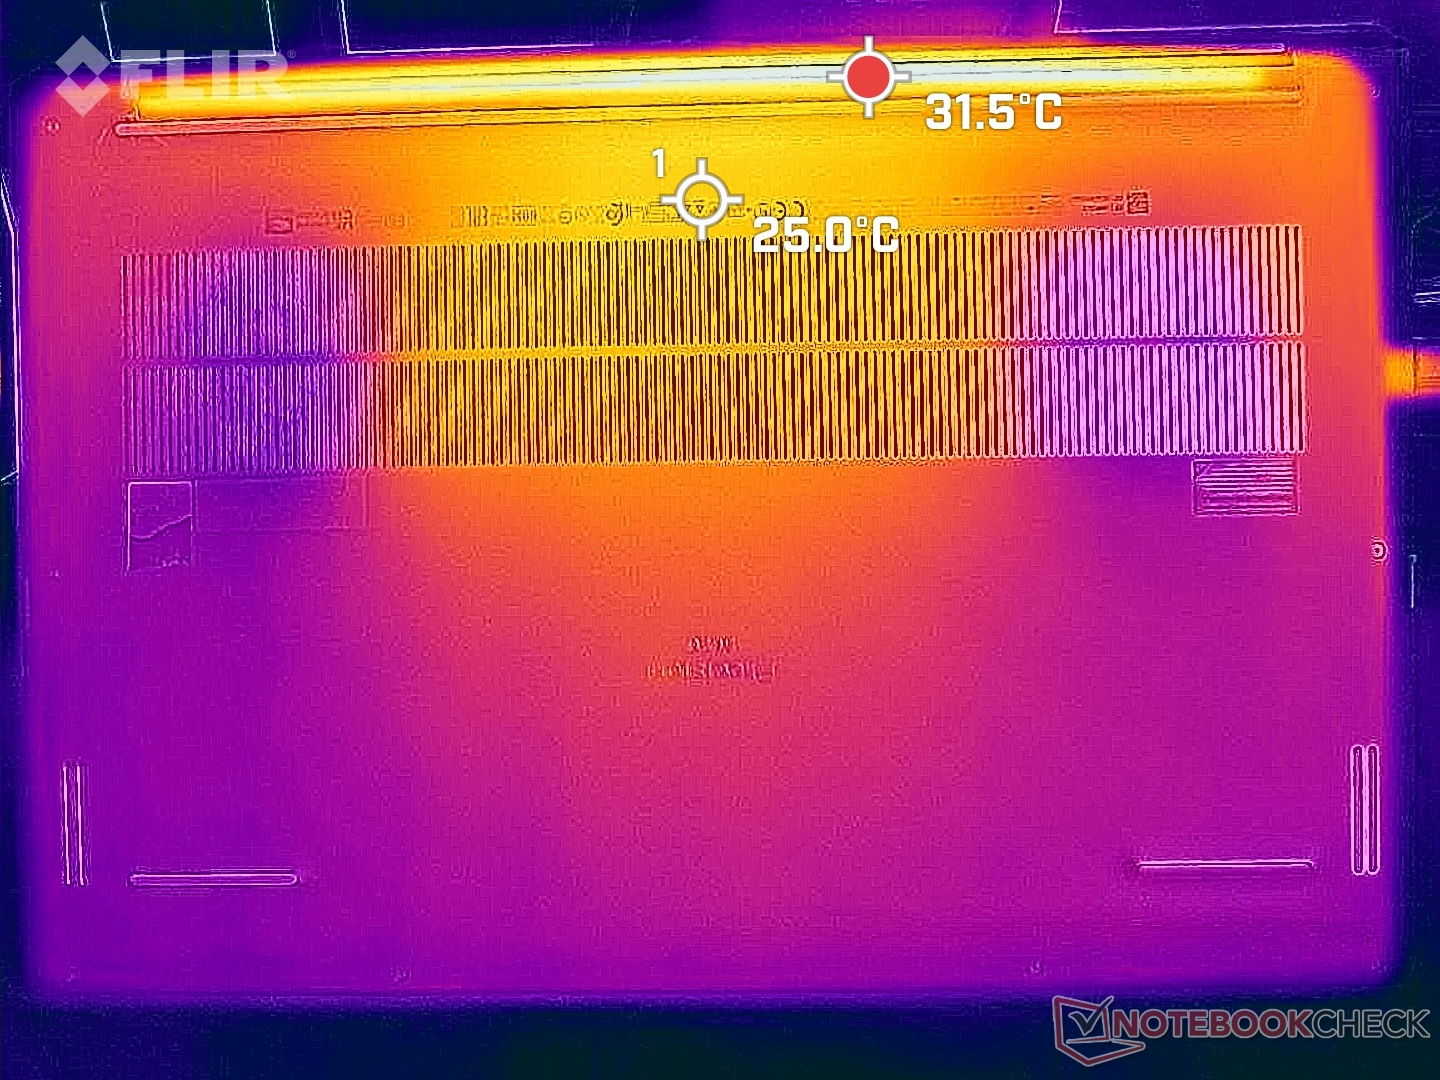
Quando si eseguono carichi più impegnativi, il centro della tastiera può raggiungere oltre 50 C, mentre la superficie inferiore si scalda appena, in parte grazie agli isolanti in Gore. Le dita e i palmi delle mani toccano il centro della tastiera solo di rado e quindi i punti caldi in genere non influiscono sul comfort.
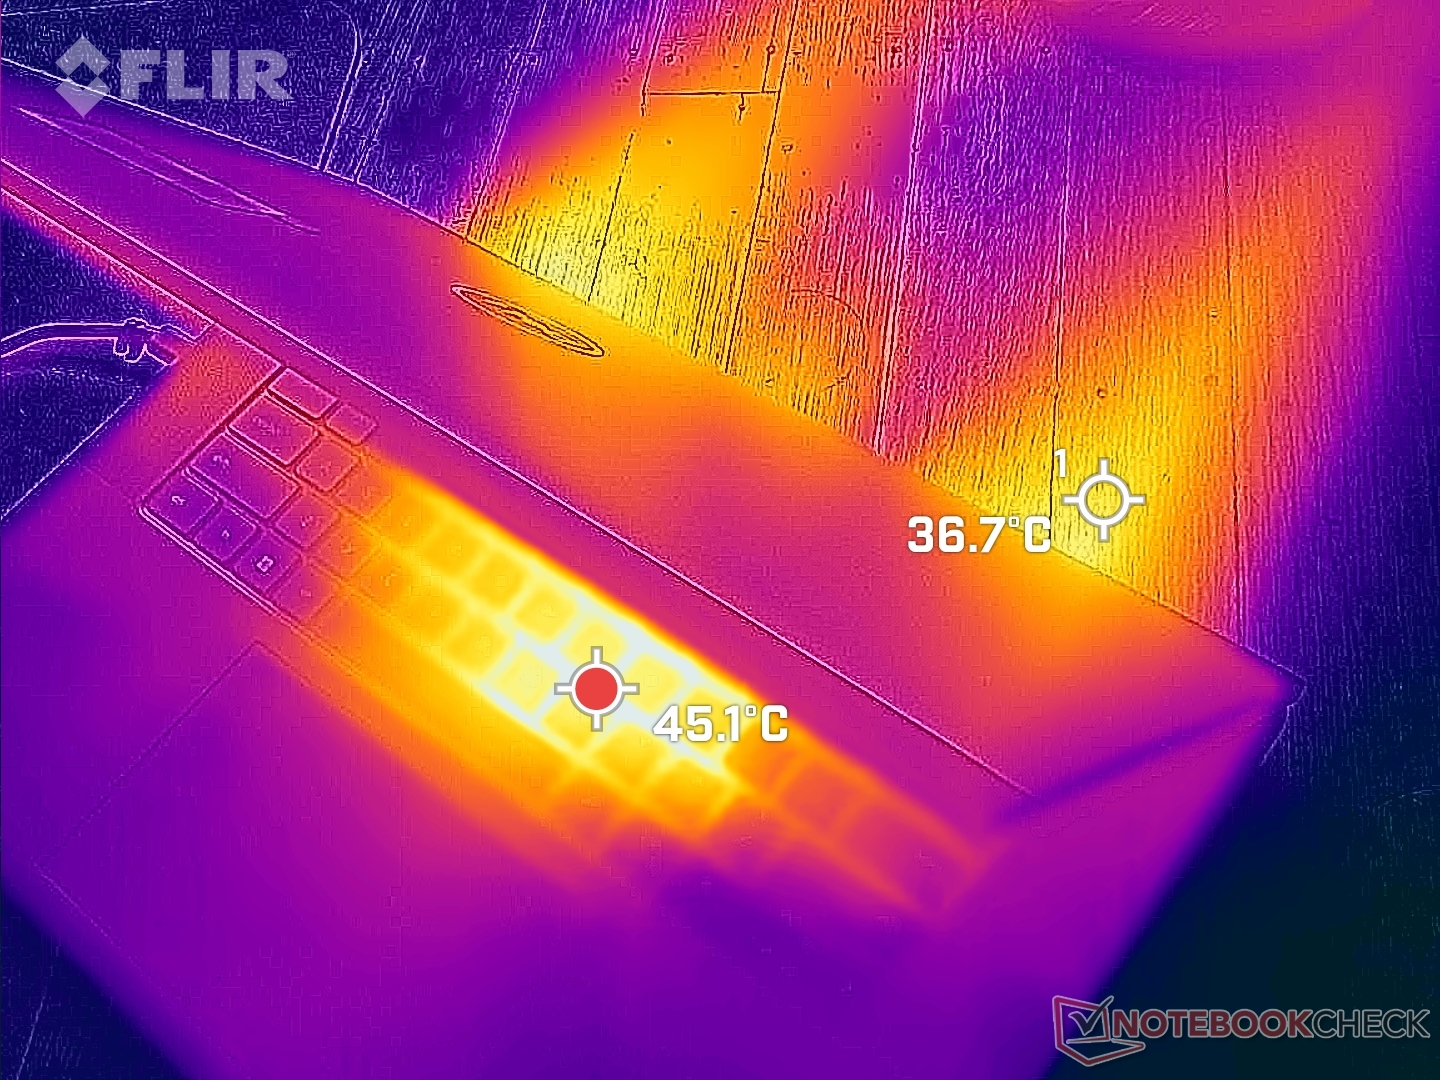
(-) La temperatura massima sul lato superiore è di 50.2 °C / 122 F, rispetto alla media di 38.2 °C / 101 F, che varia da 22.2 a 69.8 °C per questa classe Workstation.
(+) Il lato inferiore si riscalda fino ad un massimo di 32 °C / 90 F, rispetto alla media di 41.1 °C / 106 F
(+) In idle, la temperatura media del lato superiore è di 30.1 °C / 86 F, rispetto alla media deld ispositivo di 32 °C / 90 F.
(±) Riproducendo The Witcher 3, la temperatura media per il lato superiore e' di 34.6 °C / 94 F, rispetto alla media del dispositivo di 32 °C / 90 F.
(+) I poggiapolsi e il touchpad sono piu' freddi della temperatura della pelle con un massimo di 27.6 °C / 81.7 F e sono quindi freddi al tatto.
(±) La temperatura media della zona del palmo della mano di dispositivi simili e'stata di 27.8 °C / 82 F (+0.2 °C / 0.3 F).
| Dell Precision 5000 5680 Intel Core i9-13900H, NVIDIA RTX 5000 Ada Generation Laptop | Dell Precision 7000 7670 Performance Intel Core i9-12950HX, NVIDIA RTX A5500 Laptop GPU | HP ZBook Fury 16 G9 Intel Core i9-12950HX, NVIDIA RTX A5500 Laptop GPU | Lenovo ThinkPad P16 G1 RTX A5500 Intel Core i9-12950HX, NVIDIA RTX A5500 Laptop GPU | MSI CreatorPro Z16P B12UKST Intel Core i7-12700H, NVIDIA RTX A3000 Laptop GPU | Asus ExpertBook B6 Flip B6602FC2 Intel Core i9-12950HX, NVIDIA RTX A2000 Laptop GPU | |
|---|---|---|---|---|---|---|
| Heat | -12% | -3% | -13% | -19% | -8% | |
| Maximum Upper Side * (°C) | 50.2 | 53 -6% | 43.2 14% | 44.8 11% | 56.3 -12% | 48.4 4% |
| Maximum Bottom * (°C) | 32 | 43.2 -35% | 50.4 -58% | 49.8 -56% | 68.3 -113% | 52.3 -63% |
| Idle Upper Side * (°C) | 37.4 | 36.8 2% | 28.6 24% | 30.6 18% | 25.2 33% | 27.8 26% |
| Idle Bottom * (°C) | 31.2 | 33.8 -8% | 28.2 10% | 38.6 -24% | 25.9 17% | 30.3 3% |
* ... Meglio usare valori piccoli
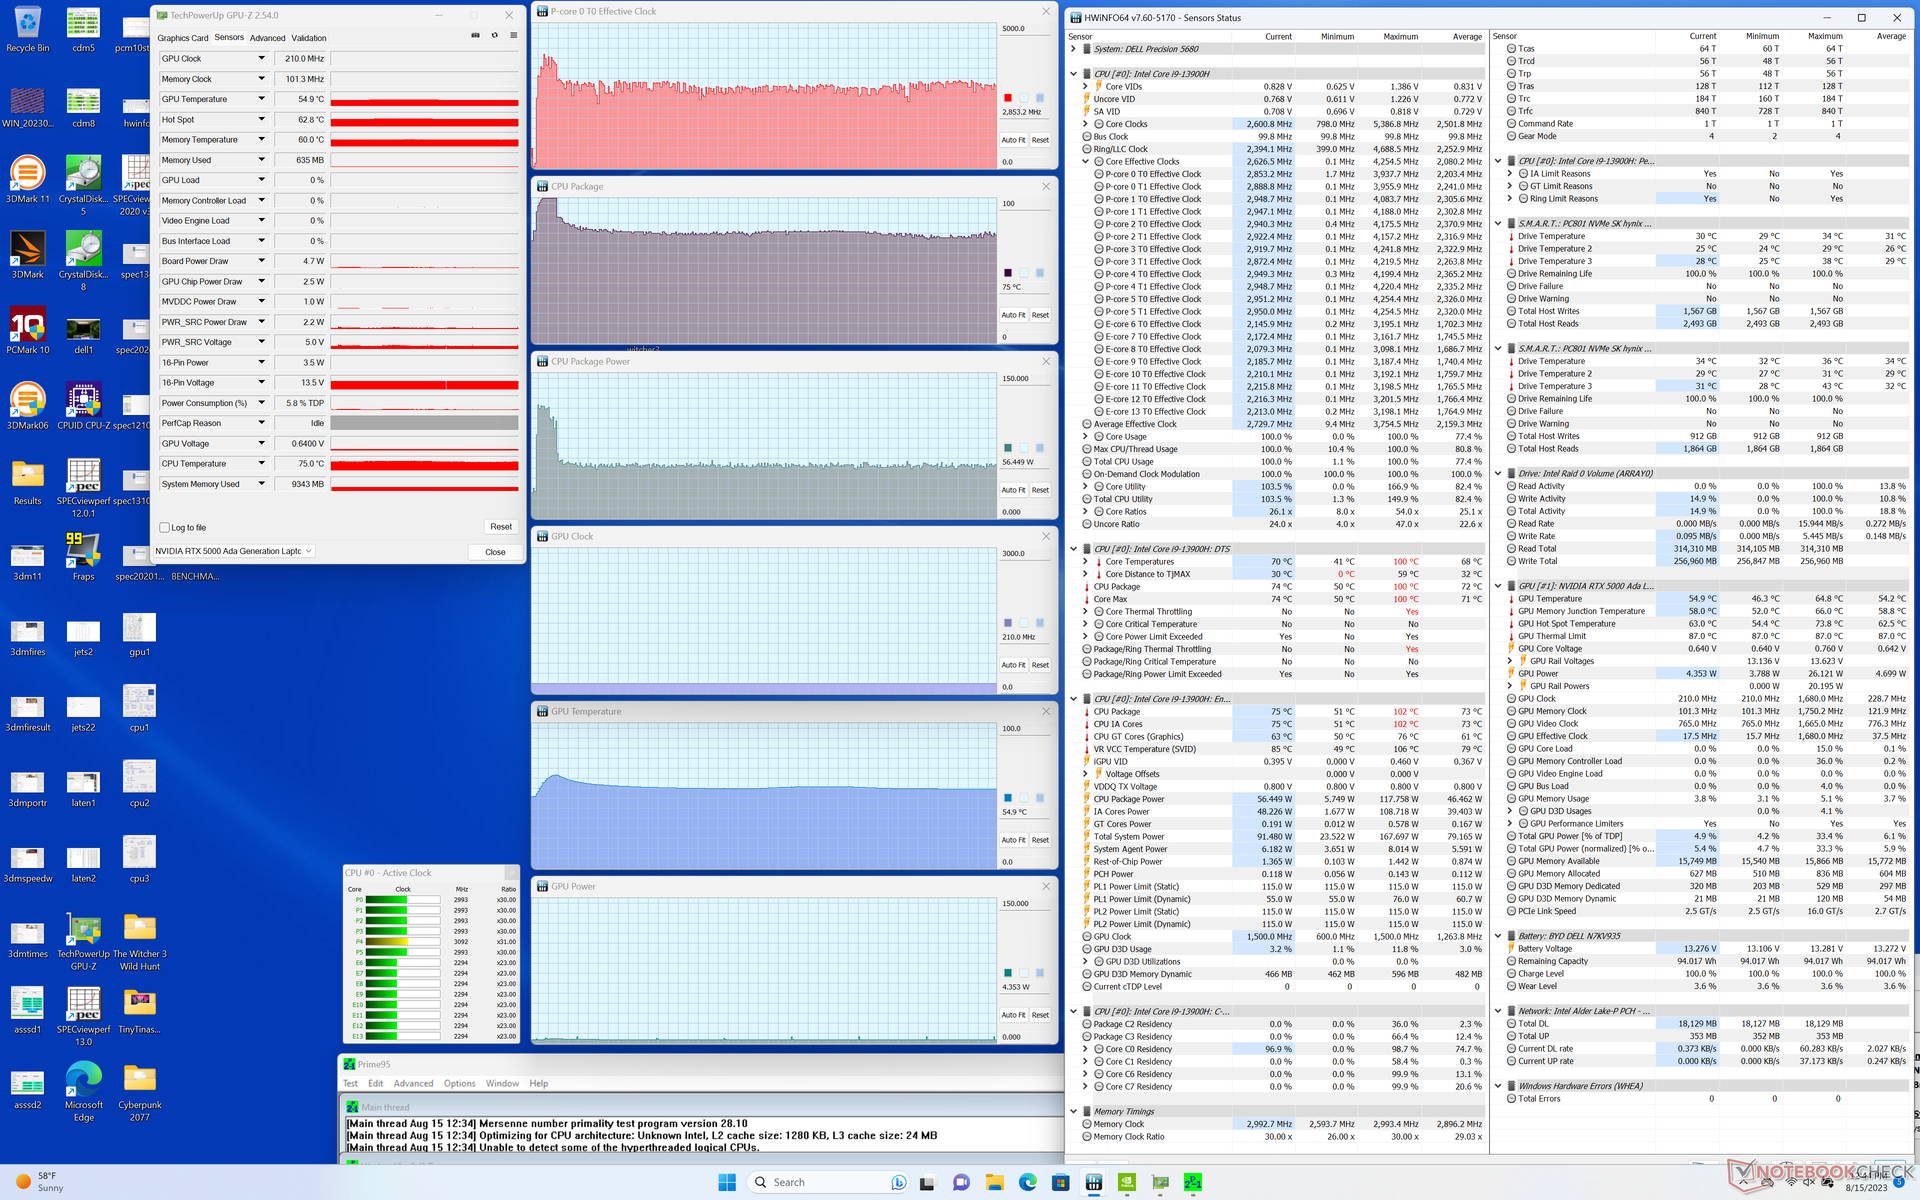
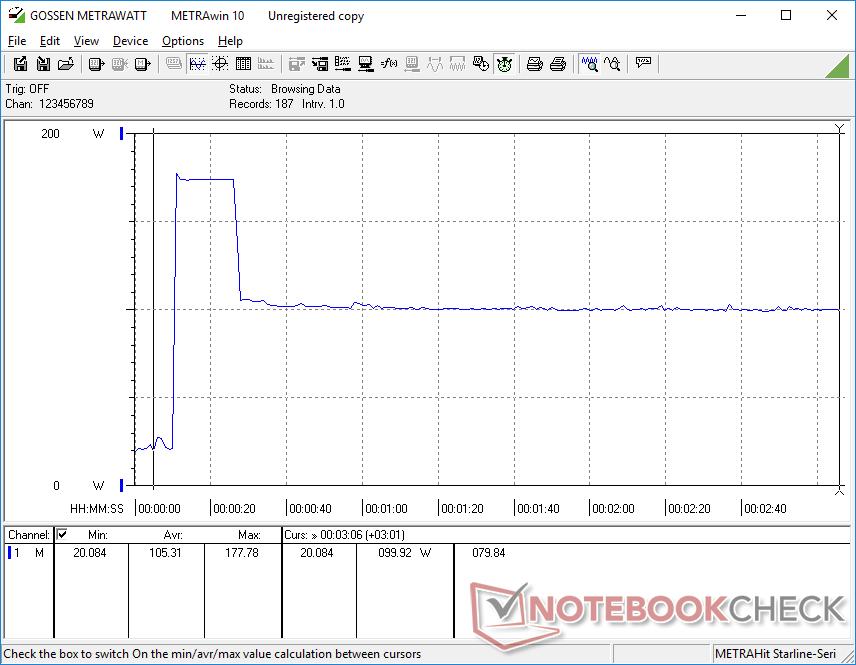
Stress test
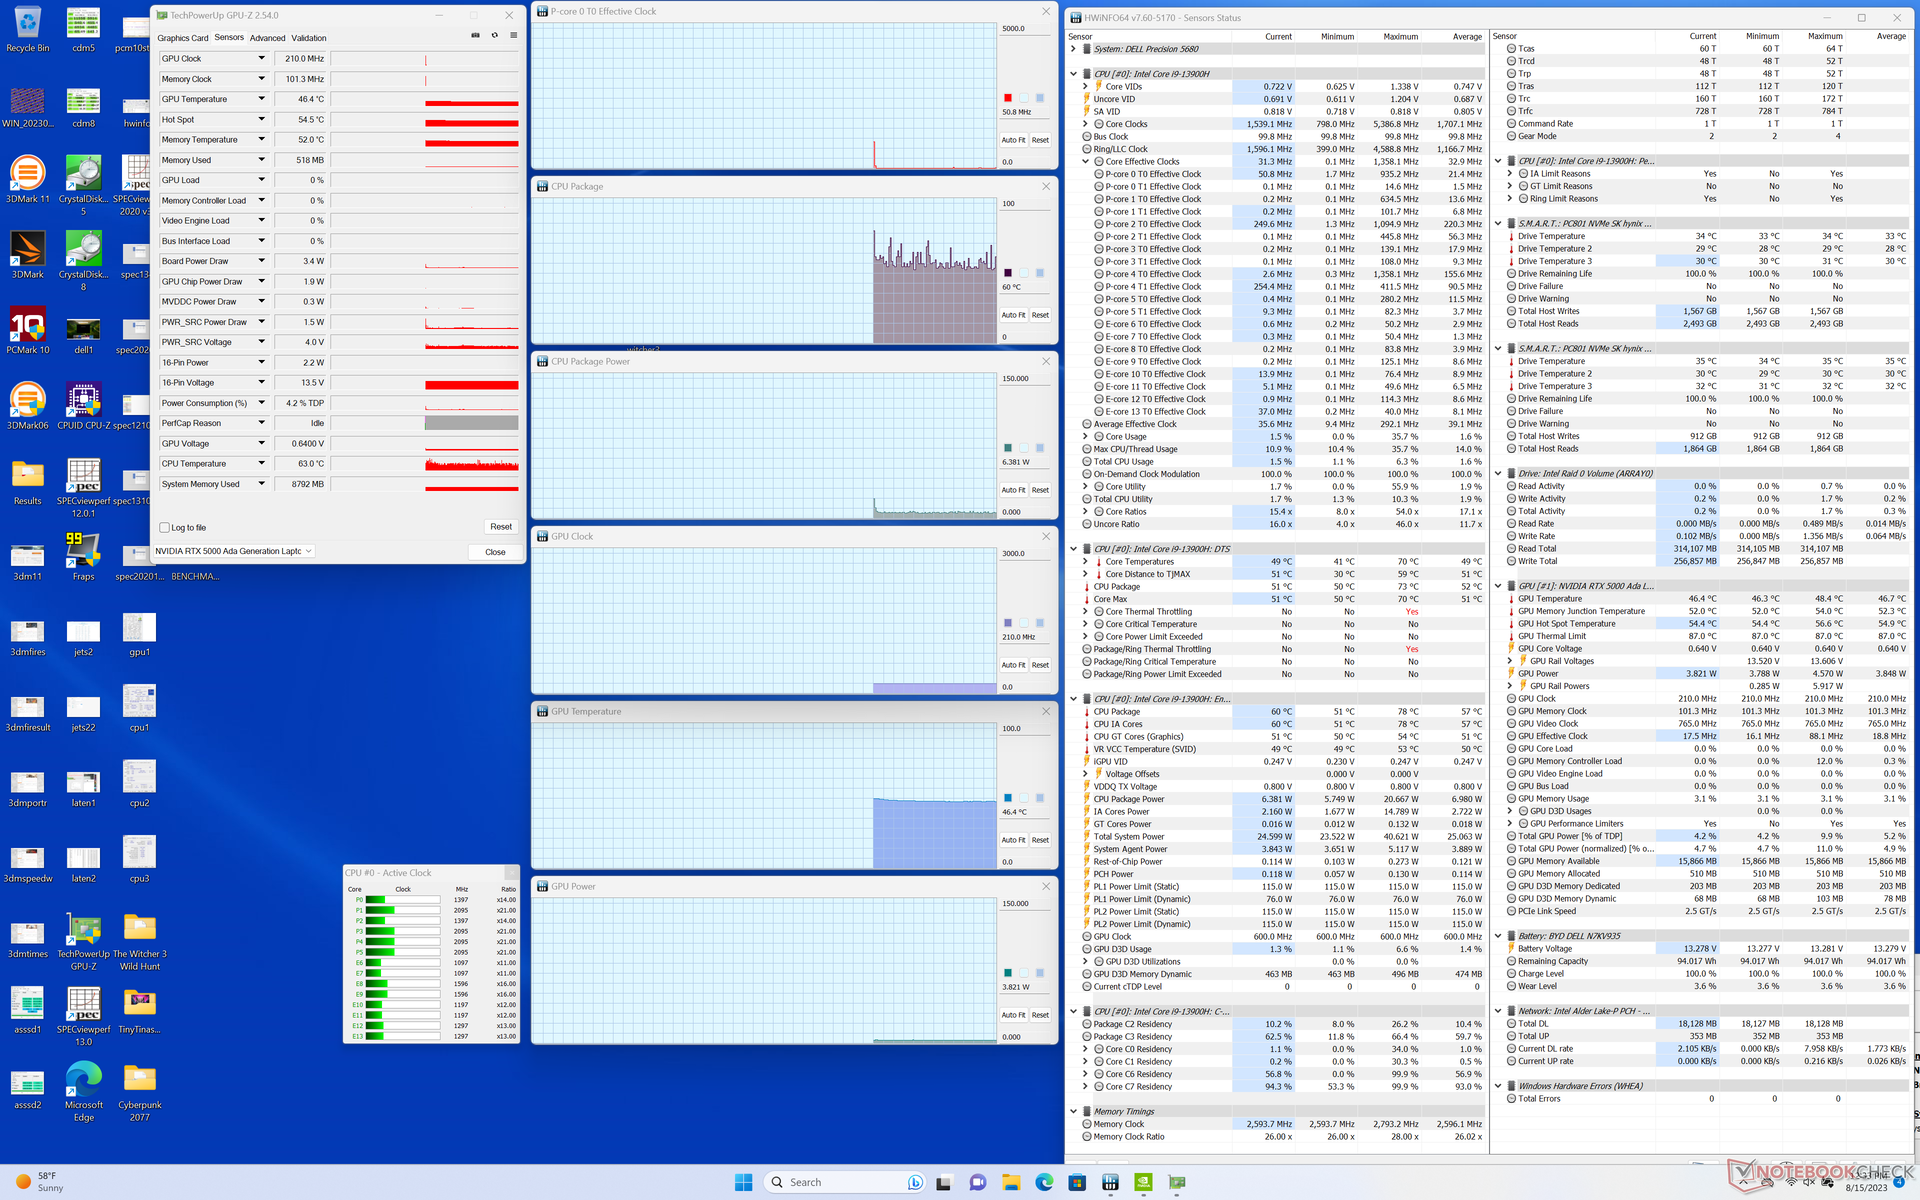
Quando si esegue lo stress Prime95, la CPU sale a 3,9 GHz, 117 W e 100 C per circa 15 secondi. In seguito, il potenziale del Turbo Boost è sceso e si è stabilizzato a circa 2,8 GHz e 56 W per una temperatura del core più ragionevole di 75 C. Il Turbo Boost massimo non è quindi sostenibile su Precision 5680 anche quando è impostato sulla modalità Performance.
L'utilizzo della modalità Balanced invece della modalità Performance non ha un impatto negativo sulle prestazioni della GPU, come già detto. Il clock della GPU, la temperatura e l'assorbimento di energia quando si utilizza la modalità Performance Witcher 3 in modalità Performance si stabilizzano rispettivamente a 1560 MHz, 72 C e 63 W, rispetto a 1665 MHz, 65 C e 69 W in modalità Balanced. La differenza maggiore tra le modalità Balanced e Performance sembra essere la temperatura della CPU, che può raggiungere i 100+ C in modalità Performance per un potenziale Turbo Boost più elevato, rispetto ai soli ~80 C in modalità Balanced.
Si noti che siamo riusciti a raggiungere un assorbimento massimo della scheda GPU di 75 W, anche se il TGP target è di 95 W secondo il pannello di controllo Nvidia.
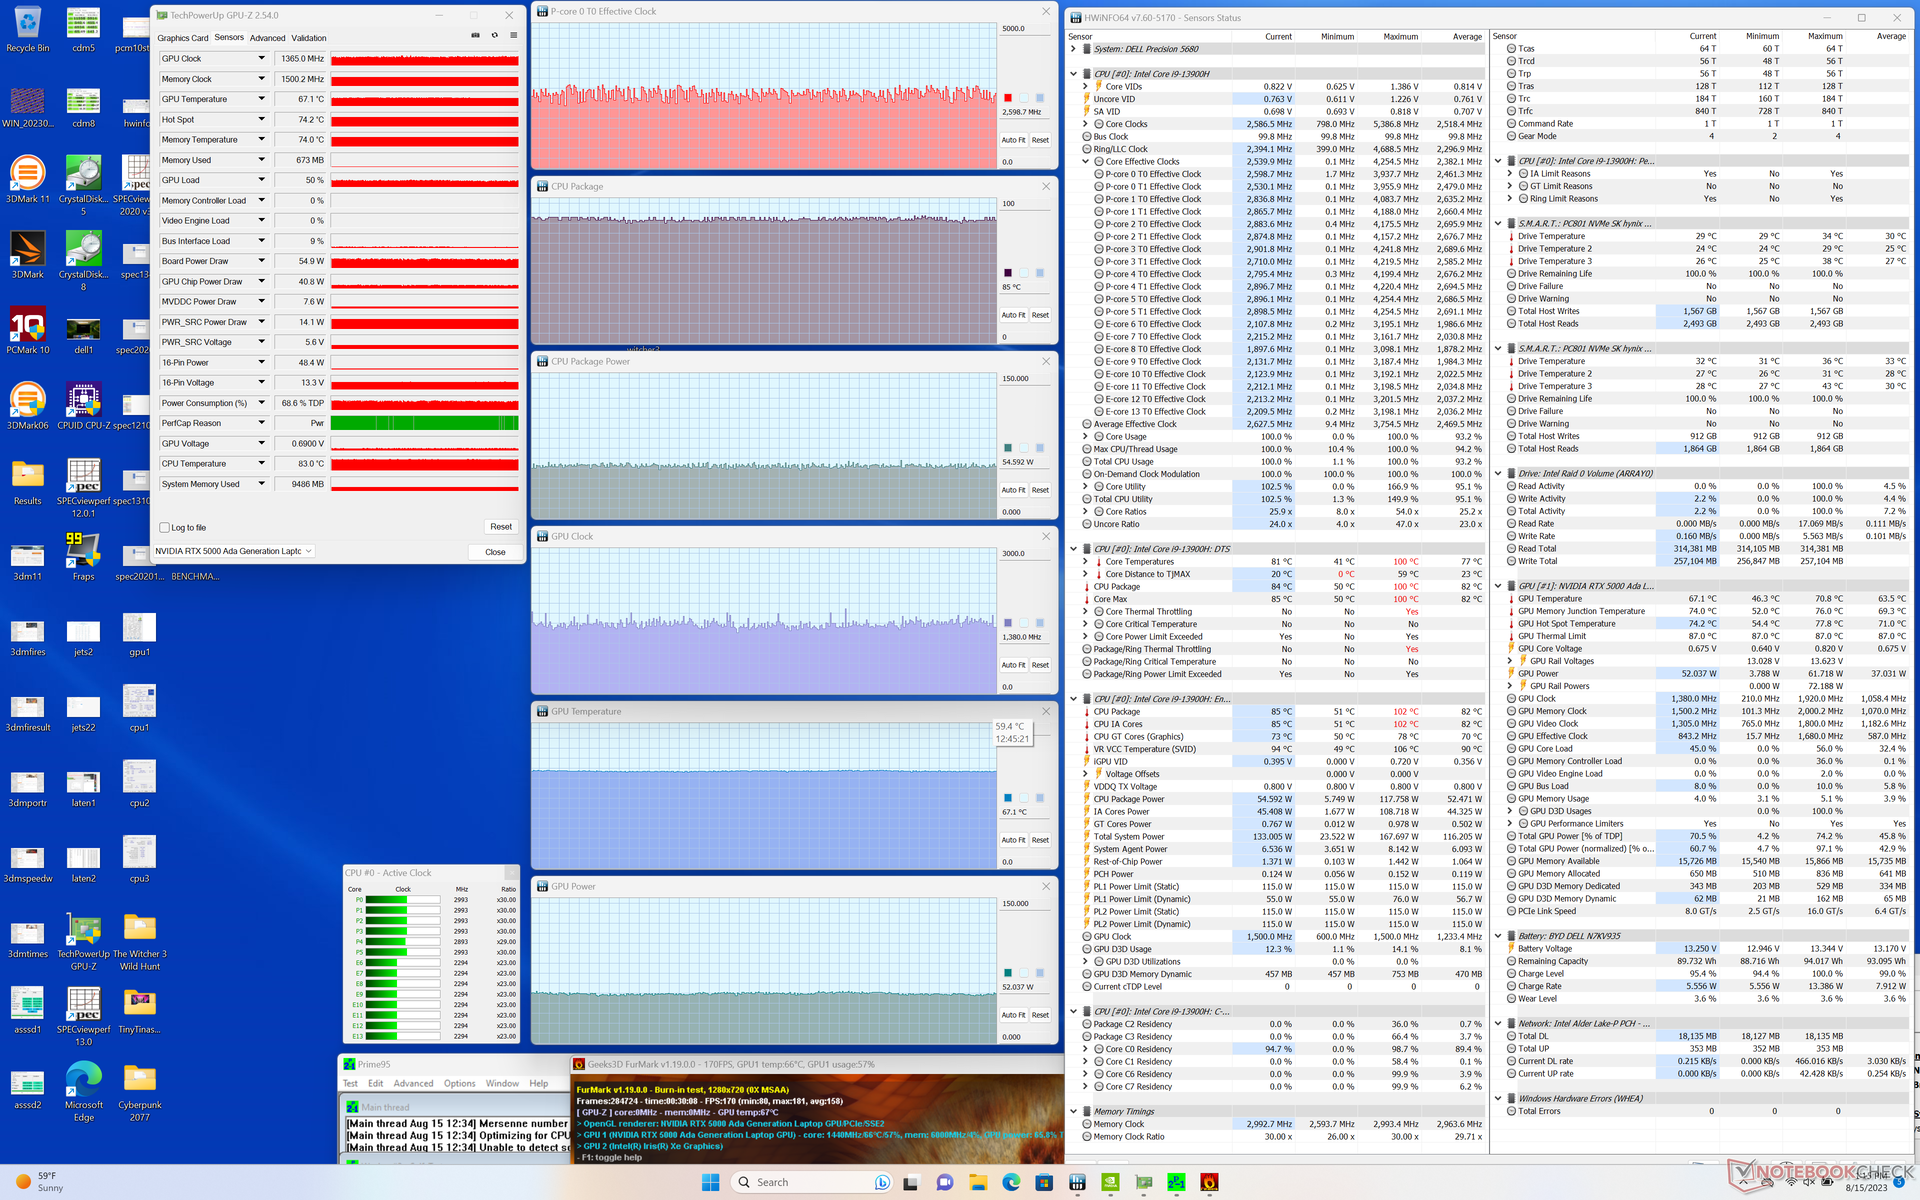
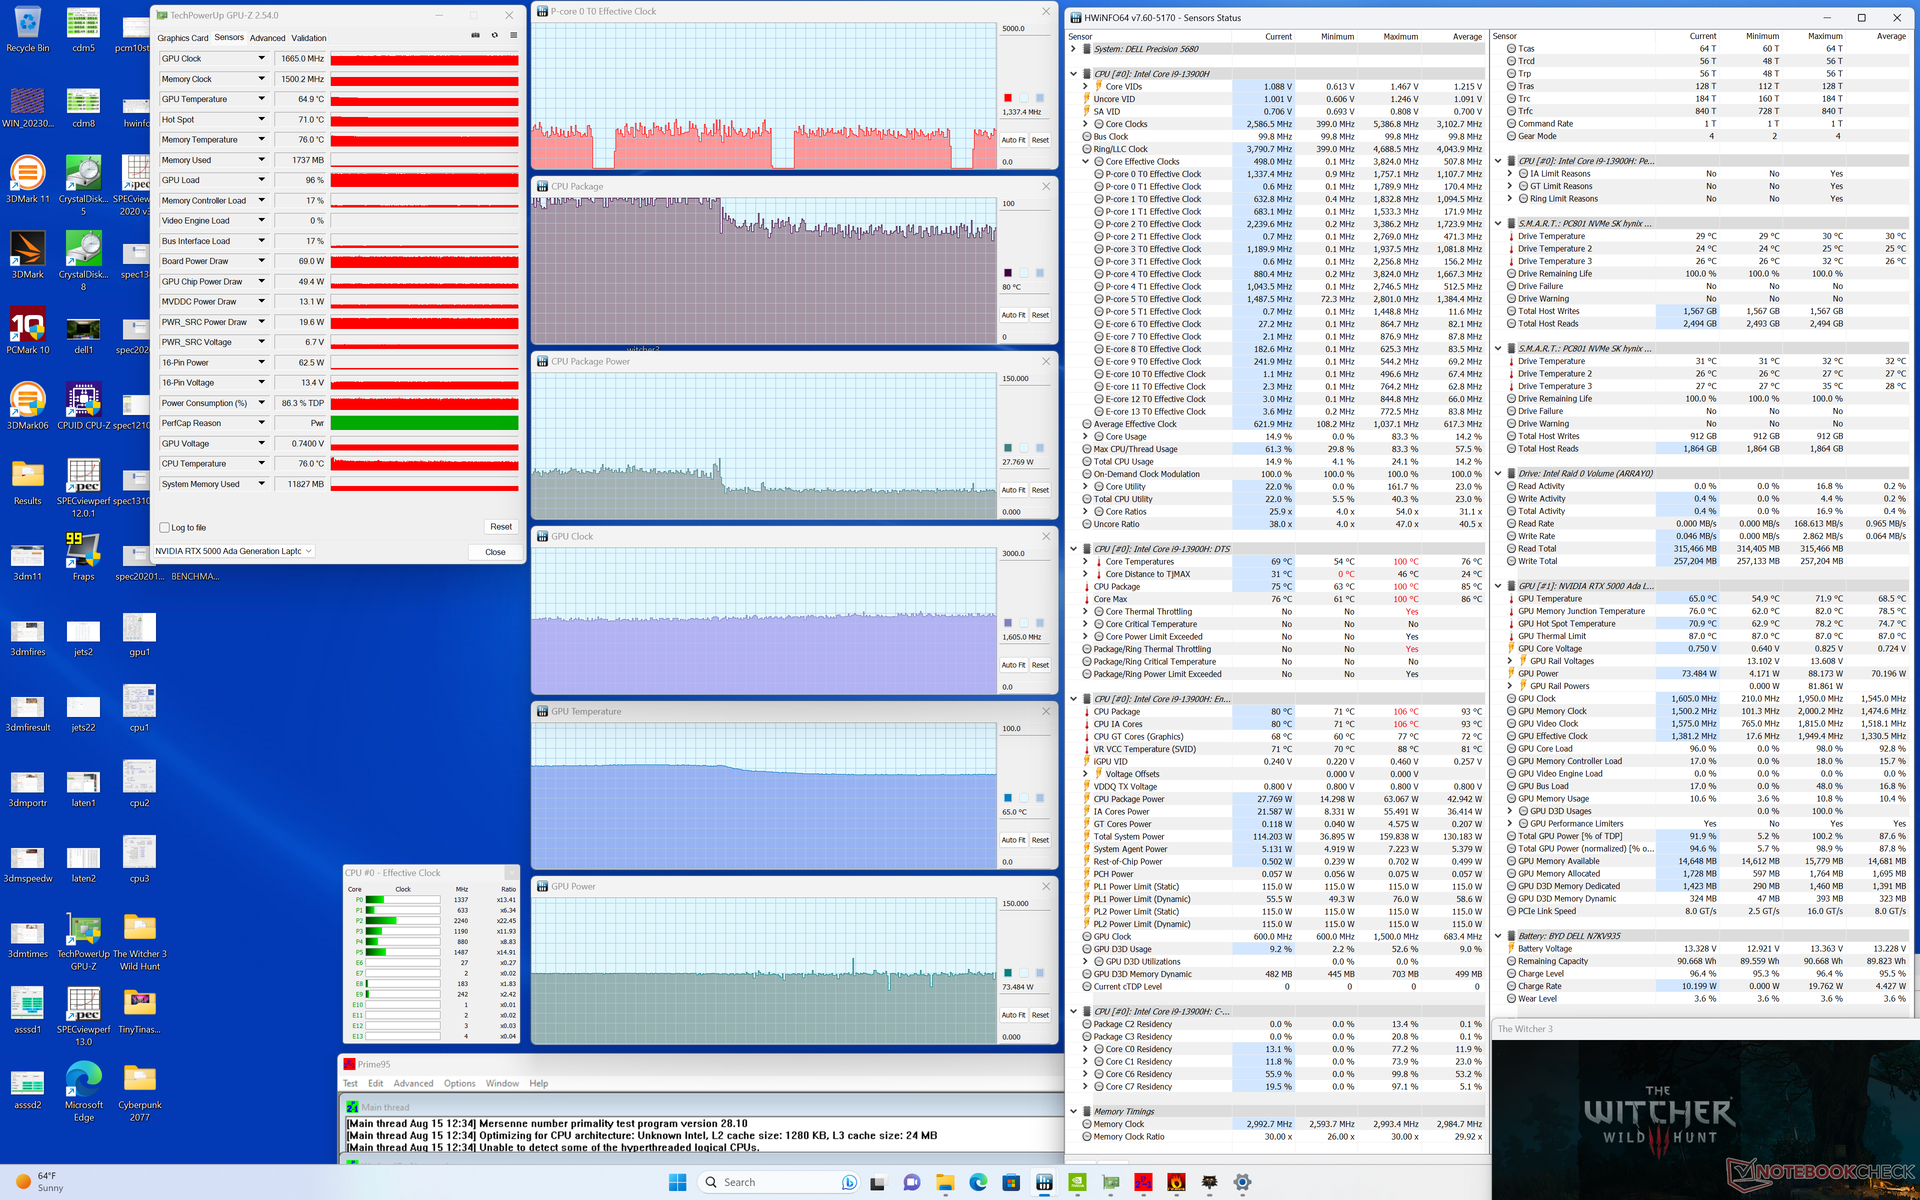
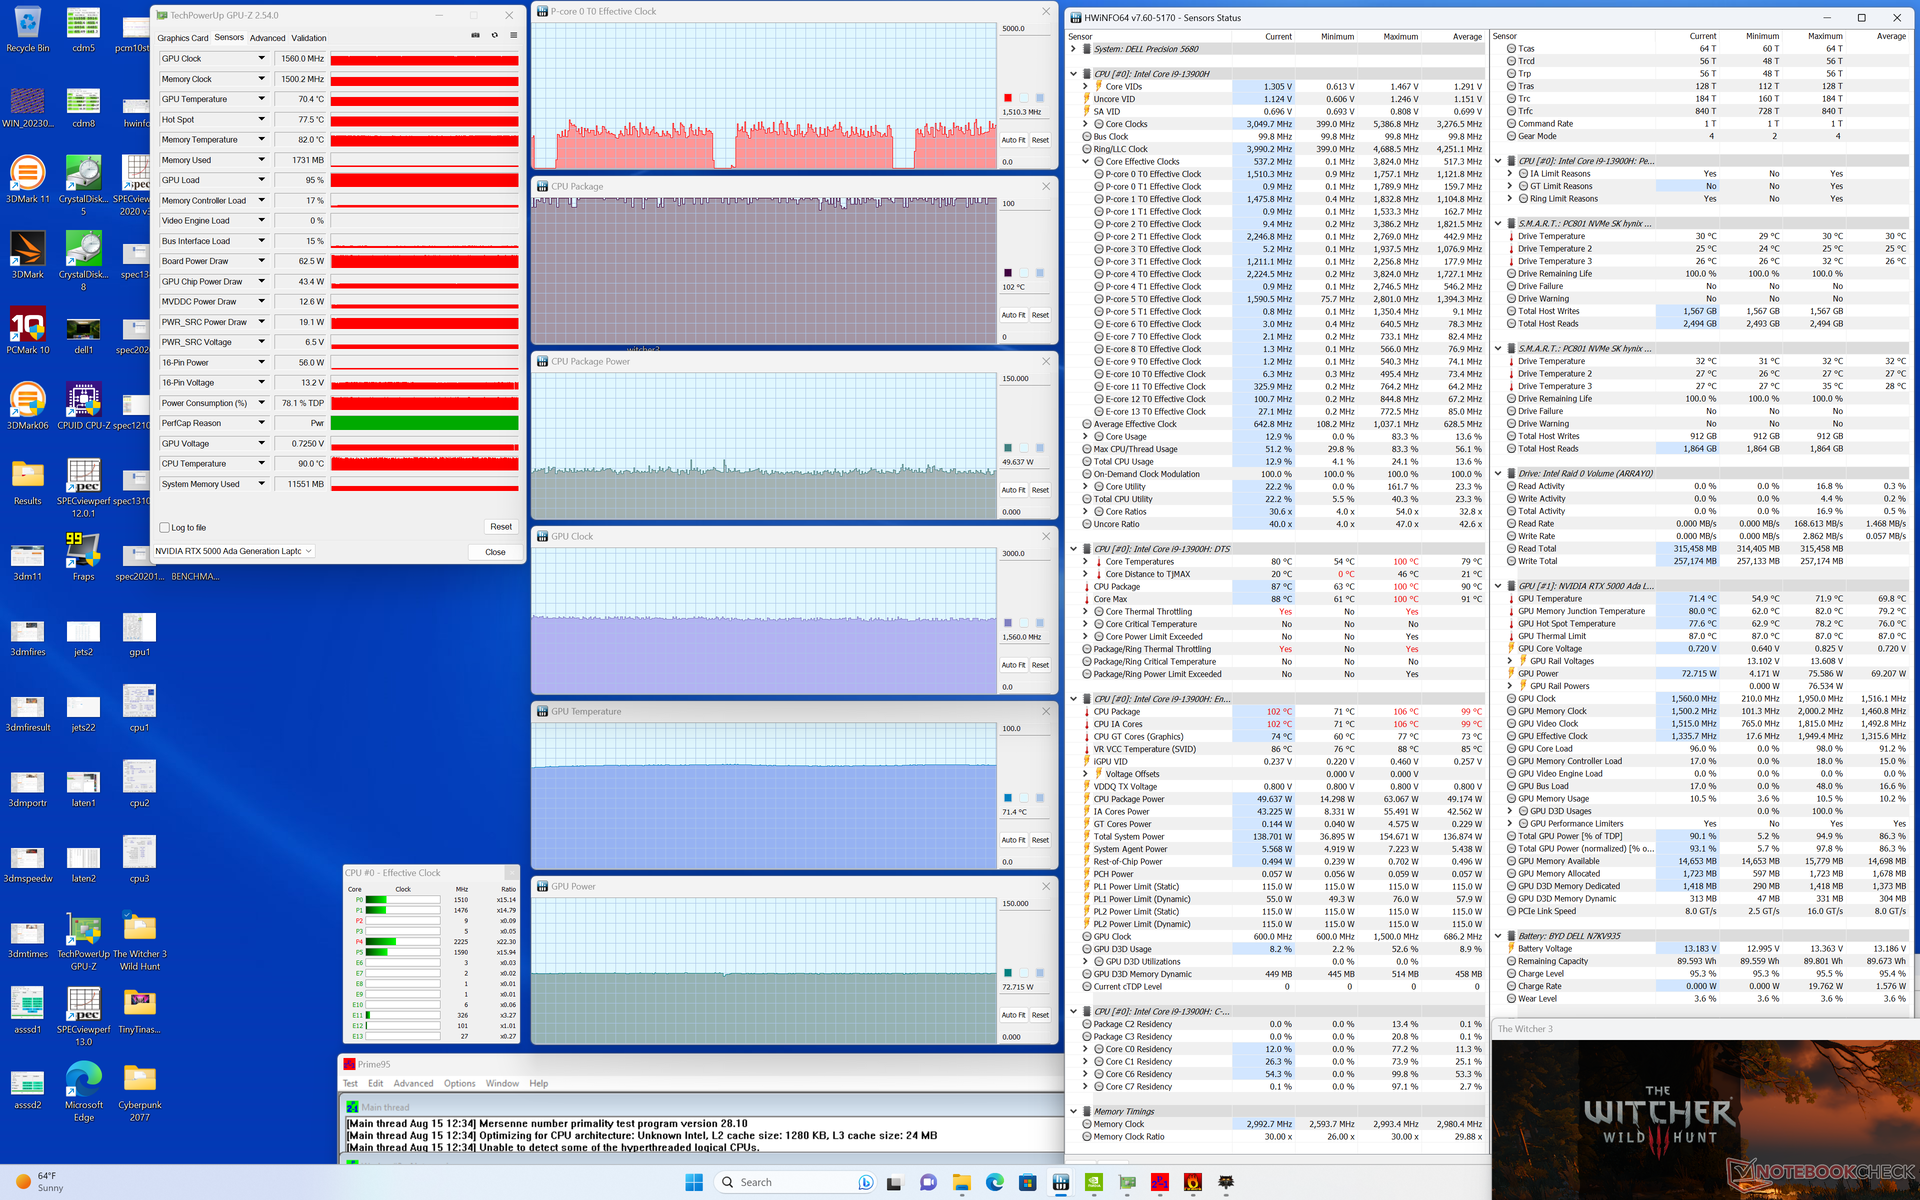
| Clock della CPU (GHz) | Clock della GPU (MHz) | Temperatura media della CPU (°C) | Temperatura media della GPU (°C) | |
| Sistema inattivo | -- | -- | 60 | 46 |
| Stress Prime95 | ~2,8 | -- | 75 | 55 |
| StressPrime95 + FurMark | ~2,6 | 1365 | 85 | 67 |
| Witcher 3 Stress (modalità Performance) | ~1,5 | 1560 | 100 | 72 |
| Witcher 3 Stress (modalità bilanciata) | ~1,3 | 1665 | 80 | 65 |
Altoparlanti
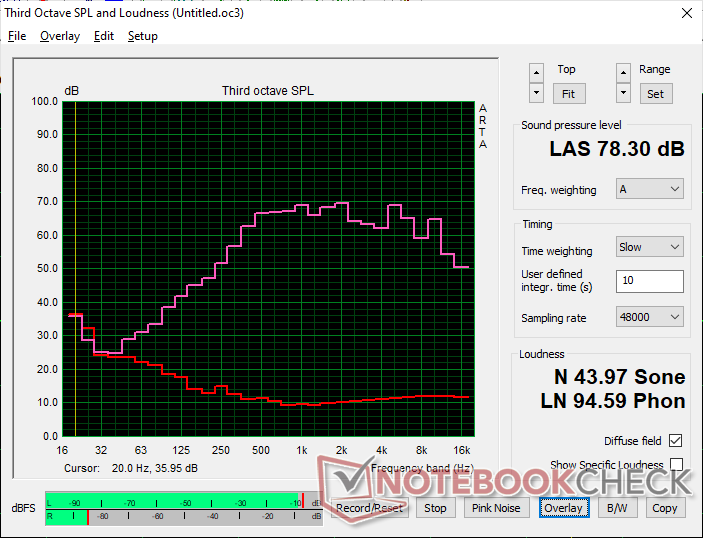
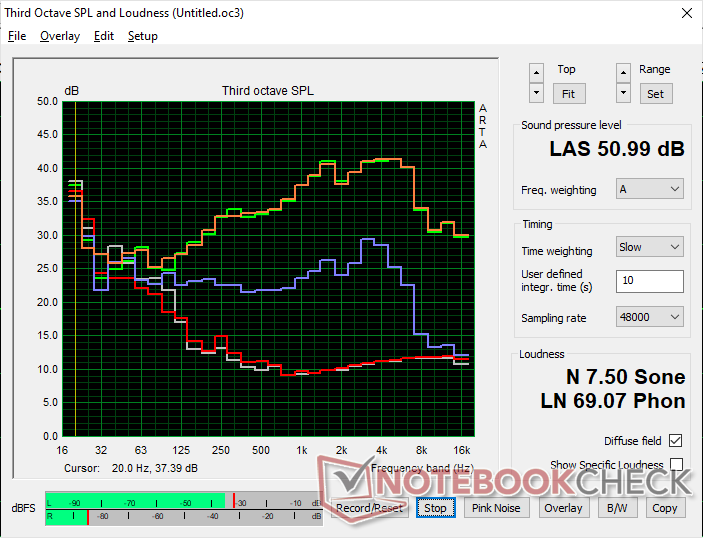
Dell Precision 5000 5680 analisi audio
(±) | potenza degli altiparlanti media ma buona (78.3 dB)
Bassi 100 - 315 Hz
(-) | quasi nessun basso - in media 16.4% inferiori alla media
(±) | la linearità dei bassi è media (7.5% delta rispetto alla precedente frequenza)
Medi 400 - 2000 Hz
(+) | medi bilanciati - solo only 3.9% rispetto alla media
(+) | medi lineari (4.5% delta rispetto alla precedente frequenza)
Alti 2 - 16 kHz
(+) | Alti bilanciati - appena 2.2% dalla media
(±) | la linearità degli alti è media (8.3% delta rispetto alla precedente frequenza)
Nel complesso 100 - 16.000 Hz
(±) | la linearità complessiva del suono è media (15.5% di differenza rispetto alla media
Rispetto alla stessa classe
» 35% di tutti i dispositivi testati in questa classe è stato migliore, 10% simile, 55% peggiore
» Il migliore ha avuto un delta di 7%, medio di 17%, peggiore di 35%
Rispetto a tutti i dispositivi testati
» 23% di tutti i dispositivi testati in questa classe è stato migliore, 4% similare, 73% peggiore
» Il migliore ha avuto un delta di 4%, medio di 24%, peggiore di 134%
Apple MacBook Pro 16 2021 M1 Pro analisi audio
(+) | gli altoparlanti sono relativamente potenti (84.7 dB)
Bassi 100 - 315 Hz
(+) | bassi buoni - solo 3.8% dalla media
(+) | bassi in lineaa (5.2% delta rispetto alla precedente frequenza)
Medi 400 - 2000 Hz
(+) | medi bilanciati - solo only 1.3% rispetto alla media
(+) | medi lineari (2.1% delta rispetto alla precedente frequenza)
Alti 2 - 16 kHz
(+) | Alti bilanciati - appena 1.9% dalla media
(+) | alti lineari (2.7% delta rispetto alla precedente frequenza)
Nel complesso 100 - 16.000 Hz
(+) | suono nel complesso lineare (4.6% differenza dalla media)
Rispetto alla stessa classe
» 0% di tutti i dispositivi testati in questa classe è stato migliore, 0% simile, 100% peggiore
» Il migliore ha avuto un delta di 5%, medio di 17%, peggiore di 45%
Rispetto a tutti i dispositivi testati
» 0% di tutti i dispositivi testati in questa classe è stato migliore, 0% similare, 100% peggiore
» Il migliore ha avuto un delta di 4%, medio di 24%, peggiore di 134%
Gestione dell'energia - Ada Lovelace brilla
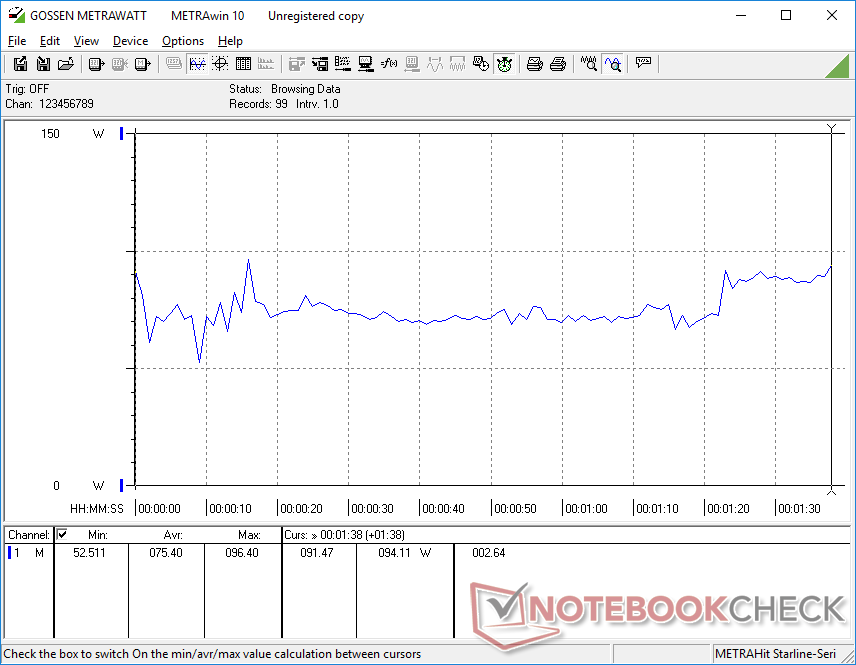
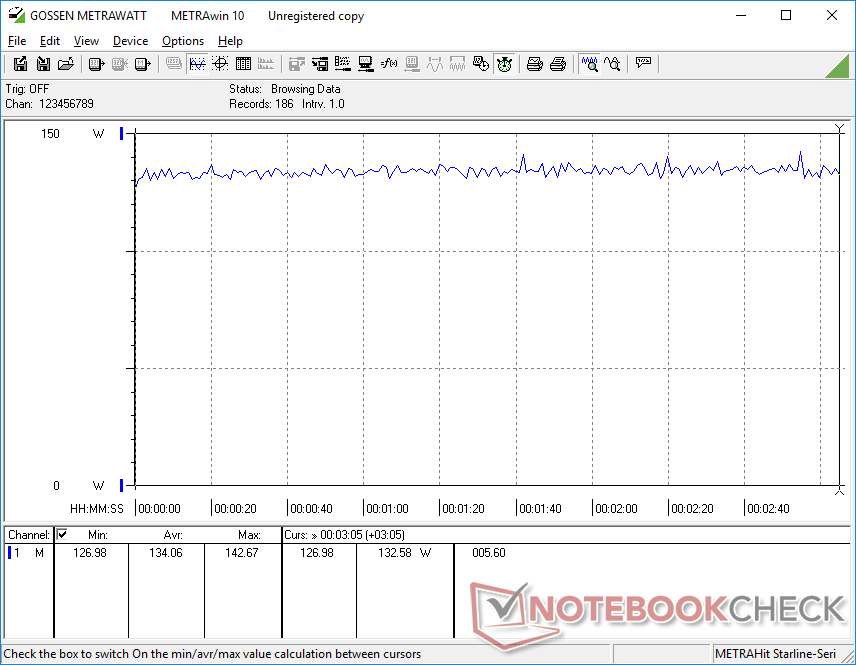
Consumo di energia
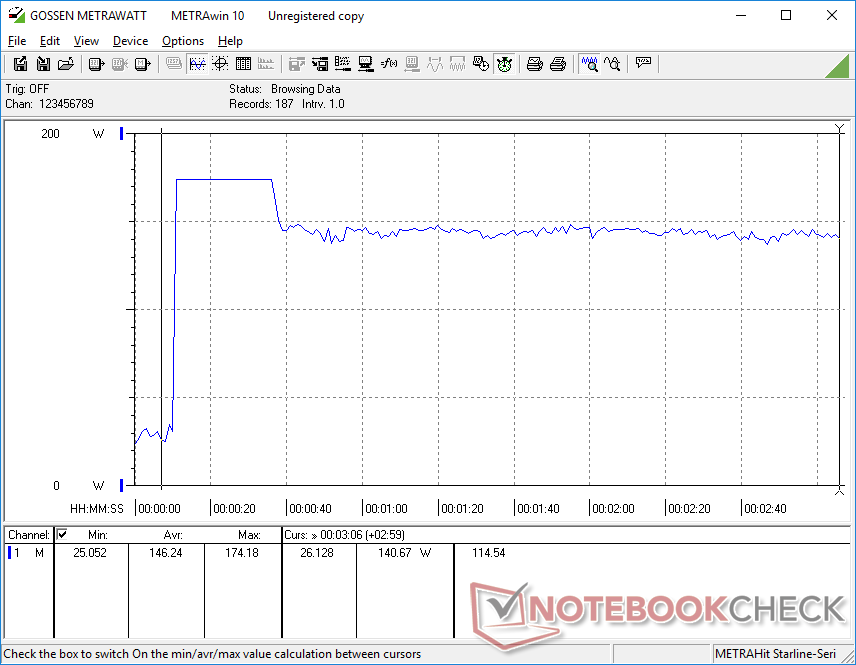
Le prestazioni per watt sono nettamente superiori a quelle della maggior parte delle altre workstation, poiché il nostro Precision utilizza una GPU Ada Lovelace di ultima generazione. L'esecuzione Witcher 3ad esempio, consumerebbe solo 134 W sul nostro sistema, rispetto ai 159 W e ai 189 W del modello 7670 Precision 7670 Performance e HP ZBook Fury 16 G9, rispettivamente, anche se la nostra GPU RTX 5000 supererebbe le loro GPU RTX A5500, come notato in precedenza.
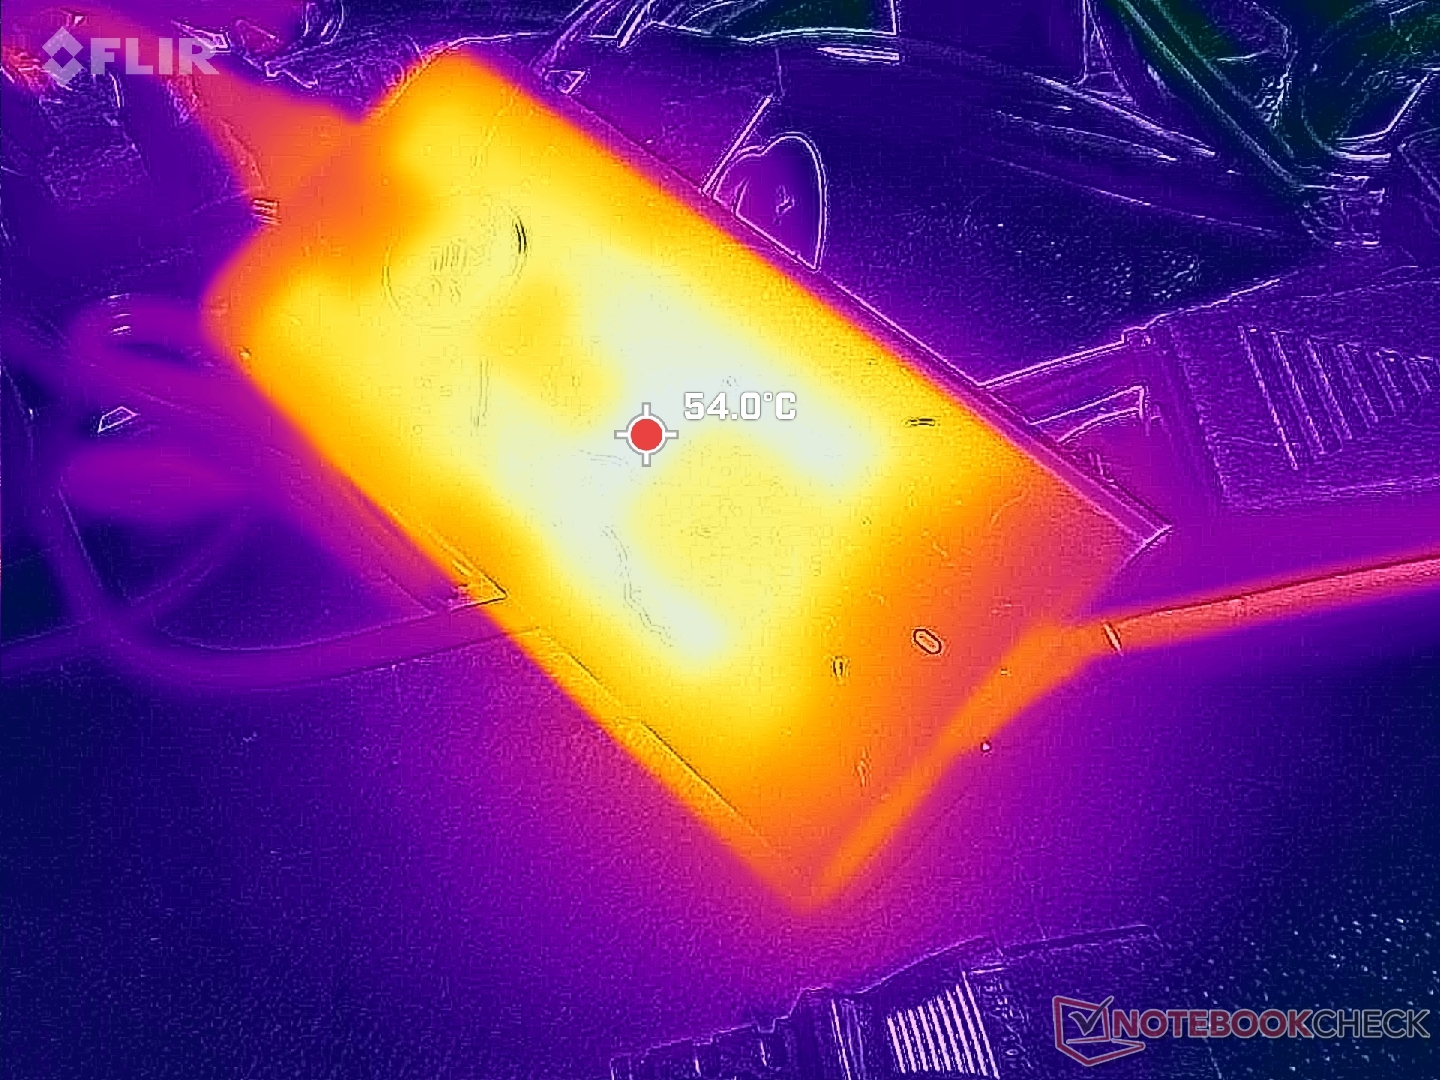
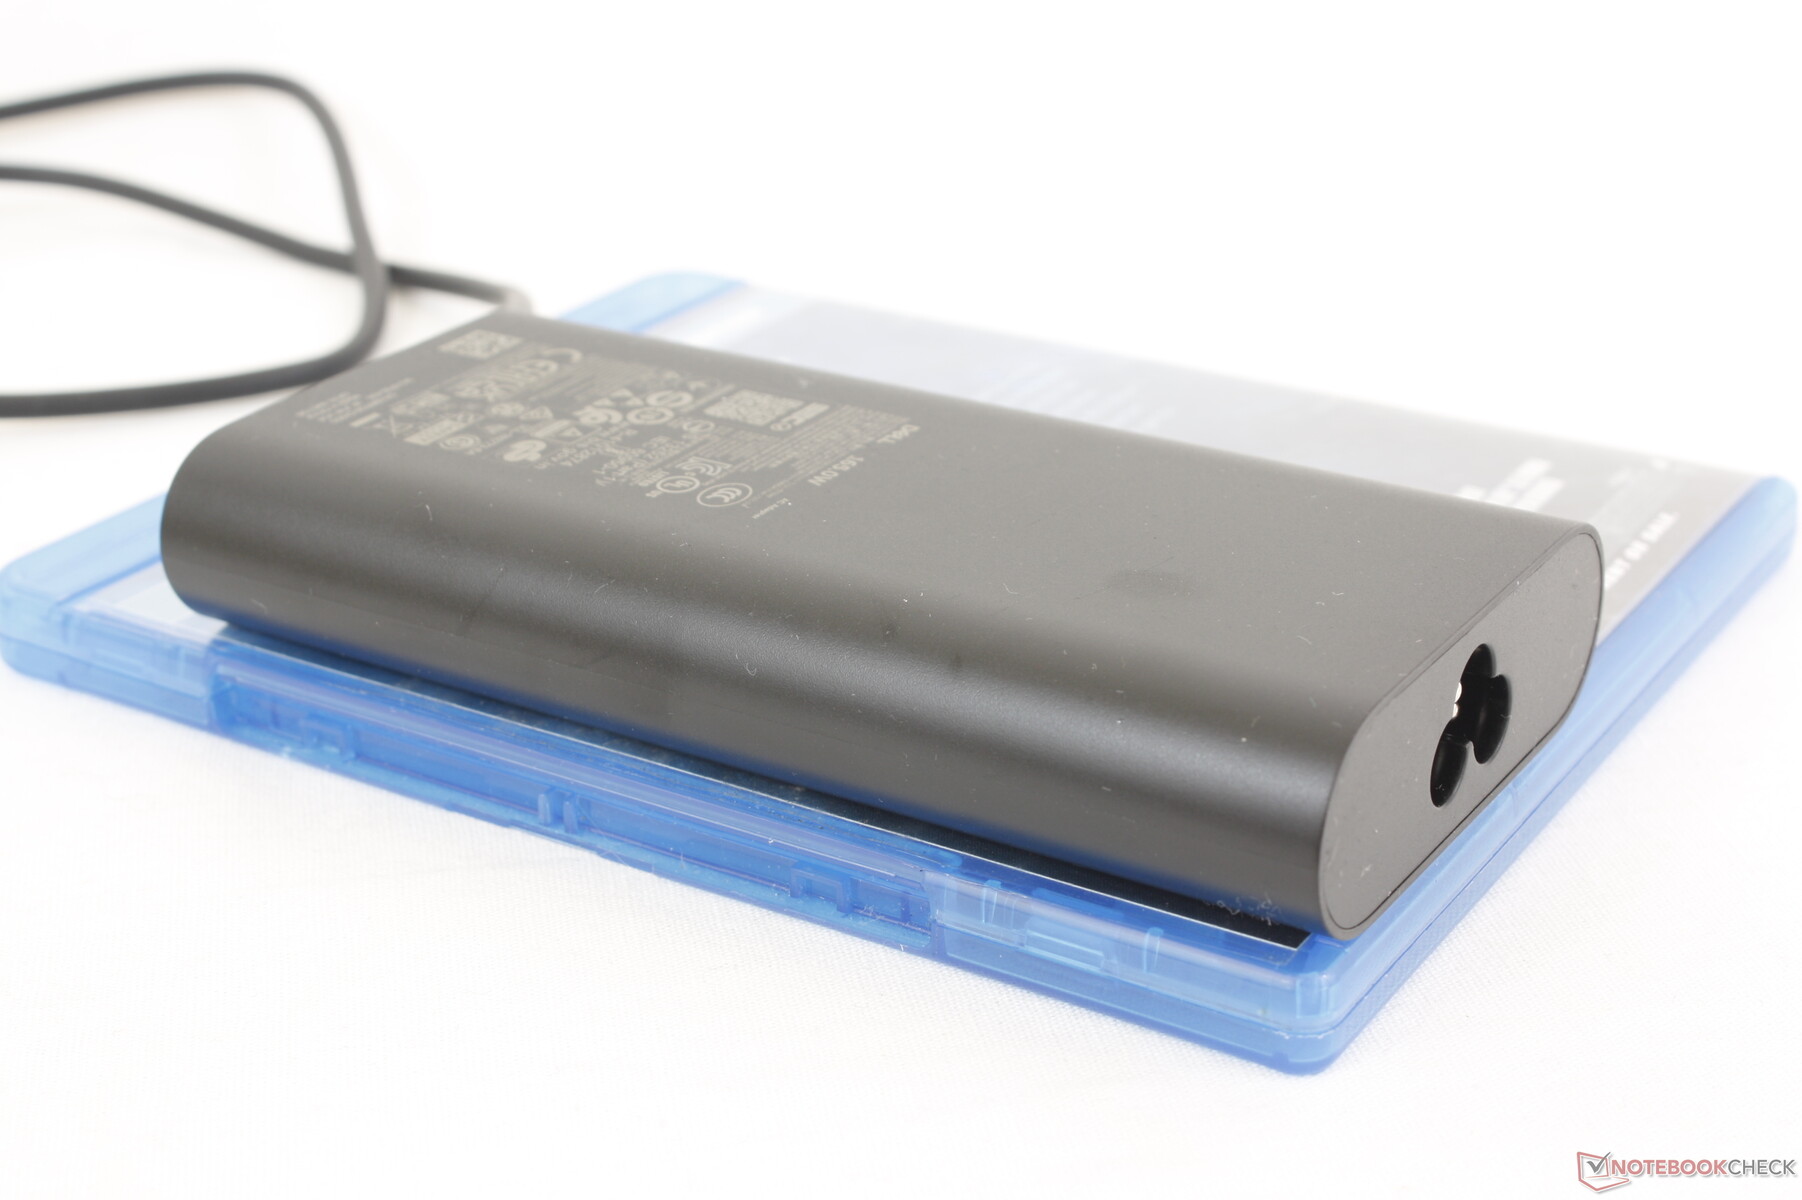
Anche l'adattatore CA USB-C da 165 W, relativamente piccolo (~13,5 x 6,5 x 2,2 cm), merita una menzione per la sua elevata potenza. La maggior parte degli adattatori USB-C esistenti si limita a una potenza compresa tra 100 e 140 W, il che rende il nostro adattatore da 165 W uno dei più versatili. Questo nuovo adattatore risolve direttamente i problemi di ricarica della batteria che abbiamo riscontrato sul vecchio modello Precision 7000, che veniva fornito con un adattatore USB-C da 130 W meno performante.
| Off / Standby | |
| Idle | |
| Sotto carico |
|
Leggenda:
min: | |
| Dell Precision 5000 5680 i9-13900H, RTX 5000 Ada Generation Laptop, 2x SK hynix PC801 HFS512GEJ9X101N RAID 0, OLED, 3840x2400, 16" | Dell Precision 7000 7670 Performance i9-12950HX, RTX A5500 Laptop GPU, , OLED, 3840x2400, 16" | HP ZBook Fury 16 G9 i9-12950HX, RTX A5500 Laptop GPU, Micron 3400 1TB MTFDKBA1T0TFH, IPS, 3840x2400, 16" | Lenovo ThinkPad P16 G1 RTX A5500 i9-12950HX, RTX A5500 Laptop GPU, WDC PC SN810 2TB, IPS, 3840x2400, 16" | MSI CreatorPro Z16P B12UKST i7-12700H, RTX A3000 Laptop GPU, Samsung PM9A1 MZVL21T0HCLR, IPS, 2560x1600, 16" | Asus ExpertBook B6 Flip B6602FC2 i9-12950HX, RTX A2000 Laptop GPU, Samsung PM9A1 MZVL21T0HCLR, IPS, 2560x1600, 16" | |
|---|---|---|---|---|---|---|
| Power Consumption | -99% | -86% | -53% | -18% | -35% | |
| Idle Minimum * (Watt) | 8 | 16.4 -105% | 19.5 -144% | 7.5 6% | 10.8 -35% | 10.5 -31% |
| Idle Average * (Watt) | 10.4 | 35.9 -245% | 29 -179% | 20.1 -93% | 16.3 -57% | 11.9 -14% |
| Idle Maximum * (Watt) | 30.5 | 47 -54% | 40.7 -33% | 40 -31% | 16.9 45% | 18 41% |
| Load Average * (Watt) | 75.4 | 147.1 -95% | 142.1 -88% | 137 -82% | 111.7 -48% | 182 -141% |
| Witcher 3 ultra * (Watt) | 134 | 158.8 -19% | 188.6 -41% | 208 -55% | 152.1 -14% | 177.5 -32% |
| Load Maximum * (Watt) | 175 | 311 -78% | 224.4 -28% | 285.9 -63% | 177.4 -1% | 229 -31% |
* ... Meglio usare valori piccoli
Power Consumption Witcher 3 / Stresstest
Power Consumption external Monitor
Durata della batteria
La durata della batteria è eccellente, considerando le prestazioni elevate e l'esigente pannello OLED 4K. Siamo riusciti a registrare quasi 10 ore di navigazione WLAN in condizioni reali con il profilo Bilanciato e l'iGPU attiva, rispetto a quasi la metà di alternative come il Lenovo ThinkPad P16 G1 o l'MSI CreatorPro Z16P.MSI CreatorPro Z16P.
La ricarica da vuoto a pieno regime richiede circa 2 ore con l'adattatore CA da 165 W in dotazione. Anche il nostro adattatore USB-C di terze parti da 65 W è in grado di ricaricare il sistema, anche se a un ritmo più lento.
| Dell Precision 5000 5680 i9-13900H, RTX 5000 Ada Generation Laptop, 98 Wh | Dell Precision 7000 7670 Performance i9-12950HX, RTX A5500 Laptop GPU, 93 Wh | HP ZBook Fury 16 G9 i9-12950HX, RTX A5500 Laptop GPU, 95 Wh | Lenovo ThinkPad P16 G1 RTX A5500 i9-12950HX, RTX A5500 Laptop GPU, 94 Wh | MSI CreatorPro Z16P B12UKST i7-12700H, RTX A3000 Laptop GPU, 90 Wh | Asus ExpertBook B6 Flip B6602FC2 i9-12950HX, RTX A2000 Laptop GPU, 90 Wh | |
|---|---|---|---|---|---|---|
| Autonomia della batteria | -53% | -46% | -41% | -41% | -14% | |
| Reader / Idle (h) | 17.9 | 5.3 -70% | 12.5 -30% | |||
| WiFi v1.3 (h) | 9.9 | 4.7 -53% | 6 -39% | 5.8 -41% | 5.8 -41% | 8.7 -12% |
| Load (h) | 1.7 | 1.2 -29% | 1.7 0% | |||
| H.264 (h) | 5.8 |
Pro
Contro
Verdetto - Più potente di quanto sembri
Il modello Precision 5680 è, in poche parole, una delle workstation mobili più snelle e veloci dell'intera gamma Dell. Il design portatile, l'adattatore USB-C da 165 W, l'eccellente display OLED 4K e la potente GPU RTX 5000 sono le caratteristiche più importanti del modello. Quest'ultima, in particolare, è responsabile di gran parte dei vantaggi in termini di prestazioni e di durata della batteria rispetto alla maggior parte delle altre workstation, grazie alla sua architettura Ada Lovelace e alle elevatissime prestazioni per watt.
Precision 5680 offre alcune delle più alte prestazioni per watt nella crescente categoria delle workstation sottili e leggere.
Gli utenti di workstation più esigenti potrebbero ancora preferire modelli più grandi e spessi come lo HP ZBook Fury 16 o Precision 7670 poiché il design sottile di Precision 5680 rinuncia ad alcune caratteristiche chiave come la RAM espandibile, la WAN, la RAM ECC e le opzioni di porte più ampie. Il suo terribile clickpad non è altrettanto preciso quanto i touchpad dei modelli HP o Lenovo ThinkPad P16 Lenovo ThinkPad P16 che dispongono di veri e propri pulsanti del mouse per un controllo migliore.
Prezzo e disponibilità
Dell distribuisce ora il modello Precision 5680 a partire da 2490 dollari fino a oltre 6500 dollari, come da recensione.
Dell Precision 5000 5680
- 08/18/2023 v7 (old)
Allen Ngo
Transparency
La selezione dei dispositivi da recensire viene effettuata dalla nostra redazione. Il campione di prova è stato fornito all'autore come prestito dal produttore o dal rivenditore ai fini di questa recensione. L'istituto di credito non ha avuto alcuna influenza su questa recensione, né il produttore ne ha ricevuto una copia prima della pubblicazione. Non vi era alcun obbligo di pubblicare questa recensione. In quanto società mediatica indipendente, Notebookcheck non è soggetta all'autorità di produttori, rivenditori o editori.
Ecco come Notebookcheck esegue i test
Ogni anno, Notebookcheck esamina in modo indipendente centinaia di laptop e smartphone utilizzando procedure standardizzate per garantire che tutti i risultati siano comparabili. Da circa 20 anni sviluppiamo continuamente i nostri metodi di prova e nel frattempo stabiliamo gli standard di settore. Nei nostri laboratori di prova, tecnici ed editori esperti utilizzano apparecchiature di misurazione di alta qualità. Questi test comportano un processo di validazione in più fasi. Il nostro complesso sistema di valutazione si basa su centinaia di misurazioni e parametri di riferimento ben fondati, che mantengono l'obiettività.Price comparison

