Recensione della workstation Lenovo ThinkPad P16 G1 RTX A5500: Più veloce del Dell Precision 7670
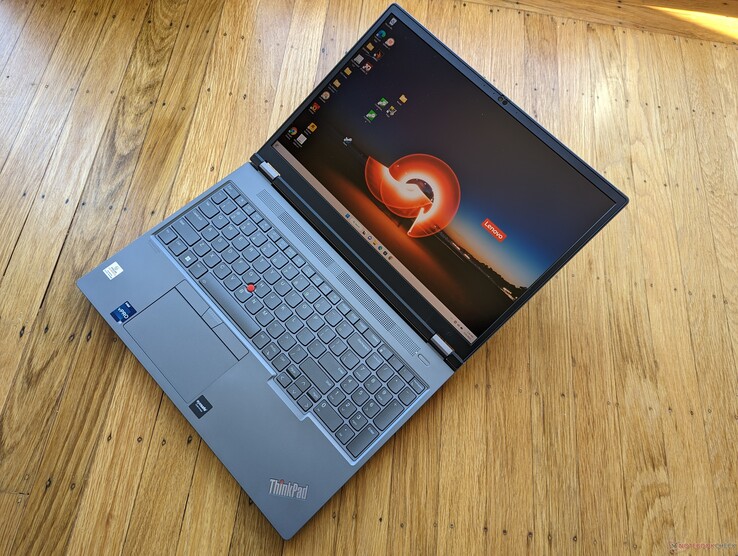
Il ThinkPad P16 G1 è una nuova generazione di workstation ThinkPad da 16 pollici progettata per superare l'attuale serie ThinkPad P1 da 16 pollici Lenovo ThinkPad P1 G4 Laptop Review: BIOS update provides more CPU performance . È dotato di alcune delle CPU e delle GPU per workstation più veloci attualmente disponibili, rispettivamente Core i9-12950HX e RTX A5500, per essere una delle workstation mobili più veloci del mercato. La nostra unità, così come configurata, viene venduta a circa 9000 dollari USA. Naturalmente, sono disponibili anche SKU di fascia inferiore con grafica UHD integrata più lenta o con l'Intel ARC Pro A30M, con prezzi di partenza di 3400 dollari.
Il modello compete direttamente con altre workstation mobili di fascia alta e con alcuni laptop Nvidia Studio come Dell Precision 7670, Asus ProArt StudioBook Pro 16, MSI CreatorPro Z16P, o HP ZBook Studio 16 G9. Consultate la nostra recensione completa della configurazione ThinkPad P16 G1 RTX A2000 per saperne di più sullo chassis e sulle altre caratteristiche fisiche del modello. Questa recensione si concentra su ciò che gli utenti possono aspettarsi dal ThinkPad P16 G1 in termini di prestazioni se si configura con le opzioni di CPU e GPU di fascia alta.
Altre recensioni Lenovo:
Potenziali concorrenti a confronto
Punteggio | Data | Modello | Peso | Altezza | Dimensione | Risoluzione | Prezzo |
|---|---|---|---|---|---|---|---|
| 91 % v7 (old) | 02/2023 | Lenovo ThinkPad P16 G1 RTX A5500 i9-12950HX, RTX A5500 Laptop GPU | 3 kg | 30.23 mm | 16.00" | 3840x2400 | |
v (old) | 12/2021 | Asus ProArt StudioBook 16 W7600H5A-2BL2 W-11955M, RTX A5000 Laptop GPU | 2.4 kg | 21.4 mm | 16.00" | 3840x2400 | |
| 89.1 % v7 (old) | 12/2022 | Dell Precision 7000 7670 Performance i9-12950HX, RTX A5500 Laptop GPU | 2.8 kg | 25.95 mm | 16.00" | 3840x2400 | |
| 88.2 % v7 (old) | 02/2023 | Lenovo ThinkPad P16 G1 21D6001DMB i7-12850HX, RTX A2000 Laptop GPU | 3 kg | 30.23 mm | 16.00" | 2560x1600 | |
| 84.3 % v7 (old) | 11/2022 | MSI CreatorPro Z16P B12UKST i7-12700H, RTX A3000 Laptop GPU | 2.4 kg | 19 mm | 16.00" | 2560x1600 | |
| 90.1 % v7 (old) | 11/2022 | HP ZBook Studio 16 G9 62U04EA i7-12800H, RTX A2000 Laptop GPU | 1.8 kg | 19 mm | 16.00" | 3840x2400 |
Caso
Lettore di schede SD
Il lettore di schede integrato offre velocità di trasferimento nella media. Per trasferire 1 GB di immagini dalla nostra scheda di prova UHS-II al desktop sono necessari circa 14 secondi, rispetto a meno della metà del tempo impiegato dal modello Precision 7670. Per una workstation mobile di fascia alta come il nostro ThinkPad P1, ci aspettavamo qualcosa di più.
| SD Card Reader | |
| average JPG Copy Test (av. of 3 runs) | |
| Dell Precision 7000 7670 Performance (Toshiba Exceria Pro SDXC 64 GB UHS-II) | |
| MSI CreatorPro Z16P B12UKST (AV Pro V60) | |
| Lenovo ThinkPad P16 G1 RTX A5500 (Toshiba Exceria Pro SDXC 64 GB UHS-II) | |
| HP ZBook Studio 16 G9 62U04EA (Angelbird AV PRO V60) | |
| Asus ProArt StudioBook 16 W7600H5A-2BL2 (AV Pro SD microSD 128 GB V60) | |
| Lenovo ThinkPad P16 G1 21D6001DMB (AV Pro V60) | |
| maximum AS SSD Seq Read Test (1GB) | |
| Dell Precision 7000 7670 Performance (Toshiba Exceria Pro SDXC 64 GB UHS-II) | |
| Asus ProArt StudioBook 16 W7600H5A-2BL2 (AV Pro SD microSD 128 GB V60) | |
| MSI CreatorPro Z16P B12UKST (AV Pro V60) | |
| Lenovo ThinkPad P16 G1 RTX A5500 (Toshiba Exceria Pro SDXC 64 GB UHS-II) | |
| HP ZBook Studio 16 G9 62U04EA (Angelbird AV PRO V60) | |
| Lenovo ThinkPad P16 G1 21D6001DMB (AV Pro V60) | |
Comunicazione
| Networking | |
| iperf3 transmit AX12 | |
| Asus ProArt StudioBook 16 W7600H5A-2BL2 | |
| iperf3 receive AX12 | |
| Asus ProArt StudioBook 16 W7600H5A-2BL2 | |
| iperf3 receive AXE11000 6GHz | |
| MSI CreatorPro Z16P B12UKST | |
| HP ZBook Studio 16 G9 62U04EA | |
| Dell Precision 7000 7670 Performance | |
| Lenovo ThinkPad P16 G1 RTX A5500 | |
| iperf3 receive AXE11000 | |
| Lenovo ThinkPad P16 G1 21D6001DMB | |
| Lenovo ThinkPad P16 G1 RTX A5500 | |
| Dell Precision 7000 7670 Performance | |
| iperf3 transmit AXE11000 | |
| Lenovo ThinkPad P16 G1 RTX A5500 | |
| Lenovo ThinkPad P16 G1 21D6001DMB | |
| Dell Precision 7000 7670 Performance | |
| iperf3 transmit AXE11000 6GHz | |
| MSI CreatorPro Z16P B12UKST | |
| HP ZBook Studio 16 G9 62U04EA | |
| Lenovo ThinkPad P16 G1 RTX A5500 | |
| Dell Precision 7000 7670 Performance | |
Webcam


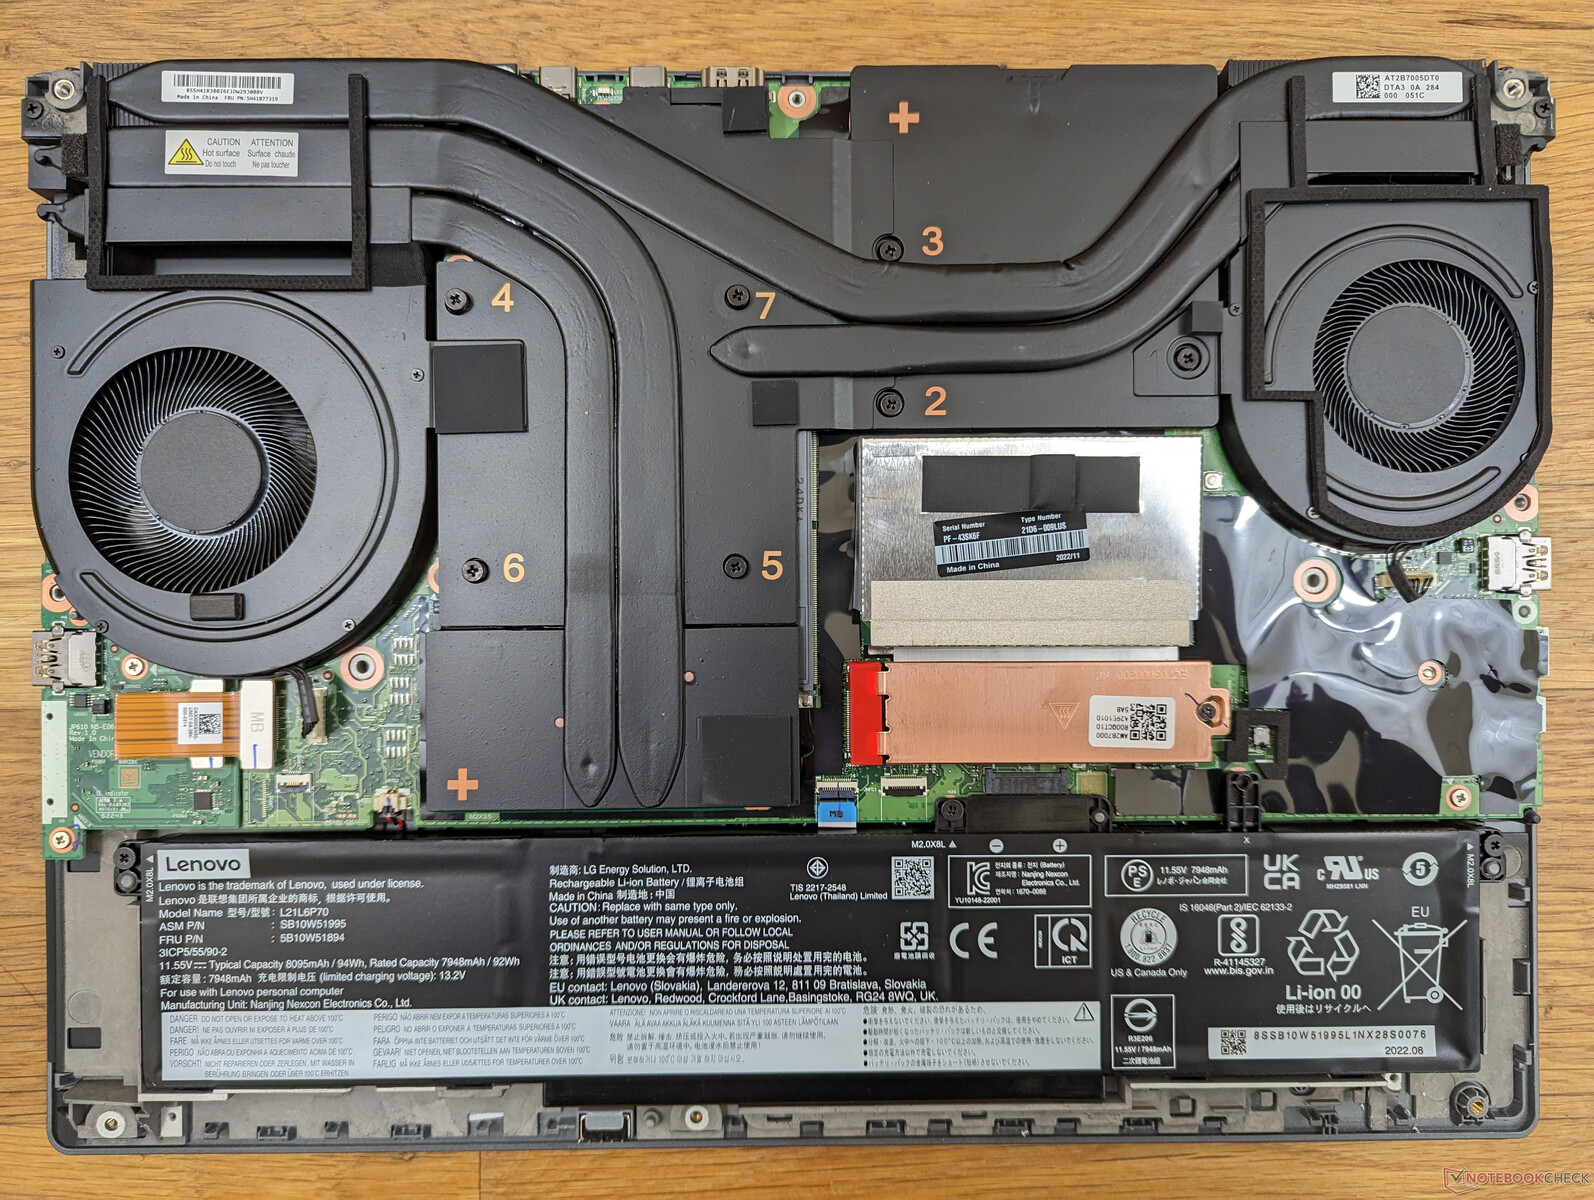
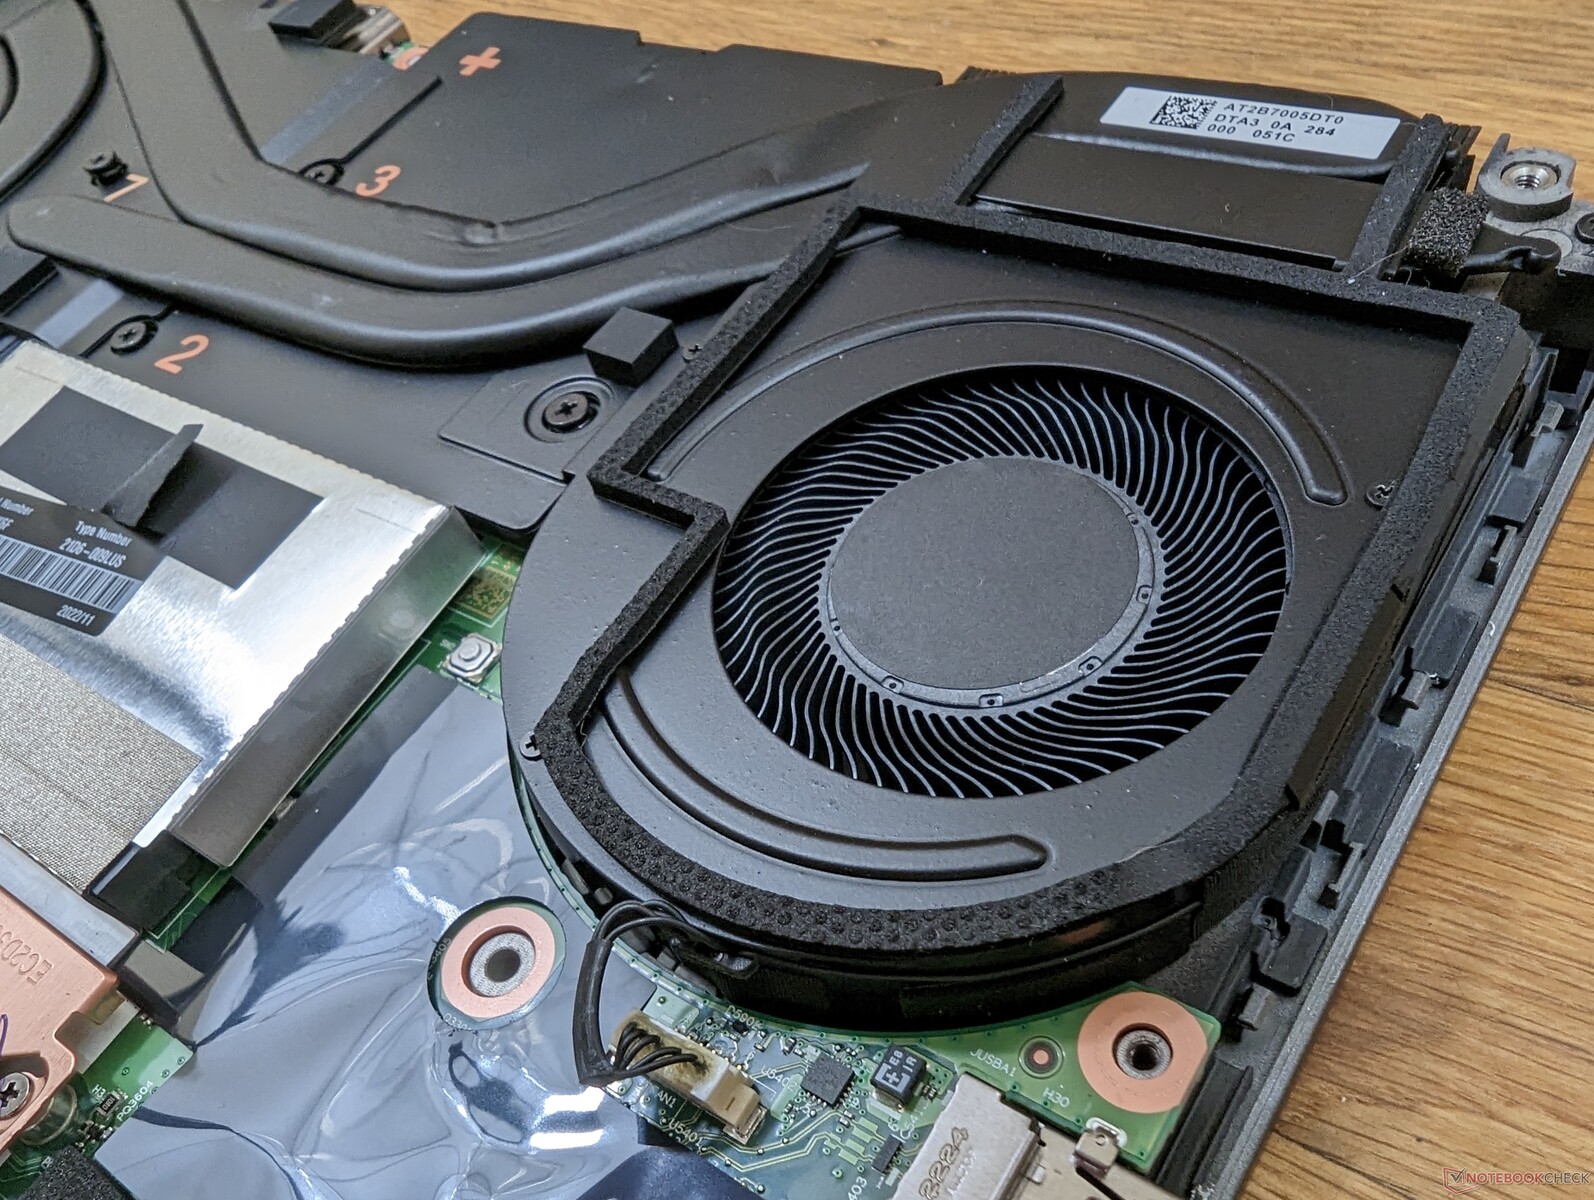
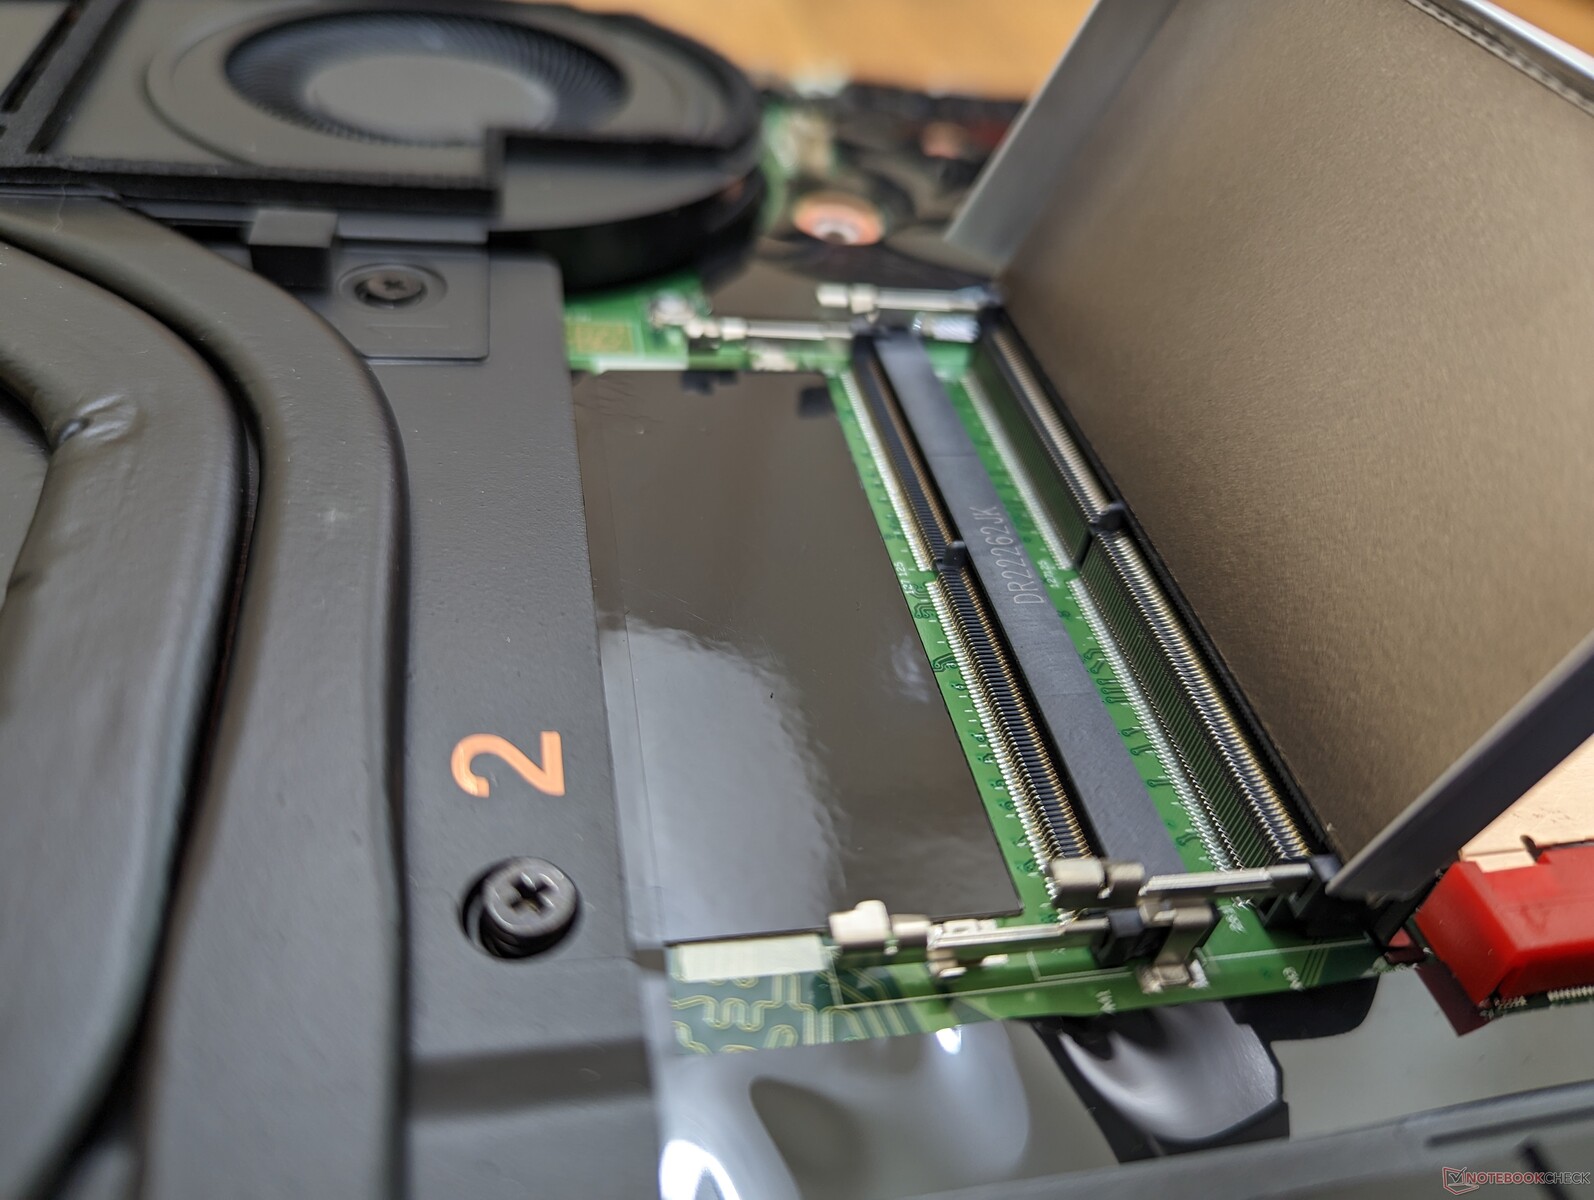
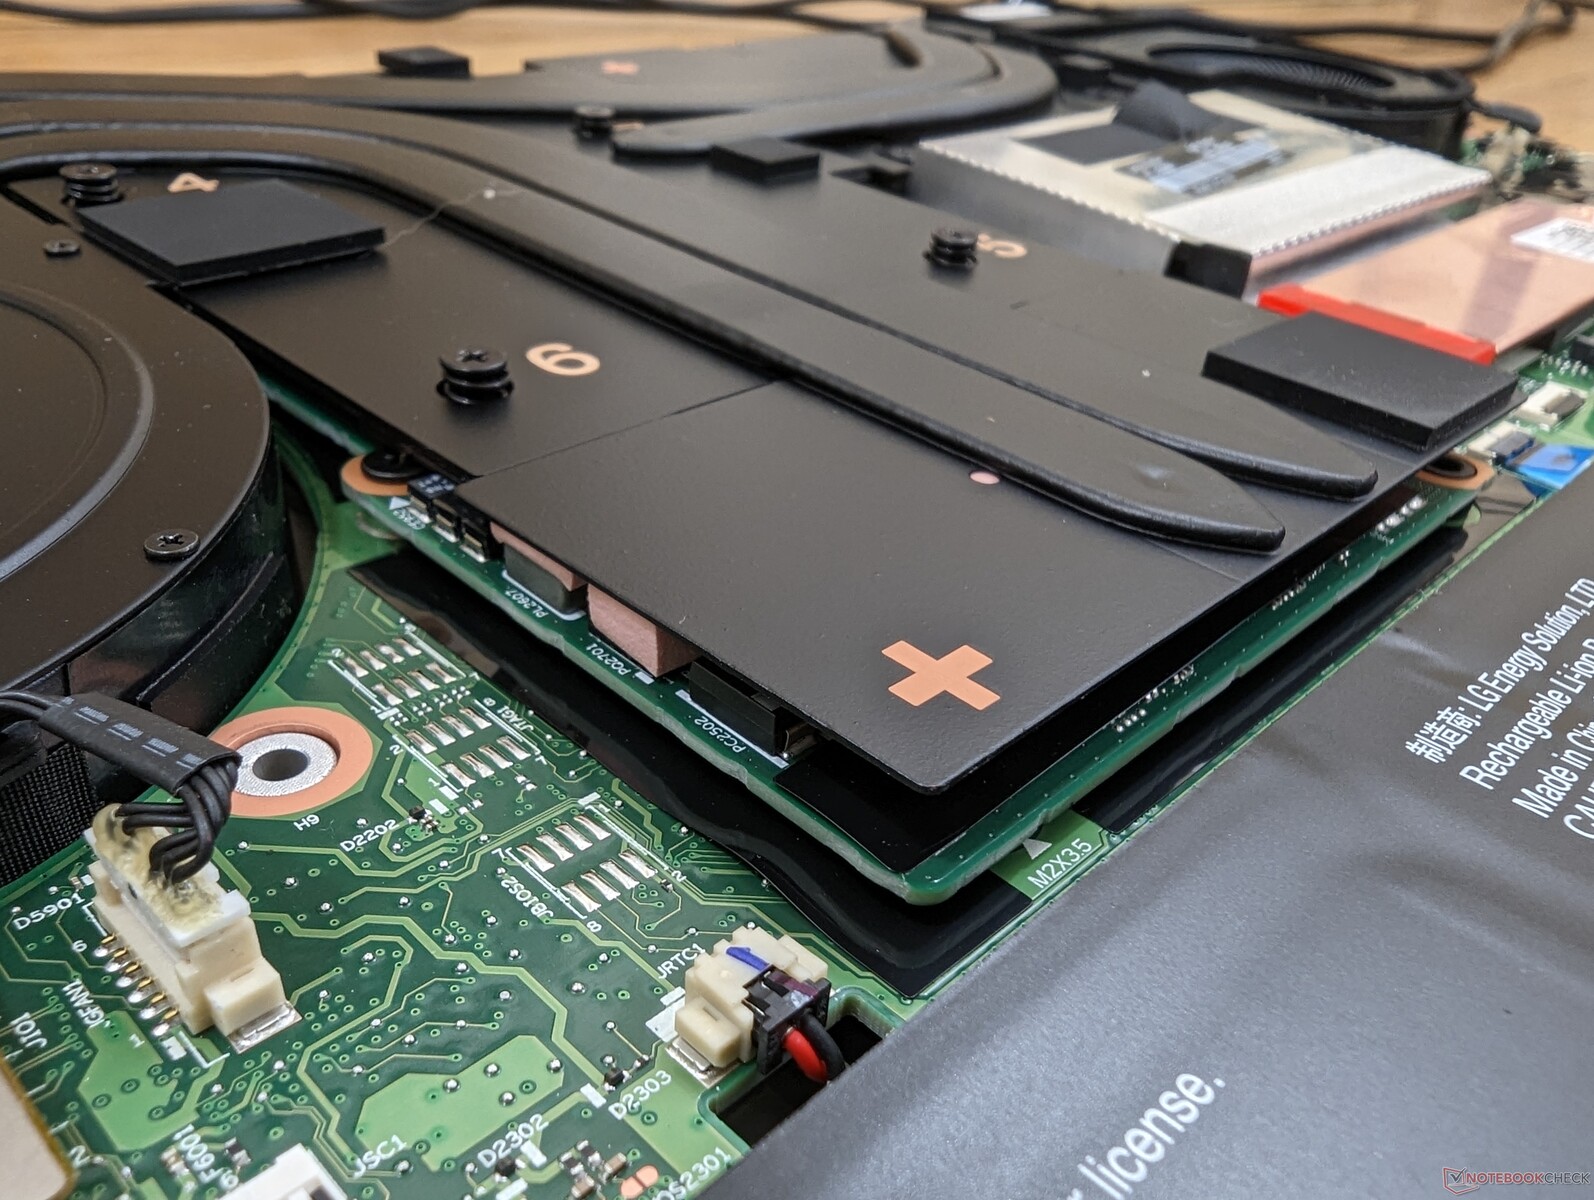
Manutenzione
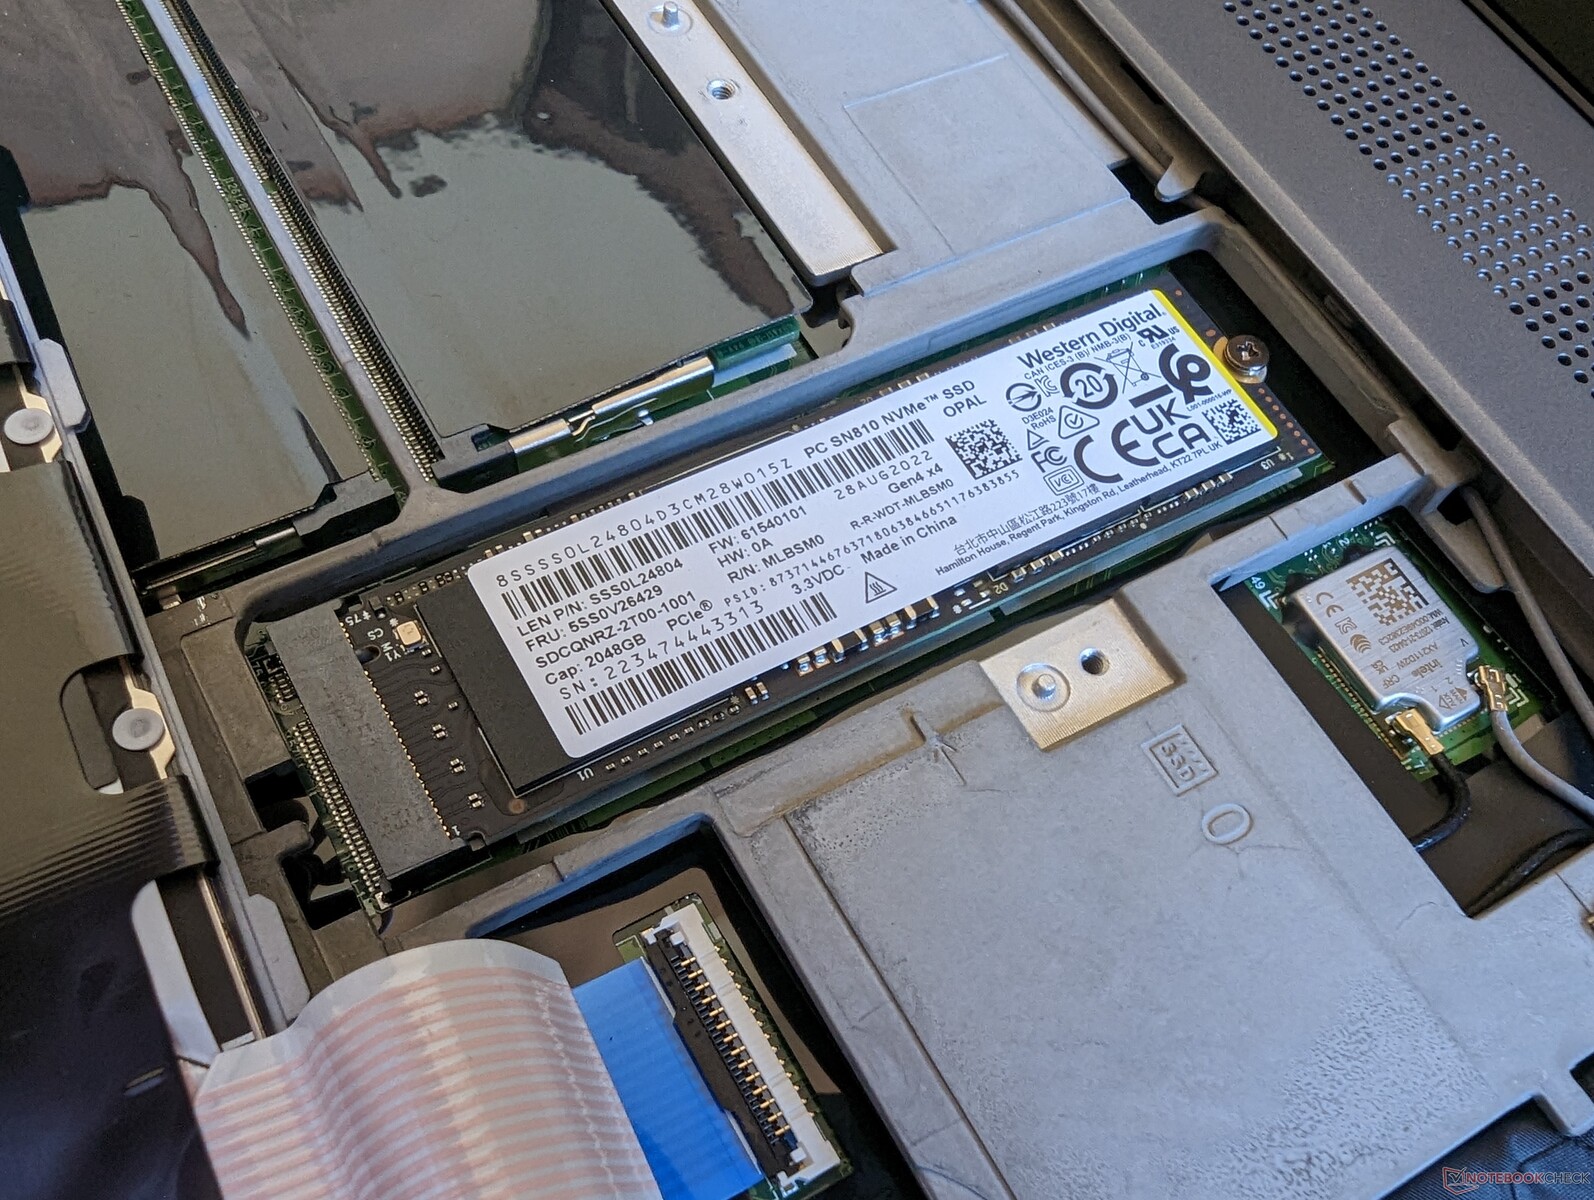
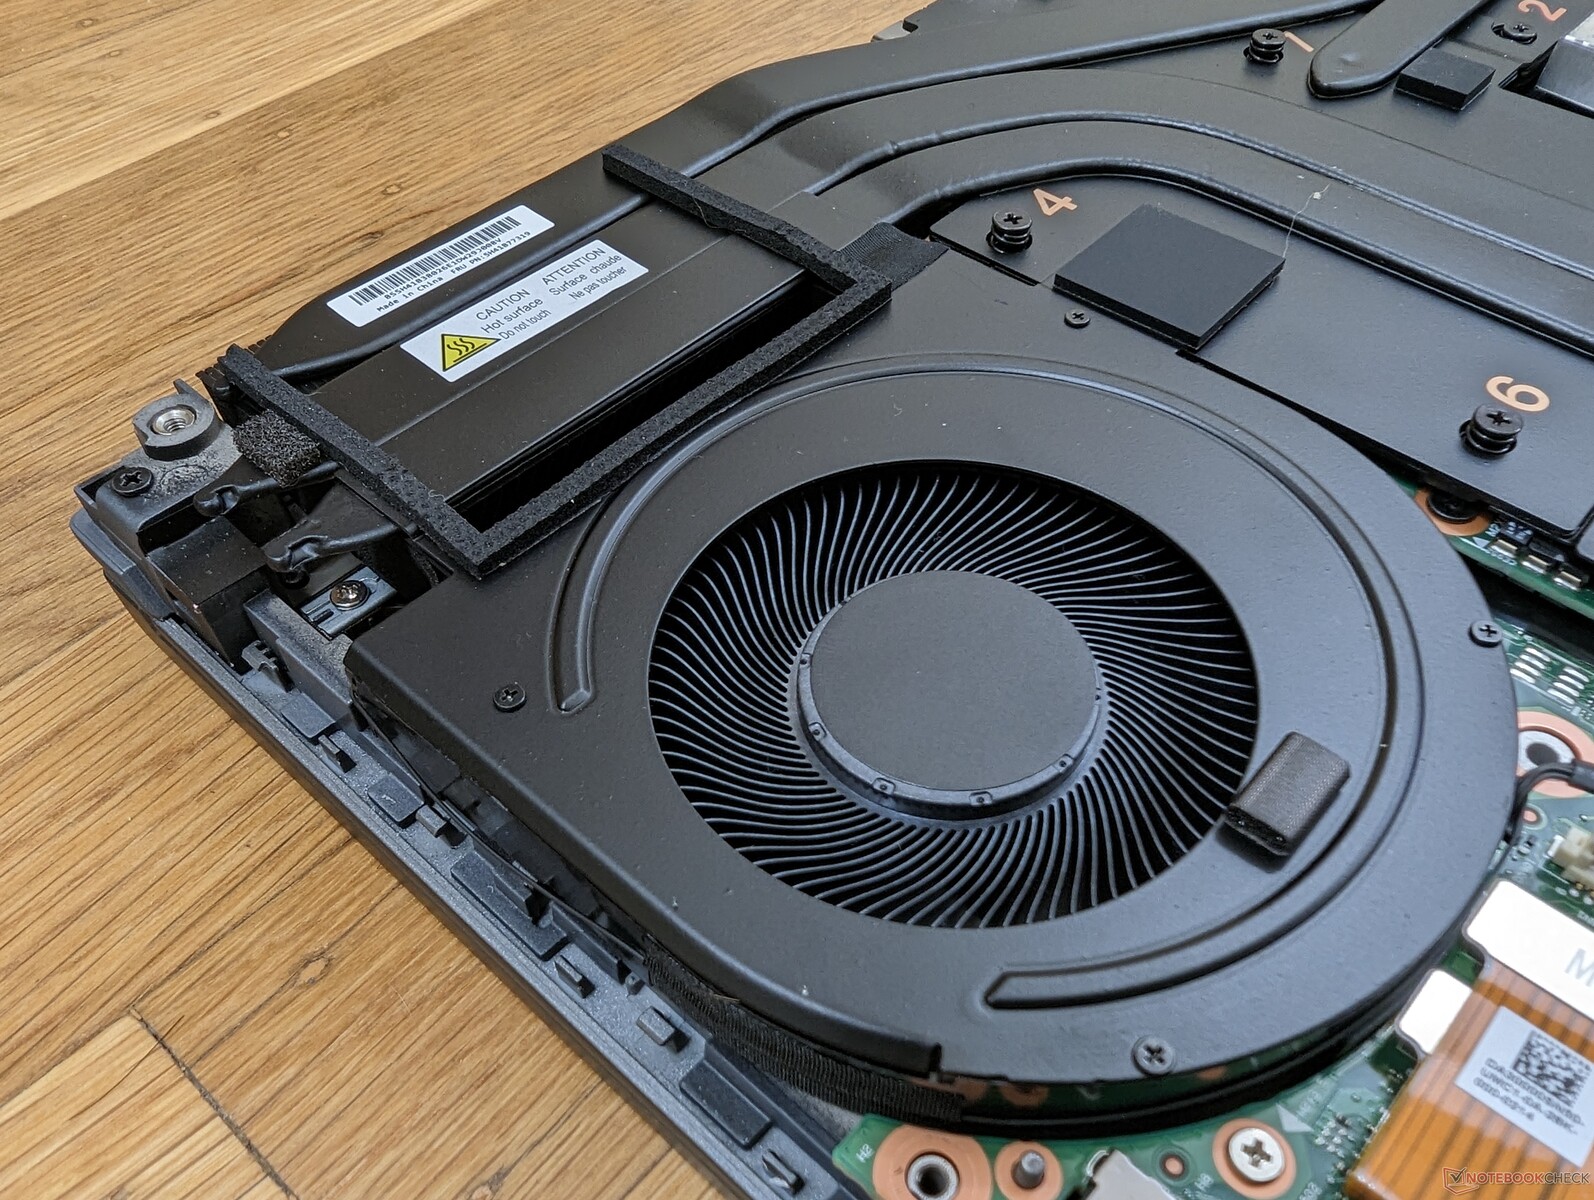
Il pannello inferiore è fissato da 12 viti Philips. La tastiera deve essere rimossa per accedere al modulo WAN, allo slot SSD M.2 primario e a due dei quattro slot SODIMM. Lenovo dispone di un manuale di manutenzione ufficiale https://download.lenovo.com/pccbbs/mobiles_pdf/p16_gen1_hmm_en.pdf per gli utenti finali.
È interessante notare che il ThinkPad P16 G1 è uno dei pochissimi portatili con GPU rimovibile. La sostituzione della scheda grafica di un computer portatile non è in genere consigliata, se non per motivi di manutenzione o sostituzione.
Accessori e garanzia
La confezione non contiene altri extra oltre all'adattatore CA e alla documentazione cartacea.
La garanzia limitata è di un anno, mentre quella del Dell Precision 7670 è di tre anni. Tuttavia, Lenovo offre un servizio di assistenza in loco durante il periodo di un anno, se necessario.
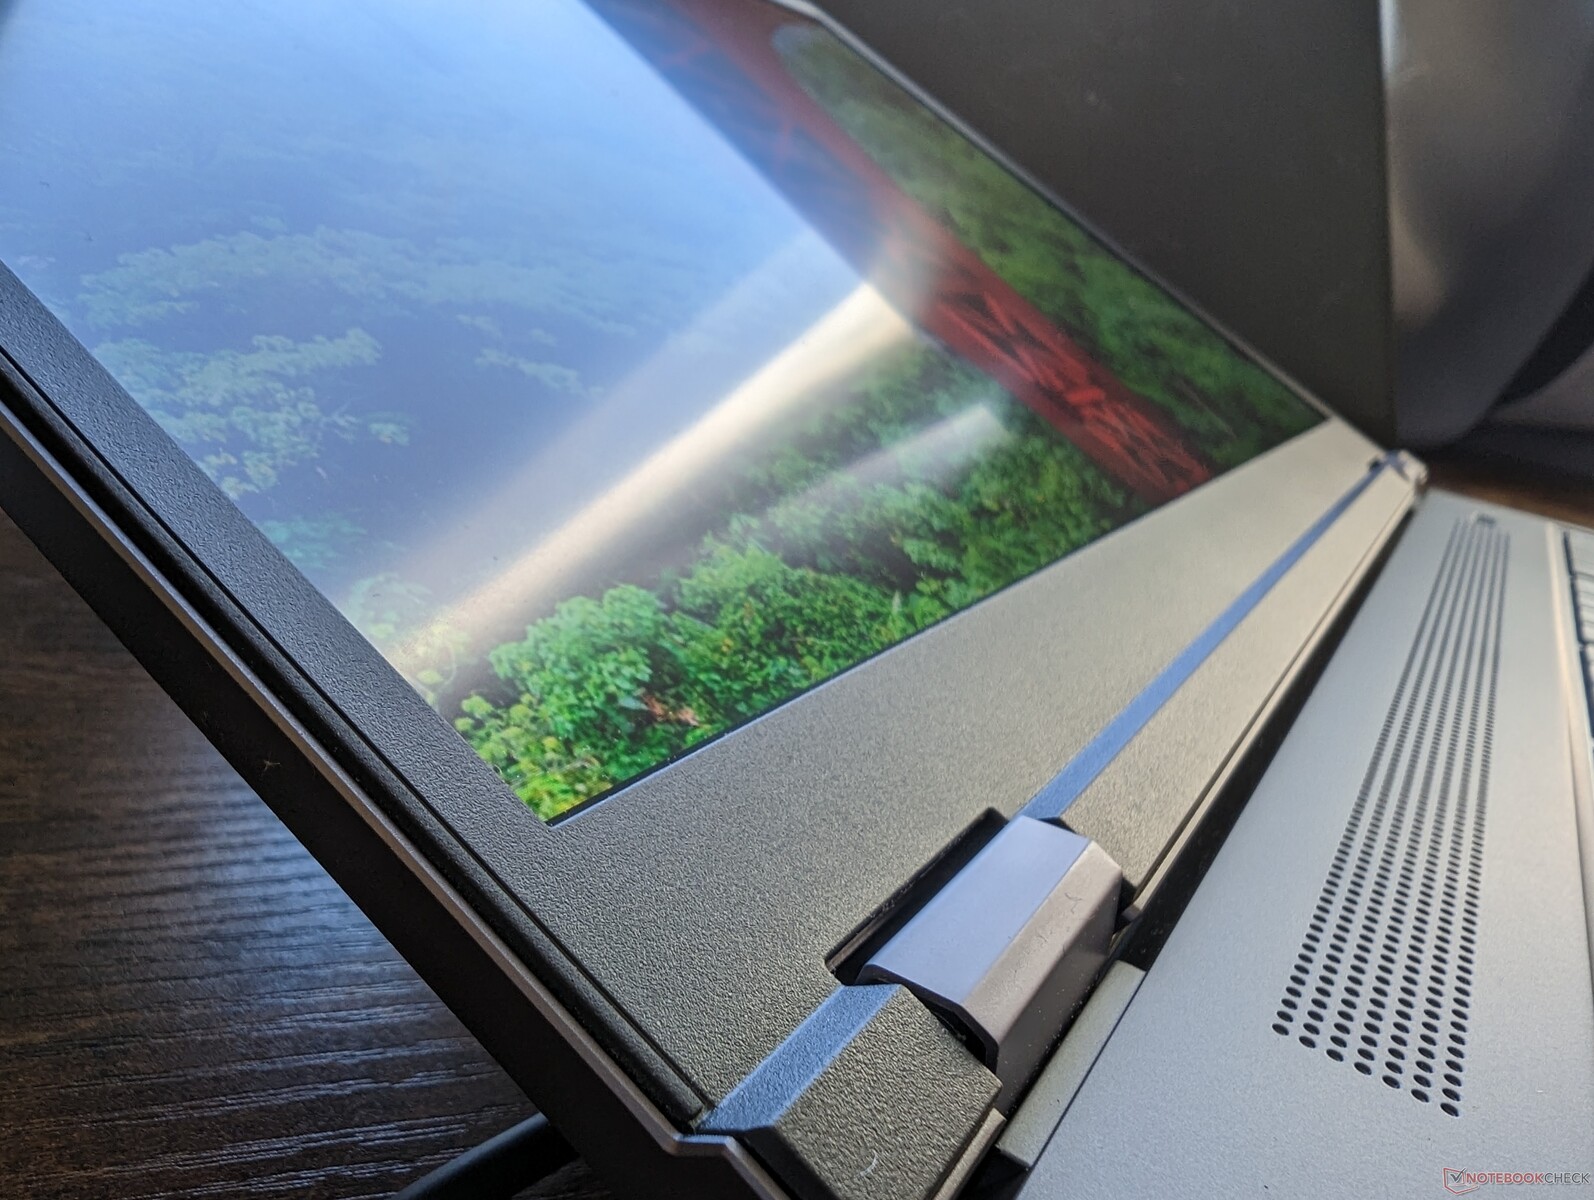
Display
Lenovo offre quattro diverse opzioni di display a 60 Hz, tutte calibrate in fabbrica con Pantone e dimmerazione DC. Le nostre misurazioni qui sotto riflettono solo l'opzione in grassetto, mentre la nostra seconda unità con GPU RTX A2000 è dotata dell'opzione 1600p.
- 1920 x 1200, non touch, IPS, 300 nit, opaco, 100% sRGB
- 2560 x 1600, non touch, IPS, 400 nit, opaco, 100% sRGB
- 3840 x 2400, non touch, IPS, 600 nit, opaco, 100% AdobeRGB
- 3840 x 2400, touch, OLED, 400 nit, lucido, 100% DCI-P3
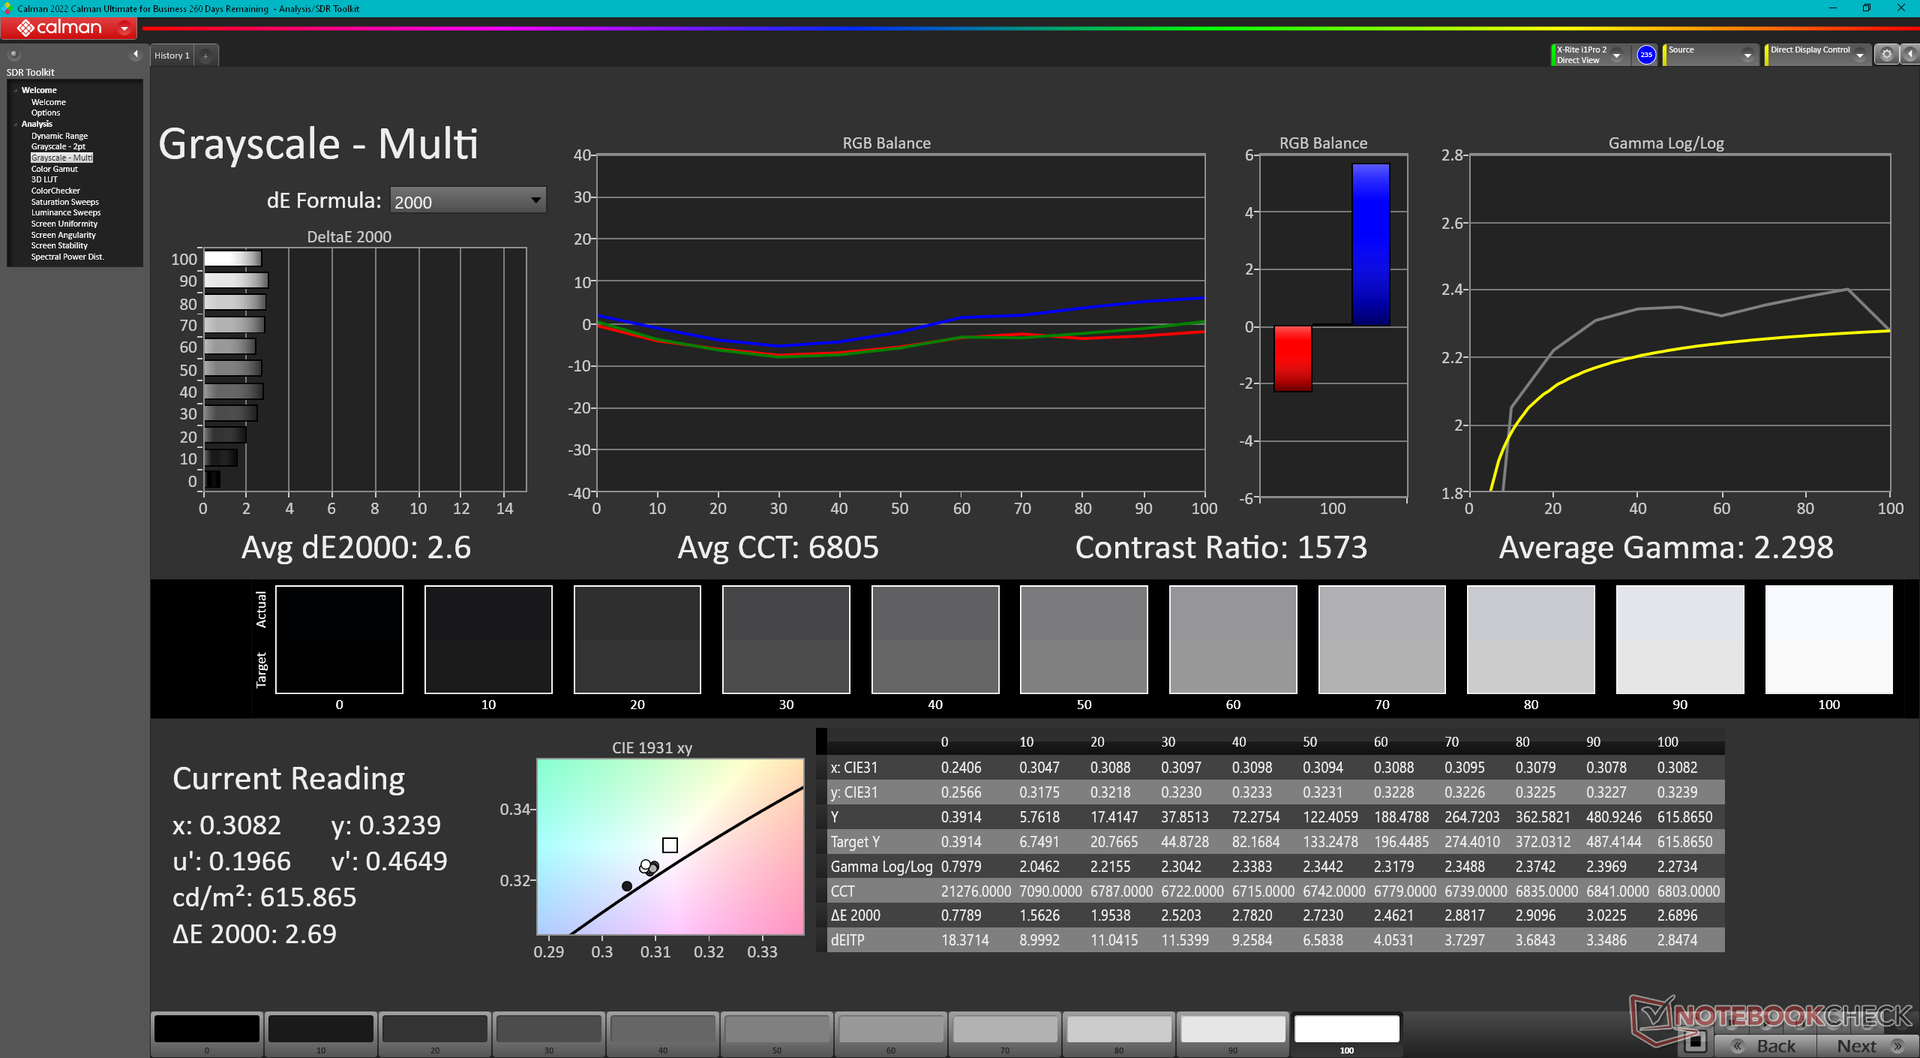
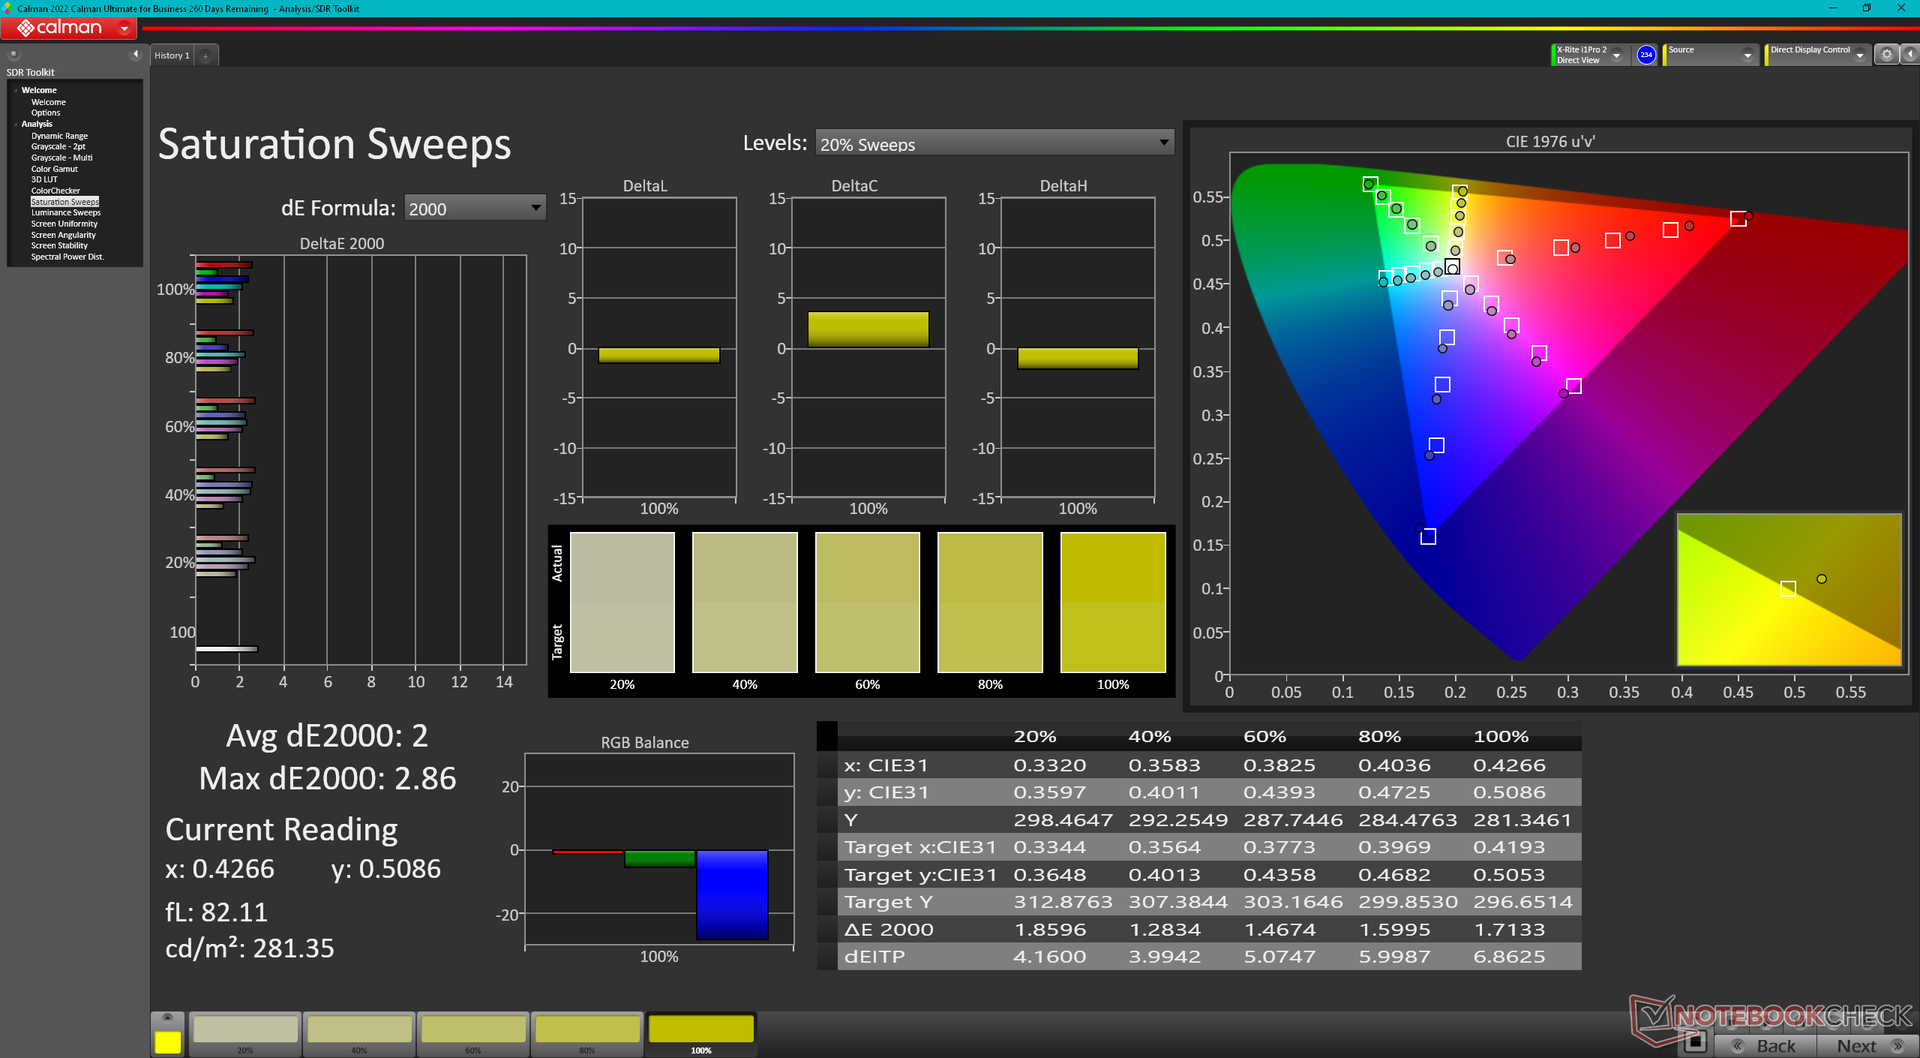
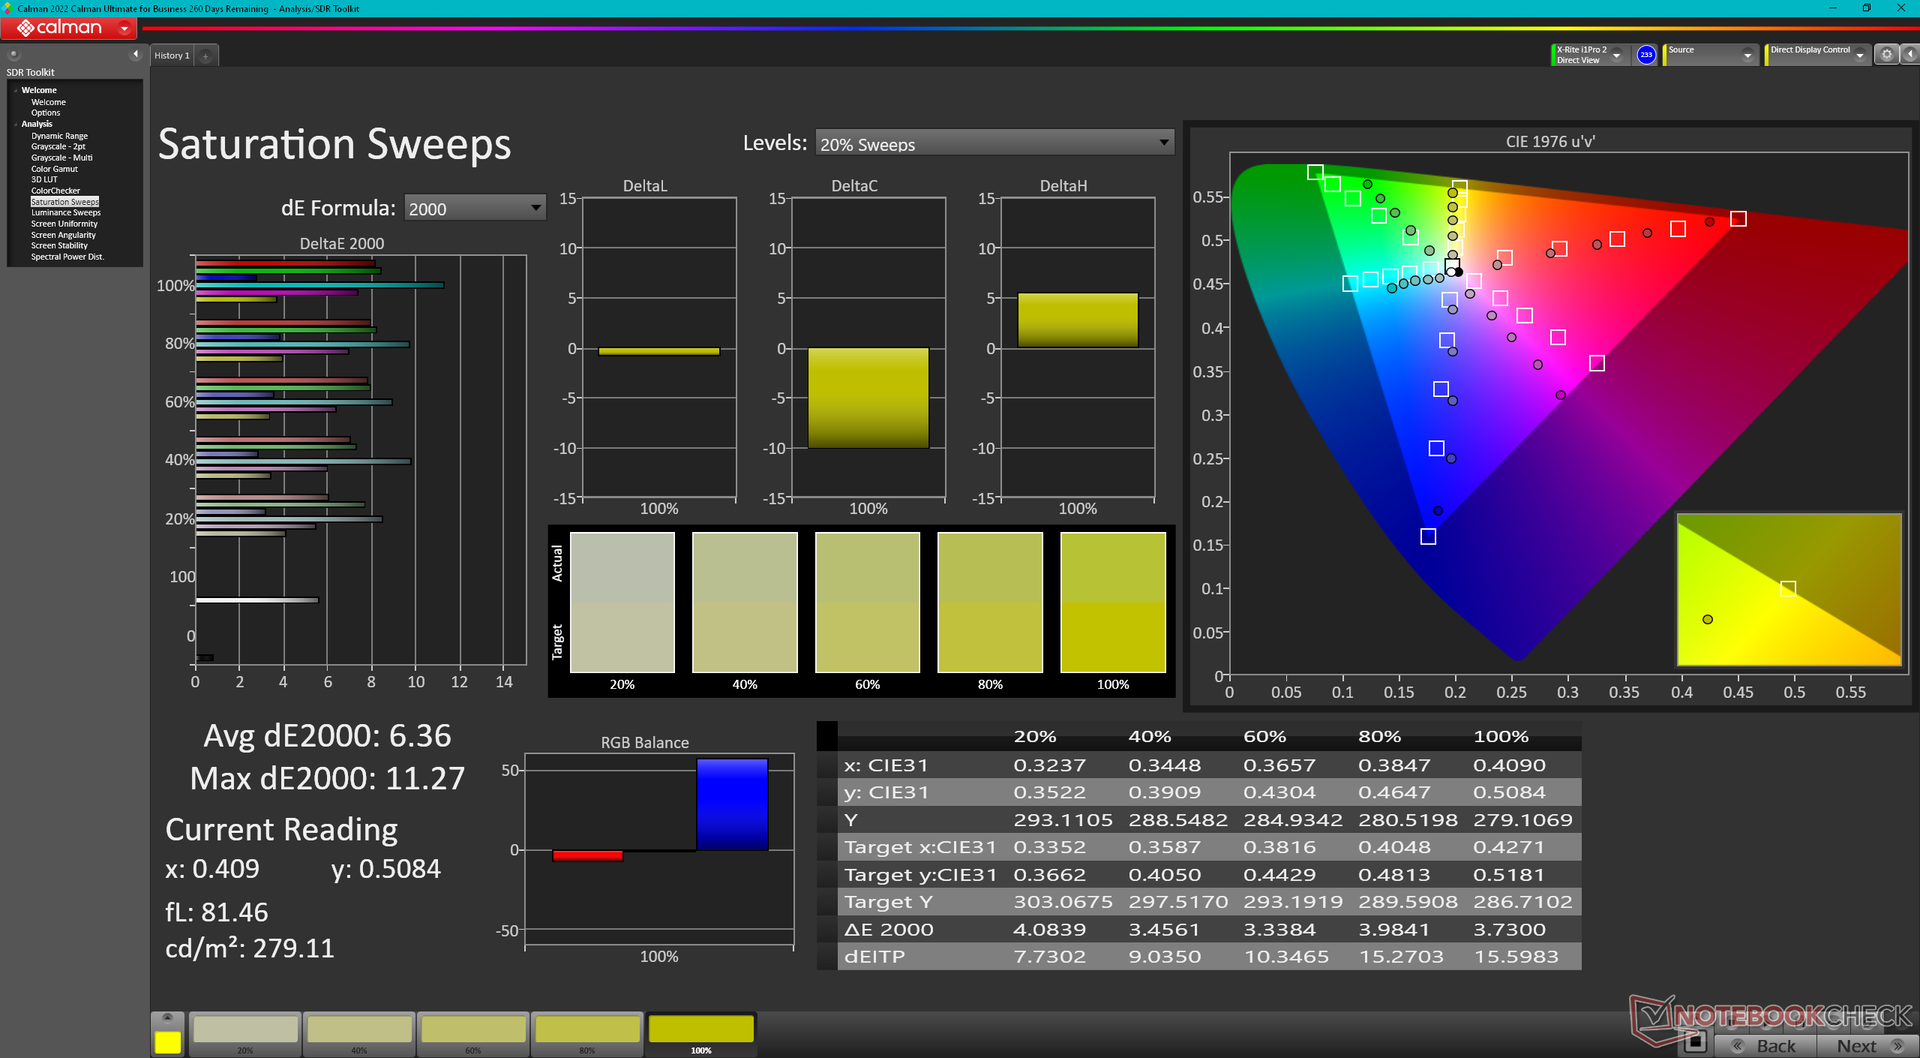
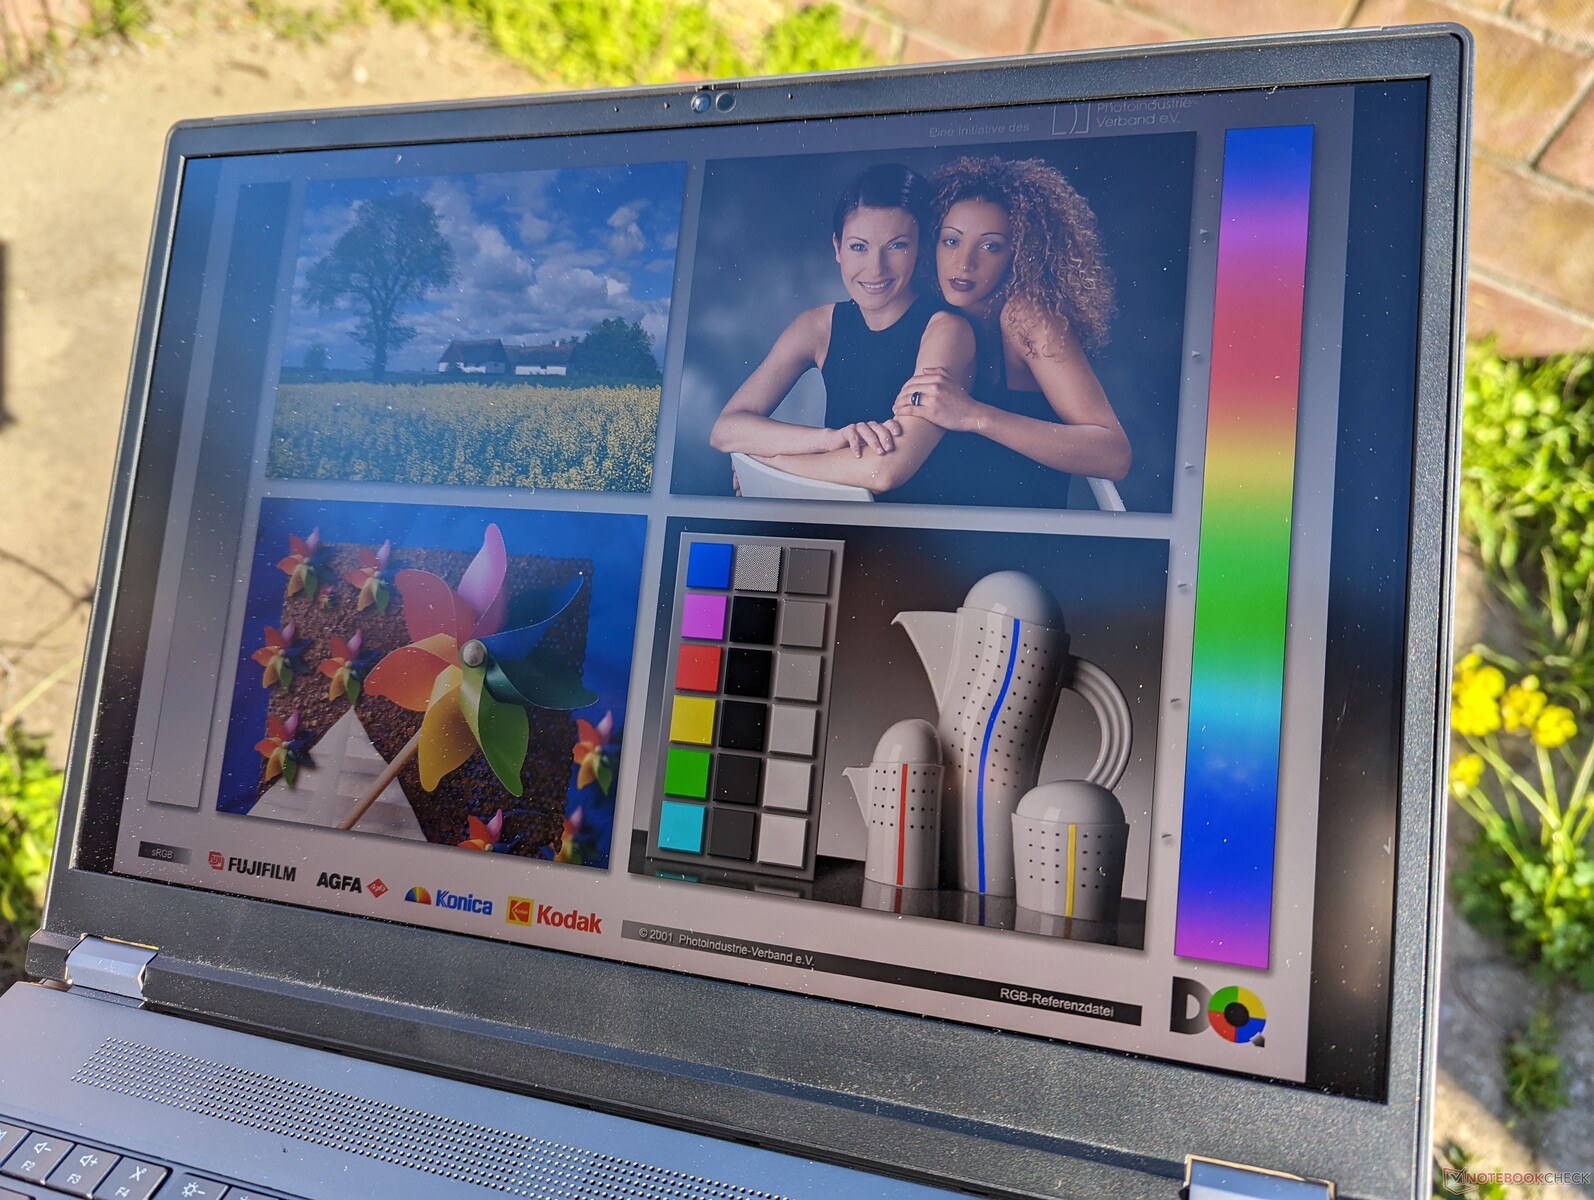
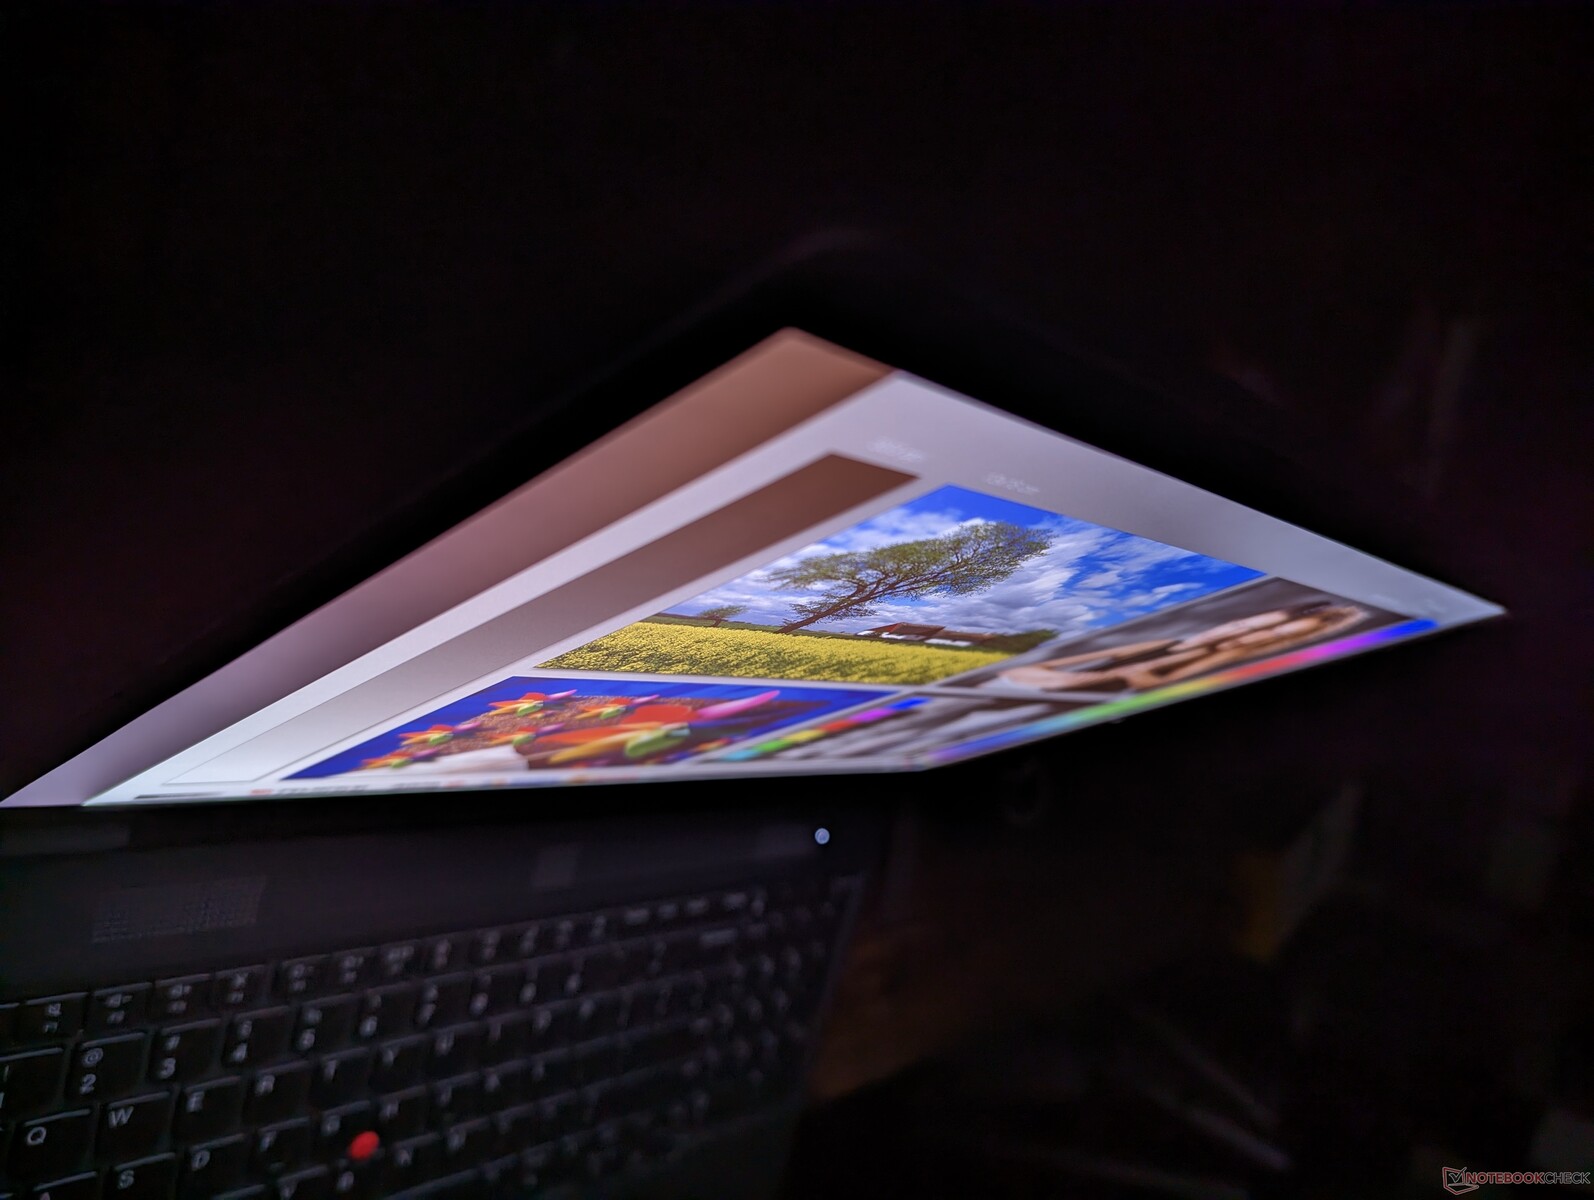
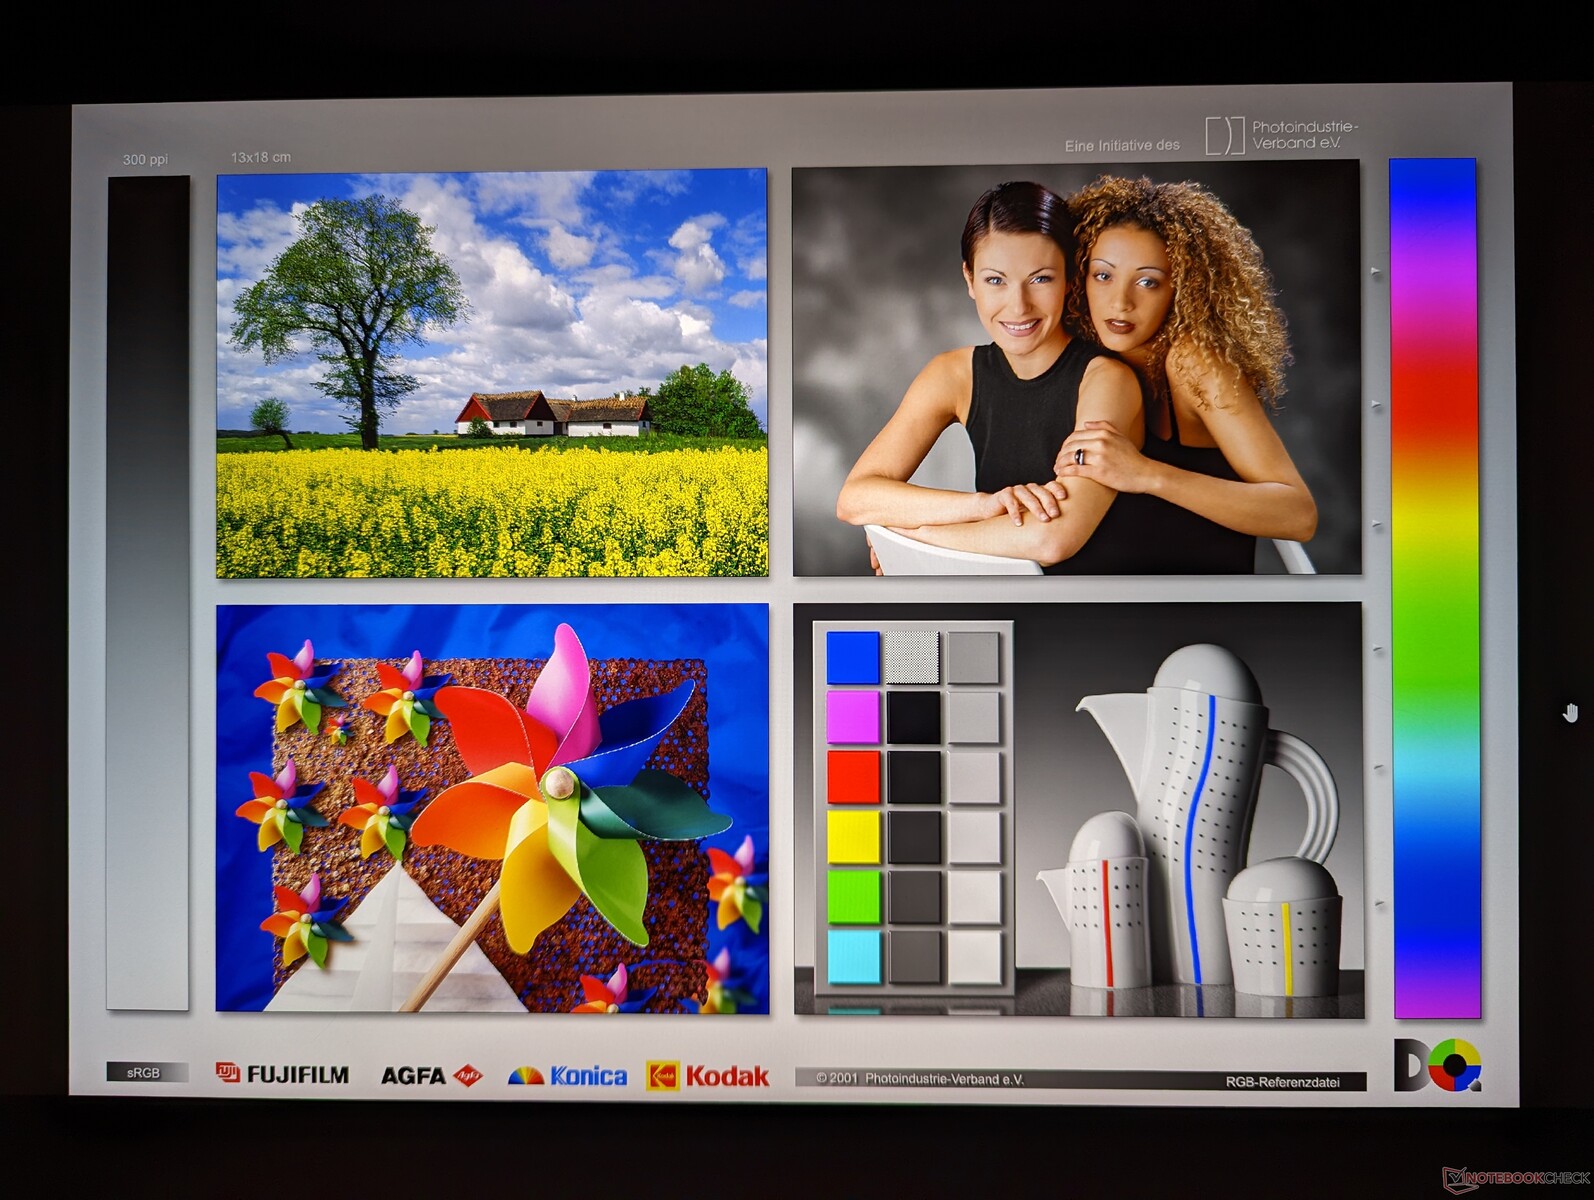
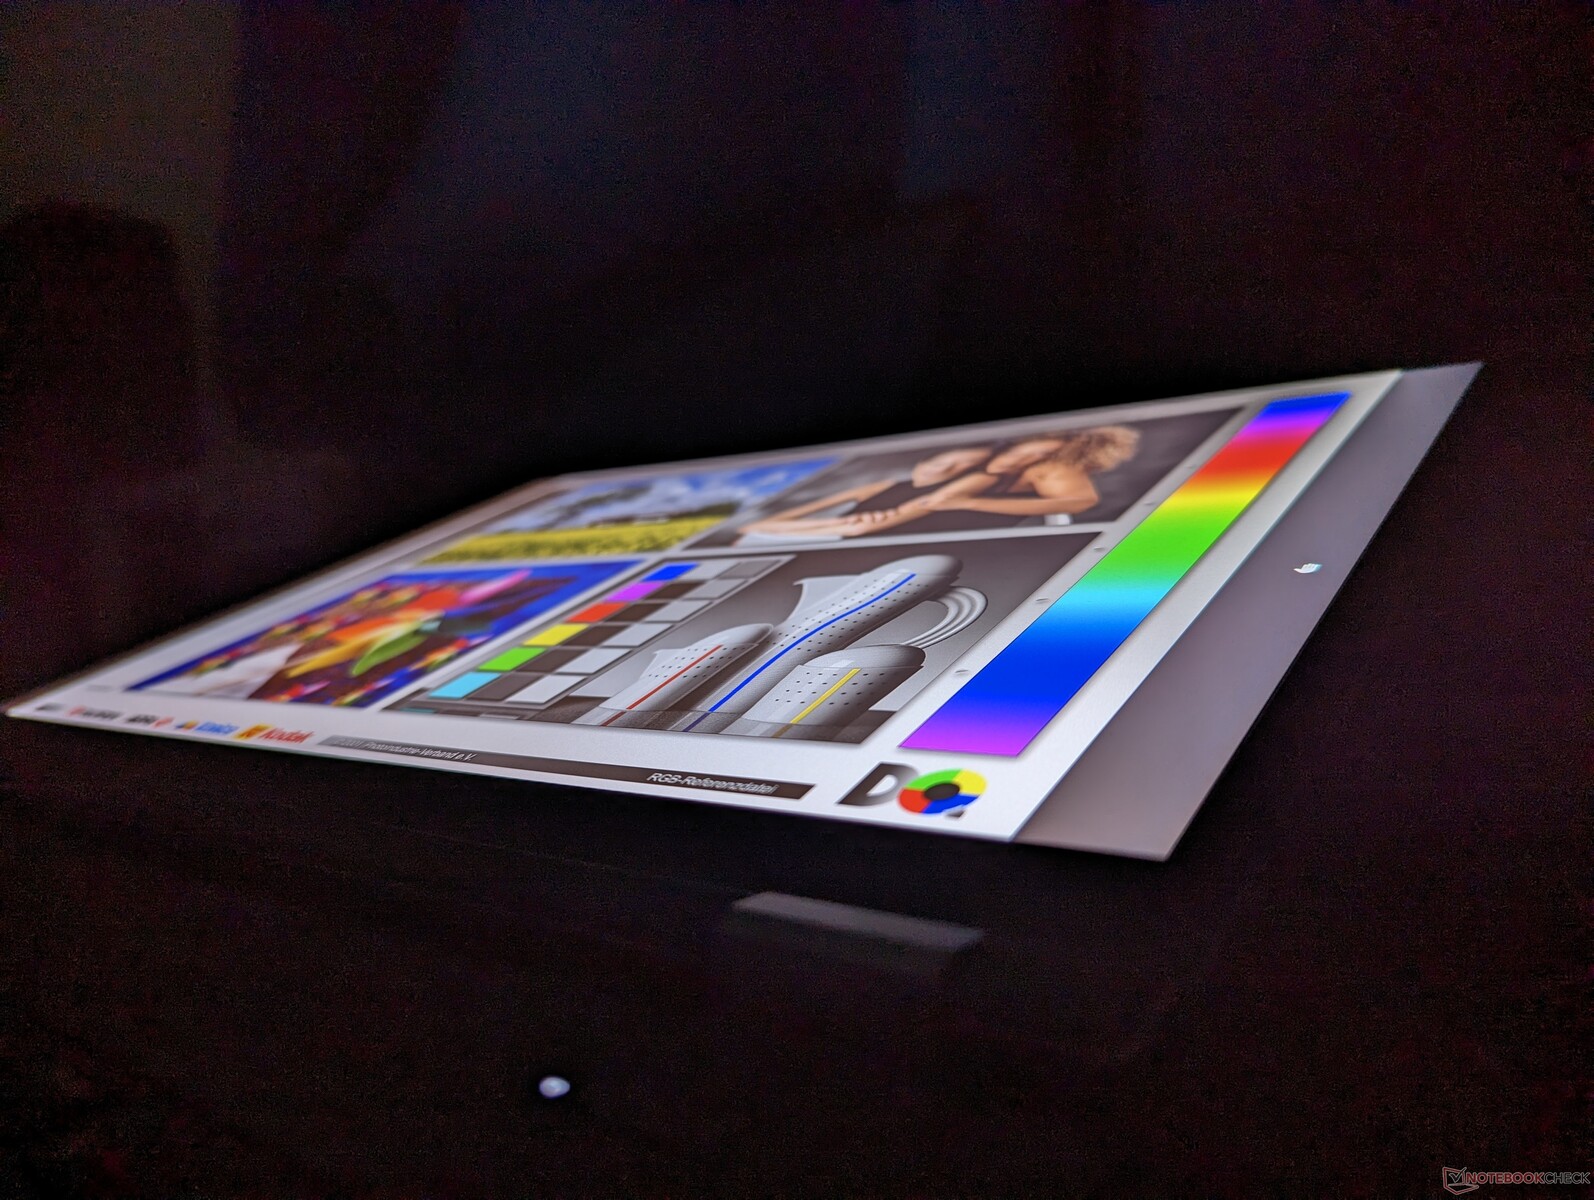
Le nostre misurazioni indipendenti possono confermare la copertura completa AdobeRGB e la luminosità di 600 nit. La distribuzione della luminosità, tuttavia, è solo nella media nonostante l'obiettivo dei 600 nit. Il quadrante in alto a sinistra del nostro display, ad esempio, è più luminoso del 29% rispetto al quadrante in basso a destra (642 nits contro 497 nits). La scelta del pannello OLED avrebbe migliorato la distribuzione della luminosità, ma ci aspettavamo di meglio dal nostro pannello IPS considerando il prezzo del ThinkPad P1 G1.
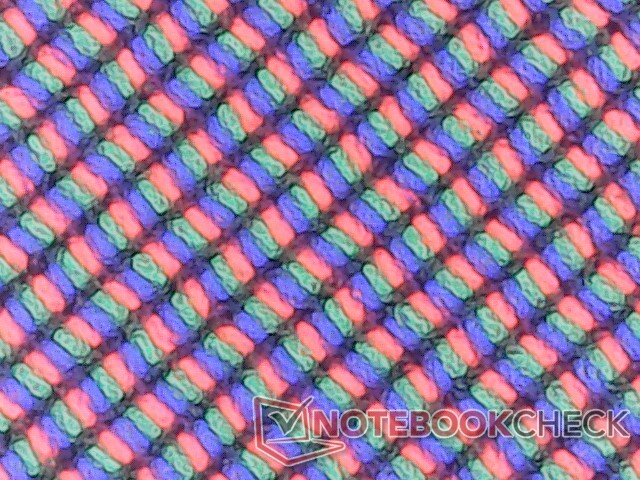
Vale la pena notare che Lenovo utilizza lo stesso pannello IPS LP160UQ1-SPB1 del ThinkPad P1 G1 anche per gli altri modelli di ThinkPad da 16 pollici, tra cui ilThinkPad P1 G4 eThinkPad X1 Extreme G4.


| |||||||||||||||||||||||||
Distribuzione della luminosità: 77 %
Al centro con la batteria: 601.9 cd/m²
Contrasto: 1281:1 (Nero: 0.47 cd/m²)
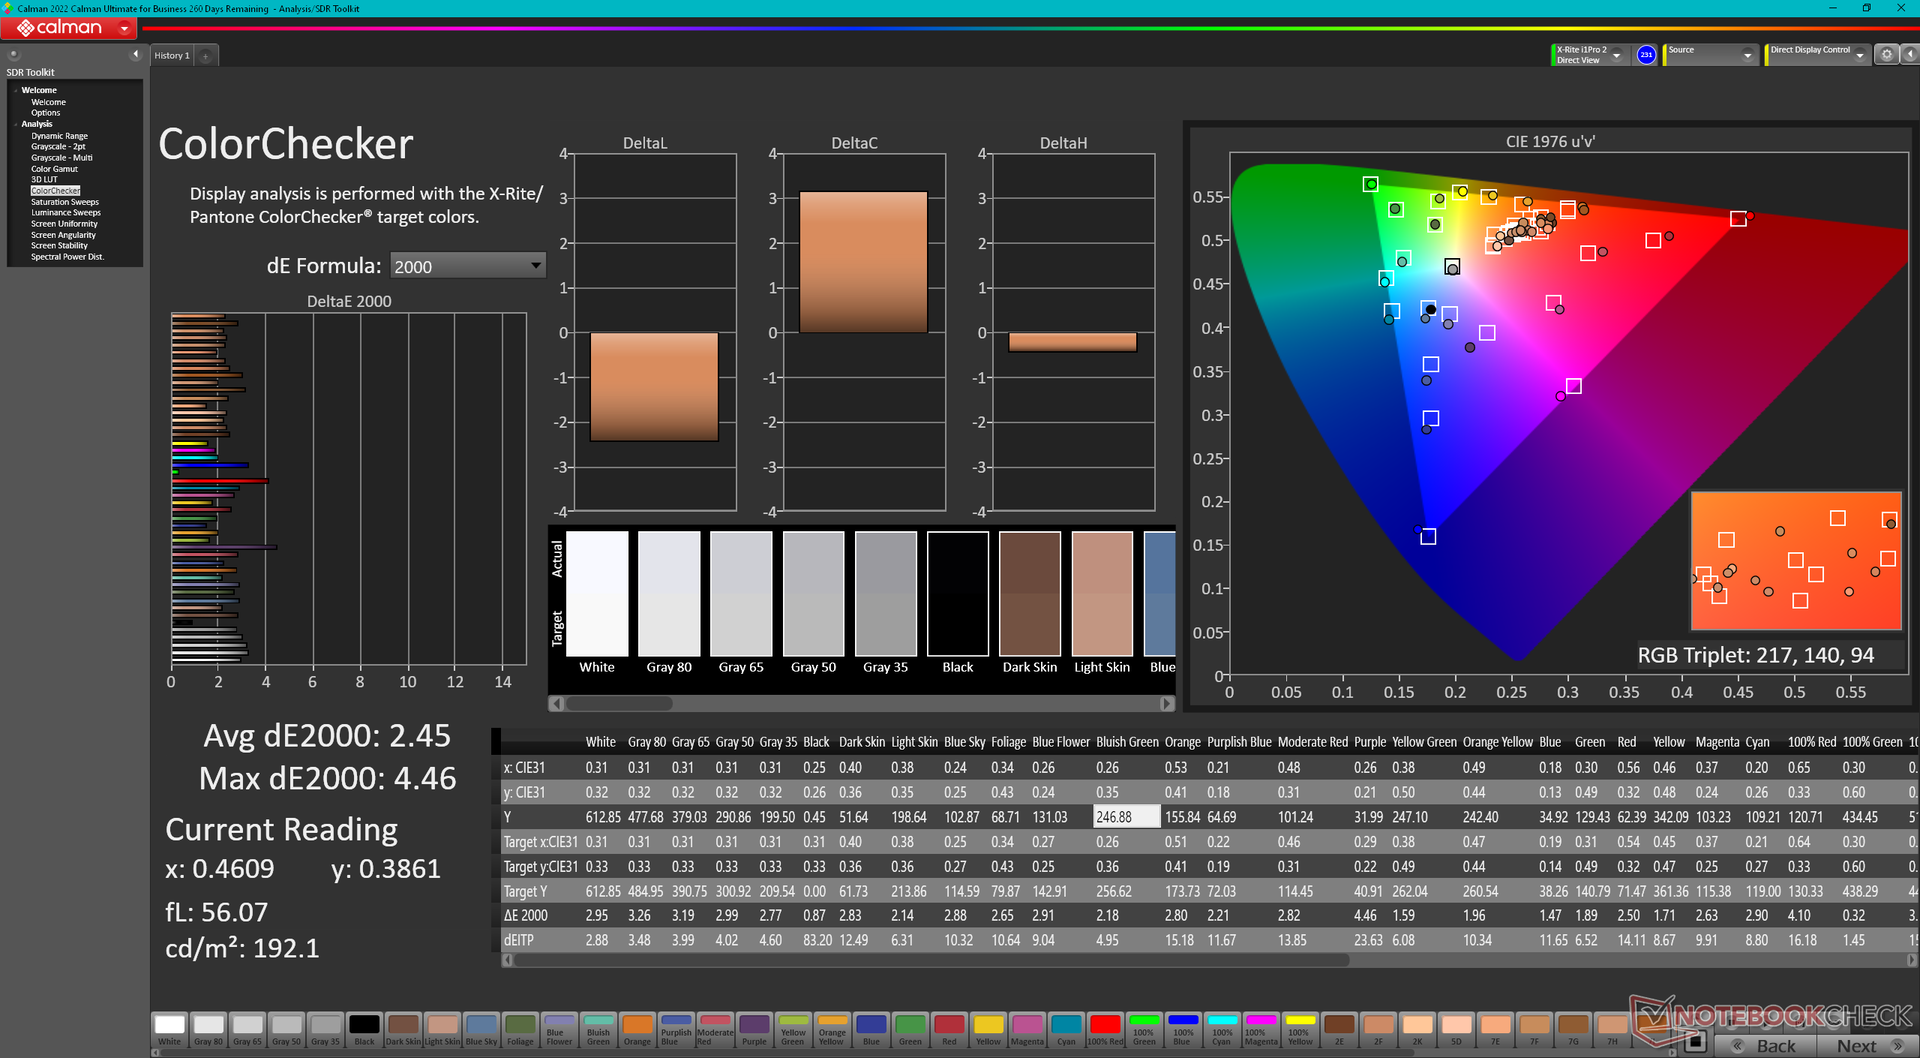
ΔE ColorChecker Calman: 2.45 | ∀{0.5-29.43 Ø4.71}
ΔE Greyscale Calman: 2.6 | ∀{0.09-98 Ø4.96}
95.9% AdobeRGB 1998 (Argyll 3D)
98.9% sRGB (Argyll 3D)
82.9% Display P3 (Argyll 3D)
Gamma: 2.3
CCT: 6805 K
| Lenovo ThinkPad P16 G1 RTX A5500 LP160UQ1-SPB1, IPS, 3840x2400, 16" | Asus ProArt StudioBook 16 W7600H5A-2BL2 ATNA60YV02-0, OLED, 3840x2400, 16" | Dell Precision 7000 7670 Performance Samsung 160YV03, OLED, 3840x2400, 16" | Lenovo ThinkPad P16 G1 21D6001DMB NE160QDM-N63 , IPS LED, 2560x1600, 16" | MSI CreatorPro Z16P B12UKST B160QAN02.N, IPS, 2560x1600, 16" | HP ZBook Studio 16 G9 62U04EA BOE0A52, IPS, 3840x2400, 16" | |
|---|---|---|---|---|---|---|
| Display | 8% | 8% | -12% | 3% | 3% | |
| Display P3 Coverage (%) | 82.9 | 99.9 21% | 99.9 21% | 71.5 -14% | 97.6 18% | 97.5 18% |
| sRGB Coverage (%) | 98.9 | 100 1% | 100 1% | 100 1% | 99.9 1% | 99.9 1% |
| AdobeRGB 1998 Coverage (%) | 95.9 | 98.6 3% | 98.1 2% | 73.3 -24% | 87.4 -9% | 86.3 -10% |
| Response Times | 96% | 96% | 23% | 76% | 75% | |
| Response Time Grey 50% / Grey 80% * (ms) | 45.6 ? | 2 ? 96% | 1.84 ? 96% | 37.7 ? 17% | 12.8 ? 72% | 15.3 ? 66% |
| Response Time Black / White * (ms) | 36.8 ? | 2 ? 95% | 1.92 ? 95% | 26.3 ? 29% | 7.4 ? 80% | 6.1 ? 83% |
| PWM Frequency (Hz) | 240 ? | 59.52 ? | ||||
| Screen | -2% | -36% | -4% | 9% | 16% | |
| Brightness middle (cd/m²) | 601.9 | 353 -41% | 325.2 -46% | 424 -30% | 407 -32% | 554 -8% |
| Brightness (cd/m²) | 569 | 360 -37% | 328 -42% | 398 -30% | 388 -32% | 516 -9% |
| Brightness Distribution (%) | 77 | 96 25% | 97 26% | 90 17% | 88 14% | 84 9% |
| Black Level * (cd/m²) | 0.47 | 0.24 49% | 0.36 23% | 0.47 -0% | ||
| Contrast (:1) | 1281 | 1767 38% | 1131 -12% | 1179 -8% | ||
| Colorchecker dE 2000 * | 2.45 | 2.45 -0% | 4.59 -87% | 2.6 -6% | 1.3 47% | 1 59% |
| Colorchecker dE 2000 max. * | 4.46 | 3.75 16% | 7.65 -72% | 4.9 -10% | 2.5 44% | 2.4 46% |
| Greyscale dE 2000 * | 2.6 | 1.88 28% | 2.5 4% | 4.1 -58% | 2.1 19% | 1.6 38% |
| Gamma | 2.3 96% | 2.31 95% | 2.1 105% | 2.13 103% | 2.26 97% | 2.29 96% |
| CCT | 6805 96% | 6441 101% | 6541 99% | 7252 90% | 6437 101% | 6458 101% |
| Colorchecker dE 2000 calibrated * | 2.77 | 0.8 | 0.7 | 0.6 | ||
| Media totale (Programma / Settaggio) | 34% /
19% | 23% /
-0% | 2% /
-2% | 29% /
18% | 31% /
22% |
* ... Meglio usare valori piccoli
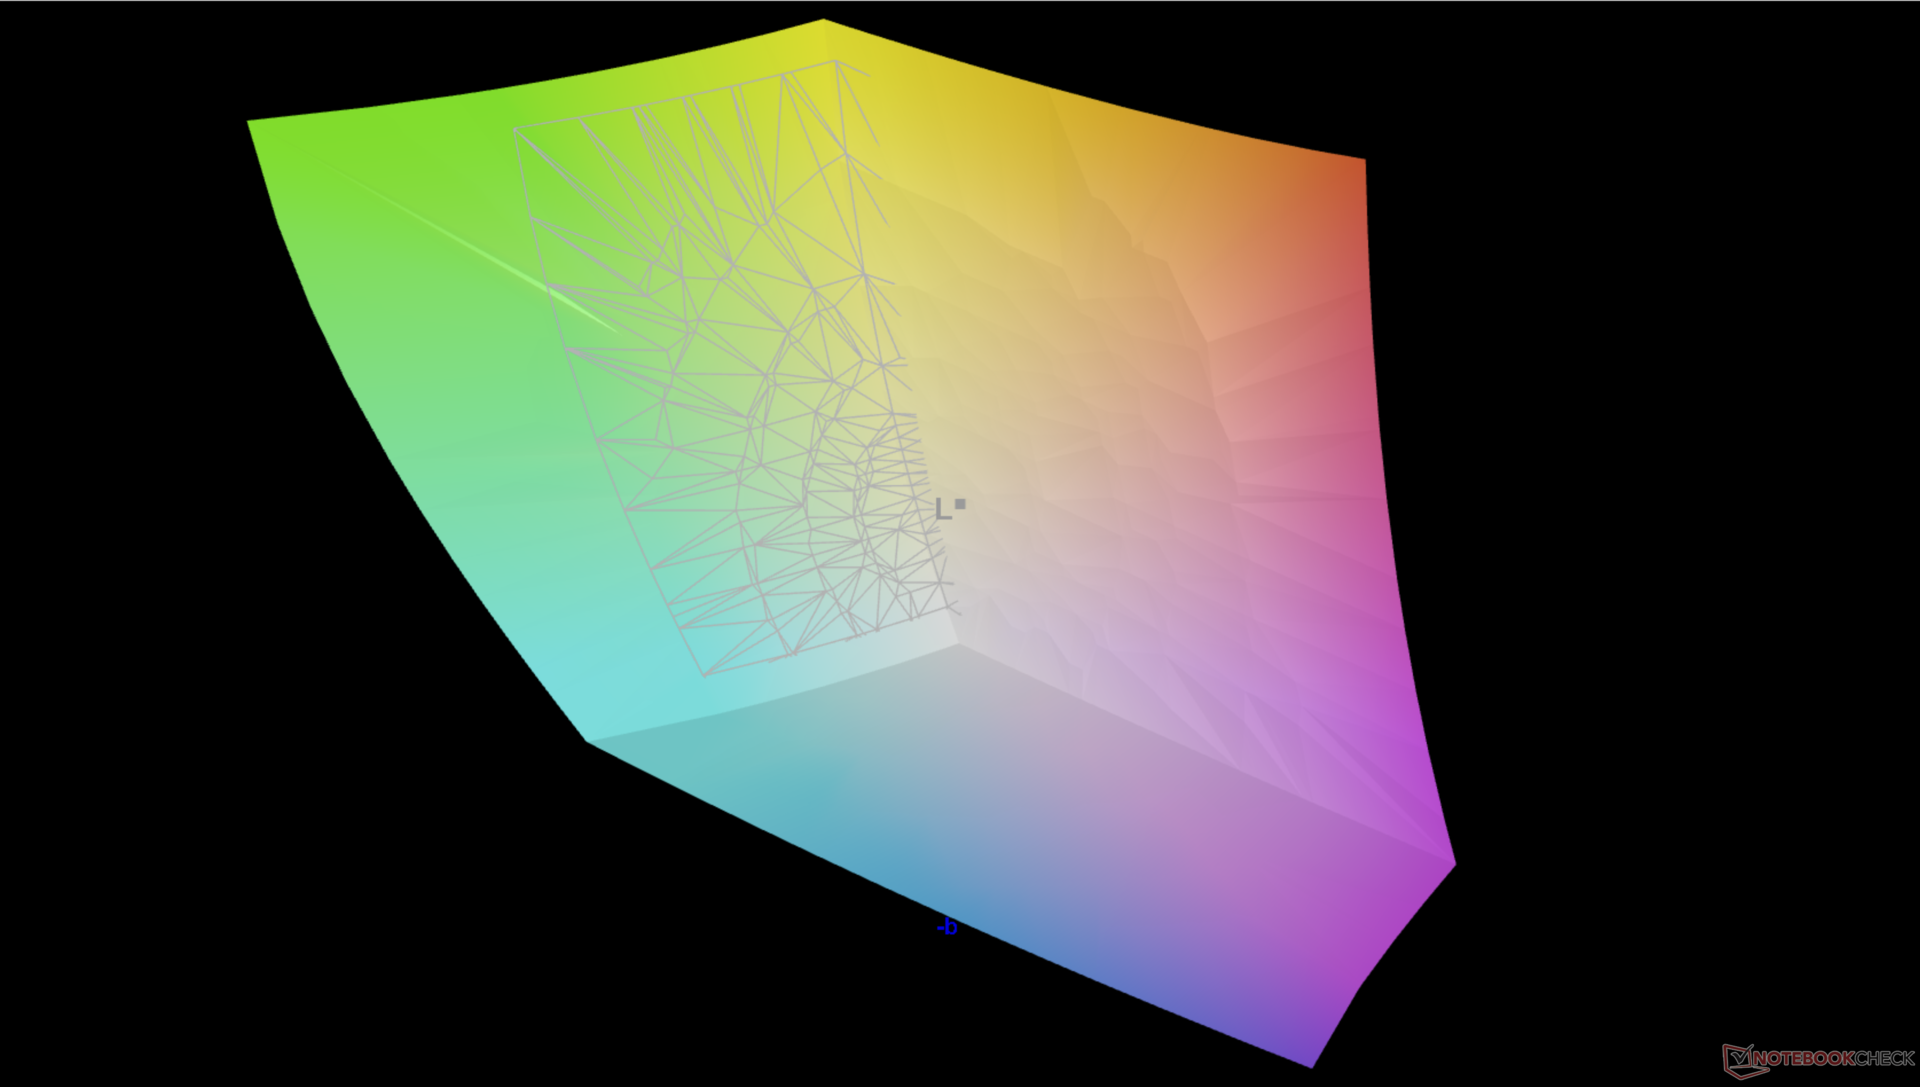
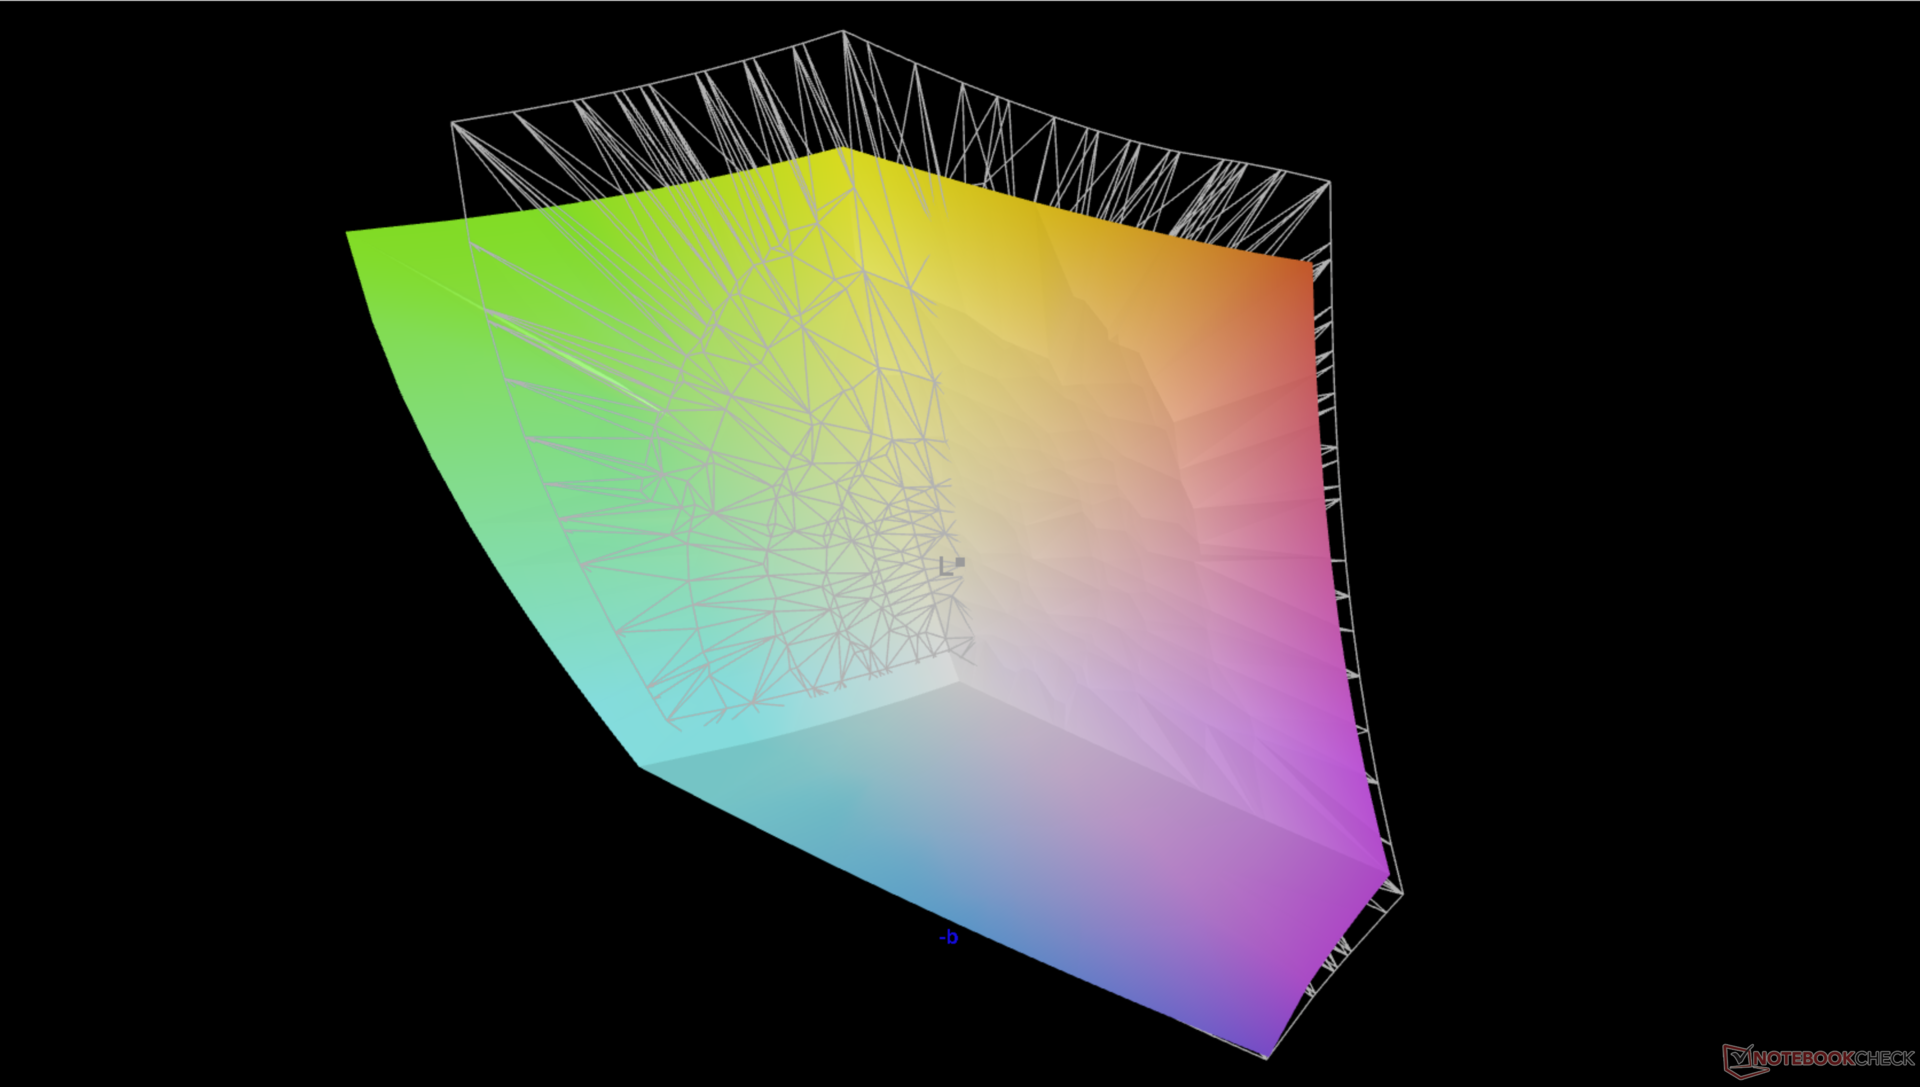
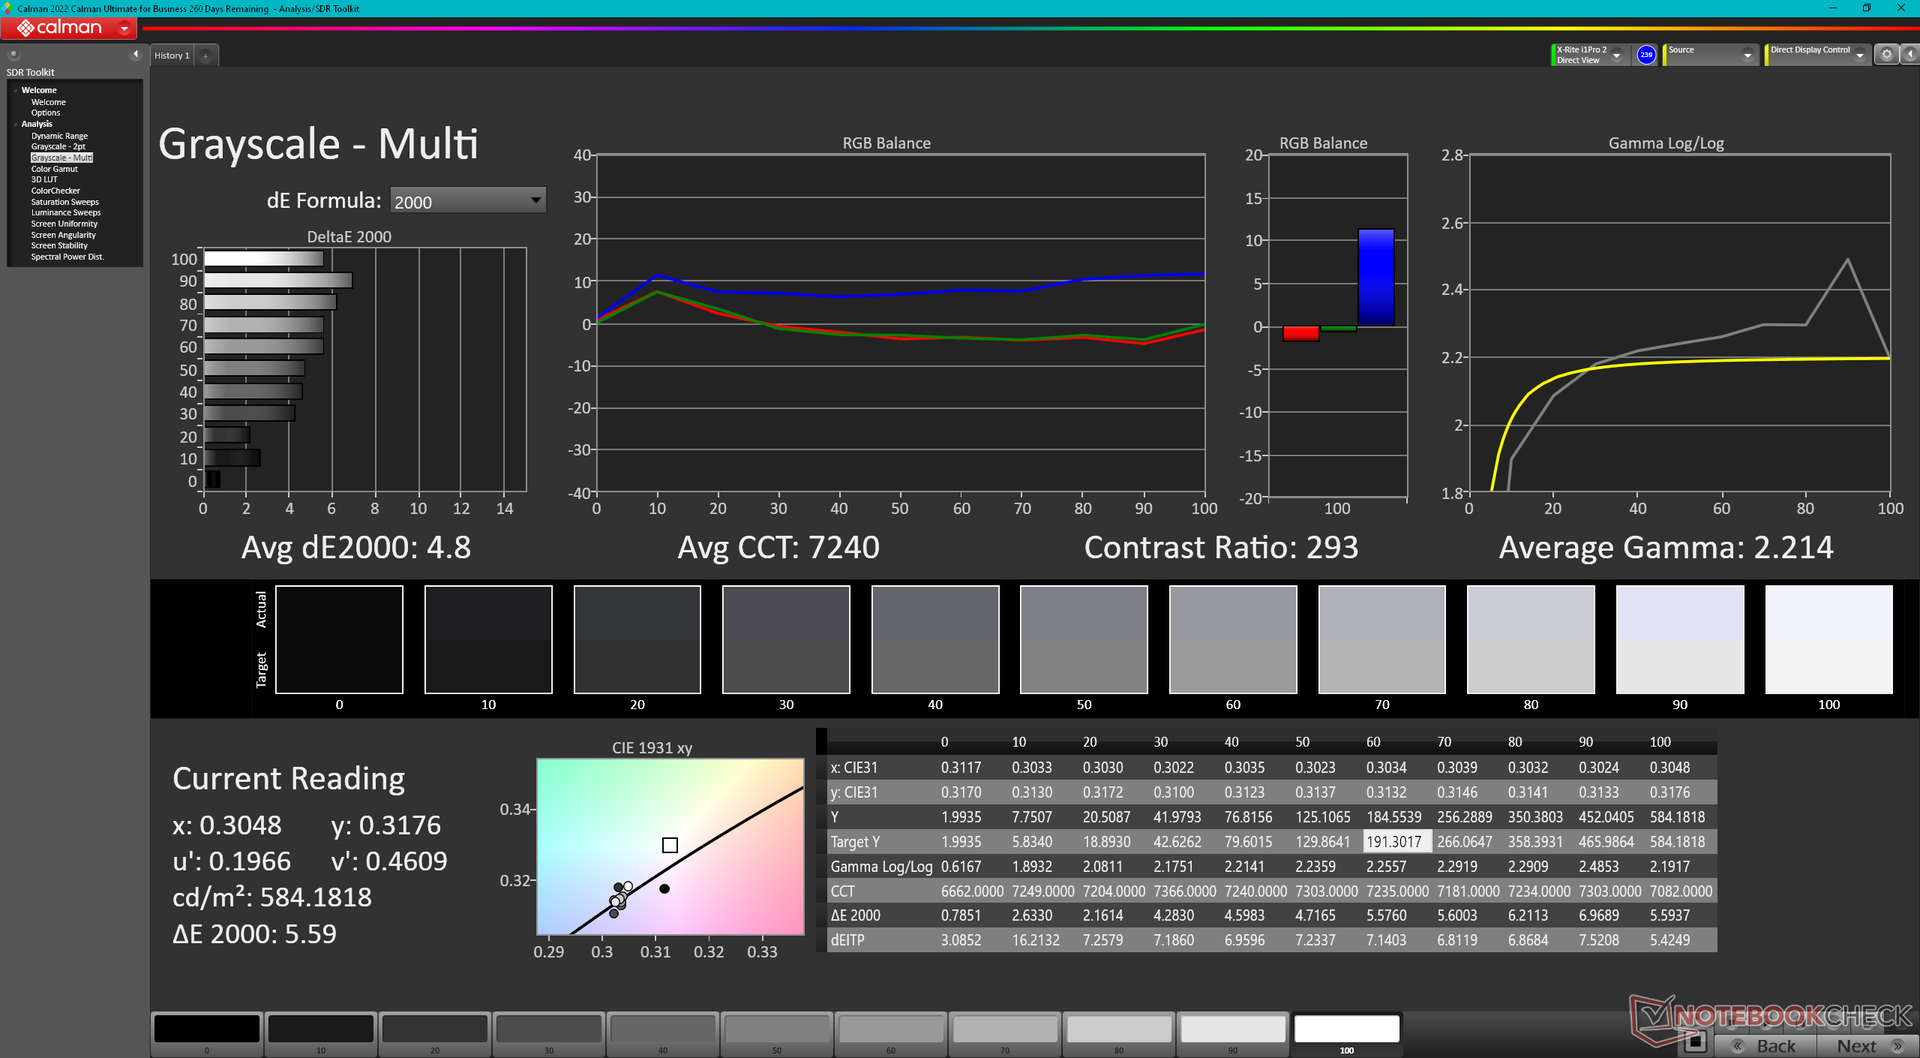
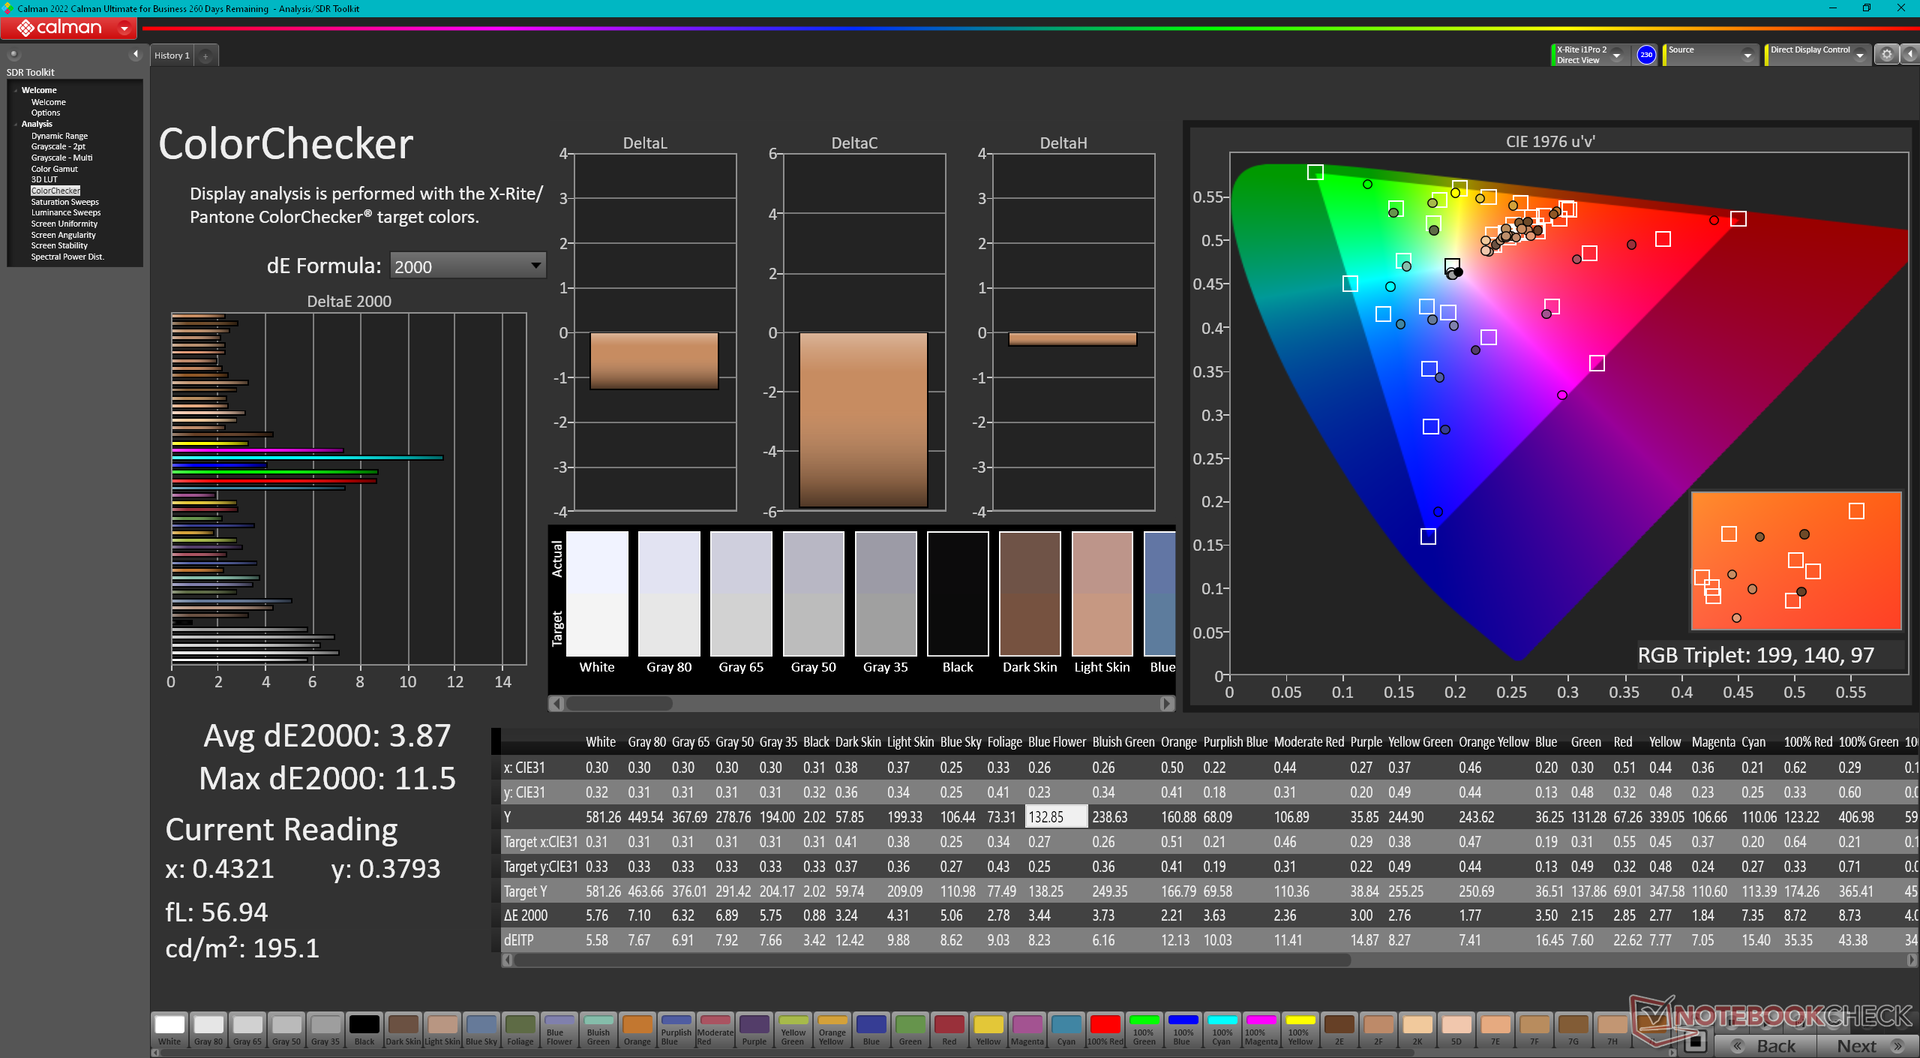
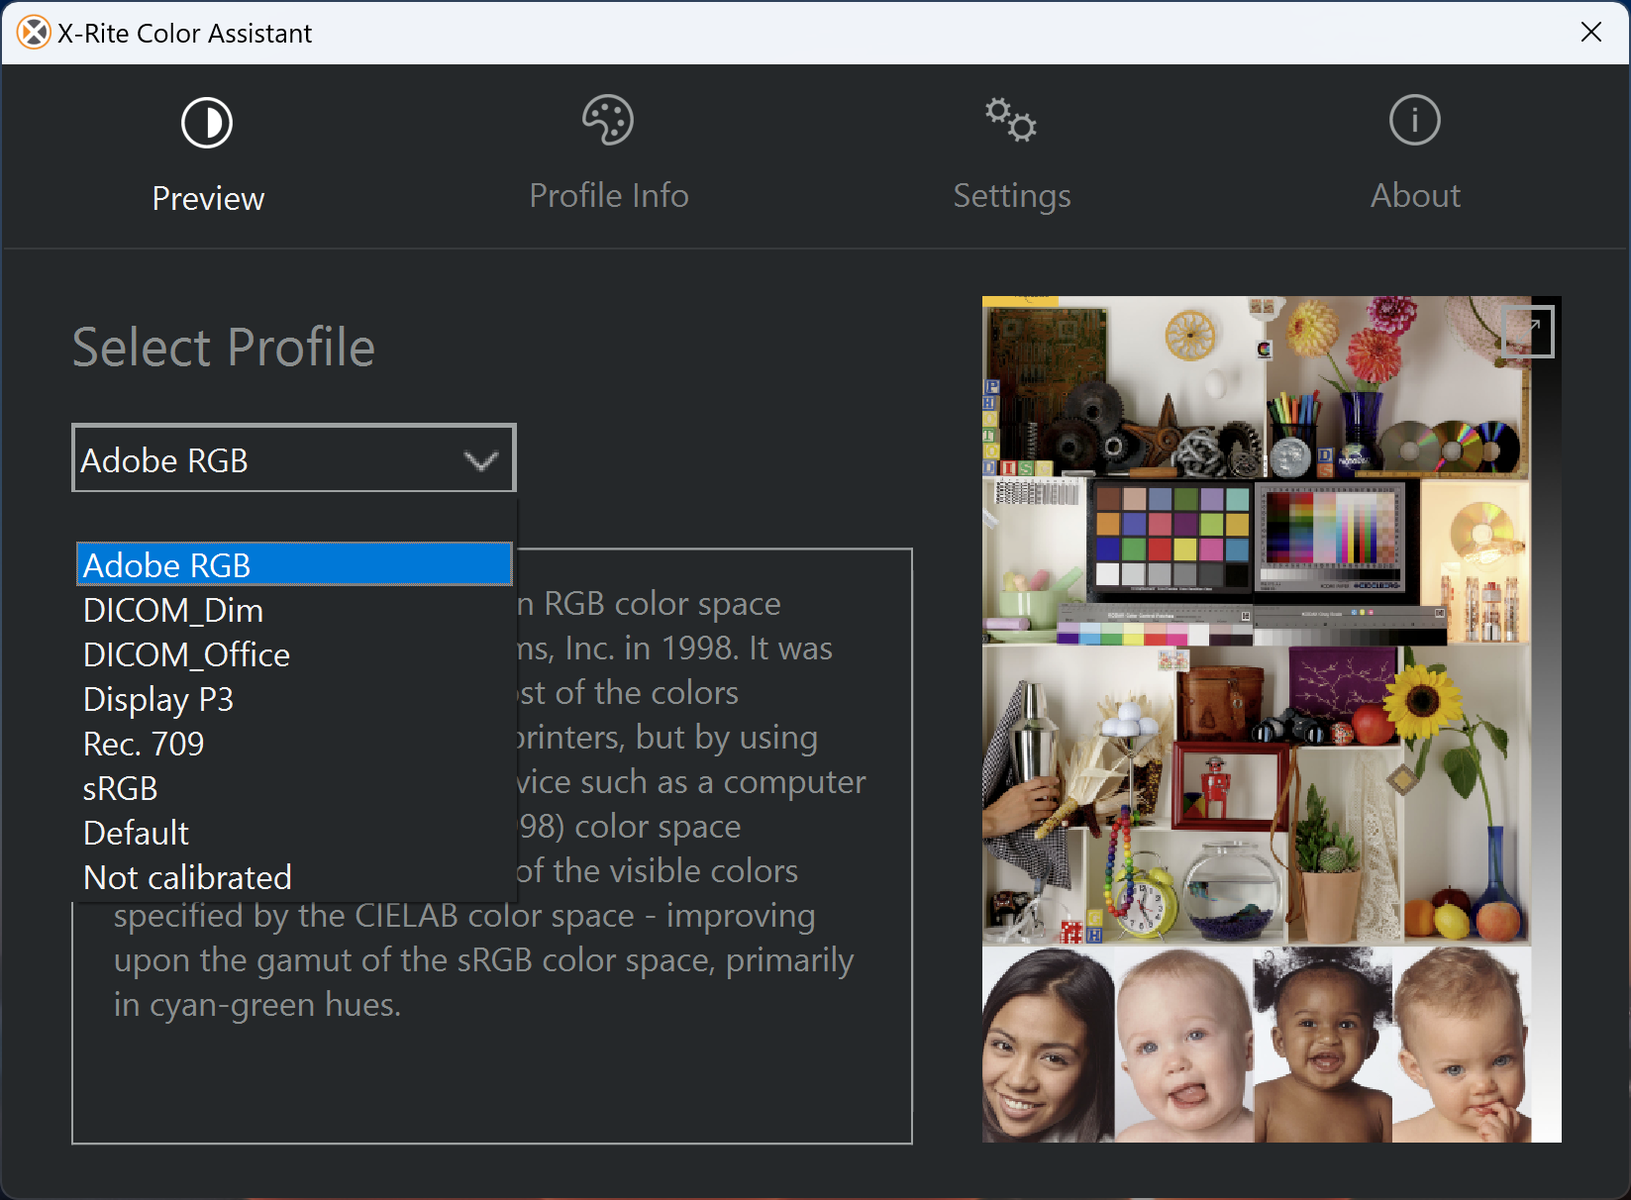
Il profilo colore può essere modificato tramite il software X-Rite Color Assistant preinstallato. Al momento sembra essere difettoso, in quanto i colori non sono così accurati come dovrebbero, nonostante la copertura AdobeRGB completa del nostro pannello. Se impostato in modalità sRGB, ad esempio, i valori medi deltaE della scala di grigi e del colore sono rispettivamente di 2,6 e 2,45, rispetto a 4,8 e 3,87 se impostato in modalità AdobeRGB.
Tempi di risposta del Display
| ↔ Tempi di risposta dal Nero al Bianco | ||
|---|---|---|
| 36.8 ms ... aumenta ↗ e diminuisce ↘ combinato | ↗ 19.6 ms Incremento | 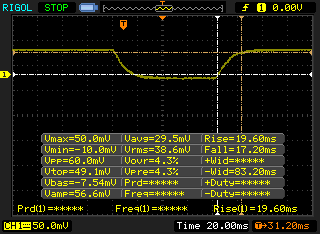 |
| ↘ 17.2 ms Calo | ||
| Lo schermo mostra tempi di risposta lenti nei nostri tests e sarà insoddisfacente per i gamers. In confronto, tutti i dispositivi di test variano da 0.1 (minimo) a 240 (massimo) ms. » 95 % di tutti i dispositivi è migliore. Questo significa che i tempi di risposta rilevati sono peggiori rispetto alla media di tutti i dispositivi testati (19.8 ms). | ||
| ↔ Tempo di risposta dal 50% Grigio all'80% Grigio | ||
| 45.6 ms ... aumenta ↗ e diminuisce ↘ combinato | ↗ 21.2 ms Incremento | 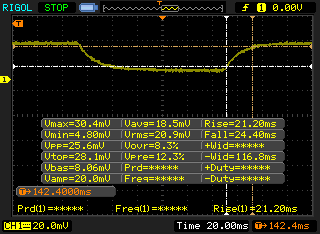 |
| ↘ 24.4 ms Calo | ||
| Lo schermo mostra tempi di risposta lenti nei nostri tests e sarà insoddisfacente per i gamers. In confronto, tutti i dispositivi di test variano da 0.165 (minimo) a 636 (massimo) ms. » 78 % di tutti i dispositivi è migliore. Questo significa che i tempi di risposta rilevati sono peggiori rispetto alla media di tutti i dispositivi testati (31 ms). | ||
Sfarfallio dello schermo / PWM (Pulse-Width Modulation)
| flickering dello schermo / PWM non rilevato | 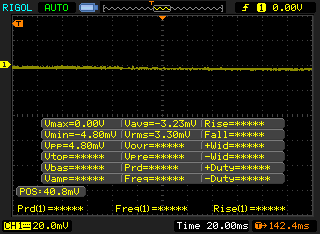 | ||
In confronto: 52 % di tutti i dispositivi testati non utilizza PWM per ridurre la luminosita' del display. Se è rilevato PWM, una media di 7747 (minimo: 5 - massimo: 343500) Hz è stata rilevata. | |||
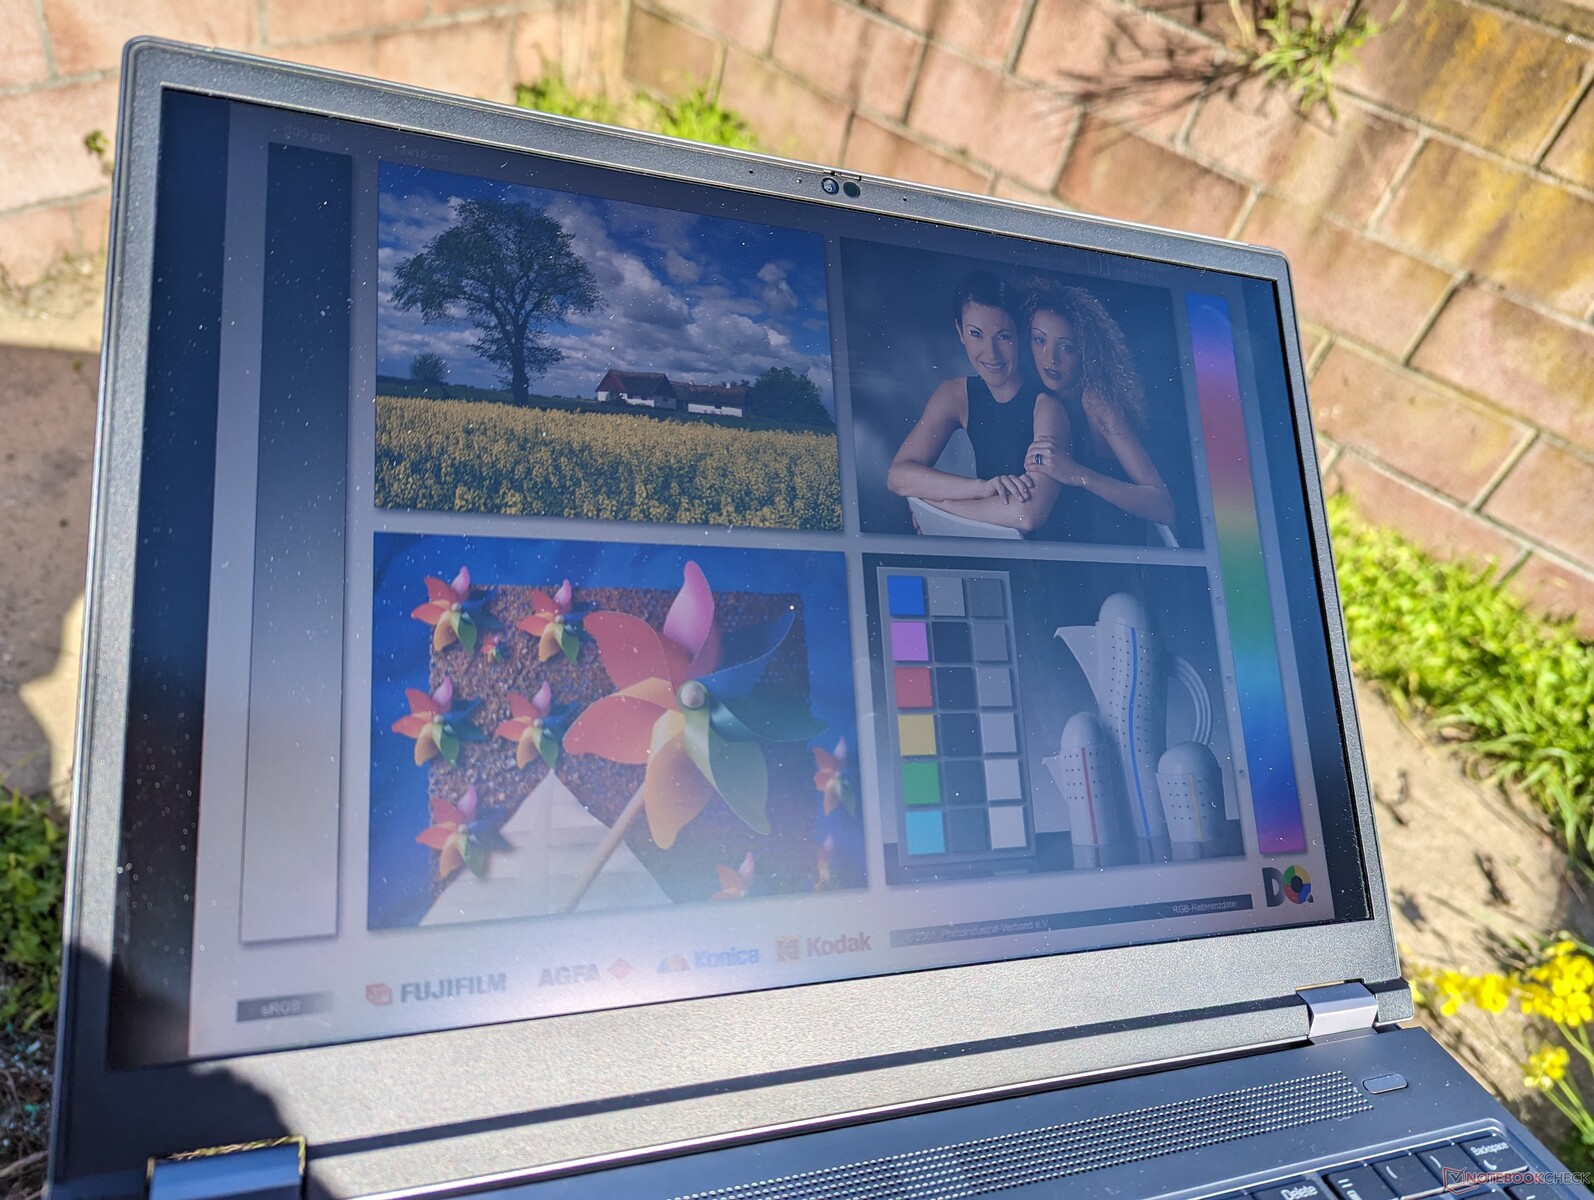
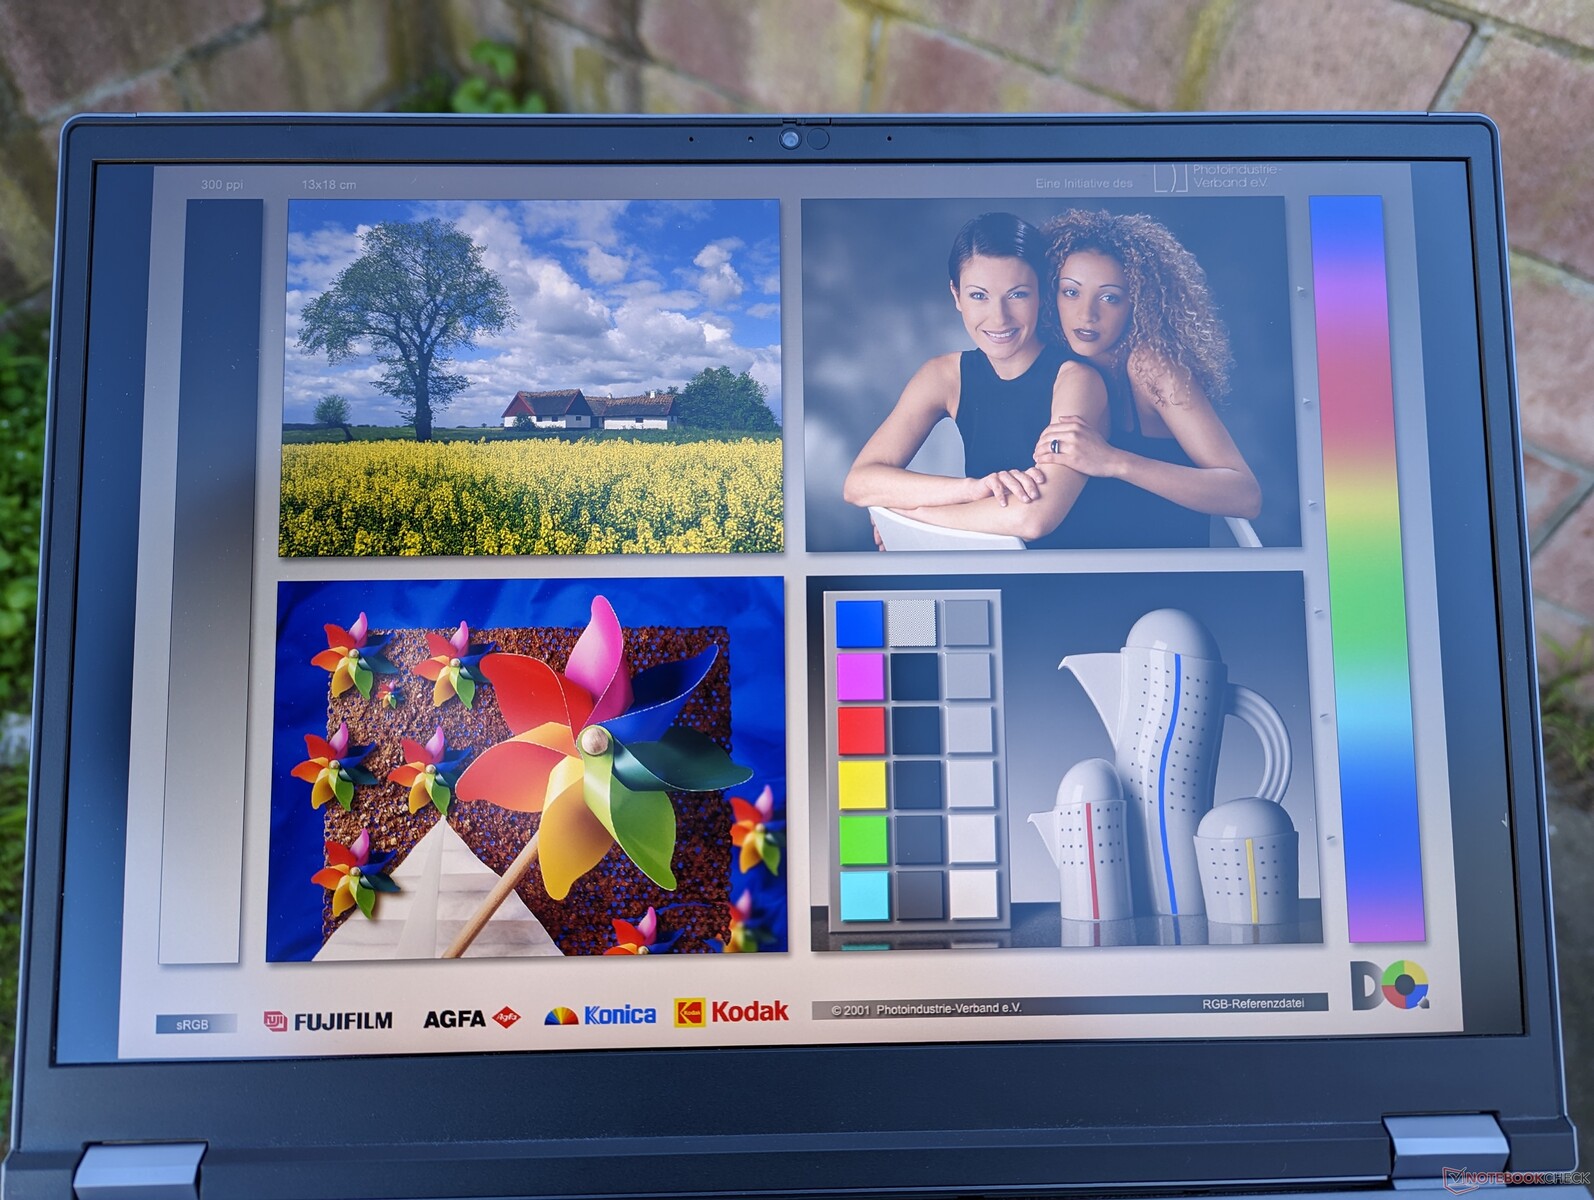
La visibilità all'aperto è discreta, poiché il display è più luminoso rispetto alla maggior parte degli altri computer portatili, dove la gamma di 300-400 nit è più comune. Si consiglia comunque di lavorare all'ombra quando possibile, poiché la luce diretta del sole degrada la qualità dell'immagine e i colori.
Prestazioni
Condizioni di test
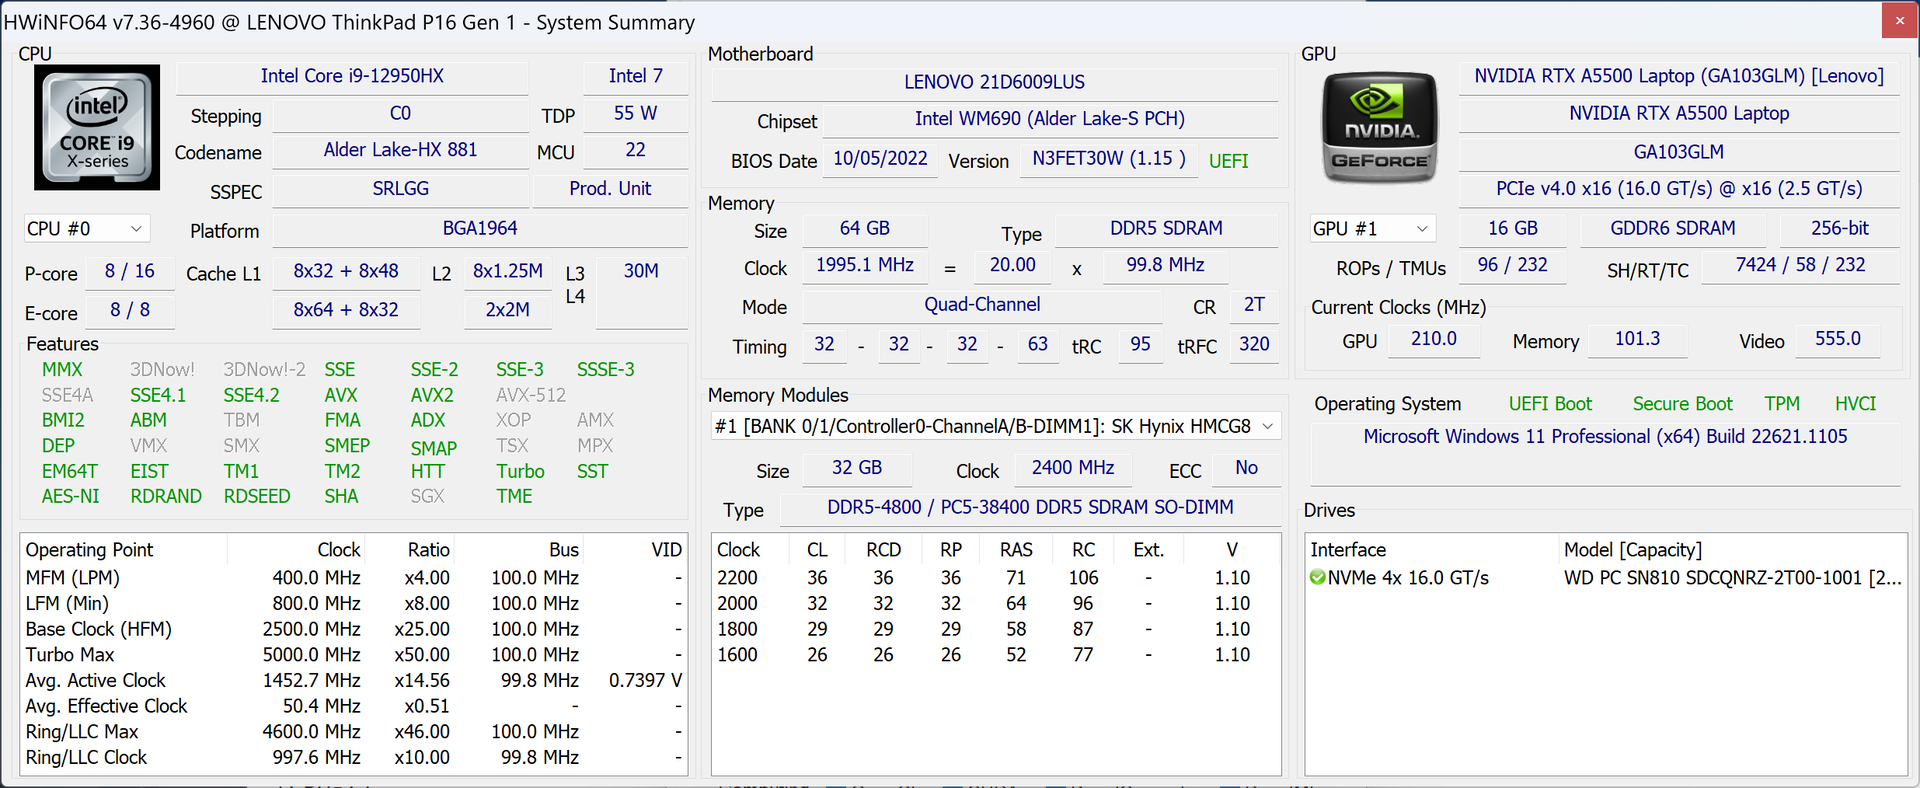
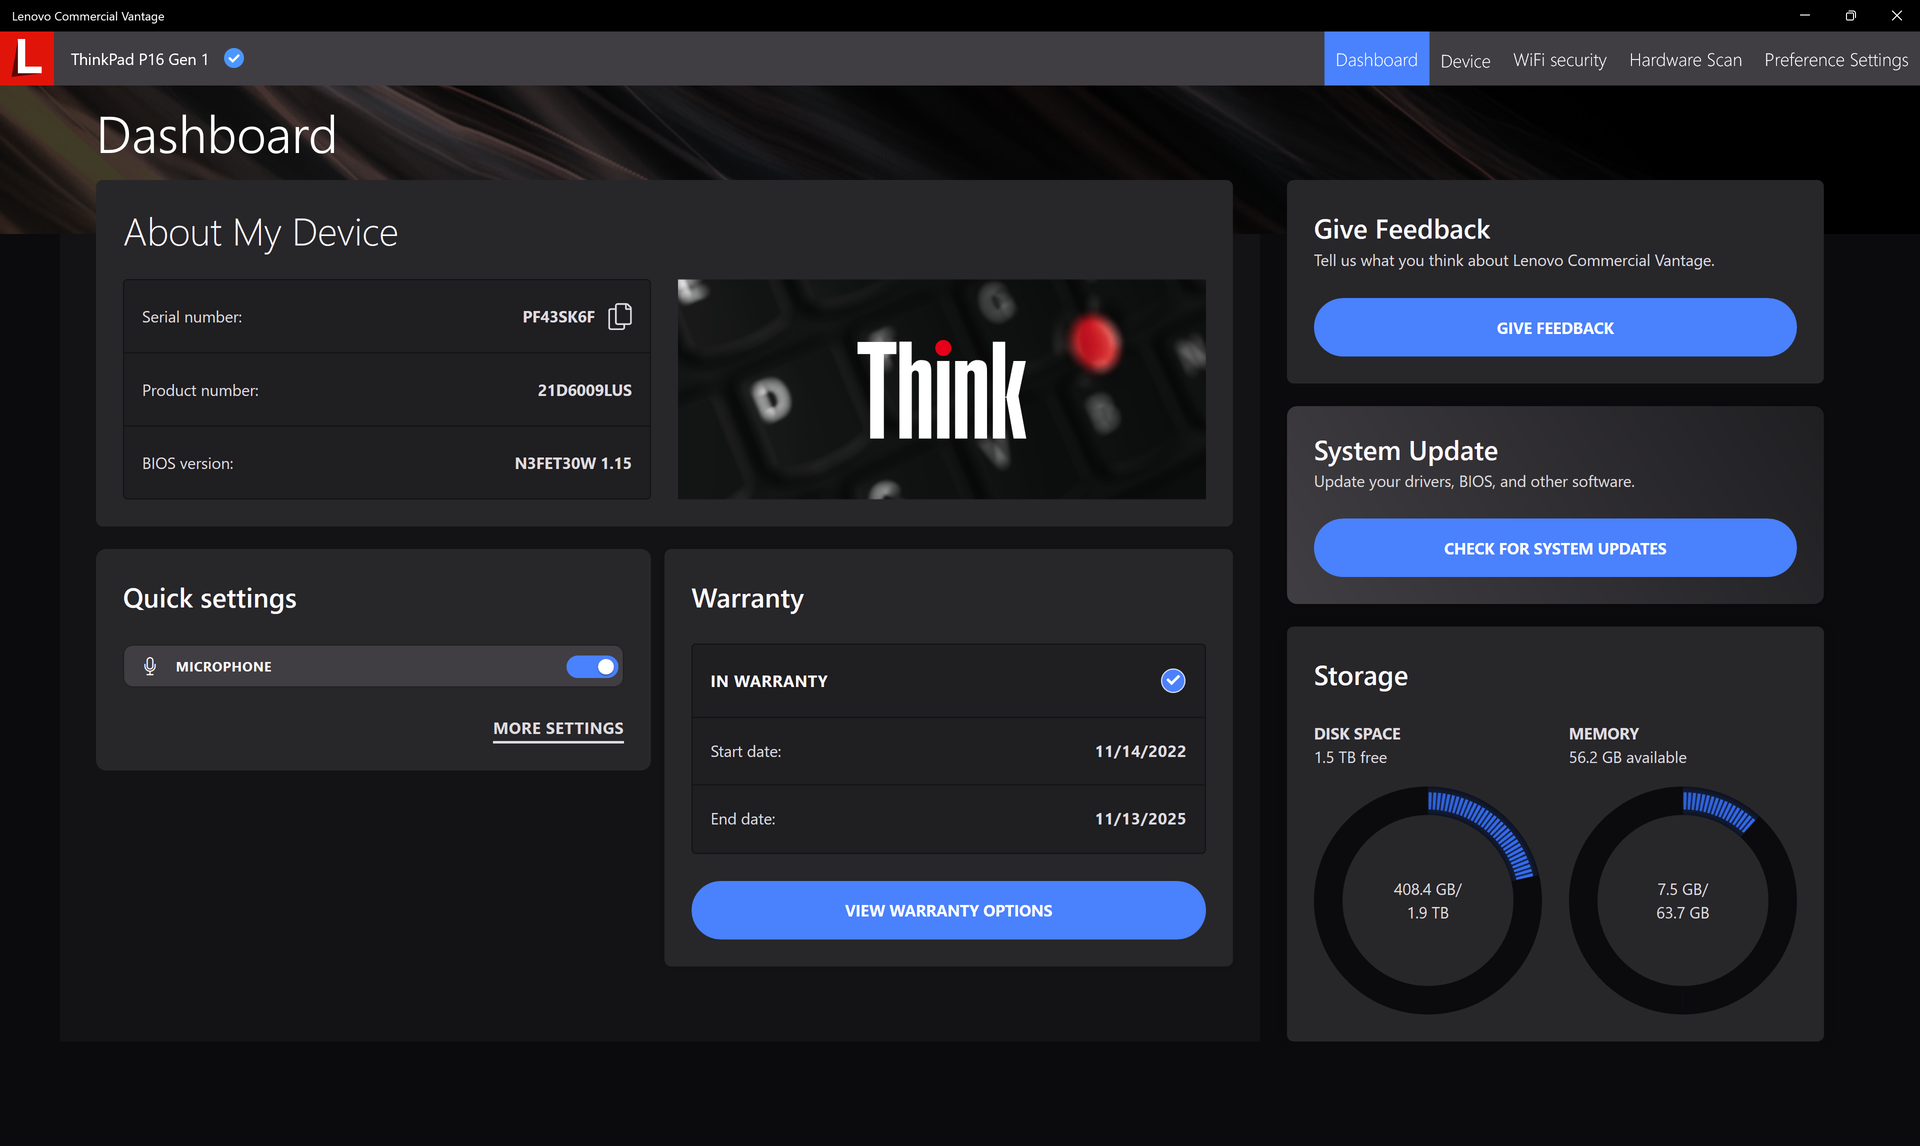
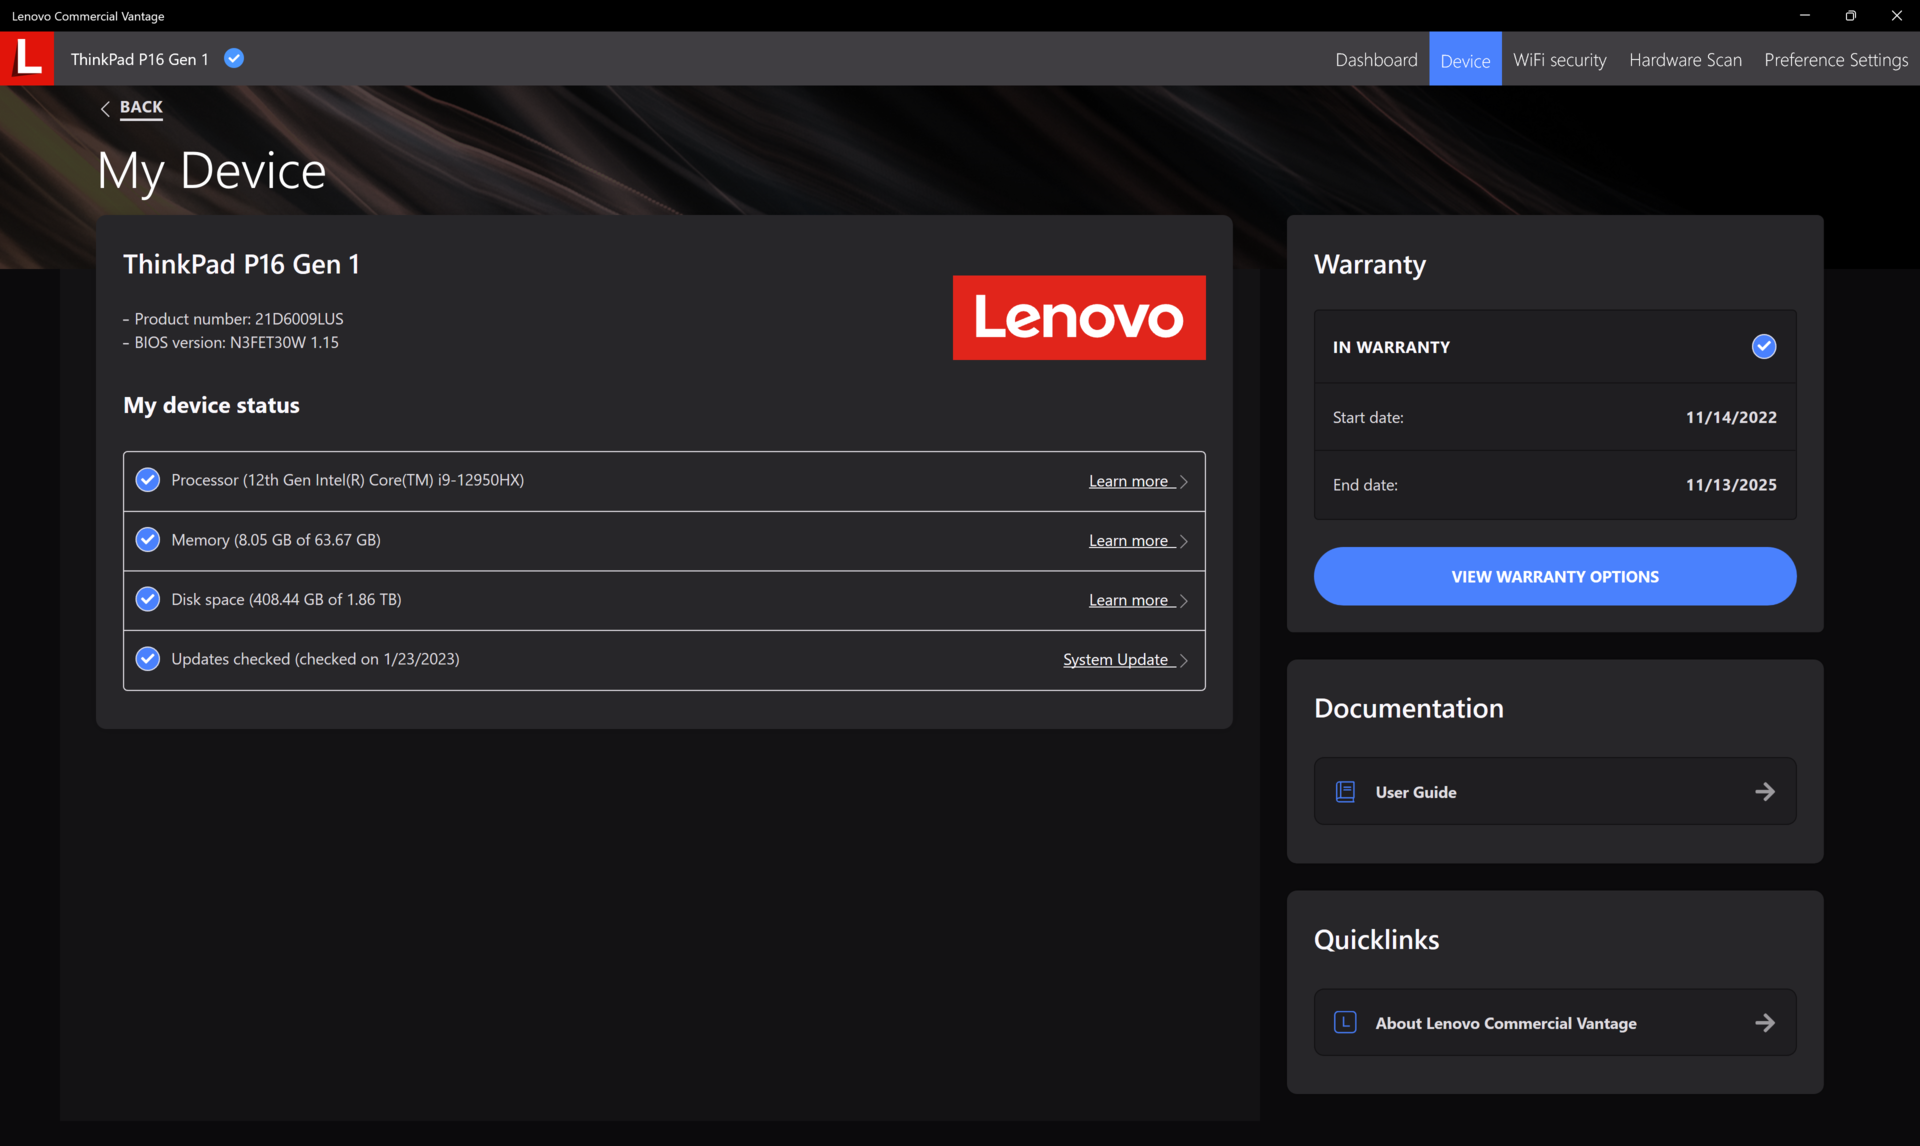
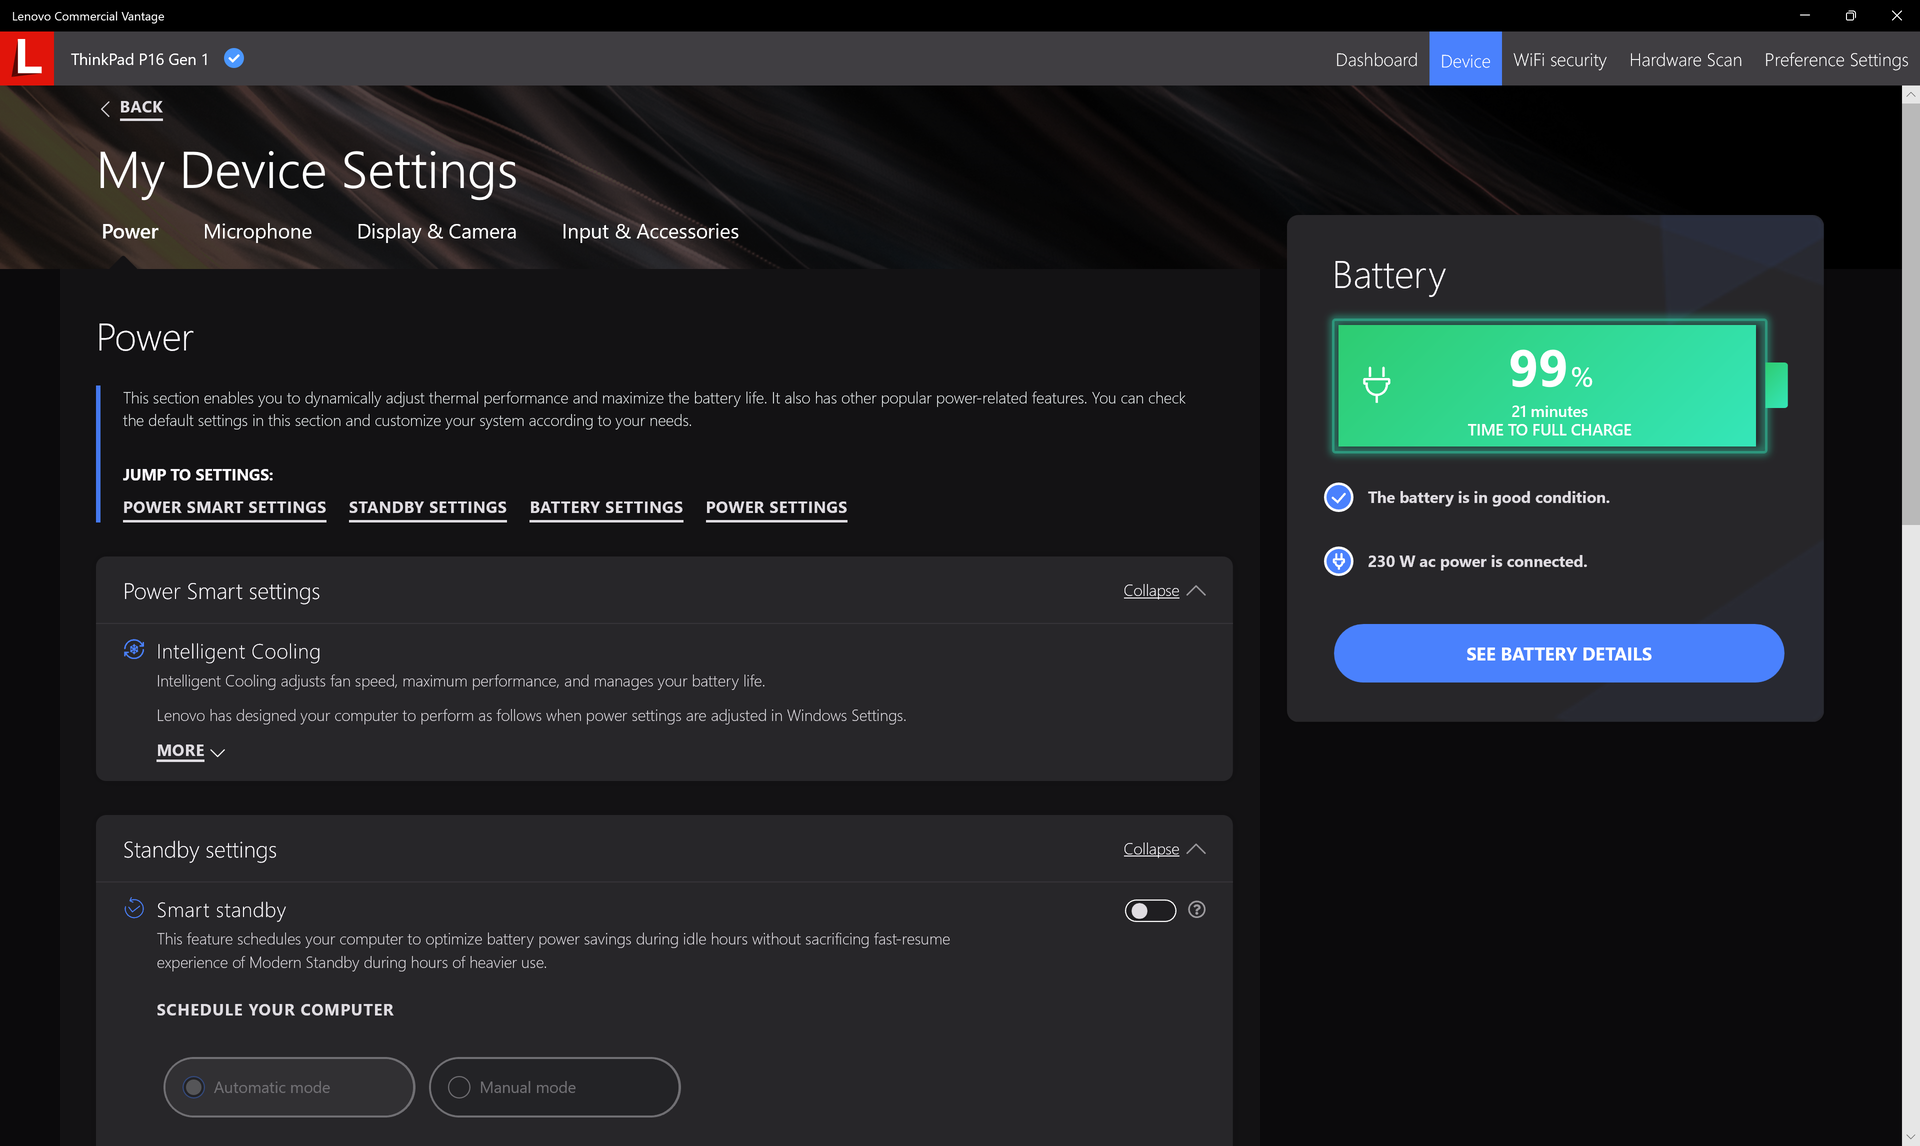
Abbiamo impostato la nostra unità in modalità Performance e dGPU rispettivamente tramite Windows e il pannello di controllo Nvidia, prima di eseguire i benchmark delle prestazioni riportati di seguito. Si consiglia agli utenti di familiarizzare con il software Lenovo Vantage preinstallato, in quanto è l'hub centrale per gli aggiornamenti del BIOS specifici di Lenovo, le funzioni, lo stato della garanzia e altro ancora.
Non ci sono opzioni per CPU Xeon e quindi la RAM ECC non è supportata. Tuttavia, lo stato ECC per la GPU può essere attivato o disattivato tramite il pannello di controllo Nvidia.
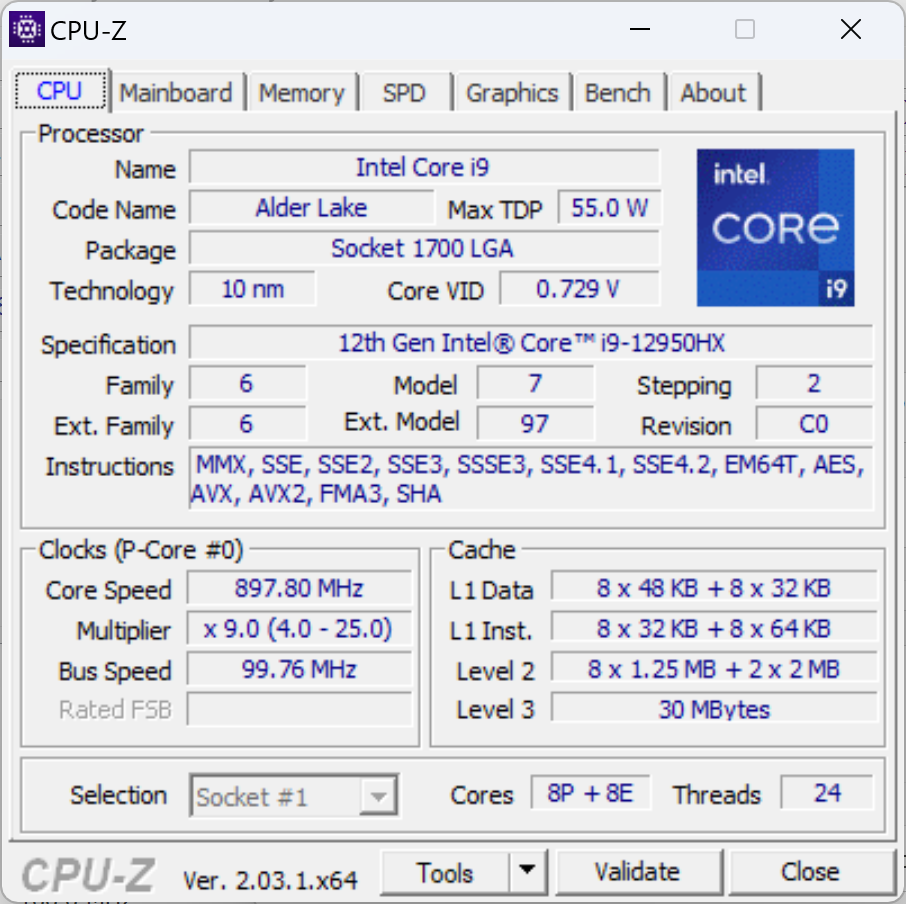
Processore
Le prestazioni multi-thread grezze sono circa il 10% più veloci rispetto al Core i9-12900H del concorrente MSI CreatorPro Z16P. Passando dalCore i7-12850HX alla nostra configurazione Core i9-12950HX aumenterà le prestazioni del 15%. Forse l'aspetto più significativo è che Precision 7670 è più lento del 15-20%, anche se viene fornito con la stessa CPU Core i9-12950HX del nostro Lenovo.
La sostenibilità del Turbo Boost è buona ma non perfetta. Quando si esegue CineBench R15 xT in loop, ad esempio, il punteggio originale di 3141 punti scende a circa 2830 punti nel tempo, con un calo delle prestazioni del 10%.
Cinebench R15 Multi Loop
Cinebench R23: Multi Core | Single Core
Cinebench R20: CPU (Multi Core) | CPU (Single Core)
Cinebench R15: CPU Multi 64Bit | CPU Single 64Bit
Blender: v2.79 BMW27 CPU
7-Zip 18.03: 7z b 4 | 7z b 4 -mmt1
Geekbench 5.5: Multi-Core | Single-Core
HWBOT x265 Benchmark v2.2: 4k Preset
LibreOffice : 20 Documents To PDF
R Benchmark 2.5: Overall mean
* ... Meglio usare valori piccoli
AIDA64: FP32 Ray-Trace | FPU Julia | CPU SHA3 | CPU Queen | FPU SinJulia | FPU Mandel | CPU AES | CPU ZLib | FP64 Ray-Trace | CPU PhotoWorxx
| Performance rating | |
| Media Intel Core i9-12950HX | |
| Lenovo ThinkPad P16 G1 RTX A5500 | |
| Lenovo ThinkPad P16 G1 21D6001DMB | |
| MSI CreatorPro Z16P B12UKST | |
| HP ZBook Studio 16 G9 62U04EA | |
| Dell Precision 7000 7670 Performance | |
| Asus ProArt StudioBook 16 W7600H5A-2BL2 -9! | |
| AIDA64 / FP32 Ray-Trace | |
| Lenovo ThinkPad P16 G1 RTX A5500 | |
| Media Intel Core i9-12950HX (15499 - 22868, n=7) | |
| Lenovo ThinkPad P16 G1 21D6001DMB | |
| Dell Precision 7000 7670 Performance | |
| HP ZBook Studio 16 G9 62U04EA | |
| MSI CreatorPro Z16P B12UKST | |
| AIDA64 / FPU Julia | |
| Lenovo ThinkPad P16 G1 RTX A5500 | |
| Media Intel Core i9-12950HX (77846 - 115907, n=7) | |
| Lenovo ThinkPad P16 G1 21D6001DMB | |
| HP ZBook Studio 16 G9 62U04EA | |
| Dell Precision 7000 7670 Performance | |
| MSI CreatorPro Z16P B12UKST | |
| AIDA64 / CPU SHA3 | |
| Lenovo ThinkPad P16 G1 RTX A5500 | |
| Media Intel Core i9-12950HX (3426 - 5069, n=7) | |
| Lenovo ThinkPad P16 G1 21D6001DMB | |
| HP ZBook Studio 16 G9 62U04EA | |
| MSI CreatorPro Z16P B12UKST | |
| Dell Precision 7000 7670 Performance | |
| AIDA64 / CPU Queen | |
| HP ZBook Studio 16 G9 62U04EA | |
| Media Intel Core i9-12950HX (102752 - 104726, n=7) | |
| Lenovo ThinkPad P16 G1 RTX A5500 | |
| Dell Precision 7000 7670 Performance | |
| MSI CreatorPro Z16P B12UKST | |
| Lenovo ThinkPad P16 G1 21D6001DMB | |
| AIDA64 / FPU SinJulia | |
| Lenovo ThinkPad P16 G1 RTX A5500 | |
| Media Intel Core i9-12950HX (10134 - 12823, n=7) | |
| Lenovo ThinkPad P16 G1 21D6001DMB | |
| Dell Precision 7000 7670 Performance | |
| HP ZBook Studio 16 G9 62U04EA | |
| MSI CreatorPro Z16P B12UKST | |
| AIDA64 / FPU Mandel | |
| Lenovo ThinkPad P16 G1 RTX A5500 | |
| Media Intel Core i9-12950HX (37146 - 57340, n=7) | |
| Lenovo ThinkPad P16 G1 21D6001DMB | |
| HP ZBook Studio 16 G9 62U04EA | |
| Dell Precision 7000 7670 Performance | |
| MSI CreatorPro Z16P B12UKST | |
| AIDA64 / CPU AES | |
| MSI CreatorPro Z16P B12UKST | |
| Media Intel Core i9-12950HX (72599 - 181128, n=7) | |
| Lenovo ThinkPad P16 G1 RTX A5500 | |
| Lenovo ThinkPad P16 G1 21D6001DMB | |
| HP ZBook Studio 16 G9 62U04EA | |
| Dell Precision 7000 7670 Performance | |
| AIDA64 / FP64 Ray-Trace | |
| Lenovo ThinkPad P16 G1 RTX A5500 | |
| Media Intel Core i9-12950HX (8455 - 12432, n=7) | |
| Lenovo ThinkPad P16 G1 21D6001DMB | |
| HP ZBook Studio 16 G9 62U04EA | |
| Dell Precision 7000 7670 Performance | |
| MSI CreatorPro Z16P B12UKST | |
| AIDA64 / CPU PhotoWorxx | |
| MSI CreatorPro Z16P B12UKST | |
| Dell Precision 7000 7670 Performance | |
| Media Intel Core i9-12950HX (35479 - 42655, n=7) | |
| Lenovo ThinkPad P16 G1 RTX A5500 | |
| HP ZBook Studio 16 G9 62U04EA | |
| Lenovo ThinkPad P16 G1 21D6001DMB | |
Prestazioni del sistema
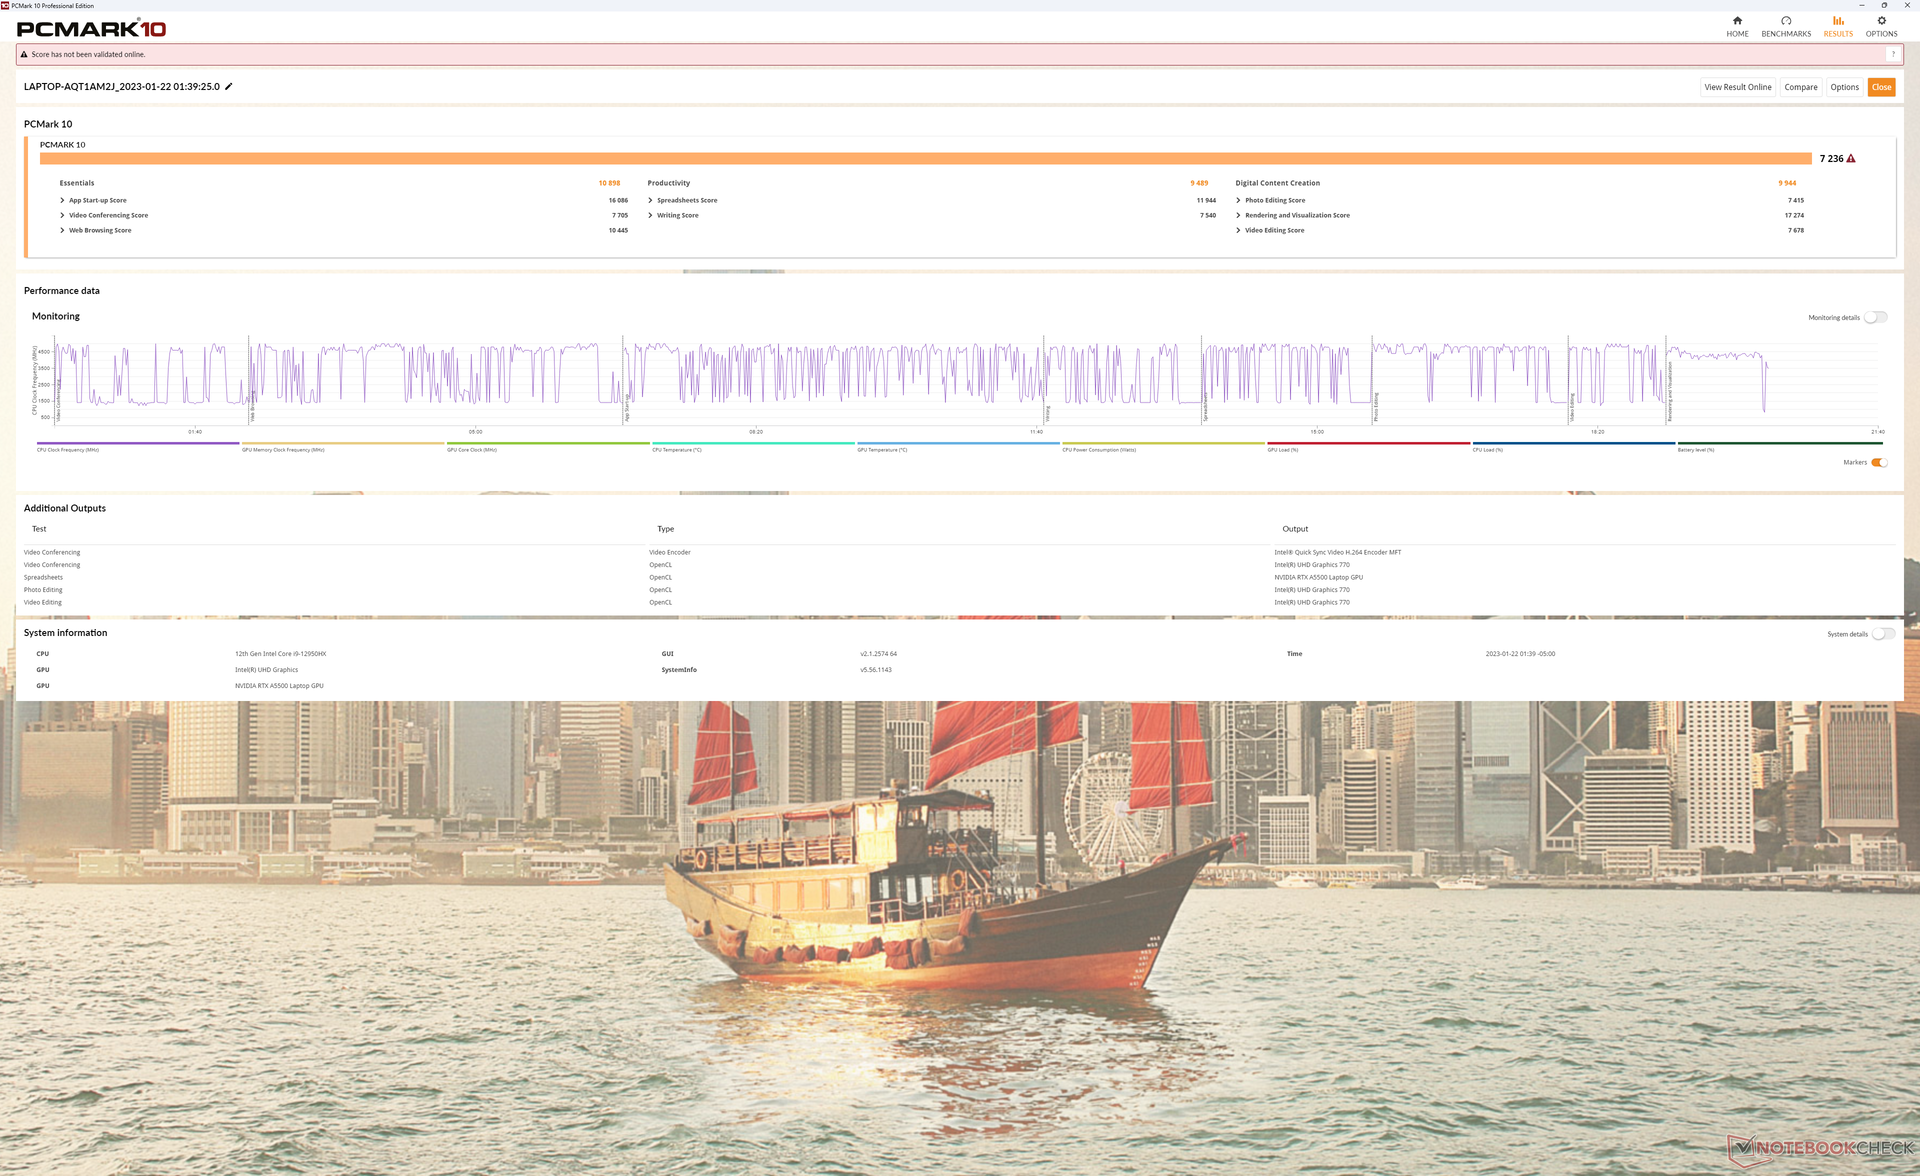
I punteggi di PCMark sono tra i più alti che abbiamo visto su qualsiasi workstation mobile. Il nostro sistema supera persino il Dell Precision 7670 che viene fornito con le stesse opzioni di CPU e GPU del ThinkPad P16 G1.
CrossMark: Overall | Productivity | Creativity | Responsiveness
| PCMark 10 / Score | |
| Lenovo ThinkPad P16 G1 RTX A5500 | |
| MSI CreatorPro Z16P B12UKST | |
| Media Intel Core i9-12950HX, NVIDIA RTX A5500 Laptop GPU (6883 - 7236, n=3) | |
| Asus ProArt StudioBook 16 W7600H5A-2BL2 | |
| Dell Precision 7000 7670 Performance | |
| HP ZBook Studio 16 G9 62U04EA | |
| Lenovo ThinkPad P16 G1 21D6001DMB | |
| PCMark 10 / Essentials | |
| Dell Precision 7000 7670 Performance | |
| Media Intel Core i9-12950HX, NVIDIA RTX A5500 Laptop GPU (10898 - 11465, n=3) | |
| Lenovo ThinkPad P16 G1 RTX A5500 | |
| MSI CreatorPro Z16P B12UKST | |
| Asus ProArt StudioBook 16 W7600H5A-2BL2 | |
| Lenovo ThinkPad P16 G1 21D6001DMB | |
| HP ZBook Studio 16 G9 62U04EA | |
| PCMark 10 / Productivity | |
| Lenovo ThinkPad P16 G1 RTX A5500 | |
| MSI CreatorPro Z16P B12UKST | |
| Lenovo ThinkPad P16 G1 21D6001DMB | |
| Asus ProArt StudioBook 16 W7600H5A-2BL2 | |
| Media Intel Core i9-12950HX, NVIDIA RTX A5500 Laptop GPU (8054 - 9489, n=3) | |
| Dell Precision 7000 7670 Performance | |
| HP ZBook Studio 16 G9 62U04EA | |
| PCMark 10 / Digital Content Creation | |
| Asus ProArt StudioBook 16 W7600H5A-2BL2 | |
| Lenovo ThinkPad P16 G1 RTX A5500 | |
| MSI CreatorPro Z16P B12UKST | |
| Dell Precision 7000 7670 Performance | |
| Media Intel Core i9-12950HX, NVIDIA RTX A5500 Laptop GPU (9155 - 9944, n=3) | |
| HP ZBook Studio 16 G9 62U04EA | |
| Lenovo ThinkPad P16 G1 21D6001DMB | |
| CrossMark / Overall | |
| MSI CreatorPro Z16P B12UKST | |
| Lenovo ThinkPad P16 G1 RTX A5500 | |
| Media Intel Core i9-12950HX, NVIDIA RTX A5500 Laptop GPU (1801 - 1889, n=3) | |
| HP ZBook Studio 16 G9 62U04EA | |
| Dell Precision 7000 7670 Performance | |
| Lenovo ThinkPad P16 G1 21D6001DMB | |
| CrossMark / Productivity | |
| MSI CreatorPro Z16P B12UKST | |
| Lenovo ThinkPad P16 G1 RTX A5500 | |
| Media Intel Core i9-12950HX, NVIDIA RTX A5500 Laptop GPU (1684 - 1785, n=3) | |
| HP ZBook Studio 16 G9 62U04EA | |
| Dell Precision 7000 7670 Performance | |
| Lenovo ThinkPad P16 G1 21D6001DMB | |
| CrossMark / Creativity | |
| Lenovo ThinkPad P16 G1 RTX A5500 | |
| Media Intel Core i9-12950HX, NVIDIA RTX A5500 Laptop GPU (2042 - 2192, n=3) | |
| HP ZBook Studio 16 G9 62U04EA | |
| MSI CreatorPro Z16P B12UKST | |
| Dell Precision 7000 7670 Performance | |
| Lenovo ThinkPad P16 G1 21D6001DMB | |
| CrossMark / Responsiveness | |
| MSI CreatorPro Z16P B12UKST | |
| HP ZBook Studio 16 G9 62U04EA | |
| Media Intel Core i9-12950HX, NVIDIA RTX A5500 Laptop GPU (1501 - 1585, n=3) | |
| Dell Precision 7000 7670 Performance | |
| Lenovo ThinkPad P16 G1 RTX A5500 | |
| Lenovo ThinkPad P16 G1 21D6001DMB | |
| PCMark 10 Score | 7236 punti | |
Aiuto | ||
| AIDA64 / Memory Copy | |
| Dell Precision 7000 7670 Performance | |
| Media Intel Core i9-12950HX (59731 - 64732, n=7) | |
| Lenovo ThinkPad P16 G1 RTX A5500 | |
| MSI CreatorPro Z16P B12UKST | |
| HP ZBook Studio 16 G9 62U04EA | |
| Lenovo ThinkPad P16 G1 21D6001DMB | |
| AIDA64 / Memory Read | |
| Dell Precision 7000 7670 Performance | |
| Media Intel Core i9-12950HX (59744 - 70359, n=7) | |
| MSI CreatorPro Z16P B12UKST | |
| HP ZBook Studio 16 G9 62U04EA | |
| Lenovo ThinkPad P16 G1 RTX A5500 | |
| Lenovo ThinkPad P16 G1 21D6001DMB | |
| AIDA64 / Memory Write | |
| MSI CreatorPro Z16P B12UKST | |
| Dell Precision 7000 7670 Performance | |
| HP ZBook Studio 16 G9 62U04EA | |
| Media Intel Core i9-12950HX (57750 - 67899, n=7) | |
| Lenovo ThinkPad P16 G1 RTX A5500 | |
| Lenovo ThinkPad P16 G1 21D6001DMB | |
* ... Meglio usare valori piccoli
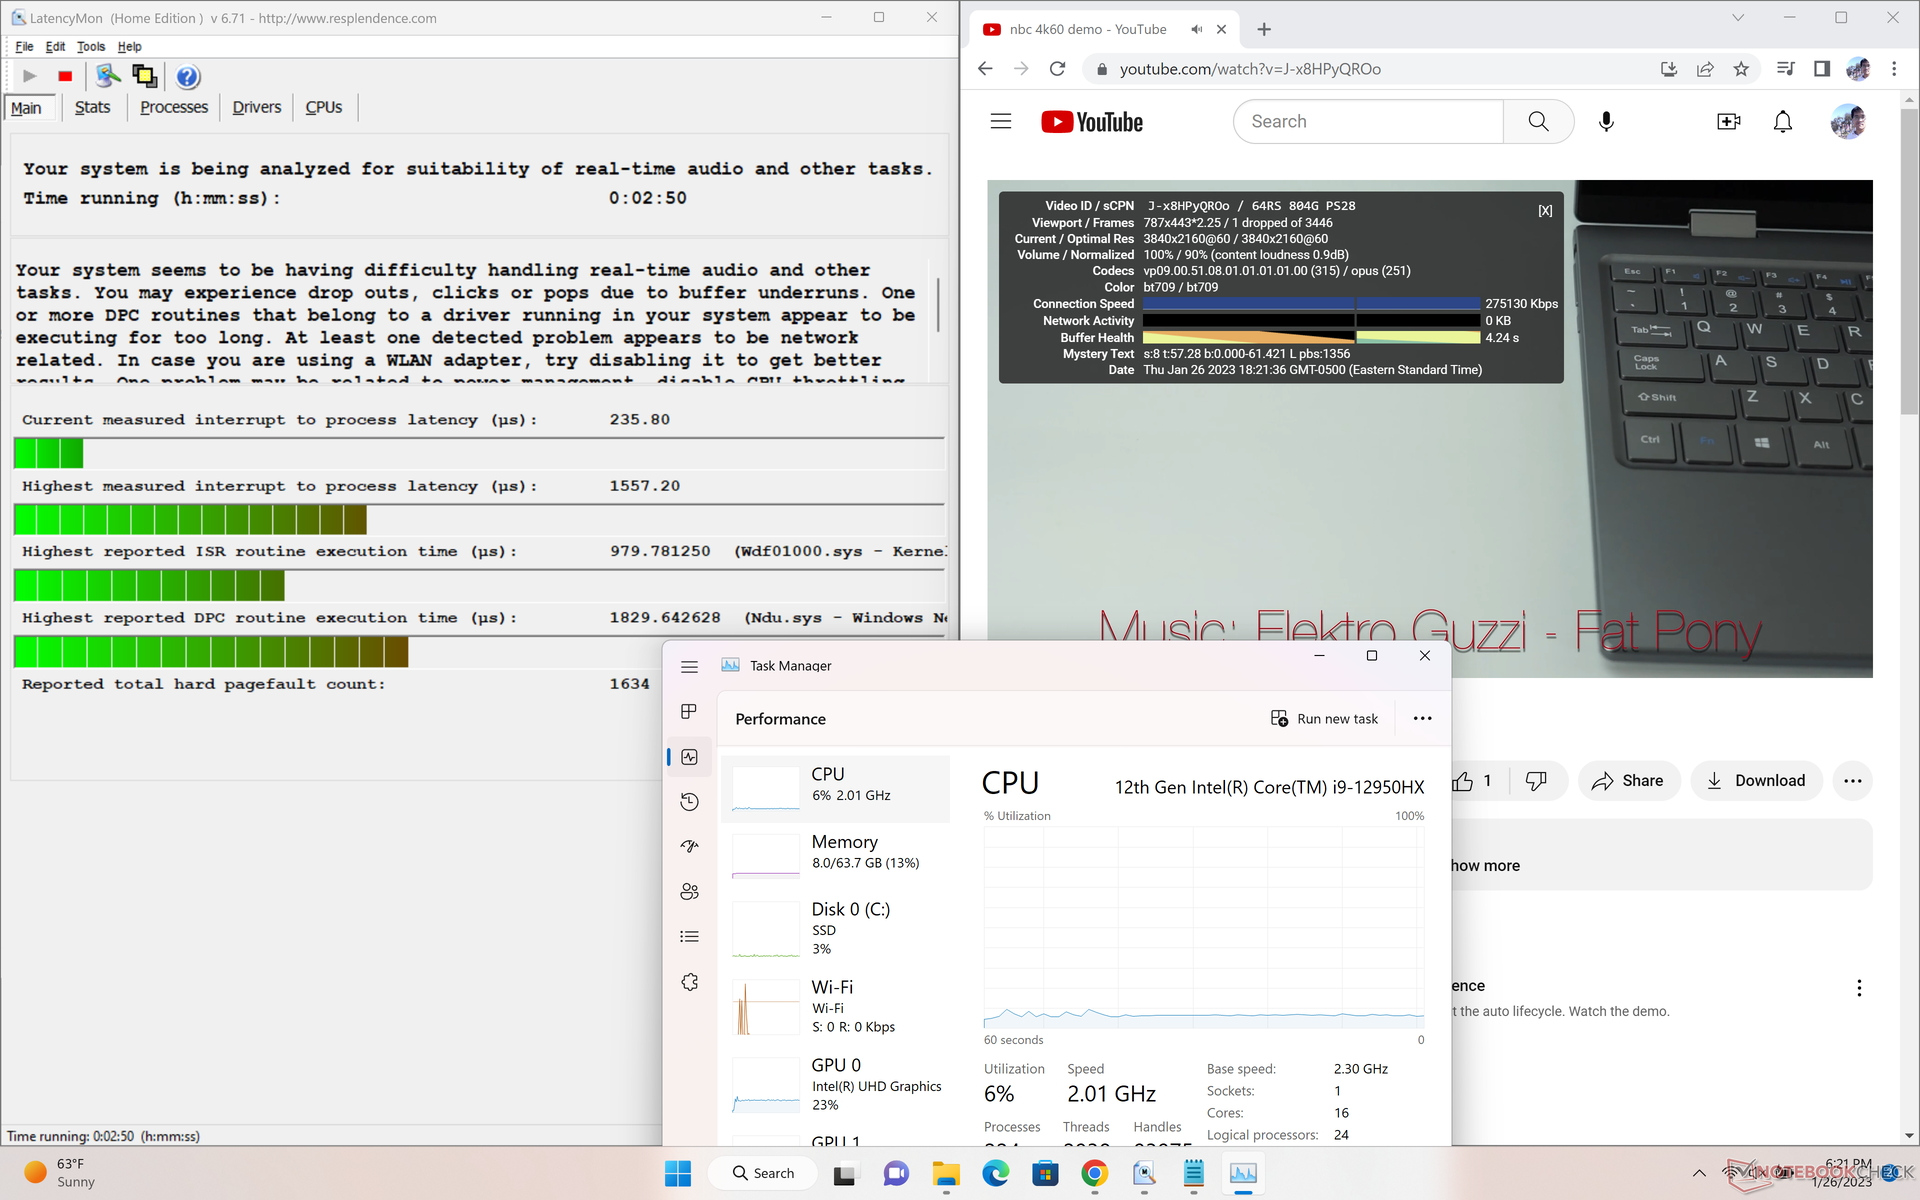
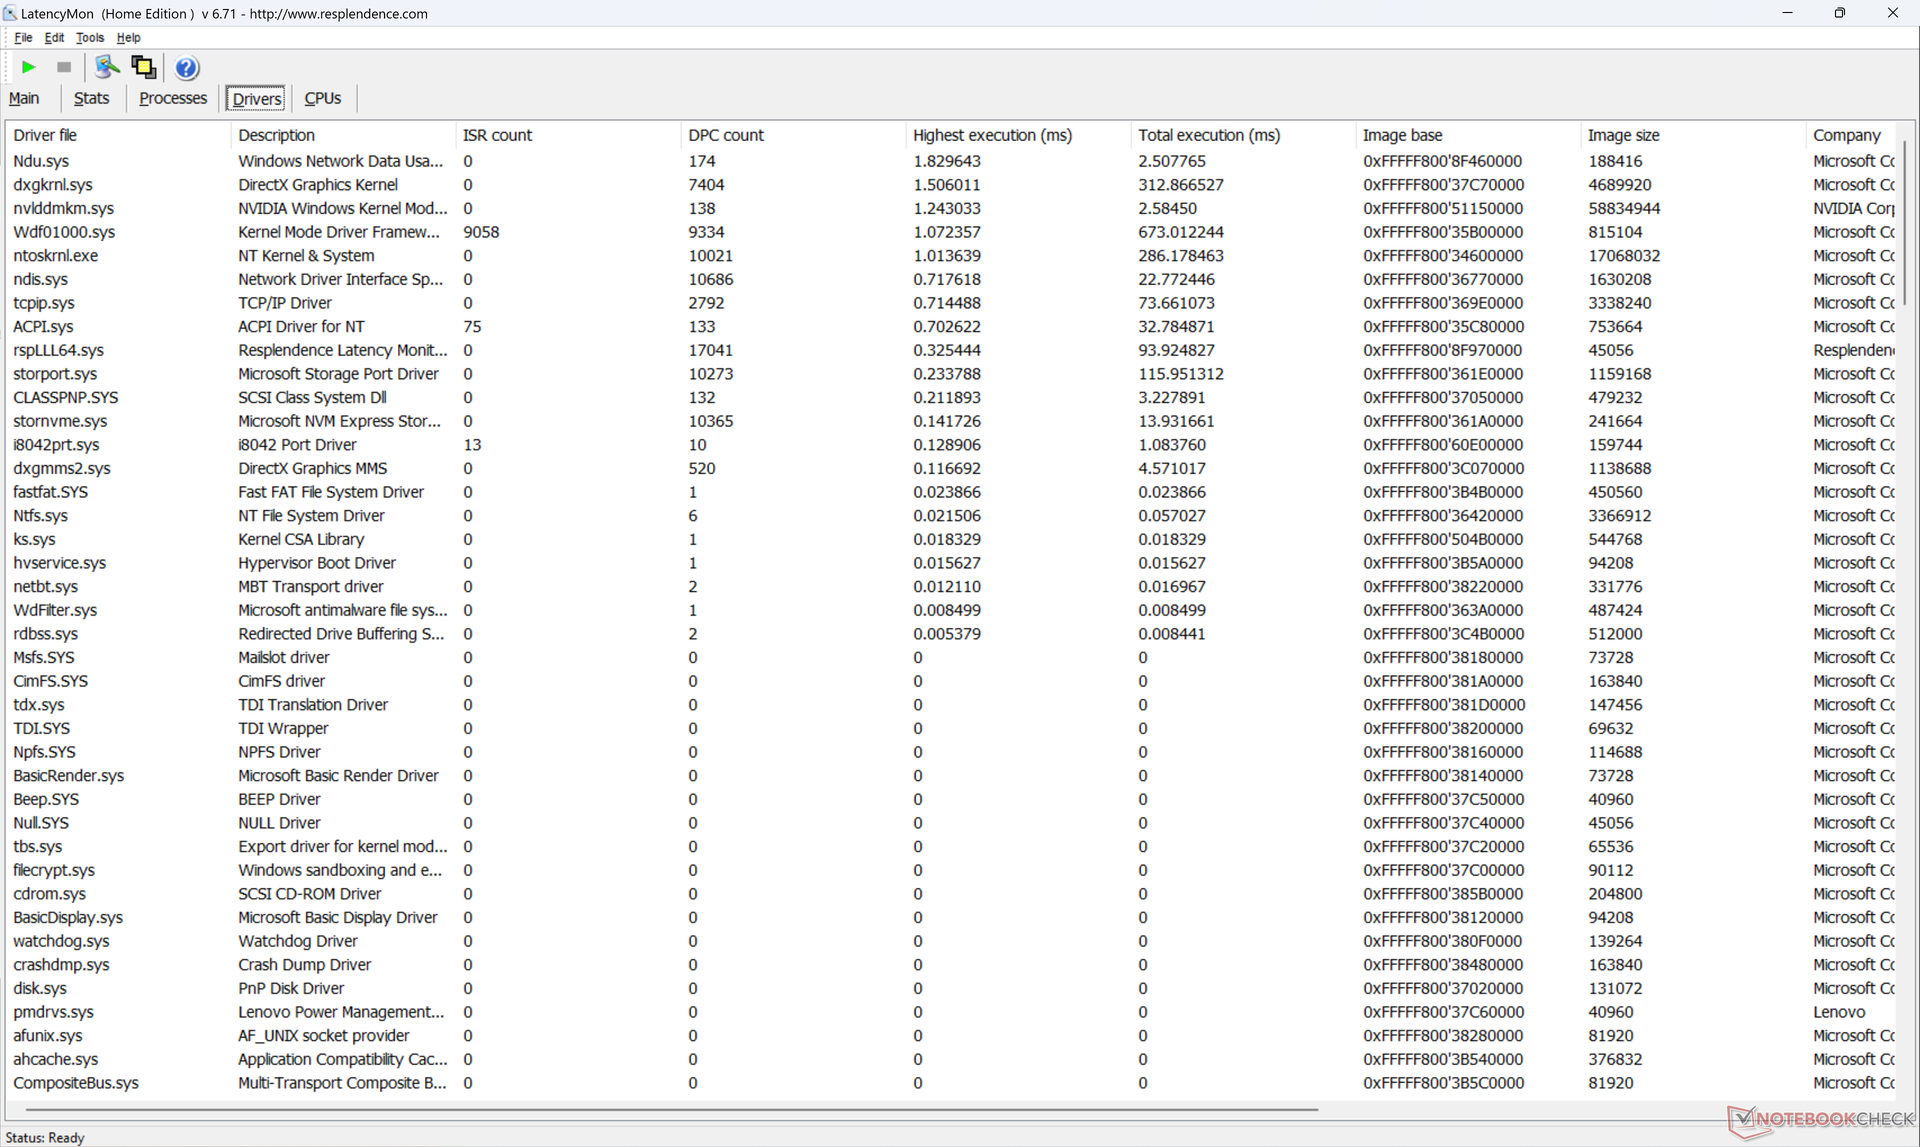
Latenza DPC
LatencyMon rivela lievi problemi di DPC quando si aprono più schede del browser della nostra homepage, il che è deludente per una workstation. la riproduzione di video 4K a 60 FPS è invece eccellente, con una sola caduta di fotogrammi durante il nostro video di prova.
| DPC Latencies / LatencyMon - interrupt to process latency (max), Web, Youtube, Prime95 | |
| Dell Precision 7000 7670 Performance | |
| Lenovo ThinkPad P16 G1 RTX A5500 | |
| Asus ProArt StudioBook 16 W7600H5A-2BL2 | |
| Lenovo ThinkPad P16 G1 21D6001DMB | |
| HP ZBook Studio 16 G9 62U04EA | |
| MSI CreatorPro Z16P B12UKST | |
* ... Meglio usare valori piccoli
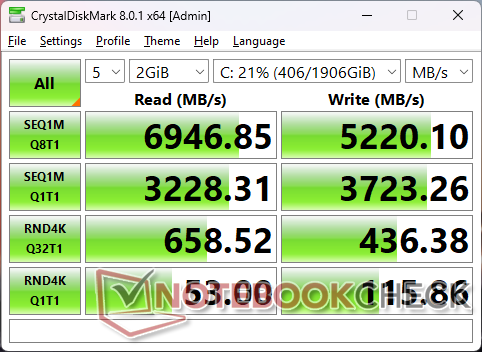
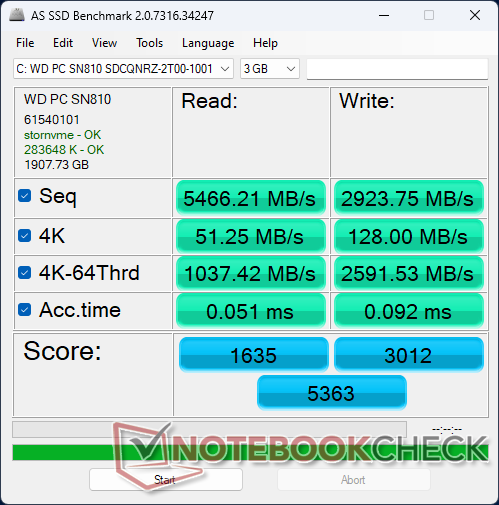
Dispositivi di archiviazione
Mentre la nostra configurazione A2000 viene fornita con un'unità SSD Micron 3400, la nostra configurazione A5500 viene fornita con un'unità WD SN810 OPAL WD SN810 OPAL WD SN810 OPAL. Le velocità di lettura e scrittura sequenziale sono paragonabili tra i due, ma l'unità WD sembra avere problemi a mantenere le velocità di trasferimento massime dopo circa 5 minuti di stress, come mostra il grafico di confronto qui sotto.

* ... Meglio usare valori piccoli
Disk Throttling: DiskSpd Read Loop, Queue Depth 8
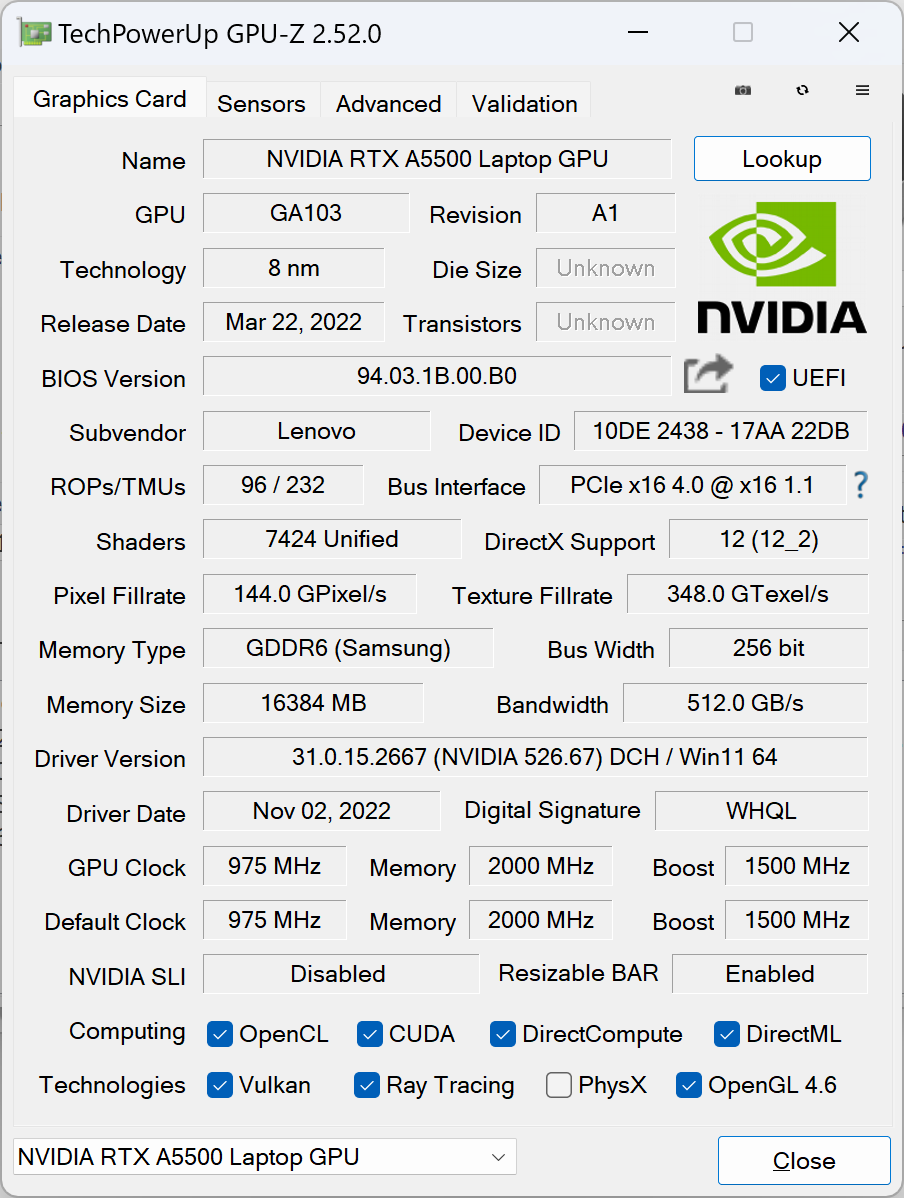
Prestazioni della GPU
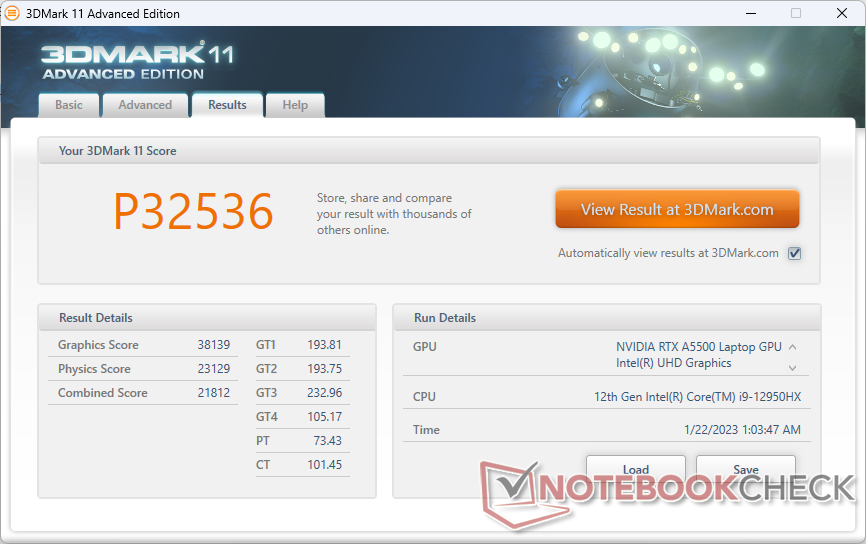
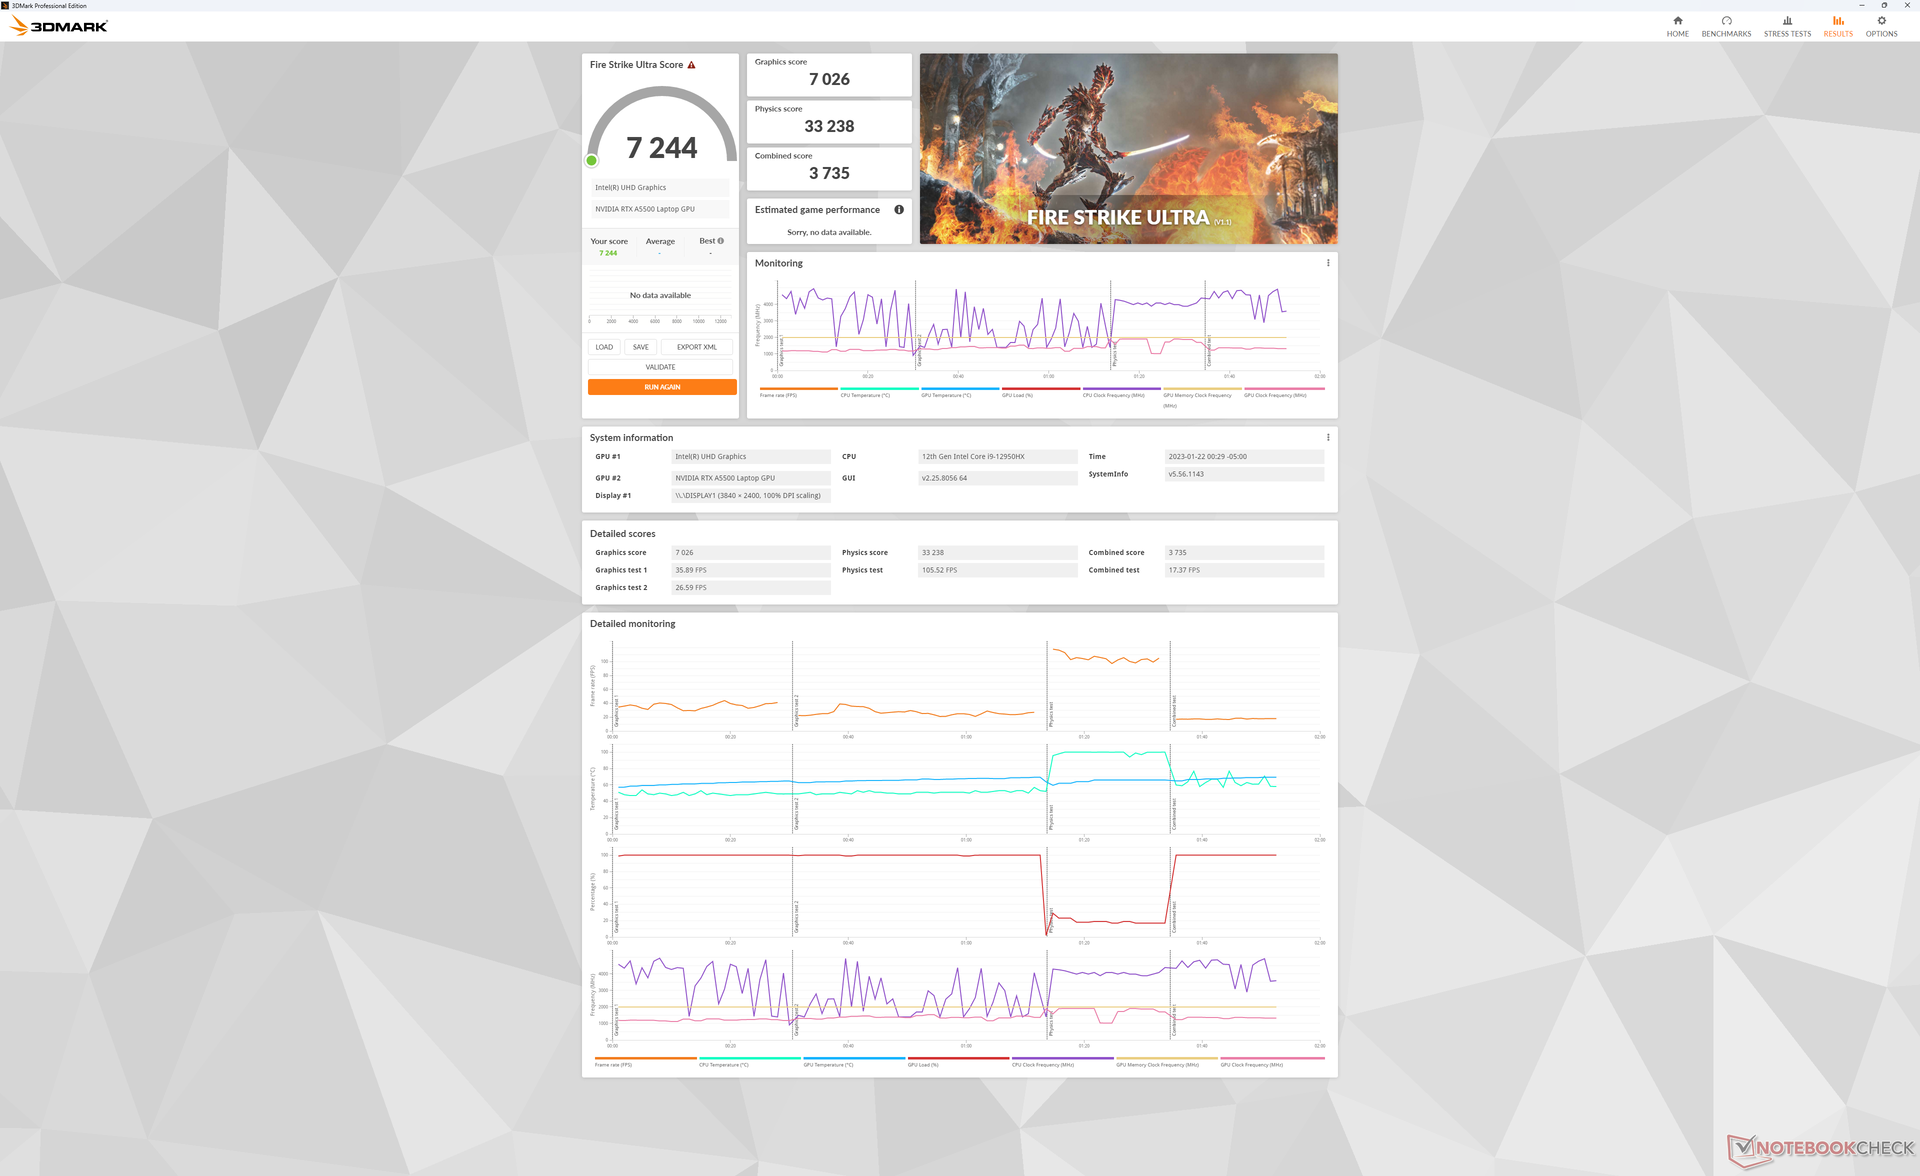
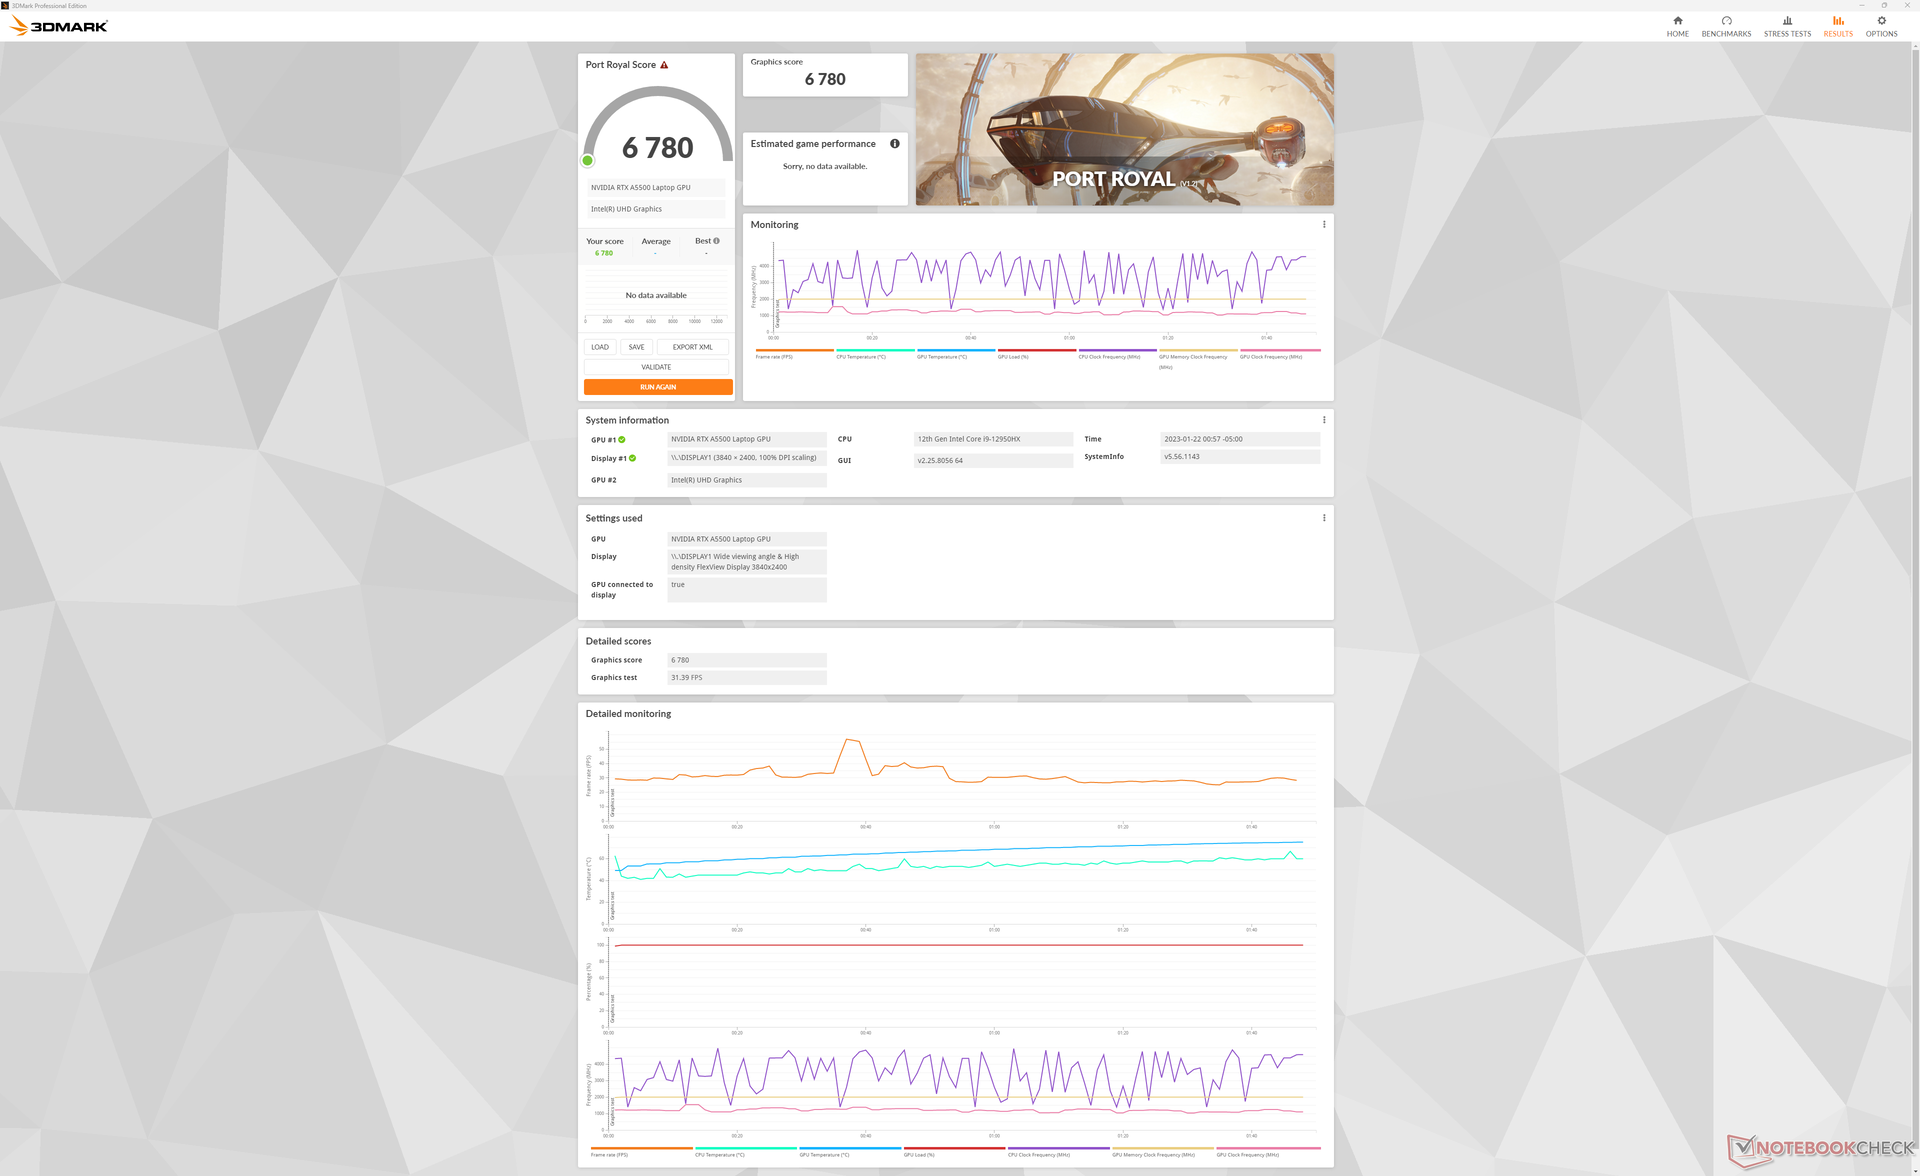
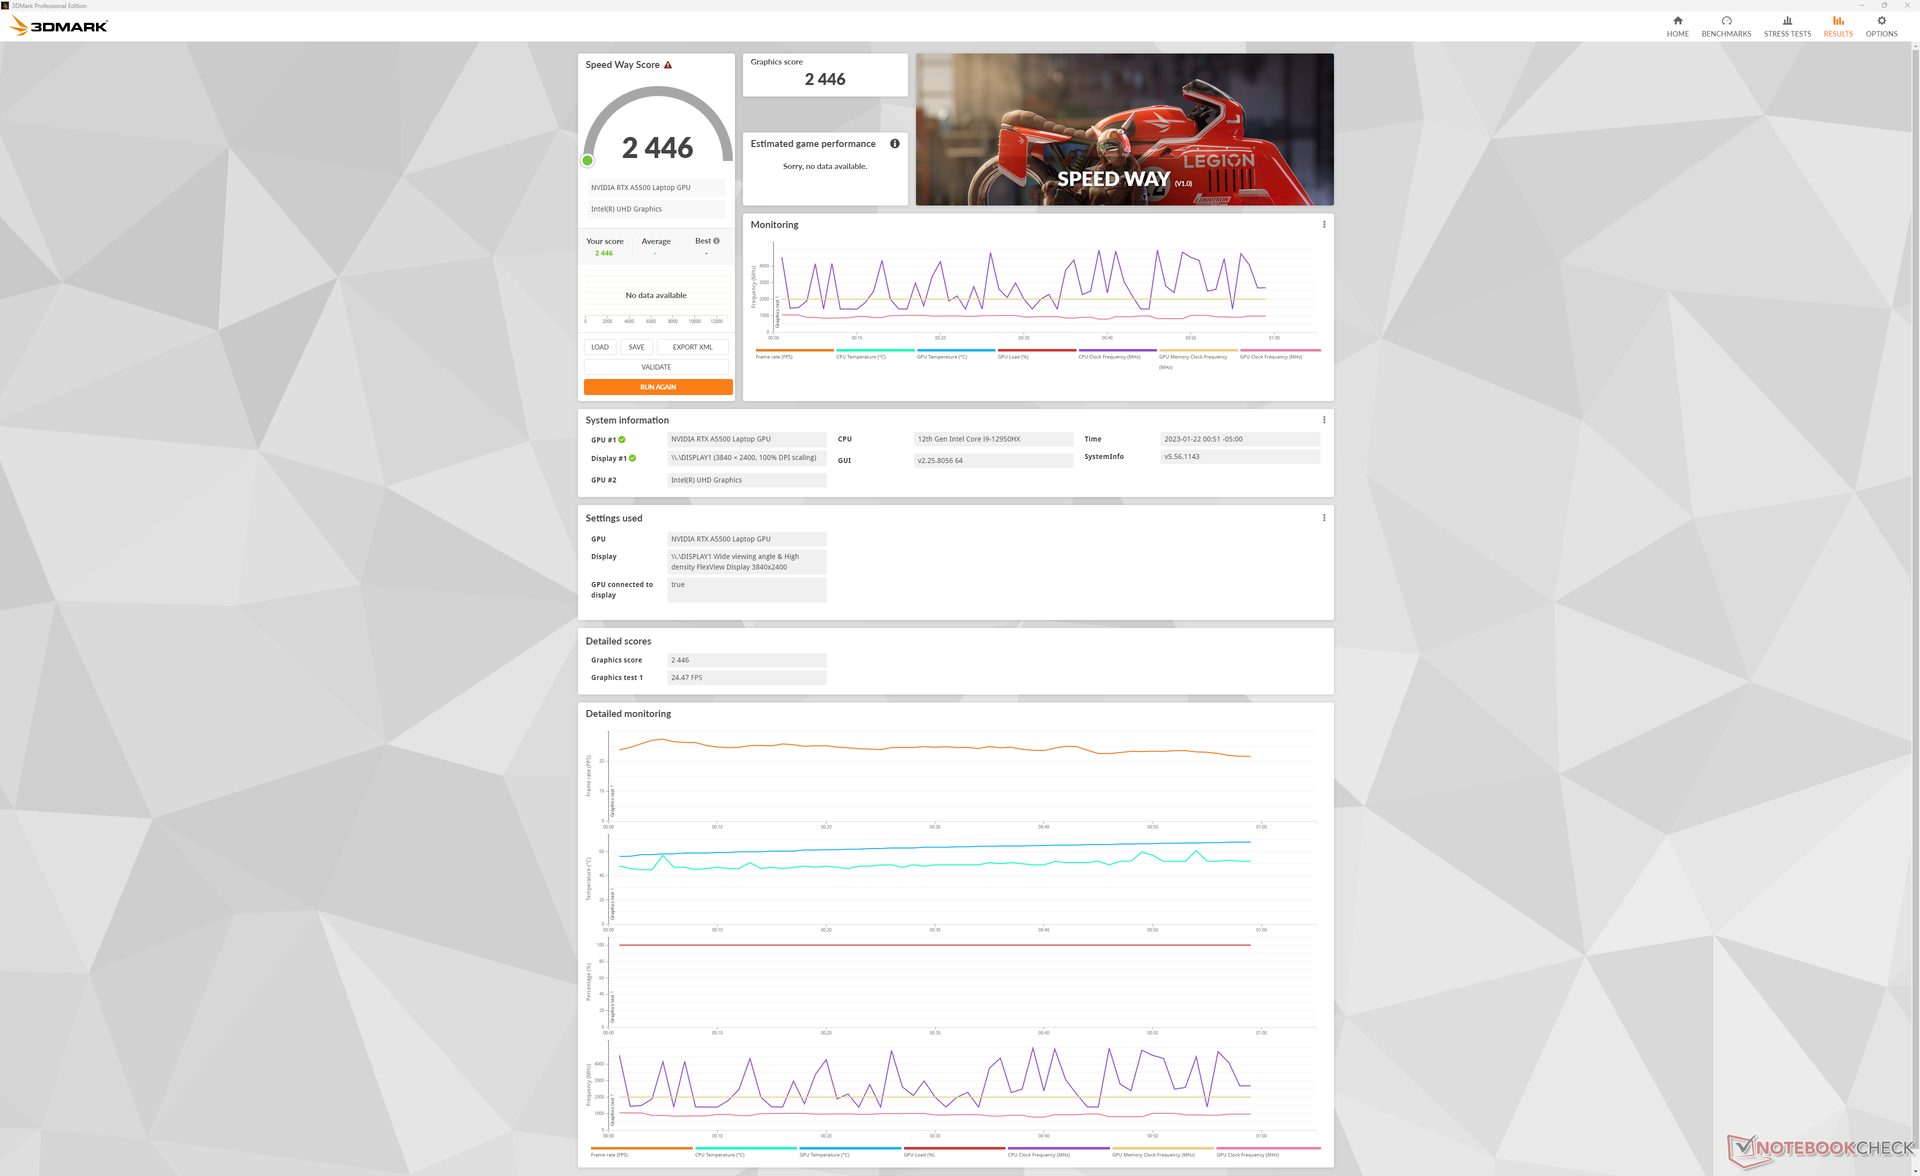
La RTX A5500 nel nostro Lenovo è più veloce di circa il 10% rispetto alla stessa GPU del concorrente Precision 7670. Questo nonostante il fatto che la GPU del Dell abbia un TGP di 135 W contro i 130 W del Lenovo, secondo il pannello di controllo Nvidia. Passando alla fascia bassa RTX A2000 Riduce le prestazioni grafiche del 50-65%.
| 3DMark Performance rating - Percent | |
| Lenovo Legion 7 16IAX7-82TD004SGE -34! | |
| Lenovo ThinkPad P16 G1 RTX A5500 | |
| Dell Precision 7000 7670 Performance -1! | |
| Media NVIDIA RTX A5500 Laptop GPU | |
| Asus ProArt StudioBook 16 W7600H5A-2BL2 -19! | |
| MSI WE76 11UM-456 -9! | |
| HP ZBook Fury 15 G8 -1! | |
| MSI CreatorPro Z16P B12UKST -17! | |
| HP ZBook Studio 15 G8 -17! | |
| HP ZBook Studio G7 -17! | |
| HP ZBook Studio 16 G9 62U04EA -9! | |
| Dell Precision 5000 5470 -9! | |
| Lenovo ThinkPad P16 G1 21D6001DMB -17! | |
| 3DMark 11 Performance | 32536 punti | |
| 3DMark Cloud Gate Standard Score | 54323 punti | |
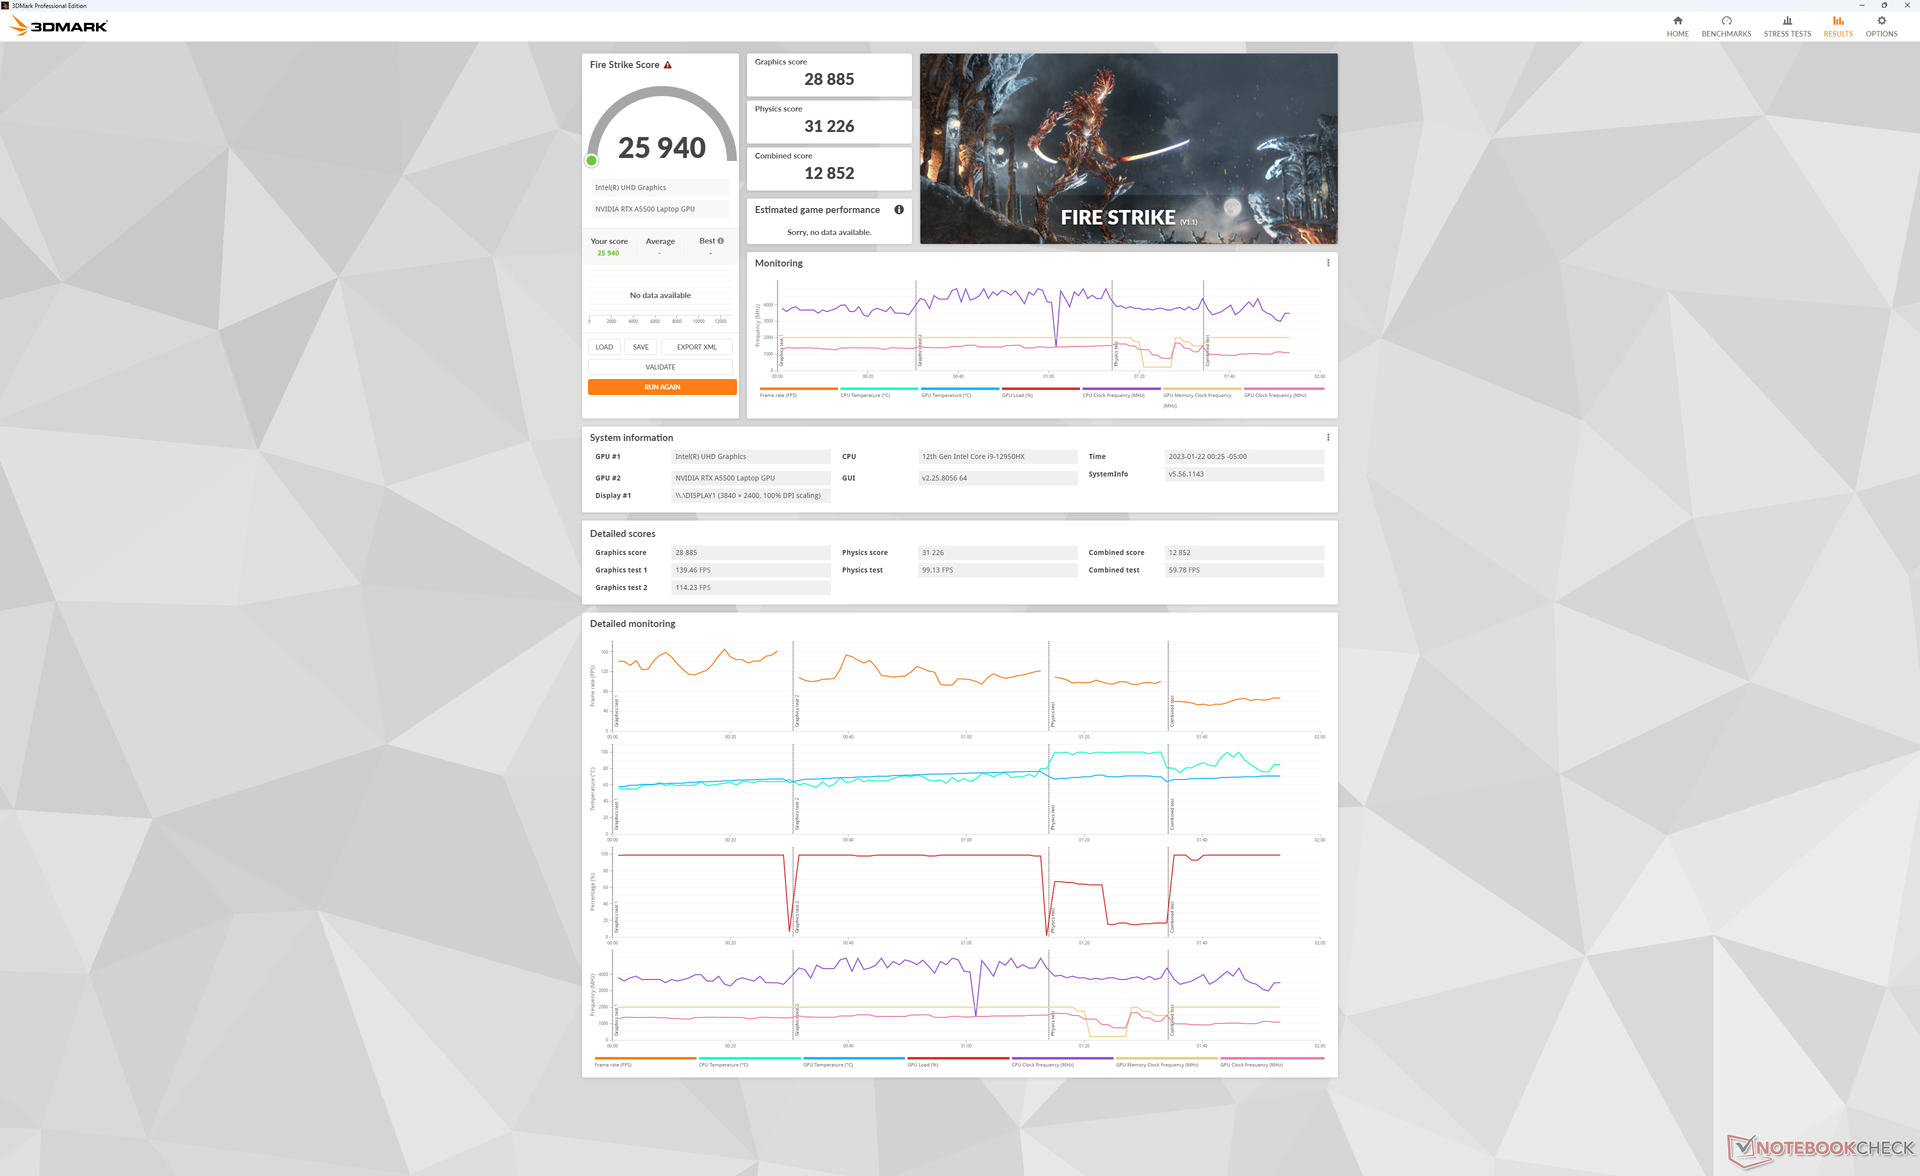
| 3DMark Fire Strike Score | 25940 punti | |
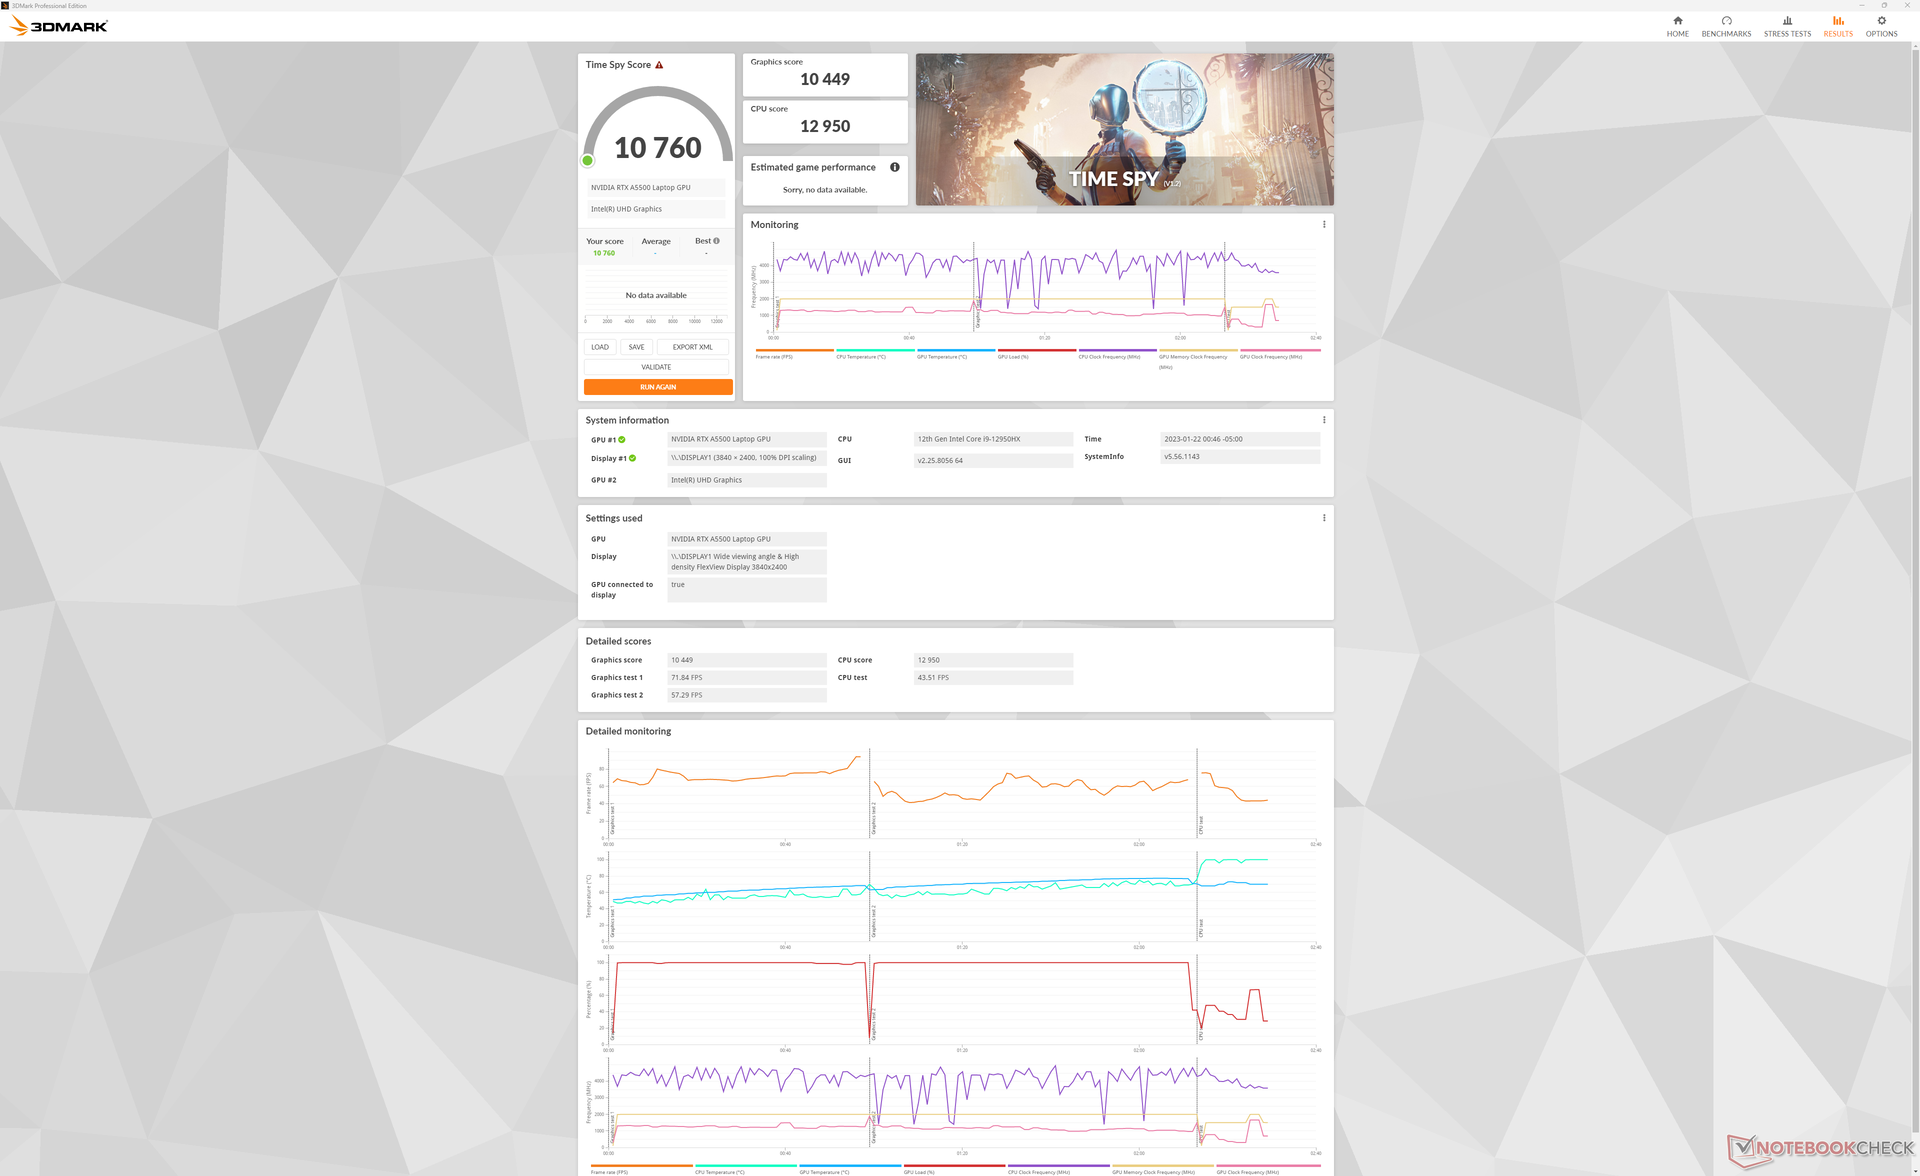
| 3DMark Time Spy Score | 10760 punti | |
Aiuto | ||
* ... Meglio usare valori piccoli
Witcher 3 FPS Chart
| basso | medio | alto | ultra | QHD | 4K | |
|---|---|---|---|---|---|---|
| GTA V (2015) | 185.9 | 183.4 | 177.7 | 124.4 | 103.5 | |
| The Witcher 3 (2015) | 489.4 | 329.9 | 211.8 | 110.4 | 63.7 | |
| Dota 2 Reborn (2015) | 194.3 | 174.5 | 166.1 | 156.3 | 132.8 | |
| Final Fantasy XV Benchmark (2018) | 212 | 142.5 | 113.1 | 83.5 | 45.4 | |
| X-Plane 11.11 (2018) | 155.8 | 137.6 | 108.8 | 93.7 | ||
| Strange Brigade (2018) | 442 | 264 | 223 | 197.7 | 138.6 | |
| Cyberpunk 2077 1.6 (2022) | 132.3 | 117.7 | 96.1 | 80.7 | 47 | 20.4 |
Emissioni
Rumore del sistema
Con la modalità predefinita Balanced, le ventole sono rimaste silenziose per periodi più lunghi del previsto, nonostante i processori ad alte prestazioni presenti all'interno. Durante l'esecuzione di 3DMark 06, ad esempio, il rumore delle ventole raggiungeva appena 28 dB(A) alla fine della prima scena del benchmark. Ci sono volute diverse esecuzioni prima che le ventole raggiungessero un numero di giri più elevato, fino a 40 dB(A).
Il rumore della ventola, quando si eseguono carichi più impegnativi in modalità Performance, raggiunge un massimo di poco più di 50 dB(A) ed è sensibilmente più rumoroso rispetto alle workstation concorrenti, tra cui Precision 7670, come mostra la tabella seguente. Naturalmente, queste alternative sono anche più lente della nostra configurazione Lenovo.
Rumorosità
| Idle |
| 23.1 / 23.1 / 23.1 dB(A) |
| Sotto carico |
| 28.9 / 51.4 dB(A) |
 | ||
30 dB silenzioso 40 dB(A) udibile 50 dB(A) rumoroso |
||
min: | ||
| Lenovo ThinkPad P16 G1 RTX A5500 RTX A5500 Laptop GPU, i9-12950HX, WDC PC SN810 2TB | Asus ProArt StudioBook 16 W7600H5A-2BL2 RTX A5000 Laptop GPU, W-11955M, 2x Micron 2300 2TB MTFDHBA2T0TDV (RAID 0) | Dell Precision 7000 7670 Performance RTX A5500 Laptop GPU, i9-12950HX | Lenovo ThinkPad P16 G1 21D6001DMB RTX A2000 Laptop GPU, i7-12850HX, Micron 3400 1TB MTFDKBA1T0TFH | MSI CreatorPro Z16P B12UKST RTX A3000 Laptop GPU, i7-12700H, Samsung PM9A1 MZVL21T0HCLR | HP ZBook Studio 16 G9 62U04EA RTX A2000 Laptop GPU, i7-12800H, Micron 3400 1TB MTFDKBA1T0TFH | |
|---|---|---|---|---|---|---|
| Noise | -14% | -16% | -6% | -11% | -9% | |
| off /ambiente * (dB) | 23.1 | 26 -13% | 23.9 -3% | 23.2 -0% | 24.1 -4% | 24 -4% |
| Idle Minimum * (dB) | 23.1 | 26 -13% | 24 -4% | 23.2 -0% | 27.1 -17% | 24 -4% |
| Idle Average * (dB) | 23.1 | 26 -13% | 24 -4% | 23.2 -0% | 27.1 -17% | 27.7 -20% |
| Idle Maximum * (dB) | 23.1 | 26.5 -15% | 38 -65% | 23.2 -0% | 27.1 -17% | 27.7 -20% |
| Load Average * (dB) | 28.9 | 42 -45% | 46.3 -60% | 47.8 -65% | 42.9 -48% | 39.8 -38% |
| Witcher 3 ultra * (dB) | 51.6 | 41.9 19% | 34.1 34% | 44 15% | 44.3 14% | |
| Load Maximum * (dB) | 51.4 | 43 16% | 47.9 7% | 56.3 -10% | 47 9% | 47.7 7% |
* ... Meglio usare valori piccoli
Temperatura
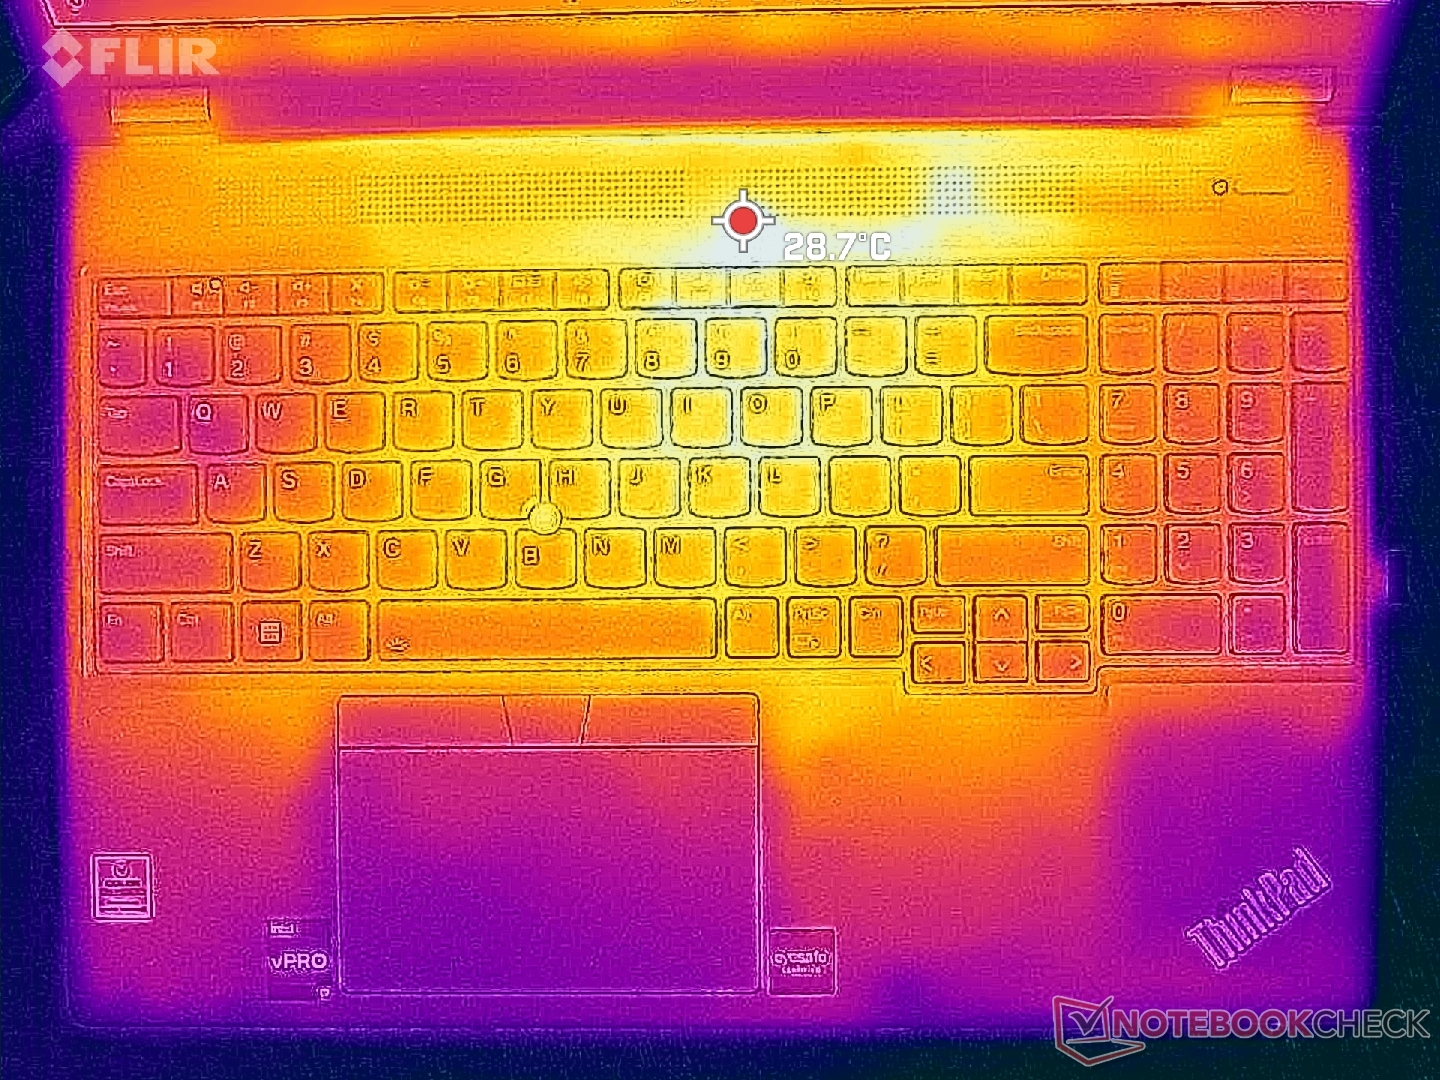
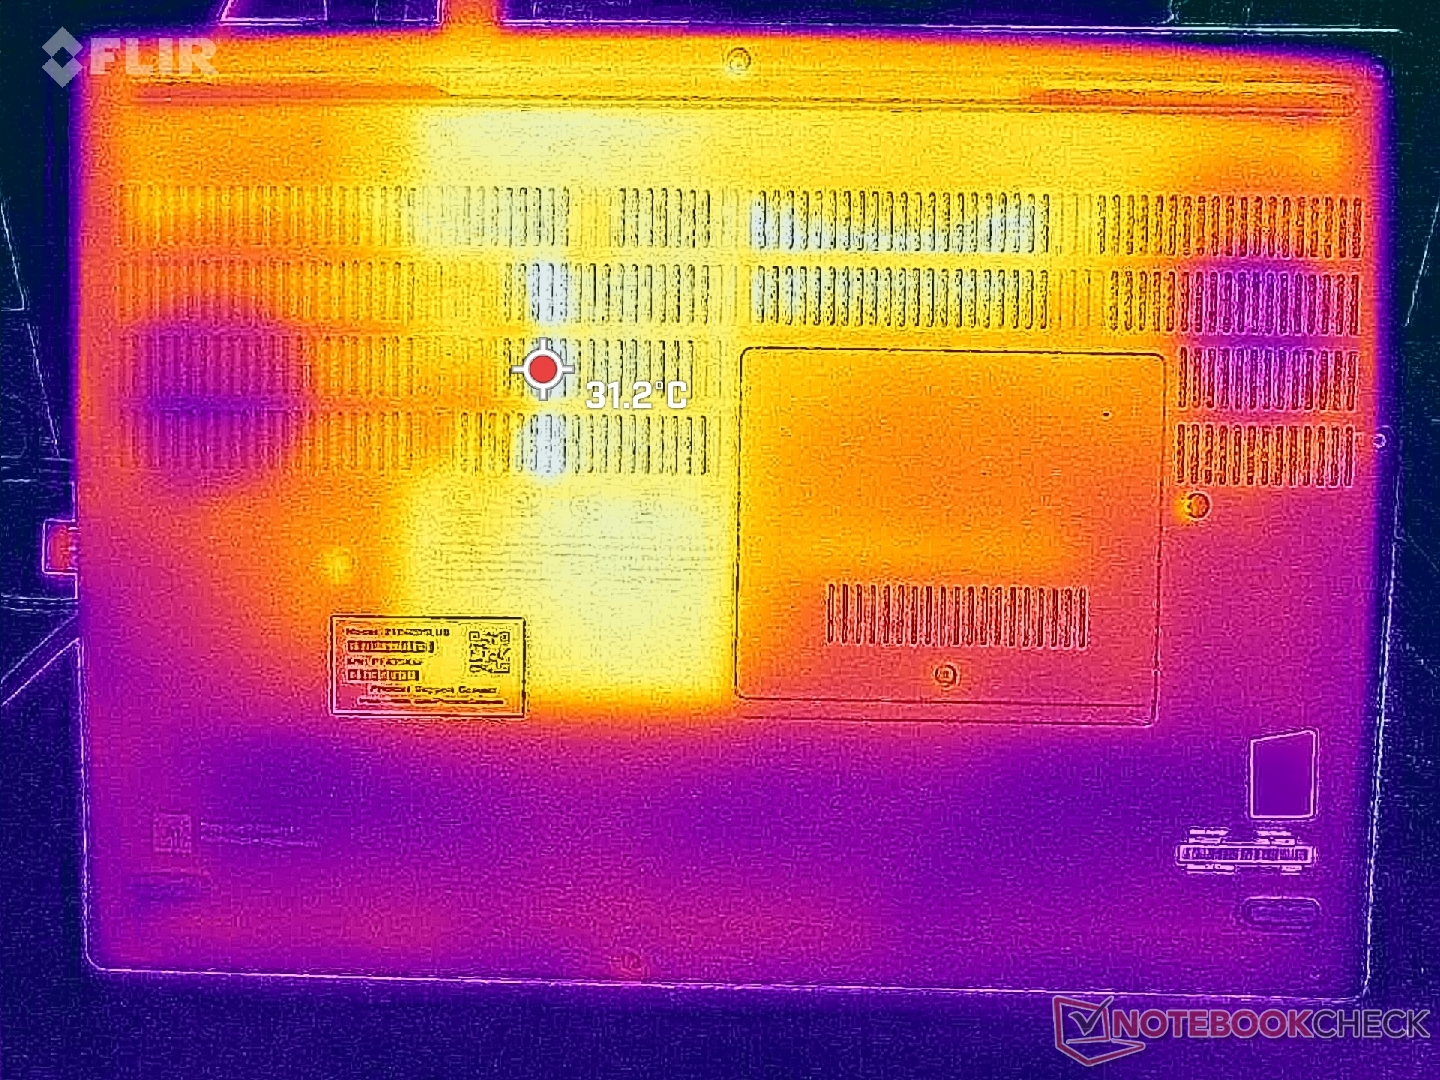
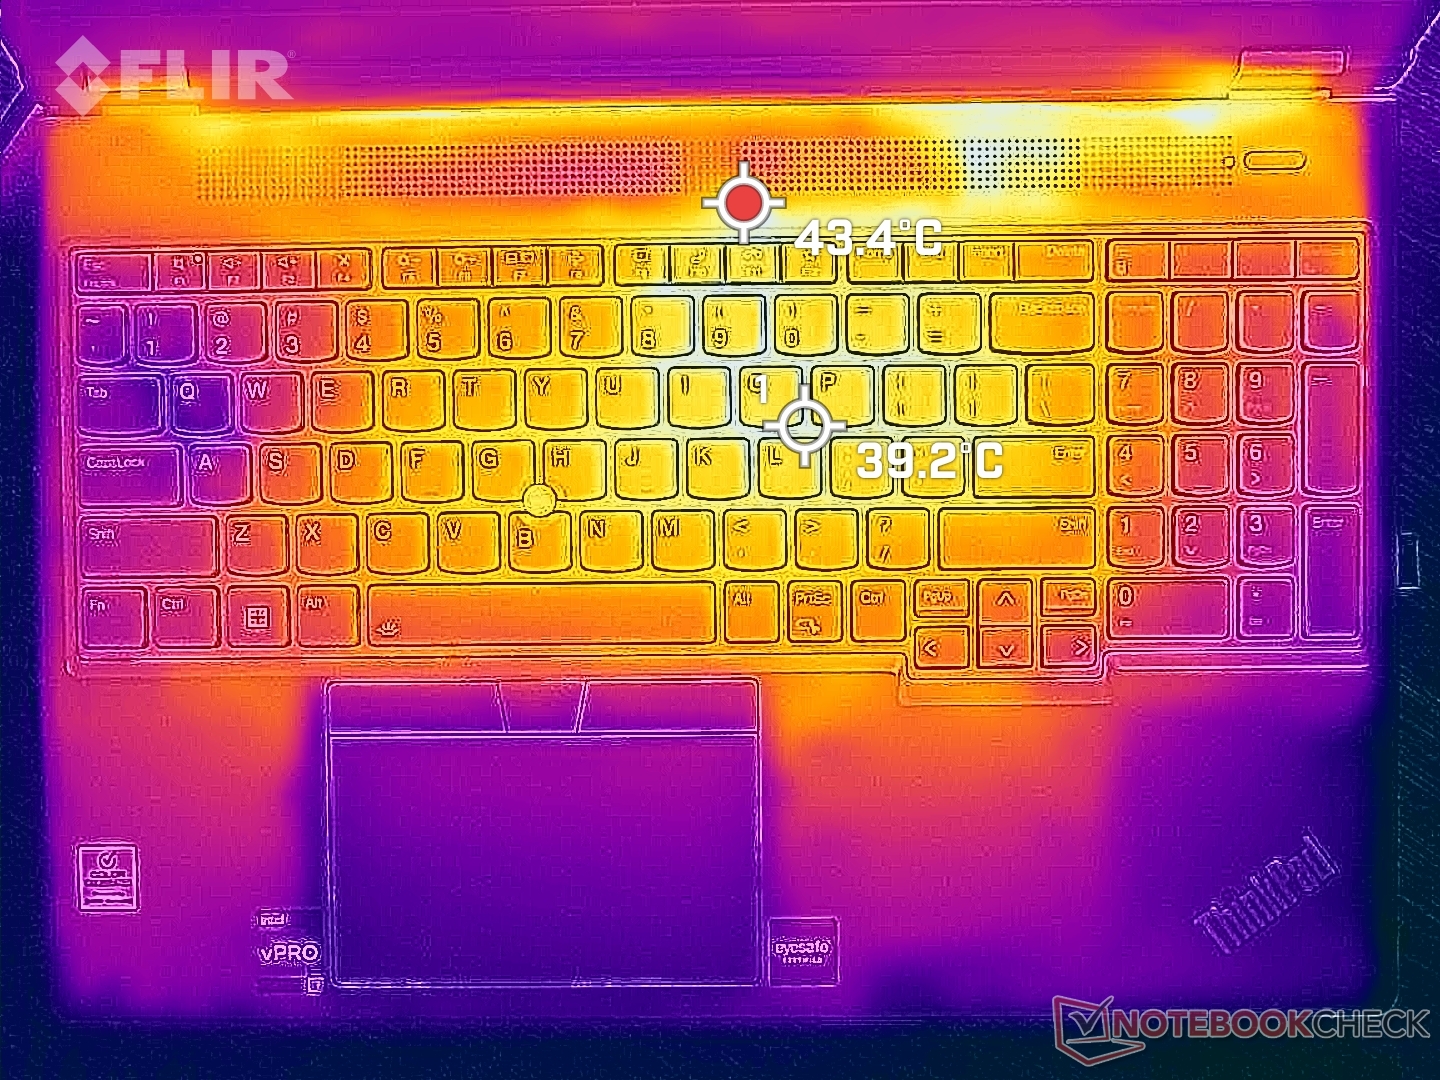
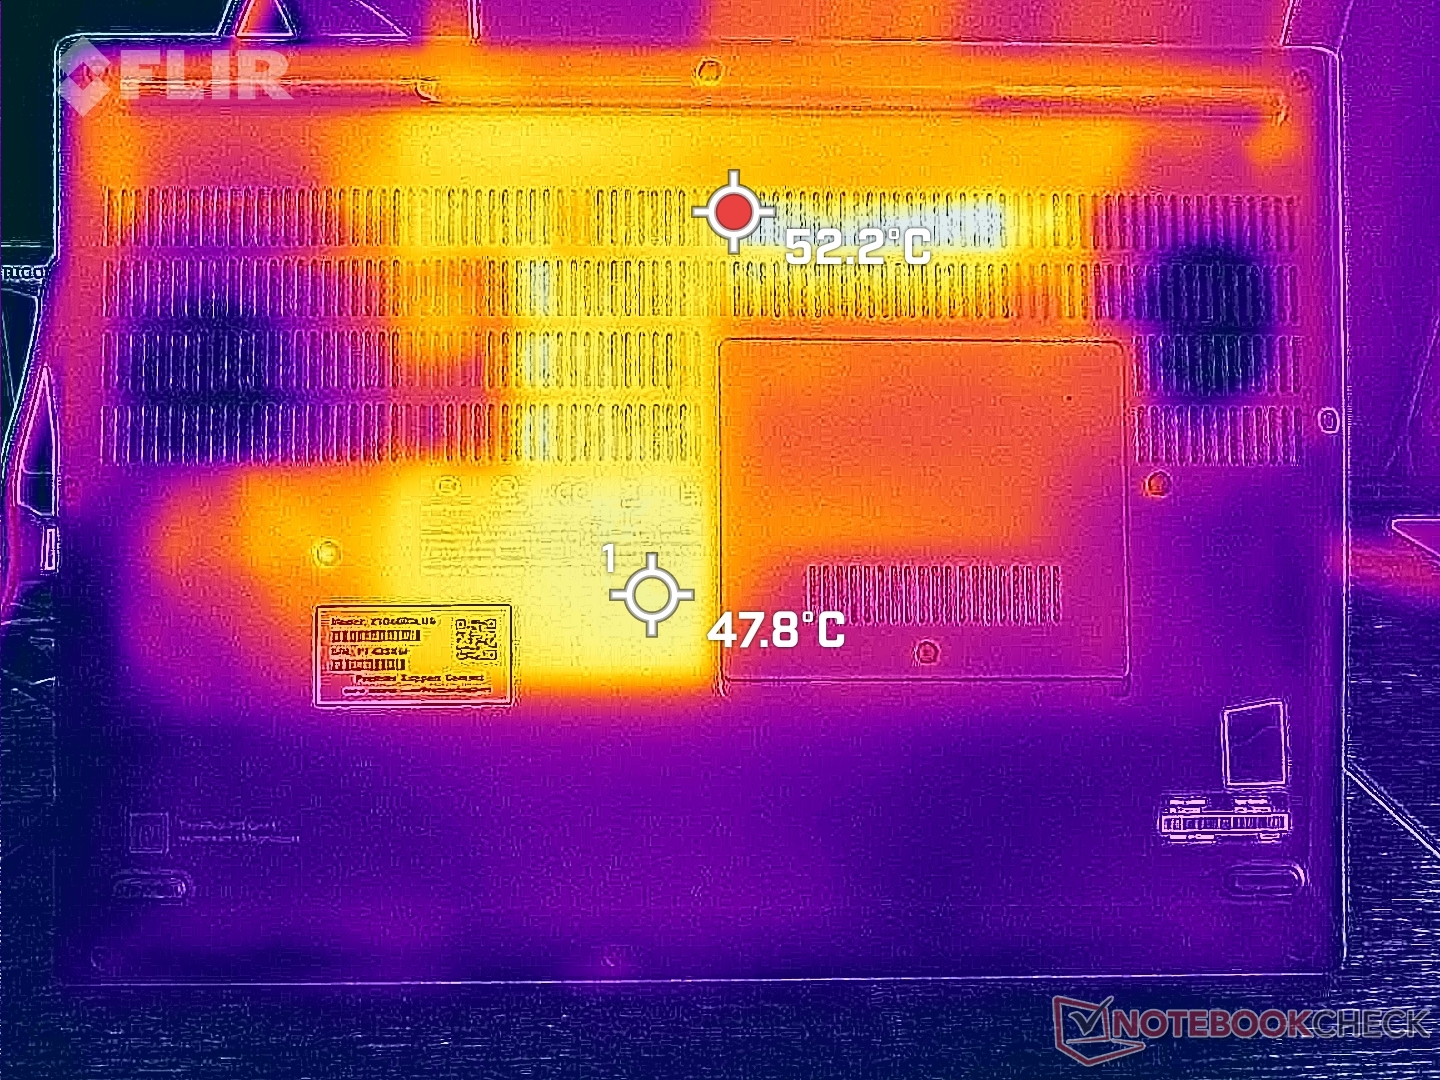
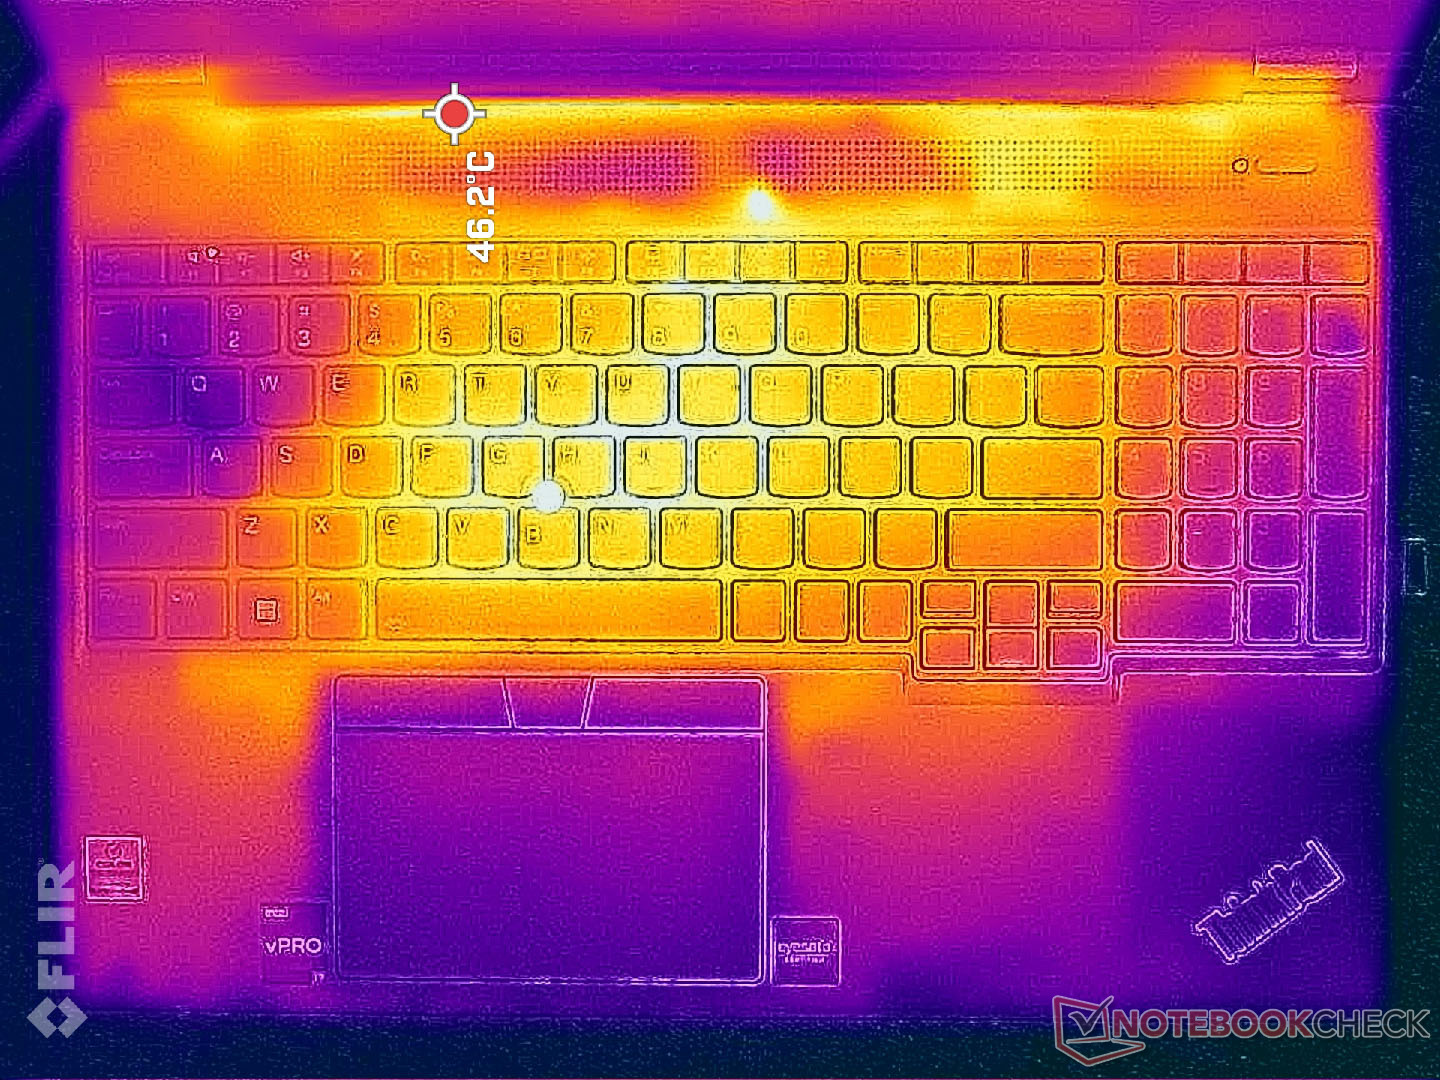
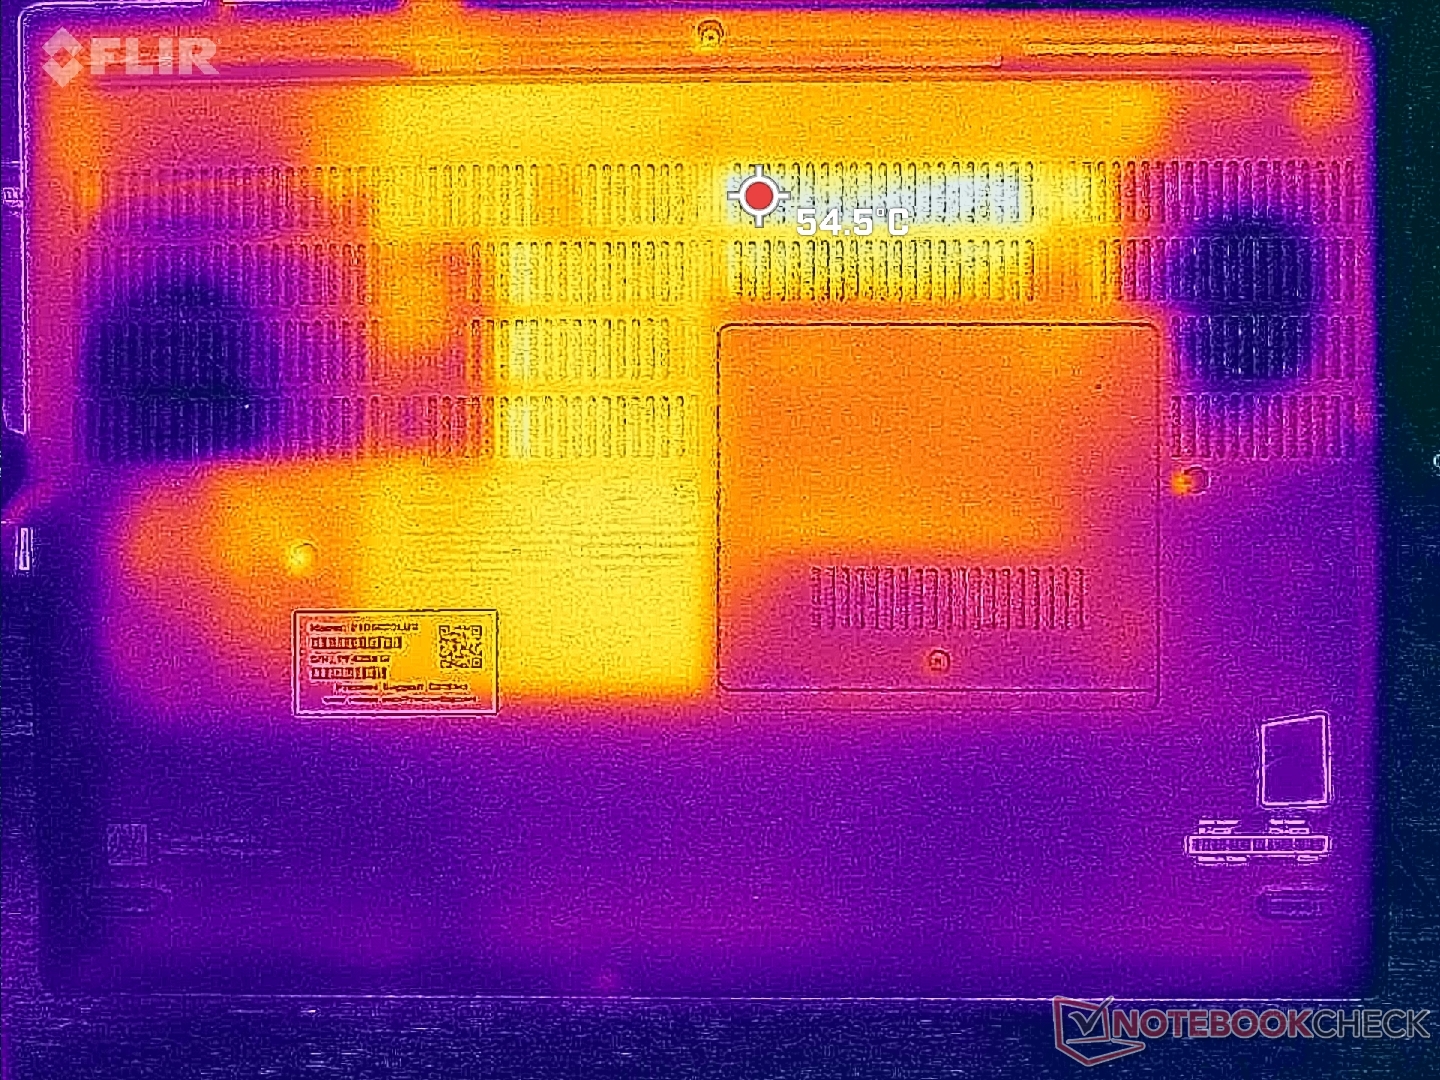
Le temperature di superficie sono più calde del previsto anche quando il computer è al minimo senza applicazioni in esecuzione. La parte inferiore, ad esempio, può raggiungere i 37 C rispetto ai 31 C del modello Precision 7670. Se si utilizzano carichi elevati, questi stessi punti caldi sul Lenovo possono raggiungere i 49 C o più, mentre il centro della tastiera può raggiungere i 40 C. Le temperature della pelle possono risultare fastidiose se il portatile è appoggiato sulle ginocchia invece che su un tavolo.
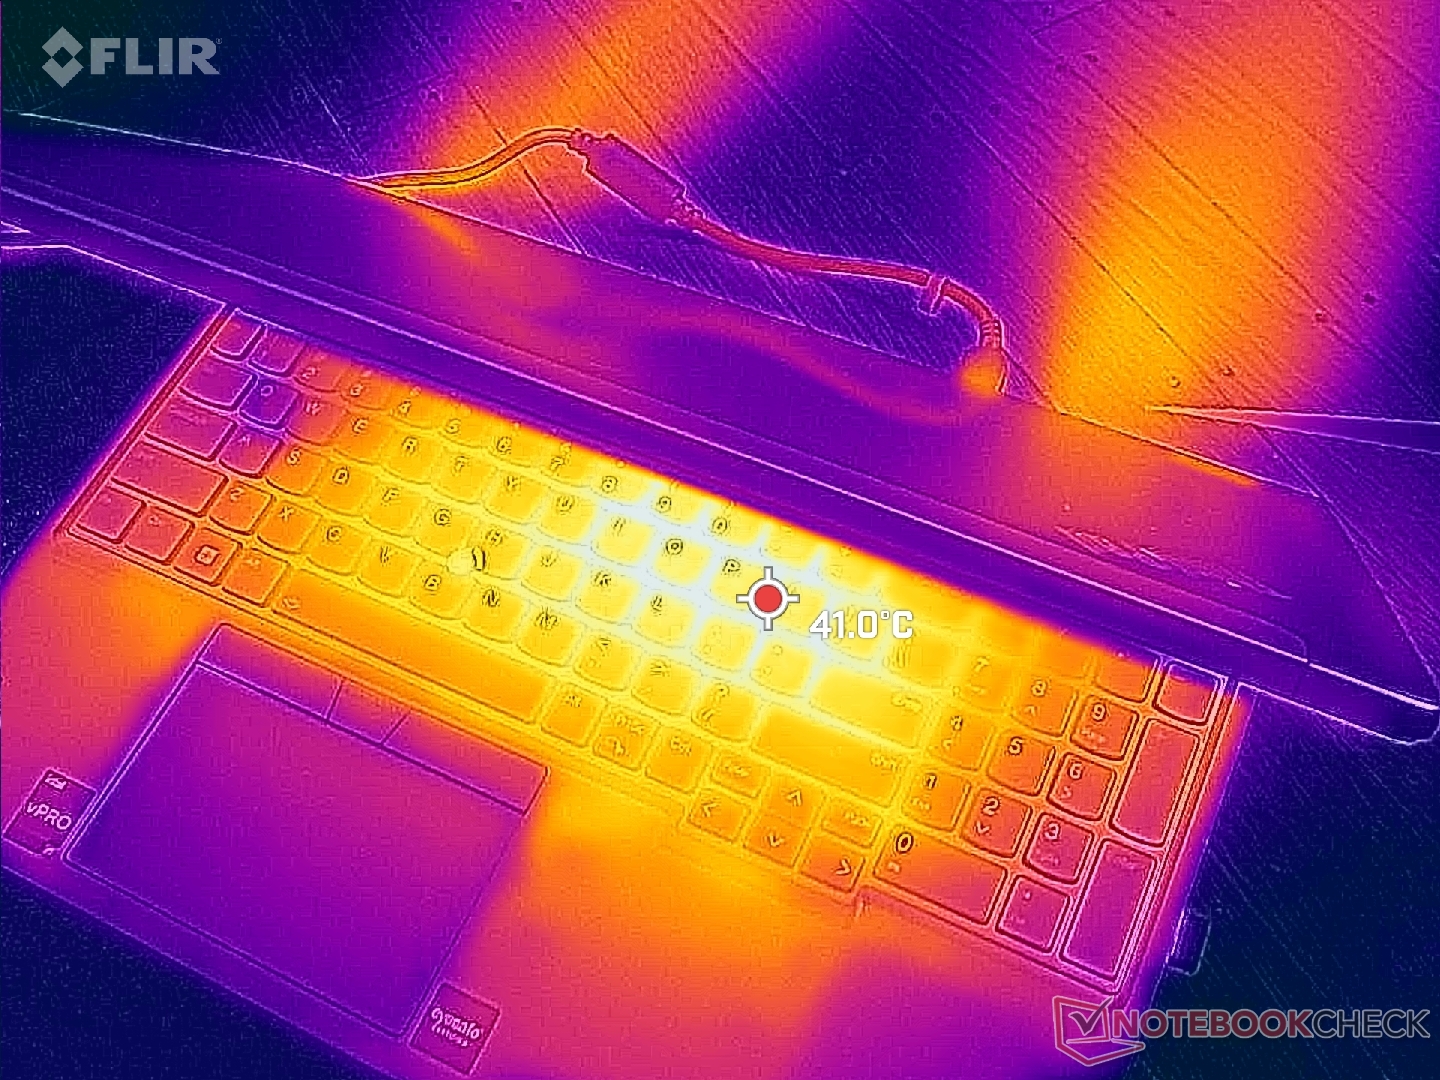
(±) La temperatura massima sul lato superiore è di 44.8 °C / 113 F, rispetto alla media di 38.2 °C / 101 F, che varia da 22.2 a 69.8 °C per questa classe Workstation.
(-) Il lato inferiore si riscalda fino ad un massimo di 49.8 °C / 122 F, rispetto alla media di 41.1 °C / 106 F
(+) In idle, la temperatura media del lato superiore è di 28.6 °C / 83 F, rispetto alla media deld ispositivo di 32 °C / 90 F.
(±) Riproducendo The Witcher 3, la temperatura media per il lato superiore e' di 36.4 °C / 98 F, rispetto alla media del dispositivo di 32 °C / 90 F.
(+) I poggiapolsi e il touchpad raggiungono la temperatura massima della pelle (32.4 °C / 90.3 F) e quindi non sono caldi.
(-) La temperatura media della zona del palmo della mano di dispositivi simili e'stata di 27.8 °C / 82 F (-4.6 °C / -8.3 F).
| Lenovo ThinkPad P16 G1 RTX A5500 Intel Core i9-12950HX, NVIDIA RTX A5500 Laptop GPU | Asus ProArt StudioBook 16 W7600H5A-2BL2 Intel Xeon W-11955M, NVIDIA RTX A5000 Laptop GPU | Dell Precision 7000 7670 Performance Intel Core i9-12950HX, NVIDIA RTX A5500 Laptop GPU | Lenovo ThinkPad P16 G1 21D6001DMB Intel Core i7-12850HX, NVIDIA RTX A2000 Laptop GPU | MSI CreatorPro Z16P B12UKST Intel Core i7-12700H, NVIDIA RTX A3000 Laptop GPU | HP ZBook Studio 16 G9 62U04EA Intel Core i7-12800H, NVIDIA RTX A2000 Laptop GPU | |
|---|---|---|---|---|---|---|
| Heat | -1% | -3% | 17% | -3% | 9% | |
| Maximum Upper Side * (°C) | 44.8 | 45.7 -2% | 53 -18% | 43.1 4% | 56.3 -26% | 38.7 14% |
| Maximum Bottom * (°C) | 49.8 | 48.3 3% | 43.2 13% | 39.9 20% | 68.3 -37% | 53.4 -7% |
| Idle Upper Side * (°C) | 30.6 | 35.3 -15% | 36.8 -20% | 26 15% | 25.2 18% | 27.3 11% |
| Idle Bottom * (°C) | 38.6 | 34.4 11% | 33.8 12% | 27.6 28% | 25.9 33% | 31.6 18% |
* ... Meglio usare valori piccoli
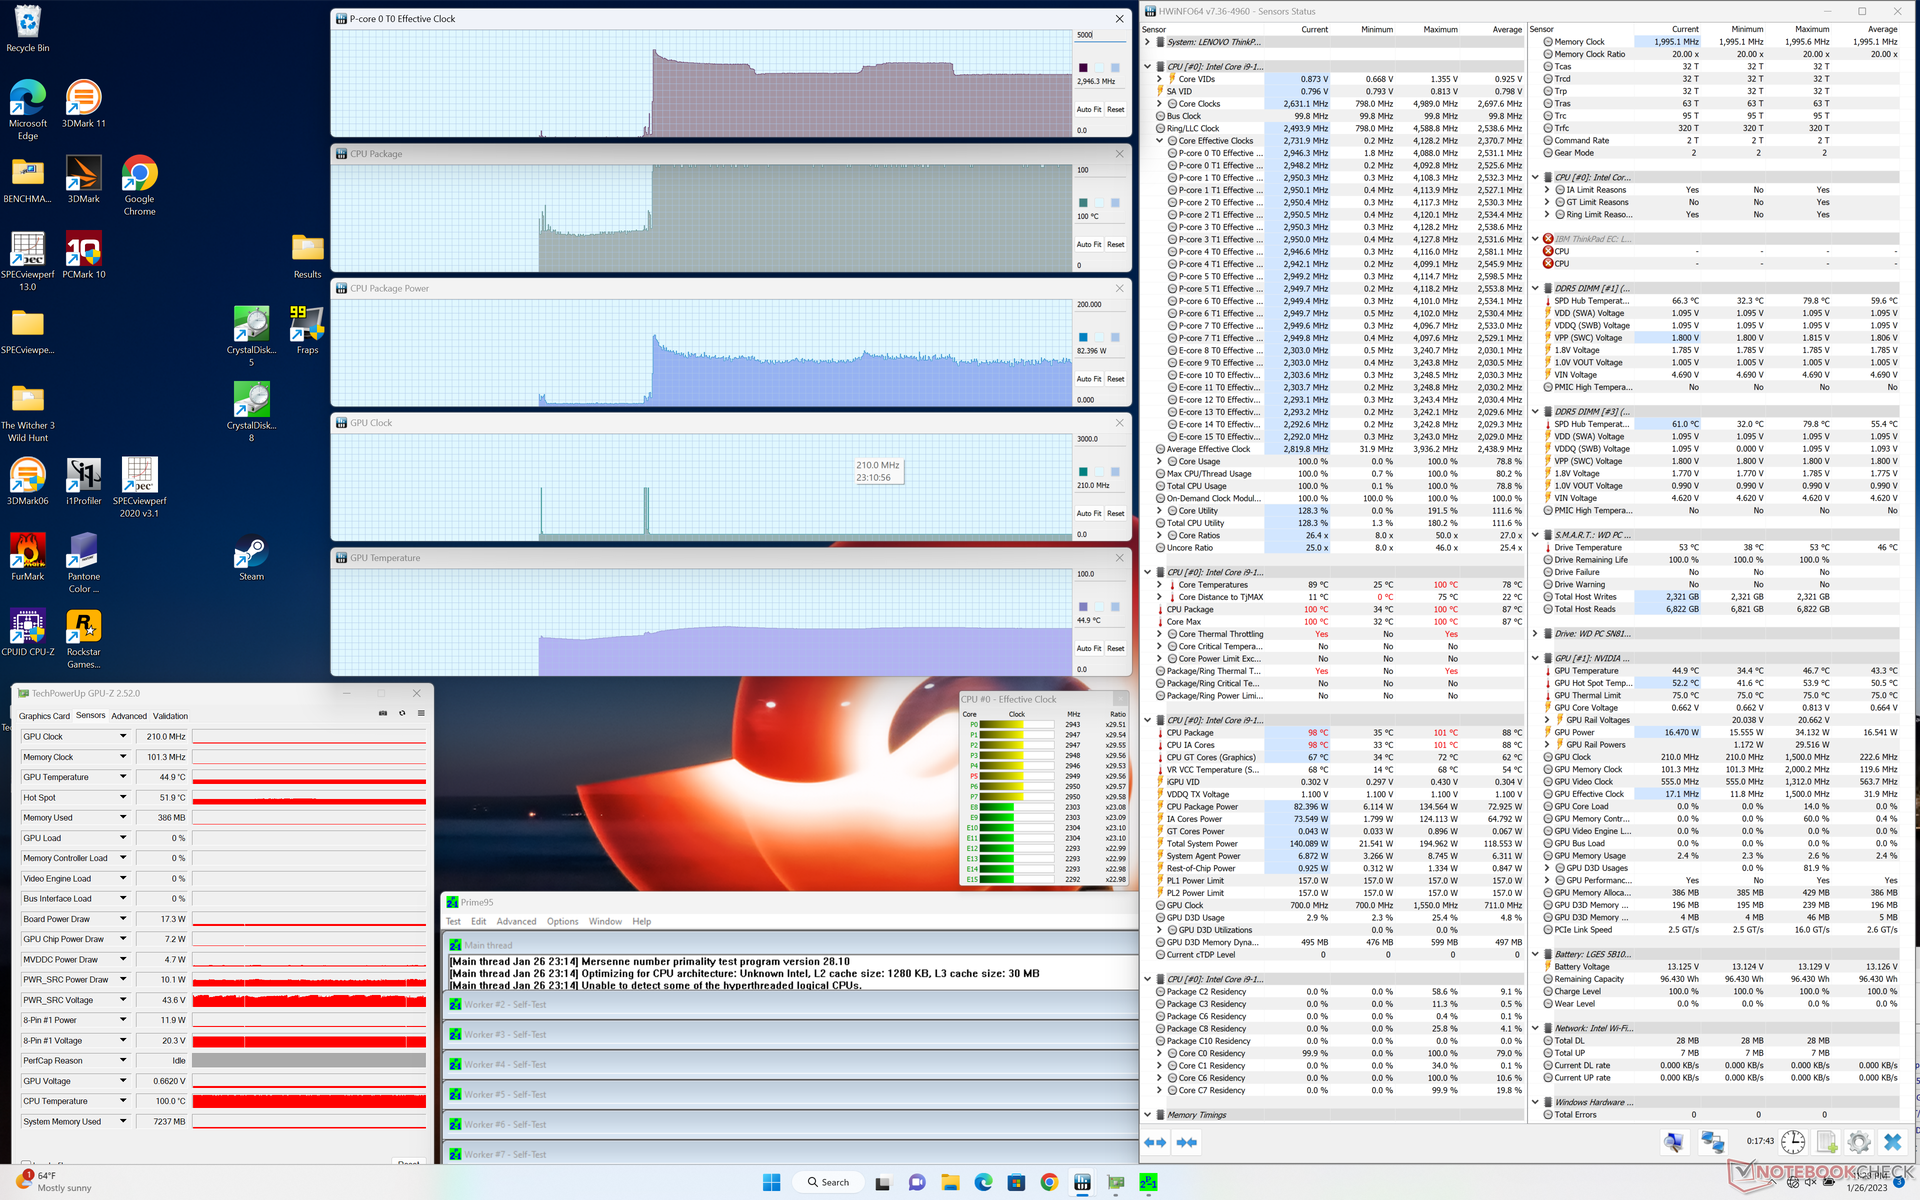
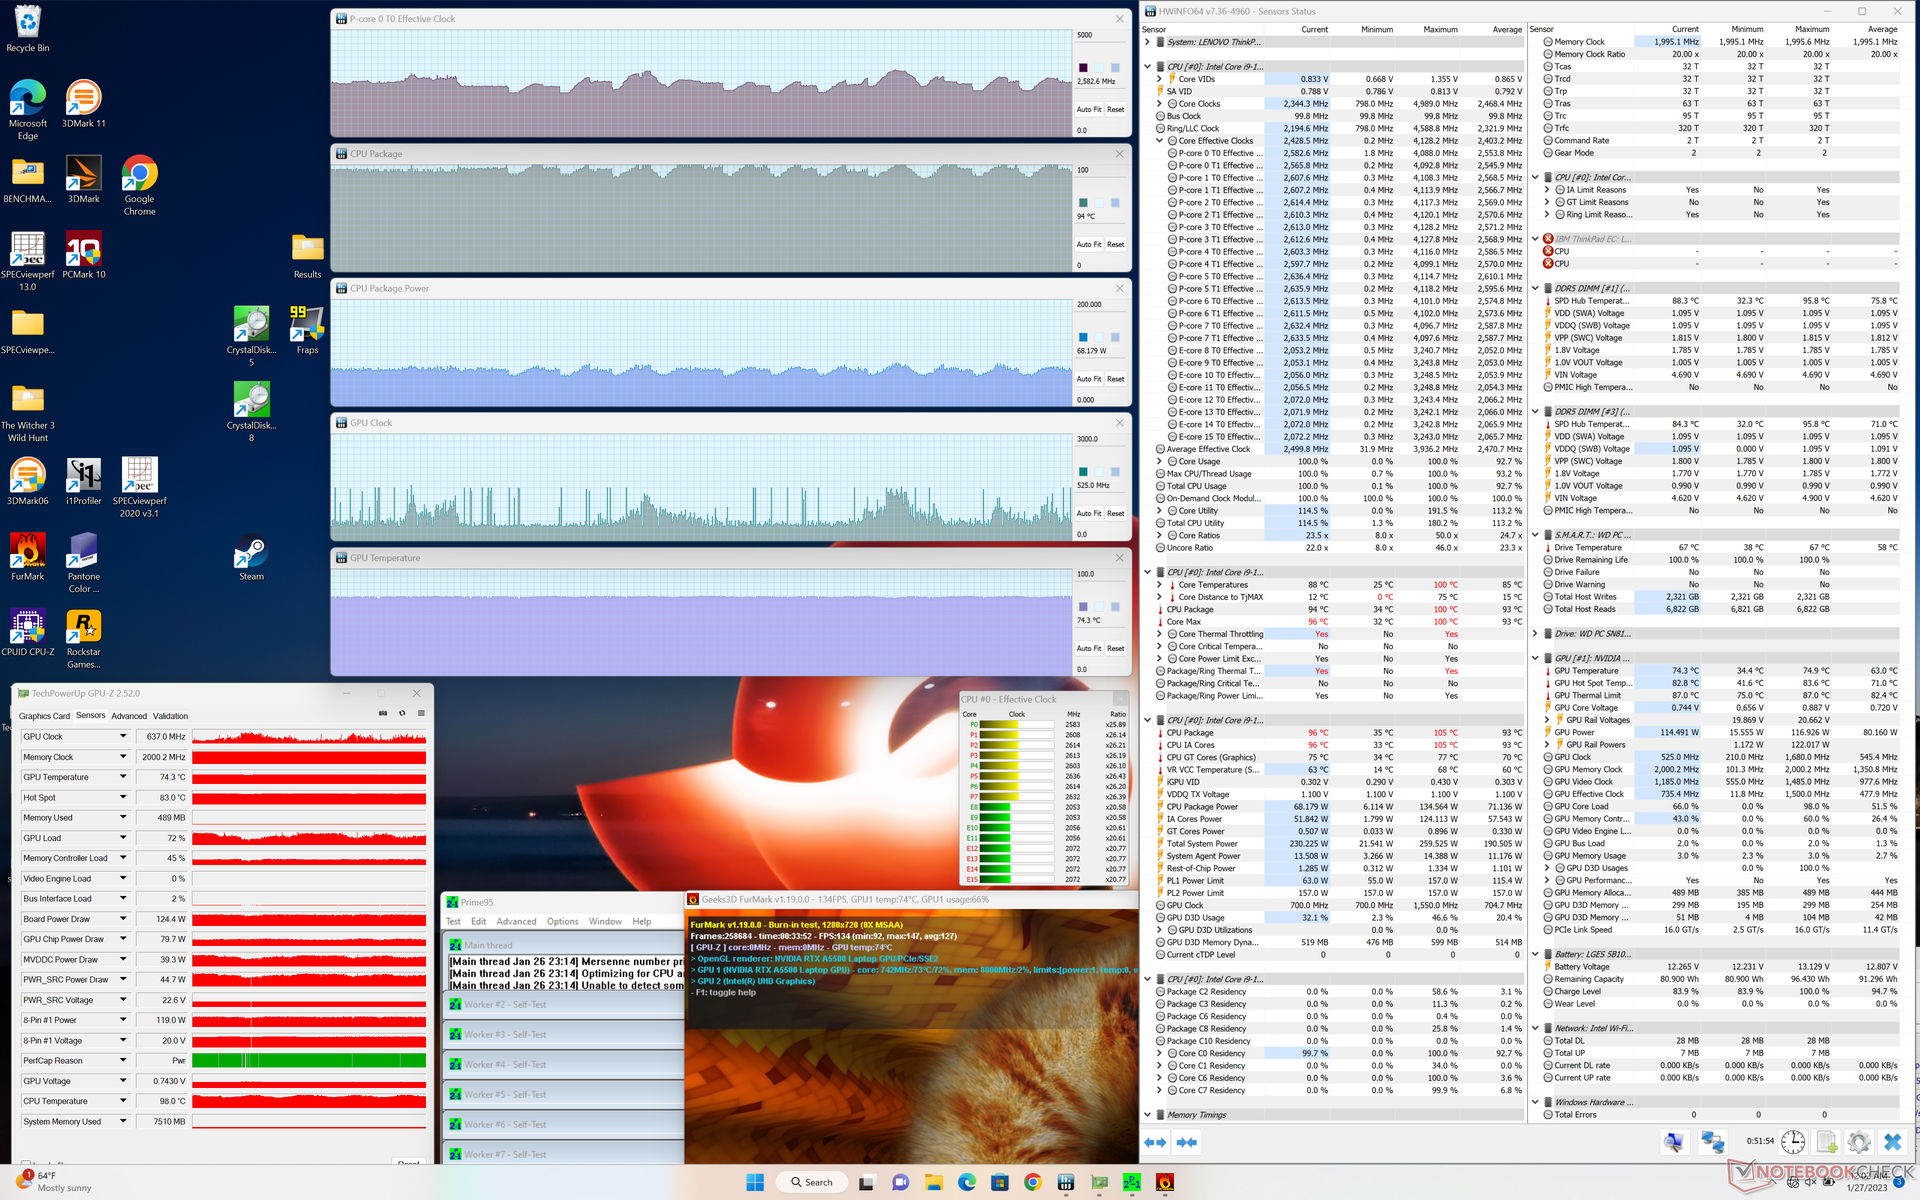
Stress test
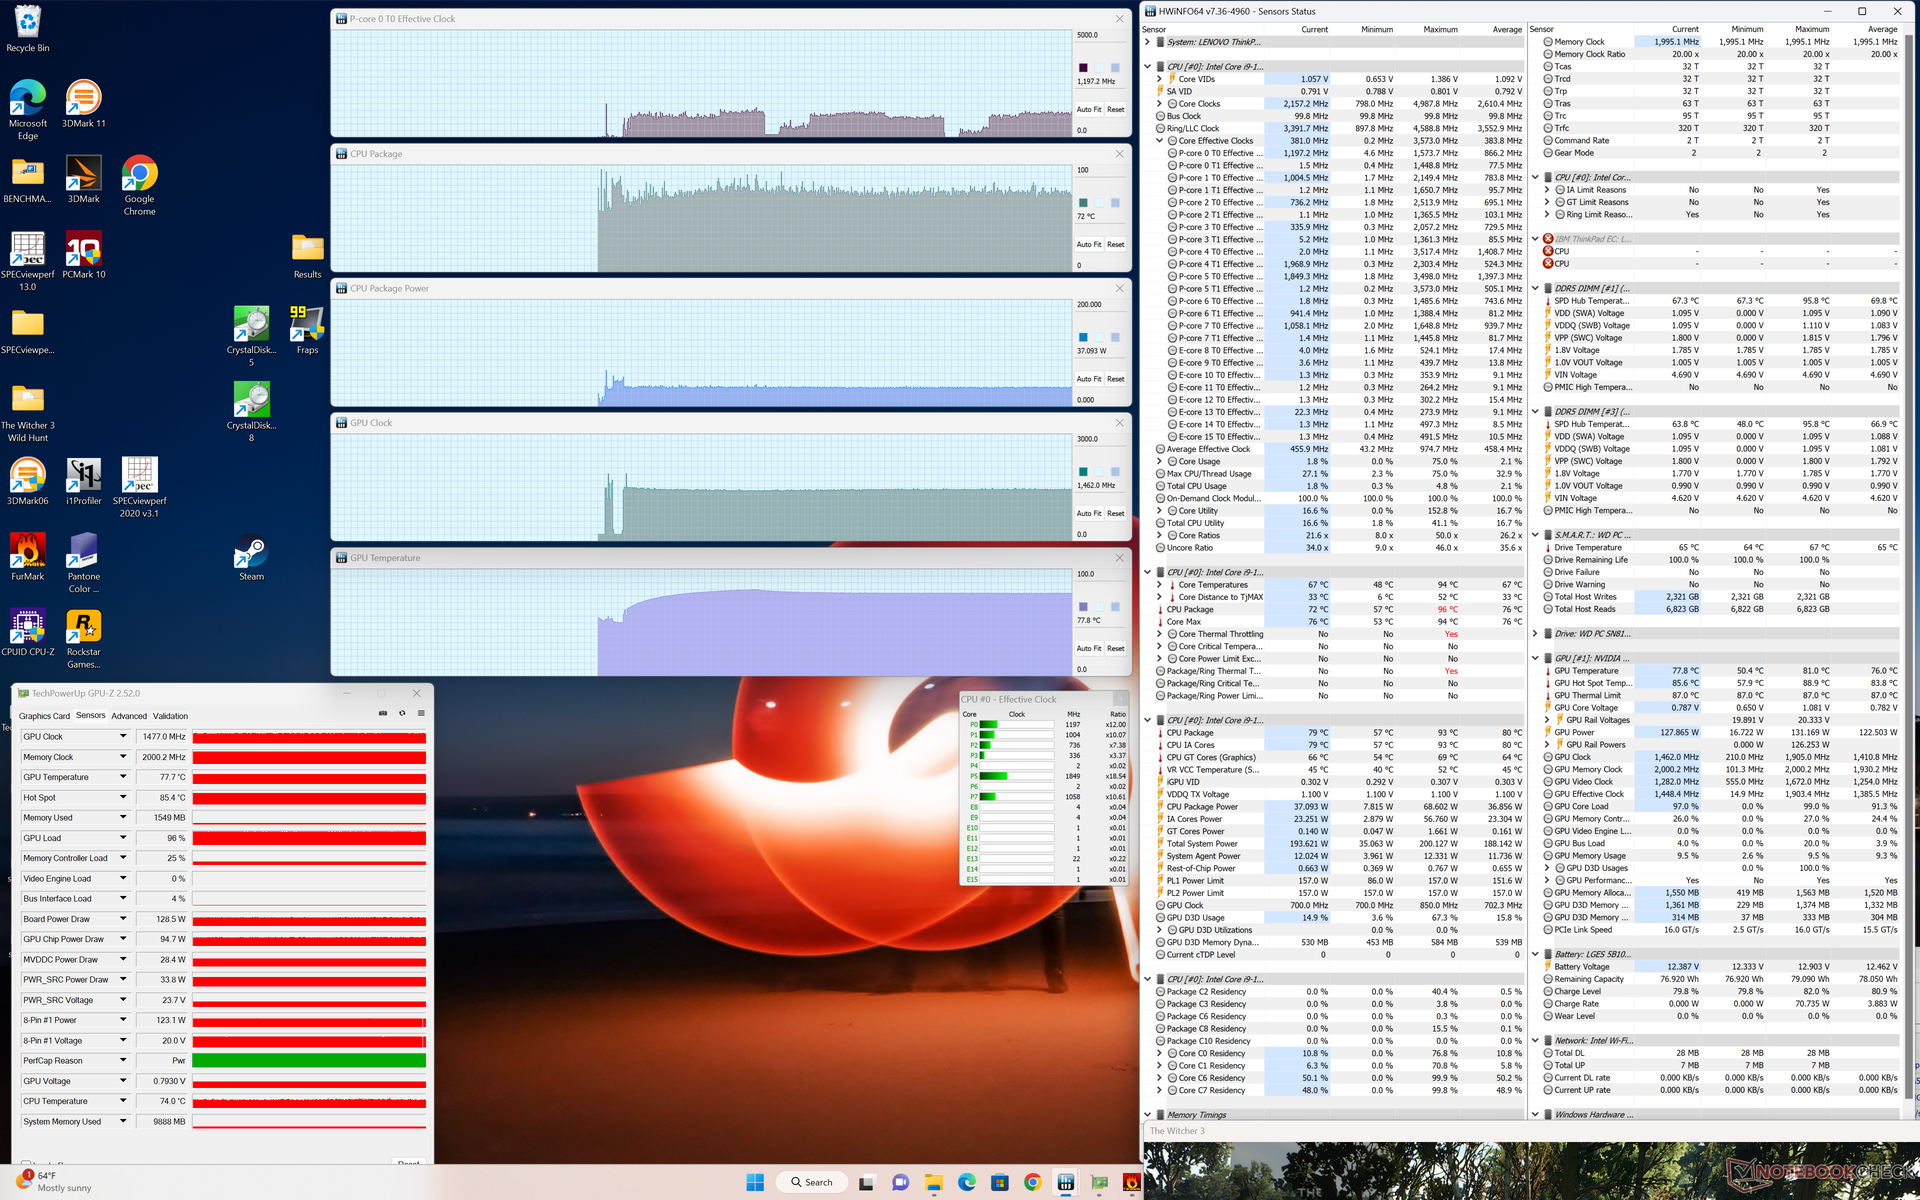
Il sistema è decisamente sotto sforzo quando i processori sono sottoposti a un carico pesante. Quando si esegue Prime95, ad esempio, la frequenza di clock della CPU e l'assorbimento di potenza della scheda aumentano rispettivamente a 4,1 GHz e 135 W. Sfortunatamente, la temperatura del core raggiungeva quasi subito i 100 C e quindi la velocità di clock si riduceva rapidamente per evitare temperature ancora più elevate. Alla fine il processore si stabilizza a 3 GHz, 82 W e 100 C, il che significa che sta superando i limiti della soluzione di raffreddamento del ThinkPad P16 G1. Ripetendo questo test su Precision 7670, dotato dello stesso processore, si otterrebbe una frequenza di clock stabile più lenta, pari a 2,3 GHz, e una temperatura interna più bassa, pari a 78 C.
Quando si esegue Witcher 3 a rappresentare carichi elevati, la velocità di clock della GPU, il clock della memoria e la temperatura si stabilizzerebbero rispettivamente a 1477 MHz, 2000 MHz e 78 C, rispetto ai 1417 MHz, 1750 MHz e 82 C di Precision 7670 in condizioni simili. Anche l'assorbimento di potenza della scheda sarebbe maggiore sul nostro Lenovo, con 129 W rispetto ai soli 100 W del Dell, il che spiegherebbe i vantaggi delle prestazioni della GPU menzionati in precedenza.
Il funzionamento a batteria limita le prestazioni. Un test di Fire Strike a batteria restituirebbe punteggi di Fisica e Grafica pari a 18903 e 12395 punti, rispettivamente, rispetto a 31226 e 28885 punti con alimentazione a rete.
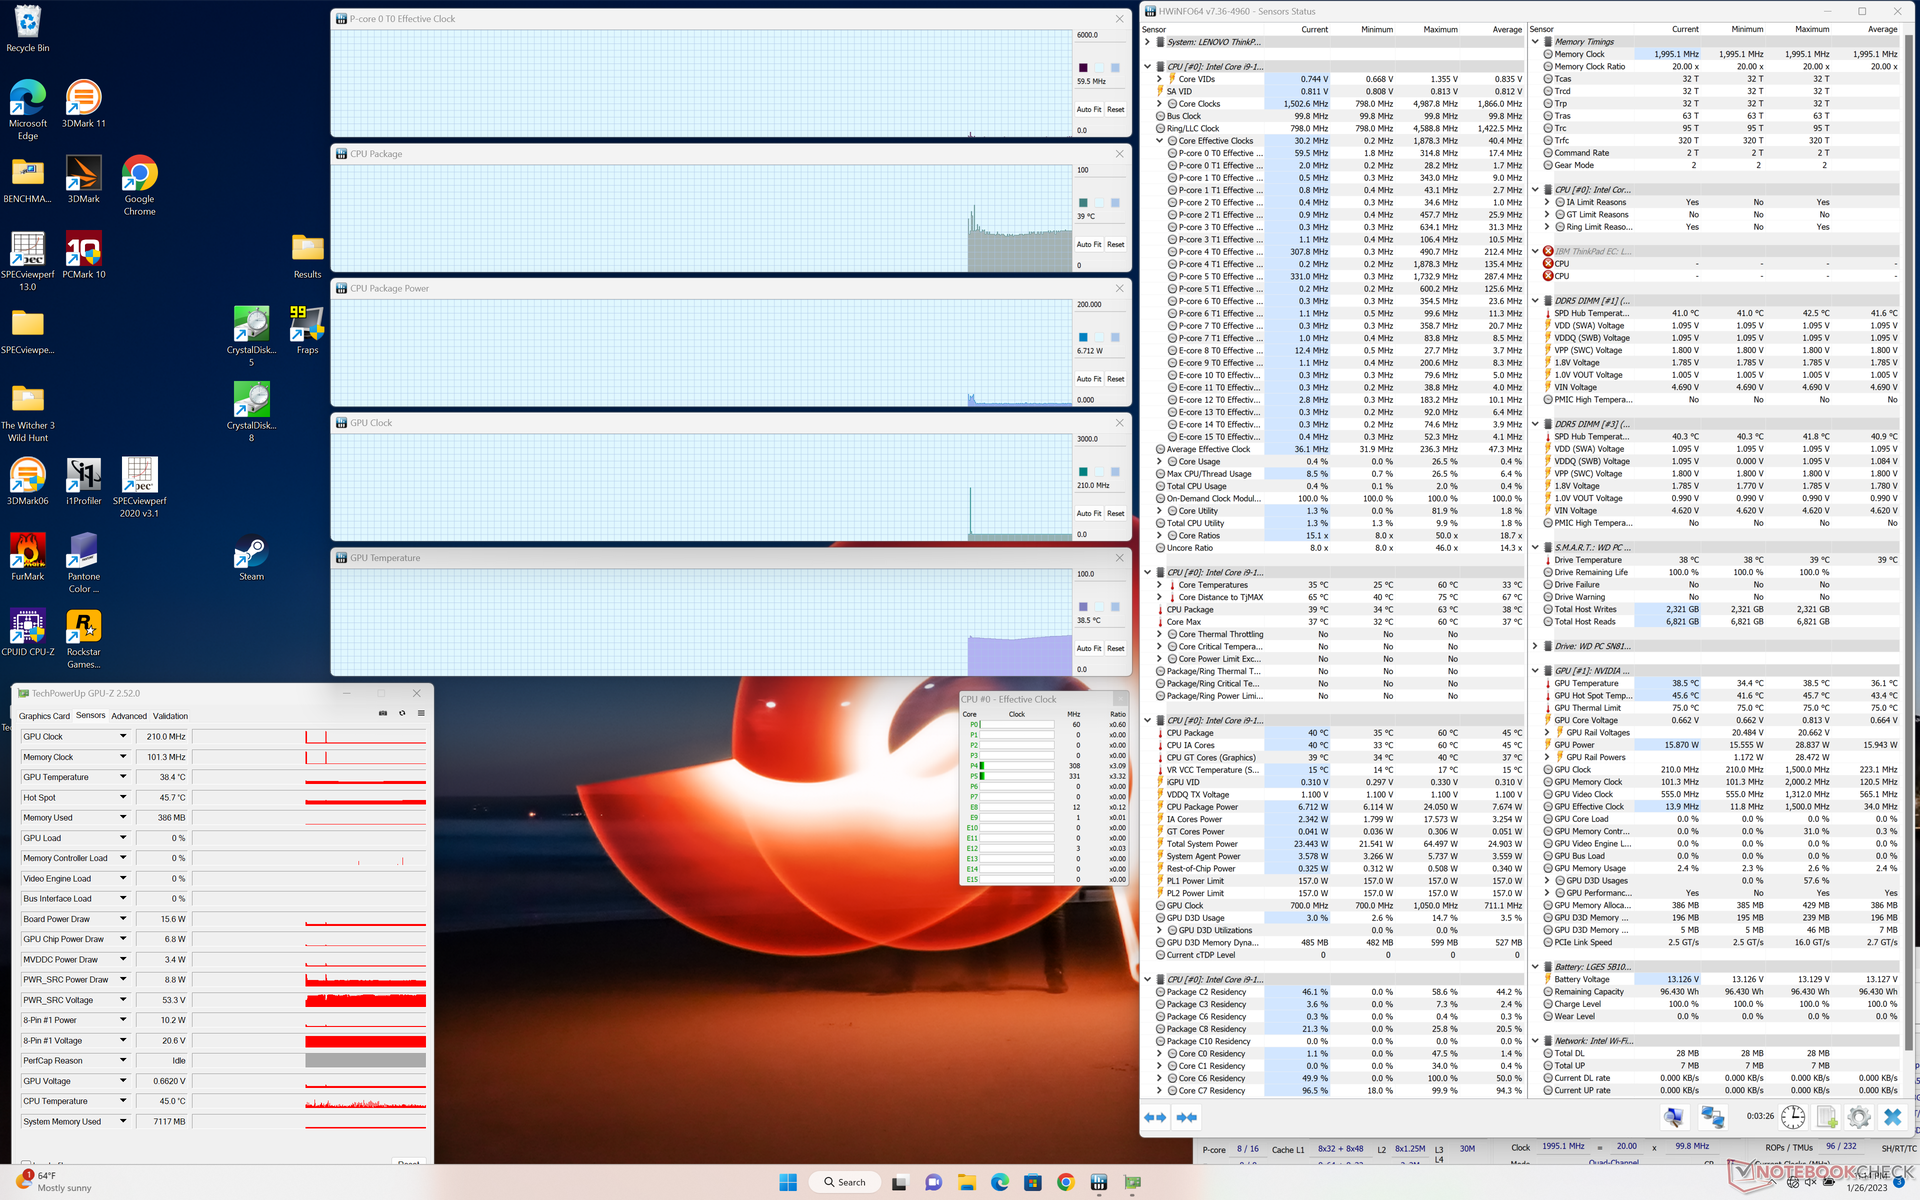
| Clock della CPU (GHz) | Clock della GPU (MHz) | Temperatura media della CPU (°C) | Temperatura media della GPU (°C) | |
| Sistema inattivo | -- | -- | 39 | 39 |
| Stress Prime95 | 3.0 | -- | 100 | 45 |
| Prime95 + FurMark Stress | 2,1 - 2,8 | ~500 - 1550 | 88 - 100 | 75 |
| Witcher 3 Stress | ~1,2 | 1477 | 72 | 78 |
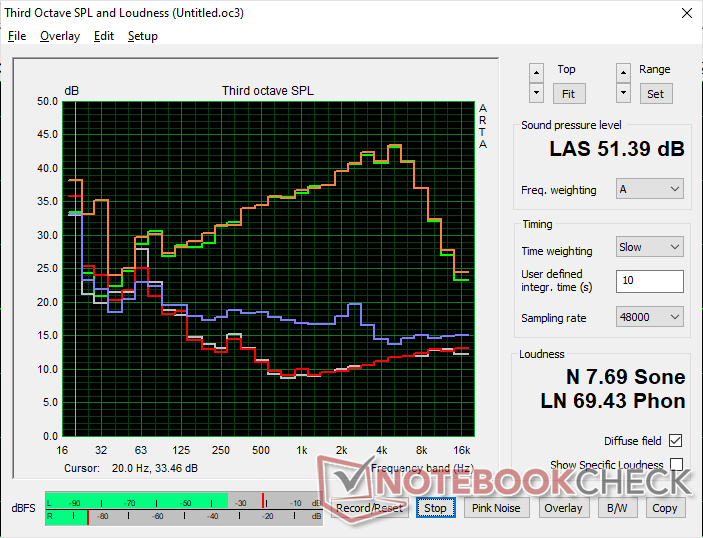
Altoparlanti
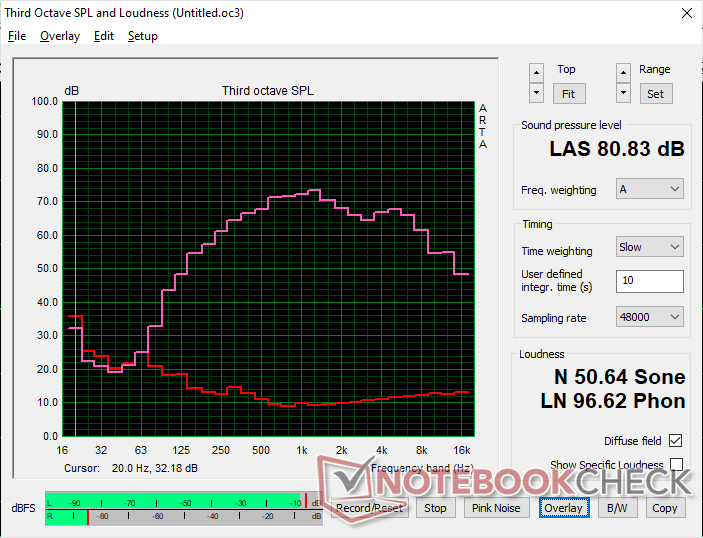
Lenovo ThinkPad P16 G1 RTX A5500 analisi audio
(±) | potenza degli altiparlanti media ma buona (80.8 dB)
Bassi 100 - 315 Hz
(±) | bassi ridotti - in media 11.1% inferiori alla media
(±) | la linearità dei bassi è media (9.7% delta rispetto alla precedente frequenza)
Medi 400 - 2000 Hz
(+) | medi bilanciati - solo only 4.1% rispetto alla media
(+) | medi lineari (3.3% delta rispetto alla precedente frequenza)
Alti 2 - 16 kHz
(+) | Alti bilanciati - appena 2.9% dalla media
(+) | alti lineari (5.2% delta rispetto alla precedente frequenza)
Nel complesso 100 - 16.000 Hz
(+) | suono nel complesso lineare (13.2% differenza dalla media)
Rispetto alla stessa classe
» 23% di tutti i dispositivi testati in questa classe è stato migliore, 6% simile, 71% peggiore
» Il migliore ha avuto un delta di 7%, medio di 17%, peggiore di 35%
Rispetto a tutti i dispositivi testati
» 13% di tutti i dispositivi testati in questa classe è stato migliore, 3% similare, 84% peggiore
» Il migliore ha avuto un delta di 4%, medio di 23%, peggiore di 134%
Apple MacBook Pro 16 2021 M1 Pro analisi audio
(+) | gli altoparlanti sono relativamente potenti (84.7 dB)
Bassi 100 - 315 Hz
(+) | bassi buoni - solo 3.8% dalla media
(+) | bassi in lineaa (5.2% delta rispetto alla precedente frequenza)
Medi 400 - 2000 Hz
(+) | medi bilanciati - solo only 1.3% rispetto alla media
(+) | medi lineari (2.1% delta rispetto alla precedente frequenza)
Alti 2 - 16 kHz
(+) | Alti bilanciati - appena 1.9% dalla media
(+) | alti lineari (2.7% delta rispetto alla precedente frequenza)
Nel complesso 100 - 16.000 Hz
(+) | suono nel complesso lineare (4.6% differenza dalla media)
Rispetto alla stessa classe
» 0% di tutti i dispositivi testati in questa classe è stato migliore, 0% simile, 100% peggiore
» Il migliore ha avuto un delta di 5%, medio di 17%, peggiore di 45%
Rispetto a tutti i dispositivi testati
» 0% di tutti i dispositivi testati in questa classe è stato migliore, 0% similare, 100% peggiore
» Il migliore ha avuto un delta di 4%, medio di 23%, peggiore di 134%
Gestione dell'energia
Consumo di energia
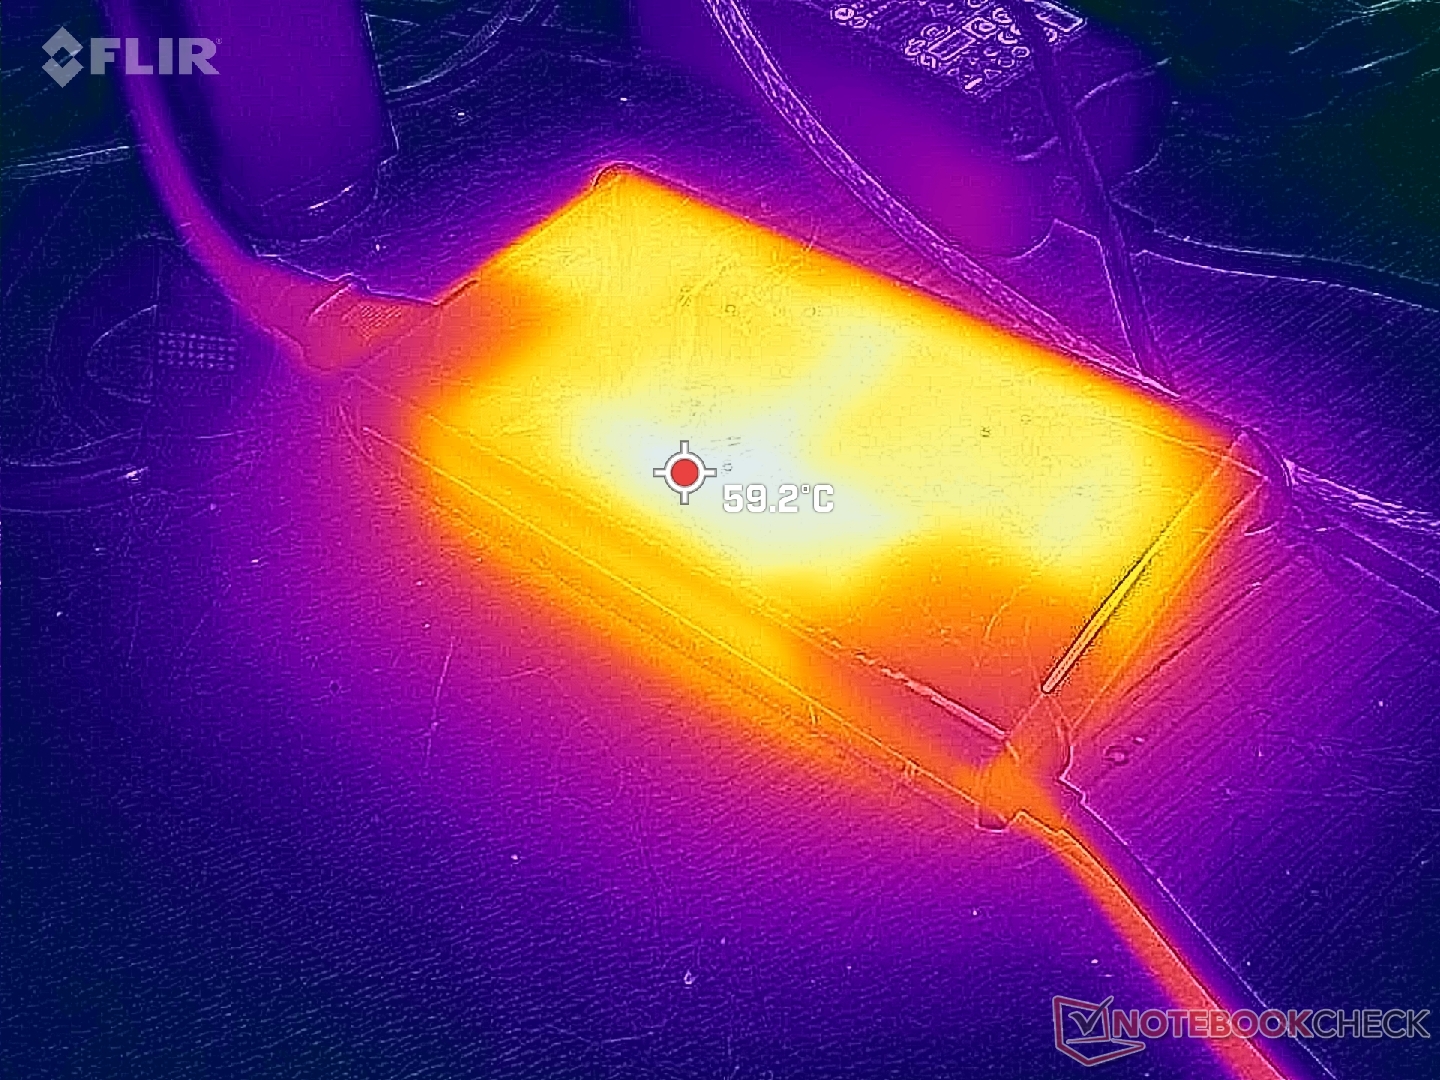
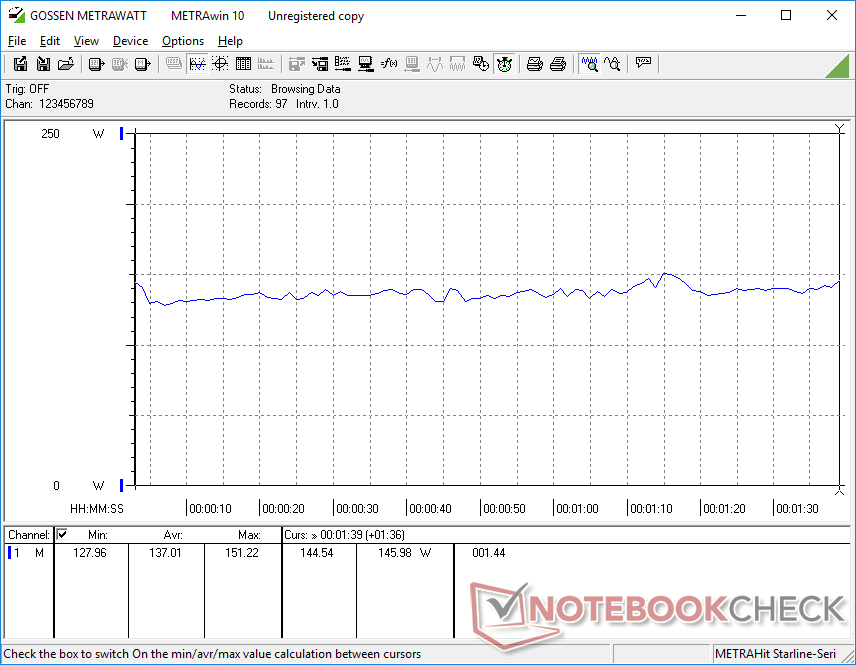
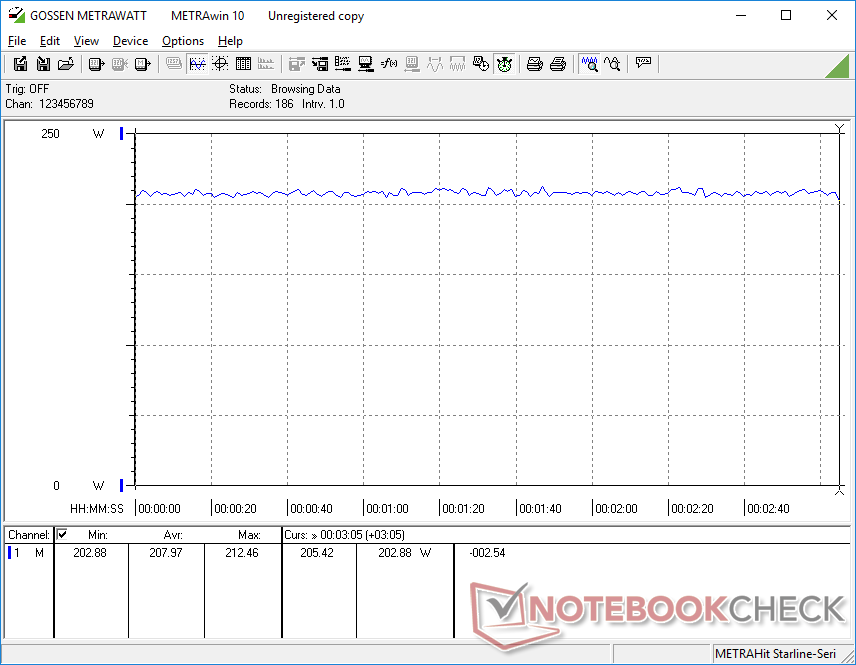
Il consumo energetico al minimo è inferiore a quello di Precision 7670 di diversi watt, probabilmente a causa del pannello OLED più esigente di quest'ultimo. Quando si eseguono carichi più elevati, come Witcher 3tuttavia, il consumo diventa sensibilmente più elevato sul Lenovo che sul Dell (208 W contro 159 W). Il consumo energetico più elevato coincide con le prestazioni più elevate di CPU e GPU rispetto al modello Dell concorrente, come dimostrato dai benchmark di cui sopra.
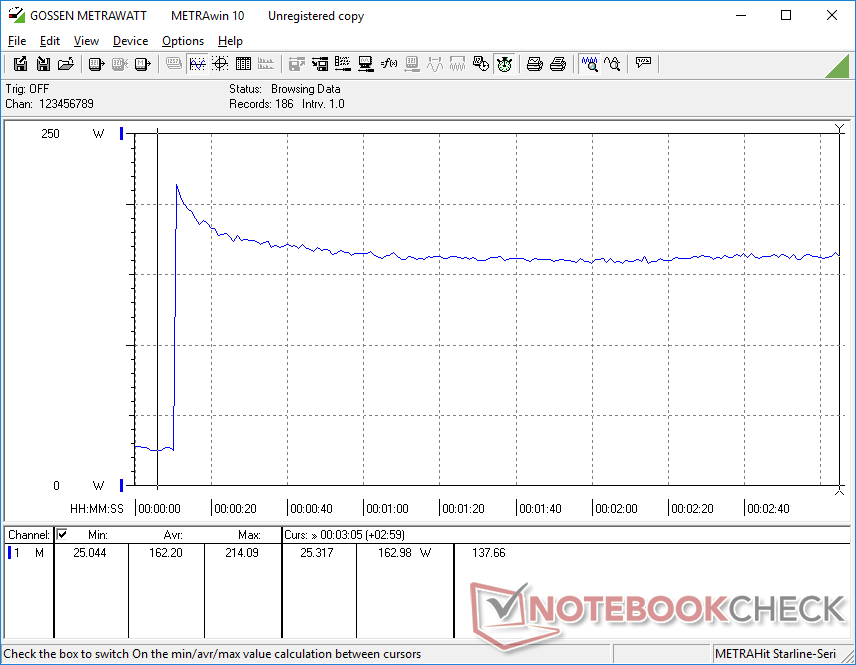
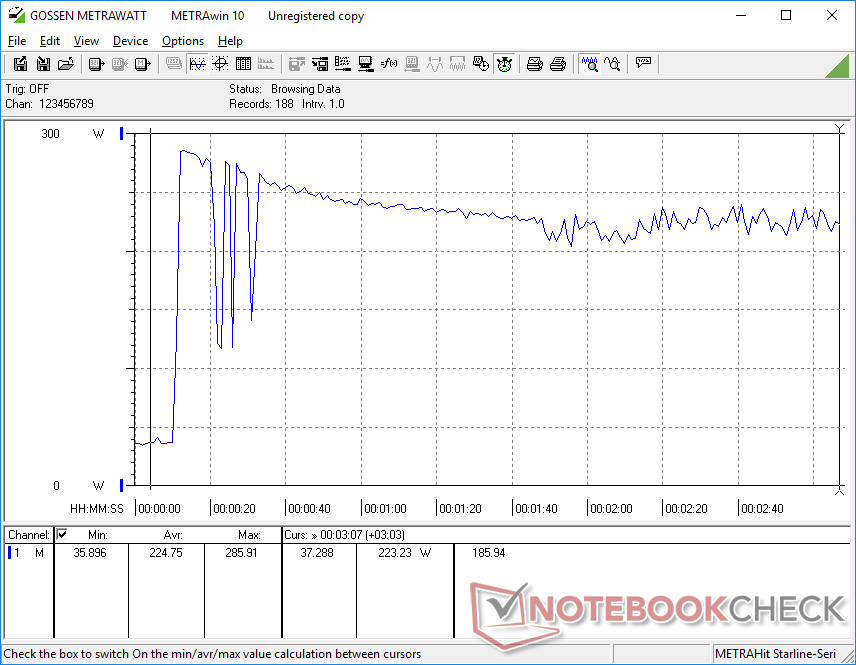
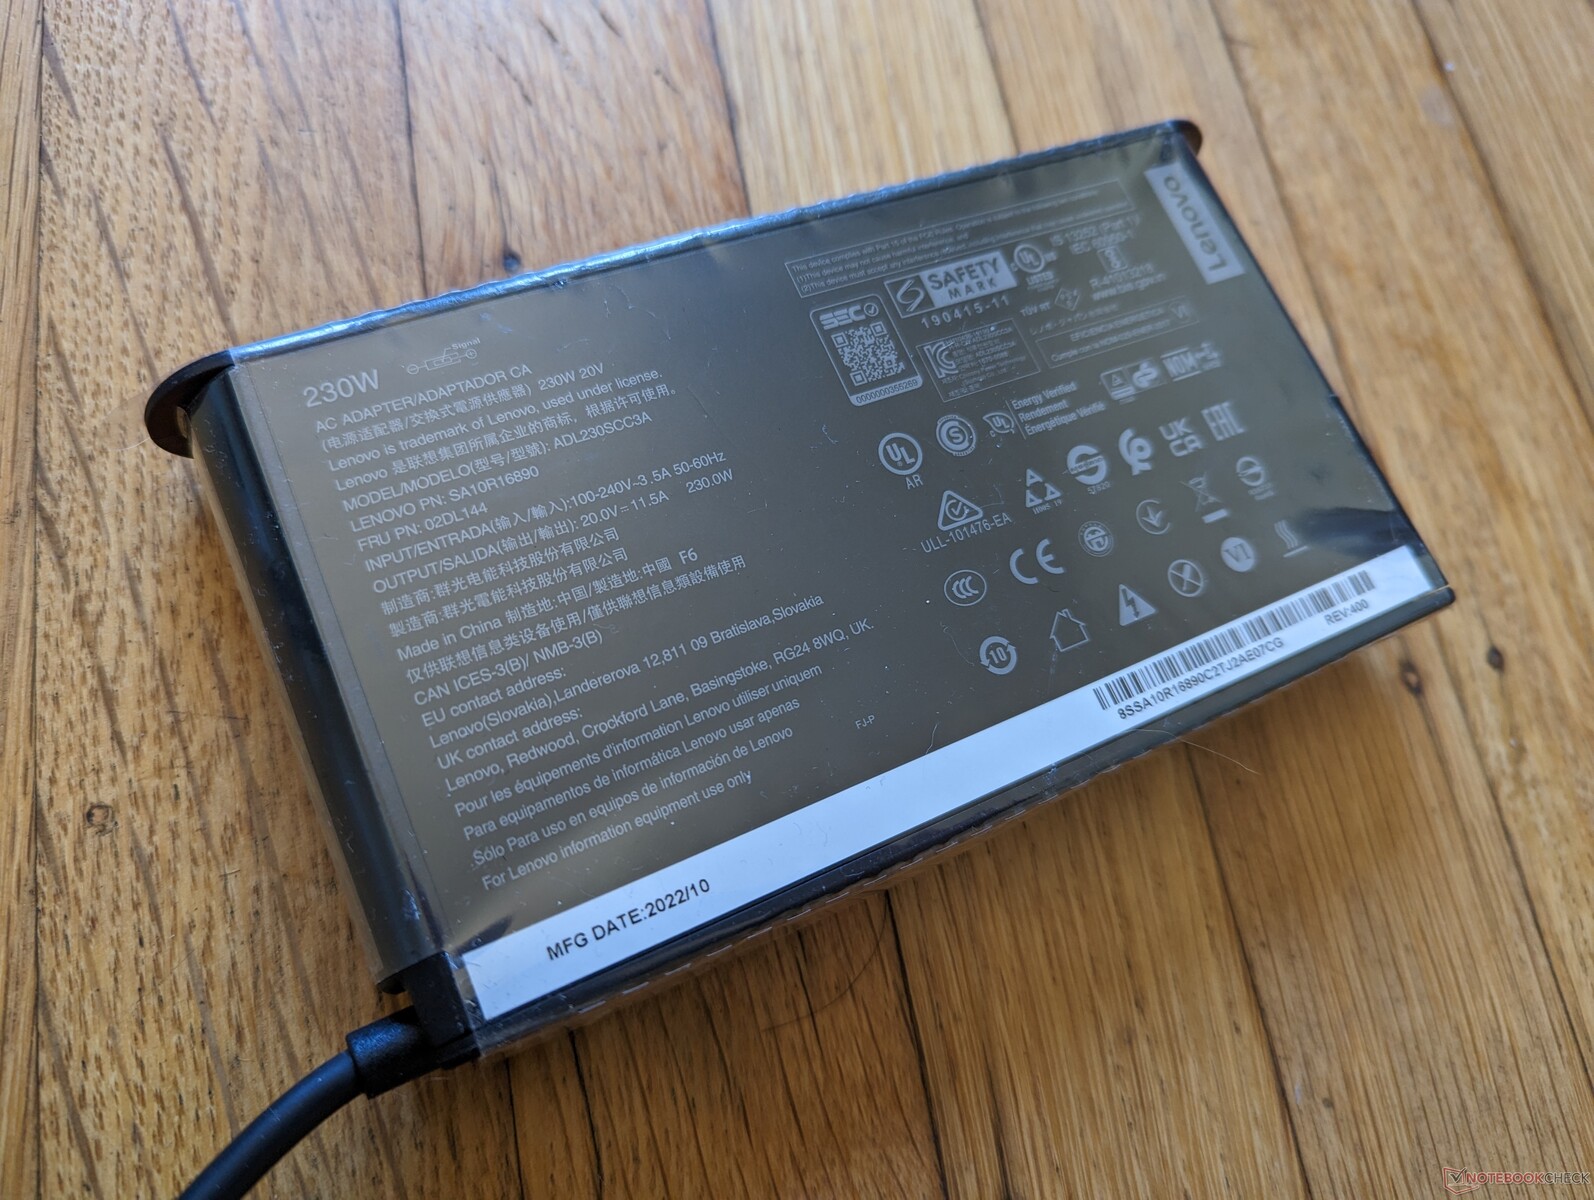
Sebbene gli utenti più esigenti possano apprezzare le prestazioni extra, il nostro Lenovo completamente carico è significativamente più esigente della maggior parte delle altre workstation mobili. Infatti, l'adattatore CA da 230 W di medie dimensioni (~15 x 8,6 x 2,6 cm) potrebbe non essere sufficiente ad alimentare la macchina quando la CPU e la GPU sono ad alto utilizzo. Siamo riusciti a misurare un assorbimento massimo temporaneo di 286 W dall'adattatore da 230 W, prima di scendere e stabilizzarsi a circa 223 W. Pertanto, ci si deve aspettare che il tasso di carica della batteria rallenti o diventi addirittura negativo quando si eseguono carichi impegnativi. Quando si lavora Witcher 3 per 90 minuti di fila, ad esempio, abbiamo osservato che il livello della batteria è sceso dal 100% all'87%. Un comportamento simile è stato osservato sul vecchio XPS 17 o Precision 5750. È un peccato che Lenovo non offra opzioni di adattatore CA superiori a 230 W al momento del checkout.
La configurazione con la RTX A2000 di fascia bassa ridurrebbe il consumo di circa la metà. In questo caso, l'adattatore CA da 230 W sarebbe sufficiente.
| Off / Standby | |
| Idle | |
| Sotto carico |
|
Leggenda:
min: | |
| Lenovo ThinkPad P16 G1 RTX A5500 i9-12950HX, RTX A5500 Laptop GPU, WDC PC SN810 2TB, IPS, 3840x2400, 16" | Asus ProArt StudioBook 16 W7600H5A-2BL2 W-11955M, RTX A5000 Laptop GPU, 2x Micron 2300 2TB MTFDHBA2T0TDV (RAID 0), OLED, 3840x2400, 16" | Dell Precision 7000 7670 Performance i9-12950HX, RTX A5500 Laptop GPU, , OLED, 3840x2400, 16" | Lenovo ThinkPad P16 G1 21D6001DMB i7-12850HX, RTX A2000 Laptop GPU, Micron 3400 1TB MTFDKBA1T0TFH, IPS LED, 2560x1600, 16" | MSI CreatorPro Z16P B12UKST i7-12700H, RTX A3000 Laptop GPU, Samsung PM9A1 MZVL21T0HCLR, IPS, 2560x1600, 16" | HP ZBook Studio 16 G9 62U04EA i7-12800H, RTX A2000 Laptop GPU, Micron 3400 1TB MTFDKBA1T0TFH, IPS, 3840x2400, 16" | |
|---|---|---|---|---|---|---|
| Power Consumption | 14% | -35% | 45% | 19% | 28% | |
| Idle Minimum * (Watt) | 7.5 | 12.4 -65% | 16.4 -119% | 5.1 32% | 10.8 -44% | 7.2 4% |
| Idle Average * (Watt) | 20.1 | 16.5 18% | 35.9 -79% | 9.2 54% | 16.3 19% | 18.1 10% |
| Idle Maximum * (Watt) | 40 | 25 37% | 47 -18% | 9.9 75% | 16.9 58% | 18.5 54% |
| Load Average * (Watt) | 137 | 132 4% | 147.1 -7% | 124.1 9% | 111.7 18% | 112.8 18% |
| Witcher 3 ultra * (Watt) | 208 | 132 37% | 158.8 24% | 87.7 58% | 152.1 27% | 106.7 49% |
| Load Maximum * (Watt) | 285.9 | 134 53% | 311 -9% | 168.9 41% | 177.4 38% | 186 35% |
* ... Meglio usare valori piccoli
Power Consumption Witcher 3 / Stresstest
Power Consumption external Monitor
Durata della batteria
L'autonomia è di diverse ore inferiore a quella della nostra SKU RTX A2000, per un totale di poco meno di 6 ore se impostata sul profilo di alimentazione bilanciato.
La ricarica da vuoto a pieno richiede circa 2 ore. Il tempo di carica stimato da Lenovo non è però così accurato, poiché Vantage può mostrare un tempo iniziale di 4 ore prima di ricalibrarsi automaticamente. Tenere presente che la velocità di ricarica rallenterà notevolmente se si eseguono applicazioni impegnative, come indicato sopra.
Il sistema non può essere ricaricato tramite USB-C.
| Lenovo ThinkPad P16 G1 RTX A5500 i9-12950HX, RTX A5500 Laptop GPU, 94 Wh | Asus ProArt StudioBook 16 W7600H5A-2BL2 W-11955M, RTX A5000 Laptop GPU, 90 Wh | Dell Precision 7000 7670 Performance i9-12950HX, RTX A5500 Laptop GPU, 93 Wh | Lenovo ThinkPad P16 G1 21D6001DMB i7-12850HX, RTX A2000 Laptop GPU, 94 Wh | MSI CreatorPro Z16P B12UKST i7-12700H, RTX A3000 Laptop GPU, 90 Wh | HP ZBook Studio 16 G9 62U04EA i7-12800H, RTX A2000 Laptop GPU, 86 Wh | |
|---|---|---|---|---|---|---|
| Autonomia della batteria | -14% | -19% | 62% | 0% | 9% | |
| WiFi v1.3 (h) | 5.8 | 5 -14% | 4.7 -19% | 9.4 62% | 5.8 0% | 6.3 9% |
| H.264 (h) | 1.8 | 8.5 | ||||
| Witcher 3 ultra (h) | 1.6 | |||||
| Load (h) | 1.8 | 1.1 |
Pro
Contro
Verdetto - L'adattatore CA da 230 W non è sufficiente
Dal punto di vista delle prestazioni, il ThinkPad P16 G1 è una delle workstation mobili più veloci attualmente disponibili, indipendentemente dalle dimensioni dello schermo. La CPU Core i9-12950HX e la GPU RTX A5500 superano leggermente, ma in modo costante, le prestazioni del modello 7670 Precision 7670 anche se il modello Dell è dotato di opzioni di processore simili.
Ci sono due inconvenienti fondamentali che speriamo Lenovo possa risolvere con le future iterazioni. In primo luogo, le temperature della CPU sono molto più alte della media quando si eseguono carichi impegnativi. Le temperature elevate non sono inaspettate, naturalmente, ma un plateau di 100 C è troppo caldo per essere considerato confortevole, quando la stessa CPU nel modello Dell citato in precedenza avrebbe a malapena superato gli 80 C in condizioni simili. La temperatura elevata è forse il prezzo da pagare per le prestazioni leggermente più elevate.
In secondo luogo, l'adattatore CA da 230 W sta sudando per cercare di alimentare una CPU da oltre 100 W e una GPU da 130 W. La difficoltà è evidente quando si eseguono carichi impegnativi, poiché la velocità di carica del sistema rallenta notevolmente o addirittura inizia a scaricare la batteria in alcuni scenari. Quando siamo in grado di misurare un assorbimento di picco di 285 W da un adattatore CA da soli 230 W, è evidente che si tratta di un collo di bottiglia. Un adattatore CA più grande, da 280 o 330 W, sarebbe stato più appropriato per il nostro livello di configurazione.
Il ThinkPad P16 Gen 1 massimizza le prestazioni anche se ciò comporta un maggiore consumo energetico e temperature più elevate del core. L'adattatore CA da 230 W potrebbe essere troppo conservativo, tuttavia, dati i processori molto esigenti della nostra configurazione top-end.
Le prestazioni complessive del sistema sono comunque innegabili, nonostante le temperature elevate e l'insufficienza del mattone di alimentazione da 230 W. Assicuratevi di uscire da qualsiasi applicazione impegnativa per ottenere una velocità di ricarica decente.
Prezzo e disponibilità
Il ThinkPad P16 G1 è ora disponibile presso Best Buy e Amazon con livelli di configurazione inferiori a partire da 2570 o 3850 dollari, rispettivamente. Raccomandiamo di acquistare direttamente da Lenovo, in quanto sono disponibili le opzioni più configurabili.
Lenovo ThinkPad P16 G1 RTX A5500
- 02/06/2023 v7 (old)
Allen Ngo
Transparency
La selezione dei dispositivi da recensire viene effettuata dalla nostra redazione. Il campione di prova è stato fornito all'autore come prestito dal produttore o dal rivenditore ai fini di questa recensione. L'istituto di credito non ha avuto alcuna influenza su questa recensione, né il produttore ne ha ricevuto una copia prima della pubblicazione. Non vi era alcun obbligo di pubblicare questa recensione. In quanto società mediatica indipendente, Notebookcheck non è soggetta all'autorità di produttori, rivenditori o editori.
Ecco come Notebookcheck esegue i test
Ogni anno, Notebookcheck esamina in modo indipendente centinaia di laptop e smartphone utilizzando procedure standardizzate per garantire che tutti i risultati siano comparabili. Da circa 20 anni sviluppiamo continuamente i nostri metodi di prova e nel frattempo stabiliamo gli standard di settore. Nei nostri laboratori di prova, tecnici ed editori esperti utilizzano apparecchiature di misurazione di alta qualità. Questi test comportano un processo di validazione in più fasi. Il nostro complesso sistema di valutazione si basa su centinaia di misurazioni e parametri di riferimento ben fondati, che mantengono l'obiettività.Price comparison

