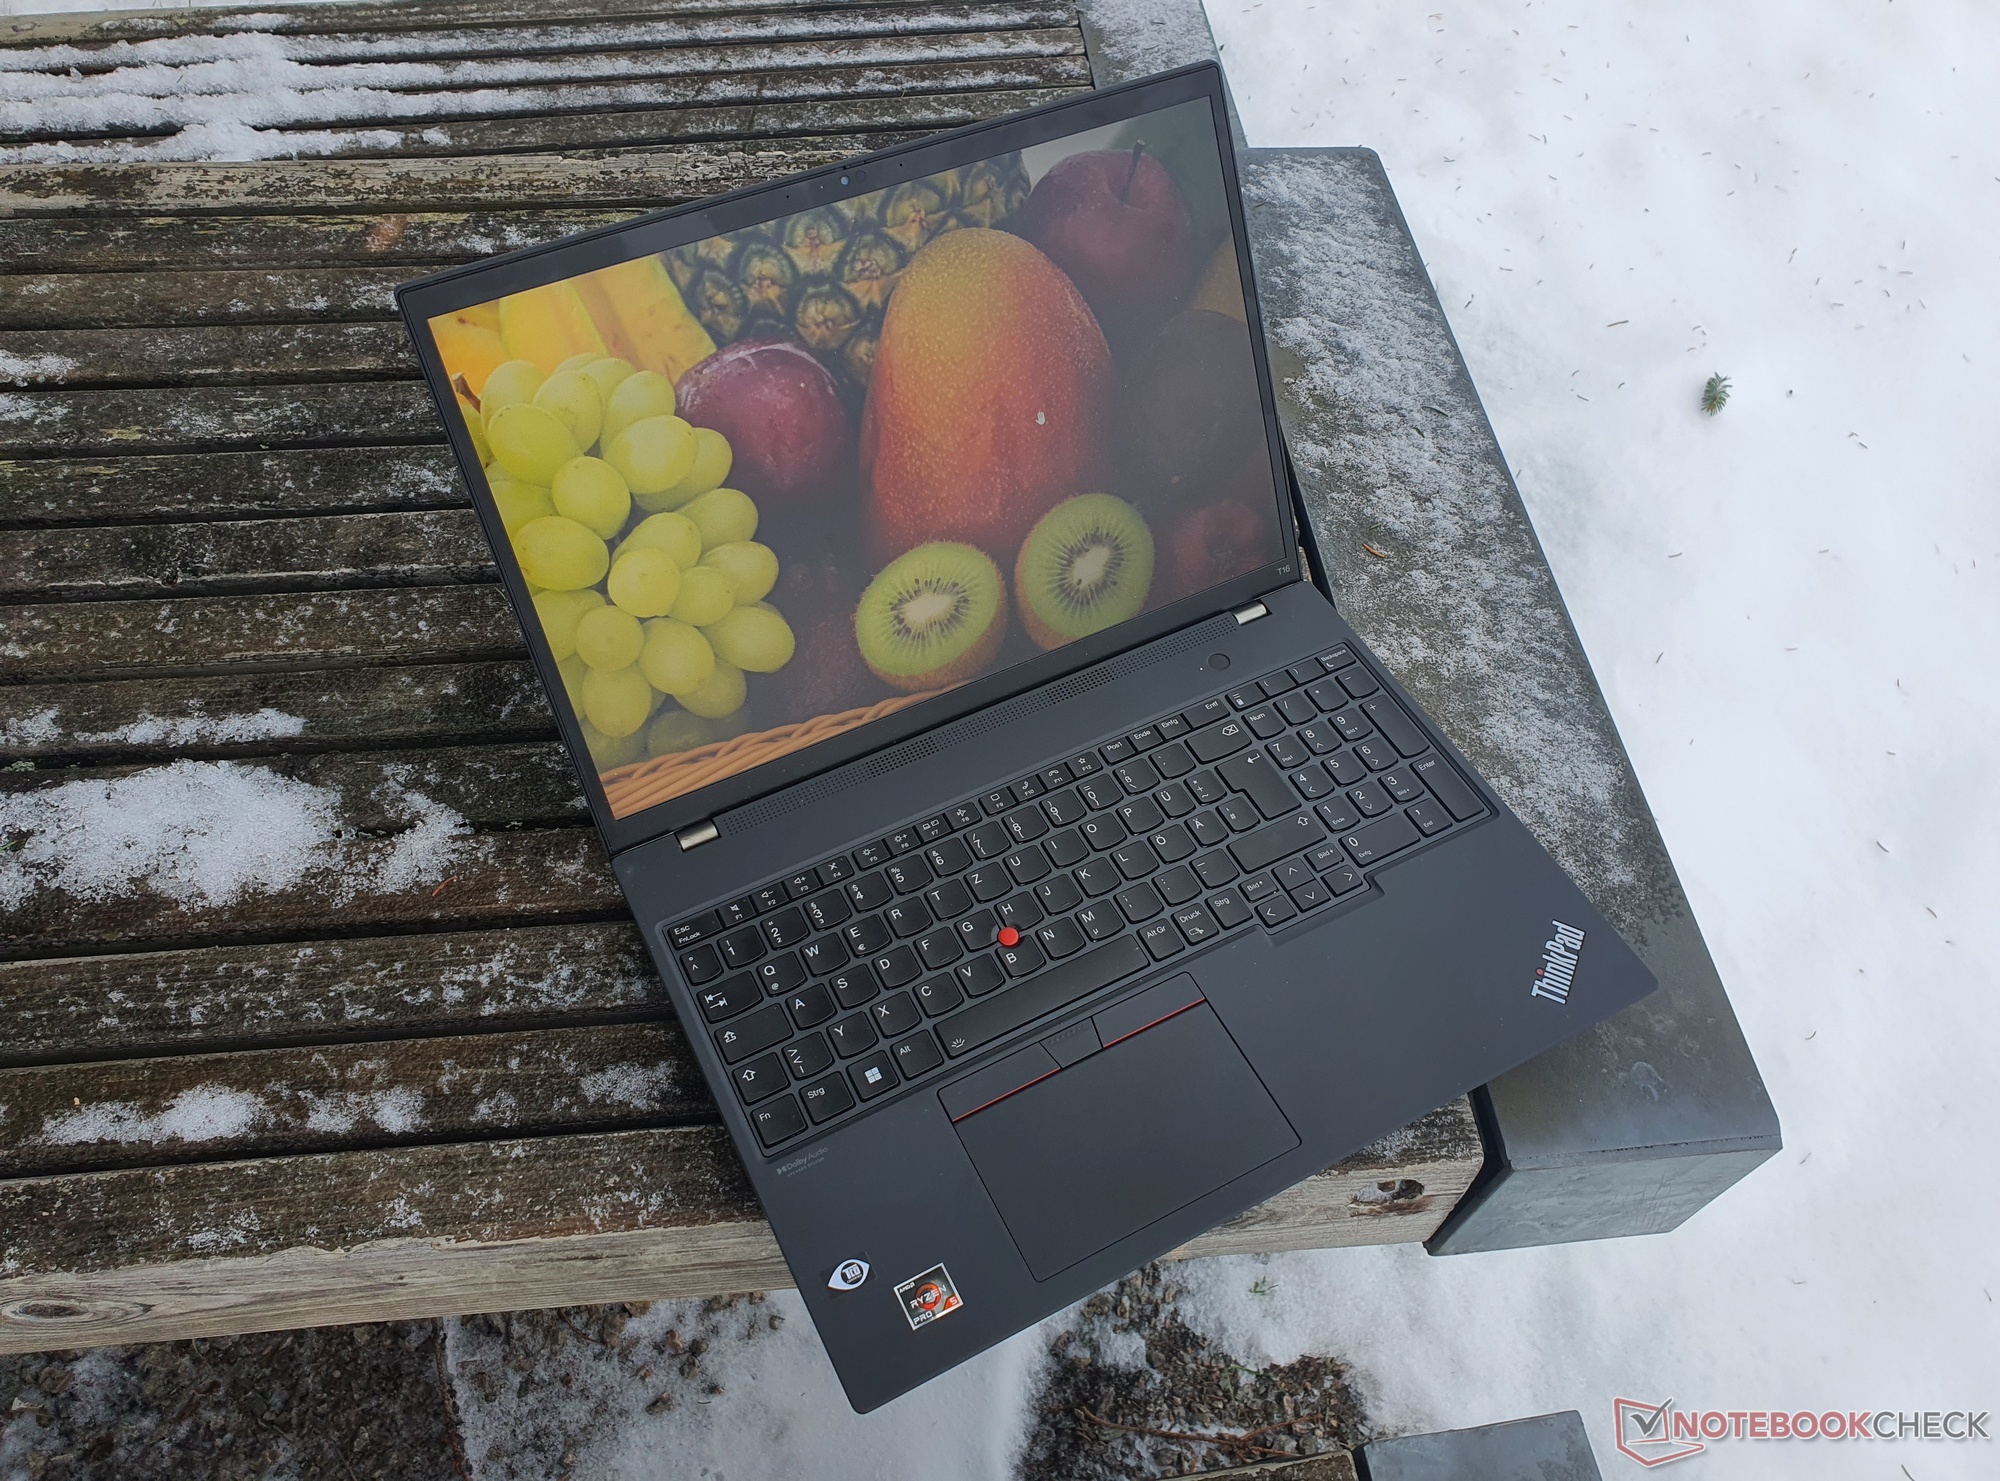
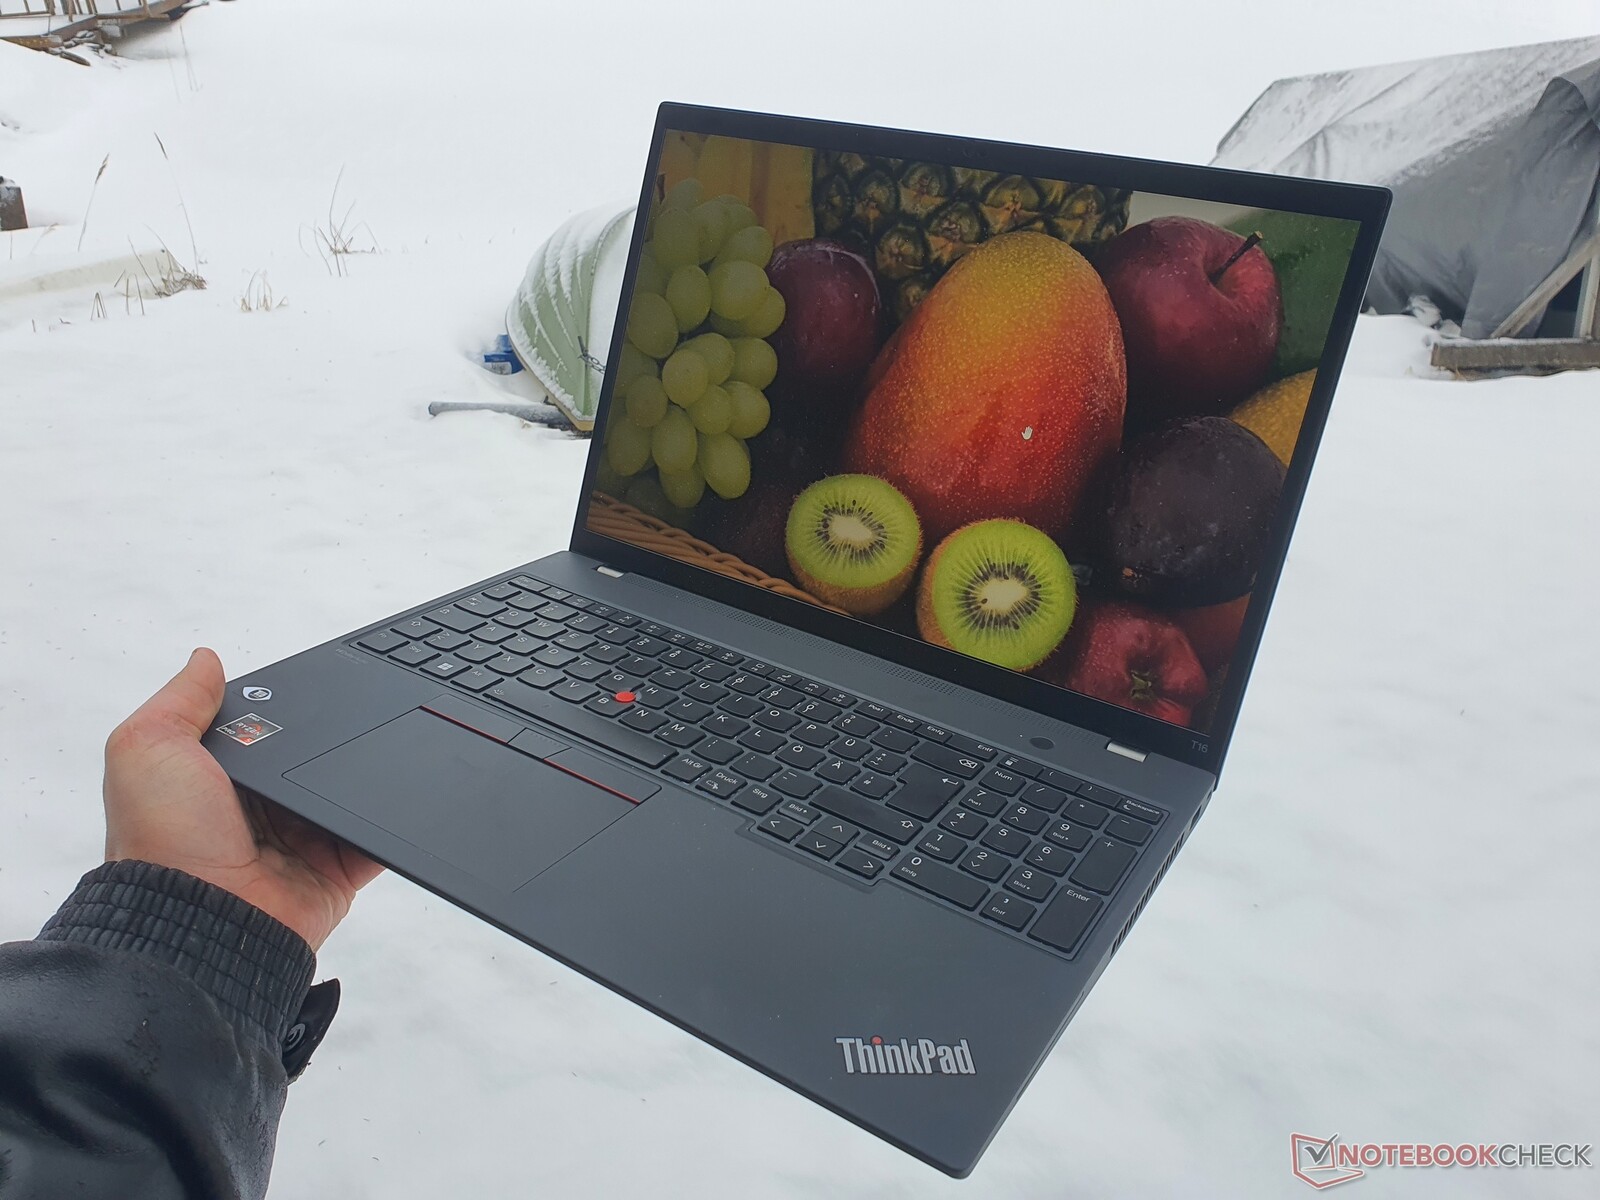
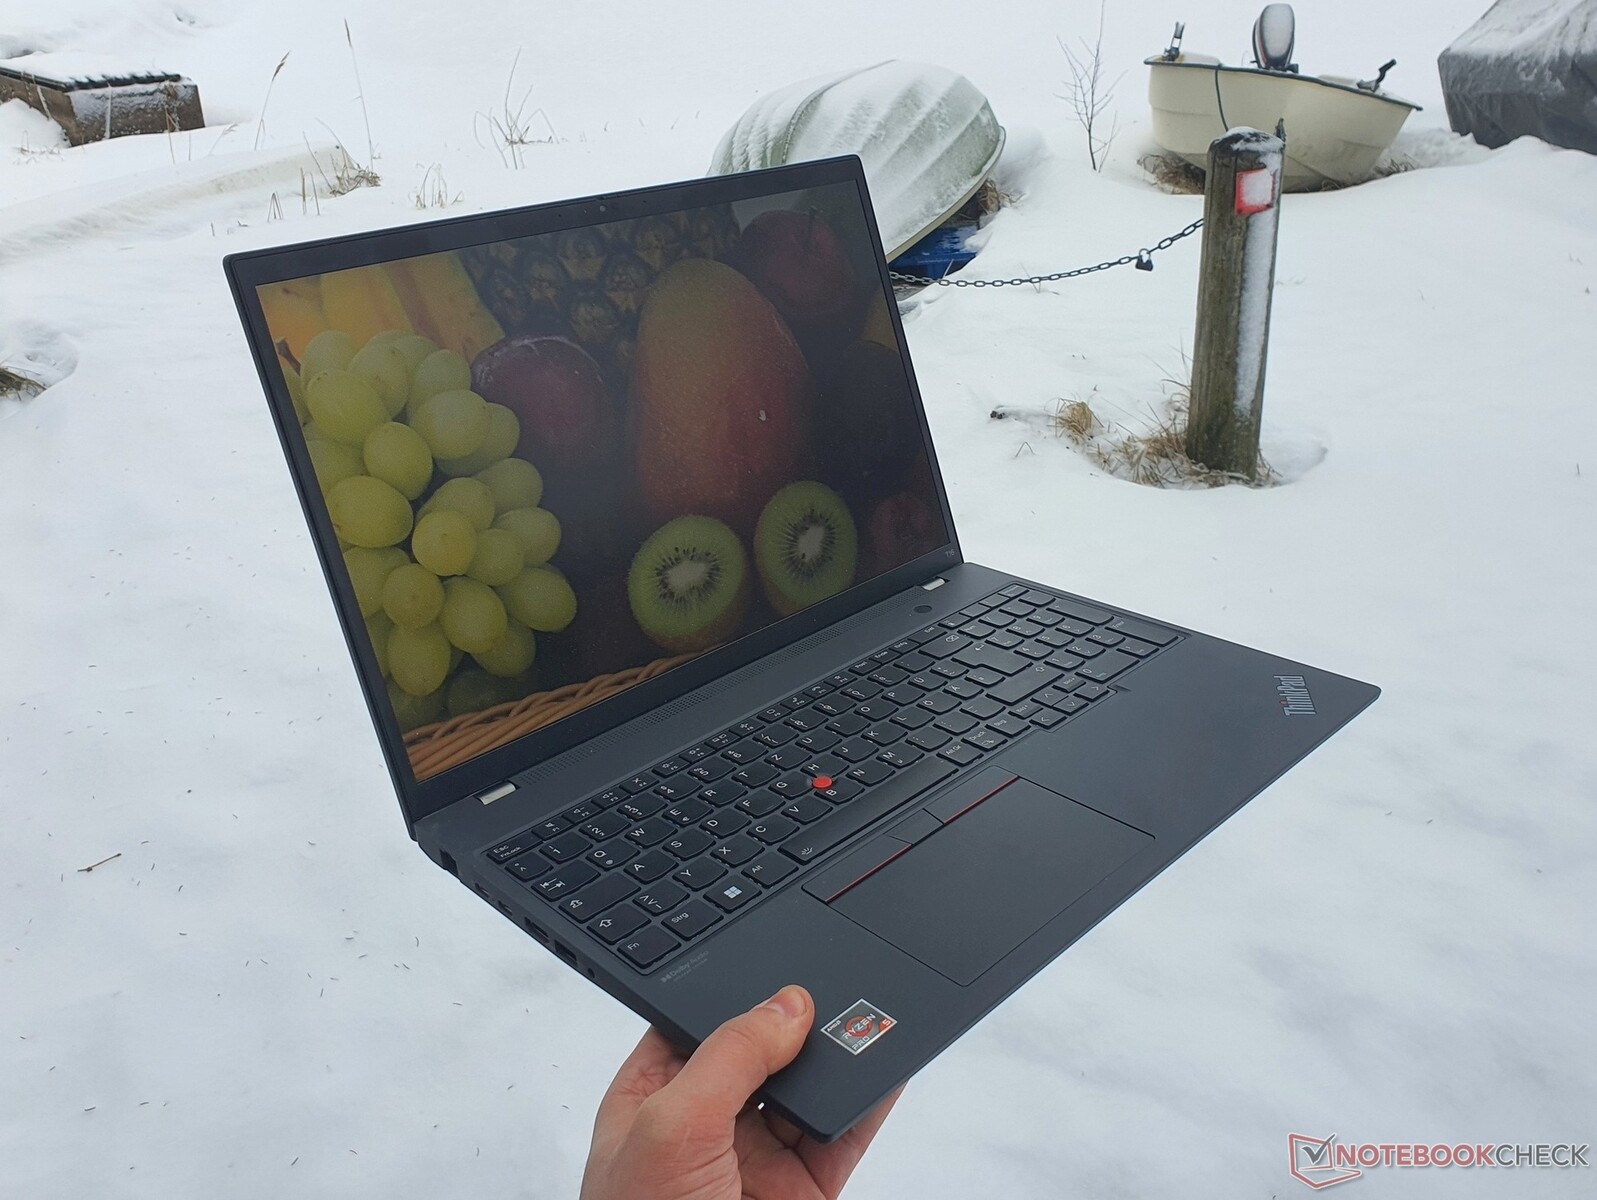
Recensione del portatile Lenovo ThinkPad T16 G1 AMD: Efficiente e più veloce di Intel
In questa recensione diamo un'occhiata alla versione AMD del Lenovo ThinkPad T16, dopo aver già testato la versione Intel testato la versione Intele ne abbiamo colto molti aspetti positivi. Tuttavia, siamo rimasti ancora delusi dalle sue prestazioni, il che ci porta a sperare in qualcosa di più dalle attuali CPU Ryzen del ThinkPad più grande della serie T. Vogliamo anche vedere se il longevo T16 G1 sarà ancora più efficiente con un processore AMD.
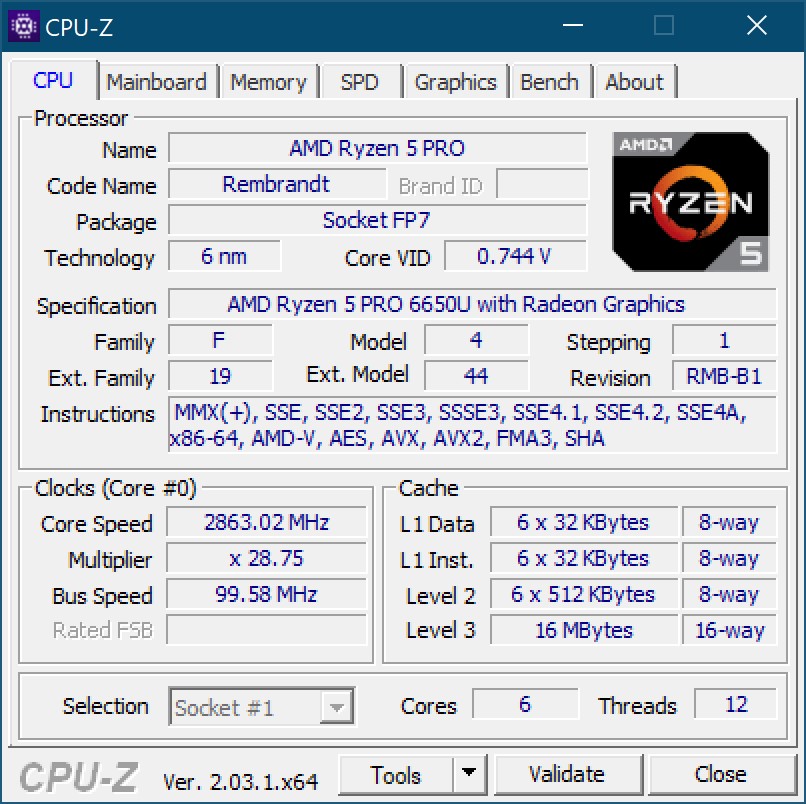
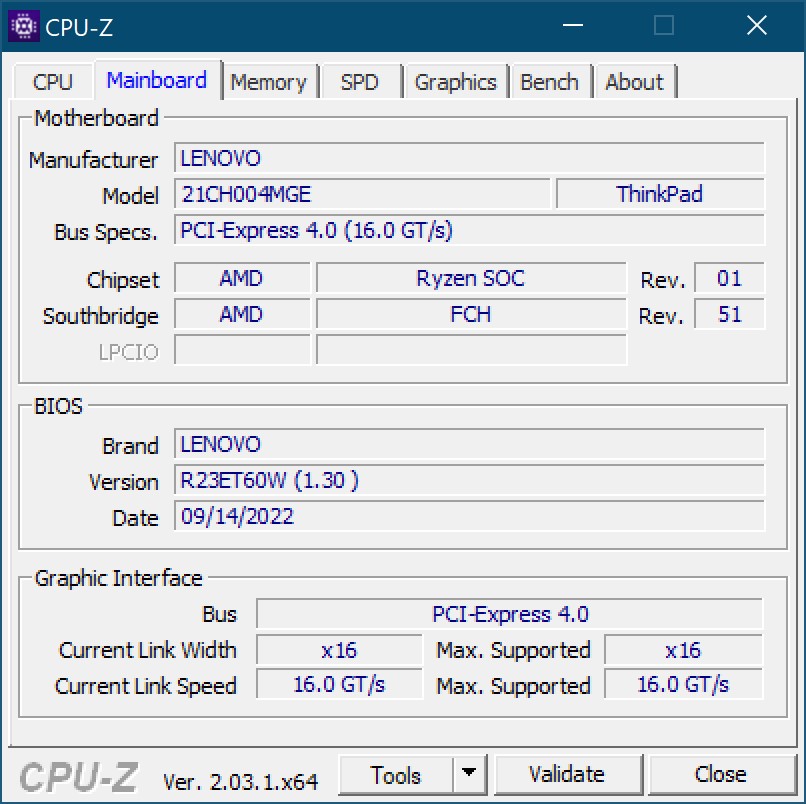
Abbiamo testato una versione con batteria più piccola da 52,5 W, display WQXGA ad alta risoluzione e processore hexa-core di AMD Ryzen 5 PRO 6650U di AMD. Inoltre, sono presenti 16 GB di RAM LPDDR5, completamente saldati nei ThinkPad T16 e T14 di AMD T14e un'unità SSD PCIe 4.0 da 512 GB. La scheda integrata Radeon 660Mintegrata gestisce le operazioni grafiche.
Tra i concorrenti troviamo in particolare l'HP EliteBook 865 G9ma il confronto con altri ThinkPad da 16 pollici come il ThinkPad Z16 o anche il ThinkPad X1 Extremesono stati inclusi anche i risultati dei test di un altro modello T16 con un processore Ryzen 7 PRO 6850Ue un equipaggiamento per il resto identico.
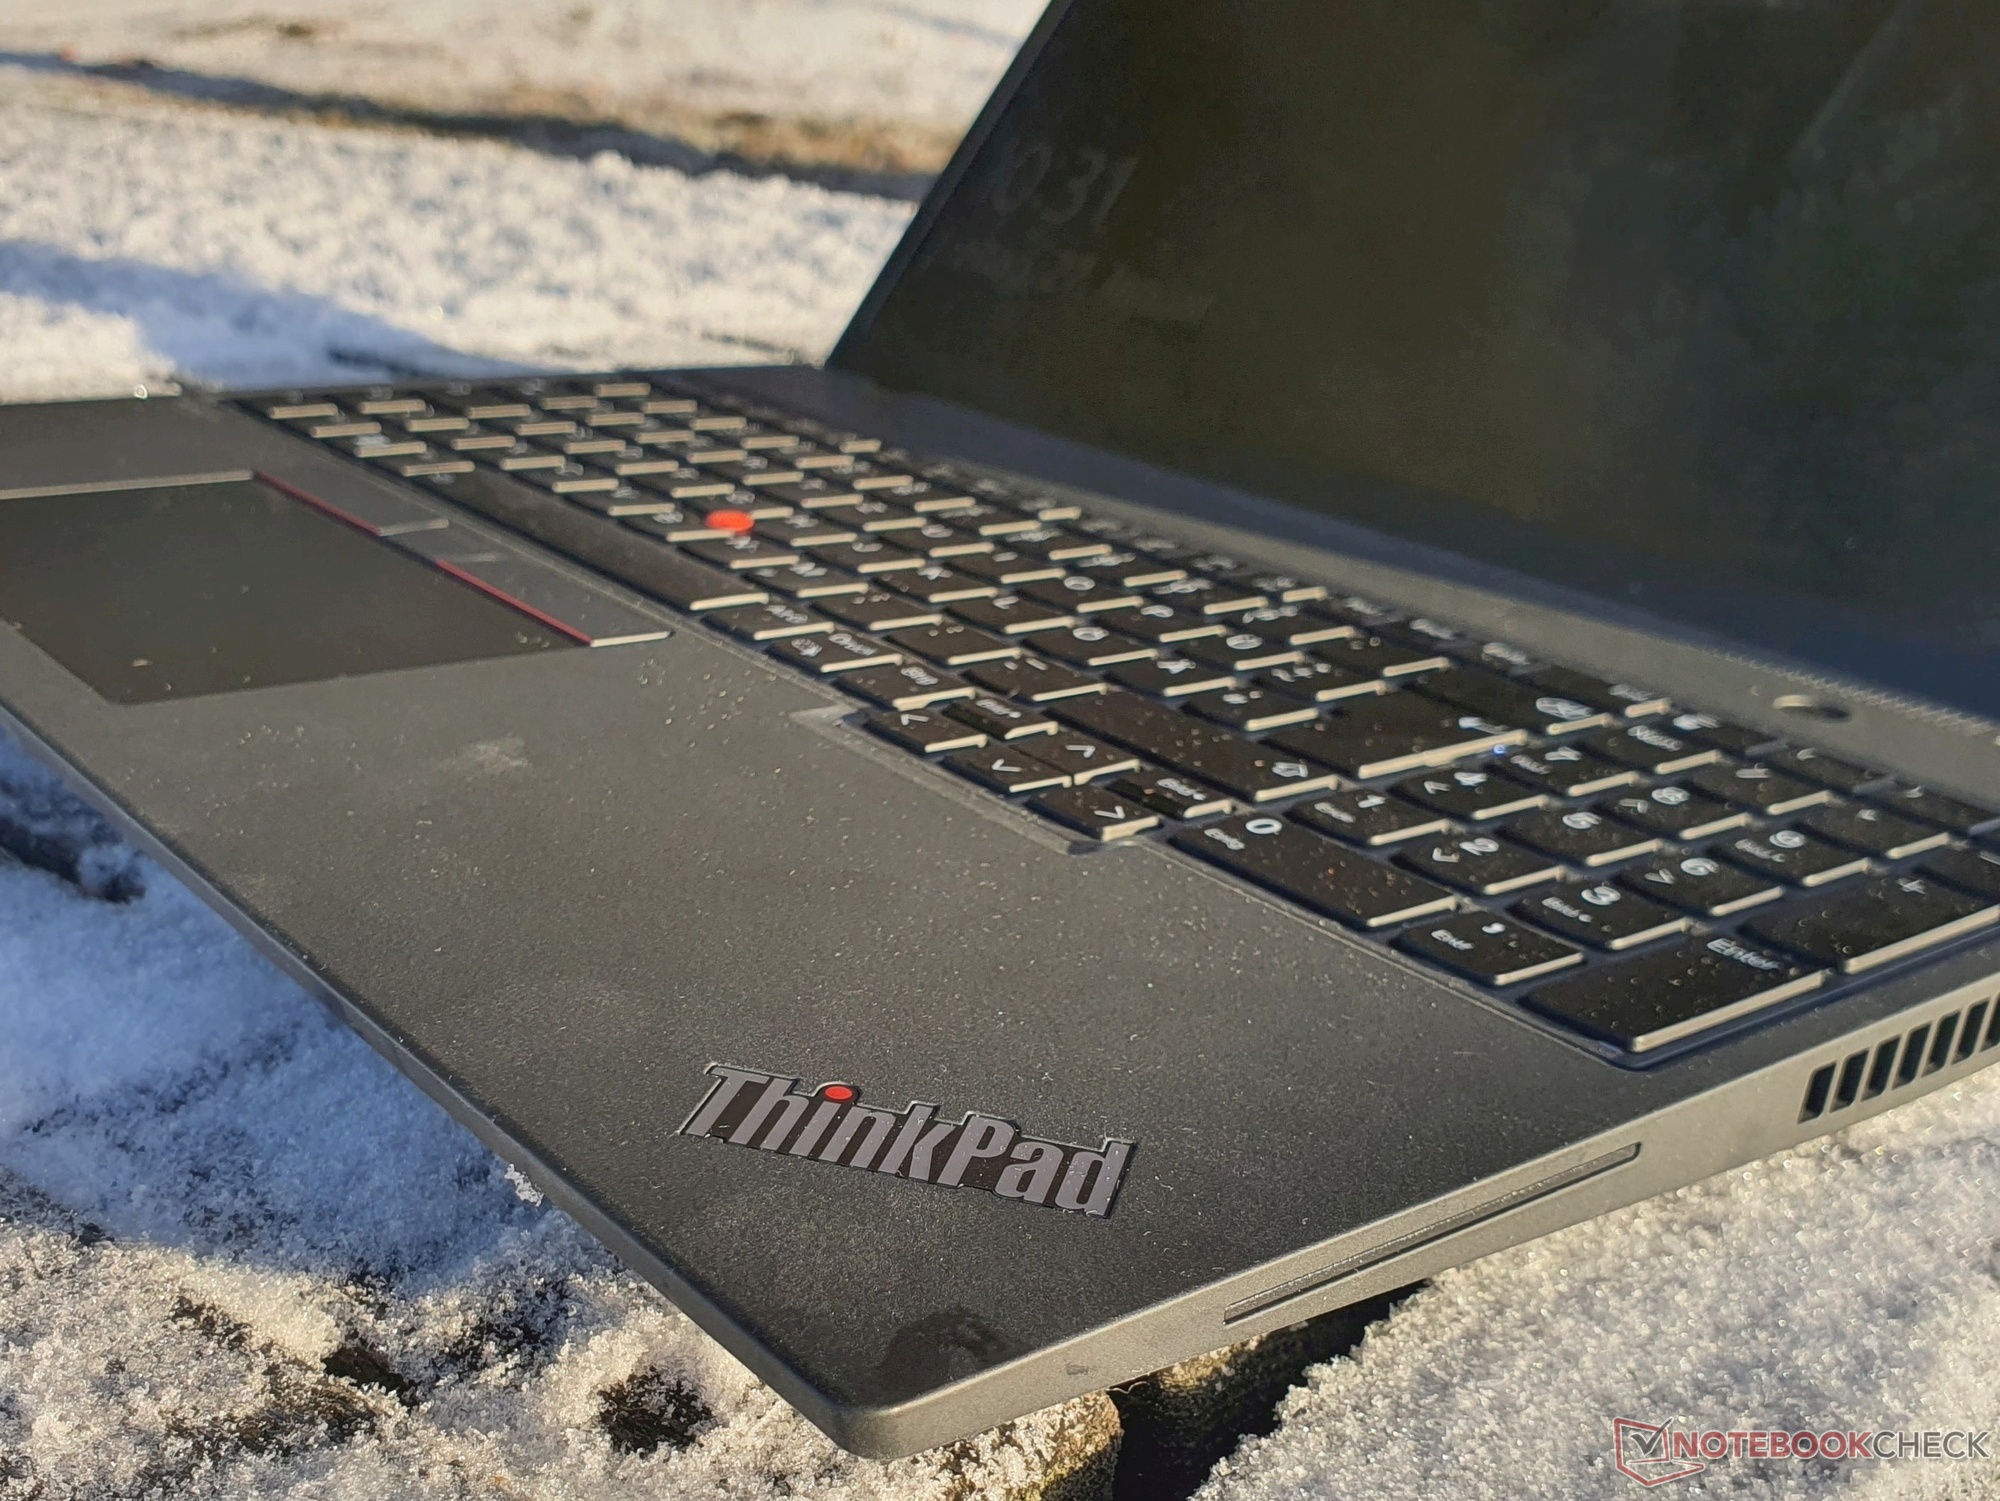
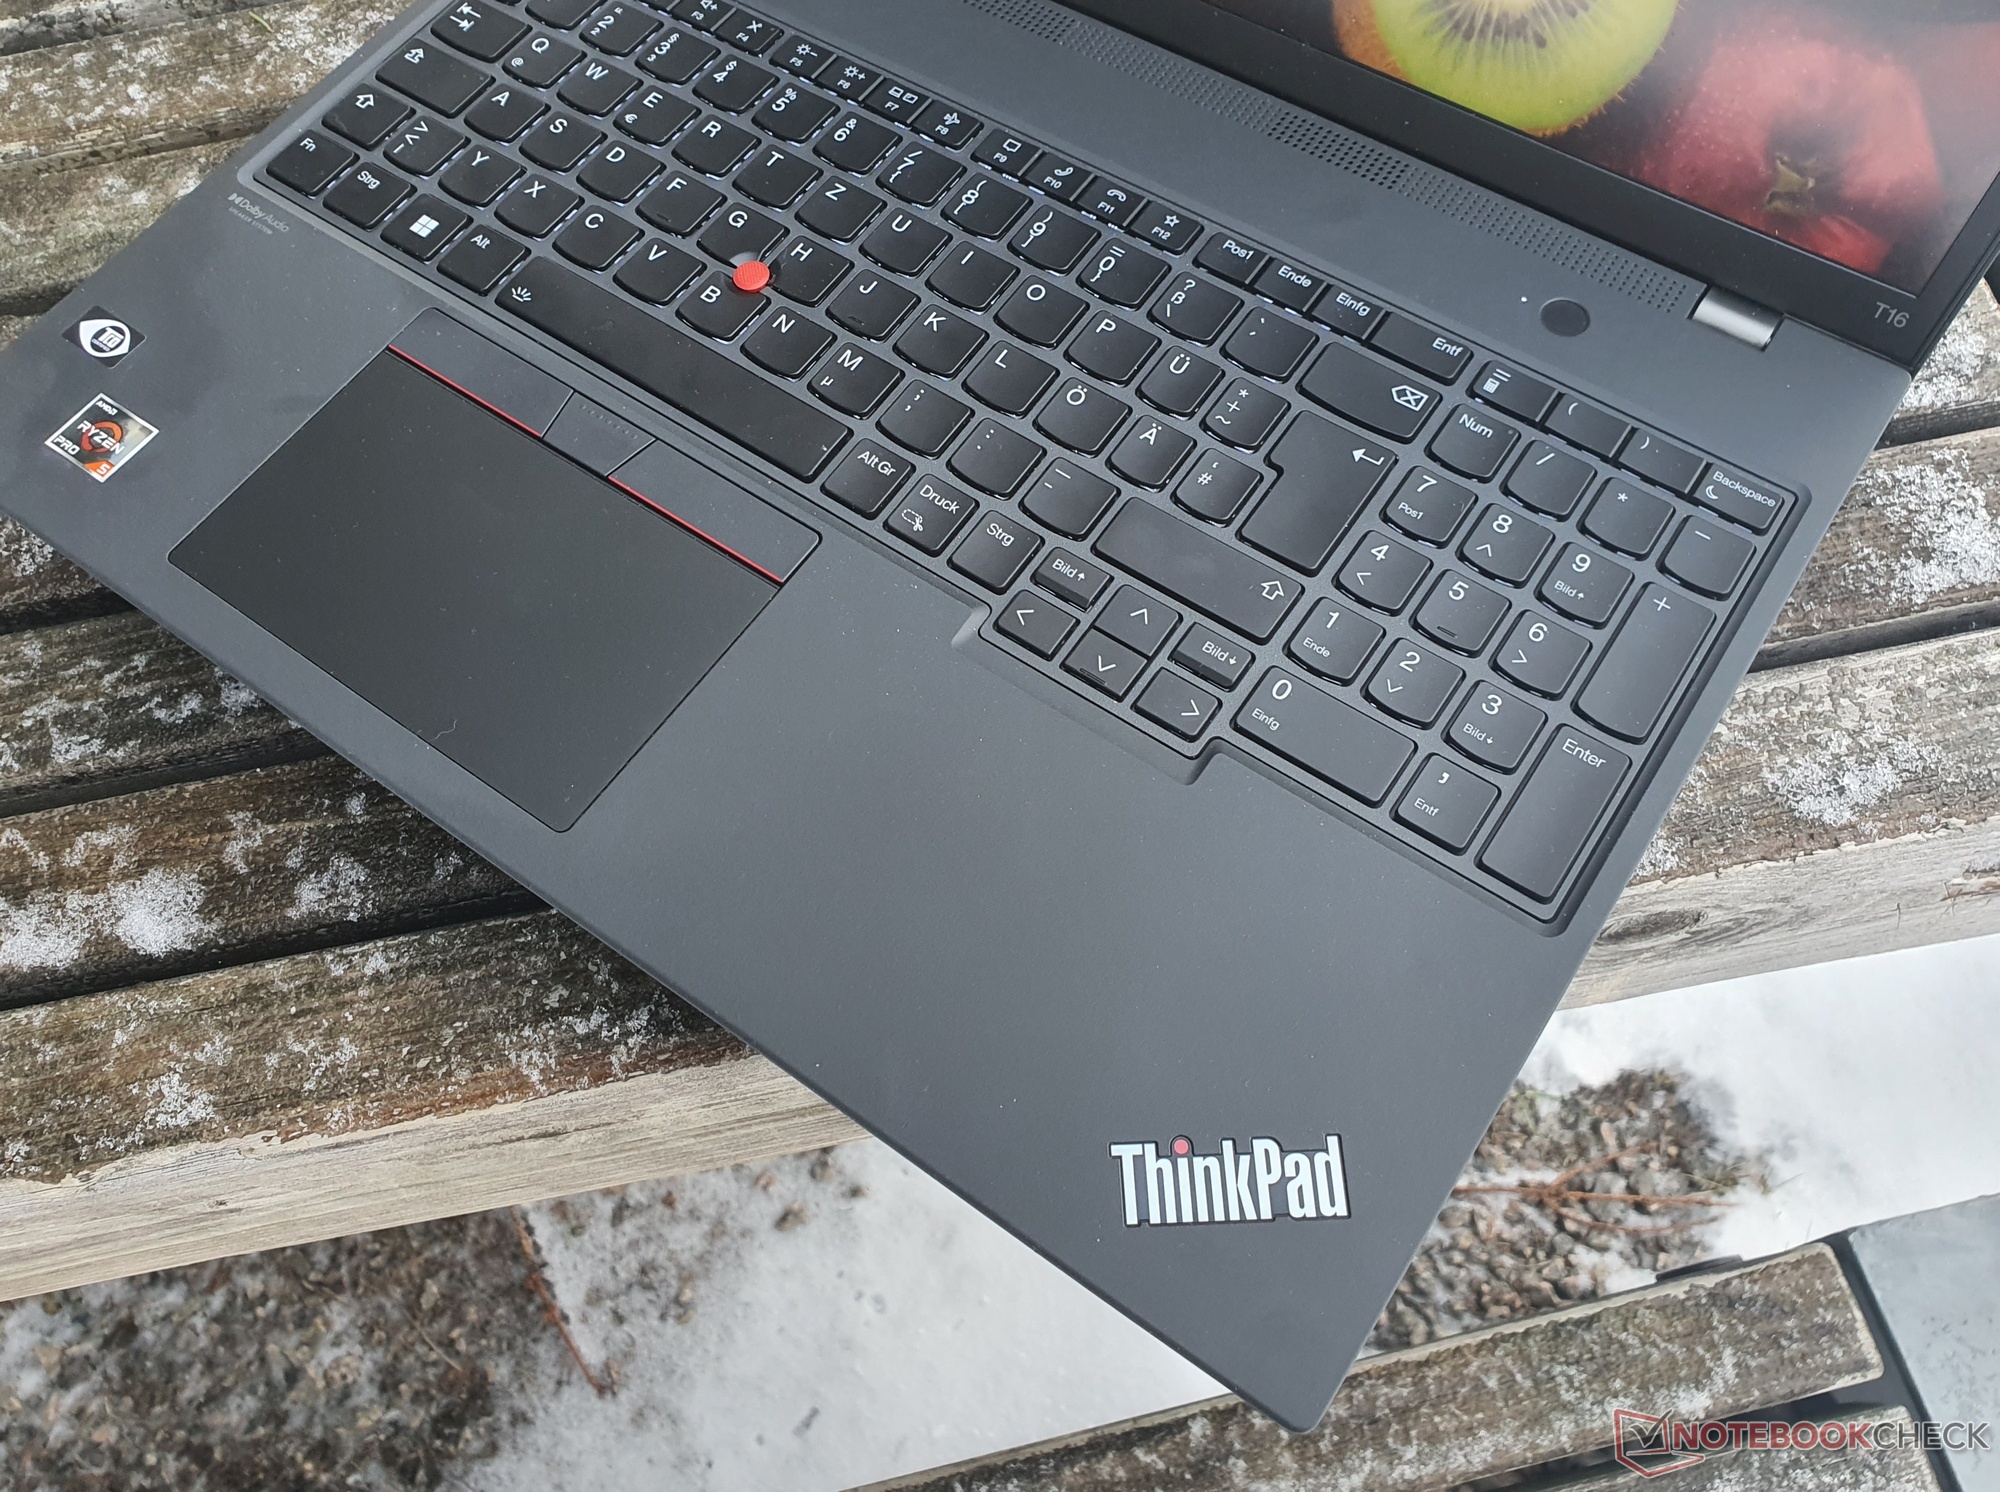
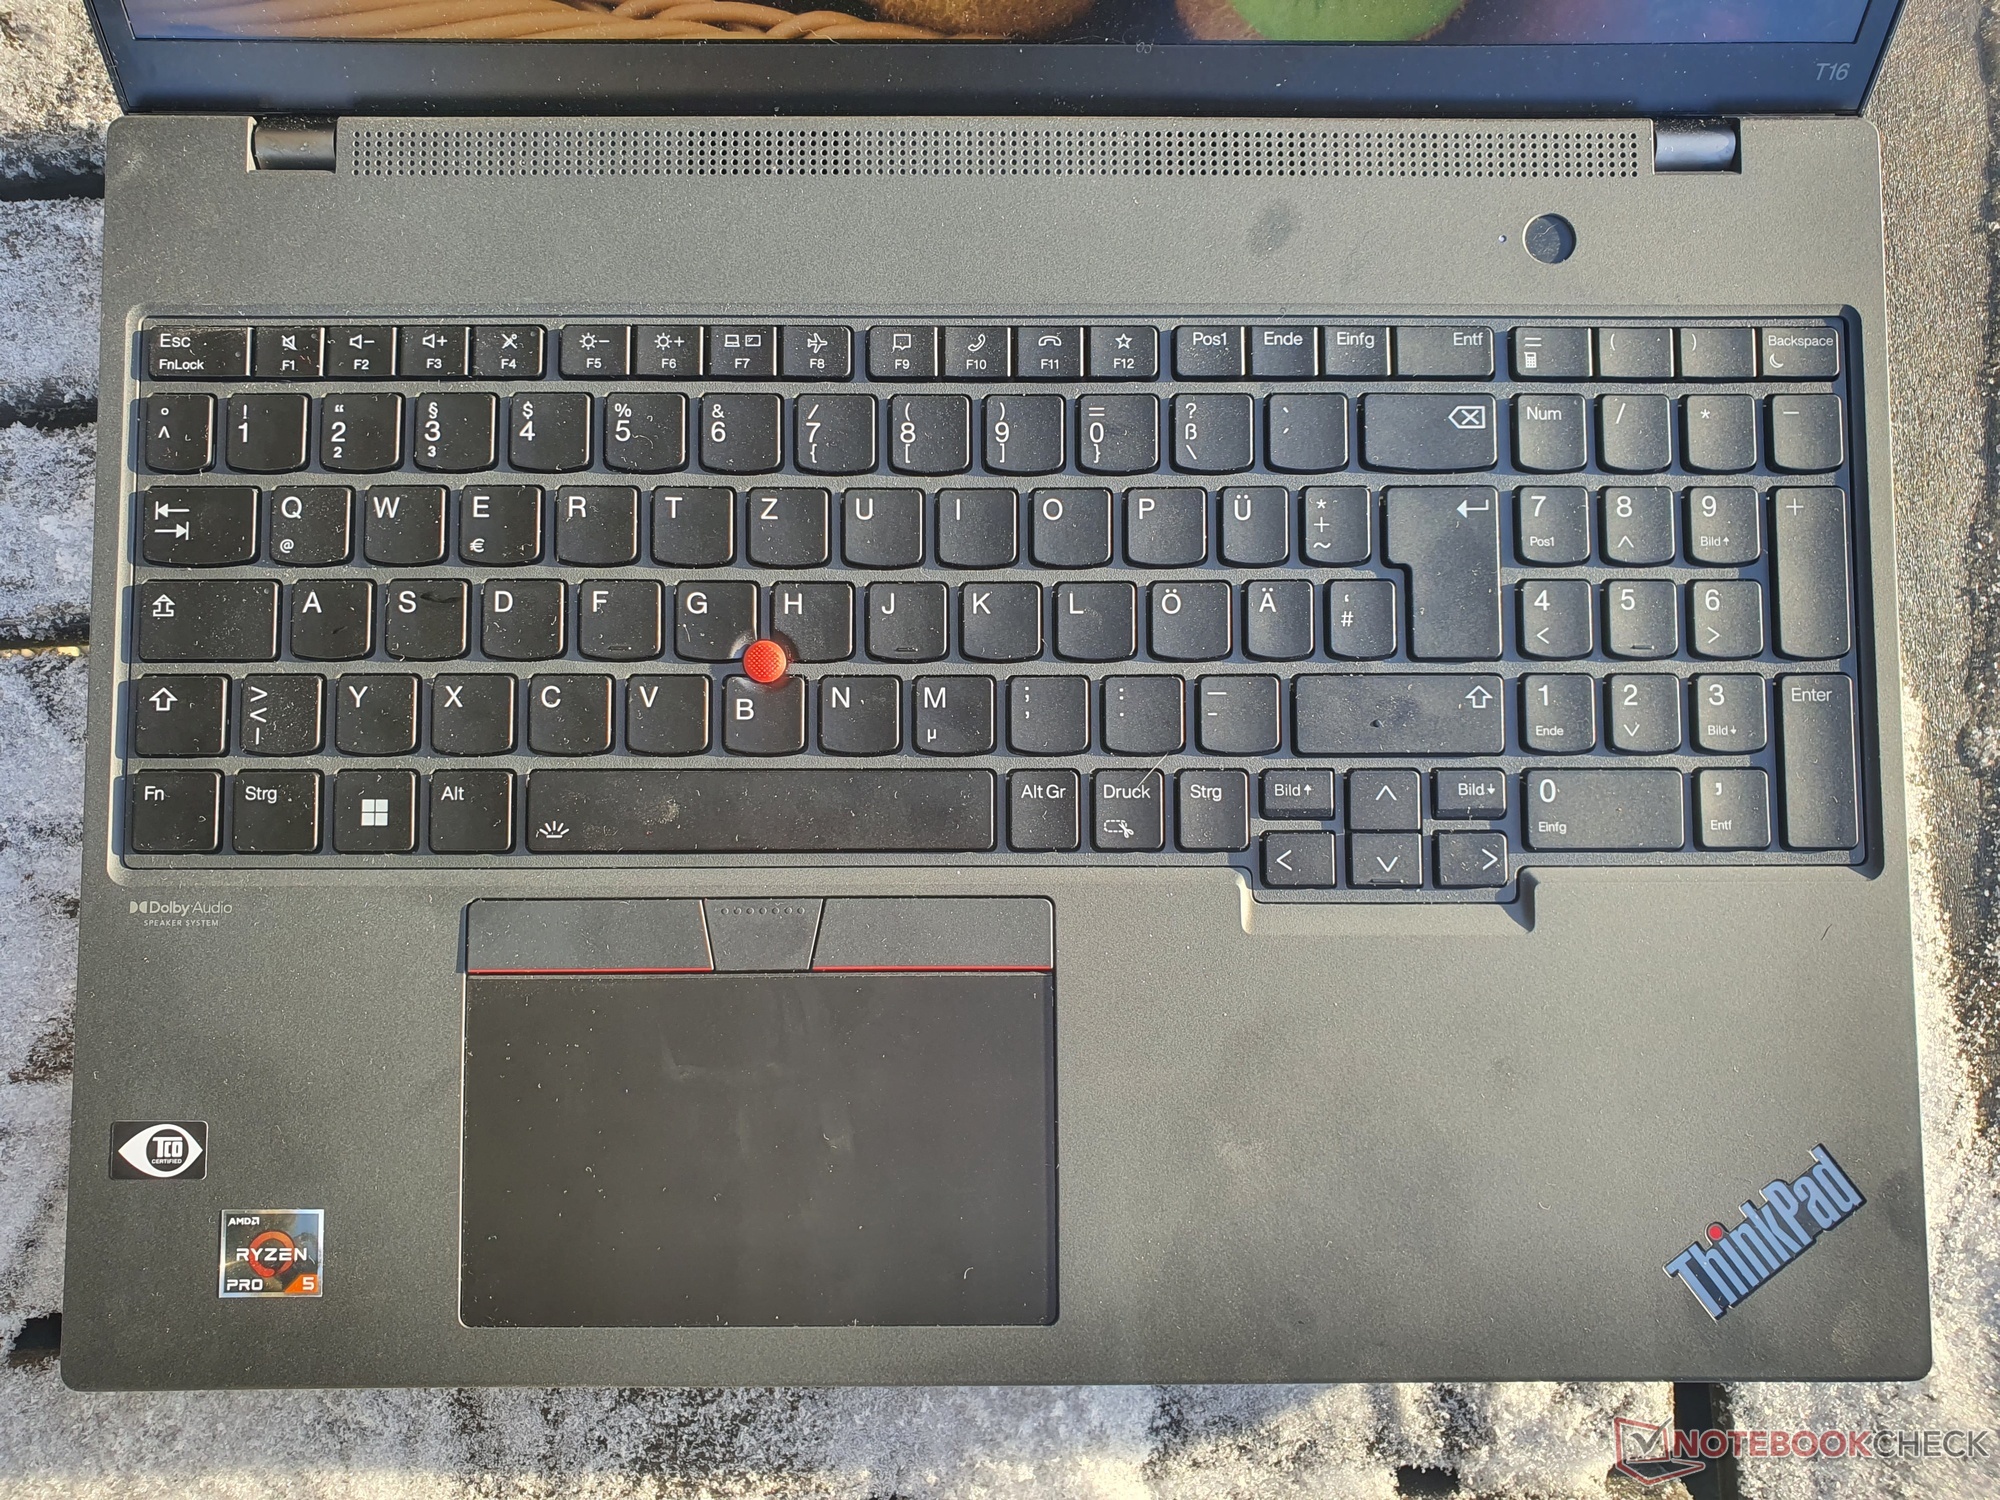
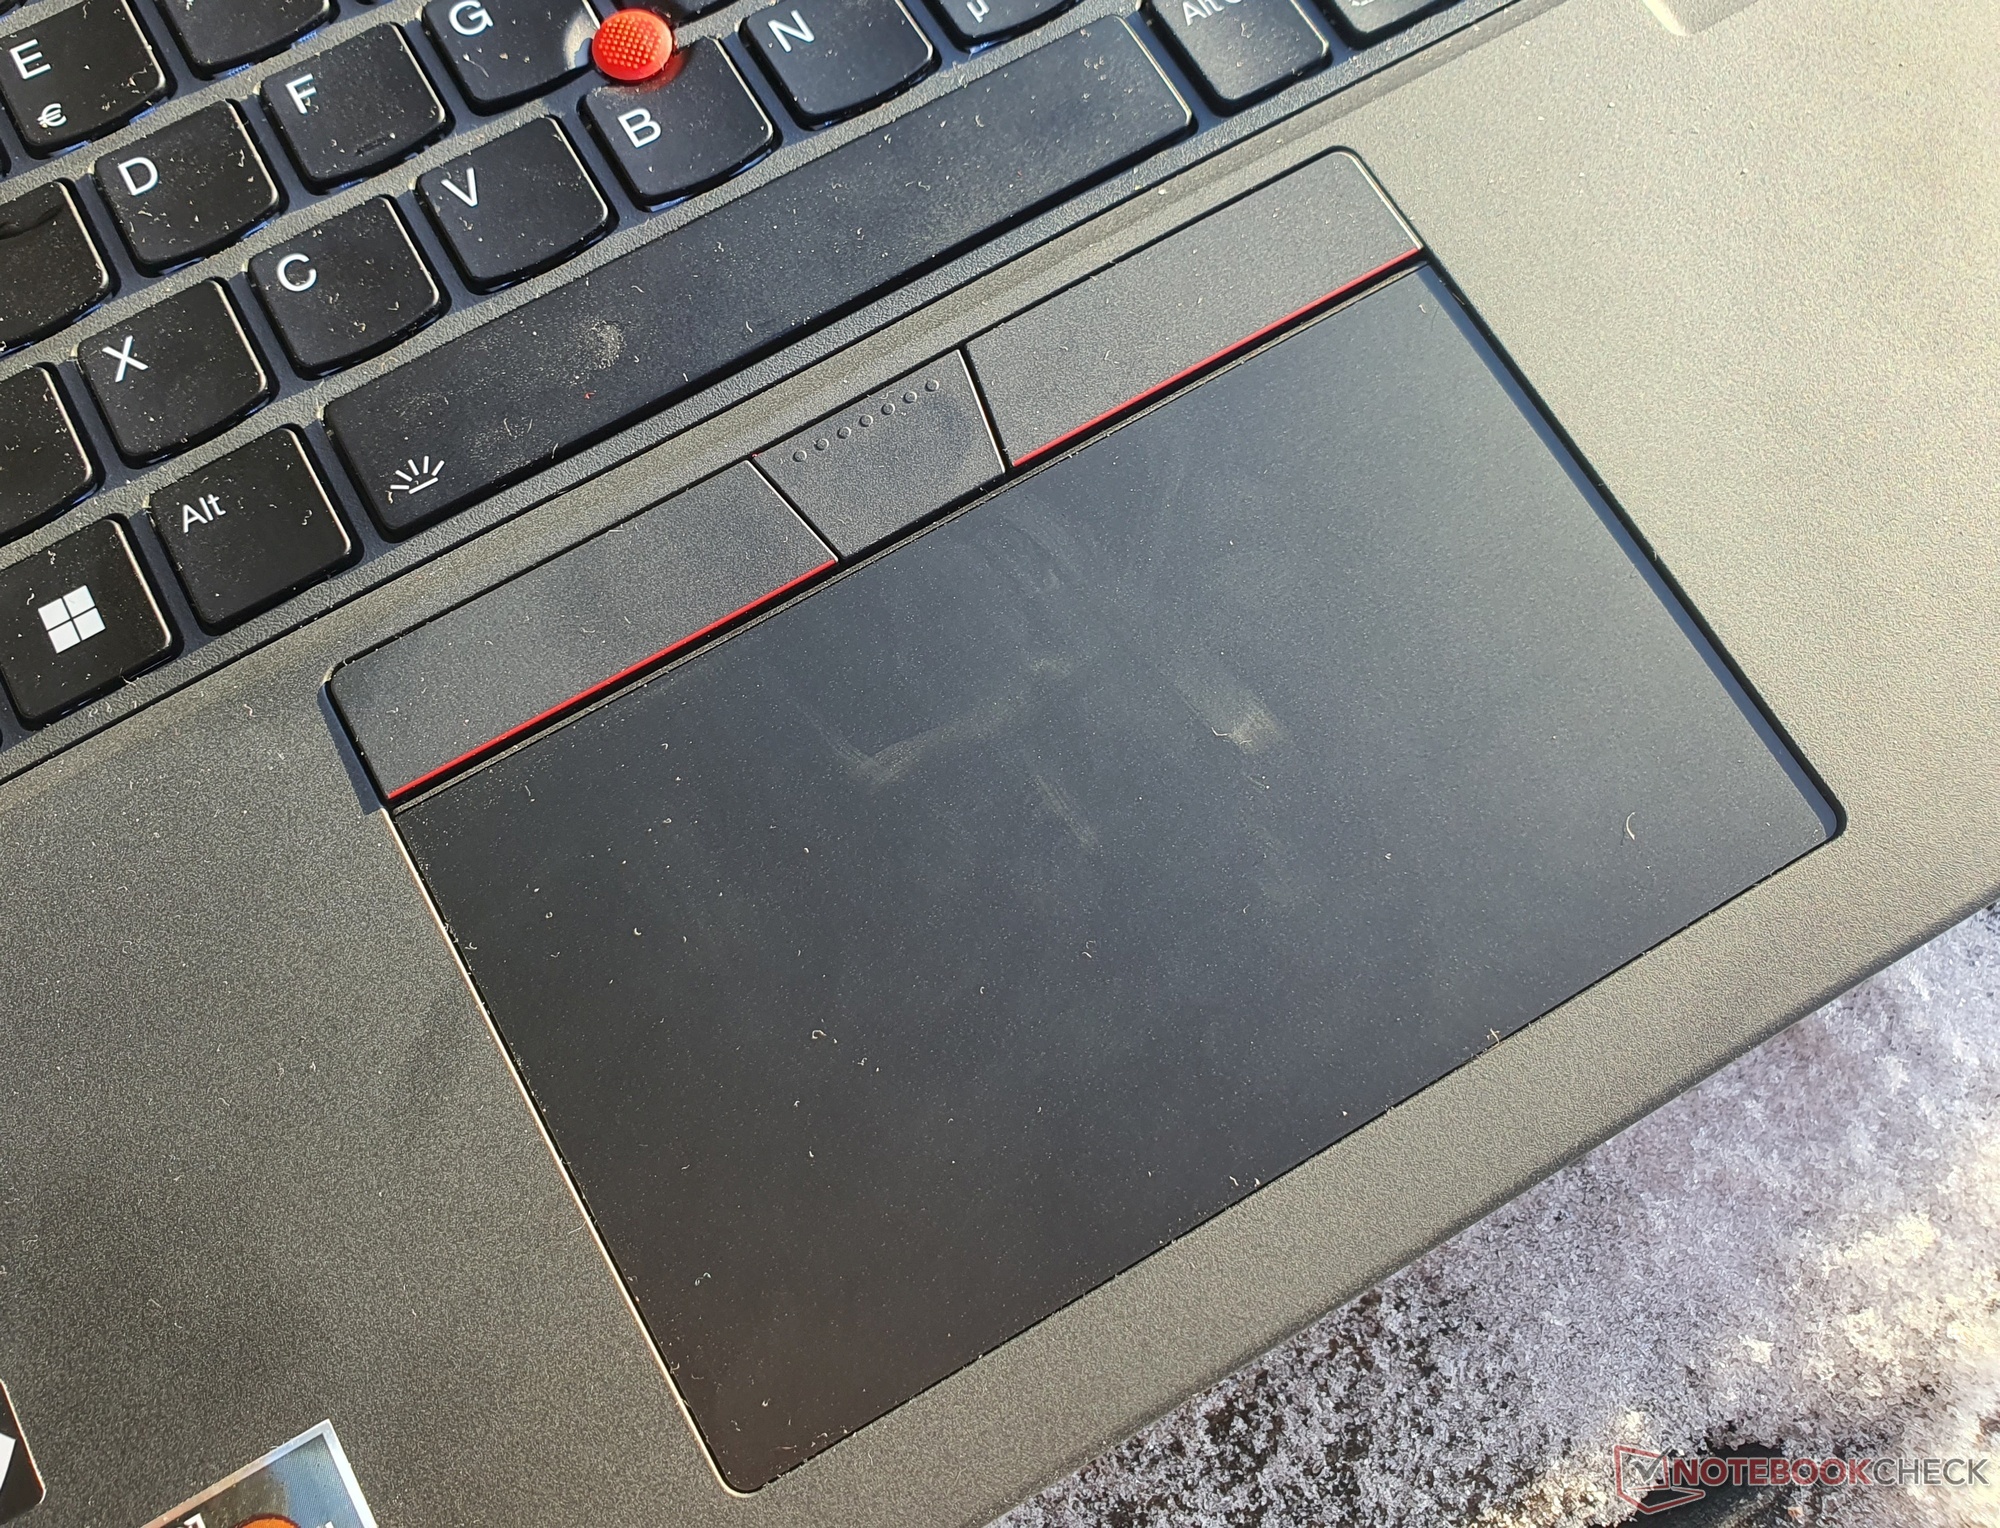
Poiché il case, le apparecchiature di connessione e i dispositivi di input sono fondamentalmente gli stessi, potete trovare informazioni dettagliate al riguardo nella nostra recensione del ThinkPad T16 G1 Intel.
Altre recensioni dei ThinkPad Lenovo:
ThinkPad P16 G1
ThinkPad T14s G3 AMD
ThinkPad T14s G3 Intel
ThinkPad X1 Carbon G10
ThinkPad X13 G3 Intel
ThinkPad X13s G1
ThinkPad Z13 G1 OLED
Potenziali concorrenti a confronto
Punteggio | Data | Modello | Peso | Altezza | Dimensione | Risoluzione | Prezzo |
|---|---|---|---|---|---|---|---|
| 90.2 % v7 (old) | 02/2023 | Lenovo ThinkPad T16 G1 21CH004MGE R5 PRO 6650U, Radeon 660M | 1.8 kg | 20.5 mm | 16.00" | 2560x1600 | |
| 89.3 % v7 (old) | 09/2022 | Lenovo ThinkPad T16 G1 21BWS00200 i5-1240P, Iris Xe G7 80EUs | 1.9 kg | 20.5 mm | 16.00" | 1920x1200 | |
| 87.2 % v7 (old) | 12/2022 | HP EliteBook 865 G9 R7 PRO 6850U, Radeon 680M | 1.9 kg | 19 mm | 16.00" | 1920x1200 | |
| 87.3 % v7 (old) | 10/2022 | Lenovo ThinkPad Z16 G1 21D5S00T00 R7 PRO 6850H, Radeon RX 6500M | 1.9 kg | 15.8 mm | 16.00" | 1920x1200 | |
| 88.7 % v7 (old) | 12/2022 | Lenovo ThinkPad X1 Extreme G5-21DE003RGE i7-12700H, GeForce RTX 3060 Laptop GPU | 2.1 kg | 17.9 mm | 16.00" | 3840x2400 | |
| 86.2 % v7 (old) | 06/2022 | Lenovo ThinkPad P15v G2 21A9000XGE i7-11800H, T1200 Laptop GPU | 2.3 kg | 22.7 mm | 15.60" | 1920x1080 | |
| 87.4 % v7 (old) | 01/2023 | HP ZBook Power 15 G9 6B8C4EA i7-12700H, RTX A2000 Laptop GPU | 2 kg | 22.8 mm | 15.60" | 3840x2160 |
Connessioni
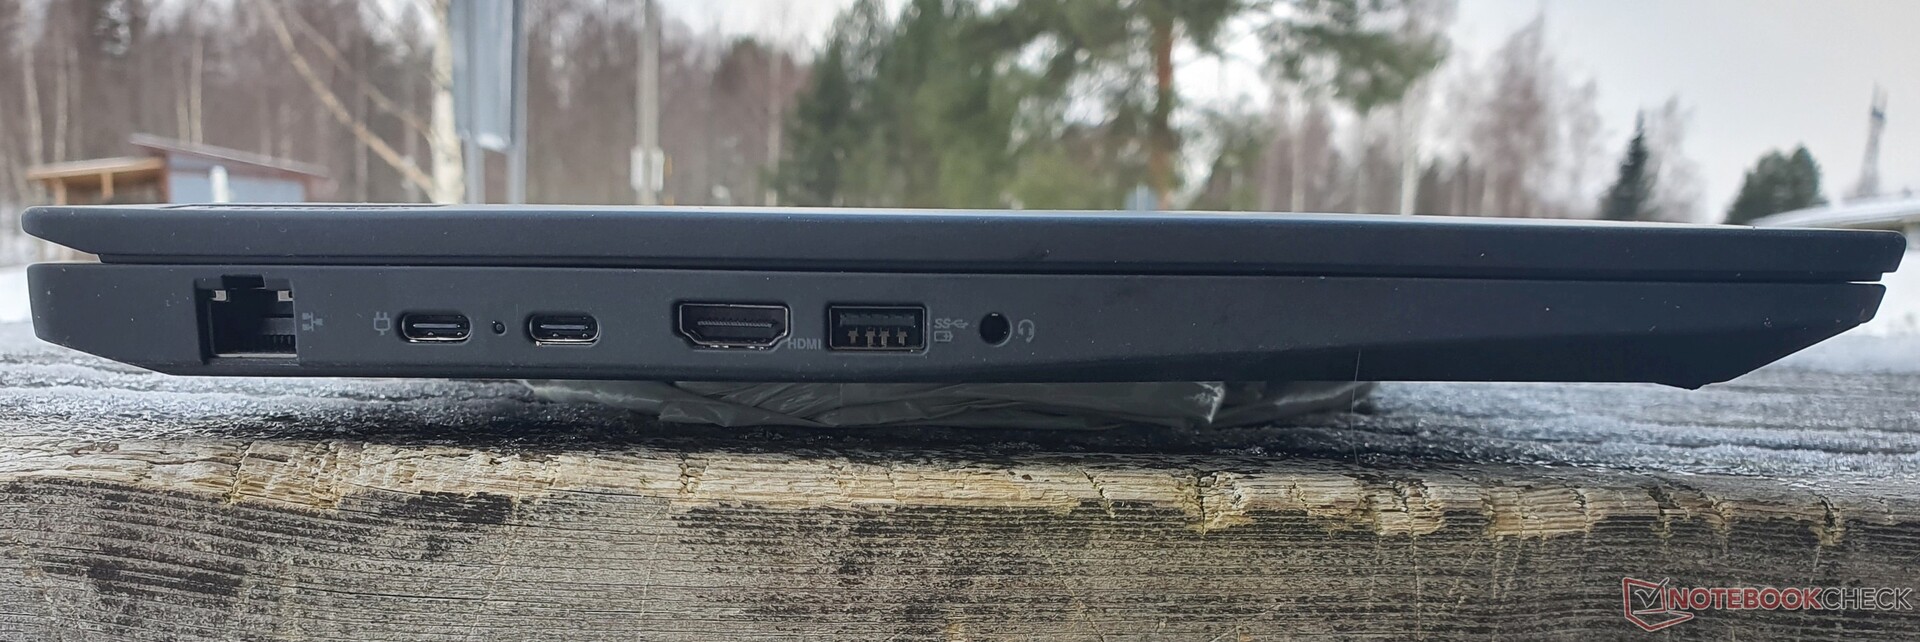
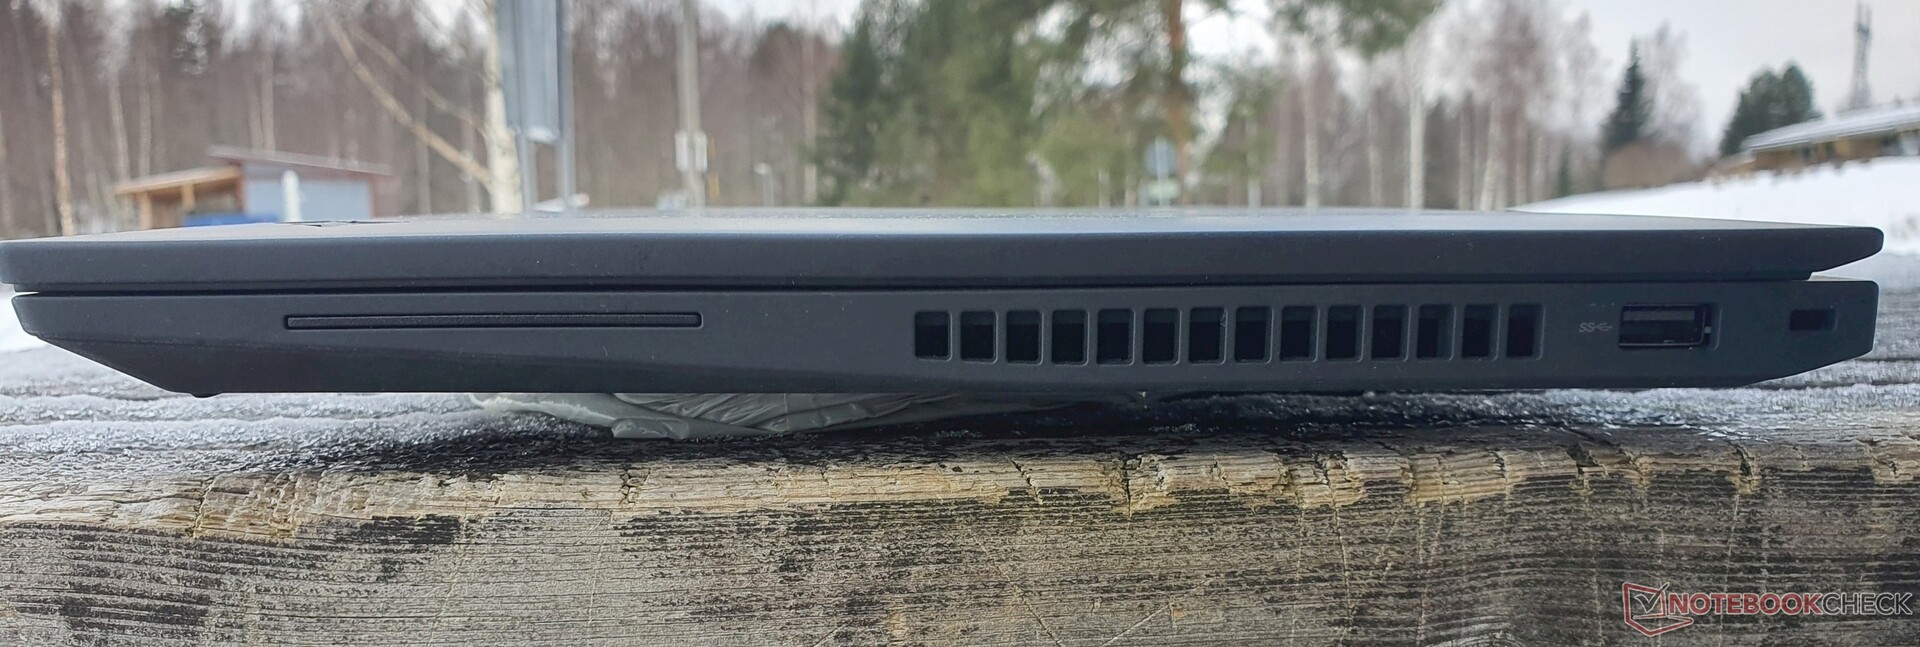
I collegamenti sono sostanzialmente gli stessi del modello Modello Intelcon l'unica differenza di non avere Thunderbolt 4 e USB 4.
Comunicazione
Come nel ThinkPad T14 AMDe ThinkPad Z16anche qui viene utilizzato il modulo Qualcomm WCN685x Wi-Fi 6E con Bluetooth 5.2, che garantisce velocità di trasferimento molto elevate. Nel nostro campo di confronto, tutti i dispositivi sono altrettanto veloci in questo senso. Anche se la nostra unità di test non dispone di un modulo WWAN, include comunque le antenne necessarie.
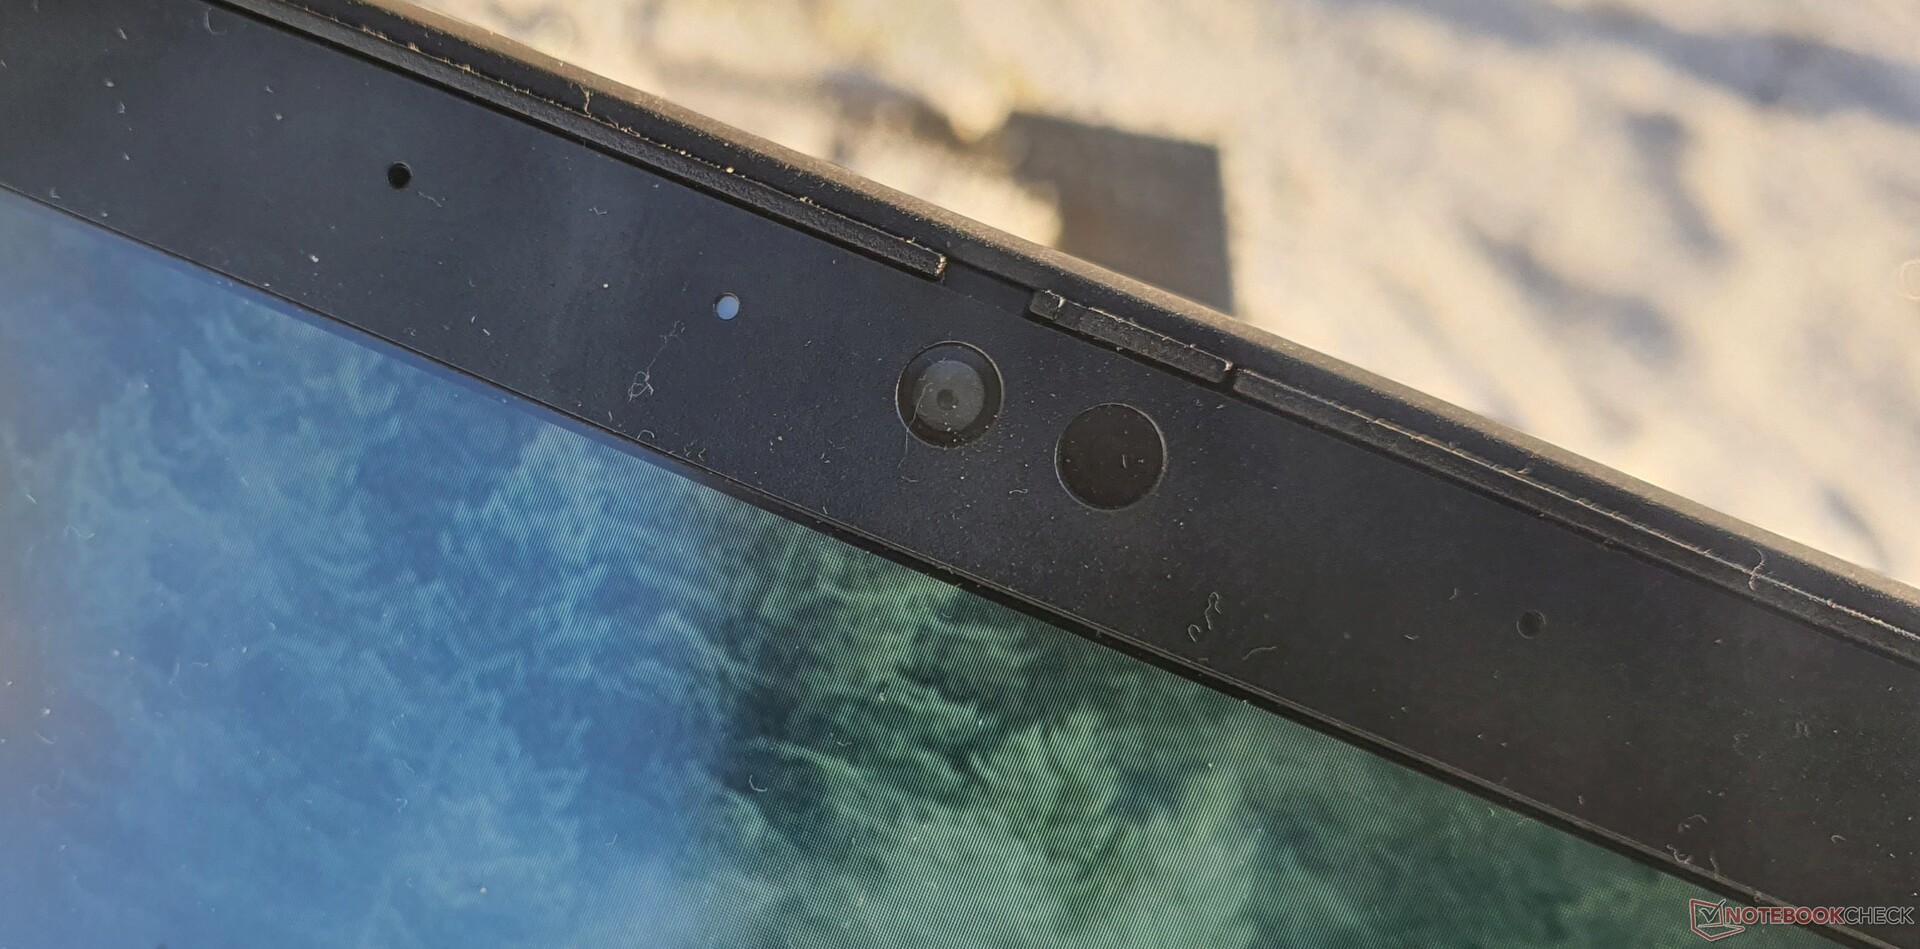
Webcam
La webcam da 1.080p è identica a quella del ThinkPad T16 Intel.


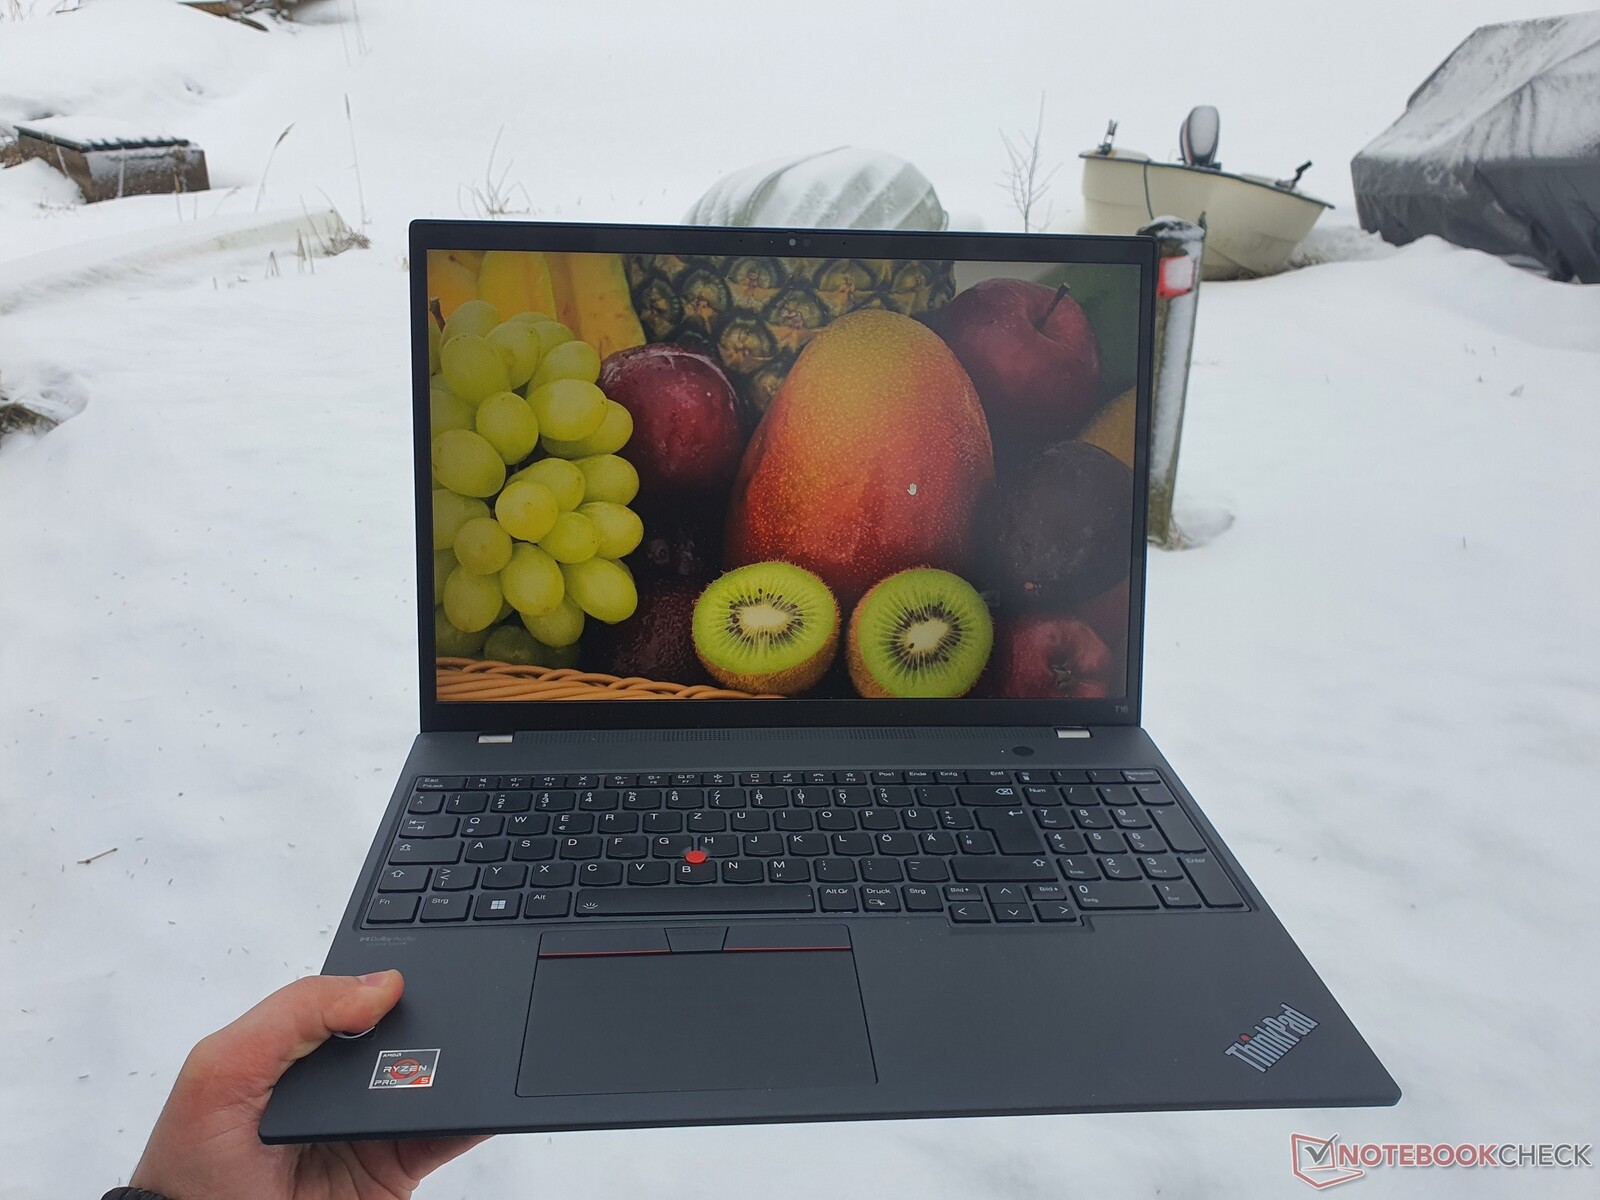
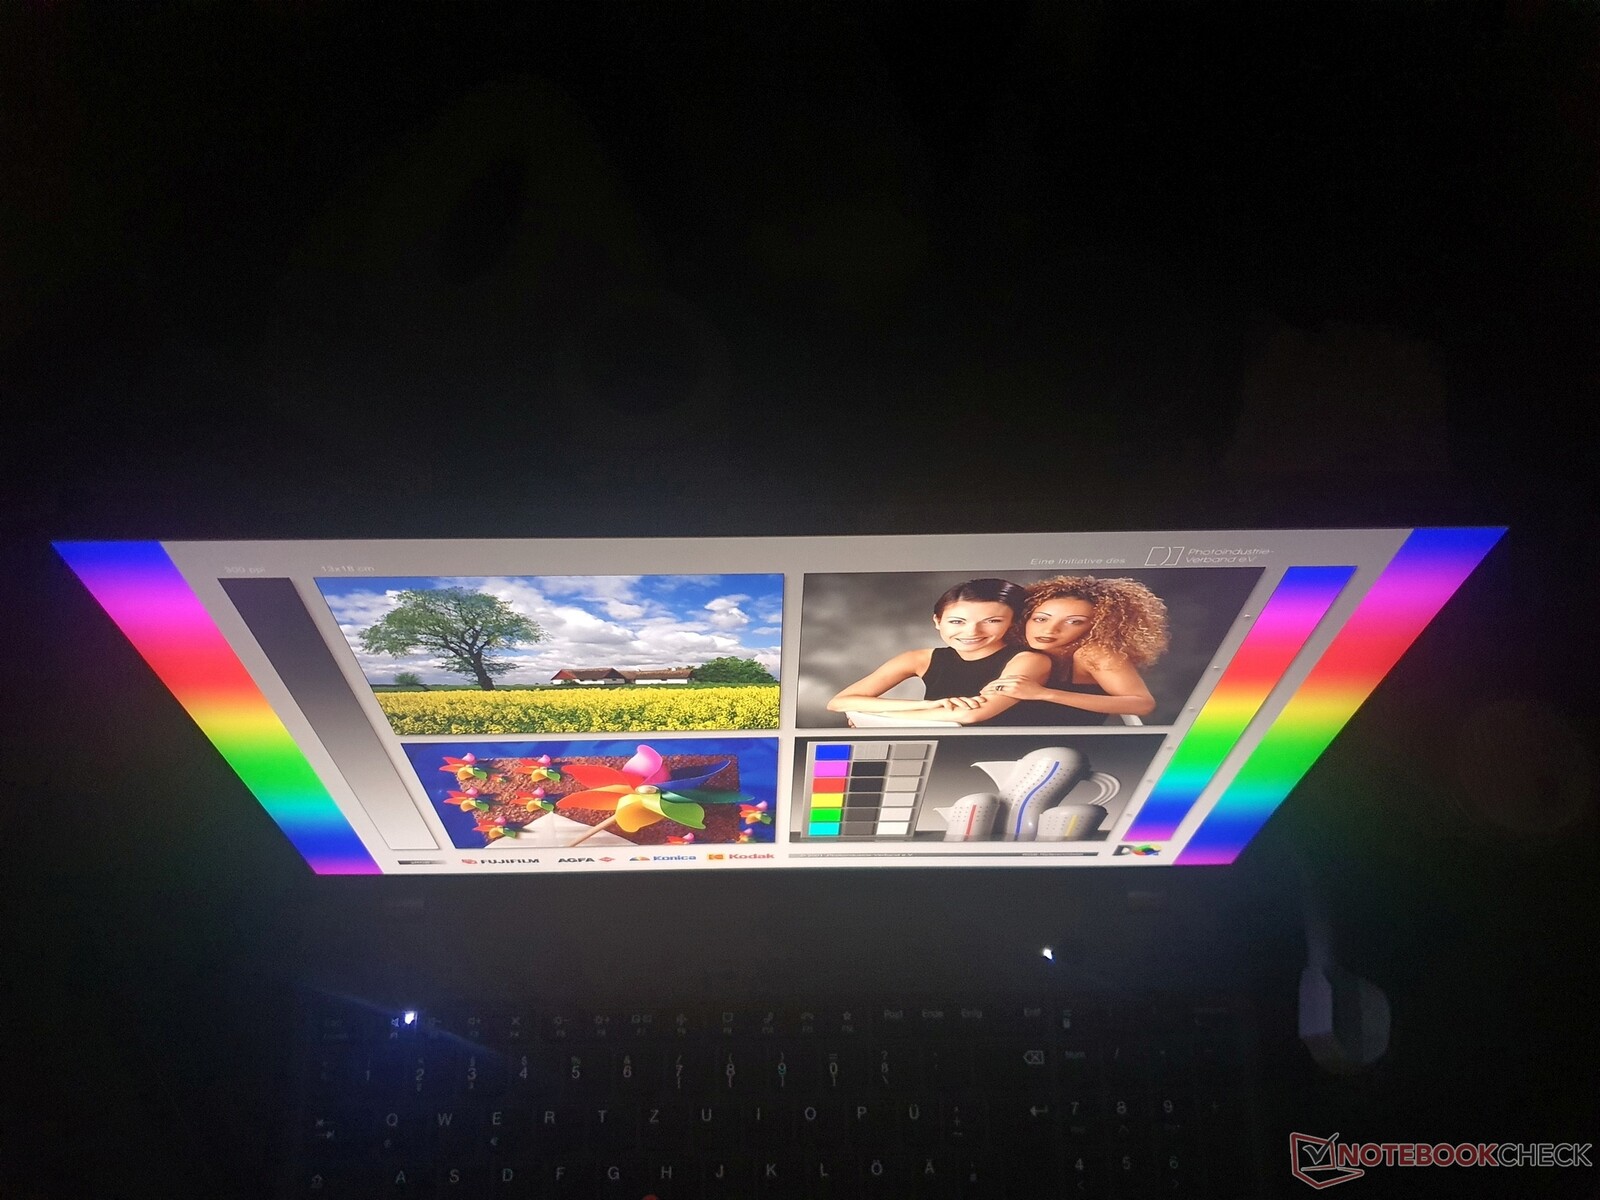
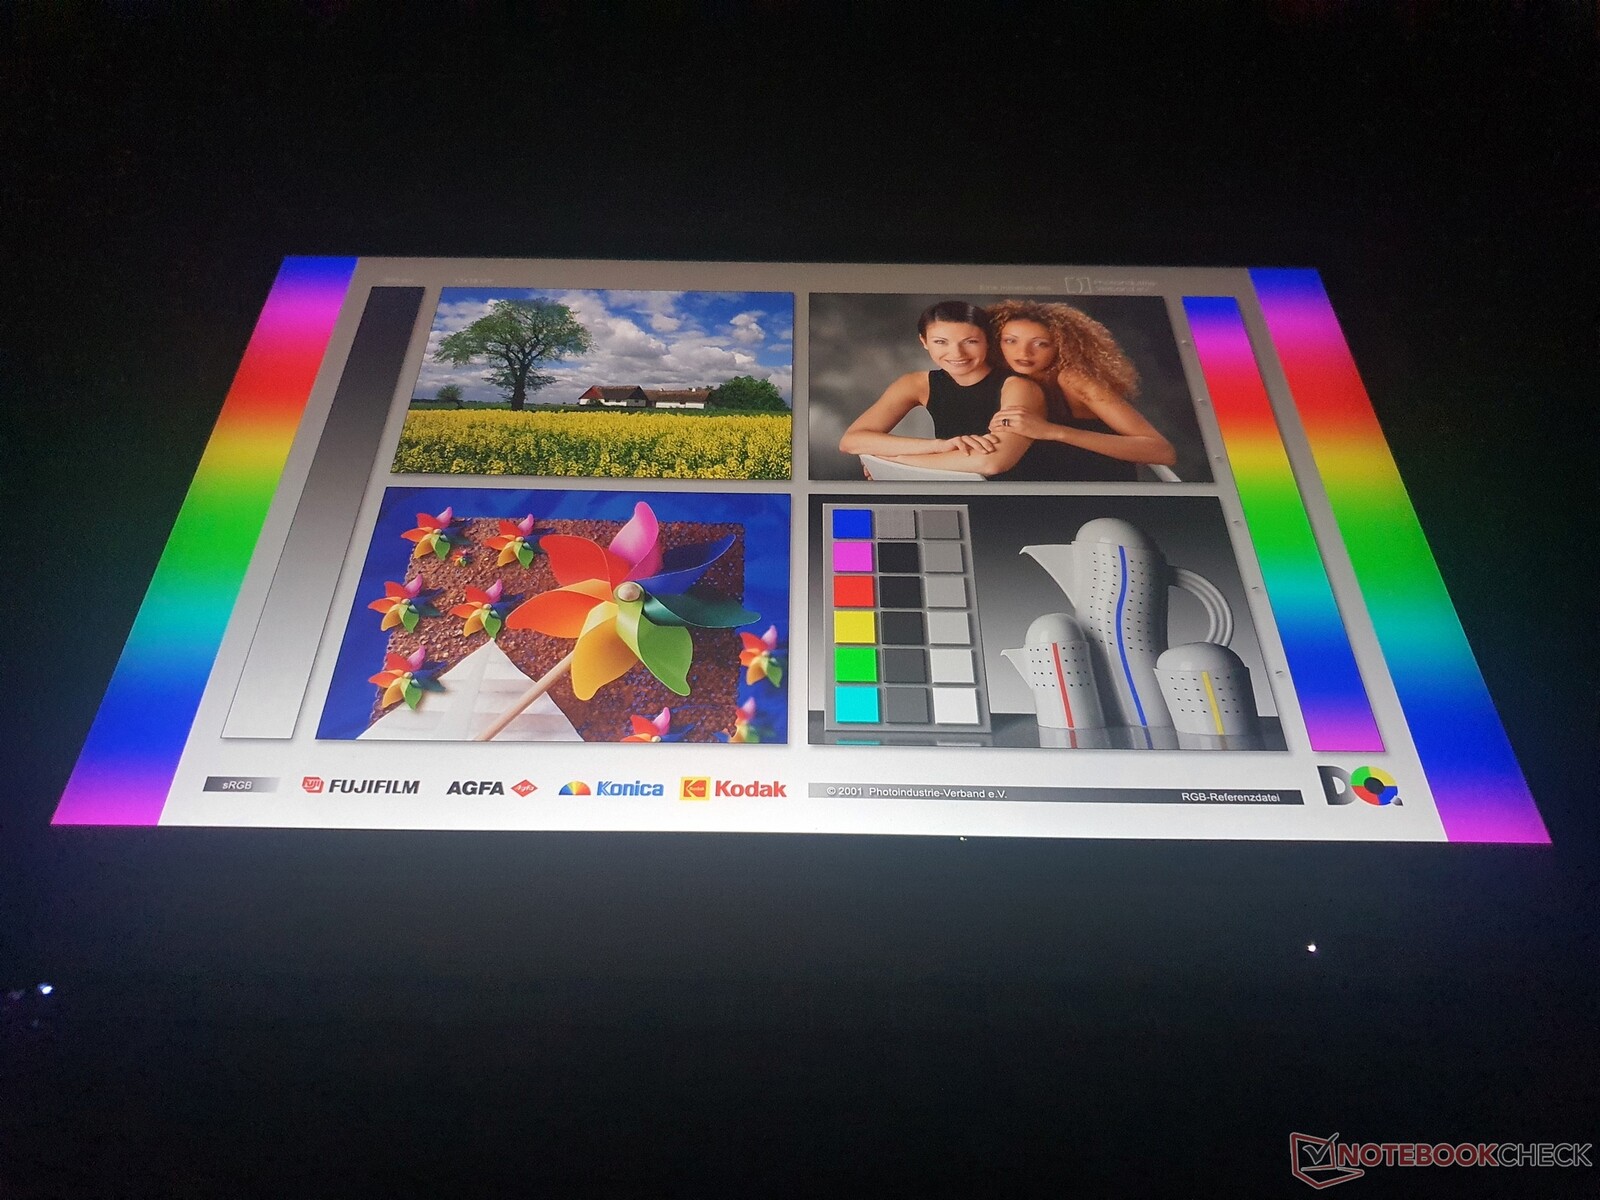
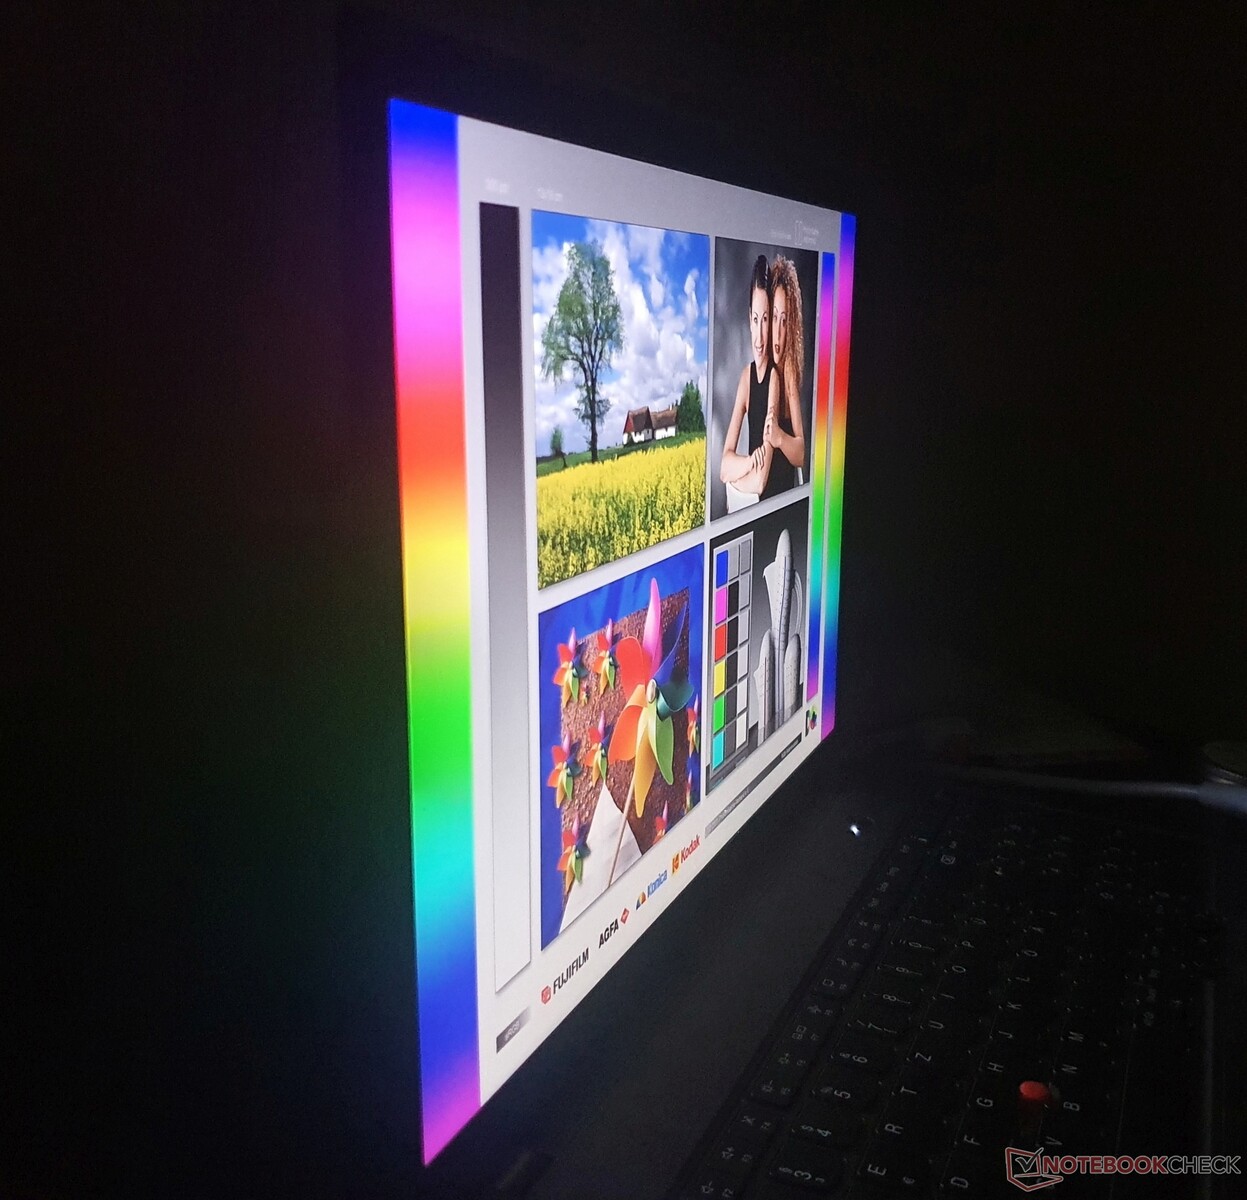
Display: Ricco di contrasto, luminoso e ad alta risoluzione nel ThinkPad T16
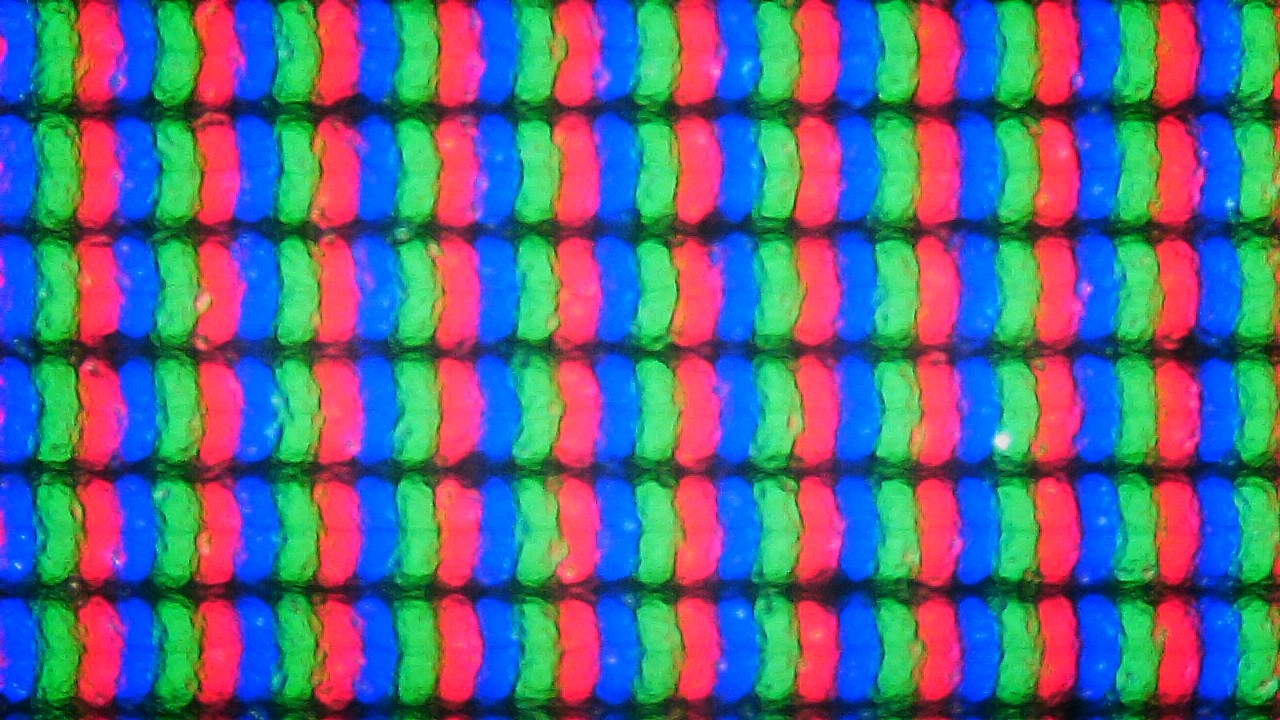

Lenovo ha equipaggiato la nostra unità di prova del ThinkPad T16 AMD con un pannello IPS da 16 pollici opaco di CSOT con una risoluzione di 2.560 x 1.600 pixel nel formato 16:10.
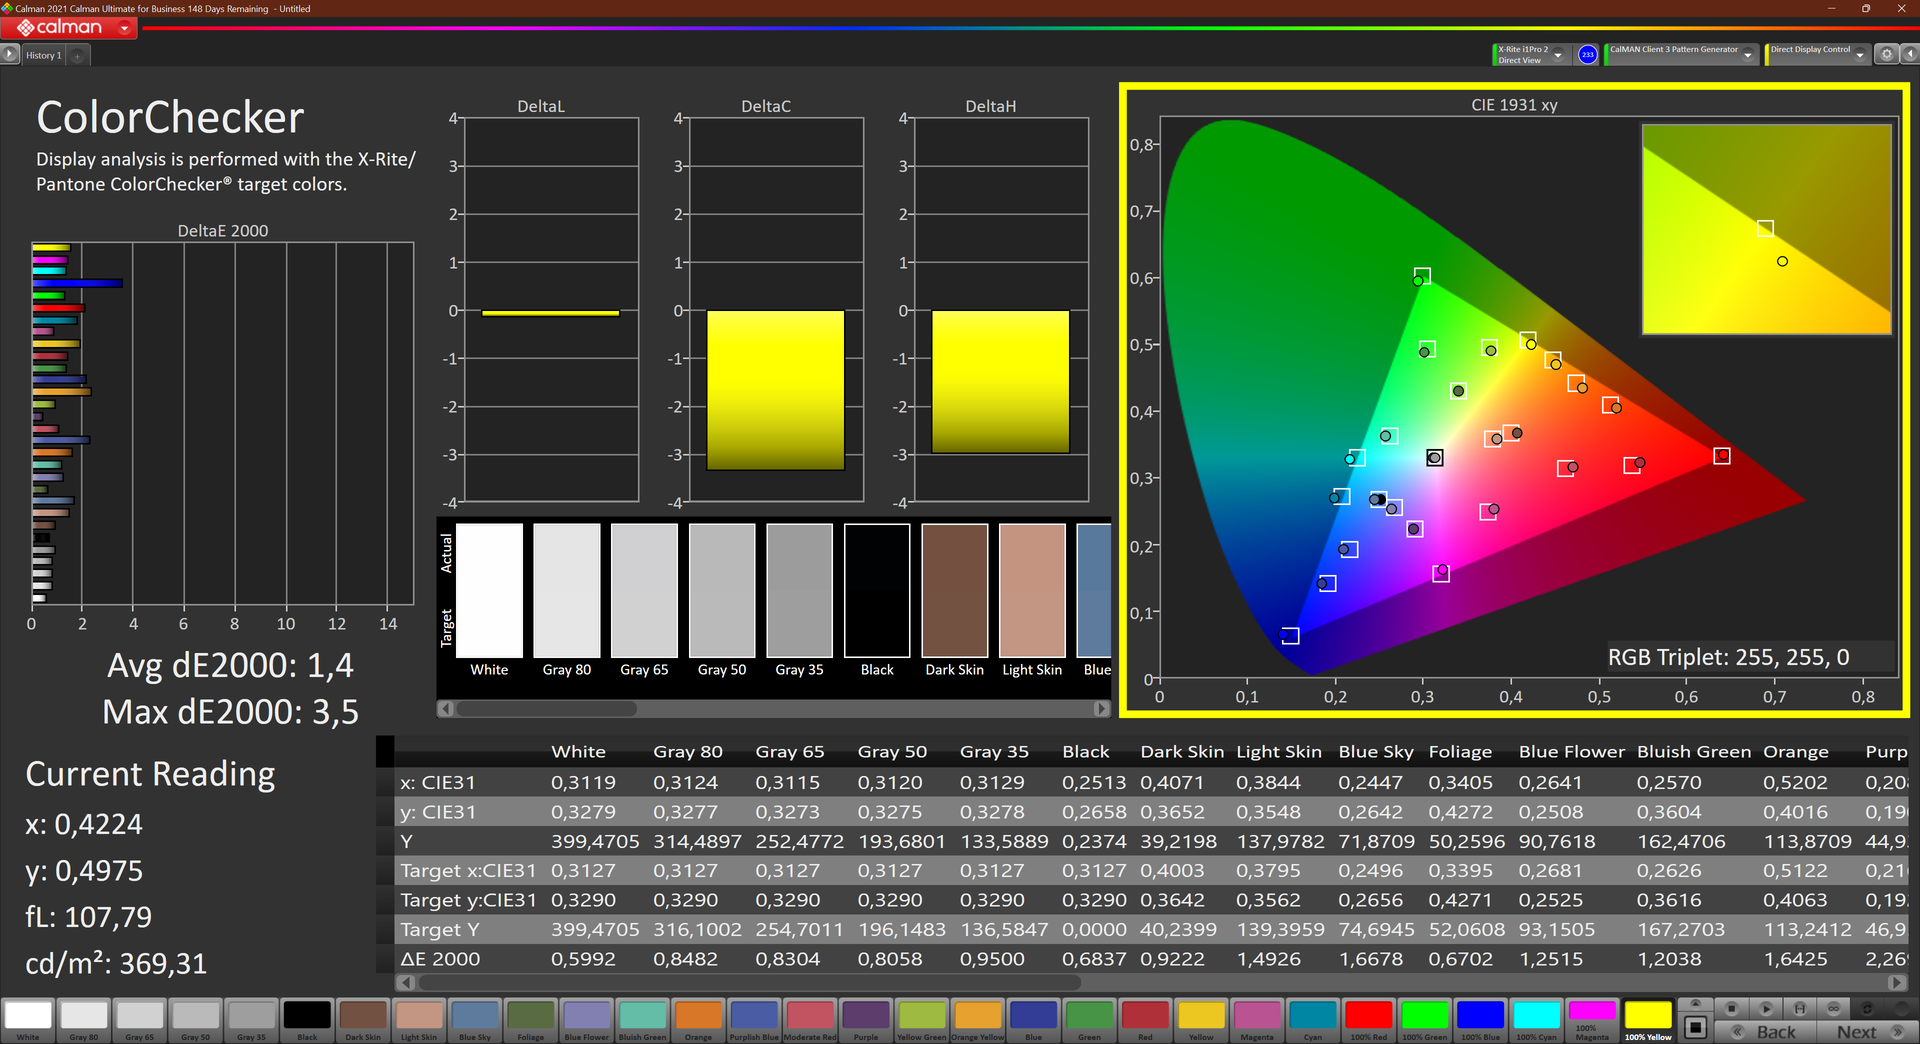
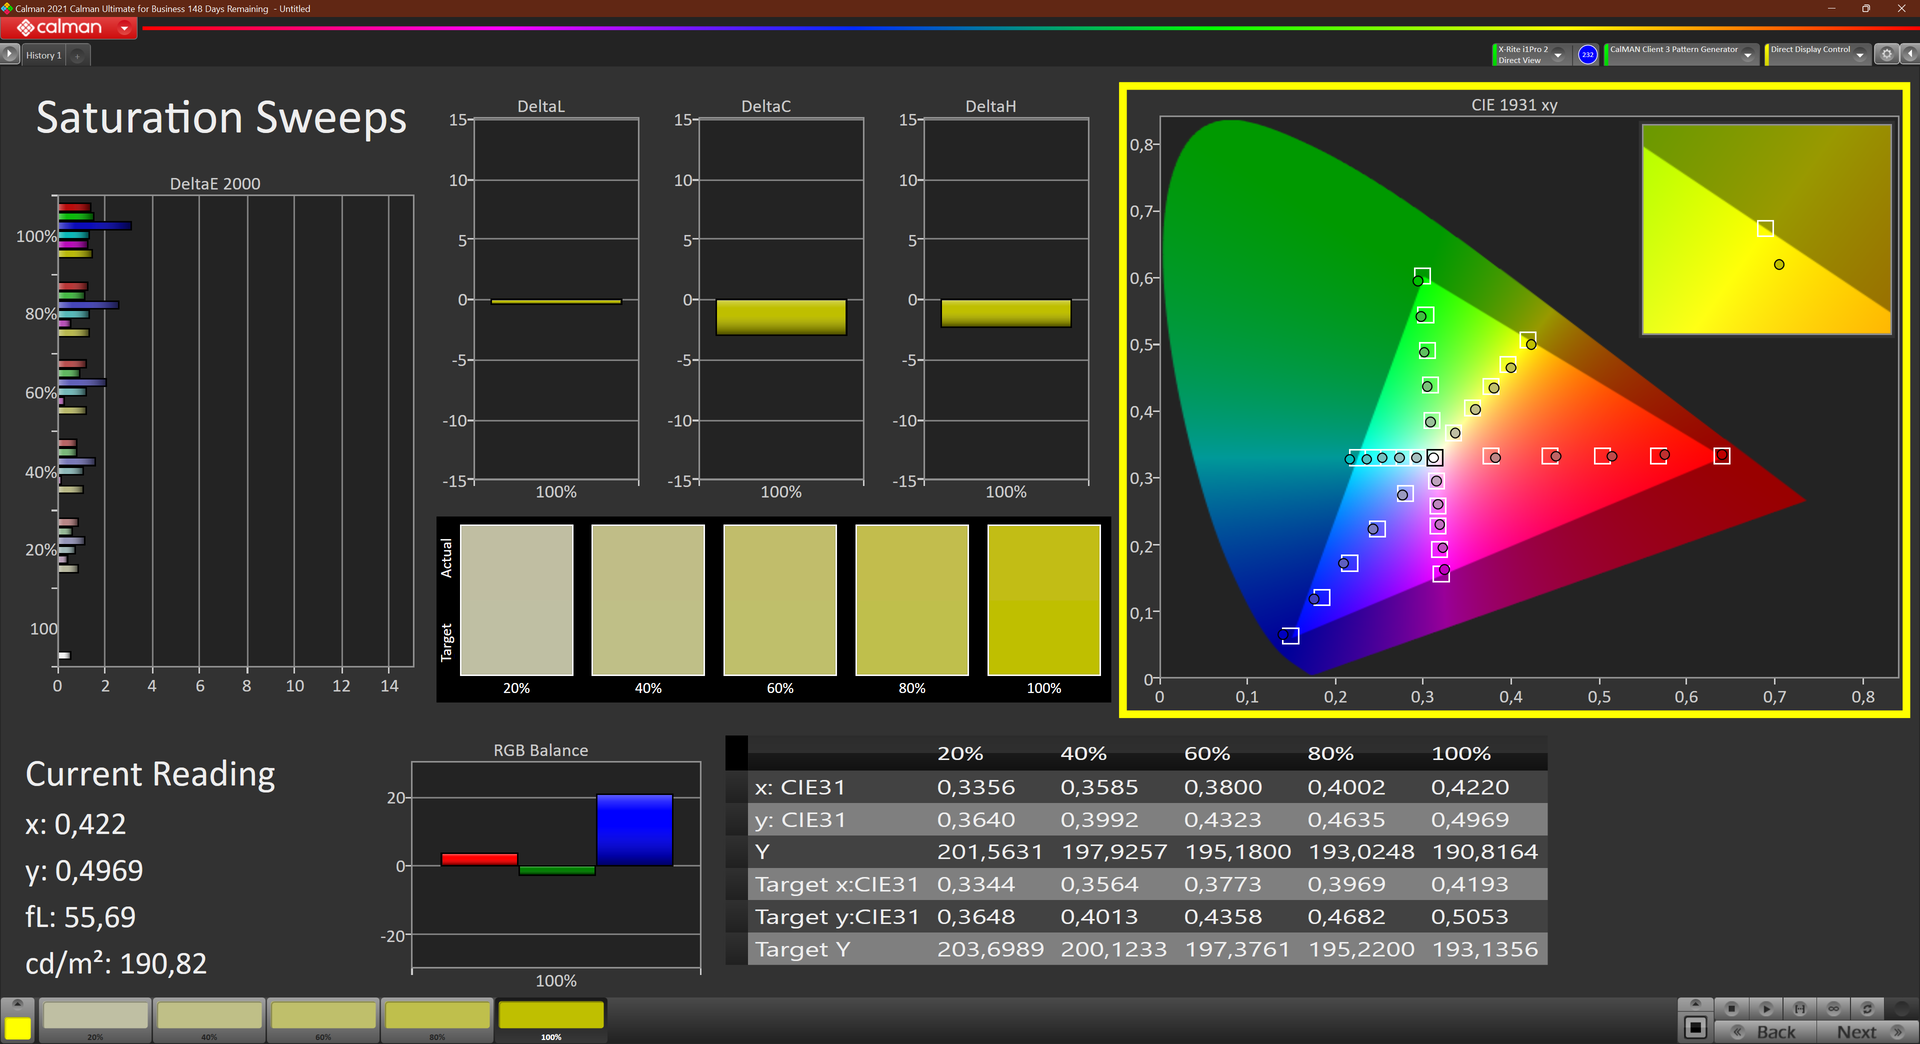
A differenza del pannello WUXGA del ThinkPad T16 Intel, questo display non è un cosiddetto "LCD a basso consumo" I valori misurati di entrambi i pannelli sono abbastanza simili, lasciando emergere soprattutto la migliore calibrazione del pannello WQXGA, ma si nota anche una copertura dello spazio colore leggermente inferiore.
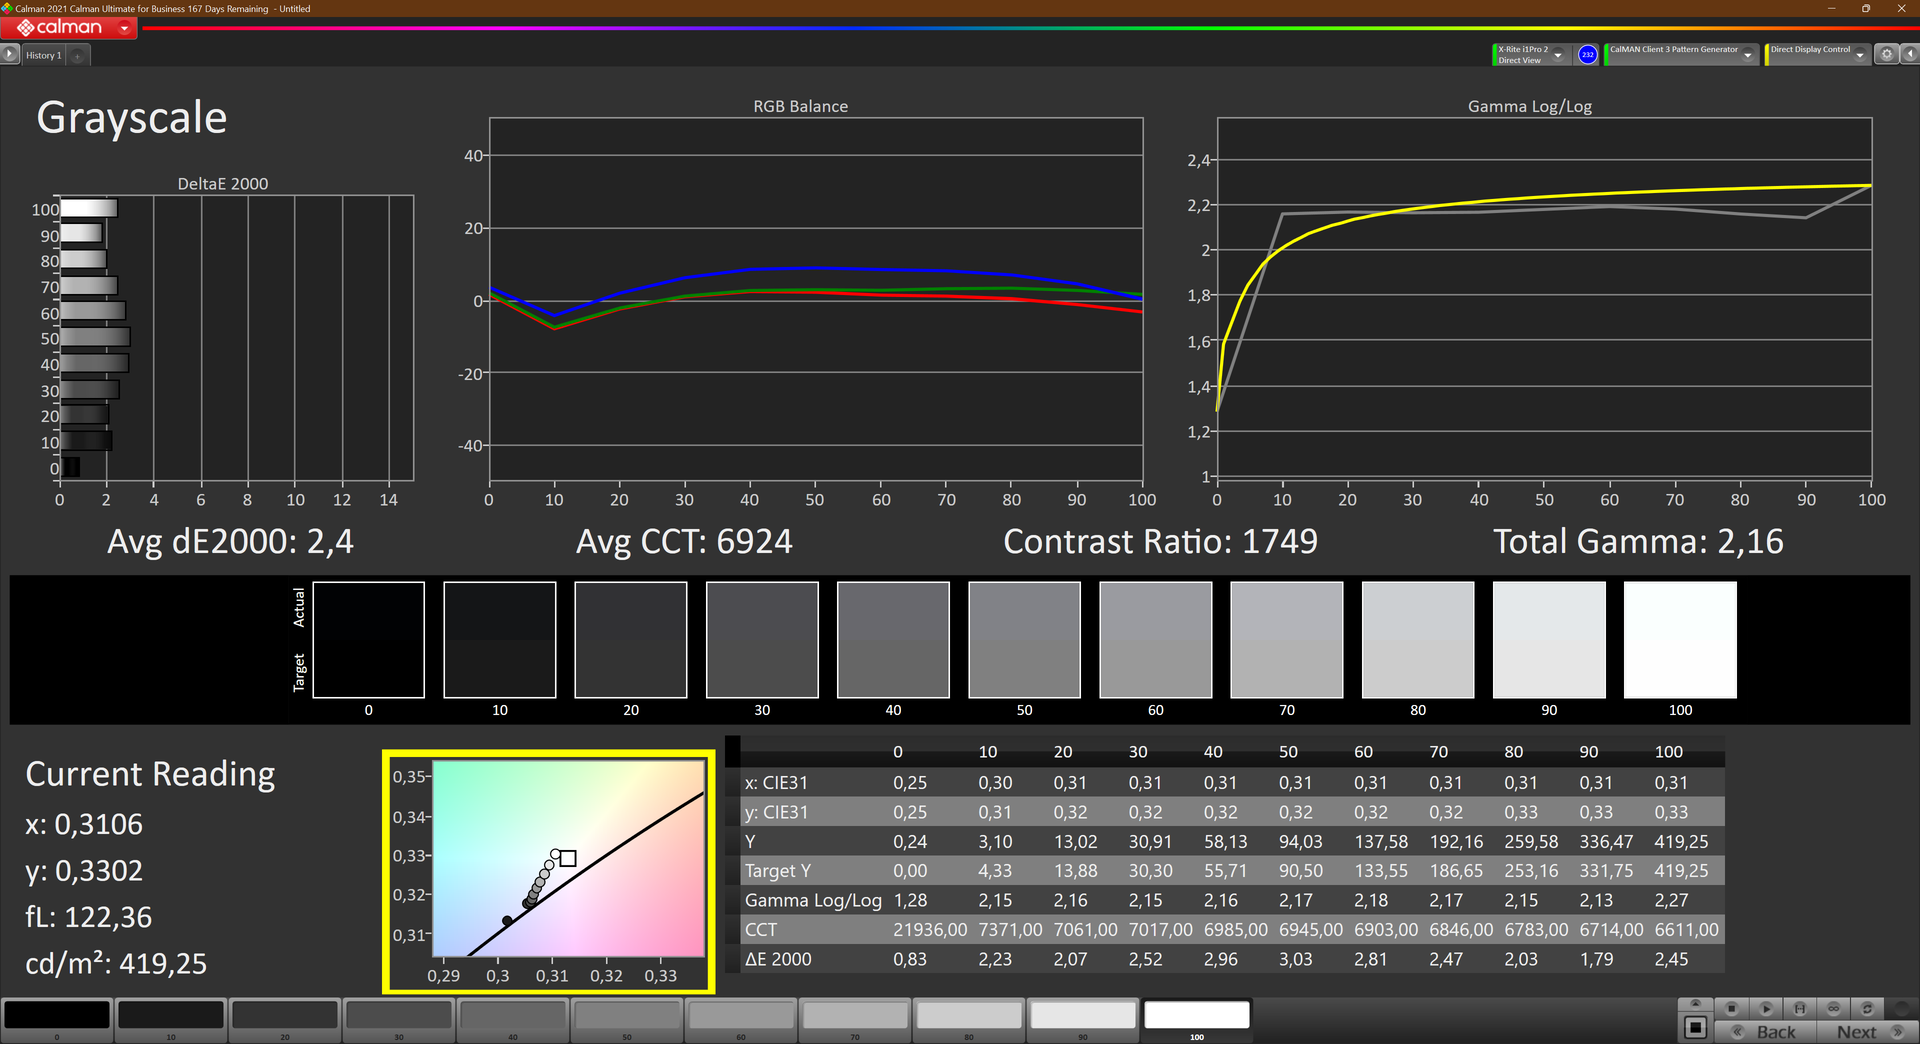
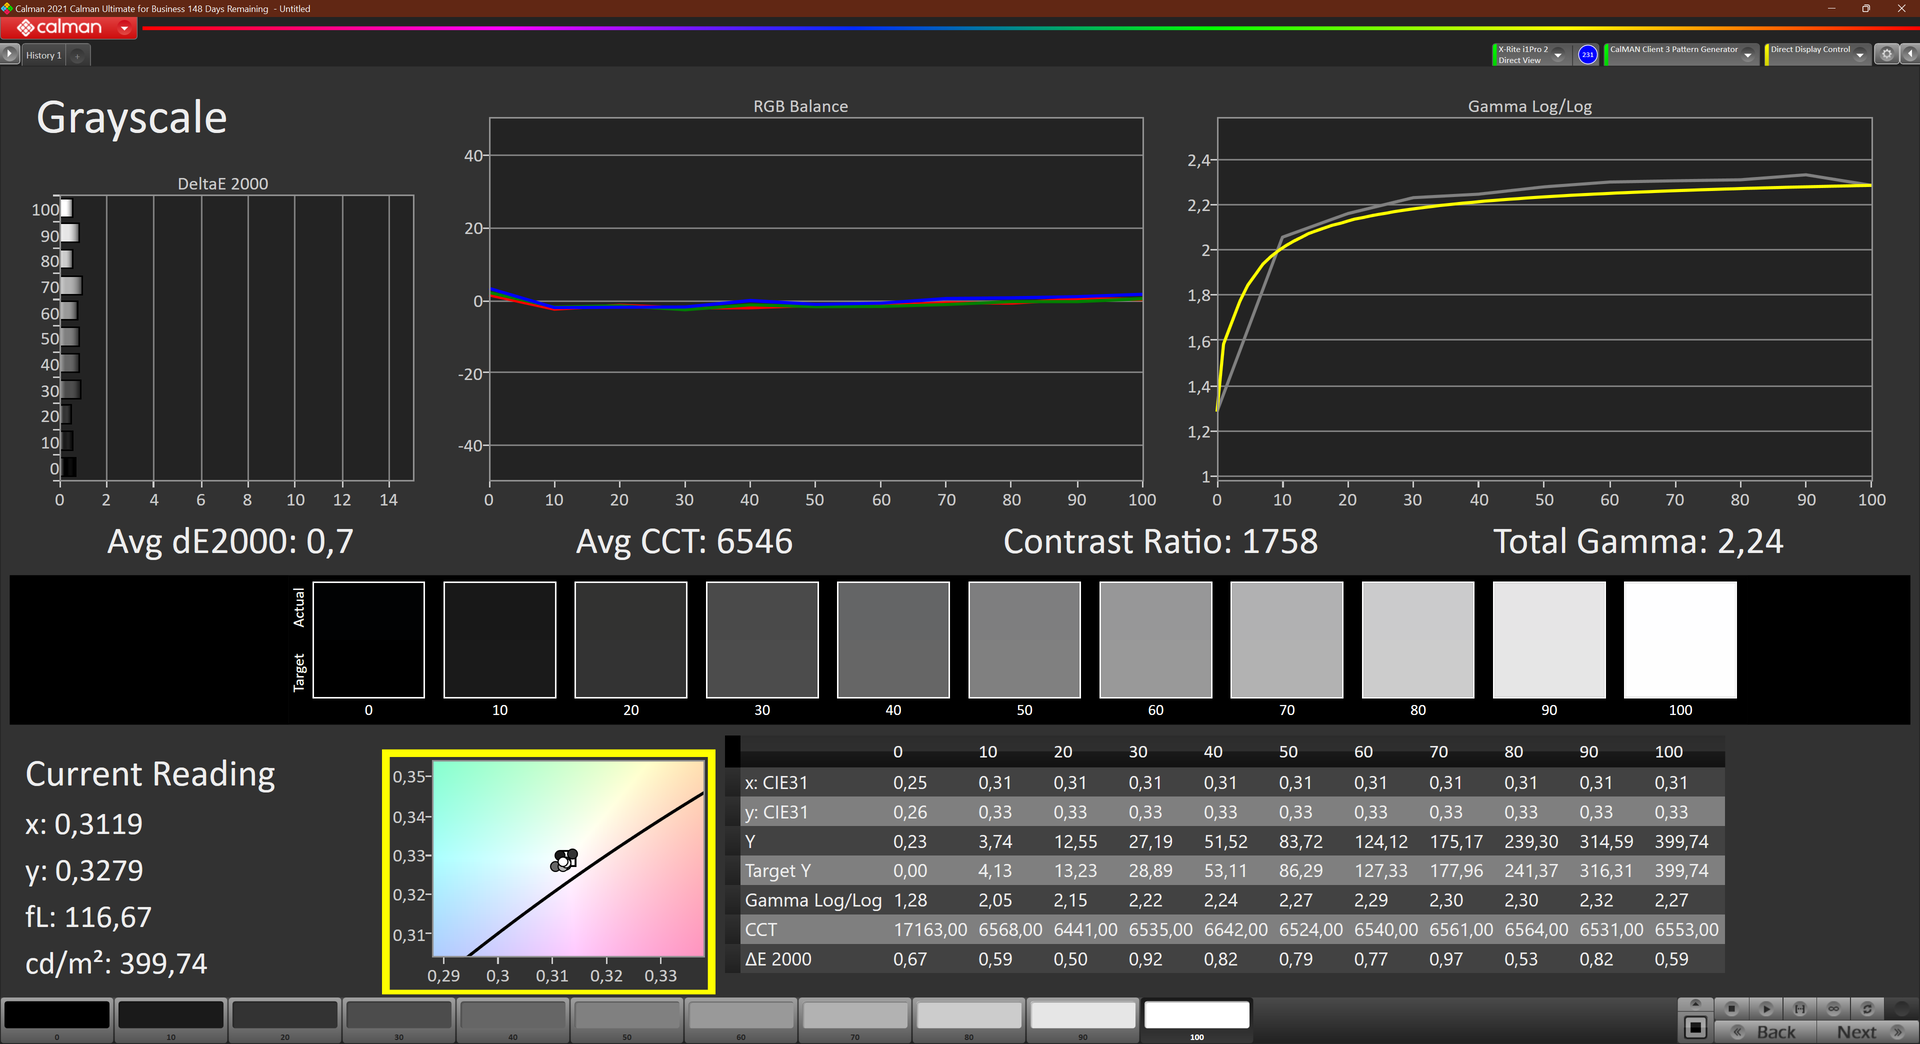
Anche la luminosità è la stessa, 388 cd/m², ma il contrasto misurato è più alto, 1738:1, e il valore del nero leggermente inferiore, con ben 0,24 cd/m². Questo fa sì che il nero appaia molto saturo, mentre la qualità dell'immagine appare complessivamente molto buona e la differenza soggettiva rispetto al pannello FHD+ a basso consumo non sembra essere molto pronunciata.
| |||||||||||||||||||||||||
Distribuzione della luminosità: 81 %
Al centro con la batteria: 417 cd/m²
Contrasto: 1738:1 (Nero: 0.24 cd/m²)
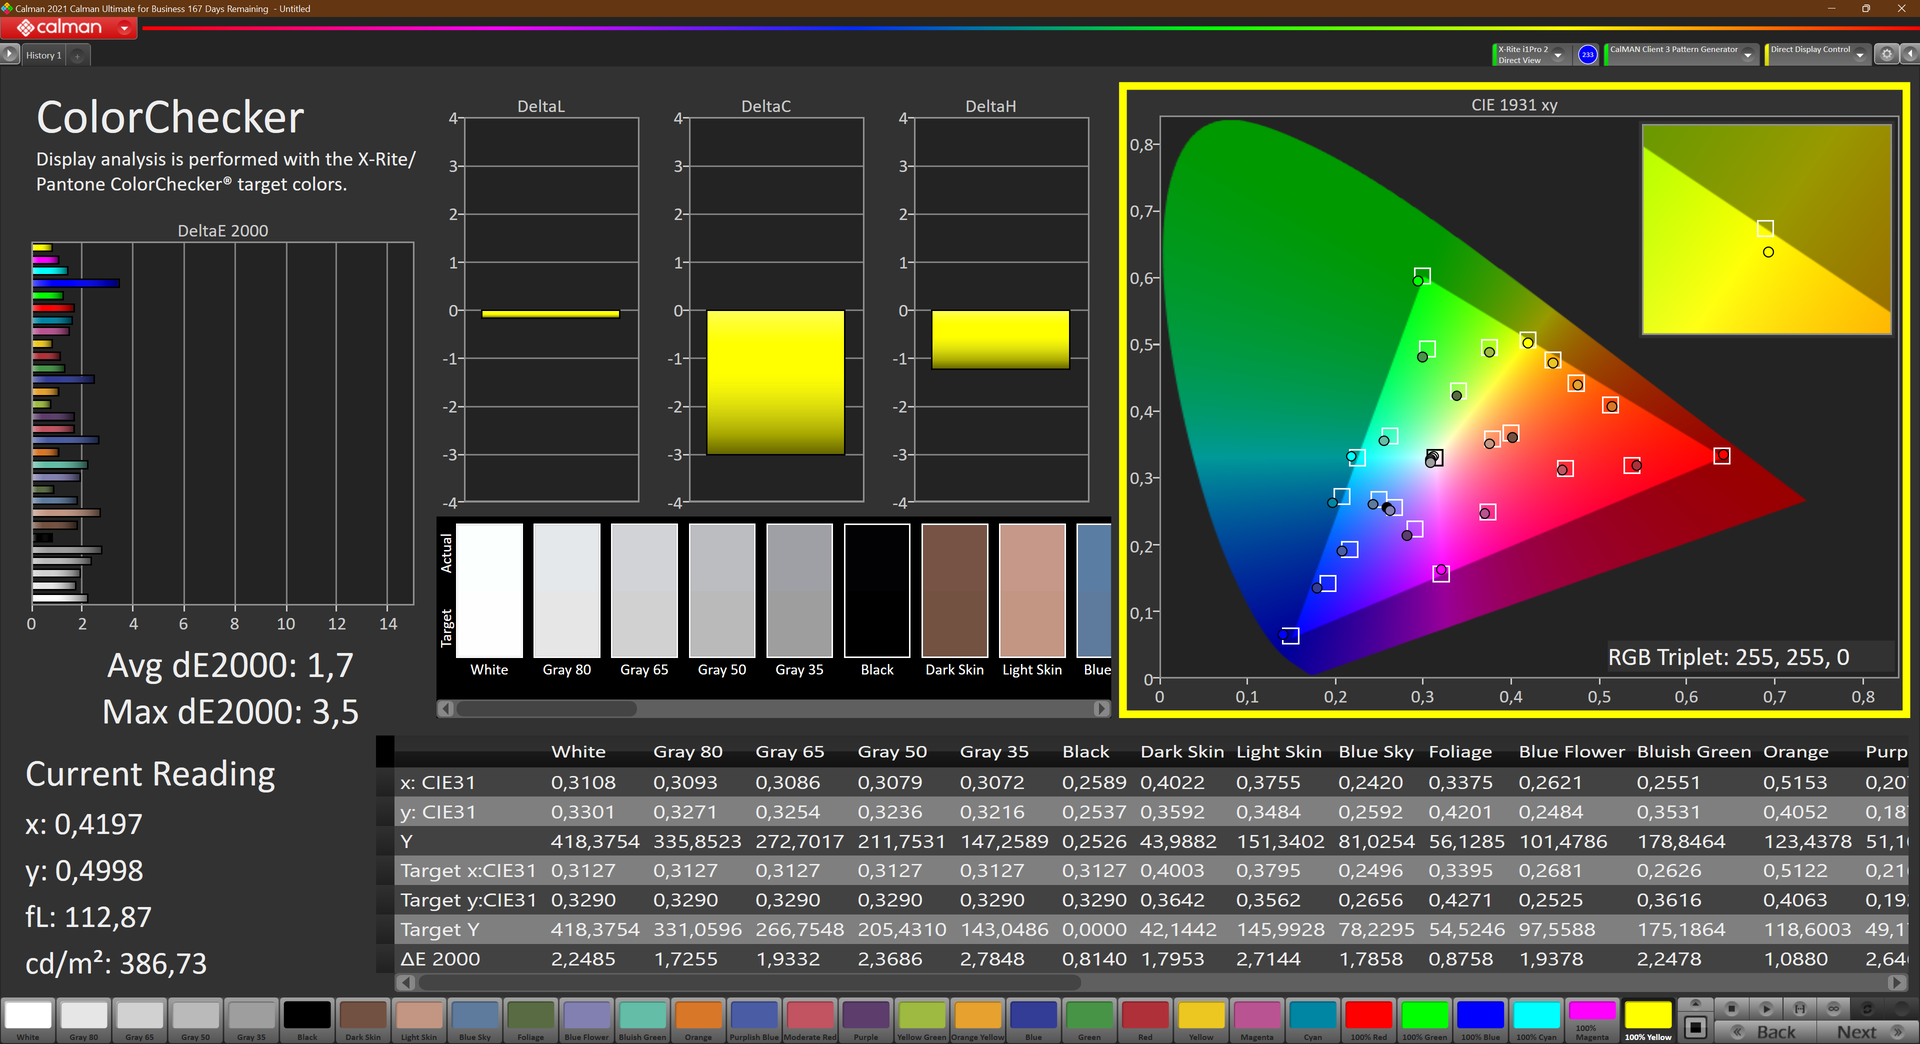
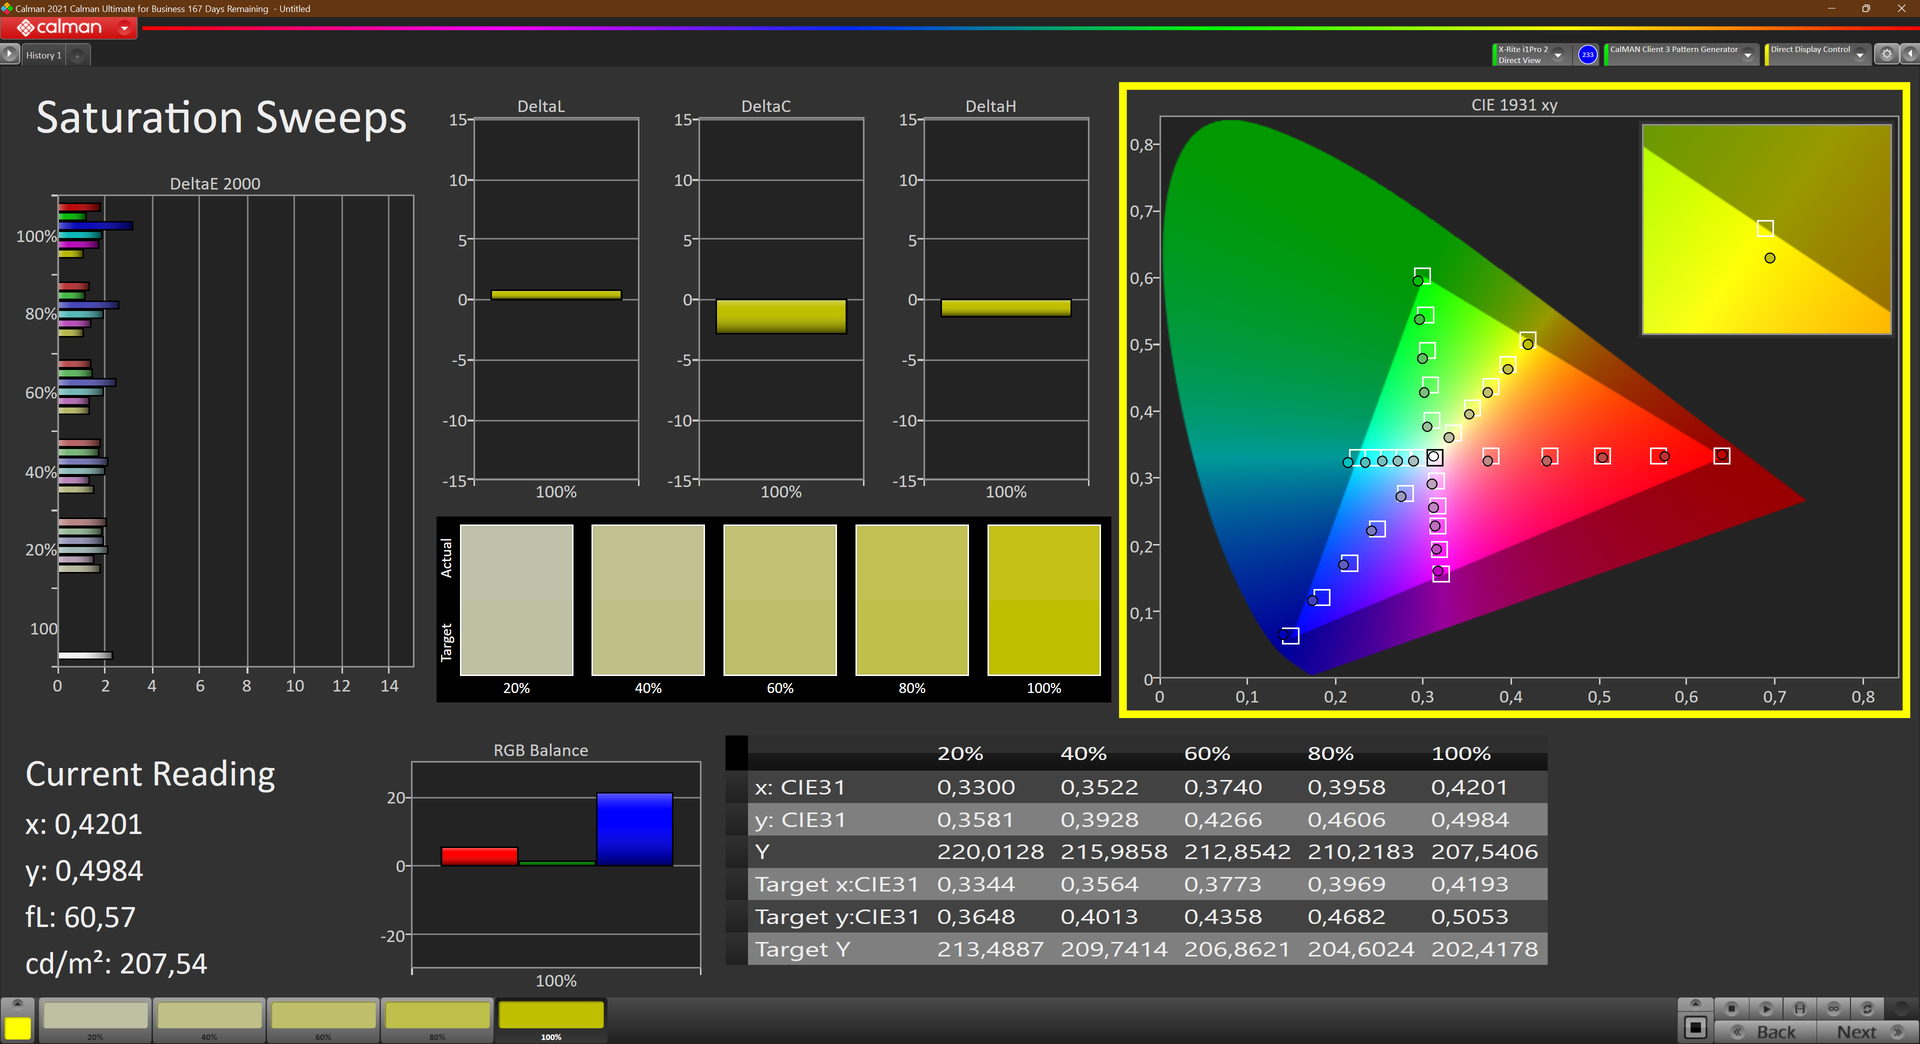
ΔE ColorChecker Calman: 1.7 | ∀{0.5-29.43 Ø4.72}
calibrated: 1.4
ΔE Greyscale Calman: 2.4 | ∀{0.09-98 Ø4.97}
69.1% AdobeRGB 1998 (Argyll 3D)
95.7% sRGB (Argyll 3D)
66.7% Display P3 (Argyll 3D)
Gamma: 2.16
CCT: 6924 K
| Lenovo ThinkPad T16 G1 21CH004MGE MNG007DA1-C, IPS-LED, 2560x1600, 16" | Lenovo ThinkPad T16 G1 21BWS00200 B160UAN01.K, IPS, 1920x1200, 16" | HP EliteBook 865 G9 X160NV42, IPS, 1920x1200, 16" | Lenovo ThinkPad Z16 G1 21D5S00T00 NE160WUM-N62 , IPS LED, 1920x1200, 16" | Lenovo ThinkPad X1 Extreme G5-21DE003RGE LP160UQ1-SPB1, IPS, 3840x2400, 16" | Lenovo ThinkPad P15v G2 21A9000XGE N156HCA-EAC, IPS LED, 1920x1080, 15.6" | HP ZBook Power 15 G9 6B8C4EA LGD073F, IPS, 3840x2160, 15.6" | |
|---|---|---|---|---|---|---|---|
| Display | 13% | 6% | 4% | 24% | -33% | 2% | |
| Display P3 Coverage (%) | 66.7 | 80.1 20% | 71.4 7% | 70 5% | 84.6 27% | 43.7 -34% | 69.1 4% |
| sRGB Coverage (%) | 95.7 | 100 4% | 99.3 4% | 99.7 4% | 99.2 4% | 65.1 -32% | 97.7 2% |
| AdobeRGB 1998 Coverage (%) | 69.1 | 80.5 16% | 73.2 6% | 72.1 4% | 97.7 41% | 45.3 -34% | 69.6 1% |
| Response Times | 13% | -18% | -29% | -23% | -49% | -47% | |
| Response Time Grey 50% / Grey 80% * (ms) | 32.1 ? | 27 ? 16% | 35.5 ? -11% | 40 ? -25% | 46 ? -43% | 48 ? -50% | 45.8 ? -43% |
| Response Time Black / White * (ms) | 18.9 ? | 17 ? 10% | 23.5 ? -24% | 25 ? -32% | 19.2 ? -2% | 28 ? -48% | 28.6 ? -51% |
| PWM Frequency (Hz) | 56.7 | ||||||
| Screen | -51% | 7% | 5% | -7% | -132% | -21% | |
| Brightness middle (cd/m²) | 417 | 404 -3% | 865 107% | 487 17% | 476 14% | 305 -27% | 392 -6% |
| Brightness (cd/m²) | 388 | 391 1% | 771 99% | 446 15% | 470 21% | 281 -28% | 388 0% |
| Brightness Distribution (%) | 81 | 80 -1% | 72 -11% | 83 2% | 90 11% | 88 9% | 88 9% |
| Black Level * (cd/m²) | 0.24 | 0.29 -21% | 0.3 -25% | 0.31 -29% | 0.35 -46% | 0.32 -33% | 0.15 37% |
| Contrast (:1) | 1738 | 1393 -20% | 2883 66% | 1571 -10% | 1360 -22% | 953 -45% | 2613 50% |
| Colorchecker dE 2000 * | 1.7 | 3.9 -129% | 2.4 -41% | 1.8 -6% | 1.9 -12% | 5.9 -247% | 3.2 -88% |
| Colorchecker dE 2000 max. * | 3.5 | 8.5 -143% | 5.8 -66% | 3.3 6% | 4.7 -34% | 20.1 -474% | 7 -100% |
| Colorchecker dE 2000 calibrated * | 1.4 | 1.7 -21% | 1.5 -7% | 0.8 43% | 1.3 7% | 4.5 -221% | 1.2 14% |
| Greyscale dE 2000 * | 2.4 | 5.4 -125% | 3.8 -58% | 2.3 4% | 2.4 -0% | 5.3 -121% | 4.9 -104% |
| Gamma | 2.16 102% | 2.21 100% | 2.36 93% | 2.16 102% | 2.24 98% | 2.1 105% | 2.13 103% |
| CCT | 6924 94% | 6242 104% | 6922 94% | 6867 95% | 6377 102% | 6307 103% | 5982 109% |
| Media totale (Programma / Settaggio) | -8% /
-28% | -2% /
3% | -7% /
-0% | -2% /
-2% | -71% /
-99% | -22% /
-20% |
* ... Meglio usare valori piccoli
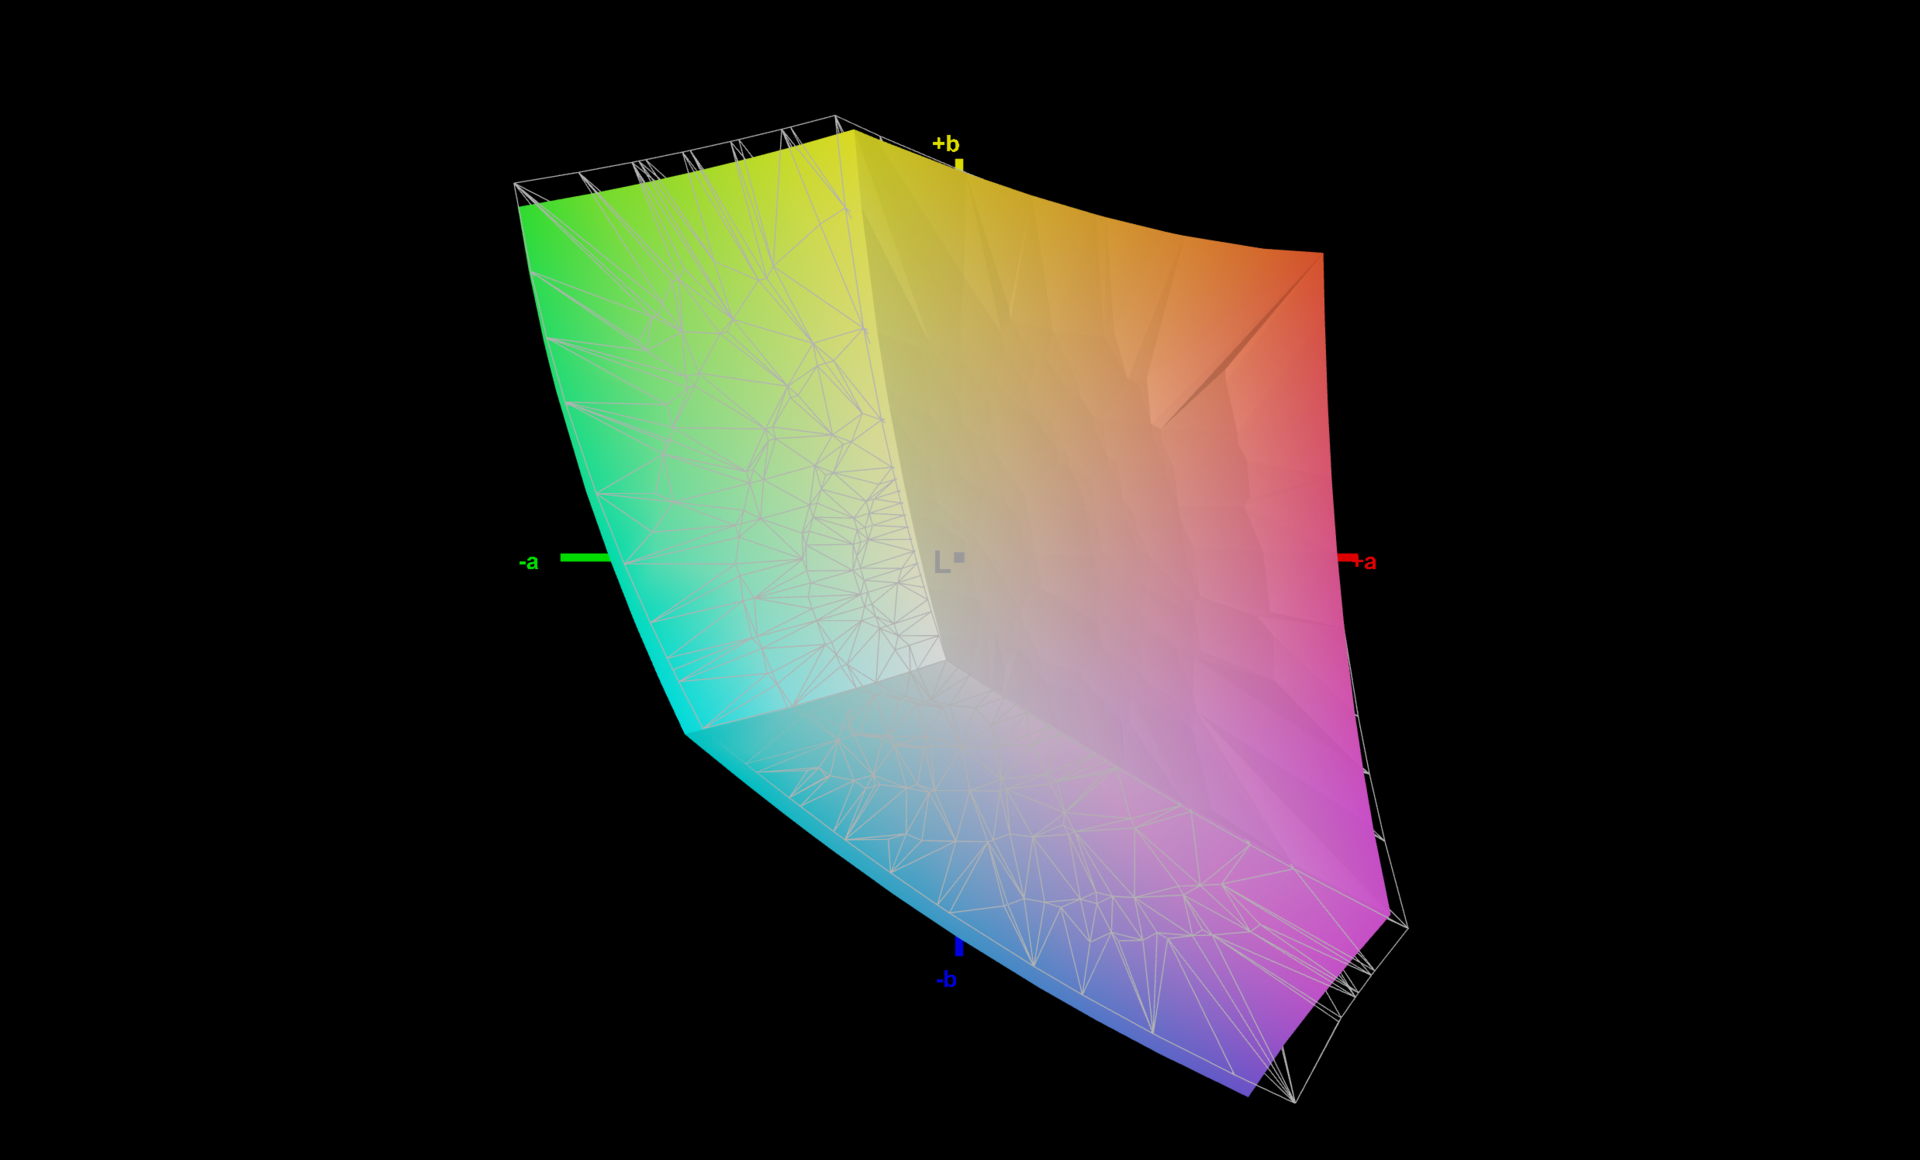
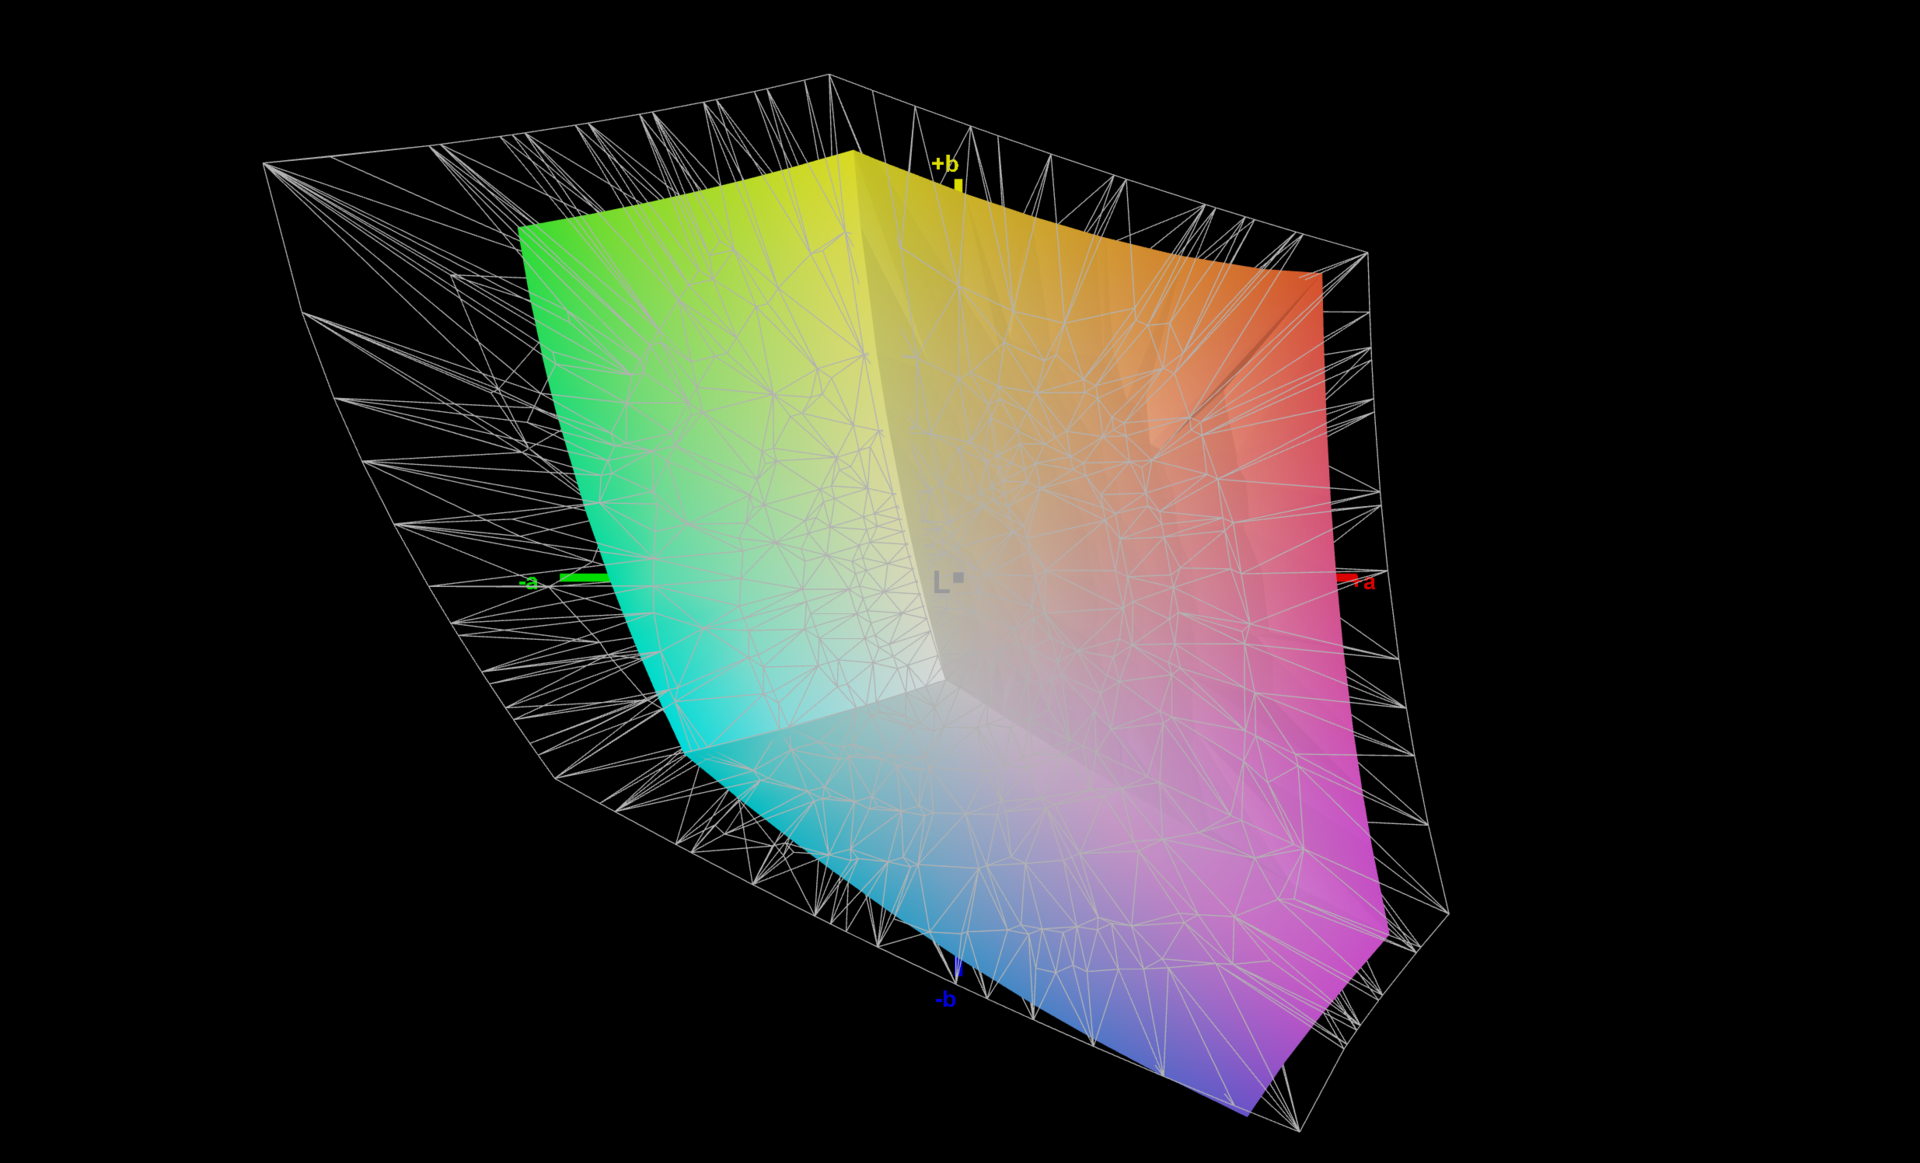
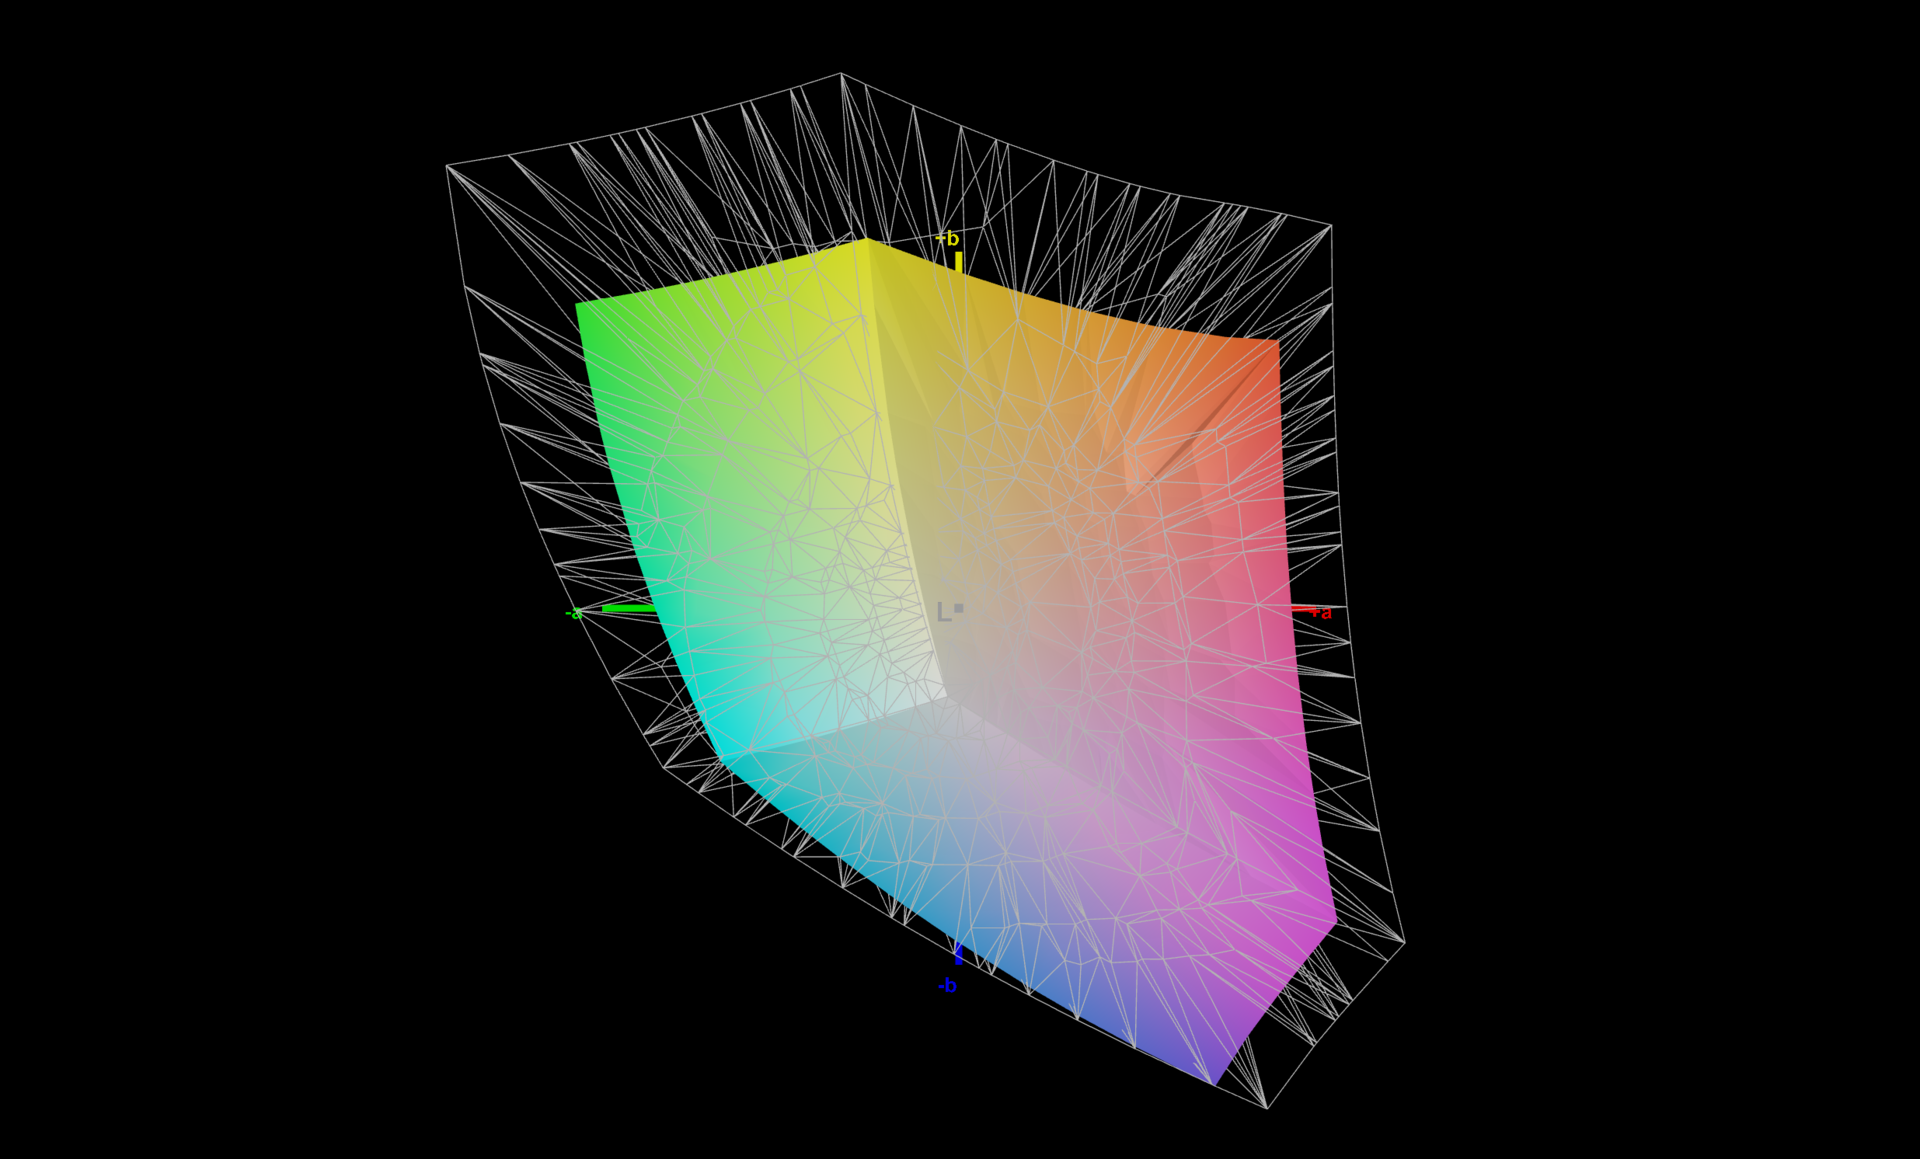
Lo spazio colore sRGB è sufficientemente coperto al 95,7%, il che dovrebbe consentire un'elaborazione professionale delle immagini in ambito digitale. Tuttavia, anche dopo la nostra calibrazione, il colore blu si discosta ancora dall'obiettivo con un valore DeltaE 2000 di 3,5, anche se siamo riusciti a porre rimedio alla tinta blu. Come al solito, è possibile scaricare il nostro profilo colore calibrato dal link in alto, a destra del grafico della distribuzione della luminosità.
Tempi di risposta del Display
| ↔ Tempi di risposta dal Nero al Bianco | ||
|---|---|---|
| 18.9 ms ... aumenta ↗ e diminuisce ↘ combinato | ↗ 9.4 ms Incremento | 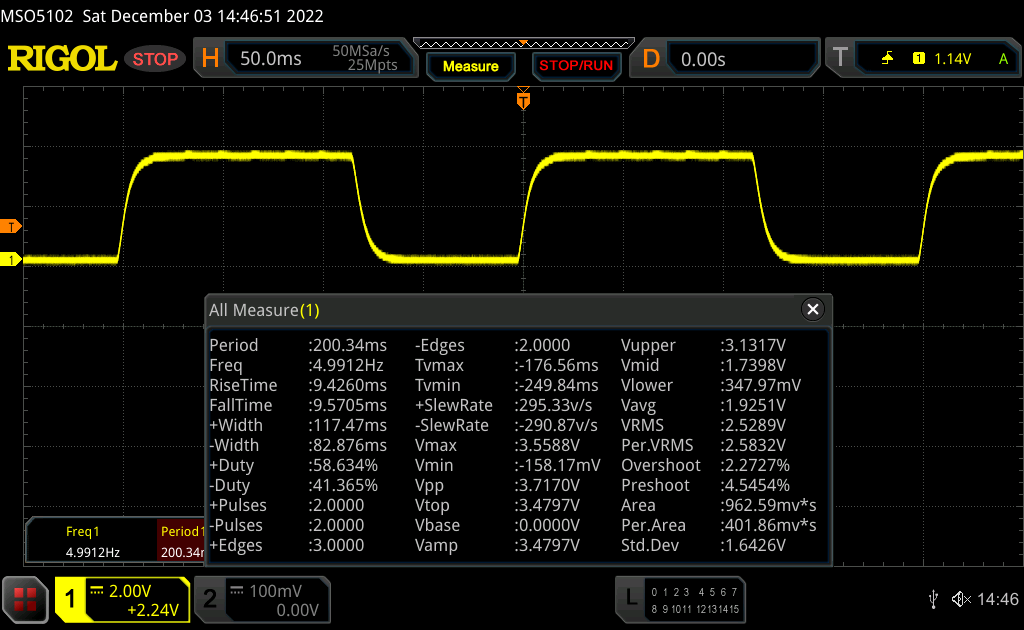 |
| ↘ 9.5 ms Calo | ||
| Lo schermo mostra buoni tempi di risposta durante i nostri tests, ma potrebbe essere troppo lento per i gamers competitivi. In confronto, tutti i dispositivi di test variano da 0.1 (minimo) a 240 (massimo) ms. » 42 % di tutti i dispositivi è migliore. Questo significa che i tempi di risposta rilevati sono simili alla media di tutti i dispositivi testati (19.8 ms). | ||
| ↔ Tempo di risposta dal 50% Grigio all'80% Grigio | ||
| 32.1 ms ... aumenta ↗ e diminuisce ↘ combinato | ↗ 15.6 ms Incremento | 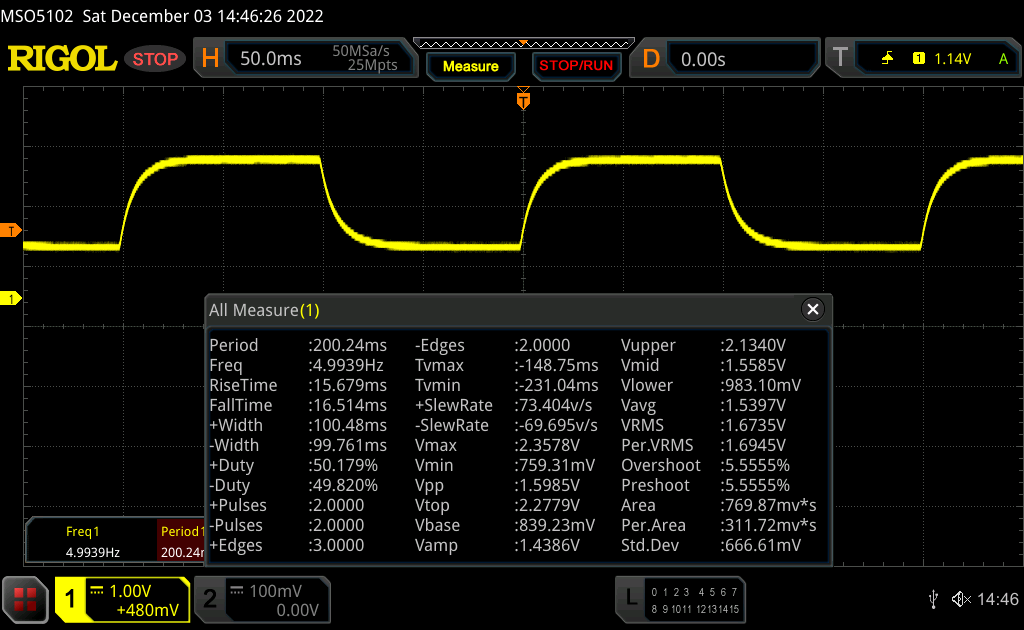 |
| ↘ 16.5 ms Calo | ||
| Lo schermo mostra tempi di risposta lenti nei nostri tests e sarà insoddisfacente per i gamers. In confronto, tutti i dispositivi di test variano da 0.165 (minimo) a 636 (massimo) ms. » 44 % di tutti i dispositivi è migliore. Questo significa che i tempi di risposta rilevati sono simili alla media di tutti i dispositivi testati (31 ms). | ||
Sfarfallio dello schermo / PWM (Pulse-Width Modulation)
| flickering dello schermo / PWM non rilevato | 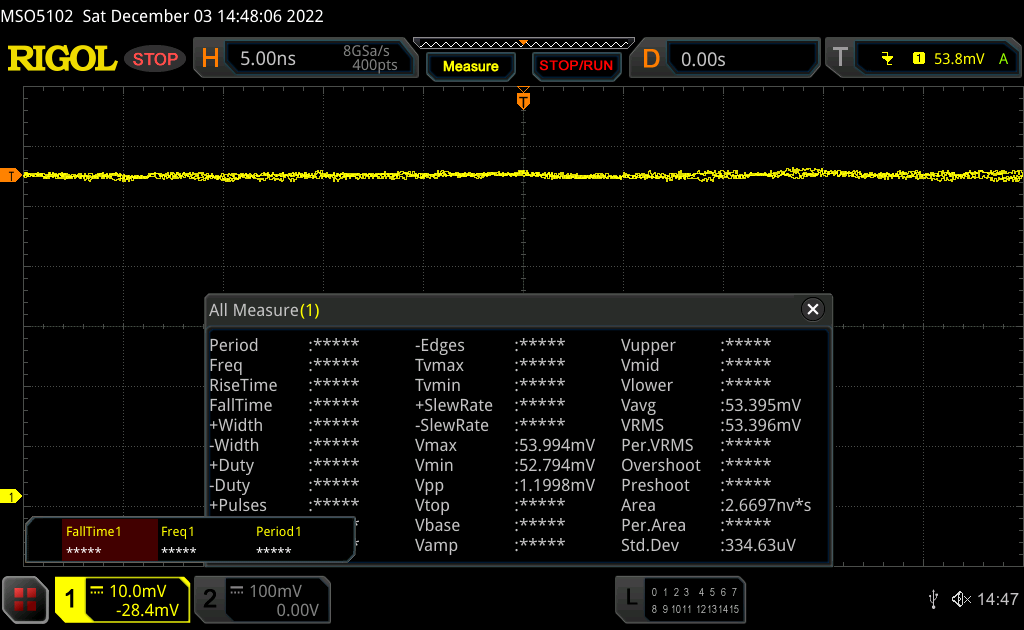 | ||
In confronto: 52 % di tutti i dispositivi testati non utilizza PWM per ridurre la luminosita' del display. Se è rilevato PWM, una media di 7763 (minimo: 5 - massimo: 343500) Hz è stata rilevata. | |||
Grazie alla luminosità piuttosto elevata di ~390 cd/m², i contenuti del display opaco rimangono facilmente leggibili anche all'aperto, a patto di evitare la luce diretta del sole.

Prestazioni: AMD hexa-core già più veloce del T16 Intel
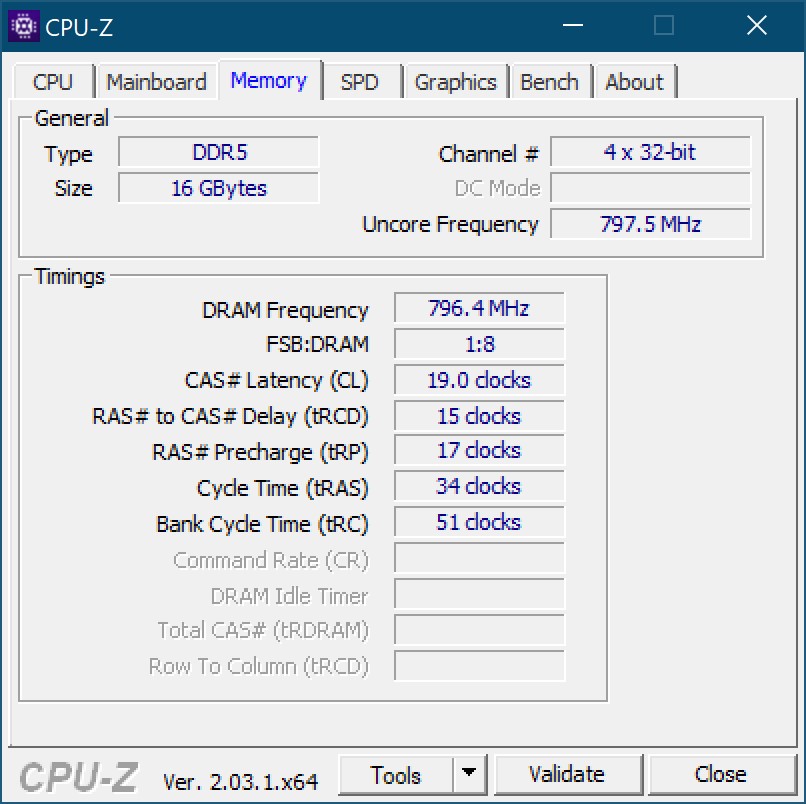
La nostra unità di prova del ThinkPad T16 AMD è dotata di 16 GB di RAM LPDDR5-6400 saldata, mentre il modello Intel offre uno slot per un modulo DDR4-3200. Il massimo disponibile per la versione AMD è di 32 GB, mentre per la versione Intel è di 48 GB.
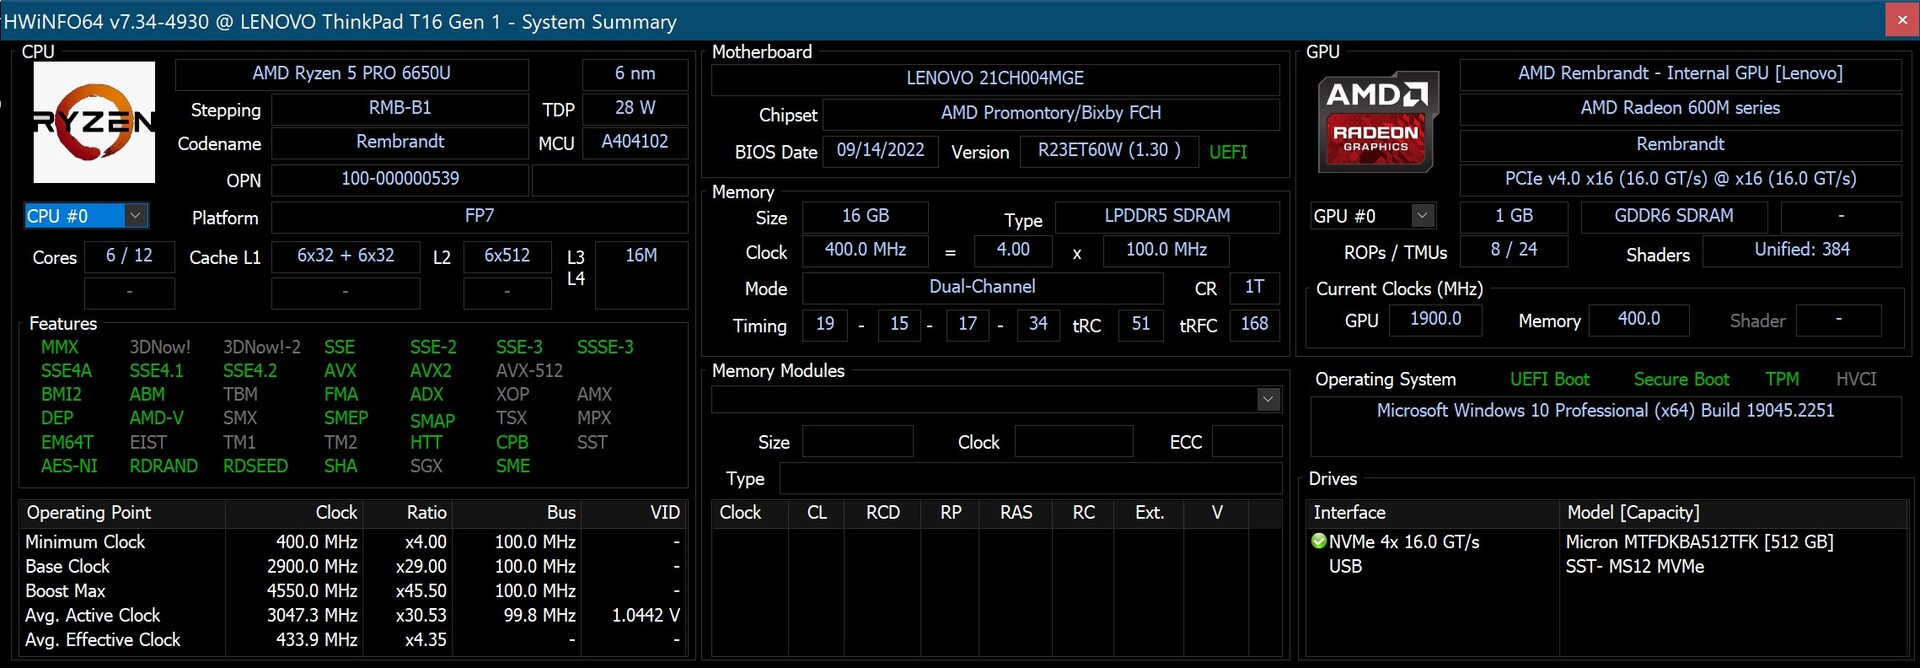
Il cuore del dispositivo è il processore AMD Ryzen 5 PRO 6650Ucon i suoi sei core, e abbiamo anche un T16 con un octa-core Ryzen 7 PRO 6850Udisponibile per diversi benchmark. Con un SSD PCIe 4.0 da 512 GB e la sola soluzione grafica integrata (Radeon 660M o Radeon 680M), il target di utilizzo è chiaramente quello dell'ufficio.

Condizioni di prova
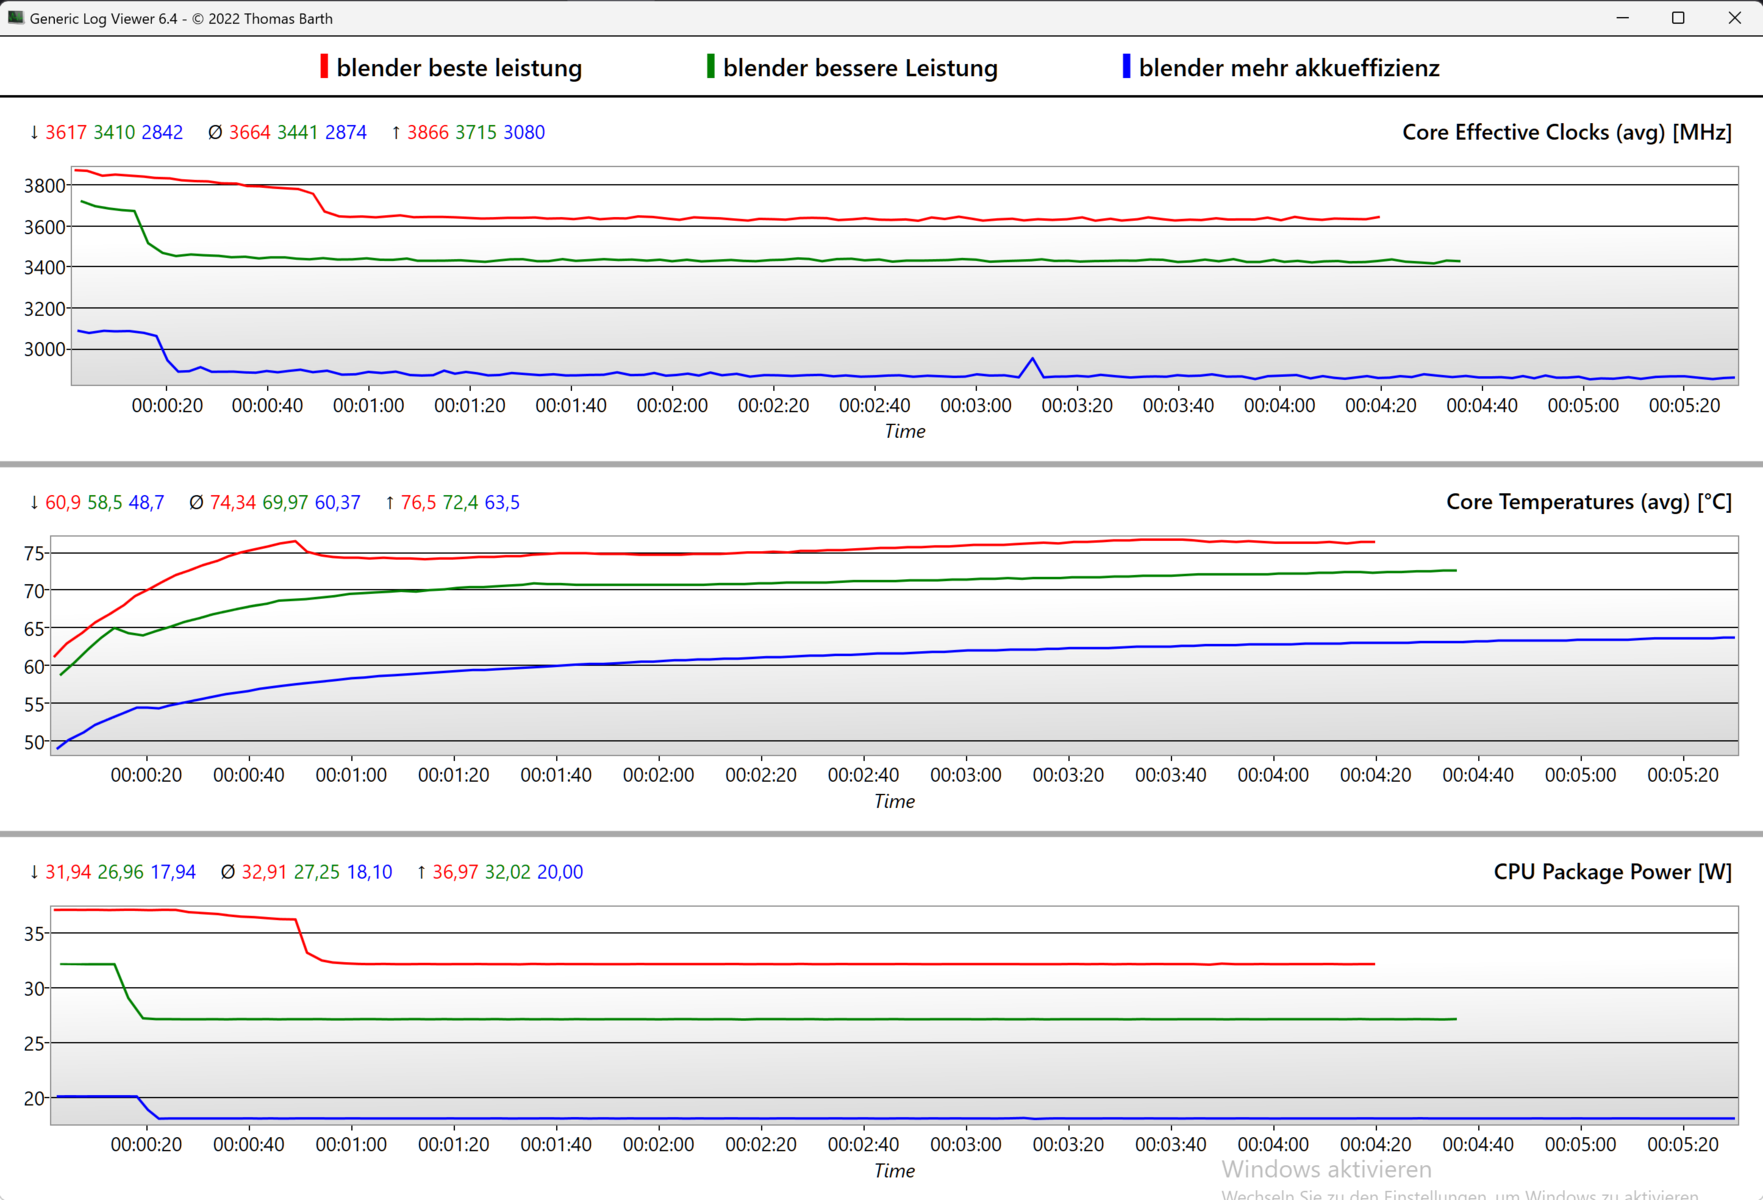
Lenovo non offre controlli propri delle modalità di prestazioni con i suoi ThinkPad, ma sono integrati nelle impostazioni di alimentazione di Windows. Ciò consente di selezionare tre profili con diversi limiti di potenza per il Turbo a breve termine (PL2) e il Boost a lungo termine (PL1):
- Migliore efficienza energetica: 20 W (PL2) / 18 W (PL1)
- Bilanciato: 32 W (PL2) / 27 W (PL1)
- Migliori prestazioni: 37 W (PL2) / 32 W (PL1)
Abbiamo eseguito tutti i test sulle prestazioni con la modalità "Prestazioni migliori" attivata. La durata della batteria Wi-Fi e video è stata determinata utilizzando la modalità "Bilanciata".
Processore
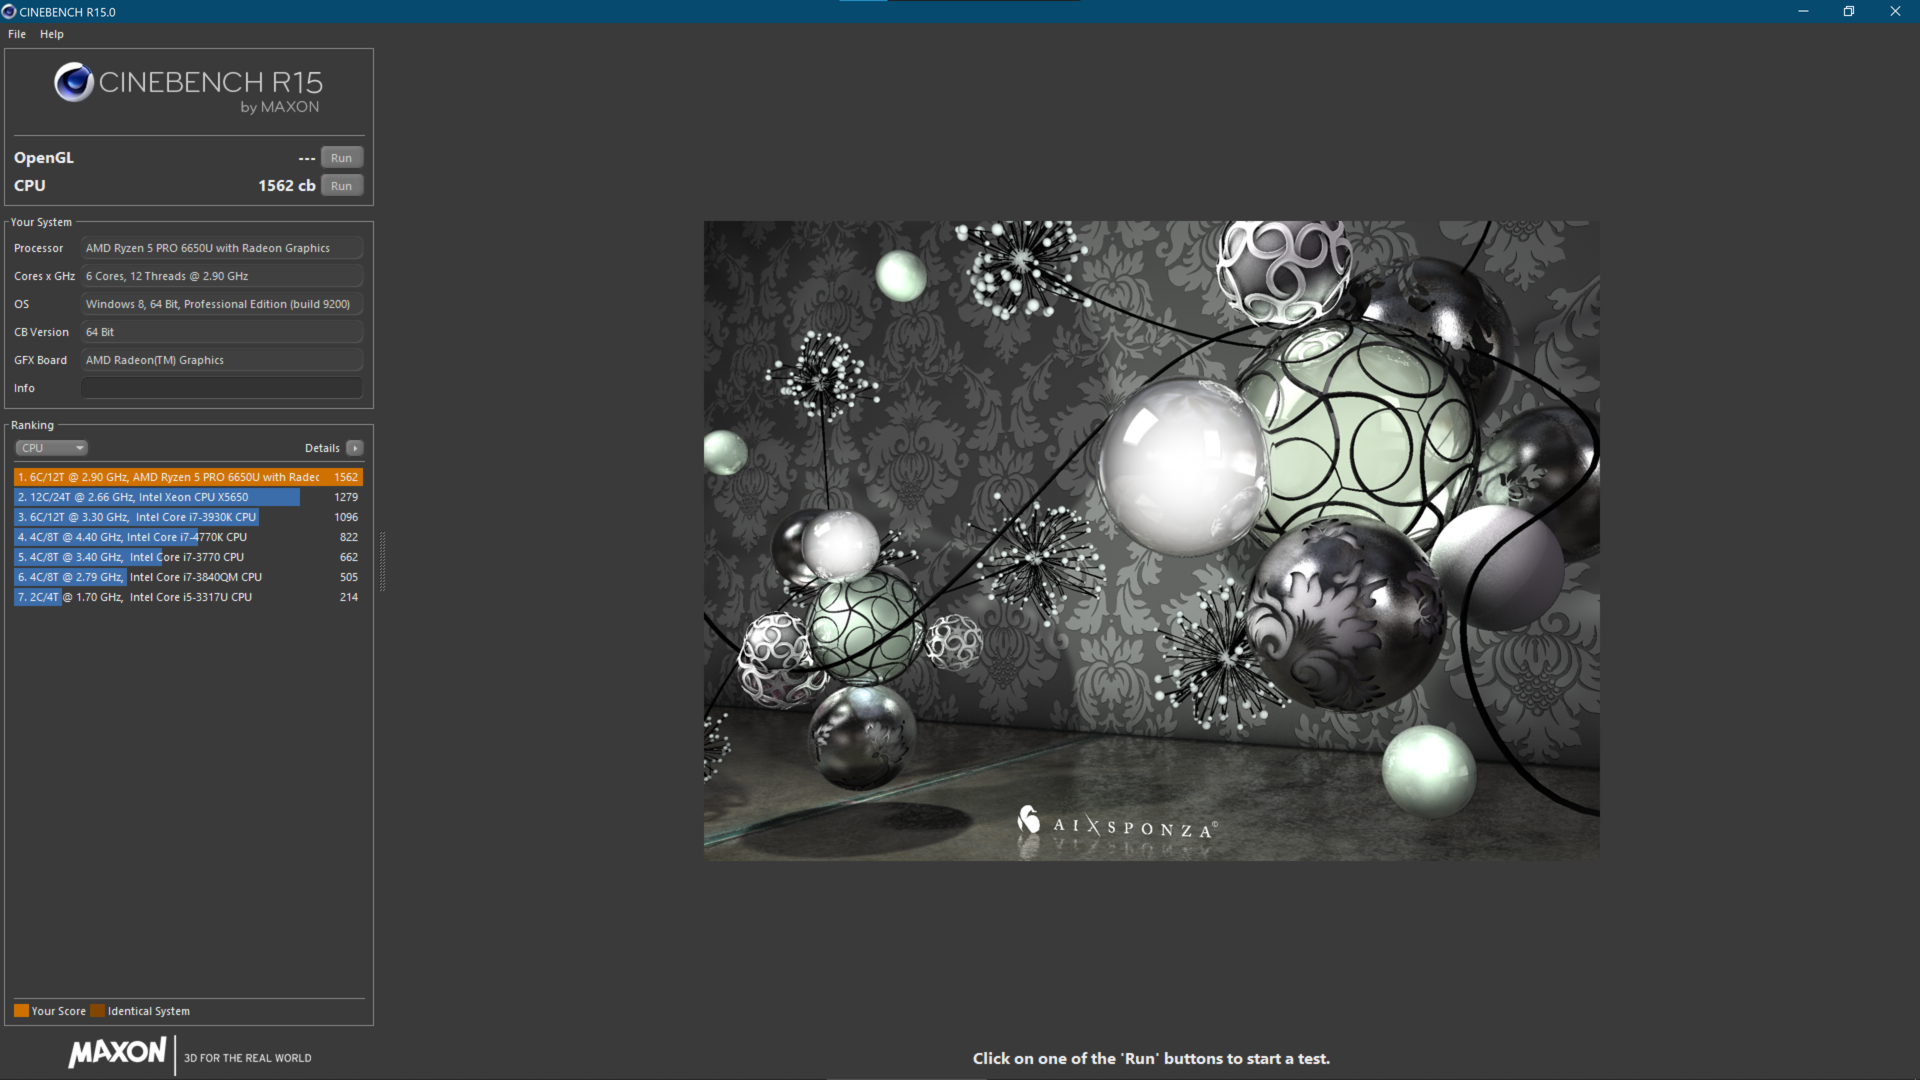
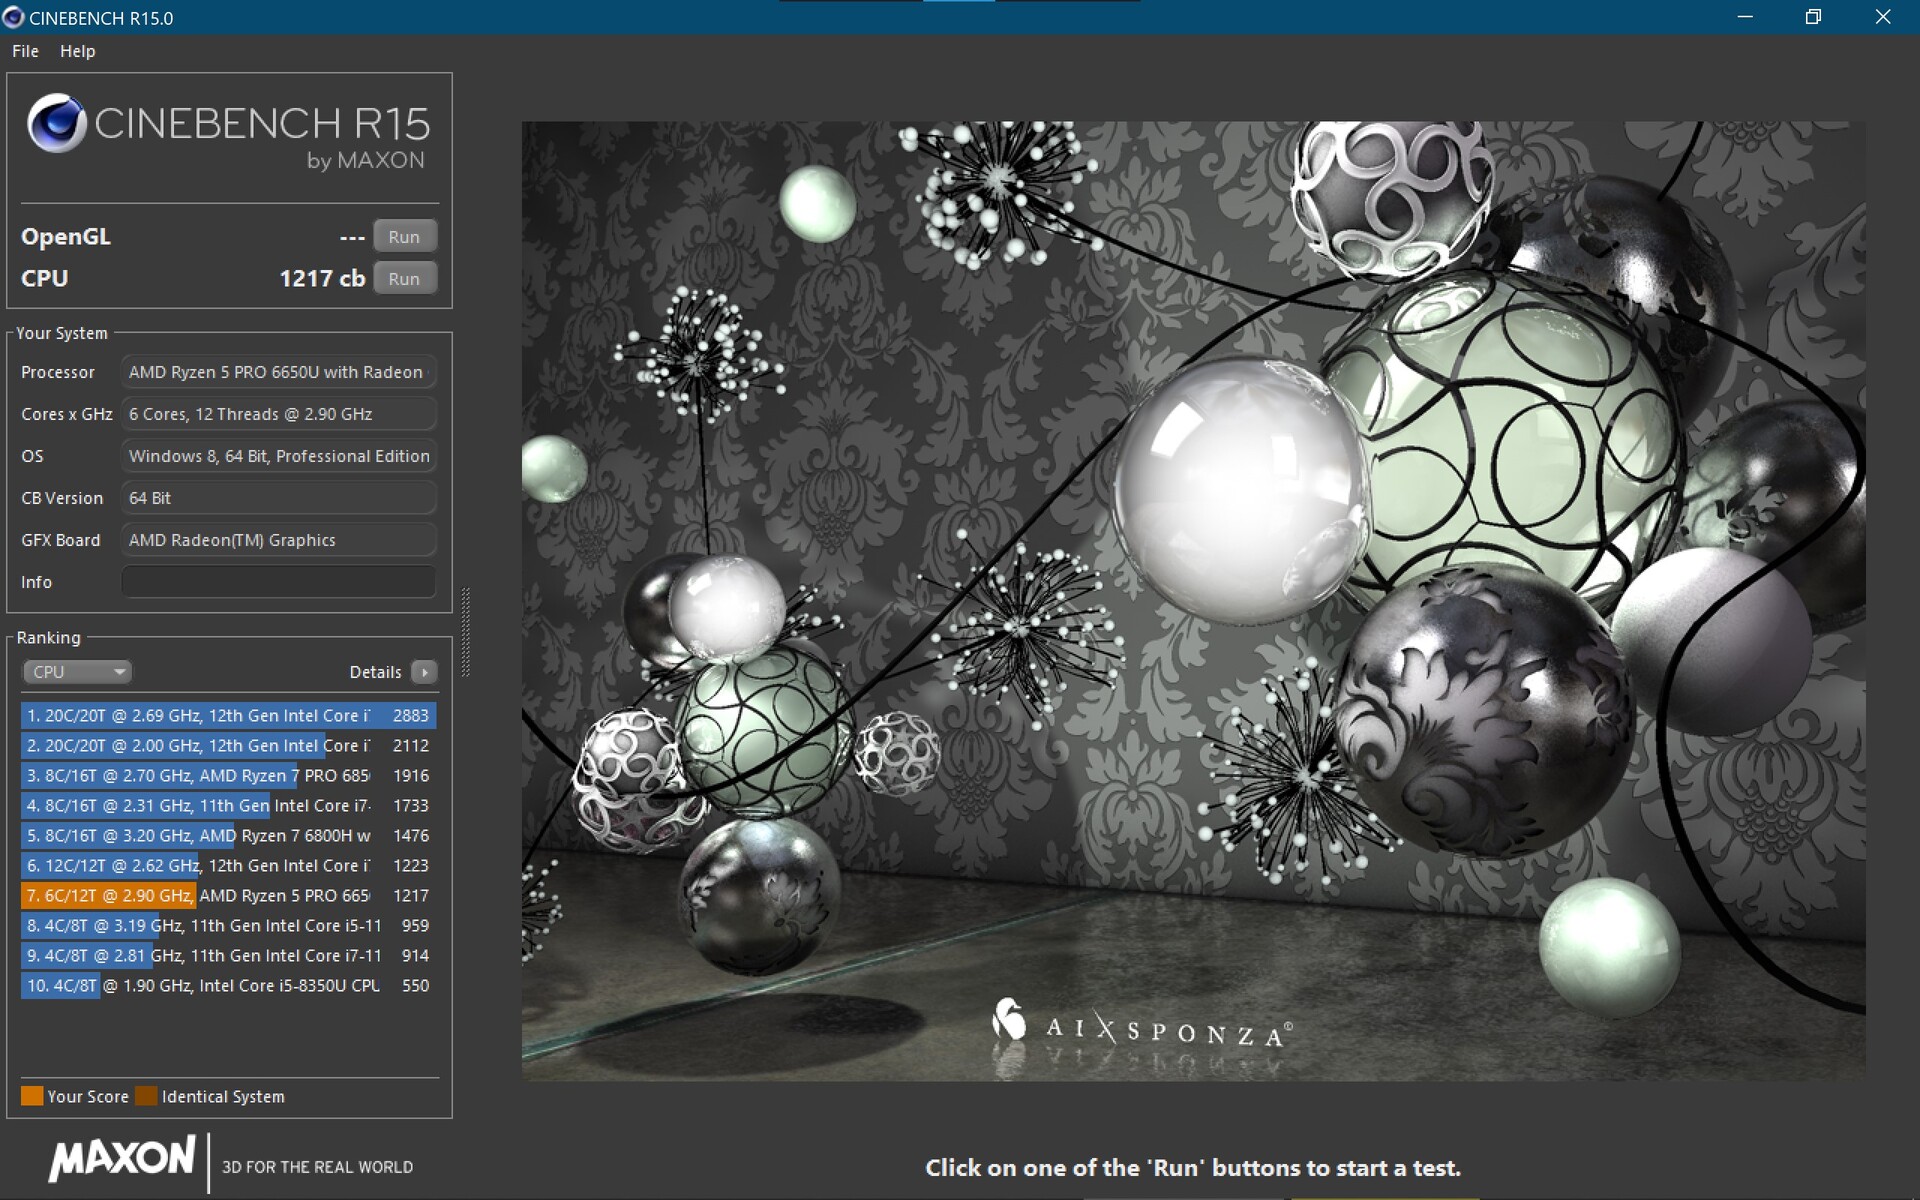
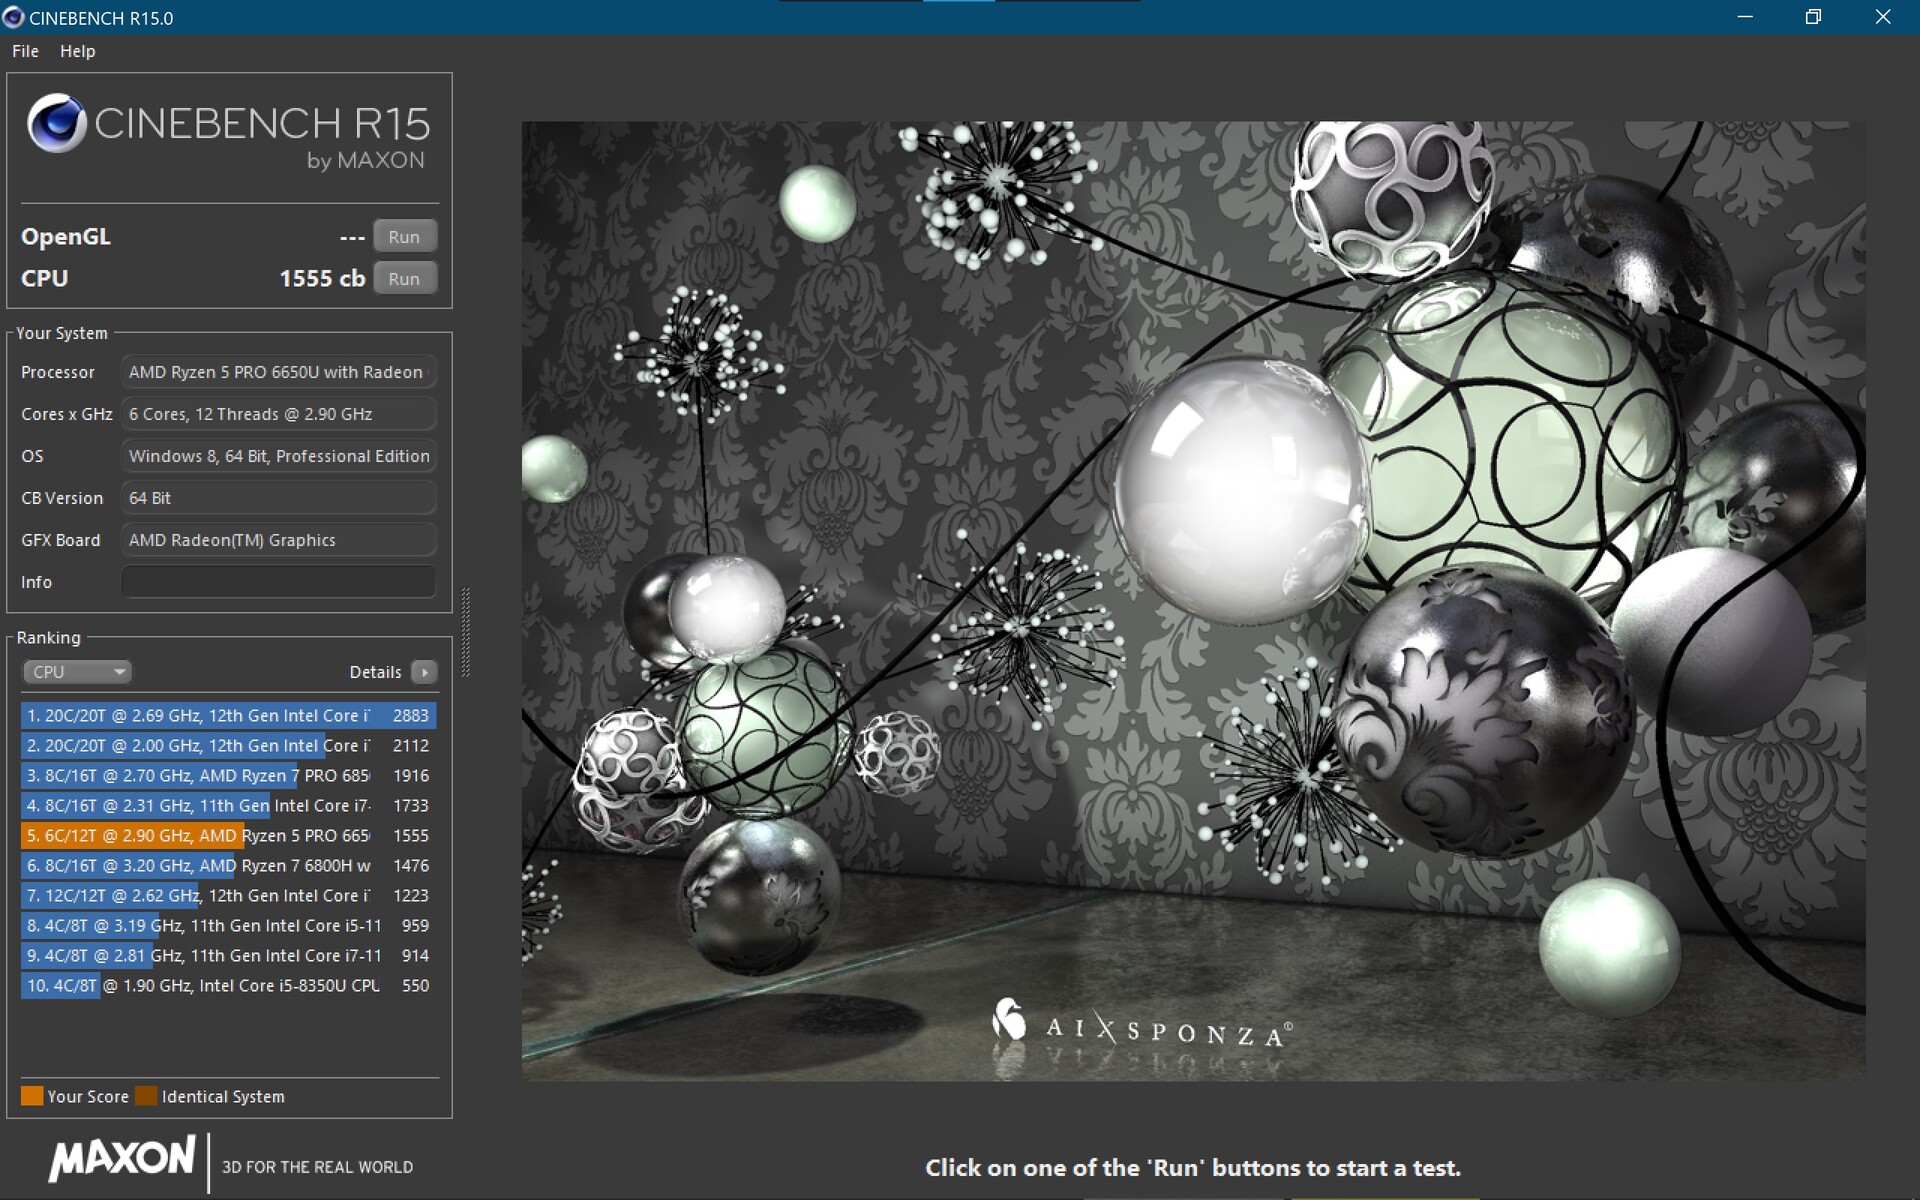
Il modello AMD Ryzen 5 Pro 6650U è un processore esa-core. È in grado di mantenere la velocità di clock massima di 3,8 GHz in tutti i core per circa 45 secondi nel ThinkPad T16 G1, prima di scendere appena al di sotto di tale velocità, a 3,65 GHz.
Questo si traduce in valori di prestazioni significativamente più elevati rispetto al modelloModello Intelche Lenovo limita a 20 watt. Nel nostro ciclo Cinebench R15, misuriamo risultati mediamente superiori del 50% rispetto al corrispondente Intel Core i5-1240Pche almeno è in vantaggio durante il primo ciclo.
La nostra seconda unità di test T16 con un Ryzen 7 Pro 6850U offre circa il 20% di prestazioni in più in questo benchmark. D'altra parte, l' EliteBook 865 G9con lo stesso chip octa-core è allo stesso livello del T16 con il suo R5 6650U. Il Core i7-12700H di Intel nelThinkPad X1 Extreme G5ha funzionato quasi due volte più velocemente nei benchmark multicore rispetto al Ryzen 5 Pro 6650Ue nel test single-core ha ottenuto prestazioni superiori di circa il 23%.
Nel funzionamento a batteria, le prestazioni non sono diminuite. Tuttavia, nel T16 con il più potente processore octa-core, osserviamo un calo delle prestazioni del 20%.

Cinebench R15 Multi Constant Load Test
Cinebench R23: Multi Core | Single Core
Cinebench R20: CPU (Multi Core) | CPU (Single Core)
Cinebench R15: CPU Multi 64Bit | CPU Single 64Bit
Blender: v2.79 BMW27 CPU
7-Zip 18.03: 7z b 4 | 7z b 4 -mmt1
Geekbench 5.5: Multi-Core | Single-Core
HWBOT x265 Benchmark v2.2: 4k Preset
LibreOffice : 20 Documents To PDF
R Benchmark 2.5: Overall mean
| CPU Performance rating | |
| Lenovo ThinkPad X1 Extreme G5-21DE003RGE | |
| HP ZBook Power 15 G9 6B8C4EA | |
| Lenovo ThinkPad Z16 G1 21D5S00T00 | |
| Media della classe Office | |
| Lenovo ThinkPad T16 G1 21CHCTO1WW | |
| HP EliteBook 865 G9 | |
| Lenovo ThinkPad T16 G1 21CH004MGE | |
| Lenovo ThinkPad T16 G1 21BWS00200 | |
| Media AMD Ryzen 5 PRO 6650U | |
| Cinebench R23 / Multi Core | |
| Lenovo ThinkPad X1 Extreme G5-21DE003RGE | |
| HP ZBook Power 15 G9 6B8C4EA | |
| Lenovo ThinkPad Z16 G1 21D5S00T00 | |
| Media della classe Office (1673 - 22808, n=73, ultimi 2 anni) | |
| Lenovo ThinkPad T16 G1 21CHCTO1WW | |
| HP EliteBook 865 G9 | |
| Lenovo ThinkPad T16 G1 21CH004MGE | |
| Media AMD Ryzen 5 PRO 6650U (7805 - 9534, n=4) | |
| Lenovo ThinkPad T16 G1 21BWS00200 | |
| Cinebench R23 / Single Core | |
| Lenovo ThinkPad X1 Extreme G5-21DE003RGE | |
| HP ZBook Power 15 G9 6B8C4EA | |
| Media della classe Office (708 - 2130, n=73, ultimi 2 anni) | |
| Lenovo ThinkPad T16 G1 21BWS00200 | |
| Lenovo ThinkPad T16 G1 21CHCTO1WW | |
| Lenovo ThinkPad Z16 G1 21D5S00T00 | |
| Lenovo ThinkPad T16 G1 21CH004MGE | |
| Media AMD Ryzen 5 PRO 6650U (1439 - 1476, n=4) | |
| HP EliteBook 865 G9 | |
| Cinebench R20 / CPU (Multi Core) | |
| Lenovo ThinkPad X1 Extreme G5-21DE003RGE | |
| HP ZBook Power 15 G9 6B8C4EA | |
| Lenovo ThinkPad Z16 G1 21D5S00T00 | |
| Media della classe Office (648 - 8840, n=72, ultimi 2 anni) | |
| Lenovo ThinkPad T16 G1 21CHCTO1WW | |
| HP EliteBook 865 G9 | |
| Lenovo ThinkPad T16 G1 21CH004MGE | |
| Media AMD Ryzen 5 PRO 6650U (3057 - 3684, n=4) | |
| Lenovo ThinkPad T16 G1 21BWS00200 | |
| Cinebench R20 / CPU (Single Core) | |
| Lenovo ThinkPad X1 Extreme G5-21DE003RGE | |
| HP ZBook Power 15 G9 6B8C4EA | |
| Media della classe Office (345 - 816, n=72, ultimi 2 anni) | |
| Lenovo ThinkPad T16 G1 21CHCTO1WW | |
| HP EliteBook 865 G9 | |
| Lenovo ThinkPad Z16 G1 21D5S00T00 | |
| Lenovo ThinkPad T16 G1 21BWS00200 | |
| Lenovo ThinkPad T16 G1 21CH004MGE | |
| Media AMD Ryzen 5 PRO 6650U (548 - 578, n=4) | |
| Cinebench R15 / CPU Multi 64Bit | |
| Lenovo ThinkPad X1 Extreme G5-21DE003RGE | |
| Lenovo ThinkPad Z16 G1 21D5S00T00 | |
| HP ZBook Power 15 G9 6B8C4EA | |
| Lenovo ThinkPad T16 G1 21CHCTO1WW | |
| Media della classe Office (250 - 3380, n=74, ultimi 2 anni) | |
| Lenovo ThinkPad T16 G1 21BWS00200 | |
| Lenovo ThinkPad T16 G1 21BWS00200 | |
| HP EliteBook 865 G9 | |
| Lenovo ThinkPad T16 G1 21CH004MGE | |
| Media AMD Ryzen 5 PRO 6650U (1299 - 1555, n=4) | |
| Cinebench R15 / CPU Single 64Bit | |
| Lenovo ThinkPad X1 Extreme G5-21DE003RGE | |
| HP ZBook Power 15 G9 6B8C4EA | |
| Media della classe Office (99.5 - 312, n=74, ultimi 2 anni) | |
| Lenovo ThinkPad Z16 G1 21D5S00T00 | |
| Lenovo ThinkPad T16 G1 21CHCTO1WW | |
| Lenovo ThinkPad T16 G1 21CH004MGE | |
| HP EliteBook 865 G9 | |
| Media AMD Ryzen 5 PRO 6650U (230 - 234, n=4) | |
| Lenovo ThinkPad T16 G1 21BWS00200 | |
| Blender / v2.79 BMW27 CPU | |
| Lenovo ThinkPad T16 G1 21BWS00200 | |
| Media AMD Ryzen 5 PRO 6650U (328 - 548, n=5) | |
| Media della classe Office (158 - 1940, n=73, ultimi 2 anni) | |
| Lenovo ThinkPad T16 G1 21CH004MGE | |
| HP EliteBook 865 G9 | |
| Lenovo ThinkPad T16 G1 21CHCTO1WW | |
| Lenovo ThinkPad Z16 G1 21D5S00T00 | |
| HP ZBook Power 15 G9 6B8C4EA | |
| Lenovo ThinkPad X1 Extreme G5-21DE003RGE | |
| 7-Zip 18.03 / 7z b 4 | |
| Lenovo ThinkPad X1 Extreme G5-21DE003RGE | |
| HP ZBook Power 15 G9 6B8C4EA | |
| Lenovo ThinkPad Z16 G1 21D5S00T00 | |
| Lenovo ThinkPad T16 G1 21CHCTO1WW | |
| HP EliteBook 865 G9 | |
| Media della classe Office (7098 - 76886, n=74, ultimi 2 anni) | |
| Lenovo ThinkPad T16 G1 21CH004MGE | |
| Media AMD Ryzen 5 PRO 6650U (32613 - 41530, n=4) | |
| Lenovo ThinkPad T16 G1 21BWS00200 | |
| 7-Zip 18.03 / 7z b 4 -mmt1 | |
| Lenovo ThinkPad X1 Extreme G5-21DE003RGE | |
| HP ZBook Power 15 G9 6B8C4EA | |
| HP EliteBook 865 G9 | |
| Media della classe Office (3387 - 6469, n=74, ultimi 2 anni) | |
| Lenovo ThinkPad Z16 G1 21D5S00T00 | |
| Lenovo ThinkPad T16 G1 21CHCTO1WW | |
| Lenovo ThinkPad T16 G1 21CH004MGE | |
| Media AMD Ryzen 5 PRO 6650U (5175 - 5427, n=4) | |
| Lenovo ThinkPad T16 G1 21BWS00200 | |
| Geekbench 5.5 / Multi-Core | |
| Lenovo ThinkPad X1 Extreme G5-21DE003RGE | |
| HP ZBook Power 15 G9 6B8C4EA | |
| Media della classe Office (1483 - 16999, n=70, ultimi 2 anni) | |
| Lenovo ThinkPad Z16 G1 21D5S00T00 | |
| Lenovo ThinkPad T16 G1 21CHCTO1WW | |
| Lenovo ThinkPad T16 G1 21CH004MGE | |
| Lenovo ThinkPad T16 G1 21BWS00200 | |
| HP EliteBook 865 G9 | |
| Media AMD Ryzen 5 PRO 6650U (6171 - 7227, n=4) | |
| Geekbench 5.5 / Single-Core | |
| Lenovo ThinkPad X1 Extreme G5-21DE003RGE | |
| Media della classe Office (811 - 2148, n=70, ultimi 2 anni) | |
| HP ZBook Power 15 G9 6B8C4EA | |
| Lenovo ThinkPad T16 G1 21BWS00200 | |
| Lenovo ThinkPad T16 G1 21CH004MGE | |
| Lenovo ThinkPad Z16 G1 21D5S00T00 | |
| Lenovo ThinkPad T16 G1 21CHCTO1WW | |
| Media AMD Ryzen 5 PRO 6650U (1433 - 1487, n=4) | |
| HP EliteBook 865 G9 | |
| HWBOT x265 Benchmark v2.2 / 4k Preset | |
| Lenovo ThinkPad X1 Extreme G5-21DE003RGE | |
| HP ZBook Power 15 G9 6B8C4EA | |
| Lenovo ThinkPad Z16 G1 21D5S00T00 | |
| Lenovo ThinkPad T16 G1 21CHCTO1WW | |
| Media della classe Office (2.21 - 26, n=73, ultimi 2 anni) | |
| Lenovo ThinkPad T16 G1 21CH004MGE | |
| HP EliteBook 865 G9 | |
| Media AMD Ryzen 5 PRO 6650U (8.71 - 11.8, n=4) | |
| Lenovo ThinkPad T16 G1 21BWS00200 | |
| LibreOffice / 20 Documents To PDF | |
| Media AMD Ryzen 5 PRO 6650U (50.3 - 63.2, n=4) | |
| Media della classe Office (39.9 - 102.3, n=73, ultimi 2 anni) | |
| HP EliteBook 865 G9 | |
| Lenovo ThinkPad Z16 G1 21D5S00T00 | |
| Lenovo ThinkPad T16 G1 21CH004MGE | |
| Lenovo ThinkPad T16 G1 21BWS00200 | |
| Lenovo ThinkPad T16 G1 21CHCTO1WW | |
| HP ZBook Power 15 G9 6B8C4EA | |
| Lenovo ThinkPad X1 Extreme G5-21DE003RGE | |
| R Benchmark 2.5 / Overall mean | |
| Media AMD Ryzen 5 PRO 6650U (0.521 - 0.59, n=4) | |
| Lenovo ThinkPad T16 G1 21CHCTO1WW | |
| Lenovo ThinkPad T16 G1 21CH004MGE | |
| Media della classe Office (0.4098 - 0.888, n=73, ultimi 2 anni) | |
| Lenovo ThinkPad T16 G1 21BWS00200 | |
| HP EliteBook 865 G9 | |
| Lenovo ThinkPad Z16 G1 21D5S00T00 | |
| HP ZBook Power 15 G9 6B8C4EA | |
| Lenovo ThinkPad X1 Extreme G5-21DE003RGE | |
* ... Meglio usare valori piccoli
AIDA64: FP32 Ray-Trace | FPU Julia | CPU SHA3 | CPU Queen | FPU SinJulia | FPU Mandel | CPU AES | CPU ZLib | FP64 Ray-Trace | CPU PhotoWorxx
| Performance rating | |
| Lenovo ThinkPad X1 Extreme G5-21DE003RGE | |
| Lenovo ThinkPad Z16 G1 21D5S00T00 | |
| HP ZBook Power 15 G9 6B8C4EA | |
| Lenovo ThinkPad T16 G1 21CHCTO1WW | |
| Media della classe Office | |
| Lenovo ThinkPad T16 G1 21CH004MGE | |
| HP EliteBook 865 G9 | |
| Lenovo ThinkPad P15v G2 21A9000XGE | |
| Media AMD Ryzen 5 PRO 6650U | |
| Lenovo ThinkPad T16 G1 21BWS00200 | |
| AIDA64 / FP32 Ray-Trace | |
| Lenovo ThinkPad X1 Extreme G5-21DE003RGE | |
| Lenovo ThinkPad Z16 G1 21D5S00T00 | |
| Media della classe Office (2083 - 31245, n=79, ultimi 2 anni) | |
| HP ZBook Power 15 G9 6B8C4EA | |
| Lenovo ThinkPad T16 G1 21CHCTO1WW | |
| Lenovo ThinkPad P15v G2 21A9000XGE | |
| HP EliteBook 865 G9 | |
| Lenovo ThinkPad T16 G1 21CH004MGE | |
| Media AMD Ryzen 5 PRO 6650U (8854 - 10630, n=4) | |
| Lenovo ThinkPad T16 G1 21BWS00200 | |
| AIDA64 / FPU Julia | |
| Lenovo ThinkPad Z16 G1 21D5S00T00 | |
| Lenovo ThinkPad X1 Extreme G5-21DE003RGE | |
| Lenovo ThinkPad T16 G1 21CHCTO1WW | |
| HP EliteBook 865 G9 | |
| Lenovo ThinkPad T16 G1 21CH004MGE | |
| HP ZBook Power 15 G9 6B8C4EA | |
| Media AMD Ryzen 5 PRO 6650U (56214 - 68106, n=4) | |
| Media della classe Office (8191 - 125394, n=79, ultimi 2 anni) | |
| Lenovo ThinkPad P15v G2 21A9000XGE | |
| Lenovo ThinkPad T16 G1 21BWS00200 | |
| AIDA64 / CPU SHA3 | |
| Lenovo ThinkPad X1 Extreme G5-21DE003RGE | |
| Lenovo ThinkPad P15v G2 21A9000XGE | |
| HP ZBook Power 15 G9 6B8C4EA | |
| Lenovo ThinkPad Z16 G1 21D5S00T00 | |
| Media della classe Office (433 - 5755, n=79, ultimi 2 anni) | |
| Lenovo ThinkPad T16 G1 21CHCTO1WW | |
| HP EliteBook 865 G9 | |
| Lenovo ThinkPad T16 G1 21CH004MGE | |
| Media AMD Ryzen 5 PRO 6650U (1881 - 2326, n=4) | |
| Lenovo ThinkPad T16 G1 21BWS00200 | |
| AIDA64 / CPU Queen | |
| Lenovo ThinkPad Z16 G1 21D5S00T00 | |
| Lenovo ThinkPad X1 Extreme G5-21DE003RGE | |
| HP ZBook Power 15 G9 6B8C4EA | |
| Lenovo ThinkPad P15v G2 21A9000XGE | |
| Lenovo ThinkPad T16 G1 21CHCTO1WW | |
| HP EliteBook 865 G9 | |
| Lenovo ThinkPad T16 G1 21CH004MGE | |
| Lenovo ThinkPad T16 G1 21BWS00200 | |
| Media AMD Ryzen 5 PRO 6650U (69023 - 78797, n=4) | |
| Media della classe Office (22784 - 115197, n=67, ultimi 2 anni) | |
| AIDA64 / FPU SinJulia | |
| Lenovo ThinkPad Z16 G1 21D5S00T00 | |
| Lenovo ThinkPad T16 G1 21CHCTO1WW | |
| HP EliteBook 865 G9 | |
| Lenovo ThinkPad X1 Extreme G5-21DE003RGE | |
| Lenovo ThinkPad T16 G1 21CH004MGE | |
| Media AMD Ryzen 5 PRO 6650U (8320 - 9488, n=4) | |
| Lenovo ThinkPad P15v G2 21A9000XGE | |
| HP ZBook Power 15 G9 6B8C4EA | |
| Media della classe Office (1378 - 18321, n=79, ultimi 2 anni) | |
| Lenovo ThinkPad T16 G1 21BWS00200 | |
| AIDA64 / FPU Mandel | |
| Lenovo ThinkPad Z16 G1 21D5S00T00 | |
| Lenovo ThinkPad T16 G1 21CHCTO1WW | |
| HP EliteBook 865 G9 | |
| Lenovo ThinkPad X1 Extreme G5-21DE003RGE | |
| Lenovo ThinkPad T16 G1 21CH004MGE | |
| Media AMD Ryzen 5 PRO 6650U (30969 - 37461, n=4) | |
| HP ZBook Power 15 G9 6B8C4EA | |
| Media della classe Office (4601 - 66922, n=79, ultimi 2 anni) | |
| Lenovo ThinkPad P15v G2 21A9000XGE | |
| Lenovo ThinkPad T16 G1 21BWS00200 | |
| AIDA64 / CPU AES | |
| Lenovo ThinkPad T16 G1 21CH004MGE | |
| Lenovo ThinkPad X1 Extreme G5-21DE003RGE | |
| Lenovo ThinkPad P15v G2 21A9000XGE | |
| HP ZBook Power 15 G9 6B8C4EA | |
| Lenovo ThinkPad Z16 G1 21D5S00T00 | |
| Media AMD Ryzen 5 PRO 6650U (37259 - 93914, n=4) | |
| Media della classe Office (4854 - 155900, n=79, ultimi 2 anni) | |
| HP EliteBook 865 G9 | |
| Lenovo ThinkPad T16 G1 21CHCTO1WW | |
| Lenovo ThinkPad T16 G1 21BWS00200 | |
| AIDA64 / CPU ZLib | |
| Lenovo ThinkPad X1 Extreme G5-21DE003RGE | |
| HP ZBook Power 15 G9 6B8C4EA | |
| Lenovo ThinkPad Z16 G1 21D5S00T00 | |
| Media della classe Office (114.6 - 1366, n=79, ultimi 2 anni) | |
| Lenovo ThinkPad T16 G1 21CHCTO1WW | |
| Lenovo ThinkPad P15v G2 21A9000XGE | |
| HP EliteBook 865 G9 | |
| Lenovo ThinkPad T16 G1 21BWS00200 | |
| Lenovo ThinkPad T16 G1 21CH004MGE | |
| Media AMD Ryzen 5 PRO 6650U (504 - 602, n=4) | |
| AIDA64 / FP64 Ray-Trace | |
| Lenovo ThinkPad X1 Extreme G5-21DE003RGE | |
| Lenovo ThinkPad Z16 G1 21D5S00T00 | |
| Media della classe Office (1109 - 17834, n=79, ultimi 2 anni) | |
| HP ZBook Power 15 G9 6B8C4EA | |
| Lenovo ThinkPad P15v G2 21A9000XGE | |
| Lenovo ThinkPad T16 G1 21CHCTO1WW | |
| HP EliteBook 865 G9 | |
| Lenovo ThinkPad T16 G1 21CH004MGE | |
| Media AMD Ryzen 5 PRO 6650U (4620 - 5468, n=4) | |
| Lenovo ThinkPad T16 G1 21BWS00200 | |
| AIDA64 / CPU PhotoWorxx | |
| HP ZBook Power 15 G9 6B8C4EA | |
| Media della classe Office (11090 - 65229, n=79, ultimi 2 anni) | |
| Lenovo ThinkPad Z16 G1 21D5S00T00 | |
| Lenovo ThinkPad T16 G1 21CH004MGE | |
| Lenovo ThinkPad T16 G1 21CHCTO1WW | |
| Media AMD Ryzen 5 PRO 6650U (19643 - 26137, n=4) | |
| Lenovo ThinkPad X1 Extreme G5-21DE003RGE | |
| HP EliteBook 865 G9 | |
| Lenovo ThinkPad T16 G1 21BWS00200 | |
| Lenovo ThinkPad P15v G2 21A9000XGE | |
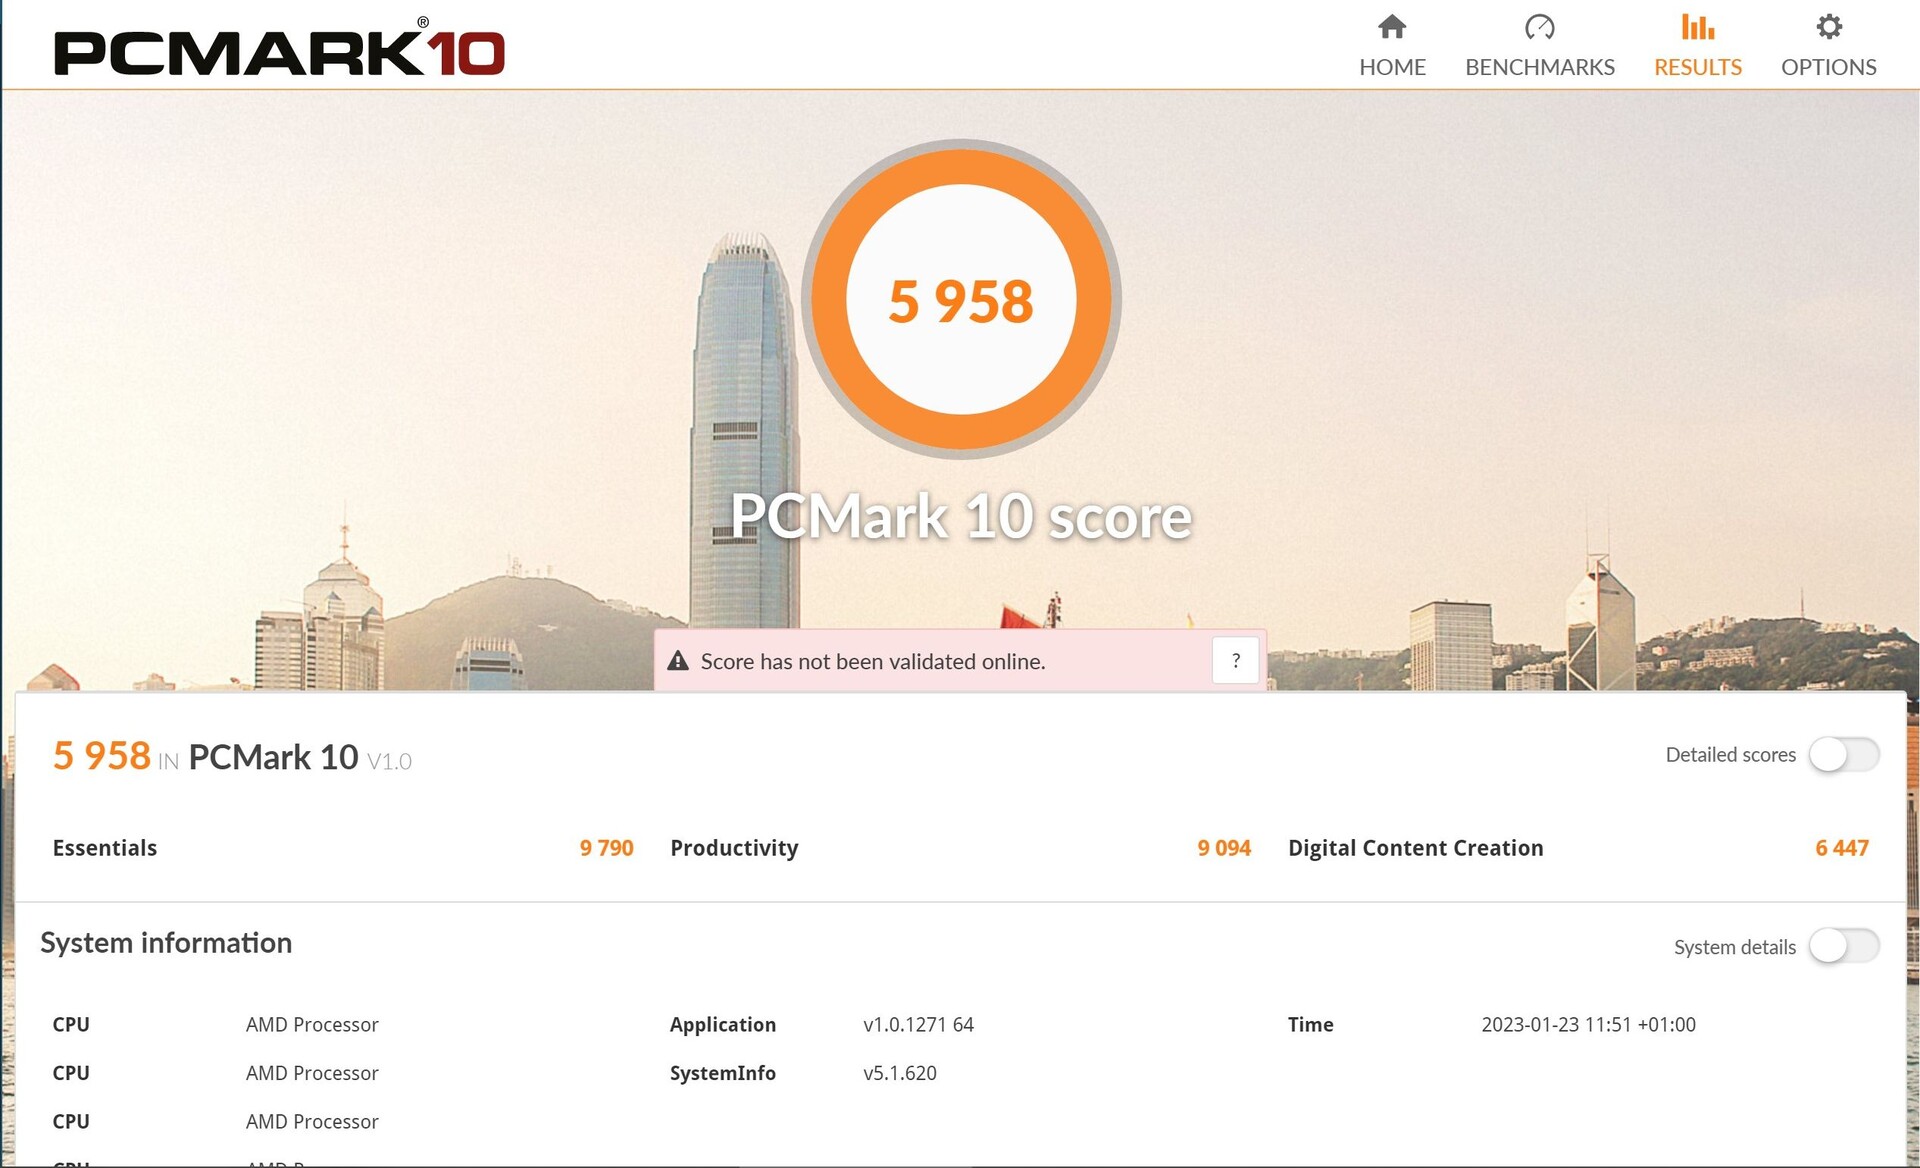
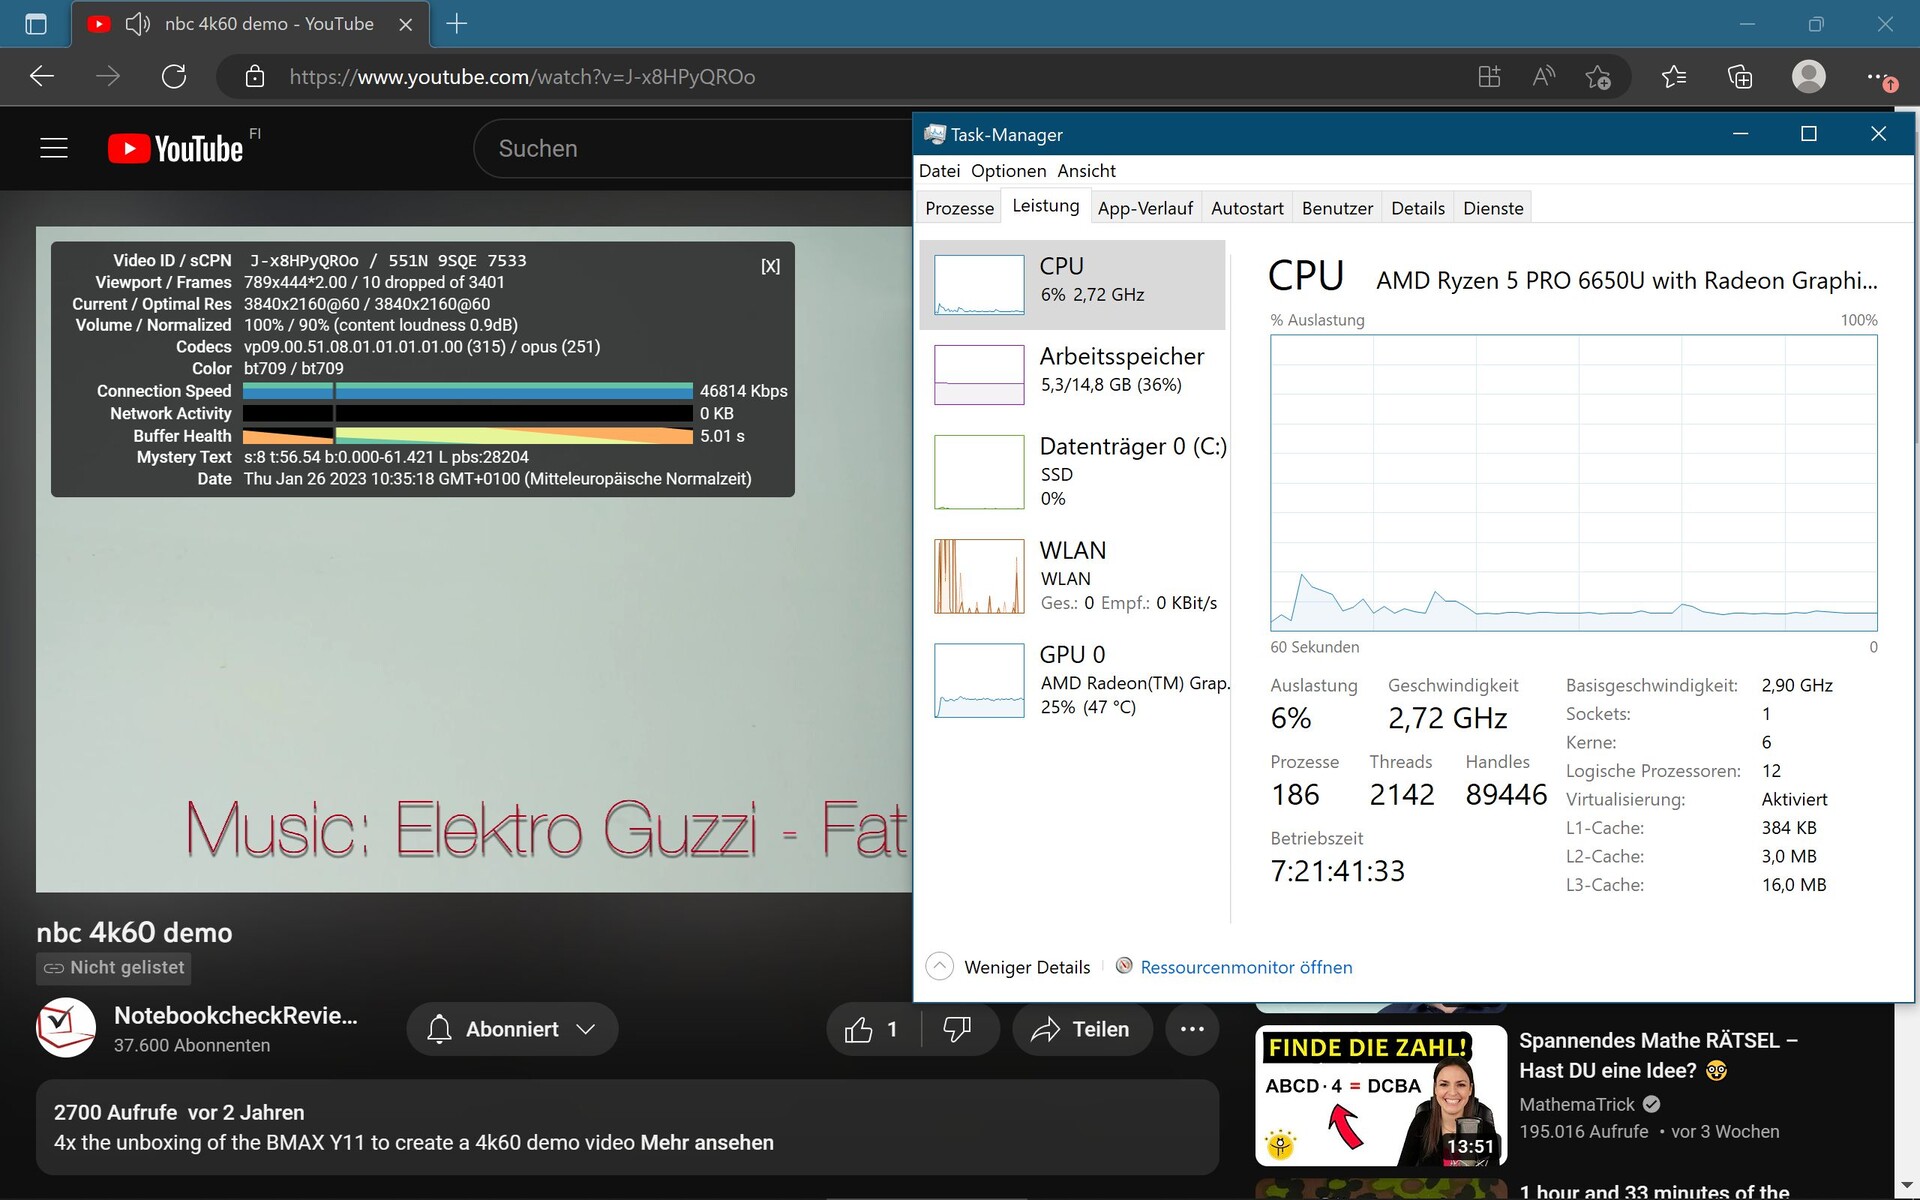
Prestazioni del sistema
La navigazione fluida sul web con diverse schede e la riproduzione simultanea di video YouTube in 4K non rappresentano assolutamente un problema per il ThinkPad T16 AMD. Tuttavia, grazie al suo Turbo più potente, il ThinkPad T16 Intel è in grado di offrire un'ottima qualità di navigazione.T16 Intelmantiene un leggero vantaggio nei benchmark dei browser come Mozilla Kraken o Octane v2. D'altra parte, la versione Intel è pesantemente strozzata dalla sua configurazione RAM a canale singolo nei benchmark PCMark e Crossmark.
CrossMark: Overall | Productivity | Creativity | Responsiveness
Mozilla Kraken 1.1: Total
Speedometer 2.0: Result 2.0
Octane V2: Total Score
Jetstream 2: 2.0 Total
WebXPRT 3: Overall
WebXPRT 4: Overall
| PCMark 10 / Score | |
| Lenovo ThinkPad X1 Extreme G5-21DE003RGE | |
| Lenovo ThinkPad Z16 G1 21D5S00T00 | |
| Media della classe Office (2601 - 9298, n=65, ultimi 2 anni) | |
| HP ZBook Power 15 G9 6B8C4EA | |
| Lenovo ThinkPad T16 G1 21CHCTO1WW | |
| Lenovo ThinkPad T16 G1 21CH004MGE | |
| Lenovo ThinkPad P15v G2 21A9000XGE | |
| HP EliteBook 865 G9 | |
| Media AMD Ryzen 5 PRO 6650U, AMD Radeon 660M (5513 - 5958, n=4) | |
| Lenovo ThinkPad T16 G1 21BWS00200 | |
| PCMark 10 / Essentials | |
| Lenovo ThinkPad X1 Extreme G5-21DE003RGE | |
| Lenovo ThinkPad T16 G1 21CHCTO1WW | |
| Lenovo ThinkPad Z16 G1 21D5S00T00 | |
| Media della classe Office (3245 - 11594, n=65, ultimi 2 anni) | |
| HP ZBook Power 15 G9 6B8C4EA | |
| Lenovo ThinkPad T16 G1 21CH004MGE | |
| Lenovo ThinkPad P15v G2 21A9000XGE | |
| Media AMD Ryzen 5 PRO 6650U, AMD Radeon 660M (9578 - 9982, n=4) | |
| Lenovo ThinkPad T16 G1 21BWS00200 | |
| HP EliteBook 865 G9 | |
| PCMark 10 / Productivity | |
| Media della classe Office (5336 - 17243, n=65, ultimi 2 anni) | |
| Lenovo ThinkPad X1 Extreme G5-21DE003RGE | |
| Lenovo ThinkPad T16 G1 21CH004MGE | |
| Lenovo ThinkPad T16 G1 21CHCTO1WW | |
| HP EliteBook 865 G9 | |
| Media AMD Ryzen 5 PRO 6650U, AMD Radeon 660M (7848 - 9094, n=4) | |
| Lenovo ThinkPad Z16 G1 21D5S00T00 | |
| Lenovo ThinkPad P15v G2 21A9000XGE | |
| HP ZBook Power 15 G9 6B8C4EA | |
| Lenovo ThinkPad T16 G1 21BWS00200 | |
| PCMark 10 / Digital Content Creation | |
| Lenovo ThinkPad X1 Extreme G5-21DE003RGE | |
| Lenovo ThinkPad Z16 G1 21D5S00T00 | |
| HP ZBook Power 15 G9 6B8C4EA | |
| Media della classe Office (2049 - 13541, n=65, ultimi 2 anni) | |
| HP EliteBook 865 G9 | |
| Lenovo ThinkPad P15v G2 21A9000XGE | |
| Lenovo ThinkPad T16 G1 21CHCTO1WW | |
| Lenovo ThinkPad T16 G1 21CH004MGE | |
| Media AMD Ryzen 5 PRO 6650U, AMD Radeon 660M (5837 - 6447, n=4) | |
| Lenovo ThinkPad T16 G1 21BWS00200 | |
| CrossMark / Overall | |
| Lenovo ThinkPad X1 Extreme G5-21DE003RGE | |
| HP ZBook Power 15 G9 6B8C4EA | |
| Media della classe Office (381 - 2010, n=72, ultimi 2 anni) | |
| Lenovo ThinkPad Z16 G1 21D5S00T00 | |
| Lenovo ThinkPad T16 G1 21CH004MGE | |
| Media AMD Ryzen 5 PRO 6650U, AMD Radeon 660M (1338 - 1432, n=3) | |
| Lenovo ThinkPad T16 G1 21BWS00200 | |
| Lenovo ThinkPad P15v G2 21A9000XGE | |
| Lenovo ThinkPad T16 G1 21CHCTO1WW | |
| HP EliteBook 865 G9 | |
| CrossMark / Productivity | |
| Lenovo ThinkPad X1 Extreme G5-21DE003RGE | |
| HP ZBook Power 15 G9 6B8C4EA | |
| Lenovo ThinkPad Z16 G1 21D5S00T00 | |
| Media della classe Office (464 - 1880, n=72, ultimi 2 anni) | |
| Lenovo ThinkPad T16 G1 21CH004MGE | |
| Media AMD Ryzen 5 PRO 6650U, AMD Radeon 660M (1366 - 1440, n=3) | |
| Lenovo ThinkPad T16 G1 21BWS00200 | |
| Lenovo ThinkPad P15v G2 21A9000XGE | |
| HP EliteBook 865 G9 | |
| Lenovo ThinkPad T16 G1 21CHCTO1WW | |
| CrossMark / Creativity | |
| HP ZBook Power 15 G9 6B8C4EA | |
| Lenovo ThinkPad X1 Extreme G5-21DE003RGE | |
| Media della classe Office (319 - 2361, n=72, ultimi 2 anni) | |
| Lenovo ThinkPad Z16 G1 21D5S00T00 | |
| Lenovo ThinkPad T16 G1 21CH004MGE | |
| Media AMD Ryzen 5 PRO 6650U, AMD Radeon 660M (1397 - 1517, n=3) | |
| Lenovo ThinkPad T16 G1 21CHCTO1WW | |
| Lenovo ThinkPad P15v G2 21A9000XGE | |
| Lenovo ThinkPad T16 G1 21BWS00200 | |
| HP EliteBook 865 G9 | |
| CrossMark / Responsiveness | |
| Lenovo ThinkPad X1 Extreme G5-21DE003RGE | |
| HP ZBook Power 15 G9 6B8C4EA | |
| Lenovo ThinkPad T16 G1 21BWS00200 | |
| Lenovo ThinkPad Z16 G1 21D5S00T00 | |
| Media della classe Office (360 - 1820, n=72, ultimi 2 anni) | |
| Lenovo ThinkPad T16 G1 21CH004MGE | |
| Media AMD Ryzen 5 PRO 6650U, AMD Radeon 660M (1106 - 1229, n=3) | |
| Lenovo ThinkPad P15v G2 21A9000XGE | |
| HP EliteBook 865 G9 | |
| Lenovo ThinkPad T16 G1 21CHCTO1WW | |
| Mozilla Kraken 1.1 / Total | |
| Lenovo ThinkPad T16 G1 21CHCTO1WW | |
| Media AMD Ryzen 5 PRO 6650U, AMD Radeon 660M (615 - 707, n=4) | |
| Lenovo ThinkPad P15v G2 21A9000XGE | |
| Lenovo ThinkPad T16 G1 21CH004MGE | |
| HP EliteBook 865 G9 | |
| Lenovo ThinkPad T16 G1 21BWS00200 | |
| Lenovo ThinkPad Z16 G1 21D5S00T00 | |
| Media della classe Office (391 - 1297, n=75, ultimi 2 anni) | |
| HP ZBook Power 15 G9 6B8C4EA | |
| Lenovo ThinkPad X1 Extreme G5-21DE003RGE | |
| Speedometer 2.0 / Result 2.0 | |
| Media della classe Office (173 - 640, n=17, ultimi 2 anni) | |
| HP ZBook Power 15 G9 6B8C4EA | |
| Lenovo ThinkPad X1 Extreme G5-21DE003RGE | |
| Lenovo ThinkPad T16 G1 21BWS00200 | |
| HP EliteBook 865 G9 | |
| Lenovo ThinkPad T16 G1 21CH004MGE | |
| Media AMD Ryzen 5 PRO 6650U, AMD Radeon 660M (n=1) | |
| Octane V2 / Total Score | |
| Media della classe Office (49011 - 126830, n=19, ultimi 2 anni) | |
| Lenovo ThinkPad X1 Extreme G5-21DE003RGE | |
| HP ZBook Power 15 G9 6B8C4EA | |
| Lenovo ThinkPad T16 G1 21BWS00200 | |
| Lenovo ThinkPad T16 G1 21CH004MGE | |
| Media AMD Ryzen 5 PRO 6650U, AMD Radeon 660M (n=1) | |
| HP EliteBook 865 G9 | |
| Jetstream 2 / 2.0 Total | |
| Media della classe Office (126.6 - 483, n=20, ultimi 2 anni) | |
| HP ZBook Power 15 G9 6B8C4EA | |
| Lenovo ThinkPad T16 G1 21BWS00200 | |
| Lenovo ThinkPad X1 Extreme G5-21DE003RGE | |
| Media AMD Ryzen 5 PRO 6650U, AMD Radeon 660M (n=1) | |
| Lenovo ThinkPad T16 G1 21CH004MGE | |
| HP EliteBook 865 G9 | |
| WebXPRT 3 / Overall | |
| HP ZBook Power 15 G9 6B8C4EA | |
| Media della classe Office (129.9 - 444, n=74, ultimi 2 anni) | |
| Lenovo ThinkPad X1 Extreme G5-21DE003RGE | |
| HP EliteBook 865 G9 | |
| Lenovo ThinkPad T16 G1 21BWS00200 | |
| Lenovo ThinkPad P15v G2 21A9000XGE | |
| Lenovo ThinkPad Z16 G1 21D5S00T00 | |
| Lenovo ThinkPad T16 G1 21CH004MGE | |
| Media AMD Ryzen 5 PRO 6650U, AMD Radeon 660M (225 - 242, n=4) | |
| Lenovo ThinkPad T16 G1 21CHCTO1WW | |
| WebXPRT 4 / Overall | |
| HP ZBook Power 15 G9 6B8C4EA | |
| Media della classe Office (104.2 - 313, n=74, ultimi 2 anni) | |
| Lenovo ThinkPad X1 Extreme G5-21DE003RGE | |
| Lenovo ThinkPad T16 G1 21BWS00200 | |
| HP EliteBook 865 G9 | |
| Lenovo ThinkPad T16 G1 21CH004MGE | |
| Lenovo ThinkPad Z16 G1 21D5S00T00 | |
| Media AMD Ryzen 5 PRO 6650U, AMD Radeon 660M (176.4 - 206, n=4) | |
| Lenovo ThinkPad T16 G1 21CHCTO1WW | |
* ... Meglio usare valori piccoli
| PCMark 10 Score | 5958 punti | |
Aiuto | ||
| AIDA64 / Memory Copy | |
| Media della classe Office (20075 - 110930, n=76, ultimi 2 anni) | |
| HP ZBook Power 15 G9 6B8C4EA | |
| Lenovo ThinkPad Z16 G1 21D5S00T00 | |
| Lenovo ThinkPad T16 G1 21CHCTO1WW | |
| Lenovo ThinkPad T16 G1 21CH004MGE | |
| Media AMD Ryzen 5 PRO 6650U (31014 - 48558, n=4) | |
| Lenovo ThinkPad X1 Extreme G5-21DE003RGE | |
| HP EliteBook 865 G9 | |
| Lenovo ThinkPad P15v G2 21A9000XGE | |
| Lenovo ThinkPad T16 G1 21BWS00200 | |
| AIDA64 / Memory Read | |
| HP ZBook Power 15 G9 6B8C4EA | |
| Media della classe Office (10084 - 128030, n=77, ultimi 2 anni) | |
| Lenovo ThinkPad Z16 G1 21D5S00T00 | |
| Lenovo ThinkPad T16 G1 21CHCTO1WW | |
| Lenovo ThinkPad T16 G1 21CH004MGE | |
| Media AMD Ryzen 5 PRO 6650U (34690 - 39833, n=4) | |
| Lenovo ThinkPad X1 Extreme G5-21DE003RGE | |
| HP EliteBook 865 G9 | |
| Lenovo ThinkPad P15v G2 21A9000XGE | |
| Lenovo ThinkPad T16 G1 21BWS00200 | |
| AIDA64 / Memory Write | |
| Media della classe Office (20073 - 119858, n=77, ultimi 2 anni) | |
| HP ZBook Power 15 G9 6B8C4EA | |
| Lenovo ThinkPad Z16 G1 21D5S00T00 | |
| Lenovo ThinkPad T16 G1 21CH004MGE | |
| Lenovo ThinkPad T16 G1 21CHCTO1WW | |
| Media AMD Ryzen 5 PRO 6650U (34563 - 51117, n=4) | |
| HP EliteBook 865 G9 | |
| Lenovo ThinkPad X1 Extreme G5-21DE003RGE | |
| Lenovo ThinkPad T16 G1 21BWS00200 | |
| Lenovo ThinkPad P15v G2 21A9000XGE | |
| AIDA64 / Memory Latency | |
| Lenovo ThinkPad T16 G1 21CHCTO1WW | |
| Lenovo ThinkPad Z16 G1 21D5S00T00 | |
| Lenovo ThinkPad T16 G1 21CH004MGE | |
| Media AMD Ryzen 5 PRO 6650U (91.6 - 126.5, n=4) | |
| Media della classe Office (7.6 - 162.9, n=72, ultimi 2 anni) | |
| Lenovo ThinkPad P15v G2 21A9000XGE | |
| Lenovo ThinkPad T16 G1 21BWS00200 | |
| HP EliteBook 865 G9 | |
| HP ZBook Power 15 G9 6B8C4EA | |
| Lenovo ThinkPad X1 Extreme G5-21DE003RGE | |
* ... Meglio usare valori piccoli
Latenze DPC
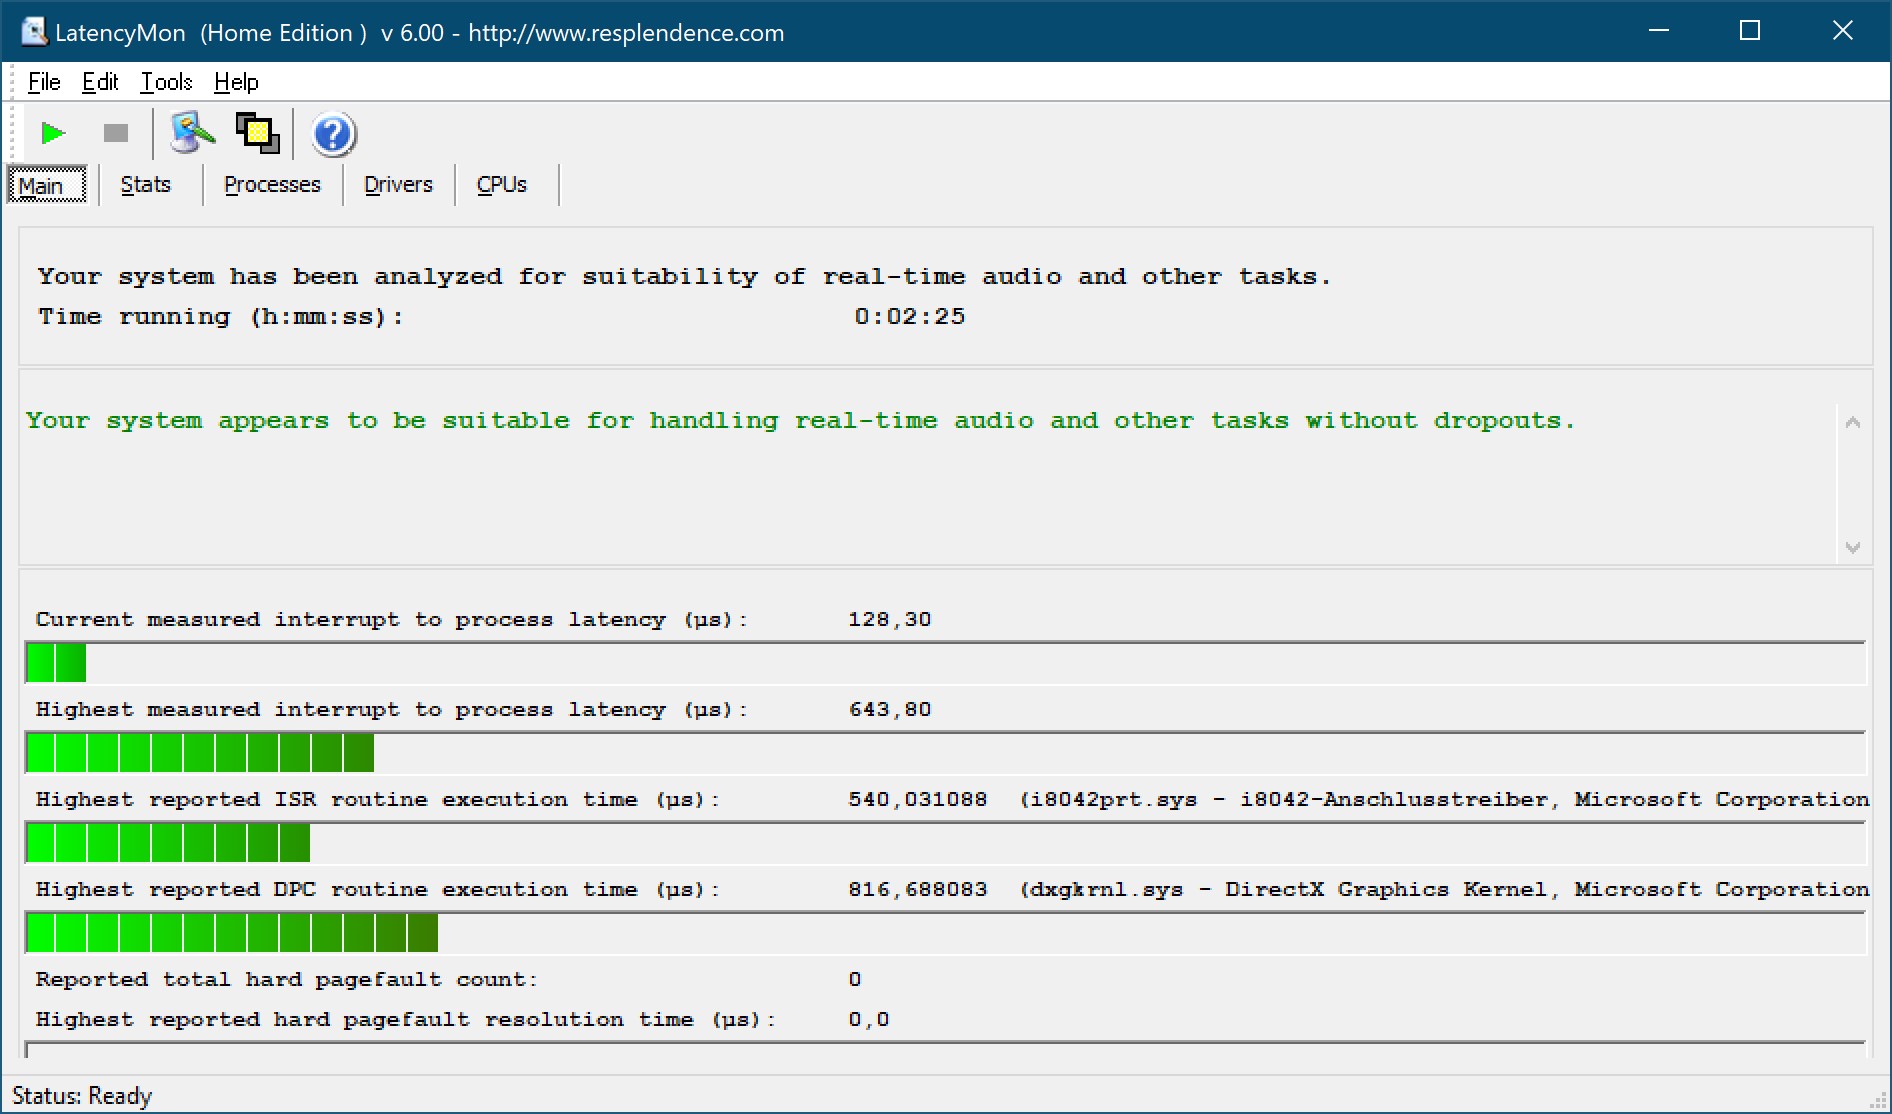
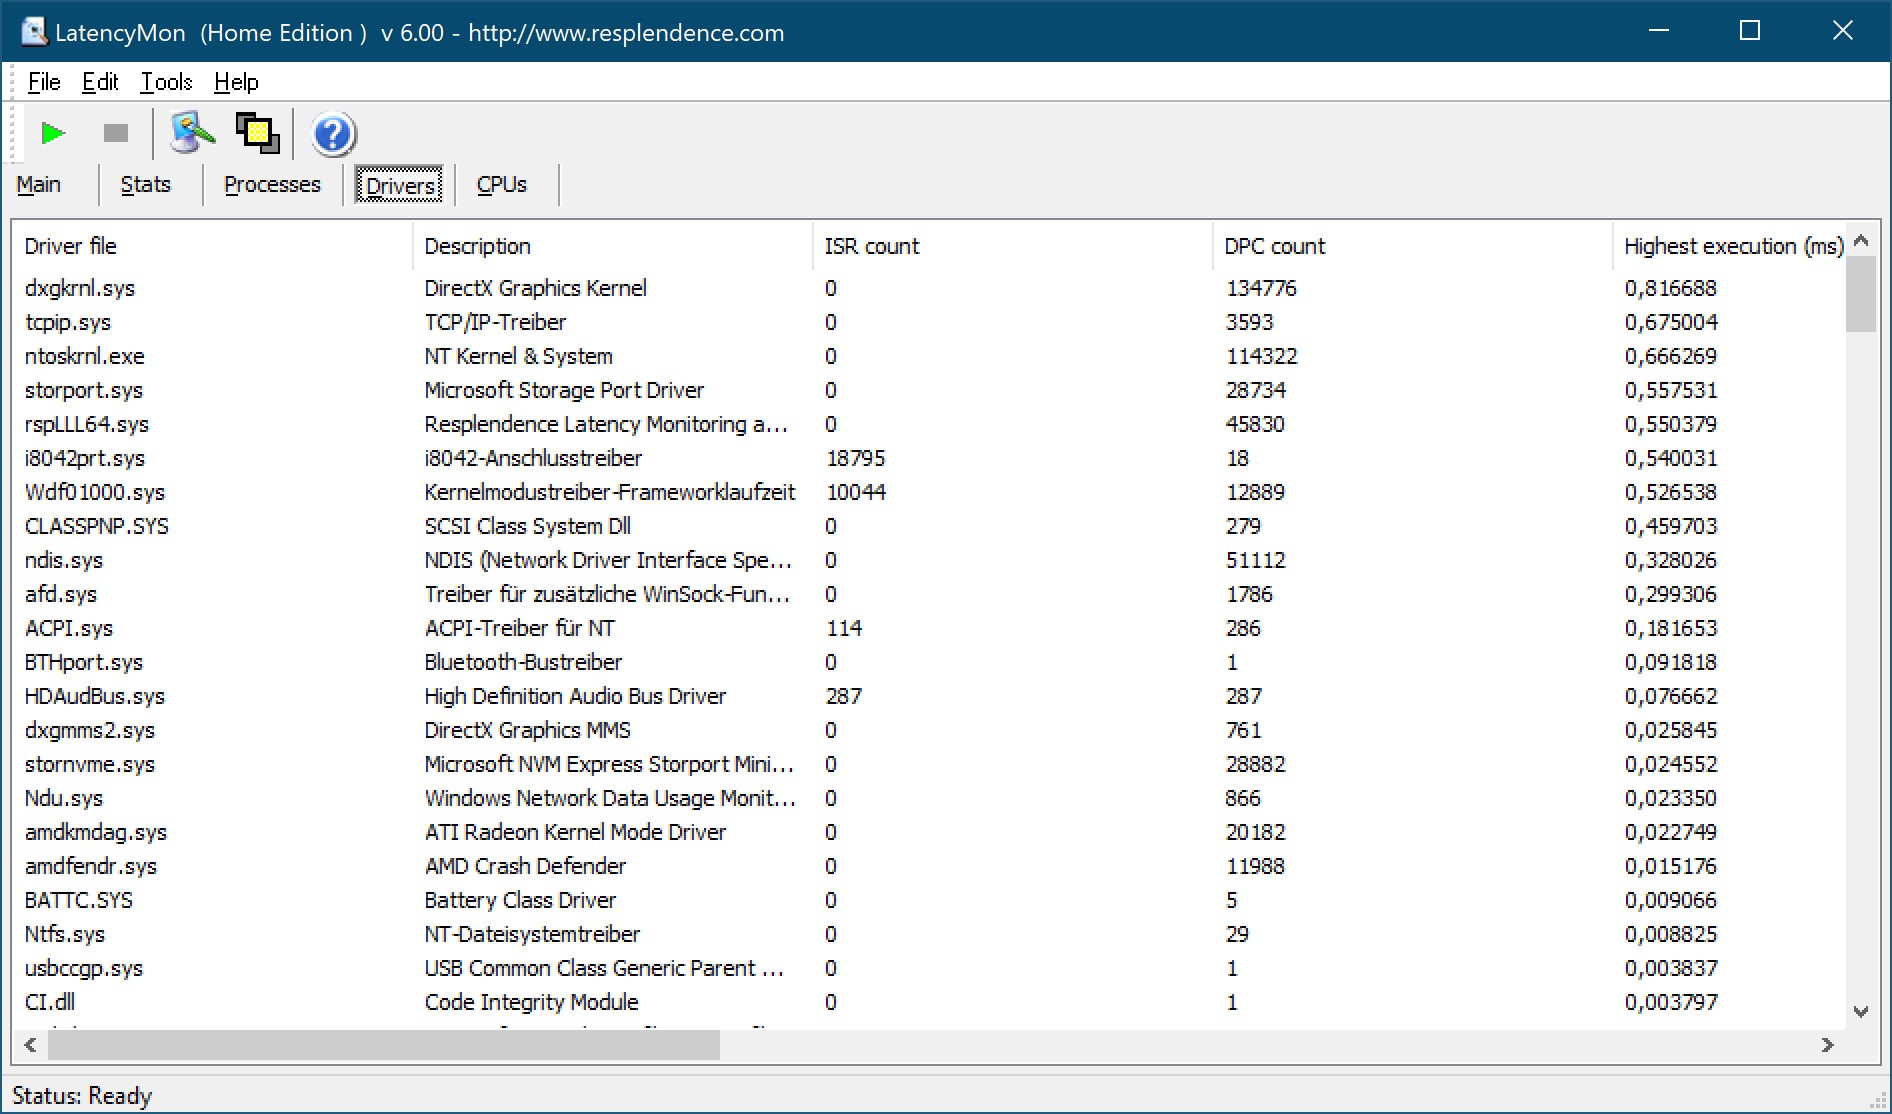
| DPC Latencies / LatencyMon - interrupt to process latency (max), Web, Youtube, Prime95 | |
| Lenovo ThinkPad T16 G1 21BWS00200 | |
| Lenovo ThinkPad X1 Extreme G5-21DE003RGE | |
| HP ZBook Power 15 G9 6B8C4EA | |
| Lenovo ThinkPad T16 G1 21CH004MGE | |
| Lenovo ThinkPad Z16 G1 21D5S00T00 | |
| HP EliteBook 865 G9 | |
* ... Meglio usare valori piccoli
Soluzione di stoccaggio
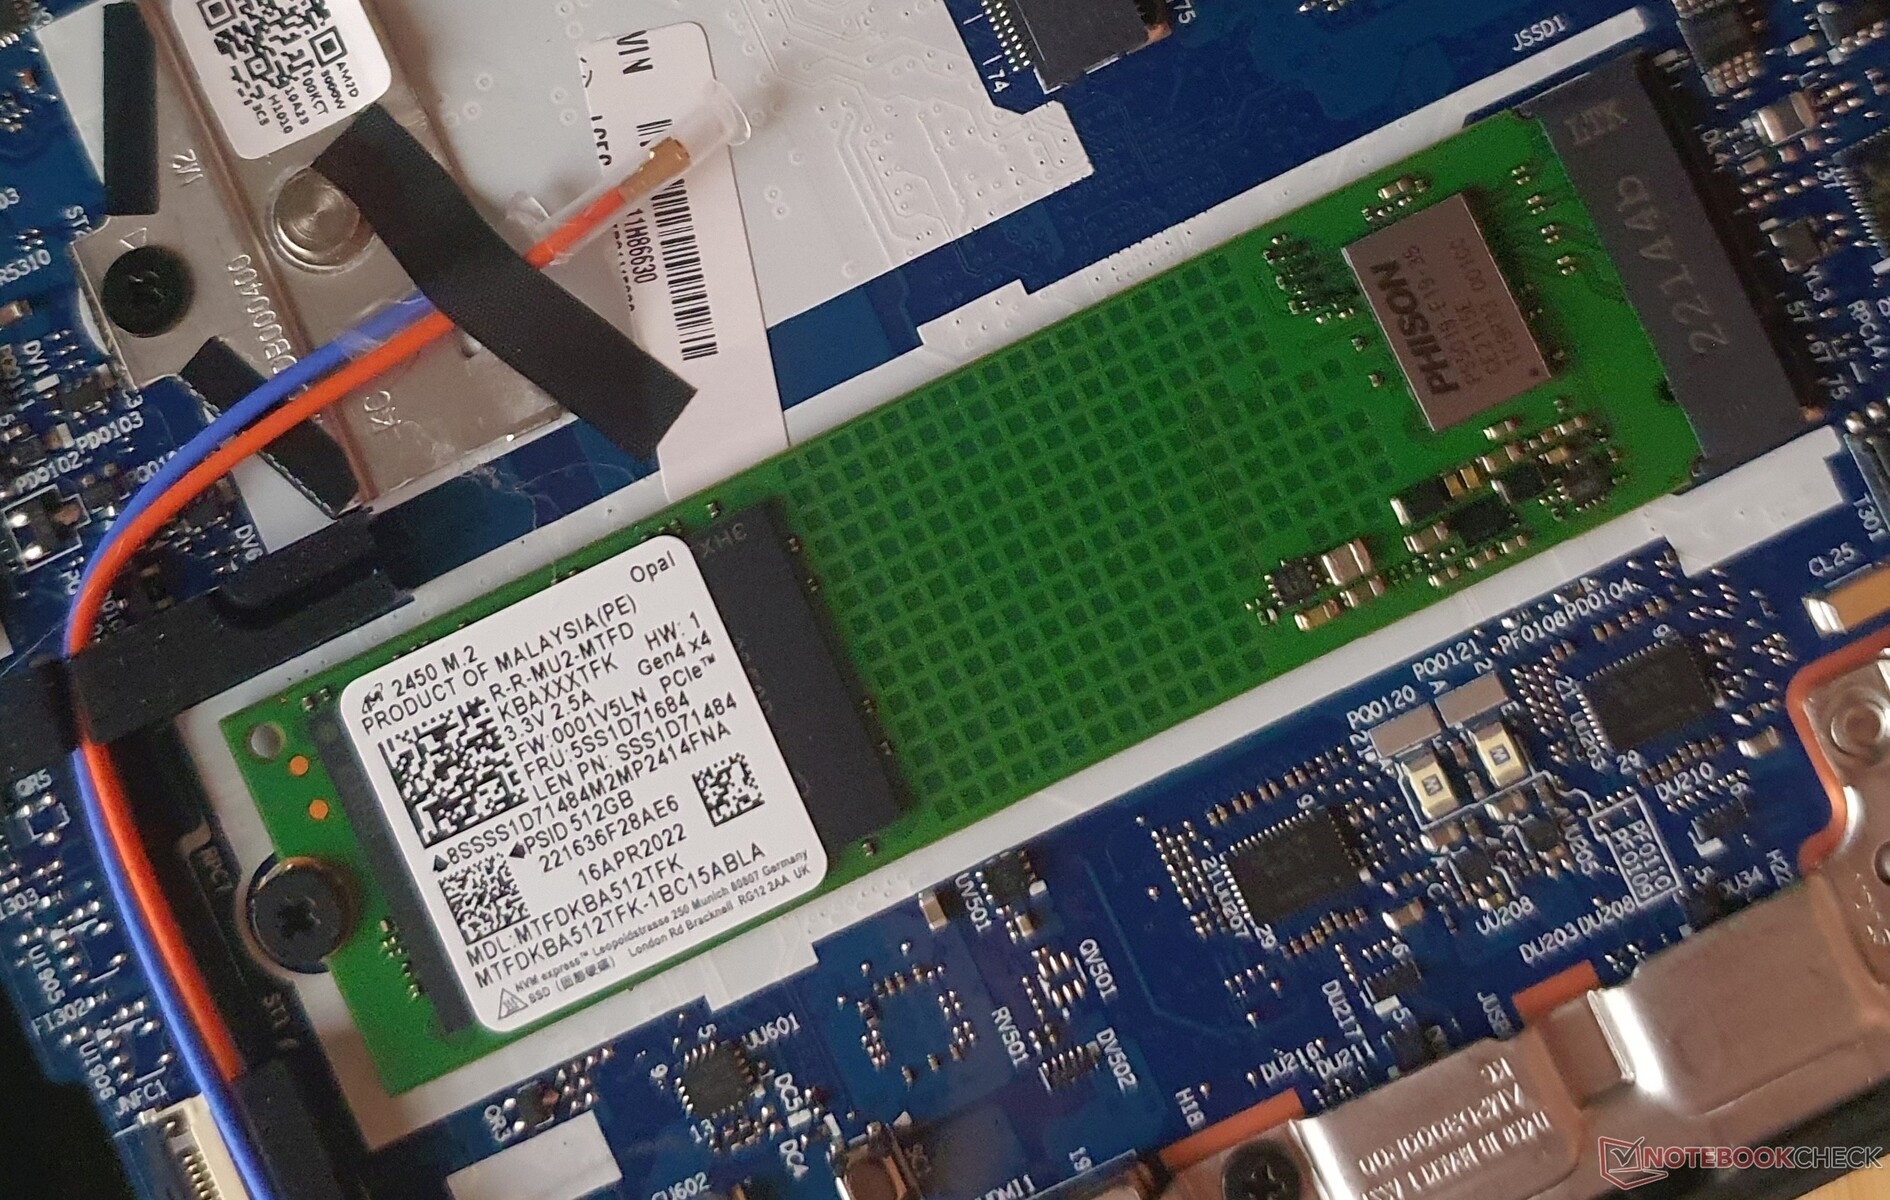
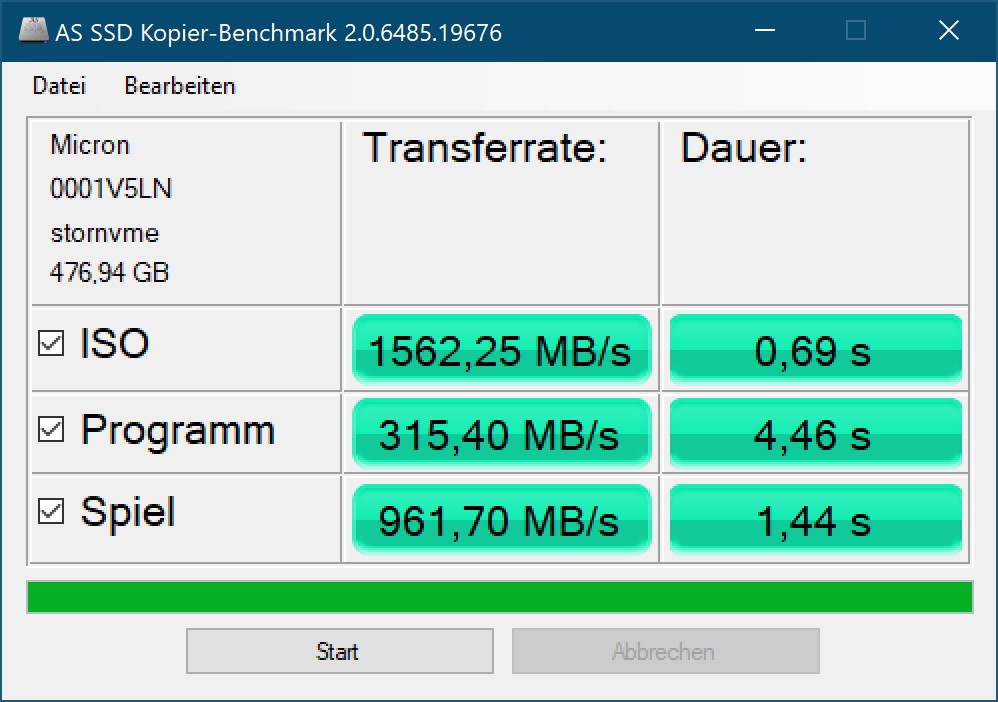
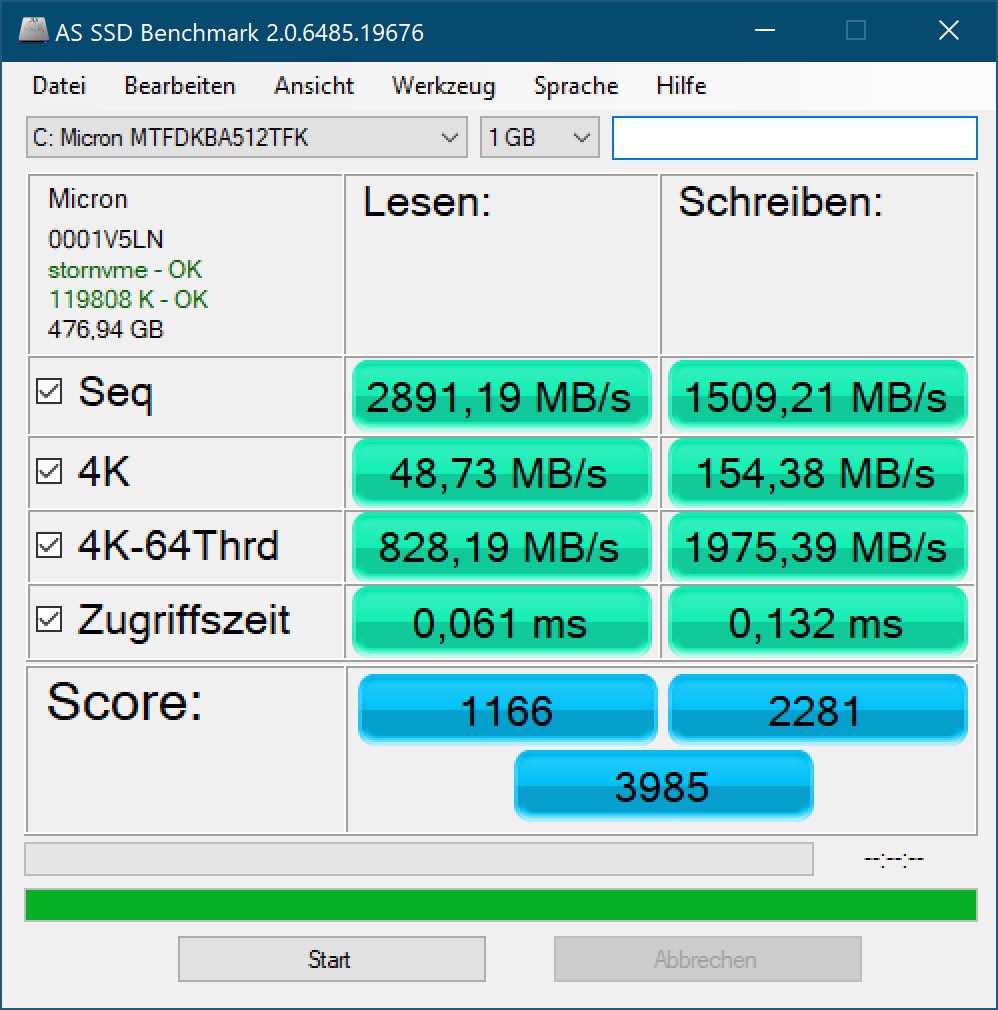
Il modello da 512 GB Micron 2450 L'unità SSD PCIe 4.0 da 512 GB legge e scrive i dati a velocità più simili a quelle dello standard PCIe 3.0. L'unitàSamsung PM9A1 nel modelloModello Intel del T16legge più velocemente, ma scende a un livello simile a quello dell'SSD Micron nel nostro test di lettura costante.
| Lenovo ThinkPad T16 G1 21CH004MGE Micron 2450 512GB MTFDKBA512TFK | Lenovo ThinkPad T16 G1 21BWS00200 Samsung PM9A1 MZVL2512HCJQ | Lenovo ThinkPad T16 G1 21CHCTO1WW Micron 2450 512GB MTFDKBA512TFK | HP EliteBook 865 G9 Samsung PM991 MZVLQ512HBLU | Lenovo ThinkPad Z16 G1 21D5S00T00 Samsung PM9A1 MZVL21T0HCLR | Lenovo ThinkPad X1 Extreme G5-21DE003RGE Micron 3400 1TB MTFDKBA1T0TFH | Lenovo ThinkPad P15v G2 21A9000XGE Toshiba XG6 KXG6AZNV512G | HP ZBook Power 15 G9 6B8C4EA Samsung PM9A1 MZVL21T0HCLR | |
|---|---|---|---|---|---|---|---|---|
| AS SSD | 16% | 20% | 2% | 32% | 38% | -8% | 50% | |
| Seq Read (MB/s) | 2891 | 3225 12% | 3107 7% | 2485 -14% | 4572.06 58% | 4766 65% | 2684 -7% | 5081 76% |
| Seq Write (MB/s) | 1509 | 1567 4% | 2965 96% | 1119 -26% | 2339.86 55% | 2159 43% | 1352 -10% | 1785 18% |
| 4K Read (MB/s) | 48.73 | 69.7 43% | 70 44% | 43.99 -10% | 63.1 29% | 44.61 -8% | 43.68 -10% | 76.86 58% |
| 4K Write (MB/s) | 154.38 | 170.9 11% | 166 8% | 117.89 -24% | 138.07 -11% | 141.69 -8% | 105.56 -32% | 197.01 28% |
| 4K-64 Read (MB/s) | 828 | 720 -13% | 1339 62% | 760.82 -8% | 863.66 4% | 877.37 6% | 976.92 18% | 912.6 10% |
| 4K-64 Write (MB/s) | 1975 | 2682 36% | 2101 6% | 1041.52 -47% | 2682.07 36% | 2594.6 31% | 1452.09 -26% | 3010.2 52% |
| Access Time Read * (ms) | 0.061 | 0.059 3% | 0.024 61% | 0.049 20% | 0.045 26% | 0.03 51% | 0.124 -103% | 0.02 67% |
| Access Time Write * (ms) | 0.132 | 0.024 82% | 0.171 -30% | 0.033 75% | 0.028 79% | 0.025 81% | 0.038 71% | 0.02 85% |
| Score Read (Points) | 1166 | 1112 -5% | 1719 47% | 1053 -10% | 1384 19% | 1399 20% | 1289 11% | 1498 28% |
| Score Write (Points) | 2281 | 3010 32% | 2563 12% | 1271 -44% | 3054 34% | 2952 29% | 1693 -26% | 3386 48% |
| Score Total (Points) | 3985 | 4630 16% | 5170 30% | 2805 -30% | 5050 27% | 4942 24% | 3582 -10% | 5506 38% |
| Copy ISO MB/s (MB/s) | 1562 | 1639 5% | 651 -58% | 1450.27 -7% | 2156.8 38% | 3591.64 130% | 1760.5 13% | 3596.51 130% |
| Copy Program MB/s (MB/s) | 315 | 326.8 4% | 408 30% | 681.41 116% | 426.1 35% | 422.46 34% | 355 13% | 418.84 33% |
| Copy Game MB/s (MB/s) | 962 | 942.7 -2% | 596 -38% | 1251.03 30% | 1157.07 20% | 1239.49 29% | 849 -12% | 1249.83 30% |
| DiskSpd | 22% | 57% | -24% | 32% | 21% | -13% | 37% | |
| seq read (MB/s) | 2012 | 3645 81% | 2309 15% | 1772 -12% | 3695 84% | 3210 60% | 2260 12% | 3945 96% |
| seq write (MB/s) | 2458 | 2809 14% | 3301 34% | 1535 -38% | 3294 34% | 2889 18% | 1837 -25% | 3039 24% |
| seq q8 t1 read (MB/s) | 3507 | 6524 86% | 3589 2% | 2741 -22% | 6628 89% | 6553 87% | 3290 -6% | 6481 85% |
| seq q8 t1 write (MB/s) | 3339 | 4812 44% | 3351 0% | 1606 -52% | 4957 48% | 4703 41% | 2902 -13% | 4914 47% |
| 4k q1 t1 read (MB/s) | 52.1 | 68.2 31% | 58.5 12% | 44.5 -15% | 65.4 26% | 48.7 -7% | 44.3 -15% | 78 50% |
| 4k q1 t1 write (MB/s) | 169.6 | 134.8 -21% | 66.6 -61% | 118 -30% | 134.8 -21% | 148.8 -12% | 113.3 -33% | 162.3 -4% |
| 4k q32 t16 read (MB/s) | 1066 | 683 -36% | 1445 36% | 814 -24% | 898 -16% | 883 -17% | 890 -17% | 866 -19% |
| 4k q32 t16 write (MB/s) | 365 | 293 -20% | 1877 414% | 361 -1% | 399 9% | 370 1% | 332 -9% | 426 17% |
| Media totale (Programma / Settaggio) | 19% /
19% | 39% /
33% | -11% /
-8% | 32% /
32% | 30% /
32% | -11% /
-10% | 44% /
45% |
* ... Meglio usare valori piccoli
* ... Meglio usare valori piccoli
Disk Throttling: DiskSpd Read Loop, Queue Depth 8
Scheda grafica
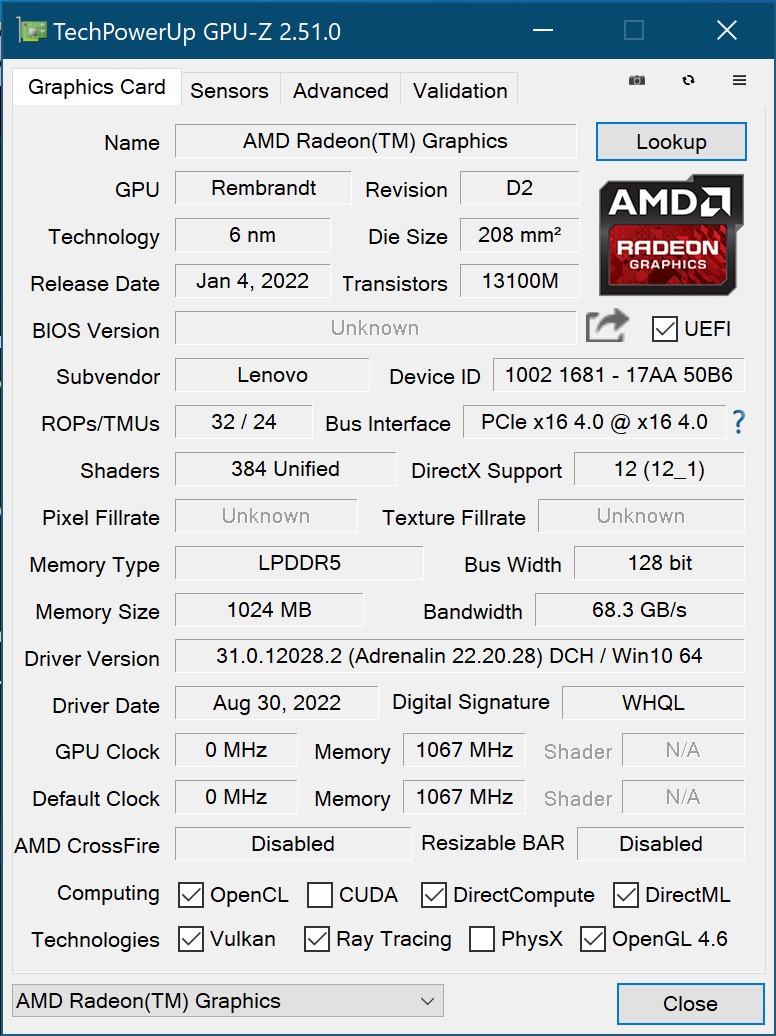

La AMD Radeon 660Mdel Ryzen 5 PRO qui utilizzato è la più debole delle due soluzioni grafiche integrate del ThinkPad T16 AMD. Mentre i giochi più vecchi possono essere giocati con impostazioni di dettaglio medio-alte, quelli nuovi sono al massimo appena giocabili con impostazioni basse, dato che il T16 non è stato progettato per i giochi.
Durante i giochi, unIntel Xe7 (96EU)rimane indietro di circa il 20%, mentre la Radeon 680Mcalcola circa il 45% più velocemente. Nel funzionamento a batteria, sono disponibili tutte le prestazioni grafiche.

| 3DMark 11 Performance | 7403 punti | |
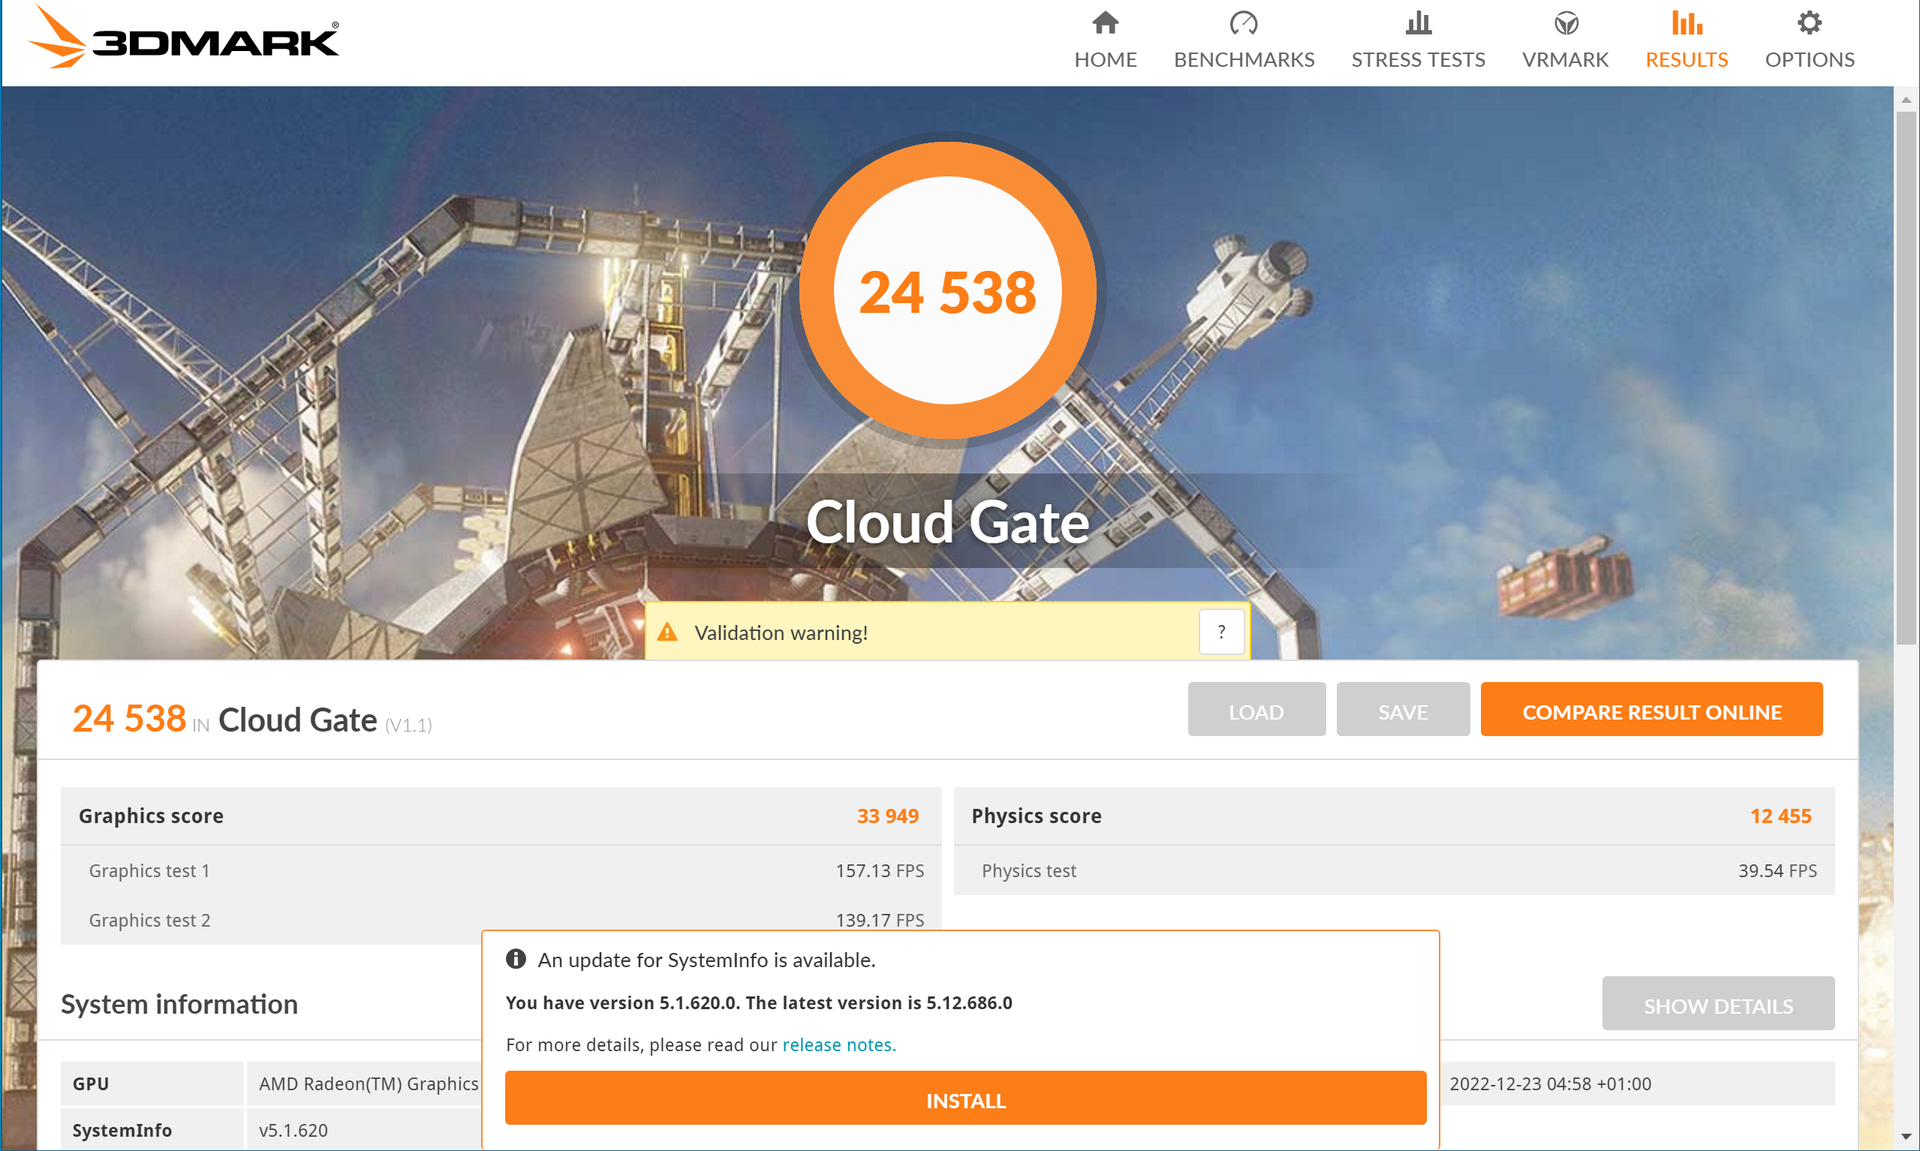
| 3DMark Cloud Gate Standard Score | 24538 punti | |
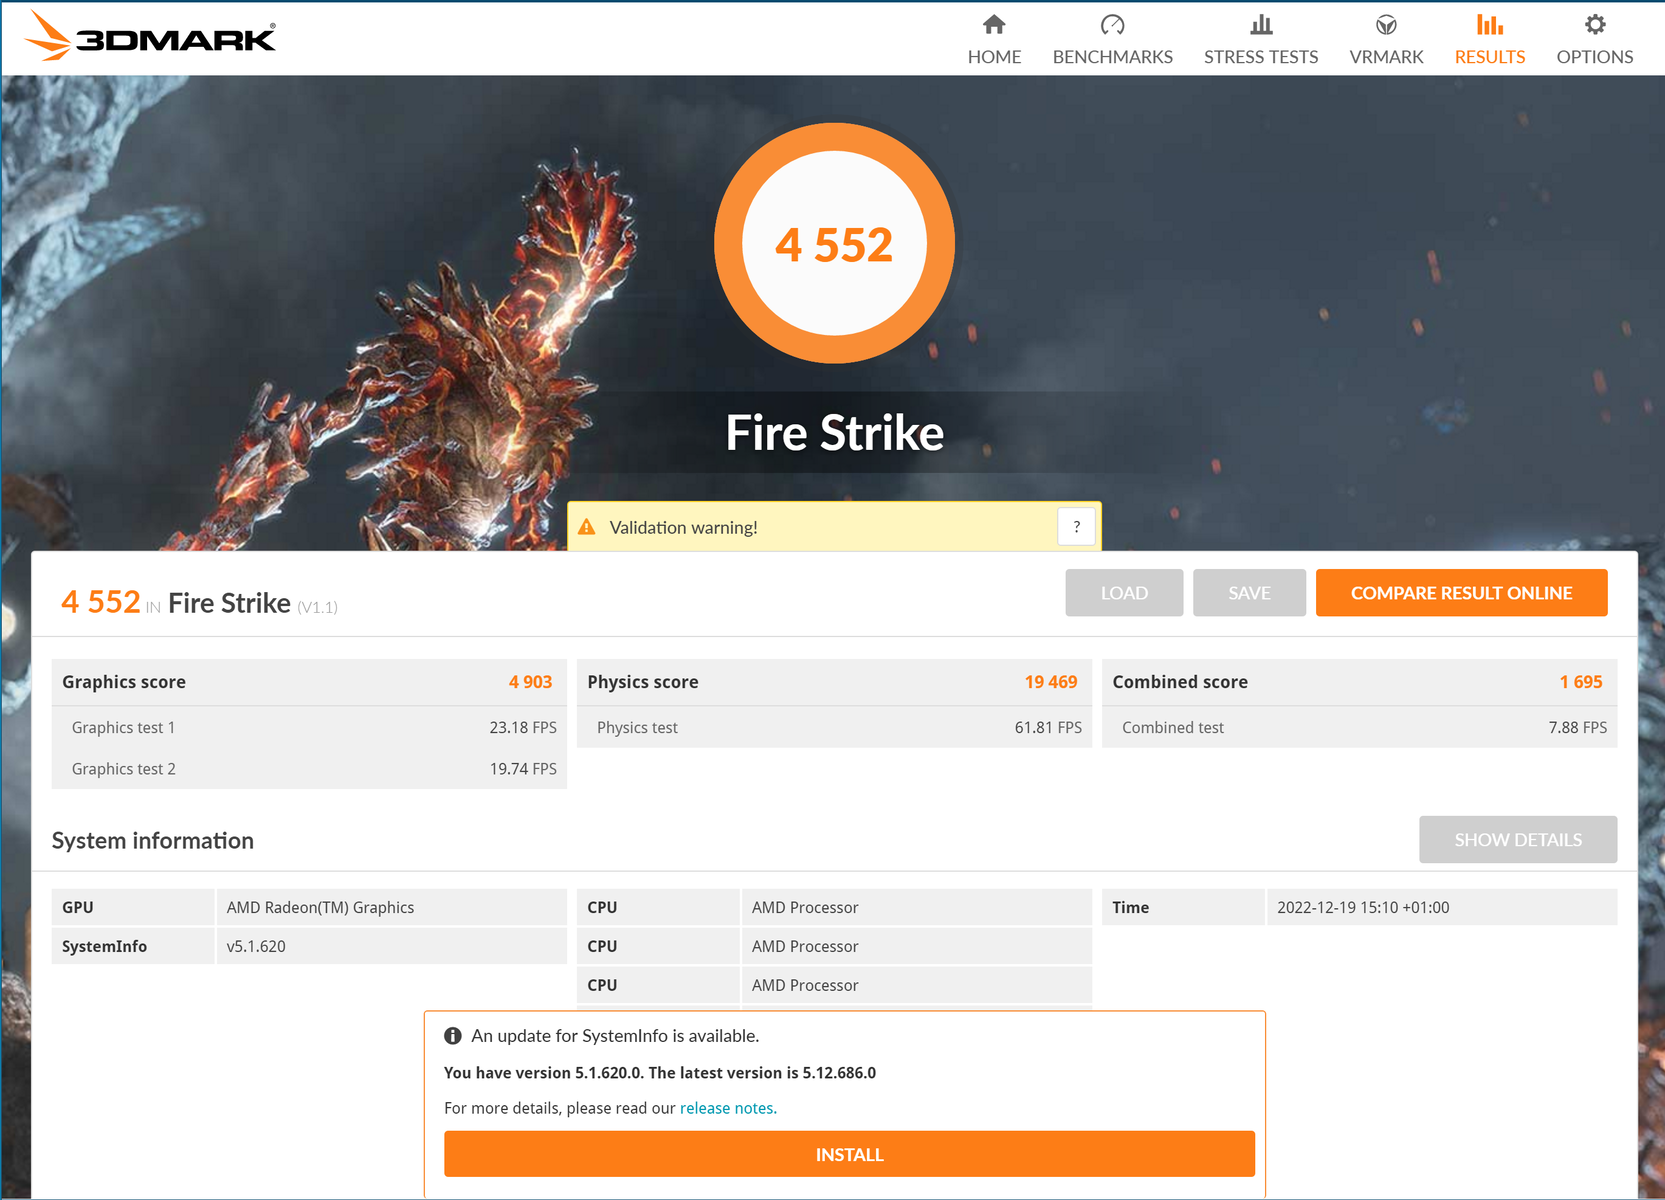
| 3DMark Fire Strike Score | 4552 punti | |
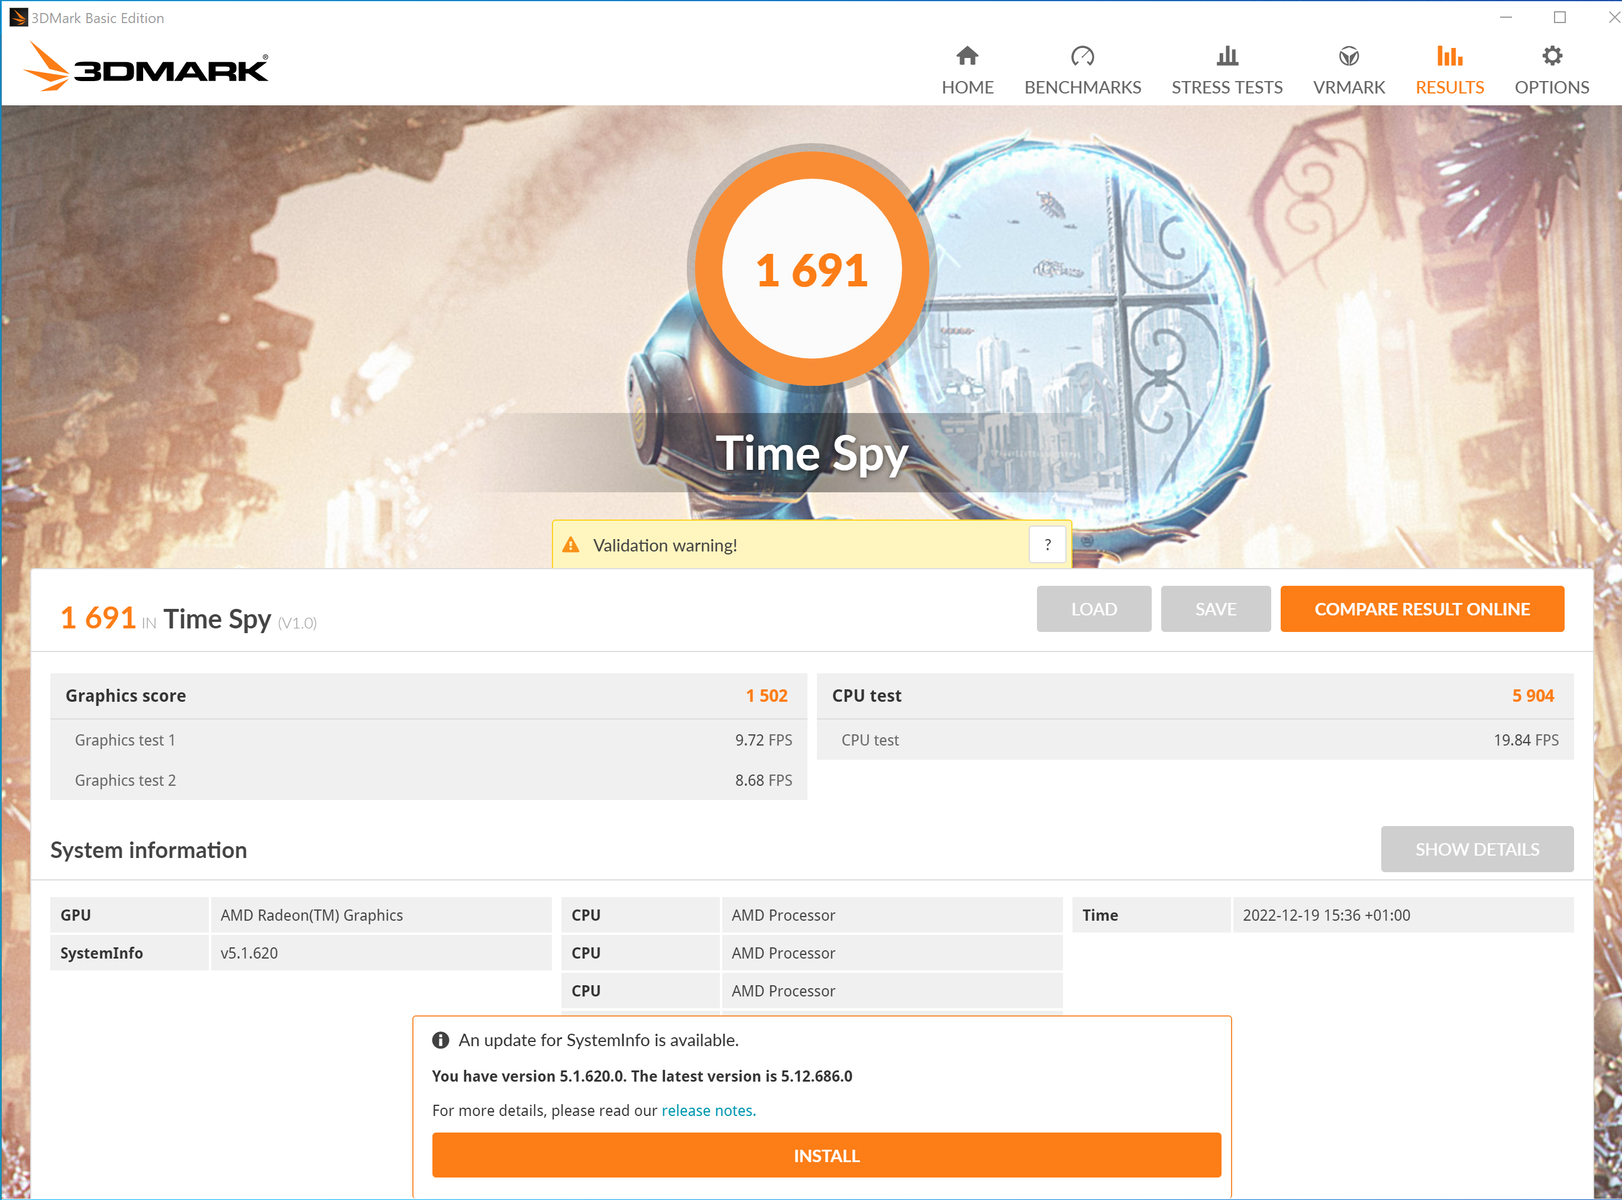
| 3DMark Time Spy Score | 1691 punti | |
Aiuto | ||
| Blender | |
| v3.3 Classroom HIP/AMD | |
| Lenovo ThinkPad T16 G1 21CH004MGE | |
| HP EliteBook 865 G9 | |
| Media AMD Radeon 660M (438 - 755, n=8) | |
| Lenovo ThinkPad T16 G1 21CHCTO1WW | |
| Media della classe Office (296 - 507, n=5, ultimi 2 anni) | |
| Lenovo ThinkPad T14 G3-21CF004NGE | |
| Lenovo ThinkPad Z16 G1 21D5S00T00 | |
| v3.3 Classroom OPTIX/RTX | |
| Media della classe Office (29 - 242, n=2, ultimi 2 anni) | |
| HP ZBook Power 15 G9 6B8C4EA | |
| v3.3 Classroom CPU | |
| Lenovo ThinkPad T16 G1 21BWS00200 | |
| Lenovo ThinkPad T16 Gen 1 Core i7-1270P | |
| Media AMD Radeon 660M (323 - 968, n=13) | |
| Media della classe Office (245 - 3219, n=72, ultimi 2 anni) | |
| Lenovo ThinkPad T16 G1 21CH004MGE | |
| Lenovo ThinkPad Z16 G1 21D5S00T00 | |
| Lenovo ThinkPad T14 G3-21CF004NGE | |
| HP EliteBook 865 G9 | |
| Lenovo ThinkPad T16 G1 21CHCTO1WW | |
| HP ZBook Power 15 G9 6B8C4EA | |
* ... Meglio usare valori piccoli
The Witcher 3 FPS Chart
| basso | medio | alto | ultra | |
|---|---|---|---|---|
| GTA V (2015) | 132.5 | 120 | 40.7 | 18 |
| The Witcher 3 (2015) | 90.5 | 52.5 | 27.1 | 17.9 |
| Dota 2 Reborn (2015) | 109.3 | 99.3 | 61 | 52.9 |
| Final Fantasy XV Benchmark (2018) | 51.6 | 24.3 | 17.4 | |
| X-Plane 11.11 (2018) | 49.1 | 33.7 | 29.3 | |
| Far Cry 5 (2018) | 61 | 31 | 26 | 25 |
| Strange Brigade (2018) | 120.7 | 44.5 | 35.3 | 29.7 |
| Shadow of the Tomb Raider (2018) | 77 | 29 | 27 | 23 |
| God of War (2022) | 23.9 | 18.9 | 16.1 | 10.8 |
Emissioni: Per la maggior parte del tempo il ThinkPad T16 AMD rimane silenzioso
Livelli di rumore
Durante il funzionamento al minimo e durante l'esecuzione di attività semplici come la navigazione web, l'avvio di applicazioni e il lavoro d'ufficio, la ventola rimane per lo più spenta o appena udibile. Solo in caso di carico costante o combinato (giochi), la ventola aumenta di giri dopo alcuni minuti. Sebbene non sia più silenziosa, con un massimo di 39 dB(A), produce una frequenza sonora bassa e confortevole.
D'altra parte, la nostra seconda unità di test ThinkPad T16 AMD ha una ventola ad altissima frequenza, che è anche menzionata da altri utenti del T16/T14 e del P16/P14s.
Rumorosità
| Idle |
| 23.1 / 23.1 / 23.1 dB(A) |
| Sotto carico |
| 25.4 / 39.1 dB(A) |
 | ||
30 dB silenzioso 40 dB(A) udibile 50 dB(A) rumoroso |
||
min: | ||
| Lenovo ThinkPad T16 G1 21CH004MGE Radeon 660M, R5 PRO 6650U, Micron 2450 512GB MTFDKBA512TFK | Lenovo ThinkPad T16 G1 21BWS00200 Iris Xe G7 80EUs, i5-1240P, Samsung PM9A1 MZVL2512HCJQ | HP EliteBook 865 G9 Radeon 680M, R7 PRO 6850U, Samsung PM991 MZVLQ512HBLU | Lenovo ThinkPad Z16 G1 21D5S00T00 Radeon RX 6500M, R7 PRO 6850H, Samsung PM9A1 MZVL21T0HCLR | Lenovo ThinkPad T14 G3-21CF004NGE Radeon 680M, R7 PRO 6850U, Kioxia BG5 KBG5AZNV512G | Lenovo ThinkPad P15v G2 21A9000XGE T1200 Laptop GPU, i7-11800H, Toshiba XG6 KXG6AZNV512G | HP ZBook Power 15 G9 6B8C4EA RTX A2000 Laptop GPU, i7-12700H, Samsung PM9A1 MZVL21T0HCLR | |
|---|---|---|---|---|---|---|---|
| Noise | 3% | 3% | -9% | -7% | -15% | -18% | |
| off /ambiente * (dB) | 23.1 | 23.3 -1% | 23 -0% | 23.7 -3% | 24.2 -5% | 25.21 -9% | 23.8 -3% |
| Idle Minimum * (dB) | 23.1 | 23.3 -1% | 23 -0% | 23.7 -3% | 24.2 -5% | 25.21 -9% | 23.8 -3% |
| Idle Average * (dB) | 23.1 | 23.3 -1% | 23 -0% | 23.7 -3% | 24.2 -5% | 25.21 -9% | 23.8 -3% |
| Idle Maximum * (dB) | 23.1 | 23.3 -1% | 23 -0% | 23.7 -3% | 25.8 -12% | 25.21 -9% | 23.8 -3% |
| Load Average * (dB) | 25.4 | 25.1 1% | 29.1 -15% | 25.9 -2% | 32.2 -27% | 39.09 -54% | 42.9 -69% |
| Witcher 3 ultra * (dB) | 35.93 | 32.1 11% | 29.1 19% | 46.9 -31% | 34.1 5% | 36.6 -2% | 44.5 -24% |
| Load Maximum * (dB) | 39.1 | 34 13% | 32.9 16% | 46.9 -20% | 38.8 1% | 43.53 -11% | 47.9 -23% |
* ... Meglio usare valori piccoli
Temperature
Le temperature del Lenovo ThinkPad T16 G1 AMD rimangono sempre straordinariamente basse. Durante il carico massimo, abbiamo misurato un massimo di 41,5 °C (106,7 °F) in un'area del fondo del case. Con 34,6 °C (94,3 °F) durante lo scenario di carico, la parte superiore del case rimane significativamente più fredda di quella del modello Intel Modello Intel con 45 °C (113 °F).
(+) La temperatura massima sul lato superiore è di 34.6 °C / 94 F, rispetto alla media di 34.3 °C / 94 F, che varia da 21.2 a 62.5 °C per questa classe Office.
(±) Il lato inferiore si riscalda fino ad un massimo di 41.5 °C / 107 F, rispetto alla media di 36.8 °C / 98 F
(+) In idle, la temperatura media del lato superiore è di 21.9 °C / 71 F, rispetto alla media deld ispositivo di 29.5 °C / 85 F.
(+) Riproducendo The Witcher 3, la temperatura media per il lato superiore e' di 29.6 °C / 85 F, rispetto alla media del dispositivo di 29.5 °C / 85 F.
(+) I poggiapolsi e il touchpad sono piu' freddi della temperatura della pelle con un massimo di 29 °C / 84.2 F e sono quindi freddi al tatto.
(±) La temperatura media della zona del palmo della mano di dispositivi simili e'stata di 27.5 °C / 81.5 F (-1.5 °C / -2.7 F).
| Lenovo ThinkPad T16 G1 21CH004MGE AMD Ryzen 5 PRO 6650U, AMD Radeon 660M | Lenovo ThinkPad T16 G1 21BWS00200 Intel Core i5-1240P, Intel Iris Xe Graphics G7 80EUs | HP EliteBook 865 G9 AMD Ryzen 7 PRO 6850U, AMD Radeon 680M | Lenovo ThinkPad Z16 G1 21D5S00T00 AMD Ryzen 7 PRO 6850H, AMD Radeon RX 6500M | Lenovo ThinkPad T14 G3-21CF004NGE AMD Ryzen 7 PRO 6850U, AMD Radeon 680M | Lenovo ThinkPad P15v G2 21A9000XGE Intel Core i7-11800H, NVIDIA T1200 Laptop GPU | HP ZBook Power 15 G9 6B8C4EA Intel Core i7-12700H, NVIDIA RTX A2000 Laptop GPU | |
|---|---|---|---|---|---|---|---|
| Heat | -29% | -8% | -34% | -19% | -29% | -9% | |
| Maximum Upper Side * (°C) | 34.6 | 45 -30% | 39.4 -14% | 56.8 -64% | 48.2 -39% | 53.8 -55% | 40.3 -16% |
| Maximum Bottom * (°C) | 41.5 | 42.8 -3% | 47.6 -15% | 53.3 -28% | 52.8 -27% | 52.1 -26% | 48.3 -16% |
| Idle Upper Side * (°C) | 22.6 | 33 -46% | 23.6 -4% | 28.2 -25% | 24.4 -8% | 27.6 -22% | 23.7 -5% |
| Idle Bottom * (°C) | 24.5 | 33.6 -37% | 24.1 2% | 29.4 -20% | 24.5 -0% | 27.7 -13% | 23.8 3% |
* ... Meglio usare valori piccoli
Stress test
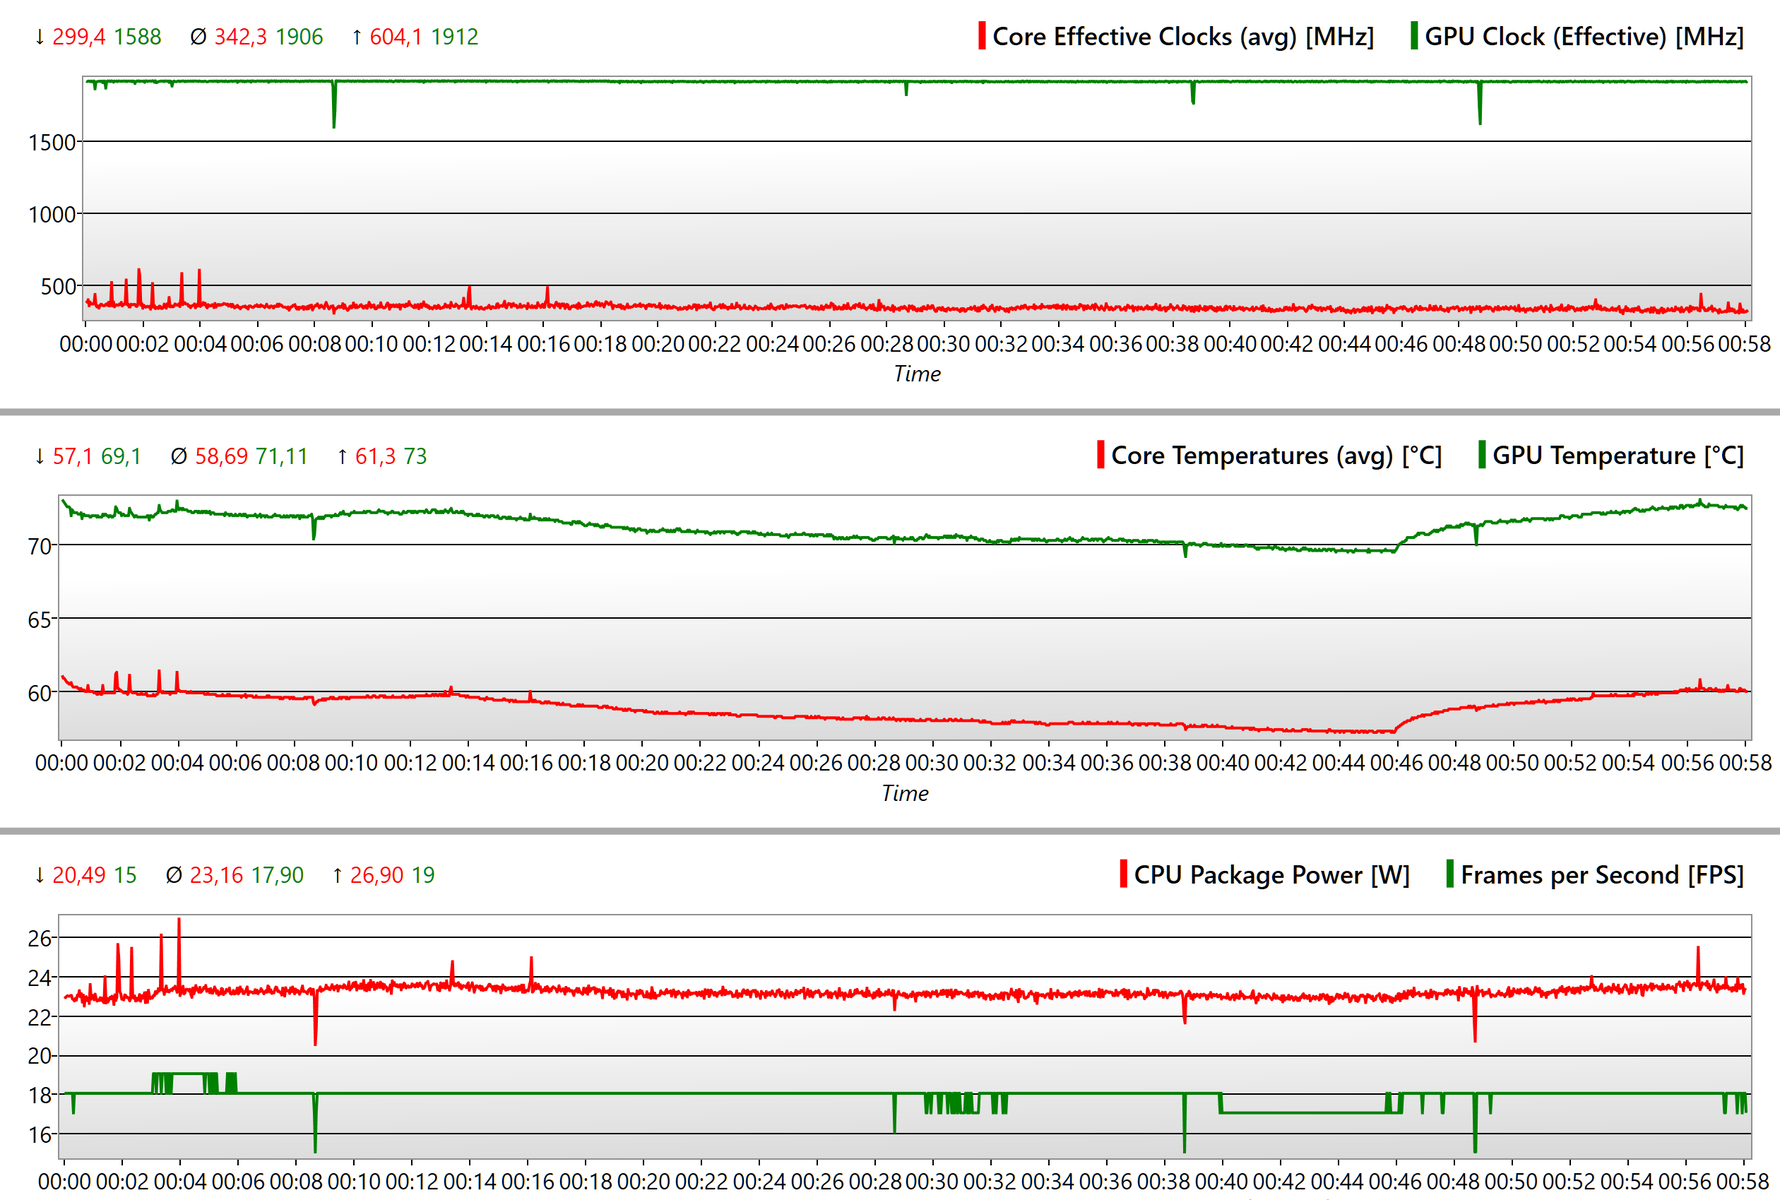
A 2,65 GHz sotto carico combinato (Prime95 + FurMark), la velocità della CPU scende leggermente al di sotto della velocità di clock di base di 2,9 GHz, con temperature del core che raggiungono solo 77 °C (171 °F). In quel momento, la iGPU funziona solo a circa la metà della sua velocità massima, raggiungendo una temperatura di 79 °C (174 °F).
Durante lo stress puro della CPU, la velocità di clock di base viene superata di 200 MHz, mentre durante lo stress puro della GPU, la iGPU Radeon funziona alla sua velocità massima di ~1.900 MHz.
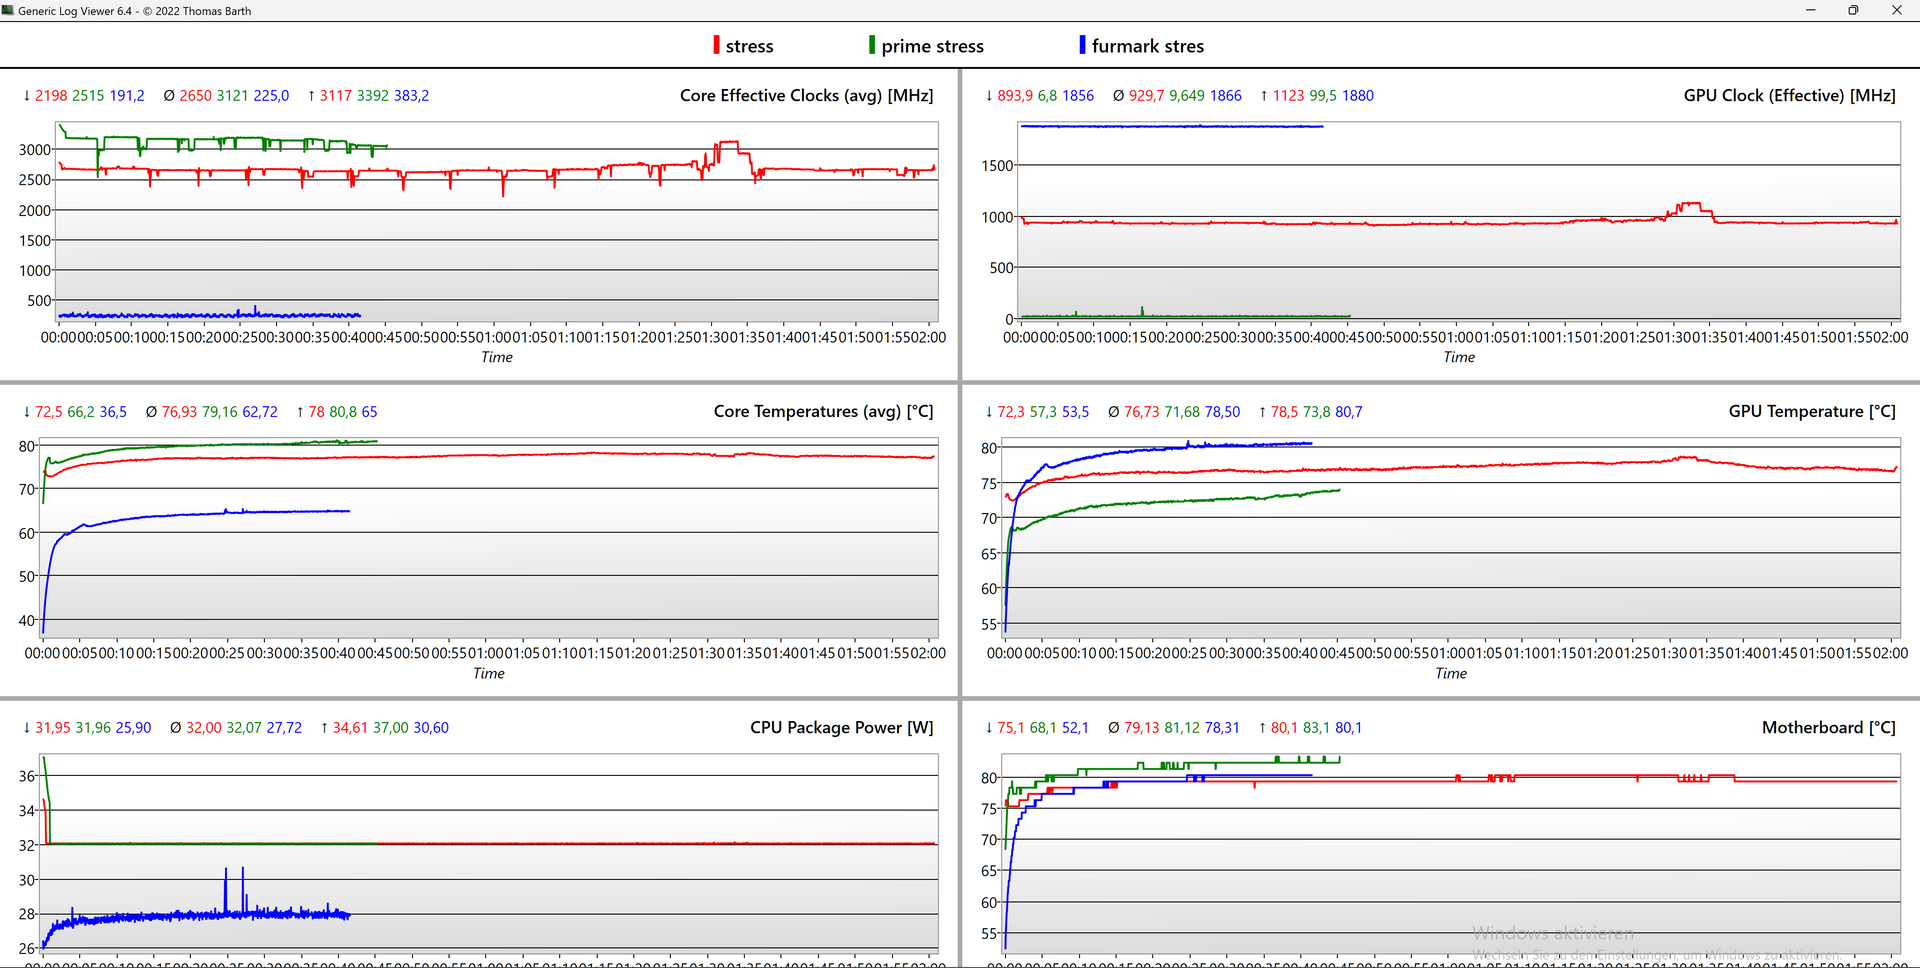
| Clock della CPU (GHz) | Clock della GPU (MHz) | Temperatura media della CPU (°C) | Temperatura media della GPU (°C) | |
| Sistema inattivo | 0,15 | 18 | 35 | 35 |
| Prime95 + FurMark Stress | 2,65 | 930 | 77 | 77 |
| Prime95 Stress | 3,12 | 10 | 79 | 72 |
| FurMark-Stress | 0,23 | 1,866 | 63 | 79 |
| The Witcher 3 Stress | 0,34 | 1,906 | 59 | 71 |
Altoparlanti
Gli altoparlanti stereo rivolti verso l'alto del ThinkPad da 16 pollici sono complessivamente nella media. Mancano di bassi e le frequenze alte sono troppo elevate. Inoltre, non ci si può aspettare un volume elevato.
Lenovo ThinkPad T16 G1 21CH004MGE analisi audio
(-) | altoparlanti non molto potenti (71.8 dB)
Bassi 100 - 315 Hz
(-) | quasi nessun basso - in media 18.5% inferiori alla media
(±) | la linearità dei bassi è media (12.3% delta rispetto alla precedente frequenza)
Medi 400 - 2000 Hz
(+) | medi bilanciati - solo only 4.5% rispetto alla media
(±) | linearità dei medi adeguata (7.8% delta rispetto alla precedente frequenza)
Alti 2 - 16 kHz
(±) | alti elevati - circa 5.3% superiori alla media
(±) | la linearità degli alti è media (7.5% delta rispetto alla precedente frequenza)
Nel complesso 100 - 16.000 Hz
(±) | la linearità complessiva del suono è media (22.5% di differenza rispetto alla media
Rispetto alla stessa classe
» 60% di tutti i dispositivi testati in questa classe è stato migliore, 8% simile, 32% peggiore
» Il migliore ha avuto un delta di 7%, medio di 21%, peggiore di 53%
Rispetto a tutti i dispositivi testati
» 66% di tutti i dispositivi testati in questa classe è stato migliore, 6% similare, 28% peggiore
» Il migliore ha avuto un delta di 4%, medio di 23%, peggiore di 134%
HP EliteBook 865 G9 analisi audio
(+) | gli altoparlanti sono relativamente potenti (82.5 dB)
Bassi 100 - 315 Hz
(-) | quasi nessun basso - in media 19.6% inferiori alla media
(±) | la linearità dei bassi è media (10.9% delta rispetto alla precedente frequenza)
Medi 400 - 2000 Hz
(+) | medi bilanciati - solo only 1.2% rispetto alla media
(+) | medi lineari (2.2% delta rispetto alla precedente frequenza)
Alti 2 - 16 kHz
(+) | Alti bilanciati - appena 3.5% dalla media
(+) | alti lineari (4% delta rispetto alla precedente frequenza)
Nel complesso 100 - 16.000 Hz
(+) | suono nel complesso lineare (13.8% differenza dalla media)
Rispetto alla stessa classe
» 8% di tutti i dispositivi testati in questa classe è stato migliore, 4% simile, 87% peggiore
» Il migliore ha avuto un delta di 7%, medio di 21%, peggiore di 53%
Rispetto a tutti i dispositivi testati
» 15% di tutti i dispositivi testati in questa classe è stato migliore, 4% similare, 81% peggiore
» Il migliore ha avuto un delta di 4%, medio di 23%, peggiore di 134%
Gestione dell'alimentazione: T16 con una lunga durata della batteria nonostante la batteria piccola
Consumo di energia
Durante il funzionamento al minimo e sotto carico, il consumo energetico del ThinkPad T16 AMD rimane inferiore a quello del modello Intel Modello Intele delThinkPad T14 G3 AMDcon la stessa scheda madre.
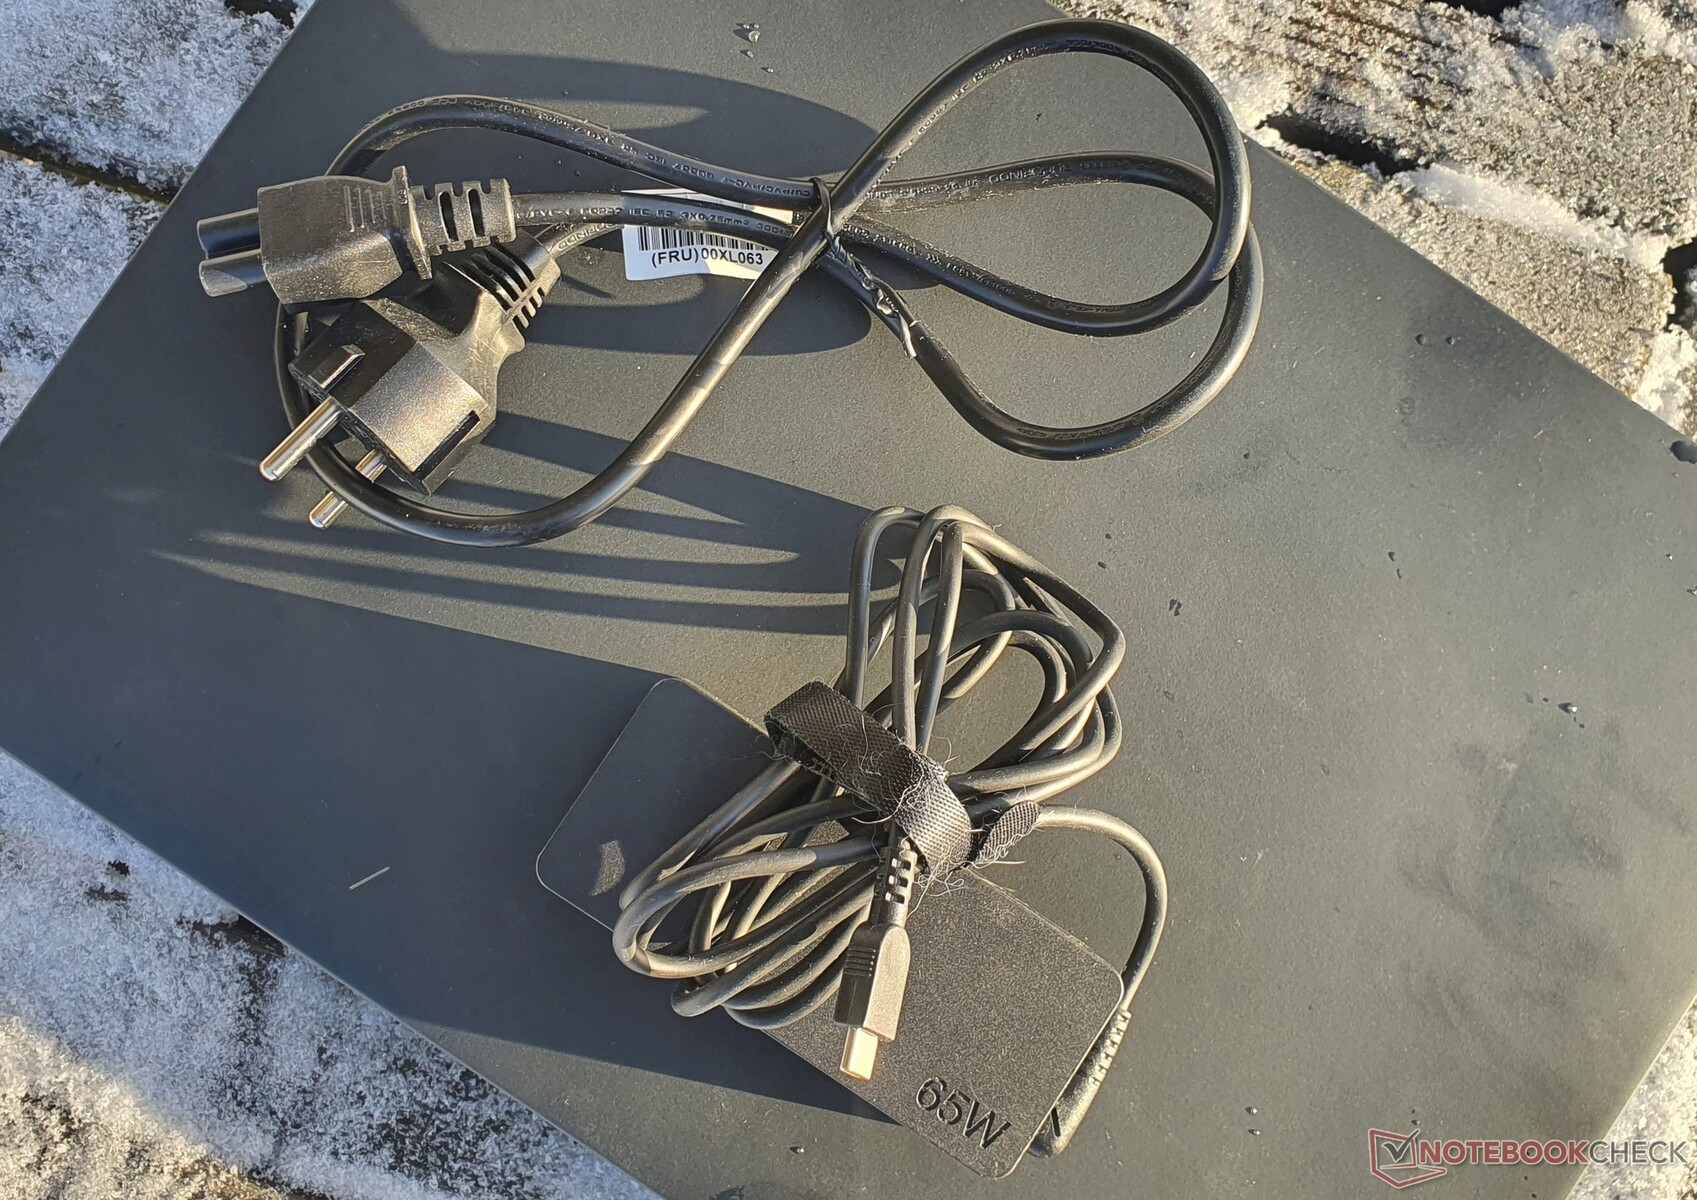
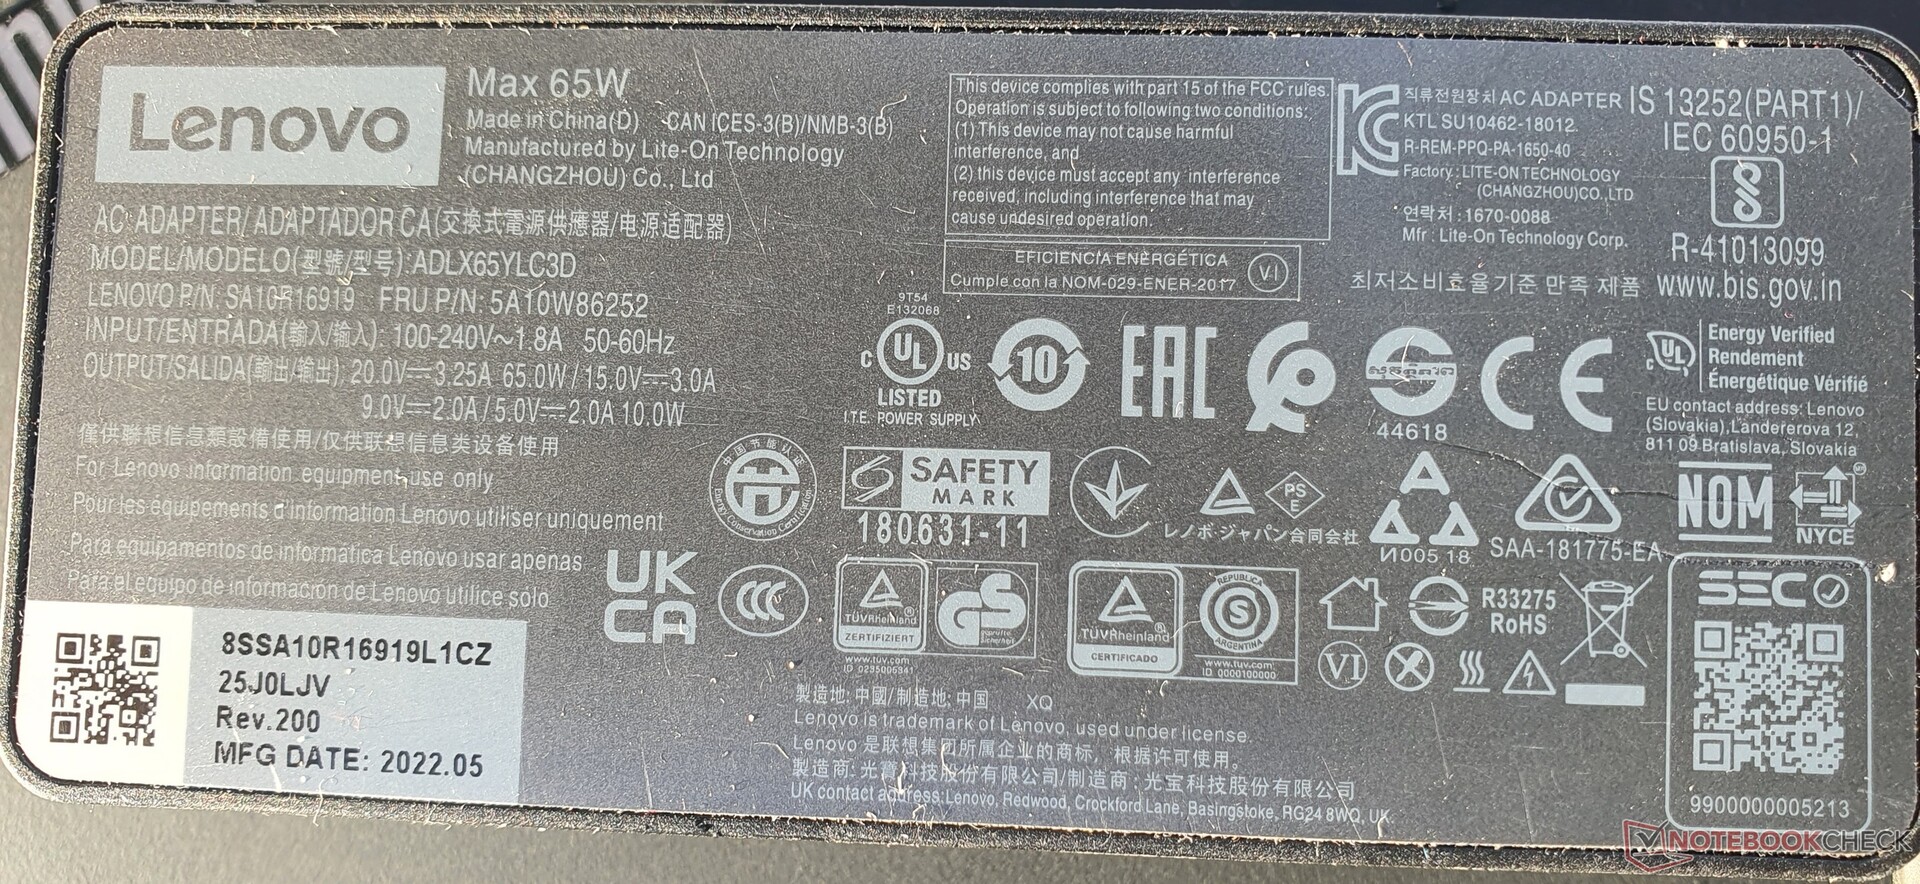
I motivi sono da ricercare nel display a risoluzione più elevata senza caratteristiche di basso consumo e nei limiti di prestazioni della CPU più elevati. Poiché il Turbo a breve termine della CPU AMD risulta significativamente inferiore, il dispositivo consuma al massimo solo 59 watt, il che significa che il caricabatterie da 65 watt è sufficiente.
| Off / Standby | |
| Idle | |
| Sotto carico |
|
Leggenda:
min: | |
| Lenovo ThinkPad T16 G1 21CH004MGE R5 PRO 6650U, Radeon 660M, Micron 2450 512GB MTFDKBA512TFK, IPS-LED, 2560x1600, 16" | Lenovo ThinkPad T16 G1 21BWS00200 i5-1240P, Iris Xe G7 80EUs, Samsung PM9A1 MZVL2512HCJQ, IPS, 1920x1200, 16" | Lenovo ThinkPad T14 G3-21CF004NGE R7 PRO 6850U, Radeon 680M, Kioxia BG5 KBG5AZNV512G, IPS, 1920x1200, 14" | HP EliteBook 865 G9 R7 PRO 6850U, Radeon 680M, Samsung PM991 MZVLQ512HBLU, IPS, 1920x1200, 16" | Lenovo ThinkPad Z16 G1 21D5S00T00 R7 PRO 6850H, Radeon RX 6500M, Samsung PM9A1 MZVL21T0HCLR, IPS LED, 1920x1200, 16" | Lenovo ThinkPad P15v G2 21A9000XGE i7-11800H, T1200 Laptop GPU, Toshiba XG6 KXG6AZNV512G, IPS LED, 1920x1080, 15.6" | HP ZBook Power 15 G9 6B8C4EA i7-12700H, RTX A2000 Laptop GPU, Samsung PM9A1 MZVL21T0HCLR, IPS, 3840x2160, 15.6" | Media AMD Radeon 660M | Media della classe Office | |
|---|---|---|---|---|---|---|---|---|---|
| Power Consumption | 9% | 19% | -35% | -64% | -77% | -59% | -8% | -7% | |
| Idle Minimum * (Watt) | 3.2 | 2.9 9% | 2.4 25% | 5.3 -66% | 5.3 -66% | 5.96 -86% | 3.9 -22% | 4.68 ? -46% | 4.4 ? -38% |
| Idle Average * (Watt) | 8.1 | 6 26% | 5.3 35% | 12.8 -58% | 8.6 -6% | 8.37 -3% | 7.2 11% | 7.08 ? 13% | 7.35 ? 9% |
| Idle Maximum * (Watt) | 8.6 | 6.9 20% | 5.6 35% | 14.1 -64% | 9.5 -10% | 9.05 -5% | 8.5 1% | 9.12 ? -6% | 8.57 ? -0% |
| Load Average * (Watt) | 45.4 | 27.3 40% | 39.7 13% | 48.5 -7% | 65.2 -44% | 91.82 -102% | 87.2 -92% | 44.2 ? 3% | 43.5 ? 4% |
| Witcher 3 ultra * (Watt) | 40 | 42.6 -7% | 42.8 -7% | 48.7 -22% | 93.6 -134% | 102 -155% | 86.8 -117% | ||
| Load Maximum * (Watt) | 59.6 | 81.53 -37% | 50.6 15% | 56.6 5% | 133.81 -125% | 126.38 -112% | 139 -133% | 62.4 ? -5% | 64.5 ? -8% |
* ... Meglio usare valori piccoli
Power Consumption The Witcher 3 / Stress Test
Power Consumption With External Monitor
Durata della batteria
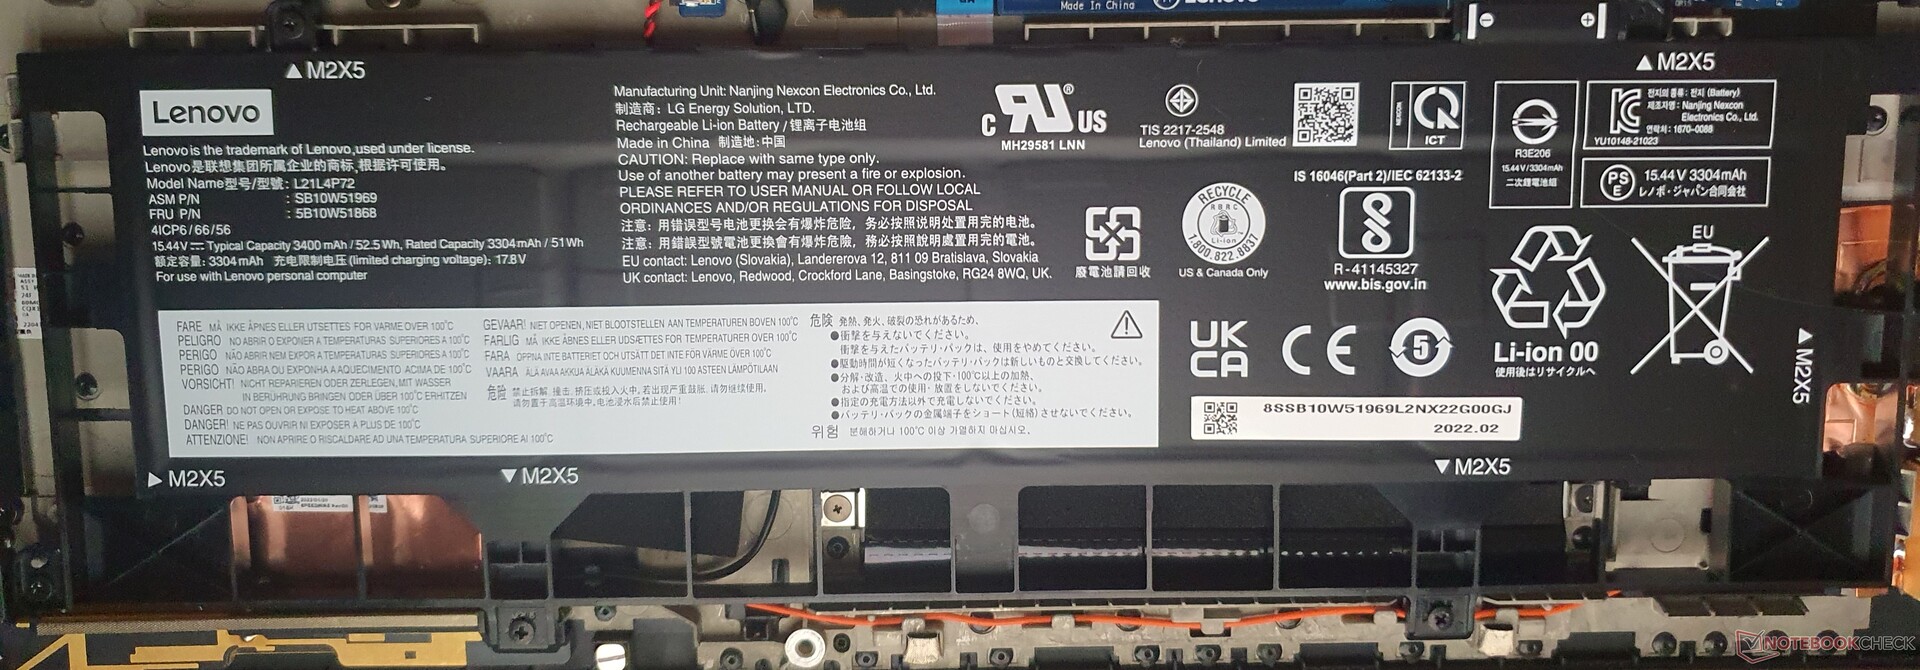
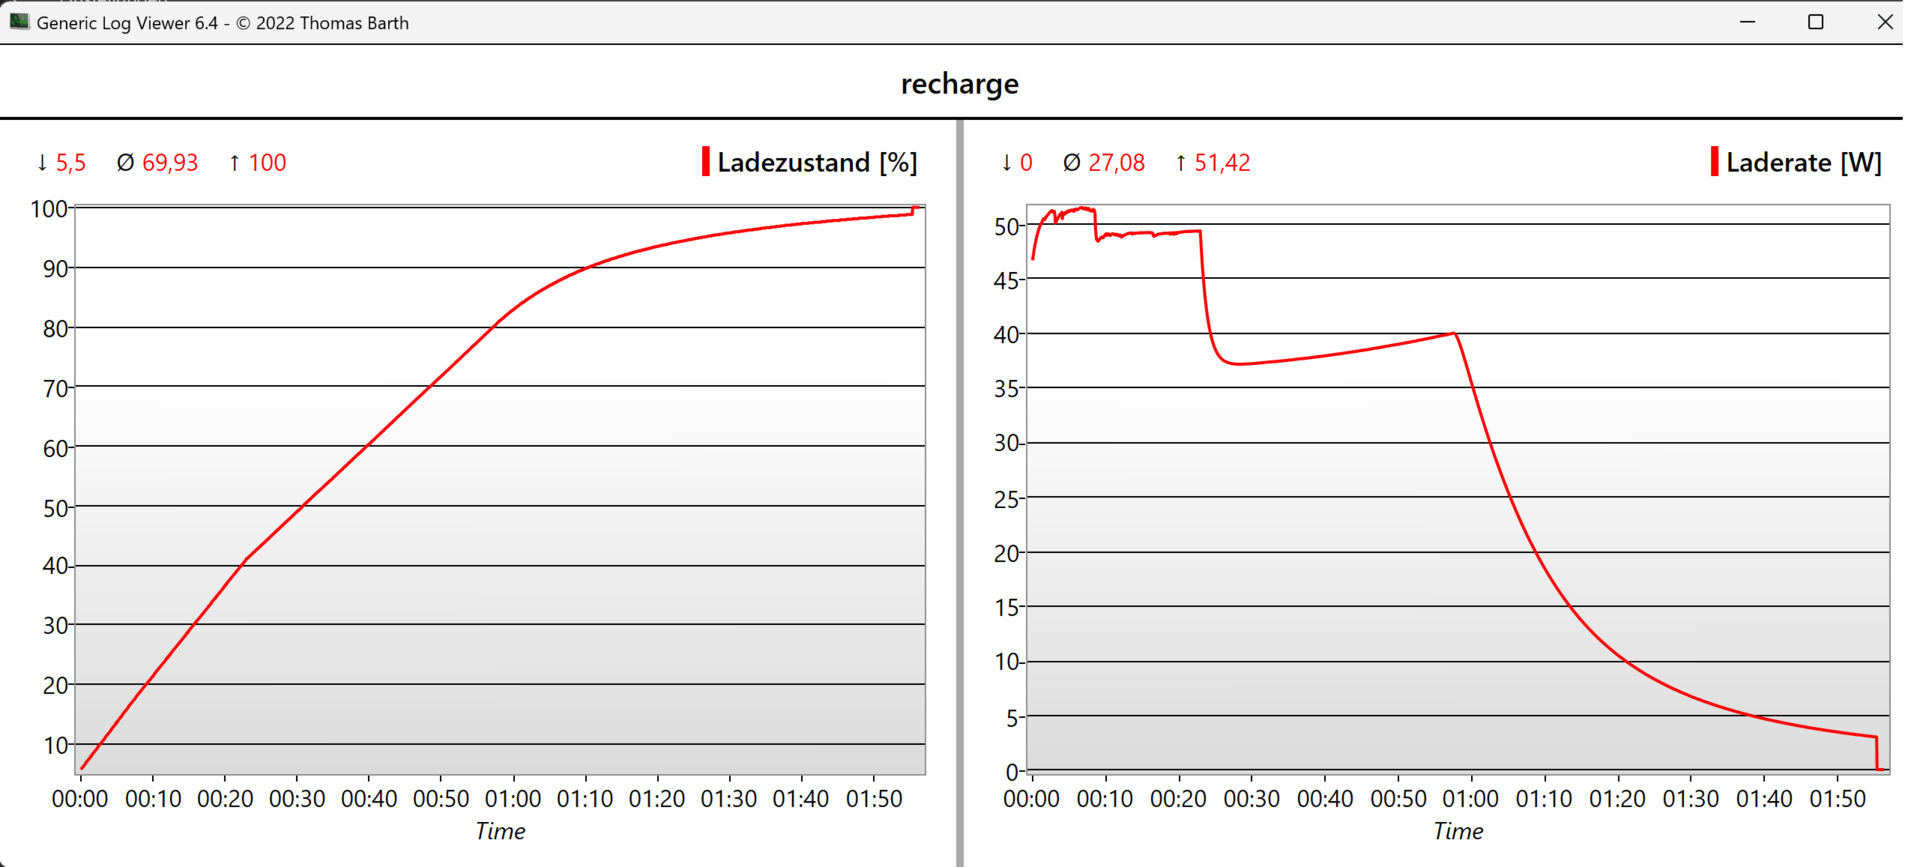
Anche se nella nostra unità di prova è stata utilizzata una batteria significativamente più piccola da 52,5 W, è possibile navigare per 10:35 ore sul web. Il Modello Intelcon batteria da 86 Wh e display a risparmio energetico raggiunge le 14 ore. Per una lunga durata della batteria, è quindi consigliabile scegliere la batteria più grande e il display a basso consumo.
A giudicare dalThinkPad T14 G3 AMDcon la stessa scheda madre e display a basso consumo, si potrebbe calcolare una durata della batteria fino a 20 ore per il T16 AMD. Tuttavia, a causa della mancanza di misurazioni reali, non siamo in grado di confermarlo.
| Lenovo ThinkPad T16 G1 21CH004MGE R5 PRO 6650U, Radeon 660M, 52.5 Wh | Lenovo ThinkPad T16 G1 21BWS00200 i5-1240P, Iris Xe G7 80EUs, 86 Wh | Lenovo ThinkPad T14 G3-21CF004NGE R7 PRO 6850U, Radeon 680M, 52.5 Wh | HP EliteBook 865 G9 R7 PRO 6850U, Radeon 680M, 76 Wh | Lenovo ThinkPad Z16 G1 21D5S00T00 R7 PRO 6850H, Radeon RX 6500M, 72 Wh | Lenovo ThinkPad P15v G2 21A9000XGE i7-11800H, T1200 Laptop GPU, 68 Wh | HP ZBook Power 15 G9 6B8C4EA i7-12700H, RTX A2000 Laptop GPU, 83 Wh | Lenovo ThinkPad X1 Extreme G5-21DE003RGE i7-12700H, GeForce RTX 3060 Laptop GPU, 90 Wh | |
|---|---|---|---|---|---|---|---|---|
| Autonomia della batteria | 82% | 30% | 59% | 31% | -25% | -6% | -5% | |
| H.264 (h) | 10.9 | 10.4 -5% | 16.4 50% | 18.5 70% | 11.9 9% | 8 -27% | 7.3 -33% | |
| WiFi v1.3 (h) | 10.6 | 14.1 33% | 12.9 22% | 15 42% | 9.9 -7% | 7.5 -29% | 10 -6% | 6.7 -37% |
| Load (h) | 1.1 | 3.5 218% | 1.3 18% | 1.8 64% | 2.1 91% | 0.9 -18% | 1.7 55% |
Pro
Contro
Verdetto: il ThinkPad T16 AMD è potente, fresco e silenzioso

Con una APU AMD, il Lenovo ThinkPad T16 diventa ancora migliore. Non solo si ottiene una CPU molto potente con limiti di potenza più elevati rispetto al modello T16 Intel T16 Intelma anche la GPU Radeon integrata è più convincente di una iGPU Intel. In questo modo, il portatile aziendale è pronto anche per le attività più impegnative e pesanti per la CPU.
Si consiglia di scegliere la batteria più grande e il display a basso consumo per ottenere la massima durata della batteria. Tuttavia, chi è alla ricerca di una vera e propria workstation entry-level dovrebbe scegliere il ThinkPad P15v o HP Zbook Power 15 G9. D'altra parte, il ThinkPad X1 Extreme G5e ThinkPad Z16rappresentano un buon compromesso tra la sottigliezza e la potenza.
Oltre alla buona dotazione, il robusto ThinkPad T16 AMD beneficia anche della silenziosità e del raffreddamento, dei buoni dispositivi di input e del luminoso display da 16 pollici con colori vivaci.
Il modello HP EliteBook 865 G9che, rispetto al T16 AMD da 1499 euro, ha come particolari vantaggi la RAM espandibile e l'USB4, rappresenta una vera alternativa.
Anche il controllo di qualità della serie T del 2022 non sembra essere ottimale: La nostra seconda unità di prova non solo soffriva di una ventola ad altissima frequenza, ma produceva anche evidenti scricchiolii nell'area del palm rest e il tasto TrackPoint sinistro spesso non si attivava. Inoltre, il potente odore chimico è ancora presente anche dopo una settimana e le cerniere si sono già leggermente allentate. D'altra parte, il modello che abbiamo testato più approfonditamente non presenta nessuno di questi problemi che sono stati spesso menzionati dagli utenti.
Prezzo e disponibilità
Lenovo vende diverse configurazioni del ThinkPad T16 AMD a partire da 969,50 dollari e anche Amazon offre diverse versioni a partire da 990 dollari.
Lenovo ThinkPad T16 G1 21CH004MGE
- 01/31/2023 v7 (old)
Marvin Gollor
Transparency
La selezione dei dispositivi da recensire viene effettuata dalla nostra redazione. Il campione di prova è stato fornito all'autore come prestito dal produttore o dal rivenditore ai fini di questa recensione. L'istituto di credito non ha avuto alcuna influenza su questa recensione, né il produttore ne ha ricevuto una copia prima della pubblicazione. Non vi era alcun obbligo di pubblicare questa recensione. In quanto società mediatica indipendente, Notebookcheck non è soggetta all'autorità di produttori, rivenditori o editori.
Ecco come Notebookcheck esegue i test
Ogni anno, Notebookcheck esamina in modo indipendente centinaia di laptop e smartphone utilizzando procedure standardizzate per garantire che tutti i risultati siano comparabili. Da circa 20 anni sviluppiamo continuamente i nostri metodi di prova e nel frattempo stabiliamo gli standard di settore. Nei nostri laboratori di prova, tecnici ed editori esperti utilizzano apparecchiature di misurazione di alta qualità. Questi test comportano un processo di validazione in più fasi. Il nostro complesso sistema di valutazione si basa su centinaia di misurazioni e parametri di riferimento ben fondati, che mantengono l'obiettività.Price comparison

