Recensione del notebook Lenovo ThinkPad T16 Gen 1 Core i7: Silenziosità a scapito delle prestazioni
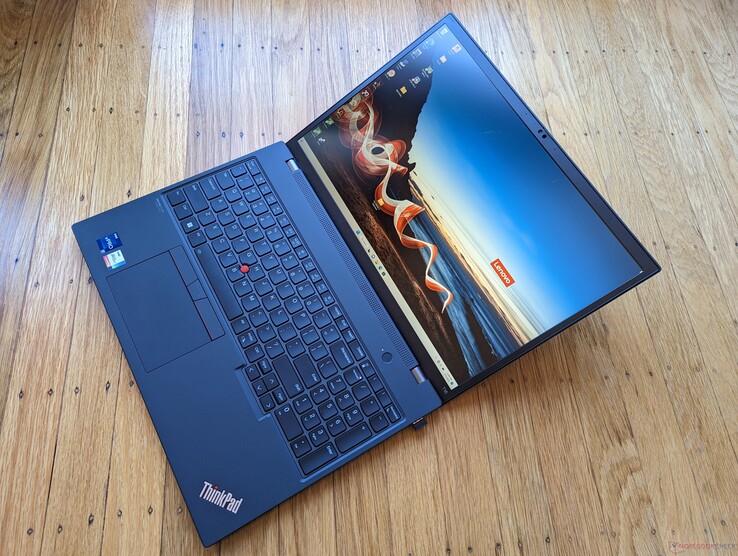
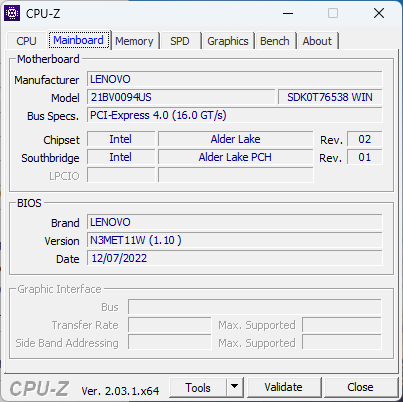
Il ThinkPad T16 G1 è il secondo ThinkPad da 16 pollici di Lenovo, progettato per essere un passo avanti rispetto alla serie prosumer ThinkBook 16 esistente. È dotato di entrambe le opzioni di CPU Core U e Core P di 12a generazione e della GPU discreta GeForce MX550 su alcune SKU.
Abbiamo recentemente recensito le configurazioni Core i5-1240P e Ryzen 5 Pro 6650U, quindi questa recensione si concentrerà sulla configurazione Core i7-1270P. Vi consigliamo di consultare la nostra recensione sulla versione Versione Core i5 per saperne di più sullo chassis e sulle altre caratteristiche fisiche del ThinkPad T16 G1. Qual è la differenza di prestazioni che gli utenti possono aspettarsi quando passano alla più costosa opzione Core i7?
I concorrenti del ThinkPad T16 G1 includono il 16 pollici LG Gram 16, MSI Summit E16o HP EliteBook 860/865 G9. Al momento in cui scriviamo, Dell non ha ancora lanciato un concorrente diretto di Latitude da 16 pollici. La configurazione da noi recensita viene venduta a circa 1.800 dollari.
Altre recensioni di Lenovo:
Potenziali concorrenti a confronto
Punteggio | Data | Modello | Peso | Altezza | Dimensione | Risoluzione | Prezzo |
|---|---|---|---|---|---|---|---|
| 88.6 % v7 (old) | 01/2023 | Lenovo ThinkPad T16 Gen 1 Core i7-1270P i7-1270P, Iris Xe G7 96EUs | 2 kg | 20.5 mm | 16.00" | 1920x1200 | |
| 90.2 % v7 (old) | 02/2023 | Lenovo ThinkPad T16 G1 21CH004MGE R5 PRO 6650U, Radeon 660M | 1.8 kg | 20.5 mm | 16.00" | 2560x1600 | |
| 86.6 % v7 (old) | 01/2023 | LG Gram 16Z90Q i7-1260P, Iris Xe G7 96EUs | 1.2 kg | 16.8 mm | 16.00" | 2560x1600 | |
| 87.2 % v7 (old) | 12/2022 | HP EliteBook 865 G9 R7 PRO 6850U, Radeon 680M | 1.9 kg | 19 mm | 16.00" | 1920x1200 | |
| 86.4 % v7 (old) | 07/2022 | Huawei MateBook 16s i7 i7-12700H, Iris Xe G7 96EUs | 2 kg | 17.8 mm | 16.00" | 2520x1680 | |
| 93.2 % v7 (old) | 11/2021 | Apple MacBook Pro 16 2021 M1 Pro M1 Pro, M1 Pro 16-Core GPU | 2.2 kg | 16.8 mm | 16.20" | 3456x2234 |
Caso - Un piccolo grande
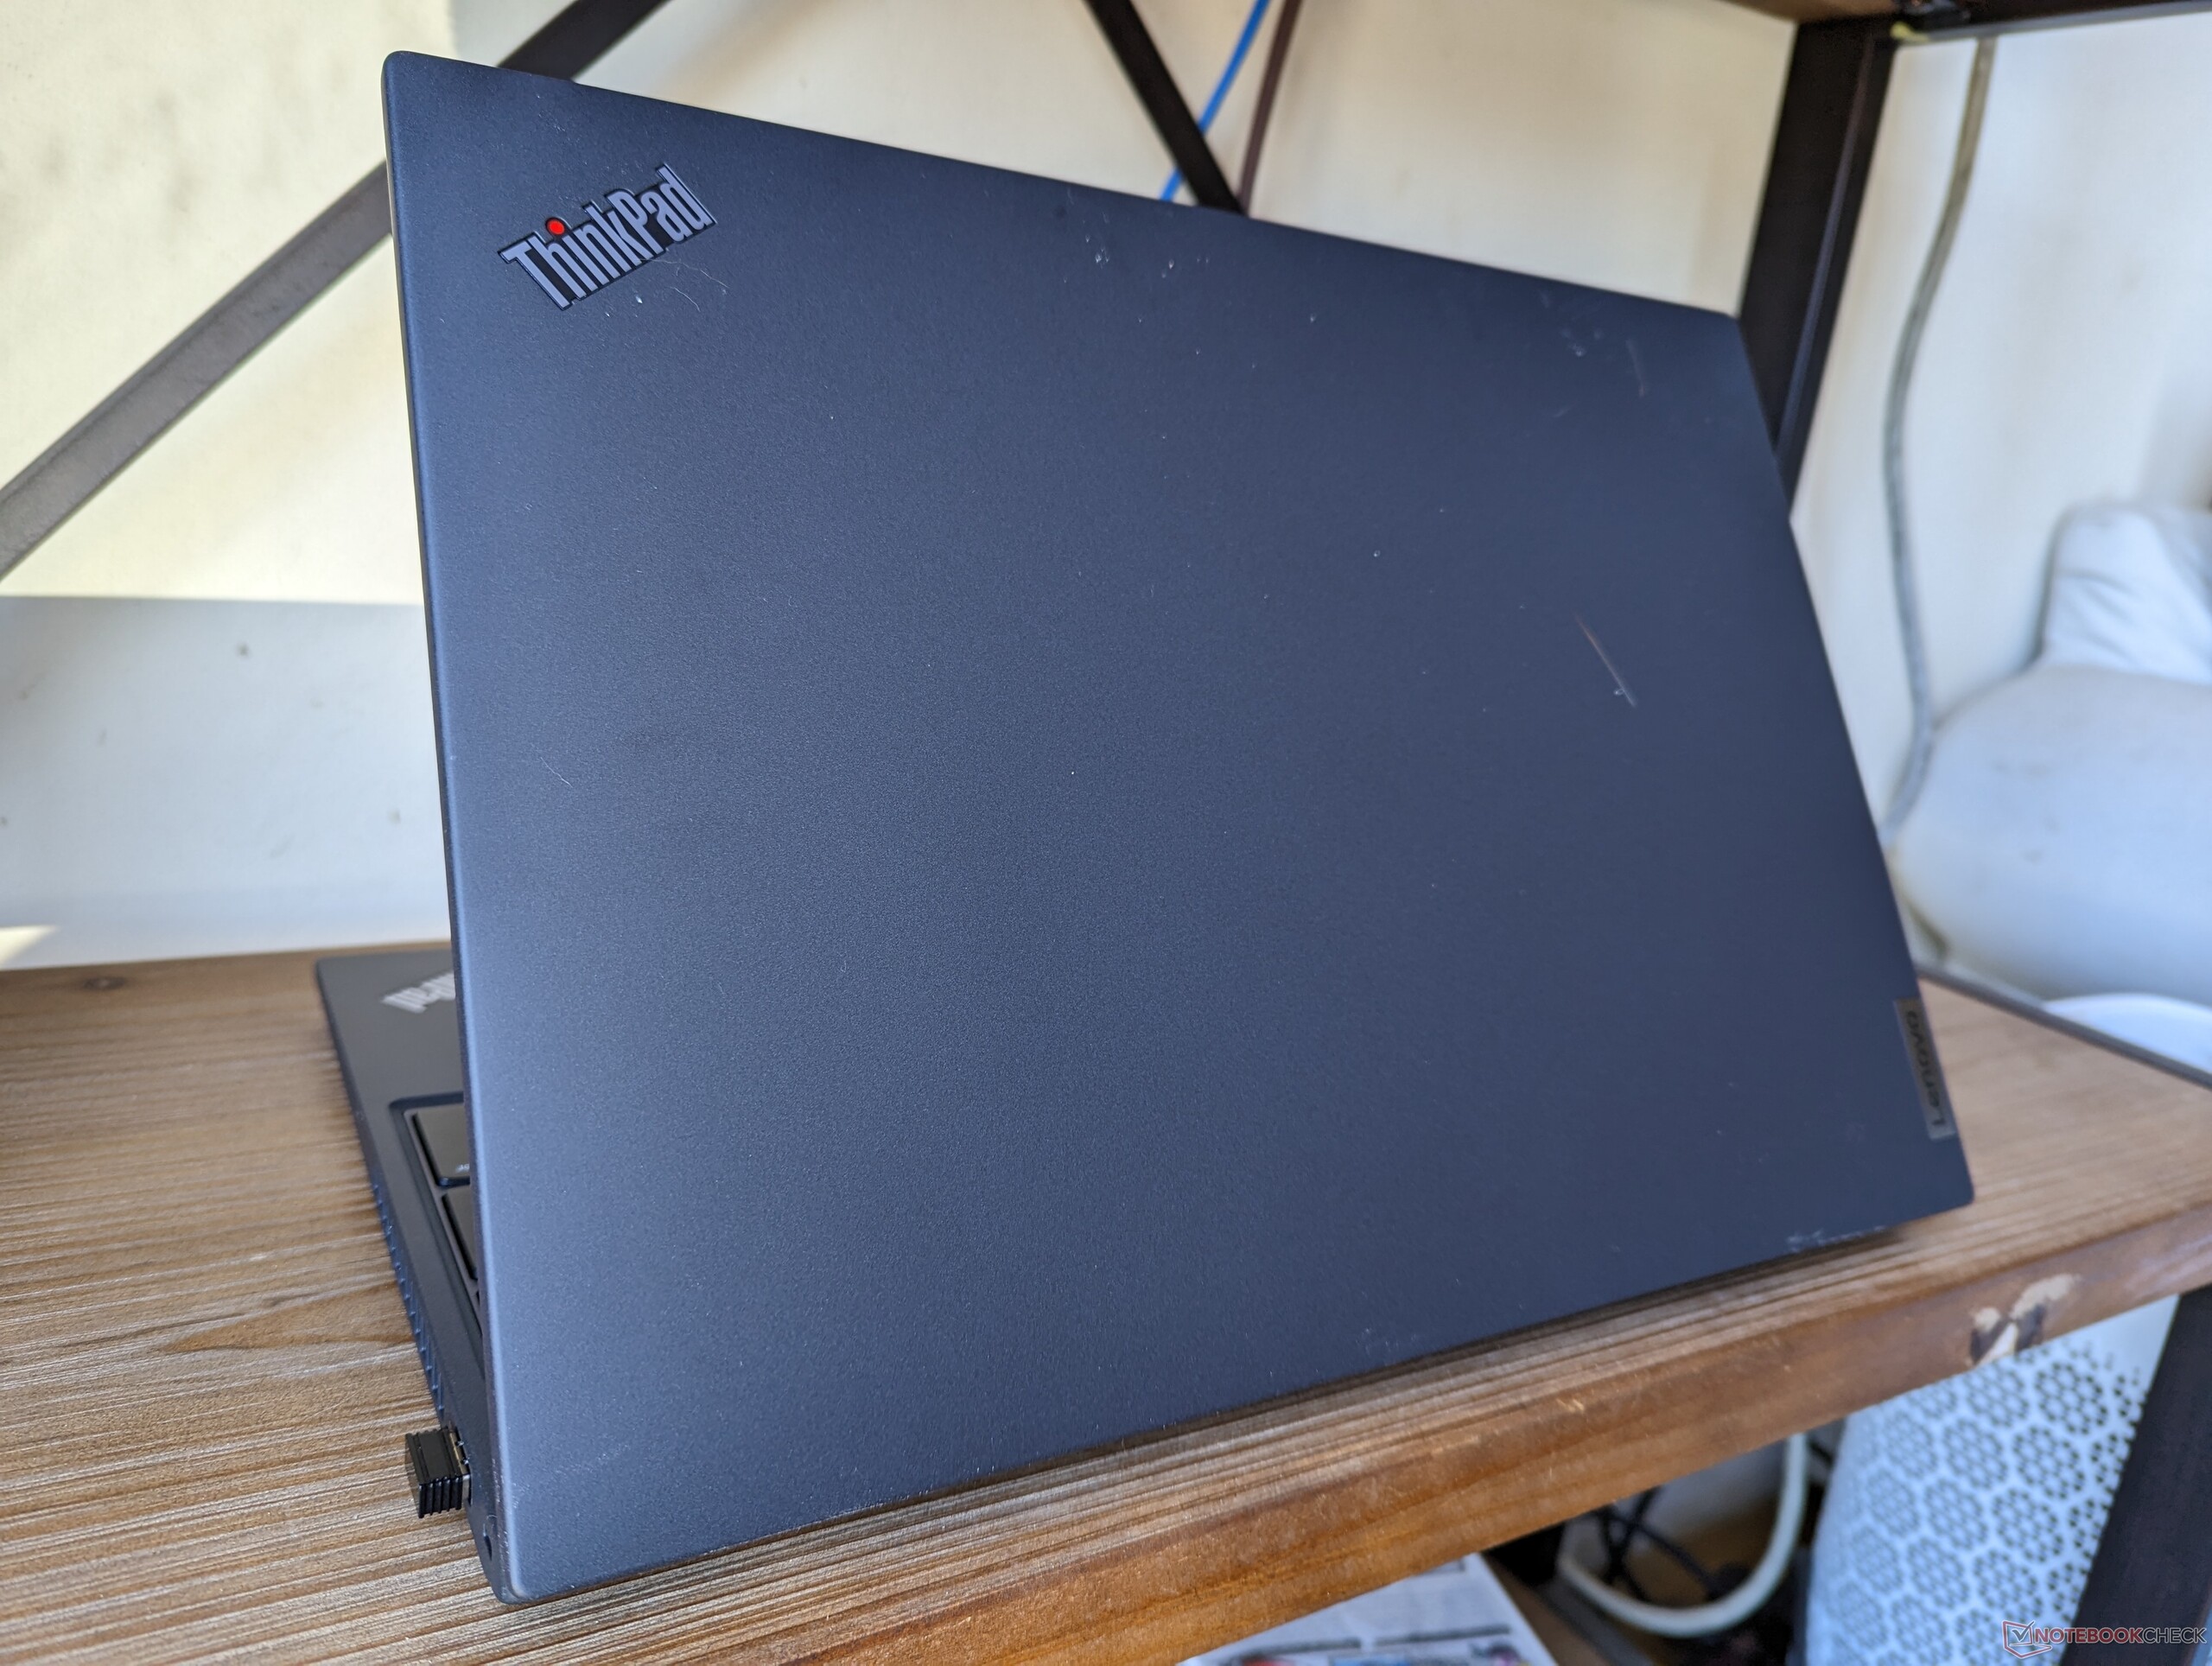
Sebbene il modello abbia solo pochi mesi di vita, il suo chassis è leggermente più grande in tutte le dimensioni rispetto ai portatili da 16 pollici della concorrenza, come l'HP EliteBook 865 G9 o il Apple MacBook Pro 16. L'LG Gram 16, in particolare, è più leggero di 800 grammi.
Le superfici nere opache sono soggette a un rapido accumulo di grasso e impronte digitali. L'approccio scuro alla fibra di carbonio, alla fibra di vetro e alla plastica contrasta con l'approccio in lega metallica grigio brillante del concorrente HP EliteBook.

Comunicazione
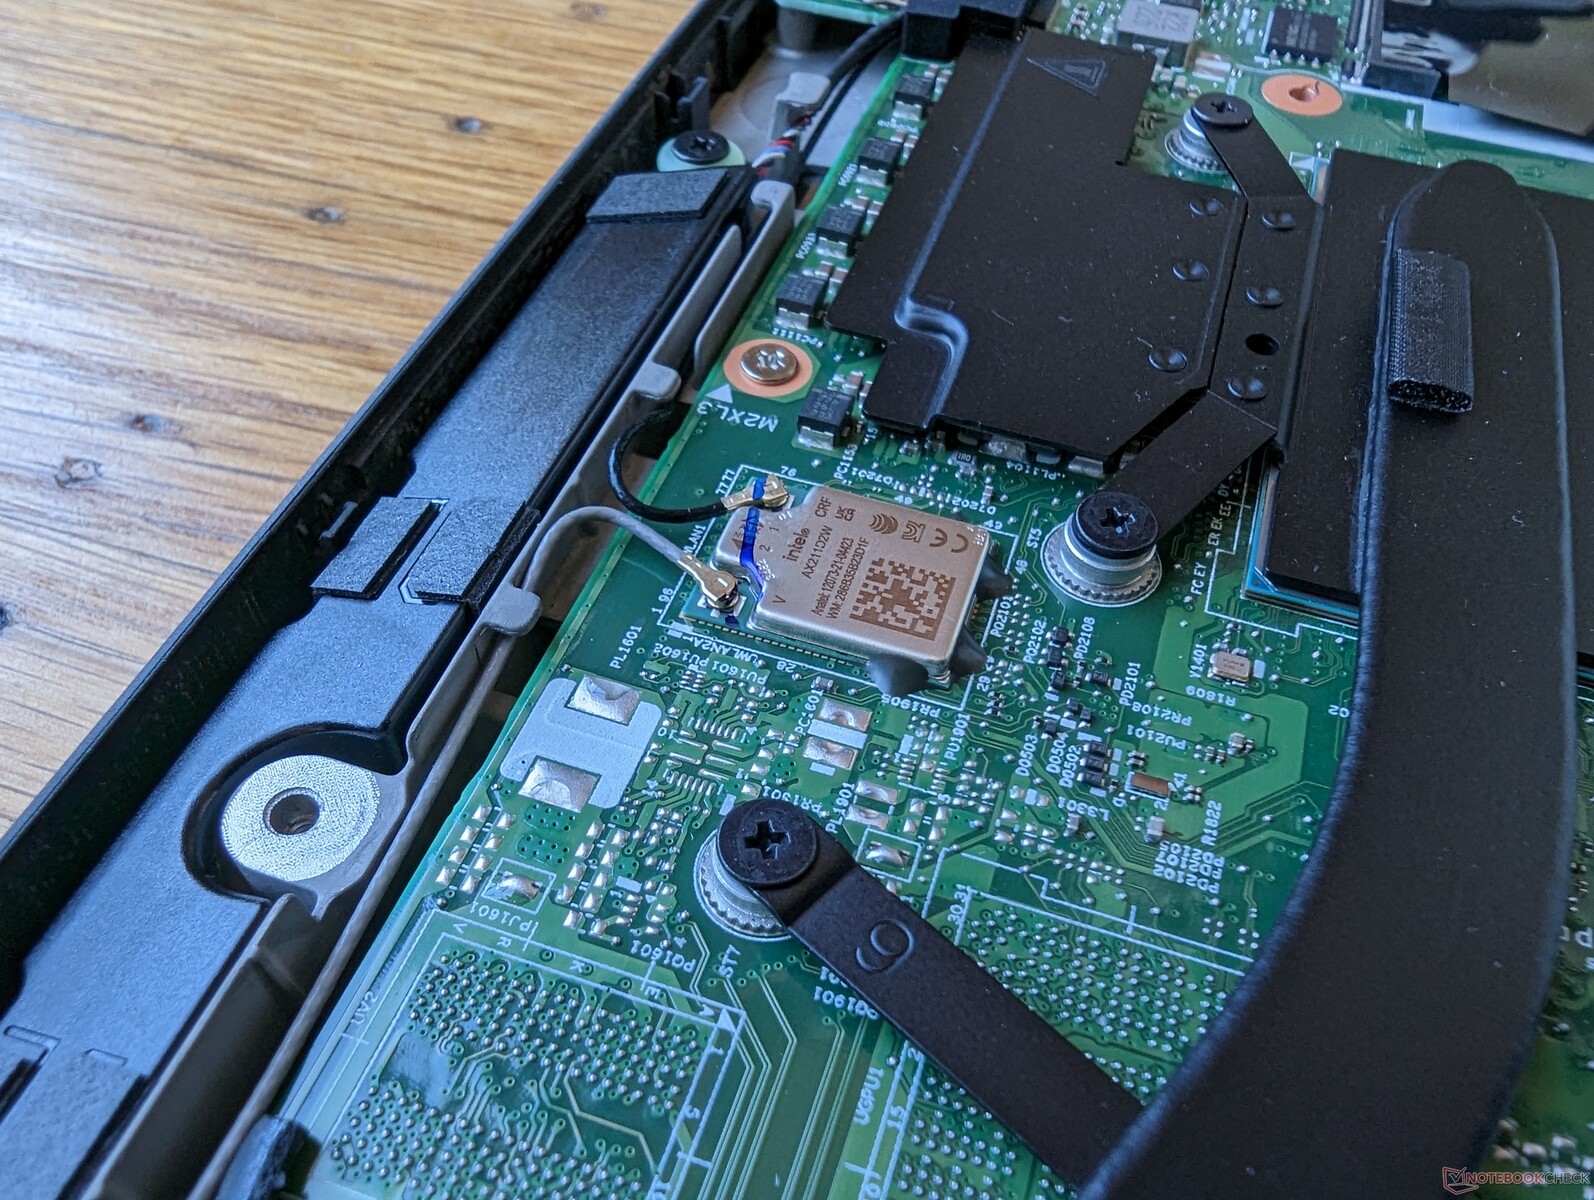
Un Intel AX211 è fornito di serie per la connettività Bluetooth 5.2 e Wi-Fi 6E. Le velocità di trasferimento sono costanti quando viene accoppiato al nostro router di prova Asus AXE11000.
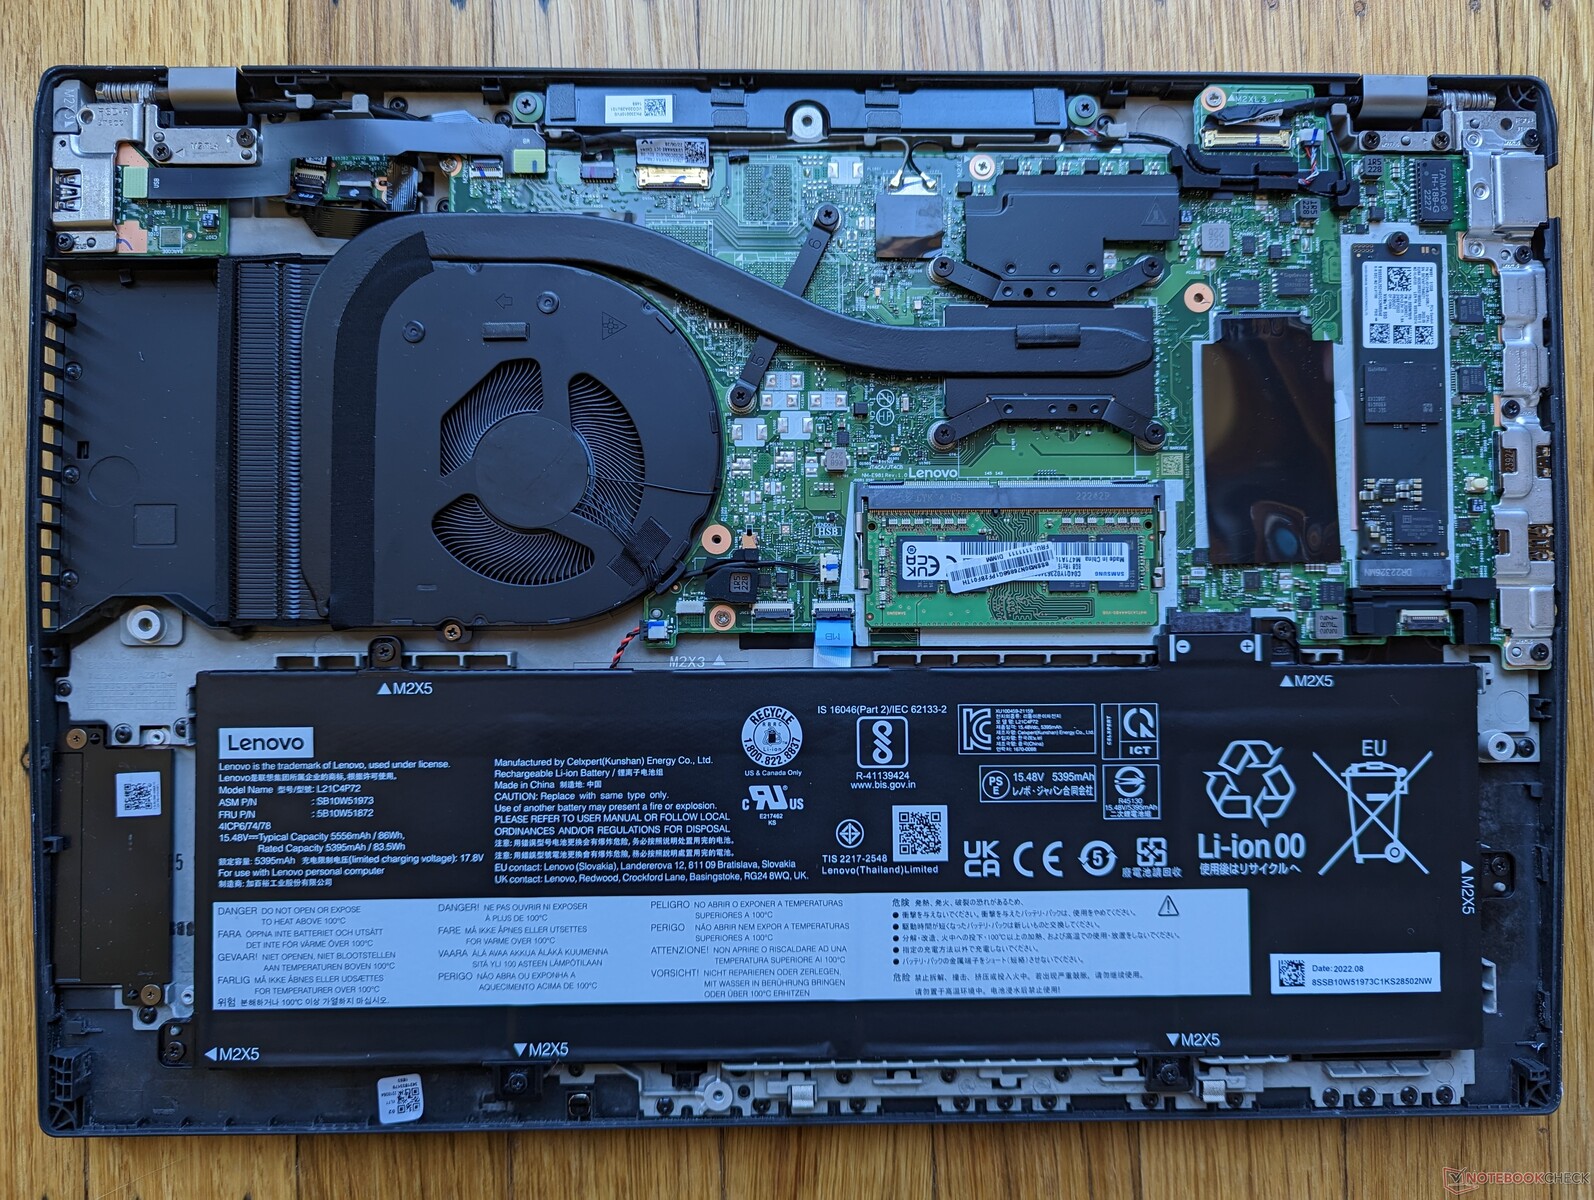
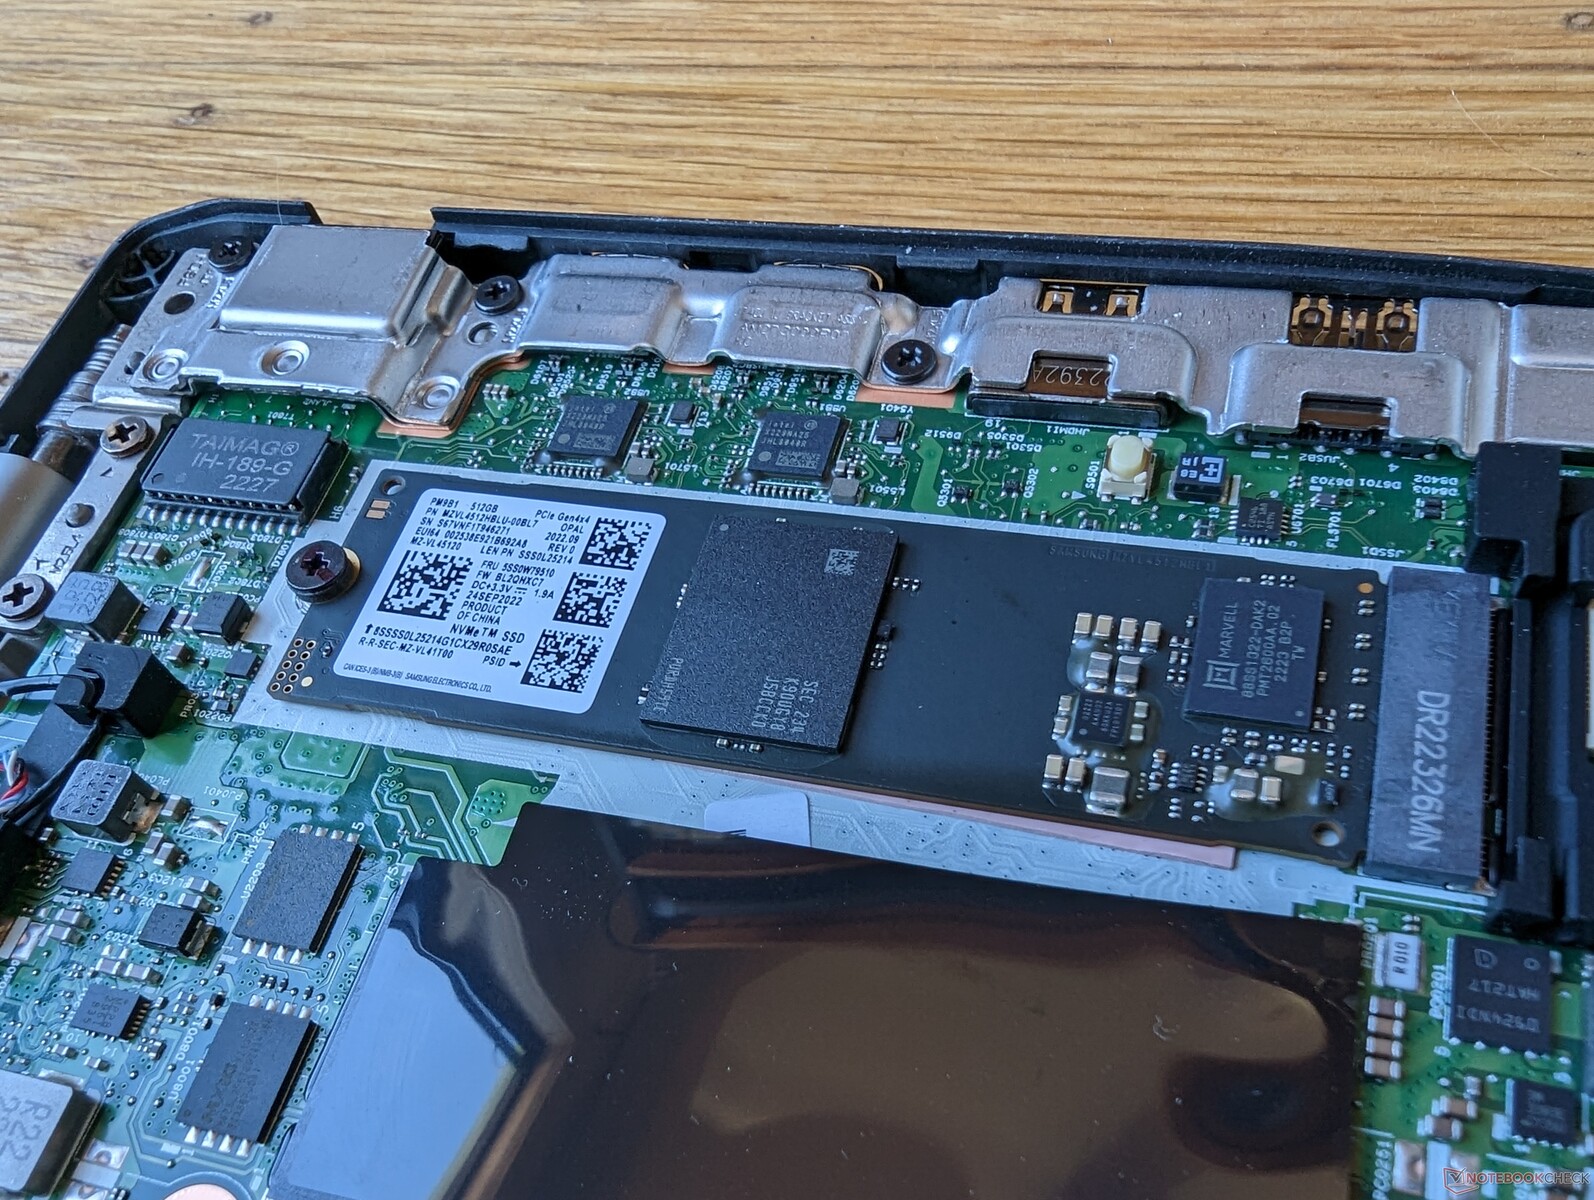
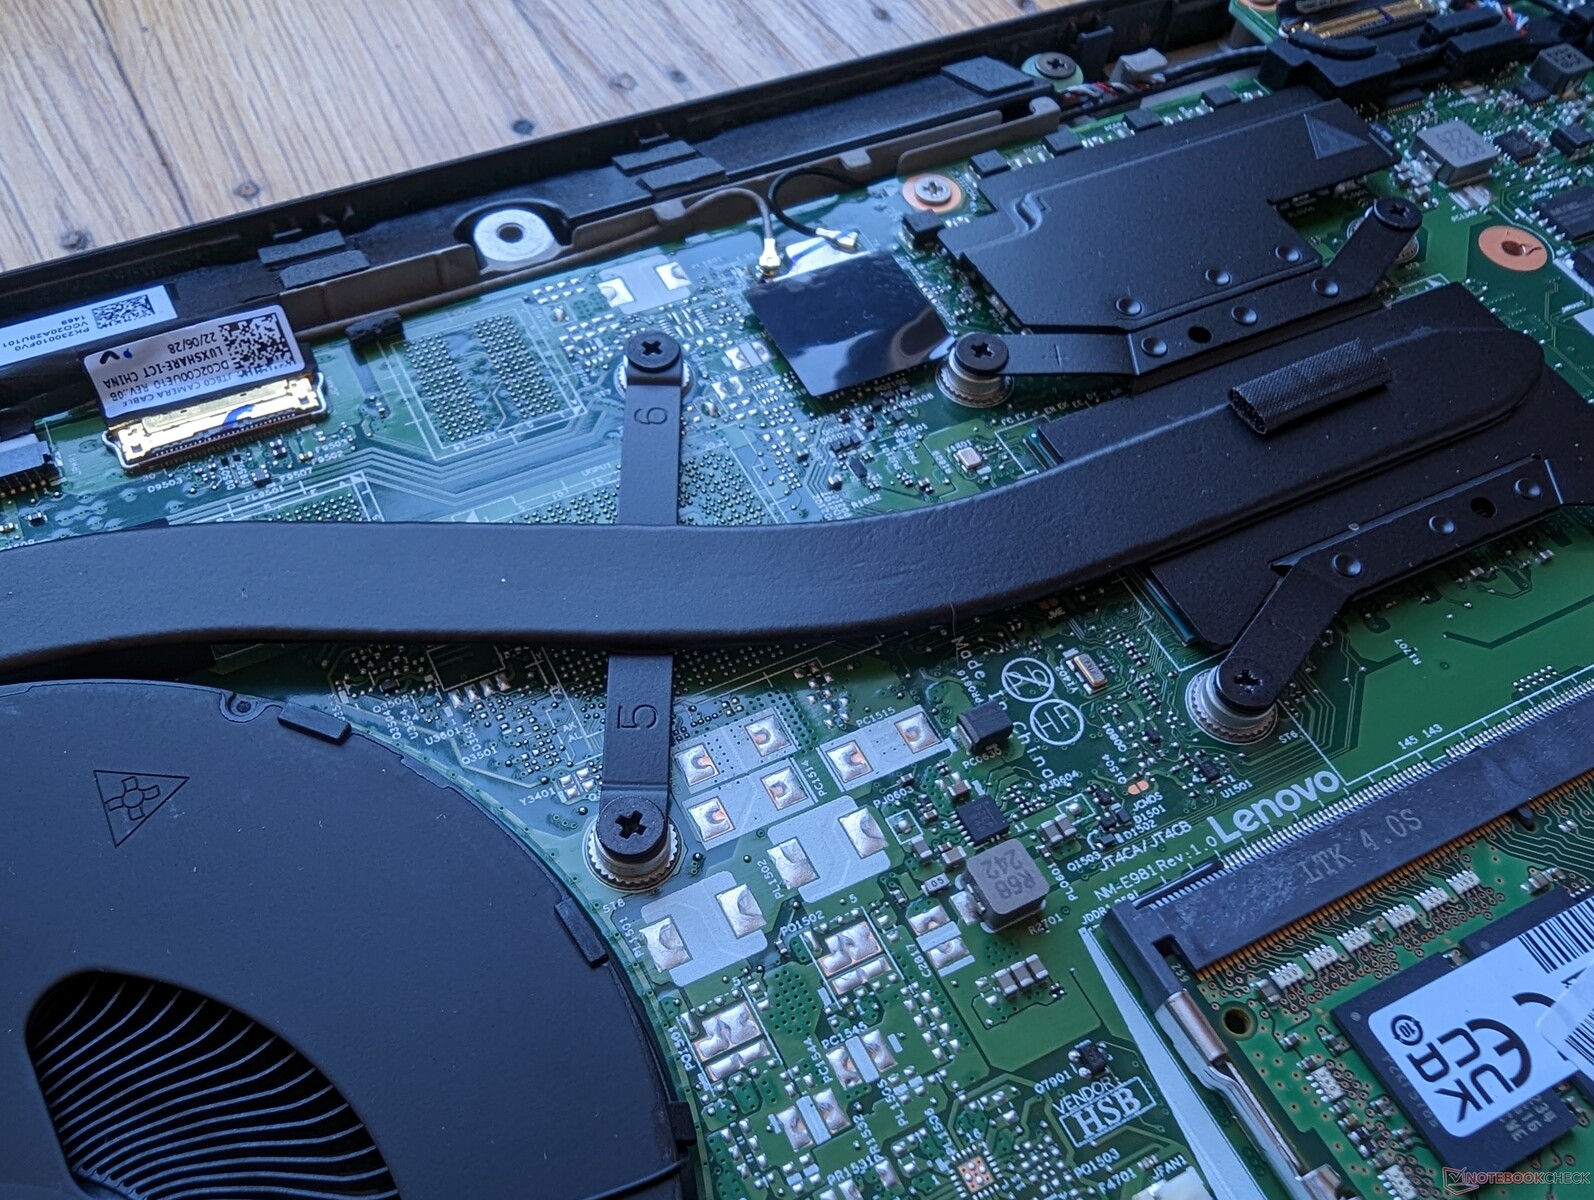
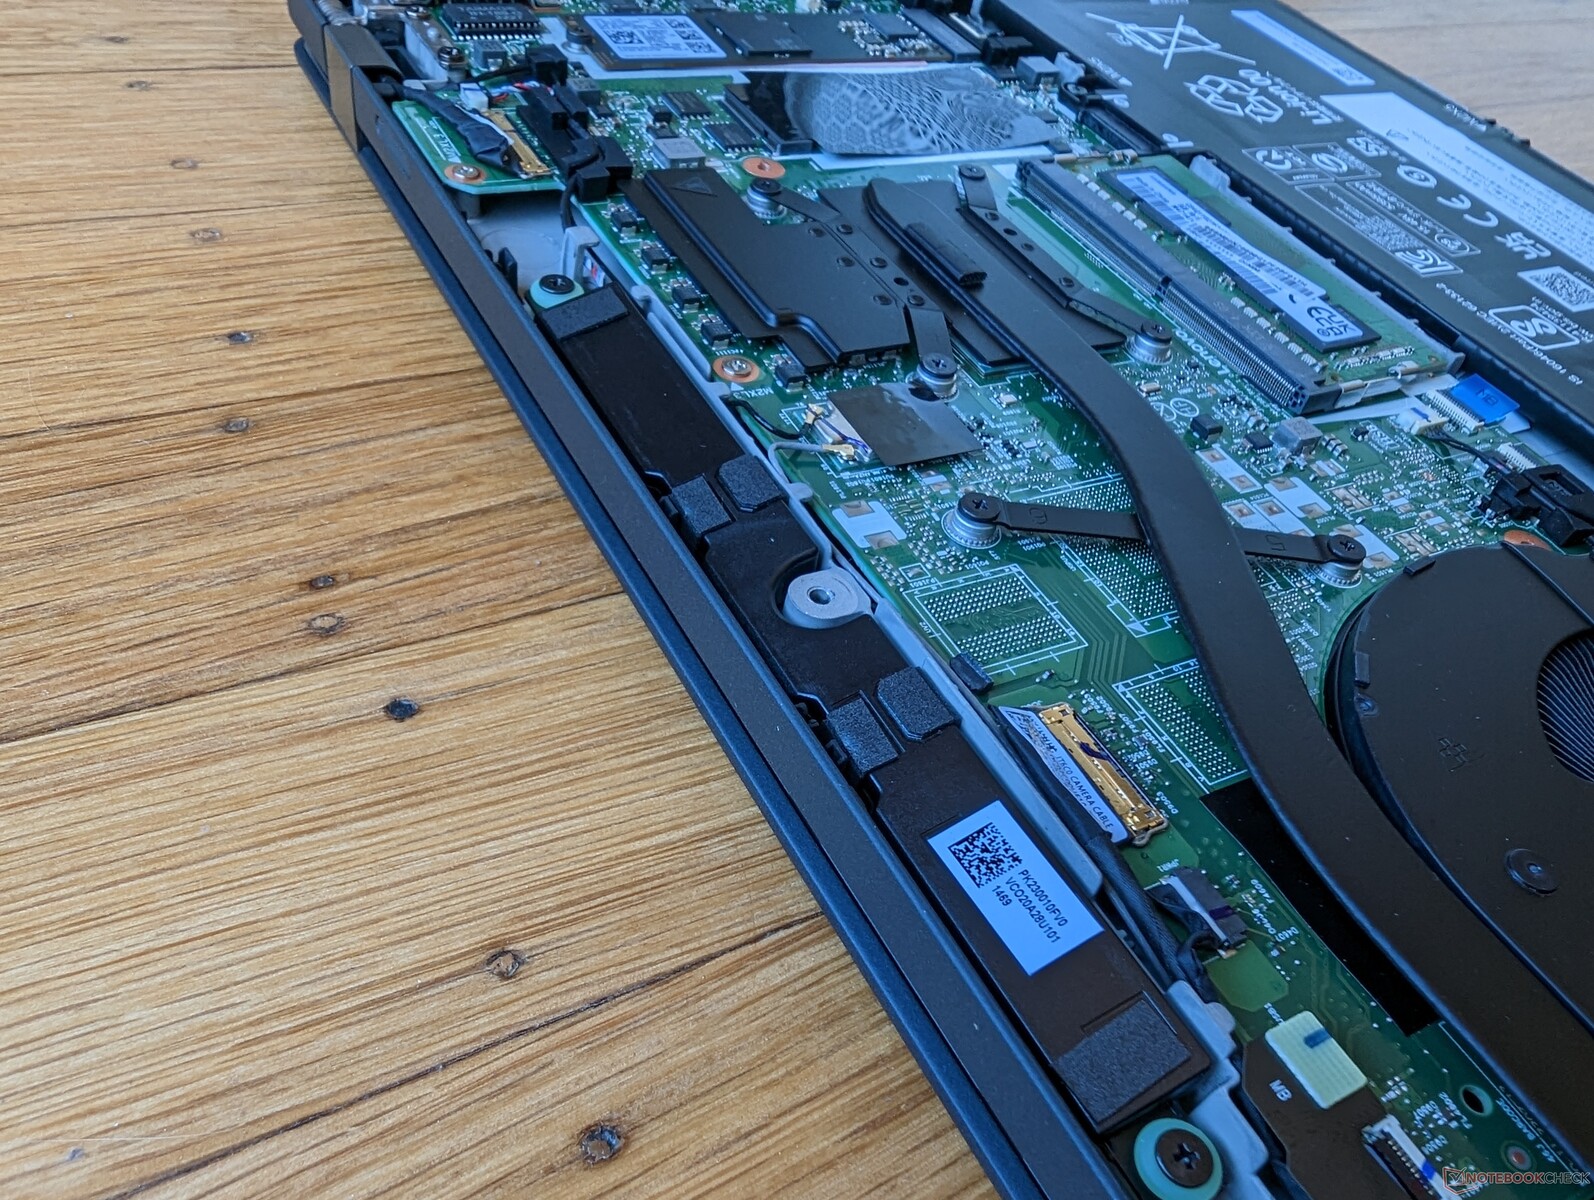
Lo slot M.2 WWAN è vuoto nella nostra configurazione specifica, come mostra l'immagine qui sotto. Purtroppo, Lenovo non include l'antenna se si configura senza WWAN.
| Networking | |
| iperf3 transmit AX12 | |
| Apple MacBook Pro 16 2021 M1 Pro | |
| iperf3 receive AX12 | |
| Apple MacBook Pro 16 2021 M1 Pro | |
| iperf3 receive AXE11000 6GHz | |
| Lenovo ThinkPad T16 G1 21CH004MGE | |
| Huawei MateBook 16s i7 | |
| Lenovo ThinkPad T16 Gen 1 Core i7-1270P | |
| iperf3 receive AXE11000 | |
| Lenovo ThinkPad T16 G1 21CH004MGE | |
| HP EliteBook 865 G9 | |
| LG Gram 16Z90Q | |
| Lenovo ThinkPad T16 Gen 1 Core i7-1270P | |
| Apple MacBook Pro 16 2021 M1 Pro | |
| iperf3 transmit AXE11000 | |
| Lenovo ThinkPad T16 G1 21CH004MGE | |
| HP EliteBook 865 G9 | |
| LG Gram 16Z90Q | |
| Lenovo ThinkPad T16 Gen 1 Core i7-1270P | |
| Apple MacBook Pro 16 2021 M1 Pro | |
| iperf3 transmit AXE11000 6GHz | |
| Lenovo ThinkPad T16 G1 21CH004MGE | |
| Huawei MateBook 16s i7 | |
| Lenovo ThinkPad T16 Gen 1 Core i7-1270P | |
Webcam
La webcam da 2 MP impallidisce in confronto alle webcam da 5 MP presenti in molti modelli HP EliteBook HP EliteBook. Il ThinkPad T16 dispone di un otturatore fisico e di uno a infrarossi.


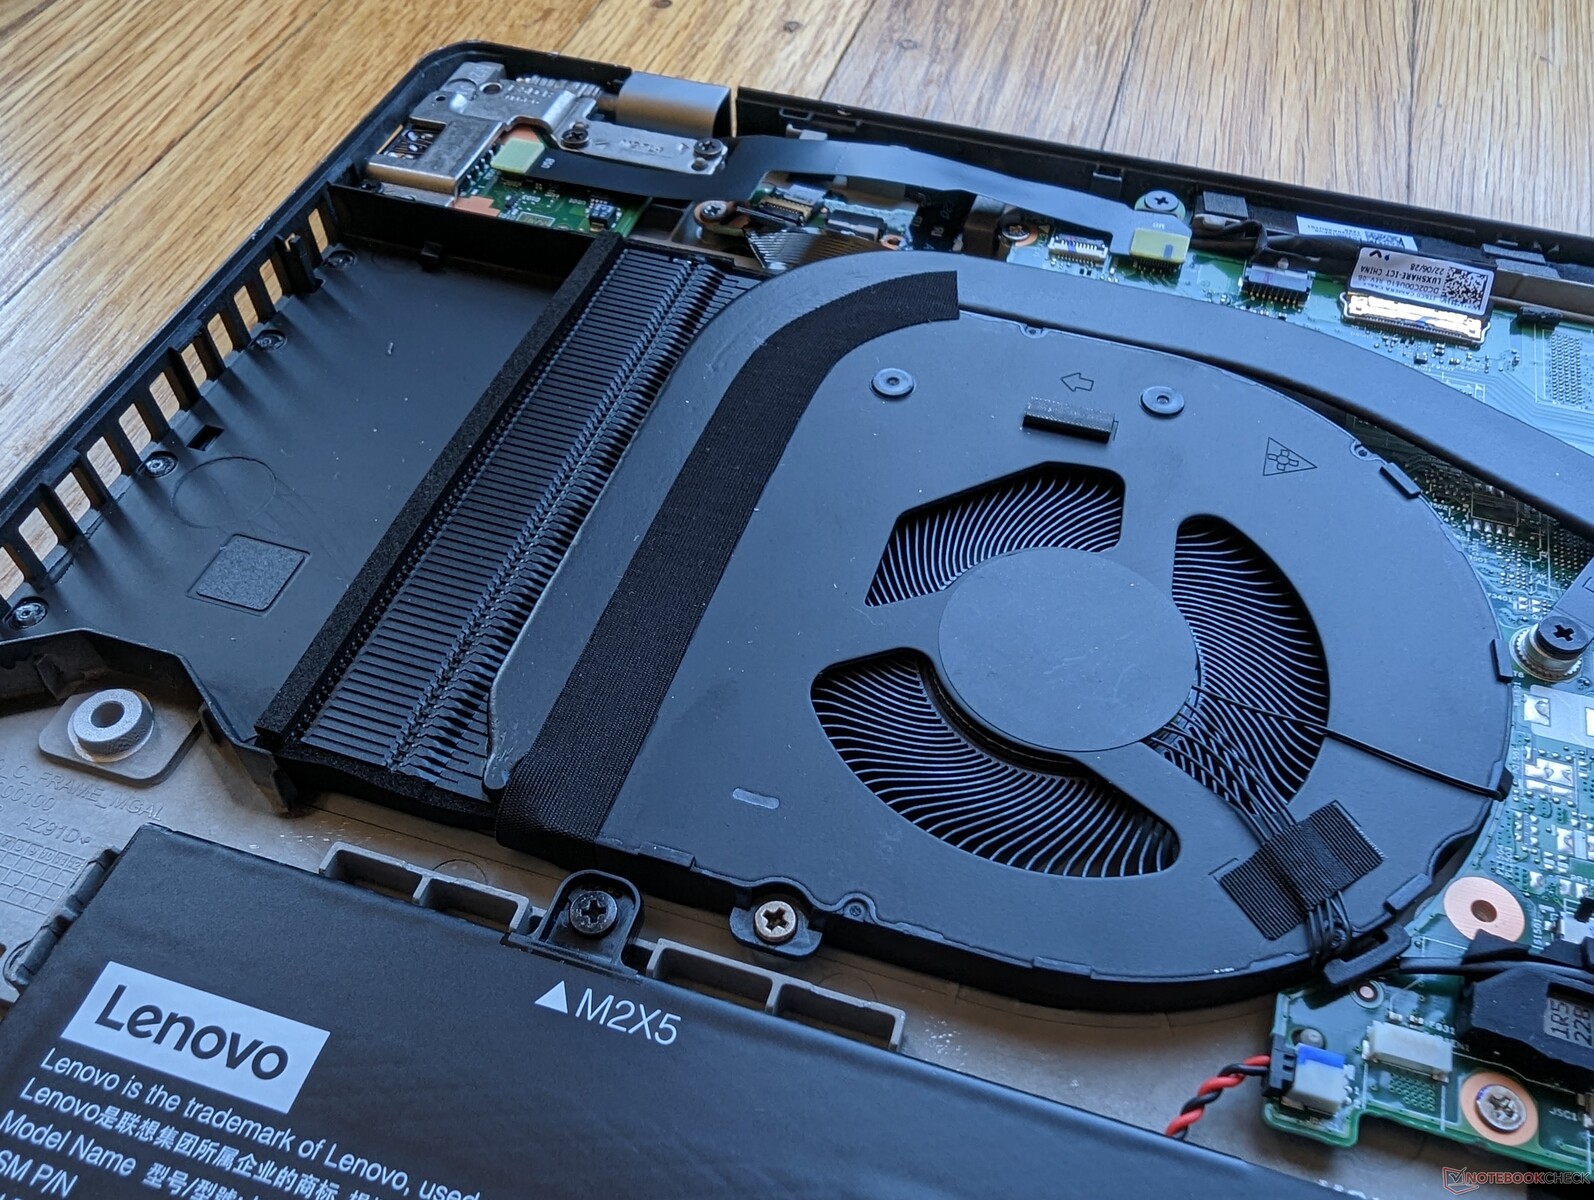
Manutenzione
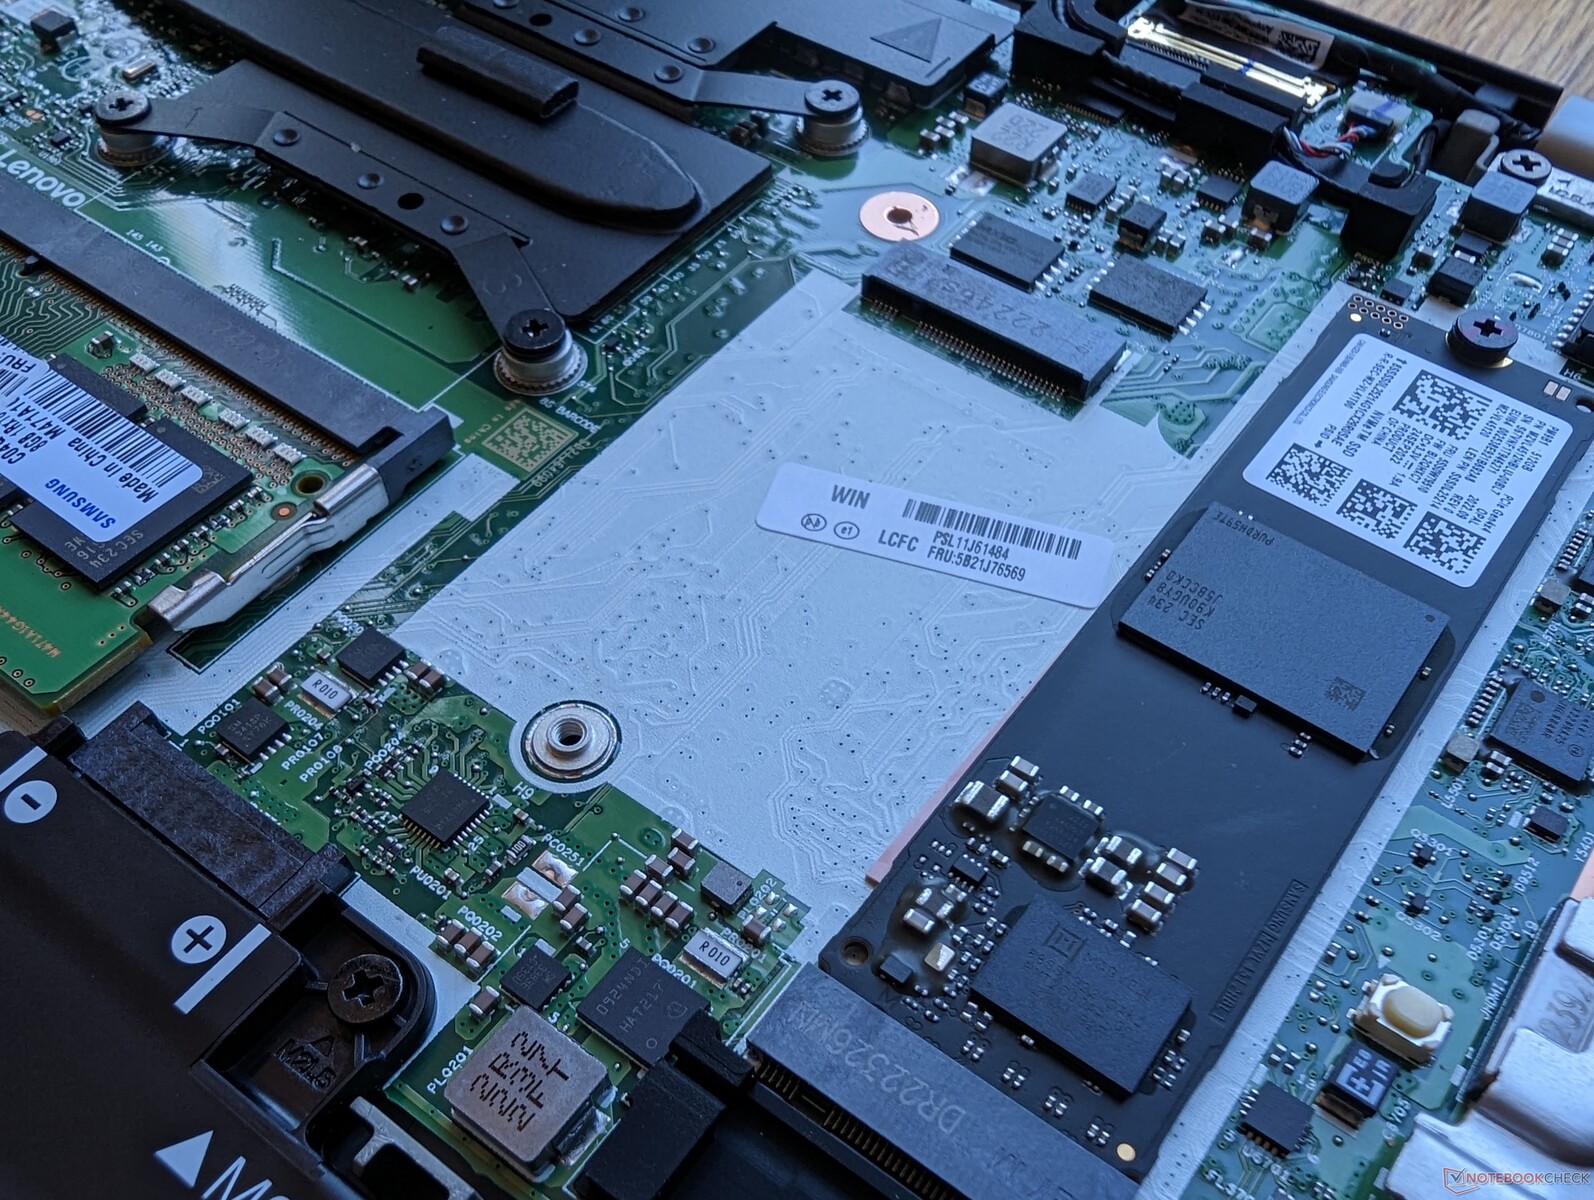
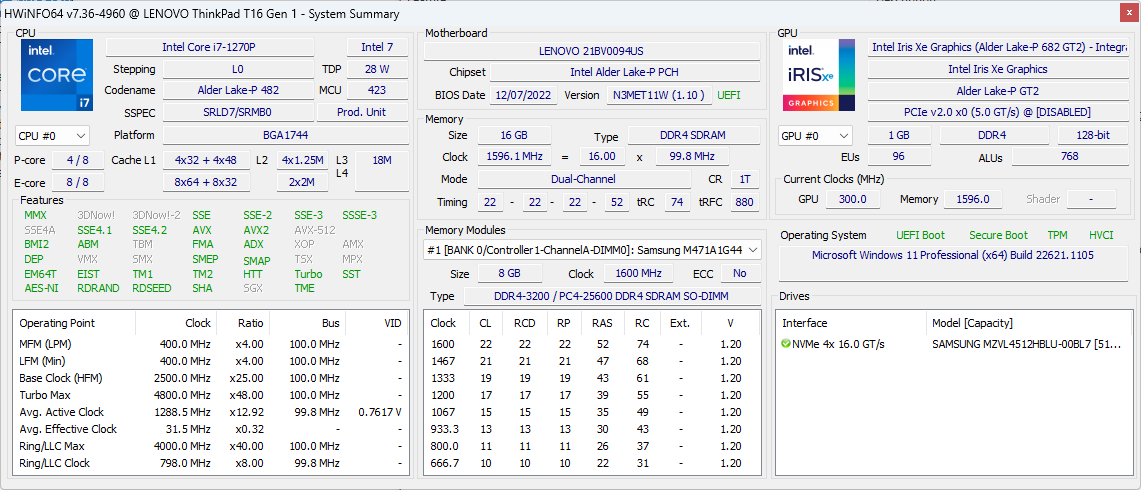
Il pannello inferiore è fissato da otto viti Philips per facilitare la manutenzione. Tenete presente che il modello è dotato di 8 GB di RAM saldata più 1 slot SODIMM per l'espansione, mentre la maggior parte degli altri portatili utilizza esclusivamente RAM saldata o 2 SODIMM. Alcune SKU possono essere dotate di 16 GB di RAM saldata.
Accessori e garanzia
La confezione non contiene altri extra oltre all'adattatore CA e alla documentazione. Se acquistato negli Stati Uniti, il produttore applica una limitazione di un anno.
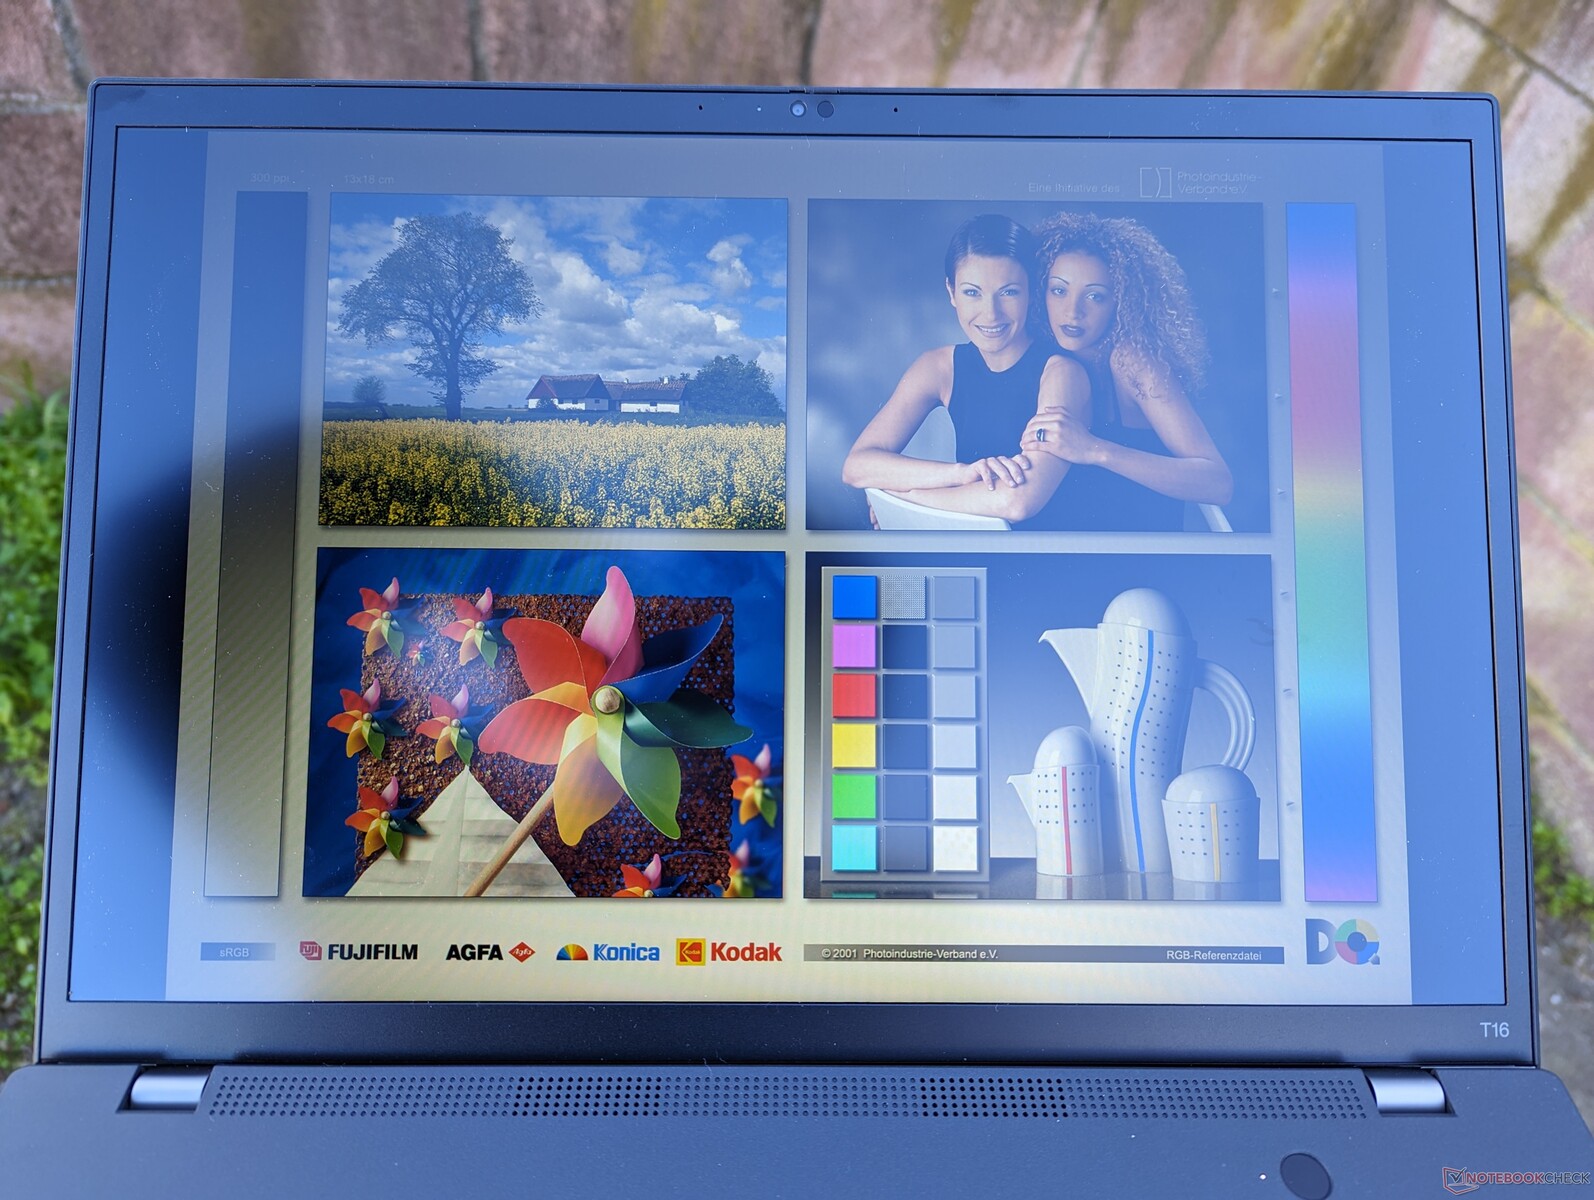
Display - Dalla fascia bassa alla fascia alta
Lenovo offre attualmente cinque diverse opzioni di display IPS opaco, come segue:
- 1920 x 1200, 300 nit, 45% NTSC
- 1920 x 1200, 300 nits, touchscreen, 45% NTSC
- 1920 x 1200, basso consumo, 400 nits, 100% sRGB, bassa luce blu
- 1920 x 1200, touchscreen con Privacy Guard, 500 nits, 100% sRGB, bassa luce blu
- 2560 x 1600, 400 nits, bassa luce blu, calibrazione International Color Consortium
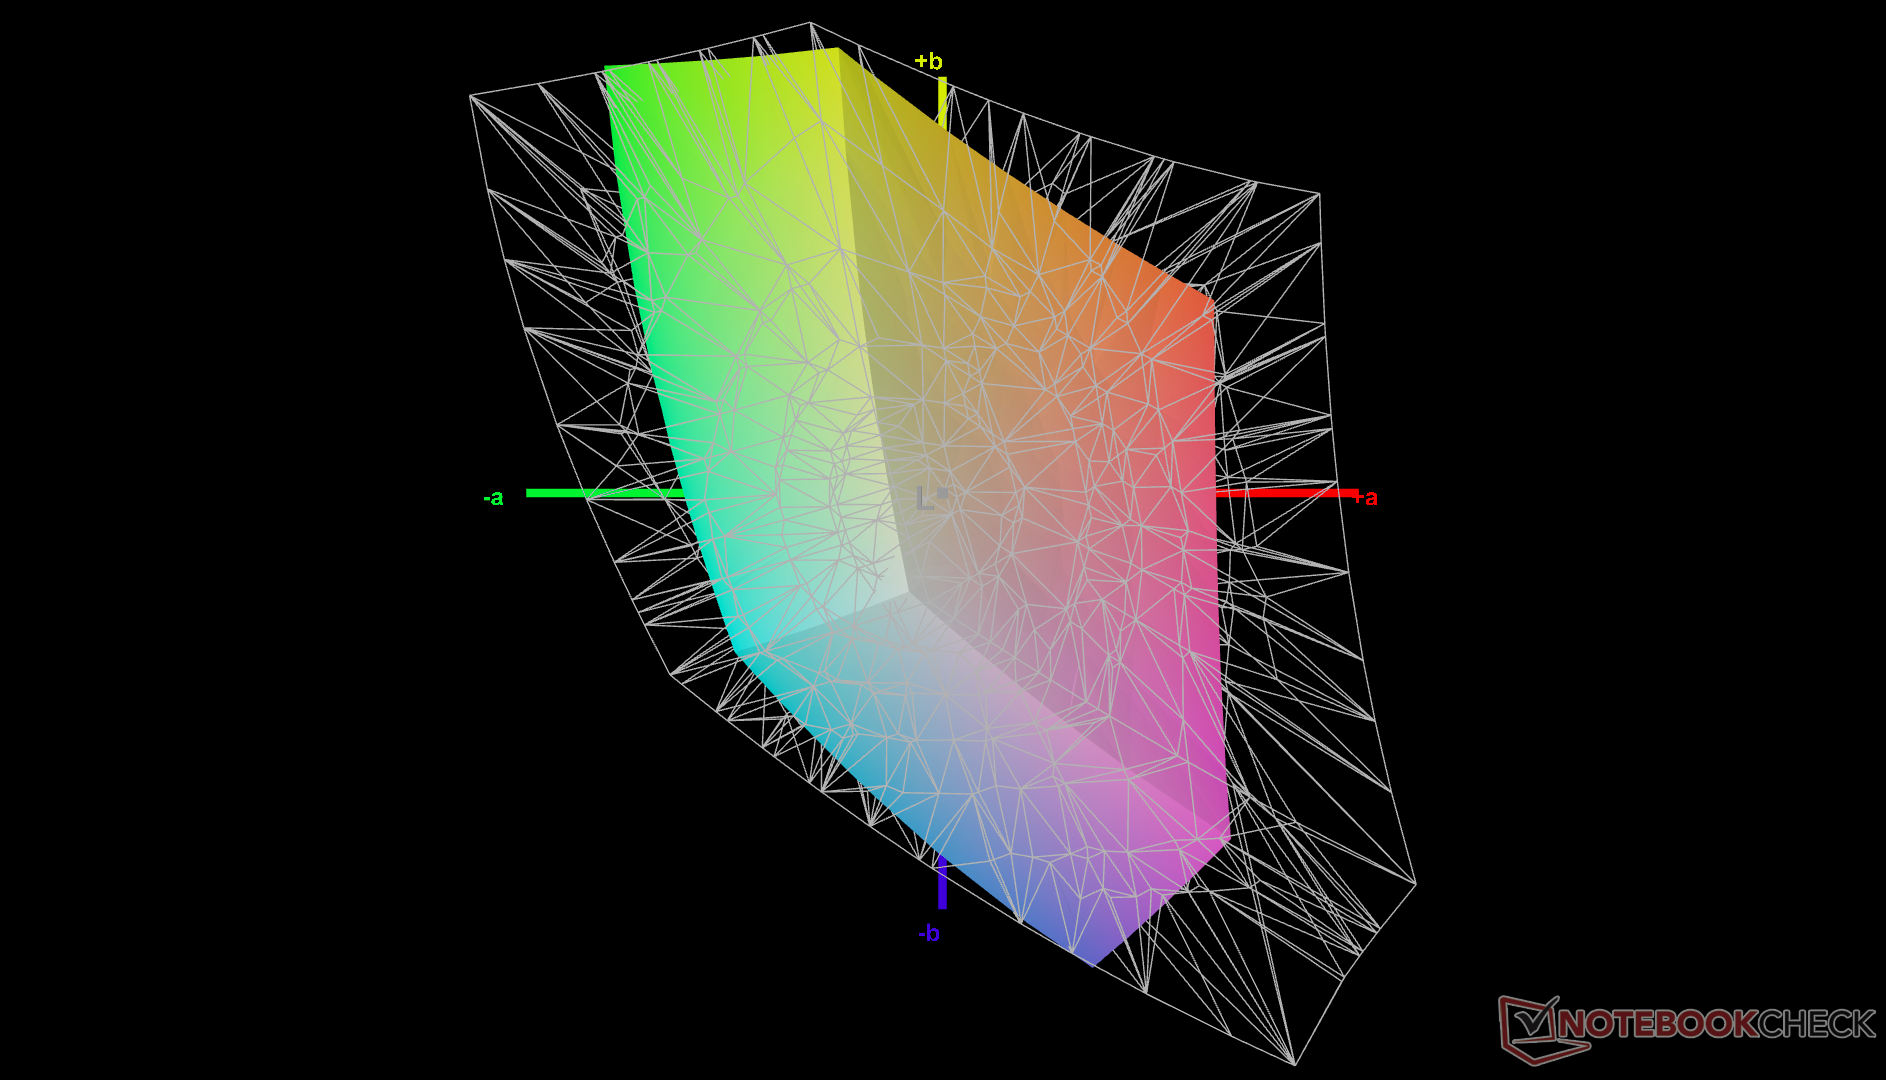
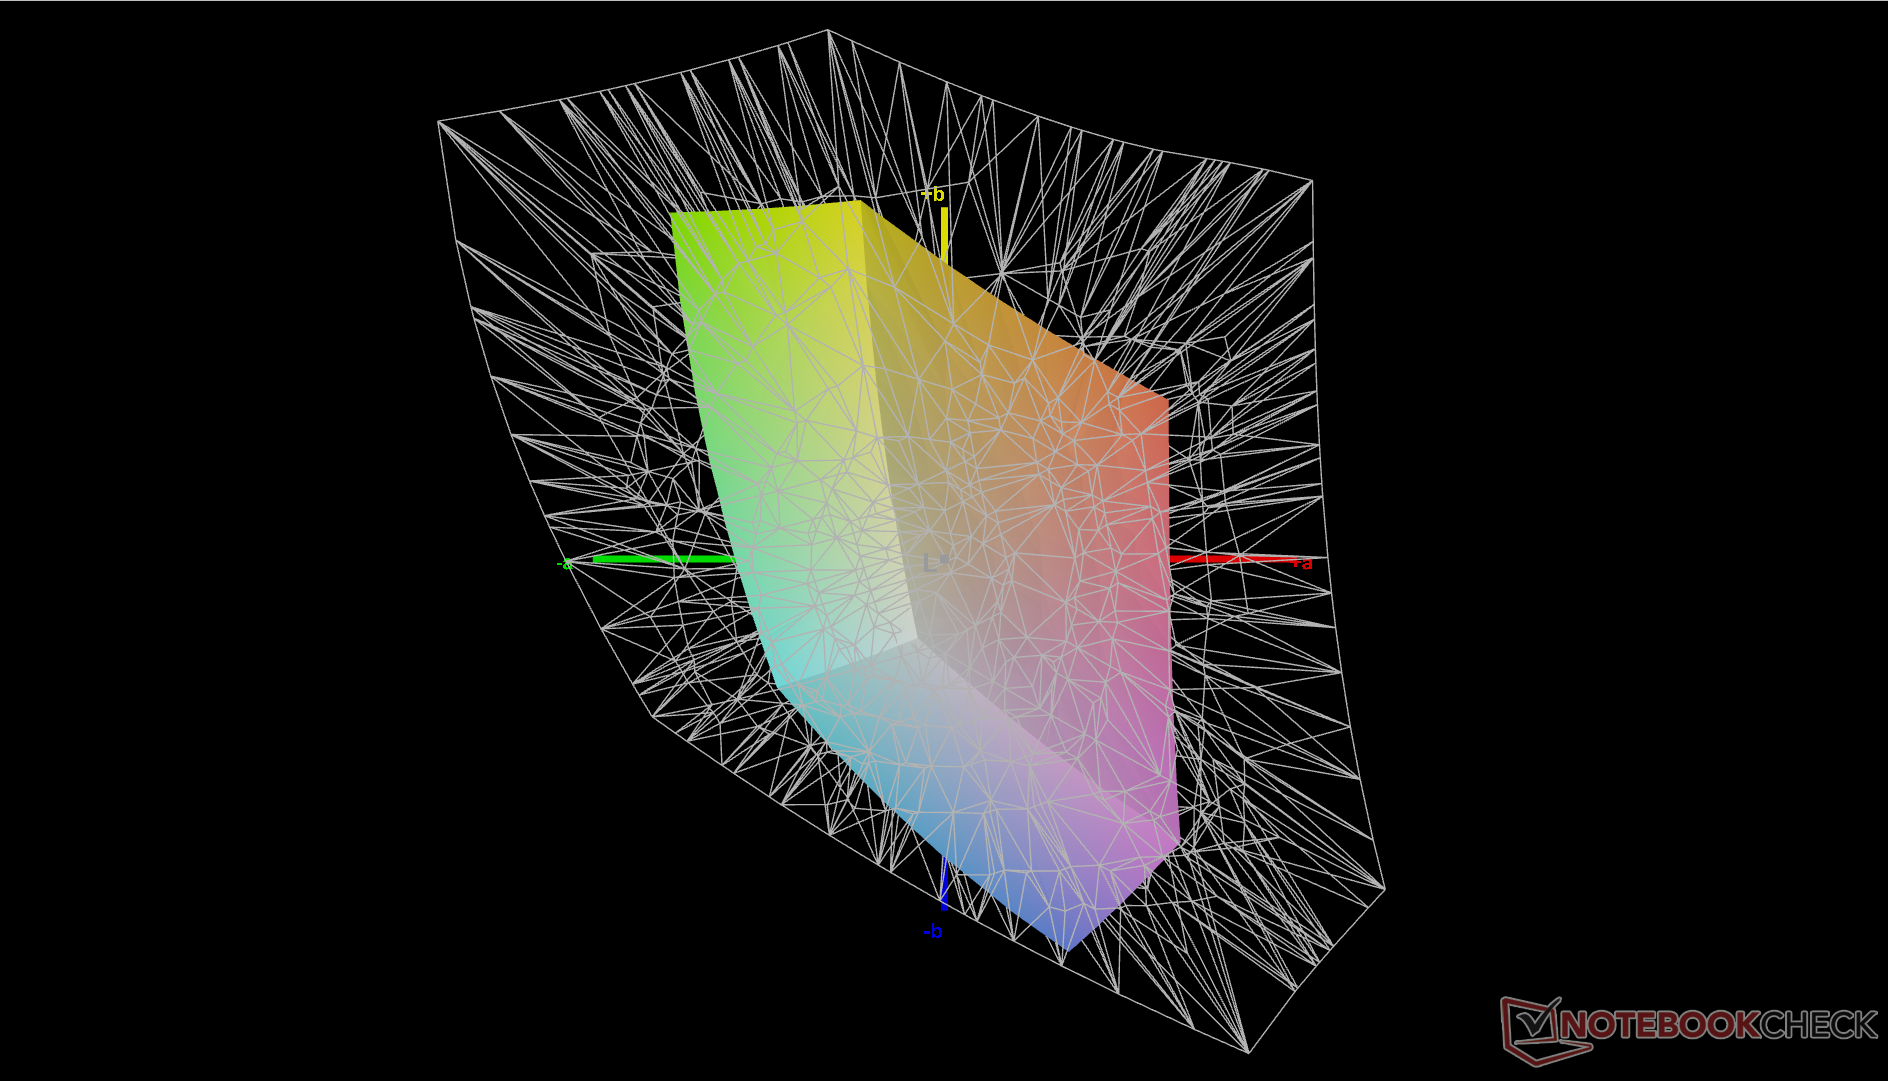
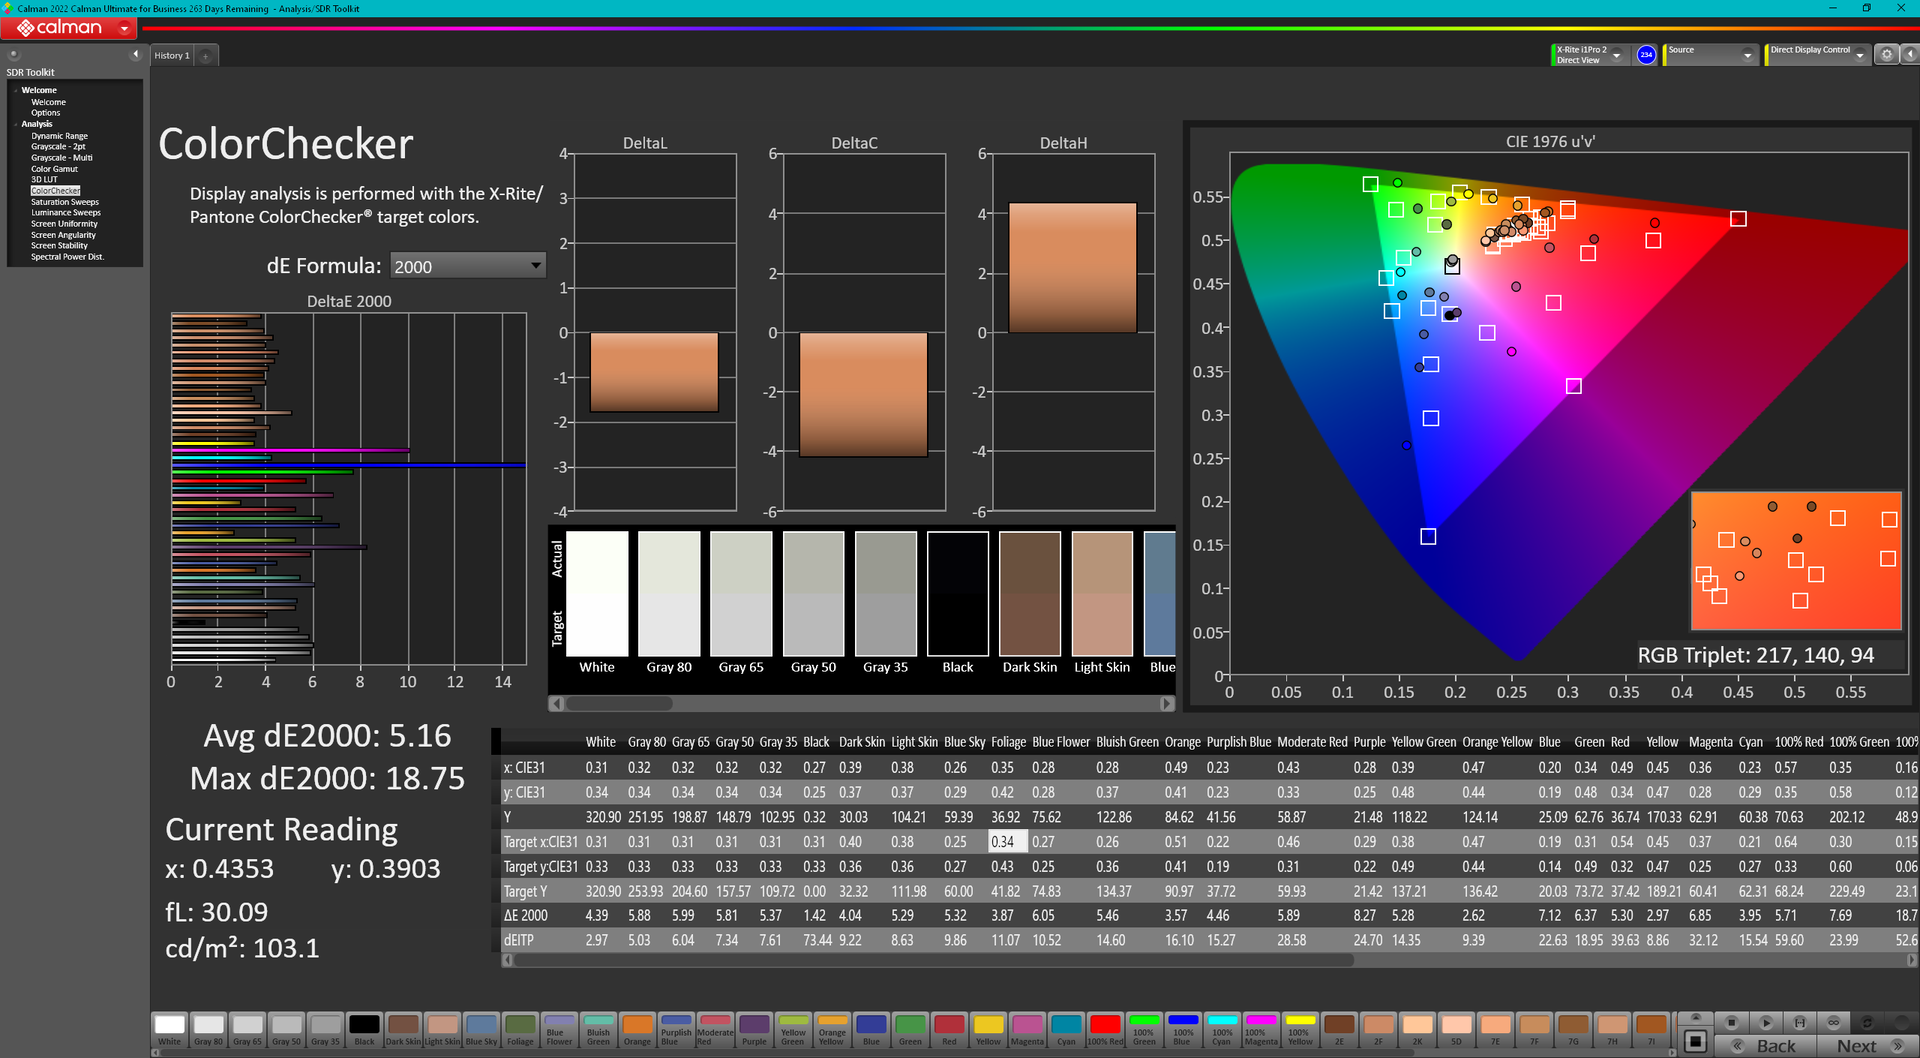
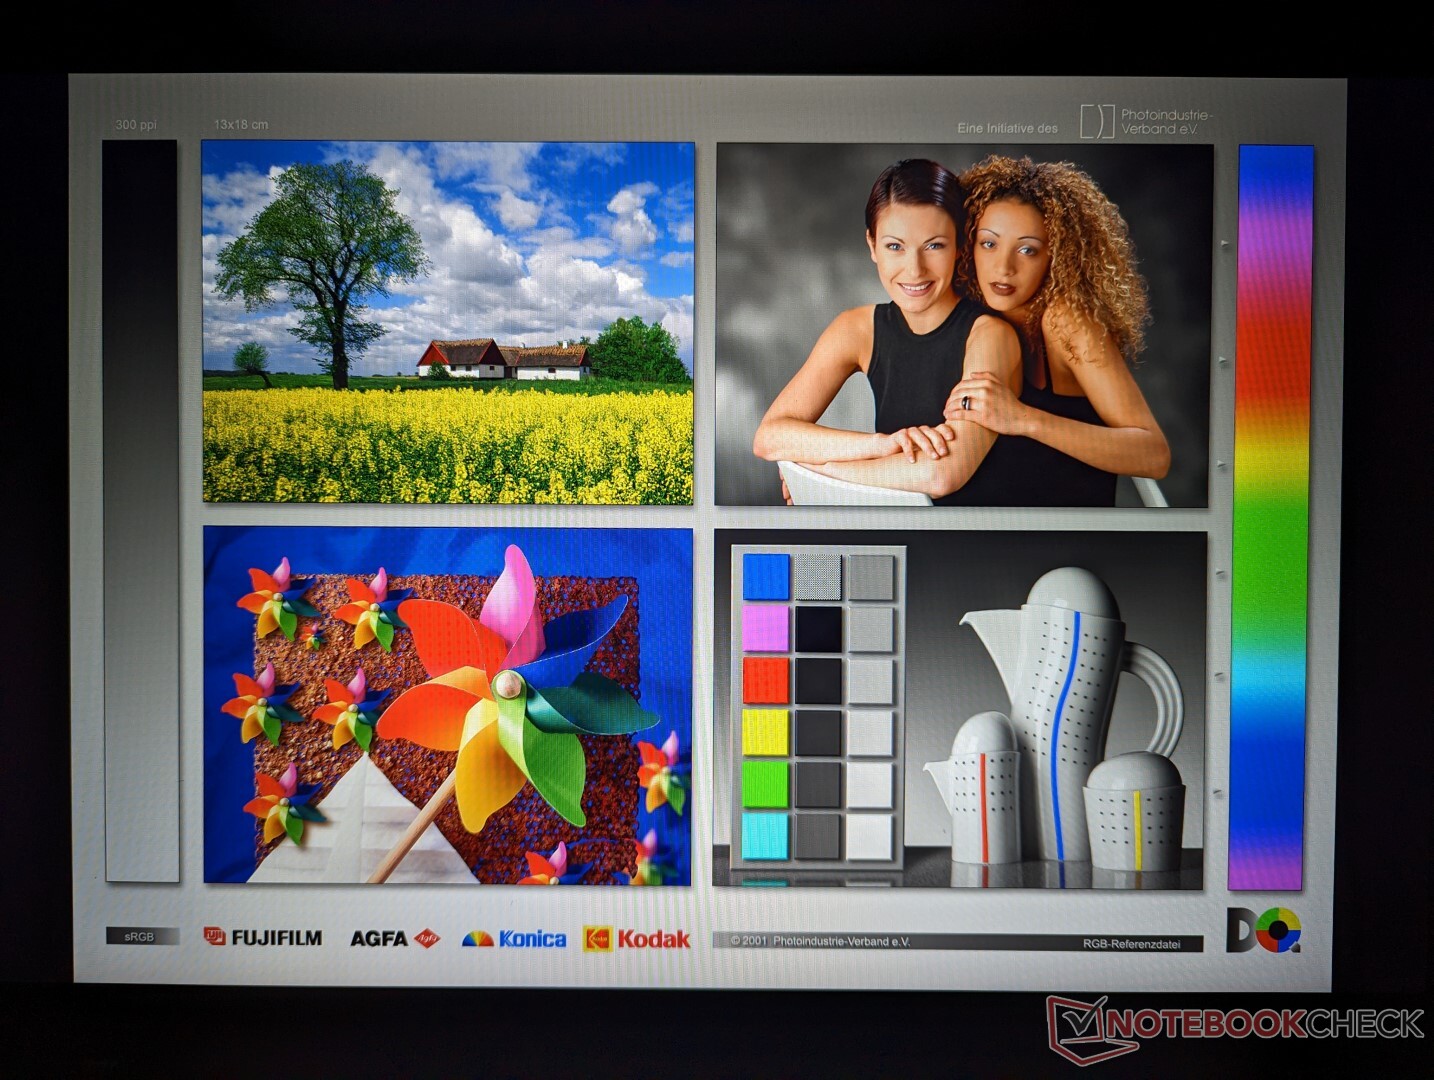
La nostra configurazione prevede il pannello B160UAN03.2 in grassetto, che è l'opzione meno costosa. Rispetto al pannello di fascia più alta da 1600p, quello da 1200p ha colori e nitidezza inferiori di molto. Si tratta comunque di un display decente, soprattutto se confrontato con altri pannelli con un gamut sRGB simile al 60%, ma è preferibile scegliere la copertura sRGB completa per qualsiasi tipo di editing video o grafico.

| |||||||||||||||||||||||||
Distribuzione della luminosità: 82 %
Al centro con la batteria: 321.3 cd/m²
Contrasto: 1036:1 (Nero: 0.31 cd/m²)
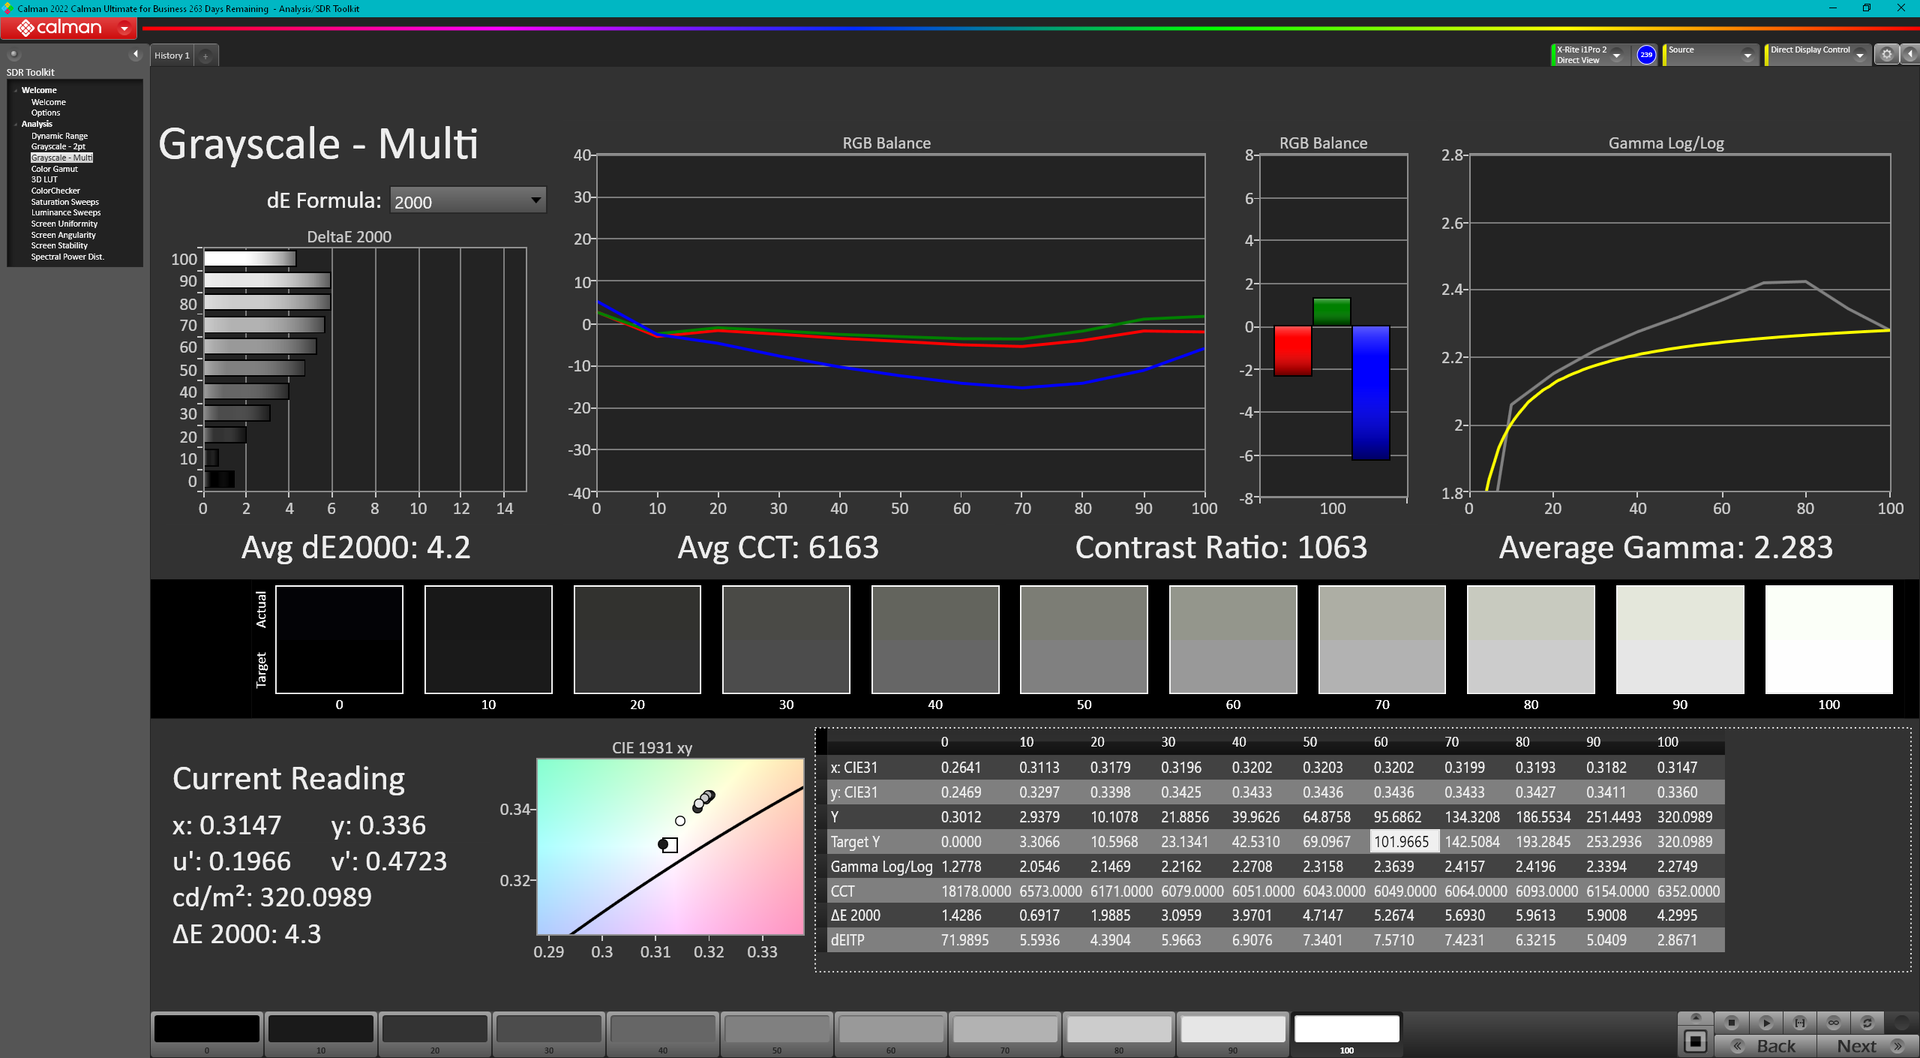
ΔE ColorChecker Calman: 5.16 | ∀{0.5-29.43 Ø4.73}
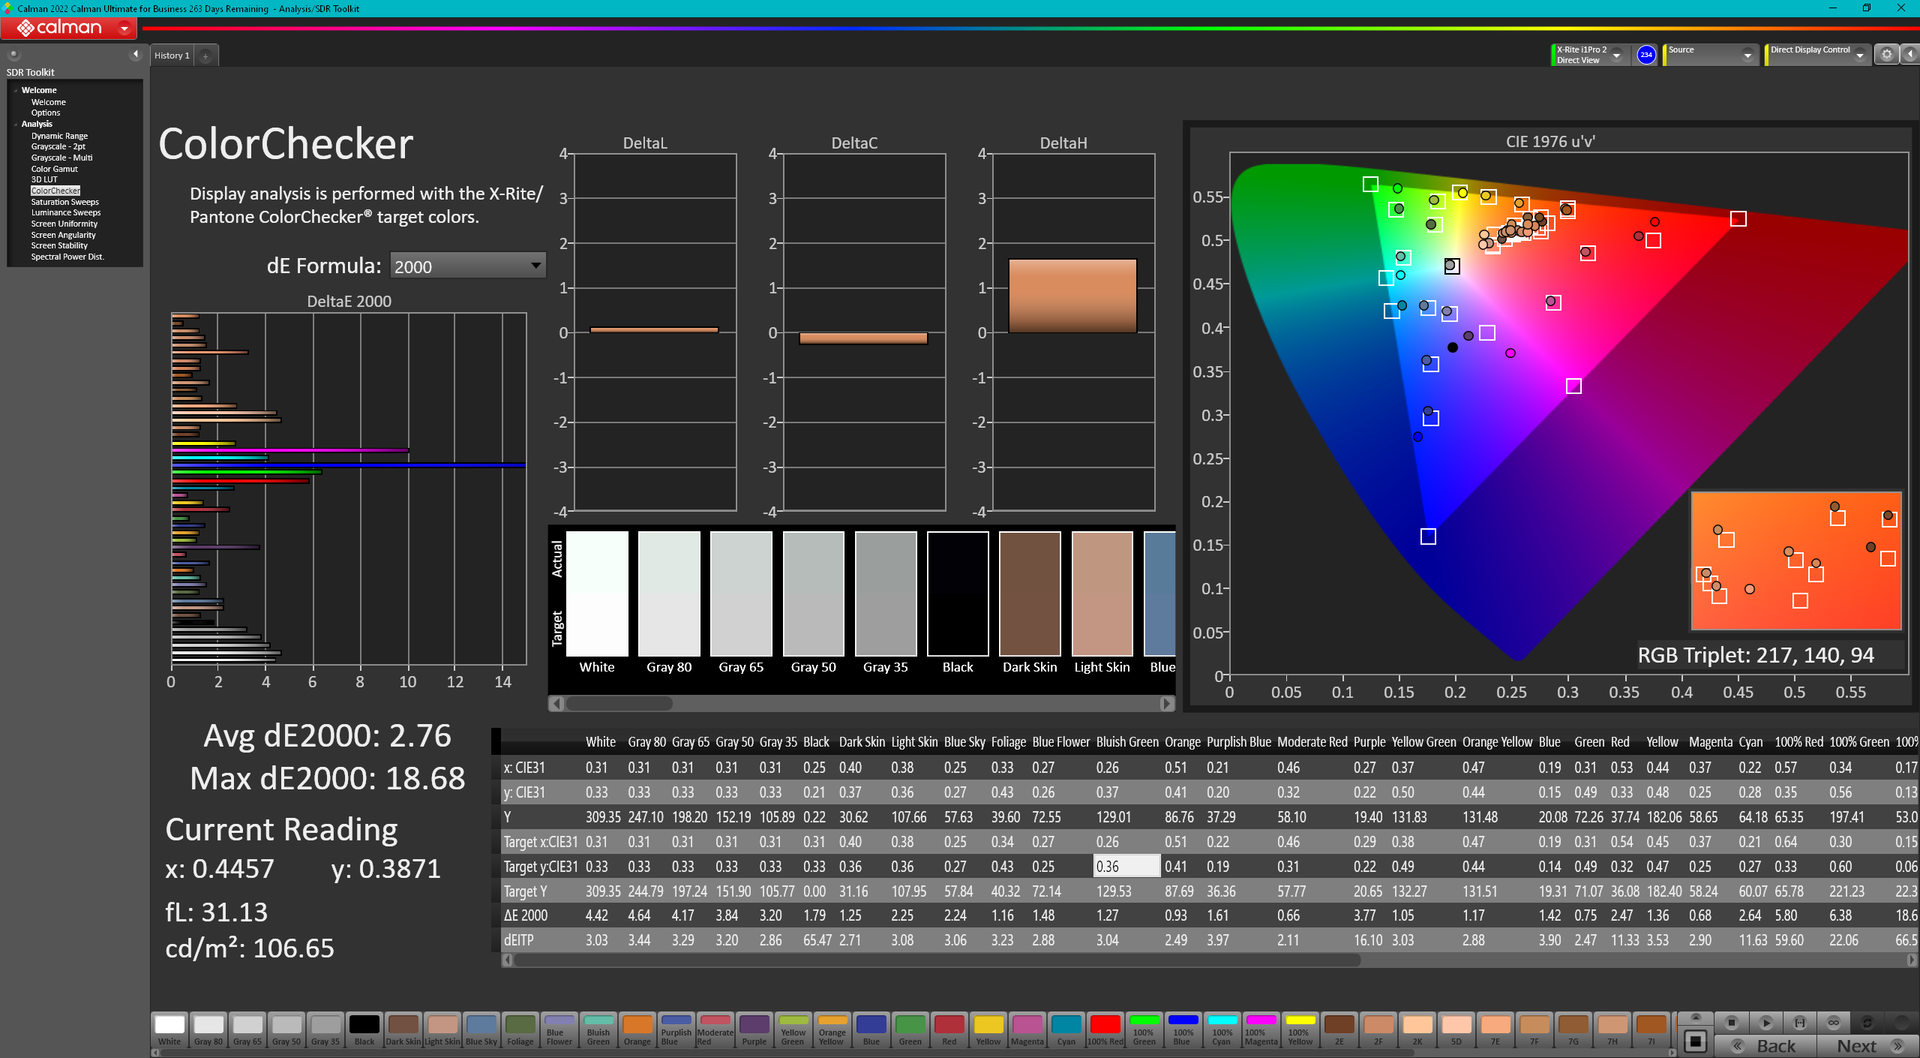
calibrated: 2.76
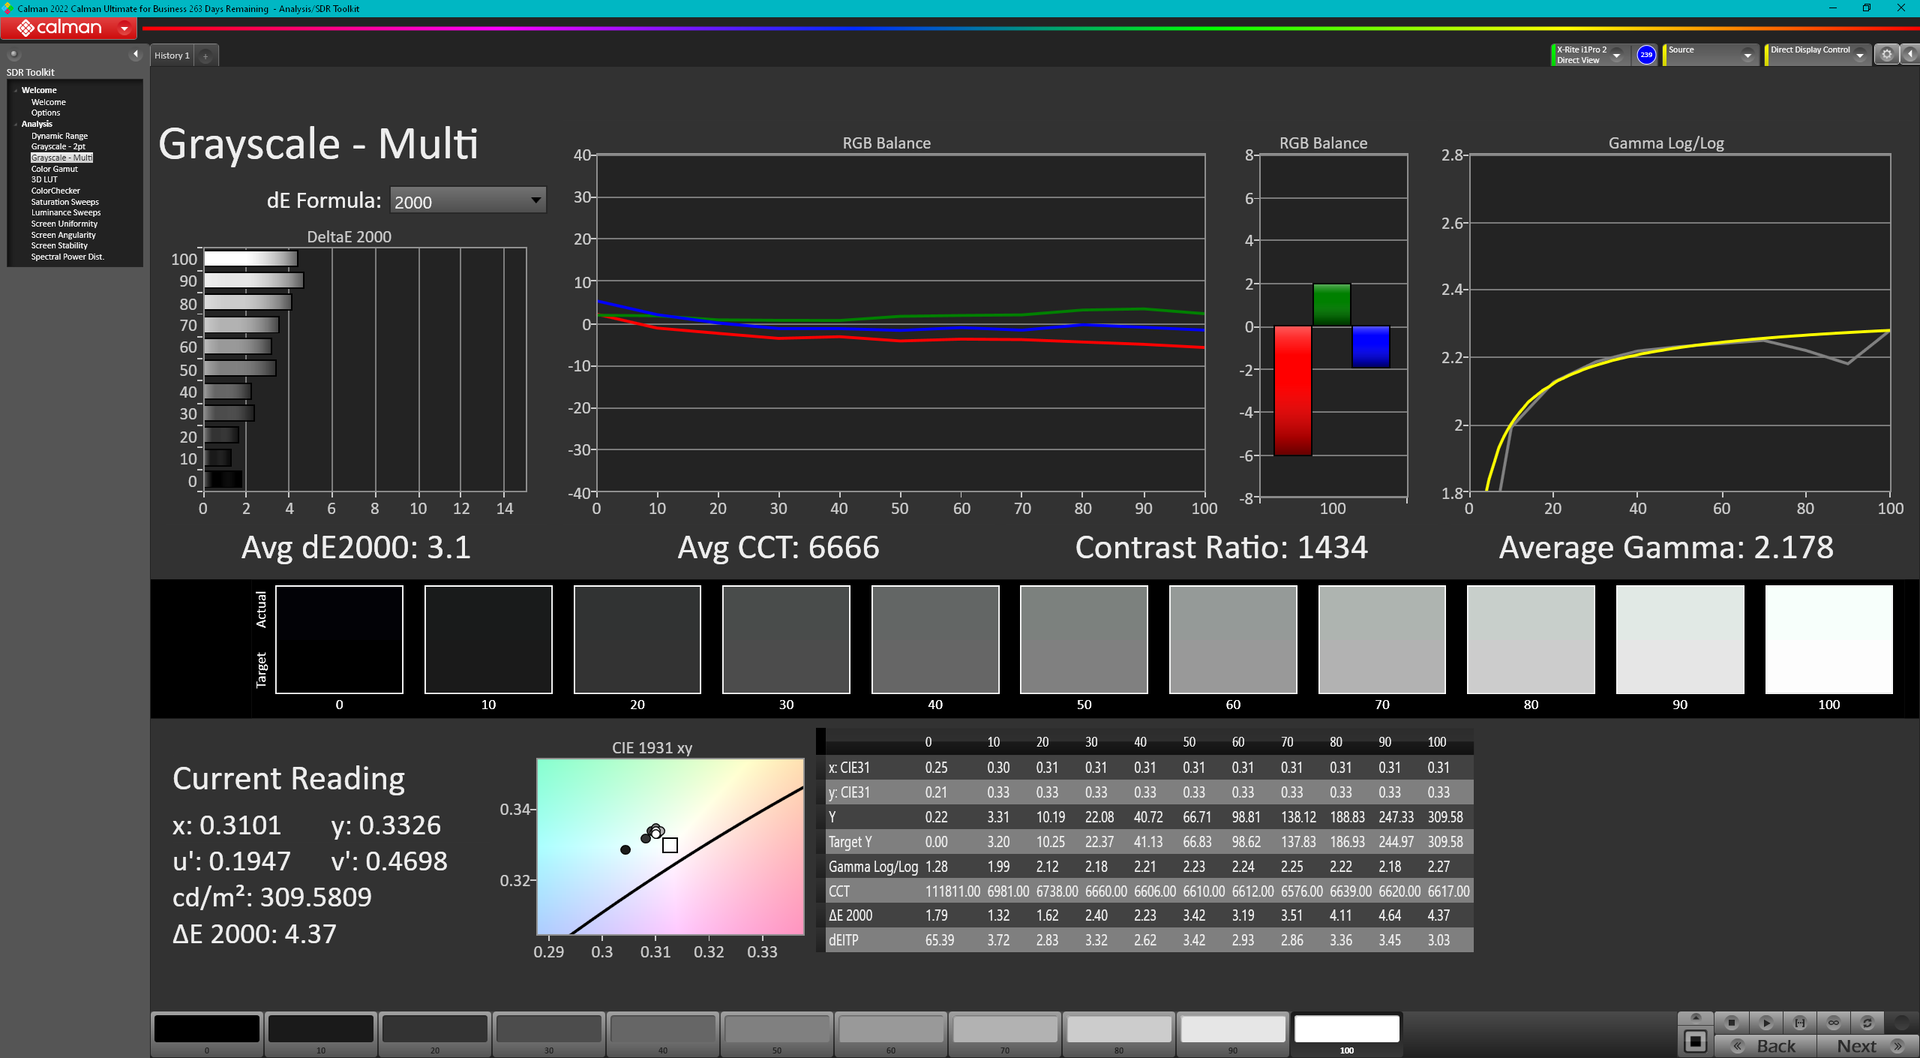
ΔE Greyscale Calman: 4.2 | ∀{0.09-98 Ø4.97}
41% AdobeRGB 1998 (Argyll 3D)
59% sRGB (Argyll 3D)
39.7% Display P3 (Argyll 3D)
Gamma: 2.28
CCT: 6163 K
| Lenovo ThinkPad T16 Gen 1 Core i7-1270P B160UAN3.2, IPS, 1920x1200, 16" | Lenovo ThinkPad T16 G1 21CH004MGE MNG007DA1-C, IPS-LED, 2560x1600, 16" | LG Gram 16Z90Q LG LP160WQ1-SPB2 (LGD06EB), IPS, 2560x1600, 16" | HP EliteBook 865 G9 X160NV42, IPS, 1920x1200, 16" | Huawei MateBook 16s i7 BOE XS TV160DKT-NH0, IPS, 2520x1680, 16" | Apple MacBook Pro 16 2021 M1 Pro Liquid Retina XDR, Mini-LED, 3456x2234, 16.2" | |
|---|---|---|---|---|---|---|
| Display | 66% | 106% | 76% | 63% | 111% | |
| Display P3 Coverage (%) | 39.7 | 66.7 68% | 96.8 144% | 71.4 80% | 64.5 62% | 99.1 150% |
| sRGB Coverage (%) | 59 | 95.7 62% | 99.9 69% | 99.3 68% | 96.7 64% | 100 69% |
| AdobeRGB 1998 Coverage (%) | 41 | 69.1 69% | 84.6 106% | 73.2 79% | 66.6 62% | 88 115% |
| Response Times | 7% | -19% | -9% | -9% | -161% | |
| Response Time Grey 50% / Grey 80% * (ms) | 29.2 ? | 32.1 ? -10% | 45.7 ? -57% | 35.5 ? -22% | 35.7 ? -22% | 42.8 ? -47% |
| Response Time Black / White * (ms) | 24.4 ? | 18.9 ? 23% | 19.7 ? 19% | 23.5 ? 4% | 23.2 ? 5% | 91.6 ? -275% |
| PWM Frequency (Hz) | 56.7 | 14880 | ||||
| Screen | 43% | 23% | 73% | 49% | 352% | |
| Brightness middle (cd/m²) | 321.3 | 417 30% | 366 14% | 865 169% | 311 -3% | 514 60% |
| Brightness (cd/m²) | 315 | 388 23% | 347 10% | 771 145% | 319 1% | 497 58% |
| Brightness Distribution (%) | 82 | 81 -1% | 89 9% | 72 -12% | 91 11% | 95 16% |
| Black Level * (cd/m²) | 0.31 | 0.24 23% | 0.32 -3% | 0.3 3% | 0.17 45% | 0.02 94% |
| Contrast (:1) | 1036 | 1738 68% | 1144 10% | 2883 178% | 1829 77% | 25700 2381% |
| Colorchecker dE 2000 * | 5.16 | 1.7 67% | 2.82 45% | 2.4 53% | 1 81% | 1.4 73% |
| Colorchecker dE 2000 max. * | 18.75 | 3.5 81% | 4.65 75% | 5.8 69% | 1.7 91% | 2.8 85% |
| Colorchecker dE 2000 calibrated * | 2.76 | 1.4 49% | 2.69 3% | 1.5 46% | 0.8 71% | |
| Greyscale dE 2000 * | 4.2 | 2.4 43% | 2.3 45% | 3.8 10% | 1.5 64% | 2.3 45% |
| Gamma | 2.28 96% | 2.16 102% | 1.971 112% | 2.36 93% | 2.15 102% | 2.27 97% |
| CCT | 6163 105% | 6924 94% | 6796 96% | 6922 94% | 6432 101% | 6792 96% |
| Media totale (Programma / Settaggio) | 39% /
43% | 37% /
35% | 47% /
62% | 34% /
44% | 101% /
217% |
* ... Meglio usare valori piccoli
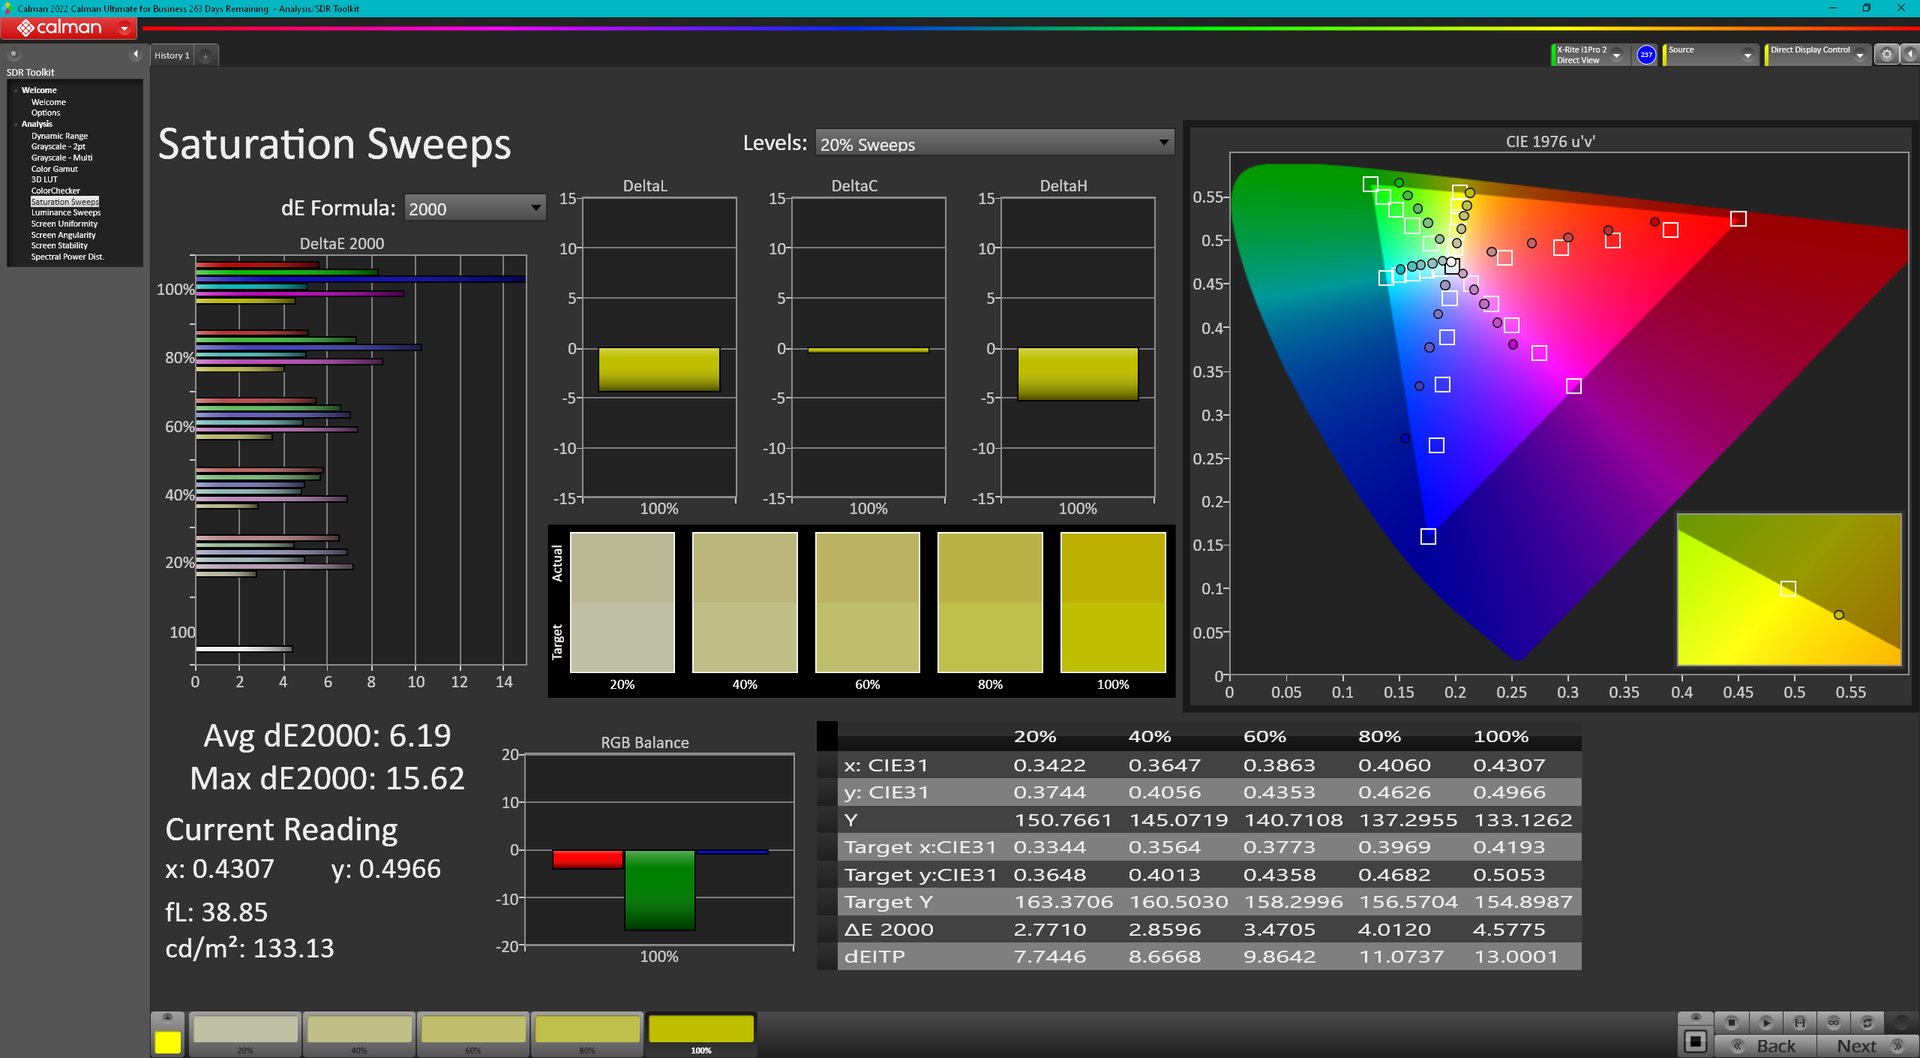
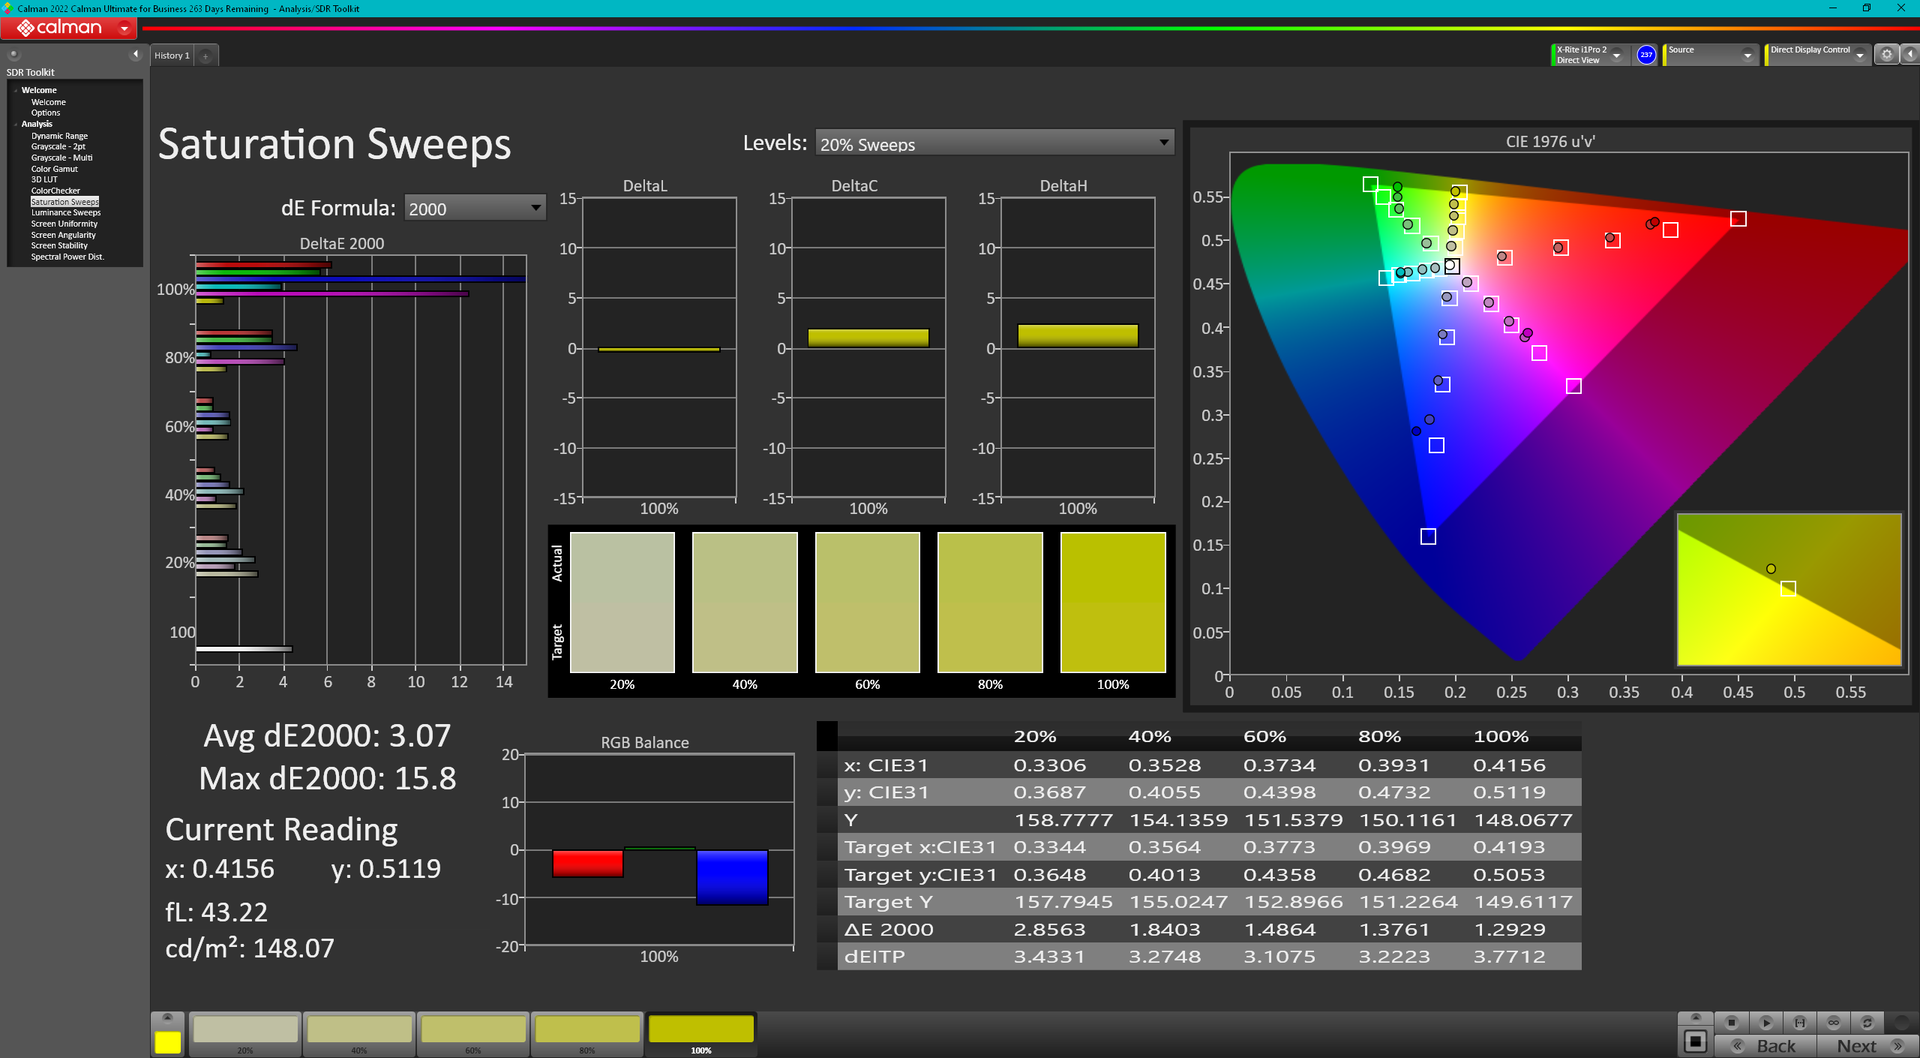
La temperatura del colore è troppo calda, cosa che fortunatamente può essere risolta con una corretta calibrazione. Il DeltaE medio del colore migliorerebbe da 5,05 a 2,23, ma i colori sono ancora imprecisi ad alti livelli di saturazione a causa della limitata copertura cromatica del pannello. Si consiglia di applicare il nostro profilo ICM calibrato sopra, poiché il display non è calibrato in fabbrica.
Tempi di risposta del Display
| ↔ Tempi di risposta dal Nero al Bianco | ||
|---|---|---|
| 24.4 ms ... aumenta ↗ e diminuisce ↘ combinato | ↗ 14 ms Incremento | 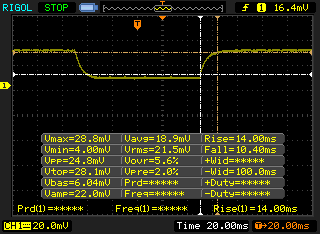 |
| ↘ 10.4 ms Calo | ||
| Lo schermo mostra buoni tempi di risposta durante i nostri tests, ma potrebbe essere troppo lento per i gamers competitivi. In confronto, tutti i dispositivi di test variano da 0.1 (minimo) a 240 (massimo) ms. » 57 % di tutti i dispositivi è migliore. Questo significa che i tempi di risposta rilevati sono peggiori rispetto alla media di tutti i dispositivi testati (19.9 ms). | ||
| ↔ Tempo di risposta dal 50% Grigio all'80% Grigio | ||
| 29.2 ms ... aumenta ↗ e diminuisce ↘ combinato | ↗ 15.6 ms Incremento | 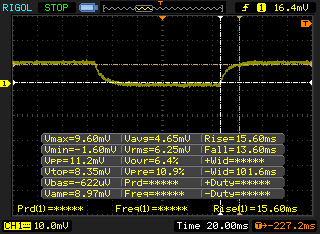 |
| ↘ 13.6 ms Calo | ||
| Lo schermo mostra tempi di risposta relativamente lenti nei nostri tests e potrebbe essere troppo lento per i gamers. In confronto, tutti i dispositivi di test variano da 0.165 (minimo) a 636 (massimo) ms. » 39 % di tutti i dispositivi è migliore. Questo significa che i tempi di risposta rilevati sono simili alla media di tutti i dispositivi testati (31.1 ms). | ||
Sfarfallio dello schermo / PWM (Pulse-Width Modulation)
| flickering dello schermo / PWM non rilevato | 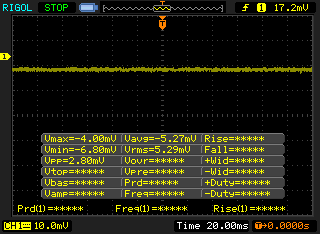 | ||
In confronto: 52 % di tutti i dispositivi testati non utilizza PWM per ridurre la luminosita' del display. Se è rilevato PWM, una media di 7798 (minimo: 5 - massimo: 343500) Hz è stata rilevata. | |||
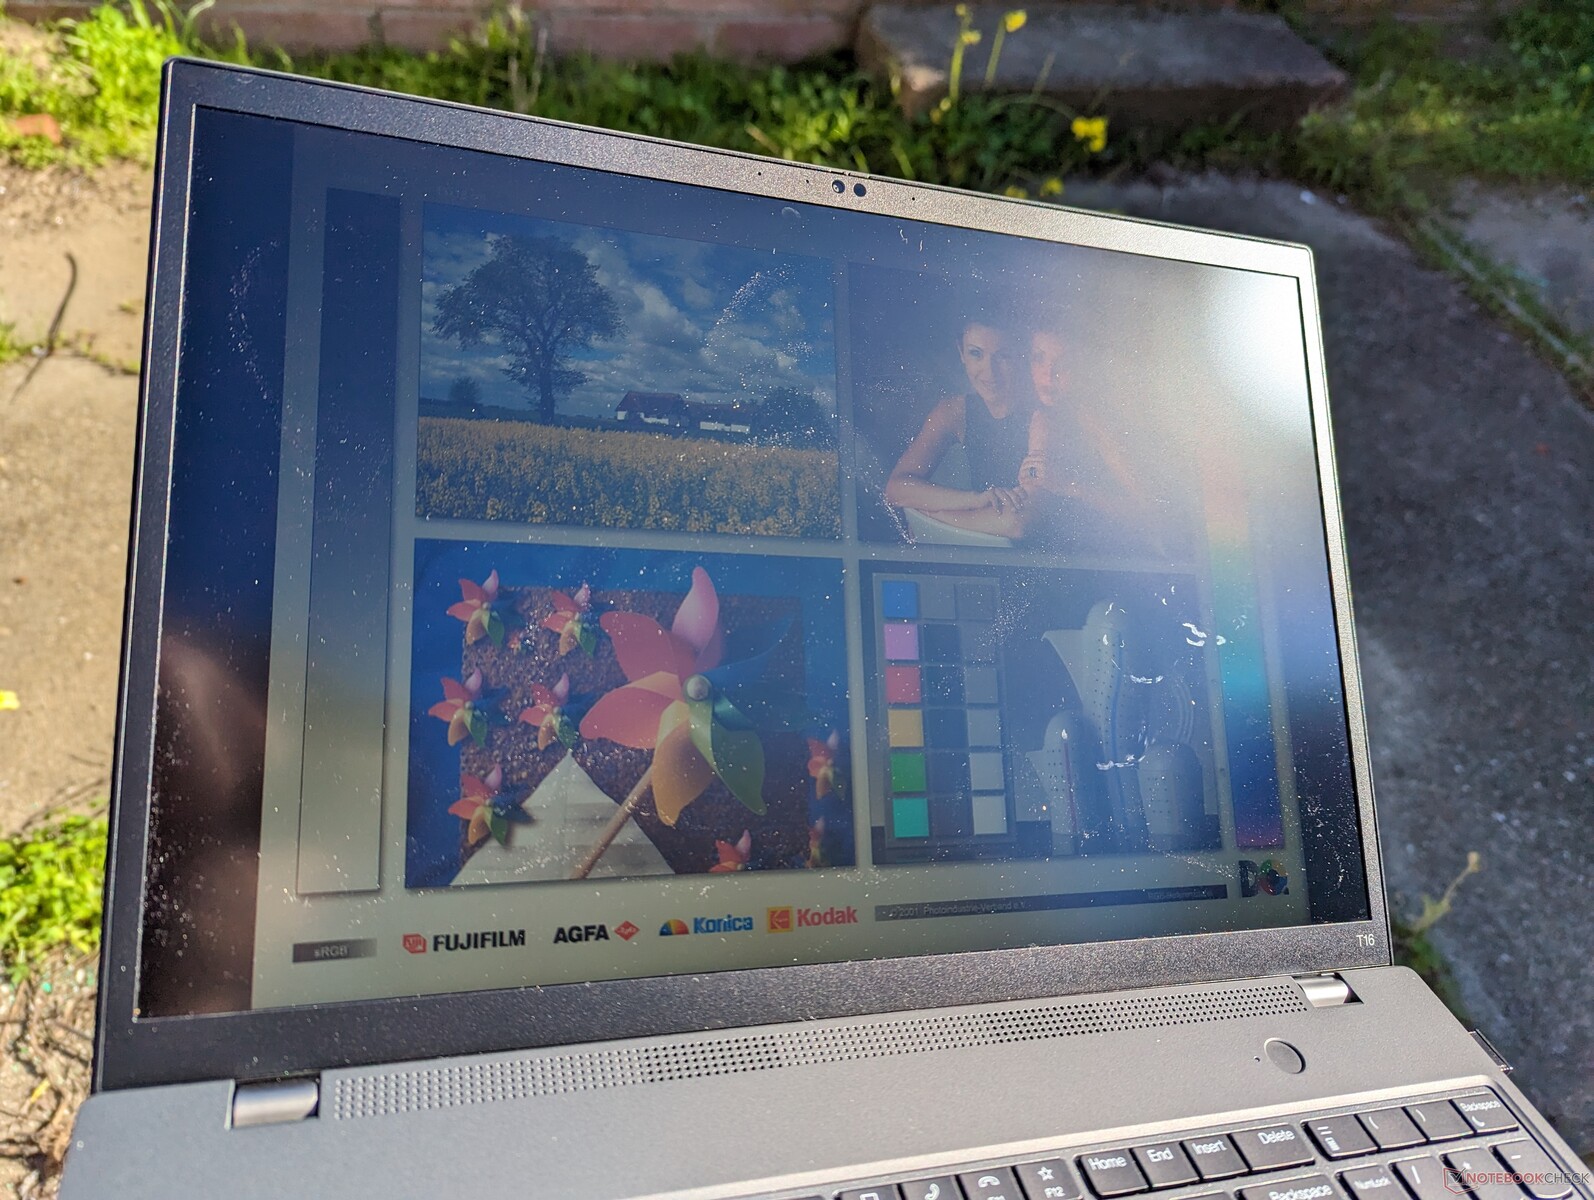
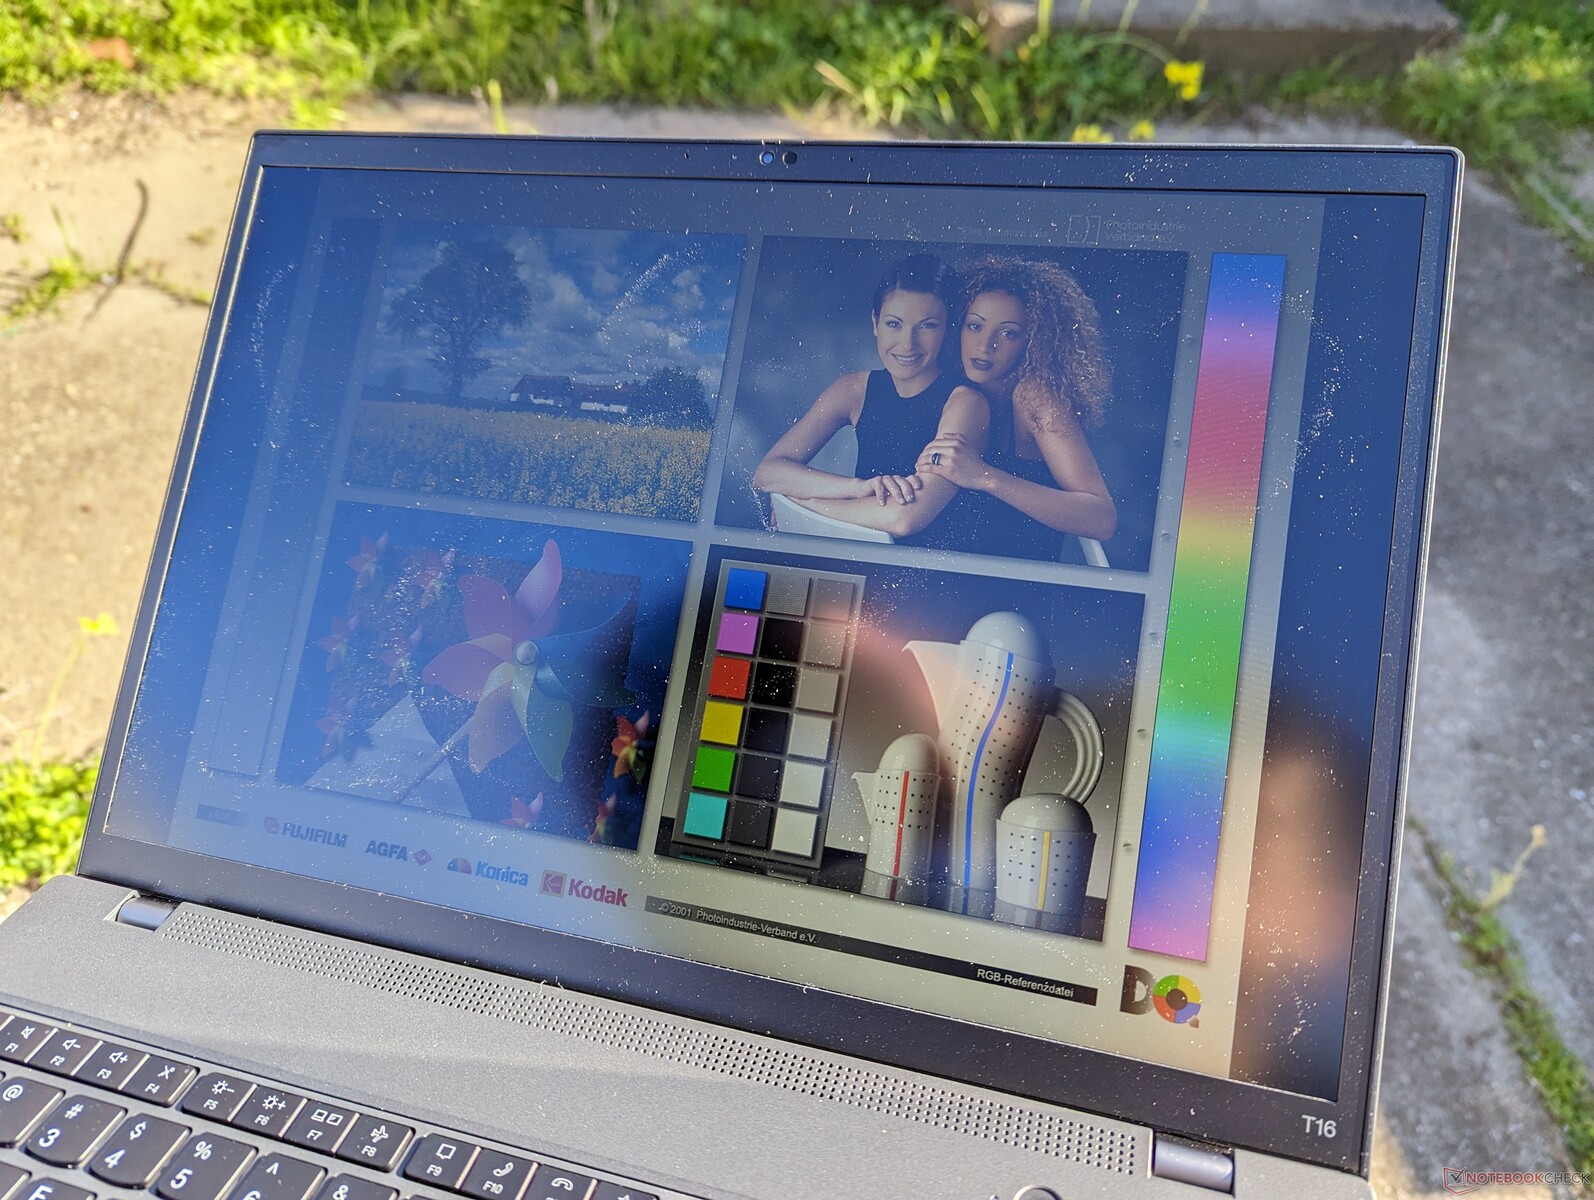
La visibilità all'aperto è nella media con il nostro pannello a 300 nit. Gli utenti potrebbero voler prendere in considerazione le opzioni a 500 nit per ridurre gli effetti dell'abbagliamento. Se la visibilità è un problema, consigliamo di dare un'occhiata all'HP EliteBook 860/865 G9 e alle sue opzioni di pannello a 1000 nit, molto più luminose.

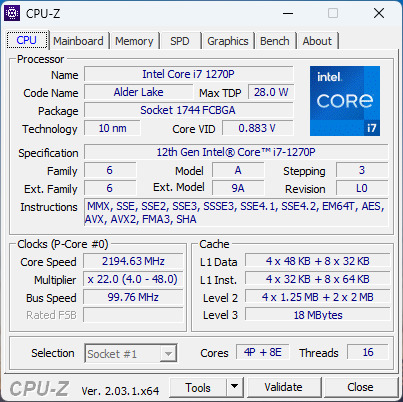
Prestazioni - Opzioni Intel di 12a generazione
Condizioni di test
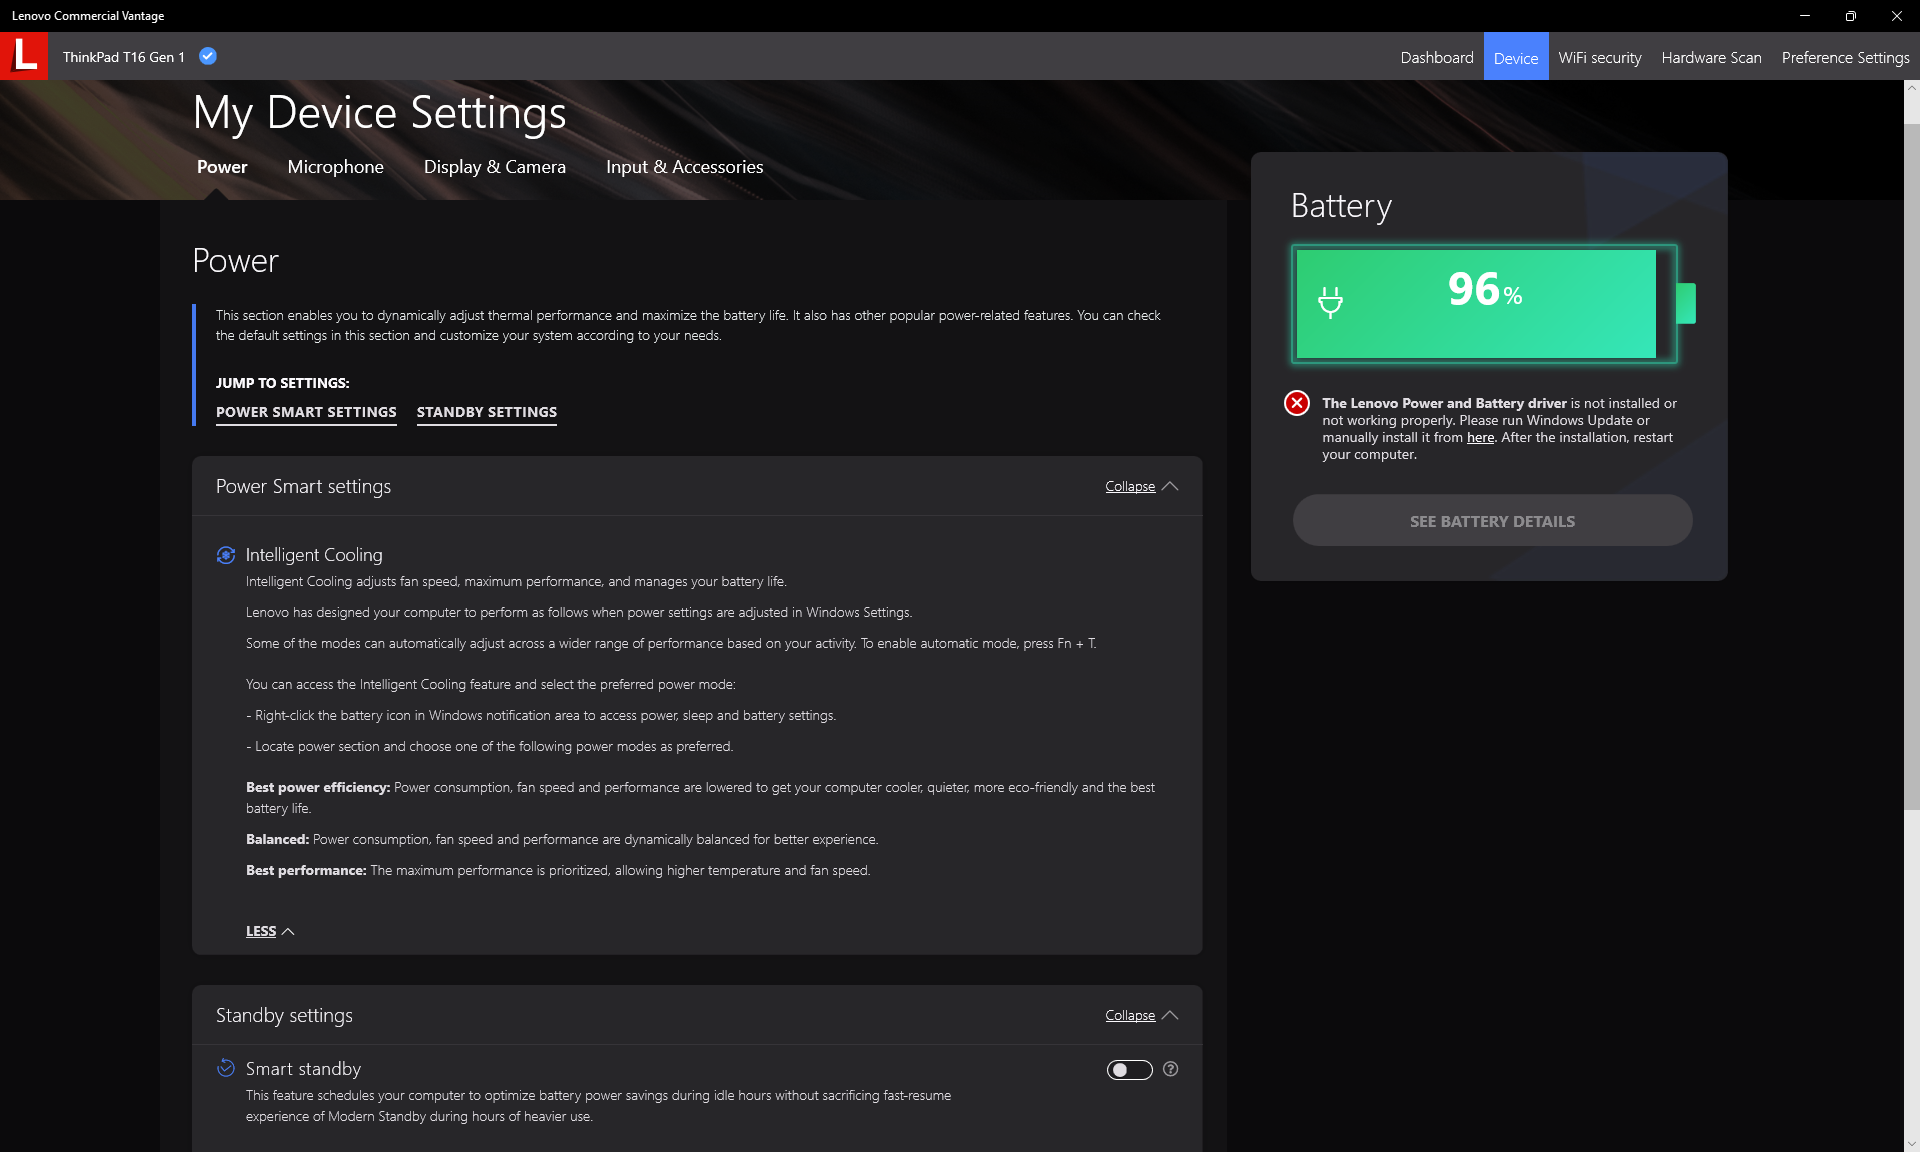
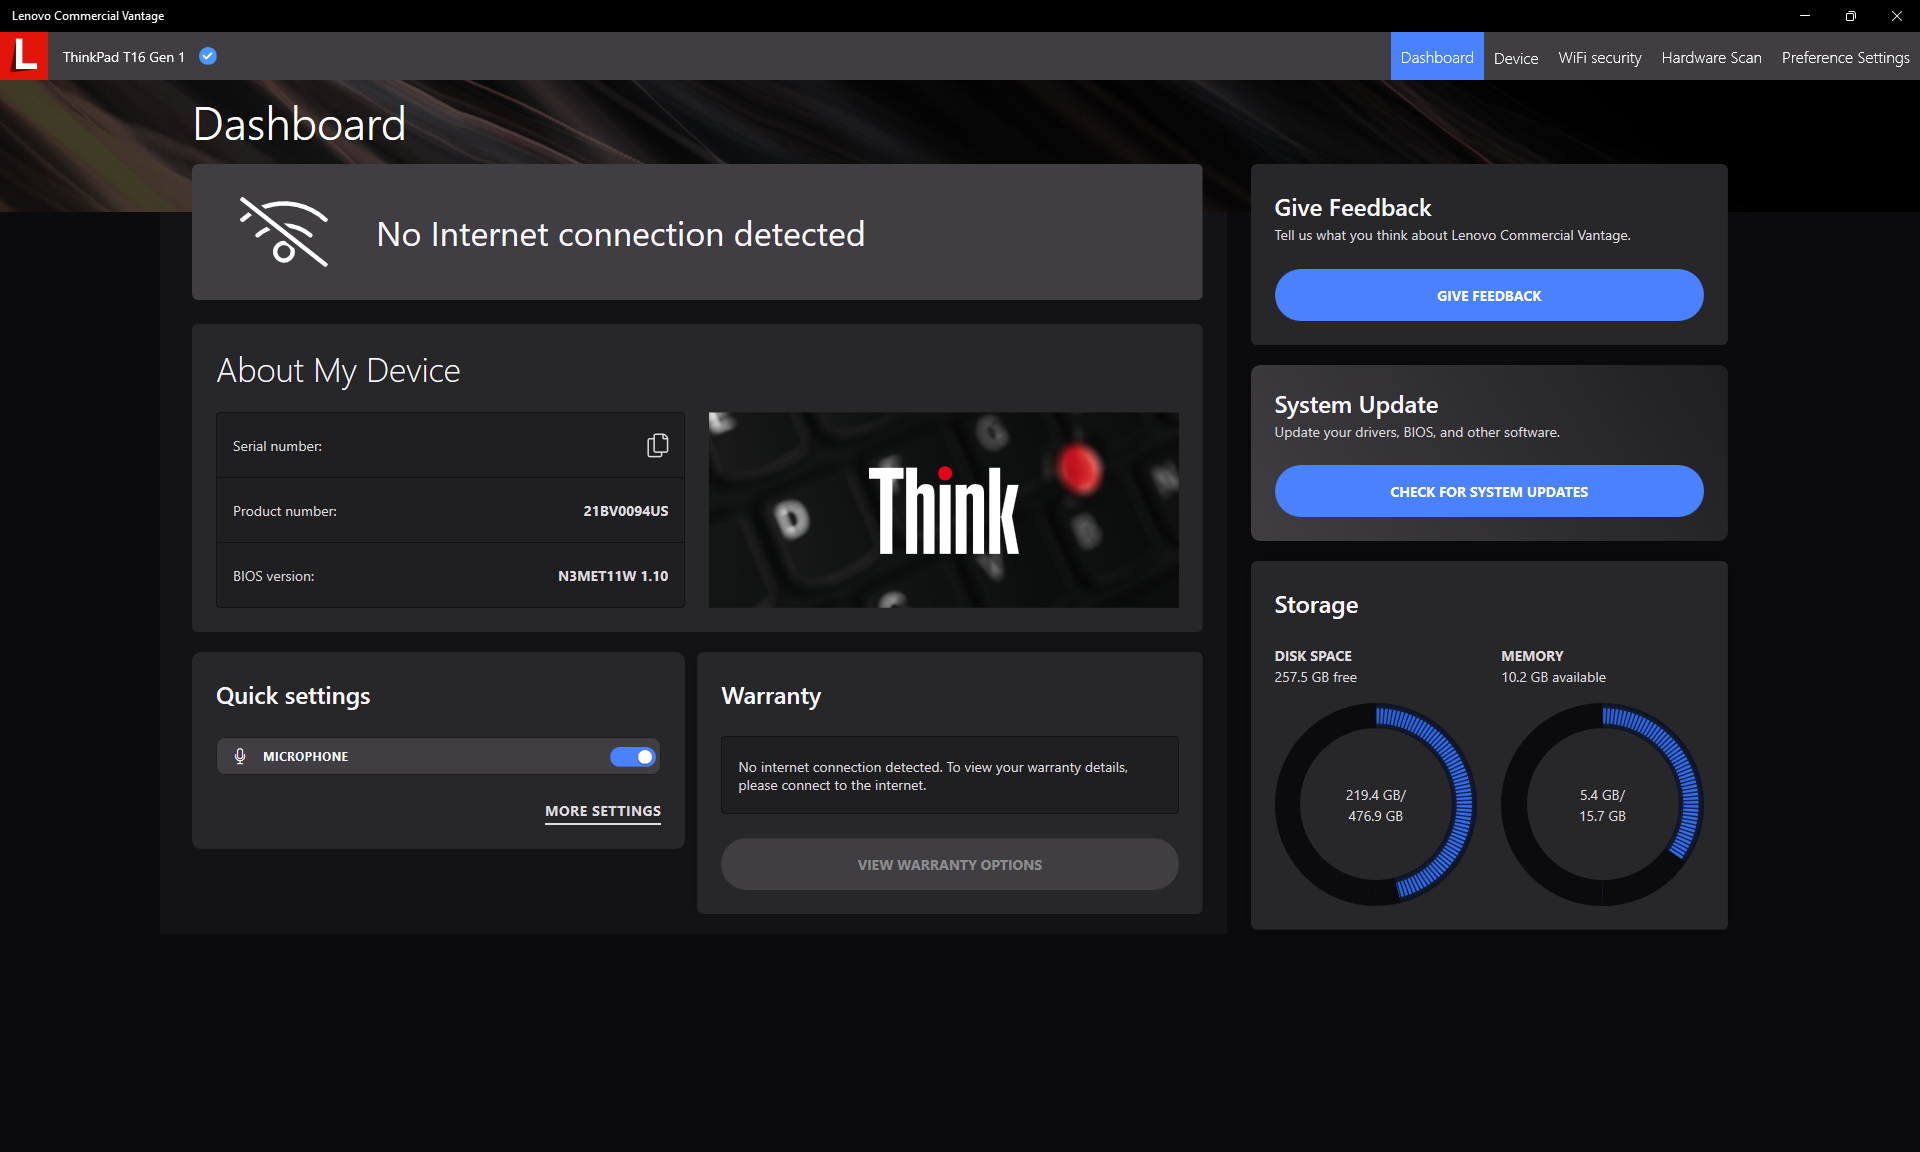
Abbiamo impostato la nostra unità in modalità Performance tramite Windows prima di eseguire i benchmark qui sotto. Gli utenti dovrebbero familiarizzare con il software Lenovo Commercial Vantage, in quanto è l'hub per le impostazioni aggiuntive relative ad aggiornamenti, garanzia, sicurezza e altro. Le schermate seguenti mostrano alcune delle opzioni.
Processore - Il Turbo Boost potrebbe essere migliore
Il nostro Core i7-1270P mostrerebbe un comportamento di throttling simile a quello che abbiamo osservato sul Core i5-1240P SKU. Quando si esegue CineBench R15 xT in loop, ad esempio, il punteggio iniziale di 1782 punti si riduce del 44% nel corso del tempo, un valore significativamente superiore a quello della maggior parte degli altri portatili. Al contrario, ilRyzen 5 PRO 6650U Sarebbe più lento durante i pochi minuti del loop test, ma è in grado di sostenere velocità di clock e prestazioni più elevate per periodi più lunghi, come mostra il grafico sottostante. I vantaggi del Turbo Boost del Core i7-1270P sono quindi di breve durata sul ThinkPad T16 G1.
Gli utenti possono installare ThrottleStop per ridurre al minimo il throttling delle prestazioni di circa il 20%, se lo desiderano. Tuttavia, è deludente che Lenovo non offra questa opzione di prestazioni senza ricorrere a software di terze parti.
Cinebench R15 Multi Loop
Cinebench R20: CPU (Multi Core) | CPU (Single Core)
Cinebench R23: Multi Core | Single Core
Cinebench R15: CPU Multi 64Bit | CPU Single 64Bit
Blender: v2.79 BMW27 CPU
7-Zip 18.03: 7z b 4 | 7z b 4 -mmt1
Geekbench 5.5: Multi-Core | Single-Core
HWBOT x265 Benchmark v2.2: 4k Preset
LibreOffice : 20 Documents To PDF
R Benchmark 2.5: Overall mean
| CPU Performance rating | |
| Huawei MateBook 16s i7 | |
| MSI Summit E16 Flip A12UDT-031 | |
| Apple MacBook Pro 16 2021 M1 Pro -5! | |
| Lenovo Yoga 7-14ARB G7 | |
| Lenovo ThinkPad T16 Gen 1 Core i7-1270P | |
| Media Intel Core i7-1270P | |
| HP EliteBook 865 G9 | |
| Lenovo ThinkPad T16 G1 21CH004MGE | |
| Lenovo ThinkBook 13s G3 20YA0005GE | |
| LG Gram 16Z90Q | |
| Lenovo ThinkPad T16 G1 21BWS00200 | |
| Asus ZenBook Flip 15 Q508U | |
| LG Gram 16 (2021) | |
| Asus ZenBook 14 UX434FL-DB77 -2! | |
| Cinebench R20 / CPU (Multi Core) | |
| Huawei MateBook 16s i7 | |
| MSI Summit E16 Flip A12UDT-031 | |
| Lenovo Yoga 7-14ARB G7 | |
| Lenovo ThinkPad T16 Gen 1 Core i7-1270P | |
| HP EliteBook 865 G9 | |
| Lenovo ThinkPad T16 G1 21CH004MGE | |
| Asus ZenBook Flip 15 Q508U | |
| Media Intel Core i7-1270P (3167 - 3905, n=2) | |
| LG Gram 16Z90Q | |
| Lenovo ThinkBook 13s G3 20YA0005GE | |
| Lenovo ThinkPad T16 G1 21BWS00200 | |
| Apple MacBook Pro 16 2021 M1 Pro | |
| LG Gram 16 (2021) | |
| Asus ZenBook 14 UX434FL-DB77 | |
| Cinebench R20 / CPU (Single Core) | |
| Huawei MateBook 16s i7 | |
| MSI Summit E16 Flip A12UDT-031 | |
| Lenovo ThinkPad T16 Gen 1 Core i7-1270P | |
| Media Intel Core i7-1270P (595 - 627, n=2) | |
| LG Gram 16Z90Q | |
| Lenovo Yoga 7-14ARB G7 | |
| HP EliteBook 865 G9 | |
| Lenovo ThinkPad T16 G1 21BWS00200 | |
| Lenovo ThinkPad T16 G1 21CH004MGE | |
| Lenovo ThinkBook 13s G3 20YA0005GE | |
| LG Gram 16 (2021) | |
| Asus ZenBook Flip 15 Q508U | |
| Asus ZenBook 14 UX434FL-DB77 | |
| Apple MacBook Pro 16 2021 M1 Pro | |
| Cinebench R23 / Multi Core | |
| MSI Summit E16 Flip A12UDT-031 | |
| Huawei MateBook 16s i7 | |
| Apple MacBook Pro 16 2021 M1 Pro | |
| Lenovo Yoga 7-14ARB G7 | |
| Lenovo ThinkPad T16 Gen 1 Core i7-1270P | |
| HP EliteBook 865 G9 | |
| Media Intel Core i7-1270P (8426 - 11010, n=2) | |
| Lenovo ThinkPad T16 G1 21CH004MGE | |
| Asus ZenBook Flip 15 Q508U | |
| Lenovo ThinkBook 13s G3 20YA0005GE | |
| LG Gram 16Z90Q | |
| Lenovo ThinkPad T16 G1 21BWS00200 | |
| LG Gram 16 (2021) | |
| Cinebench R23 / Single Core | |
| Huawei MateBook 16s i7 | |
| Lenovo ThinkPad T16 Gen 1 Core i7-1270P | |
| MSI Summit E16 Flip A12UDT-031 | |
| Lenovo ThinkPad T16 G1 21BWS00200 | |
| Media Intel Core i7-1270P (1552 - 1688, n=2) | |
| LG Gram 16Z90Q | |
| Apple MacBook Pro 16 2021 M1 Pro | |
| Lenovo Yoga 7-14ARB G7 | |
| Lenovo ThinkPad T16 G1 21CH004MGE | |
| Lenovo ThinkBook 13s G3 20YA0005GE | |
| HP EliteBook 865 G9 | |
| LG Gram 16 (2021) | |
| Asus ZenBook Flip 15 Q508U | |
| Cinebench R15 / CPU Multi 64Bit | |
| Huawei MateBook 16s i7 | |
| Huawei MateBook 16s i7 | |
| MSI Summit E16 Flip A12UDT-031 | |
| Lenovo Yoga 7-14ARB G7 | |
| Lenovo ThinkBook 13s G3 20YA0005GE | |
| Lenovo ThinkBook 13s G3 20YA0005GE | |
| Lenovo ThinkPad T16 Gen 1 Core i7-1270P | |
| Lenovo ThinkPad T16 G1 21BWS00200 | |
| Lenovo ThinkPad T16 G1 21BWS00200 | |
| Media Intel Core i7-1270P (1695 - 1783, n=2) | |
| Apple MacBook Pro 16 2021 M1 Pro | |
| HP EliteBook 865 G9 | |
| Asus ZenBook Flip 15 Q508U | |
| Lenovo ThinkPad T16 G1 21CH004MGE | |
| LG Gram 16Z90Q | |
| LG Gram 16 (2021) | |
| Asus ZenBook 14 UX434FL-DB77 | |
| Cinebench R15 / CPU Single 64Bit | |
| Huawei MateBook 16s i7 | |
| Lenovo Yoga 7-14ARB G7 | |
| MSI Summit E16 Flip A12UDT-031 | |
| Lenovo ThinkPad T16 Gen 1 Core i7-1270P | |
| Lenovo ThinkPad T16 G1 21CH004MGE | |
| HP EliteBook 865 G9 | |
| Media Intel Core i7-1270P (226 - 233, n=2) | |
| Lenovo ThinkBook 13s G3 20YA0005GE | |
| Lenovo ThinkPad T16 G1 21BWS00200 | |
| LG Gram 16Z90Q | |
| Apple MacBook Pro 16 2021 M1 Pro | |
| LG Gram 16 (2021) | |
| Asus ZenBook Flip 15 Q508U | |
| Asus ZenBook 14 UX434FL-DB77 | |
| Blender / v2.79 BMW27 CPU | |
| LG Gram 16 (2021) | |
| Asus ZenBook 14 UX434FL-DB77 | |
| LG Gram 16Z90Q | |
| Lenovo ThinkPad T16 G1 21BWS00200 | |
| Lenovo ThinkBook 13s G3 20YA0005GE | |
| Media Intel Core i7-1270P (372 - 375, n=2) | |
| Lenovo ThinkPad T16 Gen 1 Core i7-1270P | |
| Lenovo ThinkPad T16 G1 21CH004MGE | |
| Asus ZenBook Flip 15 Q508U | |
| MSI Summit E16 Flip A12UDT-031 | |
| HP EliteBook 865 G9 | |
| Lenovo Yoga 7-14ARB G7 | |
| Huawei MateBook 16s i7 | |
| Apple MacBook Pro 16 2021 M1 Pro | |
| 7-Zip 18.03 / 7z b 4 | |
| Huawei MateBook 16s i7 | |
| Lenovo Yoga 7-14ARB G7 | |
| MSI Summit E16 Flip A12UDT-031 | |
| HP EliteBook 865 G9 | |
| Asus ZenBook Flip 15 Q508U | |
| Lenovo ThinkPad T16 G1 21CH004MGE | |
| Lenovo ThinkBook 13s G3 20YA0005GE | |
| Lenovo ThinkPad T16 Gen 1 Core i7-1270P | |
| Media Intel Core i7-1270P (38099 - 38449, n=2) | |
| LG Gram 16Z90Q | |
| Lenovo ThinkPad T16 G1 21BWS00200 | |
| LG Gram 16 (2021) | |
| Asus ZenBook 14 UX434FL-DB77 | |
| 7-Zip 18.03 / 7z b 4 -mmt1 | |
| Huawei MateBook 16s i7 | |
| Lenovo ThinkPad T16 Gen 1 Core i7-1270P | |
| HP EliteBook 865 G9 | |
| Lenovo Yoga 7-14ARB G7 | |
| Lenovo ThinkBook 13s G3 20YA0005GE | |
| Media Intel Core i7-1270P (4874 - 5684, n=2) | |
| Lenovo ThinkPad T16 G1 21CH004MGE | |
| MSI Summit E16 Flip A12UDT-031 | |
| LG Gram 16Z90Q | |
| LG Gram 16 (2021) | |
| Lenovo ThinkPad T16 G1 21BWS00200 | |
| Asus ZenBook Flip 15 Q508U | |
| Asus ZenBook 14 UX434FL-DB77 | |
| Geekbench 5.5 / Multi-Core | |
| Huawei MateBook 16s i7 | |
| Apple MacBook Pro 16 2021 M1 Pro | |
| MSI Summit E16 Flip A12UDT-031 | |
| LG Gram 16Z90Q | |
| Lenovo Yoga 7-14ARB G7 | |
| Media Intel Core i7-1270P (8610 - 8710, n=2) | |
| Lenovo ThinkPad T16 Gen 1 Core i7-1270P | |
| Lenovo ThinkPad T16 G1 21CH004MGE | |
| Lenovo ThinkPad T16 G1 21BWS00200 | |
| HP EliteBook 865 G9 | |
| Lenovo ThinkBook 13s G3 20YA0005GE | |
| Asus ZenBook Flip 15 Q508U | |
| LG Gram 16 (2021) | |
| Asus ZenBook 14 UX434FL-DB77 | |
| Geekbench 5.5 / Single-Core | |
| Huawei MateBook 16s i7 | |
| Apple MacBook Pro 16 2021 M1 Pro | |
| Lenovo ThinkPad T16 Gen 1 Core i7-1270P | |
| LG Gram 16Z90Q | |
| Media Intel Core i7-1270P (1564 - 1724, n=2) | |
| MSI Summit E16 Flip A12UDT-031 | |
| Lenovo Yoga 7-14ARB G7 | |
| Lenovo ThinkPad T16 G1 21BWS00200 | |
| LG Gram 16 (2021) | |
| Lenovo ThinkPad T16 G1 21CH004MGE | |
| Lenovo ThinkBook 13s G3 20YA0005GE | |
| HP EliteBook 865 G9 | |
| Asus ZenBook Flip 15 Q508U | |
| Asus ZenBook 14 UX434FL-DB77 | |
| HWBOT x265 Benchmark v2.2 / 4k Preset | |
| Huawei MateBook 16s i7 | |
| Lenovo Yoga 7-14ARB G7 | |
| MSI Summit E16 Flip A12UDT-031 | |
| Lenovo ThinkPad T16 G1 21CH004MGE | |
| HP EliteBook 865 G9 | |
| Lenovo ThinkPad T16 Gen 1 Core i7-1270P | |
| Media Intel Core i7-1270P (9.56 - 11.3, n=2) | |
| Lenovo ThinkBook 13s G3 20YA0005GE | |
| Asus ZenBook Flip 15 Q508U | |
| Lenovo ThinkPad T16 G1 21BWS00200 | |
| LG Gram 16Z90Q | |
| LG Gram 16 (2021) | |
| Asus ZenBook 14 UX434FL-DB77 | |
| LibreOffice / 20 Documents To PDF | |
| Asus ZenBook 14 UX434FL-DB77 | |
| Asus ZenBook Flip 15 Q508U | |
| Lenovo Yoga 7-14ARB G7 | |
| LG Gram 16Z90Q | |
| HP EliteBook 865 G9 | |
| MSI Summit E16 Flip A12UDT-031 | |
| Lenovo ThinkBook 13s G3 20YA0005GE | |
| Lenovo ThinkPad T16 G1 21CH004MGE | |
| Media Intel Core i7-1270P (47.1 - 48.6, n=2) | |
| Lenovo ThinkPad T16 G1 21BWS00200 | |
| Lenovo ThinkPad T16 Gen 1 Core i7-1270P | |
| LG Gram 16 (2021) | |
| Huawei MateBook 16s i7 | |
| R Benchmark 2.5 / Overall mean | |
| Asus ZenBook 14 UX434FL-DB77 | |
| LG Gram 16 (2021) | |
| Asus ZenBook Flip 15 Q508U | |
| Lenovo ThinkBook 13s G3 20YA0005GE | |
| LG Gram 16Z90Q | |
| Media Intel Core i7-1270P (0.4926 - 0.575, n=2) | |
| Lenovo ThinkPad T16 G1 21CH004MGE | |
| Lenovo ThinkPad T16 G1 21BWS00200 | |
| HP EliteBook 865 G9 | |
| MSI Summit E16 Flip A12UDT-031 | |
| Lenovo Yoga 7-14ARB G7 | |
| Lenovo ThinkPad T16 Gen 1 Core i7-1270P | |
| Huawei MateBook 16s i7 | |
Cinebench R20: CPU (Multi Core) | CPU (Single Core)
Cinebench R23: Multi Core | Single Core
Cinebench R15: CPU Multi 64Bit | CPU Single 64Bit
Blender: v2.79 BMW27 CPU
7-Zip 18.03: 7z b 4 | 7z b 4 -mmt1
Geekbench 5.5: Multi-Core | Single-Core
HWBOT x265 Benchmark v2.2: 4k Preset
LibreOffice : 20 Documents To PDF
R Benchmark 2.5: Overall mean
* ... Meglio usare valori piccoli
* ... Meglio usare valori piccoli
AIDA64: FP32 Ray-Trace | FPU Julia | CPU SHA3 | CPU Queen | FPU SinJulia | FPU Mandel | CPU AES | CPU ZLib | FP64 Ray-Trace | CPU PhotoWorxx
| Performance rating | |
| HP EliteBook 865 G9 | |
| Lenovo ThinkPad T16 G1 21CH004MGE | |
| Huawei MateBook 16s i7 | |
| Lenovo ThinkPad T16 Gen 1 Core i7-1270P | |
| LG Gram 16Z90Q | |
| Media Intel Core i7-1270P | |
| AIDA64 / FP32 Ray-Trace | |
| HP EliteBook 865 G9 | |
| Lenovo ThinkPad T16 G1 21CH004MGE | |
| Lenovo ThinkPad T16 Gen 1 Core i7-1270P | |
| LG Gram 16Z90Q | |
| Huawei MateBook 16s i7 | |
| Media Intel Core i7-1270P (4789 - 6722, n=2) | |
| AIDA64 / FPU Julia | |
| HP EliteBook 865 G9 | |
| Lenovo ThinkPad T16 G1 21CH004MGE | |
| Lenovo ThinkPad T16 Gen 1 Core i7-1270P | |
| Media Intel Core i7-1270P (22017 - 37567, n=2) | |
| Huawei MateBook 16s i7 | |
| LG Gram 16Z90Q | |
| AIDA64 / CPU SHA3 | |
| HP EliteBook 865 G9 | |
| Lenovo ThinkPad T16 G1 21CH004MGE | |
| Huawei MateBook 16s i7 | |
| Lenovo ThinkPad T16 Gen 1 Core i7-1270P | |
| Media Intel Core i7-1270P (1543 - 1853, n=2) | |
| LG Gram 16Z90Q | |
| AIDA64 / CPU Queen | |
| Huawei MateBook 16s i7 | |
| HP EliteBook 865 G9 | |
| Lenovo ThinkPad T16 G1 21CH004MGE | |
| Lenovo ThinkPad T16 Gen 1 Core i7-1270P | |
| LG Gram 16Z90Q | |
| Media Intel Core i7-1270P (61703 - 76671, n=2) | |
| AIDA64 / FPU SinJulia | |
| HP EliteBook 865 G9 | |
| Lenovo ThinkPad T16 G1 21CH004MGE | |
| Huawei MateBook 16s i7 | |
| Media Intel Core i7-1270P (5059 - 5210, n=2) | |
| Lenovo ThinkPad T16 Gen 1 Core i7-1270P | |
| LG Gram 16Z90Q | |
| AIDA64 / FPU Mandel | |
| HP EliteBook 865 G9 | |
| Lenovo ThinkPad T16 G1 21CH004MGE | |
| Lenovo ThinkPad T16 Gen 1 Core i7-1270P | |
| Huawei MateBook 16s i7 | |
| Media Intel Core i7-1270P (12876 - 17891, n=2) | |
| LG Gram 16Z90Q | |
| AIDA64 / CPU AES | |
| Lenovo ThinkPad T16 G1 21CH004MGE | |
| Huawei MateBook 16s i7 | |
| HP EliteBook 865 G9 | |
| Lenovo ThinkPad T16 Gen 1 Core i7-1270P | |
| Media Intel Core i7-1270P (33137 - 39956, n=2) | |
| LG Gram 16Z90Q | |
| AIDA64 / CPU ZLib | |
| Huawei MateBook 16s i7 | |
| HP EliteBook 865 G9 | |
| Lenovo ThinkPad T16 G1 21CH004MGE | |
| Lenovo ThinkPad T16 Gen 1 Core i7-1270P | |
| Media Intel Core i7-1270P (553 - 579, n=2) | |
| LG Gram 16Z90Q | |
| AIDA64 / FP64 Ray-Trace | |
| HP EliteBook 865 G9 | |
| Lenovo ThinkPad T16 G1 21CH004MGE | |
| LG Gram 16Z90Q | |
| Lenovo ThinkPad T16 Gen 1 Core i7-1270P | |
| Huawei MateBook 16s i7 | |
| Media Intel Core i7-1270P (2603 - 3521, n=2) | |
| AIDA64 / CPU PhotoWorxx | |
| Huawei MateBook 16s i7 | |
| LG Gram 16Z90Q | |
| Media Intel Core i7-1270P (21056 - 34745, n=2) | |
| Lenovo ThinkPad T16 G1 21CH004MGE | |
| Lenovo ThinkPad T16 Gen 1 Core i7-1270P | |
| HP EliteBook 865 G9 | |
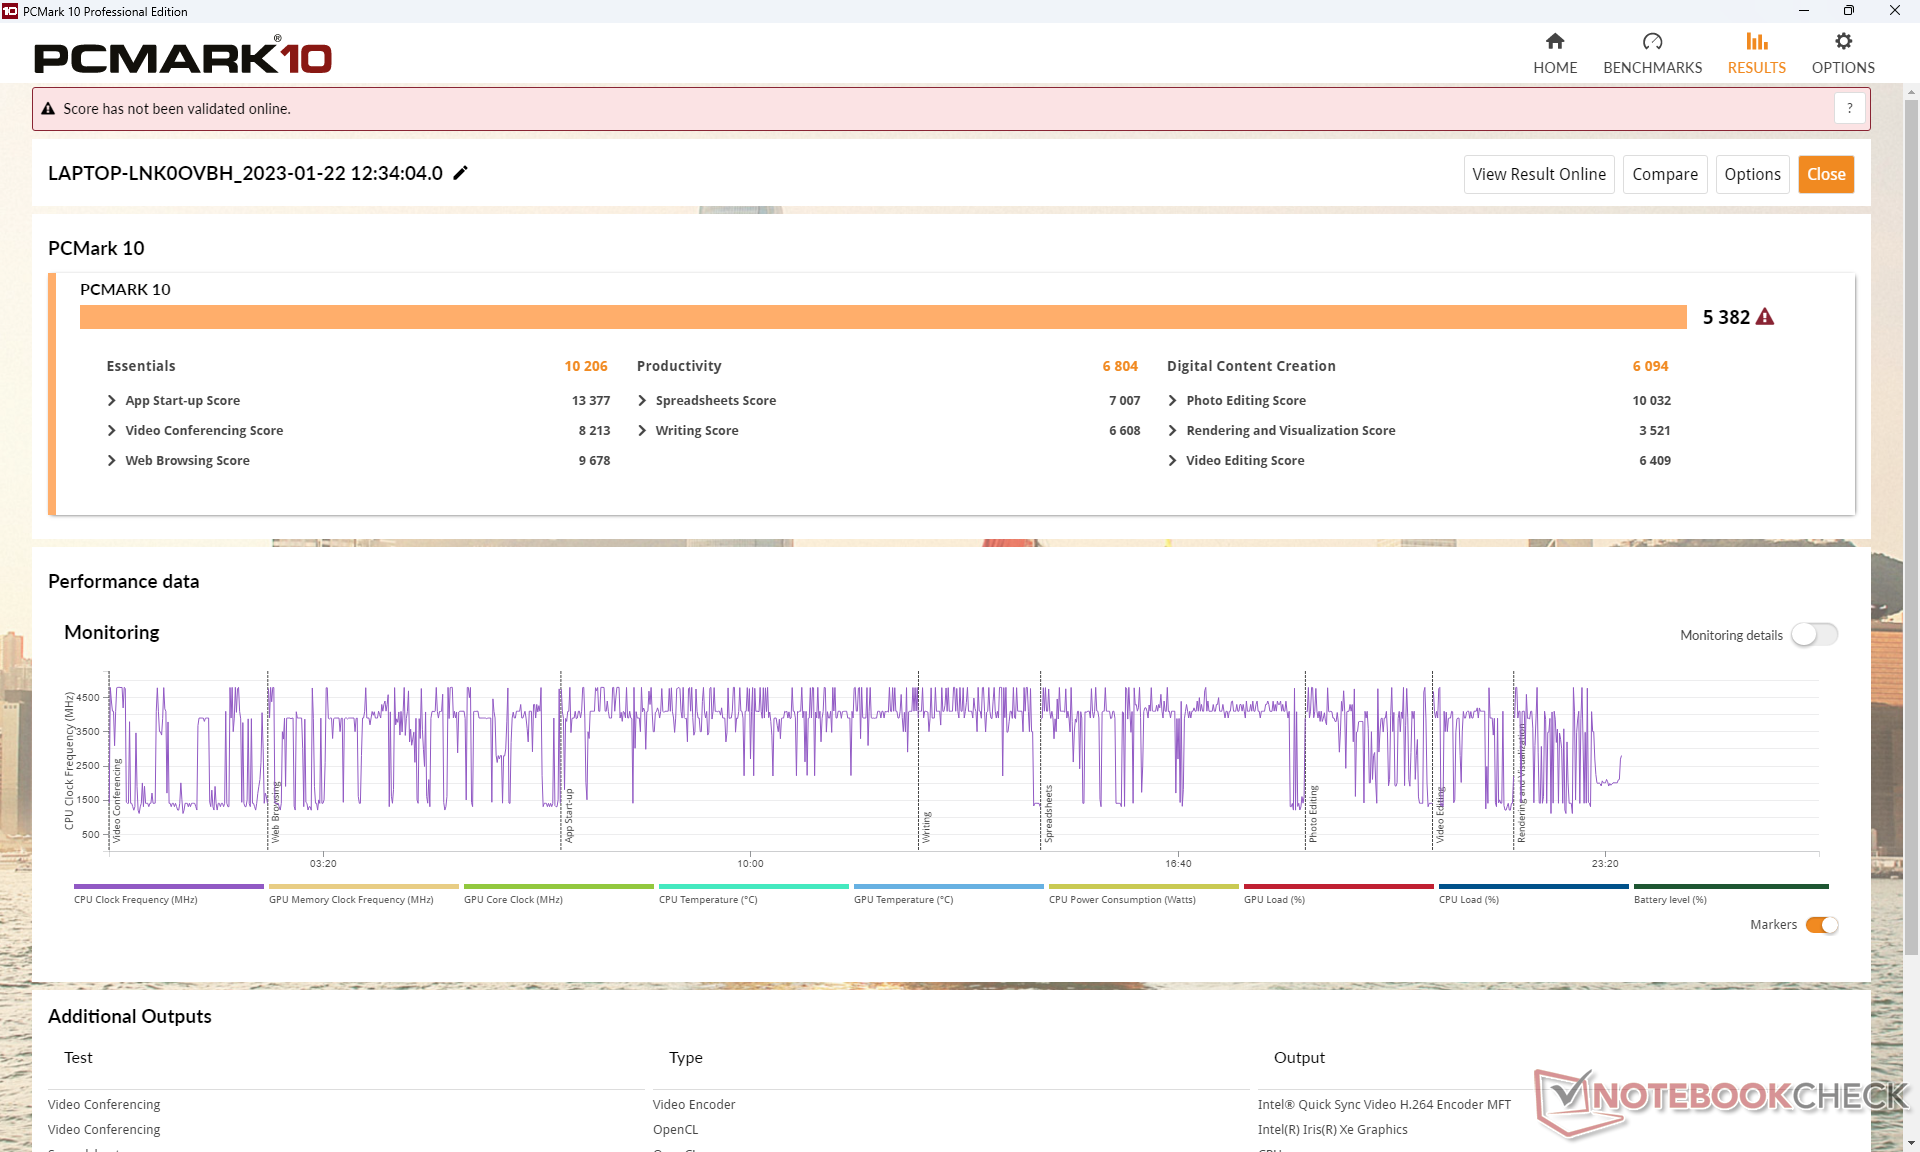
Prestazioni del sistema
I risultati medi di PCMark si collocano tra le SKU più lente con Core i5 e quelle più veloci con Ryzen 5, come mostra il grafico di confronto qui sotto. La SKU AMD è notevolmente in vantaggio nel sottotest Produttività, probabilmente grazie alle prestazioni multi-thread più veloci e alla GPU integrata rispetto alle SKU Intel.
CrossMark: Overall | Productivity | Creativity | Responsiveness
| PCMark 10 / Score | |
| Huawei MateBook 16s i7 | |
| Lenovo ThinkPad T16 G1 21CH004MGE | |
| HP EliteBook 865 G9 | |
| Media Intel Core i7-1270P, Intel Iris Xe Graphics G7 96EUs (5382 - 5647, n=2) | |
| Lenovo ThinkPad T16 Gen 1 Core i7-1270P | |
| LG Gram 16Z90Q | |
| Lenovo ThinkPad T16 G1 21BWS00200 | |
| PCMark 10 / Essentials | |
| Huawei MateBook 16s i7 | |
| Media Intel Core i7-1270P, Intel Iris Xe Graphics G7 96EUs (10206 - 11224, n=2) | |
| Lenovo ThinkPad T16 Gen 1 Core i7-1270P | |
| LG Gram 16Z90Q | |
| Lenovo ThinkPad T16 G1 21CH004MGE | |
| Lenovo ThinkPad T16 G1 21BWS00200 | |
| HP EliteBook 865 G9 | |
| PCMark 10 / Productivity | |
| Lenovo ThinkPad T16 G1 21CH004MGE | |
| HP EliteBook 865 G9 | |
| Huawei MateBook 16s i7 | |
| Media Intel Core i7-1270P, Intel Iris Xe Graphics G7 96EUs (6804 - 6805, n=2) | |
| Lenovo ThinkPad T16 Gen 1 Core i7-1270P | |
| LG Gram 16Z90Q | |
| Lenovo ThinkPad T16 G1 21BWS00200 | |
| PCMark 10 / Digital Content Creation | |
| Huawei MateBook 16s i7 | |
| HP EliteBook 865 G9 | |
| Lenovo ThinkPad T16 G1 21CH004MGE | |
| Media Intel Core i7-1270P, Intel Iris Xe Graphics G7 96EUs (6094 - 6398, n=2) | |
| Lenovo ThinkPad T16 Gen 1 Core i7-1270P | |
| LG Gram 16Z90Q | |
| Lenovo ThinkPad T16 G1 21BWS00200 | |
| CrossMark / Overall | |
| Huawei MateBook 16s i7 | |
| Media Intel Core i7-1270P, Intel Iris Xe Graphics G7 96EUs (1585 - 1712, n=2) | |
| Lenovo ThinkPad T16 Gen 1 Core i7-1270P | |
| Apple MacBook Pro 16 2021 M1 Pro | |
| Lenovo ThinkPad T16 G1 21CH004MGE | |
| Lenovo ThinkPad T16 G1 21BWS00200 | |
| HP EliteBook 865 G9 | |
| CrossMark / Productivity | |
| Huawei MateBook 16s i7 | |
| Media Intel Core i7-1270P, Intel Iris Xe Graphics G7 96EUs (1567 - 1636, n=2) | |
| Lenovo ThinkPad T16 Gen 1 Core i7-1270P | |
| Lenovo ThinkPad T16 G1 21CH004MGE | |
| Lenovo ThinkPad T16 G1 21BWS00200 | |
| HP EliteBook 865 G9 | |
| Apple MacBook Pro 16 2021 M1 Pro | |
| CrossMark / Creativity | |
| Apple MacBook Pro 16 2021 M1 Pro | |
| Huawei MateBook 16s i7 | |
| Media Intel Core i7-1270P, Intel Iris Xe Graphics G7 96EUs (1684 - 1839, n=2) | |
| Lenovo ThinkPad T16 Gen 1 Core i7-1270P | |
| Lenovo ThinkPad T16 G1 21CH004MGE | |
| Lenovo ThinkPad T16 G1 21BWS00200 | |
| HP EliteBook 865 G9 | |
| CrossMark / Responsiveness | |
| Huawei MateBook 16s i7 | |
| Media Intel Core i7-1270P, Intel Iris Xe Graphics G7 96EUs (1365 - 1584, n=2) | |
| Lenovo ThinkPad T16 Gen 1 Core i7-1270P | |
| Lenovo ThinkPad T16 G1 21BWS00200 | |
| Lenovo ThinkPad T16 G1 21CH004MGE | |
| HP EliteBook 865 G9 | |
| Apple MacBook Pro 16 2021 M1 Pro | |
| PCMark 10 Score | 5382 punti | |
Aiuto | ||
| AIDA64 / Memory Copy | |
| Huawei MateBook 16s i7 | |
| LG Gram 16Z90Q | |
| Media Intel Core i7-1270P (39471 - 62300, n=2) | |
| Lenovo ThinkPad T16 G1 21CH004MGE | |
| Lenovo ThinkPad T16 Gen 1 Core i7-1270P | |
| HP EliteBook 865 G9 | |
| AIDA64 / Memory Read | |
| Huawei MateBook 16s i7 | |
| LG Gram 16Z90Q | |
| Media Intel Core i7-1270P (42289 - 72572, n=2) | |
| Lenovo ThinkPad T16 Gen 1 Core i7-1270P | |
| Lenovo ThinkPad T16 G1 21CH004MGE | |
| HP EliteBook 865 G9 | |
| AIDA64 / Memory Write | |
| LG Gram 16Z90Q | |
| Huawei MateBook 16s i7 | |
| Media Intel Core i7-1270P (43051 - 61340, n=2) | |
| Lenovo ThinkPad T16 G1 21CH004MGE | |
| Lenovo ThinkPad T16 Gen 1 Core i7-1270P | |
| HP EliteBook 865 G9 | |
| AIDA64 / Memory Latency | |
| Lenovo ThinkPad T16 G1 21CH004MGE | |
| Huawei MateBook 16s i7 | |
| LG Gram 16Z90Q | |
| HP EliteBook 865 G9 | |
| Lenovo ThinkPad T16 Gen 1 Core i7-1270P | |
| Media Intel Core i7-1270P (89.3 - 89.3, n=2) | |
* ... Meglio usare valori piccoli
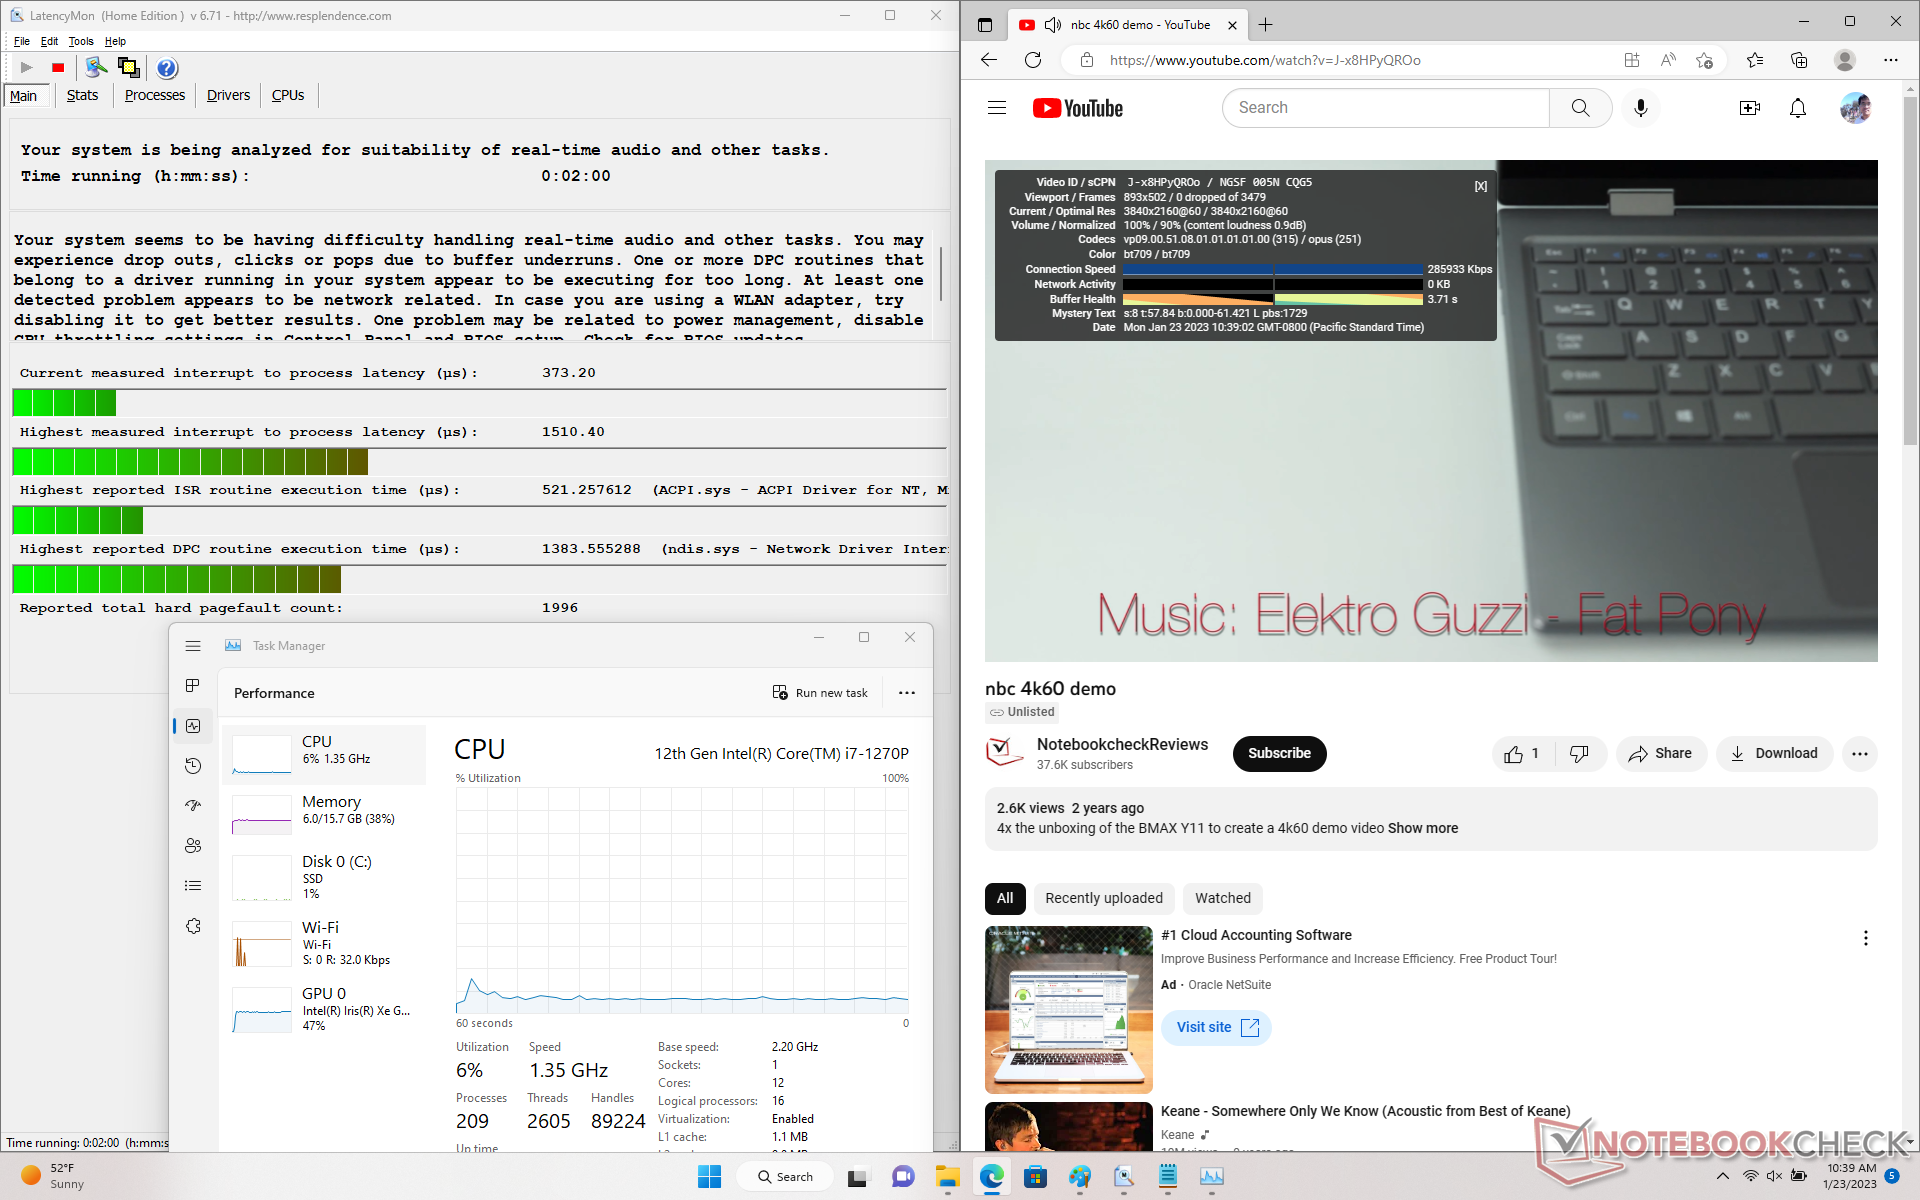
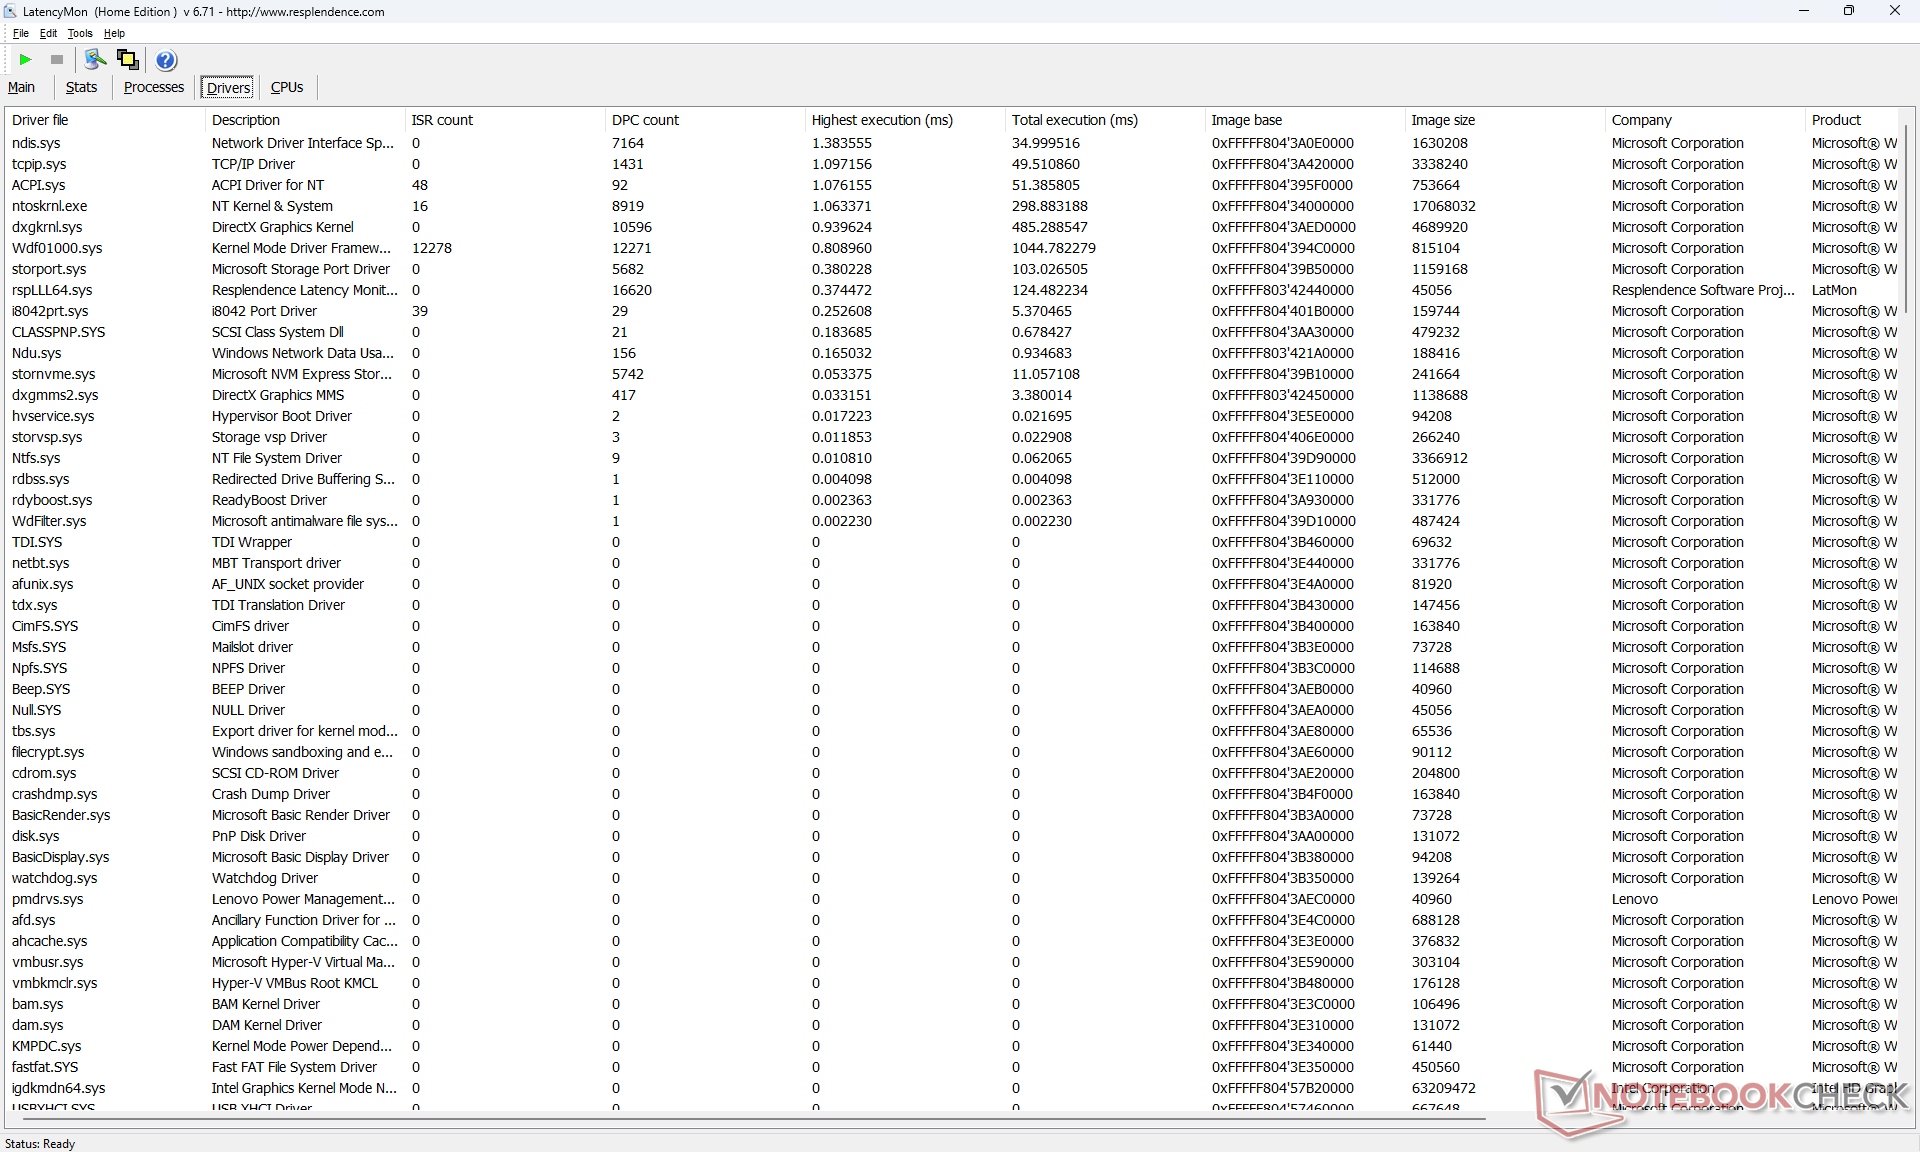
Latenza DPC
LatencyMon mostra problemi di DPC quando si aprono più schede del browser della nostra homepage. la riproduzione di video 4K a 60 FPS è invece perfetta e senza cadute di fotogrammi.
| DPC Latencies / LatencyMon - interrupt to process latency (max), Web, Youtube, Prime95 | |
| LG Gram 16Z90Q | |
| Lenovo ThinkPad T16 Gen 1 Core i7-1270P | |
| Lenovo ThinkPad T16 G1 21CH004MGE | |
| HP EliteBook 865 G9 | |
* ... Meglio usare valori piccoli
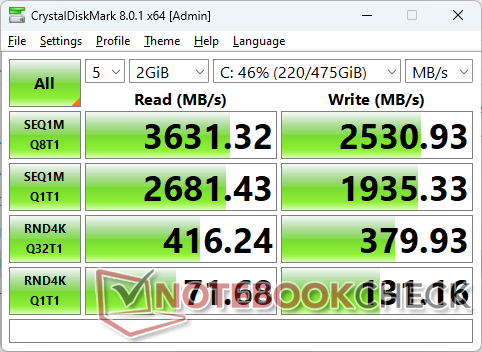
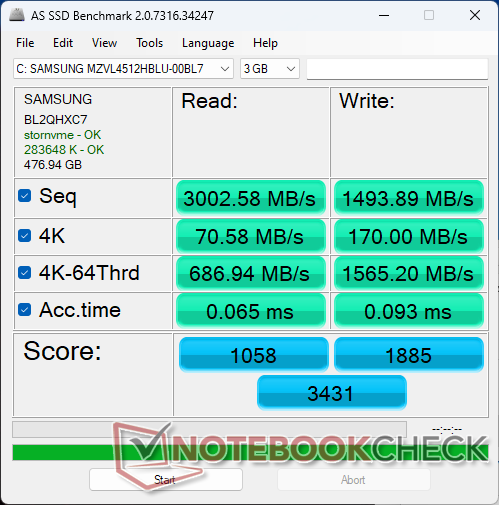
Dispositivi di archiviazione
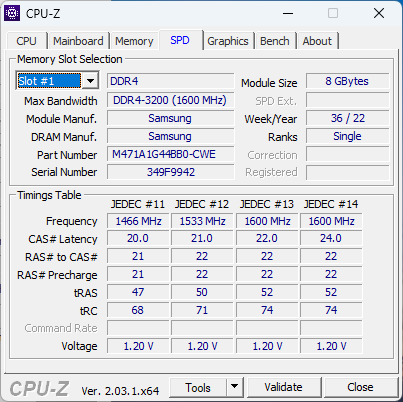
La nostra unità viene fornita con un disco da 512 GB Samsung PM9B1 PCIe4 x4 NVMe invece del più comune Samsung PM9A1. La serie PM9B1 offre velocità di trasferimento più basse di quasi la metà; le velocità di lettura sequenziale raggiungono un massimo di ~3600 MB/s sulla nostra unità, rispetto ai ~6300 MB/s dell' LG Gram 16 con il Samsung PM9A1.

| Drive Performance rating - Percent | |
| Huawei MateBook 16s i7 | |
| LG Gram 16Z90Q | |
| Lenovo ThinkPad T16 G1 21CH004MGE | |
| Lenovo ThinkPad T16 Gen 1 Core i7-1270P | |
| HP EliteBook 865 G9 | |
* ... Meglio usare valori piccoli
Disk Throttling: DiskSpd Read Loop, Queue Depth 8
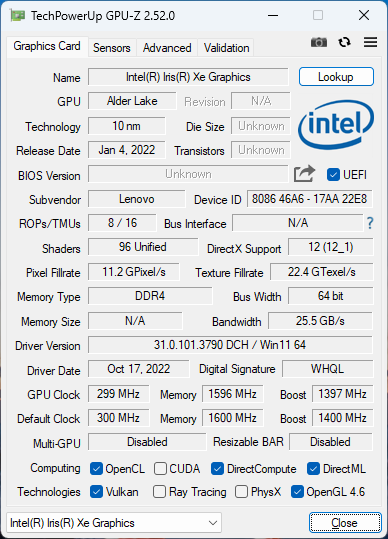
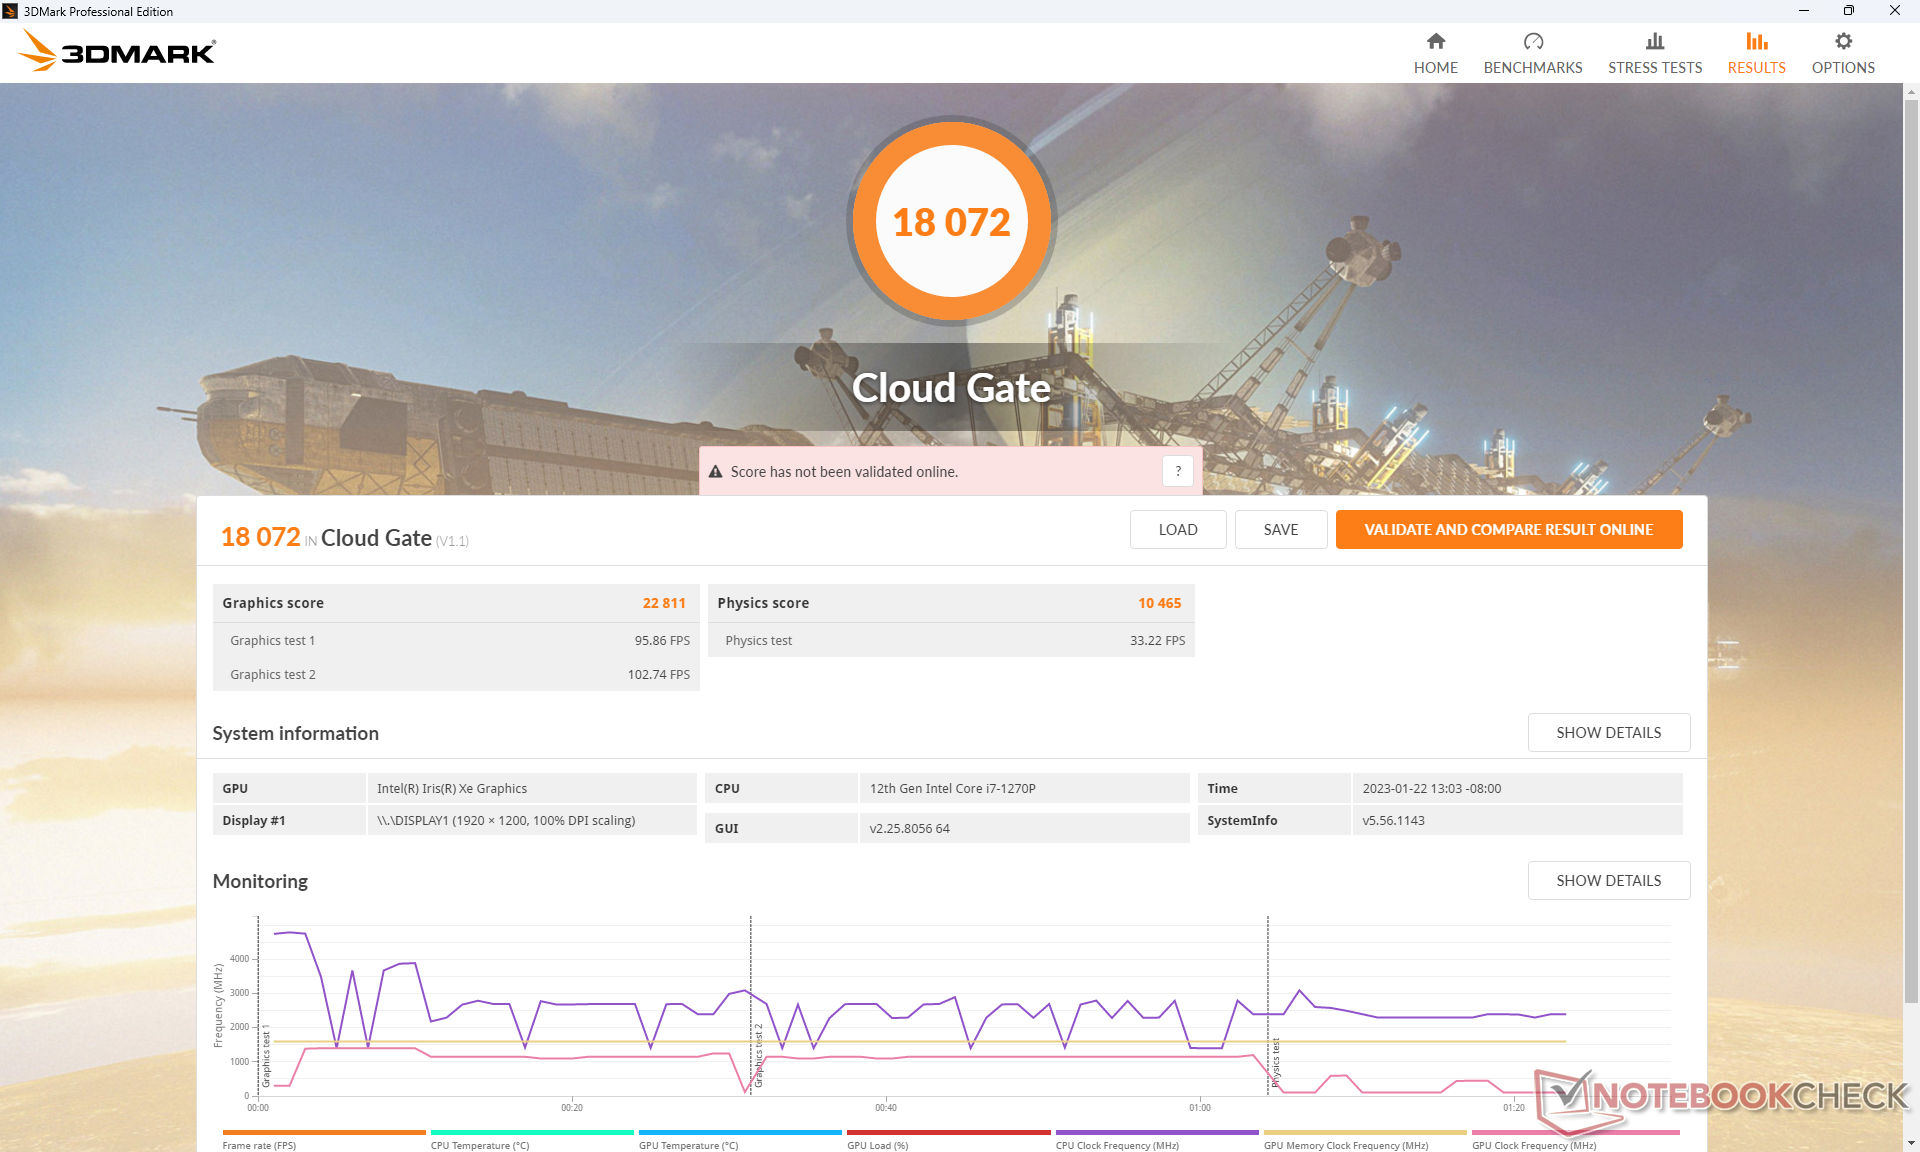
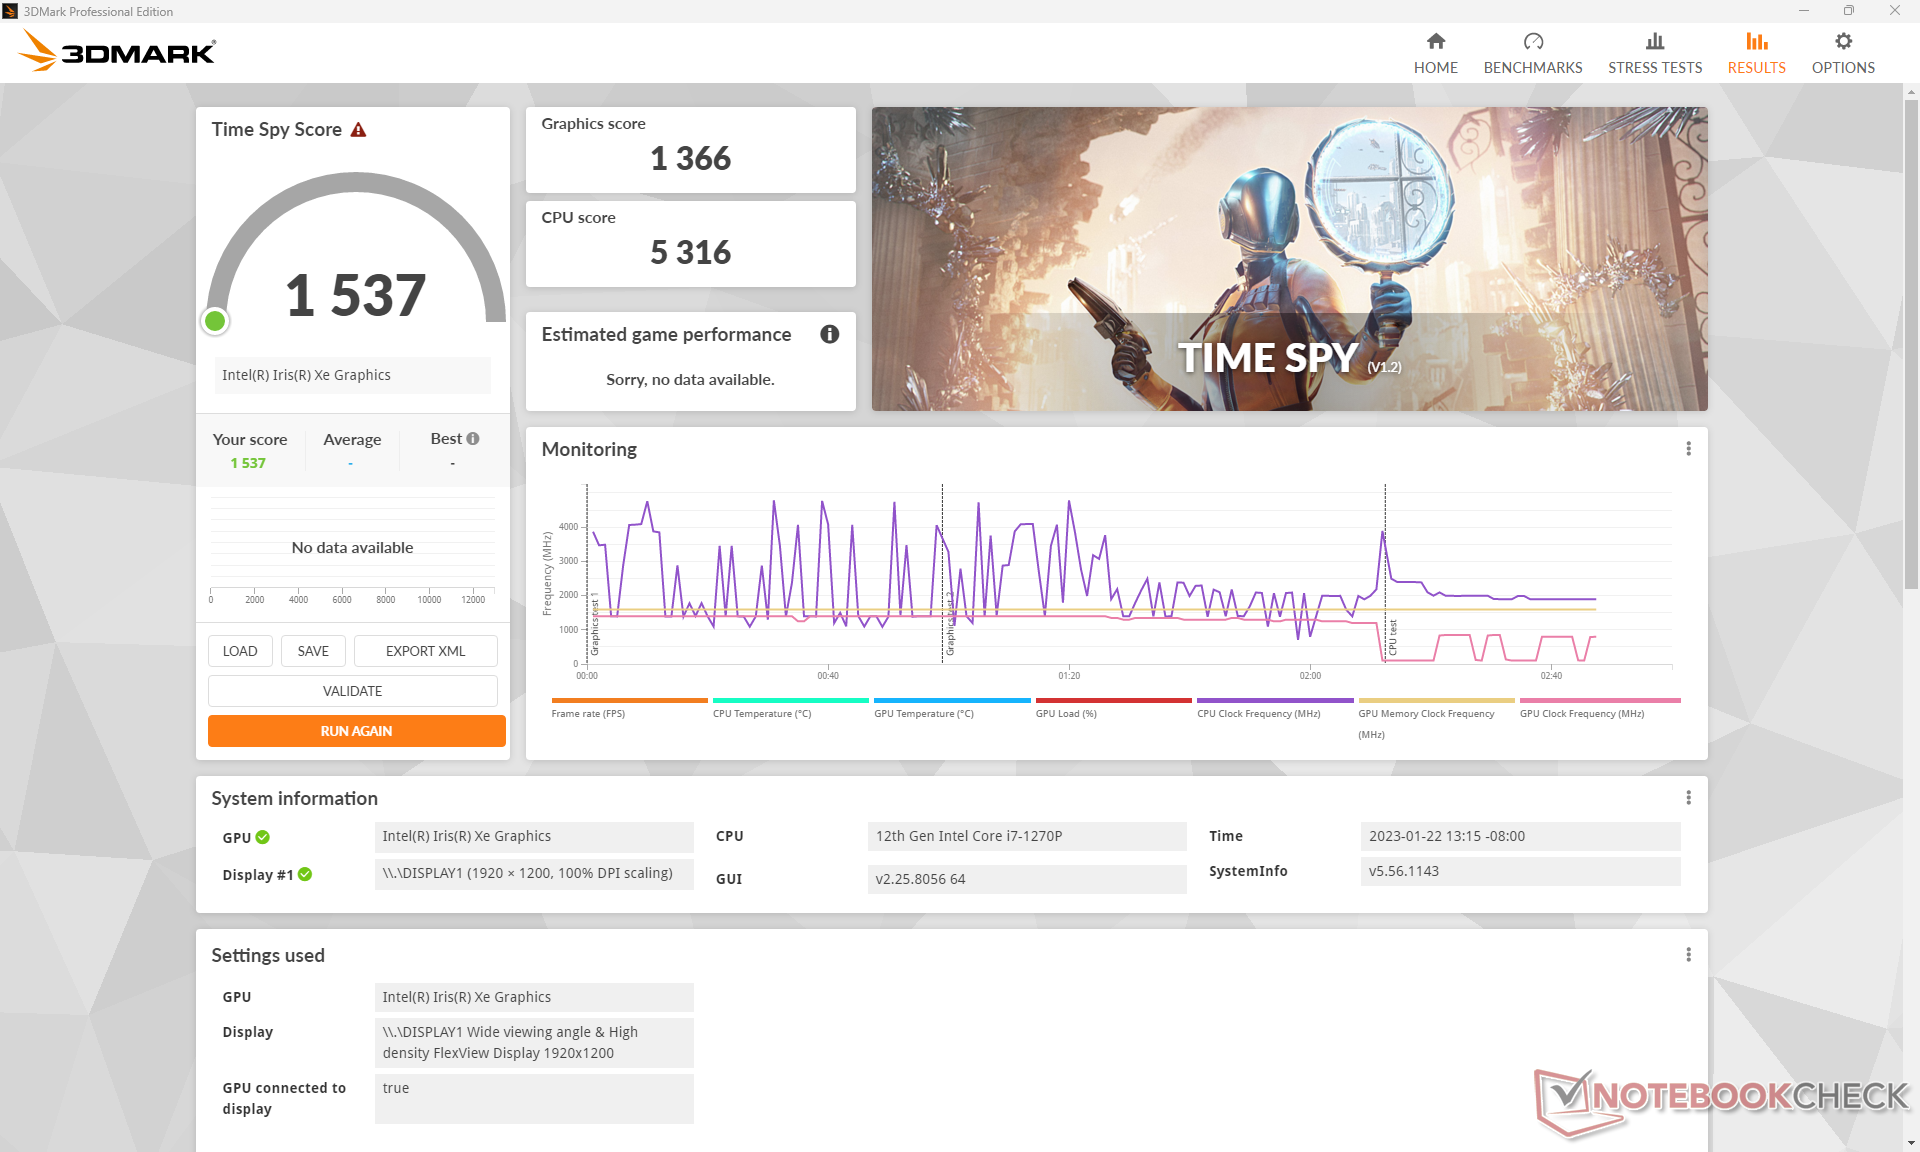
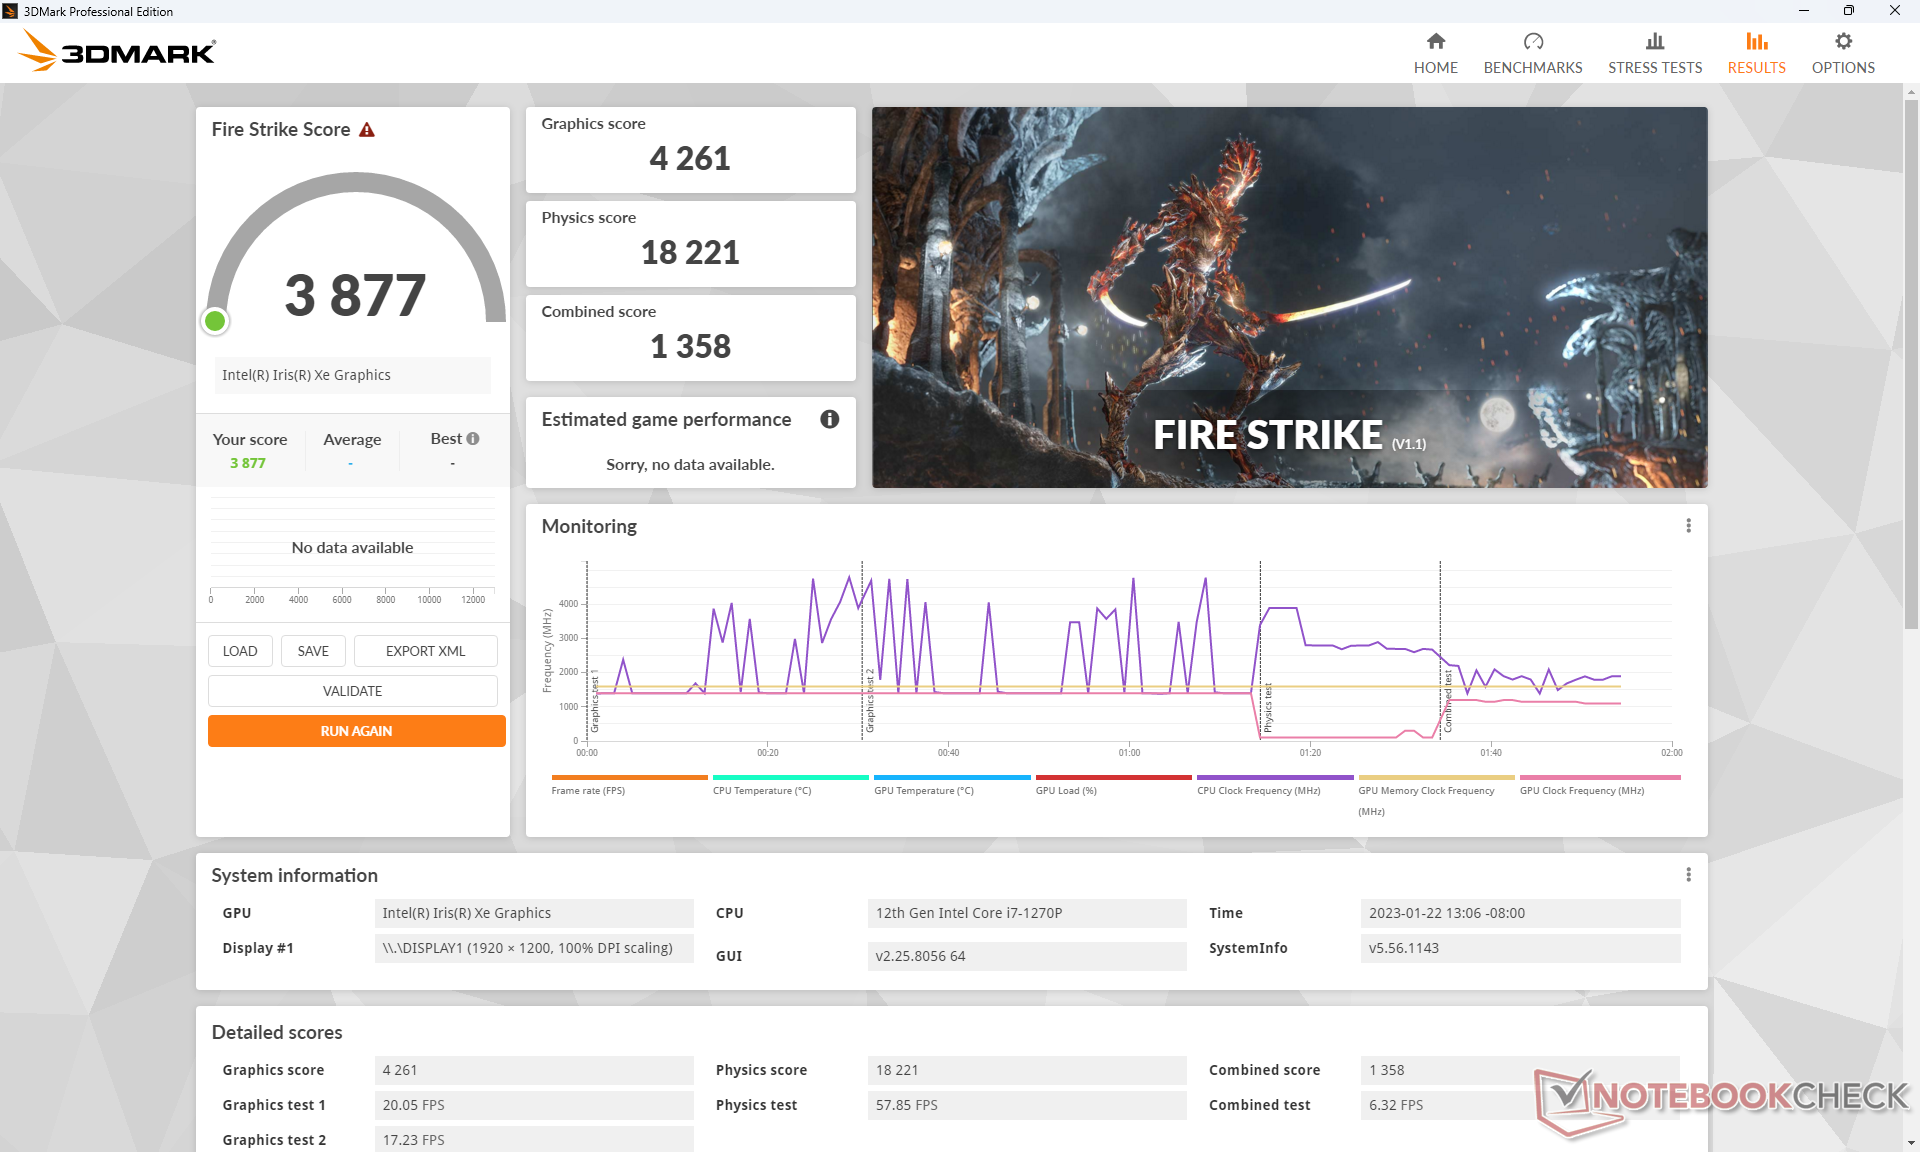
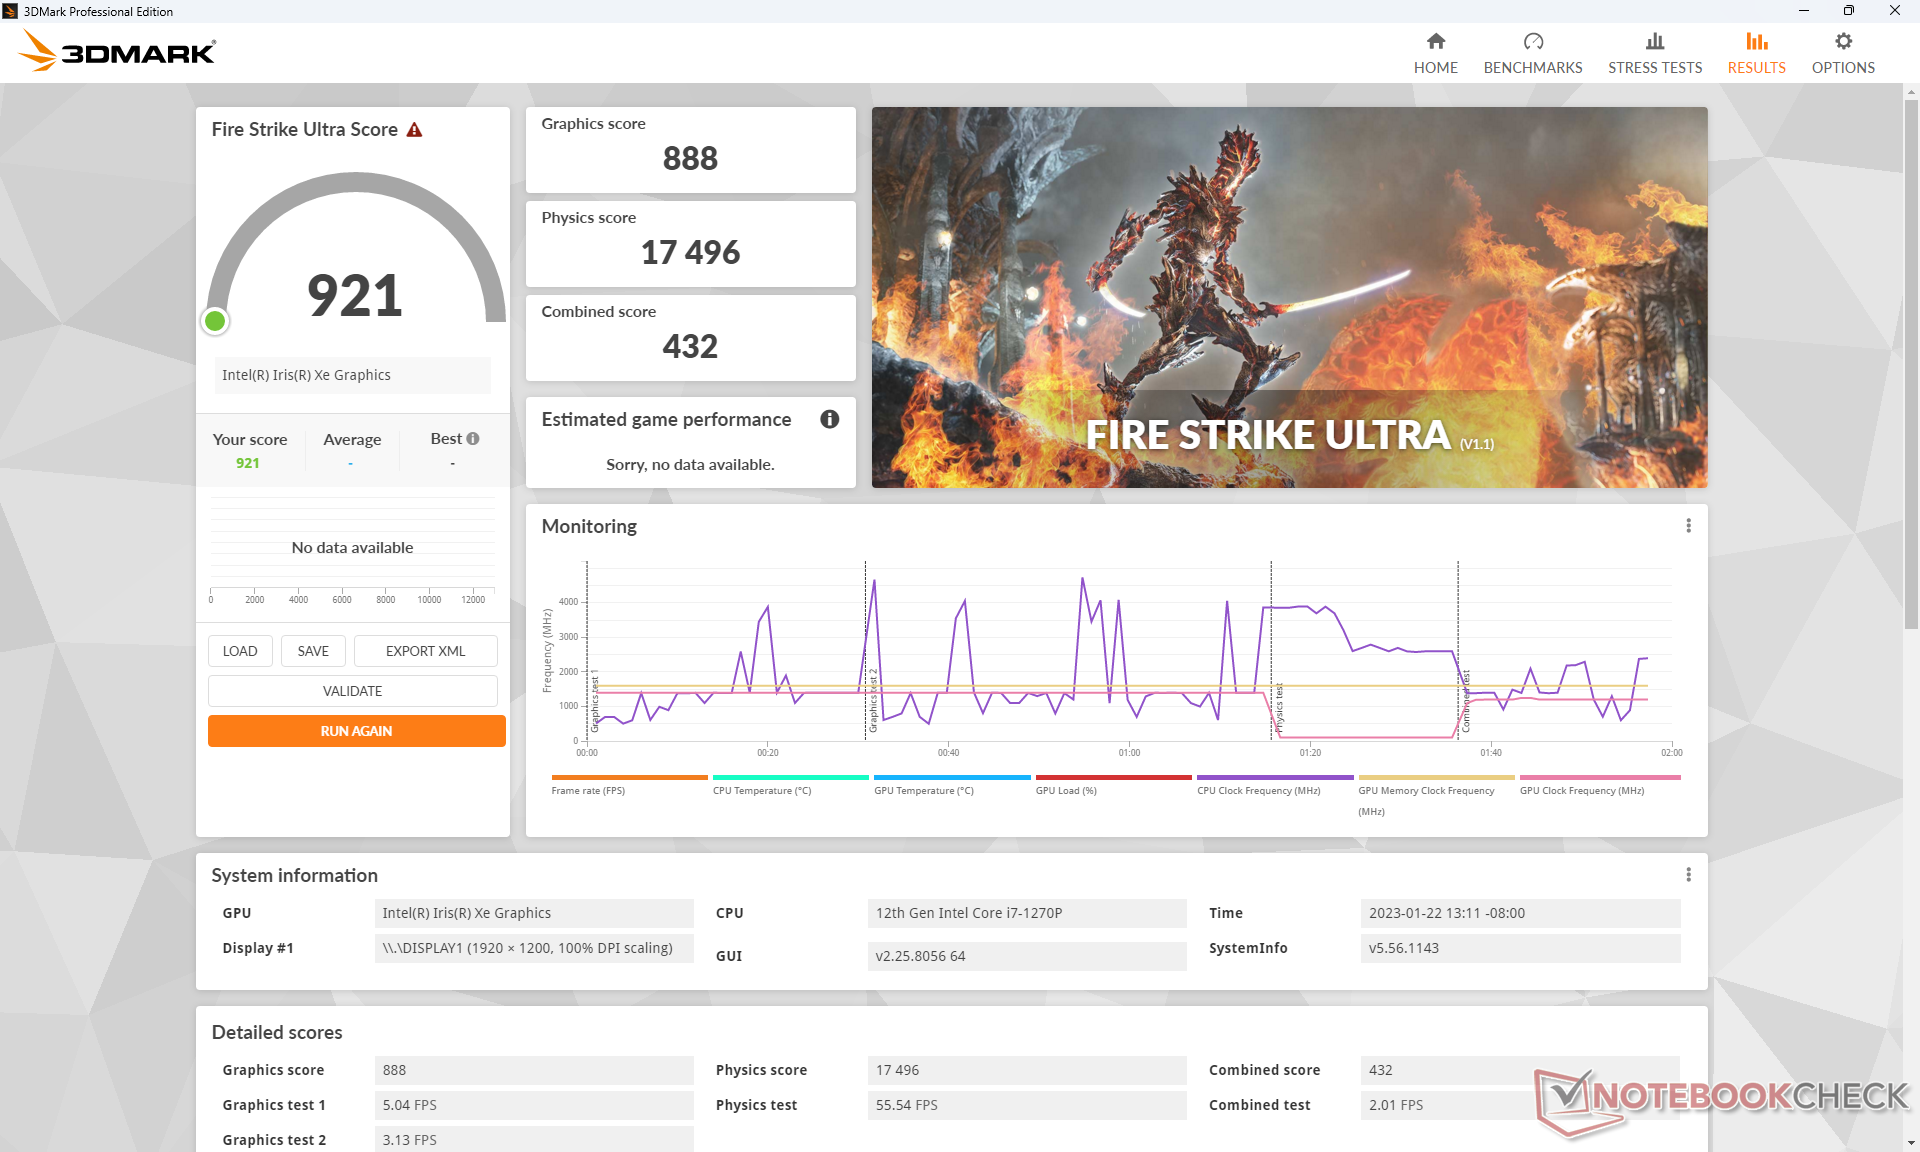
Prestazioni della GPU - frenate dalla lentezza della RAM
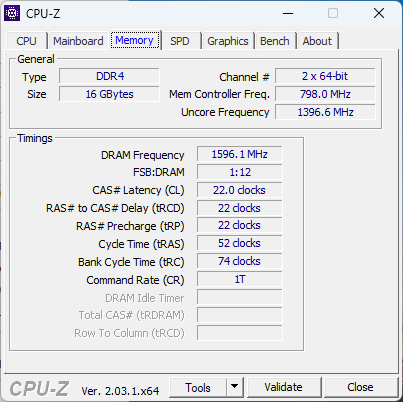
Le prestazioni grafiche sono circa il 10% più lente rispetto alla media dei computer portatili del nostro database equipaggiati con la stessa Iris Xe 96 EUs GPU. Le prestazioni inferiori possono essere in parte attribuite alla lentezza della RAM DDR4-3200 rispetto alla maggior parte degli altri portatili dotati di CPU Intel di 12a generazione. Il LG Gram 16ad esempio, viene fornito di serie con una RAM LPDDR5-5200 più veloce.
Inoltre, le prestazioni grafiche possono diventare gradualmente più lente quando si eseguono carichi elevati per periodi prolungati. Quando si utilizza il computer al minimo Witcher 3 a impostazioni basse, ad esempio, la frequenza dei fotogrammi è scesa da 84 FPS all'inizio del test a ~70 FPS dopo un paio di minuti, come mostra il grafico sottostante, a causa del limitato potenziale Turbo Boost del sistema.
Aggiornamento a Ryzen 5 Radeon 660M Dello stesso modello aumenterà le prestazioni grafiche di circa il 10-15%.
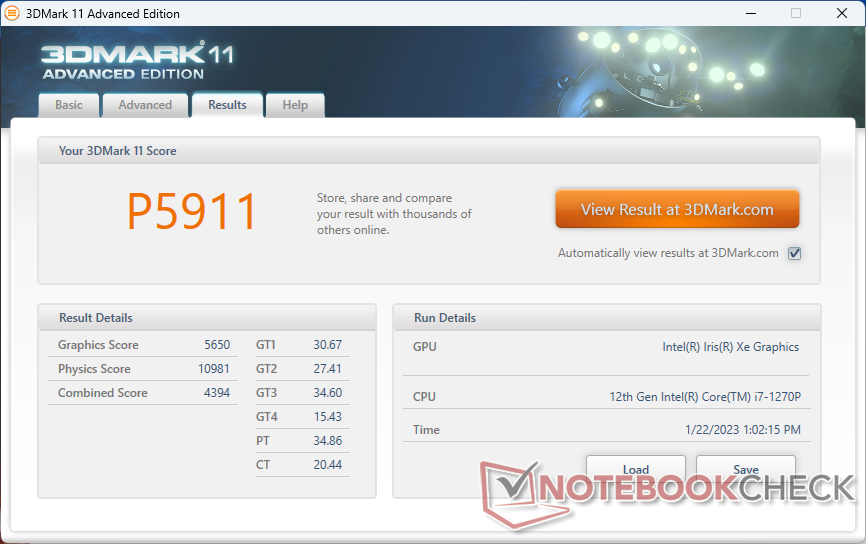
| 3DMark 11 Performance | 5911 punti | |
| 3DMark Cloud Gate Standard Score | 18072 punti | |
| 3DMark Fire Strike Score | 3877 punti | |
| 3DMark Time Spy Score | 1537 punti | |
Aiuto | ||
| Cyberpunk 2077 1.6 - 1920x1080 Low Preset | |
| Lenovo Yoga 7-14ARB G7 | |
| Asus ZenBook Flip 15 Q508U | |
| Media Intel Iris Xe Graphics G7 96EUs (13 - 25.9, n=42) | |
| Lenovo ThinkPad T16 Gen 1 Core i7-1270P | |
Witcher 3 FPS Chart
| basso | medio | alto | ultra | |
|---|---|---|---|---|
| GTA V (2015) | 97.8 | 74.8 | 14.1 | 4.85 |
| The Witcher 3 (2015) | 82.1 | 50.4 | 24.4 | 11.2 |
| Dota 2 Reborn (2015) | 110.6 | 71.9 | 48.9 | 44.6 |
| Final Fantasy XV Benchmark (2018) | 31.4 | 16.8 | 12.6 | |
| X-Plane 11.11 (2018) | 39.7 | 31.9 | 29.2 | |
| Strange Brigade (2018) | 79.2 | 29.8 | 24.2 | 19.1 |
| Cyberpunk 2077 1.6 (2022) | 18.4 |
Emissioni
Rumore del sistema - Quasi sempre silenzioso
Il rumore della ventola è uno dei più silenziosi per le dimensioni dello schermo, il che spiega in parte la scarsa sostenibilità delle prestazioni del processore nei benchmark di cui sopra. La ventola interna è appena percettibile anche quando si imposta la modalità Performance e si eseguono carichi impegnativi come i giochi. Ogni tanto può arrivare a pulsare fino a 34 dB(A) per brevi periodi prima di tornare al silenzio, ma anche questo valore massimo è più silenzioso di quello della maggior parte dei portatili. IlHP EliteBook 865 G9 adotta un approccio simile alla rumorosità delle ventole per un'esperienza d'uso molto silenziosa. Di conseguenza, non c'è motivo di selezionare una modalità diversa da Performance per il controllo del rumore della ventola.
Rumorosità
| Idle |
| 24.7 / 24.7 / 24.7 dB(A) |
| Sotto carico |
| 24.5 / 34.4 dB(A) |
 | ||
30 dB silenzioso 40 dB(A) udibile 50 dB(A) rumoroso |
||
min: | ||
| Lenovo ThinkPad T16 Gen 1 Core i7-1270P Iris Xe G7 96EUs, i7-1270P, Samsung PM9B1 512GB MZAL4512HBLU | Lenovo ThinkPad T16 G1 21CH004MGE Radeon 660M, R5 PRO 6650U, Micron 2450 512GB MTFDKBA512TFK | LG Gram 16Z90Q Iris Xe G7 96EUs, i7-1260P, Samsung PM9A1 MZVL21T0HCLR | HP EliteBook 865 G9 Radeon 680M, R7 PRO 6850U, Samsung PM991 MZVLQ512HBLU | Huawei MateBook 16s i7 Iris Xe G7 96EUs, i7-12700H, Silicon Motion PCIe-8 SSD | Apple MacBook Pro 16 2021 M1 Pro M1 Pro 16-Core GPU, M1 Pro, Apple SSD AP1024R | |
|---|---|---|---|---|---|---|
| Noise | -6% | -21% | -1% | -15% | -3% | |
| off /ambiente * (dB) | 24.7 | 23.1 6% | 25 -1% | 23 7% | 24 3% | 24.7 -0% |
| Idle Minimum * (dB) | 24.7 | 23.1 6% | 26 -5% | 23 7% | 24 3% | 24.7 -0% |
| Idle Average * (dB) | 24.7 | 23.1 6% | 27 -9% | 23 7% | 25.2 -2% | 24.7 -0% |
| Idle Maximum * (dB) | 24.7 | 23.1 6% | 28 -13% | 23 7% | 27.2 -10% | 24.7 -0% |
| Load Average * (dB) | 24.5 | 25.4 -4% | 38 -55% | 29.1 -19% | 34.8 -42% | 26.1 -7% |
| Witcher 3 ultra * (dB) | 24.3 | 35.93 -48% | 37 -52% | 29.1 -20% | 34.8 -43% | |
| Load Maximum * (dB) | 34.4 | 39.1 -14% | 38 -10% | 32.9 4% | 39 -13% | 37.4 -9% |
* ... Meglio usare valori piccoli
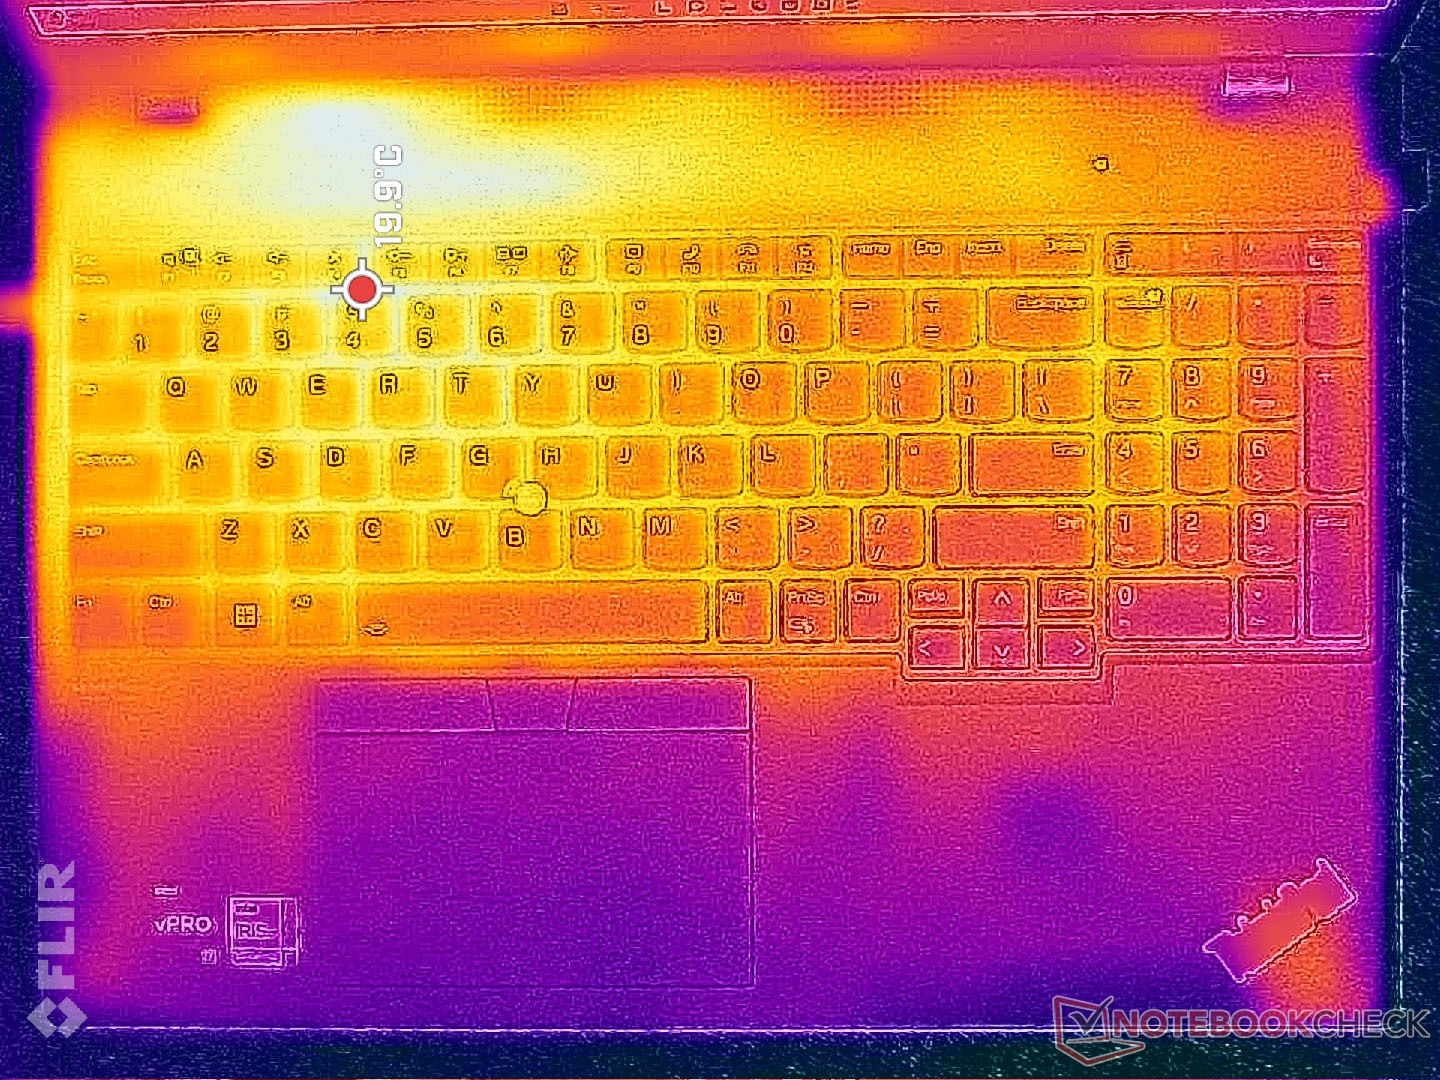
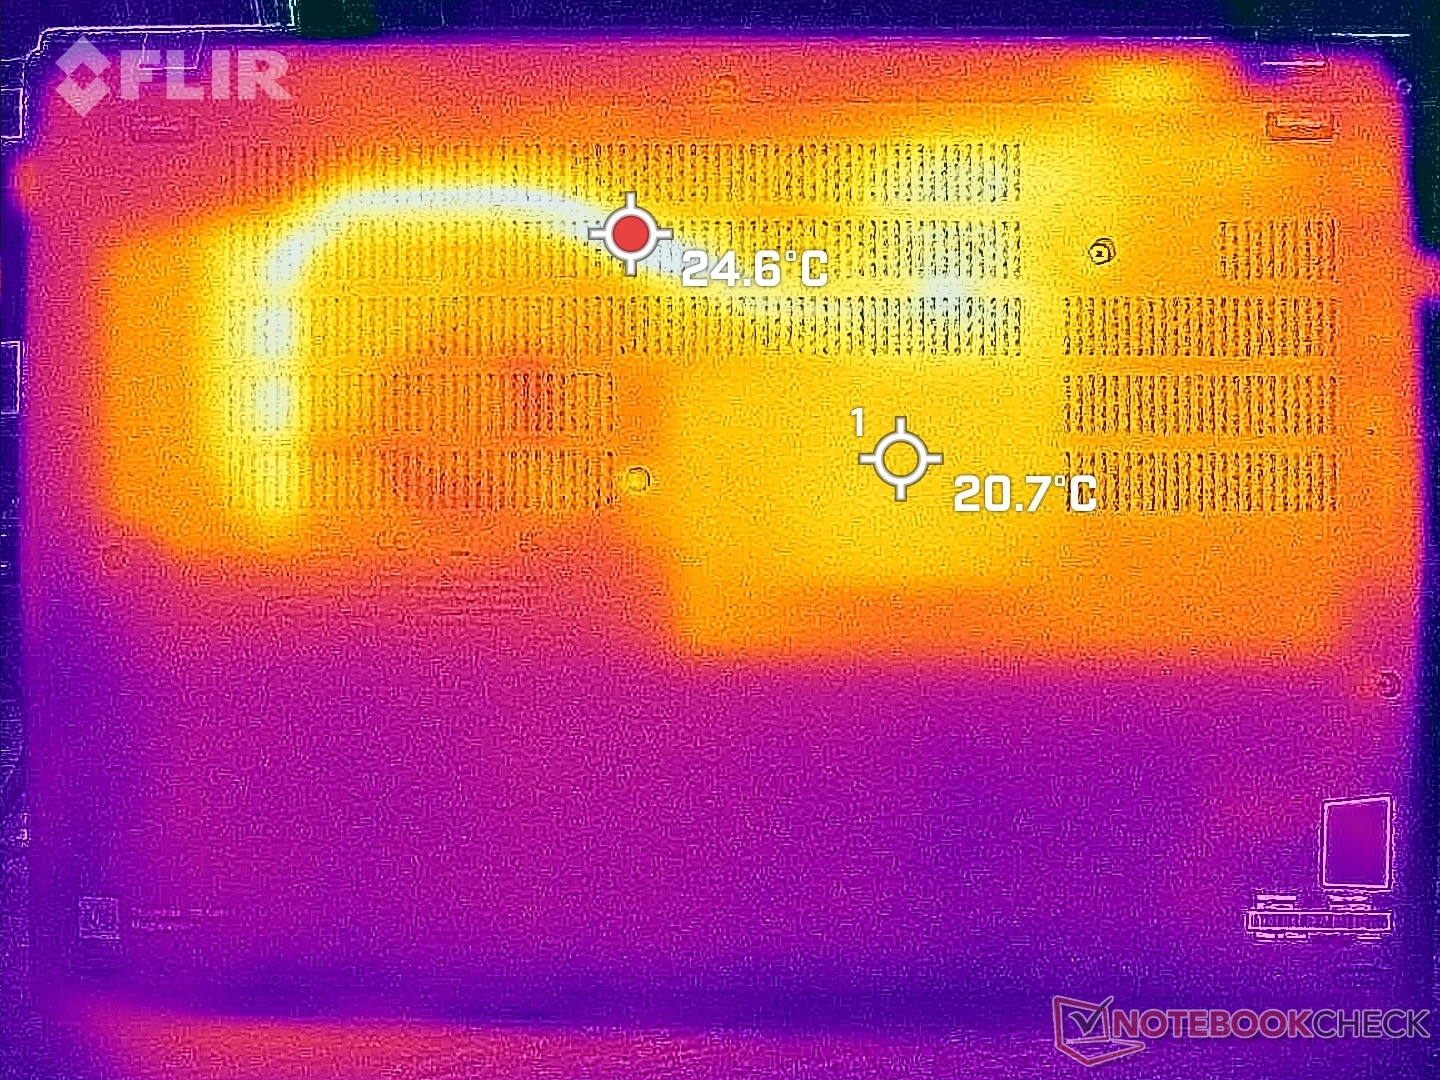
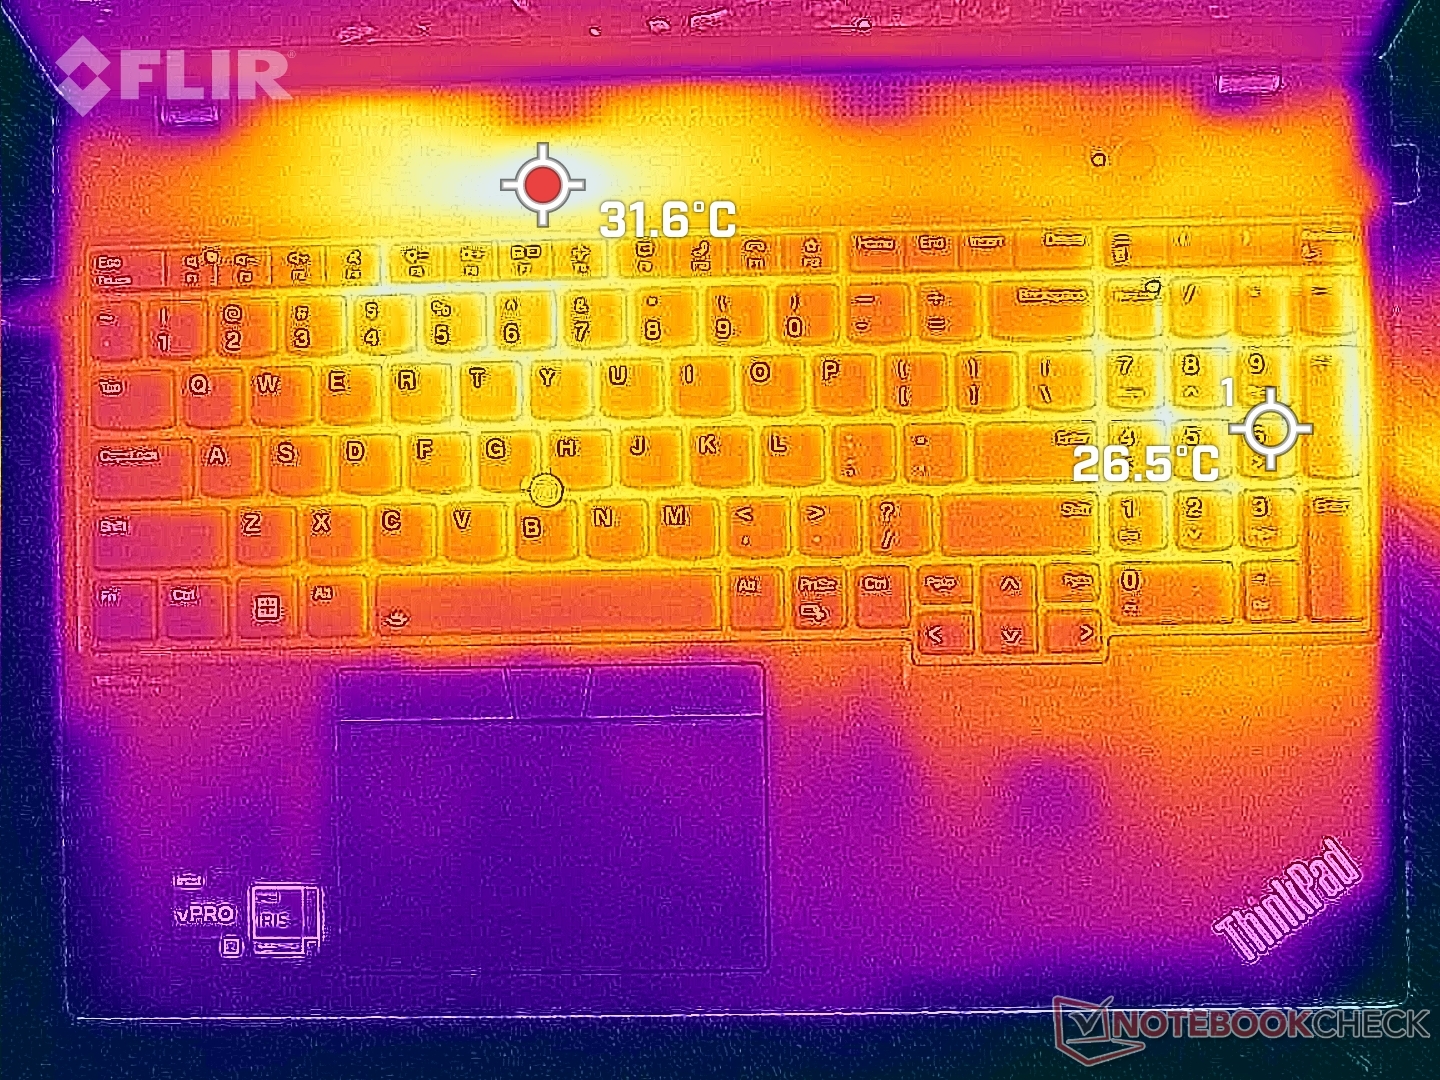
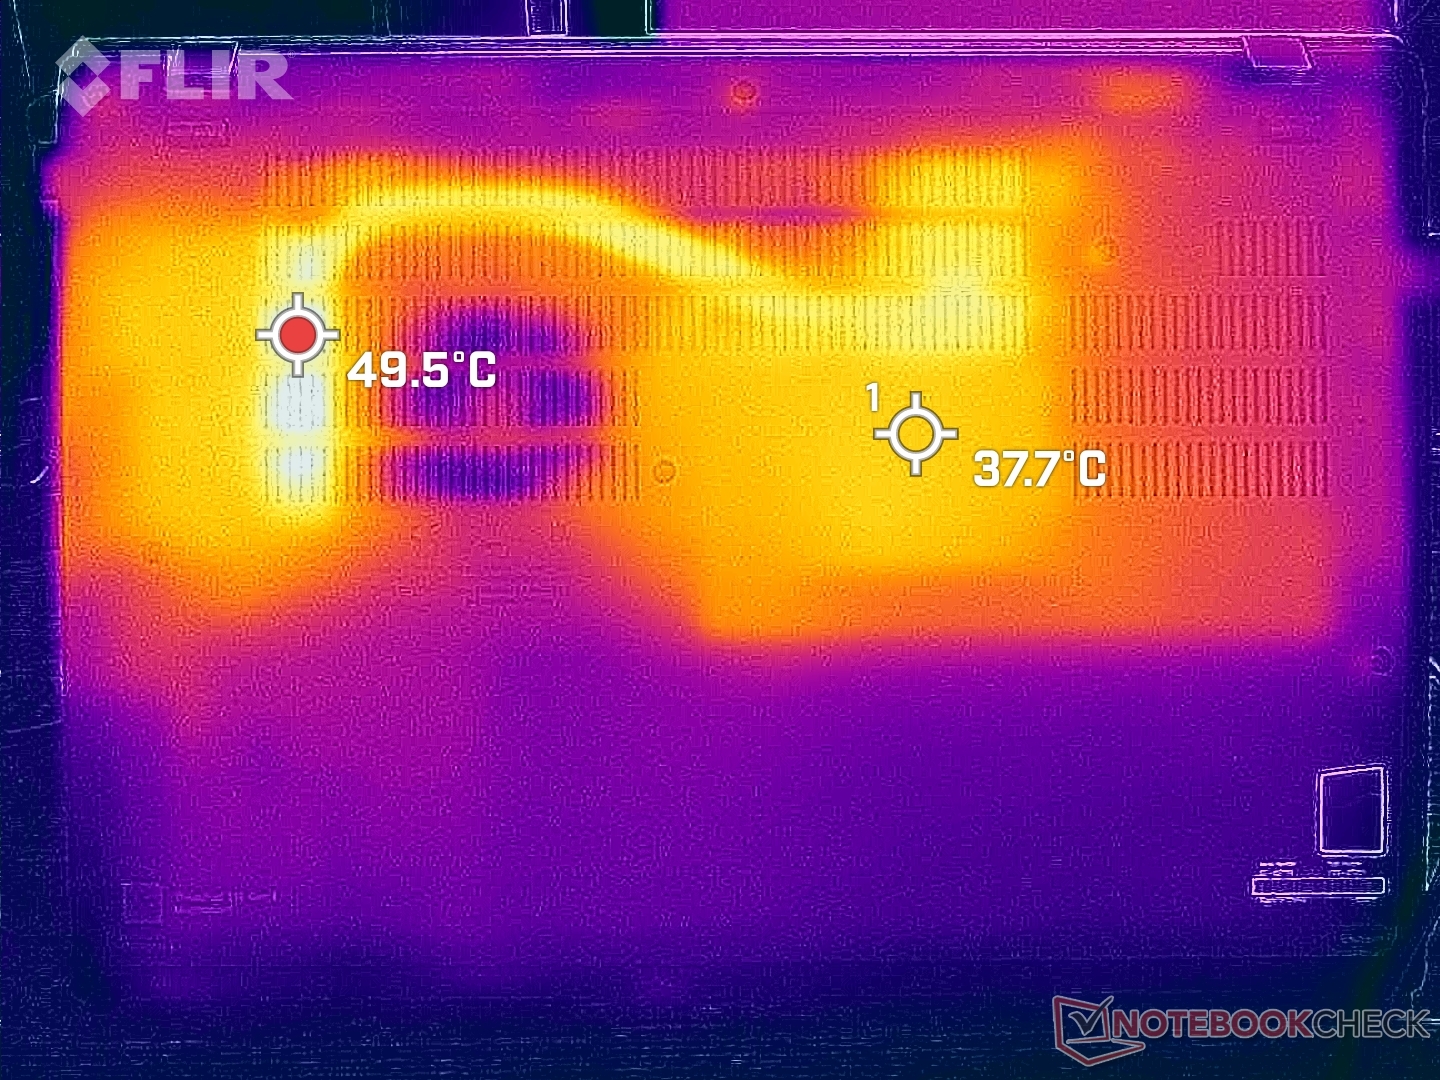
Temperatura
Le temperature della superficie sono molto più basse sul piano superiore rispetto a quello inferiore. La temperatura media del piano tastiera e dei poggiapolsi è di circa 29 C quando si eseguono carichi impegnativi, rispetto ai 36 C della superficie inferiore. Questo dato è in contrasto con la maggior parte degli altri computer portatili, come l'LG Gram 16 LG Gram 16 dove il centro della tastiera può raggiungere i 44 C ed essere più caldo di oltre 10 C rispetto al nostro ThinkPad T16 G1.
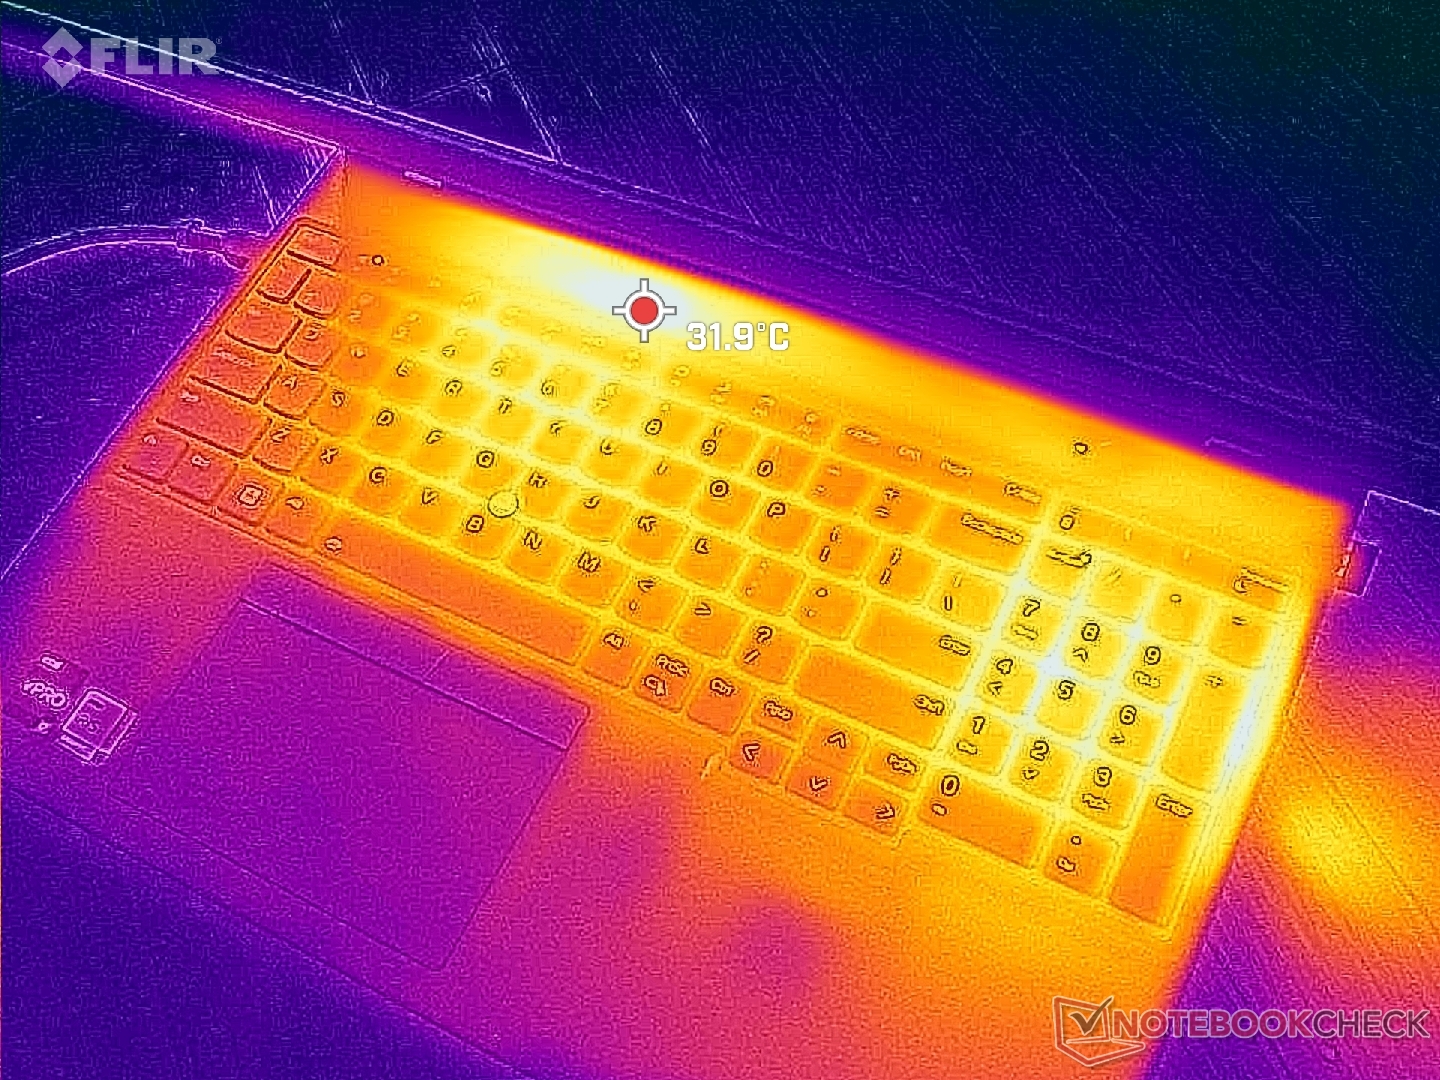
(+) La temperatura massima sul lato superiore è di 33.8 °C / 93 F, rispetto alla media di 34.3 °C / 94 F, che varia da 21.2 a 62.5 °C per questa classe Office.
(-) Il lato inferiore si riscalda fino ad un massimo di 47 °C / 117 F, rispetto alla media di 36.8 °C / 98 F
(+) In idle, la temperatura media del lato superiore è di 22.6 °C / 73 F, rispetto alla media deld ispositivo di 29.5 °C / 85 F.
(+) I poggiapolsi e il touchpad sono piu' freddi della temperatura della pelle con un massimo di 24.6 °C / 76.3 F e sono quindi freddi al tatto.
(+) La temperatura media della zona del palmo della mano di dispositivi simili e'stata di 27.5 °C / 81.5 F (+2.9 °C / 5.2 F).
| Lenovo ThinkPad T16 Gen 1 Core i7-1270P Intel Core i7-1270P, Intel Iris Xe Graphics G7 96EUs | Lenovo ThinkPad T16 G1 21BWS00200 Intel Core i5-1240P, Intel Iris Xe Graphics G7 80EUs | LG Gram 16Z90Q Intel Core i7-1260P, Intel Iris Xe Graphics G7 96EUs | HP EliteBook 865 G9 AMD Ryzen 7 PRO 6850U, AMD Radeon 680M | Huawei MateBook 16s i7 Intel Core i7-12700H, Intel Iris Xe Graphics G7 96EUs | Apple MacBook Pro 16 2021 M1 Pro Apple M1 Pro, Apple M1 Pro 16-Core GPU | |
|---|---|---|---|---|---|---|
| Heat | -19% | -6% | 0% | -13% | 3% | |
| Maximum Upper Side * (°C) | 33.8 | 45 -33% | 45 -33% | 39.4 -17% | 40.9 -21% | 41 -21% |
| Maximum Bottom * (°C) | 47 | 42.8 9% | 43 9% | 47.6 -1% | 48.3 -3% | 39 17% |
| Idle Upper Side * (°C) | 24.6 | 33 -34% | 26 -6% | 23.6 4% | 29.2 -19% | 24 2% |
| Idle Bottom * (°C) | 28.2 | 33.6 -19% | 26 8% | 24.1 15% | 30.4 -8% | 24 15% |
* ... Meglio usare valori piccoli
Stress test
I forti cali di prestazioni durante i nostri Witcher 3 e CineBench R15 xT possono essere osservati tramite HWiNFO. Durante l'esecuzione di Prime95, ad esempio, la velocità di clock della CPU e l'assorbimento di potenza della scheda sono aumentati fino a 3,5 GHz e 48 W, rispettivamente. Una volta che la temperatura del core raggiunge i 97 C pochi secondi dopo, tuttavia, le velocità di clock e l'assorbimento di potenza della scheda iniziano a diminuire costantemente fino a 1,7 GHz e 22 W, rispettivamente, al fine di mantenere una temperatura del core più fredda di 69 C. L'implementazione di ThrottleStop aumenterà la velocità di clock stabile a un intervallo superiore di 2 o 3 GHz, anche se al costo di temperature del core più calde.
La velocità di clock della GPU e la temperatura Witcher 3 si stabilizzerebbero rispettivamente a 998 MHz e 67 C, rispetto ai 1100 MHz e 58 C del modello più piccolo HP Dragonfly Folio 13.5 G3. Il funzionamento a batteria non sembra avere un impatto sulle prestazioni.
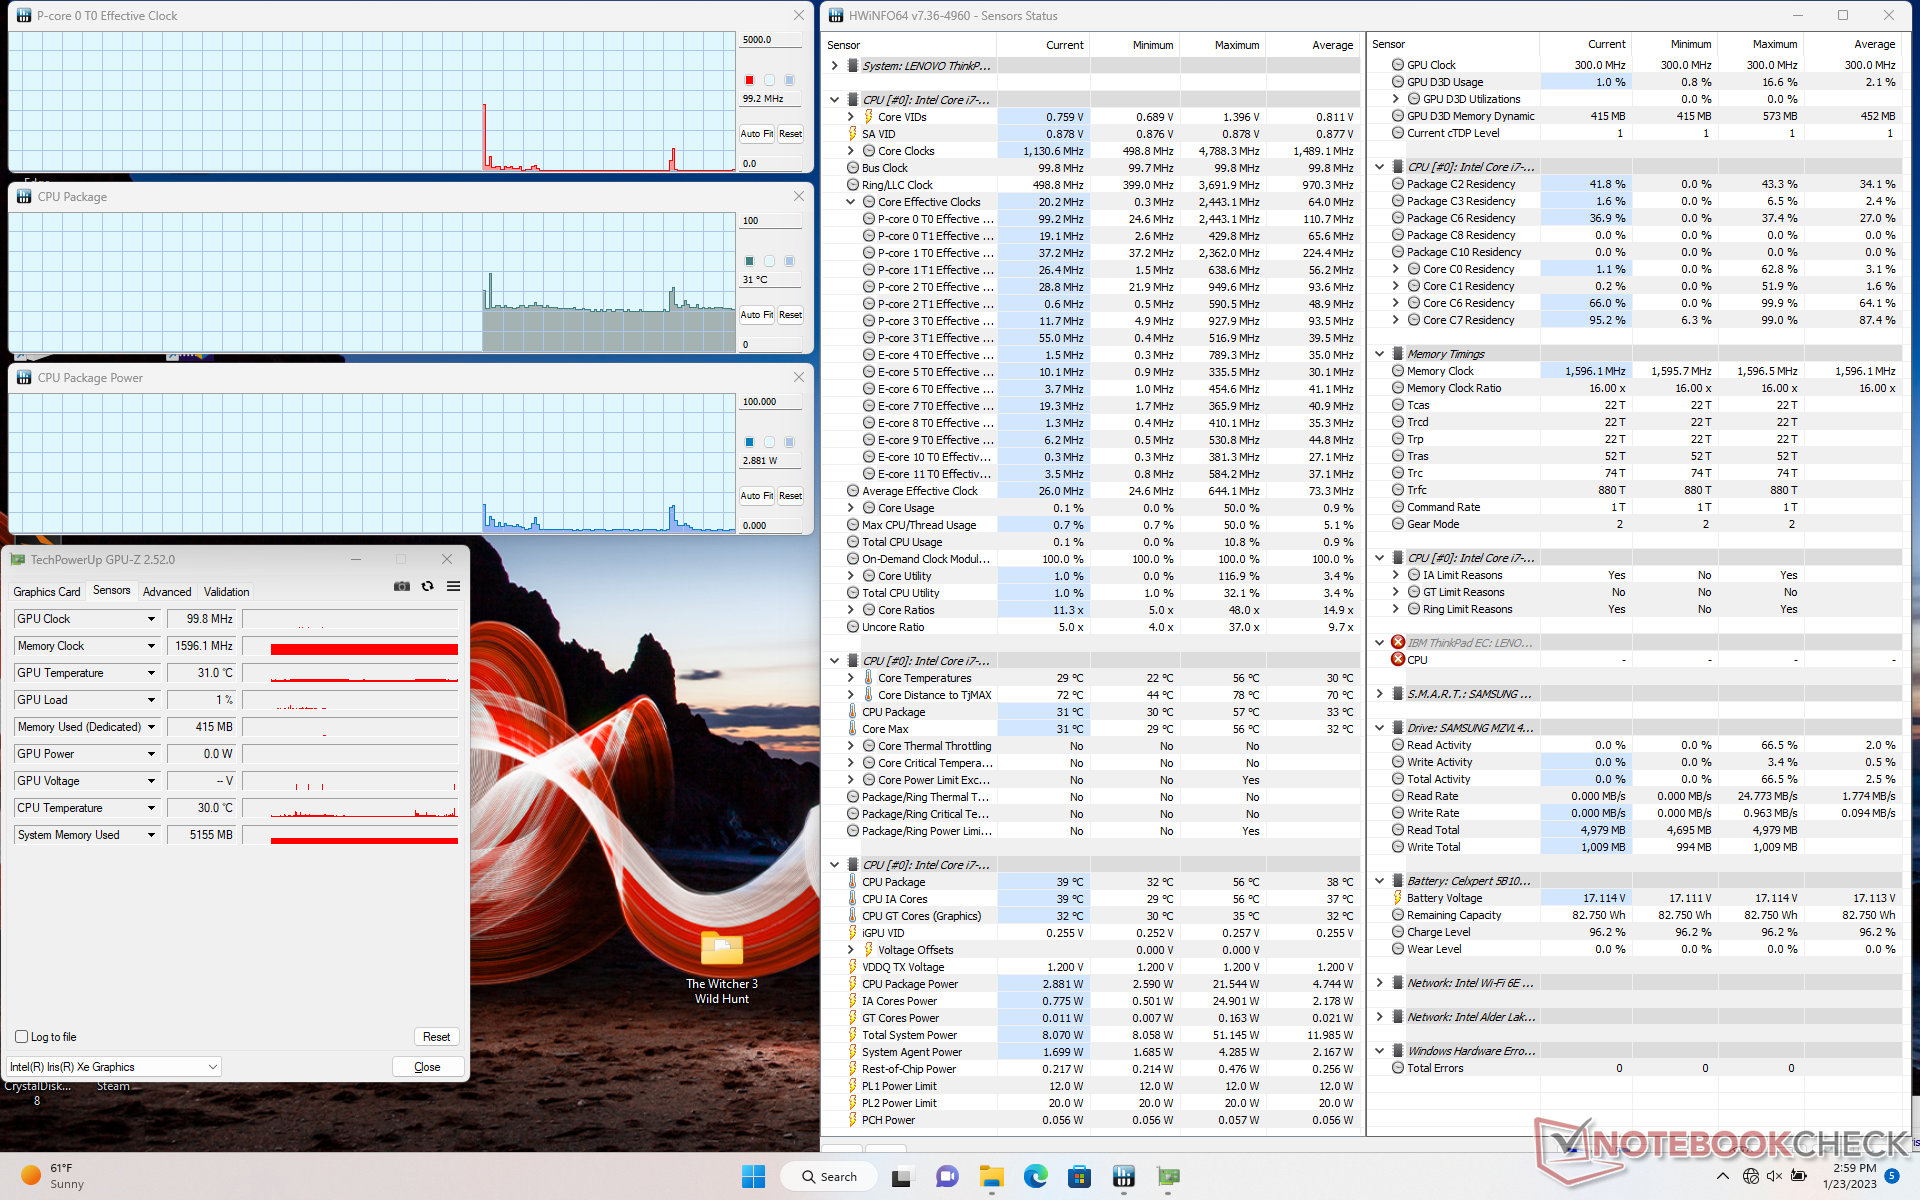
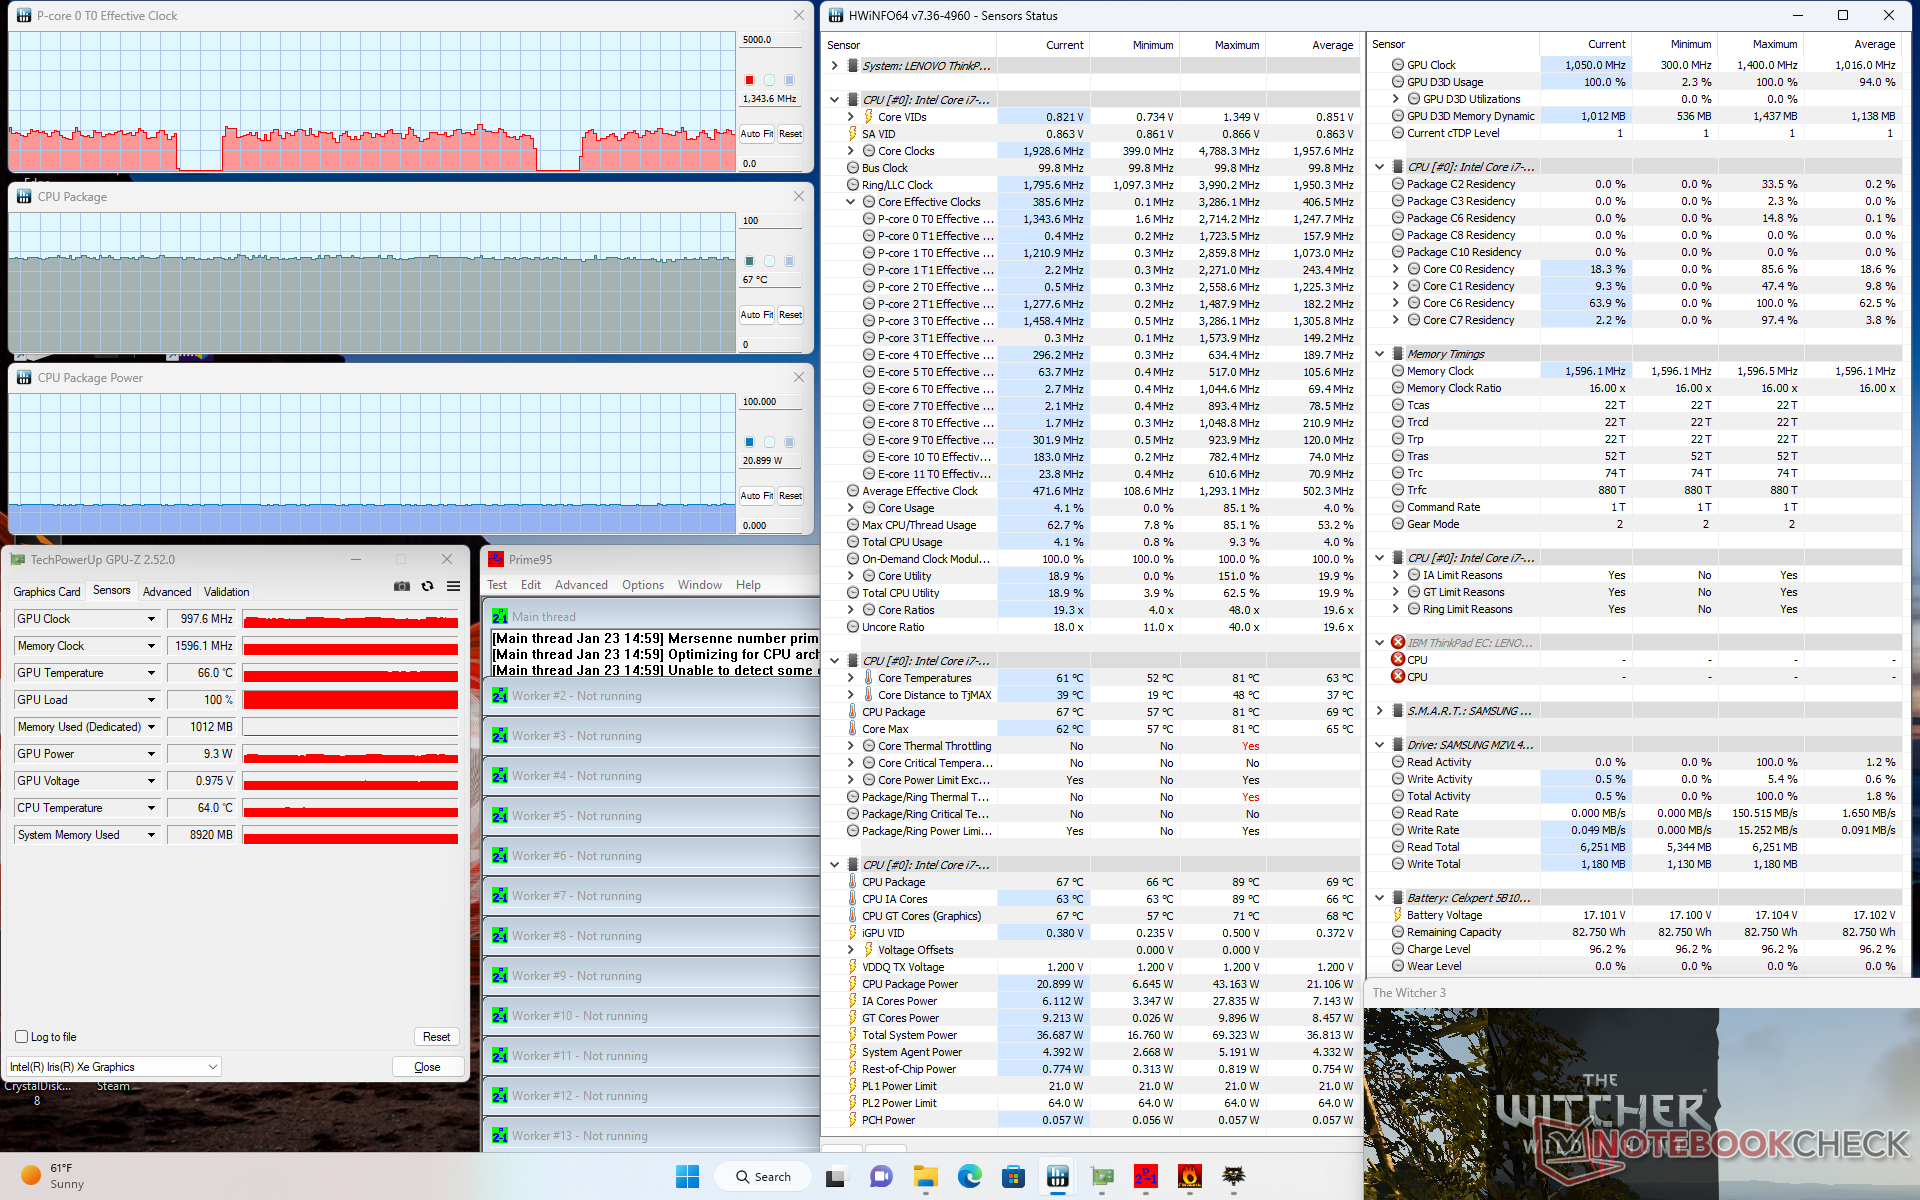
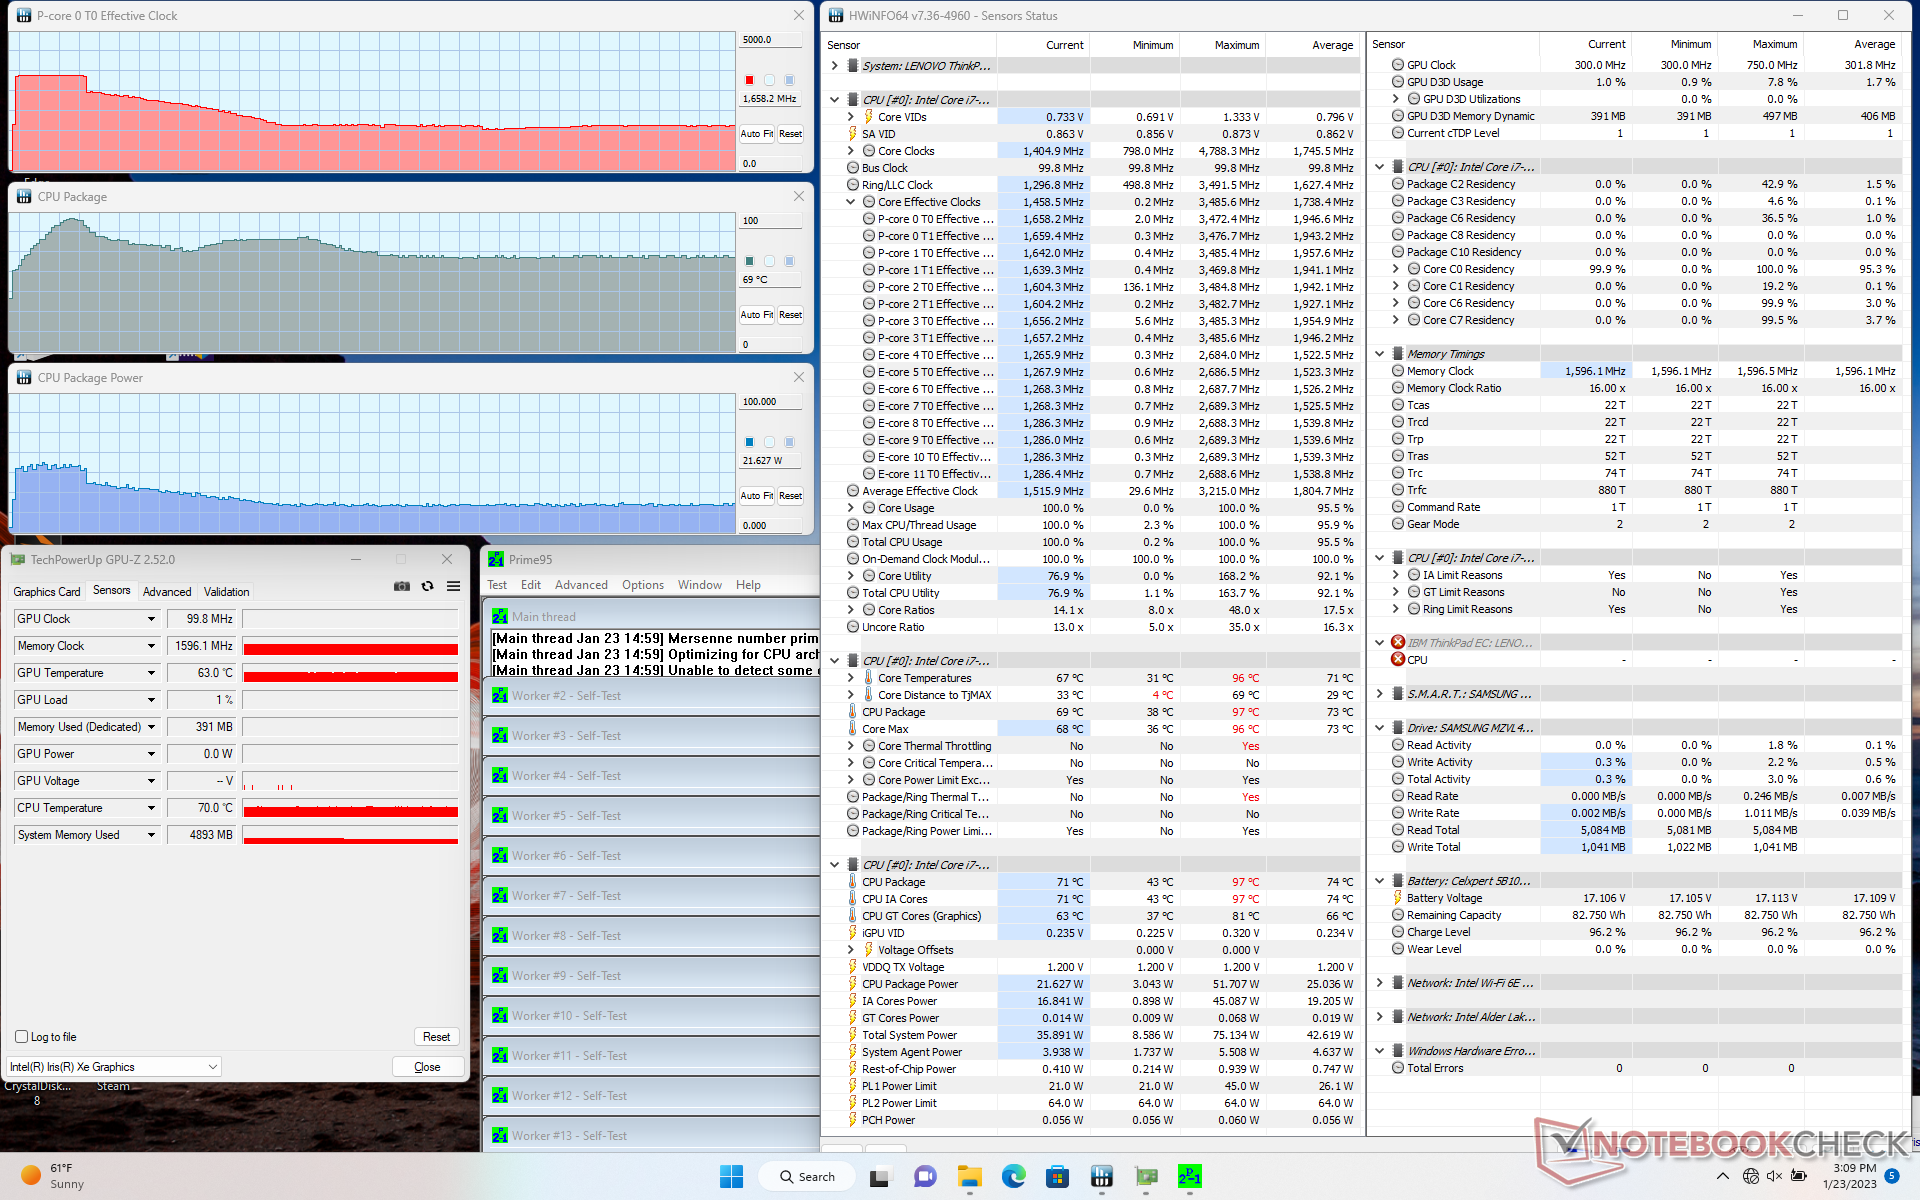
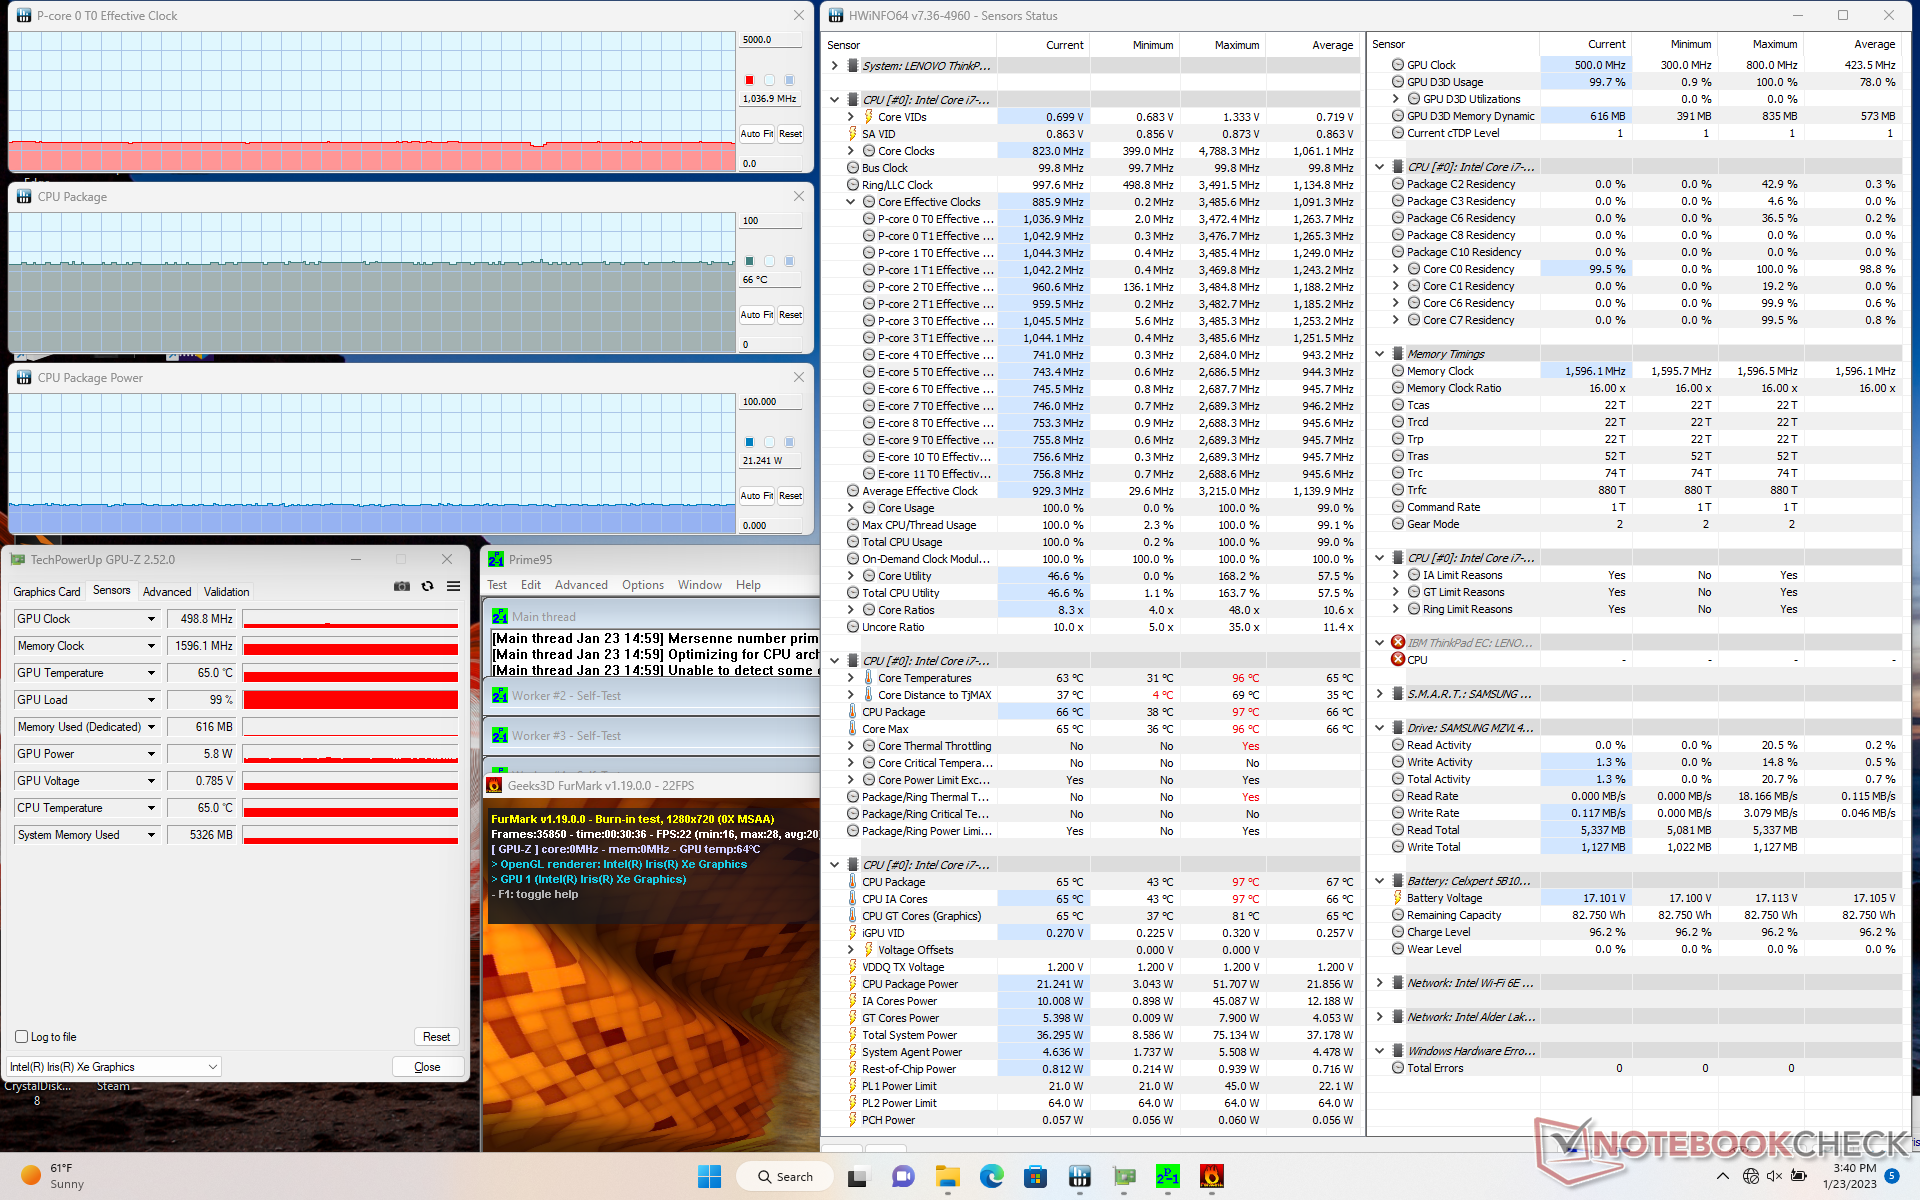
| Clock della CPU (GHz) | Clock della GPU (MHz) | Temperatura media della CPU (°C) | |
| Sistema inattivo | -- | -- | 31 |
| Stress Prime95 | 1,7 | -- | 69 |
| Prime95 + FurMark Stress | 1,0 | 499 | 66 |
| Witcher 3 Stress | ~1,3 | 998 | 67 |
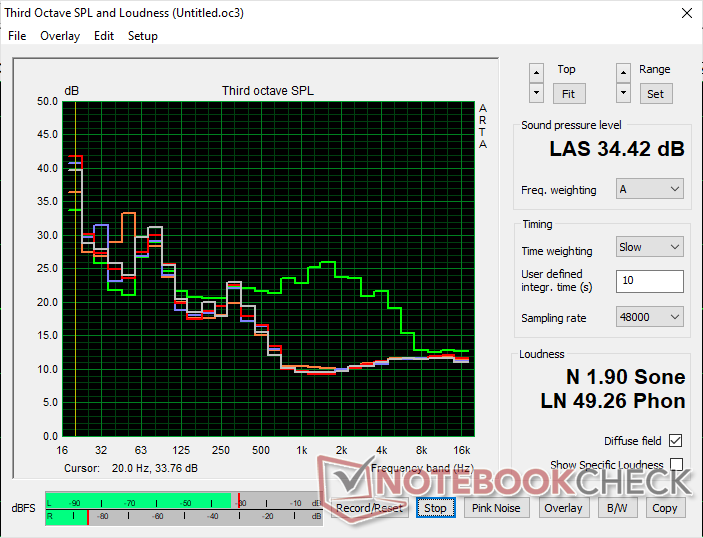
Altoparlanti
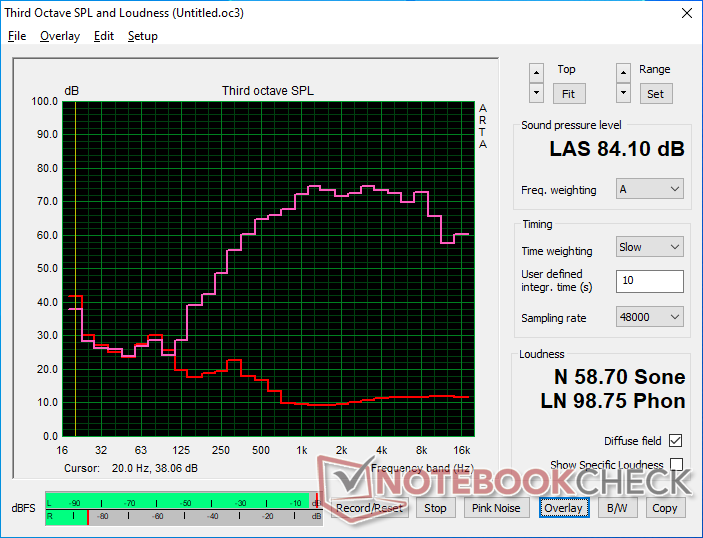
Lenovo ThinkPad T16 Gen 1 Core i7-1270P analisi audio
(+) | gli altoparlanti sono relativamente potenti (84.1 dB)
Bassi 100 - 315 Hz
(-) | quasi nessun basso - in media 26.3% inferiori alla media
(±) | la linearità dei bassi è media (11.1% delta rispetto alla precedente frequenza)
Medi 400 - 2000 Hz
(+) | medi bilanciati - solo only 4.5% rispetto alla media
(+) | medi lineari (5.1% delta rispetto alla precedente frequenza)
Alti 2 - 16 kHz
(±) | alti elevati - circa 5.8% superiori alla media
(+) | alti lineari (4.8% delta rispetto alla precedente frequenza)
Nel complesso 100 - 16.000 Hz
(±) | la linearità complessiva del suono è media (20.1% di differenza rispetto alla media
Rispetto alla stessa classe
» 42% di tutti i dispositivi testati in questa classe è stato migliore, 10% simile, 47% peggiore
» Il migliore ha avuto un delta di 7%, medio di 21%, peggiore di 53%
Rispetto a tutti i dispositivi testati
» 52% di tutti i dispositivi testati in questa classe è stato migliore, 8% similare, 40% peggiore
» Il migliore ha avuto un delta di 4%, medio di 24%, peggiore di 134%
Apple MacBook Pro 16 2021 M1 Pro analisi audio
(+) | gli altoparlanti sono relativamente potenti (84.7 dB)
Bassi 100 - 315 Hz
(+) | bassi buoni - solo 3.8% dalla media
(+) | bassi in lineaa (5.2% delta rispetto alla precedente frequenza)
Medi 400 - 2000 Hz
(+) | medi bilanciati - solo only 1.3% rispetto alla media
(+) | medi lineari (2.1% delta rispetto alla precedente frequenza)
Alti 2 - 16 kHz
(+) | Alti bilanciati - appena 1.9% dalla media
(+) | alti lineari (2.7% delta rispetto alla precedente frequenza)
Nel complesso 100 - 16.000 Hz
(+) | suono nel complesso lineare (4.6% differenza dalla media)
Rispetto alla stessa classe
» 0% di tutti i dispositivi testati in questa classe è stato migliore, 0% simile, 100% peggiore
» Il migliore ha avuto un delta di 5%, medio di 17%, peggiore di 45%
Rispetto a tutti i dispositivi testati
» 0% di tutti i dispositivi testati in questa classe è stato migliore, 0% similare, 100% peggiore
» Il migliore ha avuto un delta di 4%, medio di 24%, peggiore di 134%
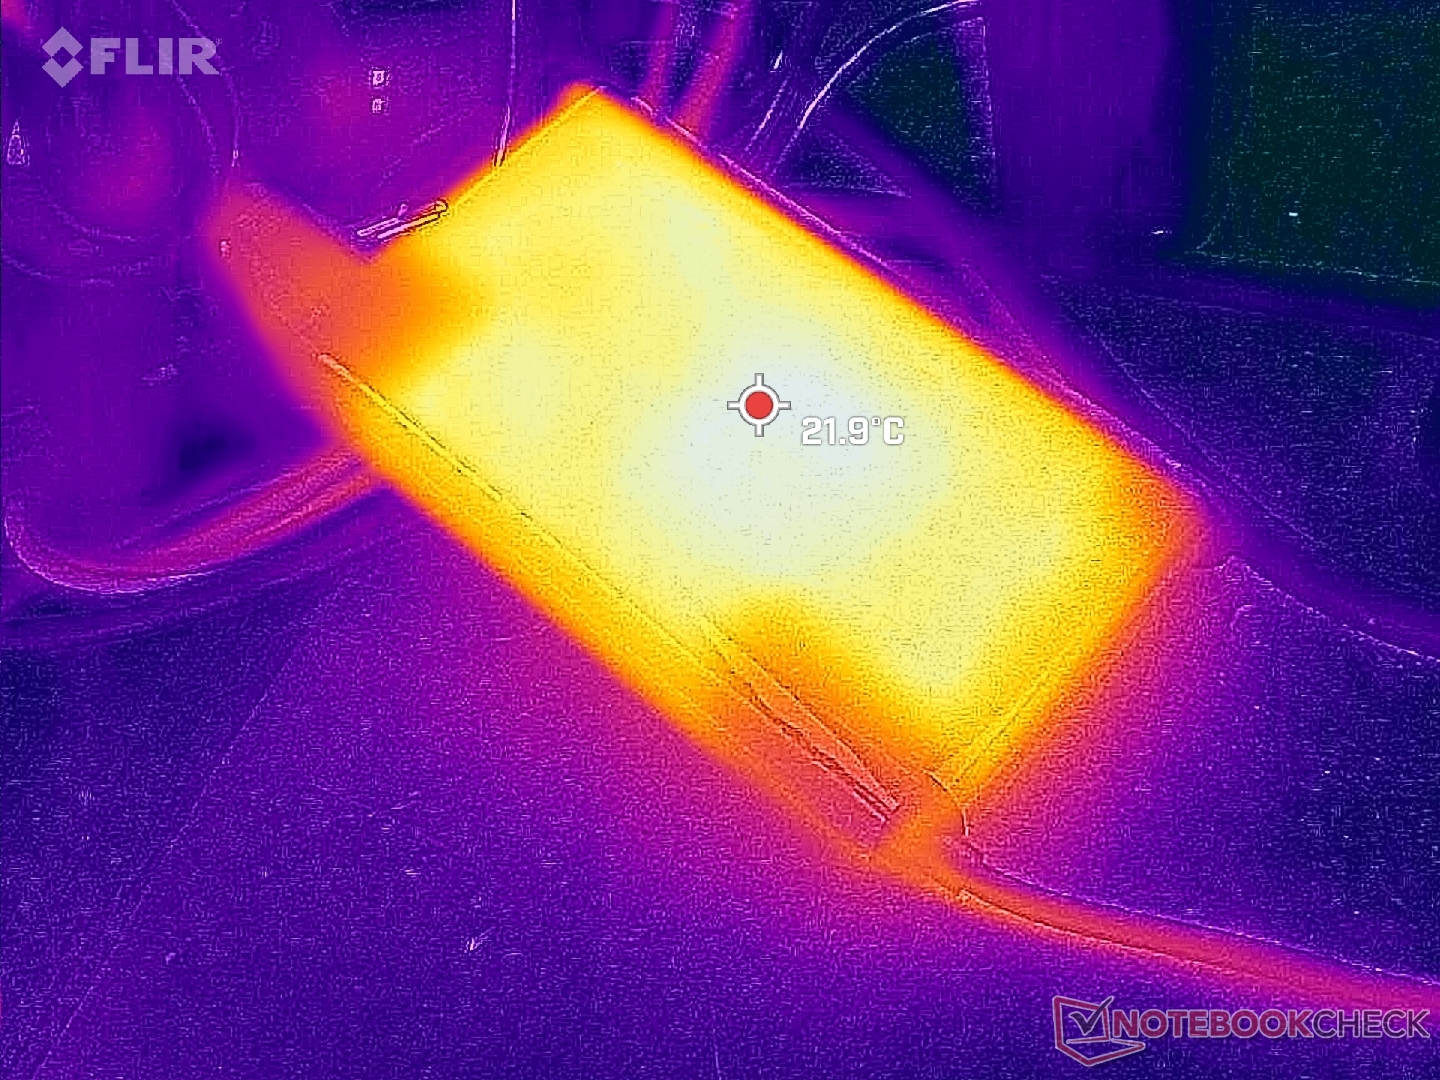
Gestione dell'energia
Consumo di energia
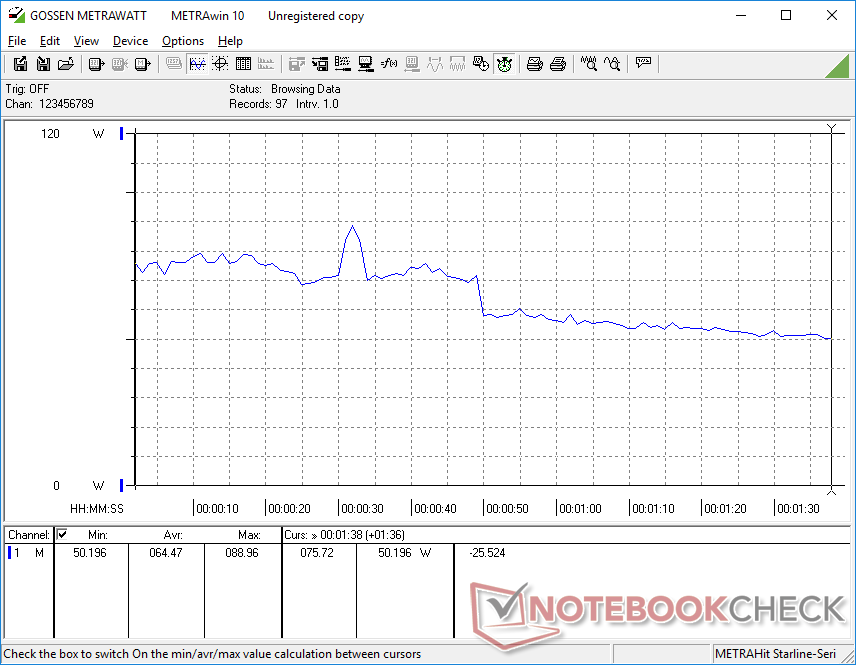
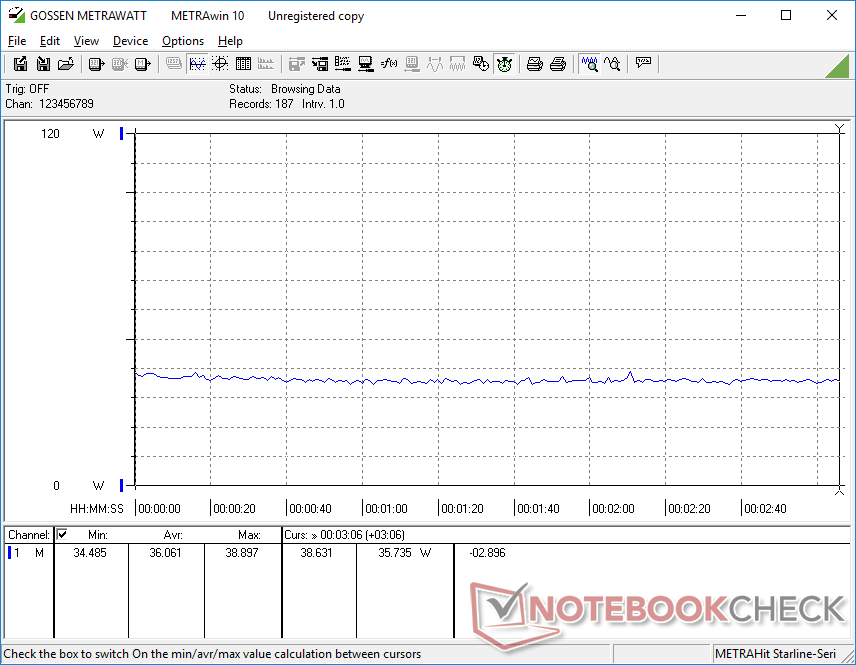
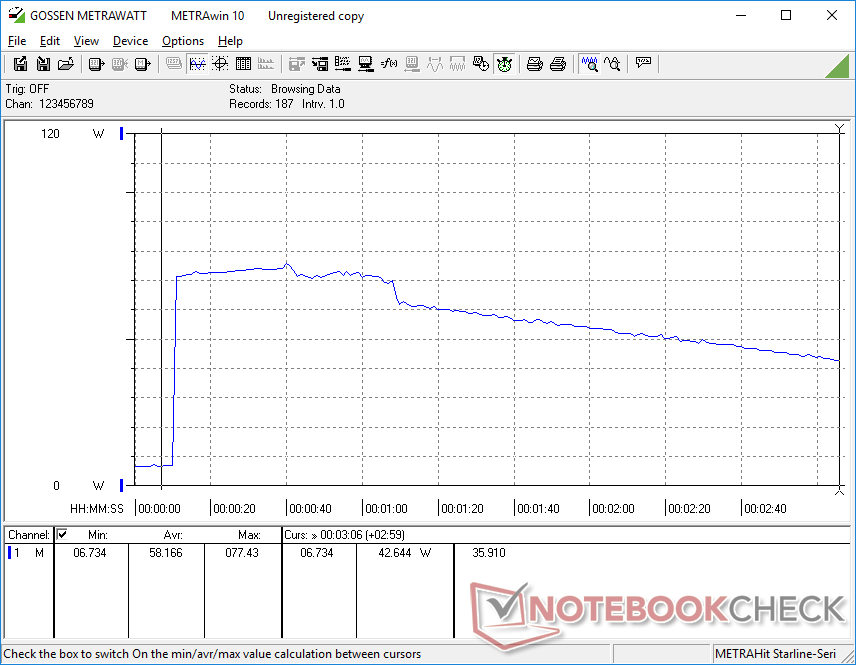
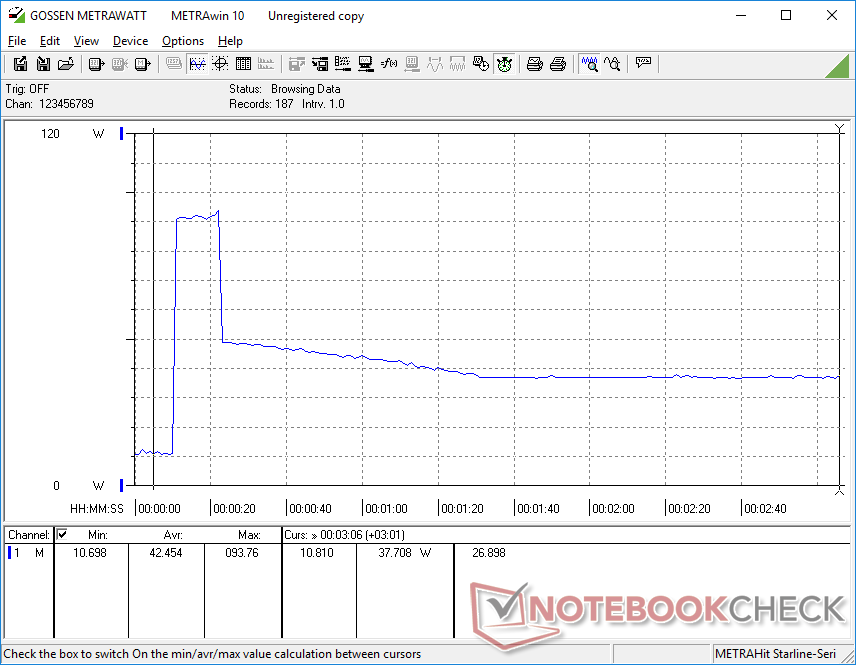
Il consumo di energia durante l'esecuzione di carichi elevati riflette le osservazioni sulla frequenza di clock e sulle prestazioni di cui sopra. In particolare, può essere elevato durante i primi momenti di stress prima di scendere a livelli inferiori a causa del throttling delle prestazioni. Quando si esegue Prime95, ad esempio, il consumo sarebbe elevato a circa 77 W per circa 60 secondi, prima di scendere a 42 W o meno nel corso del tempo. Questo accade anche se si imposta la modalità ad alte prestazioni.
Siamo riusciti a registrare un consumo massimo di 94 W dall'adattatore CA USB-C da 135 W di dimensioni medio-piccole (~14,6 x 7,7 x 2,5 cm) quando la CPU e la GPU integrata sono utilizzate al 100%. Tuttavia, questo tasso è solo temporaneo, come mostra il grafico seguente. Il consumo relativamente elevato consente al portatile di alimentare dispositivi Thunderbolt più esigenti, come alcuni dock e monitor. In alternativa, Lenovo offre un adattatore CA da 65 W, più piccolo e portatile.
| Off / Standby | |
| Idle | |
| Sotto carico |
|
Leggenda:
min: | |
| Lenovo ThinkPad T16 Gen 1 Core i7-1270P i7-1270P, Iris Xe G7 96EUs, Samsung PM9B1 512GB MZAL4512HBLU, IPS, 1920x1200, 16" | Lenovo ThinkPad T16 G1 21BWS00200 i5-1240P, Iris Xe G7 80EUs, Samsung PM9A1 MZVL2512HCJQ, IPS, 1920x1200, 16" | LG Gram 16Z90Q i7-1260P, Iris Xe G7 96EUs, Samsung PM9A1 MZVL21T0HCLR, IPS, 2560x1600, 16" | HP EliteBook 865 G9 R7 PRO 6850U, Radeon 680M, Samsung PM991 MZVLQ512HBLU, IPS, 1920x1200, 16" | Huawei MateBook 16s i7 i7-12700H, Iris Xe G7 96EUs, Silicon Motion PCIe-8 SSD, IPS, 2520x1680, 16" | Apple MacBook Pro 16 2021 M1 Pro M1 Pro, M1 Pro 16-Core GPU, Apple SSD AP1024R, Mini-LED, 3456x2234, 16.2" | |
|---|---|---|---|---|---|---|
| Power Consumption | 21% | -3% | -21% | -45% | -34% | |
| Idle Minimum * (Watt) | 3.5 | 2.9 17% | 5 -43% | 5.3 -51% | 6.8 -94% | 5 -43% |
| Idle Average * (Watt) | 7.4 | 6 19% | 8 -8% | 12.8 -73% | 13.2 -78% | 15.1 -104% |
| Idle Maximum * (Watt) | 10.7 | 6.9 36% | 14 -31% | 14.1 -32% | 13.8 -29% | 15.5 -45% |
| Load Average * (Watt) | 64.5 | 27.3 58% | 47 27% | 48.5 25% | 75.2 -17% | 54 16% |
| Witcher 3 ultra * (Watt) | 36.1 | 42.6 -18% | 37.8 -5% | 48.7 -35% | 56.1 -55% | |
| Load Maximum * (Watt) | 93.8 | 81.53 13% | 56 40% | 56.6 40% | 90.6 3% | 90 4% |
* ... Meglio usare valori piccoli
Power Consumption Witcher 3 / Stresstest
Power Consumption external Monitor
Durata della batteria - Navigazione web per tutto il giorno
Il tempo di esecuzione della WLAN è significativamente più breve di quello registrato sulla SKU Core i5 del Thinkpad T16 G1, come mostra la tabella seguente. Ci siamo assicurati di eseguire il test con le stesse impostazioni del profilo energetico Bilanciato tra le due configurazioni e i risultati non sono cambiati. Anche così, 8 ore di navigazione nel mondo reale sono probabilmente sufficienti per la maggior parte degli utenti.
La ricarica da vuoto a pieno regime richiede circa 90 minuti con l'adattatore CA in dotazione.
| Lenovo ThinkPad T16 Gen 1 Core i7-1270P i7-1270P, Iris Xe G7 96EUs, 86 Wh | Lenovo ThinkPad T16 G1 21BWS00200 i5-1240P, Iris Xe G7 80EUs, 86 Wh | LG Gram 16Z90Q i7-1260P, Iris Xe G7 96EUs, 80 Wh | HP EliteBook 865 G9 R7 PRO 6850U, Radeon 680M, 76 Wh | Huawei MateBook 16s i7 i7-12700H, Iris Xe G7 96EUs, 84 Wh | Apple MacBook Pro 16 2021 M1 Pro M1 Pro, M1 Pro 16-Core GPU, 99.6 Wh | |
|---|---|---|---|---|---|---|
| Autonomia della batteria | 76% | 26% | 88% | 1% | 111% | |
| WiFi v1.3 (h) | 8 | 14.1 76% | 10.1 26% | 15 88% | 8.1 1% | 16.9 111% |
| H.264 (h) | 10.4 | 18.5 | 9.3 | 17.5 | ||
| Load (h) | 3.5 | 2.6 | 1.8 | 1.9 | ||
| Reader / Idle (h) | 18.1 |
Pro
Contro
Verdetto - Non per utenti con prestazioni estreme
Sebbene il ThinkPad T16 G1 non sia stato progettato per utenti con prestazioni elevate, è comunque deludente vedere un tasso di throttling della CPU così elevato quando si eseguono carichi più impegnativi. Il throttling è abbastanza significativo da far sì che le prestazioni del nostro Core i7-1270P, dopo un certo periodo di tempo, diventino lente come quelle del più economico Core i5-1240P. Questo comportamento significa che l'opzione Core i7-1270P dà il meglio di sé solo per brevi raffiche di prestazioni elevate, come l'avvio di applicazioni o l'elaborazione di immagini, piuttosto che per lunghe operazioni di codifica video o di grafica pesante, dove il throttling può verificarsi nel tempo.
Un'opzione integrata per aumentare le prestazioni del processore al costo di un rumore più forte della ventola e/o di temperature più elevate avrebbe mitigato in qualche modo il throttling.
L'opzione Ryzen 5 Pro 6650U offre prestazioni più costanti rispetto all'opzione Core i7-1270P. Il rallentamento delle prestazioni è più pesante della configurazione con una CPU della serie Core P.
Oltre al processore, gli utenti devono prestare attenzione anche alla lentezza della RAM di sistema e ad alcune opzioni di visualizzazione disponibili. La prima incide sulle prestazioni grafiche fino al 10%, mentre alcuni pannelli potrebbero non avere i colori richiesti dai professionisti della grafica. Il concorrenteHP EliteBook 865 G9 è un'alternativa più sottile con opzioni non disponibili sul ThinkPad T16 G1, tra cui un display più luminoso da 1000 nit e una webcam da 5 MP a risoluzione più elevata.
Prezzo e disponibilità
Il ThinkPad T16 G1 viene ora spedito direttamente da Lenovo a partire da 1050 dollari per la configurazione base Core i5-1235U fino a 2040 dollari per la configurazione Core i7-1270P. Anche Newegg e Amazon hanno in stock il modello in varie configurazioni a partire da circa 1500 dollari se configurato con il Core i7-1270P.
Lenovo ThinkPad T16 Gen 1 Core i7-1270P
- 01/25/2023 v7 (old)
Allen Ngo
Transparency
La selezione dei dispositivi da recensire viene effettuata dalla nostra redazione. Il campione di prova è stato fornito all'autore come prestito dal produttore o dal rivenditore ai fini di questa recensione. L'istituto di credito non ha avuto alcuna influenza su questa recensione, né il produttore ne ha ricevuto una copia prima della pubblicazione. Non vi era alcun obbligo di pubblicare questa recensione. In quanto società mediatica indipendente, Notebookcheck non è soggetta all'autorità di produttori, rivenditori o editori.
Ecco come Notebookcheck esegue i test
Ogni anno, Notebookcheck esamina in modo indipendente centinaia di laptop e smartphone utilizzando procedure standardizzate per garantire che tutti i risultati siano comparabili. Da circa 20 anni sviluppiamo continuamente i nostri metodi di prova e nel frattempo stabiliamo gli standard di settore. Nei nostri laboratori di prova, tecnici ed editori esperti utilizzano apparecchiature di misurazione di alta qualità. Questi test comportano un processo di validazione in più fasi. Il nostro complesso sistema di valutazione si basa su centinaia di misurazioni e parametri di riferimento ben fondati, che mantengono l'obiettività.Price comparison

