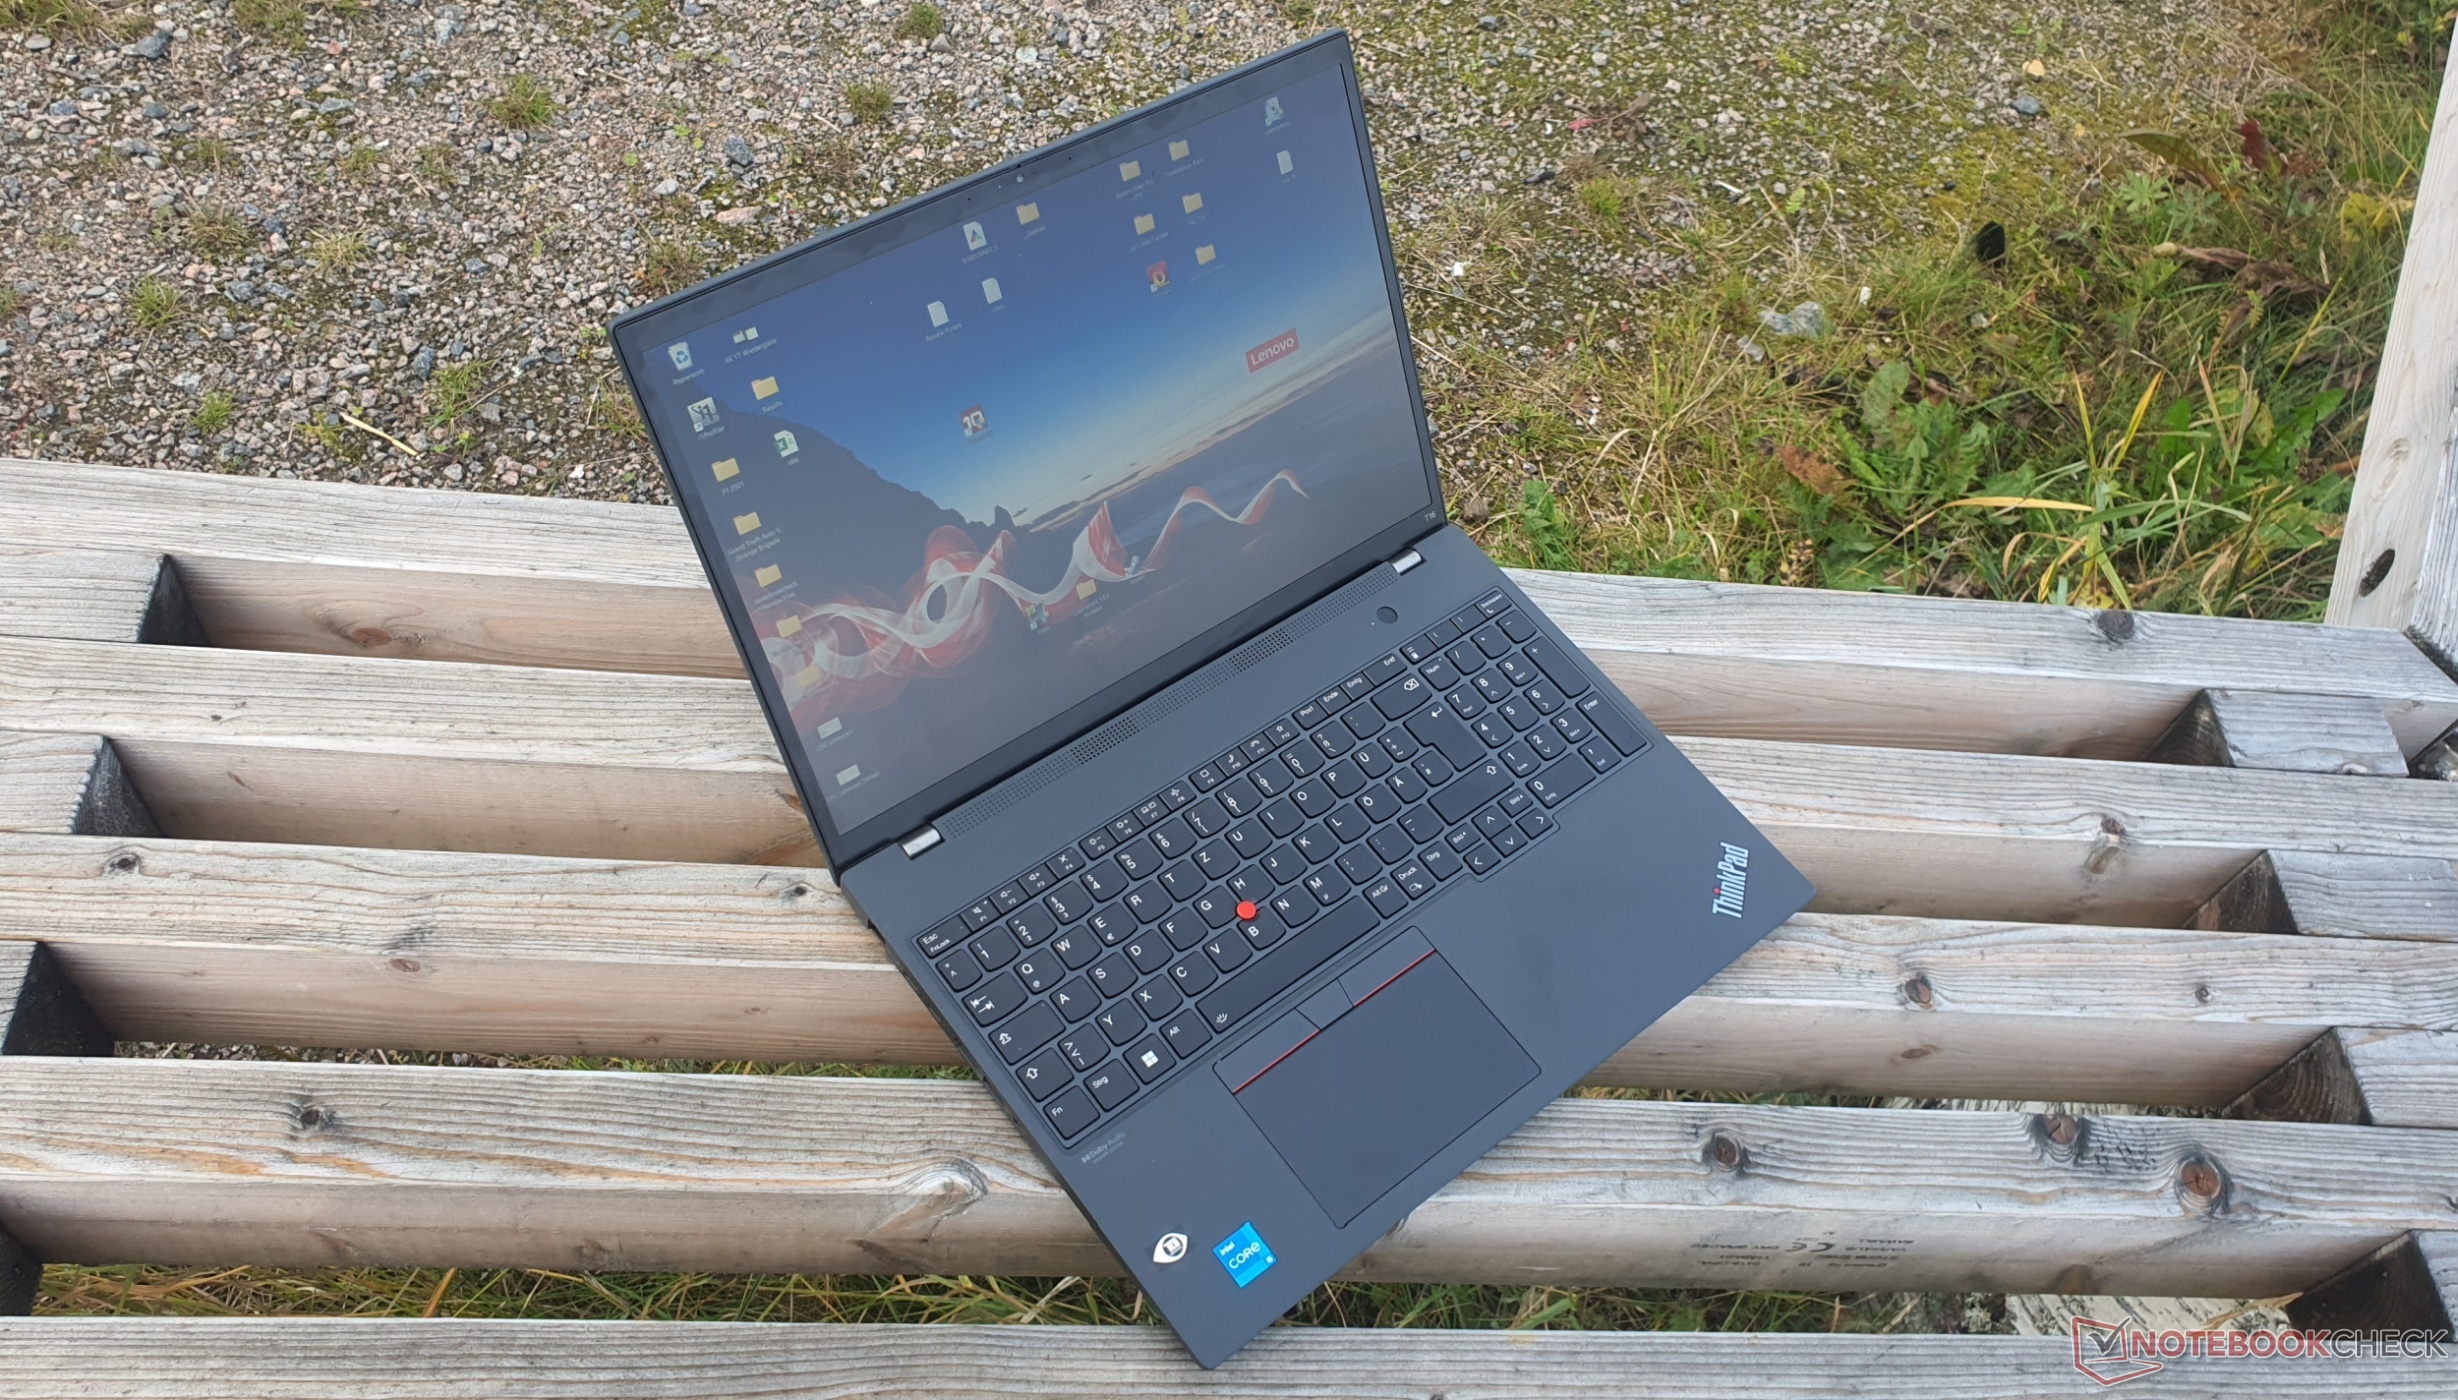
Recensione del portatile Lenovo ThinkPad T16 G1 Intel: un maratoneta da 16 pollici
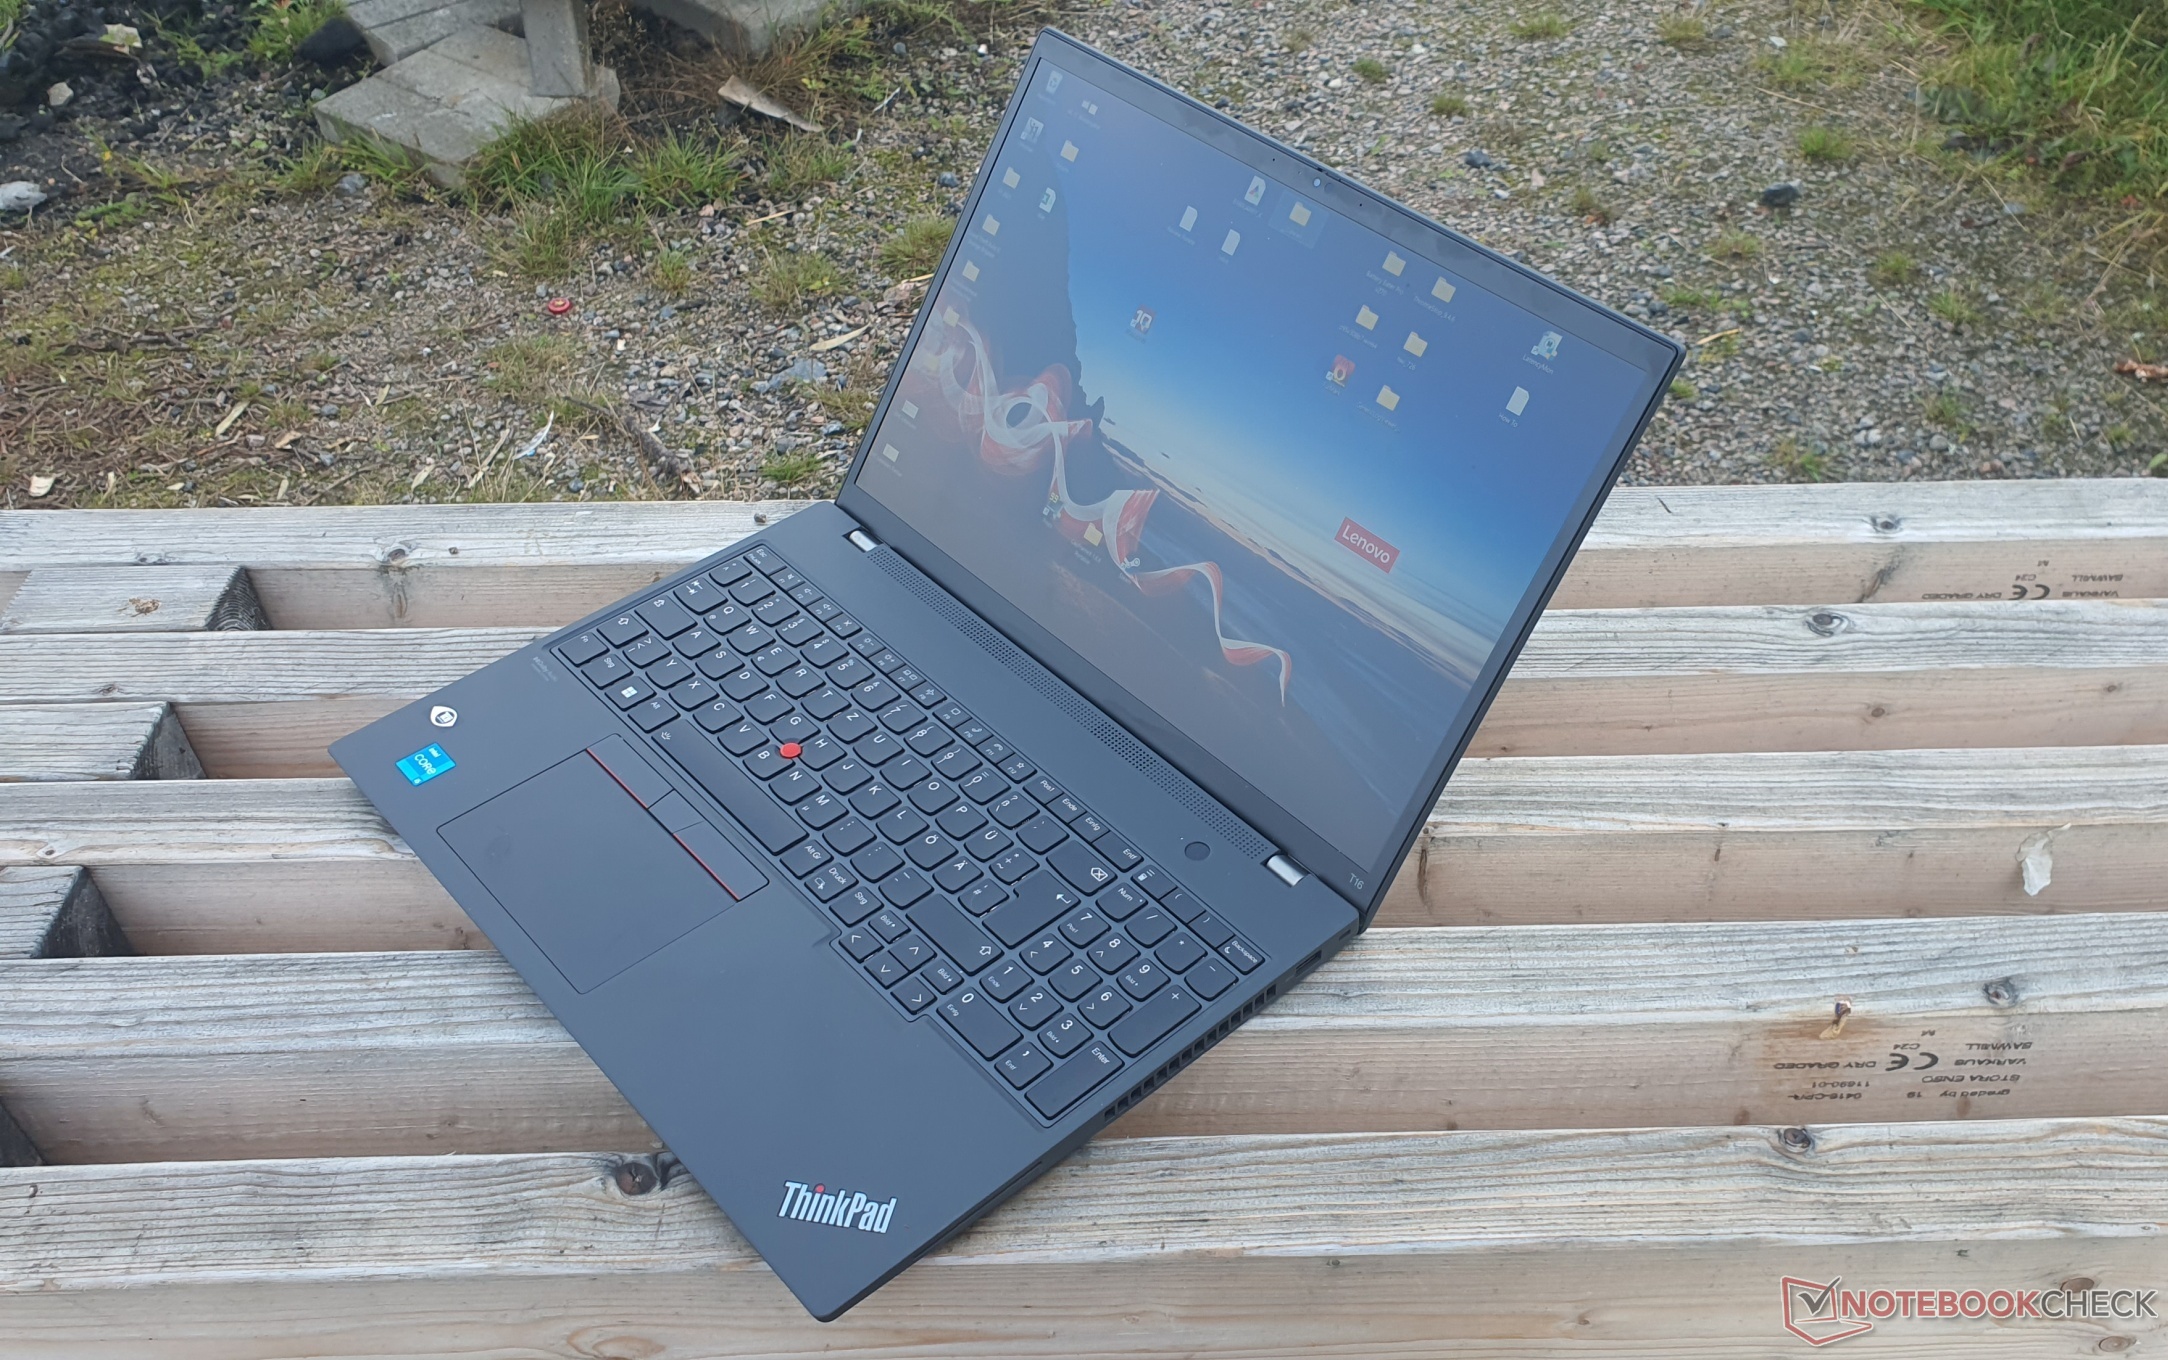
Infine, anche i ThinkPad Lenovo della classica serie T vengono ridisegnati. Il display 16:10 del ThinkPad T16 G1, ingrandito a 16 pollici, è probabilmente la prima cosa che salta all'occhio. L'opzione di una batteria significativamente più grande fa sperare in una lunga autonomia, così come il display opzionale a basso consumo. Altri cambiamenti saranno illustrati nel corso di questa recensione, così come i possibili svantaggi rispetto al predecessorerispetto al predecessore.
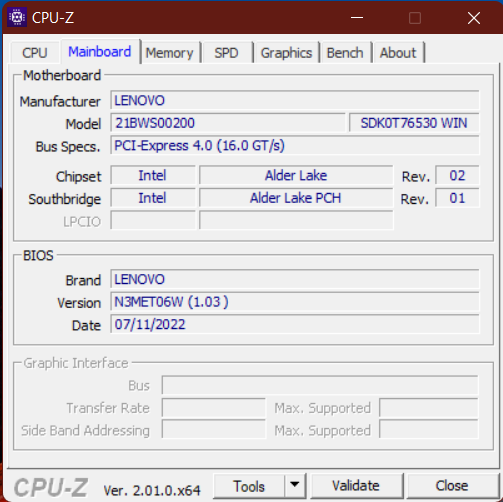
Il nostro modello è dotato di un Intel Core i5-1240P, 16 GB di RAM DDR4-3200, un SSD PCIe 4.0 da 512 GB, un display FHD+ a basso consumo e una grande batteria da 86 Wh. Le CPU Intel U opzionali sembrano essere un po' più economiche secondo le nostre recensioni finora. È disponibile anche un pannello da 2,5K, ma l'opzione 4K UHD del predecessore con 100% DCI-P3 non è più disponibile. Anche GeForce MX550 Nvidia è opzionale
La concorrenza del ThinkPad T16 come dispositivo aziendale di fascia alta tra i portatili da 15/16 pollici comprende principalmente Latitude 15 5531 di Dell e EliteBook 865 G9 di HP. Ma il confronto con i portatili di fascia media è sicuramente interessante, compresi gli ibridi multimediali da ufficio come MateBook D 16 di Huawei e Vivobook Pro 16X di Asus.
Potenziali concorrenti a confronto
Punteggio | Data | Modello | Peso | Altezza | Dimensione | Risoluzione | Prezzo |
|---|---|---|---|---|---|---|---|
| 89.3 % v7 (old) | 09/2022 | Lenovo ThinkPad T16 G1 21BWS00200 i5-1240P, Iris Xe G7 80EUs | 1.9 kg | 20.5 mm | 16.00" | 1920x1200 | |
| 87.1 % v7 (old) | 05/2021 | Lenovo ThinkPad T15 Gen2-20W5S00100 i7-1165G7, GeForce MX450 | 1.9 kg | 19.1 mm | 15.60" | 1920x1080 | |
| 85.5 % v7 (old) | 08/2021 | Lenovo ThinkPad E15 G3-20YG003UGE R7 5700U, Vega 8 | 1.8 kg | 18.9 mm | 15.60" | 1920x1080 | |
| 85.1 % v7 (old) | 07/2021 | Lenovo ThinkPad L15 G2 AMD R5 5600U, Vega 7 | 1.9 kg | 21 mm | 15.60" | 1920x1080 | |
| 85 % v7 (old) | 08/2022 | HP ProBook 450 G9 6A180EA i7-1255U, Iris Xe G7 96EUs | 1.7 kg | 19.9 mm | 15.60" | 1920x1080 | |
| 87.7 % v7 (old) | 07/2022 | HP ZBook Power 15 G8 313S5EA i7-11800H, T600 Laptop GPU | 2 kg | 22.8 mm | 15.60" | 1920x1080 | |
v (old) | 09/2022 | Dell Latitude 15 5531, i5-12600H MX550 i5-12600H, GeForce MX550 | 1.8 kg | 24.05 mm | 15.60" | 1920x1080 | |
| 87.4 % v7 (old) | 08/2022 | Dell Inspiron 16 Plus 7620 i7-12700H, GeForce RTX 3050 Ti Laptop GPU | 2.1 kg | 18.99 mm | 16.00" | 3072x1920 | |
| 83.6 % v7 (old) | 07/2022 | Huawei MateBook D 16 2022 i7-12700H, Iris Xe G7 96EUs | 1.7 kg | 18.4 mm | 16.00" | 1920x1200 | |
v (old) | 12/2021 | Asus Vivobook Pro 16X-M7600QE R9 5900HX, GeForce RTX 3050 Ti Laptop GPU | 1.9 kg | 19 mm | 16.10" | 3840x2400 |
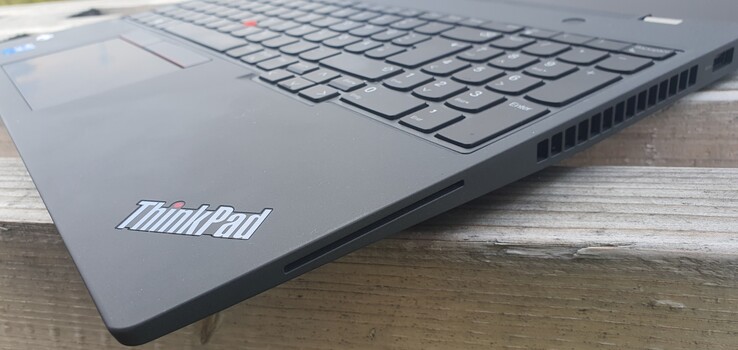
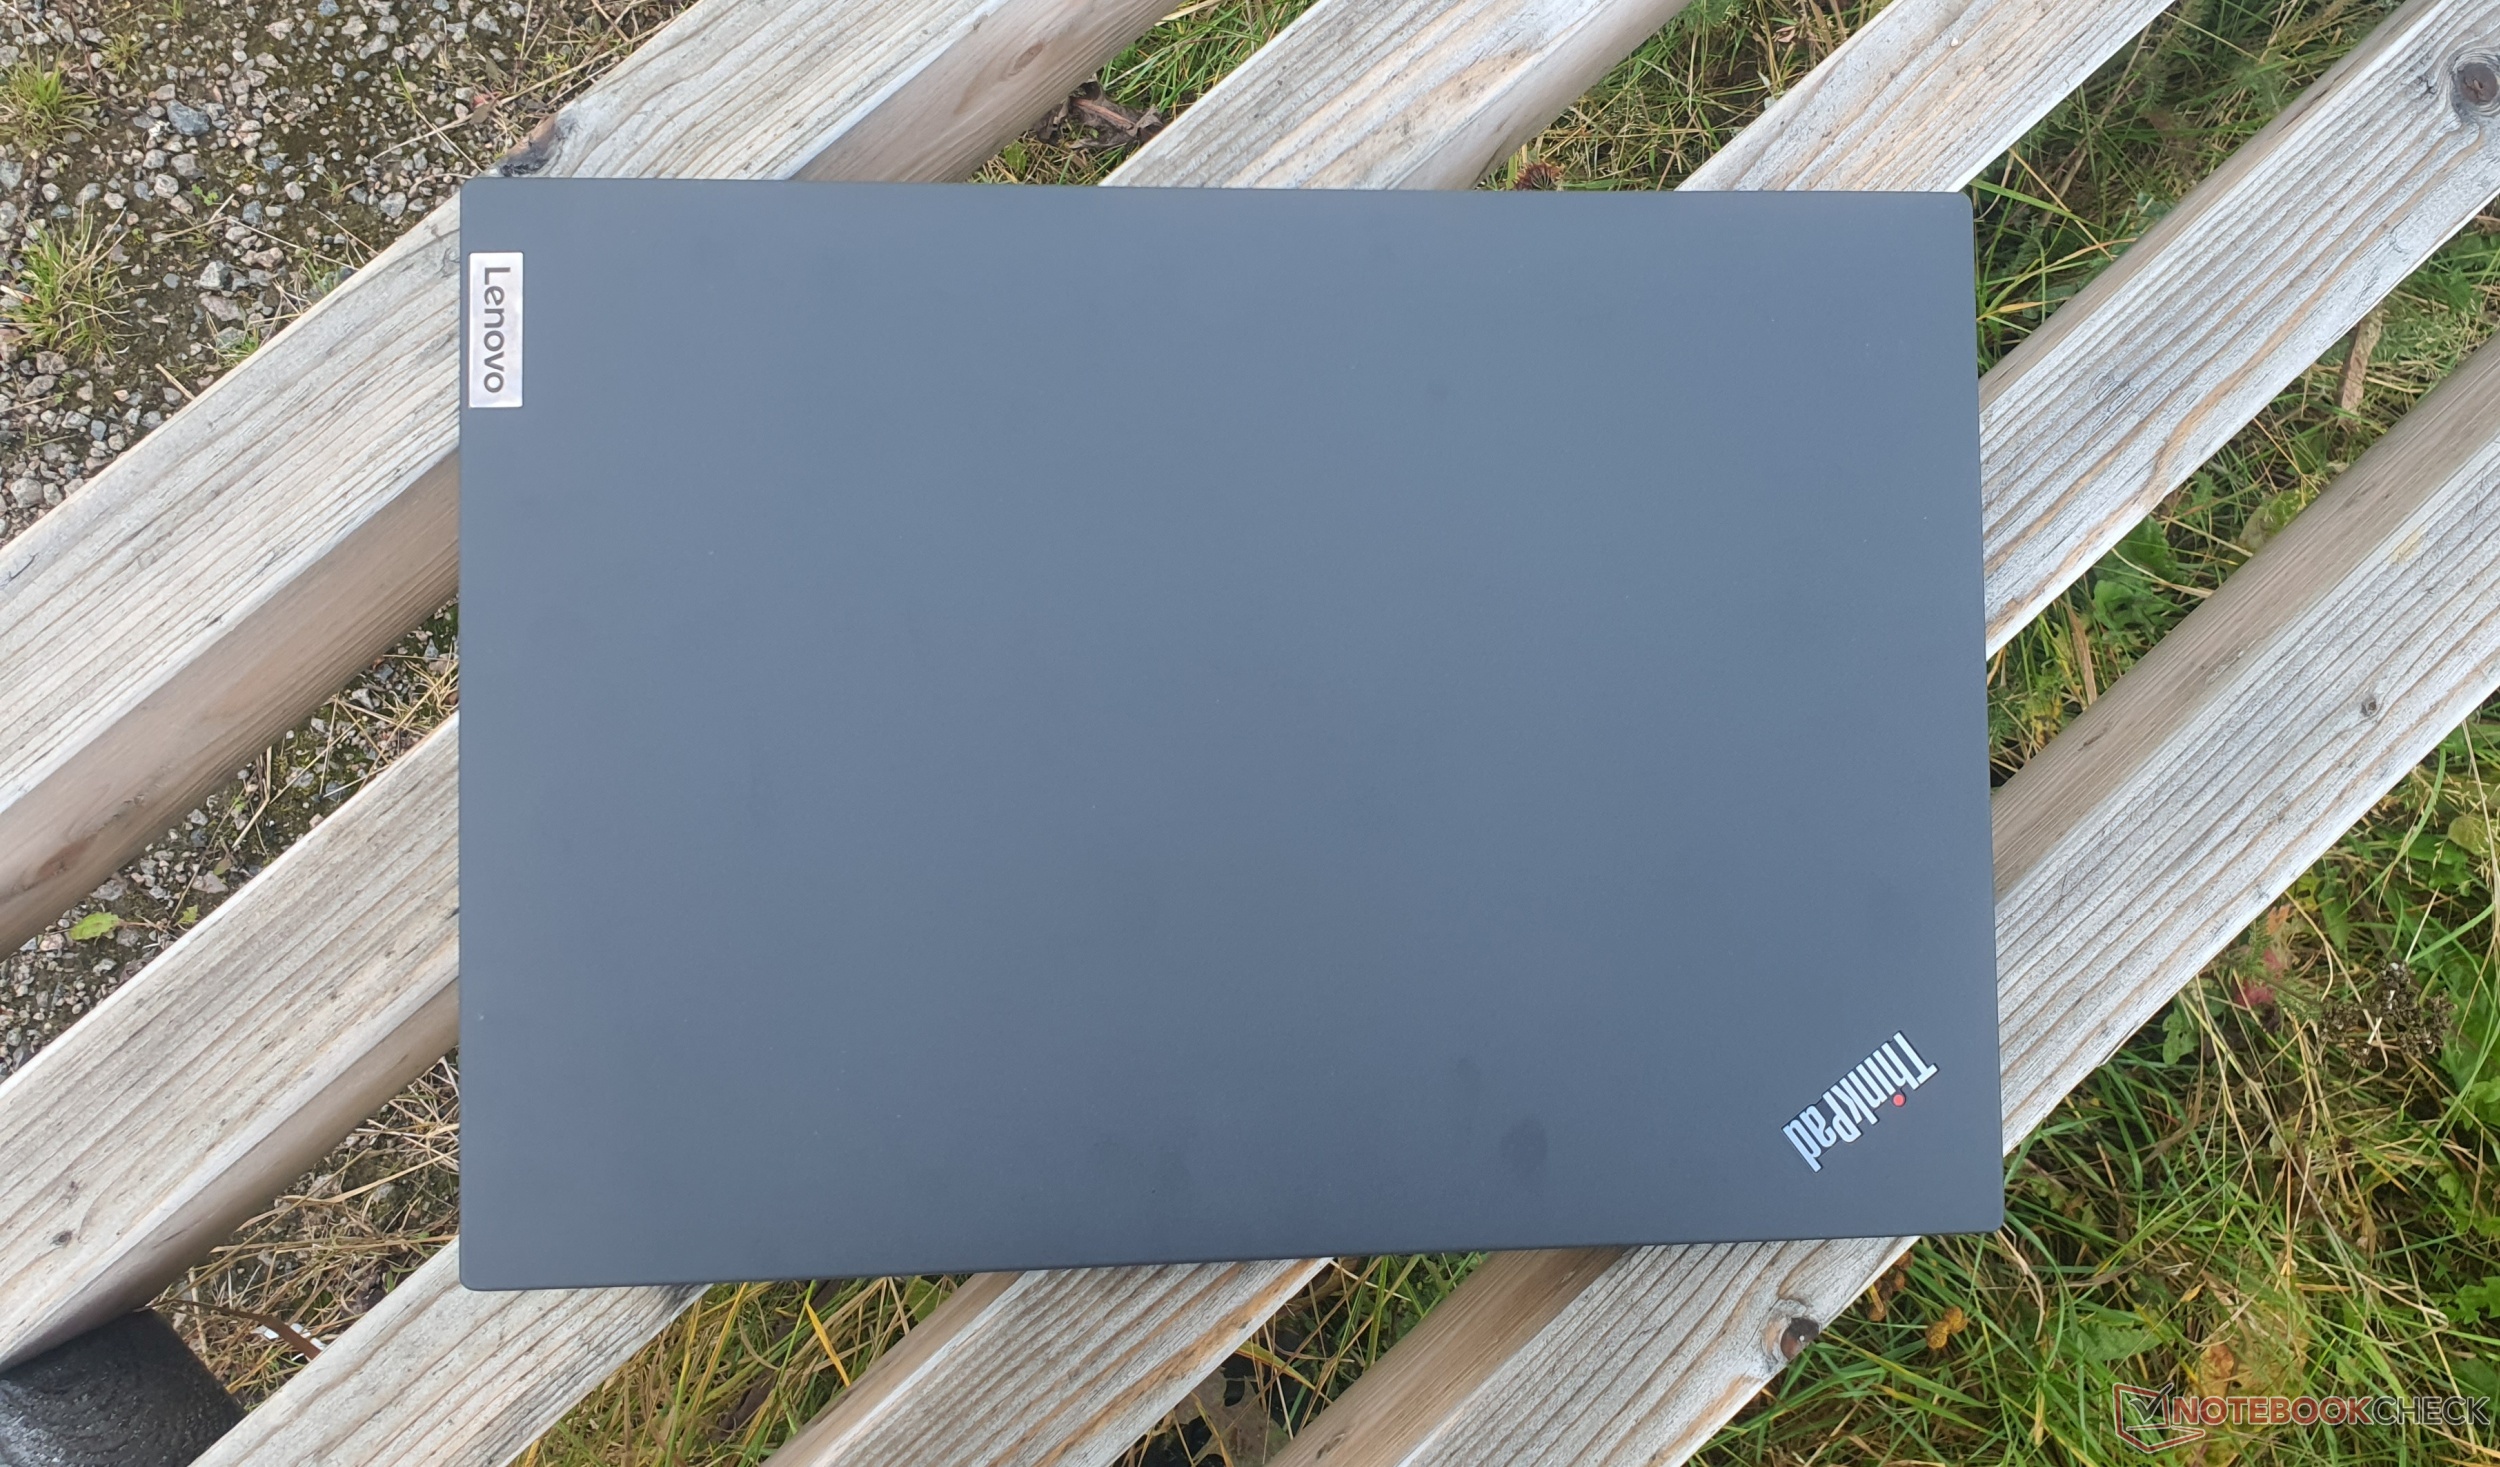
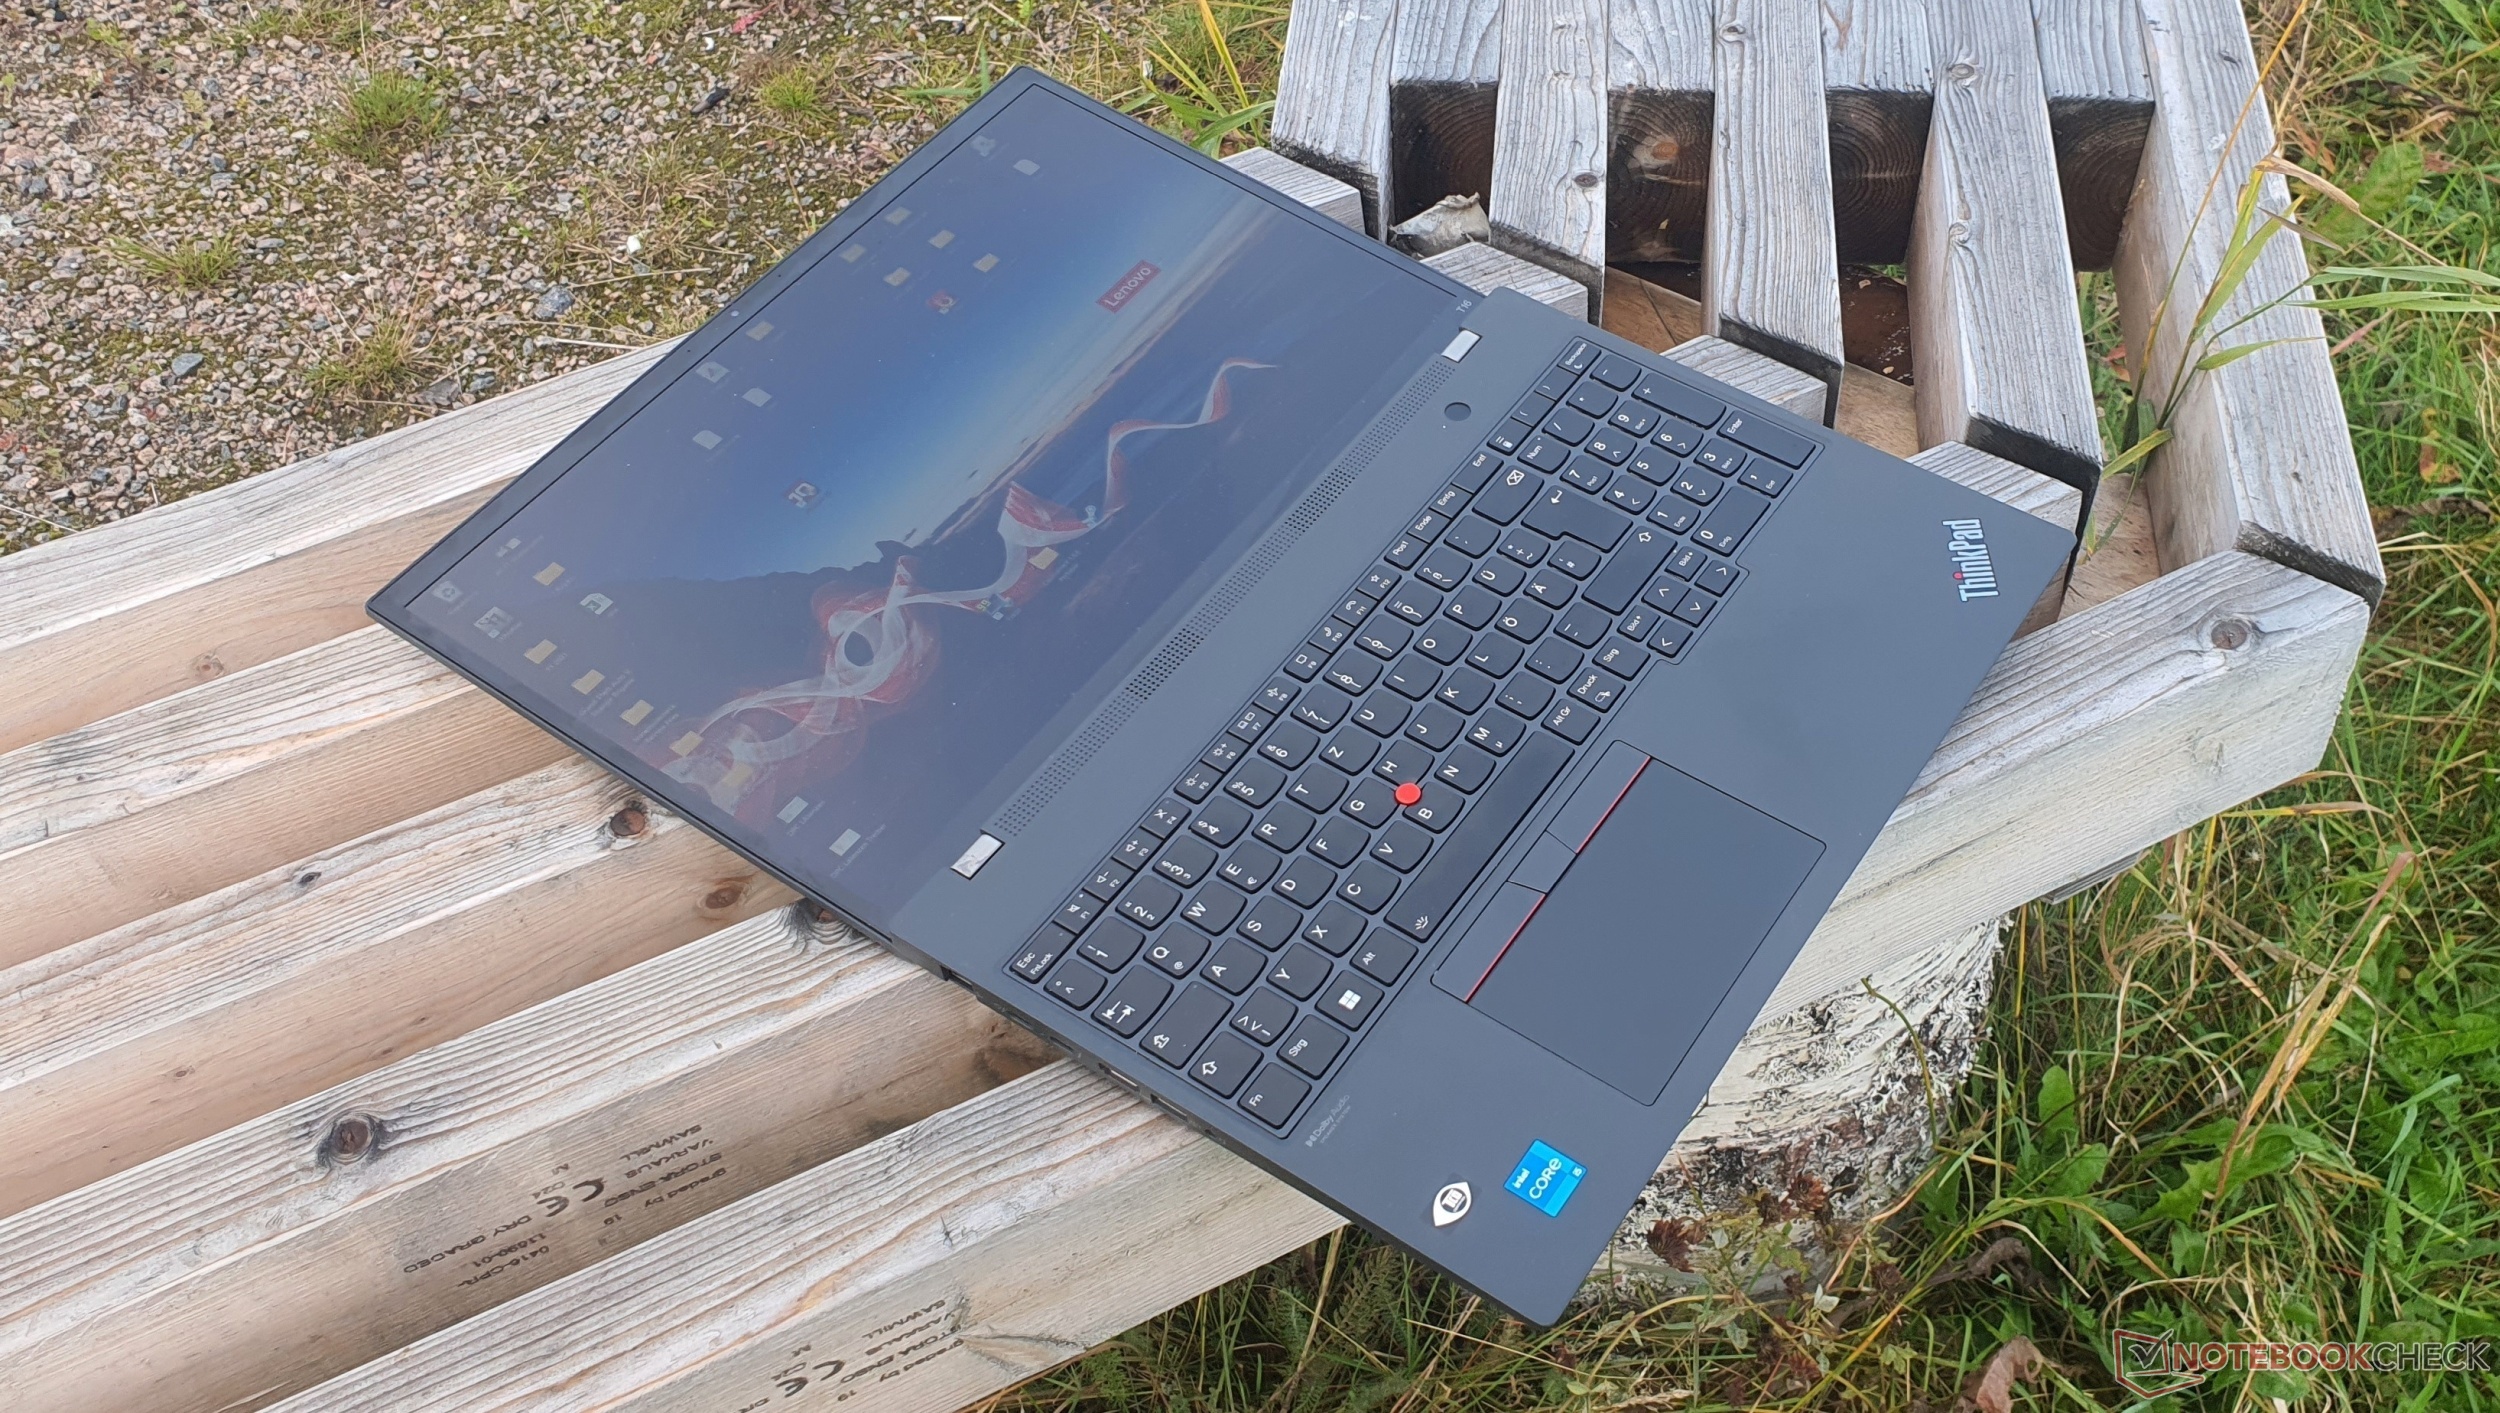
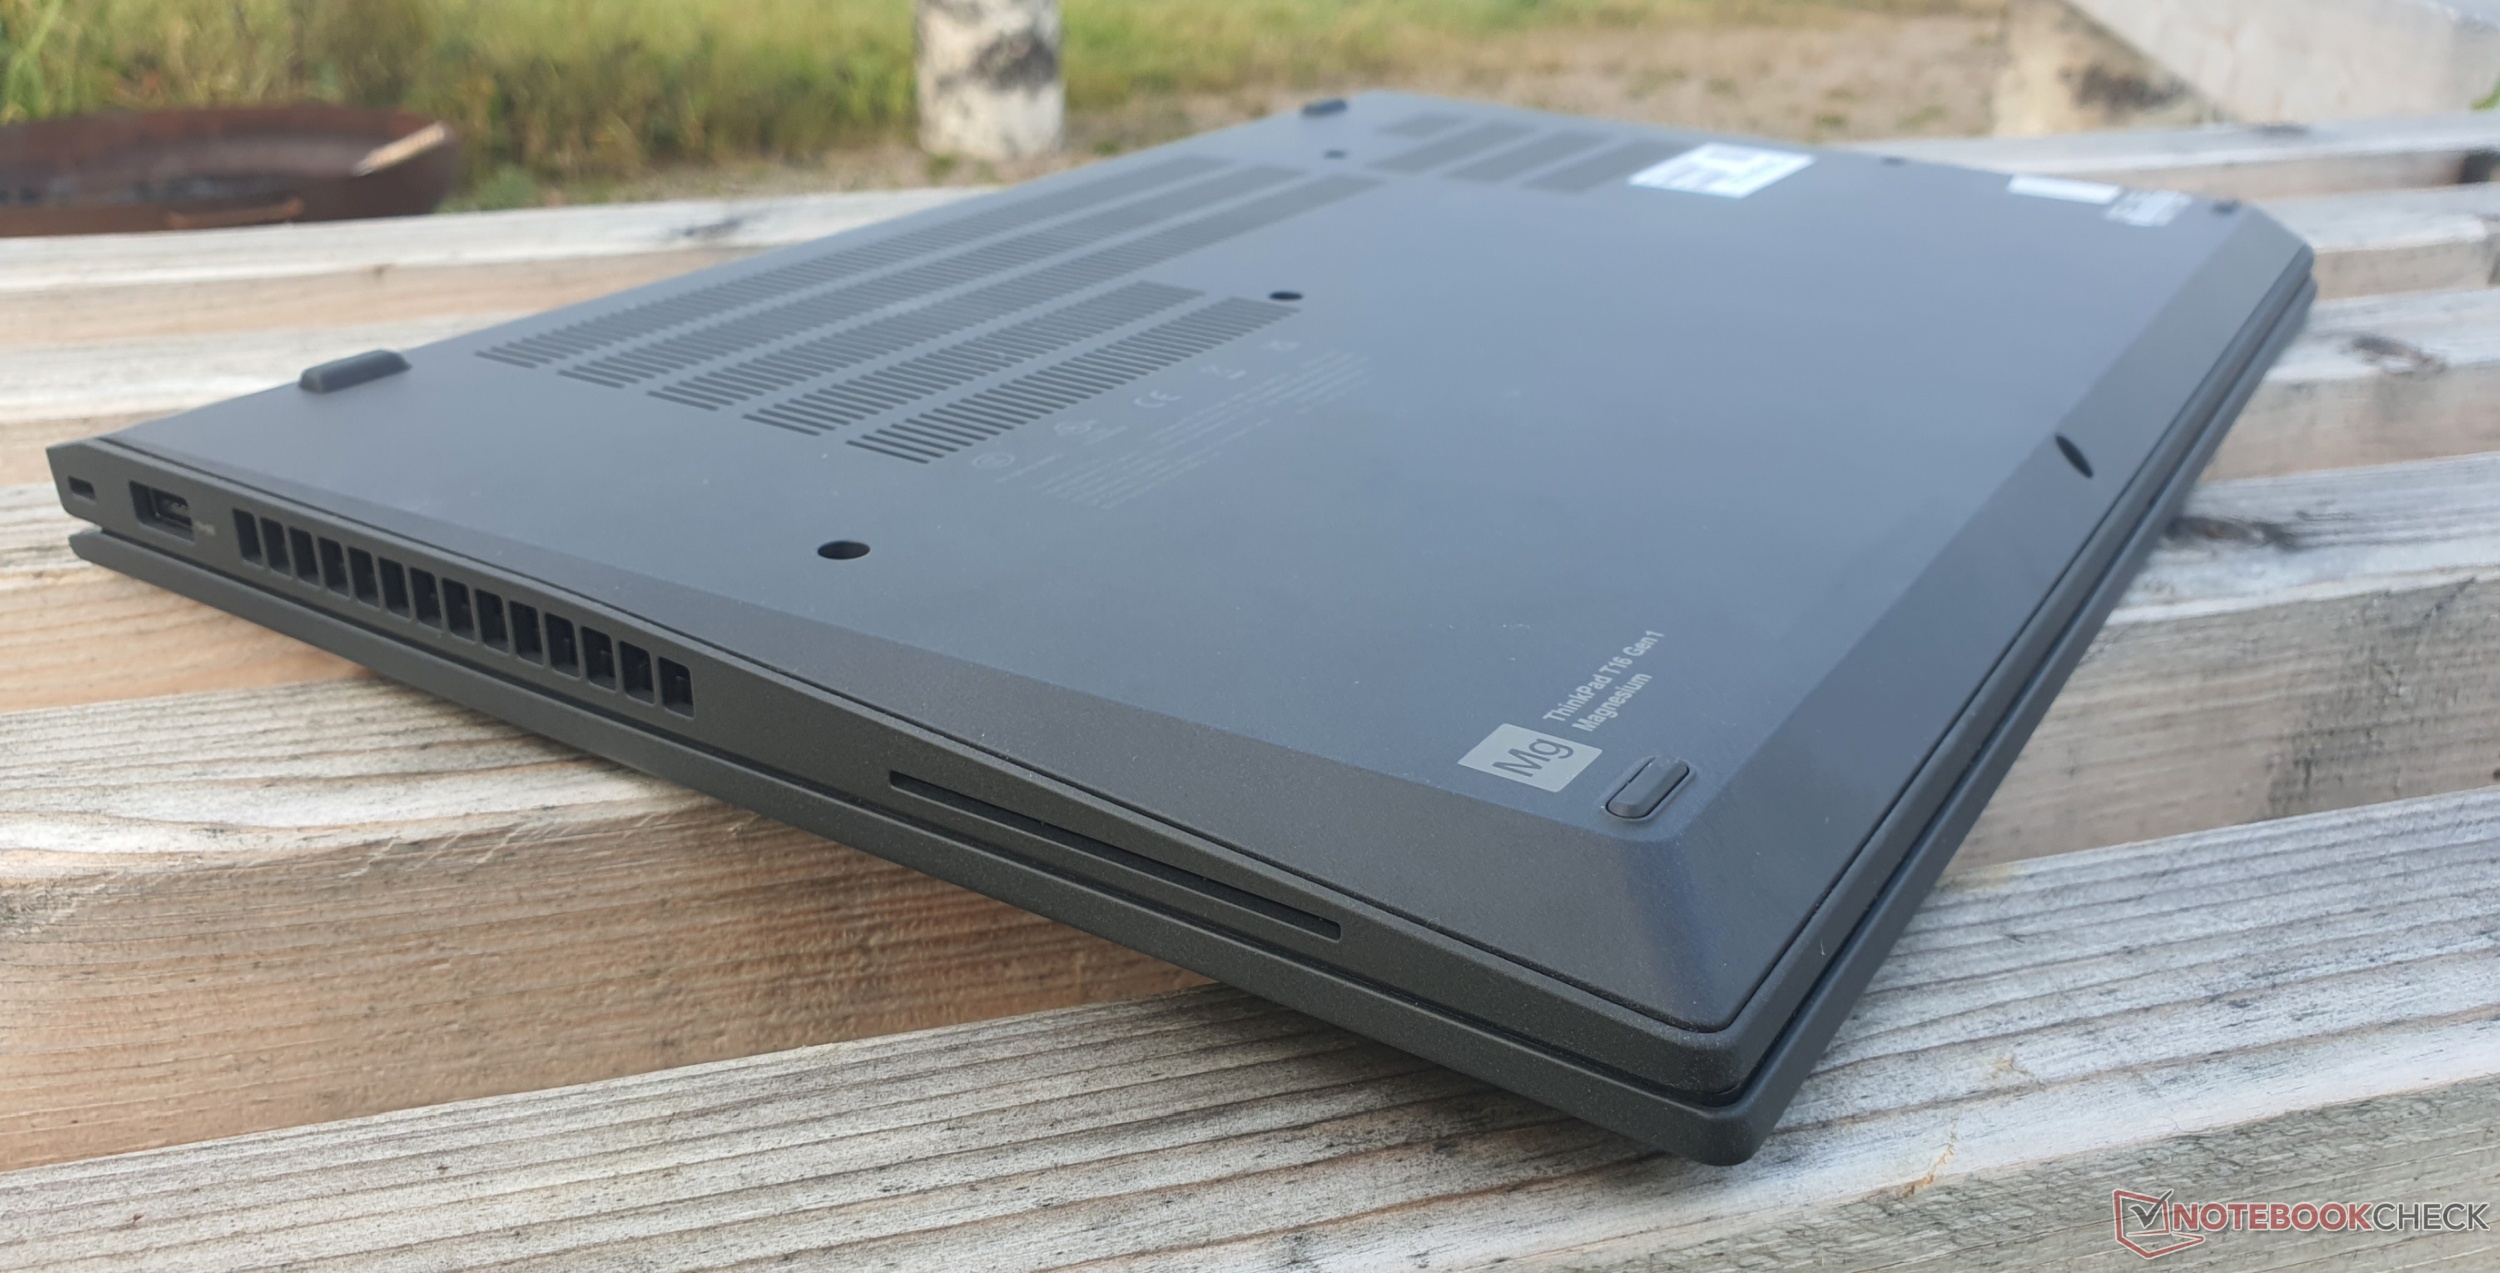
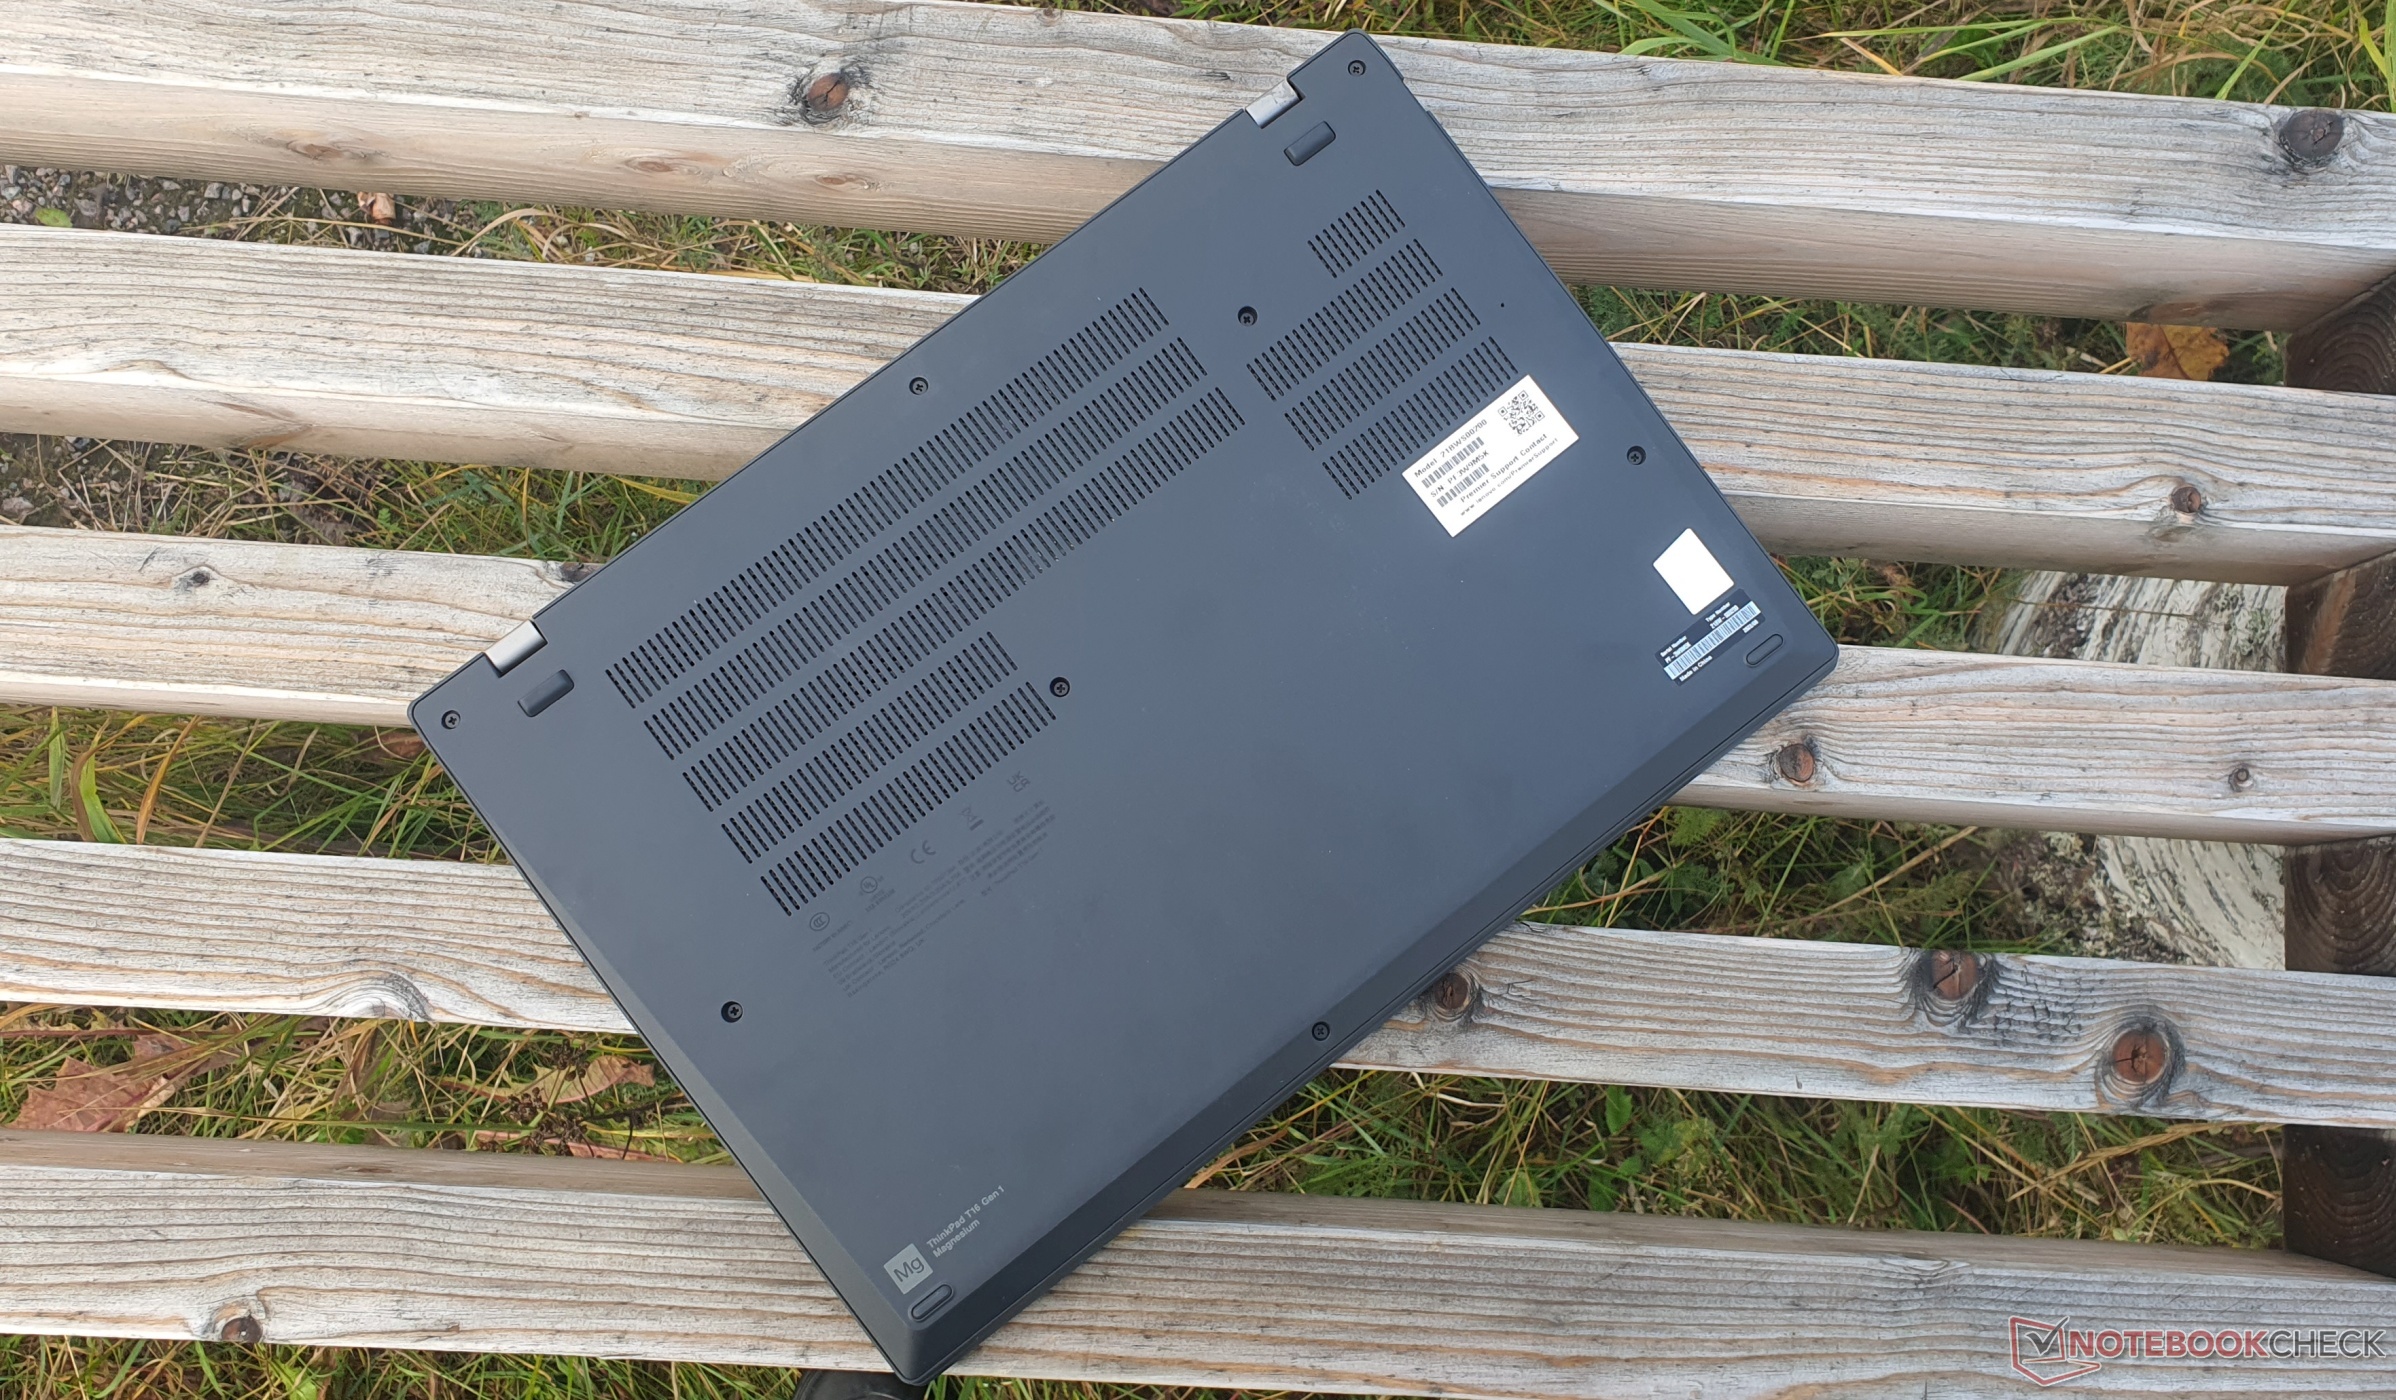
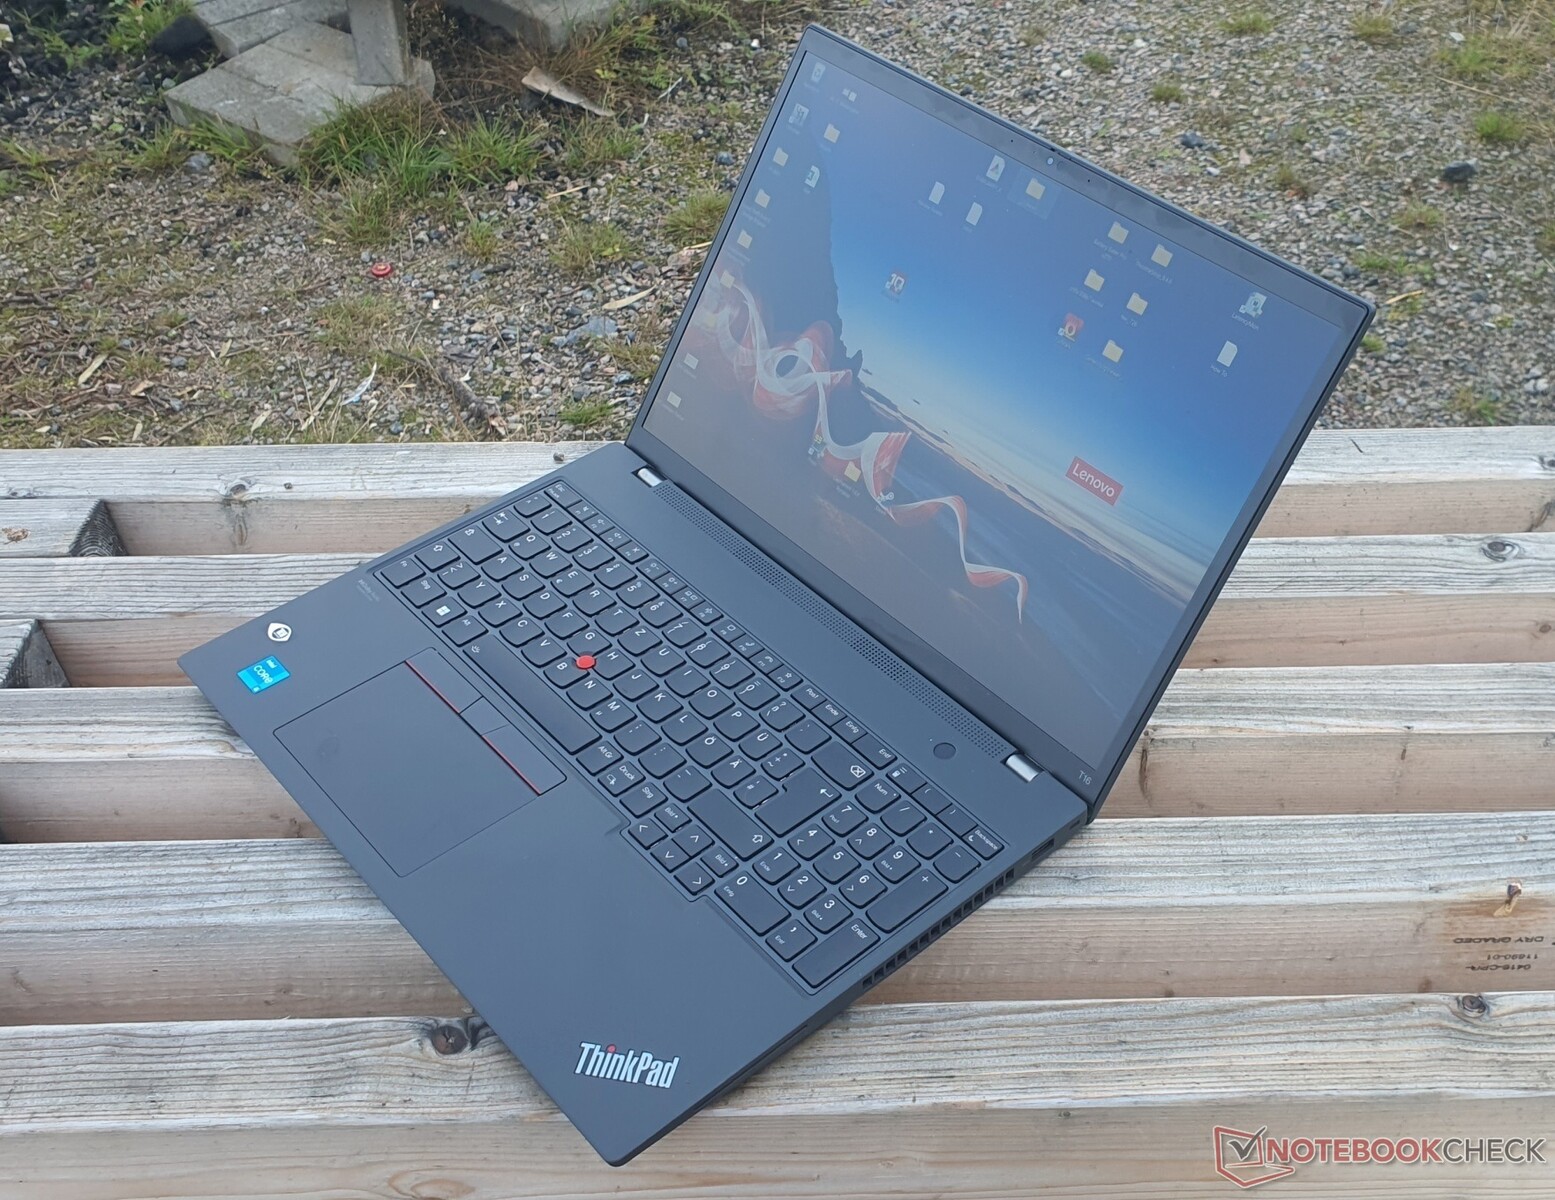
Case - Fibra di carbonio utilizzata per la prima volta nel robusto ThinkPad T16
Il ThinkPad T16 è di colore antracite, simile al modello T14 G2.T14 G2anche le superfici leggermente ruvide e gommate sono le stesse e hanno una sensazione di alta qualità.
Le impronte digitali sono visibili, ma molto meno di prima. I bordi dello schermo sono più stretti grazie al formato 16:10, mentre il resto del design rimane più o meno lo stesso. Tuttavia, il dispositivo è più spesso di 1,4 mm, un po' più corto, ma anche un po' più profondo. Il nostro modello pesa 1,95 kg, il che è dovuto principalmente alla capacità della batteria selezionata.
La lavorazione, priva di lacune, è eccezionale, così come la stabilità. Il coperchio può essere difficilmente ruotato e una pressione mirata sul coperchio posteriore non provoca alcuna distorsione dell'immagine. Non c'è da stupirsi, visto che il coperchio è realizzato con un mix di fibra di carbonio, fibra di vetro e plastica. La fibra di carbonio era precedentemente ed esclusivamente riservata ai modelli più costosi con la s-suffix
Il poggiapolsi è realizzato con una combinazione di plastica, fibra di vetro, magnesio e alluminio. La base si dimostra quindi molto resistente alle sollecitazioni torsionali. La parte inferiore è interamente realizzata in termoplastica. Le robuste cerniere sono strette, ma l'apertura con una sola mano fino a 180° è comunque possibile.
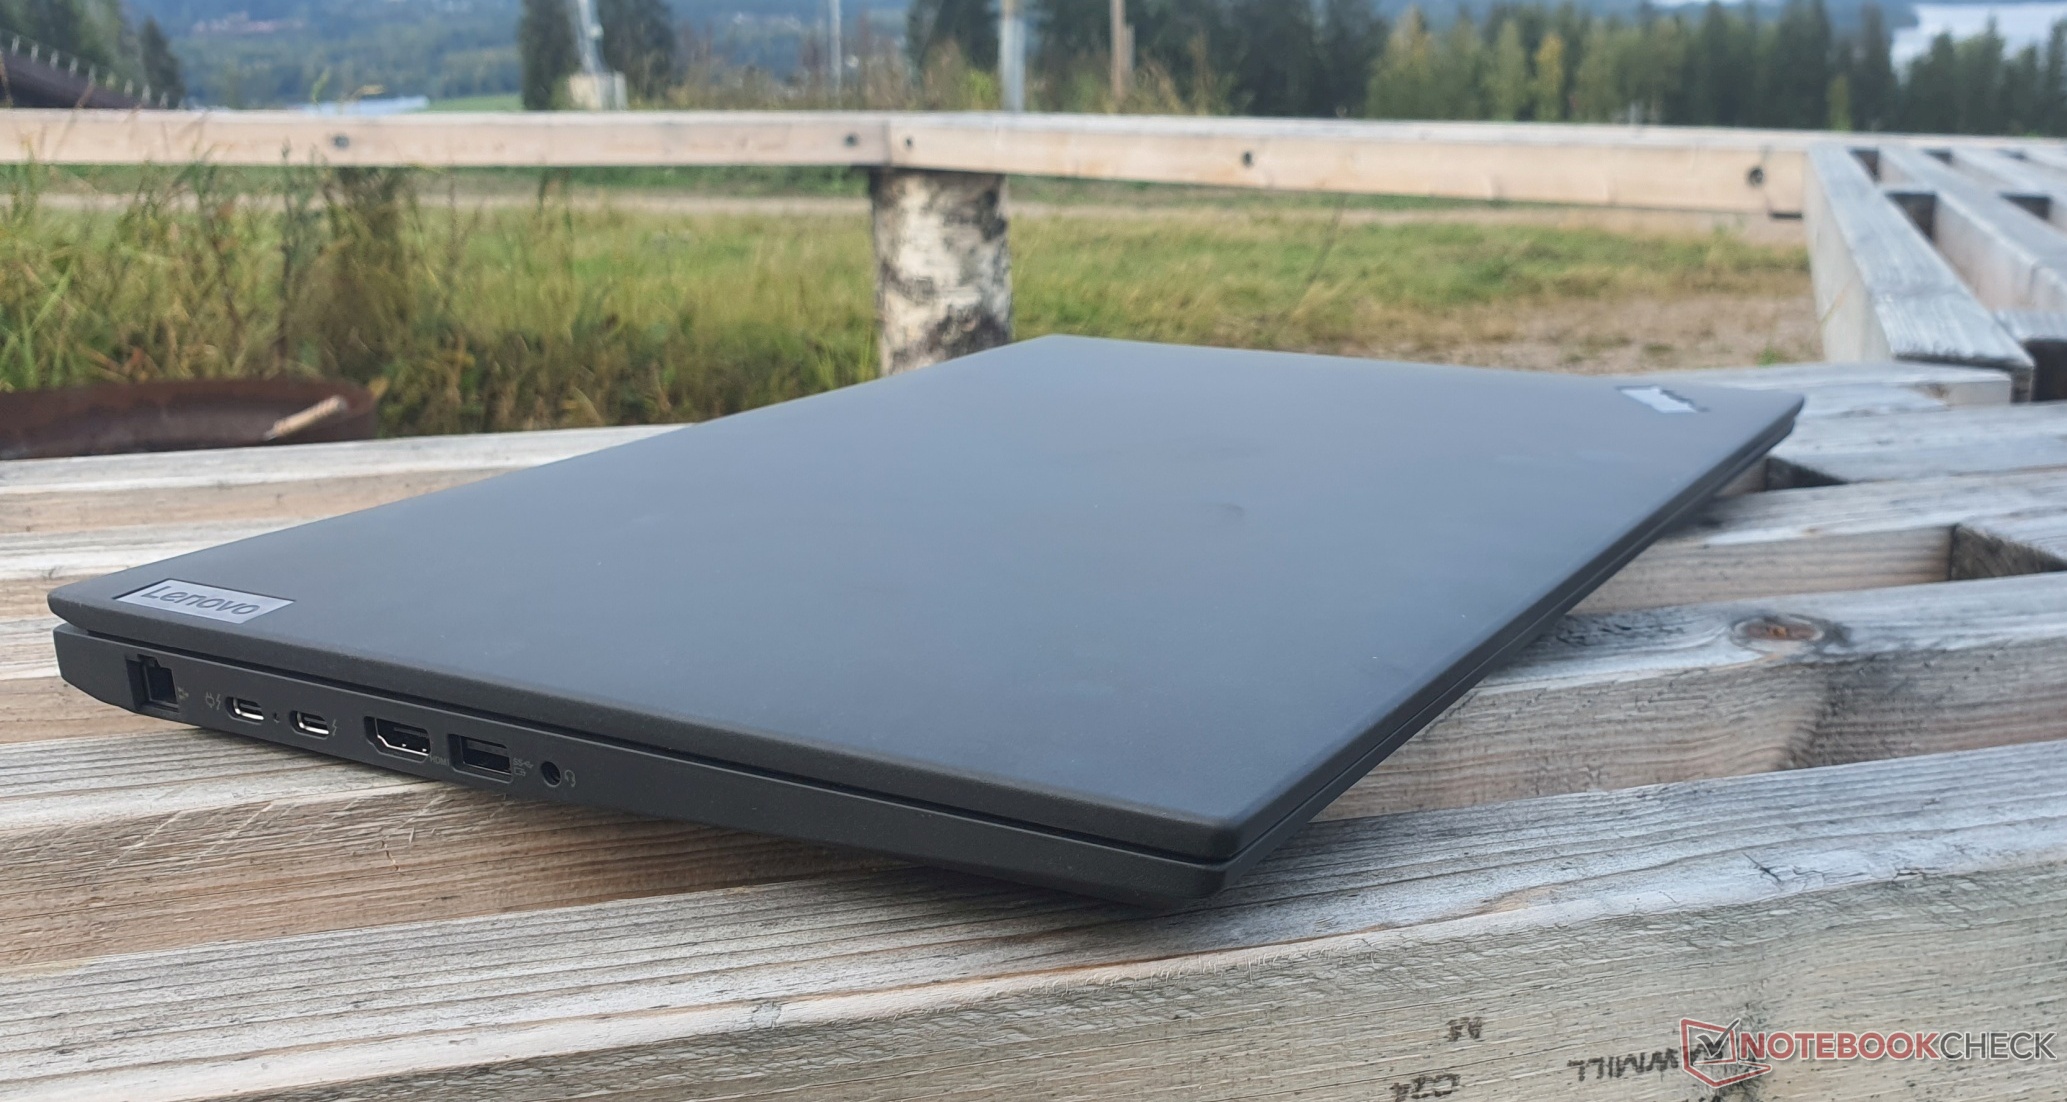

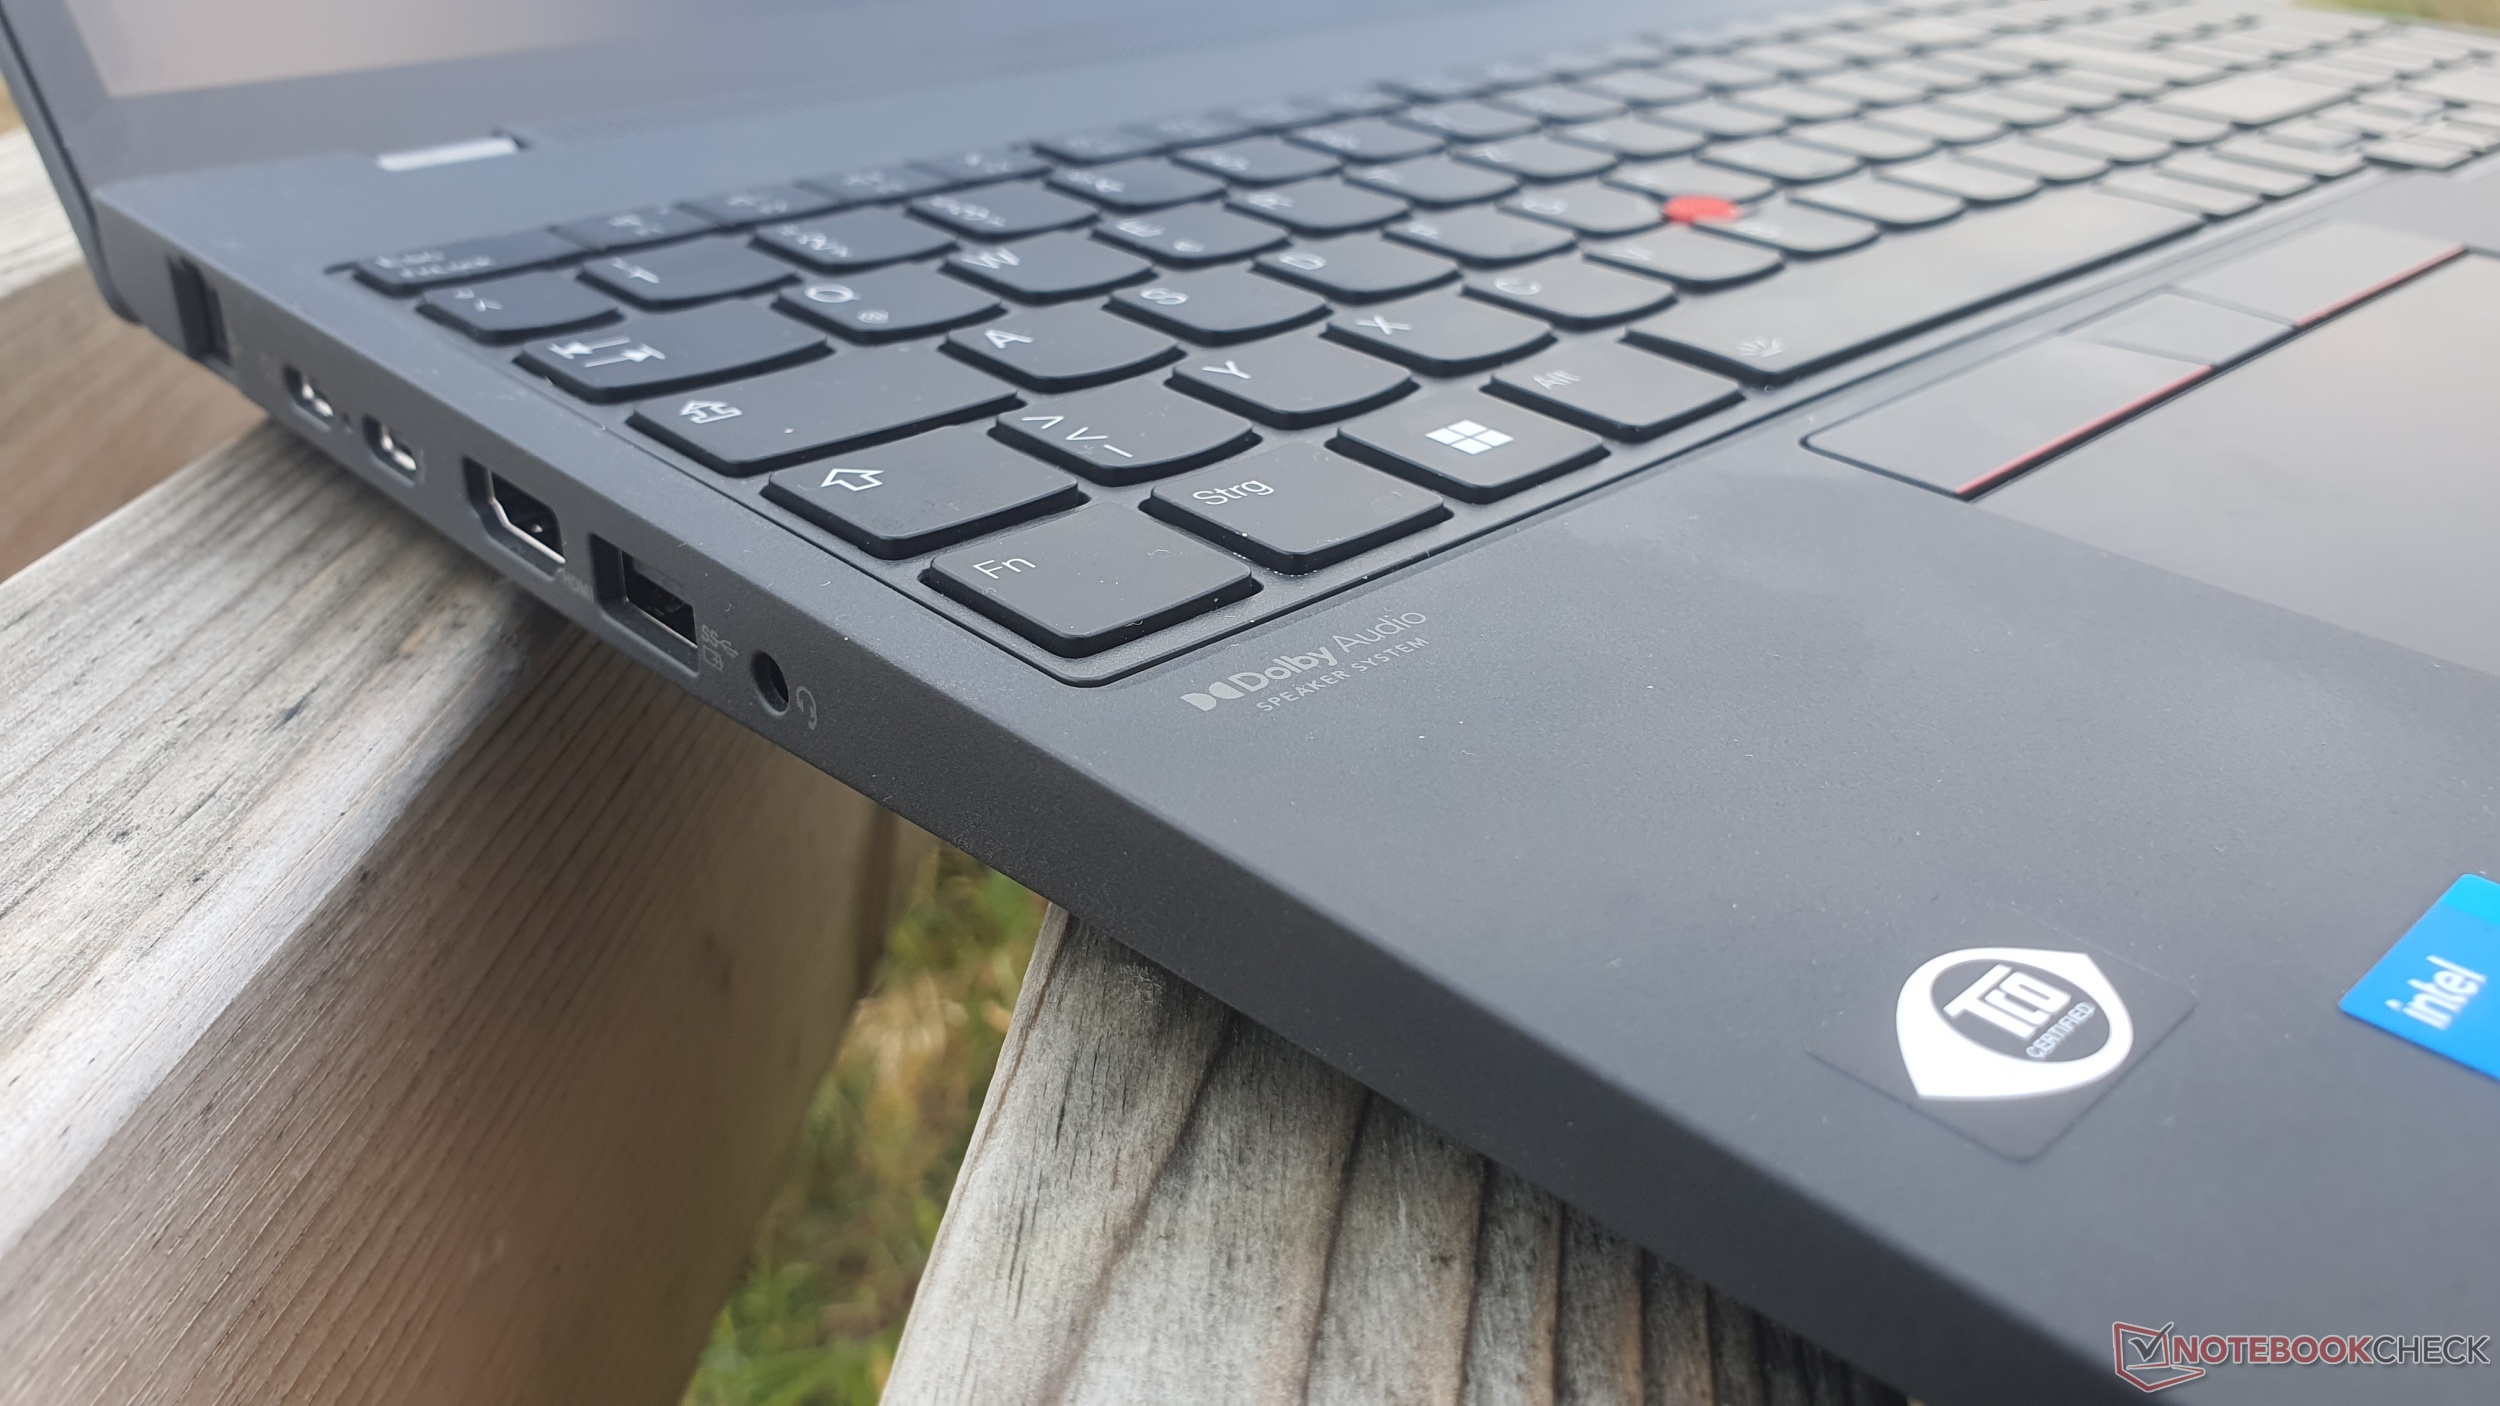
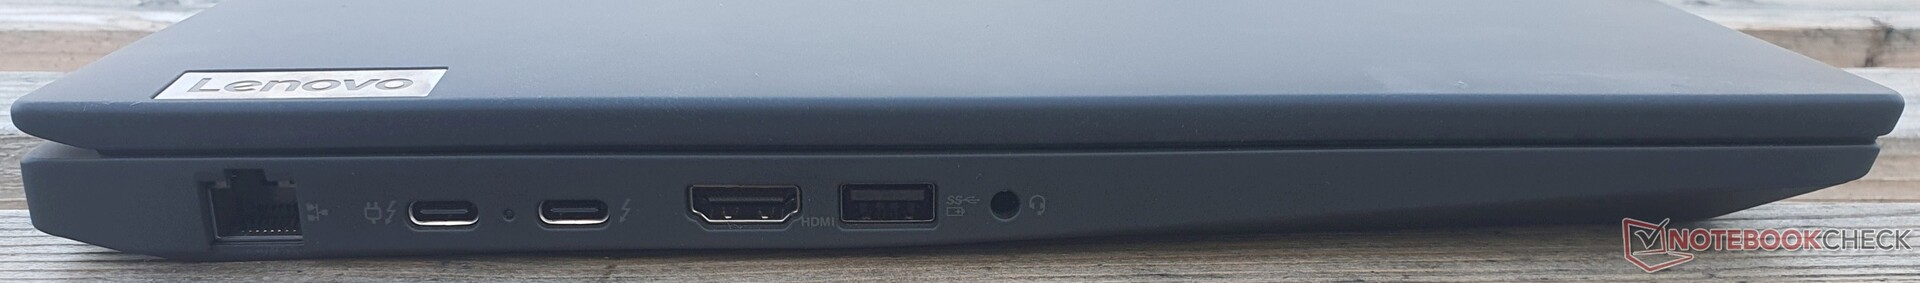
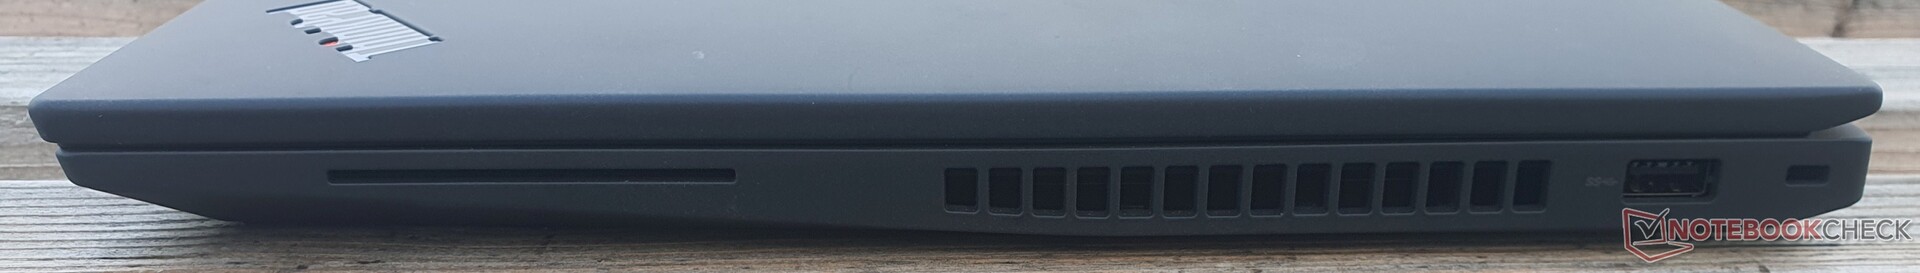
Apparecchiatura - RJ45, TB4, Wi-Fi 6E saldato e telecamera 1080p
L'uso continuo di una porta LAN GBit è piacevole, ma l'omissione del lettore di schede microSD nella serie T lo è meno. Per il resto, il ThinkPad offre tutto ciò che serve con 2x USB-A 3.2 Gen 1, HDMI 2.0b e 2x Thunderbolt 4, inclusa la ricarica da 100 watt e DisplayPort 1.4. Ciò significa che è possibile collegare fino a tre monitor aggiuntivi: 2x 5K60 @TB4 + 1x 4K60 @HDMI.
Comunicazione
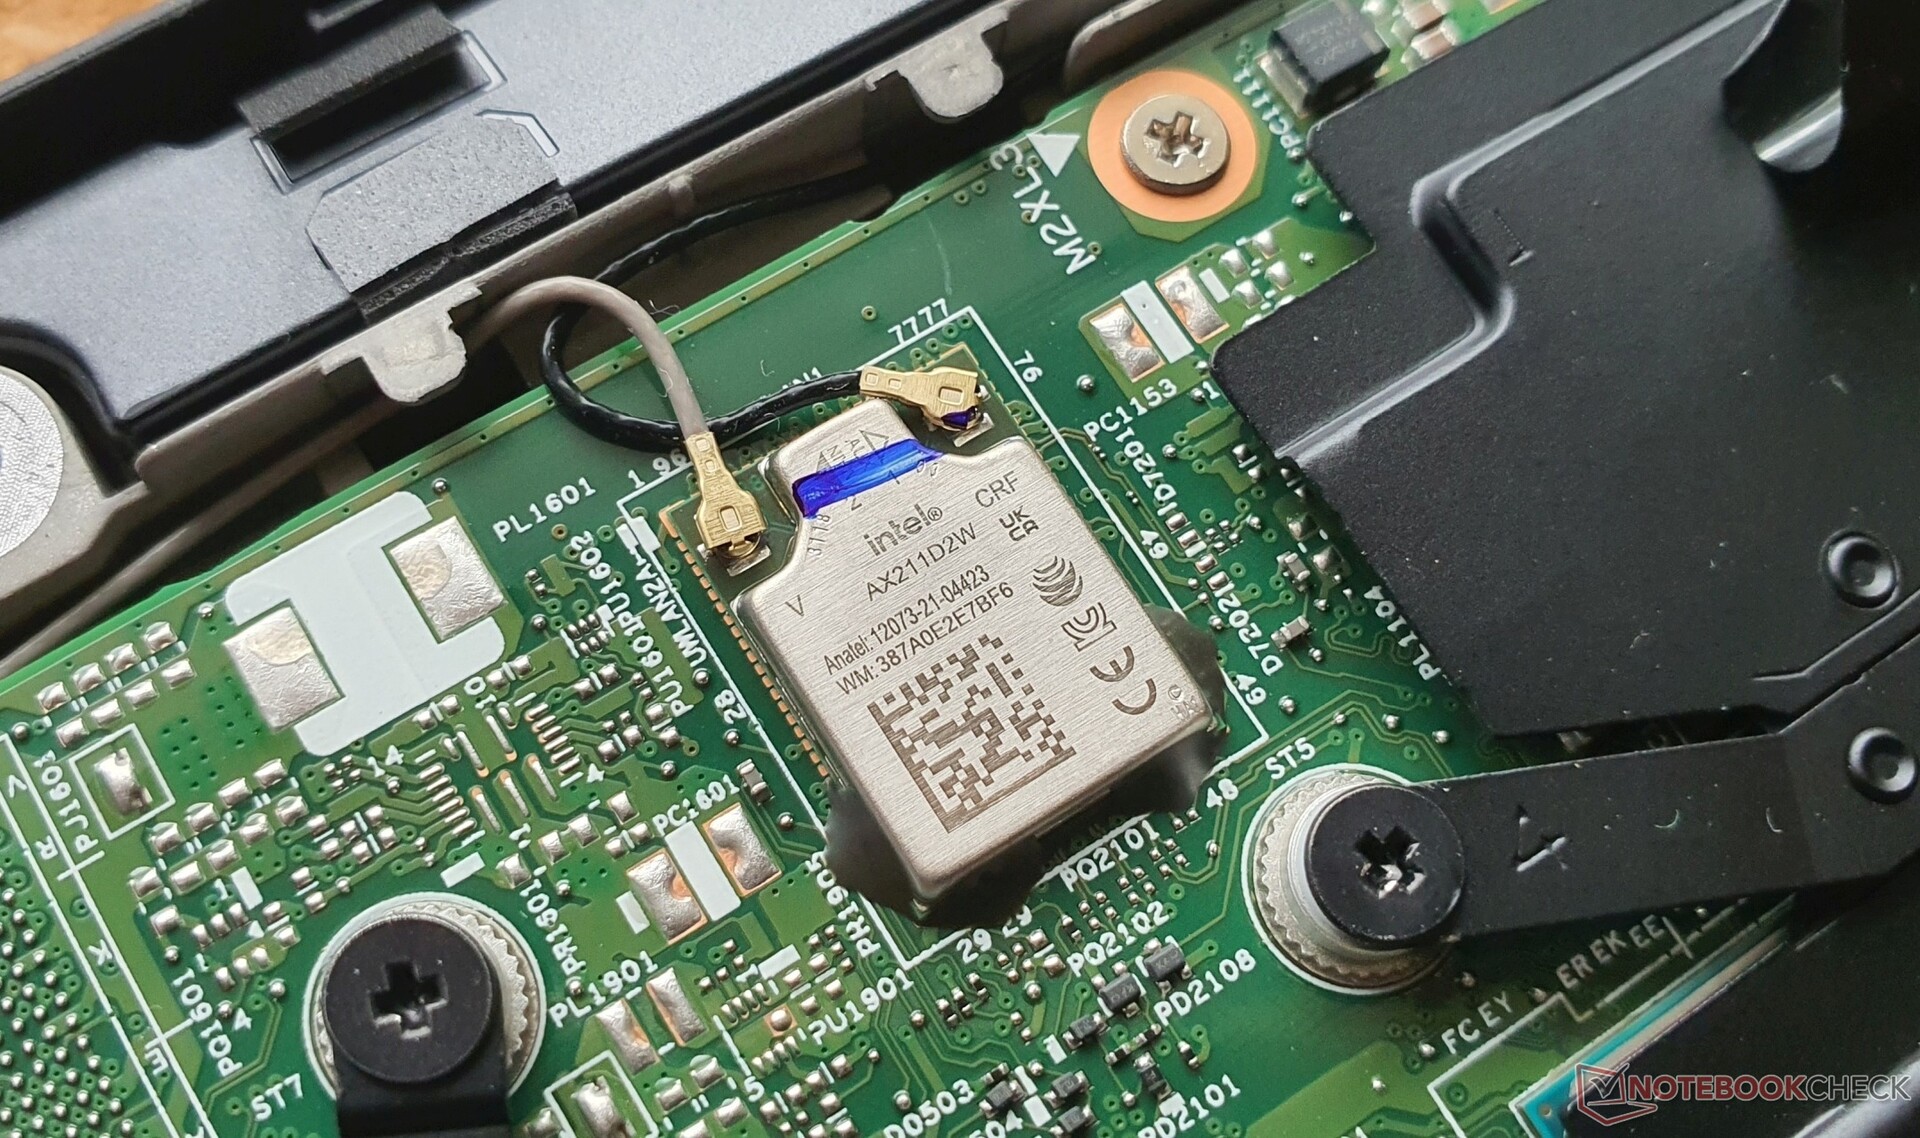
L'AX211 saldato di Intel è responsabile del Wi-Fi 6E. Abbiamo registrato velocità esemplari di oltre 1,6 GBit/s in entrambe le direzioni, per cui il nostro campo di confronto è facilmente guidato dal Lenovo ThinkPad T16 G1.
Sono disponibili anche il Bluetooth 5.2 e la WWAN opzionale con 4G. Nell'esemplare da noi recensito è presente uno slot M.2 2242 libero e le antenne possono essere aggiornate. L'NFC è opzionale.
| Networking | |
| Lenovo ThinkPad T16 G1 21BWS00200 | |
| iperf3 transmit AXE11000 6GHz | |
| iperf3 receive AXE11000 6GHz | |
| Huawei MateBook D 16 2022 | |
| iperf3 receive AXE11000 | |
| iperf3 transmit AXE11000 | |
| Lenovo ThinkPad T15 Gen2-20W5S00100 | |
| iperf3 transmit AX12 | |
| iperf3 receive AX12 | |
| HP ZBook Power 15 G8 313S5EA | |
| iperf3 transmit AX12 | |
| iperf3 receive AX12 | |
| HP ProBook 450 G9 6A180EA | |
| iperf3 transmit AXE11000 6GHz | |
| iperf3 receive AXE11000 6GHz | |
| Lenovo ThinkPad X1 Extreme G4-20Y5CTO1WW (3050 Ti) | |
| iperf3 transmit AX12 | |
| iperf3 receive AX12 | |
| Dell Inspiron 16 Plus 7620 | |
| iperf3 transmit AXE11000 6GHz | |
| iperf3 receive AXE11000 6GHz | |
| Lenovo ThinkPad E15 G3-20YG003UGE | |
| iperf3 transmit AX12 | |
| iperf3 receive AX12 | |
| Lenovo ThinkPad L15 G2 AMD | |
| iperf3 transmit AX12 | |
| iperf3 receive AX12 | |
Webcam
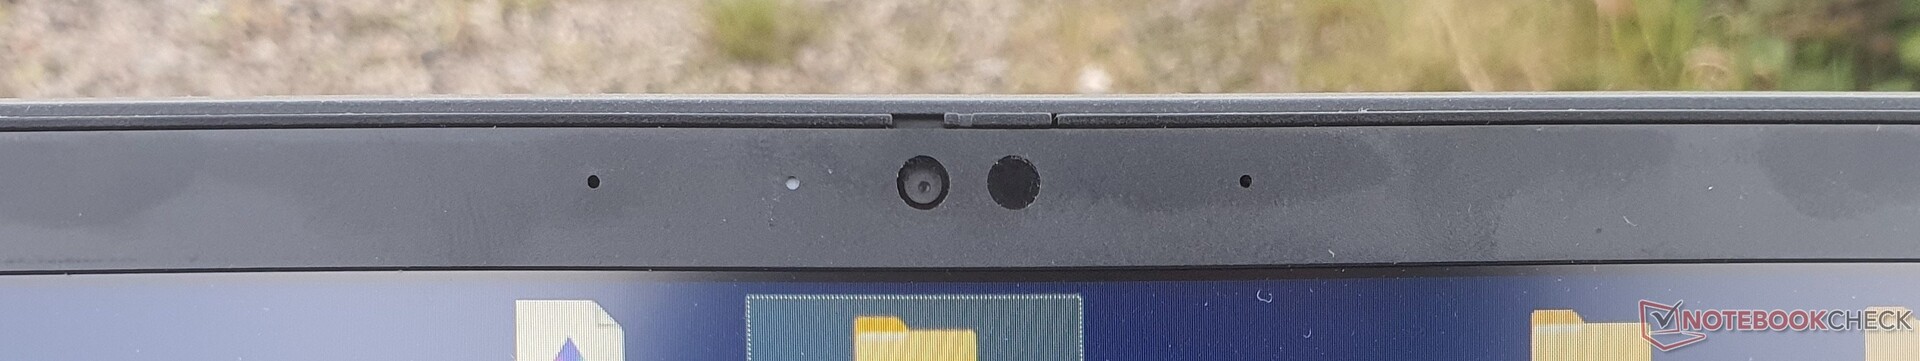
La webcam a 1080p rimane poco impressionante, ma è molto meno rumorosa e slavata. Inoltre, sono presenti due microfoni a doppio array con una buona qualità di registrazione e IR per Windows Hello.


Sicurezza
Per quanto riguarda la sicurezza, Lenovo offre un lettore di smart card opzionale, IR per Windows Hello e un'apertura fisica della fotocamera nel ThinkPad T16 Gen. 1. Altre caratteristiche di sicurezza sono il TPM 2.0, il lucchetto Kensington e il lettore di impronte digitali opzionale. Per il software vengono utilizzati Human Presence Detection e Mirametrix Glance di https://help.mirametrix.com/hc/en-us/articles/360037792732-What-is-Glance- sono utilizzati per il software.
Accessori
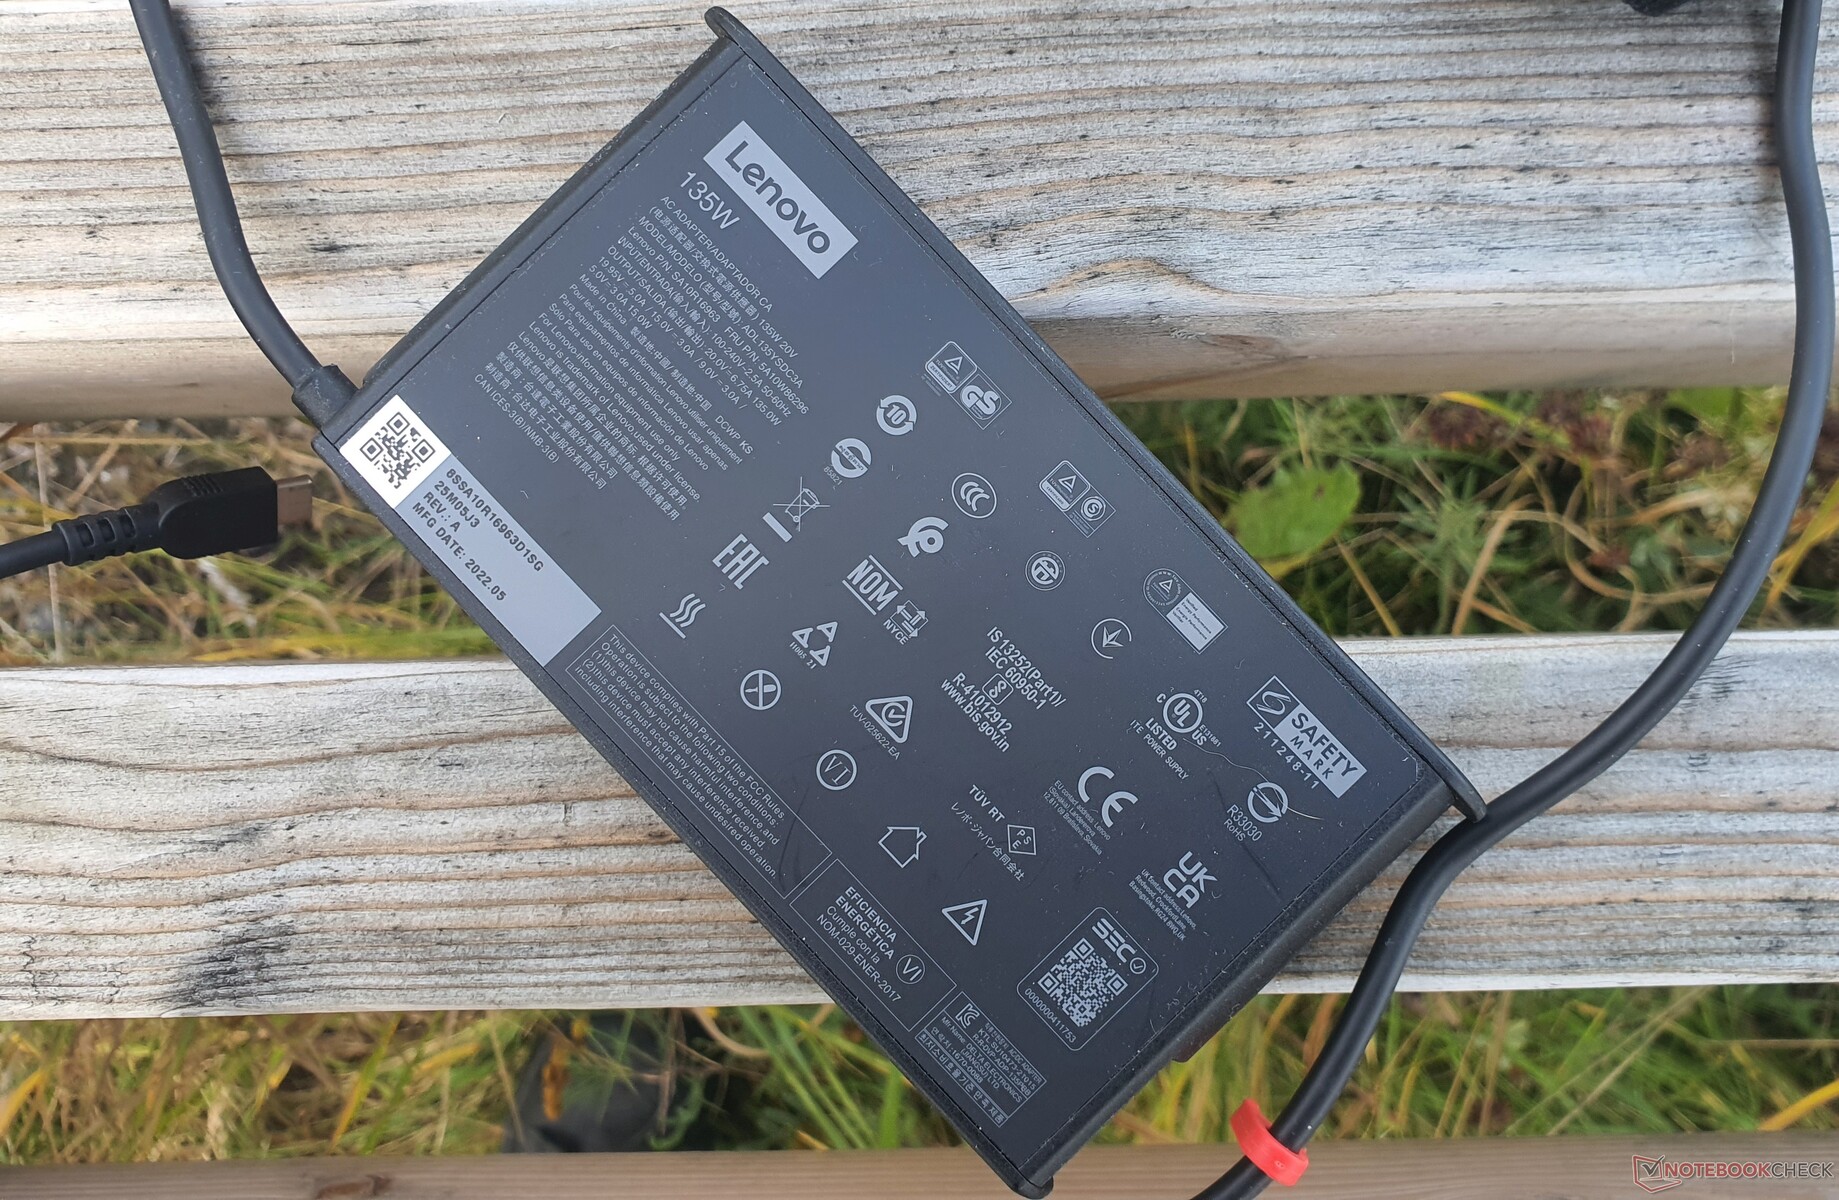
Non è presente una porta docking, ma è possibile utilizzare i dock USB-C. La dotazione comprende solo un caricabatterie USB-C Slim da 135 watt. I modelli con CPU serie U devono accontentarsi di 65 watt. D'altra parte, è anche possibile utilizzare il proprio caricabatterie da 45 watt. L'imballaggio è riciclato al 90% o realizzato con legno sostenibile.
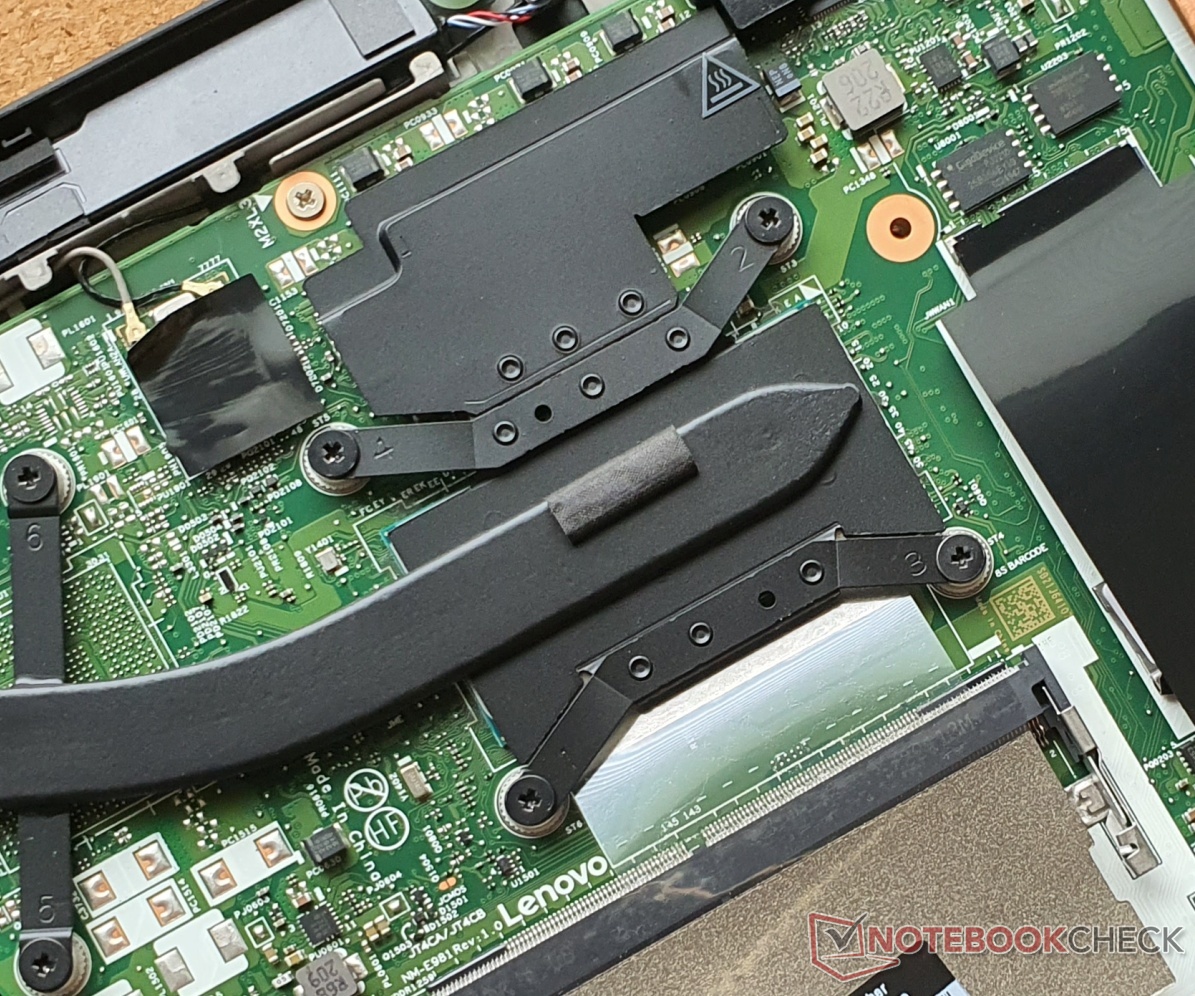
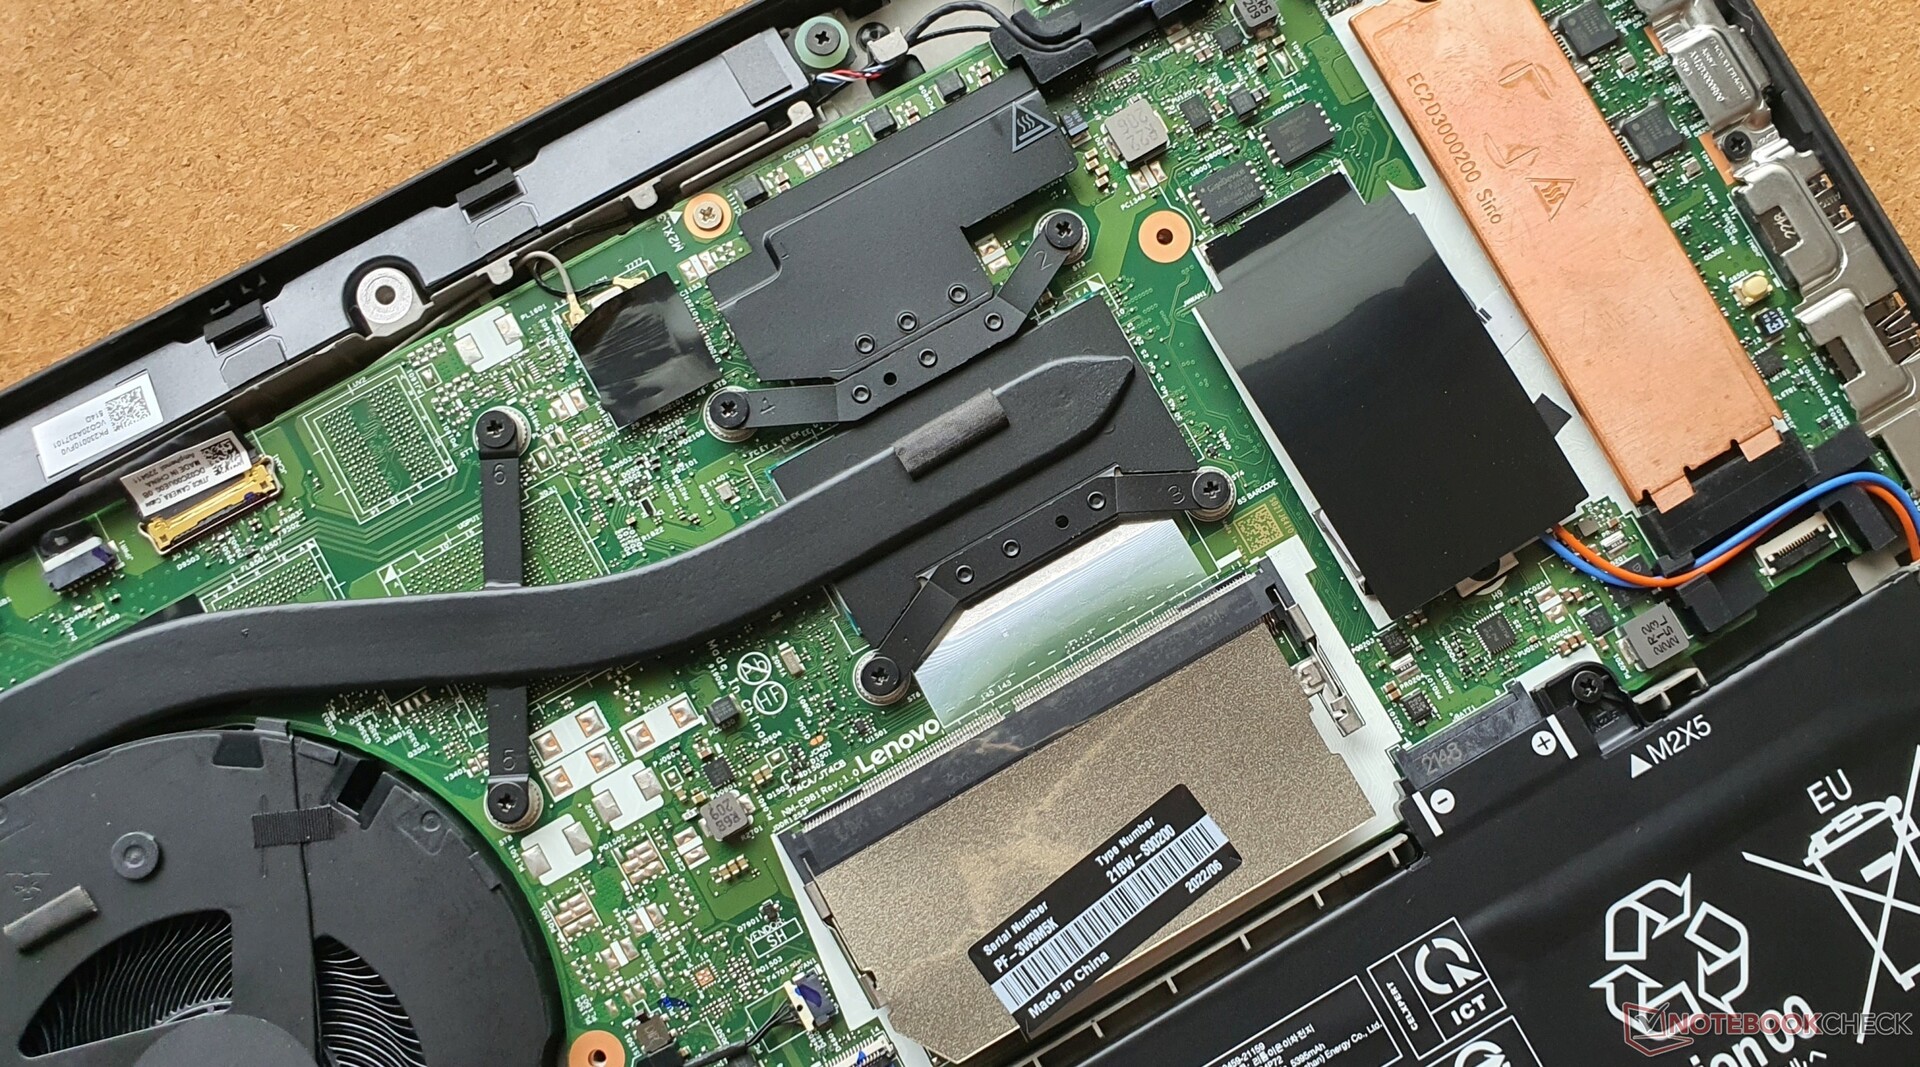
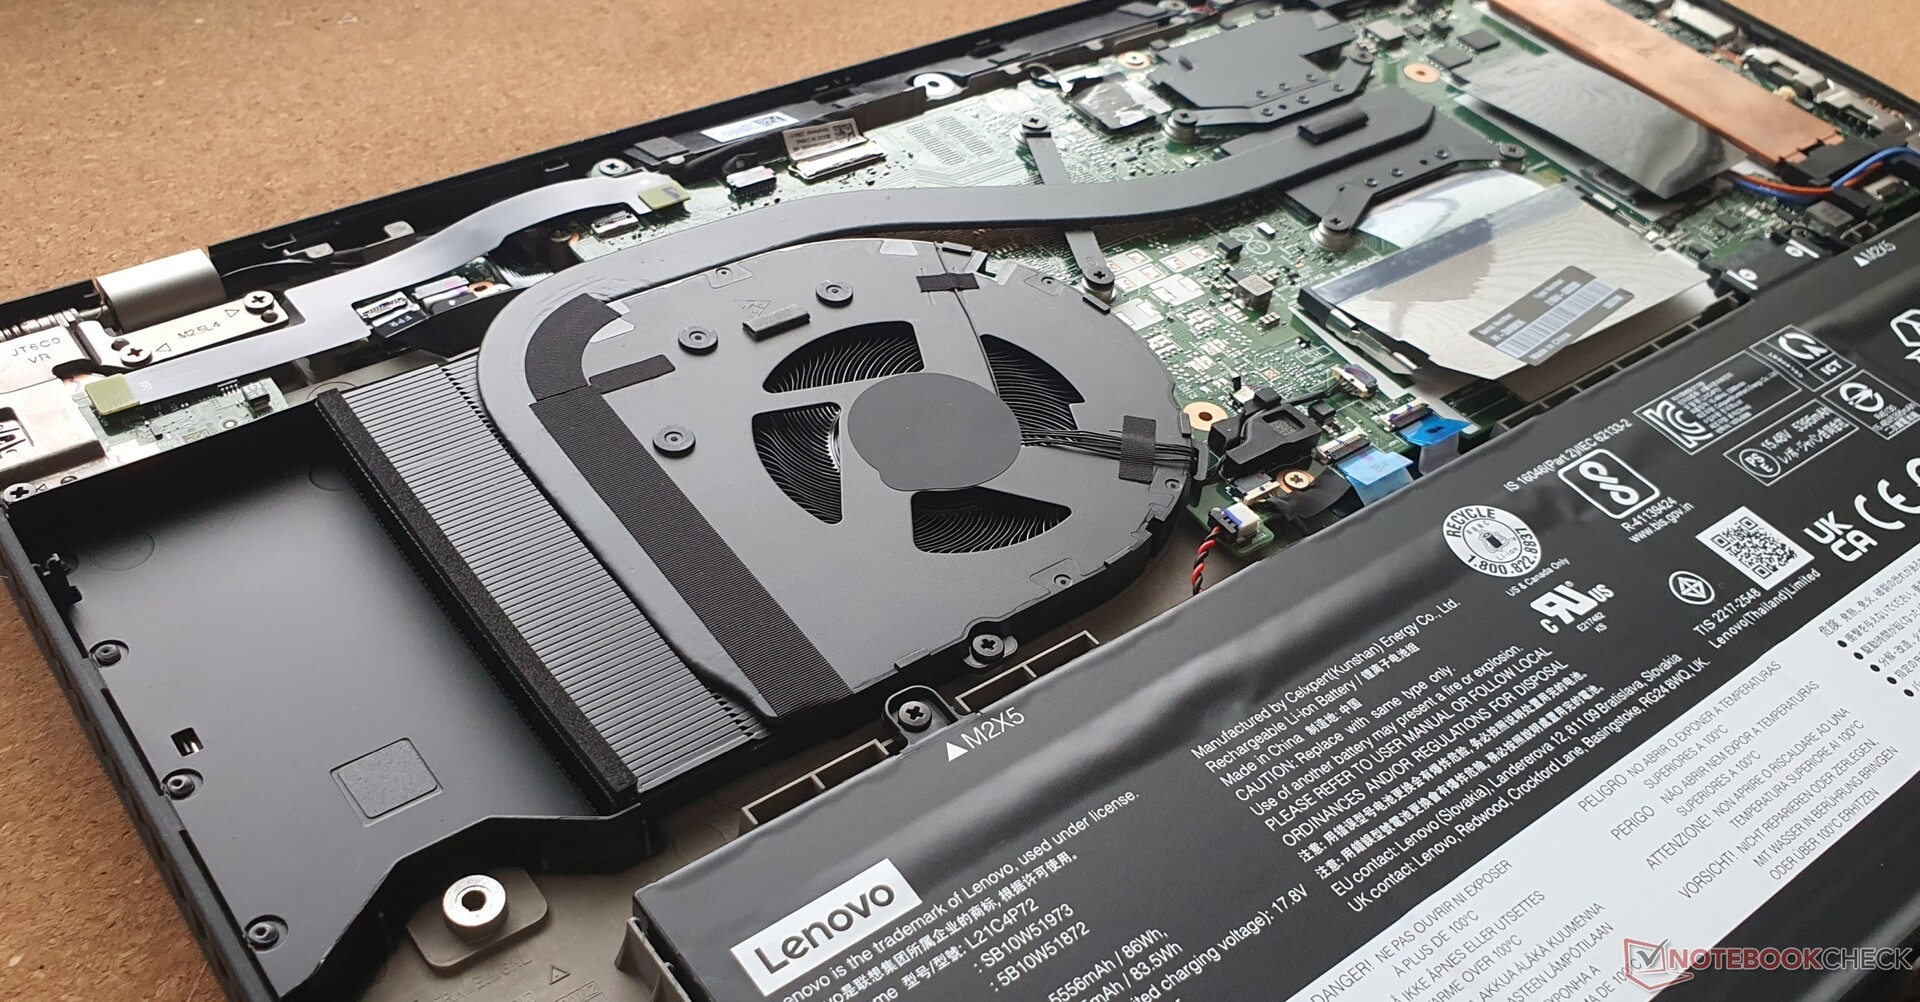
Manutenzione
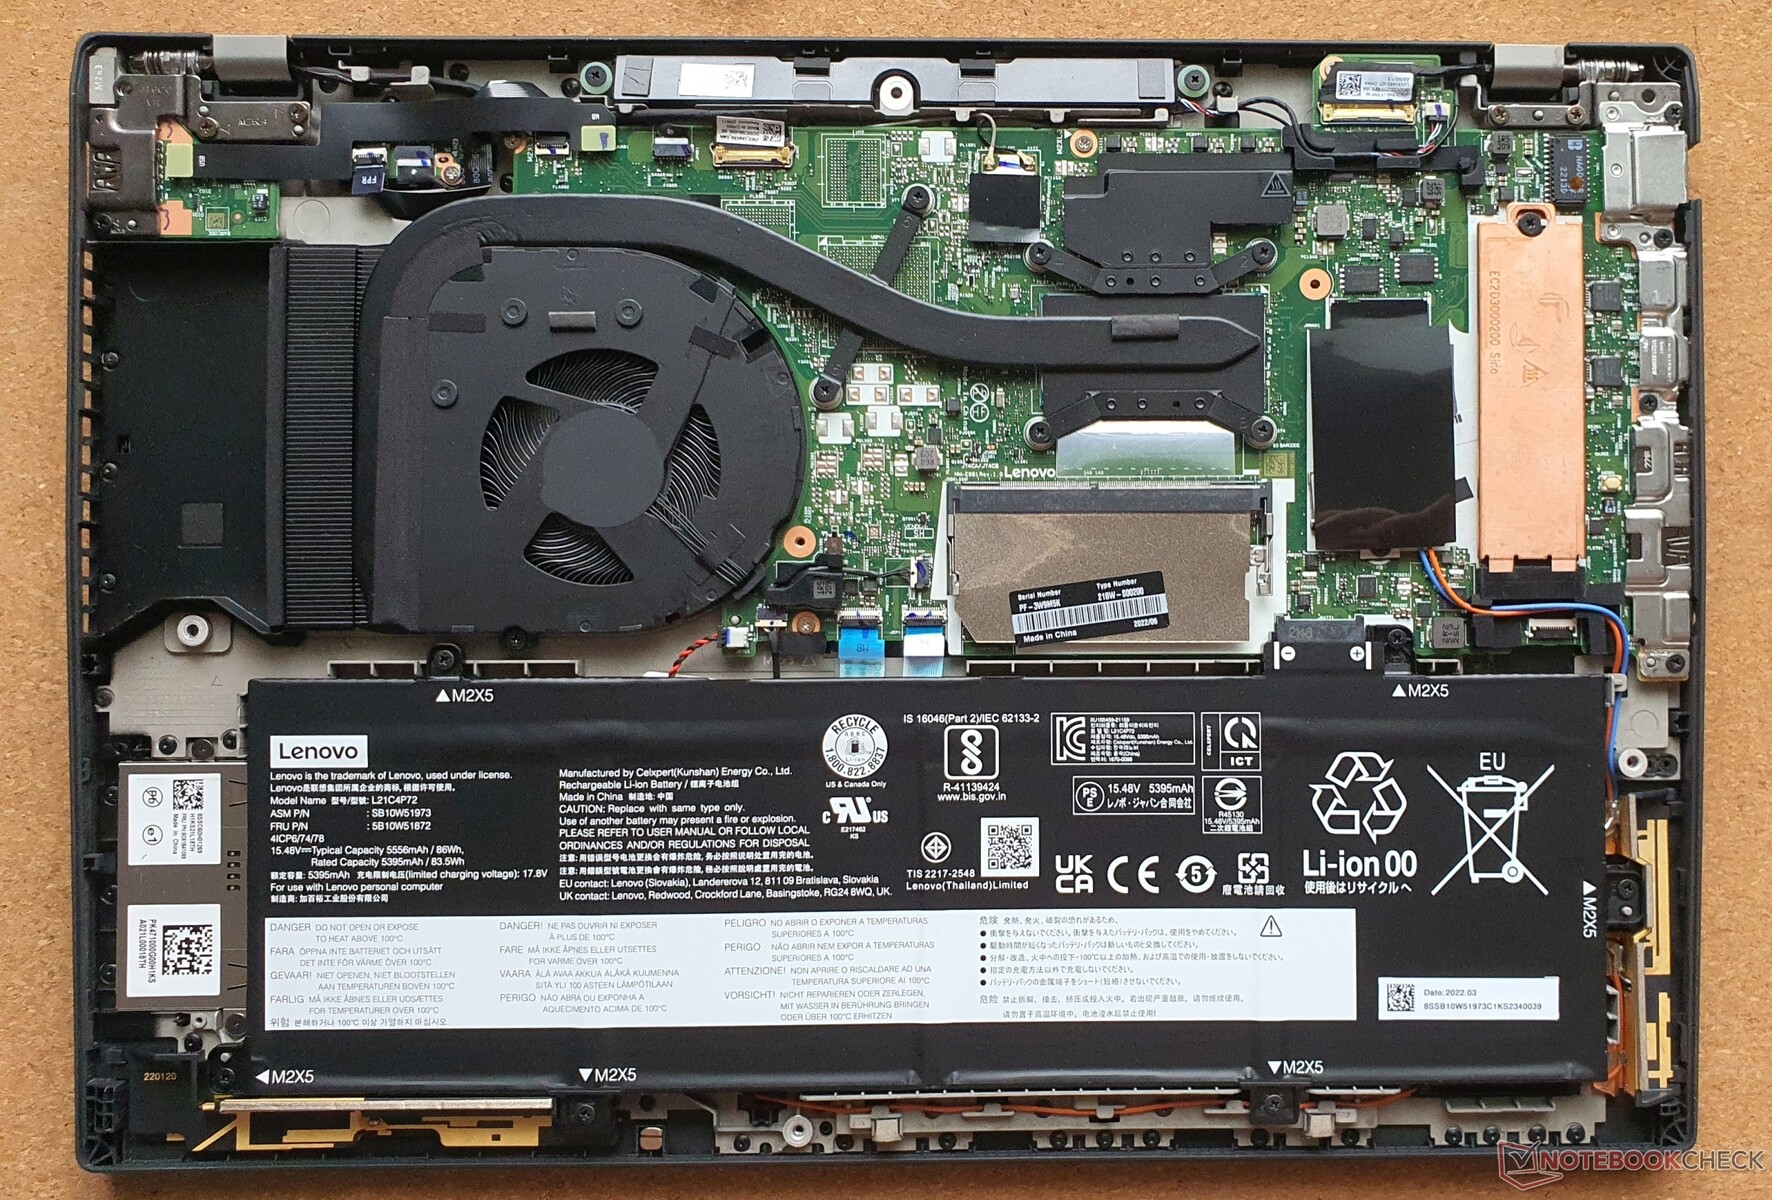
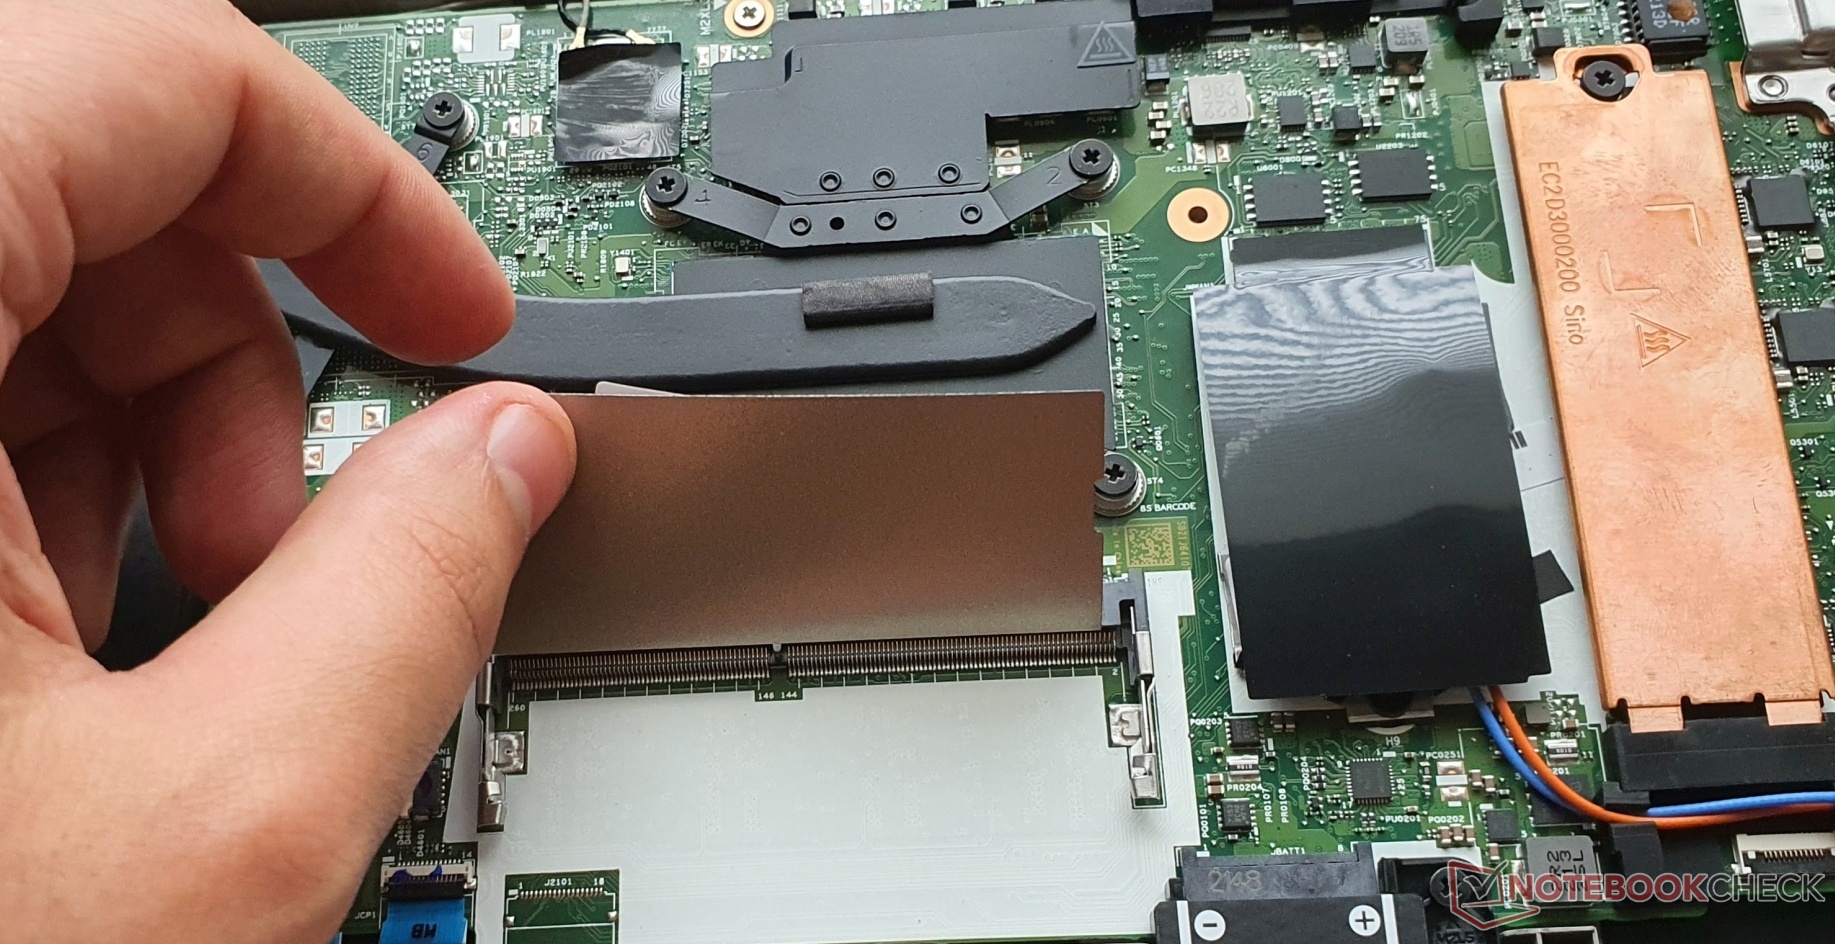
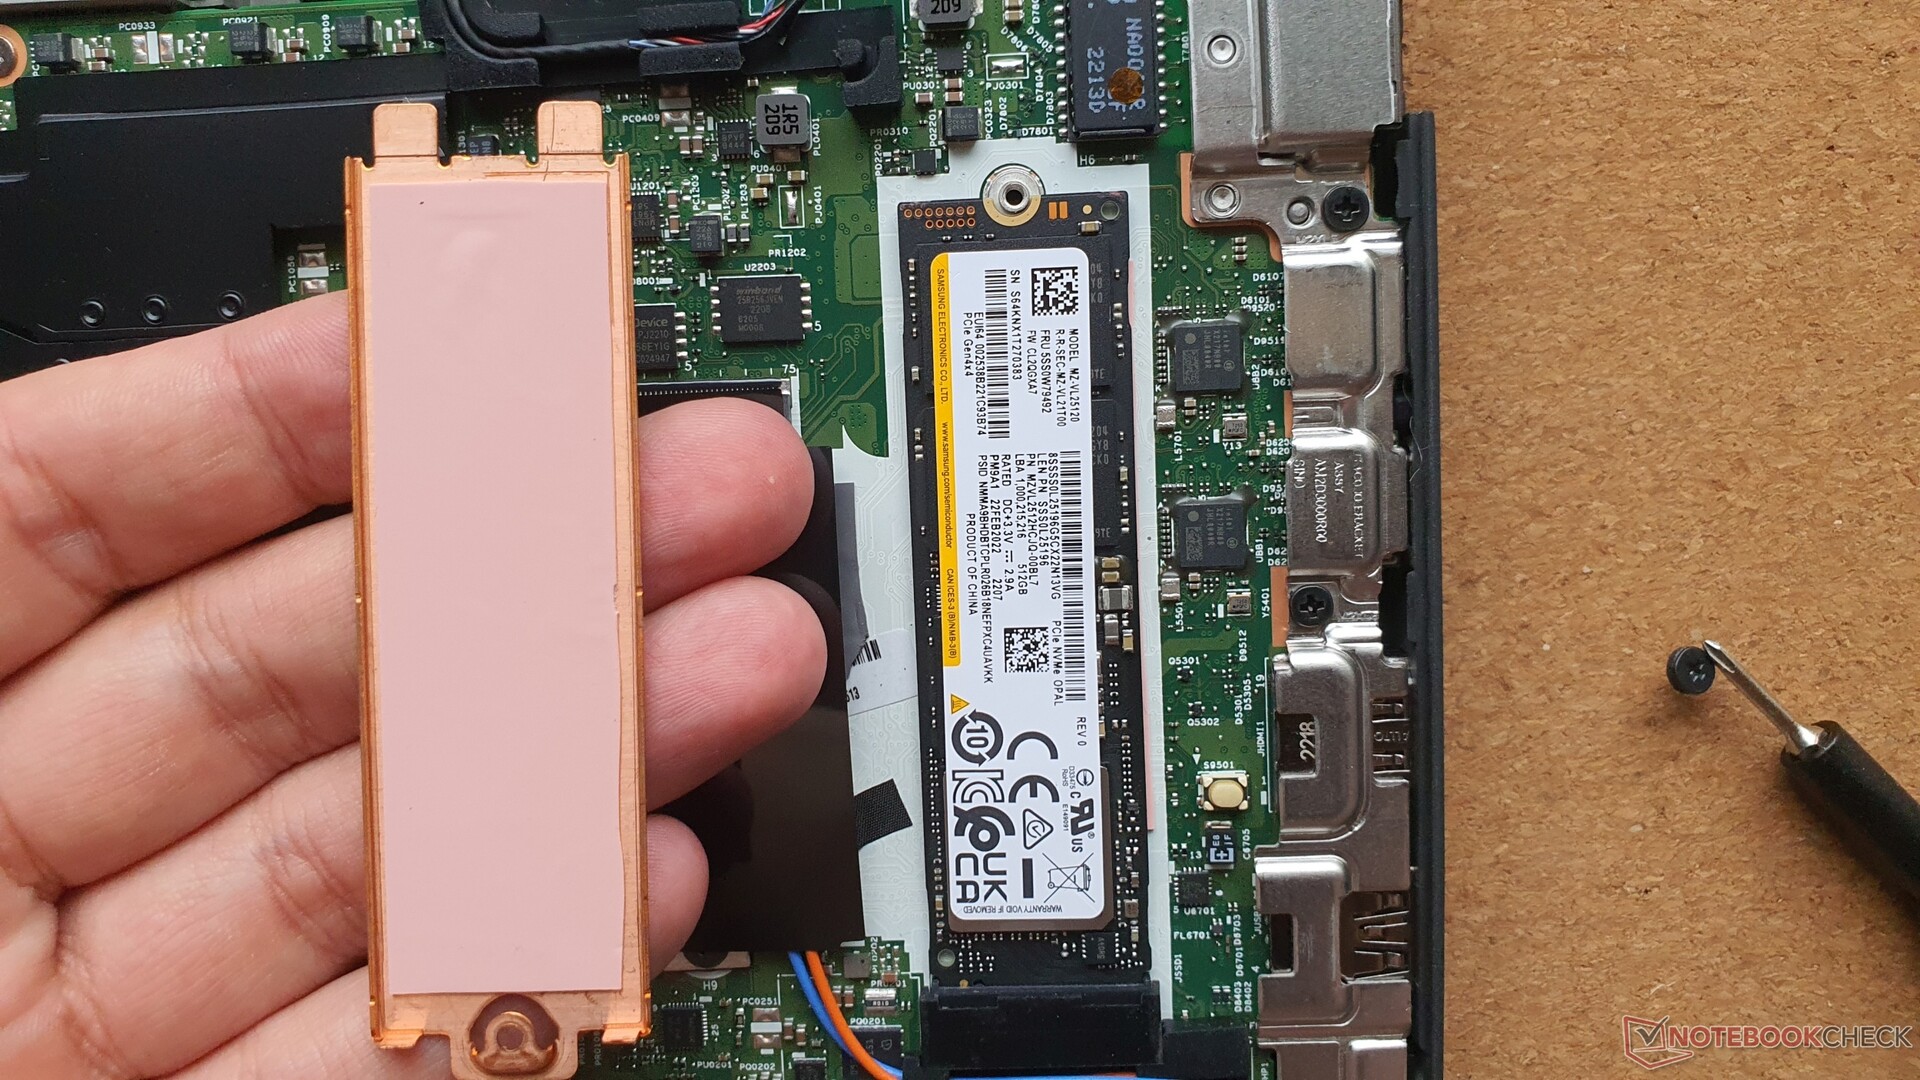
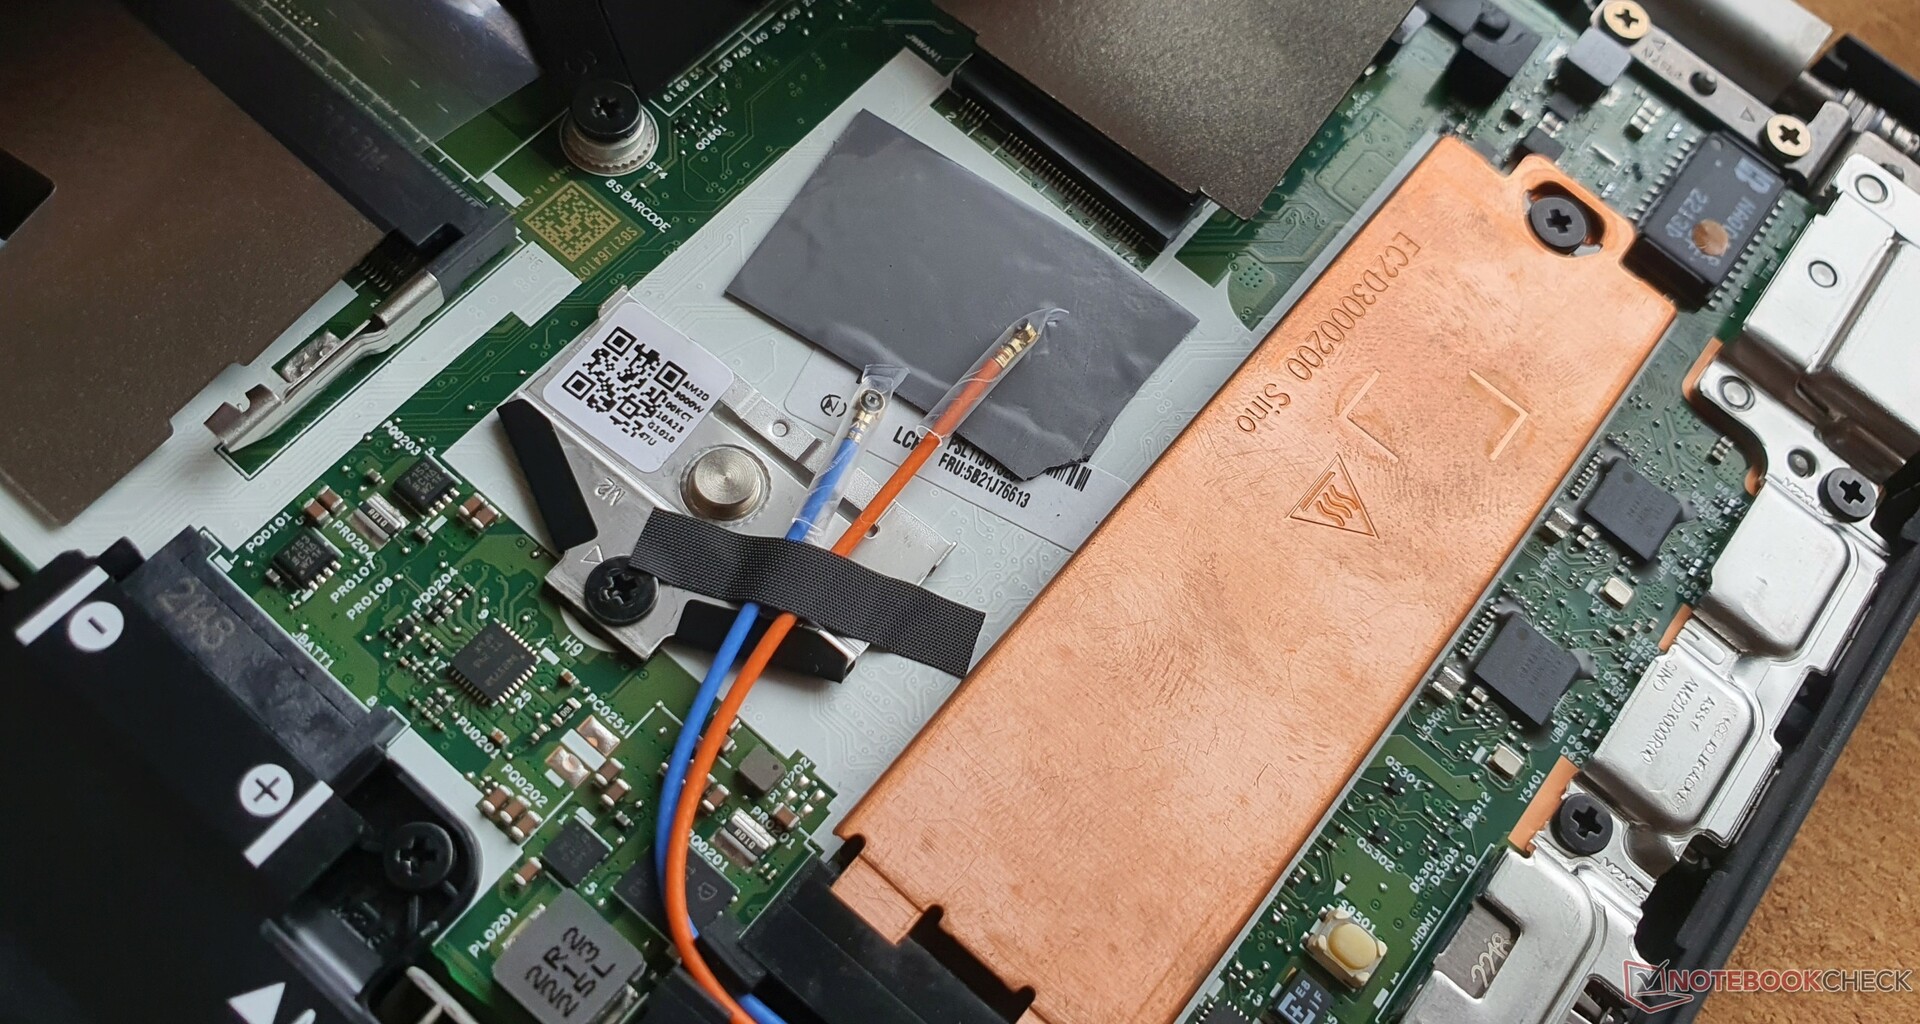
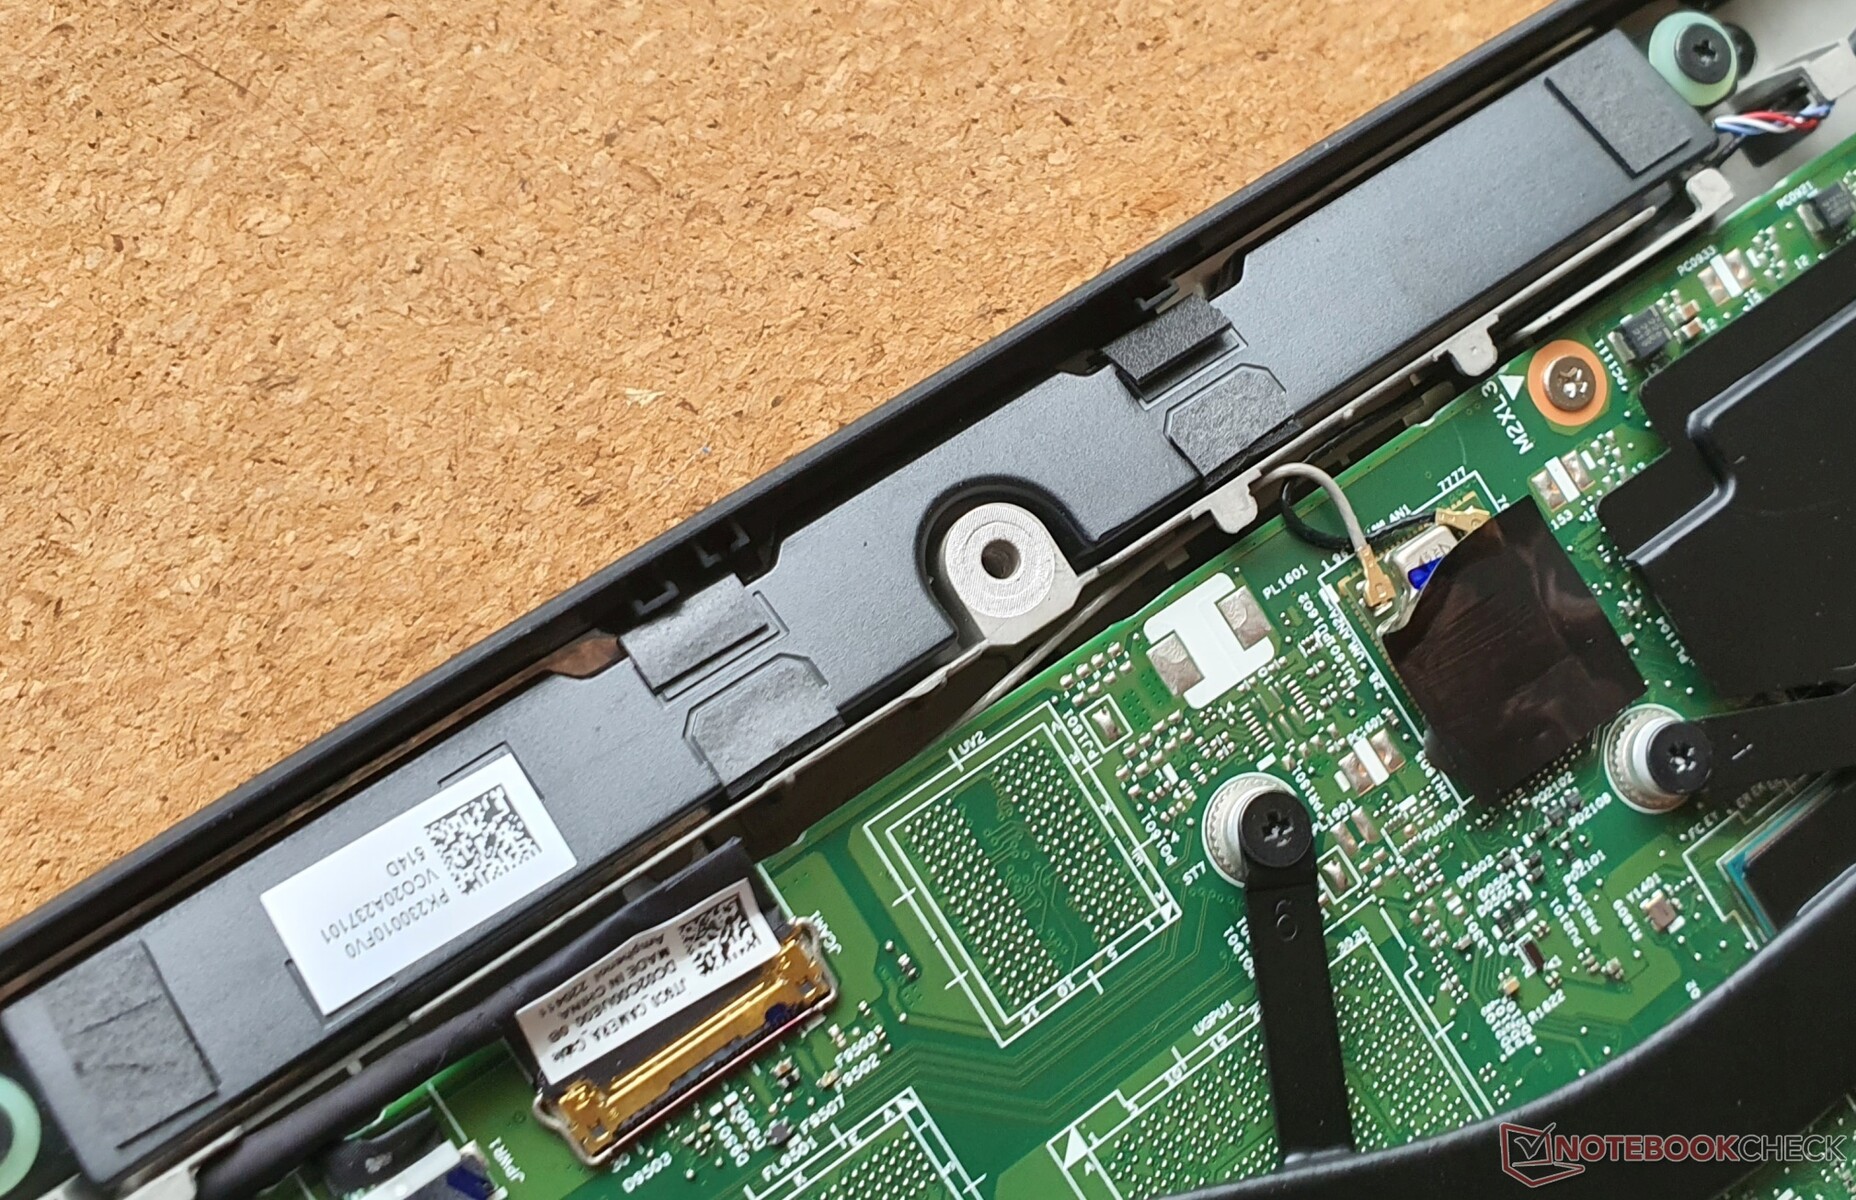
Prima di aprire il dispositivo, è necessario disattivare la batteria interna nel BIOS. Dopo aver allentato 8 viti Phillips, è necessario allentare alcune chiusure con un cacciavite. Successivamente, è possibile accedere all'unità M.2-2280-SSD (PCIe 4.0) inserita, a uno slot per la RAM (libero), a uno slot WWAN, alla batteria da 86 Wh avvitata e al sistema di raffreddamento, che può essere pulito.
Non è possibile inserire un'unità SSD nello slot WWAN.
Garanzia
In Germania, Lenovo offre una garanzia di 3 anni (1 anno per la batteria). Il nostro modello è dotato di assistenza Premier, che include il servizio in loco. Tuttavia, lo standard è il servizio di corriere o di trasporto. È possibile un'estensione fino a 5 anni: 223 euro (~US$ 223) per il primo e 521 euro (~US$ 521) per due anni aggiuntivi.
Questi termini di garanzia possono differire in altri Paesi, quindi assicuratevi di verificare con il vostro fornitore prima dell'acquisto.
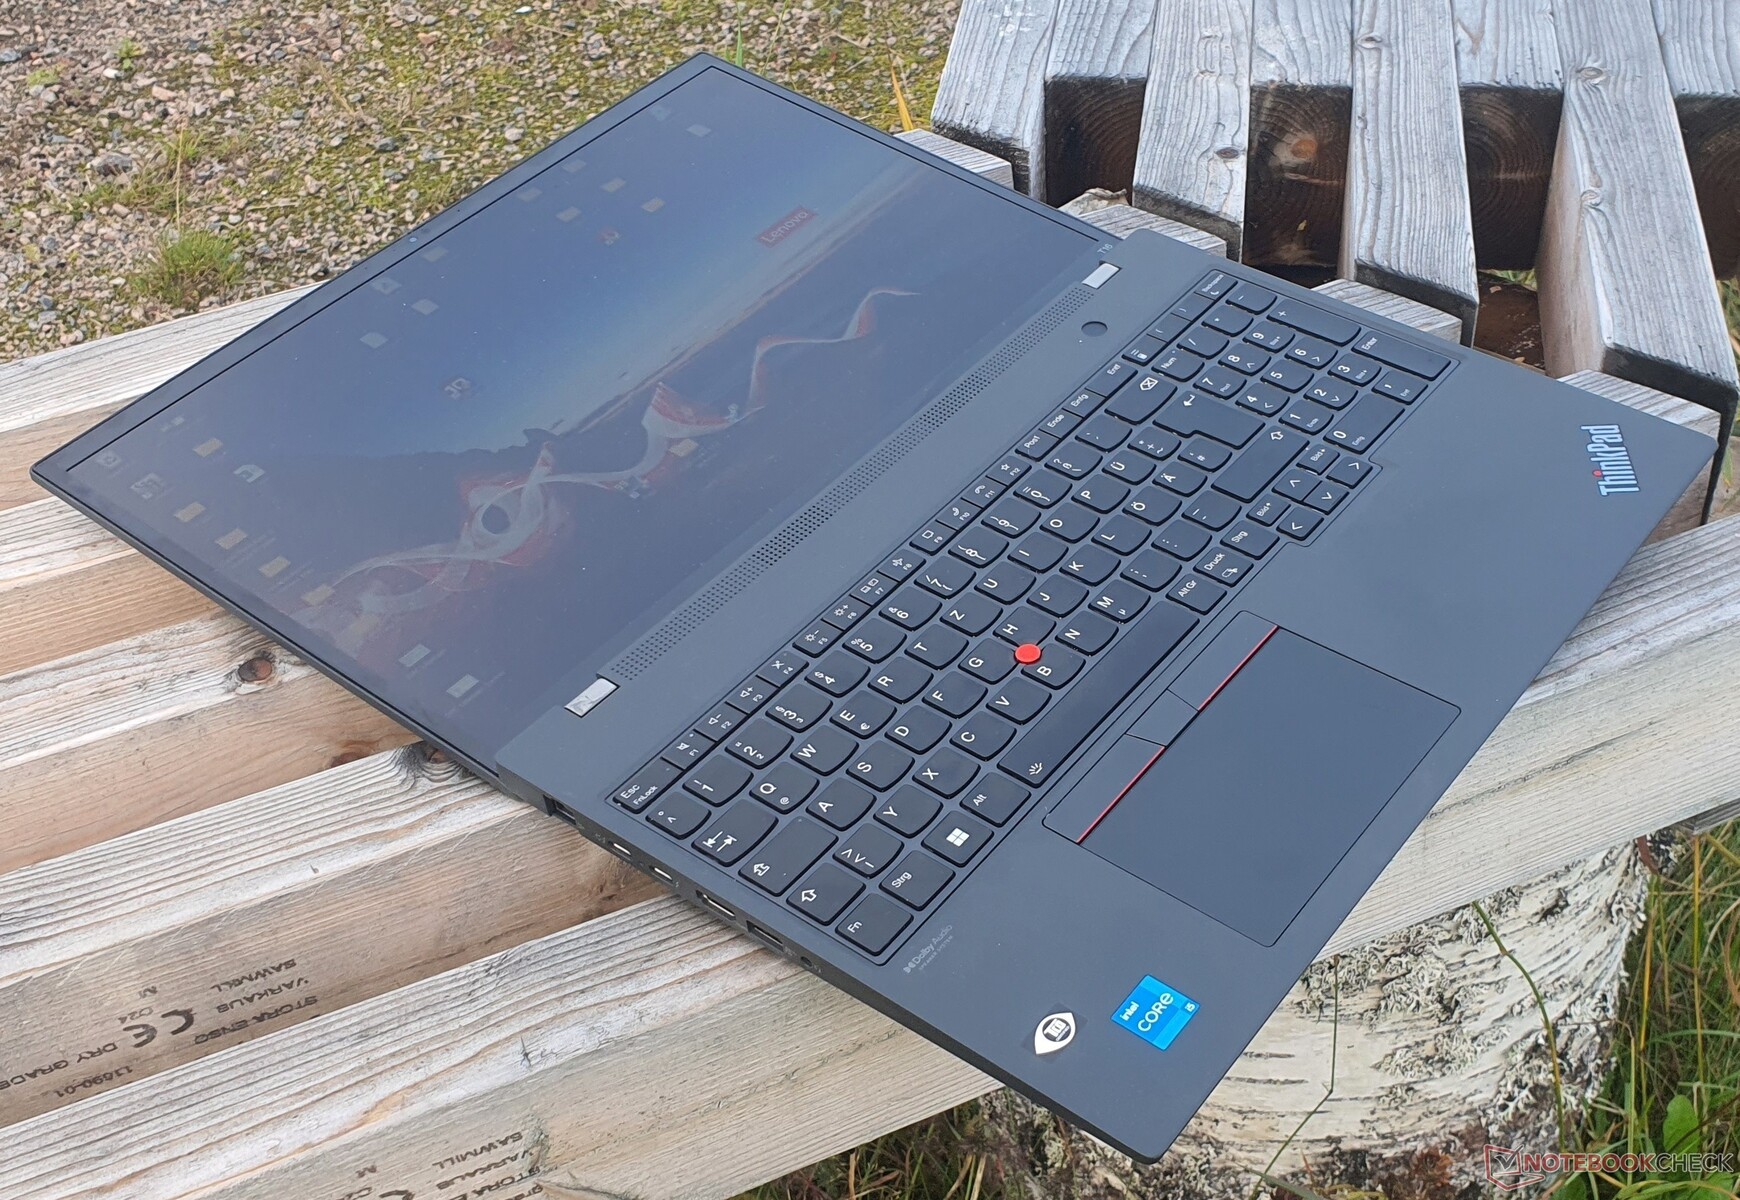
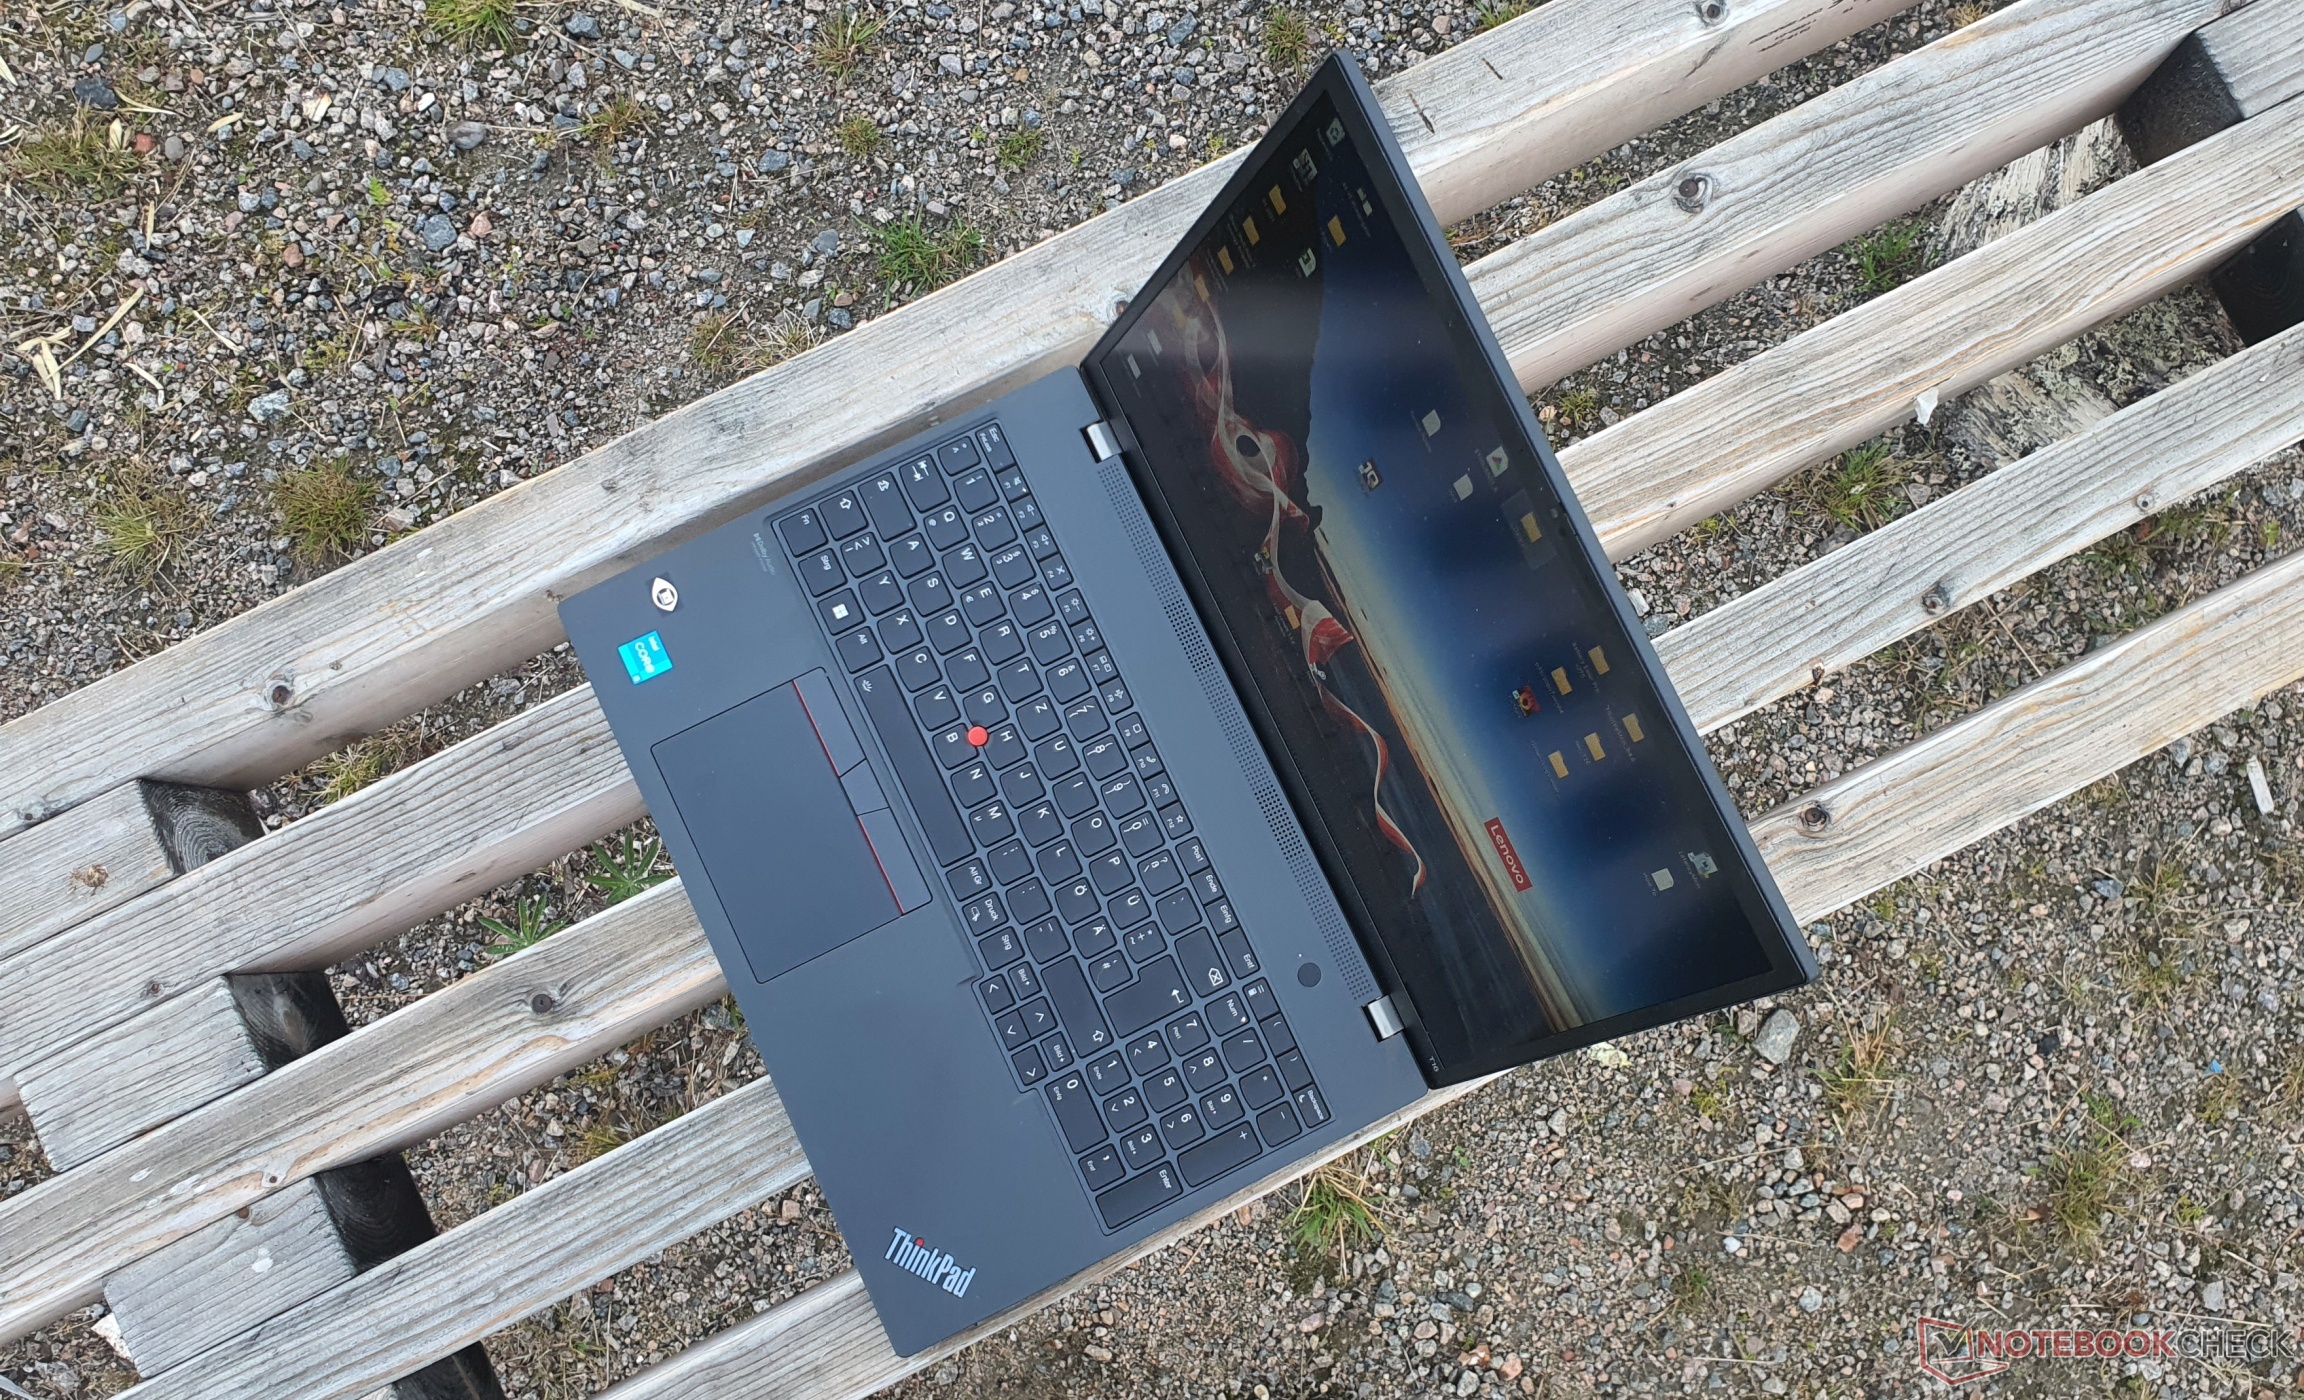
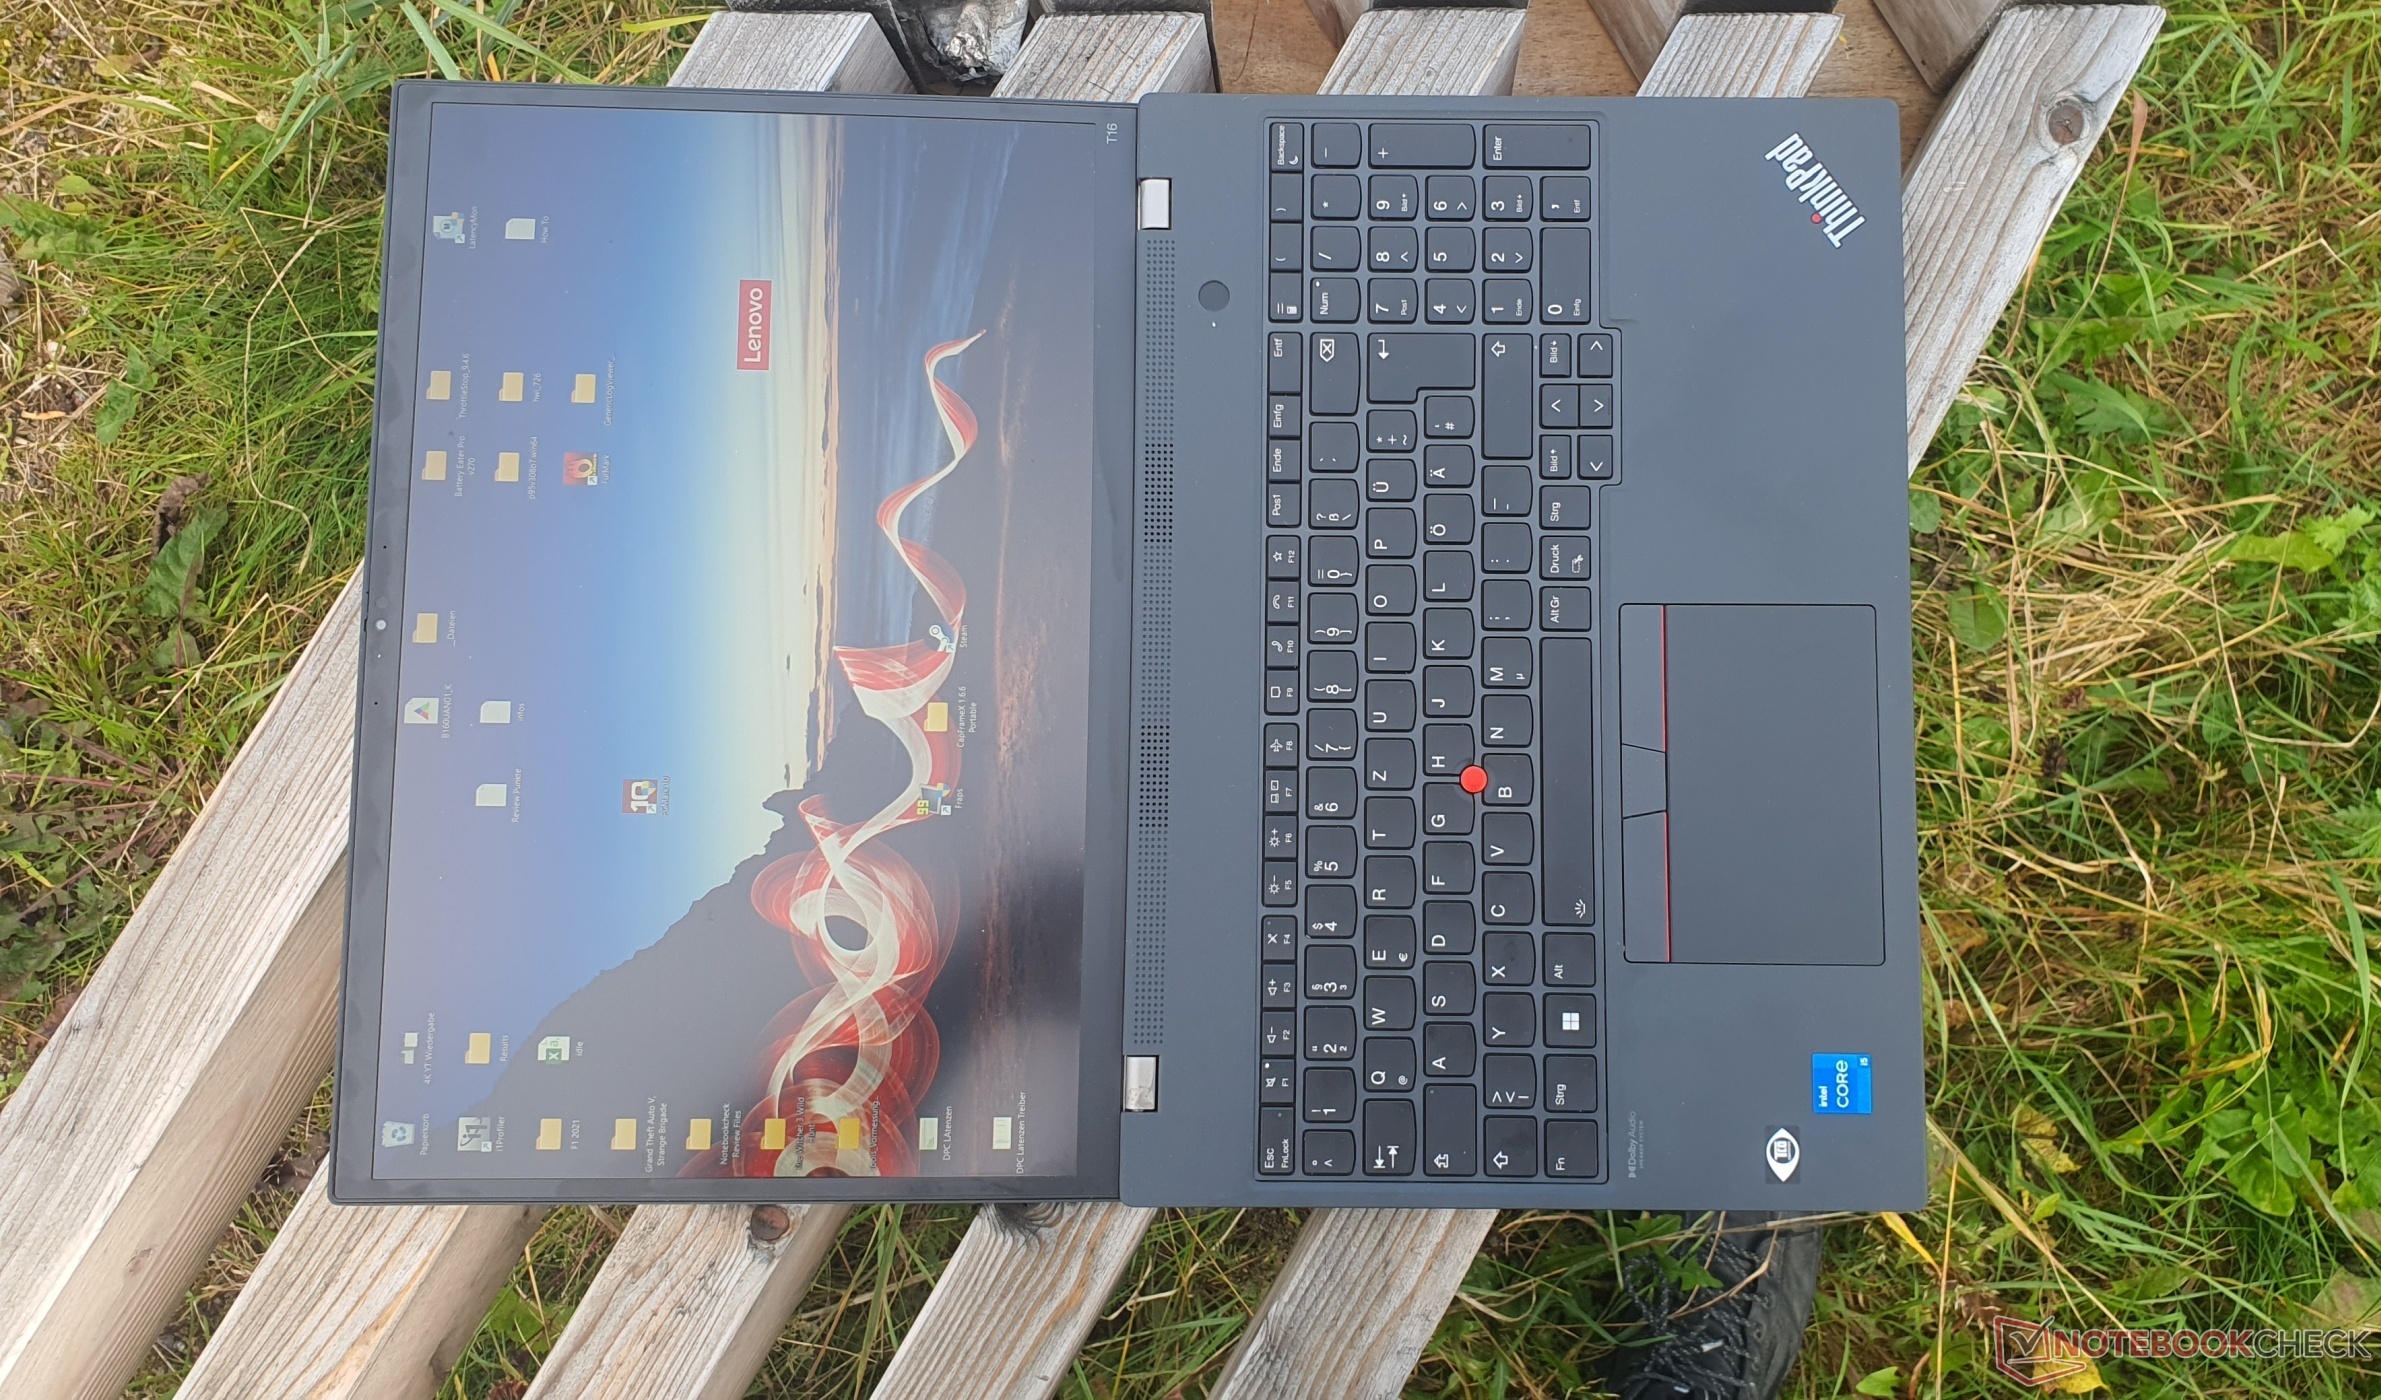
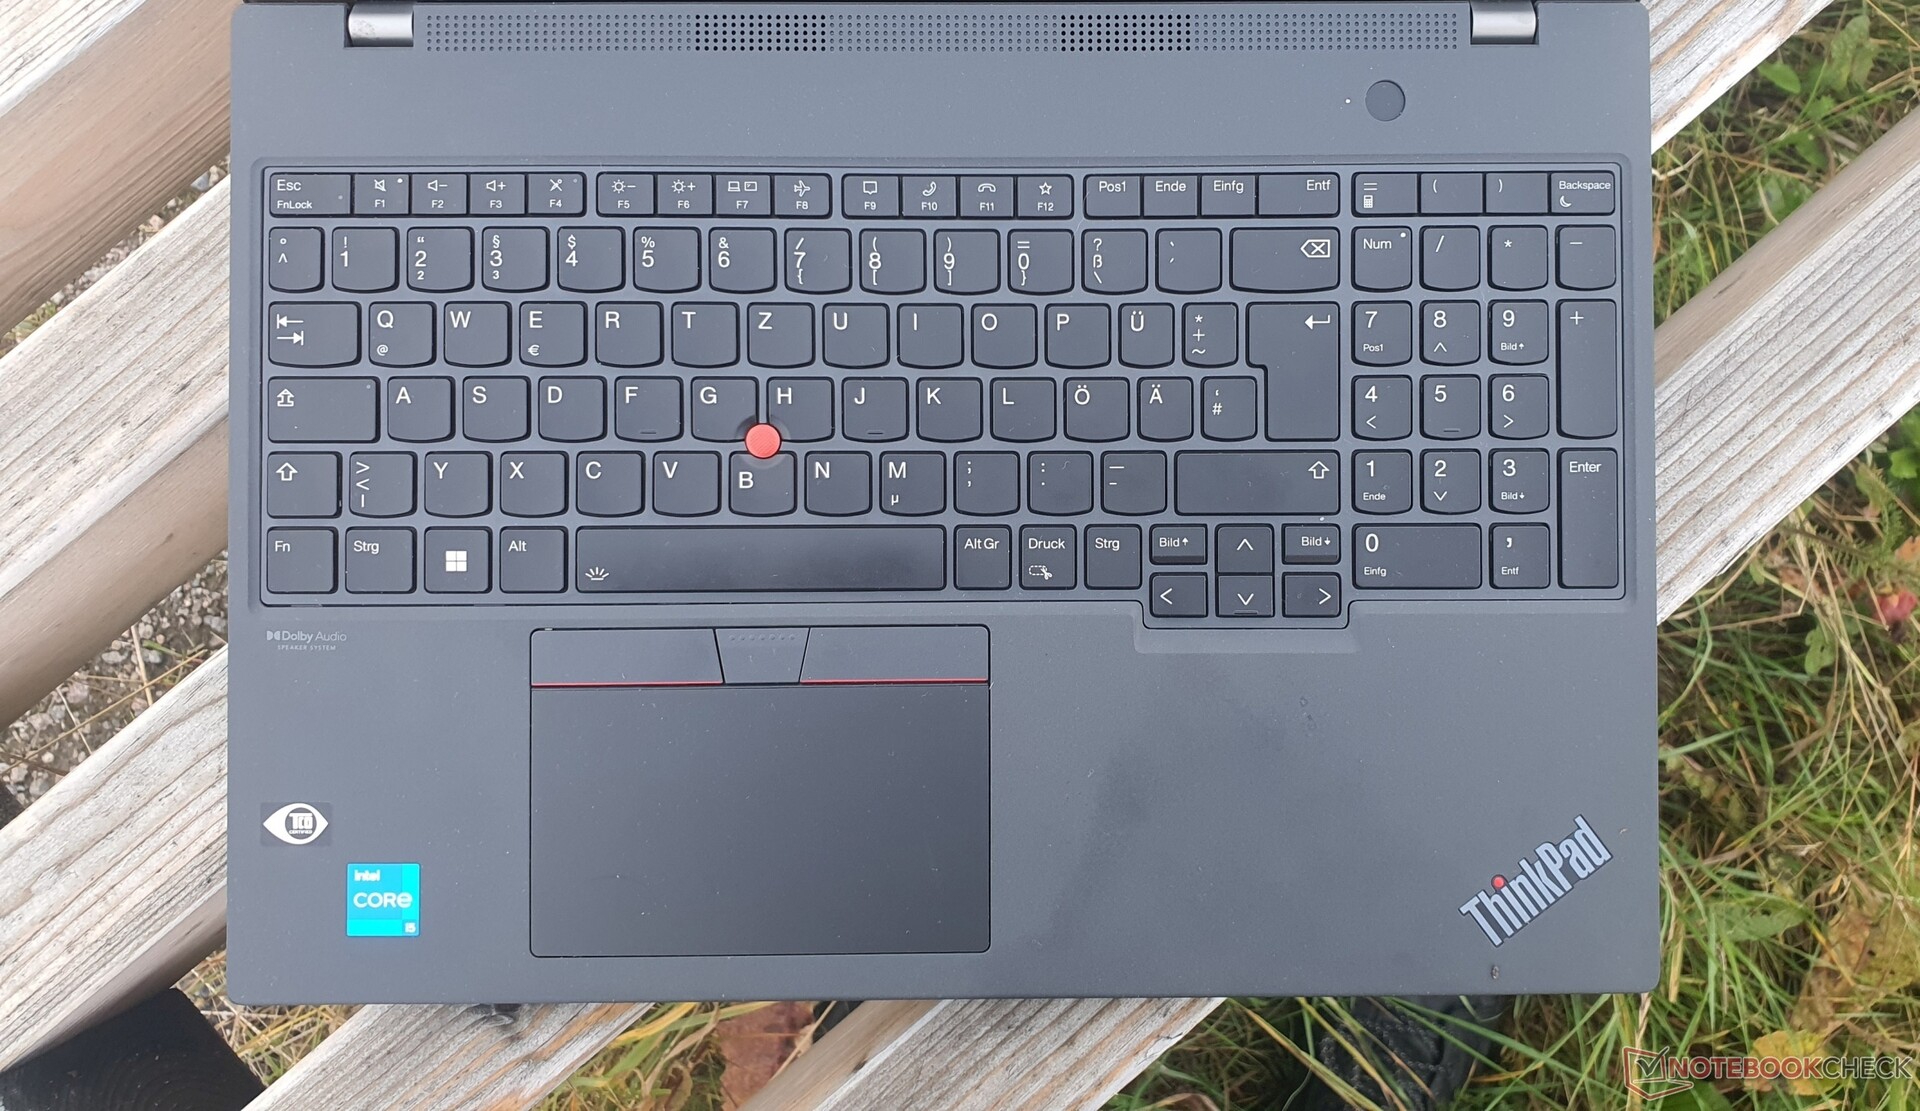
Dispositivi di input - Corsa di 1,5 mm con tastiera ThinkPad sostituibile
Tastiera
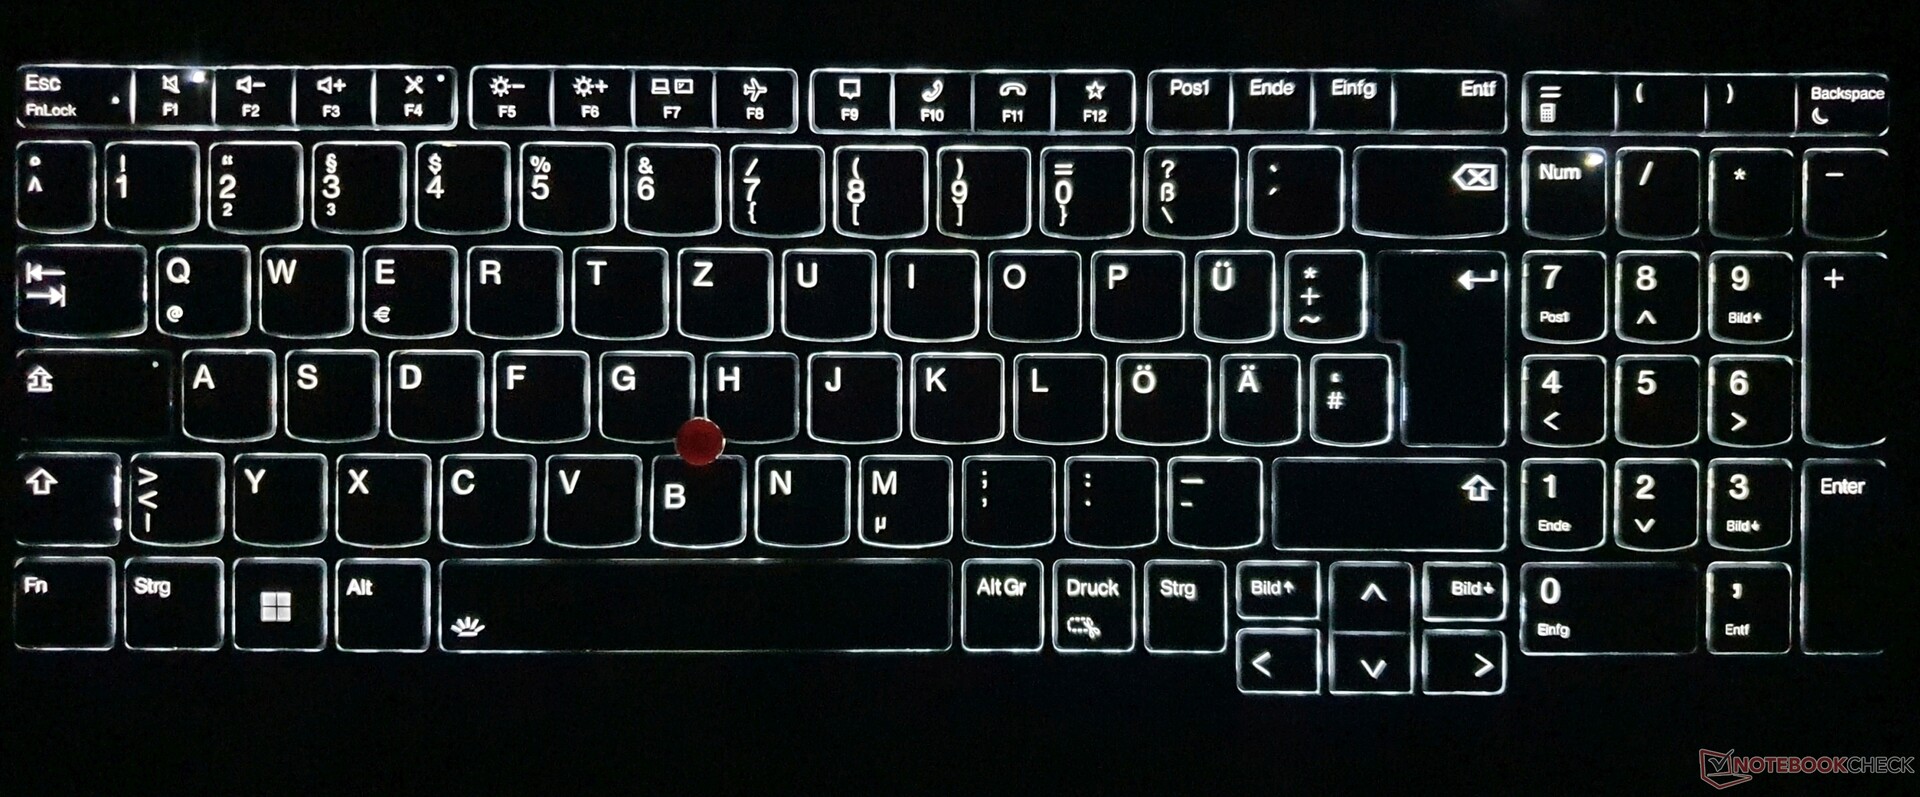
La tastiera chiclet a 6 file, resistente agli schizzi, è dotata di tasti da 16x16 mm. La fila inferiore e i tasti shift sono ora quadrati. Alcuni tasti sono stati ridotti di dimensioni, come il NumPad e i tasti freccia, ma non dimezzati (come in altri modelli). Tutti i tasti importanti sono inoltre dedicati.
La corsa dei tasti, ridotta a 1,5 mm, è stata introdotta quest'anno nella serie T senza la s-suffix. Poiché il punto di pressione è molto preciso e la resistenza dei tasti è ben implementata, questo garantisce una digitazione più veloce, precisa e silenziosa rispetto a quasi tutte le altre tastiere. Inoltre, la tastiera può essere sostituita in caso di usura o danneggiamento. La base della tastiera cede solo leggermente sotto una pressione mirata, cosa che non accade durante la digitazione.
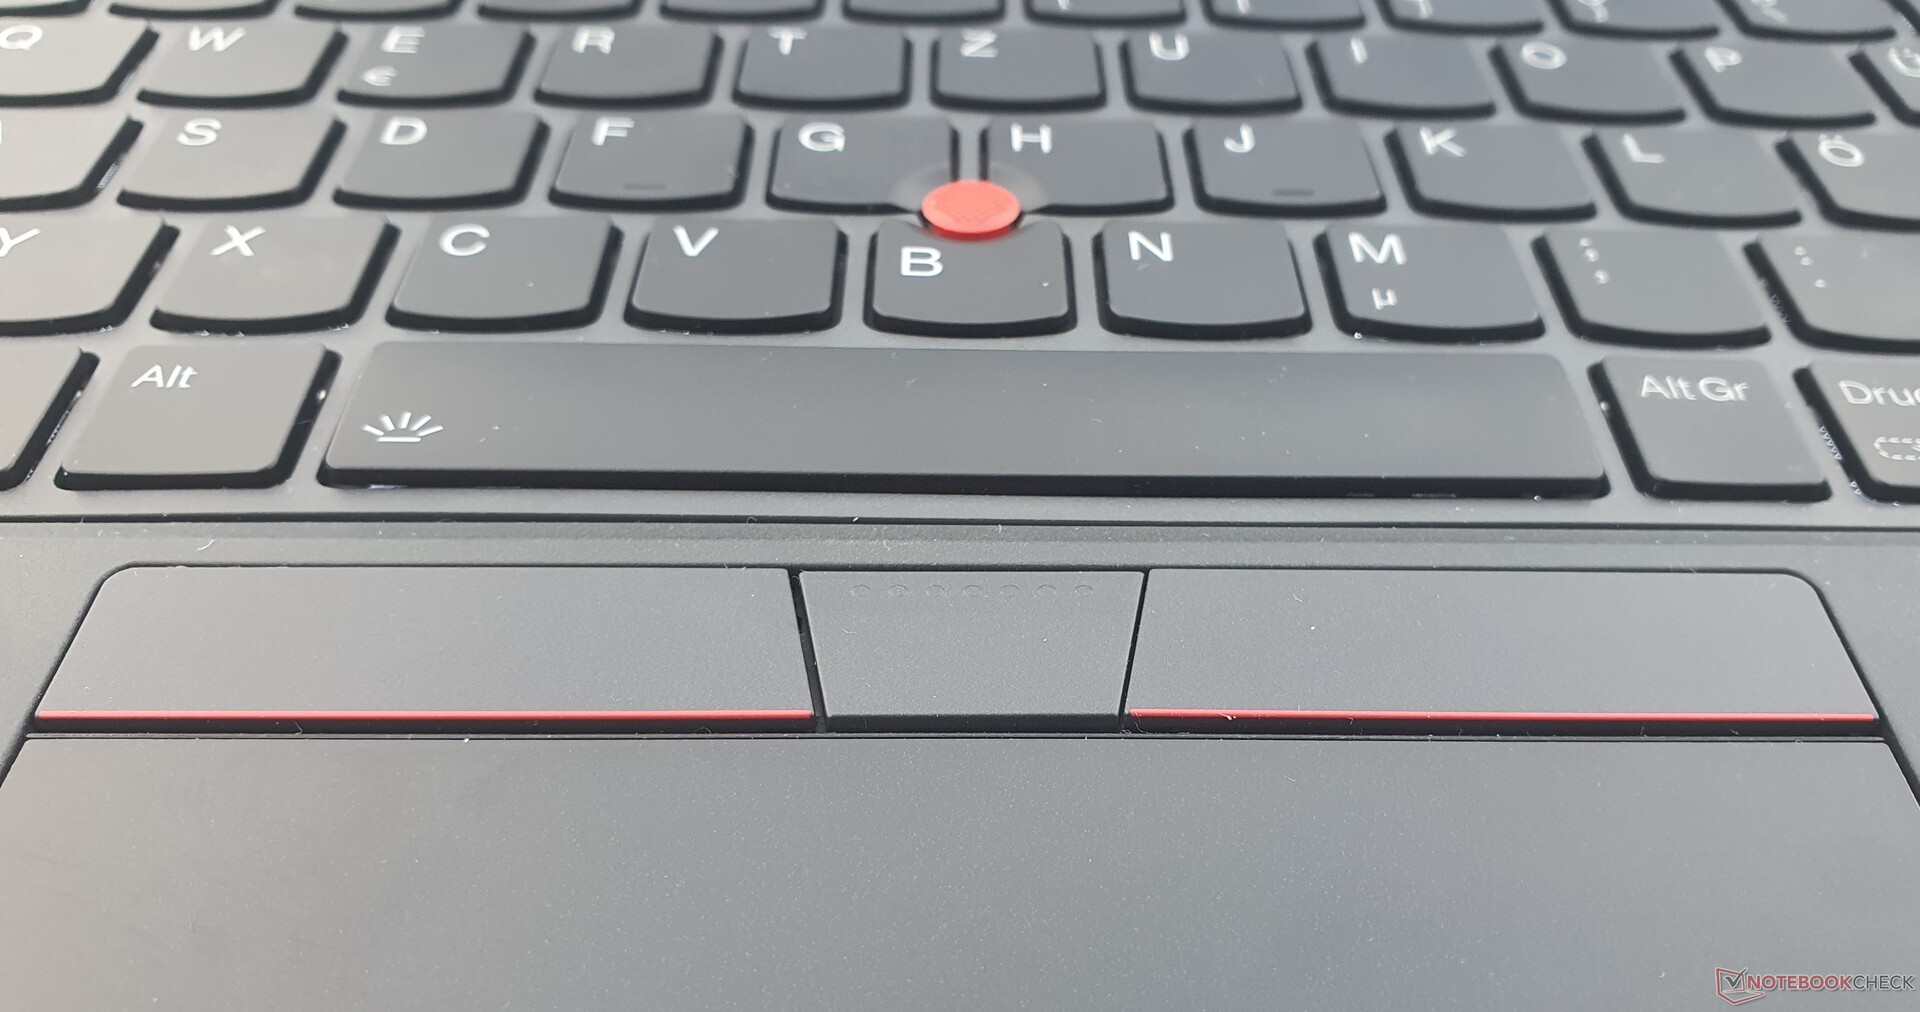
Touchpad e TrackPoint
Il touchpad, che è stato ingrandito a 11,5x6,7 cm con una superficie in Mylar migliorata, è un passo avanti in termini di reattività, scivola più agevolmente e sembra più simile a un vetro liscio. Il pinch-to-zoom e il drag & drop funzionano a meraviglia. Gli input sono implementati con precisione. I tasti a scatto integrati offrono una corsa breve, ma un feedback ricco e chiaro.
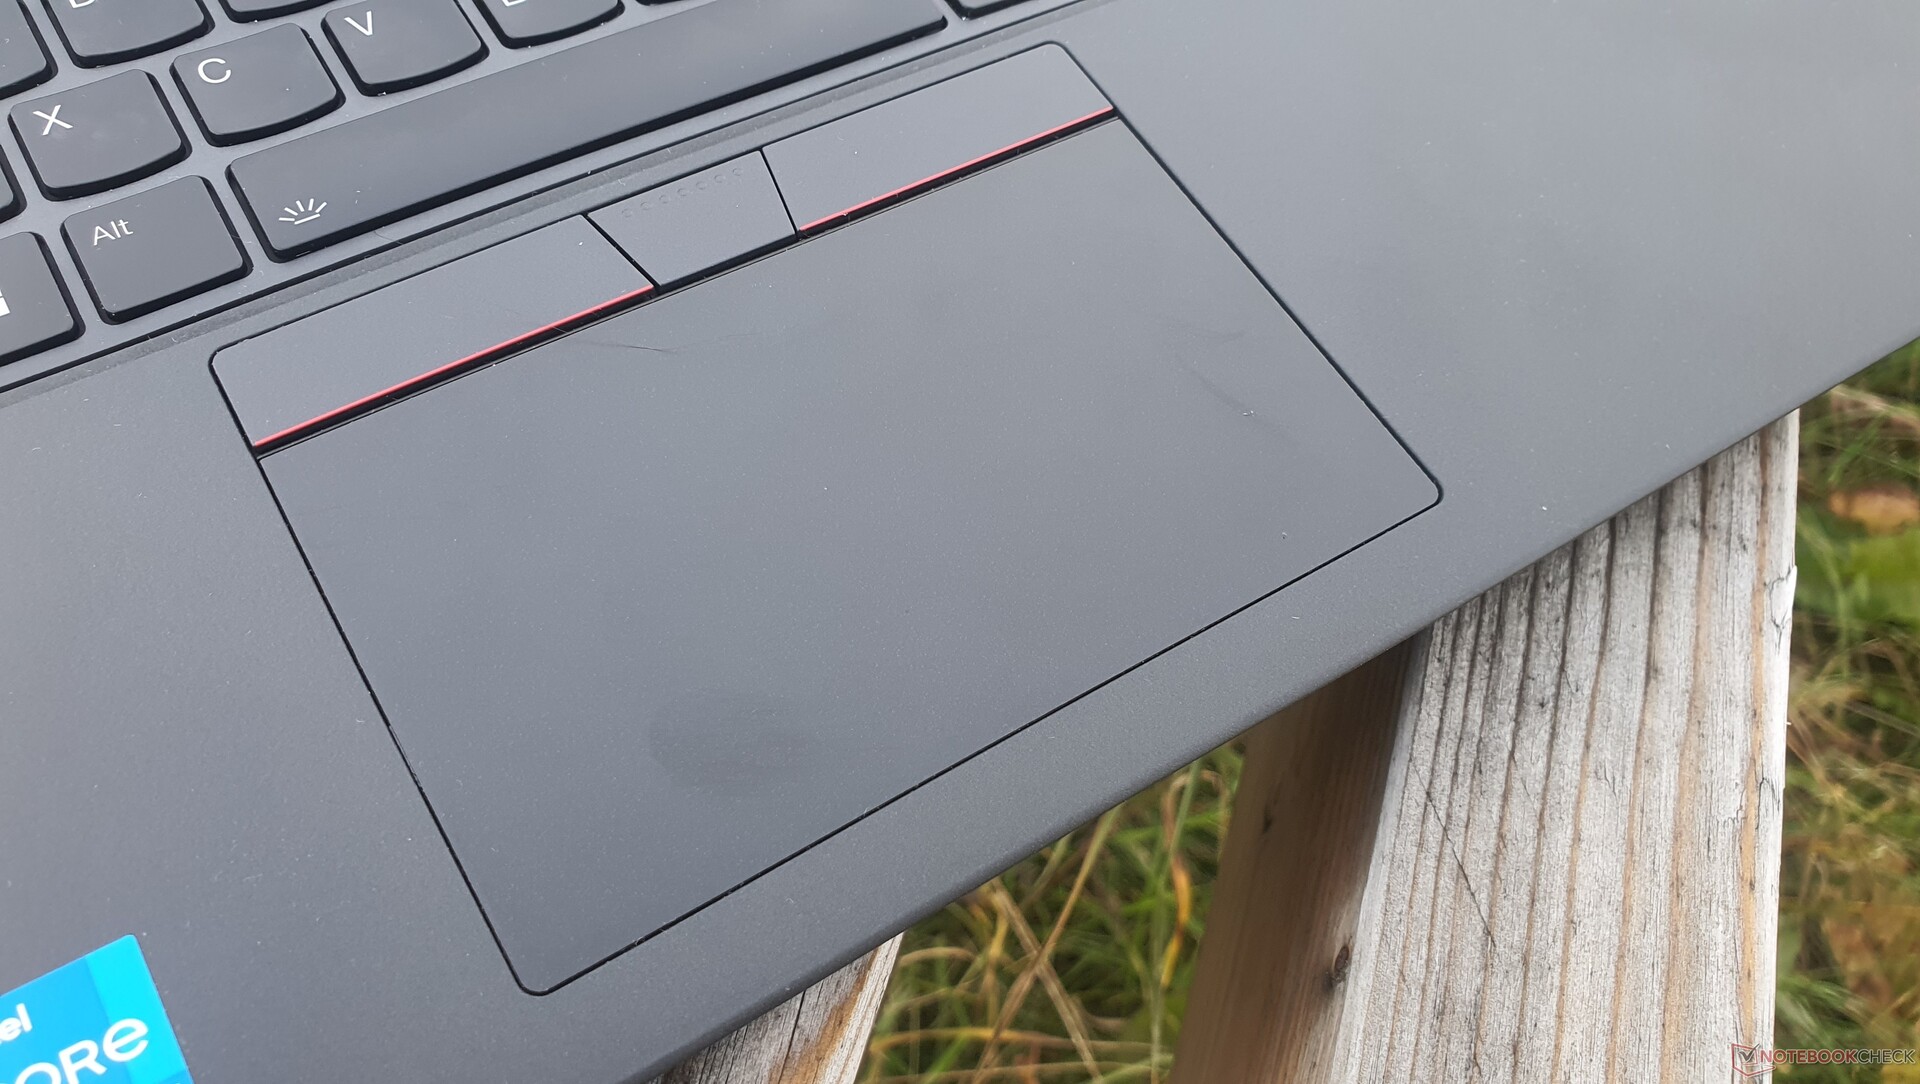
I fan del TrackPoint possono ancora utilizzare questo metodo vantaggioso per il controllo del mouse, che rende superflua la rimozione della mano dalla tastiera. Tuttavia, i tre tasti associati sopra il touchpad sono ora completamente piatti, con un feedback e una corsa minori. Potrebbe essere necessario un po' di tempo per abituarsi. Tuttavia, funzionano ancora in modo preciso e affidabile.
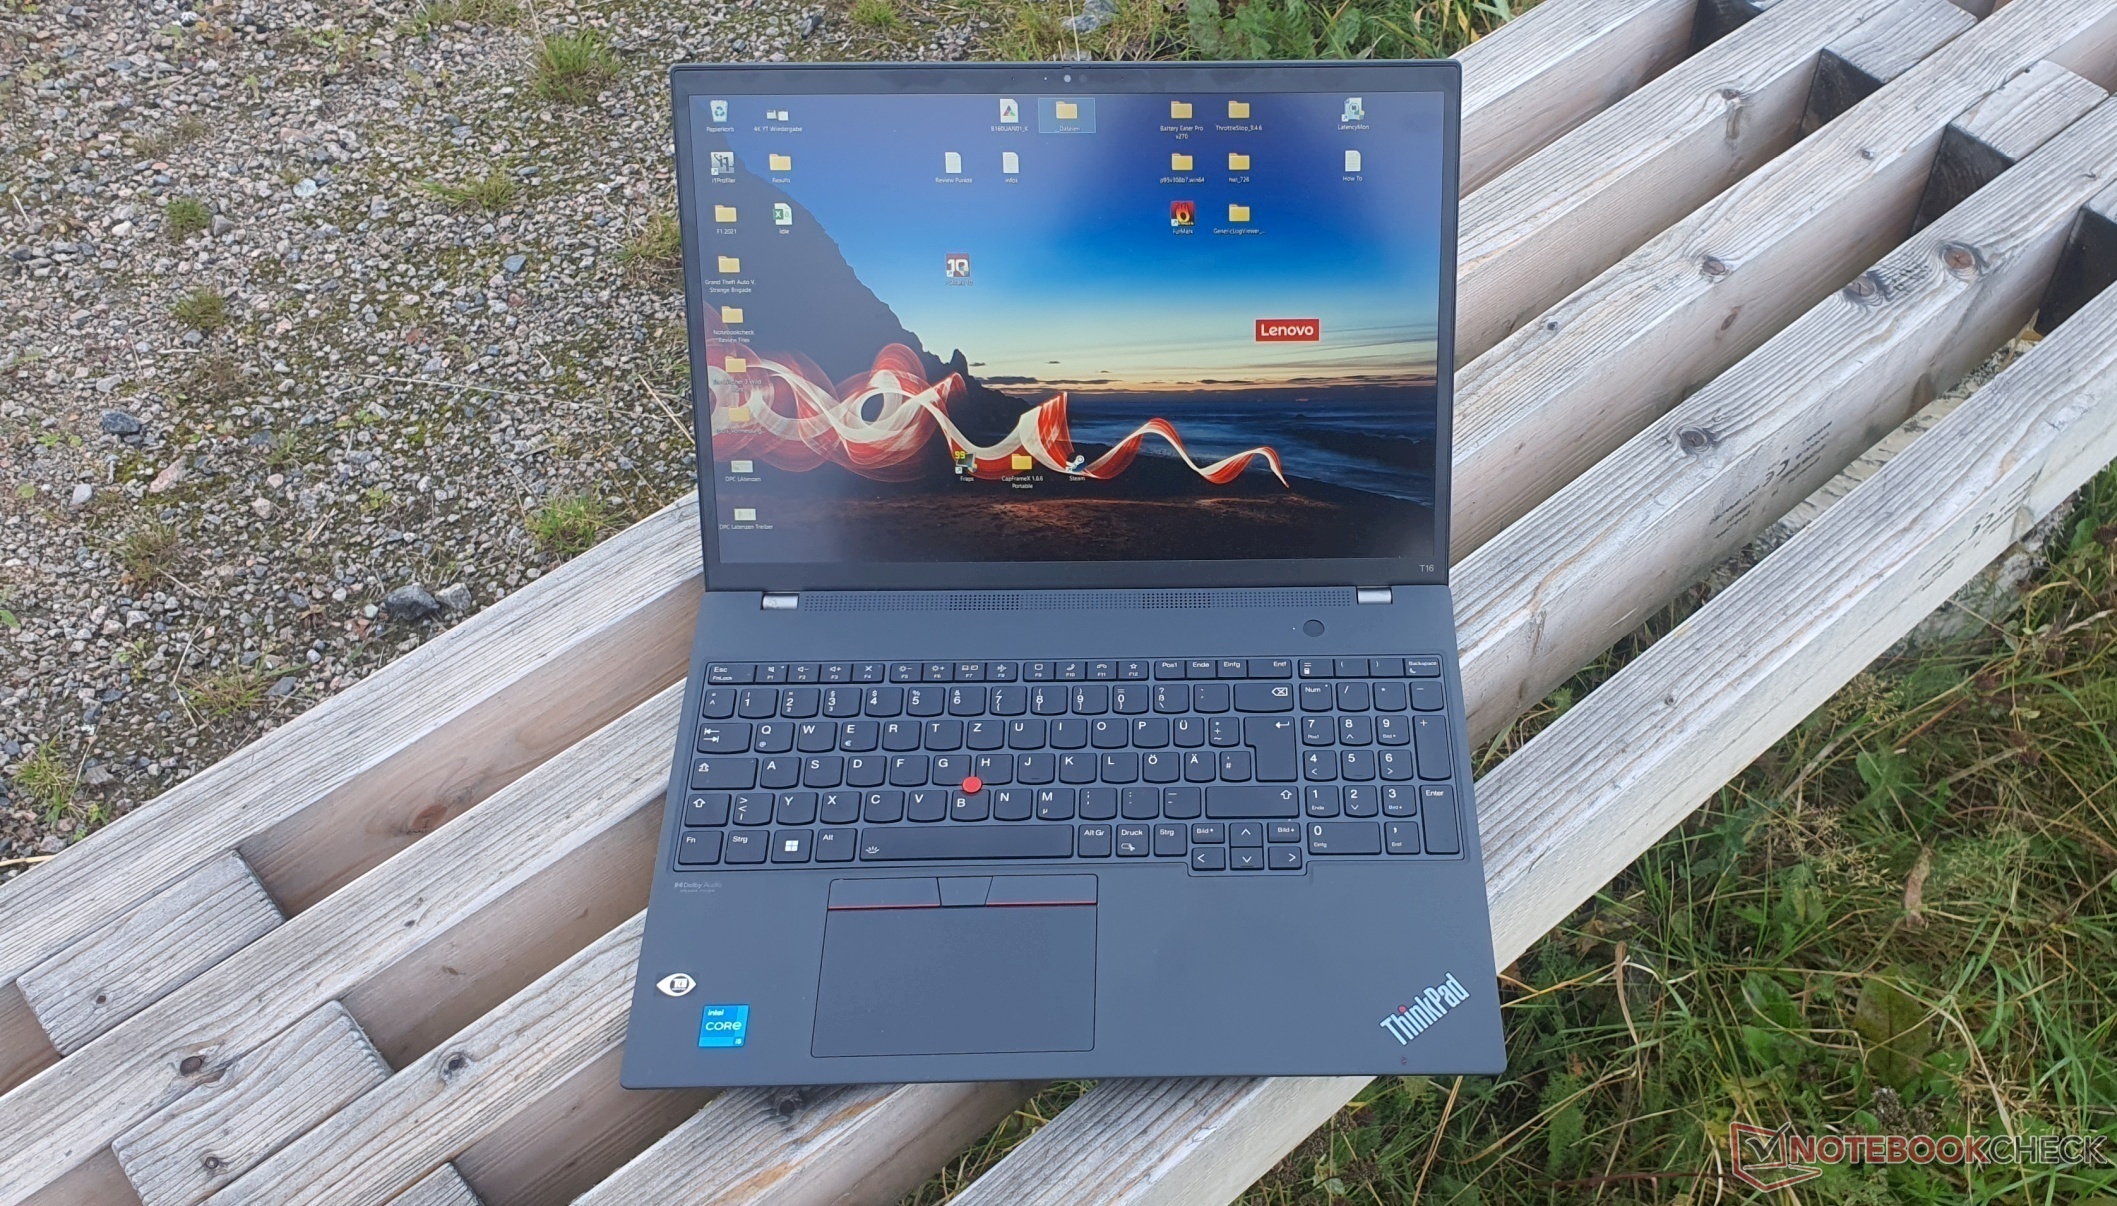
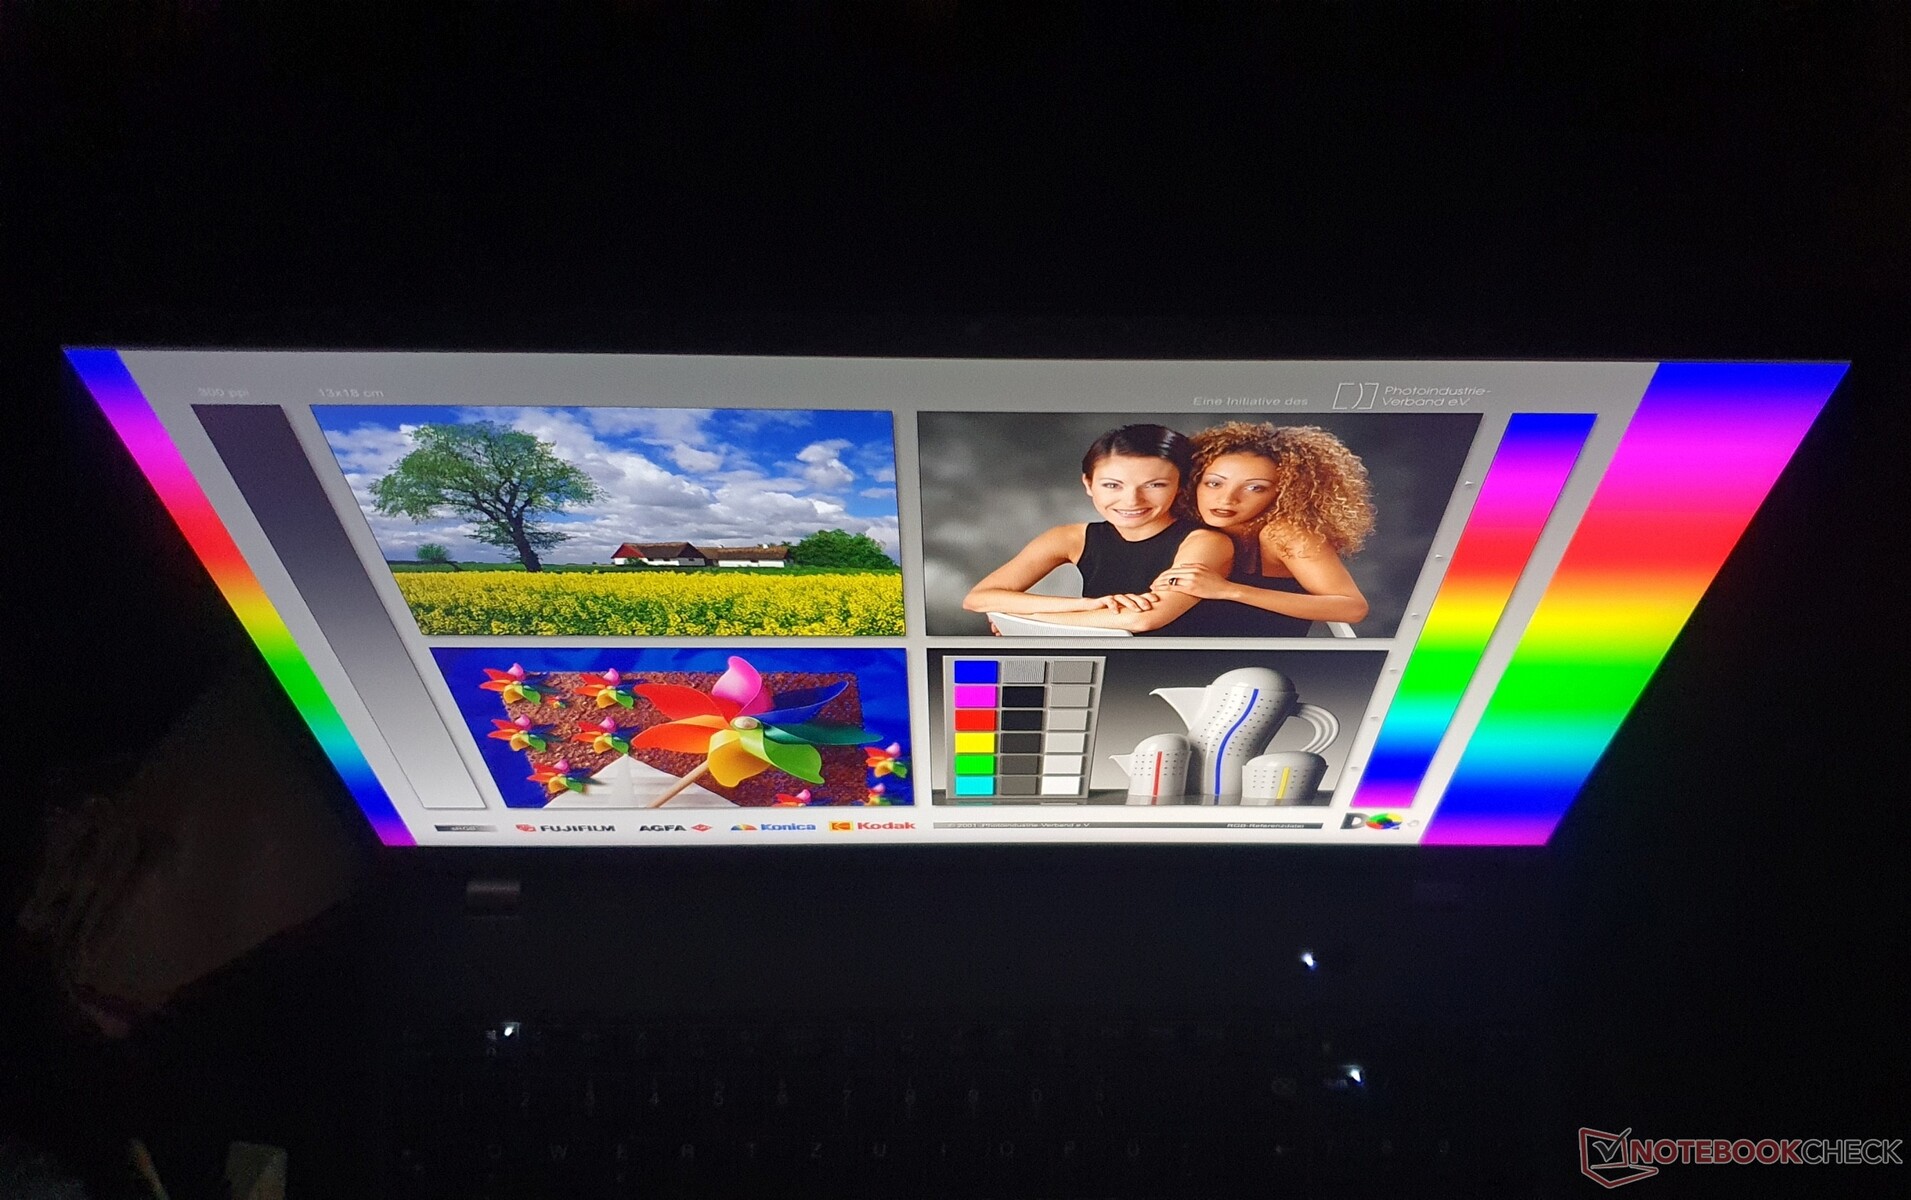
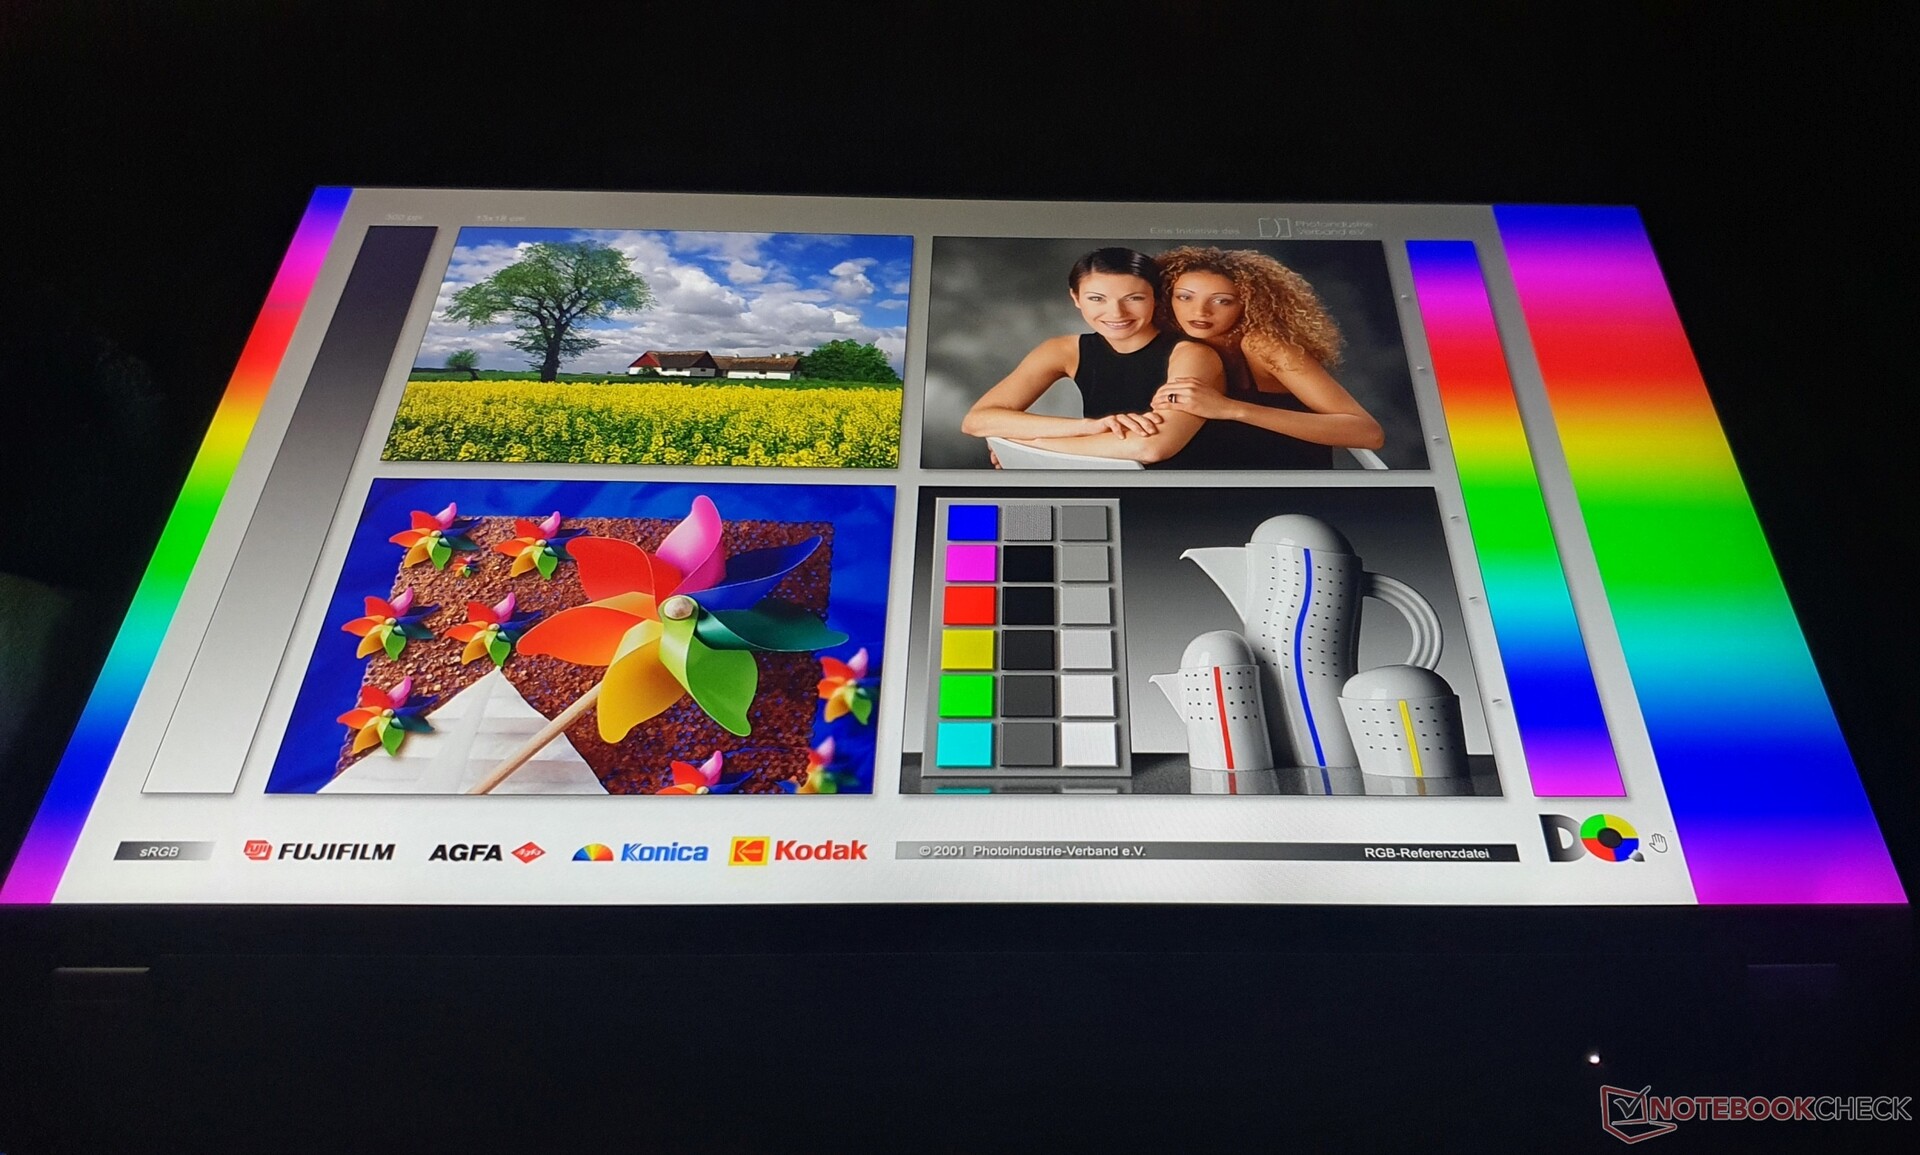
Display - Display Sharp FHD+ a basso consumo nel ThinkPad T16
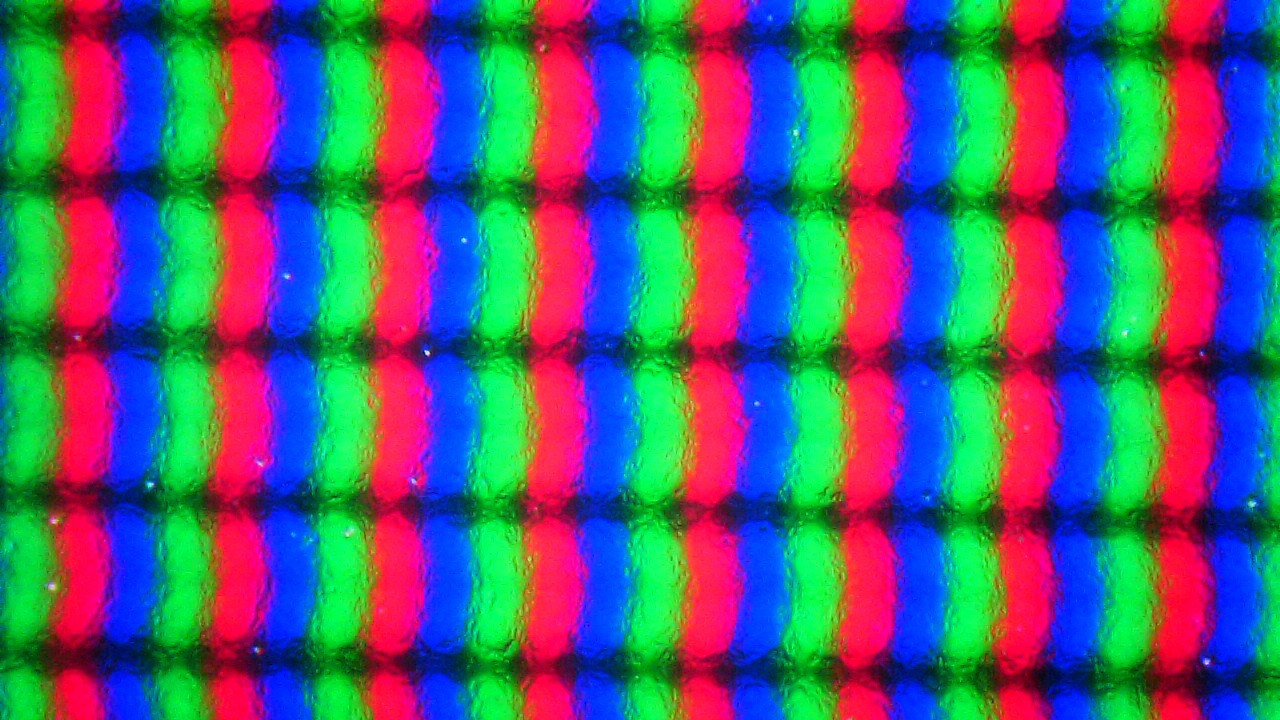

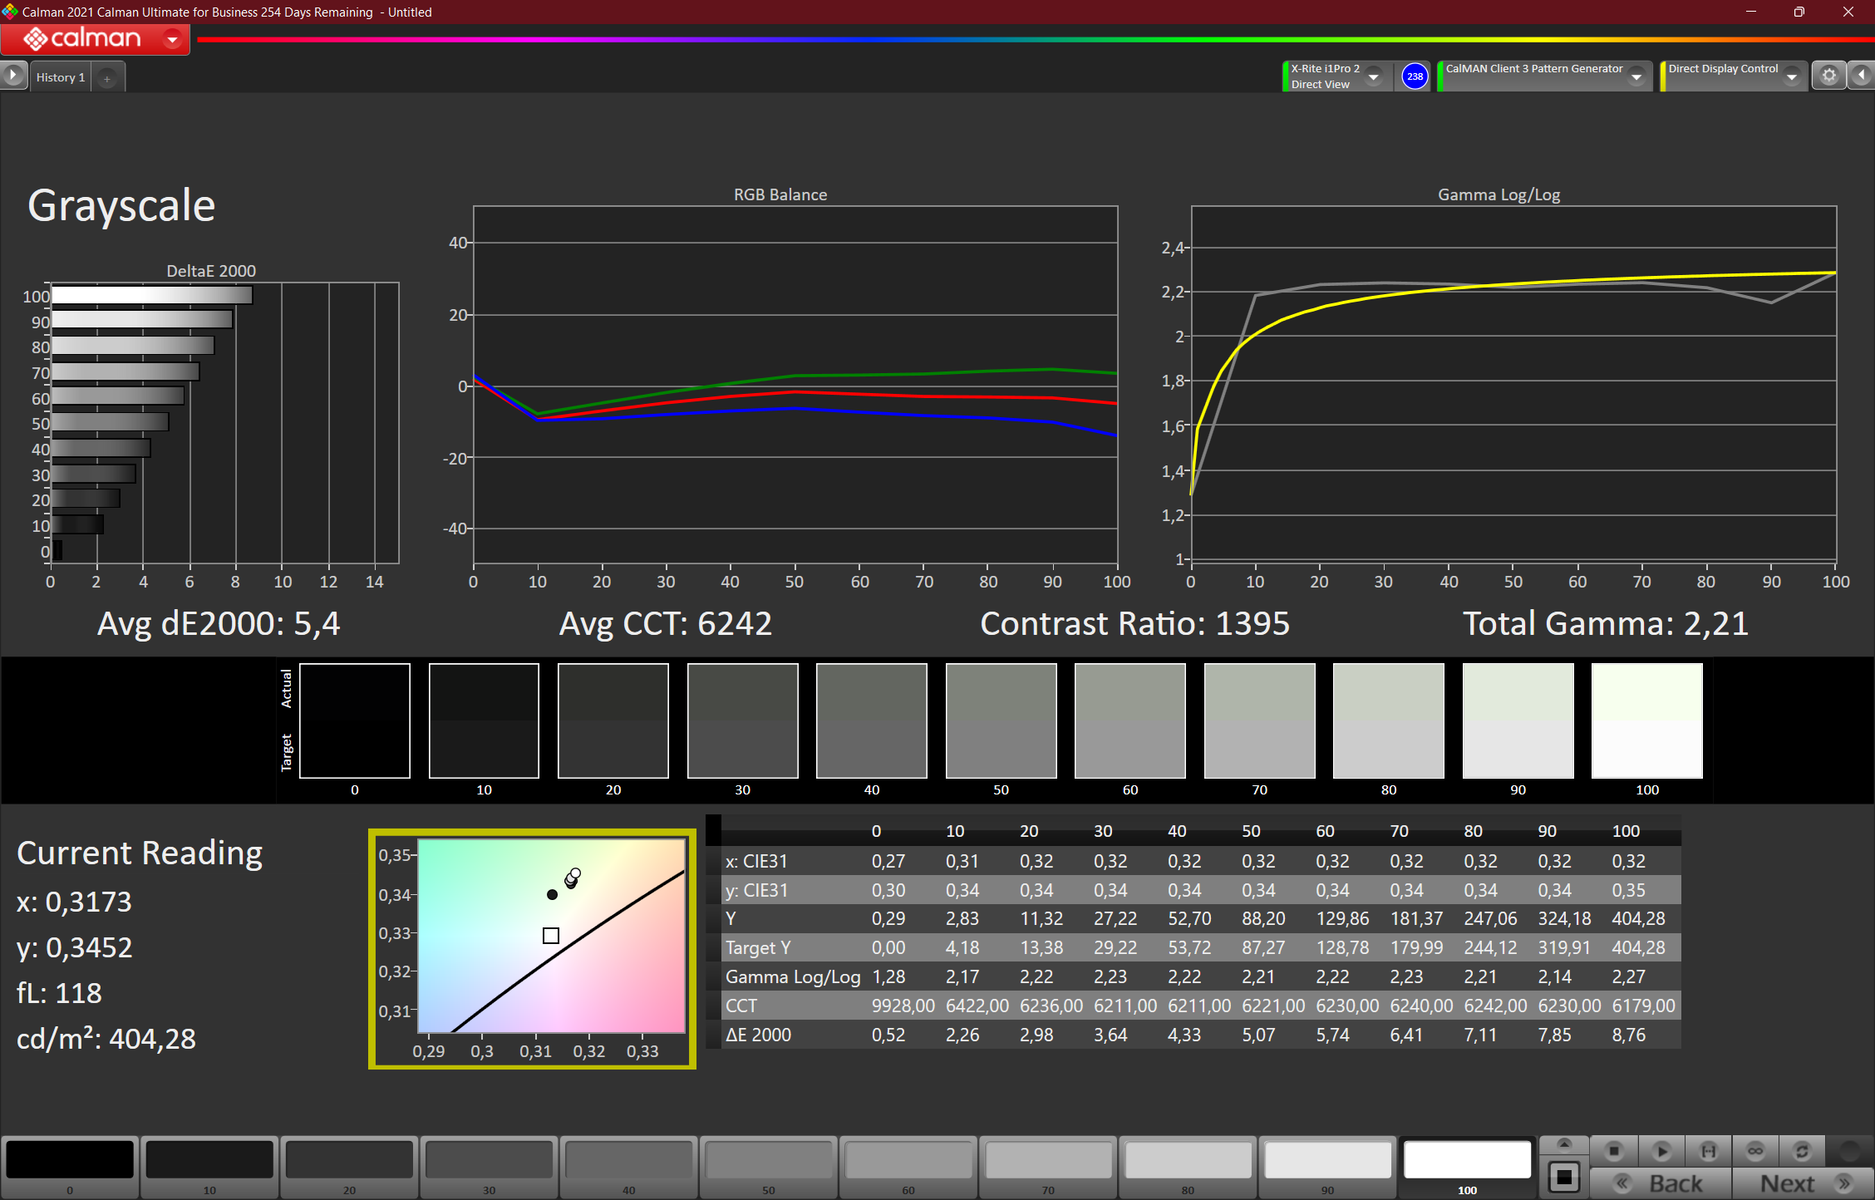
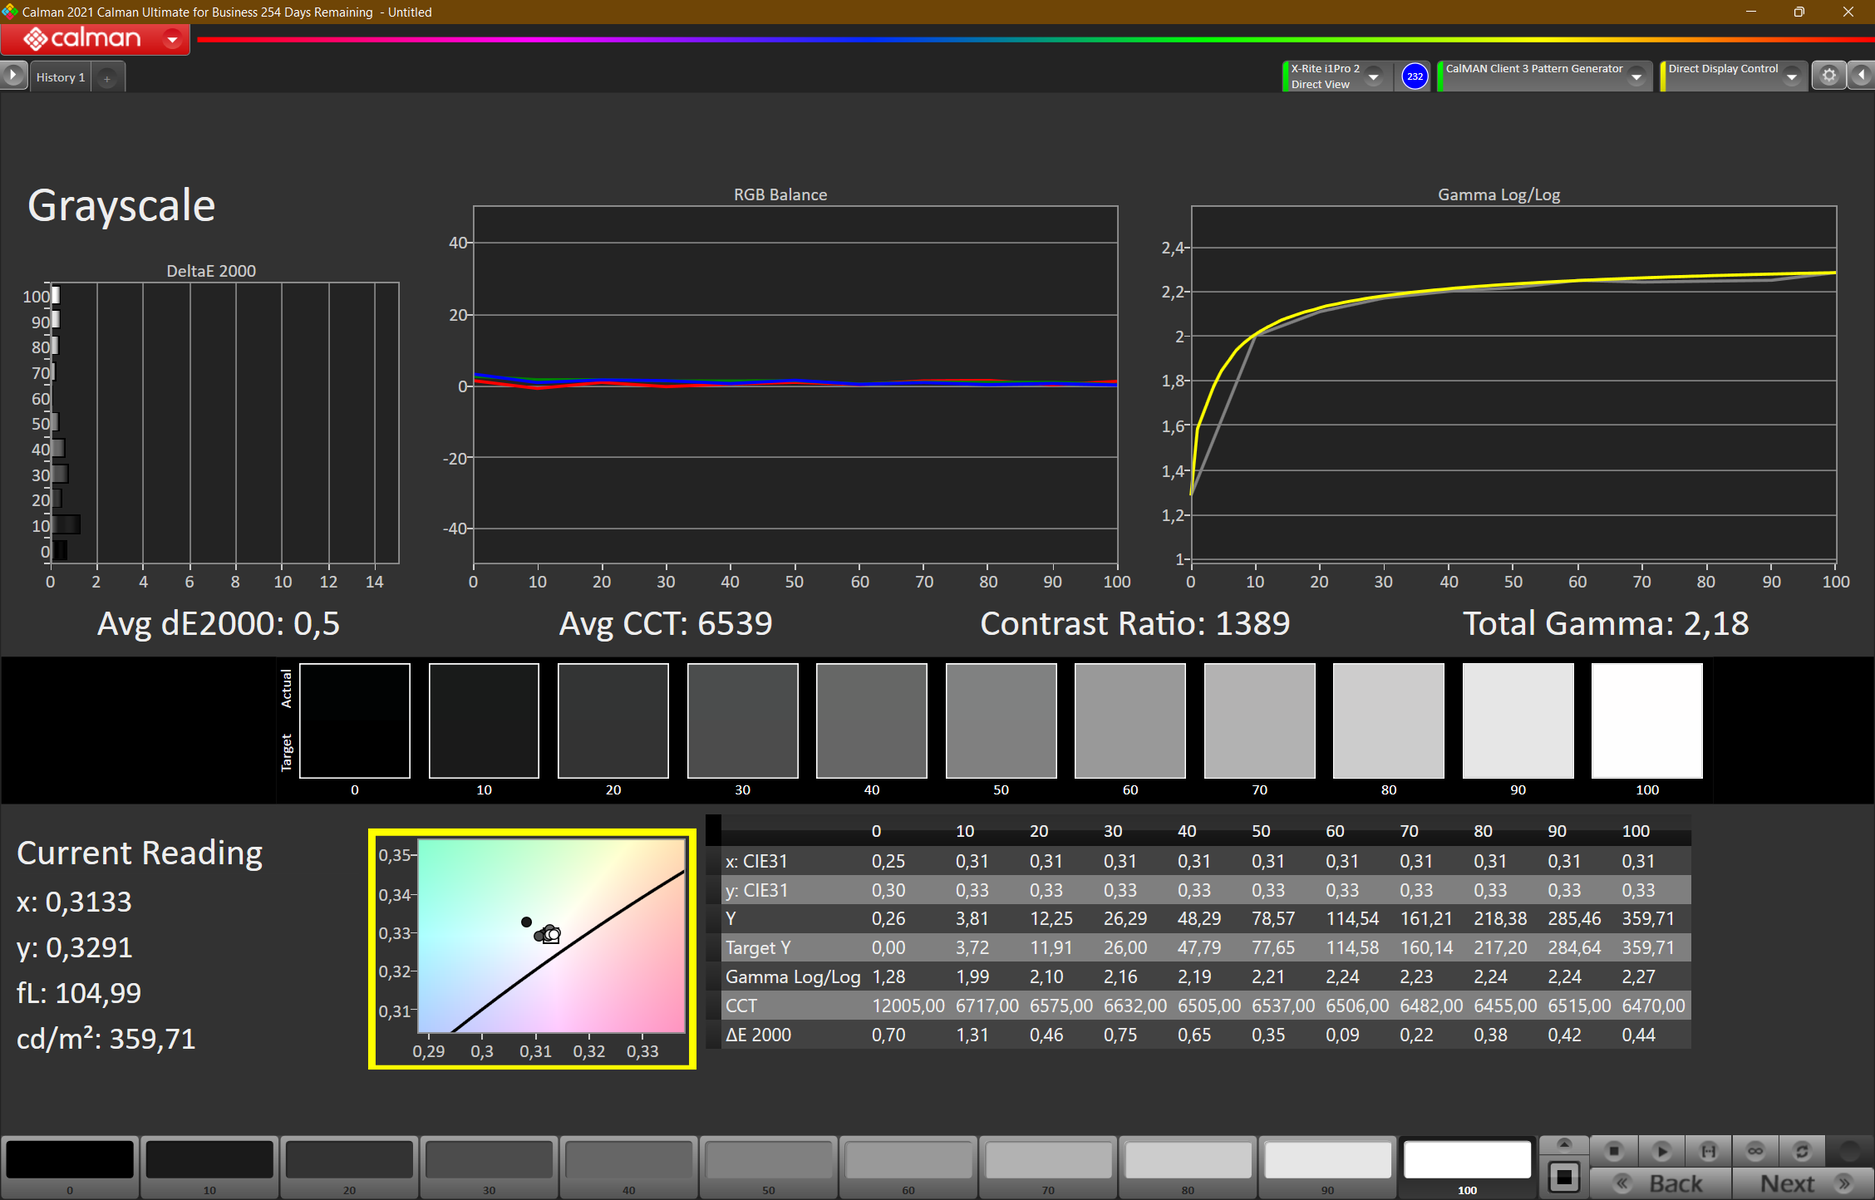
Il display opaco a basso consumo in formato 16:10 installato nel nostro esemplare in prova ha una risoluzione di 1920x1200 (WUXGA/FHD+) e offre una buona nitidezza su 16 pollici. La luminosità, pari a 390 nits, è quasi quella specificata (400 nits). Anche il rapporto di contrasto (1393:1) e il valore del nero (0,29 nits) sono di alto livello. Il contenuto dell'immagine nera appare quindi ricco e profondo.
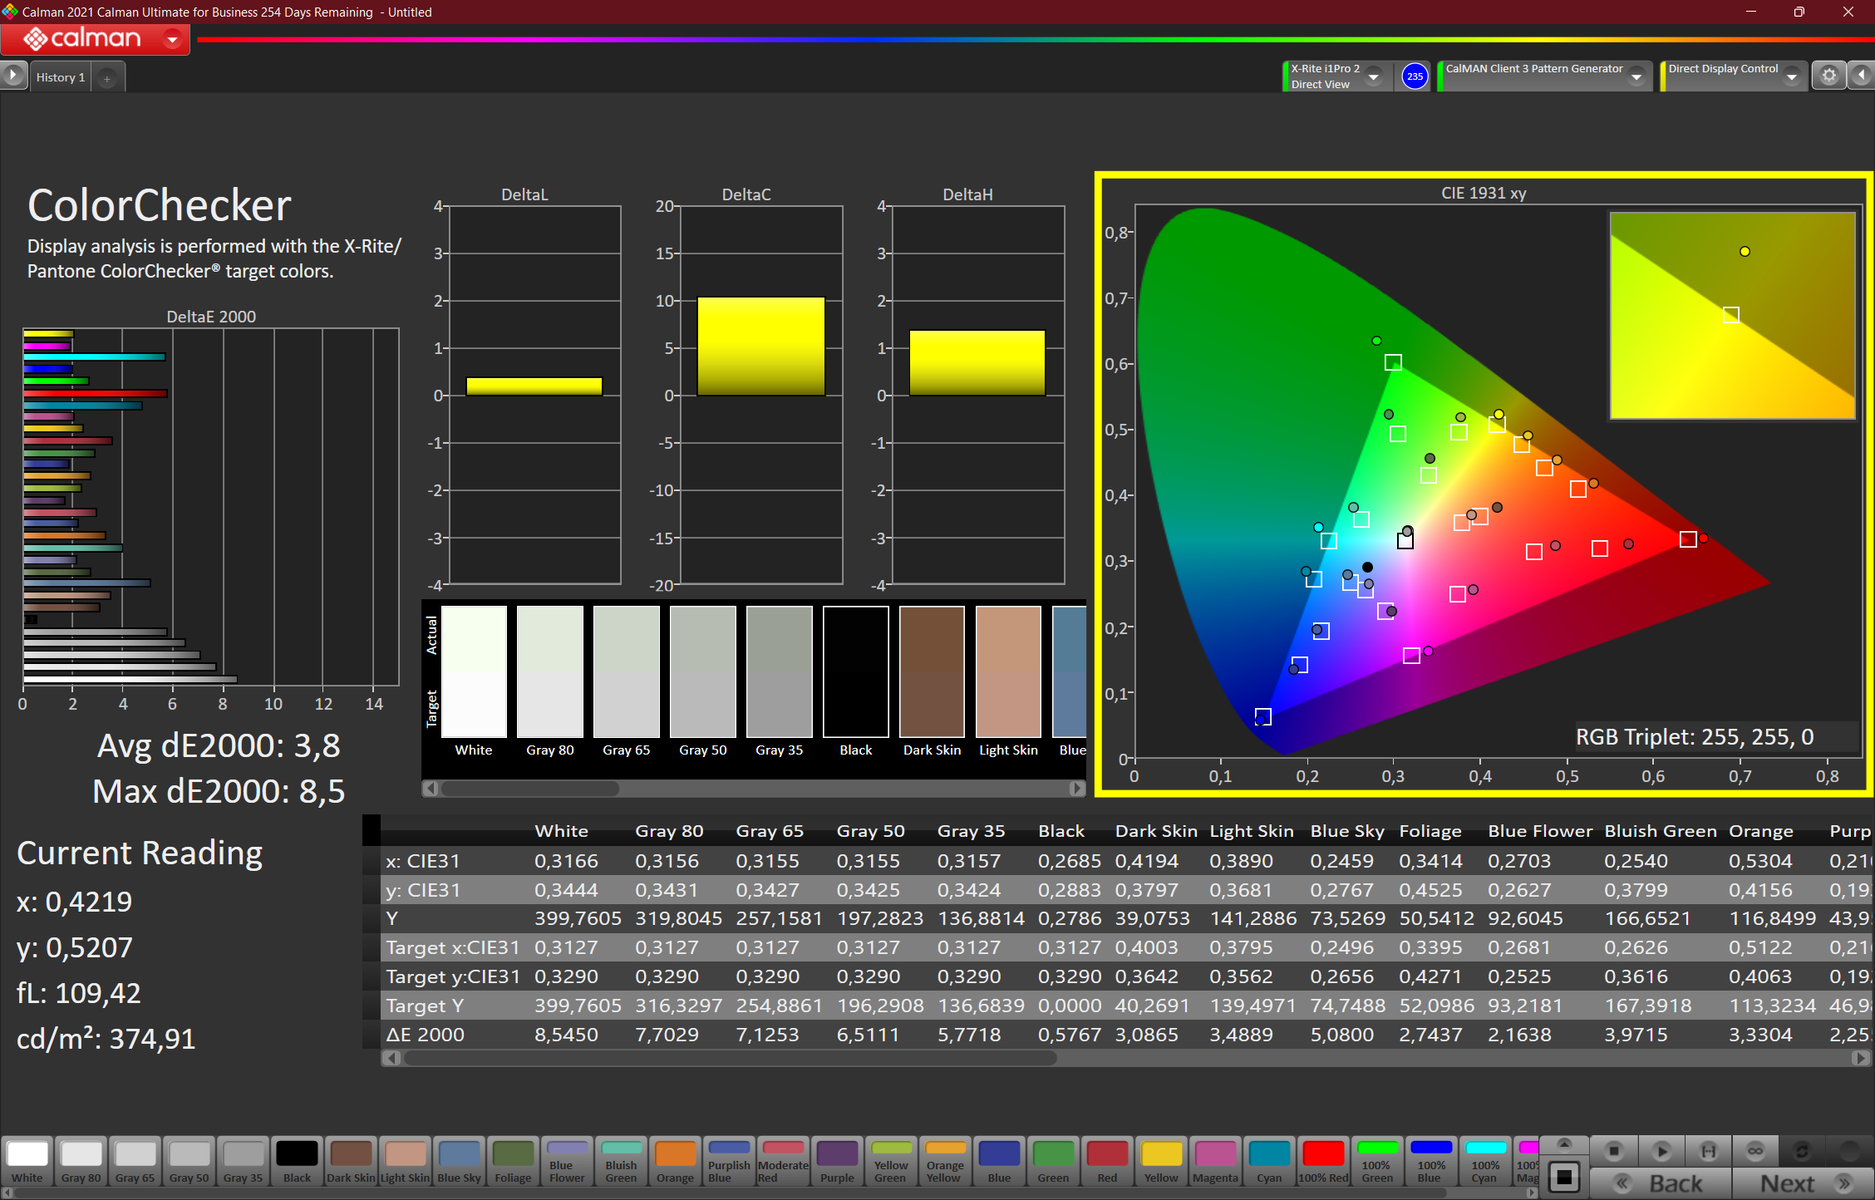
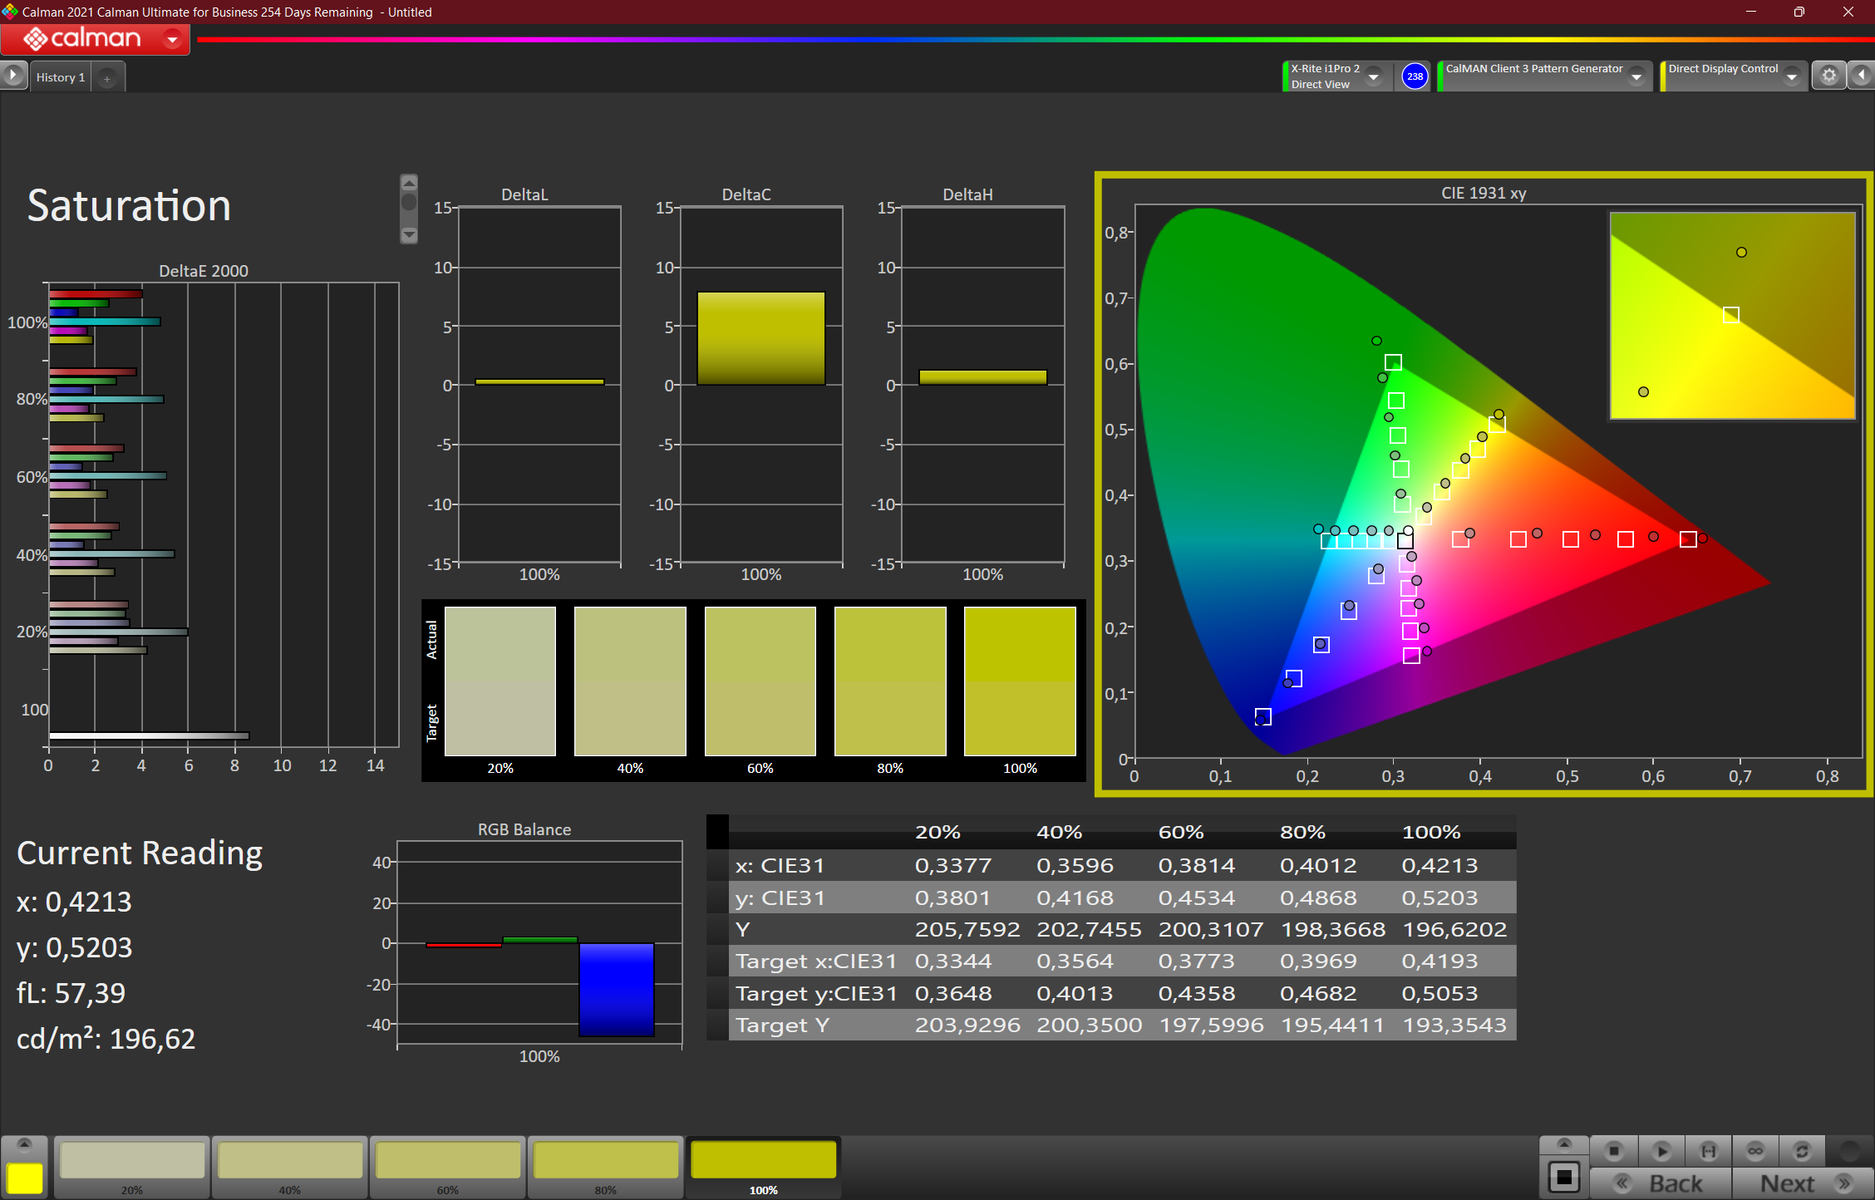
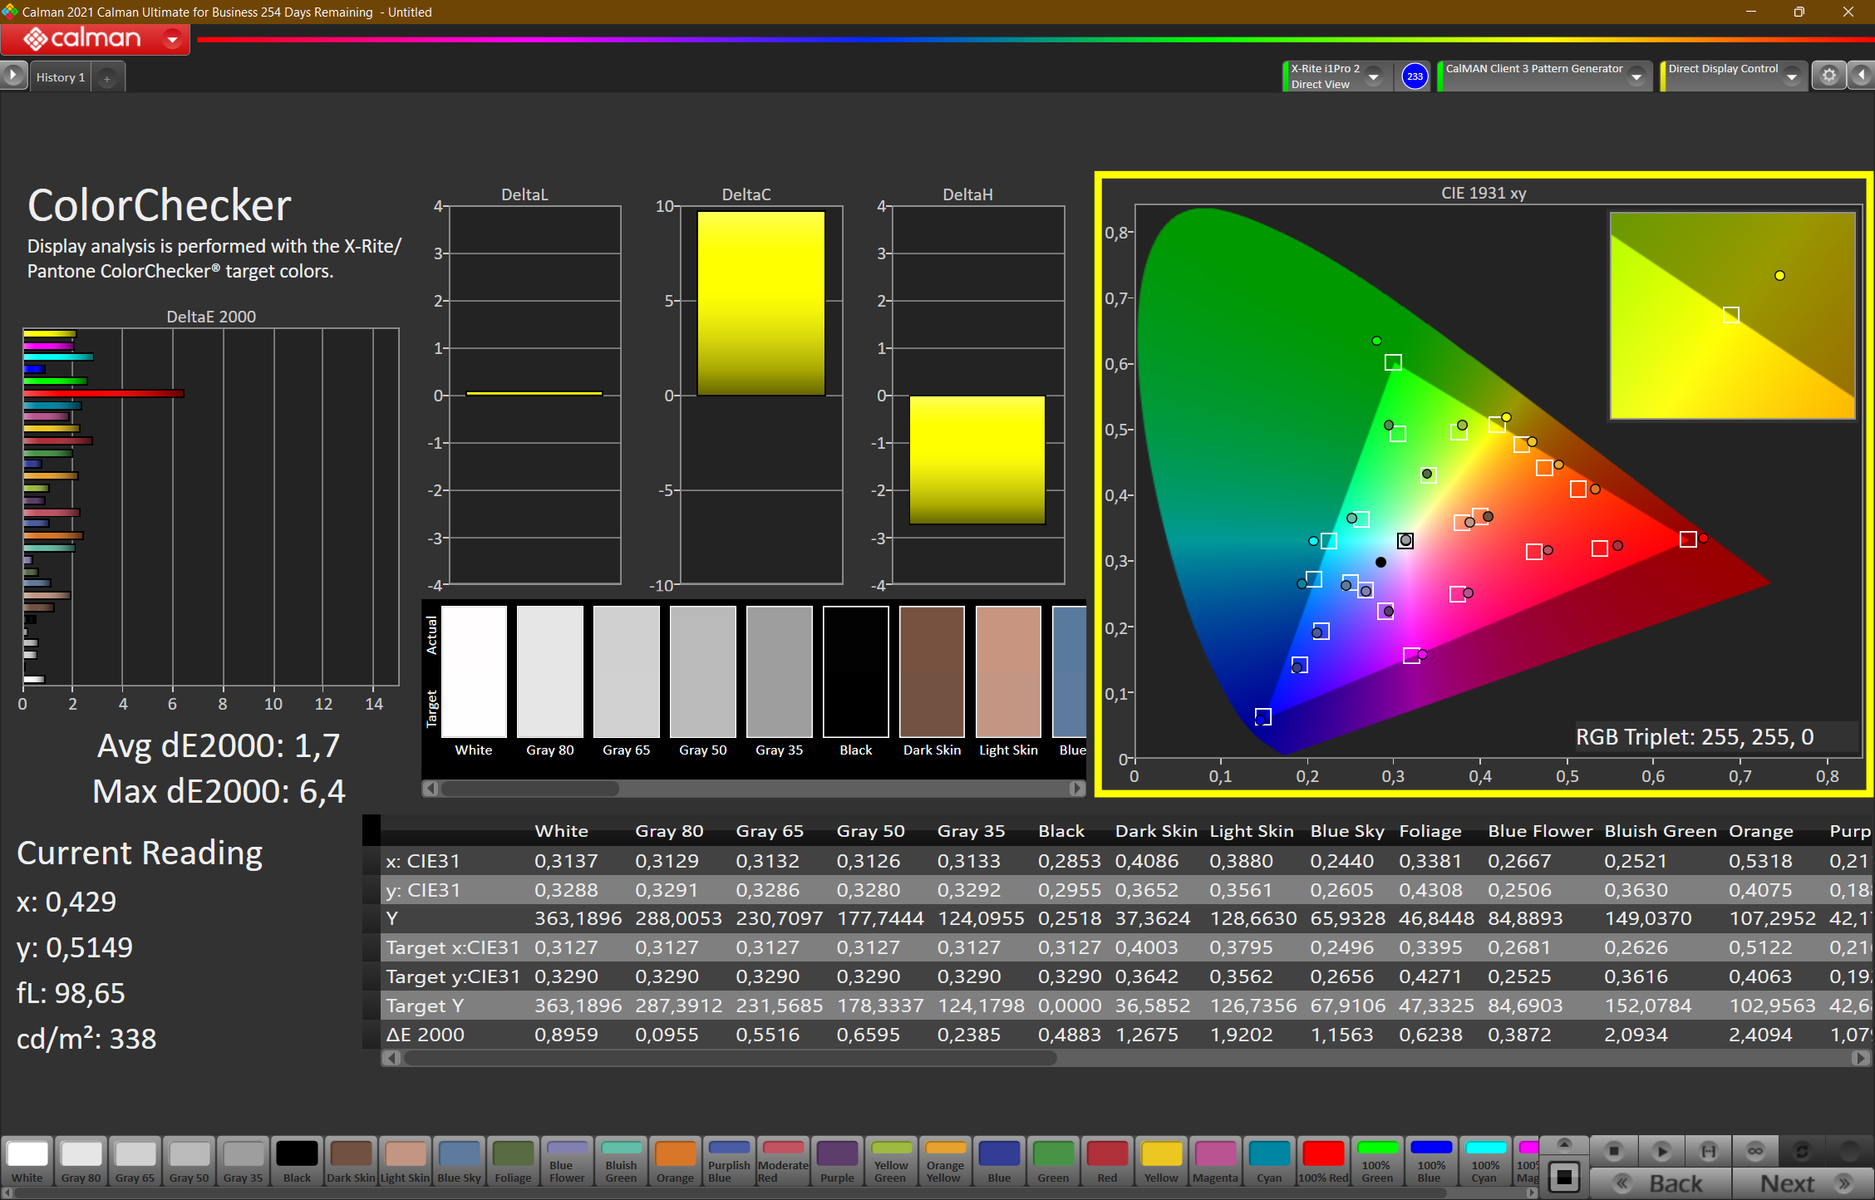
Il punto di bianco, pari a 6.300K, è vicino a quello ottimale di 6.500K. Anche i colori sono relativamente vivaci e, secondo la nostra calibrazione, abbastanza equilibrati. Il DeltaE-2000 passa da 3,9 a un ottimo 1,7, anche se il rosso si discosta ancora molto.
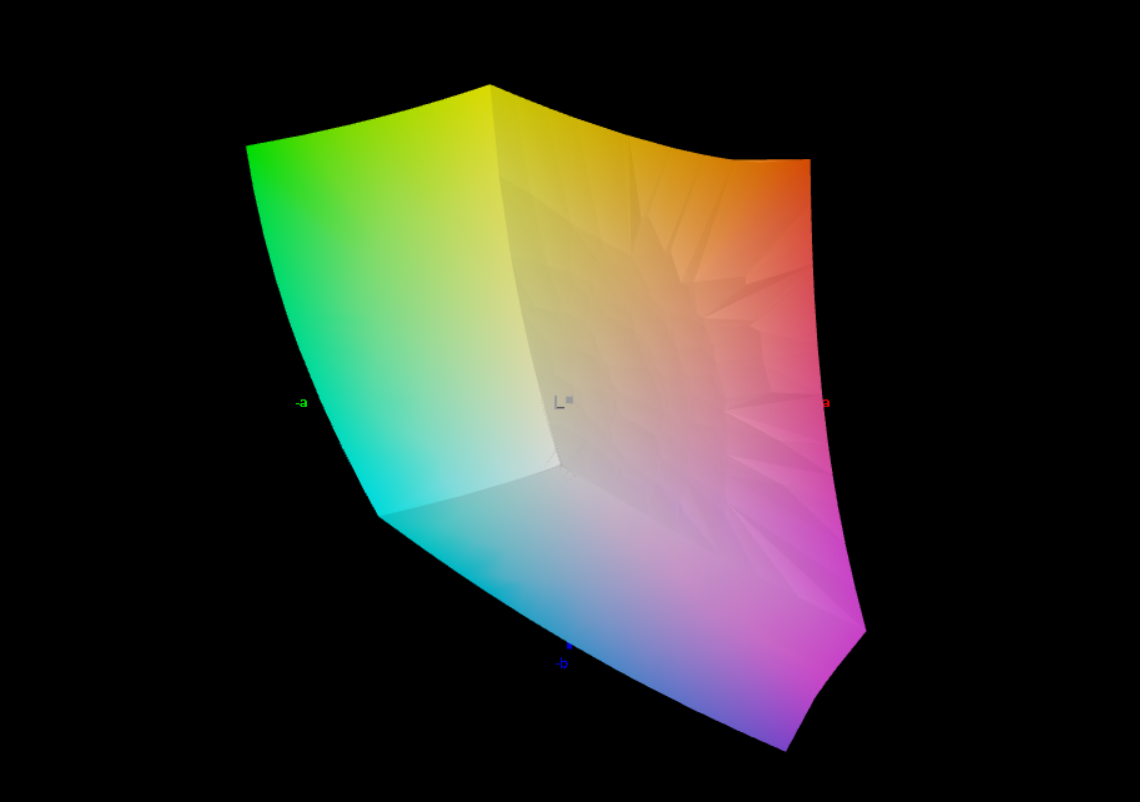
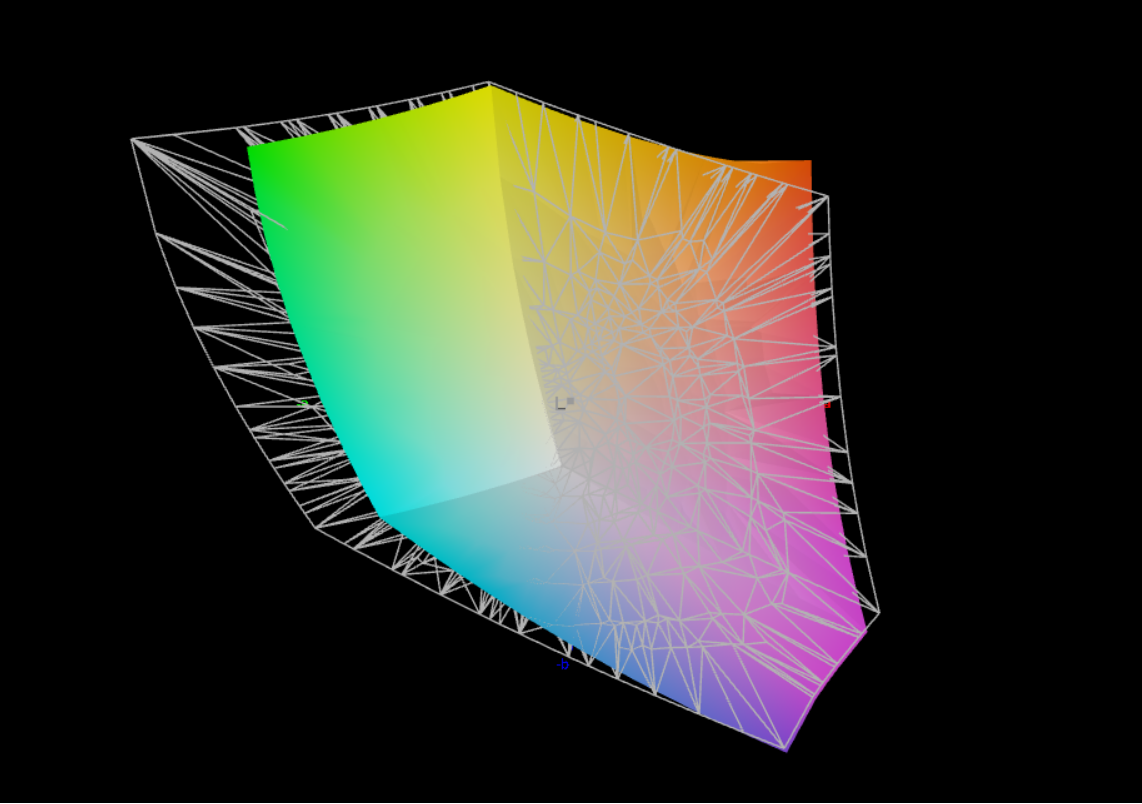
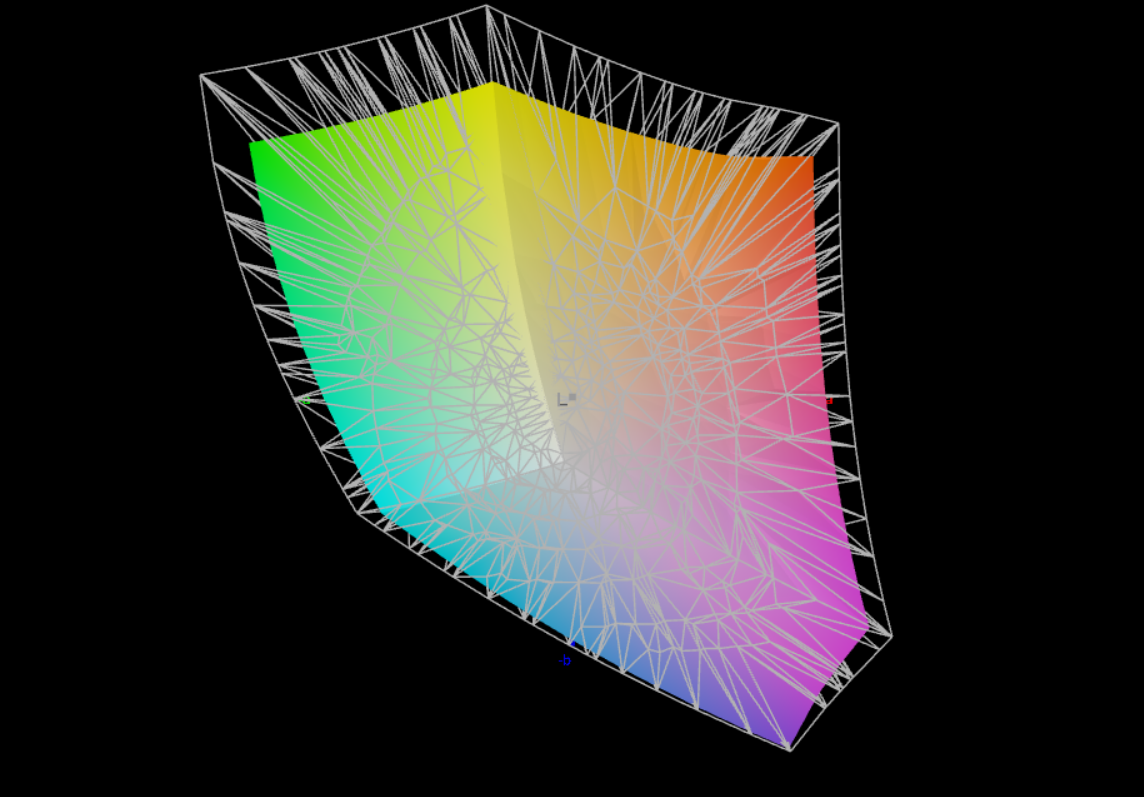
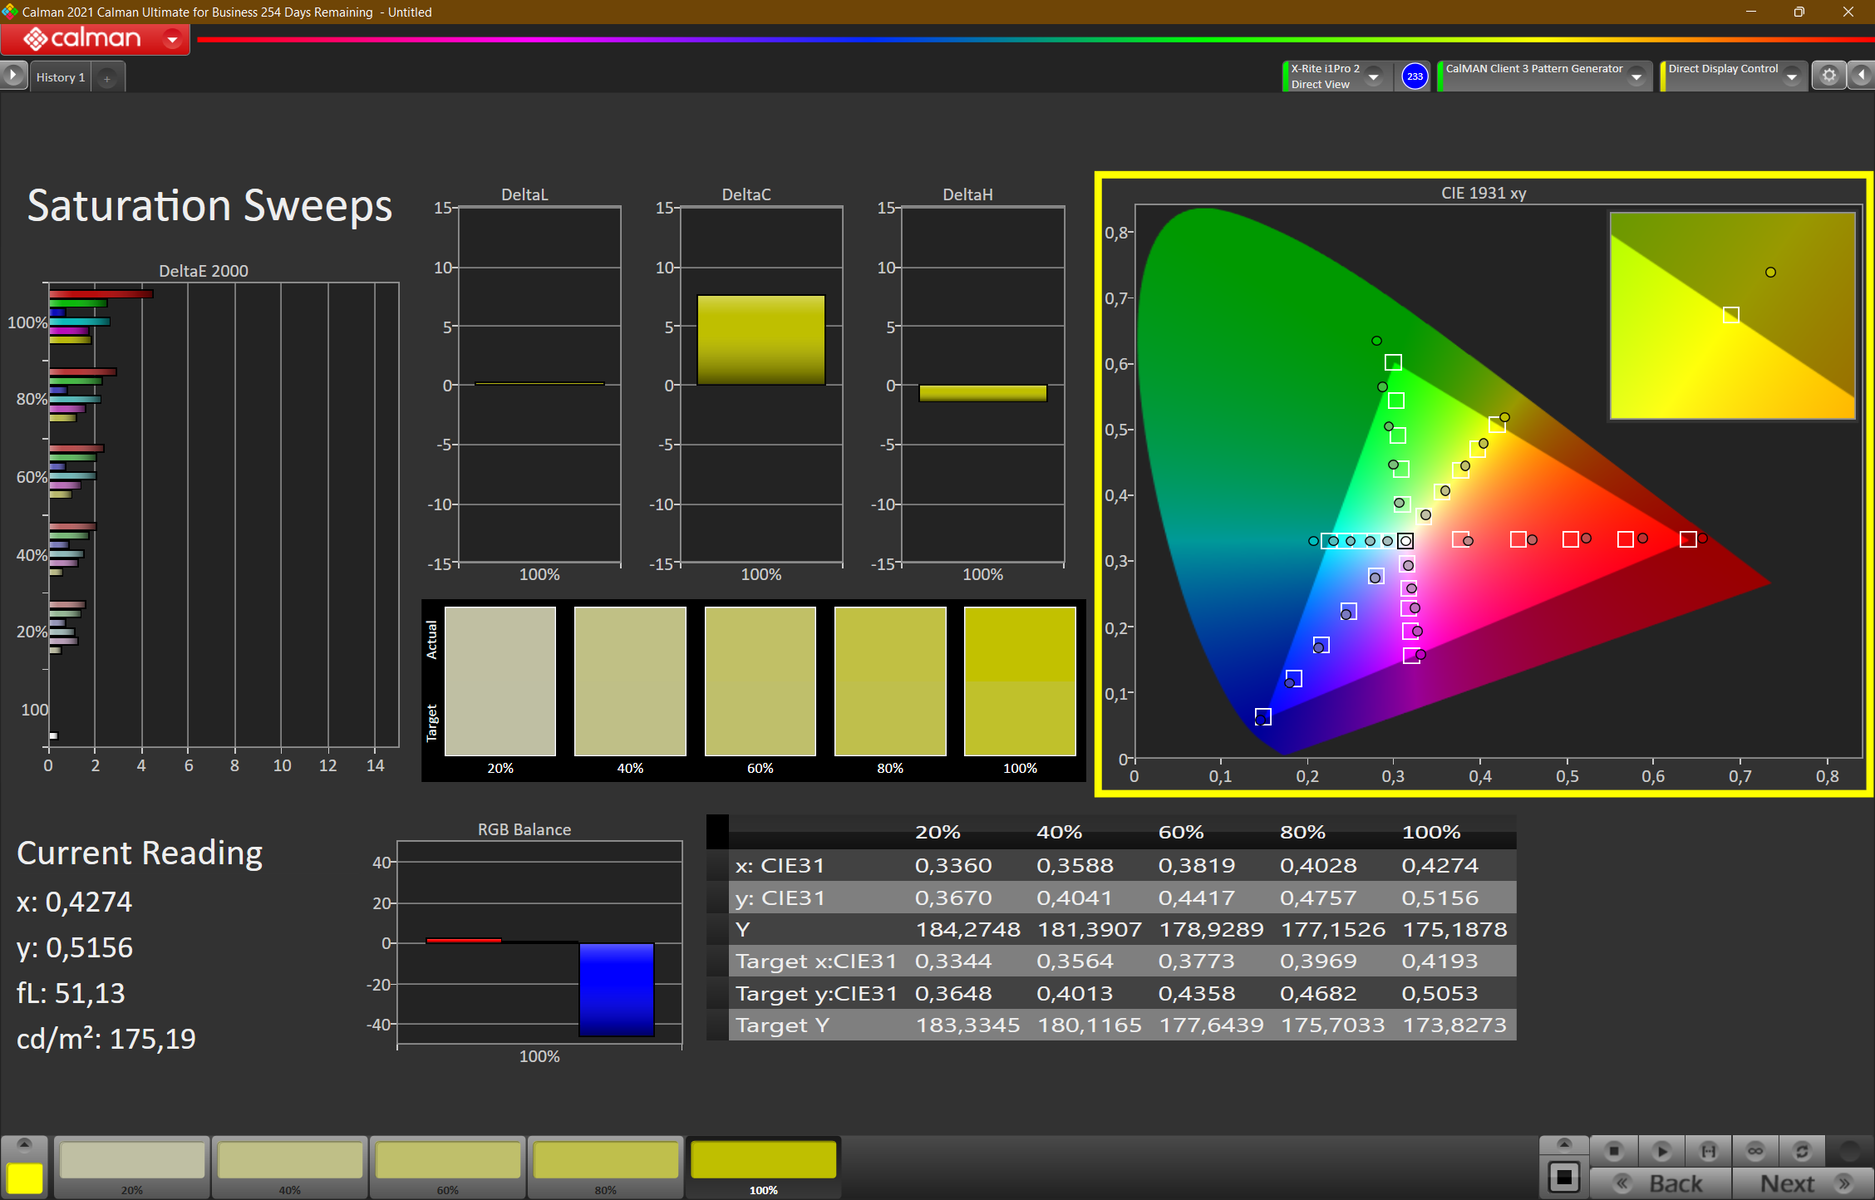
Lo spazio colore sRGB è coperto al 100%, il che è sufficiente per l'editing di immagini meno impegnative. Non è stato rilevato alcuno sfarfallio PWM. Come sempre, il nostro profilo colore può essere scaricato a destra del grafico dell'illuminazione. Vengono offerti tre display alternativi, con il pannello da 2,5K come novità. Purtroppo, l'opzione 4K UHD con il 100% di DCI-P3 non è più disponibile. Nel nostro campo di confronto, il pannello FHD+ LP ha ottenuto le migliori prestazioni.
- WUXGA (1920x1200) IPS, touch, opaco, 300 cd/m², 45% NTSC
- WUXGA (1920x1200) IPS, basso consumo, opaco, 400 cd/m², 100% sRGB, bassa luce blu
- WUXGA (1920x1200) IPS, opaco, touch, PrivacyGuard, 500 cd/m², 100% sRGB
- WQXGA (2.560x1.600) IPS, opaco, basso consumo, 400 cd/m², 100% sRGB, bassa luce blu
| |||||||||||||||||||||||||
Distribuzione della luminosità: 80 %
Al centro con la batteria: 404 cd/m²
Contrasto: 1393:1 (Nero: 0.29 cd/m²)
ΔE ColorChecker Calman: 3.9 | ∀{0.5-29.43 Ø4.73}
calibrated: 1.7
ΔE Greyscale Calman: 5.4 | ∀{0.09-98 Ø4.97}
80.5% AdobeRGB 1998 (Argyll 3D)
100% sRGB (Argyll 3D)
80.1% Display P3 (Argyll 3D)
Gamma: 2.21
CCT: 6242 K
| Lenovo ThinkPad T16 G1 21BWS00200 B160UAN01.K, IPS, 1920x1200, 16" | Lenovo ThinkPad T15 Gen2-20W5S00100 B156HAN02.1, IPS, 1920x1080, 15.6" | Huawei MateBook D 16 2022 BOE NV160WUM-NH0, IPS, 1920x1200, 16" | Dell Inspiron 16 Plus 7620 BOE NE16N41, IPS, 3072x1920, 16" | HP ZBook Power 15 G8 313S5EA AUOA08B, IPS LED, 1920x1080, 15.6" | HP ProBook 450 G9 6A180EA Chi Mei CMN1512, , 1920x1080, 15.6" | Lenovo ThinkPad E15 G3-20YG003UGE B156HAN02.1, IPS, 1920x1080, 15.6" | Lenovo ThinkPad L15 G2 AMD N156HCA-EAB, IPS LED, 1920x1080, 15.6" | |
|---|---|---|---|---|---|---|---|---|
| Display | -46% | -12% | -7% | -8% | -43% | -46% | -41% | |
| Display P3 Coverage (%) | 80.1 | 40.18 -50% | 66.2 -17% | 70.8 -12% | 70.5 -12% | 42.76 -47% | 40.3 -50% | 43.8 -45% |
| sRGB Coverage (%) | 100 | 60.2 -40% | 96.4 -4% | 99.5 0% | 99 -1% | 63.9 -36% | 60.2 -40% | 65.7 -34% |
| AdobeRGB 1998 Coverage (%) | 80.5 | 41.55 -48% | 68.3 -15% | 73.2 -9% | 71.3 -11% | 44.2 -45% | 41.6 -48% | 45.3 -44% |
| Response Times | -85% | -12% | -53% | -125% | -11% | -71% | -62% | |
| Response Time Grey 50% / Grey 80% * (ms) | 27 ? | 48.8 ? -81% | 30.5 ? -13% | 38 ? -41% | 61 -126% | 28 ? -4% | 44 ? -63% | 40 -48% |
| Response Time Black / White * (ms) | 17 ? | 32 ? -88% | 18.7 ? -10% | 28 ? -65% | 38 ? -124% | 20 ? -18% | 30.4 ? -79% | 30 -76% |
| PWM Frequency (Hz) | ||||||||
| Screen | -39% | 7% | 22% | 25% | -34% | -27% | -18% | |
| Brightness middle (cd/m²) | 404 | 353 -13% | 319 -21% | 288.9 -28% | 393 -3% | 234 -42% | 347 -14% | 298 -26% |
| Brightness (cd/m²) | 391 | 348 -11% | 317 -19% | 276 -29% | 385 -2% | 218 -44% | 329 -16% | 276 -29% |
| Brightness Distribution (%) | 80 | 95 19% | 90 13% | 92 15% | 78 -2% | 85 6% | 93 16% | 86 8% |
| Black Level * (cd/m²) | 0.29 | 0.2 31% | 0.23 21% | 0.26 10% | 0.25 14% | 0.17 41% | 0.25 14% | 0.26 10% |
| Contrast (:1) | 1393 | 1765 27% | 1387 0% | 1111 -20% | 1572 13% | 1376 -1% | 1388 0% | 1146 -18% |
| Colorchecker dE 2000 * | 3.9 | 6.1 -56% | 3.4 13% | 1.88 52% | 1.5 62% | 5.04 -29% | 4.7 -21% | 3.7 5% |
| Colorchecker dE 2000 max. * | 8.5 | 23.5 -176% | 8.1 5% | 4.37 49% | 4.3 49% | 18.04 -112% | 19.4 -128% | 15 -76% |
| Colorchecker dE 2000 calibrated * | 1.7 | 4.9 -188% | 0.8 53% | 0.42 75% | 1.4 18% | 4.13 -143% | 4.4 -159% | 3.5 -106% |
| Greyscale dE 2000 * | 5.4 | 4.6 15% | 5.7 -6% | 1.4 74% | 1.3 76% | 4.43 18% | 1.7 69% | 1.7 69% |
| Gamma | 2.21 100% | 2.26 97% | 2.1 105% | 2.3 96% | 2.26 97% | 2.41 91% | 2.2 100% | 2.21 100% |
| CCT | 6242 104% | 6732 97% | 7433 87% | 6634 98% | 6435 101% | 6350 102% | 6475 100% | 6588 99% |
| Color Space (Percent of AdobeRGB 1998) (%) | 38.2 | |||||||
| Color Space (Percent of sRGB) (%) | 59.8 | |||||||
| Media totale (Programma / Settaggio) | -57% /
-47% | -6% /
0% | -13% /
5% | -36% /
-4% | -29% /
-33% | -48% /
-37% | -40% /
-29% |
* ... Meglio usare valori piccoli
Tempi di risposta del Display
| ↔ Tempi di risposta dal Nero al Bianco | ||
|---|---|---|
| 17 ms ... aumenta ↗ e diminuisce ↘ combinato | ↗ 8 ms Incremento | 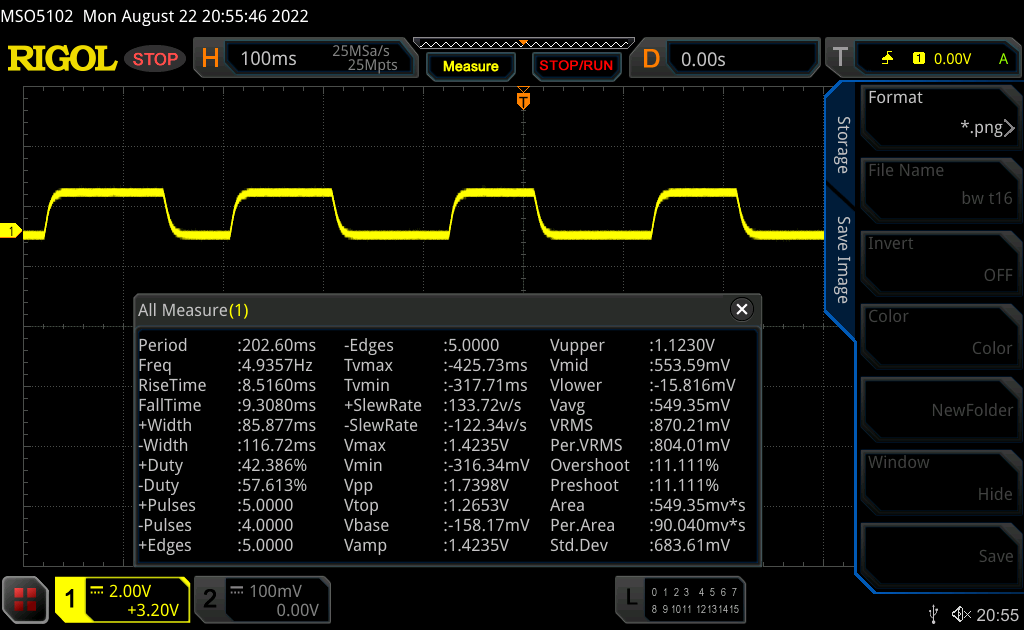 |
| ↘ 9 ms Calo | ||
| Lo schermo mostra buoni tempi di risposta durante i nostri tests, ma potrebbe essere troppo lento per i gamers competitivi. In confronto, tutti i dispositivi di test variano da 0.1 (minimo) a 240 (massimo) ms. » 39 % di tutti i dispositivi è migliore. Questo significa che i tempi di risposta rilevati sono migliori rispettto alla media di tutti i dispositivi testati (19.9 ms). | ||
| ↔ Tempo di risposta dal 50% Grigio all'80% Grigio | ||
| 27 ms ... aumenta ↗ e diminuisce ↘ combinato | ↗ 12 ms Incremento | 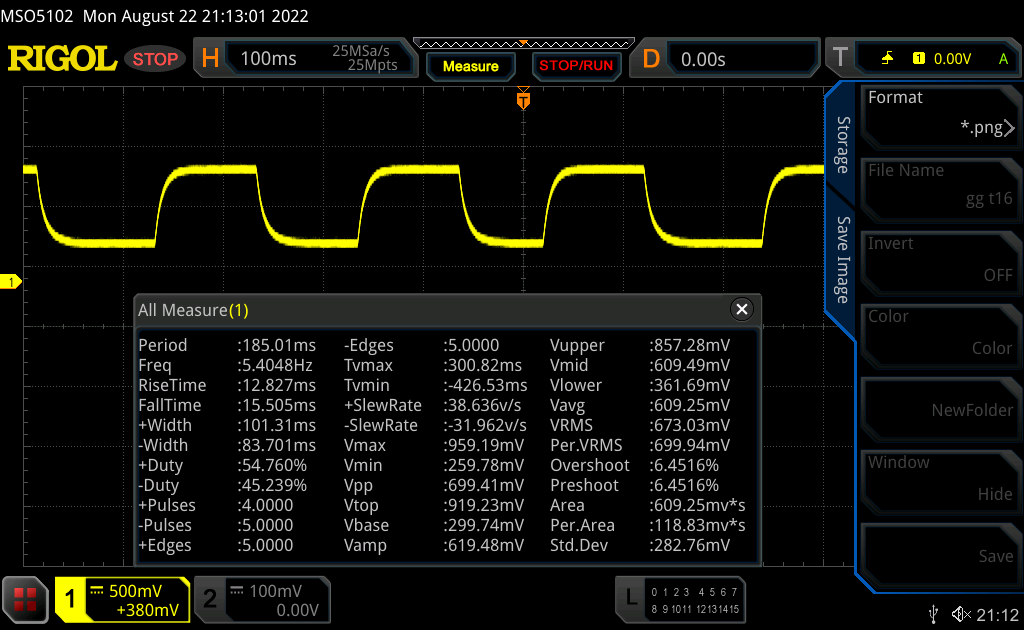 |
| ↘ 15 ms Calo | ||
| Lo schermo mostra tempi di risposta relativamente lenti nei nostri tests e potrebbe essere troppo lento per i gamers. In confronto, tutti i dispositivi di test variano da 0.165 (minimo) a 636 (massimo) ms. » 37 % di tutti i dispositivi è migliore. Questo significa che i tempi di risposta rilevati sono migliori rispettto alla media di tutti i dispositivi testati (31.1 ms). | ||
Sfarfallio dello schermo / PWM (Pulse-Width Modulation)
| flickering dello schermo / PWM non rilevato | 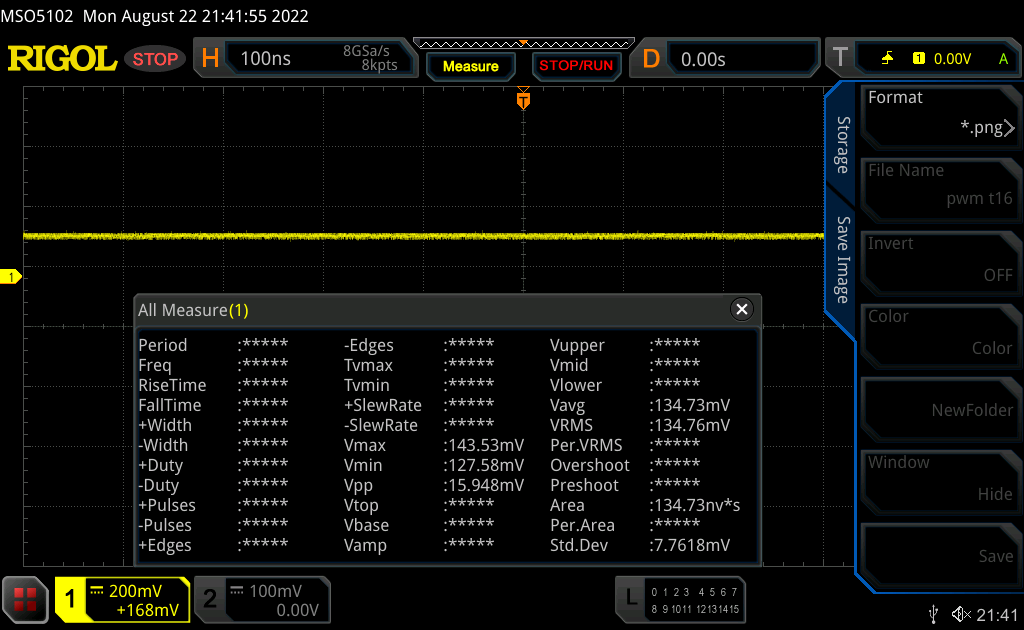 | ||
In confronto: 52 % di tutti i dispositivi testati non utilizza PWM per ridurre la luminosita' del display. Se è rilevato PWM, una media di 7801 (minimo: 5 - massimo: 343500) Hz è stata rilevata. | |||
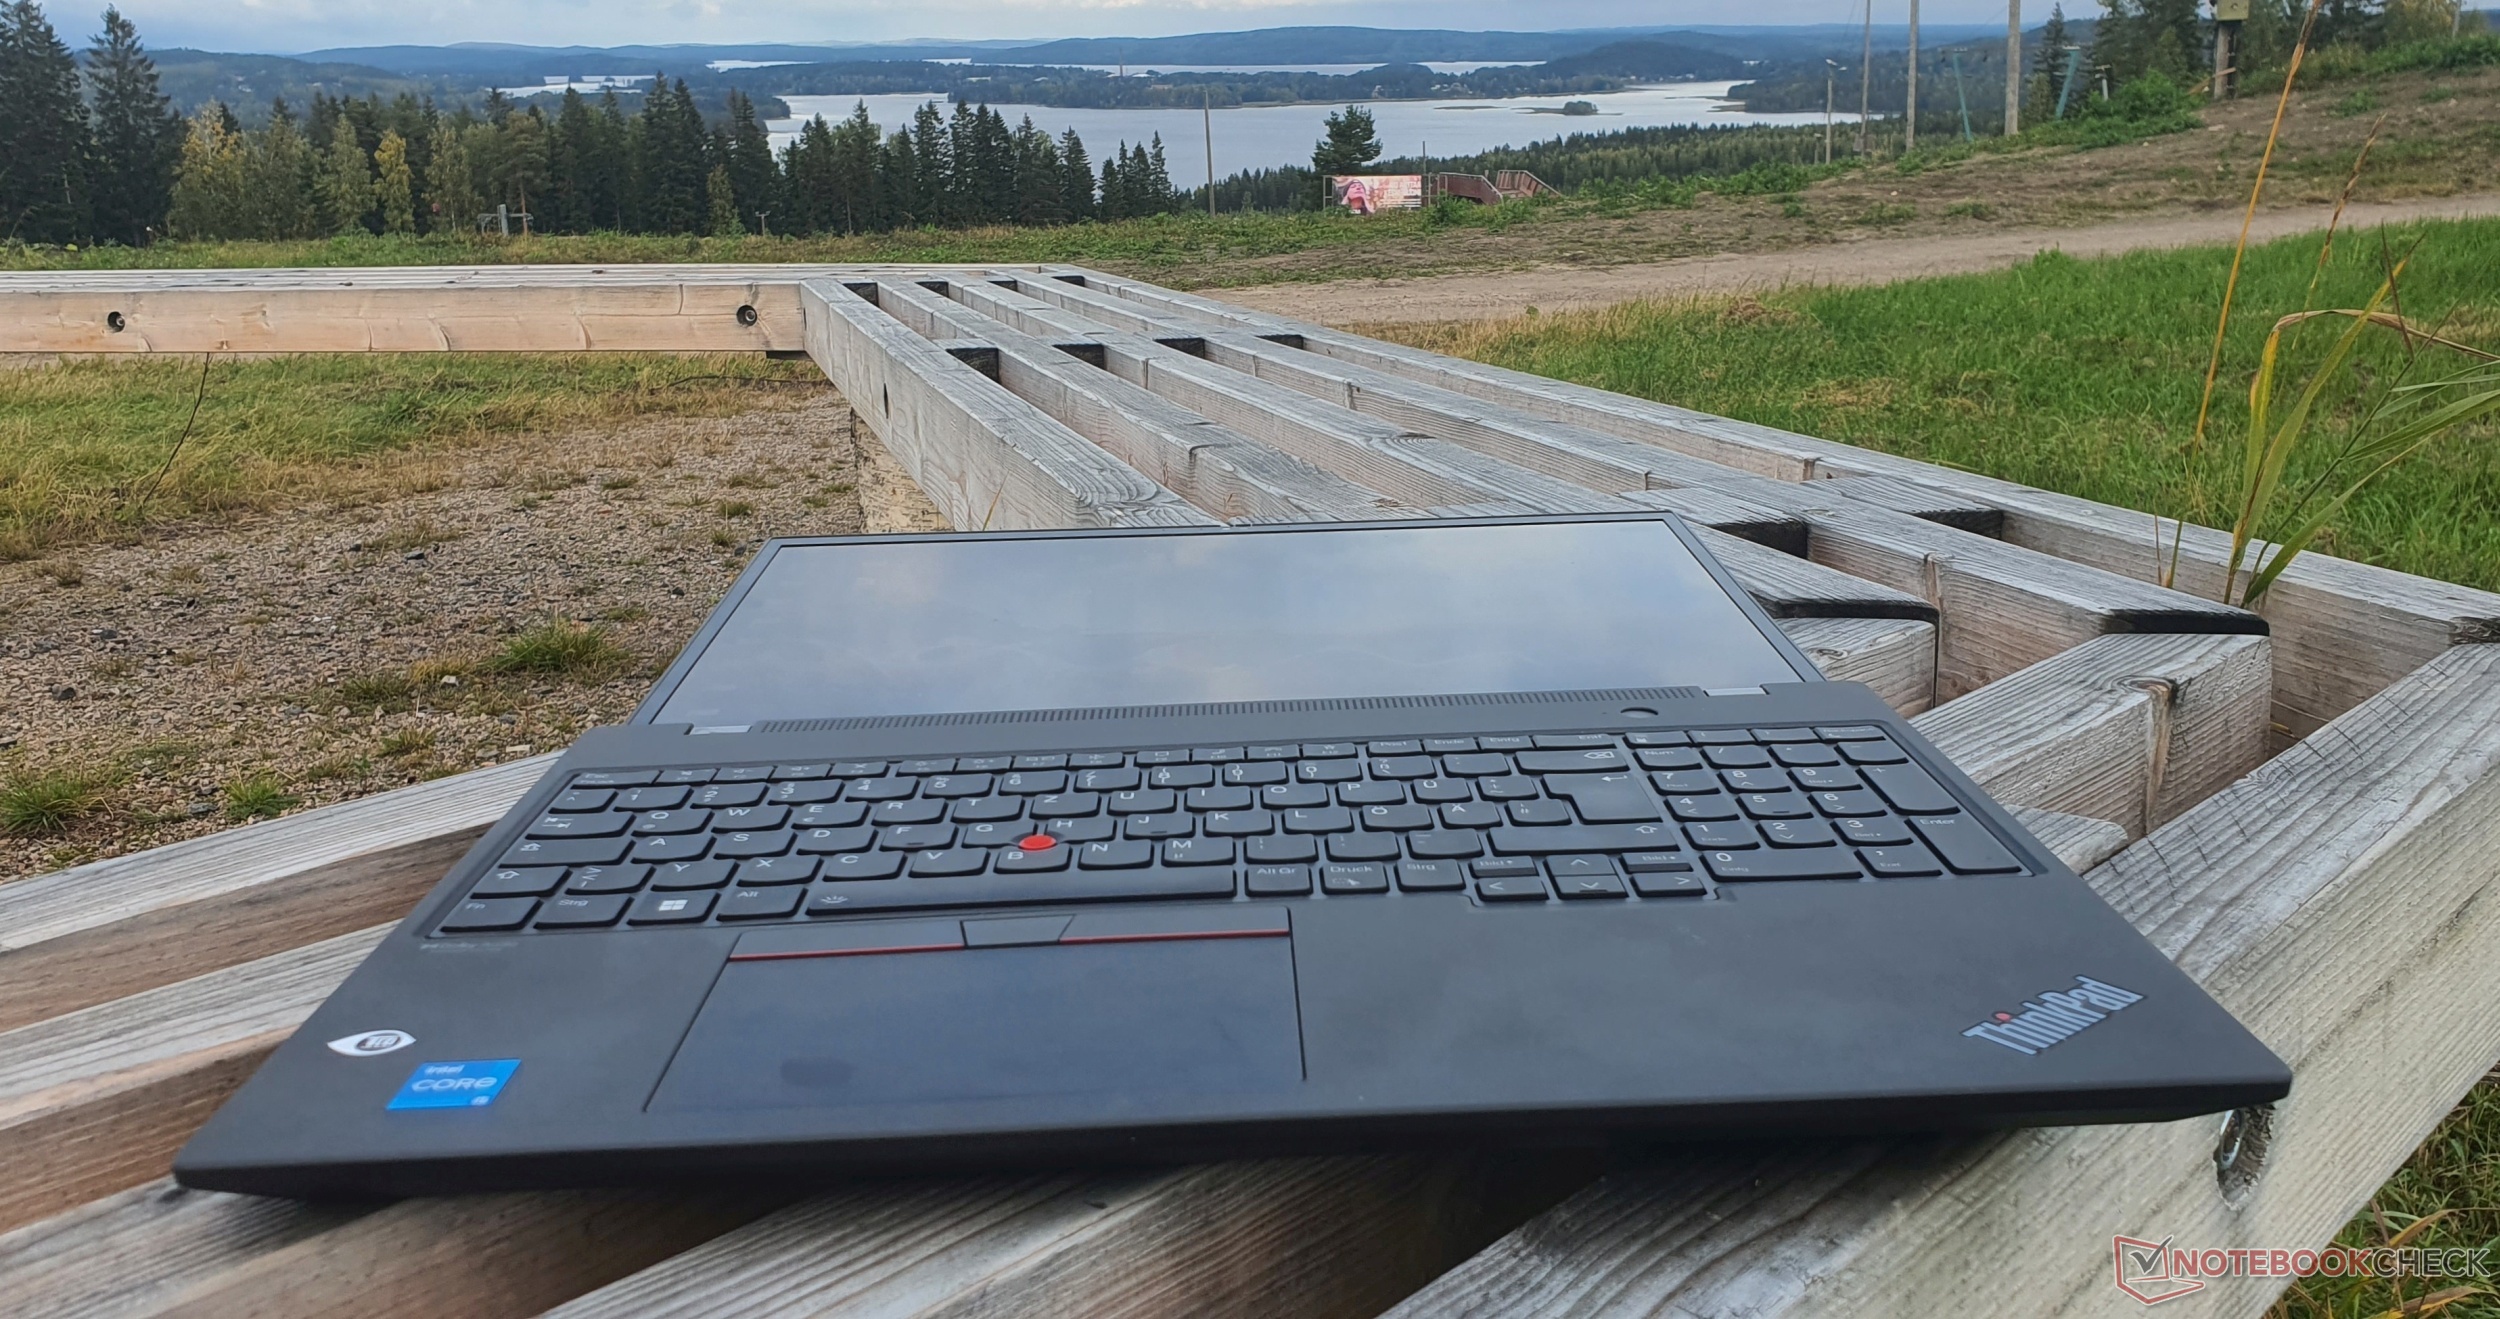
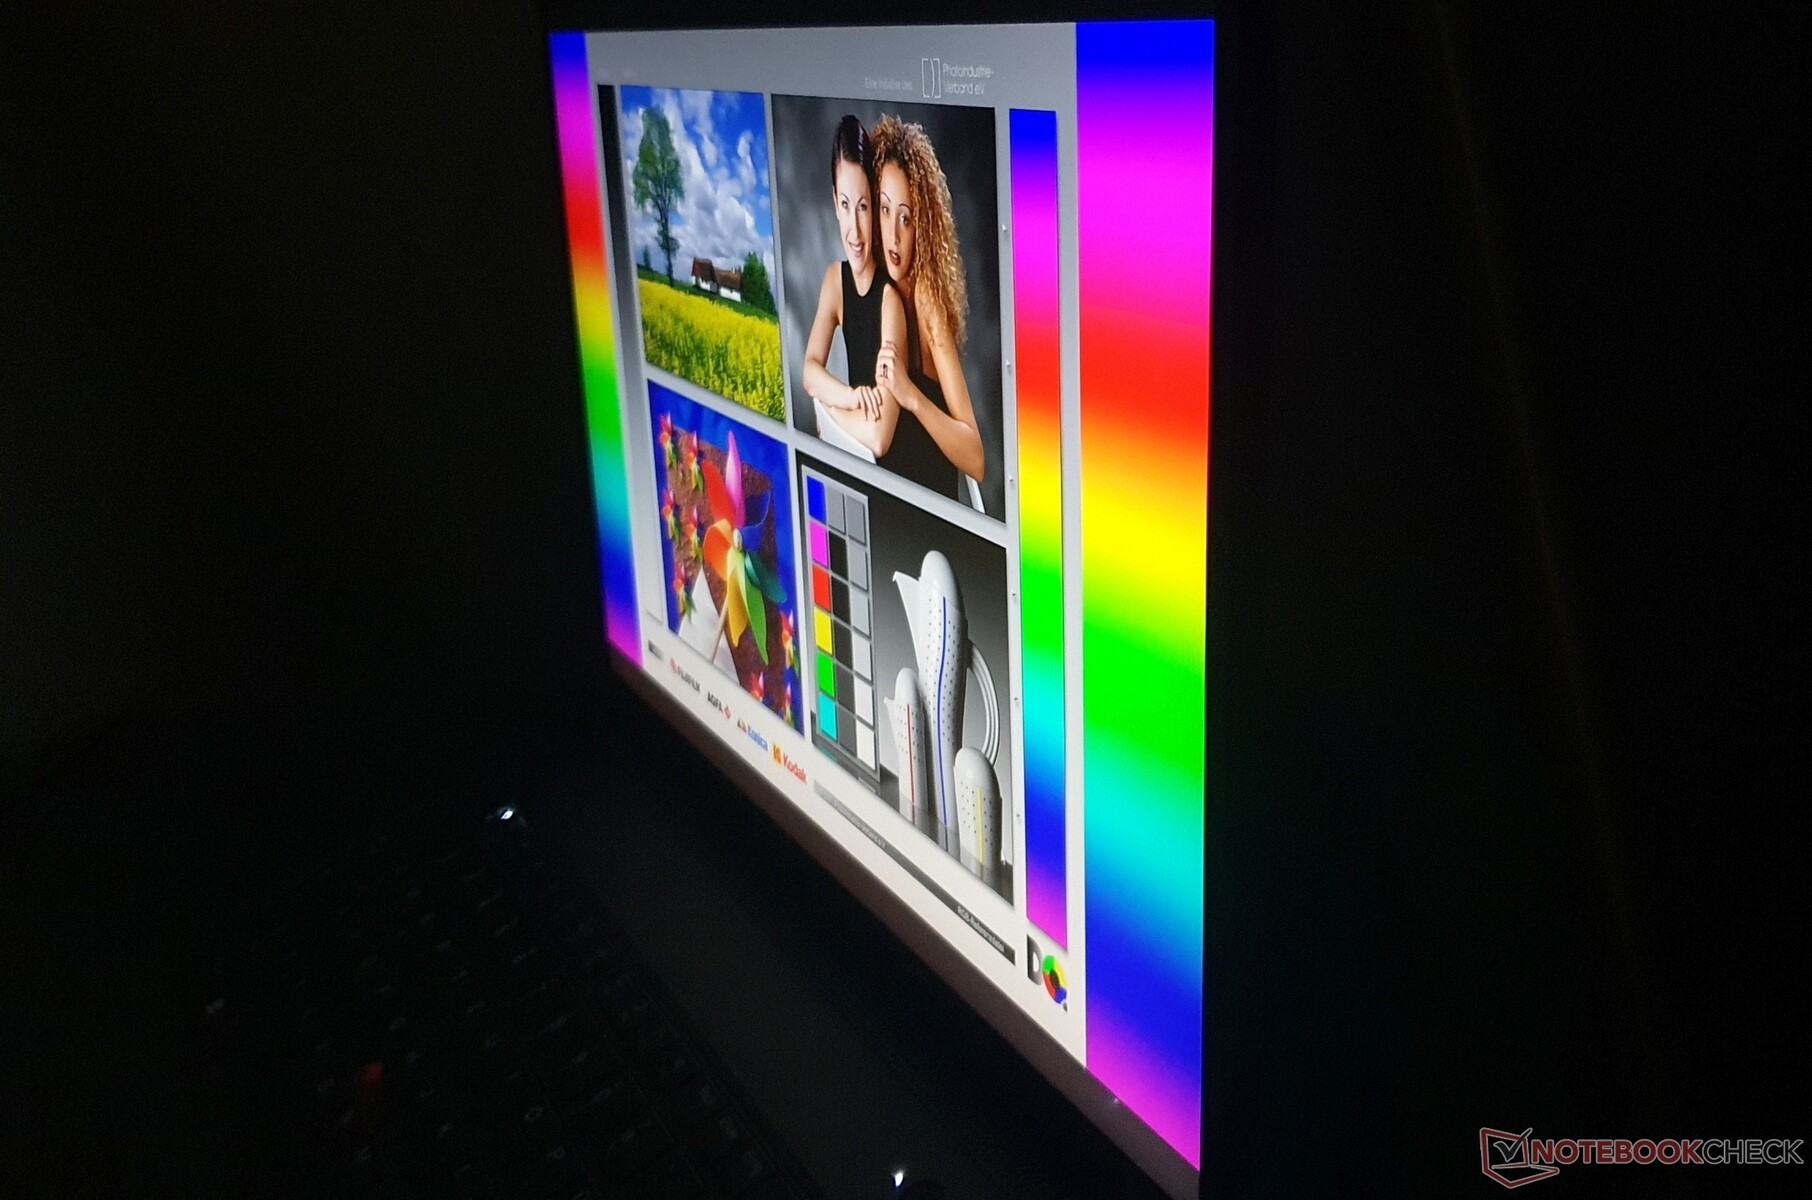
All'aperto, il display opaco è facilmente leggibile con una media di 390 nit. Tuttavia, è necessario evitare la luce diretta del sole.


Prestazioni - Limiti Lenovo con throttling artificiale
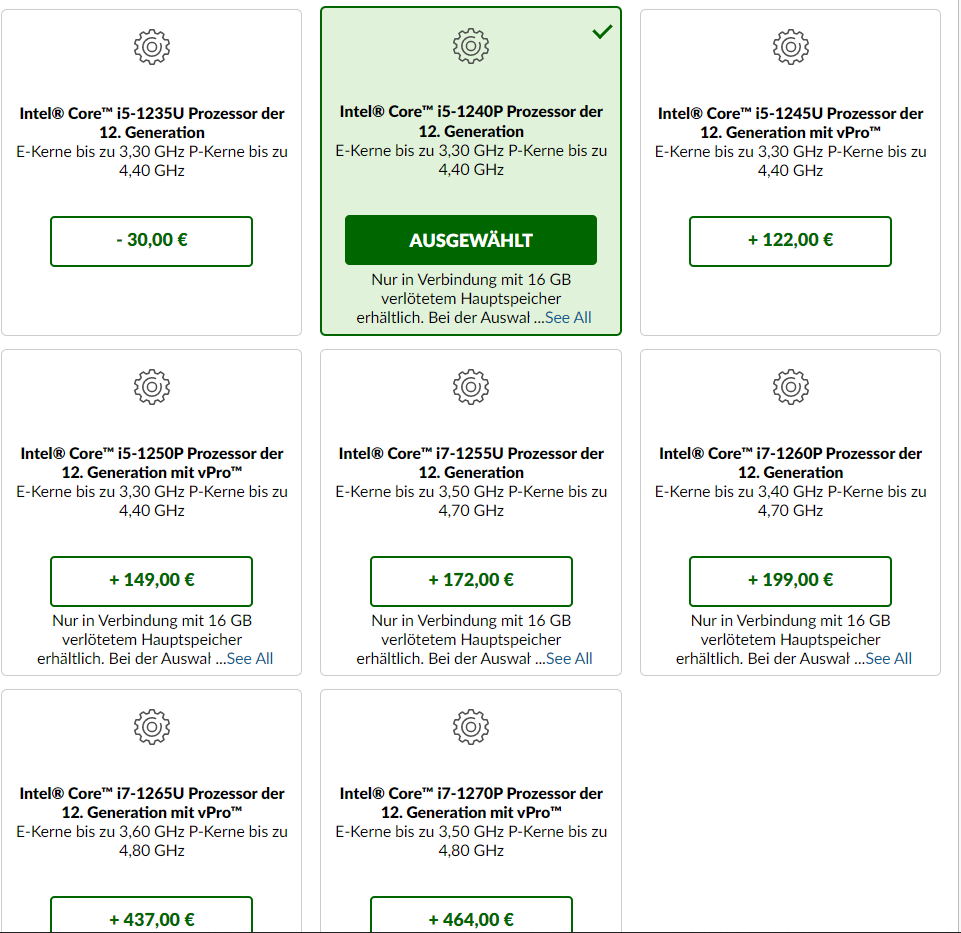
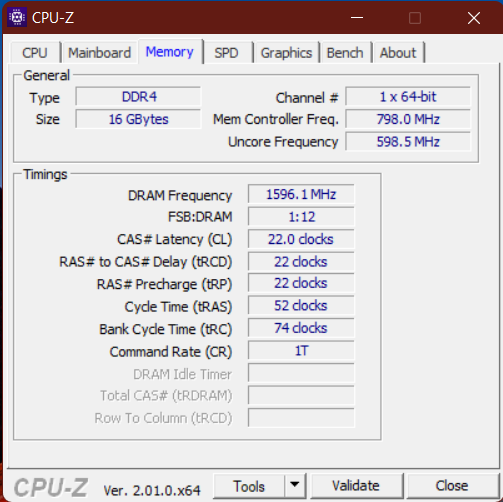
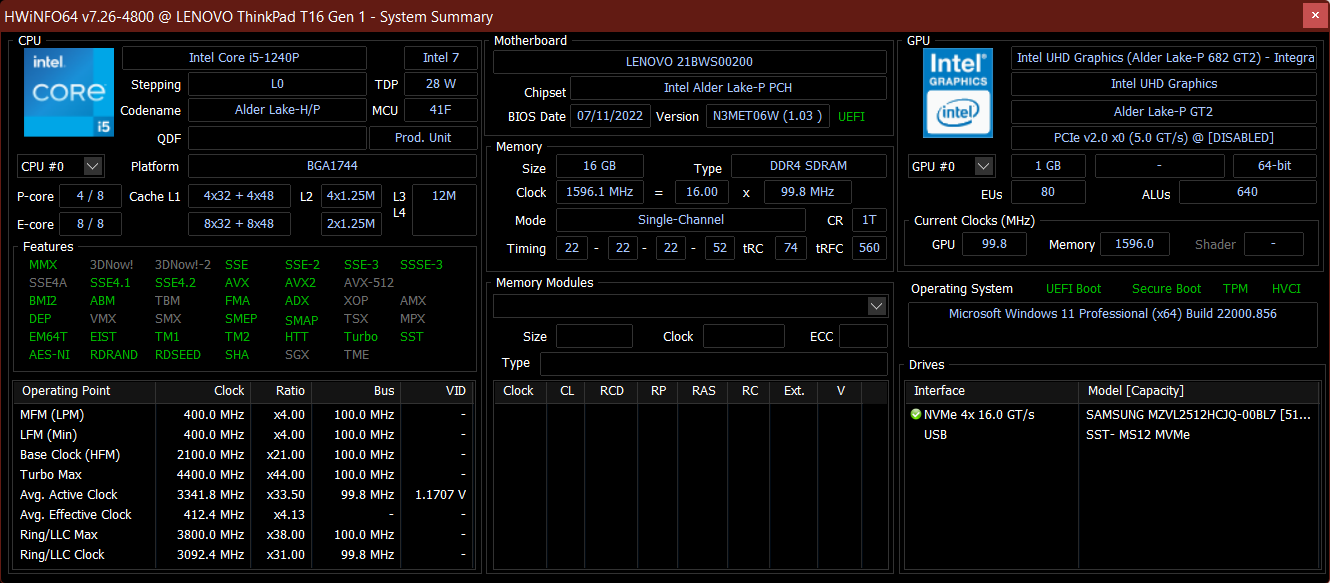
Il nostro modello è dotato di 16 GB di RAM DDR4-3200 saldata (a canale singolo) ed è alimentato dal processore Intel Core i5-1240Pcon unità grafica integrata. Inoltre, è presente un'unità SSD da 512 GB in standard PCIe 4.0. Il sistema è destinato alle attività d'ufficio e ad altre attività tipicamente aziendali.
Non è destinato all'editing video e ai giochi ed è disponibile solo in configurazioni alternative con il modello GeForce MX550più RAM (in SODIMM libere) e possibilmente una CPU più potente (i7-1280Pdato che quest'anno sono disponibili anche modelli con AMD, vale la pena prendere in considerazione questa opzione. Cercheremo di recensire anche questo modello.
Condizioni di test
Lenovo non offre profili energetici propri per i suoi ThinkPad, ma li integra nelle impostazioni energetiche di Windows. La modalità automatica di "raffreddamento intelligente" può essere disattivata con "Fn+T". I benchmark relativi alle prestazioni sono stati eseguiti con il profilo di prestazioni massime e la modalità automatica disattivata
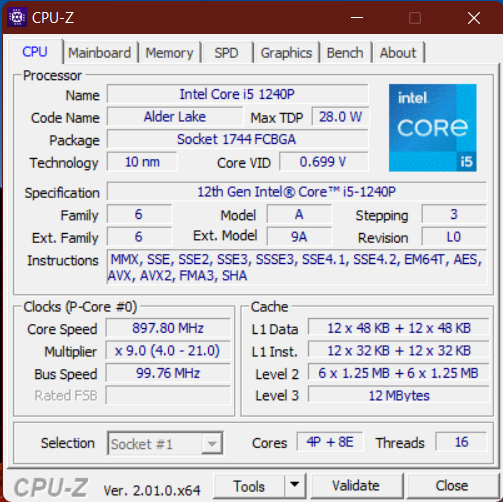
Processore
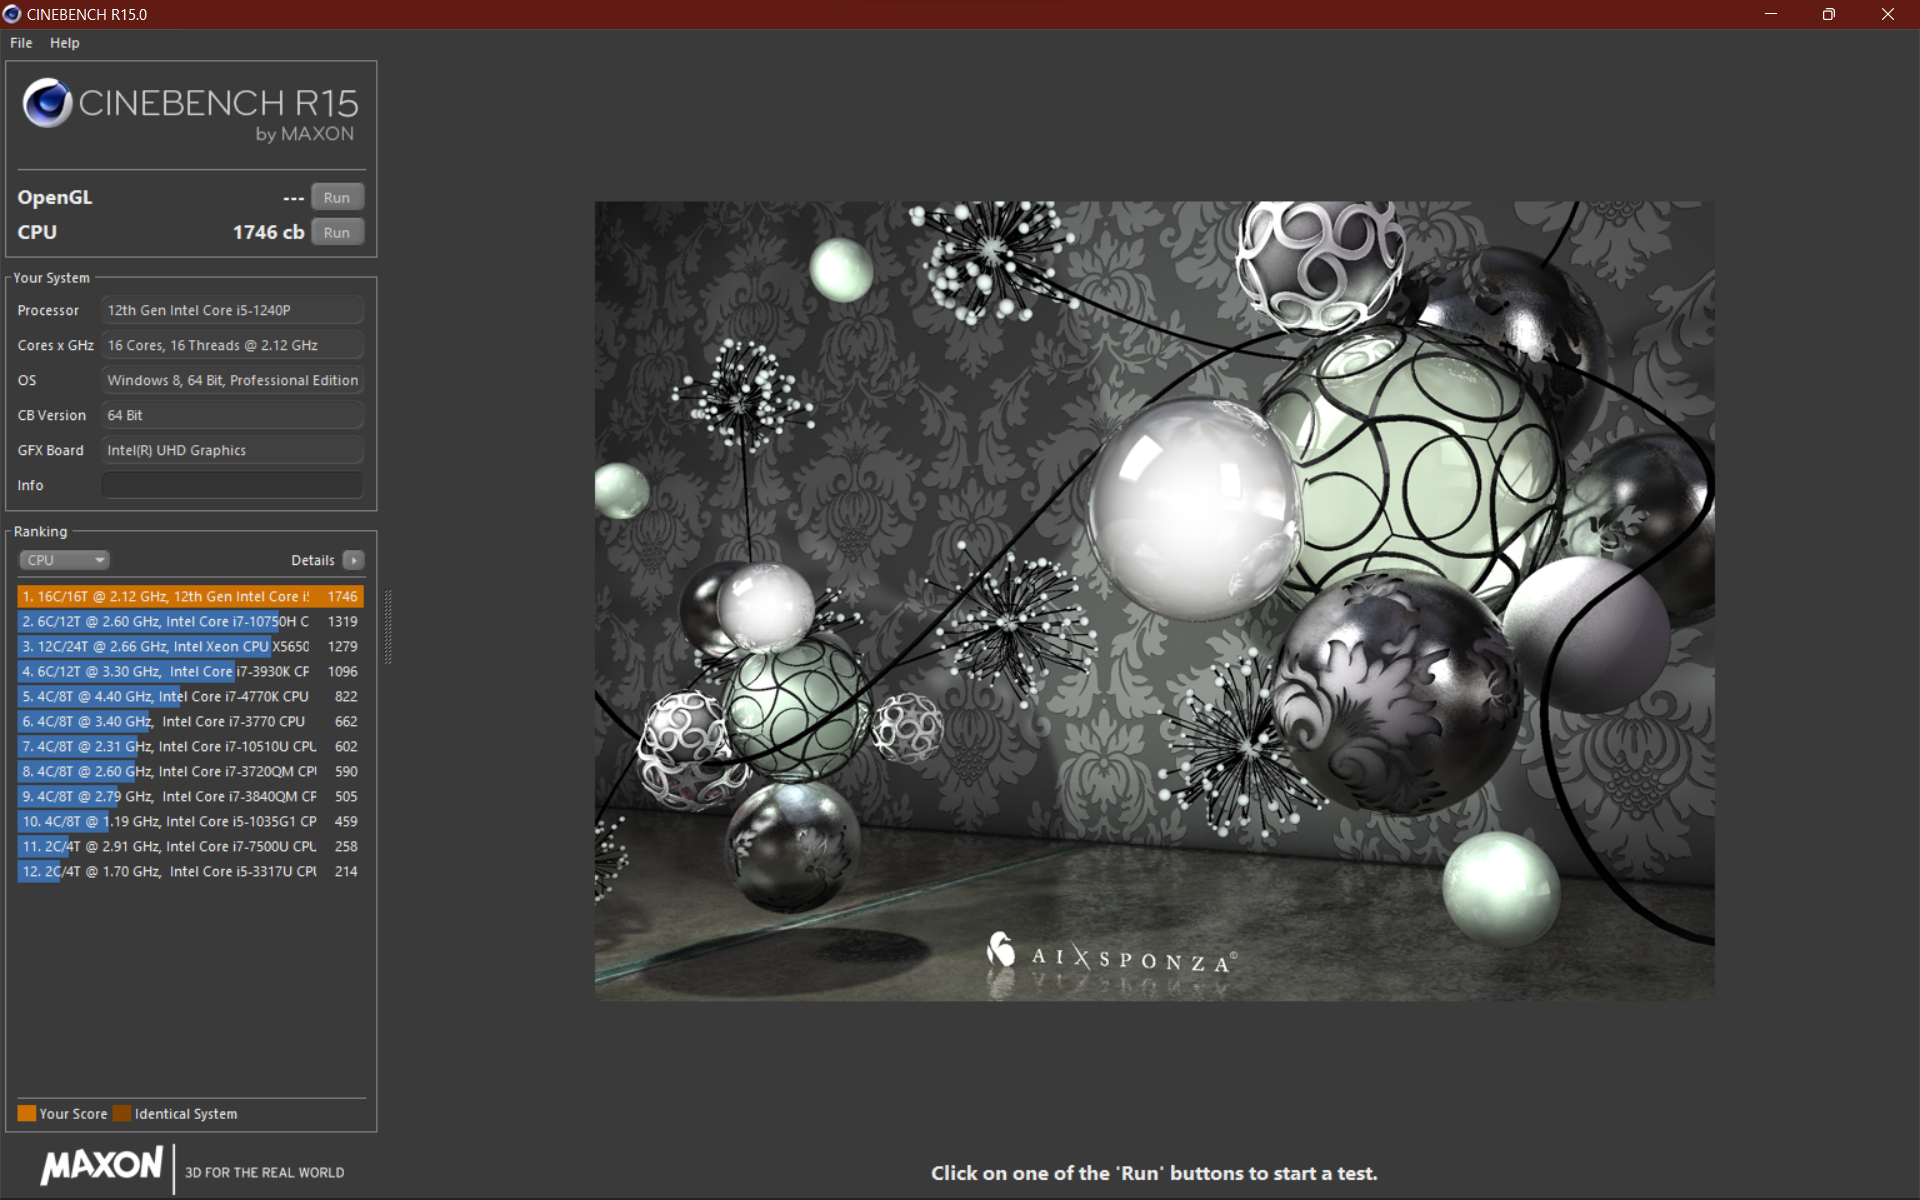
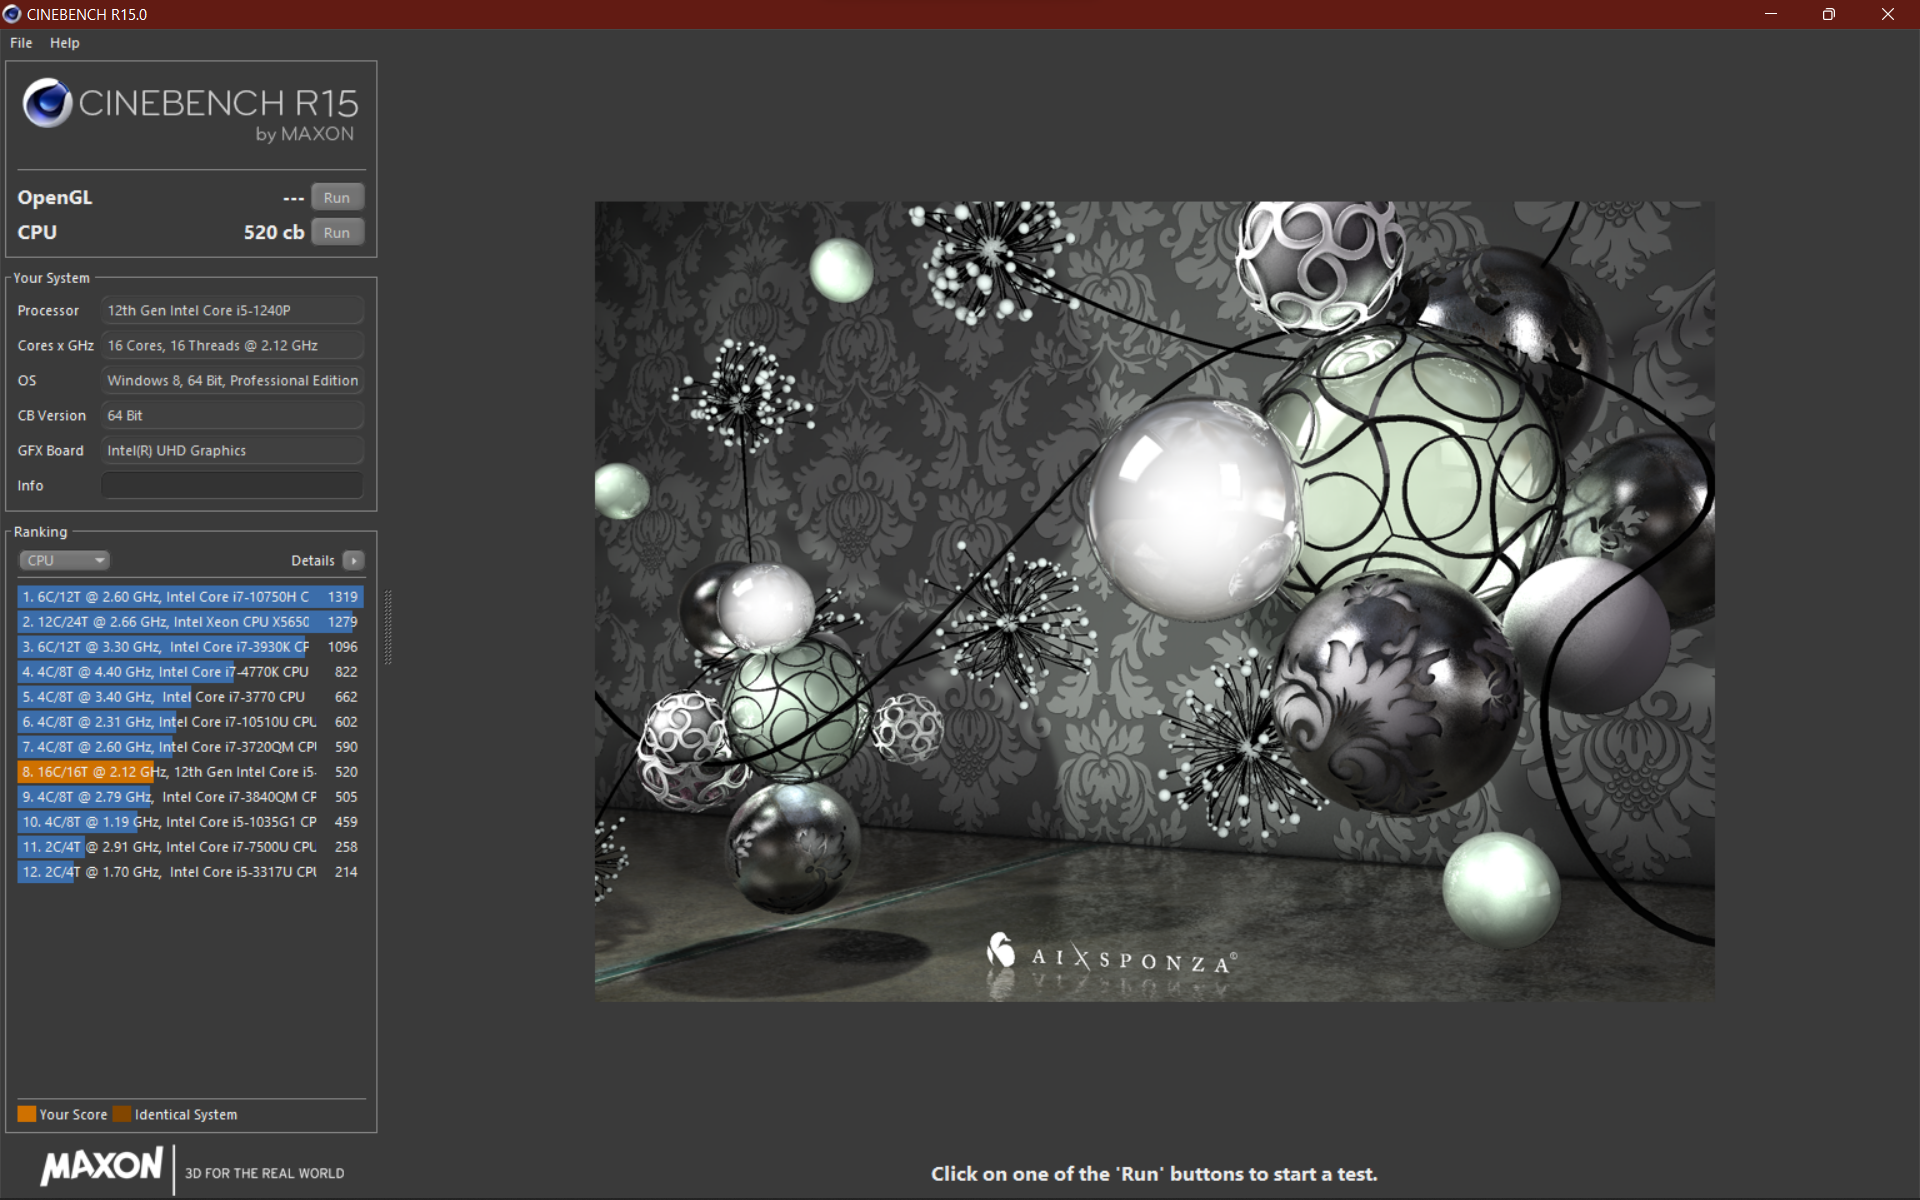
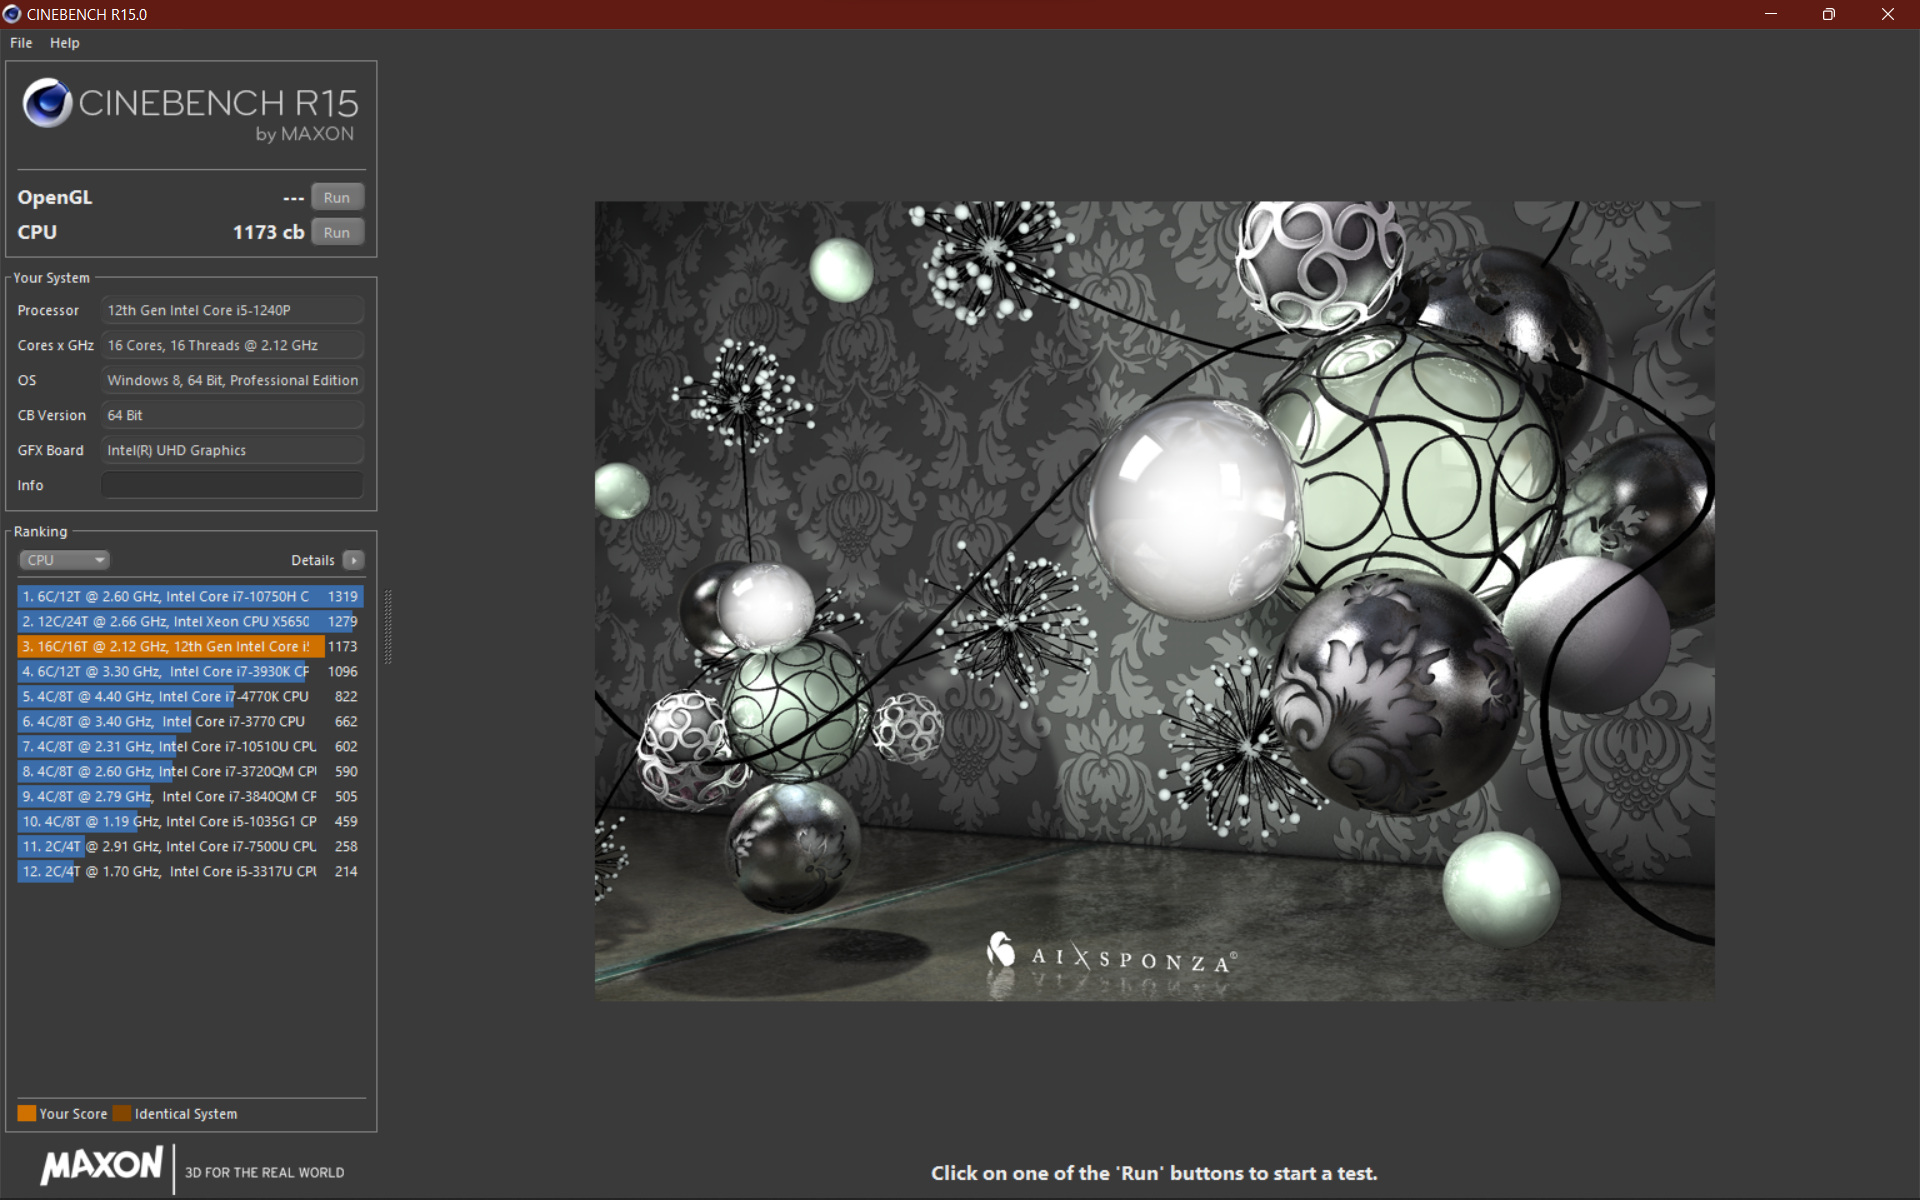
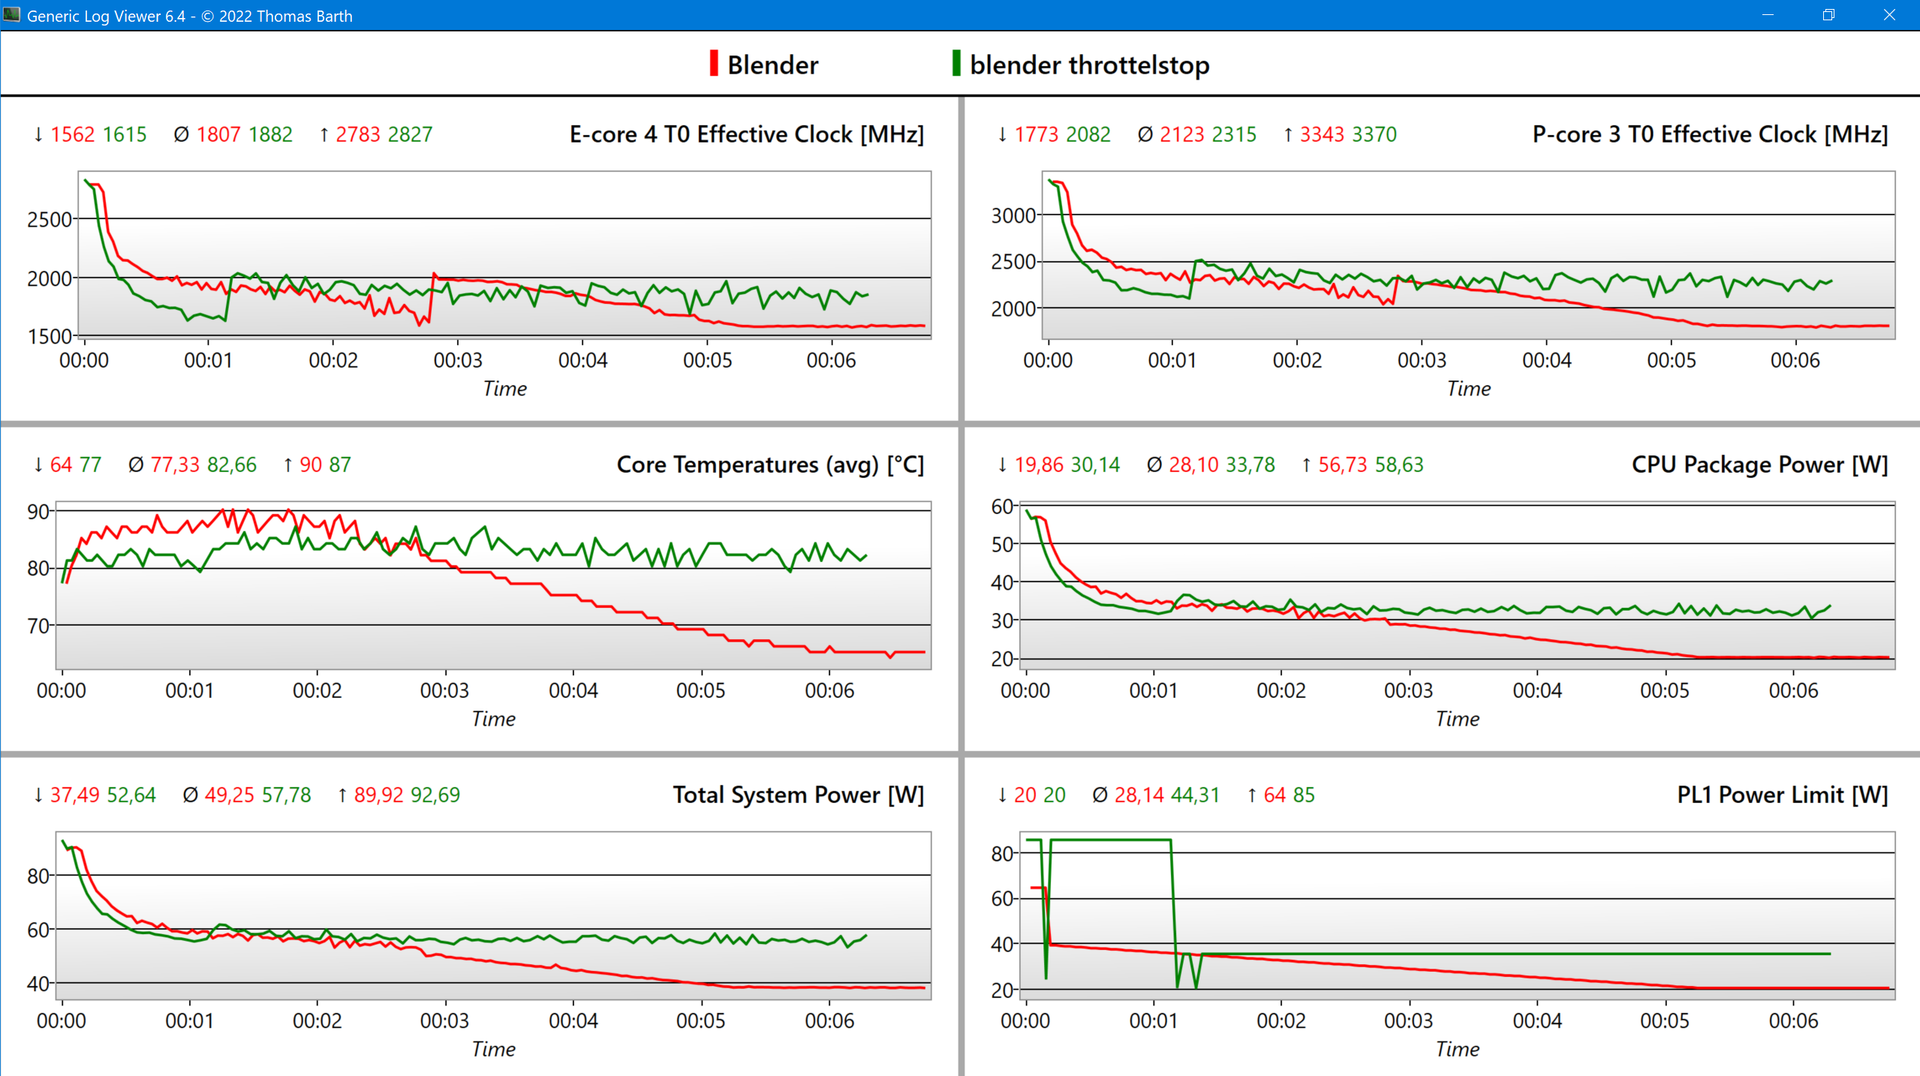
Il processore Intel Core i5-1240P è una CPU a 12 core con 4 core per le prestazioni e 8 per l'efficienza. Il TDP di 28 W viene utilizzato per la prima volta nella serie T di Lenovo. Tuttavia, i nostri test rivelano che Lenovo limita il PL1 a 20 watt, mentre il turbo breve di 12 secondi (PL2) è di 59 watt.
Le temperature molto basse di 63 °C dimostrano che questo approccio limita inutilmente le prestazioni ed è appena sufficiente per raggiungere il clock di base di 1,7 GHz. Questo è incomprensibile, dato che il predecessore funziona costantemente a 35 watt. Di conseguenza, le prestazioni sostenute sono solo del 15% superiori a quelle del predecessore.predecessorementre il ThinkPad E15 con Ryzen dell'anno scorso calcola circa il 50% in più. D'altra parte, il T16 è molto veloce nelle attività che richiedono brevi incrementi.
Se il throttling, che è stato confermato da molte fonti come si verifica anche nel T14 G3(stessa scheda madre), non verrà risolto in futuro tramite un aggiornamento del BIOS, AMD sarebbe probabilmente la scelta migliore in questo caso, dato che i Ryzen possono fornire risultati di gran lunga migliori con poca energia.
In modalità batteria, la potenza è ulteriormente limitata a 10 watt, ma "Max Performance on Battery" può essere impostato nel BIOS, in modo che il risultato sia più o meno lo stesso. È possibile mantenere un totale di 30 watt utilizzando lo strumento "ThrottleStop", ma si sconsiglia di sovrascrivere le impostazioni scelte dal produttore.

Cinebench R15 Multi Sustained Load
Cinebench R23: Multi Core | Single Core
Cinebench R20: CPU (Multi Core) | CPU (Single Core)
Cinebench R15: CPU Multi 64Bit | CPU Single 64Bit
Blender: v2.79 BMW27 CPU | v3.3 Classroom CPU
7-Zip 18.03: 7z b 4 | 7z b 4 -mmt1
Geekbench 5.5: Multi-Core | Single-Core
HWBOT x265 Benchmark v2.2: 4k Preset
LibreOffice : 20 Documents To PDF
R Benchmark 2.5: Overall mean
V-Ray 5 Benchmark: CPU
V-Ray Benchmark Next 4.10: CPU
| CPU Performance rating | |
| Dell Inspiron 16 Plus 7620 -1! | |
| Huawei MateBook D 16 2022 -1! | |
| Asus Vivobook Pro 16X-M7600QE -2! | |
| Lenovo ThinkPad X1 Extreme G4-20Y5CTO1WW (3050 Ti) -2! | |
| HP ZBook Power 15 G8 313S5EA -2! | |
| Media della classe Office | |
| Lenovo ThinkPad T16 G1 21BWS00200 | |
| Lenovo ThinkPad E15 G3-20YG003UGE -2! | |
| Lenovo ThinkPad L15 G2 AMD -1! | |
| Media Intel Core i5-1240P | |
| Lenovo ThinkPad T15 Gen2-20W5S00100 -4! | |
| HP ProBook 450 G9 6A180EA | |
| Blender / v3.3 Classroom CPU | |
| HP ProBook 450 G9 6A180EA | |
| Media Intel Core i5-1240P (552 - 3047, n=12) | |
| Lenovo ThinkPad T16 G1 21BWS00200 | |
| Media della classe Office (245 - 3219, n=72, ultimi 2 anni) | |
| Huawei MateBook D 16 2022 | |
| Dell Inspiron 16 Plus 7620 | |
| V-Ray 5 Benchmark / CPU | |
| Dell Inspiron 16 Plus 7620 | |
| Media della classe Office (5027 - 13111, n=20, ultimi 2 anni) | |
| Lenovo ThinkPad L15 G2 AMD | |
| Lenovo ThinkPad T16 G1 21BWS00200 | |
| Media Intel Core i5-1240P (1334 - 7321, n=6) | |
| HP ProBook 450 G9 6A180EA | |
* ... Meglio usare valori piccoli
AIDA64: FP32 Ray-Trace | FPU Julia | CPU SHA3 | CPU Queen | FPU SinJulia | FPU Mandel | CPU AES | CPU ZLib | FP64 Ray-Trace | CPU PhotoWorxx
| Performance rating | |
| Lenovo ThinkPad X1 Extreme G4-20Y5CTO1WW (3050 Ti) | |
| HP ZBook Power 15 G8 313S5EA | |
| Dell Inspiron 16 Plus 7620 | |
| Huawei MateBook D 16 2022 | |
| Media della classe Office | |
| Lenovo ThinkPad E15 G3-20YG003UGE | |
| Lenovo ThinkPad L15 G2 AMD | |
| Lenovo ThinkPad T16 G1 21BWS00200 | |
| Media Intel Core i5-1240P | |
| HP ProBook 450 G9 6A180EA | |
| AIDA64 / FP32 Ray-Trace | |
| HP ZBook Power 15 G8 313S5EA | |
| Lenovo ThinkPad X1 Extreme G4-20Y5CTO1WW (3050 Ti) | |
| Media della classe Office (2083 - 31245, n=79, ultimi 2 anni) | |
| Dell Inspiron 16 Plus 7620 | |
| Huawei MateBook D 16 2022 | |
| Lenovo ThinkPad E15 G3-20YG003UGE | |
| Lenovo ThinkPad L15 G2 AMD | |
| Lenovo ThinkPad T16 G1 21BWS00200 | |
| Media Intel Core i5-1240P (2405 - 9694, n=16) | |
| HP ProBook 450 G9 6A180EA | |
| AIDA64 / FPU Julia | |
| Dell Inspiron 16 Plus 7620 | |
| Lenovo ThinkPad E15 G3-20YG003UGE | |
| Lenovo ThinkPad X1 Extreme G4-20Y5CTO1WW (3050 Ti) | |
| HP ZBook Power 15 G8 313S5EA | |
| Media della classe Office (8191 - 125394, n=79, ultimi 2 anni) | |
| Huawei MateBook D 16 2022 | |
| Lenovo ThinkPad L15 G2 AMD | |
| Lenovo ThinkPad T16 G1 21BWS00200 | |
| Media Intel Core i5-1240P (7407 - 49934, n=16) | |
| HP ProBook 450 G9 6A180EA | |
| AIDA64 / CPU SHA3 | |
| Lenovo ThinkPad X1 Extreme G4-20Y5CTO1WW (3050 Ti) | |
| HP ZBook Power 15 G8 313S5EA | |
| Dell Inspiron 16 Plus 7620 | |
| Media della classe Office (433 - 5755, n=79, ultimi 2 anni) | |
| Huawei MateBook D 16 2022 | |
| Lenovo ThinkPad E15 G3-20YG003UGE | |
| Lenovo ThinkPad L15 G2 AMD | |
| Lenovo ThinkPad T16 G1 21BWS00200 | |
| Media Intel Core i5-1240P (415 - 2462, n=16) | |
| HP ProBook 450 G9 6A180EA | |
| AIDA64 / CPU Queen | |
| Huawei MateBook D 16 2022 | |
| Dell Inspiron 16 Plus 7620 | |
| Lenovo ThinkPad X1 Extreme G4-20Y5CTO1WW (3050 Ti) | |
| HP ZBook Power 15 G8 313S5EA | |
| Lenovo ThinkPad E15 G3-20YG003UGE | |
| Lenovo ThinkPad T16 G1 21BWS00200 | |
| Lenovo ThinkPad L15 G2 AMD | |
| Media Intel Core i5-1240P (29405 - 76736, n=16) | |
| Media della classe Office (22784 - 115197, n=69, ultimi 2 anni) | |
| HP ProBook 450 G9 6A180EA | |
| AIDA64 / FPU SinJulia | |
| Lenovo ThinkPad E15 G3-20YG003UGE | |
| HP ZBook Power 15 G8 313S5EA | |
| Lenovo ThinkPad X1 Extreme G4-20Y5CTO1WW (3050 Ti) | |
| Dell Inspiron 16 Plus 7620 | |
| Lenovo ThinkPad L15 G2 AMD | |
| Huawei MateBook D 16 2022 | |
| Media della classe Office (1378 - 18321, n=79, ultimi 2 anni) | |
| Lenovo ThinkPad T16 G1 21BWS00200 | |
| Media Intel Core i5-1240P (2135 - 6540, n=16) | |
| HP ProBook 450 G9 6A180EA | |
| AIDA64 / FPU Mandel | |
| HP ZBook Power 15 G8 313S5EA | |
| Lenovo ThinkPad X1 Extreme G4-20Y5CTO1WW (3050 Ti) | |
| Lenovo ThinkPad E15 G3-20YG003UGE | |
| Media della classe Office (4601 - 66922, n=79, ultimi 2 anni) | |
| Dell Inspiron 16 Plus 7620 | |
| Lenovo ThinkPad L15 G2 AMD | |
| Huawei MateBook D 16 2022 | |
| Lenovo ThinkPad T16 G1 21BWS00200 | |
| Media Intel Core i5-1240P (5113 - 23992, n=16) | |
| HP ProBook 450 G9 6A180EA | |
| AIDA64 / CPU ZLib | |
| Dell Inspiron 16 Plus 7620 | |
| Lenovo ThinkPad X1 Extreme G4-20Y5CTO1WW (3050 Ti) | |
| HP ZBook Power 15 G8 313S5EA | |
| Huawei MateBook D 16 2022 | |
| Media della classe Office (114.6 - 1366, n=79, ultimi 2 anni) | |
| Lenovo ThinkPad E15 G3-20YG003UGE | |
| Lenovo ThinkPad T16 G1 21BWS00200 | |
| Media Intel Core i5-1240P (101.6 - 812, n=16) | |
| Lenovo ThinkPad L15 G2 AMD | |
| HP ProBook 450 G9 6A180EA | |
| AIDA64 / FP64 Ray-Trace | |
| HP ZBook Power 15 G8 313S5EA | |
| Lenovo ThinkPad X1 Extreme G4-20Y5CTO1WW (3050 Ti) | |
| Media della classe Office (1109 - 17834, n=79, ultimi 2 anni) | |
| Dell Inspiron 16 Plus 7620 | |
| Lenovo ThinkPad E15 G3-20YG003UGE | |
| Huawei MateBook D 16 2022 | |
| Lenovo ThinkPad L15 G2 AMD | |
| Lenovo ThinkPad T16 G1 21BWS00200 | |
| Media Intel Core i5-1240P (1154 - 5258, n=16) | |
| HP ProBook 450 G9 6A180EA | |
| AIDA64 / CPU PhotoWorxx | |
| Huawei MateBook D 16 2022 | |
| Media della classe Office (11090 - 65229, n=79, ultimi 2 anni) | |
| Dell Inspiron 16 Plus 7620 | |
| Media Intel Core i5-1240P (11873 - 43661, n=16) | |
| Lenovo ThinkPad E15 G3-20YG003UGE | |
| Lenovo ThinkPad X1 Extreme G4-20Y5CTO1WW (3050 Ti) | |
| HP ProBook 450 G9 6A180EA | |
| Lenovo ThinkPad T16 G1 21BWS00200 | |
| HP ZBook Power 15 G8 313S5EA | |
| Lenovo ThinkPad L15 G2 AMD | |
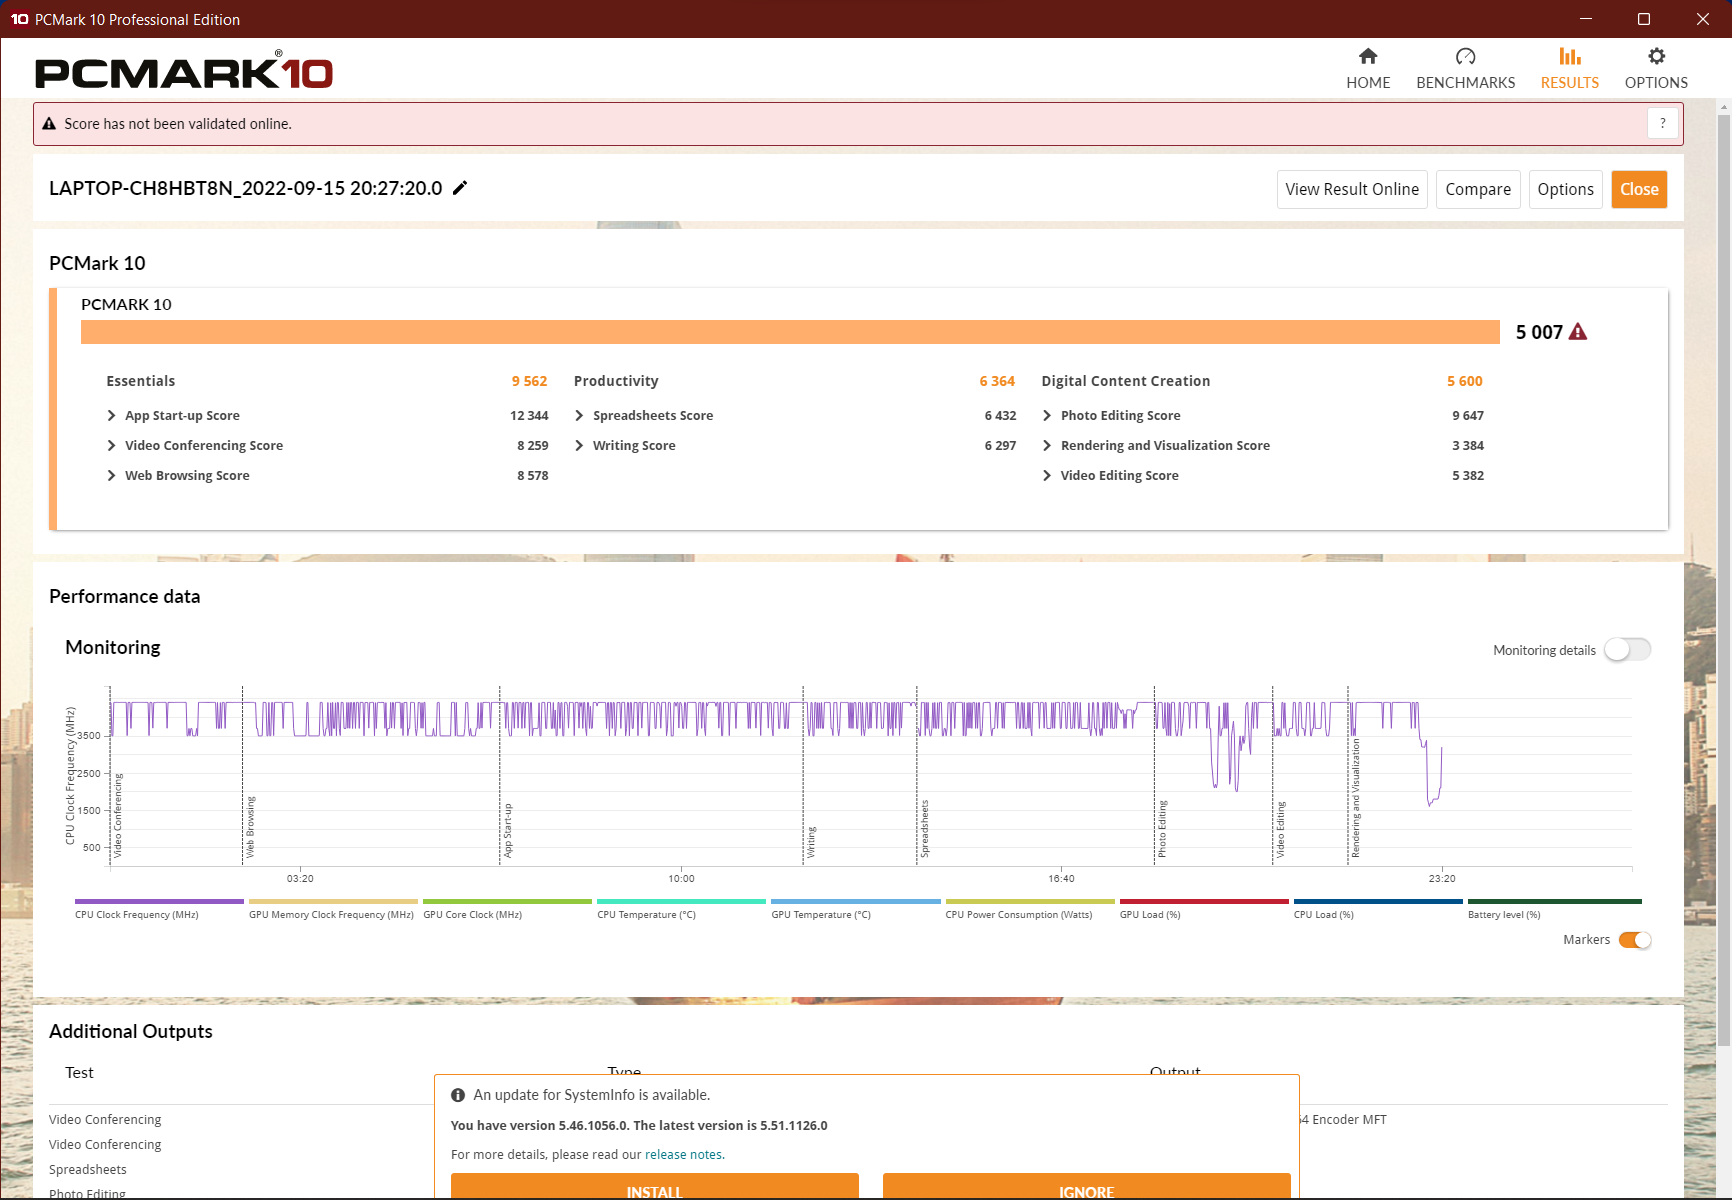
Prestazioni del sistema
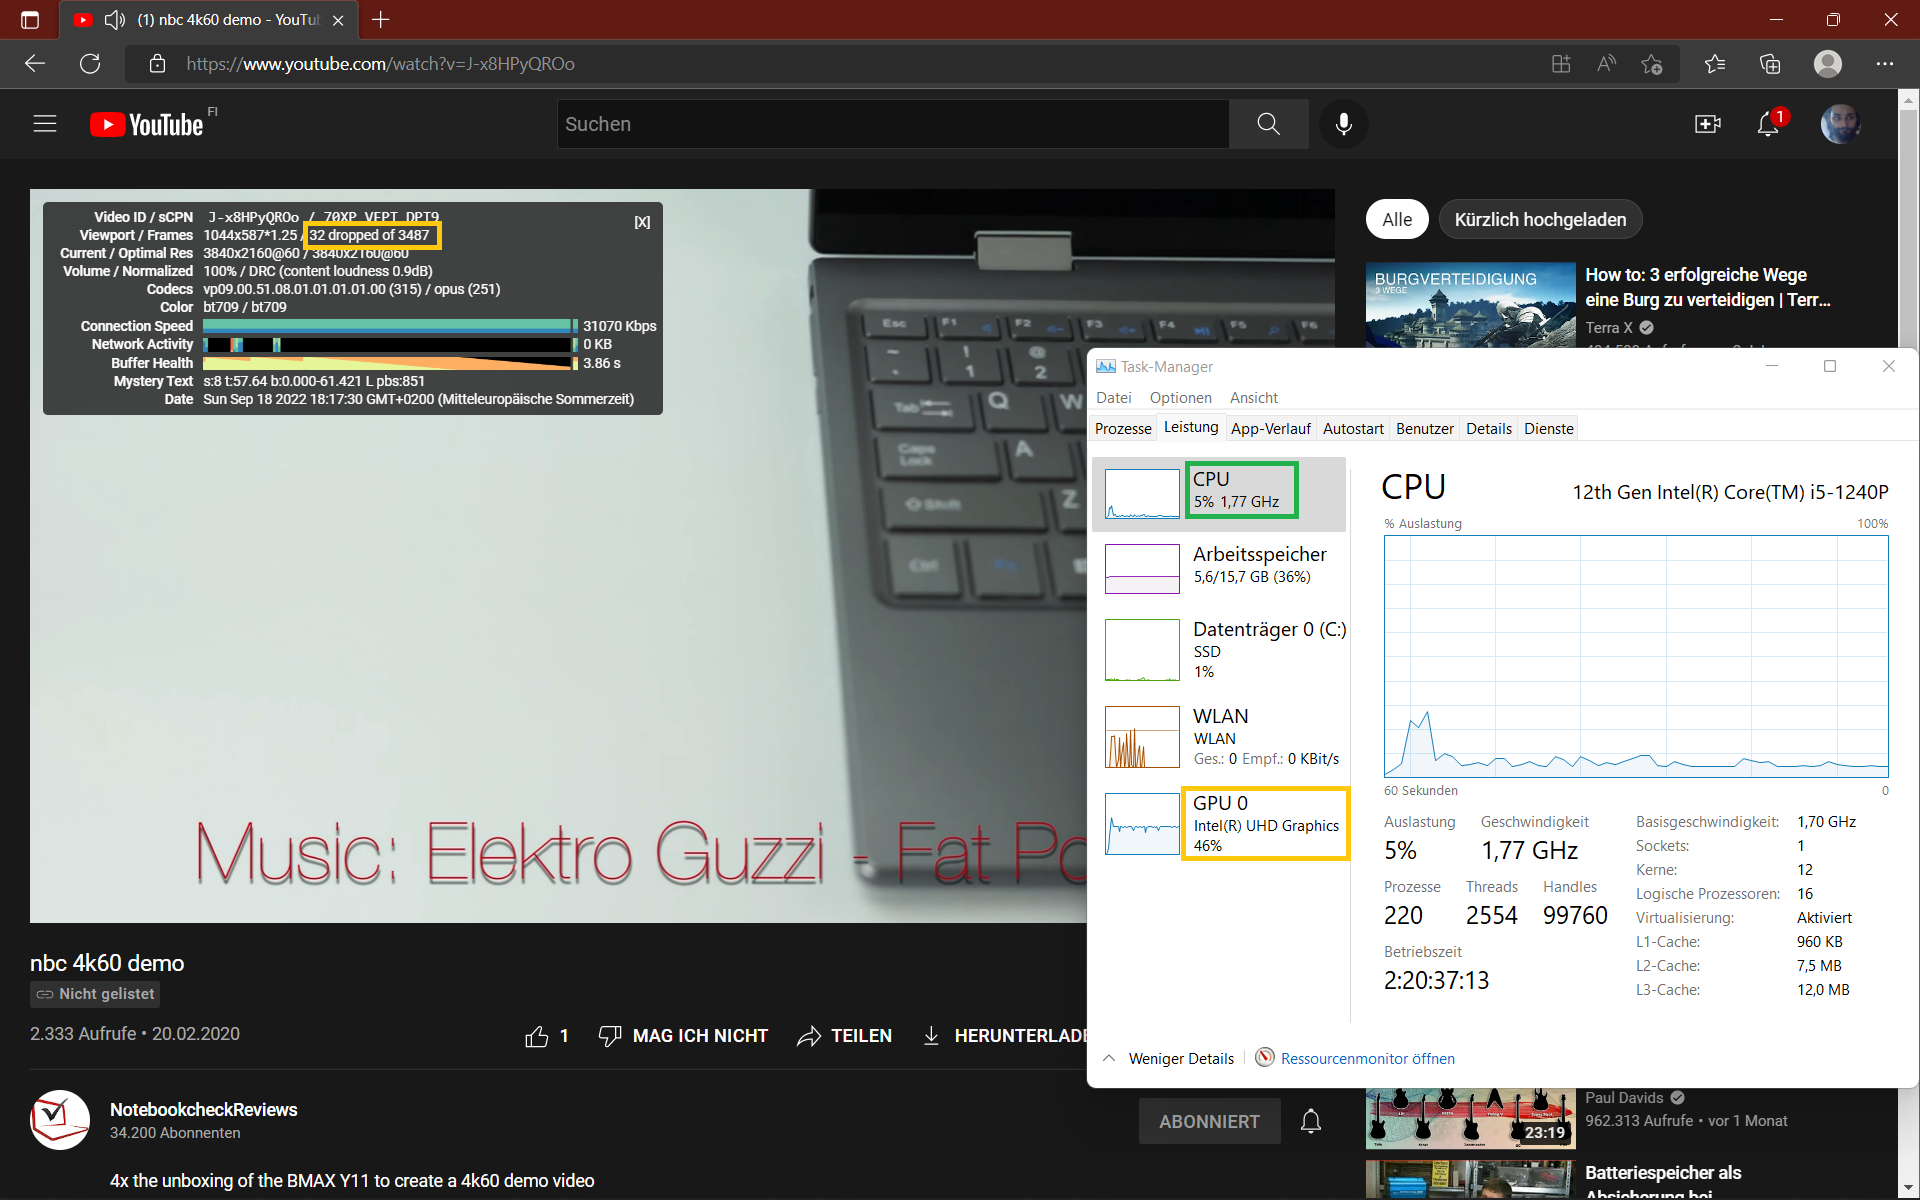
Grazie al forte turbo a breve termine, il sistema è molto reattivo nonostante la RAM a canale singolo. La navigazione web durante la riproduzione di YouTube 4K non è un problema, ma si verificano cali di frame.
Questo problema potrebbe essere risolto con l'inserimento di un secondo modulo di RAM, oltre che con un miglioramento delle prestazioni complessive del sistema. La CPU Alder Lake si comporta molto bene nei benchmark di navigazione web grazie al turbo, ma le prestazioni di PCMark sono nella media.
CrossMark: Overall | Productivity | Creativity | Responsiveness
Sunspider: 1.0 Total Score
Mozilla Kraken 1.1: Total
Speedometer 2.0: Result 2.0
Octane V2: Total Score
Jetstream 2: 2.0 Total
WebXPRT 3: Overall
WebXPRT 4: Overall
| PCMark 10 / Score | |
| Dell Inspiron 16 Plus 7620 | |
| Lenovo ThinkPad X1 Extreme G4-20Y5CTO1WW (3050 Ti) | |
| Media della classe Office (2601 - 9298, n=63, ultimi 2 anni) | |
| Huawei MateBook D 16 2022 | |
| Lenovo ThinkPad L15 G2 AMD | |
| Lenovo ThinkPad E15 G3-20YG003UGE | |
| Lenovo ThinkPad T15 Gen2-20W5S00100 | |
| Media Intel Core i5-1240P, Intel Iris Xe Graphics G7 80EUs (4881 - 5345, n=11) | |
| Lenovo ThinkPad T16 G1 21BWS00200 | |
| HP ZBook Power 15 G8 313S5EA | |
| HP ProBook 450 G9 6A180EA | |
| PCMark 10 / Essentials | |
| Huawei MateBook D 16 2022 | |
| Lenovo ThinkPad X1 Extreme G4-20Y5CTO1WW (3050 Ti) | |
| Dell Inspiron 16 Plus 7620 | |
| Lenovo ThinkPad L15 G2 AMD | |
| Media della classe Office (3245 - 11594, n=63, ultimi 2 anni) | |
| Media Intel Core i5-1240P, Intel Iris Xe Graphics G7 80EUs (8890 - 10652, n=11) | |
| Lenovo ThinkPad T16 G1 21BWS00200 | |
| HP ProBook 450 G9 6A180EA | |
| Lenovo ThinkPad E15 G3-20YG003UGE | |
| Lenovo ThinkPad T15 Gen2-20W5S00100 | |
| HP ZBook Power 15 G8 313S5EA | |
| PCMark 10 / Productivity | |
| Media della classe Office (5336 - 17243, n=63, ultimi 2 anni) | |
| Lenovo ThinkPad L15 G2 AMD | |
| Dell Inspiron 16 Plus 7620 | |
| Lenovo ThinkPad T15 Gen2-20W5S00100 | |
| Lenovo ThinkPad X1 Extreme G4-20Y5CTO1WW (3050 Ti) | |
| Lenovo ThinkPad E15 G3-20YG003UGE | |
| HP ZBook Power 15 G8 313S5EA | |
| Huawei MateBook D 16 2022 | |
| HP ProBook 450 G9 6A180EA | |
| Media Intel Core i5-1240P, Intel Iris Xe Graphics G7 80EUs (6118 - 7058, n=11) | |
| Lenovo ThinkPad T16 G1 21BWS00200 | |
| PCMark 10 / Digital Content Creation | |
| Dell Inspiron 16 Plus 7620 | |
| Lenovo ThinkPad X1 Extreme G4-20Y5CTO1WW (3050 Ti) | |
| Media della classe Office (2049 - 13541, n=63, ultimi 2 anni) | |
| Huawei MateBook D 16 2022 | |
| Media Intel Core i5-1240P, Intel Iris Xe Graphics G7 80EUs (5169 - 6213, n=11) | |
| Lenovo ThinkPad E15 G3-20YG003UGE | |
| Lenovo ThinkPad T16 G1 21BWS00200 | |
| Lenovo ThinkPad T15 Gen2-20W5S00100 | |
| HP ZBook Power 15 G8 313S5EA | |
| Lenovo ThinkPad L15 G2 AMD | |
| HP ProBook 450 G9 6A180EA | |
| CrossMark / Overall | |
| Huawei MateBook D 16 2022 | |
| Dell Inspiron 16 Plus 7620 | |
| Media Intel Core i5-1240P, Intel Iris Xe Graphics G7 80EUs (1392 - 1553, n=7) | |
| Media della classe Office (381 - 2010, n=74, ultimi 2 anni) | |
| HP ZBook Power 15 G8 313S5EA | |
| Lenovo ThinkPad T16 G1 21BWS00200 | |
| HP ProBook 450 G9 6A180EA | |
| CrossMark / Productivity | |
| Huawei MateBook D 16 2022 | |
| Dell Inspiron 16 Plus 7620 | |
| HP ZBook Power 15 G8 313S5EA | |
| Media Intel Core i5-1240P, Intel Iris Xe Graphics G7 80EUs (1393 - 1524, n=7) | |
| Media della classe Office (464 - 1880, n=74, ultimi 2 anni) | |
| Lenovo ThinkPad T16 G1 21BWS00200 | |
| HP ProBook 450 G9 6A180EA | |
| CrossMark / Creativity | |
| Huawei MateBook D 16 2022 | |
| Dell Inspiron 16 Plus 7620 | |
| Media della classe Office (319 - 2361, n=74, ultimi 2 anni) | |
| Media Intel Core i5-1240P, Intel Iris Xe Graphics G7 80EUs (1426 - 1647, n=7) | |
| HP ZBook Power 15 G8 313S5EA | |
| Lenovo ThinkPad T16 G1 21BWS00200 | |
| HP ProBook 450 G9 6A180EA | |
| CrossMark / Responsiveness | |
| Huawei MateBook D 16 2022 | |
| Dell Inspiron 16 Plus 7620 | |
| Media Intel Core i5-1240P, Intel Iris Xe Graphics G7 80EUs (1267 - 1545, n=7) | |
| Lenovo ThinkPad T16 G1 21BWS00200 | |
| Media della classe Office (360 - 1690, n=74, ultimi 2 anni) | |
| HP ZBook Power 15 G8 313S5EA | |
| HP ProBook 450 G9 6A180EA | |
| Sunspider / 1.0 Total Score | |
| Lenovo ThinkPad T16 G1 21BWS00200 | |
| Media Intel Core i5-1240P, Intel Iris Xe Graphics G7 80EUs (n=1) | |
| Media della classe Office (87.2 - 111.8, n=2, ultimi 2 anni) | |
| HP ProBook 450 G9 6A180EA | |
| Mozilla Kraken 1.1 / Total | |
| Lenovo ThinkPad E15 G3-20YG003UGE | |
| HP ProBook 450 G9 6A180EA | |
| Media Intel Core i5-1240P, Intel Iris Xe Graphics G7 80EUs (575 - 1422, n=12) | |
| HP ZBook Power 15 G8 313S5EA | |
| Lenovo ThinkPad L15 G2 AMD | |
| Lenovo ThinkPad T15 Gen2-20W5S00100 | |
| Lenovo ThinkPad X1 Extreme G4-20Y5CTO1WW (3050 Ti) | |
| Lenovo ThinkPad T16 G1 21BWS00200 | |
| Media della classe Office (391 - 1297, n=76, ultimi 2 anni) | |
| Dell Inspiron 16 Plus 7620 | |
| Huawei MateBook D 16 2022 | |
| Speedometer 2.0 / Result 2.0 | |
| Media della classe Office (173 - 640, n=17, ultimi 2 anni) | |
| Huawei MateBook D 16 2022 | |
| Media Intel Core i5-1240P, Intel Iris Xe Graphics G7 80EUs (241 - 266, n=3) | |
| Lenovo ThinkPad T16 G1 21BWS00200 | |
| HP ProBook 450 G9 6A180EA | |
| Octane V2 / Total Score | |
| Media della classe Office (49011 - 122119, n=19, ultimi 2 anni) | |
| Huawei MateBook D 16 2022 | |
| Lenovo ThinkPad T16 G1 21BWS00200 | |
| Media Intel Core i5-1240P, Intel Iris Xe Graphics G7 80EUs (70915 - 80743, n=5) | |
| HP ProBook 450 G9 6A180EA | |
| HP ZBook Power 15 G8 313S5EA | |
| Jetstream 2 / 2.0 Total | |
| Media della classe Office (126.6 - 455, n=20, ultimi 2 anni) | |
| Media Intel Core i5-1240P, Intel Iris Xe Graphics G7 80EUs (203 - 418, n=4) | |
| Dell Inspiron 16 Plus 7620 | |
| Huawei MateBook D 16 2022 | |
| Lenovo ThinkPad T16 G1 21BWS00200 | |
| HP ProBook 450 G9 6A180EA | |
| HP ZBook Power 15 G8 313S5EA | |
| WebXPRT 3 / Overall | |
| Huawei MateBook D 16 2022 | |
| Dell Inspiron 16 Plus 7620 | |
| Media della classe Office (129.9 - 455, n=73, ultimi 2 anni) | |
| Lenovo ThinkPad X1 Extreme G4-20Y5CTO1WW (3050 Ti) | |
| HP ZBook Power 15 G8 313S5EA | |
| Lenovo ThinkPad L15 G2 AMD | |
| Lenovo ThinkPad T16 G1 21BWS00200 | |
| Media Intel Core i5-1240P, Intel Iris Xe Graphics G7 80EUs (119.2 - 268, n=11) | |
| Lenovo ThinkPad E15 G3-20YG003UGE | |
| HP ProBook 450 G9 6A180EA | |
| WebXPRT 4 / Overall | |
| Huawei MateBook D 16 2022 | |
| Dell Inspiron 16 Plus 7620 | |
| Media della classe Office (104.2 - 313, n=75, ultimi 2 anni) | |
| Lenovo ThinkPad T16 G1 21BWS00200 | |
| Media Intel Core i5-1240P, Intel Iris Xe Graphics G7 80EUs (217 - 231, n=6) | |
| HP ProBook 450 G9 6A180EA | |
* ... Meglio usare valori piccoli
| PCMark 10 Score | 5007 punti | |
Aiuto | ||
| AIDA64 / Memory Copy | |
| Media della classe Office (20075 - 110930, n=76, ultimi 2 anni) | |
| Huawei MateBook D 16 2022 | |
| Dell Inspiron 16 Plus 7620 | |
| Media Intel Core i5-1240P (23312 - 70537, n=16) | |
| Lenovo ThinkPad X1 Extreme G4-20Y5CTO1WW (3050 Ti) | |
| Lenovo ThinkPad E15 G3-20YG003UGE | |
| HP ZBook Power 15 G8 313S5EA | |
| Lenovo ThinkPad T16 G1 21BWS00200 | |
| HP ProBook 450 G9 6A180EA | |
| Lenovo ThinkPad L15 G2 AMD | |
| AIDA64 / Memory Read | |
| Media della classe Office (10084 - 128030, n=77, ultimi 2 anni) | |
| Dell Inspiron 16 Plus 7620 | |
| Huawei MateBook D 16 2022 | |
| Media Intel Core i5-1240P (18989 - 70553, n=16) | |
| Lenovo ThinkPad E15 G3-20YG003UGE | |
| Lenovo ThinkPad X1 Extreme G4-20Y5CTO1WW (3050 Ti) | |
| HP ZBook Power 15 G8 313S5EA | |
| Lenovo ThinkPad T16 G1 21BWS00200 | |
| Lenovo ThinkPad L15 G2 AMD | |
| HP ProBook 450 G9 6A180EA | |
| AIDA64 / Memory Write | |
| Media della classe Office (20073 - 119858, n=77, ultimi 2 anni) | |
| Huawei MateBook D 16 2022 | |
| Dell Inspiron 16 Plus 7620 | |
| Media Intel Core i5-1240P (23454 - 62496, n=16) | |
| Lenovo ThinkPad X1 Extreme G4-20Y5CTO1WW (3050 Ti) | |
| Lenovo ThinkPad E15 G3-20YG003UGE | |
| Lenovo ThinkPad L15 G2 AMD | |
| Lenovo ThinkPad T16 G1 21BWS00200 | |
| HP ProBook 450 G9 6A180EA | |
| HP ZBook Power 15 G8 313S5EA | |
| AIDA64 / Memory Latency | |
| Media Intel Core i5-1240P (85.1 - 188.3, n=11) | |
| Huawei MateBook D 16 2022 | |
| Lenovo ThinkPad E15 G3-20YG003UGE | |
| Media della classe Office (7.6 - 162.9, n=72, ultimi 2 anni) | |
| Dell Inspiron 16 Plus 7620 | |
| Lenovo ThinkPad T16 G1 21BWS00200 | |
| Lenovo ThinkPad L15 G2 AMD | |
| Lenovo ThinkPad X1 Extreme G4-20Y5CTO1WW (3050 Ti) | |
| HP ProBook 450 G9 6A180EA | |
| HP ZBook Power 15 G8 313S5EA | |
* ... Meglio usare valori piccoli
Latenza DPC
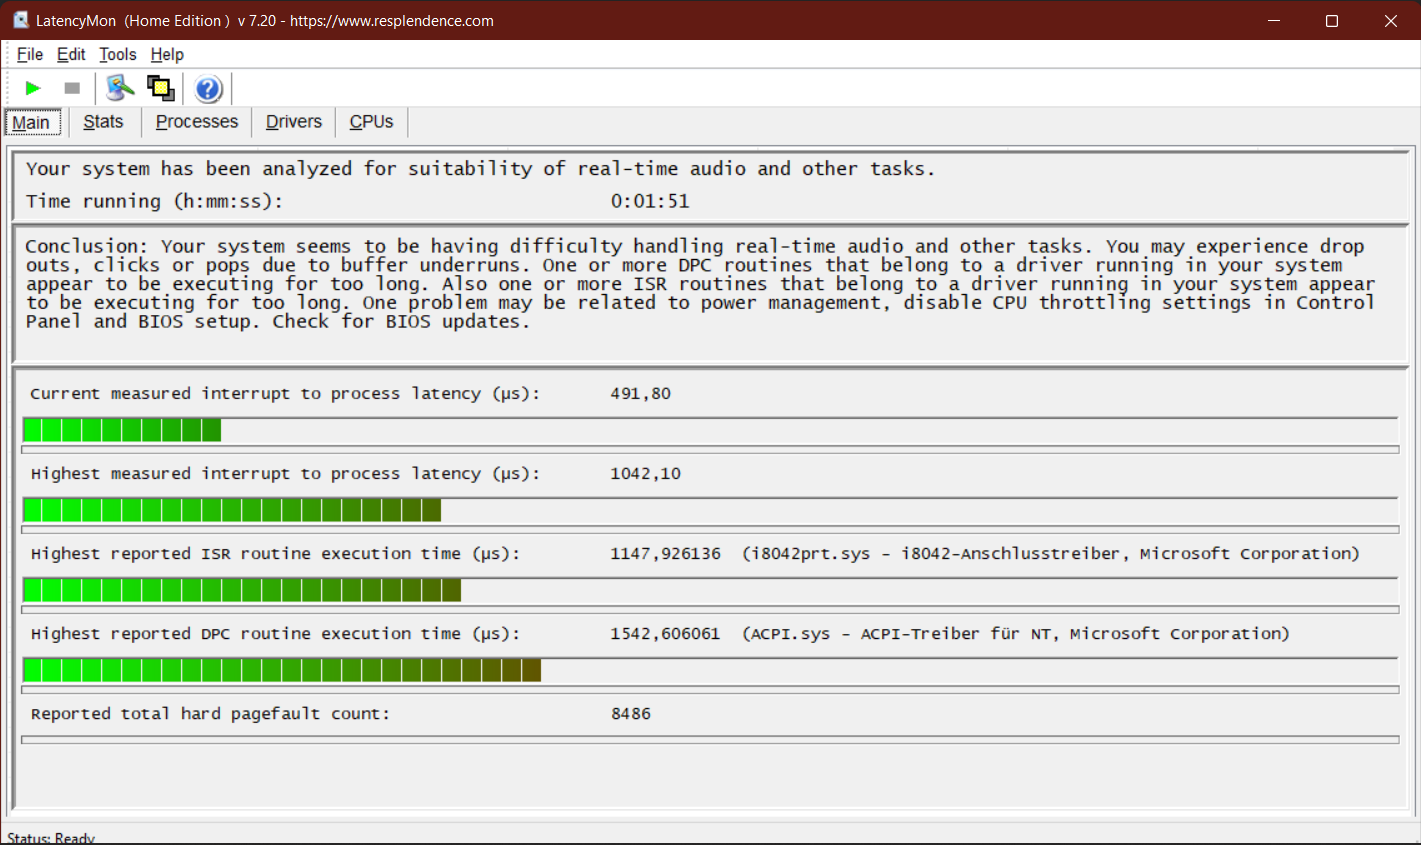
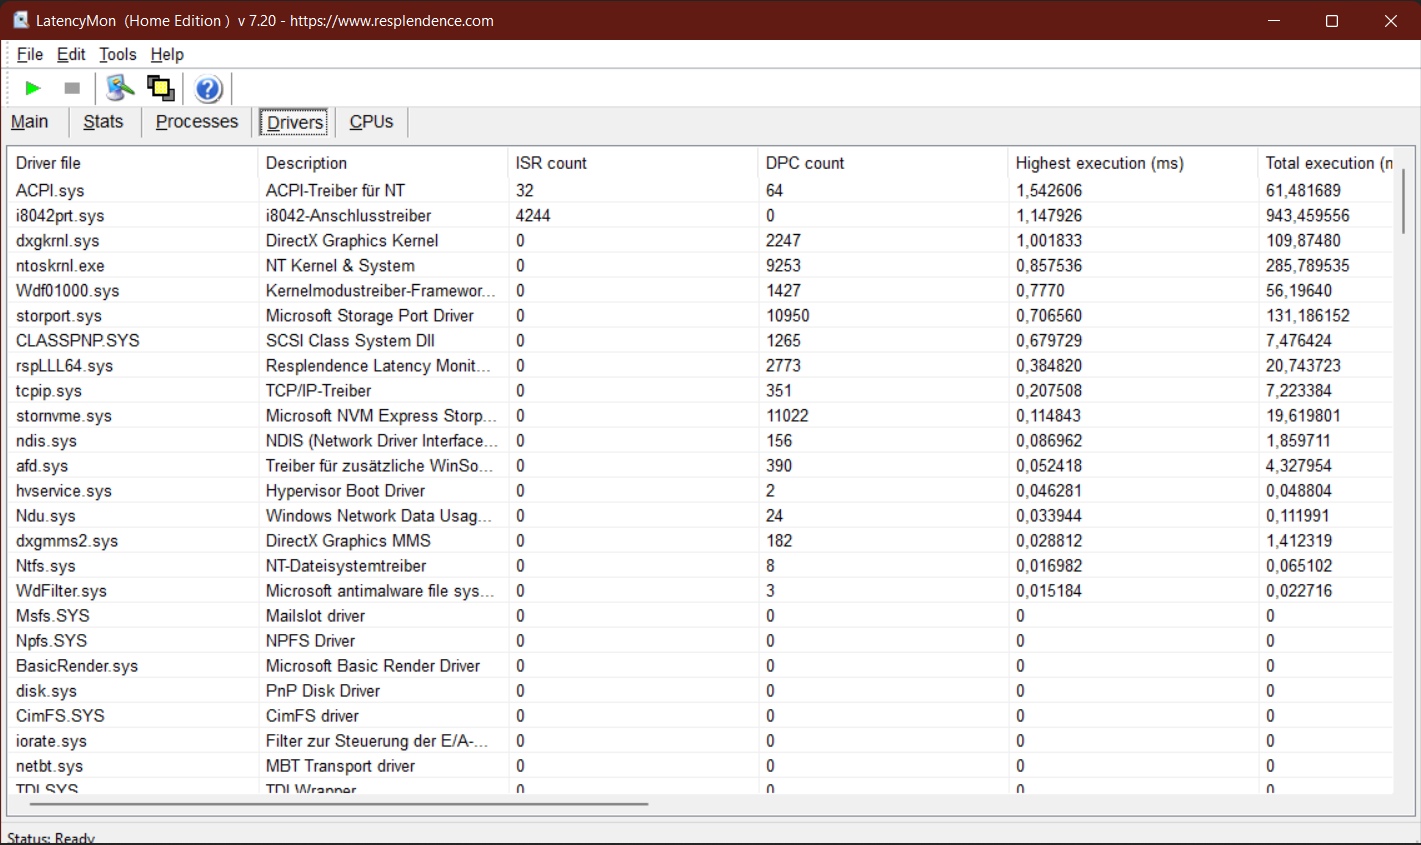
| DPC Latencies / LatencyMon - interrupt to process latency (max), Web, Youtube, Prime95 | |
| HP ProBook 450 G9 6A180EA | |
| Lenovo ThinkPad L15 G2 AMD | |
| Lenovo ThinkPad T16 G1 21BWS00200 | |
| Lenovo ThinkPad T15 Gen2-20W5S00100 | |
| Dell Inspiron 16 Plus 7620 | |
| Lenovo ThinkPad E15 G3-20YG003UGE | |
| Huawei MateBook D 16 2022 | |
| HP ZBook Power 15 G8 313S5EA | |
* ... Meglio usare valori piccoli
Dispositivi di archiviazione
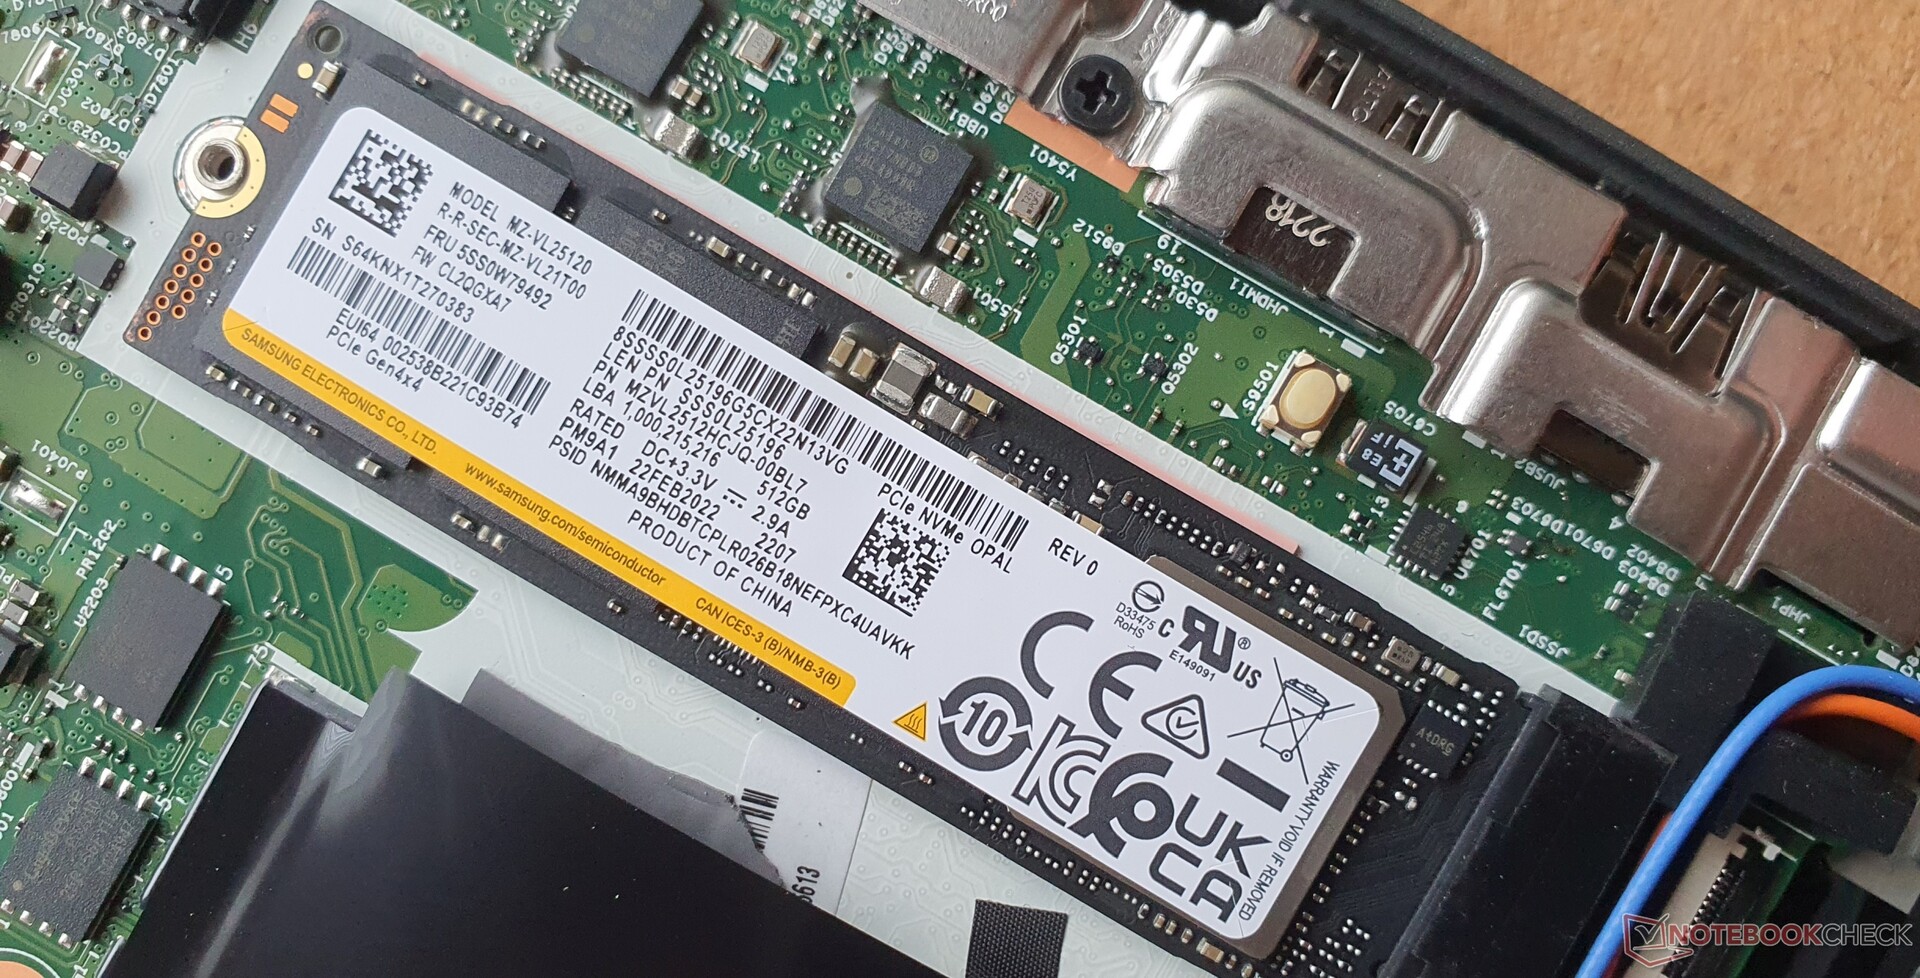
Il modello PM9A1 di Samsungè un'unità SSD PCIe 4.0 con una capacità di 512 GB. La velocità è buona, ma le letture 4K 16/64 sono piuttosto lente e si dimezzano rapidamente nel test read-loop a causa del surriscaldamento. Il predecessore aveva un'unità SSD più veloce e il resto del nostro campo di confronto ha prestazioni simili a quelle del nostro campione in esame.
| Lenovo ThinkPad T16 G1 21BWS00200 Samsung PM9A1 MZVL2512HCJQ | Lenovo ThinkPad T15 Gen2-20W5S00100 Samsung PM981a MZVLB1T0HBLR | Lenovo ThinkPad X1 Extreme G4-20Y5CTO1WW (3050 Ti) Samsung PM9A1 MZVL21T0HCLR | HP ZBook Power 15 G8 313S5EA Samsung PM9A1 MZVL2512HCJQ | HP ProBook 450 G9 6A180EA SK Hynix HFM512GD3JX013N | Huawei MateBook D 16 2022 Silicon Motion PCIe-8 SSD | Dell Inspiron 16 Plus 7620 Kioxia BG5 KBG50ZNS512G | Lenovo ThinkPad E15 G3-20YG003UGE SK Hynix PC711 1TB HFS001TDE9X084N | Lenovo ThinkPad L15 G2 AMD SK Hynix HFS512 GDE9X081N | |
|---|---|---|---|---|---|---|---|---|---|
| DiskSpd | 104% | 18% | 60% | -38% | 36% | -15% | 67% | -10% | |
| seq read (MB/s) | 3645 | 2090 -43% | 3285 -10% | 3354.8 -8% | 1914 -47% | 2012 -45% | 2355 -35% | 1624 -55% | 1688 -54% |
| seq write (MB/s) | 2809 | 2270 -19% | 2886 3% | 1353.3 -52% | 1762 -37% | 1438 -49% | 2020 -28% | 1901 -32% | 2072 -26% |
| seq q8 t1 read (MB/s) | 6524 | 3448 -47% | 6641 2% | 6230 -5% | 3463 -47% | 2883 -56% | 2569 -61% | 3269 -50% | 3582 -45% |
| seq q8 t1 write (MB/s) | 4812 | 2945 -39% | 4922 2% | 4757.9 -1% | 2600 -46% | 1911 -60% | 2752 -43% | 3250 -32% | 3072 -36% |
| 4k q1 t1 read (MB/s) | 68.2 | 74.4 9% | 78.4 15% | 51.8 -24% | 52.7 -23% | 43.1 -37% | 62.7 -8% | 57.4 -16% | 46.7 -32% |
| 4k q1 t1 write (MB/s) | 134.8 | 231 71% | 161 19% | 150.2 11% | 112.4 -17% | 273 103% | 162.6 21% | 128 -5% | 123 -9% |
| 4k q32 t16 read (MB/s) | 683 | 2506 267% | 1270 86% | 2187 220% | 328 -52% | 1391 104% | 652 -5% | 2037 198% | 983 44% |
| 4k q32 t16 write (MB/s) | 293 | 2137 629% | 373 27% | 1284.7 338% | 192.2 -34% | 1241 324% | 408 39% | 1833 526% | 521 78% |
| AS SSD | 11% | 28% | 22% | -21% | 11% | -23% | 12% | -8% | |
| Seq Read (MB/s) | 3225 | 2694 -16% | 4588 42% | 4951 54% | 2687 -17% | 2802 -13% | 2693.29 -16% | 2432 -25% | 2721 -16% |
| Seq Write (MB/s) | 1567 | 2370 51% | 1625 4% | 3725 138% | 1476.14 -6% | 1879 20% | 1683.46 7% | 1266 -19% | 1329 -15% |
| 4K Read (MB/s) | 69.7 | 68.4 -2% | 75.2 8% | 52.9 -24% | 60 -14% | 61.03 -12% | 65.01 -7% | 48.88 -30% | 51.5 -26% |
| 4K Write (MB/s) | 170.9 | 208.1 22% | 182.9 7% | 105.35 -38% | 176.81 3% | 248.56 45% | 197.81 16% | 128.4 -25% | 132.5 -22% |
| 4K-64 Read (MB/s) | 720 | 1961 172% | 1318 83% | 2200.26 206% | 696.46 -3% | 1135.53 58% | 855.48 19% | 1805 151% | 932 29% |
| 4K-64 Write (MB/s) | 2682 | 1935 -28% | 3056 14% | 2314.41 -14% | 1624.91 -39% | 1402.68 -48% | 395.8 -85% | 2470 -8% | 1856 -31% |
| Access Time Read * (ms) | 0.059 | 0.032 46% | 0.041 31% | 0.054 8% | 0.04 32% | 0.025 58% | 0.078 -32% | 0.044 25% | 0.038 36% |
| Access Time Write * (ms) | 0.024 | 0.081 -238% | 0.022 8% | 0.04 -67% | 0.028 -17% | 0.016 33% | 0.06 -150% | 0.038 -58% | 0.028 -17% |
| Score Read (Points) | 1112 | 2299 107% | 1852 67% | 2748 147% | 1025 -8% | 1477 33% | 1190 7% | 2097 89% | 1256 13% |
| Score Write (Points) | 3010 | 2380 -21% | 3402 13% | 2792 -7% | 1949 -35% | 1839 -39% | 762 -75% | 2725 -9% | 2122 -30% |
| Score Total (Points) | 4630 | 5846 26% | 6069 31% | 6880 49% | 3457 -25% | 4039 -13% | 2529 -45% | 5837 26% | 3961 -14% |
| Copy ISO MB/s (MB/s) | 1639 | 1287.6 -21% | 863.41 -47% | 1352.52 -17% | 1634.1 0% | 1301 -21% | |||
| Copy Program MB/s (MB/s) | 326.8 | 115.3 -65% | 127.34 -61% | 435.92 33% | 379.46 16% | 554 70% | |||
| Copy Game MB/s (MB/s) | 942.7 | 390.1 -59% | 384.67 -59% | 1058.52 12% | 1174.45 25% | 993 5% | |||
| Media totale (Programma / Settaggio) | 58% /
50% | 23% /
24% | 41% /
36% | -30% /
-27% | 24% /
20% | -19% /
-20% | 40% /
32% | -9% /
-9% |
* ... Meglio usare valori piccoli
* ... Meglio usare valori piccoli
Sustained Read Performance: DiskSpd Read Loop, Queue Depth 8
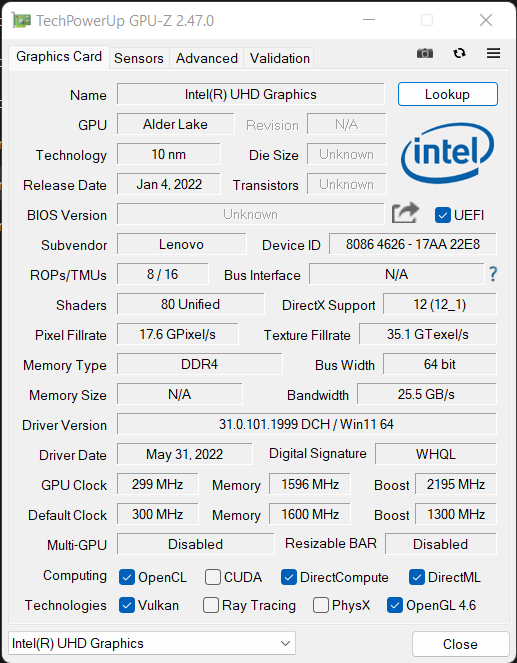
Scheda grafica
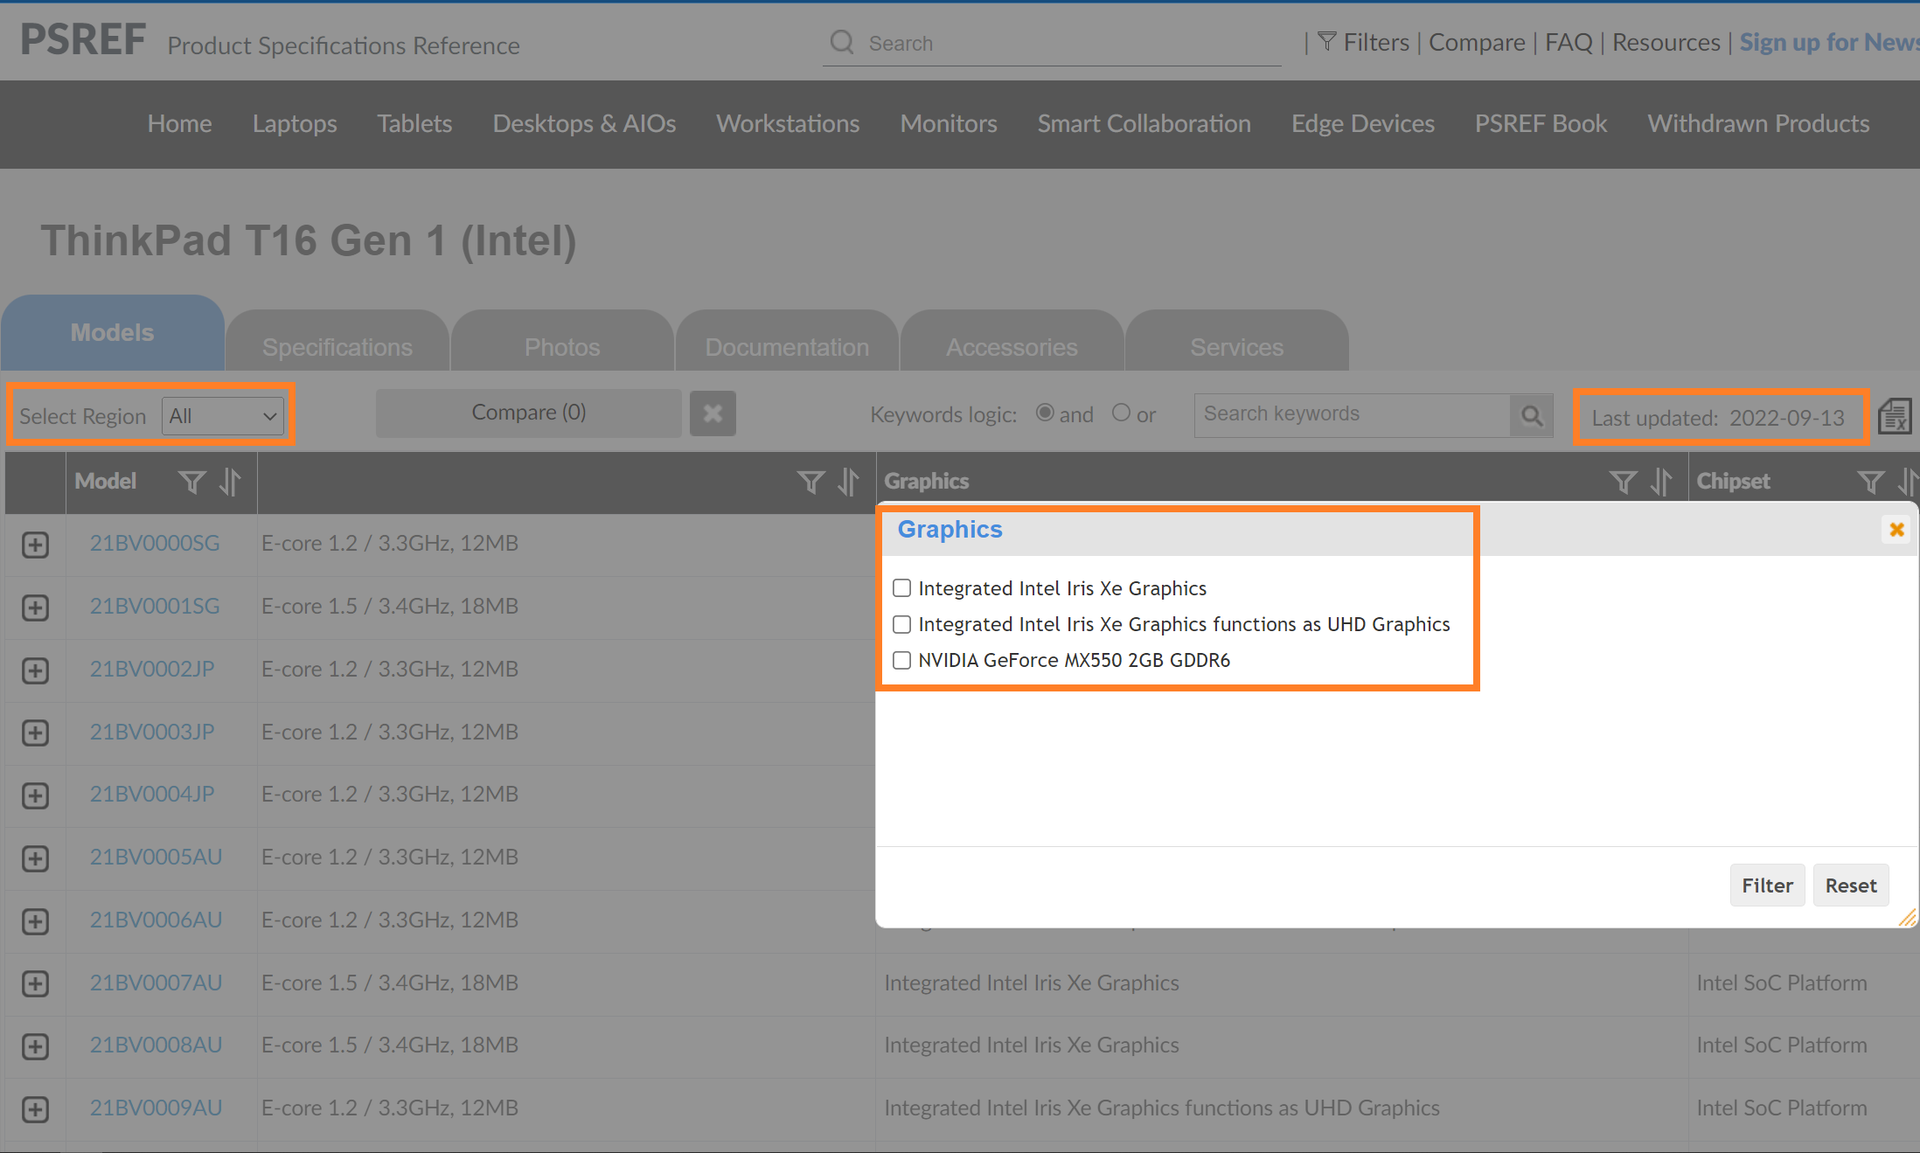
L'integratoIntel UHD Graphics è tecnicamente un Xe G7 (80 EUs)che è legato alla RAM a canale singolo. Di conseguenza, le sue prestazioni sono limitate e i livelli di dettaglio bassi sono all'ordine del giorno. Dato che il notebook non è stato progettato per i giochi, questa situazione è tollerabile e può essere migliorata in modo significativo con un secondo modulo RAM. Il MX450del predecessore sarebbe un buon miglioramento, mentre il modello GeForce, disponibile come opzione, è in grado di offrire un'ottima qualità MX550 è ancora più veloce.
Il ThinkPad T16 è stato annunciato anche con una scheda opzionale NvidiaGeForce RTX 2050che non è nemmeno elencata nelle schede tecniche, ma solo come nota che non è disponibile nella regione EMEA. In modalità batteria, gli fps nelle impostazioni di The Witcher 3 @Medium scendono da 32 a 24, il che corrisponde a un throttling del 25%. I 1.300 MHz scendono a ~750 MHz.
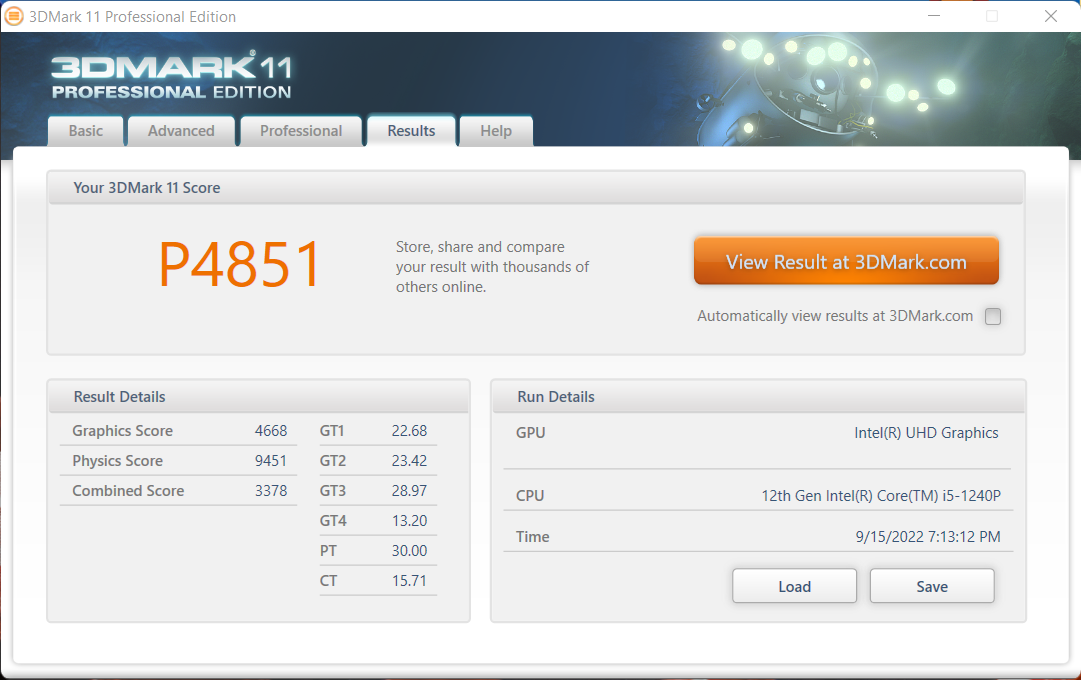
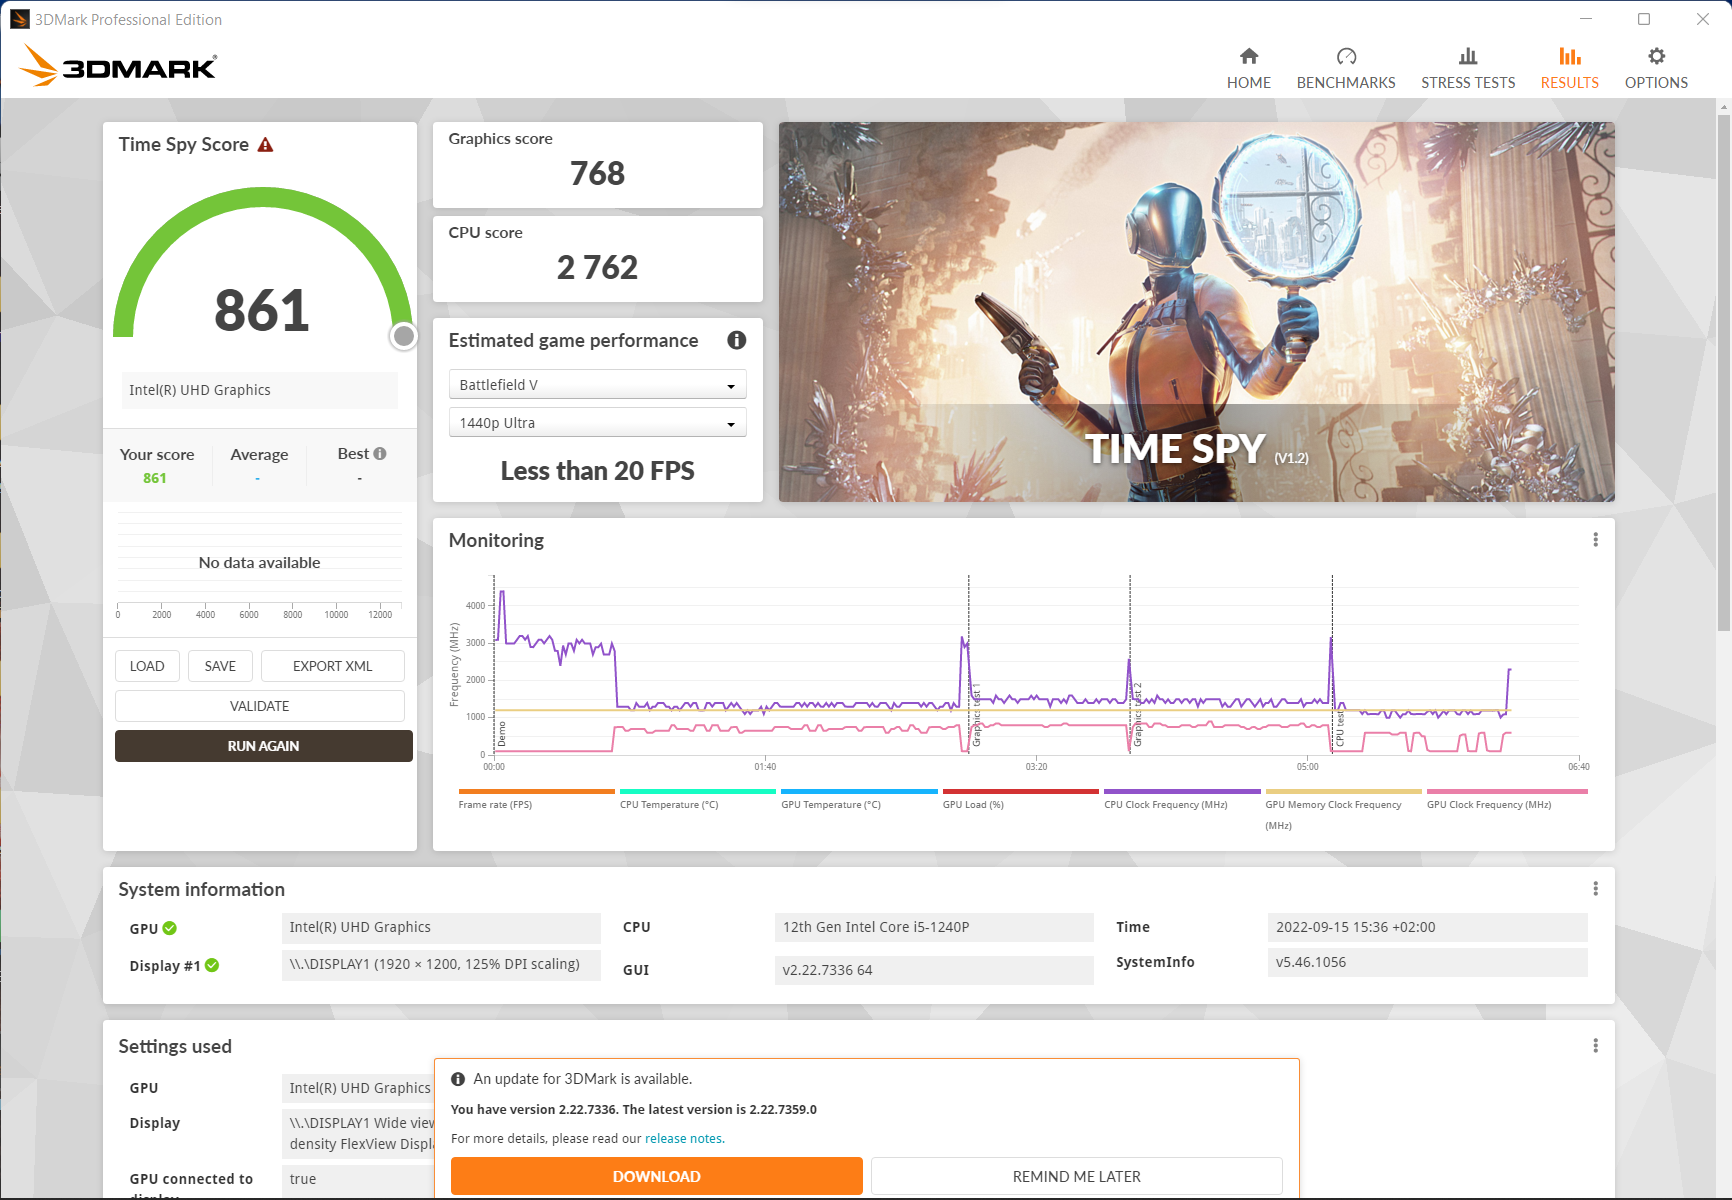
| 3DMark 11 Performance | 4851 punti | |
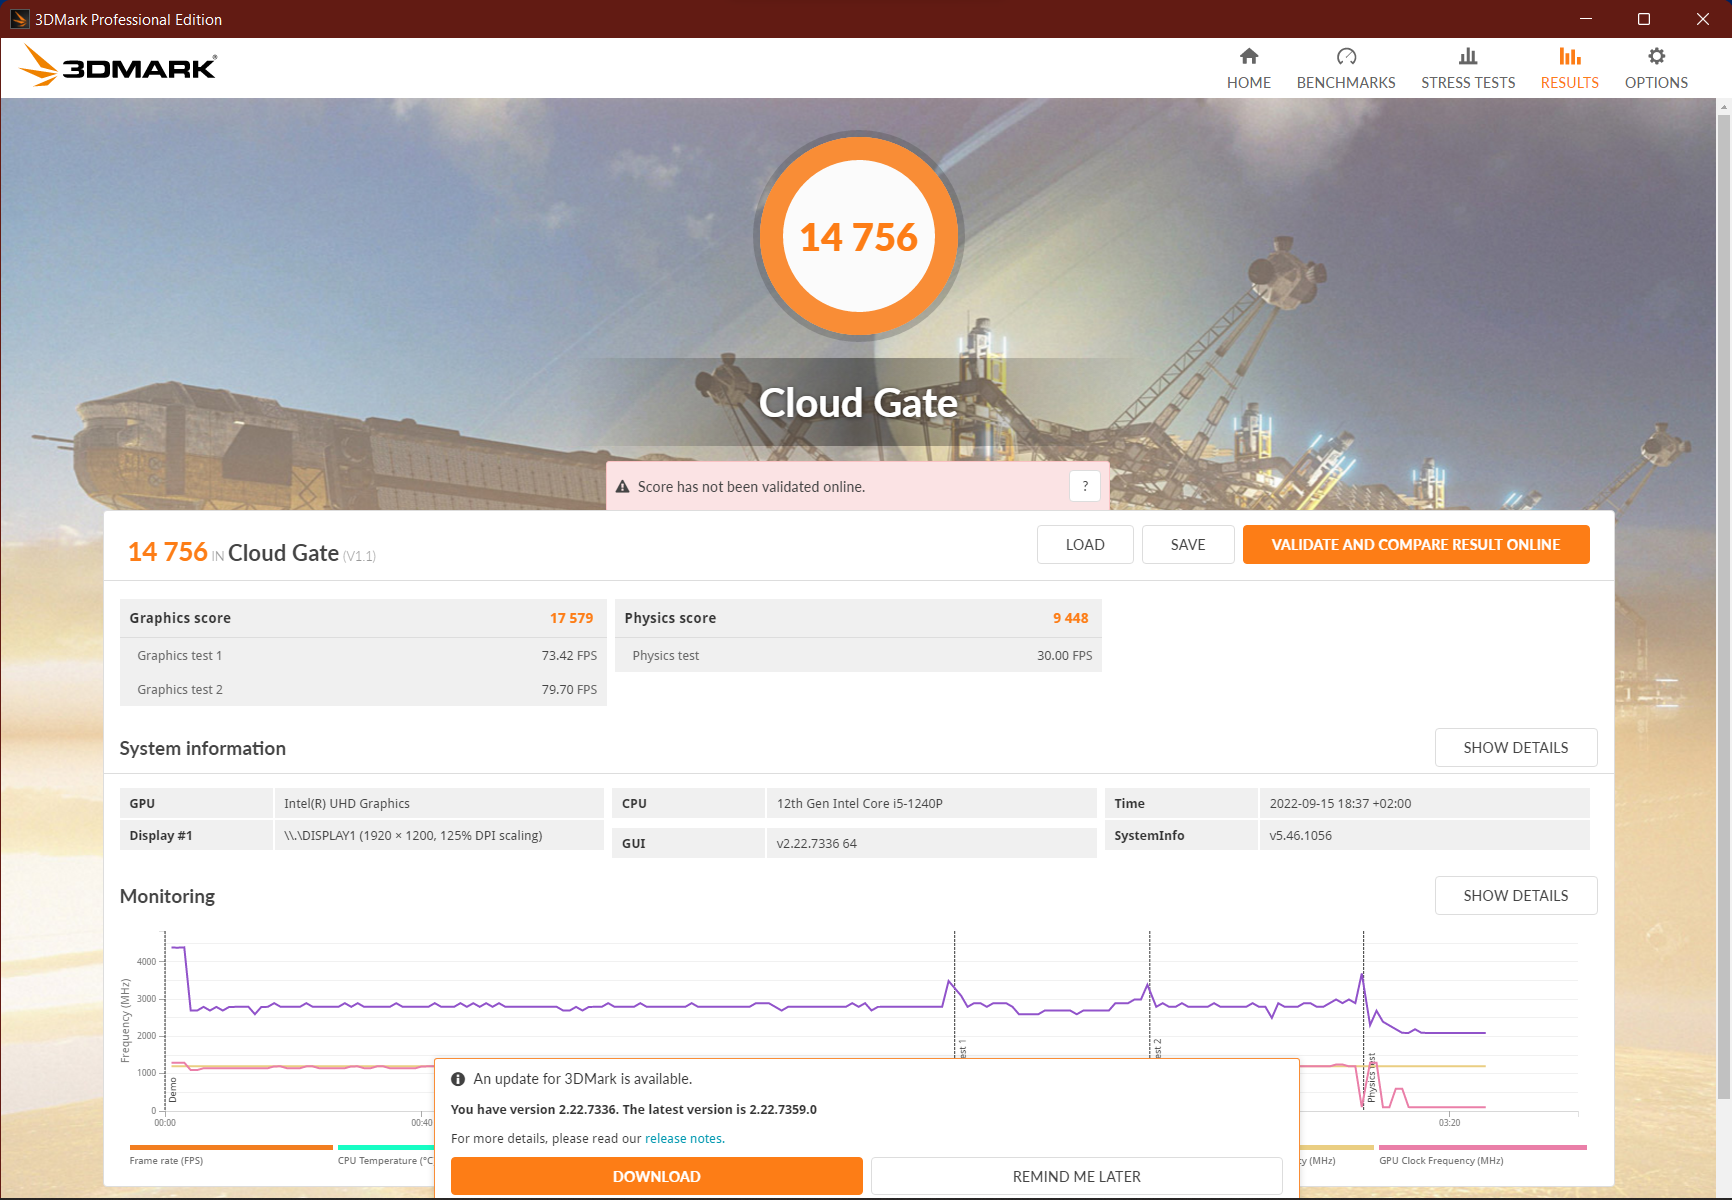
| 3DMark Cloud Gate Standard Score | 14756 punti | |
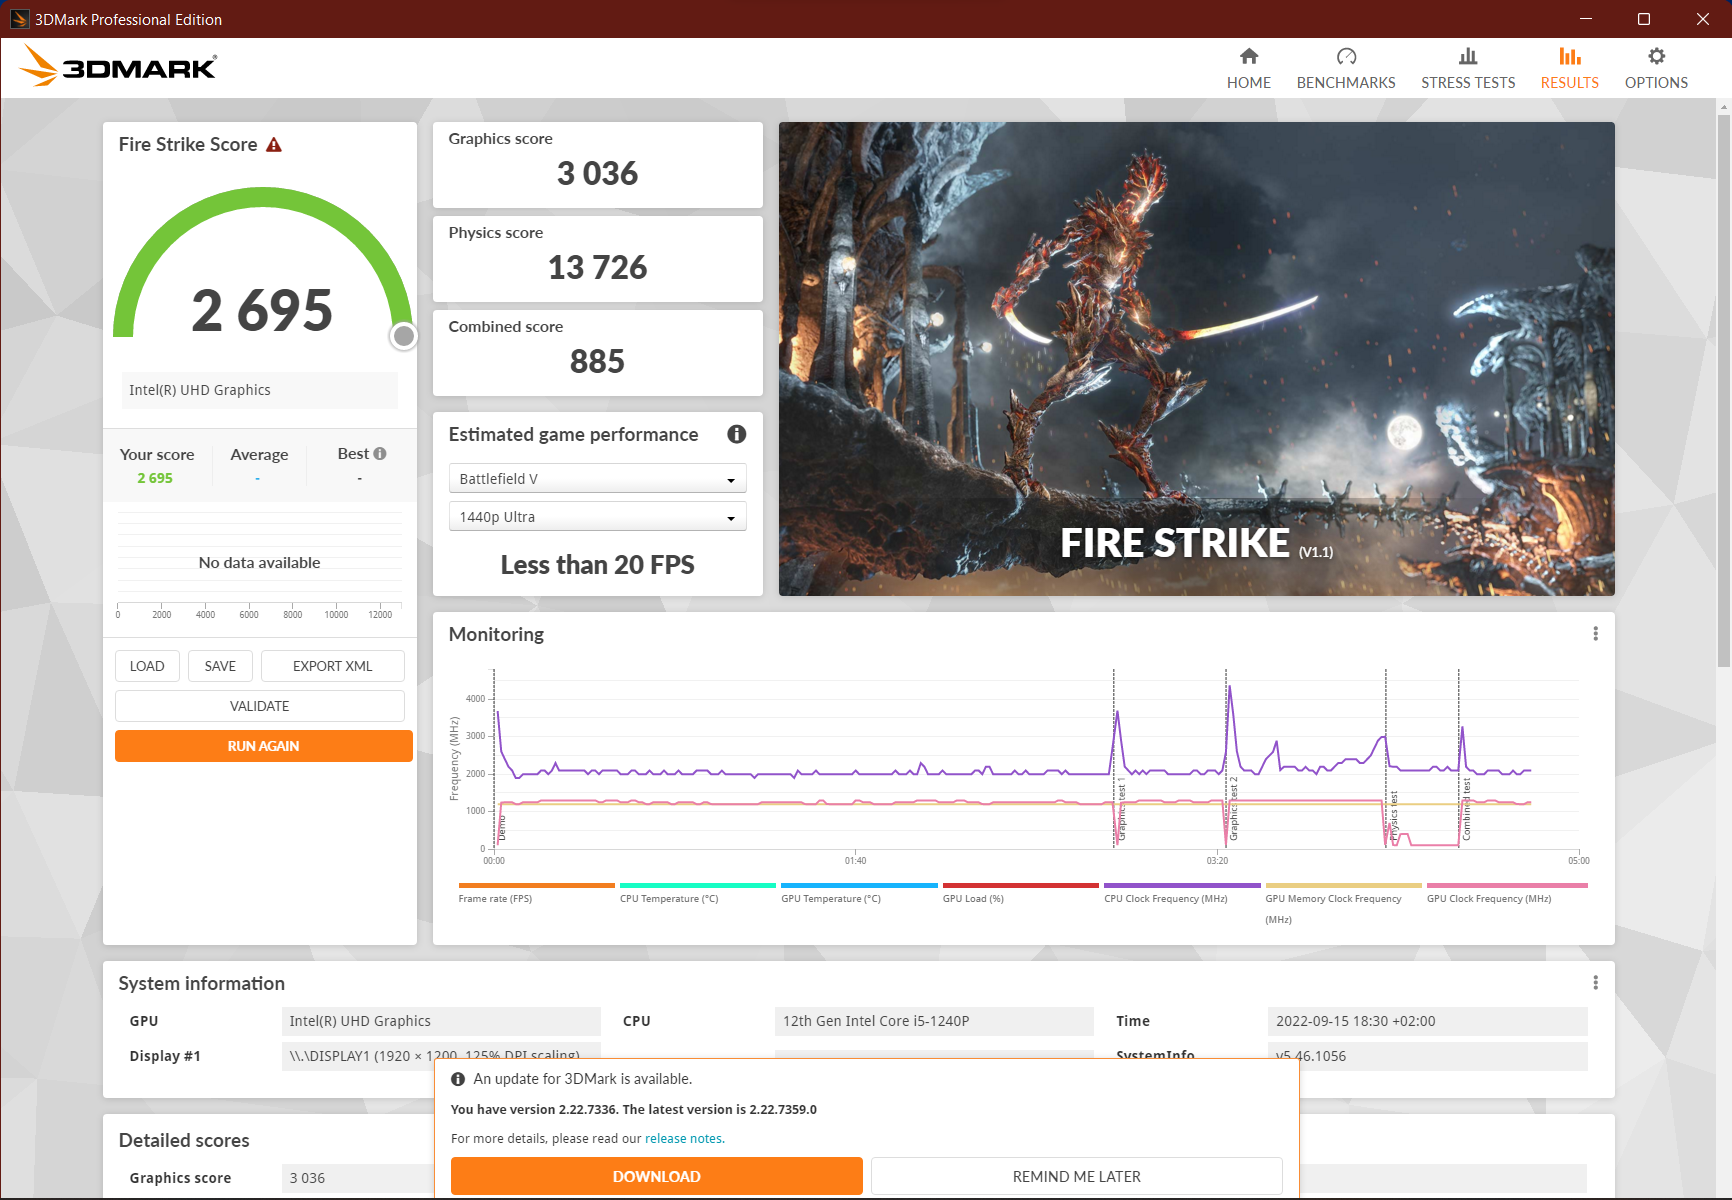
| 3DMark Fire Strike Score | 2695 punti | |
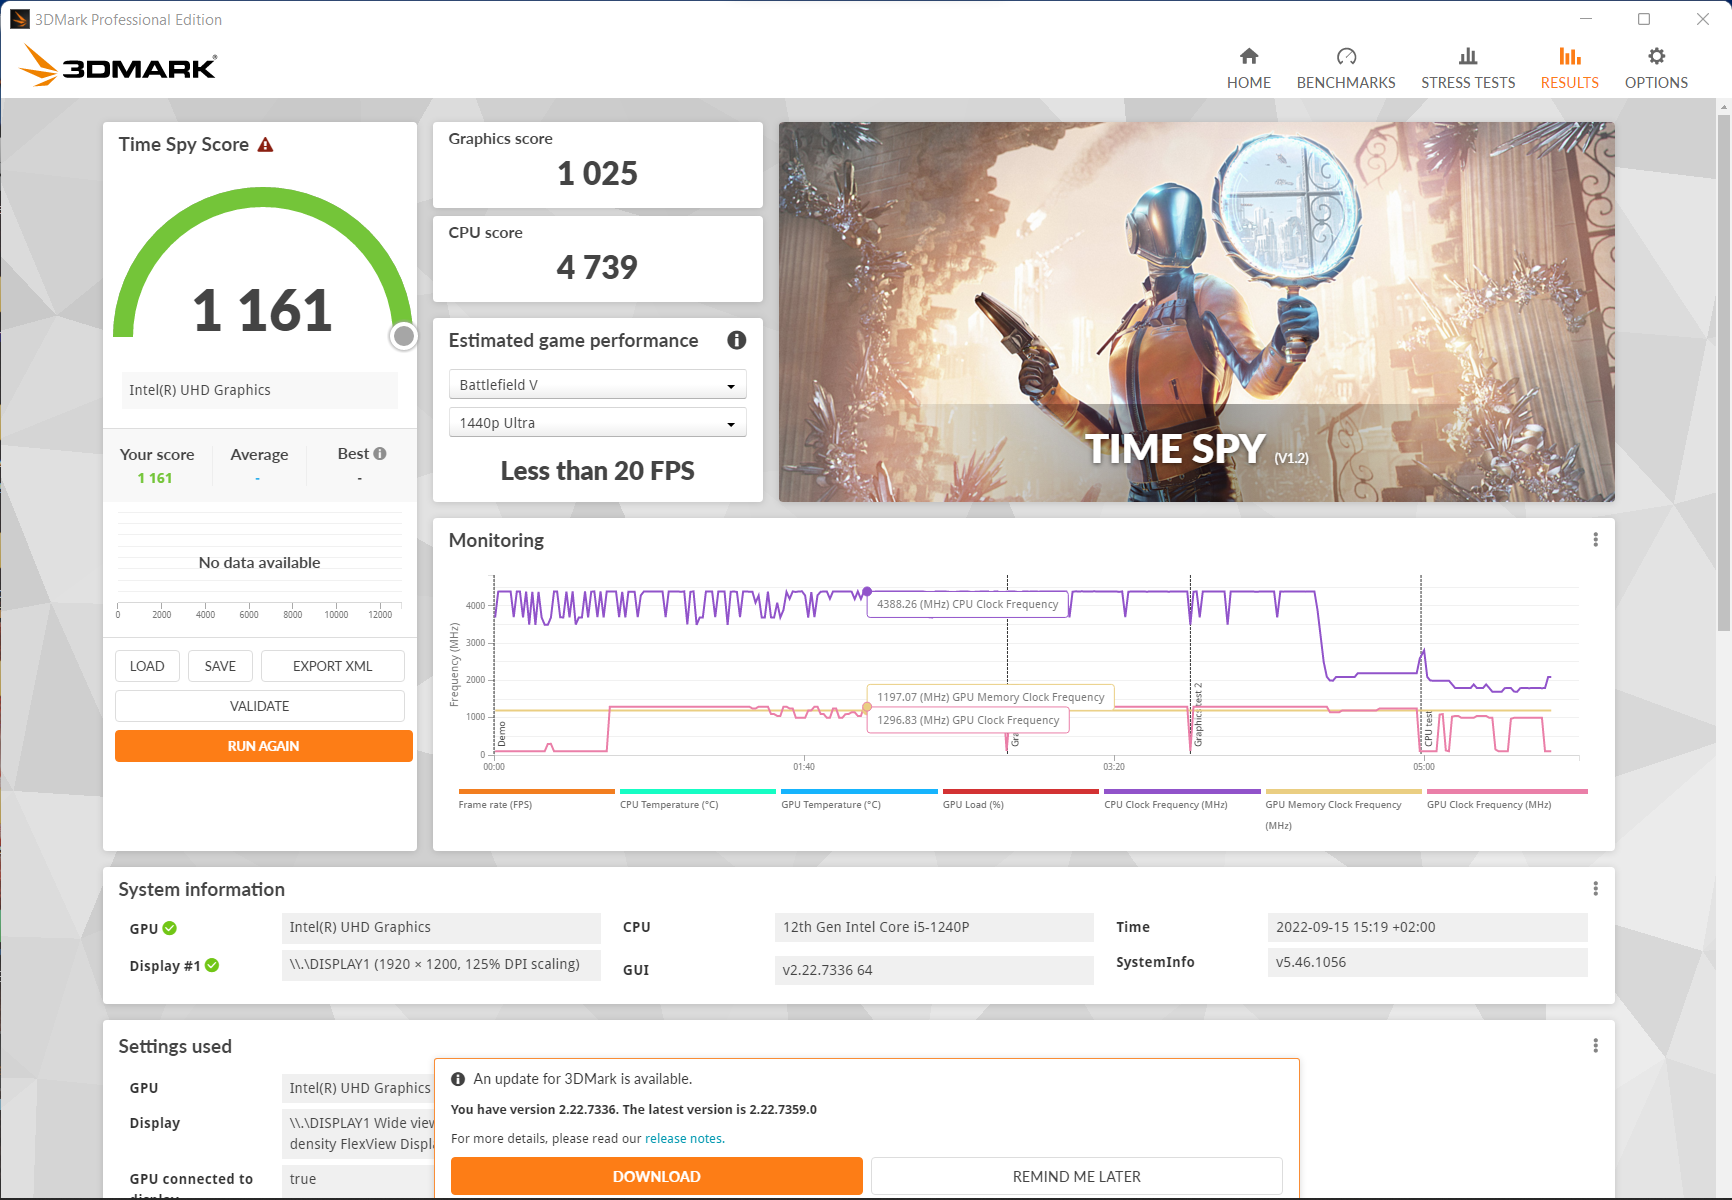
| 3DMark Time Spy Score | 1161 punti | |
Aiuto | ||
| Shadow of the Tomb Raider - 1280x720 Lowest Preset | |
| HP ZBook Power 15 G8 313S5EA | |
| Media della classe Office (16 - 105, n=3, ultimi 2 anni) | |
| Media Intel Iris Xe Graphics G7 80EUs (31 - 62.8, n=6) | |
| HP ProBook 450 G9 6A180EA | |
| Lenovo ThinkPad T16 G1 21BWS00200 | |
| GRID Legends - 1920x1080 Medium Preset | |
| HP ZBook Power 15 G8 313S5EA | |
| Media Intel Iris Xe Graphics G7 80EUs (25.7 - 39.7, n=4) | |
| HP ProBook 450 G9 6A180EA | |
| Lenovo ThinkPad T16 G1 21BWS00200 | |
Witcher 3 FPS Chart
| basso | medio | alto | ultra | |
|---|---|---|---|---|
| GTA V (2015) | 61.9 | 50.1 | 9.54 | |
| The Witcher 3 (2015) | 50.7 | 32.1 | 15.7 | 8.36 |
| Dota 2 Reborn (2015) | 97.5 | 66.3 | 35.2 | 32.7 |
| Final Fantasy XV Benchmark (2018) | 24.9 | 13.5 | ||
| X-Plane 11.11 (2018) | 42.5 | 29.1 | 26.5 | |
| Far Cry 5 (2018) | 30 | 15 | 14 | 13 |
| Strange Brigade (2018) | 52.7 | 20.3 | 17 | 13.8 |
| Shadow of the Tomb Raider (2018) | 31 | 11 | ||
| GRID Legends (2022) | 36.2 | 25.7 | 21 |
Emissioni - Un portatile da 16 pollici per lo più silenzioso di Lenovo
Rumore
Quando è inattivo, il ThinkPad T16 rimane assolutamente silenzioso. Anche durante la navigazione web intensiva e le attività ad alta intensità di CPU, la ventola rimane così silenziosa, con una media di 25 dB(A), che è difficile distinguerla dal rumore ambientale.
Solo sotto carico combinato, ad esempio durante i giochi, ci si rende conto che non si tratta di un dispositivo raffreddato passivamente, anche se il portatile mantiene comunque un profilo basso con 32 dB(A). Tuttavia, la ventola funziona a toni piuttosto elevati. Almeno non ci sono rumori elettronici fastidiosi.
Solo il ThinkPad L15 G2 AMD di e il ProBook 450 G9 di HP sono altrettanto silenziosi
Rumorosità
| Idle |
| 23.3 / 23.3 / 23.3 dB(A) |
| Sotto carico |
| 25.1 / 34 dB(A) |
 | ||
30 dB silenzioso 40 dB(A) udibile 50 dB(A) rumoroso |
||
min: | ||
| Lenovo ThinkPad T16 G1 21BWS00200 Iris Xe G7 80EUs, i5-1240P, Samsung PM9A1 MZVL2512HCJQ | Lenovo ThinkPad T15 Gen2-20W5S00100 GeForce MX450, i7-1165G7, Samsung PM981a MZVLB1T0HBLR | Lenovo ThinkPad E15 G3-20YG003UGE Vega 8, R7 5700U, SK Hynix PC711 1TB HFS001TDE9X084N | Lenovo ThinkPad L15 G2 AMD Vega 7, R5 5600U, SK Hynix HFS512 GDE9X081N | HP ProBook 450 G9 6A180EA Iris Xe G7 96EUs, i7-1255U, SK Hynix HFM512GD3JX013N | HP ZBook Power 15 G8 313S5EA T600 Laptop GPU, i7-11800H, Samsung PM9A1 MZVL2512HCJQ | Dell Inspiron 16 Plus 7620 GeForce RTX 3050 Ti Laptop GPU, i7-12700H, Kioxia BG5 KBG50ZNS512G | Huawei MateBook D 16 2022 Iris Xe G7 96EUs, i7-12700H, Silicon Motion PCIe-8 SSD | Asus Vivobook Pro 16X-M7600QE GeForce RTX 3050 Ti Laptop GPU, R9 5900HX, SK Hynix HFM001TD3JX013N | |
|---|---|---|---|---|---|---|---|---|---|
| Noise | -12% | -10% | -4% | -5% | -33% | -34% | -21% | -27% | |
| off /ambiente * (dB) | 23.3 | 24.2 -4% | 23.8 -2% | 24.22 -4% | 25.5 -9% | 25.54 -10% | 23.3 -0% | 24.2 -4% | 26 -12% |
| Idle Minimum * (dB) | 23.3 | 24.2 -4% | 23.8 -2% | 24.22 -4% | 25.5 -9% | 25.54 -10% | 25.7 -10% | 24.2 -4% | 27 -16% |
| Idle Average * (dB) | 23.3 | 24.2 -4% | 23.8 -2% | 24.22 -4% | 25.5 -9% | 25.54 -10% | 26.1 -12% | 25.8 -11% | 27 -16% |
| Idle Maximum * (dB) | 23.3 | 24.2 -4% | 28 -20% | 24.22 -4% | 25.5 -9% | 25.54 -10% | 30.6 -31% | 30.5 -31% | 27.5 -18% |
| Load Average * (dB) | 25.1 | 34.5 -37% | 32.9 -31% | 25.84 -3% | 28 -12% | 48.85 -95% | 46.2 -84% | 39.8 -59% | 41.7 -66% |
| Witcher 3 ultra * (dB) | 32.1 | 37.6 -17% | 46.58 -45% | 49.2 -53% | 39.8 -24% | ||||
| Load Maximum * (dB) | 34 | 37.6 -11% | 35 -3% | 36.02 -6% | 27.7 19% | 50.98 -50% | 49.4 -45% | 39.8 -17% | 45.3 -33% |
* ... Meglio usare valori piccoli
Temperatura
Il ThinkPad T16 rimane fresco nella maggior parte degli scenari, riscaldandosi in modo normale solo in caso di carico prolungato. Non si nota molto nell'area della tastiera, ma solo al di sopra di essa e anche in questo caso non si sente troppo caldo per molto tempo. Il lato inferiore rimane generalmente più fresco, per cui è possibile utilizzare il ThinkPad T16 sulle ginocchia.
Il diretto predecessore e anche il ThinkPad E15si riscaldano molto di più, con un massimo di 55 °C e 60 °C, rispettivamente, sul fondo. Lo ZBook Power 15 e Vivobook Pro 16Xinvece, rimangono ugualmente freschi.
(±) La temperatura massima sul lato superiore è di 45 °C / 113 F, rispetto alla media di 34.3 °C / 94 F, che varia da 21.2 a 62.5 °C per questa classe Office.
(±) Il lato inferiore si riscalda fino ad un massimo di 42.8 °C / 109 F, rispetto alla media di 36.8 °C / 98 F
(+) In idle, la temperatura media del lato superiore è di 30.4 °C / 87 F, rispetto alla media deld ispositivo di 29.5 °C / 85 F.
(±) Riproducendo The Witcher 3, la temperatura media per il lato superiore e' di 35.9 °C / 97 F, rispetto alla media del dispositivo di 29.5 °C / 85 F.
(+) I poggiapolsi e il touchpad raggiungono la temperatura massima della pelle (33.4 °C / 92.1 F) e quindi non sono caldi.
(-) La temperatura media della zona del palmo della mano di dispositivi simili e'stata di 27.5 °C / 81.5 F (-5.9 °C / -10.6 F).
| Lenovo ThinkPad T16 G1 21BWS00200 Intel Core i5-1240P, Intel Iris Xe Graphics G7 80EUs | Lenovo ThinkPad T15 Gen2-20W5S00100 Intel Core i7-1165G7, NVIDIA GeForce MX450 | Lenovo ThinkPad E15 G3-20YG003UGE AMD Ryzen 7 5700U, AMD Radeon RX Vega 8 (Ryzen 4000/5000) | Lenovo ThinkPad L15 G2 AMD AMD Ryzen 5 5600U, AMD Radeon RX Vega 7 | HP ProBook 450 G9 6A180EA Intel Core i7-1255U, Intel Iris Xe Graphics G7 96EUs | HP ZBook Power 15 G8 313S5EA Intel Core i7-11800H, NVIDIA T600 Laptop GPU | Dell Inspiron 16 Plus 7620 Intel Core i7-12700H, NVIDIA GeForce RTX 3050 Ti Laptop GPU | Huawei MateBook D 16 2022 Intel Core i7-12700H, Intel Iris Xe Graphics G7 96EUs | Asus Vivobook Pro 16X-M7600QE AMD Ryzen 9 5900HX, NVIDIA GeForce RTX 3050 Ti Laptop GPU | |
|---|---|---|---|---|---|---|---|---|---|
| Heat | 8% | -2% | 6% | -1% | 16% | 3% | 5% | 11% | |
| Maximum Upper Side * (°C) | 45 | 42.2 6% | 46.4 -3% | 42.8 5% | 40.5 10% | 41.4 8% | 46 -2% | 41.8 7% | 39.4 12% |
| Maximum Bottom * (°C) | 42.8 | 55.1 -29% | 60.9 -42% | 46 -7% | 47.6 -11% | 41.5 3% | 45.8 -7% | 47.3 -11% | 43.6 -2% |
| Idle Upper Side * (°C) | 33 | 23.8 28% | 26.5 20% | 26.9 18% | 32.6 1% | 23.8 28% | 29.2 12% | 28.3 14% | 27.6 16% |
| Idle Bottom * (°C) | 33.6 | 25.1 25% | 27.5 18% | 31.1 7% | 34.2 -2% | 25 26% | 31 8% | 30.2 10% | 27.5 18% |
* ... Meglio usare valori piccoli
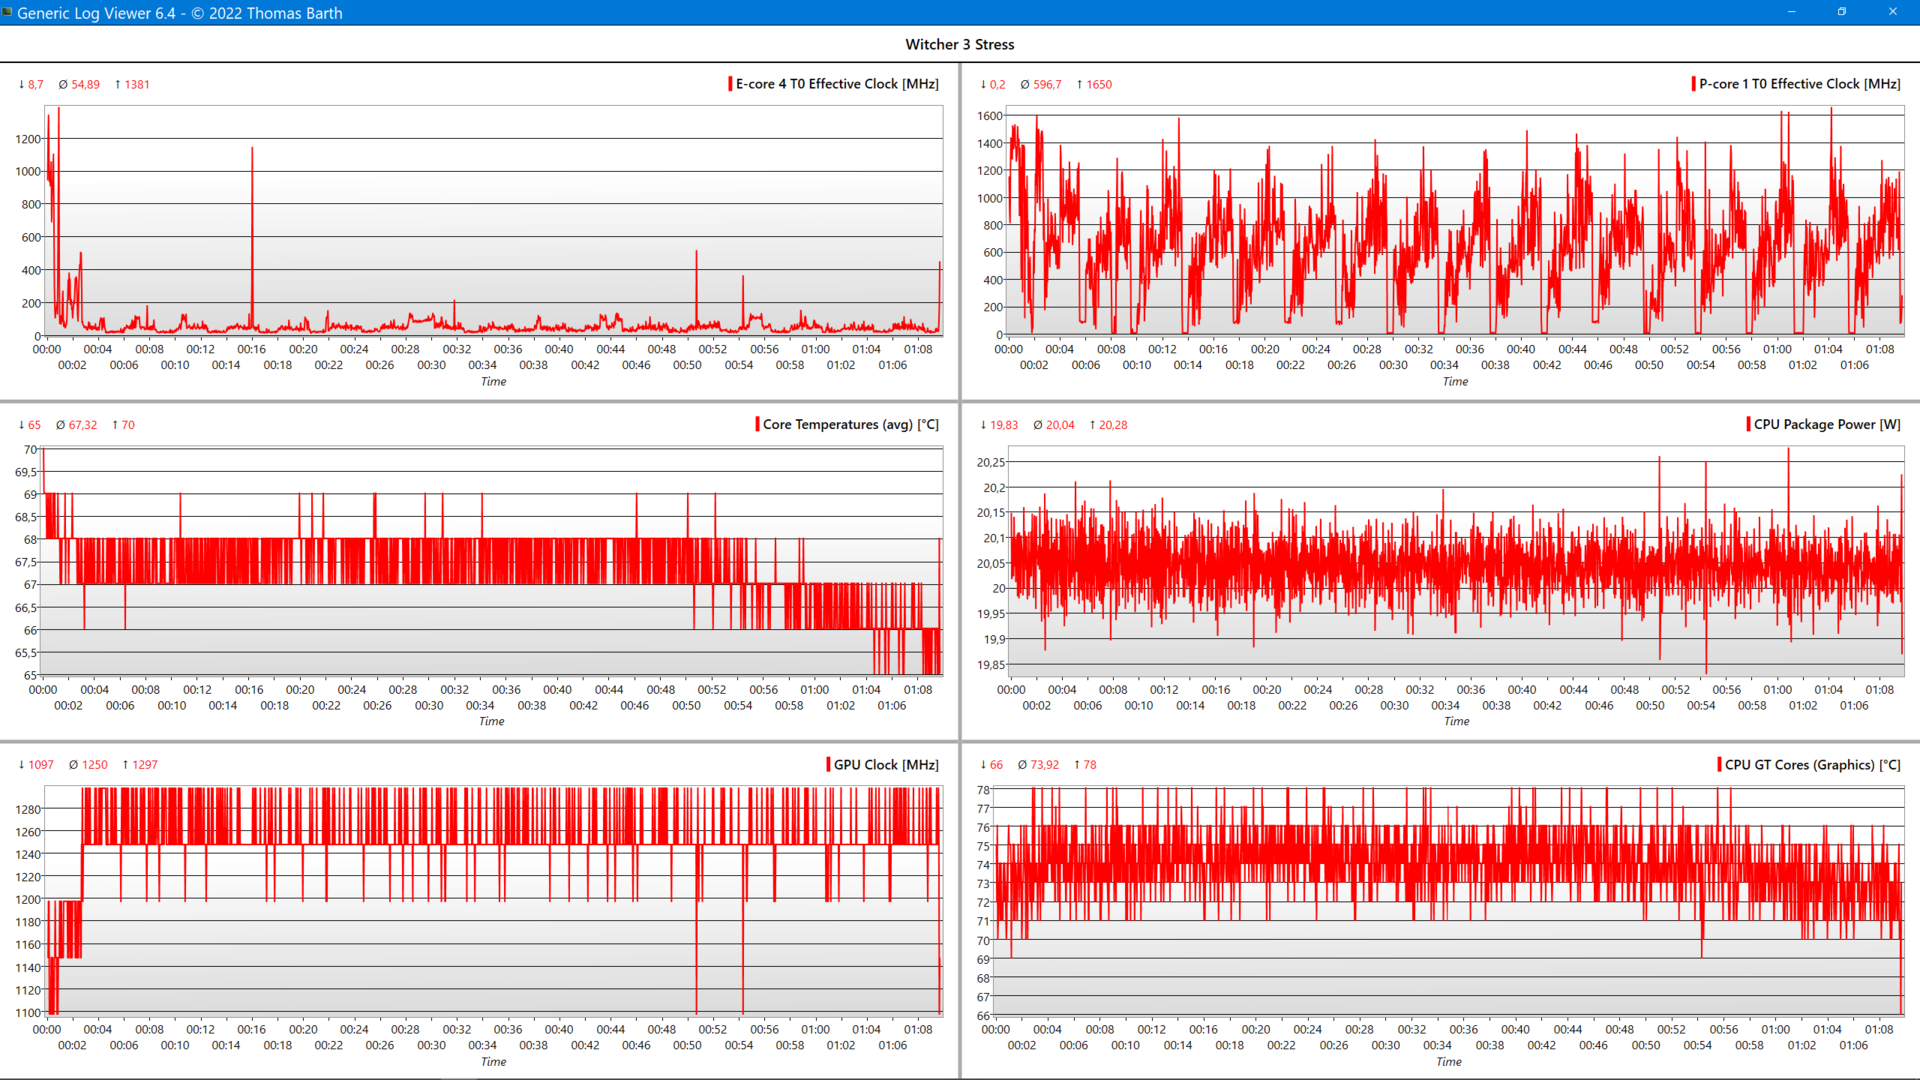
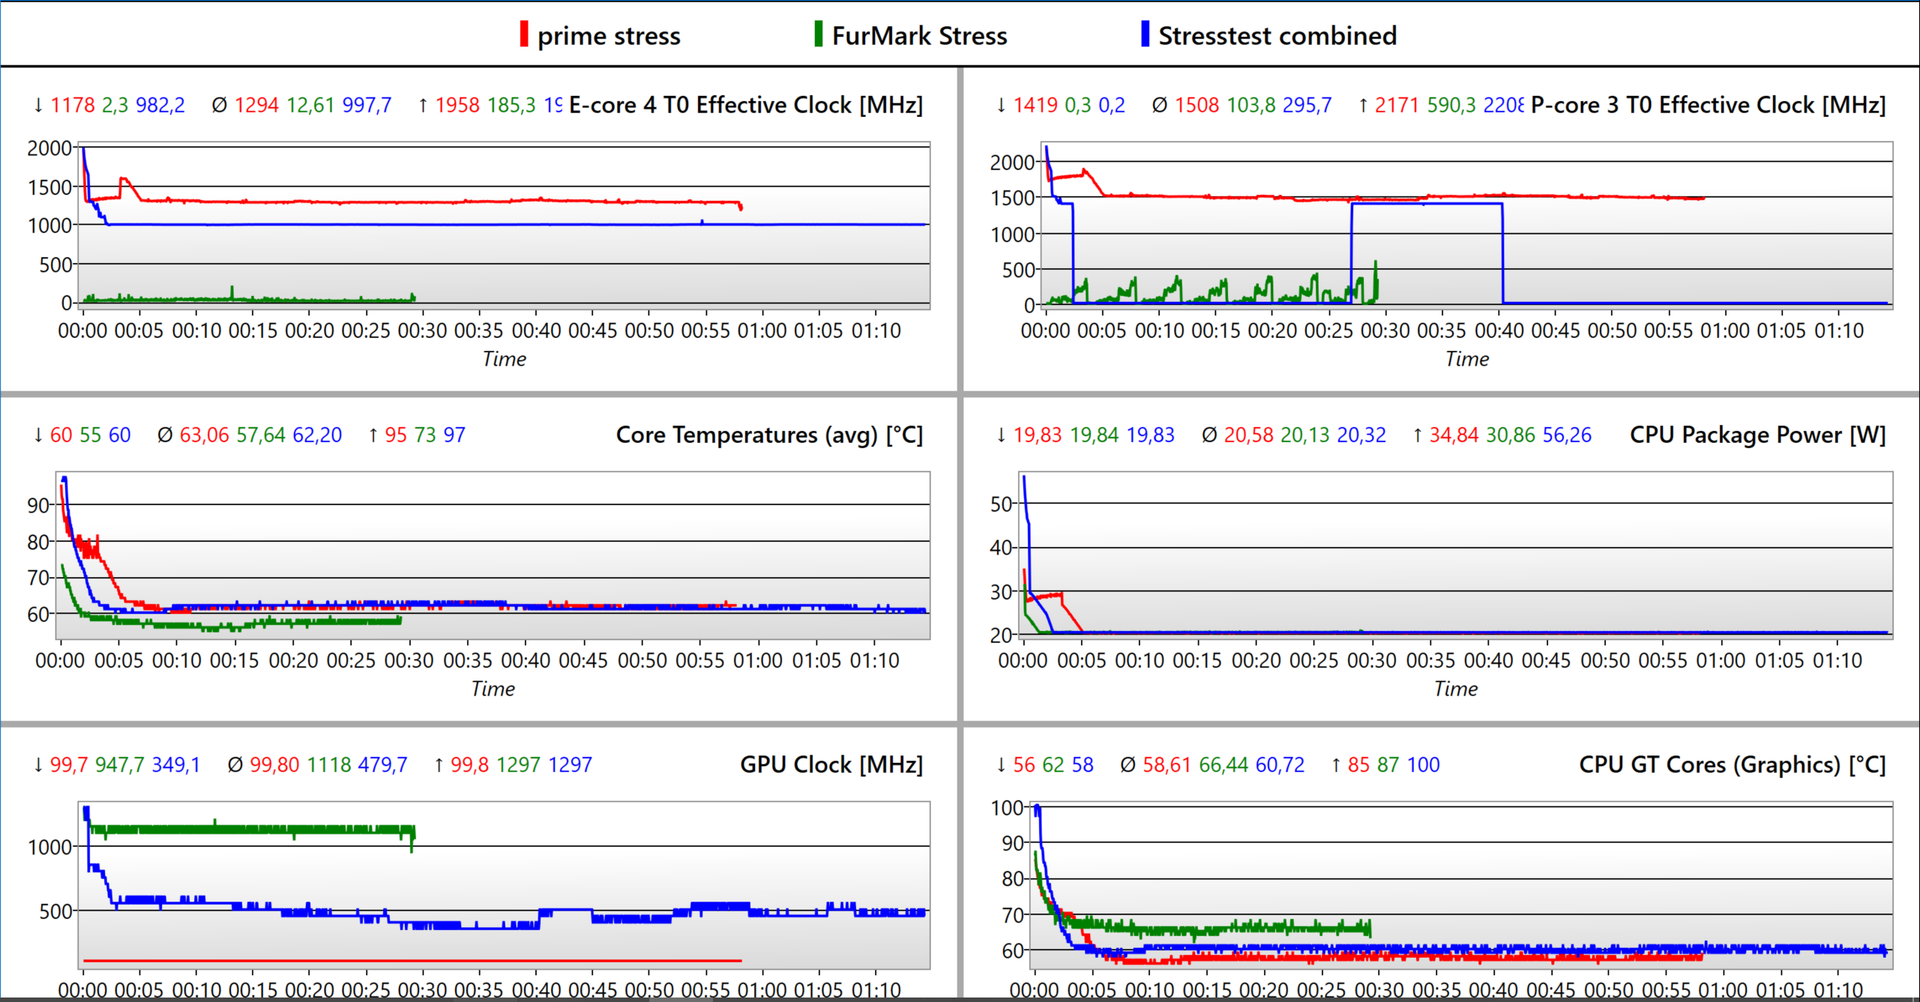
Test di stress
Sotto carico combinato (Prime95+FurMark), i core P sono scesi da 2,2 a 1,4 GHz dopo poco tempo, leggermente al di sotto del clock di base di 1,7 GHz. Uno dei core (P-Core 0) sembra essere disattivato per la maggior parte del tempo (0 MHz). La temperatura scende dai 95 °C iniziali a 62 °C stabili. La iGPU passa da 1300 MHz a 480 MHz a 61 °C. Ancora una volta, il problema è il limite di potenza impostato di 20 watt.
In condizioni di puro stress della CPU, anche i core P non raggiungono il clock di base, ma si attestano a 1,5 GHz (tutti i core attivi). Solo quando la iGPU è sotto stress, riesce a raggiungere 1.118 MHz a 66 °C.
| Clock CPU P- & E-Cores (GHz) | Clock GPU (MHz) | Temperatura media CPU (°C) | Temperatura media GPU (°C) | |
| Sistema inattivo | - | 100 | 34 | 36 |
| Prime95 + FurMark Stress | 1,4 / 1 | 480 | 62 | 61 |
| Prime95 Stress | 1,5 / 1,3 | 100 | 63 | 58 |
| FurMark Stress | 0,1 / 0,01 | 1.120 | 58 | 66 |
| Witcher 3 Stress | 0,6 / 0,05 | 1.250 | 67 | 74 |
Altoparlanti
Fortunatamente, i diffusori della serie T sono stati migliorati. I bassi sono ancora assenti, ma i medi e gli alti sono bilanciati e riprodotti in modo lineare.
Questo è accettabile per film e video, ma l'ascolto della musica è possibile solo con un sistema audio esterno o con cuffie collegate tramite jack o Bluetooth. Con un massimo di 75 dB(A), è possibile riempire di suono una stanza di medie dimensioni.
Lenovo ThinkPad T16 G1 21BWS00200 analisi audio
(±) | potenza degli altiparlanti media ma buona (75.16 dB)
Bassi 100 - 315 Hz
(-) | quasi nessun basso - in media 20.5% inferiori alla media
(-) | bassi non lineari (15.5% delta rispetto alla precedente frequenza)
Medi 400 - 2000 Hz
(+) | medi bilanciati - solo only 2.3% rispetto alla media
(+) | medi lineari (4.1% delta rispetto alla precedente frequenza)
Alti 2 - 16 kHz
(+) | Alti bilanciati - appena 3.2% dalla media
(+) | alti lineari (5.5% delta rispetto alla precedente frequenza)
Nel complesso 100 - 16.000 Hz
(±) | la linearità complessiva del suono è media (17% di differenza rispetto alla media
Rispetto alla stessa classe
» 24% di tutti i dispositivi testati in questa classe è stato migliore, 8% simile, 69% peggiore
» Il migliore ha avuto un delta di 7%, medio di 21%, peggiore di 53%
Rispetto a tutti i dispositivi testati
» 30% di tutti i dispositivi testati in questa classe è stato migliore, 8% similare, 62% peggiore
» Il migliore ha avuto un delta di 4%, medio di 24%, peggiore di 134%
Huawei MateBook D 16 2022 analisi audio
(±) | potenza degli altiparlanti media ma buona (76 dB)
Bassi 100 - 315 Hz
(-) | quasi nessun basso - in media 17.7% inferiori alla media
(±) | la linearità dei bassi è media (9.8% delta rispetto alla precedente frequenza)
Medi 400 - 2000 Hz
(+) | medi bilanciati - solo only 1.9% rispetto alla media
(+) | medi lineari (5.6% delta rispetto alla precedente frequenza)
Alti 2 - 16 kHz
(+) | Alti bilanciati - appena 4.4% dalla media
(+) | alti lineari (3.1% delta rispetto alla precedente frequenza)
Nel complesso 100 - 16.000 Hz
(±) | la linearità complessiva del suono è media (16.2% di differenza rispetto alla media
Rispetto alla stessa classe
» 41% di tutti i dispositivi testati in questa classe è stato migliore, 7% simile, 51% peggiore
» Il migliore ha avuto un delta di 5%, medio di 17%, peggiore di 45%
Rispetto a tutti i dispositivi testati
» 26% di tutti i dispositivi testati in questa classe è stato migliore, 6% similare, 68% peggiore
» Il migliore ha avuto un delta di 4%, medio di 24%, peggiore di 134%
Gestione dell'alimentazione - Batteria da 14 ore nel ThinkPad da 16 pollici
Consumo di energia
Abbiamo misurato un consumo energetico in idle di ~6 watt e un consumo minimo di 2,9 watt. Il nostro campo di confronto, compresi i derivati AMD, non ha nulla da invidiare a questo. Sotto carico, abbiamo misurato una media di 27,9 watt, un valore dovuto alla CPU strozzata. Il carico combinato (CPU+iGPU) risulta di 42,6 watt.
I picchi di potenza fino a 90 watt, causati dal turbo a breve termine, possono essere assorbiti bene dall'adattatore di alimentazione da 135 W. Inoltre, l'adattatore di alimentazione consente di utilizzare le grandi dimensioni della CPU e della GPU. Inoltre, l'alimentatore consente di caricare rapidamente la grande batteria da 86 Wh all'80% in un'ora. Resta da chiedersi se un alimentatore da 100 watt, che sarebbe un po' più compatto e viene offerto con la versione AMD, sarebbe altrettanto efficace.
| Off / Standby | |
| Idle | |
| Sotto carico |
|
Leggenda:
min: | |
| Lenovo ThinkPad T16 G1 21BWS00200 i5-1240P, Iris Xe G7 80EUs, Samsung PM9A1 MZVL2512HCJQ, IPS, 1920x1200, 16" | Lenovo ThinkPad T15 Gen2-20W5S00100 i7-1165G7, GeForce MX450, Samsung PM981a MZVLB1T0HBLR, IPS, 1920x1080, 15.6" | Lenovo ThinkPad X1 Extreme G4-20Y5CTO1WW (3050 Ti) i7-11800H, GeForce RTX 3050 Ti Laptop GPU, Samsung PM9A1 MZVL21T0HCLR, IPS LED, 3840x2400, 16" | HP ProBook 450 G9 6A180EA i7-1255U, Iris Xe G7 96EUs, SK Hynix HFM512GD3JX013N, , 1920x1080, 15.6" | HP ZBook Power 15 G8 313S5EA i7-11800H, T600 Laptop GPU, Samsung PM9A1 MZVL2512HCJQ, IPS LED, 1920x1080, 15.6" | Huawei MateBook D 16 2022 i7-12700H, Iris Xe G7 96EUs, Silicon Motion PCIe-8 SSD, IPS, 1920x1200, 16" | Dell Inspiron 16 Plus 7620 i7-12700H, GeForce RTX 3050 Ti Laptop GPU, Kioxia BG5 KBG50ZNS512G, IPS, 3072x1920, 16" | Lenovo ThinkPad L15 G2 AMD R5 5600U, Vega 7, SK Hynix HFS512 GDE9X081N, IPS LED, 1920x1080, 15.6" | Media della classe Office | |
|---|---|---|---|---|---|---|---|---|---|
| Power Consumption | -44% | -210% | -8% | -55% | -70% | -151% | -14% | -27% | |
| Idle Minimum * (Watt) | 2.9 | 4.5 -55% | 10.3 -255% | 4.5 -55% | 4.17 -44% | 6.1 -110% | 6.8 -134% | 4.57 -58% | 4.4 ? -52% |
| Idle Average * (Watt) | 6 | 8.8 -47% | 22.06 -268% | 7.3 -22% | 6.32 -5% | 10.6 -77% | 9.6 -60% | 8.2 -37% | 7.32 ? -22% |
| Idle Maximum * (Watt) | 6.9 | 11.6 -68% | 23 -233% | 8.1 -17% | 7.1 -3% | 11.5 -67% | 17 -146% | 9.3 -35% | 8.56 ? -24% |
| Load Average * (Watt) | 27.3 | 60 -120% | 102.57 -276% | 32.8 -20% | 80.41 -195% | 65.5 -140% | 117.5 -330% | 31.9 -17% | 42.5 ? -56% |
| Witcher 3 ultra * (Watt) | 42.6 | 39.2 8% | 106 -149% | 32 25% | 62.3 -46% | 61.2 -44% | 113.1 -165% | 34.5 19% | |
| Load Maximum * (Watt) | 81.53 | 68.5 16% | 147.8 -81% | 47 42% | 110.18 -35% | 68.4 16% | 137.4 -69% | 47.4 42% | 64.1 ? 21% |
* ... Meglio usare valori piccoli
Power consumption Witcher 3 / Stress test
Power consumption with an external monitor
Durata della batteria
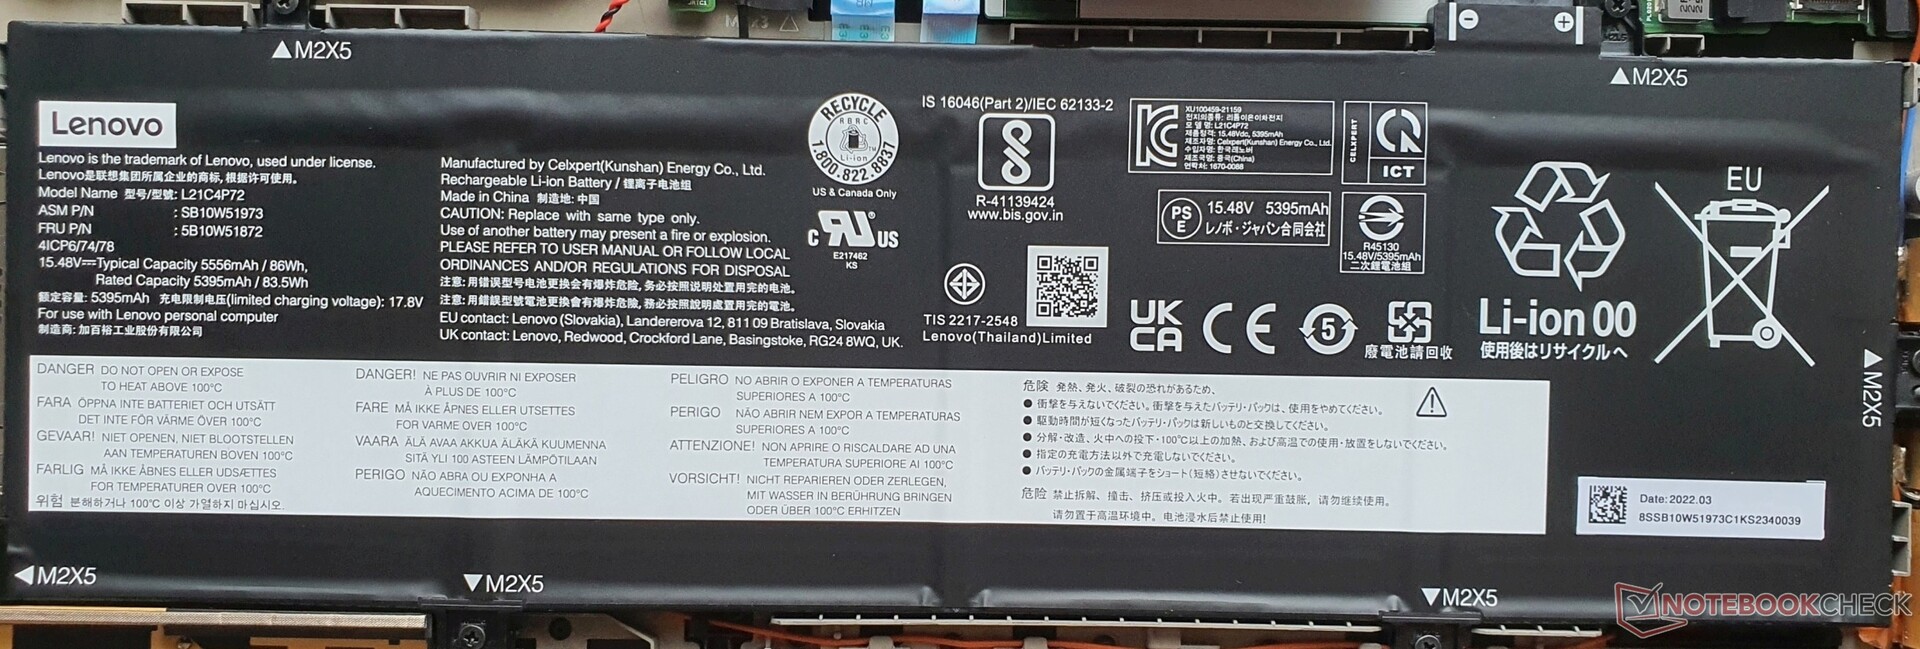
Nonostante l'ampia batteria da 86 Wh del nostro modello, non ci aspettavamo che il test WLAN durasse più di 14 ore. Abbiamo utilizzato uno script che simula la navigazione web a 150 nit fissi, utilizzando il profilo energetico "Bilanciato" di Windows. IlCore i5-1240P sembra essere più economico del Core i7-1280Pprobabilmente perché quest'ultimo ha un maggior numero di core P. Anche il display a basso consumo con risoluzione FHD+ ha un effetto positivo, soprattutto alla massima luminosità di 390 nits, dove il ThinkPad raggiunge quasi le 11 ore.
Una prospettiva interessante è quella di vedere se una variante AMD del T16 sarà in grado di offrire ancora di più. Il tempo di funzionamento a pieno carico di 3,5 ore è relativamente lungo a causa del basso limite di potenza di 20 watt.
| Lenovo ThinkPad T16 G1 21BWS00200 i5-1240P, Iris Xe G7 80EUs, 86 Wh | Lenovo ThinkPad T15 Gen2-20W5S00100 i7-1165G7, GeForce MX450, 57 Wh | Lenovo ThinkPad E15 G3-20YG003UGE R7 5700U, Vega 8, 57 Wh | Lenovo ThinkPad L15 G2 AMD R5 5600U, Vega 7, 45 Wh | HP ProBook 450 G9 6A180EA i7-1255U, Iris Xe G7 96EUs, 51 Wh | HP ZBook Power 15 G8 313S5EA i7-11800H, T600 Laptop GPU, 83 Wh | Dell Inspiron 16 Plus 7620 i7-12700H, GeForce RTX 3050 Ti Laptop GPU, 86 Wh | Huawei MateBook D 16 2022 i7-12700H, Iris Xe G7 96EUs, 60 Wh | Asus Vivobook Pro 16X-M7600QE R9 5900HX, GeForce RTX 3050 Ti Laptop GPU, 96 Wh | |
|---|---|---|---|---|---|---|---|---|---|
| Autonomia della batteria | -44% | -29% | -45% | -17% | -19% | -49% | -50% | -45% | |
| H.264 (h) | 10.4 | 10.1 -3% | |||||||
| WiFi v1.3 (h) | 14.1 | 7.9 -44% | 10 -29% | 7.8 -45% | 10.1 -28% | 12.3 -13% | 9.6 -32% | 7.1 -50% | 11.3 -20% |
| Load (h) | 3.5 | 3.3 -6% | 2.1 -40% | 1.2 -66% | 1.1 -69% | ||||
| Witcher 3 ultra (h) | 2.7 |
Pro
Contro
Verdetto - ThinkPad T16: display potente, tempi di esecuzione lunghi, prestazioni limitate

Il ThinkPad T16 G1 Intel offre molto: un display luminoso da 16 pollici in formato 16:10 a basso consumo, una batteria di lunghissima durata, un equipaggiamento vario e un funzionamento per lo più silenzioso. A tutto questo si aggiunge un robusto design di fascia alta
Una riprogettazione complessivamente riuscita, nonostante la corsa più breve dei tasti e la mancanza dell'opzione 4K. La limitazione PL1 di 20 watt è un po' fastidiosa e limita inutilmente le prestazioni altrimenti buone
Con il ThinkPad T16 G1, Lenovo offre un solido notebook business con una batteria di lunghissima durata, un luminoso display 16:10 a basso consumo e basse emissioni. Tuttavia, il throttling della CPU potrebbe rivelarsi problematico al di fuori delle attività d'ufficio.
Per gli utenti business che cercano un dispositivo compatto con un'ampia superficie dello schermo e una lunga durata della batteria, il T16 sembra non avere rivali per quanto riguarda la tastiera, le funzioni e la silenziosità. La recensione dell'EliteBook 865 G9 di HP, di prossima pubblicazione, è quindi una prospettiva interessante. Altrettanto interessante sarà il confronto con la variante AMD del T16, che ha il potenziale per offrire maggiori prestazioni con emissioni ancora più basse e tempi di esecuzione ancora più elevati, ma questo resta da vedere in una futura recensione
Chi ha bisogno di una GPU per workstation dovrebbe dare un'occhiata allo ZBook Power 15. Coloro che non hanno bisogno del meglio del meglio troveranno un miglior rapporto prezzo-prestazioni nel modello ThinkPad E15 AMDche costa più del doppio
Prezzo e disponibilità
Il portatile Lenovo ThinkPad T16 G1 Intel sembra essere ampiamente disponibile come portatile liberamente configurabile tramite il sito Web ufficiale di Lenovo. Ad esempio, abbiamo trovato il portatile su negli USA (a partire da 1.099,50 dollari), nel Regno Unito (1.169,99 sterline), India (₹97.185), Francia (1.427,25 €), Singapore (SG$1.494,58) e Australia (2.229,00 DOLLARI AUSTRALIANI). Questo elenco non è esaustivo.
I prezzi sono aggiornati al 23.09.22 e sono soggetti a modifiche
Lenovo ThinkPad T16 G1 21BWS00200
- 09/21/2022 v7 (old)
Marvin Gollor
Price comparison

