Recensioni Notebook con NVIDIA GeForce RTX 2050 Mobile la scheda grafica
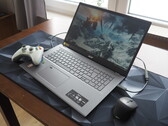
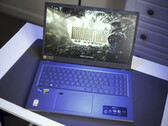
Recensione del portatile Acer Aspire 17 2024: Una dGPU debole e un display deludente
Al giorno d'oggi, le schede grafiche dedicate entry-level e di fascia media vengono sempre più messe da parte dai chip integrati. Abbiamo effettuato un test pratico e abbiamo messo a confronto la Nvidia GeForce RTX 2050 dell'Acer Aspire 17 con gli attuali modelli di iGPU di Intel e AMD.
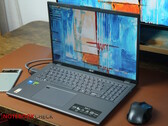
Intel Core 7 150U, NVIDIA GeForce RTX 2050 Mobile, 17.3", 2.2 kgRecensione dell'Acer Aspire 16 2024: Multimediale tuttofare senza uno schermo degno di essere usato per la multimedialità
Al prezzo di 899 euro, il modello 2024 Aspire 16 A16-51GM-77G2 accoppia il Core 7 150U a basso consumo e di generazione attuale con la vecchia RTX 2050. Il portatile è destinato a essere un portatile multimediale economico a tutto tondo. In questa recensione, discuteremo se Acer riesce a raggiungere questo obiettivo.
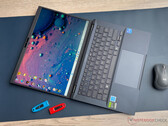
Intel Core 7 150U, NVIDIA GeForce RTX 2050 Mobile, 16", 1.9 kgRecensione dell'Asus ExpertBook B3: Il potente portatile da ufficio con autonomia di 11 ore
L'ExpertBook B3 vanta emissioni moderate, lunghi tempi di esecuzione, due slot per la RAM, molta potenza di calcolo e Thunderbolt 4. Grazie alla RTX 2050 di GeForce, il laptop da 14 pollici è ben equipaggiato per le attività e i giochi che richiedono una GPU. Positivo: Asus offre questo dispositivo con una garanzia di tre anni.
Intel Core i7-1355U, NVIDIA GeForce RTX 2050 Mobile, 14", 1.7 kgRecensione dell'HP ProBook 450 G10: la potenza della GeForce RTX in un laptop da ufficio
Il laptop business di HP vanta emissioni ridotte, lunghi tempi di esecuzione, due slot RAM e ottimi dispositivi di input. Grazie alla RTX 2050 di GeForce, il dispositivo è anche in grado di svolgere compiti impegnativi per la GPU. I prezzi partono da circa 750 dollari.
Intel Core i7-1355U, NVIDIA GeForce RTX 2050 Mobile, 15.6", 1.8 kgRecensione dell'Acer Aspire 5 A515-58GM: Il portatile per l'ufficio con una GPU gaming
L'Acer Aspire 5 (2023) è un portatile da ufficio venduto a un prezzo molto più alto grazie alla GPU RTX 2050 installata per i giochi. In questa recensione dettagliata, potete leggere se questa ricetta ha dato vita a un prodotto allrounder degno di nota. Di certo si può contare su due banchi di RAM, Thunderbolt 4 e numerosi miglioramenti rispetto al suo predecessore.
Intel Core i7-1355U, NVIDIA GeForce RTX 2050 Mobile, 15.6", 1.8 kgHP Envy 17-cr0079ng: Intel Core i7-1255U, 17.30", 2.6 kg
recensione » Recensione del portatile HP Envy 17: GeForce La GPU lavora sull'elegante display 4K del portatile multimediale
LG Gram 17Z90Q-E.AD78G: Intel Core i7-1260P, 17.00", 1.4 kg
recensione » Recensione dell'LG Gram 17 - Un portatile da 17 pollici superleggero con una modesta dGPU
Acer Aspire 5 A515-57G-53N8: Intel Core i5-1240P, 15.60", 1.8 kg
recensione » Recensione del portatile Acer Aspire 5 A515-57G: qualche debolezza con la RTX 2050
Lenovo ThinkBook 16 G4+ IAP: Intel Core i7-12700H, 16.00", 1.8 kg
recensione » Recensione del Lenovo ThinkBook 16 G4+: Un buon portatile multimediale con molta potenza
Honor MagicBook 14 2022: Intel Core i5-12500H, 14.00", 1.6 kg
recensione » Recensione dell'Honor MagicBook 14 2022: Laptop multimediale con RTX 2050
Acer Aspire 17 A17-51GM-70LZ: Intel Core 7 150U, 17.30", 2.2 kg
Recensioni esterne » Acer Aspire 17 A17-51GM-70LZ
Asus TUF Gaming A15 FA507NFR: AMD Ryzen 7 7435HS, 15.60", 2.3 kg
Recensioni esterne » Asus TUF Gaming A15 FA507NFR
Acer Nitro Lite 16 NL16-71G, RTX 2050 : Intel Core i7-13620H, 16.00", 1.9 kg
Recensioni esterne » Acer Nitro Lite 16 NL16-71G, RTX 2050
Acer Nitro V 15 ANV15-51, RTX 2050: Intel Core i5-13420H, 15.60", 2.1 kg
Recensioni esterne » Acer Nitro V 15 ANV15-51, RTX 2050
Acer Nitro V15 ANV15-41, RTX 2050: AMD Ryzen 5 7535HS, 15.60", 2.1 kg
Recensioni esterne » Acer Nitro V15 ANV15-41, RTX 2050
Acer Aspire 16 A16-51GM-77G2: Intel Core 7 150U, 16.00", 1.9 kg
Recensioni esterne » Acer Aspire 16 A16-51GM-77G2
Asus Vivobook 14X K3405ZF: Intel Core i5-12500H, 14.50", 1.4 kg
Recensioni esterne » Asus Vivobook 14X K3405ZF
Asus ExpertBook B3 B3604CVF: Intel Core i7-1355U, 16.00", 2 kg
Recensioni esterne » Asus ExpertBook B3 B3604CVF
Asus ExpertBook B5 B5404CVF: Intel Core i7-1355U, 14.00", 1.7 kg
Recensioni esterne » Asus ExpertBook B5 B5404CVF
Asus VivoBook 16X K3605ZF, i5-12450H: Intel Core i5-12450H, 16.00", 1.8 kg
Recensioni esterne » Asus VivoBook 16X K3605ZF, i5-12450H
Dell Inspiron 16 5630: Intel Core i7-1360P, 16.00", 1.9 kg
Recensioni esterne » Dell Inspiron 16 5630
HP Victus 15-fb1000AX: AMD Ryzen 5 7535HS, 15.60", 2.3 kg
Recensioni esterne » HP Victus 15-fb1000AX
Lenovo Ideapad Gaming 3 15ACH16, R5 5500H RTX 2050: unknown, 15.60", 2.3 kg
Recensioni esterne » Lenovo Ideapad Gaming 3 15ACH16, R5 5500H RTX 2050
MSI GF63 Thin 12UCX: Intel Core i7-12650H, 15.60", 1.9 kg
Recensioni esterne » MSI GF63 Thin 12UCX
HP Victus 15-fa1100tx: Intel Core i5-12450H, 15.60", 2.3 kg
Recensioni esterne » HP Victus 15-fa1100tx
Asus VivoBook 16X K3605ZF: Intel Core i7-12650H, 16.00", 1.8 kg
Recensioni esterne » Asus VivoBook 16X K3605ZF
Medion Erazer Crawler E30e: Intel Core i5-12450H, 15.60", 2 kg
Recensioni esterne » Medion Erazer Crawler E30e
Acer Aspire 5 A515-58GM, i7-1355U: Intel Core i7-1355U, 15.60", 1.8 kg
Recensioni esterne » Acer Aspire 5 A515-58GM, i7-1355U
Acer Aspire 7 A715-76G, i5-12450H RTX 2050: Intel Core i5-12450H, 15.60", 2.1 kg
Recensioni esterne » Acer Aspire 7 A715-76G, i5-12450H RTX 2050
Acer Aspire 5 A515-58GM: Intel Core i5-13420H, 15.60", 1.7 kg
Recensioni esterne » Acer Aspire 5 A515-58GM
Asus TUF Gaming F17 FX706HF: Intel Core i5-11400H, 17.30", 2.6 kg
Recensioni esterne » Asus TUF Gaming F17 FX706HF
HP Pavilion Plus 14-eh1299nr: Intel Core i7-1355U, 14.50", 1.4 kg
Recensioni esterne » HP Pavilion Plus 14-eh1299nr
Asus TUF Gaming F15 FX506HF: Intel Core i5-11400H, 15.60", 2.3 kg
Recensioni esterne » Asus TUF Gaming FX506HF
LG Gram 17Z90Q-E.AD78G: Intel Core i7-1260P, 17.00", 1.4 kg
Recensioni esterne » LG Gram 17Z90Q-E.AD78G
HP Envy 17-cr0079ng: Intel Core i7-1255U, 17.30", 2.6 kg
Recensioni esterne » HP Envy 17-cr0079ng
HP Pavilion Plus 14-eh0032TX: Intel Core i7-1255U, 14.00", 1.4 kg
Recensioni esterne » HP Pavilion Plus 14-eh0032TX
HP Envy x360 15-ew0170nd: Intel Core i7-1255U, 15.60", 1.7 kg
Recensioni esterne » HP Envy x360 15-ew0170nd
Lenovo Ideapad 5 Pro 14IAP7, i7-1260P RTX 2050: Intel Core i7-1260P, 14.00", 1.4 kg
Recensioni esterne » Lenovo Ideapad 5 Pro 14IAP7, i7-1260P RTX 2050
HP Pavilion Plus 14-eh0001nf: Intel Core i7-1255U, 14.00", 1.4 kg
Recensioni esterne » HP Pavilion Plus 14-eh0001nf
Honor MagicBook 14 2022: Intel Core i5-12500H, 14.00", 1.6 kg
Recensioni esterne » Honor MagicBook 14 2022
Acer Aspire 5 A515-57G-705U: Intel Core i7-1260P, 15.60", 1.8 kg
Recensioni esterne » Acer Aspire 5 A515-57G-705U
Lenovo ThinkBook 16 G4+ IAP: Intel Core i7-12700H, 16.00", 1.8 kg
Recensioni esterne » Lenovo ThinkBook 16 G4+ IAP
Xiaomi RedmiBook Pro 15 2022, i7 RTX 2050: Intel Core i7-12650H, 15.60", 1.8 kg
Recensioni esterne » Xiaomi RedmiBook Pro 15 2022, i7 RTX 2050
LG Gram 17Z90Q-E.AD78G: Intel Core i7-1260P, 17.00", 1.4 kg
» Test a lungo termine di LG Gram 17: Due anni con il gigante leggero
Xiaomi RedmiBook Pro 15 2022, i7 RTX 2050: Intel Core i7-12650H, 15.60", 1.8 kg
» Xiaomi rinnova il RedmiBook Pro 15 2022 con una CPU più potente e una riduzione del prezzo